Embed Size (px)
Citation preview

Egypt. J. Plant Breed. 19 (2):355 –373 (2015)
GENETIC ANALYSIS IN THE F1 AND F2 WHEAT
GENERATIONS OF DIALLEL CROSSES
A.A.A. EL-Hosary1 and Gehan A. Nour El Deen
2
1- Department of Agronomy, Faculty of Agriculture, Benha University, Egypt.
2-Wheat Res. Dept., Field Crops Res. Institute, ARC, Egypt.
ABSTRACT Heterosis and nature of genetic effects on plant height and yield traits were
studied in a 6x6 diallel cross without reciprocals and their F2 generation in wheat to
define and select an efficient and prospective material for immediate use in hybridization
programs to improve grain yield of wheat in Egypt. Parents, F1 and F2 were evaluated
using a randomized complete block design (RCBD) with four replications for quantitative
traits in 2013/2014 season. Significant genotype mean squares and its components
(parents and crosses) were obtained for all traits in both generations. Significant
heterosis in F1 generation was obtained for all studied traits. The useful heterosis of
grain yield plant-1
relative to better parent varied from 9.65 to 29.88% in F1 crosses. The
P2xP3 and P4xP6 were the best crosses for grain yield heterosis. General (GCA) and
specific (SCA) combining ability mean squares were significant for all traits. MS (GCA)/
MS (SCA) ratios indicated the relative importance of additive and additive by additive
gene action in their inheritance for all the traits. The three parents P1, P4 and P5 gave
the highest positive significant ig effects for grain yield plant
-1 in both generations and
eleven crosses had significant and positive ijS
^
effects in the F1 crosses, where only seven
of them were significant and positive in F2 generation. The three crosses P2xP3, P4xP6
and P3xP4 showed significantly desirable heterotic effects for most studied traits.
Generally, there were no wide differences in the genetic parameters in F1 and F2
generations. Highly significant and larger (in magnitude) values of dominance
component (H1) than additive were obtained for all studied traits resulting in more
values of (H1/D)0.5
which were more than unity in both generations. High heritability
values (in a broad-sense) along with medium or low ones in narrow-sense were exhibited
in both generations, indicating that most genetic variances were due to non-additive
genetic effects. Number of spikes plant-1
and the 1000-grain weight in F1 and grain yield
plant-1
in F2, showed a complete dominance. Regression line intersects the Wr axis above
the origin in plant height in F1 and No. of spikes plant-1
and No. of grains spike-1
in F2,
reflecting partial dominance.
Key words: Wheat, Diallel analysis, Gene action, Combining ability.
INTRODUCTION
Wheat (Triticum aestivum L.) is the most important cereal crop in
Egypt. Increasing wheat production to narrowing the gap between
production and consumption is vital in Egypt. Big variation in wheat
productivity in different parts of the country should be reduced to achieve a
projected high productivity, through diversification of wheat breeding
programs and developing new set of wheat varieties with high yielding.
Heterosis is a complex phenomenon, which depends on the balance
of different combinations of gene effects as well as on the distribution of
plus and minus alleles in the parents of a mating system. In self-pollinated
crops, like wheat, the scope for utilization of heterosis depends mainly upon
the direction and magnitude of heterosis. Heterosis over better parent may

356
be useful in identifying the best crosses but these hybrids can be of immense
practical value if they involve the best cultivars of the area (Prasad et al
1998). Production of wheat hybrid seed is expensive and the economics of
the commercial production of hybrid wheat have not yet been worked out.
The economic feasibility would be considerably improved if sufficient
heterosis were retained in the F2 generation to render its production value.
The segregation that occurs in an F2 generation could, however, cause
problems. Further advancement in yield of this important species requires
adequate information regarding the nature of the combining ability of the
parents available in a wide array of genetic material to be used in the
hybridization programme and also the nature of gene action involved in the
expression of traits of economic importance. According to Arunachalam
(1976), Baker (1978), Esmail (2002), Joshi et al (2004), Hasnain et al
(2006) and Farooq et al (2010), the combining ability is a most reliable
biometrical tool to circumvent plant breeding programs. The diallel analysis
also provides a unique opportunity to test a number of lines in all possible
combinations. The present study is aimed at estimating heterosis in F1 and
comparing combining ability obtained from F2 crosses with those of F1
resulting from a set of diallel crosses for certain quantitative traits of wheat.
MATERIALS AND METHODS
Six parents of bread wheat were selected for this study representing
a wide range of variability. The code number, names and pedigree for the
genotypes are presented in Table 1.
Table 1. The code number, name and pedigree of the studied parental
bread wheat varieties and lines.
Pedigree Name Code
No.
Giza WBLL2/BRAMBLIN6 –
CGSS01B00062Z=0094=009Y-009M-0099M-0091-0099M-
73Y-0B.
Line 162 P1
KAUZ // ALTAR 84/ AOS. Giza 170 P2
Indus66 x Norteno"S"/PK 3418-65-ISW-0S Sakha 8 P3
Ina-RL4220x7C/yr'S' CM1540-25-65-0S Sakha 69 P4
WHEAR/ KUKUNA/WHEAR.
CGSS03B00070T-099Y-009M-009Y-009M-50WGY-0B Line 156 P5
BABAXILRY2//3ABAX2/3/VIVLTST
CGSS01B0046T-009Y-009M-009M-009Y-009M-30Y-0B. Line 159 P6
There were crossed in all possible combinations excluding
reciprocals during 2011/2012 growing season, giving seeds of F1 15 crosses
In 2012/ 2013 season, hybrid seeds were sown to obtain F2 seeds and parents
were re-crossed for obtaining adequate hybrid seeds. The hybridization was
made at the Agricultural Research and Experimental Station of the Fac. of
Agric., Moshtohor, Benha University. In 2013/2014 season, the experiment

357
involved parents, F1 hybrids and F2 crosses was conducted in a randomized
complete block design with four replications in the Agricultural Experiment
Station, at Bahteem, El-Qualyobia Governorate Egypt. Plots of parents and
F1's consisted of two rows and F2 consisted four rows 3 meter long and 30
cm wide, plants within row were 20 cm apart. The recommended
agricultural practices for wheat production were applied. Data were
recorded on individual plant basis: 10 for F1 and parents and 30 guarded
plants for F2 were randomly chosen from each plot. The following traits
were measured: plant height, No. of spikes plant-1
, No. of grains spike-1
,
grain weight spike-1
, 1000-grain weight, grain yield plant-1
.
Heterosis relative to better parent was computed according to Bhatt
(1971) as a deviation of F1 mean performance from the better parent mean
value. The general and specific combining ability estimates were determined
according to Griffing (1956) for method 2 model 1. The genetic parameters
were estimated using the procedure described by Hayman (1954 a and b).
Heritability in narrow-sense was estimated according to Mather and Jinks
(1971) for F1's data, and Verhalen and Murray (1969) for the F2's data.
RESULTS AND DISCUSSION
Analysis of variance of both F1 and F2 generations for all studied
characters is shown in Table 2. Genotypes, parents, crosses and parent vs
crosses mean squares were significant for all traits in both F1 and F2
generations, indicating the presence of diversity in the material and
sufficient amount of genetic variability adequate for further biometrical
assessment. The parents vs crosses mean squares were large in magnitude in
F1 analysis than F2 ones for all studied traits except plant height. These
findings are reasonable and might be due to inbreeding depression existing
the F2 which would reduce the heterosis effects. Significant differences
among genotypes for grain yield and related traits in different sets of
material of wheat were reported by Joshi et al (2004) and Seleem and
Koumber (2011).
Mean performance values of the parents, F1 and F2 generations for all
traits are presented in Table 3. For plant height, the F2 hybrids: P1xP3,
P1xP5, P3xP4 and P3xP6 had the lowest values. On the other hand, for F1
hybrids: P2xP4, P2xP6, P3xP5, P4xP5 and P4xP6 had the highest values.
Three F1 hybrids (P1xP4, P1xP6 and P4xP5) had the highest number
of spikes plant-1
. For No. of grains spike-1
; the P1 and the three F1 hybrids
P1xP4, P1xP5 and P1xP6 as well as the F2 hybrid P1xP4 expressed the
highest values for this trait. The F1 hybrid P1xP6 was the highest hybrid for
grain yield spike-1
. As for 1000-grain weight, the F1 hybrid P2xP5 exhibited
the highest weight.

358
Table 2. Significance of mean squares from ordinary and combining
ability analysis for all characters studied in F1 and F2
generations.
SOV df
Mean squares
Plant
height
No. of
spike
plant-1
No. of
grains
spike-1
Grain
weight
spike-1
1000-
grain
weight
Grain
yield
plant-1
F1 diallel cross
Blocks 3 2.58 1.35 5.10 0.041 1.38 10.81
Genotypes 20 19.20** 75.82** 209.14** 0.91** 294.53** 1069.38**
Parent (P) 5 21.87** 39.47** 296.90** 1.55** 430.28** 1587.94**
F1 hybrid
(h) 14 18.80** 85.95** 110.73** 0.669** 244.89** 767.45**
P vs h
(heterosis ) 1 11.43* 115.89** 1148.00** 1.086** 310.86** 2703.63**
Error 60 3.63 1.46 2.14 0.034 6.43 10.94
GCA 5 12.03** 32.33** 99.52** 0.435** 92.01** 640.00**
SCA 15 2.39** 14.50** 36.54** 0.158** 67.51** 143.13**
Error 60 0.91 0.36 0.53 0.009 1.607 2.73
GCA/SCA 5.03 2.23 2.72 2.748 1.363 4.47
F2 generation.
Blocks 3 2.28 1.54 1.11 0.01 8.74 5.29
Genotypes 20 25.06** 56.80** 263.62** 0.87** 205.56** 999.99**
Parent (P) 5 21.87** 39.47** 296.90** 1.59** 430.28** 1587.94**
F2 hybrid 14 12.89** 65.03** 267.87** 0.65** 134.37** 851.31**
P vs F2
hybrid 1 211.40** 28.23** 37.72** 0.36** 78.63** 141.70**
Error 60 3.10 1.82 4.89 0.02 5.09 5.91
GCA 5 9.79** 28.93** 83.74** 0.45** 65.04** 581.50**
SCA 15 5.09** 9.29** 59.96** 0.14** 46.84** 139.50**
Error 60 0.77 0.4548 1.22 0.005 1.273 1.48
GCA/SCA
1.92 3.1151 1.40 3.217 1.388 4.17
* p> 0.05; ** p> 0.01

359
Table 3. Mean performance of all studied genotypes (parents, F1 and F2
generations) for all studied traits.
Genotype Plant height
(cm)
No. of spikes
plant-1
No. of grain
spike-1
Grain weight
spike -1(g)
1000-grain
weight (g)
Grain yield
plant-1 (g)
Parents
P1 (Line 162) 83.75 CG 23.75 FH 56.75 AB 3.625 B 57.00 MN 89.00 BC
P2 (Giza 170) 84.25 BF 22.00 IK 42.25 KL 2.950 HL 67.25 DE 62.75 IK
P3 (Sakha 8) 80.00 HJ 15.25 NO 30.25 P 1.775 T 46.25 P 28.50 N
P4 (Sakha 69) 86.50 AC 23.25 GI 42.75 K 2.725 LO 58.50 KN 66.75 HI
P5 (Line 156) 86.25 AC 22.50 HJ 39.00 MN 3.150 EH 72.75 BC 73.50 FG
P6 (Line 159) 84.25 BF 20.25 KL 39.50 LN 3.125 FI 72.50 BC 64.75 IJ
F1 crosses
P1xP2 85.00 BE 24.00 FH 50.50 DF 2.775 KN 56.25 N 88.25 CD
P1xP3 81.25 FI 16.75 MN 42.25 KL 2.475 OQ 64.75 DI 61.50 JK
P1xP4 85.00 BE 28.00 AB 57.75 A 3.575 B 57.25 LN 89.50 BC
P1xP5 83.00 DH 26.50 BD 59.00 A 3.525 BC 60.75 JL 89.00 BC
P1xP6 86.00 BC 29.25 A 57.25 AB 3.925 A 65.75 DG 93.50 AB
P2xP3 85.00 BE 23.50 FI 50.50 DF 2.975 GL 71.25 C 81.50 E
P2xP4 87.00 AB 16.00 MO 44.25 IK 3.025 FK 66.25 DF 66.75 HI
P2xP5 85.50 BD 25.00 DF 49.00 EH 3.225 DG 80.25 A 84.25 DE
P2xP6 86.25 AC 26.00 CE 50.00 DG 3.475 BD 67.25 DE 71.00 GH
P3xP4 82.50 DH 23.25 GI 49.25 DH 3.450 BD 74.50 BC 76.50 F
P3xP5 86.75 AC 15.25 NO 41.25 KM 2.900 HL 75.00 B 41.75 M
P3xP6 81.25 FI 20.50 KL 47.75 FH 2.775 KN 65.50 DH 62.25 IK
P4xP5 89.00 A 29.00 A 51.25 DE 2.600 MP 52.00 O 82.00 E
P4xP6 86.25 AC 26.25 CE 46.75 HI 3.400 BE 74.75 BC 81.25 E
P5xP6 85.00 BE 27.25 BC 52.25 CD 3.050 FK 68.00 D 82.50 E
F2 generation
P1xP2 80.75 GI 17.00 M 25.25 Q 2.575 NQ 47.25 P 45.75 M
P1xP3 77.19 K 16.25 MO 41.50 KM 2.025 S 60.50 JM 59.25 K
P1xP4 80.75 GI 27.25 BC 57.25 AB 3.425 BD 56.25 N 89.75 BC
P1xP5 78.85 IK 24.75 EG 54.75 BC 2.975 GL 62.25 GJ 95.25 A
P1xP6 81.70 FI 21.50 JK 49.00 EH 3.275 CF 61.50 IK 75.00 FG
P2xP3 80.75 GI 15.25 NO 46.25 HJ 2.900 HL 63.25 FJ 62.00 IK
P2xP4 82.89 DH 13.50 P 35.75 O 2.325 QR 58.50 KN 54.50 L
P2xP5 81.46 FI 20.25 KL 36.00 O 2.850 IM 64.00 EJ 73.00 FG
PxP6 82.65 DH 20.50 KL 48.00 FH 2.825 JN 56.25 N 66.50 HI
P3xP4 78.85 IK 20.50 KL 48.50 EH 2.950 HL 66.75 DF 73.00 FG
P3xP5 81.70 FI 14.75 OP 39.25 LN 2.150 RS 63.50 EJ 43.75 M
P3xP6 77.66 JK 19.50 L 37.50 NO 2.475 OQ 62.00 HK 54.50 L
P4xP5 82.18 EH 25.75 CE 47.00 GI 2.400 PQ 49.50 OP 75.75 FG
P4xP6 82.41 EH 20.75 KL 43.50 JK 3.075 FJ 66.00 DF 74.25 FG
P5xP6 80.04 HJ 20.75 KL 39.00 MN 2.900 HL 66.00 DF 64.00 IK
Means followed by the same letter for each tested parameter are not
significantly different by Duncan’s test (P < 0.05)
For grain yield plant-1
; three F1 hybrids (P1xP4, P1xP5 and P1xP6)
and one F2 hybrid (P1xP5) as well as P1 showed the highest values. The
high yield plant-1
of the P1 could be attributed to its high No. of grains
spike-1
and grain weight spike-1
. On the other hand, the high grain yield
plant-1
of the three aforementioned F1 hybrids and the F2 hybrid could be
360
attributed to the high values of No. of spikes plant, No. of grains spike-1
and
grain yield plant-1
. Therefore, these crosses could be efficient for
prospective wheat breeding programs aiming at improving wheat grain
yield.
Heterosis
Mean squares for parents vs crosses in F1 generation, as an
indication of average of heterosis in F1 across all crosses were significant for
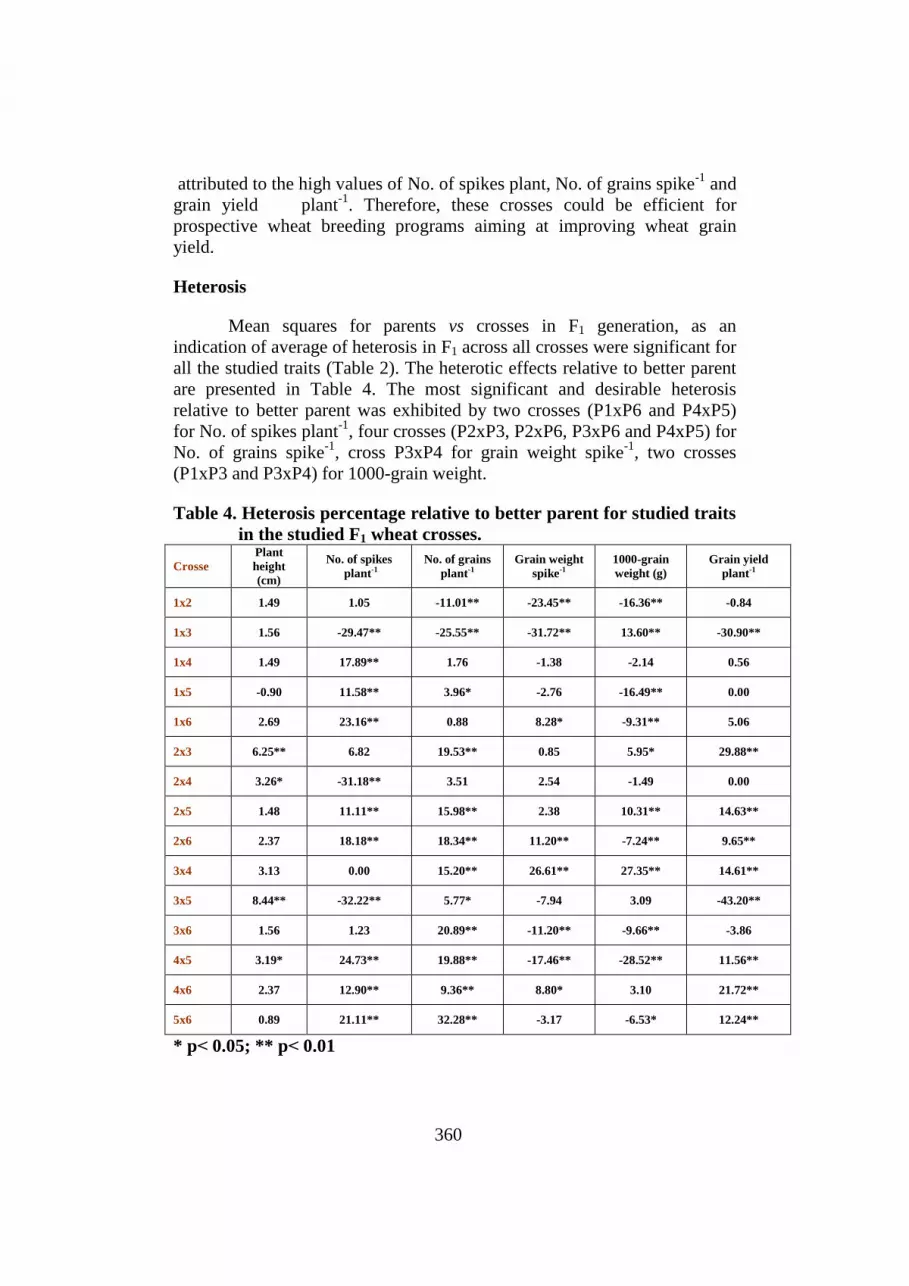
all the studied traits (Table 2). The heterotic effects relative to better parent
are presented in Table 4. The most significant and desirable heterosis
relative to better parent was exhibited by two crosses (P1xP6 and P4xP5)
for No. of spikes plant-1
, four crosses (P2xP3, P2xP6, P3xP6 and P4xP5) for
No. of grains spike-1
, cross P3xP4 for grain weight spike-1
, two crosses
(P1xP3 and P3xP4) for 1000-grain weight.
Table 4. Heterosis percentage relative to better parent for studied traits
in the studied F1 wheat crosses.
Crosse
Plant
height
(cm)
No. of spikes
plant-1
No. of grains
plant-1
Grain weight
spike-1
1000-grain
weight (g)
Grain yield
plant-1
1x2 1.49 1.05 -11.01** -23.45** -16.36** -0.84
1x3 1.56 -29.47** -25.55** -31.72** 13.60** -30.90**
1x4 1.49 17.89** 1.76 -1.38 -2.14 0.56
1x5 -0.90 11.58** 3.96* -2.76 -16.49** 0.00
1x6 2.69 23.16** 0.88 8.28* -9.31** 5.06
2x3 6.25** 6.82 19.53** 0.85 5.95* 29.88**
2x4 3.26* -31.18** 3.51 2.54 -1.49 0.00
2x5 1.48 11.11** 15.98** 2.38 10.31** 14.63**
2x6 2.37 18.18** 18.34** 11.20** -7.24** 9.65**
3x4 3.13 0.00 15.20** 26.61** 27.35** 14.61**
3x5 8.44** -32.22** 5.77* -7.94 3.09 -43.20**
3x6 1.56 1.23 20.89** -11.20** -9.66** -3.86
4x5 3.19* 24.73** 19.88** -17.46** -28.52** 11.56**
4x6 2.37 12.90** 9.36** 8.80* 3.10 21.72**
5x6 0.89 21.11** 32.28** -3.17 -6.53* 12.24**
* p> 0.05; ** p> 0.01

361
Concerning grain yield plant-1
, the seven crosses (P2xP3, P2xP5,
P2xP6, P3xP4, P4xP5, P4xP6 and P5xP6) showed significant positive
heterotic effects. These hybrids exhibited heterosis for one or more of the
contributing traits. Significant positive heterotic effects relative to higher
yielding parent were obtained by Fonseca and Patterson (1968), Prasad et al
(1998) and Abdullah et al (2002). 11111111111111111111111111111111
Combining ability…………………………………………………………... ………The analysis of variance for both general (GCA) and specific (SCA)
combining abilities show that the mean squares were highly significant for
all studied traits in both generations (Table 2) which indicates the
importance of both additive and non-additive gene effects in the inheritance
of such traits.
The relative importance of additive and non-additive gene action is
essential for the development of an efficient hybridization program. The
concept of combining ability as a measure of gene action refers to the
capacity or ability of genotype to transmit superior performance to its
crosses. The value of an inbred line depends on its ability to produce
superior hybrids in combination with other inbreds. If both GCA and SCA
mean squares are significant, it is vital to determine the type of gene action
which is important in determining the performance of progeny. To
overcome such situation the magnitude of mean squares can be used to
assume the relative importance of general and specific combining ability
mean squares which were highly significant. Hence, GCA/ SCA ratio was
used to reveal the nature of genetic variance involved. The ratio of MS
GCA/ MS SCA (Table 2) displays the relative importance of additive and
additive by additive gene action effects in their inheritance. Therefore,
selection for these traits in early generations would be effective in
developing the high yielding varieties in wheat breeding programs. The
preponderance of additive genetic variation for yield and its related
characters in F1 and F2 generations indicate that the parents involved in
these crosses could be selected based on their GCA values. The genetic
variance was previously reported to be mostly due to additive for yield
traits by El Seidy and Hamada (1997). On the other hand, the non-additive
genetic variance was previously reported to be the most prevalent for plant
height by Abd El-Aty and Katta (2002); No. of spike plant-1
and No. of
kernels spike-1
by Abd El-Aty and Katta (2002); for 1000-grain weight by
Abd El-Aty and Katta (2002); For grain yield plant-1
by Siddique et al.
(2004).………………………………………………………………………
General combining ability effects
General combining ability effects ig of individual parent for each
trait from both F1 and F2 generations are presented in Table 5.

362
Table 5. Estimates of parental general combining ability effects for all
studied traits in F1 and F2 generations.
Parent Plant height No. of spikes
plant-1
No. of grains
plant-1
Grain weight
spike-1
1000-grain
weight
Grain yield
plant-1
F1
P1 -0.69* 1.35** 5.89** 0.25** -4.90** 10.94**
P2 0.5 -0.33 -0.55* -0.02 2.23** 0.63
P3 -2.06** -3.93** -5.21** -0.42** -1.80** -16.47**
P4 1.19** 0.98** 0.2 0 -2.02** 2.16**
P5 1.06** 0.85** -0.3 0.01 2.95** 1.78**
P6 0 1.07** -0.02 0.17** 3.54** 0.97
LSD gi 5% 0.62 0.39 0.48 0.06 0.83 1.08
LSD gi 1% 0.83 0.53 0.64 0.08 1.11 1.44
LSD gi-gj 5% 0.96 0.61 0.74 0.09 1.28 1.67
LSD gi-gj 1% 1.29 0.82 0.99 0.13 1.71 2.24
r 0.97** 0.91** 0.98** 0.96** 0.80** 0.99**
F2
P1 -0.61* 1.56** 5.20** 0.26** -3.02** 9.90**
P2 0.67* -1.41** -2.99** -0.01 -0.27 -4.57**
P3 -1.93** -3.13** -3.27** -0.44** -2.18** -14.29**
P4 1.06** 1.56** 2.23** 0.02 -1.49** 4.61**
P5 0.64* 1.19** -0.71 0.01 3.10** 4.36**
P6 0.17 0.22 -0.46 0.16** 3.85** -0.01
LSD gi 5% 0.57 0.44 0.72 0.04 0.74 0.79
LSD gi 1% 0.77 0.59 0.96 0.06 0.98 1.06
LSD gi-gj 5% 0.89 0.68 1.12 0.07 1.14 1.23
LSD gi-gj 1% 1.19 0.91 1.49 0.09 1.53 1.64
r 0.94** 0.87** 0.86** 0.96** 0.86** 0.96**
* p> 0.05; ** p> 0.01 and r refer to the correlation coefficient between GCA effects for
parents and its mean performance.
The estimates of ig effects obtained from F2 generation were similar
to those of F1 generation in most cases. High positive response would be of
interest for all studied traits except for plant height since short stature is
preferred due to non-liability to lodging and progressive response to increased
rate of fertilizer. Therefore, negative combining ability effects regarding plant
height are preferred in wheat.
The parental line P1 exhibited significant desirable ig effect among
all the tested parents for all studied traits in both F1 and F2 except for the,

363
1000- grain weight. The parental variety P2 (G. 170) gave significant positive
ig effects for the 1000-kernel weight only in the F1 generation. But, it gave
significant undesirable or insignificant ig effects for other traits. The variety P3
(Sakha 8) expressed significant negative ig effects and seemed to be the best
combiner for plant height in both F1 and F2. Thus it could be utilized to reduce
plant height in wheat. The parental variety P4 (Sakha 64) expressed significant
positive ig effects for No. of spikes plant-1
and grain yield plant-1
. The parental
line P5 expressed significant desirable ig effects for No. of spikes plant-1
,
1000-kernel weight and grain yield plant-1
in both F1 and F2 generations. The
parental line P6 expressed significant positive ig effects for No. of spikes
plant-1
in the F1. It gave significant positive ig effects for grain weight
spike-1
, 1000-grain weight and grain yield plant-1
in both F1 and F2
generations. Such obtained results suggested that a great opportunity for
selection would be possible for yield and its components having a semi-dwarf
plant height hence can response to more N fertilizers without least of lodging.
The correlation between parental mean performance and ig effects
were significantly positive for most studied traits in F1 and F2.This indicates
highly valuable agreement between the parental performance and its ig effects.
Therefore, the mean performance of the genotypes could be a reliable and
effective indication for their general combining ability effects for most traits.
Therefore, selection among the tested parental population for initiating any
proposed breeding program could be practiced either on mean performance or
ig effects basis with similar efficiency. These results are in harmony with
those obtained by Hasnain et al (2006), Seleem (2006), Gurmani et al (2007),
EL-Shaarawy and Koumber (2010) and Seleem and Koumber (2011).
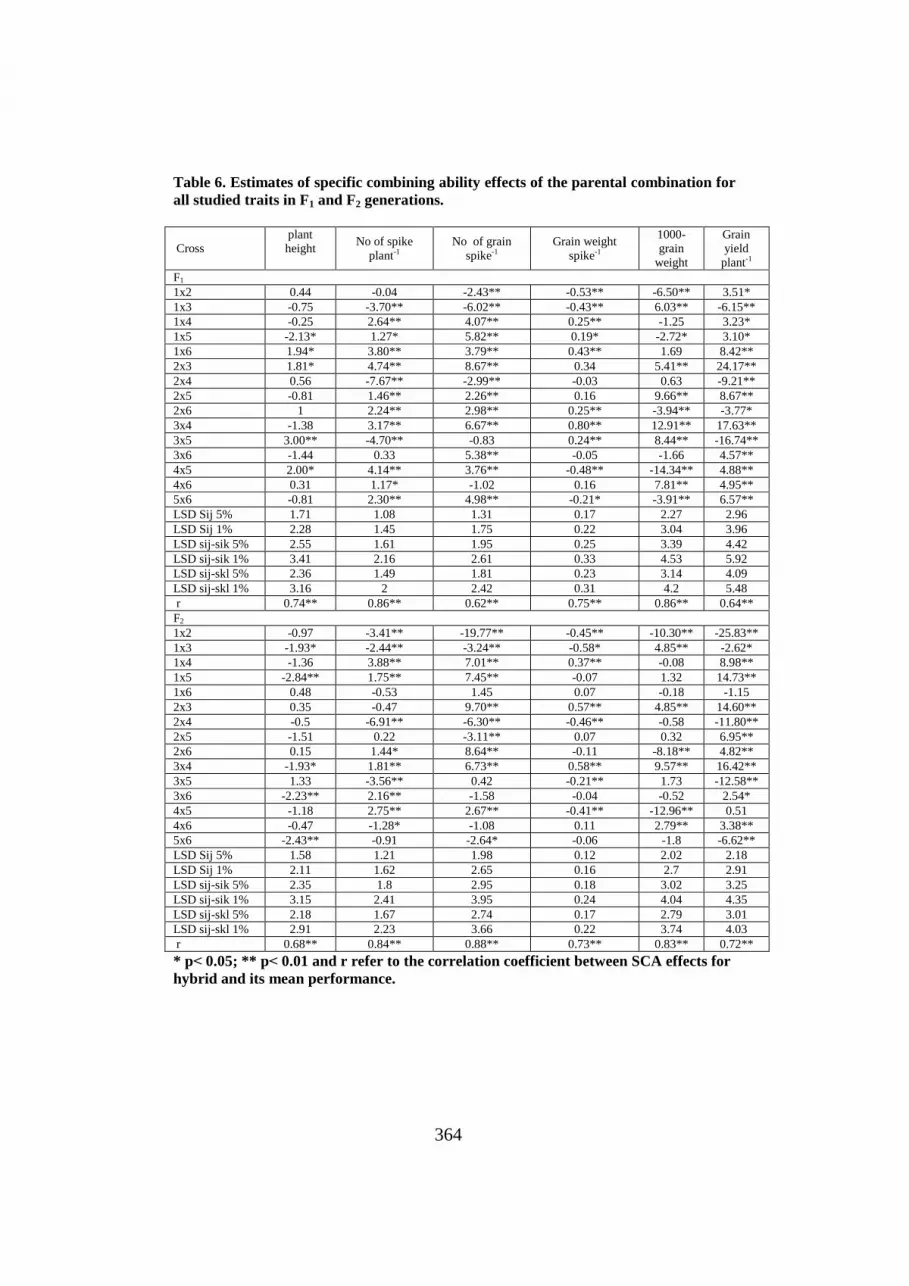
Specific combining ability effects
Specific combining ability effects ijS^
of both F1 and F2 for all traits
are presented in Table 6, and show highly significant desirable ijS^
values
for some crosses in the F1 than F2 generation. This result is expected
indicating inbreeding depression in the F2 reducing the non-additive or
increased the additive portion.
As for plant height the cross P1xP5 in F1 generation and the crosses of:
P1xP3, P1xP5, P3xP4, P3xP6 and P5xP6 gave significant and negative ijS^
effects. With regard to No. of spikes plant-1
, ten and six crosses expressed
significant and positive ijS^
effects at F1 and F2 generation, respectively.
364
Table 6. Estimates of specific combining ability effects of the parental combination for
all studied traits in F1 and F2 generations.
Cross plant height
No of spike
plant-1
No of grain
spike-1
Grain weight
spike-1
1000-grain
weight
Grain yield
plant-1
F1
1x2 0.44 -0.04 -2.43** -0.53** -6.50** 3.51*
1x3 -0.75 -3.70** -6.02** -0.43** 6.03** -6.15**
1x4 -0.25 2.64** 4.07** 0.25** -1.25 3.23*
1x5 -2.13* 1.27* 5.82** 0.19* -2.72* 3.10*
1x6 1.94* 3.80** 3.79** 0.43** 1.69 8.42**
2x3 1.81* 4.74** 8.67** 0.34 5.41** 24.17**
2x4 0.56 -7.67** -2.99** -0.03 0.63 -9.21**
2x5 -0.81 1.46** 2.26** 0.16 9.66** 8.67**
2x6 1 2.24** 2.98** 0.25** -3.94** -3.77*
3x4 -1.38 3.17** 6.67** 0.80** 12.91** 17.63**
3x5 3.00** -4.70** -0.83 0.24** 8.44** -16.74**
3x6 -1.44 0.33 5.38** -0.05 -1.66 4.57**
4x5 2.00* 4.14** 3.76** -0.48** -14.34** 4.88**
4x6 0.31 1.17* -1.02 0.16 7.81** 4.95**
5x6 -0.81 2.30** 4.98** -0.21* -3.91** 6.57**
LSD Sij 5% 1.71 1.08 1.31 0.17 2.27 2.96
LSD Sij 1% 2.28 1.45 1.75 0.22 3.04 3.96
LSD sij-sik 5% 2.55 1.61 1.95 0.25 3.39 4.42
LSD sij-sik 1% 3.41 2.16 2.61 0.33 4.53 5.92
LSD sij-skl 5% 2.36 1.49 1.81 0.23 3.14 4.09
LSD sij-skl 1% 3.16 2 2.42 0.31 4.2 5.48
r 0.74** 0.86** 0.62** 0.75** 0.86** 0.64**
F2
1x2 -0.97 -3.41** -19.77** -0.45** -10.30** -25.83**
1x3 -1.93* -2.44** -3.24** -0.58* 4.85** -2.62*
1x4 -1.36 3.88** 7.01** 0.37** -0.08 8.98**
1x5 -2.84** 1.75** 7.45** -0.07 1.32 14.73**
1x6 0.48 -0.53 1.45 0.07 -0.18 -1.15
2x3 0.35 -0.47 9.70** 0.57** 4.85** 14.60**
2x4 -0.5 -6.91** -6.30** -0.46** -0.58 -11.80**
2x5 -1.51 0.22 -3.11** 0.07 0.32 6.95**
2x6 0.15 1.44* 8.64** -0.11 -8.18** 4.82**
3x4 -1.93* 1.81** 6.73** 0.58** 9.57** 16.42**
3x5 1.33 -3.56** 0.42 -0.21** 1.73 -12.58**
3x6 -2.23** 2.16** -1.58 -0.04 -0.52 2.54*
4x5 -1.18 2.75** 2.67** -0.41** -12.96** 0.51
4x6 -0.47 -1.28* -1.08 0.11 2.79** 3.38**
5x6 -2.43** -0.91 -2.64* -0.06 -1.8 -6.62**
LSD Sij 5% 1.58 1.21 1.98 0.12 2.02 2.18
LSD Sij 1% 2.11 1.62 2.65 0.16 2.7 2.91
LSD sij-sik 5% 2.35 1.8 2.95 0.18 3.02 3.25
LSD sij-sik 1% 3.15 2.41 3.95 0.24 4.04 4.35
LSD sij-skl 5% 2.18 1.67 2.74 0.17 2.79 3.01
LSD sij-skl 1% 2.91 2.23 3.66 0.22 3.74 4.03
r 0.68** 0.84** 0.88** 0.73** 0.83** 0.72**
* p> 0.05; ** p> 0.01 and r refer to the correlation coefficient between SCA effects for
hybrid and its mean performance.

365
Such results indicate that crosses P1xP6, P2xP3 and P4xP5 of F1 and
crosses of P1xP4 and P4xP5 of F2 recorded the highest desirable ijS^
effects.
The other crosses had either significant negative or insignificant ijS^
effects
for this trait. As for No of grains spike-1
; all crosses gave significant and
positive ijS^
effects, except the five crosses P1xP2, P1xP3, P2xP4, P3xP5 and
P4xP6 in F1 and nine crosses in F2 gave undesirable ijS^
effects for this trait.
For grain weight spike-1
, three crosses in both generations had
significant positive ijS^
effects. With respect to 1000-grain weight, six and
four crosses exhibited significant and positive ijS^
effects in F1 and F2
generations, respectively. Inter-and intera-allelic interactions were detected
in the crosses P3xP4, P1xP3, P4xP6 and P2xP3 in both generations.
For grain yield plant-1
, eleven and seven crosses had significant and
positive ijS^
effects in F1 and F2 generations, respectively. The crosses
P2xP3 and P3xP4 gave the highest desirable ijS^
effects in both generations.
If crosses of high SCA involve both parental lines which also are good
combiners, they could be exploited for breeding varieties. Nevertheless, if
crosses of high SCA involve only one good combiner, such combinations
would throw out desirable transgressive segregates provided that the
additive genetic system in the good combiner (as well as complementary
and epistatic effects in the crosses) act in the same direction to reduce
undesirable characteristics and maximize the character under consideration.
The correlation coefficient between mean performance of crosses and their
ijS^
effects was positive and significant. Therefore, the mean performance of
crosses could be a reliable and effective indication for their specific combining
ability effects for all studied traits.
Genetic components and heritability
The half diallel analysis of Hayman method (Hayman 1954 a and b)
provided six genetic statistical parameters. They are D, H1, H2, h2, F and E
(Table 7). Several ratios were derived as given by method of Hayman
(1954b) and Jinks (1954) to provide further genetic information about each
trait. The additive component (D) reached the significant level of probability
for all studied traits in both F1 and F2. These results indicate that the additive
gene effects were involved in the inheritance of these traits in both
generations. Significant values for the dominance component (H1) were
obtained for all traits in both generations and large of magnitude than D one,

366
Table 7. Hayman's analysis for all studied traits in F1 and F2 generations.
component plant height No of spikes
plant -1 No of gains
spike-1 grain weight
spike-1 1000-grain
weight grain yield
plant-1
F1
D 4.57** 9.50* 73.65** 0.38** 106.41** 394.25**
H1 7.18** 56.57** 117.02** 0.62** 142.94** 501.03*
H2 7.14** 51.28** 108.85** 0.54** 168.83** 481.02**
h2 1.35* 18.576** 185.70** 0.17* 103.23** 436.57**
F -1.45 -4.73 38.26* 0.27* 142.94** 115.38*
E 0.9 0.36 0.57 0.01 1.16 2.73*
(H1/D) 0.5 1.25 2.44 1.26 1.28 1.26 1.13
H2/4H1 0.25 0.23 0.23 0.22 0.15 0.24
KD/KR 0.78 0.81 1.52 1.79 3.28 1.3
r -0.38 0.34 -0.19 -0.01 -0.23 -0.37
r2 0.14 0.11 0.03 0 0.46 0.14
h2 (b.s) 0.84 0.98 0.99 0.96 0.96 0.99
h2 (n.s) 0.53 0.43 0.44 0.38 0.35 0.55
t2 0.49 0.24 0.02 0.01 0.45 0.52
b 0.54 0.62 0.88 0.66 0.57 0.48
F2
D 4.70** 9.42* 73.04* 0.39** 106.25** 395.52**
H1 12.99** 38.31** 254.02* 0.582** 215.87** 582.17**
H2 12.41** 32.32** 218.08* 0.50** 148.36** 519.07**
h2 33.83** 4.32* 5.45* 0.06* 12.01* 22.14*
F 0.57 -2.02 69.11* 0.29* 149.60** 187.75*
E 0.76 0.45 1.18 0.004 1.32 1.47
(H1/D) 0.5 1.66 2.02 1.86 1.21 1.43 1.21
H2/4H1 0.24 0.21 0.21 0.22 0.17 0.22
KD/KR 1.08 0.9 1.68 1.86 2.95 1.49
r 0.76 0.72 0.66 0.38 -0.06 0.25
r2 0.58 0.52 0.43 0.15 0.01 0.06
h2 (b.s) 0.88 0.97 0.98 0.98 0.97 0.99
h2 (n.s) 0.38 0.51 0.26 0.42 0.24 0.51
t2 0.23 3.11 0.08 0.09 5.44 0.02
b 0.63 0.3 -0.04 0.71 1.2 0.79
* p> 0.05; ** p> 0.01
Where: E= the expected environmental component of variation, D= Variation due to additive
effect, F= Refers to relative frequencies of dominant Vs recessive genes in the parents, H1 =
component of variation due to dominance effects, H2 = Component of variation due to non-
additive effects, h2= Overall dominance gene effects of the heterozygous loci in all crosses,
(H1/D)0.5 = mean degree of dominance at each locus over all loc, H2/4H1 = measures the average
frequency of positive versus negative allels at loci exhibiting dominance, KD/KR = the ratio of
total number of dominant to receive allels in the parents, h2 (b.s) = broad sense heritability and
h2 (ns) = narrow sense heritability.

367
indicating that the dominance type of gene action was the most prevalent
genetic component in inheritance of these traits. These results are in
agreement with those reported by Ashoush (2006), Seleem and Koumber
(2011) and Farshadfar et al (2012).
Highly significant values for dominance components associated with
gene distribution (H2) were obtained for all traits in both generations. The
H2 values were smaller than the H1 values for most traits indicating unequal
allel frequency in the parents. These agree with findings obtained by
Hayman (1954 b). The overall dominance effects of heterozygous loci (h2)
proved significant for all traits in both generations, indicating that the
dominance was due to heterozygosity and was unidirectional with
appreciable heterotic effect.
The proportion of dominant to recessive gene in parents KD/KR
were more than unity for most studied characters indicating that the
dominant alleles govern these in both generations. Meanwhile, the KD/KR
value was less than unity for plant height in F1 and No. of spikes plant-1
in
F1 and F2; an excess of decreasing alleles among parental genotypes. The
distributions of the relative frequencies of dominant versus recessive gene
(F) were not significant for plant height and No. of spikes plant-1
in the both
generations. Thus, it could be concluded that an equality of the relative
frequencies of dominant and recessive alleles were present in parents for
studied traits. For other cases significant F values were obtained indicating a
symmetry of gene frequency among the parental population were detected.
The same conclusion was obtained for proportion of genes with positive and
negative effects by H2/4H1. The weighted measure of average degree of
dominance (H1/D)0.5
exceeded unity for all studied traits in both
generations, indicating that presence of over dominance for these traits.
Consequently, selection for any of these traits in the early segregating
generations will be of little use.
Heritability estimates in both broad and narrow sense for the studied
attributes were computed according to Mather and Jinks (1971) In addition,
the computed t2 was low and not significant for most traits as shown in
Table 7. High values for heritability in broad sense were obtained for all
traits, revealing that most phenotypic variability in each trait was due to
genetic causes. High heritability values in broad sense along with medium
or low ones in narrow sense were exhibited in both generations, indicating
that most genetic variances were due to non- additive genetic effects. These
finding support the aformentioned results on genetic components in which
H1 estimates played a greater role in the inheritance of these characters.
Therefore, the bulk method program for improving such traits might be
promising Bakhsh, et al (2003), Allah et al (2010) , Kumber (2011).

368
Graphical (wr/vr) analysis.
Graphical presentation (Vr,Wr) of different traits in both generations
are given in Figures from 1 to 6. The regression coefficient significantly
differed from zero but not from unity for F1 and in F2, indicating that the
genetic system could be deduced to be additive without the complication of
non-allelic interaction. For the other cases, regression slope differed from
unity, indicating that a complementary type of epistasis was involved.
The regression line passed through the origin in grain weight spike-1
in both generations, No. of spikes plant-1
and the 1000-grain weight in the F1
and grain yield plant-1
in the F2, revealed a presence of complete dominance.
Meanwhile, it intersects the Wr axis above the origin in plant height in the
F1 and No. of spikes plant-1
and No. of grains spike-1
in the F2, reflecting
partial dominance. The presence of over dominance, however, was obtained
from computing the ratio of H1 to D for these cases (Table 7). This
contradiction between the two types of analysis might be an expected result
of the presence of complementary type of non-allelic interaction which
inflated the ratios of H1 to D and distorted the Vr,Wr (Hayman 1954 b and
Mather and Jinks 1971). However, the regression line intersected the Wr
below the point of origin in the remaining cases, indicating an over
dominance in the inheritance of these cases. The array points scattered along
the regression line for all traits in both generations indicating genetic
diversity among the parents. The low magnitude of correlation coefficient
between parental mean (Yr) and the (Wr+Vr) might be due to a presence of
nonallelic interation in some parental line or variety.
The parental line P1 for grain weight spike-1
, grain and No. of spikes
plant-1
in both generation, 1000-kernel weight in the F1 and grain yield
plant-1
in the F2 included largest number of recessive genes for these cases.
On the other hand, P5 for grain yield plant-1
in the F1 and for 1000-kernel
weight in the F2 seemed to have the highest number of recessive genes. The
P2 and P6 were high for grain weight spike-1
, grain yield plant-1
in both
generations, 1000-grain weight and No. of spikes plant-1
in the F1 and No of
grain spike-1
in F2 and P2 in the F2, P3 for No. of spikes plant-1
in the F2 and
P1 and P6 for 1000-kernel weight in the F2, contained maximum number of
dominant allels for those cases.

369
Fig 1. Wr/Vr graph for plant height in F1 and F2 generations.
Fig 2. Wr/Vr graph for No of spikes plant
-1 in F1 and F2 generations.
_____ ●Pi the F1 generation
........xPi the F2 generation
_____ ●Pi the F1 generation
........xPi the F2 generation

370
Fig 3. Wr/Vr graph for No of grain spike
-1 in F1 and F2 generations.
Fig 4. Wr/Vr graph for grain weight spike
-1 in F1 and F2 generations.
Fig 5. Wr/Vr graph for 1000-grain weight in F1 and F2 generations.
_____ ●Pi the F1 generation
........xPi the F2 generation
_____ ●Pi the F1 generation
........xPi the F2 generation
_____ ●Pi the F1 generation
........xPi the F2 generation

371
Fig 6. Wr/Vr graph for grain yield plant
-1 in F1 and F2 generations.
REFFERENCES Abd El-Aty, M.A. and Y. S. Katta (2002). Genetic analysis and heterosis of grain yield
and related traits in bread wheat (Triticum aestivum L.). J. Agric. Res. Tanta Univ.,
28 (2): 287-300.
Abdullah, G.M., A.S. Khan and Z. Ali (2002). Heterosis study of certain important traits
in wheat. Int. J. Agri. Biol. 4:326-328.
Allah, S.U., A.S. Khan, A. Raza and S. Sadique (2010). Gene action analysis of yield and
yield related traits in spring wheat (Triticum aestivum). Int. J. Agri. Biol. 12:125-128.
Arunachalam, V. (1976). Evaluation of diallel crosses by graphical and combining ability
methods. Indian J. Genet. 36: 358-366.
Ashoush, H.A. (2006). Breeding for yield and its components in some bread wheat crosses
(Triticum aestivum L.). Alex. J. of Agric Sci. 27 (3): 322-335.
Baker, R.J. (1978). Issues in diallel analysis. Crop Sci. 18: 533-536.
Bakhsh A., A. Hussain and A.S. Khan (2003). Genetic studies of plant height, yield and
its components in bread wheat. Sarhad J. Agric. 19:529-534.
Bhatt, G.M. (1971). Heterosis performance and combining ability in a diallel cross among
spring wheat. (Triticum aestivm L.). Ast. J. Agric. Res. 22:359-369.
El-Seidy, E. H. and A. A. Hamada (1997). Genetic analysis of diallel crosses in wheat
under normal irrigation and drainage water conditions. Annals of Agric. Sc.,
Moshtohor, 35 (4) : 1915-1932.
EL-Shaarawy, G.A. and R.M.A. Koumber (2010). Genetical studies on some agronomic
characters in bread wheat crosses under low nitrogen fertilizer condition. J. Plant
Prod., Mansoura Univ. 1(11): 1495-1519.
Esmail, R.M. (2002). Estimation of genetic parameters in the F1 and F2 generation of
diallel crosses of bread wheat (Triticum aestivum L.). Bull. NRC, Egypt. 27(1) 85-
106.
_____ ●Pi the F1 generation
........xPi the F2 generation

372
Farooq, J., I. Khaliq, A.S. Khan and M.A. Pervez (2010). Studing the genetic
mechanism of some yield contributing traits in wheat. (Triticum aestivum). Int. J.
Agri. Biol. 12:241-246.
Farshadfar, E., F. Rafiee and A. Yghotipoor (2012). Comparison of the efficiency
among half diallel methods in the genetic analysis of bread wheat (Triticum aestivum
L.) under drought stress condition. Annals of Biological Res. 3(3):1607-1622.
Fonseca, S. and F.L. Patterson (1968). Hybrid vigour in seven parent diallel cross in
common winter wheat (Triticium aestivum L.). Crop Sci. 8: 85-88.
Griffing, B. (1956). Concept of general and specific combining ability in relation to diallel
crossing systems. Aus. J. of Biol. Sci. 9: 463-493.
Gurmani R., S.J. Khan, Z.A. Saqib, R. Khan, A. Shakeel and M. Ullah (2007).
Genetic evaluation of some yield and yield related traits in wheat. Pak. J. Agric. Sci.
44:6-11.
Hasnain Z., G. Abbas, A. Saeed, A. Shakeel, A. Muhammad and M.A. Rahim (2006).
Combining ability for plant height and yield related traits in wheat (Triticum aestivum
L.). J. Agric. Res. 44:167-175.
Hayman, B. I. (1954a). The analysis of variance of diallel tables. Biometrics 10: 235-244.
Hayman, B. I. (1954b). The theory and analysis of diallel crosses. Genetics 39: 789-809.
Jinks, J. L. (1954). The analysis of continuous varation in a diallel cross of Nicotiana rustica
varieties. Genetics 39: 767-788.
Joshi, S.K., S. N. Sharma, D. L. Sinnghania and R. S. Sain (2004). Combining ability in
the F1 and F2 generations of diallel cross in hexaploid wheat (Triticum aestivum L.
Em. Thell). Hereditas.141:115-121.
Koumber, R.M. (2011). Estimation of genetic parameters for some quantitative traits in
two bread wheat crosses (Triticum aestivum, L.) Minufiya J. Agric. Res. 36(2):359-
369.
Mather, K. and J.L. Jinks (1971). Biometrical Genetics. (2nd
ed.), Chapman and Hall Ltd.
London.
Prasad, K.D., M.F. Haque and D.K. Ganguli (1998). Heterosis studies for yield and its
components in bread wheat (Triticum aestivum L.). Indian J. Genet. 58: 97-100.
Seleem, S.A. (2006). Combining ability and type of gene action in common wheat.
Minufiya J. Agric. Res. 31(2): 399-420.
Seleem, S.A. and R.M.A. Koumber (2011). Estimation of combining ability and gene
action in the F1 and F2 generations in some breed wheat crosses. Minufiya J. Agric.
Res. 36(6): 1627-1648.
Siddique, M., S. Ali , M. F. A. Malik and S. I. Awan (2004). Combining bility estimates
for yield and yield components in spring wheat. Sarhad J. Agric. 20 (4): 48-63.
Verhalen, I.M. and J.C. Murray (1969). A diallel analysis of several fiber property traits
in upland cotton (Gossypium hirsutum L.) Crop Sci. (9): 311-315.

373
الرحليل الىساش للعيل األول و الصا ف الهعي الرثادليح للقوحاحوذ عل الحصشي
1و ظيهاى عثذ الىاحذ ىس الذيي
2
ظاهعح تها –كليح الضساعح –قسن الوحاصيل -1
هصش –هشكض الثحىز الضساعيح العيضج –ليح هعهذ تحىز الوحاصيل الحق –قسن تحىز القوح -2
يهذف الثحس ال ذحذيذ و اخرياس الهعي الورويضج ألسرخذاهها ف ذحسيي هحصىل تزوس القوح فى هصىش
و دساسح قىج الهعيي, القىذسج على الرىا ل و ذقىذيش الاعىل العيى للوحصىىل و هفىاذىي فى العيىل ا ول و
ذثادل تيي سرح أصاف و سىال خ هىي قوىح الخثىض و ذىن ارىاض تىزوس العيىل الصا. اظشي الرهعيي الص
ا ول و الصا. و قيود ا تاء و العيل ا ول و الصىا هعىا فى ذصىوين القتاعىاخ الفاهلىح الع ىىابيح ت ستعىح
–تىاء . كاى الرثايي الشاظع ال الرشاكية الىساشيح )ا 2013/2014هفشساخ للوحصىل و هفىاذي ف هىسن
الهعىىيم هعىيىىا فىى العيىىل ا ول و الصىىا فىى هع ىىن الصىىااخ. و أيهىىا , كاىىد قىىىج الهعىىيي هعىيىىح فىى كىىل
ال 5.65الصااخ ذحد الذساسح . ذشاوحد قيوح قىج الهعيي الوىظثح و الوعىيح هقاسح تاألب األفهل هي
عىي قىىج فى الهعىيي لىىصى م افهىل الهP2xP3و (P4xP6 % ف العيل األول. و كىاى الهعيىيي25.22
حثىب الثاخ. كاى الرثايي الشاظع للقذسج العاهح و الخاصىح على الرىا ل هعىيىا لفىل الصىااخ الوذسوسىح و
السثح تيهن ذ يش ال اهويح الاعل العي الوهي ف ذىسيس ظويع الصااخ ذحد الذساسح. اظهشخ ا تاء
غىتح لوع ن الصااخ ذحد الذساسح و اظهش احذي ع ش هعيىا قذسج عاليح عل الرا ل و هش 5و 4, 1سقن
ف العيل ا ول قذسج خاصىح على الرىا ل تيوىا اعتى سىثعح هعىي هىهن قىذسج خاصىح هشغىتىح فى العيىل
ذىى شيشاخ قىىذسج P3xP4و P2xP3 ,P4xP6الصىىا لصىىاح هحصىىىل حثىىىب الثىىاخ. أعتىىد الصالشىىح هعىىي
خاصح عل الرا ل عاليح الوعىيح لوحصىل لىصى هحصىل حثىب الثاخ ف كل هي العيىل ا ول و الصىا.
م هعىي لفل الصااخ الوذسوسي و كاى H1يوفي اسرخذام ذلك الهعي ف تشاهط الرشتيح. كاى ذ شيش السيادج )
(H1/D) اكثش هي العضء الوهي و كاد السثح0.5
الىحذج ف كل الصااخ الوذسوسح. كاد قيوح اكثش هي
كااءج الرىسيس توعاها الىاسع كثيشج تالوقاسح تذسظح الرىسيس تالوع الهىي الرى ظهىشخ هخاهىح الى
هرىستح و هزا يذل عل اى العضء السيادي هى الزي يرحفن ف اظهاس الصااخ . كاىد ا لىيالخ الورحيىح و
م. و كاد السىيادج Fم و قيوح )H2/4H1تاء لوع ن الصااخ و رلك ت سرخذام )السابذج غيش هرساويح ف األ
فى 1و سقىن 2فى الويعىاد الوثفىش و سقىن 5الاابقح راخ الر شيش ا كثش ف كل الصااخ. أظهشخ السىاللح سقىن
ىد ذحوىل كا 4الويعاد الور خش اها ذحول هع ن ا ليالخ السابذج لصاح الوحصىل/ ثاخ تيوىا السىاللح سقىن
حثىح فى 1000هع ن األليالخ الورحيح. أظهشخ رابط الرحليل الثيا أى صاح عىذد السىاتل/ ثىاخ و وصى
العيل ا ول و صاح هحصىل حثىب الثاخ ف العيل الصا سيادج كاهلي. تيوا أظهشخ صاح طىل الثاخ ف
العيل الصا سيادج ظضبيح. العيل األول و عذد الساتل/ ثاخ و عذد عذد حثىب السثلح ف
(2113) 373 -333( :2)19لتربية النبات المصرية المجلة


