Embed Size (px)
Citation preview
GCOOS Build-Out Plan Version 2.1
A Sustained, Integrated Ocean Observing System for the Gulf of Mexico: Infrastructure for Decision-Making
GCOOS Regional Association Board of Directors
and GCOOS Office Staff
Comments welcome. Send to [email protected].
27 January 2015
i
Table of Contents A Sustained, Integrated Ocean Observing System for the Gulf of Mexico (GCOOS) Infrastructure
for Decision-making Version 2.1
PAGE
1. Executive Summary .................................................................................................................... 1 2. Introduction ................................................................................................................................ 4 2.1 National Importance of the Gulf of Mexico ..................................................................... 4 2.2 What GCOOS Is ............................................................................................................... 6 2.3 Purpose of the GCOOS ..................................................................................................... 6 2.4 Societal Goals and Infrastructure Needs ........................................................................... 7 2.5. Development of the GCOOS Build-out Plan .................................................................... 10 2.6 The GCOOS Build-Out Plan Elements ............................................................................ 11 2.7 GCOOS Build-Out Implementation ................................................................................. 12 3. Observing Subsystem ................................................................................................................. 13 3.1 Introduction to Observing System Components ............................................................... 13 3.2 Surface Currents and Waves Network .............................................................................. 15 3.3 Mooring Network ............................................................................................................. 18 3.4 Autonomous Meteorological Measurement Network ....................................................... 19 3.5 Gliders and Autonomous Underwater and Surface Vehicles ........................................... 20 3.6 Satellite Observations and Products ................................................................................. 26 3.7 Aircraft Observations and Unmanned Aerial Systems ..................................................... 27 3.8 Bathymetry and Topography Mapping ............................................................................. 31 3.9 Enhanced Water Level Network ....................................................................................... 32 3.10 Enhanced Physical Oceanography Real-Time Systems (PORTS®) Network .................. 33 3.11 Ecosystem Monitoring ..................................................................................................... 34 3.12 Harmful Algal Bloom Integrated Observing System ....................................................... 49 3.13 Integrated Water Quality Monitoring Network and Beach Quality Monitoring .............. 51 3.14 Hypoxia Monitoring ......................................................................................................... 54 3.15 Monitoring of River Discharge to the Gulf ...................................................................... 56 4. Modeling and Analysis Subsystem ............................................................................................. 57 4.1 Introduction ....................................................................................................................... 57 4.2 Circulation Modeling ....................................................................................................... 58 4.3 Ecosystem Modeling ....................................................................................................... 61 5. Data Management and Communication (DMAC) Subsystem ................................................... 62 6. Outreach and Education Subsystem ........................................................................................... 64 7. Governance and Management Subsystem .................................................................................. 67 8. Role of Research and Development in GCOOS ......................................................................... 68 9. Budget and Funding .................................................................................................................... 68 9.1 Development Sequence ..................................................................................................... 69 9.2 Cost Estimates [Total cost not included at this time] ....................................................... 69 9.3 Multifaceted Nature of Development ............................................................................... 69 Bibliography ....................................................................................................................................... 70 Appendix A: Integrated GCOOS Stakeholder Priorities .................................................................... 71 Appendix B: Priority Tables ............................................................................................................... 72 Appendix C: GCOOS-RA Workshops and Meetings ........................................................................ 79 Appendix D: Suggested Initial Enhancements to the Gulf Observing System ................................... 81 Appendix E: Links to Detailed Element Descriptions ........................................................................ 91 Appendix F: Details for Ecosystem Monitoring ................................................................................. 92
1
A Sustained, Integrated Ocean Observing System for the Gulf of Mexico (GCOOS): Infrastructure for Decision-making
1. Executive Summary
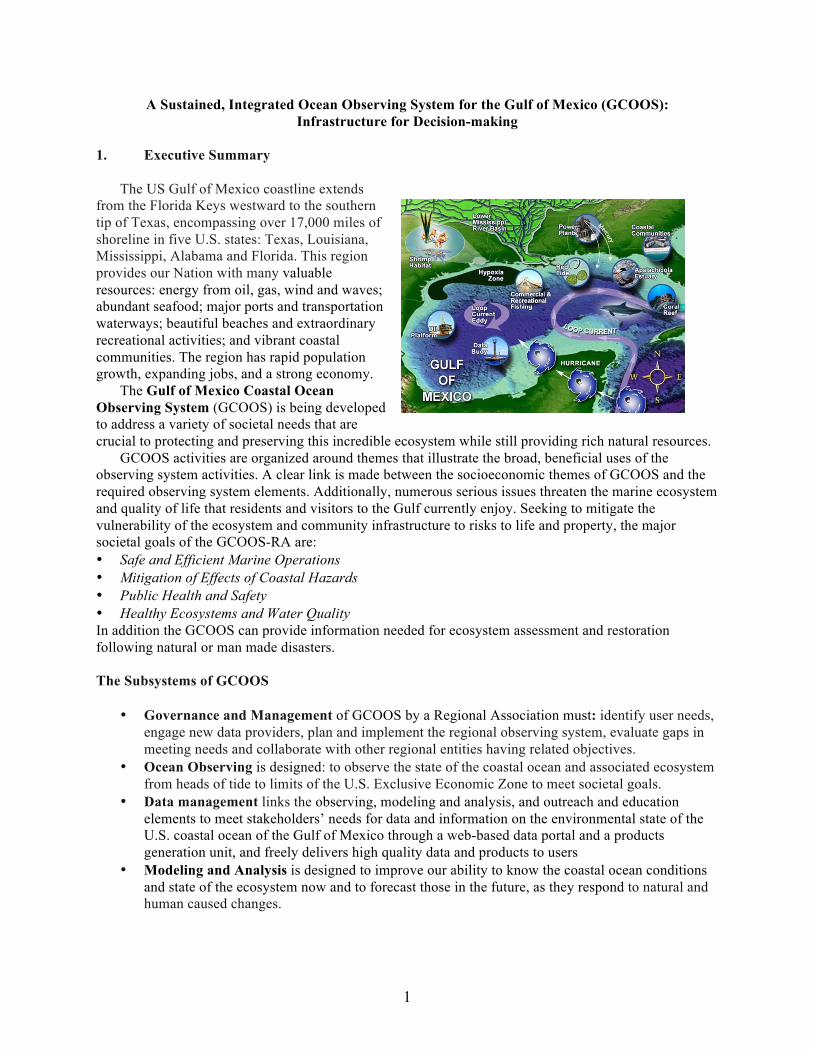
The US Gulf of Mexico coastline extends from the Florida Keys westward to the southern tip of Texas, encompassing over 17,000 miles of shoreline in five U.S. states: Texas, Louisiana, Mississippi, Alabama and Florida. This region provides our Nation with many valuable resources: energy from oil, gas, wind and waves; abundant seafood; major ports and transportation waterways; beautiful beaches and extraordinary recreational activities; and vibrant coastal communities. The region has rapid population growth, expanding jobs, and a strong economy.
The Gulf of Mexico Coastal Ocean Observing System (GCOOS) is being developed to address a variety of societal needs that are crucial to protecting and preserving this incredible ecosystem while still providing rich natural resources.
GCOOS activities are organized around themes that illustrate the broad, beneficial uses of the observing system activities. A clear link is made between the socioeconomic themes of GCOOS and the required observing system elements. Additionally, numerous serious issues threaten the marine ecosystem and quality of life that residents and visitors to the Gulf currently enjoy. Seeking to mitigate the vulnerability of the ecosystem and community infrastructure to risks to life and property, the major societal goals of the GCOOS-RA are: • Safe and Efficient Marine Operations • Mitigation of Effects of Coastal Hazards • Public Health and Safety • Healthy Ecosystems and Water Quality In addition the GCOOS can provide information needed for ecosystem assessment and restoration following natural or man made disasters. The Subsystems of GCOOS
• Governance and Management of GCOOS by a Regional Association must: identify user needs, engage new data providers, plan and implement the regional observing system, evaluate gaps in meeting needs and collaborate with other regional entities having related objectives.
• Ocean Observing is designed: to observe the state of the coastal ocean and associated ecosystem from heads of tide to limits of the U.S. Exclusive Economic Zone to meet societal goals.
• Data management links the observing, modeling and analysis, and outreach and education elements to meet stakeholders’ needs for data and information on the environmental state of the U.S. coastal ocean of the Gulf of Mexico through a web-based data portal and a products generation unit, and freely delivers high quality data and products to users
• Modeling and Analysis is designed to improve our ability to know the coastal ocean conditions and state of the ecosystem now and to forecast those in the future, as they respond to natural and human caused changes.
2
• Outreach and education trains the teachers, provides materials that will achieve ocean and climate literacy in and out of the classroom and helps the public toward an enhanced understanding of the coastal ocean and its ecosystem.
• Research and Development informs the research community of current and future needs for knowledge and technology.
This plan addresses the key elements deemed needed as parts of the GCOOS in order to address the
societal needs discussed above. Some observing system elements have a long history of use; others involve newer and developing capabilities (e.g., autonomous monitoring of biogeochemical parameters). So we use a hybrid approach in selecting the observing system elements. Some focus on monitoring platforms: moorings, others on observing subsystems, others on the measurand, and at least one on a particular class of instrumentation. One thing that all elements of the plan have in common is that there were selected to respond to the articulated stakeholder needs. The elements chosen are:
• Surface currents and waves network • Mooring Network • Autonomous Meteorological Measurement Network • Gliders and Autonomous Underwater and Surface Vehicles • Satellite Observations and Products • Aircraft Observations and Unmanned Aerial Systems • Bathymetry and Topography Mapping • Enhanced Water Level Network • Enhanced Physical Oceanography Real-Time Systems • Ecosystem Monitoring • Harmful Algal Bloom Integrated Observing System • Integrated Water Quality Monitoring Network and Beach Quality Monitoring • Hypoxia Monitoring • Monitoring of River Discharge to the Gulf • Circulation Modeling • Ecosystem Modeling • Data Management and Communication Subsystem • Outreach and Education Subsystem
Additionally, the governance of the GCOOS Regional Association is an important element of the
sustained, integrated observing system. A 20th element is continuing identification of stakeholder needs for data and products. The current status of such identification is contained in Appendices A and B of the plan.
We use several approaches to obtaining stakeholder priorities for measurements and derived products. (1) We hold workshops for specific stakeholder communities (e.g., recreational boaters, emergency managers, or petroleum producers) to identify with priorities the measurements and products needed by the specific community. We have held seventeen workshops involving 631 participants representing 297 distinct organizations. At least fifty other individuals have contributed via mail. These workshops are listed in Appendix C.
(2) We incorporate inputs from guiding documents such as: planning documents prepared by the Gulf of Mexico Alliance or the Southeast Coastal Ocean Observing Regional Association; A Network Gaps Analysis for the National Water Level Observation Network (Gill and Fisher 2008) produced by the National Ocean Service; priority actions recommended to NOAA by the Hydrographic Services Review Panel as necessary to maintain and improve a competitive U.S. Marine Transportation System; environmental data needs for U.S. Coast Guard’s search and Rescue Optimal Planning System; or the IOOS plan for a national high-frequency radar network. Thirty-two national, regional or local documents have been reviewed and considered. In this manner the needs of many different stakeholder sectors are
3
incorporated into our overall planning. (3) We use advice from the groups comprising the organizational structure of the GCOOS-RA: the
Board of Directors, Councils, Committees and Task Teams. These groups consist of people from many different stakeholder sectors of the private, governmental, and academic communities, so the advice given is a realistic representation of many different sectors and contributes to the determination of priorities. Meetings of these groups are listed in Appendix C.
We are committed to freely share data, model output, and products via the Internet for the common benefit of all participants, including industry, NGOs, academia, federal, state, regional, and local government agencies and the public. It is understood that this Gulf of Mexico observing system will be integrated with other regional coastal ocean observing systems, in particular to create an integrated and sustained component of the U.S. Integrated Ocean Observing System.
This build-out plan is divided into phases because we recognize that the system will require start-up and sustained financial support from a combination of government, private, and non-governmental organizations. That will be possible only if the system is built and remains responsive to the needs of these organizations and to the public. Thus, the system will be subject to continuing oversight by representatives of such organizations and of the public.
It also is understood that the GCOOS-RA alone cannot fully implement and maintain this observing system. We welcome and will assist with the participation by all participants committed to developing and maintaining a system for all stakeholders.
This document describes a full build out for the observing system. The body of the report gives summaries of all the needed elements for the full plan. Appendix D gives suggested initial enhancements to the Gulf observing system. Those enhancements are a selection of observing stations and activities that fill the most important gaps in the existing observing system at a relatively modest cost. The estimated cost is ~$35M for capital equipment and ~$33M per year for replacement and maintenance. This initial enhancement, while a substantial step forward, is really just a foundation and ultimately should be expanded into the full plan.
The full plan may be viewed via Appendix E containing links to detailed descriptions of each element of the plan. Because of the importance of ecosystem monitoring and observations, an expanded description of that element is given as Appendix F.
The Gulf of Mexico is a precious and important U.S. resource. Many short-term and long-term management and other stakeholder decisions are based on limited information. The Deepwater Horizon disaster was a vivid illustration both that GCOOS assets are extremely valuable, and that the ocean observing and information system in the Gulf needs enhancement. The plan that follows would build-out the GCOOS system to a level that can meet the major information needs identified by a wide range of Gulf stakeholders.
This is Version 2.1 of the Build-out Plan. It will evolve over the coming years to meet stakeholder needs.
4
2. Introduction 2.1 National Importance of the Gulf of Mexico1
The northern Gulf of Mexico extends from the Florida Keys westward to the southern tip of Texas, encompassing over 17,000 miles of tidal shoreline in five U.S. states: Texas, Louisiana, Mississippi, Alabama, and Florida. This region provides our nation with many valuable resources: energy from oil, gas, wind and waves; abundant seafood; ports; transportation waterways; beautiful beaches and extraordinary recreational activities; and vibrant coastal communities. It also has endured both natural and manmade catastrophes, including the 2005 Hurricane Katrina, which remains the most costly U.S. natural disaster, and the 2010 BP Deepwater Horizon Macondo well blowout, which became the world's largest accidental marine oil spill.
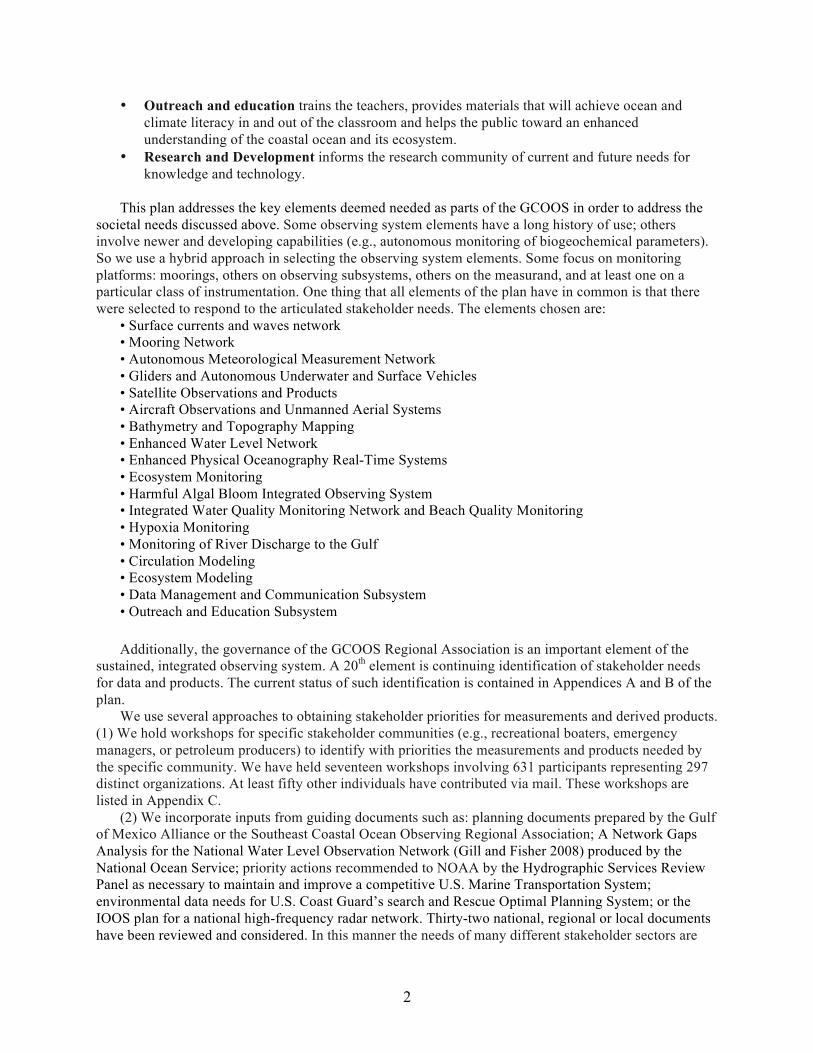
The Gulf of Mexico is the ninth largest water body in the world. It is a semi-closed basin connected to the Caribbean Sea and the Atlantic Ocean. The major current system is the Loop Current, which enters the Gulf through the Yucatán Channel, circulates clockwise in the eastern Gulf, and exits through the Florida Strait to eventually form the Gulf Stream along the eastern seaboard. Portions of the Loop Current break off forming eddies that affect regional current patterns throughout the Gulf. The Gulf also receives the runoff from 33 U.S. states with 20 major river systems with over 150 rivers and covering over 3.8 million square kilometers of the continental United States.
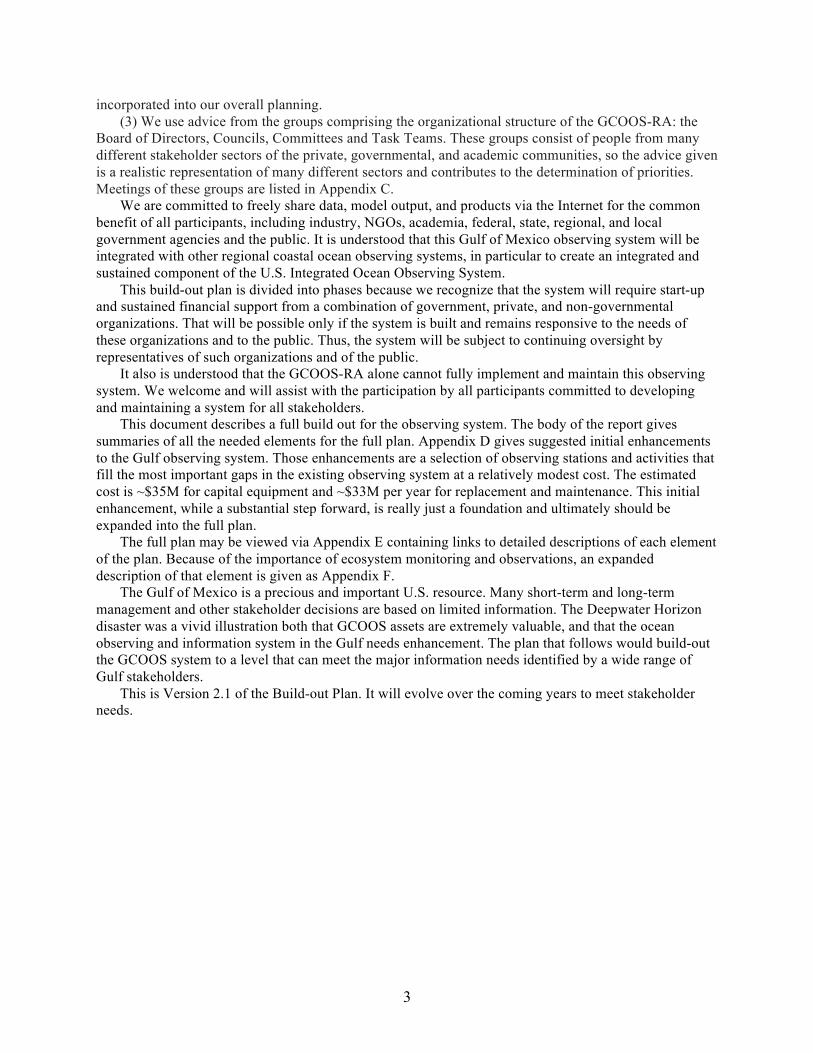
Some of the most densely populated areas in the Nation are the coastal regions. The Gulf of Mexico is no exception. Approximately 37 percent of the Gulf States’ population lives in the coastal region, which comprises ~25 percent of the states’ land area. Rapid coastal development presents a dichotomy: the natural beauty and resources of the coastal environment attracts people, but the ecosystems that provide them are stressed by increased population and associated urban development. The Gulf Coast human population increased 109% between 1970 and 20102.
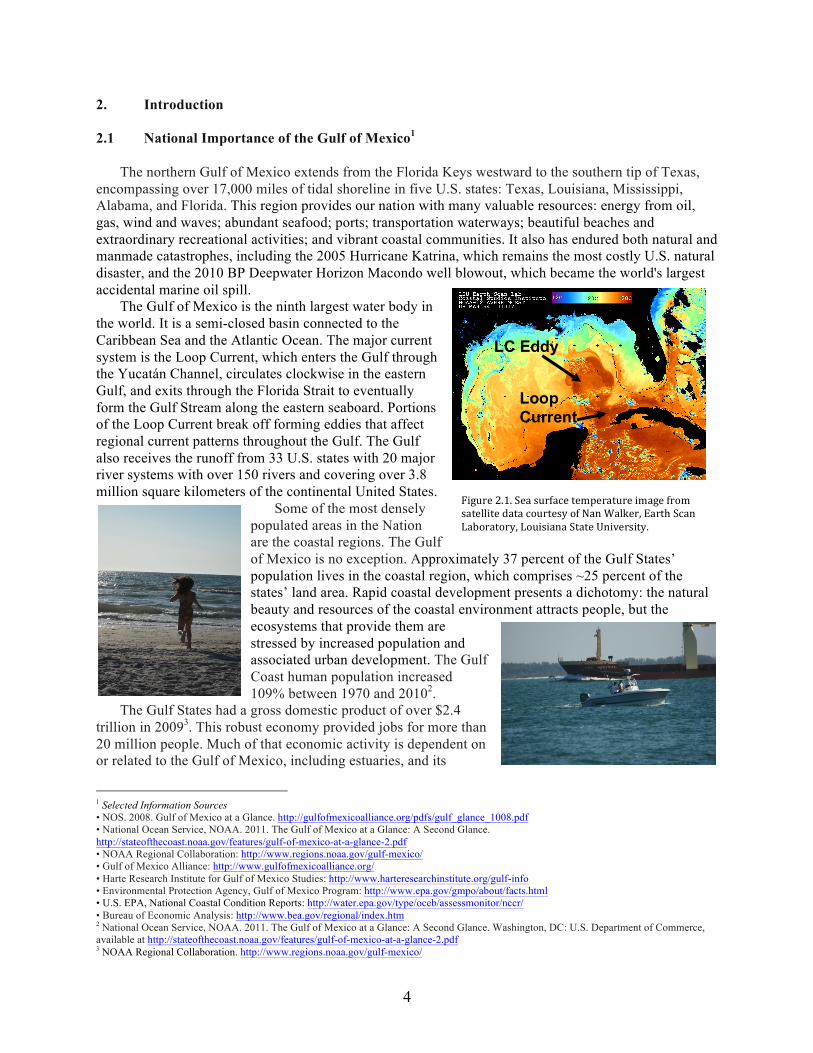
The Gulf States had a gross domestic product of over $2.4 trillion in 20093. This robust economy provided jobs for more than 20 million people. Much of that economic activity is dependent on or related to the Gulf of Mexico, including estuaries, and its
1 Selected Information Sources • NOS. 2008. Gulf of Mexico at a Glance. http://gulfofmexicoalliance.org/pdfs/gulf_glance_1008.pdf • National Ocean Service, NOAA. 2011. The Gulf of Mexico at a Glance: A Second Glance. http://stateofthecoast.noaa.gov/features/gulf-of-mexico-at-a-glance-2.pdf • NOAA Regional Collaboration: http://www.regions.noaa.gov/gulf-mexico/ • Gulf of Mexico Alliance: http://www.gulfofmexicoalliance.org/ • Harte Research Institute for Gulf of Mexico Studies: http://www.harteresearchinstitute.org/gulf-info • Environmental Protection Agency, Gulf of Mexico Program: http://www.epa.gov/gmpo/about/facts.html • U.S. EPA, National Coastal Condition Reports: http://water.epa.gov/type/oceb/assessmonitor/nccr/ • Bureau of Economic Analysis: http://www.bea.gov/regional/index.htm 2 National Ocean Service, NOAA. 2011. The Gulf of Mexico at a Glance: A Second Glance. Washington, DC: U.S. Department of Commerce, available at http://stateofthecoast.noaa.gov/features/gulf-of-mexico-at-a-glance-2.pdf 3 NOAA Regional Collaboration. http://www.regions.noaa.gov/gulf-mexico/
Figure2.1.SeasurfacetemperatureimagefromsatellitedatacourtesyofNanWalker,EarthScanLaboratory,LouisianaStateUniversity.
LC Eddy
Loop Current
5
natural resources. The largest industries are oil and gas, tourism, fishing, and shipping. Table 2.1 provides facts that highlight the importance of the Gulf of Mexico region to the entire nation and countries around the globe.
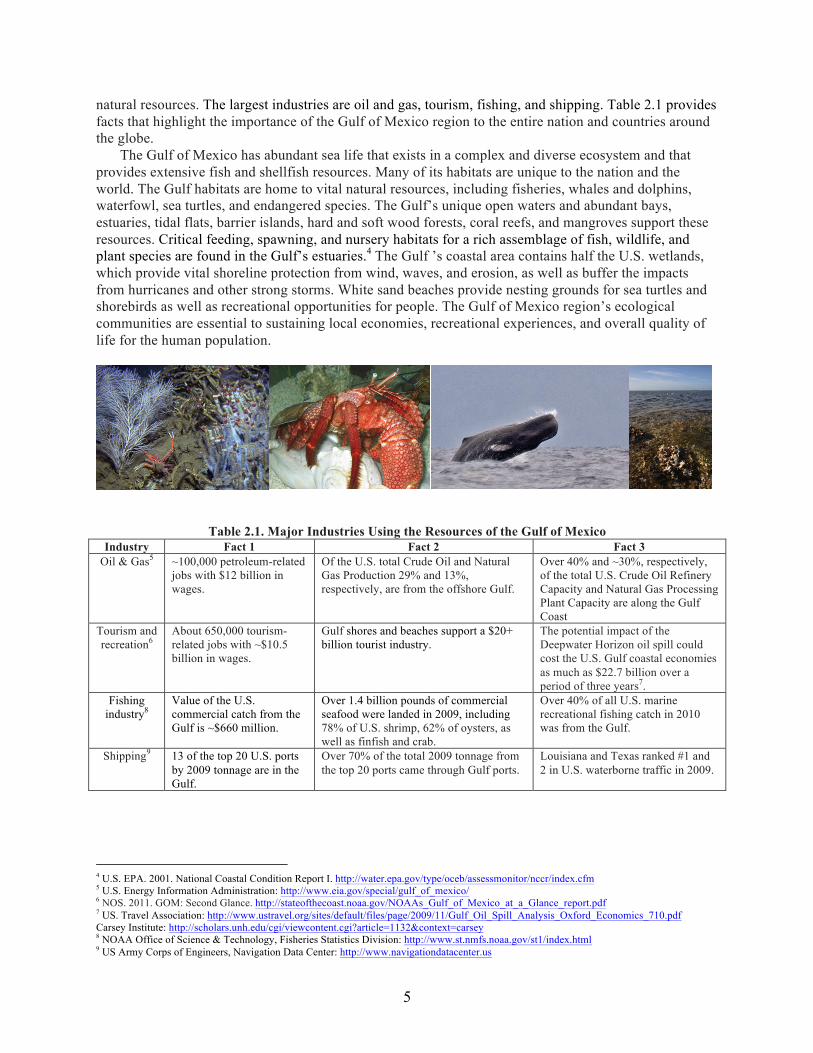
The Gulf of Mexico has abundant sea life that exists in a complex and diverse ecosystem and that provides extensive fish and shellfish resources. Many of its habitats are unique to the nation and the world. The Gulf habitats are home to vital natural resources, including fisheries, whales and dolphins, waterfowl, sea turtles, and endangered species. The Gulf’s unique open waters and abundant bays, estuaries, tidal flats, barrier islands, hard and soft wood forests, coral reefs, and mangroves support these resources. Critical feeding, spawning, and nursery habitats for a rich assemblage of fish, wildlife, and plant species are found in the Gulf’s estuaries.4 The Gulf ’s coastal area contains half the U.S. wetlands, which provide vital shoreline protection from wind, waves, and erosion, as well as buffer the impacts from hurricanes and other strong storms. White sand beaches provide nesting grounds for sea turtles and shorebirds as well as recreational opportunities for people. The Gulf of Mexico region’s ecological communities are essential to sustaining local economies, recreational experiences, and overall quality of life for the human population.
Table 2.1. Major Industries Using the Resources of the Gulf of Mexico Industry Fact 1 Fact 2 Fact 3
Oil & Gas5 ~100,000 petroleum-related jobs with $12 billion in wages.
Of the U.S. total Crude Oil and Natural Gas Production 29% and 13%, respectively, are from the offshore Gulf.
Over 40% and ~30%, respectively, of the total U.S. Crude Oil Refinery Capacity and Natural Gas Processing Plant Capacity are along the Gulf Coast
Tourism and recreation6
About 650,000 tourism-related jobs with ~$10.5 billion in wages.
Gulf shores and beaches support a $20+ billion tourist industry.
The potential impact of the Deepwater Horizon oil spill could cost the U.S. Gulf coastal economies as much as $22.7 billion over a period of three years7.
Fishing industry8
Value of the U.S. commercial catch from the Gulf is ~$660 million.
Over 1.4 billion pounds of commercial seafood were landed in 2009, including 78% of U.S. shrimp, 62% of oysters, as well as finfish and crab.
Over 40% of all U.S. marine recreational fishing catch in 2010 was from the Gulf.
Shipping9 13 of the top 20 U.S. ports by 2009 tonnage are in the Gulf.
Over 70% of the total 2009 tonnage from the top 20 ports came through Gulf ports.
Louisiana and Texas ranked #1 and 2 in U.S. waterborne traffic in 2009.
4 U.S. EPA. 2001. National Coastal Condition Report I. http://water.epa.gov/type/oceb/assessmonitor/nccr/index.cfm 5 U.S. Energy Information Administration: http://www.eia.gov/special/gulf_of_mexico/ 6 NOS. 2011. GOM: Second Glance. http://stateofthecoast.noaa.gov/NOAAs_Gulf_of_Mexico_at_a_Glance_report.pdf 7 US. Travel Association: http://www.ustravel.org/sites/default/files/page/2009/11/Gulf_Oil_Spill_Analysis_Oxford_Economics_710.pdf Carsey Institute: http://scholars.unh.edu/cgi/viewcontent.cgi?article=1132&context=carsey 8 NOAA Office of Science & Technology, Fisheries Statistics Division: http://www.st.nmfs.noaa.gov/st1/index.html 9 US Army Corps of Engineers, Navigation Data Center: http://www.navigationdatacenter.us
6
2.2 What GCOOS Is
The Gulf of Mexico Coastal Ocean Observing System (GCOOS) is the regional observing system being built under the auspices of the Integrated Coastal Ocean Observing System Act of 200910 for the U.S. waters of the Gulf of Mexico from the boundary of the U.S. Exclusive Economic Zone inshore to the end of the tidal effects in estuaries.
The GCOOS is being developed to serve data and products of many types, being freely shared by diverse providers, in an interoperable way. To build the GCOOS requires the partnership of many organizations—from governments to industry to academia to educators to the public—to integrate the measurements already being made and to fill gaps where necessary to meet local, regional, and national, requirements. GCOOS will provide data, information and products on coastal, marine and estuarine systems deemed necessary to the users in a common manner and according to sound scientific practice. Elements of the GCOOS consist of five interconnecting subsystems with input to a sixth that identifies needed research and development to meet future stakeholder requirements.
The GCOOS Regional Association (GCOOS-RA) is the body charged with development of the GCOOS. The GCOOS-RA provides office staff sufficient to conduct the day-to-day business, coordinate the activities of the diverse data providers, support the activities of the GCOOS-RA governing bodies, and prepare and submit necessary fiscal and progress reports to funding entities. It also facilitates meetings and workshops to allow the GCOOS governing bodies to conduct their business, engage stakeholders from different sectors, identify gaps in needs and develop ways to fill them, and prepare and disseminate information on GCOOS and its Regional Association for diverse audiences. 2.3 Purpose of the GCOOS
The purpose of GCOOS is to empower people, communities and businesses to improve decision-making about our lives, work, and play along the Nation's Gulf Coast. Examples of useful information: • Search and rescue—find lost boaters in rough seas. • Monitor tide, water level, and wind in ports to ensure
commercial vessels enter and exit safely and efficiently. • Improved hurricane intensity estimates and
tracking for timely evacuation warnings. 10http://www.ioos.noaa.gov/library/icoos_act.pdf
TheSubsystemsofGCOOSRAGovernanceandManagement:toidentifyuserneeds,engagenewdataproviders,planandimplementtheregionalsystem,evaluategapsinmeetingneeds.OceanObserving:toobservethestateofthecoast,ocean,andassociatedecosystemtomeetsocietalgoals.DataManagement:tolinktheobservingandmonitoring,modeling,andeducationalandoutreachelementstomeetstakeholders’needsfordataandinformationontheenvironmentalstateofthecoastalanddeepwatersoftheGulfofMexicothroughadatamanagementsystemandaproductsgenerationunit;andtodeliverhigh-qualitydataandproductstousers.ModelingandAnalysis:toimproveourabilitytoforecastoceanconditions,aswellasecosystemresponsestonaturalandhuman-causedchanges.OutreachandEducation:totraintheteachers,toprovidematerialsthatwillachieveoceanandclimateliteracyinandoutoftheclassroom,tohelpthepublictowardanenhancedunderstandingoftheoceanicecosystem.ResearchandDevelopment:toinformtheresearchcommunityofupcomingandfutureneedsforknowledgeandtechnology.
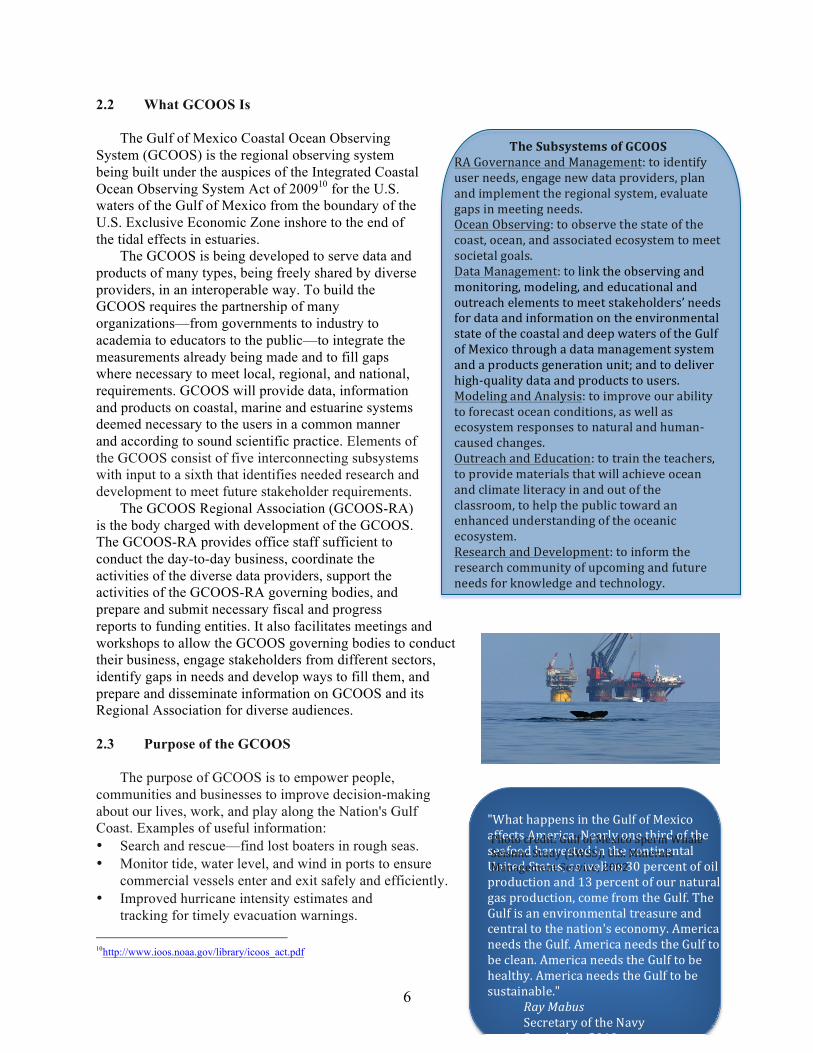
"WhathappensintheGulfofMexicoaffectsAmerica.NearlyonethirdoftheseafoodharvestedinthecontinentalUnitedStates,aswellas30percentofoilproductionand13percentofournaturalgasproduction,comefromtheGulf.TheGulfisanenvironmentaltreasureandcentraltothenation'seconomy.AmericaneedstheGulf.AmericaneedstheGulftobeclean.AmericaneedstheGulftobehealthy.AmericaneedstheGulftobesustainable." RayMabus SecretaryoftheNavy September2010
Photocredit:GulfofMexicoSpermWhaleSeismicStudy(SWSS),U.S.MineralsManagementService,2002
7
• Storm surge and inundation flooding information for the population living or visiting at the coast. • Surf's up? Waves too small for my board? Too big for my boat? • Efficient tracking of oil spilled into surface and subsurface waters. • Planning for roads and urban development along the coast as sea level rises and land subsides. • Monitoring the biodiversity in the coastal waters to improve fisheries and ecosystem management. • Keep our coral reefs, sea grass beds, and mangrove forests healthy. • Early warnings of toxic aerosols from harmful algal blooms for beach goers. • Prompt reopening of shellfish beds when danger from pathogens or "red tide" ends.
Decisions require science-based information, including biological, geochemical and physical data and the tools to generate forecasts, graphics and products to inform the impacted stakeholder community. One effective tool is a sustained operational ocean observing system—the Gulf of Mexico Coastal Ocean Observing System.
2.4 Societal Goals and Infrastructure Needs
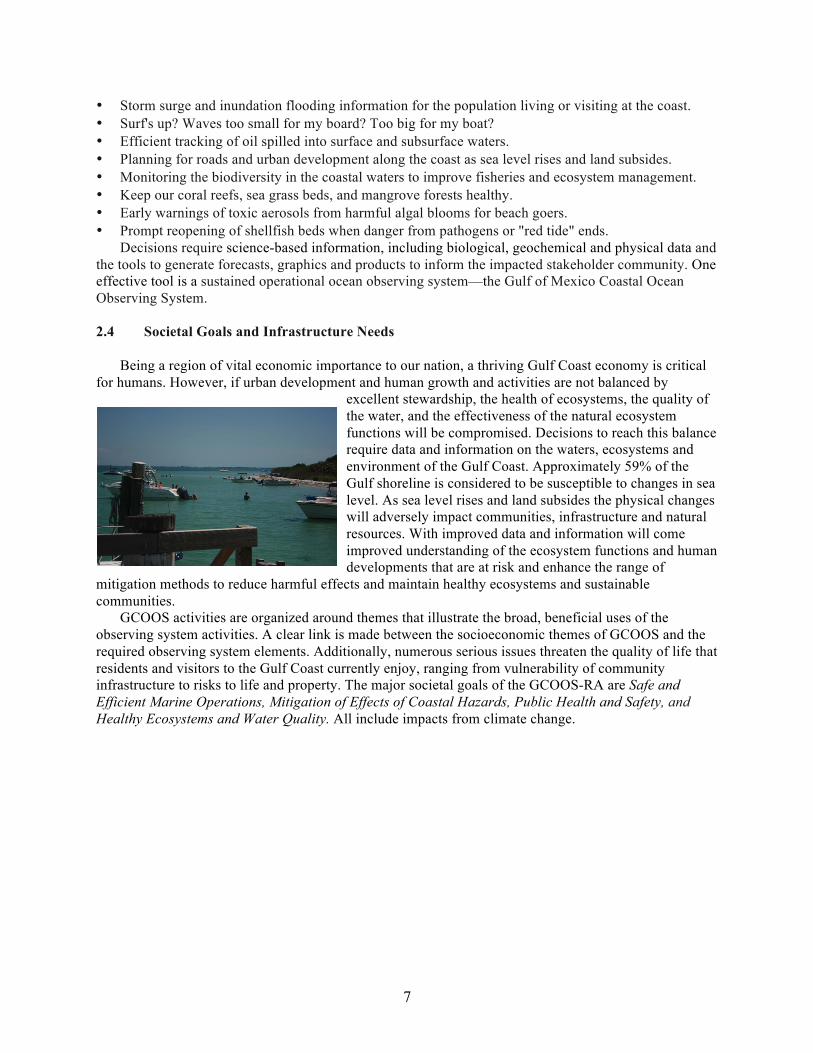
Being a region of vital economic importance to our nation, a thriving Gulf Coast economy is critical
for humans. However, if urban development and human growth and activities are not balanced by excellent stewardship, the health of ecosystems, the quality of the water, and the effectiveness of the natural ecosystem functions will be compromised. Decisions to reach this balance require data and information on the waters, ecosystems and environment of the Gulf Coast. Approximately 59% of the Gulf shoreline is considered to be susceptible to changes in sea level. As sea level rises and land subsides the physical changes will adversely impact communities, infrastructure and natural resources. With improved data and information will come improved understanding of the ecosystem functions and human developments that are at risk and enhance the range of
mitigation methods to reduce harmful effects and maintain healthy ecosystems and sustainable communities.
GCOOS activities are organized around themes that illustrate the broad, beneficial uses of the observing system activities. A clear link is made between the socioeconomic themes of GCOOS and the required observing system elements. Additionally, numerous serious issues threaten the quality of life that residents and visitors to the Gulf Coast currently enjoy, ranging from vulnerability of community infrastructure to risks to life and property. The major societal goals of the GCOOS-RA are Safe and Efficient Marine Operations, Mitigation of Effects of Coastal Hazards, Public Health and Safety, and Healthy Ecosystems and Water Quality. All include impacts from climate change.
8
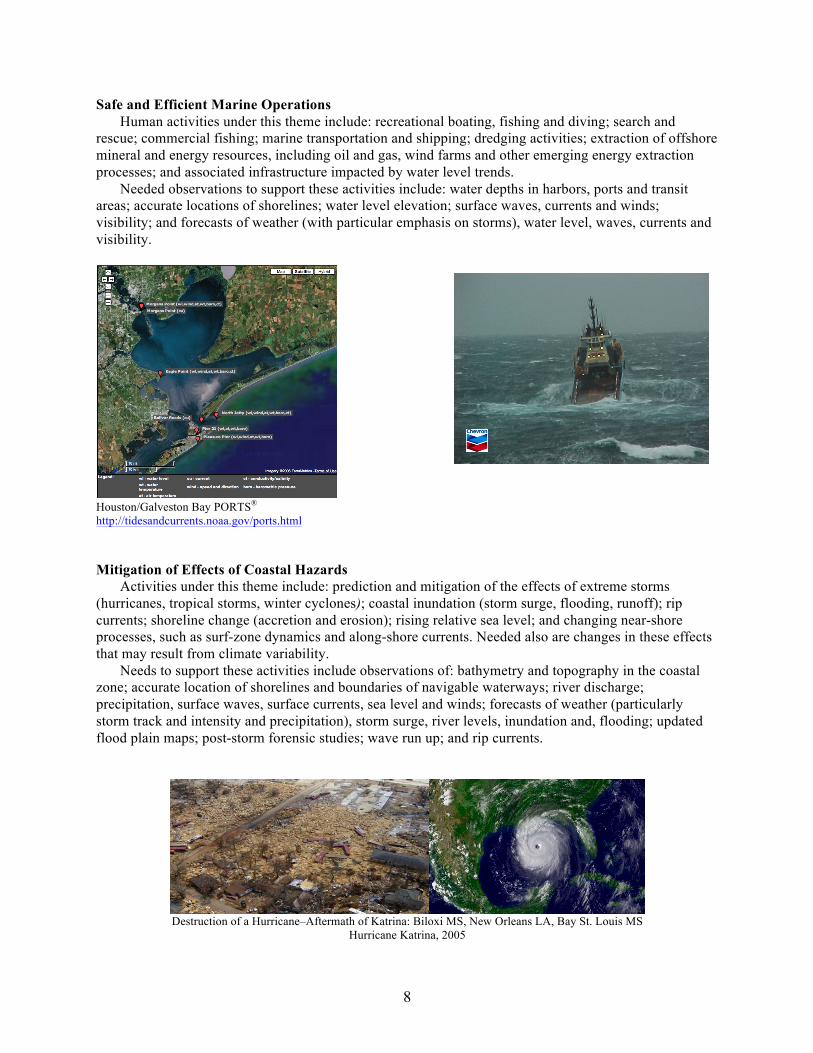
Safe and Efficient Marine Operations Human activities under this theme include: recreational boating, fishing and diving; search and
rescue; commercial fishing; marine transportation and shipping; dredging activities; extraction of offshore mineral and energy resources, including oil and gas, wind farms and other emerging energy extraction processes; and associated infrastructure impacted by water level trends.
Needed observations to support these activities include: water depths in harbors, ports and transit areas; accurate locations of shorelines; water level elevation; surface waves, currents and winds; visibility; and forecasts of weather (with particular emphasis on storms), water level, waves, currents and visibility.
Houston/Galveston Bay PORTS® http://tidesandcurrents.noaa.gov/ports.html Mitigation of Effects of Coastal Hazards
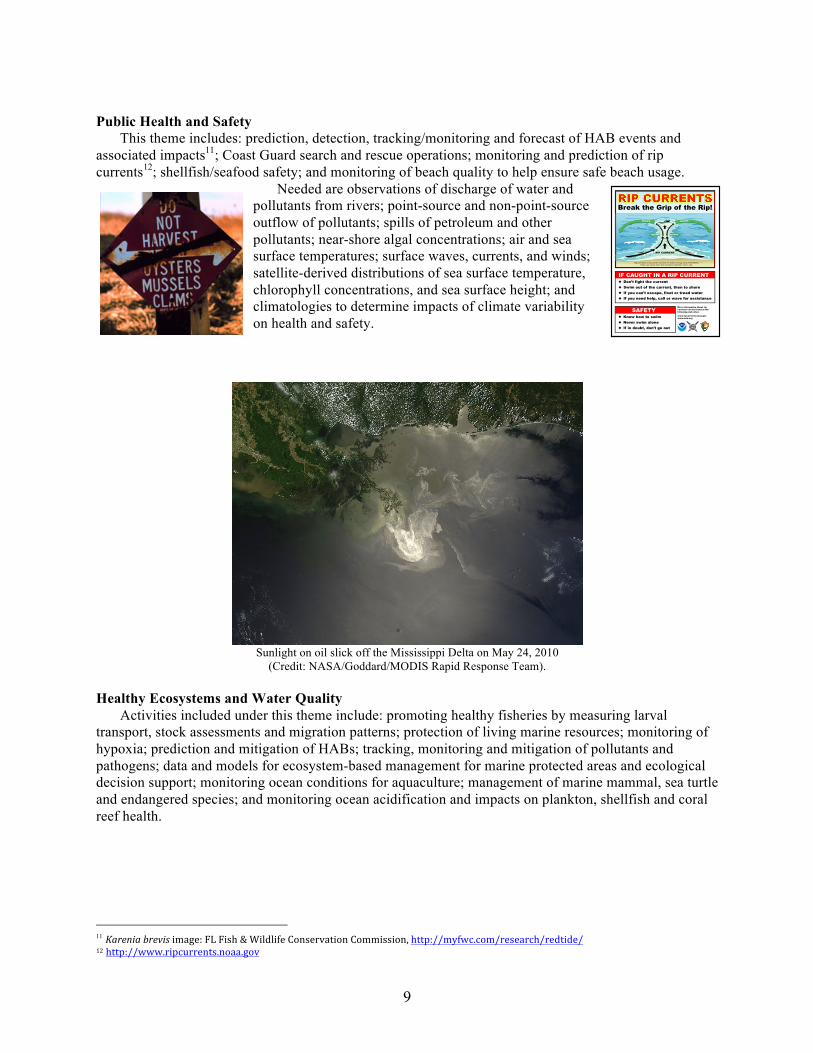
Activities under this theme include: prediction and mitigation of the effects of extreme storms (hurricanes, tropical storms, winter cyclones); coastal inundation (storm surge, flooding, runoff); rip currents; shoreline change (accretion and erosion); rising relative sea level; and changing near-shore processes, such as surf-zone dynamics and along-shore currents. Needed also are changes in these effects that may result from climate variability.
Needs to support these activities include observations of: bathymetry and topography in the coastal zone; accurate location of shorelines and boundaries of navigable waterways; river discharge; precipitation, surface waves, surface currents, sea level and winds; forecasts of weather (particularly storm track and intensity and precipitation), storm surge, river levels, inundation and, flooding; updated flood plain maps; post-storm forensic studies; wave run up; and rip currents.
Destruction of a Hurricane–Aftermath of Katrina: Biloxi MS, New Orleans LA, Bay St. Louis MS
Hurricane Katrina, 2005
9
Public Health and Safety
This theme includes: prediction, detection, tracking/monitoring and forecast of HAB events and associated impacts11; Coast Guard search and rescue operations; monitoring and prediction of rip currents12; shellfish/seafood safety; and monitoring of beach quality to help ensure safe beach usage.
Needed are observations of discharge of water and pollutants from rivers; point-source and non-point-source outflow of pollutants; spills of petroleum and other pollutants; near-shore algal concentrations; air and sea surface temperatures; surface waves, currents, and winds; satellite-derived distributions of sea surface temperature, chlorophyll concentrations, and sea surface height; and climatologies to determine impacts of climate variability on health and safety.
Sunlight on oil slick off the Mississippi Delta on May 24, 2010
(Credit: NASA/Goddard/MODIS Rapid Response Team). Healthy Ecosystems and Water Quality
Activities included under this theme include: promoting healthy fisheries by measuring larval transport, stock assessments and migration patterns; protection of living marine resources; monitoring of hypoxia; prediction and mitigation of HABs; tracking, monitoring and mitigation of pollutants and pathogens; data and models for ecosystem-based management for marine protected areas and ecological decision support; monitoring ocean conditions for aquaculture; management of marine mammal, sea turtle and endangered species; and monitoring ocean acidification and impacts on plankton, shellfish and coral reef health.
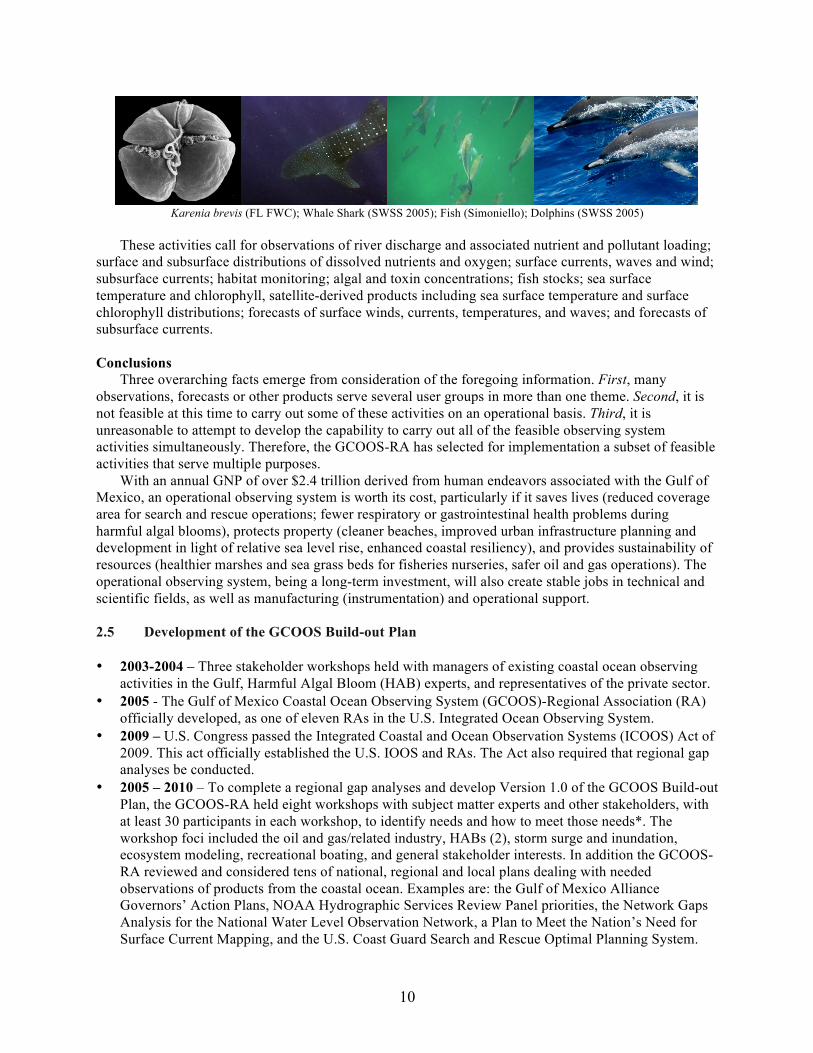
11 Kareniabrevisimage:FLFish&WildlifeConservationCommission,http://myfwc.com/research/redtide/12http://www.ripcurrents.noaa.gov
10
Karenia brevis (FL FWC); Whale Shark (SWSS 2005); Fish (Simoniello); Dolphins (SWSS 2005)
These activities call for observations of river discharge and associated nutrient and pollutant loading;
surface and subsurface distributions of dissolved nutrients and oxygen; surface currents, waves and wind; subsurface currents; habitat monitoring; algal and toxin concentrations; fish stocks; sea surface temperature and chlorophyll, satellite-derived products including sea surface temperature and surface chlorophyll distributions; forecasts of surface winds, currents, temperatures, and waves; and forecasts of subsurface currents.
Conclusions
Three overarching facts emerge from consideration of the foregoing information. First, many observations, forecasts or other products serve several user groups in more than one theme. Second, it is not feasible at this time to carry out some of these activities on an operational basis. Third, it is unreasonable to attempt to develop the capability to carry out all of the feasible observing system activities simultaneously. Therefore, the GCOOS-RA has selected for implementation a subset of feasible activities that serve multiple purposes.
With an annual GNP of over $2.4 trillion derived from human endeavors associated with the Gulf of Mexico, an operational observing system is worth its cost, particularly if it saves lives (reduced coverage area for search and rescue operations; fewer respiratory or gastrointestinal health problems during harmful algal blooms), protects property (cleaner beaches, improved urban infrastructure planning and development in light of relative sea level rise, enhanced coastal resiliency), and provides sustainability of resources (healthier marshes and sea grass beds for fisheries nurseries, safer oil and gas operations). The operational observing system, being a long-term investment, will also create stable jobs in technical and scientific fields, as well as manufacturing (instrumentation) and operational support. 2.5 Development of the GCOOS Build-out Plan • 2003-2004 – Three stakeholder workshops held with managers of existing coastal ocean observing
activities in the Gulf, Harmful Algal Bloom (HAB) experts, and representatives of the private sector. • 2005 - The Gulf of Mexico Coastal Ocean Observing System (GCOOS)-Regional Association (RA)
officially developed, as one of eleven RAs in the U.S. Integrated Ocean Observing System. • 2009 – U.S. Congress passed the Integrated Coastal and Ocean Observation Systems (ICOOS) Act of
2009. This act officially established the U.S. IOOS and RAs. The Act also required that regional gap analyses be conducted.
• 2005 – 2010 – To complete a regional gap analyses and develop Version 1.0 of the GCOOS Build-out Plan, the GCOOS-RA held eight workshops with subject matter experts and other stakeholders, with at least 30 participants in each workshop, to identify needs and how to meet those needs*. The workshop foci included the oil and gas/related industry, HABs (2), storm surge and inundation, ecosystem modeling, recreational boating, and general stakeholder interests. In addition the GCOOS-RA reviewed and considered tens of national, regional and local plans dealing with needed observations of products from the coastal ocean. Examples are: the Gulf of Mexico Alliance Governors’ Action Plans, NOAA Hydrographic Services Review Panel priorities, the Network Gaps Analysis for the National Water Level Observation Network, a Plan to Meet the Nation’s Need for Surface Current Mapping, and the U.S. Coast Guard Search and Rescue Optimal Planning System.
11
• 2010 - The GCOOS-RA coordinated staff, Board members (experts representing the private, academic, government, and outreach and education sectors), and subject matter experts in thirteen teams to write the initial integrated Build-out Plan, cross-correlating needs in existing plans and programs, to meet identified needs. Draft Version 1.0 was posted to the GCOOS-RA website (http://www.gcoos.org) and was open to comments at anytime.
• 2011 – Version 1.0 of plan officially posted to GCOOS website. • 2010 – 2012 – Additional needs were identified following the Deepwater Horizon oil spill, and
additional stakeholder comments were received. Two working sessions of the GCOOS-RA Board of Directors helped to address feedback.
• 2012 – 2014 – Six additional stakeholder workshops were held (Integrated Water Quality Network (2), HABs, ecosystem modeling, integrated tracking of animals in the Gulf, and Non-Governmental Organizations). Additional plans of other groups were reviewed and considered (e.g., NOAA RESTORE Science Program framework document and the Ocean Conservancy’s Restoring the Gulf of Mexico Framework document). The GCOOS-RA coordinated staff, Board members, and subject matter experts to update and expand the build-out plan into Version 2.0. Requests for comments were made during conferences, Email listservs, direct emails, and the GCOOS-RA website.
• 2014 – Version 2.0 posted at http://gcoos.tamu.edu/BuildOut/BuildOutPlan-V2.pdf. This plan is open to comments at anytime. Future versions will be posted periodically.
* The typical activities involved in the GCOOS-RA workshop process are: identify a topic or stakeholder group to engage, select an organizing committee to formulate goals, refine the agenda, decide on dates and venue and identify prospective participants, invite participants and announce workshop, hold workshop to begin identifying priority needs for data or products, further refine priorities identified post-workshop via survey or draft workshop report for comment, finalize report and post it online at http://www.gcoos.org. Following the workshop work begins to identify resources for implementation of observations, product development, or outreach/education to meet those needs identified at the workshop. 2.6 The GCOOS Build-Out Plan Elements
As discussed in the preceding Section2.5, the GCOOS-RA has worked over the past decade to identify the needs of the stakeholders for data, information, and products about the Gulf of Mexico, its resources, and its ecosystem. These results were used by the GCOOS-RA Board to identify the key elements of the GCOOS Build-Out Plan:
• Surface Currents and Waves Network • Fixed Mooring Network • Autonomous Meteorological Measurement Network • Gliders and Autonomous Underwater and Surface Vehicles • Satellite Observations and Products • Aircraft Observations and Unmanned Aerial Systems • Bathymetry and Topography Mapping • Enhanced Water Level Network • Enhanced Physical Oceanographic Real-time System (PORTS) • Ecosystem Monitoring • Harmful Algal Bloom Integrated Observing System • Integrated Water Quality Monitoring Network and Beach Quality Monitoring • Hypoxia Monitoring • Monitoring of River Discharge to the Gulf • Hydrodynamic Modeling • Ecosystem Modeling
12
• Data Management • Outreach and Education Additionally, Governance of the Regional Association is an important element of the sustained,
integrated system. Likewise, the continued refinement of stakeholder needs for data and produced products, with priorities, must be considered an element of the system.
This is the second version of the Plan. However, it will be under continuing development to reflect changing needs of stakeholders and developing technology. 2.7 GCOOS Build-Out Implementation
Being an integrated system, the observations that form the basis for the GCOOS come from many sources—federal, state, local, and tribal governments, academia, NGOs, and private industry. The implementation of the GCOOS build-out is based on engaging these entities and integrating their observations and products to the greater benefit of our society.
Implementation The GCOOS will be built and implemented over the course of four Phases. Phase I is to engage, integrate and maintain existing observing resources. The GCOOS build-out has been initiated through integration of an initial set of observations and products from federal and non-federal resources. Additional existing resources are being identified and the resulting observations and products will be integrated into the GCOOS. Phase II is to add the suggested initial new enhancements given in Appendix D to the existing system. Phase III will be the completion of the full system described in this document. Phase IV is to maintain, modify, and enhance the GCOOS so it provides a sustained, integrated network of data and products to benefit the many stakeholders in the Gulf and beyond.
Collaborative Engagements The GCOOS and its Regional Association are part of the U.S. Integrated Ocean Observing System (IOOS), which is a contribution to the multinational Global Ocean Observing System13. U.S. IOOS consists of two modules: global and coastal14. The coastal module includes 11 regional coastal ocean observing systems15, of which GCOOS is one. The goal of the U.S. IOOS is to provide societal benefits that will (a) Improve predictions of climate change and weather and their effects on coastal communities and the nation, (b) Protect and restore healthy coastal ecosystems more effectively, (c) Reduce public health risks, (d) Enable the sustained use of ocean and coastal resources, (e) Improve the safety and efficiency of maritime operations, (f) Improve national and homeland security and (g) Mitigate the effects of natural hazards more effectively. The GCOOS plan is aimed at meeting the national goal for the Gulf of Mexico region.
The GCOOS-RA is closely coordinating with the other regional associations, including our neighboring regional associations, the Southeast Coastal Ocean Observing Regional Association (SECOORA) and the Caribbean Regional Association (CaRA). The priority areas of SECOORA are well aligned with those of GCOOS-RA. Their areas16 are: ecosystems, living marine resources and water quality; coastal hazards; marine operations; and climate change. The GCOOS-RA and SECOORA priorities are consistent with the five consensus priority theme areas of the IOOS Association17: marine operations; climate variability and change; ecosystems, fisheries and water quality; coastal hazards; and coastal and marine spatial planning.
It is clear that the GCOOS-RA alone will be unable to garner the resources and carry out the activities needed to complete this Gulf observing system. We welcome and support the activities of all collaborators. The building of the GCOOS is being closely coordinated with other groups in the area that seek to develop the means to achieve a sustained healthy and resilient ecosystem in the Gulf of Mexico as well as a robust Gulf Coast economy. In addition to our collaborations with SECOORA, three other key groups are the Gulf Coastal States’ governors’ alliance for healthy and resilient Gulf coasts, the Gulf of 13http://www.ioc-goos.org/14http://www.ioos.noaa.gov;http://www.aoml.noaa.gov/phod/goos.php15http://www.ioosassociation.org16http://secoora.org/sites/default/files/webfm/members/documents/SECOORA_Strategic_Priorities.pdf17http://www.usnfra.org/documents/03.10_RCBooklet_lo-res.pdf
13
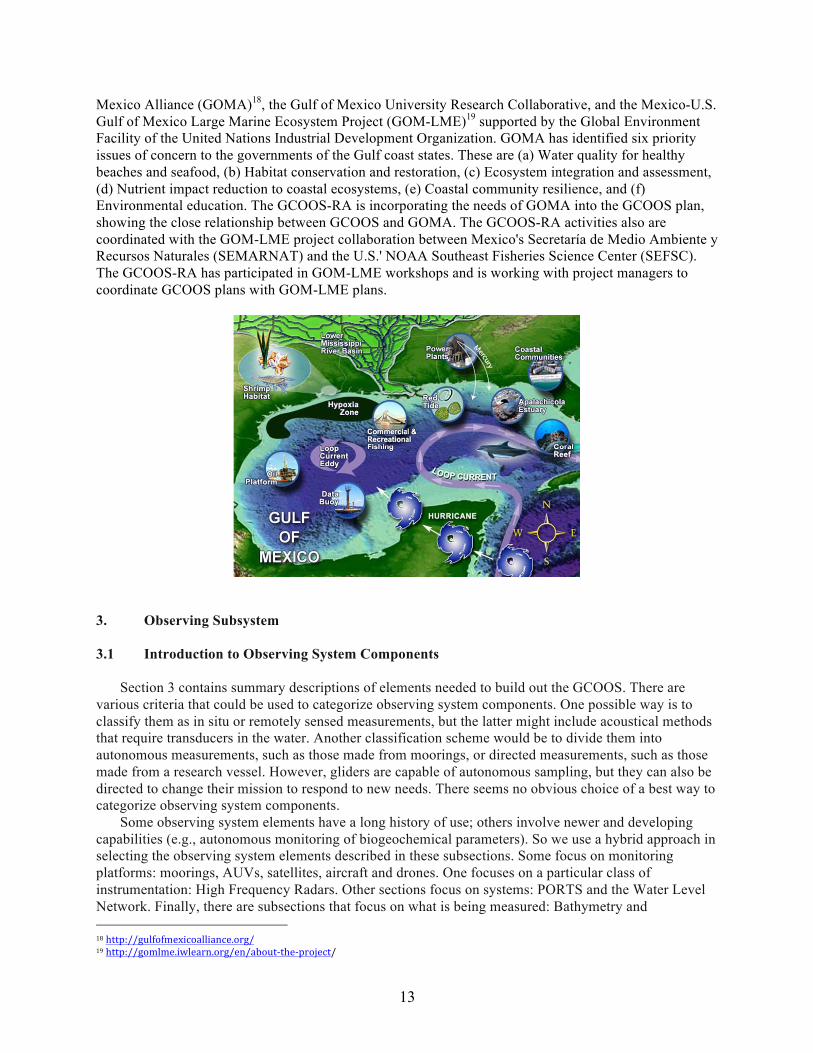
Mexico Alliance (GOMA)18, the Gulf of Mexico University Research Collaborative, and the Mexico-U.S. Gulf of Mexico Large Marine Ecosystem Project (GOM-LME)19 supported by the Global Environment Facility of the United Nations Industrial Development Organization. GOMA has identified six priority issues of concern to the governments of the Gulf coast states. These are (a) Water quality for healthy beaches and seafood, (b) Habitat conservation and restoration, (c) Ecosystem integration and assessment, (d) Nutrient impact reduction to coastal ecosystems, (e) Coastal community resilience, and (f) Environmental education. The GCOOS-RA is incorporating the needs of GOMA into the GCOOS plan, showing the close relationship between GCOOS and GOMA. The GCOOS-RA activities also are coordinated with the GOM-LME project collaboration between Mexico's Secretaría de Medio Ambiente y Recursos Naturales (SEMARNAT) and the U.S.' NOAA Southeast Fisheries Science Center (SEFSC). The GCOOS-RA has participated in GOM-LME workshops and is working with project managers to coordinate GCOOS plans with GOM-LME plans.
3. Observing Subsystem 3.1 Introduction to Observing System Components
Section 3 contains summary descriptions of elements needed to build out the GCOOS. There are various criteria that could be used to categorize observing system components. One possible way is to classify them as in situ or remotely sensed measurements, but the latter might include acoustical methods that require transducers in the water. Another classification scheme would be to divide them into autonomous measurements, such as those made from moorings, or directed measurements, such as those made from a research vessel. However, gliders are capable of autonomous sampling, but they can also be directed to change their mission to respond to new needs. There seems no obvious choice of a best way to categorize observing system components.
Some observing system elements have a long history of use; others involve newer and developing capabilities (e.g., autonomous monitoring of biogeochemical parameters). So we use a hybrid approach in selecting the observing system elements described in these subsections. Some focus on monitoring platforms: moorings, AUVs, satellites, aircraft and drones. One focuses on a particular class of instrumentation: High Frequency Radars. Other sections focus on systems: PORTS and the Water Level Network. Finally, there are subsections that focus on what is being measured: Bathymetry and 18http://gulfofmexicoalliance.org/19http://gomlme.iwlearn.org/en/about-the-project/
14
Topography Mapping and Ecosystem Monitoring. In subsequent versions of this Build-out Plan different criteria may be used for the subsections. One thing that all subsections of the section have in common is that there were written to respond to the articulated stakeholder needs.
Considering the different types of platforms available for the observing system, there are strengths and weaknesses for each, and some review may be useful. A major strength of satellite platforms is that many types of geophysical and biogeochemical parameters can be monitored, but they are only capable of synoptic views of the ocean at time scales that are dependent on orbit and sensor type. GCOOS has little control over what types of sensors are put onto satellite platforms and a weakness with them is that the direct information from the ocean is limited to the penetration depth of the particular wavelength or wavelengths of electromagnetic radiation being measured. Ships are very versatile platforms, but are expensive to operate, have limited endurance, and engage scientists and technicians for the duration of a cruise. Moorings are well suited to obtaining observations over a wide range of time scales, but are expensive to deploy in sufficient numbers for resolving measurments over a wide range of spatial scales.
In addition to the sampling compromises that are based on platform/sensor characteristics and costs, there are those based on bandwidth limitations or power budget considerations. For example, it is much more expensive to log and telemeter raw 1-3 Hz acoustic Doppler profiler data than to log 10-minute averaged data every hour. The latter case is useful for averaging out orbital velocities of surface gravity waves. The former is useful for a wide range of purposes including monitoring backscatters, and measuring high frequency internal waves, but can break a power budget and be expensive to telemeter. AUVs and drifting platforms can provide a mix of spatial and temporal coverage and range from the very expensive to purchase and operate to very cheap. One type of AUV, buoyancy gliders, combines long-duration capabilities with low cost to deploy and recover and the ability to change missions when surfaced. A disadvantage is their limited payloads. Wave gliders and sail buoys are more expensive and are limited to the near-ocean surface, but have very long duration and can be controlled remotely. High Frequency Radar can monitor surface current over large regions at a relatively small cost per area covered, but there are some difficult logistical issues in operating them in the northern Gulf. Aircraft are also expensive to operate, but can measure at higher spatial resolution than satellites, and can measure where and when desired. An intriguing new possibility is drones. These are becoming a mature technology, but the FAA has not set the regulations for civilian operation.
Given the design constraints for an ocean observing system for the Gulf of Mexico, the GCOOS-RA has selected a multi-platform system with components chosen to strive to meet identified needs of stakeholders in the Gulf of Mexico in an integrated and complementary fashion. Although there are mission-specific components (Enhanced Water Level Network, Enhanced PORTS, Harmful Algal Bloom Integrated Observing System, and Hypoxia Monitoring System) to address priority issues in the Gulf, these components were not designed in isolation from the rest of the plan. A fixed mooring component that can measure a suite of water column properties at high temporal resolution is complemented by an Autonomous Underwater Vehicle component that can measure a limited number of water column parameters along pre-determined routes or along new routes telemetered from the operators as conditions or needs warrant. An Autonomous Surface Vehicle component adds longer duration and offers higher power vehicles that are continuously available for communication with operators. Remote sensing components provide large-scale, synoptic snap-shots of oceanic parameters that can put the in-situ observations into larger kinematical, dynamical, and ecosystem-state contexts. Such components include utilization of satellite platforms operated by federal agencies and other entities, aircraft, unmanned aerial systems, and shore-based radar systems. An enhanced marine meteorological observation network utilizes the network of oil and gas platforms in the Gulf to complement other marine meteorological measurements and improve the forcing terms for numerical models of the Gulf that improve ocean state forecasting. A new focus on utilizing sampling platforms designed initially for other purposes and adding techniques specifically designed for a range of ecosystem monitoring applications begins to realize the aspirations for the ability to establish baselines and to monitor changes to the state of the oceanic ecosystem in near-real time. Ship and boat operations that support the mooring network, autonomous underwater and surface vehicles, ecosystem monitoring, and other also will be used for oceanographic
15
measurements and for calibration and validation of other components. Finally, the plan has a Citizen Scientist component that uses beach lifeguards for water quality monitoring. 3.2 Surface Currents and Waves Network
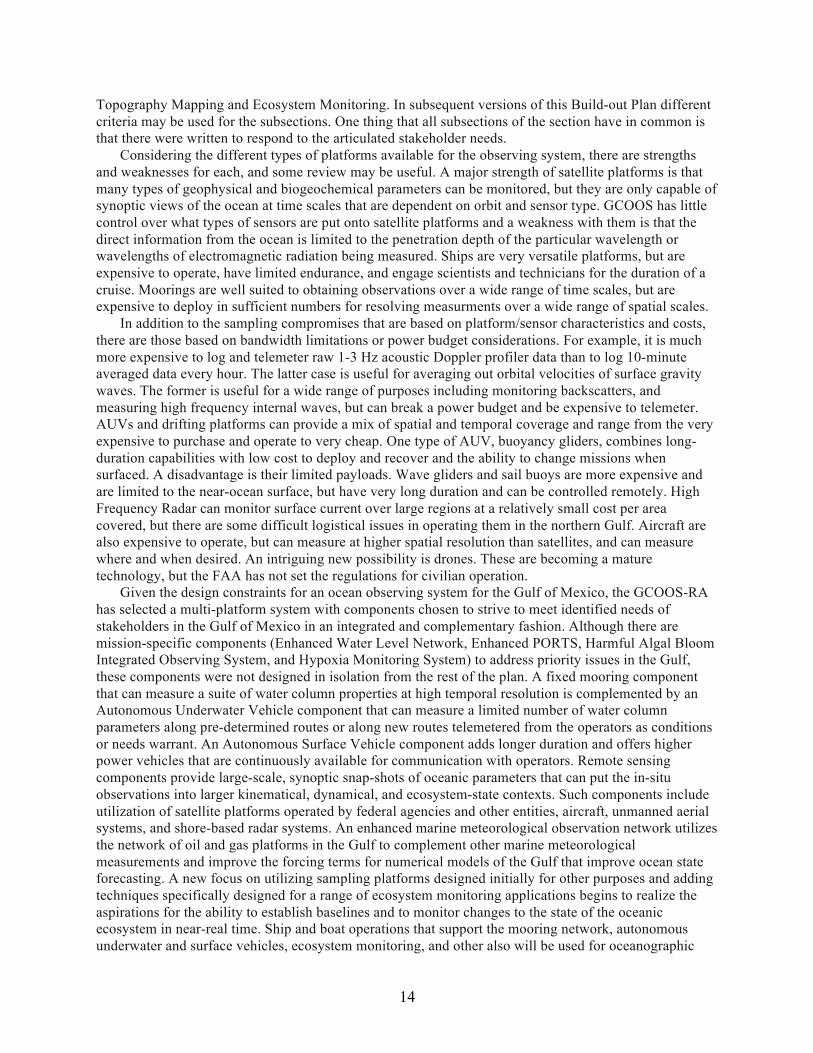
Knowledge of surface conditions, and surface currents in particular, is fundamental to addressing most coastal ocean issues, including maritime transportation, natural and living resource exploitation, recreational boating and fishing, search and rescue, pollution cleanup, and tracking harmful algal blooms to name a few. Thus a high priority goal for the GCOOS-RA is to develop the capacity to monitor ocean surface currents over the U.S. continental shelf of the Gulf of Mexico. This objective will be accomplished in part by deploying long-distance (>75 km) radar systems along the US Gulf Coast with continuous, overlapping coverage in order to retrieve two‐dimensional surface current fields. Thirty-four new HFR sites are needed to provide surface currents over much of the shelf.
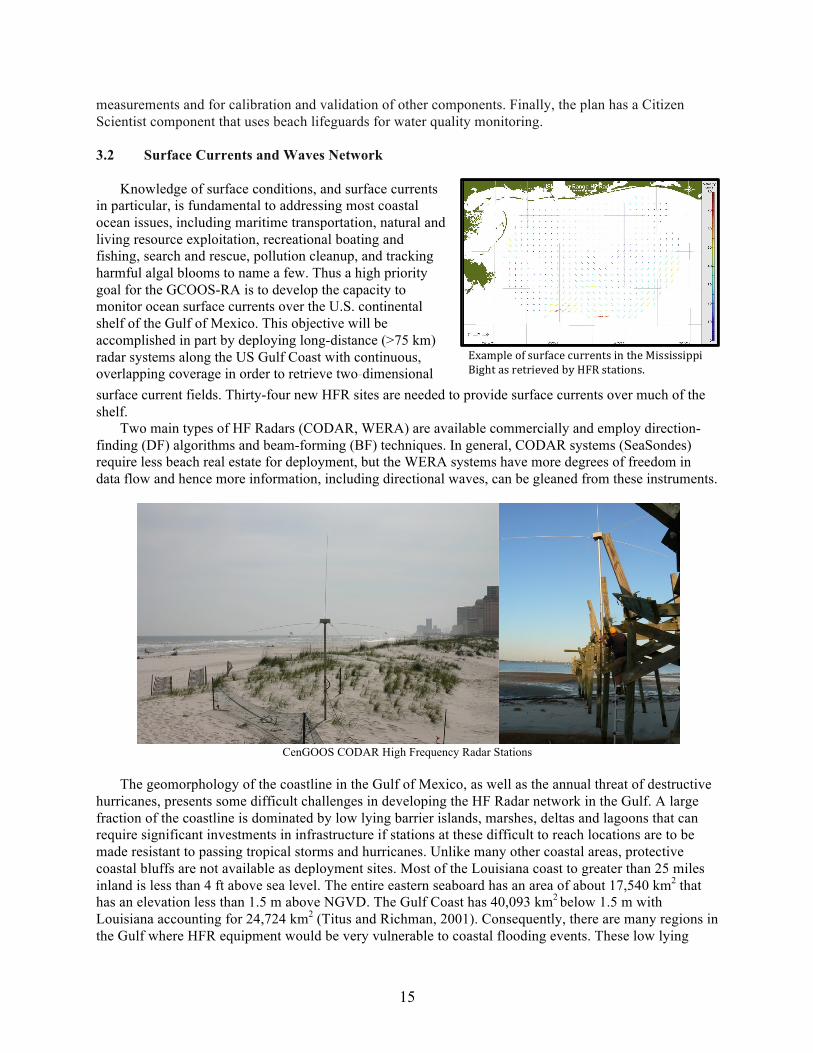
Two main types of HF Radars (CODAR, WERA) are available commercially and employ direction-finding (DF) algorithms and beam-forming (BF) techniques. In general, CODAR systems (SeaSondes) require less beach real estate for deployment, but the WERA systems have more degrees of freedom in data flow and hence more information, including directional waves, can be gleaned from these instruments.
CenGOOS CODAR High Frequency Radar Stations
The geomorphology of the coastline in the Gulf of Mexico, as well as the annual threat of destructive
hurricanes, presents some difficult challenges in developing the HF Radar network in the Gulf. A large fraction of the coastline is dominated by low lying barrier islands, marshes, deltas and lagoons that can require significant investments in infrastructure if stations at these difficult to reach locations are to be made resistant to passing tropical storms and hurricanes. Unlike many other coastal areas, protective coastal bluffs are not available as deployment sites. Most of the Louisiana coast to greater than 25 miles inland is less than 4 ft above sea level. The entire eastern seaboard has an area of about 17,540 km2 that has an elevation less than 1.5 m above NGVD. The Gulf Coast has 40,093 km2 below 1.5 m with Louisiana accounting for 24,724 km2 (Titus and Richman, 2001). Consequently, there are many regions in the Gulf where HFR equipment would be very vulnerable to coastal flooding events. These low lying
ExampleofsurfacecurrentsintheMississippiBightasretrievedbyHFRstations.

16
areas can experience significant storm surge even by hurricanes in the Gulf that do not make a direct hit on them. For example, in 2005 Hurricane Rita caused coastal flooding along the entire Louisiana coastline even though the hurricane came ashore at the border between Texas and Louisiana.
To mitigate the threat of damage due to tropical cyclones, three strategies for HFR installations can be pursued. The first is to build expensive, hurricane--‐hardened platforms for stations that are elevated above expected storm surge levels. The second is to evacuate equipment prior to storm landfall. The third is to leave stations in place and let the equipment be destroyed. Options one and three are expensive. The National Ocean Service has chosen option 1 for a set of “Sentinel” tide gauge stations in the Gulf and each one costs about $0.5M. Clearly this would be cost prohibitive for an HFR network of over 30 stations. Option 2 is attractive, but in many locales it is not a trivial endeavor once hurricane evacuations plans are activated, and in many areas installation costs could still be substantial. In Louisiana these evacuation orders can begin as early as 72 hrs before projected landfall. Although hurricane hardened structures are preferable from an operational standpoint, and may allow for data to be collected through a storm, the high cost of such structures leads GCOOS to adopt an evacuation strategy for coastal HFR stations.
There are 3 existing HFR networks in the Gulf of Mexico (Figure 3.1) that provide surface currents from near shore out to about 150 km offshore: one is over the MS-AL-FL panhandle shelf (3 stations), another is over the west FL shelf (3 stations), and the third is in the vicinity of Miami (3 stations). The costs of the Gulf's HFR network may be higher than estimated in the national plan20 because (1) infrastructure costs are expected to be higher than average in the low-lying ground of LA and TX; (2) hurricane replacement costs throughout the Gulf coast are expected to be high; and (3) four locations in Texas were removed after the national plan had included them in the plan as existing resources.
Figure 3.1 Site plan for the GCOOS HFR network. Diamonds = long--‐range stations presently in
operation. Squares = proposed long-range stations. Pentagrams = operational, or soon to be operational, short--‐range stations. Triangles pointed up = proposed long--‐range stations at
locations where stations were previously deployed. Triangles pointed down = sites where short--‐range stations were previously deployed.
The University of Southern Mississippi (USM) Central Gulf of Mexico Ocean Observing System
(CenGOOS) has long-range CODAR stations operating in Pascagoula, MS, Orange Beach, AL, and Destin, FL. In addition to the existing HFR stations, two short-range (25 MHz) SeaSondes are being deployed in Pass Christian, MS and east of Gulfport, MS. Data and plots are available at the web site: http://www.cengoos.org/index.html
17
The University of South Florida (USF) Coastal Ocean Monitoring and Prediction System (COMPS) has three CODAR SeaSonde stations and two WERA sites at Redington Shores, FL, Venice, FL, and Naples, FL. The data are served at http://seacoos.marine.usf.edu/HFRadar1/.
The University of Miami/Rosenstiel School of Marine and Atmospheric Sciences (UM) is currently operating three WERA High Frequency radars in Dania Beach, Virginia Key and Crandon Park on Key Biscayne. The radars transmit at 12.6 and 16-MHz and provide measurement of currents and significant wave heights on the ocean's surface over a large area of the ocean off Miami, FL. Additional information is available at the web site: http://iwave.rsmas.miami.edu/wera/.
Scripps Institute of Oceanography operates a SeaSonde on the BP production platform Atlantis. At the present time HFR operation from production platforms must be considered pre-operational because some quality control issues associated with changing antenna beam patterns still need to be resolved. For this reason, although the oil platforms in the Gulf may yet prove to be valuable for HFR deployments, they are not considered further in this plan, but may be incorporated in the future.
The US Gulf Coast could be covered with approximately 34 5-MHz CODAR and/or 8-16-MHz HFRs. This excludes the Florida Straits, but includes the Keys. Ten locations have been identified as being the sites of previous HFR deployments and hence have a high probability of being well suited (previous permitting and agreements for installing the equipment, and available power and communications) for new deployments. Thirty-four other locations have been identified as potentially good deployment sites based upon existing coastal infrastructure. Some of these sites would cover nearly the same area and hence are mutually exclusive, but they provide more options. The WFS is an overlap region for GCOOS and SECOORA. The sites in the Gulf on the WFS are in both the GCOOS and SECOORA HFR plans.
We intend to build out the system within a 5-year period, as has been recommended for the national network. This will entail continued funding of the existing network and the addition of six stations per year. In the build-out of the system, a key factor in setting priorities should be the existing infrastructure for a given location. Locations that have previously hosted an HFR site would be good candidates, assuming no major damage has occurred in the intervening time. Although setting a higher priority for locations that overlap with the existing system is desirable, the fact that there are no operating systems from Brownsville Texas to Gulfport Mississippi argues for giving a high priority to beginning a western Gulf build-out early in the process. The build-out plan is as follows:
YR 1: Three stations in southeastern Louisiana, with radials overlapping the western CenGOOS station in Pascagoula, and three stations in the upper Texas coast.
YR 2: Three stations on the southwest Louisiana coast and three in the Coastal Texas Bend. YR 3: Three stations on the Florida Big Bend, a fourth at Cape San Blas, and two in the Florida Keys YR 4: Three stations on the Florida Big Bend and three in the Florida Keys YR 5: One station in the Florida Keys, four along the south Texas coast, and one in the Everglades
outflow. Cost estimates: Site selection first requires identification of potential sites that have the desirable
characteristics of a seaside location, easy access for power and communications, and security. That step has been completed in this plan. The next step requires one, or more likely several, reconnaissance trips to determine if the site is actually suitable and then to begin to determine how to obtain permission to utilize the site and ascertain if any permits are required. The driving distances between long-range sites makes it likely that one or more overnight stays would be required for many of the reconnaissance trips. For the purposes of this plan three trips of $500 each are estimated for each site, totaling $1500 per new site.
Equipment costs depend upon whether WERA or CODAR equipment is purchased, and upon choices of optional configurations. WERA costs are approximately $190k per station, and CODAR are approximately $120,000 per station. The higher costs for the WERA equipment are due to its greater complexity. That added cost buys more information collection capability. For greatest flexibility in implementation, the higher WERA cost will be used for estimates. It is assumed that the sites will be located where AC power is available. DC powered stations are available, but are more costly. Along the
18
Gulf coast a suitable enclosure for the electronics must be air-conditioned. The actual enclosure used may be site dependent. Suitably outfitted, powder-coated aluminum or stainless steel enclosures run from about $5,500 for the former to about $20,000 for the latter. Some sites may require a more aesthetically pleasing enclosure as has been used by USF at some of their sites on the west coast of Florida. For greatest flexibility the enclosures will be estimated at $20k each. Communications equipment can be as cheap as a $100 cable or DSL modem to $1000 for a cellular or satellite modem and antenna ($1480 with 48% overhead). An 8-element WERA station with an air-conditioned stainless steel structure and a cellular or satellite communications system would total $212k. Replacing the WERA with a CODAR station drops the cost to $142k. A 15% recapitalization cost per year is budgeted for spares and replacement systems.
Evacuation costs are estimated at $3000/year when tropical storms are forecast to strike within 73 hours. In the aftermath of a coastal hit from a tropical storm, for a number of reasons, it is not uncommon for utilities at the coast to take from 6-12 months to be re-established. Two portable power systems with batteries, solar panels, and inverters are needed at $6000 each for the long-term, but temporary occurrences. 3.3 Mooring Network
Moorings are a key component of coastal ocean observing systems. They are needed to monitor many
oceanographic and marine meteorological variables. Other elements of the GCOOS Build-Out Plan that call for moorings include: harmful algal blooms, hypoxia, Physical Oceanographic Real-Time Systems (PORTS®), autonomous offshore weather stations on oil platforms, and land-based water level and meteorological stations. The GCOOS Mooring Plan does not consider those specialized observations, which are covered in following sections. The mooring element is intended to provide information for safe and efficient marine operations, improved meteorological analyses and forecasts, assimilation into and verification of numerical models, safer recreational opportunities, and long-term observations for planning and design considerations, among other needs.
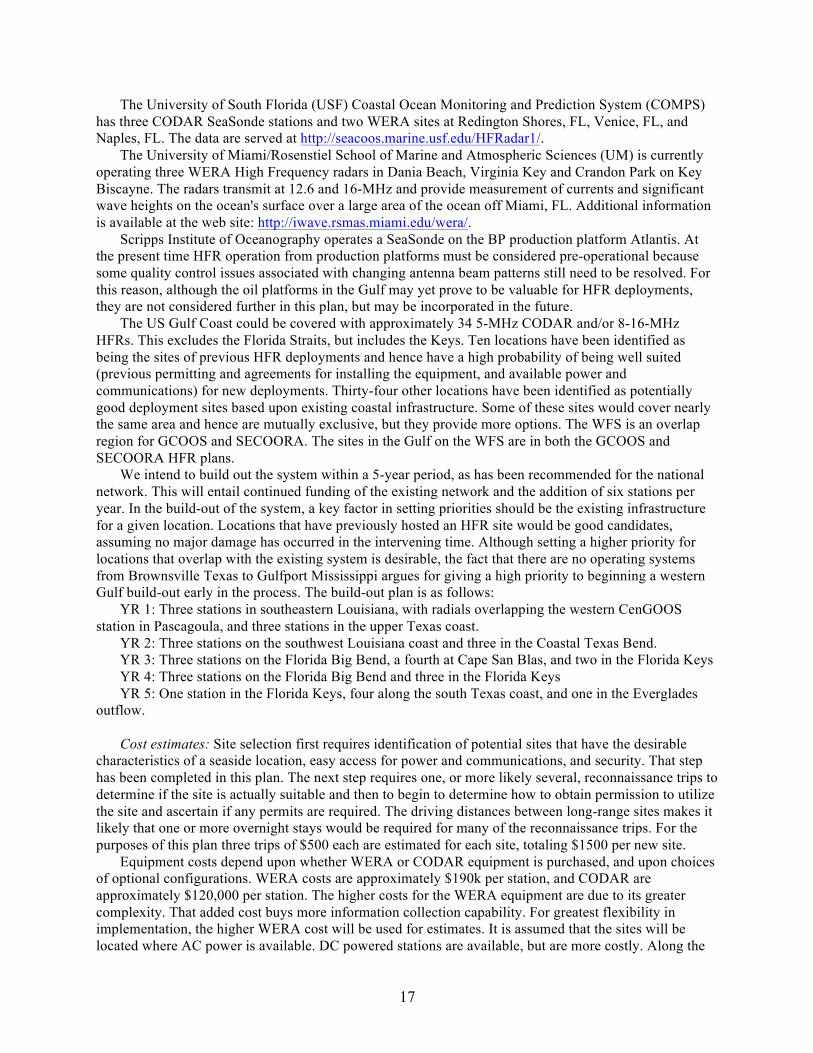
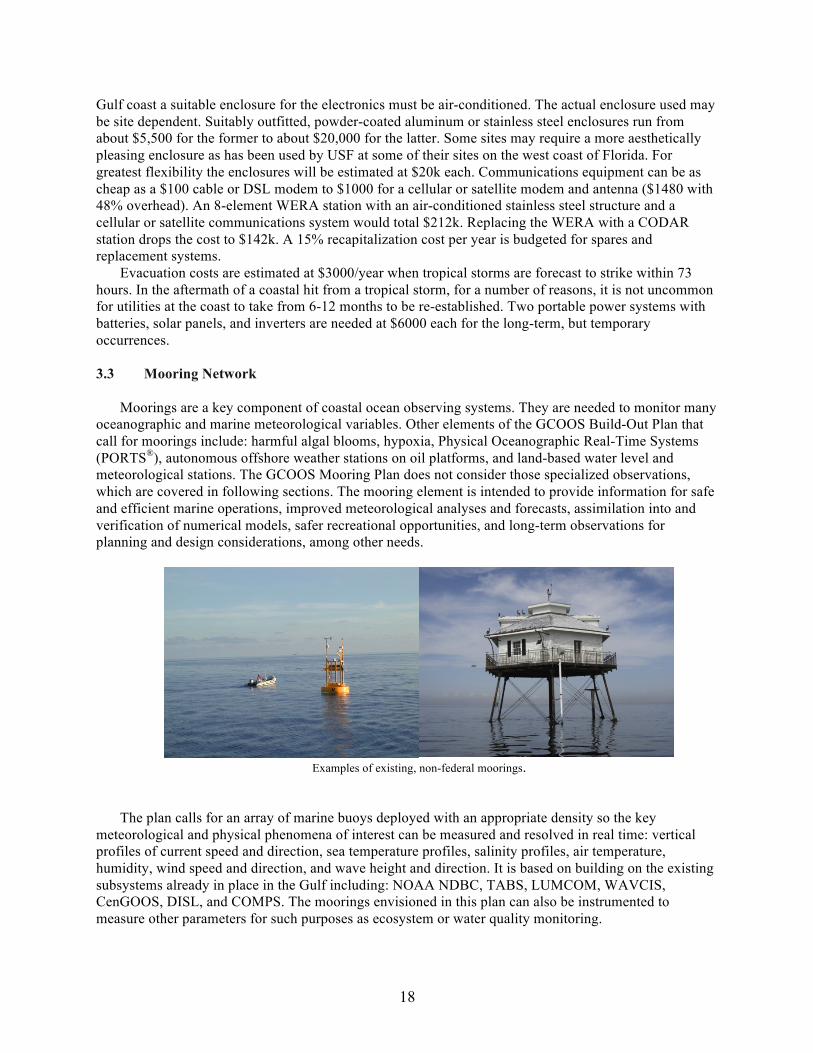
Examples of existing, non-federal moorings.
The plan calls for an array of marine buoys deployed with an appropriate density so the key
meteorological and physical phenomena of interest can be measured and resolved in real time: vertical profiles of current speed and direction, sea temperature profiles, salinity profiles, air temperature, humidity, wind speed and direction, and wave height and direction. It is based on building on the existing subsystems already in place in the Gulf including: NOAA NDBC, TABS, LUMCOM, WAVCIS, CenGOOS, DISL, and COMPS. The moorings envisioned in this plan can also be instrumented to measure other parameters for such purposes as ecosystem or water quality monitoring.
19
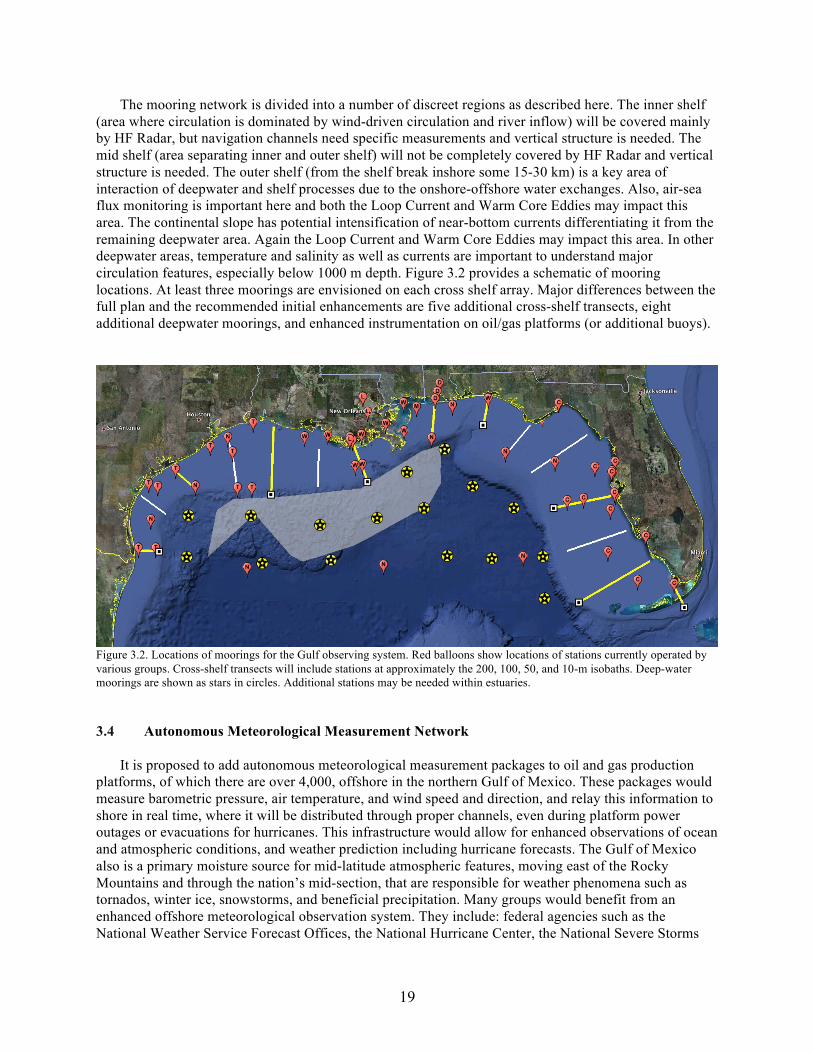
The mooring network is divided into a number of discreet regions as described here. The inner shelf (area where circulation is dominated by wind-driven circulation and river inflow) will be covered mainly by HF Radar, but navigation channels need specific measurements and vertical structure is needed. The mid shelf (area separating inner and outer shelf) will not be completely covered by HF Radar and vertical structure is needed. The outer shelf (from the shelf break inshore some 15-30 km) is a key area of interaction of deepwater and shelf processes due to the onshore-offshore water exchanges. Also, air-sea flux monitoring is important here and both the Loop Current and Warm Core Eddies may impact this area. The continental slope has potential intensification of near-bottom currents differentiating it from the remaining deepwater area. Again the Loop Current and Warm Core Eddies may impact this area. In other deepwater areas, temperature and salinity as well as currents are important to understand major circulation features, especially below 1000 m depth. Figure 3.2 provides a schematic of mooring locations. At least three moorings are envisioned on each cross shelf array. Major differences between the full plan and the recommended initial enhancements are five additional cross-shelf transects, eight additional deepwater moorings, and enhanced instrumentation on oil/gas platforms (or additional buoys).
Figure 3.2. Locations of moorings for the Gulf observing system. Red balloons show locations of stations currently operated by various groups. Cross-shelf transects will include stations at approximately the 200, 100, 50, and 10-m isobaths. Deep-water moorings are shown as stars in circles. Additional stations may be needed within estuaries. 3.4 Autonomous Meteorological Measurement Network
It is proposed to add autonomous meteorological measurement packages to oil and gas production platforms, of which there are over 4,000, offshore in the northern Gulf of Mexico. These packages would measure barometric pressure, air temperature, and wind speed and direction, and relay this information to shore in real time, where it will be distributed through proper channels, even during platform power outages or evacuations for hurricanes. This infrastructure would allow for enhanced observations of ocean and atmospheric conditions, and weather prediction including hurricane forecasts. The Gulf of Mexico also is a primary moisture source for mid-latitude atmospheric features, moving east of the Rocky Mountains and through the nation’s mid-section, that are responsible for weather phenomena such as tornados, winter ice, snowstorms, and beneficial precipitation. Many groups would benefit from an enhanced offshore meteorological observation system. They include: federal agencies such as the National Weather Service Forecast Offices, the National Hurricane Center, the National Severe Storms
20
Labs, and National Center for Environmental Prediction, the US Coast Guard, Navy, Department of Homeland Defense, Department of Energy, and EPA; state and local governmental agencies; and private sector firms including petroleum and service companies, merchant shipping, operators of sport fishing, sailing and diving businesses, and the insurance and re-insurance sectors.
The National Data Buoy Center currently processes and displays information from just 5 out of 4,000 platforms in the Gulf of Mexico. The plan is for a pilot project consisting of six autonomous weather stations for a period of three years. Discussions with platform operators will be necessary regarding instrumentation requirements and platform locations. Following evaluation of their operation, decisions will be made on whether the project should continue, be expanded, or terminated. If the system were to be expanded, the equipment used will be re-evaluated. 3.5 Gliders and Autonomous Underwater and Surface Vehicles
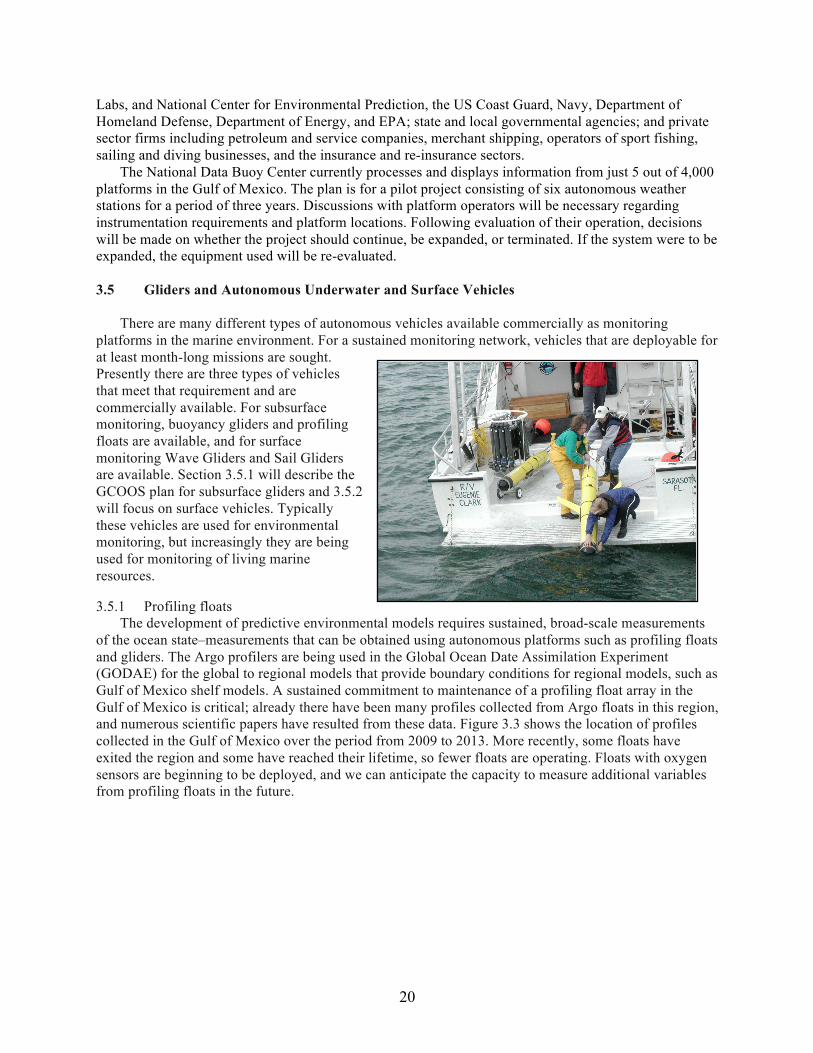
There are many different types of autonomous vehicles available commercially as monitoring platforms in the marine environment. For a sustained monitoring network, vehicles that are deployable for at least month-long missions are sought. Presently there are three types of vehicles that meet that requirement and are commercially available. For subsurface monitoring, buoyancy gliders and profiling floats are available, and for surface monitoring Wave Gliders and Sail Gliders are available. Section 3.5.1 will describe the GCOOS plan for subsurface gliders and 3.5.2 will focus on surface vehicles. Typically these vehicles are used for environmental monitoring, but increasingly they are being used for monitoring of living marine resources. Photo credit: Mote Marine Laboratories 3.5.1 Profiling floats
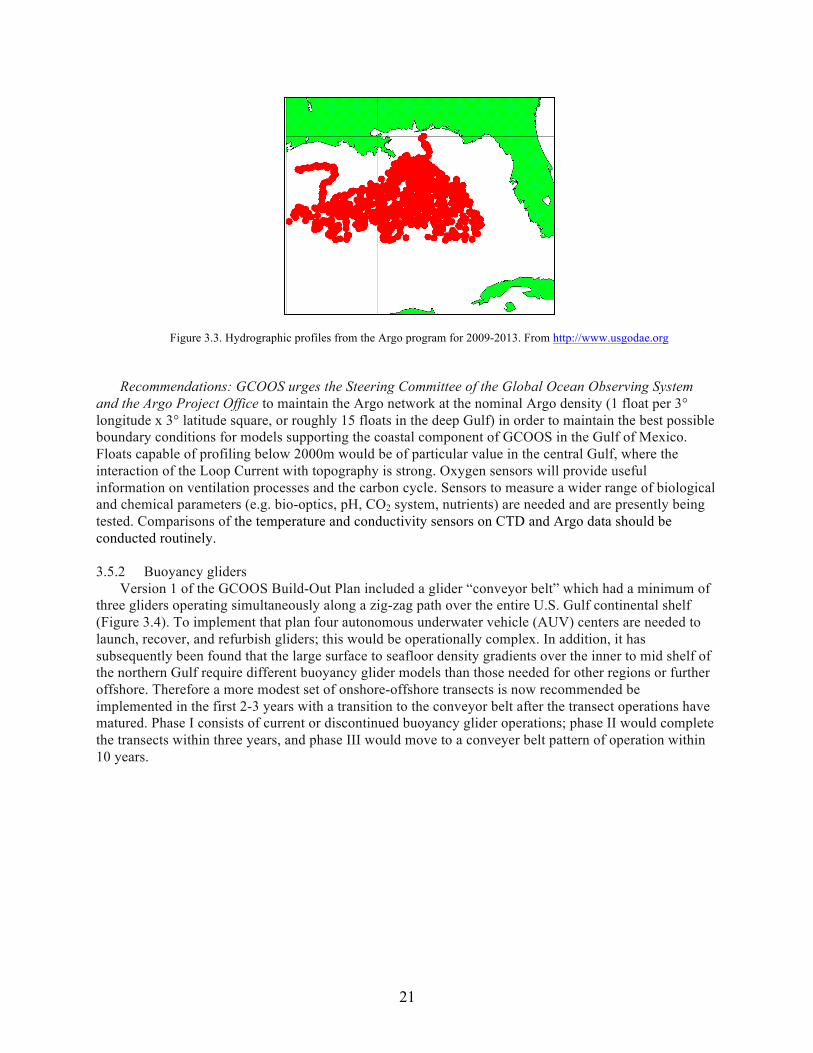
The development of predictive environmental models requires sustained, broad-scale measurements of the ocean state–measurements that can be obtained using autonomous platforms such as profiling floats and gliders. The Argo profilers are being used in the Global Ocean Date Assimilation Experiment (GODAE) for the global to regional models that provide boundary conditions for regional models, such as Gulf of Mexico shelf models. A sustained commitment to maintenance of a profiling float array in the Gulf of Mexico is critical; already there have been many profiles collected from Argo floats in this region, and numerous scientific papers have resulted from these data. Figure 3.3 shows the location of profiles collected in the Gulf of Mexico over the period from 2009 to 2013. More recently, some floats have exited the region and some have reached their lifetime, so fewer floats are operating. Floats with oxygen sensors are beginning to be deployed, and we can anticipate the capacity to measure additional variables from profiling floats in the future.
21
Figure 3.3. Hydrographic profiles from the Argo program for 2009-2013. From http://www.usgodae.org Recommendations: GCOOS urges the Steering Committee of the Global Ocean Observing System
and the Argo Project Office to maintain the Argo network at the nominal Argo density (1 float per 3° longitude x 3° latitude square, or roughly 15 floats in the deep Gulf) in order to maintain the best possible boundary conditions for models supporting the coastal component of GCOOS in the Gulf of Mexico. Floats capable of profiling below 2000m would be of particular value in the central Gulf, where the interaction of the Loop Current with topography is strong. Oxygen sensors will provide useful information on ventilation processes and the carbon cycle. Sensors to measure a wider range of biological and chemical parameters (e.g. bio-optics, pH, CO2 system, nutrients) are needed and are presently being tested. Comparisons of the temperature and conductivity sensors on CTD and Argo data should be conducted routinely. 3.5.2 Buoyancy gliders
Version 1 of the GCOOS Build-Out Plan included a glider “conveyor belt” which had a minimum of three gliders operating simultaneously along a zig-zag path over the entire U.S. Gulf continental shelf (Figure 3.4). To implement that plan four autonomous underwater vehicle (AUV) centers are needed to launch, recover, and refurbish gliders; this would be operationally complex. In addition, it has subsequently been found that the large surface to seafloor density gradients over the inner to mid shelf of the northern Gulf require different buoyancy glider models than those needed for other regions or further offshore. Therefore a more modest set of onshore-offshore transects is now recommended be implemented in the first 2-3 years with a transition to the conveyor belt after the transect operations have matured. Phase I consists of current or discontinued buoyancy glider operations; phase II would complete the transects within three years, and phase III would move to a conveyer belt pattern of operation within 10 years.
22
Figure 3.4. Glider tracks for the GCOOS conveyor belt pattern.
3.5.2.1 Glider Onshore-Offshore Transects Onshore-offshore glider transects are called for in the NOAA Glider Hypoxia Implementation Plan
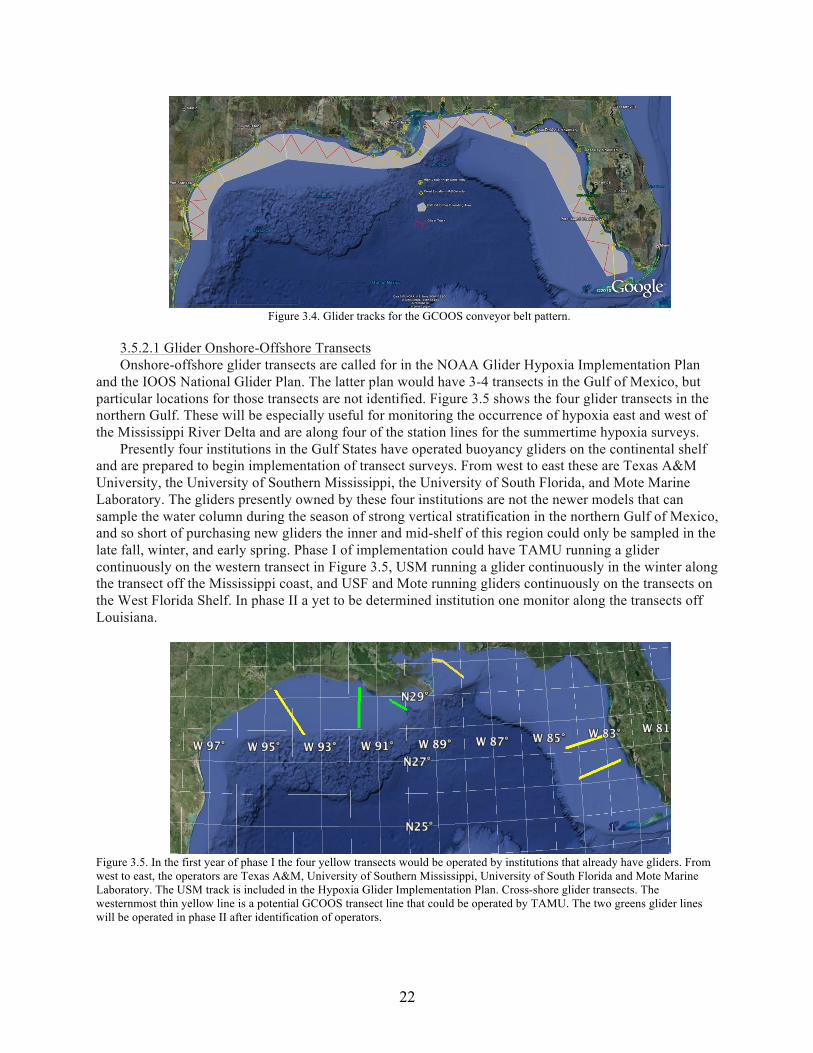
and the IOOS National Glider Plan. The latter plan would have 3-4 transects in the Gulf of Mexico, but particular locations for those transects are not identified. Figure 3.5 shows the four glider transects in the northern Gulf. These will be especially useful for monitoring the occurrence of hypoxia east and west of the Mississippi River Delta and are along four of the station lines for the summertime hypoxia surveys.
Presently four institutions in the Gulf States have operated buoyancy gliders on the continental shelf and are prepared to begin implementation of transect surveys. From west to east these are Texas A&M University, the University of Southern Mississippi, the University of South Florida, and Mote Marine Laboratory. The gliders presently owned by these four institutions are not the newer models that can sample the water column during the season of strong vertical stratification in the northern Gulf of Mexico, and so short of purchasing new gliders the inner and mid-shelf of this region could only be sampled in the late fall, winter, and early spring. Phase I of implementation could have TAMU running a glider continuously on the western transect in Figure 3.5, USM running a glider continuously in the winter along the transect off the Mississippi coast, and USF and Mote running gliders continuously on the transects on the West Florida Shelf. In phase II a yet to be determined institution one monitor along the transects off Louisiana.
Figure 3.5. In the first year of phase I the four yellow transects would be operated by institutions that already have gliders. From west to east, the operators are Texas A&M, University of Southern Mississippi, University of South Florida and Mote Marine Laboratory. The USM track is included in the Hypoxia Glider Implementation Plan. Cross-shore glider transects. The westernmost thin yellow line is a potential GCOOS transect line that could be operated by TAMU. The two greens glider lines will be operated in phase II after identification of operators.
23
3.5.2.2 Glider Conveyor Belt Phase III of glider operations is a transition to the glider conveyor belt. At least four AUV field
operation centers need to be established for operation and maintenance of the AUVs. The centers will be spaced along the conveyor belt and each will launch, recover and refurbish AUVs. The glider conveyor belt will be designed so that gliders transit along the cross-shelf mooring lines and transit in a diagonal fashion between mooring lines (somewhat different from the pattern pictured in Figure 3.4). Where the mooring lines are far apart, the conveyor belt is designed to run the pattern over a virtual mooring line in between. Using a horizontal glider speed of 0.4 m/s (34.6 km/d), one glider can traverse 864 km in 25 days. The entire line is 4,202 km, so it would take one glider five 25-day missions to traverse the entire line. A minimum of three gliders should be out at any one time along the entire line. Four AUVs will be used to routinely monitor the Loop Current (track not shown). Harmful algal bloom and nutrient sensors will be added to the AUV payload suite as sensor technology improves, and additional AUVs will be added to provide denser coverage in algal bloom and hypoxic areas.
A summary of AUV operations follows: 1. Maintain existing glider operations (Mote, TAMU, USF) and restart dropped glider operations (USM)
(Phase I) 2. Create 4-7 continuously monitored cross-shore glider transects in the Gulf (Phase II) 3. Upgrade payloads on existing platforms (Phases I and II)
a. CTD, DO, CDOM, Chlorophyll, Turbidity, and, for selected AUVs, OPD 4. Add 11 gliders for conveyor belt coverage (Phase II) 5. Add 4 gliders to map the deep waters and the Loop Current (Phase II) 6. Upgrade with HAB sensors when available after R&D (Phase II or III)
3.5.3 Autonomous Surface Vehicles (ASVs)
Recent advances in all aspects of autonomous surface vehicles (ASV) have resulted in the development of a number of mission-specific vehicles. Smaller, lower-cost vessels can incorporate a variety of sensor packages, including Acoustic Doppler Current Profilers for high-quality current monitoring, passive acoustic monitors, subsea data uploads, and meteorological sensors. The unmanned aspect significantly reduces the human risk. ASVs should be considered a viable option when planning the GCOOS.
There are two types of ASVs that derive their propulsion from the environment, and hence are capably of missions of a month or more. The “Wave Glider” from Liquid Robotics, Inc. uses wave energy for propulsion and solar panels for recharging of batteries that power the sensors, navigation and telemetry package. The “Sailbuoy” uses wind for propulsion and was developed by CMR Instrumentation. These platforms are particularly suited for making measurements at the important air-sea interface. Additionally, using passive and active acoustical sensors, information from within the water column can be obtained. The Wave Glider has been used in the Gulf of Mexico for sampling by the petroleum industry, by the National Data Buoy Center for testing as a surface telemetry platform for the tsunami detection network, and by the University of Southern Mississippi and LRI for monitoring of air-sea pCO2 and ocean acidification. Those projects have utilized the original model of the Wave Glider, but there is now a new model with larger payload capacity and even a propeller for situations when the glider is caught in strong currents.
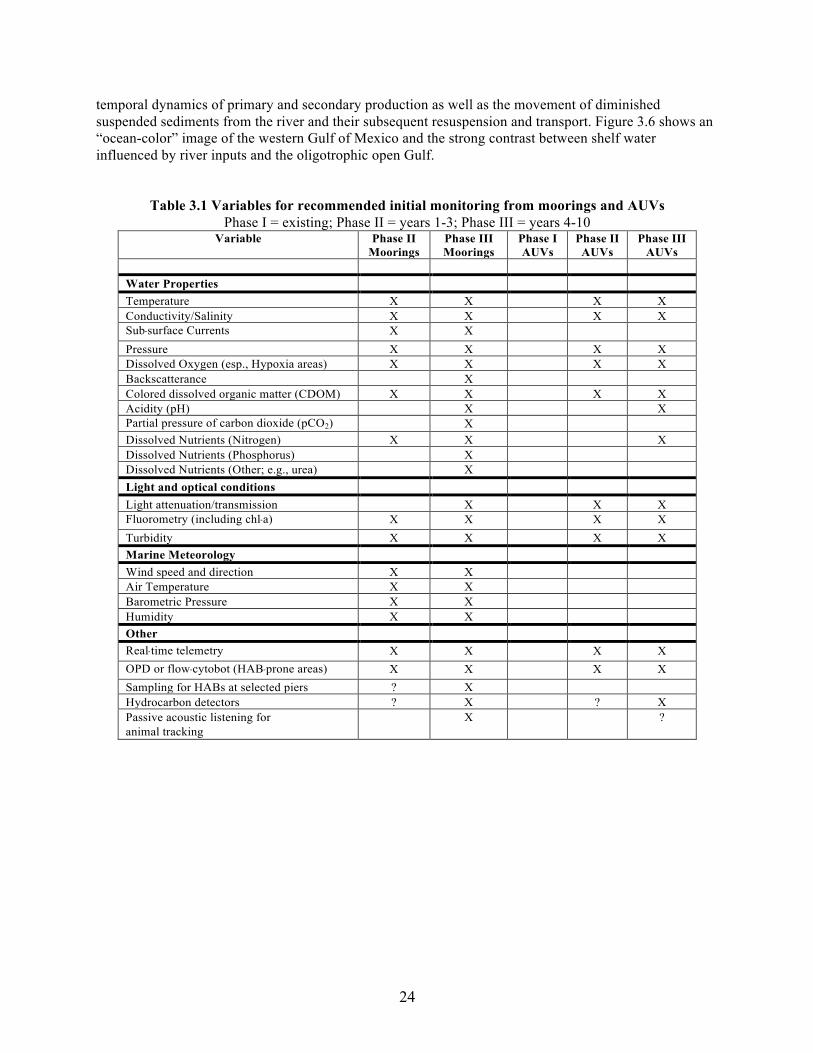
ASVs may be used to monitor the surface waters of the northern Gulf that are greatly influenced by the discharge of the Mississippi River with regard to physics (buoyancy outflows), nutrients and nutrient-enhanced primary production, chromophoric dissolved organic carbon (CDOM), and suspended sediment load. These factors interact to generate a complex visual field with high biomass of phytoplankton and microbes of varying sizes and range of light reflectance, mixed with suspended sediments. The waters near the coast with high turbidity are often omitted from satellite imagery analyses (Walker and Rabalais, 2006) because of interference with interpretation of the light fields. Being able to identify and delineate Mississippi River plume waters from open Gulf water is important to better understand the spatial and
24
temporal dynamics of primary and secondary production as well as the movement of diminished suspended sediments from the river and their subsequent resuspension and transport. Figure 3.6 shows an “ocean-color” image of the western Gulf of Mexico and the strong contrast between shelf water influenced by river inputs and the oligotrophic open Gulf.
Table 3.1 Variables for recommended initial monitoring from moorings and AUVs Phase I = existing; Phase II = years 1-3; Phase III = years 4-10
Variable Phase II Moorings
Phase III Moorings
Phase I AUVs
Phase II AUVs
Phase III AUVs
Water Properties Temperature X X X X Conductivity/Salinity X X X X Sub--‐surface Currents X X Pressure X X X X Dissolved Oxygen (esp., Hypoxia areas) X X X X Backscatterance X Colored dissolved organic matter (CDOM) X X X X Acidity (pH) X X Partial pressure of carbon dioxide (pCO2) X Dissolved Nutrients (Nitrogen) X X X Dissolved Nutrients (Phosphorus) X Dissolved Nutrients (Other; e.g., urea) X Light and optical conditions Light attenuation/transmission X X X Fluorometry (including chl--‐a) X X X X Turbidity X X X X Marine Meteorology Wind speed and direction X X Air Temperature X X Barometric Pressure X X Humidity X X Other Real--‐time telemetry X X X X OPD or flow--‐cytobot (HAB--‐prone areas) X X X X Sampling for HABs at selected piers ? X Hydrocarbon detectors ? X ? X Passive acoustic listening for animal tracking
X ?
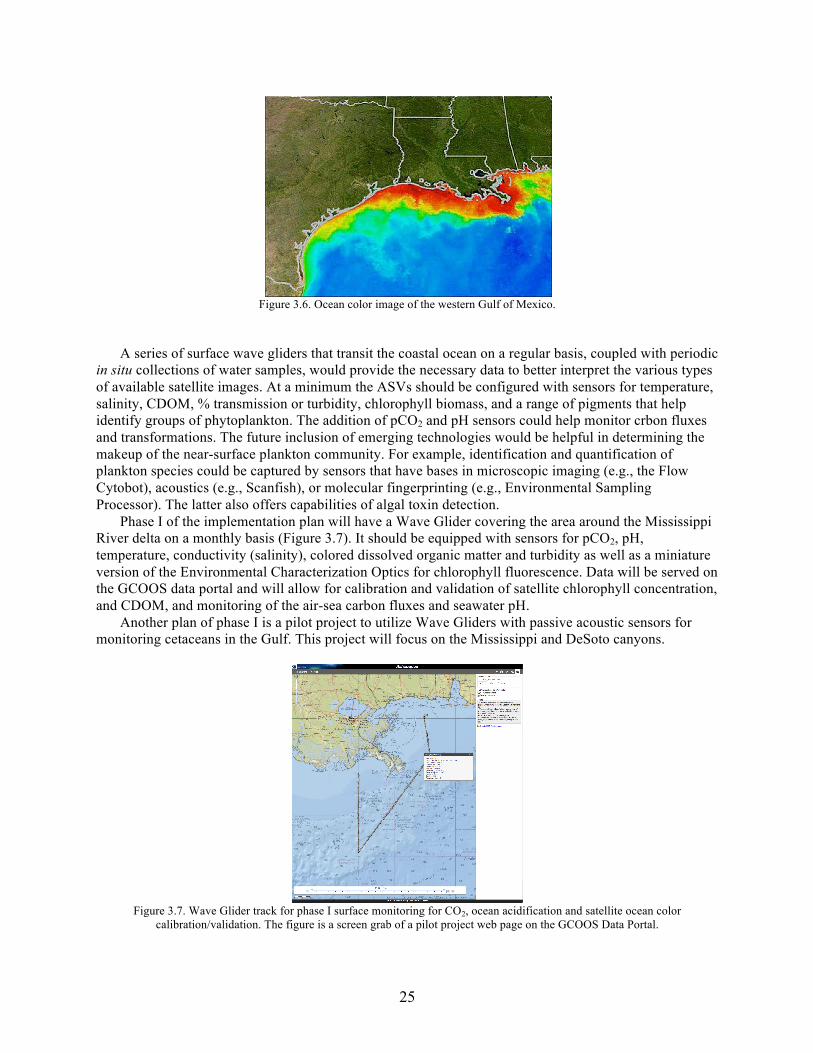
25
Figure 3.6. Ocean color image of the western Gulf of Mexico.
A series of surface wave gliders that transit the coastal ocean on a regular basis, coupled with periodic in situ collections of water samples, would provide the necessary data to better interpret the various types of available satellite images. At a minimum the ASVs should be configured with sensors for temperature, salinity, CDOM, % transmission or turbidity, chlorophyll biomass, and a range of pigments that help identify groups of phytoplankton. The addition of pCO2 and pH sensors could help monitor crbon fluxes and transformations. The future inclusion of emerging technologies would be helpful in determining the makeup of the near-surface plankton community. For example, identification and quantification of plankton species could be captured by sensors that have bases in microscopic imaging (e.g., the Flow Cytobot), acoustics (e.g., Scanfish), or molecular fingerprinting (e.g., Environmental Sampling Processor). The latter also offers capabilities of algal toxin detection.
Phase I of the implementation plan will have a Wave Glider covering the area around the Mississippi River delta on a monthly basis (Figure 3.7). It should be equipped with sensors for pCO2, pH, temperature, conductivity (salinity), colored dissolved organic matter and turbidity as well as a miniature version of the Environmental Characterization Optics for chlorophyll fluorescence. Data will be served on the GCOOS data portal and will allow for calibration and validation of satellite chlorophyll concentration, and CDOM, and monitoring of the air-sea carbon fluxes and seawater pH.
Another plan of phase I is a pilot project to utilize Wave Gliders with passive acoustic sensors for monitoring cetaceans in the Gulf. This project will focus on the Mississippi and DeSoto canyons.
Figure 3.7. Wave Glider track for phase I surface monitoring for CO2, ocean acidification and satellite ocean color
calibration/validation. The figure is a screen grab of a pilot project web page on the GCOOS Data Portal.
26
Table 3.2. Variables for recommended initial Monitoring from ASVs
Phase I = Existing; Phase II = years 1-3; Phase III = years 4-10 Variable Phase I
ASVs Phase II
ASVs Phase III
ASVs Water Properties Temperature X X Conductivity/Salinity X X Sub--‐surface Currents Pressure X X Dissolved Oxygen (esp., Hypoxia areas) X X Backscatterance Colored dissolved organic matter (CDOM) X X Acidity (pH) X X Partial pressure of carbon dioxide (pCO2) X X Dissolved Nutrients (Nitrogen) X Dissolved Nutrients (Phosphorus) Dissolved Nutrients (Other; e.g., urea) Light and optical conditions Light attenuation/transmission X X Fluorometry (including chl--‐a) X X Turbidity X X Marine Meteorology Wind speed and direction Air Temperature Barometric Pressure Humidity Other Real--‐time telemetry X X OPD or flow--‐cytobot (HAB--‐prone areas) X X Sampling for HABs at selected piers Hydrocarbon detectors ? X Passive acoustic listening for animal tracking X X
3.6 Satellite Observations and Products
One of the cornerstones of a real-time observing system for the Gulf of Mexico is a robust infrastructure for capturing synoptic observations from satellite-based sensors that target the ocean, adjacent land, and the atmosphere in real time, and process and distribute the data on relevant space and time scales. Operational support to direct broadcast stations for data capture and integration will enable the real-time provision of needed products. These data and products support the following scientific and operational application areas: ocean physics, ocean biogeochemistry, coastal water quality, meteorology, coastal land use, coastal air quality, and episodic events and hazards. Relevant observable parameters to support these areas are given in the plan. The plan considers real-time satellite observations and products, including archived historical data required over the next ten years to evaluate baselines and change as it occurs.
The primary assumptions for design considerations are: 1) Satellite sensors will be launched by the U.S. government, private industry or foreign governments; 2) Raw data covering the GCOOS region will be available for direct broadcast in the GCOOS region, or will be provided by government entities in near-real-time format; 3) Data are well calibrated; 4) Sensors are well-characterized radiometrically and geometrically; and 5) Data transmissions are stable and do not interfere with or are not affected by other uses of the electromagnetic spectrum.
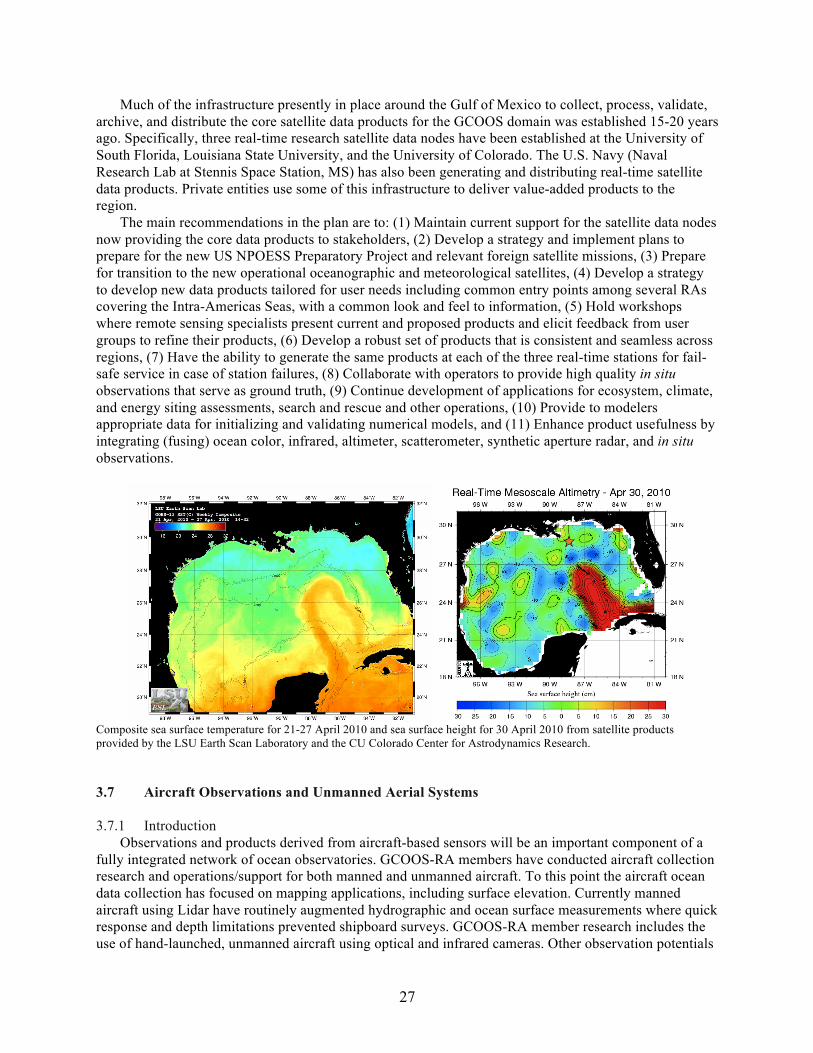
27
Much of the infrastructure presently in place around the Gulf of Mexico to collect, process, validate, archive, and distribute the core satellite data products for the GCOOS domain was established 15-20 years ago. Specifically, three real-time research satellite data nodes have been established at the University of South Florida, Louisiana State University, and the University of Colorado. The U.S. Navy (Naval Research Lab at Stennis Space Station, MS) has also been generating and distributing real-time satellite data products. Private entities use some of this infrastructure to deliver value-added products to the region.
The main recommendations in the plan are to: (1) Maintain current support for the satellite data nodes now providing the core data products to stakeholders, (2) Develop a strategy and implement plans to prepare for the new US NPOESS Preparatory Project and relevant foreign satellite missions, (3) Prepare for transition to the new operational oceanographic and meteorological satellites, (4) Develop a strategy to develop new data products tailored for user needs including common entry points among several RAs covering the Intra-Americas Seas, with a common look and feel to information, (5) Hold workshops where remote sensing specialists present current and proposed products and elicit feedback from user groups to refine their products, (6) Develop a robust set of products that is consistent and seamless across regions, (7) Have the ability to generate the same products at each of the three real-time stations for fail-safe service in case of station failures, (8) Collaborate with operators to provide high quality in situ observations that serve as ground truth, (9) Continue development of applications for ecosystem, climate, and energy siting assessments, search and rescue and other operations, (10) Provide to modelers appropriate data for initializing and validating numerical models, and (11) Enhance product usefulness by integrating (fusing) ocean color, infrared, altimeter, scatterometer, synthetic aperture radar, and in situ observations.
Composite sea surface temperature for 21-27 April 2010 and sea surface height for 30 April 2010 from satellite products provided by the LSU Earth Scan Laboratory and the CU Colorado Center for Astrodynamics Research. 3.7 Aircraft Observations and Unmanned Aerial Systems 3.7.1 Introduction
Observations and products derived from aircraft-based sensors will be an important component of a fully integrated network of ocean observatories. GCOOS-RA members have conducted aircraft collection research and operations/support for both manned and unmanned aircraft. To this point the aircraft ocean data collection has focused on mapping applications, including surface elevation. Currently manned aircraft using Lidar have routinely augmented hydrographic and ocean surface measurements where quick response and depth limitations prevented shipboard surveys. GCOOS-RA member research includes the use of hand-launched, unmanned aircraft using optical and infrared cameras. Other observation potentials
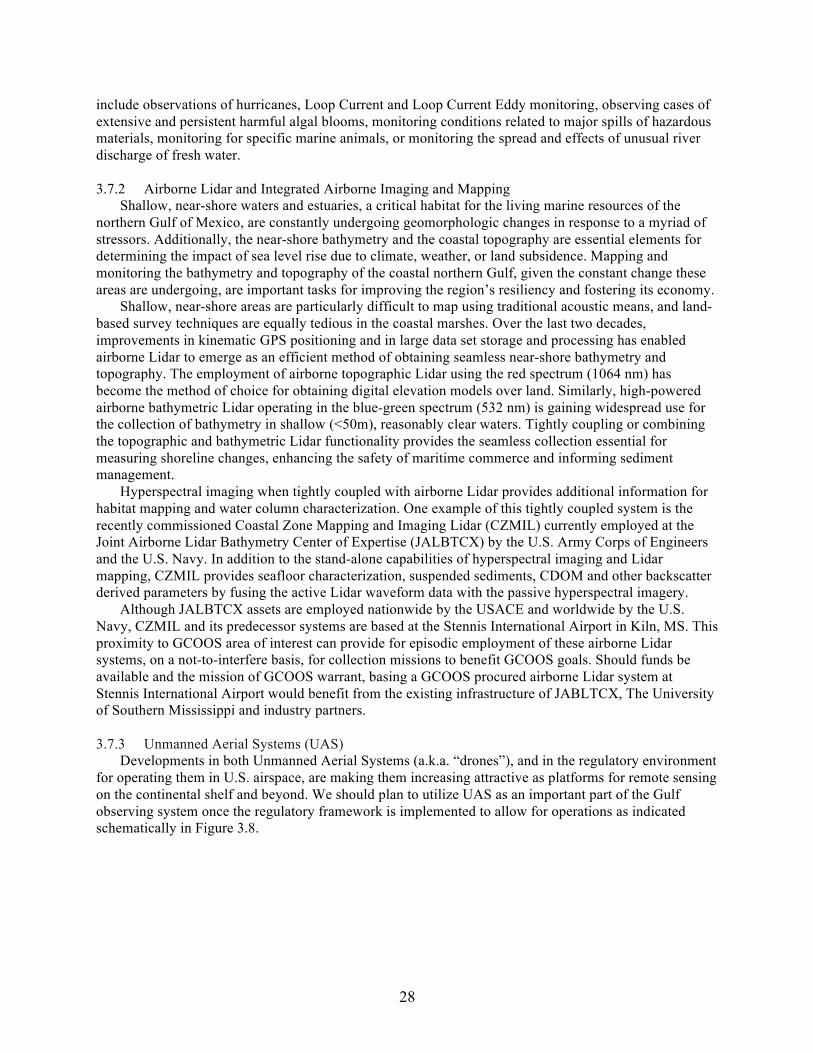
28
include observations of hurricanes, Loop Current and Loop Current Eddy monitoring, observing cases of extensive and persistent harmful algal blooms, monitoring conditions related to major spills of hazardous materials, monitoring for specific marine animals, or monitoring the spread and effects of unusual river discharge of fresh water. 3.7.2 Airborne Lidar and Integrated Airborne Imaging and Mapping
Shallow, near-shore waters and estuaries, a critical habitat for the living marine resources of the northern Gulf of Mexico, are constantly undergoing geomorphologic changes in response to a myriad of stressors. Additionally, the near-shore bathymetry and the coastal topography are essential elements for determining the impact of sea level rise due to climate, weather, or land subsidence. Mapping and monitoring the bathymetry and topography of the coastal northern Gulf, given the constant change these areas are undergoing, are important tasks for improving the region’s resiliency and fostering its economy.
Shallow, near-shore areas are particularly difficult to map using traditional acoustic means, and land-based survey techniques are equally tedious in the coastal marshes. Over the last two decades, improvements in kinematic GPS positioning and in large data set storage and processing has enabled airborne Lidar to emerge as an efficient method of obtaining seamless near-shore bathymetry and topography. The employment of airborne topographic Lidar using the red spectrum (1064 nm) has become the method of choice for obtaining digital elevation models over land. Similarly, high-powered airborne bathymetric Lidar operating in the blue-green spectrum (532 nm) is gaining widespread use for the collection of bathymetry in shallow (<50m), reasonably clear waters. Tightly coupling or combining the topographic and bathymetric Lidar functionality provides the seamless collection essential for measuring shoreline changes, enhancing the safety of maritime commerce and informing sediment management.
Hyperspectral imaging when tightly coupled with airborne Lidar provides additional information for habitat mapping and water column characterization. One example of this tightly coupled system is the recently commissioned Coastal Zone Mapping and Imaging Lidar (CZMIL) currently employed at the Joint Airborne Lidar Bathymetry Center of Expertise (JALBTCX) by the U.S. Army Corps of Engineers and the U.S. Navy. In addition to the stand-alone capabilities of hyperspectral imaging and Lidar mapping, CZMIL provides seafloor characterization, suspended sediments, CDOM and other backscatter derived parameters by fusing the active Lidar waveform data with the passive hyperspectral imagery.
Although JALBTCX assets are employed nationwide by the USACE and worldwide by the U.S. Navy, CZMIL and its predecessor systems are based at the Stennis International Airport in Kiln, MS. This proximity to GCOOS area of interest can provide for episodic employment of these airborne Lidar systems, on a not-to-interfere basis, for collection missions to benefit GCOOS goals. Should funds be available and the mission of GCOOS warrant, basing a GCOOS procured airborne Lidar system at Stennis International Airport would benefit from the existing infrastructure of JABLTCX, The University of Southern Mississippi and industry partners. 3.7.3 Unmanned Aerial Systems (UAS)
Developments in both Unmanned Aerial Systems (a.k.a. “drones”), and in the regulatory environment for operating them in U.S. airspace, are making them increasing attractive as platforms for remote sensing on the continental shelf and beyond. We should plan to utilize UAS as an important part of the Gulf observing system once the regulatory framework is implemented to allow for operations as indicated schematically in Figure 3.8.
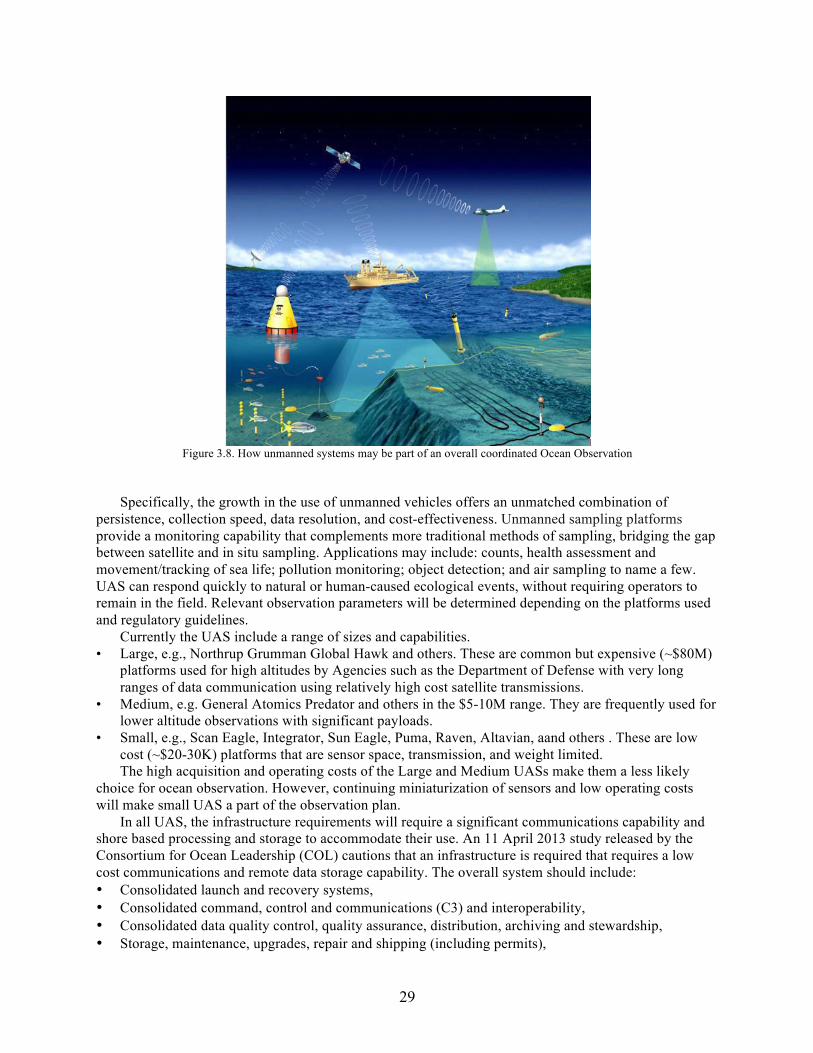
29
Figure 3.8. How unmanned systems may be part of an overall coordinated Ocean Observation
Specifically, the growth in the use of unmanned vehicles offers an unmatched combination of persistence, collection speed, data resolution, and cost-effectiveness. Unmanned sampling platforms provide a monitoring capability that complements more traditional methods of sampling, bridging the gap between satellite and in situ sampling. Applications may include: counts, health assessment and movement/tracking of sea life; pollution monitoring; object detection; and air sampling to name a few. UAS can respond quickly to natural or human-caused ecological events, without requiring operators to remain in the field. Relevant observation parameters will be determined depending on the platforms used and regulatory guidelines.
Currently the UAS include a range of sizes and capabilities. • Large, e.g., Northrup Grumman Global Hawk and others. These are common but expensive (~$80M)
platforms used for high altitudes by Agencies such as the Department of Defense with very long ranges of data communication using relatively high cost satellite transmissions.
• Medium, e.g. General Atomics Predator and others in the $5-10M range. They are frequently used for lower altitude observations with significant payloads.
• Small, e.g., Scan Eagle, Integrator, Sun Eagle, Puma, Raven, Altavian, aand others . These are low cost (~$20-30K) platforms that are sensor space, transmission, and weight limited. The high acquisition and operating costs of the Large and Medium UASs make them a less likely
choice for ocean observation. However, continuing miniaturization of sensors and low operating costs will make small UAS a part of the observation plan.
In all UAS, the infrastructure requirements will require a significant communications capability and shore based processing and storage to accommodate their use. An 11 April 2013 study released by the Consortium for Ocean Leadership (COL) cautions that an infrastructure is required that requires a low cost communications and remote data storage capability. The overall system should include: • Consolidated launch and recovery systems, • Consolidated command, control and communications (C3) and interoperability, • Consolidated data quality control, quality assurance, distribution, archiving and stewardship, • Storage, maintenance, upgrades, repair and shipping (including permits),
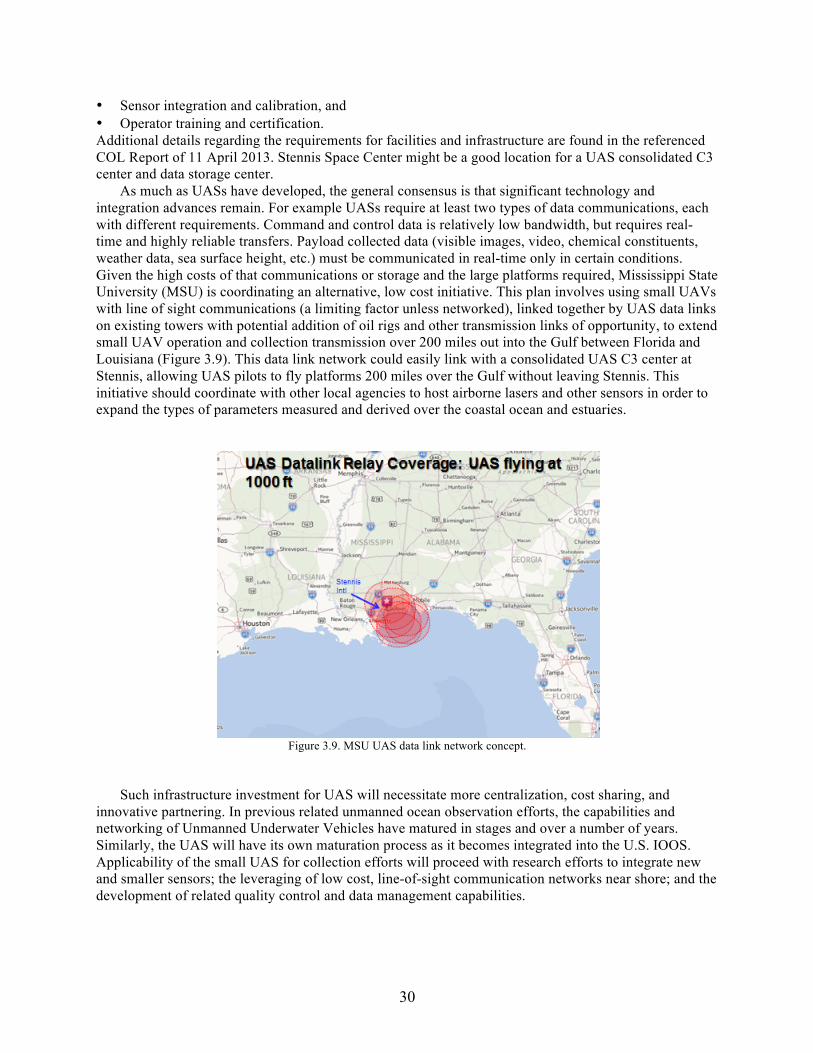
30
• Sensor integration and calibration, and • Operator training and certification. Additional details regarding the requirements for facilities and infrastructure are found in the referenced COL Report of 11 April 2013. Stennis Space Center might be a good location for a UAS consolidated C3 center and data storage center.
As much as UASs have developed, the general consensus is that significant technology and integration advances remain. For example UASs require at least two types of data communications, each with different requirements. Command and control data is relatively low bandwidth, but requires real-time and highly reliable transfers. Payload collected data (visible images, video, chemical constituents, weather data, sea surface height, etc.) must be communicated in real-time only in certain conditions. Given the high costs of that communications or storage and the large platforms required, Mississippi State University (MSU) is coordinating an alternative, low cost initiative. This plan involves using small UAVs with line of sight communications (a limiting factor unless networked), linked together by UAS data links on existing towers with potential addition of oil rigs and other transmission links of opportunity, to extend small UAV operation and collection transmission over 200 miles out into the Gulf between Florida and Louisiana (Figure 3.9). This data link network could easily link with a consolidated UAS C3 center at Stennis, allowing UAS pilots to fly platforms 200 miles over the Gulf without leaving Stennis. This initiative should coordinate with other local agencies to host airborne lasers and other sensors in order to expand the types of parameters measured and derived over the coastal ocean and estuaries.
Figure 3.9. MSU UAS data link network concept.
Such infrastructure investment for UAS will necessitate more centralization, cost sharing, and innovative partnering. In previous related unmanned ocean observation efforts, the capabilities and networking of Unmanned Underwater Vehicles have matured in stages and over a number of years. Similarly, the UAS will have its own maturation process as it becomes integrated into the U.S. IOOS. Applicability of the small UAS for collection efforts will proceed with research efforts to integrate new and smaller sensors; the leveraging of low cost, line-of-sight communication networks near shore; and the development of related quality control and data management capabilities.
31
3.8 Bathymetry and Topography Mapping
Bathymetry and topography were identified as the number one priority dataset of most stakeholders in the Gulf region. While these data do not fall into the category of real-time observations, they serve as an important interpretive backdrop for coastal and ocean observations and are a primary bounding condition for most ocean models. These data support a multitude of activities beyond the IOOS community: regional sediment management, dredging, engineering plans and specifications, regulatory enforcement, emergency response, ecosystem evaluation, coastal restoration, flood hazard mapping, marine geology and extreme storm studies, nautical chart production, shoreline management, environmental permitting, emergency management, marine spatial planning, and planning for resilient communities.
GCOOS-RA does not propose an allocation of funding to support the collection of these very valuable datasets; however, it is uniquely positioned to provide coordination, integration, assimilation, and distribution of these data and their derivative products. The provision of these, as well as supporting and ancillary data, will be provided by others: federal, state, and local government, academia, and NGOs. The proposed activities described herein will leverage the Gulf of Mexico Master Mapping Plan currently under development within the Gulf of Mexico Alliance Ecosystems Integration and Assessment Priority Issue Team and activities of the Interagency Working Group on Ocean and Coastal Mapping.
Existing Assets: GCOOS-RA currently makes existing topography and bathymetry datasets available on its website: SRTM and NOAA NGDC Coastal Relief Model and multibeam data; along with some derivative products: contours and NOAA shoreline data. The current data holding represents only a small portion of the data available for the region, primarily collected to support the NOAA nautical charting mission.
The Gulf of Mexico Alliance is developing a Gulf of Mexico Master Mapping Plan that includes identifying requirements for bathymetry, topography, imagery data, and value-added decision-support products; identifying planned mapping activities for the next ten years; and developing a strategy for meeting the most requirements leveraging the planned activities.
The Interagency Working Group on Ocean and Coastal Mapping is currently undertaking a bathymetry-topography inventory effort that includes current data holdings and planned acquisition activities. The USACE, USGS, NOAA, and FEMA have all made coastal topography, bathymetry, imagery, and derived products available on the NOAA Digital Coast. The USGS Hazard Data Distribution System is employed for use by emergency responders. While typically dominated by imagery, it also serves topographic and bathymetric data when made available immediately before or after a hazard event, such as a hurricane, oil spill, earthquake, etc. The NOAA Coastal Services Center published a document containing the best-available bathymetry and topography data sets for the Gulf of Mexico in 2007. The NCDDC is currently in the process of developing a Gulf of Mexico Digital Atlas that will presumably include a compilation of bathymetric and topographic data. The USGS has proposed an enhanced National Elevation Dataset that includes coastal bathymetry.
Easy access to current bathymetry and topography data is the greatest need of the Gulf of Mexico community. Most agencies and states that collect bathymetry and topography data strive to make the data accessible to the public. The result is series of websites, mapping services, and metadata catalogs that users must first be aware of, understand the interfaces of, and finally navigate through to download.
The Gulf of Mexico Master Mapping Plan (GMMMP) identifies requirements for bathymetry and topography, and planned mapping activities in the near-term. However, requirements will change with the next disaster or coastal issue, and the planned activities will transition from a planned state to production of data. In the original proposal for the creation of the GMMMP, GCOOS was identified as the eventual owner of the plan, with the responsibility to update requirements and planned activities on an annual basis, or as the need arises.
The two main components of the GMMMP, requirements and planned mapping activities, should be updated on a regular schedule, and continuously through automated means. A requirements workshop will be held each GCOOS funding cycle to re-evaluate priorities in the document. An interactive website will allow input of new requirements throughout the funding cycle to keep the document current. Planned
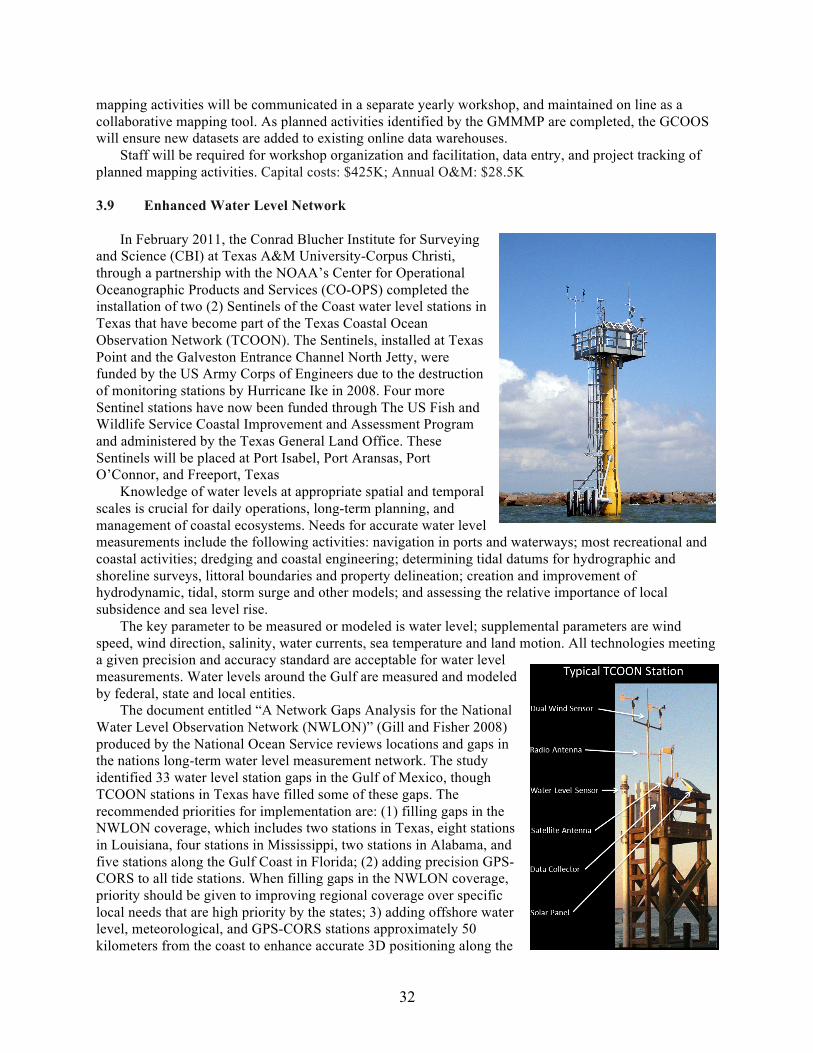
32
mapping activities will be communicated in a separate yearly workshop, and maintained on line as a collaborative mapping tool. As planned activities identified by the GMMMP are completed, the GCOOS will ensure new datasets are added to existing online data warehouses.
Staff will be required for workshop organization and facilitation, data entry, and project tracking of planned mapping activities. Capital costs: $425K; Annual O&M: $28.5K 3.9 Enhanced Water Level Network
In February 2011, the Conrad Blucher Institute for Surveying and Science (CBI) at Texas A&M University-Corpus Christi, through a partnership with the NOAA’s Center for Operational Oceanographic Products and Services (CO-OPS) completed the installation of two (2) Sentinels of the Coast water level stations in Texas that have become part of the Texas Coastal Ocean Observation Network (TCOON). The Sentinels, installed at Texas Point and the Galveston Entrance Channel North Jetty, were funded by the US Army Corps of Engineers due to the destruction of monitoring stations by Hurricane Ike in 2008. Four more Sentinel stations have now been funded through The US Fish and Wildlife Service Coastal Improvement and Assessment Program and administered by the Texas General Land Office. These Sentinels will be placed at Port Isabel, Port Aransas, Port O’Connor, and Freeport, Texas
Knowledge of water levels at appropriate spatial and temporal scales is crucial for daily operations, long-term planning, and management of coastal ecosystems. Needs for accurate water level measurements include the following activities: navigation in ports and waterways; most recreational and coastal activities; dredging and coastal engineering; determining tidal datums for hydrographic and shoreline surveys, littoral boundaries and property delineation; creation and improvement of hydrodynamic, tidal, storm surge and other models; and assessing the relative importance of local subsidence and sea level rise.
The key parameter to be measured or modeled is water level; supplemental parameters are wind speed, wind direction, salinity, water currents, sea temperature and land motion. All technologies meeting a given precision and accuracy standard are acceptable for water level measurements. Water levels around the Gulf are measured and modeled by federal, state and local entities.
The document entitled “A Network Gaps Analysis for the National Water Level Observation Network (NWLON)” (Gill and Fisher 2008) produced by the National Ocean Service reviews locations and gaps in the nations long-term water level measurement network. The study identified 33 water level station gaps in the Gulf of Mexico, though TCOON stations in Texas have filled some of these gaps. The recommended priorities for implementation are: (1) filling gaps in the NWLON coverage, which includes two stations in Texas, eight stations in Louisiana, four stations in Mississippi, two stations in Alabama, and five stations along the Gulf Coast in Florida; (2) adding precision GPS-CORS to all tide stations. When filling gaps in the NWLON coverage, priority should be given to improving regional coverage over specific local needs that are high priority by the states; 3) adding offshore water level, meteorological, and GPS-CORS stations approximately 50 kilometers from the coast to enhance accurate 3D positioning along the
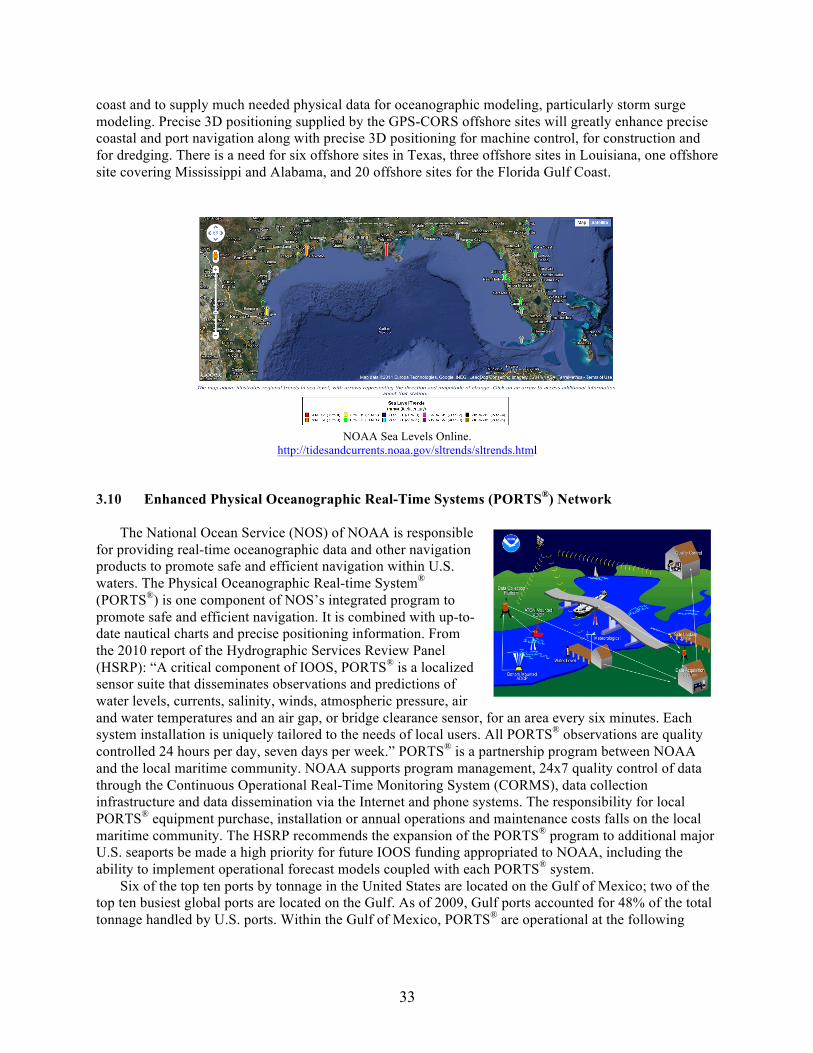
33
coast and to supply much needed physical data for oceanographic modeling, particularly storm surge modeling. Precise 3D positioning supplied by the GPS-CORS offshore sites will greatly enhance precise coastal and port navigation along with precise 3D positioning for machine control, for construction and for dredging. There is a need for six offshore sites in Texas, three offshore sites in Louisiana, one offshore site covering Mississippi and Alabama, and 20 offshore sites for the Florida Gulf Coast.
NOAA Sea Levels Online.
http://tidesandcurrents.noaa.gov/sltrends/sltrends.html 3.10 Enhanced Physical Oceanographic Real-Time Systems (PORTS®) Network
The National Ocean Service (NOS) of NOAA is responsible for providing real-time oceanographic data and other navigation products to promote safe and efficient navigation within U.S. waters. The Physical Oceanographic Real-time System® (PORTS®) is one component of NOS’s integrated program to promote safe and efficient navigation. It is combined with up-to-date nautical charts and precise positioning information. From the 2010 report of the Hydrographic Services Review Panel (HSRP): “A critical component of IOOS, PORTS® is a localized sensor suite that disseminates observations and predictions of water levels, currents, salinity, winds, atmospheric pressure, air and water temperatures and an air gap, or bridge clearance sensor, for an area every six minutes. Each system installation is uniquely tailored to the needs of local users. All PORTS® observations are quality controlled 24 hours per day, seven days per week.” PORTS® is a partnership program between NOAA and the local maritime community. NOAA supports program management, 24x7 quality control of data through the Continuous Operational Real-Time Monitoring System (CORMS), data collection infrastructure and data dissemination via the Internet and phone systems. The responsibility for local PORTS® equipment purchase, installation or annual operations and maintenance costs falls on the local maritime community. The HSRP recommends the expansion of the PORTS® program to additional major U.S. seaports be made a high priority for future IOOS funding appropriated to NOAA, including the ability to implement operational forecast models coupled with each PORTS® system.
Six of the top ten ports by tonnage in the United States are located on the Gulf of Mexico; two of the top ten busiest global ports are located on the Gulf. As of 2009, Gulf ports accounted for 48% of the total tonnage handled by U.S. ports. Within the Gulf of Mexico, PORTS® are operational at the following
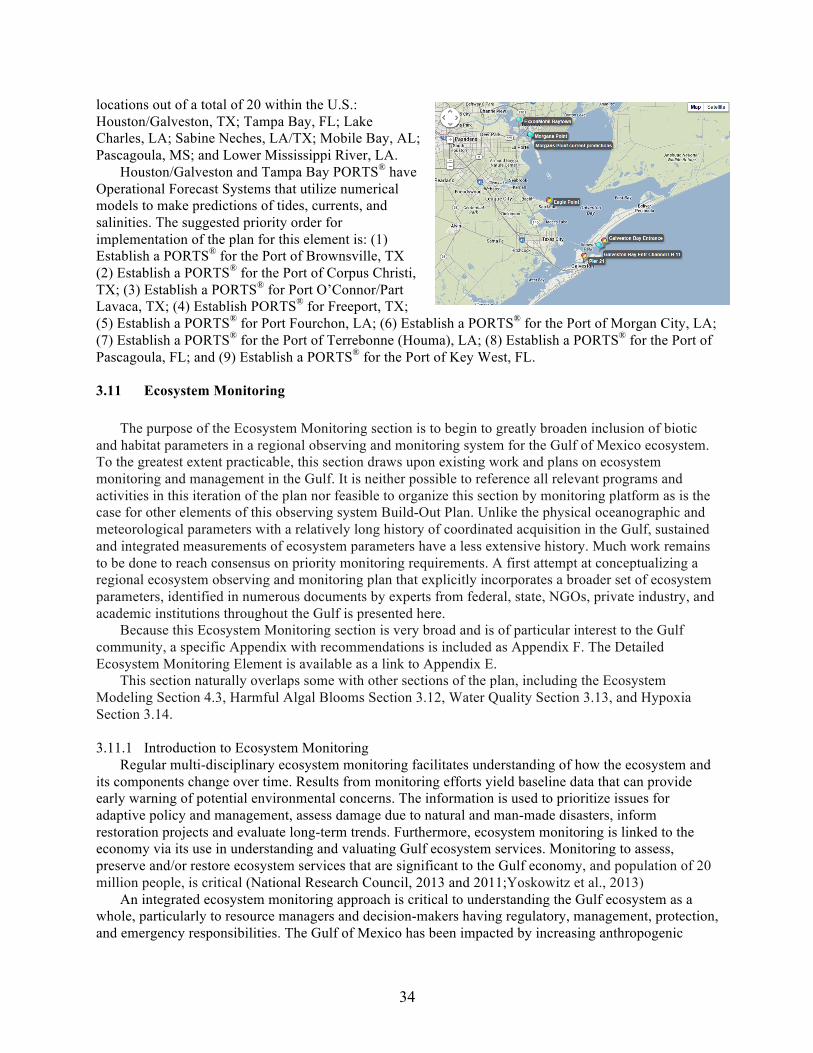
34
locations out of a total of 20 within the U.S.: Houston/Galveston, TX; Tampa Bay, FL; Lake Charles, LA; Sabine Neches, LA/TX; Mobile Bay, AL; Pascagoula, MS; and Lower Mississippi River, LA.
Houston/Galveston and Tampa Bay PORTS® have Operational Forecast Systems that utilize numerical models to make predictions of tides, currents, and salinities. The suggested priority order for implementation of the plan for this element is: (1) Establish a PORTS® for the Port of Brownsville, TX (2) Establish a PORTS® for the Port of Corpus Christi, TX; (3) Establish a PORTS® for Port O’Connor/Part Lavaca, TX; (4) Establish PORTS® for Freeport, TX; (5) Establish a PORTS® for Port Fourchon, LA; (6) Establish a PORTS® for the Port of Morgan City, LA; (7) Establish a PORTS® for the Port of Terrebonne (Houma), LA; (8) Establish a PORTS® for the Port of Pascagoula, FL; and (9) Establish a PORTS® for the Port of Key West, FL. 3.11 Ecosystem Monitoring
The purpose of the Ecosystem Monitoring section is to begin to greatly broaden inclusion of biotic and habitat parameters in a regional observing and monitoring system for the Gulf of Mexico ecosystem. To the greatest extent practicable, this section draws upon existing work and plans on ecosystem monitoring and management in the Gulf. It is neither possible to reference all relevant programs and activities in this iteration of the plan nor feasible to organize this section by monitoring platform as is the case for other elements of this observing system Build-Out Plan. Unlike the physical oceanographic and meteorological parameters with a relatively long history of coordinated acquisition in the Gulf, sustained and integrated measurements of ecosystem parameters have a less extensive history. Much work remains to be done to reach consensus on priority monitoring requirements. A first attempt at conceptualizing a regional ecosystem observing and monitoring plan that explicitly incorporates a broader set of ecosystem parameters, identified in numerous documents by experts from federal, state, NGOs, private industry, and academic institutions throughout the Gulf is presented here.
Because this Ecosystem Monitoring section is very broad and is of particular interest to the Gulf community, a specific Appendix with recommendations is included as Appendix F. The Detailed Ecosystem Monitoring Element is available as a link to Appendix E.
This section naturally overlaps some with other sections of the plan, including the Ecosystem Modeling Section 4.3, Harmful Algal Blooms Section 3.12, Water Quality Section 3.13, and Hypoxia Section 3.14. 3.11.1 Introduction to Ecosystem Monitoring
Regular multi-disciplinary ecosystem monitoring facilitates understanding of how the ecosystem and its components change over time. Results from monitoring efforts yield baseline data that can provide early warning of potential environmental concerns. The information is used to prioritize issues for adaptive policy and management, assess damage due to natural and man-made disasters, inform restoration projects and evaluate long-term trends. Furthermore, ecosystem monitoring is linked to the economy via its use in understanding and valuating Gulf ecosystem services. Monitoring to assess, preserve and/or restore ecosystem services that are significant to the Gulf economy, and population of 20 million people, is critical (National Research Council, 2013 and 2011;Yoskowitz et al., 2013)
An integrated ecosystem monitoring approach is critical to understanding the Gulf ecosystem as a whole, particularly to resource managers and decision-makers having regulatory, management, protection, and emergency responsibilities. The Gulf of Mexico has been impacted by increasing anthropogenic
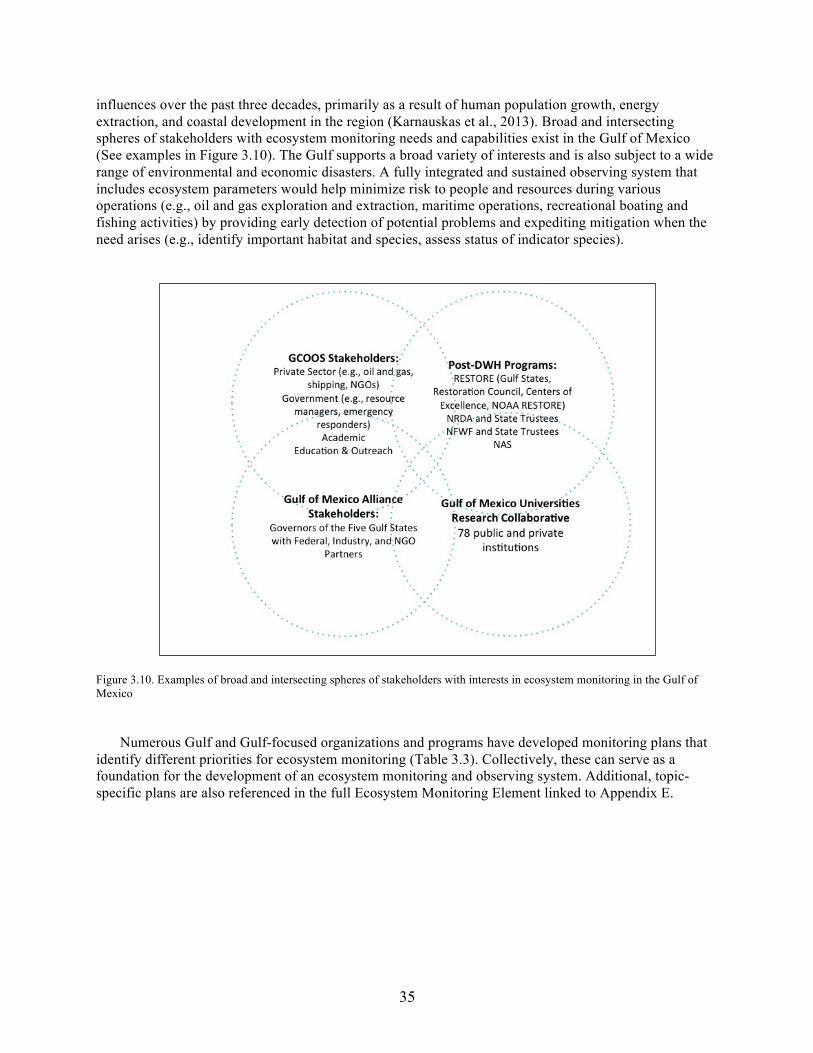
35
influences over the past three decades, primarily as a result of human population growth, energy extraction, and coastal development in the region (Karnauskas et al., 2013). Broad and intersecting spheres of stakeholders with ecosystem monitoring needs and capabilities exist in the Gulf of Mexico (See examples in Figure 3.10). The Gulf supports a broad variety of interests and is also subject to a wide range of environmental and economic disasters. A fully integrated and sustained observing system that includes ecosystem parameters would help minimize risk to people and resources during various operations (e.g., oil and gas exploration and extraction, maritime operations, recreational boating and fishing activities) by providing early detection of potential problems and expediting mitigation when the need arises (e.g., identify important habitat and species, assess status of indicator species).
Figure 3.10. Examples of broad and intersecting spheres of stakeholders with interests in ecosystem monitoring in the Gulf of Mexico
Numerous Gulf and Gulf-focused organizations and programs have developed monitoring plans that
identify different priorities for ecosystem monitoring (Table 3.3). Collectively, these can serve as a foundation for the development of an ecosystem monitoring and observing system. Additional, topic-specific plans are also referenced in the full Ecosystem Monitoring Element linked to Appendix E.
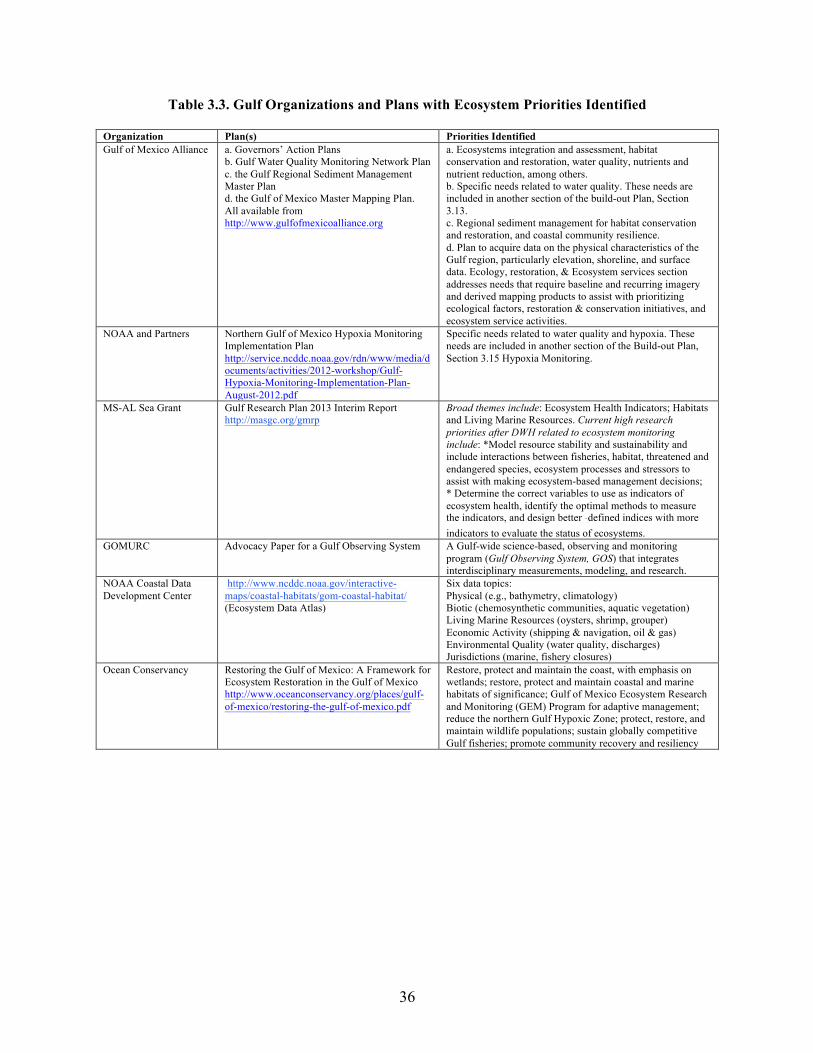
36
Table 3.3. Gulf Organizations and Plans with Ecosystem Priorities Identified
Organization Plan(s) Priorities Identified Gulf of Mexico Alliance a. Governors’ Action Plans
b. Gulf Water Quality Monitoring Network Plan c. the Gulf Regional Sediment Management Master Plan d. the Gulf of Mexico Master Mapping Plan. All available from http://www.gulfofmexicoalliance.org
a. Ecosystems integration and assessment, habitat conservation and restoration, water quality, nutrients and nutrient reduction, among others. b. Specific needs related to water quality. These needs are included in another section of the build-out Plan, Section 3.13. c. Regional sediment management for habitat conservation and restoration, and coastal community resilience. d. Plan to acquire data on the physical characteristics of the Gulf region, particularly elevation, shoreline, and surface data. Ecology, restoration, & Ecosystem services section addresses needs that require baseline and recurring imagery and derived mapping products to assist with prioritizing ecological factors, restoration & conservation initiatives, and ecosystem service activities.
NOAA and Partners
Northern Gulf of Mexico Hypoxia Monitoring Implementation Plan http://service.ncddc.noaa.gov/rdn/www/media/documents/activities/2012-workshop/Gulf-Hypoxia-Monitoring-Implementation-Plan-August-2012.pdf
Specific needs related to water quality and hypoxia. These needs are included in another section of the Build-out Plan, Section 3.15 Hypoxia Monitoring.
MS-AL Sea Grant Gulf Research Plan 2013 Interim Report http://masgc.org/gmrp
Broad themes include: Ecosystem Health Indicators; Habitats and Living Marine Resources. Current high research priorities after DWH related to ecosystem monitoring include: *Model resource stability and sustainability and include interactions between fisheries, habitat, threatened and endangered species, ecosystem processes and stressors to assist with making ecosystem-based management decisions; * Determine the correct variables to use as indicators of ecosystem health, identify the optimal methods to measure the indicators, and design better ‐defined indices with more indicators to evaluate the status of ecosystems.
GOMURC Advocacy Paper for a Gulf Observing System A Gulf-wide science-based, observing and monitoring program (Gulf Observing System, GOS) that integrates interdisciplinary measurements, modeling, and research.
NOAA Coastal Data Development Center
http://www.ncddc.noaa.gov/interactive-maps/coastal-habitats/gom-coastal-habitat/ (Ecosystem Data Atlas)
Six data topics: Physical (e.g., bathymetry, climatology) Biotic (chemosynthetic communities, aquatic vegetation) Living Marine Resources (oysters, shrimp, grouper) Economic Activity (shipping & navigation, oil & gas) Environmental Quality (water quality, discharges) Jurisdictions (marine, fishery closures)
Ocean Conservancy Restoring the Gulf of Mexico: A Framework for Ecosystem Restoration in the Gulf of Mexico http://www.oceanconservancy.org/places/gulf-of-mexico/restoring-the-gulf-of-mexico.pdf
Restore, protect and maintain the coast, with emphasis on wetlands; restore, protect and maintain coastal and marine habitats of significance; Gulf of Mexico Ecosystem Research and Monitoring (GEM) Program for adaptive management; reduce the northern Gulf Hypoxic Zone; protect, restore, and maintain wildlife populations; sustain globally competitive Gulf fisheries; promote community recovery and resiliency
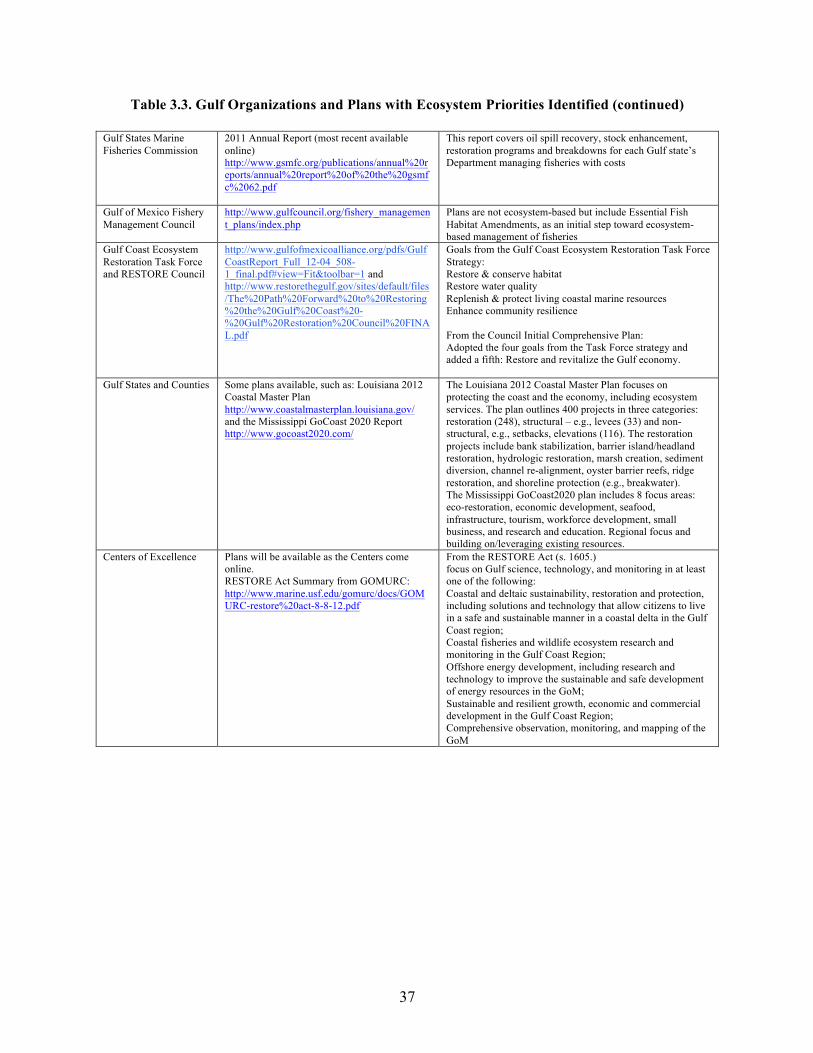
37
Table 3.3. Gulf Organizations and Plans with Ecosystem Priorities Identified (continued)
Gulf States Marine Fisheries Commission
2011 Annual Report (most recent available online) http://www.gsmfc.org/publications/annual%20reports/annual%20report%20of%20the%20gsmfc%2062.pdf
This report covers oil spill recovery, stock enhancement, restoration programs and breakdowns for each Gulf state’s Department managing fisheries with costs
Gulf of Mexico Fishery Management Council
http://www.gulfcouncil.org/fishery_management_plans/index.php
Plans are not ecosystem-based but include Essential Fish Habitat Amendments, as an initial step toward ecosystem-based management of fisheries
Gulf Coast Ecosystem Restoration Task Force and RESTORE Council
http://www.gulfofmexicoalliance.org/pdfs/GulfCoastReport_Full_12-04_508-1_final.pdf#view=Fit&toolbar=1 and http://www.restorethegulf.gov/sites/default/files/The%20Path%20Forward%20to%20Restoring%20the%20Gulf%20Coast%20-%20Gulf%20Restoration%20Council%20FINAL.pdf
Goals from the Gulf Coast Ecosystem Restoration Task Force Strategy: Restore & conserve habitat Restore water quality Replenish & protect living coastal marine resources Enhance community resilience From the Council Initial Comprehensive Plan: Adopted the four goals from the Task Force strategy and added a fifth: Restore and revitalize the Gulf economy.
Gulf States and Counties Some plans available, such as: Louisiana 2012 Coastal Master Plan http://www.coastalmasterplan.louisiana.gov/ and the Mississippi GoCoast 2020 Report http://www.gocoast2020.com/
The Louisiana 2012 Coastal Master Plan focuses on protecting the coast and the economy, including ecosystem services. The plan outlines 400 projects in three categories: restoration (248), structural – e.g., levees (33) and non-structural, e.g., setbacks, elevations (116). The restoration projects include bank stabilization, barrier island/headland restoration, hydrologic restoration, marsh creation, sediment diversion, channel re-alignment, oyster barrier reefs, ridge restoration, and shoreline protection (e.g., breakwater). The Mississippi GoCoast2020 plan includes 8 focus areas: eco-restoration, economic development, seafood, infrastructure, tourism, workforce development, small business, and research and education. Regional focus and building on/leveraging existing resources.
Centers of Excellence Plans will be available as the Centers come online. RESTORE Act Summary from GOMURC: http://www.marine.usf.edu/gomurc/docs/GOMURC-restore%20act-8-8-12.pdf
From the RESTORE Act (s. 1605.) focus on Gulf science, technology, and monitoring in at least one of the following: Coastal and deltaic sustainability, restoration and protection, including solutions and technology that allow citizens to live in a safe and sustainable manner in a coastal delta in the Gulf Coast region; Coastal fisheries and wildlife ecosystem research and monitoring in the Gulf Coast Region; Offshore energy development, including research and technology to improve the sustainable and safe development of energy resources in the GoM; Sustainable and resilient growth, economic and commercial development in the Gulf Coast Region; Comprehensive observation, monitoring, and mapping of the GoM
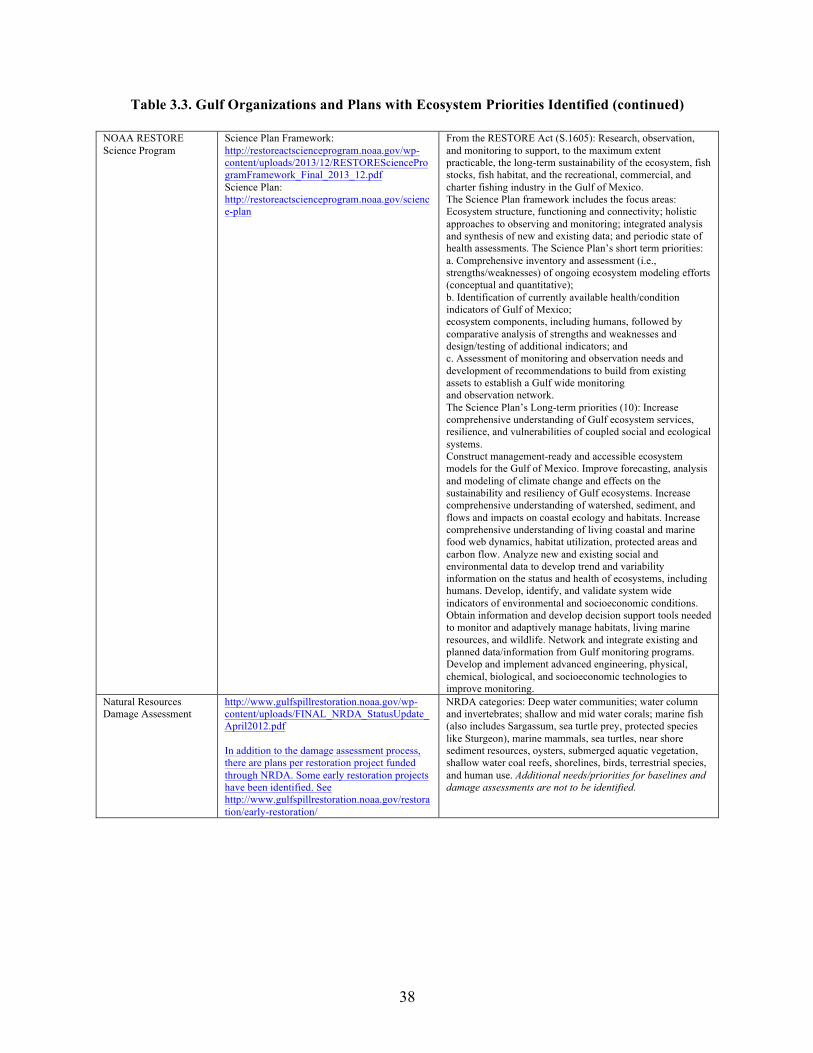
38
Table 3.3. Gulf Organizations and Plans with Ecosystem Priorities Identified (continued)
NOAA RESTORE Science Program
Science Plan Framework: http://restoreactscienceprogram.noaa.gov/wp-content/uploads/2013/12/RESTOREScienceProgramFramework_Final_2013_12.pdf Science Plan: http://restoreactscienceprogram.noaa.gov/science-plan
From the RESTORE Act (S.1605): Research, observation, and monitoring to support, to the maximum extent practicable, the long-term sustainability of the ecosystem, fish stocks, fish habitat, and the recreational, commercial, and charter fishing industry in the Gulf of Mexico. The Science Plan framework includes the focus areas: Ecosystem structure, functioning and connectivity; holistic approaches to observing and monitoring; integrated analysis and synthesis of new and existing data; and periodic state of health assessments. The Science Plan’s short term priorities: a. Comprehensive inventory and assessment (i.e., strengths/weaknesses) of ongoing ecosystem modeling efforts (conceptual and quantitative); b. Identification of currently available health/condition indicators of Gulf of Mexico; ecosystem components, including humans, followed by comparative analysis of strengths and weaknesses and design/testing of additional indicators; and c. Assessment of monitoring and observation needs and development of recommendations to build from existing assets to establish a Gulf wide monitoring and observation network. The Science Plan’s Long-term priorities (10): Increase comprehensive understanding of Gulf ecosystem services, resilience, and vulnerabilities of coupled social and ecological systems. Construct management-ready and accessible ecosystem models for the Gulf of Mexico. Improve forecasting, analysis and modeling of climate change and effects on the sustainability and resiliency of Gulf ecosystems. Increase comprehensive understanding of watershed, sediment, and flows and impacts on coastal ecology and habitats. Increase comprehensive understanding of living coastal and marine food web dynamics, habitat utilization, protected areas and carbon flow. Analyze new and existing social and environmental data to develop trend and variability information on the status and health of ecosystems, including humans. Develop, identify, and validate system wide indicators of environmental and socioeconomic conditions. Obtain information and develop decision support tools needed to monitor and adaptively manage habitats, living marine resources, and wildlife. Network and integrate existing and planned data/information from Gulf monitoring programs. Develop and implement advanced engineering, physical, chemical, biological, and socioeconomic technologies to improve monitoring.
Natural Resources Damage Assessment
http://www.gulfspillrestoration.noaa.gov/wp-content/uploads/FINAL_NRDA_StatusUpdate_April2012.pdf In addition to the damage assessment process, there are plans per restoration project funded through NRDA. Some early restoration projects have been identified. See http://www.gulfspillrestoration.noaa.gov/restoration/early-restoration/
NRDA categories: Deep water communities; water column and invertebrates; shallow and mid water corals; marine fish (also includes Sargassum, sea turtle prey, protected species like Sturgeon), marine mammals, sea turtles, near shore sediment resources, oysters, submerged aquatic vegetation, shallow water coal reefs, shorelines, birds, terrestrial species, and human use. Additional needs/priorities for baselines and damage assessments are not to be identified.
39
Table 3.3. Gulf Organizations and Plans with Ecosystem Priorities Identified (continued)
NOAA Ecosystem Status Report for the Gulf of Mexico, 2013 (Karnauskus et al., 2013)
http://www.gulfcouncil.org/docs/Gulf%20of%20Mexico%20Ecosystem%20Status%20Report.pdf
Specific needs related to priorities identified. Priorities identified include commercial fishing, energy, population, recreation & tourism, shipping, and stressors. Environmental stressors include coastal wetland erosion, harmful algal blooms, hypoxic zone, non-indigenous aquatic species, hurricanes & tropical storms, and oil spills & hazardous releases. Integrated existing resources (GoM Data Atlas, IOOS CAGES, Hypoxia Watch). Example priority indicators: Spatial and temporal data on benthic habitats, river inputs of nutrients, long-term time series data on Living Marine Resources indicator and protected species, sediment transport processes, improved understanding of LOOP current.
Integrated Assessment and Management of the Gulf of Mexico Large Marine Ecosystem
http://gomlme.iwlearn.org/en/activities/sap Strategic Action Program
Improve water quality, avoid depletion and recover depleted living marine resources, conserve coastal and marine ecosystems, mitigate and adapt to climate change and sea level rise, improve science education and outreach, and cross-cutting issues
40
Table 3.3. Gulf Organizations and Plans with Ecosystem Priorities Identified (continued)
National Academy of Sciences (NAS) and NAS Gulf Program
Lubchencho et al. 2012: http://www.pnas.org/content/109/50/20212.full#sec-7 Strategic Vision for a Gulf Research Program http://nas.edu/gulf/vision/index.htm
From Lubchencho et al., 2012: • Gather adequate environmental baselines for all regions at
risk. • Build coupled ecosystem-scale routine
monitoring/research/communications for every large marine ecosystem (LME) in US waters, including the coastal zone, to provide integrated interdisciplinary understanding of how the ecosystem works and is changing, ideally as a partnership with academic institutions in the region.
• Basic understanding of the dynamics of the ecosystem and consequences of changes to people requires a comprehensive, integrated monitoring/research/communication effort focused on an LME, ideally through the development of regional scientific collaboration networks. This understanding must be more than spatially explicit descriptions of the species present. It should include an integrated understanding of the physical and ecosystem dynamics sufficient to know where oil is likely to flow (along the shallow and deep inner shelf and not just open surface waters), which species and life stages would be affected at different times of the year, and how impacts to those species would affect other species, the functioning of the ecosystem, the provision of ecosystem services, and other impacts on people. This knowledge is needed for every LME in the US Exclusive Economic Zone (and adjacent waters, where relevant), and it would vastly enhance effective response and understanding of impacts. Moreover, it has the added benefit of significantly enhancing a variety of other management efforts—water quality, invasive species, fisheries, shipping, recreation, and conservation. Achieving this integrated knowledge and sharing it publicly require stable funding and mechanisms to integrate monitoring, research, and communication activities across a region and the nation.
From Strategic Vision for Gulf Research Program: Goal 1: Foster innovative improvements to safety technologies, safety culture, and environmental protection systems associated with offshore oil and gas development. Goal 2: Improve understanding of the connections between human health and the environment to support the development of healthy and resilient Gulf communities. Goal 3: Advance understanding of the Gulf of Mexico region as a dynamic system with complex, interconnecting human and environmental systems, functions, and processes to inform the protection and restoration of ecosystem services. One of NAS’ strategies is the integration and synthesis of monitoring data.
41
Table 3.3. Gulf Organizations and Plans with Ecosystem Priorities Identified (continued)
National Fish and Wildlife Foundation’s Gulf Environmental Benefit Fund
http://www.nfwf.org/gulf/Pages/home.aspx Each state Trustee identifies priorities for NFWF funds in their state.
Overall priorities: 1) habitats and 2) living coastal resources. State Trustee priorities: AL: focus on the overall health of coastal bays and estuaries and their associate tributaries, marine and coastal habitat improvements, coastal shoreline protection and targeted species-specific habitat restoration. FL: focus natural resource restoration efforts on these marine and coastal environments by improving water quality and other critical habitat elements, strengthening management of important fish and wildlife populations, and enhancing the resiliency of coastal resources and communities by implementing outcomes-based projects that maximize environmental benefits. LA: funds will be allocated solely to barrier island restoration projects and river diversion projects along the Mississippi and Atchafalaya Rivers. MS: a holistic approach to restoration efforts that maximizes the benefit of current and future funding with the overall goal of achieving long-lasting and sustainable environmental benefit for the state and region. TX: no official statement of priorities, but initial projects include restoration of dunes, marshes, barrier island, oyster reef, and waterfowl habitats.
Ecosystem Approach to Management for the Northern Gulf of Mexico
http://www.northerngulfinstitute.org/publications/docs/2012/09/10367McAnally_EAM_Report2_2012.09.14reduced.pdf
Document consolidates efforts toward implementing an Integrated Ecosystem Assessment of selected Gulf of Mexico ecosystems in NOAA Ecosystem Approach to Management (i.e. the assessment of ecosystems in Gulf including modeling). Priorities include developing indicators to define ecosystems ‘states’ for 5 Gulf locations and create a prototype system, with model framework, to identify indicators to drivers and pressures for Gulf ecosystem. 3 drivers categories and 13 pressures are identified, including habitat modification or loss and primary ecosystem services.
The Gulf of Mexico Ecosystem: A Coastal and Marine Atlas (Ocean Conservancy)
http://www.oceanconservancy.org/places/gulf-of-mexico/gulf-atlas.html
Atlas developed to 1. Provide big-picture view of GOM and its resources, 2. Support multi-layered understanding of how Gulf ecosystem functions, 3. Highlight overlapping distributions and ecological linkages, and 4. Serve as a tool for identifying knowledge gaps Atlas include maps and companion descriptions of 54 physical and geographic features, animals, habitats, environmental stressors, and human uses in the Gulf20.
EPA National Coastal Condition Report (2012)
http://water.epa.gov/type/oceb/assessmonitor/nccr/index.cfm
Priorities include habitats, benthic indices, and living marine resources. Note: data is from 2003-2006.
GCOOS Stakeholder Workshops (see rows below)
Instead of plans, the listing below includes reports from selected GCOOS stakeholder workshops with priorities identified. Nearly 800 individuals from industries, academia, government, and non-profit corporations, who have participated in 20 GCOOS workshops to identify needs. Workshops’ reports: http://gcoos.tamu.edu/?page_id=391
Priorities: http://gcoos.tamu.edu/?page_id=51
20OceanConservancyGulfofMexicoGeospatialAtlasContents:Oceanography&Benthos(bathymetry,bottomsediments,temperature,salinity,riverflow,surfacecurrents,netprimaryproductivity),Habitats(saltmarshes&mangroves,oysterreefs,seagrasses,barrierislands,corals,sargassum,hydrocarbonseeps),Invertebrates(brown,white,andredshrimp,oysters),Fish(whaleshark,bullshark,gulfmenhaden,redsnapper,reddrum,tuna),Birds(commonloon,northerngannet,brownpelican,clapperrail,leasttern,royaltern,blackskimmer),SeaTurtles&MarineMammals(kemp’sridleyseaturtle,spermwhale,dolphins,manatee),etc.
42
Table 3.3. Gulf Organizations and Plans with Ecosystem Priorities Identified (continued)
Oil and Gas Industry Workshop
http://gcoos.org/?page_id=754 a) Maps of water quality, including dissolved oxygen, pH, nutrients, chemical oxygen demand, hydrocarbons, salinity, temperature, river inputs, models, currents, winds, hyperspectral imagery; b) maps of hydrocarbon seeps; c) maps of chemosynthetic and archaeological sites; maps of SSH, ocean color imagery; d) bathymetry, topography, and soil maps; e) probability maps of bottom hazards; f) marine mammal and turtle maps (physical sightings, tagging, currents as a proxy).
Harmful Algal Bloom Workshop Reports
http://gcoos.tamu.edu/documents/HAB_GCOOS_report.pdf , http://gcoos.org/?page_id=1452 and http://gcoos.org/?page_id=881 . Report from 2012 workshop soon to be posted.
Specific needs related to HABS. HABS have their own section of the Build-out Plan, Section 3.12 Harmful Algal Bloom Integrated Observing System.
Recreational Boaters Workshops
http://gcoos.org/?page_id=1026 and http://gcoos.org/?page_id=1551
Salinity, turbidity, chlorophyll, dissolved oxygen, bacteriological water quality products.
Water Quality workshops
http://gcoos.org/?page_id=3316 and http://gcoos.tamu.edu/?page_id=4013
Specific needs related to water quality. Water Quality is a separate section of the Build-out Plan, Section 3.13 Integrated Water Quality Network and Beach Monitoring
NRDA Early Restoration Phase III Report
http://www.gulfspillrestoration.noaa.gov/wp-content/uploads/phase-III-overview_links.pdf
12 types of early restoration projects. These 12 early restoration project types are designed to restore ecological and recreational use losses resulting from the spill: create and improve wetlands, protect shorelines and reduce erosion, restore barrier islands and beaches, restore and protect submerged aquatic vegetation, conserve habitat, restore oysters, restore and protect finfish and shellfish, restore and protect birds, restore and protect sea turtles, enhance public access to natural resources for recreational use, enhance recreational experiences, promote environmental and cultural stewardship, education, and outreach.
USFWS Vision for Healthy Gulf Watershed from North American Conservation Wetlands Act Fund:
http://www.fws.gov/gulfrestoration/pdf/VisionDocument.pdf
5 goals: Restore and conserve habitat; Restore water quality; Replenish and protect living coastal and marine species; Enhance community resilience; and Restore and revitalize the Gulf economy. Conservation strategies under those goals include: Use sound science; Restore resources impacted by the Deepwater Horizon oil spill; Create a network of public and private conservation lands; Restore wetland and aquatic ecosystems; Conserve prairies and forests; Protect and restore coastal strand, barrier island and estuarine island habitats; Conserve working lands; and Manage lands and waters for sustainable populations of fish and wildlife. 16 Conservation Focal Areas throughout the Gulf.
Landscape Conservation Cooperatives Gulf Coast Vulnerabillity Assessments – pilot habitat and species
http://peninsularfloridalcc.org/group/gulf-coast-vulnerability-assessment
Identify species and habitats most vulnerable to different climate factors. Use the Strategic Habitat Conservation Approach, which can employ surrogate species as indicators.
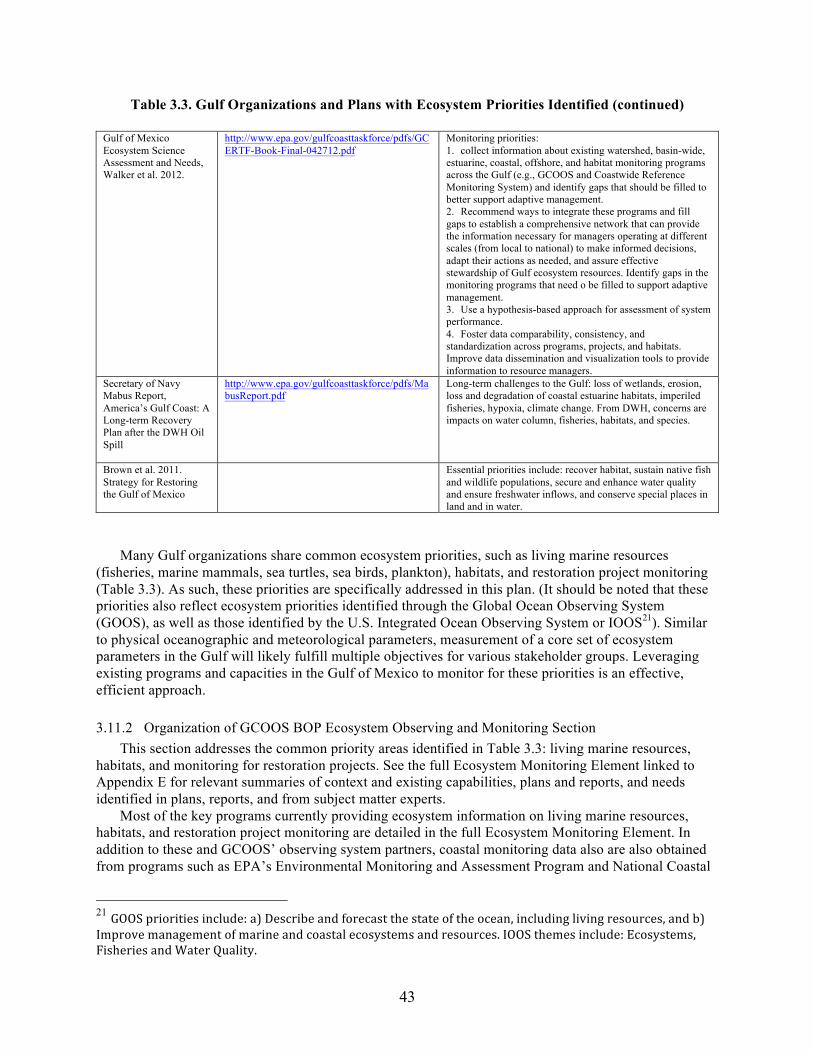
43
Table 3.3. Gulf Organizations and Plans with Ecosystem Priorities Identified (continued)
Gulf of Mexico Ecosystem Science Assessment and Needs, Walker et al. 2012.
http://www.epa.gov/gulfcoasttaskforce/pdfs/GCERTF-Book-Final-042712.pdf
Monitoring priorities: 1. collect information about existing watershed, basin-wide, estuarine, coastal, offshore, and habitat monitoring programs across the Gulf (e.g., GCOOS and Coastwide Reference Monitoring System) and identify gaps that should be filled to better support adaptive management. 2. Recommend ways to integrate these programs and fill gaps to establish a comprehensive network that can provide the information necessary for managers operating at different scales (from local to national) to make informed decisions, adapt their actions as needed, and assure effective stewardship of Gulf ecosystem resources. Identify gaps in the monitoring programs that need o be filled to support adaptive management. 3. Use a hypothesis-based approach for assessment of system performance. 4. Foster data comparability, consistency, and standardization across programs, projects, and habitats. Improve data dissemination and visualization tools to provide information to resource managers.
Secretary of Navy Mabus Report, America’s Gulf Coast: A Long-term Recovery Plan after the DWH Oil Spill
http://www.epa.gov/gulfcoasttaskforce/pdfs/MabusReport.pdf
Long-term challenges to the Gulf: loss of wetlands, erosion, loss and degradation of coastal estuarine habitats, imperiled fisheries, hypoxia, climate change. From DWH, concerns are impacts on water column, fisheries, habitats, and species.
Brown et al. 2011. Strategy for Restoring the Gulf of Mexico
Essential priorities include: recover habitat, sustain native fish and wildlife populations, secure and enhance water quality and ensure freshwater inflows, and conserve special places in land and in water.
Many Gulf organizations share common ecosystem priorities, such as living marine resources (fisheries, marine mammals, sea turtles, sea birds, plankton), habitats, and restoration project monitoring (Table 3.3). As such, these priorities are specifically addressed in this plan. (It should be noted that these priorities also reflect ecosystem priorities identified through the Global Ocean Observing System (GOOS), as well as those identified by the U.S. Integrated Ocean Observing System or IOOS21). Similar to physical oceanographic and meteorological parameters, measurement of a core set of ecosystem parameters in the Gulf will likely fulfill multiple objectives for various stakeholder groups. Leveraging existing programs and capacities in the Gulf of Mexico to monitor for these priorities is an effective, efficient approach. 3.11.2 Organization of GCOOS BOP Ecosystem Observing and Monitoring Section
This section addresses the common priority areas identified in Table 3.3: living marine resources, habitats, and monitoring for restoration projects. See the full Ecosystem Monitoring Element linked to Appendix E for relevant summaries of context and existing capabilities, plans and reports, and needs identified in plans, reports, and from subject matter experts.
Most of the key programs currently providing ecosystem information on living marine resources, habitats, and restoration project monitoring are detailed in the full Ecosystem Monitoring Element. In addition to these and GCOOS’ observing system partners, coastal monitoring data also are also obtained from programs such as EPA’s Environmental Monitoring and Assessment Program and National Coastal
21 GOOSprioritiesinclude:a)Describeandforecastthestateoftheocean,includinglivingresources,andb)Improvemanagementofmarineandcoastalecosystemsandresources.IOOSthemesinclude:Ecosystems,FisheriesandWaterQuality.
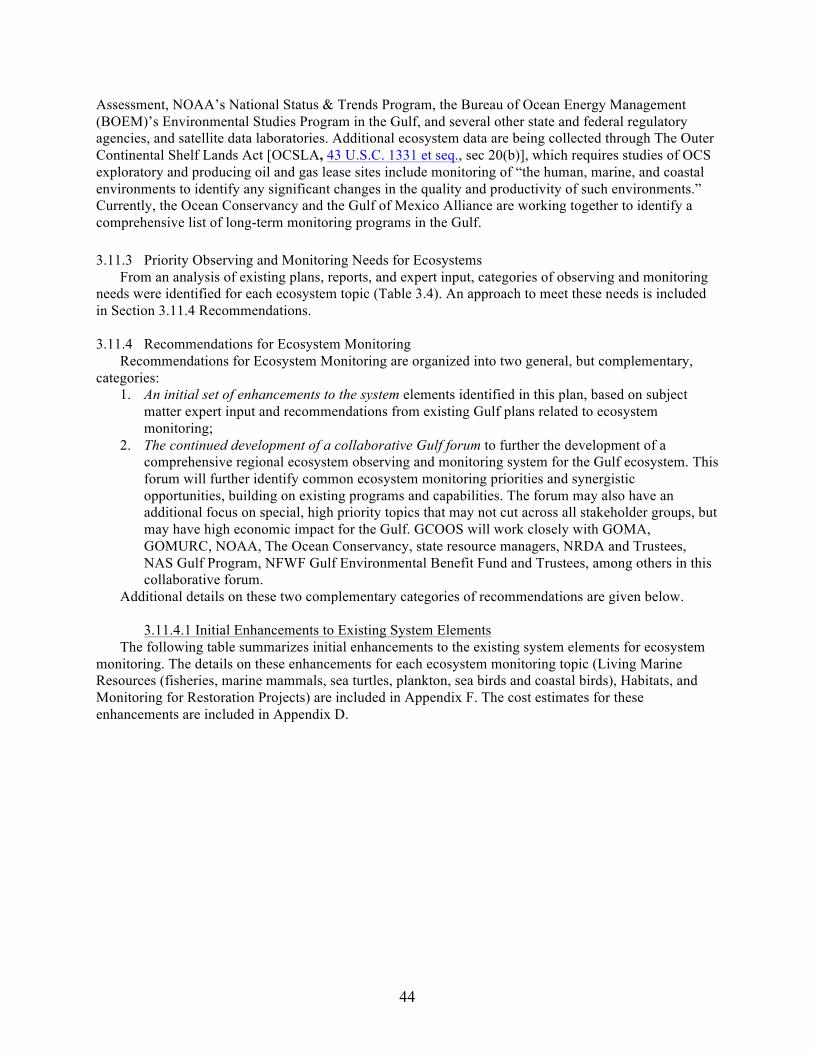
44
Assessment, NOAA’s National Status & Trends Program, the Bureau of Ocean Energy Management (BOEM)’s Environmental Studies Program in the Gulf, and several other state and federal regulatory agencies, and satellite data laboratories. Additional ecosystem data are being collected through The Outer Continental Shelf Lands Act [OCSLA, 43 U.S.C. 1331 et seq., sec 20(b)], which requires studies of OCS exploratory and producing oil and gas lease sites include monitoring of “the human, marine, and coastal environments to identify any significant changes in the quality and productivity of such environments.” Currently, the Ocean Conservancy and the Gulf of Mexico Alliance are working together to identify a comprehensive list of long-term monitoring programs in the Gulf. 3.11.3 Priority Observing and Monitoring Needs for Ecosystems
From an analysis of existing plans, reports, and expert input, categories of observing and monitoring needs were identified for each ecosystem topic (Table 3.4). An approach to meet these needs is included in Section 3.11.4 Recommendations. 3.11.4 Recommendations for Ecosystem Monitoring
Recommendations for Ecosystem Monitoring are organized into two general, but complementary, categories:
1. An initial set of enhancements to the system elements identified in this plan, based on subject matter expert input and recommendations from existing Gulf plans related to ecosystem monitoring;
2. The continued development of a collaborative Gulf forum to further the development of a comprehensive regional ecosystem observing and monitoring system for the Gulf ecosystem. This forum will further identify common ecosystem monitoring priorities and synergistic opportunities, building on existing programs and capabilities. The forum may also have an additional focus on special, high priority topics that may not cut across all stakeholder groups, but may have high economic impact for the Gulf. GCOOS will work closely with GOMA, GOMURC, NOAA, The Ocean Conservancy, state resource managers, NRDA and Trustees, NAS Gulf Program, NFWF Gulf Environmental Benefit Fund and Trustees, among others in this collaborative forum.
Additional details on these two complementary categories of recommendations are given below. 3.11.4.1 Initial Enhancements to Existing System Elements
The following table summarizes initial enhancements to the existing system elements for ecosystem monitoring. The details on these enhancements for each ecosystem monitoring topic (Living Marine Resources (fisheries, marine mammals, sea turtles, plankton, sea birds and coastal birds), Habitats, and Monitoring for Restoration Projects) are included in Appendix F. The cost estimates for these enhancements are included in Appendix D.
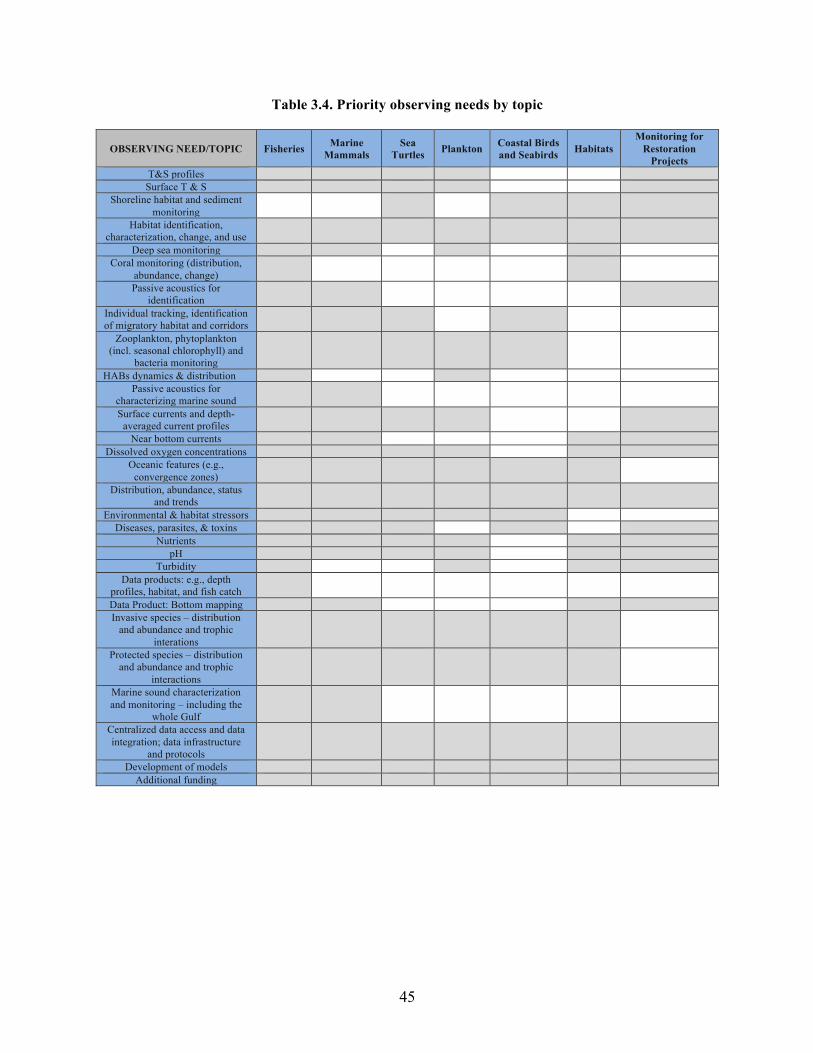
45
Table 3.4. Priority observing needs by topic
OBSERVING NEED/TOPIC Fisheries Marine Mammals
Sea Turtles Plankton Coastal Birds
and Seabirds Habitats Monitoring for
Restoration Projects
T&S profiles Surface T & S
Shoreline habitat and sediment monitoring
Habitat identification, characterization, change, and use
Deep sea monitoring Coral monitoring (distribution,
abundance, change)
Passive acoustics for identification
Individual tracking, identification of migratory habitat and corridors
Zooplankton, phytoplankton (incl. seasonal chlorophyll) and
bacteria monitoring
HABs dynamics & distribution Passive acoustics for
characterizing marine sound
Surface currents and depth-averaged current profiles
Near bottom currents Dissolved oxygen concentrations
Oceanic features (e.g., convergence zones)
Distribution, abundance, status and trends
Environmental & habitat stressors Diseases, parasites, & toxins
Nutrients pH
Turbidity Data products: e.g., depth
profiles, habitat, and fish catch
Data Product: Bottom mapping Invasive species – distribution
and abundance and trophic interations
Protected species – distribution and abundance and trophic
interactions
Marine sound characterization and monitoring – including the
whole Gulf
Centralized data access and data integration; data infrastructure
and protocols
Development of models Additional funding
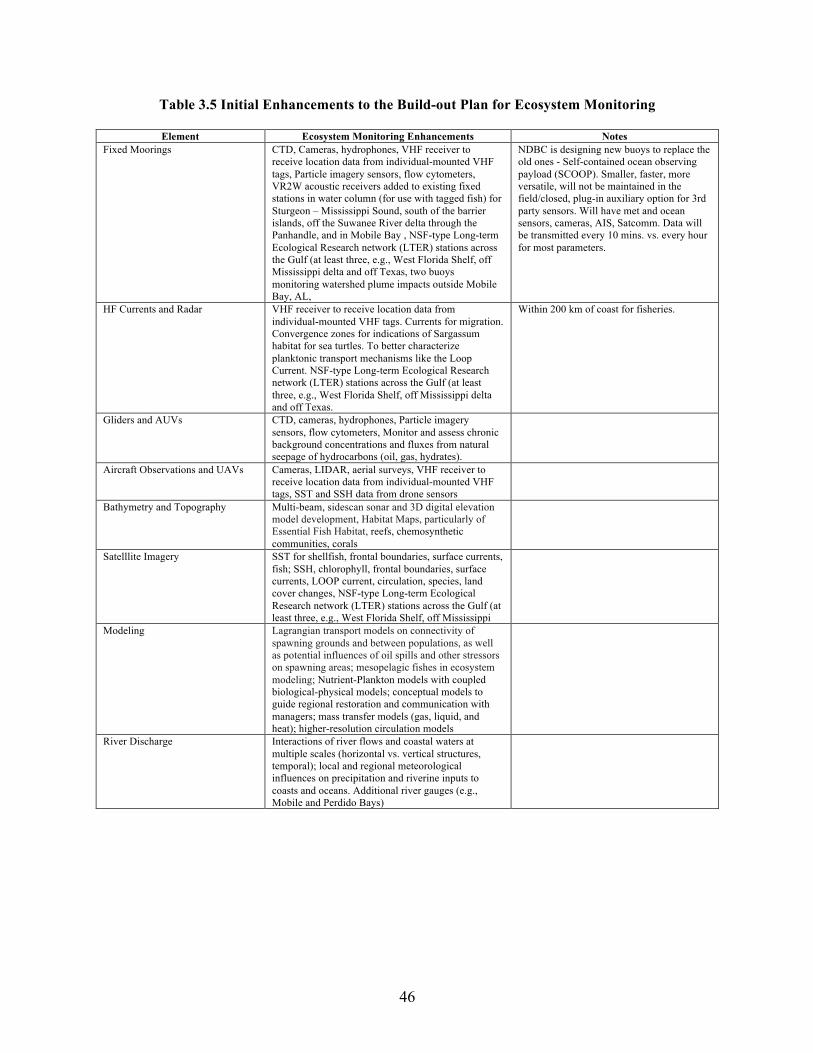
46
Table 3.5 Initial Enhancements to the Build-out Plan for Ecosystem Monitoring
Element Ecosystem Monitoring Enhancements Notes Fixed Moorings CTD, Cameras, hydrophones, VHF receiver to
receive location data from individual-mounted VHF tags, Particle imagery sensors, flow cytometers, VR2W acoustic receivers added to existing fixed stations in water column (for use with tagged fish) for Sturgeon – Mississippi Sound, south of the barrier islands, off the Suwanee River delta through the Panhandle, and in Mobile Bay , NSF-type Long-term Ecological Research network (LTER) stations across the Gulf (at least three, e.g., West Florida Shelf, off Mississippi delta and off Texas, two buoys monitoring watershed plume impacts outside Mobile Bay, AL,
NDBC is designing new buoys to replace the old ones - Self-contained ocean observing payload (SCOOP). Smaller, faster, more versatile, will not be maintained in the field/closed, plug-in auxiliary option for 3rd party sensors. Will have met and ocean sensors, cameras, AIS, Satcomm. Data will be transmitted every 10 mins. vs. every hour for most parameters.
HF Currents and Radar VHF receiver to receive location data from individual-mounted VHF tags. Currents for migration. Convergence zones for indications of Sargassum habitat for sea turtles. To better characterize planktonic transport mechanisms like the Loop Current. NSF-type Long-term Ecological Research network (LTER) stations across the Gulf (at least three, e.g., West Florida Shelf, off Mississippi delta and off Texas.
Within 200 km of coast for fisheries.
Gliders and AUVs CTD, cameras, hydrophones, Particle imagery sensors, flow cytometers, Monitor and assess chronic background concentrations and fluxes from natural seepage of hydrocarbons (oil, gas, hydrates).
Aircraft Observations and UAVs Cameras, LIDAR, aerial surveys, VHF receiver to receive location data from individual-mounted VHF tags, SST and SSH data from drone sensors
Bathymetry and Topography Multi-beam, sidescan sonar and 3D digital elevation model development, Habitat Maps, particularly of Essential Fish Habitat, reefs, chemosynthetic communities, corals
Satelllite Imagery SST for shellfish, frontal boundaries, surface currents, fish; SSH, chlorophyll, frontal boundaries, surface currents, LOOP current, circulation, species, land cover changes, NSF-type Long-term Ecological Research network (LTER) stations across the Gulf (at least three, e.g., West Florida Shelf, off Mississippi
Modeling Lagrangian transport models on connectivity of spawning grounds and between populations, as well as potential influences of oil spills and other stressors on spawning areas; mesopelagic fishes in ecosystem modeling; Nutrient-Plankton models with coupled biological-physical models; conceptual models to guide regional restoration and communication with managers; mass transfer models (gas, liquid, and heat); higher-resolution circulation models
River Discharge Interactions of river flows and coastal waters at multiple scales (horizontal vs. vertical structures, temporal); local and regional meteorological influences on precipitation and riverine inputs to coasts and oceans. Additional river gauges (e.g., Mobile and Perdido Bays)
47
Table 3.5 Initial Enhancements to the Build-out Plan for Ecosystem Monitoring (continued)
Multiple Elements (e.g., Fixed Moorings, Gliders and AUVs)
In situ measurements of salinity, oxygen, nutrients, particulate organic carbon/nitrogen, pH, pCO2, alkalinity (ocean acidification parameters), including the use of CTDs with additional profiling instrumentation for oxygen concentrations, nitrate concentrations, and in situ fluorescence; ADCP to better characterize transport mechanisms, such as the Loop Current (and to cover Eastern Gulf)
DMAC Expand data interoperability to broader ecosystem monitoring data; Development of an Information Management System (this may be just an expanded vision of the current GCOOS data portal); ecosystem services database
Research and Development Development of new sensor packages that use pre-processing (e.g., matching algorithms, etc.) to help reduce data intensity of passive acoustics
4 factors limiting bio-sensor development: funds, biofouling, physical size, power requirements (Virmani and Estevez, 2007)
Additional Funding For additional analyses during existing vessel-based surveys (e.g., SEAMAP)
3.11.4.2 Collaborative Forum
This collaborative, broad-based stakeholder forum will complement the initial enhancements to the system for ecosystem monitoring. The forum will further the development of a Gulf ecosystem monitoring and observing system will include the following components:
• Workshops; • Email lists and a collaborative website, such as a Drupal content management system website; • Pilot projects as a foundation for expanded observing and monitoring, following the guidelines in
the GCOOS Business Model; and • Expansion of the regional observing and monitoring system in the Gulf. Pending resource availability, four ecosystem-monitoring workshops will be held in the first 12-18
months; one will be held annually thereafter. The purpose of these workshops will be to continue chart the plans for expanded ecosystem monitoring, as required by the broad Gulf and Gulf-focused community. The workshops will be focused so as to continue to obtain specific information regarding needs and priorities of users with direct participation of existing or potential data and information providers. In addition, GCOOS will continue to participate in other related Gulf meetings and liaise with other groups interested in Gulf ecosystem monitoring.
To complement the workshops, email lists and a Drupal or similar collaborative website will be developed (in year one) and maintained (after year one) for the ecosystem monitoring section of the plan and associated implementation activities to ensure additional progress.
The workshops, email lists, and Drupal site will be used to design and improve pilot projects that will inform further development of the Gulf-wide system for ecosystem monitoring. Ideas for pilot projects are included in the specific topic sections in the full Ecosystem Monitoring Element linked to Appendix E. Approximately one pilot project will be implemented per year.
Based on results of this plan, the workshops, email lists, collaborative website, and pilot projects, and as opportunities allow, new assets will be added to the Gulf-wide system for ecosystem monitoring.
In priority order, implementation of ecosystem observing and monitoring in the Gulf will include the following steps involving broad stakeholder groups through the collaborative forum:
• Identify ecosystem indicators that can be used to measure the health of, and stress on, the ecosystem. (The Gulf of Mexico Alliance, The Harte Research Institute, and The Ocean Conservancy have initiated this process. NOAA, 2013 also describes a set of ecosystem indicators to capture the current status and trends of the physical, biological, and socio-economic elements of the Gulf of Mexico ecosystem.)
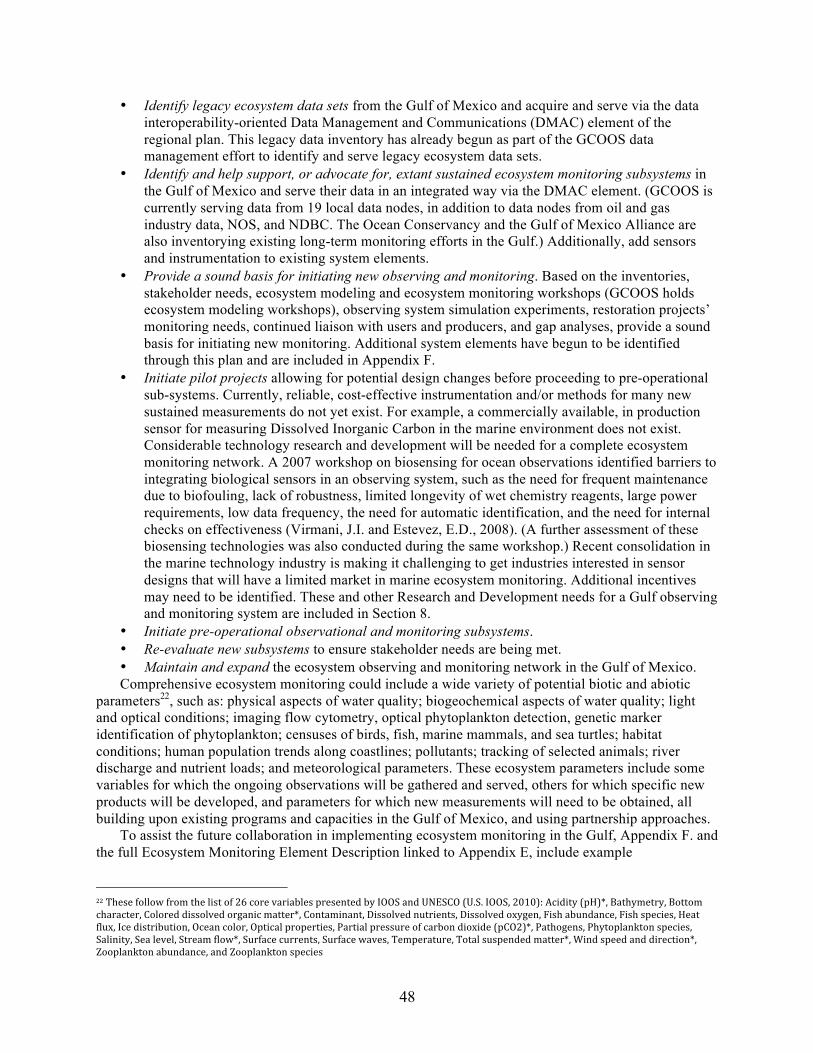
48
• Identify legacy ecosystem data sets from the Gulf of Mexico and acquire and serve via the data interoperability-oriented Data Management and Communications (DMAC) element of the regional plan. This legacy data inventory has already begun as part of the GCOOS data management effort to identify and serve legacy ecosystem data sets.
• Identify and help support, or advocate for, extant sustained ecosystem monitoring subsystems in the Gulf of Mexico and serve their data in an integrated way via the DMAC element. (GCOOS is currently serving data from 19 local data nodes, in addition to data nodes from oil and gas industry data, NOS, and NDBC. The Ocean Conservancy and the Gulf of Mexico Alliance are also inventorying existing long-term monitoring efforts in the Gulf.) Additionally, add sensors and instrumentation to existing system elements.
• Provide a sound basis for initiating new observing and monitoring. Based on the inventories, stakeholder needs, ecosystem modeling and ecosystem monitoring workshops (GCOOS holds ecosystem modeling workshops), observing system simulation experiments, restoration projects’ monitoring needs, continued liaison with users and producers, and gap analyses, provide a sound basis for initiating new monitoring. Additional system elements have begun to be identified through this plan and are included in Appendix F.
• Initiate pilot projects allowing for potential design changes before proceeding to pre-operational sub-systems. Currently, reliable, cost-effective instrumentation and/or methods for many new sustained measurements do not yet exist. For example, a commercially available, in production sensor for measuring Dissolved Inorganic Carbon in the marine environment does not exist. Considerable technology research and development will be needed for a complete ecosystem monitoring network. A 2007 workshop on biosensing for ocean observations identified barriers to integrating biological sensors in an observing system, such as the need for frequent maintenance due to biofouling, lack of robustness, limited longevity of wet chemistry reagents, large power requirements, low data frequency, the need for automatic identification, and the need for internal checks on effectiveness (Virmani, J.I. and Estevez, E.D., 2008). (A further assessment of these biosensing technologies was also conducted during the same workshop.) Recent consolidation in the marine technology industry is making it challenging to get industries interested in sensor designs that will have a limited market in marine ecosystem monitoring. Additional incentives may need to be identified. These and other Research and Development needs for a Gulf observing and monitoring system are included in Section 8.
• Initiate pre-operational observational and monitoring subsystems. • Re-evaluate new subsystems to ensure stakeholder needs are being met. • Maintain and expand the ecosystem observing and monitoring network in the Gulf of Mexico. Comprehensive ecosystem monitoring could include a wide variety of potential biotic and abiotic
parameters22, such as: physical aspects of water quality; biogeochemical aspects of water quality; light and optical conditions; imaging flow cytometry, optical phytoplankton detection, genetic marker identification of phytoplankton; censuses of birds, fish, marine mammals, and sea turtles; habitat conditions; human population trends along coastlines; pollutants; tracking of selected animals; river discharge and nutrient loads; and meteorological parameters. These ecosystem parameters include some variables for which the ongoing observations will be gathered and served, others for which specific new products will be developed, and parameters for which new measurements will need to be obtained, all building upon existing programs and capacities in the Gulf of Mexico, and using partnership approaches.
To assist the future collaboration in implementing ecosystem monitoring in the Gulf, Appendix F. and the full Ecosystem Monitoring Element Description linked to Appendix E, include example
22Thesefollowfromthelistof26corevariablespresentedbyIOOSandUNESCO(U.S.IOOS,2010):Acidity(pH)*,Bathymetry,Bottomcharacter,Coloreddissolvedorganicmatter*,Contaminant,Dissolvednutrients,Dissolvedoxygen,Fishabundance,Fishspecies,Heatflux,Icedistribution,Oceancolor,Opticalproperties,Partialpressureofcarbondioxide(pCO2)*,Pathogens,Phytoplanktonspecies,Salinity,Sealevel,Streamflow*,Surfacecurrents,Surfacewaves,Temperature,Totalsuspendedmatter*,Windspeedanddirection*,Zooplanktonabundance,andZooplanktonspecies
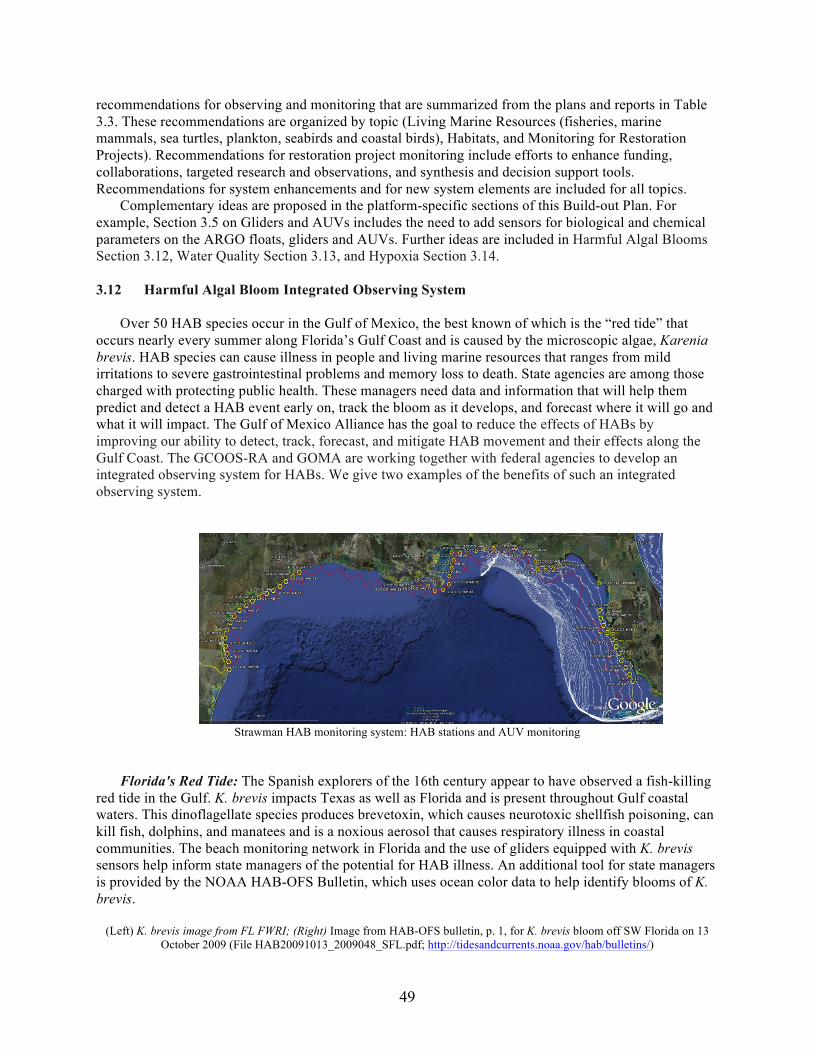
49
recommendations for observing and monitoring that are summarized from the plans and reports in Table 3.3. These recommendations are organized by topic (Living Marine Resources (fisheries, marine mammals, sea turtles, plankton, seabirds and coastal birds), Habitats, and Monitoring for Restoration Projects). Recommendations for restoration project monitoring include efforts to enhance funding, collaborations, targeted research and observations, and synthesis and decision support tools. Recommendations for system enhancements and for new system elements are included for all topics.
Complementary ideas are proposed in the platform-specific sections of this Build-out Plan. For example, Section 3.5 on Gliders and AUVs includes the need to add sensors for biological and chemical parameters on the ARGO floats, gliders and AUVs. Further ideas are included in Harmful Algal Blooms Section 3.12, Water Quality Section 3.13, and Hypoxia Section 3.14.
3.12 Harmful Algal Bloom Integrated Observing System
Over 50 HAB species occur in the Gulf of Mexico, the best known of which is the “red tide” that occurs nearly every summer along Florida’s Gulf Coast and is caused by the microscopic algae, Karenia brevis. HAB species can cause illness in people and living marine resources that ranges from mild irritations to severe gastrointestinal problems and memory loss to death. State agencies are among those charged with protecting public health. These managers need data and information that will help them predict and detect a HAB event early on, track the bloom as it develops, and forecast where it will go and what it will impact. The Gulf of Mexico Alliance has the goal to reduce the effects of HABs by improving our ability to detect, track, forecast, and mitigate HAB movement and their effects along the Gulf Coast. The GCOOS-RA and GOMA are working together with federal agencies to develop an integrated observing system for HABs. We give two examples of the benefits of such an integrated observing system.
Strawman HAB monitoring system: HAB stations and AUV monitoring
Florida's Red Tide: The Spanish explorers of the 16th century appear to have observed a fish-killing red tide in the Gulf. K. brevis impacts Texas as well as Florida and is present throughout Gulf coastal waters. This dinoflagellate species produces brevetoxin, which causes neurotoxic shellfish poisoning, can kill fish, dolphins, and manatees and is a noxious aerosol that causes respiratory illness in coastal communities. The beach monitoring network in Florida and the use of gliders equipped with K. brevis sensors help inform state managers of the potential for HAB illness. An additional tool for state managers is provided by the NOAA HAB-OFS Bulletin, which uses ocean color data to help identify blooms of K. brevis.
(Left) K. brevis image from FL FWRI; (Right) Image from HAB-OFS bulletin, p. 1, for K. brevis bloom off SW Florida on 13 October 2009 (File HAB20091013_2009048_SFL.pdf; http://tidesandcurrents.noaa.gov/hab/bulletins/)
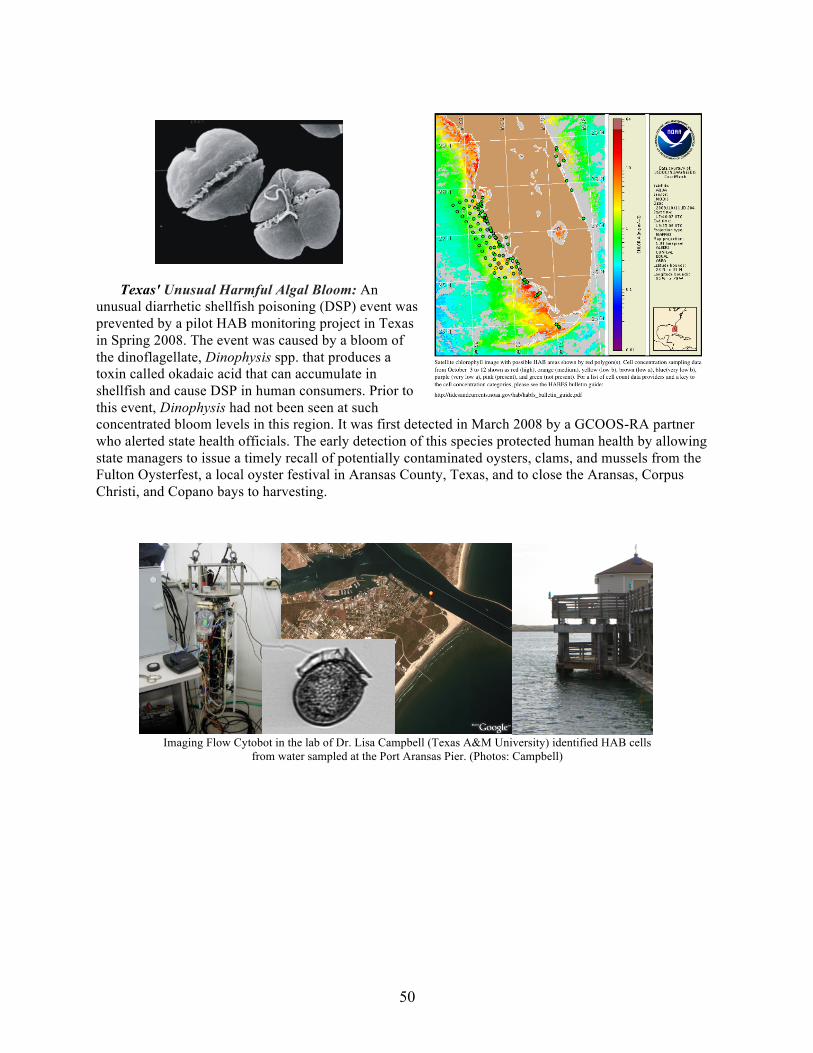
50
Texas' Unusual Harmful Algal Bloom: An
unusual diarrhetic shellfish poisoning (DSP) event was prevented by a pilot HAB monitoring project in Texas in Spring 2008. The event was caused by a bloom of the dinoflagellate, Dinophysis spp. that produces a toxin called okadaic acid that can accumulate in shellfish and cause DSP in human consumers. Prior to this event, Dinophysis had not been seen at such concentrated bloom levels in this region. It was first detected in March 2008 by a GCOOS-RA partner who alerted state health officials. The early detection of this species protected human health by allowing state managers to issue a timely recall of potentially contaminated oysters, clams, and mussels from the Fulton Oysterfest, a local oyster festival in Aransas County, Texas, and to close the Aransas, Corpus Christi, and Copano bays to harvesting.
Imaging Flow Cytobot in the lab of Dr. Lisa Campbell (Texas A&M University) identified HAB cells from water sampled at the Port Aransas Pier. (Photos: Campbell)
51
3.13 Integrated Water Quality Monitoring Network and Beach Quality Monitoring Integrated Water Quality Network
In 2011, the decision was made to implement an Integrated Water Quality Network (IWQN) along the coast of the five Gulf States. The general guidelines established by the GCOOS-RA for this network are:
• We are seeking water quality data from sites located from the head of tide in estuaries and rivers to the inner continental shelf.
• Our priorities for data, with highest being named first, are: Near-real time physical, meteorological, and biogeochemical Legacy data (physical, meteorological and biogeochemical) Model output (physical, meteorological and biogeochemical)
This priority will determine the priority given to entities that are potential data providers. • We are guided by the principle of freely sharing data, products and information from many
sources available to all for integration, product development and multiple use. • We provide technical assistance to entities that are willing to share data from most or all of their
monitoring devices over the foreseeable future. • Normally, we do not provide funds for completely new monitoring stations. However, we may, as
funding permits, provide limited funds, usually on a one-time basis, for support of a resident technician for software modification or addition/replacement of hardware needed to activate an existing monitoring site.
• At this time we are prepared to accept principally near-real time data. As our Data Portal capabilities are enhanced we expect to be able to accept all data needed by Gulf coast stakeholders.
We began our search for new data providers with a Regional Southwest Florida Workshop for Potential Data Providers held on March 28, 2012 at the Sanibel-Captiva Conservation Foundation in Sanibel, Florida. It was attended by 27 participants representing 19 potential data providers. Based on the success of that start, hired two-time employees to identify potential data providers between Brownsville, TX and the Florida Keys and to contact them to solicit permission to acquire data. A special session on the IWQN Project was held during the GCOOS-RA semiannual meeting on September 26, 2012 in Corpus Christi, Texas. Six major data collectors were invited to make presentations and discuss data sharing. On March 12, 2013 we held in New Orleans a workshop for potential data providers from the central Gulf region, including AL, MS, LA, and TX east of Galveston Bay.
A great many potential data providers have been identified—more, in fact, than our present level of data management staff can handle. Also we have found that most of the data are collected only sporadically or they are historical data, collection having been interrupted. As noted above, we are practically limited to accept principally near-real time data at this time. However, we maintain records of all potential data providers identified and intend to be in contact again as our capabilities improve. Meanwhile, we continue to search for additional potential providers.
In addition to seeking out data already being collected for the IQWN, the long-term plan is to establish additional monitoring stations. The Gulf of Mexico Alliance has prepared a design for a Gulf monitoring network with four zones: Estuaries, Coastal (shore to 10-m depth), Shelf (10- to 200-m depths) and Deep Gulf (>200-m depths). The templates suggested for monitoring in the estuaries and shelf areas should be considered when adding stations to the IWQN. This material is contained within the two documents:
Gulf Monitoring Network: Monitoring Design, Gulf of Mexico Alliance Water Quality Team and GCOOS, August 2013, 31 pp plus three appendices, and
White Paper on Gulf of Mexico Water-quality Monitoring: Providing Water-quality Information to Support Informed Resource Management and Public Knowledge (Draft), Gulf of Mexico Alliance Water Quality Team—Monitoring Workgroup, December 2013, 27 pp plus six appendices.
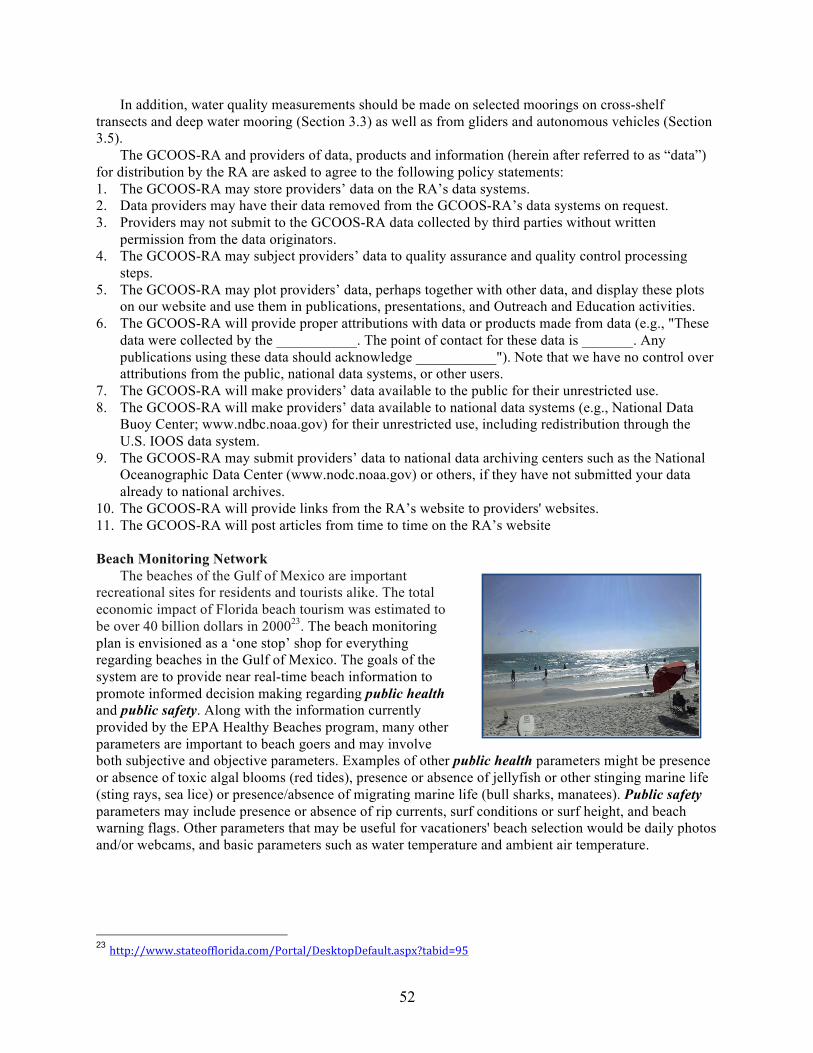
52
In addition, water quality measurements should be made on selected moorings on cross-shelf transects and deep water mooring (Section 3.3) as well as from gliders and autonomous vehicles (Section 3.5).
The GCOOS-RA and providers of data, products and information (herein after referred to as “data”) for distribution by the RA are asked to agree to the following policy statements: 1. The GCOOS-RA may store providers’ data on the RA’s data systems. 2. Data providers may have their data removed from the GCOOS-RA’s data systems on request. 3. Providers may not submit to the GCOOS-RA data collected by third parties without written
permission from the data originators. 4. The GCOOS-RA may subject providers’ data to quality assurance and quality control processing
steps. 5. The GCOOS-RA may plot providers’ data, perhaps together with other data, and display these plots
on our website and use them in publications, presentations, and Outreach and Education activities. 6. The GCOOS-RA will provide proper attributions with data or products made from data (e.g., "These
data were collected by the ___________. The point of contact for these data is _______. Any publications using these data should acknowledge ___________"). Note that we have no control over attributions from the public, national data systems, or other users.
7. The GCOOS-RA will make providers’ data available to the public for their unrestricted use. 8. The GCOOS-RA will make providers’ data available to national data systems (e.g., National Data
Buoy Center; www.ndbc.noaa.gov) for their unrestricted use, including redistribution through the U.S. IOOS data system.
9. The GCOOS-RA may submit providers’ data to national data archiving centers such as the National Oceanographic Data Center (www.nodc.noaa.gov) or others, if they have not submitted your data already to national archives.
10. The GCOOS-RA will provide links from the RA’s website to providers' websites. 11. The GCOOS-RA will post articles from time to time on the RA’s website Beach Monitoring Network
The beaches of the Gulf of Mexico are important recreational sites for residents and tourists alike. The total economic impact of Florida beach tourism was estimated to be over 40 billion dollars in 200023. The beach monitoring plan is envisioned as a ‘one stop’ shop for everything regarding beaches in the Gulf of Mexico. The goals of the system are to provide near real-time beach information to promote informed decision making regarding public health and public safety. Along with the information currently provided by the EPA Healthy Beaches program, many other parameters are important to beach goers and may involve both subjective and objective parameters. Examples of other public health parameters might be presence or absence of toxic algal blooms (red tides), presence or absence of jellyfish or other stinging marine life (sting rays, sea lice) or presence/absence of migrating marine life (bull sharks, manatees). Public safety parameters may include presence or absence of rip currents, surf conditions or surf height, and beach warning flags. Other parameters that may be useful for vacationers' beach selection would be daily photos and/or webcams, and basic parameters such as water temperature and ambient air temperature.
23 http://www.stateofflorida.com/Portal/DesktopDefault.aspx?tabid=95
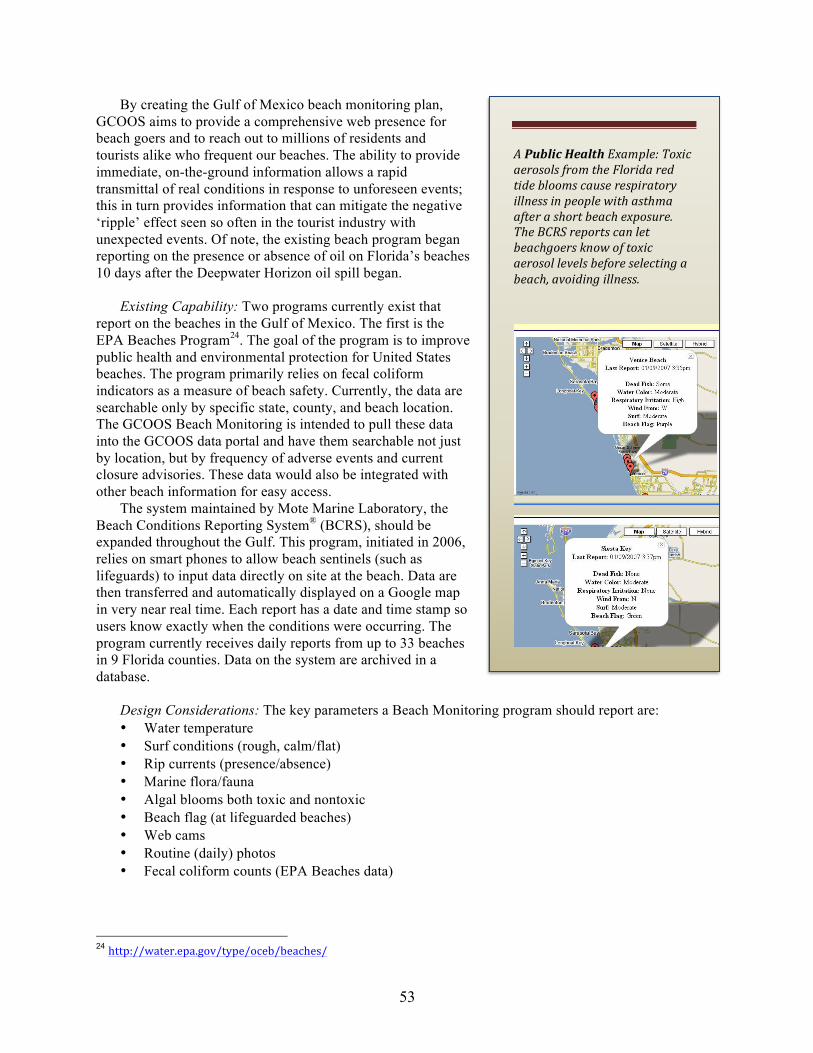
53
By creating the Gulf of Mexico beach monitoring plan, GCOOS aims to provide a comprehensive web presence for beach goers and to reach out to millions of residents and tourists alike who frequent our beaches. The ability to provide immediate, on-the-ground information allows a rapid transmittal of real conditions in response to unforeseen events; this in turn provides information that can mitigate the negative ‘ripple’ effect seen so often in the tourist industry with unexpected events. Of note, the existing beach program began reporting on the presence or absence of oil on Florida’s beaches 10 days after the Deepwater Horizon oil spill began.
Existing Capability: Two programs currently exist that
report on the beaches in the Gulf of Mexico. The first is the EPA Beaches Program24. The goal of the program is to improve public health and environmental protection for United States beaches. The program primarily relies on fecal coliform indicators as a measure of beach safety. Currently, the data are searchable only by specific state, county, and beach location. The GCOOS Beach Monitoring is intended to pull these data into the GCOOS data portal and have them searchable not just by location, but by frequency of adverse events and current closure advisories. These data would also be integrated with other beach information for easy access.
The system maintained by Mote Marine Laboratory, the Beach Conditions Reporting System® (BCRS), should be expanded throughout the Gulf. This program, initiated in 2006, relies on smart phones to allow beach sentinels (such as lifeguards) to input data directly on site at the beach. Data are then transferred and automatically displayed on a Google map in very near real time. Each report has a date and time stamp so users know exactly when the conditions were occurring. The program currently receives daily reports from up to 33 beaches in 9 Florida counties. Data on the system are archived in a database.
Design Considerations: The key parameters a Beach Monitoring program should report are: • Water temperature • Surf conditions (rough, calm/flat) • Rip currents (presence/absence) • Marine flora/fauna • Algal blooms both toxic and nontoxic • Beach flag (at lifeguarded beaches) • Web cams • Routine (daily) photos • Fecal coliform counts (EPA Beaches data)
24 http://water.epa.gov/type/oceb/beaches/
APublicHealthExample:ToxicaerosolsfromtheFloridaredtidebloomscauserespiratoryillnessinpeoplewithasthmaafterashortbeachexposure.TheBCRSreportscanletbeachgoersknowoftoxicaerosollevelsbeforeselectingabeach,avoidingillness.
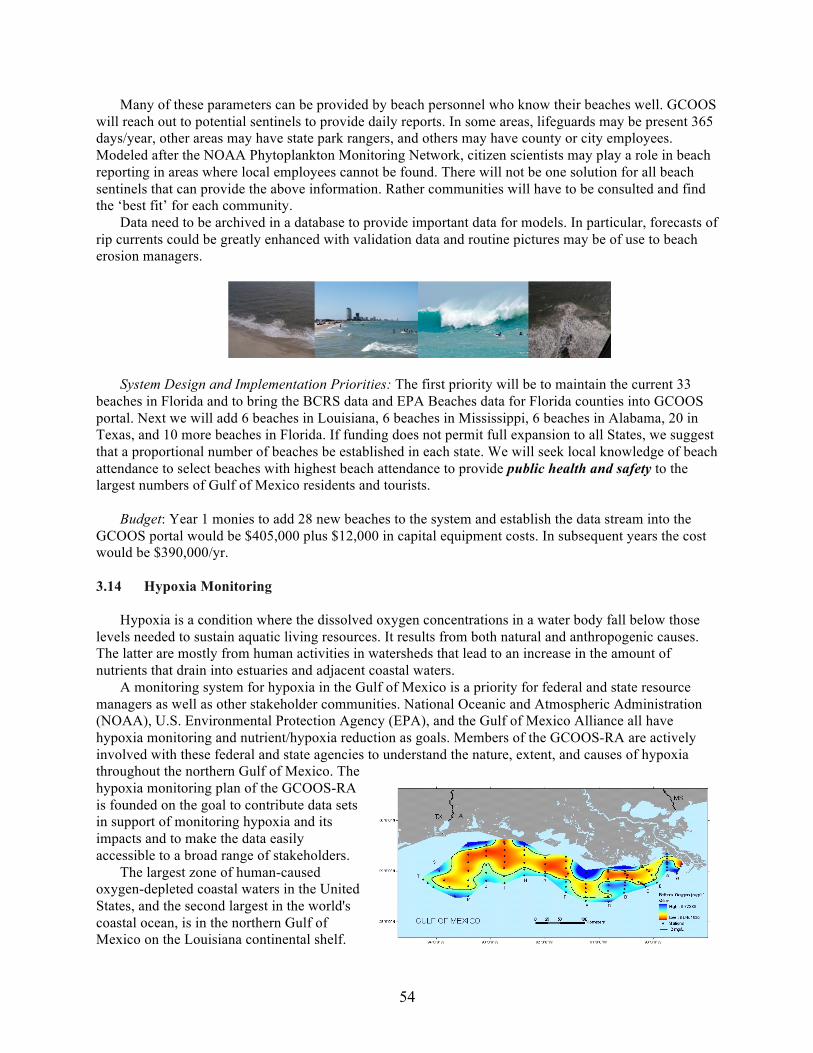
54
Many of these parameters can be provided by beach personnel who know their beaches well. GCOOS will reach out to potential sentinels to provide daily reports. In some areas, lifeguards may be present 365 days/year, other areas may have state park rangers, and others may have county or city employees. Modeled after the NOAA Phytoplankton Monitoring Network, citizen scientists may play a role in beach reporting in areas where local employees cannot be found. There will not be one solution for all beach sentinels that can provide the above information. Rather communities will have to be consulted and find the ‘best fit’ for each community.
Data need to be archived in a database to provide important data for models. In particular, forecasts of rip currents could be greatly enhanced with validation data and routine pictures may be of use to beach erosion managers.
System Design and Implementation Priorities: The first priority will be to maintain the current 33 beaches in Florida and to bring the BCRS data and EPA Beaches data for Florida counties into GCOOS portal. Next we will add 6 beaches in Louisiana, 6 beaches in Mississippi, 6 beaches in Alabama, 20 in Texas, and 10 more beaches in Florida. If funding does not permit full expansion to all States, we suggest that a proportional number of beaches be established in each state. We will seek local knowledge of beach attendance to select beaches with highest beach attendance to provide public health and safety to the largest numbers of Gulf of Mexico residents and tourists.
Budget: Year 1 monies to add 28 new beaches to the system and establish the data stream into the
GCOOS portal would be $405,000 plus $12,000 in capital equipment costs. In subsequent years the cost would be $390,000/yr. 3.14 Hypoxia Monitoring
Hypoxia is a condition where the dissolved oxygen concentrations in a water body fall below those levels needed to sustain aquatic living resources. It results from both natural and anthropogenic causes. The latter are mostly from human activities in watersheds that lead to an increase in the amount of nutrients that drain into estuaries and adjacent coastal waters.
A monitoring system for hypoxia in the Gulf of Mexico is a priority for federal and state resource managers as well as other stakeholder communities. National Oceanic and Atmospheric Administration (NOAA), U.S. Environmental Protection Agency (EPA), and the Gulf of Mexico Alliance all have hypoxia monitoring and nutrient/hypoxia reduction as goals. Members of the GCOOS-RA are actively involved with these federal and state agencies to understand the nature, extent, and causes of hypoxia throughout the northern Gulf of Mexico. The hypoxia monitoring plan of the GCOOS-RA is founded on the goal to contribute data sets in support of monitoring hypoxia and its impacts and to make the data easily accessible to a broad range of stakeholders.
The largest zone of human-caused oxygen-depleted coastal waters in the United States, and the second largest in the world's coastal ocean, is in the northern Gulf of Mexico on the Louisiana continental shelf.
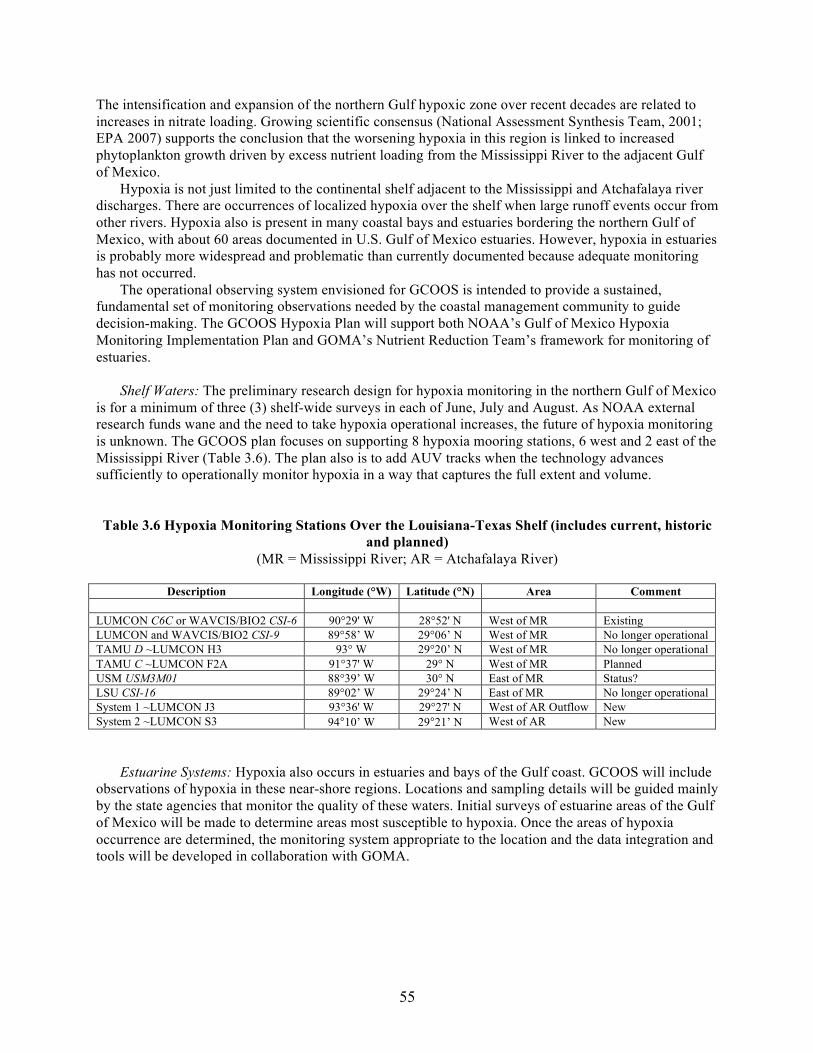
55
The intensification and expansion of the northern Gulf hypoxic zone over recent decades are related to increases in nitrate loading. Growing scientific consensus (National Assessment Synthesis Team, 2001; EPA 2007) supports the conclusion that the worsening hypoxia in this region is linked to increased phytoplankton growth driven by excess nutrient loading from the Mississippi River to the adjacent Gulf of Mexico.
Hypoxia is not just limited to the continental shelf adjacent to the Mississippi and Atchafalaya river discharges. There are occurrences of localized hypoxia over the shelf when large runoff events occur from other rivers. Hypoxia also is present in many coastal bays and estuaries bordering the northern Gulf of Mexico, with about 60 areas documented in U.S. Gulf of Mexico estuaries. However, hypoxia in estuaries is probably more widespread and problematic than currently documented because adequate monitoring has not occurred.
The operational observing system envisioned for GCOOS is intended to provide a sustained, fundamental set of monitoring observations needed by the coastal management community to guide decision-making. The GCOOS Hypoxia Plan will support both NOAA’s Gulf of Mexico Hypoxia Monitoring Implementation Plan and GOMA’s Nutrient Reduction Team’s framework for monitoring of estuaries.
Shelf Waters: The preliminary research design for hypoxia monitoring in the northern Gulf of Mexico
is for a minimum of three (3) shelf-wide surveys in each of June, July and August. As NOAA external research funds wane and the need to take hypoxia operational increases, the future of hypoxia monitoring is unknown. The GCOOS plan focuses on supporting 8 hypoxia mooring stations, 6 west and 2 east of the Mississippi River (Table 3.6). The plan also is to add AUV tracks when the technology advances sufficiently to operationally monitor hypoxia in a way that captures the full extent and volume. Table 3.6 Hypoxia Monitoring Stations Over the Louisiana-Texas Shelf (includes current, historic
and planned) (MR = Mississippi River; AR = Atchafalaya River)
Description Longitude (°W) Latitude (°N) Area Comment
LUMCON C6C or WAVCIS/BIO2 CSI-6 90°29' W 28°52' N West of MR Existing LUMCON and WAVCIS/BIO2 CSI-9 89°58’ W 29°06’ N West of MR No longer operational TAMU D ~LUMCON H3 93° W 29°20’ N West of MR No longer operational TAMU C ~LUMCON F2A 91°37' W 29° N West of MR Planned USM USM3M01 88°39’ W 30° N East of MR Status? LSU CSI-16 89°02’ W 29°24’ N East of MR No longer operational System 1 ~LUMCON J3 93°36' W 29°27' N West of AR Outflow New System 2 ~LUMCON S3 94°10’ W 29°21’ N West of AR New
Estuarine Systems: Hypoxia also occurs in estuaries and bays of the Gulf coast. GCOOS will include observations of hypoxia in these near-shore regions. Locations and sampling details will be guided mainly by the state agencies that monitor the quality of these waters. Initial surveys of estuarine areas of the Gulf of Mexico will be made to determine areas most susceptible to hypoxia. Once the areas of hypoxia occurrence are determined, the monitoring system appropriate to the location and the data integration and tools will be developed in collaboration with GOMA.
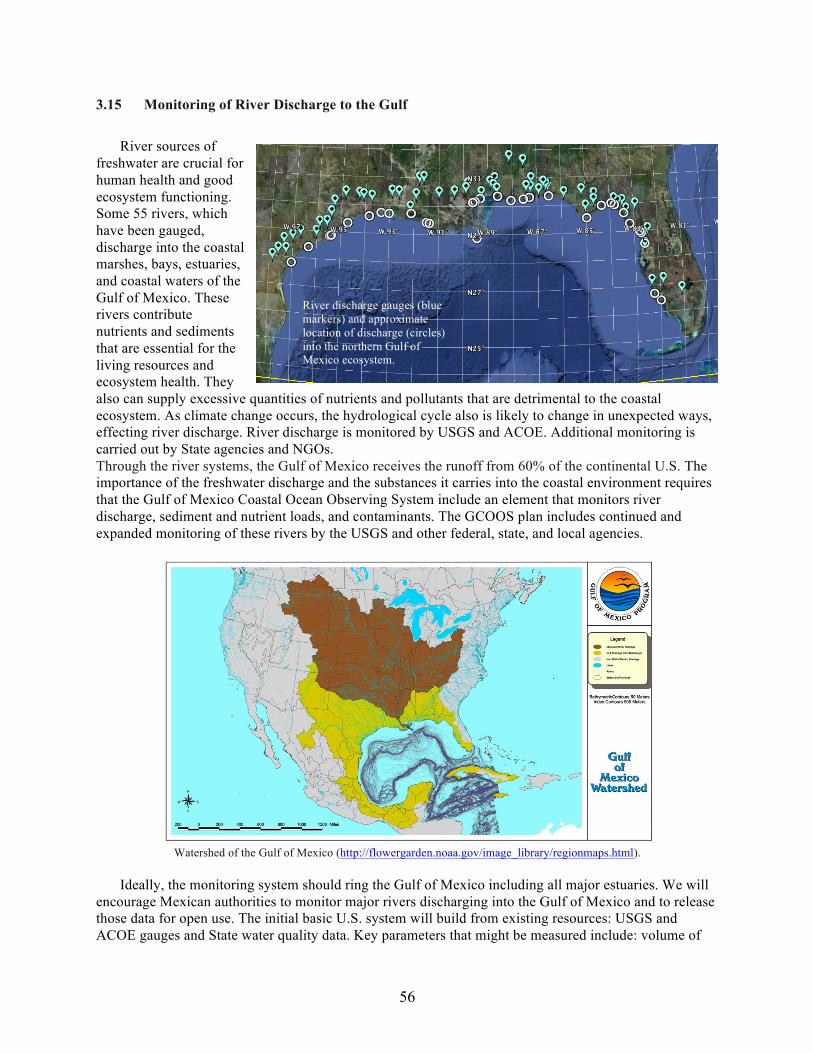
56
3.15 Monitoring of River Discharge to the Gulf
River sources of freshwater are crucial for human health and good ecosystem functioning. Some 55 rivers, which have been gauged, discharge into the coastal marshes, bays, estuaries, and coastal waters of the Gulf of Mexico. These rivers contribute nutrients and sediments that are essential for the living resources and ecosystem health. They also can supply excessive quantities of nutrients and pollutants that are detrimental to the coastal ecosystem. As climate change occurs, the hydrological cycle also is likely to change in unexpected ways, effecting river discharge. River discharge is monitored by USGS and ACOE. Additional monitoring is carried out by State agencies and NGOs. Through the river systems, the Gulf of Mexico receives the runoff from 60% of the continental U.S. The importance of the freshwater discharge and the substances it carries into the coastal environment requires that the Gulf of Mexico Coastal Ocean Observing System include an element that monitors river discharge, sediment and nutrient loads, and contaminants. The GCOOS plan includes continued and expanded monitoring of these rivers by the USGS and other federal, state, and local agencies.
Watershed of the Gulf of Mexico (http://flowergarden.noaa.gov/image_library/regionmaps.html).
Ideally, the monitoring system should ring the Gulf of Mexico including all major estuaries. We will
encourage Mexican authorities to monitor major rivers discharging into the Gulf of Mexico and to release those data for open use. The initial basic U.S. system will build from existing resources: USGS and ACOE gauges and State water quality data. Key parameters that might be measured include: volume of
River discharge gauges (blue markers) and approximate location of discharge (circles) into the northern Gulf of Mexico ecosystem.
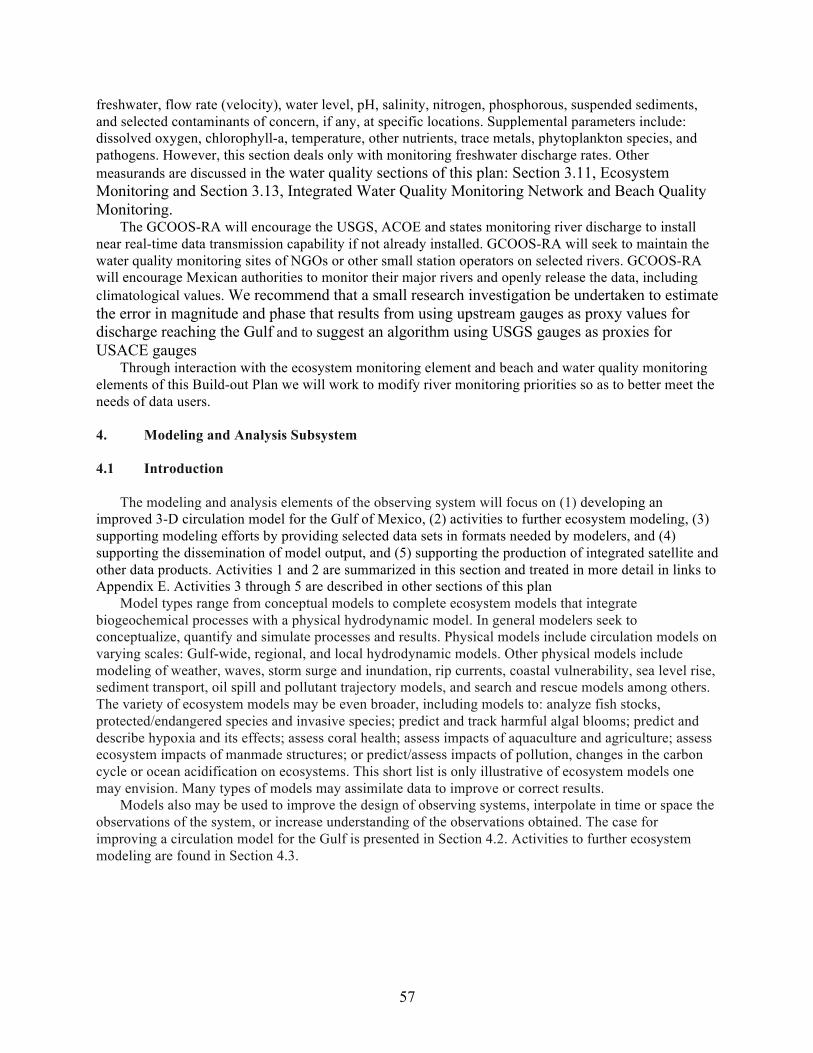
57
freshwater, flow rate (velocity), water level, pH, salinity, nitrogen, phosphorous, suspended sediments, and selected contaminants of concern, if any, at specific locations. Supplemental parameters include: dissolved oxygen, chlorophyll-a, temperature, other nutrients, trace metals, phytoplankton species, and pathogens. However, this section deals only with monitoring freshwater discharge rates. Other measurands are discussed in the water quality sections of this plan: Section 3.11, Ecosystem Monitoring and Section 3.13, Integrated Water Quality Monitoring Network and Beach Quality Monitoring.
The GCOOS-RA will encourage the USGS, ACOE and states monitoring river discharge to install near real-time data transmission capability if not already installed. GCOOS-RA will seek to maintain the water quality monitoring sites of NGOs or other small station operators on selected rivers. GCOOS-RA will encourage Mexican authorities to monitor their major rivers and openly release the data, including climatological values. We recommend that a small research investigation be undertaken to estimate the error in magnitude and phase that results from using upstream gauges as proxy values for discharge reaching the Gulf and to suggest an algorithm using USGS gauges as proxies for USACE gauges
Through interaction with the ecosystem monitoring element and beach and water quality monitoring elements of this Build-out Plan we will work to modify river monitoring priorities so as to better meet the needs of data users. 4. Modeling and Analysis Subsystem 4.1 Introduction
The modeling and analysis elements of the observing system will focus on (1) developing an improved 3-D circulation model for the Gulf of Mexico, (2) activities to further ecosystem modeling, (3) supporting modeling efforts by providing selected data sets in formats needed by modelers, and (4) supporting the dissemination of model output, and (5) supporting the production of integrated satellite and other data products. Activities 1 and 2 are summarized in this section and treated in more detail in links to Appendix E. Activities 3 through 5 are described in other sections of this plan
Model types range from conceptual models to complete ecosystem models that integrate biogeochemical processes with a physical hydrodynamic model. In general modelers seek to conceptualize, quantify and simulate processes and results. Physical models include circulation models on varying scales: Gulf-wide, regional, and local hydrodynamic models. Other physical models include modeling of weather, waves, storm surge and inundation, rip currents, coastal vulnerability, sea level rise, sediment transport, oil spill and pollutant trajectory models, and search and rescue models among others. The variety of ecosystem models may be even broader, including models to: analyze fish stocks, protected/endangered species and invasive species; predict and track harmful algal blooms; predict and describe hypoxia and its effects; assess coral health; assess impacts of aquaculture and agriculture; assess ecosystem impacts of manmade structures; or predict/assess impacts of pollution, changes in the carbon cycle or ocean acidification on ecosystems. This short list is only illustrative of ecosystem models one may envision. Many types of models may assimilate data to improve or correct results.
Models also may be used to improve the design of observing systems, interpolate in time or space the observations of the system, or increase understanding of the observations obtained. The case for improving a circulation model for the Gulf is presented in Section 4.2. Activities to further ecosystem modeling are found in Section 4.3.
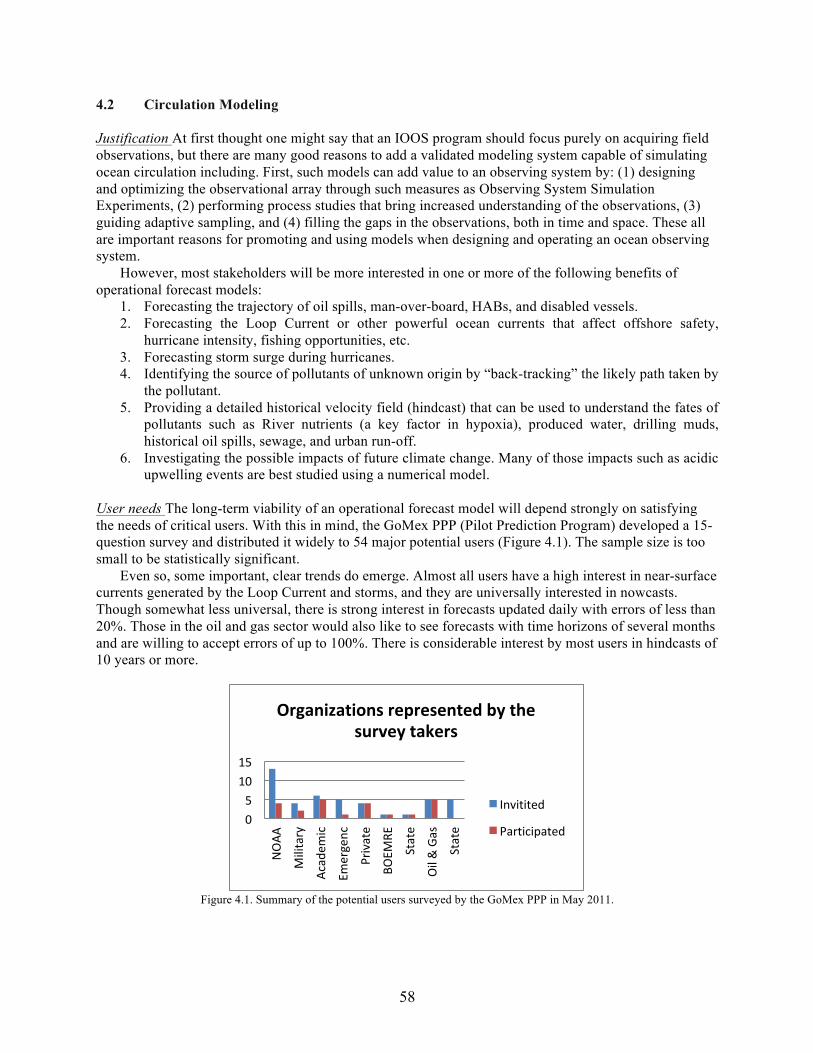
58
4.2 Circulation Modeling Justification At first thought one might say that an IOOS program should focus purely on acquiring field observations, but there are many good reasons to add a validated modeling system capable of simulating ocean circulation including. First, such models can add value to an observing system by: (1) designing and optimizing the observational array through such measures as Observing System Simulation Experiments, (2) performing process studies that bring increased understanding of the observations, (3) guiding adaptive sampling, and (4) filling the gaps in the observations, both in time and space. These all are important reasons for promoting and using models when designing and operating an ocean observing system.
However, most stakeholders will be more interested in one or more of the following benefits of operational forecast models:
1. Forecasting the trajectory of oil spills, man-over-board, HABs, and disabled vessels. 2. Forecasting the Loop Current or other powerful ocean currents that affect offshore safety,
hurricane intensity, fishing opportunities, etc. 3. Forecasting storm surge during hurricanes. 4. Identifying the source of pollutants of unknown origin by “back-tracking” the likely path taken by
the pollutant. 5. Providing a detailed historical velocity field (hindcast) that can be used to understand the fates of
pollutants such as River nutrients (a key factor in hypoxia), produced water, drilling muds, historical oil spills, sewage, and urban run-off.
6. Investigating the possible impacts of future climate change. Many of those impacts such as acidic upwelling events are best studied using a numerical model.
User needs The long-term viability of an operational forecast model will depend strongly on satisfying the needs of critical users. With this in mind, the GoMex PPP (Pilot Prediction Program) developed a 15-question survey and distributed it widely to 54 major potential users (Figure 4.1). The sample size is too small to be statistically significant.
Even so, some important, clear trends do emerge. Almost all users have a high interest in near-surface currents generated by the Loop Current and storms, and they are universally interested in nowcasts. Though somewhat less universal, there is strong interest in forecasts updated daily with errors of less than 20%. Those in the oil and gas sector would also like to see forecasts with time horizons of several months and are willing to accept errors of up to 100%. There is considerable interest by most users in hindcasts of 10 years or more.
Figure 4.1. Summary of the potential users surveyed by the GoMex PPP in May 2011.
05
1015
NOAA
Military
Academ
ic
Emergenc
Private
BOEM
RE
State
Oil&Gas
State
Organizationsrepresentedbythesurveytakers
Invitited
Participated
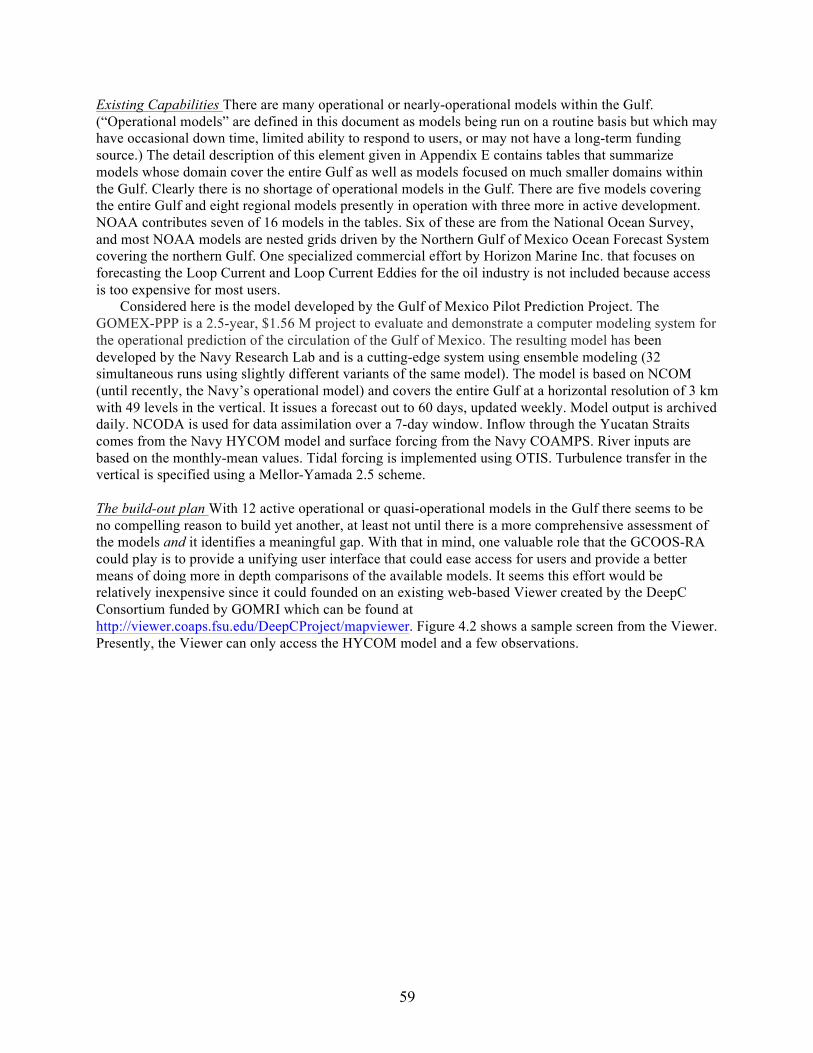
59
Existing Capabilities There are many operational or nearly-operational models within the Gulf. (“Operational models” are defined in this document as models being run on a routine basis but which may have occasional down time, limited ability to respond to users, or may not have a long-term funding source.) The detail description of this element given in Appendix E contains tables that summarize models whose domain cover the entire Gulf as well as models focused on much smaller domains within the Gulf. Clearly there is no shortage of operational models in the Gulf. There are five models covering the entire Gulf and eight regional models presently in operation with three more in active development. NOAA contributes seven of 16 models in the tables. Six of these are from the National Ocean Survey, and most NOAA models are nested grids driven by the Northern Gulf of Mexico Ocean Forecast System covering the northern Gulf. One specialized commercial effort by Horizon Marine Inc. that focuses on forecasting the Loop Current and Loop Current Eddies for the oil industry is not included because access is too expensive for most users.
Considered here is the model developed by the Gulf of Mexico Pilot Prediction Project. The GOMEX-PPP is a 2.5-year, $1.56 M project to evaluate and demonstrate a computer modeling system for the operational prediction of the circulation of the Gulf of Mexico. The resulting model has been developed by the Navy Research Lab and is a cutting-edge system using ensemble modeling (32 simultaneous runs using slightly different variants of the same model). The model is based on NCOM (until recently, the Navy’s operational model) and covers the entire Gulf at a horizontal resolution of 3 km with 49 levels in the vertical. It issues a forecast out to 60 days, updated weekly. Model output is archived daily. NCODA is used for data assimilation over a 7-day window. Inflow through the Yucatan Straits comes from the Navy HYCOM model and surface forcing from the Navy COAMPS. River inputs are based on the monthly-mean values. Tidal forcing is implemented using OTIS. Turbulence transfer in the vertical is specified using a Mellor-Yamada 2.5 scheme. The build-out plan With 12 active operational or quasi-operational models in the Gulf there seems to be no compelling reason to build yet another, at least not until there is a more comprehensive assessment of the models and it identifies a meaningful gap. With that in mind, one valuable role that the GCOOS-RA could play is to provide a unifying user interface that could ease access for users and provide a better means of doing more in depth comparisons of the available models. It seems this effort would be relatively inexpensive since it could founded on an existing web-based Viewer created by the DeepC Consortium funded by GOMRI which can be found at http://viewer.coaps.fsu.edu/DeepCProject/mapviewer. Figure 4.2 shows a sample screen from the Viewer. Presently, the Viewer can only access the HYCOM model and a few observations.
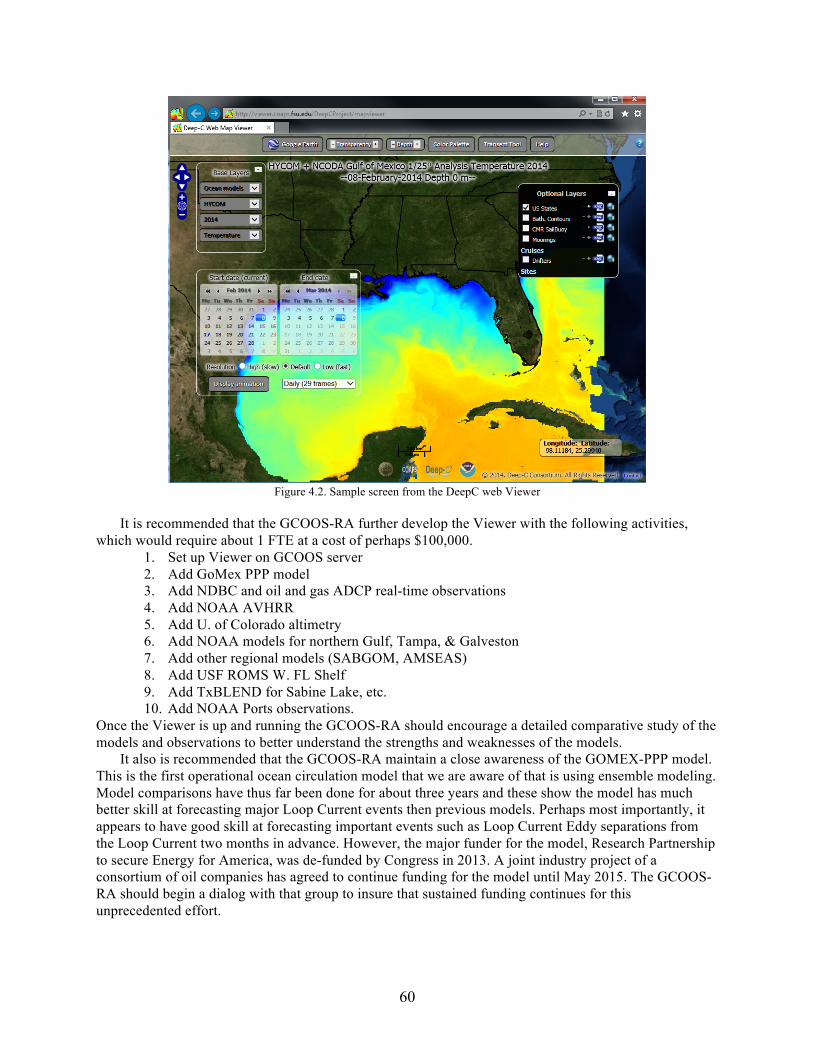
60
Figure 4.2. Sample screen from the DeepC web Viewer
It is recommended that the GCOOS-RA further develop the Viewer with the following activities,
which would require about 1 FTE at a cost of perhaps $100,000. 1. Set up Viewer on GCOOS server 2. Add GoMex PPP model 3. Add NDBC and oil and gas ADCP real-time observations 4. Add NOAA AVHRR 5. Add U. of Colorado altimetry 6. Add NOAA models for northern Gulf, Tampa, & Galveston 7. Add other regional models (SABGOM, AMSEAS) 8. Add USF ROMS W. FL Shelf 9. Add TxBLEND for Sabine Lake, etc. 10. Add NOAA Ports observations.
Once the Viewer is up and running the GCOOS-RA should encourage a detailed comparative study of the models and observations to better understand the strengths and weaknesses of the models.
It also is recommended that the GCOOS-RA maintain a close awareness of the GOMEX-PPP model. This is the first operational ocean circulation model that we are aware of that is using ensemble modeling. Model comparisons have thus far been done for about three years and these show the model has much better skill at forecasting major Loop Current events then previous models. Perhaps most importantly, it appears to have good skill at forecasting important events such as Loop Current Eddy separations from the Loop Current two months in advance. However, the major funder for the model, Research Partnership to secure Energy for America, was de-funded by Congress in 2013. A joint industry project of a consortium of oil companies has agreed to continue funding for the model until May 2015. The GCOOS-RA should begin a dialog with that group to insure that sustained funding continues for this unprecedented effort.
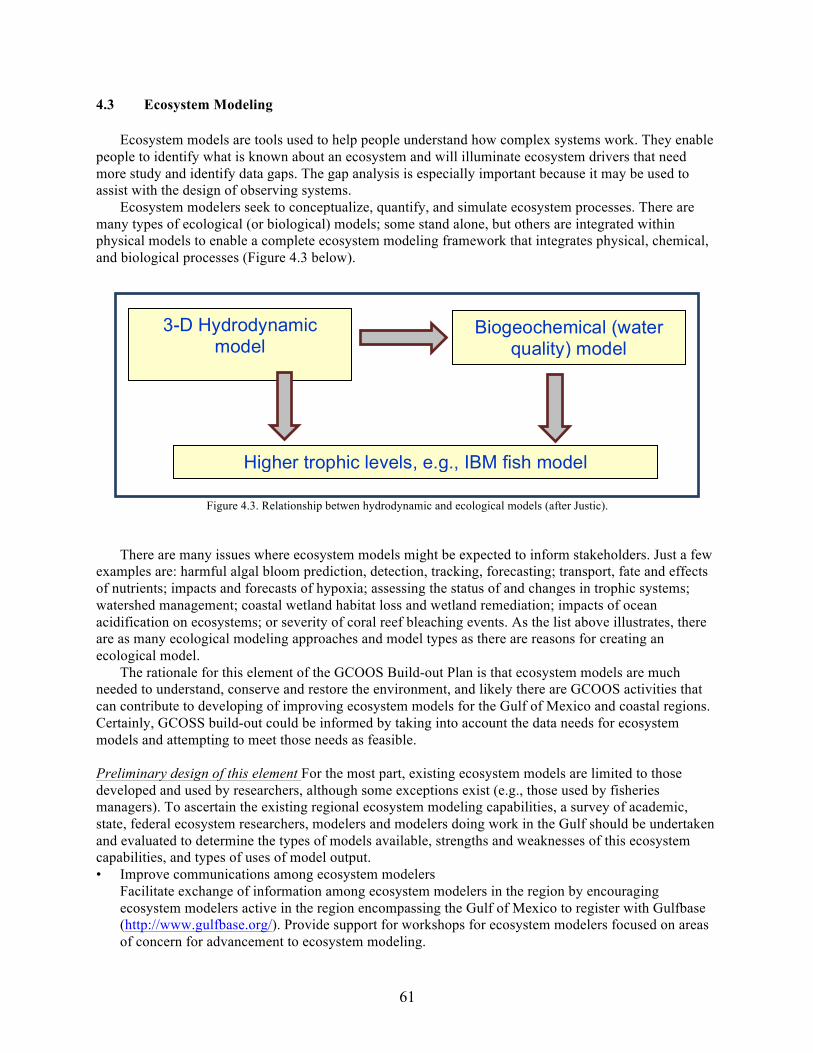
61
4.3 Ecosystem Modeling Ecosystem models are tools used to help people understand how complex systems work. They enable people to identify what is known about an ecosystem and will illuminate ecosystem drivers that need more study and identify data gaps. The gap analysis is especially important because it may be used to assist with the design of observing systems. Ecosystem modelers seek to conceptualize, quantify, and simulate ecosystem processes. There are many types of ecological (or biological) models; some stand alone, but others are integrated within physical models to enable a complete ecosystem modeling framework that integrates physical, chemical, and biological processes (Figure 4.3 below).
Figure 4.3. Relationship betwen hydrodynamic and ecological models (after Justic).
There are many issues where ecosystem models might be expected to inform stakeholders. Just a few examples are: harmful algal bloom prediction, detection, tracking, forecasting; transport, fate and effects of nutrients; impacts and forecasts of hypoxia; assessing the status of and changes in trophic systems; watershed management; coastal wetland habitat loss and wetland remediation; impacts of ocean acidification on ecosystems; or severity of coral reef bleaching events. As the list above illustrates, there are as many ecological modeling approaches and model types as there are reasons for creating an ecological model.
The rationale for this element of the GCOOS Build-out Plan is that ecosystem models are much needed to understand, conserve and restore the environment, and likely there are GCOOS activities that can contribute to developing of improving ecosystem models for the Gulf of Mexico and coastal regions. Certainly, GCOSS build-out could be informed by taking into account the data needs for ecosystem models and attempting to meet those needs as feasible. Preliminary design of this element For the most part, existing ecosystem models are limited to those developed and used by researchers, although some exceptions exist (e.g., those used by fisheries managers). To ascertain the existing regional ecosystem modeling capabilities, a survey of academic, state, federal ecosystem researchers, modelers and modelers doing work in the Gulf should be undertaken and evaluated to determine the types of models available, strengths and weaknesses of this ecosystem capabilities, and types of uses of model output. • Improve communications among ecosystem modelers Facilitate exchange of information among ecosystem modelers in the region by encouraging
ecosystem modelers active in the region encompassing the Gulf of Mexico to register with Gulfbase (http://www.gulfbase.org/). Provide support for workshops for ecosystem modelers focused on areas of concern for advancement to ecosystem modeling.
3-D Hydrodynamic model
Biogeochemical (water quality) model
Higher trophic levels, e.g., IBM fish model
62
• Identification and dissemination of existing ecosystem products There are few ecosystem modeling products being produced, and they are not widely disseminated. A
concerted, sustained effort should be made to identify such products of potential use to the public, ecosystem managers and others, and to disseminate them via the Internet using a variety of means. The GCOOS Data and Products Portal as well social media will be utilized.
• Demonstration Projects Using new equipment and technology to demonstrate the capabilities that exist for monitoring and
modeling ecosystem components are useful. These can be used to test the ecosystem modeling framework and demonstrate the value of modeling products.
Cost estimate Total annual costs follow. One FTE in GCOOS-RA Office: $125,000 Travel: $20,000 Two workshops: $25,000 Miscellaneous office costs: $10,000 Product generation and dissemination: $10,000 Demonstration projects 2 @ ~$150k each: $300,000 Cost Summary: $240K in year one; $390K in following years. 5. Data Management and Communication (DMAC) Subsystem
The GCOOS Data Management and Communications (DMAC) element lies at the core of the GCOOS-RA enterprise. This element links together the observing and monitoring, modeling, and educational and outreach elements to meet stakeholders’ needs for data and information on the environmental state of the coastal and deep waters of the Gulf of Mexico. This element has two principal components: a data management system and a products generation unit. GCOOS DMAC wants to produce products that the region’s stakeholders want. Building upon earlier GCOOS-RA stakeholder workshops, GCOOS-RA Outreach and Education activities, various national plans for observing sub-systems, and deliberations of GCOOS-RA groups, an initial set of stakeholders’ needs and requirements were identified and prioritized. These are being translated into services, aggregated datasets, and tailored web pages for specific user groups as resources permit.
The goal of the GCOOS DMAC element is an automated and largely unattended data system that delivers high-quality data and products to consumers. Data management system activities include: development, enhancement, operation and maintenance of software and a networked computer system that aggregates data and model output from independent, distributed, heterogeneous sources and makes these available to users in easy to use formats. The U.S. IOOS DMAC Plan, our participation in NOAA-led pilots such as the Data Integration Framework (DIF) Project, and our stakeholders’ needs and preferences guide our system design. The mission is to facilitate broader use of data, model output, and products by stakeholders. The types of data the system must manage are broadly classified as real-time, or non real-time. Products include plots, graphs, images, and maps of environmental properties. Real-time data or near real-time data are typically data streams from regularly recurring or continuous and relatively dense (spatially or temporally) sources such as buoy sensors and numerical weather model output. The near real-time attribute makes them useful for certain applications such as search and rescue and oil spill response where delayed-mode or archived data would not be useful.
GCOOS DMAC will acquire non real-time data from their own or NDBC’s archives of real-time data feeds, from previous field campaigns such as the Louisiana-Texas Shelf Physical Oceanography Program (LATEX) and Northeastern Gulf of Mexico Physical Oceanography Program: Chemical Oceanography and Hydrography (NEGOM), from trusted digital repositories such as NODC and in some cases from data rescue or data archeology efforts. GCOOS DMAC currently makes satellite data accessible in two ways. The first way is to download MODIS images and offer them as Open Geospatial Consortium (OGC) Web Coverage Service (WCS) through a GCOOS DMAC THREDDS server. The second way is
63
to link to a satellite node with its own THREDDS. The operation of nowcast or forecast models is external to the GCOOS DMAC element. However, supplying model output to others, supporting modeling efforts by supplying observations and climatologies, deriving products from model output and observations, and monitoring model performance may be within the scope of work of the GCOOS DMAC element. The resulting model output may be served by the modeling group that produced it, or by other groups.
The most relevant federal agencies to the GCOOS DMAC element are the NOAA National Data Buoy Center (NDBC) and the NOAA National Coastal Data Development Center (NCDDC). NDBC is focused on the present as defined by their mission and most of their own data comes in hourly. Currently, they deal in marine meteorological and physical oceanographic data. NDBC receives data from the sub-regional nodes and makes them available through the Global Telecommunications System (GTS) as well as available on NDBC web pages. NCDDC is very strong in the area of metadata and has a number of catalogs under development. Their software designs include some of the best online browse capability. They do have the capability to deliver data or point to data but do not do so in an interoperable way. The Gulf of Mexico Alliance (GOMA) has developed as an influential organization in the U.S. states bordering the Gulf of Mexico. GOMA will control the $500M BP Gulf of Mexico Research Initiative. GCOOS has been asked to hire a full-time person to provide collaborative data services to the data management group of the Gulf of Mexico Research Initiative.
Development of the GCOOS data management system began with NOAA grant funding in 2007 to build a Data Portal. GCOOS received a pair of NOAA grants for the period 2008-2010. One continued the development of the Data Portal; the second was to make the local data systems of 10 principal sub-regional data providers interoperable with the NOAA IOOS Data Integration Framework (DIF) Pilot Project. In the future, GCOOS DMAC staff will help sub-regional providers: meet NOAA criteria and requirements for data providers, generate metrics to quantify the usage and value of the IOOS, and perform some roles of an operational center such as monitoring and reporting the availability of data. In addition to IT components (e.g., software, hardware and standardized protocols) this element contains outreach activities (e.g., training, financial support, and technical assistance) needed to entrain new data providers and perform surveys and interviews to define and fulfill end-user requirements for particular formats and products.
In 2011 we began planning to serve biological parameters (e.g., abundance, biomass, species) and beach water quality data (e.g., cell counts, coliform bacteria concentrations, advisories, closures, river discharge). Additionally, bathymetric data, coastal elevation and coastlines, bottom-type, land-use, offshore platform locations, and habitat and ecosystem classifications have the potential to be included in our holdings. The GCOOS Data Portal currently holds several climatological summaries for temperature and salinity. We do not envision being a repository for jurisdiction-boundary-cadastral surveys or similar items that might be better held in an atlas. The NCDDC is developing an online digital atlas to update the 1985 Gulf of Mexico Coastal and Ocean Zones Strategic Assessment Data Atlas.
Below are brief descriptions of the staff and skills needed to manage the data from the fully developed, integrated GCOOS, including new sub-systems such those operating High-Frequency Radars or autonomous underwater vehicles and to manage the web sites needed for data and product distribution. These are full time except where noted. • Data manager to direct the GCOOS DMAC operation. • Information architect responsible for interoperable elements of the system. • Web programmer/developer responsible for interactive and dynamic elements of the website. • Web designer/producer responsible for the website look and feel, layout, and navigation. • Graphic artist responsible for generating graphical content for the website (part time or contract). • Remote sensing subject matter expert with broad knowledge about environmental satellite and HF
Radar datasets. • Subject matter expert with broad knowledge about in situ observations, including ecosystem data. • Model infrastructure subject matter expert with broad knowledge on managing model input and
outputs and associated IT infrastructure.
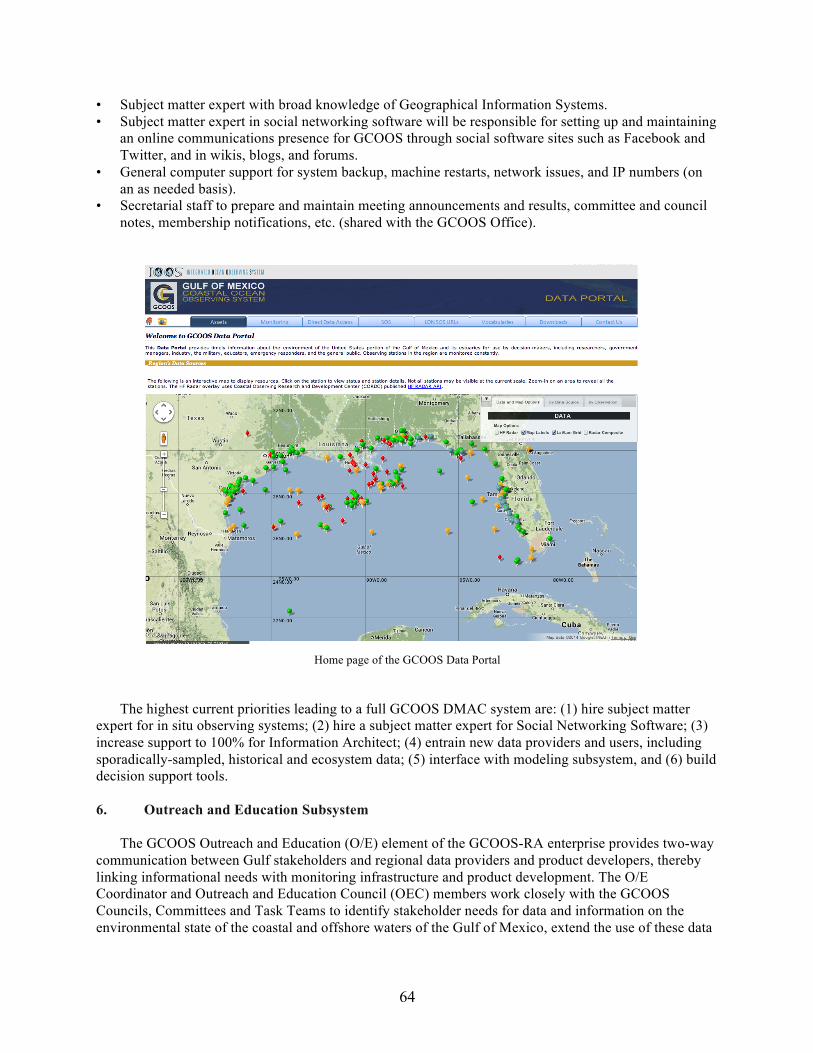
64
• Subject matter expert with broad knowledge of Geographical Information Systems. • Subject matter expert in social networking software will be responsible for setting up and maintaining
an online communications presence for GCOOS through social software sites such as Facebook and Twitter, and in wikis, blogs, and forums.
• General computer support for system backup, machine restarts, network issues, and IP numbers (on an as needed basis).
• Secretarial staff to prepare and maintain meeting announcements and results, committee and council notes, membership notifications, etc. (shared with the GCOOS Office).
Home page of the GCOOS Data Portal
The highest current priorities leading to a full GCOOS DMAC system are: (1) hire subject matter expert for in situ observing systems; (2) hire a subject matter expert for Social Networking Software; (3) increase support to 100% for Information Architect; (4) entrain new data providers and users, including sporadically-sampled, historical and ecosystem data; (5) interface with modeling subsystem, and (6) build decision support tools. 6. Outreach and Education Subsystem
The GCOOS Outreach and Education (O/E) element of the GCOOS-RA enterprise provides two-way communication between Gulf stakeholders and regional data providers and product developers, thereby linking informational needs with monitoring infrastructure and product development. The O/E Coordinator and Outreach and Education Council (OEC) members work closely with the GCOOS Councils, Committees and Task Teams to identify stakeholder needs for data and information on the environmental state of the coastal and offshore waters of the Gulf of Mexico, extend the use of these data
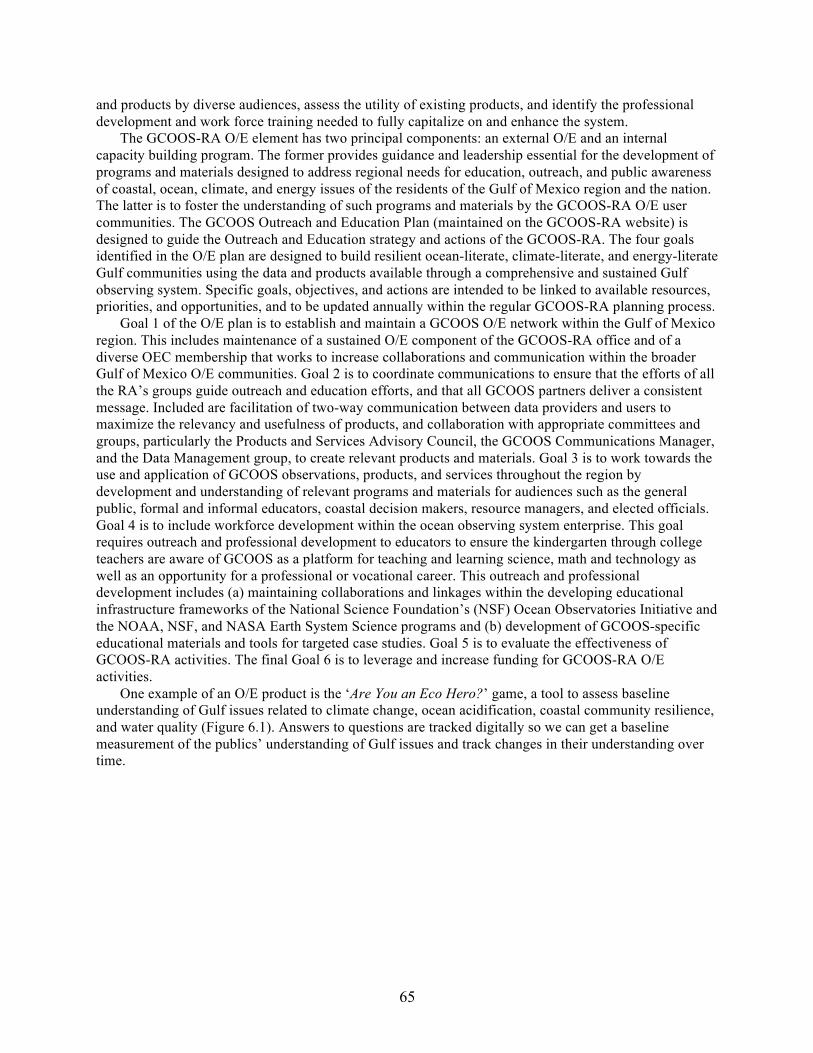
65
and products by diverse audiences, assess the utility of existing products, and identify the professional development and work force training needed to fully capitalize on and enhance the system.
The GCOOS-RA O/E element has two principal components: an external O/E and an internal capacity building program. The former provides guidance and leadership essential for the development of programs and materials designed to address regional needs for education, outreach, and public awareness of coastal, ocean, climate, and energy issues of the residents of the Gulf of Mexico region and the nation. The latter is to foster the understanding of such programs and materials by the GCOOS-RA O/E user communities. The GCOOS Outreach and Education Plan (maintained on the GCOOS-RA website) is designed to guide the Outreach and Education strategy and actions of the GCOOS-RA. The four goals identified in the O/E plan are designed to build resilient ocean-literate, climate-literate, and energy-literate Gulf communities using the data and products available through a comprehensive and sustained Gulf observing system. Specific goals, objectives, and actions are intended to be linked to available resources, priorities, and opportunities, and to be updated annually within the regular GCOOS-RA planning process.
Goal 1 of the O/E plan is to establish and maintain a GCOOS O/E network within the Gulf of Mexico region. This includes maintenance of a sustained O/E component of the GCOOS-RA office and of a diverse OEC membership that works to increase collaborations and communication within the broader Gulf of Mexico O/E communities. Goal 2 is to coordinate communications to ensure that the efforts of all the RA’s groups guide outreach and education efforts, and that all GCOOS partners deliver a consistent message. Included are facilitation of two-way communication between data providers and users to maximize the relevancy and usefulness of products, and collaboration with appropriate committees and groups, particularly the Products and Services Advisory Council, the GCOOS Communications Manager, and the Data Management group, to create relevant products and materials. Goal 3 is to work towards the use and application of GCOOS observations, products, and services throughout the region by development and understanding of relevant programs and materials for audiences such as the general public, formal and informal educators, coastal decision makers, resource managers, and elected officials. Goal 4 is to include workforce development within the ocean observing system enterprise. This goal requires outreach and professional development to educators to ensure the kindergarten through college teachers are aware of GCOOS as a platform for teaching and learning science, math and technology as well as an opportunity for a professional or vocational career. This outreach and professional development includes (a) maintaining collaborations and linkages within the developing educational infrastructure frameworks of the National Science Foundation’s (NSF) Ocean Observatories Initiative and the NOAA, NSF, and NASA Earth System Science programs and (b) development of GCOOS-specific educational materials and tools for targeted case studies. Goal 5 is to evaluate the effectiveness of GCOOS-RA activities. The final Goal 6 is to leverage and increase funding for GCOOS-RA O/E activities.
One example of an O/E product is the ‘Are You an Eco Hero?’ game, a tool to assess baseline understanding of Gulf issues related to climate change, ocean acidification, coastal community resilience, and water quality (Figure 6.1). Answers to questions are tracked digitally so we can get a baseline measurement of the publics’ understanding of Gulf issues and track changes in their understanding over time.
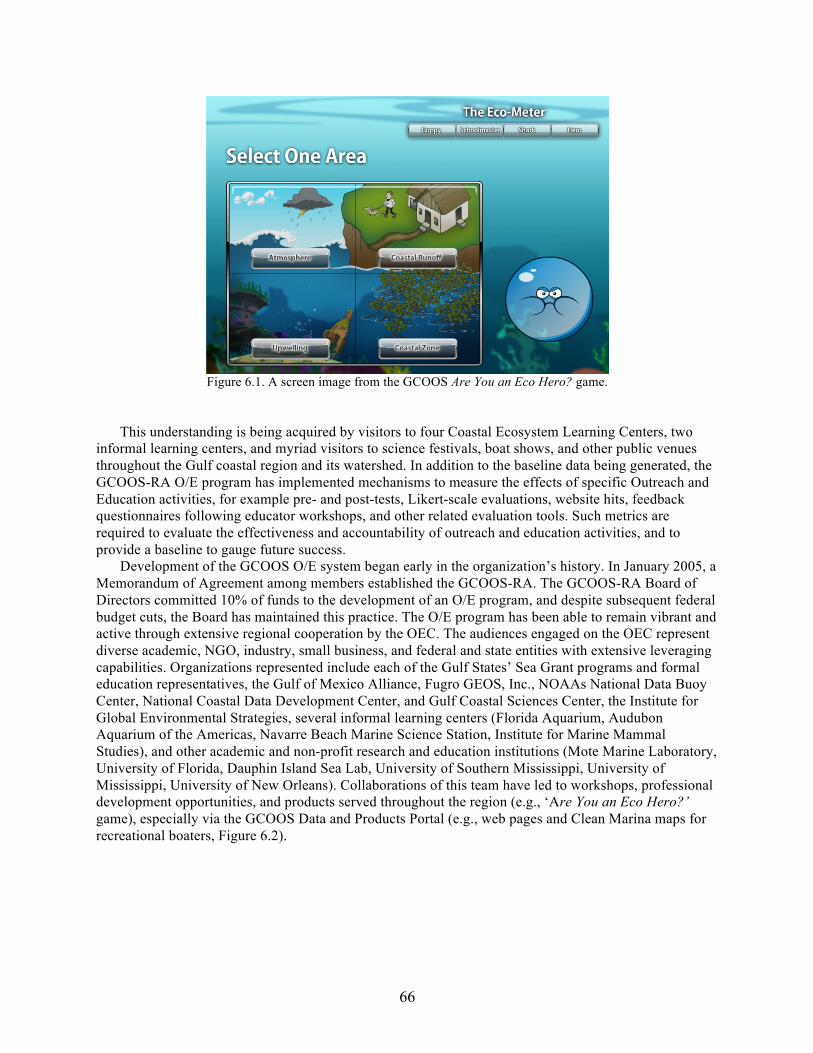
66
Figure 6.1. A screen image from the GCOOS Are You an Eco Hero? game.
This understanding is being acquired by visitors to four Coastal Ecosystem Learning Centers, two informal learning centers, and myriad visitors to science festivals, boat shows, and other public venues throughout the Gulf coastal region and its watershed. In addition to the baseline data being generated, the GCOOS-RA O/E program has implemented mechanisms to measure the effects of specific Outreach and Education activities, for example pre- and post-tests, Likert-scale evaluations, website hits, feedback questionnaires following educator workshops, and other related evaluation tools. Such metrics are required to evaluate the effectiveness and accountability of outreach and education activities, and to provide a baseline to gauge future success.
Development of the GCOOS O/E system began early in the organization’s history. In January 2005, a Memorandum of Agreement among members established the GCOOS-RA. The GCOOS-RA Board of Directors committed 10% of funds to the development of an O/E program, and despite subsequent federal budget cuts, the Board has maintained this practice. The O/E program has been able to remain vibrant and active through extensive regional cooperation by the OEC. The audiences engaged on the OEC represent diverse academic, NGO, industry, small business, and federal and state entities with extensive leveraging capabilities. Organizations represented include each of the Gulf States’ Sea Grant programs and formal education representatives, the Gulf of Mexico Alliance, Fugro GEOS, Inc., NOAAs National Data Buoy Center, National Coastal Data Development Center, and Gulf Coastal Sciences Center, the Institute for Global Environmental Strategies, several informal learning centers (Florida Aquarium, Audubon Aquarium of the Americas, Navarre Beach Marine Science Station, Institute for Marine Mammal Studies), and other academic and non-profit research and education institutions (Mote Marine Laboratory, University of Florida, Dauphin Island Sea Lab, University of Southern Mississippi, University of Mississippi, University of New Orleans). Collaborations of this team have led to workshops, professional development opportunities, and products served throughout the region (e.g., ‘Are You an Eco Hero?’ game), especially via the GCOOS Data and Products Portal (e.g., web pages and Clean Marina maps for recreational boaters, Figure 6.2).
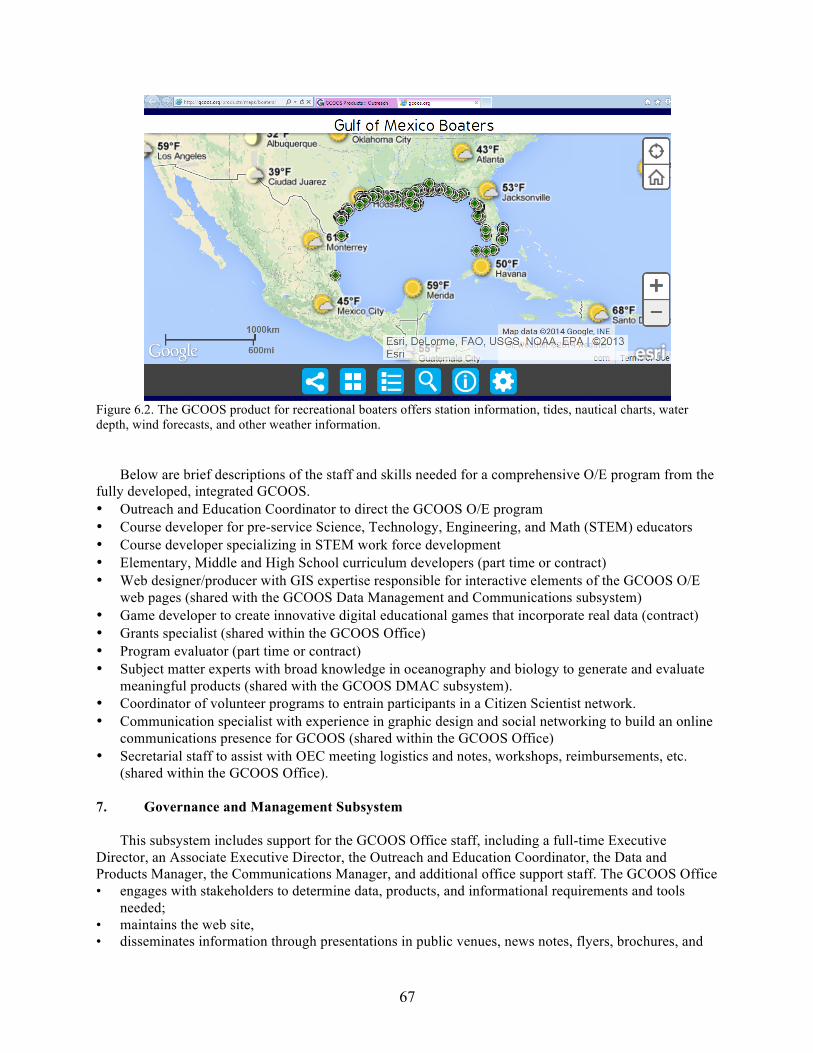
67
Figure 6.2. The GCOOS product for recreational boaters offers station information, tides, nautical charts, water depth, wind forecasts, and other weather information.
Below are brief descriptions of the staff and skills needed for a comprehensive O/E program from the fully developed, integrated GCOOS. • Outreach and Education Coordinator to direct the GCOOS O/E program • Course developer for pre-service Science, Technology, Engineering, and Math (STEM) educators • Course developer specializing in STEM work force development • Elementary, Middle and High School curriculum developers (part time or contract) • Web designer/producer with GIS expertise responsible for interactive elements of the GCOOS O/E
web pages (shared with the GCOOS Data Management and Communications subsystem) • Game developer to create innovative digital educational games that incorporate real data (contract) • Grants specialist (shared within the GCOOS Office) • Program evaluator (part time or contract) • Subject matter experts with broad knowledge in oceanography and biology to generate and evaluate
meaningful products (shared with the GCOOS DMAC subsystem). • Coordinator of volunteer programs to entrain participants in a Citizen Scientist network. • Communication specialist with experience in graphic design and social networking to build an online
communications presence for GCOOS (shared within the GCOOS Office) • Secretarial staff to assist with OEC meeting logistics and notes, workshops, reimbursements, etc.
(shared within the GCOOS Office). 7. Governance and Management Subsystem
This subsystem includes support for the GCOOS Office staff, including a full-time Executive Director, an Associate Executive Director, the Outreach and Education Coordinator, the Data and Products Manager, the Communications Manager, and additional office support staff. The GCOOS Office • engages with stakeholders to determine data, products, and informational requirements and tools
needed; • maintains the web site, • disseminates information through presentations in public venues, news notes, flyers, brochures, and
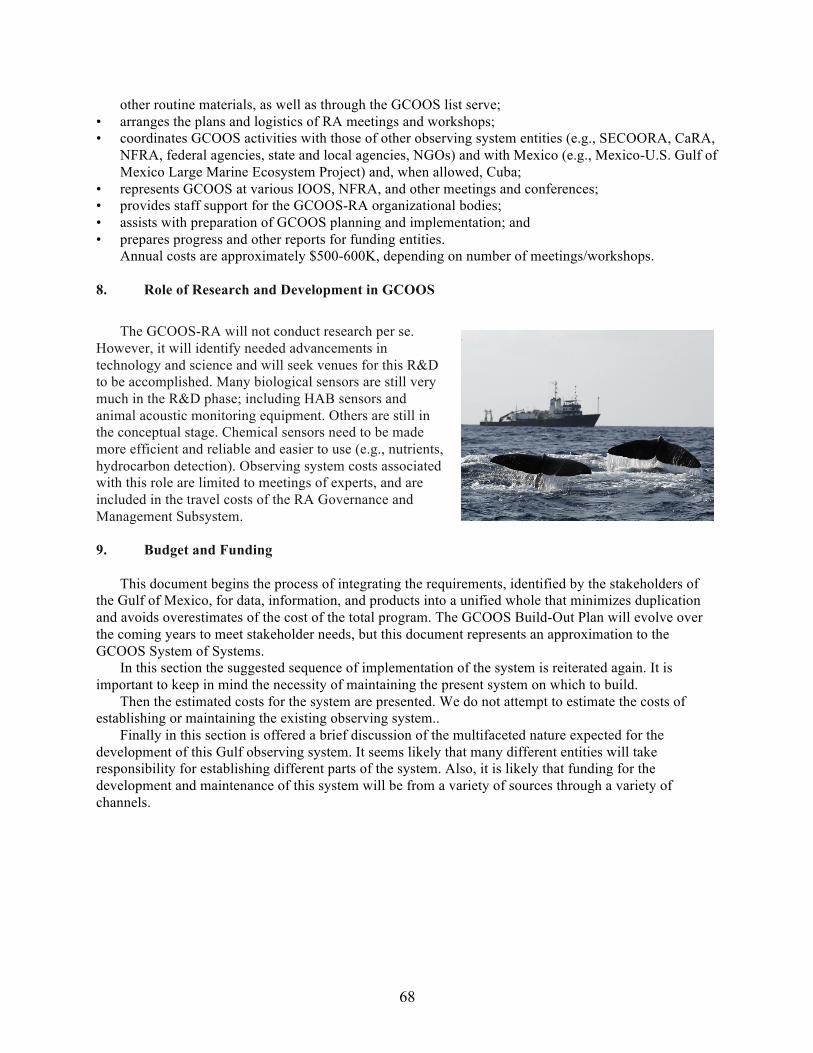
68
other routine materials, as well as through the GCOOS list serve; • arranges the plans and logistics of RA meetings and workshops; • coordinates GCOOS activities with those of other observing system entities (e.g., SECOORA, CaRA,
NFRA, federal agencies, state and local agencies, NGOs) and with Mexico (e.g., Mexico-U.S. Gulf of Mexico Large Marine Ecosystem Project) and, when allowed, Cuba;
• represents GCOOS at various IOOS, NFRA, and other meetings and conferences; • provides staff support for the GCOOS-RA organizational bodies; • assists with preparation of GCOOS planning and implementation; and • prepares progress and other reports for funding entities.
Annual costs are approximately $500-600K, depending on number of meetings/workshops. 8. Role of Research and Development in GCOOS
The GCOOS-RA will not conduct research per se. However, it will identify needed advancements in technology and science and will seek venues for this R&D to be accomplished. Many biological sensors are still very much in the R&D phase; including HAB sensors and animal acoustic monitoring equipment. Others are still in the conceptual stage. Chemical sensors need to be made more efficient and reliable and easier to use (e.g., nutrients, hydrocarbon detection). Observing system costs associated with this role are limited to meetings of experts, and are included in the travel costs of the RA Governance and Management Subsystem. 9. Budget and Funding
This document begins the process of integrating the requirements, identified by the stakeholders of the Gulf of Mexico, for data, information, and products into a unified whole that minimizes duplication and avoids overestimates of the cost of the total program. The GCOOS Build-Out Plan will evolve over the coming years to meet stakeholder needs, but this document represents an approximation to the GCOOS System of Systems.
In this section the suggested sequence of implementation of the system is reiterated again. It is important to keep in mind the necessity of maintaining the present system on which to build.
Then the estimated costs for the system are presented. We do not attempt to estimate the costs of establishing or maintaining the existing observing system..
Finally in this section is offered a brief discussion of the multifaceted nature expected for the development of this Gulf observing system. It seems likely that many different entities will take responsibility for establishing different parts of the system. Also, it is likely that funding for the development and maintenance of this system will be from a variety of sources through a variety of channels.
69
9.1 Development Sequence
The important continuing action toward development of a Gulf observing system is to ensure that the existing system components are maintained. This in itself can be difficult because in some cases the sponsors of components may no longer feel the need for data there from or may not be able to continue financial support.
This plan recommends in Appendix D a suite of initial enhancements to the system. Together these by no means constitute the complete needed system. However, they have been selected to fill the most important gaps in the existing observing system at a relatively modest cost. An attempt has been made to ‘seize the low hanging fruit’ by upgrading some of the existing buoys, building on previous HFR sites, and adding cross-shelf mooring arrays to existing moorings. These enhancements pull many of stated stakeholder requirements together into a unified whole that minimizes duplication and avoids overestimates of the cost of the total program.
Finally, this Build-out Plan and the details linked to Appendix E describe the complete Gulf observing system as now envisioned. Clearly this plan will evolve based on requests from stakeholders, developing technology, and new knowledge regarding the environment. 9.2 Cost Estimates
An estimated budget for the complete build-out of the system described in this plan in not yet available. However, cost estimates for most of the elements are in the detailed descriptions of the elements to be linked soon to Appendix E. 9.3 Multifaceted Nature of Development
It is the hope of the GCOOS-RA that this plan will be implemented through a number of different, complementary partners. Funding for implementation can flow a number of ways, including: 1. Directly to partners implementing the plan, 2. To the GCOOS-RA Corporation (with sub-contracting), 3. Through partner federal agency budgets, and/or 4. Through in-kind activities of partners.
Regardless of the funding path, the following two actions must occur for successful implementation of the broad stakeholder-based Build-out plan: 1. All data from the observing system should be submitted to the GCOOS data portal so that it can be
freely distributed; and 2. Information relevant to implementation of the system should be submitted to the GCOOS-RA office
so that progress toward achieving the full plan can be monitored and reported.
70
Bibliography Gill, S K., and K. M. Fisher. 2008, A Network Gaps Analysis for the National Water Level Observation
Network. NOAA Technical Memorandum NOS CO-OPS 0048. http://tidesandcurrents.noaa.gov/publications/Technical_Memorandum_NOS_COOPS_0048.pdf.
Gulf of Mexico Sperm Whale Seismic Study (SWSS), U.S. Minerals Management Service, 2002. http://seawater.tamu.edu/SWSS/
Gulf of Mexico Sperm Whale Seismic Study (SWSS), U.S. Minerals Management Service, 2005. http://seawater.tamu.edu/SWSS
Jordan, S. J., S. E. Hayes, D. Yoskowitz, L. M. Smith, J. K. Summers, M. Russell, and W. H. Benson. 2010. Accounting for natural resources and environmental sustainability: linking ecosystem services to human well-being. Environmental science & technology 44:1530-1536.
Karnauskas, M, M. J. Schirripa, C. R. Kelbe, G. S. Cook, and J. K. Craig. 2013. Ecosystem Status Report for the Gulf of Mexico. NOAA Technical Memorandum NMFS-SEFSC-653.
National Assessment Synthesis Team. 2001. Climate Change Impacts on the United States: The Potential Consequences of Climate Variability and Change, Report for the U.S. Global Change Research Program. Cambridge: University Press, Cambridge UK. 620 pp. Available from http://www.gcrio.org/NationalAssessment/foundation.html.
National Research Council. 2011. America's Climate Choices. Washington, DC: The National Academies Press.
National Research Council. 2013. Abrupt Impacts of Climate Change: Anticipating Surprises. Washington, DC: The National Academies Press.
Titus, J. G., and C. Richman. 2001. Maps of lands vulnerable to sea level rise: modeled elevations along the US Atlantic and Gulf coasts. Climate Research 18.3:205-228
U.S. Environmental Protection Agency. 2007. Hypoxia in the Northern Gulf of Mexico, An Update by the EPA Science Advisory Board. EPA-SAB-08-003. 333 pp. Available from http://yosemite.epa.gov/sab%5Csabproduct.nsf/C3D2F27094E03F90852573B800601D93/$File/EPA-SAB-08-003complete.unsigned.pdf.
U.S. Integrated Ocean Observing System. 2010. A blueprint for Full Capacity. Version 1.0. U.S. IOOS Office.
Virmani, J.I., and E. D. Estevez. 2007. Biosensing in ocean observation: Workshop program and Report, Mote Marine Laboratory Technical Report, GC 10.4.R4V57.
Walker, N. D., and N. N. Rabalais. 2006. Relationships among satellite cholorphylla, river inputs, and hypoxia on the Louisiana Continental shelf, Gulf of Mexico. Estuaries and Coasts 29:1081-1093.
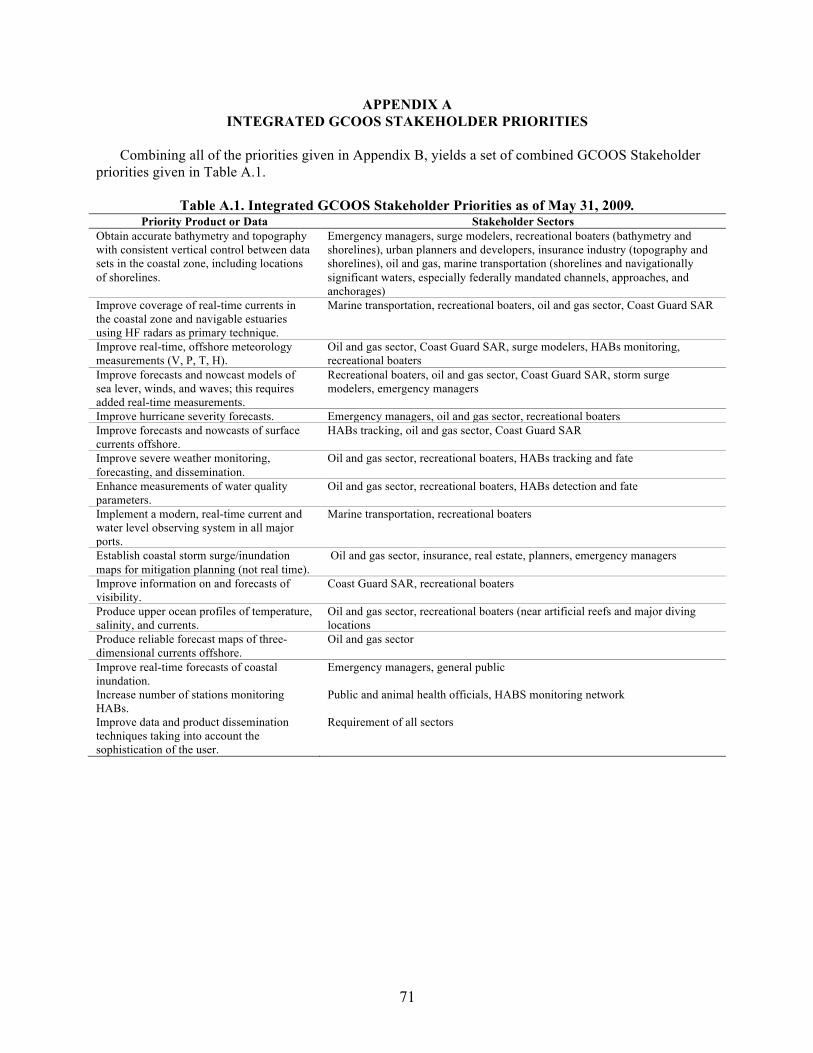
71
APPENDIX A INTEGRATED GCOOS STAKEHOLDER PRIORITIES
Combining all of the priorities given in Appendix B, yields a set of combined GCOOS Stakeholder
priorities given in Table A.1.
Table A.1. Integrated GCOOS Stakeholder Priorities as of May 31, 2009. Priority Product or Data Stakeholder Sectors
Obtain accurate bathymetry and topography with consistent vertical control between data sets in the coastal zone, including locations of shorelines.
Emergency managers, surge modelers, recreational boaters (bathymetry and shorelines), urban planners and developers, insurance industry (topography and shorelines), oil and gas, marine transportation (shorelines and navigationally significant waters, especially federally mandated channels, approaches, and anchorages)
Improve coverage of real-time currents in the coastal zone and navigable estuaries using HF radars as primary technique.
Marine transportation, recreational boaters, oil and gas sector, Coast Guard SAR
Improve real-time, offshore meteorology measurements (V, P, T, H).
Oil and gas sector, Coast Guard SAR, surge modelers, HABs monitoring, recreational boaters
Improve forecasts and nowcast models of sea lever, winds, and waves; this requires added real-time measurements.
Recreational boaters, oil and gas sector, Coast Guard SAR, storm surge modelers, emergency managers
Improve hurricane severity forecasts. Emergency managers, oil and gas sector, recreational boaters Improve forecasts and nowcasts of surface currents offshore.
HABs tracking, oil and gas sector, Coast Guard SAR
Improve severe weather monitoring, forecasting, and dissemination.
Oil and gas sector, recreational boaters, HABs tracking and fate
Enhance measurements of water quality parameters.
Oil and gas sector, recreational boaters, HABs detection and fate
Implement a modern, real-time current and water level observing system in all major ports.
Marine transportation, recreational boaters
Establish coastal storm surge/inundation maps for mitigation planning (not real time).
Oil and gas sector, insurance, real estate, planners, emergency managers
Improve information on and forecasts of visibility.
Coast Guard SAR, recreational boaters
Produce upper ocean profiles of temperature, salinity, and currents.
Oil and gas sector, recreational boaters (near artificial reefs and major diving locations
Produce reliable forecast maps of three-dimensional currents offshore.
Oil and gas sector
Improve real-time forecasts of coastal inundation.
Emergency managers, general public
Increase number of stations monitoring HABs.
Public and animal health officials, HABS monitoring network
Improve data and product dissemination techniques taking into account the sophistication of the user.
Requirement of all sectors
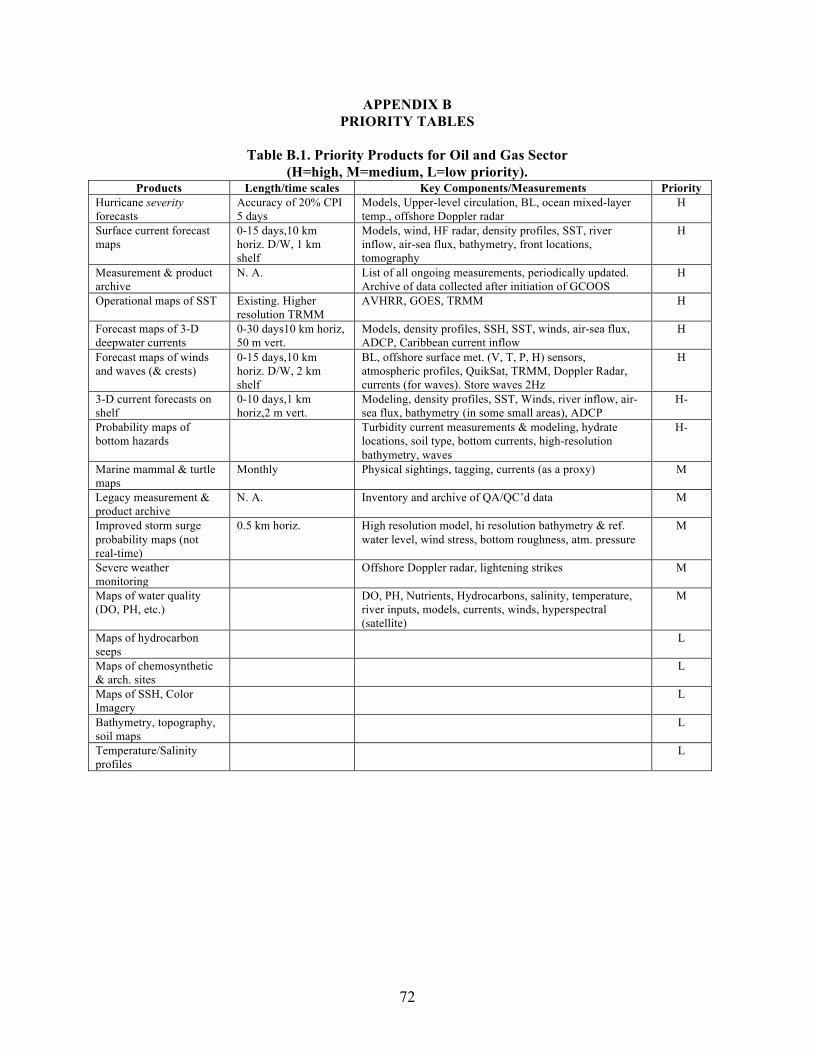
72
APPENDIX B PRIORITY TABLES
Table B.1. Priority Products for Oil and Gas Sector
(H=high, M=medium, L=low priority). Products Length/time scales Key Components/Measurements Priority
Hurricane severity forecasts
Accuracy of 20% CPI 5 days
Models, Upper-level circulation, BL, ocean mixed-layer temp., offshore Doppler radar
H
Surface current forecast maps
0-15 days,10 km horiz. D/W, 1 km shelf
Models, wind, HF radar, density profiles, SST, river inflow, air-sea flux, bathymetry, front locations, tomography
H
Measurement & product archive
N. A. List of all ongoing measurements, periodically updated. Archive of data collected after initiation of GCOOS
H
Operational maps of SST Existing. Higher resolution TRMM
AVHRR, GOES, TRMM H
Forecast maps of 3-D deepwater currents
0-30 days10 km horiz, 50 m vert.
Models, density profiles, SSH, SST, winds, air-sea flux, ADCP, Caribbean current inflow
H
Forecast maps of winds and waves (& crests)
0-15 days,10 km horiz. D/W, 2 km shelf
BL, offshore surface met. (V, T, P, H) sensors, atmospheric profiles, QuikSat, TRMM, Doppler Radar, currents (for waves). Store waves 2Hz
H
3-D current forecasts on shelf
0-10 days,1 km horiz,2 m vert.
Modeling, density profiles, SST, Winds, river inflow, air-sea flux, bathymetry (in some small areas), ADCP
H-
Probability maps of bottom hazards
Turbidity current measurements & modeling, hydrate locations, soil type, bottom currents, high-resolution bathymetry, waves
H-
Marine mammal & turtle maps
Monthly Physical sightings, tagging, currents (as a proxy) M
Legacy measurement & product archive
N. A. Inventory and archive of QA/QC’d data M
Improved storm surge probability maps (not real-time)
0.5 km horiz. High resolution model, hi resolution bathymetry & ref. water level, wind stress, bottom roughness, atm. pressure
M
Severe weather monitoring
Offshore Doppler radar, lightening strikes M
Maps of water quality (DO, PH, etc.)
DO, PH, Nutrients, Hydrocarbons, salinity, temperature, river inputs, models, currents, winds, hyperspectral (satellite)
M
Maps of hydrocarbon seeps
L
Maps of chemosynthetic & arch. sites
L
Maps of SSH, Color Imagery
L
Bathymetry, topography, soil maps
L
Temperature/Salinity profiles
L
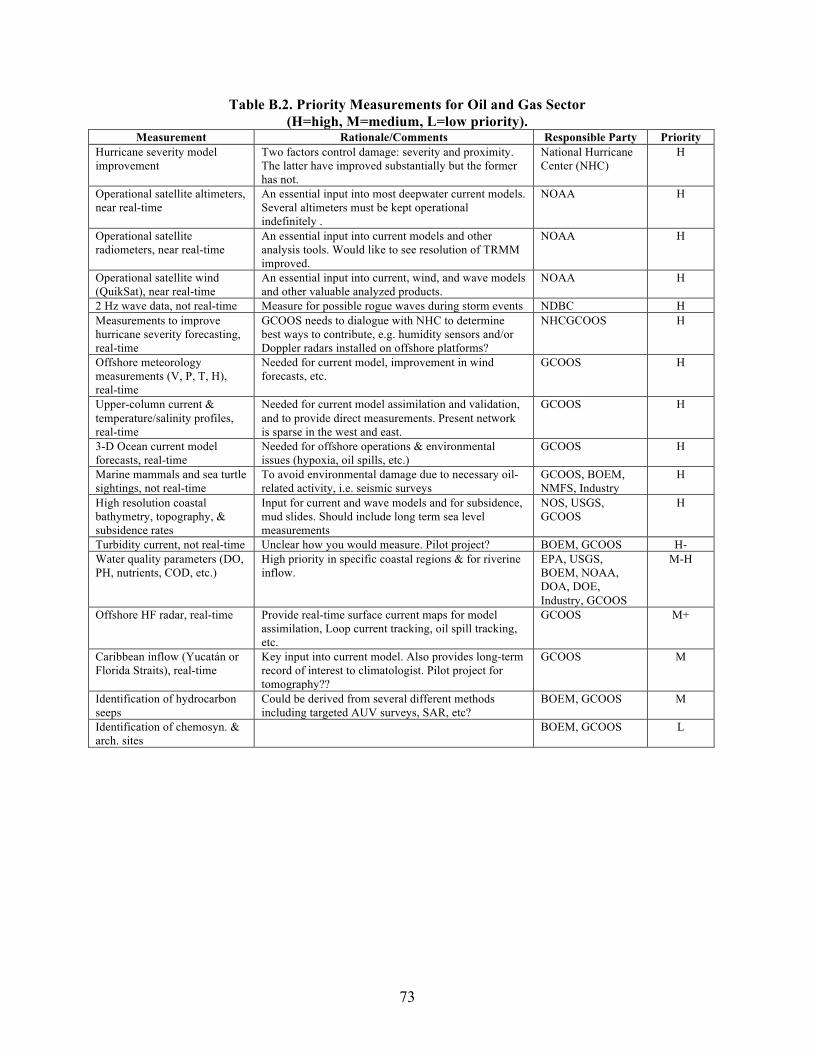
73
Table B.2. Priority Measurements for Oil and Gas Sector (H=high, M=medium, L=low priority).
Measurement Rationale/Comments Responsible Party Priority Hurricane severity model improvement
Two factors control damage: severity and proximity. The latter have improved substantially but the former has not.
National Hurricane Center (NHC)
H
Operational satellite altimeters, near real-time
An essential input into most deepwater current models. Several altimeters must be kept operational indefinitely .
NOAA H
Operational satellite radiometers, near real-time
An essential input into current models and other analysis tools. Would like to see resolution of TRMM improved.
NOAA H
Operational satellite wind (QuikSat), near real-time
An essential input into current, wind, and wave models and other valuable analyzed products.
NOAA H
2 Hz wave data, not real-time Measure for possible rogue waves during storm events NDBC H Measurements to improve hurricane severity forecasting, real-time
GCOOS needs to dialogue with NHC to determine best ways to contribute, e.g. humidity sensors and/or Doppler radars installed on offshore platforms?
NHCGCOOS H
Offshore meteorology measurements (V, P, T, H), real-time
Needed for current model, improvement in wind forecasts, etc.
GCOOS H
Upper-column current & temperature/salinity profiles, real-time
Needed for current model assimilation and validation, and to provide direct measurements. Present network is sparse in the west and east.
GCOOS H
3-D Ocean current model forecasts, real-time
Needed for offshore operations & environmental issues (hypoxia, oil spills, etc.)
GCOOS H
Marine mammals and sea turtle sightings, not real-time
To avoid environmental damage due to necessary oil-related activity, i.e. seismic surveys
GCOOS, BOEM, NMFS, Industry
H
High resolution coastal bathymetry, topography, & subsidence rates
Input for current and wave models and for subsidence, mud slides. Should include long term sea level measurements
NOS, USGS, GCOOS
H
Turbidity current, not real-time Unclear how you would measure. Pilot project? BOEM, GCOOS H- Water quality parameters (DO, PH, nutrients, COD, etc.)
High priority in specific coastal regions & for riverine inflow.
EPA, USGS, BOEM, NOAA, DOA, DOE, Industry, GCOOS
M-H
Offshore HF radar, real-time Provide real-time surface current maps for model assimilation, Loop current tracking, oil spill tracking, etc.
GCOOS M+
Caribbean inflow (Yucatán or Florida Straits), real-time
Key input into current model. Also provides long-term record of interest to climatologist. Pilot project for tomography??
GCOOS M
Identification of hydrocarbon seeps
Could be derived from several different methods including targeted AUV surveys, SAR, etc?
BOEM, GCOOS M
Identification of chemosyn. & arch. sites
BOEM, GCOOS L
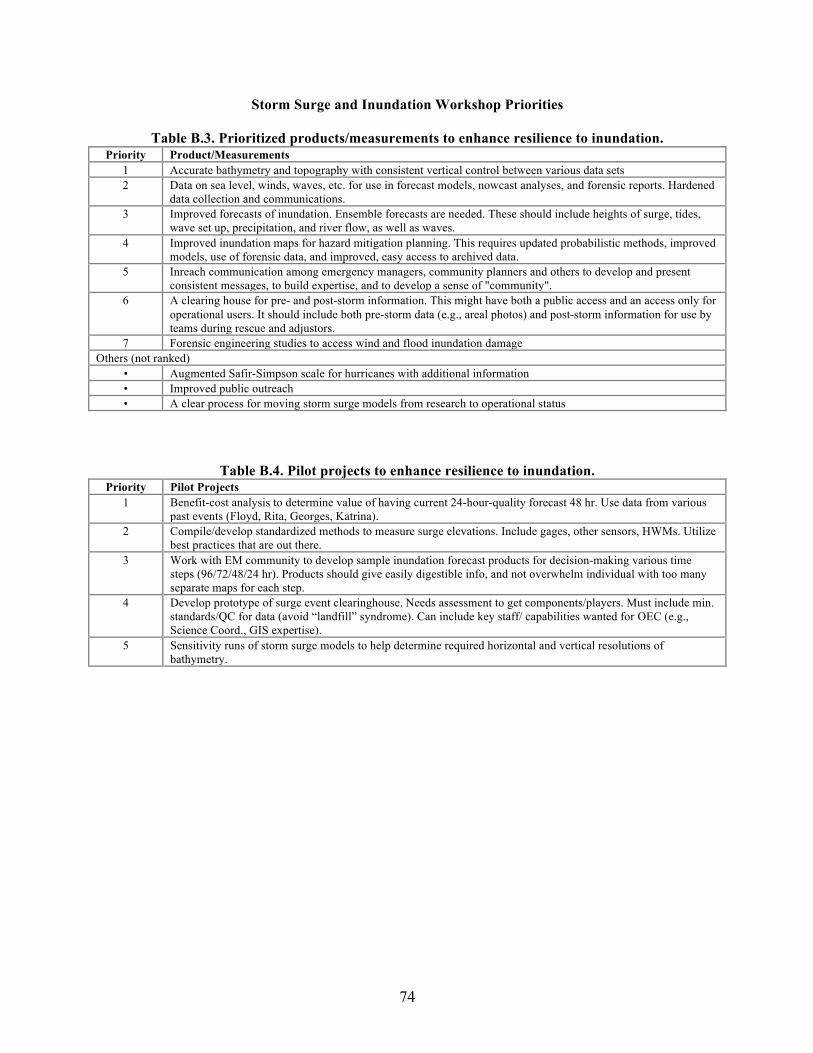
74
Storm Surge and Inundation Workshop Priorities
Table B.3. Prioritized products/measurements to enhance resilience to inundation. Priority Product/Measurements
1 Accurate bathymetry and topography with consistent vertical control between various data sets 2 Data on sea level, winds, waves, etc. for use in forecast models, nowcast analyses, and forensic reports. Hardened
data collection and communications. 3 Improved forecasts of inundation. Ensemble forecasts are needed. These should include heights of surge, tides,
wave set up, precipitation, and river flow, as well as waves. 4 Improved inundation maps for hazard mitigation planning. This requires updated probabilistic methods, improved
models, use of forensic data, and improved, easy access to archived data. 5 Inreach communication among emergency managers, community planners and others to develop and present
consistent messages, to build expertise, and to develop a sense of "community". 6 A clearing house for pre- and post-storm information. This might have both a public access and an access only for
operational users. It should include both pre-storm data (e.g., areal photos) and post-storm information for use by teams during rescue and adjustors.
7 Forensic engineering studies to access wind and flood inundation damage Others (not ranked)
• Augmented Safir-Simpson scale for hurricanes with additional information • Improved public outreach • A clear process for moving storm surge models from research to operational status
Table B.4. Pilot projects to enhance resilience to inundation. Priority Pilot Projects
1 Benefit-cost analysis to determine value of having current 24-hour-quality forecast 48 hr. Use data from various past events (Floyd, Rita, Georges, Katrina).
2 Compile/develop standardized methods to measure surge elevations. Include gages, other sensors, HWMs. Utilize best practices that are out there.
3 Work with EM community to develop sample inundation forecast products for decision-making various time steps (96/72/48/24 hr). Products should give easily digestible info, and not overwhelm individual with too many separate maps for each step.
4 Develop prototype of surge event clearinghouse. Needs assessment to get components/players. Must include min. standards/QC for data (avoid “landfill” syndrome). Can include key staff/ capabilities wanted for OEC (e.g., Science Coord., GIS expertise).
5 Sensitivity runs of storm surge models to help determine required horizontal and vertical resolutions of bathymetry.
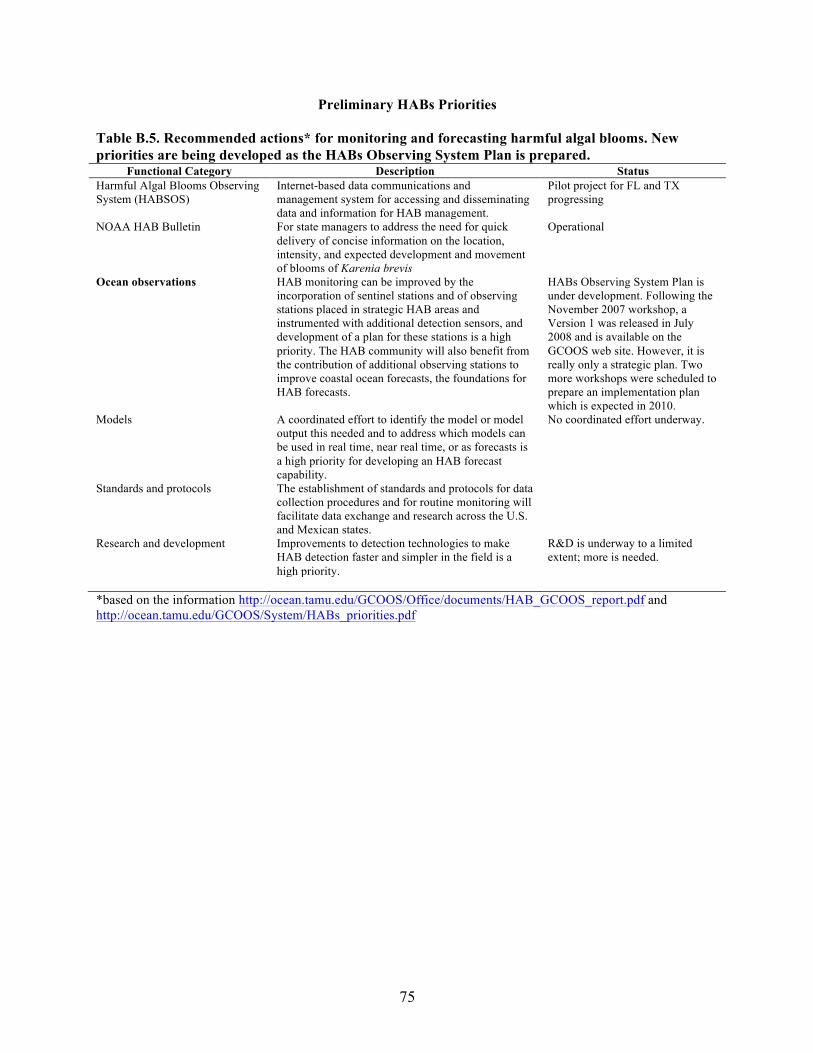
75
Preliminary HABs Priorities Table B.5. Recommended actions* for monitoring and forecasting harmful algal blooms. New priorities are being developed as the HABs Observing System Plan is prepared.
Functional Category Description Status Harmful Algal Blooms Observing System (HABSOS)
Internet-based data communications and management system for accessing and disseminating data and information for HAB management.
Pilot project for FL and TX progressing
NOAA HAB Bulletin For state managers to address the need for quick delivery of concise information on the location, intensity, and expected development and movement of blooms of Karenia brevis
Operational
Ocean observations HAB monitoring can be improved by the incorporation of sentinel stations and of observing stations placed in strategic HAB areas and instrumented with additional detection sensors, and development of a plan for these stations is a high priority. The HAB community will also benefit from the contribution of additional observing stations to improve coastal ocean forecasts, the foundations for HAB forecasts.
HABs Observing System Plan is under development. Following the November 2007 workshop, a Version 1 was released in July 2008 and is available on the GCOOS web site. However, it is really only a strategic plan. Two more workshops were scheduled to prepare an implementation plan which is expected in 2010.
Models A coordinated effort to identify the model or model output this needed and to address which models can be used in real time, near real time, or as forecasts is a high priority for developing an HAB forecast capability.
No coordinated effort underway.
Standards and protocols The establishment of standards and protocols for data collection procedures and for routine monitoring will facilitate data exchange and research across the U.S. and Mexican states.
Research and development Improvements to detection technologies to make HAB detection faster and simpler in the field is a high priority.
R&D is underway to a limited extent; more is needed.
*based on the information http://ocean.tamu.edu/GCOOS/Office/documents/HAB_GCOOS_report.pdf and http://ocean.tamu.edu/GCOOS/System/HABs_priorities.pdf
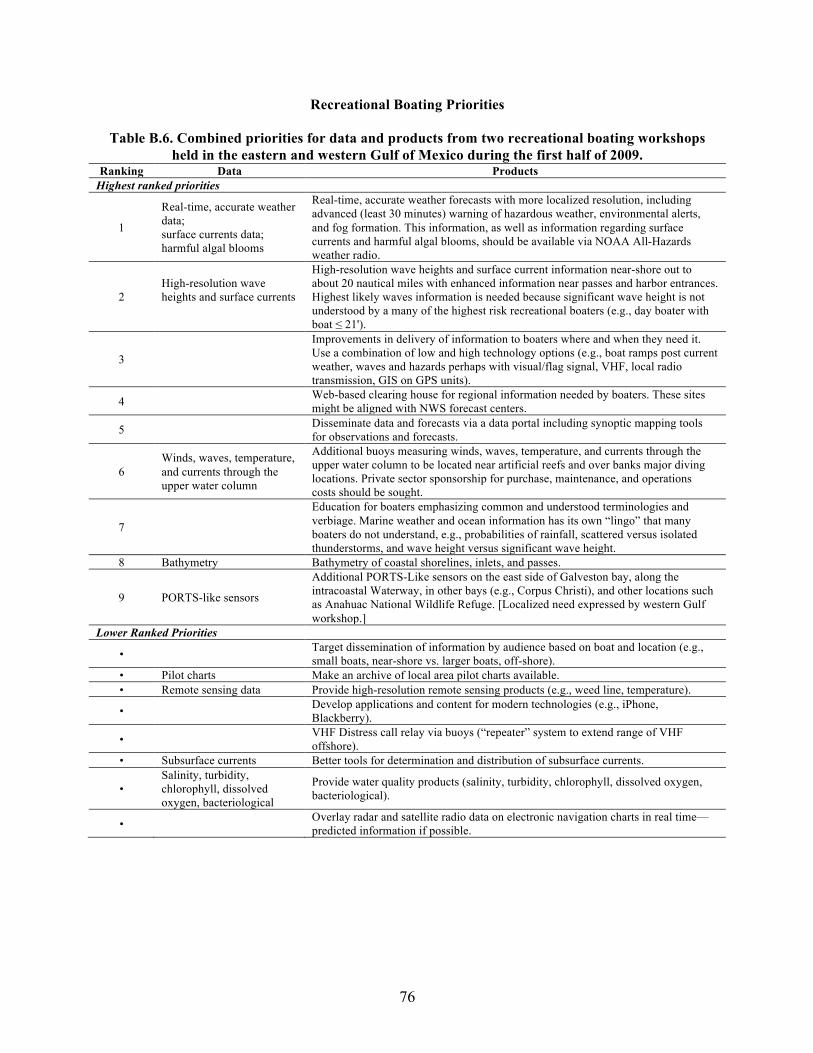
76
Recreational Boating Priorities
Table B.6. Combined priorities for data and products from two recreational boating workshops held in the eastern and western Gulf of Mexico during the first half of 2009.
Ranking Data Products Highest ranked priorities
1
Real-time, accurate weather data; surface currents data; harmful algal blooms
Real-time, accurate weather forecasts with more localized resolution, including advanced (least 30 minutes) warning of hazardous weather, environmental alerts, and fog formation. This information, as well as information regarding surface currents and harmful algal blooms, should be available via NOAA All-Hazards weather radio.
2 High-resolution wave heights and surface currents
High-resolution wave heights and surface current information near-shore out to about 20 nautical miles with enhanced information near passes and harbor entrances. Highest likely waves information is needed because significant wave height is not understood by a many of the highest risk recreational boaters (e.g., day boater with boat ≤ 21').
3
Improvements in delivery of information to boaters where and when they need it. Use a combination of low and high technology options (e.g., boat ramps post current weather, waves and hazards perhaps with visual/flag signal, VHF, local radio transmission, GIS on GPS units).
4 Web-based clearing house for regional information needed by boaters. These sites might be aligned with NWS forecast centers.
5 Disseminate data and forecasts via a data portal including synoptic mapping tools for observations and forecasts.
6 Winds, waves, temperature, and currents through the upper water column
Additional buoys measuring winds, waves, temperature, and currents through the upper water column to be located near artificial reefs and over banks major diving locations. Private sector sponsorship for purchase, maintenance, and operations costs should be sought.
7
Education for boaters emphasizing common and understood terminologies and verbiage. Marine weather and ocean information has its own “lingo” that many boaters do not understand, e.g., probabilities of rainfall, scattered versus isolated thunderstorms, and wave height versus significant wave height.
8 Bathymetry Bathymetry of coastal shorelines, inlets, and passes.
9 PORTS-like sensors
Additional PORTS-Like sensors on the east side of Galveston bay, along the intracoastal Waterway, in other bays (e.g., Corpus Christi), and other locations such as Anahuac National Wildlife Refuge. [Localized need expressed by western Gulf workshop.]
Lower Ranked Priorities
• Target dissemination of information by audience based on boat and location (e.g., small boats, near-shore vs. larger boats, off-shore).
• Pilot charts Make an archive of local area pilot charts available. • Remote sensing data Provide high-resolution remote sensing products (e.g., weed line, temperature).
• Develop applications and content for modern technologies (e.g., iPhone, Blackberry).
• VHF Distress call relay via buoys (“repeater” system to extend range of VHF offshore).
• Subsurface currents Better tools for determination and distribution of subsurface currents.
• Salinity, turbidity, chlorophyll, dissolved oxygen, bacteriological
Provide water quality products (salinity, turbidity, chlorophyll, dissolved oxygen, bacteriological).
• Overlay radar and satellite radio data on electronic navigation charts in real time—predicted information if possible.
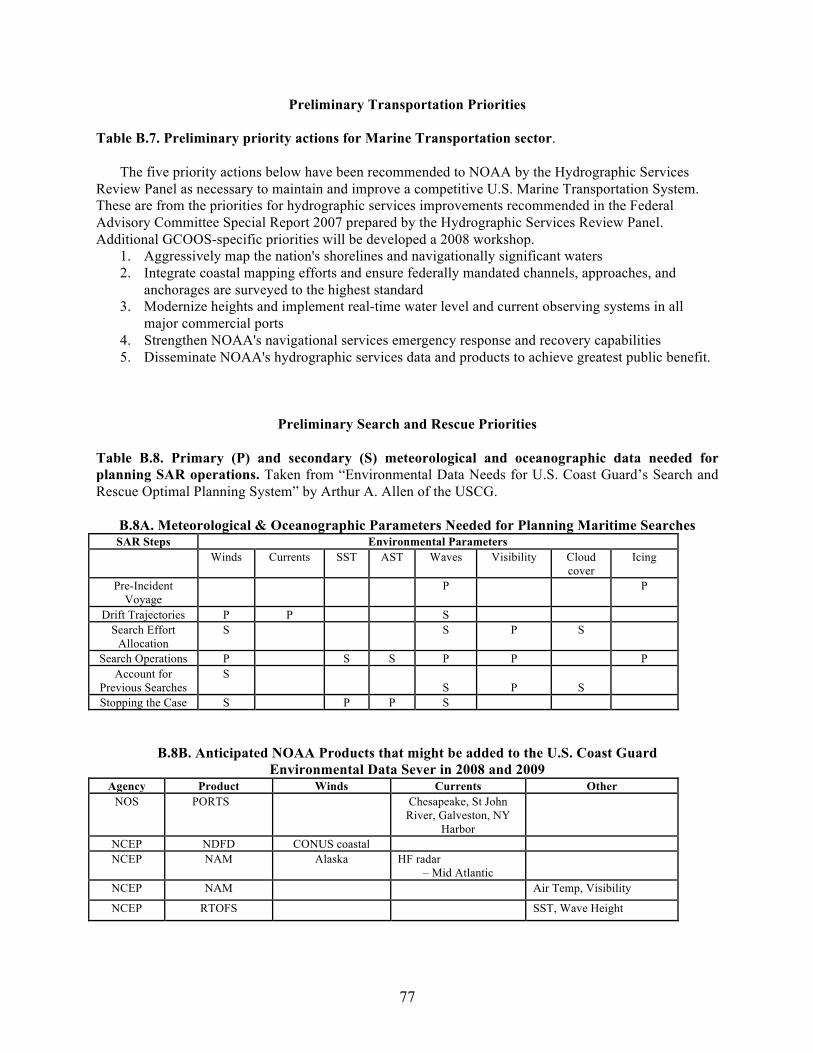
77
Preliminary Transportation Priorities Table B.7. Preliminary priority actions for Marine Transportation sector.
The five priority actions below have been recommended to NOAA by the Hydrographic Services Review Panel as necessary to maintain and improve a competitive U.S. Marine Transportation System. These are from the priorities for hydrographic services improvements recommended in the Federal Advisory Committee Special Report 2007 prepared by the Hydrographic Services Review Panel. Additional GCOOS-specific priorities will be developed a 2008 workshop.
1. Aggressively map the nation's shorelines and navigationally significant waters 2. Integrate coastal mapping efforts and ensure federally mandated channels, approaches, and
anchorages are surveyed to the highest standard 3. Modernize heights and implement real-time water level and current observing systems in all
major commercial ports 4. Strengthen NOAA's navigational services emergency response and recovery capabilities 5. Disseminate NOAA's hydrographic services data and products to achieve greatest public benefit.
Preliminary Search and Rescue Priorities Table B.8. Primary (P) and secondary (S) meteorological and oceanographic data needed for planning SAR operations. Taken from “Environmental Data Needs for U.S. Coast Guard’s Search and Rescue Optimal Planning System” by Arthur A. Allen of the USCG.
B.8A. Meteorological & Oceanographic Parameters Needed for Planning Maritime Searches SAR Steps Environmental Parameters
Winds Currents SST AST Waves Visibility Cloud cover
Icing
Pre-Incident Voyage
P P
Drift Trajectories P P S Search Effort
Allocation S S P S
Search Operations P S S P P P Account for
Previous Searches S
S
P
S
Stopping the Case S P P S
B.8B. Anticipated NOAA Products that might be added to the U.S. Coast Guard Environmental Data Sever in 2008 and 2009
Agency Product Winds Currents Other NOS PORTS Chesapeake, St John
River, Galveston, NY Harbor
NCEP NDFD CONUS coastal NCEP NAM Alaska HF radar
– Mid Atlantic
NCEP NAM Air Temp, Visibility
NCEP RTOFS SST, Wave Height
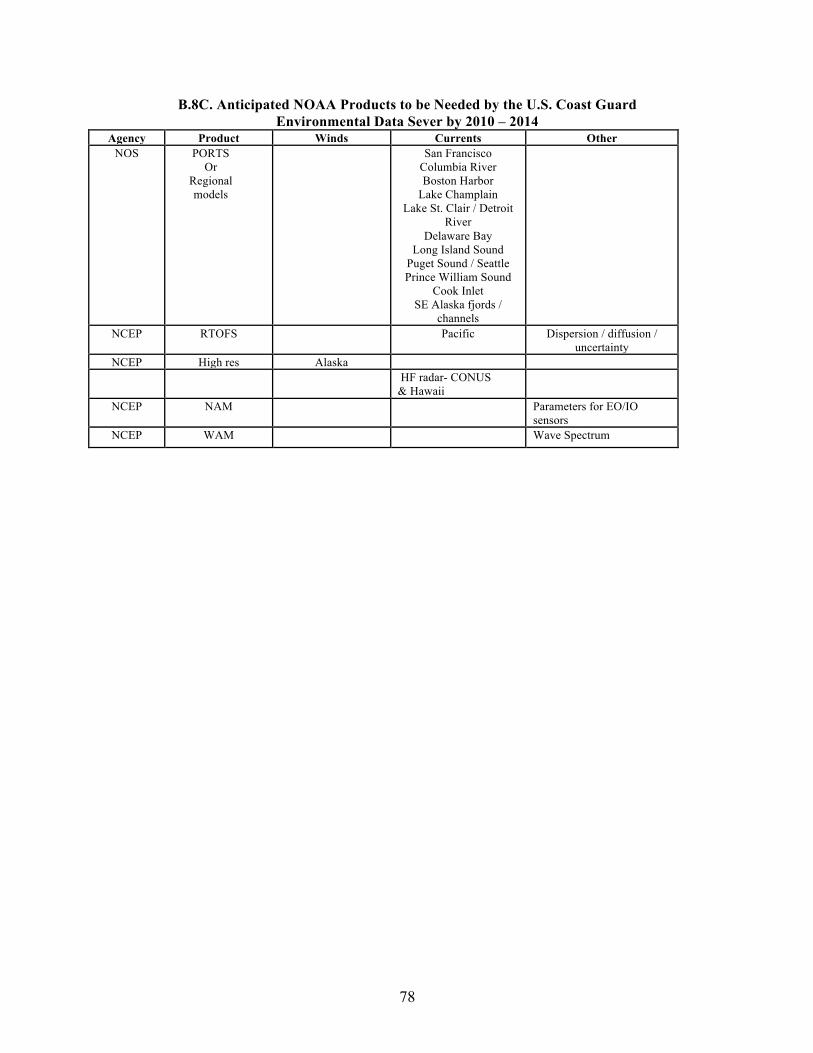
78
B.8C. Anticipated NOAA Products to be Needed by the U.S. Coast Guard Environmental Data Sever by 2010 – 2014
Agency Product Winds Currents Other NOS PORTS
Or Regional models
San Francisco Columbia River Boston Harbor
Lake Champlain Lake St. Clair / Detroit
River Delaware Bay
Long Island Sound Puget Sound / Seattle Prince William Sound
Cook Inlet SE Alaska fjords /
channels
NCEP RTOFS Pacific Dispersion / diffusion / uncertainty
NCEP High res Alaska HF radar- CONUS
& Hawaii
NCEP NAM Parameters for EO/IO sensors
NCEP WAM Wave Spectrum
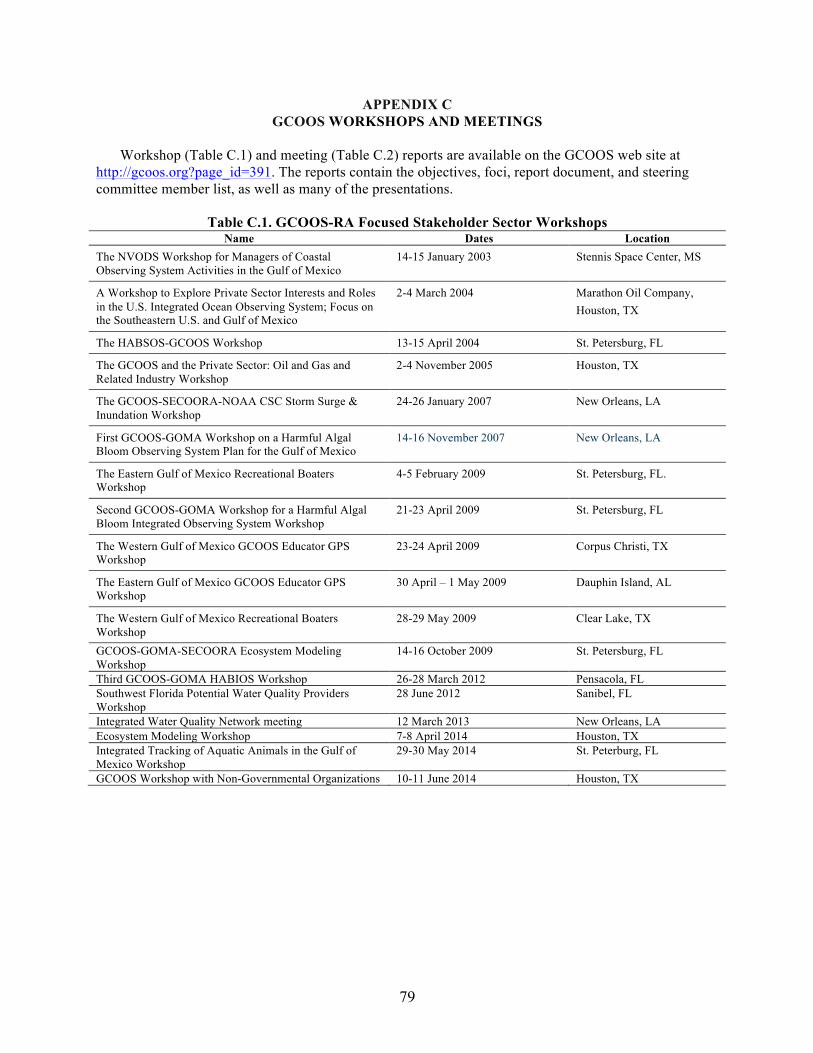
79
APPENDIX C GCOOS WORKSHOPS AND MEETINGS
Workshop (Table C.1) and meeting (Table C.2) reports are available on the GCOOS web site at
http://gcoos.org?page_id=391. The reports contain the objectives, foci, report document, and steering committee member list, as well as many of the presentations.
Table C.1. GCOOS-RA Focused Stakeholder Sector Workshops Name Dates Location
The NVODS Workshop for Managers of Coastal Observing System Activities in the Gulf of Mexico
14-15 January 2003 Stennis Space Center, MS
A Workshop to Explore Private Sector Interests and Roles in the U.S. Integrated Ocean Observing System; Focus on the Southeastern U.S. and Gulf of Mexico
2-4 March 2004 Marathon Oil Company, Houston, TX
The HABSOS-GCOOS Workshop 13-15 April 2004 St. Petersburg, FL
The GCOOS and the Private Sector: Oil and Gas and Related Industry Workshop
2-4 November 2005 Houston, TX
The GCOOS-SECOORA-NOAA CSC Storm Surge & Inundation Workshop
24-26 January 2007 New Orleans, LA
First GCOOS-GOMA Workshop on a Harmful Algal Bloom Observing System Plan for the Gulf of Mexico
14-16 November 2007 New Orleans, LA
The Eastern Gulf of Mexico Recreational Boaters Workshop
4-5 February 2009 St. Petersburg, FL.
Second GCOOS-GOMA Workshop for a Harmful Algal Bloom Integrated Observing System Workshop
21-23 April 2009 St. Petersburg, FL
The Western Gulf of Mexico GCOOS Educator GPS Workshop
23-24 April 2009 Corpus Christi, TX
The Eastern Gulf of Mexico GCOOS Educator GPS Workshop
30 April – 1 May 2009 Dauphin Island, AL
The Western Gulf of Mexico Recreational Boaters Workshop
28-29 May 2009 Clear Lake, TX
GCOOS-GOMA-SECOORA Ecosystem Modeling Workshop
14-16 October 2009 St. Petersburg, FL
Third GCOOS-GOMA HABIOS Workshop 26-28 March 2012 Pensacola, FL Southwest Florida Potential Water Quality Providers Workshop
28 June 2012 Sanibel, FL
Integrated Water Quality Network meeting 12 March 2013 New Orleans, LA Ecosystem Modeling Workshop 7-8 April 2014 Houston, TX Integrated Tracking of Aquatic Animals in the Gulf of Mexico Workshop
29-30 May 2014 St. Peterburg, FL
GCOOS Workshop with Non-Governmental Organizations 10-11 June 2014 Houston, TX
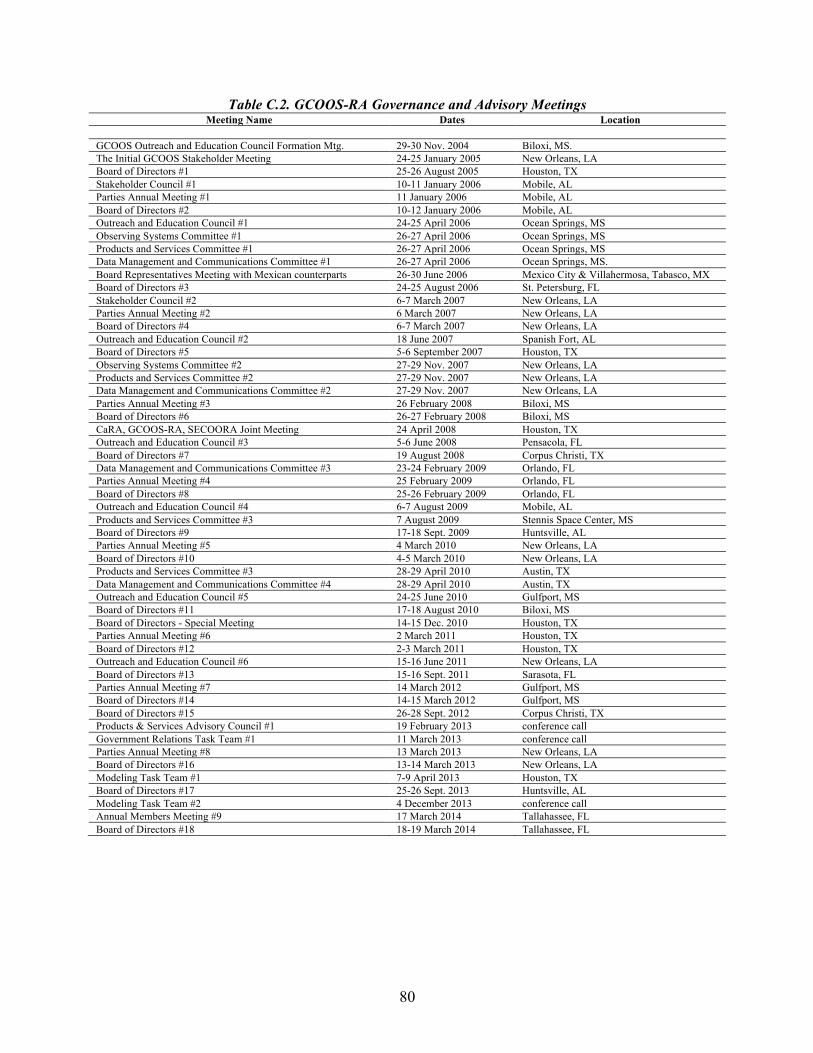
80
Table C.2. GCOOS-RA Governance and Advisory Meetings Meeting Name Dates Location
GCOOS Outreach and Education Council Formation Mtg. 29-30 Nov. 2004 Biloxi, MS. The Initial GCOOS Stakeholder Meeting 24-25 January 2005 New Orleans, LA Board of Directors #1 25-26 August 2005 Houston, TX Stakeholder Council #1 10-11 January 2006 Mobile, AL Parties Annual Meeting #1 11 January 2006 Mobile, AL Board of Directors #2 10-12 January 2006 Mobile, AL Outreach and Education Council #1 24-25 April 2006 Ocean Springs, MS Observing Systems Committee #1 26-27 April 2006 Ocean Springs, MS Products and Services Committee #1 26-27 April 2006 Ocean Springs, MS Data Management and Communications Committee #1 26-27 April 2006 Ocean Springs, MS. Board Representatives Meeting with Mexican counterparts 26-30 June 2006 Mexico City & Villahermosa, Tabasco, MX Board of Directors #3 24-25 August 2006 St. Petersburg, FL Stakeholder Council #2 6-7 March 2007 New Orleans, LA Parties Annual Meeting #2 6 March 2007 New Orleans, LA Board of Directors #4 6-7 March 2007 New Orleans, LA Outreach and Education Council #2 18 June 2007 Spanish Fort, AL Board of Directors #5 5-6 September 2007 Houston, TX Observing Systems Committee #2 27-29 Nov. 2007 New Orleans, LA Products and Services Committee #2 27-29 Nov. 2007 New Orleans, LA Data Management and Communications Committee #2 27-29 Nov. 2007 New Orleans, LA Parties Annual Meeting #3 26 February 2008 Biloxi, MS Board of Directors #6 26-27 February 2008 Biloxi, MS CaRA, GCOOS-RA, SECOORA Joint Meeting 24 April 2008 Houston, TX Outreach and Education Council #3 5-6 June 2008 Pensacola, FL Board of Directors #7 19 August 2008 Corpus Christi, TX Data Management and Communications Committee #3 23-24 February 2009 Orlando, FL Parties Annual Meeting #4 25 February 2009 Orlando, FL Board of Directors #8 25-26 February 2009 Orlando, FL Outreach and Education Council #4 6-7 August 2009 Mobile, AL Products and Services Committee #3 7 August 2009 Stennis Space Center, MS Board of Directors #9 17-18 Sept. 2009 Huntsville, AL Parties Annual Meeting #5 4 March 2010 New Orleans, LA Board of Directors #10 4-5 March 2010 New Orleans, LA Products and Services Committee #3 28-29 April 2010 Austin, TX Data Management and Communications Committee #4 28-29 April 2010 Austin, TX Outreach and Education Council #5 24-25 June 2010 Gulfport, MS Board of Directors #11 17-18 August 2010 Biloxi, MS Board of Directors - Special Meeting 14-15 Dec. 2010 Houston, TX Parties Annual Meeting #6 2 March 2011 Houston, TX Board of Directors #12 2-3 March 2011 Houston, TX Outreach and Education Council #6 15-16 June 2011 New Orleans, LA Board of Directors #13 15-16 Sept. 2011 Sarasota, FL Parties Annual Meeting #7 14 March 2012 Gulfport, MS Board of Directors #14 14-15 March 2012 Gulfport, MS Board of Directors #15 26-28 Sept. 2012 Corpus Christi, TX Products & Services Advisory Council #1 19 February 2013 conference call Government Relations Task Team #1 11 March 2013 conference call Parties Annual Meeting #8 13 March 2013 New Orleans, LA Board of Directors #16 13-14 March 2013 New Orleans, LA Modeling Task Team #1 7-9 April 2013 Houston, TX Board of Directors #17 25-26 Sept. 2013 Huntsville, AL Modeling Task Team #2 4 December 2013 conference call Annual Members Meeting #9 17 March 2014 Tallahassee, FL Board of Directors #18 18-19 March 2014 Tallahassee, FL
81
APPENDIX D SUGGESTED INITIAL ENHANCEMENTS TO THE GULF OBSERVING SYSTEM
These enhancements to the system aim to fill the most important gaps in the existing observing
system at a relatively modest cost. An attempt has been made to ‘seize the low hanging fruit’ by upgrading some of the existing buoy systems, building on previous HFR sites, and adding cross-shelf mooring arrays to existing moorings. In developing these enhancements, we chose to include only elements that were needed for a wide range of users and were not dependent upon development of specific local requirements.
The enhancements were developed from the detailed plans for the 17 elements summarized in the text of this Build-out Plan. Those elements were developed independently of each other so no cost or organizational synergies between elements were exploited. For example, the hypoxia and HAB elements call for AUV surveys that are largely a subset of the AUV surveys contained in the overall glider/AUV element. This description of enhancements pulls many of the requirements together into a unified whole that minimizes duplication and avoids overestimates of the cost of the total program.
Critical to achieving this enhanced system is the maintenance of existing capabilities. This includes both the federal (e.g., NDBC buoys, C-MAN weather stations, PORTS®, satellites, river discharge stations) and non-federal (e.g., state agencies, academic/research institutions, nongovernmental organizations, private industry) data sources. We assume here that the current level of funding for the federal measurement activities will continue to be supported at an inflation-adjusted rate. The budget for these enhances does not include the funding needed to maintain existing federal measurements. We also assume that the current funding from other present sources, such as the petroleum industry, will continue to be supported; and their costs are not included.
This plan for enhancements focuses on populating the shelf, slope, and deepwater portions of the northern Gulf of Mexico with stations sufficient to fill the gaps in the federal system of measurements. Shallow water measurements, such as in estuaries and bays, are not included because, although very important, these are specific local measurements targeted for specific requirements (e.g., monitoring for compliance with nutrient criteria) that depend on agreements of the local community to determine what measurements are necessary. Therefore, the budget does not include the funding needed to maintain existing shallow water measuring sites.
This plan also includes initial enhancements for broader ecosystem monitoring to include more observations for living marine resources, habitats, and restoration projects. These enhancements are detailed in Table D.3.
Phased Implementation Action Steps: There are three action steps to implementation of this
enhancement plan. The first step is to maintain existing observing systems for surface currents, subsurface currents, hypoxia, and HABs. The second is to enhance existing stations with needed new measurements, such as hydrocarbon detection parameters for Gulf Restoration monitoring. The third step is to add stations to fill the largest gaps.
Existing Resources: Figure D1a shows locations of existing moored stations that are part of the
GCOOS. The letter in the marker denotes the entity currently supporting that station. The existing non-federal stations, many of which are in jeopardy of being removed, should be maintained so the existing capability of the GCOOS is not diminished. These existing stations include moorings on the TX (10), LA (9), MS (2), AL (6), and FL (22) shelves and estuaries. Two of the stations over the Louisiana shelf include capabilities for monitoring hypoxia. In the central and western Gulf are a number of oil and gas platforms that measure currents (Figure D.1b); currents also are measured at drilling rigs, but only temporarily while the drilling activities are being undertaken. These industry measurements are an important component of the current measurement system; however, this budget does not include the costs to maintain or enhance these capabilities.
82
There are 3 existing HFR networks in the Gulf of Mexico (Figure D.1c) that provides surface currents from near shore out to about 150 km offshore: one is over the MS-AL-FL panhandle shelf (3 stations), another is over the west Florida shelf (3 stations), and the third is in the vicinity of Miami (3 stations). The costs of the Gulf's HFR network may be higher than estimated in the national plan25 because (1) infrastructure costs are expected to be higher than average in the low-lying ground of LA and TX; (2) hurricane replacement costs throughout the Gulf coast are expected to be high; and (3) four locations in Texas were removed after the national plan had included them in the plan as existing resources.
There are four HAB-related networks (not shown). One is a phytoplankton imaging station at Port Aransas, TX. Another is a mooring and a set of AUVs equipped with optical phytoplankton detectors that are deployed off Sarasota, FL. A third is the Harmful Algal Bloom Marine Observation Network (HABMON) of the Fish and Wildlife Research Institute, FL Fish and Wildlife Conservation Commission. All three are in jeopardy of being shut down due to lack of funding. The fourth network is the Beach Monitoring System, originally covering 33 FL beaches, that provides early warning of poor water quality or HAB events; beach coverage is being reduced due to lack of funding. Additional existing capabilities include AUVs that are deployed sporadically off MS and TX-LA when funding allows.
Total cost to maintain the existing non-federal, non-industry moorings and HFR stations (Figure D.1) is estimated at approximately $4M per year, including operation and maintenance (O&M) costs and replacement costs. The goal is to enhance these existing capabilities through the addition of new sensors, such as dissolved oxygen as a hypoxia indicator or CDOM as a hydrocarbon detector proxy, to their existing sensor suites. This would add approximately $500K per year for sensor purchase, incorporation into moorings, and O&M.
New Resources Needed: The recommended enhancements (Figure D.2) include the addition of new
stations to those already existing. New moorings are required at 35 locations on the priority cross-shelf transects, and 3 moorings are needed to fill the large gaps in the deepwater of the eastern Gulf. Two existing moorings should be upgraded to hypoxia moorings and 6 new hypoxia moorings should be added (Figure D.3). These can serve also as cross-shelf moored stations. Thirty-four new HFR sites are needed to provide surface currents over much of the shelf.
25http://www.ioos.noaa.gov/library/surfacecurrentplan9_3lowres.pdf
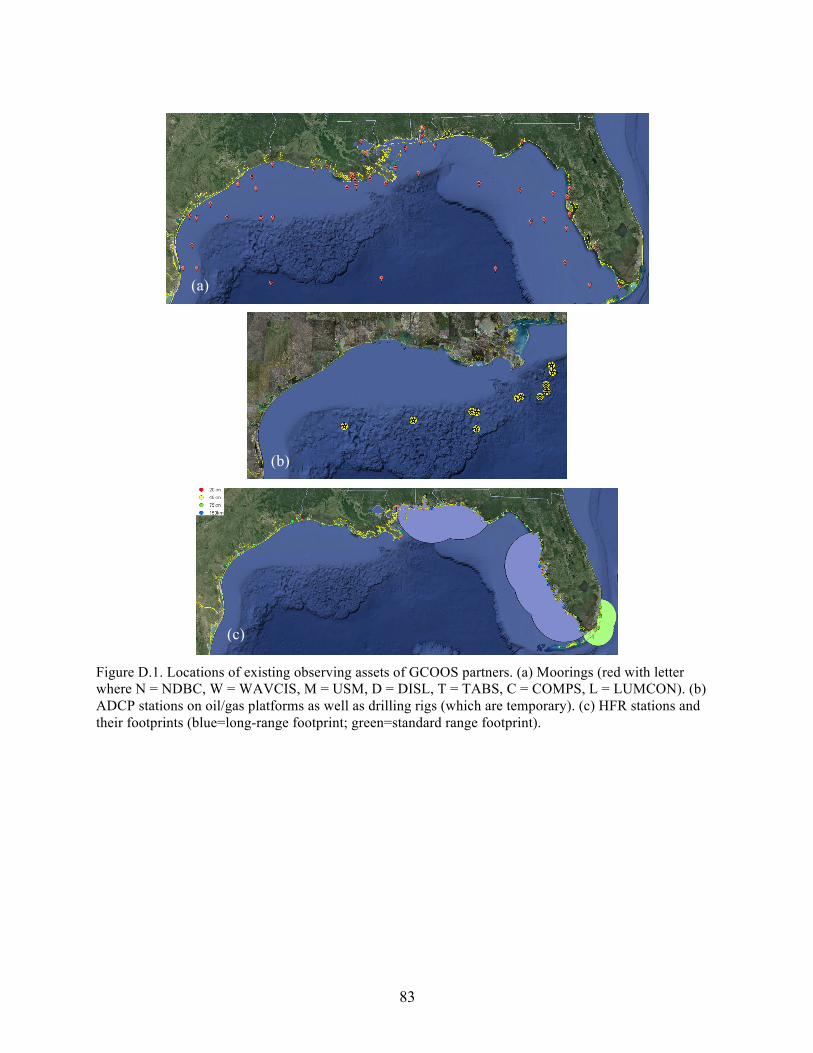
83
Figure D.1. Locations of existing observing assets of GCOOS partners. (a) Moorings (red with letter where N = NDBC, W = WAVCIS, M = USM, D = DISL, T = TABS, C = COMPS, L = LUMCON). (b) ADCP stations on oil/gas platforms as well as drilling rigs (which are temporary). (c) HFR stations and their footprints (blue=long-range footprint; green=standard range footprint).
(a)
(c)
(b)
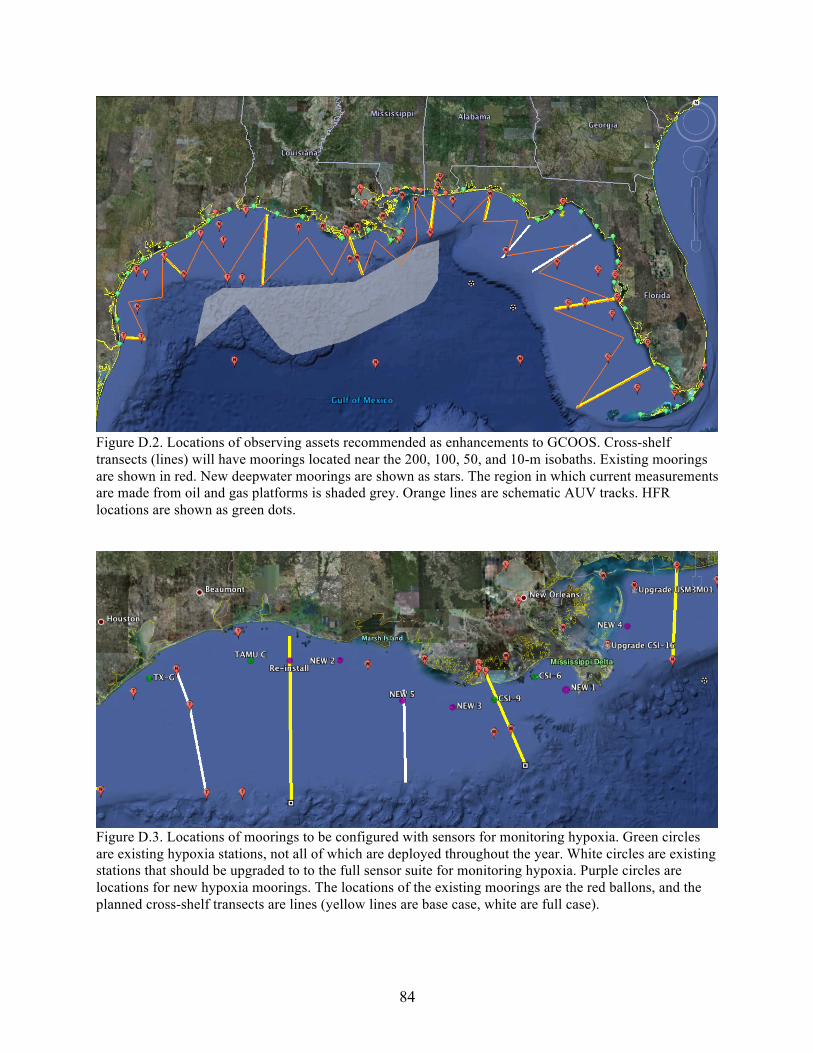
84
Figure D.2. Locations of observing assets recommended as enhancements to GCOOS. Cross-shelf transects (lines) will have moorings located near the 200, 100, 50, and 10-m isobaths. Existing moorings are shown in red. New deepwater moorings are shown as stars. The region in which current measurements are made from oil and gas platforms is shaded grey. Orange lines are schematic AUV tracks. HFR locations are shown as green dots.
Figure D.3. Locations of moorings to be configured with sensors for monitoring hypoxia. Green circles are existing hypoxia stations, not all of which are deployed throughout the year. White circles are existing stations that should be upgraded to to the full sensor suite for monitoring hypoxia. Purple circles are locations for new hypoxia moorings. The locations of the existing moorings are the red ballons, and the planned cross-shelf transects are lines (yellow lines are base case, white are full case).
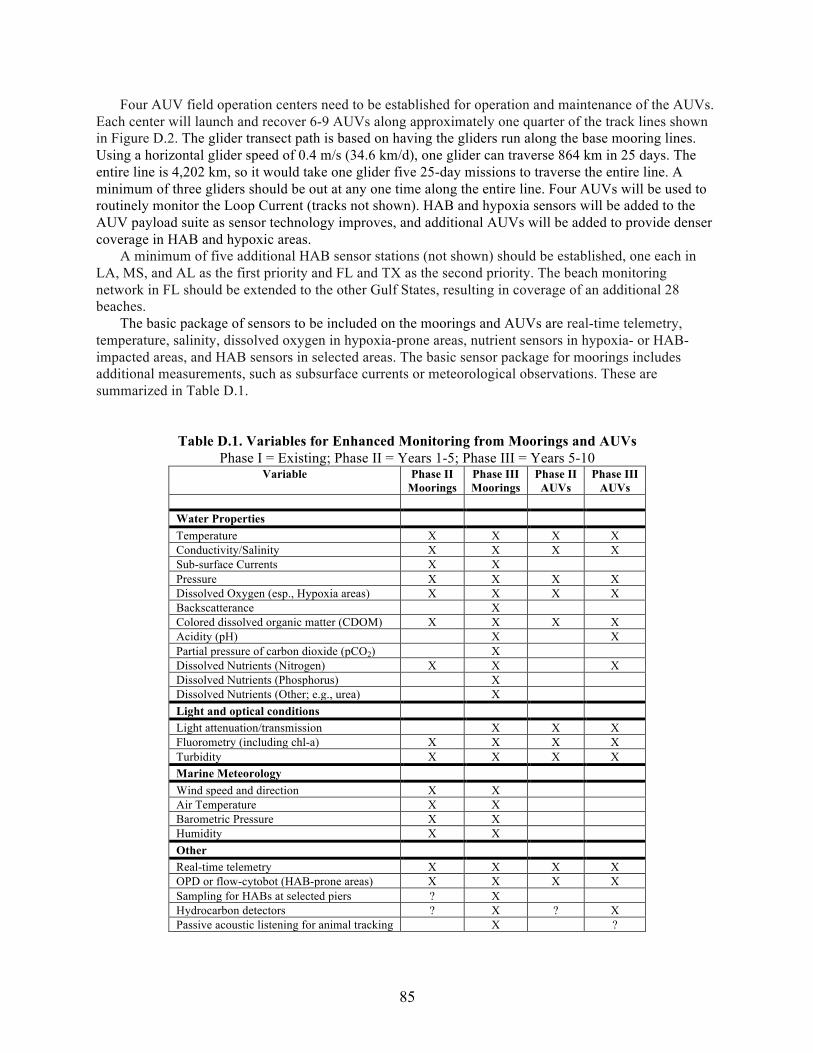
85
Four AUV field operation centers need to be established for operation and maintenance of the AUVs. Each center will launch and recover 6-9 AUVs along approximately one quarter of the track lines shown in Figure D.2. The glider transect path is based on having the gliders run along the base mooring lines. Using a horizontal glider speed of 0.4 m/s (34.6 km/d), one glider can traverse 864 km in 25 days. The entire line is 4,202 km, so it would take one glider five 25-day missions to traverse the entire line. A minimum of three gliders should be out at any one time along the entire line. Four AUVs will be used to routinely monitor the Loop Current (tracks not shown). HAB and hypoxia sensors will be added to the AUV payload suite as sensor technology improves, and additional AUVs will be added to provide denser coverage in HAB and hypoxic areas.
A minimum of five additional HAB sensor stations (not shown) should be established, one each in LA, MS, and AL as the first priority and FL and TX as the second priority. The beach monitoring network in FL should be extended to the other Gulf States, resulting in coverage of an additional 28 beaches.
The basic package of sensors to be included on the moorings and AUVs are real-time telemetry, temperature, salinity, dissolved oxygen in hypoxia-prone areas, nutrient sensors in hypoxia- or HAB-impacted areas, and HAB sensors in selected areas. The basic sensor package for moorings includes additional measurements, such as subsurface currents or meteorological observations. These are summarized in Table D.1.
Table D.1. Variables for Enhanced Monitoring from Moorings and AUVs Phase I = Existing; Phase II = Years 1-5; Phase III = Years 5-10
Variable Phase II Moorings
Phase III Moorings
Phase II AUVs
Phase III AUVs
Water Properties Temperature X X X X Conductivity/Salinity X X X X Sub-surface Currents X X Pressure X X X X Dissolved Oxygen (esp., Hypoxia areas) X X X X Backscatterance X Colored dissolved organic matter (CDOM) X X X X Acidity (pH) X X Partial pressure of carbon dioxide (pCO2) X Dissolved Nutrients (Nitrogen) X X X Dissolved Nutrients (Phosphorus) X Dissolved Nutrients (Other; e.g., urea) X Light and optical conditions Light attenuation/transmission X X X Fluorometry (including chl-a) X X X X Turbidity X X X X Marine Meteorology Wind speed and direction X X Air Temperature X X Barometric Pressure X X Humidity X X Other Real-time telemetry X X X X OPD or flow-cytobot (HAB-prone areas) X X X X Sampling for HABs at selected piers ? X Hydrocarbon detectors ? X ? X Passive acoustic listening for animal tracking X ?
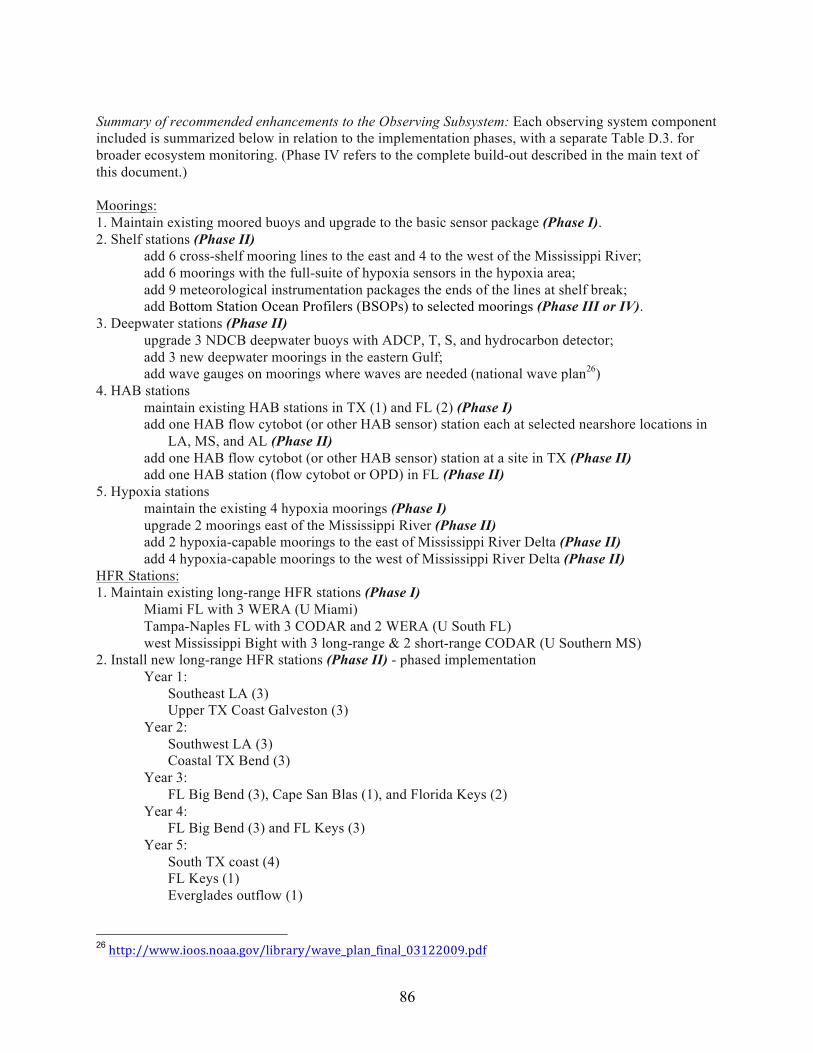
86
Summary of recommended enhancements to the Observing Subsystem: Each observing system component included is summarized below in relation to the implementation phases, with a separate Table D.3. for broader ecosystem monitoring. (Phase IV refers to the complete build-out described in the main text of this document.) Moorings: 1. Maintain existing moored buoys and upgrade to the basic sensor package (Phase I). 2. Shelf stations (Phase II)
add 6 cross-shelf mooring lines to the east and 4 to the west of the Mississippi River; add 6 moorings with the full-suite of hypoxia sensors in the hypoxia area; add 9 meteorological instrumentation packages the ends of the lines at shelf break; add Bottom Station Ocean Profilers (BSOPs) to selected moorings (Phase III or IV).
3. Deepwater stations (Phase II) upgrade 3 NDCB deepwater buoys with ADCP, T, S, and hydrocarbon detector; add 3 new deepwater moorings in the eastern Gulf; add wave gauges on moorings where waves are needed (national wave plan26)
4. HAB stations maintain existing HAB stations in TX (1) and FL (2) (Phase I) add one HAB flow cytobot (or other HAB sensor) station each at selected nearshore locations in
LA, MS, and AL (Phase II) add one HAB flow cytobot (or other HAB sensor) station at a site in TX (Phase II) add one HAB station (flow cytobot or OPD) in FL (Phase II)
5. Hypoxia stations maintain the existing 4 hypoxia moorings (Phase I) upgrade 2 moorings east of the Mississippi River (Phase II) add 2 hypoxia-capable moorings to the east of Mississippi River Delta (Phase II) add 4 hypoxia-capable moorings to the west of Mississippi River Delta (Phase II)
HFR Stations: 1. Maintain existing long-range HFR stations (Phase I)
Miami FL with 3 WERA (U Miami) Tampa-Naples FL with 3 CODAR and 2 WERA (U South FL) west Mississippi Bight with 3 long-range & 2 short-range CODAR (U Southern MS)
2. Install new long-range HFR stations (Phase II) - phased implementation Year 1: Southeast LA (3) Upper TX Coast Galveston (3) Year 2: Southwest LA (3) Coastal TX Bend (3) Year 3: FL Big Bend (3), Cape San Blas (1), and Florida Keys (2) Year 4: FL Big Bend (3) and FL Keys (3) Year 5: South TX coast (4) FL Keys (1) Everglades outflow (1)
26http://www.ioos.noaa.gov/library/wave_plan_final_03122009.pdf
87
3. Install short-range HFR stations (Phase III) – not in base case plan Locations and numbers to be determined
AUVs: 1. Maintain existing glider operations (Mote, USM) (Phase I) 2. Upgrade payloads on existing platforms (Phase I)
CTD, DO, CDOM, Chlorophyll, Turbidity, and, for selected AUVs, OPD 3. Add 11 gliders for conveyor belt coverage (Phase II) 4. Add 4 gliders to map the deep waters and the Loop Current (Phase II) 5. Upgrade with HAB sensors when available after R&D (Phase II or III) Beach Monitoring: 1. Maintain existing network (33 beaches in FL) (Phase I) 2. Expand to Louisiana (6), Mississippi (6), Alabama (6) (Phase II) 3. Expand to Texas (20) and Florida (10) (Phase II)
Budget for Enhancements: Estimates of the capital and O&M costs for the base case GCOOS are summarized in Table D.2. The capital costs associated with the existing resources are not included, but the annual O&M costs are included. Neither the capital nor the annual O&M costs associated with the oil and gas current measurements or with any federal measurements are included. Additional subsystems of GCOOS include modeling, outreach and stakeholder engagement, and governance. Estimates for the recommended initial enhancements are approximately $21M in capital costs and $20M in annual replacement and operating costs. Additional cost estimates for broader ecosystem monitoring are included in Table D.3.
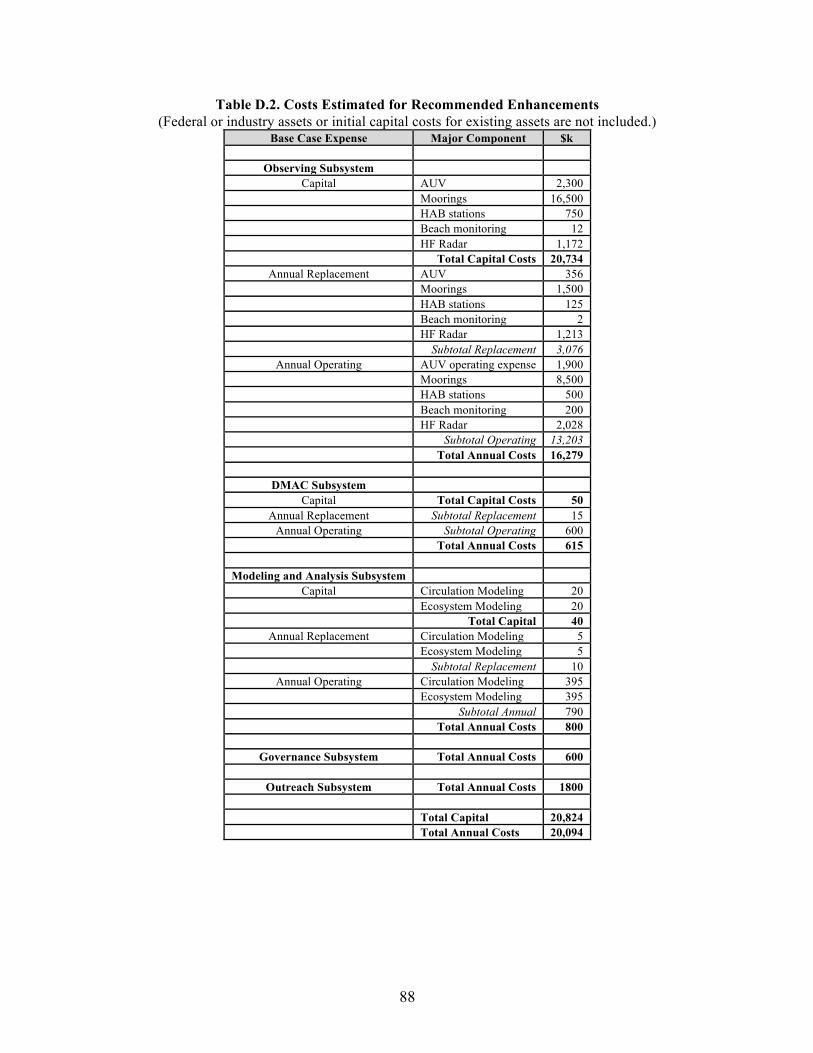
88
Table D.2. Costs Estimated for Recommended Enhancements (Federal or industry assets or initial capital costs for existing assets are not included.)
Base Case Expense Major Component $k
Observing Subsystem Capital AUV 2,300
Moorings 16,500 HAB stations 750 Beach monitoring 12 HF Radar 1,172 Total Capital Costs 20,734
Annual Replacement AUV 356 Moorings 1,500 HAB stations 125 Beach monitoring 2 HF Radar 1,213 Subtotal Replacement 3,076
Annual Operating AUV operating expense 1,900 Moorings 8,500 HAB stations 500 Beach monitoring 200 HF Radar 2,028 Subtotal Operating 13,203 Total Annual Costs 16,279
DMAC Subsystem Capital Total Capital Costs 50
Annual Replacement Subtotal Replacement 15 Annual Operating Subtotal Operating 600
Total Annual Costs 615
Modeling and Analysis Subsystem Capital Circulation Modeling 20
Ecosystem Modeling 20 Total Capital 40
Annual Replacement Circulation Modeling 5 Ecosystem Modeling 5 Subtotal Replacement 10
Annual Operating Circulation Modeling 395 Ecosystem Modeling 395 Subtotal Annual 790 Total Annual Costs 800
Governance Subsystem Total Annual Costs 600
Outreach Subsystem Total Annual Costs 1800 Total Capital 20,824 Total Annual Costs 20,094
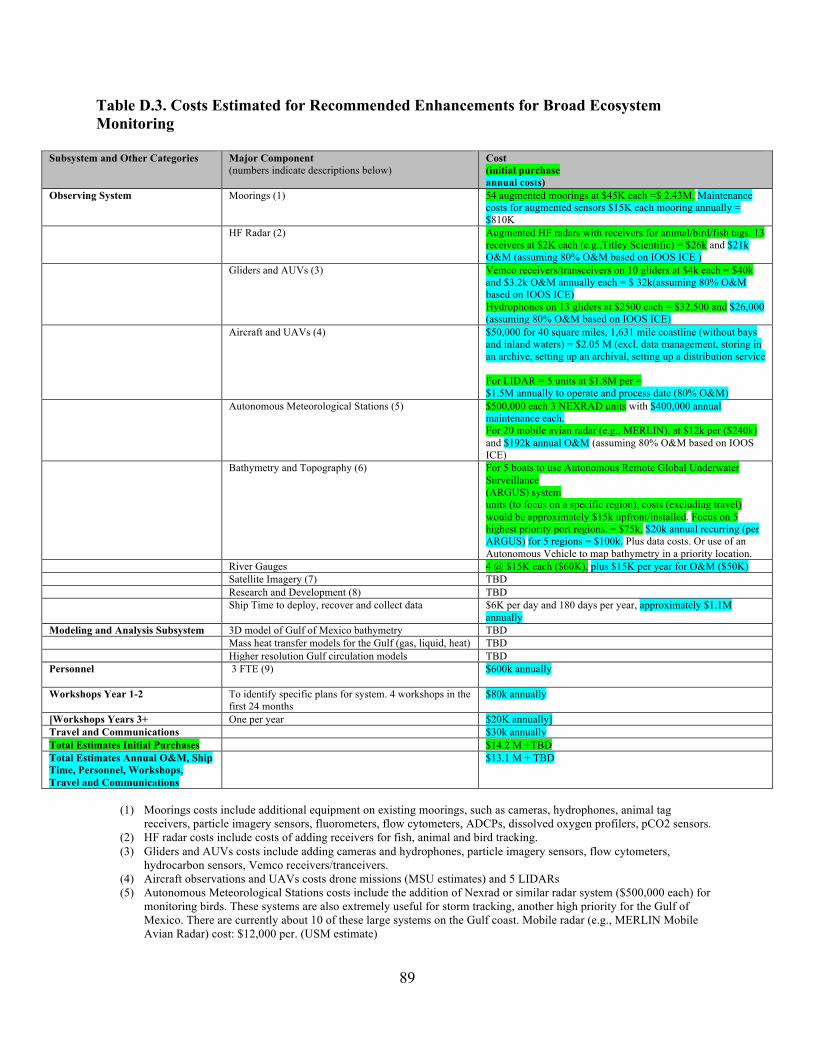
89
Table D.3. Costs Estimated for Recommended Enhancements for Broad Ecosystem Monitoring
Subsystem and Other Categories Major Component (numbers indicate descriptions below)
Cost (initial purchase annual costs)
Observing System Moorings (1) 54 augmented moorings at $45K each =$ 2.43M. Maintenance costs for augmented sensors $15K each mooring annually = $810K
HF Radar (2) Augmented HF radars with receivers for animal/bird/fish tags. 13 receivers at $2K each (e.g.,Titley Scientific) = $26k and $21k O&M (assuming 80% O&M based on IOOS ICE )
Gliders and AUVs (3) Vemco receivers/transceivers on 10 gliders at $4k each = $40k and $3.2k O&M annually each = $ 32k(assuming 80% O&M based on IOOS ICE) Hydrophones on 13 gliders at $2500 each = $32,500 and $26,000 (assuming 80% O&M based on IOOS ICE)
Aircraft and UAVs (4) $50,000 for 40 square miles, 1,631 mile coastline (without bays and inland waters) = $2.05 M (excl. data management, storing in an archive, setting up an archival, setting up a distribution service For LIDAR = 5 units at $1.8M per = $1.5M annually to operate and process date (80% O&M)
Autonomous Meteorological Stations (5) $500,000 each 3 NEXRAD units with $400,000 annual maintenance each. For 20 mobile avian radar (e.g., MERLIN), at $12k per ($240k) and $192k annual O&M (assuming 80% O&M based on IOOS ICE)
Bathymetry and Topography (6) For 5 boats to use Autonomous Remote Global Underwater Surveillance (ARGUS) system units (to focus on a specific region), costs (excluding travel) would be approximately $15k upfront/installed. Focus on 5 highest priority port regions. = $75k, $20k annual recurring (per ARGUS) for 5 regions = $100k. Plus data costs. Or use of an Autonomous Vehicle to map bathymetry in a priority location.
River Gauges 4 @ $15K each ($60K), plus $15K per year for O&M ($50K) Satellite Imagery (7) TBD Research and Development (8) TBD Ship Time to deploy, recover and collect data $6K per day and 180 days per year, approximately $1.1M
annually Modeling and Analysis Subsystem 3D model of Gulf of Mexico bathymetry TBD Mass heat transfer models for the Gulf (gas, liquid, heat) TBD Higher resolution Gulf circulation models TBD Personnel
3 FTE (9) $600k annually
Workshops Year 1-2 To identify specific plans for system. 4 workshops in the first 24 months
$80k annually
[Workshops Years 3+ One per year $20K annually] Travel and Communications $30k annually Total Estimates Initial Purchases $14.2 M +TBD Total Estimates Annual O&M, Ship Time, Personnel, Workshops, Travel and Communications
$13.1 M + TBD
(1) Moorings costs include additional equipment on existing moorings, such as cameras, hydrophones, animal tag
receivers, particle imagery sensors, fluorometers, flow cytometers, ADCPs, dissolved oxygen profilers, pCO2 sensors. (2) HF radar costs include costs of adding receivers for fish, animal and bird tracking. (3) Gliders and AUVs costs include adding cameras and hydrophones, particle imagery sensors, flow cytometers,
hydrocarbon sensors, Vemco receivers/tranceivers. (4) Aircraft observations and UAVs costs drone missions (MSU estimates) and 5 LIDARs (5) Autonomous Meteorological Stations costs include the addition of Nexrad or similar radar system ($500,000 each) for
monitoring birds. These systems are also extremely useful for storm tracking, another high priority for the Gulf of Mexico. There are currently about 10 of these large systems on the Gulf coast. Mobile radar (e.g., MERLIN Mobile Avian Radar) cost: $12,000 per. (USM estimate)
90
(6) Bathymetry and topography costs include use of crowdsourcing to provide real-time bathymetric data on spatial and temporal scales to complement nautical charts (after van Norden et al., 2013) and the development of integrated benthic habitat map products. For 5 boats (to focus on a specific region as a pilot), costs (excluding travel) would be approximately $15,000 upfront/installed and $20,000 annual recurring. Benthic map products costs TBD.
(7) Satellite Imagery costs include additional images showing land cover changes, frontal boundaries, chlorophyll, SSH, and Loop Current.
(8) Research and Development on limitations of biological sensors including biofouling, physical size and power requirement. Additionally, development of new sensor packages that use pre-processing (matching algorithms, etc.) to help reduce data intensity of acoustics data.
Personnel costs estimated at 3 FTEs at an average of $200k each per year over 10 years. This includes 1 FTE for overall coordination, 1 FTE for workshops and communications, and 1 FTE for DMAC enhancements associated with new types of ecosystem monitoring data and new data providers.
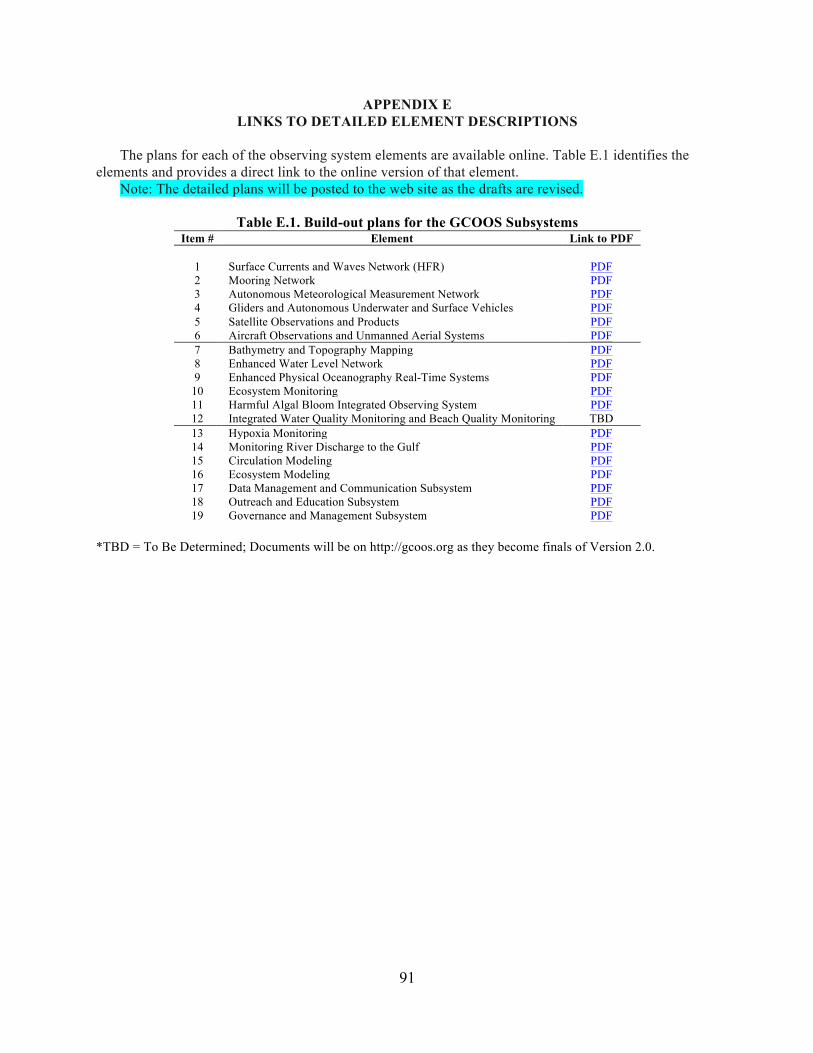
91
APPENDIX E LINKS TO DETAILED ELEMENT DESCRIPTIONS
The plans for each of the observing system elements are available online. Table E.1 identifies the
elements and provides a direct link to the online version of that element. Note: The detailed plans will be posted to the web site as the drafts are revised.
Table E.1. Build-out plans for the GCOOS Subsystems
Item # Element Link to PDF
1 Surface Currents and Waves Network (HFR) PDF 2 Mooring Network PDF 3 Autonomous Meteorological Measurement Network PDF 4 Gliders and Autonomous Underwater and Surface Vehicles PDF 5 Satellite Observations and Products PDF 6 Aircraft Observations and Unmanned Aerial Systems PDF 7 Bathymetry and Topography Mapping PDF 8 Enhanced Water Level Network PDF 9 Enhanced Physical Oceanography Real-Time Systems PDF
10 Ecosystem Monitoring PDF 11 Harmful Algal Bloom Integrated Observing System PDF 12 Integrated Water Quality Monitoring and Beach Quality Monitoring TBD 13 Hypoxia Monitoring PDF 14 Monitoring River Discharge to the Gulf PDF 15 Circulation Modeling PDF 16 Ecosystem Modeling PDF 17 Data Management and Communication Subsystem PDF 18 Outreach and Education Subsystem PDF 19 Governance and Management Subsystem PDF
*TBD = To Be Determined; Documents will be on http://gcoos.org as they become finals of Version 2.0.
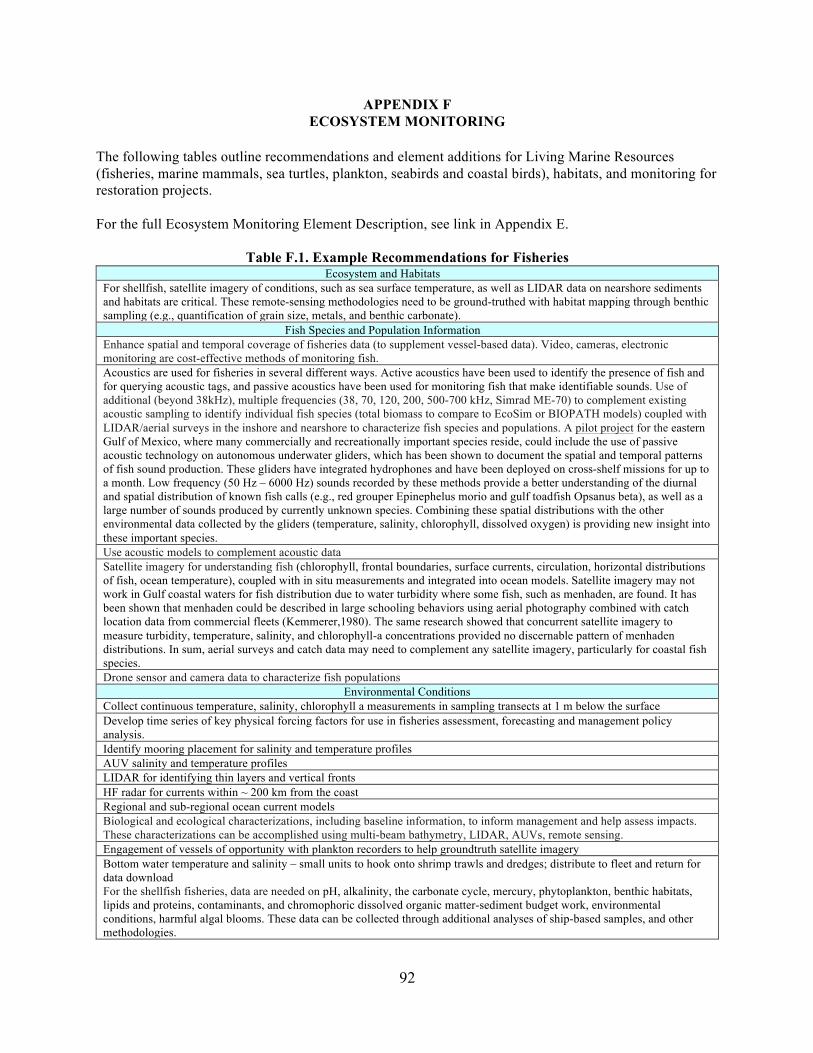
92
APPENDIX F ECOSYSTEM MONITORING
The following tables outline recommendations and element additions for Living Marine Resources (fisheries, marine mammals, sea turtles, plankton, seabirds and coastal birds), habitats, and monitoring for restoration projects. For the full Ecosystem Monitoring Element Description, see link in Appendix E.
Table F.1. Example Recommendations for Fisheries Ecosystem and Habitats For shellfish, satellite imagery of conditions, such as sea surface temperature, as well as LIDAR data on nearshore sediments and habitats are critical. These remote-sensing methodologies need to be ground-truthed with habitat mapping through benthic sampling (e.g., quantification of grain size, metals, and benthic carbonate). Fish Species and Population Information Enhance spatial and temporal coverage of fisheries data (to supplement vessel-based data). Video, cameras, electronic monitoring are cost-effective methods of monitoring fish. Acoustics are used for fisheries in several different ways. Active acoustics have been used to identify the presence of fish and for querying acoustic tags, and passive acoustics have been used for monitoring fish that make identifiable sounds. Use of additional (beyond 38kHz), multiple frequencies (38, 70, 120, 200, 500-700 kHz, Simrad ME-70) to complement existing acoustic sampling to identify individual fish species (total biomass to compare to EcoSim or BIOPATH models) coupled with LIDAR/aerial surveys in the inshore and nearshore to characterize fish species and populations. A pilot project for the eastern Gulf of Mexico, where many commercially and recreationally important species reside, could include the use of passive acoustic technology on autonomous underwater gliders, which has been shown to document the spatial and temporal patterns of fish sound production. These gliders have integrated hydrophones and have been deployed on cross-shelf missions for up to a month. Low frequency (50 Hz – 6000 Hz) sounds recorded by these methods provide a better understanding of the diurnal and spatial distribution of known fish calls (e.g., red grouper Epinephelus morio and gulf toadfish Opsanus beta), as well as a large number of sounds produced by currently unknown species. Combining these spatial distributions with the other environmental data collected by the gliders (temperature, salinity, chlorophyll, dissolved oxygen) is providing new insight into these important species. Use acoustic models to complement acoustic data Satellite imagery for understanding fish (chlorophyll, frontal boundaries, surface currents, circulation, horizontal distributions of fish, ocean temperature), coupled with in situ measurements and integrated into ocean models. Satellite imagery may not work in Gulf coastal waters for fish distribution due to water turbidity where some fish, such as menhaden, are found. It has been shown that menhaden could be described in large schooling behaviors using aerial photography combined with catch location data from commercial fleets (Kemmerer,1980). The same research showed that concurrent satellite imagery to measure turbidity, temperature, salinity, and chlorophyll-a concentrations provided no discernable pattern of menhaden distributions. In sum, aerial surveys and catch data may need to complement any satellite imagery, particularly for coastal fish species. Drone sensor and camera data to characterize fish populations
Environmental Conditions Collect continuous temperature, salinity, chlorophyll a measurements in sampling transects at 1 m below the surface Develop time series of key physical forcing factors for use in fisheries assessment, forecasting and management policy analysis. Identify mooring placement for salinity and temperature profiles AUV salinity and temperature profiles LIDAR for identifying thin layers and vertical fronts HF radar for currents within ~ 200 km from the coast Regional and sub-regional ocean current models Biological and ecological characterizations, including baseline information, to inform management and help assess impacts. These characterizations can be accomplished using multi-beam bathymetry, LIDAR, AUVs, remote sensing. Engagement of vessels of opportunity with plankton recorders to help groundtruth satellite imagery Bottom water temperature and salinity – small units to hook onto shrimp trawls and dredges; distribute to fleet and return for data download For the shellfish fisheries, data are needed on pH, alkalinity, the carbonate cycle, mercury, phytoplankton, benthic habitats, lipids and proteins, contaminants, and chromophoric dissolved organic matter-sediment budget work, environmental conditions, harmful algal blooms. These data can be collected through additional analyses of ship-based samples, and other methodologies.
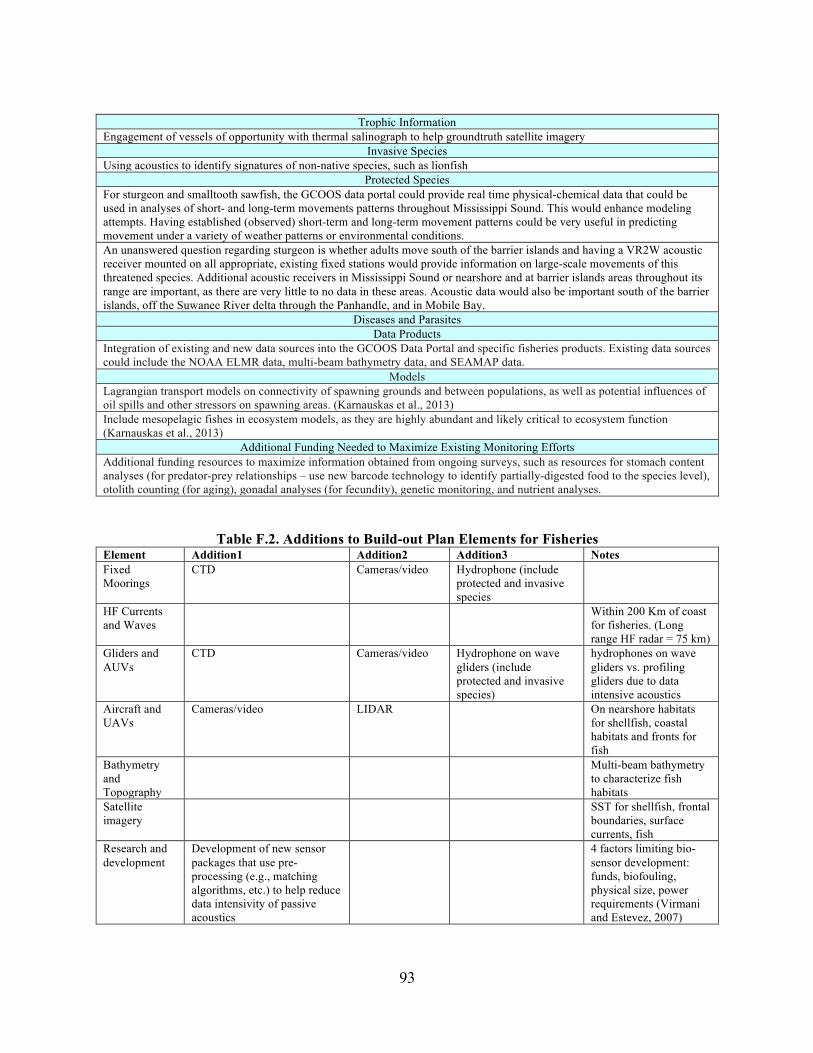
93
Trophic Information
Engagement of vessels of opportunity with thermal salinograph to help groundtruth satellite imagery Invasive Species
Using acoustics to identify signatures of non-native species, such as lionfish Protected Species
For sturgeon and smalltooth sawfish, the GCOOS data portal could provide real time physical-chemical data that could be used in analyses of short- and long-term movements patterns throughout Mississippi Sound. This would enhance modeling attempts. Having established (observed) short-term and long-term movement patterns could be very useful in predicting movement under a variety of weather patterns or environmental conditions. An unanswered question regarding sturgeon is whether adults move south of the barrier islands and having a VR2W acoustic receiver mounted on all appropriate, existing fixed stations would provide information on large-scale movements of this threatened species. Additional acoustic receivers in Mississippi Sound or nearshore and at barrier islands areas throughout its range are important, as there are very little to no data in these areas. Acoustic data would also be important south of the barrier islands, off the Suwanee River delta through the Panhandle, and in Mobile Bay.
Diseases and Parasites Data Products
Integration of existing and new data sources into the GCOOS Data Portal and specific fisheries products. Existing data sources could include the NOAA ELMR data, multi-beam bathymetry data, and SEAMAP data.
Models Lagrangian transport models on connectivity of spawning grounds and between populations, as well as potential influences of oil spills and other stressors on spawning areas. (Karnauskas et al., 2013) Include mesopelagic fishes in ecosystem models, as they are highly abundant and likely critical to ecosystem function (Karnauskas et al., 2013)
Additional Funding Needed to Maximize Existing Monitoring Efforts Additional funding resources to maximize information obtained from ongoing surveys, such as resources for stomach content analyses (for predator-prey relationships – use new barcode technology to identify partially-digested food to the species level), otolith counting (for aging), gonadal analyses (for fecundity), genetic monitoring, and nutrient analyses.
Table F.2. Additions to Build-out Plan Elements for Fisheries Element Addition1 Addition2 Addition3 Notes Fixed Moorings
CTD Cameras/video Hydrophone (include protected and invasive species
HF Currents and Waves
Within 200 Km of coast for fisheries. (Long range HF radar = 75 km)
Gliders and AUVs
CTD Cameras/video Hydrophone on wave gliders (include protected and invasive species)
hydrophones on wave gliders vs. profiling gliders due to data intensive acoustics
Aircraft and UAVs
Cameras/video LIDAR On nearshore habitats for shellfish, coastal habitats and fronts for fish
Bathymetry and Topography
Multi-beam bathymetry to characterize fish habitats
Satellite imagery
SST for shellfish, frontal boundaries, surface currents, fish
Research and development
Development of new sensor packages that use pre-processing (e.g., matching algorithms, etc.) to help reduce data intensivity of passive acoustics
4 factors limiting bio-sensor development: funds, biofouling, physical size, power requirements (Virmani and Estevez, 2007)
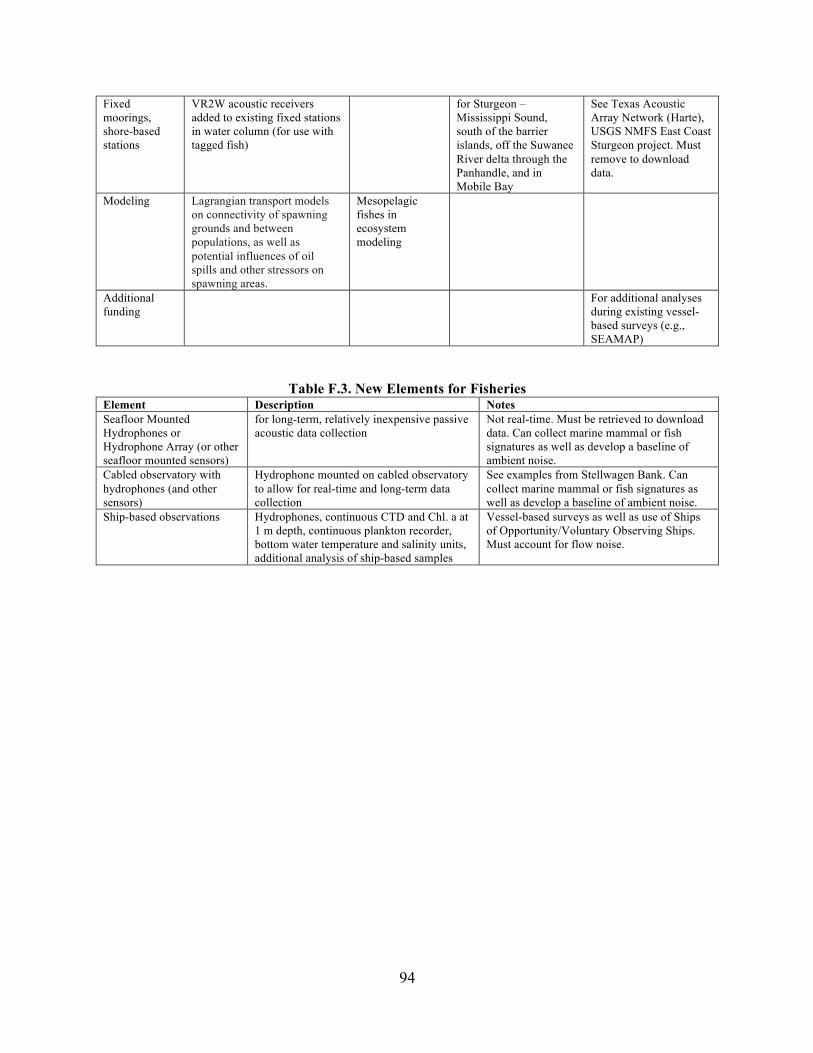
94
Fixed moorings, shore-based stations
VR2W acoustic receivers added to existing fixed stations in water column (for use with tagged fish)
for Sturgeon – Mississippi Sound, south of the barrier islands, off the Suwanee River delta through the Panhandle, and in Mobile Bay
See Texas Acoustic Array Network (Harte), USGS NMFS East Coast Sturgeon project. Must remove to download data.
Modeling Lagrangian transport models on connectivity of spawning grounds and between populations, as well as potential influences of oil spills and other stressors on spawning areas.
Mesopelagic fishes in ecosystem modeling
Additional funding
For additional analyses during existing vessel-based surveys (e.g., SEAMAP)
Table F.3. New Elements for Fisheries Element Description Notes Seafloor Mounted Hydrophones or Hydrophone Array (or other seafloor mounted sensors)
for long-term, relatively inexpensive passive acoustic data collection
Not real-time. Must be retrieved to download data. Can collect marine mammal or fish signatures as well as develop a baseline of ambient noise.
Cabled observatory with hydrophones (and other sensors)
Hydrophone mounted on cabled observatory to allow for real-time and long-term data collection
See examples from Stellwagen Bank. Can collect marine mammal or fish signatures as well as develop a baseline of ambient noise.
Ship-based observations Hydrophones, continuous CTD and Chl. a at 1 m depth, continuous plankton recorder, bottom water temperature and salinity units, additional analysis of ship-based samples
Vessel-based surveys as well as use of Ships of Opportunity/Voluntary Observing Ships. Must account for flow noise.
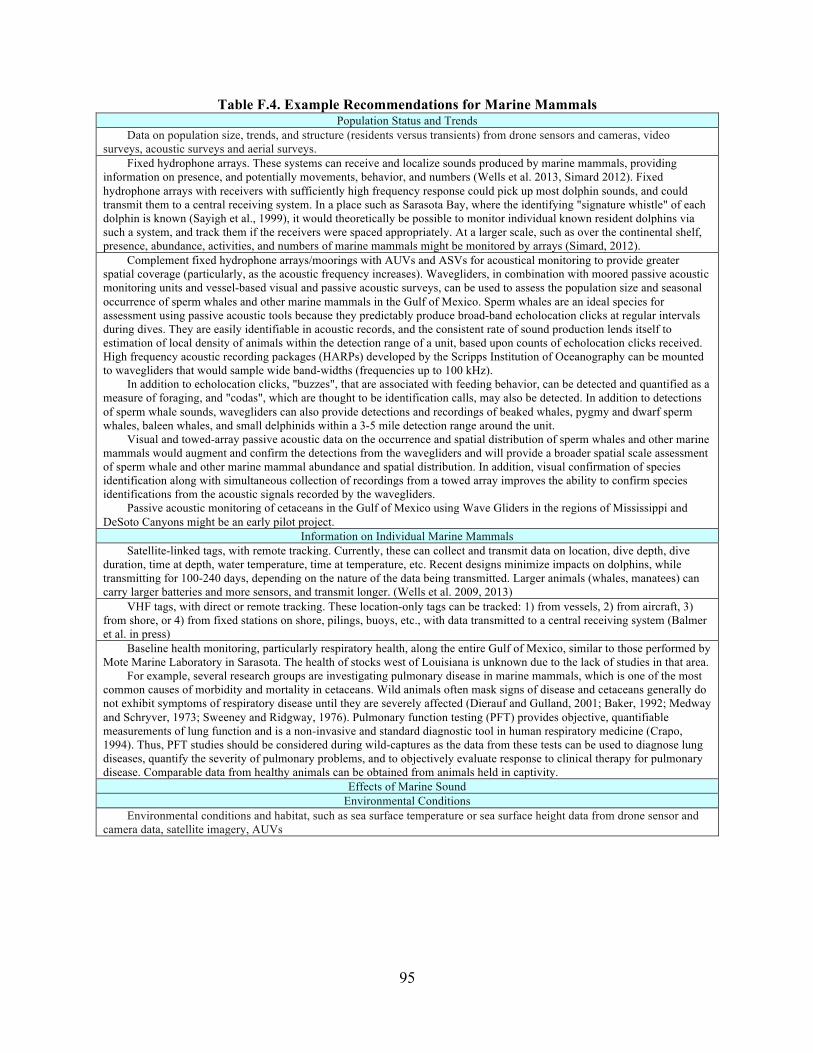
95
Table F.4. Example Recommendations for Marine Mammals Population Status and Trends
Data on population size, trends, and structure (residents versus transients) from drone sensors and cameras, video surveys, acoustic surveys and aerial surveys.
Fixed hydrophone arrays. These systems can receive and localize sounds produced by marine mammals, providing information on presence, and potentially movements, behavior, and numbers (Wells et al. 2013, Simard 2012). Fixed hydrophone arrays with receivers with sufficiently high frequency response could pick up most dolphin sounds, and could transmit them to a central receiving system. In a place such as Sarasota Bay, where the identifying "signature whistle" of each dolphin is known (Sayigh et al., 1999), it would theoretically be possible to monitor individual known resident dolphins via such a system, and track them if the receivers were spaced appropriately. At a larger scale, such as over the continental shelf, presence, abundance, activities, and numbers of marine mammals might be monitored by arrays (Simard, 2012).
Complement fixed hydrophone arrays/moorings with AUVs and ASVs for acoustical monitoring to provide greater spatial coverage (particularly, as the acoustic frequency increases). Wavegliders, in combination with moored passive acoustic monitoring units and vessel-based visual and passive acoustic surveys, can be used to assess the population size and seasonal occurrence of sperm whales and other marine mammals in the Gulf of Mexico. Sperm whales are an ideal species for assessment using passive acoustic tools because they predictably produce broad-band echolocation clicks at regular intervals during dives. They are easily identifiable in acoustic records, and the consistent rate of sound production lends itself to estimation of local density of animals within the detection range of a unit, based upon counts of echolocation clicks received. High frequency acoustic recording packages (HARPs) developed by the Scripps Institution of Oceanography can be mounted to wavegliders that would sample wide band-widths (frequencies up to 100 kHz).
In addition to echolocation clicks, "buzzes", that are associated with feeding behavior, can be detected and quantified as a measure of foraging, and "codas", which are thought to be identification calls, may also be detected. In addition to detections of sperm whale sounds, wavegliders can also provide detections and recordings of beaked whales, pygmy and dwarf sperm whales, baleen whales, and small delphinids within a 3-5 mile detection range around the unit.
Visual and towed-array passive acoustic data on the occurrence and spatial distribution of sperm whales and other marine mammals would augment and confirm the detections from the wavegliders and will provide a broader spatial scale assessment of sperm whale and other marine mammal abundance and spatial distribution. In addition, visual confirmation of species identification along with simultaneous collection of recordings from a towed array improves the ability to confirm species identifications from the acoustic signals recorded by the wavegliders.
Passive acoustic monitoring of cetaceans in the Gulf of Mexico using Wave Gliders in the regions of Mississippi and DeSoto Canyons might be an early pilot project.
Information on Individual Marine Mammals Satellite-linked tags, with remote tracking. Currently, these can collect and transmit data on location, dive depth, dive
duration, time at depth, water temperature, time at temperature, etc. Recent designs minimize impacts on dolphins, while transmitting for 100-240 days, depending on the nature of the data being transmitted. Larger animals (whales, manatees) can carry larger batteries and more sensors, and transmit longer. (Wells et al. 2009, 2013)
VHF tags, with direct or remote tracking. These location-only tags can be tracked: 1) from vessels, 2) from aircraft, 3) from shore, or 4) from fixed stations on shore, pilings, buoys, etc., with data transmitted to a central receiving system (Balmer et al. in press)
Baseline health monitoring, particularly respiratory health, along the entire Gulf of Mexico, similar to those performed by Mote Marine Laboratory in Sarasota. The health of stocks west of Louisiana is unknown due to the lack of studies in that area.
For example, several research groups are investigating pulmonary disease in marine mammals, which is one of the most common causes of morbidity and mortality in cetaceans. Wild animals often mask signs of disease and cetaceans generally do not exhibit symptoms of respiratory disease until they are severely affected (Dierauf and Gulland, 2001; Baker, 1992; Medway and Schryver, 1973; Sweeney and Ridgway, 1976). Pulmonary function testing (PFT) provides objective, quantifiable measurements of lung function and is a non-invasive and standard diagnostic tool in human respiratory medicine (Crapo, 1994). Thus, PFT studies should be considered during wild-captures as the data from these tests can be used to diagnose lung diseases, quantify the severity of pulmonary problems, and to objectively evaluate response to clinical therapy for pulmonary disease. Comparable data from healthy animals can be obtained from animals held in captivity.
Effects of Marine Sound Environmental Conditions
Environmental conditions and habitat, such as sea surface temperature or sea surface height data from drone sensor and camera data, satellite imagery, AUVs
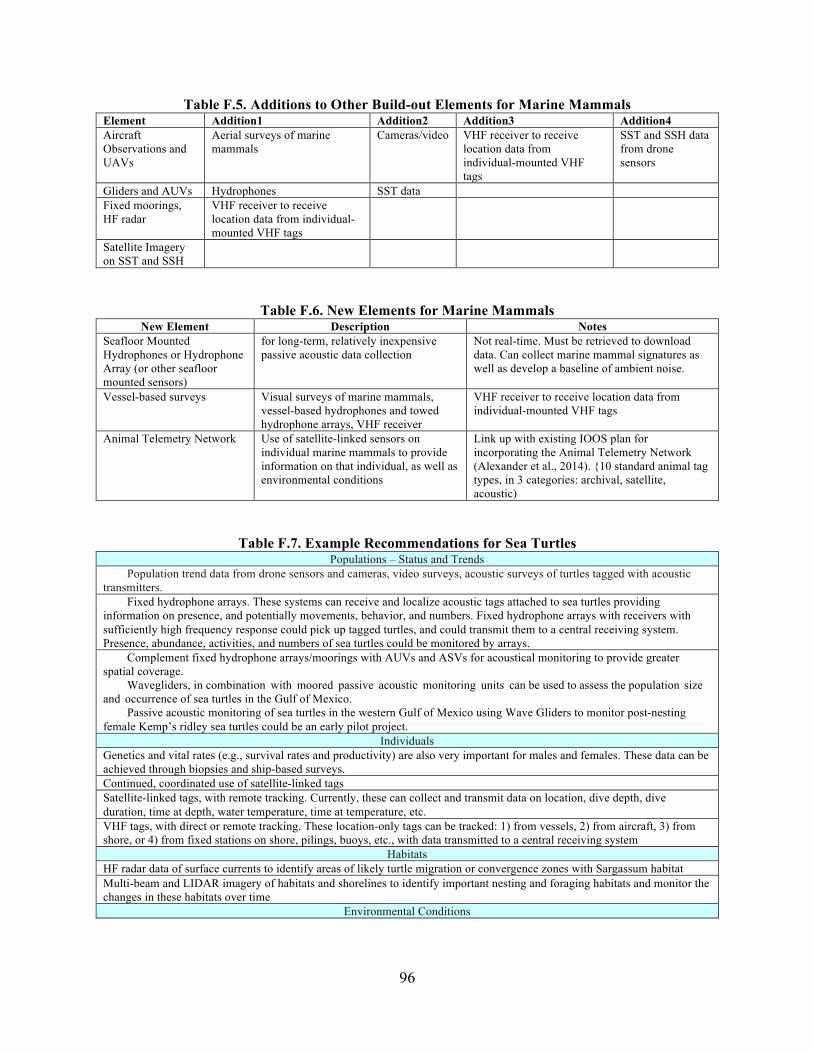
96
Table F.5. Additions to Other Build-out Elements for Marine Mammals Element Addition1 Addition2 Addition3 Addition4 Aircraft Observations and UAVs
Aerial surveys of marine mammals
Cameras/video VHF receiver to receive location data from individual-mounted VHF tags
SST and SSH data from drone sensors
Gliders and AUVs Hydrophones SST data Fixed moorings, HF radar
VHF receiver to receive location data from individual-mounted VHF tags
Satellite Imagery on SST and SSH
Table F.6. New Elements for Marine Mammals New Element Description Notes
Seafloor Mounted Hydrophones or Hydrophone Array (or other seafloor mounted sensors)
for long-term, relatively inexpensive passive acoustic data collection
Not real-time. Must be retrieved to download data. Can collect marine mammal signatures as well as develop a baseline of ambient noise.
Vessel-based surveys Visual surveys of marine mammals, vessel-based hydrophones and towed hydrophone arrays, VHF receiver
VHF receiver to receive location data from individual-mounted VHF tags
Animal Telemetry Network Use of satellite-linked sensors on individual marine mammals to provide information on that individual, as well as environmental conditions
Link up with existing IOOS plan for incorporating the Animal Telemetry Network (Alexander et al., 2014). {10 standard animal tag types, in 3 categories: archival, satellite, acoustic)
Table F.7. Example Recommendations for Sea Turtles Populations – Status and Trends
Population trend data from drone sensors and cameras, video surveys, acoustic surveys of turtles tagged with acoustic transmitters.
Fixed hydrophone arrays. These systems can receive and localize acoustic tags attached to sea turtles providing information on presence, and potentially movements, behavior, and numbers. Fixed hydrophone arrays with receivers with sufficiently high frequency response could pick up tagged turtles, and could transmit them to a central receiving system. Presence, abundance, activities, and numbers of sea turtles could be monitored by arrays.
Complement fixed hydrophone arrays/moorings with AUVs and ASVs for acoustical monitoring to provide greater spatial coverage.
Wavegliders, in combination with moored passive acoustic monitoring units can be used to assess the population size and occurrence of sea turtles in the Gulf of Mexico.
Passive acoustic monitoring of sea turtles in the western Gulf of Mexico using Wave Gliders to monitor post-nesting female Kemp’s ridley sea turtles could be an early pilot project.
Individuals Genetics and vital rates (e.g., survival rates and productivity) are also very important for males and females. These data can be achieved through biopsies and ship-based surveys. Continued, coordinated use of satellite-linked tags Satellite-linked tags, with remote tracking. Currently, these can collect and transmit data on location, dive depth, dive duration, time at depth, water temperature, time at temperature, etc. VHF tags, with direct or remote tracking. These location-only tags can be tracked: 1) from vessels, 2) from aircraft, 3) from shore, or 4) from fixed stations on shore, pilings, buoys, etc., with data transmitted to a central receiving system
Habitats HF radar data of surface currents to identify areas of likely turtle migration or convergence zones with Sargassum habitat Multi-beam and LIDAR imagery of habitats and shorelines to identify important nesting and foraging habitats and monitor the changes in these habitats over time
Environmental Conditions
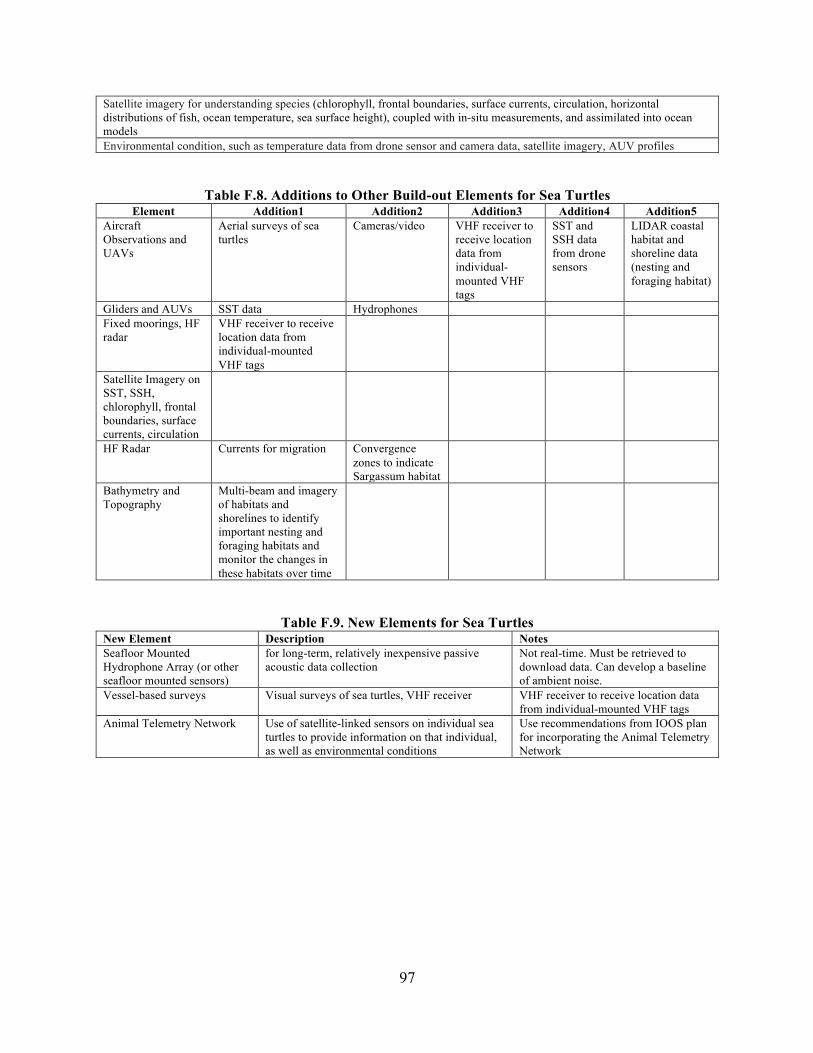
97
Satellite imagery for understanding species (chlorophyll, frontal boundaries, surface currents, circulation, horizontal distributions of fish, ocean temperature, sea surface height), coupled with in-situ measurements, and assimilated into ocean models Environmental condition, such as temperature data from drone sensor and camera data, satellite imagery, AUV profiles
Table F.8. Additions to Other Build-out Elements for Sea Turtles Element Addition1 Addition2 Addition3 Addition4 Addition5
Aircraft Observations and UAVs
Aerial surveys of sea turtles
Cameras/video VHF receiver to receive location data from individual-mounted VHF tags
SST and SSH data from drone sensors
LIDAR coastal habitat and shoreline data (nesting and foraging habitat)
Gliders and AUVs SST data Hydrophones Fixed moorings, HF radar
VHF receiver to receive location data from individual-mounted VHF tags
Satellite Imagery on SST, SSH, chlorophyll, frontal boundaries, surface currents, circulation
HF Radar Currents for migration Convergence zones to indicate Sargassum habitat
Bathymetry and Topography
Multi-beam and imagery of habitats and shorelines to identify important nesting and foraging habitats and monitor the changes in these habitats over time
Table F.9. New Elements for Sea Turtles New Element Description Notes Seafloor Mounted Hydrophone Array (or other seafloor mounted sensors)
for long-term, relatively inexpensive passive acoustic data collection
Not real-time. Must be retrieved to download data. Can develop a baseline of ambient noise.
Vessel-based surveys Visual surveys of sea turtles, VHF receiver VHF receiver to receive location data from individual-mounted VHF tags
Animal Telemetry Network Use of satellite-linked sensors on individual sea turtles to provide information on that individual, as well as environmental conditions
Use recommendations from IOOS plan for incorporating the Animal Telemetry Network

98
Table F.10. Example Recommendations for Plankton Expanded Monitoring
Include monitoring of all plankton (bacteria, phytoplankton, micro-, mero-, and holo-zooplankton). This information is critical to an ecosystem based management approach and essential to understanding the ecosystem impacts of oil spills, hypoxia, HABS, ocean acidification, and overfishing, etc. For example, bacteria play an important role in the degradation of oil. Overfishing has led to trophic cascades, which resulted in decreased zooplankton stocks allowing an increase in harmful algal blooms on the west Florida shelf and other global regions. Ocean acidification is impacting coral reefs and causing financial losses to shellfish fisheries (e.g., oysters). SEAMAP plankton sample collection needs to be continued and analyzed for zooplankton abundance and distribution in addition to ichthyoplankton, using microscopy, imagine system analysis (e.g., Zooscan), and/or genetic markers. Use ocean optics and acoustics as part of observing systems. Tools include: fluorometers, transmissometers, spectrophotometers, scattering sensors, beam attenuation. Flow cytobot-cytometery uses optical properties of individual cells or particles in a flow stream. Other technologies include Continuous Plankton sampler, Flow Cam, Sipper, Next Generation Video Plankton Recorder, OASIS 3D Acoustic Imaging System, WASP wide angle seabed photography system, and MBARIs Microbial molecular technology Environmental Sample Processor. Particle imagery sensors on AUVs and buoys, flow cytometers Automated continuous plankton recorders on ships-of-opportunity A pilot project could include plankton monitoring efforts near the mouths of representative estuaries within the Gulf. These could target recruitment of estuarine dependent species with traditional plankton net collections or with more sophisticated optical detection systems. The monitoring could include phytoplankton biomass as chlorophyll measured continually using in situ fluorometers, and extracted and measured from water samples. For extracted samples, perform size-fractionated chlorophyll measurements – this provides a lot of information about the possible trophic pathways of this primary production for a relatively small effort. The pilot project could also employ high frequency oxygen, temperature, salinity and weather data to calculate Net Ecosystem Metabolism. This provides estimates of Gross Primary Production and community respiration, and is a sound index of the system. In addition to shipboard sampling, it would be useful to obtain observations from mooring or cabled observatories using physical, chemical, and biological sensors. For plankton, sensor/instruments include PAR, spectral radiometers, CDOM fluorescence, chlorophyll fluorescence, optical backscatter, optical attenuation/absorbance spectrophotometer, transmissometer, acoustic and camera systems, Environmental Sample Processor (ESP, McLane), etc.
Habitats and Environmental Conditions Satellite imagery for understanding habitat (chlorophyll a, frontal boundaries, surface currents, Loop Current, circulation, ocean temperature, salinity), and species when combined with in situ measurements, and assimilated into ocean models. For example, hyperspectral ocean color data will help define how the biodiversity of the phytoplankton and particle size distributions change over large areas of the ocean. Chlorophyll fluorescence line height is of critical importance in this process, to identify phytoplankton blooms in coastal, estuarine, and shelf waters where the traditional algorithms for chlorophyll concentration based on blue to green radiance ratios often give erroneous values. This may prove useful to help quantify global ocean ecosystem structure and biodiversity from space for the first time. (Muller-Karger et al., 2013). Use of LIDAR to identify habitats and thin layers, in coordination with other observing assets, such as moored bio-optical profiler arrays, submersible imaging flow cytometers on autonomous profilers. In situ measurements of salinity, oxygen, nutrients, particulate organic carbon/nitrogen, ph, pCO2, alkalinity (ocean acidification parameters), including the use of CTDs with additional profiling instrumentation for oxygen concentrations, nitrate concentrations, and in situ fluorescence HF radar on surface currents to identify transport mechanisms ADCP data on Loop Current
Models Nutrient and plankton models (NPZ) and coupled physical-biological models
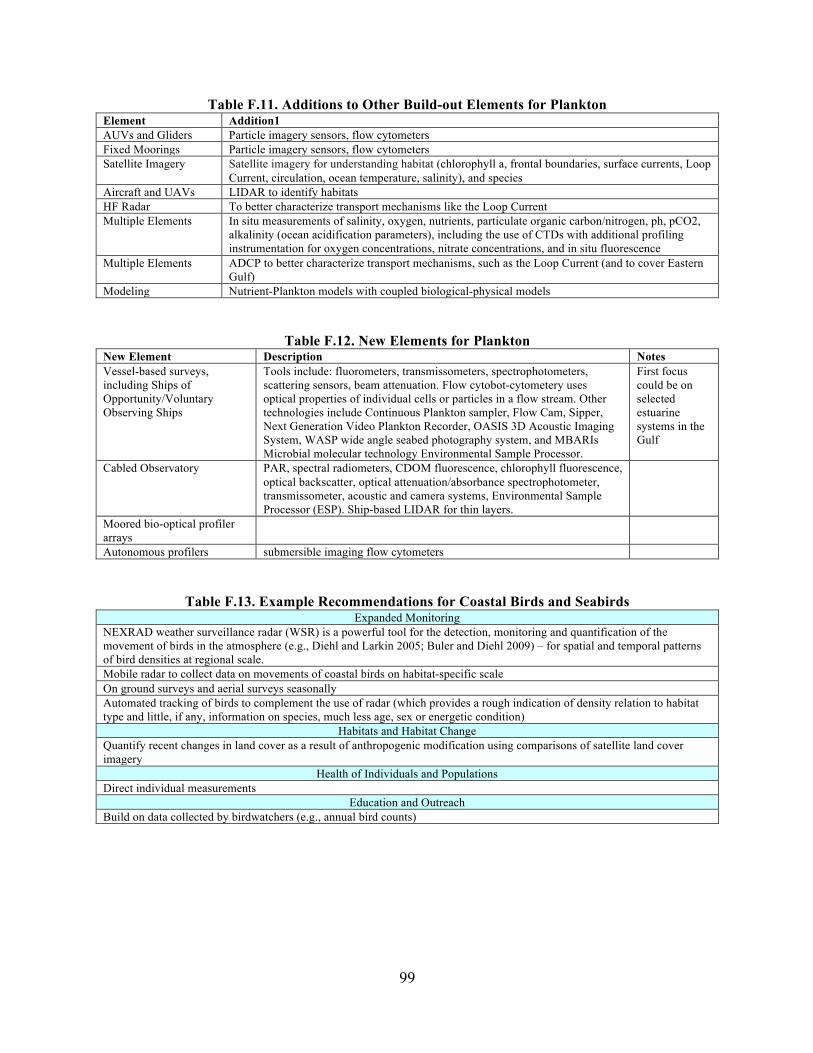
99
Table F.11. Additions to Other Build-out Elements for Plankton Element Addition1 AUVs and Gliders Particle imagery sensors, flow cytometers Fixed Moorings Particle imagery sensors, flow cytometers Satellite Imagery Satellite imagery for understanding habitat (chlorophyll a, frontal boundaries, surface currents, Loop
Current, circulation, ocean temperature, salinity), and species Aircraft and UAVs LIDAR to identify habitats HF Radar To better characterize transport mechanisms like the Loop Current Multiple Elements In situ measurements of salinity, oxygen, nutrients, particulate organic carbon/nitrogen, ph, pCO2,
alkalinity (ocean acidification parameters), including the use of CTDs with additional profiling instrumentation for oxygen concentrations, nitrate concentrations, and in situ fluorescence
Multiple Elements ADCP to better characterize transport mechanisms, such as the Loop Current (and to cover Eastern Gulf)
Modeling Nutrient-Plankton models with coupled biological-physical models
Table F.12. New Elements for Plankton New Element Description Notes Vessel-based surveys, including Ships of Opportunity/Voluntary Observing Ships
Tools include: fluorometers, transmissometers, spectrophotometers, scattering sensors, beam attenuation. Flow cytobot-cytometery uses optical properties of individual cells or particles in a flow stream. Other technologies include Continuous Plankton sampler, Flow Cam, Sipper, Next Generation Video Plankton Recorder, OASIS 3D Acoustic Imaging System, WASP wide angle seabed photography system, and MBARIs Microbial molecular technology Environmental Sample Processor.
First focus could be on selected estuarine systems in the Gulf
Cabled Observatory PAR, spectral radiometers, CDOM fluorescence, chlorophyll fluorescence, optical backscatter, optical attenuation/absorbance spectrophotometer, transmissometer, acoustic and camera systems, Environmental Sample Processor (ESP). Ship-based LIDAR for thin layers.
Moored bio-optical profiler arrays
Autonomous profilers submersible imaging flow cytometers
Table F.13. Example Recommendations for Coastal Birds and Seabirds Expanded Monitoring
NEXRAD weather surveillance radar (WSR) is a powerful tool for the detection, monitoring and quantification of the movement of birds in the atmosphere (e.g., Diehl and Larkin 2005; Buler and Diehl 2009) – for spatial and temporal patterns of bird densities at regional scale. Mobile radar to collect data on movements of coastal birds on habitat-specific scale On ground surveys and aerial surveys seasonally Automated tracking of birds to complement the use of radar (which provides a rough indication of density relation to habitat type and little, if any, information on species, much less age, sex or energetic condition)
Habitats and Habitat Change Quantify recent changes in land cover as a result of anthropogenic modification using comparisons of satellite land cover imagery
Health of Individuals and Populations Direct individual measurements
Education and Outreach Build on data collected by birdwatchers (e.g., annual bird counts)
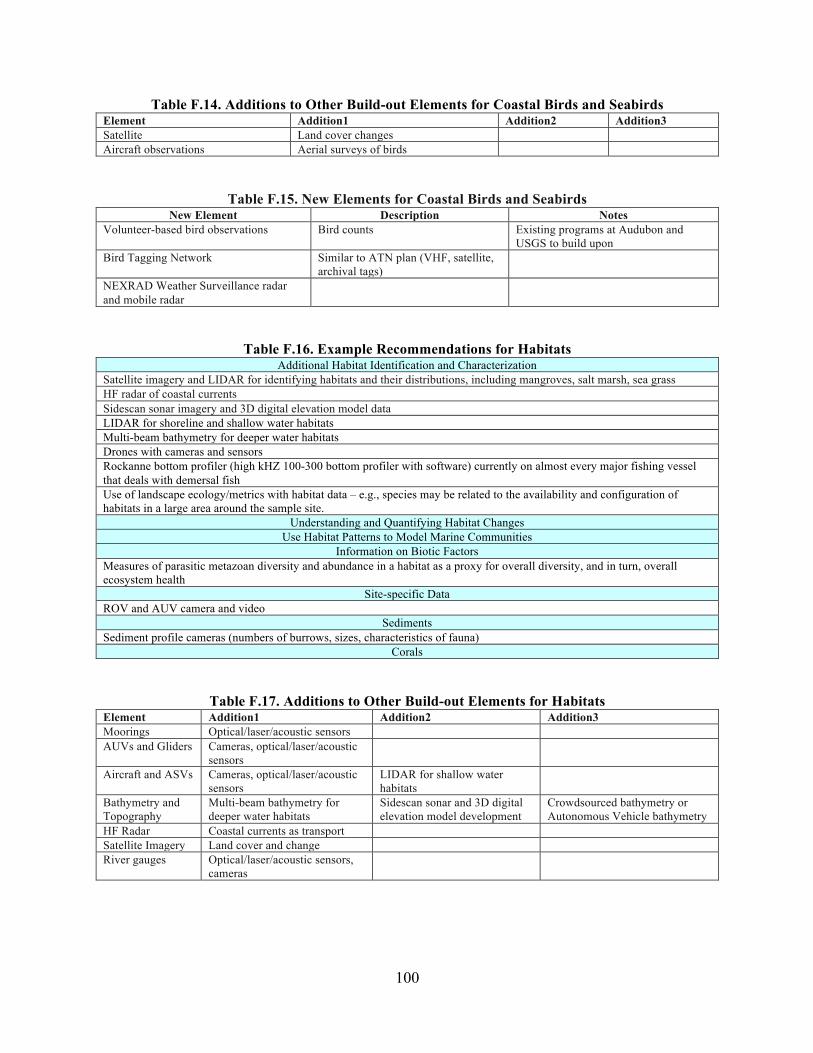
100
Table F.14. Additions to Other Build-out Elements for Coastal Birds and Seabirds Element Addition1 Addition2 Addition3 Satellite Land cover changes Aircraft observations Aerial surveys of birds
Table F.15. New Elements for Coastal Birds and Seabirds New Element Description Notes
Volunteer-based bird observations Bird counts Existing programs at Audubon and USGS to build upon
Bird Tagging Network Similar to ATN plan (VHF, satellite, archival tags)
NEXRAD Weather Surveillance radar and mobile radar
Table F.16. Example Recommendations for Habitats Additional Habitat Identification and Characterization
Satellite imagery and LIDAR for identifying habitats and their distributions, including mangroves, salt marsh, sea grass HF radar of coastal currents Sidescan sonar imagery and 3D digital elevation model data LIDAR for shoreline and shallow water habitats Multi-beam bathymetry for deeper water habitats Drones with cameras and sensors Rockanne bottom profiler (high kHZ 100-300 bottom profiler with software) currently on almost every major fishing vessel that deals with demersal fish Use of landscape ecology/metrics with habitat data – e.g., species may be related to the availability and configuration of habitats in a large area around the sample site.
Understanding and Quantifying Habitat Changes Use Habitat Patterns to Model Marine Communities
Information on Biotic Factors Measures of parasitic metazoan diversity and abundance in a habitat as a proxy for overall diversity, and in turn, overall ecosystem health
Site-specific Data ROV and AUV camera and video
Sediments Sediment profile cameras (numbers of burrows, sizes, characteristics of fauna)
Corals
Table F.17. Additions to Other Build-out Elements for Habitats
Element Addition1 Addition2 Addition3 Moorings Optical/laser/acoustic sensors AUVs and Gliders Cameras, optical/laser/acoustic
sensors
Aircraft and ASVs Cameras, optical/laser/acoustic sensors
LIDAR for shallow water habitats
Bathymetry and Topography
Multi-beam bathymetry for deeper water habitats
Sidescan sonar and 3D digital elevation model development
Crowdsourced bathymetry or Autonomous Vehicle bathymetry
HF Radar Coastal currents as transport Satellite Imagery Land cover and change River gauges Optical/laser/acoustic sensors,
cameras
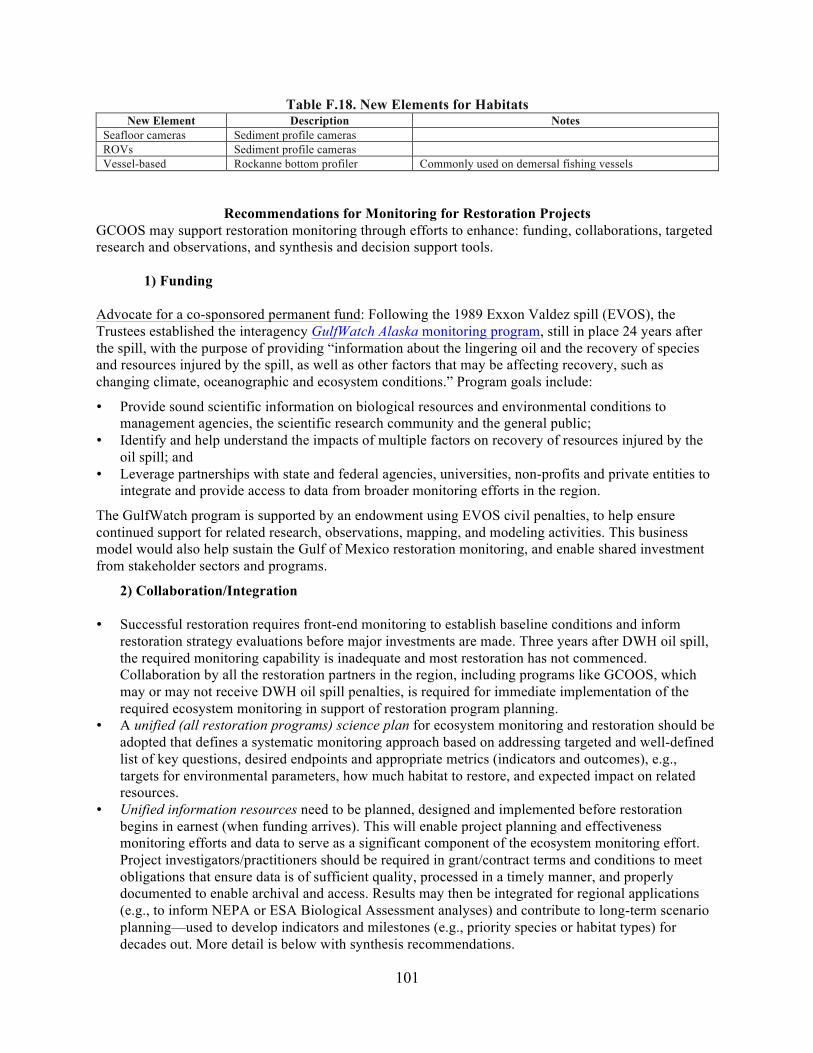
101
Table F.18. New Elements for Habitats New Element Description Notes
Seafloor cameras Sediment profile cameras ROVs Sediment profile cameras Vessel-based Rockanne bottom profiler Commonly used on demersal fishing vessels
Recommendations for Monitoring for Restoration Projects GCOOS may support restoration monitoring through efforts to enhance: funding, collaborations, targeted research and observations, and synthesis and decision support tools.
1) Funding
Advocate for a co-sponsored permanent fund: Following the 1989 Exxon Valdez spill (EVOS), the Trustees established the interagency GulfWatch Alaska monitoring program, still in place 24 years after the spill, with the purpose of providing “information about the lingering oil and the recovery of species and resources injured by the spill, as well as other factors that may be affecting recovery, such as changing climate, oceanographic and ecosystem conditions.” Program goals include:
• Provide sound scientific information on biological resources and environmental conditions to management agencies, the scientific research community and the general public;
• Identify and help understand the impacts of multiple factors on recovery of resources injured by the oil spill; and
• Leverage partnerships with state and federal agencies, universities, non-profits and private entities to integrate and provide access to data from broader monitoring efforts in the region.
The GulfWatch program is supported by an endowment using EVOS civil penalties, to help ensure continued support for related research, observations, mapping, and modeling activities. This business model would also help sustain the Gulf of Mexico restoration monitoring, and enable shared investment from stakeholder sectors and programs.
2) Collaboration/Integration • Successful restoration requires front-end monitoring to establish baseline conditions and inform
restoration strategy evaluations before major investments are made. Three years after DWH oil spill, the required monitoring capability is inadequate and most restoration has not commenced. Collaboration by all the restoration partners in the region, including programs like GCOOS, which may or may not receive DWH oil spill penalties, is required for immediate implementation of the required ecosystem monitoring in support of restoration program planning.
• A unified (all restoration programs) science plan for ecosystem monitoring and restoration should be adopted that defines a systematic monitoring approach based on addressing targeted and well-defined list of key questions, desired endpoints and appropriate metrics (indicators and outcomes), e.g., targets for environmental parameters, how much habitat to restore, and expected impact on related resources.
• Unified information resources need to be planned, designed and implemented before restoration begins in earnest (when funding arrives). This will enable project planning and effectiveness monitoring efforts and data to serve as a significant component of the ecosystem monitoring effort. Project investigators/practitioners should be required in grant/contract terms and conditions to meet obligations that ensure data is of sufficient quality, processed in a timely manner, and properly documented to enable archival and access. Results may then be integrated for regional applications (e.g., to inform NEPA or ESA Biological Assessment analyses) and contribute to long-term scenario planning—used to develop indicators and milestones (e.g., priority species or habitat types) for decades out. More detail is below with synthesis recommendations.
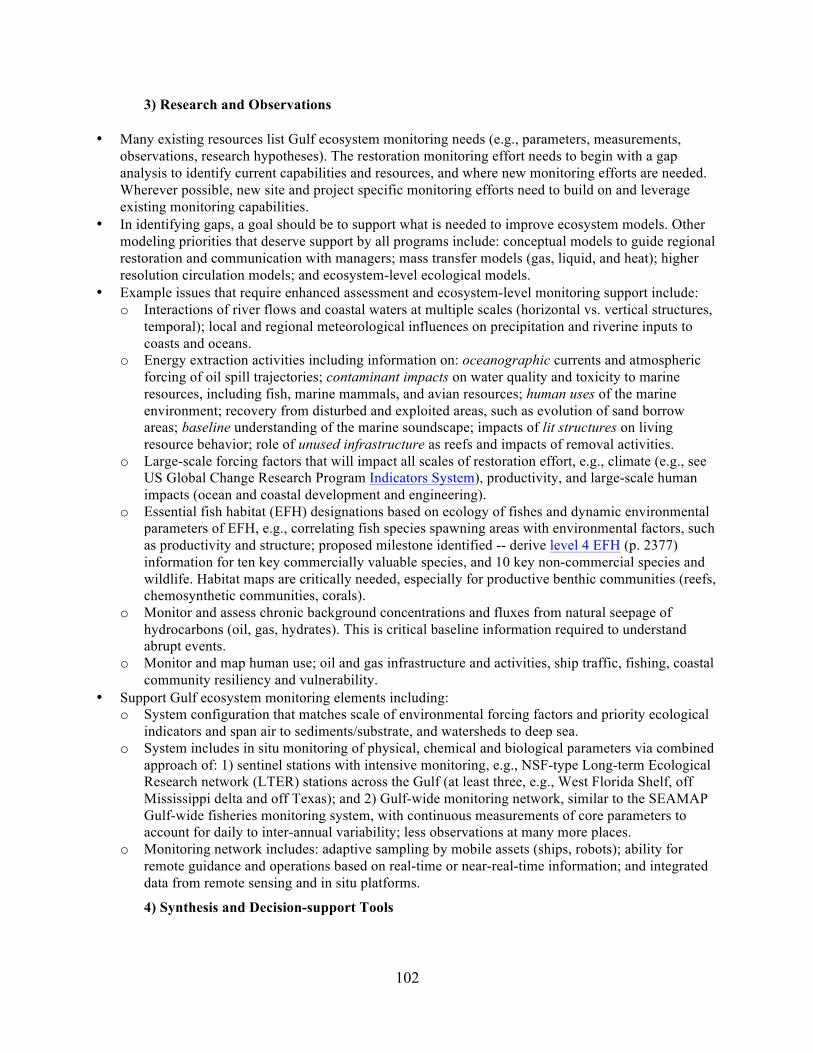
102
3) Research and Observations
• Many existing resources list Gulf ecosystem monitoring needs (e.g., parameters, measurements, observations, research hypotheses). The restoration monitoring effort needs to begin with a gap analysis to identify current capabilities and resources, and where new monitoring efforts are needed. Wherever possible, new site and project specific monitoring efforts need to build on and leverage existing monitoring capabilities.
• In identifying gaps, a goal should be to support what is needed to improve ecosystem models. Other modeling priorities that deserve support by all programs include: conceptual models to guide regional restoration and communication with managers; mass transfer models (gas, liquid, and heat); higher resolution circulation models; and ecosystem-level ecological models.
• Example issues that require enhanced assessment and ecosystem-level monitoring support include: o Interactions of river flows and coastal waters at multiple scales (horizontal vs. vertical structures,
temporal); local and regional meteorological influences on precipitation and riverine inputs to coasts and oceans.
o Energy extraction activities including information on: oceanographic currents and atmospheric forcing of oil spill trajectories; contaminant impacts on water quality and toxicity to marine resources, including fish, marine mammals, and avian resources; human uses of the marine environment; recovery from disturbed and exploited areas, such as evolution of sand borrow areas; baseline understanding of the marine soundscape; impacts of lit structures on living resource behavior; role of unused infrastructure as reefs and impacts of removal activities.
o Large-scale forcing factors that will impact all scales of restoration effort, e.g., climate (e.g., see US Global Change Research Program Indicators System), productivity, and large-scale human impacts (ocean and coastal development and engineering).
o Essential fish habitat (EFH) designations based on ecology of fishes and dynamic environmental parameters of EFH, e.g., correlating fish species spawning areas with environmental factors, such as productivity and structure; proposed milestone identified -- derive level 4 EFH (p. 2377) information for ten key commercially valuable species, and 10 key non-commercial species and wildlife. Habitat maps are critically needed, especially for productive benthic communities (reefs, chemosynthetic communities, corals).
o Monitor and assess chronic background concentrations and fluxes from natural seepage of hydrocarbons (oil, gas, hydrates). This is critical baseline information required to understand abrupt events.
o Monitor and map human use; oil and gas infrastructure and activities, ship traffic, fishing, coastal community resiliency and vulnerability.
• Support Gulf ecosystem monitoring elements including: o System configuration that matches scale of environmental forcing factors and priority ecological
indicators and span air to sediments/substrate, and watersheds to deep sea. o System includes in situ monitoring of physical, chemical and biological parameters via combined
approach of: 1) sentinel stations with intensive monitoring, e.g., NSF-type Long-term Ecological Research network (LTER) stations across the Gulf (at least three, e.g., West Florida Shelf, off Mississippi delta and off Texas); and 2) Gulf-wide monitoring network, similar to the SEAMAP Gulf-wide fisheries monitoring system, with continuous measurements of core parameters to account for daily to inter-annual variability; less observations at many more places.
o Monitoring network includes: adaptive sampling by mobile assets (ships, robots); ability for remote guidance and operations based on real-time or near-real-time information; and integrated data from remote sensing and in situ platforms.
4) Synthesis and Decision-support Tools
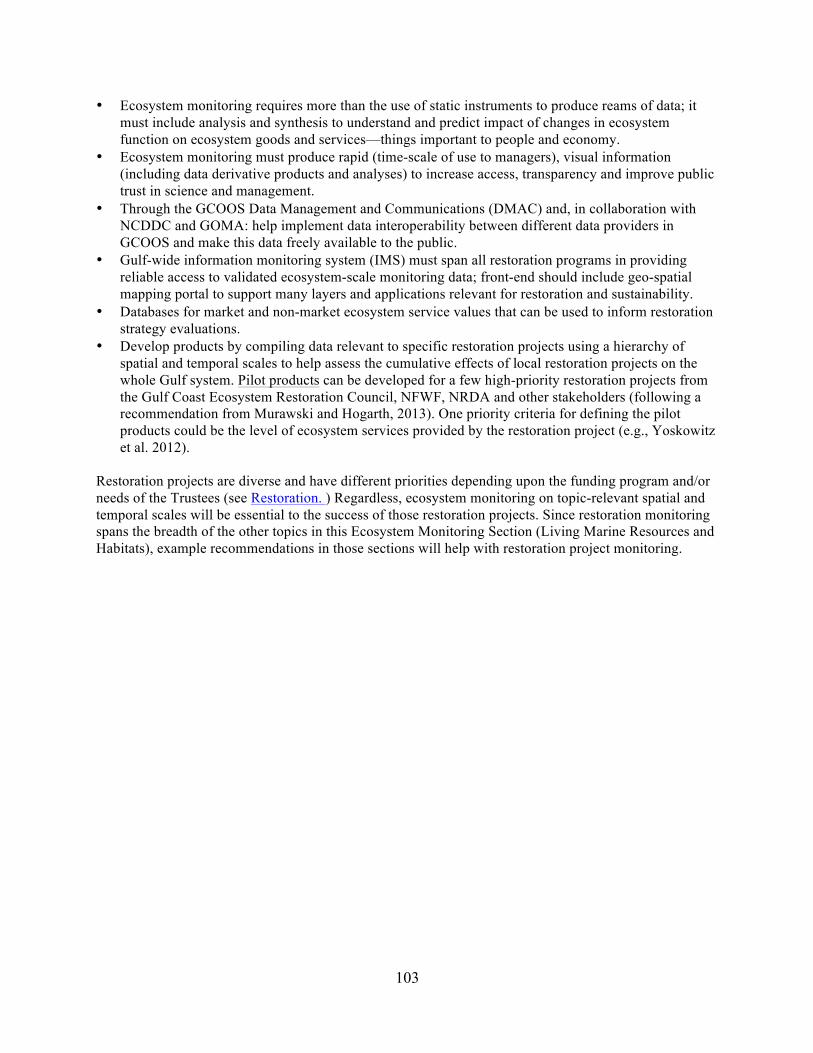
103
• Ecosystem monitoring requires more than the use of static instruments to produce reams of data; it must include analysis and synthesis to understand and predict impact of changes in ecosystem function on ecosystem goods and services—things important to people and economy.
• Ecosystem monitoring must produce rapid (time-scale of use to managers), visual information (including data derivative products and analyses) to increase access, transparency and improve public trust in science and management.
• Through the GCOOS Data Management and Communications (DMAC) and, in collaboration with NCDDC and GOMA: help implement data interoperability between different data providers in GCOOS and make this data freely available to the public.
• Gulf-wide information monitoring system (IMS) must span all restoration programs in providing reliable access to validated ecosystem-scale monitoring data; front-end should include geo-spatial mapping portal to support many layers and applications relevant for restoration and sustainability.
• Databases for market and non-market ecosystem service values that can be used to inform restoration strategy evaluations.
• Develop products by compiling data relevant to specific restoration projects using a hierarchy of spatial and temporal scales to help assess the cumulative effects of local restoration projects on the whole Gulf system. Pilot products can be developed for a few high-priority restoration projects from the Gulf Coast Ecosystem Restoration Council, NFWF, NRDA and other stakeholders (following a recommendation from Murawski and Hogarth, 2013). One priority criteria for defining the pilot products could be the level of ecosystem services provided by the restoration project (e.g., Yoskowitz et al. 2012).
Restoration projects are diverse and have different priorities depending upon the funding program and/or needs of the Trustees (see Restoration. ) Regardless, ecosystem monitoring on topic-relevant spatial and temporal scales will be essential to the success of those restoration projects. Since restoration monitoring spans the breadth of the other topics in this Ecosystem Monitoring Section (Living Marine Resources and Habitats), example recommendations in those sections will help with restoration project monitoring.
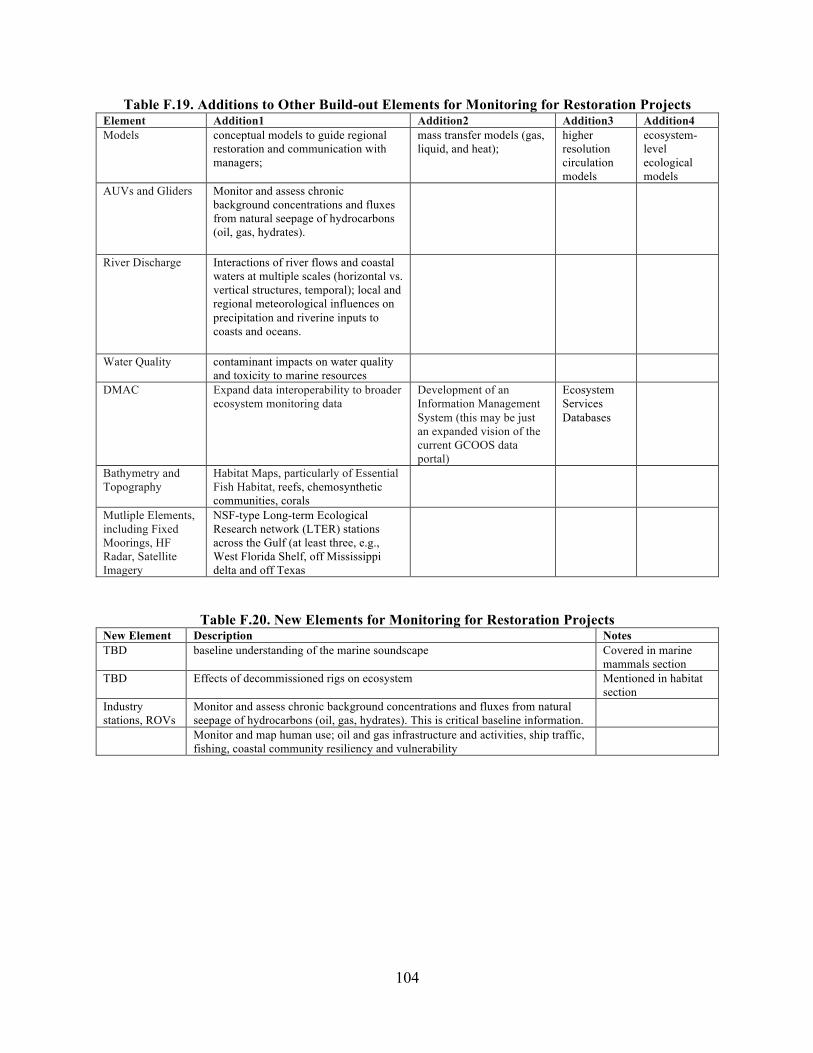
104
Table F.19. Additions to Other Build-out Elements for Monitoring for Restoration Projects Element Addition1 Addition2 Addition3 Addition4 Models conceptual models to guide regional
restoration and communication with managers;
mass transfer models (gas, liquid, and heat);
higher resolution circulation models
ecosystem-level ecological models
AUVs and Gliders Monitor and assess chronic background concentrations and fluxes from natural seepage of hydrocarbons (oil, gas, hydrates).
River Discharge Interactions of river flows and coastal waters at multiple scales (horizontal vs. vertical structures, temporal); local and regional meteorological influences on precipitation and riverine inputs to coasts and oceans.
Water Quality contaminant impacts on water quality and toxicity to marine resources
DMAC Expand data interoperability to broader ecosystem monitoring data
Development of an Information Management System (this may be just an expanded vision of the current GCOOS data portal)
Ecosystem Services Databases
Bathymetry and Topography
Habitat Maps, particularly of Essential Fish Habitat, reefs, chemosynthetic communities, corals
Mutliple Elements, including Fixed Moorings, HF Radar, Satellite Imagery
NSF-type Long-term Ecological Research network (LTER) stations across the Gulf (at least three, e.g., West Florida Shelf, off Mississippi delta and off Texas
Table F.20. New Elements for Monitoring for Restoration Projects New Element Description Notes TBD baseline understanding of the marine soundscape Covered in marine
mammals section TBD Effects of decommissioned rigs on ecosystem Mentioned in habitat
section Industry stations, ROVs
Monitor and assess chronic background concentrations and fluxes from natural seepage of hydrocarbons (oil, gas, hydrates). This is critical baseline information.
Monitor and map human use; oil and gas infrastructure and activities, ship traffic, fishing, coastal community resiliency and vulnerability