Embed Size (px)
Citation preview
Gate-tuning of graphene plasmons revealed by infrared nano-imaging
Z. Fei1, A. S. Rodin1, G. O. Andreev1, W. Bao2,3, A. S. McLeod1, M. Wagner1, L. M.
Zhang4, Z. Zhao2, M. Thiemens5, G. Dominguez6, M. M. Fogler1, A. H. Castro-Neto7, C.
N. Lau2, F. Keilmann8, D. N. Basov1
1Department of Physics, University of California, San Diego, La Jolla, California 92093,
USA 2Department of Physics and Astronomy, University of California, Riverside, California
92521, USA 3Materials Research Science and Engineering Center, University of Maryland, College
Park, Maryland 20742, USA 4Department of Physics, Boston University, Boston, Massachusetts 02215, USA 5Department of Chemistry and Biochemistry, University of California, San Diego, La
Jolla, California 92093, USA 6Department of Physics, California State University, San Marcos, California 92096, USA 7Graphene Research Centre and Department of Physics, National University of Singapore,
117542, Singapore 8Max Planck Institute of Quantum Optics and Center for Nanoscience, 85714 Garching,
Germany
Surface plasmons are collective oscillations of electrons in metals or semiconductors
enabling confinement and control of electromagnetic energy at subwavelength
scales1-5. Rapid progress in plasmonics has largely relied on advances in device
nano-fabrication5-7, whereas less attention has been paid to the tunable properties of
plasmonic media. One such medium—graphene—is amenable to convenient tuning
of its electronic and optical properties with gate voltage8-11. Through infrared nano-
imaging we explicitly show that common graphene/SiO2/Si back-gated structures
support propagating surface plasmons. The wavelength of graphene plasmons is of
the order of 200 nm at technologically relevant infrared frequencies, and they can
propagate several times this distance. We have succeeded in altering both the
amplitude and wavelength of these plasmons by gate voltage. We investigated losses
in graphene using plasmon interferometry: by exploring real space profiles of
plasmon standing waves formed between the tip of our nano-probe and edges of the
samples. Plasmon dissipation quantified through this analysis is linked to the exotic
electrodynamics of graphene10. Standard plasmonic figures of merits of our tunable
graphene devices surpass that of common metal-based structures.
In general, surface plasmons can exist in any material with mobile charge carriers
whose response to electric field remains reactive, i.e., whose in-plane momentum- and
frequency-dependent complex conductivity, σ(q,ω)=σ1+iσ2, is predominantly imaginary.
Of particular interest are plasmons with high momenta qp >> ω/c, which may be utilized
for extreme concentration of electromagnetic energy1-5. In conventional bulk metals, the
frequencies of such high-q plasmons reside in the visible or ultraviolet ranges. In
graphene, they are expected to appear in the terahertz and infrared (IR) domains12.
However, these high-q IR plasmons are dormant in conventional spectroscopy of
graphene. Here we utilized the scattering-type scanning near-field optical microscope (s-
SNOM) to experimentally access high-q plasmons by illuminating the sharp tip of an
atomic force microscope (AFM) with a focused IR beam (Fig. 1a). The momenta
imparted by the tip extend up to a few times 1/a, where 25 nma ≈ is the curvature radius
of the tip13, thus spanning the typical range of IR plasmon momenta qp in graphene12. The
spatial resolution of s-SNOM is also set by a, and proves to be an order of magnitude
smaller than the plasmon wavelength λp. The direct observable of our method—the
scattering amplitude s(ω)—is a measure of the electric field strength inside the tip-sample
nanogap. Consequently, the s-SNOM technique enables spectroscopy13 and IR nano-
imaging of graphene plasmons without the need to fabricate specialized periodic
structures14. Our imaging data elucidate real-space characteristics of IR plasmons in
graphene such as reflection, interference and damping. All these phenomena can be
readily manipulated with gate voltage – a noteworthy property unattainable in metal-
based plasmonics.
To probe directly the properties of graphene plasmons, we utilize a frequency ω =
892 cm-1 corresponding to the wavelength λIR = 11.2 µm in the IR regime where the
plasmon is unimpeded by the surface optical phonon supported in graphene/SiO2/Si

structures13. The nano-imaging results are shown in Figs. 1b-e, where we plot normalized
near-field amplitude Si3 3( ) ( ) / ( )s s sω ω ω= . Here, s3(ω) and Si
3 ( )s ω are the 3rd order
demodulated harmonics of the near-field amplitude measured for the given sample and
for a Si reference sample, respectively13. The near-field amplitude s(ω) tracks real-space
variations in the local electric field underneath the tip, enabling exploration of surface
phonon polaritons and surface plasmons17,18.
In Fig. 1b, we present a s(ω) image acquired at the graphene-SiO2 interface
revealing periodic oscillations of the s(ω) signal extending along the graphene edge.
Point and circular defects (Fig. 1d) trigger circular fringe patterns. Line defects (Fig. 1b)
produce elongated, elliptical patterns. We observed fringes at both sides of the
single/bilayer graphene boundary (Fig. 1c). Finally, strongly tapered corners of graphene
(Fig. 1e) reveal the two groups of fringes oriented along both edges of graphene in the
field of view. In all cases, the periodicity of the fringe patterns is around 100 nm.
Images in Fig. 1 are consistent with the following scenario. Illuminated by focused
IR light, the AFM tip launches plasmon waves of wavelength λp propagating radially
outward from the tip. Sample edges or defects act as (imperfect) reflectors of the plasmon
waves, directing them back to the tip. Therefore complex patterns of interference between
launched and reflected plasmons should form inside graphene. We emphasize that our
experimental technique does not capture instantaneous snapshots of these complex
patterns. Instead, while the tip “launches” plasmon waves propagating in all directions, it
only “detects” the cumulative near-field plasmonic signal arising underneath it. This
stands in rough analogy with the operating principle of sonar echolocation. In Fig. 2a, we
sketch the plasmon interference pattern in the form of plasmon amplitude revealing
standing wave oscillations between the tip and sample edge. As the tip is scanned towards
the edge, it registers these oscillations with periodicity given by λp/2 as shown in bottom
panels of Fig. 2a. Our plasmon interference interpretation is supported by theoretical
estimates of the wavelength λp. The plasmon dispersion of a two-dimensional (2D) metal
residing at the interface of vacuum (dielectric constant ε0 = 1) and a substrate with
dielectric function εsub(ω) is given by the formula:
Assuming that the conductivity σ of graphene takes a Drude form with relaxation time τ,
one can rewrite equation (1) as:
2
2
( )( )
2pF
iq
e E
κ ω ω ωτ
= +h.
(2)
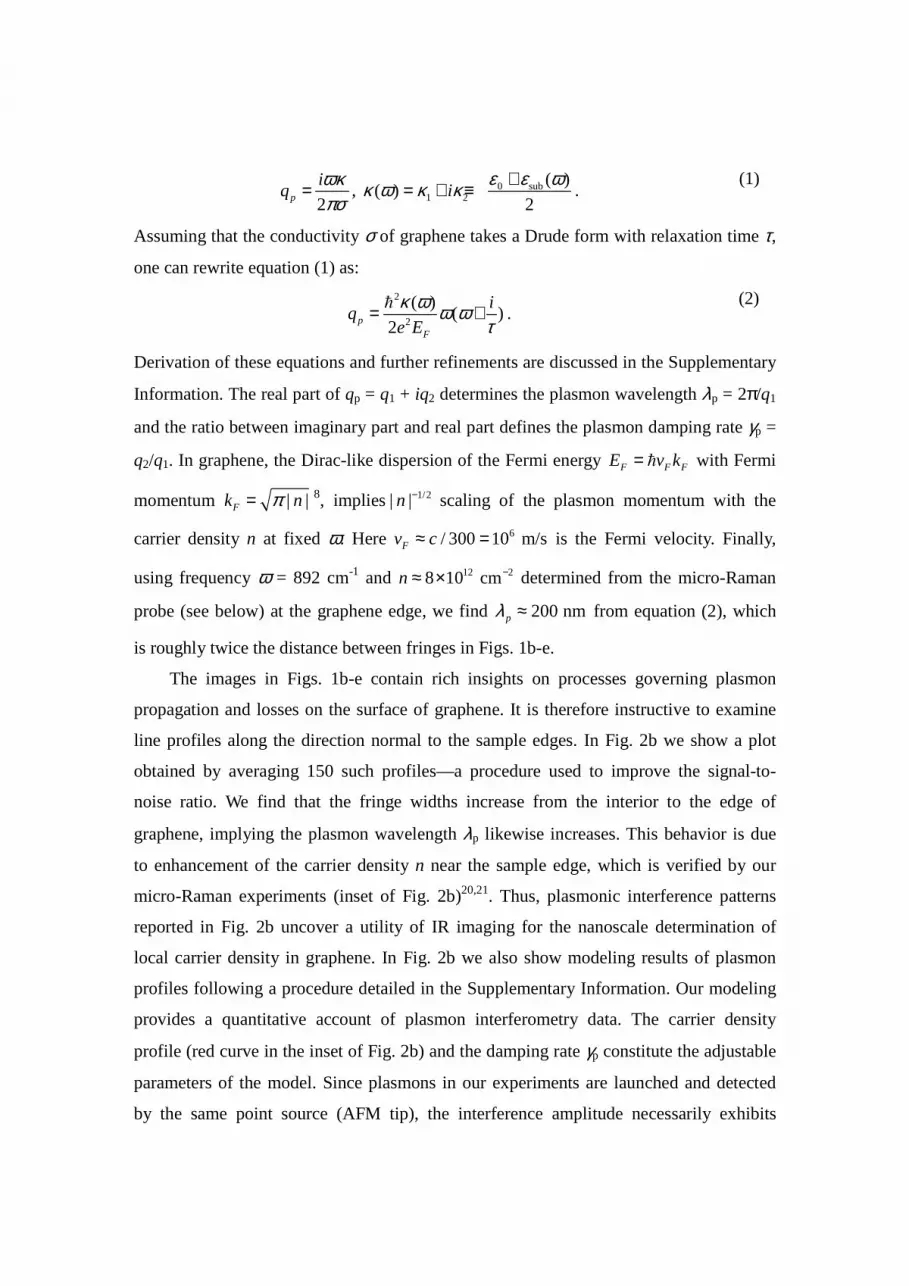
Derivation of these equations and further refinements are discussed in the Supplementary
Information. The real part of qp = q1 + iq2 determines the plasmon wavelength λp = 2π/q1
and the ratio between imaginary part and real part defines the plasmon damping rate γp =
q2/q1. In graphene, the Dirac-like dispersion of the Fermi energy F F FE v k= h with Fermi
momentum | |Fk nπ= 8, implies 1/2| |n − scaling of the plasmon momentum with the
carrier density n at fixed ω. Here 6/ 300 10 m/sFv c≈ = is the Fermi velocity. Finally,
using frequency ω = 892 cm-1 and 12 28 10 cmn −≈ × determined from the micro-Raman
probe (see below) at the graphene edge, we find 200 nmpλ ≈ from equation (2), which
is roughly twice the distance between fringes in Figs. 1b-e.
The images in Figs. 1b-e contain rich insights on processes governing plasmon
propagation and losses on the surface of graphene. It is therefore instructive to examine
line profiles along the direction normal to the sample edges. In Fig. 2b we show a plot
obtained by averaging 150 such profiles—a procedure used to improve the signal-to-
noise ratio. We find that the fringe widths increase from the interior to the edge of
graphene, implying the plasmon wavelength λp likewise increases. This behavior is due
to enhancement of the carrier density n near the sample edge, which is verified by our
micro-Raman experiments (inset of Fig. 2b)20,21. Thus, plasmonic interference patterns
reported in Fig. 2b uncover a utility of IR imaging for the nanoscale determination of
local carrier density in graphene. In Fig. 2b we also show modeling results of plasmon
profiles following a procedure detailed in the Supplementary Information. Our modeling
provides a quantitative account of plasmon interferometry data. The carrier density
profile (red curve in the inset of Fig. 2b) and the damping rate γp constitute the adjustable
parameters of the model. Since plasmons in our experiments are launched and detected
by the same point source (AFM tip), the interference amplitude necessarily exhibits
2p
iq
ωκπσ
= , 0 sub1 2
( )( )
2i
ε ε ωκ ω κ κ += + ≡ . (1)
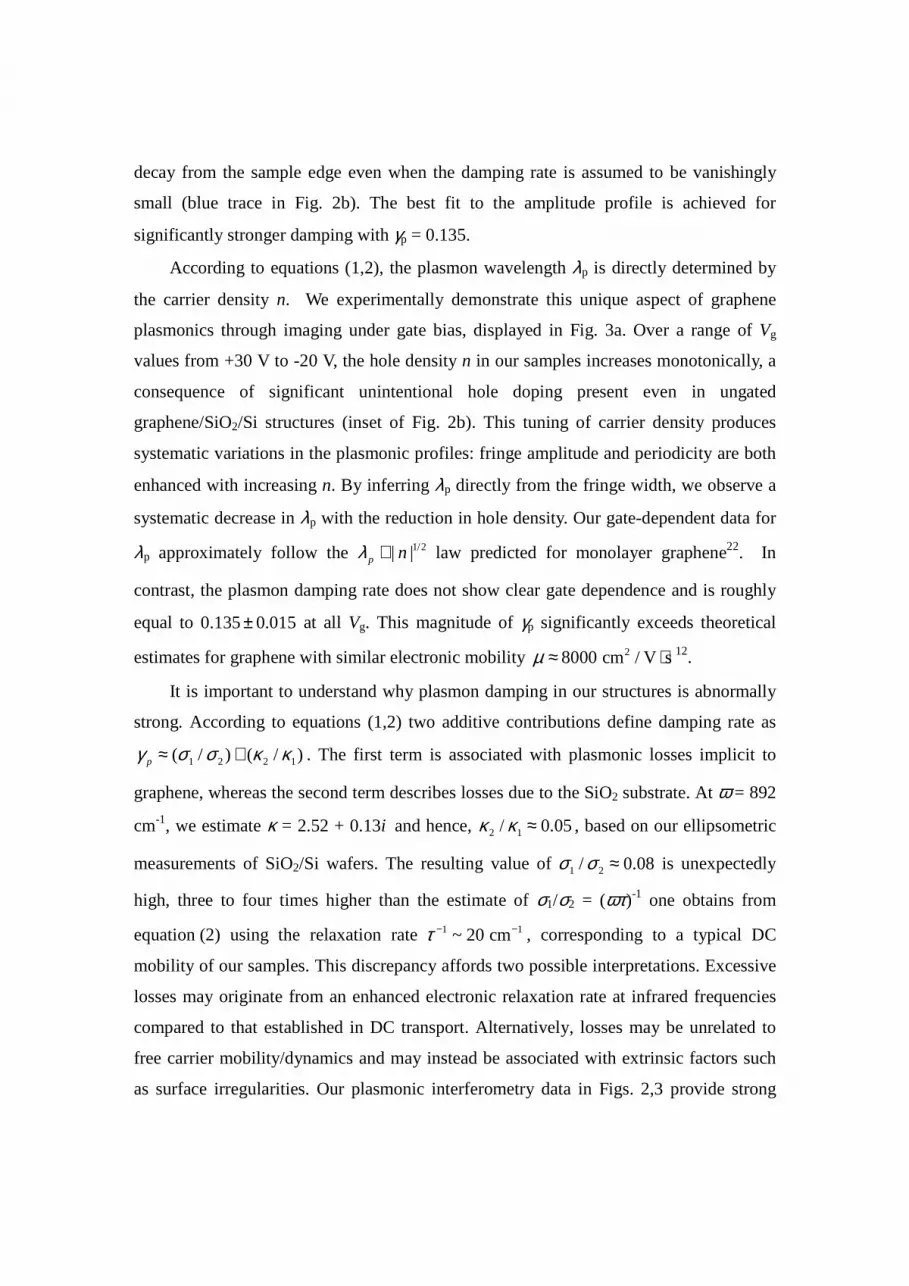
decay from the sample edge even when the damping rate is assumed to be vanishingly
small (blue trace in Fig. 2b). The best fit to the amplitude profile is achieved for
significantly stronger damping with γp = 0.135.
According to equations (1,2), the plasmon wavelength λp is directly determined by
the carrier density n. We experimentally demonstrate this unique aspect of graphene
plasmonics through imaging under gate bias, displayed in Fig. 3a. Over a range of Vg
values from +30 V to -20 V, the hole density n in our samples increases monotonically, a
consequence of significant unintentional hole doping present even in ungated
graphene/SiO2/Si structures (inset of Fig. 2b). This tuning of carrier density produces
systematic variations in the plasmonic profiles: fringe amplitude and periodicity are both
enhanced with increasing n. By inferring λp directly from the fringe width, we observe a
systematic decrease in λp with the reduction in hole density. Our gate-dependent data for
λp approximately follow the 1/2| |p nλ ∝ law predicted for monolayer graphene22. In
contrast, the plasmon damping rate does not show clear gate dependence and is roughly
equal to 0.135 0.015± at all Vg. This magnitude of γp significantly exceeds theoretical
estimates for graphene with similar electronic mobility 28000 cm / V sµ ≈ ⋅ 12.
It is important to understand why plasmon damping in our structures is abnormally
strong. According to equations (1,2) two additive contributions define damping rate as
1 2 2 1( / ) ( / )pγ σ σ κ κ≈ + . The first term is associated with plasmonic losses implicit to
graphene, whereas the second term describes losses due to the SiO2 substrate. At ω = 892
cm-1, we estimate κ = 2.52 + 0.13i and hence, 2 1/ 0.05κ κ ≈ , based on our ellipsometric
measurements of SiO2/Si wafers. The resulting value of 1 2/ 0.08σ σ ≈ is unexpectedly
high, three to four times higher than the estimate of σ1/σ2 = (ωτ)-1 one obtains from
equation (2) using the relaxation rate 1 1~ 20 cmτ − − , corresponding to a typical DC
mobility of our samples. This discrepancy affords two possible interpretations. Excessive
losses may originate from an enhanced electronic relaxation rate at infrared frequencies
compared to that established in DC transport. Alternatively, losses may be unrelated to
free carrier mobility/dynamics and may instead be associated with extrinsic factors such
as surface irregularities. Our plasmonic interferometry data in Figs. 2,3 provide strong
support for the former hypothesis. Indeed, these images yield γp and λp (Fig. 3b) and thus
allow us to determine the complex optical conductivity of graphene (inset of Fig. 3b)
based on the formulae: 2 1 2 2 12; ( / )
4 p p
ωκσ λ σ σ γ κ κπ
≈ = − . We remark that these relations
between plasmonic parameters (λp, γp) and the complex optical conductivity σ of
graphene hold true for any plasmonic material for which σ1<<σ2. Therefore these
expressions apply even if the frequency-dependent conductivity deviates from the simple
Drude model. The appeal of this analysis lies in establishing a link between real-space
plasmonic profiles and the optical constants inferred from conventional IR spectroscopy.
Our imaging data reveal that the real part of the conductivity of graphene is as high as
21 0.5 /e hσ ≈ . This value greatly exceeds the theoretical estimate of
-1 12 2 1 1 21( 892 cm , 8 10 cm , 20 cm ) 0.13 /n e hσ ω τ− − −= = × = = obtained from a model of
non-interacting Dirac quasiparticles weakly scattered by disorder23-25, but is comparable
to IR spectroscopy results for back-gated graphene on SiO2/Si10. In an ideal, non-
interacting graphene σ1(ω < 2EF) is vanishingly small due to the phenomenon of “Pauli
blocking”10. Thus the source of strong plasmonic losses in our back-gated samples is
traced to the unexpectedly large magnitude of σ1. This result supports the notion of
prominent many-body effects in graphene beyond the picture of non-interacting Dirac
fermions27-29. Further experiments on suspended graphene as well as devices employing
various types of dielectric substrates such as BN are needed to disentangle the roles of
electron-electron and graphene-substrate interactions in the dissipation we observe at
infrared frequencies. Our work uncovers an experimental path and analysis methodology
for these future studies of many-body interactions in graphene.
Infrared nano-imaging experiments reported here established graphene/SiO2/Si
structures as a potent plasmonic medium that enables voltage control of both the plasmon
wavelength and amplitude. Higher gate voltages than used in our study will allow for the
binary on/off switching of plasmon propagation with a possibility of potentially local
control by a top gate or a biased tip. The plasmon wavelength in graphene 200 nmpλ ≈
is one of the shortest imaged for any material whereas the propagation length is on par
with Au in experiments monitoring strongly confined plasmons launched by AFM tips18.
An important figure of merit λIR/λp = 50-60 for our back-gated devices surpasses that of
conventional Ag-based structures12. Intrinsic plasmonic losses in graphene that we
analyzed in detail can be substantially reduced or even eliminated through population
inversion30. We stress that plasmon tuning is realized here in the architecture of a
Metal(graphene)-Oxide-Semiconductor(Si) device: a ubiquitous system in modern
information processing. Furthermore, the performance of even the first generation of
plasmonic devices reported here and in Ref. 15 is rather promising against non-tunable
metal-based structures12. For all these reasons we believe that graphene may be an ideal
medium for active infrared plasmonics.
Methods Summary
Infrared nano-imaging using s-SNOM: Our s-SNOM apparatus (Neaspec) is based on
an atomic force microscope (AFM) operating in tapping-mode. Measurements were
performed at an AFM tapping frequency of Ω = 270 kHz and tapping amplitude of 40 nm.
The shaft of the conducting AFM tip acts as an antenna that boosts the efficiency of near-
field interaction26. The back-scattered signal registered by the detector is strongly
dependent on the tip-sample distance. This enables isolation of the genuine near-field
contribution from the overall back-scattered signal, which is periodically modulated at
harmonics of the tapping frequency Ω. The mth harmonic component of this signal mims e φ ,
termed the mth demodulated signal (here m = 3), represents the desired near-field
contribution.
Samples and devices: Our graphene samples were obtained by mechanical cleavage of
bulk graphite and then transferred to SiO2/Si substrate. To avoid surface contamination by
lithographic procedures, bulk graphite connected to our graphene sample was utilized as
an electrode in our back-gating experiments. To verify the gating functionality of our
devices, we first performed a spectroscopic study of the hybrid plasmon-phonon
resonance at various gate voltages and found good agreement with the published data13.
Transport measurements of graphene samples fabricated following identical procedures
indicate that the typical mobility of our graphene samples is about 8000 cm2/Vs. Plasmon
imaging experiments were completed for more than 30 graphene samples. All these
structures exhibited highly reproducible behavior and consistent values for the plasmon
wavelength and damping. The data displayed in Figs.1-3 were obtained for devices with
some of the weakest damping revealing the largest number of plasmonic oscillations.
Nevertheless, even in these devices the plasmonic losses are stronger than expectations
based on typical electronic mobility measurements.
Micro-Raman measurements: According to previous studies, the G-peak position of the
graphene Raman signal is directly linked to its carrier density19-21. Therefore, the G-peak
profile shown in the inset of Fig. 2b reflects the range of the variation in graphene carrier
density close to the edge20-22. Our micro-Raman experiments were carried out using a
Renishaw inVia Raman microscope equipped with a 50× , NA = 0.75 long-distance
objective, a 1800 l/mm grating and an XY stage with the resolution of 100 nm. The spot
size in these experiments is limited by diffraction. Therefore, the fragment of the line
profile of the G-peak frequency shown in the inset of Fig. 2b is instrumentally broadened.
Acknowledgements
Authors acknowledge support from AFOSR, and ONR. The analysis of plasmonic losses
and many body effects is supported by DOE-BES. W.B, Z.Z, and C.N.L were supported
by NSF DMR/1106358, ONR N00014-09-1-0724, ONR/DMEA H94003-10-2-1003 and
FENA focus center. G.D. and M.T. were supported by NASA. M.F. is supported by
UCOP and NSF PHY11-25915. A.H.C.N. acknowledges NRF-CRP grant R-144-000-
295-281. M.W. thanks the Alexander von Humboldt Foundation for financial support. F.K.
was supported by Deutsche Forschungsgemeinschaft through the Cluster of Excellence
Munich Centre for Advanced Photonics.
Author contributions
All authors were involved in designing the research, performing the research, and writing
the paper.
Additional information
The authors declare no competing financial interests; F.K. is cofounder of Neaspec,
producer of the s-SNOM apparatus used in this study. Supplementary information
accompanies this paper on www.nature.com/naturematerials. Reprints and permission
information is available online at http://npg.nature.com/reprintsandpermissions.
Correspondence and requests for materials should be addressed to D. N. B.
References
1. Atwater, H. A. The promise of plasmonics. Sci. Am. 296, 56–63 (2008).
2. West, P. R. et al. Searching for better plasmonic materials. Laser & Photon. Rev. 1-13
(2010).
3. Stockman, M. I. Nanoplasmonics: The physics behind the applications. Phys. Today
64, 39-44 (2011).
4. Maier, S. A. Plasmonics: Fundamentals and Applications Ch. 4 (Springer, New York,
2007).
5. Schuller, J. A. et al. Plasmonics for extreme light concentration and manipulation.
Nature Mater. 9, 193-204 (2010).
6. Nagpal, P., Lindquist, N. C., Oh, S.-H. & Norris, D. J. Ultrasmooth patterned metals
for plasmonics and metamaterials. Science 325, 594-597 (2009).
7. Lal, S., Link, S. & Halas, N. J. Nano-optics from sensing to waveguiding. Nature
Photon. 1, 641-648 (2007).
8. Castro-Neto, A. H., Guinea, F., Peres, N. M. R., Novoselov, K. S. & Geim, A. K. The
electronic properties of graphene. Rev. Mod. Phys. 81, 109-162 (2009).
9. Wang, F. et al. Gate-variable optical transitions in graphene. Science 320, 206-209
(2008)
10. Li, Z. Q. et al. Dirac charge dynamics in graphene by infrared spectroscopy. Nature
Phys. 4, 532-535 (2008).
11. Vakil, A. & Engheta, N. Transformation optics using graphene. Science 332, 1291-
1294 (2011).
12. Jablan, M., Buljan, H. & Soljacic, M. Plasmonics in graphene at infrared frequencies.
Phys. Rev. B 80, 245435 (2009).
13. Fei, Z. et al. Infrared nanoscopy of Dirac plasmons at the graphene-SiO2 interface.
Nano Lett. 11, 4701-4705 (2011).
14. Ju, L. et al. Graphene plasmonics for tunable terahertz metamaterials. Nature Nano. 6,
630-634 (2011).
15. Chen, J., Badioli, M., Alonso-González, P., Thongrattanasiri, S., Huth, F., Osmond, J.,
Spasenović, M., Centeno, A., Pesquera, A., Godignon, P., Zurutuza, A., Camara, N.,
Garcia de Abajo, J., Hillenbrand, R. & Koppens, F. Optical nano-imaging of gate-
tunable graphene plasmons. (submitted, 2012).
16. Rodin, A. S. Electronic Properties of Low-Dimensional Systems (PhD thesis of
UCSD, 2012).
17. Huber, A., Ocelic, N., Kazantsev, D. & Hillenbrand, R. Near-field imaging of mid-
infrared surface phonon polariton propagation. Appl. Phys. Letts. 87, 081103 (2005).
18. Dallapiccola, R., Dubois, C., Gopinath, A., Stellacci, F.& Dal Negro, L. Near-field
excitation and near-field detection of propagating surface plasmon polaritons on Au
waveguide structures. Appl. Phys. Lett. 94, 243118 (2009).
19. Das, A. et al. Monitoring dopants by Raman scattering in an electrochemically top-
gated graphene transistor. Nature Nano. 3, 210-215 (2008).
20. Casiraghi, C. et al. Raman spectroscopy of graphene edges. Nano. Lett. 9 1433-1441
(2009).
21. Caridad, J. M. et al. Effects of particle contamination and substrate interaction on the
Raman response of unintentionally doped graphene. J. Appl. Phys. 108, 084321
(2010).
22. E. H. Hwang & Das Sarma, S. Dielectric function, screening, and plasmons in two-
dimensional graphene. Phys. Rev. B 75, 205418 (2007).
23. Ando, T., Zheng, Y. & Suzuura, H. Dynamical conductivity and zero-mode anomaly
in honeycomb lattices. J. Phys. Soc. Jpn. 71, 1318–1324 (2002).
24. Peres, N. M. R., Guinea, F. & Castro Neto, A. H. Electronic properties of disordered
two-dimensional carbon. Phys. Rev. B 73, 125411 (2006).
25. Gusynin, V. P. & Sharapov, S. G. Transport of Dirac quasiparticles in graphene: Hall
and optical conductivities. Phys. Rev. B 73, 125411 (2006).
26. Novotny, L. & Hecht, B. Principles of Nano-Optics (Cambridge University Press,
New York, 2006).
27. Grushin, A. G., Valenzuela, B. & Vozmediano, M. A. H. Effect of coulomb
interactions on the optical properties of doped graphene. Phys. Rev. B 80, 155417
(2009).

28. Peres, N. M. R., Ribeiro, R. M. & Castro-Neto, A. H. Excitonic effects in the optical
conductivity of gated graphene. Phys. Rev. Lett. 105, 055501 (2010).
29. Hwang, J., Leblanc, J. P. F. & Carbotte, J. P. Optical self energy in graphene due to
correlations. arXiv.org > cond-mat > arXiv:1202.1059 (2012).
30. Rana, F. Graphene terahertz plasmon oscillators. Nano. IEEE Trans. 7, 91 (2008).
Figure Legends
Figure 1 | Infrared nano-imaging experiment and results. a, Schematic of an infrared
nano-imaging experiment at the surface of graphene (labeled as G) on SiO2. Green and
blue arrows display the directions of incident and back-scattered light, respectively.
Concentric red circles illustrate plasmon waves launched by the illuminated tip. b-e,
Images of infrared amplitude s(ω = 892 cm-1) defined in the text taken at zero gate
voltage. These images show a characteristic interference pattern close to graphene edges
(blue dashed lines), defects (green dashed lines), at the boundary between single (G) and
bilayer (BG) graphene (white dashed line). Additional features marked with the arrows in
e are analyzed in Refs. 15,16. Locations of boundaries and defects were determined from
AFM topography taken simultaneously with the near-field data. Scale bars are 100 nm in
all panels. All data were acquired at ambient conditions.
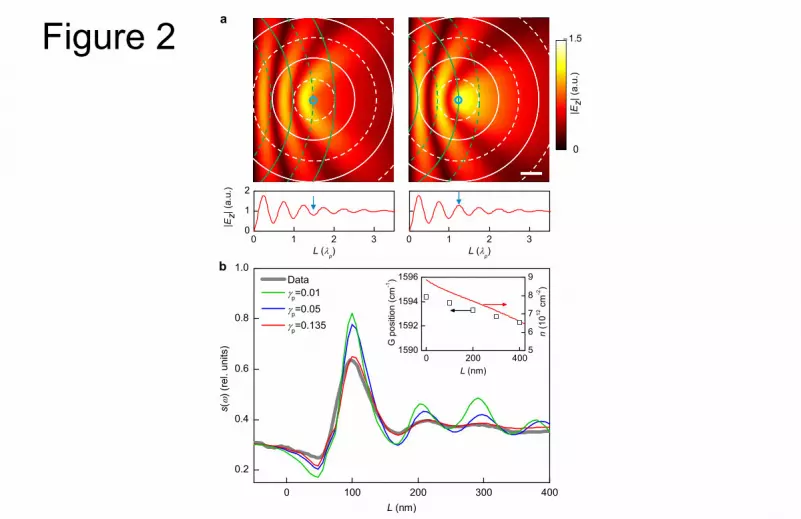
Figure 2 | Spatial variation of the near-field amplitude at the graphene edge. For all
panels, graphene extends at L > 0, and SiO2 not covered by graphene is displayed at L < 0.
a, Illustration of interference between tip-launched plasmon waves (white) and their
reflection (green) from the edge at L = 0. Solid and dashed lines correspond to positive
and negative field maxima of the propagating plasmon, respectively. False color plots of
the absolute value of electric field |Ez| reveal standing waves formed between the tip and
the edge. Left and right panels show snapshots of destructive (minimum signal) and
constructive (maximum signal) interference underneath the tip, respectively. Scale bar,
0.5λp. We also plot profiles of |Ez| underneath the tip versus its distance to the edge. The
blue circles and arrows mark the positions of the tip. b, Experimental (grey) and
calculated (color) s(ω) line profiles at zero gate voltage. Inset shows the G-peak positions
inferred from micro-Raman data and the carrier density profile (red line) we used to
model the plasmonic standing wave (panel b). The Raman G-peak positions are
associated with the variation of the local carrier density in graphene (right-hand scale)19-21.
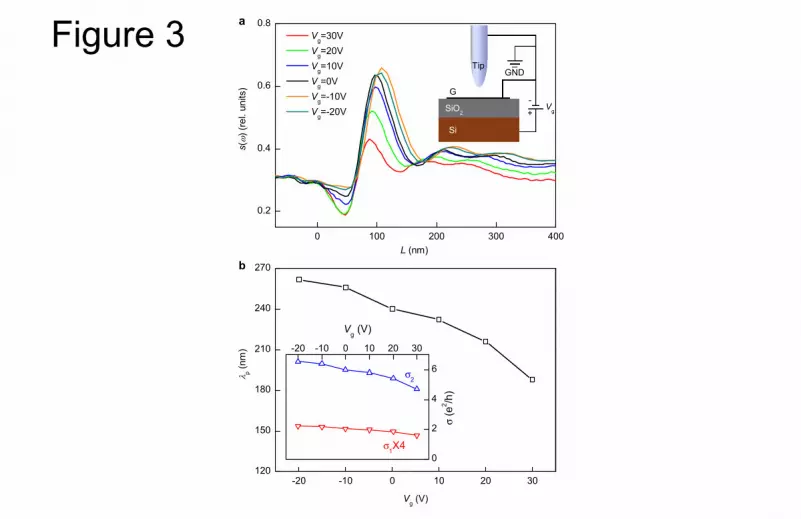
Figure 3 | Electrostatically tunable plasmon in back-gated graphene. a, s(ω) line
profiles perpendicular to the graphene edge at various gate voltages. Inset illustrates our
gate bias setup. b, Gate-dependent plasmon wavelength λp. Inset displays the real and
imaginary part of the optical conductivity of graphene at various gate voltages estimated
from λp and γp as described in the text. These conductivity data directly show that the
response of graphene is predominantly reactive: σ2 >> σ1 thus fulfilling an essential
precondition for excitation of plasmons.

SiO2
a
G0.1
1.1
s (
ω )
e
G
SiO2
G
b
SiO2
s (
ω )
SiO2
BG
G
dc
G
0.2
0.5
Figure 1
0 100 200 300 400
0.2
0.4
0.6
0.8
1.0
0 200 4005
6
7
8
9
1590
1592
1594
1596
0 1 2 30
1
2
0 1 2 3
1.5
s(
) (re
l. un
its)
L (nm)
Data p=0.01 p=0.05 p=0.135
0
|Ez|
(a.u
.)
n (1
012 c
m-2
)
L (nm)
G p
ositi
on (c
m-1
)
|Ez|
(a.u
.)
L (p)
a
L (p)
b
Figure 2
0 100 200 300 400
0.2
0.4
0.6
0.8
-20 -10 0 10 20 30120
150
180
210
240
270
-20 -10 0 10 20 30
0
2
4
6
b
s(
) (re
l. un
its)
L (nm)
Vg=30V Vg=20V Vg=10V Vg=0V Vg=-10V Vg=-20V
a
Tip
G
SiO2
Si
GND
Vg+-
p (
nm)
Vg (V)
σ2
Vg (V)
σ (e
2 /h)
σ1X4
Figure 3


