Embed Size (px)
Citation preview

GROUP FOR AERONAUTICAL RESEARCH AND TECHNOLOGY IN EUROPE
FRANCE ⋅ GERMANY ⋅ ITALY ⋅ THE NETHERLANDS ⋅ SPAIN ⋅ SWEDEN ⋅ UNITED KINGDOM
ORIGINAL: ENGLISH GARTEUR TP 145 July 4th, 2003
GARTEUR Open
Final Report for GARTEUR Flight Mechanics Action Group FM AG13
GARTEUR Handbook of Mental Workload Measurement
by
GARTEUR Action Group FM AG13
GARTEUR aims at stimulating and co-ordinating co-operation between Research Establishments, Industry and Academia in the areas of Aerodynamics, Flight Mechanics, Helicopters, Structure & Material and Propulsion Technology.


GROUP FOR AERONAUTICAL RESEARCH AND TECHNOLOGY IN EUROPE
FRANCE ⋅ GERMANY ⋅ ITALY ⋅ THE NETHERLANDS ⋅ SPAIN ⋅ SWEDEN ⋅ UNITED KINGDOM
ORIGINAL: ENGLISH GARTEUR TP 145 July 4th, 2003
GARTEUR Open
Final Report for GARTEUR Flight Mechanics Action Group FM AG13
GARTEUR Handbook of Mental Workload Measurement
by
GARTEUR Action Group FM AG13
This report has been published under auspices of the Flight Mechanics Group of Responsables of the Group for Aeronautical Research and
Technology in EURope (GARTEUR) Group of Resp. : FM GoR Action Group : FM AG13 Report Resp. : Martin Castor, FOI Version : 2.0 Project Manager : Martin Castor, FOI Completed : [030704] Monitoring Resp. : Bertil Brännström, FMV GARTEUR [2003]

GARTEUR FM AG13 FINAL REPORT – GARTEUR TP 145
iv
List of Authors
Martin Castor FOI Eamonn Hanson NLR Erland Svensson FOI Staffan Nählinder FOI Patrick Le Blaye ONERA Iain MacLeod AeI/ Atkins Aviation and Defence Systems Nicky Wright QINETIQ Jens Alfredson FOI Lotta Ågren SAAB Peter Berggren FOI Valérie Juppet Dassault Aviation Brian Hilburn NLR Kjell Ohlsson LiU

GARTEUR FM AG13 FINAL REPORT – GARTEUR TP 145
v
Summary
The mental workload problems experienced by current and future pilots of fixed and rotary wing aircraft constitute a major limiting factor on information processing capabilities and mission performance. Studies of mental workload issues are therefore highly important. However, current workload measurement techniques still need refinement, and as the methods used are not standardised it is problematic to compare results from different studies. The present report summarises the work executed in the GARTEUR Action Group on Mental Workload Measurement (FM AG13). The objectives of the present Action Group were to make an inventory of mental workload measurement methods and techniques, and present a method to choose between different methods and advise on their use in various operational settings. In order to be able to recommend suitable measures for different studies, the Action Group has developed Measures Assessment Matrices (MAMs) that assist in the selection of appropriate measures from the workload “toolbox”. The report also describes a number of example studies performed by the Action Group members where issues such as experimental protocol and how results are put in context are discussed. Finally, the report describes a number of available approaches to summarise data when several different types of measures have been used in an experiment.

GARTEUR FM AG13 FINAL REPORT – GARTEUR TP 145
vi
Distribution List
GARTEUR Executive Committee (XC) B. Oskam (NL) NLR P. Garcia Samitier (SP) – XC Chairman INTA T. J. Birch (UK) DSTL D. Nouailhas (FR) ONERA W. Riha (DE) DLR L. Falk (SE) FMV A. Amendola (IT) CIRA GARTEUR XC Secretary F. Merida Martin (SP) INTA GARTEUR Flight Mechanics Group of Responsables (FM GoR) C. Barrouil (FR) ONERA P. Hecker (DE) DLR W.P. de Boer (NL) NLR B. Brännström (SE) - Chairman FM GoR FMV M. Hagström (SE) FOI J. Keirl (UK) DSTL F. Muñoz Sanz (SP) INTA L. Verde (IT) CIRA A. Kröger (DE) Airbus GARTEUR Flight Mechanics Industry Points of Contact (FM IPoC) R. Carabelli (IT) Alenia J. Enhagen (SE) SAAB L. Goerig (FR) Dassault Aviation GARTEUR FM AG13 Members Lotta Ågren (SE) SAAB Jens Alfredson (SE) FOI Martin Castor (SE) - Chairman FM AG13 FOI Xavier Chalandon (FR) Dassault Aviation Carole Deighton (UK) AeI Eamonn Hanson (NL) NLR Brian Hilburn (NL) NLR Valérie Juppet (FR) Dassault Aviation Patrick Le Blaye (FR) ONERA Iain MacLeod (UK) AeI/ Atkins Aviation and Defence Systems Staffan Nählinder (SE) FOI Nicolas Maille (FR) ONERA Kjell Ohlsson (SE) LiU Fredrik Romare (SE) SAAB Erland Svensson (SE) FOI Nicky Wright (UK) QINETIQ
GARTEUR FM AG13 FINAL REPORT – GARTEUR TP 145
vii
Contents List of Authors iv Summary v Distribution List vi List of Abbreviations xii 1 Introduction 14
1.1 Background 14 1.2 The workload concept 14 1.3 Approaches to mental workload 15 1.4 A comprehensive approach to workload 16 1.5 Creating the Methods Assessment Matrices 18 1.6 Choosing the best instrument for the job 21
2 Description of workload assessment tools 24 2.1 Criteria 24 2.2 Summary table of additional requirements 28 2.3 Descriptions of the measures 29
2.3.1 Bedford Scale 30 2.3.2 Modified Cooper-Harper Scale 32 2.3.3 NASA TLX 35 2.3.4 FOI Pilot Performance Scale 40 2.3.5 Rating Scale Mental Effort 42 2.3.6 DRAWS – DRA (Defence Research Agency) Workload Scales 44 2.3.7 Instantaneous Self-Assessment (ISA) 46 2.3.8 SWAT 48 2.3.9 Task Analysis 52 2.3.10 Usability methods 56 2.3.11 Heart rate (HR) and Heart Rate Variability (HRV) 58 2.3.12 EPOG and scan patterns 62 2.3.13 Blink rate 65 2.3.14 Eye movements via electro-oculogram (EOG) 67 2.3.15 Blood pressure and ear pulse 70 2.3.16 Brain activity: electroencephalogram (EEG) & event-related potentials (ERP)72 2.3.17 Respiration 76 2.3.18 Secondary Embedded Task 78 2.3.19 MOEs/MOPs 81 2.3.20 “Second pilot” or instructor assessment of performance 83 2.3.21 Subjective assessment of performance 85

GARTEUR FM AG13 FINAL REPORT – GARTEUR TP 145
viii
3 Example studies 87 3.1 NLR contribution 87
3.1.1 Mission 87 3.1.2 Experimental protocol 88 3.1.3 Methods and analysis 90 3.1.4 Results in context 91
3.2 SAAB contribution 94 3.2.1 Mission 94 3.2.2 Experimental protocol 94 3.2.3 Methods and analysis 95 3.2.4 Results in context 95
3.3 AeI contribution 97 3.3.1 Mission 97 3.3.2 Experimental protocol 97 3.3.3 Methods and analysis 98 3.3.4 Results in context 98
3.4 FOI contribution 100 3.4.1 Mission 100 3.4.2 Experimental protocol 100 3.4.3 Methods and analysis 100 3.4.4 Results in context 101
3.5 ONERA contribution 103 3.5.1 Mission 103 3.5.2 Experimental protocol 103 3.5.3 Methods and analysis 105 3.5.4 Results in context 105
4 Mission examples 108 4.1 Introduction 108 4.2 Military fixed wing mission 108 4.3 Civil fixed wing mission 109 4.4 Military rotor wing mission 111 4.5 Differences between military and civilian missions 112
5 Aggregation of results 115 5.1 Standardization of psychophysiological data 115
5.1.1 Other uses 116 5.1.2 Theoretical illustration 117 5.1.3 Conclusion 118
5.2 Generalised Formal Concept Analysis 118

GARTEUR FM AG13 FINAL REPORT – GARTEUR TP 145
ix
5.3 Triangulation 118 5.4 Statistical techniques for data reduction and modelling 122
5.4.1 Factor analysis (FA) 122 5.4.2 Multidimensional scaling (MDS) 126 5.4.3 Illustrations of the techniques 126
6 Modelling of operator performance 133 6.1 Conceptual modelling 133 6.2 Computer based modelling 134 6.3 Data-based modelling 135 6.4 Applied examples of data-based modelling 136 6.5 Conclusions on modelling 144
7 Concluding remarks 147 8 References 149 APPENDIX 1: The modified Cooper-Harper scale 155 APPENDIX 2: The Bedford scale 156 APPENDIX 3: Rating Scale Mental Effort 157 APPENDIX 4: Online Use of ISA Ratings 158 APPENDIX 5: NASA TLX 159 APPENDIX 6: DRA Workload Scales (DRAWS) 163
GARTEUR FM AG13 FINAL REPORT – GARTEUR TP 145
x
List of Figures Figure 1. Four main approaches to workload. ............................................................................ 15 Figure 2. A simplified model of the human operator environment illustrating the importance of
a multi-dimensional approach to workload measurements................................................. 16 Figure 3. Examples of Methods Assessment Matrices (MAM).................................................. 18 Figure 4. Four-leafed clover representing the important sources of Human Factors expertise. . 88 Figure 5. Gaze scan patterns. ...................................................................................................... 91 Figure 6. Spheres of activity at NLR. ......................................................................................... 93 Figure 7. Galois Lattice of the Bourget’2001 experiment. ....................................................... 106 Figure 8. A suggested standardization method. ........................................................................ 116 Figure 9. Heart Rate responses of two pilots. ........................................................................... 117 Figure 10. Standarized Heart Rate of the same two pilots........................................................ 117 Figure 11. The latent construct temperature and (some of) its manifest measures................... 123 Figure 12. Plot of eigenvalues extracted from successive residual correlation matrices. ......... 127 Figure 13. Plot of loadings........................................................................................................ 128 Figure 14. A two-dimensional MDS......................................................................................... 128 Figure 15. A MDS solution separating markers for cognitive and perceptual processes. ........ 129 Figure 16. The structural model of example 4. ......................................................................... 130 Figure 17. The structural model of example 5. ......................................................................... 131 Figure 18. A structural LISREL model from Svensson et al, 1993. ......................................... 137 Figure 19. A structural LISREL model from Angelborg-Thanderz, 1997. .............................. 138 Figure 20. A causal model from Svensson et al, 1997.............................................................. 140 Figure 21. The final structural model presented in Svensson et al, 1999. ................................ 141 Figure 22. A submodel from from Svensson et al, 1997. ......................................................... 142 Figure 23. A model based on the relationships between mental workload, eye fixation rate, heart
rate, situational awareness, and pilot performance ........................................................... 143 Figure 24. A model based on the relationships between mental workload, heart rate, situational
awareness, and pilot performance..................................................................................... 144
GARTEUR FM AG13 FINAL REPORT – GARTEUR TP 145
xi
List of Tables Table 1. The Workload Decomposition-matrix. ......................................................................... 19 Table 2. The Measures, Methods and Instruments-matrix.......................................................... 22 Table 3. The Additional Requirements-matrix. .......................................................................... 28 Table 4. Experiment environments at NLR ................................................................................ 89 Table 5. Examples of parameters that can be measured, necessary equipment and the underlying
constructs or topics of interest for the three........................................................................ 90 Table 6. Differences between military and civilian missions ................................................... 112

GARTEUR FM AG13 FINAL REPORT – GARTEUR TP 145
xii
List of Abbreviations
AG Action Group AeI Aerosystems International DIVA Design of Human Machine Interfaces and their Validation in
Aeronautics DLR Deutsches Zentrum für Luft- und Raumfahrt
The German Aerospace Center DSTL Defence Science and Technology Laboratory ECG Electrocardiogram EEG Electroencephalogram EG Exploratory Group EOG Electro-oculogram EPOG Eye Point Of Gaze ERP Event Related Potentials EU European Union FOI Totalförsvarets Forskningsinstitut
The Swedish Defence Research Agency GARTEUR Group for Aeronautical Research and Technology in EURope GSR Galvanic Skin Response HF Human Factors HR Heart Rate HRV Heart Rate Variability IPME Integrated Performance Measurement Environment IR Intermediate Report ISA Instantaneous Self-Assessment LiU Linköpings Universitet
The University of Linköping MIDAS Man-machine Integration and Design and Analysis System MAM Methods Assessment Matrices MCH Modified Cooper-Harper Scale MDS Multi Dimensional Scaling MoE Measures of Effectiveness MoP Measures of Performance NLR Nationaal Lucht- en Ruimtevaartlaboratorium
National Aerospace Laboratory of the Netherlands ONERA Office National d'Etudes et de Recherches Aérospatiales
The French National Aerospace Research Establishment PPS Pilot Performance Scale RSME Rating Scale Mental Effort SA Situation Awareness SPR Sensory-Processing-Response SWAT Subjective Workload Assessment Technique UAV Unmanned (or Uninhabited) Aerial Vehicle WP Work Package XC GARTEUR Executive Committee

GARTEUR FM AG13 FINAL REPORT – GARTEUR TP 145
xiii

GARTEUR FM AG13 FINAL REPORT – GARTEUR TP 145
14
1 Introduction
1.1 Background One goal of the present report is to provide an inventory of mental workload measurement methods used within the research community. The existing knowledge and experience of the Action Group members is integrated with local findings and experiences to describe a toolbox of workload measures. The present report is the final report summarising the inputs provided by GARTEUR partners. In addition to the review of workload measurement instruments, a method is provided that can be used to select appropriate workload measures to determine workload levels in varying conditions and circumstances. The method which entails the use of Methods Assessment Matrices (MAMs) has been reported in the EU DIVA project (Hoogeboom, 2000). A number of important issues such as experimental protocol (briefing, subject handling etc.), and data analysis are also discussed in the report. The workload methods and instruments discussed in this report are a cross-section of the most important instruments used by the Action Group members. 1.2 The workload concept The concept of “workload” has received a lot of attention in aviation, ever since it has been linked with aircraft performance and safety issues (Moray, 1979). Because of this, workload was considered a useful tool, for instance, to aid the evaluation of new cockpit designs or predict crew performance and aid safety. However, the enthusiasm for the use of workload has tempered. This is mainly due to invalid assumptions based on outdated theoretical models of workload (Hart, 1988; Kantowitz, 1988). To date, there is consensus that no unified theory of workload exists. Miller and Hart (1984) identified nine dimensions worth examining in detail when studying total workload: task difficulty, time pressure, own performance, mental effort, physical effort, frustration, stress, fatigue, and activity type. Each of these dimensions affects the information processing capacity of the human operator.

GARTEUR FM AG13 FINAL REPORT – GARTEUR TP 145
15
1.3 Approaches to mental workload The information processing approach (Wickens, 1984) has dominated workload research for two decades. Besides the information processing approach, three other major approaches to workload can be identified (see Figure 1): The information processing and performance approach (Hockey, 1986), approaches emphasising task analysis of task load and task environment (Kirwan & Ainsworth, 1992), and approaches emphasising the self-regulation of behaviour and strategies (Carver & Scheier, 1998). Figure 1. Four main approaches to workload. HTA = Hierarchical Task analysis (Kirwan & Ainsworth, 1992), GOMS = Goals, Operators, Methods and Selection (Card et al., 1986), SPR = Sensors Processing Response model (Bohnen & Jorna, 1997), IT = Image Theory (Beach & Mitchell, 1998). Figure 1 illustrates that workload is a multi-dimensional concept, and that adapting one theory to measure workload may mean that aspects of another may be left out. There also may be overlap between the theories, indicated by the cross-section of lines.
Self-regulation • Strategies, IT
Task load • HTA • GOMS
Information processing• SPR • State control
Performance • SPR • GOMS
GARTEUR FM AG13 FINAL REPORT – GARTEUR TP 145
16
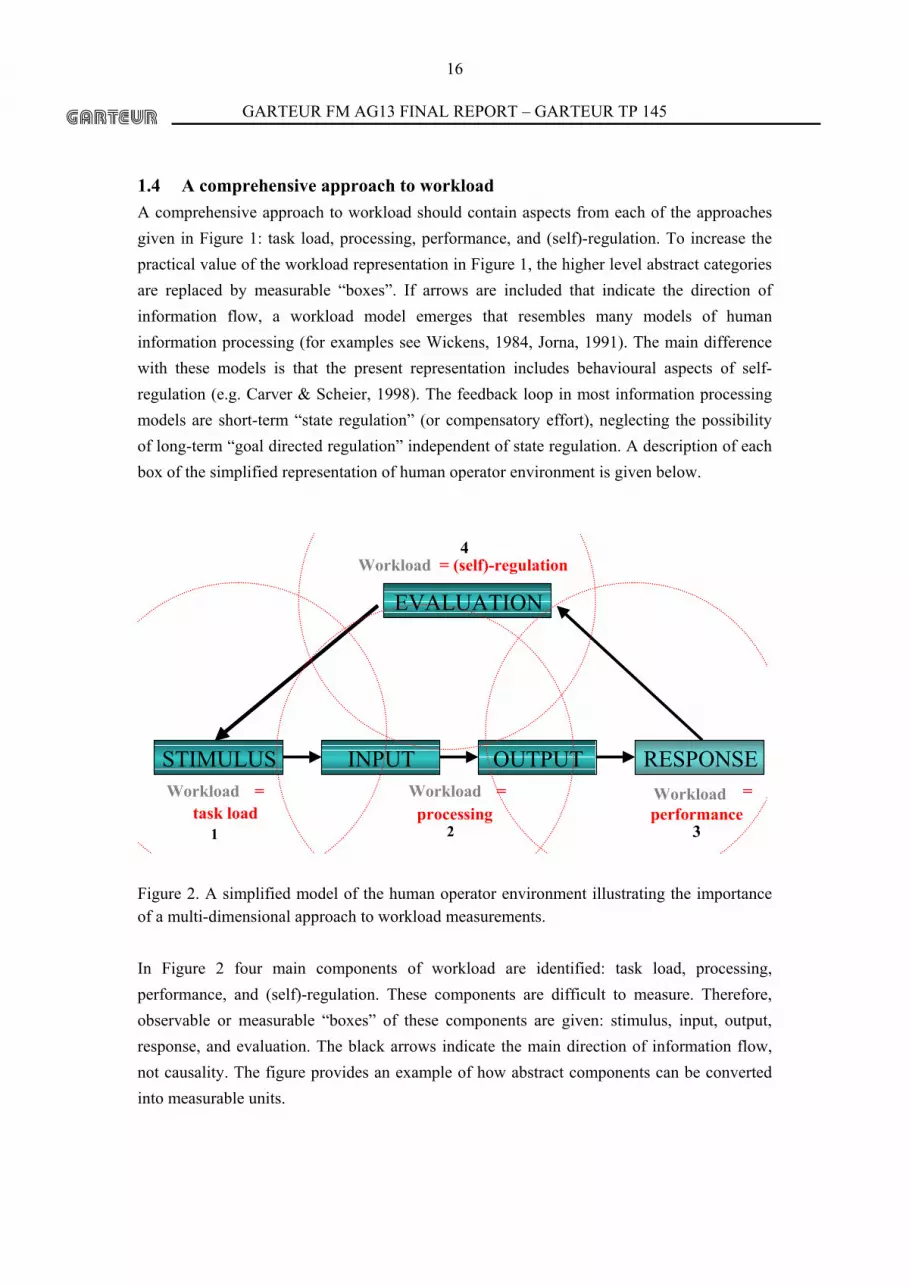
1.4 A comprehensive approach to workload A comprehensive approach to workload should contain aspects from each of the approaches given in Figure 1: task load, processing, performance, and (self)-regulation. To increase the practical value of the workload representation in Figure 1, the higher level abstract categories are replaced by measurable “boxes”. If arrows are included that indicate the direction of information flow, a workload model emerges that resembles many models of human information processing (for examples see Wickens, 1984, Jorna, 1991). The main difference with these models is that the present representation includes behavioural aspects of self-regulation (e.g. Carver & Scheier, 1998). The feedback loop in most information processing models are short-term “state regulation” (or compensatory effort), neglecting the possibility of long-term “goal directed regulation” independent of state regulation. A description of each box of the simplified representation of human operator environment is given below.
STIMULUS RESPONSEOUTPUTINPUT
EVALUATION
4Workload = (self)-regulation
Workload = task load
1
Workload =performance
3
Workload =processing
2
Figure 2. A simplified model of the human operator environment illustrating the importance of a multi-dimensional approach to workload measurements. In Figure 2 four main components of workload are identified: task load, processing, performance, and (self)-regulation. These components are difficult to measure. Therefore, observable or measurable “boxes” of these components are given: stimulus, input, output, response, and evaluation. The black arrows indicate the main direction of information flow, not causality. The figure provides an example of how abstract components can be converted into measurable units.

GARTEUR FM AG13 FINAL REPORT – GARTEUR TP 145
17
1. STIMULUS. This box represents the external stimuli that can be perceived by an operator. Examples of stimuli are the physical work environment (i.e., including the displays and controls), communication (with crewmembers of air traffic control), mission requirements or the aircraft operation at hand.
2. INPUT. This box refers to the sensory perception of relevant external stimuli. It is similar to the “sensory reception” or S-box described by Bohnen & Jorna (1997). The eyes, ears and other sensory organs have unique characteristics and limitations that influence the quality and quantity of information flow. Characteristics of the retina of the eye, for example, influence the conditions under which colour can be perceived and hence processed.
OUTPUT. Perceived information can be filtered or processed, affecting pilot situation awareness, decision-making, anticipation, planning etc. Importantly these processes may occur without immediate behavioural changes or responses, and is therefore separated from the response box. Mental and physical state changes (e.g. anxiety or fatigue) related to motivation or adapted strategy fall within this box. This is also referred to as state-control (Hockey, 1986).
3. RESPONSE. Overt behaviour, including manual inputs or verbal commands, is the main behaviour observed in this box. Measurements of Performance adequately indicate its contents.
4. EVALUATION. The information flow through the previous boxes and their effects are evaluated in this box. The outcome of the evaluation may or may not result in a behavioural response (Carver & Scheier, 1998). The evaluation process may be long term (i.e. after several stimulus-input-output-response cycles). Operator training and experience are the major factors that affect this box. Measurements of Effectiveness adequately indicate its contents.
The representation provides an example of how abstract categories can be translated into measurable boxes, bearing in mind that each box should measure a different aspect of workload. It should be noted that a more detailed decomposition of workload is possible, leading to more and different measurable boxes. The purpose of the present representation of the human operator environment is to assist the process of choosing adequate workload assessment methods or instruments, in light of the existing theoretical approaches. The model reflects important components of the human operator environment, that otherwise may be overlooked. A new system design (or design improvement) should affect some (or perhaps all) of the boxes in the model. For example, a synthetic vision system may be designed to assist the pilot when landing under cat.III circumstances. The symbology that is used in the vision system should (at least) affect the input-box as well as the performance-box. If a Human Factors expert intends to measure the effects of the system on workload, instruments

GARTEUR FM AG13 FINAL REPORT – GARTEUR TP 145
18
should be chosen that can measure the processes that occur within these two boxes. The Methods Assessment Matrices described in this report can provide the researcher with valuable advice in the search for the appropriate instrument. 1.5 Creating the Methods Assessment Matrices
Figure 3. Examples of Methods Assessment Matrices (MAM). In Figure 3 examples of Methods Assessment Matrices designed to facilitate the selection of appropriate instruments from the workload “methods and instruments toolbox” are presented. The top matrix represents the “Workload decomposition versus Measures Matrix” The matrix shows which measures are most suitable as indices of the different components of workload. See Table 1 for the full version. In the middle of Figure 3 the “Measures, Methods and Instruments Matrix” is represented. The middle matrix shows the extent in which each of the given methods and instruments can be used to indicate stimulus, input, output, response and evaluation. See Table 2.
GARTEUR FM AG13 FINAL REPORT – GARTEUR TP 145
19
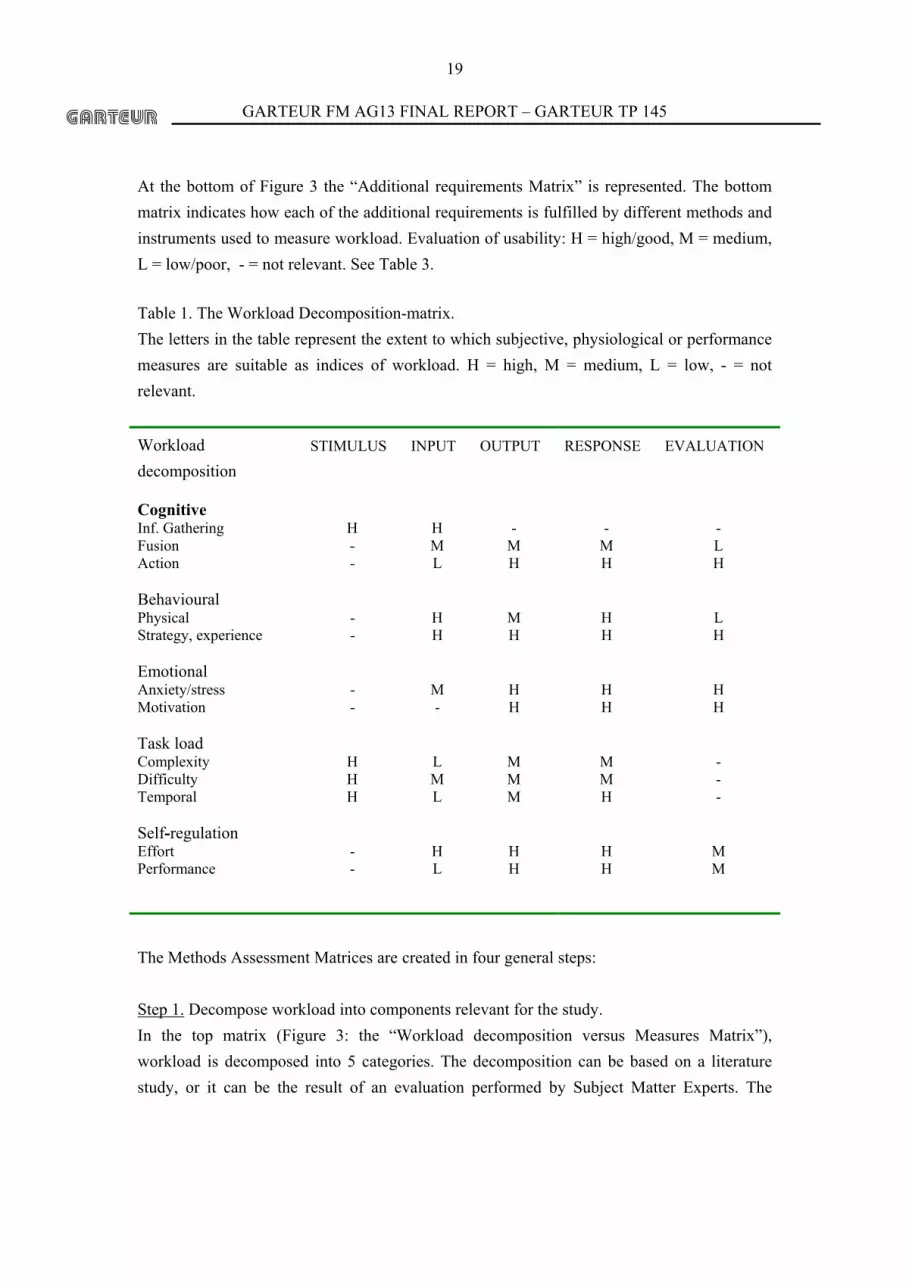
At the bottom of Figure 3 the “Additional requirements Matrix” is represented. The bottom matrix indicates how each of the additional requirements is fulfilled by different methods and instruments used to measure workload. Evaluation of usability: H = high/good, M = medium, L = low/poor, - = not relevant. See Table 3. Table 1. The Workload Decomposition-matrix. The letters in the table represent the extent to which subjective, physiological or performance measures are suitable as indices of workload. H = high, M = medium, L = low, - = not relevant.
Workload decomposition
STIMULUS INPUT OUTPUT RESPONSE EVALUATION
Cognitive Inf. Gathering H H - - - Fusion - M M M L Action - L H H H Behavioural Physical - H M H L Strategy, experience - H H H H Emotional Anxiety/stress - M H H H Motivation - - H H H Task load Complexity H L M M - Difficulty H M M M - Temporal H L M H - Self-regulation Effort - H H H M Performance - L H H M
The Methods Assessment Matrices are created in four general steps: Step 1. Decompose workload into components relevant for the study. In the top matrix (Figure 3: the “Workload decomposition versus Measures Matrix”), workload is decomposed into 5 categories. The decomposition can be based on a literature study, or it can be the result of an evaluation performed by Subject Matter Experts. The

GARTEUR FM AG13 FINAL REPORT – GARTEUR TP 145
20
workload components are derived from a synthesis of workload approaches 1 given in Figure 1. The components are: task load, processing, performance, and (self)-regulation. Step 2. Transform components into measurable boxes. The components task load, processing, performance, and (self)-regulation are difficult to measure. Therefore, observable or measurable “boxes” of these components are given: stimulus, input, output, response, and evaluation. These are the so-called workload measures (see Figure 3 and top horizontal row of Table 1). Step 3. Compare workload measures with workload instruments. In the middle of Figure 3 a Measures Methods and Instruments matrix is constructed. The middle matrix shows the extent in which each of the given methods and instruments can be used to indicate stimulus, input, output, response and evaluation. Step 4. Evaluate the workload instruments according to the additional requirements matrix .At the bottom of Figure 3 an “Additional requirements- matrix” is represented. It indicates how each of the additional requirements is fulfilled by different methods and instruments used to measure workload. According to Hoogeboom (2000), the Assessment Matrices should be “orthogonal”. This has two important implications: 1) the categories in the tables should be mutually exclusive, and 2) the transition between step 1 and step 2 should be reversible. Only if this is the case will it be possible to rate the usability of the workload measures, methods and instruments
1 The present decomposition is a result of consensus achieved in the GARTEUR Action Group. Other decompositions of workload are also possible, and do not affect the essence of the Assessment Matrix.

GARTEUR FM AG13 FINAL REPORT – GARTEUR TP 145
21
1.6 Choosing the best instrument for the job GARTEUR FM AG13 describes 3 choices to be made when selecting of the “right instrument for the job” (see Figure 3).
1. The first choice entails choosing the appropriate box (also referred to as MEASURE in Figure 3 from the “workload decomposition-measures matrix”. It should be noted that workload was decomposed into 5 mutually exclusive categories: cognition, behaviour, emotion, task load, and self-regulation. Although the categories may be interrelated, they are considered mutually exclusive. For example, physical workload is not considered the same as workload induced by task complexity. Depending on the research topic of interest, workload can be decomposed into more (or fewer) categories. It can be derived from Table 1 that physical workload is not indicated by the STIMULUS box (or measure). The RESPONSE box seems a more suitable candidate, as indicated by “H” (high) in the table.
2. The second choice involves selecting a number of measures or instruments that are
indicated as promising to indicate workload associated with the RESPONSE box. A good strategy would be to choose from the methods and instruments that show a high (H in Table 2) relation with the respective measure (or box). Thus in the case of the example above we see (in Table 2) that in order to measure the RESPONSE box we can select all questionnaires, usability measures, scan pattern and all performance measures. This part of the Assessment Matrix is fixed. The relations between the components remain the same no matter what the workload decomposition is or what the additional requirements are.
GARTEUR FM AG13 FINAL REPORT – GARTEUR TP 145
22
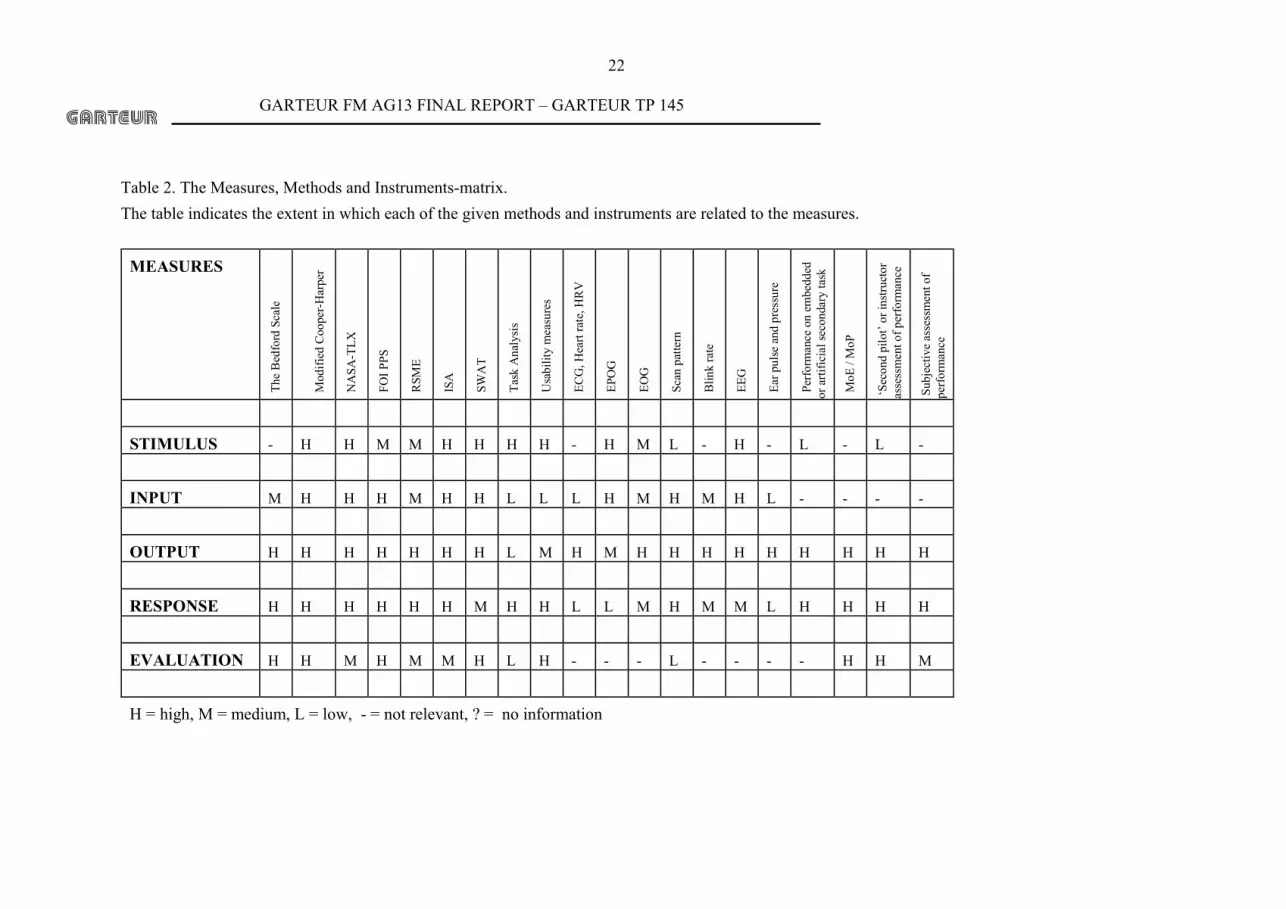
Table 2. The Measures, Methods and Instruments-matrix. The table indicates the extent in which each of the given methods and instruments are related to the measures.
MEASURES
The
Bed
ford
Sca
le
Mod
ified
Coo
per-H
arpe
r
NA
SA-T
LX
FO
I PPS
RSM
E
ISA
SW
AT
Tas
k A
naly
sis
Usa
bilit
y m
easu
res
EC
G, H
eart
rate
, HR
V
EPO
G
EO
G
Sca
n pa
ttern
Blin
k ra
te
EEG
Ear
pul
se a
nd p
ress
ure
Per
form
ance
on
embe
dded
or
arti
ficia
l sec
onda
ry ta
sk
MoE
/ M
oP
‘Sec
ond
pilo
t’ or
inst
ruct
or
asse
ssm
ent o
f per
form
ance
Sub
ject
ive
asse
ssm
ent o
f pe
rform
ance
STIMULUS - H H M M H H H H - H M L - H - L - L -
INPUT M H H H M H H L L L H M H M H L - - - -
OUTPUT H H H H H H H L M H M H H H H H H H H H
RESPONSE H H H H H H M H H L L M H M M L H H H H
EVALUATION H H M H M M H L H - - - L - - - - H H M
H = high, M = medium, L = low, - = not relevant, ? = no information

GARTEUR FM AG13 FINAL REPORT – GARTEUR TP 145
23
3. The third choice is the final step of the selection process. The bottom matrix in Figure 3
(see Table 3 for more details) indicates how each of the additional requirements is fulfilled by different methods and instruments used to measure workload. Based on availability and previous experience with the instrument, a choice can be made. Each method or instrument differs in its usability to measure workload. The criteria used to determine the usability of methods and instruments are given in chapter 2. Furthermore a description is given of all methods and instruments used by members of the GARTEUR Action Group.

GARTEUR FM AG13 FINAL REPORT – GARTEUR TP 145
24
2 Description of workload assessment tools
In this chapter the methods and instruments used by the members of the GARTEUR Action Group are presented. 2.1 Criteria The instruments used by the Action Group members have been described according to the following criteria, also called additional requirements in the MAM. This presentation of the criteria and additional requirements used to determine the usability of workload methods and instruments is primarily based upon Lysaght et al. (1989), Carmody (1994), Caldwell et al. (1994), and DCIEM (1988). Theoretical Background Here references are made to the theoretical foundations and assumptions on which the measurement method rests: For example the assumption that psycho-physiological phenomena reflect some inner cognitive processes and that mental workload is a result of perceptual or cognitive processes/processing. Maturity of method The notion of maturity could be considered as a sum of: • Theoretical foundation • Experience of use in applied situation • Construct validity • Reliability • In widespread use (Kramer, 1991) Validity problems In crudest terms validity refers to the extent a variable measures what it is presumed to measure. Content validity refers to the degree a measure assesses appropriate, domain-specific knowledge or behaviour. It gives (often multiple) meanings to a variable. At least three different aspects of validity are important: Factorial or construct validity is based upon factor analysis. From theoretical reasoning and empirical research it is reasonable to conclude that mental workload, pilot performance, as well as SA are multifaceted concepts or constructs (i. e. factors). The validity of a manifest measure of one of these constructs or factors is indicated by its correlation with the factor, which is its factor loading. The correlation indicates to what extent the specific measure represents the construct. Both predictive and concurrent validity are expressed by the correlation between a criterion variable and a specific measure (criterion validity). Face validity

GARTEUR FM AG13 FINAL REPORT – GARTEUR TP 145
25
is related to acceptance of a variable and is of special importance when measuring subjective experience. Reliability problems According to the reliability theory, reliability can be defined as the proportion of the total variance of a measure that is true variance. An obtained measure or score is assumed to be the sum of a true measure and an error component. Test-retest reliability (stability) refers to the capability of a measure to provide the same results when the exact conditions are replicated on two or more separate occasions. Internal consistency refers to the extent different measures are similar with respect to factorial content. Generally validity criteria can be considered more important than reliability criteria. A valid measure can be useful even if its reliability is moderate or low. Sensitivity The sensitivity of a measure is closely related to its reliability (relationship between true and total variance). It indicates a measure's capability to distinguish between different conditions of interest imposed on an operator or pilot. For example, the sensitivity of a mental workload measure would increase with the technique's capacity to measure mental workload variations during a flight. Sensitivity is a very important criterion and critical in the selection of empirical measures. Furthermore, sensitivity is fundamental for dynamic measures. Known correlation with other measures Here references to correlations with other measures are presented. One measure confounding the results of another Under this heading discussions on how for example online subjective measures might interfere with the dynamic psycho-physiological measures or how the application of for example subjective measures changes the situation are introduced. Diagnosticity Diagnosticity refers to the extent a measure expresses not only overall assessments but also gives information about specific components of that assessment. According to Lysaght et al. (1989) the essence of the notion of diagnosticity is to be able to identify the specific mechanism (sensory, perceptual, cognitive, and psychomotor), the process involved during the performance of a particular task and which part of an interface an operator has problems with .
GARTEUR FM AG13 FINAL REPORT – GARTEUR TP 145
26
Use in different design stages Here information concerning which stages of a design process the contributing researchers have used the methods is presented. For example, is the method suitable to use in an interface design process (i.e. has a high diagnosticity), whether it is an analytical or empirical technique etc. Applicability This criterion refers to the ability of a measure to reproduce in the field the same results obtained in the laboratory and the ability of the measure to produce valid results over a wide range of situations during a flight (e.g. variations in information load). Administration details and practical aspects How is the measure administered? For example, the same subjective rating scales could be administered in a number of different ways (after or during a mission) and plausibly yield different results. Implementation requirements The criterion of implementation requirements concerns practical aspects of necessary equipment and procedures (hardware such as EPOG measurement systems, recorders of psycho-physiological data, computers, and software for data reduction, statistical analyses, and procedures for the presentation of results). Physical space requirements, portability of equipment, and integration of the equipment into a simulator or a real system are all vital for the collection of valid and reliable data. Description of the actual forms and/or equipment used. If applicable and allowed due to copyright reasons the actual forms and or equipment used is described here. Intrusiveness Intrusiveness refers to the degree to which a measure interferes with the normal or prescribed activities of a situation. For example, an intrusive measure can interfere with a pilot's flight performance or its mere presence may impose additional load. Pilot acceptance Pilot acceptance is related to intrusiveness. The pilot's acceptance of empirical devices may affect performance outcome. The assessment procedures may be ignored or inadequately performed, if pilot acceptance is low. From our own experiences we consider the pilot's acceptance of measurement procedures very important. A measure perceived as bothersome and unnecessary may affect the outcome of all other measures.

GARTEUR FM AG13 FINAL REPORT – GARTEUR TP 145
27
Analysis of results Here information concerning the analysis of results is presented. Used by whom Indicates which of the members of the GARTEUR Action Group that have used the test. References Provide references to important scientific articles in which the measurement methods are explained or used.
GARTEUR FM AG13 FINAL REPORT – GARTEUR TP 145
28
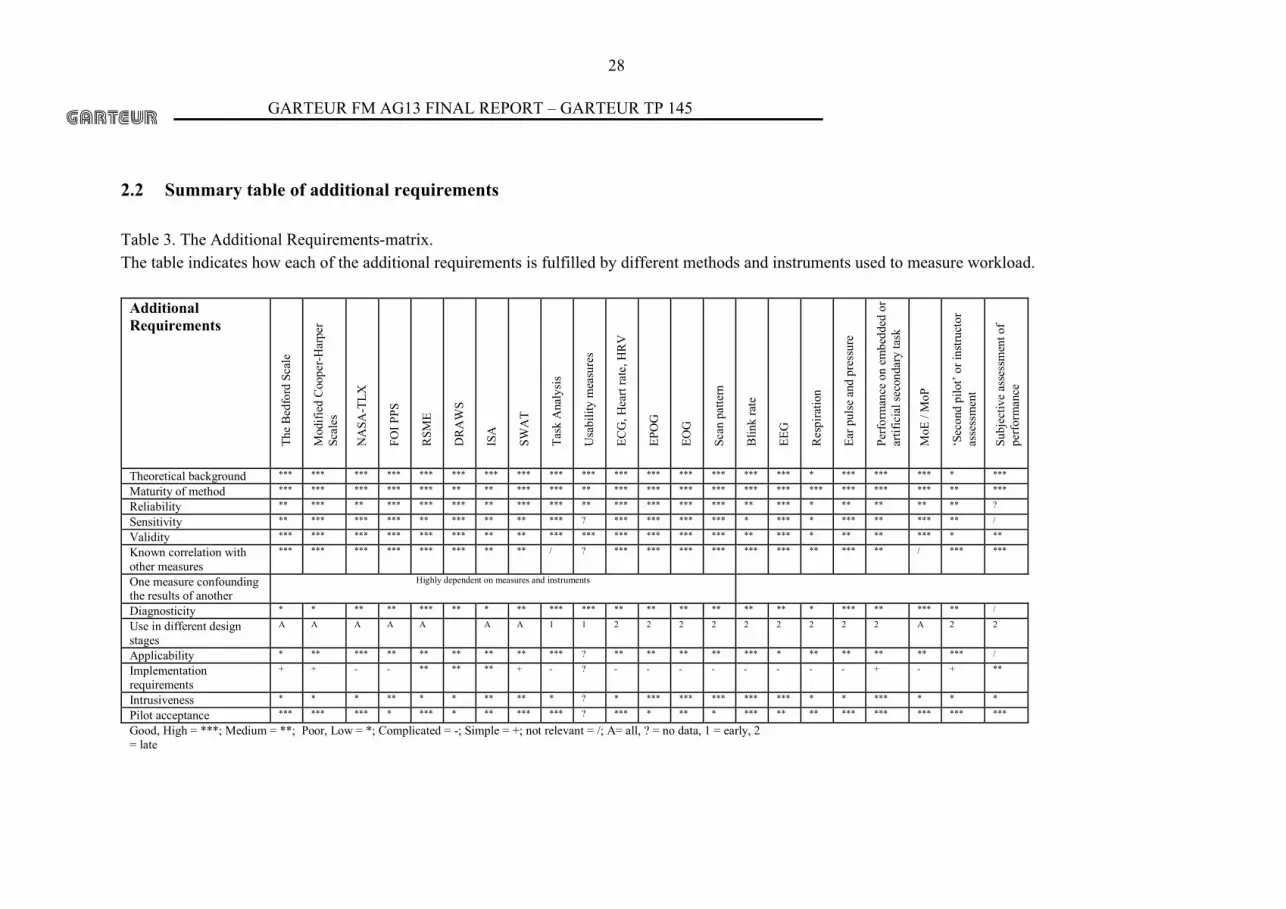
2.2 Summary table of additional requirements Table 3. The Additional Requirements-matrix. The table indicates how each of the additional requirements is fulfilled by different methods and instruments used to measure workload.
Additional Requirements
The
Bed
ford
Sca
le
Mod
ified
Coo
per-H
arpe
r Sc
ales
NA
SA-T
LX
FOI P
PS
RSM
E
DR
AW
S
ISA
SWA
T
Task
Ana
lysi
s
Usa
bilit
y m
easu
res
ECG
, Hea
rt ra
te, H
RV
EPO
G
EOG
Scan
pat
tern
Blin
k ra
te
EEG
Res
pira
tion
Ear p
ulse
and
pre
ssur
e
Perfo
rman
ce o
n em
bedd
ed o
r ar
tific
ial s
econ
dary
task
MoE
/ M
oP
‘Sec
ond
pilo
t’ or
inst
ruct
or
asse
ssm
ent
Subj
ectiv
e as
sess
men
t of
perfo
rman
ce
Theoretical background *** *** *** *** *** *** *** *** *** *** *** *** *** *** *** *** * *** *** *** * ***
Maturity of method *** *** *** *** *** ** ** *** *** ** *** *** *** *** *** *** *** *** *** *** ** ***
Reliability ** *** ** *** *** *** ** *** *** ** *** *** *** *** ** *** * ** ** ** ** ?
Sensitivity ** *** *** *** ** *** ** ** *** ? *** *** *** *** * *** * *** ** *** ** /
Validity *** *** *** *** *** *** ** ** *** *** *** *** *** *** ** *** * ** ** *** * **
Known correlation with other measures
*** *** *** *** *** *** ** ** / ? *** *** *** *** *** *** ** *** ** / *** ***
One measure confounding the results of another
Highly dependent on measures and instruments
Diagnosticity * * ** ** *** ** * ** *** *** ** ** ** ** ** ** * *** ** *** ** /
Use in different design stages
A A A A A A A 1 1 2 2 2 2 2 2 2 2 2 A 2 2
Applicability * ** *** ** ** ** ** ** *** ? ** ** ** ** *** * ** ** ** ** *** /
Implementation requirements
+ + - - ** ** ** + - ? - - - - - - - - + - + **
Intrusiveness * * * ** * * ** ** * ? * *** *** *** *** *** * * *** * * *
Pilot acceptance *** *** *** * *** * ** *** *** ? *** * ** * *** ** ** *** *** *** *** ***
Good, High = ***; Medium = **; Poor, Low = *; Complicated = -; Simple = +; not relevant = /; A= all, ? = no data, 1 = early, 2 = late

GARTEUR FM AG13 FINAL REPORT – GARTEUR TP 145
29
2.3 Descriptions of the measures The description of methods and instruments are given in the next pages. The 22 measures form a subset of all measures described in the research literature and represent the measures used by the Action Group members.

GARTEUR FM AG13 FINAL REPORT – GARTEUR TP 145
30
2.3.1 Bedford Scale Requirement Description Theoretical background
Based upon single resource models of human attention. Performance on a mental or physical task absorbs a given amount of human capacity from a finite resource. Concurrent measurement of the capacity remaining to respond to an additional task is an indicator of the resources that are used by the primary task.
Maturity of method
The measure was first introduced by Roscoe (Roscoe, 1987; Roscoe & Ellis, 1990), and is derived from the Cooper-Harper Scale (see modified Cooper-Harper). The scale was not derived using classical scaling techniques (e.g. Factor analysis). The technique has been used predominantly within aerospace operations in the laboratory, simulated and flight environments.
Reliability problems
Test-Retest Reliability is unknown. The reliability of Assessors to complete the Bedford Rating Scale is likely to be enhanced by operationalising the additional task. Feedback to the Assessors on their ability to achieve the additional task provides the Assessors with tangible evidence of their ‘spare capacity’.
Sensitivity Usually quoted as a global measure of workload that is sensitive to gross changes in workload. Insensitive particularly to low levels of workload (ratings 1-3). Insensitivity a product of the technique not being derived using formal scaling techniques: what is the difference between Ratings 1 and 2, “workload insignificant” and “workload low” and Rating 3, “Enough spare capacity for all desirable additional tasks”? The descriptor assigned to Rating 3 should be an integral feature of ratings 1 and 2.
Validity problems
No data on psychometric measures of validity. Face validity tends to be high in the Test Pilot community for two key reasons: similarity to the decision-tree format of the Cooper-Harper and quick to use, albeit inappropriately on several occasions.
Known correlation with other measures
-
One measure confounding the results of another
Use alongside the Cooper-Harper HQR Scale should be avoided given the similarity in scale format. Care needs to be taken to provide a realistic additional task against which the Assessors can make a judgement of their additional capacity. The additional task needs to be developed according to the environment; it is inappropriate to ask the pilot during a flight trial to count backwards in 3’s if that is not part of normal operations! Additional tasks must be embedded and a natural part of the flying task. Skill is required in the development of such tasks to ensure that they are truly additional tasks and do not overwhelm the primary task.
Diagnosticity Low with respect to the many other forms of workload that may be experienced by the operator. Time and Stress load are particularly important types of workload experienced during the performance of discrete and continuous flight path control tasks in rotorcraft operations. The Bedford Workload Scale does not address these dimensions of workload. As a result detailed debriefing questionnaires to capture other fundamental sources of workload are essential.
GARTEUR FM AG13 FINAL REPORT – GARTEUR TP 145
31
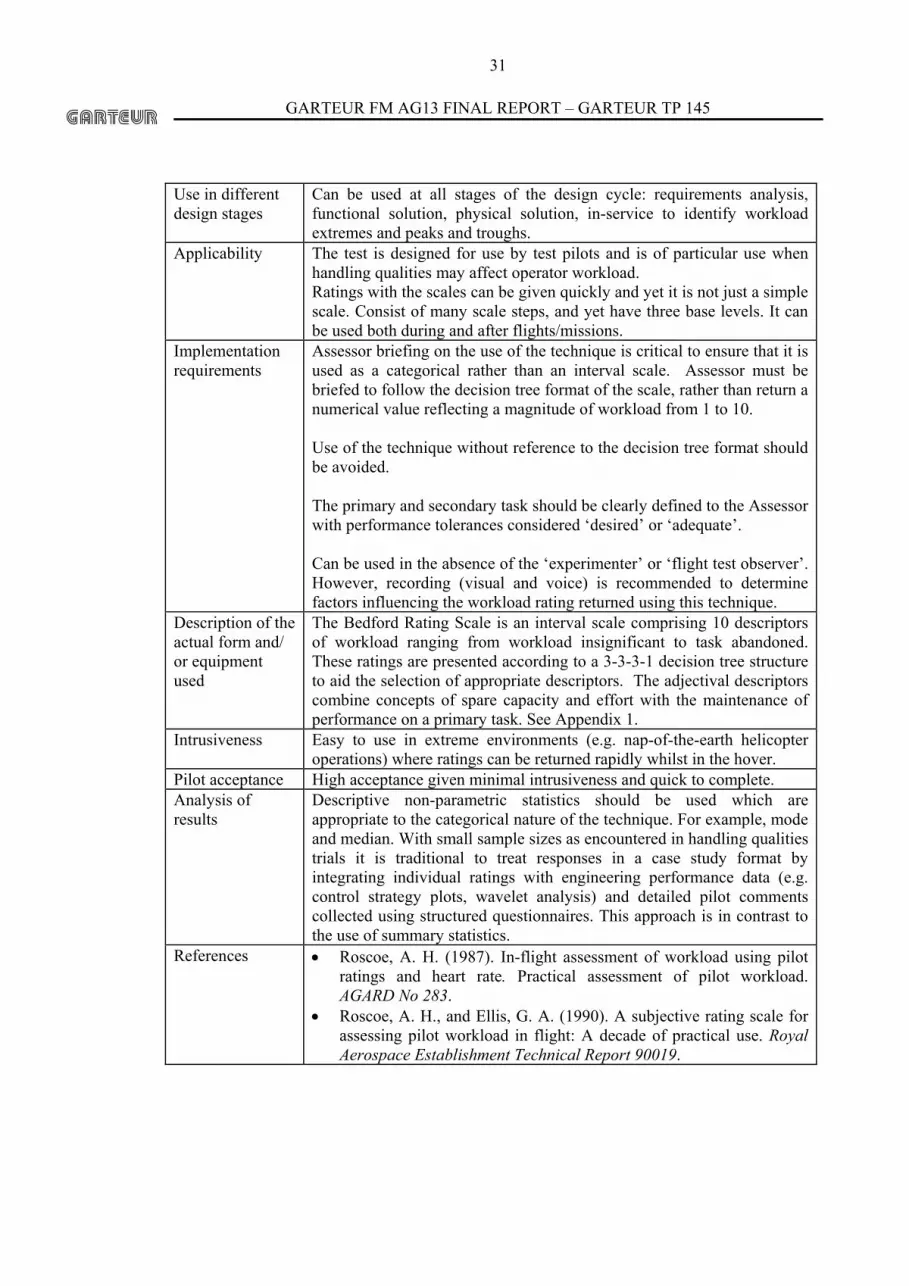
Use in different design stages
Can be used at all stages of the design cycle: requirements analysis, functional solution, physical solution, in-service to identify workload extremes and peaks and troughs.
Applicability The test is designed for use by test pilots and is of particular use when handling qualities may affect operator workload. Ratings with the scales can be given quickly and yet it is not just a simple scale. Consist of many scale steps, and yet have three base levels. It can be used both during and after flights/missions.
Implementation requirements
Assessor briefing on the use of the technique is critical to ensure that it is used as a categorical rather than an interval scale. Assessor must be briefed to follow the decision tree format of the scale, rather than return a numerical value reflecting a magnitude of workload from 1 to 10. Use of the technique without reference to the decision tree format should be avoided. The primary and secondary task should be clearly defined to the Assessor with performance tolerances considered ‘desired’ or ‘adequate’. Can be used in the absence of the ‘experimenter’ or ‘flight test observer’. However, recording (visual and voice) is recommended to determine factors influencing the workload rating returned using this technique.
Description of the actual form and/ or equipment used
The Bedford Rating Scale is an interval scale comprising 10 descriptors of workload ranging from workload insignificant to task abandoned. These ratings are presented according to a 3-3-3-1 decision tree structure to aid the selection of appropriate descriptors. The adjectival descriptors combine concepts of spare capacity and effort with the maintenance of performance on a primary task. See Appendix 1.
Intrusiveness Easy to use in extreme environments (e.g. nap-of-the-earth helicopter operations) where ratings can be returned rapidly whilst in the hover.
Pilot acceptance High acceptance given minimal intrusiveness and quick to complete. Analysis of results
Descriptive non-parametric statistics should be used which are appropriate to the categorical nature of the technique. For example, mode and median. With small sample sizes as encountered in handling qualities trials it is traditional to treat responses in a case study format by integrating individual ratings with engineering performance data (e.g. control strategy plots, wavelet analysis) and detailed pilot comments collected using structured questionnaires. This approach is in contrast to the use of summary statistics.
References • Roscoe, A. H. (1987). In-flight assessment of workload using pilot ratings and heart rate. Practical assessment of pilot workload. AGARD No 283.
• Roscoe, A. H., and Ellis, G. A. (1990). A subjective rating scale for assessing pilot workload in flight: A decade of practical use. Royal Aerospace Establishment Technical Report 90019.

GARTEUR FM AG13 FINAL REPORT – GARTEUR TP 145
32
2.3.2 Modified Cooper-Harper Scale Requirement Description Theoretical background
The Cooper-Harper Scale (C-H scale) was originally designed to measure aircraft handling skills and pilot workload (Cooper & Harper, 1969; Boff & Lincoln, 1988). It uses a decision-tree format in which the pilot makes a number of yes-no decisions, eventually arriving at a rating on a 10-point scale. The terms that deal with mental workload or effort are operationally defined as they relate to task demand, errors, or controllability.
Maturity of method
The Modified Cooper-Harper Scale (MCH) was first introduced in 1969, and has been widely used ever since (Cooper & Harper, 1969).
Reliability problems
Since (test) pilots have to clearly define performance criteria before use of the scale, the test-retest reliability is very good. A score on the scale, e.g. 6 always means the same: “adequate performance, requires considerable pilot compensation”.
Sensitivity Because the modified Cooper-Harper scale is sensitive to different types of loading (e.g. perceptual or problem-solving), it may serve as a global workload measure.
Validity problems
The scale shows a monotonic relationship with perceptual, central processing and communications loading levels (Casali & Wierwille, 1983).
Known correlation with other measures
The scale correlates highly with primary, secondary and opinion variables (r = +0.80) (Boff & Lincoln, 1988). The scales are sensitive to task difficulty and are closely related to capacity limitations. Ratings on the scales correlate significantly with situational awareness (SA) measures, and psychophysiological measures (heart rate and blink rate) (Svensson et al., 1997).
One measure confounding the results of another
Since the questionnaire is fill out after the task is performed, memory of workload may be impaired. If more than one questionnaire has to be filled in, (which is often the case in human factors research) the C-H rating may be confounded. The difference between the Bedford and MCH is that while the MCH scales contain elements of performance and difficulty the Bedford scale is more explicitly concerned with workload.
Diagnosticity It is not likely that this scale would be diagnostic of the sources of workload variation.
Use in different design stages
The Bedford and MCH scales can be used in many settings, from desk-top simulation to real flight, during most design stages and tasks. Due to the generic design of the measures they can be used to establish reference to other studies from different domains/missions. They can be used both during mission and for post-mission evaluations. The scale is of particular use in later stages of design, in experimental circumstances.
Applicability The test is designed for use by test pilots and is of particular use when handling qualities may affect operator workload. Ratings with the scales can be given quickly and yet it is not just a simple scale. Consist of many scale steps, and yet have three base levels. It can be used both during and after flights/missions. In the VINTHEC project modified Cooper Harper scales have also been

GARTEUR FM AG13 FINAL REPORT – GARTEUR TP 145
33
used for SA ratings (Svensson, Angelborg-Thanderz, & Van Avermaete, 1997, Alfredson, 2001, Berggren, 2000).
Implementation requirements
The terminology used in the scale e.g. “adequate performance”, and “considerable pilot compensation” have to be defined very precisely beforehand. The definitions should lead to the same observation by all test pilots using the scale.
Description of the actual form used
See appendix 2 for an example of the scale (Wierwille & Casali, 1983).
Intrusiveness The test cannot be filled out using paper-and-pencil during actual aircraft manoeuvres. The pilots may want to memorise C-H categories beforehand and call them aloud verbally during flight. During a simulator experiment the simulation can be “frozen” to fill out the questionnaire.
Pilot acceptance Test pilots are usually very critical about the “inter-test pilot” reliability. A precise definition of terminology and intensive briefing and debriefing prevent this. The scales are easy to administer and are well accepted by pilots.
Analysis of results
Depends on research goals. Correlation scores are most frequently observed in the literature. Ratings on the MCH and Bedford scales are useful as a part of causal modelling, e.g. LISREL models (Jöreskog & Sörbom, 1993). See for example Svensson et al., 1997, 1999, 2002 and chapter 6 of this report. All C-H ratings are standardised and therefore comparable with C-H scores derived for other experiments, increasing the generalisability and acceptability of the results.
Used by whom NLR, FOI, QINETIQ References • Alfredson, J. (2001). Aspects of situational awareness and its
measures in an aircraft simulation context. Linkoping Studies in Science and Technology, Thesis No. 865, LiU-Tek-Lic-2001:2, Linköping University, Sweden.
• Berggren, P. (2000). Situational awareness, mental workload, and pilot performance - relationships and conceptual aspects. FOA-R-00-01438-706-SE.
• Boff, K. R., & Lincoln, J. E. (1988). Engineering Data Compendium: Human Perception and Performance. Wright-Patterson: AAMRL.
• Casali, J. G., & Wierwille, W. W. (1983). Communications imposed pilot workload: A comparison of sixteen estimation techniques. In Proceedings of second Symposium on Aviation Psychology. p 223-235. Ohio State University, Aviation Psychology Laboratory.
• Cooper, G. E. & Harper, R. P. Jr. (1969). The Use of Pilot Rating in the Evaluation of Aircraft Handling Qualities. NASA TN D-5153.
• Jöreskog K. G., & Sörbom, D. (1993). LISREL8: Structural equation modeling with the SIMPLIS command language. Hillsdale: Lawrence Erlbaum Associates.
• Svensson, E., Angelborg-Thanderz, M., & Van Avermaete, J. (1997). Dynamic measures of pilot mental workload, pilot performance, and situational awareness. NLR Technical Report: VINTHEC-WP3-TR01. NLR, Amsterdam.
• Svensson, E., Angelborg-Thanderz, M., & Wilson, G. F. (1999). Models of pilot performance for systems and mission evaluation – psychological and psychophysiological aspects. AFRL-HE-WP-TR-

GARTEUR FM AG13 FINAL REPORT – GARTEUR TP 145
34
1999-0215. • Svensson, E., and Wilson, G.F. (2002). Psychological and psycho-
physiological models of pilot performance for systems development and mission evaluation. International Journal of Aviation Psychology Vol 12 (1). p. 95-110.
• Wierwille, W. W., & Casali, J. G. A (1983). Validated rating scale for global mental workload measurement applications. Proceedings of the Human Factors Society 27th Annual Meeting. Norfolk: Human Factors Society.

GARTEUR FM AG13 FINAL REPORT – GARTEUR TP 145
35
2.3.3 NASA TLX Requirement Description Theoretical background
The NASA-TLX is based upon a human centred, rather than task-centred conceptual framework. The NASA-TLX assumes that workload is not an inherent property, but rather emerges from the interaction between the requirements of a task, the circumstances under which it is performed, and the skills, behaviours and perceptions of the operator. The NASA Task Load Index is a multi-dimensional rating procedure that provides an overall workload score based on a weighted average of ratings on six subscales: Mental Demands, Physical Demands, Temporal Demands, Own Performance, Effort, and Frustration (Mental, Physical. and Temporal Demands) and three to the interaction of a subject with the task (Effort, Frustration. and Performance). A workload score from 0 to 100 is then obtained by multiplying the weight by the dimensions scale score, summing across scales and dividing by the total weights (15 paired comparisons). A thorough discussion of the development can be found in Hart and Staveland (1987). Although it is clear that definitions of workload do indeed vary among experimenters and among subjects (contributing to confusion in the workload literature and between-rater variability), it was found that the specific sources of loading imposed by different tasks are an even more important determinant of workload experiences. Thus, the current version of the scale (the Task Load Index) combines subscale ratings that are weighted according to their subjective importance to raters in a specific task, rather than their a priori relevance to raters' definitions of workload in general.
Maturity of method
NASA-TLX was developed by a team of researchers headed by Sandra G. Hart at NASA Ames Research Center, CA. It is a mature method having been applied successfully in a variety of domains from assessing usability of office-based applications through to car and flight deck workload.
Reliability problems
Some reliability problems may be associated due to problems encountered in sub scale definitions. High reliability coefficients (Cronbachs alfa 0.77) have been found (Svensson et al, 1997).
Sensitivity NASA-TLX ratings have been shown to be very sensitive to experimentally manipulated levels of workload and substantially more reliable as measured by test/re-test manipulation than were SWAT ratings. The TLX scale has been shown to be valid for a number of different task environments including both simulated and actual flight environments, air defence, and remotely-piloted vehicles. In each of these studies, the TLX was demonstrated to be sensitive to varying levels of mental demand imposed by the task.

GARTEUR FM AG13 FINAL REPORT – GARTEUR TP 145
36
2.3.3 NASA TLX Requirement Description Validity problems
Haworth et al. (1986) implemented the TLX procedure to assess levels of workload associated with different scenarios of flight during actual helicopter flight. TLX ratings were found to be significantly different between demands imposed by the different flight scenarios and correlated significantly with pilot performance data. Multi Dimensional Scaling (MDS) analysis of how the six dimensions rated in NASA-TLX relate to each other all dimensions except performance lie very close to one another, and if they cluster close in the MDS analysis they are close in the pilots idea of what workload is. Thus the Performance dimension does not need to be part of the NASA-TLX. When changes in this dimension appear, the increased mental workload has already been captured by other markers. This means that the construct validity of the NASA-TLX factor probably isn’t perfect and factor analysis would break up the TLX into two factors.
Known correlation with other measures
Byers et. al. (1988) compared NASA-TLX to SWAT and MCH and found NASA-TLX was both the most valid measure of subjective workload and had the highest user acceptance. SWAT was second and MCH last. Also, NASA-TLX was also found to correlate significantly with performance, and to correlate highly (0.75) with heart rate. The weighting technique succeeds in reducing between subjects variability more than any other commonly used subjective rating technique.
One measure confounding the results of another
The NASA-TLX is completed by the work participant after the completion of a body of work (i.e. task or group of tasks). As such it gives an overall assessment of that piece of work that may conflict with physiological measurements covering much smaller time spans of that work.
Diagnosticity The multidimensional nature of the NASA-TLX means that it has greater diagnosticity than traditional global measures of workload. Using structured debriefing methods to form recommendations for system improvement enhances diagnosticity. International publications in this area however are still lacking. However, when MDS (Multi Dimensional Scaling) is used in the analysis you can see that the constructs place themselves close to each other (i.e. they express the same thing), except for performance which clearly is an outlier.
Use in different design stages
NASA-TLX can be used throughout the design lifecycle from initial prototype through to completed product evaluations. However, it cannot be used effectively during the logical concept phase of design.
Applicability The NASA-TLX can be used for any human - system interaction with focus on the workload of the users. Measurement of workload is acquired by user ratings. The NASA-TLX can be applied in field or laboratory studies. The Task Load Index has been tested in a variety of experimental tasks that range from simulated flight to supervisory control simulations and
GARTEUR FM AG13 FINAL REPORT – GARTEUR TP 145
37
2.3.3 NASA TLX Requirement Description
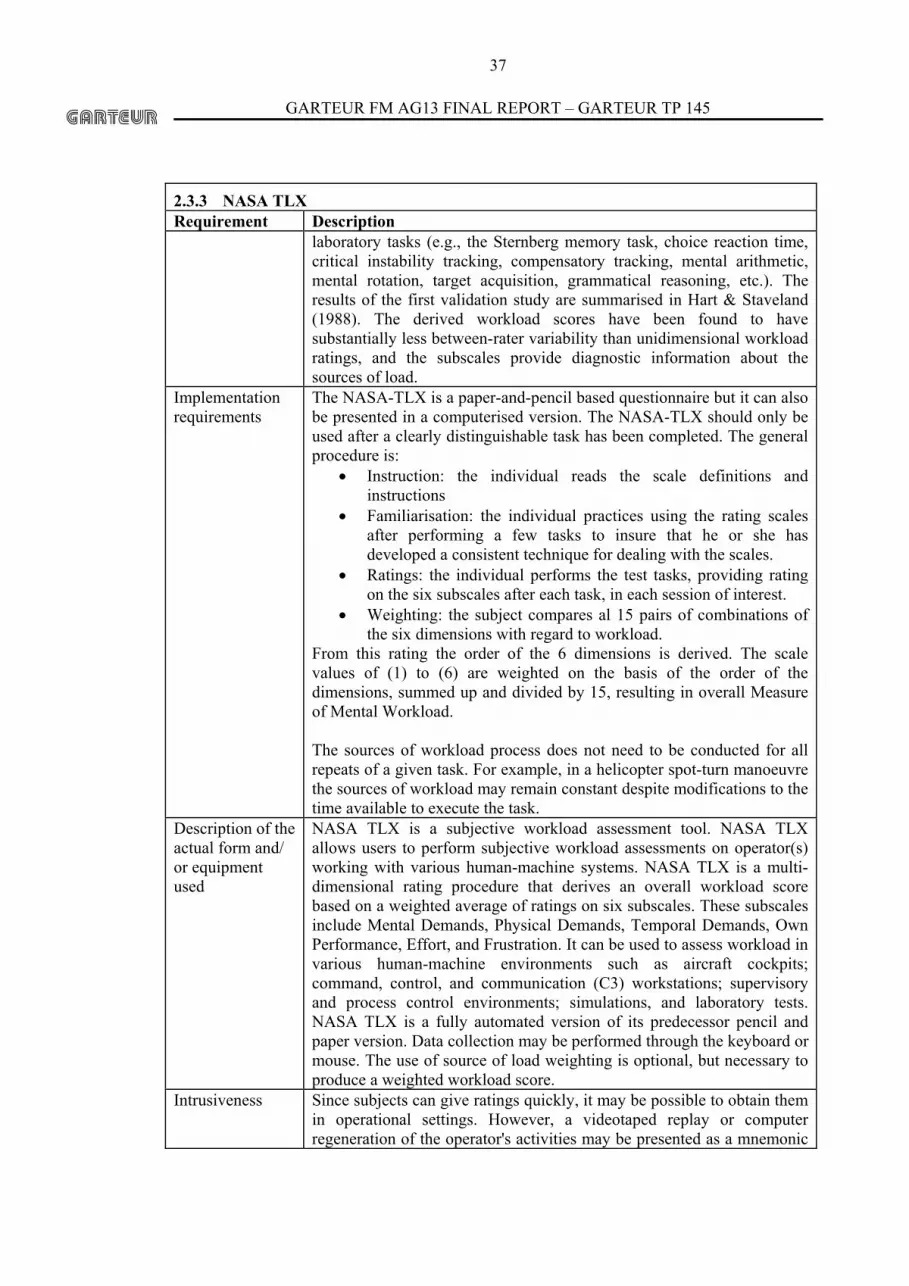
laboratory tasks (e.g., the Sternberg memory task, choice reaction time, critical instability tracking, compensatory tracking, mental arithmetic, mental rotation, target acquisition, grammatical reasoning, etc.). The results of the first validation study are summarised in Hart & Staveland (1988). The derived workload scores have been found to have substantially less between-rater variability than unidimensional workload ratings, and the subscales provide diagnostic information about the sources of load.
Implementation requirements
The NASA-TLX is a paper-and-pencil based questionnaire but it can also be presented in a computerised version. The NASA-TLX should only be used after a clearly distinguishable task has been completed. The general procedure is:
• Instruction: the individual reads the scale definitions and instructions
• Familiarisation: the individual practices using the rating scales after performing a few tasks to insure that he or she has developed a consistent technique for dealing with the scales.
• Ratings: the individual performs the test tasks, providing rating on the six subscales after each task, in each session of interest.
• Weighting: the subject compares al 15 pairs of combinations of the six dimensions with regard to workload.
From this rating the order of the 6 dimensions is derived. The scale values of (1) to (6) are weighted on the basis of the order of the dimensions, summed up and divided by 15, resulting in overall Measure of Mental Workload. The sources of workload process does not need to be conducted for all repeats of a given task. For example, in a helicopter spot-turn manoeuvre the sources of workload may remain constant despite modifications to the time available to execute the task.
Description of the actual form and/ or equipment used
NASA TLX is a subjective workload assessment tool. NASA TLX allows users to perform subjective workload assessments on operator(s) working with various human-machine systems. NASA TLX is a multi-dimensional rating procedure that derives an overall workload score based on a weighted average of ratings on six subscales. These subscales include Mental Demands, Physical Demands, Temporal Demands, Own Performance, Effort, and Frustration. It can be used to assess workload in various human-machine environments such as aircraft cockpits; command, control, and communication (C3) workstations; supervisory and process control environments; simulations, and laboratory tests. NASA TLX is a fully automated version of its predecessor pencil and paper version. Data collection may be performed through the keyboard or mouse. The use of source of load weighting is optional, but necessary to produce a weighted workload score.
Intrusiveness Since subjects can give ratings quickly, it may be possible to obtain them in operational settings. However, a videotaped replay or computer regeneration of the operator's activities may be presented as a mnemonic
GARTEUR FM AG13 FINAL REPORT – GARTEUR TP 145
38
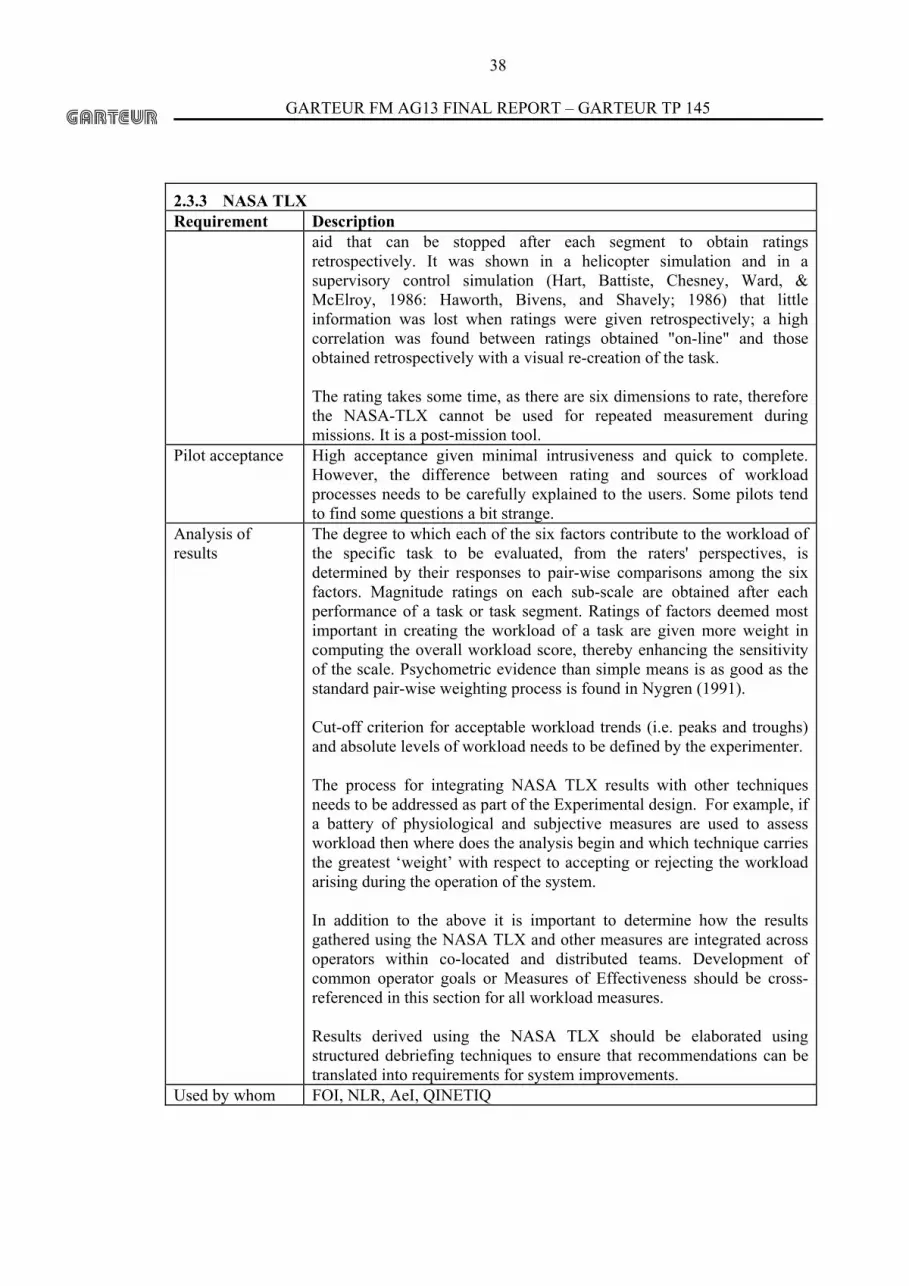
2.3.3 NASA TLX Requirement Description
aid that can be stopped after each segment to obtain ratings retrospectively. It was shown in a helicopter simulation and in a supervisory control simulation (Hart, Battiste, Chesney, Ward, & McElroy, 1986: Haworth, Bivens, and Shavely; 1986) that little information was lost when ratings were given retrospectively; a high correlation was found between ratings obtained "on-line" and those obtained retrospectively with a visual re-creation of the task. The rating takes some time, as there are six dimensions to rate, therefore the NASA-TLX cannot be used for repeated measurement during missions. It is a post-mission tool.
Pilot acceptance High acceptance given minimal intrusiveness and quick to complete. However, the difference between rating and sources of workload processes needs to be carefully explained to the users. Some pilots tend to find some questions a bit strange.
Analysis of results
The degree to which each of the six factors contribute to the workload of the specific task to be evaluated, from the raters' perspectives, is determined by their responses to pair-wise comparisons among the six factors. Magnitude ratings on each sub-scale are obtained after each performance of a task or task segment. Ratings of factors deemed most important in creating the workload of a task are given more weight in computing the overall workload score, thereby enhancing the sensitivity of the scale. Psychometric evidence than simple means is as good as the standard pair-wise weighting process is found in Nygren (1991). Cut-off criterion for acceptable workload trends (i.e. peaks and troughs) and absolute levels of workload needs to be defined by the experimenter. The process for integrating NASA TLX results with other techniques needs to be addressed as part of the Experimental design. For example, if a battery of physiological and subjective measures are used to assess workload then where does the analysis begin and which technique carries the greatest ‘weight’ with respect to accepting or rejecting the workload arising during the operation of the system. In addition to the above it is important to determine how the results gathered using the NASA TLX and other measures are integrated across operators within co-located and distributed teams. Development of common operator goals or Measures of Effectiveness should be cross-referenced in this section for all workload measures. Results derived using the NASA TLX should be elaborated using structured debriefing techniques to ensure that recommendations can be translated into requirements for system improvements.
Used by whom FOI, NLR, AeI, QINETIQ

GARTEUR FM AG13 FINAL REPORT – GARTEUR TP 145
39
2.3.3 NASA TLX Requirement Description References • Byers, J. C., Bittner, A. C., Jr., Hill, S. G., Zaklad, A. L., & Christ, R.
E. (1988). Workload assessment of a remotely piloted vehicle (RPV) system. Proceedings of the Human Factor Society 32nd Annual Meeting, p 1145-1149. Santa Monica, CA: HFES.
• Hart. S. G., Battiste. V., Chesney. M. A., Ward. M. M., & McElroy, M. (1986). Comparison of workload, performance, and cardiovascular measures: Type A personalities vs. Type B. Working paper. Moffett Field, CA: NASA Ames Research Center.
• Hart, S. G., & Staveland., L. E. (1988). Development of a multi-dimensional workload rating scale: Results of empirical and theoretical research. In P. A. Hancock & N. Meshkati (Eds.), Human Mental Workload. Amsterdam. The Netherlands: Elsevier.
• Haworth, L. A., Bivens, C. C., & Shavely, R. J. (1986). An investigation of single-piloted advanced cockpit and control configurations for nap-of-the-earth helicopter combat mission tasks. Proceedings of the 1986 Meeting of the American Helicopter Society, p 657-672. Washington, D.C.
• MacLeod, I. S., Wells, L., & Lane, K. (2000), The Practice of Triangulation. Contemporary Ergonomics 2000, Taylor and Francis.
• Nygren, T. E. (1991). Psychometric properties of subjective workload measurement techniques. Human Factors, 33, No. 1, p 17-33.
• Svensson, E., Angelborg-Thanderz, M., Sjöberg, L., & Olsson, S. (1997). Information complexity-mental workload and performance in combat aircraft. Ergonomics, 40, No. 3, p 362-380.
GARTEUR FM AG13 FINAL REPORT – GARTEUR TP 145
40
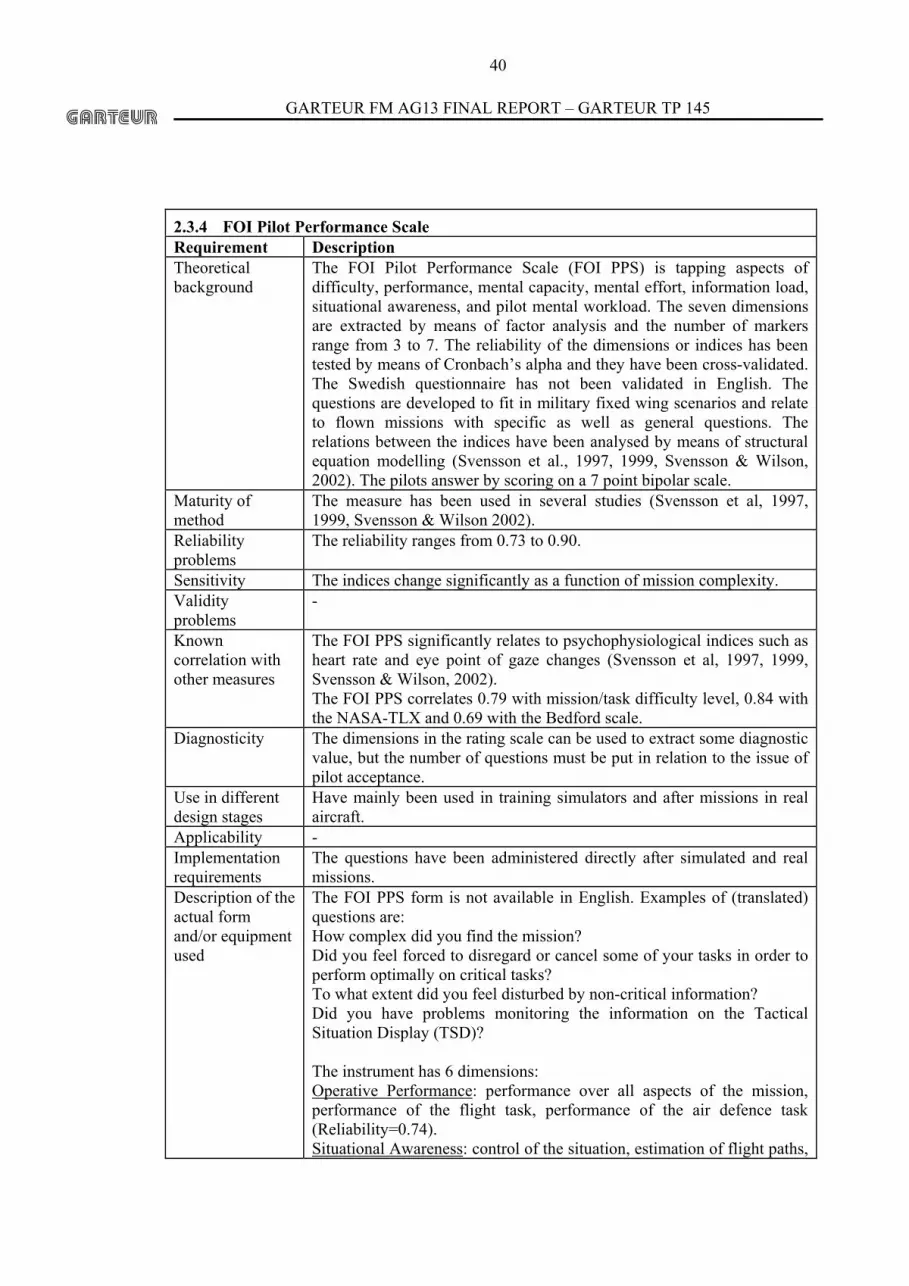
2.3.4 FOI Pilot Performance Scale Requirement Description Theoretical background
The FOI Pilot Performance Scale (FOI PPS) is tapping aspects of difficulty, performance, mental capacity, mental effort, information load, situational awareness, and pilot mental workload. The seven dimensions are extracted by means of factor analysis and the number of markers range from 3 to 7. The reliability of the dimensions or indices has been tested by means of Cronbach’s alpha and they have been cross-validated. The Swedish questionnaire has not been validated in English. The questions are developed to fit in military fixed wing scenarios and relate to flown missions with specific as well as general questions. The relations between the indices have been analysed by means of structural equation modelling (Svensson et al., 1997, 1999, Svensson & Wilson, 2002). The pilots answer by scoring on a 7 point bipolar scale.
Maturity of method
The measure has been used in several studies (Svensson et al, 1997, 1999, Svensson & Wilson 2002).
Reliability problems
The reliability ranges from 0.73 to 0.90.
Sensitivity The indices change significantly as a function of mission complexity. Validity problems
-
Known correlation with other measures
The FOI PPS significantly relates to psychophysiological indices such as heart rate and eye point of gaze changes (Svensson et al, 1997, 1999, Svensson & Wilson, 2002). The FOI PPS correlates 0.79 with mission/task difficulty level, 0.84 with the NASA-TLX and 0.69 with the Bedford scale.
Diagnosticity The dimensions in the rating scale can be used to extract some diagnostic value, but the number of questions must be put in relation to the issue of pilot acceptance.
Use in different design stages
Have mainly been used in training simulators and after missions in real aircraft.
Applicability - Implementation requirements
The questions have been administered directly after simulated and real missions.
Description of the actual form and/or equipment used
The FOI PPS form is not available in English. Examples of (translated) questions are: How complex did you find the mission? Did you feel forced to disregard or cancel some of your tasks in order to perform optimally on critical tasks? To what extent did you feel disturbed by non-critical information? Did you have problems monitoring the information on the Tactical Situation Display (TSD)? The instrument has 6 dimensions: Operative Performance: performance over all aspects of the mission, performance of the flight task, performance of the air defence task (Reliability=0.74). Situational Awareness: control of the situation, estimation of flight paths,

GARTEUR FM AG13 FINAL REPORT – GARTEUR TP 145
41
recognition of course of events, expectation of course of events, prediction of course of events, mental lead with respect to the task, co-operation within the group (Reliability=0.80). Pilot Mental Workload: estimation of overall information load, mental workload with respect to the air defence task, mental workload with respect to the flight task, general pilot mental workload (Reliability=0.87). Mental Capacity: interference between the flight- and air defence tasks, mental capacity to use other information exceeding the information necessary for the flight- and air defence tasks, interruption of the air defence task in order to manage the flight task, evaluation of the relative importance of information from different sources, need to ‘turn off’ information, estimation of mental reserve capacity (Reliability=0.77) Information Handling Tactical Situation Display: difficulty in structuring information on TSD, difficulties in surveying the information on TSD, efficiency in utilisation of information on TSD, difficulties in drawing conclusions from the information on TSD, mental overload from information on TSD, degree of perceived complexity of information on TSD, missed information on TSD (Reliability=0.92). Information Handling Target Information Display (TI) difficulty in structuring information on TI, difficulties in surveying the information on TI, efficiency in utilisation of information on TI, difficulties in drawing conclusions from the information on TI, mental overload from information on TI, degree of perceived complexity of information on TI, missed information on TI (Reliability=0.93). The Information Handling TSD and TI indices contain items reflecting perceptual and items reflecting cognitive aspects. Accordingly the indices have diagnostic value with respect to the perceptual and cognitive steps of the information process.
Intrusiveness It takes about 5 minutes to answer the questionnaire. Pilot acceptance Some pilots find the questionnaire being too long and time-consuming. Analysis of results
The indices are suitable to use in causal analyses (LISREL, Jöreskog & Sörbom, 1993, Svensson et al, 1997, 1999, Svensson & Wilson, 2002).
Used by whom FOI References • Jöreskog K. G., & Sörbom, D. (1993). LISREL8: Structural equation
modeling with the SIMPLIS command language. Hillsdale: Lawrence Erlbaum Associates.
• Svensson, E., Angelborg-Thanderz, M., Sjöberg, L., & Olsson, S. (1997). Information complexity-mental workload and performance in combat aircraft. Ergonomics, 40, No. 3, p 362-380.
• Svensson, E., Angelborg-Thanderz, M., & Wilson, G. F. (1999). Models of pilot performance for systems and mission evaluation – psychological and psychophysiological aspects. AFRL-HE-WP-TR-1999-0215.
• Svensson, E. & Wilson, G. F. (2002) Psychological and psychophysiological models of pilot performance for systems development and mission evaluation. International Journal of Aviation Psychology, Vol 12 (1).

GARTEUR FM AG13 FINAL REPORT – GARTEUR TP 145
42
2.3.5 Rating Scale Mental Effort Requirement Description Theoretical background
The Rating Scale Mental Effort (RSME) (or Beordelingschaal Subjectieve Mentale Inspanning, BSMI) was constructed in 1985 by Zijlstra and van Doorn (1985). It is a valid, simple and quick method to measure mental effort (Meijman et al., 1986). The unidimensional questionnaire is usually applied after recognisable tasks have been performed. Specific attention has been paid to the choice of the verbal labels and their location on the scale. In normal numeric scales, the middle is often labelled as “average”. However, it appears that the term “average” may not always be the true middlepoint (French-Lazovick & Gibson, 1984). People do not like to be quantified as average, and the use of the term may result in a shifting of the distribution of the cores obtained towards the higher end of the scale. The RSME resolves this problem.
Maturity of method
The questionnaire has been validated in the Dutch language. An English version has been frequently used by NLR. This questionnaire has proven to be an accurate index of effort (Hanson & Bazanski, 2001).
Reliability problems
Subjects tend to have their own personal references for the RSME. When reference scores are accounted for both intra-individual and inter-individual reliability is high.
Sensitivity The measure is sensitive to subjective changes in workload. Validity problems
The instrument is related to subjective perception of workload. Although not systematically studied, it may be influenced by factors such as stress and anxiety.
Known correlation with other measures
Moderately high (-.43) negative correlations are found with heart rate variability (Hanson & Bazanski, 2001). The RSME also increases in response to increasing task load (Meijman et al., 1986).
One measure confounding the results of another
The instrument is easily filled in, and is unlikely to confound other results.
Diagnosticity It is not likely that this scale would be diagnostic of the sources of workload variation. Especially strategy changes (e.g. to automated or skill based task execution) affect RSME scores. However, the instrument does not register such changes.
Use in different design stages
It is of particular use in later stages of design, in experimental circumstances.
Applicability The test is devised to measure mental effort investment. Implementation requirements
For a valid test, the labels should be applied at the correct (logarithmic) intervals. The length of the line should be exactly 150 mm. The test should be administered immediately after task execution is completed, long delays will impair subject recall of workload levels.
Description of the actual form and/ or equipment used
The RSME consists of a 15 cm long vertical line with a number of statements that act as anchors. The minimum score is 0, and the maximum is 150 (exceptionally effortful). The English translation of the labels are: “exceptional”, “very strong”, “strong”, “fair”, “reasonable”, “somewhat”, “a little”, “hardly”, “not at all”(see appendix).
Intrusiveness Since the test is administered after task execution normal task execution
GARTEUR FM AG13 FINAL REPORT – GARTEUR TP 145
43
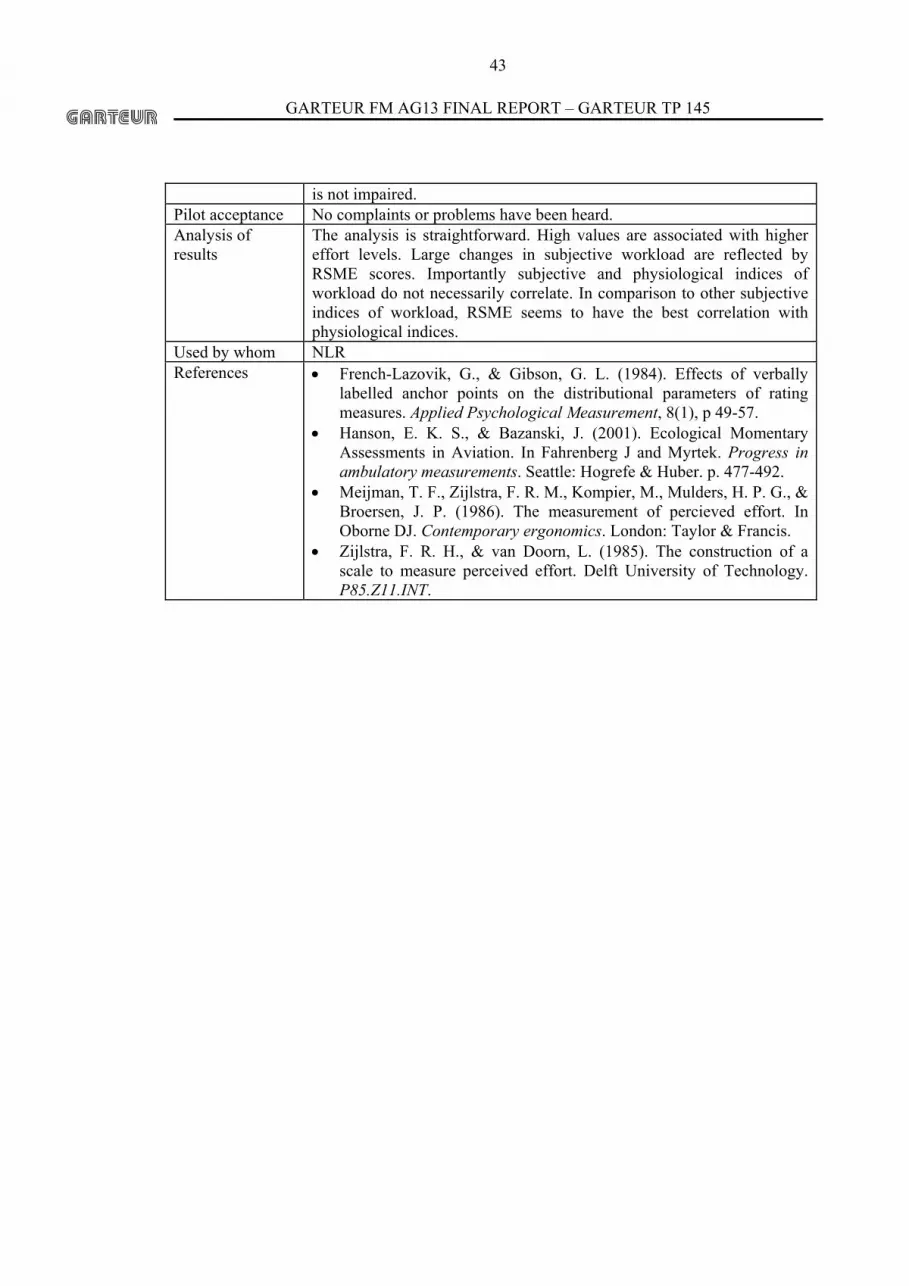
is not impaired. Pilot acceptance No complaints or problems have been heard. Analysis of results
The analysis is straightforward. High values are associated with higher effort levels. Large changes in subjective workload are reflected by RSME scores. Importantly subjective and physiological indices of workload do not necessarily correlate. In comparison to other subjective indices of workload, RSME seems to have the best correlation with physiological indices.
Used by whom NLR References • French-Lazovik, G., & Gibson, G. L. (1984). Effects of verbally
labelled anchor points on the distributional parameters of rating measures. Applied Psychological Measurement, 8(1), p 49-57.
• Hanson, E. K. S., & Bazanski, J. (2001). Ecological Momentary Assessments in Aviation. In Fahrenberg J and Myrtek. Progress in ambulatory measurements. Seattle: Hogrefe & Huber. p. 477-492.
• Meijman, T. F., Zijlstra, F. R. M., Kompier, M., Mulders, H. P. G., & Broersen, J. P. (1986). The measurement of percieved effort. In Oborne DJ. Contemporary ergonomics. London: Taylor & Francis.
• Zijlstra, F. R. H., & van Doorn, L. (1985). The construction of a scale to measure perceived effort. Delft University of Technology. P85.Z11.INT.

GARTEUR FM AG13 FINAL REPORT – GARTEUR TP 145
44
2.3.6 DRAWS – DRA (Defence Research Agency) Workload Scales Requirement Description Theoretical background
DRAWS, developed by the UK Defence Research Agency, is a scale derived from the NASA TLX, and is based upon a meta-analysis of research results where TLX scores had been obtained under different conditions. Four fundamental components of workload emerged, namely ‘input demand’, ‘mental demand’, ‘output demand’ and ‘temporal demand’ and these were used to specify the DRAWS as a workload assessment technique. The form of the questions posed relates to stages of information processing, and therefore may be beneficial in the context of task analytic components of workload assessment.
Maturity of method
The method has been used in laboratory studies and operational simulations.
Reliability problems
-
Sensitivity Sensitive over a range of workload levels. Validity problems
High face validity and construct validity.
Known correlation with other measures
Correlates highly with other subjective workload scales.
One measure confounding the results of another
-
Diagnosticity Directly related to different components of workload. Use in different design stages
All stages.
Applicability Applicable to laboratory and operational settings. Implementation requirements
Administration in pencil and paper format or by computer.
Description of the actual form and/ or equipment used
Presented as 4 visual-analogue scales. See Appendix 6 for DRAWS proforma.
Intrusiveness Non-intrusive. Pilot acceptance Requires some explanation. Analysis of results
Measurements from 4 visual analogue scales.
Used by whom QINETIQ

GARTEUR FM AG13 FINAL REPORT – GARTEUR TP 145
45
2.3.6 DRAWS – DRA (Defence Research Agency) Workload Scales Requirement Description References • Farmer, E. W., Jordan, C. S., Belyavin, A. J., Bunting, A. J.,
Tattersall, & A. J., Jones, D. M. (1995). Dimensions of operator workload: final report. Defence Research Agency Report No. DRA/AS/MMI/CR95098/1.
• Farmer, E. W. (1998). Subjective assessment of mental demand: implications for workload prediction. Defence Research Agency Report No DRA/AS/FS/CR93060/1.
• Farmer, E. W., Jordan, C. S., Tattersall, A. J, Belyavin, A. J., Bunting, A. J., & Birch, C. L. (1998). A preliminary validation study of the prediction of operator performance. Defence Research Agency Report No DRA/AS/FS/CR93088/1.
• McGown, A. S., Montgomery, J. M., & Wright, & N. A. (1997). Validation of DRA workload scales using a simulated operational task. Defence Research Agency Report No PLSD-CHS-5-CR-97-015.
• McGown, A. S., Wright, N. A., Emery, L., & Monella, M. (1998). Validation of the DRA workload scales in a simulated environment. Defence Research Agency Report No DERA/CHS/PPD/ TR980117/1.0.
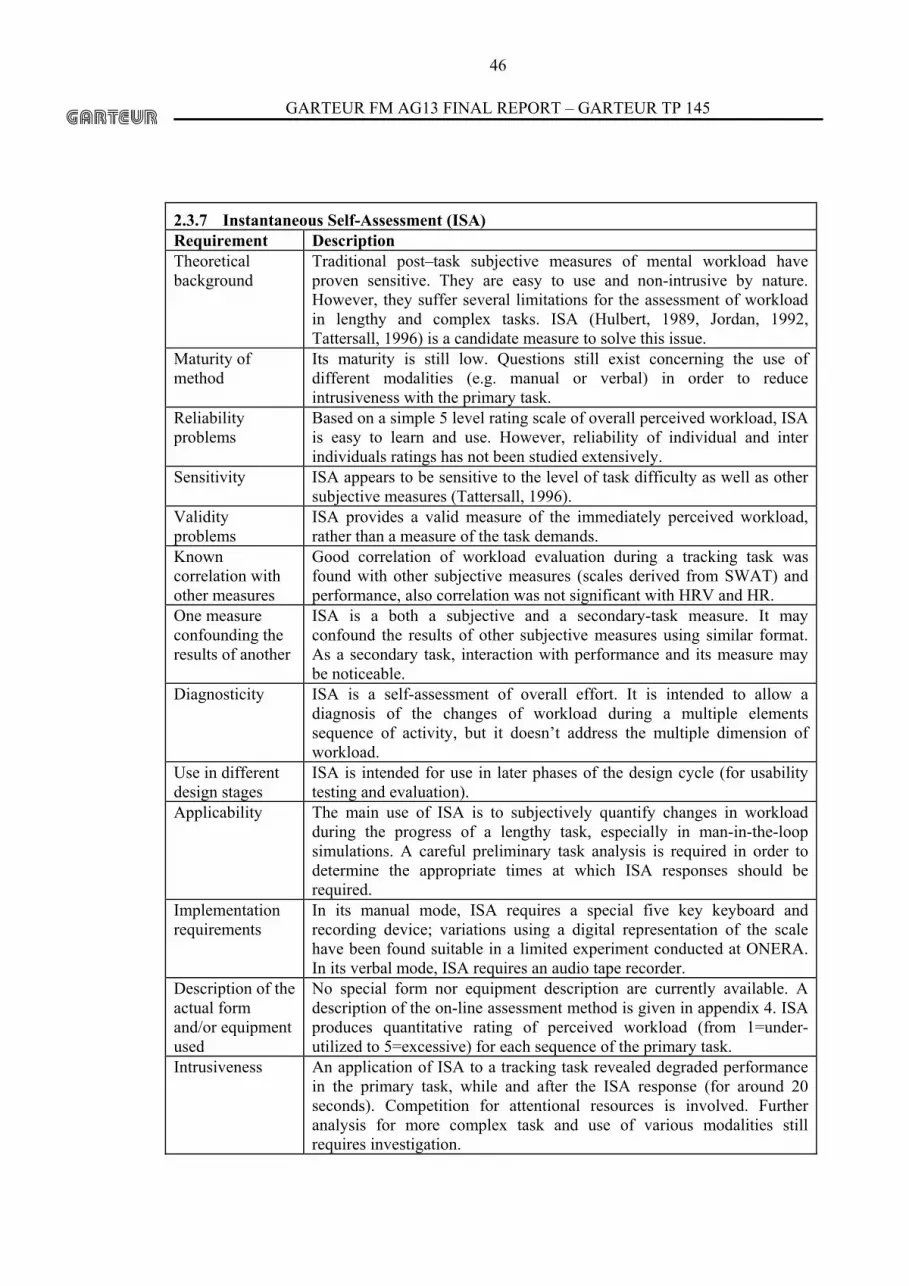
GARTEUR FM AG13 FINAL REPORT – GARTEUR TP 145
46
2.3.7 Instantaneous Self-Assessment (ISA) Requirement Description Theoretical background
Traditional post–task subjective measures of mental workload have proven sensitive. They are easy to use and non-intrusive by nature. However, they suffer several limitations for the assessment of workload in lengthy and complex tasks. ISA (Hulbert, 1989, Jordan, 1992, Tattersall, 1996) is a candidate measure to solve this issue.
Maturity of method
Its maturity is still low. Questions still exist concerning the use of different modalities (e.g. manual or verbal) in order to reduce intrusiveness with the primary task.
Reliability problems
Based on a simple 5 level rating scale of overall perceived workload, ISA is easy to learn and use. However, reliability of individual and inter individuals ratings has not been studied extensively.
Sensitivity ISA appears to be sensitive to the level of task difficulty as well as other subjective measures (Tattersall, 1996).
Validity problems
ISA provides a valid measure of the immediately perceived workload, rather than a measure of the task demands.
Known correlation with other measures
Good correlation of workload evaluation during a tracking task was found with other subjective measures (scales derived from SWAT) and performance, also correlation was not significant with HRV and HR.
One measure confounding the results of another
ISA is a both a subjective and a secondary-task measure. It may confound the results of other subjective measures using similar format. As a secondary task, interaction with performance and its measure may be noticeable.
Diagnosticity ISA is a self-assessment of overall effort. It is intended to allow a diagnosis of the changes of workload during a multiple elements sequence of activity, but it doesn’t address the multiple dimension of workload.
Use in different design stages
ISA is intended for use in later phases of the design cycle (for usability testing and evaluation).
Applicability The main use of ISA is to subjectively quantify changes in workload during the progress of a lengthy task, especially in man-in-the-loop simulations. A careful preliminary task analysis is required in order to determine the appropriate times at which ISA responses should be required.
Implementation requirements
In its manual mode, ISA requires a special five key keyboard and recording device; variations using a digital representation of the scale have been found suitable in a limited experiment conducted at ONERA. In its verbal mode, ISA requires an audio tape recorder.
Description of the actual form and/or equipment used
No special form nor equipment description are currently available. A description of the on-line assessment method is given in appendix 4. ISA produces quantitative rating of perceived workload (from 1=under-utilized to 5=excessive) for each sequence of the primary task.
Intrusiveness An application of ISA to a tracking task revealed degraded performance in the primary task, while and after the ISA response (for around 20 seconds). Competition for attentional resources is involved. Further analysis for more complex task and use of various modalities still requires investigation.

GARTEUR FM AG13 FINAL REPORT – GARTEUR TP 145
47
Pilot acceptance The use of ISA is easy. Acceptance is high, as long as safety isn’t involved by possible degraded performance in the primary task.
Analysis of results
ISA ratings corresponding to each element of the main task as determined during the preliminary task analysis may be used for statistical post analysis.
Used by whom UK CAA, ONERA References • Hulbert, T. (1989). A comparison of the 'NASA-TLX' and 'ISA'
subjective workload rating techniques. Internal Report, Civil Aviation Authority Air Trafic Control Evaluation Unit, Bournemouth, UK.
• Jordon, C. S. (1992). Experimental study of the effect of an instantaneous self assessment workload recorder on task performance. Defence Research Agency Technical memorandum, DRA TM (CADS) 92011, DRA, Portsdown, Hants (UK).
• Tattersall, A. J. & Foord P. S. (1996). An experimental evaluation of instantaneous self-assessment as a measure of workload, Ergonomics, 39(5), p. 740-728.
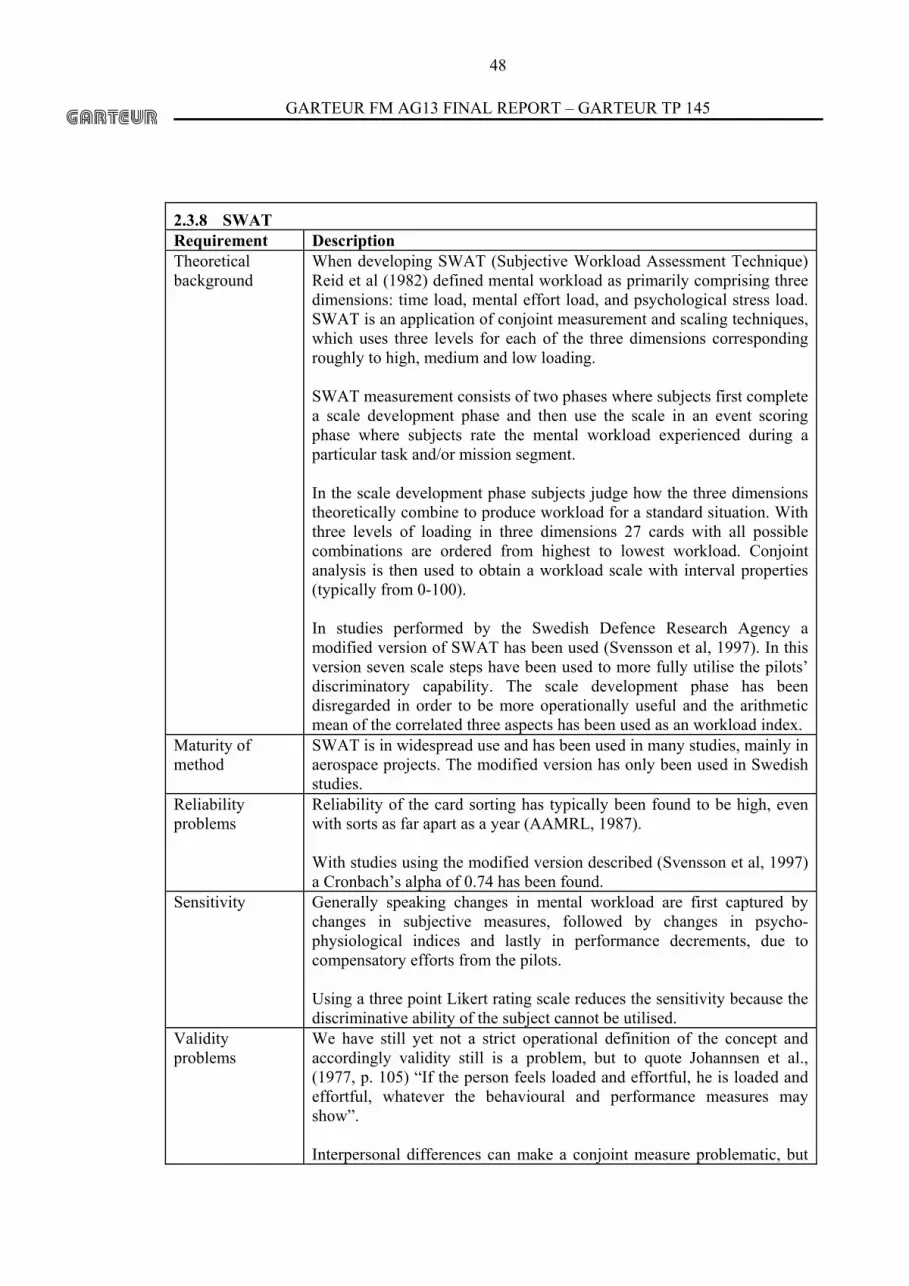
GARTEUR FM AG13 FINAL REPORT – GARTEUR TP 145
48
2.3.8 SWAT Requirement Description Theoretical background
When developing SWAT (Subjective Workload Assessment Technique) Reid et al (1982) defined mental workload as primarily comprising three dimensions: time load, mental effort load, and psychological stress load. SWAT is an application of conjoint measurement and scaling techniques, which uses three levels for each of the three dimensions corresponding roughly to high, medium and low loading. SWAT measurement consists of two phases where subjects first complete a scale development phase and then use the scale in an event scoring phase where subjects rate the mental workload experienced during a particular task and/or mission segment. In the scale development phase subjects judge how the three dimensions theoretically combine to produce workload for a standard situation. With three levels of loading in three dimensions 27 cards with all possible combinations are ordered from highest to lowest workload. Conjoint analysis is then used to obtain a workload scale with interval properties (typically from 0-100). In studies performed by the Swedish Defence Research Agency a modified version of SWAT has been used (Svensson et al, 1997). In this version seven scale steps have been used to more fully utilise the pilots’ discriminatory capability. The scale development phase has been disregarded in order to be more operationally useful and the arithmetic mean of the correlated three aspects has been used as an workload index.
Maturity of method
SWAT is in widespread use and has been used in many studies, mainly in aerospace projects. The modified version has only been used in Swedish studies.
Reliability problems
Reliability of the card sorting has typically been found to be high, even with sorts as far apart as a year (AAMRL, 1987). With studies using the modified version described (Svensson et al, 1997) a Cronbach’s alpha of 0.74 has been found.
Sensitivity Generally speaking changes in mental workload are first captured by changes in subjective measures, followed by changes in psycho-physiological indices and lastly in performance decrements, due to compensatory efforts from the pilots. Using a three point Likert rating scale reduces the sensitivity because the discriminative ability of the subject cannot be utilised.
Validity problems
We have still yet not a strict operational definition of the concept and accordingly validity still is a problem, but to quote Johannsen et al., (1977, p. 105) “If the person feels loaded and effortful, he is loaded and effortful, whatever the behavioural and performance measures may show”. Interpersonal differences can make a conjoint measure problematic, but

GARTEUR FM AG13 FINAL REPORT – GARTEUR TP 145
49
there are techniques to weigh different subjects’ ratings differently. If sufficient agreement exists in a group of subjects after the card sorting, i.e., a Kendall's Coefficient of Concordance greater than 0.75, then the remainder of the procedure can be based on group data. If not, an independent scale for each subject can be generated. Hill et al. (1988) also reports that some subjects, regardless of amount of explanation, fail to provide an acceptable card sort during the scale development phase.
Known correlation with other measures
The correlation between ratings with SWAT and the FOI PPS in Svensson et al (1997) is 0.64. In Svensson et al (1997) both the FOI PPS and the NASA-TLX correlates with a performance factor (r = -0.43) where SWAT has a correlation of –0.18. It thus appears that SWAT is less sensitive than the FOI PPS and the NASA-TLX. SWAT is also insensitive to the factor ‘information load’ (r=0.19) and the ‘information complexity’ factor (r=0.10) in the FOI PPS.
One measure confounding the results of another
-
Diagnosticity SWAT is mainly to be seen as a general indicator of mental workload. However, if ratings only correlate with one of the dimensions some diagnostic value can be extracted. Reid and Colle (1988) describe the search for the “red-line” values in SWAT.
Use in different design stages
SWAT can be used both in development evaluation and operational test phases.
Applicability SWAT requires a large investment of time by both the experimenter and the subjects for the scale development phase. The measure is mostly often used for post-mission ratings but, can be used during missions (Svensson et al, 1997, 1999) when a simulator instructor prompts subjects to rate their workload in flight.
Implementation requirements
The ‘Swedish version’ is quick and easy to use even during missions. In Svensson et al (1997, 1999) the simulator instructor noted the pilots ratings received via intercom.
Description of the actual form and/or equipment used
Definition of dimension levels Time Load 1. Often have spare time. Interruptions or overlap among activities occur infrequently or not at all. 2. Occasionally have spare time. Interruptions or overlap among activities occur frequently. 3. Almost never have spare time. Interruptions or overlap among activities are frequent or occur all the time. Mental Effort Load 1. Very little conscious mental effort or concentration required. Activity is almost automatic, requiring little or no attention. 2. Moderate conscious mental effort or concentration required. Complexity of activity is moderately high due to uncertainty, unpredictability, or unfamiliarity. Considerable attention required.

GARTEUR FM AG13 FINAL REPORT – GARTEUR TP 145
50
3. Extensive mental effort and concentration are necessary. Very complex activity requiring total attention. Psychological Stress Load 1. Little confusion, risk, frustration, or anxiety exists and can be easily accommodated. 2. Moderate stress due to confusion, frustration, or anxiety noticeably adds to workload. Significant compensation is required to maintain adequate performance. 3. High to very intense stress due to confusion, frustration or anxiety. High to extreme determination and self-control required. Source: American National Standard Guide to Human Performance Measurements (1992).
Intrusiveness The ratings in the event scoring phase are quick, but training is required so that meaningful event-related scores can be obtained with a minimum of intrusion. A minimum of 3-4 practice sorties or flights in flight test simulation has proved to be a reasonable number of practice sessions (Meshkati et al, 1995).
Pilot acceptance The acceptance of the pilots in the version used in FOI studies has been high.
Analysis of results
-
Used by whom FOI References • AAMRL Armstrong Aerospace Medical Research Laboratory
(1987). Subjective Workload Assessment Technique (SWAT): A User’s Guide. Dayton, OH: AAMRL, Wright Patterson AFB.
• American National Standard. Guide to Human Performance Measurements (1992). BSR/AIAA, G-035-1992.
• Hill, S. G., Zaklad, A. L., Bittner, Jr., A. C., Byers, J. C. and Christ, R. E. (1988). Workload assessment of a Mobile Air Defense Missile System. Proceedings of the Human Factors Society, 32nd Annual Meeting, p 1068-1072.
• Meshkati, N., Hancock, P., Rahimi, M., & Dawes, S. (1995). Techniques in mental workload assessment. In N. Wilson & N. Corlett (Eds.) Evaluation of Human Work. Taylor & Francis, p 772-782.
• Svensson, E., Angelborg-Thanderz, M., Sjöberg, L., & Olsson, S. (1997). Information complexity – mental workload and performance in combat aircraft. Ergonomics, 40, p 362-380.
• Svensson, E., Angelborg-Thanderz, M., & Wilson, G. F. (1999). Models of pilot performance for systems and mission evaluation – psychological and psychophysiological aspects. AFRL-HE-WP-TR-1999-0215.
• Johannsen, G., Moray, N., Pew, R., Rasmussen, J., Sanders, A., & Wickens, C. (1979). Final report of experimental psychology group. In N. Moray (Ed.) Mental Workload, its theory and measurement. New York, Plenum Press, p 101-114.
• Reid, G. B., Singledecker, C. A., Nygren, T. E., & Eggemeier, F. T.

GARTEUR FM AG13 FINAL REPORT – GARTEUR TP 145
51
(1982). Development of multidimensional subjective measures of workload. Proceedings of the Human Factors Society, 26th Annual Meeting, p 403-406.
• American National Standard. (1992) Guide to Human Performance Measurements. BSR/AIAA, G-035-1992.
• Reid, G. B., & Colle, H. A. (1988). Critical SWAT values for predicting operator overload. Proceedings of the Human Factors Society, 32nd Annual Meeting, p 1414-1418.

GARTEUR FM AG13 FINAL REPORT – GARTEUR TP 145
52
2.3.9 Task Analysis Requirement Description Theoretical background
“Task analysis can be defined as the study of what an operator (or team of operators) is required to do, in terms of actions and/or cognitive processes, to achieve a system goal” (Kirwan & Ainsworth, 1992). Without knowledge of what work tasks an operator is required to do it must be almost impossible to assess the workload required to do that work. Task analysis is not a method of assessing workload but its effective completion is essential to the quality and pertinence of the selection and performance of all workload methods. In the current sense Job and Task Analysis were primarily founded in the 1940s (Chapanis, 1959) as a result of problems found with the use of military equipment. At that time Job Analysis tended to be the term used by Industry (Stammers et al, 1975, McCormick, 1985) with Task Analysis being the term used by the military and Human Factors personnel. All work effort whether by a Human, or an Engineered System, or both, requires at least one Goal and the Means to achieve that goal. For goals to be effective they must be specific, unambiguous, achievable, and easily understood. One means of defining system related goals is termed Measures Of Effectiveness (MOEs). The expected effort partition between Human and Engineered System depends on the overall system architecture and the system design efficacy with respect to a set of specified/expected performance criteria. In reality there can be many ways of achieving system goals, these ways directed by the use of both proactive and reactive plans mediating between the application of system means, the influences of the work situation, and events originating from the operating environment. In reality work involves both physical and cognitive task elements (Mitchell, 1996, MacLeod, 2000). These plans are strongly influenced by conditions relating to the sustenance of the work tasks involved in maintaining the planned effort, the use of the products of that effort relating to their quality and timeliness, and the pertinence of the product to the current plan(s). To efficiently perform a task analysis requires a collection and amalgam of diverse areas of knowledge pertaining to that system. These areas include a knowledge on the expected operating requirements of the system, the environments under which the system is expected to operate, the actual missions involved and the goal criteria of these missions, other co-operating systems, knowledge of the system design (functionality, technology, and performance), constraints on the system operation, organisational and operating procedures, and the personnel and skills involved.
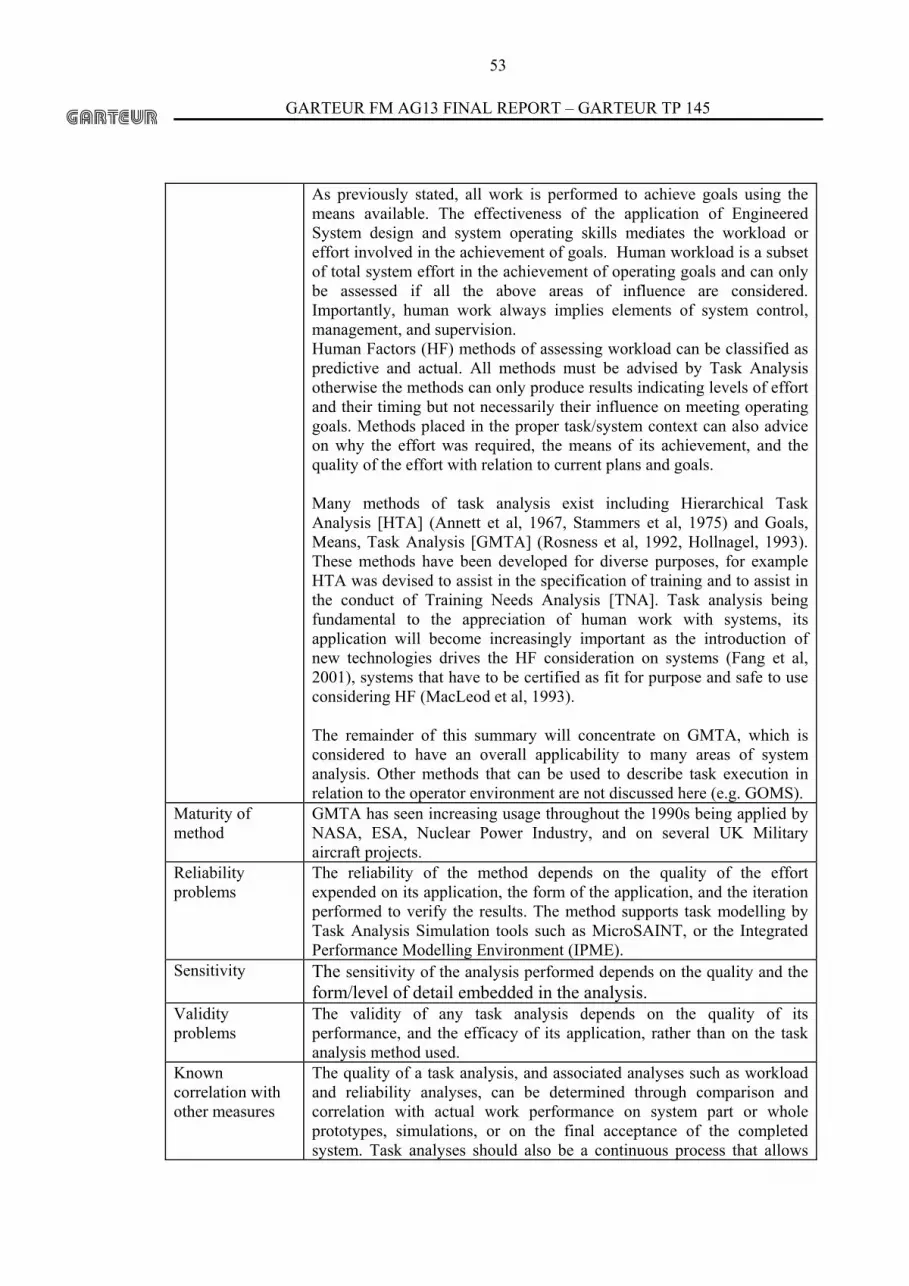
GARTEUR FM AG13 FINAL REPORT – GARTEUR TP 145
53
As previously stated, all work is performed to achieve goals using the means available. The effectiveness of the application of Engineered System design and system operating skills mediates the workload or effort involved in the achievement of goals. Human workload is a subset of total system effort in the achievement of operating goals and can only be assessed if all the above areas of influence are considered. Importantly, human work always implies elements of system control, management, and supervision. Human Factors (HF) methods of assessing workload can be classified as predictive and actual. All methods must be advised by Task Analysis otherwise the methods can only produce results indicating levels of effort and their timing but not necessarily their influence on meeting operating goals. Methods placed in the proper task/system context can also advice on why the effort was required, the means of its achievement, and the quality of the effort with relation to current plans and goals. Many methods of task analysis exist including Hierarchical Task Analysis [HTA] (Annett et al, 1967, Stammers et al, 1975) and Goals, Means, Task Analysis [GMTA] (Rosness et al, 1992, Hollnagel, 1993). These methods have been developed for diverse purposes, for example HTA was devised to assist in the specification of training and to assist in the conduct of Training Needs Analysis [TNA]. Task analysis being fundamental to the appreciation of human work with systems, its application will become increasingly important as the introduction of new technologies drives the HF consideration on systems (Fang et al, 2001), systems that have to be certified as fit for purpose and safe to use considering HF (MacLeod et al, 1993). The remainder of this summary will concentrate on GMTA, which is considered to have an overall applicability to many areas of system analysis. Other methods that can be used to describe task execution in relation to the operator environment are not discussed here (e.g. GOMS).
Maturity of method
GMTA has seen increasing usage throughout the 1990s being applied by NASA, ESA, Nuclear Power Industry, and on several UK Military aircraft projects.
Reliability problems
The reliability of the method depends on the quality of the effort expended on its application, the form of the application, and the iteration performed to verify the results. The method supports task modelling by Task Analysis Simulation tools such as MicroSAINT, or the Integrated Performance Modelling Environment (IPME).
Sensitivity The sensitivity of the analysis performed depends on the quality and the form/level of detail embedded in the analysis.
Validity problems
The validity of any task analysis depends on the quality of its performance, and the efficacy of its application, rather than on the task analysis method used.
Known correlation with other measures
The quality of a task analysis, and associated analyses such as workload and reliability analyses, can be determined through comparison and correlation with actual work performance on system part or whole prototypes, simulations, or on the final acceptance of the completed system. Task analyses should also be a continuous process that allows
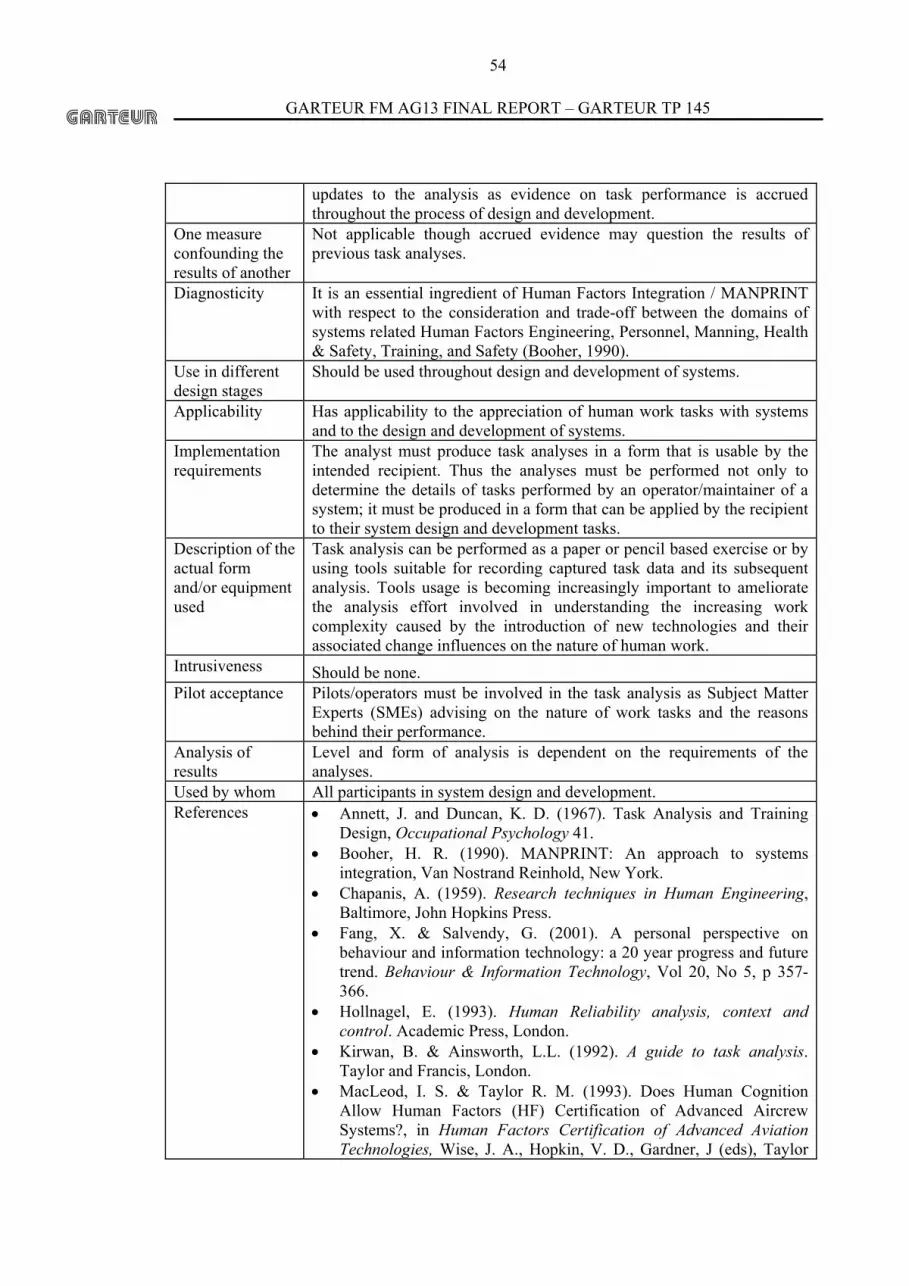
GARTEUR FM AG13 FINAL REPORT – GARTEUR TP 145
54
updates to the analysis as evidence on task performance is accrued throughout the process of design and development.
One measure confounding the results of another
Not applicable though accrued evidence may question the results of previous task analyses.
Diagnosticity It is an essential ingredient of Human Factors Integration / MANPRINT with respect to the consideration and trade-off between the domains of systems related Human Factors Engineering, Personnel, Manning, Health & Safety, Training, and Safety (Booher, 1990).
Use in different design stages
Should be used throughout design and development of systems.
Applicability Has applicability to the appreciation of human work tasks with systems and to the design and development of systems.
Implementation requirements
The analyst must produce task analyses in a form that is usable by the intended recipient. Thus the analyses must be performed not only to determine the details of tasks performed by an operator/maintainer of a system; it must be produced in a form that can be applied by the recipient to their system design and development tasks.
Description of the actual form and/or equipment used
Task analysis can be performed as a paper or pencil based exercise or by using tools suitable for recording captured task data and its subsequent analysis. Tools usage is becoming increasingly important to ameliorate the analysis effort involved in understanding the increasing work complexity caused by the introduction of new technologies and their associated change influences on the nature of human work.
Intrusiveness Should be none. Pilot acceptance Pilots/operators must be involved in the task analysis as Subject Matter
Experts (SMEs) advising on the nature of work tasks and the reasons behind their performance.
Analysis of results
Level and form of analysis is dependent on the requirements of the analyses.
Used by whom All participants in system design and development. References • Annett, J. and Duncan, K. D. (1967). Task Analysis and Training
Design, Occupational Psychology 41. • Booher, H. R. (1990). MANPRINT: An approach to systems
integration, Van Nostrand Reinhold, New York. • Chapanis, A. (1959). Research techniques in Human Engineering,
Baltimore, John Hopkins Press. • Fang, X. & Salvendy, G. (2001). A personal perspective on
behaviour and information technology: a 20 year progress and future trend. Behaviour & Information Technology, Vol 20, No 5, p 357-366.
• Hollnagel, E. (1993). Human Reliability analysis, context and control. Academic Press, London.
• Kirwan, B. & Ainsworth, L.L. (1992). A guide to task analysis. Taylor and Francis, London.
• MacLeod, I. S. & Taylor R. M. (1993). Does Human Cognition Allow Human Factors (HF) Certification of Advanced Aircrew Systems?, in Human Factors Certification of Advanced Aviation Technologies, Wise, J. A., Hopkin, V. D., Gardner, J (eds), Taylor
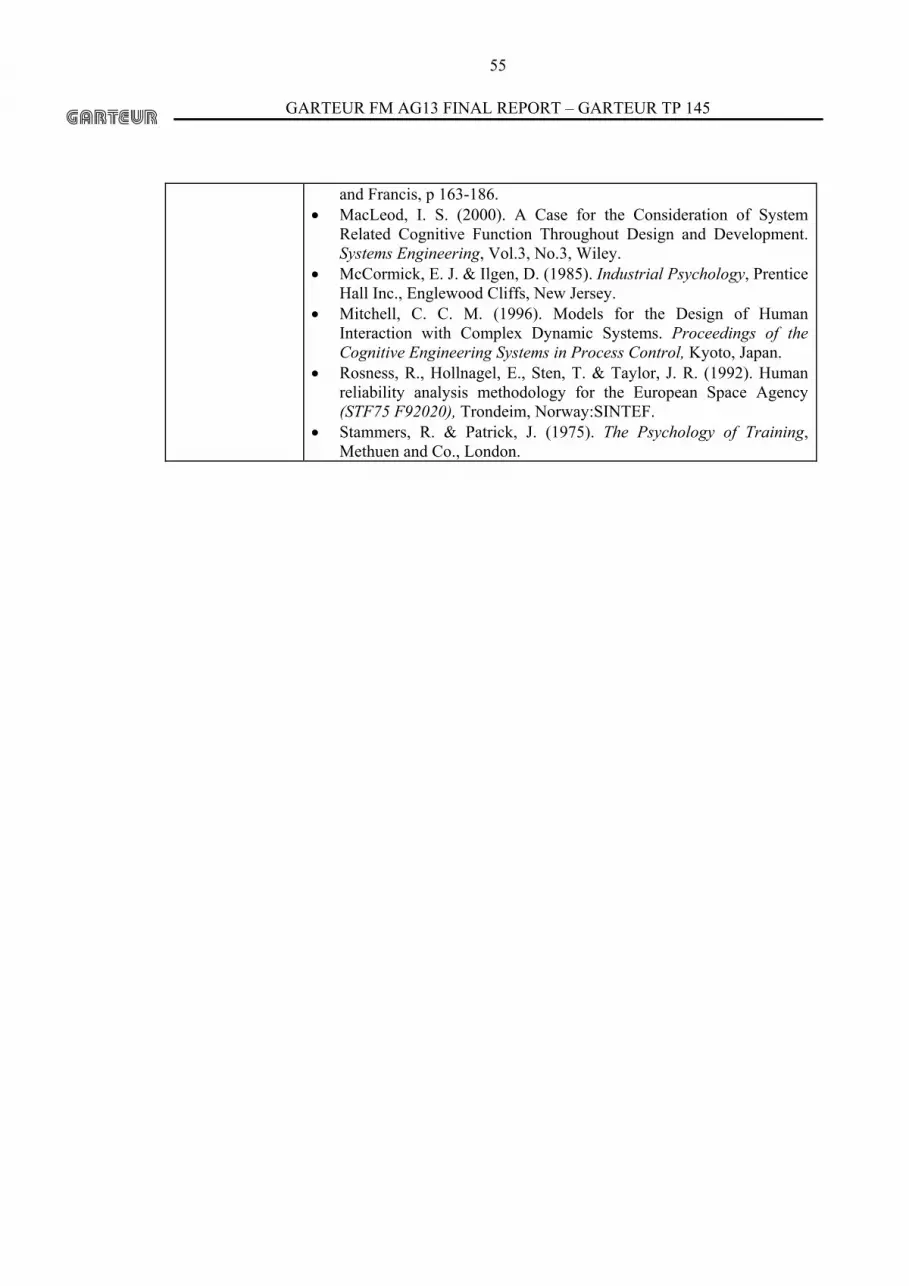
GARTEUR FM AG13 FINAL REPORT – GARTEUR TP 145
55
and Francis, p 163-186. • MacLeod, I. S. (2000). A Case for the Consideration of System
Related Cognitive Function Throughout Design and Development. Systems Engineering, Vol.3, No.3, Wiley.
• McCormick, E. J. & Ilgen, D. (1985). Industrial Psychology, Prentice Hall Inc., Englewood Cliffs, New Jersey.
• Mitchell, C. C. M. (1996). Models for the Design of Human Interaction with Complex Dynamic Systems. Proceedings of the Cognitive Engineering Systems in Process Control, Kyoto, Japan.
• Rosness, R., Hollnagel, E., Sten, T. & Taylor, J. R. (1992). Human reliability analysis methodology for the European Space Agency (STF75 F92020), Trondeim, Norway:SINTEF.
• Stammers, R. & Patrick, J. (1975). The Psychology of Training, Methuen and Co., London.

GARTEUR FM AG13 FINAL REPORT – GARTEUR TP 145
56
2.3.10 Usability methods Requirement Description Theoretical background
Within the field of human computer interaction (HCI) a system with good usability is defined as a system that is easy to learn, easy and efficient to use, and where recovery from errors is easy. Any interface details hindering this is a usability problem. A number of methods to identify usability problems have been developed. Two examples are heuristic evaluation and cognitive walkthrough. Heuristic evaluation is proposed by Jacob Nielsen (e.g., 1993) as a budget usability method that is easy to use, is quick and can be used by non-HCI people. The evaluation is based on ten heuristics, e.g., give the user feedback or limit the memory load imposed on the user. The method, analysis of results and a comparison with other usability methods is presented in Nielsen and Mack (1994). Cognitive walkthrough is described in Nielsen & Mack (1994) as a method that strives to identify interface details that hinders exploratory learning of a computer system. Exploratory learning is defined as when users only learn to use new features of a system when they need them and while working with their normal tasks. In a walkthrough a task is defined and then a group of human factors experts and designers talk their way through an hypothetical interaction sequence, trying to identify interface details like menu’s, icons, etc., that are usability problems. In a pluralistic usability walkthrough users and system developers join the evaluation group to provide plural perspectives. Direct observation of users trying to use a system in a usability lab is also used when trying to identify usability problems.
Maturity of method
These methods cannot be seen as true mental workload measurement methods but could have their value in early system design phases.
Reliability problems
The results of a usability evaluation, i.e., the number of potential usability problems identified, is very dependent upon the analytic capability of the observers/experts performing the evaluation.
Sensitivity - Validity problems
The goal when using usability methods is to identify as many usability problems as possible to provide input for the next design iteration. Nielsen & Mack (1994) claim that usability evaluations using 3-5 users find 60-75% of the usability problems in a system. This is considered good enough as the next design iteration potentially leads to new usability issues.
Known correlation with other measures
Usability methods are used to provide qualitative design input and thus do not shown statistical correlations with the other measures described.
One measure confounding the results of another
-
Diagnosticity The main goal of usability evaluations is to find interface details leading

GARTEUR FM AG13 FINAL REPORT – GARTEUR TP 145
57
to bad usability and they thus have high diagnosticity, directly identifying which parts of an interface users have problems with.
Use in different design stages
Heuristic evaluation and cognitive walkthrough can be used in very early design stages with the interface just being a pen and paper prototype. Direct observation in a usability lab of course requires a working prototype of the system.
Applicability - Implementation requirements
-
Description of the actual form and/or equipment used
-
Intrusiveness - Pilot acceptance - Analysis of results
-
Used by whom DA References • Nielsen, J. (1993). Usability Engineering. Academic Ltd.
• Nielsen, J., & Mack, R. L. (1994). Usability Inspection Methods. John Wiley & Sons.
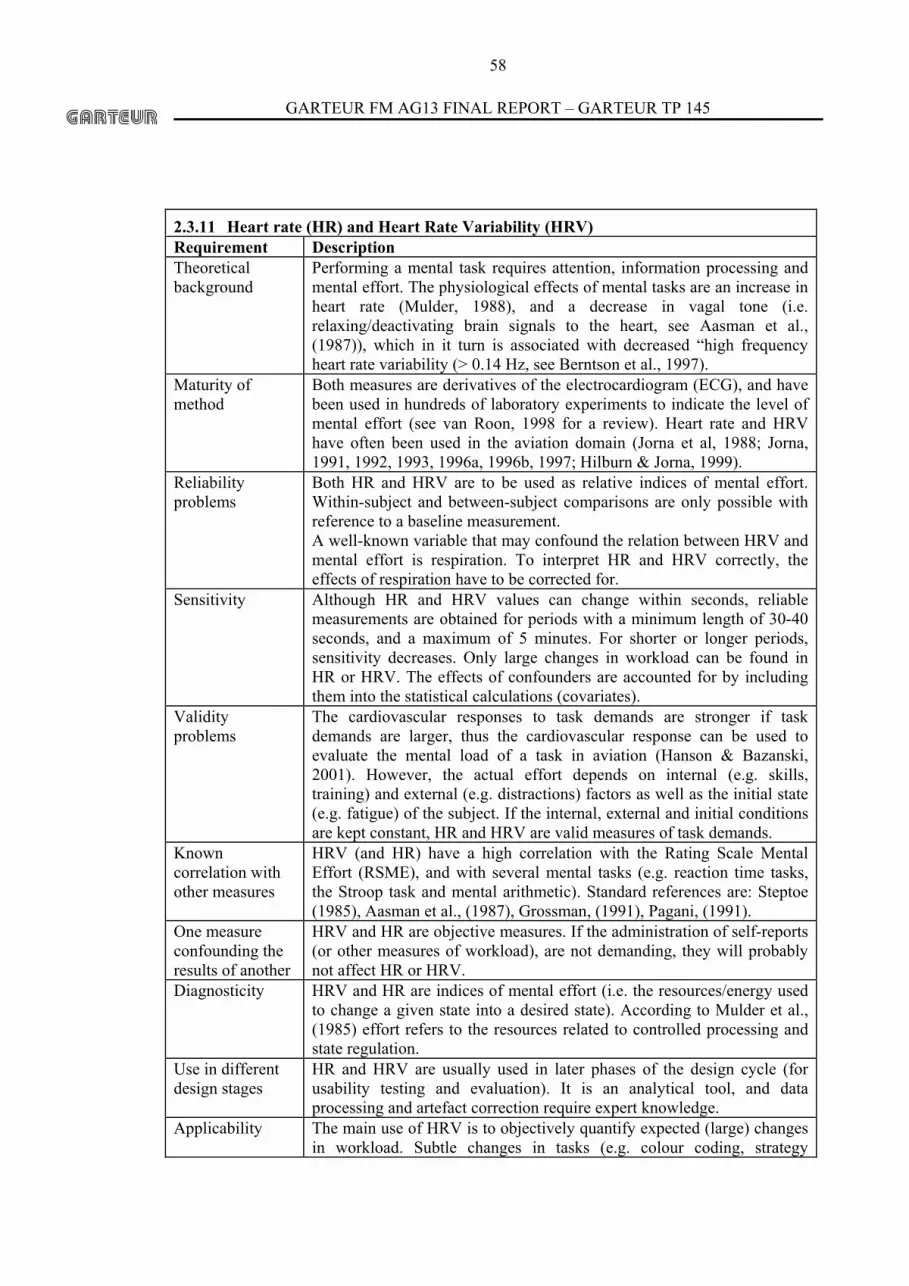
GARTEUR FM AG13 FINAL REPORT – GARTEUR TP 145
58
2.3.11 Heart rate (HR) and Heart Rate Variability (HRV) Requirement Description Theoretical background
Performing a mental task requires attention, information processing and mental effort. The physiological effects of mental tasks are an increase in heart rate (Mulder, 1988), and a decrease in vagal tone (i.e. relaxing/deactivating brain signals to the heart, see Aasman et al., (1987)), which in it turn is associated with decreased “high frequency heart rate variability (> 0.14 Hz, see Berntson et al., 1997).
Maturity of method
Both measures are derivatives of the electrocardiogram (ECG), and have been used in hundreds of laboratory experiments to indicate the level of mental effort (see van Roon, 1998 for a review). Heart rate and HRV have often been used in the aviation domain (Jorna et al, 1988; Jorna, 1991, 1992, 1993, 1996a, 1996b, 1997; Hilburn & Jorna, 1999).
Reliability problems
Both HR and HRV are to be used as relative indices of mental effort. Within-subject and between-subject comparisons are only possible with reference to a baseline measurement. A well-known variable that may confound the relation between HRV and mental effort is respiration. To interpret HR and HRV correctly, the effects of respiration have to be corrected for.
Sensitivity Although HR and HRV values can change within seconds, reliable measurements are obtained for periods with a minimum length of 30-40 seconds, and a maximum of 5 minutes. For shorter or longer periods, sensitivity decreases. Only large changes in workload can be found in HR or HRV. The effects of confounders are accounted for by including them into the statistical calculations (covariates).
Validity problems
The cardiovascular responses to task demands are stronger if task demands are larger, thus the cardiovascular response can be used to evaluate the mental load of a task in aviation (Hanson & Bazanski, 2001). However, the actual effort depends on internal (e.g. skills, training) and external (e.g. distractions) factors as well as the initial state (e.g. fatigue) of the subject. If the internal, external and initial conditions are kept constant, HR and HRV are valid measures of task demands.
Known correlation with other measures
HRV (and HR) have a high correlation with the Rating Scale Mental Effort (RSME), and with several mental tasks (e.g. reaction time tasks, the Stroop task and mental arithmetic). Standard references are: Steptoe (1985), Aasman et al., (1987), Grossman, (1991), Pagani, (1991).
One measure confounding the results of another
HRV and HR are objective measures. If the administration of self-reports (or other measures of workload), are not demanding, they will probably not affect HR or HRV.
Diagnosticity HRV and HR are indices of mental effort (i.e. the resources/energy used to change a given state into a desired state). According to Mulder et al., (1985) effort refers to the resources related to controlled processing and state regulation.
Use in different design stages
HR and HRV are usually used in later phases of the design cycle (for usability testing and evaluation). It is an analytical tool, and data processing and artefact correction require expert knowledge.
Applicability The main use of HRV is to objectively quantify expected (large) changes in workload. Subtle changes in tasks (e.g. colour coding, strategy
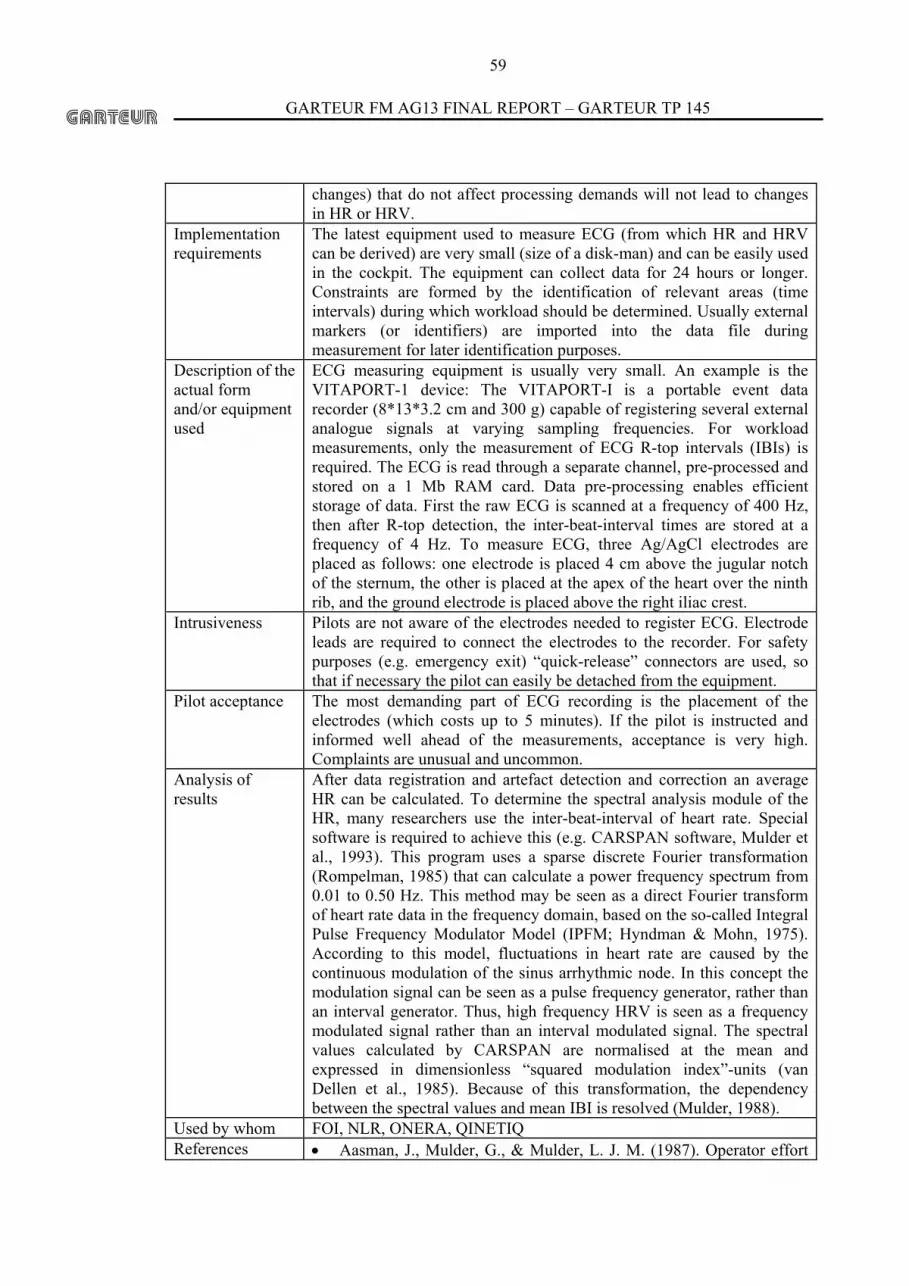
GARTEUR FM AG13 FINAL REPORT – GARTEUR TP 145
59
changes) that do not affect processing demands will not lead to changes in HR or HRV.
Implementation requirements
The latest equipment used to measure ECG (from which HR and HRV can be derived) are very small (size of a disk-man) and can be easily used in the cockpit. The equipment can collect data for 24 hours or longer. Constraints are formed by the identification of relevant areas (time intervals) during which workload should be determined. Usually external markers (or identifiers) are imported into the data file during measurement for later identification purposes.
Description of the actual form and/or equipment used
ECG measuring equipment is usually very small. An example is the VITAPORT-1 device: The VITAPORT-I is a portable event data recorder (8*13*3.2 cm and 300 g) capable of registering several external analogue signals at varying sampling frequencies. For workload measurements, only the measurement of ECG R-top intervals (IBIs) is required. The ECG is read through a separate channel, pre-processed and stored on a 1 Mb RAM card. Data pre-processing enables efficient storage of data. First the raw ECG is scanned at a frequency of 400 Hz, then after R-top detection, the inter-beat-interval times are stored at a frequency of 4 Hz. To measure ECG, three Ag/AgCl electrodes are placed as follows: one electrode is placed 4 cm above the jugular notch of the sternum, the other is placed at the apex of the heart over the ninth rib, and the ground electrode is placed above the right iliac crest.
Intrusiveness Pilots are not aware of the electrodes needed to register ECG. Electrode leads are required to connect the electrodes to the recorder. For safety purposes (e.g. emergency exit) “quick-release” connectors are used, so that if necessary the pilot can easily be detached from the equipment.
Pilot acceptance The most demanding part of ECG recording is the placement of the electrodes (which costs up to 5 minutes). If the pilot is instructed and informed well ahead of the measurements, acceptance is very high. Complaints are unusual and uncommon.
Analysis of results
After data registration and artefact detection and correction an average HR can be calculated. To determine the spectral analysis module of the HR, many researchers use the inter-beat-interval of heart rate. Special software is required to achieve this (e.g. CARSPAN software, Mulder et al., 1993). This program uses a sparse discrete Fourier transformation (Rompelman, 1985) that can calculate a power frequency spectrum from 0.01 to 0.50 Hz. This method may be seen as a direct Fourier transform of heart rate data in the frequency domain, based on the so-called Integral Pulse Frequency Modulator Model (IPFM; Hyndman & Mohn, 1975). According to this model, fluctuations in heart rate are caused by the continuous modulation of the sinus arrhythmic node. In this concept the modulation signal can be seen as a pulse frequency generator, rather than an interval generator. Thus, high frequency HRV is seen as a frequency modulated signal rather than an interval modulated signal. The spectral values calculated by CARSPAN are normalised at the mean and expressed in dimensionless “squared modulation index”-units (van Dellen et al., 1985). Because of this transformation, the dependency between the spectral values and mean IBI is resolved (Mulder, 1988).
Used by whom FOI, NLR, ONERA, QINETIQ References • Aasman, J., Mulder, G., & Mulder, L. J. M. (1987). Operator effort
GARTEUR FM AG13 FINAL REPORT – GARTEUR TP 145
60
and the measurement of heart-rate variability. Human Factors, 29, p 161-170.
• Berntson, G. G., Bigger, J. T., Eckberg, D. L., Grossman, P., Kaufmann, P. G., Malik, M., Nagaraja, H. N., Porges, S. W., Saul, J. P., Stone, P. H., & Molen, M. W. v. d. (1997). Heart rate variability: Origins, methods, and interpretive caveats. Psychophysiology, 34, p 623-648.
• Grossman, P., Karemaker, J., & Wieling, W. (1991). Prediction of tonic parasympathetic cardiac control using respiratory sinus arrhythmia: the need for respiratory control. Psychophysiology, 28, p 201-216.
• Hanson, E. K. S., & Bazanski, J. (2001). Ecological Momentary Assessments in Aviation. In Fahrenberg J and Myrtek: Progress ambulatory measurements. Seattle: Hogrefe & Huber.
• Hyndman, B. W., & Mohn, R. K. (1975). A model of the cardiac pacemaker and it's use in decoding the information content of cardiac intervals. Automedica, 1, 239-252.
• Mulder, L. J. M. (1988). Assessment of cardiovascular reactivity by means of spectral analysis. University of Groningen.
• Mulder, G., Mulder, L. J. M., & Veldman, J. B. P. (1985). Mental task as stressors. In Steptoe A, Ruddel H, and Neus H. Clinical and methodological issues in cardiovascular control. (pp. 30-44). Berlin: Springer Verlag.
• Mulder, L. J. M., Schweizer, D., & Roon, A. M. v. (1993). An environment for data reduction correction, and analysis of cardiovacular signals. In Maarse F. J., Akkerman, A. E., Brand, A. N., Mulder, L. J. M., and Stelt, M. J. Computers in psychology 4. Tools for experimental and applied psychology. p 72-83. Lisse: Swets & Zeitlinger.
• Jorna, P. G. A. M., Van der Meyden, P. & de Jong, R. (1988). COMMOD: A program for the complex demodulation of heart-rate data. TNO Institute for Perception, report 1988-12.
• Jorna, P. G. A. M. (1991). Heart rate variability as an index for pilot workload. Proceedings of the sixth international symposium on Aviation Psychology. Columbus Ohio.
• Jorna, P. G. A. M. (1992). Spectral analysis of heart rate and psychological state: A review of its validity as a workload index. Biological psychology, 34, 237-257.
• Jorna, P. G. A. M. (1993). Heart-rate and workload variations in actual and simulated flight. In: special issue Ergonomics "Psycho physiological measures in transport operations.
• Jorna, P. G. A. M. (1996a). Simulator characteristics and Pilot workload during helicopter missions: An analysis of heart rate and heart rate variability patterns. NLR Memorandum VE-96-001.
• Jorna, P. G. A. M. (1996b). Pilot Performance in Automated cockpits: demonstration of Event-related Heart rate responses to cockpit datalink. NLR CR-96-12.
• Jorna, P. G. A. M. (1997). Pilot performance in automated cockpits: event related heart rate responses to datalink applications.

GARTEUR FM AG13 FINAL REPORT – GARTEUR TP 145
61
Proceedings of the ninth international conference on aviation psychology, Columbus, Ohio, USA.
• Hilburn, B & Jorna, P. G. A. M. (1999). Workload in Air Traffic Control. In P. A. Hancock and P. Desmond [Eds.] Stress, Workload, and Fatigue: Theory, Research, and Practice. Hillsdale, New Jersey, USA: Lawrence Erlbaum, Associates.
• Jorna, P. G. A. M., (1999) Applications of psycho-physiogical measures in the aeronautical domain. Psycho-physiological society, Graz.
• Pagani, M., Mazzuero, G., Ferrari, A., Liberati, D., Cerutti, S., Vaitl, D., Tavazzi, L., & Malliani, A. (1990). Sympathovagal interaction during mental stress. Circulation supplement, p. 83, I1-I9.
• Rompelman, O. (1985). Spectral analysis of heart rate variability. In Orlebeke J. F., Mulder G., and Doornen L.J.Pv. The psychophysiology of cardiovascular control, p. 315-331. New York: Plenum Press.
• Steptoe, A. (1985). Theoretical bases for task selection in cardiovascular psychophysiology. In Steptoe A, Ruddel H, and Neus H. Clinical and methodological issues in cardiovascular psychophysiology, p. 6-15. Berlin: Springer Verlag.
• Van Dellen, H. J., Aasman, J., Mulder, L. J. M., & Mulder, G. (1985). Statistical versus spectral measures of heart rate variability. In Orlebeke JF, Mulder LJM, and Doornen LJPv. The psychophysiology of cardiovascular control, p. 353-374. New York: Plenum Press.
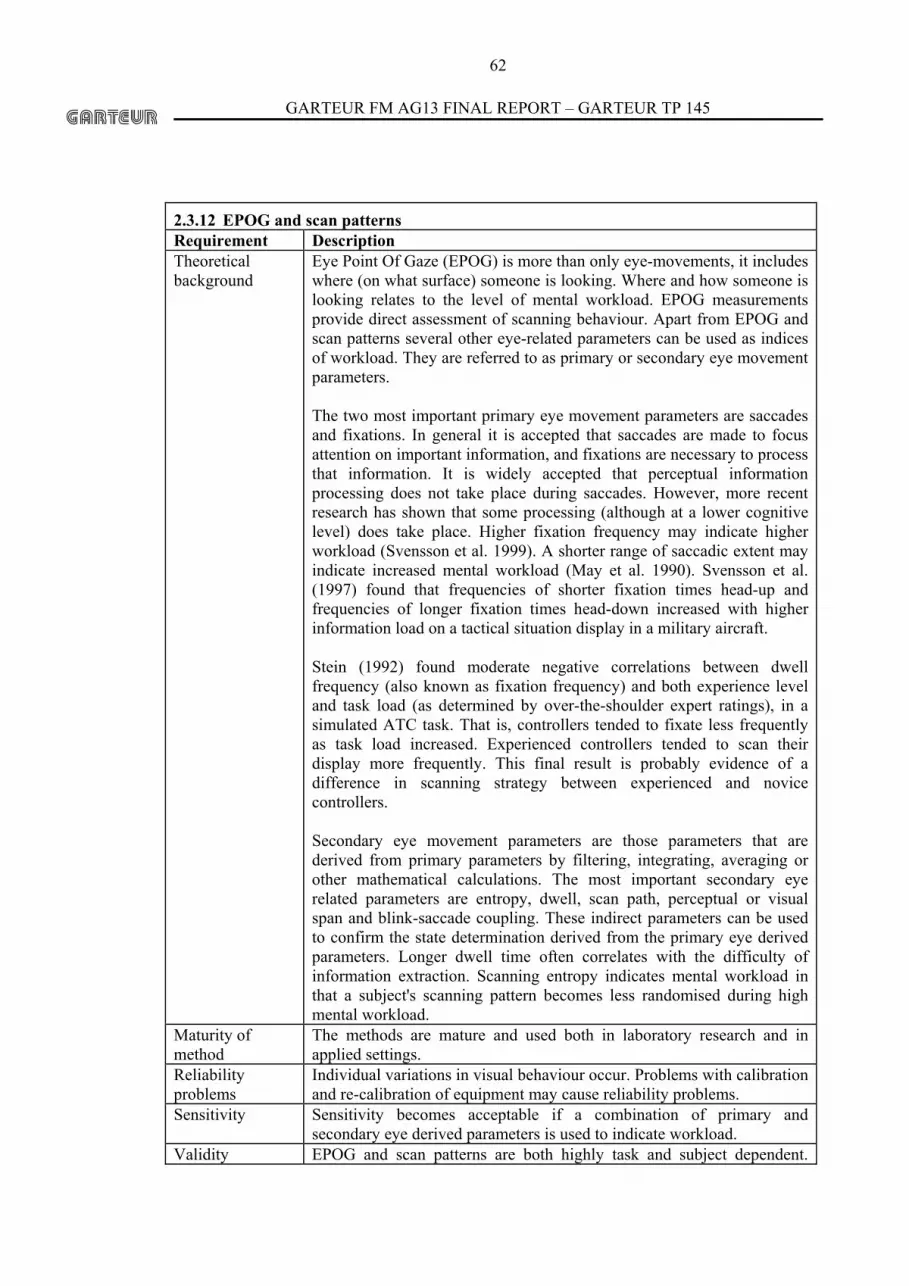
GARTEUR FM AG13 FINAL REPORT – GARTEUR TP 145
62
2.3.12 EPOG and scan patterns Requirement Description Theoretical background
Eye Point Of Gaze (EPOG) is more than only eye-movements, it includes where (on what surface) someone is looking. Where and how someone is looking relates to the level of mental workload. EPOG measurements provide direct assessment of scanning behaviour. Apart from EPOG and scan patterns several other eye-related parameters can be used as indices of workload. They are referred to as primary or secondary eye movement parameters. The two most important primary eye movement parameters are saccades and fixations. In general it is accepted that saccades are made to focus attention on important information, and fixations are necessary to process that information. It is widely accepted that perceptual information processing does not take place during saccades. However, more recent research has shown that some processing (although at a lower cognitive level) does take place. Higher fixation frequency may indicate higher workload (Svensson et al. 1999). A shorter range of saccadic extent may indicate increased mental workload (May et al. 1990). Svensson et al. (1997) found that frequencies of shorter fixation times head-up and frequencies of longer fixation times head-down increased with higher information load on a tactical situation display in a military aircraft. Stein (1992) found moderate negative correlations between dwell frequency (also known as fixation frequency) and both experience level and task load (as determined by over-the-shoulder expert ratings), in a simulated ATC task. That is, controllers tended to fixate less frequently as task load increased. Experienced controllers tended to scan their display more frequently. This final result is probably evidence of a difference in scanning strategy between experienced and novice controllers. Secondary eye movement parameters are those parameters that are derived from primary parameters by filtering, integrating, averaging or other mathematical calculations. The most important secondary eye related parameters are entropy, dwell, scan path, perceptual or visual span and blink-saccade coupling. These indirect parameters can be used to confirm the state determination derived from the primary eye derived parameters. Longer dwell time often correlates with the difficulty of information extraction. Scanning entropy indicates mental workload in that a subject's scanning pattern becomes less randomised during high mental workload.
Maturity of method
The methods are mature and used both in laboratory research and in applied settings.
Reliability problems
Individual variations in visual behaviour occur. Problems with calibration and re-calibration of equipment may cause reliability problems.
Sensitivity Sensitivity becomes acceptable if a combination of primary and secondary eye derived parameters is used to indicate workload.
Validity EPOG and scan patterns are both highly task and subject dependent.

GARTEUR FM AG13 FINAL REPORT – GARTEUR TP 145
63
problems Pupil diameter is sensitive to, for example, illumination conditions. Known correlation with other measures
Frequency of critical fixations head-down correlates .51 (p<0.01) with ratings of pilot mental workload on the Bedford scale (Svensson et al., 1997).
One measure confounding the results of another
The objective measures of EPOG and scan patterns do not confound with other measures of workload, unless the actual recording equipment is intrusive.
Diagnosticity EPOG and scan patterns are indices of mental workload, effected both by cognitive and visually demanding tasks.
Use in different design stages
Less suitable for the earliest design stages, due to context sensitivity.
Applicability EPOG and scan patterns allow dynamic measures of workload. It might even be that information from multiple eye measures is suitable for near-real-time evaluation of workload (Van Orden et al. 2001).
Implementation requirements
Technical solutions are developed for measuring EPOG and scan patterns in simulators as well as in flight, although some measuring systems are only suitable for non-flying conditions.
Description of the actual form and/or equipment used
An example of a EPOG equipment is the Mooij Holding GazeTracker II, were Applied Science Laboratory Series 4000 Eye Tracker (using a head mounted infra-red source and CCD camera) and Ascension Technology Corporation Flock of Birds (magnetic head tracker) are used as subsystems.
Intrusiveness Head-mounted systems may disturb directly or indirectly. New non-intrusive systems for EPOG are in use and under further development.
Pilot acceptance Pilot acceptance is generally good, even though some head-mounted systems may distract them because they are considered restrictive or heavy.
Analysis of results
Analysis could be made in near-real-time, as well as stored for off-line analysis. Results are easier to interpret if it is complemented with additional measures, such as subjective ratings and performance measures (VINTHEC, 1999).
Used by whom NLR, FOI, QinetiQ, SAAB, LiU References • Beatty, J. (1982). Task-evoked pupillary responses, processing load,
and the structure of processing resources. Psychological Bulletin, Vol. 91, No. 2, p. 276-292.
• May, J. G., Kennedy, R. S., Williams, M. C., Dunlap, W. P., & Brannan, J. R. (1990). Eye Movements indices of Mental Workload. Acta Psychologica, 75, p. 75-89.
• Van Orden, K. F., Limbert, W., Makeig, S., & Jung, T. P. (2001). Eye activity correlates of workload during a visuospatial memory task. Human Factors, Vol. 43, No. 1, p. 111-121.
• Stein, E. S. (1992). Air Traffic Control Visual Scanning. FAA Technical Report DOT/FAA/CT-TN92/16. US Department of Transportation.
• Svensson, E., Angelborg-Thanderz, M., Sjöberg, L., and Olsson, S. (1997). Information complexity - mental workload and performance in combat aircraft. Ergonomics, 40, p. 362-380.
• Svensson, E., Angelborg-Thanderz, M., & Wilson, G. F. (1999). Models of pilot performance for systems and mission evaluation

GARTEUR FM AG13 FINAL REPORT – GARTEUR TP 145
64
psychological and psychophysiological aspects. AFRL-HE-WP-Tr-1999-0215.
• VINTHEC (1999). Final Report.

GARTEUR FM AG13 FINAL REPORT – GARTEUR TP 145
65
2.3.13 Blink rate Requirement Description Theoretical background
Components of the endogenous eye blink (i.e., an eye blink not elicited by an external stimulus) have been studied with respect to mental workload (Kramer, 1991; Stein, 1992). Relevant components of the endogenous eye blink have included blink rate, blink latency, and blink duration. In general, fewer and shorter duration blinks have been associated with increased workload, in such tasks as city driving, reading, and aircraft weapon delivery (Brookings et al., 1994; Krebs, Wingert & Cunningham, 1977).
Maturity of method
The method is mature.
Reliability problems
Individual differences between subjects lead to a decrease in reliability.
Sensitivity The measure can only be used for tasks longer that 3 minutes. Validity problems
Despite some empirical evidence that blink rate decreases slightly with task load, several authors have noted that the connection between mental workload and blink rate remains fairly weak (Krebs, Wingert & Cunningham, 1977; Casali & Wierwille, 1983). Blink rate, it seems, might be more useful in the measurement of fatigue. Stern (1993) found that it could distinguish fatigue in pilots and non-flying co-pilots of military aircraft. Blink latency and blink duration appear promising candidate workload measures (Kramer, 1991). Latency has been found to increase with memory and response demands. Kramer (1991) noted that both blink latency and blink duration suggest that fixation time increases with the visual demands of a task. Earl Stein has done seminal work into the use of ocular measures with ATC. Stein (1992) found that saccade duration varied inversely with ATC task load.
Known correlation with other measures
Blink rate is strongly related to fatigue.
One measure confounding the results of another
-
Diagnosticity - Use in different design stages
Blink rate is usually used in later phases of the design cycle (for usability testing and evaluation). It is an analytical tool, and data processing and artefact correction require expert knowledge.
Applicability The main use of blink rate is to objectively quantify visual workload. Subtle changes in tasks (e.g. colour coding, strategy changes) that do not affect processing demands will not lead to changes in blink rate.
Implementation requirements
See VITAPORT for blink rate derived from EOG, and Gazetracker for blink rate derived from EPOG data.
Description of the actual form an/or equipment used
See VITAPORT for blink rate derived from EOG, and Gazetracker for blink rate derived from EPOG data.
Intrusiveness Intrusiveness depends on the type of equipment used. Determining blink rate from EOG using electrodes and VITAPORT is less intrusive that

GARTEUR FM AG13 FINAL REPORT – GARTEUR TP 145
66
using Gazetracker. The least intrusive method will to derive blinks from video data.
Pilot acceptance Depends on intrusiveness and thus type of equipment used. Analysis of results
Results are easier to interpret if it is complemented with additional measures, such as subjective ratings and performance measures (VINTHEC, 1999).
Used by whom NLR, FOI, SAAB, QINETIQ References • Brookings, J. B. & Wilson, G. F. (1994). Physiological and workload
changes during a simulated air traffic control task. Proceedings of the Human Factors and Ergonomic Society, 38th Annual Meeting.
• Casali, J. & Wierwille, W. (1983). A comparison of rating scale, secondary task, physiological, and primary task workload estimation techniques in a simulated flight task emphasizing communications load. Human Factors, 25, 623-642.
• Kramer, A. F. (1991). Physiological metrics of mental workload: a review of recent progress. In D.L. Damos (Ed.), Multiple Task Performance. London: Taylor & Francis.
• Krebs, M. J., Wingert, J. W. & Cunningham, T. (1977). Exploration of an Oculometer-Based Model of Pilot Workload. NASA Technical report CR-145153. Minneapolis, Minnesota: Honeywell Systems & Research Center.
• Stein, E. S. (1992). Air Traffic Control Visual Scanning. FAA Technical Report DOT/FAA/CT-TN92/16. US Department of Transportation.
• Stern, J. A. (1993). The eyes: reflector of attentional processes (synopsis by J. J. Kelly). CSERIAC Gateway, 4 (4), 7-12.
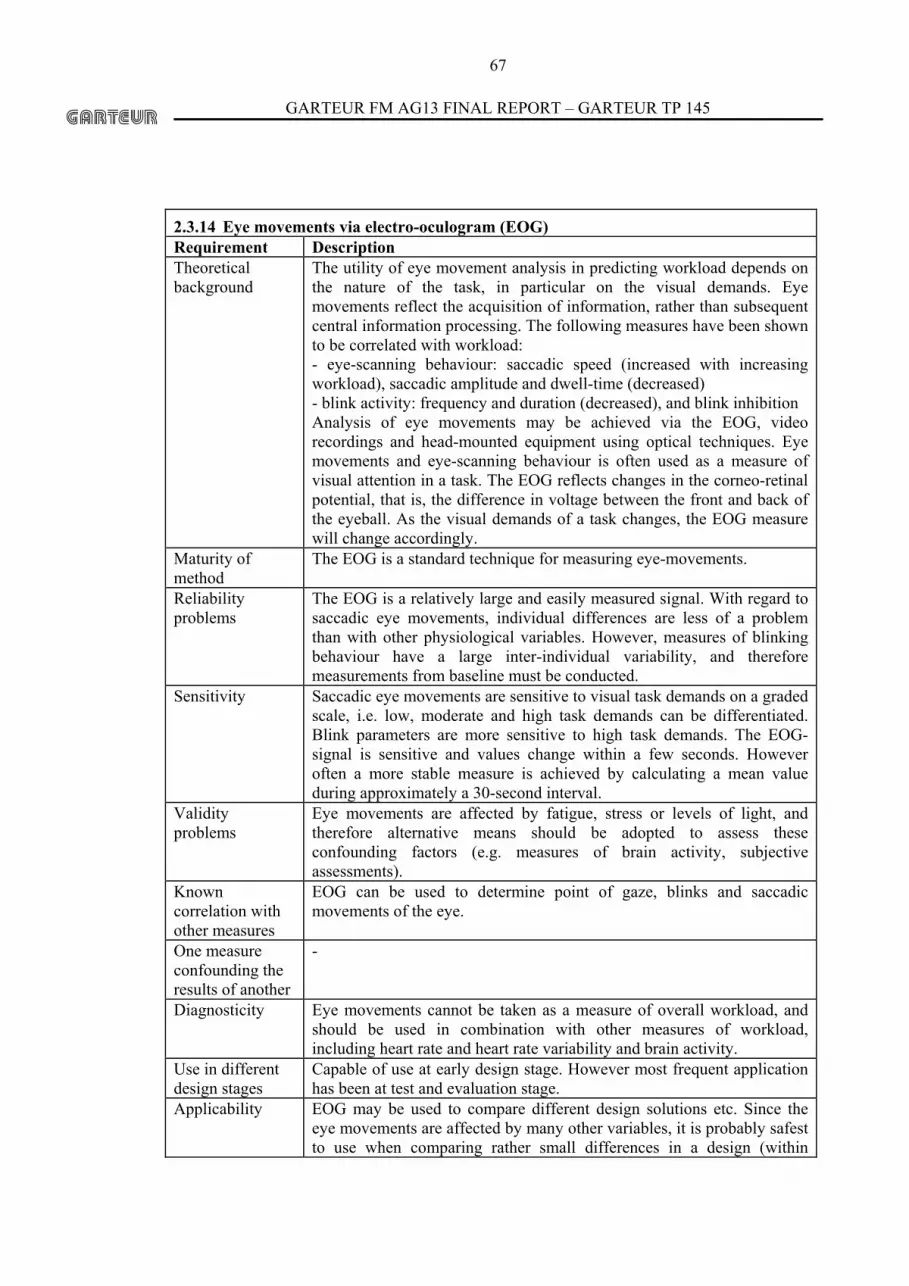
GARTEUR FM AG13 FINAL REPORT – GARTEUR TP 145
67
2.3.14 Eye movements via electro-oculogram (EOG) Requirement Description Theoretical background
The utility of eye movement analysis in predicting workload depends on the nature of the task, in particular on the visual demands. Eye movements reflect the acquisition of information, rather than subsequent central information processing. The following measures have been shown to be correlated with workload: - eye-scanning behaviour: saccadic speed (increased with increasing workload), saccadic amplitude and dwell-time (decreased) - blink activity: frequency and duration (decreased), and blink inhibition Analysis of eye movements may be achieved via the EOG, video recordings and head-mounted equipment using optical techniques. Eye movements and eye-scanning behaviour is often used as a measure of visual attention in a task. The EOG reflects changes in the corneo-retinal potential, that is, the difference in voltage between the front and back of the eyeball. As the visual demands of a task changes, the EOG measure will change accordingly.
Maturity of method
The EOG is a standard technique for measuring eye-movements.
Reliability problems
The EOG is a relatively large and easily measured signal. With regard to saccadic eye movements, individual differences are less of a problem than with other physiological variables. However, measures of blinking behaviour have a large inter-individual variability, and therefore measurements from baseline must be conducted.
Sensitivity Saccadic eye movements are sensitive to visual task demands on a graded scale, i.e. low, moderate and high task demands can be differentiated. Blink parameters are more sensitive to high task demands. The EOG-signal is sensitive and values change within a few seconds. However often a more stable measure is achieved by calculating a mean value during approximately a 30-second interval.
Validity problems
Eye movements are affected by fatigue, stress or levels of light, and therefore alternative means should be adopted to assess these confounding factors (e.g. measures of brain activity, subjective assessments).
Known correlation with other measures
EOG can be used to determine point of gaze, blinks and saccadic movements of the eye.
One measure confounding the results of another
-
Diagnosticity Eye movements cannot be taken as a measure of overall workload, and should be used in combination with other measures of workload, including heart rate and heart rate variability and brain activity.
Use in different design stages
Capable of use at early design stage. However most frequent application has been at test and evaluation stage.
Applicability EOG may be used to compare different design solutions etc. Since the eye movements are affected by many other variables, it is probably safest to use when comparing rather small differences in a design (within
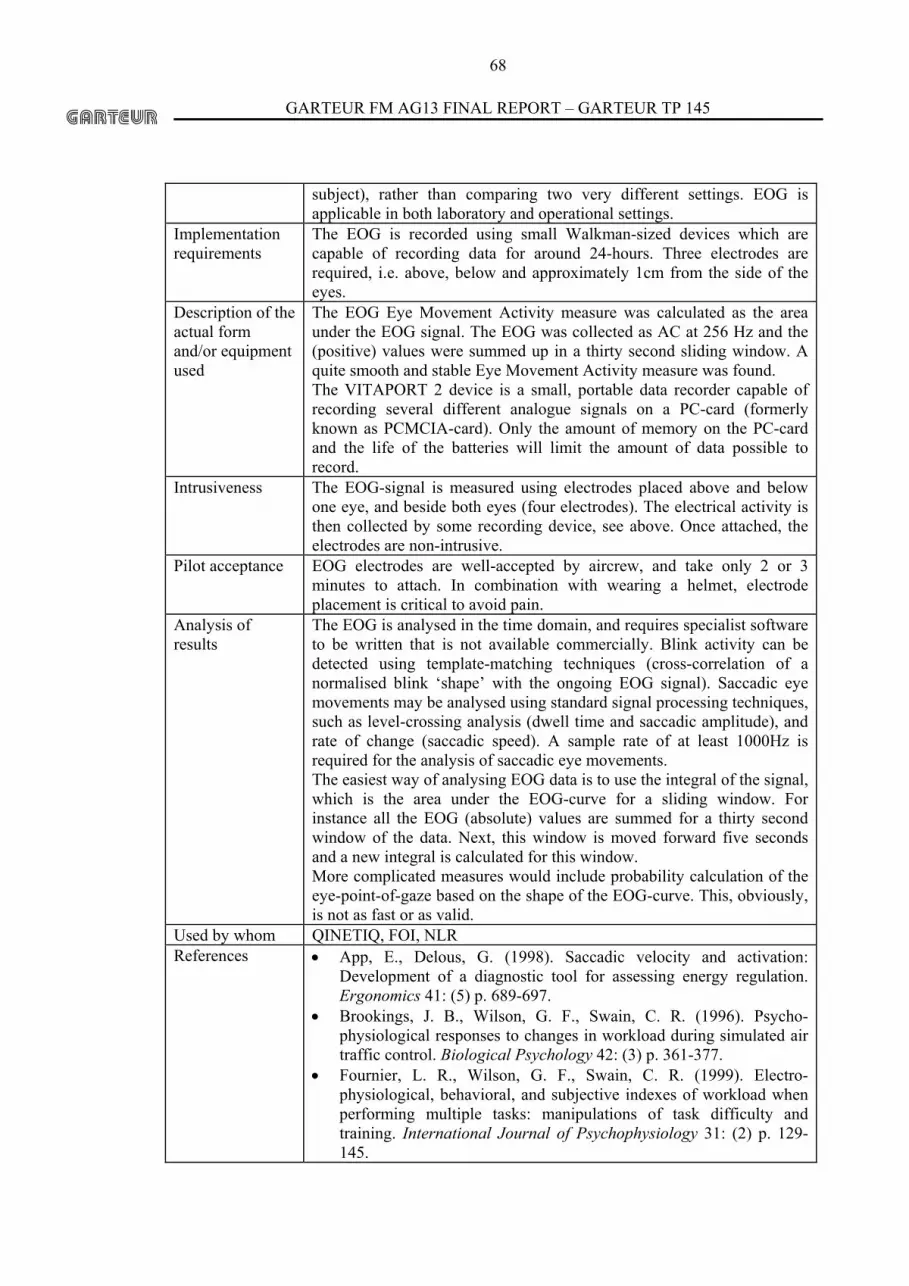
GARTEUR FM AG13 FINAL REPORT – GARTEUR TP 145
68
subject), rather than comparing two very different settings. EOG is applicable in both laboratory and operational settings.
Implementation requirements
The EOG is recorded using small Walkman-sized devices which are capable of recording data for around 24-hours. Three electrodes are required, i.e. above, below and approximately 1cm from the side of the eyes.
Description of the actual form and/or equipment used
The EOG Eye Movement Activity measure was calculated as the area under the EOG signal. The EOG was collected as AC at 256 Hz and the (positive) values were summed up in a thirty second sliding window. A quite smooth and stable Eye Movement Activity measure was found. The VITAPORT 2 device is a small, portable data recorder capable of recording several different analogue signals on a PC-card (formerly known as PCMCIA-card). Only the amount of memory on the PC-card and the life of the batteries will limit the amount of data possible to record.
Intrusiveness The EOG-signal is measured using electrodes placed above and below one eye, and beside both eyes (four electrodes). The electrical activity is then collected by some recording device, see above. Once attached, the electrodes are non-intrusive.
Pilot acceptance EOG electrodes are well-accepted by aircrew, and take only 2 or 3 minutes to attach. In combination with wearing a helmet, electrode placement is critical to avoid pain.
Analysis of results
The EOG is analysed in the time domain, and requires specialist software to be written that is not available commercially. Blink activity can be detected using template-matching techniques (cross-correlation of a normalised blink ‘shape’ with the ongoing EOG signal). Saccadic eye movements may be analysed using standard signal processing techniques, such as level-crossing analysis (dwell time and saccadic amplitude), and rate of change (saccadic speed). A sample rate of at least 1000Hz is required for the analysis of saccadic eye movements. The easiest way of analysing EOG data is to use the integral of the signal, which is the area under the EOG-curve for a sliding window. For instance all the EOG (absolute) values are summed for a thirty second window of the data. Next, this window is moved forward five seconds and a new integral is calculated for this window. More complicated measures would include probability calculation of the eye-point-of-gaze based on the shape of the EOG-curve. This, obviously, is not as fast or as valid.
Used by whom QINETIQ, FOI, NLR References • App, E., Delous, G. (1998). Saccadic velocity and activation:
Development of a diagnostic tool for assessing energy regulation. Ergonomics 41: (5) p. 689-697.
• Brookings, J. B., Wilson, G. F., Swain, C. R. (1996). Psycho-physiological responses to changes in workload during simulated air traffic control. Biological Psychology 42: (3) p. 361-377.
• Fournier, L. R., Wilson, G. F., Swain, C. R. (1999). Electro-physiological, behavioral, and subjective indexes of workload when performing multiple tasks: manipulations of task difficulty and training. International Journal of Psychophysiology 31: (2) p. 129-145.
GARTEUR FM AG13 FINAL REPORT – GARTEUR TP 145
69
• Hankins, T. C, Wilson, G. F. (1998). A comparison of heart rate, eye activity, EEG and subjective measures of pilot mental workload during flight. Aviation Space Environmental Medicine 69: (4) p. 360-367.
• Katoh, Z. (1997). Saccade amplitude as a discriminator of flight types. Aviation Space Environmental Medicine 68: (3) p. 205-208.
• Szczechura J, Terelak, J. F., Kobos, Z, et al. (1998). Oculographic assessment of workload influence on flight performance. International Journal of Aviation Psychology 8: (2) p. 157-176.
• Van Orden, K. F., Limbert, W., Makeig, S, et al. (2001). Eye activity correlates of workload during a visuospatial memory task. Human Factors 43: (1) p. 111-121.
• Veltman, J. A., Gaillard, A. W. K. (1996). Physiological indices of workload in a simulated flight task. Biological Psychology 42: (3) p. 323-342.
• Veltman, J. A., Gaillard, A. W. K. (1998). Physiological workload reactions to increasing levels of task difficulty. Ergonomics 41: (5) p. 656-669.
• Wilson, G. F. (1993). Air-to-ground training missions - a psychophysiological workload analysis. Ergonomics 36: (9) p. 1071-1087.
• Wilson, G. F., Fullenkamp, P., Davis I. (1994). Evoked-potential, cardiac, blink, and respiration measures of pilot workload in air-to-ground missions. Aviation Space Environmental Medicine 65: (2) p. 100-105.
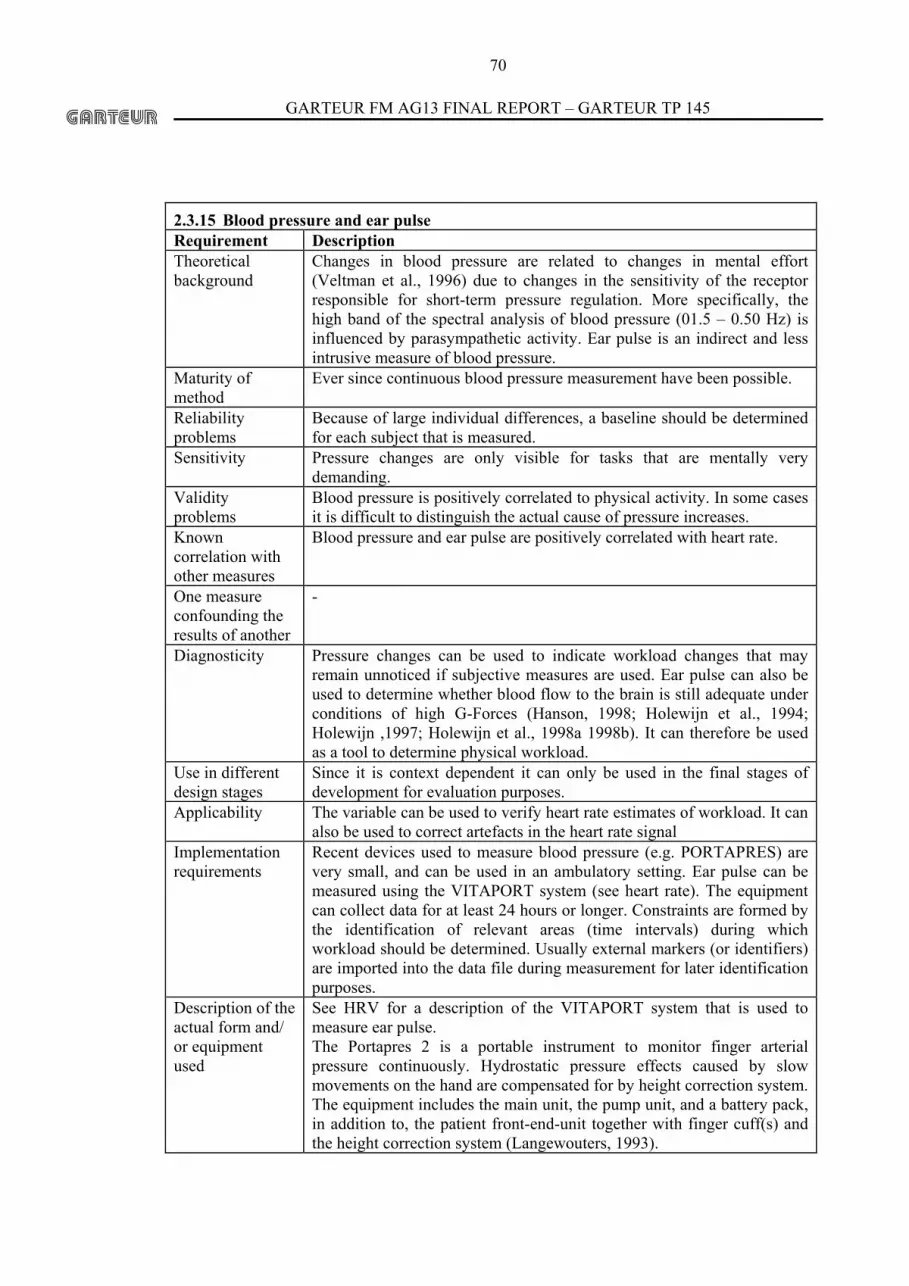
GARTEUR FM AG13 FINAL REPORT – GARTEUR TP 145
70
2.3.15 Blood pressure and ear pulse Requirement Description Theoretical background
Changes in blood pressure are related to changes in mental effort (Veltman et al., 1996) due to changes in the sensitivity of the receptor responsible for short-term pressure regulation. More specifically, the high band of the spectral analysis of blood pressure (01.5 – 0.50 Hz) is influenced by parasympathetic activity. Ear pulse is an indirect and less intrusive measure of blood pressure.
Maturity of method
Ever since continuous blood pressure measurement have been possible.
Reliability problems
Because of large individual differences, a baseline should be determined for each subject that is measured.
Sensitivity Pressure changes are only visible for tasks that are mentally very demanding.
Validity problems
Blood pressure is positively correlated to physical activity. In some cases it is difficult to distinguish the actual cause of pressure increases.
Known correlation with other measures
Blood pressure and ear pulse are positively correlated with heart rate.
One measure confounding the results of another
-
Diagnosticity Pressure changes can be used to indicate workload changes that may remain unnoticed if subjective measures are used. Ear pulse can also be used to determine whether blood flow to the brain is still adequate under conditions of high G-Forces (Hanson, 1998; Holewijn et al., 1994; Holewijn ,1997; Holewijn et al., 1998a 1998b). It can therefore be used as a tool to determine physical workload.
Use in different design stages
Since it is context dependent it can only be used in the final stages of development for evaluation purposes.
Applicability The variable can be used to verify heart rate estimates of workload. It can also be used to correct artefacts in the heart rate signal
Implementation requirements
Recent devices used to measure blood pressure (e.g. PORTAPRES) are very small, and can be used in an ambulatory setting. Ear pulse can be measured using the VITAPORT system (see heart rate). The equipment can collect data for at least 24 hours or longer. Constraints are formed by the identification of relevant areas (time intervals) during which workload should be determined. Usually external markers (or identifiers) are imported into the data file during measurement for later identification purposes.
Description of the actual form and/ or equipment used
See HRV for a description of the VITAPORT system that is used to measure ear pulse. The Portapres 2 is a portable instrument to monitor finger arterial pressure continuously. Hydrostatic pressure effects caused by slow movements on the hand are compensated for by height correction system. The equipment includes the main unit, the pump unit, and a battery pack, in addition to, the patient front-end-unit together with finger cuff(s) and the height correction system (Langewouters, 1993).

GARTEUR FM AG13 FINAL REPORT – GARTEUR TP 145
71
Intrusiveness Pilots clearly are aware of the presence of the bloodpressure equipment
(especially the pressure band). The ear pulse measurements are less intrusive, but pilots report some irritation from the clip. Connectors to the recording device may restrict the freedom of movement. For safety purposes (e.g. emergency exit) “quick-release” connectors are used, so that if necessary the pilot can easily be detached from the equipment
Pilot acceptance The ambulatory blood pressure measuring devise is very intrusive, and cannot be used properly in-flight. Only measurements in the simulator are possible, therefore acceptance amongst pilots is low. In contrast to blood pressure, ear pulse can easily be measures during flight. Pilots seem willing to measure the device during training flights.
Analysis of results
Dedicated software and expertise is necessary to analyse the data. The data can be used as external control, and correction of heart rate data. It increases the confidence in heart rate measurements.
Used by whom NLR, FOI References • Veltman, J. A., & Gaillard, A. W. K. (1993). Evaluation of subjective
and physiological measurement techniques for pilot workload. Soesterberg: TNO-TM. IZF 1993 A-5.
• Hanson, E. K. S. Feedback of pilot training performance. Summary report - Phase I 1997. (1998). Amsterdam: NLR. NLR-CR-98142.
• Holewijn, M. (1997). The use of the ear pulse as a feedback signal for pilots. Soesterberg: NAMC. 1997-M8.
• Holewijn, M., Endt, M. v., Rijkelijkhuizen, J. M., & Los, M. (1998). Feedback of pilot training performance-phase II: Validation of the use of ear pulse waveform parameters as feedback of blood pressure changes during centrifuge training. Soesterberg: AMI. 21-98-2201.
• Holewijn, M., Endt, M. v., Rijkelijkhuizen, J. M., & Los, M. (1998). Feedback of anti-G straining performance of pilots: the use of the ear pulse waveform as a feedback signal for blood pressure. Soesterberg: AMI. 1998-K4.
• Holewijn, M., Krol, J. R., & Simons, M. (1994). De oorpuls tijdens +Gz versnellingen. Soesterberg: NAMC. 1994-K5.
• Langewourters, G. J. (1993). Portapres Model 2.0. User Manual. TNO-TPD Biomedical Instrumentation, Academic Medical Centre, Amsterdam.
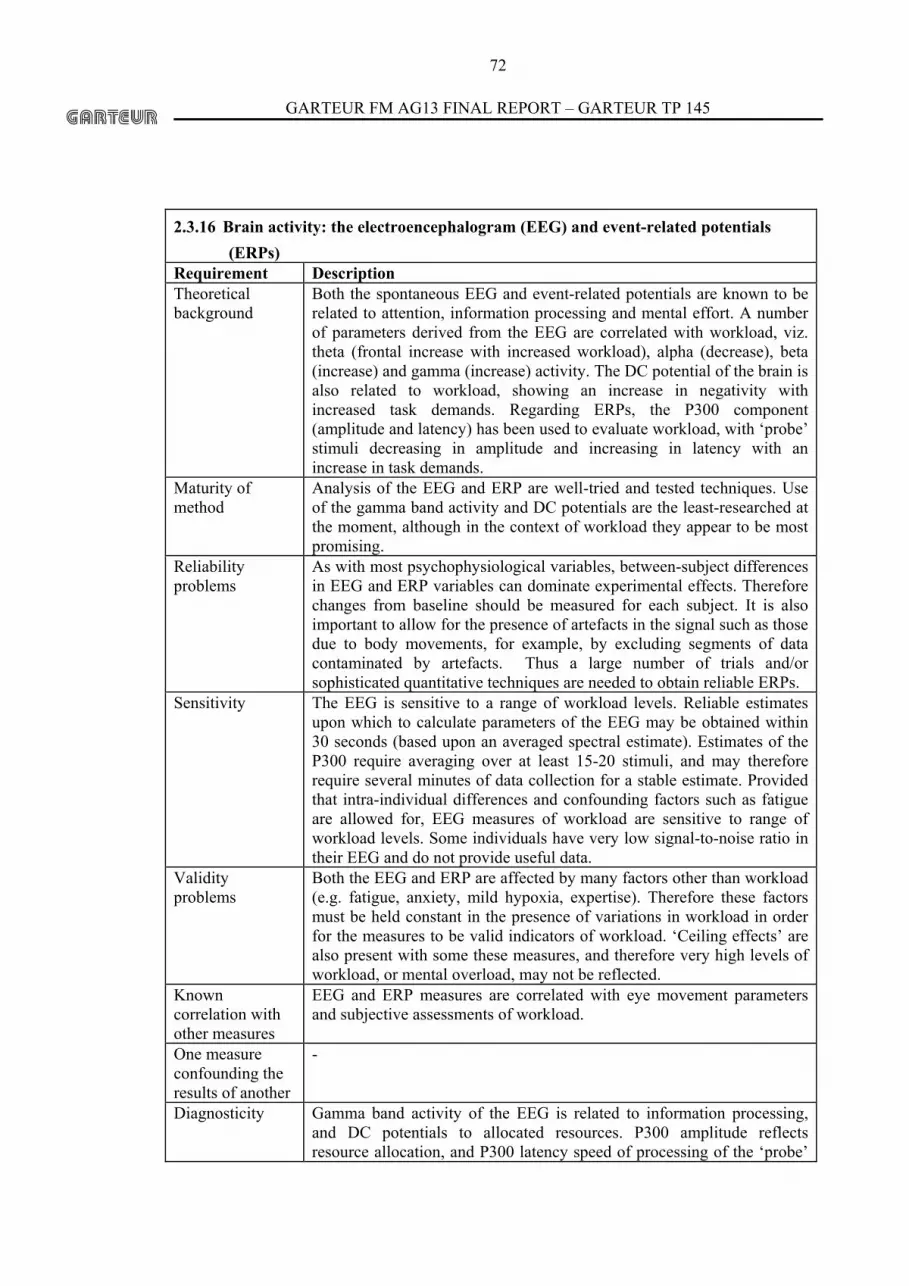
GARTEUR FM AG13 FINAL REPORT – GARTEUR TP 145
72
2.3.16 Brain activity: the electroencephalogram (EEG) and event-related potentials
(ERPs) Requirement Description Theoretical background
Both the spontaneous EEG and event-related potentials are known to be related to attention, information processing and mental effort. A number of parameters derived from the EEG are correlated with workload, viz. theta (frontal increase with increased workload), alpha (decrease), beta (increase) and gamma (increase) activity. The DC potential of the brain is also related to workload, showing an increase in negativity with increased task demands. Regarding ERPs, the P300 component (amplitude and latency) has been used to evaluate workload, with ‘probe’ stimuli decreasing in amplitude and increasing in latency with an increase in task demands.
Maturity of method
Analysis of the EEG and ERP are well-tried and tested techniques. Use of the gamma band activity and DC potentials are the least-researched at the moment, although in the context of workload they appear to be most promising.
Reliability problems
As with most psychophysiological variables, between-subject differences in EEG and ERP variables can dominate experimental effects. Therefore changes from baseline should be measured for each subject. It is also important to allow for the presence of artefacts in the signal such as those due to body movements, for example, by excluding segments of data contaminated by artefacts. Thus a large number of trials and/or sophisticated quantitative techniques are needed to obtain reliable ERPs.
Sensitivity The EEG is sensitive to a range of workload levels. Reliable estimates upon which to calculate parameters of the EEG may be obtained within 30 seconds (based upon an averaged spectral estimate). Estimates of the P300 require averaging over at least 15-20 stimuli, and may therefore require several minutes of data collection for a stable estimate. Provided that intra-individual differences and confounding factors such as fatigue are allowed for, EEG measures of workload are sensitive to range of workload levels. Some individuals have very low signal-to-noise ratio in their EEG and do not provide useful data.
Validity problems
Both the EEG and ERP are affected by many factors other than workload (e.g. fatigue, anxiety, mild hypoxia, expertise). Therefore these factors must be held constant in the presence of variations in workload in order for the measures to be valid indicators of workload. ‘Ceiling effects’ are also present with some these measures, and therefore very high levels of workload, or mental overload, may not be reflected.
Known correlation with other measures
EEG and ERP measures are correlated with eye movement parameters and subjective assessments of workload.
One measure confounding the results of another
-
Diagnosticity Gamma band activity of the EEG is related to information processing, and DC potentials to allocated resources. P300 amplitude reflects resource allocation, and P300 latency speed of processing of the ‘probe’

GARTEUR FM AG13 FINAL REPORT – GARTEUR TP 145
73
stimulus.. Use in different design stages
Measures of brain activity have been used to evaluate interfaces and variations in workload levels of existing designs. The techniques are not generally used in the early stages of design.
Applicability Changes in brain activity occur over a range of workload levels, from underload to high levels of workload, although with overload ‘ceiling effects’ occur.
Implementation requirements
The EEG is recorded using small Walkman-sized devices which are capable of recording data for around 24-hours. These recordings are easily performed in operational environments. Recording ERPs is technically more difficult because a means of delivering the stimulus must be provided. While ERP recordings have been conducted in flight, a laboratory setting is more usual. DC potentials can be difficult to record due to electrode ‘drift’ (a shift in baseline due to skin/electrode characteristics) and low inter-electrode impedances are required.
Description of the actual form and/or equipment used
Examples of recording devices are: 1. Medilogs recoders are 8 or 16-channel analogue devices, and record
raw signals for up to 24 hours. 2. VITAPORT-1 or VITAPORT-2 devices record up to 16 channels.
Recording time is limited by the digital storage capacity to several hours.
3. The EMBLA systems record 16 channels, and can store in excess of 24 hours of data.
In each of these devices, raw signals are stored, and data processing must be performed afterwards. Depending on the number of channels acquired, this post-processing can be time-consuming. Both the EEG and ERP are recorded using Ag/AgCl electrodes attached either using non-toxic glue or by electrodes housed within a headcap or headband.
Intrusiveness Once attached, the electrodes are relatively non-intrusive. However, time must be allowed within the experimental protocol for electrode attachment (10-45 minutes depending on method of attachment and number of electrodes).
Pilot acceptance Pilot acceptance is generally high, provided that explanation is provided and recordings are confined to a few planned sessions.
Analysis of results
The most frequent method of analysing the EEG is via the power spectrum derived from the FFT, with the frequency range usually covering 0.5-100Hz). This procedure is readily available within commercially-available signal processing packages, and can also be performed in real-time. The spectrum is usually divided into bands, including delta (0.5-3Hz), theta (3.5-7.5Hz), alpha (8-13Hz, often split into two bands: 8-10Hz, 10-13Hz), beta (13.5-30Hz, also split into two usually) and gamma (greater than 30Hz). The epoch size for analysing the EEG is usually 2-4 seconds, with data values over these epochs frequently being averaged to improve the stability of the estimate, e.g. to represent a time period of one minute. The DC EEG is represented by mean levels at various sites over the scalp. The number of sites on the scalp used to measure the EEG varies from several to in excess of 20. However, to assess workload, it is recommended that at least five sites are used, including frontal, pre-frontal, temporal, parietal and occipital derivations. Care must be taken to exclude artefacts from the signal
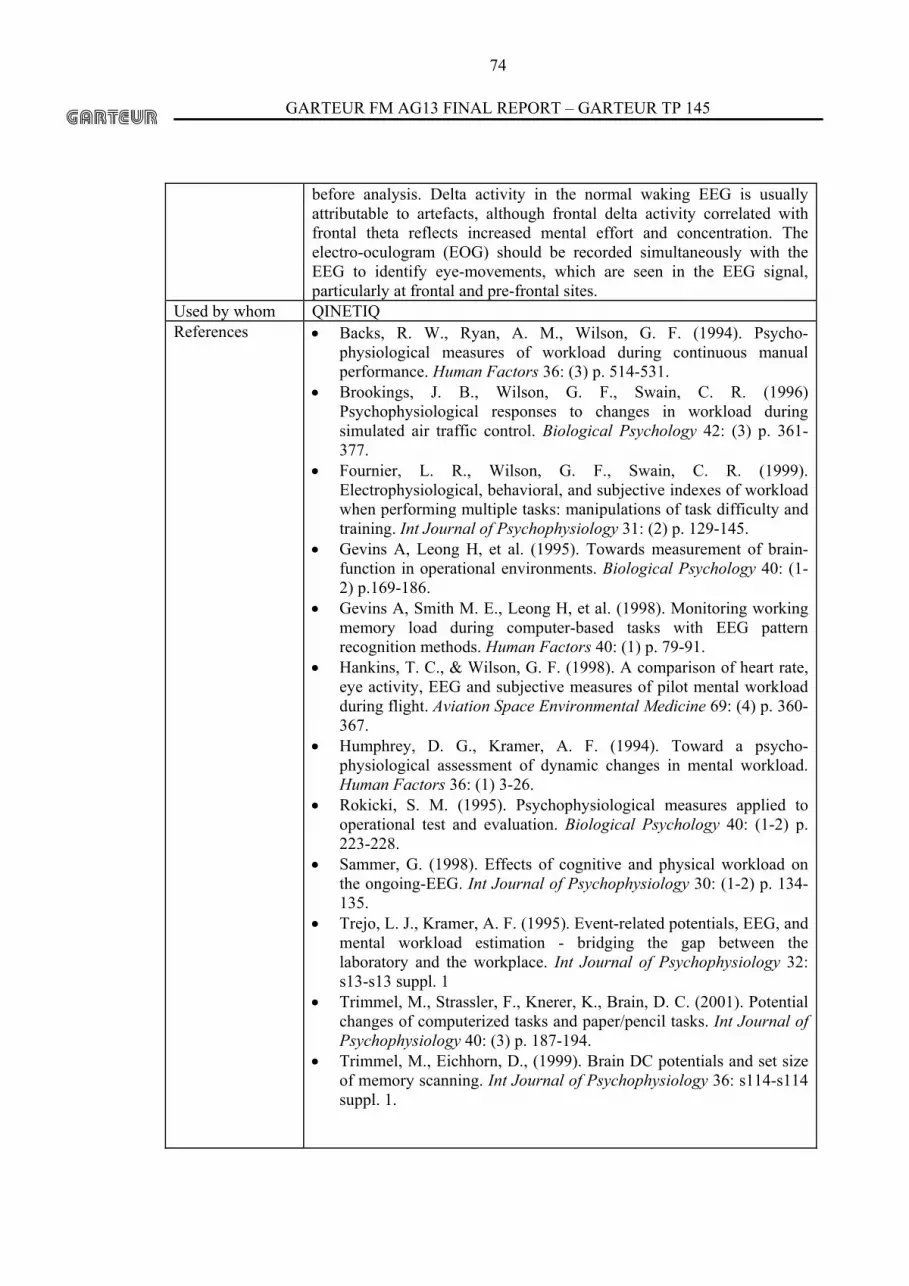
GARTEUR FM AG13 FINAL REPORT – GARTEUR TP 145
74
before analysis. Delta activity in the normal waking EEG is usually attributable to artefacts, although frontal delta activity correlated with frontal theta reflects increased mental effort and concentration. The electro-oculogram (EOG) should be recorded simultaneously with the EEG to identify eye-movements, which are seen in the EEG signal, particularly at frontal and pre-frontal sites.
Used by whom QINETIQ References • Backs, R. W., Ryan, A. M., Wilson, G. F. (1994). Psycho-
physiological measures of workload during continuous manual performance. Human Factors 36: (3) p. 514-531.
• Brookings, J. B., Wilson, G. F., Swain, C. R. (1996) Psychophysiological responses to changes in workload during simulated air traffic control. Biological Psychology 42: (3) p. 361-377.
• Fournier, L. R., Wilson, G. F., Swain, C. R. (1999). Electrophysiological, behavioral, and subjective indexes of workload when performing multiple tasks: manipulations of task difficulty and training. Int Journal of Psychophysiology 31: (2) p. 129-145.
• Gevins A, Leong H, et al. (1995). Towards measurement of brain-function in operational environments. Biological Psychology 40: (1-2) p.169-186.
• Gevins A, Smith M. E., Leong H, et al. (1998). Monitoring working memory load during computer-based tasks with EEG pattern recognition methods. Human Factors 40: (1) p. 79-91.
• Hankins, T. C., & Wilson, G. F. (1998). A comparison of heart rate, eye activity, EEG and subjective measures of pilot mental workload during flight. Aviation Space Environmental Medicine 69: (4) p. 360-367.
• Humphrey, D. G., Kramer, A. F. (1994). Toward a psycho-physiological assessment of dynamic changes in mental workload. Human Factors 36: (1) 3-26.
• Rokicki, S. M. (1995). Psychophysiological measures applied to operational test and evaluation. Biological Psychology 40: (1-2) p. 223-228.
• Sammer, G. (1998). Effects of cognitive and physical workload on the ongoing-EEG. Int Journal of Psychophysiology 30: (1-2) p. 134-135.
• Trejo, L. J., Kramer, A. F. (1995). Event-related potentials, EEG, and mental workload estimation - bridging the gap between the laboratory and the workplace. Int Journal of Psychophysiology 32: s13-s13 suppl. 1
• Trimmel, M., Strassler, F., Knerer, K., Brain, D. C. (2001). Potential changes of computerized tasks and paper/pencil tasks. Int Journal of Psychophysiology 40: (3) p. 187-194.
• Trimmel, M., Eichhorn, D., (1999). Brain DC potentials and set size of memory scanning. Int Journal of Psychophysiology 36: s114-s114 suppl. 1.

GARTEUR FM AG13 FINAL REPORT – GARTEUR TP 145
75
• Trimmel, M., Kunkel, V., Strassler, F., et al. (1998). Brain DC potentials of a cognitive task and relationship to performance. Int Journal of Psychophysiology 30: (1-2) p. 264-264.
• Wilson, G. F., Fullenkamp, P., Davis, I. (1994). Evoked-potential, cardiac, blink, and respiration measures of pilot workload in air-to-ground missions. Aviation Space Environmental Medicine 65: (2) p. 100-105.
• Wilson, G. F., Lambert, J. (1999). Physiological effects of varied mental workload in pilots during flight. Int Journal of Psychophysiology 36: s126-s126 suppl. 1.
• Wilson, G. F., Swain, R.A., Davis, I. (1994). Topographical analysis of cortical evoked activity during a variable demand spatial processing task. Aviation Space Environmental Medicine 65: (5) a54-a61 suppl. 5.
• Wilson, G. F., Swain, C. R., Ullsperger, P. (1998). ERP components elicited in response to warning stimuli: the influence of task difficulty. Biological Psychology 47: (2) p. 137-158.
• Wilson, G. F., Swain, C. R., Ullsperger P. (1999). EEG power changes during a multiple level memory retention task. Int Journal of Psychophysiology 32: (2) p. 107-118.

GARTEUR FM AG13 FINAL REPORT – GARTEUR TP 145
76
2.3.17 Respiration Requirement Description Theoretical background
Respiration is a complex psychophysiological function that involves a number of processes: 1) air passage (ventilation, sound production) 2) rhythmic volume changes and 3) sensory awareness (internal tension state of the body). Mental state and behaviour have strong influences on respiration, which is affected by psychological factors such as stress, arousal, workload and emotions (anxiety, tension, etc.). Changes in the function of the autonomic nervous system influence respiration. The main problem with using respiration as an indicator of workload is the difficulty of separating the effects of workload from those of stress, particularly related to emotion.
Maturity of method
Respiration has been researched extensively in the context of mental function and workload.
Reliability problems
High test-retest reliability.
Sensitivity Respiration is sensitive to changes in the central and autonomic nervous system.
Validity problems
Does not have a direct relationship with workload.
Known correlation with other measures
Correlated with components of heart rate variability.
One measure confounding the results of another
Respiration is modified by changes in heart rate and heart rate variability
Diagnosticity Correlated with workload but used alone is not a good predictor of workload.
Use in different design stages
-
Applicability Laboratory and operational contexts. Implementation requirements
Requires abdominal belt to be worn around the chest of the subject.
Description of the actual form and/ or equipment used
Respiration is recorded using a strain gauge, and the signal is recorded on a DC channel of VITAPORT recorder or similar.
Intrusiveness Of the psychophysiological methods considered here, respiration is relatively intrusive, requiring the subject to wear an abdominal belt
Pilot acceptance Low – medium, not amenable to routine recording. Analysis of results
10Hz sampling rate. Breathing rate and variability, inter-beat interval, breathing amplitude.
Used by whom QINETIQ
GARTEUR FM AG13 FINAL REPORT – GARTEUR TP 145
77
2.3.17 Respiration Requirement Description References • Backs, R. W., & Seljos, K. A. (1994). Metabolic and
cardiorespiratory measures of mental effort - the effects of level of difficulty in a working-memory task. Int Journal of Psychophysiology, 16(1), p. 57-68.
• Brookings, J. B., Wilson, G. F, & Swain C. R. (1996). Psycho-physiological responses to changes in workload during simulated air traffic control. Biological Psychology, 42(3) p. 361-377.
• Ohsuga, M., Shimono, F., & Genno, H. (2001). Assessment of phasic work stress using autonomic indices. Int Journal of Psychophysiology, 40(3), p. 211-220.
• Fournier, L. R., Wilson, G. F., & Swain, C. R. (1999). Electro-physiological, behavioral, and subjective indexes of workload when performing multiple tasks manipulations of task difficulty and training. Int Journal of Psychophysiology, 31(2) p. 129-145.
• Pettyjohn, E. S., & McNeil, R. J. (1977). Use of inspiratory minute volumes in evaluation of rotary and fixed wing pilot workload. In ‘Methods to assess workload, AGARD Aerospace Medical Panel Meeting, Cologne, FRG, 18-22 April 1977.
• Smit, J. (1977). Physiological measurements and subjective ratings obtained during instrument flying with an alouette III helicopter. NLR-TR-77073-C.
• Veltman, J. A., & Gaillard, A. W. K. (1998). Physiological workload reactions to increasing levels of task difficulty. Ergonomics, 41(5) p. 656-669.
• Veltman, J. A., & Gaillard, A. W. K. (1996). Physiological indices of workload in a simulated flight task. Biological Psychology, 42(3), p. 323-342.
• Wilson G. F., Fullenkamp, P., Davis, I. (1994). Evoked-potential, cardiac, blink and respiration measures of pilot workload in Air-To-Ground Missions. Aviation Space and Environmental Medicine, 65(2), p. 100-105.

GARTEUR FM AG13 FINAL REPORT – GARTEUR TP 145
78
2.3.18 Secondary Embedded Task (dual task) Requirement Description Theoretical background
Traditional second task performance methods are based on the paradigm of the human operator being a limited capacity information processing system. They attempt to measure the spare capacity by the extent a second task can be carried out together with the primary task. A variety of secondary tasks have been investigated, with an emphasis on laboratory studies. Examples are resolving arithmetic problems, choice reaction time, generating a random sequence, interval generation and regularity of tapping. It has been realised that not every task is suitable as a secondary task and that some basic requirements should be met : the task should require little learning (to avoid practice effects), it should be self-paced (to avoid interference with the primary task performance). However, the secondary task may still decrease the primary task performance (Sanders, 1979), and the traditional secondary tasks generally raise specific problems such as instrumentation limitations, task intrusion and poor operator acceptance (Shingledecker, 1987). Secondary embedded tasks have been proposed to avoid these drawbacks. An embedded secondary task is an operator function performed during normal system operations (e.g. radio communication task with ATC), but is distinct from the primary operator function that is under assessment. Such secondary tasks are usually assigned lower priority than the primary task (e.g. flying a level course at fixed height and speed) and it is expected that the secondary task will deteriorate when performed concurrently with a harder primary task. The choice of a task already existing in the crewmember’s environment increases the ecological validity of the method and its direct applicability to flight test. Although based on the single channel model, which has proved its practical utility (Liao and Moray, 1993), the method may be refined in order to address the multi dimensional aspects of workload, and to better fit with the multiple ressources theory (Wickens, 1981). In particular, the selection of an appropriate task and modalities requires careful attention. For instance, the radio communication task may include manual radio switches, and so involve audio, verbal and motor activity. It has been reported that communication tasks requiring manual activity (e;g. radio tuning) tend to provide better measures of crew workload in tasks which involve aircraft control as a primary component (Shingledecker, 1987).
Maturity of method
The method is described in a number of different articles. A particularly good review is by Shingledecker and Crabtree, 1982.
Reliability problems
Learning effects may contaminate results on secondary tasks, especially if the embedded task is not exactly a task usually performed.
Sensitivity Changes in operator strategy may remain unnoticed and therefore accompanying changes in workload will not be registered.
Validity problems
The validity of the method is largely dependent on the structure of the embedded task, which selection requires special attention. Guidelines to establish this selection have been provided in the literature (Fisk & all,

GARTEUR FM AG13 FINAL REPORT – GARTEUR TP 145
79
1983, de Waard, 1996). Remaining capacity may depend on operator strategy and experience. Scores on secondary tasks are therefore highly dependent on the characteristics of the individual.
Known correlation with other measures
Negative correlation with primary task performance measure may be found, which reveal changes of the operator’s performance objectives. This should be avoided by briefing instruction.
One measure confounding the results of another
-
Diagnosticity - Use in different design stages
Secondary embedded tasks can be applied during the evaluation stage of the design cycle. Secondary embedded tasks have been used in civil and military aviation studies as well as in maritime and military vehicle environments.
Applicability Secondary embedded tasks are particularly useful for evaluating designs whose performance measures are insensitive. For example, an innovative 3D landing approach display may not improve the primary glide slope task (because it is being performed at a ceiling level) but it could reduce workload so as the pilot has more spare capacity to be able to improve the secondary communication task.
Implementation requirements
There are several advantages of secondary embedded tasks. Such tasks have a great deal of face validity. This is often useful if the customer of the design evaluation does not want to introduce additional tasks to the test evaluation. And it is quite common that experimental participants do not understand the use of standard secondary tasks (e.g. Sternberg memory task) and do not accept them. Embedded tasks also have the practical advantage of not requiring additional equipment (screens, etc.) and require little or no additional participant training because they use existing standard tasks (e.g. radio communications).
Description of the actual form and/or equipment used
Embedded secondary task is a technique, which uses existing sub-task performance as an indicator of primary task workload. It assumes that if the primary task is less workload intensive the operator has more spare capacity to perform the less important secondary task. Typical embedded secondary tasks are radio communication tasks, recognition of emergency conditions and navigational problems during simulated flights.
Intrusiveness There is always the possibility of task intrusion, where the secondary task interferes with the primary flight task. However, a review of the literature has failed to identify this experimentally.
Pilot acceptance Participants usually favour embedded secondary tasks because they use existing tasks that require no additional training.
Analysis of results
Embedded secondary tasks can provide a variety of different data types depending upon the type of task selected. For instance, the performance criteria for a radio communication task is the completion time; during the briefing, the operators are instructed that the radio communication task will be used as a workload measure and that it should be performed as soon as possible, but without allowing any reduction in the performance of the primary task, nor more attention to the secondary task than usually provided. Ambiguity may appear in the interpretation of the results if primary task performance appears to be reduced when the secondary task
GARTEUR FM AG13 FINAL REPORT – GARTEUR TP 145
80
is performed. Used by whom References • Shingledecker, C. A. & Crabtree, M. S. (1982). Subsidiary radio
communications tasks for workload assessments in R & D simulations: II. Task sensitivity evaluations Report no. AFAMRL-TR-82-57, Wright Patterson Air Force Base, US Air Force Medical Research Laboratory.
• Sanders A. F. (1979). Some remarks on mental load, in “Mental Workload: its theory and measurement", N. Moray, ed., New York: Plenum Press.
• Shingledecker, C. A. (1987). In-flight workload assessment using embedded secondary radio communications tasks. Proceedings of the Symposium on the Practical Assessment of Pilot Workload (Paris: AGARD AG 282), p. 11-31.
• Fisk A. D., Derrick W. L., & Schneider W. (1983). The assessment of workload: dual task methodology. Proceedings of the 27th. Annual Meeting of the Human Factor Society.
• Liao, J. & Moray N. (1993). A Simulation Study of Human Performance Deterioration and Mental Workload, Le Travail Humain, 56, (4), p. 321-344.
• de Waard, D. (1996). The Measurement of Drivers' Mental Workload, p. 34-36.

GARTEUR FM AG13 FINAL REPORT – GARTEUR TP 145
81
2.3.19 MOEs/MOPs Requirement Description Theoretical background
Measures Of Effectiveness (MOEs) are an objective measure of how well a high level operational task is accomplished through using a system – they represent system operating goals. Measures of Performance (MOPs) are qualitative or quantitative measures of system capabilities or characteristics such as task performance goals. They indicate the degree to which that capability or characteristic performs or meets the requirement under specific conditions. MOPs are components, or subsets of MOEs; i.e., the "degree-to-which" a system performs is one of a number of possible measures of "how well" a system's task is accomplished. Each MOE may support one or more MOPs. MOEs were initially conceived as objective measures of a systems achievement of system goals. As such they must have specific conditions for their satisfaction that are unambiguous and achievable within the specified/expected performance of the system. The definition of MOEs depends on a thorough knowledge of system specification, operations, performance, and operational tasks. As such the definition of conditions that must be met to satisfy the requirements of MOEs must be derived from the above areas of knowledge and are dependant on the performance of an effective analysis of a system including Task Analysis. MOEs can be system related or applied specifically to the achievement of human goals using the system (Meister, 1985, Gentner, 1996).
Maturity of method
MOEs have been used in HF since the 1970s (Meister, 1985). MOEs have been formulated for the acceptance of several UK military systems including the RN Merlin Helicopter and the RAF Nimrod MRA4 Maritime Patrol aircraft.
Reliability problems
The reliability of an MOE/MOP depends on the quality of the effort expended on its formulation, especially that related to the conditions attached to the achievement of the MOE.MOP.
Sensitivity The sensitivity of the measures depends on the quality and the form/level of detail embedded in the measure.
Validity problems
The validity of any measure is in its usefulness. In the area of HF, The validity is the explicit representation of goals and sub goals.
Known correlation with other measures
The quality of measures can be determined through comparison and correlation with actual work performance on system part or whole prototypes, simulations, or on the final acceptance of the completed system. MoPs can be effectively used to delineate the sub goals of the most common task route to MOE satisfaction. As such they can be used as a template against which to assess workload and work performance.
One measure confounding the results of another
Sets of MOEs need to be carefully formulated to ensure that their respective goals do not clash. Similarly, MOPs must be devised with care to ensure that they serve the intended purpose under a particular MOE and do not contradict the purpose of MOPs associated with another MOE.
Diagnosticity MOPs provide the main diagnostics with relation to the reasons behind
GARTEUR FM AG13 FINAL REPORT – GARTEUR TP 145
82
the level of achievement of MOE conditions. Results from the application of workload methods can be associated with the level of satisfaction of MOP conditions to determine the resultant effects on explicitly stated work goals of the form, periodicity, or levels of associated operator workloads.
Use in different design stages
Should be used throughout design and development of systems.
Applicability Has applicability to the appreciation of the degree of achievement of human goals in specified work domains and contexts.
Implementation requirements
MOEs/MOPs must be derived and agreed with the majority of parties associated with system design and development. This is because they must be related to system specifications of performance, constraints, mission form, practices of the system’s user organisation, manning and skills used, system design and architecture, operating environment parameters, test requirements, and the technology adopted by the system to name but a few considerations.
Description of the actual form and/or equipment used
Achievement of an MOE/MOP can be determined through the logged observations of appropriately trained personnel or system based data loggers. It is normal to assess the satisfaction of an MOE/MOP over repeated evaluations/acceptance tests.
Intrusiveness Should be none if MOEs/MOPs are formulated to represent to the operator a set of easily understandable goals and the determination of results is performed to ensure that operators work performance suffers minimal interference.
Pilot acceptance The pilots/operators/Maintainers should be involved in the formulation of the MOEs/MOPs and must be intimately acquainted with these goals as they are the objectives of the effort they should expend through their planned work tasks.
Analysis of results
Level and form of analysis dependent on the requirements of the analyses.
Used by whom All participants in system design and development. References • Meister, D. (1985). Behavioral Analysis and Measurement Methods.
New York: John Wiley. • Gentner, F. C., Best, P. S., & Cunningham, P. H. (1996). Sources of
Measures of Effectiveness (MOEs) for Assessing Human Performance in Aeronautical Systems. Proceedings of 38th International Military Testing Association (IMTA) Conference, San Antonio, Texas, USA.

GARTEUR FM AG13 FINAL REPORT – GARTEUR TP 145
83
2.3.20 “Second pilot” or instructor assessment of performance Requirement Description Theoretical background
One of the most common ways of determining workload is by having and instructor or test pilot rating of the workload. A vast disadvantage of the methods is that ratings are base on “gut feeling” rather than observable or measurable data. In spite of the absence of scientific backing, such ratings have a high predicative value, usually not better or worse than the scientifically collected predictions.
Maturity of method
This method has been used ever since the beginning of flight-testing.
Reliability problems
Second pilot or instructor ratings are highly individual leading to low inter-rater reliability. Discussing individual ratings in a group of Subject Matter Experts (instructors or test pilots) so that a consensus is formed can solve this problem.
Sensitivity Subtle changes in workload can be observed. Validity problems
External validity is hard to determine since the theoretical background is lacking. Expert assessment allows rapid feedback to the crew in debrief after a standardisation or assessment check, this supporting the Face Validity of the method. Expert assessment is the method normally used for the regular appraisal of the overall quality of operational crew performance in the UK military.
Known correlation with other measures
-
One measure confounding the results of another
-
Diagnosticity Such methods can be used for pilot selection purposes or examinations, with satisfactory results.
Use in different design stages
Since observation of pilot behaviour is necessary, this technique can only be used later stages of system design or prototype development.
Applicability The method is easy to use if a second pilot or instructor is available. Implementation requirements
To prevent the assessor being overloaded with too much information, appraisals must be focused on an assessor selection of primary cues. The assessor must possess several skills including an acknowledged high skill in the area of the assessment, an understanding of the accepted standards on which to base the assessment, and a trusted fairness in their assessment of others. Military assessment and standardisation of aircrew is performed on the professional level by trade, and at the crew level considering levels of crew teamwork and overall performance.
Description of the actual form and/or equipment used
An example of an automated device used to measure instructor ratings is PEED (Hanson & Bazanski, 2001).
Intrusiveness The pilot need not know that he or she is being rated. However if he or she does now that, it may increase workload. Being observed by an instructor may pressurise subjects and thus increase workload.
Pilot acceptance High.

GARTEUR FM AG13 FINAL REPORT – GARTEUR TP 145
84
Analysis of results
-
Used by whom NLR, The Netherlands Royal Air Force References • Hanson, E. K. S., & Bazanski, J. (2001). Ecological Momentary
Assessments in Aviation. In Fahrenberg J and Myrtek: Progress ambulatory measurements. Seattle: Hogrefe & Huber.
• MacLeod, I. S., Taylor, R. M., and Davies, C. L. (1995). Perspectives on the appreciation of team situational awareness. In: Experimental Analysis and Measurement of Team Situation Awareness. Garland, D. J. and Endsley, M. R (Eds). Florida: Embry-Riddle Aeronautical University Press.

GARTEUR FM AG13 FINAL REPORT – GARTEUR TP 145
85
2.3.21 Subjective assessment of performance Requirement Description Theoretical background
FOI uses subjective ratings to assess performance. Subjective assessment of performance gives an important contribution to the understanding of what it is that constitutes good, or bad, performance. There are two main groups of subjective assessment: 1) the operator rating him/herself, i.e. self assessment, and 2) someone else rating the operator. The method of assessing performance that is most commonly used by the FOI is a modified version of BFRS (Berggren, 2000). The pilots answer by scoring on the 10 point scale. The modified scale can then be formulated in either first person or third person to. It can also be used pseudodynamically, that is, that scale is being used repeatedly throughout a mission after important aspects of the mission. For example, FOI has used the scale to assess pilot performance during an attack mission in a simulator. The pilots rated themselves after each important phase, so that for each attack mission four ratings of performance were collected for each pilot (Magnusson & Berggren, 2001).
Maturity of method
The measure has been used in several studies (Svensson et al, 1997, 1999).
Reliability problems
There are sometimes a difference between pilot ratings and instructor ratings. These differences can be explained by different understanding of what constitutes performance.
Sensitivity Validity problems
The main problem with the modified BFRS is that the questions are about performance in general. Sometimes more defined aspects of performance are needed.
Known correlation with other measures
The FOI Subjective ratings of pilot performance correlates with mental workload (r= -0.55), situational awareness(r= 0.52), and Heart Rate (r= -0.59) (Magnusson & Berggren, 2001).
One measure confounding the results of another
-
Diagnosticity - Use in different design stages
Have mainly been used in training simulators and after missions in real aircraft.
Applicability Implementation requirements
The questions have been administered directly after simulated and real missions. They are usually presented as questionnaires or as verbal reports.
Description of the actual form and/or equipment used
Self assessment: How well did you perform? Instructor assessment: How well did the operator perform?
Intrusiveness Using the modified BFRS to assess performance the rating is done very quickly after an initial learning period that takes approximately 5 minutes. They do not intrude much on the main objective.
Pilot acceptance The questions are well accepted by the pilots. Analysis of The ratings can be used either separately or used as input in causal

GARTEUR FM AG13 FINAL REPORT – GARTEUR TP 145
86
results analyses (Svensson et al, 1997,1999). Used by whom FOI References • Berggren, P. (2000). Situational awareness, mental workload, and
pilot performance - relationships and conceptual aspects. Linköping: Human Sciences Division. FOA-R-00-01438-706-SE.
• Magnusson, S., & Berggren, P. (2001). Measuring pilot mental status, NAMA conference, Stockholm.
• Richardson J.T.E (Ed), 1996, Handbook of Qualitative Research Methods for Psychology and the Social Sciences, BPS Books, Leicester, UK.
• Svensson, E., Angelborg-Thanderz, M., Sjöberg, L., & Olsson, S. (1997). Information complexity-mental workload and performance in combat aircraft. Ergonomics, 40, No. 3, p. 362-380.
• Svensson, E., Angelborg-Thanderz, M., & Wilson, G. F. (1999). Models of pilot performance for systems and mission evaluation – psychological and psychophysiological aspects. AFRL-HE-WP-TR-1999-0215.
GARTEUR FM AG13 FINAL REPORT – GARTEUR TP 145
87
3 Example studies
In this chapter the Action Group members have provided descriptions of example studies where issues of experimental protocol, how results were analysed and presented to customers etc. are described. 3.1 NLR contribution 3.1.1 Mission New technologies developed by the aviation industry are aimed at enhancing the safety and efficiency of commercial aviation. NLR has developed cost effective “human-centred” experiments and evaluations that enable early implementation of such new technologies prior to roll-out and operational testing. This innovative approach is illustrated by shortly describing how pilot workload was measured in-flight in the “Feedback of Pilot Training Performance” project. NLRs innovative approach to the in-flight measurement of workload is illustrated by describing the design and evaluations of the project “Feedback of Pilot Training Performance”. The feedback-project started in 1997, and had as main goal the development of a prototype debriefing aid, that is beneficial to both the Netherlands and Polish Armed Forces. Part of the study was focussed on exploring whether debriefing information could be handed to pilots when workload was low during flight. To achieve this it was necessary to determine whether workload could be measured in-flight. The in-flight workload assessments were performed at the Test & Training Centre Seppe (TTC Seppe, The Netherlands). The project is carried out under contract to the Netherlands Ministry of Defence, and involves collaboration between the National Aerospace Laboratory (NLR), the National AeroMedical Institute (AMI) and the Polish Air Force Institute of Aviation Medicine (PAFIAM).
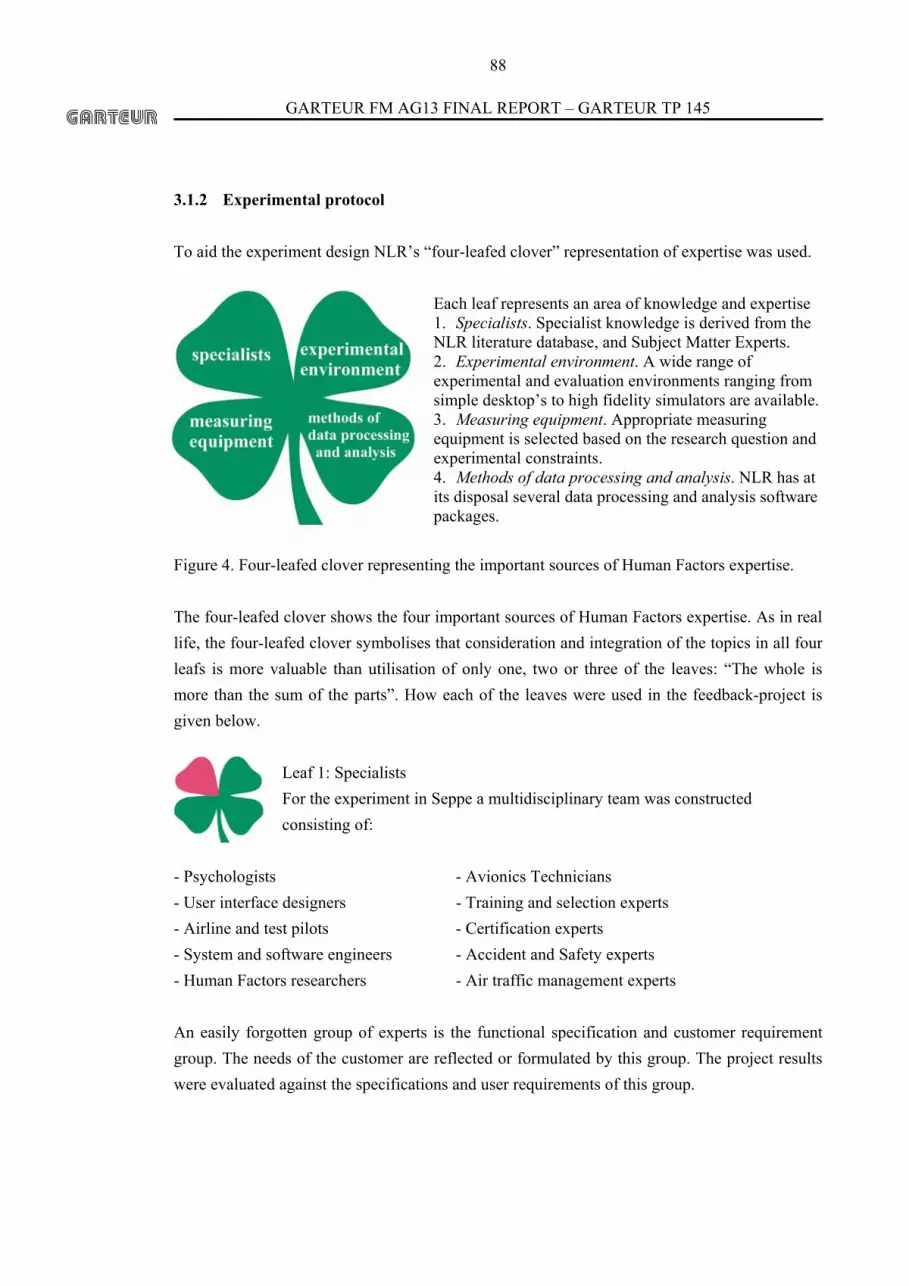
GARTEUR FM AG13 FINAL REPORT – GARTEUR TP 145
88
3.1.2 Experimental protocol To aid the experiment design NLR’s “four-leafed clover” representation of expertise was used.
Each leaf represents an area of knowledge and expertise 1. Specialists. Specialist knowledge is derived from the NLR literature database, and Subject Matter Experts. 2. Experimental environment. A wide range of experimental and evaluation environments ranging from simple desktop’s to high fidelity simulators are available. 3. Measuring equipment. Appropriate measuring equipment is selected based on the research question and experimental constraints. 4. Methods of data processing and analysis. NLR has at its disposal several data processing and analysis software packages.
Figure 4. Four-leafed clover representing the important sources of Human Factors expertise. The four-leafed clover shows the four important sources of Human Factors expertise. As in real life, the four-leafed clover symbolises that consideration and integration of the topics in all four leafs is more valuable than utilisation of only one, two or three of the leaves: “The whole is more than the sum of the parts”. How each of the leaves were used in the feedback-project is given below.
Leaf 1: Specialists For the experiment in Seppe a multidisciplinary team was constructed consisting of:
- Psychologists - Avionics Technicians - User interface designers - Training and selection experts - Airline and test pilots - Certification experts - System and software engineers - Accident and Safety experts - Human Factors researchers - Air traffic management experts An easily forgotten group of experts is the functional specification and customer requirement group. The needs of the customer are reflected or formulated by this group. The project results were evaluated against the specifications and user requirements of this group.

GARTEUR FM AG13 FINAL REPORT – GARTEUR TP 145
89
Leaf 2: Experimental environment Naturally the customers’ requirements, research question and project restrictions drive the choice of experiment and evaluation environment. NLR has at its disposal several flexible environments fully equipped with data collection and
observation facilities (see Table 4). For experiments and evaluations outside NLR an ambulatory measurement toolkit is also available. Table 4. Experiment environments at NLR Desktop experiment • In contrast to a high fidelity user environment, a simple configuration
can be built using desk top computers.
Air Traffic Control • the NLR Air traffic control Research SIMulator (NARSIM) • Tower Research Simulator (TRS) with outside visual
Civil Flight Deck • a rapid prototyping GEneric SIMulatOr (GESIMO) • a motion platform Research Flight Simulator (RFS) with a glass cockpit
Military Cockpit • fixed base Fighter Pilot Station (FPS) • a motion platform fighter simulator, National Simulation Facility (NSF)
Helicopter Cockpit • fixed base Helicopter Pilot Station (HPS)
Research aircraft • Fairchild Metro II, a twin engine turboprop aircraft • Cessna Citation II, a twinjet aircraft
In the case of the feedback-project, experimental data was collected during flight in a trainer aircraft (Slingsby T67M200). Six candidate-pilots from the Royal Netherlands Military Academy participated in the study. They were randomly divided into 2 groups. Both groups performed 2 flights. One group received supplemental parameter feedback of aircraft performance data during the debriefing, the others did not. Performance was derived from instructor ratings, and objective flight parameter (e.g. airspeed, roll-angle and altitude deviations). Mental effort was derived from self-reports, and physiological measurements (e.g. heart rate variability). The benefits of the debriefing were determined by calculating the changes in candidate-pilot performance, and mental effort after the debriefing session.
Leaf 3: Equipment For human-centred experiments and design, the Human Factors specialists can choose out of a large number of assessment methods, in order to address and resolve problems in design, training and evaluation projects. Availability,
expertise, and research environment drive the eventual choice. We distinguish 3 categories associated with specific parameters and equipment that can be used to measure different topics of interest (see Table 5). PERFORMANCE (e.g. assessment of vehicle parameters), Assessment of operator PHYSIOLOGY AND BEHAVIOUR, SELF-REPORTS AND OBSERVATIONS of actions and intentions, or expert ratings.

GARTEUR FM AG13 FINAL REPORT – GARTEUR TP 145
90
Table 5. Examples of parameters that can be measured, necessary equipment and the underlying constructs or topics of interest for the three.
Parameters Equipment Topic of interest
CATEGORY 1: PERFORMANCE Vehicle speed, altitude, etc. task/flight performance
operator inputs operator performance
experimental environment (e.g. for
pilot, air traffic controller)
simulator/aircraft recording
system (e.g. in-flight airborne
recording equipment) experimental conditions
CATEGORY 2: PHYSIOLOGY AND BEHAVIOUR
heart rate (variability), respiration,
Electro-oculogram
VITAPORT workload, anxiety, fatigue,
visual attention
eye-derived parameters (e.g. blink
rate, pupil diameter, dwell time,
scan pattern and scan entropy)
GazeTracker
(combined eye tracking and
head tracking system)
workload, (shared) situation
awareness, anxiety, fatigue,
visual attention
CATEGORY 3: SELF REPORTS AND OBSERVATIONS
rating scale mental effort-value questionnaires and rating scales workload, situation
awareness, performance etc.
verbal protocol video debriefing actions, intentions
In the case of the feedback-project workload was measured using (1) heart rate variability, (2) self-reports with a device specifically designed for in-flight measurements of workload (PEED). The validation of this equipment is reported in Hanson & Bazanski (2001). 3.1.3 Methods and analysis
Leaf 4: Methods of data processing and analysis A large quantity of data is usually collected in human-centred experiment and evaluations often from different sources and recorded by different systems. To
save time and money data handling, processing and analysis should be well defined and optimised before the data collection is even initiated. For this purpose, NLR has developed an efficient data collection and analysis process using commercialy available tools in combination
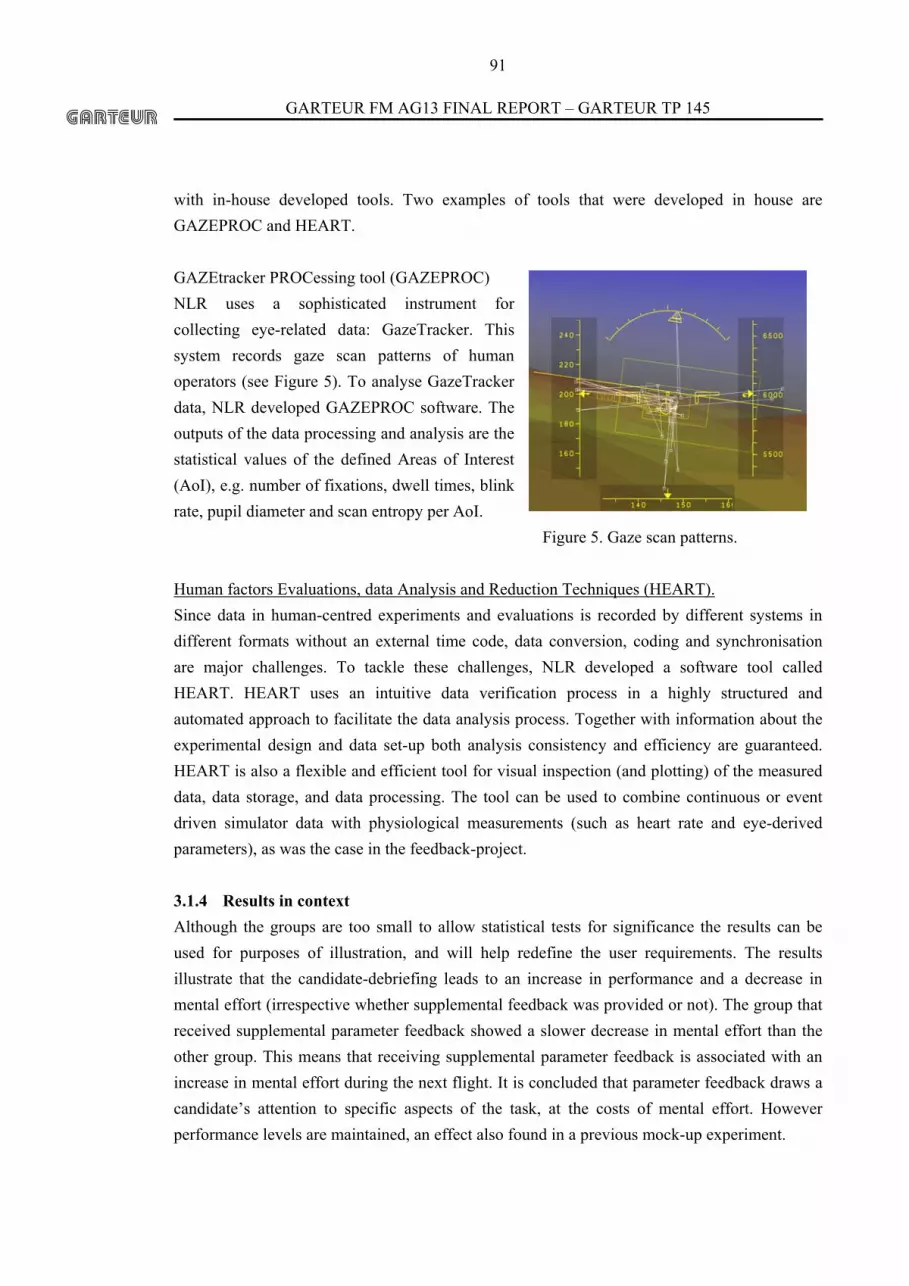
GARTEUR FM AG13 FINAL REPORT – GARTEUR TP 145
91
with in-house developed tools. Two examples of tools that were developed in house are GAZEPROC and HEART. GAZEtracker PROCessing tool (GAZEPROC) NLR uses a sophisticated instrument for collecting eye-related data: GazeTracker. This system records gaze scan patterns of human operators (see Figure 5). To analyse GazeTracker data, NLR developed GAZEPROC software. The outputs of the data processing and analysis are the statistical values of the defined Areas of Interest (AoI), e.g. number of fixations, dwell times, blink rate, pupil diameter and scan entropy per AoI. Figure 5. Gaze scan patterns. Human factors Evaluations, data Analysis and Reduction Techniques (HEART). Since data in human-centred experiments and evaluations is recorded by different systems in different formats without an external time code, data conversion, coding and synchronisation are major challenges. To tackle these challenges, NLR developed a software tool called HEART. HEART uses an intuitive data verification process in a highly structured and automated approach to facilitate the data analysis process. Together with information about the experimental design and data set-up both analysis consistency and efficiency are guaranteed. HEART is also a flexible and efficient tool for visual inspection (and plotting) of the measured data, data storage, and data processing. The tool can be used to combine continuous or event driven simulator data with physiological measurements (such as heart rate and eye-derived parameters), as was the case in the feedback-project. 3.1.4 Results in context Although the groups are too small to allow statistical tests for significance the results can be used for purposes of illustration, and will help redefine the user requirements. The results illustrate that the candidate-debriefing leads to an increase in performance and a decrease in mental effort (irrespective whether supplemental feedback was provided or not). The group that received supplemental parameter feedback showed a slower decrease in mental effort than the other group. This means that receiving supplemental parameter feedback is associated with an increase in mental effort during the next flight. It is concluded that parameter feedback draws a candidate’s attention to specific aspects of the task, at the costs of mental effort. However performance levels are maintained, an effect also found in a previous mock-up experiment.
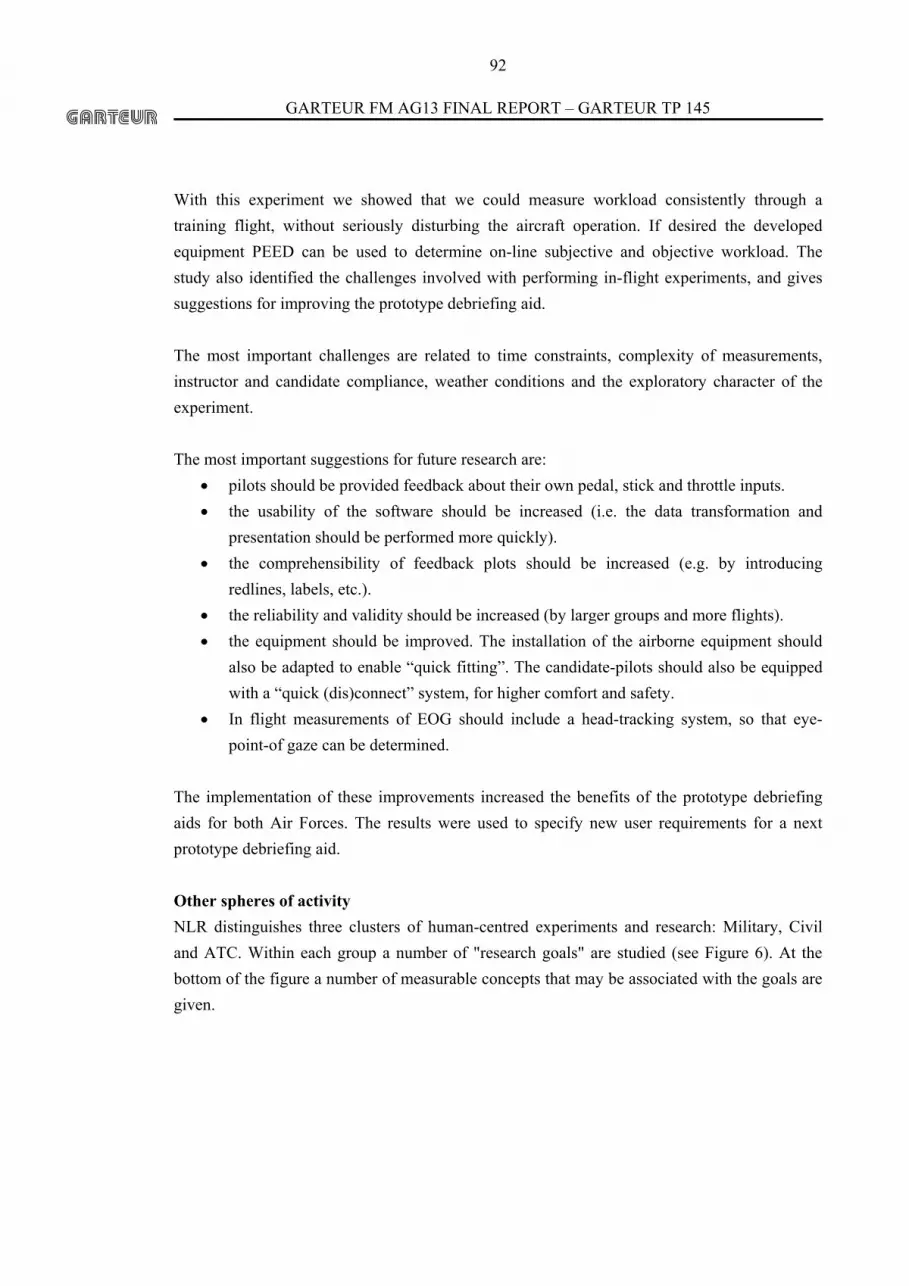
GARTEUR FM AG13 FINAL REPORT – GARTEUR TP 145
92
With this experiment we showed that we could measure workload consistently through a training flight, without seriously disturbing the aircraft operation. If desired the developed equipment PEED can be used to determine on-line subjective and objective workload. The study also identified the challenges involved with performing in-flight experiments, and gives suggestions for improving the prototype debriefing aid. The most important challenges are related to time constraints, complexity of measurements, instructor and candidate compliance, weather conditions and the exploratory character of the experiment. The most important suggestions for future research are:
• pilots should be provided feedback about their own pedal, stick and throttle inputs. • the usability of the software should be increased (i.e. the data transformation and
presentation should be performed more quickly). • the comprehensibility of feedback plots should be increased (e.g. by introducing
redlines, labels, etc.). • the reliability and validity should be increased (by larger groups and more flights). • the equipment should be improved. The installation of the airborne equipment should
also be adapted to enable “quick fitting”. The candidate-pilots should also be equipped with a “quick (dis)connect” system, for higher comfort and safety.
• In flight measurements of EOG should include a head-tracking system, so that eye-point-of gaze can be determined.
The implementation of these improvements increased the benefits of the prototype debriefing aids for both Air Forces. The results were used to specify new user requirements for a next prototype debriefing aid. Other spheres of activity NLR distinguishes three clusters of human-centred experiments and research: Military, Civil and ATC. Within each group a number of "research goals" are studied (see Figure 6). At the bottom of the figure a number of measurable concepts that may be associated with the goals are given.
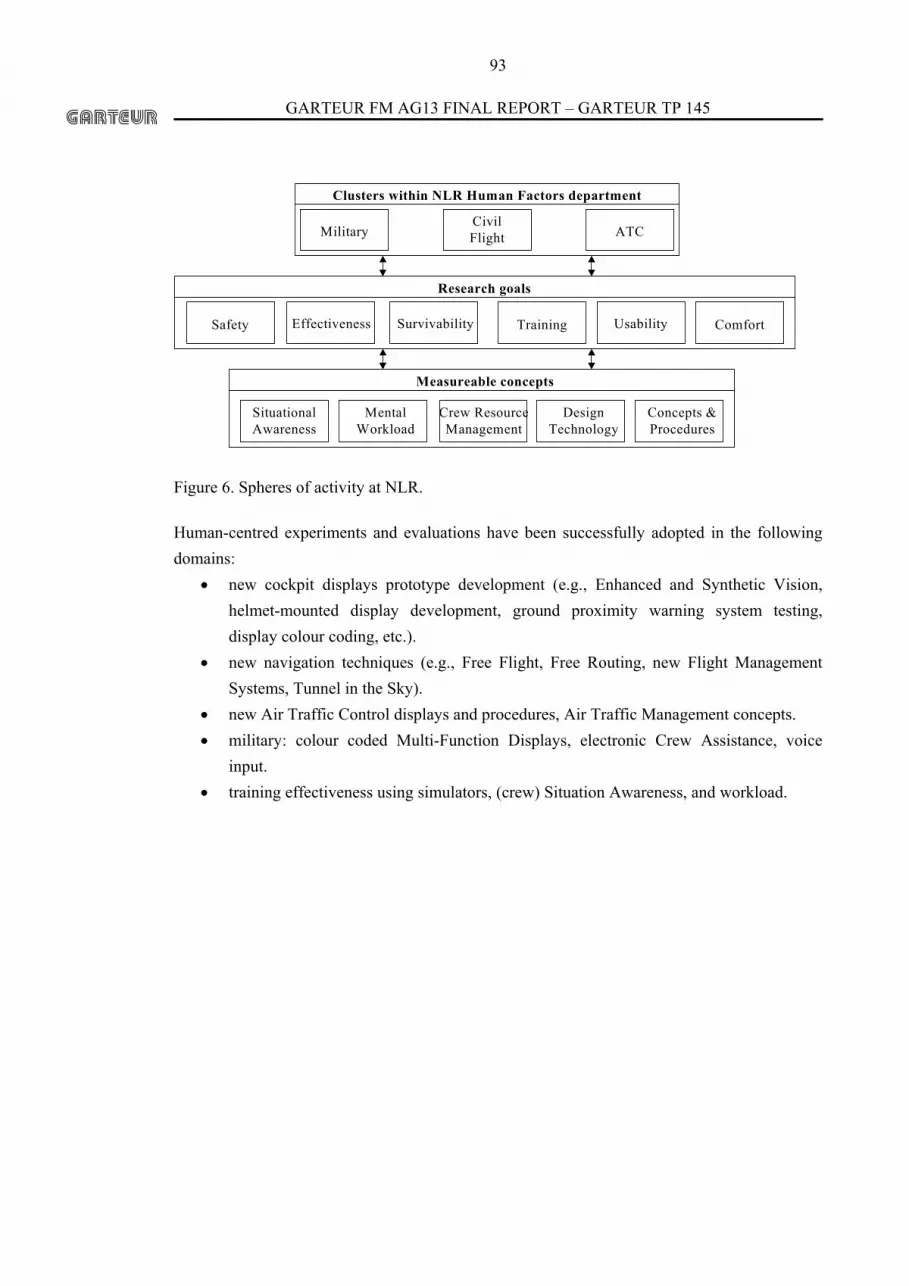
GARTEUR FM AG13 FINAL REPORT – GARTEUR TP 145
93
ATCCivilFlightMilitary
Clusters within NLR Human Factors department
EffectivenessSafety ComfortUsabilitySurvivability
Research goals
Training
DesignTechnology
MentalWorkload
SituationalAwareness
Concepts &Procedures
Measureable concepts
Crew ResourceManagement
Figure 6. Spheres of activity at NLR. Human-centred experiments and evaluations have been successfully adopted in the following domains:
• new cockpit displays prototype development (e.g., Enhanced and Synthetic Vision, helmet-mounted display development, ground proximity warning system testing, display colour coding, etc.).
• new navigation techniques (e.g., Free Flight, Free Routing, new Flight Management Systems, Tunnel in the Sky).
• new Air Traffic Control displays and procedures, Air Traffic Management concepts. • military: colour coded Multi-Function Displays, electronic Crew Assistance, voice
input. • training effectiveness using simulators, (crew) Situation Awareness, and workload.

GARTEUR FM AG13 FINAL REPORT – GARTEUR TP 145
94
3.2 SAAB contribution 3.2.1 Mission During 2001 Saab AB (publ.) performed a study where the main purpose was to find out how much mental workload in a Command and Control room (C2) can be increased before the operators’ situation awareness deteriorate. Increase in mental workload was produced by adding more and more information. The created scenarios simulate situations that are easy for the participants to understand, allowing for them to obtain situation awareness. The experiment mainly focus on situation awareness, human cognition and perception, not on decision-making or decision-making experience, therefore, the only demand on the participants was that they met the gender and age criteria. 3.2.2 Experimental protocol Participants of the study were 16 subjects, eight men and eight women between the ages of 25 and 45. It was endeavoured to keep the age interval short but still cover the ages that are most likely to be represented in a future C2 system. A few days prior to the participation in the experiments each participant received a document containing pictures of the electronic map and the symbols used in the experiments. This was done in order to give the participant some time to get acquainted with the map and the symbols. Prior to each experiment the participant received an instruction-document, which describes the proceedings of the current experiment. Written instructions were used in order to eliminate possible research assistant effects that may occur with spoken instructions given by the research assistant. As the participant arrived at the experimental area he or she was given an introduction to the workspace and the previously received document was reviewed together with the research assistant. The research assistant then showed a scenario on the C2 table and explained what was going on during that scenario. After that the participant got to perform a training-session by observing a scenario and explaining to the research assistant what is going on. The training-session also included training in rating the subjective SA according to the Cooper-Harper model. In trying to minimize the effects of learning, a counterbalance of the order, in which the scenarios are performed, was done.
GARTEUR FM AG13 FINAL REPORT – GARTEUR TP 145
95
3.2.3 Methods and analysis In this study measure of performance was used according to Endsley’s situation awareness measurement technique SAGAT. Furthermore subjective measure in the form of modified Cooper-Harper Scales was used. To find out the results of the study, statistical analyses of the values were performed. A one-way repeated measures analysis of variance (ANOVA) was performed with the total achieved score for each scenario as dependent variables, that is performance during the five different scenarios. Post hoc analysis using a Tukey HSD showed a significant difference between performances in scenarios one and five, and also a significant difference between performance in scenarios two and five. This means that the participants performed significantly better in scenarios one and two than in scenario five. The total achieved score for each scenario was calculated as a percentage value, which in turn was converted to a value from zero to ten in order to be able to be compared with the mean value of the estimated performance. The estimated performance is the result of the subjective ratings according to the Cooper-Harper model. Since both men and women participated in this study it might be of interest to compare the performance of the two groups. Therefore an analysis of variance (ANOVA) was performed with the total achieved score for each scenario as dependent variables and gender as the factor. No significant difference was obtained between the performance of men and women. 3.2.4 Results in context Endsley (1995a, 1995b) asserts that people are likely to overestimate their SA and therefore a subjective measurement technique alone is not reliable. However, in this study, the participants have rated their SA according to the Cooper-Harper method surprisingly well. The results follow each other amazingly well and the participants have not overestimated their performance but rather underestimated their performance a bit. In spite of this finding it is still recommended that a subjective measurement technique is used as a compliment to some other method, such as SAGAT and verbal protocols. Researchers have to live with the fact that both SA and bits of memory are tested to some extent when situation awareness is being investigated. In this case, we cannot be sure of whether participants figured out when the scenario would stop and just memorized the last scene, but it seems to be a quite impossible thing to do with such heavy mental workload.

GARTEUR FM AG13 FINAL REPORT – GARTEUR TP 145
96
By choosing SAGAT as the method for collecting data we have to be aware of the fact that stopping the scenarios might affect the achieved SA in a positive or negative direction. The blanking of the scenarios might change the participant’s SA and therefore have affected the obtained results. The Cooper-Harper scale was another method used in trying to figure out the participants’ achieved SA. It was used as a compliment to SAGAT since it provides a subjective rating of the achieved SA. This could make a comparison between the actual performance and the experienced performance. There is a notable difference in the SA achieved during the different scenarios. A gradual deterioration from scenario one until scenario four could be seen, with an even more striking deterioration between scenario four and five. This reflects the quite obvious phenomenon, the more symbols that are presented on the C2 table, that is, the higher mental workload, the less SA. The results from the study were presented at a meeting with the customer and distribution of the project report.

GARTEUR FM AG13 FINAL REPORT – GARTEUR TP 145
97
3.3 AeI contribution 3.3.1 Mission In a project studying anti-submarine warfare performed by AeI, extensive evaluations concerning a large mission system using many workstations related to the use of diverse sensors and the tactical employment of a maritime patrol aircraft was performed. This description is considering only one of many airborne sensors (sonobuoys) and one phase of the use of that sensor. Acoustics operation and sonobuoy usage varies with different phase of target acquisition, tracking, and attack. First of all a large area buoy pattern is used to conduct a search of an assigned search area, then after submarine detection the use of additional buoys allows refinement of the location of a submarine, and aids the identification and classification of the target. If the target is one of interest then tracking of the target is commenced through the deployment of tracking buoy patterns. When transiting from tracking to attack the accuracy of sonobuoy based tracking is improved using more buoys to allow an attack to be made within the acquisition range/effective range of the weapon to be employed. Finally, further sonobuoys are used for attack assessment and further attacks, if required. The aim of the study was to determine how well new acoustic processing equipment would aid the transition from on phase of acoustics sensor operations to another. Real aircraft equipment was used. Workstation design and orientation one to the other was positioned as in the aircraft. However, all equipments were separately stimulated and located in a designed to purpose software integration laboratory. 3.3.2 Experimental protocol The participating aircrew were briefed on the nature of the assessment, the limitations of the assessment, and any assumptions made on the use of the aircraft equipments or aircraft tactical manoeuvre. The protocol then used was to brief the participating operational aircrew in the manner of briefing a real operational mission. This brief included intelligence on expected targets, oceanography, meteorology, mission restrictions, stores and weapons carried, time check, etc. Aircrew were also briefed on the assessment to be made and the applicable methods to be used in that assessment.

GARTEUR FM AG13 FINAL REPORT – GARTEUR TP 145
98
3.3.3 Methods and analysis All above choices based on the objective(s) of the assessment, the number of people actually involved in the assessment; the roles, skills and expertise of the aircrew; the state of the equipment to be used; the level of stimulation or simulation to be used, and so forth. Generally use as many methods as possible ensuring that associated data is collected and tagged as appropriate. Detail a test plan indication the purpose of the assessment, the scenario, the brief to the participants, the phases of acoustic tracking to be assessed, the number of participants. Methods selected included application pre evaluation, concurrent to the evaluation, and retrospective to the evaluation. Retrospective included method application adjacent to the end of the evaluation and also at a set time post the evaluation. Also some methods were applied solely to assessment of the work of the individual and some to the assessment of the work of the mission team. Methods used were both objective and subjective in nature varying from a system engineered data logger to protocol collection and analysis. Combination was by triangulation principles using explicit sets of assumptions and rules. The analysis method and form of the analysis report was pre determined in the evaluation/assessment plan. Because of the ‘real’ nature of the work being evaluated it was impossible to fully determine and control confounding variables. The premise was that the data would drive the findings not that it would confirm or not a priori hypothesis. 3.3.4 Results in context The maturity of the equipment, its software, and the equipment stimulators was always addressed in that it placed a constraint on what could or could not be assessed. The system was evaluated with the assistance of operational aircrew of many trades. Some were new to the equipments and none had flown with the actual equipment as the first aircraft full simulation, ground tests, and flight was well into the future. Aircrew Subject Matter Experts (SMEs) we fully involved in scenario compilation (not a determinist form of script) as the basis for their work that is largely external event driven. This continued with completion of many methods of system and individual assessment including rating scales and questionnaires, debriefs, construction of concept maps on tactics, team working, equipment integration etc. Team debriefs were conducted at a later time post individual debriefs.

GARTEUR FM AG13 FINAL REPORT – GARTEUR TP 145
99
Reports were made to defined formats and rules agreed with the design and development team’s management and senior engineers. Senior management had a presentation on the report contents of each experiment/evaluation and had veto rights on the contents prior to its issue to other parties including the participating aircrew. The aircrew always made explicit their opinions on the report contents – both good and bad. The evaluations thus served six main purposes, namely:
• Stress testing of each software drop into the hardware • Usability testing of the workstations • The formulation of crew/team procedures and refinement of their work roles • Early practice and familiarisation of the aircrew with new systems • Early notice to the manufacturer of areas of risk graduated to consider what
must/should/might be fixed. • Provide visibility of development progress to the main customer of the system

GARTEUR FM AG13 FINAL REPORT – GARTEUR TP 145
100
3.4 FOI contribution 3.4.1 Mission In 1997 a co-operation started between Saab AB and FOI (at that time FOA) studying the effects of motion during turbulent landings of high performance military aircraft. The series of studies also included modelling and psychometric aspects. One central objective of the studies was to analyse whether a moving base simulator could produce more realistic and useful cues (i.e., give the pilot better sensory feedback) than a fixed base simulator in simulations of turbulent approach/landings of high performance aircraft. 3.4.2 Experimental protocol Six experienced test pilots performed in all about 150 simulated landings under five different levels of turbulence, and a repeated measurement design was used. Directly after each landing the pilots rated six different aspects: 'risk of crash during approach/landing', 'difficulty in manoeuvring the aircraft', 'pilot mental workload', 'pilot performance', 'aircraft handling qualities', and 'pilot induced oscillations'. The results are based on these rated variables, the independent variable 'turbulence', and the pilots' 'stick activity'. The studies were performed at NLR by Saab AB in co-operation with FOI. 3.4.3 Methods and analysis In the flight task analysed in the first study, we found that the pilot's 'stick inputs' were increased, when the motion system was engaged. We also found that the 'difficulty' level was higher and the 'performance' level lower under the same condition. Hence, in simulations without motion, important problems of the pilot - aircraft interaction in real flight will be underestimated, or one runs the risk of overestimating the 'handling qualities' of the real aircraft. The pilot's acquisition of skill (i.e., his learning process) is based on his performance feedback. However, lack of relevant cues diminishes the pilot's possibilities to estimate his performance (i.e., to get performance feedback), and a positive transfer of training from simulations to real landings is less likely. When comparing the correlation matrices (i.e., the relations between the measured variables) we found a close correspondence between the 'motion' conditions of the two studies. The relations between 'performance' and the other variables were almost identical under the 'motion' conditions of the two studies. These relations are important, as the pilots’ acquisition of skill is

GARTEUR FM AG13 FINAL REPORT – GARTEUR TP 145
101
based on their performance feedback. Accordingly, the results of the second study validated the importance of motion in these types of simulations. The inter-individual differences in 'stick activity' in study one were also verified in the second study. Furthermore, there were differences in the pilots’ increase in gain as a function of 'turbulence'. The pilots used the stick in different manners, like different people having different handwriting. These differences are, of course, of central importance in control systems development. The systems must tackle the inter-individual differences. Could these inter-individual differences in control behaviour be reduced by means of specific training, or are they manifest traits? In this study we found that the pilots' gain changed over time. Accordingly, the pilots' control behaviour has state characteristics and training might influence it. Contrary to the pilots' control behaviour there were no differences between the pilots with respect to 'aircraft movements at touch down'. Accordingly, good landing performance may be achieved with different 'control behaviour'. On the other hand, perceived 'risk', 'induced oscillations', and 'mental workload' increased, and 'performance' (both subjective and objective), and 'aircraft handling qualities' decreased as a function of 'stick activity' or gain when the 'turbulence' was held constant. Thus, there were genuine relations between gain and the other measures. Our conclusions from the decreases in 'stick activity' and increases in 'performance' as a function of the 'landing sequence' are that these changes reflect learning processes and that the pilots change their techniques to cope with the landings. These changes are interesting, as the pilots are experienced and their learning curves should have levelled out. Our conclusion is that the curves may reflect learning processes related to specific characteristics of the simulation. It should be noted that the curves reflect an accelerating learning process. 3.4.4 Results in context From causal model analyses, increases in 'turbulence' are followed by increases in 'workload', and increases in 'workload' are, in their turn, followed by decreases in 'efficiency'. Thus, 'workload' mediates the effects of 'turbulence' on 'efficiency'. We found that low 'workload' predicts high 'efficiency', but also that high 'workload', not by necessity, predicts low 'efficiency'. The variance in 'efficiency' increases as a function of 'workload'. The increased variance shows that the precision in the predictions of the pilots’ performance decreases when 'workload' increases. However, high 'efficiency' or performance in combination with high 'workload' (i.e., high mental effort) is more liable or sensitive to disturbances than high performance in combination with low 'workload'. The mental reserve capacity is reduced in the
GARTEUR FM AG13 FINAL REPORT – GARTEUR TP 145
102
former case. Thus, the relation between 'workload' and 'efficiency' discloses how robust the pilot's landing performance is. From psychometric and statistical points of view the factors 'workload' and 'efficiency' are powerful. This means that they can be used as practicable measures in systems evaluation and development. They can be used in, e.g., comparisons of different editions of flight control systems. That the researchers, to a substantial degree, could estimate or predict the pilots ratings of ‘aircraft handling qualities’ and ‘pilot induced oscillations’ is an important finding. The estimates are of practical interest because they can be used as guides by systems developer as measures in the evaluation and development of electrical flight control systems (EFCS) of modern aircraft. Theoretically, it is of general interest to know the factors underlying pilot ratings.
GARTEUR FM AG13 FINAL REPORT – GARTEUR TP 145
103
3.5 ONERA contribution 3.5.1 Mission Workload measurement is an issue frequently raised when studying new concepts of technologies interacting with a human operator. It is also a critical factor affecting the performance of subjects, which may be addressed as a fundamental research issue by itself. One can mention two example studies in which ONERA has been involved, in order to illustrate the use of workload measurement: - As an evaluation criterion of the possible impact of new technologies, workload has been
evaluated during a international simulation trial concerning some candidate technologies to improve air combat efficiency (aircraft, avionics, armament). Subjective evaluation were collected from the subjects (fighter pilots) using a rating scale and related to performance measures. The analysis of the results provided interesting findings, which were usually confirmed by post interviews of the subjects and which would have been hardly suspected without the use of the subjective ratings.
- Fundamental research experiments are also conducted to investigate the possible relationships between several factors (among which the task load and external perturbations), the actual performance and the subjective assessments made by the subject. These experiments make use of a laboratory simulation environment: the missions typically consist of the control of a dynamic process (such as water flooding a system of tanks and controlled by several valves, or a simplified aircraft simulation with a navigation plan and several refuelling points). The results are analysed with a powerful methodology, in order to help identify the possible relationships between the numerous experimental variables of different natures.
3.5.2 Experimental protocol The experimental protocol includes the way of receiving, briefing and training the subjects of the experiment. The principles described below are applied during human-in-the-loop simulation trials, the objective of which is to practically assess the use of new concepts or technologies introduced in the cockpit. Receiving The simulation trial is usually conducted with subjects volunteered by their own organisation (e.g. air forces); a common request is addressed to the organisations, describing the level and type of experience of the subjects expected, together with the scope of the study and the date and location of the trial.

GARTEUR FM AG13 FINAL REPORT – GARTEUR TP 145
104
A “pilot guide” is then sent to the designated subjects. This document precisely describes the controls, displays and other available systems which will be used during the trial, so that the subjects have time to get knowledge of the simulation environment before the trial begins. As far as feasible, all the subjects are received at the same time; they all follow the same briefing and training procedure, in order to avoid possible differences among subjects at this preliminary level. Briefing A detailed briefing is given to the subjects at the beginning of the trial. A preliminary questionnaire is filled by the subjects, concerning their personal experience (instruction, flight hours, qualification, current aircraft and mission) and their motivation and expectations for the trial. This briefing then addresses the following points:
• scope of the study. • what is to be evaluated (e.g. the effect of a new system on workload). • what are the mission objective, rules and performance criteria. • which factors may be changed from one run to another (e.g. system available, flight
plan, failures, meteorological conditions,…). • what will be recorded and what will be used for post analysis. • the questionnaires and briefings as planned for the trial.
Regarding workload issues, a special explanation of the concept of workload (e.g., the effort required to perform the task within the given objectives) and of the evaluation methodology (e.g., ISA or MCH) is needed. Training The time required for training depends on the novelty of the task and on the subjects’ experience. A typical schedule for a one week trial is two days for training and three days for the production runs, plus briefings and debriefings. The training is usually made using especially prepared scenarios, getting more and more complex as the subjects develop their proficiency. Special training is also required for the use of the questionnaires and workload measures to be used during the trial, in order to help the subject calibrate their assessment of workload on various well known cases. The training is considered to be sufficient once the subjects declare they feel comfortable with the task and once their performance is stabilised.
GARTEUR FM AG13 FINAL REPORT – GARTEUR TP 145
105
3.5.3 Methods and analysis The methods currently used consist of subjective evaluations, whether in real-time (ISA) and/or after the task has been performed (5 levels rating or MCH scale). Performance measures (time, number of successes, precision,…) are also collected. If feasible, debriefings with the subjects are organised: they may provide interesting insights on the influencing factors, together with a feedback on the perception of the experiment by the subject (understanding of the objectives, level of confidence in the subjective evaluations, motivation and effort involved in the experiment,..). The analysis of the results should as far as possible make use of all the data collected, which may be of very different natures. A methodology such as the Generalised Formal Concept Analysis (see the example application reported below) may be applied in order to help discover the possible relationships between all the experimental variables. 3.5.4 Results in context
Within a study of the relationships between noise and annoyance (Boyer & Chaudron, 2000), an experiment was conducted during the Paris Air Show’ 2001 which consisted in assessing the cognitive performance in a set of cognitive tasks for which a comfort parameter was introduced in the environment (with or without the aircraft’s noise).
Given the crucial role of the operator’s reasoning in man-machine interactions and the supposed variability of the cognitive performance associated with noisy conditions, the chosen task T consisted of deductive reasoning for the evaluation of a set of logical questions.
The measures of the actual performances A were: - the logical performance, i.e. the discrepancies between the subjects’ answers and the reasoning logic model based upon the theory of formal rules of inferences and, - the answer’s time in seconds.
A questionnaire was distributed to each person in order to express his/her feeling F of the conditions of the task (annoyance or no-annoyance) and also his/her self-evaluation S of the performance. 54 voluntary persons - visitors or professionals of the Paris Air Show - participated to the experiment. Each subject had to answer the whole set of questions, with and without external noise. For all subjects, the vector (T,A,F,S) were recorded in a logical database as:
subject(name,<task,actual-performance,feeling,self-evaluation>),
The results were analysed through the qualitative analysis model - called “Generalised Formal Analysis”, which allows qualitative clustering and rules induction capabilities. The global

GARTEUR FM AG13 FINAL REPORT – GARTEUR TP 145
106
database of the 54 subjects with their characteristics can be analysed and the clusters: (groups of subjects, common (T,A,F,R) features) can be computed so as to form the global lattice structure shown below :
Figure 7. Galois Lattice of the Bourget’2001 experiment.
The Generalised Formal Analysis allows the induction of symbolic rules which can be gradated according to their degree of plausibility, i.e. the support which is the ratio of interest of the rule among the data-base and, the confidence, i.e. the ratio of validity.
The main characteristics of the results can be summarised as follows: dF(+)→dT(+),conf=1,supp=0.98; dS(time,–)→dT(+),conf=1,supp=0.54; dA(time,+)→dT(+),conf=1,supp=0.56; dS(time,–)→dF(+),conf=1,supp=0.54; dA(time,+)→dF(+),conf=1,supp=0.56;
,conf=0.93,supp=0.52; ,conf=0.97,supp=0.52.
The last result is interesting as it shows that a significant (52%) proportion of the subjects did improve their performance in the noisy environment while they thought they degraded them.
The formal analysis of the data revealed significant differences between the following dimensions: - the Task T, - the actual Activity of the operator A, - his/her Feelings F of the conditions of the task, - his/her Self evaluation of the performance S.
From a formal point of view, the functional relation between the partially ordered task space T and the objective/subjective performance P is not monotonic. The results reveal a conjecture in

GARTEUR FM AG13 FINAL REPORT – GARTEUR TP 145
107
which a “greater” cognitive task may lead to an “easier” performance, what we call the Eucalepic effect.
The conclusion from this experiment is that GFA may be used for the evaluation of pilot-system interaction. Preferentially devoted to the applications in which the operator’s variability is high, the method allows a formal analysis of the vectors (T,A,F,S). Thus, it is possible to assess in a qualitative and comparative manner the subjective and objective effects on the cognitive performance of the operator.
GARTEUR FM AG13 FINAL REPORT – GARTEUR TP 145
108
4 Mission examples
4.1 Introduction
The aim of this chapter is to provide typical examples of missions, specified at the required level of detail for the assessment of workload and the acquisition of psychophysiological, performance and subjective data that represent variations in workload within the mission. Missions from three different domains will be provided, as follows:
• military fixed wing • civil fixed wing • military rotor wing
Typical differences between military and civilian missions will also be discussed.
4.2 Military fixed wing mission
This air to ground mission is set during a UN Peace Enforcement scenario. The target of the mission is a mobile communications mast or command post. The target has some limited air defence from nearby anti-aircraft units. Visual acknowledgement of the target ID is deemed necessary and therefore the pilot has to fly in close to the target. 1. The pilot begins the mission in the air at a safe distance (X minutes) from the target. 2. The pilot navigates towards the target via several (3-5) way-points, flying at low
altitude and high speed. 3. En-route to the target the pilot receives a radar lock-on warning from a previously
unknown enemy anti-air system. 4. At a certain distance from the target, the pilot performs a pop-up manoeuvre and brings
the aircraft to a higher altitude and inverts the aircraft in order to get a better view of the target.
5. The pilot then flies the aircraft towards the target and releases the weapon(s). 6. After the attack is completed, the pilot disengages from the scene and resumes the low-
altitude, high-speed flight back towards the base.

GARTEUR FM AG13 FINAL REPORT – GARTEUR TP 145
109
The following variations to modify the workload may be included in the scenario:
7. Several waves may be incorporated, for example, as follows: a) initially a reconnaissance flight is completed b) followed by the subject’s attack wave c) and thereafter an aircraft flies over the target to evaluate the results The above waves force the pilot to communicate with the reconnaissance asset and to transmit information to accompanying aircraft.
8. Additional workload may be induced by requiring communication with ground units illuminating the target with laser guidance systems.
9. Re-planning during the flight may be forced upon the pilot by moving the target during the en-route flight or based on information from the reconnaissance flight, for example, detection of the presence of new anti-aircraft units.
4.3 Civil fixed wing mission
This mission consists of a Fokker 100 return flight between Amsterdam (AMS) to London (LHR).
Amsterdam (AMS) – London (LHR)
1. Plan flight (including an alternative route), weather good at AMS, poor at LHR.
Perform checklist. ATC gives clearance via EH029 and ready for take off. Heavy aircraft, max T/O weight.
2. Line up RWY 19L. Aircraft already lined up. No need to taxi.
3. Take-off. 4. Departure from AMS (ASIR page 27) 19L/RNAV.
More ATC clearance included. 5. Just before reaching EH029: LNAV becomes disconnected without obvious warning.
This brings the aircraft to Basic Mode only; heading select and vertical speed, leading the aircraft to continue straight forward with current vertical speed. The pilots need to re-engage LNAV, involving re-programming, and to re-capture the chosen flight path. Record how quickly the pilots resolve the problem. Failure expected to be corrected within 30 miles from PAM (Pampus).
6. Expedite climb, rate of climb 3000 ft/min. ATC gives order to expedite climb.

GARTEUR FM AG13 FINAL REPORT – GARTEUR TP 145
110
7. With fully loaded aircraft, this rapid rate of climb will cause problems because the aircraft speed will be too low. Communications with ATC are required to solve the problem.
8. ATIS LHR: Fog at London and alternate. ”RWY in use: 27R”. Weather will demand a CAT II approach.
9. “Descend FL150 to be level at SABER.” or in chart: “Be at FL150 at SABER”. Purpose is to make pilots’ under-shoot FL clearance.
10. Radar vector ILS RWY 27 R (KLM maps for London). 11. “Descend to 2500 ft”. Glide is armed. 12. Glide slope armed but doesn’t capture.
Flight passes through glide slope and stays at 2500 ft. 13. Either the pilots miss the glide slope and have to do a go-around. Alternatively, the
pilots react quickly and start the approach; however, in this case the ATC orders a go-around due to traffic on RWY. The go-around will be at 2500 ft ordered/performed just before D4 IRR (distance 4 NM on ILS DME), which is an unusually high altitude for a simulator go-around. Crew should perform a normal Go-around even at this altitude and also follow lateral track.
14. Weather improves and flight is finished with a CAT 1 ILS-approach at London.
London (LHR) – Amsterdam (AMS)
1. Plan flight (including an alternative route), weather still quite poor at LHR but not as much fog as earlier in the day. Perform checklist. ATC gives clearance and ready for take off. Light aircraft, only half-full with passengers.
2. Line up RWY 27R or 27L. Aircraft already lined up. No need to taxi. Clearance to AMS via Detling 2F
3. Take-off. 4. Departure from LHR. 5. Low level level-off at 2000 ft “climb initially to 2000 ft”, low speed and idle thrust
scenario. 6. Change to London CTR at 2000 ft. 7. Give clearances to FL 80, 100, 120, 140 and finally to cruising FL.
These clearances are given before the aircraft reaches the previous level. 8. Leave the crew alone and expect them to change to VNAV-mode after clearance to
cruise FL, and aircraft should descent to 6000 ft if the crew hasn’t deleted the altitude constraint at D5 DET.

GARTEUR FM AG13 FINAL REPORT – GARTEUR TP 145
111
Record when the pilots notice this, and how they deal with the situation; also record time taken to complete the action.
9. ATIS AMS: wind 190/08, RWY in use 01R. Cloud base 300 ft Poor visibility. 10. Fly via Logan, Gabad. Nothing eventful happens. 11. REDFA STAR for approach RWY 01R – wind 190/8. 12. At distance 15 miles from SPL at FL 70 re-clear for approach 19R with radar vectors to
speed up things – wind 200/15. Late RWY-change: record the time taken for the pilots’ to re-program the FMS, as this may be time consuming. Alternatively, the pilots may omit re-programming the FMS and follow radar vectors to the ILS.
13. On approach RWY 19R - glide slope failure occurs at 500 ft with 300 ft cloud base 14. Go-around with radar vectors to localizer approach 19R. 15. Landing RWY 19R.
4.4 Military rotor wing mission
This mission profile is generic and covers missions performed by attack, antitank, transport (special operations), search and rescue, and antisubmarine warfare helicopters. In the document ADS 33 (Aeronautical Design Standard Performance Specification Handling Qualities Requirements for Military Rotorcraft) acceptable and desirable performance on more than 20 mission task elements (handling qualities tasks) is described. In this generic helicopter profile a number of these ADS manoeuvres can be naturally inserted and be used as performance measures.
The mission consists of the following phases: 1. The pilot receives orders and plans the mission in a base well away from the task zone.
After planning the pilot performs take-off procedures and at this point automation or take-off errors can occur. The task to be performed in the task zone is dependent upon type of helicopter but a number of ADS 33 manoeuvres to be performed in a specified order fit many different helicopter missions.
2. The pilot then performs a 20 min regroup towards the forward refueling point. The flight starts in WFR condition. During the flight the pilot receives the order to land at the forward refueling point 3-5 minutes later than planned and has to perform a minor replanning in-flight. This order can be received at the same time as the pilot enters
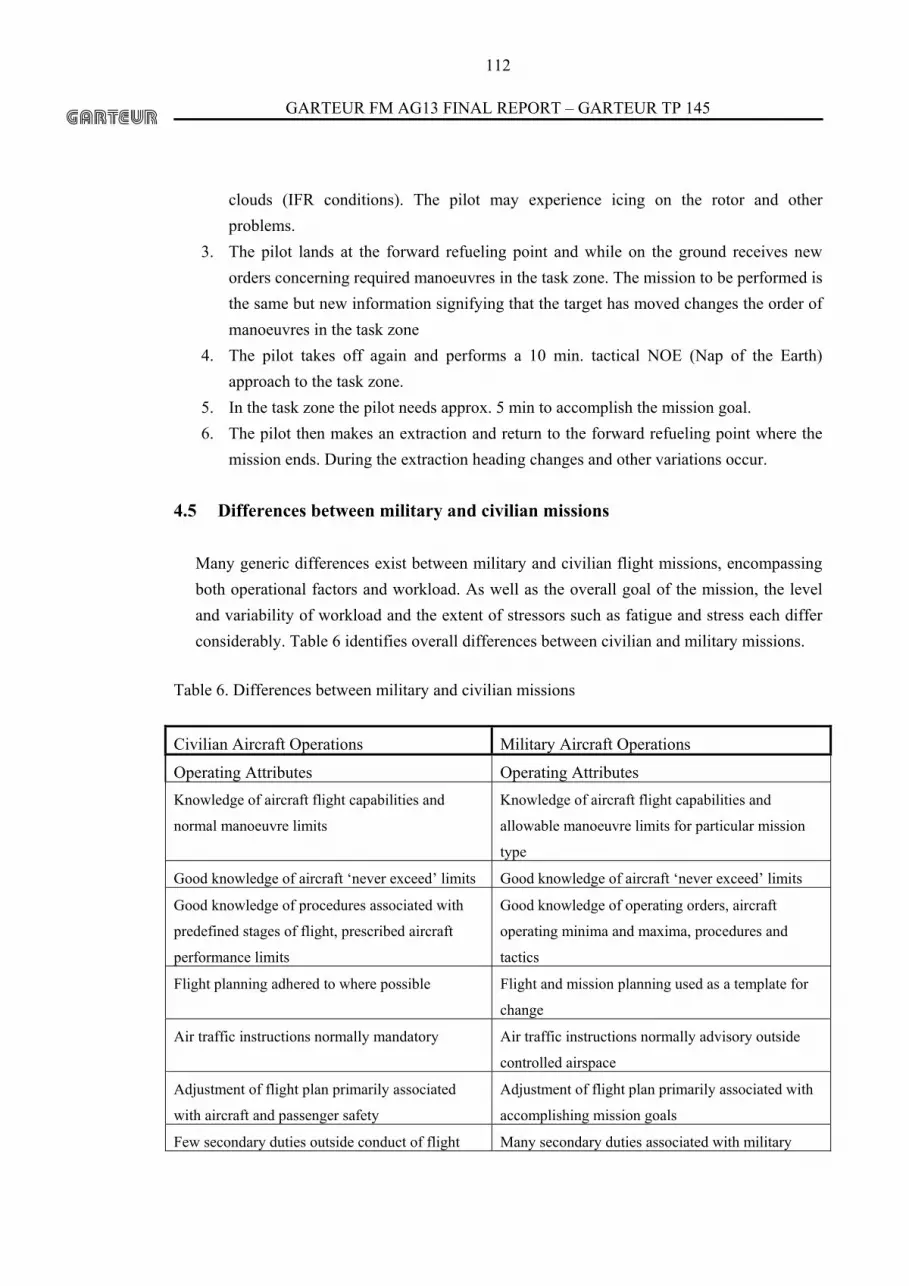
GARTEUR FM AG13 FINAL REPORT – GARTEUR TP 145
112
clouds (IFR conditions). The pilot may experience icing on the rotor and other problems.
3. The pilot lands at the forward refueling point and while on the ground receives new orders concerning required manoeuvres in the task zone. The mission to be performed is the same but new information signifying that the target has moved changes the order of manoeuvres in the task zone
4. The pilot takes off again and performs a 10 min. tactical NOE (Nap of the Earth) approach to the task zone.
5. In the task zone the pilot needs approx. 5 min to accomplish the mission goal. 6. The pilot then makes an extraction and return to the forward refueling point where the
mission ends. During the extraction heading changes and other variations occur. 4.5 Differences between military and civilian missions
Many generic differences exist between military and civilian flight missions, encompassing both operational factors and workload. As well as the overall goal of the mission, the level and variability of workload and the extent of stressors such as fatigue and stress each differ considerably. Table 6 identifies overall differences between civilian and military missions.
Table 6. Differences between military and civilian missions
Civilian Aircraft Operations Military Aircraft Operations
Operating Attributes Operating Attributes Knowledge of aircraft flight capabilities and
normal manoeuvre limits
Knowledge of aircraft flight capabilities and
allowable manoeuvre limits for particular mission
type
Good knowledge of aircraft ‘never exceed’ limits Good knowledge of aircraft ‘never exceed’ limits
Good knowledge of procedures associated with
predefined stages of flight, prescribed aircraft
performance limits
Good knowledge of operating orders, aircraft
operating minima and maxima, procedures and
tactics
Flight planning adhered to where possible Flight and mission planning used as a template for
change
Air traffic instructions normally mandatory Air traffic instructions normally advisory outside
controlled airspace
Adjustment of flight plan primarily associated
with aircraft and passenger safety
Adjustment of flight plan primarily associated with
accomplishing mission goals
Few secondary duties outside conduct of flight Many secondary duties associated with military

GARTEUR FM AG13 FINAL REPORT – GARTEUR TP 145
113
and mandatory training effectiveness. Training both mandatory and
advisory.
Work largely procedural and mainly governed by
checklists
Work largely tactical and governed by appreciation
of external events. Checklists used for non event
driven flight phase activities such as departure,
descent, and landing.
Generally good advance notice of work
requirements and timing
Advance notice on work requirements dependent on
mission and role
Mandatory rules on allowable hours of work and
intermediate rest periods
Advisory rules on hours of work and intermediate
rest periods
Airline works mainly on criteria of profit Military works mainly on criteria of success
Flight safety always a primary consideration Flight safety usually a primary consideration unless
superseded by dictates of the military mission
High respect of others property Occasional disrespect for others property
Workload Properties Workload Properties Usually predictable Frequently unpredictable
Unwanted workload element, for example,
frequent low levels of workload for extended
periods, resulting in boredom and lack of attention
Unwanted workload element, that is, frequent high
or variable levels of workload for both short and
extended periods, resulting in fatigue and stress
Influences of ‘Peer’ and regulatory pressure on
performance and workload
Influences of ‘Peer’ and regulatory pressure on
performance and workload frequently
combined/exacerbated with various degrees of
trepidation or fear
Consistent levels of workload for each flight
phase
Flight phase levels of workload vary with mission
and the influence of external events
Workload well within trained/skill capabilities of
crew within acceptable flight environments for
passenger carriage. Workload usually ameliorated
by Air Traffic assistance throughout the flight.
Capabilities to handle workload not only associated
with skill but also with experience of work in
unpredictable and diverse hostile environments.
Workload often only assisted by Air Traffic Control
during aircraft departure and arrival.
Workload high in emergencies but partly
mediated by use of checklists in the form of flight
reference cards
Workload high in emergencies but may be partly
mediated in certain emergencies by use of checklists
in the form of flight reference cards
Automation in the cockpit primarily to save costs
under the ‘umbrella’ of arguments on improved
reliability and safety. Can decrease ‘Situational
Automation introduced to increase mission
effectiveness and, in some cases, to equate
decreasing levels of retention and skill. Can change

GARTEUR FM AG13 FINAL REPORT – GARTEUR TP 145
114
Awareness’ and ability to respond to unforeseen
circumstances.
the nature of work and promote ‘work arounds’ the
automation in certain circumstances
Required communications prescribed by
internationally agreed language and message
protocols. Communications contribution to
workload generally low outside most airfield
approaches and departures
Communications use several protocols depending
whether the medium is tactical or strategic radio,
intercom, data link, with same or dissimilar roles of
another party, or co-operating with international
‘others’ or with own forces. Communications
contribution to workload can be high (for example,
of the order of 20%) depending on type of mission,
mission complexity, and size/ composition of
mission crew or number of units participating in a
mission.
Major replanning during the flight is unusual i.e. a
deliberately delivering of a payload to a different
destination other than planned. This is in addition
to uncontrollable influences such as weather and
technical problems
Replanning in the air is common and may be
complex. Old adage that 5 minutes planning on the
ground can take 10 minutes to perform in the air.
Little activity related to presence and identity of
other aircraft that may impinge on the safety of
flight
Activity related to concern that objects leaving
aircraft are released during the correct flight
configuration for their release, and at the right place
and time. Also that their purpose is fulfilled – this
may include the destruction or injury of another
party. Activity based on concern regarding the
amount of hostility that aircraft presence and
identity may evoke from another party.
Any adverse airline culture effects on
performance partly ameliorated by international
regulations.
Strong emphasis of organisational cultural on the
performance of work. The influence of this on
workload depends on whether peace, crisis, or war
prevails.

GARTEUR FM AG13 FINAL REPORT – GARTEUR TP 145
115
5 Aggregation of results
A problem which has to be addressed after the completion of an experimental program making use of several mental workload measures is the aggregation of the numerous results collected. Experiments generally make use of different scenarios (simulation factors) and of different kinds of measures (subjective, quantitative and performance). Although a lot of time and effort can be spared by a thoughtful preliminary determination of the methodology to be used to analyse the data, a common solution is to collect a large amount of data during the experiment and then to make use of different methodologies to proceed to their analysis and hopefully obtain the results expected. Several techniques are available today to proceed to the post analysis of results, ranging from traditional numerical statistics (principal components analysis, ANOVA) to new methods better adapted to the analysis of data of different natures, often based on fuzzy logic or artificial neural networks. A common solution to cope with subjective data is to directly translate the subjective assessment into numerical values, using rating scales or decision trees. Although there is no doubt about the value of the raw subjective assessments made by the subject, their interpretation as numerical values is somewhat abusive, as their precision is limited and their meaning is not linear.
Moreover, the aggregation of subjective ratings ignoring the differences between the subjects is questionable and should require special attention. At least, the variability among subjects is an interesting source of information which may reveal possible operational difficulties and strategies of use. So the analysis methodology should be able to address the individual differences. 5.1 Standardization of psychophysiological data People are different. Some individuals react more than others when presented the same stimuli. The difference itself can be interesting; it might be caused by different physiological resources, different experiences, expectancies, demands, requirements etc. However, in psychological testing, often there is a need to standardize such data. That is, to remove the individual differences in order to highlight the reactions within each individual. A psychological question could be, does the heart rate increase when an individual is exposed to a high workload

GARTEUR FM AG13 FINAL REPORT – GARTEUR TP 145
116
situation? To answer this question, one might want to decrease the variation between individuals (between subject variation) in order to enhance the variation within each individual (within subject variation). By doing this, the differences between individuals are erased. This might be justified, caution is necessary: the differences between individuals might be of interest. There are several ways of standardizing data, and the suggested method (see Figure 8, below) is just one of these. However, it has some desirable properties. Firstly, it reduces the difference of level between different individuals. For instance, the average heart rate of an individual can be quite different from that of another individual. Secondly, it reduces the difference in change between different individuals. For instance, when aroused, some individuals get a high increase in heart rate, while others get a more moderate increase. This is sometimes called reactivity. Thirdly, the proposed method restores the data into meaningful quantities. A normal standardization (Z-transformation, for instance) will convert all data to values with a mean of zero and standard deviation one. For instance, it is difficult to interpret a 1.3 increase, since the scale is undefined.
µσ +−
=s
xxx 01
Figure 8. A suggested standardization method.
The figure above shows the standardization formula. 1x is the new value to replace 0x . x and s are the individuals average and standard deviation respectively. µ and σ are the group average and standard deviation, respectively. The variable 1x is the new value to replace 0x . x and s are the individuals average and standard deviation respectively. µ and σ are the group
average and standard deviation, respectively. 5.1.1 Other uses The suggested method can be useful not only regarding psychophysiological measures, but also on psychological scales, for instance. The same logic applies: some individuals tend to rate themselves towards the centre of the scale: when asked: What is your mental workload right now, they generally answer 4 on a seven-point scale. And when they are highly loaded, they might give you a 5. Other individuals tend to use more of the scale and will rate themselves 1 or 2 when the situation is calm and 7 when they become mentally loaded. So, by using the same suggested standardization method, these differences are removed and only the fact that there is an increase in the rating remains.

GARTEUR FM AG13 FINAL REPORT – GARTEUR TP 145
117
5.1.2 Theoretical illustration Consider the following made-up psychophysiological example. Two pilots fly the exact same mission and their heart rates are recorded during some routine flight, see Figure 9.
0
10
20
30
40
50
60
70
80
90
100
12:00 12:02 12:04 12:06 12:08 12:10 12:12
Pilot 1
Pilot 2
Figure 9. Heart Rate responses of two pilots. The two pilots both react at 12:07 by having an increased Heart Rate. However, the difference between the two pilots is too big to be able to draw any general conclusions about this increase. However, by standardizing the data, the results look quite different, see figure 10. The increase at 12:07 is much clearer and can more easily be analyzed statistically.
0
10
20
30
40
50
60
70
80
90
100
12:00 12:02 12:04 12:06 12:08 12:10 12:12
Pilot 1
Pilot 2
Figure 10. Standarized Heart Rate of the same two pilots. Each individuals average Heart Rate as well as his or her standard deviation will be the same as all the others. However, the correlation between the pilots remains the same, but the between-individual variation is minimized. The proposed method also restores the values to an intuitive and understandable scale. None of the pilots actually had a Heart Rate of 65 at the beginning, but after standardization, it looks as if they both had just that. The increase at 12:07 is about 20 beats per minute, a result much easier than one interpreted from the un-standardised data in

GARTEUR FM AG13 FINAL REPORT – GARTEUR TP 145
118
Figure 9. It is obviously important to remember that the new values are not the true values of each individual Heart Rate, but represent a standardized representation of all the individuals Heart Rate. 5.1.3 Conclusion The standardization, no matter what method is used, always comes with a drawback. It is important to consider this before using applying any standardization method. In the current proposed method the drawback is that the between individual differences are completely erased. This is the price one has to pay for increasing the within individual differences and reactions. The proposed method has several properties that are useful, and it is suggested that this method is used whenever standardized data are required and the price is considered and found worth it. 5.2 Generalised Formal Concept Analysis A candidate method to analyse data of different natures has been developed at ONERA. This method called Generalised Formal Concept Analysis (Chaudron and Maille, 2000) makes use of logical constraint programming (Prolog) and provides a useful tool to explore large amounts sequences of first order literals (e.g. : a parameter name + its value). This method is especially useful as a help to discover unknown relationships among the elements of a database. This method was applied for instance to help determine typical families of cases among large incidents databases, or to formally identify the possible relationships between noise measurements around an airport and the level of annoyance perceived by the surrounding inhabitants, together with other factors such as time and day of occurrence, activity of the subjects, age, etc. (see experiment described in § 3.5.4). A possible application of this methodology may be found for the analysis of the relationships between the different factors involved (e.g. context, initial training and experience of the subjects, test cases, elements of the scenarios) and the different dimensions of workload or subjective assessments as captured during the experiment. 5.3 Triangulation
Richardson (1996) describes the practice of triangulation in social sciences as a methodological approach where the application and combination of several research or evaluation methodologies are used in the study of the same phenomenon. The practice of triangulation thus describes the combination of information in such a way as to give substance and rigour to the
GARTEUR FM AG13 FINAL REPORT – GARTEUR TP 145
119
results of the investigations. Triangulation is especially relevant to evaluations where only a limited number of subjects are available and it can be used in both quantitative and qualitative studies. Richardson describes four basic types of triangulation:
• Data triangulation • Investigator triangulation, consist of the use of multiple, rather than single observers. • Theory triangulation, which consists of using more than one theoretical scheme in the
interpretation of the phenomenon • Methodological triangulation, which involves using more than one method and may
consist of within-method or between-method strategies By combining multiple observers, theories, methods, and empirical materials, sociologists can hope to overcome the weakness or intrinsic biases and the problems that come from single method, single-observer, single-theory studies. The central issue in triangulation is to make explicit the rules of how the different ratings and data sources will be combined. The combination is made under stated rules on the primacy, influence, and methods of combination of the forms of information under consideration. The results are assigned to categories, their definition and boundaries also made explicit. Triangulation Rule Examples Below an exemplification of the rules used in the triangulation of SME/investigator observations is provided. Issues or features of the system addressed are rated in five categories: Very Good, Good, Reasonable, Poor, and Unacceptable. In the example the results of a questionnaire (Q. scale) and a rating scale (R. scale) and SME observations are triangulated. Good result Good results are (Above 6 on the 9 point Q. scale and 4 or above on the 5 point R. scale) on all applicable assessments with similar topic focus. To maintain a Good result, topic debrief comments must be supportive or, if not supportive, must be individually of a minor nature Little Fault Found Results with “Little Fault Found” are considered to be results where all assessors gave high scores (above 8 on the 9 point scale and at 5 on the 5 point rating scales) on all applicable assessments for test areas with similar subject focus. To obtain a “Little Fault Found” result, the directly associated debrief comments on the tests must all be supportive.

GARTEUR FM AG13 FINAL REPORT – GARTEUR TP 145
120
Positive discriminating of results from tests Positive discriminating results are considered to be results where all assessors gave high scores (Above 6 on the 9 point questionnaire scale and above 4 on the 5 point rating scales) on all applicable assessments for test areas with similar subject focus. To obtain a positive results, debrief comments on the tests must be supportive or, if not supportive, individually of a minor nature. Note that a large Standard Deviation associated with some of the results could arguably place then in a lower category of result. Intermediate Discrimination Results from Tests Intermediate or inconclusive discriminating results are considered to be results where Assessors scores showed a broad divergence of ratings on tests with similar subject focus. With the Questionnaire the average of these results lies between 4 and 6 out of a maximum 9, often accompanied by a high Standard Deviation. Rating Scales would score near 3 out of 5. In addition, a diverse range of comments should accompany all ratings, including comments both of a critical and of a supportive nature. Negative Discrimination Results from Tests Negative discriminating results are considered to be results where the majority of assessors gave low scores on all applicable assessments for test areas with similar subject focus. Generally a low score is considered to be below a rating of 4, with the questionnaire, and below or near 2 on a Rating Scale. To obtain a negative result, some of the debrief comments on the tests must also be highly critical. Major Drawback Found Results with “Major Drawback Found” are considered to be results where all assessors gave poor scores on all applicable assessments for test areas with similar subject focus. Poor scores are considered to lie at the bottom of the scale and be placed there by all the participating Assessors. To obtain a “Major Drawback Found” result, the debrief comments on the tests must all be highly critical. At Aerosystems International the practice of investigator triangulation of SME/observers opinions/ratings have been used when performing system evaluations in applied, complex, multi-crew settings. A number of lessons learned and practices to be observed have is described in MacLeod et al (2000) and are described on the following page.

GARTEUR FM AG13 FINAL REPORT – GARTEUR TP 145
121
When the use of investigator and data triangulation is used the following should be observed:
• The data and information collection methodologies must be carefully planned. • Classification categories should be defined from the onset. • The form of the triangulation results must be planned. • Any form of triangulation needs rules and guidance for the processes of classification,
interpretation, and comparison of diverse data and information within the triangulation • The presentation of the final report is important to the interpretation of the explicitly
stated triangulation associated assumptions and arguments. • The triangulation process is completed by examining both the consistencies and
inconsistencies of collated data in each of the assigned categories and arguing the resultant issues and implications primarily from a Bottom Up perspective.
• The issues and their implications must all arise from the experimental data, though they can then be supported by the results of previous tests, and their implication on operator work and mission / flight effectiveness argued with relation to system performance requirements, it's ‘fitness for purpose’, and human factors advice.
Some “lessons learned” are summarized below:
• The more novel the system to be evaluated, the less SMEs are available to assess its usability.
• All assumptions must be made explicit. • Four participating SMEs is suggested as the minimum used. • Both guided and freeplay exercises during the evaluation are required. • An approach with multiple assessment techniques and measures is required. • The evaluators must remember to the assess the system and not the subjects. • The evaluation and data collection must raise issues and argue implications.
GARTEUR FM AG13 FINAL REPORT – GARTEUR TP 145
122
5.4 Statistical techniques for data reduction and modelling Correlational statistics, different factor analytical techniques, ‘second generation’ multivariate analytical techniques including structural equation modelling and multidimensional scaling have been found most valuable methodological tools in behavioural sciences research. Multivariate statistical techniques are important tools for analyses of multiple relationships and application of experimental designs in applied situations. They make possible parsimonious descriptions of complex psychological and physiological relationships and they are prerequisites for modelling of human behaviour. By means of ‘second generation’ multivariate statistics we can analyse causal relationships and the relative effects of different causal factors. The techniques are based on correlational statistics, i.e., the linear relationships between variables, and the common variance between the variables forms the base for the analyses. Accordingly, the techniques present the degree of relationship between variables in terms of explained variance. This makes the techniques more powerful than ‘first generation’ statistical techniques as e.g. comparisons of group means by means of t-tests and analyses of variance.
Factor analysis (FA) is, by far, the most used data reduction technique, and it forms the base for related techniques as cluster analysis, multidimensional scaling, and structural equation modelling. Therefore, we will give a more detailed presentation of the factor analytical procedure, determination of appropriateness of FA, and limitations of the technique. The techniques presented will be illustrated by means of simple practical applications. In studies of extreme physiological and/or psychological load or stress there is a striving for using as few cases as possible, and accordingly, designs of repeated measurement are called for. The principles for repeated measurement design make possible the use of multivariate analytical techniques to be described.
5.4.1 Factor analysis (FA) Rationale. Factor analysis is an analytical technique that makes possible the reduction of a larger number of interrelated manifest variables to a smaller number of latent variables or factors. The FA technique is based on the co-variation between manifest measured variables, and the goal of the technique is to achieve a parsimonious and simplified description by using the smallest number of explanatory concepts needed to explain the maximum amount of common variance in a
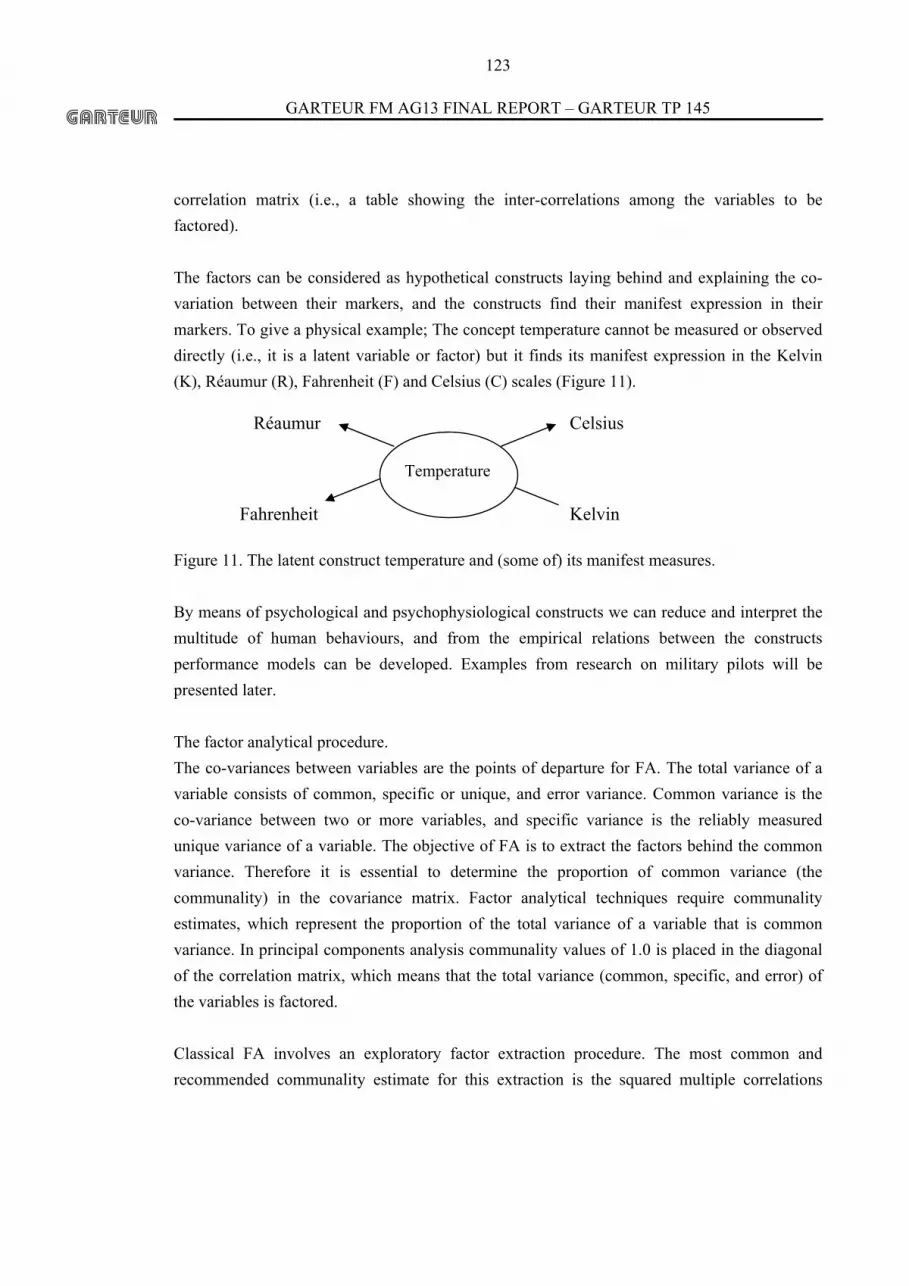
GARTEUR FM AG13 FINAL REPORT – GARTEUR TP 145
123
correlation matrix (i.e., a table showing the inter-correlations among the variables to be factored). The factors can be considered as hypothetical constructs laying behind and explaining the co-variation between their markers, and the constructs find their manifest expression in their markers. To give a physical example; The concept temperature cannot be measured or observed directly (i.e., it is a latent variable or factor) but it finds its manifest expression in the Kelvin (K), Réaumur (R), Fahrenheit (F) and Celsius (C) scales (Figure 11). Figure 11. The latent construct temperature and (some of) its manifest measures. By means of psychological and psychophysiological constructs we can reduce and interpret the multitude of human behaviours, and from the empirical relations between the constructs performance models can be developed. Examples from research on military pilots will be presented later. The factor analytical procedure. The co-variances between variables are the points of departure for FA. The total variance of a variable consists of common, specific or unique, and error variance. Common variance is the co-variance between two or more variables, and specific variance is the reliably measured unique variance of a variable. The objective of FA is to extract the factors behind the common variance. Therefore it is essential to determine the proportion of common variance (the communality) in the covariance matrix. Factor analytical techniques require communality estimates, which represent the proportion of the total variance of a variable that is common variance. In principal components analysis communality values of 1.0 is placed in the diagonal of the correlation matrix, which means that the total variance (common, specific, and error) of the variables is factored. Classical FA involves an exploratory factor extraction procedure. The most common and recommended communality estimate for this extraction is the squared multiple correlations
Temperature
Celsius
Kelvin
Réaumur
Fahrenheit

GARTEUR FM AG13 FINAL REPORT – GARTEUR TP 145
124
(SMC) of the variables2. Iterations with these initial estimates in the diagonal of the matrix will give the final communalities. The factor extraction procedures can be divided into exploratory and confirmative (hypothesis testing) methods. Explorative solutions cannot be generalised to populations. Generalisation requires replications in new samples. Factor solutions from confirmative methods of factor extraction, on the other hand, can be generalised from a sample to a population of subjects. The exploratory methods as principal factors analysis assume populations of subjects and variables, and provide descriptive solutions. Principal FA (also called common FA) is the method preferred when analysis of common variance is desired. Principal FA is a practicable tool for generation of hypotheses about factor structures to be analysed further and confirmed in future research. A principal FA solution will be presented as an illustrative example of the technique. From inferential and confirmatory methods as maximum likelihood FA, on the other hand, generalisations to other members of the population are possible. LISREL (analysis of linear structural relationships) is a practicable tool for confirmation and generalisation of factor structures. LISREL can be used to perform both exploratory and confirmatory FA. LISREL is characterised by two basic components: a structural model and a measurement model. The structural model is a ‘path’ model, relating independent variables to dependent variables. The measurement model is a maximum likelihood FA defining the relations between manifest variables and latent variables or factors. Above all, the combination of the models offers a powerful method for examination of theories and testing of causal models (Structural Equation Modelling, SEM). A simple LISREL analysis will be presented as an illustrative example (example 4). An illustration of a ‘full scale’ LISREL analysis will also be presented (example 5). This example shows that the technique is a powerful tool for development and testing of causal models. The number of factors for the final factor analytical solution must always be specified. The basic principle of FA is to explain as much true variance as possible in the covariance matrix with so few factors as possible. Different statistical tests of the significance of the variance remaining in the matrix after that a given number of factors have been extracted have been developed. Two practicable criteria for optimisation of number of factors in exploratory FA are
2 Each variable is used as criterion in a multiple regression analysis with all other variables as predictors.
GARTEUR FM AG13 FINAL REPORT – GARTEUR TP 145
125
Kaiser’s criterion and Cattell’s scree test. Kaiser’s criterion states that only factors with eigenvalues greater than 1.0, should be retained3. Cattell’s scree test identifies the number of factors that can be extracted before the amount of unique and error variance begins to dominate over the amount of common variance. When using confirmative or hypothesis testing FA, the number of factors, and the variables that load on each factor must be stated prior to the analysis. These techniques test the fit of the data to the hypothesised factor structure. LISREL and other confirmatory techniques present different goodness of fit indices for the number of factors and factor structures. An important tool for factor interpretation is factor rotation. The initial un-rotated factor matrix (a table showing the factor loadings of all variables on each factor) assists in obtaining a preliminary indication of the numbers of factors to extract. The factor variances of the un-rotated factor matrix are in general unevenly distributed and the first factor is mostly a general factor with high loadings on the majority of the variables. Factor rotation results in a more even variance distribution, and in a more interpretable and simple factor structure. Thurstone’s criteria for simple structure mean that every variable should have at least one non-zero loading, each factor should be highly loaded by a few variables, and, ideally, each variable should load highly on only one factor. Factor rotation procedures for both orthogonal and oblique rotations are available. Orthogonal techniques are mostly to be preferred on both theoretical and empirical grounds. Independent or uncorrelated factors are a strong assumption, and it is therefore appropriate to let the factor inter-correlations be free in the rotation. Furthermore, factor inter-correlations form the base for path analysis and structural equation modelling. The most common measure of association in FA is the product moment correlation coefficient. It is a scale free (differences in means and variances of variables are eliminated) measure of the linear relationships between the variables. One aspect that will reduce the correlation coefficient is variables with differences in skewness. Curvilinear relationships attenuate the correlation coefficient and it is therefore important to examine scatter plots between variables when curvilinearity is suspected. Moderate curvilinear relationships are not severely disturbing the correlation coefficient but U-shaped relationships have serious attenuating effects. Sometimes the effects can be mitigated and the optimal
3 The eigenvalue is equal to the sum of the squared factor loadings. The eigenvalues from a components analysis should be used (i.e., 1.0 in the diagonal of the matrix).

GARTEUR FM AG13 FINAL REPORT – GARTEUR TP 145
126
correlation can be estimated by means of scores of deviation from the mean of the U-shaped distribution. Unfortunately, U-shaped relationships are quite common in the behavioural sciences. So far we have no general measure of association that can handle curvlinearity.
5.4.2 Multidimensional scaling (MDS) Rationale. MultiDimensional Scaling (MDS) is a procedure for fitting a set of objects or variables in a space (or plane) such that the distances between the objects correspond as close as possible to a given set of similarities or dissimilarities between the objects. Similarities can be measured directly or derived indirectly from e.g., correlation matrices. Especially components analysis is closely related to MDS in function, but there are also differences. Usually MDS can fit an appropriate model in fewer dimensions than can FA. Furthermore, MDS provides a dimensional model even if a linear relationship between distances and dissimilarities cannot be assumed. As compared to other multivariate techniques MDS is easy to use and the statistical assumptions are mostly easy to fulfil. Procedure. The scaling procedure starts by generating a configuration of points, for which the inter-point distances are a linear function of the input data. From this initial configuration the MDS algorithm constructs better solutions by an iterative procedure. The fit is expressed as a stress value ranging from 0.00 to 1.00. The closer the stress comes to zero the more adequately the spatial configuration represents the relations between the objects or variables. In contrast to FA no statistical distribution assumptions are necessary, even if some metric conditions must be satisfied. 5.4.3 Illustrations of the techniques Exemple 1. Factor analysis. Data from a study by Svensson and Wilson (2002) will be used to illustrate FA, MDS, and structural equation modelling (SEM). In the study, military pilots answered questions on pilot mental workload (PMWL), situational awareness (SA), and pilot performance (PERF) directly after intercepts during combat simulation. During the intercepts heart rate (HR), and eye fixation rate (FIXRATE) were registered. The correlations between the five variables were estimated and used as input in a FA.

GARTEUR FM AG13 FINAL REPORT – GARTEUR TP 145
127
Figure 12. Plot of eigenvalues extracted from successive residual correlation matrices. Figure 12 presents the latent roots or eigenvalues from the FA extraction procedure. As can be seen two eigenvalues are greater than 1.00 (Kaiser’s criterion) and for the other three eigenvalues the error variance dominates over common variance (Cattell’s scree test). Our conclusion from the criteria is that a two factors solution is the most parsimonious with respect to proportion of explained common variance. Figure 13 presents the factor loadings after varimax rotation. As can be seen from the figure the variables pilot mental workload (PMWL), heart rate (HR), and eye fixation rate (FIXRATE) are significantly loaded in factor 2, and situational awareness (SA) and pilot performance (PERF) are significantly loaded in factor 1. The markers of factor 2 reflect the mental workload construct and the markers of factor 1 the performance construct. The result illustrates the multifacettedness of the two constructs. For example, the workload factor is manifested in both psychological and psychophysiological variables.
0.00
1.00
Eigenvalues
1 2 3 4 5 Factors
2.00

GARTEUR FM AG13 FINAL REPORT – GARTEUR TP 145
128
Figure 13. Plot of loadings. The figure shows the plot of loadings of heart rate, pilot mental workload (PMWL), eye fixation rate (FIXRATE), pilot performance (PERF), and situational awareness (SA) for factors 1 and 2 after rotation to simple structure. Example 2. Multidimensional scaling. The correlation matrix for the five variables was also analysed by means of MDS. The MDS procedure automatically transforms correlations to dissimilarities. The MDS plot is presented in Figure 14. The fit of the final configuration is perfect and the stress value is .00031. This means that the distances between the variables represent the correlations perfectly in two dimensions (i.e., in a plane). Figure 14. A two-dimensional MDS. The figure shows the solution for the five variables situational awareness (SA), pilot performance (PERF), eye fixation rate (FIXRATE), heart rate, and pilot mental workload
0.00
-1.00
1.00
2.00
-2.00-2.00 -1.00 0.00 1.00 2.00
Dim I
Dim
II
PMWL
SA
PERF.
FIXRATE
HEARTRATE
0.50
0.00
1.00
-.50 -.50 .00 0.50 1.00
Factor 1
Fact
or 2 PMWL
SA
PERF.
FIXRATE
HEARTRATE

GARTEUR FM AG13 FINAL REPORT – GARTEUR TP 145
129
(PMWL). Stress = .00013. As can be seen, the dimension I of the MDS solution separates the variables in the same way as the factor solution presented in Figure 13. The second dimension seems hard to interpret but the relative nearness between situational awareness and eye fixation rate seems reasonable. Example 3. Multidimensional scaling. Figure 15 represents a MDS solution from a study of the structure of two parallel indices (with seven corresponding items in each index) for measurement of the perceived complexity of information on displays in military aircraft (Tactical Situation Display, TDS, and Target Indicator, TI, respectively) (Svensson, Angelborg-Thanderz, & Wilson, 1999). The correlations between the markers of the indices TSD and TI were used as input to the MDS analysis. The fit of the data is almost perfect (99 % of the variance in data is explained by the solution) and the relations between the items could be described in terms of distances on a plane. As can be seen from Figure 15 dimension I arrange the markers in a sequence common to both indices (equivalent items of the two indices are connected with lines in the figure). The dashed arrows show the sequences. When analysing the sequences we found that the left ends represent items of perceptual content (e.g., difficulties in surveying the symbolic representations), and that the right ends represent items of cognitive content (e.g., difficulties in understanding and integration of information before decisions). Thus, dimension I separates perceptual and cognitive processes. Dimension II separates the TSD items (squares) from the TI items (circles). Figure 15. A two-dimensional MDS solution separating markers for cognitive and perceptual processes.
0.00
-1.00
1.00
2.00
-2.00-2.00 -1.00 0.00 1.00 2.00
Dim I
Dim
II
TI
TSD

GARTEUR FM AG13 FINAL REPORT – GARTEUR TP 145
130
Example 4. Structural equation modelling. The correlations between the five variables of examples 1 and 2 were input for a structural equation modelling ad modum LISREL. From the FA and MDS analyses we found that the variables formed two factors (Figure 13) or dimensions (Figure 14). The factors were named mental workload and performance, respectively. Our hypothesised model was that increases in workload cause decreases in the pilots’ performance. Figure 16. The structural model of example 4. The structural model is based on the relationships between rated mental workload (Bedford rating scale, BFRS), fixation rate (FIXRATE), heart rate (HR), situational awareness (SA), and performance ratings (PERF). Factors are denoted by ellipses and manifest variables by squares. Factor loadings are presented in italics. The effect (-.45) can be considered as a regression or normalised beta weight ranging from -1.00 to 1.00. All coefficients are significant (p < .01). The fit of the LISREL solution in Figure 16 is acceptable (Goodness of Fit Index = .85). The ratings of mental workload by means of BFRS, the fixation rate (FIXRATE), and heart rate (HR) are significant markers of the workload factor. This means that an increased activity in the pilot’s visual search behaviour, an increase in his heart rate, and an increase in his perceived mental workload go together in a workload factor. The ratings of performance and situational awareness are significant markers of a workload factor. From the solution we can conclude that increases in mental workload cause decreases in the pilots’ operative performance. Example 5. Structural equation modelling. Finally, we present a ‘full scale’ structural equation model from the study of Svensson and Wilson (2002). In the analysis we have used the following factors: mission difficulty (DIFFIC), complexity information Tactical Situation Display (TSD), complexity information Target Indicator (TI), mental capacity reduction (CAPAC), situational awareness (SA), and pilot performance (PERF). Pilot mental workload was measured by means of BFRS (the BedFord Rating Scale). The final model is presented in Figure 17.
HR
SABFRS .84
.57
.90
PERF.56
-.45 PerformanceWorkloadFIXRATE.28

GARTEUR FM AG13 FINAL REPORT – GARTEUR TP 145
131
The circles represent the different indices or factors (the markers of the factors are not shown in the figure) and the arrows the directions of the effects. The fit of the model is good, and the model can be generalised to the pilot population of the system (Goodness of Fit Index = .95, and Root Mean Square = .053). Figure 17. The structural model of example 5. The structural model of the relationships between the six indices and the BFRS workload scale. The circles represent indices or factors and the arrows directions of effects. All effects are significant (p < .05). As can be seen from Figure 17, the model has its starting point in the difficulty and complexity of the missions and its terminal point in the performance of the pilots. An increasing mission difficulty is followed by an increased general mental workload (BFRS) and, furthermore, the complexity of the synthetic information on the Tactical Situation Display (TSD) and the Target Indicator (TI) increases. We find that increases in general mental workload (BFRS), in their turn, reduce mental capacity (CAPAC). Increases in information complexity on TSD and TI give a reduction of mental capacity of about the same size. Regression analyses show that the common effect of TSD, TI, and BFRS accounts for 65 percent of the variance of the mental capacity index. It is also evident from the model that increases in general workload (BFRS) and information complexity on TSD and TI both decrease situational awareness (SA), and that SA is a precursor to the pilots’ operative performance (PERF). The model can be divided into three consecutive parts: A, B, and C. Part A consists of aspects of missions and systems demands, part B comprises aspects of mental workload, information load and mental capacity, and part C includes situational awareness and performance aspects.
DIFFIC
BFRS
TI
TSD
CAPAC
.62
.30 .34 .51
.37.44
-.35
-.29
.17
.36
.64SA
A B C
PERF

GARTEUR FM AG13 FINAL REPORT – GARTEUR TP 145
132
Concluding remarks on statistical techniques. In modern research on human behaviour there is a strong demand for data reduction techniques. There is also a need for modelling techniques that are based on empirical data. We have in this chapter given a sketchy presentation of the most common standard techniques with simple examples as well as examples of a promising technique for development of models of operator functional state and performance.

GARTEUR FM AG13 FINAL REPORT – GARTEUR TP 145
133
6 Modelling of operator performance
The complexity of systems in modern aviation is increasing. This greatly increases the amount of information the human operator has to process before decision and action. To achieve knowledge of the operators’ actual cognitive needs, models of operator performance must be developed as well as reliable and valid methods to assess the central concepts workload, situational awareness, and operative performance (Svensson, Angelborg-Thanderz & Wilson, 1999; Svensson, 2000). Pilot Mental WorkLoad (PMWL) and Pilot Performance (PP) have been central concepts since more than thirty years, and the concept Situational Awareness (SA) has been an actor on the scene since ten or fifteen. The concepts and their relationships lay the basis of research in modelling of operator performance. Why do we need models of the operator? One self evident and important reason is that models describe, and sometimes also explain, how the operator copes with the situation and the system. The final goal of a model is to reliably predict the outcomes of complex and multifactorial processes by means of a small number of central concepts. It has been hard to formulate operational definitions of the concepts PMWL, SA, and PP, and we have found it even harder to develop practicable measures. Operational definitions and practical, valid, and reliable measures are, of course, necessary, but this is not enough. Development of models of the interaction between the concepts, their causal relationships, and how systems- and operational factors and pilot experience affect the concepts is a necessary second step. By means of these models we can predict and estimate the relative sensitivity of PMWL, SA, and PP as a function of the complexity of operations, and we can find cognitive and technical 'bottle necks' of the technical systems. According to our experience, one reason behind the difficulties in the development of e.g. useful decision support systems is the lack of useful psychological models of operator performance. 6.1 Conceptual modelling Modelling can be approached from different angles. The conceptual models are descriptive and they provide a framework for investigation of the components of human performance. They provide a useful technique for examining potential limitations in operator performance. Wickens (1992) model of human information processing describes the critical stages of information processing involved in human performance. The model assumes that each stage of
GARTEUR FM AG13 FINAL REPORT – GARTEUR TP 145
134
processing performs some transformation of the data and demands some time for its operation. Wickens (1992) multiple-resource theory is another fruitful example modelling the proposed structure of cognitive processing resources. 6.2 Computer based modelling Another approach is concerned with the development of computer programs modelling human as well as technical systems. Modelling of technical systems is a prerequisite for and very close to simulation. The fidelity of e.g. a flight simulator is a function of the validity and reliability of the models of the situation. Detailed and exact data (e.g. physical relationships, and algorithms) are generally available, when it concerns models of technical systems, and, accordingly, the fidelity of such simulations usually is rather high. Recent examples of this kind are treat modelling and simulation of flight incidents and accidents (Smaili, 2000; Maraoka, & Noriaki, 2000). Because of the successful modelling of technical systems (e.g. flight and weapon systems) it is tempting to try to model human systems in the same way. Modelling of physiological and perceptual processes has already been successful, and these models are now used in the development of simulation systems. However, there is so far an obvious difference between technical/physiological and psychological systems with regard to basic knowledge. Even if existing computer models of human cognitive performance seem to have fidelity and validity at the first glance, closer inspection often discloses restrictions with respect to their ability to predict human behaviour and performance. The main reason is lack of psychological knowledge, and, accordingly, the empirical bases of the models are mostly weak or non-existent. Despite these shortcomings cognitive computational modelling can help in characterising what changes occur in order to facilitate improved crew performance, because it enables e.g. learning and knowledge to be independently and directly manipulated. Models can predict what initial knowledge is required to produce the observed behaviour, how new strategies are acquired, and how task knowledge is learned. Soar (Laird, Newell & Rosenbloom, 1987) and ACT-R (Anderson, 1993) are two main symbolic cognitive architectures that are used to model human behaviour. Both do this by reducing much of human behaviour to problem solving. Soar does this rather explicitly, being based upon Newell’s information processing theory of problem solving whereas ACT-R merely implies it by being goal directed.

GARTEUR FM AG13 FINAL REPORT – GARTEUR TP 145
135
Predictions on pilot tracking behaviour concerning delays can be made using models of human manual control performance, such as the Crossover Model, that is frequently used to describe pilot performance (Wickens, 1986). In the crossover model, the pilot is represented as a number of simple elements; a gain, a threshold, an information-processing delay, a source of noise and a filter that can be configured according to the characteristics of the given tracking task. Parks and Boucek (1989) developed an approach for TimeLine Analysis and Prediction (TLAP), which was also used for diagnostic applications. TLAP assesses cognitive load on the basis of eye movement data. TLAP is based upon the time required to perform a task versus the time available within the task sequence. MIDAS (Man-machine Integrated Design and Analysis System; Corker and Smith, 1993; Staveland, 1991, 1994) is a set of software modules and editors that allow simulation of humans interacting with crew station equipment, vehicle dynamics, and a dynamically generated environment. Quantitative models of the operator, the crew stations, and the environment of the vehicle are implemented with emphasis on operator performance under mission conditions. The models of human perception, cognitive behaviour and all responses are detailed and allow analysis of critical areas of human performance, such as information management, cognition, and mental workload. MIDAS also admits for the inclusion of probabilistic events and errors and is able to model interruption and resumption of tasks in single and multiple operator interaction. IPME (Integrated Performance Modelling Environment; Dahn, Laughery and Belyavin, 1997) is an integrated environment of models intended to help analyse human system performance. The base technologies that have gone into IPME are Micro Saint and Human Operator Simulator (HOS). The latter contributes human characteristics to Micro Saint. IPME provides a more or less realistic representation of humans in complex environments, and interoperability with other model components and external simulations. 6.3 Data-based modelling This modelling approach is primarily based on empirical data, and, accordingly, the resulting models represent the empirical relationships between concepts. The approach is based on ‘second generation’ multivariate statistical techniques that make statistical tests of causal flow models possible. These techniques are described in the section 5.3 of this report. Thus the theory is based on, and can be rejected on the basis of empirical observations and experience.
GARTEUR FM AG13 FINAL REPORT – GARTEUR TP 145
136
Causal explanations represent the most fundamental understanding of the processes studied, and such knowledge is invariant over time. It is more important to know that one phenomenon is a cause of another than merely to know that these phenomena appear together. Potentially, knowledge of cause and effect makes it possible to influence reality in an intelligent way. The techniques are especially suited for non-experimental research and data (Jöreskog & Sörbom, 1984, 1993; Saris & Stronkhorst, 1984). The major characteristic of non-experimental research is that the experimenter cannot strictly manipulate the relevant variables. This is often the case in applied research in operative settings (e.g., studies of pilot performance in realistic flight scenarios). The major strength of the technique is that it makes it possible to draw experimental conclusions from non-experimental real and operative situations. Since the seventies the computer program LISREL (analysis of linear structural relationships) has been available. The current version is LISREL 8. (Jöreskog & Sörbom, 1984; 1993). The models produced are based on the relationship between the measures of co-variation between variables (co-variances and correlations) and the causal effects. 6.4 Applied examples of data-based modelling Data based modelling has been used in a series of studies within the Swedish Air Force. In the first study we were interested to measure Pilot Mental WorkLoad (PMWL) as a consequence of prior mission factors, and, as a precursor of consequent Pilot Performance (PP). Before that time the empirical causal relationships between pilot performance expectations, mission complexity, PMWL, and PP had not been thoroughly analysed. A first study concerned complementary attack training and a second intermittent fighter pilot training (Angelborg-Thanderz, 1982, 1989, 1990, 1997). From a psychological model based on data from the first study, a set of variables (both psychological and psychophysiological) reflecting different aspects of PMWL were selected. The validity of the workload index was tested on data from a second study (Svensson, Angelborg-Thanderz, Sjöberg, & Gillberg, 1988; Svensson, Angelborg-Thanderz, Sjöberg, 1993). Performance was modelled as a result of PMWL, and workload was construed as a consequence of mission characteristics. A factor analysis was the starting point for the causal modelling. The proposed model had its starting point in a challenge factor (a weighted combination of perceived risk and mission complexity) and its terminal point in the pilots’ performance (PP). Two intervening processes
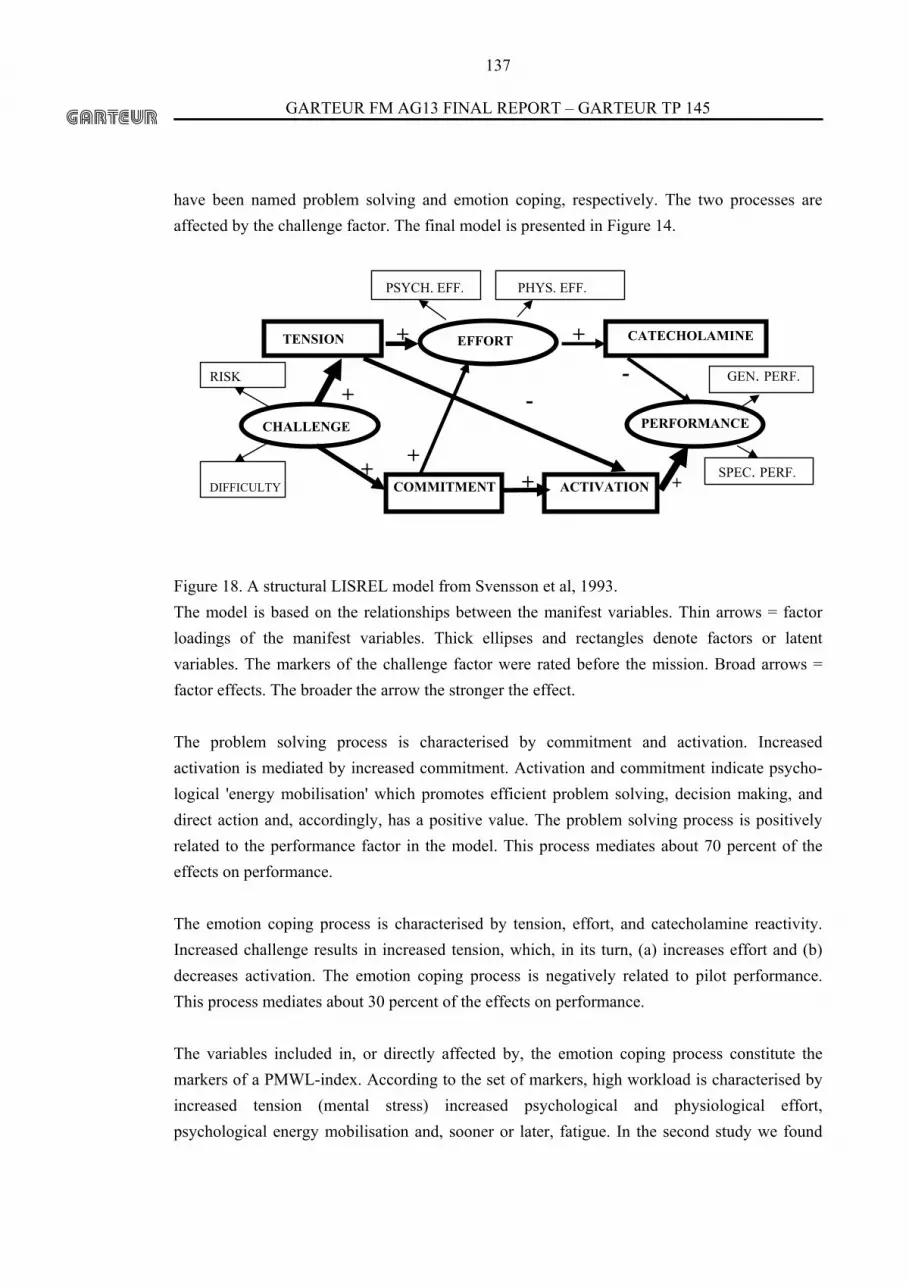
GARTEUR FM AG13 FINAL REPORT – GARTEUR TP 145
137
have been named problem solving and emotion coping, respectively. The two processes are affected by the challenge factor. The final model is presented in Figure 14. Figure 18. A structural LISREL model from Svensson et al, 1993. The model is based on the relationships between the manifest variables. Thin arrows = factor loadings of the manifest variables. Thick ellipses and rectangles denote factors or latent variables. The markers of the challenge factor were rated before the mission. Broad arrows = factor effects. The broader the arrow the stronger the effect. The problem solving process is characterised by commitment and activation. Increased activation is mediated by increased commitment. Activation and commitment indicate psycho-logical 'energy mobilisation' which promotes efficient problem solving, decision making, and direct action and, accordingly, has a positive value. The problem solving process is positively related to the performance factor in the model. This process mediates about 70 percent of the effects on performance. The emotion coping process is characterised by tension, effort, and catecholamine reactivity. Increased challenge results in increased tension, which, in its turn, (a) increases effort and (b) decreases activation. The emotion coping process is negatively related to pilot performance. This process mediates about 30 percent of the effects on performance. The variables included in, or directly affected by, the emotion coping process constitute the markers of a PMWL-index. According to the set of markers, high workload is characterised by increased tension (mental stress) increased psychological and physiological effort, psychological energy mobilisation and, sooner or later, fatigue. In the second study we found
TENSION
RISK
DIFFICULTY
CHALLENGE
PSYCH. EFF.
CATECHOLAMINE
PERFORMANCE
GEN. PERF.
ACTIVATION COMMITMENT
+
+ +
- +
+
+ +
PHYS. EFF.
EFFORT
SPEC. PERF.
- -

GARTEUR FM AG13 FINAL REPORT – GARTEUR TP 145
138
that our workload index changed significantly as a function of a training program including 25 missions (r = -.43; p < .01). The correlation was the same, even when the effects of challenge and training were controlled for. Our conclusion was that the significant reduction in PMWL was a genuine effect of the training program. At the same time, we also studied the effects of experience and the effects of different training programs on operative performance (Angelborg-Thanderz, 1990; 1997). Nineteen different types of intercepts were analysed down to their components. From these concrete actions, checkout points, corresponding to what are expected from a trained pilot, were selected and used as input in our modelling. Figure 19 presents the final model solution. Figure 19. A structural LISREL model from Angelborg-Thander, 1997. The structural model is based on the relationships between the manifest variables (not shown in the model). Thick arrows indicate strong effects. As can be seen from the model, the pilots’ capability or skill affects aircraft operations and weapon operations with the same strength. We can also see that good aircraft operations is a prerequisite for good radar operations, and that good radar operations, in its turn, is a prerequisite for good weapons operation. Weapons operation explains the lion’s share (60 %) of the variance in operative performance. The purpose of a third study was to analyse the effects of information complexity of Head Down Displays (HDD) on PMWL and PP. The HDD information was varied as a function of
+ +
+ +
+ +
CAPA-BILITY
AIRCRAFTOPERATION
RADAROPERATION
WEAPONOPERATION
OPERATIVEPERFORM-ANCE
GARTEUR FM AG13 FINAL REPORT – GARTEUR TP 145
139
the tactical situation of simulated low level - high speed missions (Svensson, Angelborg-Thanderz, Sjöberg, & Olsson, 1997). The pilots' eye movements were video taped. During and after the missions the pilots rated workload on BedFord Rating Scale (BFRS), SWAT, and NASA-TLX), mission complexity, difficulty, and performance. Instructors rated different aspects of the pilots' performance. The final model is presented in Figure 20. The model has its starting point in the task related indices complexity TSD (Tactical Situation Display) and mission difficulty and its terminal points in different aspects of the pilot’s performance. The PMWL measures form an intervening process. The perceived difficulty increased as a function of the complexity of the tactical information. The increasing difficulty resulted in decreased performance and increased PMWL. An increased PMWL caused changes in the objective registrations. The number of eye fixations HD and the variation in speed increased, and the precision of information handling decreased as a function of PMWL.

GARTEUR FM AG13 FINAL REPORT – GARTEUR TP 145
140
Figure 20. A causal model from Svensson et al, 1997. This causal model shows the relationships between the indices complexity, difficulty, performance, PMWL, objective registrations, and instructor ratings. Objective registrations are marked by thin, and instructor ratings by thick rectangles. Thick arrows indicate strong effects. All effects are significant. The purpose of a fourth study was to analyse the effects of mission complexity and information load on PMWL, Situational awareness (SA), and operative performance (OP) (Svensson, Angelborg-Thanderz, & Wilson, 1999). In a first phase, 20 fighter pilots performed 140 real missions. In a second phase, 15 pilots performed 40 simulated missions. The pilots answered questionnaires tapping mission complexity, mental workload, mental capacity, situational awareness, and operative performance. During the simulated missions eye fixations, heart rate, and blink rate were obtained. The final model is presented in Figure 21. The model has its starting point in the difficulty or complexity of the mission. An increasing mission difficulty is followed by an increased general mental workload. Furthermore, the complexity of the synthetic information on the Tactical Situation Display and the Target Indicator increases. That the increase in general mental workload, in its turn, reduced the mental capacity was expected. But that the increase of the information complexity gave a strong reduction of the mental capacity was somewhat surprising. The markers of the capacity index
-
PMWL
DIFFICULTY
COMPLEXITY PERFORMANCE
SPEED STABILITY
START TURN
TURN BANKING EYE FIXATIONS HD (>4 s.)
ALTERNATION HU/HD
PRECISION INFO. HANDL.
SPEED VARIATION
+
+
_ _
_
_
+ +
+ _
+ INFORMATION
HANDLING

GARTEUR FM AG13 FINAL REPORT – GARTEUR TP 145
141
deal with difficulties in evaluating the synthetic information and the necessity to reduce the flow of information. In other words, the model tells us that there is a strong connection between the information load on the displays and 'mental overloading' with 'mental tunnel vision' as a consequence. Figure 21. The final structural model presented in Svensson et al, 1999. This LISREL model shows the relationships between the indices motivation (MOTIV) rated before the mission, difficulty (DIFFIC), complexity tactical situation display (COMP TSD), complexity target indicator (COMP TI), mental reserve capacity (CAPAC), situational awareness (SA), pilot performance (PP), and BFRS. The manifest variables are not shown in the model. All effects are significant (p < .05). Thick arrows indicate strong effects. It is evident from the model that increases in general workload and information complexity on Tactical Situation Display and Target Indicator both decrease the situational awareness of the pilots. That the pilots' situational awareness grew worse as a function of high information complexity is a memento.
DIFFIC
PMWL
COMP TSD
CAPAC SA PP
+
+ + +
+ + _
_
+
++
MOTIV
+
+
Before
After A B C
COMP TI
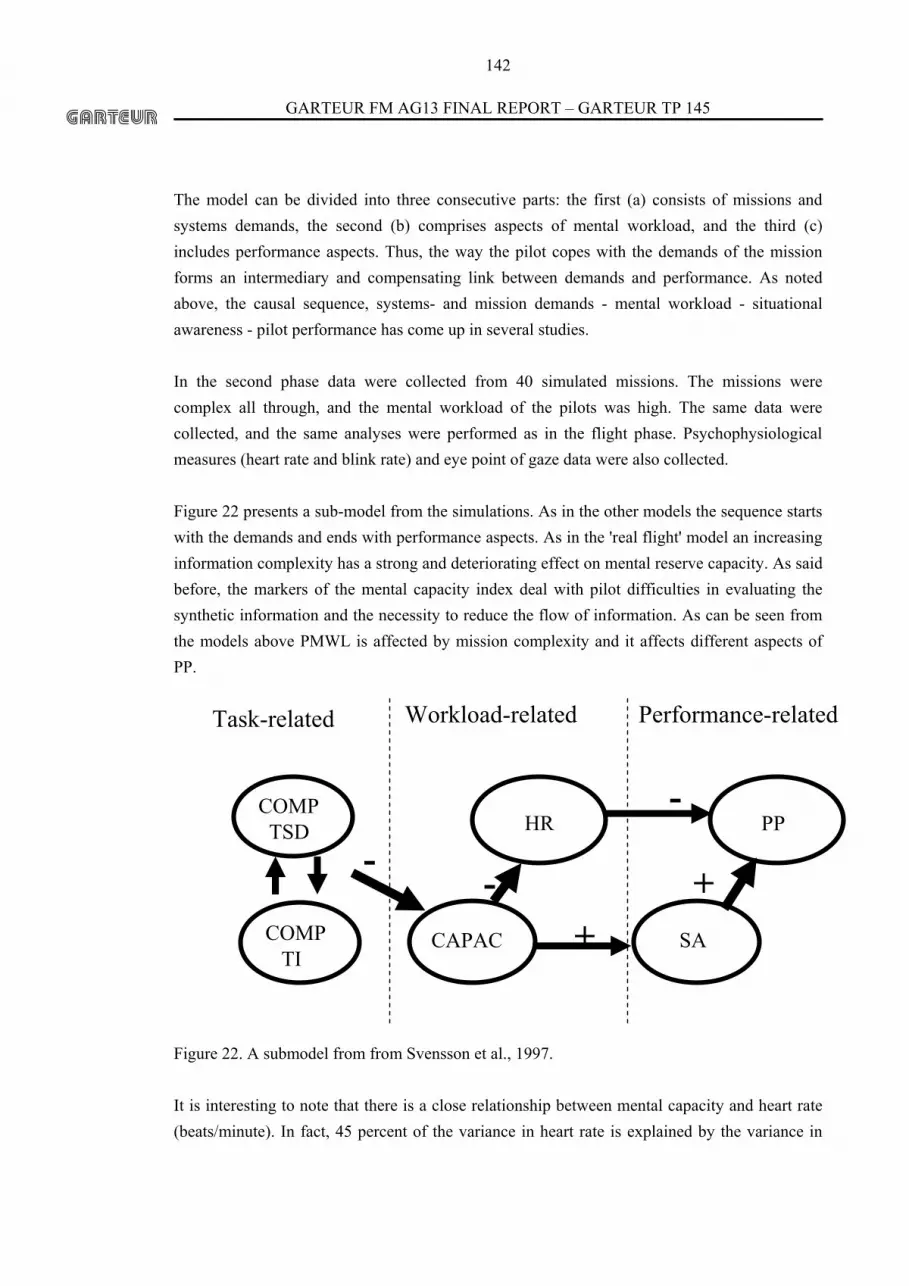
GARTEUR FM AG13 FINAL REPORT – GARTEUR TP 145
142
The model can be divided into three consecutive parts: the first (a) consists of missions and systems demands, the second (b) comprises aspects of mental workload, and the third (c) includes performance aspects. Thus, the way the pilot copes with the demands of the mission forms an intermediary and compensating link between demands and performance. As noted above, the causal sequence, systems- and mission demands - mental workload - situational awareness - pilot performance has come up in several studies. In the second phase data were collected from 40 simulated missions. The missions were complex all through, and the mental workload of the pilots was high. The same data were collected, and the same analyses were performed as in the flight phase. Psychophysiological measures (heart rate and blink rate) and eye point of gaze data were also collected. Figure 22 presents a sub-model from the simulations. As in the other models the sequence starts with the demands and ends with performance aspects. As in the 'real flight' model an increasing information complexity has a strong and deteriorating effect on mental reserve capacity. As said before, the markers of the mental capacity index deal with pilot difficulties in evaluating the synthetic information and the necessity to reduce the flow of information. As can be seen from the models above PMWL is affected by mission complexity and it affects different aspects of PP. Figure 22. A submodel from from Svensson et al., 1997. It is interesting to note that there is a close relationship between mental capacity and heart rate (beats/minute). In fact, 45 percent of the variance in heart rate is explained by the variance in
Task-related
COMP TI
HR
- -
-
+ +
COMP TSD PP
Workload-related Performance-related
SA CAPAC

GARTEUR FM AG13 FINAL REPORT – GARTEUR TP 145
143
mental capacity. Thus, a decreased mental capacity results in an increased psychophysiological activation. And the effect of an increased information complexity on heart rate is mediated by a reduced mental capacity. Another finding is that it is the need of the pilots to reduce and shut off themselves from superfluous information that show the highest relationships with heart rate. Directly after each of the intercepts of the missions the pilots were asked to respond to questions about mental workload, performance, and situational awareness. The latter was measured by means of the scale developed in VINTHEC I. (Svensson, Angelborg-Thanderz, & van Awermaete, 1997). Except HR, we also measured eye fixation rate (FIXRATE). We have used the fixation rate as a crude index of the pilots’ visual search behaviour. The correlations between the variables were used as input for a LISREL model. The solution is shown in Figure 23 (same figure as in example 4 of the previous chapter). The ratings of mental workload by means of the Bedford scale (BFRS), the fixations rate (FIXRATE), and heart rate (HR) are significant markers of a workload factor. This means that an increased activity in the pilot’s visual search behaviour, an increase in his heart rate, and an increase in his perceived mental workload go together in a workload factor. It is of special interest that two psychophysiological variables go together with a psychological variable. Figure 23. A model based on the relationships between mental workload (BFRS), eye fixation rate (FIXRATE), heart rate (HR), situational awareness (SA), and pilot performance (PP). A study was set up in 2001 to examine the similarities and differences in psychophysiological reactions between simulated and real flight. Some of the results are published in Magnusson (2002). Fighter pilots from the Swedish air force participated in the study, flying the same mission in a simulator and in real flight. The exact same mission was flown in the simulator and later in real flight. The pilots’ heart rate, heart rate variability, and eye movements were measured continuously. In a first step the correlations between the variables pilot mental workload, situational awareness, pilot performance, and heart rate were used as input for a LISREL model. The model solution is shown in Figure 24.
Work-load
Performance
HRPP
SA
FIXRATE
BFRS
_Work-load
Performance
HRPP
SA
FIXRATE
BFRS
_

GARTEUR FM AG13 FINAL REPORT – GARTEUR TP 145
144
Figure 24. A model based on the relationships between mental workload (BFRS), heart rate (HR), situational awareness (SA), and pilot performance (PERF). As can be seen from the figure the perceived workload increases heart rate and decreases situational awareness. Increases in heart rate also decrease situational awareness. As in the former models perceived mental workload and heart rate are both manifest markers of the mental workload factor. Situational awareness affects performance in the same way as in the models described above. Thirty one percent of the variance in heart rate is explained by the variance in mental workload. Rated workload and heart rate explains 33% of the variance in situational awareness. 6.5 Conclusions on modelling Different kinds of modelling approaches (primarily computer based modelling and data based modelling) have been described in brief. One conclusion is that the validity of the computer-based models of operators is restricted by lack of psychological and psychophysiological knowledge. Simplistic ideas of the operator result in low fidelity models. Another conclusion is that data-based modelling increases our knowledge about the operator function, and that these models are appropriate as input to computer-based modelling. Accordingly, data-based modelling forms a first and necessary step in the modelling process. The lion’s share of the presentation concerns data based operator models. Two of the models presented have been used as input in computer based modelling. In the research at FOI structural equation modelling ad modum LISREL have been found to be a powerful method of examining theories and testing causal data based models. By means of this technique we have gained a more thorough explanatory (rather than simply descriptive) understanding of data. The method provides a basis for quantification and operationalisation of concepts and adds to the rigor of experimental research. Even if knowledge of the causal
+0.56
-0.42
-0.39
+0.42
PMWL
HR
SA PERF

GARTEUR FM AG13 FINAL REPORT – GARTEUR TP 145
145
relationships is theoretically central, we have found the knowledge of the relative importance of different causal factors on operative performance to be even more important for military decision-makers. The results from the studies presented show the following recurrent sequence of the concepts: mission complexity > pilot mental workload > situational awareness > pilot performance. An increase in the complexity of the missions increases the pilots' mental workload, and an increase in their mental workload decreases their situational awareness, which, in its turn, is positively related to their performance. The sequence represents three related groups: task-, workload-, and performance-related aspects. In the first model (Figure 18) we identified problem solving and emotion coping as two separate but interacting processes. From the model we also could estimate the relative importance of the two processes on performance. In the second model (Figure 19) we could predict the operative performance from a capability index and estimate the relative importance of aircraft operation performance, radar operation performance, and weapons operation performance on the final outcome of the mission. In the third model (Figure 20) we found that increased mental workload caused changes in different objective registrations. The pilots' tactical situational awareness4 decreased, and the number of eye fixations HD increased as a function of increases in mental workload. In the fourth model (Figure 21) we could separate the relative effects of general mental workload of the missions, and the information load of the two main displays (TSD and TI) on the pilots’ mental capacity. The information load from the displays explained the lion’s share of the variance in the reduction of the pilots’ mental capacity. It is also evident from the model that increases in general workload and information complexity on TSD and TI, sooner or later, decrease the situational awareness of the pilots. From the model we found that situational awareness is a precursor to performance. This supports the reasoning of Endsley (1995a). If we know the complexity level of the mission, we can, by means of the model, make precise predictions of mental workload, situational awareness, and performance.
4 This objective index of tactical SA is based on the difference between the actual number of objects (own and enemy aircraft and air defence) on TSD and the number reported by the pilot.

GARTEUR FM AG13 FINAL REPORT – GARTEUR TP 145
146
In the fifth model (Figure 22) we found that increases in information load from the tactical displays have a deteriorating effect on the pilots’ mental reserve capacity. We also found that decreases in mental reserve capacity increase the psychophysiological response. Forty-five percent of the variance in heart rate is explained by the variance in mental capacity. There is a close correspondence between models four and five in spite of the fact that they are based on real flight- and simulated flight-data, respectively. In the sixth model (Figure 23) we found that the co-variation of psychological and psychophysiological variables forms a workload factor, and that that this factor affects a second order performance factor. In the final model (Figure 24) the perceived workload increases heart rate and decreases situational awareness. Increases in heart rate also decrease situational awareness. Situational awareness affects performance in the same way as in the models described above. We believe that the causal relationships found in our modelling research form a valuable input to computer models. The more precise information we have about psychological and psychophysiological processes, the better the computer models and simulations of human behaviour.
GARTEUR FM AG13 FINAL REPORT – GARTEUR TP 145
147
7 Concluding remarks
As made evident by the descriptions of the various mental workload measures in Chapter 2 of the present report, all the measures have their pros and cons. Different levels of experimenter knowledge are certainly required in order to apply the measures and to analyse the results. They also require a different amount of special apparatus. The lack of “redline values”, indicating too high (or too low) mental workload is evident for most of the measures. There is therefore a need for further development of analytical methods with high diagnostic capability to analyse task demands and predict mental workload in early design stages. Changes in workload levels should always be related to aspects of performance and other constructs seen as important, such as for example situation awareness. Even though the definition of the mental workload construct is not fixed, and the full understanding of the underlying mechanisms in the human brain is not understood, it is still important to try to measure mental workload. As a parallel even the structural mechanics of say bridge building and the development of cracks in structures are not fully understood, but continued development of measures for crack development increases the predictive power of different equations and measures even though the underlying mechanisms still are not fully understood. The sole measurement of objective performance variables, say hits and misses when evaluating a new weapons performance, is not enough for optimal systems development. A system might function well enough, but with high mental effort and the need of expensive training on behalf of the pilots, resulting in a system with an unnecessarily high total life-cycle cost. Statistical modelling often becomes necessary as simple correlations between task load and mental workload often are hard to find, due to the strategic re-allocation of mental resources exhibited by skilled operators. Performance also exhibits graceful degradation when mental resources dwindle, as the operator focuses on central tasks. As put forward in chapter 1 of this report, mental workload is a multidimensional concept, and hence the best conclusions are achieved when a number of measures are combined, and results are aggregated. With an increasing number of the human bodily functions being tapped for information regarding the operator’s mental state the problem of mental workload classification not only grows, but also transforms. As the number of different measures used increase, both in absolute numbers and the number of channels in the psycho-physiological measurements, the problem is not just the application and data collection but also the aggregation of several data sources. So with the multifaceted construct of mental workload, the adaptivity and complexity

GARTEUR FM AG13 FINAL REPORT – GARTEUR TP 145
148
of human action in a complex situation the quest for the “one measure” becomes questionable. Perhaps more energy should be directed towards methods on how to combine data from different measures. Some methods for data reduction and aggregation of results have been described in the report, but for online classification of a pilot’s mental workload other techniques will be needed such as for example artificial neural networks, genetic algorithms and fuzzy logic in different forms and combinations. The need for online classification of the pilot’s mental workload becomes critical if the quest for systems adaptive to the pilot’s mental state is to succeed. However, for the industrial practitioner in a design process, much valuable design input can be collected with more easily administered and analysed measures. The design process is much better off with measures that are simple to administer (for example, workload questionnaires) rather than none at all. The novice practitioner should thus not be deterred by the requirements of some of the psychophysiological measures. If in fact these more complex measures are to be used, it is highly recommended that first-time users collaborate with experienced laboratories with several years experience of using psychophysiological measures in applied contexts. The involvement of human factors specialists in workload studies is also highly recommended. As for most human factors work, the need to approach the design process early and with systematicity is clear. Mental workload can be measured both early and late in the development process. When the mental workload measurement has become a natural part of the development cycle, the developer will be able to build an understanding of which aspects in the design are critical for managing the mental workload. In the end, mental workload measurements help bring human factors considerations to the same “game-table” as technical design considerations. With mental workload seen as a performance modifier for the capacity of the whole pilot (or operator) and aircraft system, mental workload as an influential factor is equally as important as for example laws of aerodynamics or computer system performance.

GARTEUR FM AG13 FINAL REPORT – GARTEUR TP 145
149
8 References
Anderson J. R. (1993). Rules of the Mind. In Anderson J.R. & Matessa M. P (Eds.). A Production System Theory of Serial Memory. Lawrence Erlbaum Associates. Angelborg-Thanderz, M. (1982). Assessing pilot performance and mental workload in training simulators. The Royal Aeronautical Society, London. Angelborg-Thanderz, M. (1989). Assessing pilot performance in training simulators - A structural analysis. Proceedings of 1989 Spring Convention - Flight simulation: Assessing the benefits and economics, The Royal Aeronautical Society, London. Angelborg-Thanderz, M. (1990). Military flight training at a reasonable price and risk. Economics Research Institute, Stockholm School of Economics and FOA report C-50083- 5.1. (report in Swedish, summary in English). Angelborg-Thanderz, M. (1997). Military pilot performance – dynamic decisionmaking in its extreme, in Decision Making Under Stress, Emerging Themes and Applications, (eds.), Flin, F., Salas, E., Strub, M., and Martin, L. (Ashgate Publishing Company, Aldershot. Hants, England), p. 225-232. Beach, L. R., & Mitchell, T. R. (1998). The basic of image theory. In Beach L. R. Image theory: Theoretical and empirical foundations. Hove: Lawrence Erlbaum Associates. Bohnen, H. G. M., & Jorna, P. G. A. M. (1997). Cockpit Operability and Design Evaluation Procedure (CODEP). A systematic approach to cockpit effectiveness. Amsterdam: NLR TP 97621 L. Boyer M. and Chaudron L. (2000). Airport noise/annoyance analysis. In Proceedings of ICAS’2000 Intl. Congress for Aeronautical Sciences, Harrogate, United Kingdom, 27 August-1 September 2000. Caldwell, J. A., Wilson, G. F., Cetinguc, M., Gallard, A. W. K., Gundel, A., Lagarde, D., Makeig, S., Myhre, G. and Wright, N. A. (1994) Psychophysiological assessment methods, AGARD-AR-324. Neuilly Sur Seine, France: NATO.

GARTEUR FM AG13 FINAL REPORT – GARTEUR TP 145
150
Card, S. K., Moran, T. P., & Newell, A. (1986). The model human processor. An engineering model of human performance. In Handbook of perception and human performance, Volume II; cognitive processes and performance. New York: Wiley. Carmody, M. A. (1994). Current issues in the measurement of military aircrew performance: A consideration of the relationship between available metrics and operational concerns. Air Vehicle and Crew Systems Technology Department, Naval Air Warfare Center: Aircraft Division, Warminster, PA. Carver, C. S., & Scheier, M. F. (2000) On the structure of behavioural self-regulation. In Boekaerts M. & Pintrich, P. (Eds); et al; 2000. Handbook of self-regulation. San Diego, US: Academic Press. p. 41-84 Chaudron L. and Maille N. (2000). Generalized formal concept analysis. In Proceedings of ICCS'2000 Intl. Conf. on Conceptual Structures, Darmstadt, Germany, 14 - 18 August 2000. Cooper, G.E. and Harper, R.P. (1969). The use of pilot rating in the evaluation of aircraft handling qualities. NASA TN D-5153. Corker. K.M & Smith, B.R. (1993). An architecture and model for cognitive engineering simulation analysis: application to advanced aviation automation. American Institute of Aeronautics and Astronautics, p.1079-1088. Dahn, D.A., Laugehry, K.R. & Belyavin, A.J. (1997). The integrated performance modelling environment: a tool for simulating human-system performance. Proceedings of the 42ste Human Factors and Ergonomics Society Conference, p. 1037-1041. Davey, B.A. and Priestley, H.A. (1990). Introduction to lattices and order. Cambridge University Press. DCIEM, Defence and Civil Institute of Environmental Medicine (1988). A preliminary examination of mental workload, its measurement and prediction. Technical Report No. AD-B123-23, Canada: DCIEM. Endsley, M. R. (1995a). Theoretical underpinnings of situational awareness: A critical review, in D. Garland, and M. R. Endsley (eds) Experimental Analysis and Measurement of Situational Awareness. Embry-Riddle Aeronautical University Press, Daytona Beach.

GARTEUR FM AG13 FINAL REPORT – GARTEUR TP 145
151
Endsley, M. R (1995b). Toward a Theory of Situation Awareness in Dynamic Systems Situation Awareness Global Assessment Technique. Human Factors, 37 (1), p. 32-64. Fassinger, R. E. (1987). Use of structural equation modeling in counceling psychology research. Journal of Counceling Psychology, 34, p. 425-436. Fitzgerald, L.F., and Hubert, L.J. (1987). Multidimensional scaling: some possibilities for counseling research. Journal of Counseling Psychology, 34, p. 469-480. Flügel, S. & Ågren, L. (2001). Recommendations for the Design of a Future Command and Control Table. Department of Computer and Information Science, Linköping University. Gorsuch, R.L. (1974). Factor analysis. Saunders Company, Philadelphia. Hair, J.F., Jr., Anderson, R.E., Tatham, R.L., and Black, W.C. (1998). Multivariate data analysis. Prentice Hall, New Jersey. Hanson, E.K.S. and Bazanski J. (2001). Ecological Momentary Assessments in Aviation. In Progress ambulatory measurements, edited by Fahrenberg, J. and Myrtek. Seattle: Hogrefe & Huber. Hart, S. (1988). Workload: A new perspective. NASA-Ames, Moffett Field. Hockey, G. R. J. (1986). A state-control theory of adaption of stress and individual differences in state management. In Hockey G. R. J, Gaillard A. W. K., and Coles M. G. H. Energetics and human information processing. Dordrecht: Martinus Nijhoff Publishers. p. 285-298. Hoogeboom, P. J. (2000). DIVA – WP3: Evaluation methodology. Amsterdam. NLR-TR-2000-517. Jöreskog K.G., and Sörbom, D. (1984). LISREL VI. Analysis of linear structural relationships by maximum likelihood, instrumental variables, and least squares methods, Department of Statistics, University of Uppsala, Sweden. Jöreskog K.G., and Sörbom, D. (1993). LISREL8: Structural equation modeling with the SIMPLIS command language. Lawrence Erlbaum Associates, Inc., Hillsdale.

GARTEUR FM AG13 FINAL REPORT – GARTEUR TP 145
152
Jorna, P. G. A. M. (1991). Operator workload as a limiting factor in complex systems. In Wise J and Hopkin D. Automation and systems issues in ATC. NATO ASI series. Kantowitz, B.H. (1988). Defining and measuring mental workload. In: Comstock, J.R. (Ed.), Mental State Estimation. National Aeronautics and Space Administration, Scientific and Technical Information Division, Hampton, p. 179-188. Kirwan, B., & Ainsworth, L. K. (1992). A guide to task analysis. London: Taylor & Francis. Kramer, A. F. (1991). Physiological metrics of mental workload: A review of recent progress. In Damos DL. Multiple task performance. p. 279-360. Taylor & Francis. Laird, J., Newell A., and Rosenbloom, P. (1987). SOAR: An Architecture for General Intelligence. Artificial Intelligence, 33, p. 1-64. Lysaght R. J., Hill S. G., Dick A. O., Plamondon B. D., Linton P. M., Wierwille W. W., Zaklad A. L., Bittner Jr A. C., Wherry R. J. (1989). Operator workload: comprehensive review and evaluation of operator workload methodologies. U.S. Army Research Institute. Fort Bliss, TX: Technical Report No. 851 MDA 903-86-C-0384. MacLeod, I.S, Wells, L., & Lane, K. (2000). The Practice of Triangulation. Contemporary Ergonomics 2000. Taylor and Francis. Maraoka, K., & Okada, N. (2000). FBSS-RAIS: Flight crew behavior SimulationSystem – Reconstruction of Accident/Incident Scenario. AIAA Modeling and Simulation Technologies & Exhibit, Denver, August, 2000. The American Institute of Aeronautics and Astronautics. McMillan, G. R., Bushman, J. and C. L. A. Judge. (1996). Keynote Adress: - Evaluating Pilot Situational Awareness in an Operational Environment, in AGARD Conference Proceedings 575, Situational Awareness: Limitations and Enhancement in the Aviation Environment. Brussels. Millar, R.C., Hart, S.G. (1984). Assessing the subjective workload of directional orientation tasks. Proceedings of the 20th Annual Conference on Manual Control. Moray, N.P. (1979). Mental workload: Theory and measurement. New York: Plenum. Proceedings of the IEEE National aerospace and electronics conference, (pp 789-795).
GARTEUR FM AG13 FINAL REPORT – GARTEUR TP 145
153
Richardson J.T.E. (Ed) (1996). Handbook of Qualitative Research Methods for Psychology and the Social Sciences. BPS Books, Leicester, UK. Saris, W., & Stronkhorst, H. P. (1984). Causal modelling in non experimental research. An introduction to the LISREL approach. Amsterdam: Sociometric Research Foundation. Schiffrin, S. S., Reynolds, M. L., and Young, F. W. (1981). Introduction to multi-dimensional scaling theory, methods, and applications. Academic Press, New York. Smaili, M. H. (2000). Flight data reconstruction and simulation of the 1992 Amsterdam Bijlmermeer airplane accident. AIAA Modeling and Simulation Technologies & Exhibit, Denver, August, 2000. The American Institute of Aeronautics and Astronautics. Staveland, L. (1991). MIDAS TLM: Man-machine Integrated Design and Analysis System Task Loading Model. Proceedings of EEE/SMC, p.1219-1223. Staveland, L. (1994). Man-machine Integration Design and Analysis System (MIDAS) Task Loading Model (TLM) experimental and software detailed design report. NASA CR-177640. Svensson, E., Angelborg-Thanderz M., Sjöberg, L., and Gillberg, M. (1988), Military flight experience and sympatho-adrenal activity. Aviation, Space, and Environmental Medicine, 59, p. 411-416. Svensson, E., Angelborg-Thanderz, M., and Sjöberg, L. (1993). Mission challenge, mental workload and performance in military aviation, Aviation, Space, and Environmental Medicine, 64, p. 985-991. Svensson, E., and Angelborg-Thanderz, M. (1995). Mental workload and performance in combat aircraft: systems evaluation, In Fuller, R., Johnston, N., and McDonald, N. (Eds), Human Factors in Aviation Operations. Aldershot, Hants, England: Avebury Aviation. Svensson, E. (1997). Pilot mental workload and situational awareness – psychological models of the pilot, in Decision Making Under Stress, Emerging Themes and Applications, (eds.), Flin, F., Salas, E., Strub, M. and Martin, L. (Ashgate Publishing Company, Aldershot. Hants, England), p. 261-267.
GARTEUR FM AG13 FINAL REPORT – GARTEUR TP 145
154
Svensson, E., Angelborg-Thanderz, M., and van Awermaete, J. (1997). Dynamic measures of pilot mental workload, pilot performance, and situational awareness. Technical Report: VINTHEC-WP3-TR01. NLR, Amsterdam. Svensson, E., Angelborg-Thanderz, M., Sjöberg, L., and Olsson, S. (1997). Information complexity - mental workload and performance in combat aircraft. Ergonomics, 40, 362-380. Systems. Svensson, E., Angelborg-Thanderz, M., & Wilson, G. F. (1999). Models of pilot performance for systems and mission evaluation – psychological and psychophysiological aspects. AFRL-HE-WP-TR-1999-0215. Svensson, E. (2000) Models of pilot performance – effects of motivation and form. Paper presented at the ’5th Conference on Naturalistic Decision Making’, Tammsvik, Stockholm, May 26-28, 2000. Svensson, E., & Angelborg-Thanderz, M. (2000). Simulated landings in turbulence – motion, predictive modelling, and psychometric aspects. American Institute of Aeronautics and Astronautics, AIAA-2000-4076. Svensson, E., and Wilson, G.F. (2002). Psychological and psychophysiological models of pilot performance for systems development and mission evaluation. International Journal of Aviation Psychology, Vol 12 (1). p. 95-110. Tinsley, H.F., and Tinselly, DJ (1987). Uses of factor analyses in counseling psychology research. Journal of Counseling Psychology, 34, p. 414-424. Wickens, C. D. (1984). Engineering psychology and human performance. Columbus: Merrill. Wickens, C.D. (1986). The effects on control dynamics on performance. In K.R. Boff, L. Kaufman & J.P. Thomas (Eds), Handbook of Perception and Human Performance. Wiley, New York, NY. Wilkinson, L. (1990) SYSTAT: The system for statistics. SYSTAT Inc, Evanston.
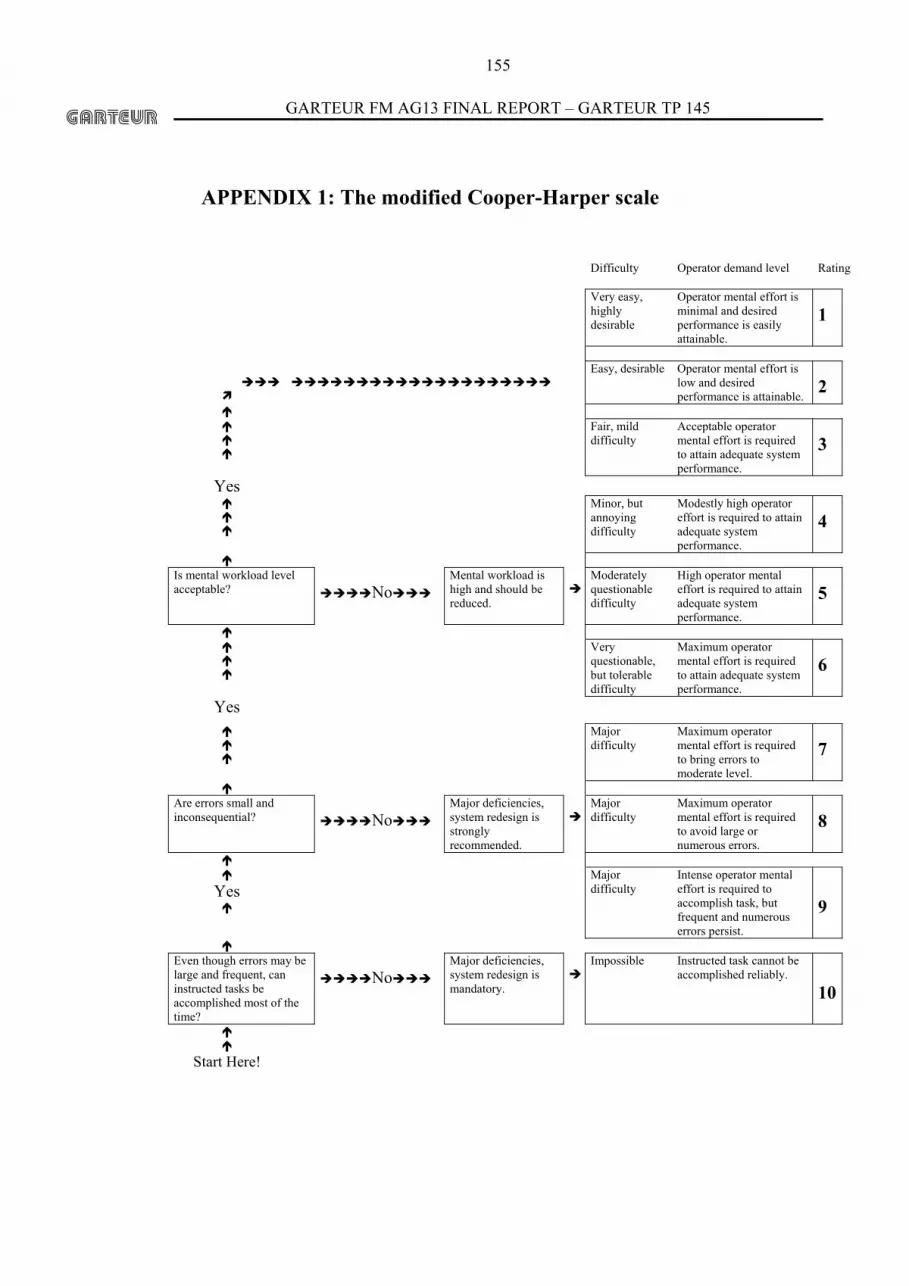
GARTEUR FM AG13 FINAL REPORT – GARTEUR TP 145
155
APPENDIX 1: The modified Cooper-Harper scale
Difficulty Operator demand level Rating
Very easy,
highly desirable
Operator mental effort is minimal and desired performance is easily attainable.
1
Easy, desirable Operator mental effort is low and desired performance is attainable.
2
Fair, mild difficulty
Acceptable operator mental effort is required to attain adequate system performance.
3
Yes
Minor, but annoying difficulty
Modestly high operator effort is required to attain adequate system performance.
4
Is mental workload level acceptable?
No
Mental workload is high and should be reduced.
Moderately questionable difficulty
High operator mental effort is required to attain adequate system performance.
5
Very questionable, but tolerable difficulty
Maximum operator mental effort is required to attain adequate system performance.
6
Yes
Major difficulty
Maximum operator mental effort is required to bring errors to moderate level.
7
Are errors small and inconsequential?
No
Major deficiencies, system redesign is strongly recommended.
Major difficulty
Maximum operator mental effort is required to avoid large or numerous errors.
8
Yes
Major difficulty
Intense operator mental effort is required to accomplish task, but frequent and numerous errors persist.
9
Even though errors may be large and frequent, can instructed tasks be accomplished most of the time?
No
Major deficiencies, system redesign is mandatory.
Impossible Instructed task cannot be accomplished reliably.
10
Start Here!

GARTEUR FM AG13 FINAL REPORT – GARTEUR TP 145
156
APPENDIX 2: The Bedford scale
Workload description
Rating
Workload insignificant. 1
Workload low. 2
Enough spare capacity for all desirable additional tasks 3
Yes
Insufficient spare capacity for easy attention to additional tasks. 4
Was workload satisfactory without reduction?
No
Reduced spare capacity, additional tasks cannot be given the desired amount of attention. 5
Little spare capacity, level of effort allows little attention to additional tasks.
6
Yes
Very little spare capacity, but maintenance of effort in the primary task not in question.
7
Was workload tolerable for the task?
No
Very high workload with almost no spare capacity. Difficulty in maintaining level of effort.
8
Yes
Extremely high workload. No spare capacity. Serious doubts as to ability to maintain level of effort.
9
Was it possible to complete the task?
No
Task abandoned. Pilot unable to apply sufficient effort.
10
Start here!

GARTEUR FM AG13 FINAL REPORT – GARTEUR TP 145
157
APPENDIX 3: Rating Scale Mental Effort
Rating Scale Mental Effort(RSME)
Please indicate, by placing a mark on the vertical line belowhow much effort you had to invest in order to execute the task(that you have just been working on)
150
140
130
120
110
100
90
80
70
60
50
40
30
20
10
0
Exceptional
Very strong
Strong
Fair
Reasonable
Somewhat effortful
A little effortful
Hardly effortful
Not at all effortful
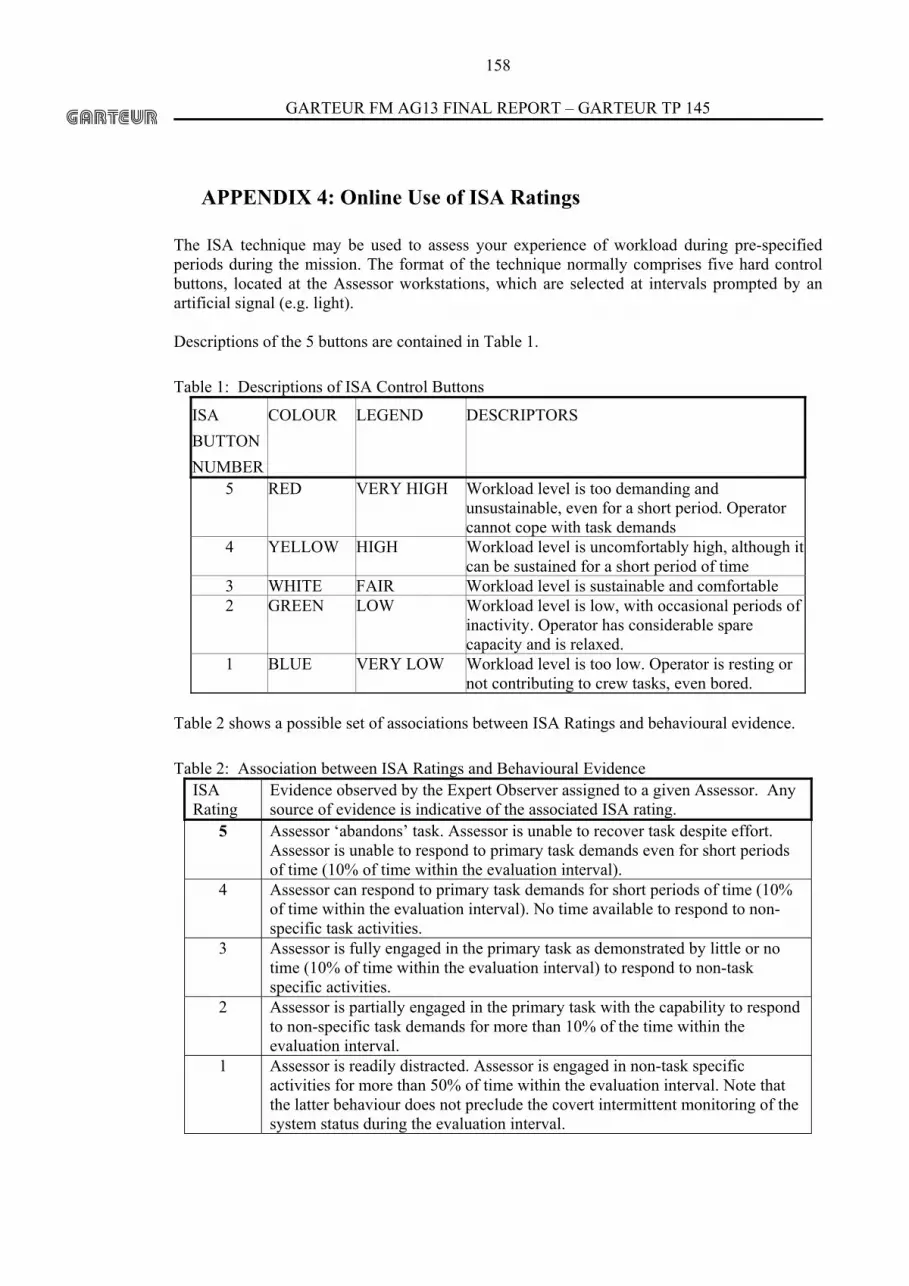
GARTEUR FM AG13 FINAL REPORT – GARTEUR TP 145
158
APPENDIX 4: Online Use of ISA Ratings
The ISA technique may be used to assess your experience of workload during pre-specified periods during the mission. The format of the technique normally comprises five hard control buttons, located at the Assessor workstations, which are selected at intervals prompted by an artificial signal (e.g. light). Descriptions of the 5 buttons are contained in Table 1. Table 1: Descriptions of ISA Control Buttons
ISA BUTTON NUMBER
COLOUR LEGEND DESCRIPTORS
5 RED VERY HIGH Workload level is too demanding and unsustainable, even for a short period. Operator cannot cope with task demands
4 YELLOW HIGH Workload level is uncomfortably high, although it can be sustained for a short period of time
3 WHITE FAIR Workload level is sustainable and comfortable 2 GREEN LOW Workload level is low, with occasional periods of
inactivity. Operator has considerable spare capacity and is relaxed.
1 BLUE VERY LOW Workload level is too low. Operator is resting or not contributing to crew tasks, even bored.
Table 2 shows a possible set of associations between ISA Ratings and behavioural evidence. Table 2: Association between ISA Ratings and Behavioural Evidence
ISA Rating
Evidence observed by the Expert Observer assigned to a given Assessor. Any source of evidence is indicative of the associated ISA rating.
5 Assessor ‘abandons’ task. Assessor is unable to recover task despite effort. Assessor is unable to respond to primary task demands even for short periods of time (10% of time within the evaluation interval).
4 Assessor can respond to primary task demands for short periods of time (10% of time within the evaluation interval). No time available to respond to non-specific task activities.
3 Assessor is fully engaged in the primary task as demonstrated by little or no time (10% of time within the evaluation interval) to respond to non-task specific activities.
2 Assessor is partially engaged in the primary task with the capability to respond to non-specific task demands for more than 10% of the time within the evaluation interval.
1 Assessor is readily distracted. Assessor is engaged in non-task specific activities for more than 50% of time within the evaluation interval. Note that the latter behaviour does not preclude the covert intermittent monitoring of the system status during the evaluation interval.

GARTEUR FM AG13 FINAL REPORT – GARTEUR TP 145
159
APPENDIX 5: NASA TLX
Reprinted with permission. Human Performance Research Group NASA Ames Research Center Moffet Field, California The Workload Comparison Cards Cards with these texts are used in the cardsort. Effort or Performance Temporal demand or Frustration Temporal demand or Effort Physical demand or Frustration Performance or Frustration Physical demand or Temporal demand Physical demand or Performance Temporal demand or Mental demand Frustration or Effort Performance or Mental demand Performance or Temporal Demand Mental demand or Effort Mental demand or Physical demand Effort or Physical demand Frustration or Mental demand

GARTEUR FM AG13 FINAL REPORT – GARTEUR TP 145
160
NASA TLX Rating Sheet Subject ID: Task ID: Mental demand Low High
Physical demand Low High
Temporal demand Low High
Performance
Good Poor
Effort Low High
Frustration Low High
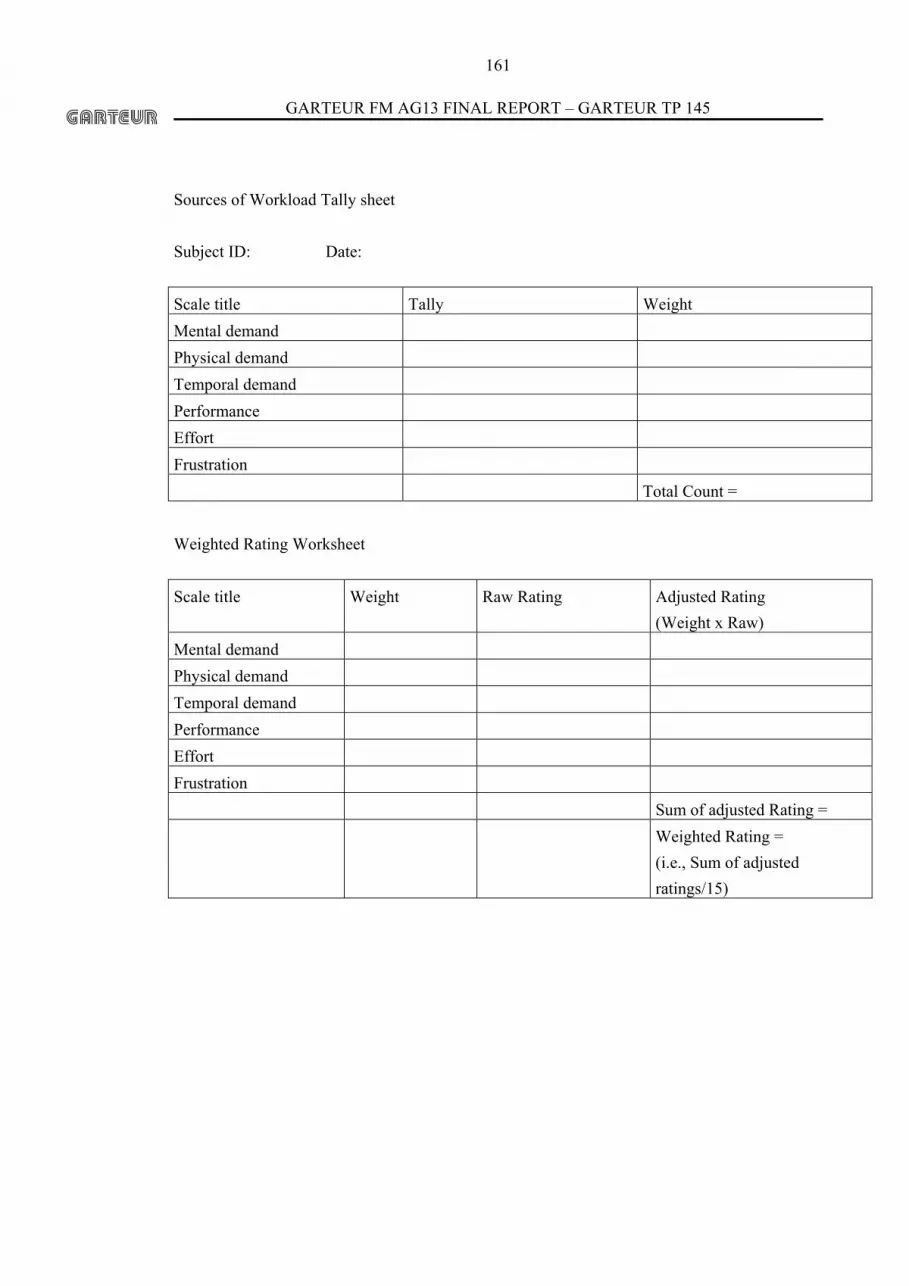
GARTEUR FM AG13 FINAL REPORT – GARTEUR TP 145
161
Sources of Workload Tally sheet Subject ID: Date: Scale title Tally Weight Mental demand Physical demand Temporal demand Performance Effort Frustration Total Count = Weighted Rating Worksheet Scale title Weight Raw Rating Adjusted Rating
(Weight x Raw) Mental demand Physical demand Temporal demand Performance Effort Frustration Sum of adjusted Rating = Weighted Rating =
(i.e., Sum of adjusted ratings/15)


GARTEUR FM AG13 FINAL REPORT – GARTEUR TP 145
163
APPENDIX 6: DRA Workload Scales (DRAWS)
The items below consider separately the demands associated with: a) receiving the information necessary to perform the task b) performing mental operations on this information c) making responses d) the time pressure associated with the task

GARTEUR FM AG13 FINAL REPORT – GARTEUR TP 145
164
Use the cursor to indicate your assessment of each demand. Point at the appropriate point on each line in tun, and click the left mouse button. The graduations on the bar are equivalent to the different workload levels used in the Bedford or Cooper-Harper workload scales.
Low workload demand Moderate demand High demand Excessive demand
INPUT DEMAND:
How much demand was imposed by the acquisition of information
from external sources (e.g. from a visual display or auditory signals)?
CENTRAL DEMAND:
How much demand was imposed by the mental operations (e.g.
memorisation, calculation, decision making) required by the task?
OUTPUT DEMAND:
How much demand was imposed by the responses (e.g. keypad
entries, control adjustments, vocal utterances) required by the task?
TEMPORAL DEMAND:
How much demand was imposed by time pressure?


