Embed Size (px)
Citation preview
Trends and markets to watch
Future of Trade 2030

0302 Future of Trade 2030
Globalisation is not dead. On the contrary, it is very much alive, with global trade predicted to grow by 70 per cent to almost USD30 trillion by the end of this decade. That’s the headline from our new research based on the analysis of trade data and a survey of more than 500 C-suite and senior leaders in global companies.
The report also identifies 13 markets across Asia, Africa and the Middle East that will drive much of this growth.
‘Future of Trade’ identifies five trends that are shaping globalisation, including a wider adoption of sustainable and fair-trade practices; a push for more inclusive trade, with more people participating; greater risk diversification; more digitisation; and an accelerated shift towards high-growth emerging markets.
It has been well documented that intra-regional trade is growing in response to pandemic-led disruptions and a shift to ‘just-in-case’ supply chains, as well as with growing sources of consumer demand in developing markets.
Growth paths, however, are not limited to proximity: trade corridors of the future will still cut across continents – between South Asia and the US; between Africa and Asia; between Europe and East Asia and between the Middle East and Asia.
The research shows that 89 per cent of company leaders recognise the need to implement sustainable trade practices, but only 34 per cent say it’s a top-three priority over the next five to 10 years. To help them address this challenge and contribute to the net zero transition, we recently launched a range of new Sustainable Trade Finance solutions.
To improve participation in global trade, we will need to make it more accessible, transparent and secure. Our partnerships with leading supply chain platforms including Contour, SAP Ariba and Linklogis are using tools including blockchain and AI to make trade finance more widely and efficiently accessible by lowering cost whilst increasing security. Our B2B marketplace, Solv, digitises end-to-end transactions and goes beyond finance to provide access to services such as professional accounting and HR.
These are some of the ways that we are trying to help make globalisation work for more markets and businesses, ranging from micro to multinational, and drive a more sustainable and inclusive model for global trade.
Foreword
Simon CooperCEO Corporate, Commercial & Institutional Banking and Europe & the Americas

05Future of Trade 203004
Contents
Executive summary 4Global trade in 2030Survey snapshot
The trends shaping global trade 14The future of global tradeSustainable and fair tradeInclusive participationDigitalisationRisk diversificationRebalancingOutlook 2030
Corridors of the future 34
East Asia 40Hong Kong 42
Mainland China 60
South Korea 76
ASEAN 92Indonesia 94
Malaysia 110Singapore 126
Vietnam 144
South Asia 160Bangladesh 162
India 178
Middle East 194Saudi Arabia 196
United Arab Emirates 212
Africa 228Kenya 230
Nigeria 246
Appendix 262Key sources 266Disclaimer 267
06 Future of Trade 2030 07
Executive summary
Executive summary 07
Global exports to hit
USD 29.7 trillion
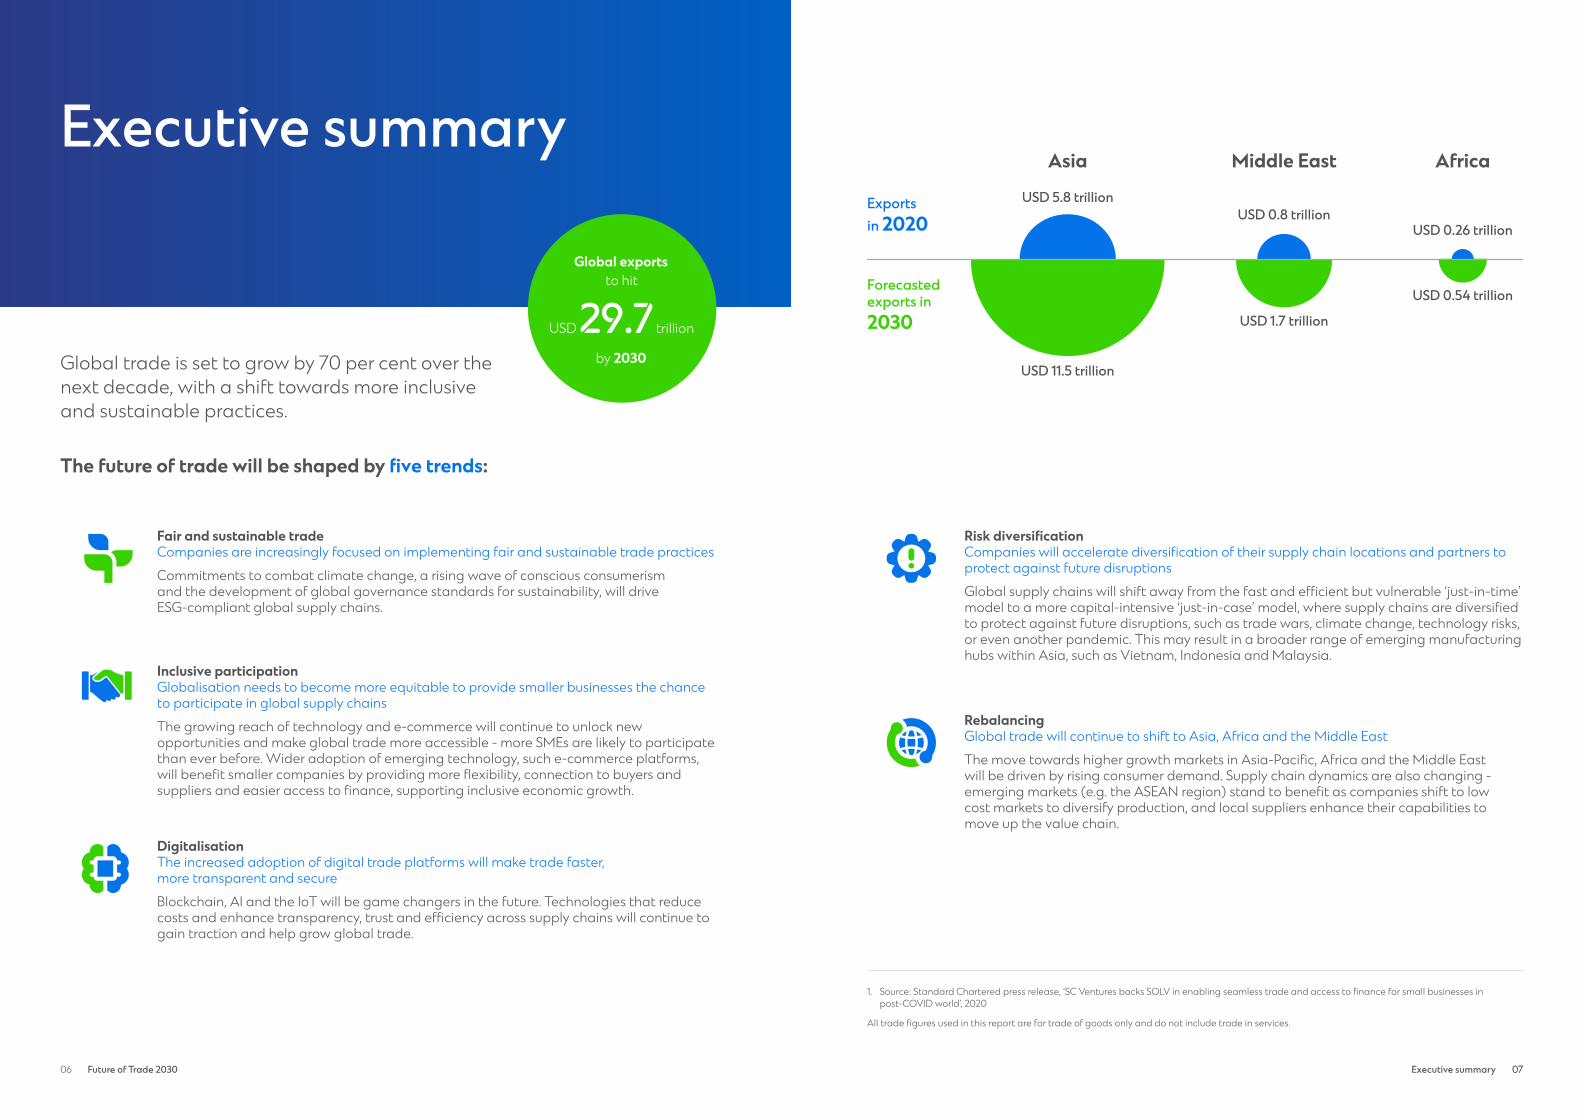
by 2030Global trade is set to grow by 70 per cent over the next decade, with a shift towards more inclusive and sustainable practices.
The future of trade will be shaped by five trends:
RebalancingGlobal trade will continue to shift to Asia, Africa and the Middle East
The move towards higher growth markets in Asia-Pacific, Africa and the Middle East will be driven by rising consumer demand. Supply chain dynamics are also changing - emerging markets (e.g. the ASEAN region) stand to benefit as companies shift to low cost markets to diversify production, and local suppliers enhance their capabilities to move up the value chain.
Risk diversificationCompanies will accelerate diversification of their supply chain locations and partners to protect against future disruptions
Global supply chains will shift away from the fast and efficient but vulnerable ‘just-in-time’ model to a more capital-intensive ‘just-in-case’ model, where supply chains are diversified to protect against future disruptions, such as trade wars, climate change, technology risks, or even another pandemic. This may result in a broader range of emerging manufacturing hubs within Asia, such as Vietnam, Indonesia and Malaysia.
DigitalisationThe increased adoption of digital trade platforms will make trade faster, more transparent and secure
Blockchain, AI and the IoT will be game changers in the future. Technologies that reduce costs and enhance transparency, trust and efficiency across supply chains will continue to gain traction and help grow global trade.
Inclusive participationGlobalisation needs to become more equitable to provide smaller businesses the chance to participate in global supply chains
The growing reach of technology and e-commerce will continue to unlock new opportunities and make global trade more accessible - more SMEs are likely to participate than ever before. Wider adoption of emerging technology, such e-commerce platforms, will benefit smaller companies by providing more flexibility, connection to buyers and suppliers and easier access to finance, supporting inclusive economic growth.
Fair and sustainable tradeCompanies are increasingly focused on implementing fair and sustainable trade practices
Commitments to combat climate change, a rising wave of conscious consumerism and the development of global governance standards for sustainability, will drive ESG-compliant global supply chains.
USD 0.26 trillion
USD 0.54 trillion
USD 0.8 trillion
USD 1.7 trillion
USD 5.8 trillion
USD 11.5 trillion
Asia Middle East Africa
Exports in 2020
Forecasted exports in 2030
1. Source: Standard Chartered press release, ‘SC Ventures backs SOLV in enabling seamless trade and access to finance for small businesses in post-COVID world’, 2020
All trade figures used in this report are for trade of goods only and do not include trade in services.
08 Future of Trade 2030 09
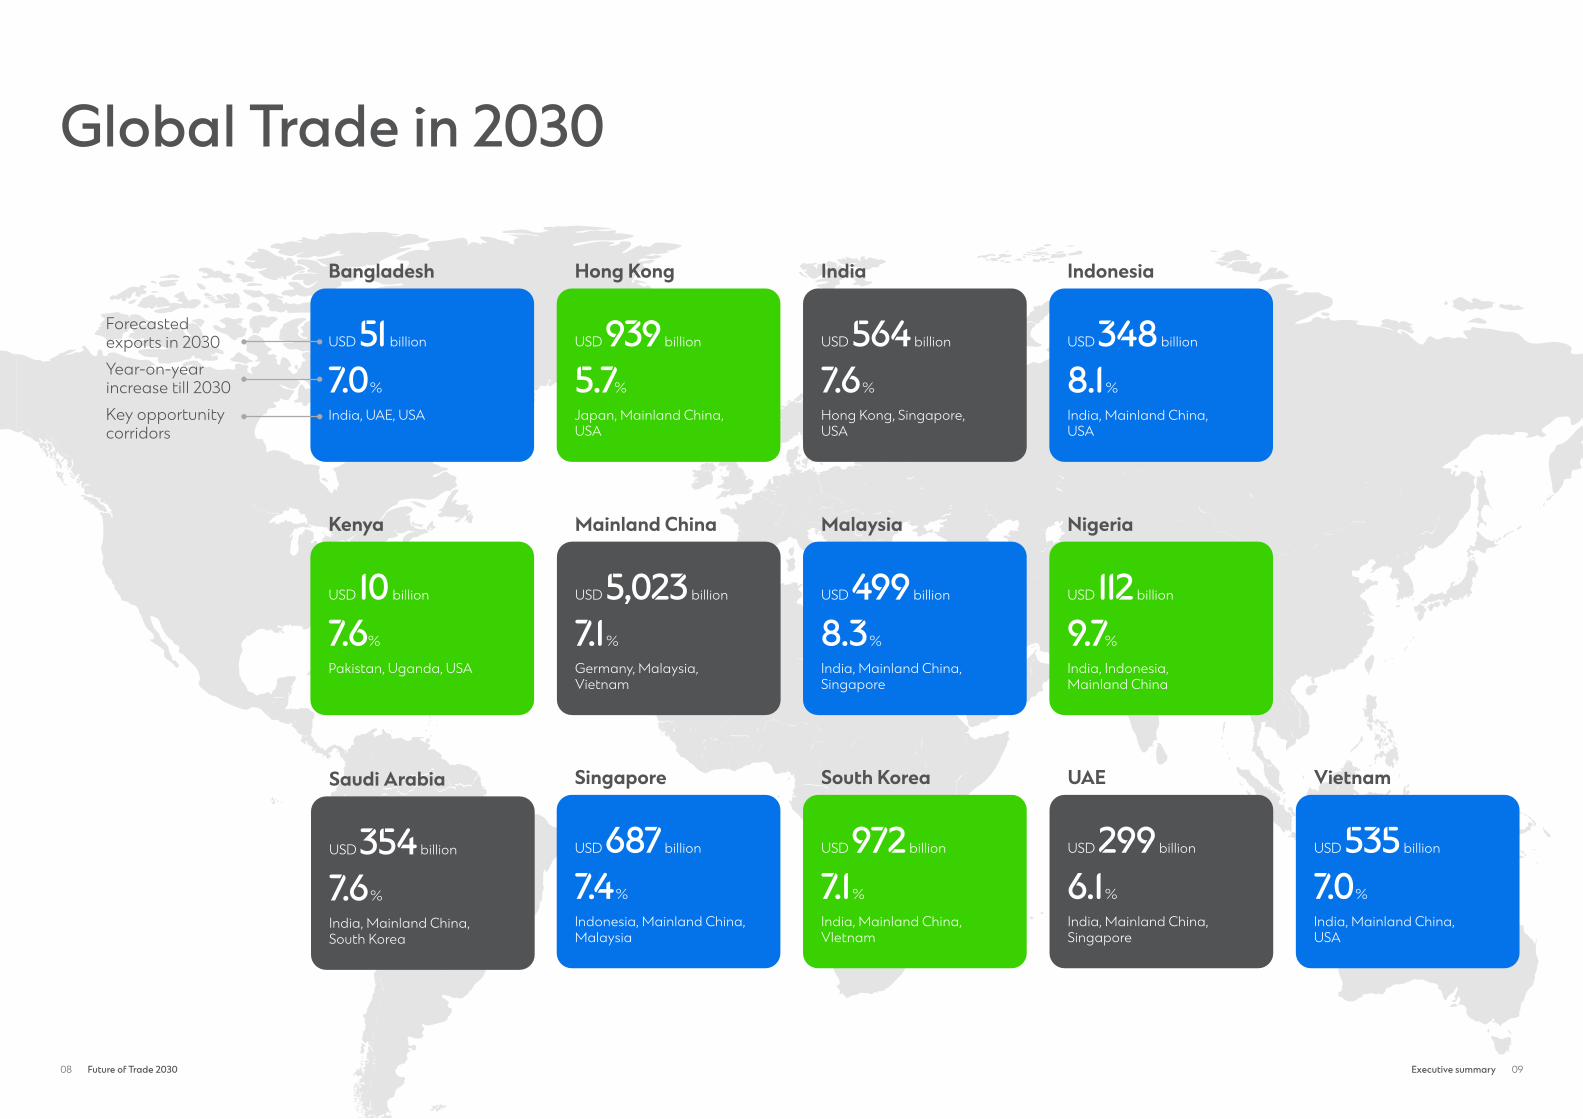
Global Trade in 2030
Forecasted exports in 2030Year-on-year increase till 2030Key opportunity corridors
USD 51 billion
7.0%
India, UAE, USA
Bangladesh
USD 939 billion
5.7%
Japan, Mainland China, USA
Hong Kong India
USD 564 billion
7.6%
Hong Kong, Singapore, USA
Indonesia
USD 348 billion
8.1%
India, Mainland China, USA
Saudi Arabia
USD 354 billion
7.6%
India, Mainland China, South Korea
Nigeria
USD 112 billion
9.7%
India, Indonesia, Mainland China
Singapore
USD 687 billion
7.4%
Indonesia, Mainland China, Malaysia
South Korea
USD 972 billion
7.1%
India, Mainland China, VIetnam
UAE
USD 299 billion
6.1%
India, Mainland China, Singapore
Vietnam
USD 535 billion
7.0%
India, Mainland China, USA
Kenya
USD 10 billion
7.6%
Pakistan, Uganda, USA
Mainland China
USD 5,023 billion
7.1%
Germany, Malaysia, Vietnam
Malaysia
USD 499 billion
8.3%
India, Mainland China, Singapore
Executive summary
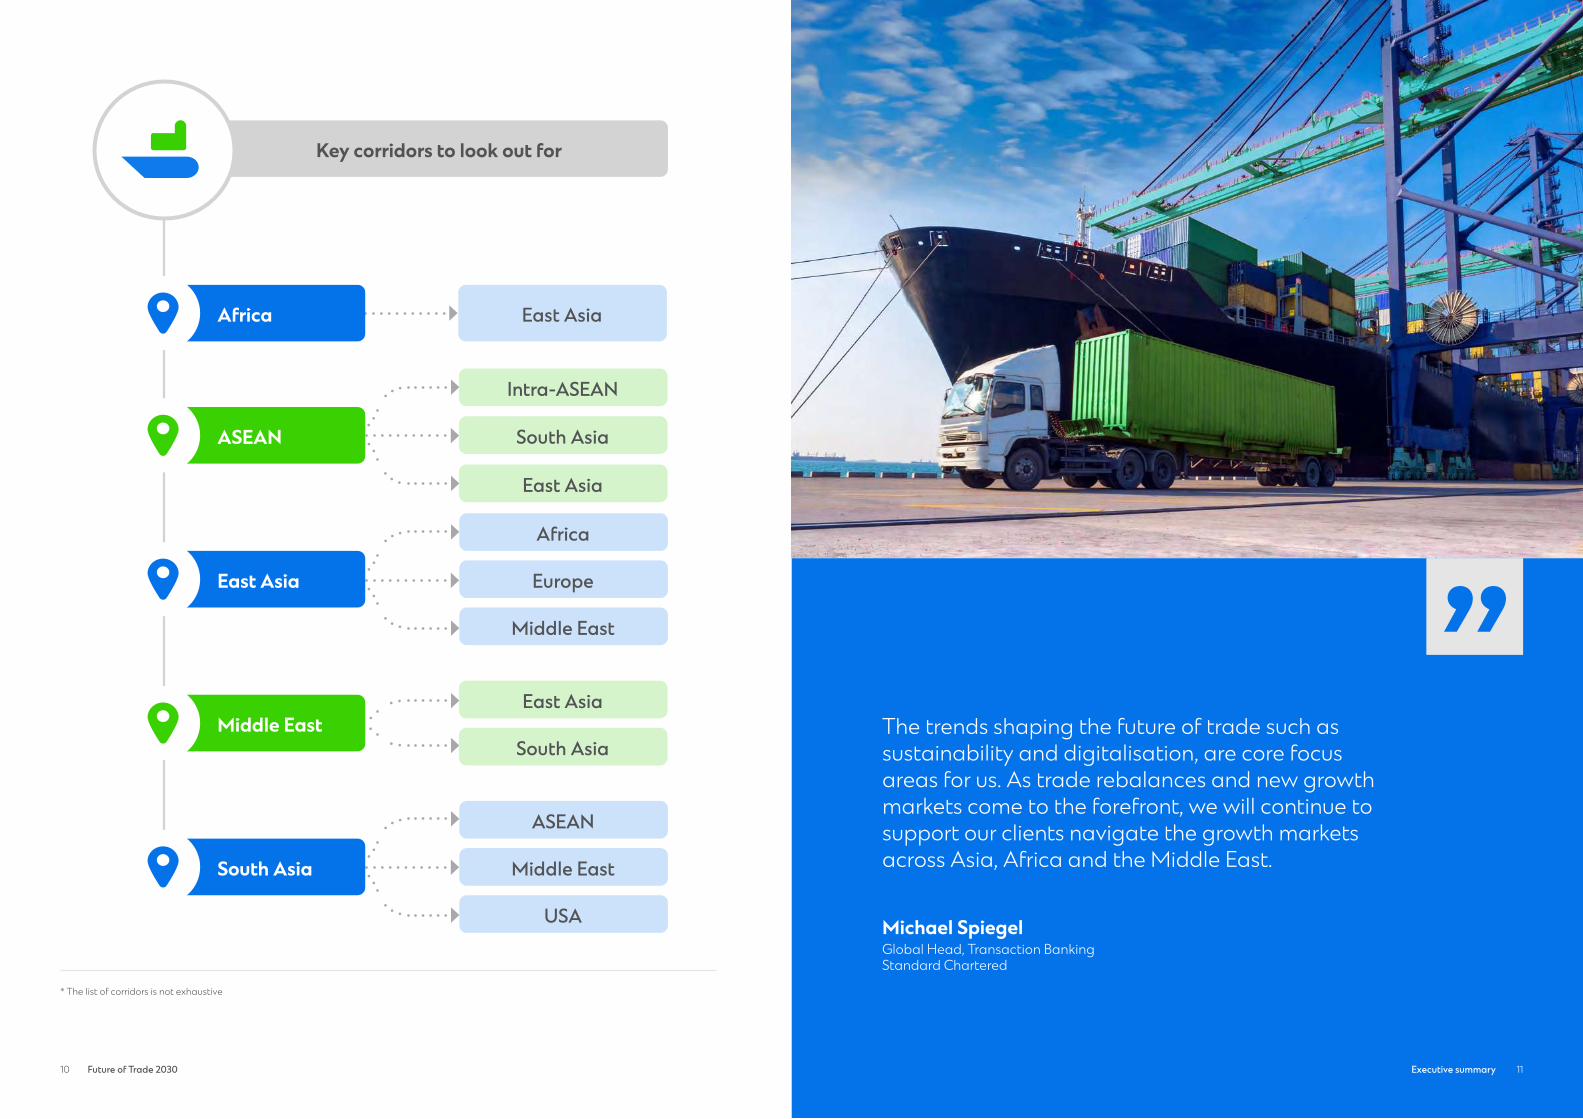
”The trends shaping the future of trade such as sustainability and digitalisation, are core focus areas for us. As trade rebalances and new growth markets come to the forefront, we will continue to support our clients navigate the growth markets across Asia, Africa and the Middle East.
Michael SpiegelGlobal Head, Transaction BankingStandard Chartered
10 Future of Trade 2030 11
* The list of corridors is not exhaustive
Key corridors to look out for
East Asia
Intra-ASEAN
South Asia
East Asia
East Asia
South Asia
Europe
Africa
Middle East
Middle East
ASEAN
USA
Africa
ASEAN
East Asia
Middle East
South Asia
Executive summary
12 Future of Trade 2030 13
Survey snapshot
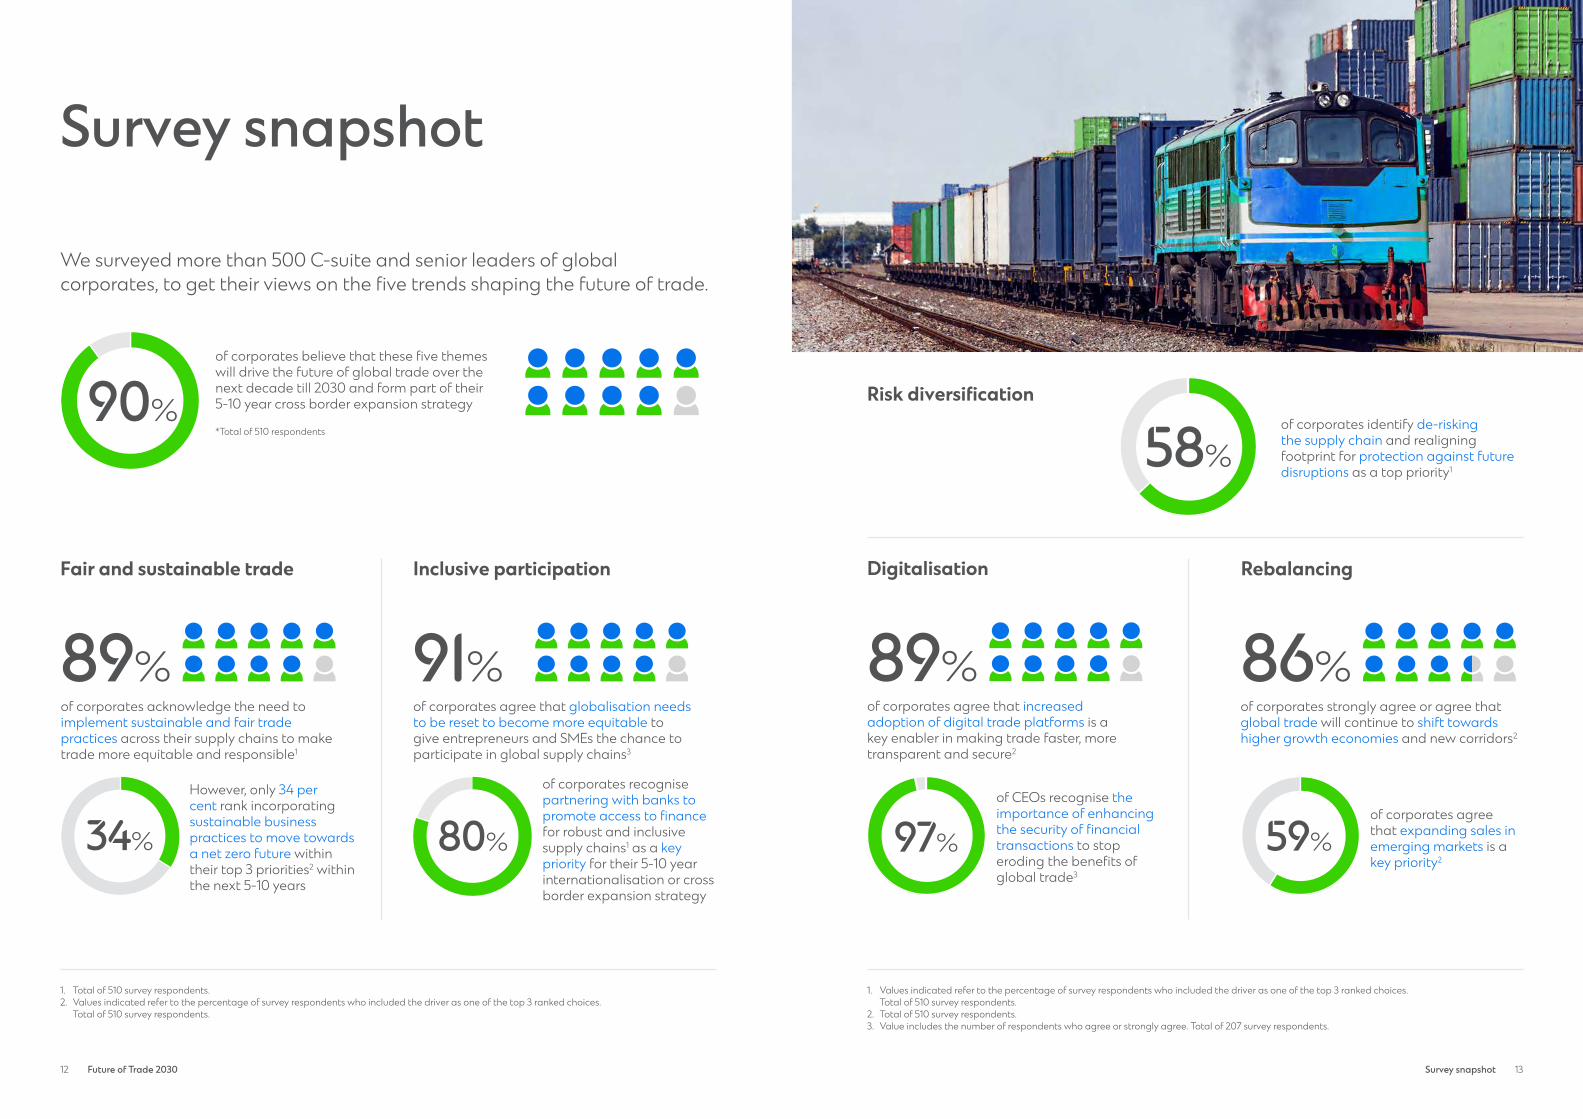
We surveyed more than 500 C-suite and senior leaders of global corporates, to get their views on the five trends shaping the future of trade.
Fair and sustainable trade Digitalisation
Risk diversification
Inclusive participation
90%
of corporates believe that these five themes will drive the future of global trade over the next decade till 2030 and form part of their 5-10 year cross border expansion strategy
*Total of 510 respondents
of corporates acknowledge the need to implement sustainable and fair trade practices across their supply chains to make trade more equitable and responsible1
89% 89%91%of corporates agree that globalisation needs to be reset to become more equitable to give entrepreneurs and SMEs the chance to participate in global supply chains3
of corporates agree that increased adoption of digital trade platforms is a key enabler in making trade faster, more transparent and secure2
of corporates identify de-risking the supply chain and realigning footprint for protection against future disruptions as a top priority1
58%
of CEOs recognise the importance of enhancing the security of financial transactions to stop eroding the benefits of global trade3
80%
of corporates recognise partnering with banks to promote access to finance for robust and inclusive supply chains1 as a key priority for their 5-10 year internationalisation or cross border expansion strategy
However, only 34 per cent rank incorporating sustainable business practices to move towards a net zero future within their top 3 priorities2 within the next 5-10 years
of corporates strongly agree or agree that global trade will continue to shift towards higher growth economies and new corridors2
34%of corporates agree that expanding sales in emerging markets is a key priority2
1. Total of 510 survey respondents.2. Values indicated refer to the percentage of survey respondents who included the driver as one of the top 3 ranked choices.
Total of 510 survey respondents.
1. Values indicated refer to the percentage of survey respondents who included the driver as one of the top 3 ranked choices. Total of 510 survey respondents.
2. Total of 510 survey respondents.3. Value includes the number of respondents who agree or strongly agree. Total of 207 survey respondents.
Rebalancing
86%
59%97%
Survey snapshot

Future of Trade 203014 15
The trends shaping global trade
16 Future of Trade 2030 17
Towards fairer and more inclusive trade
The future of global trade
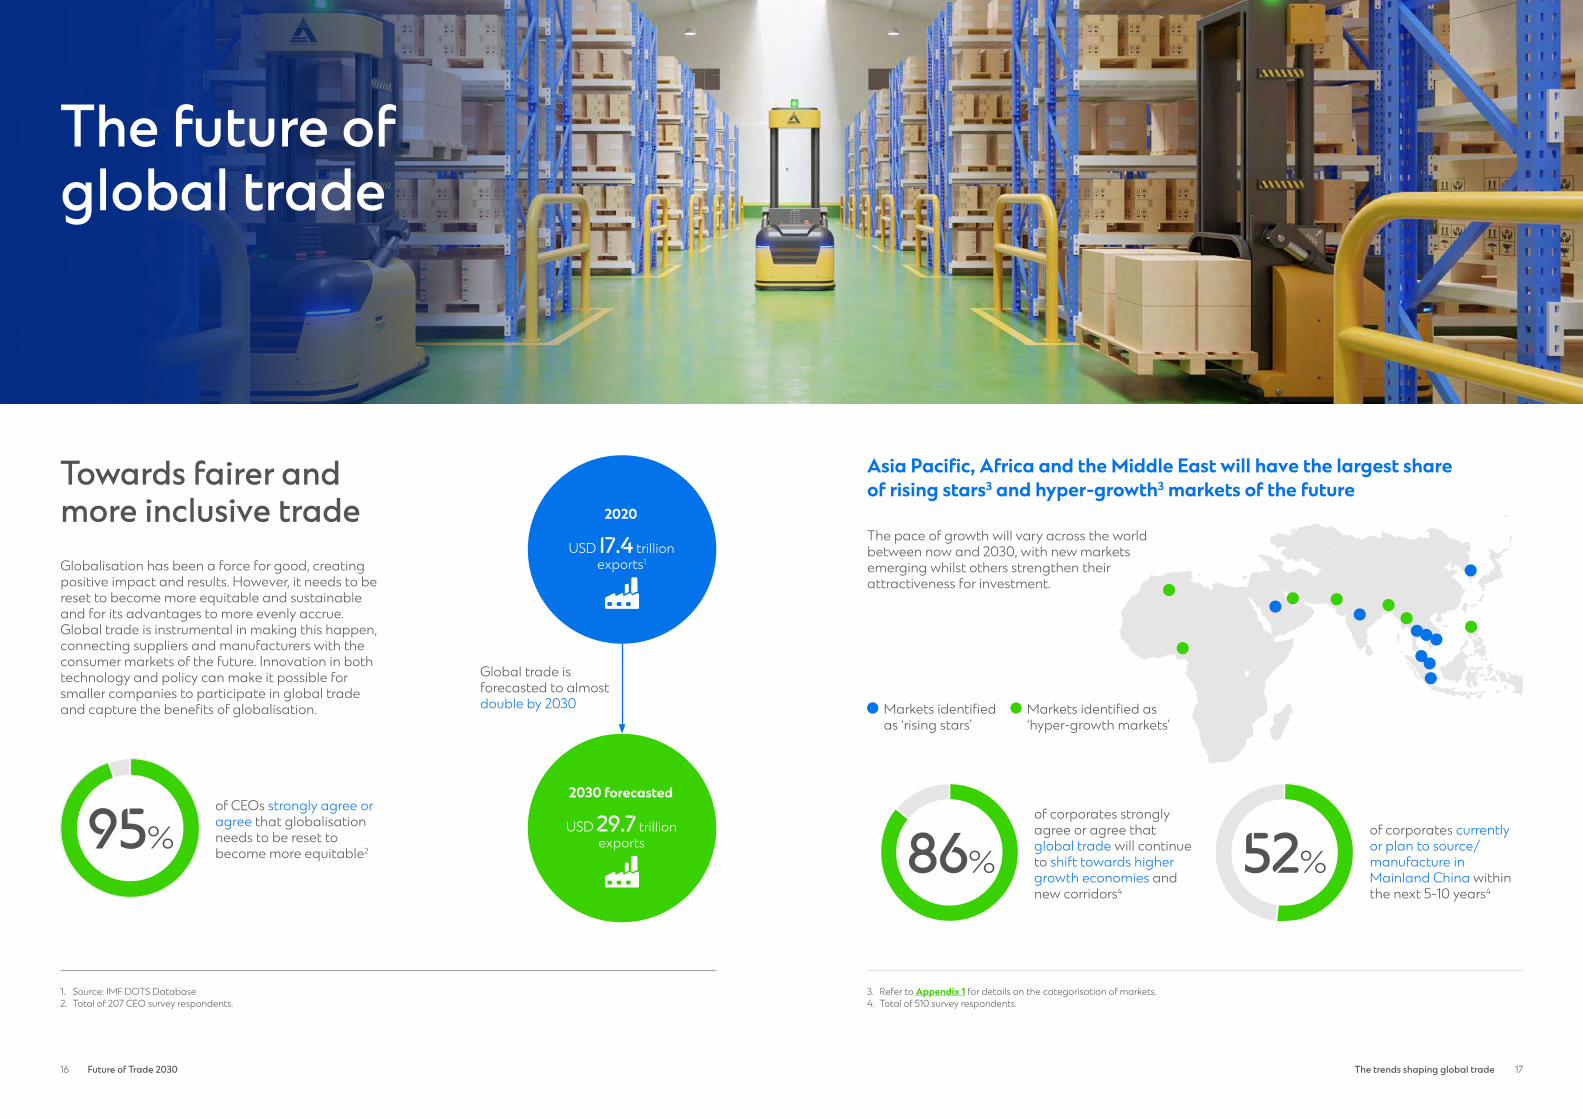
Globalisation has been a force for good, creatingpositive impact and results. However, it needs to be reset to become more equitable and sustainable and for its advantages to more evenly accrue. Global trade is instrumental in making this happen, connecting suppliers and manufacturers with the consumer markets of the future. Innovation in both technology and policy can make it possible for smaller companies to participate in global trade and capture the benefits of globalisation.
The pace of growth will vary across the world between now and 2030, with new markets emerging whilst others strengthen theirattractiveness for investment.
95% 52%86%
of CEOs strongly agree or agree that globalisation needs to be reset to become more equitable2
Global trade is forecasted to almost double by 2030
2030 forecasted
USD 29.7 trillion exports
2020
USD 17.4 trillion exports1
1. Source: IMF DOTS Database2. Total of 207 CEO survey respondents.
Asia Pacific, Africa and the Middle East will have the largest share of rising stars3 and hyper-growth3 markets of the future
of corporates currently or plan to source/manufacture in Mainland China within the next 5-10 years4
of corporates strongly agree or agree that global trade will continue to shift towards higher growth economies and new corridors4
Markets identified as ‘rising stars’
Markets identified as‘hyper-growth markets’
3. Refer to Appendix 1 for details on the categorisation of markets.4. Total of 510 survey respondents.
The trends shaping global trade
18 Future of Trade 2030 19
1. Source: IMF DOTS Database
Future engines of global trade Emerging markets at the centre of trade
In this study, 77 global markets were assessed based on their projected exports share and growth from 2020 to 2030, amongst which five categories of trade growth trajectories were established.
The future of global trade will be driven by these five categories of markets, each of them playing a different role, and, therefore, introducing the need for investors to consider and adopt an appropriate portfolio mix for resilient growth.
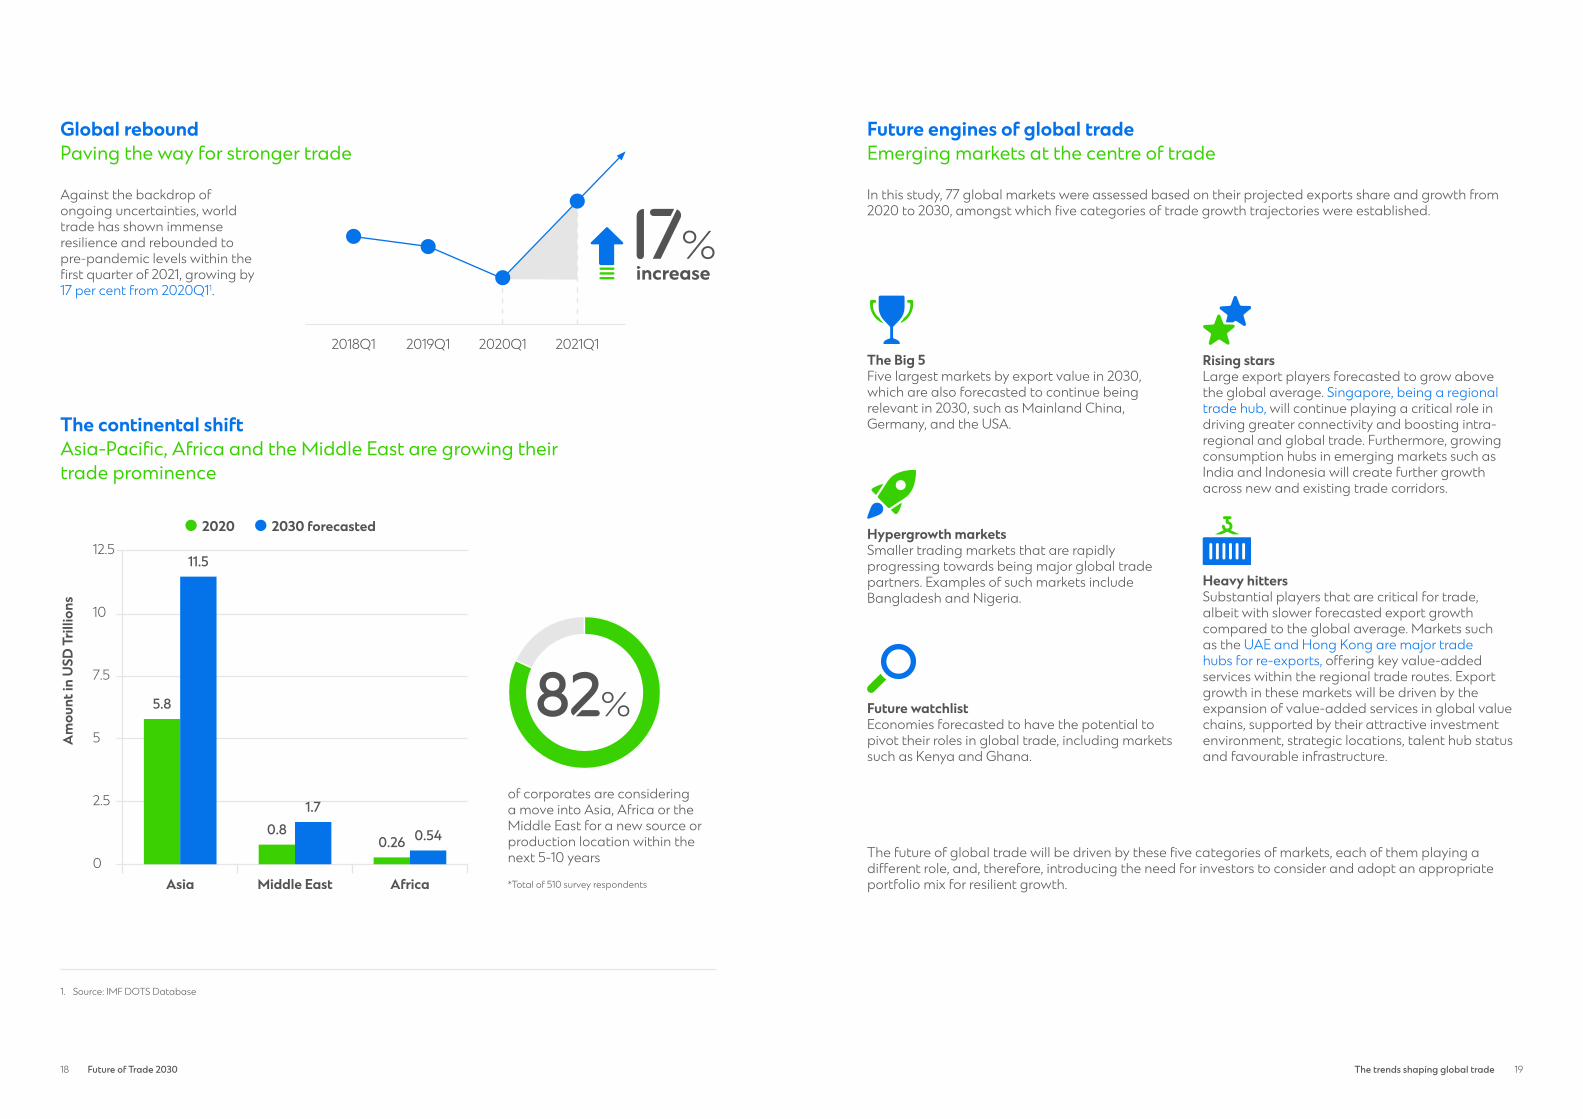
Against the backdrop of ongoing uncertainties, world trade has shown immense resilience and rebounded to pre-pandemic levels within the first quarter of 2021, growing by 17 per cent from 2020Q11.
Global rebound Paving the way for stronger trade
The continental shift Asia-Pacific, Africa and the Middle East are growing their trade prominence
2018Q1 2019Q1 2020Q1 2021Q1
17%increase
The Big 5Five largest markets by export value in 2030, which are also forecasted to continue being relevant in 2030, such as Mainland China, Germany, and the USA.
The Big 5
Rising starsLarge export players forecasted to grow above the global average. Singapore, being a regional trade hub, will continue playing a critical role in driving greater connectivity and boosting intra-regional and global trade. Furthermore, growing consumption hubs in emerging markets such as India and Indonesia will create further growth across new and existing trade corridors.
Rising Stars
Hypergrowth marketsSmaller trading markets that are rapidly progressing towards being major global trade partners. Examples of such markets include Bangladesh and Nigeria.
Hypergrowth markets
Future watchlistEconomies forecasted to have the potential to pivot their roles in global trade, including markets such as Kenya and Ghana.
Future watchlist
Heavy hittersSubstantial players that are critical for trade, albeit with slower forecasted export growth compared to the global average. Markets such as the UAE and Hong Kong are major trade hubs for re-exports, offering key value-added services within the regional trade routes. Export growth in these markets will be driven by the expansion of value-added services in global value chains, supported by their attractive investment environment, strategic locations, talent hub status and favourable infrastructure.
Heavy hitters
of corporates are considering a move into Asia, Africa or the Middle East for a new source or production location within the next 5-10 years
*Total of 510 survey respondents
2020 2030 forecasted
Am
ount
in U
SD T
rillio
ns
12.5
10
7.5
5
2.5
0Asia Middle East Africa
5.8
11.5
0.81.7
0.26 0.54
82%
The trends shaping global trade
2120
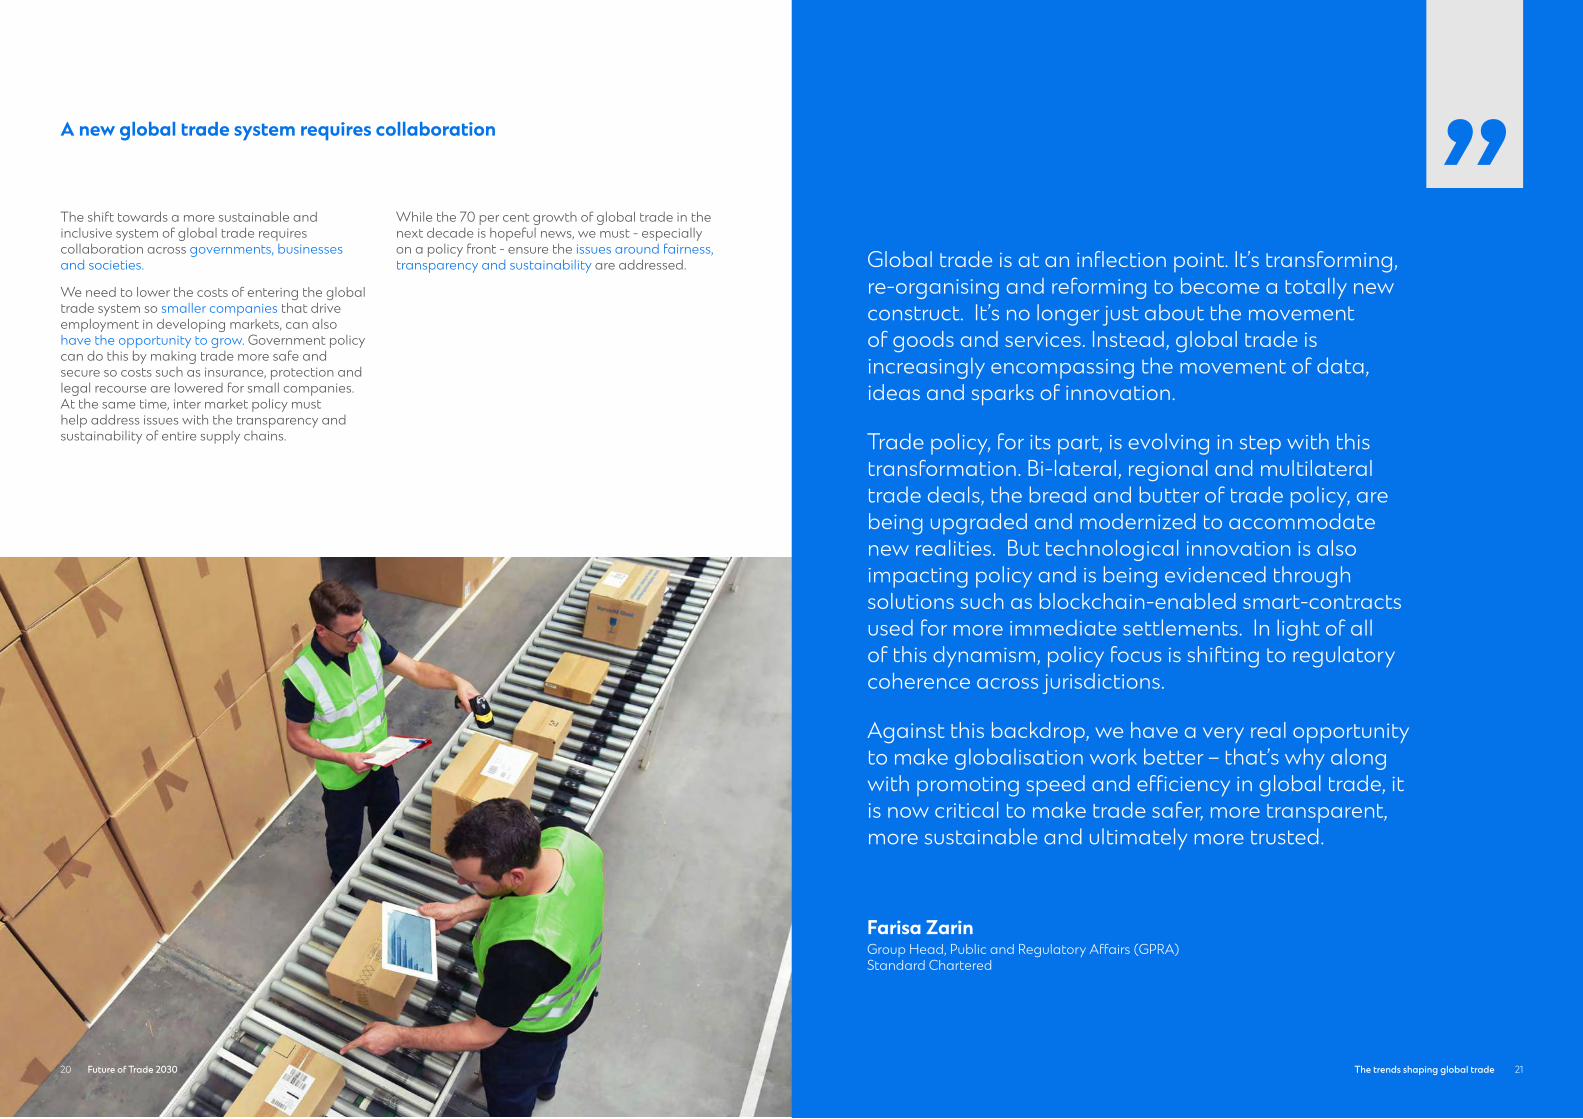
Global trade is at an inflection point. It’s transforming, re-organising and reforming to become a totally new construct. It’s no longer just about the movement of goods and services. Instead, global trade is increasingly encompassing the movement of data, ideas and sparks of innovation.
Trade policy, for its part, is evolving in step with this transformation. Bi-lateral, regional and multilateral trade deals, the bread and butter of trade policy, are being upgraded and modernized to accommodate new realities. But technological innovation is also impacting policy and is being evidenced through solutions such as blockchain-enabled smart-contracts used for more immediate settlements. In light of all of this dynamism, policy focus is shifting to regulatory coherence across jurisdictions.
Against this backdrop, we have a very real opportunity to make globalisation work better – that’s why along with promoting speed and efficiency in global trade, it is now critical to make trade safer, more transparent, more sustainable and ultimately more trusted.
Farisa ZarinGroup Head, Public and Regulatory Affairs (GPRA) Standard Chartered
”A new global trade system requires collaboration
The shift towards a more sustainable and inclusive system of global trade requires collaboration across governments, businesses and societies.
We need to lower the costs of entering the global trade system so smaller companies that drive employment in developing markets, can also have the opportunity to grow. Government policy can do this by making trade more safe and secure so costs such as insurance, protection and legal recourse are lowered for small companies. At the same time, inter market policy must help address issues with the transparency and sustainability of entire supply chains.
While the 70 per cent growth of global trade in the next decade is hopeful news, we must - especially on a policy front - ensure the issues around fairness, transparency and sustainability are addressed.
21The trends shaping global tradeFuture of Trade 2030
22 Future of Trade 2030 23
”
Sustainable and fair trade
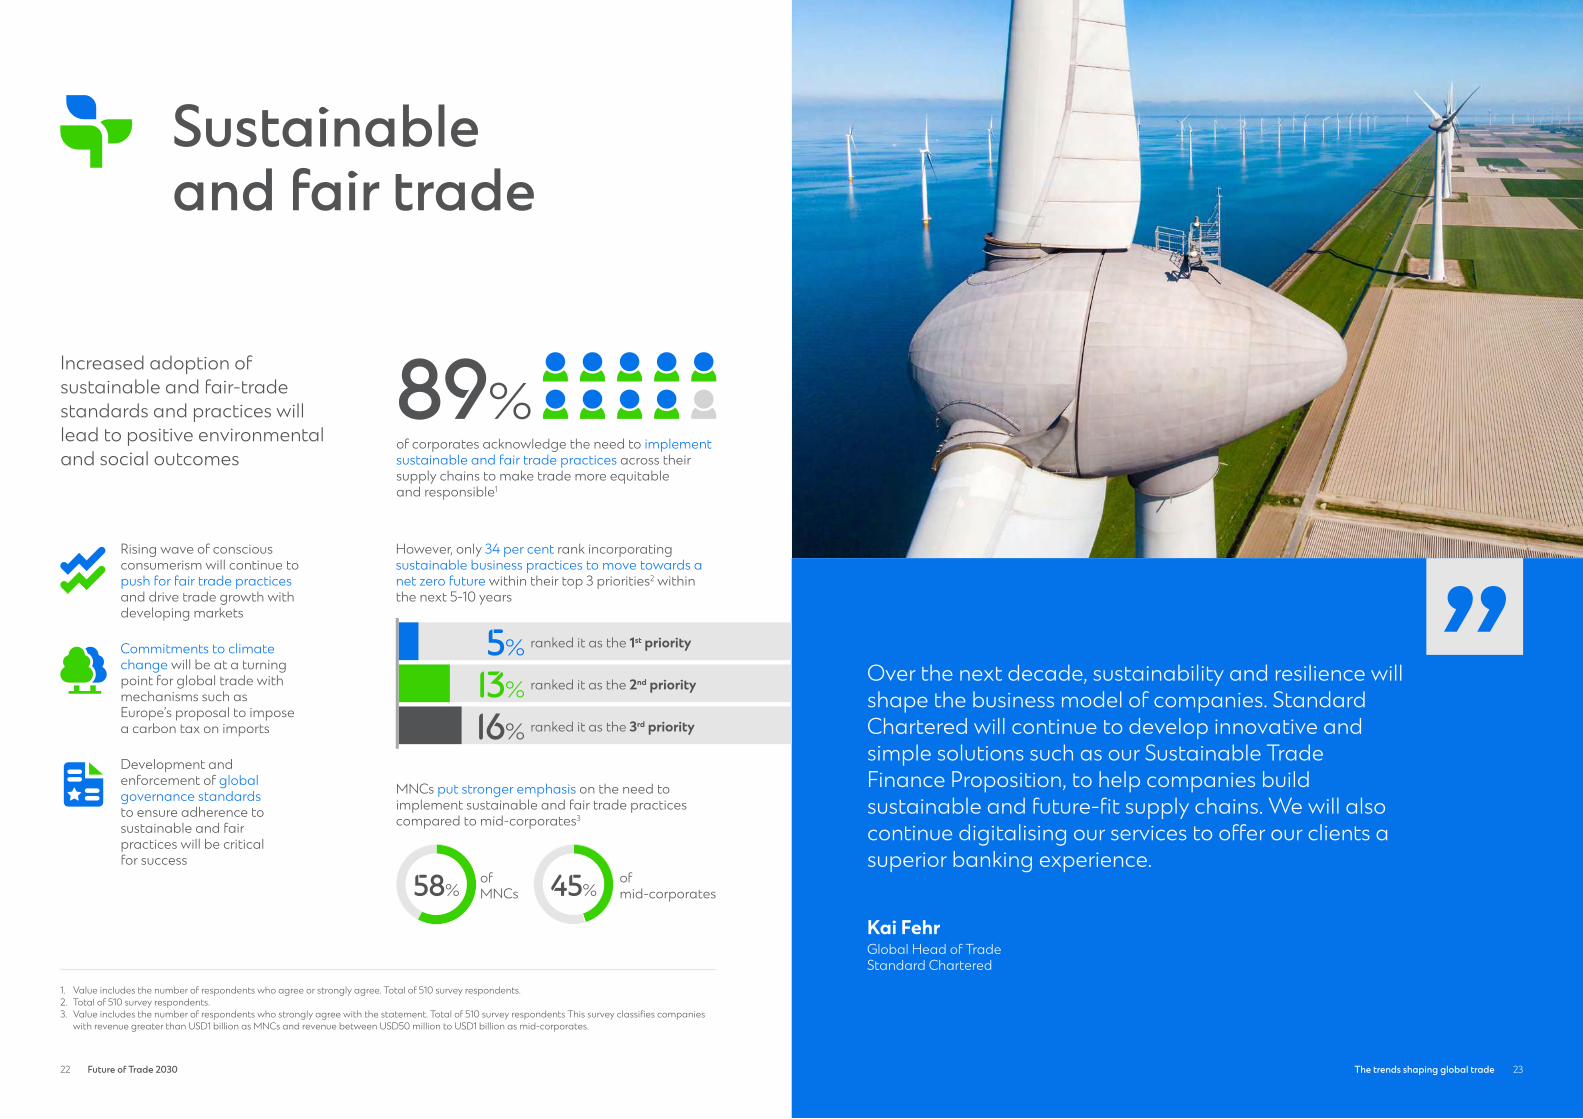
Increased adoption of sustainable and fair-trade standards and practices willlead to positive environmentaland social outcomes
Over the next decade, sustainability and resilience will shape the business model of companies. Standard Chartered will continue to develop innovative and simple solutions such as our Sustainable Trade Finance Proposition, to help companies build sustainable and future-fit supply chains. We will also continue digitalising our services to offer our clients a superior banking experience.
Kai FehrGlobal Head of TradeStandard Chartered
Rising wave of consciousconsumerism will continue topush for fair trade practicesand drive trade growth withdeveloping markets
Development andenforcement of globalgovernance standards to ensure adherence tosustainable and fair practices will be critical for success
Commitments to climatechange will be at a turningpoint for global trade withmechanisms such asEurope’s proposal to imposea carbon tax on imports
1. Value includes the number of respondents who agree or strongly agree. Total of 510 survey respondents.2. Total of 510 survey respondents.3. Value includes the number of respondents who strongly agree with the statement. Total of 510 survey respondents This survey classifies companies
with revenue greater than USD1 billion as MNCs and revenue between USD50 million to USD1 billion as mid-corporates.
of corporates acknowledge the need to implement sustainable and fair trade practices across their supply chains to make trade more equitableand responsible1
89%
MNCs put stronger emphasis on the need to implement sustainable and fair trade practicescompared to mid-corporates3
of MNCs
of mid-corporates
However, only 34 per cent rank incorporating sustainable business practices to move towards a net zero future within their top 3 priorities2 within the next 5-10 years
ranked it as the 1st priority5%ranked it as the 2nd priority13%ranked it as the 3rd priority16%
58% 45%
23The trends shaping global trade
24 Future of Trade 2030 25
”
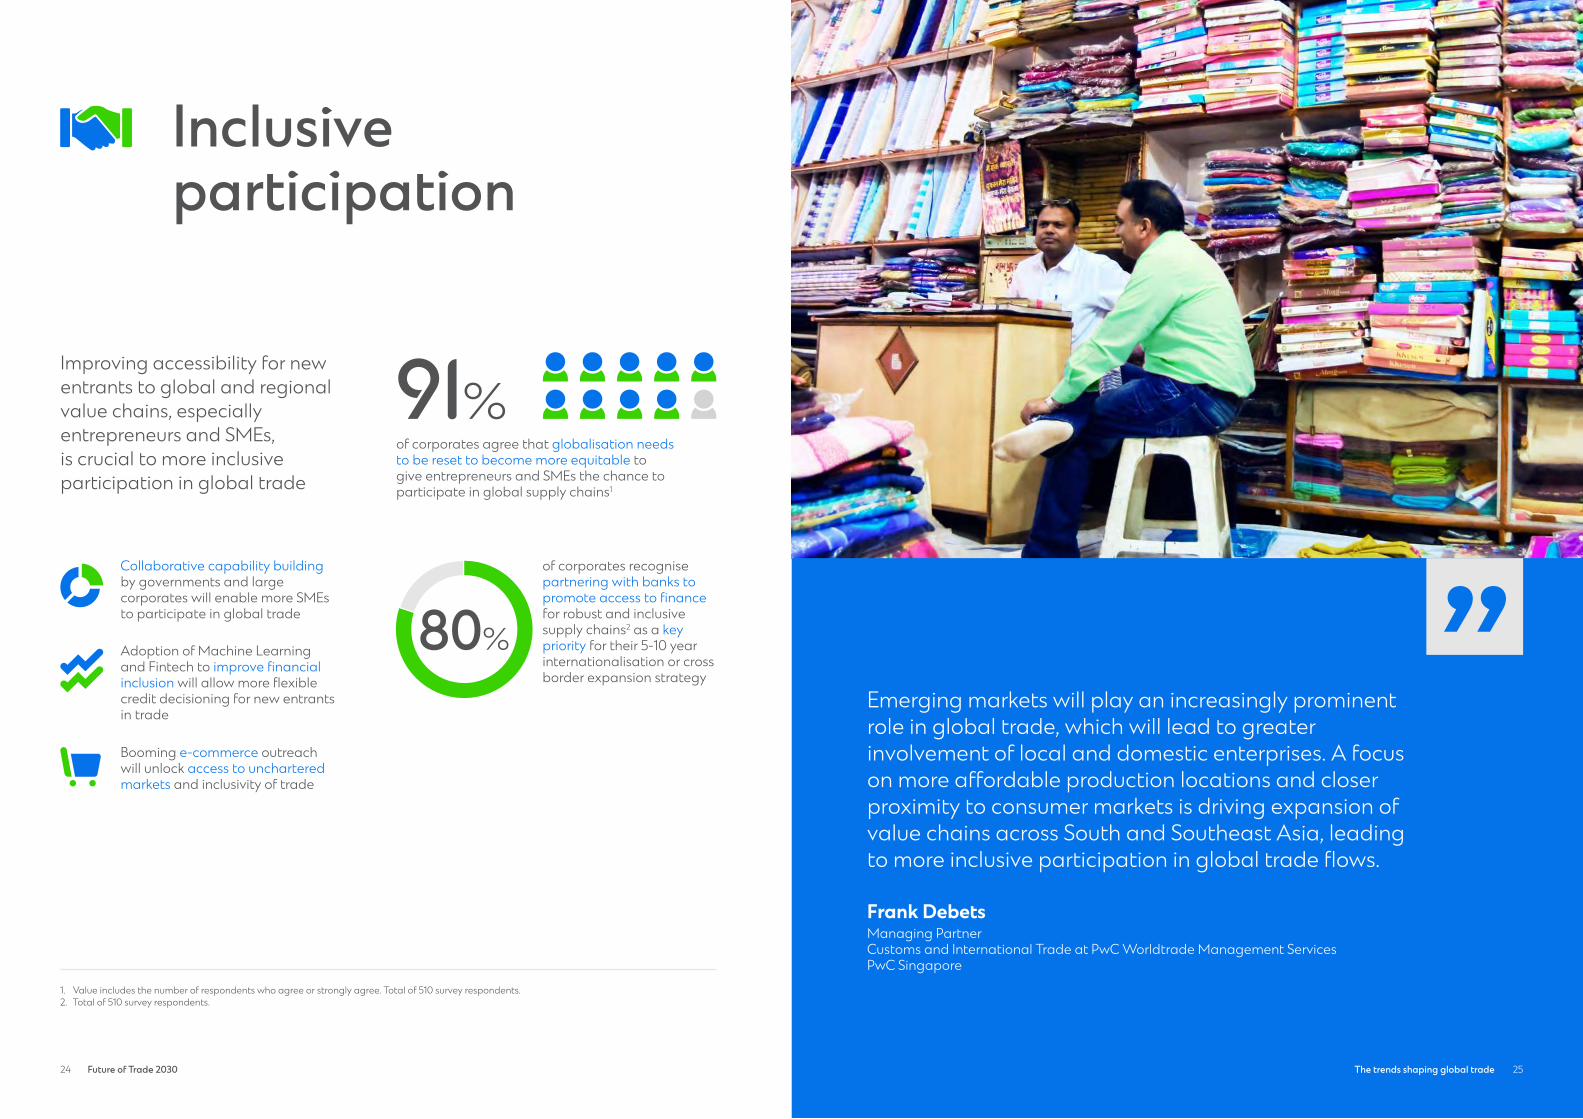
Improving accessibility for new entrants to global and regional value chains, especially entrepreneurs and SMEs, is crucial to more inclusive participation in global trade
Inclusive participation
1. Value includes the number of respondents who agree or strongly agree. Total of 510 survey respondents.2. Total of 510 survey respondents.
Adoption of Machine Learning and Fintech to improve financial inclusion will allow more flexible credit decisioning for new entrants in trade
Collaborative capability building by governments and large corporates will enable more SMEs to participate in global trade
Booming e-commerce outreach will unlock access to unchartered markets and inclusivity of trade
of corporates agree that globalisation needs to be reset to become more equitable to give entrepreneurs and SMEs the chance to participate in global supply chains1
91%
Emerging markets will play an increasingly prominent role in global trade, which will lead to greater involvement of local and domestic enterprises. A focus on more affordable production locations and closer proximity to consumer markets is driving expansion of value chains across South and Southeast Asia, leading to more inclusive participation in global trade flows.
Frank DebetsManaging PartnerCustoms and International Trade at PwC Worldtrade Management ServicesPwC Singapore
80%
of corporates recognise partnering with banks to promote access to finance for robust and inclusive supply chains2 as a key priority for their 5-10 year internationalisation or cross border expansion strategy
25The trends shaping global trade

26 Future of Trade 2030 27
”
Enhanced digitalisation across the ecosystem will lead to faster trade flows, greater transparency and an elevated customer experience
Digitalisation
1. Total of 510 survey respondents.2. Values refer to the percentage of survey respondents who included the driver as one of the top 3 ranked choices. Total of 510 survey respondents.3. Value includes the number of respondents who agree or strongly agree. Total of 207 survey respondents.
5 out of 10 corporates place accelerating the next wave of technology adoption for more efficiency and transparency within top priorities2
of corporates agree that increased adoption of digital trade platforms is a key enabler in making trade faster, more transparent and secure1
of CEOs recognise the importance of enhancing the security of financial transactions to stop eroding the benefits of global trade3
89%
97%
Augmentation of manufacturing technology will reduce marginal cost and allow higher customisation with faster lead time
Supply chain technology will continue to gain traction to reduce costs and enhance transparency and efficiency
Concerted efforts to foster regional harmonisation of regulations in the digital world will improve trade transparency and trust
ranked it as the 1st priority12%ranked it as the 2nd priority20%ranked it as the 3rd priority17%
27
The increasing use of technology and digital platforms across trade corridors offers the potential for faster and more seamless trade flows. Governments play a critical role in supporting the development of innovative digital solutions. We see promising progress across many centres such as Hong Kong, Singapore, the UAE and Mainland China as just some examples, supporting the growth of these markets as regional trade hubs.
Ricky KauraHead, Transaction Banking Asia Pacific, Africa and Middle EastStandard Chartered
The trends shaping global trade
28 Future of Trade 2030 29
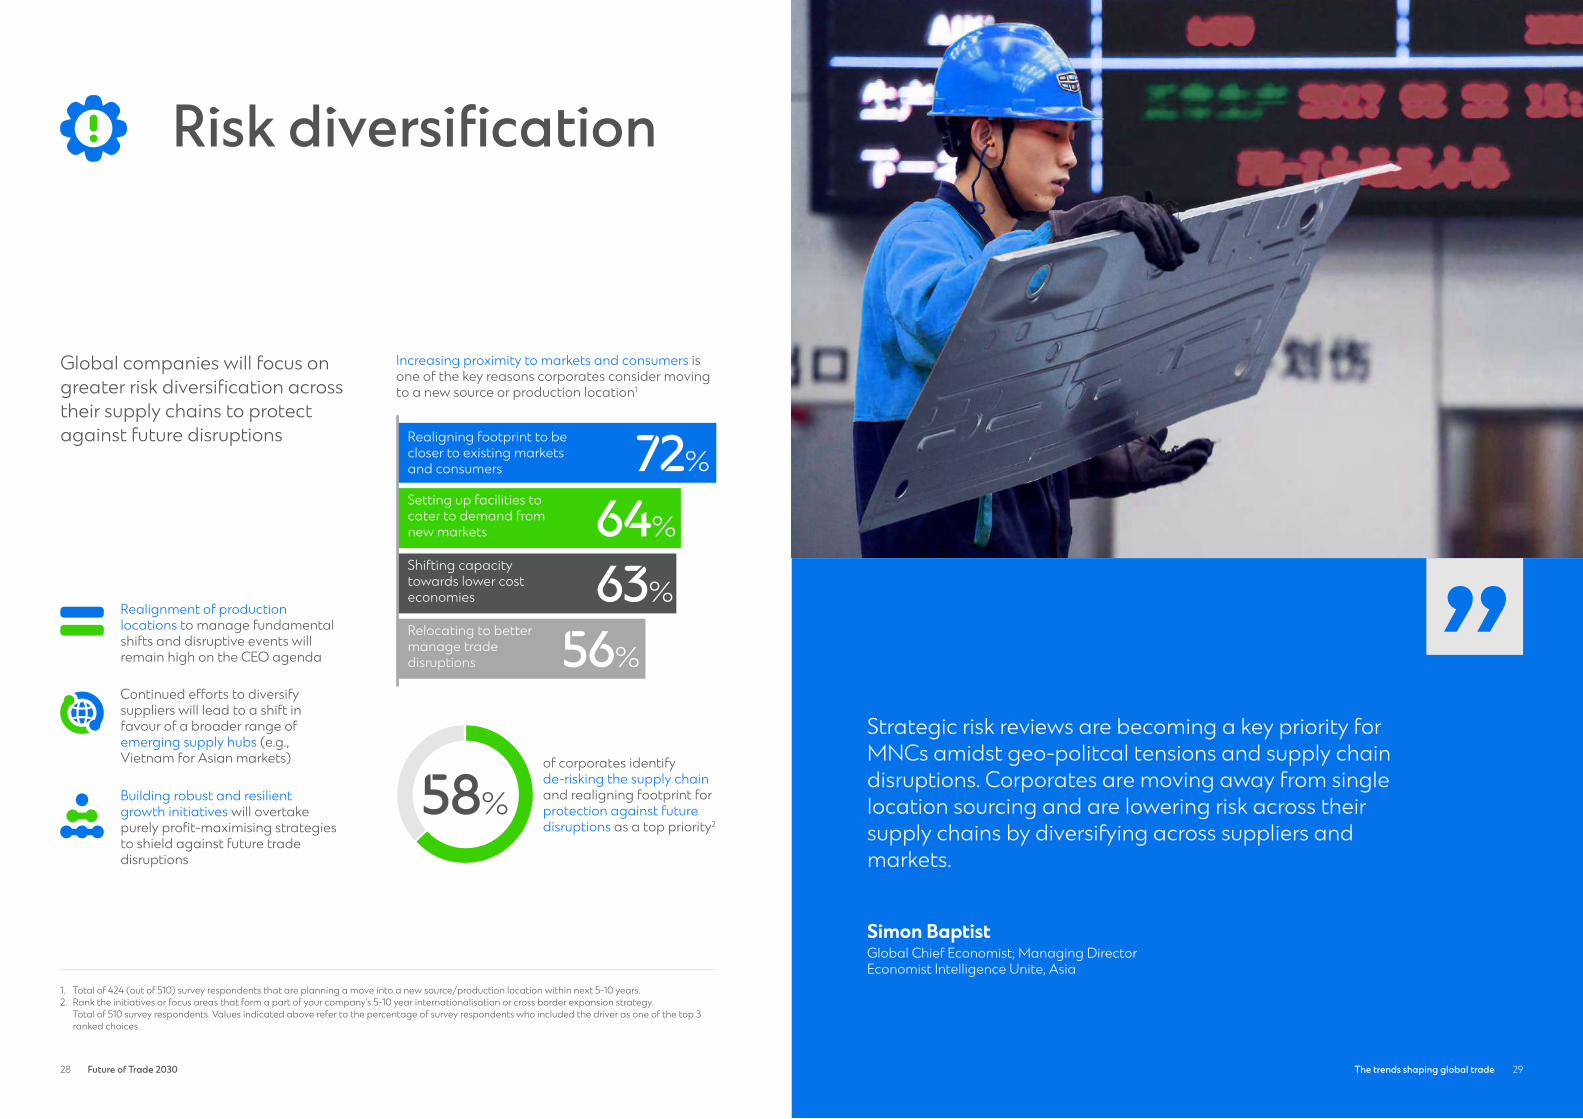
Strategic risk reviews are becoming a key priority for MNCs amidst geo-politcal tensions and supply chain disruptions. Corporates are moving away from single location sourcing and are lowering risk across their supply chains by diversifying across suppliers and markets.
Simon BaptistGlobal Chief Economist; Managing Director Economist Intelligence Unite, Asia
”
Global companies will focus on greater risk diversification across their supply chains to protect against future disruptions
Risk diversification
1. Total of 424 (out of 510) survey respondents that are planning a move into a new source/production location within next 5-10 years.2. Rank the initiatives or focus areas that form a part of your company’s 5-10 year internationalisation or cross border expansion strategy.
Total of 510 survey respondents. Values indicated above refer to the percentage of survey respondents who included the driver as one of the top 3 ranked choices.
of corporates identify de-risking the supply chain and realigning footprint for protection against future disruptions as a top priority2
Realigning footprint to be closer to existing markets and consumers 72%Setting up facilities to cater to demand from new markets 64%Shifting capacity towards lower cost economies
Relocating to bettermanage trade disruptions
63%
56%
Increasing proximity to markets and consumers isone of the key reasons corporates consider moving to a new source or production location1
58%
Continued efforts to diversify suppliers will lead to a shift in favour of a broader range of emerging supply hubs (e.g., Vietnam for Asian markets)
Realignment of production locations to manage fundamental shifts and disruptive events will remain high on the CEO agenda
Building robust and resilient growth initiatives will overtake purely profit-maximising strategies to shield against future trade disruptions
29The trends shaping global trade

30 Future of Trade 2030 31
The signing of RCEP and CPTPP trade deals gives hope for a more integrated version of the global economy. These two significant pieces of trading infrastructure will be the building blocks for the world’s new economic geography. Such cooperation provides a promising outlook for rebalanced global trade.
James CrabtreeExecutive DirectorInternational Institute for Strategic Studies (IISS) – Asia
”
Trade dynamics will shift in the coming decade, with high-growth economies and new corridors poised to gain, leading to a rebalancing of the global trade system
Rebalancing
1. Total of 510 survey respondents.2. This survey classifies companies with revenue between USD50 million to USD1 billion as mid-corporates.
Total of 363 survey respondents are identified as mid-corporates.3. Values indicated refer to the percentage of survey respondents who included the driver as one of the top 3 ranked choices.
Total of 510 survey respondents.
Capturing value from bilateral, regional and trade bloc agreements3 is a priority for corporates for their 5-10 year cross border expansion strategy
ranked it as the 1st priority14%ranked it as the 2nd priority18%ranked it as the 3rd priority12%
Enhanced cost-effectiveness and capabilities in emerging markets will establish new source markets
Significant shift in consumptiongrowth towards the East hascreated new destination markets
New and emerging trade blocs and FTAs will facilitate regional and global trade flows
of corporates agree that expanding sales in emerging markets is a key priority1
59%
1st priority for cross border expansion strategy by mid-corporates2
31The trends shaping global trade

32 Future of Trade 2030 33
Outlook 2030
Trading with more resilience, sustainability, and inclusivity
Moving forward, global trade has the potential to deliver more holistic and sustainable growth, uplifting both businesses and people. Key markets in Asia, the Middle East, and Africa are expected to be at the forefront of this change, delivering the most striking progress in the trade landscape over the next decade or so. The five trends will shape the future of global trade, leading to new opportunities for resilient growth with the potential to have a broader environmental and societal impact.
33
Key takeaways
13 Key markets 13 key markets across Asia Pacific, the Middle East, and Africa are expected to define the flow of future global trade, driven by the growing consumption in emerging markets and the increasing attractiveness of these markets as sourcing locations.
Amongst these markets, five categories of trade growth trajectories are the big 5, rising stars, hypergrowth markets, heavy hitters, and future watchlist.
3 Trade hubsThe three regional trade hubs - Singapore, Hong Kong, and the UAE - will continue to play a critical role in driving greater connectivity and boosting regional and global trade. These are trade hubs for re-exports as well as offer key value-added services within the regional trades routes.
5 trendsAs global trade is rebalancing with the ambition to become more sustainable and inclusive, five trends shaping the future of global trade:• Fair and sustainable trade• Inclusive participation• Digitisation• Risk diversification• Rebalancing
Trade is still a formidable force for good with the ability to deliver sustainable business as well as positive human impact. To address the new fundamentals of trade growth multi-stakeholder collaboration is required with governments, businesses and society collectively moving towards the new future. Guided by a common purpose and enabled by technology, stakeholders need to take a unified approach to further accelerate sustainable and inclusive global trade growth.
The trends shaping global trade

34 Future of Trade 2030 35
Corridors of the future
36 Future of Trade 2030 37
1. Based on the survey commissioned by Standard Chartered in June 2021 and completed by senior executives at 510 MNCs and mid-corporates globally. Survey questions asked: ‘Which locations do you currently source/produce from or are planning to source/produce from within the next 5-10 years?’
Corridors of the future
Future trade corridors
High potential opportunities for cross-border growth
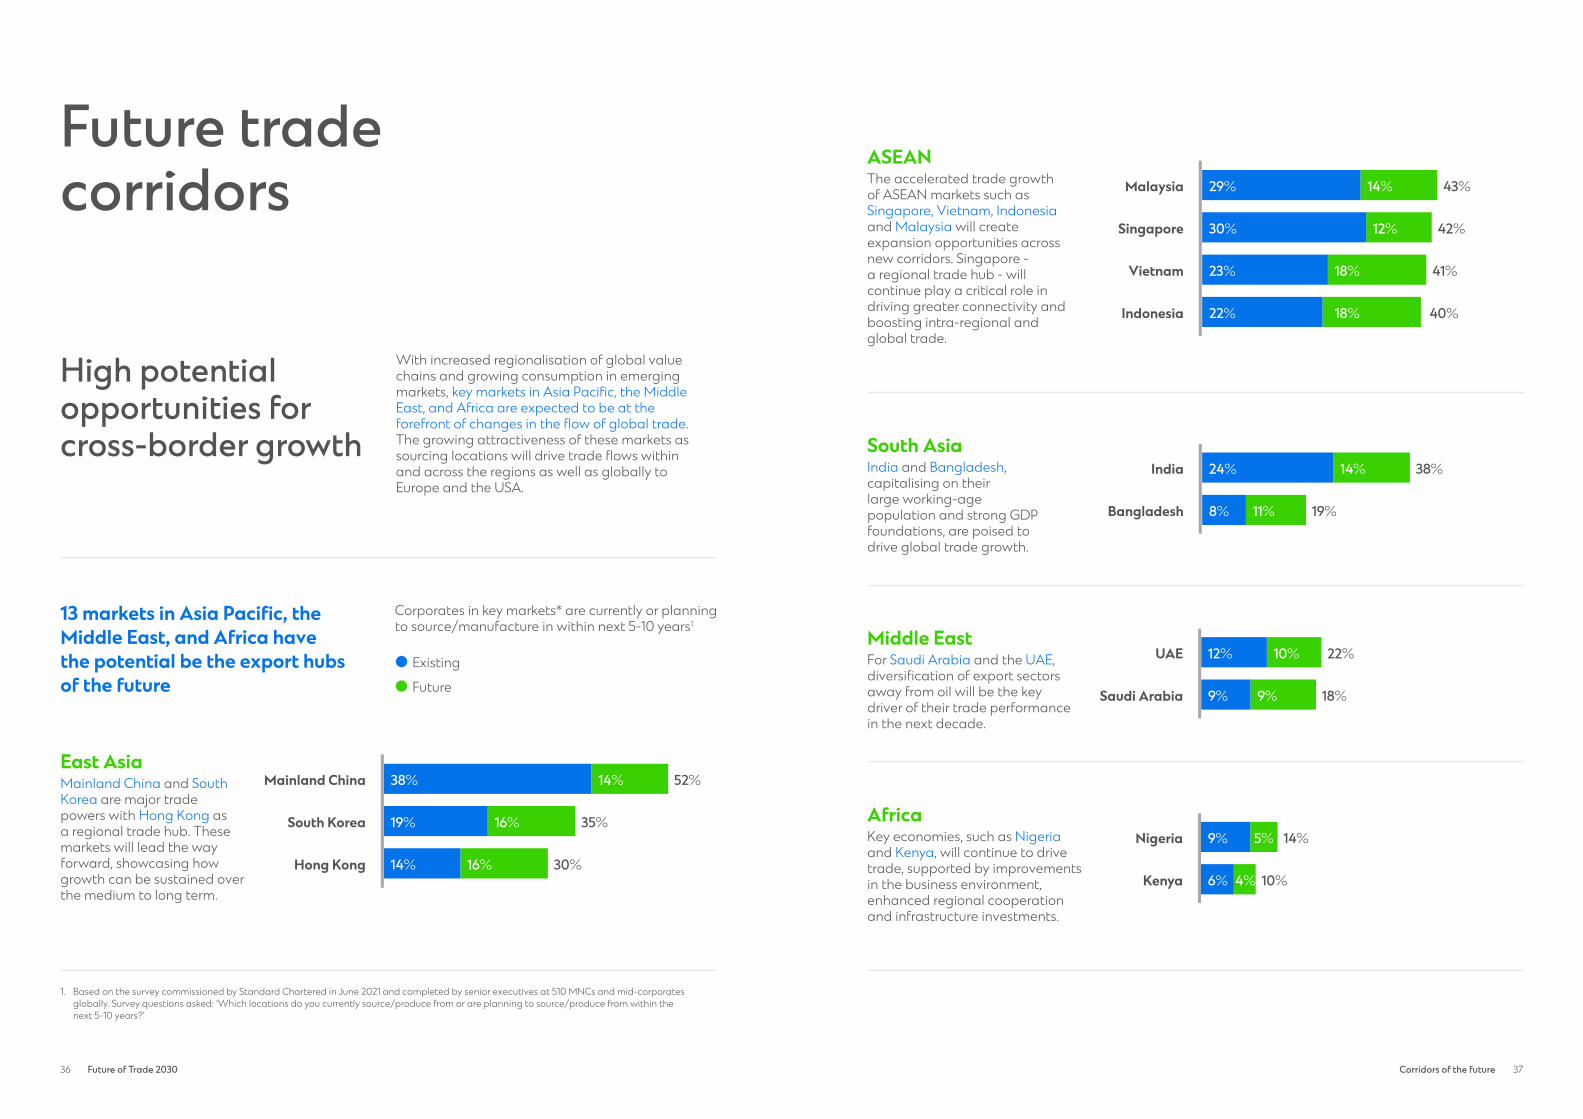
13 markets in Asia Pacific, the Middle East, and Africa have the potential be the export hubs of the future
With increased regionalisation of global value chains and growing consumption in emerging markets, key markets in Asia Pacific, the Middle East, and Africa are expected to be at the forefront of changes in the flow of global trade. The growing attractiveness of these markets as sourcing locations will drive trade flows within and across the regions as well as globally to Europe and the USA.
East AsiaMainland China and South Korea are major trade powers with Hong Kong as a regional trade hub. These markets will lead the way forward, showcasing how growth can be sustained over the medium to long term.
Mainland China
South Korea
Hong Kong
38% 14% 52%
35%
30%
19% 16%
14% 16%
ASEANThe accelerated trade growth of ASEAN markets such as Singapore, Vietnam, Indonesia and Malaysia will create expansion opportunities across new corridors. Singapore - a regional trade hub - will continue play a critical role in driving greater connectivity and boosting intra-regional and global trade.
Malaysia
Singapore
Vietnam
Indonesia
29% 43%
42%
41%
40%
14%
30%
23%
12%
18%
22% 18%
South AsiaIndia and Bangladesh, capitalising on their large working-age population and strong GDP foundations, are poised to drive global trade growth.
India
Bangladesh
38%
19%
24% 14%
8% 11%
Middle EastFor Saudi Arabia and the UAE, diversification of export sectors away from oil will be the key driver of their trade performance in the next decade.
UAE
Saudi Arabia
22%
18%
12% 10%
9% 9%
AfricaKey economies, such as Nigeria and Kenya, will continue to drive trade, supported by improvements in the business environment, enhanced regional cooperation and infrastructure investments.
Nigeria
Kenya
14%
10%
9% 5%
6% 4%
Corporates in key markets* are currently or planning to source/manufacture in within next 5-10 years1
Existing
Future

38 Future of Trade 2030 39
Trade flows within and between Asia Pacific, the Middle East and Africa are on the rise, extending globally to Europe and the USA
Between Africa and East AsiaBetween South Asia and ASEAN
Between East Asia and ASEAN
South Asia to USA East Asia to Europe
Between Middle East and East Asia and South Asia
Intra-ASEAN
• Boosted by Mainland China’s Belt and Road initiative
• Growing demand of commodities in Mainland China
• Driven by trade agreements such as ASEAN-India FTA
• Growing e-commerce sector
• Increasing consumer spending
• Strong regional trade agreements such as RCEP
• Supply chain rebalancing
• Growing consumer demand
• E-commerce sector growth
• Strong trade ties
• Robust consumer demand in the USA
• Growing strategic ties
• Strong consumer demand in Europe
• Rising energy demand in Asia
• Increasing investments by the Middle East in downstream sectors in Asian markets
• Boosted by regional integration
• Increasing manufacturing capabilities in ASEAN
Corridors of the future

40 Future of Trade 2030 4140 41Corridors of the future | East Asia
Growth drivers and trends
Key trade corridors
East Asia
Key markets in East Asia are strong in hardware-driven innovations and are home to manufacturing powerhouses such as Sony, Samsung, and Lenovo. This has positioned the region as a leading production hub with strong global exports. The markets in the region are increasingly investing and building capabilities in emerging technologies such as 5G, AI, cloud, and clean energy.
Selected markets for analysis: Hong Kong, Mainland China and South Korea
High e-commerce adoptionDriven by high smartphone and internet adoption as well as strong logistics and IT infrastructureOnline sales as a percentage of total retail sales (2020)1
Mainland China
Mainland China Hong Kong
South Korea
South Korea
Digital economy growthLeveraging digital technologies to drive economic transformation 2020 Digital competitiveness (out of 63)2
1. UNCTAD ‘Estimates of global e-commerce 2019 and preliminary assessment of COVID-19 impact on online retail 2020’ According to the USA’s International Trade Administration (ITA) e-commerce accounts for 11 per cent of Hong Kong’s total retail sales.
2. IMD World Digital Competitiveness Ranking 2020
24.9%
#16 #5 #8
25.9%
of corporates identify catering to demand from high growth markets and consumers as a key reason for setting up a new production location in East Asia3
Key priorities4 for corporates in East Asia for their internationalisation strategy5
72%
Accelerating new technology adoption for more efficiency and transparency 51%
De-risking the supply chain and realigning footprint to protect against disruptions 57%
Expanding sales in emerging markets to capitalise on increasing demand 60%
3. Survey questions asked: ‘What are your reasons for considering new source/production locations?’ Total of 332 responses for this region.4. Sum of responses who ranked the focus area as a top three priority.5. Survey question asked: ‘Which of these initiatives/focus areas form part of your company’s 5-10 year internationalisation or cross border
expansion strategy?’ Total of 375 responses for this region.
East Asia
Japan
Mainland China
USA
Hong Kong
India
Mainland China
Vietnam
South Korea
Germany
Malaysia
Vietnam
Mainland China
42 Future of Trade 2030 4343Corridors of the future | East Asia — Hong Kong42 The Future of Global Trade 2030
Hong Kong
Key Markets in East AsiaHeavy Hitters
Heavy hitters
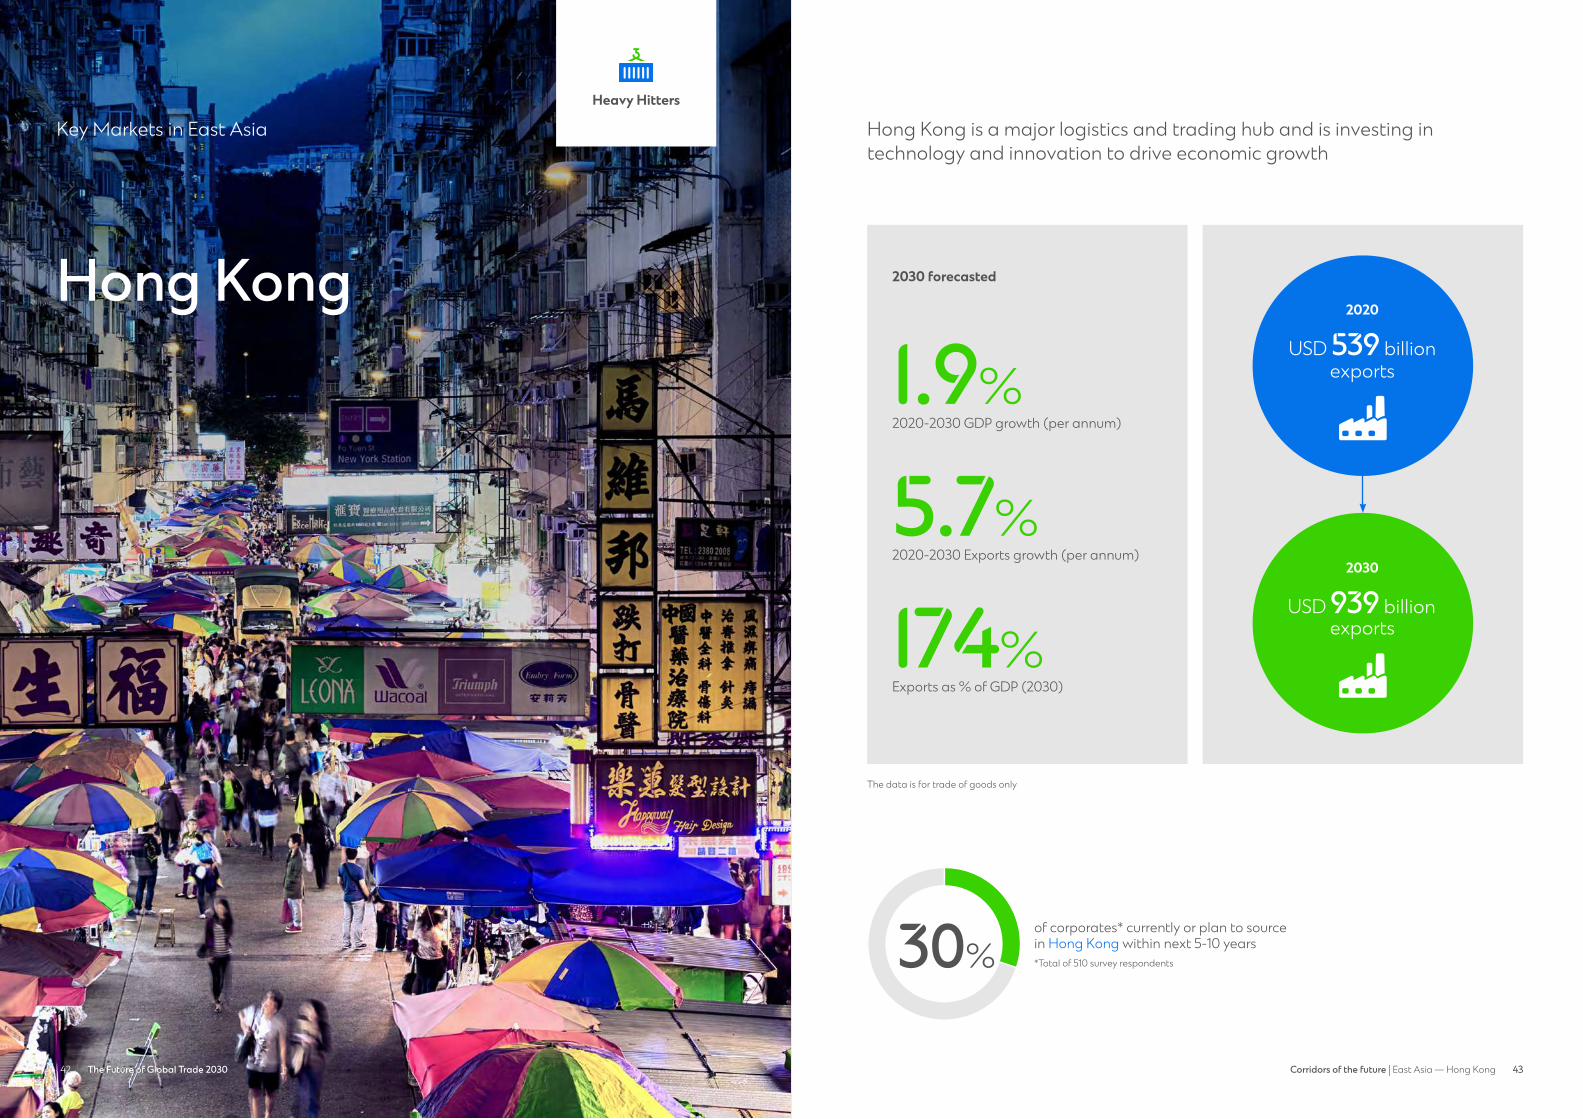
Hong Kong is a major logistics and trading hub and is investing in technology and innovation to drive economic growth
30%of corporates* currently or plan to source in Hong Kong within next 5-10 years*Total of 510 survey respondents
The data is for trade of goods only
2030 forecasted
2020-2030 GDP growth (per annum)
1.9%
2020-2030 Exports growth (per annum)
5.7%
Exports as % of GDP (2030)
174%
2020
USD 539 billion exports
2030
USD 939 billion exports
44 Future of Trade 2030 4544 45Corridors of the future | East Asia — Hong Kong
Hong Kong’s future growth: Hong Kong is a major global transhipment huband is increasingly investing in technology and innovation
A transhipment hubLeveraging its strategic location, multiple Free Trade Agreements, a business-friendly environment, and a strong logistics sector, Hong Kong is positioned as a global merchandise re-export hub while also offering value-added capabilities. To strengthen its logistics leadership, Hong Kong is investing in talent development and technology to improve operational efficiencies whilst reducing emissions.
Focus on innovation and technologyHong Kong has committed USD6.4 billion (HKD50 billion) to promote innovation and technology and has identified four areas of strength for development: biotechnology, artificial intelligence, smart cities, and fintech. Hong Kong’s start-up ecosystem has been gaining traction in recent years on the back of increased funding andinvestment in the necessary infrastructure.
Future sectors of growth: Machinery and electricals will continue to be the primary export from Hong Kong while metals and minerals and precision equipment exports are expected to grow from 2020 to 2030
Precision Equipment
Precision equipment Hong Kong exports medical and scientific equipment, watches, and their components. It is a distribution hub for multinational companies to further transport medical devices. The exports of medical equipment are expected to grow as Hong Kong invests in its biotechnology sector with a focus on research and innovation.
4% forecasted share of exports in 20303.7% 2020-2030 CAGR
Machinery and electricals Hong Kong heavily exports electronic components and products, such as integrated circuits (IC), broadcasting equipment, and consumer electronics. Components and parts constitute about three quarters of Hong Kong’s electronics exports, the majority of which are re-exported to mainland China. The rest are finished goods that are exported globally, driven by a growing demand for consumer electronics.
71% forecasted share of exports in 20304.9% 2020-2030 CAGRMachinery &
Electricals
Metals and minerals Hong Kong exports diamonds and precious stones due to its local jewellery industry that offers a wide range of medium to high-priced products. Future exports will be boosted by a rebound in global demand due to a growing middle-class population and increasing spending power of millennials.
5% forecasted share of exports in 20304.1% 2020-2030 CAGRMetals & Minerals
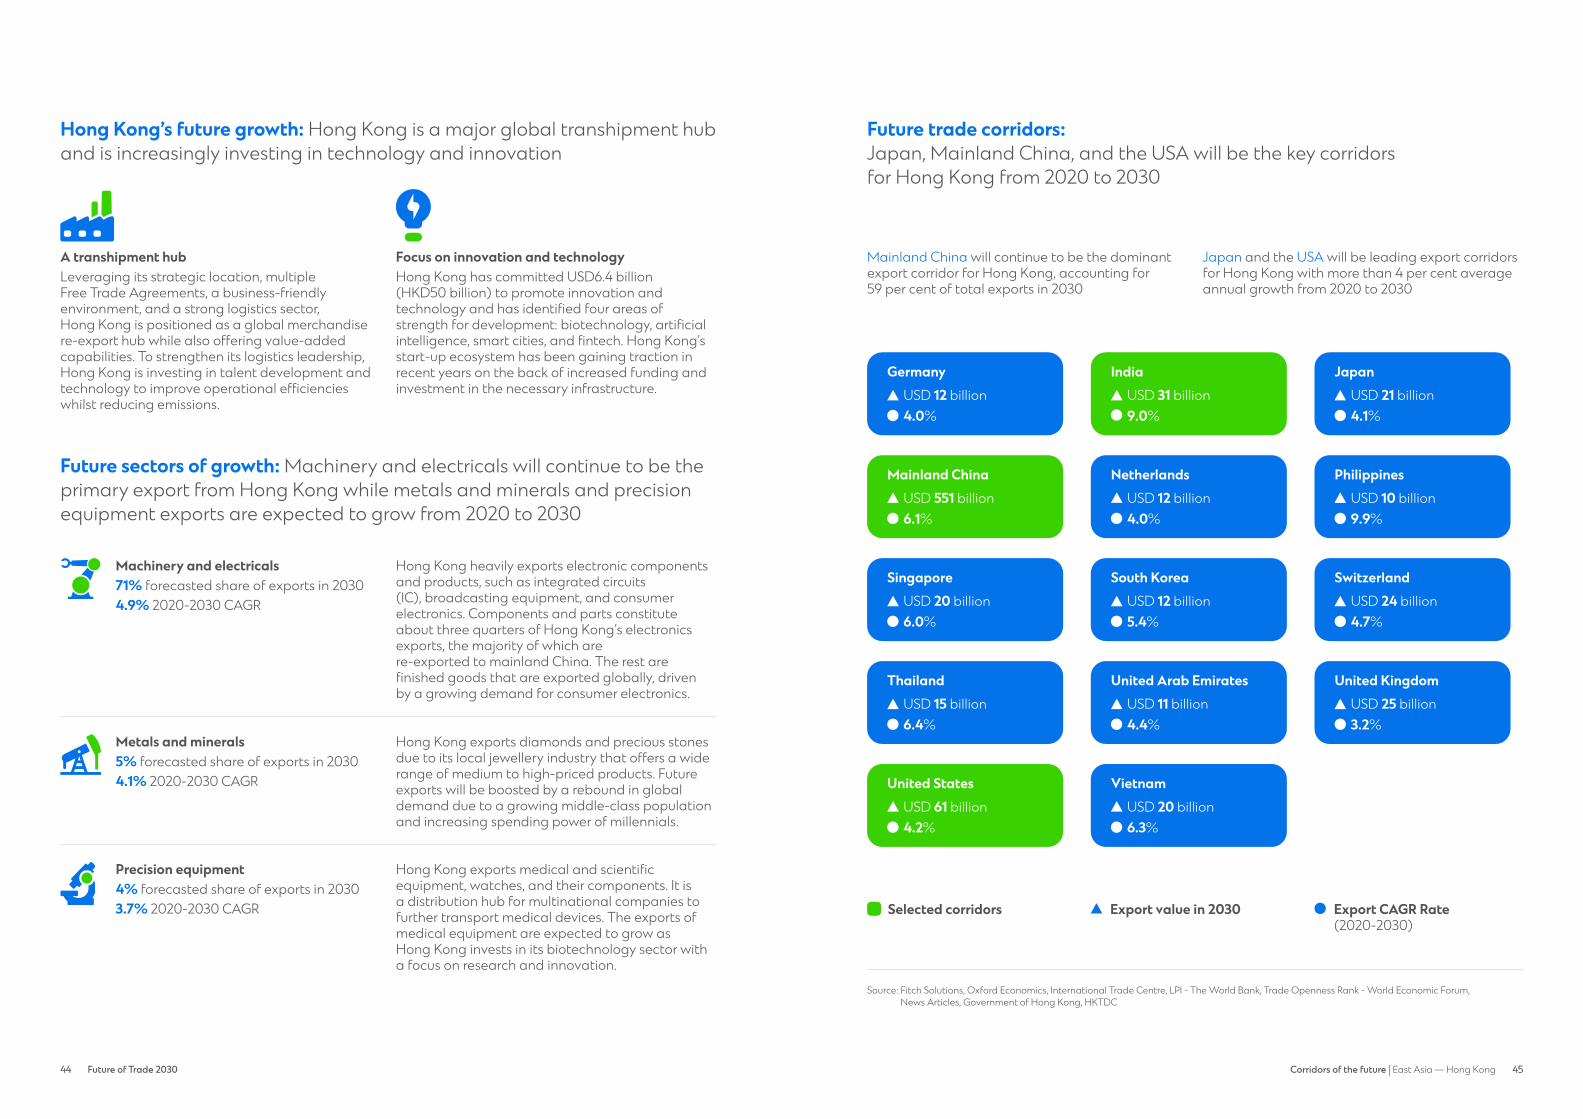
Future trade corridors: Japan, Mainland China, and the USA will be the key corridors for Hong Kong from 2020 to 2030
Source: Fitch Solutions, Oxford Economics, International Trade Centre, LPI - The World Bank, Trade Openness Rank - World Economic Forum, News Articles, Government of Hong Kong, HKTDC
Mainland China will continue to be the dominant export corridor for Hong Kong, accounting for 59 per cent of total exports in 2030
Japan and the USA will be leading export corridors for Hong Kong with more than 4 per cent average annual growth from 2020 to 2030
Export CAGR Rate (2020-2030)
Selected corridors
IndiaUSD 31 billion9.0%
JapanUSD 21 billion4.1%
GermanyUSD 12 billion4.0%
South KoreaUSD 12 billion5.4%
SwitzerlandUSD 24 billion4.7%
SingaporeUSD 20 billion6.0%
United Arab EmiratesUSD 11 billion4.4%
United KingdomUSD 25 billion3.2%
ThailandUSD 15 billion6.4%
NetherlandsUSD 12 billion4.0%
PhilippinesUSD 10 billion9.9%
Mainland ChinaUSD 551 billion6.1%
VietnamUSD 20 billion6.3%
United StatesUSD 61 billion4.2%
Export value in 2030
46 4747Corridors of the future | East Asia — Hong KongFuture of Trade 203046
Machinery and Electricals
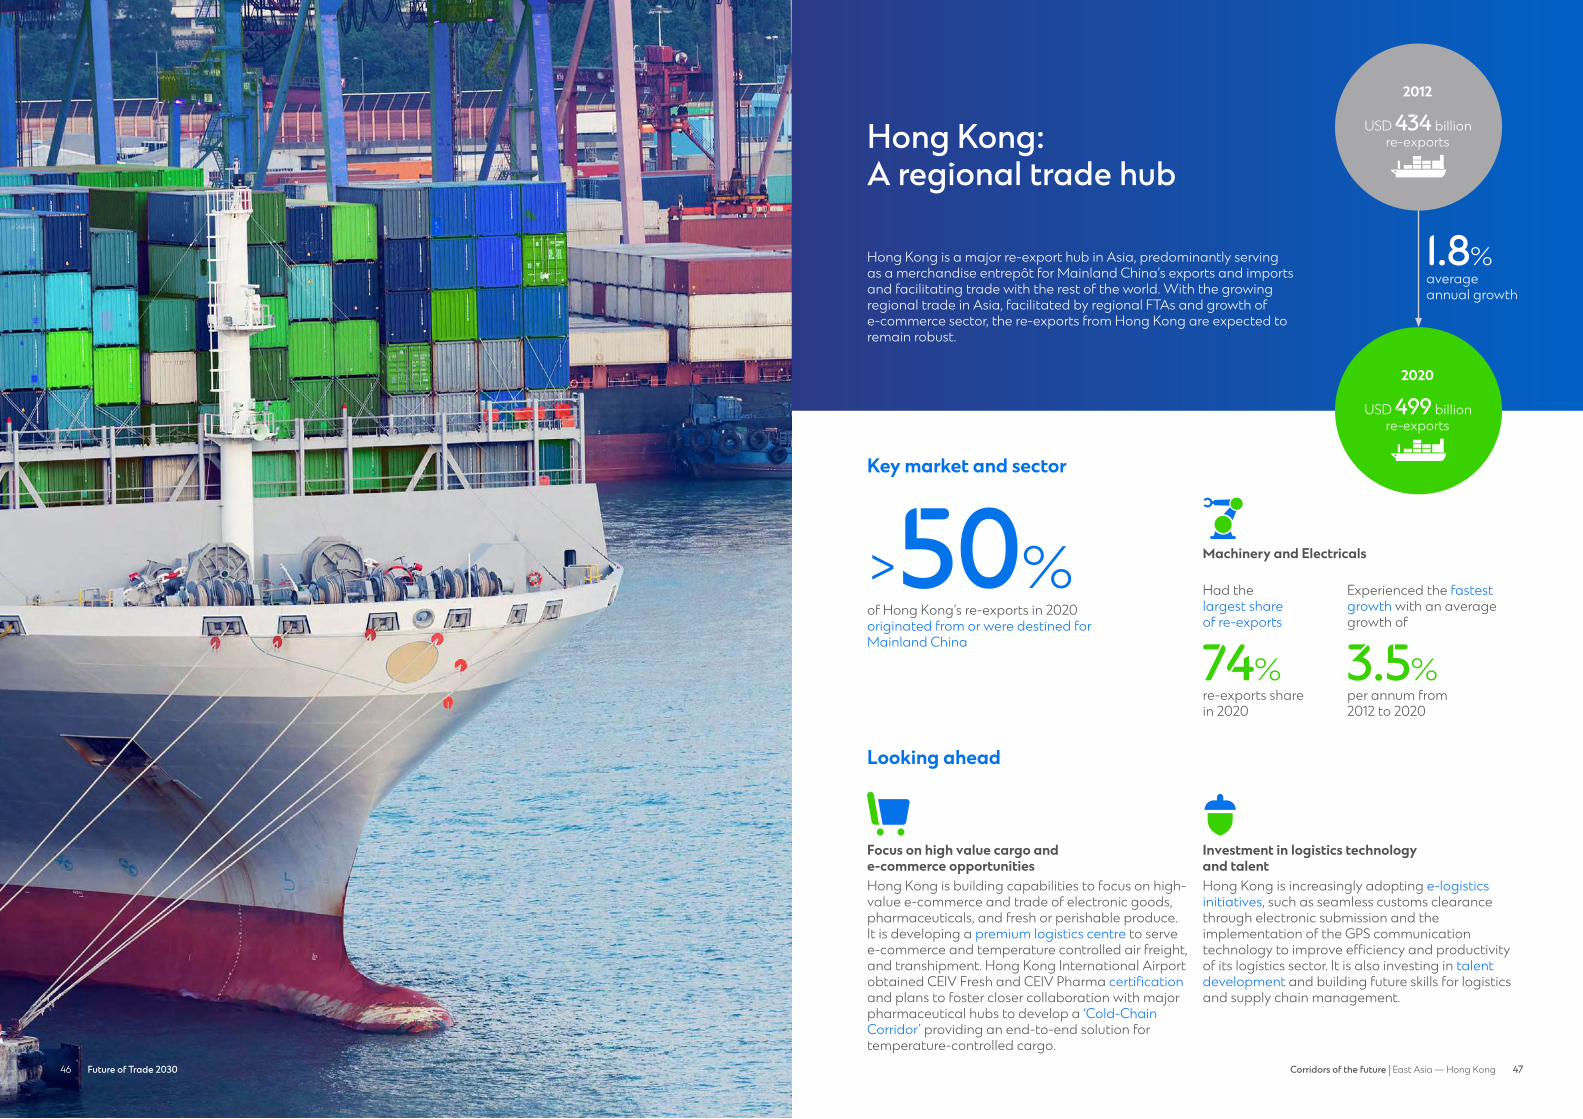
Hong Kong: A regional trade hub
Hong Kong is a major re-export hub in Asia, predominantly serving as a merchandise entrepôt for Mainland China’s exports and imports and facilitating trade with the rest of the world. With the growing regional trade in Asia, facilitated by regional FTAs and growth of e-commerce sector, the re-exports from Hong Kong are expected to remain robust.
Focus on high value cargo and e-commerce opportunitiesHong Kong is building capabilities to focus on high-value e-commerce and trade of electronic goods, pharmaceuticals, and fresh or perishable produce. It is developing a premium logistics centre to serve e-commerce and temperature controlled air freight, and transhipment. Hong Kong International Airport obtained CEIV Fresh and CEIV Pharma certification and plans to foster closer collaboration with major pharmaceutical hubs to develop a ‘Cold-Chain Corridor’ providing an end-to-end solution for temperature-controlled cargo.
Investment in logistics technology and talentHong Kong is increasingly adopting e-logistics initiatives, such as seamless customs clearancethrough electronic submission and the implementation of the GPS communication technology to improve efficiency and productivityof its logistics sector. It is also investing in talent development and building future skills for logistics and supply chain management.
Key market and sector
Looking ahead
2020
USD 499 billion re-exports
of Hong Kong’s re-exports in 2020 originated from or were destined for Mainland China
>50%
re-exports share in 2020
per annum from 2012 to 2020
74% 3.5%
2012
USD 434 billion re-exports
Had the largest share of re-exports
Experienced the fastest growth with an average growth of
average annual growth
1.8%
Machinery & Electricals
48 Future of Trade 2030 4948 49Corridors of the future | East Asia — Hong Kong
Hong Kong-to-Japan trade corridor
Japan will continue to be among the key exportcorridors for Hong Kong from 2020 to 2030
Key export corridor
2019 Trade Openness Rank (out of 141)
#9
2020 2030 forecasted
The data is for trade of goods only
1.5 times growth in trade by 2030
2020-2030 GDP growth (per annum)
2020-2030 Global imports growth (per annum)
1.2%
5.8%
Hong Kong to Japan export value growth forecast
4.1%
Exports growth per annum
2030 forecasted
USD 21.2 billion exports
2020
USD 14.1 billion exports
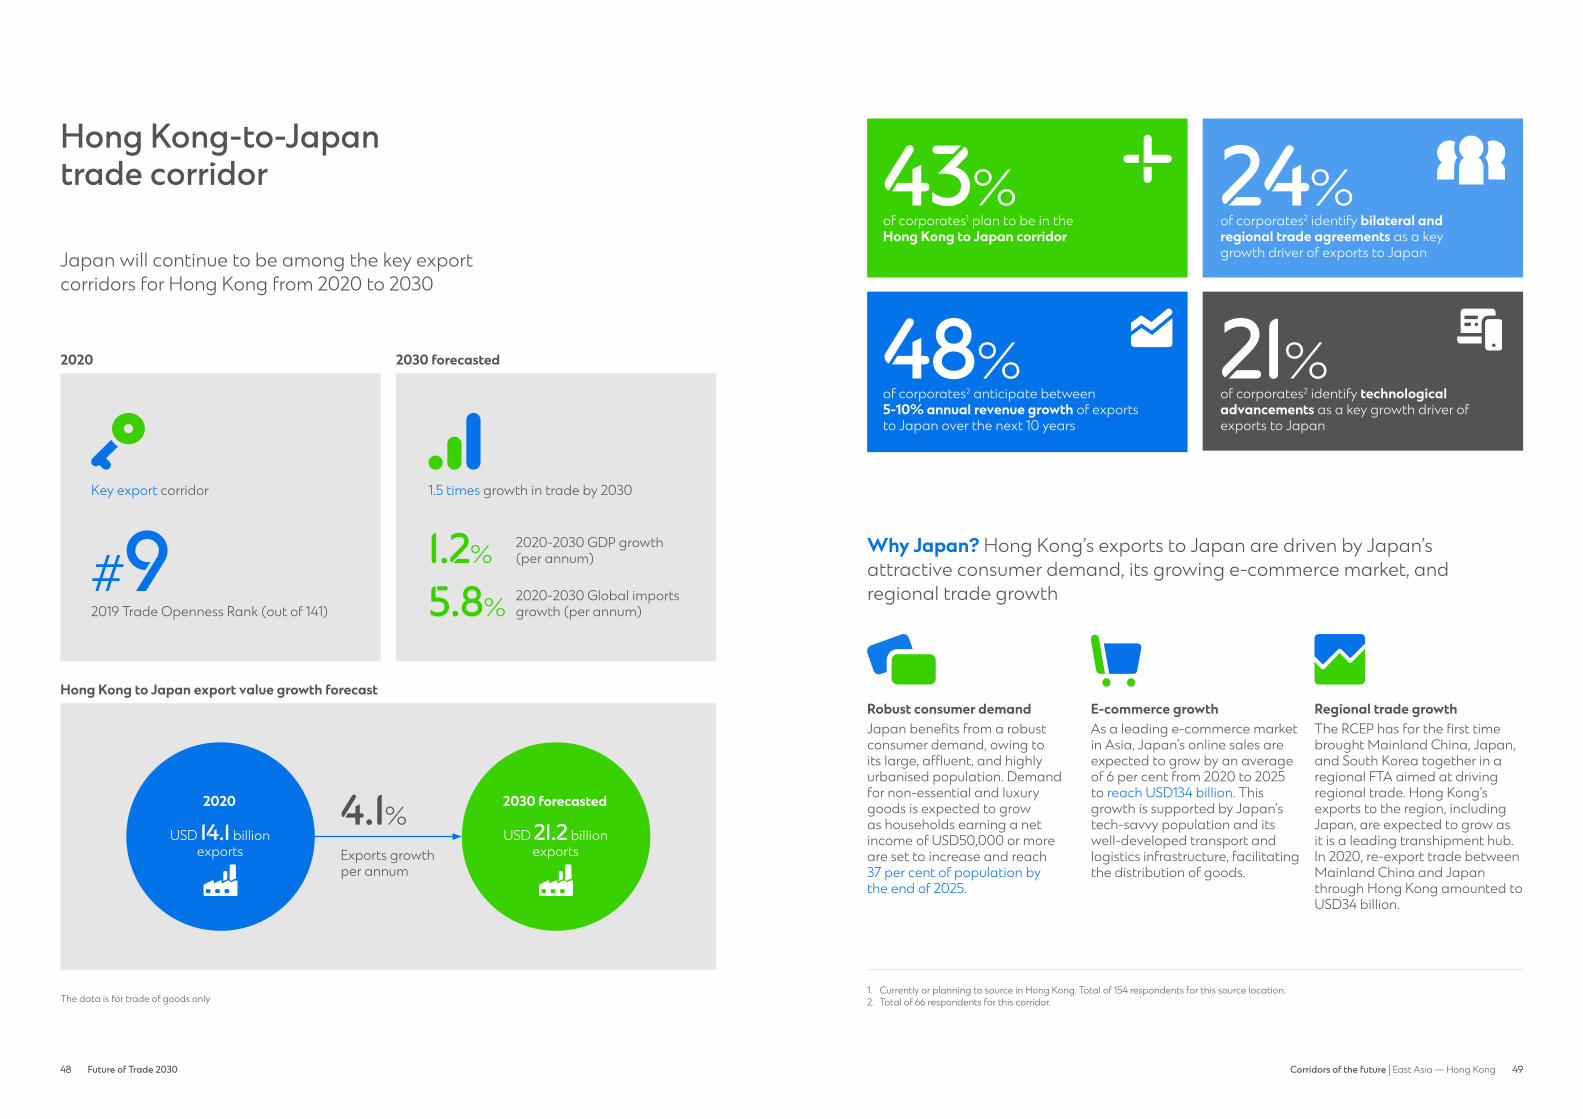
of corporates1 plan to be in the Hong Kong to Japan corridor
of corporates2 identify bilateral andregional trade agreements as a key growth driver of exports to Japan
of corporates2 anticipate between 5-10% annual revenue growth of exports to Japan over the next 10 years
of corporates2 identify technologicaladvancements as a key growth driver of exports to Japan
43% 24%
48% 21%
Why Japan? Hong Kong’s exports to Japan are driven by Japan’sattractive consumer demand, its growing e-commerce market, andregional trade growth
Robust consumer demandJapan benefits from a robust consumer demand, owing to its large, affluent, and highly urbanised population. Demand for non-essential and luxurygoods is expected to grow as households earning a net income of USD50,000 or more are set to increase and reach 37 per cent of population by the end of 2025.
E-commerce growthAs a leading e-commerce market in Asia, Japan’s online sales are expected to grow by an averageof 6 per cent from 2020 to 2025 to reach USD134 billion. This growth is supported by Japan’s tech-savvy population and its well-developed transport and logistics infrastructure, facilitating the distribution of goods.
Regional trade growthThe RCEP has for the first time brought Mainland China, Japan, and South Korea together in a regional FTA aimed at driving regional trade. Hong Kong’s exports to the region, including Japan, are expected to grow as it is a leading transhipment hub. In 2020, re-export trade between Mainland China and Japan through Hong Kong amounted to USD34 billion.
1. Currently or planning to source in Hong Kong. Total of 154 respondents for this source location. 2. Total of 66 respondents for this corridor.
consumer demographic
technological advancement
plan to be in corridor
50 Future of Trade 2030 5150 51Corridors of the future | East Asia — Hong Kong
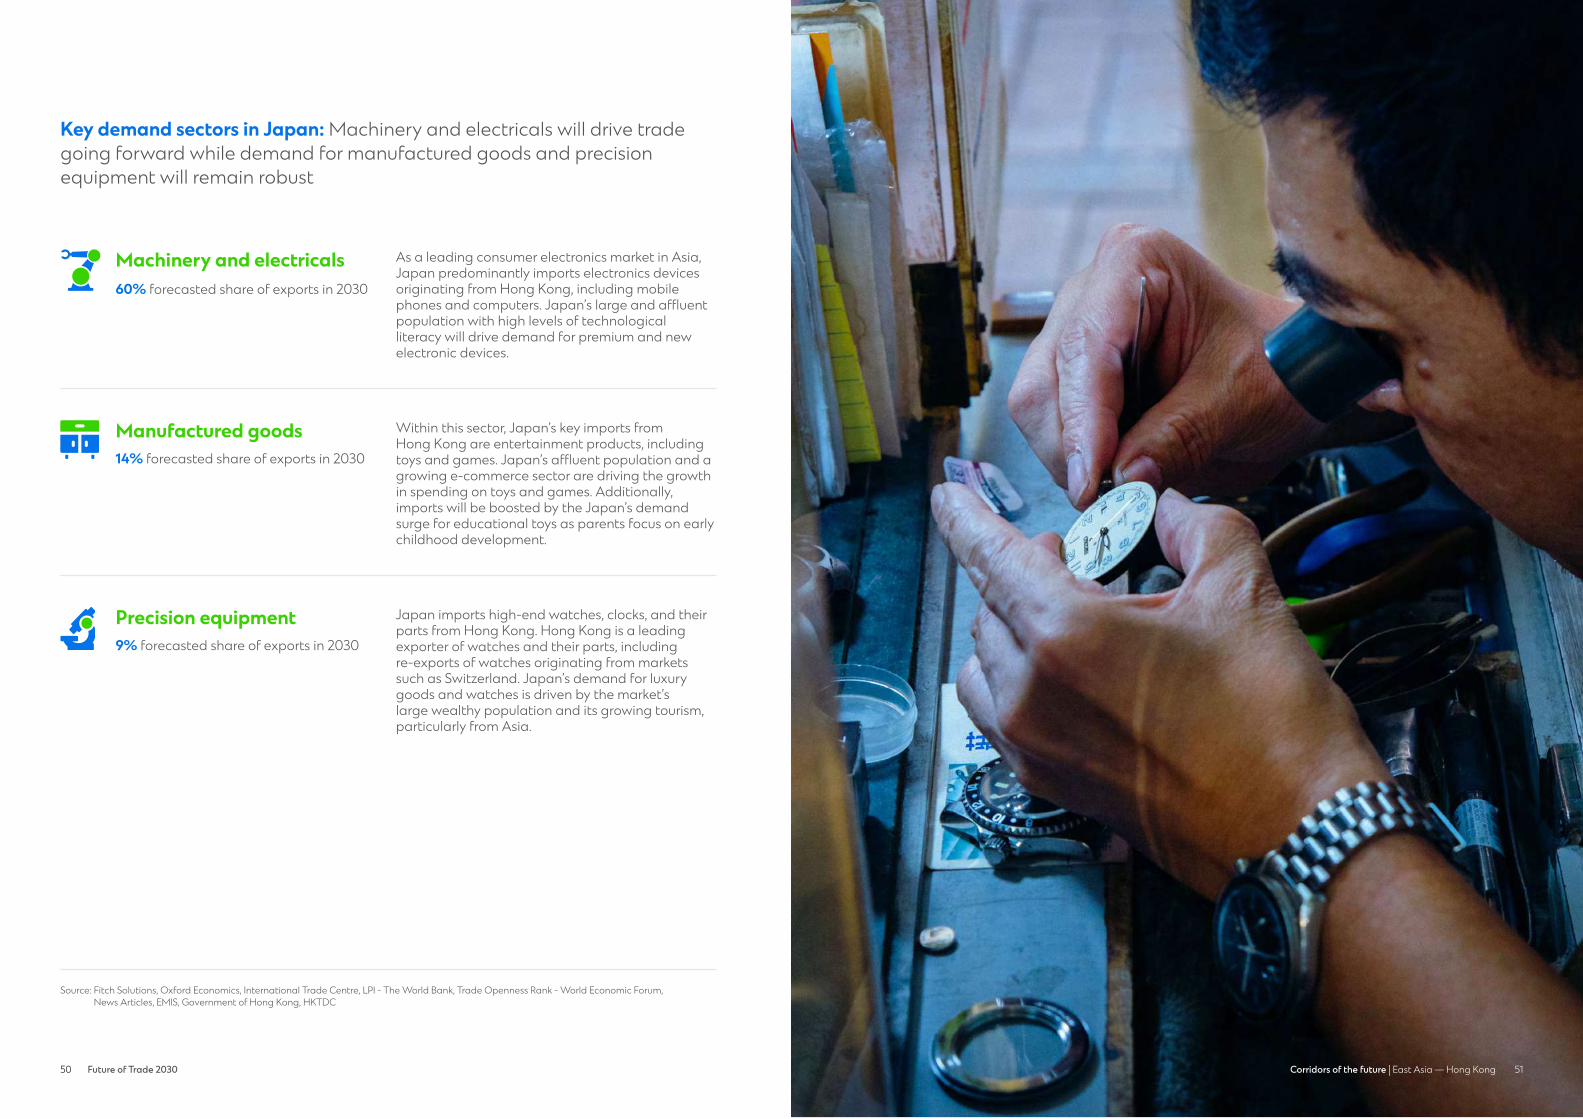
Key demand sectors in Japan: Machinery and electricals will drive trade going forward while demand for manufactured goods and precision equipment will remain robust
Source: Fitch Solutions, Oxford Economics, International Trade Centre, LPI - The World Bank, Trade Openness Rank - World Economic Forum, News Articles, EMIS, Government of Hong Kong, HKTDC
As a leading consumer electronics market in Asia, Japan predominantly imports electronics devices originating from Hong Kong, including mobile phones and computers. Japan’s large and affluent population with high levels of technological literacy will drive demand for premium and new electronic devices.
Machinery & Electricals
Japan imports high-end watches, clocks, and their parts from Hong Kong. Hong Kong is a leading exporter of watches and their parts, including re-exports of watches originating from markets such as Switzerland. Japan’s demand for luxury goods and watches is driven by the market’s large wealthy population and its growing tourism, particularly from Asia.
Precision Equipment
Within this sector, Japan’s key imports from Hong Kong are entertainment products, including toys and games. Japan’s affluent population and a growing e-commerce sector are driving the growth in spending on toys and games. Additionally, imports will be boosted by the Japan’s demand surge for educational toys as parents focus on early childhood development.
Chemicals & Pharmaceuticals
Other Manufac-tured Goods
Machinery and electricals60% forecasted share of exports in 2030
Precision equipment9% forecasted share of exports in 2030
Manufactured goods14% forecasted share of exports in 2030

52 Future of Trade 2030 5352 53Corridors of the future | East Asia — Hong Kong
Hong Kong-to-Mainland China trade corridor
Mainland China will continue to be the largest export corridor for Hong Kong from 2020 to 2030
Largest export corridor
2019 Trade Openness Rank (out of 141)
#71#1
2020 2030 forecasted
The data is for trade of goods only
1.8 times growth in trade by 2030
2020-2030 GDP growth (per annum)
of corporates1 plan to be in the Hong Kong to Mainland China corridor
of corporates2 anticipate between 5-10% annual revenue growth of exports to Mainland China over the next 10 years
2020-2030 Global imports growth (per annum)
5.5%
34%
42%
7.8%
Hong Kong to Mainland China export value growth forecast
6.1%
Exports growth per annum
Why Mainland China? Hong Kong’s exports to Mainland China are driven by their strategic trade ties, growing integration of transport networks, and Mainland China’s robust demand for electronic chips and components
Strategic trade tiesCloser Economic Partnership Arrangement (CEPA), signed between Hong Kong and Mainland China in 2003, offers Hong Kong’s products and companies preferential access to Mainland China’s mainland market. Hong Kong plays an important entrepot role for the trade between Mainland China and the rest of the world.
Integration of transport networksGuangdong-Hong Kong-Macao Greater Bay Area (GBA) development allows full integration of transport networks in the region. Infrastructure development, such as The Hong Kong-Zhuhai-Macao Bridge (HKZMB), is expected to reduce travel time and enhance cargo movement between Hong Kong and Mainland China.
Robust demand for electronic chips and componentsMainland China is an important manufacturing centre for consumer electronics goods and it heavily imports electronic chips and components. Mainland China has also committed USD1.4 trillion for developing its digital infrastructure, including 5G, smart cities, and IoT, which will further drive the demand for electronic components.
1. Currently or planning to source in Hong Kong. Total of 154 respondents for this source location. 2. Total of 52 respondents for this corridor.
2030 forecasted
USD 551.3 billion exports
2020
USD 304.9 billion exports
of corporates2 identify attractive consumer demographics as a key growth driver of exports to Mainland China
of corporates2 identify bilateral and regional trade agreements as a key growth driver of exports to Mainland China
44%
25% trade agreement
consumer demographic
plan to be in corridor
54 Future of Trade 2030 5554 55Corridors of the future | East Asia — Hong Kong
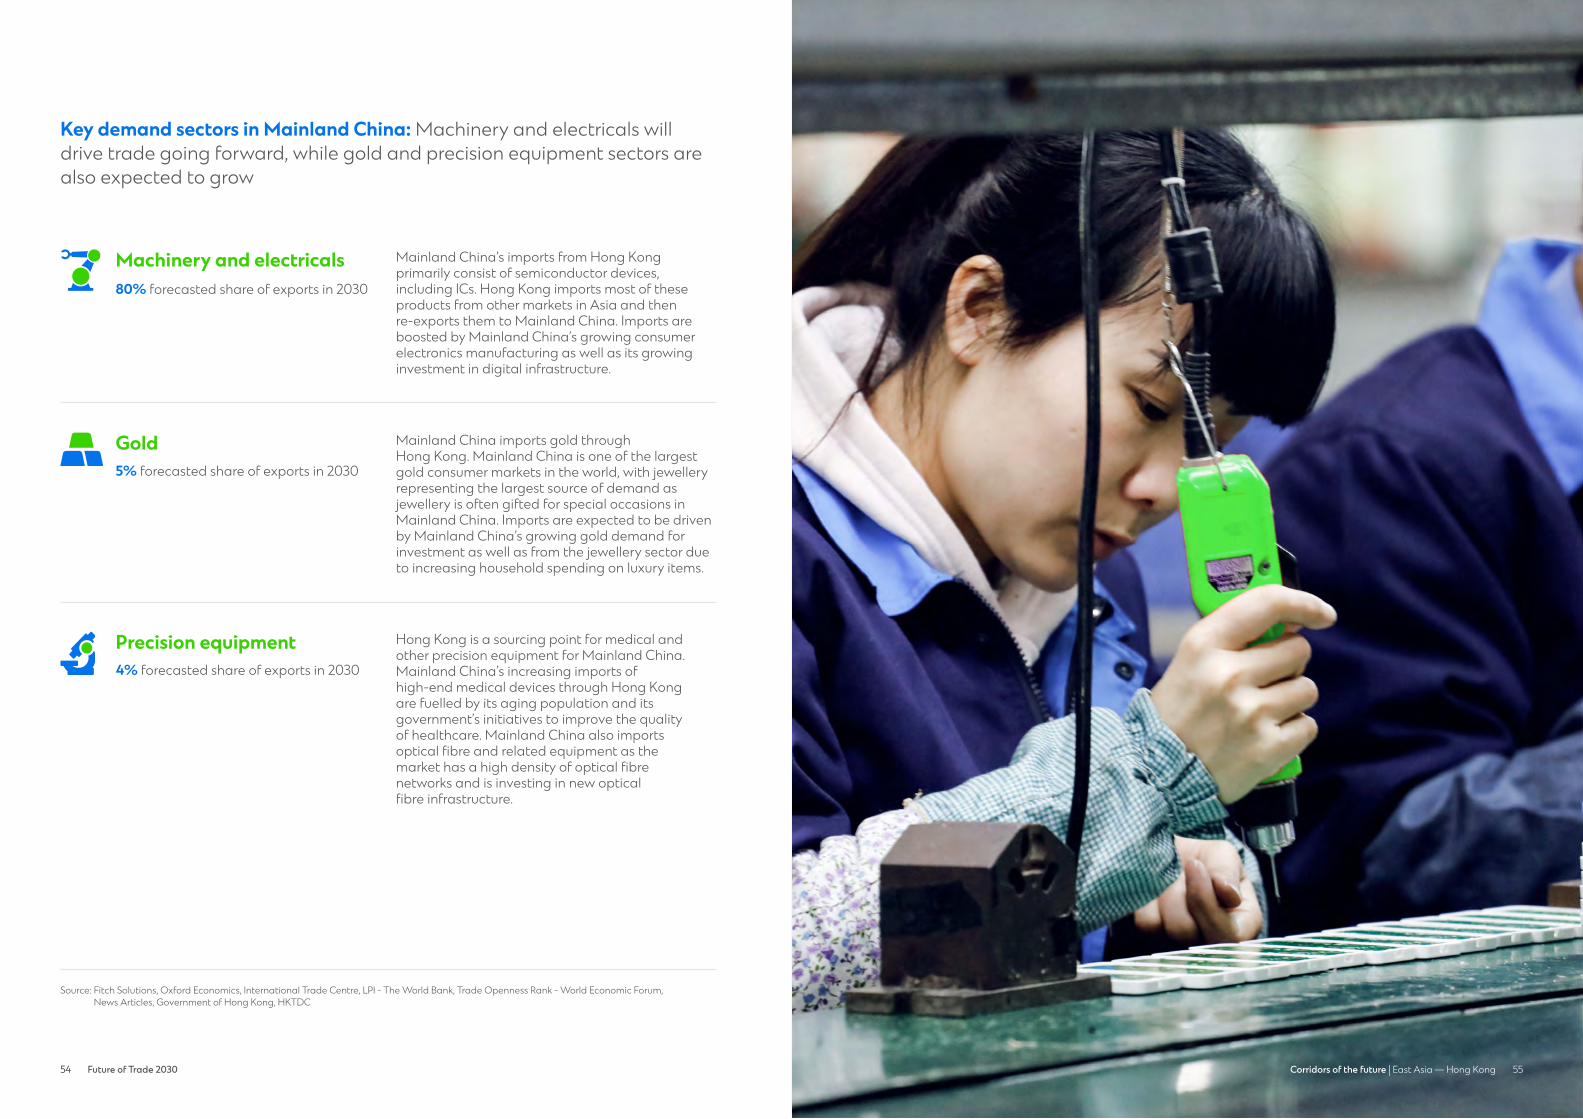
Key demand sectors in Mainland China: Machinery and electricals will drive trade going forward, while gold and precision equipment sectors are also expected to grow
Source: Fitch Solutions, Oxford Economics, International Trade Centre, LPI - The World Bank, Trade Openness Rank - World Economic Forum, News Articles, Government of Hong Kong, HKTDC
Mainland China’s imports from Hong Kong primarily consist of semiconductor devices, including ICs. Hong Kong imports most of these products from other markets in Asia and then re-exports them to Mainland China. Imports are boosted by Mainland China’s growing consumer electronics manufacturing as well as its growing investment in digital infrastructure.
Machinery & Electricals
Hong Kong is a sourcing point for medical and other precision equipment for Mainland China. Mainland China’s increasing imports of high-end medical devices through Hong Kong are fuelled by its aging population and its government’s initiatives to improve the quality of healthcare. Mainland China also imports optical fibre and related equipment as the market has a high density of optical fibre networks and is investing in new optical fibre infrastructure.
Precision Equipment
Mainland China imports gold through Hong Kong. Mainland China is one of the largest gold consumer markets in the world, with jewellery representing the largest source of demand as jewellery is often gifted for special occasions in Mainland China. Imports are expected to be driven by Mainland China’s growing gold demand for investment as well as from the jewellery sector due to increasing household spending on luxury items.
Gold
Machinery and electricals80% forecasted share of exports in 2030
Precision equipment4% forecasted share of exports in 2030
Gold5% forecasted share of exports in 2030

56 Future of Trade 2030 5756 57Corridors of the future | East Asia — Hong Kong
Hong Kong-to-USA trade corridor
The USA will continue to be the second largest exportcorridor for Hong Kong from 2020 to 2030
Second largest trade corridor
2019 Trade Openness Rank (out of 141)
#14#2
2020 2030 forecasted
The data is for trade of goods only
1.5 times growth in trade by 2030
2020-2030 GDP growth (per annum)
2020-2030 Global imports growth (per annum)
2.4%
5.9%
Hong Kong to the USA export value growth forecast
4.2%
Exports growth per annum
2030 forecasted
USD 61.1 billion exports
2020
USD 40.4 billion exports
of corporates1 plan to be in the Hong Kong to USA corridor
of corporates2 anticipate between 5-10% annual revenue growth of exports to USA over the next 10 years
23%
36%
Why the USA? Hong Kong’s exports to the USA are driven by its robust consumer spending, a growing e-commerce sector, and the ever-increasing adoption of new technology devices
1. Currently or planning to source in Hong Kong. Total of 154 respondents for this source location. 2. Total of 36 respondents for this corridor.
Robust consumer demandSpending on non-essentials in the USA is expected to grow by an average of 6 per cent from 2020 to 2025 to reach USD11.1 trillion. This is driven by the growing number of households with disposable income of more than USD50,000, which are expected to account for 65 per cent of the USA population in 2025.
Growing e-commerce sectorThe USA is the second largest e-commerce market in the world in term of sales, with top segments including fashion, electronics and media, and toys. As e-commerce sales are expected to grow by an average of 11 per cent from 2020 to 2025 to reach USD1.1 trillion, the imports of goods in these segments are expected to grow.
Adoption of new technology devicesThe USA is among the leading markets globally for the uptake of newer technologies, such assmart watches, wireless earphones, fitness trackers, smart assistant devices, and AR/VR. Hong Kong, being a leading transhipment hub forconsumer electronics, could expect increased exports to the USA for these new technologies.
of corporates2 identify attractive consumer demographics as a key growth driver of exports to the USA
of corporates2 identify technological advancements as a key growth driver of exports to the USA
25%
19% technological advancement
consumer demographic
plan to be in corridor

58 Future of Trade 2030 5958 59Corridors of the future | East Asia — Hong Kong
Source: Fitch Solutions, Oxford Economics, International Trade Centre, LPI - The World Bank, Trade Openness Rank - World Economic Forum, News Articles, EMIS, Government of Hong Kong, HKTDC
Key demand sectors in the USA: Machinery and electricals will drive trade going forward while demand for manufactured goods and metals and minerals is expected to grow
The USA’s imports from Hong Kong mainly comprise of consumer electronics, such as mobile phones and computers. Imports will be boosted by the USA’s tech-savvy population and the rapid growth of its consumer electronics market driven by the development of the cloud computing market and the expansion of fibre and 5G technology.
Machinery & Electricals
The USA imports manufactured goods, such as toys, stuffed animals, and video games from Hong Kong. Hong Kong exports/re-exports a wide range of high-quality toys and does contract manufacturing for leading brands. The export of toys to the USA is driven by increasing online sales. There is a growing demand for themed toys, driven by social media influence, as well as demand for educational toys due to a focus on childhood development.
Chemicals & Pharmaceuticals
Other Manufac-tured Goods
The USA imports jewellery, diamonds, and other precious stones from Hong Kong. The USA’s demand for precious stones and jewellery is driven by rising per capita disposable income, an increasing female workforce population, and a growing number of e-commerce buyers.
Metals & Minerals
Machinery and electricals55% forecasted share of exports in 2030
Metals and minerals8% forecasted share of exports in 2030
Manufactured goods18% forecasted share of exports in 2030
60 6161Corridors of the future | East Asia — Mainland ChinaFuture of Trade 203060
Mainland China
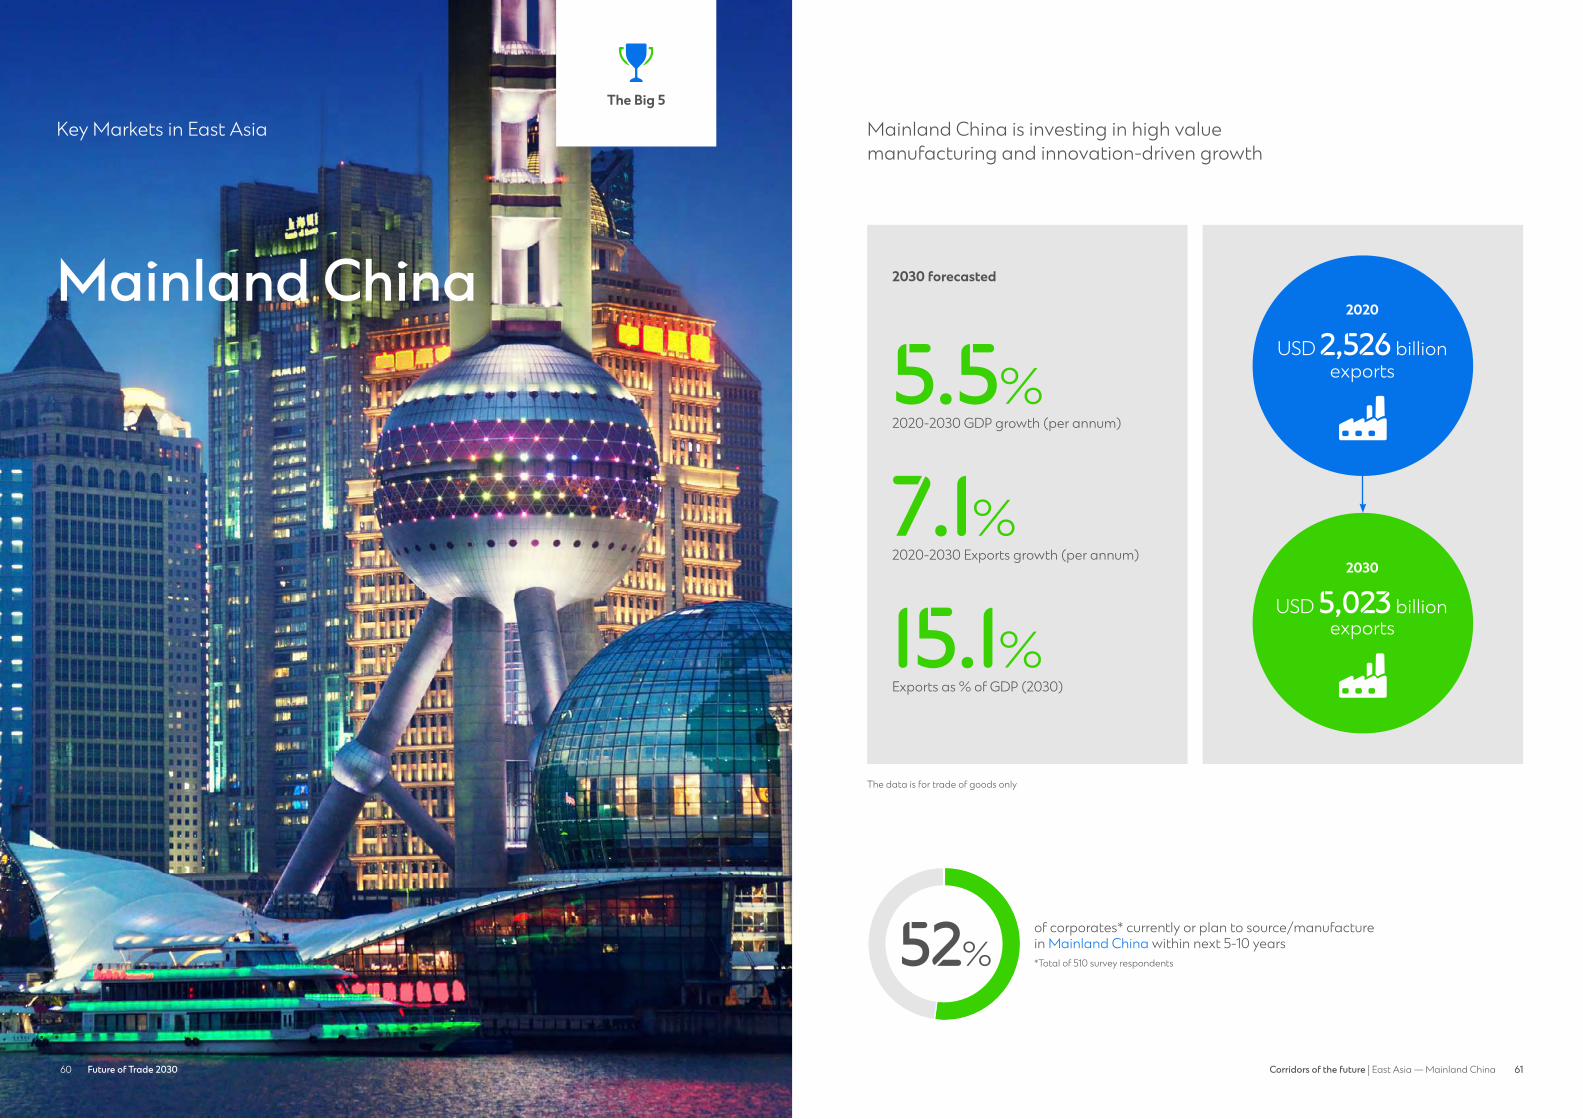
Key Markets in East Asia Mainland China is investing in high value manufacturing and innovation-driven growth
52%of corporates* currently or plan to source/manufacture in Mainland China within next 5-10 years*Total of 510 survey respondents
The data is for trade of goods only
The Big 5The Big 5
2030 forecasted
2020-2030 GDP growth (per annum)
5.5%
2020-2030 Exports growth (per annum)
7.1%
Exports as % of GDP (2030)
15.1%
2020
USD 2,526 billion exports
2030
USD 5,023 billion exports
62 Future of Trade 2030 6362 63Corridors of the future | East Asia — Mainland China
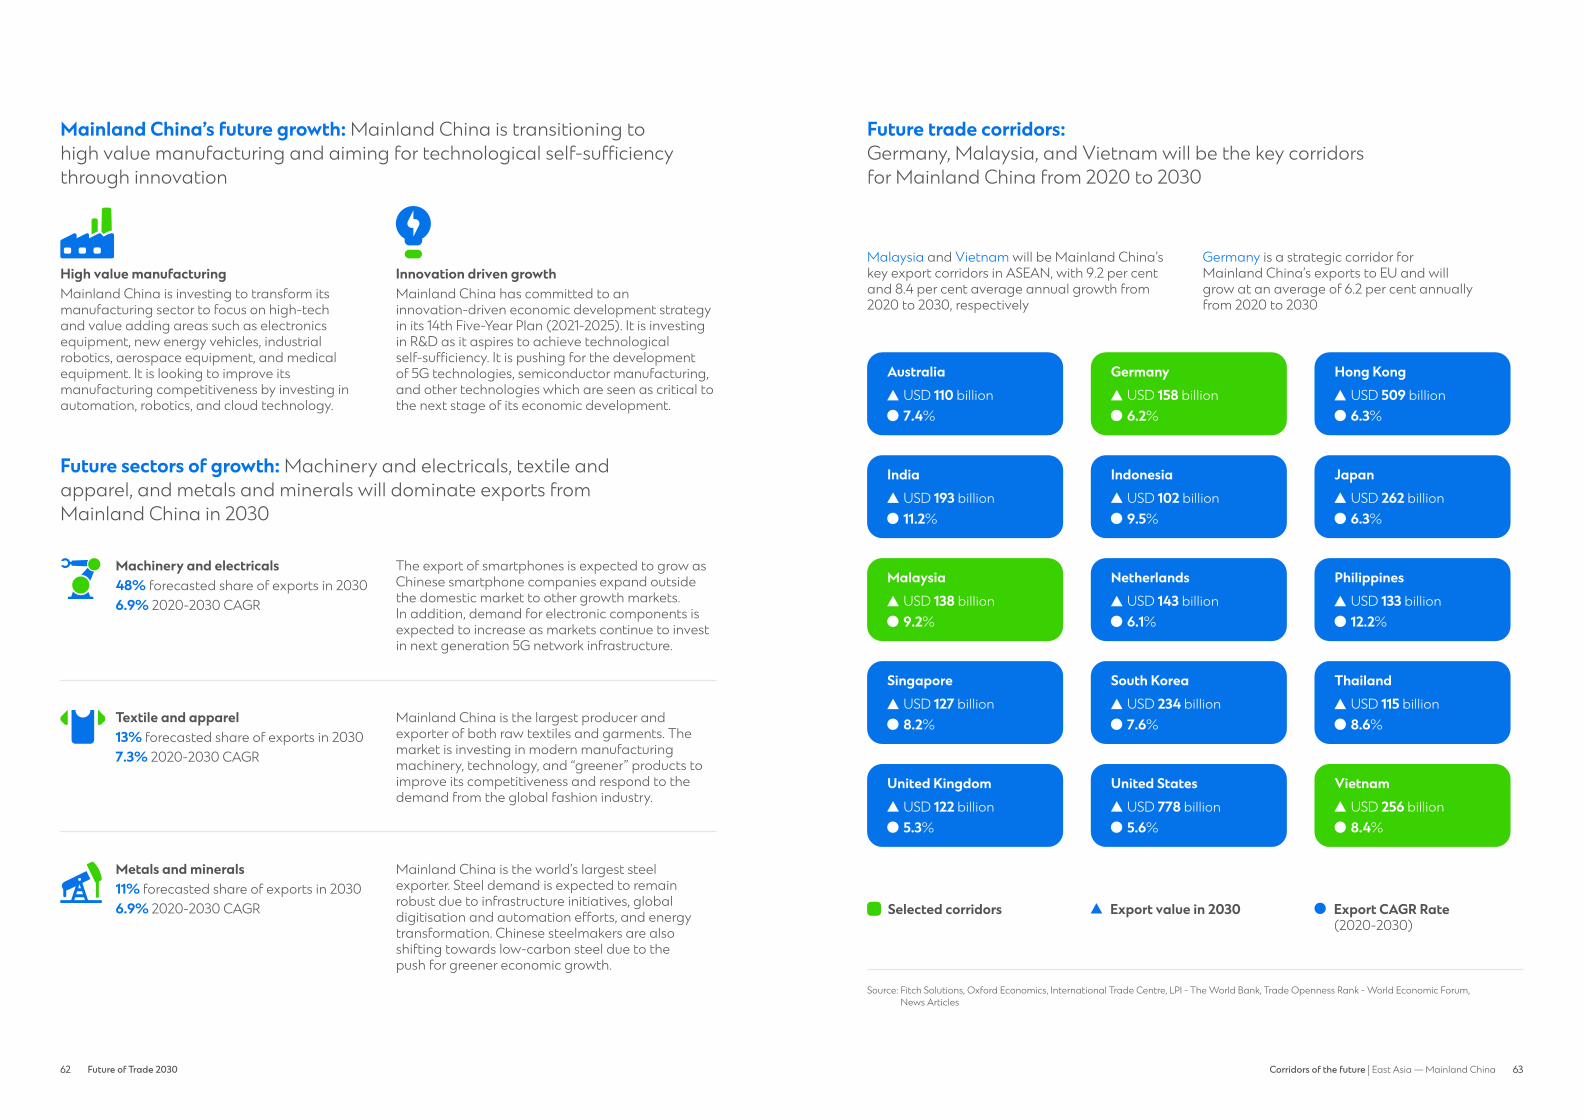
Mainland China’s future growth: Mainland China is transitioning to high value manufacturing and aiming for technological self-sufficiency through innovation
High value manufacturingMainland China is investing to transform its manufacturing sector to focus on high-tech and value adding areas such as electronics equipment, new energy vehicles, industrial robotics, aerospace equipment, and medical equipment. It is looking to improve its manufacturing competitiveness by investing in automation, robotics, and cloud technology.
Innovation driven growthMainland China has committed to an innovation-driven economic development strategy in its 14th Five-Year Plan (2021-2025). It is investing in R&D as it aspires to achieve technological self-sufficiency. It is pushing for the development of 5G technologies, semiconductor manufacturing, and other technologies which are seen as critical to the next stage of its economic development.
Future sectors of growth: Machinery and electricals, textile and apparel, and metals and minerals will dominate exports from Mainland China in 2030
Future trade corridors: Germany, Malaysia, and Vietnam will be the key corridors for Mainland China from 2020 to 2030
Source: Fitch Solutions, Oxford Economics, International Trade Centre, LPI - The World Bank, Trade Openness Rank - World Economic Forum, News Articles
Malaysia and Vietnam will be Mainland China’s key export corridors in ASEAN, with 9.2 per cent and 8.4 per cent average annual growth from 2020 to 2030, respectively
Germany is a strategic corridor for Mainland China’s exports to EU and will grow at an average of 6.2 per cent annually from 2020 to 2030
Machinery and electricals The export of smartphones is expected to grow as Chinese smartphone companies expand outside the domestic market to other growth markets. In addition, demand for electronic components is expected to increase as markets continue to invest in next generation 5G network infrastructure.
48% forecasted share of exports in 20306.9% 2020-2030 CAGRMachinery &
Electricals
Metals and minerals Mainland China is the world’s largest steel exporter. Steel demand is expected to remain robust due to infrastructure initiatives, global digitisation and automation efforts, and energy transformation. Chinese steelmakers are also shifting towards low-carbon steel due to the push for greener economic growth.
11% forecasted share of exports in 20306.9% 2020-2030 CAGRMetals & Minerals
Textile and apparel Mainland China is the largest producer and exporter of both raw textiles and garments. The market is investing in modern manufacturing machinery, technology, and “greener” products to improve its competitiveness and respond to the demand from the global fashion industry.
13% forecasted share of exports in 20307.3% 2020-2030 CAGRTextile & Apparel
GermanyUSD 158 billion6.2%
Hong KongUSD 509 billion6.3%
AustraliaUSD 110 billion7.4%
NetherlandsUSD 143 billion6.1%
PhilippinesUSD 133 billion12.2%
MalaysiaUSD 138 billion9.2%
South KoreaUSD 234 billion7.6%
ThailandUSD 115 billion8.6%
SingaporeUSD 127 billion8.2%
IndonesiaUSD 102 billion9.5%
JapanUSD 262 billion6.3%
IndiaUSD 193 billion11.2%
United States VietnamUSD 778 billion USD 256 billion5.6% 8.4%
United KingdomUSD 122 billion5.3%
Export CAGR Rate (2020-2030)
Selected corridors Export value in 2030
64 Future of Trade 2030 6564 65Corridors of the future | East Asia — Mainland China
Mainland China-to-Germanytrade corridor
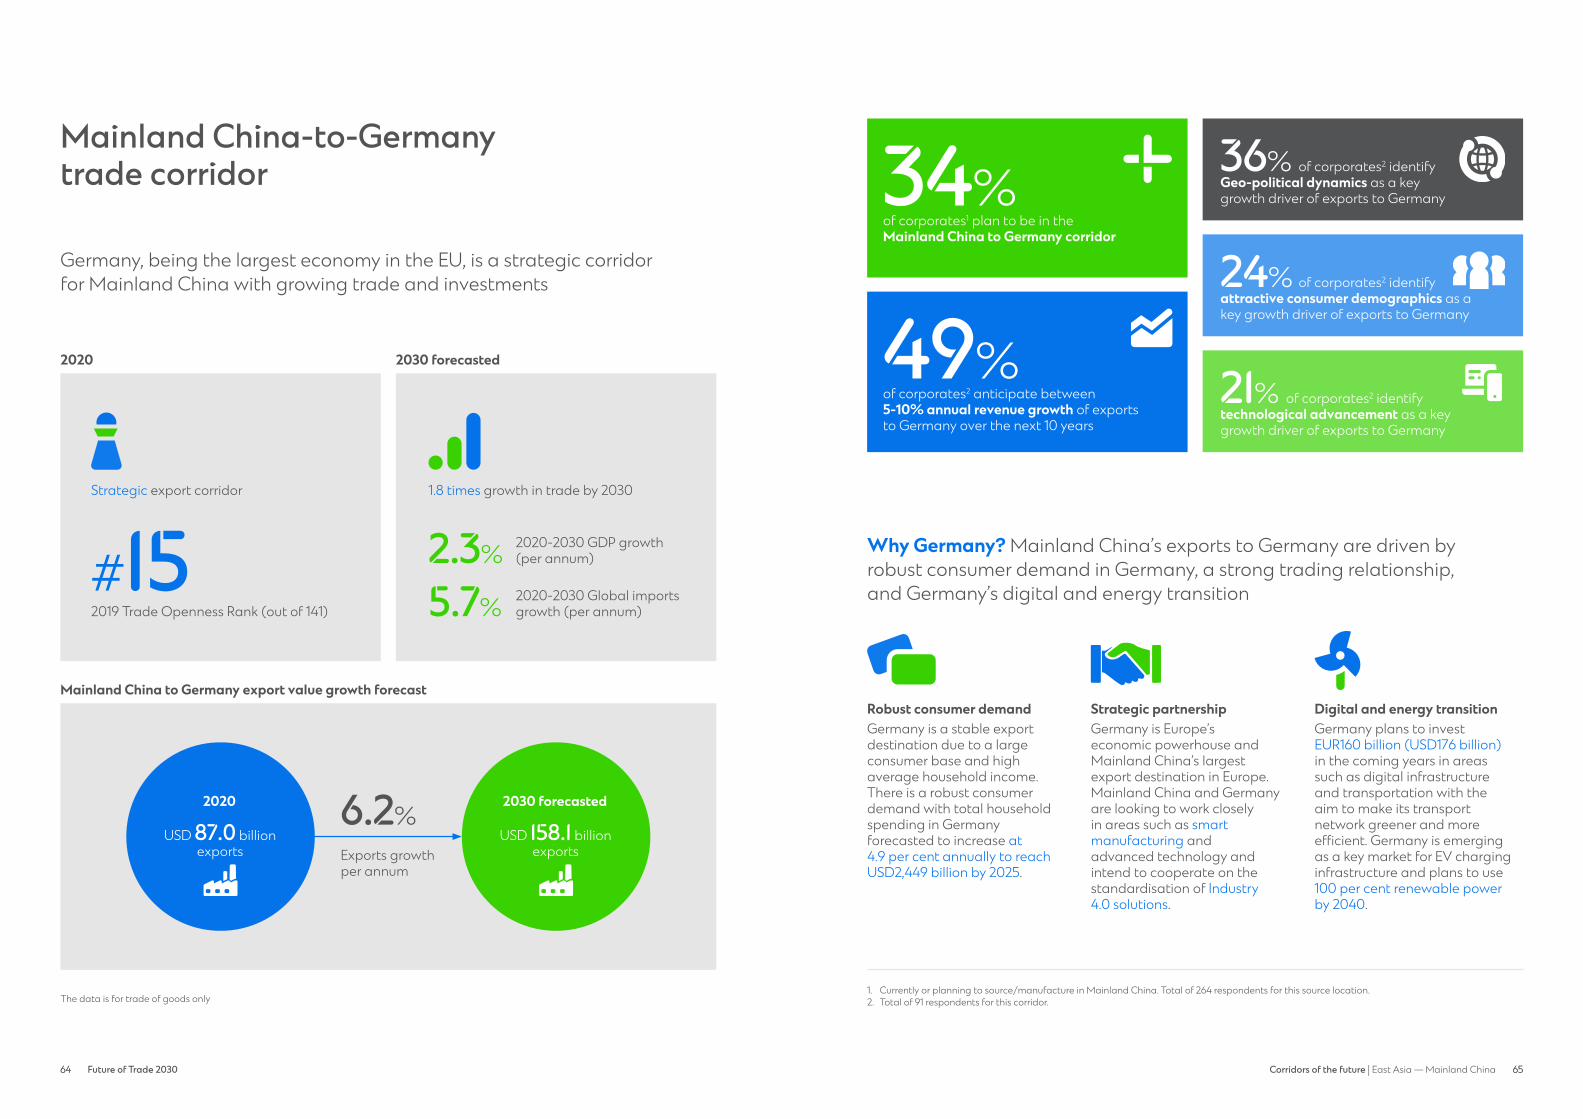
Germany, being the largest economy in the EU, is a strategic corridor for Mainland China with growing trade and investments
Strategic export corridor
2019 Trade Openness Rank (out of 141)
#15
2020 2030 forecasted
The data is for trade of goods only
1.8 times growth in trade by 2030
2020-2030 GDP growth (per annum)
2020-2030 Global imports growth (per annum)
2.3%
5.7%
Mainland China to Germany export value growth forecast
6.2%
Exports growth per annum
2030 forecasted
USD 158.1 billion exports
2020
USD 87.0 billion exports
of corporates1 plan to be in the Mainland China to Germany corridor
of corporates2 anticipate between 5-10% annual revenue growth of exports to Germany over the next 10 years
34%
49%
Why Germany? Mainland China’s exports to Germany are driven by robust consumer demand in Germany, a strong trading relationship, and Germany’s digital and energy transition
Robust consumer demandGermany is a stable export destination due to a large consumer base and high average household income. There is a robust consumerdemand with total household spending in Germany forecasted to increase at 4.9 per cent annually to reach USD2,449 billion by 2025.
Strategic partnershipGermany is Europe’s economic powerhouse and Mainland China’s largest export destination in Europe. Mainland China and Germany are looking to work closely in areas such as smart manufacturing andadvanced technology and intend to cooperate on the standardisation of Industry 4.0 solutions.
Digital and energy transitionGermany plans to invest EUR160 billion (USD176 billion) in the coming years in areas such as digital infrastructure and transportation with the aim to make its transport network greener and more efficient. Germany is emerging as a key market for EV charging infrastructure and plans to use 100 per cent renewable power by 2040.
1. Currently or planning to source/manufacture in Mainland China. Total of 264 respondents for this source location. 2. Total of 91 respondents for this corridor.
of corporates2 identify attractive consumer demographics as a key growth driver of exports to Germany
24%
of corporates2 identify technological advancement as a key growth driver of exports to Germany
21%
of corporates2 identify Geo-political dynamics as a key growth driver of exports to Germany
36%geo-political
dynamic
technological advancement
consumer demographic
plan to be in corridor
66 Future of Trade 2030 6766 67Corridors at the forefront of future global trade flows | East Asia — Mainland China
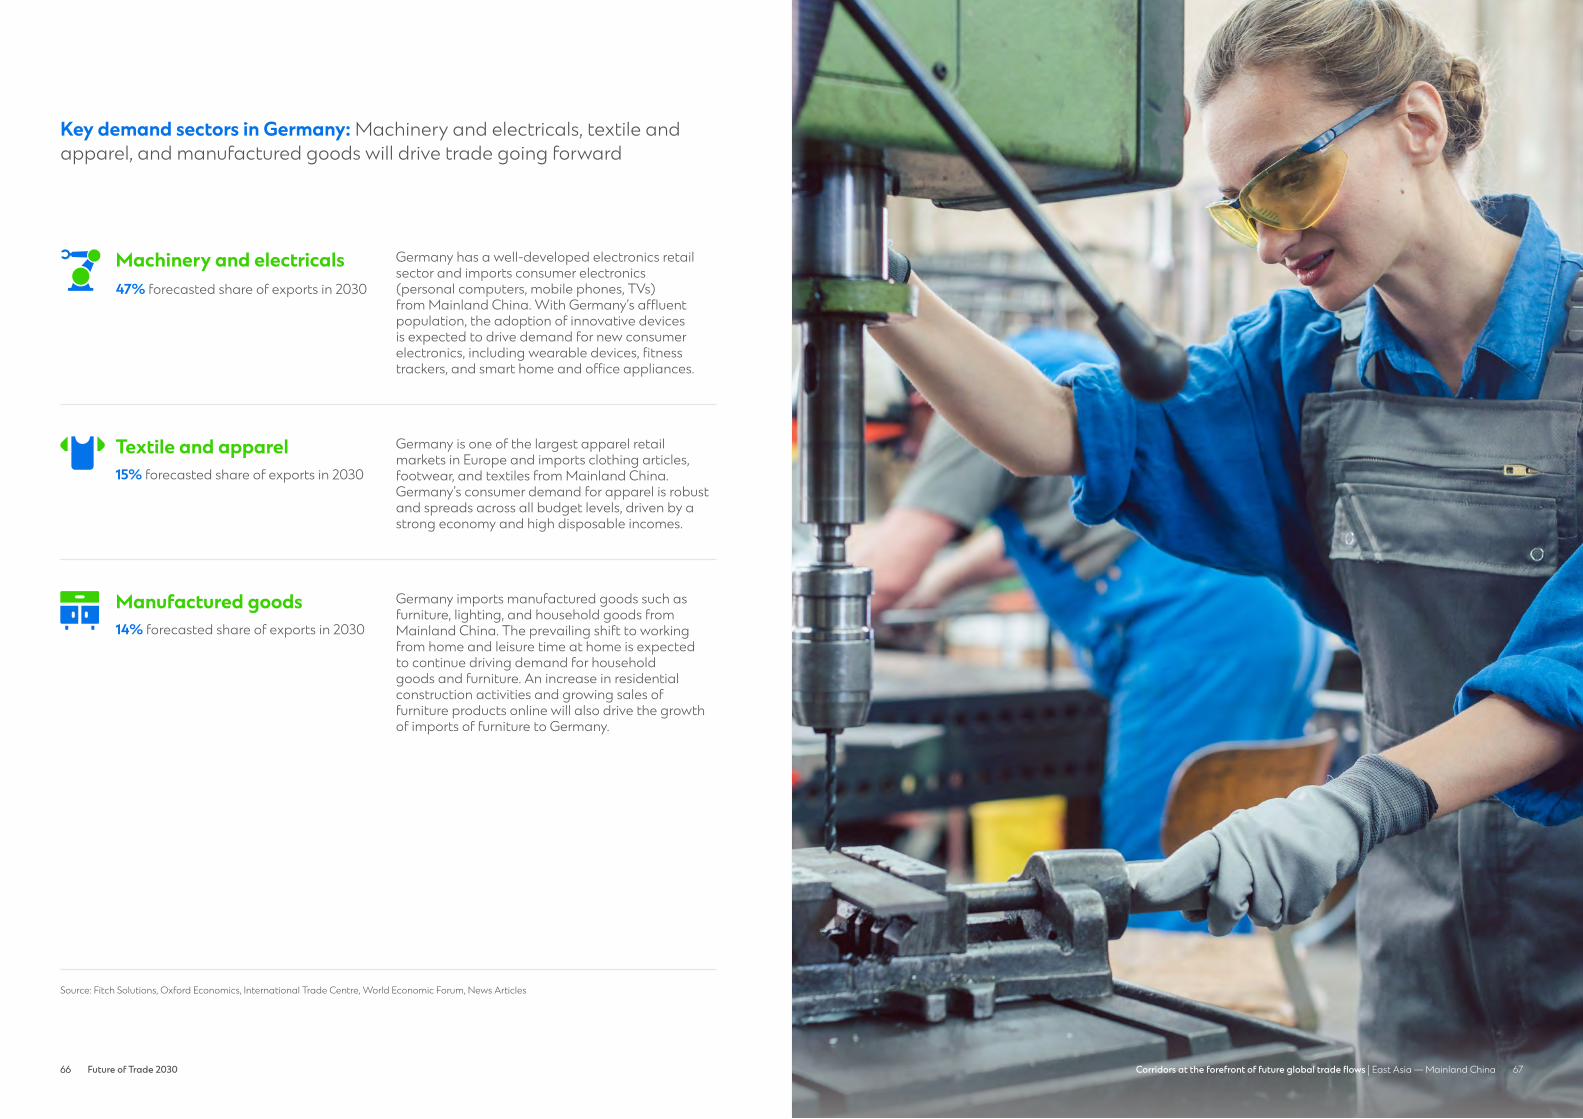
Key demand sectors in Germany: Machinery and electricals, textile and apparel, and manufactured goods will drive trade going forward
Source: Fitch Solutions, Oxford Economics, International Trade Centre, World Economic Forum, News Articles
Germany has a well-developed electronics retail sector and imports consumer electronics (personal computers, mobile phones, TVs) from Mainland China. With Germany’s affluent population, the adoption of innovative devices is expected to drive demand for new consumer electronics, including wearable devices, fitness trackers, and smart home and office appliances.
Machinery & Electricals
Germany is one of the largest apparel retail markets in Europe and imports clothing articles, footwear, and textiles from Mainland China. Germany’s consumer demand for apparel is robust and spreads across all budget levels, driven by a strong economy and high disposable incomes.
Textile & Apparel
Germany imports manufactured goods such as furniture, lighting, and household goods from Mainland China. The prevailing shift to working from home and leisure time at home is expected to continue driving demand for household goods and furniture. An increase in residential construction activities and growing sales of furniture products online will also drive the growth of imports of furniture to Germany.
Chemicals & Pharmaceuticals
Other Manufac-tured Goods
Machinery and electricals47% forecasted share of exports in 2030
Manufactured goods14% forecasted share of exports in 2030
Textile and apparel15% forecasted share of exports in 2030
68 Future of Trade 2030 6968 69Corridors of the future | East Asia — Mainland China
Mainlnd China-to-Malaysiatrade corridor
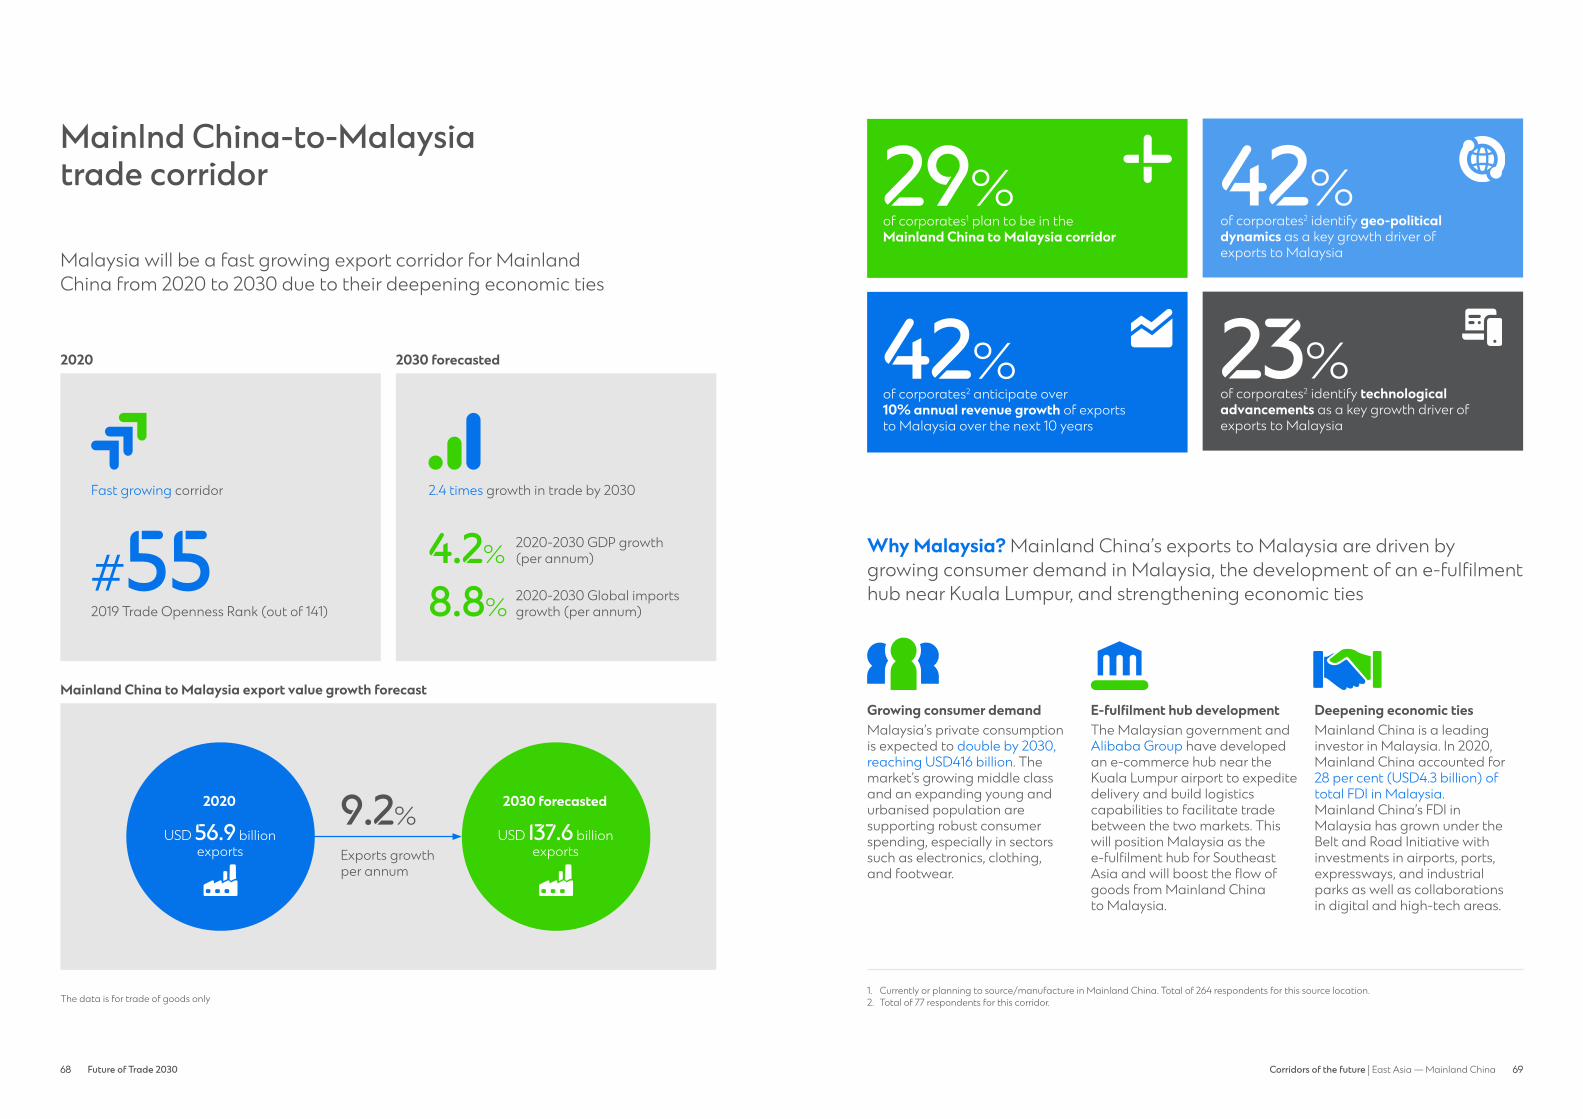
Malaysia will be a fast growing export corridor for Mainland China from 2020 to 2030 due to their deepening economic ties
Fast growing corridor
2019 Trade Openness Rank (out of 141)
#55
2020 2030 forecasted
The data is for trade of goods only
2.4 times growth in trade by 2030
2020-2030 GDP growth (per annum)
2020-2030 Global imports growth (per annum)
4.2%
8.8%
Mainland China to Malaysia export value growth forecast
9.2%
Exports growth per annum
2030 forecasted
USD 137.6 billion exports
2020
USD 56.9 billion exports
of corporates1 plan to be in the Mainland China to Malaysia corridor
of corporates2 anticipate over 10% annual revenue growth of exports to Malaysia over the next 10 years
29%
42%
Why Malaysia? Mainland China’s exports to Malaysia are driven by growing consumer demand in Malaysia, the development of an e-fulfilment hub near Kuala Lumpur, and strengthening economic ties
Growing consumer demandMalaysia’s private consumption is expected to double by 2030, reaching USD416 billion. Themarket’s growing middle class and an expanding young and urbanised population aresupporting robust consumer spending, especially in sectors such as electronics, clothing, and footwear.
E-fulfilment hub developmentThe Malaysian government and Alibaba Group have developed an e-commerce hub near theKuala Lumpur airport to expedite delivery and build logistics capabilities to facilitate tradebetween the two markets. This will position Malaysia as the e-fulfilment hub for SoutheastAsia and will boost the flow of goods from Mainland China to Malaysia.
Deepening economic tiesMainland China is a leading investor in Malaysia. In 2020, Mainland China accounted for 28 per cent (USD4.3 billion) of total FDI in Malaysia. Mainland China’s FDI in Malaysia has grown under the Belt and Road Initiative with investments in airports, ports,expressways, and industrial parks as well as collaborations in digital and high-tech areas.
1. Currently or planning to source/manufacture in Mainland China. Total of 264 respondents for this source location. 2. Total of 77 respondents for this corridor.
of corporates2 identify geo-political dynamics as a key growth driver of exports to Malaysia
of corporates2 identify technological advancements as a key growth driver of exports to Malaysia
42%
23%
geo-political dynamic
technological advancement
plan to be in corridor
70 Future of Trade 2030 7170 71Corridors of the future | East Asia — Mainland China
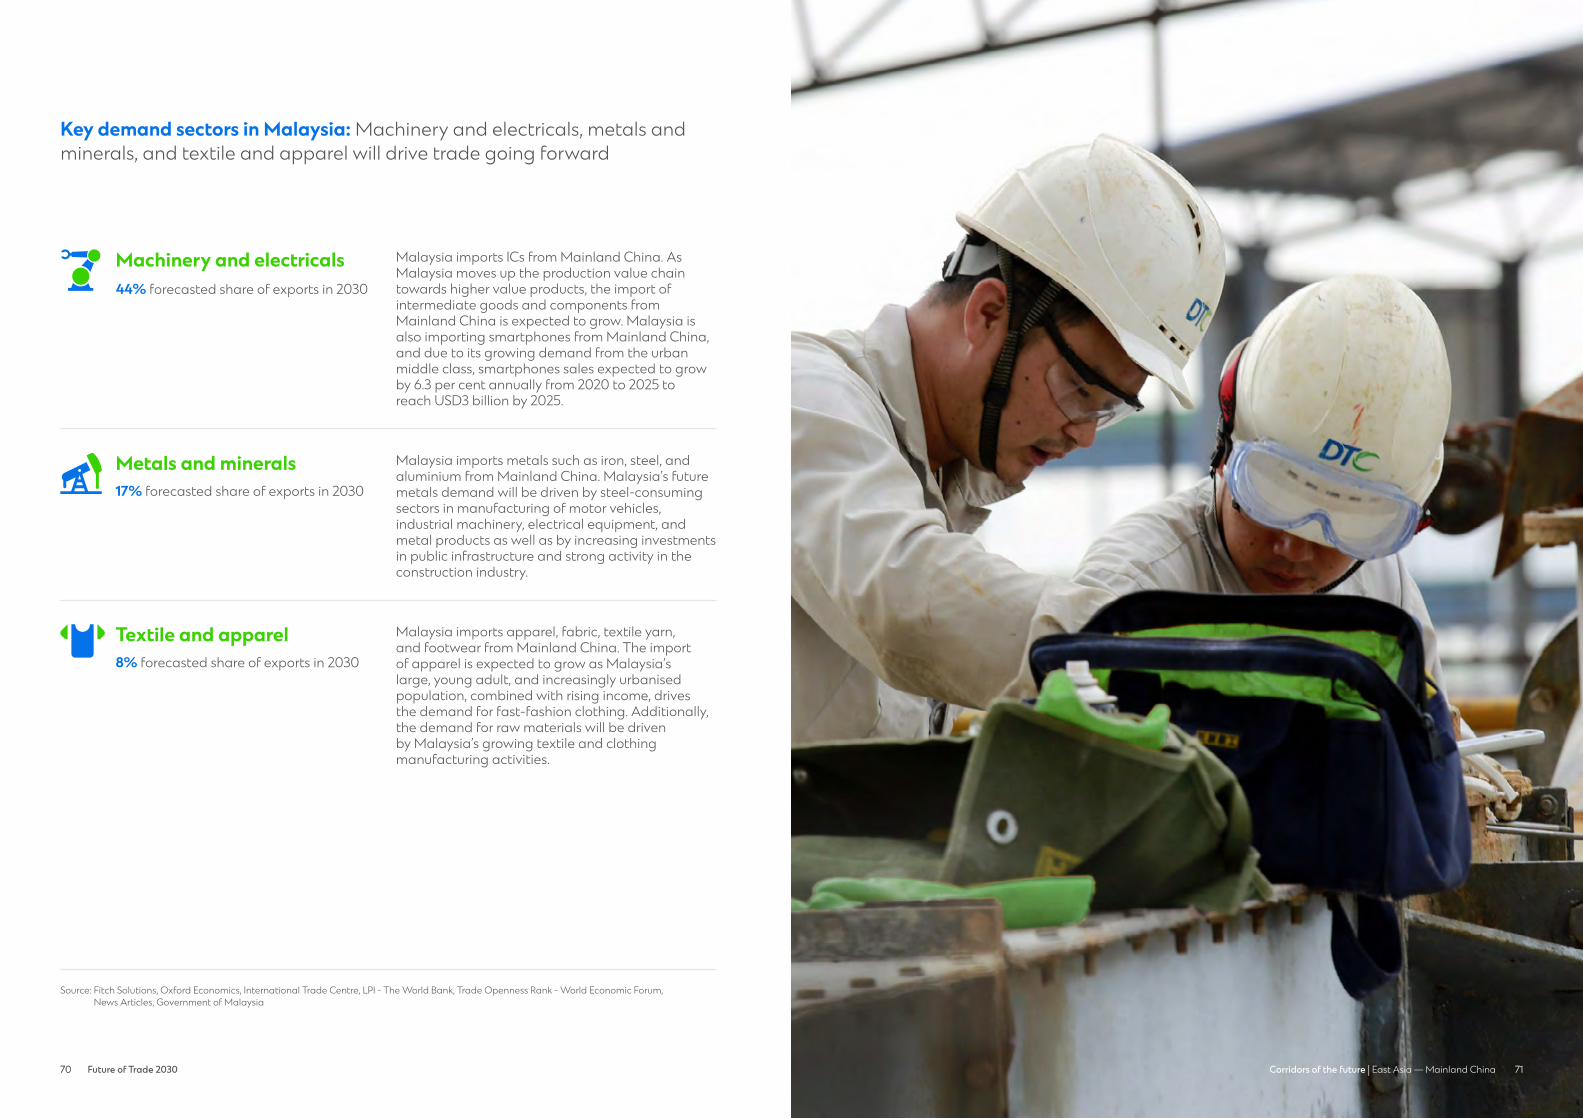
Key demand sectors in Malaysia: Machinery and electricals, metals andminerals, and textile and apparel will drive trade going forward
Source: Fitch Solutions, Oxford Economics, International Trade Centre, LPI - The World Bank, Trade Openness Rank - World Economic Forum, News Articles, Government of Malaysia
Malaysia imports ICs from Mainland China. As Malaysia moves up the production value chain towards higher value products, the import of intermediate goods and components from Mainland China is expected to grow. Malaysia is also importing smartphones from Mainland China, and due to its growing demand from the urban middle class, smartphones sales expected to grow by 6.3 per cent annually from 2020 to 2025 to reach USD3 billion by 2025.
Machinery & Electricals
Malaysia imports apparel, fabric, textile yarn, and footwear from Mainland China. The import of apparel is expected to grow as Malaysia’s large, young adult, and increasingly urbanised population, combined with rising income, drives the demand for fast-fashion clothing. Additionally, the demand for raw materials will be driven by Malaysia’s growing textile and clothing manufacturing activities.
Textile & Apparel
Malaysia imports metals such as iron, steel, and aluminium from Mainland China. Malaysia’s future metals demand will be driven by steel-consuming sectors in manufacturing of motor vehicles, industrial machinery, electrical equipment, and metal products as well as by increasing investments in public infrastructure and strong activity in the construction industry.
Metals & Minerals
Machinery and electricals44% forecasted share of exports in 2030
Textile and apparel8% forecasted share of exports in 2030
Metals and minerals17% forecasted share of exports in 2030

72 Future of Trade 2030 7372 73Corridors of the future | East Asia — Mainland China
Mainland China-to-Vietnam trade corridor
Vietnam is a large and growing export corridor for Mainland China enhanced by recent supply chain diversification
Fourth largest trade corridor
2019 Trade Openness Rank (out of 141)
#91#4
2020 2030 forecasted
The data is for trade of goods only
2 .2 times growth in trade by 2030
2020-2030 GDP growth (per annum)
of corporates1 plan to be in the Mainland China to Vietnam corridor
of corporates2 identify supply chain rebalancing as a key growth driver of exports to Vietnam
of corporates2 anticipate between 5-10% annual revenue growth of exports to Vietnam over the next 10 years
of corporates2 identify attractive consumer demographics as a key growth driver of exports to Vietnam
2020-2030 Global imports growth (per annum)
6.4%
27% 33%
35% 22%
8.0%
Mainland China to Vietnam export value growth forecast
8.4%
Exports growth per annum
Why Vietnam? Mainland China’s exports to Vietnam are driven by Vietnam’s growing manufacturing sector, supply chain diversification, and growing Vietnamese consumer demand
A growing manufacturing hubVietnam’s manufacturing sector is highly dependent on Mainland China for the supply of intermediate goods used in industries such as textile and electronics. As Vietnam grows as a global manufacturing hub, the demand for intermediate goods from Mainland China will continue.
Supply chain diversificationVietnam provides access to several key markets through its FTA. Chinese manufacturers are establishing production bases in Vietnam due to lower costs and to diversify due to geopolitical tensions. This is facilitating the export of various materials from Mainland China to Vietnam to then produce in Vietnam and export to other markets.
Growing consumer demandVietnam’s consumer demand is expected to experience fast growth as rising household incomes and a growing middle class will boost disposable income levels. The e-commerce market is also growing fast with 18 per cent growth in 2020, reaching USD11.8 billion. This is driving the demand of consumer goods.
1. Currently or planning to source/manufacture in Mainland China. Total of 264 respondents for this source location. 2. Total of 72 respondents for this corridor.
2030 forecasted
USD 256.4 billion exports
2020
USD 114.2 billion exports
supply chain rebalancing
consumer demographic
plan to be in corridor

74 Future of Trade 2030 7574 75Corridors of the future | East Asia — Mainland China
Key demand sectors in Vietnam: Machinery and electricals, textile and apparel, and metals and minerals will drive trade going forward
Vietnam’s imports from Mainland China comprise of electronic components and mobile phones. The demand for smartphones is driven by the expansion of the Vietnamese middle class, first-time buyers and the growing adoption of wireless connectivity. Demand for electronic components will be driven by Vietnam’s growing position as a key electronics assembly centre in Asia-Pacific.
Machinery & Electricals
Vietnam imports iron and steel from Mainland China. As Vietnam’s economy develops and the living standards of residents rise, the demand for steel will grow. Steel will be needed for the construction of roads, airports and other infrastructure, housing construction, and the manufacturing of automobiles and home appliances.
Metals & Minerals
Vietnam imports fabric from Mainland China. Its demand is expected to rise in response to Vietnam’s growth as a textile producer and apparel exporter. It is home to multinational companies’ factories, ranging from textiles and apparel to shoemakers, yet relies on Mainland China for fabric imports due to its limited domestic production capacity.
Textile & Apparel
Source: Fitch Solutions, Oxford Economics, International Trade Centre, LPI - The World Bank, Trade Openness Rank - World Economic Forum, News Articles
Machinery and electricals38% forecasted share of exports in 2030
Metals and minerals17% forecasted share of exports in 2030
Textile and apparel20% forecasted share of exports in 2030
76 7777Corridors of the future | East Asia — South KoreaFuture of Trade 203076
South Korea
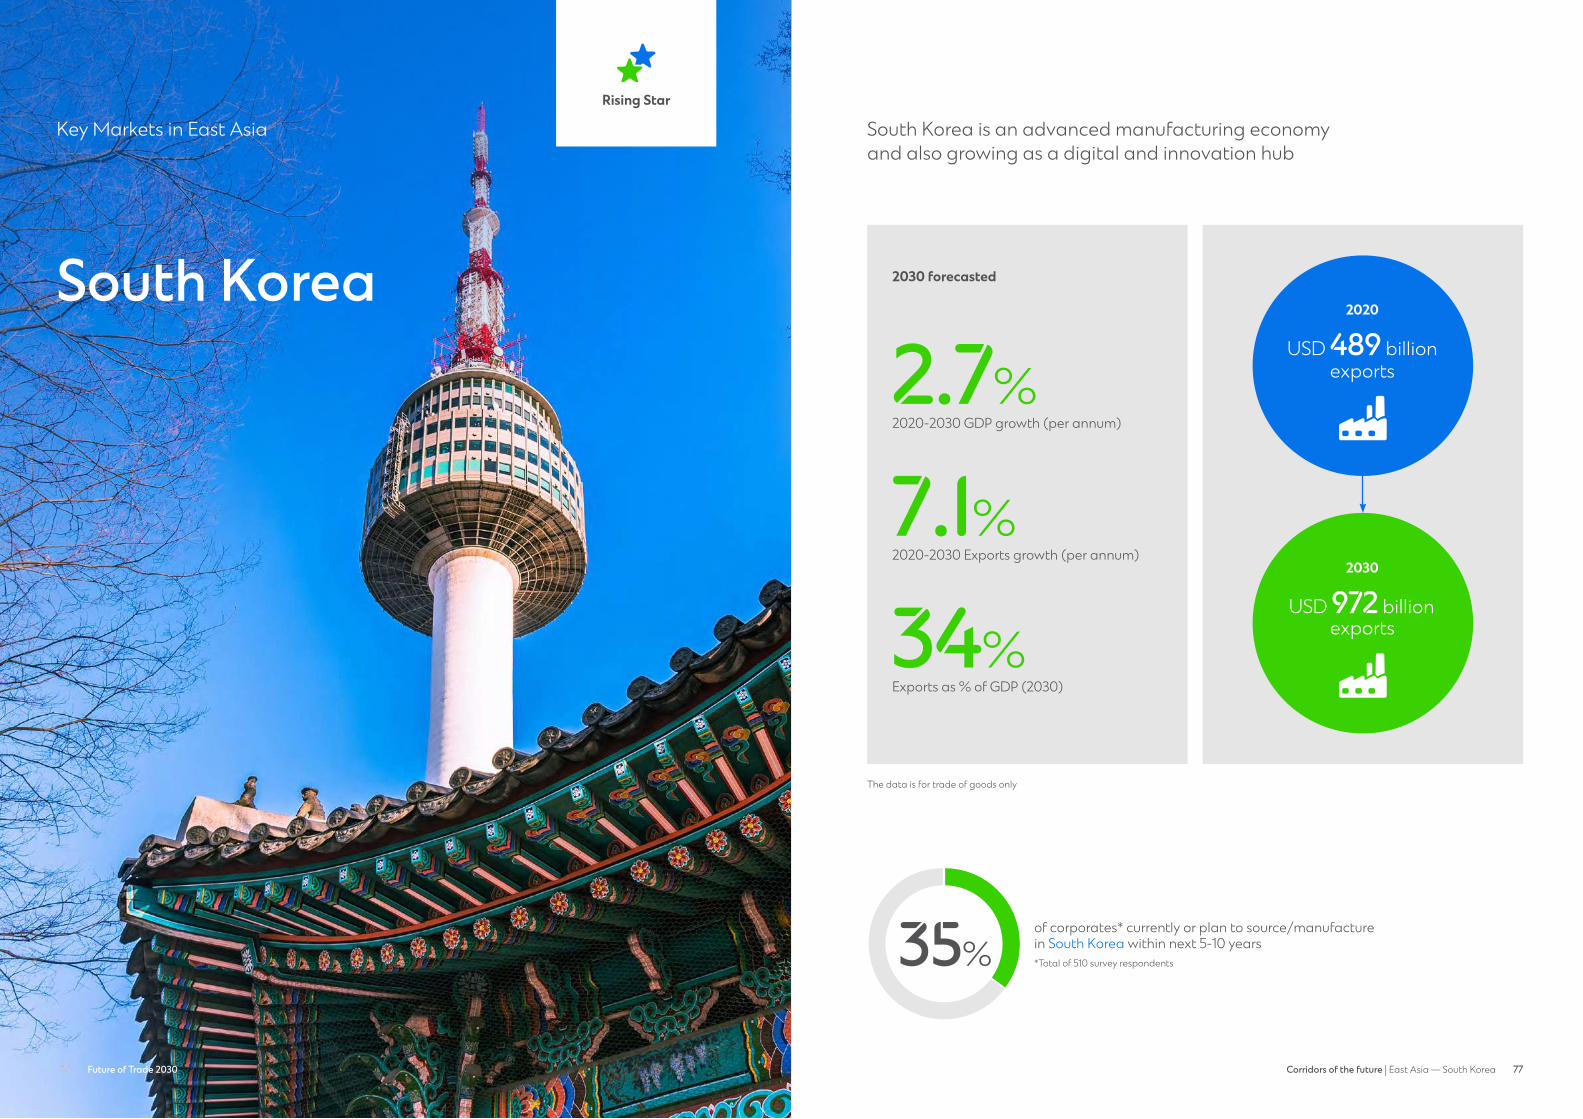
Key Markets in East Asia South Korea is an advanced manufacturing economy and also growing as a digital and innovation hub
35%of corporates* currently or plan to source/manufacture in South Korea within next 5-10 years*Total of 510 survey respondents
The data is for trade of goods only
Rising StarRising Stars
2030 forecasted
2020-2030 GDP growth (per annum)
2.7%
2020-2030 Exports growth (per annum)
7.1%
Exports as % of GDP (2030)
34%
2020
USD 489 billion exports
2030
USD 972 billion exports
78 Future of Trade 2030 7978 79Corridors of the future | East Asia — South Korea
South Korea’s future growth: South Korea is investing to transitiontowards a more digital, low-carbon, and innovation driven economy
Digital and green economySouth Korea is investing in its digital economy by focusing on 5G, big data and AI technologies. In support of this, it is building a nationwide 5G infrastructure and promoting its domestic AI sector. The market is moving towards a low-carbon economy by increasing production of EV vehicles and clean energy as well as investing in smart-grid technology.
Innovation driven growthSouth Korea is capitalising on its highly skilled labour force, IT infrastructure, and digital competitiveness to emerge as a hub for innovation. With a focus on next generation technologies, South Korea is developing capabilities inareas including logic chips, biotechnology and autonomous vehicles.
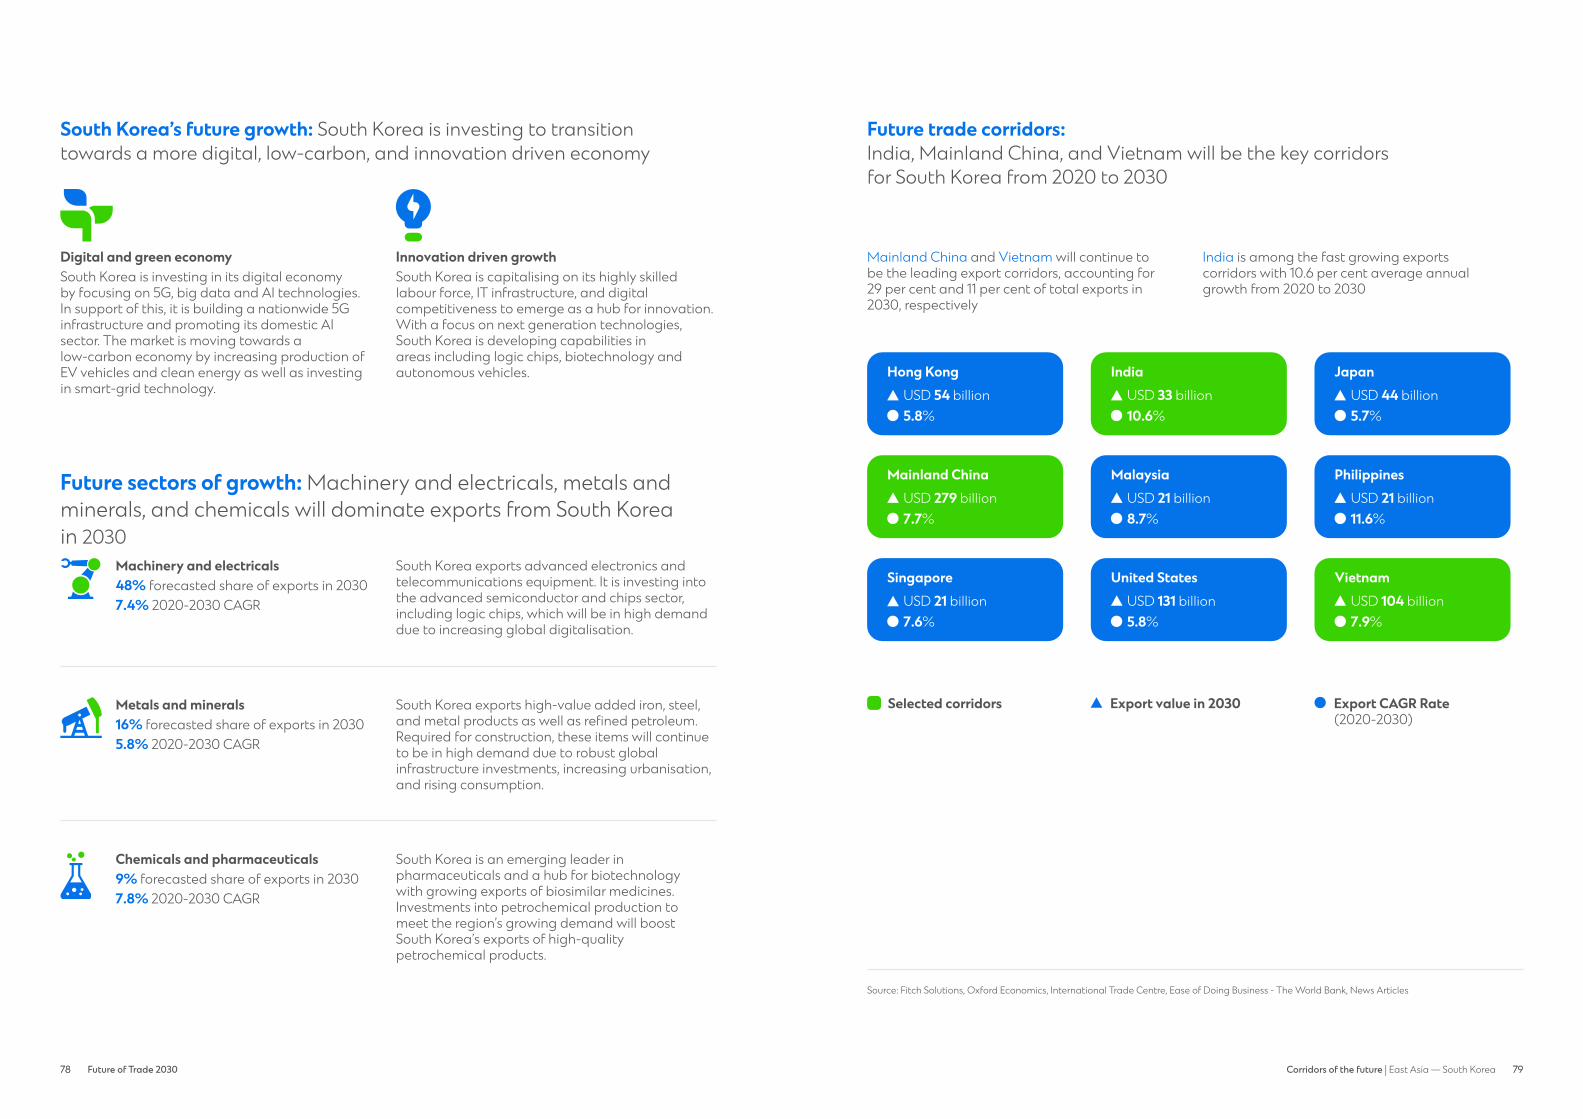
Future sectors of growth: Machinery and electricals, metals and minerals, and chemicals will dominate exports from South Korea in 2030
Machinery and electricals South Korea exports advanced electronics andtelecommunications equipment. It is investing into the advanced semiconductor and chips sector, including logic chips, which will be in high demand due to increasing global digitalisation.
48% forecasted share of exports in 20307.4% 2020-2030 CAGR
Chemicals and pharmaceuticals South Korea is an emerging leader in pharmaceuticals and a hub for biotechnology with growing exports of biosimilar medicines. Investments into petrochemical production tomeet the region’s growing demand will boost South Korea’s exports of high-quality petrochemical products.
9% forecasted share of exports in 20307.8% 2020-2030 CAGR
Metals and minerals South Korea exports high-value added iron, steel, and metal products as well as refined petroleum. Required for construction, these items will continue to be in high demand due to robust global infrastructure investments, increasing urbanisation, and rising consumption.
16% forecasted share of exports in 20305.8% 2020-2030 CAGR
Future trade corridors: India, Mainland China, and Vietnam will be the key corridors for South Korea from 2020 to 2030
Source: Fitch Solutions, Oxford Economics, International Trade Centre, Ease of Doing Business - The World Bank, News Articles
Machinery & Electricals
Metals & Minerals
Chemicals & Pharmaceuticals
Mainland China and Vietnam will continue to be the leading export corridors, accounting for 29 per cent and 11 per cent of total exports in 2030, respectively
India is among the fast growing exports corridors with 10.6 per cent average annual growth from 2020 to 2030
IndiaUSD 33 billion10.6%
JapanUSD 44 billion5.7%
Hong KongUSD 54 billion5.8%
SingaporeUSD 21 billion7.6%
MalaysiaUSD 21 billion8.7%
PhilippinesUSD 21 billion11.6%
Mainland ChinaUSD 279 billion7.7%
United States VietnamUSD 131 billion USD 104 billion5.8% 7.9%
Export CAGR Rate (2020-2030)
Selected corridors Export value in 2030
80 Future of Trade 2030 8180 81Corridors of the future | East Asia — South Korea
South Korea-to-Indiatrade corridor
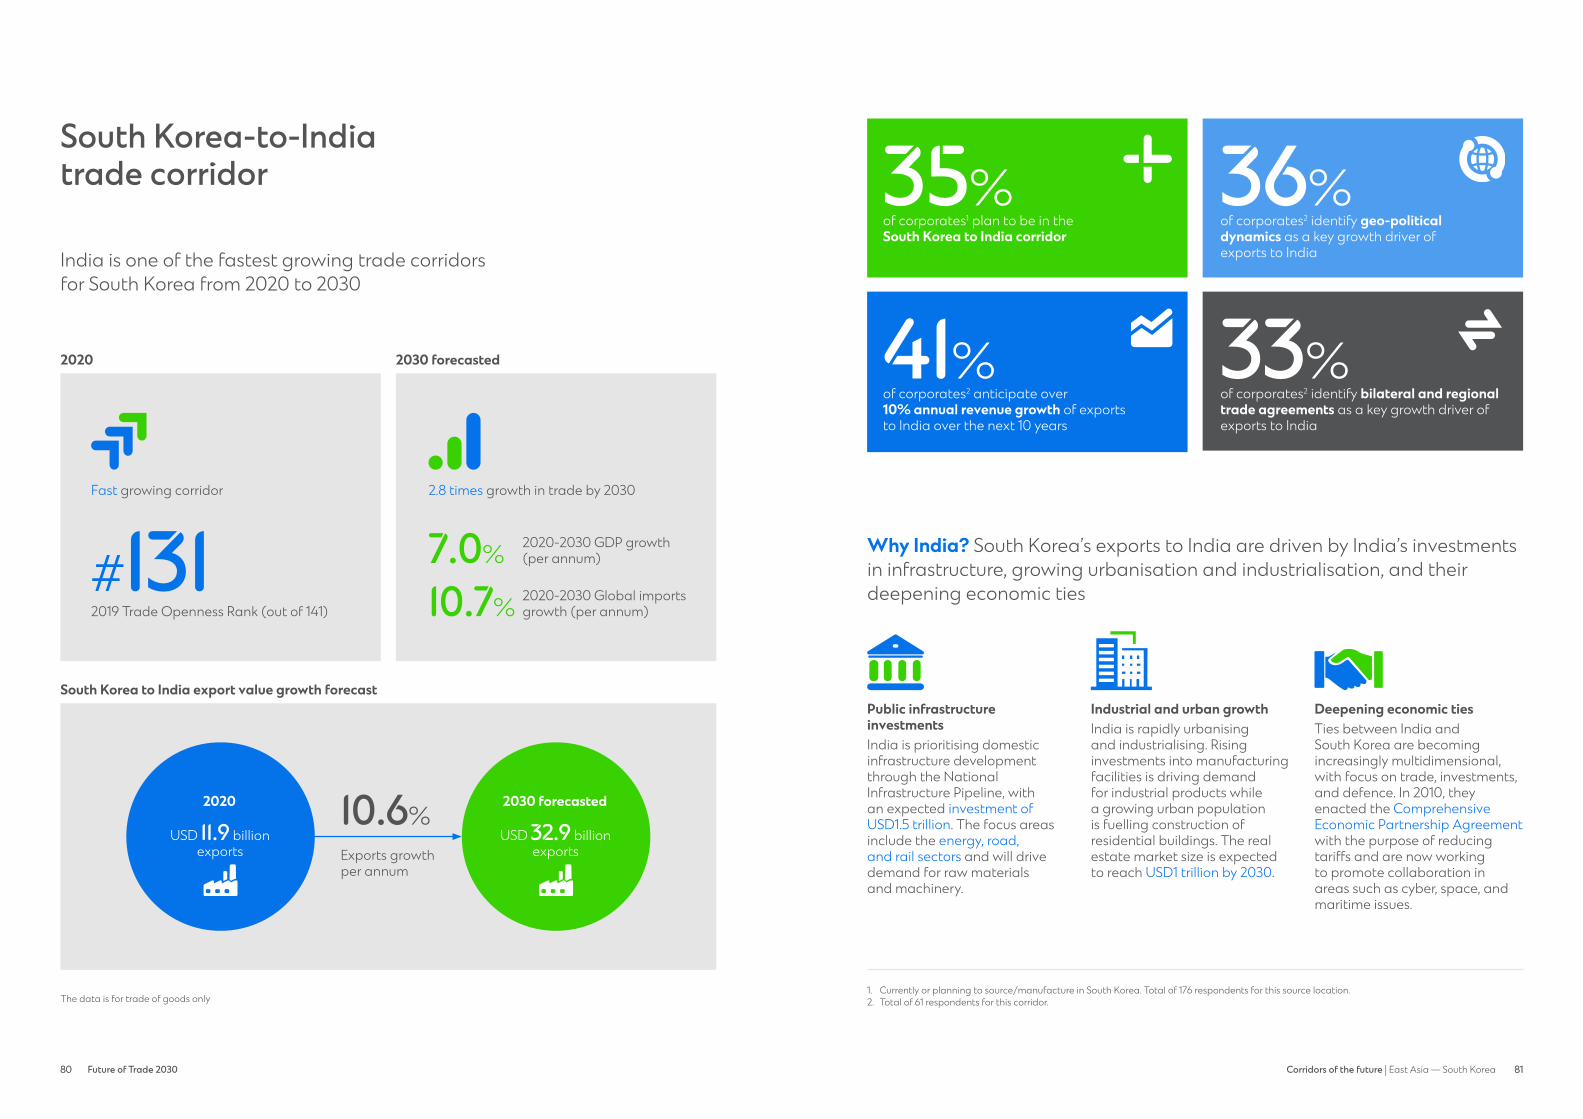
India is one of the fastest growing trade corridors for South Korea from 2020 to 2030
Fast growing corridor
2019 Trade Openness Rank (out of 141)
#131
2020 2030 forecasted
The data is for trade of goods only
2.8 times growth in trade by 2030
2020-2030 GDP growth (per annum)
2020-2030 Global imports growth (per annum)
7.0%
10.7%
South Korea to India export value growth forecast
10.6%
Exports growth per annum
2030 forecasted
USD 32.9 billion exports
2020
USD 11.9 billion exports
Why India? South Korea’s exports to India are driven by India’s investments in infrastructure, growing urbanisation and industrialisation, and their deepening economic ties
Public infrastructure investmentsIndia is prioritising domestic infrastructure development through the National Infrastructure Pipeline, with an expected investment of USD1.5 trillion. The focus areas include the energy, road, and rail sectors and will drive demand for raw materials and machinery.
Industrial and urban growthIndia is rapidly urbanising and industrialising. Rising investments into manufacturing facilities is driving demand for industrial products while a growing urban population is fuelling construction of residential buildings. The real estate market size is expected to reach USD1 trillion by 2030.
Deepening economic tiesTies between India and South Korea are becoming increasingly multidimensional, with focus on trade, investments, and defence. In 2010, they enacted the Comprehensive Economic Partnership Agreement with the purpose of reducing tariffs and are now working to promote collaboration in areas such as cyber, space, and maritime issues.
1. Currently or planning to source/manufacture in South Korea. Total of 176 respondents for this source location. 2. Total of 61 respondents for this corridor.
of corporates1 plan to be in the South Korea to India corridor
of corporates2 anticipate over 10% annual revenue growth of exports to India over the next 10 years
35%
41%
of corporates2 identify geo-political dynamics as a key growth driver of exports to India
of corporates2 identify bilateral and regional trade agreements as a key growth driver of exports to India
36%
33%
geo-political dynamic
trade agreement
plan to be in corridor
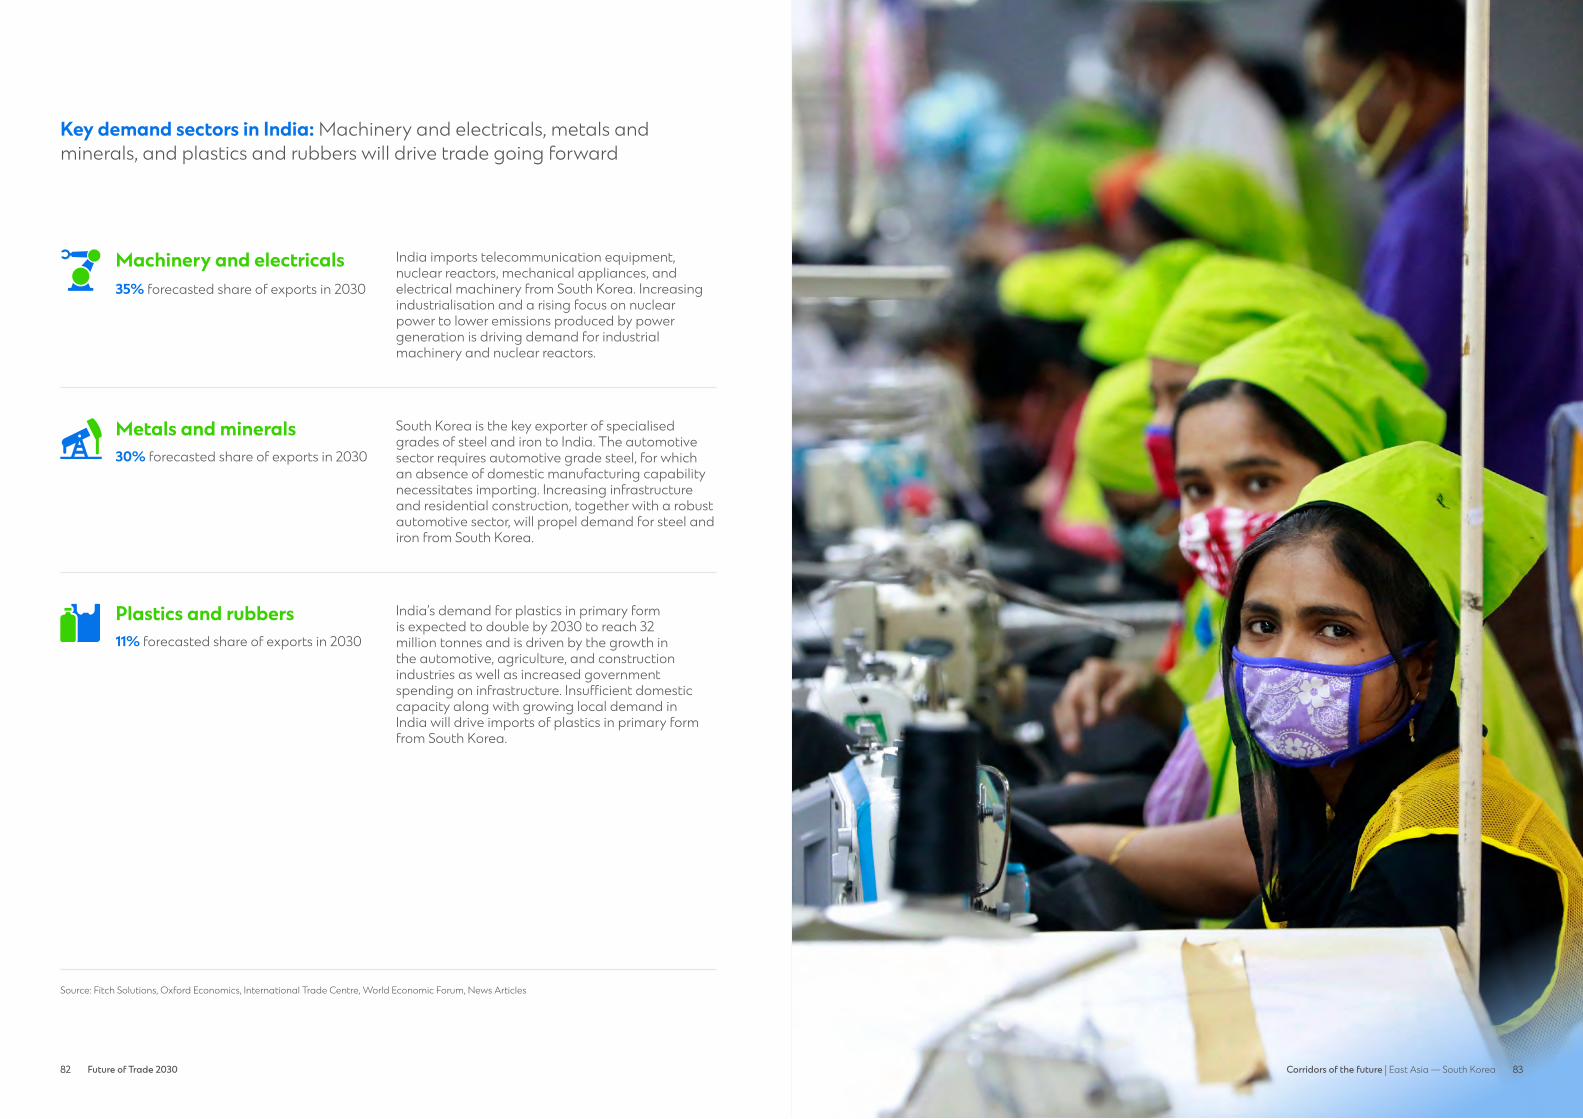
82 Future of Trade 2030 8382 83Corridors of the future | East Asia — South Korea
Key demand sectors in India: Machinery and electricals, metals and minerals, and plastics and rubbers will drive trade going forward
Source: Fitch Solutions, Oxford Economics, International Trade Centre, World Economic Forum, News Articles
India imports telecommunication equipment, nuclear reactors, mechanical appliances, and electrical machinery from South Korea. Increasing industrialisation and a rising focus on nuclearpower to lower emissions produced by power generation is driving demand for industrial machinery and nuclear reactors.
Machinery & Electricals
India’s demand for plastics in primary form is expected to double by 2030 to reach 32 million tonnes and is driven by the growth in the automotive, agriculture, and construction industries as well as increased government spending on infrastructure. Insufficient domestic capacity along with growing local demand in India will drive imports of plastics in primary form from South Korea.
Machinery & Electricals
Plastics & Rubbers
South Korea is the key exporter of specialised grades of steel and iron to India. The automotive sector requires automotive grade steel, for which an absence of domestic manufacturing capabilitynecessitates importing. Increasing infrastructure and residential construction, together with a robust automotive sector, will propel demand for steel and iron from South Korea.
Metals & Minerals
Machinery and electricals35% forecasted share of exports in 2030
Plastics and rubbers11% forecasted share of exports in 2030
Metals and minerals30% forecasted share of exports in 2030
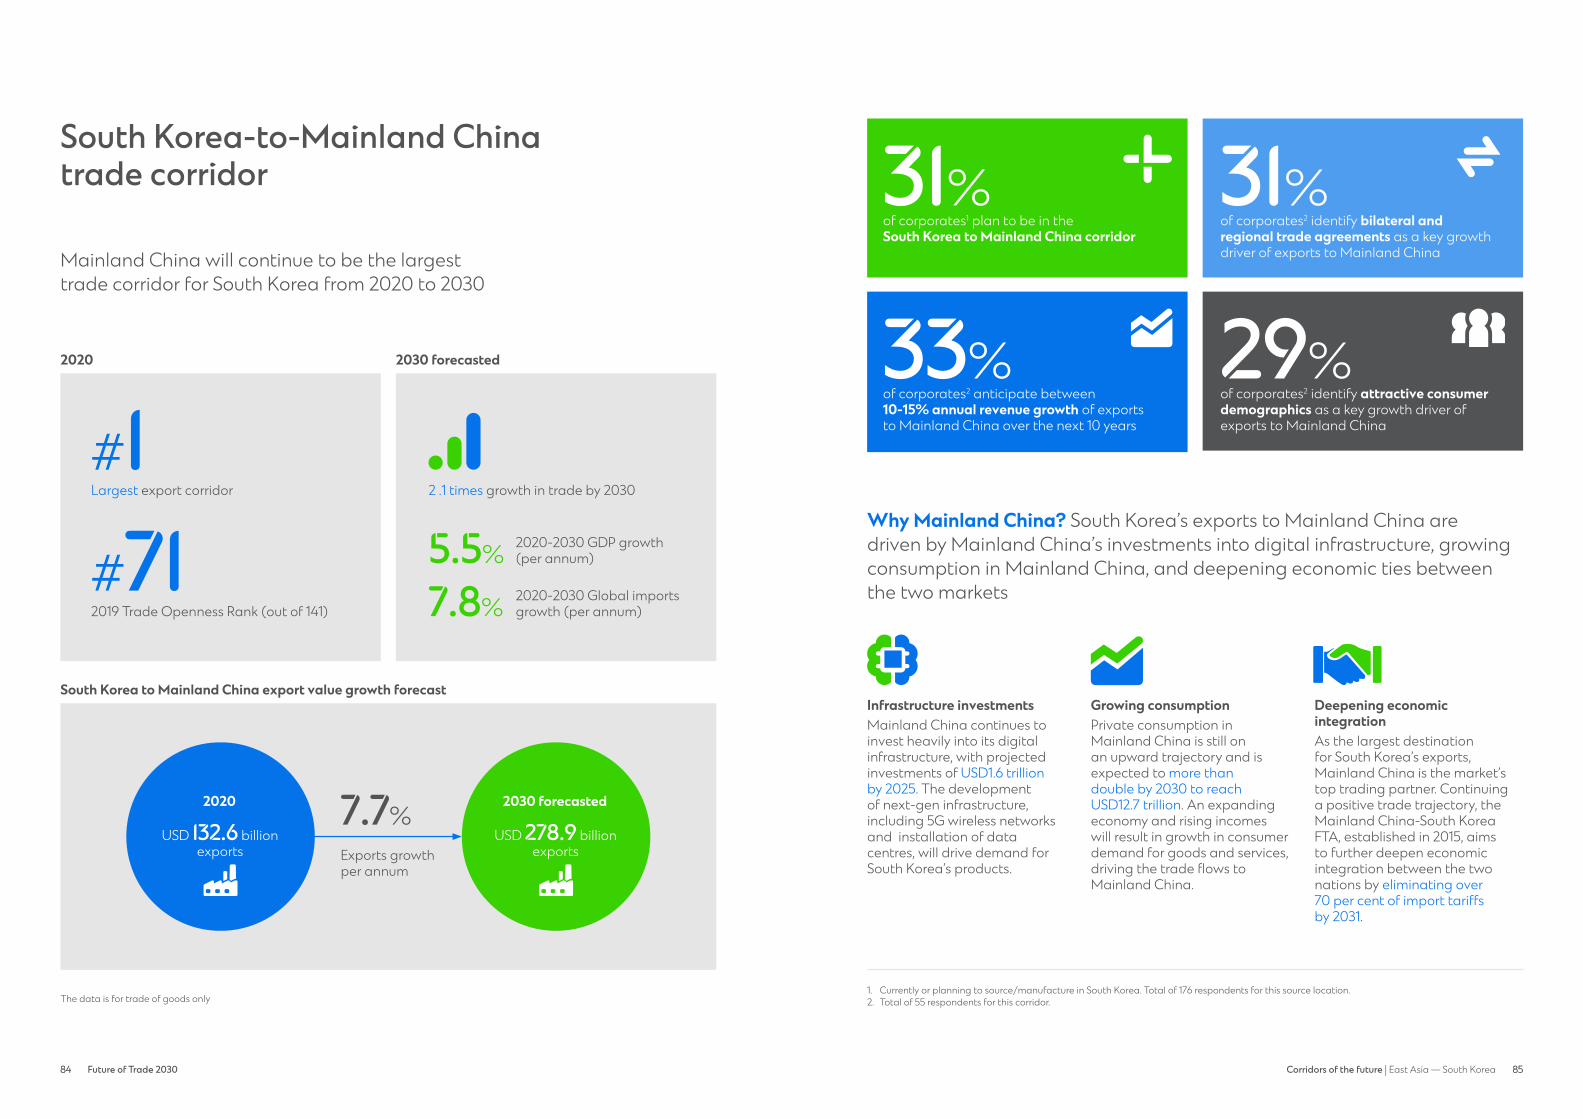
84 Future of Trade 2030 8584 85Corridors of the future | East Asia — South Korea
South Korea-to-Mainland Chinatrade corridor
Mainland China will continue to be the largest trade corridor for South Korea from 2020 to 2030
Largest export corridor
2019 Trade Openness Rank (out of 141)
#71#1
2020 2030 forecasted
The data is for trade of goods only
2 .1 times growth in trade by 2030
2020-2030 GDP growth (per annum)
2020-2030 Global imports growth (per annum)
5.5%
7.8%
South Korea to Mainland China export value growth forecast
7.7%
Exports growth per annum
2030 forecasted
USD 278.9 billion exports
2020
USD 132.6 billion exports
of corporates1 plan to be in the South Korea to Mainland China corridor
of corporates2 anticipate between 10-15% annual revenue growth of exports to Mainland China over the next 10 years
31%
33%
Why Mainland China? South Korea’s exports to Mainland China are driven by Mainland China’s investments into digital infrastructure, growing consumption in Mainland China, and deepening economic ties between the two markets
Infrastructure investmentsMainland China continues to invest heavily into its digital infrastructure, with projected investments of USD1.6 trillion by 2025. The development of next-gen infrastructure, including 5G wireless networks and installation of data centres, will drive demand for South Korea’s products.
Growing consumptionPrivate consumption in Mainland China is still on an upward trajectory and is expected to more than double by 2030 to reach USD12.7 trillion. An expanding economy and rising incomes will result in growth in consumer demand for goods and services, driving the trade flows to Mainland China.
Deepening economic integrationAs the largest destination for South Korea’s exports, Mainland China is the market’s top trading partner. Continuing a positive trade trajectory, the Mainland China-South Korea FTA, established in 2015, aims to further deepen economic integration between the two nations by eliminating over 70 per cent of import tariffs by 2031.
1. Currently or planning to source/manufacture in South Korea. Total of 176 respondents for this source location. 2. Total of 55 respondents for this corridor.
of corporates2 identify bilateral and regional trade agreements as a key growth driver of exports to Mainland China
of corporates2 identify attractive consumer demographics as a key growth driver of exports to Mainland China
31%
29% consumer demographic
trade agreementplan to be in
corridor

86 Future of Trade 2030 8786 87Corridors of the future | East Asia — South Korea
Key demand sectors in Mainland China: Machinery and electricals, chemicals, and plastics and rubbers will drive trade going forward
Source: Fitch Solutions, Oxford Economics, International Trade Centre, World Economic Forum, News Articles
Mainland China’s imports are dominated by ICs. Despite its investments into domestic IC production, Mainland China’s demand for South Korea’s advanced logic chips is expected to keep growing due to an expanding economy and large-scale investments into IT infrastructure, including 5G, cloud computing, IoT, and AI.
Machinery & Electricals
Mainland China imports cyclic hydrocarbons, which are used in the polyethylene terephthalate (PET) value chain. It also imports chemical preparations for beauty products. The growing demand for beauty products in Mainland China is driven by rising incomes, social media influence, and e-commerce. Korea’s Ministry of Food and Drug Safety is supporting cosmetics trade through regulatory harmonisation and reduction of trade barriers.
Chemicals & Pharmaceuticals
In this sector, Mainland China imports mostly plastics in primary form from South Korea, which is one of the key suppliers, enabled by large volumes of export-oriented capacity and geographical proximity. Mainland China’s demand for plastics in primary form is driven by domestic growth in the production of consumer goods, packaging, agricultural and construction materials, and electronic and hygiene products to supply both domestic and export markets.
Machinery & Electricals
Plastics & Rubbers
Machinery and electricals57% forecasted share of exports in 2030
Plastics and rubbers9% forecasted share of exports in 2030
Chemicals and pharmaceuticals14% forecasted share of exports in 2030
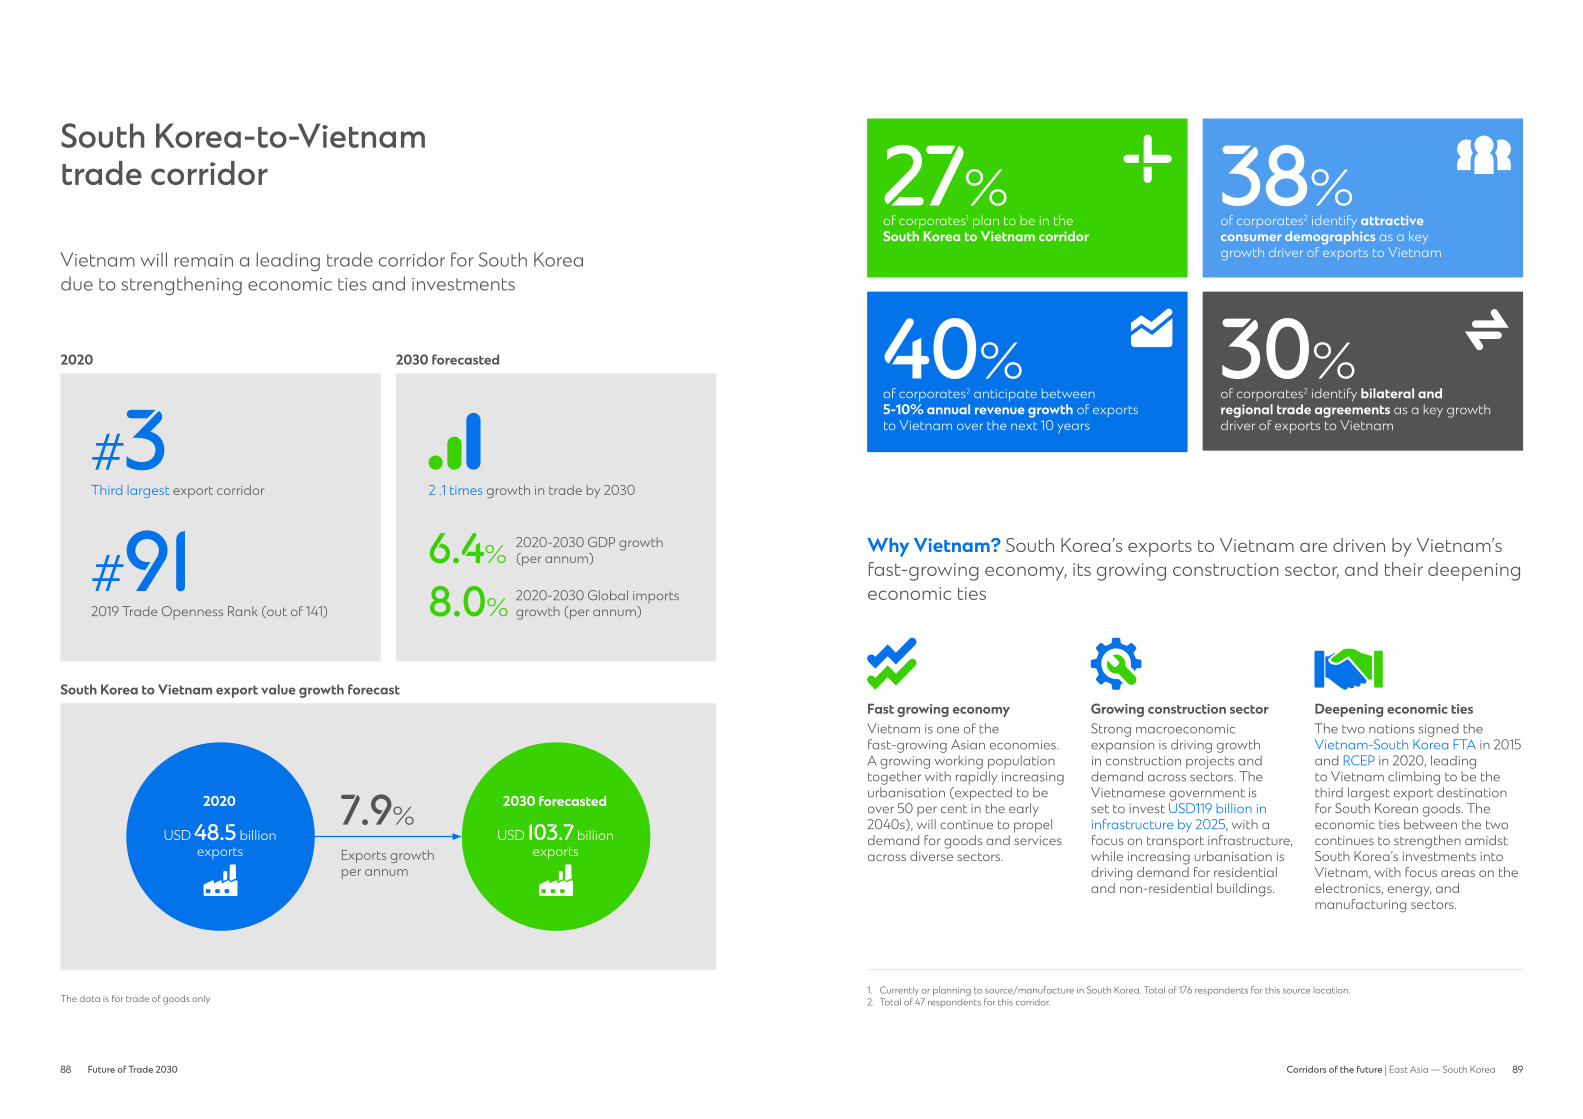
88 Future of Trade 2030 8988 89Corridors of the future | East Asia — South Korea
South Korea-to-Vietnam trade corridor
Vietnam will remain a leading trade corridor for South Korea due to strengthening economic ties and investments
Third largest export corridor
2019 Trade Openness Rank (out of 141)
#91#3
2020 2030 forecasted
The data is for trade of goods only
2 .1 times growth in trade by 2030
2020-2030 GDP growth (per annum)
of corporates1 plan to be in the South Korea to Vietnam corridor
of corporates2 identify attractive consumer demographics as a key growth driver of exports to Vietnam
of corporates2 anticipate between 5-10% annual revenue growth of exports to Vietnam over the next 10 years
of corporates2 identify bilateral andregional trade agreements as a key growth driver of exports to Vietnam
2020-2030 Global imports growth (per annum)
6.4%
27% 38%
40% 30%
8.0%
South Korea to Vietnam export value growth forecast
7.9%
Exports growth per annum
Why Vietnam? South Korea’s exports to Vietnam are driven by Vietnam’s fast-growing economy, its growing construction sector, and their deepening economic ties
Fast growing economyVietnam is one of the fast-growing Asian economies. A growing working populationtogether with rapidly increasing urbanisation (expected to be over 50 per cent in the early2040s), will continue to propel demand for goods and services across diverse sectors.
Growing construction sectorStrong macroeconomic expansion is driving growth in construction projects and demand across sectors. The Vietnamese government isset to invest USD119 billion in infrastructure by 2025, with a focus on transport infrastructure,while increasing urbanisation is driving demand for residential and non-residential buildings.
Deepening economic tiesThe two nations signed the Vietnam-South Korea FTA in 2015 and RCEP in 2020, leadingto Vietnam climbing to be the third largest export destination for South Korean goods. Theeconomic ties between the two continues to strengthen amidst South Korea’s investments into Vietnam, with focus areas on theelectronics, energy, and manufacturing sectors.
1. Currently or planning to source/manufacture in South Korea. Total of 176 respondents for this source location. 2. Total of 47 respondents for this corridor.
2030 forecasted
USD 103.7 billion exports
2020
USD 48.5 billion exports
consumer demographic
trade agreement
plan to be in corridor
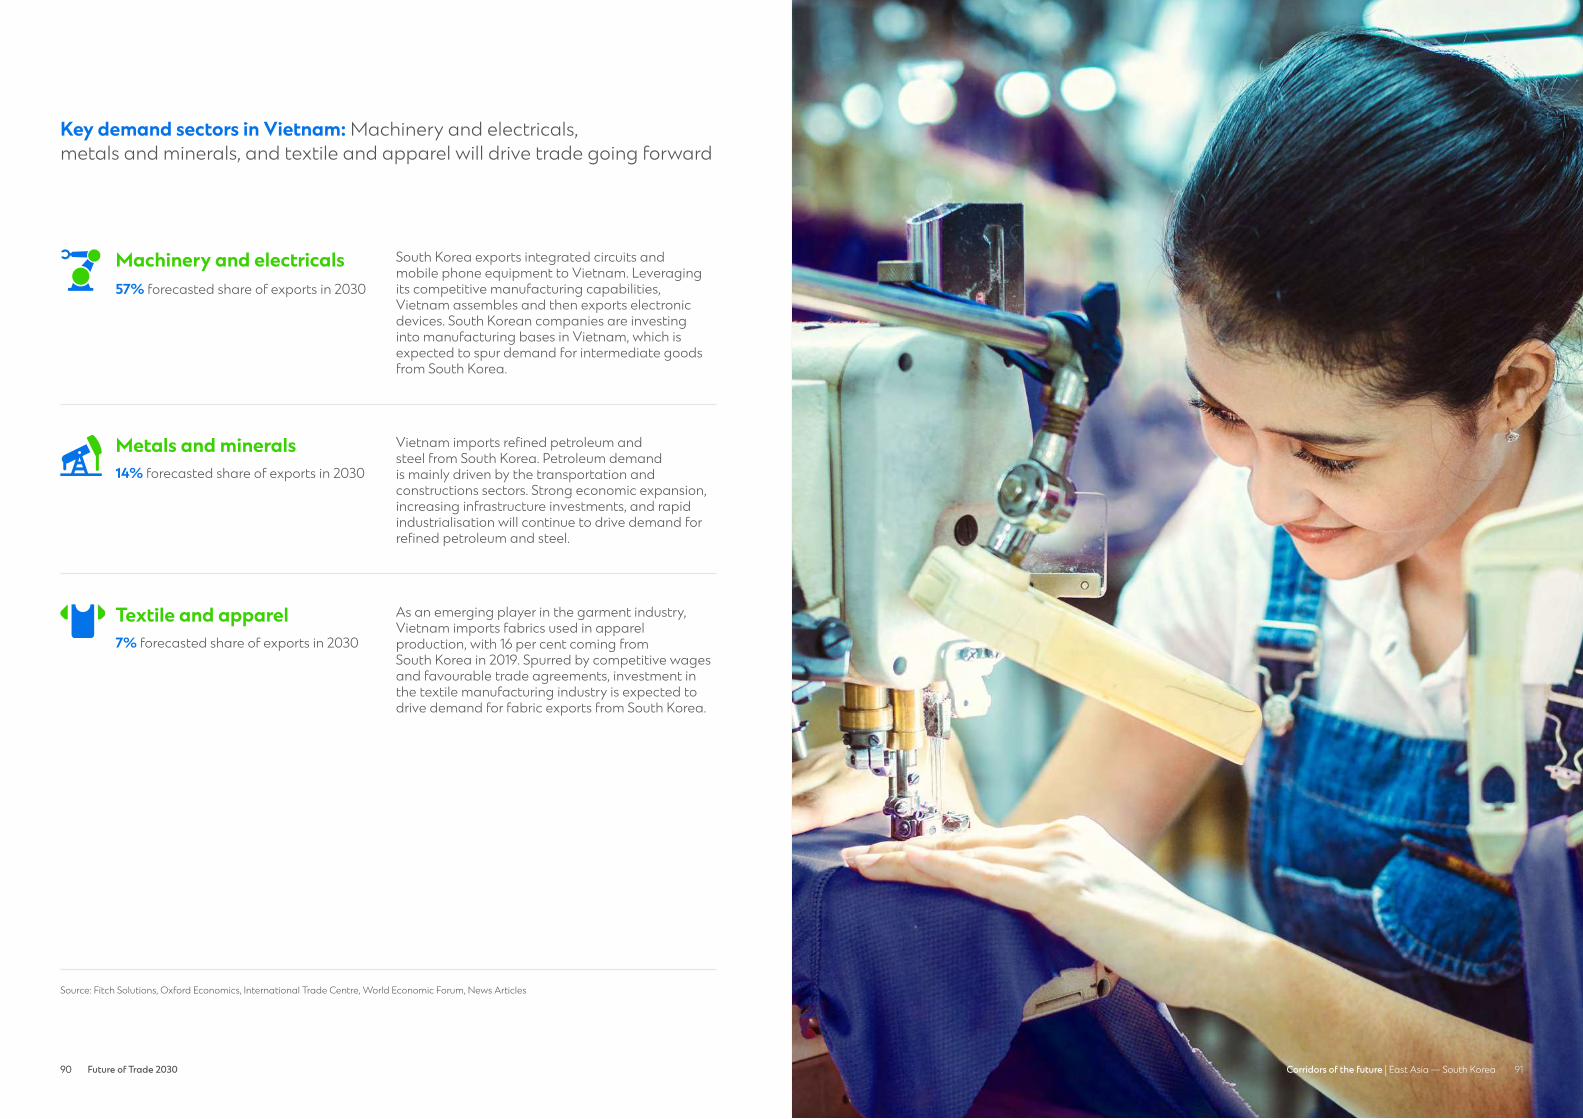
90 Future of Trade 2030 9190 91Corridors of the future | East Asia — South Korea
Key demand sectors in Vietnam: Machinery and electricals, metals and minerals, and textile and apparel will drive trade going forward
South Korea exports integrated circuits and mobile phone equipment to Vietnam. Leveraging its competitive manufacturing capabilities, Vietnam assembles and then exports electronic devices. South Korean companies are investing into manufacturing bases in Vietnam, which is expected to spur demand for intermediate goods from South Korea.
Machinery & Electricals
Vietnam imports refined petroleum and steel from South Korea. Petroleum demand is mainly driven by the transportation and constructions sectors. Strong economic expansion, increasing infrastructure investments, and rapid industrialisation will continue to drive demand for refined petroleum and steel.
Metals & Minerals
As an emerging player in the garment industry, Vietnam imports fabrics used in apparel production, with 16 per cent coming from South Korea in 2019. Spurred by competitive wages and favourable trade agreements, investment in the textile manufacturing industry is expected to drive demand for fabric exports from South Korea.
Textile & Apparel
Source: Fitch Solutions, Oxford Economics, International Trade Centre, World Economic Forum, News Articles
Machinery and electricals57% forecasted share of exports in 2030
Textile and apparel7% forecasted share of exports in 2030
Metals and minerals14% forecasted share of exports in 2030

92 Future of Trade 2030 9392 93Corridors of the future | ASEAN
Growth drivers and trends
Key trade corridors
ASEAN
The 10 markets in the Southeast Asia region are members of The Association of Southeast Asian Nations (ASEAN). ASEAN is progressing towards economic integration and free trade in the region, and as the member markets reduce trade costs and identify new sectors/products with high trade potentials, intra-ASEAN trade is expected to increase. Beyond ASEAN, businesses will also benefit from its free trade agreements, such as the RCEP, and trade links with other key markets such as Mainland China, India, Australia, Japan, South Korea, Europe, and the USA.
Selected markets for analysis: Indonesia, Malaysia, Singapore, Vietnam
A trading hub
of global trade passes through ASEAN sea lanes each year1
people in ASEAN creating a unified, large and growing consumer market1
Large consumer base
1. Association of Southeast Asian Nations, Investing in ASEAN 2019-2020
USD 5.3 trillion
>650 million
of corporates identify shifting capacity to lower cost economies with good labour market and infrastructure as a key reason for setting up a new production location in Southeast Asia2
Key priorities3 for corporates in Southeast Asia for their internationalisation strategy4
68%
Accelerating new technology adoption for more efficiency and transparency 51%
De-risking the supply chain and realigning footprint to protect against disruptions 57%
Expanding sales in emerging markets to capitalise on increasing demand 62%
2. Survey questions asked: ‘What are your reasons for considering new source/production locations?’ Total of 365 responses for this region.3. Sum of responses who ranked the focus area as a top three priority.4. Survey question asked: ‘Which of these initiatives/focus areas form part of your company’s 5-10 year internationalisation or cross border
expansion strategy?’ Total of 394 responses for this region.
ASEAN
India
Mainland China
USA
Indonesia
India
Mainland China
USA
Vietnam
India
Mainland China
Singapore
Malaysia
Mainland China
Indonesia
Malaysia
Singapore
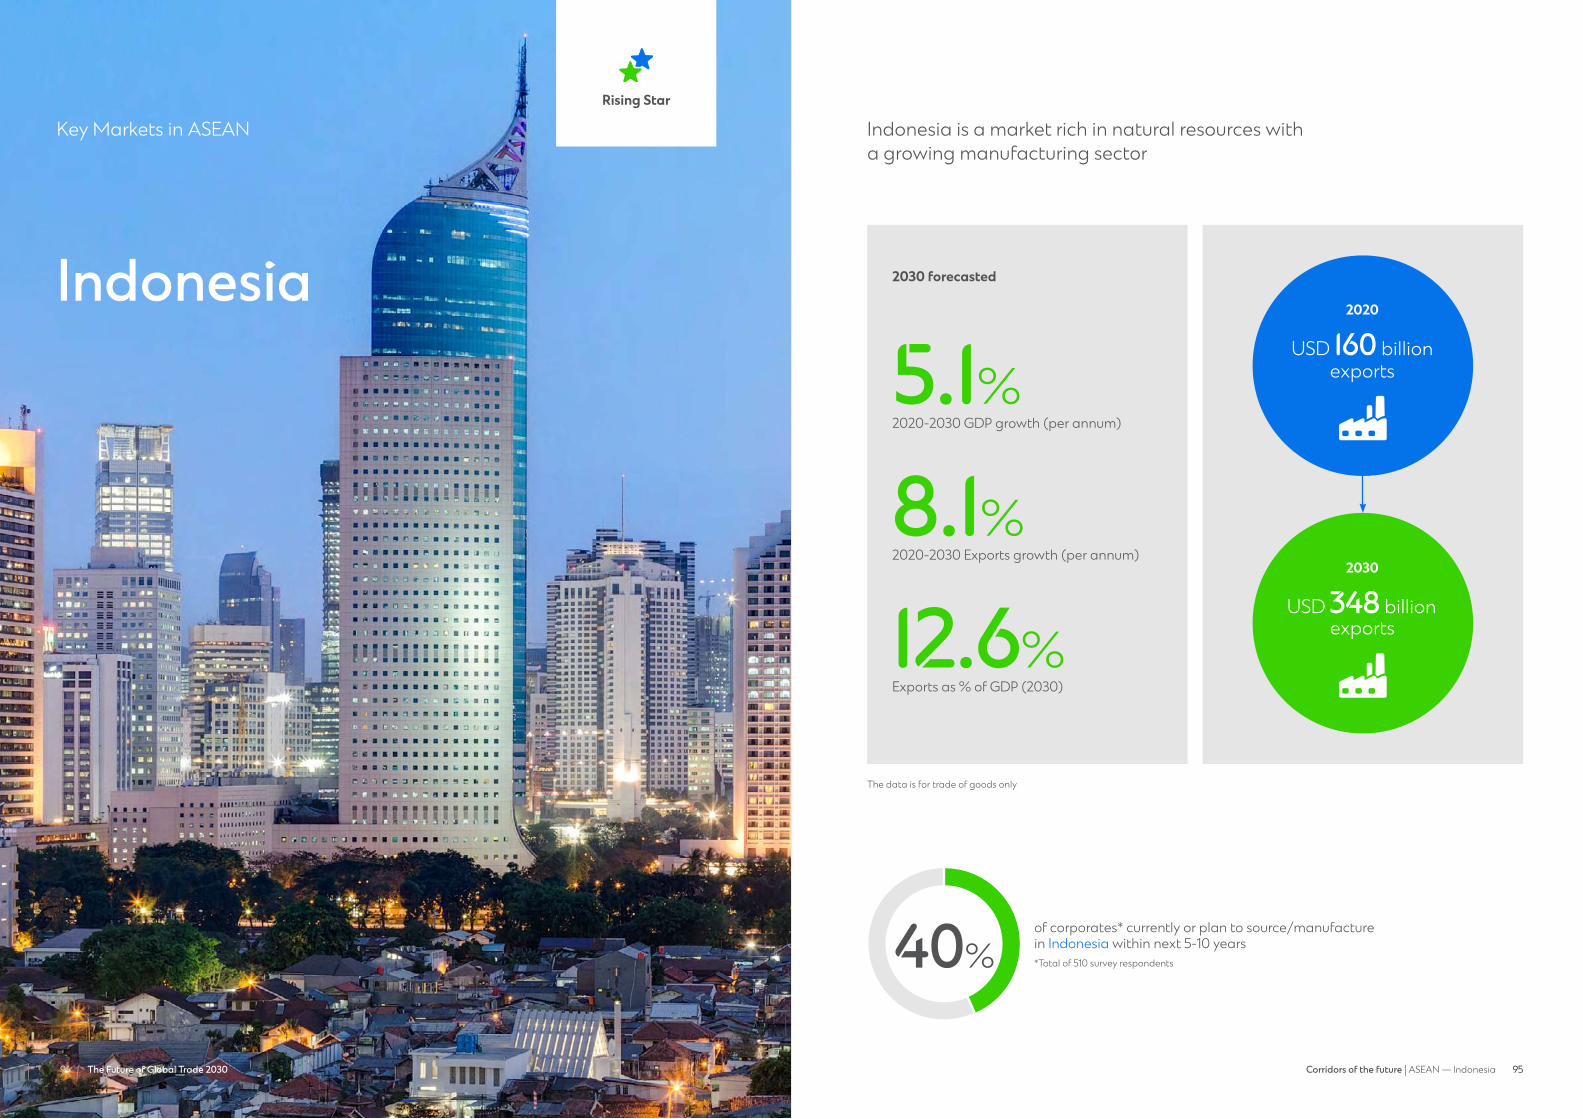
94 Future of Trade 2030 9594 95Corridors of the future | ASEAN — Indonesia94 The Future of Global Trade 2030
Indonesia
Key Markets in ASEANRising Star
Indonesia is a market rich in natural resources with a growing manufacturing sector
40%of corporates* currently or plan to source/manufacture in Indonesia within next 5-10 years*Total of 510 survey respondents
The data is for trade of goods only
Rising Stars
2030 forecasted
2020-2030 GDP growth (per annum)
5.1%
2020-2030 Exports growth (per annum)
8.1%
Exports as % of GDP (2030)
12.6%
2020
USD 160 billion exports
2030
USD 348 billion exports
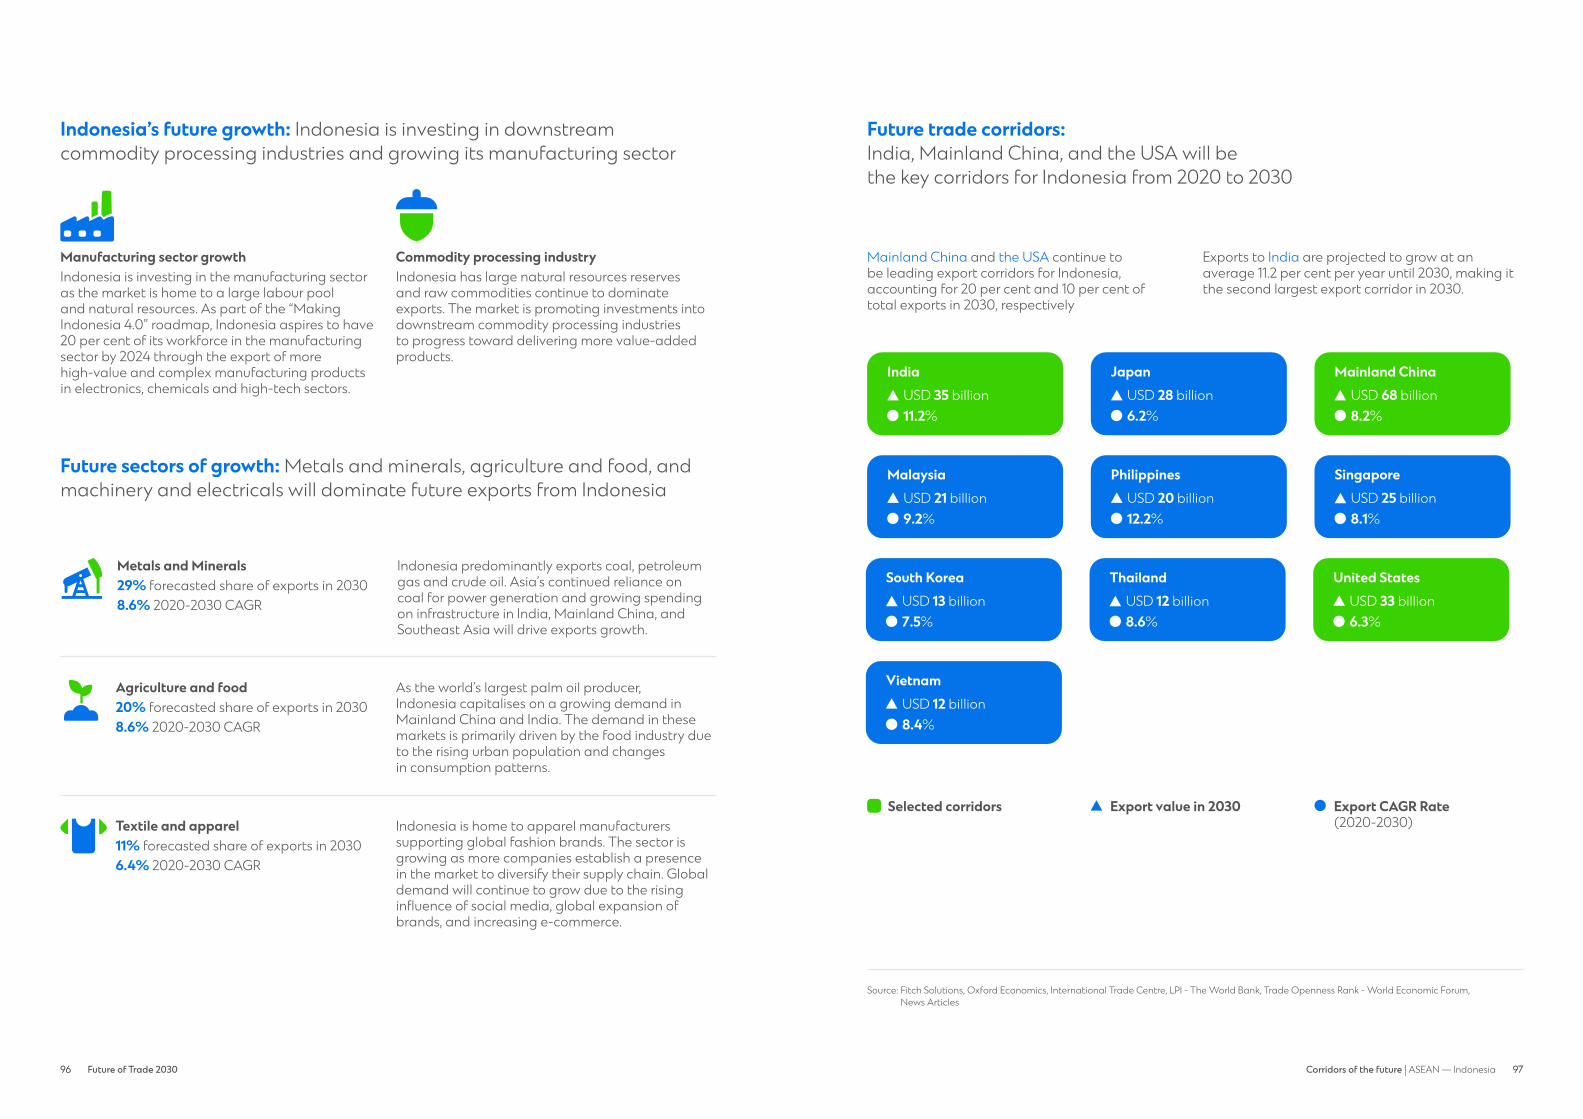
96 Future of Trade 2030 9796 97Corridors of the future | ASEAN — Indonesia
Indonesia’s future growth: Indonesia is investing in downstream commodity processing industries and growing its manufacturing sector
Manufacturing sector growthIndonesia is investing in the manufacturing sector as the market is home to a large labour pool and natural resources. As part of the “Making Indonesia 4.0” roadmap, Indonesia aspires to have 20 per cent of its workforce in the manufacturing sector by 2024 through the export of more high-value and complex manufacturing products in electronics, chemicals and high-tech sectors.
Commodity processing industryIndonesia has large natural resources reserves and raw commodities continue to dominate exports. The market is promoting investments into downstream commodity processing industries to progress toward delivering more value-added products.
Future sectors of growth: Metals and minerals, agriculture and food, and machinery and electricals will dominate future exports from Indonesia
Textile & Apparel
Textile and apparel Indonesia is home to apparel manufacturers supporting global fashion brands. The sector is growing as more companies establish a presence in the market to diversify their supply chain. Global demand will continue to grow due to the rising influence of social media, global expansion of brands, and increasing e-commerce.
11% forecasted share of exports in 20306.4% 2020-2030 CAGR
Agriculture and food As the world’s largest palm oil producer, Indonesia capitalises on a growing demand in Mainland China and India. The demand in these markets is primarily driven by the food industry due to the rising urban population and changes in consumption patterns.
20% forecasted share of exports in 20308.6% 2020-2030 CAGRAgriculture & Food
Metals and Minerals Indonesia predominantly exports coal, petroleum gas and crude oil. Asia’s continued reliance on coal for power generation and growing spending on infrastructure in India, Mainland China, and Southeast Asia will drive exports growth.
29% forecasted share of exports in 20308.6% 2020-2030 CAGRMetals & Minerals
Future trade corridors: India, Mainland China, and the USA will be the key corridors for Indonesia from 2020 to 2030
Source: Fitch Solutions, Oxford Economics, International Trade Centre, LPI - The World Bank, Trade Openness Rank - World Economic Forum, News Articles
Mainland China and the USA continue to be leading export corridors for Indonesia, accounting for 20 per cent and 10 per cent of total exports in 2030, respectively
Exports to India are projected to grow at an average 11.2 per cent per year until 2030, making it the second largest export corridor in 2030.
JapanUSD 28 billion6.2%
Mainland ChinaUSD 68 billion8.2%
IndiaUSD 35 billion11.2%
South KoreaUSD 13 billion7.5%
ThailandUSD 12 billion8.6%
SingaporeUSD 25 billion8.1%
PhilippinesUSD 20 billion12.2%
MalaysiaUSD 21 billion9.2%
United States
Vietnam
USD 33 billion
USD 12 billion
6.3%
8.4%
Export CAGR Rate (2020-2030)
Selected corridors Export value in 2030

98 Future of Trade 2030 9998 99Corridors of the future | ASEAN — Indonesia
Indonesia-to-India trade corridor
Indonesia and India are strengthening their economic ties and India is one of the fastest growing corridors for Indonesia
Fast growing corridor
2019 Trade Openness Rank (out of 141)
#131
2020 2030 forecasted
The data is for trade of goods only
~3 times growth in trade by 2030
2020-2030 GDP growth (per annum)
2020-2030 Global imports growth (per annum)
7.0%
10.7%
Indonesia to India export value growth forecast
11.2%
Exports growth per annum
2030 forecasted
USD 35.0 billion exports
2020
USD 12.1 billion exports
of corporates1 plan to be in the Indonesia to India corridor
of corporates2 anticipate over 10% annual revenue growth of exports to India over the next 10 years
32%
52%
Why India? Indonesia’s exports to India are driven by India’s rising middle class, infrastructure development, and enhanced economic ties between the two markets
1. Currently or planning to source/manufacture in Indonesia. Total of 205 respondents for this source location. 2. Total of 65 respondents for this corridor.
Rising middle classAs incomes continue to rise, millions of people are added to India’s middle class. The middle class is projected to comprise almost 80 per cent of households and account for 75 per cent of consumer spending in India in 2030. This will lead increased demand for good and services across sectors.
Infrastructure investmentsIndia is investing heavily into infrastructure through public projects and business investment. The agenda, called the National Infrastructure Pipeline, totals USD1.5 trillion of investment into key areas including transportation, energy, communication, and water and sanitation. This will lead to increased demand for raw materials.
Enhanced trade tiesIndia and Indonesia are looking to enhance trade and investment ties and have set a target of USD50 billion in bilateral trade by 2025. The key sectors are information technology (IT), health and pharmaceuticals, agriculture products, automotive components, and tourism.
of corporates2 identify attractive consumer demographics as a key growth driver of exports to India
34%
of corporates2 identify geo-political dynamics as a key growth driver of exports to India
38% geo-political dynamic
consumer demographic
plan to be in corridor
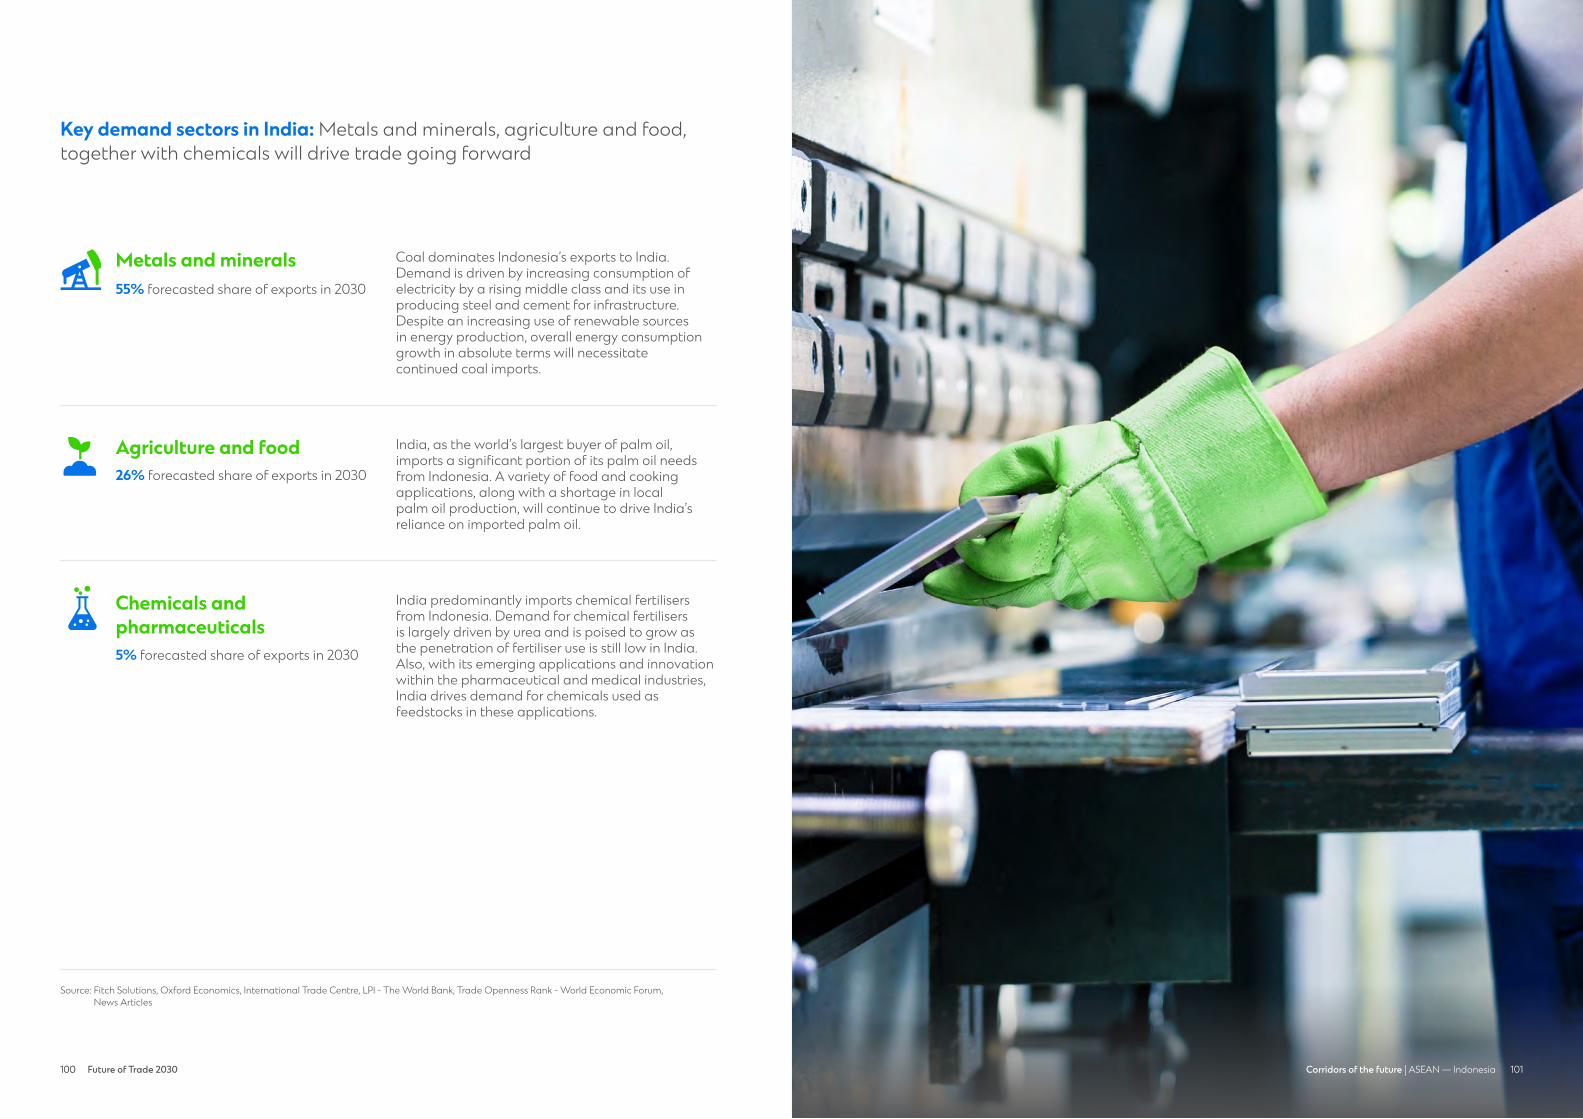
100 Future of Trade 2030 101100 101Corridors of the future | ASEAN — Indonesia
Source: Fitch Solutions, Oxford Economics, International Trade Centre, LPI - The World Bank, Trade Openness Rank - World Economic Forum, News Articles
Key demand sectors in India: Metals and minerals, agriculture and food, together with chemicals will drive trade going forward
Coal dominates Indonesia’s exports to India. Demand is driven by increasing consumption of electricity by a rising middle class and its use in producing steel and cement for infrastructure. Despite an increasing use of renewable sources in energy production, overall energy consumption growth in absolute terms will necessitate continued coal imports.
Metals & Minerals
India, as the world’s largest buyer of palm oil, imports a significant portion of its palm oil needs from Indonesia. A variety of food and cooking applications, along with a shortage in local palm oil production, will continue to drive India’s reliance on imported palm oil.
Agriculture & Food
India predominantly imports chemical fertilisers from Indonesia. Demand for chemical fertilisers is largely driven by urea and is poised to grow as the penetration of fertiliser use is still low in India. Also, with its emerging applications and innovation within the pharmaceutical and medical industries, India drives demand for chemicals used as feedstocks in these applications.
Chemicals & Pharmaceuticals
Metals and minerals55% forecasted share of exports in 2030
Chemicals and pharmaceuticals5% forecasted share of exports in 2030
Agriculture and food26% forecasted share of exports in 2030

102 Future of Trade 2030 103102 103Corridors of the future | ASEAN — Indonesia
Indonesia-to-Mainland China trade corridor
Mainland China has strong economic ties with Indonesia and will continue to be largest corridor for Indonesia from 2020 to 2030
Largest corridor
2019 Trade Openness Rank (out of 141)
#71#1
2020 2030 forecasted
The data is for trade of goods only
2.2 times growth in trade by 2030
2020-2030 GDP growth (per annum)
2020-2030 Global imports growth (per annum)
5.5%
7.8%
Indonesia to Mainland China export value growth forecast
8.2%
Exports growth per annum
2030 forecasted
USD 67.8 billion exports
2020
USD 30.7 billion exports
of corporates1 plan to be in the Indonesia to Mainland China corridor
of corporates2 identify bilateral andregional trade agreements as a key growth driver of exports to Mainland China
of corporates2 anticipate between 5-10% annual revenue growth of exports to Mainland China over the next 10 years
30%
25%46%
Why Mainland China? Indonesia’s exports to Mainland China are driven by Mainland China’s growing demand for raw materials, supportive trade policies, and Mainland China’s private consumption growth
Growing demand for raw materialsGrowing demand for raw materials, such as iron and coal, is bolstered by government spending on infrastructure and rising urbanisation, which is driving demand for new commercial and residential buildings. Adoption of automation will support manufacturing competitiveness and further drive demand for raw materials.
Private consumption growthRising disposable incomes and increasing urbanisation are driving consumption growth in Mainland China. Disposable income in Mainland China is predicted to double from USD6,000 a year to USD12,000 in 2030. The growth of e-commerce in Mainland China has also enhanced consumption, especially in rural areas.
Supportive trade policiesChina and Indonesia are both members of RCEP, which lowers barriers to trade for its members. There is growing collaboration between the markets for the Belt and Road Initiative and support for Chinese firms to boost investment in Indonesia is increasing.
1. Currently or planning to source/manufacture in Indonesia. Total of 205 respondents for this source location. 2. Total of 61 respondents for this corridor.
of corporates2 identify attractive consumer demographics as a key growth driver of exports to Mainland China
44% consumer demographic
trade agreement
plan to be in corridor
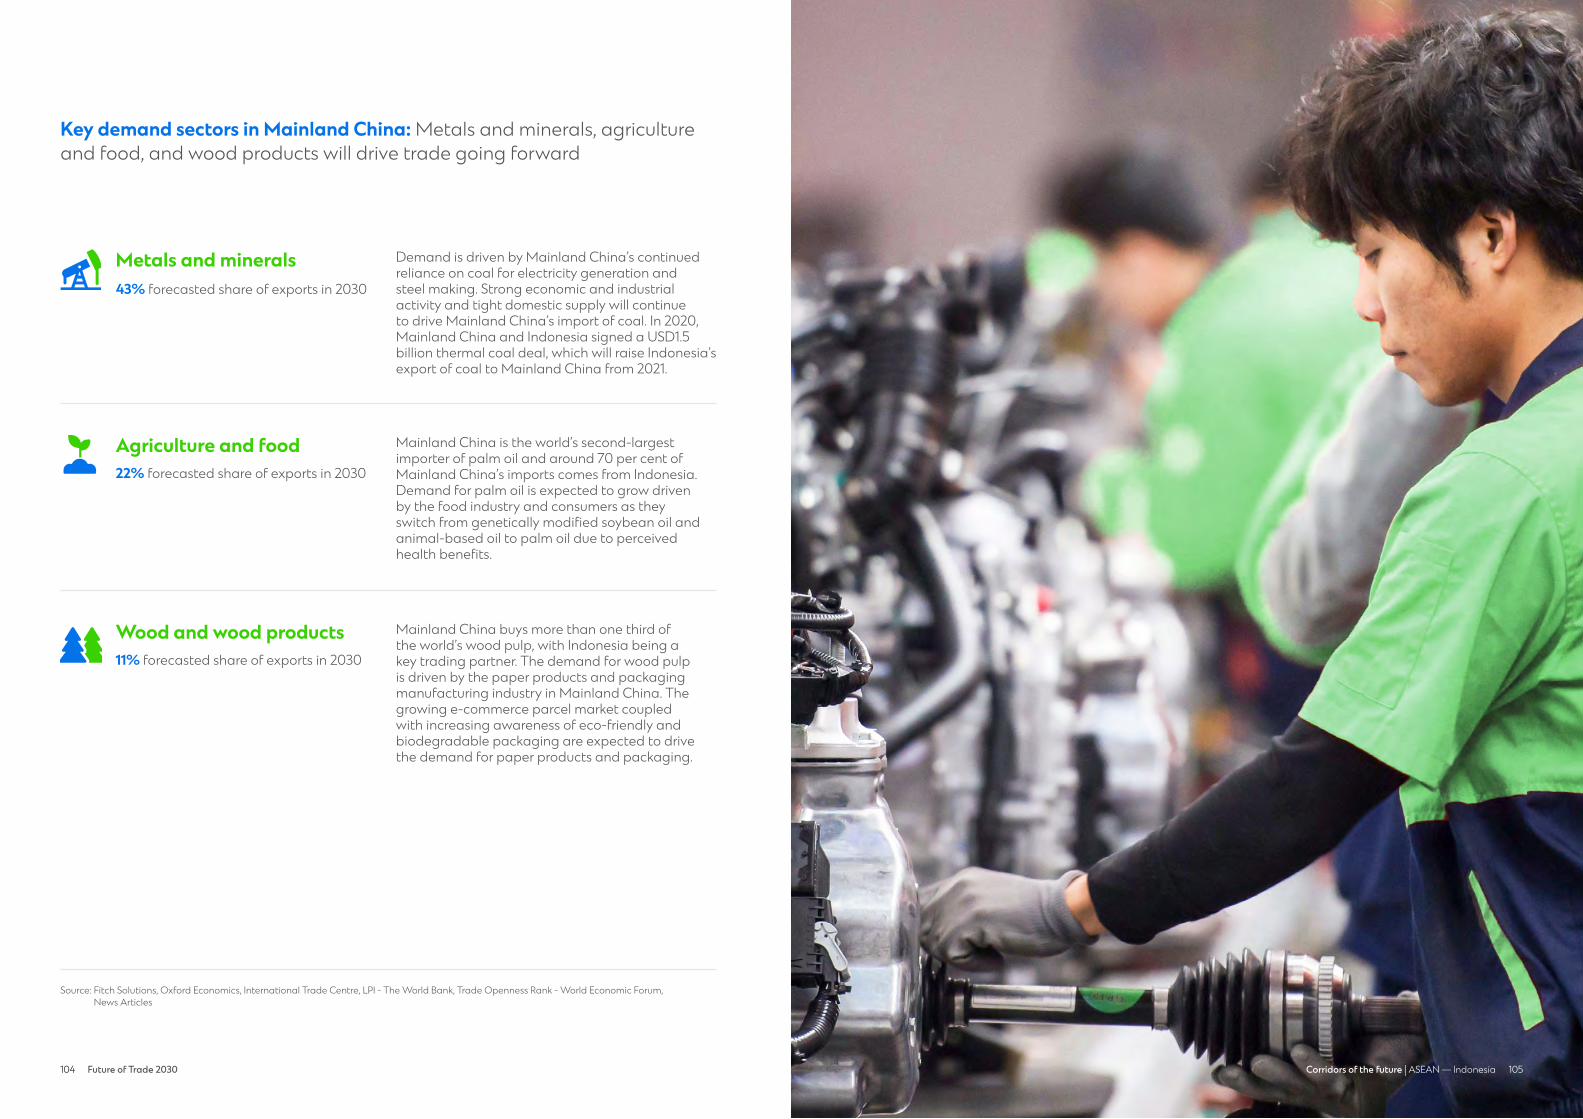
104 Future of Trade 2030 105104 105Corridors of the future | ASEAN — Indonesia
Key demand sectors in Mainland China: Metals and minerals, agriculture and food, and wood products will drive trade going forward
Source: Fitch Solutions, Oxford Economics, International Trade Centre, LPI - The World Bank, Trade Openness Rank - World Economic Forum, News Articles
Demand is driven by Mainland China’s continued reliance on coal for electricity generation and steel making. Strong economic and industrial activity and tight domestic supply will continue to drive Mainland China’s import of coal. In 2020, Mainland China and Indonesia signed a USD1.5 billion thermal coal deal, which will raise Indonesia’s export of coal to Mainland China from 2021.
Metals & Minerals
Mainland China buys more than one third of the world’s wood pulp, with Indonesia being a key trading partner. The demand for wood pulp is driven by the paper products and packaging manufacturing industry in Mainland China. The growing e-commerce parcel market coupled with increasing awareness of eco-friendly and biodegradable packaging are expected to drive the demand for paper products and packaging.
Other Manufac-tured Goods
Wood & Woods Products
Mainland China is the world’s second-largest importer of palm oil and around 70 per cent of Mainland China’s imports comes from Indonesia. Demand for palm oil is expected to grow driven by the food industry and consumers as they switch from genetically modified soybean oil and animal-based oil to palm oil due to perceived health benefits.
Agriculture & Food
Metals and minerals43% forecasted share of exports in 2030
Wood and wood products11% forecasted share of exports in 2030
Agriculture and food22% forecasted share of exports in 2030
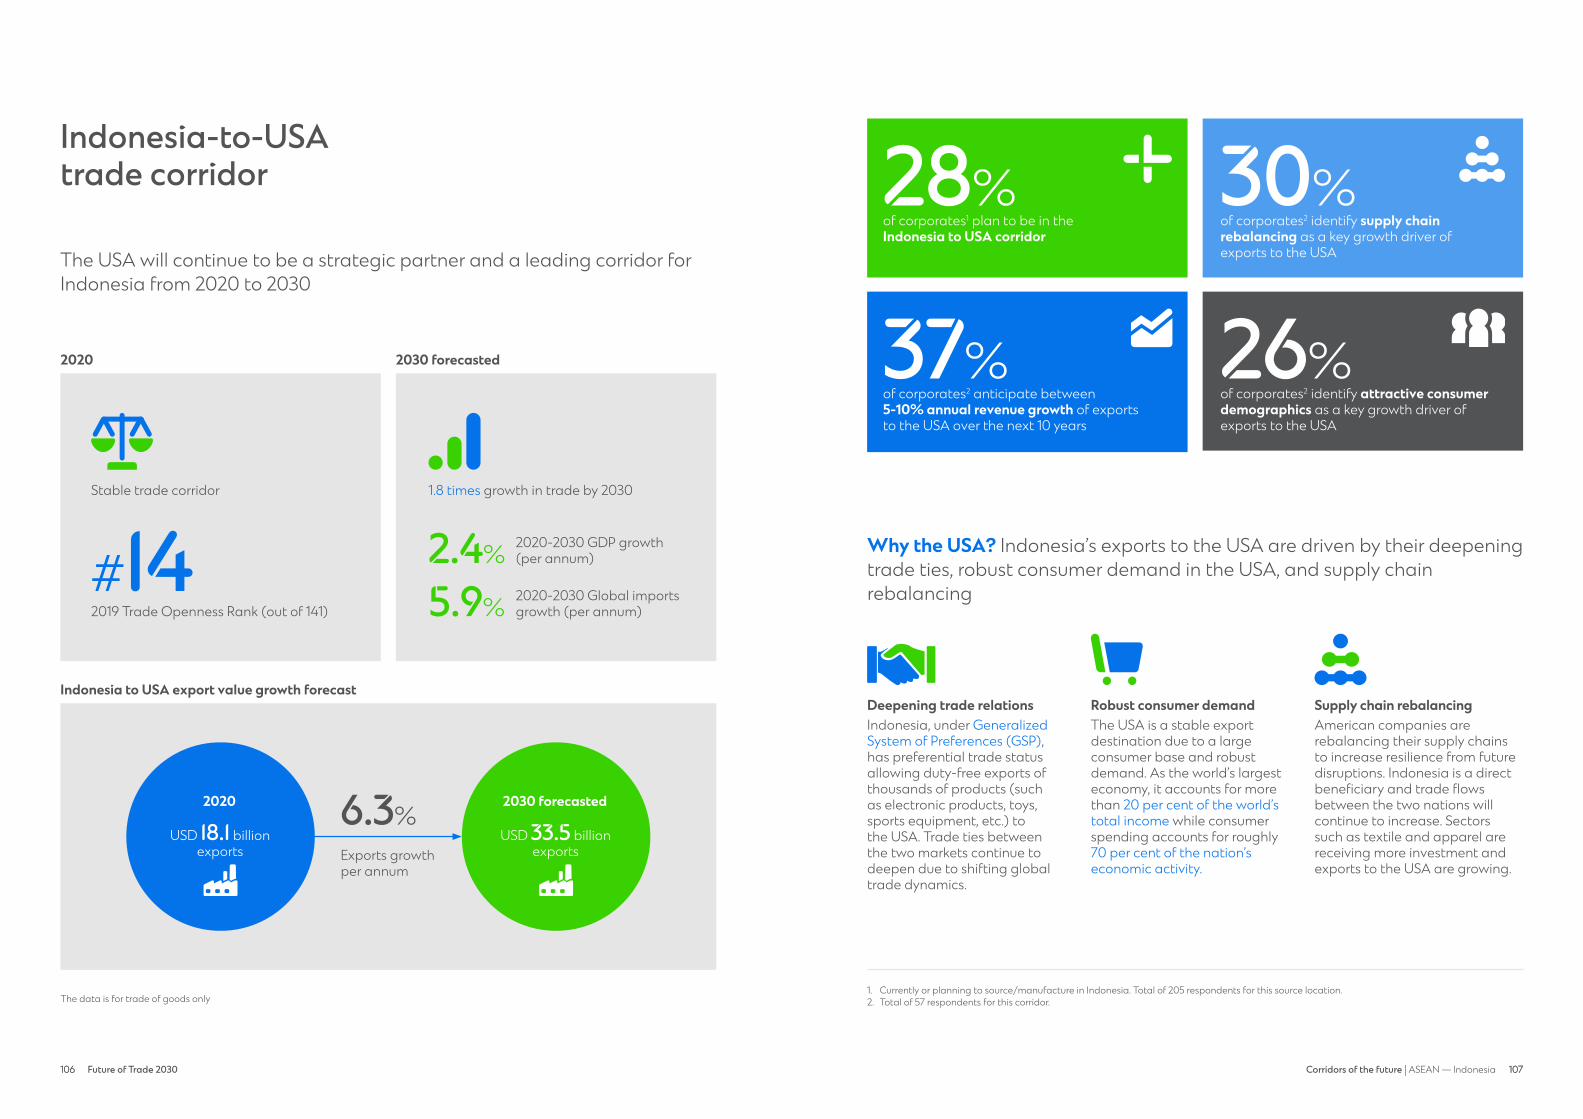
106 Future of Trade 2030 107106 107Corridors of the future | ASEAN — Indonesia
Indonesia-to-USA trade corridor
The USA will continue to be a strategic partner and a leading corridor for Indonesia from 2020 to 2030
Stable trade corridor
2019 Trade Openness Rank (out of 141)
#14
2020 2030 forecasted
The data is for trade of goods only
1.8 times growth in trade by 2030
2020-2030 GDP growth (per annum)
of corporates1 plan to be in the Indonesia to USA corridor
of corporates2 anticipate between 5-10% annual revenue growth of exports to the USA over the next 10 years
2020-2030 Global imports growth (per annum)
2.4%
28%
37%
5.9%
Indonesia to USA export value growth forecast
6.3%
Exports growth per annum
Why the USA? Indonesia’s exports to the USA are driven by their deepening trade ties, robust consumer demand in the USA, and supply chain rebalancing
Deepening trade relationsIndonesia, under Generalized System of Preferences (GSP), has preferential trade status allowing duty-free exports of thousands of products (such as electronic products, toys, sports equipment, etc.) to the USA. Trade ties between the two markets continue to deepen due to shifting global trade dynamics.
Robust consumer demandThe USA is a stable export destination due to a large consumer base and robust demand. As the world’s largest economy, it accounts for more than 20 per cent of the world’s total income while consumer spending accounts for roughly 70 per cent of the nation’s economic activity.
Supply chain rebalancingAmerican companies are rebalancing their supply chains to increase resilience from future disruptions. Indonesia is a direct beneficiary and trade flows between the two nations will continue to increase. Sectors such as textile and apparel are receiving more investment and exports to the USA are growing.
1. Currently or planning to source/manufacture in Indonesia. Total of 205 respondents for this source location. 2. Total of 57 respondents for this corridor.
2030 forecasted
USD 33.5 billion exports
2020
USD 18.1 billion exports
of corporates2 identify supply chain rebalancing as a key growth driver of exports to the USA
of corporates2 identify attractive consumer demographics as a key growth driver of exports to the USA
30%
26%
supply chain rebalancing
consumer demographic
plan to be in corridor
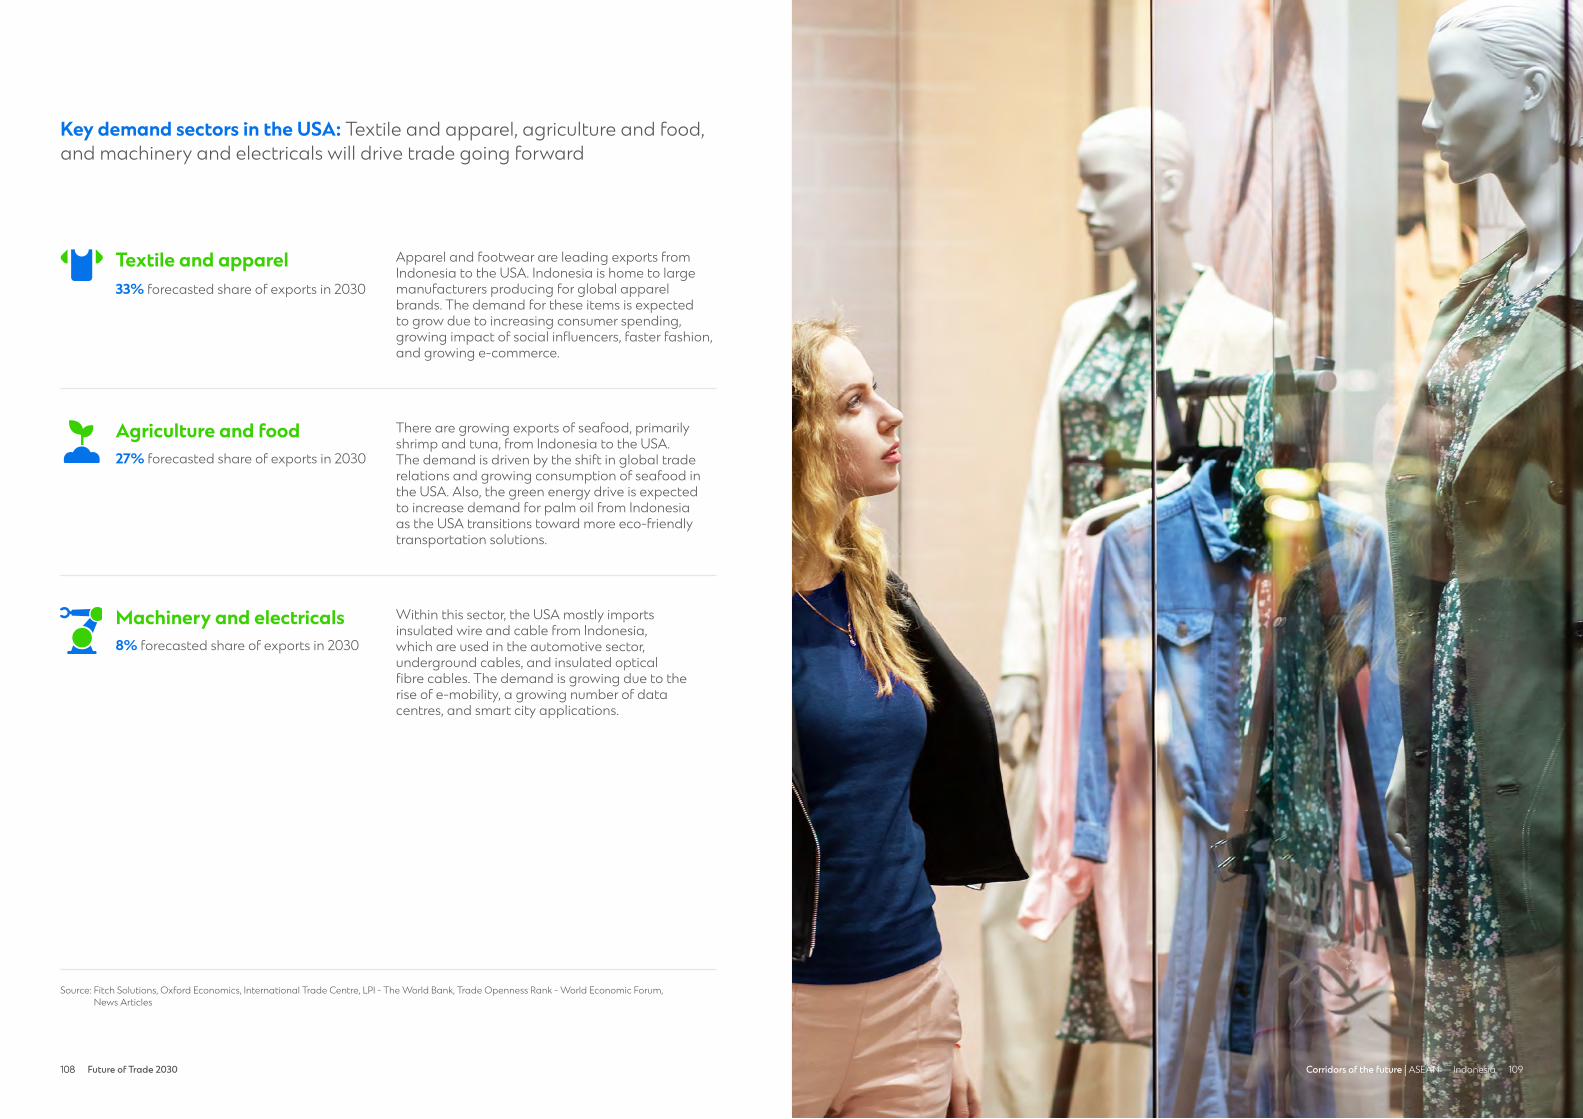
108 Future of Trade 2030 109108 109Corridors of the future | ASEAN — Indonesia
Key demand sectors in the USA: Textile and apparel, agriculture and food, and machinery and electricals will drive trade going forward
Source: Fitch Solutions, Oxford Economics, International Trade Centre, LPI - The World Bank, Trade Openness Rank - World Economic Forum, News Articles
Apparel and footwear are leading exports from Indonesia to the USA. Indonesia is home to large manufacturers producing for global apparel brands. The demand for these items is expected to grow due to increasing consumer spending, growing impact of social influencers, faster fashion, and growing e-commerce.
Textile & Apparel
Within this sector, the USA mostly imports insulated wire and cable from Indonesia, which are used in the automotive sector, underground cables, and insulated optical fibre cables. The demand is growing due to the rise of e-mobility, a growing number of data centres, and smart city applications.
There are growing exports of seafood, primarily shrimp and tuna, from Indonesia to the USA. The demand is driven by the shift in global trade relations and growing consumption of seafood in the USA. Also, the green energy drive is expected to increase demand for palm oil from Indonesia as the USA transitions toward more eco-friendly transportation solutions.
Agriculture & Food
Machinery & Electricals
Textile and apparel33% forecasted share of exports in 2030
Machinery and electricals8% forecasted share of exports in 2030
Agriculture and food27% forecasted share of exports in 2030
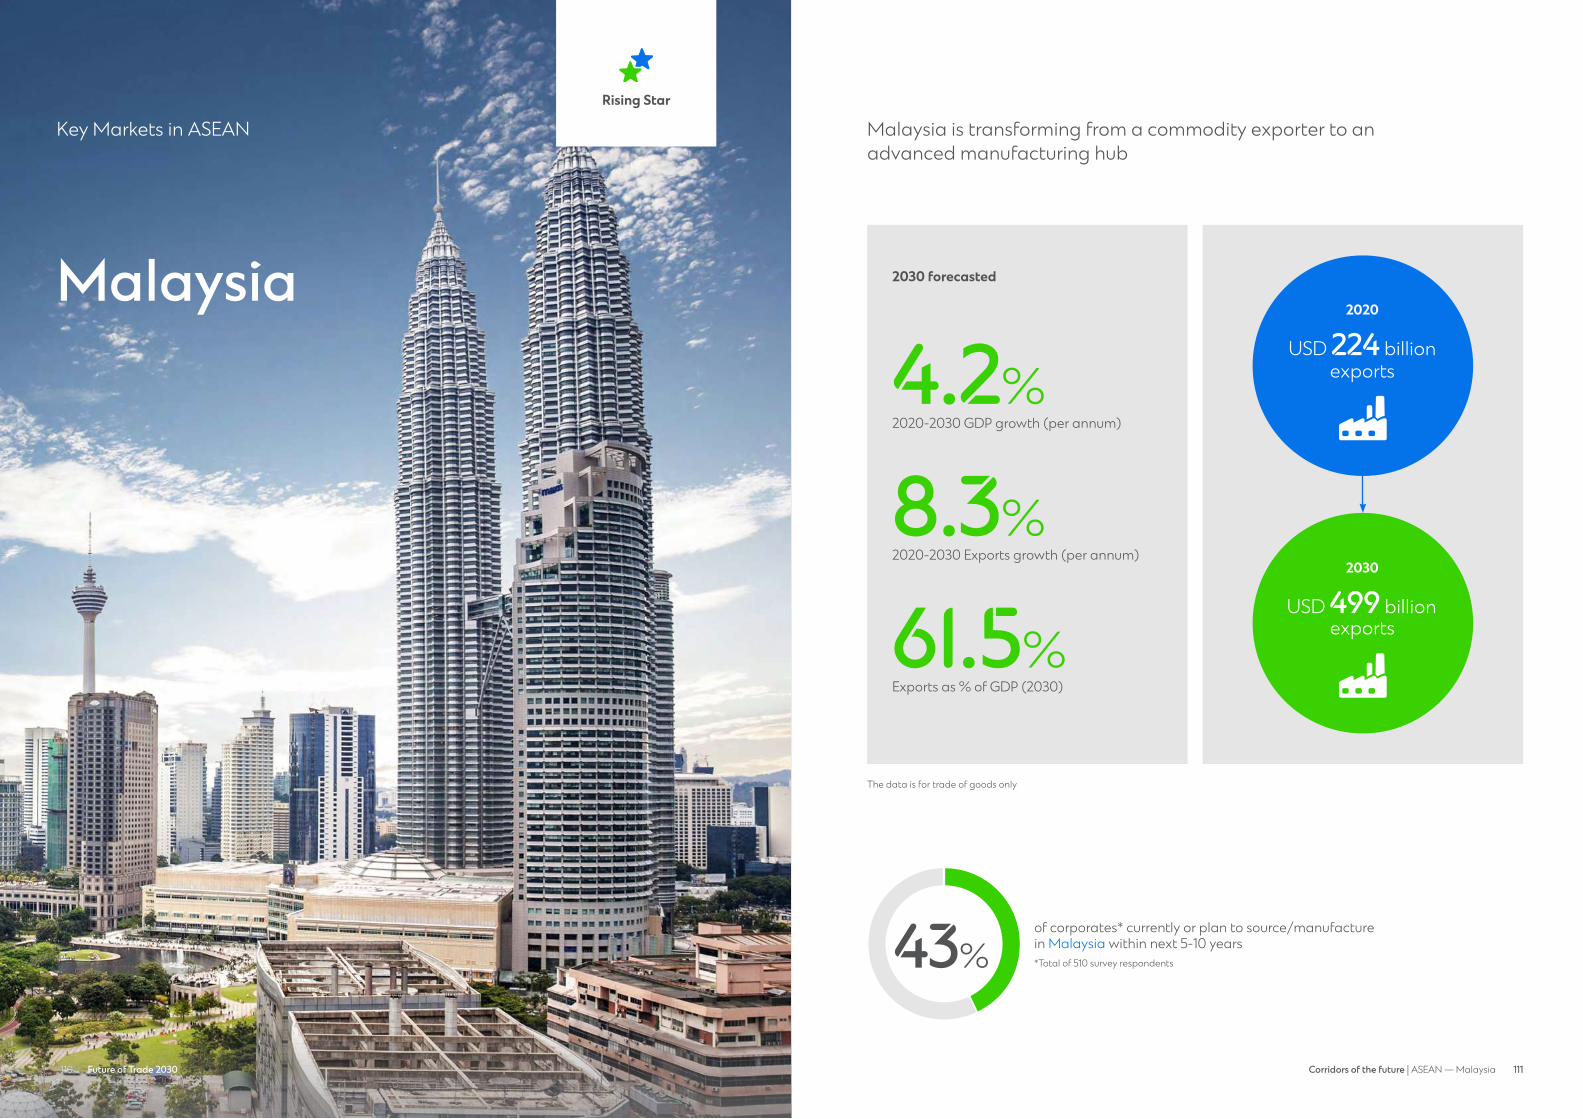
110 111111Corridors of the future | ASEAN — MalaysiaFuture of Trade 2030110
Malaysia
Key Markets in ASEANRising Star
Malaysia is transforming from a commodity exporter to an advanced manufacturing hub
43%of corporates* currently or plan to source/manufacture in Malaysia within next 5-10 years*Total of 510 survey respondents
The data is for trade of goods only
Rising Stars
2030 forecasted
2020-2030 GDP growth (per annum)
4.2%
2020-2030 Exports growth (per annum)
8.3%
Exports as % of GDP (2030)
61.5%
2020
USD 224 billion exports
2030
USD 499 billion exports
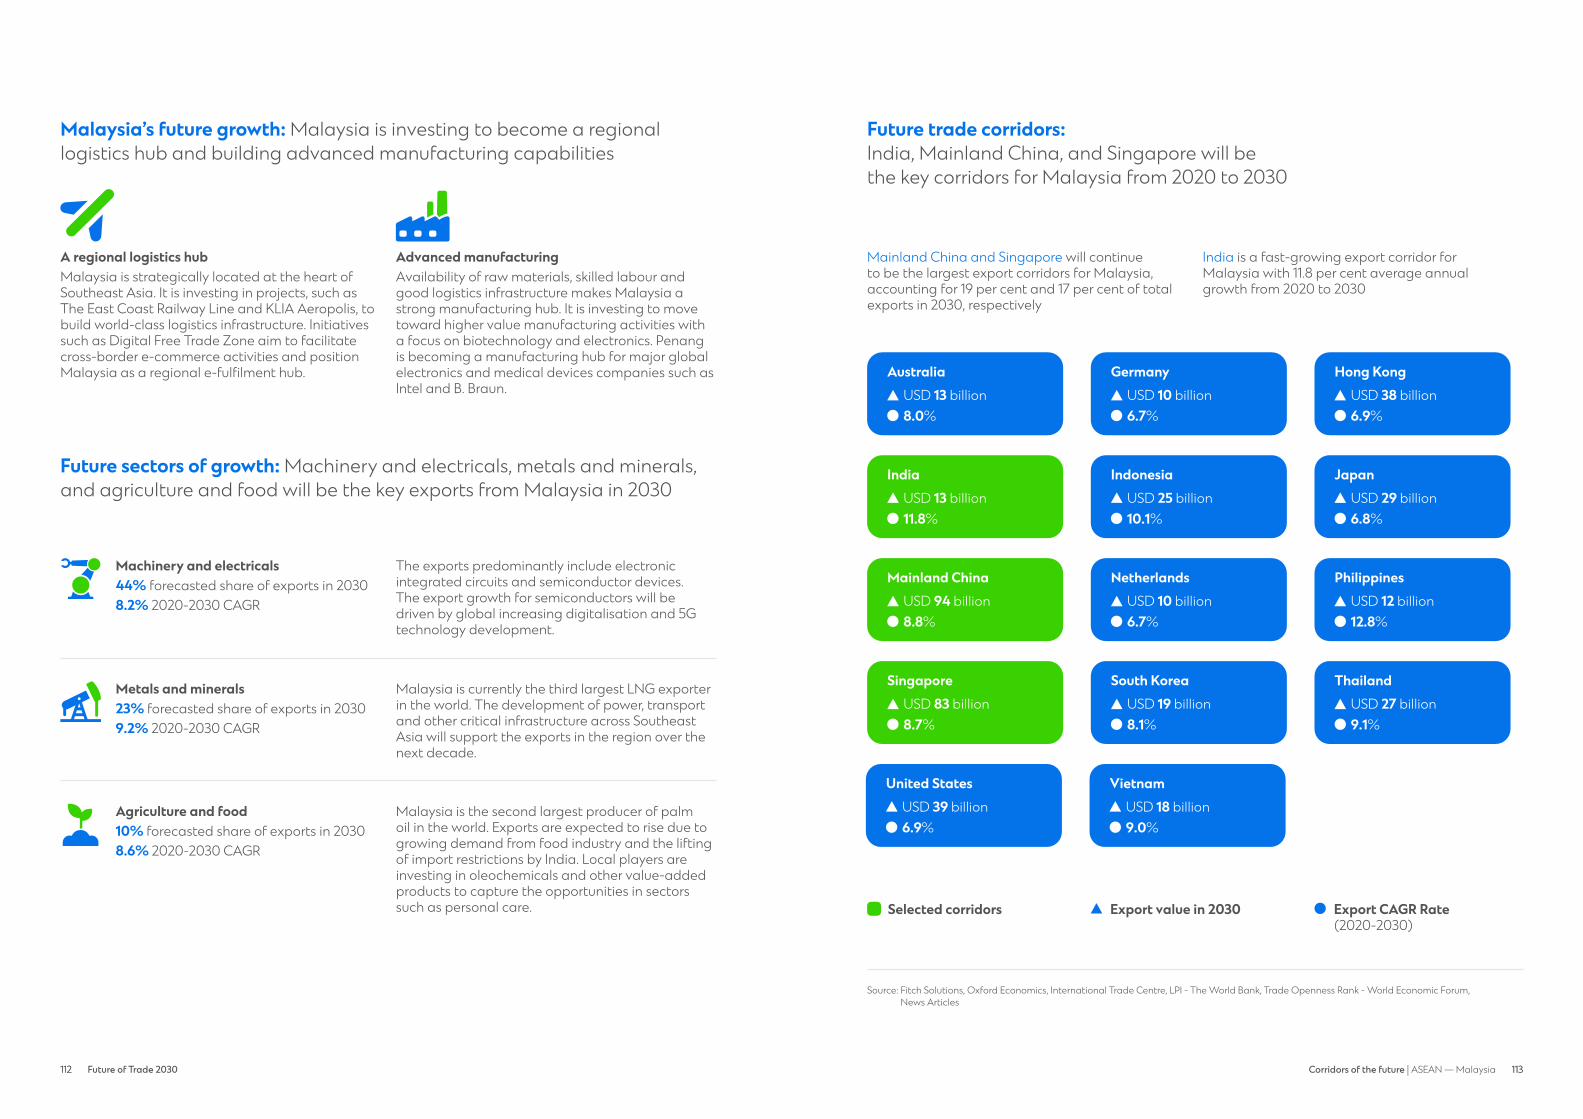
112 Future of Trade 2030 113112 113Corridors of the future | ASEAN — Malaysia
Malaysia’s future growth: Malaysia is investing to become a regional logistics hub and building advanced manufacturing capabilities
A regional logistics hubMalaysia is strategically located at the heart of Southeast Asia. It is investing in projects, such as The East Coast Railway Line and KLIA Aeropolis, to build world-class logistics infrastructure. Initiatives such as Digital Free Trade Zone aim to facilitate cross-border e-commerce activities and position Malaysia as a regional e-fulfilment hub.
Advanced manufacturingAvailability of raw materials, skilled labour and good logistics infrastructure makes Malaysia a strong manufacturing hub. It is investing to move toward higher value manufacturing activities with a focus on biotechnology and electronics. Penang is becoming a manufacturing hub for major global electronics and medical devices companies such as Intel and B. Braun.
Future sectors of growth: Machinery and electricals, metals and minerals, and agriculture and food will be the key exports from Malaysia in 2030
Agriculture & Food
Agriculture and food Malaysia is the second largest producer of palm oil in the world. Exports are expected to rise due to growing demand from food industry and the lifting of import restrictions by India. Local players are investing in oleochemicals and other value-added products to capture the opportunities in sectors such as personal care.
10% forecasted share of exports in 20308.6% 2020-2030 CAGR
Machinery and electricals The exports predominantly include electronic integrated circuits and semiconductor devices. The export growth for semiconductors will be driven by global increasing digitalisation and 5G technology development.
44% forecasted share of exports in 20308.2% 2020-2030 CAGRMachinery &
Electricals
Metals and minerals Malaysia is currently the third largest LNG exporter in the world. The development of power, transport and other critical infrastructure across Southeast Asia will support the exports in the region over the next decade.
23% forecasted share of exports in 20309.2% 2020-2030 CAGRMetals & Minerals
Future trade corridors: India, Mainland China, and Singapore will be the key corridors for Malaysia from 2020 to 2030
Source: Fitch Solutions, Oxford Economics, International Trade Centre, LPI - The World Bank, Trade Openness Rank - World Economic Forum, News Articles
Mainland China and Singapore will continue to be the largest export corridors for Malaysia, accounting for 19 per cent and 17 per cent of total exports in 2030, respectively
India is a fast-growing export corridor for Malaysia with 11.8 per cent average annual growth from 2020 to 2030
GermanyUSD 10 billion6.7%
Hong KongUSD 38 billion6.9%
AustraliaUSD 13 billion8.0%
NetherlandsUSD 10 billion6.7%
PhilippinesUSD 12 billion12.8%
Mainland ChinaUSD 94 billion8.8%
South KoreaUSD 19 billion8.1%
ThailandUSD 27 billion9.1%
SingaporeUSD 83 billion8.7%
IndonesiaUSD 25 billion10.1%
JapanUSD 29 billion6.8%
IndiaUSD 13 billion11.8%
United States VietnamUSD 39 billion USD 18 billion6.9% 9.0%
Export CAGR Rate (2020-2030)
Selected corridors Export value in 2030
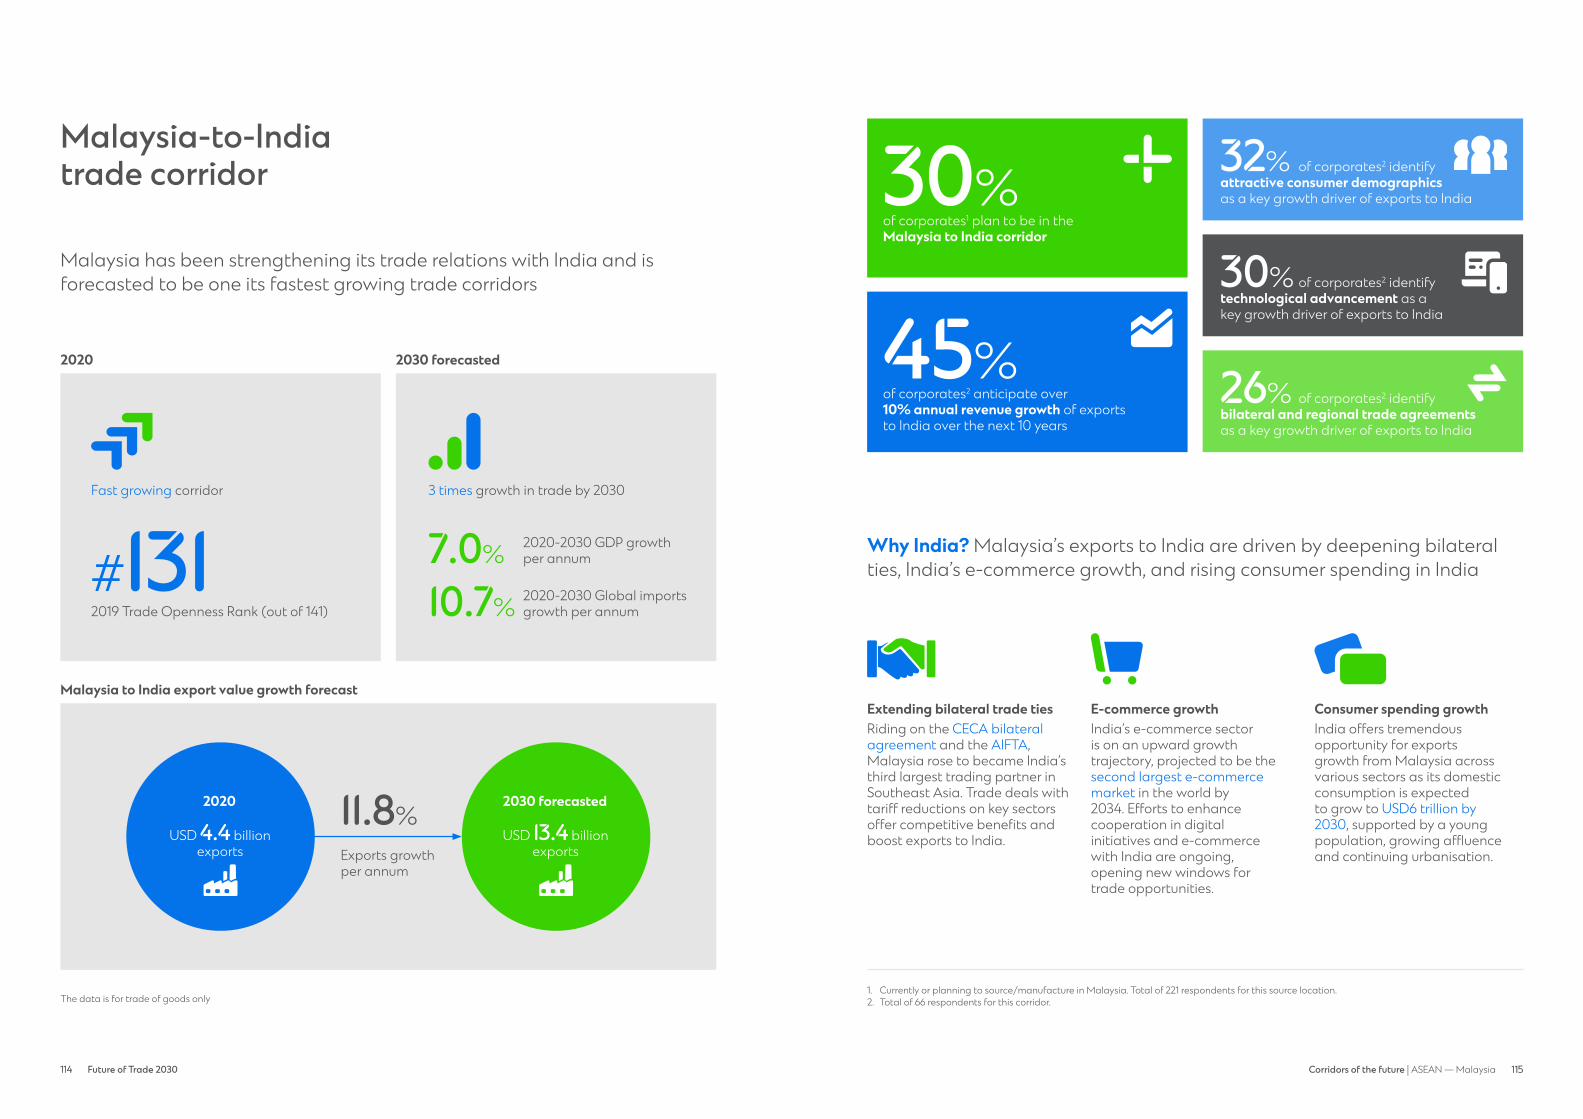
114 Future of Trade 2030 115114 115Corridors of the future | ASEAN — Malaysia
Malaysia-to-India trade corridor
Malaysia has been strengthening its trade relations with India and is forecasted to be one its fastest growing trade corridors
Fast growing corridor
2019 Trade Openness Rank (out of 141)
#131
2020 2030 forecasted
The data is for trade of goods only
3 times growth in trade by 2030
2020-2030 GDP growth per annum
2020-2030 Global imports growth per annum
7.0%
10.7%
Malaysia to India export value growth forecast
11.8%
Exports growth per annum
2030 forecasted
USD 13.4 billion exports
2020
USD 4.4 billion exports
of corporates1 plan to be in the Malaysia to India corridor
of corporates2 anticipate over 10% annual revenue growth of exports to India over the next 10 years
30%
45%
Why India? Malaysia’s exports to India are driven by deepening bilateral ties, India’s e-commerce growth, and rising consumer spending in India
1. Currently or planning to source/manufacture in Malaysia. Total of 221 respondents for this source location. 2. Total of 66 respondents for this corridor.
Extending bilateral trade tiesRiding on the CECA bilateral agreement and the AIFTA, Malaysia rose to became India’s third largest trading partner in Southeast Asia. Trade deals with tariff reductions on key sectors offer competitive benefits and boost exports to India.
E-commerce growthIndia’s e-commerce sector is on an upward growth trajectory, projected to be the second largest e-commerce market in the world by 2034. Efforts to enhance cooperation in digital initiatives and e-commerce with India are ongoing, opening new windows for trade opportunities.
Consumer spending growthIndia offers tremendous opportunity for exports growth from Malaysia across various sectors as its domestic consumption is expected to grow to USD6 trillion by 2030, supported by a young population, growing affluence and continuing urbanisation.
of corporates2 identify attractive consumer demographics as a key growth driver of exports to India
32%
of corporates2 identify bilateral and regional trade agreements as a key growth driver of exports to India
26%
of corporates2 identify technological advancement as a key growth driver of exports to India
30%
consumer demographic
technological advancement
trade agreement
plan to be in corridor
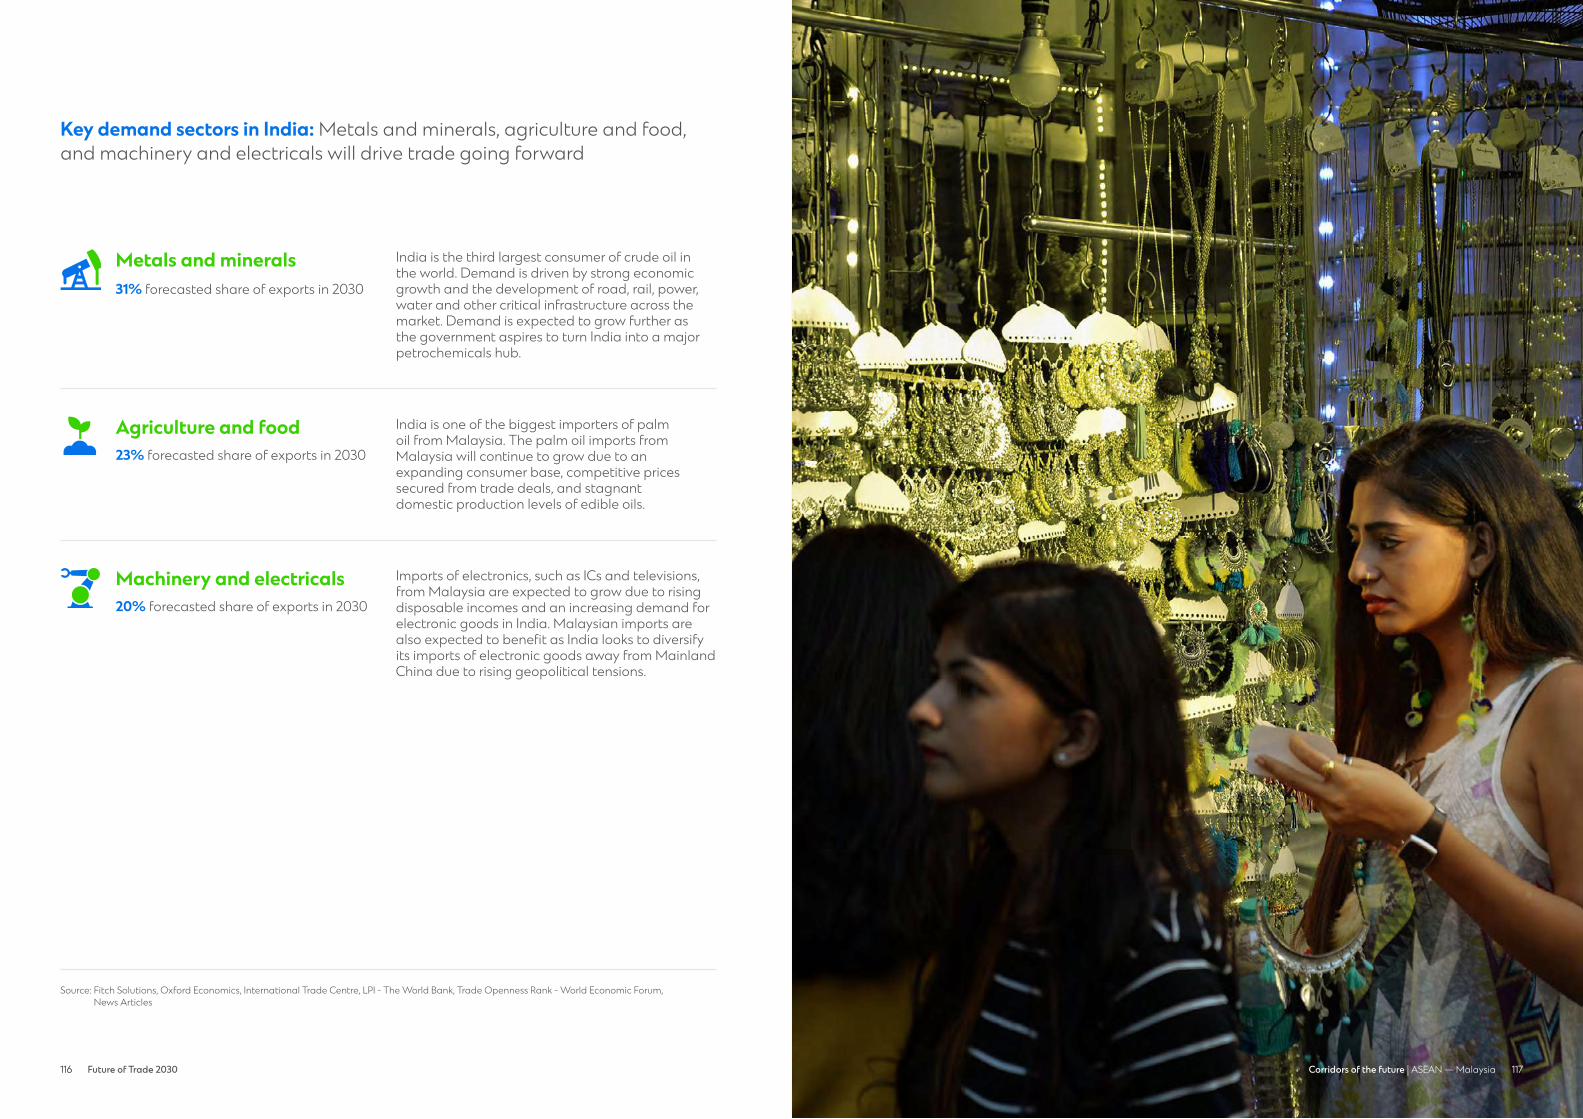
116 Future of Trade 2030 117116 117Corridors of the future | ASEAN — Malaysia
Source: Fitch Solutions, Oxford Economics, International Trade Centre, LPI - The World Bank, Trade Openness Rank - World Economic Forum, News Articles
Key demand sectors in India: Metals and minerals, agriculture and food, and machinery and electricals will drive trade going forward
India is the third largest consumer of crude oil in the world. Demand is driven by strong economic growth and the development of road, rail, power, water and other critical infrastructure across the market. Demand is expected to grow further as the government aspires to turn India into a major petrochemicals hub.
Metals & Minerals
India is one of the biggest importers of palm oil from Malaysia. The palm oil imports from Malaysia will continue to grow due to an expanding consumer base, competitive prices secured from trade deals, and stagnant domestic production levels of edible oils.
Agriculture & Food
Imports of electronics, such as ICs and televisions, from Malaysia are expected to grow due to rising disposable incomes and an increasing demand for electronic goods in India. Malaysian imports are also expected to benefit as India looks to diversify its imports of electronic goods away from Mainland China due to rising geopolitical tensions.
Machinery & Electricals
Metals and minerals31% forecasted share of exports in 2030
Machinery and electricals20% forecasted share of exports in 2030
Agriculture and food23% forecasted share of exports in 2030

118 Future of Trade 2030 119118 119Corridors of the future | ASEAN — Malaysia
Malaysia-to-Mainland China trade corridor
Malaysia and Mainland China are strong strategic partners and Mainland China will continue to be the largest trading partner for Malaysia
Largest trade corridor
2019 Trade Openness Rank (out of 141)
#71#1
2020 2030 forecasted
The data is for trade of goods only
2.3 times growth in trade by 2030
2020-2030 GDP growth (per annum)
2020-2030 Global imports growth (per annum)
5.5%
7.8%
Malaysia to Mainland China export value growth forecast
8.8%
Exports growth per annum
2030 forecasted
USD 93.7 billion exports
2020
USD 40.2 billion exports
of corporates1 plan to be in the Malaysia to Mainland China corridor
of corporates2 anticipate between 5-10% annual revenue growth of exports to Mainland China over the next 10 years
33%
46%
Why Mainland China? Malaysia’s exports to Mainland China are driven by Mainland China’s local demand growth, their strong economic ties, and growing e-commerce trade between the two markets
Growing local demandAs Mainland China aims to double the size of its economy to USD30 trillion and become a global technology leader by 2035, local demand will create a boom for consumer goods, infrastructure spending, commodity-based products, and electronic components.
Cross-border e-commerce growthThe establishment of Malaysia’s Digital Free Trade Zone allows Malaysian companies/SMEs to conduct free digital trade with Mainland China via cross-border e-commerce. The e-commerce market in Mainland China is projected to reach USD3 trillion in 2024 (12.4 per cent annual growth from 2021).
Deepening strategic partnershipThe signing of the RCEP trade agreement will lower barriers to entry for Malaysian goods and services in East Asia, thus boosting trade with Mainland China. The two markets are also working to strengthen bilateral collaborations in the fields of high technology, electronic commerce, and the digital economy.
1. Currently or planning to source/manufacture in Malaysia. Total of 221 respondents for this source location. 2. Total of 74 respondents for this corridor.
of corporates2 identify technological advancement as a key growth driver of exports to Mainland China
22%
of corporates2 identify attractive consumer demographics as a key growth driver of exports to Mainland China
39% consumer demographic
technological advancement
plan to be in corridor
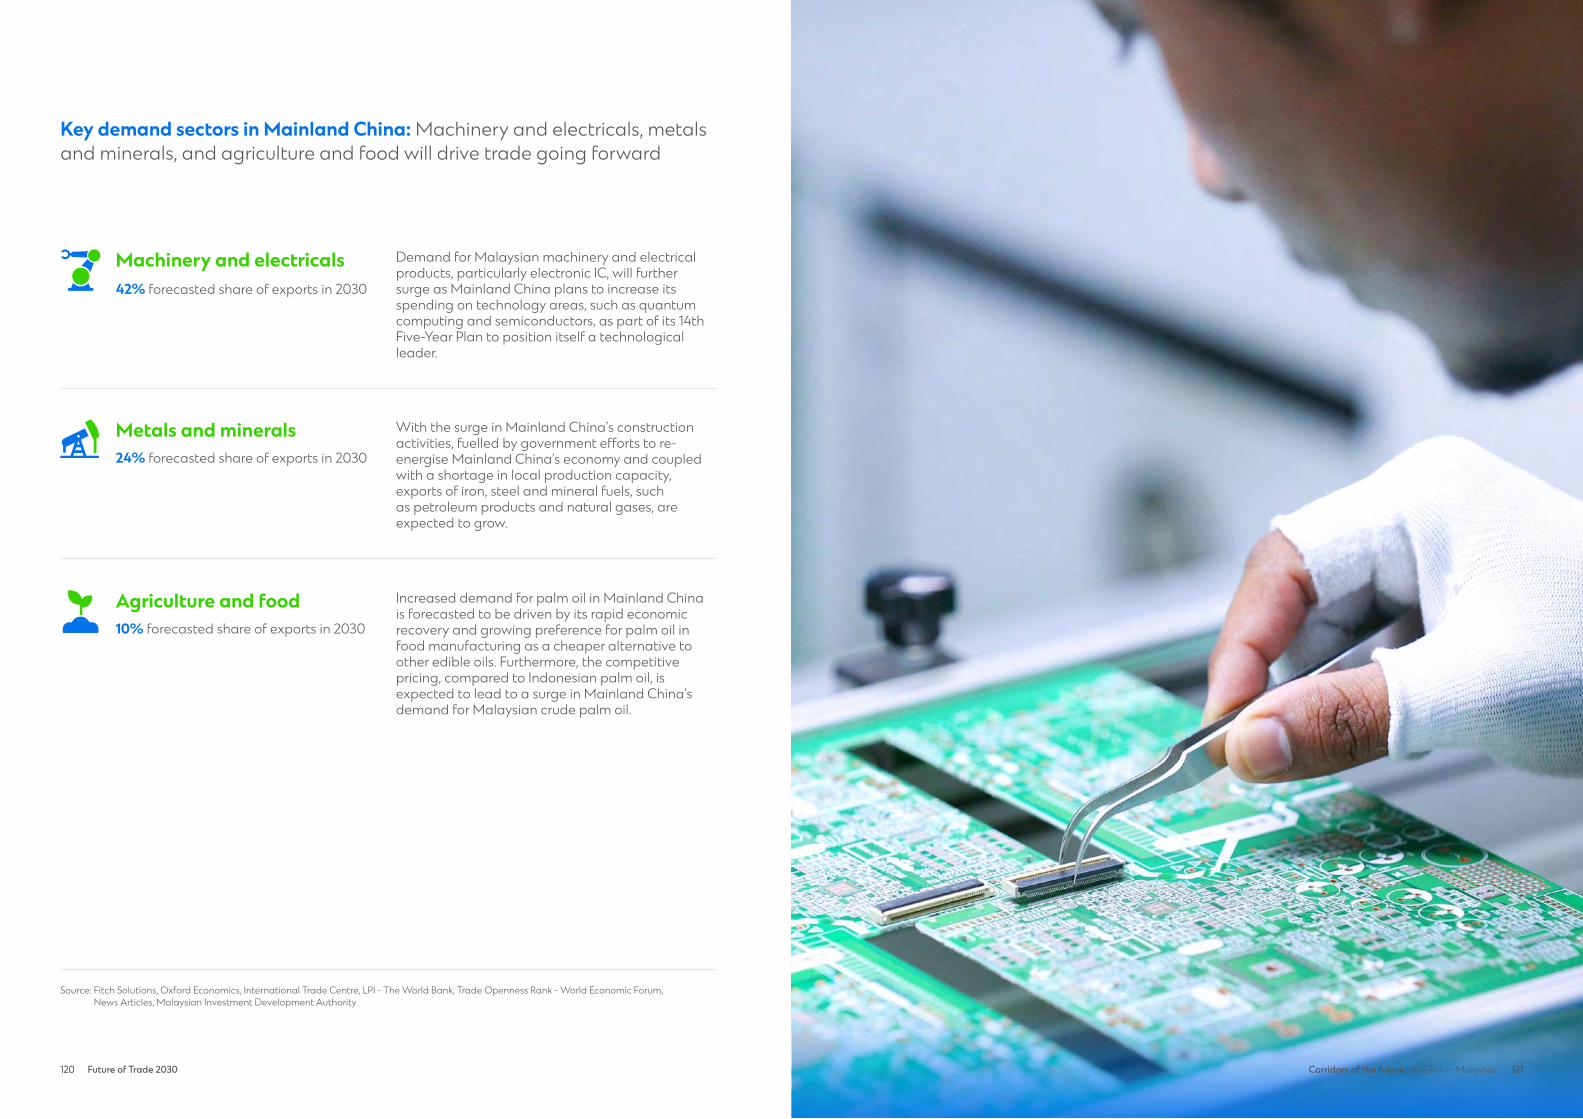
120 Future of Trade 2030 121120 121Corridors of the future | ASEAN — Malaysia
Key demand sectors in Mainland China: Machinery and electricals, metals and minerals, and agriculture and food will drive trade going forward
Source: Fitch Solutions, Oxford Economics, International Trade Centre, LPI - The World Bank, Trade Openness Rank - World Economic Forum, News Articles, Malaysian Investment Development Authority
Demand for Malaysian machinery and electrical products, particularly electronic IC, will further surge as Mainland China plans to increase its spending on technology areas, such as quantum computing and semiconductors, as part of its 14th Five-Year Plan to position itself a technological leader.
Machinery & Electricals
Increased demand for palm oil in Mainland China is forecasted to be driven by its rapid economic recovery and growing preference for palm oil in food manufacturing as a cheaper alternative to other edible oils. Furthermore, the competitive pricing, compared to Indonesian palm oil, is expected to lead to a surge in Mainland China’s demand for Malaysian crude palm oil.
Agriculture & Food
With the surge in Mainland China’s construction activities, fuelled by government efforts to re-energise Mainland China’s economy and coupled with a shortage in local production capacity, exports of iron, steel and mineral fuels, such as petroleum products and natural gases, are expected to grow.
Metals & Minerals
Machinery and electricals42% forecasted share of exports in 2030
Agriculture and food10% forecasted share of exports in 2030
Metals and minerals24% forecasted share of exports in 2030
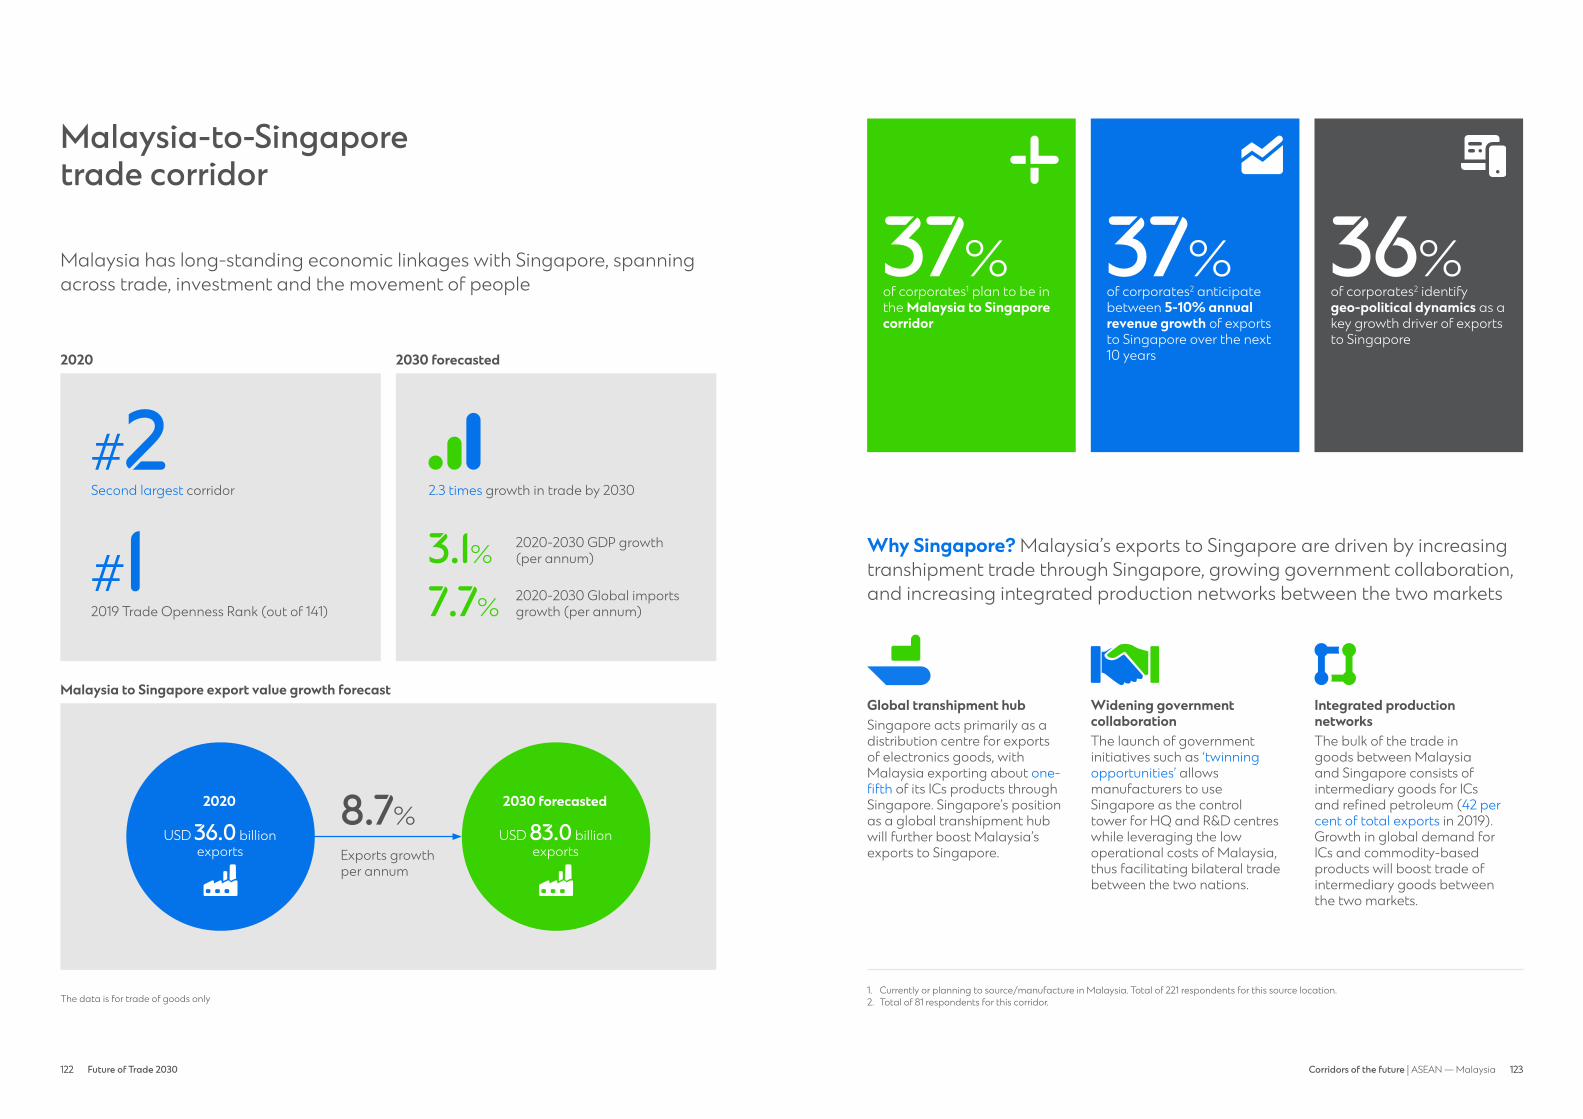
122 Future of Trade 2030 123122 123Corridors of the future | ASEAN — Malaysia
Malaysia-to-Singapore trade corridor
Malaysia has long-standing economic linkages with Singapore, spanning across trade, investment and the movement of people
Second largest corridor
2019 Trade Openness Rank (out of 141)
#1#2
2020 2030 forecasted
The data is for trade of goods only
2.3 times growth in trade by 2030
2020-2030 GDP growth (per annum)
of corporates1 plan to be in the Malaysia to Singapore corridor
of corporates2 anticipate between 5-10% annual revenue growth of exports to Singapore over the next 10 years
2020-2030 Global imports growth (per annum)
3.1%
37% 37%
7.7%
Malaysia to Singapore export value growth forecast
8.7%
Exports growth per annum
Why Singapore? Malaysia’s exports to Singapore are driven by increasing transhipment trade through Singapore, growing government collaboration, and increasing integrated production networks between the two markets
Global transhipment hubSingapore acts primarily as a distribution centre for exports of electronics goods, with Malaysia exporting about one-fifth of its ICs products through Singapore. Singapore’s position as a global transhipment hub will further boost Malaysia’s exports to Singapore.
Widening government collaborationThe launch of government initiatives such as ‘twinning opportunities’ allows manufacturers to use Singapore as the control tower for HQ and R&D centres while leveraging the low operational costs of Malaysia, thus facilitating bilateral trade between the two nations.
Integrated production networksThe bulk of the trade in goods between Malaysia and Singapore consists of intermediary goods for ICs and refined petroleum (42 per cent of total exports in 2019). Growth in global demand for ICs and commodity-based products will boost trade of intermediary goods between the two markets.
1. Currently or planning to source/manufacture in Malaysia. Total of 221 respondents for this source location. 2. Total of 81 respondents for this corridor.
2030 forecasted
USD 83.0 billion exports
2020
USD 36.0 billion exports
of corporates2 identify geo-political dynamics as a key growth driver of exports to Singapore
36%plan to be in
corridor
technological advancement
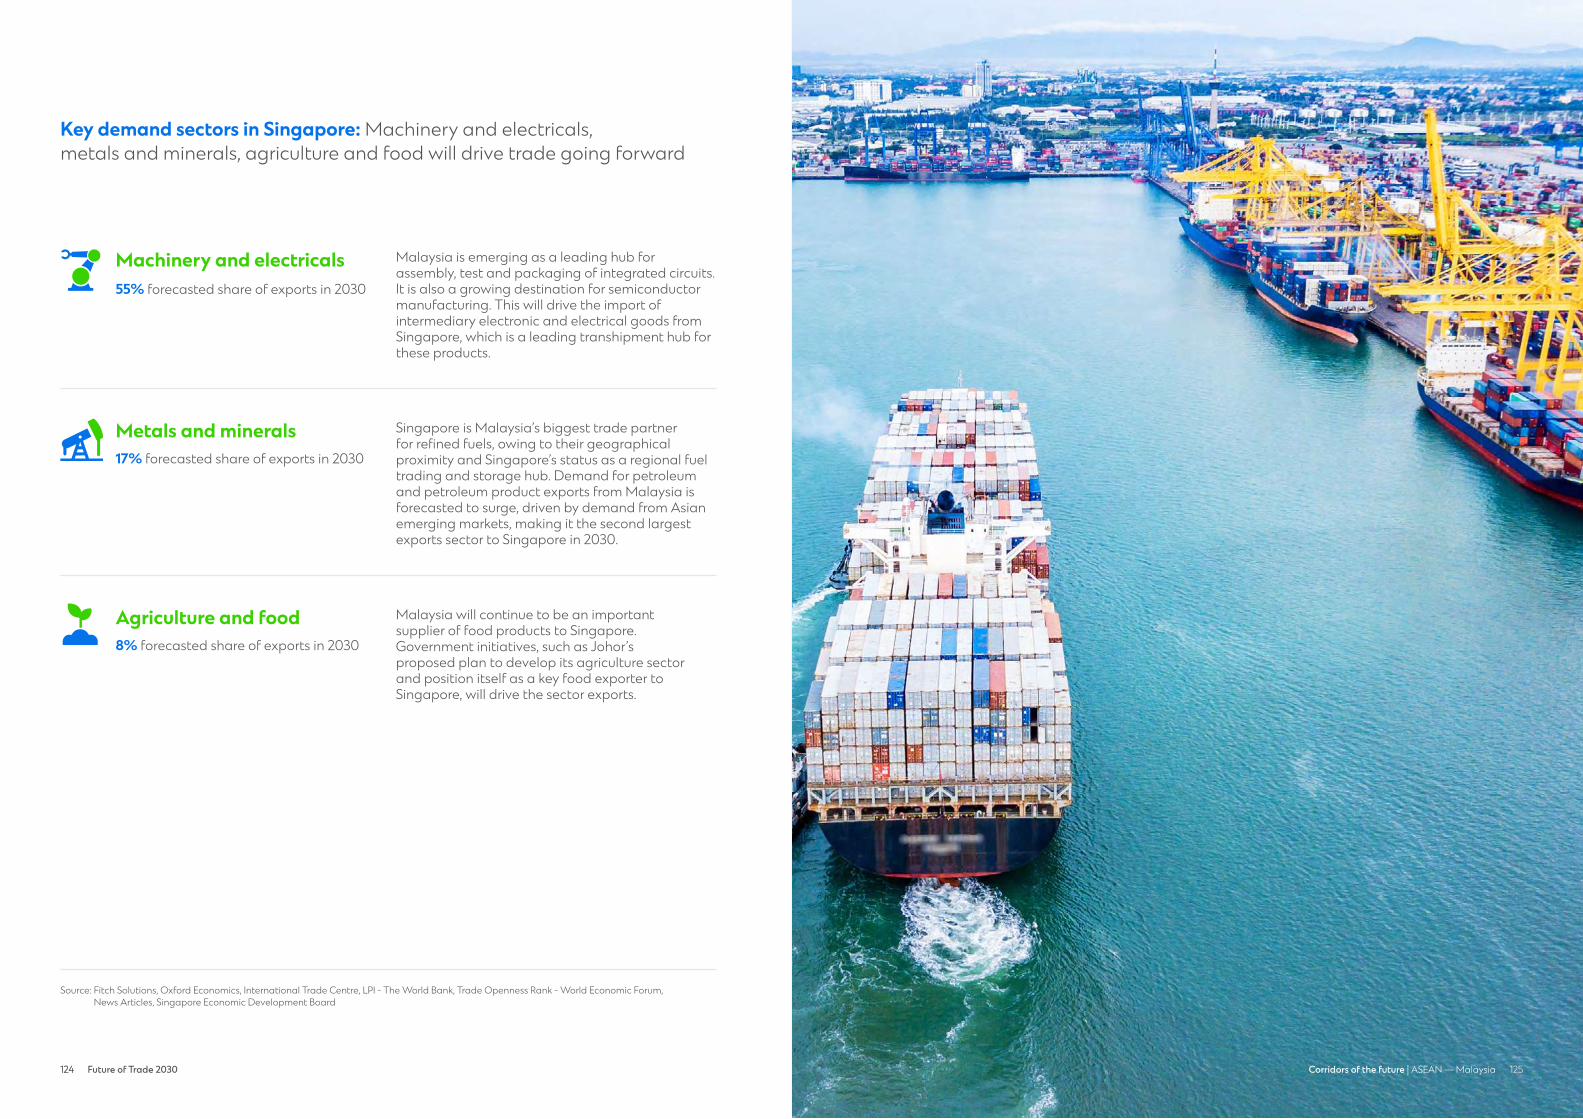
124 Future of Trade 2030 125124 125Corridors of the future | ASEAN — Malaysia
Key demand sectors in Singapore: Machinery and electricals, metals and minerals, agriculture and food will drive trade going forward
Source: Fitch Solutions, Oxford Economics, International Trade Centre, LPI - The World Bank, Trade Openness Rank - World Economic Forum, News Articles, Singapore Economic Development Board
Malaysia is emerging as a leading hub for assembly, test and packaging of integrated circuits. It is also a growing destination for semiconductor manufacturing. This will drive the import of intermediary electronic and electrical goods from Singapore, which is a leading transhipment hub for these products.
Machinery & Electricals
Malaysia will continue to be an important supplier of food products to Singapore. Government initiatives, such as Johor’s proposed plan to develop its agriculture sector and position itself as a key food exporter to Singapore, will drive the sector exports.
Singapore is Malaysia’s biggest trade partner for refined fuels, owing to their geographical proximity and Singapore’s status as a regional fuel trading and storage hub. Demand for petroleum and petroleum product exports from Malaysia is forecasted to surge, driven by demand from Asian emerging markets, making it the second largest exports sector to Singapore in 2030.
Metals & Minerals
Agriculture & Food
Machinery and electricals55% forecasted share of exports in 2030
Agriculture and food8% forecasted share of exports in 2030
Metals and minerals17% forecasted share of exports in 2030

126 127127Corridors of the future | ASEAN — SingaporeFuture of Trade 2030126
Singapore
Key Markets in ASEANRising Star
Singapore is a global transport, logistics, and financial hub, and is fast-emerging as a digital and innovation centre
42%of corporates* currently or plan to source/manufacture in Singapore within next 5-10 years*Total of 510 survey respondents
The data is for trade of goods only
Rising Stars
2030 forecasted
2020-2030 GDP growth (per annum)
3.1%
2020-2030 Exports growth (per annum)
7.4%
Exports as % of GDP (2030)
107%
2020
USD 336 billion exports
2030
USD 687 billion exports
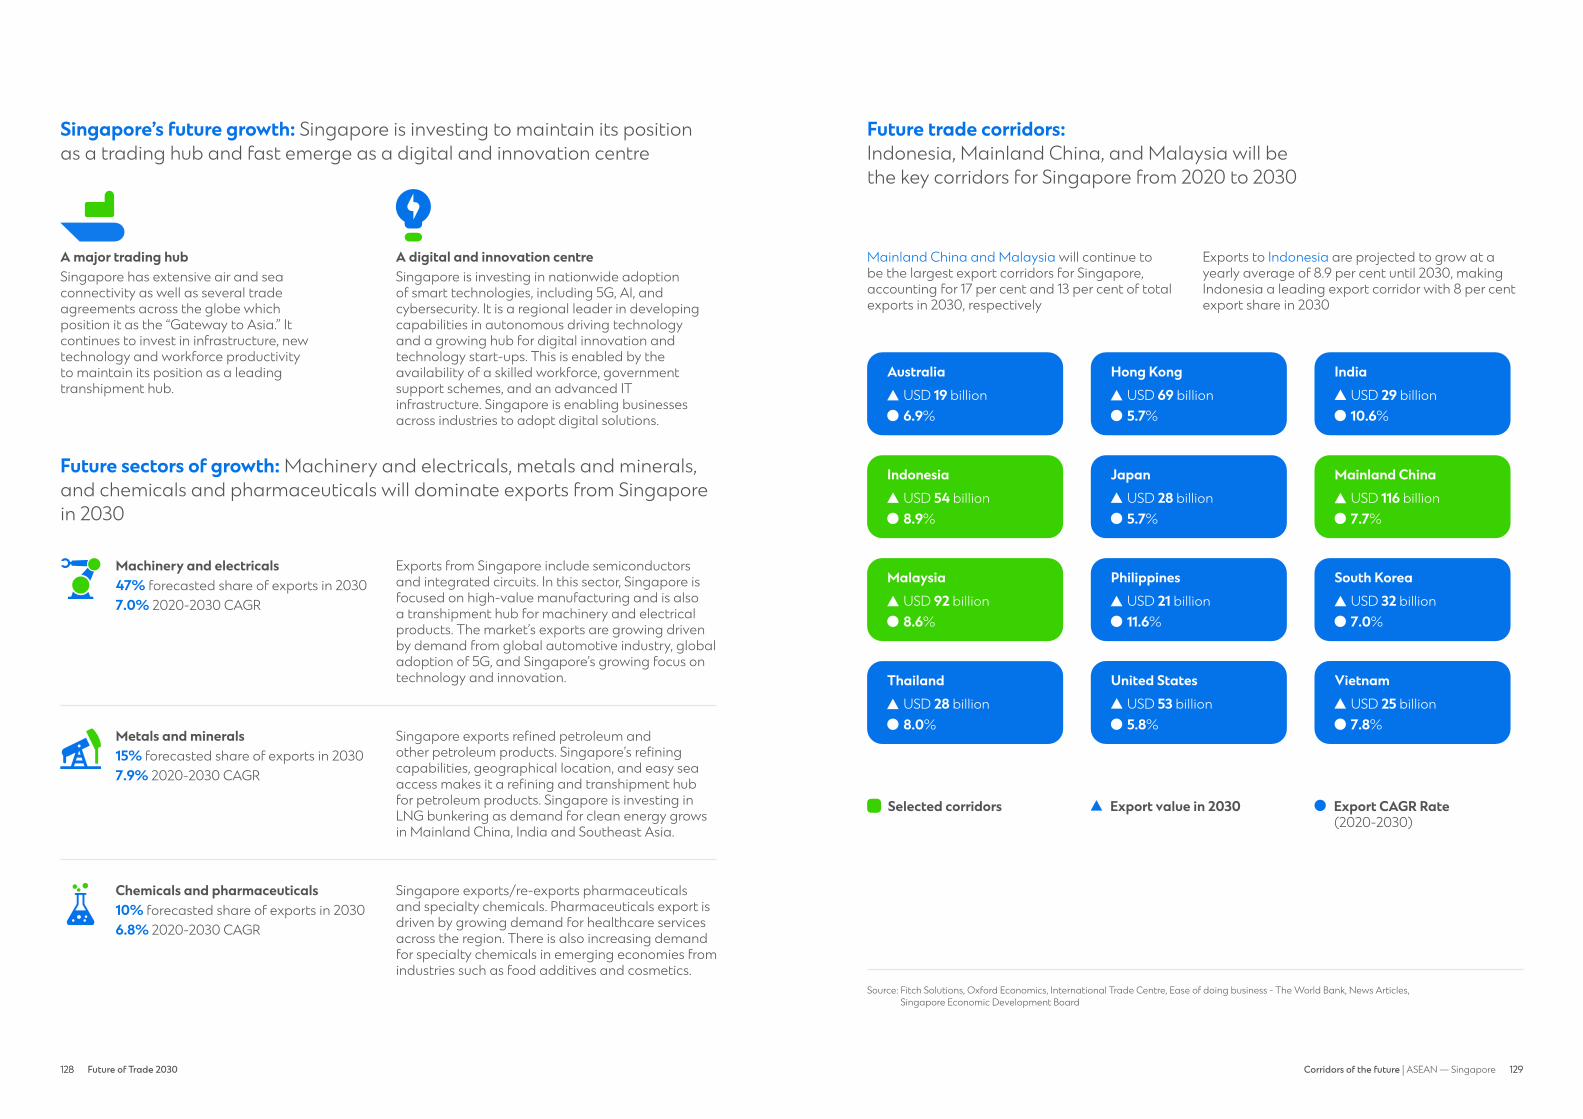
128 Future of Trade 2030 129128 129Corridors of the future | ASEAN — Singapore
Singapore’s future growth: Singapore is investing to maintain its position as a trading hub and fast emerge as a digital and innovation centre
A major trading hubSingapore has extensive air and sea connectivity as well as several trade agreements across the globe which position it as the “Gateway to Asia.” It continues to invest in infrastructure, new technology and workforce productivity to maintain its position as a leading transhipment hub.
A digital and innovation centreSingapore is investing in nationwide adoption of smart technologies, including 5G, AI, and cybersecurity. It is a regional leader in developing capabilities in autonomous driving technology and a growing hub for digital innovation and technology start-ups. This is enabled by the availability of a skilled workforce, government support schemes, and an advanced IT infrastructure. Singapore is enabling businesses across industries to adopt digital solutions.
Future sectors of growth: Machinery and electricals, metals and minerals, and chemicals and pharmaceuticals will dominate exports from Singapore in 2030
Chemicals & Pharmaceuticals
Chemicals and pharmaceuticals Singapore exports/re-exports pharmaceuticals and specialty chemicals. Pharmaceuticals export is driven by growing demand for healthcare services across the region. There is also increasing demand for specialty chemicals in emerging economies from industries such as food additives and cosmetics.
10% forecasted share of exports in 20306.8% 2020-2030 CAGR
Machinery and electricals Exports from Singapore include semiconductors and integrated circuits. In this sector, Singapore is focused on high-value manufacturing and is also a transhipment hub for machinery and electrical products. The market’s exports are growing driven by demand from global automotive industry, global adoption of 5G, and Singapore’s growing focus on technology and innovation.
47% forecasted share of exports in 20307.0% 2020-2030 CAGRMachinery &
Electricals
Metals and minerals Singapore exports refined petroleum and other petroleum products. Singapore’s refining capabilities, geographical location, and easy sea access makes it a refining and transhipment hub for petroleum products. Singapore is investing in LNG bunkering as demand for clean energy grows in Mainland China, India and Southeast Asia.
15% forecasted share of exports in 20307.9% 2020-2030 CAGRMetals & Minerals
Future trade corridors: Indonesia, Mainland China, and Malaysia will be the key corridors for Singapore from 2020 to 2030
Source: Fitch Solutions, Oxford Economics, International Trade Centre, Ease of doing business - The World Bank, News Articles, Singapore Economic Development Board
Mainland China and Malaysia will continue to be the largest export corridors for Singapore, accounting for 17 per cent and 13 per cent of total exports in 2030, respectively
Exports to Indonesia are projected to grow at a yearly average of 8.9 per cent until 2030, making Indonesia a leading export corridor with 8 per cent export share in 2030
Hong KongUSD 69 billion5.7%
AustraliaUSD 19 billion6.9%
PhilippinesUSD 21 billion11.6%
ThailandUSD 28 billion8.0%
IndonesiaUSD 54 billion8.9%
JapanUSD 28 billion5.7%
IndiaUSD 29 billion10.6%
United States VietnamUSD 53 billion USD 25 billion5.8% 7.8%
Mainland ChinaUSD 116 billion7.7%
South KoreaUSD 32 billion7.0%
MalaysiaUSD 92 billion8.6%
Export CAGR Rate (2020-2030)
Selected corridors Export value in 2030
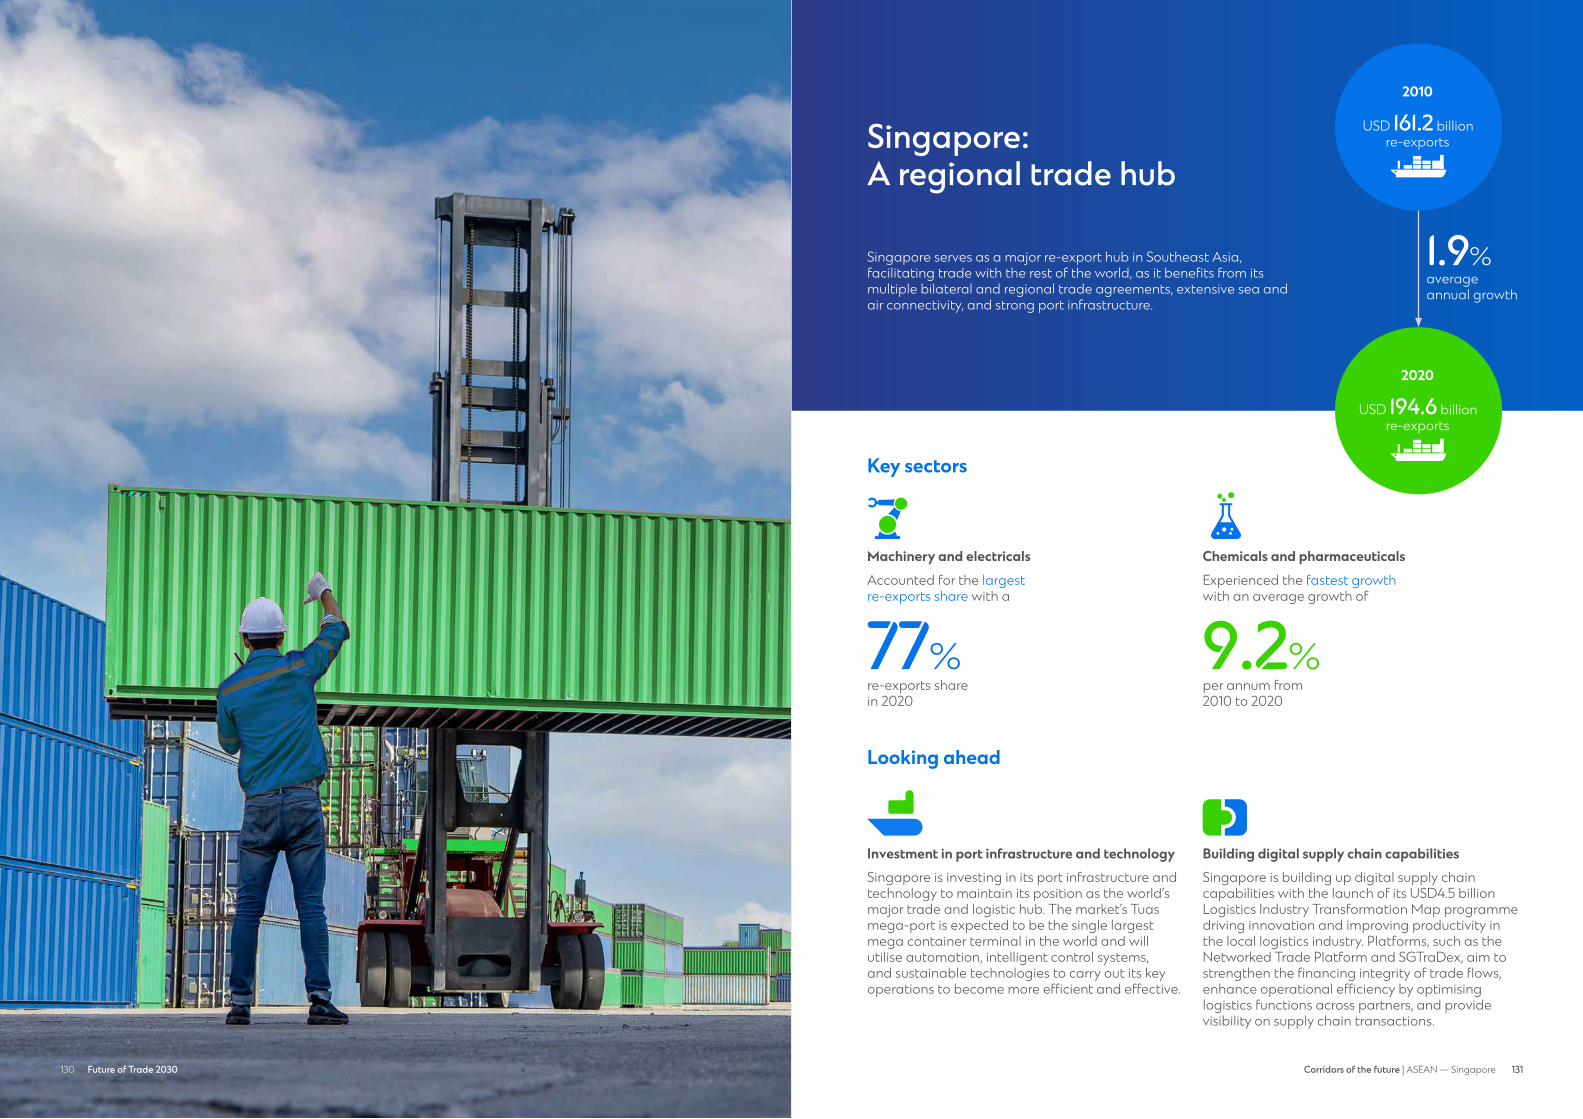
130 131131Corridors of the future | ASEAN — SingaporeFuture of Trade 2030130
Machinery and electricals Chemicals and pharmaceuticals
Singapore: A regional trade hub
Singapore serves as a major re-export hub in Southeast Asia, facilitating trade with the rest of the world, as it benefits from its multiple bilateral and regional trade agreements, extensive sea and air connectivity, and strong port infrastructure.
Investment in port infrastructure and technologySingapore is investing in its port infrastructure and technology to maintain its position as the world’s major trade and logistic hub. The market’s Tuas mega-port is expected to be the single largest mega container terminal in the world and will utilise automation, intelligent control systems, and sustainable technologies to carry out its key operations to become more efficient and effective.
Building digital supply chain capabilitiesSingapore is building up digital supply chain capabilities with the launch of its USD4.5 billion Logistics Industry Transformation Map programme driving innovation and improving productivity in the local logistics industry. Platforms, such as the Networked Trade Platform and SGTraDex, aim to strengthen the financing integrity of trade flows, enhance operational efficiency by optimising logistics functions across partners, and provide visibility on supply chain transactions.
Key sectors
Looking ahead
2020
USD 194.6 billion re-exports
re-exports share in 2020
per annum from 2010 to 2020
77% 9.2%
2010
USD 161.2 billion re-exports
Accounted for the largest re-exports share with a
Experienced the fastest growth with an average growth of
average annual growth
1.9%
Machinery & Electricals
Chemicals & Pharmaceuticals

132 Future of Trade 2030 133132 133Corridors of the future | ASEAN — Singapore
Singapore-to-Indonesia trade corridor
Singapore and Indonesia have strong economic ties and Indonesia will continue to grow as a leading export corridor for Singapore
Fast growing corridor
2019 Trade Openness Rank (out of 141)
#62
2020 2030 forecasted
The data is for trade of goods only
2.4 times growth in trade by 2030
2020-2030 GDP growth (per annum)
2020-2030 Global imports growth (per annum)
5.1%
9.1%
Singapore to Indonesia export value growth forecast
8.9%
Exports growth per annum
2030 forecasted
USD 54.5 billion exports
2020
USD 23.2 billion exports
of corporates1 plan to be in the Singapore to Indonesia corridor
of corporates2 anticipate over 10% annual revenue growth of exports to Indonesia over the next 10 years
31%
41%
Why Indonesia? Singapore’s exports to Indonesia are driven by deepening economic ties, Indonesia’s increasing private consumption, and a growing e-commerce sector
1. Currently or planning to source/manufacture in Singapore. Total of 214 respondents for this source location. 2. Total of 66 respondents for this corridor
Deeping economic tiesAs strong trading partners, Singapore and Indonesia signed the Bilateral Investment Treaty in 2018, which came into force in 2021 and is expected to deepen economic integration. Bilateral investments are projected to increase 18 to 22 per cent over the next five years.
Private consumption growthRising incomes, along with increasing urbanisation, is fuelling consumption growth. Indonesia has the world’s fourth largest population and a growing middle class (expected to be 23 million by 2030), which will drive demand for goods and services across several sectors.
E-commerce growthE-commerce is projected to be a USD51 billion market in Indonesia in 2024, growing at 19 per cent yearly from 2020 to 2024. Increasing online shopping, along with the rise of regional e-commerce players, will fuel the trade of consumer goods.
of corporates2 identify attractive consumer demographics as a key growth driver of exports to Indonesia
24%
of corporates2 identify technological advancement as a key growth driver of exports to Indonesia
27%plan to be in corridor
technological advancement
consumer demographic
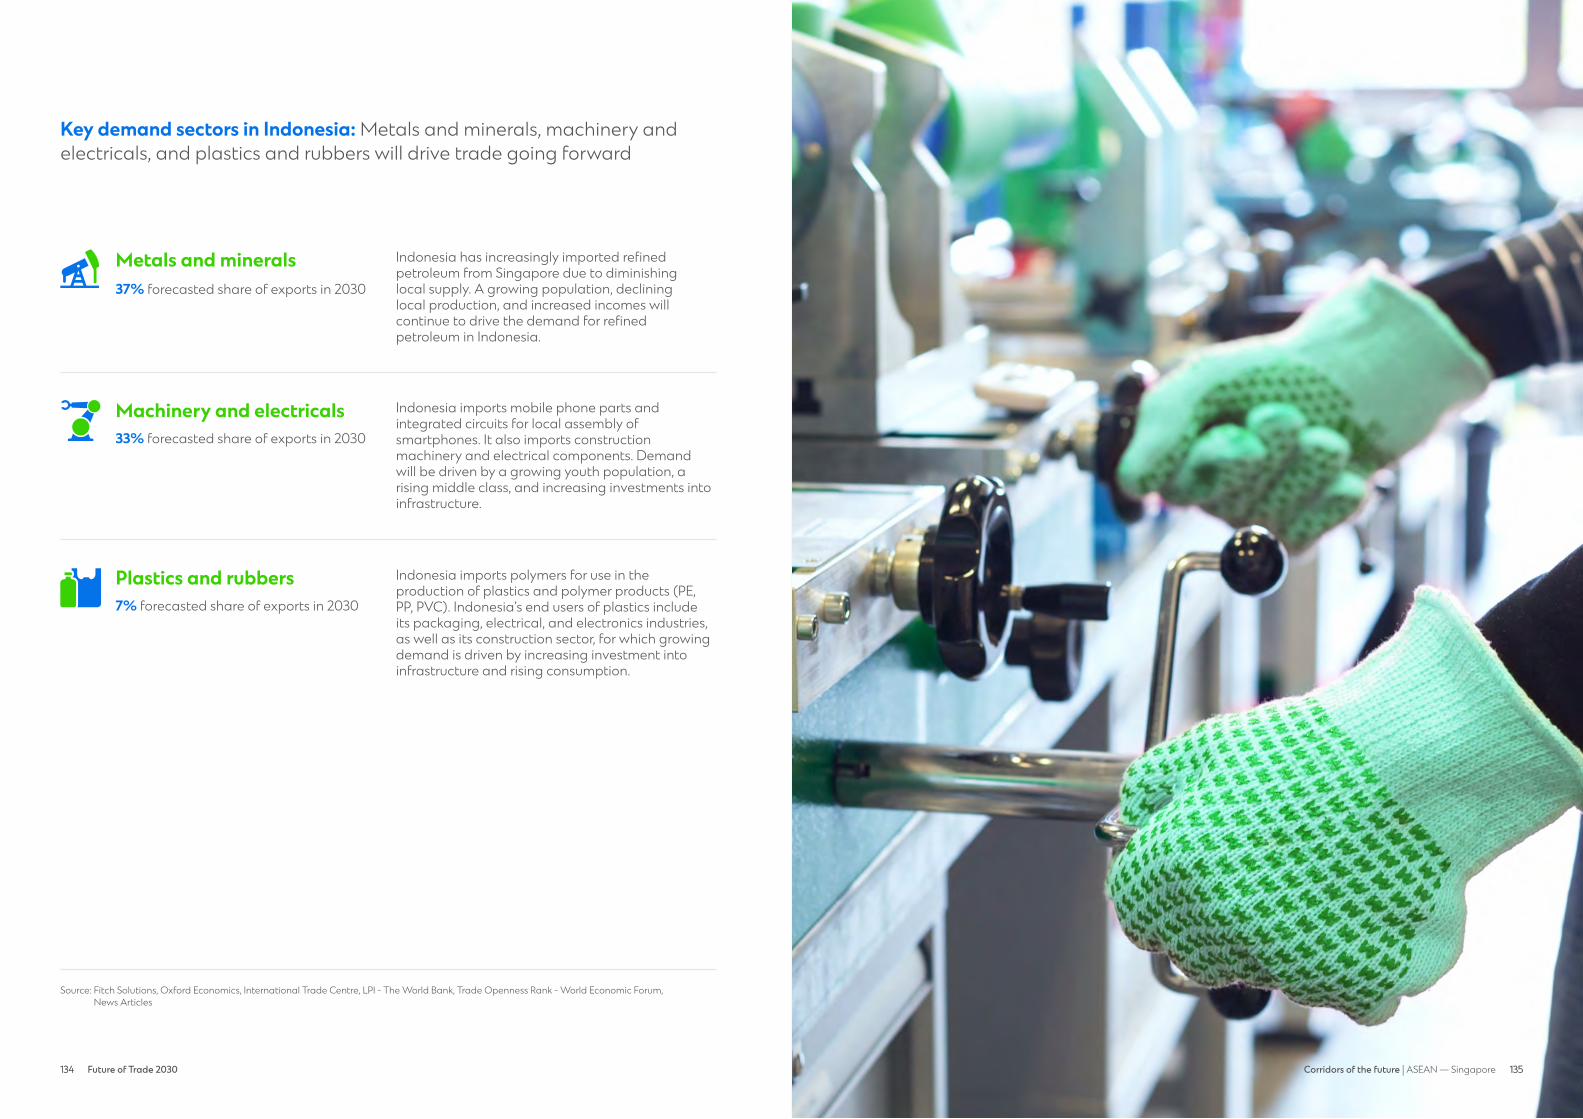
134 Future of Trade 2030 135134 135Corridors of the future | ASEAN — Singapore
Source: Fitch Solutions, Oxford Economics, International Trade Centre, LPI - The World Bank, Trade Openness Rank - World Economic Forum, News Articles
Key demand sectors in Indonesia: Metals and minerals, machinery and electricals, and plastics and rubbers will drive trade going forward
Indonesia imports mobile phone parts and integrated circuits for local assembly of smartphones. It also imports construction machinery and electrical components. Demand will be driven by a growing youth population, a rising middle class, and increasing investments into infrastructure.
Machinery & Electricals
Indonesia has increasingly imported refined petroleum from Singapore due to diminishing local supply. A growing population, declining local production, and increased incomes will continue to drive the demand for refined petroleum in Indonesia.
Metals & Minerals
Indonesia imports polymers for use in the production of plastics and polymer products (PE, PP, PVC). Indonesia’s end users of plastics include its packaging, electrical, and electronics industries, as well as its construction sector, for which growing demand is driven by increasing investment into infrastructure and rising consumption.
Machinery & Electricals
Plastics & Rubbers
Metals and minerals37% forecasted share of exports in 2030
Plastics and rubbers7% forecasted share of exports in 2030
Machinery and electricals33% forecasted share of exports in 2030
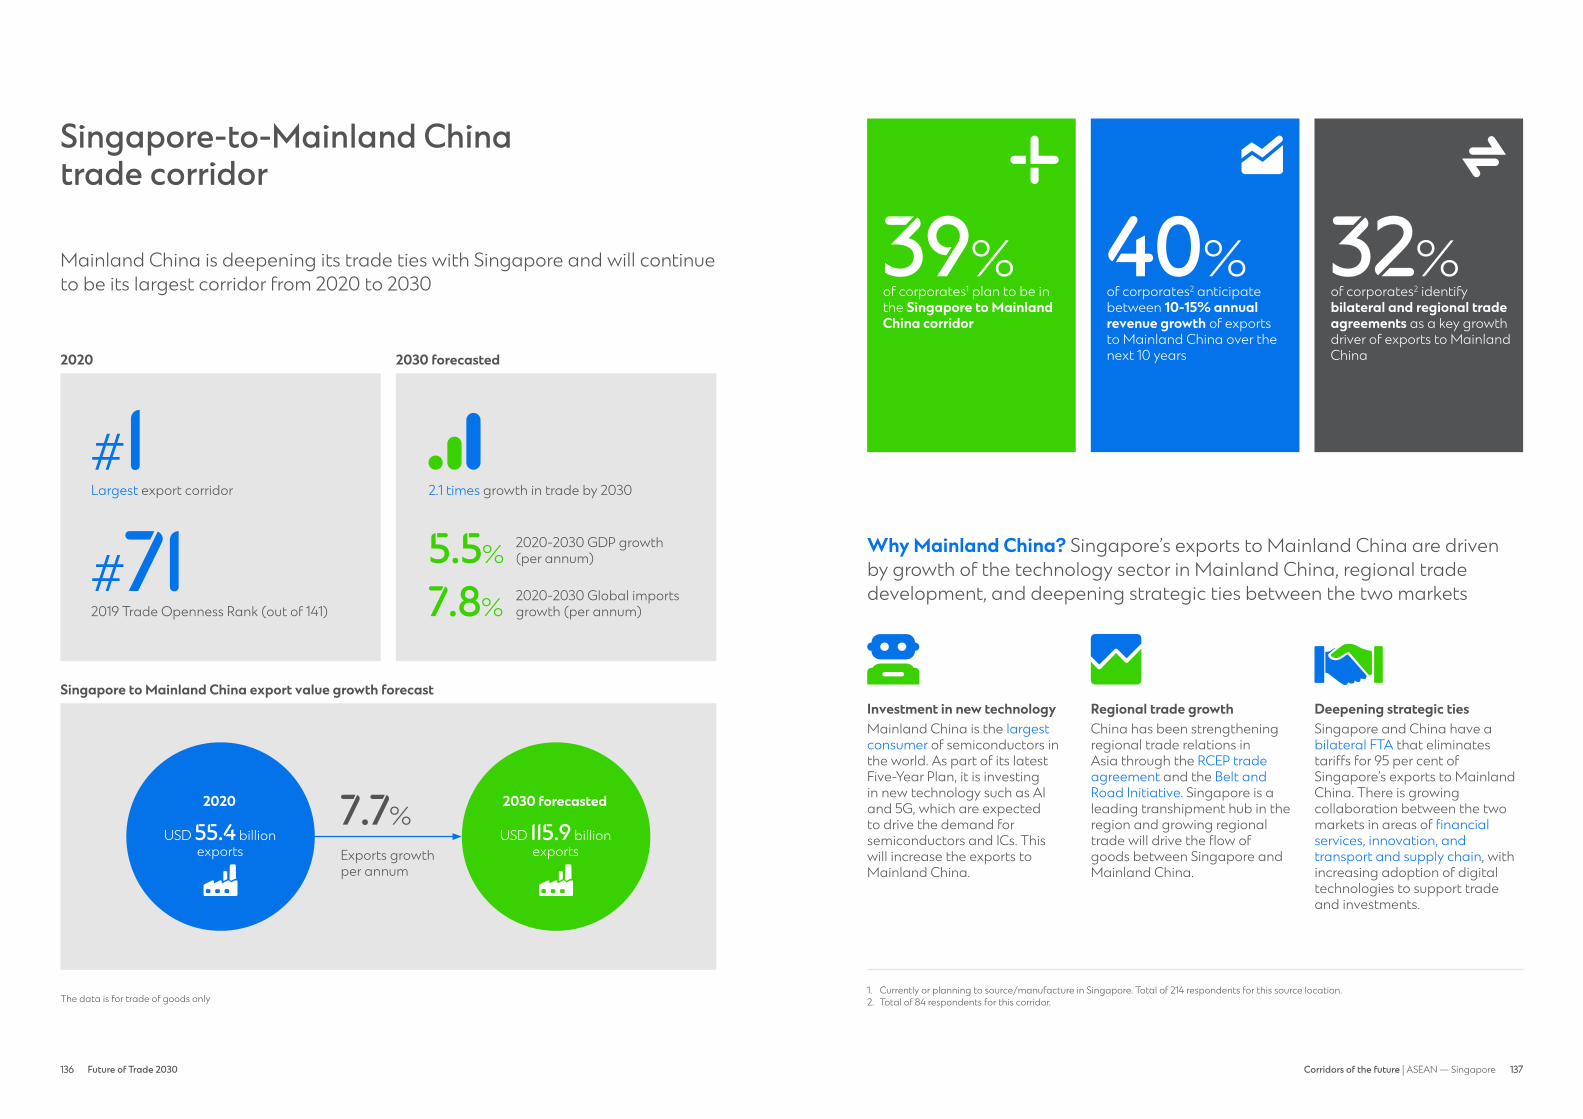
136 Future of Trade 2030 137136 137Corridors of the future | ASEAN — Singapore
Singapore-to-Mainland China trade corridor
Mainland China is deepening its trade ties with Singapore and will continue to be its largest corridor from 2020 to 2030
Largest export corridor
2019 Trade Openness Rank (out of 141)
#71#1
2020 2030 forecasted
The data is for trade of goods only
2.1 times growth in trade by 2030
2020-2030 GDP growth (per annum)
2020-2030 Global imports growth (per annum)
5.5%
7.8%
Singapore to Mainland China export value growth forecast
7.7%
Exports growth per annum
2030 forecasted
USD 115.9 billion exports
2020
USD 55.4 billion exports
Why Mainland China? Singapore’s exports to Mainland China are driven by growth of the technology sector in Mainland China, regional trade development, and deepening strategic ties between the two markets
Investment in new technologyMainland China is the largest consumer of semiconductors in the world. As part of its latest Five-Year Plan, it is investing in new technology such as AI and 5G, which are expected to drive the demand for semiconductors and ICs. This will increase the exports to Mainland China.
Deepening strategic tiesSingapore and China have a bilateral FTA that eliminates tariffs for 95 per cent of Singapore’s exports to Mainland China. There is growing collaboration between the two markets in areas of financial services, innovation, and transport and supply chain, with increasing adoption of digital technologies to support trade and investments.
Regional trade growthChina has been strengthening regional trade relations in Asia through the RCEP trade agreement and the Belt and Road Initiative. Singapore is a leading transhipment hub in the region and growing regional trade will drive the flow of goods between Singapore and Mainland China.
1. Currently or planning to source/manufacture in Singapore. Total of 214 respondents for this source location. 2. Total of 84 respondents for this corridor.
of corporates1 plan to be in the Singapore to Mainland China corridor
of corporates2 anticipate between 10-15% annual revenue growth of exports to Mainland China over the next 10 years
39% 40%of corporates2 identify bilateral and regional trade agreements as a key growth driver of exports to Mainland China
32%plan to be in
corridor
trade agreement

138 Future of Trade 2030 139138 139Corridors of the future | ASEAN — Singapore
Key demand sectors in Mainland China: Machinery and electricals, plastics and rubbers, and chemicals will drive trade going forward
Source: Fitch Solutions, Oxford Economics, International Trade Centre, World Economic Forum, News Articles
Within this sector, Mainland China’s imports ICs and semiconductors from Singapore. Increasing demand for these imports is bolstered by growing domestic production of end products, construction of Mainland China’s 5G network, and the increasing production of new energy vehicles.
Machinery & Electricals
In this sector, organic chemicals are a key export from Singapore to Mainland China with growth driven by the rising demand for organic cosmetics and higher-end personal-care products in Mainland China. This is due to rising disposable incomes among the younger generations, increasing working women population, and growing social media influence.
Chemicals & Pharmaceuticals
Mainland China imports ethylene and propylene polymers (plastic) from Singapore. The import growth is driven by the automotive and electronic industry. Demand for lightweight components to improve vehicle efficiency and reduce the weight of electronics components are leading to the increased demand for plastic.
Machinery & Electricals
Plastics & Rubbers
Machinery and electricals44% forecasted share of exports in 2030
Chemicals and pharmaceuticals12% forecasted share of exports in 2030
Plastics and rubbers13% forecasted share of exports in 2030
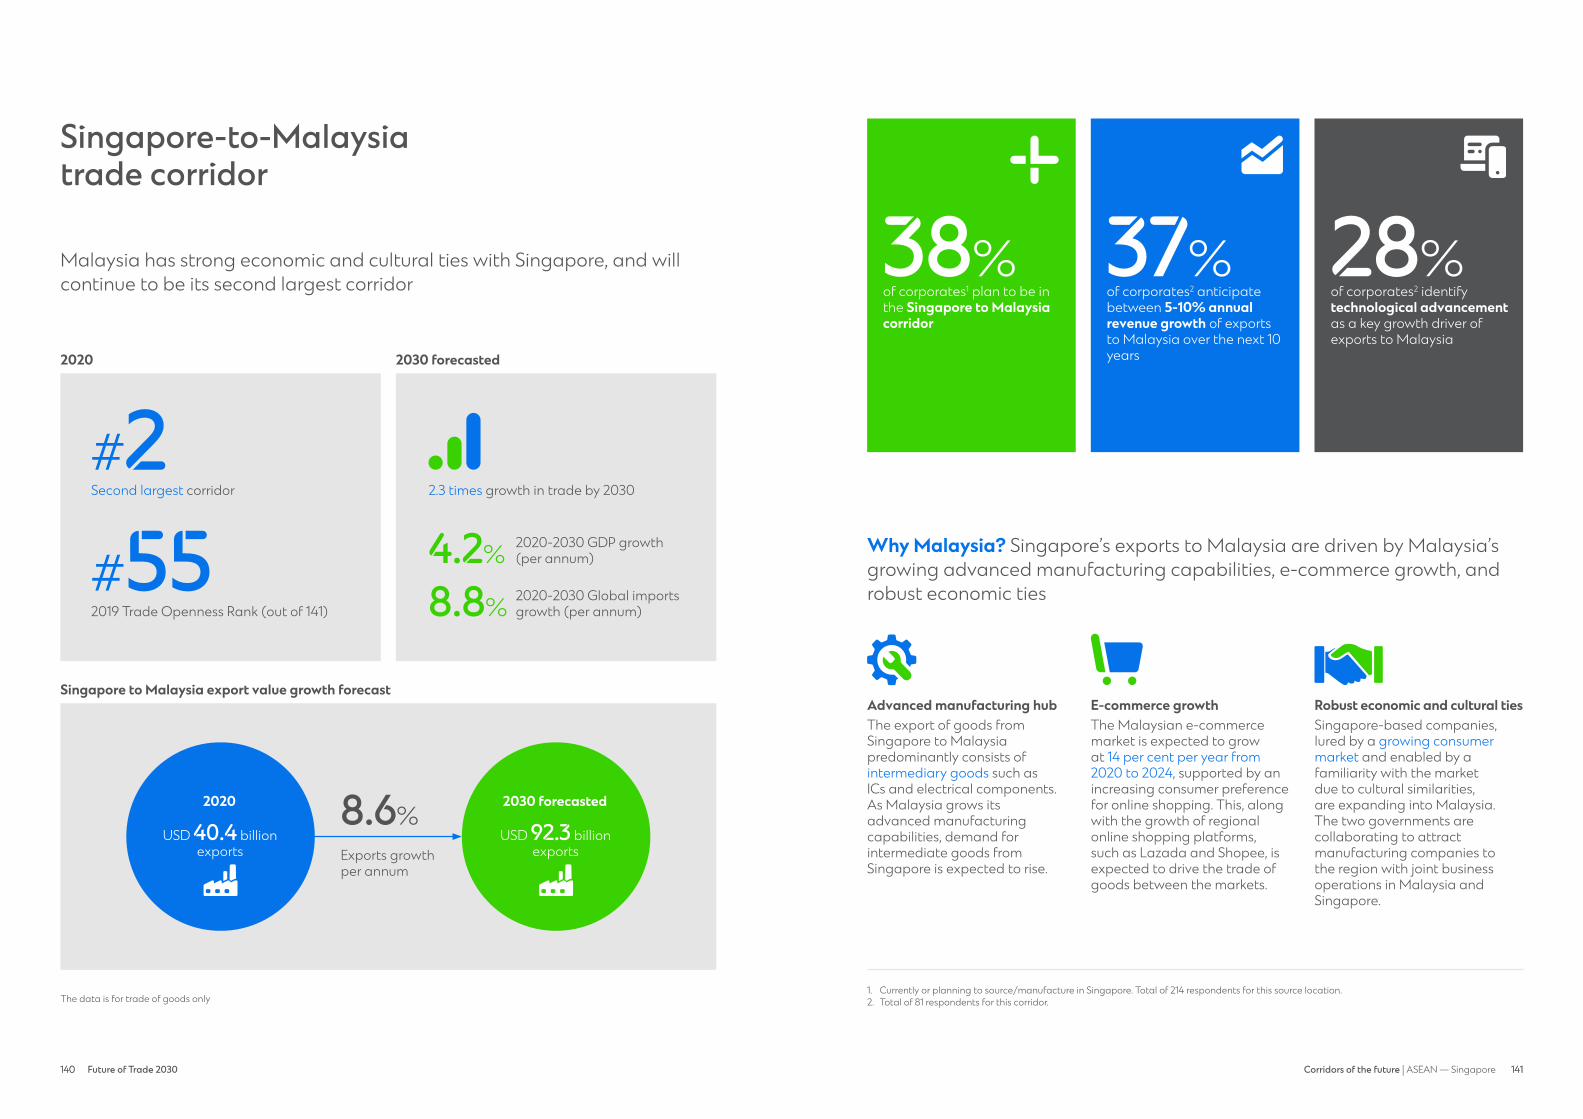
140 Future of Trade 2030 141140 141Corridors of the future | ASEAN — Singapore
Singapore-to-Malaysia trade corridor
Malaysia has strong economic and cultural ties with Singapore, and will continue to be its second largest corridor
Second largest corridor
2019 Trade Openness Rank (out of 141)
#55#2
2020 2030 forecasted
The data is for trade of goods only
2.3 times growth in trade by 2030
2020-2030 GDP growth (per annum)
2020-2030 Global imports growth (per annum)
4.2%
8.8%
Singapore to Malaysia export value growth forecast
8.6%
Exports growth per annum
Why Malaysia? Singapore’s exports to Malaysia are driven by Malaysia’s growing advanced manufacturing capabilities, e-commerce growth, and robust economic ties
Advanced manufacturing hubThe export of goods from Singapore to Malaysia predominantly consists of intermediary goods such as ICs and electrical components. As Malaysia grows its advanced manufacturing capabilities, demand for intermediate goods from Singapore is expected to rise.
E-commerce growthThe Malaysian e-commerce market is expected to grow at 14 per cent per year from 2020 to 2024, supported by an increasing consumer preference for online shopping. This, along with the growth of regional online shopping platforms, such as Lazada and Shopee, is expected to drive the trade of goods between the markets.
Robust economic and cultural tiesSingapore-based companies, lured by a growing consumer market and enabled by a familiarity with the market due to cultural similarities, are expanding into Malaysia. The two governments are collaborating to attract manufacturing companies to the region with joint business operations in Malaysia and Singapore.
1. Currently or planning to source/manufacture in Singapore. Total of 214 respondents for this source location. 2. Total of 81 respondents for this corridor.
2030 forecasted
USD 92.3 billion exports
2020
USD 40.4 billion exports
of corporates1 plan to be in the Singapore to Malaysia corridor
of corporates2 anticipate between 5-10% annual revenue growth of exports to Malaysia over the next 10 years
38% 37%of corporates2 identify technological advancement as a key growth driver of exports to Malaysia
28%plan to be in
corridor
technological advancement

142 Future of Trade 2030 143142 143Corridors of the future | ASEAN — Singapore
Key demand sectors in Malaysia: Machinery and electricals, metals and minerals, and chemicals will drive trade going forward
Source: Fitch Solutions, Oxford Economics, International Trade Centre, World Economic Forum, News Articles, Government of Singapore
Malaysia is a major centre for integrated circuit assembly, testing, and packaging. The Penang region is emerging as an electronics and technology hub and is home to several foreign companies such as Intel. The growth of the electronics industry will continue to drive the imports of ICs and electronic components from Singapore.
Machinery & Electricals
In this sector, Malaysia’s imports primarily consist of higher value specialty chemicals from Singapore for domestic consumption. The demand comes from the cosmetics and personal care products industry, driven by growing per-capita incomes and increased awareness regarding skin and beauty care products through social media.
Malaysia imports refined petroleum from Singapore due to its geographical proximity and refining capabilities. Transport fuel is the biggest component of total refined fuels consumption in Malaysia. The demand will continue to grow due to the projected growth for passenger and commercial car sales in the market.
Metals & Minerals
Chemicals & Pharmaceuticals
Machinery and electricals47% forecasted share of exports in 2030
Metals and minerals29% forecasted share of exports in 2030
Chemicals and pharmaceuticals7% forecasted share of exports in 2030
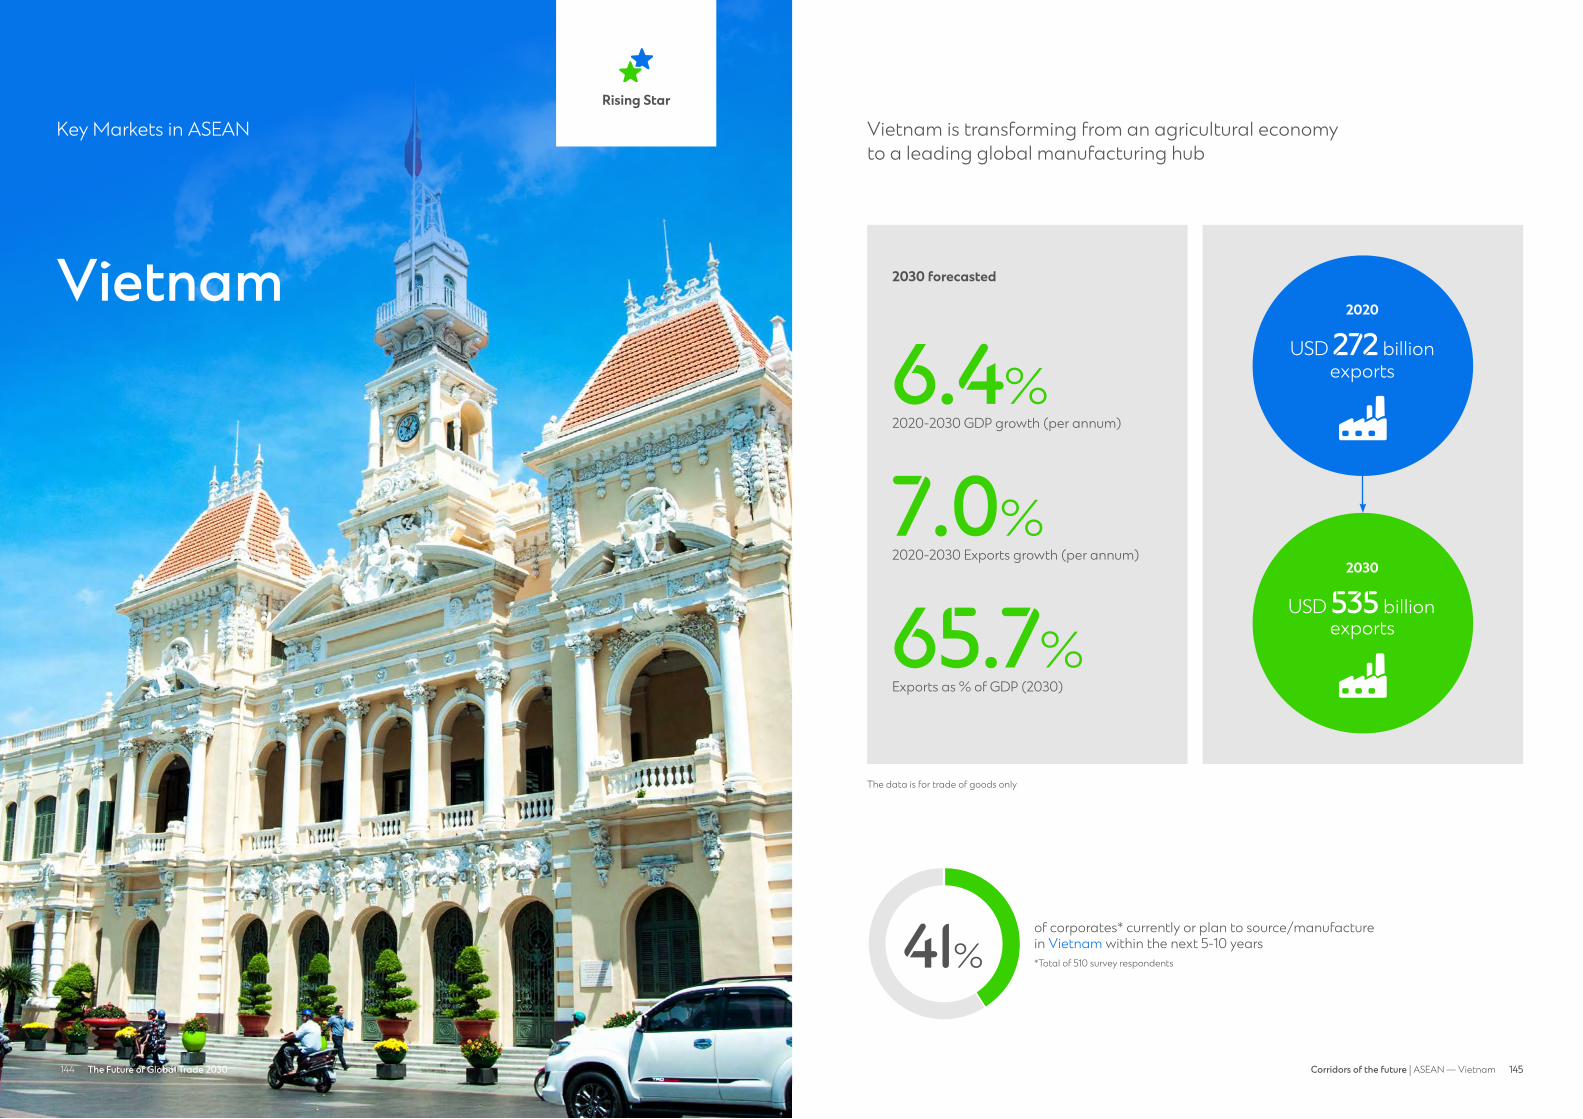
144 Future of Trade 2030 145145Corridors of the future | ASEAN — Vietnam144 The Future of Global Trade 2030
Vietnam
Key Markets in ASEANRising Star
Vietnam is transforming from an agricultural economy to a leading global manufacturing hub
41%of corporates* currently or plan to source/manufacture in Vietnam within the next 5-10 years*Total of 510 survey respondents
The data is for trade of goods only
Rising Stars
2030 forecasted
2020-2030 GDP growth (per annum)
6.4%
2020-2030 Exports growth (per annum)
7.0%
Exports as % of GDP (2030)
65.7%
2020
USD 272 billion exports
2030
USD 535 billion exports
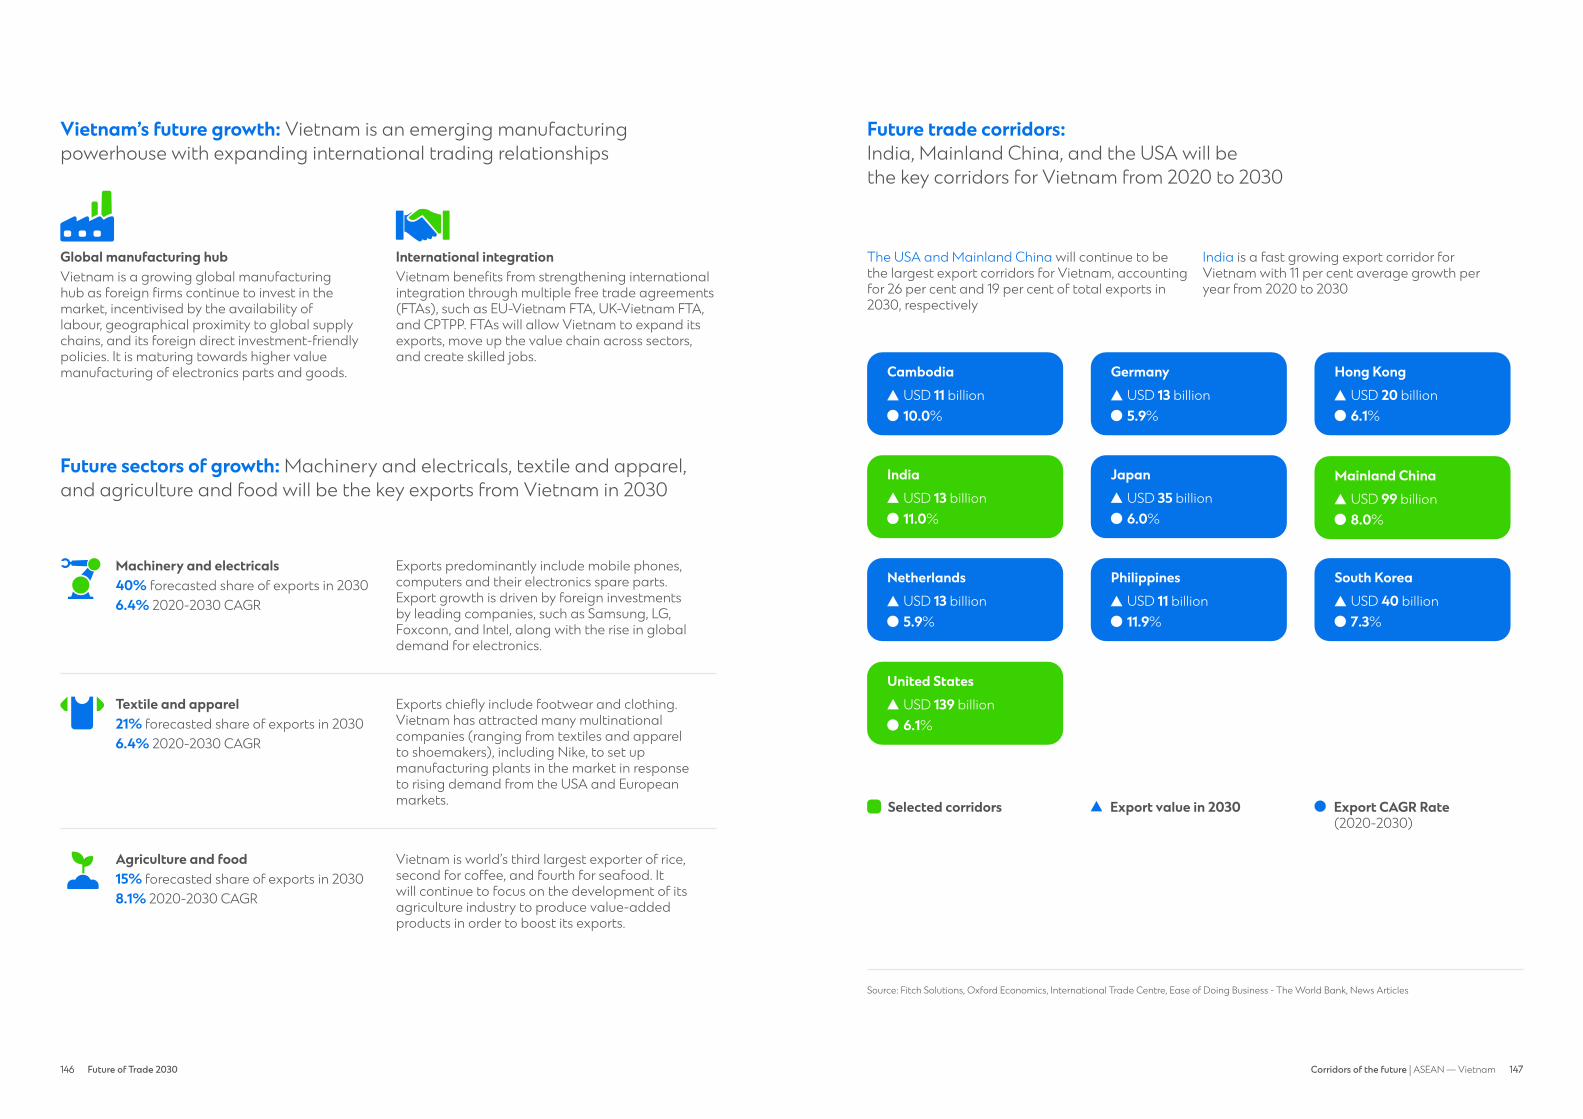
146 Future of Trade 2030 147146 147Corridors of the future | ASEAN — Vietnam
Vietnam’s future growth: Vietnam is an emerging manufacturing powerhouse with expanding international trading relationships
Global manufacturing hubVietnam is a growing global manufacturing hub as foreign firms continue to invest in the market, incentivised by the availability of labour, geographical proximity to global supply chains, and its foreign direct investment-friendly policies. It is maturing towards higher value manufacturing of electronics parts and goods.
International integrationVietnam benefits from strengthening international integration through multiple free trade agreements (FTAs), such as EU-Vietnam FTA, UK-Vietnam FTA, and CPTPP. FTAs will allow Vietnam to expand its exports, move up the value chain across sectors, and create skilled jobs.
Future sectors of growth: Machinery and electricals, textile and apparel, and agriculture and food will be the key exports from Vietnam in 2030
Agriculture & Food
Agriculture and food Vietnam is world’s third largest exporter of rice, second for coffee, and fourth for seafood. It will continue to focus on the development of its agriculture industry to produce value-added products in order to boost its exports.
15% forecasted share of exports in 20308.1% 2020-2030 CAGR
Machinery and electricals Exports predominantly include mobile phones, computers and their electronics spare parts. Export growth is driven by foreign investments by leading companies, such as Samsung, LG, Foxconn, and Intel, along with the rise in global demand for electronics.
40% forecasted share of exports in 20306.4% 2020-2030 CAGRMachinery &
Electricals
Textile and apparel Exports chiefly include footwear and clothing. Vietnam has attracted many multinational companies (ranging from textiles and apparel to shoemakers), including Nike, to set up manufacturing plants in the market in response to rising demand from the USA and European markets.
21% forecasted share of exports in 20306.4% 2020-2030 CAGRTextile & Apparel
Future trade corridors: India, Mainland China, and the USA will be the key corridors for Vietnam from 2020 to 2030
Source: Fitch Solutions, Oxford Economics, International Trade Centre, Ease of Doing Business - The World Bank, News Articles
The USA and Mainland China will continue to be the largest export corridors for Vietnam, accounting for 26 per cent and 19 per cent of total exports in 2030, respectively
India is a fast growing export corridor for Vietnam with 11 per cent average growth per year from 2020 to 2030
GermanyUSD 13 billion5.9%
Hong KongUSD 20 billion6.1%
CambodiaUSD 11 billion10.0%
NetherlandsUSD 13 billion5.9%
PhilippinesUSD 11 billion11.9%
Mainland ChinaUSD 99 billion8.0%
South KoreaUSD 40 billion7.3%
JapanUSD 35 billion6.0%
IndiaUSD 13 billion11.0%
United StatesUSD 139 billion6.1%
Export CAGR Rate (2020-2030)
Selected corridors Export value in 2030
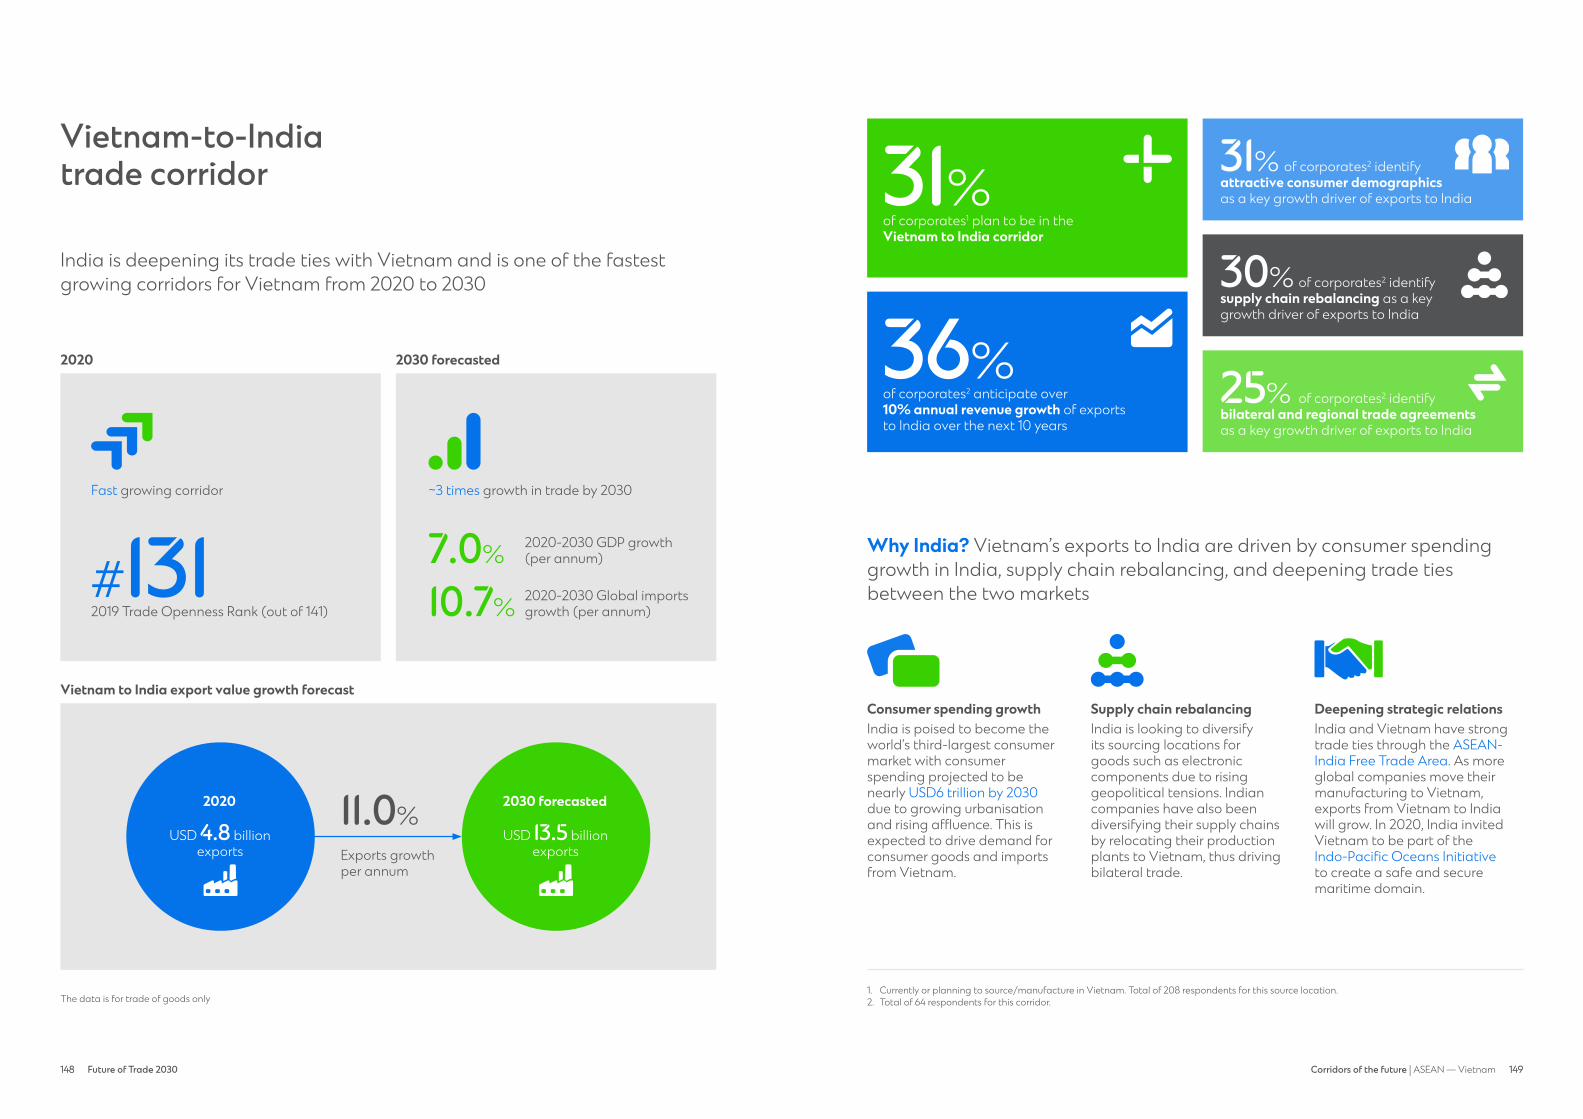
148 Future of Trade 2030 149148 149Corridors of the future | ASEAN — Vietnam
Vietnam-to-India trade corridor
India is deepening its trade ties with Vietnam and is one of the fastest growing corridors for Vietnam from 2020 to 2030
Fast growing corridor
2019 Trade Openness Rank (out of 141)#131
2020 2030 forecasted
The data is for trade of goods only
~3 times growth in trade by 2030
2020-2030 GDP growth (per annum)
2020-2030 Global imports growth (per annum)
7.0%
10.7%
Vietnam to India export value growth forecast
11.0%
Exports growth per annum
2030 forecasted
USD 13.5 billion exports
2020
USD 4.8 billion exports
of corporates1 plan to be in the Vietnam to India corridor
of corporates2 anticipate over 10% annual revenue growth of exports to India over the next 10 years
31%
36%
Why India? Vietnam’s exports to India are driven by consumer spending growth in India, supply chain rebalancing, and deepening trade ties between the two markets
1. Currently or planning to source/manufacture in Vietnam. Total of 208 respondents for this source location. 2. Total of 64 respondents for this corridor.
Consumer spending growthIndia is poised to become the world’s third-largest consumer market with consumer spending projected to be nearly USD6 trillion by 2030 due to growing urbanisation and rising affluence. This is expected to drive demand for consumer goods and imports from Vietnam.
Supply chain rebalancingIndia is looking to diversify its sourcing locations for goods such as electronic components due to rising geopolitical tensions. Indian companies have also been diversifying their supply chains by relocating their production plants to Vietnam, thus driving bilateral trade.
Deepening strategic relationsIndia and Vietnam have strong trade ties through the ASEAN-India Free Trade Area. As more global companies move their manufacturing to Vietnam, exports from Vietnam to India will grow. In 2020, India invited Vietnam to be part of the Indo-Pacific Oceans Initiative to create a safe and secure maritime domain.
of corporates2 identify supply chain rebalancing as a key growth driver of exports to India
30%
of corporates2 identify bilateral and regional trade agreements as a key growth driver of exports to India
25%
of corporates2 identify attractive consumer demographics as a key growth driver of exports to India
31%plan to be in
corridorconsumer
demographic
supply chain rebalancing
trade agreement

150 Future of Trade 2030 151150 151Corridors of the future | ASEAN — Vietnam
Source: Fitch Solutions, Oxford Economics, International Trade Centre, World Economic Forum, News Articles
Key demand sectors in India: Machinery and electricals, metals and minerals, and agriculture and food will drive trade going forward
India imports predominantly consumer electronics, such as mobile phones, video displays, and recording equipment from Vietnam. The demand is driven by the large young population with rising disposable incomes. The rapid rollout of 4G network and services in India has further boosted sales of imported smartphones.
Machinery & Electricals
India is increasingly importing copper pipes and wire from Vietnam. Since the shutdown of the Sterlite Copper plant in 2018, which accounted for 40 per cent of copper production in India, imports of copper have grown, driven by insufficient domestic production and rising demand from increasing urbanisation and infrastructure projects in the market.
Metals & Minerals
India’s imports from Vietnam include raw spices and coffee beans, which are processed in India for domestic consumption as well as exported globally. Imports are boosted by India’s growing coffee culture among the young and urban population, the increasing use of spices globally due to the demand for authentic cuisines, and Vietnam’s competitive spices and coffee prices.
Agriculture & Food
Machinery and electricals52% forecasted share of exports in 2030
Agriculture and food9% forecasted share of exports in 2030
Metals and minerals20% forecasted share of exports in 2030
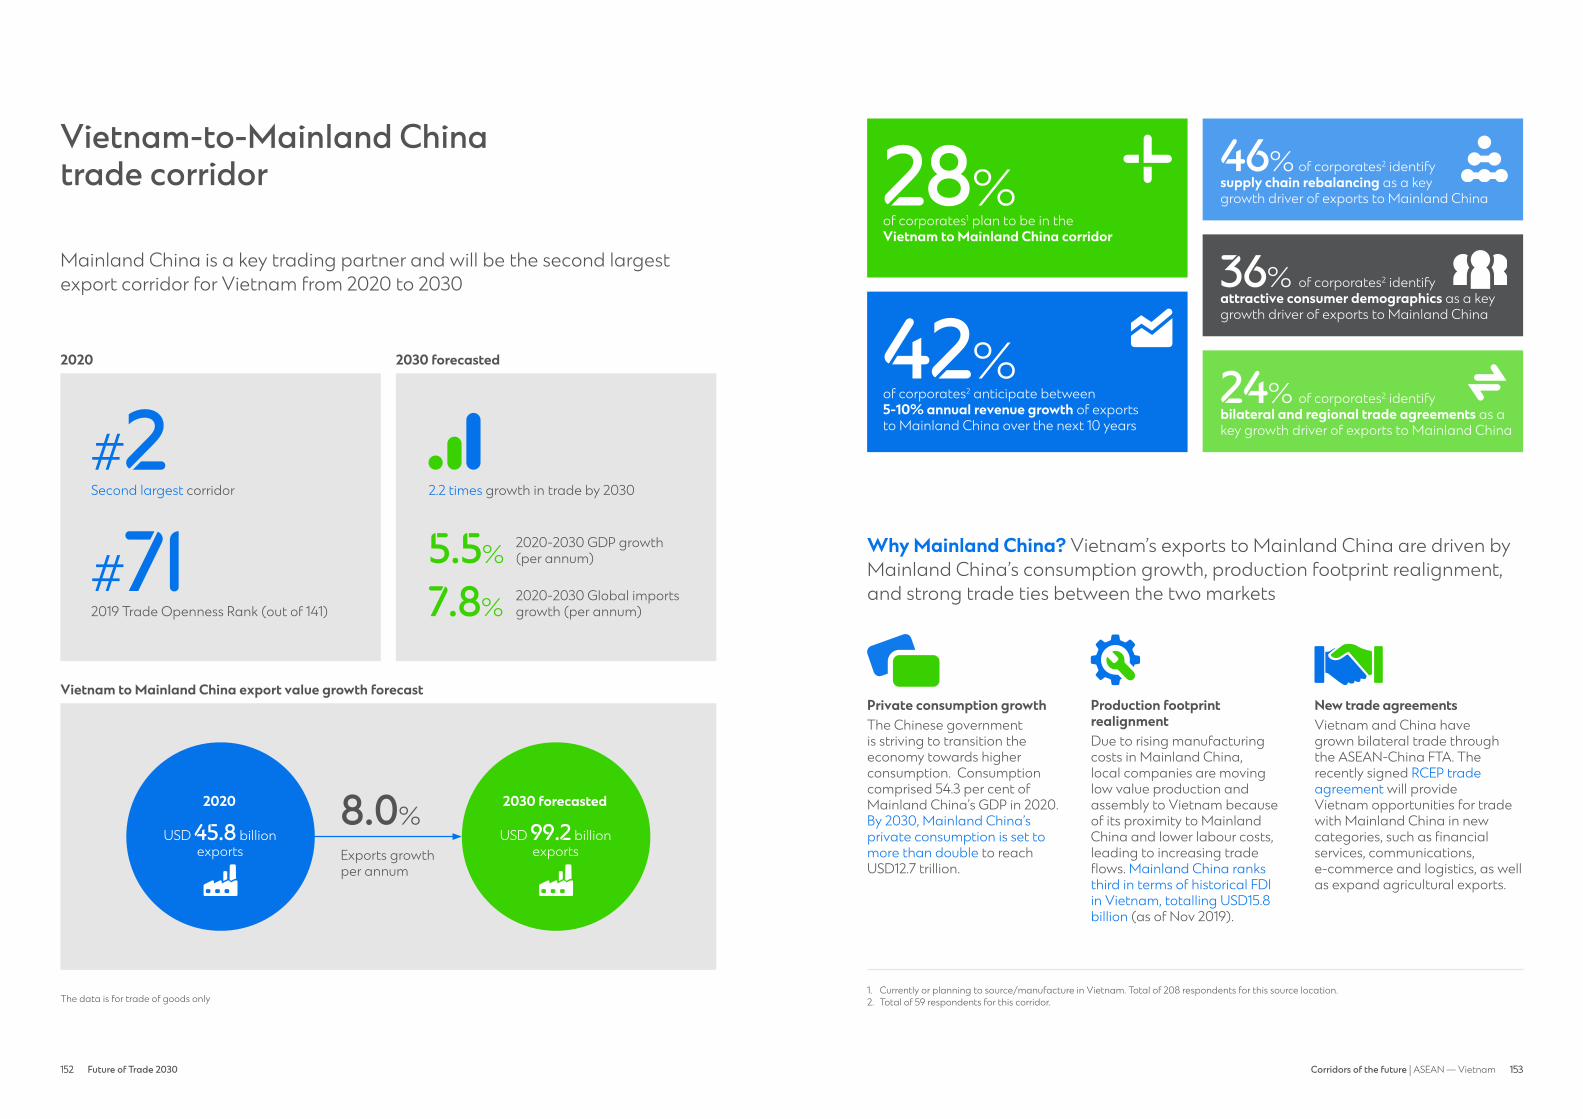
152 Future of Trade 2030 153152 153Corridors of the future | ASEAN — Vietnam
Vietnam-to-Mainland China trade corridor
Mainland China is a key trading partner and will be the second largest export corridor for Vietnam from 2020 to 2030
Second largest corridor
2019 Trade Openness Rank (out of 141)
#71
2020 2030 forecasted
The data is for trade of goods only
2.2 times growth in trade by 2030
2020-2030 GDP growth (per annum)
of corporates1 plan to be in the Vietnam to Mainland China corridor
of corporates2 anticipate between 5-10% annual revenue growth of exports to Mainland China over the next 10 years
2020-2030 Global imports growth (per annum)
5.5%
28%
42%
7.8%
Vietnam to Mainland China export value growth forecast
8.0%
Exports growth per annum
Why Mainland China? Vietnam’s exports to Mainland China are driven by Mainland China’s consumption growth, production footprint realignment, and strong trade ties between the two markets
Private consumption growthThe Chinese government is striving to transition the economy towards higher consumption. Consumption comprised 54.3 per cent of Mainland China’s GDP in 2020. By 2030, Mainland China’s private consumption is set to more than double to reach USD12.7 trillion.
Production footprint realignmentDue to rising manufacturing costs in Mainland China, local companies are moving low value production and assembly to Vietnam because of its proximity to Mainland China and lower labour costs, leading to increasing trade flows. Mainland China ranks third in terms of historical FDI in Vietnam, totalling USD15.8 billion (as of Nov 2019).
New trade agreementsVietnam and China have grown bilateral trade through the ASEAN-China FTA. The recently signed RCEP trade agreement will provide Vietnam opportunities for trade with Mainland China in new categories, such as financial services, communications, e-commerce and logistics, as well as expand agricultural exports.
1. Currently or planning to source/manufacture in Vietnam. Total of 208 respondents for this source location. 2. Total of 59 respondents for this corridor.
2030 forecasted
USD 99.2 billion exports
2020
USD 45.8 billion exports
#2
of corporates2 identify supply chain rebalancing as a key growth driver of exports to Mainland China
46%
of corporates2 identify bilateral and regional trade agreements as a key growth driver of exports to Mainland China
24%
of corporates2 identify attractive consumer demographics as a key growth driver of exports to Mainland China
36%
plan to be in corridor
consumer demographic
supply chain rebalancing
trade agreement
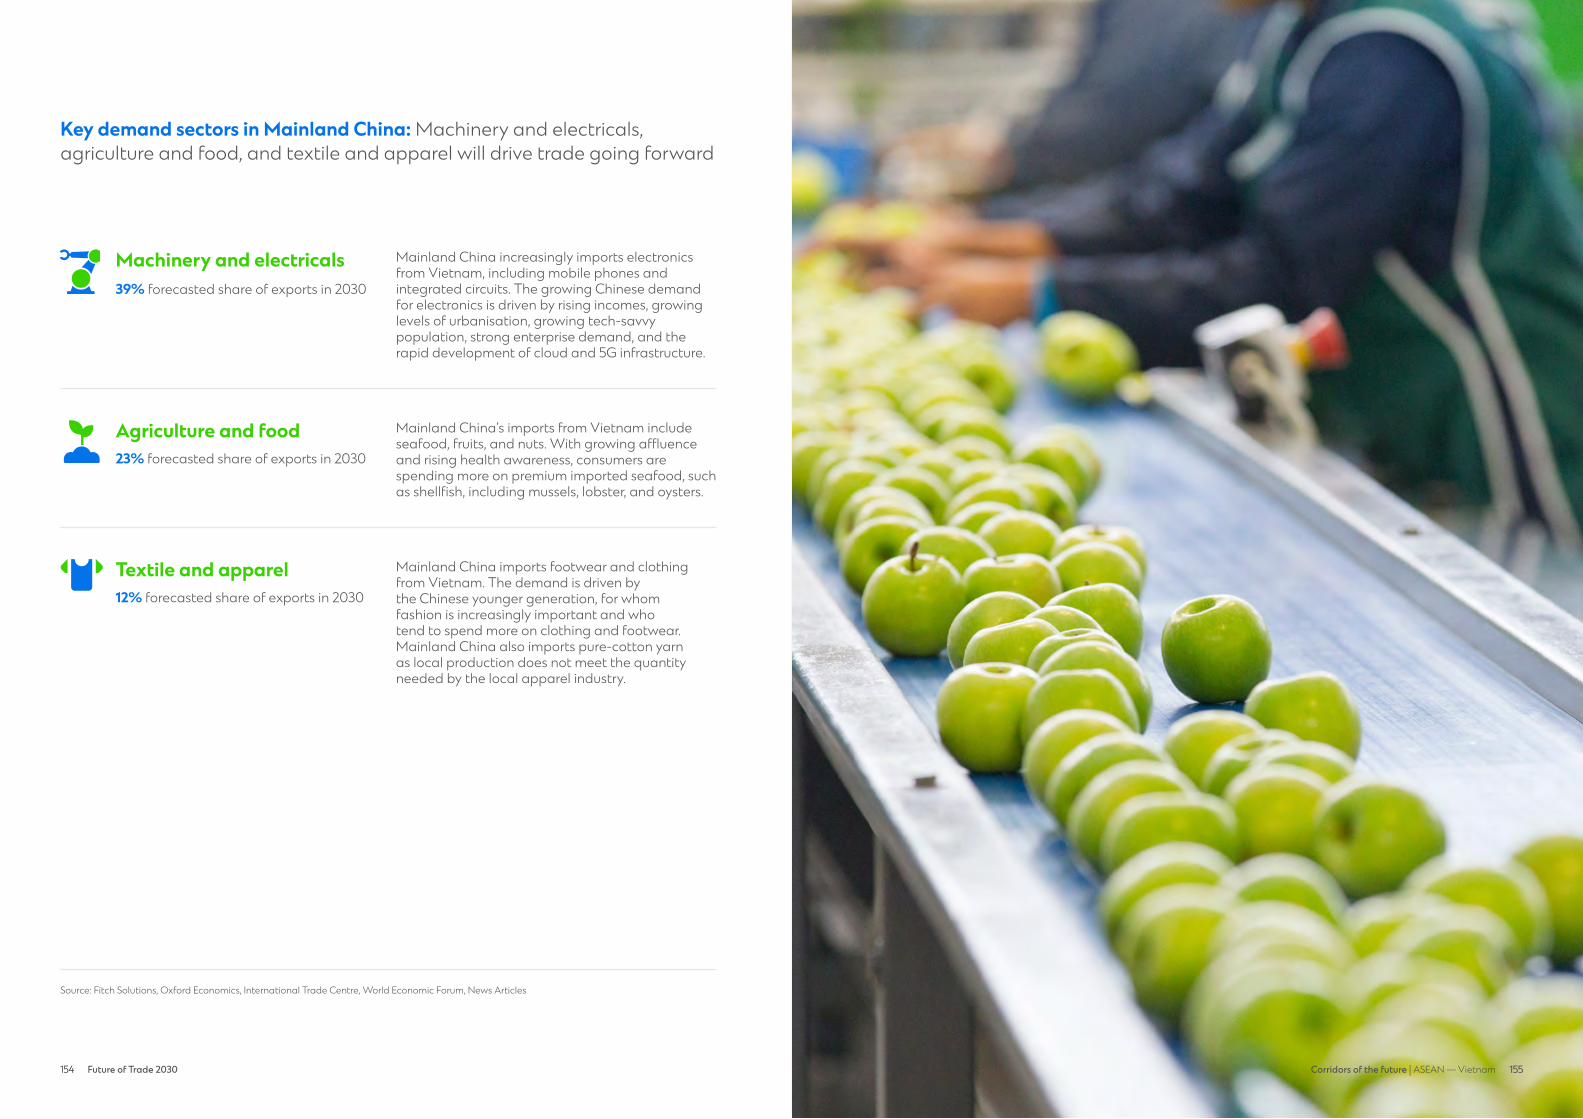
154 Future of Trade 2030 155154 155Corridors of the future | ASEAN — Vietnam
Key demand sectors in Mainland China: Machinery and electricals, agriculture and food, and textile and apparel will drive trade going forward
Source: Fitch Solutions, Oxford Economics, International Trade Centre, World Economic Forum, News Articles
Mainland China increasingly imports electronics from Vietnam, including mobile phones and integrated circuits. The growing Chinese demand for electronics is driven by rising incomes, growing levels of urbanisation, growing tech-savvy population, strong enterprise demand, and the rapid development of cloud and 5G infrastructure.
Textile & Apparel
Mainland China imports footwear and clothing from Vietnam. The demand is driven by the Chinese younger generation, for whom fashion is increasingly important and who tend to spend more on clothing and footwear. Mainland China also imports pure-cotton yarn as local production does not meet the quantity needed by the local apparel industry.
Mainland China’s imports from Vietnam include seafood, fruits, and nuts. With growing affluence and rising health awareness, consumers are spending more on premium imported seafood, such as shellfish, including mussels, lobster, and oysters.
Agriculture & Food
Machinery & Electricals
Machinery and electricals39% forecasted share of exports in 2030
Textile and apparel12% forecasted share of exports in 2030
Agriculture and food23% forecasted share of exports in 2030
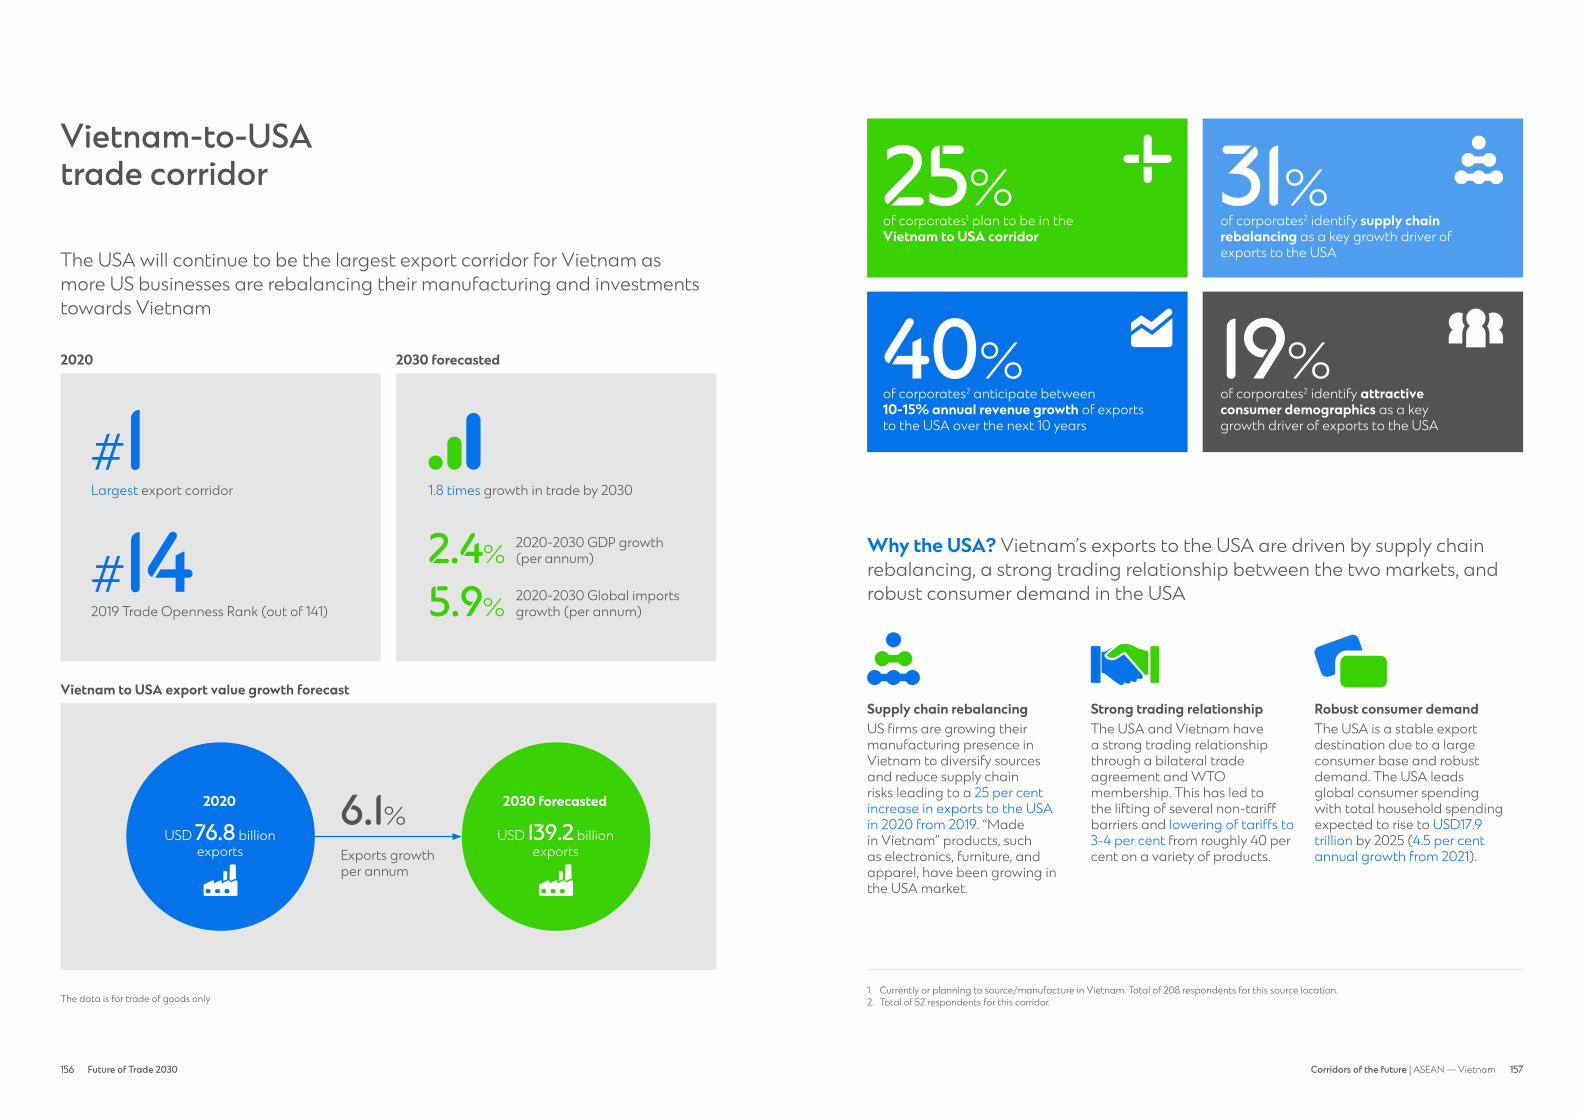
156 Future of Trade 2030 157156 157Corridors of the future | ASEAN — Vietnam
Vietnam-to-USA trade corridor
The USA will continue to be the largest export corridor for Vietnam as more US businesses are rebalancing their manufacturing and investments towards Vietnam
Largest export corridor
2019 Trade Openness Rank (out of 141)
#14#1
2020 2030 forecasted
The data is for trade of goods only
1.8 times growth in trade by 2030
2020-2030 GDP growth (per annum)
2020-2030 Global imports growth (per annum)
2.4%
5.9%
Vietnam to USA export value growth forecast
6.1%
Exports growth per annum
2030 forecasted
USD 139.2 billion exports
2020
USD 76.8 billion exports
of corporates1 plan to be in the Vietnam to USA corridor
of corporates2 identify attractive consumer demographics as a key growth driver of exports to the USA
of corporates2 anticipate between 10-15% annual revenue growth of exports to the USA over the next 10 years
25%
19%40%
Why the USA? Vietnam’s exports to the USA are driven by supply chain rebalancing, a strong trading relationship between the two markets, and robust consumer demand in the USA
Supply chain rebalancingUS firms are growing their manufacturing presence in Vietnam to diversify sources and reduce supply chain risks leading to a 25 per cent increase in exports to the USA in 2020 from 2019. “Made in Vietnam” products, such as electronics, furniture, and apparel, have been growing in the USA market.
Robust consumer demandThe USA is a stable export destination due to a large consumer base and robust demand. The USA leads global consumer spending with total household spending expected to rise to USD17.9 trillion by 2025 (4.5 per cent annual growth from 2021).
Strong trading relationshipThe USA and Vietnam have a strong trading relationship through a bilateral trade agreement and WTO membership. This has led to the lifting of several non-tariff barriers and lowering of tariffs to 3-4 per cent from roughly 40 per cent on a variety of products.
1. Currently or planning to source/manufacture in Vietnam. Total of 208 respondents for this source location. 2. Total of 52 respondents for this corridor.
of corporates2 identify supply chain rebalancing as a key growth driver of exports to the USA
31%plan to be in corridor
supply chain rebalancing
consumer demographic
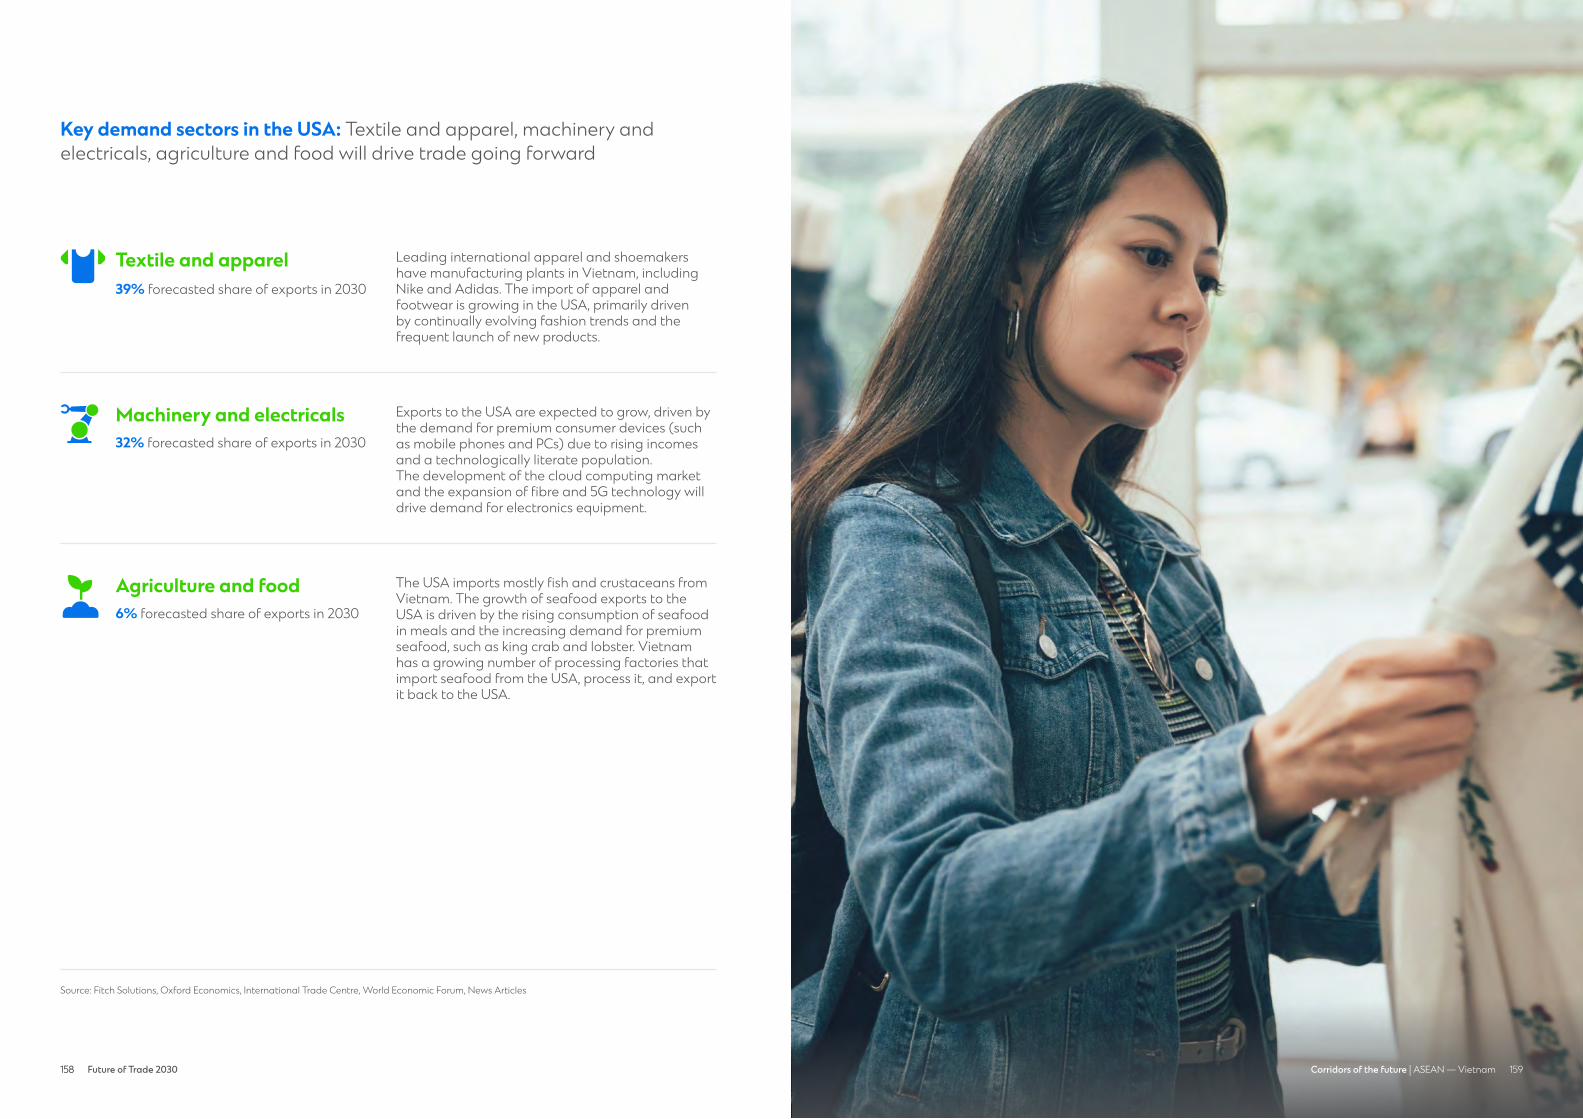
158 Future of Trade 2030 159158 159Corridors of the future | ASEAN — Vietnam
Key demand sectors in the USA: Textile and apparel, machinery and electricals, agriculture and food will drive trade going forward
Source: Fitch Solutions, Oxford Economics, International Trade Centre, World Economic Forum, News Articles
Leading international apparel and shoemakers have manufacturing plants in Vietnam, including Nike and Adidas. The import of apparel and footwear is growing in the USA, primarily driven by continually evolving fashion trends and the frequent launch of new products.
Textile & Apparel
The USA imports mostly fish and crustaceans from Vietnam. The growth of seafood exports to the USA is driven by the rising consumption of seafood in meals and the increasing demand for premium seafood, such as king crab and lobster. Vietnam has a growing number of processing factories that import seafood from the USA, process it, and export it back to the USA.
Agriculture & Food
Exports to the USA are expected to grow, driven by the demand for premium consumer devices (such as mobile phones and PCs) due to rising incomes and a technologically literate population. The development of the cloud computing market and the expansion of fibre and 5G technology will drive demand for electronics equipment.
Machinery & Electricals
Textile and apparel39% forecasted share of exports in 2030
Agriculture and food6% forecasted share of exports in 2030
Machinery and electricals32% forecasted share of exports in 2030
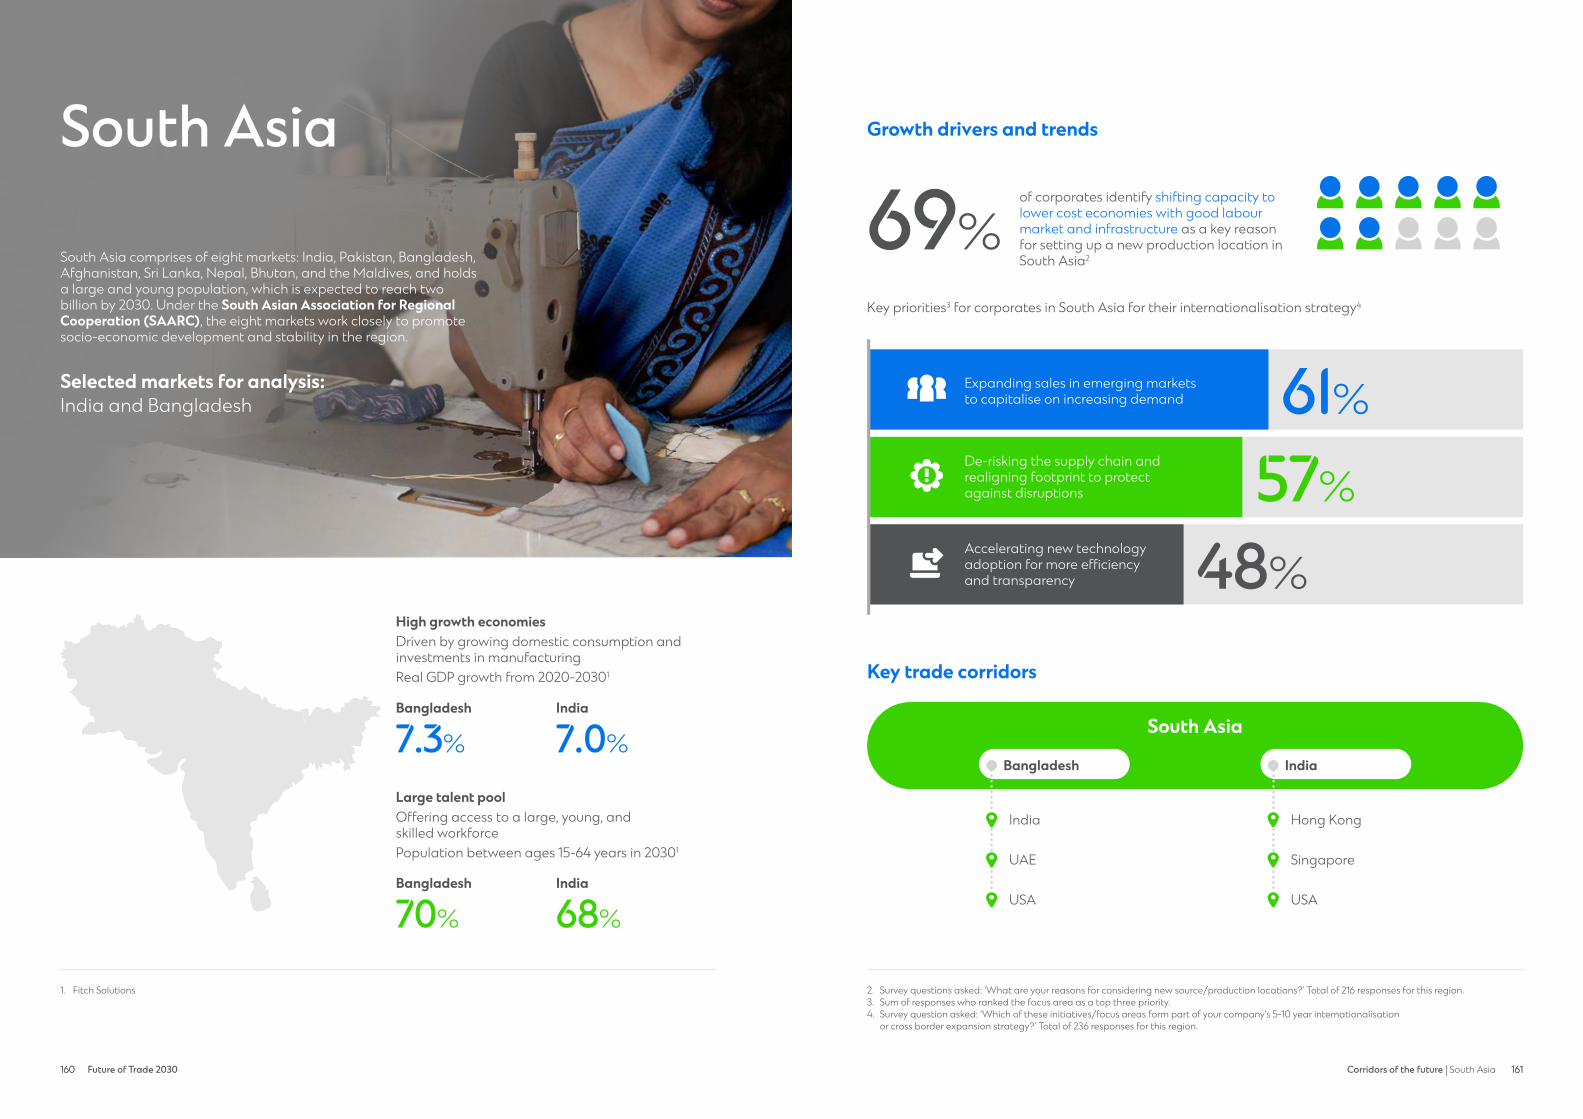
160 Future of Trade 2030 161160 161Corridors of the future | South Asia
Growth drivers and trends
Key trade corridors
South Asia
South Asia comprises of eight markets: India, Pakistan, Bangladesh, Afghanistan, Sri Lanka, Nepal, Bhutan, and the Maldives, and holds a large and young population, which is expected to reach two billion by 2030. Under the South Asian Association for Regional Cooperation (SAARC), the eight markets work closely to promote socio-economic development and stability in the region.
Selected markets for analysis: India and Bangladesh
High growth economiesDriven by growing domestic consumption and investments in manufacturingReal GDP growth from 2020-20301
Bangladesh
Bangladesh India
India
Large talent poolOffering access to a large, young, and skilled workforcePopulation between ages 15-64 years in 20301
1. Fitch Solutions
7.3%
70% 68%
7.0%
of corporates identify shifting capacity to lower cost economies with good labour market and infrastructure as a key reason for setting up a new production location in South Asia2
Key priorities3 for corporates in South Asia for their internationalisation strategy4
69%
Accelerating new technology adoption for more efficiency and transparency 48%
De-risking the supply chain and realigning footprint to protect against disruptions 57%
Expanding sales in emerging markets to capitalise on increasing demand 61%
2. Survey questions asked: ‘What are your reasons for considering new source/production locations?’ Total of 216 responses for this region.3. Sum of responses who ranked the focus area as a top three priority.4. Survey question asked: ‘Which of these initiatives/focus areas form part of your company’s 5-10 year internationalisation
or cross border expansion strategy?’ Total of 236 responses for this region.
South Asia
India
UAE
USA
Bangladesh
Hong Kong
Singapore
USA
India
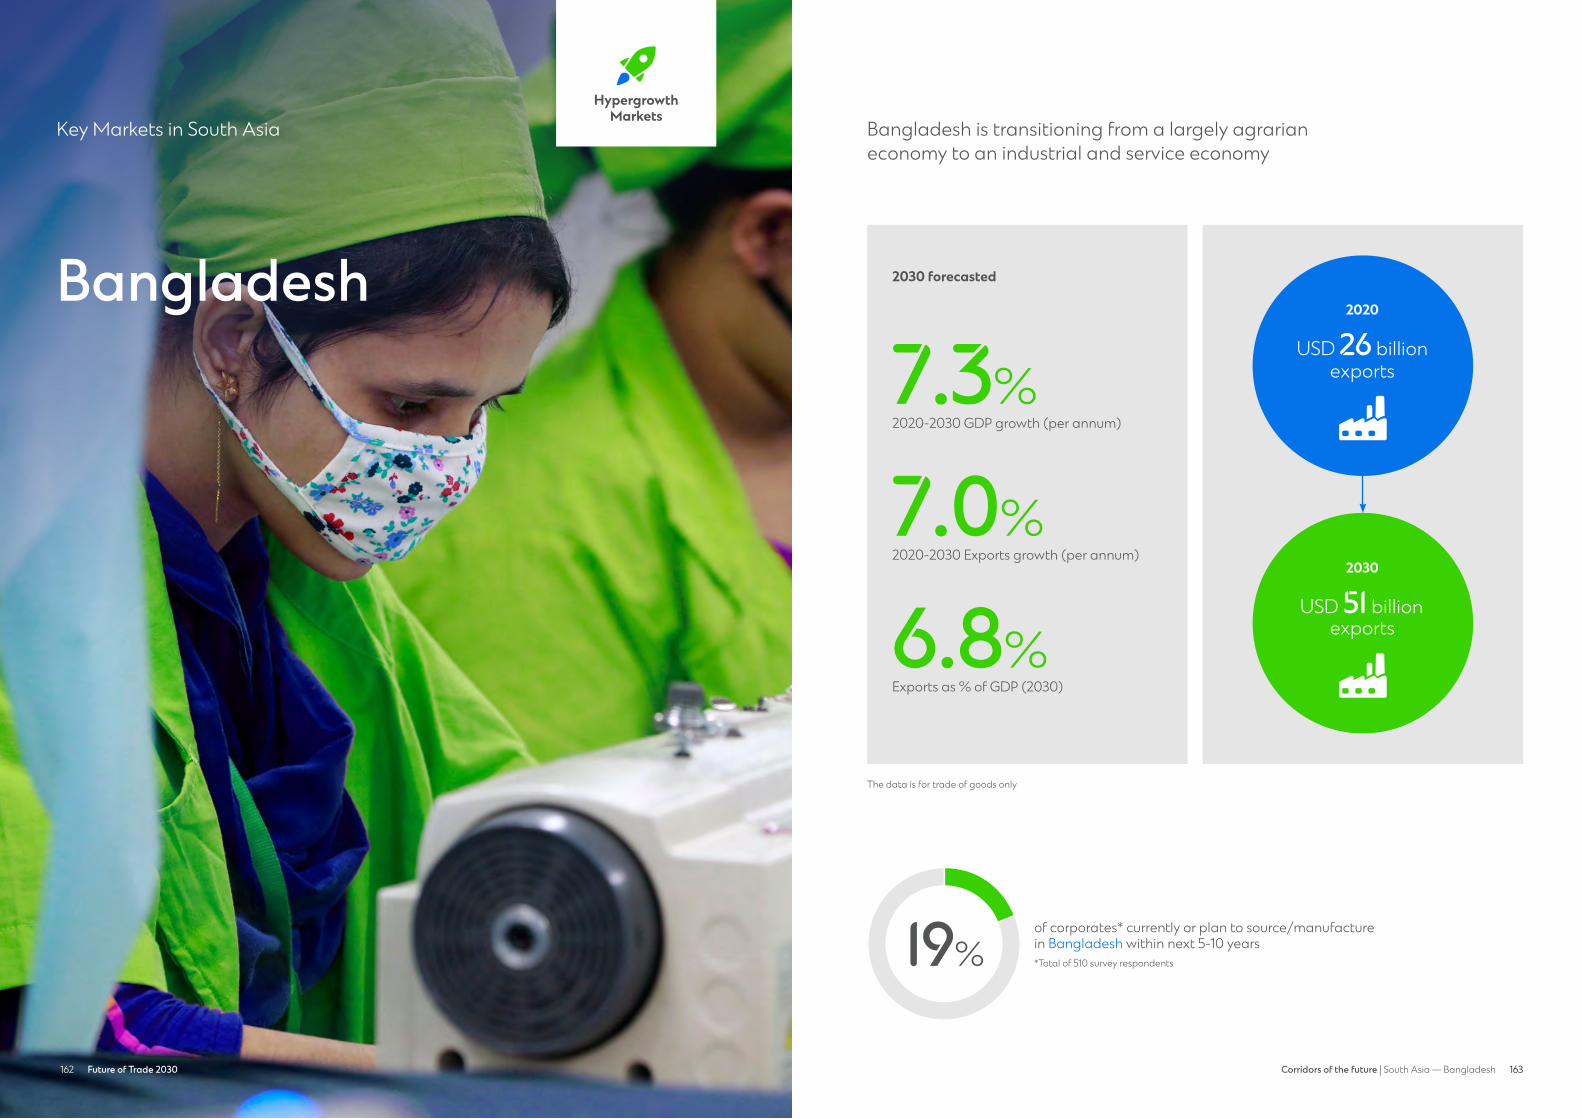
162 163163Future of Trade 2030162 Corridors of the future | South Asia — Bangladesh
Bangladesh
Key Markets in South Asia Bangladesh is transitioning from a largely agrarian economy to an industrial and service economy
19%of corporates* currently or plan to source/manufacture in Bangladesh within next 5-10 years*Total of 510 survey respondents
The data is for trade of goods only
Hypergrowth Markets
Hypergrowth markets
2030 forecasted
2020-2030 GDP growth (per annum)
7.3%
2020-2030 Exports growth (per annum)
7.0%
Exports as % of GDP (2030)
6.8%
2020
USD 26 billion exports
2030
USD 51 billion exports
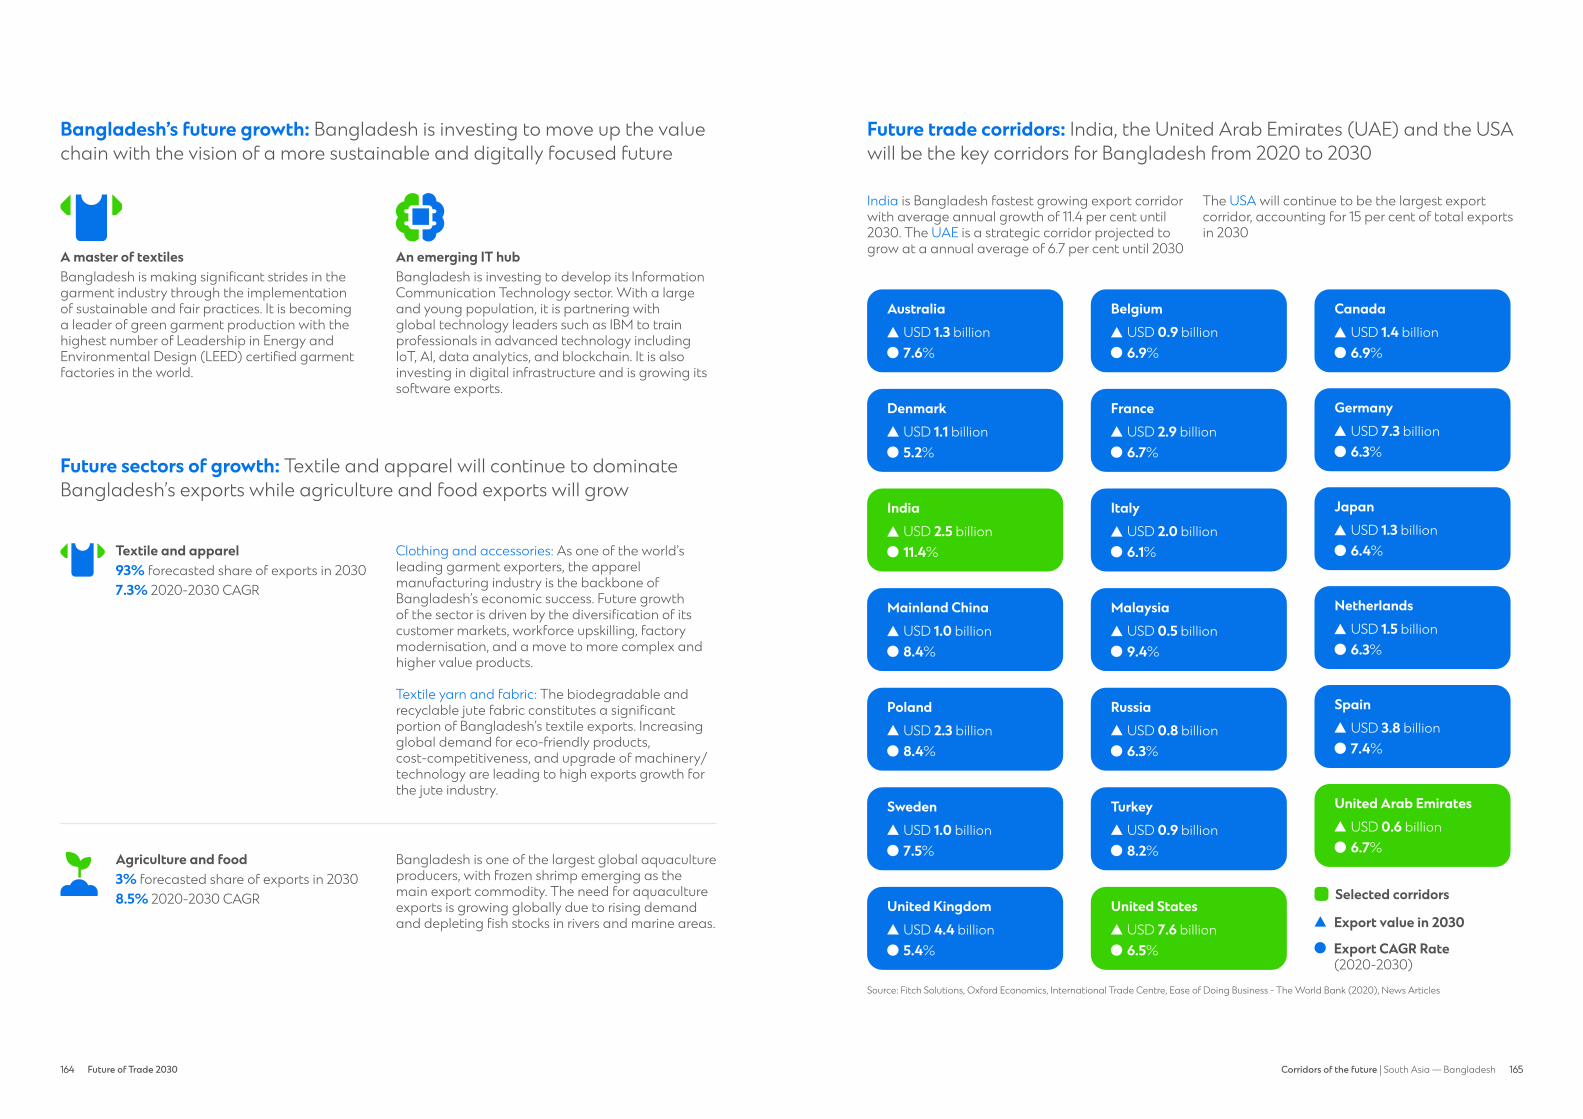
164 Future of Trade 2030 165164 165Corridors of the future | South Asia — Bangladesh
Bangladesh’s future growth: Bangladesh is investing to move up the value chain with the vision of a more sustainable and digitally focused future
A master of textilesBangladesh is making significant strides in the garment industry through the implementation of sustainable and fair practices. It is becoming a leader of green garment production with the highest number of Leadership in Energy and Environmental Design (LEED) certified garment factories in the world.
An emerging IT hubBangladesh is investing to develop its Information Communication Technology sector. With a large and young population, it is partnering with global technology leaders such as IBM to train professionals in advanced technology including IoT, AI, data analytics, and blockchain. It is also investing in digital infrastructure and is growing its software exports.
Future sectors of growth: Textile and apparel will continue to dominate Bangladesh’s exports while agriculture and food exports will grow
Future trade corridors: India, the United Arab Emirates (UAE) and the USA will be the key corridors for Bangladesh from 2020 to 2030
Source: Fitch Solutions, Oxford Economics, International Trade Centre, Ease of Doing Business - The World Bank (2020), News Articles
India is Bangladesh fastest growing export corridor with average annual growth of 11.4 per cent until 2030. The UAE is a strategic corridor projected to grow at a annual average of 6.7 per cent until 2030
The USA will continue to be the largest export corridor, accounting for 15 per cent of total exports in 2030
Textile and apparel Clothing and accessories: As one of the world’s leading garment exporters, the apparel manufacturing industry is the backbone of Bangladesh’s economic success. Future growth of the sector is driven by the diversification of its customer markets, workforce upskilling, factory modernisation, and a move to more complex and higher value products.
93% forecasted share of exports in 20307.3% 2020-2030 CAGR
Textile yarn and fabric: The biodegradable and recyclable jute fabric constitutes a significant portion of Bangladesh’s textile exports. Increasing global demand for eco-friendly products, cost-competitiveness, and upgrade of machinery/technology are leading to high exports growth for the jute industry.
Agriculture and food Bangladesh is one of the largest global aquaculture producers, with frozen shrimp emerging as the main export commodity. The need for aquaculture exports is growing globally due to rising demand and depleting fish stocks in rivers and marine areas.
3% forecasted share of exports in 20308.5% 2020-2030 CAGRAgriculture & Food
Textile & Apparel
Textile & Apparel
BelgiumUSD 0.9 billion6.9%
FranceUSD 2.9 billion6.7%
ItalyUSD 2.0 billion6.1%
MalaysiaUSD 0.5 billion9.4%
RussiaUSD 0.8 billion6.3%
TurkeyUSD 0.9 billion8.2%
United StatesUSD 7.6 billion6.5%
CanadaUSD 1.4 billion6.9%
GermanyUSD 7.3 billion6.3%
JapanUSD 1.3 billion6.4%
NetherlandsUSD 1.5 billion6.3%
SpainUSD 3.8 billion7.4%
United Arab EmiratesUSD 0.6 billion6.7%
AustraliaUSD 1.3 billion7.6%
DenmarkUSD 1.1 billion5.2%
IndiaUSD 2.5 billion11.4%
Mainland ChinaUSD 1.0 billion8.4%
PolandUSD 2.3 billion8.4%
SwedenUSD 1.0 billion7.5%
United KingdomUSD 4.4 billion5.4% Export CAGR Rate
(2020-2030)
Selected corridors
Export value in 2030
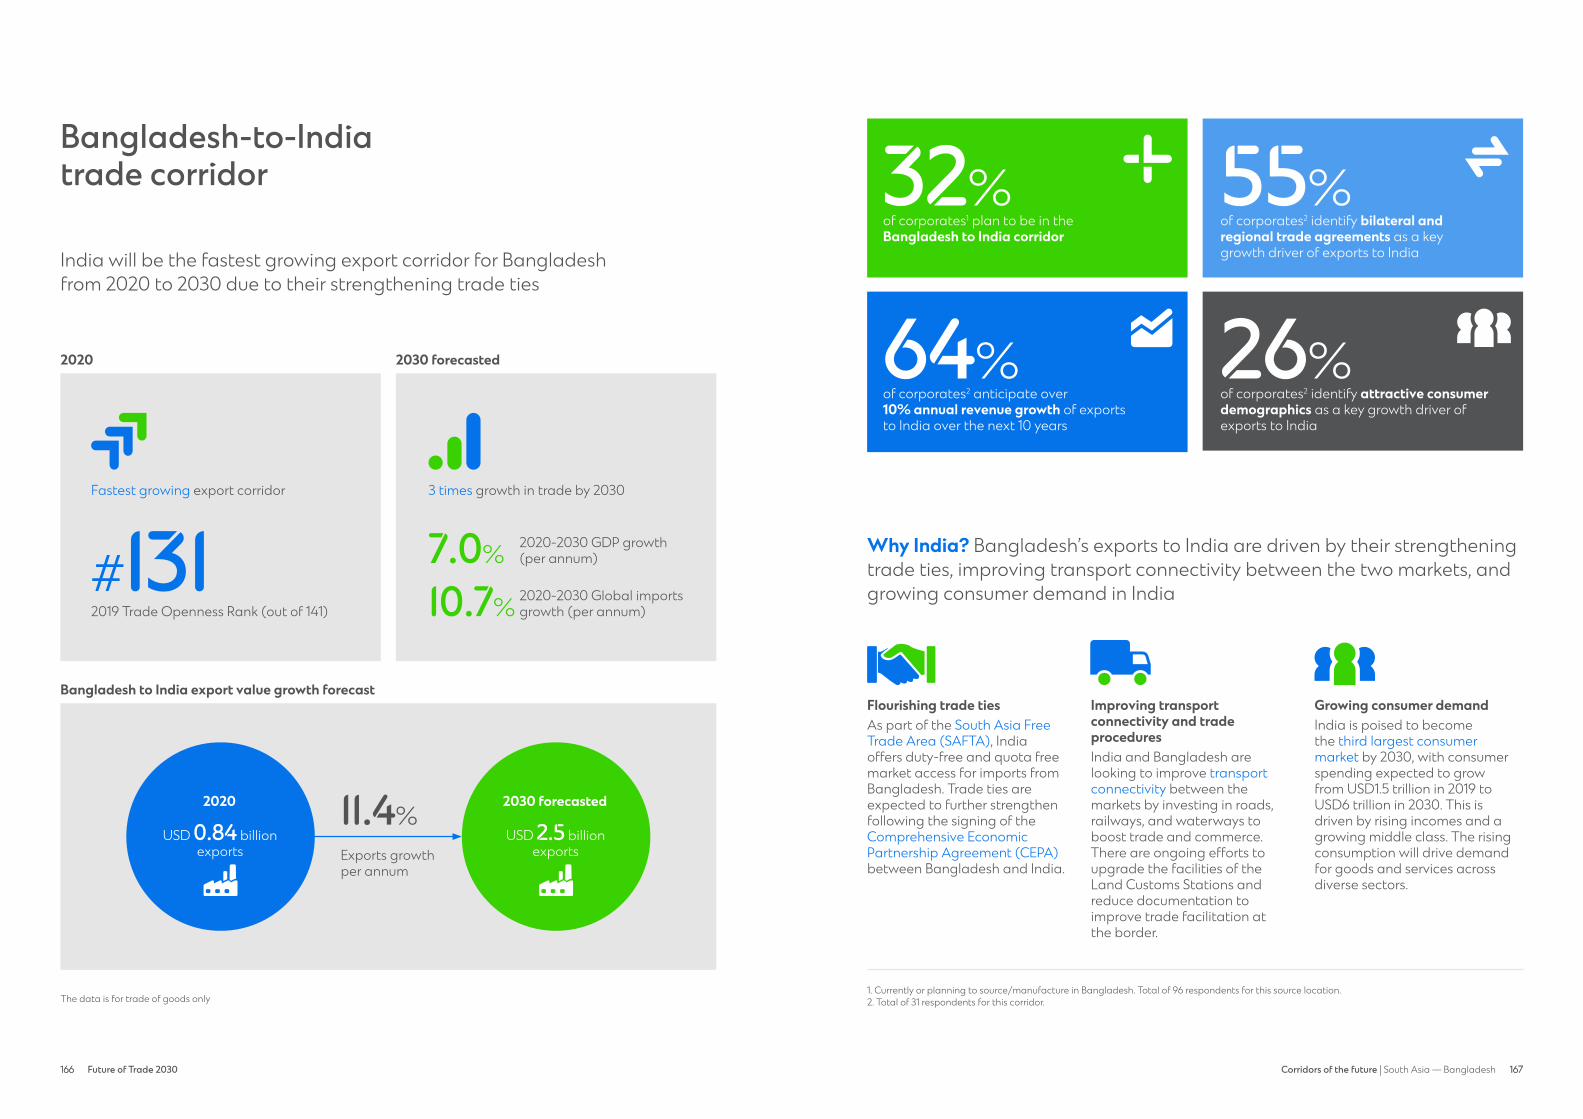
166 Future of Trade 2030 167166 167Corridors of the future | South Asia — Bangladesh
Bangladesh-to-Indiatrade corridor
India will be the fastest growing export corridor for Bangladeshfrom 2020 to 2030 due to their strengthening trade ties
Fastest growing export corridor
2019 Trade Openness Rank (out of 141)
#131
2020 2030 forecasted
The data is for trade of goods only
3 times growth in trade by 2030
2020-2030 GDP growth (per annum)
2020-2030 Global imports growth (per annum)
7.0%
10.7%
Bangladesh to India export value growth forecast
11.4%
Exports growth per annum
2030 forecasted
USD 2.5 billion exports
2020
USD 0.84 billion exports
of corporates1 plan to be in the Bangladesh to India corridor
of corporates2 anticipate over 10% annual revenue growth of exports to India over the next 10 years
32%
64%
Why India? Bangladesh’s exports to India are driven by their strengthening trade ties, improving transport connectivity between the two markets, and growing consumer demand in India
Flourishing trade tiesAs part of the South Asia Free Trade Area (SAFTA), India offers duty-free and quota free market access for imports from Bangladesh. Trade ties are expected to further strengthen following the signing of the Comprehensive Economic Partnership Agreement (CEPA) between Bangladesh and India.
Improving transport connectivity and trade proceduresIndia and Bangladesh are looking to improve transport connectivity between the markets by investing in roads, railways, and waterways to boost trade and commerce. There are ongoing efforts to upgrade the facilities of the Land Customs Stations and reduce documentation to improve trade facilitation at the border.
Growing consumer demandIndia is poised to become the third largest consumer market by 2030, with consumer spending expected to grow from USD1.5 trillion in 2019 to USD6 trillion in 2030. This is driven by rising incomes and a growing middle class. The rising consumption will drive demand for goods and services across diverse sectors.
1. Currently or planning to source/manufacture in Bangladesh. Total of 96 respondents for this source location. 2. Total of 31 respondents for this corridor.
of corporates2 identify bilateral and regional trade agreements as a key growth driver of exports to India
of corporates2 identify attractive consumer demographics as a key growth driver ofexports to India
55%
26% consumer demographic
trade agreementplan to be in
corridor
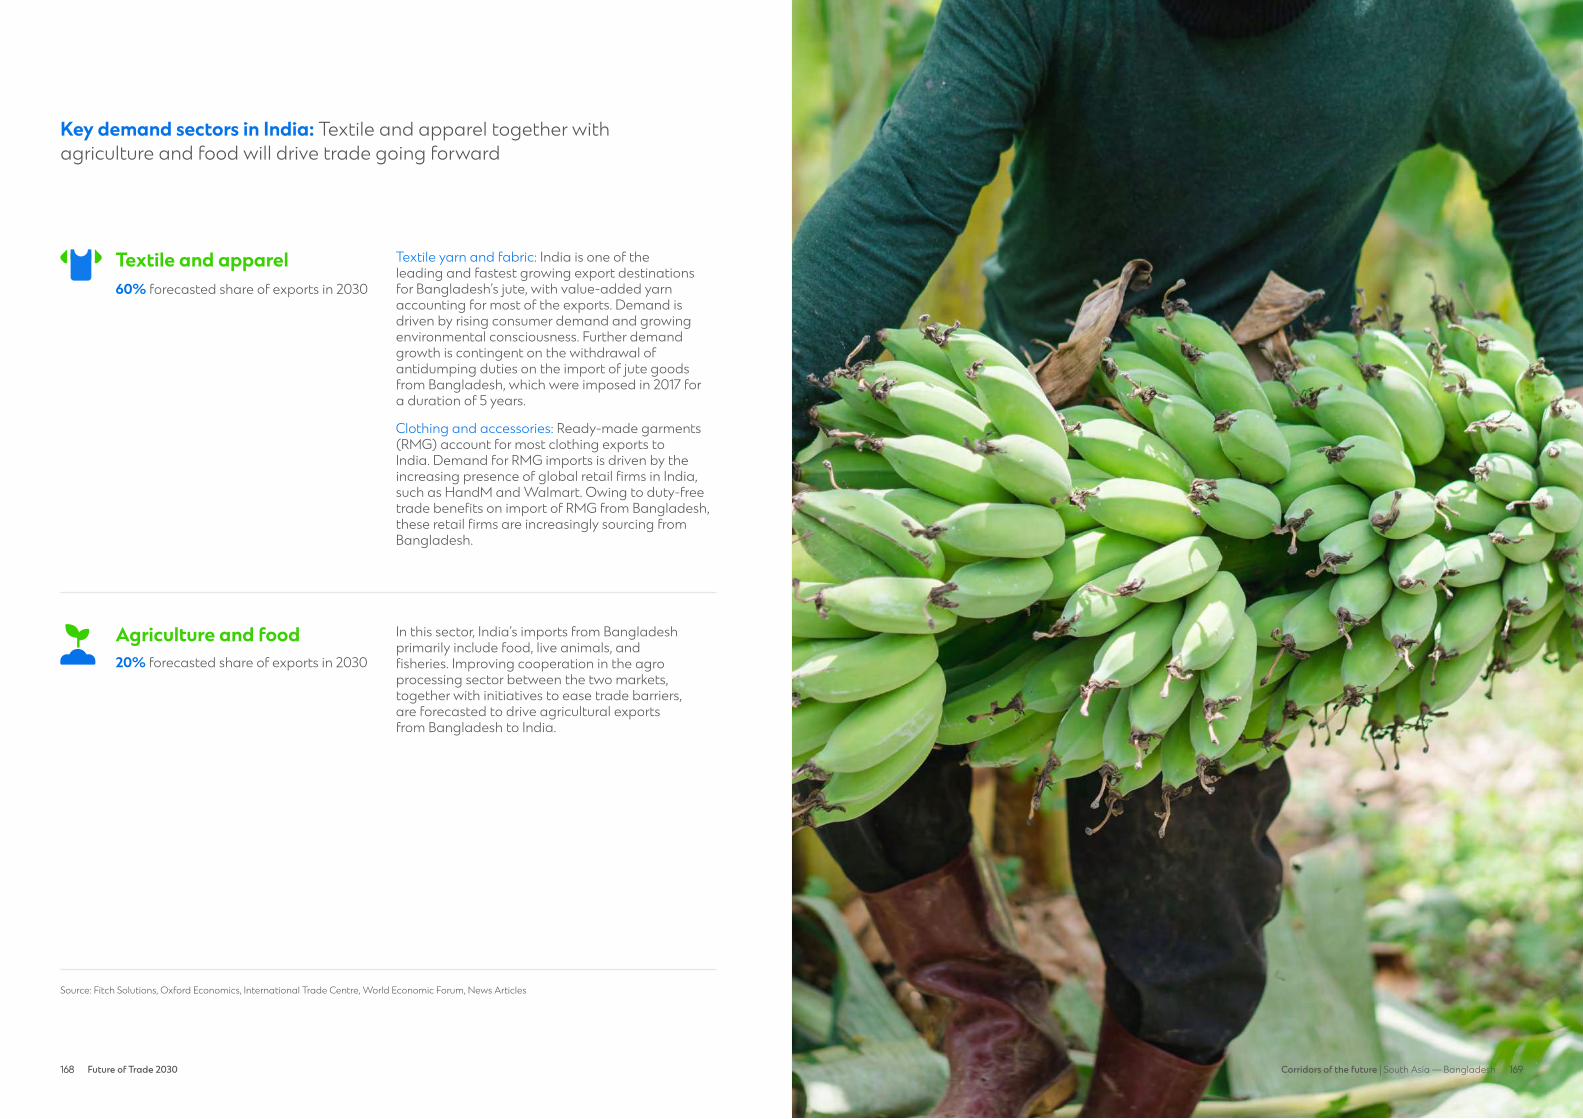
168 Future of Trade 2030 169168 169Corridors of the future | South Asia — Bangladesh
Key demand sectors in India: Textile and apparel together with agriculture and food will drive trade going forward
Source: Fitch Solutions, Oxford Economics, International Trade Centre, World Economic Forum, News Articles
Textile yarn and fabric: India is one of the leading and fastest growing export destinations for Bangladesh’s jute, with value-added yarn accounting for most of the exports. Demand is driven by rising consumer demand and growing environmental consciousness. Further demand growth is contingent on the withdrawal of antidumping duties on the import of jute goods from Bangladesh, which were imposed in 2017 for a duration of 5 years.
In this sector, India’s imports from Bangladesh primarily include food, live animals, and fisheries. Improving cooperation in the agro processing sector between the two markets, together with initiatives to ease trade barriers, are forecasted to drive agricultural exports from Bangladesh to India.
Clothing and accessories: Ready-made garments (RMG) account for most clothing exports to India. Demand for RMG imports is driven by the increasing presence of global retail firms in India, such as HandM and Walmart. Owing to duty-free trade benefits on import of RMG from Bangladesh, these retail firms are increasingly sourcing from Bangladesh.
Textile and apparel60% forecasted share of exports in 2030
Agriculture and food20% forecasted share of exports in 2030
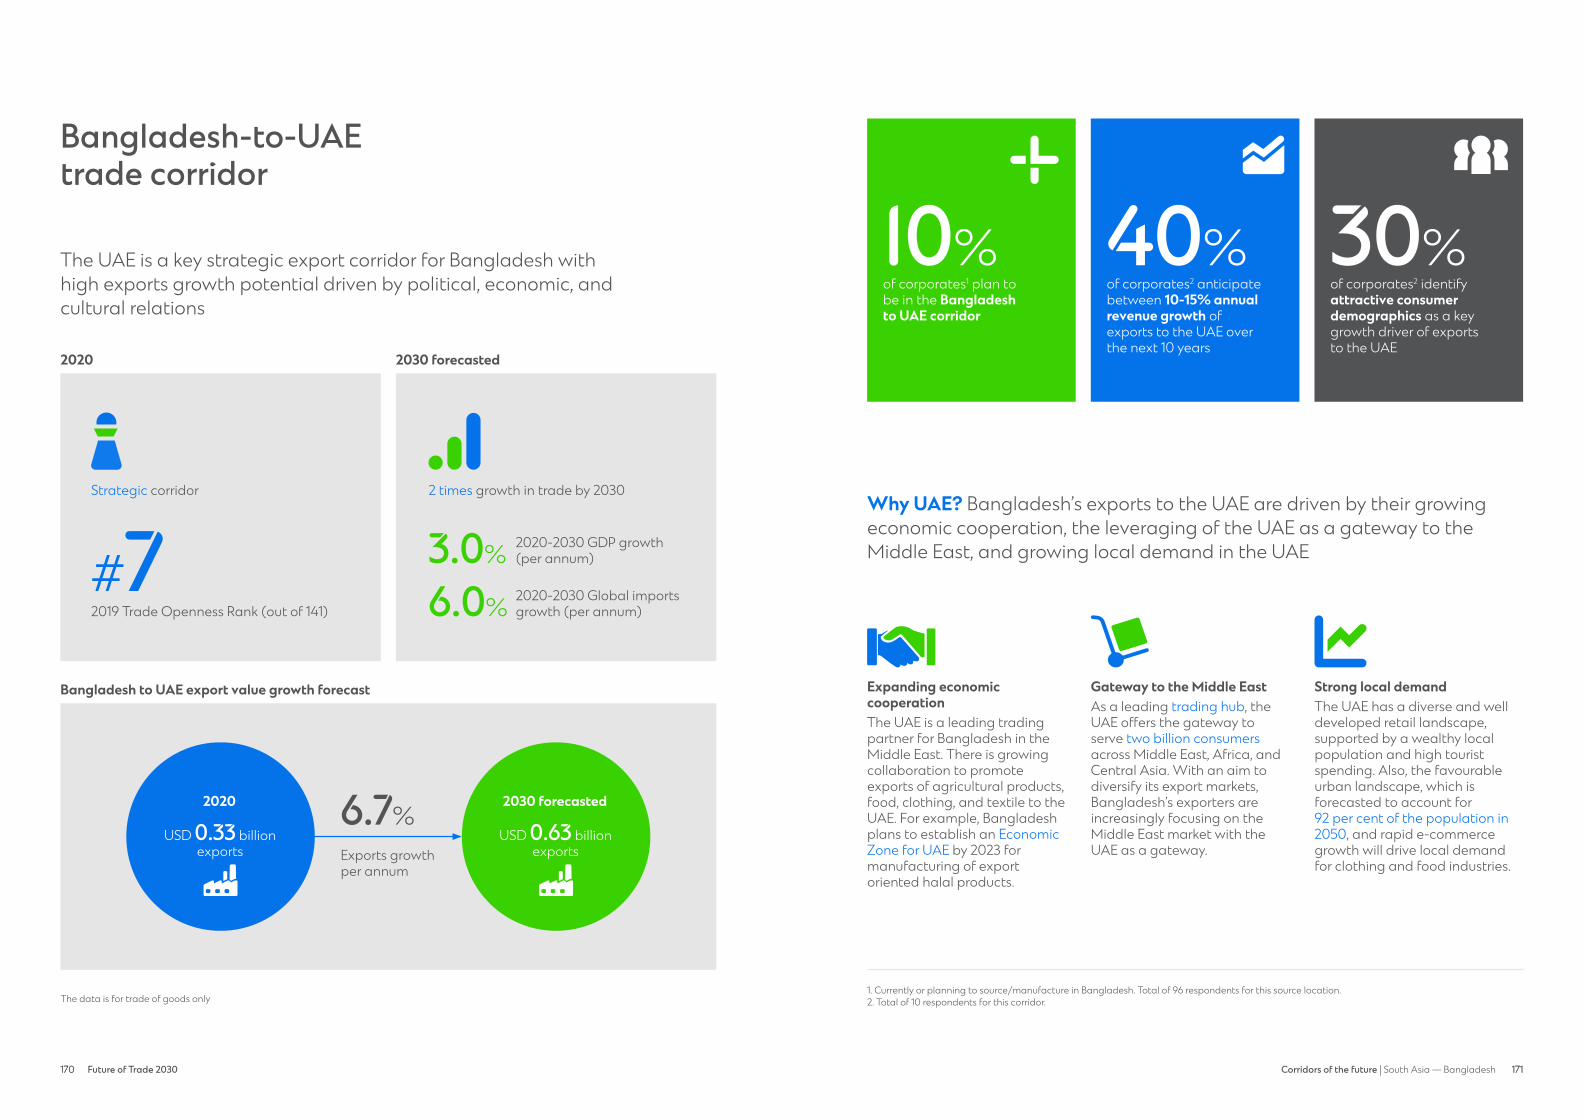
170 Future of Trade 2030 171170 171Corridors of the future | South Asia — Bangladesh
Bangladesh-to-UAEtrade corridor
The UAE is a key strategic export corridor for Bangladesh with high exports growth potential driven by political, economic, and cultural relations
Strategic corridor
2019 Trade Openness Rank (out of 141)
#7
2020 2030 forecasted
The data is for trade of goods only
2 times growth in trade by 2030
2020-2030 GDP growth (per annum)
2020-2030 Global imports growth (per annum)
3.0%
6.0%
Bangladesh to UAE export value growth forecast
6.7%
Exports growth per annum
2030 forecasted
USD 0.63 billion exports
2020
USD 0.33 billion exports
Why UAE? Bangladesh’s exports to the UAE are driven by their growing economic cooperation, the leveraging of the UAE as a gateway to the Middle East, and growing local demand in the UAE
Expanding economic cooperationThe UAE is a leading trading partner for Bangladesh in the Middle East. There is growing collaboration to promote exports of agricultural products, food, clothing, and textile to the UAE. For example, Bangladesh plans to establish an Economic Zone for UAE by 2023 for manufacturing of export oriented halal products.
Gateway to the Middle EastAs a leading trading hub, the UAE offers the gateway to serve two billion consumers across Middle East, Africa, and Central Asia. With an aim to diversify its export markets, Bangladesh’s exporters are increasingly focusing on the Middle East market with the UAE as a gateway.
Strong local demandThe UAE has a diverse and well developed retail landscape, supported by a wealthy local population and high tourist spending. Also, the favourable urban landscape, which is forecasted to account for 92 per cent of the population in 2050, and rapid e-commerce growth will drive local demand for clothing and food industries.
1. Currently or planning to source/manufacture in Bangladesh. Total of 96 respondents for this source location. 2. Total of 10 respondents for this corridor.
of corporates1 plan to be in the Bangladesh to UAE corridor
of corporates2 anticipate between 10-15% annual revenue growth of exports to the UAE over the next 10 years
of corporates2 identify attractive consumer demographics as a key growth driver of exports to the UAE
10% 40% 30%consumer
demographicplan to be in corridor

172 Future of Trade 2030 173172 173Corridors of the future | South Asia — Bangladesh
Key demand sectors in UAE: Textile and apparel will drive trade going forward while agriculture and food and machinery and electricals exports to the UAE are expected to grow
Machinery & Electricals
The UAE imports machinery and electricals, such as batteries for its automotive sector, from Bangladesh. As a high export potential sector, key battery manufacturers in Bangladesh are implementing advanced technologies and increasing manufacturing capacity to gain exports share in the Middle Eastern automotive market by leveraging the UAE as a gateway.
Source: Fitch Solutions, Oxford Economics, International Trade Centre, World Economic Forum, News Articles
The UAE mostly imports knitwear, ready-made garments, and home textiles from Bangladesh. Dubai is emerging as a leading global fashion hotspot and a shopping destination. Additionally, rising social media influence and the growing e-commerce sector in the UAE is driving demand for fast-fashion brands, boosting Bangladesh clothing exports.
Textile & Apparel
The UAE imports vegetables, fish, meat, tea, and spices from Bangladesh. There is increasing domestic demand for halal food in the UAE due to its growing Muslim population and rising per capita income. The establishment of the Economic Zone in Bangladesh, where the UAE companies plan to establish halal food processing units, are also expected to increase exports of halal products from Bangladesh to the UAE.
Agriculture & Food
Textile and apparel71% forecasted share of exports in 2030
Agriculture and food16% forecasted share of exports in 2030
Machinery and electricals11% forecasted share of exports in 2030
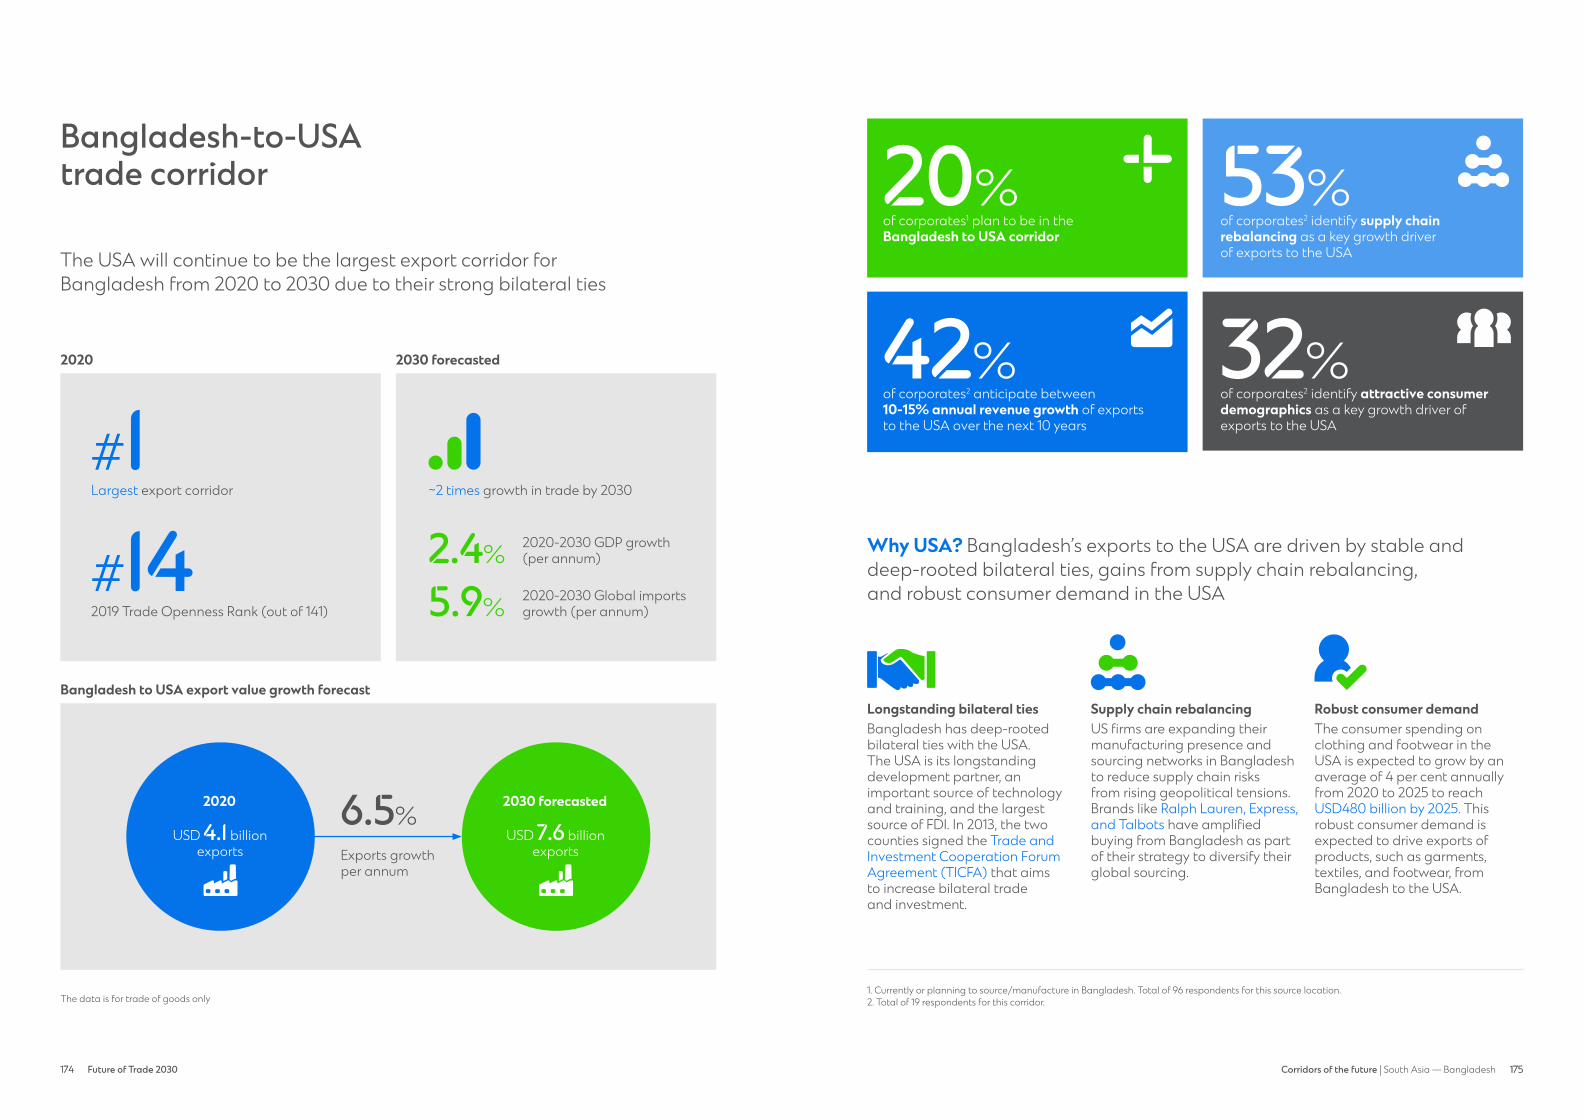
174 Future of Trade 2030 175174 175Corridors of the future | South Asia — Bangladesh
Bangladesh-to-USAtrade corridor
The USA will continue to be the largest export corridor forBangladesh from 2020 to 2030 due to their strong bilateral ties
2019 Trade Openness Rank (out of 141)
#14
2020 2030 forecasted
The data is for trade of goods only
~2 times growth in trade by 2030
2020-2030 GDP growth (per annum)
2020-2030 Global imports growth (per annum)
2.4%
5.9%
Bangladesh to USA export value growth forecast
6.5%
Exports growth per annum
2030 forecasted
USD 7.6 billion exports
2020
USD 4.1 billion exports
Why USA? Bangladesh’s exports to the USA are driven by stable anddeep-rooted bilateral ties, gains from supply chain rebalancing,and robust consumer demand in the USA
Longstanding bilateral tiesBangladesh has deep-rooted bilateral ties with the USA. The USA is its longstanding development partner, an important source of technology and training, and the largest source of FDI. In 2013, the two counties signed the Trade and Investment Cooperation Forum Agreement (TICFA) that aims to increase bilateral trade and investment.
Supply chain rebalancingUS firms are expanding their manufacturing presence and sourcing networks in Bangladesh to reduce supply chain risks from rising geopolitical tensions. Brands like Ralph Lauren, Express, and Talbots have amplified buying from Bangladesh as part of their strategy to diversify their global sourcing.
Robust consumer demandThe consumer spending on clothing and footwear in the USA is expected to grow by an average of 4 per cent annually from 2020 to 2025 to reach USD480 billion by 2025. This robust consumer demand is expected to drive exports of products, such as garments, textiles, and footwear, from Bangladesh to the USA.
1. Currently or planning to source/manufacture in Bangladesh. Total of 96 respondents for this source location. 2. Total of 19 respondents for this corridor.
of corporates1 plan to be in the Bangladesh to USA corridor
of corporates2 anticipate between 10-15% annual revenue growth of exports to the USA over the next 10 years
20%
42%
Largest export corridor
#1
of corporates2 identify supply chain rebalancing as a key growth driver of exports to the USA
of corporates2 identify attractive consumer demographics as a key growth driver ofexports to the USA
53%
32% consumer demographic
supply chain rebalancing
plan to be in corridor

176 Future of Trade 2030 177176 177Corridors of the future | South Asia — Bangladesh
Key demand sectors in USA: Textile and apparel will continue to drive demand
Source: Fitch Solutions, Oxford Economics, International Trade Centre, World Economic Forum, News Articles
Clothing and accessories: The USA mainly imports ready-made garments (RMG), including knit sweaters and t-shirts, together with non-knit suits and shirts from Bangladesh. In addition to growing consumer demand, RMG exports to the USA are driven by Bangladesh’s enhanced cost effectiveness and favourable tariff regime.
Footwear: Bangladesh’s footwear exports are gaining market share in the USA on the back of cost-competitiveness enabled by favourable government support, such as a cash incentive offered by the government for leather shoe exports.
Textiles yarn and fabric: Bangladesh exports jute yarn, jute woven fabric, and textile scraps to the USA. The rising wave of conscious consumerism is driving the demand for sustainable fabrics, such as jute, in the USA. Furthermore, growing demand for recycled fabric is leading to increased imports of textile scraps in the USA.
Textile and apparel98% forecasted share of exports in 2030

178 Future of Trade 2030 179178 179Corridors of the future | South Asia — India178 The Future of Global Trade 2030
India
Key Markets in South Asia India is a service-sector driven economy with a increasing focus on the growth of the manufacturing sector and digital economy
38%of corporates* currently or plan to source/manufacture in India within next 5-10 years*Total of 510 survey respondents
The data is for trade of goods only
Rising StarRising Stars
2030 forecasted
2020-2030 GDP growth (per annum)
7.0%
2020-2030 Exports growth (per annum)
7.6%
Exports as % of GDP (2030)
7.3%
2020
USD 271 billion exports
2030
USD 564 billion exports
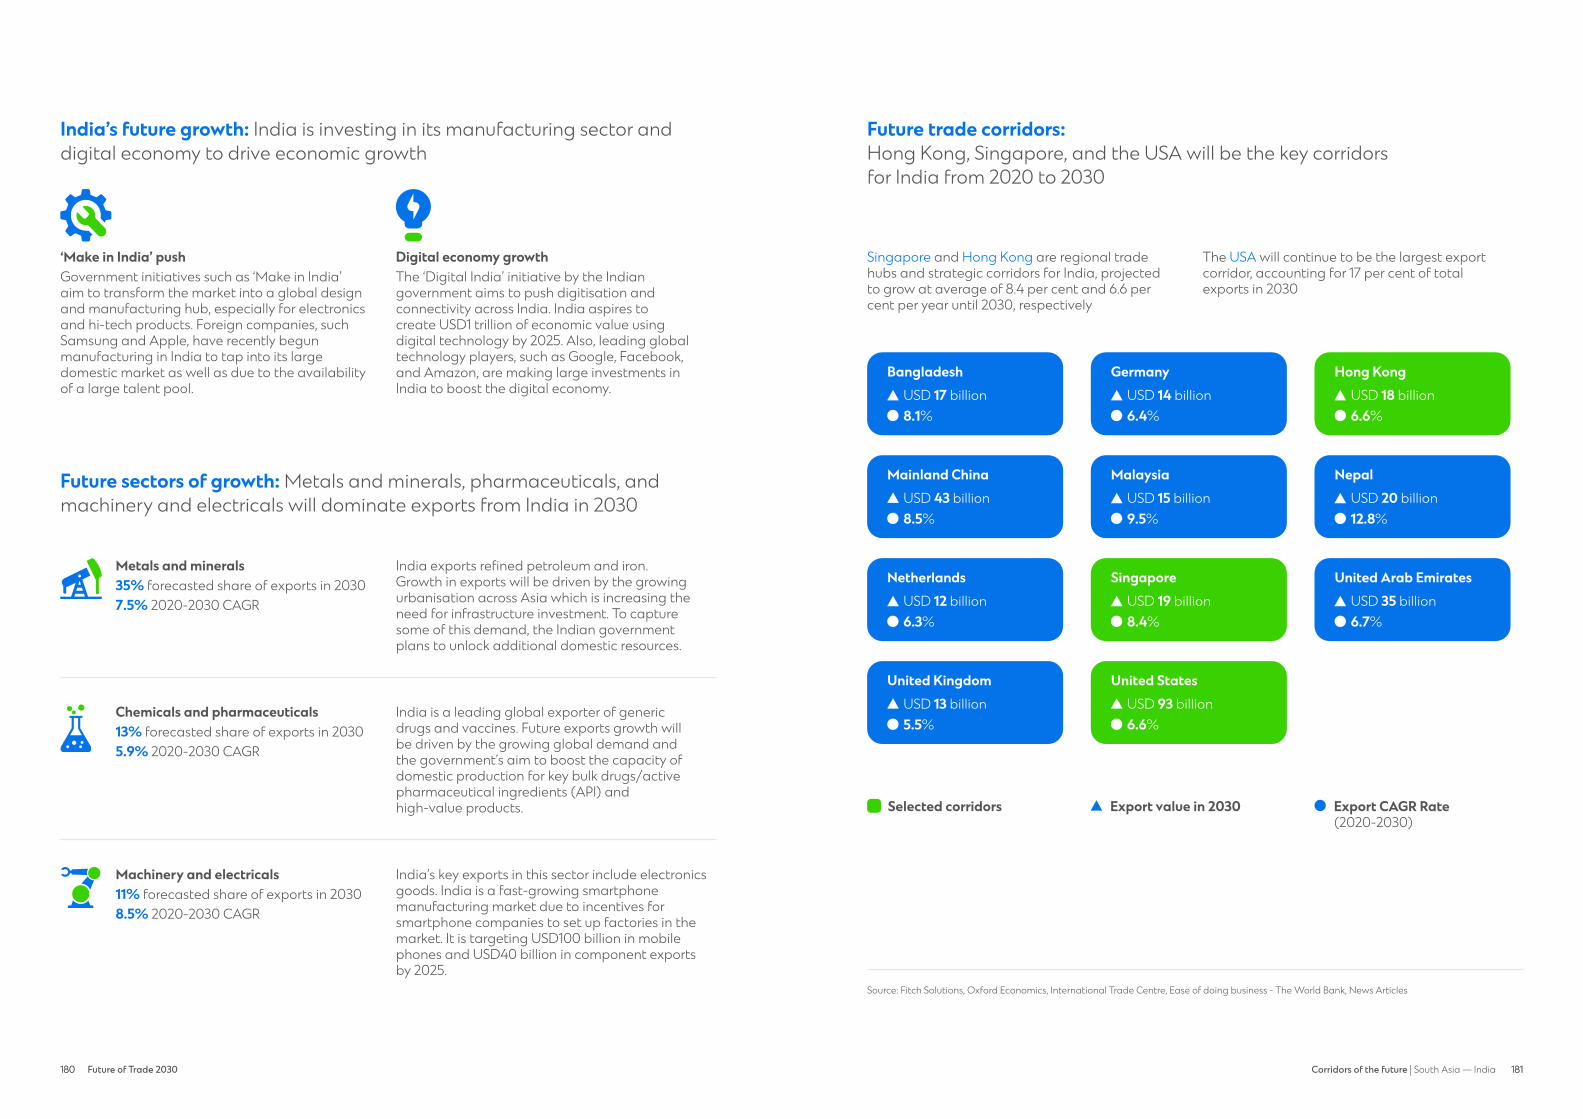
180 Future of Trade 2030 181180 181Corridors of the future | South Asia — India
India’s future growth: India is investing in its manufacturing sector anddigital economy to drive economic growth
‘Make in India’ pushGovernment initiatives such as ‘Make in India’ aim to transform the market into a global design and manufacturing hub, especially for electronics and hi-tech products. Foreign companies, such Samsung and Apple, have recently begun manufacturing in India to tap into its large domestic market as well as due to the availability of a large talent pool.
Digital economy growthThe ‘Digital India’ initiative by the Indian government aims to push digitisation and connectivity across India. India aspires to create USD1 trillion of economic value using digital technology by 2025. Also, leading global technology players, such as Google, Facebook, and Amazon, are making large investments in India to boost the digital economy.
Future sectors of growth: Metals and minerals, pharmaceuticals, and machinery and electricals will dominate exports from India in 2030
Future trade corridors: Hong Kong, Singapore, and the USA will be the key corridors for India from 2020 to 2030
Source: Fitch Solutions, Oxford Economics, International Trade Centre, Ease of doing business - The World Bank, News Articles
Machinery and electricals India’s key exports in this sector include electronics goods. India is a fast-growing smartphone manufacturing market due to incentives for smartphone companies to set up factories in the market. It is targeting USD100 billion in mobile phones and USD40 billion in component exports by 2025.
11% forecasted share of exports in 20308.5% 2020-2030 CAGRMachinery &
Electricals
Metals and minerals India exports refined petroleum and iron. Growth in exports will be driven by the growing urbanisation across Asia which is increasing the need for infrastructure investment. To capture some of this demand, the Indian government plans to unlock additional domestic resources.
35% forecasted share of exports in 20307.5% 2020-2030 CAGRMetals & Minerals
Chemicals and pharmaceuticals India is a leading global exporter of generic drugs and vaccines. Future exports growth will be driven by the growing global demand and the government’s aim to boost the capacity of domestic production for key bulk drugs/active pharmaceutical ingredients (API) and high-value products.
13% forecasted share of exports in 20305.9% 2020-2030 CAGRChemicals &
Pharmaceuticals
Singapore and Hong Kong are regional trade hubs and strategic corridors for India, projected to grow at average of 8.4 per cent and 6.6 per cent per year until 2030, respectively
The USA will continue to be the largest export corridor, accounting for 17 per cent of total exports in 2030
GermanyUSD 14 billion6.4%
Hong KongUSD 18 billion6.6%
BangladeshUSD 17 billion8.1%
NetherlandsUSD 12 billion6.3%
NepalUSD 20 billion12.8%
MalaysiaUSD 15 billion9.5%
United Arab EmiratesUSD 35 billion6.7%
SingaporeUSD 19 billion8.4%
Mainland ChinaUSD 43 billion8.5%
United StatesUSD 93 billion6.6%
United KingdomUSD 13 billion5.5%
Export CAGR Rate (2020-2030)
Selected corridors Export value in 2030

182 Future of Trade 2030 183182 183Corridors of the future | South Asia — India
India-to-Hong Kongtrade corridor
Hong Kong is a strategic and growing export corridor for India due to their strengthening economic and trade ties
Strategic corridor
2019 Trade Openness Rank (out of 141)
#2
2020 2030 forecasted
The data is for trade of goods only
~2 times growth in trade by 2030
2020-2030 GDP growth (per annum)
2020-2030 Global imports growth (per annum)
1.9%
5.9%
India to Hong Kong export value growth forecast
6.6%
Exports growth per annum
2030 forecasted
USD 18.1 billion exports
2020
USD 9.6 billion exports
Why Hong Kong? India’s exports to Hong Kong are driven by Hong Kong’s status as a transhipment hub, strengthening economic ties, and India’s business and start-up expansion in Hong Kong
A transhipment hubHong Kong is a major hub for merchandise trade between India and Mainland China. Due to its status as an entrepôt for goods, total exports between Mainland China’s and India’s markets through Hong Kong amounted to USD10 billion in 2020.
Strengthening economic tiesIndia and Hong Kong signed a Double Taxation Avoidance Agreement in 2018. In addition to prevention of double taxation, the agreementstimulates flow of investment, technology, and personnel. It gives financial incentives for both markets to work together and increase trade.
Business and start-up expansionsHong Kong is supporting Indian businesses from a diverse range of sectors, such as technology,financial services, and retail, to expand into the market. Also, many Indian start-ups are expanding in the Chinese market. Hong Kong is emerging as a gateway for start-ups andcompanies looking to enter the Mainland China market.
1. Currently or planning to source/manufacture in India. Total of 194 respondents for this source location. 2. Total of 52 respondents for this corridor.
of corporates1 plan to be in the India to Hong Kong corridor
of corporates2 anticipate between 5-10% annual revenue growth of exports to Hong Kong over the next 10 years
27%
37%
of corporates2 identify attractive consumer demographics as a key growth driver of exports to Hong Kong
of corporates2 identify bilateral and regional trade agreements as a key growth driver of exports to Hong Kong
35%
25%
consumer demographic
trade agreement
plan to be in corridor
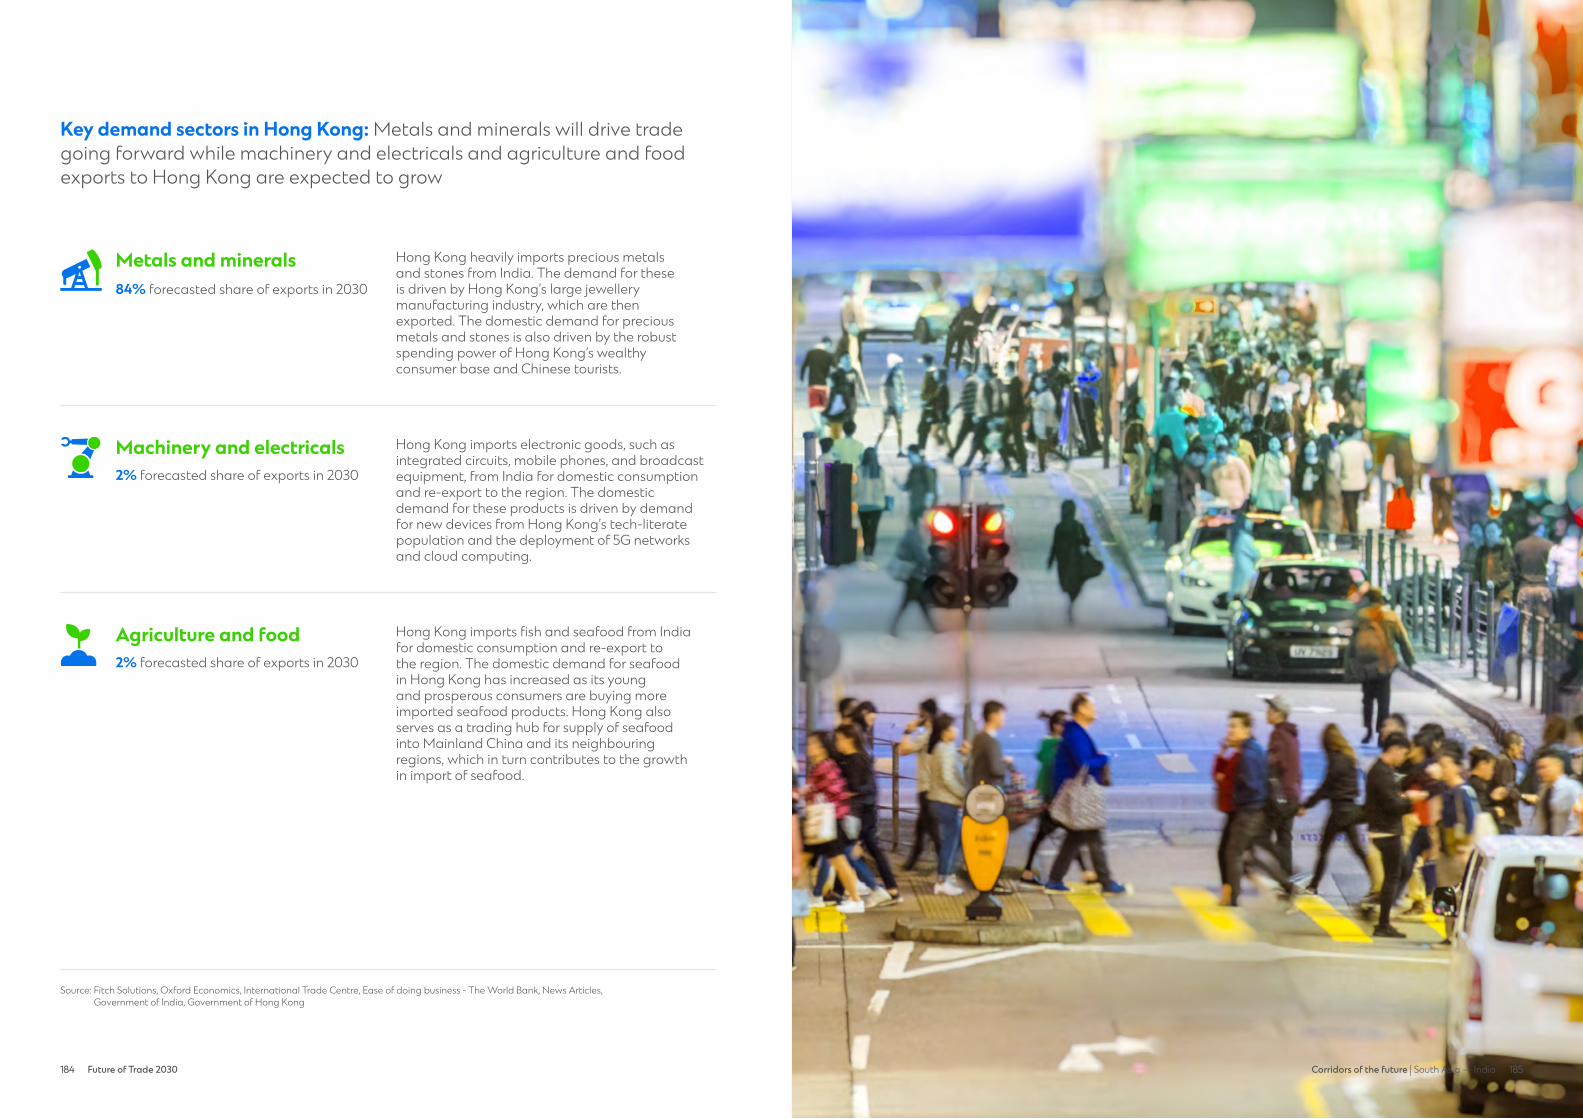
184 Future of Trade 2030 185184 185Corridors of the future | South Asia — India
Key demand sectors in Hong Kong: Metals and minerals will drive trade going forward while machinery and electricals and agriculture and food exports to Hong Kong are expected to grow
Source: Fitch Solutions, Oxford Economics, International Trade Centre, Ease of doing business - The World Bank, News Articles, Government of India, Government of Hong Kong
Hong Kong imports electronic goods, such as integrated circuits, mobile phones, and broadcast equipment, from India for domestic consumption and re-export to the region. The domestic demand for these products is driven by demand for new devices from Hong Kong’s tech-literate population and the deployment of 5G networks and cloud computing.
Machinery & Electricals
Hong Kong heavily imports precious metals and stones from India. The demand for these is driven by Hong Kong’s large jewellery manufacturing industry, which are then exported. The domestic demand for precious metals and stones is also driven by the robust spending power of Hong Kong’s wealthy consumer base and Chinese tourists.
Metals & Minerals
Hong Kong imports fish and seafood from India for domestic consumption and re-export to the region. The domestic demand for seafood in Hong Kong has increased as its young and prosperous consumers are buying more imported seafood products. Hong Kong also serves as a trading hub for supply of seafood into Mainland China and its neighbouring regions, which in turn contributes to the growth in import of seafood.
Agriculture & Food
Metals and minerals84% forecasted share of exports in 2030
Agriculture and food2% forecasted share of exports in 2030
Machinery and electricals2% forecasted share of exports in 2030
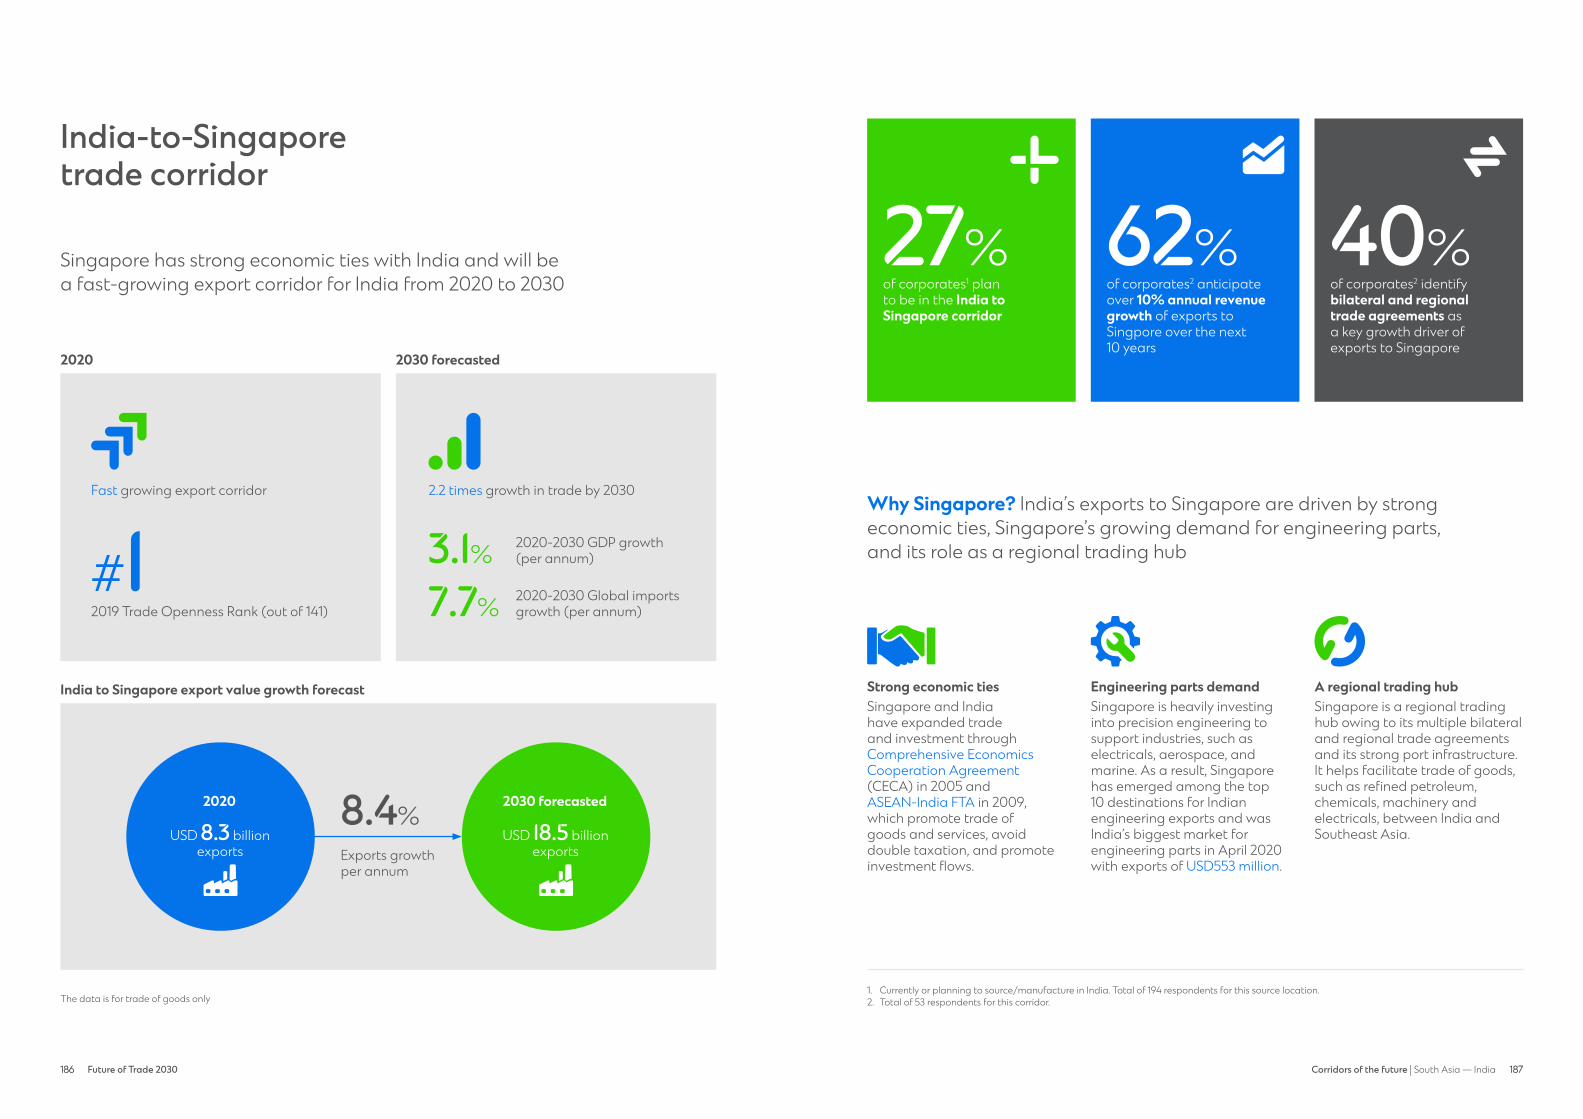
186 Future of Trade 2030 187186 187Corridors of the future | South Asia — India
India-to-Singaporetrade corridor
Singapore has strong economic ties with India and will be a fast-growing export corridor for India from 2020 to 2030
Fast growing export corridor
2019 Trade Openness Rank (out of 141)
#1
2020 2030 forecasted
The data is for trade of goods only
2.2 times growth in trade by 2030
2020-2030 GDP growth (per annum)
2020-2030 Global imports growth (per annum)
3.1%
7.7%
India to Singapore export value growth forecast
8.4%
Exports growth per annum
2030 forecasted
USD 18.5 billion exports
2020
USD 8.3 billion exports
of corporates1 plan to be in the India to Singapore corridor
of corporates2 anticipate over 10% annual revenue growth of exports to Singpore over the next 10 years
of corporates2 identify bilateral and regionaltrade agreements as a key growth driver of exports to Singapore
27% 62% 40%
Why Singapore? India’s exports to Singapore are driven by strong economic ties, Singapore’s growing demand for engineering parts, and its role as a regional trading hub
Strong economic tiesSingapore and India have expanded trade and investment through Comprehensive Economics Cooperation Agreement (CECA) in 2005 and ASEAN-India FTA in 2009, which promote trade of goods and services, avoid double taxation, and promote investment flows.
Engineering parts demandSingapore is heavily investing into precision engineering to support industries, such as electricals, aerospace, and marine. As a result, Singapore has emerged among the top 10 destinations for Indian engineering exports and was India’s biggest market for engineering parts in April 2020 with exports of USD553 million.
A regional trading hubSingapore is a regional trading hub owing to its multiple bilateral and regional trade agreements and its strong port infrastructure. It helps facilitate trade of goods, such as refined petroleum, chemicals, machinery and electricals, between India and Southeast Asia.
1. Currently or planning to source/manufacture in India. Total of 194 respondents for this source location. 2. Total of 53 respondents for this corridor.
trade agreementplan to be in
corridor
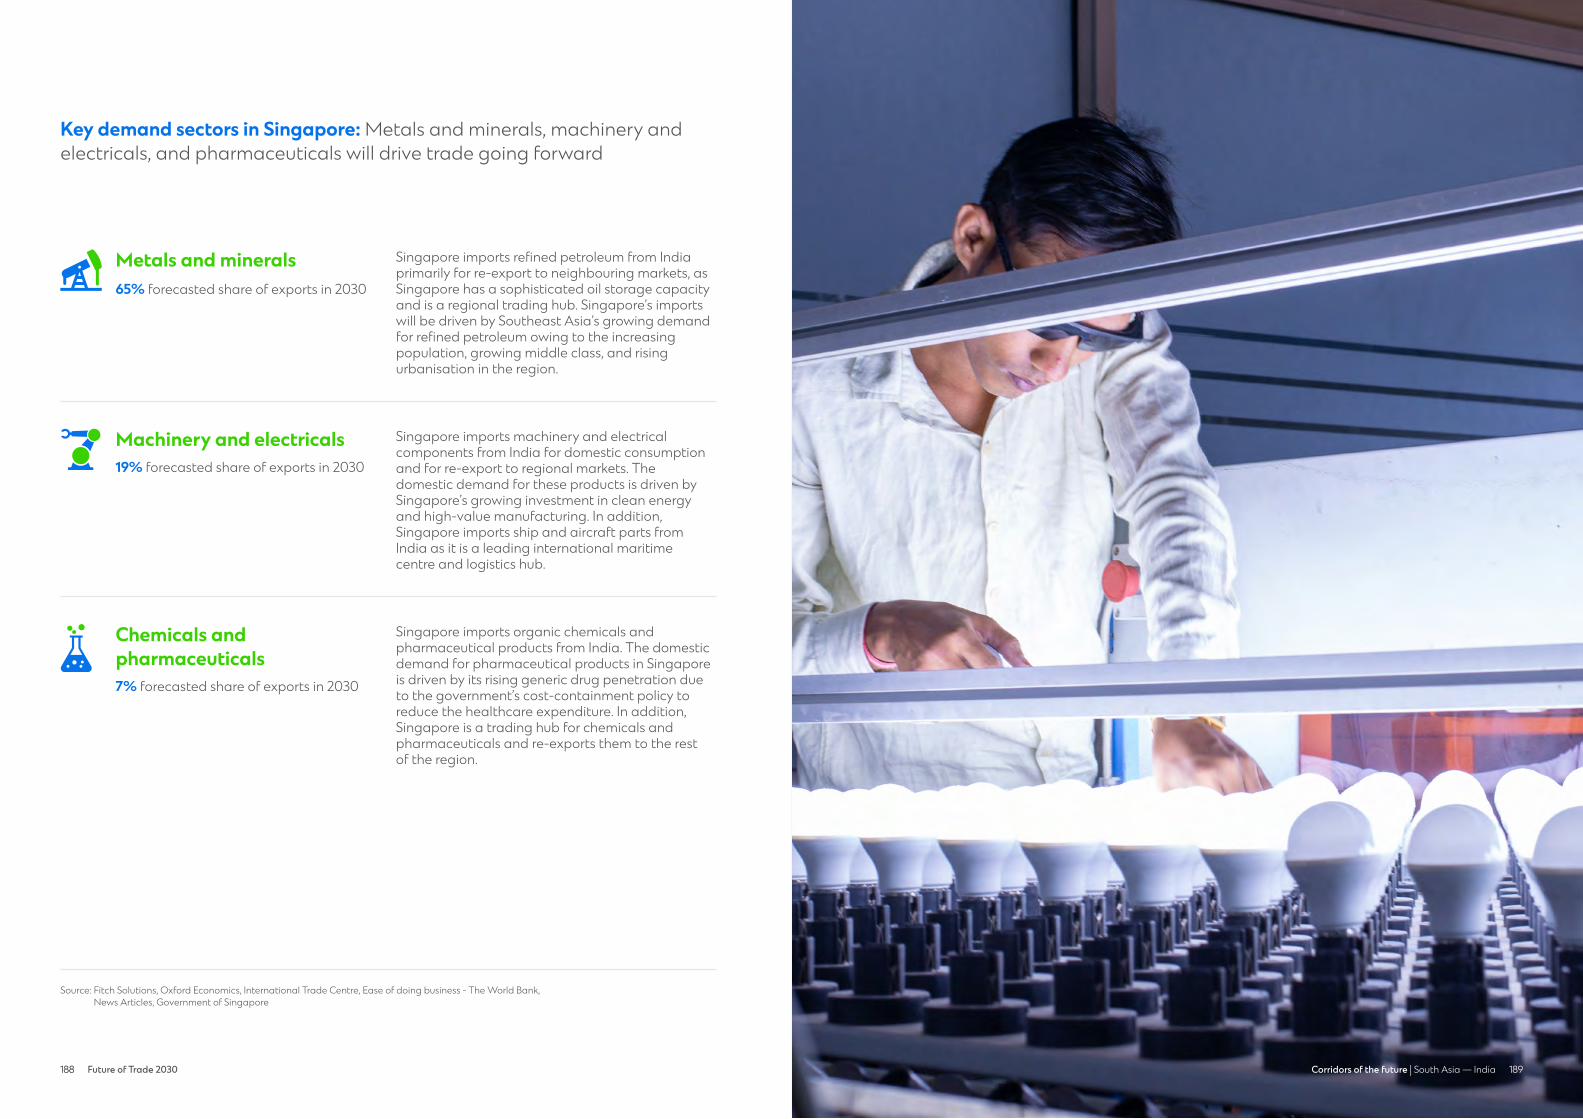
188 Future of Trade 2030 189188 189Corridors of the future | South Asia — India
Key demand sectors in Singapore: Metals and minerals, machinery and electricals, and pharmaceuticals will drive trade going forward
Source: Fitch Solutions, Oxford Economics, International Trade Centre, Ease of doing business - The World Bank, News Articles, Government of Singapore
Singapore imports machinery and electrical components from India for domestic consumption and for re-export to regional markets. The domestic demand for these products is driven by Singapore’s growing investment in clean energy and high-value manufacturing. In addition, Singapore imports ship and aircraft parts from India as it is a leading international maritime centre and logistics hub.
Machinery & Electricals
Singapore imports organic chemicals and pharmaceutical products from India. The domestic demand for pharmaceutical products in Singapore is driven by its rising generic drug penetration due to the government’s cost-containment policy to reduce the healthcare expenditure. In addition, Singapore is a trading hub for chemicals and pharmaceuticals and re-exports them to the rest of the region.
Chemicals & Pharmaceuticals
Singapore imports refined petroleum from India primarily for re-export to neighbouring markets, as Singapore has a sophisticated oil storage capacity and is a regional trading hub. Singapore’s imports will be driven by Southeast Asia’s growing demand for refined petroleum owing to the increasing population, growing middle class, and rising urbanisation in the region.
Metals & Minerals
Metals and minerals65% forecasted share of exports in 2030
Machinery and electricals19% forecasted share of exports in 2030
Chemicals and pharmaceuticals7% forecasted share of exports in 2030

190 Future of Trade 2030 191190 191Corridors of the future | South Asia — India
India-to-USAtrade corridor
The USA will continue to be the largest export corridorfor India from 2020 to 2030
Largest export corridor
2019 Trade Openness Rank (out of 141)
#14#1
2020 2030 forecasted
The data is for trade of goods only
~2 times growth in trade by 2030
2020-2030 GDP growth (per annum)
of corporates1 plan to be in the India to the USA corridor
of corporates2 anticipate between 5-10% annual revenue growth of exports to the USA over the next 10 years
2020-2030 Global imports growth (per annum)
2.4%
26%
39%
5.9%
India to USA export value growth forecast
6.6%
Exports growth per annum
Why the USA? India’s exports to the USA are driven by the USA’s robust consumer demand, e-commerce growth, and strong bilateral relations
Robust consumer demandThe USA has a large consumer base with a robust demand. The market leads global consumer spending with total household spending expected to reach USD17.9 trillion by 2025 (4.5 per cent annual growth from 2021). This will continue to drive the demand for goods and services across sectors.
E-commerce growthThe USA is the second largest market for e-commerce with a revenue of USD432 billion in 2020. The e-commerce growth is allowing SMEs in India to sell their products directly to American consumers through online marketplaces such as eBay and Amazon.
Strong bilateral relationsIndia and the USA are strengthening bilateralrelations into a Comprehensive Global Strategic Partnership. This bilateral cooperation is based on increasing convergence interests covering multiple sectors including trade and investment, high-technology, clean energy, and health.
1. Currently or planning to source/manufacture in India. Total of 194 respondents for this source location. 2. Total of 51 respondents for this corridor.
2030 forecasted
USD 93.4 billion exports
2020
USD 49.3 billion exports
of corporates2 identify attractive consumer demographics as a key growth driver of exports to the USA
of corporates2 identify technological advancement as a key growth driver of exports to the USA
27%
22%
consumer demographic
technological advancement
plan to be in corridor

192 Future of Trade 2030 193192 193Corridors of the future | South Asia — India
The USA is India’s biggest importer of pharmaceuticals. Exports from India account for about 40 per cent of the USA’s generic drug supply. The growth in exports from India to the USA will bedriven by the rising generic drugs penetration in the USA due to their lower price compared to branded drugs, patent expiration of blockbuster innovator drugs, an ageing population, and an increasing prevalence of chronic diseases.
Chemicals & Pharmaceuticals
Key demand sectors in the USA: Metals and minerals, textile and apparel, and pharmaceuticals will drive trade going forward
The USA imports significant amounts of precious metals and gems from India. Imports of gold and silver are due to rising investment in bullion, whilst the import of diamonds and gems is driven byrising per capita disposable income, an increasing urban and female workforce population, and growing e-commerce buyers.
Metals & Minerals
Within this sector, the USA imports mainly home textiles from India. Increasing demand for home textiles in the market is driven by a rise in disposable incomes and rapid urbanisation resulting in high standards of living, rising consumer spending on home renovation, and fashion sensitivity toward household furnishings.
Textile & Apparel
Source: Fitch Solutions, Oxford Economics, International Trade Centre, Ease of doing business - The World Bank, News Articles, Government of India
Metals and minerals33% forecasted share of exports in 2030
Textile and apparel18% forecasted share of exports in 2030
Chemicals and pharmaceuticals16% forecasted share of exports in 2030
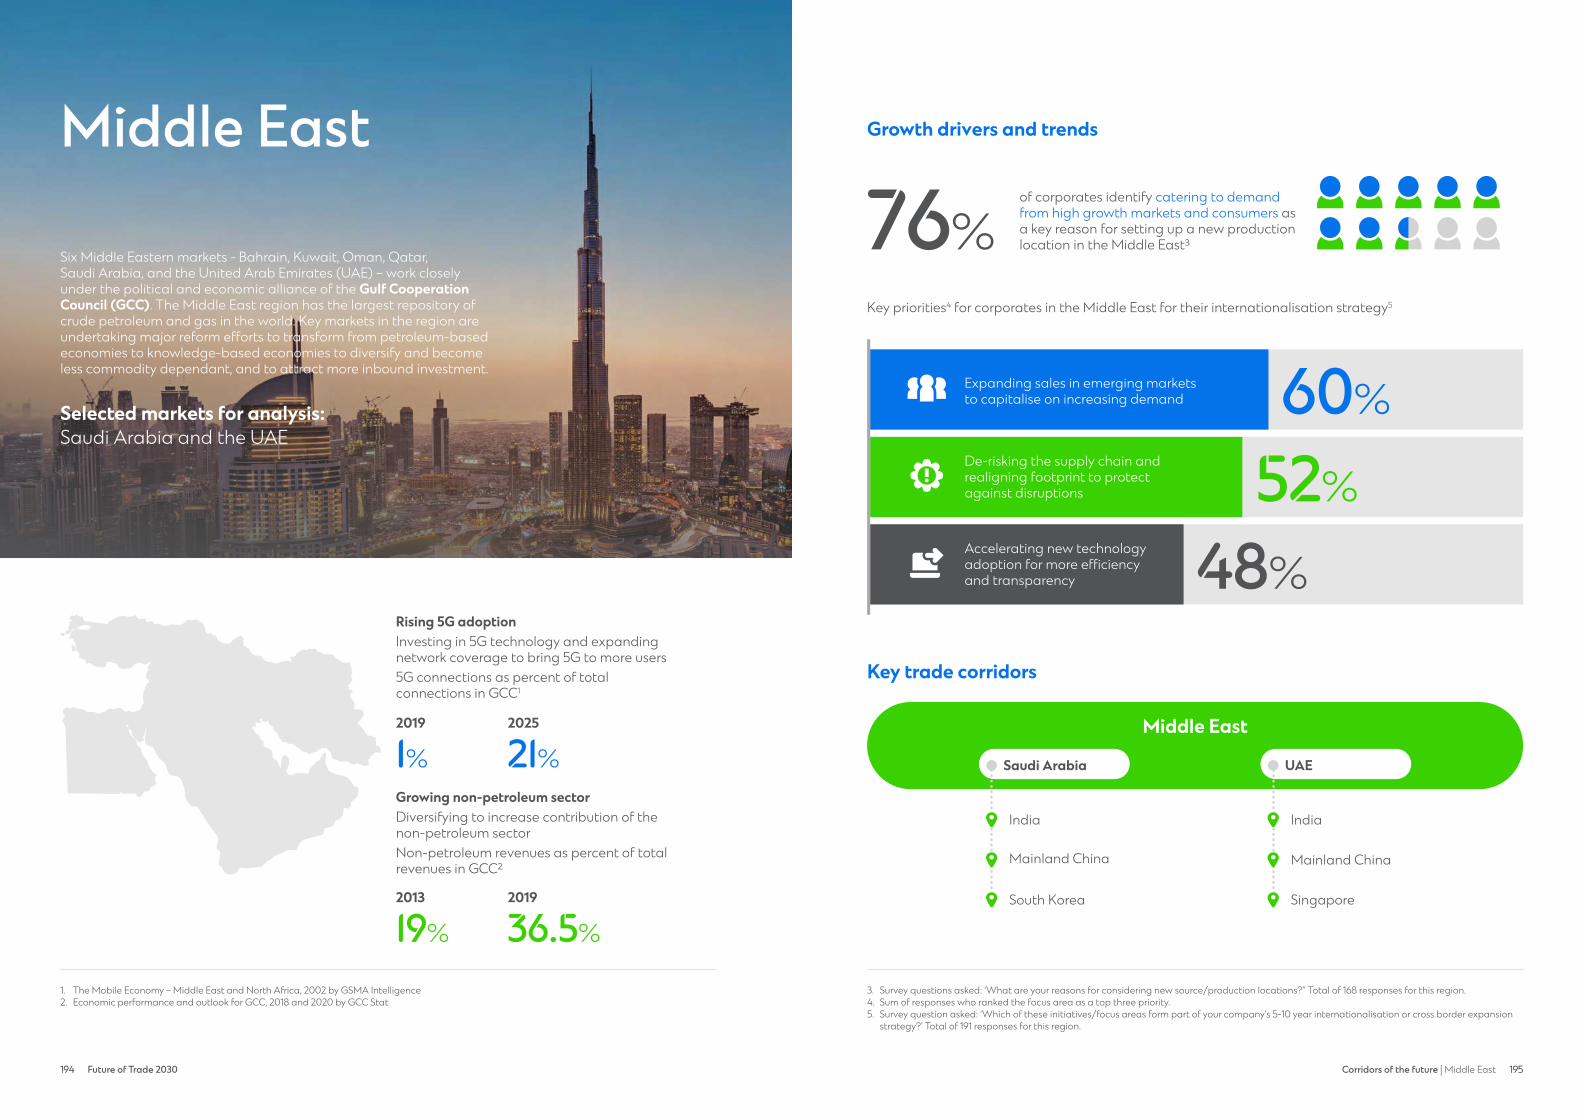
194 Future of Trade 2030 195194 195Corridors of the future | Middle East
Growth drivers and trendsMiddle East
Six Middle Eastern markets - Bahrain, Kuwait, Oman, Qatar, Saudi Arabia, and the United Arab Emirates (UAE) – work closely under the political and economic alliance of the Gulf Cooperation Council (GCC). The Middle East region has the largest repository of crude petroleum and gas in the world. Key markets in the region are undertaking major reform efforts to transform from petroleum-based economies to knowledge-based economies to diversify and become less commodity dependant, and to attract more inbound investment.
Selected markets for analysis: Saudi Arabia and the UAE
Rising 5G adoptionInvesting in 5G technology and expanding network coverage to bring 5G to more users5G connections as percent of total connections in GCC1
2019
2013 2019
2025
Growing non-petroleum sectorDiversifying to increase contribution of the non-petroleum sectorNon-petroleum revenues as percent of total revenues in GCC²
3. Survey questions asked: ‘What are your reasons for considering new source/production locations?” Total of 168 responses for this region.4. Sum of responses who ranked the focus area as a top three priority.5. Survey question asked: ‘Which of these initiatives/focus areas form part of your company’s 5-10 year internationalisation or cross border expansion
strategy?’ Total of 191 responses for this region.
1. The Mobile Economy – Middle East and North Africa, 2002 by GSMA Intelligence2. Economic performance and outlook for GCC, 2018 and 2020 by GCC Stat
1%
19% 36.5%
21%
of corporates identify catering to demand from high growth markets and consumers as a key reason for setting up a new production location in the Middle East³
Key priorities4 for corporates in the Middle East for their internationalisation strategy5
76%
Accelerating new technology adoption for more efficiency and transparency 48%
De-risking the supply chain and realigning footprint to protect against disruptions 52%
Expanding sales in emerging markets to capitalise on increasing demand 60%
Key trade corridors
Middle East
India
Mainland China
South Korea
Saudi Arabia
India
Mainland China
Singapore
UAE
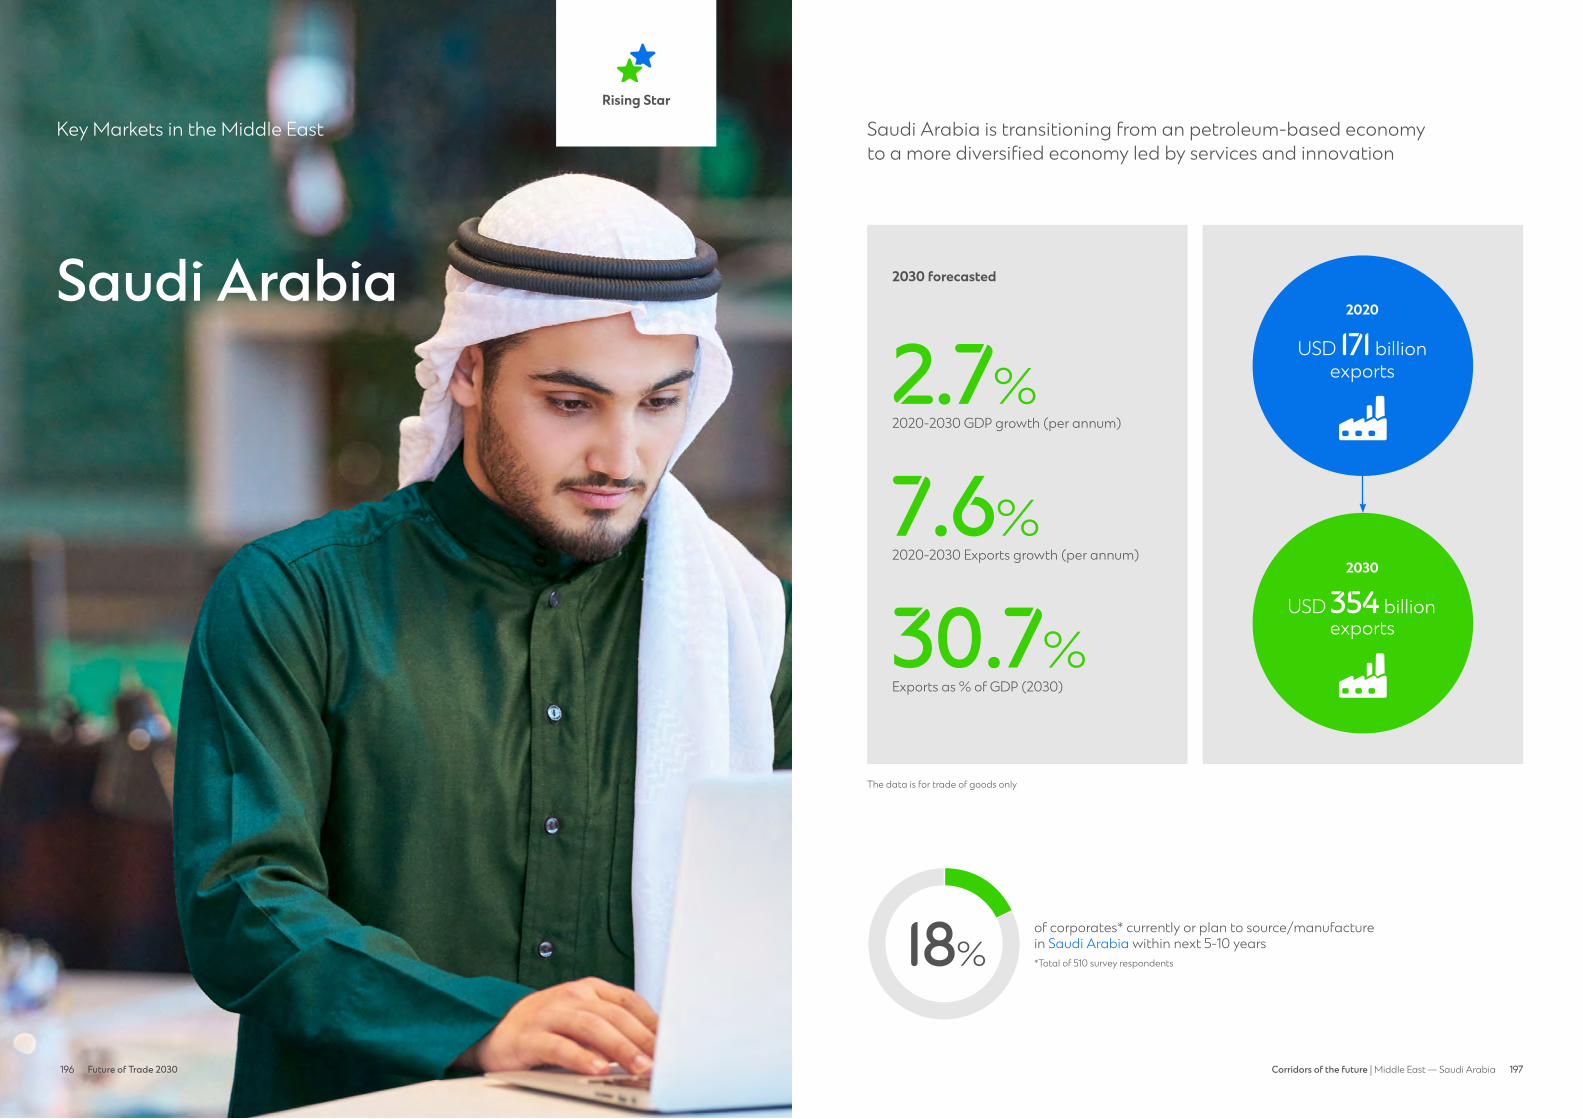
196 Future of Trade 2030 197196 197Corridors of the future | Middle East — Saudi Arabia
Saudi Arabia
Key Markets in the Middle East Saudi Arabia is transitioning from an petroleum-based economy to a more diversified economy led by services and innovation
18%of corporates* currently or plan to source/manufacture in Saudi Arabia within next 5-10 years*Total of 510 survey respondents
The data is for trade of goods only
Rising StarRising Stars
2030 forecasted
2020-2030 GDP growth (per annum)
2.7%
2020-2030 Exports growth (per annum)
7.6%
Exports as % of GDP (2030)
30.7%
2020
USD 171 billion exports
2030
USD 354 billion exports
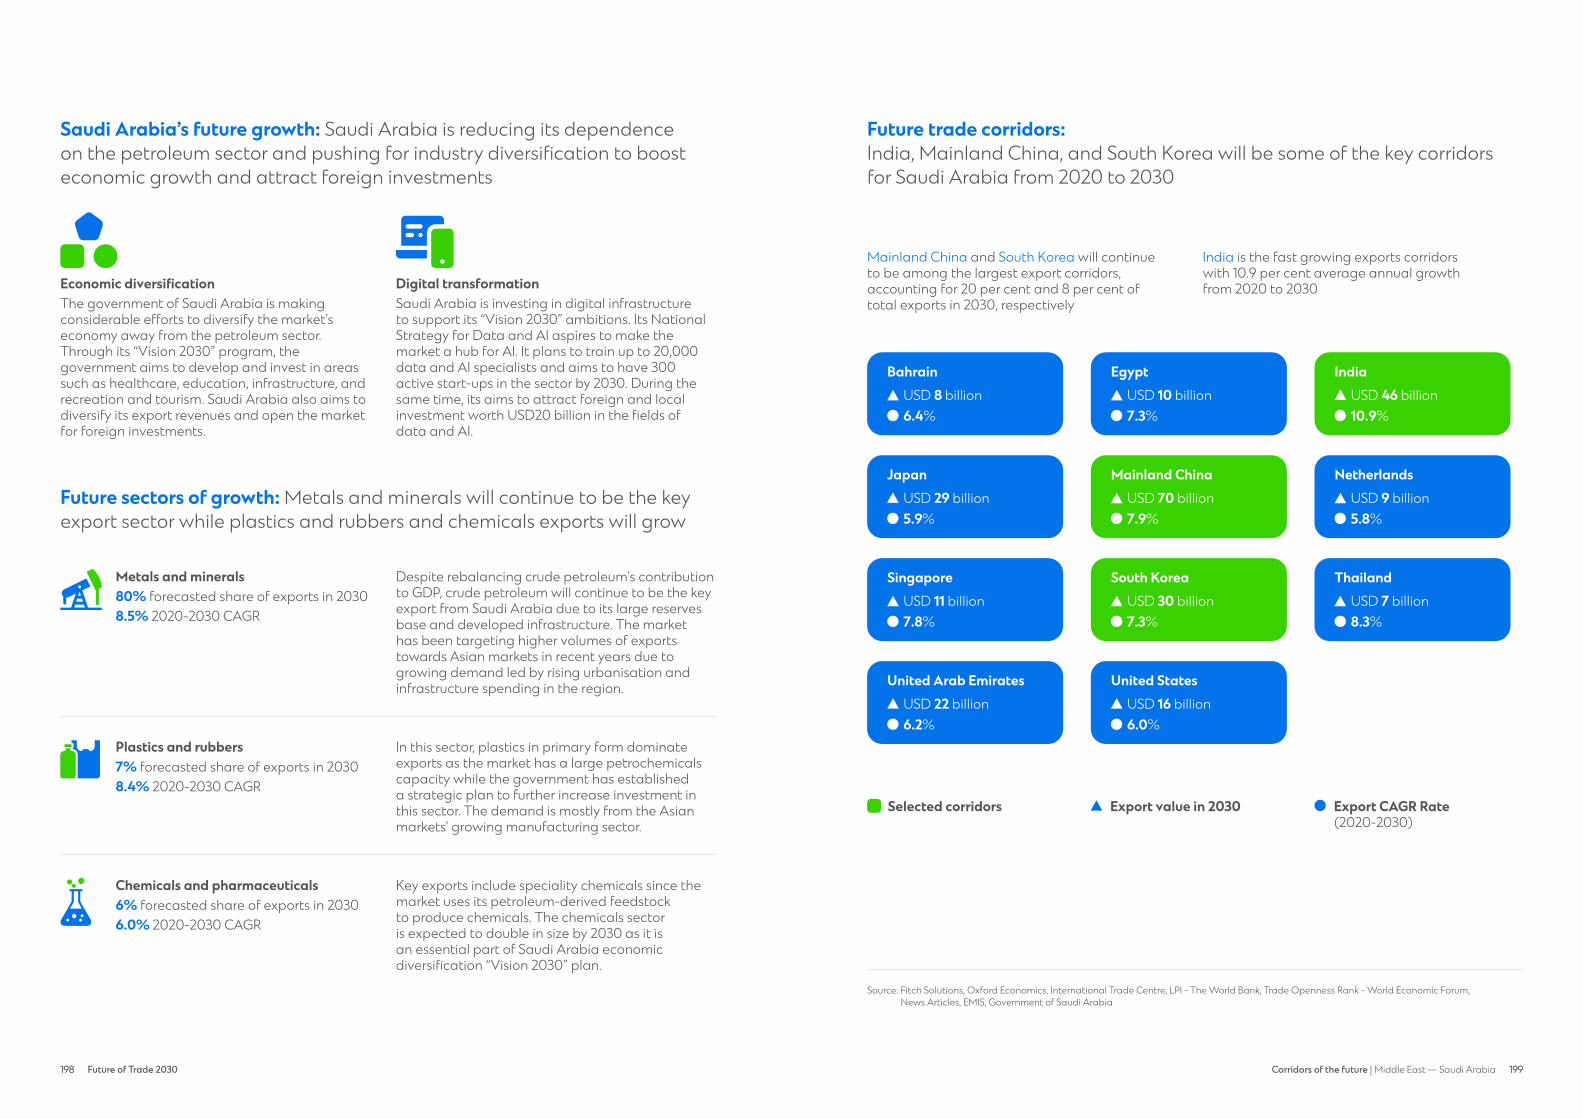
198 Future of Trade 2030 199198 199Corridors of the future | Middle East — Saudi Arabia
Saudi Arabia’s future growth: Saudi Arabia is reducing its dependence on the petroleum sector and pushing for industry diversification to boosteconomic growth and attract foreign investments
Economic diversificationThe government of Saudi Arabia is making considerable efforts to diversify the market’s economy away from the petroleum sector. Through its “Vision 2030” program, the government aims to develop and invest in areas such as healthcare, education, infrastructure, and recreation and tourism. Saudi Arabia also aims to diversify its export revenues and open the market for foreign investments.
Digital transformationSaudi Arabia is investing in digital infrastructure to support its “Vision 2030” ambitions. Its National Strategy for Data and AI aspires to make the market a hub for AI. It plans to train up to 20,000 data and AI specialists and aims to have 300active start-ups in the sector by 2030. During the same time, its aims to attract foreign and local investment worth USD20 billion in the fields of data and AI.
Future sectors of growth: Metals and minerals will continue to be the key export sector while plastics and rubbers and chemicals exports will grow
Future trade corridors: India, Mainland China, and South Korea will be some of the key corridors for Saudi Arabia from 2020 to 2030
Source: Fitch Solutions, Oxford Economics, International Trade Centre, LPI - The World Bank, Trade Openness Rank - World Economic Forum, News Articles, EMIS, Government of Saudi Arabia
Metals and minerals Despite rebalancing crude petroleum’s contribution to GDP, crude petroleum will continue to be the key export from Saudi Arabia due to its large reserves base and developed infrastructure. The market has been targeting higher volumes of exports towards Asian markets in recent years due to growing demand led by rising urbanisation and infrastructure spending in the region.
80% forecasted share of exports in 20308.5% 2020-2030 CAGRMetals & Minerals
Chemicals and pharmaceuticals Key exports include speciality chemicals since themarket uses its petroleum-derived feedstock to produce chemicals. The chemicals sector is expected to double in size by 2030 as it is an essential part of Saudi Arabia economic diversification “Vision 2030” plan.
6% forecasted share of exports in 20306.0% 2020-2030 CAGRChemicals &
Pharmaceuticals
Mainland China and South Korea will continue to be among the largest export corridors, accounting for 20 per cent and 8 per cent of total exports in 2030, respectively
India is the fast growing exports corridors with 10.9 per cent average annual growth from 2020 to 2030
7% forecasted share of exports in 20308.4% 2020-2030 CAGR
Plastics and rubbers In this sector, plastics in primary form dominate exports as the market has a large petrochemicals capacity while the government has established a strategic plan to further increase investment in this sector. The demand is mostly from the Asian markets’ growing manufacturing sector.
Machinery & Electricals
Plastics & Rubbers
EgyptUSD 10 billion7.3%
BahrainUSD 8 billion6.4%
NetherlandsUSD 9 billion5.8%
Mainland ChinaUSD 70 billion7.9%
South KoreaUSD 30 billion7.3%
ThailandUSD 7 billion8.3%
SingaporeUSD 11 billion7.8%
JapanUSD 29 billion5.9%
IndiaUSD 46 billion10.9%
United StatesUSD 16 billion6.0%
United Arab EmiratesUSD 22 billion6.2%
Export CAGR Rate (2020-2030)
Selected corridors Export value in 2030
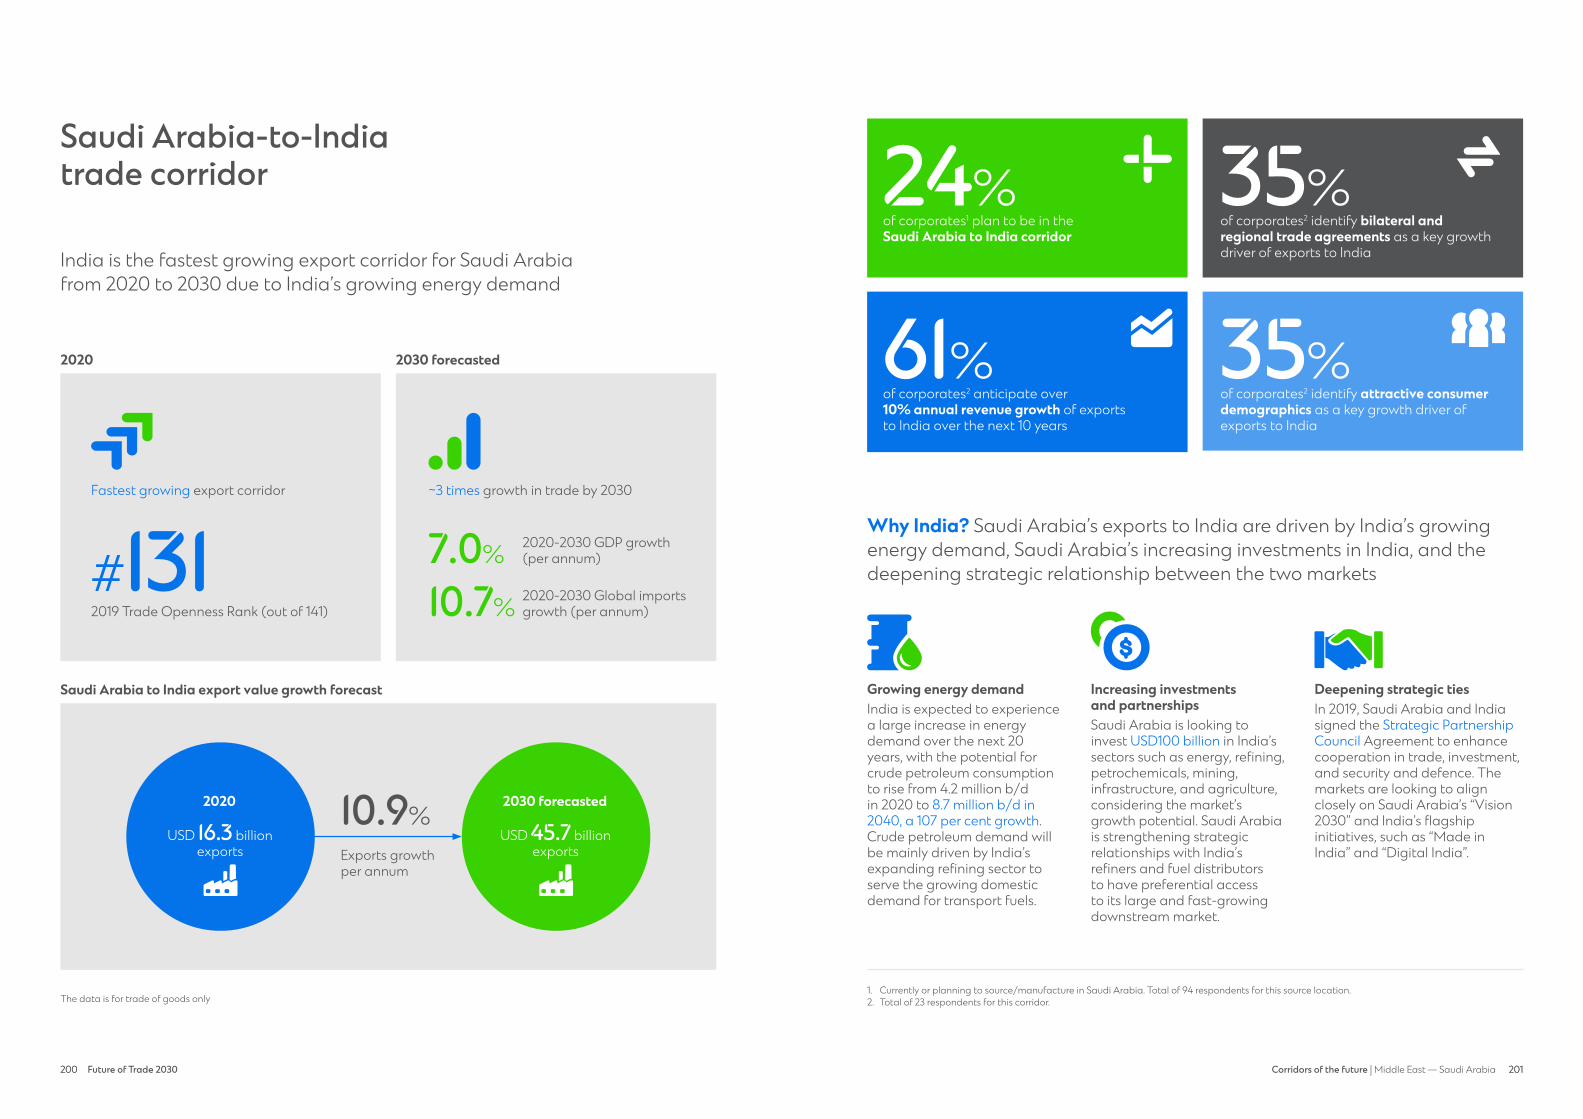
200 Future of Trade 2030 201200 201Corridors of the future | Middle East — Saudi Arabia
of corporates2 identify attractive consumer demographics as a key growth driver of exports to India
35% consumer demographic
Saudi Arabia-to-Indiatrade corridor
India is the fastest growing export corridor for Saudi Arabia from 2020 to 2030 due to India’s growing energy demand
Fastest growing export corridor
2019 Trade Openness Rank (out of 141)
2020 2030 forecasted
The data is for trade of goods only
~3 times growth in trade by 2030
2020-2030 GDP growth (per annum)
2020-2030 Global imports growth (per annum)
7.0%
10.7%
Saudi Arabia to India export value growth forecast
10.9%
Exports growth per annum
2030 forecasted
USD 45.7 billion exports
2020
USD 16.3 billion exports
Why India? Saudi Arabia’s exports to India are driven by India’s growing energy demand, Saudi Arabia’s increasing investments in India, and the deepening strategic relationship between the two markets
Growing energy demandIndia is expected to experience a large increase in energy demand over the next 20 years, with the potential for crude petroleum consumption to rise from 4.2 million b/d in 2020 to 8.7 million b/d in 2040, a 107 per cent growth. Crude petroleum demand will be mainly driven by India’s expanding refining sector to serve the growing domestic demand for transport fuels.
Increasing investmentsand partnershipsSaudi Arabia is looking to invest USD100 billion in India’s sectors such as energy, refining, petrochemicals, mining, infrastructure, and agriculture, considering the market’s growth potential. Saudi Arabia is strengthening strategic relationships with India’s refiners and fuel distributors to have preferential access to its large and fast-growing downstream market.
Deepening strategic tiesIn 2019, Saudi Arabia and India signed the Strategic Partnership Council Agreement to enhance cooperation in trade, investment, and security and defence. The markets are looking to align closely on Saudi Arabia’s “Vision 2030” and India’s flagship initiatives, such as “Made in India” and “Digital India”.
1. Currently or planning to source/manufacture in Saudi Arabia. Total of 94 respondents for this source location. 2. Total of 23 respondents for this corridor.
of corporates1 plan to be in the Saudi Arabia to India corridor
of corporates2 anticipate over 10% annual revenue growth of exports to India over the next 10 years
24%
61%
of corporates2 identify bilateral and regional trade agreements as a key growth driver of exports to India
35% trade agreementplan to be in
corridor
#131
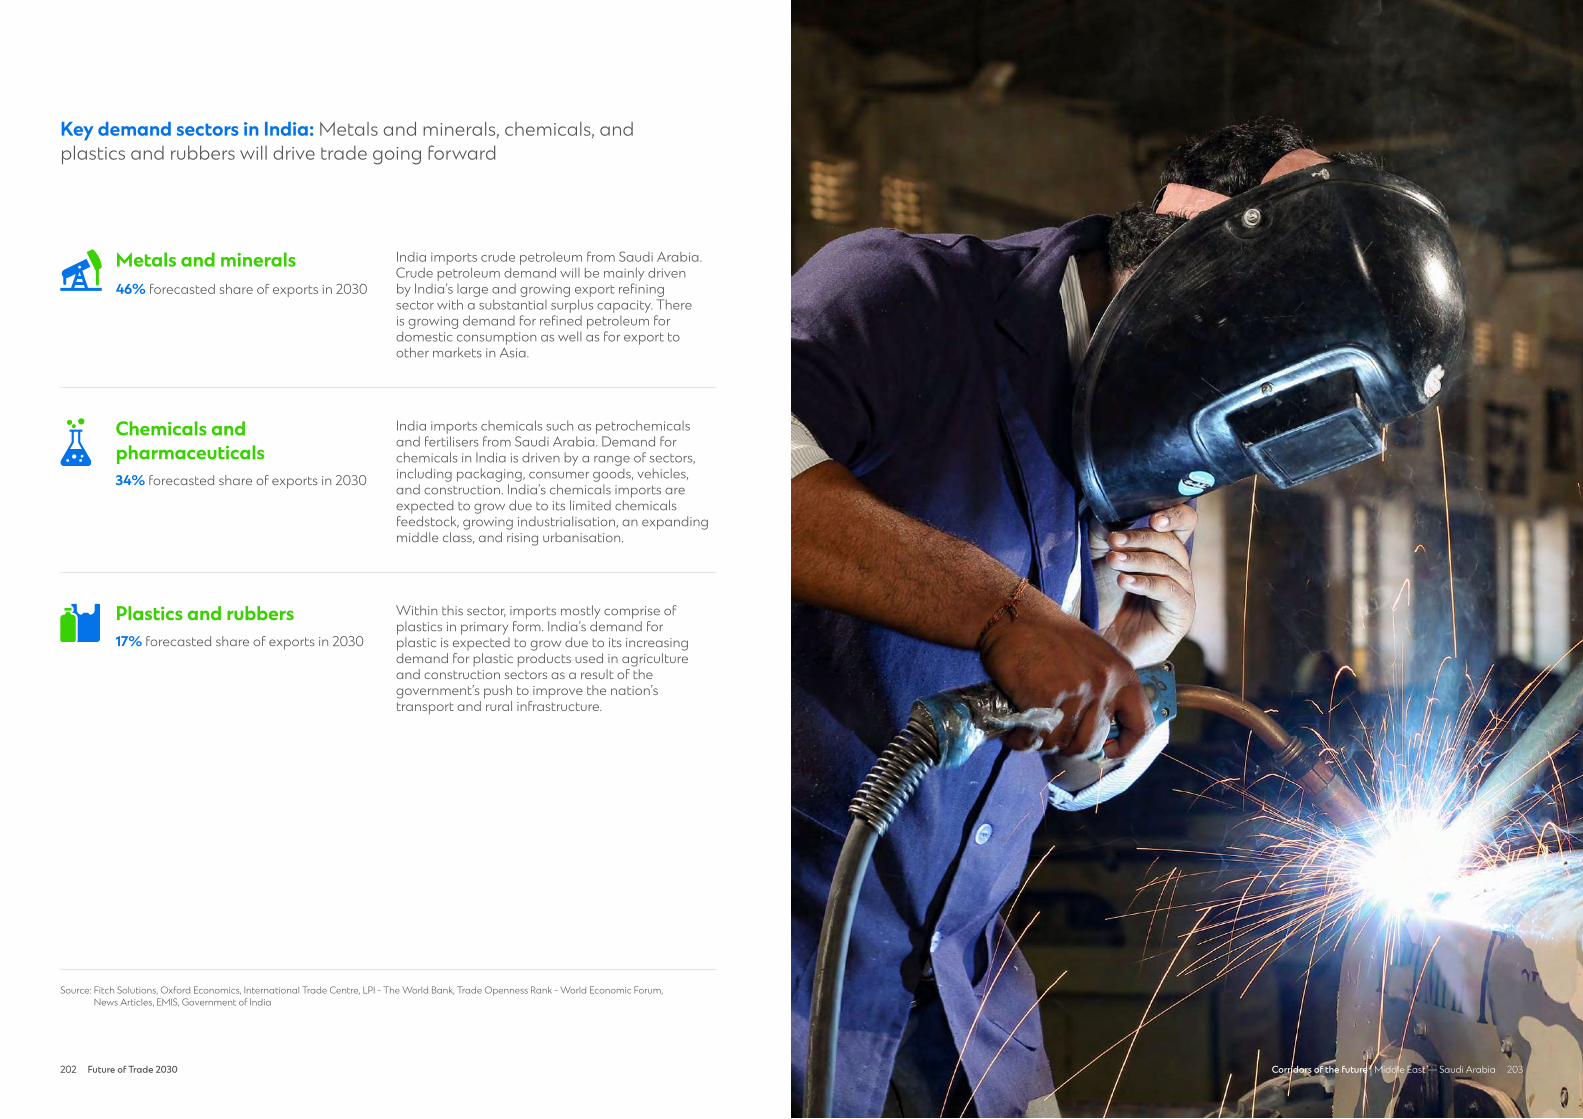
202 Future of Trade 2030 203202 203Corridors of the future | Middle East — Saudi Arabia
Key demand sectors in India: Metals and minerals, chemicals, andplastics and rubbers will drive trade going forward
Source: Fitch Solutions, Oxford Economics, International Trade Centre, LPI - The World Bank, Trade Openness Rank - World Economic Forum, News Articles, EMIS, Government of India
Within this sector, imports mostly comprise of plastics in primary form. India’s demand for plastic is expected to grow due to its increasing demand for plastic products used in agriculture and construction sectors as a result of the government’s push to improve the nation’s transport and rural infrastructure.
Machinery & Electricals
Plastics & Rubbers
India imports crude petroleum from Saudi Arabia. Crude petroleum demand will be mainly driven by India’s large and growing export refining sector with a substantial surplus capacity. There is growing demand for refined petroleum for domestic consumption as well as for export to other markets in Asia.
Metals & Minerals
India imports chemicals such as petrochemicals and fertilisers from Saudi Arabia. Demand for chemicals in India is driven by a range of sectors, including packaging, consumer goods, vehicles,and construction. India’s chemicals imports are expected to grow due to its limited chemicals feedstock, growing industrialisation, an expanding middle class, and rising urbanisation.
Chemicals & Pharmaceuticals
Metals and minerals46% forecasted share of exports in 2030
Plastics and rubbers17% forecasted share of exports in 2030
Chemicals and pharmaceuticals34% forecasted share of exports in 2030
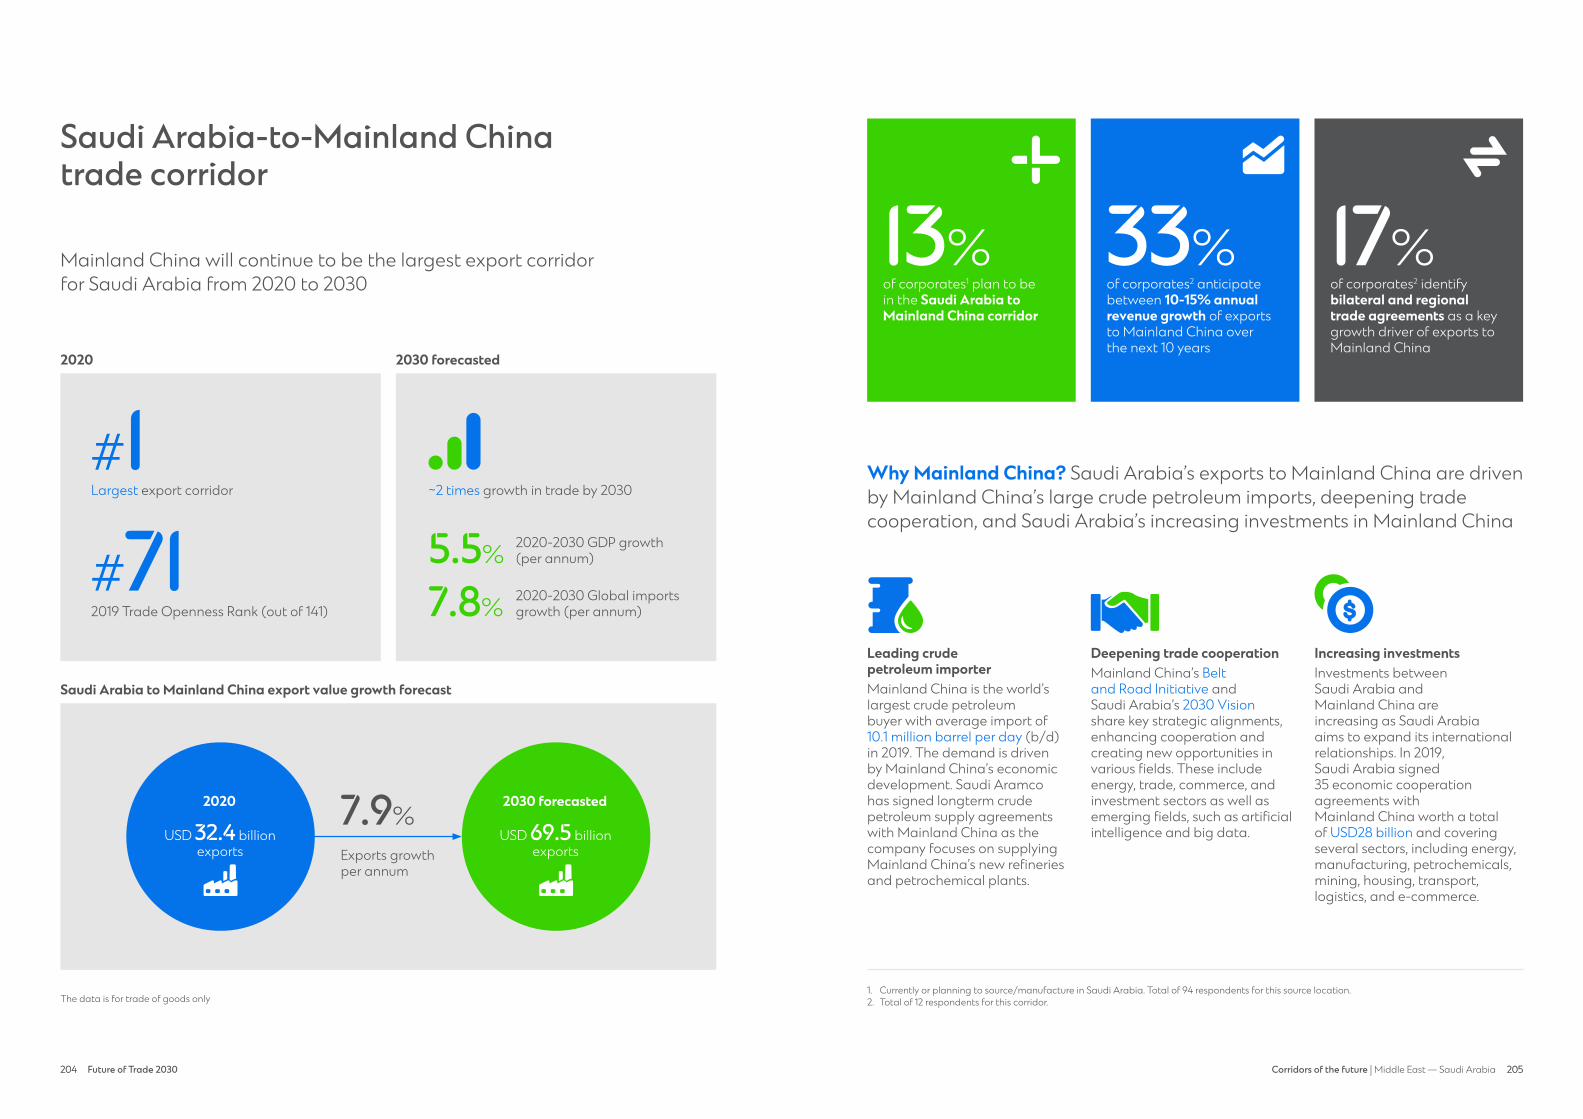
204 Future of Trade 2030 205204 205Corridors of the future | Middle East — Saudi Arabia
Saudi Arabia-to-Mainland Chinatrade corridor
Mainland China will continue to be the largest export corridor for Saudi Arabia from 2020 to 2030
Largest export corridor
2019 Trade Openness Rank (out of 141)
#71#1
2020 2030 forecasted
The data is for trade of goods only
~2 times growth in trade by 2030
2020-2030 GDP growth (per annum)
2020-2030 Global imports growth (per annum)
5.5%
7.8%
Saudi Arabia to Mainland China export value growth forecast
7.9%
Exports growth per annum
2030 forecasted
USD 69.5 billion exports
2020
USD 32.4 billion exports
Why Mainland China? Saudi Arabia’s exports to Mainland China are driven by Mainland China’s large crude petroleum imports, deepening trade cooperation, and Saudi Arabia’s increasing investments in Mainland China
Leading crude petroleum importerMainland China is the world’s largest crude petroleum buyer with average import of 10.1 million barrel per day (b/d)in 2019. The demand is driven by Mainland China’s economic development. Saudi Aramco has signed longterm crude petroleum supply agreements with Mainland China as the company focuses on supplying Mainland China’s new refineries and petrochemical plants.
Deepening trade cooperationMainland China’s Belt and Road Initiative and Saudi Arabia’s 2030 Vision share key strategic alignments, enhancing cooperation and creating new opportunities in various fields. These include energy, trade, commerce, and investment sectors as well as emerging fields, such as artificial intelligence and big data.
Increasing investmentsInvestments between Saudi Arabia and Mainland China are increasing as Saudi Arabia aims to expand its international relationships. In 2019, Saudi Arabia signed 35 economic cooperation agreements with Mainland China worth a total of USD28 billion and covering several sectors, including energy, manufacturing, petrochemicals, mining, housing, transport, logistics, and e-commerce.
1. Currently or planning to source/manufacture in Saudi Arabia. Total of 94 respondents for this source location. 2. Total of 12 respondents for this corridor.
of corporates1 plan to be in the Saudi Arabia to Mainland China corridor
of corporates2 anticipate between 10-15% annual revenue growth of exports to Mainland China over the next 10 years
13% 33%of corporates2 identify bilateral and regional trade agreements as a key growth driver of exports to Mainland China
17%plan to be in
corridor
trade agreement
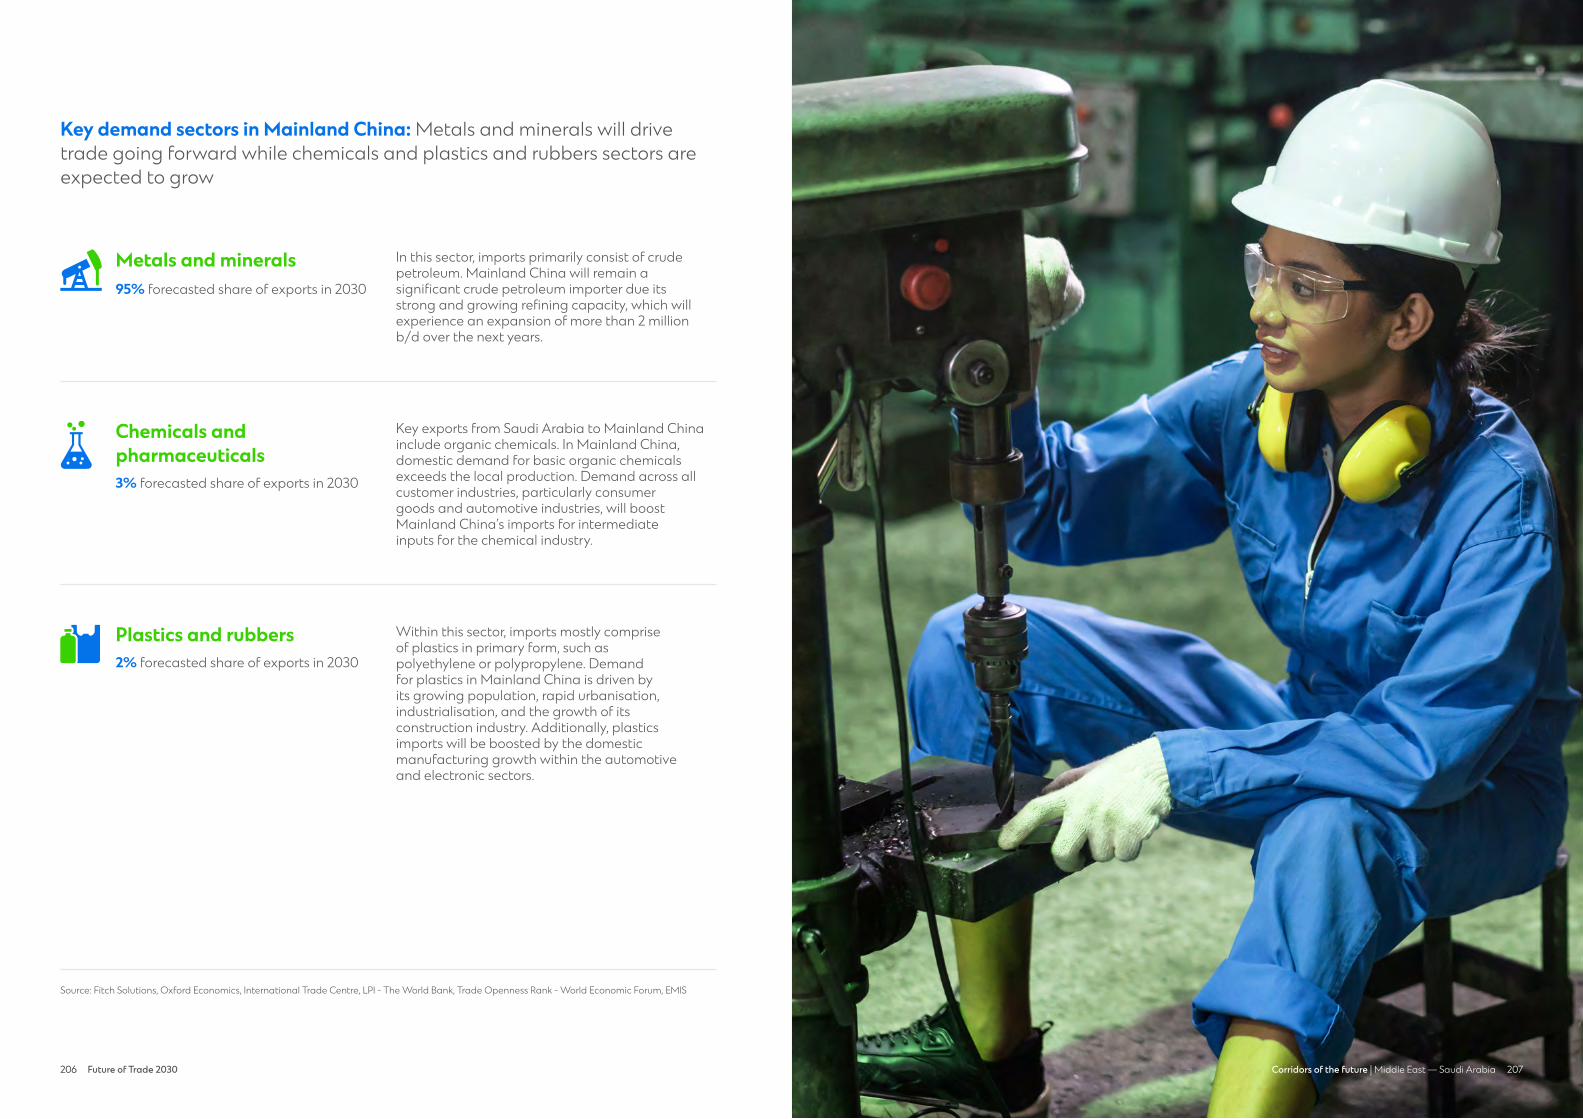
206 Future of Trade 2030 207206 207Corridors of the future | Middle East — Saudi Arabia
Key demand sectors in Mainland China: Metals and minerals will drive trade going forward while chemicals and plastics and rubbers sectors areexpected to grow
Source: Fitch Solutions, Oxford Economics, International Trade Centre, LPI - The World Bank, Trade Openness Rank - World Economic Forum, EMIS
Key exports from Saudi Arabia to Mainland China include organic chemicals. In Mainland China, domestic demand for basic organic chemicals exceeds the local production. Demand across all customer industries, particularly consumer goods and automotive industries, will boost Mainland China’s imports for intermediate inputs for the chemical industry.
Chemicals & Pharmaceuticals
Within this sector, imports mostly comprise of plastics in primary form, such as polyethylene or polypropylene. Demand for plastics in Mainland China is driven by its growing population, rapid urbanisation, industrialisation, and the growth of its construction industry. Additionally, plastics imports will be boosted by the domestic manufacturing growth within the automotive and electronic sectors.
Machinery & Electricals
Plastics & Rubbers
In this sector, imports primarily consist of crude petroleum. Mainland China will remain a significant crude petroleum importer due its strong and growing refining capacity, which will experience an expansion of more than 2 million b/d over the next years.
Metals & Minerals
Metals and minerals95% forecasted share of exports in 2030
Plastics and rubbers2% forecasted share of exports in 2030
Chemicals and pharmaceuticals3% forecasted share of exports in 2030
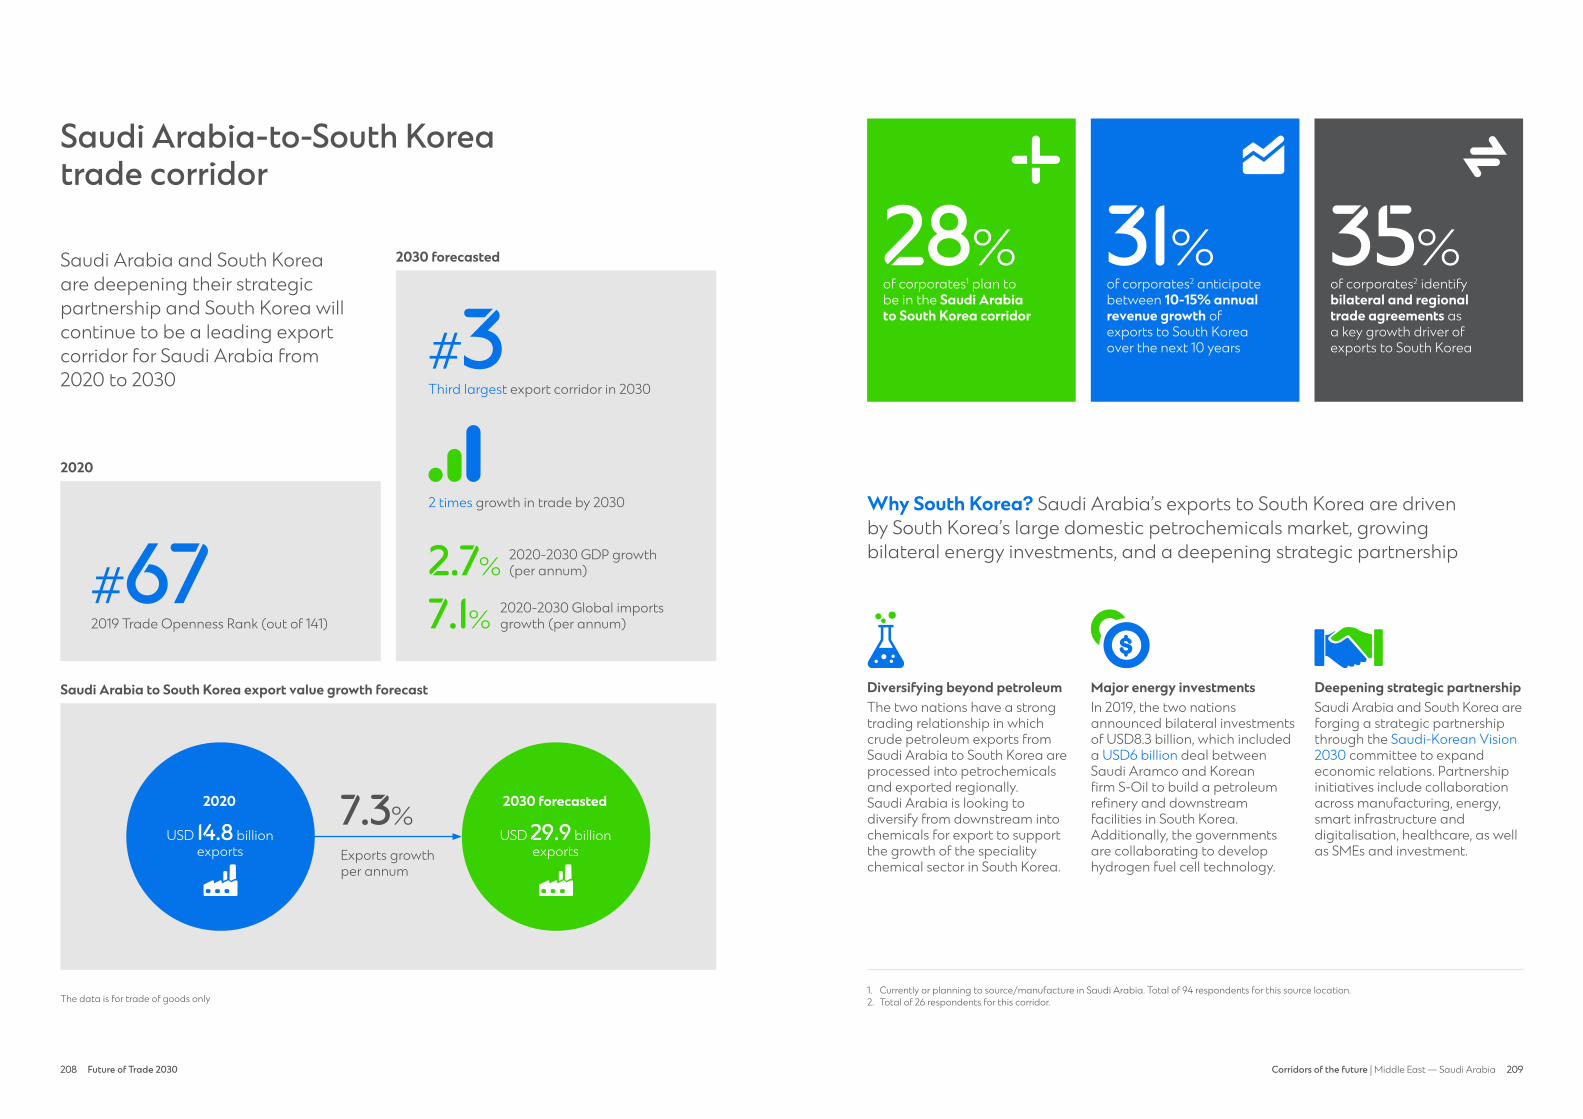
208 Future of Trade 2030 209208 209Corridors of the future | Middle East — Saudi Arabia
Saudi Arabia-to-South Korea trade corridor
Saudi Arabia and South Korea are deepening their strategic partnership and South Korea will continue to be a leading export corridor for Saudi Arabia from 2020 to 2030
The data is for trade of goods only
Saudi Arabia to South Korea export value growth forecast
7.3%
Exports growth per annum
Why South Korea? Saudi Arabia’s exports to South Korea are drivenby South Korea’s large domestic petrochemicals market, growingbilateral energy investments, and a deepening strategic partnership
Diversifying beyond petroleumThe two nations have a strong trading relationship in which crude petroleum exports from Saudi Arabia to South Korea are processed into petrochemicals and exported regionally. Saudi Arabia is looking to diversify from downstream into chemicals for export to support the growth of the speciality chemical sector in South Korea.
Major energy investmentsIn 2019, the two nations announced bilateral investments of USD8.3 billion, which included a USD6 billion deal between Saudi Aramco and Korean firm S-Oil to build a petroleum refinery and downstream facilities in South Korea.Additionally, the governments are collaborating to develop hydrogen fuel cell technology.
Deepening strategic partnershipSaudi Arabia and South Korea are forging a strategic partnership through the Saudi-Korean Vision 2030 committee to expand economic relations. Partnership initiatives include collaboration across manufacturing, energy, smart infrastructure and digitalisation, healthcare, as well as SMEs and investment.
1. Currently or planning to source/manufacture in Saudi Arabia. Total of 94 respondents for this source location. 2. Total of 26 respondents for this corridor.
2030 forecasted
USD 29.9 billion exports
2020
USD 14.8 billion exports
of corporates1 plan to be in the Saudi Arabia to South Korea corridor
of corporates2 anticipate between 10-15% annual revenue growth of exports to South Korea over the next 10 years
of corporates2 identify bilateral and regionaltrade agreements as a key growth driver of exports to South Korea
28% 31% 35%
Chemicals & Pharmaceuticals
Third largest export corridor in 2030
#3
2019 Trade Openness Rank (out of 141)
#672020
2030 forecasted
2 times growth in trade by 2030
2020-2030 GDP growth (per annum)
2020-2030 Global imports growth (per annum)
2.7%
7.1%
plan to be in corridor
trade agreement
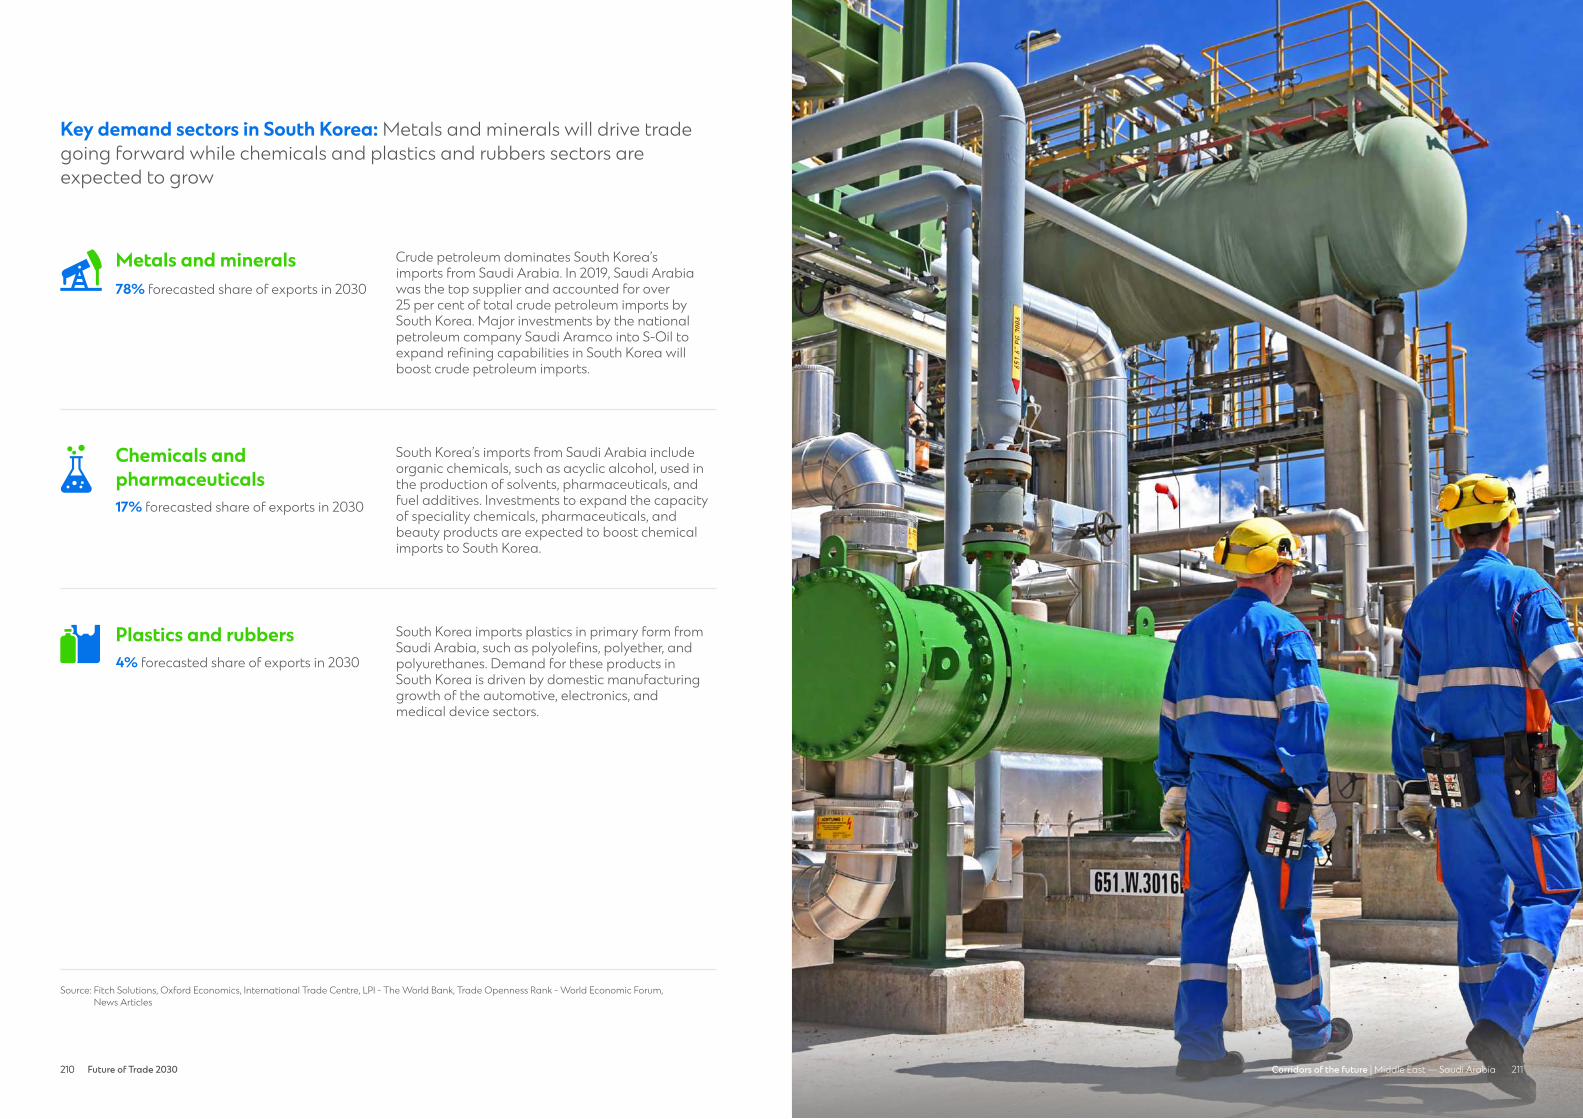
210 Future of Trade 2030 211210 211Corridors of the future | Middle East — Saudi Arabia
Key demand sectors in South Korea: Metals and minerals will drive trade going forward while chemicals and plastics and rubbers sectors are expected to grow
South Korea’s imports from Saudi Arabia include organic chemicals, such as acyclic alcohol, used in the production of solvents, pharmaceuticals, and fuel additives. Investments to expand the capacity of speciality chemicals, pharmaceuticals, and beauty products are expected to boost chemical imports to South Korea.
Chemicals & Pharmaceuticals
South Korea imports plastics in primary form from Saudi Arabia, such as polyolefins, polyether, and polyurethanes. Demand for these products in South Korea is driven by domestic manufacturing growth of the automotive, electronics, and medical device sectors.
Machinery & Electricals
Plastics & Rubbers
Crude petroleum dominates South Korea’s imports from Saudi Arabia. In 2019, Saudi Arabia was the top supplier and accounted for over 25 per cent of total crude petroleum imports by South Korea. Major investments by the national petroleum company Saudi Aramco into S-Oil to expand refining capabilities in South Korea will boost crude petroleum imports.
Metals & Minerals
Source: Fitch Solutions, Oxford Economics, International Trade Centre, LPI - The World Bank, Trade Openness Rank - World Economic Forum, News Articles
Metals and minerals78% forecasted share of exports in 2030
Plastics and rubbers4% forecasted share of exports in 2030
Chemicals and pharmaceuticals17% forecasted share of exports in 2030
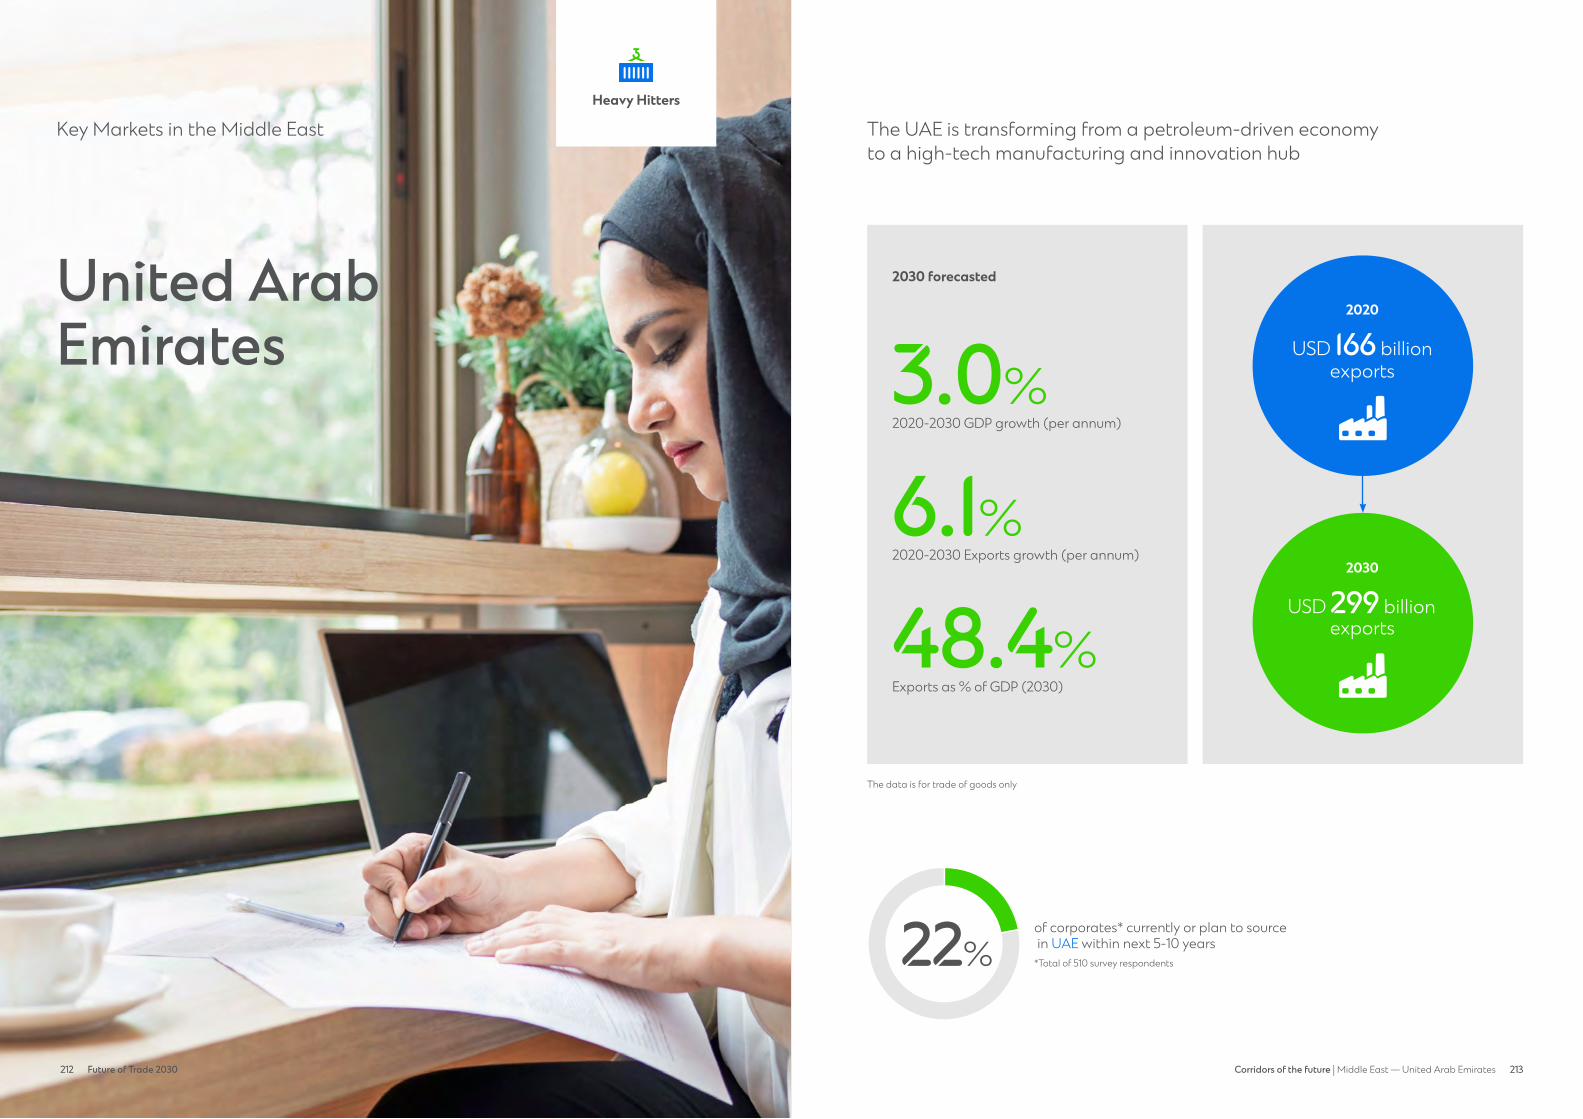
212 Future of Trade 2030 213212 213Corridors of the future | Middle East — United Arab Emirates
United Arab Emirates
Key Markets in the Middle East The UAE is transforming from a petroleum-driven economy to a high-tech manufacturing and innovation hub
22%of corporates* currently or plan to source in UAE within next 5-10 years*Total of 510 survey respondents
The data is for trade of goods only
Heavy HittersHeavy hitters
2030 forecasted
2020-2030 GDP growth (per annum)
3.0%
2020-2030 Exports growth (per annum)
6.1%
Exports as % of GDP (2030)
48.4%
2020
USD 166 billion exports
2030
USD 299 billion exports
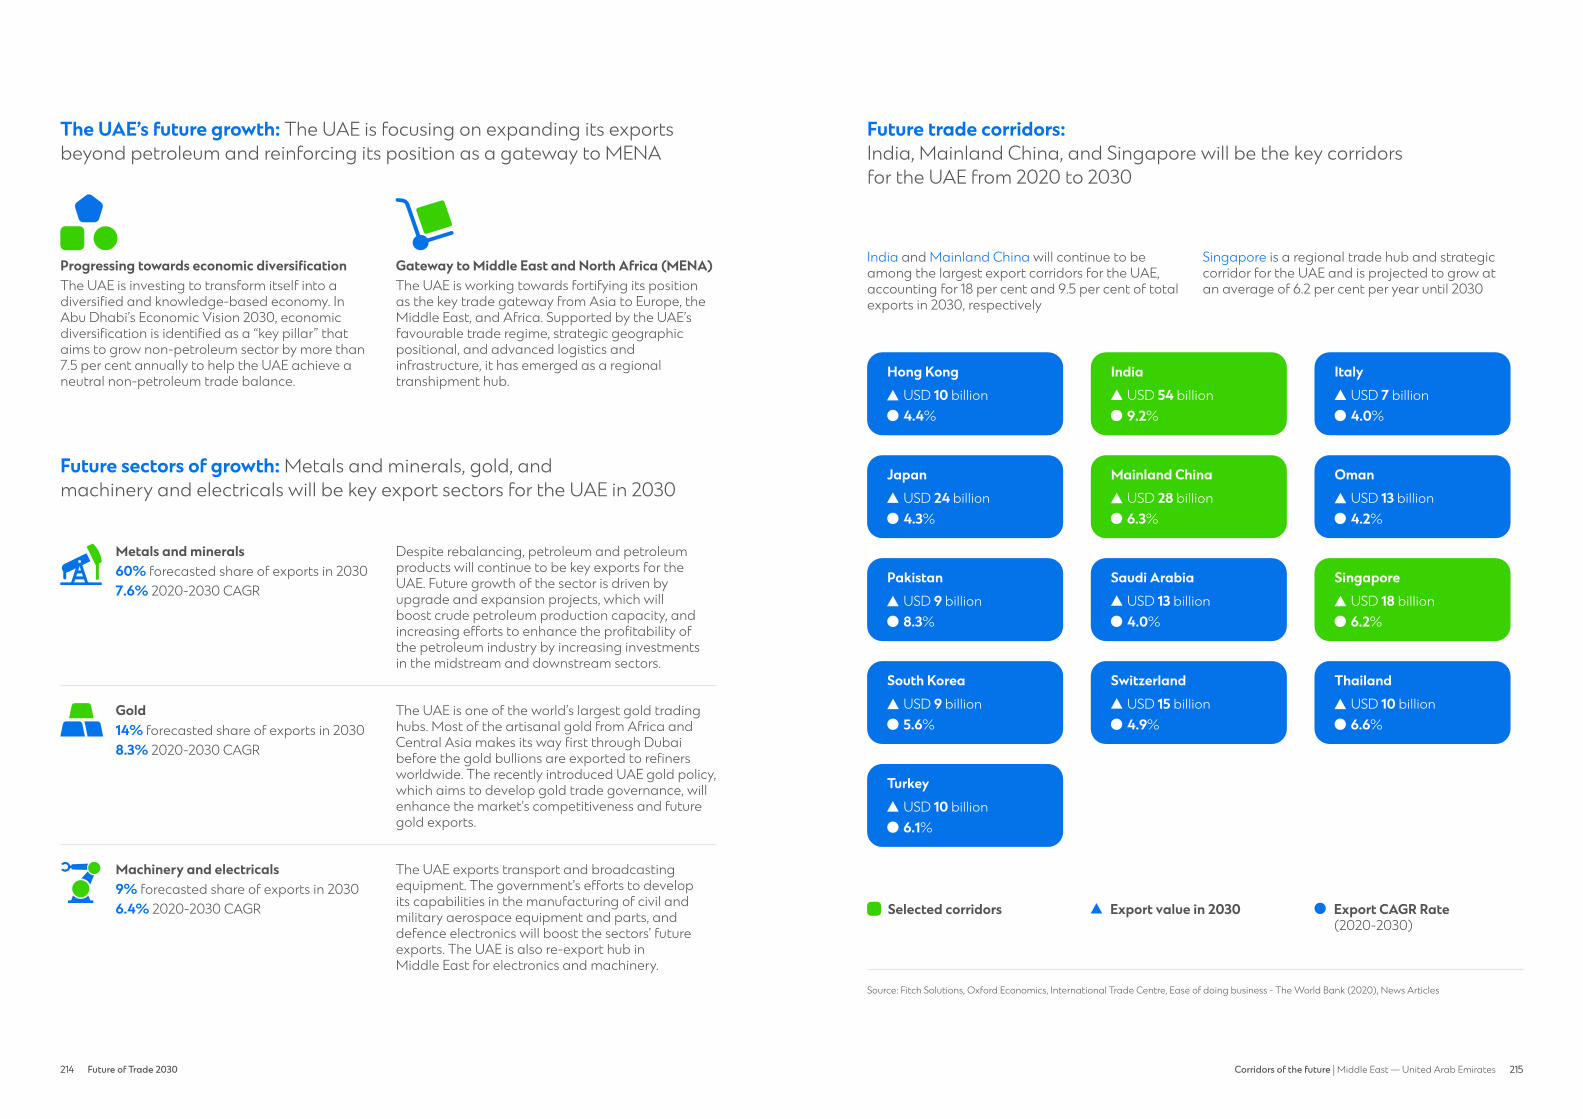
214 Future of Trade 2030 215214 215Corridors of the future | Middle East — United Arab Emirates
The UAE’s future growth: The UAE is focusing on expanding its exportsbeyond petroleum and reinforcing its position as a gateway to MENA
Progressing towards economic diversificationThe UAE is investing to transform itself into a diversified and knowledge-based economy. In Abu Dhabi’s Economic Vision 2030, economic diversification is identified as a “key pillar” that aims to grow non-petroleum sector by more than 7.5 per cent annually to help the UAE achieve a neutral non-petroleum trade balance.
Gateway to Middle East and North Africa (MENA)The UAE is working towards fortifying its position as the key trade gateway from Asia to Europe, the Middle East, and Africa. Supported by the UAE’sfavourable trade regime, strategic geographic positional, and advanced logistics and infrastructure, it has emerged as a regional transhipment hub.
Future sectors of growth: Metals and minerals, gold, and machinery and electricals will be key export sectors for the UAE in 2030
Future trade corridors: India, Mainland China, and Singapore will be the key corridors for the UAE from 2020 to 2030
Source: Fitch Solutions, Oxford Economics, International Trade Centre, Ease of doing business - The World Bank (2020), News Articles
Metals and minerals Despite rebalancing, petroleum and petroleum products will continue to be key exports for the UAE. Future growth of the sector is driven by upgrade and expansion projects, which will boost crude petroleum production capacity, and increasing efforts to enhance the profitability of the petroleum industry by increasing investments in the midstream and downstream sectors.
60% forecasted share of exports in 20307.6% 2020-2030 CAGRMetals & Minerals
India and Mainland China will continue to be among the largest export corridors for the UAE, accounting for 18 per cent and 9.5 per cent of total exports in 2030, respectively
Singapore is a regional trade hub and strategic corridor for the UAE and is projected to grow at an average of 6.2 per cent per year until 2030
Machinery and electricals The UAE exports transport and broadcasting equipment. The government’s efforts to develop its capabilities in the manufacturing of civil and military aerospace equipment and parts, and defence electronics will boost the sectors’ future exports. The UAE is also re-export hub in Middle East for electronics and machinery.
9% forecasted share of exports in 20306.4% 2020-2030 CAGRMachinery &
Electricals
Gold14% forecasted share of exports in 20308.3% 2020-2030 CAGR
The UAE is one of the world’s largest gold trading hubs. Most of the artisanal gold from Africa and Central Asia makes its way first through Dubai before the gold bullions are exported to refiners worldwide. The recently introduced UAE gold policy, which aims to develop gold trade governance, will enhance the market’s competitiveness and future gold exports.
Gold
Hong KongUSD 10 billion4.4%
OmanUSD 13 billion4.2%
PakistanUSD 9 billion8.3%
South KoreaUSD 9 billion5.6%
ThailandUSD 10 billion6.6%
SingaporeUSD 18 billion6.2%
ItalyUSD 7 billion4.0%
JapanUSD 24 billion4.3%
IndiaUSD 54 billion9.2%
Switzerland
Turkey
USD 15 billion
USD 10 billion
4.9%
6.1%
Saudi ArabiaUSD 13 billion4.0%
Mainland ChinaUSD 28 billion6.3%
Export CAGR Rate (2020-2030)
Selected corridors Export value in 2030

216 Future of Trade 2030 217216 217Corridors of the future | Middle East — United Arab Emirates
UAE-to-Indiatrade corridor
India will continue to be the largest export corridor for the UAE due to their well-established trade relations
2019 Trade Openness Rank (out of 141)
#131
2020 2030 forecasted
The data is for trade of goods only
2.4 times growth in trade by 2030
2020-2030 GDP growth (per annum)
2020-2030 Global imports growth (per annum)
7.0%
10.7%
UAE to India export value growth forecast
9.2%
Exports growth per annum
2030 forecasted
USD 54.5 billion exports
2020
USD 22.6 billion exports
Why India? The UAE’s exports to India are driven by India’s growing energy demand, their strong economic ties, and growing investments between the two markets
Growing energy demandIndia is the world’s third-largest energy consumer, underpinned by an expanding economy and population, as well as urbanisation and industrialisation. India’s requirement for natural gas imports is forecasted to more than double by 2030, making India one of the fastest-growing markets for the UAE’s exports.
Strong economic tiesThe UAE and India upgraded their bilateral ties related to the ‘Comprehensive Strategic Partnership’ in 2017 and increased cooperation in areas of trade, energy, defence, and security. Prospects of a free trade agreement between India and the UAE are underway, which will further drive trade between the two markets.
Growing investmentsThe UAE is investing in India to expand in the downstream sectors, particularly petroleumrefining and petrochemicals, to develop a strong partnership with India. Both markets have also expanded their cooperation and investment in sectors such as healthcare, food, and logistics.
1. Currently or planning to source in the UAE. Total of 111 respondents for this source location. 2. Total of 33 respondents for this corridor.
of corporates1 plan to be in the UAE to India corridor
of corporates2 anticipate between 10-15% annual revenue growth of exports to India over the next 10 years
30%
36%
Largest export corridor
#1of corporates2 identify bilateral and regional trade agreements as a key growth driver of exports to India
39% trade agreement
of corporates2 identify attractive consumer demographics as a key growth driver of exports to India
39% consumer demographicplan to be in
corridor

218 Future of Trade 2030 219218 219Corridors of the future | Middle East — United Arab Emirates
Key demand sectors in India: Metals and minerals together with goldwill drive trade going forward
Source: Fitch Solutions, Oxford Economics, International Trade Centre, World Economic Forum, News Articles
Non-metallic mineral manufactures: India, as one of the world’s largest diamond cutting and polishing centres, imports diamonds from the UAE. The signing of The Abraham Accords in 2020 allows Israel-UAE diamond trade agreements and enables the UAE to reinforce itself as a leading diamond trading hub. Based on this, diamond exports to India for polishing are projected to further increase.
Petroleum and petroleum products: India imports crude petroleum and petroleum gases from the UAE. The UAE was India’s third-largest supplier of crude petroleum in 2020. India’s growing dependency on crude petroleum and petroleum gases imports is driven by its energy demand growth. There are growing energy partnerships and investments between the UAE and India, which will pave the way for new export opportunities with India.
Metals & Minerals
India is a leading consumer of gold, and the UAE is India’s second largest source for gold. Underpinned by rising per capita income, local demand for gold is driving the UAE’s gold exports to India. Furthermore, India’s gold import is projected to rise following a 5 per cent cut in import duties and rising local demand.
Gold
Metals and minerals69% forecasted share of exports in 2030
Gold30% forecasted share of exports in 2030
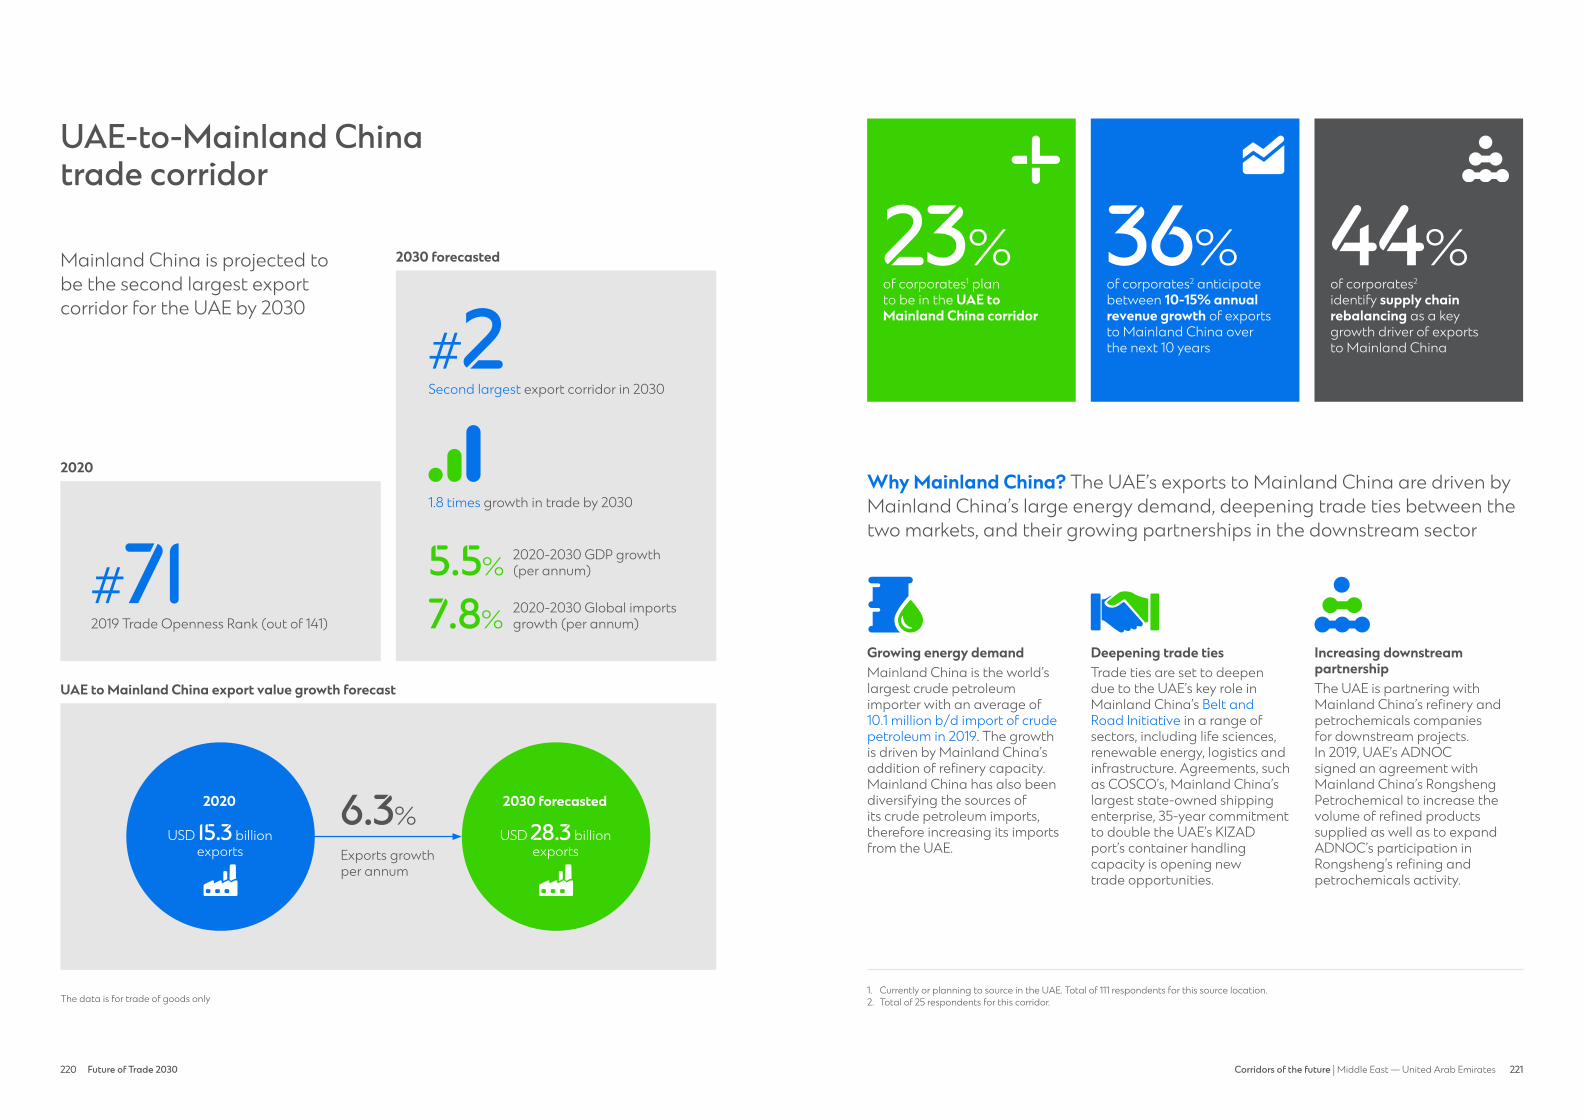
220 Future of Trade 2030 221220 221Corridors of the future | Middle East — United Arab Emirates
UAE-to-Mainland Chinatrade corridor
Mainland China is projected to be the second largest export corridor for the UAE by 2030
Second largest export corridor in 2030
#2
2019 Trade Openness Rank (out of 141)
#712020
2030 forecasted
The data is for trade of goods only
1.8 times growth in trade by 2030
2020-2030 GDP growth (per annum)
2020-2030 Global imports growth (per annum)
5.5%
7.8%
UAE to Mainland China export value growth forecast
6.3%
Exports growth per annum
2030 forecasted
USD 28.3 billion exports
2020
USD 15.3 billion exports
Why Mainland China? The UAE’s exports to Mainland China are driven by Mainland China’s large energy demand, deepening trade ties between the two markets, and their growing partnerships in the downstream sector
Growing energy demandMainland China is the world’s largest crude petroleum importer with an average of 10.1 million b/d import of crude petroleum in 2019. The growth is driven by Mainland China’s addition of refinery capacity. Mainland China has also been diversifying the sources of its crude petroleum imports, therefore increasing its imports from the UAE.
Deepening trade tiesTrade ties are set to deepen due to the UAE’s key role in Mainland China’s Belt and Road Initiative in a range of sectors, including life sciences, renewable energy, logistics and infrastructure. Agreements, such as COSCO’s, Mainland China’s largest state-owned shipping enterprise, 35-year commitment to double the UAE’s KIZAD port’s container handling capacity is opening new trade opportunities.
Increasing downstream partnershipThe UAE is partnering with Mainland China’s refinery and petrochemicals companies for downstream projects. In 2019, UAE’s ADNOC signed an agreement with Mainland China’s Rongsheng Petrochemical to increase the volume of refined products supplied as well as to expand ADNOC’s participation in Rongsheng’s refining and petrochemicals activity.
1. Currently or planning to source in the UAE. Total of 111 respondents for this source location. 2. Total of 25 respondents for this corridor.
of corporates1 plan to be in the UAE to Mainland China corridor
of corporates2 anticipate between 10-15% annual revenue growth of exports to Mainland China over the next 10 years
23% 36%of corporates2 identify supply chain rebalancing as a key growth driver of exports to Mainland China
44%supply chain rebalancing
plan to be in corridor
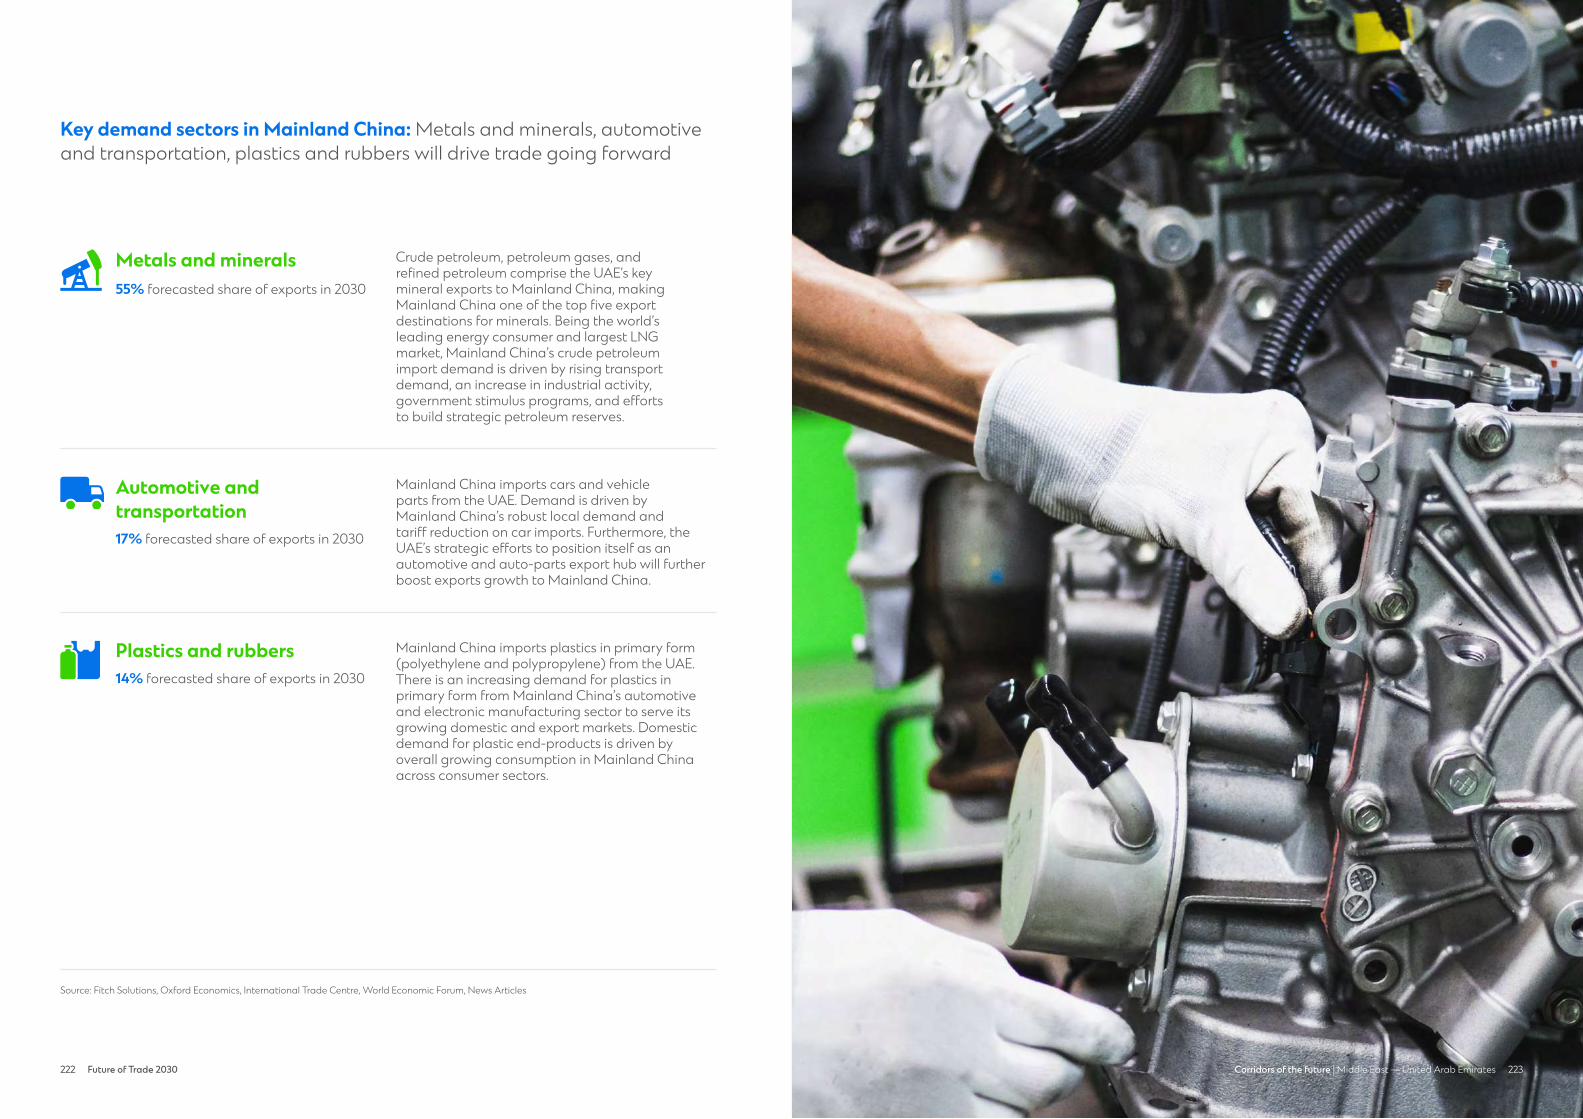
222 Future of Trade 2030 223222 223Corridors of the future | Middle East — United Arab Emirates
Key demand sectors in Mainland China: Metals and minerals, automotive and transportation, plastics and rubbers will drive trade going forward
Source: Fitch Solutions, Oxford Economics, International Trade Centre, World Economic Forum, News Articles
Mainland China imports plastics in primary form (polyethylene and polypropylene) from the UAE. There is an increasing demand for plastics in primary form from Mainland China’s automotive and electronic manufacturing sector to serve its growing domestic and export markets. Domestic demand for plastic end-products is driven by overall growing consumption in Mainland China across consumer sectors.
Machinery & Electricals
Plastics & Rubbers
Crude petroleum, petroleum gases, and refined petroleum comprise the UAE’s key mineral exports to Mainland China, making Mainland China one of the top five export destinations for minerals. Being the world’s leading energy consumer and largest LNG market, Mainland China’s crude petroleum import demand is driven by rising transport demand, an increase in industrial activity, government stimulus programs, and efforts to build strategic petroleum reserves.
Metals & Minerals
Mainland China imports cars and vehicle parts from the UAE. Demand is driven by Mainland China’s robust local demand and tariff reduction on car imports. Furthermore, the UAE’s strategic efforts to position itself as an automotive and auto-parts export hub will further boost exports growth to Mainland China.
Hypergrowth markets
Automotive & Transportation
Metals and minerals55% forecasted share of exports in 2030
Plastics and rubbers14% forecasted share of exports in 2030
Automotive and transportation17% forecasted share of exports in 2030
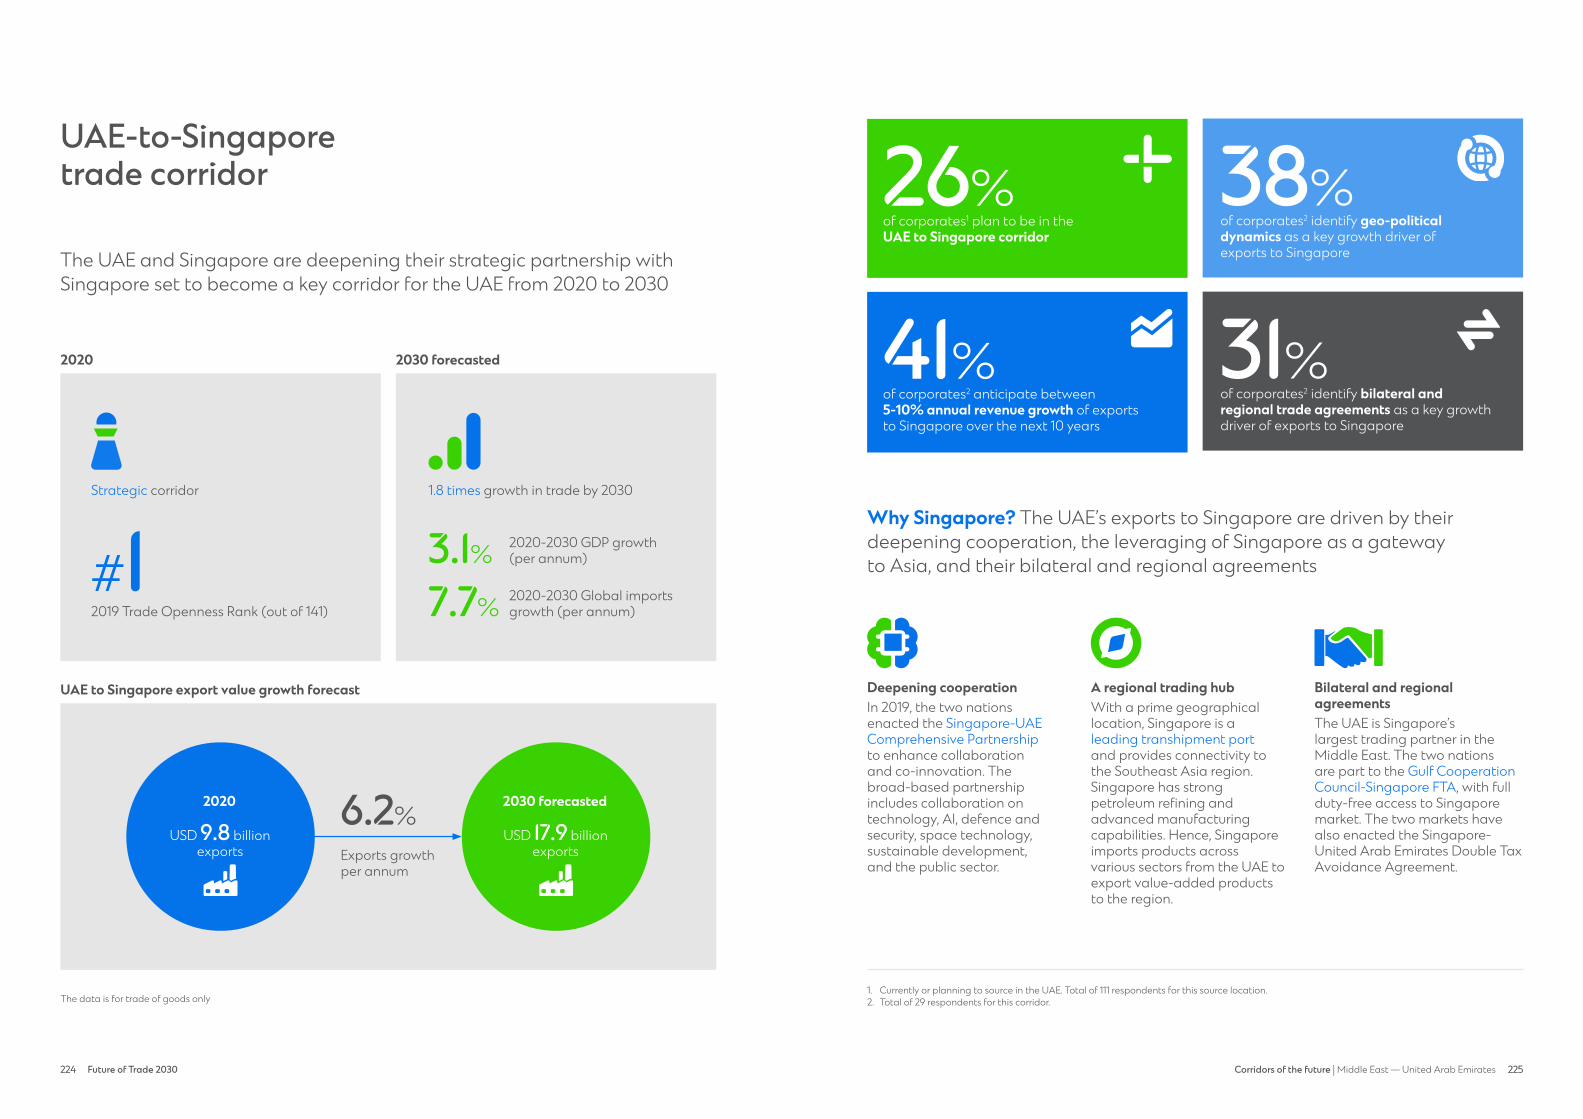
224 Future of Trade 2030 225224 225Corridors of the future | Middle East — United Arab Emirates
UAE-to-Singaporetrade corridor
The UAE and Singapore are deepening their strategic partnership with Singapore set to become a key corridor for the UAE from 2020 to 2030
2019 Trade Openness Rank (out of 141)
#1
2020 2030 forecasted
The data is for trade of goods only
1.8 times growth in trade by 2030
2020-2030 GDP growth (per annum)
2020-2030 Global imports growth (per annum)
3.1%
7.7%
UAE to Singapore export value growth forecast
6.2%
Exports growth per annum
Why Singapore? The UAE’s exports to Singapore are driven by their deepening cooperation, the leveraging of Singapore as a gateway to Asia, and their bilateral and regional agreements
Deepening cooperationIn 2019, the two nations enacted the Singapore-UAE Comprehensive Partnership to enhance collaboration and co-innovation. The broad-based partnership includes collaboration on technology, AI, defence and security, space technology, sustainable development, and the public sector.
A regional trading hubWith a prime geographical location, Singapore is a leading transhipment port and provides connectivity to the Southeast Asia region. Singapore has strong petroleum refining and advanced manufacturing capabilities. Hence, Singapore imports products across various sectors from the UAE to export value-added products to the region.
Bilateral and regionalagreementsThe UAE is Singapore’s largest trading partner in the Middle East. The two nations are part to the Gulf Cooperation Council-Singapore FTA, with full duty-free access to Singapore market. The two markets have also enacted the Singapore-United Arab Emirates Double Tax Avoidance Agreement.
1. Currently or planning to source in the UAE. Total of 111 respondents for this source location. 2. Total of 29 respondents for this corridor.
2030 forecasted
USD 17.9 billion exports
2020
USD 9.8 billion exports
Strategic corridor
of corporates1 plan to be in the UAE to Singapore corridor
of corporates2 anticipate between 5-10% annual revenue growth of exports to Singapore over the next 10 years
26%
41%of corporates2 identify bilateral and regional trade agreements as a key growth driver of exports to Singapore
31% trade agreement
geo-political dynamic
of corporates2 identify geo-politicaldynamics as a key growth driver of exports to Singapore
38%plan to be in corridor
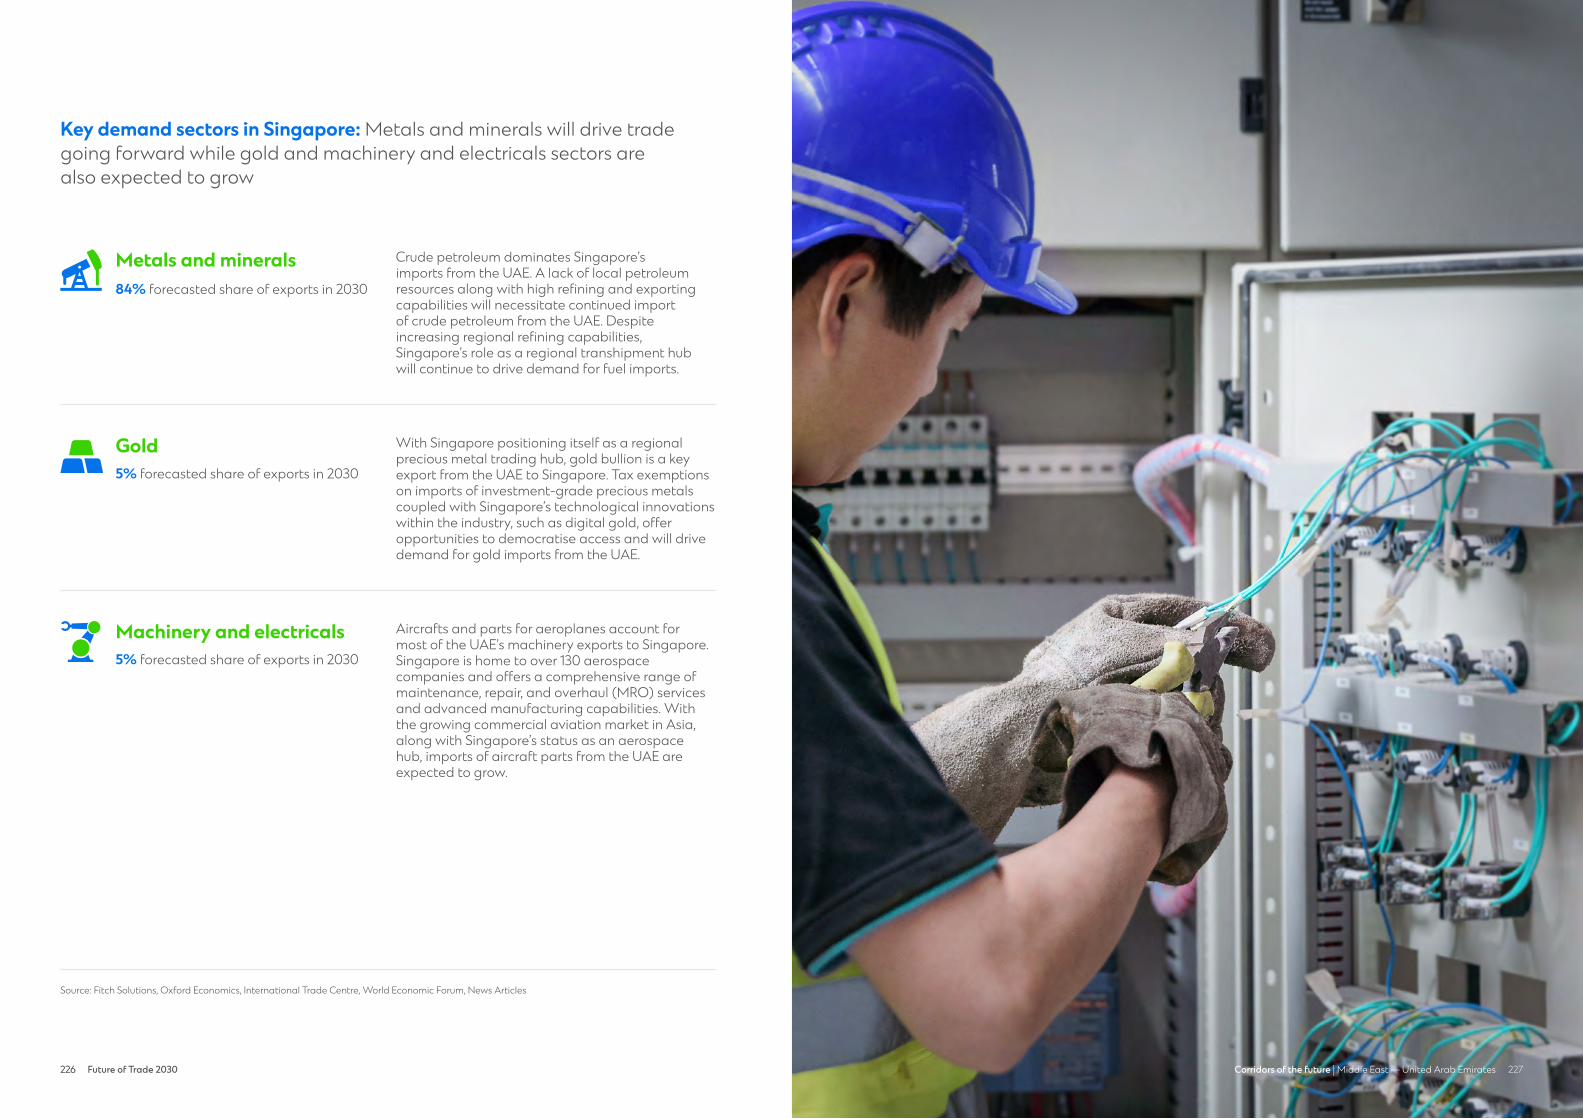
226 Future of Trade 2030 227226 227Corridors of the future | Middle East — United Arab Emirates
Key demand sectors in Singapore: Metals and minerals will drive trade going forward while gold and machinery and electricals sectors are also expected to grow
Source: Fitch Solutions, Oxford Economics, International Trade Centre, World Economic Forum, News Articles
Crude petroleum dominates Singapore’s imports from the UAE. A lack of local petroleum resources along with high refining and exporting capabilities will necessitate continued import of crude petroleum from the UAE. Despite increasing regional refining capabilities, Singapore’s role as a regional transhipment hub will continue to drive demand for fuel imports.
Metals & Minerals
With Singapore positioning itself as a regional precious metal trading hub, gold bullion is a key export from the UAE to Singapore. Tax exemptions on imports of investment-grade precious metalscoupled with Singapore’s technological innovations within the industry, such as digital gold, offer opportunities to democratise access and will drive demand for gold imports from the UAE.
Gold
Aircrafts and parts for aeroplanes account for most of the UAE’s machinery exports to Singapore. Singapore is home to over 130 aerospace companies and offers a comprehensive range ofmaintenance, repair, and overhaul (MRO) services and advanced manufacturing capabilities. With the growing commercial aviation market in Asia, along with Singapore’s status as an aerospacehub, imports of aircraft parts from the UAE are expected to grow.
Machinery & Electricals
Metals and minerals84% forecasted share of exports in 2030
Machinery and electricals5% forecasted share of exports in 2030
Gold5% forecasted share of exports in 2030
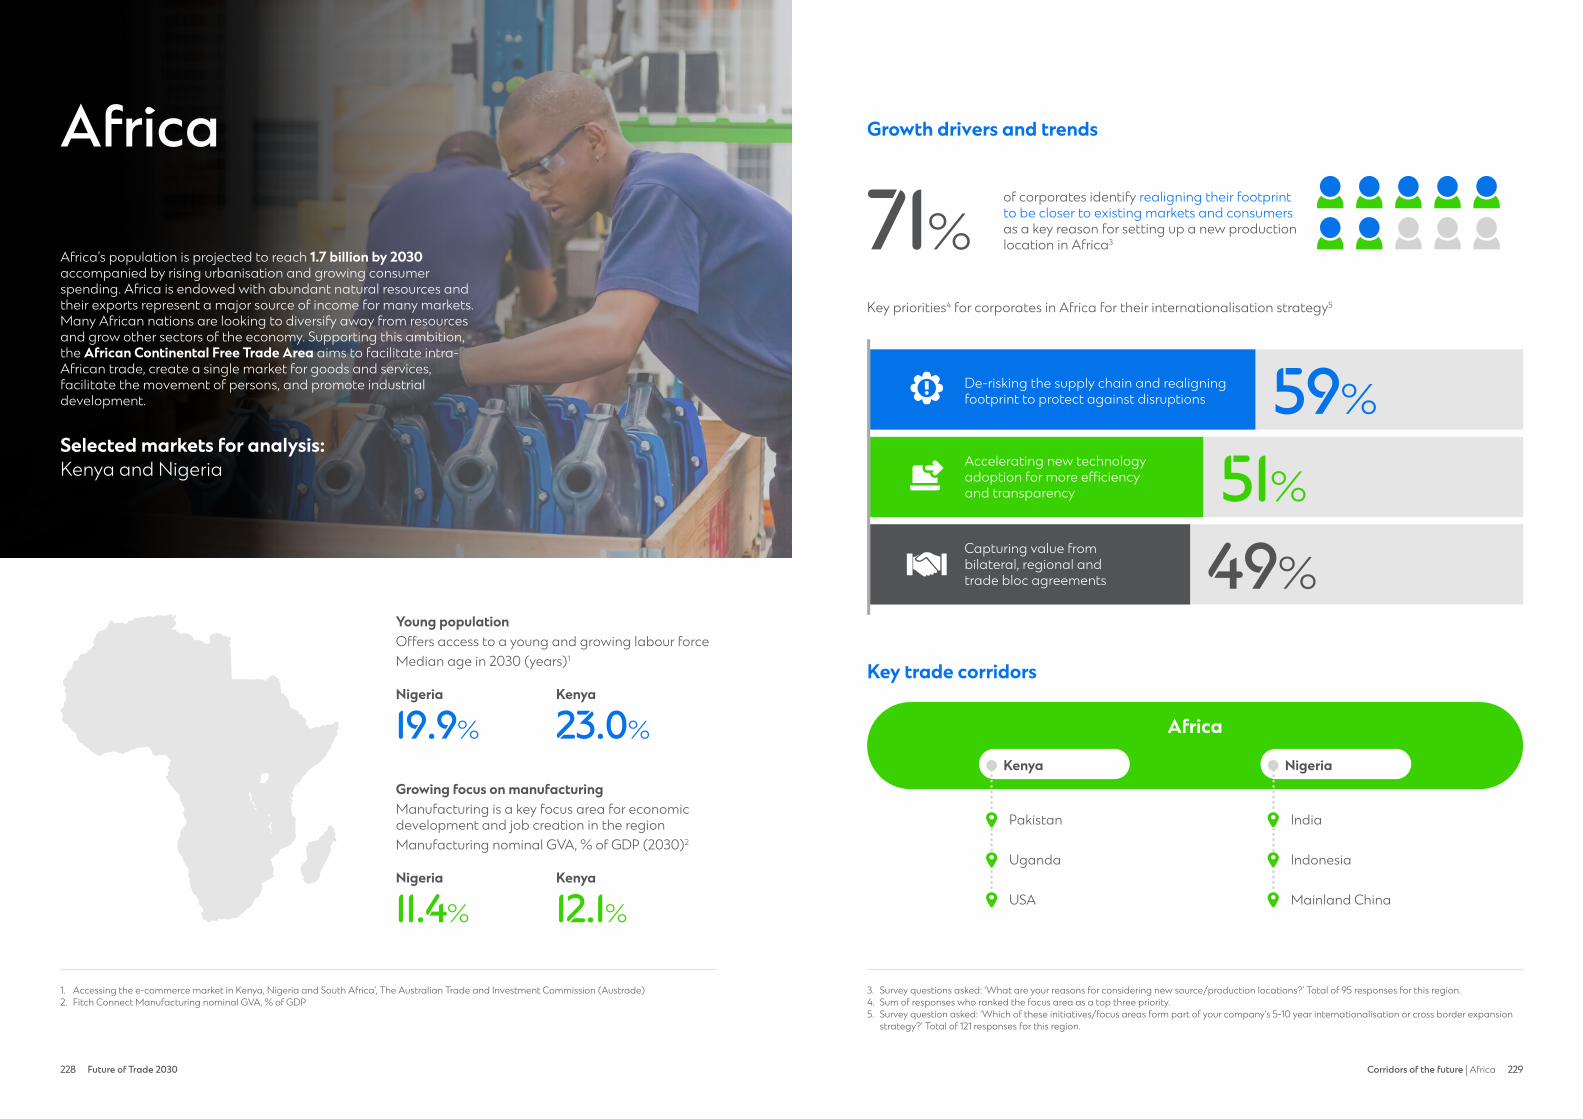
228 Future of Trade 2030 229228 229Corridors of the future | Africa
Growth drivers and trends
Key trade corridors
Africa
Africa’s population is projected to reach 1.7 billion by 2030 accompanied by rising urbanisation and growing consumer spending. Africa is endowed with abundant natural resources and their exports represent a major source of income for many markets. Many African nations are looking to diversify away from resources and grow other sectors of the economy. Supporting this ambition, the African Continental Free Trade Area aims to facilitate intra-African trade, create a single market for goods and services, facilitate the movement of persons, and promote industrial development.
Selected markets for analysis: Kenya and Nigeria
Young populationOffers access to a young and growing labour forceMedian age in 2030 (years)1
Nigeria
Nigeria
Kenya
Kenya
Growing focus on manufacturingManufacturing is a key focus area for economic development and job creation in the region Manufacturing nominal GVA, % of GDP (2030)2
1. Accessing the e-commerce market in Kenya, Nigeria and South Africa’, The Australian Trade and Investment Commission (Austrade)2. Fitch Connect Manufacturing nominal GVA, % of GDP
19.9%
11.4%
23.0%
12.1%
of corporates identify realigning their footprint to be closer to existing markets and consumers as a key reason for setting up a new production location in Africa3
Key priorities4 for corporates in Africa for their internationalisation strategy5
71%
Capturing value from bilateral, regional and trade bloc agreements 49%
Accelerating new technology adoption for more efficiency and transparency 51%
De-risking the supply chain and realigning footprint to protect against disruptions 59%
3. Survey questions asked: ‘What are your reasons for considering new source/production locations?’ Total of 95 responses for this region.4. Sum of responses who ranked the focus area as a top three priority.5. Survey question asked: ‘Which of these initiatives/focus areas form part of your company’s 5-10 year internationalisation or cross border expansion
strategy?’ Total of 121 responses for this region.
Africa
Pakistan
Uganda
USA
Kenya
India
Indonesia
Mainland China
Nigeria
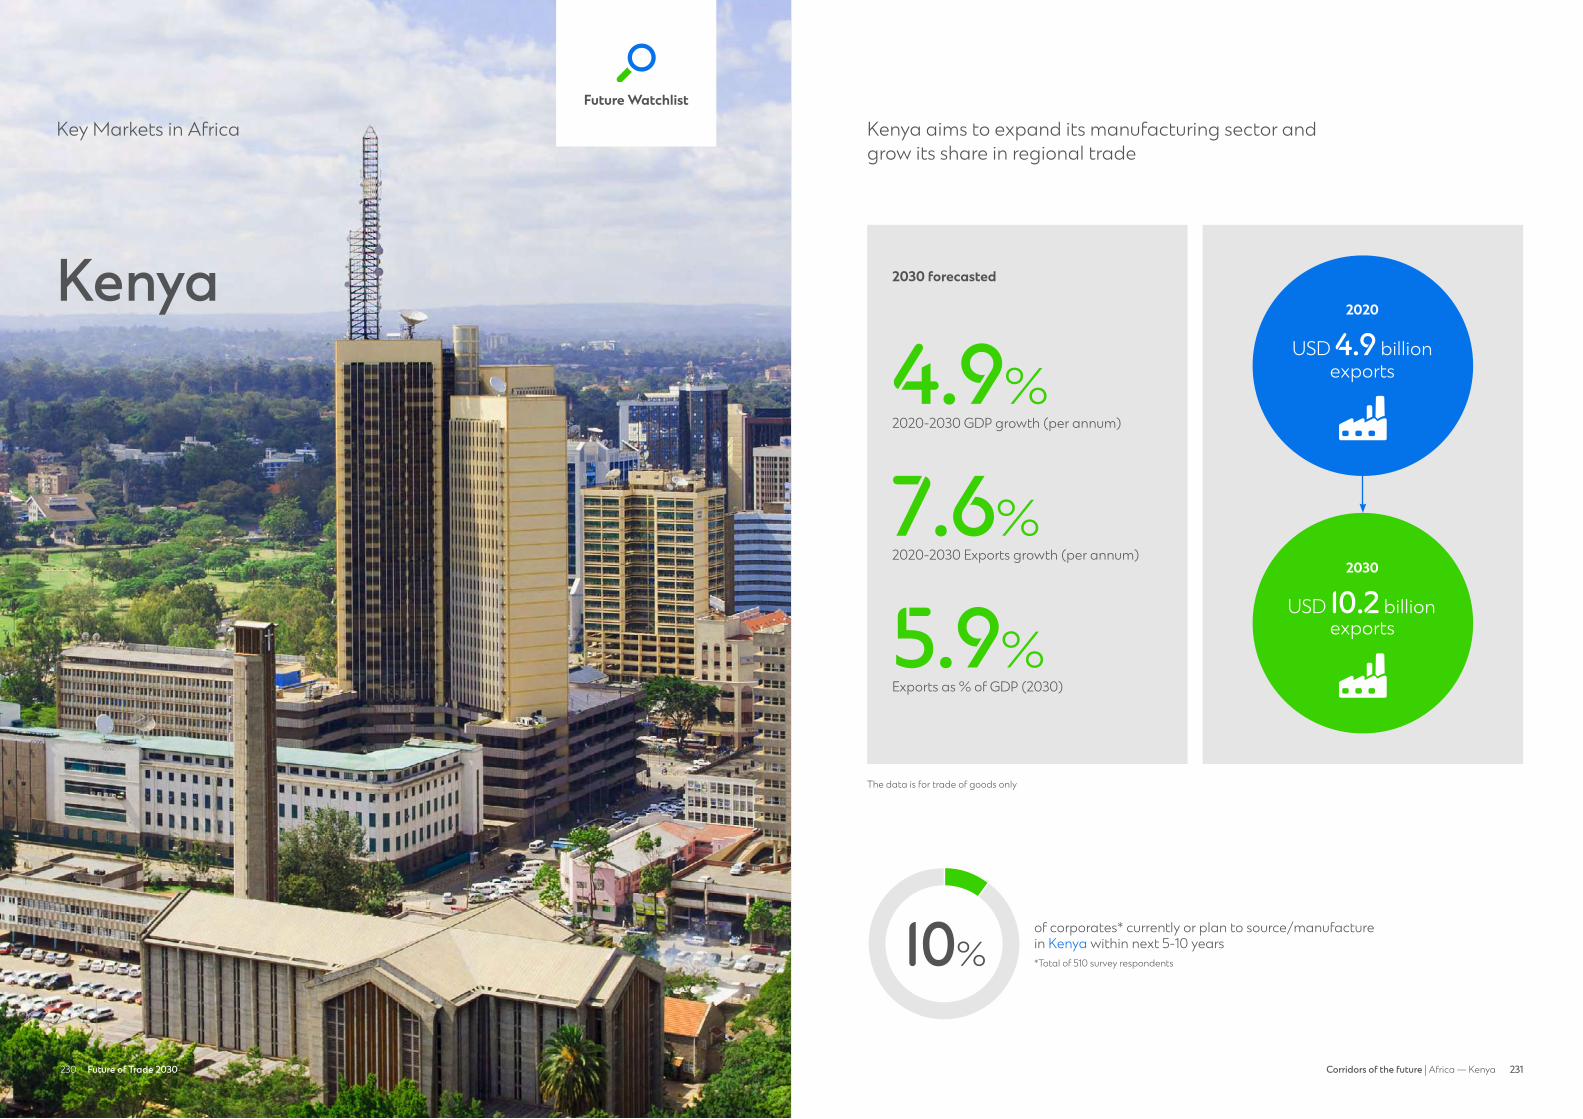
230 231231Corridors of the future | Africa — Kenya230 Future of Trade 2030
Kenya
Key Markets in Africa Kenya aims to expand its manufacturing sector and grow its share in regional trade
10%of corporates* currently or plan to source/manufacture in Kenya within next 5-10 years*Total of 510 survey respondents
The data is for trade of goods only
Future WatchlistFuture watchlist
2030 forecasted
2020-2030 GDP growth (per annum)
4.9%
2020-2030 Exports growth (per annum)
7.6%
Exports as % of GDP (2030)
5.9%
2020
USD 4.9 billion exports
2030
USD 10.2 billion exports
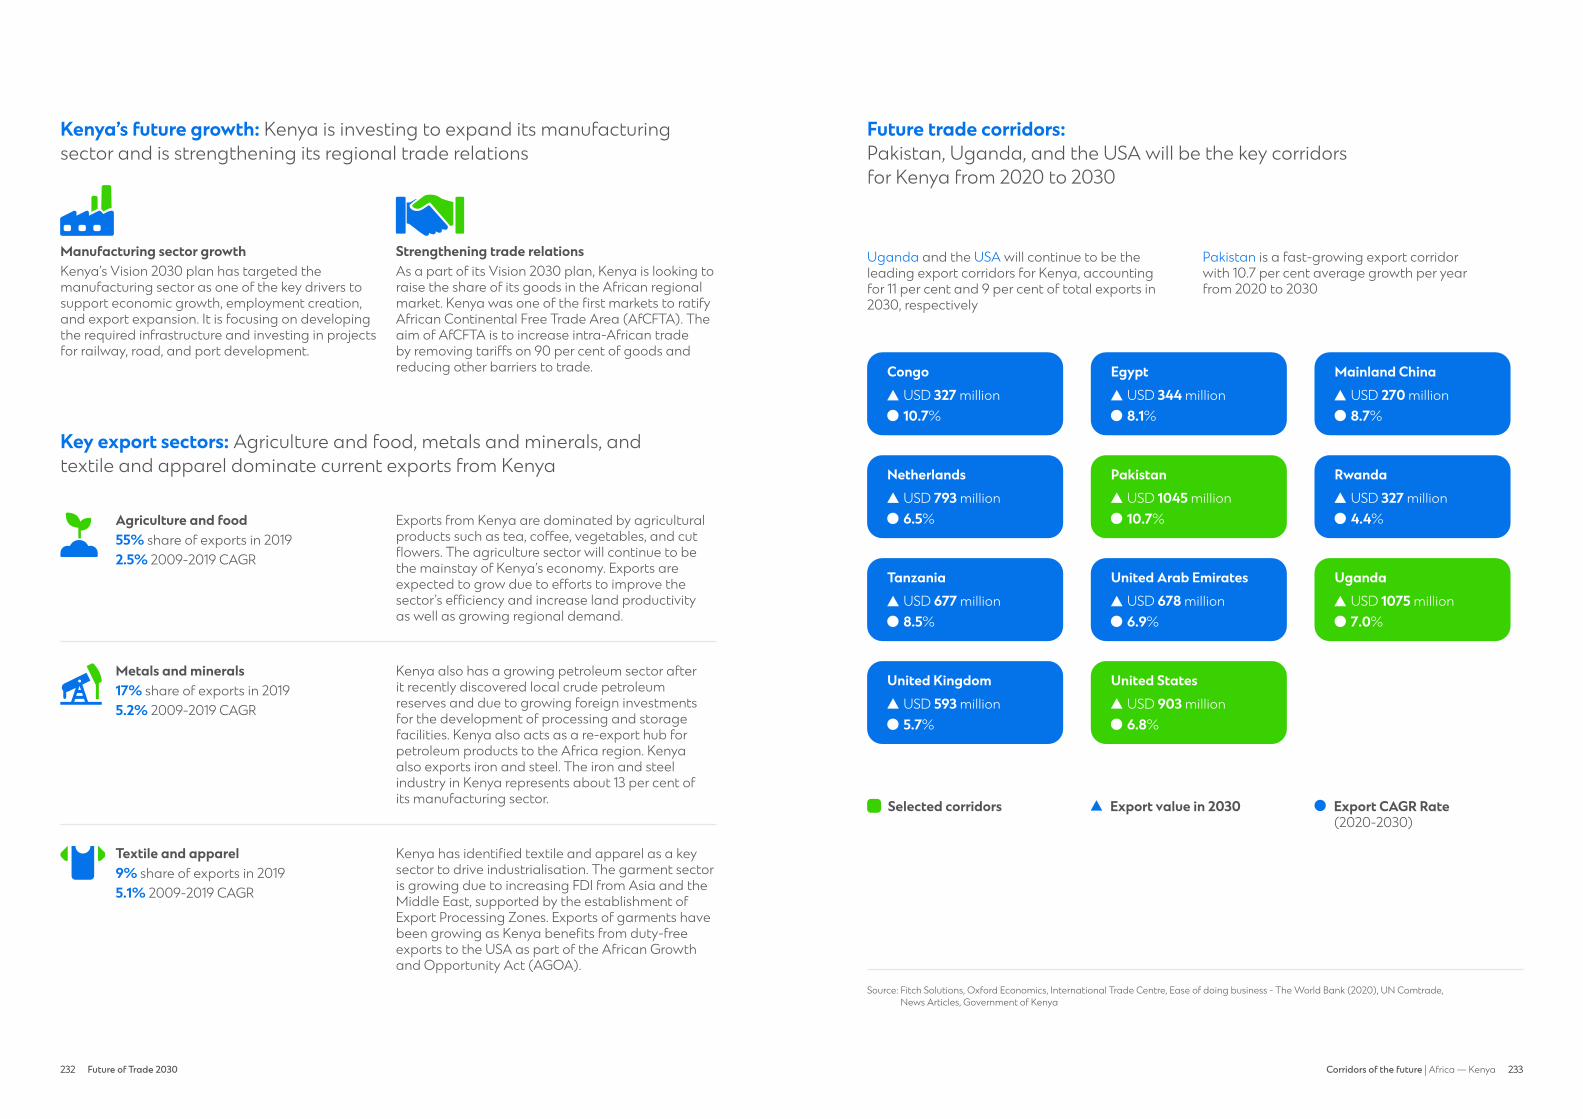
232 Future of Trade 2030 233232 233Corridors of the future | Africa — Kenya
Kenya’s future growth: Kenya is investing to expand its manufacturingsector and is strengthening its regional trade relations
Manufacturing sector growthKenya’s Vision 2030 plan has targeted the manufacturing sector as one of the key drivers to support economic growth, employment creation, and export expansion. It is focusing on developing the required infrastructure and investing in projects for railway, road, and port development.
Strengthening trade relationsAs a part of its Vision 2030 plan, Kenya is looking to raise the share of its goods in the African regional market. Kenya was one of the first markets to ratify African Continental Free Trade Area (AfCFTA). Theaim of AfCFTA is to increase intra-African trade by removing tariffs on 90 per cent of goods and reducing other barriers to trade.
Key export sectors: Agriculture and food, metals and minerals, and textile and apparel dominate current exports from Kenya
Future trade corridors: Pakistan, Uganda, and the USA will be the key corridors for Kenya from 2020 to 2030
Metals and minerals Kenya also has a growing petroleum sector after it recently discovered local crude petroleum reserves and due to growing foreign investments for the development of processing and storage facilities. Kenya also acts as a re-export hub for petroleum products to the Africa region. Kenya also exports iron and steel. The iron and steel industry in Kenya represents about 13 per cent of its manufacturing sector.
17% share of exports in 20195.2% 2009-2019 CAGRMetals & Minerals
Uganda and the USA will continue to be the leading export corridors for Kenya, accounting for 11 per cent and 9 per cent of total exports in 2030, respectively
Pakistan is a fast-growing export corridor with 10.7 per cent average growth per year from 2020 to 2030
Textile and apparel Kenya has identified textile and apparel as a key sector to drive industrialisation. The garment sector is growing due to increasing FDI from Asia and the Middle East, supported by the establishment of Export Processing Zones. Exports of garments have been growing as Kenya benefits from duty-free exports to the USA as part of the African Growth and Opportunity Act (AGOA).
9% share of exports in 20195.1% 2009-2019 CAGRTextile & Apparel
Agriculture and food Exports from Kenya are dominated by agriculturalproducts such as tea, coffee, vegetables, and cut flowers. The agriculture sector will continue to be the mainstay of Kenya’s economy. Exports are expected to grow due to efforts to improve the sector’s efficiency and increase land productivity as well as growing regional demand.
55% share of exports in 20192.5% 2009-2019 CAGRAgriculture & Food
Source: Fitch Solutions, Oxford Economics, International Trade Centre, Ease of doing business - The World Bank (2020), UN Comtrade, News Articles, Government of Kenya
EgyptUSD 344 million8.1%
Mainland ChinaUSD 270 million8.7%
CongoUSD 327 million10.7%
United Arab EmiratesUSD 678 million6.9%
UgandaUSD 1075 million7.0%
TanzaniaUSD 677 million8.5%
PakistanUSD 1045 million10.7%
RwandaUSD 327 million4.4%
NetherlandsUSD 793 million6.5%
United StatesUSD 903 million6.8%
United KingdomUSD 593 million5.7%
Export CAGR Rate (2020-2030)
Selected corridors Export value in 2030
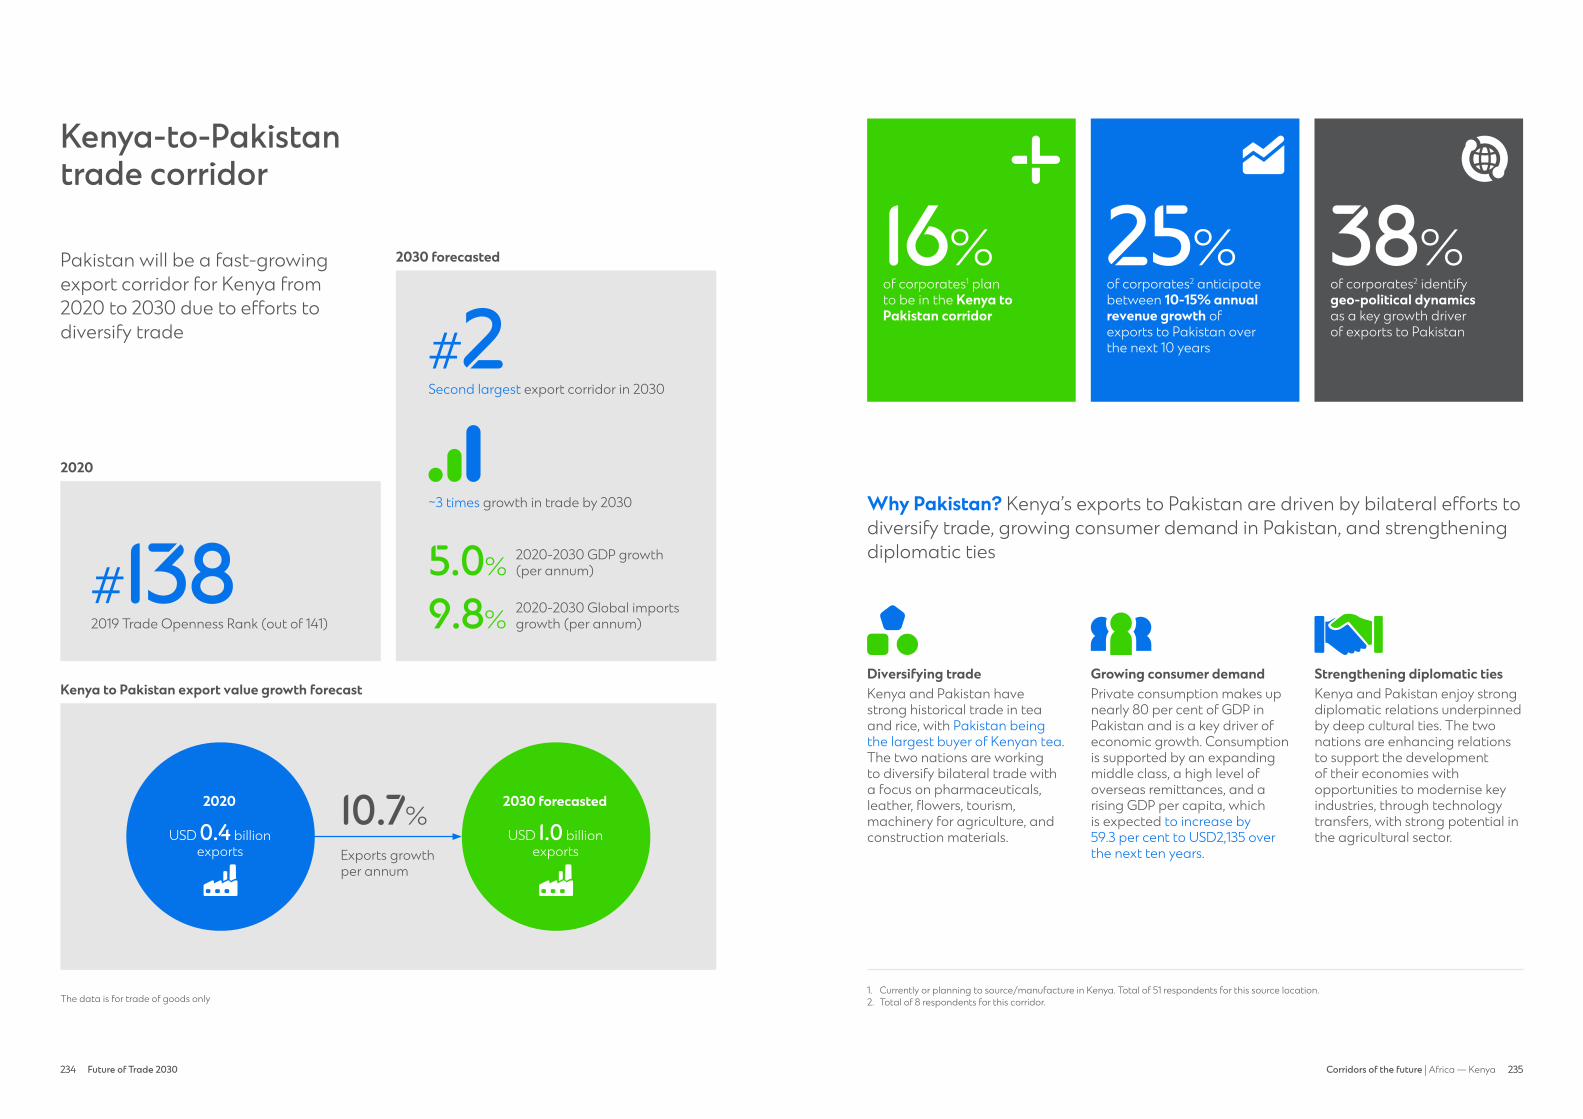
234 Future of Trade 2030 235234 235Corridors of the future | Africa — Kenya
Kenya-to-Pakistantrade corridor
Pakistan will be a fast-growing export corridor for Kenya from 2020 to 2030 due to efforts to diversify trade
The data is for trade of goods only
Kenya to Pakistan export value growth forecast
10.7%
Exports growth per annum
2030 forecasted
USD 1.0 billion exports
2020
USD 0.4 billion exports
Why Pakistan? Kenya’s exports to Pakistan are driven by bilateral efforts to diversify trade, growing consumer demand in Pakistan, and strengthening diplomatic ties
Diversifying tradeKenya and Pakistan have strong historical trade in tea and rice, with Pakistan being the largest buyer of Kenyan tea. The two nations are working to diversify bilateral trade with a focus on pharmaceuticals, leather, flowers, tourism, machinery for agriculture, and construction materials.
Growing consumer demandPrivate consumption makes up nearly 80 per cent of GDP in Pakistan and is a key driver of economic growth. Consumption is supported by an expanding middle class, a high level of overseas remittances, and a rising GDP per capita, which is expected to increase by 59.3 per cent to USD2,135 over the next ten years.
Strengthening diplomatic tiesKenya and Pakistan enjoy strong diplomatic relations underpinned by deep cultural ties. The two nations are enhancing relations to support the development of their economies with opportunities to modernise key industries, through technology transfers, with strong potential in the agricultural sector.
1. Currently or planning to source/manufacture in Kenya. Total of 51 respondents for this source location. 2. Total of 8 respondents for this corridor.
geo-political dynamic
Second largest export corridor in 2030
#2
2019 Trade Openness Rank (out of 141)
#1382020
2030 forecasted
~3 times growth in trade by 2030
2020-2030 GDP growth (per annum)
2020-2030 Global imports growth (per annum)
5.0%
9.8%
of corporates1 plan to be in the Kenya to Pakistan corridor
of corporates2 anticipate between 10-15% annual revenue growth of exports to Pakistan over the next 10 years
of corporates2 identify geo-political dynamics as a key growth driver of exports to Pakistan
16% 25% 38%plan to be in
corridor

236 Future of Trade 2030 237236 237Corridors of the future | Africa — Kenya
Key demand sectors in Pakistan: The agriculture and food sector accounts for most of the exports from Kenya to Pakistan
Source: Fitch Solutions, Oxford Economics, International Trade Centre, World Economic Forum, UN Comtrade, News Articles
Tea: Kenya exports largely tea to Pakistan, which accounted for over 70 per cent of the tea imported to Pakistan in 2019. Pakistan boasts some of the highest per capita tea consumption in the world yet lacks the local production necessary to meet the high domestic demand for tea.
Consumers in Pakistan are increasingly focused on high quality teas, thus presenting opportunities for premiumisation to drive the value of tea sales. The demand for tea and other hot drinks in Pakistan is expected to grow at an average of 8 per cent annually from 2021 to 2025, supported by strong consumer preferences for tea and rising disposable incomes.
Vegetables and legumes: Kenya exports vegetables, such as onions and garlic, and legumes to Pakistan. Food consumption in Pakistan remains resilient due to a large consumer market while increasing health consciousness is boosting demand for vegetables.
Agriculture and food98% share of exports in 2019

238 Future of Trade 2030 239238 239Corridors of the future | Africa — Kenya
of corporates2 identify bilateral and regional trade agreements as a key growth driver of exports to Uganda
24% trade agreement
Kenya-to-Ugandatrade corridor
Uganda will continue to be the largest export corridor for Kenya from 2020 to 2030 due to their strong economic ties
Largest export corridor
2019 Trade Openness Rank (out of 141)
#97#1
2020 2030 forecasted
The data is for trade of goods only
2 times growth in trade by 2030
2020-2030 GDP growth (per annum)
2020-2030 Global imports growth (per annum)
5.8%
6.1%
Kenya to Uganda export value growth forecast
7.0%
Exports growth per annum
2030 forecasted
USD 1.1 billion exports
2020
USD 0.5 billion exports
of corporates1 plan to be in the Kenya to Uganda corridor
of corporates2 anticipate between 10-15% annual revenue growth of exports to Uganda over the next 10 years
57%
34%
Why Uganda? Kenya’s exports to Uganda are driven by supportive trade agreements, reliance on Kenya as a transhipment point, and growing private consumption in Uganda
Supportive trade agreementsKenya and Uganda are members of the East Africa Community (EAC) and the Common Market for Eastern and Southern Africa (COMESA), which allow for reduced trade costs and facilitate the trade of goods and services between the two markets.
Reliance on Kenya as a transhipment pointKenya’s geographic location positions it as a trade gateway, linking the landlocked Uganda to the rest of the word via maritime routes. Uganda imports high value products, such as machinery, vehicles, and refined petroleum, with Kenya acting as a transhipment point via the port of Mombasa.
Growing private consumptionPrivate consumption is driving economic growth in Uganda. The market has a fast-growing and young population, rising urbanisation, and low and stable unemployment, boosting consumer spending. Spending on essential goods, such as food, drinks, and clothing, accounts for 66 per cent of total household expenditure in 2021.
1. Currently or planning to source/manufacture in Kenya. Total of 51 respondents for this source location. 2. Total of 29 respondents for this corridor.
of corporates2 identify attractive consumer demographics as a key growth driver of exports to Uganda
34% consumer demographicplan to be in
corridor
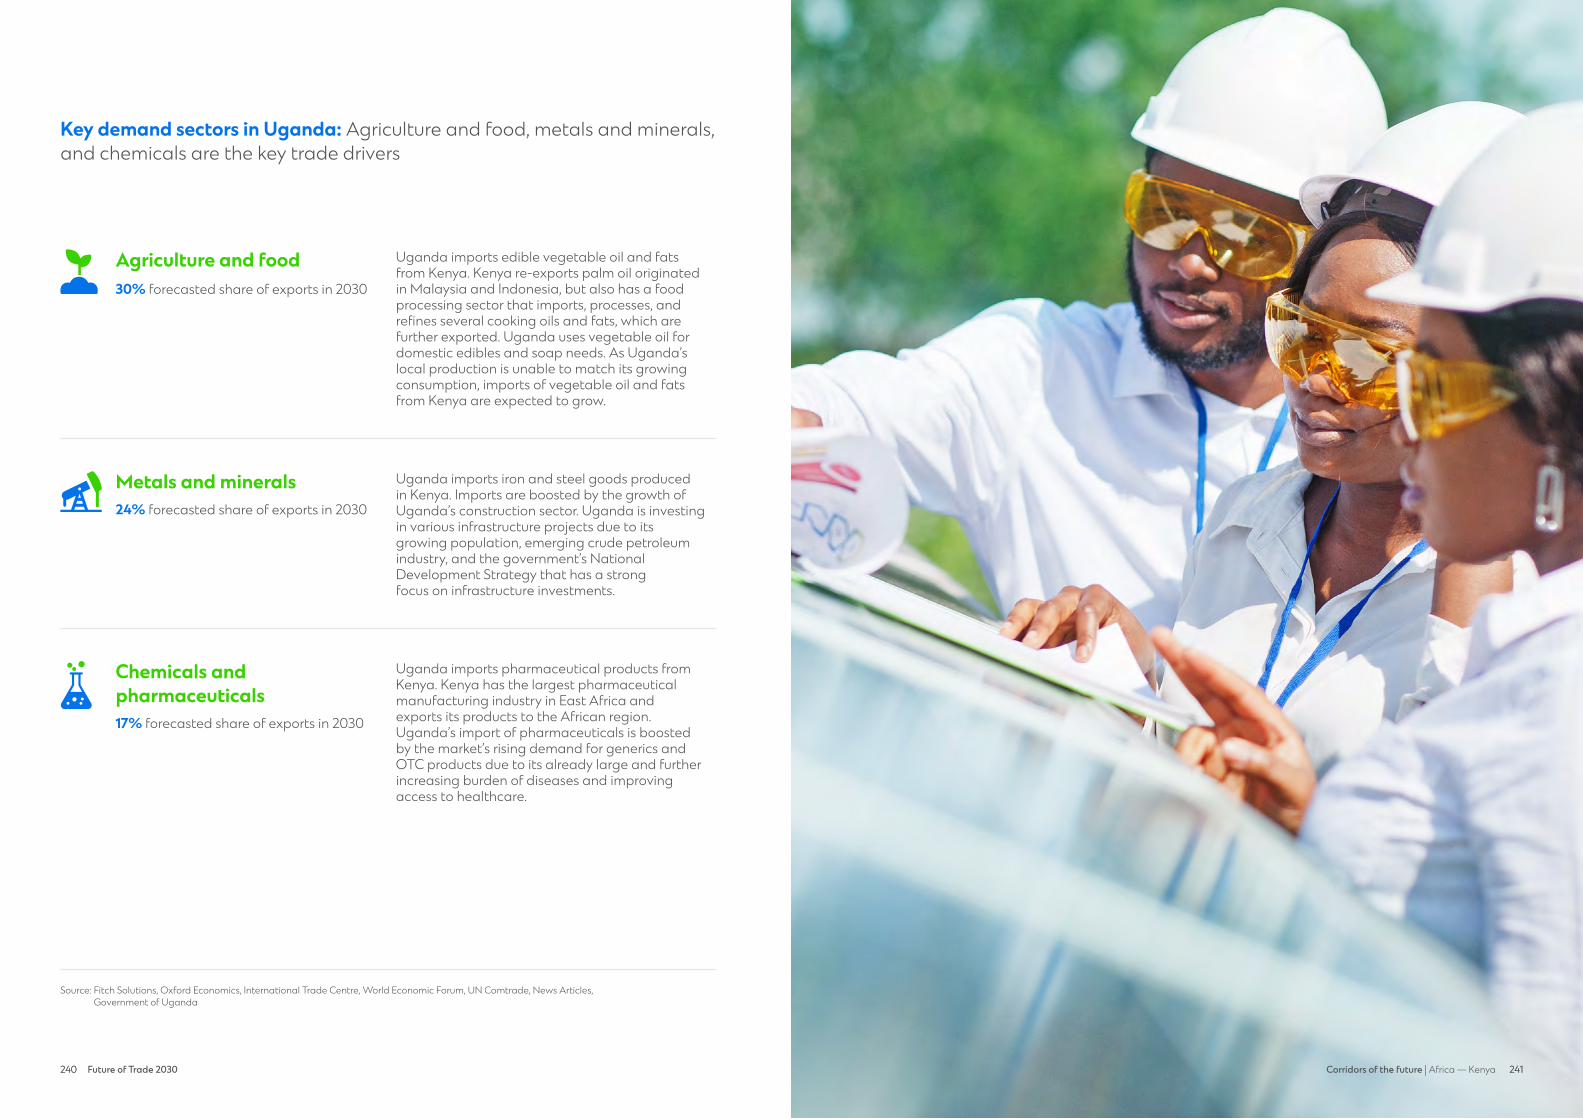
240 Future of Trade 2030 241240 241Corridors of the future | Africa — Kenya
Key demand sectors in Uganda: Agriculture and food, metals and minerals, and chemicals are the key trade drivers
Uganda imports pharmaceutical products from Kenya. Kenya has the largest pharmaceutical manufacturing industry in East Africa and exports its products to the African region. Uganda’s import of pharmaceuticals is boosted by the market’s rising demand for generics and OTC products due to its already large and furtherincreasing burden of diseases and improving access to healthcare.
Chemicals & Pharmaceuticals
Uganda imports iron and steel goods produced in Kenya. Imports are boosted by the growth of Uganda’s construction sector. Uganda is investing in various infrastructure projects due to itsgrowing population, emerging crude petroleum industry, and the government’s National Development Strategy that has a strongfocus on infrastructure investments.
Metals & Minerals
Uganda imports edible vegetable oil and fats from Kenya. Kenya re-exports palm oil originated in Malaysia and Indonesia, but also has a food processing sector that imports, processes, and refines several cooking oils and fats, which are further exported. Uganda uses vegetable oil for domestic edibles and soap needs. As Uganda’s local production is unable to match its growingconsumption, imports of vegetable oil and fats from Kenya are expected to grow.
Agriculture & Food
Source: Fitch Solutions, Oxford Economics, International Trade Centre, World Economic Forum, UN Comtrade, News Articles, Government of Uganda
Agriculture and food30% forecasted share of exports in 2030
Metals and minerals24% forecasted share of exports in 2030
Chemicals and pharmaceuticals17% forecasted share of exports in 2030
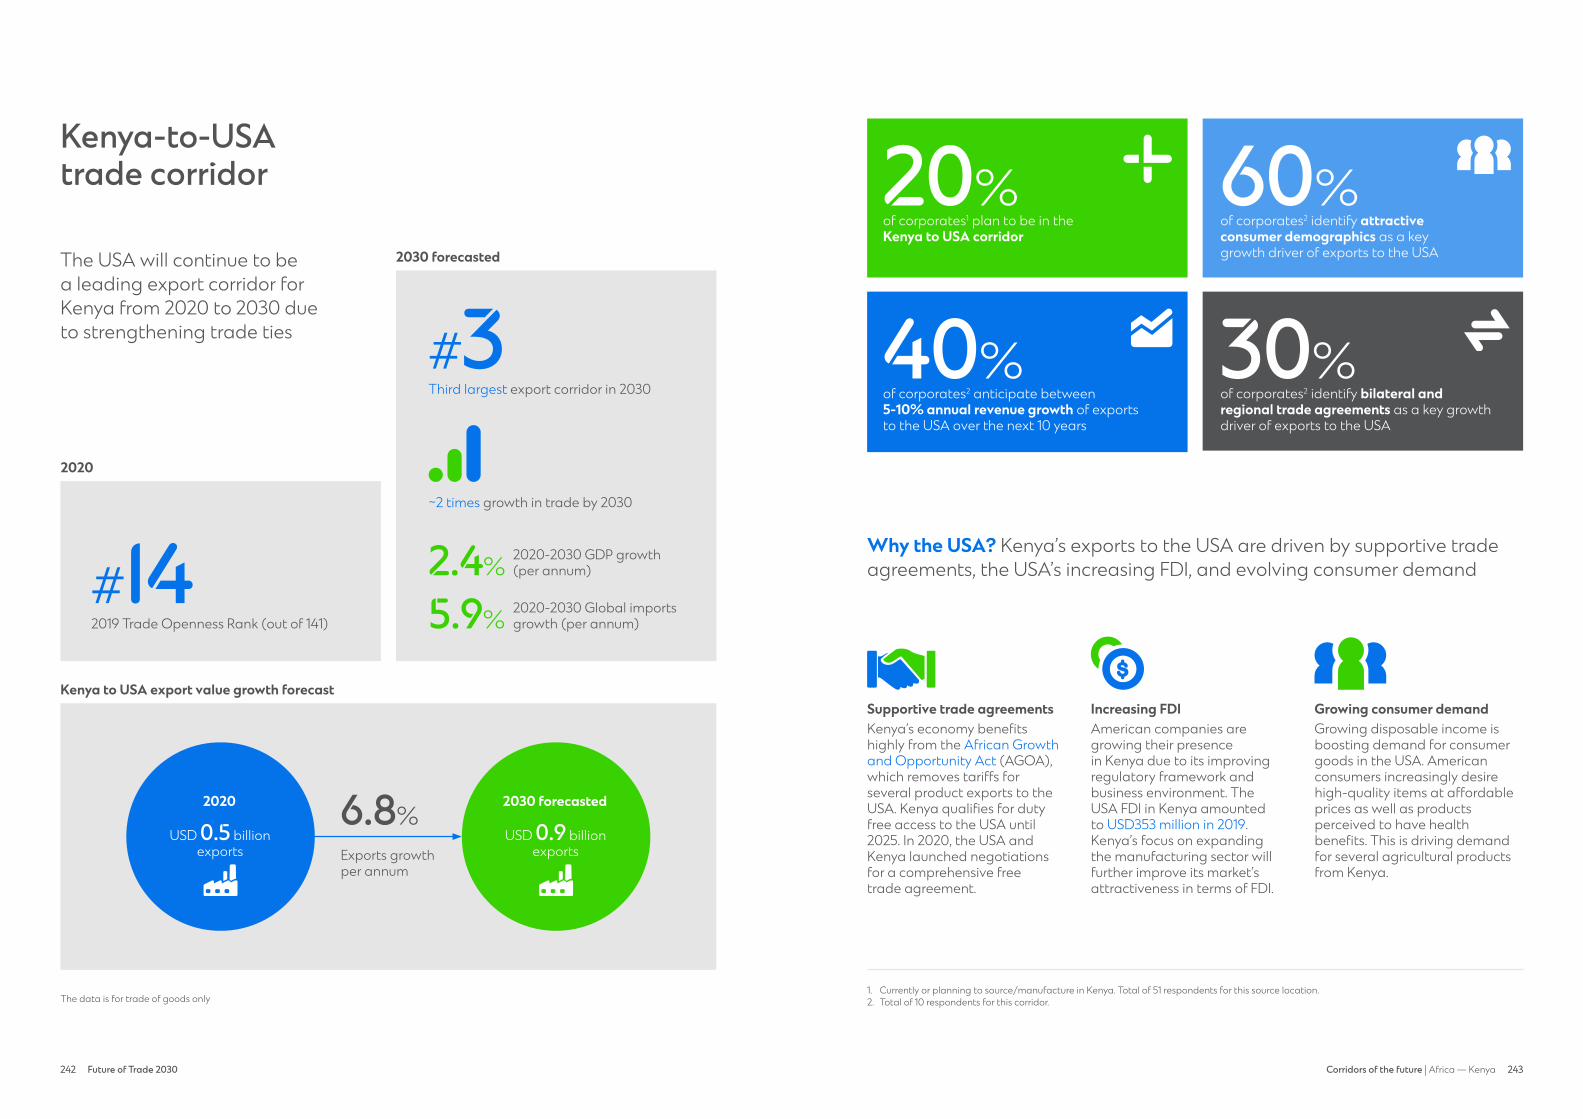
242 Future of Trade 2030 243242 243Corridors of the future | Africa — Kenya
Kenya-to-USA trade corridor
The USA will continue to be a leading export corridor forKenya from 2020 to 2030 due to strengthening trade ties
The data is for trade of goods only
of corporates1 plan to be in the Kenya to USA corridor
of corporates2 identify attractive consumer demographics as a key growth driver of exports to the USA
of corporates2 anticipate between 5-10% annual revenue growth of exports to the USA over the next 10 years
of corporates2 identify bilateral andregional trade agreements as a key growth driver of exports to the USA
20% 60%
40% 30%
Kenya to USA export value growth forecast
6.8%
Exports growth per annum
Why the USA? Kenya’s exports to the USA are driven by supportive trade agreements, the USA’s increasing FDI, and evolving consumer demand
Supportive trade agreementsKenya’s economy benefits highly from the African Growth and Opportunity Act (AGOA), which removes tariffs for several product exports to the USA. Kenya qualifies for duty free access to the USA until 2025. In 2020, the USA and Kenya launched negotiations for a comprehensive free trade agreement.
Increasing FDIAmerican companies are growing their presencein Kenya due to its improving regulatory framework and business environment. The USA FDI in Kenya amounted to USD353 million in 2019. Kenya’s focus on expanding the manufacturing sector will further improve its market’s attractiveness in terms of FDI.
Growing consumer demandGrowing disposable income is boosting demand for consumer goods in the USA. Americanconsumers increasingly desire high-quality items at affordable prices as well as products perceived to have health benefits. This is driving demand for several agricultural products from Kenya.
1. Currently or planning to source/manufacture in Kenya. Total of 51 respondents for this source location. 2. Total of 10 respondents for this corridor.
2030 forecasted
USD 0.9 billion exports
2020
USD 0.5 billion exports
consumer demographic
trade agreement
Third largest export corridor in 2030
#3
2019 Trade Openness Rank (out of 141)
#142020
2030 forecasted
~2 times growth in trade by 2030
2020-2030 GDP growth (per annum)
2020-2030 Global imports growth (per annum)
2.4%
5.9%
plan to be in corridor
244 Future of Trade 2030 245244 245Corridors of the future | Africa — Kenya
Key demand sectors in the USA: Textile and apparel, agriculture and food, and metals and minerals are the key trade drivers
The USA mostly imports ready-made garments (RMG), including woven and knit apparel. Imports are boosted by the USA’s status as the largest apparel market in the world and the rising number of international brands. Brands, such as Calvin Klein and H&M, are sourcing their clothing items from Africa, including Kenya, to diversify their supply chains away from Asia.
Textile & Apparel
Source: Fitch Solutions, Oxford Economics, International Trade Centre, World Economic Forum, UN Comtrade, News Articles
Within this sector, the key import is titanium. The USA relies on titanium imports for its primary use in the aerospace and defence industries. The closure of the last domestic titanium sponge plant in Nevada in August 2020 increased the market’s reliance on titanium imports from markets such as Kenya.
Metals & Minerals
Key imports by the USA constitute of coffee and macadamia nuts. Growing imports are driven by the growth of USA coffee consumption due to busy lifestyles and growing preference forpremium and specialty coffee. Rising health awareness is also supporting consumer demand for coffee and dried nuts because of their perceived health benefits.
Agriculture & Food
Textile and apparel64% forecasted share of exports in 2030
Metals and minerals14% forecasted share of exports in 2030
Agriculture and food19% forecasted share of exports in 2030
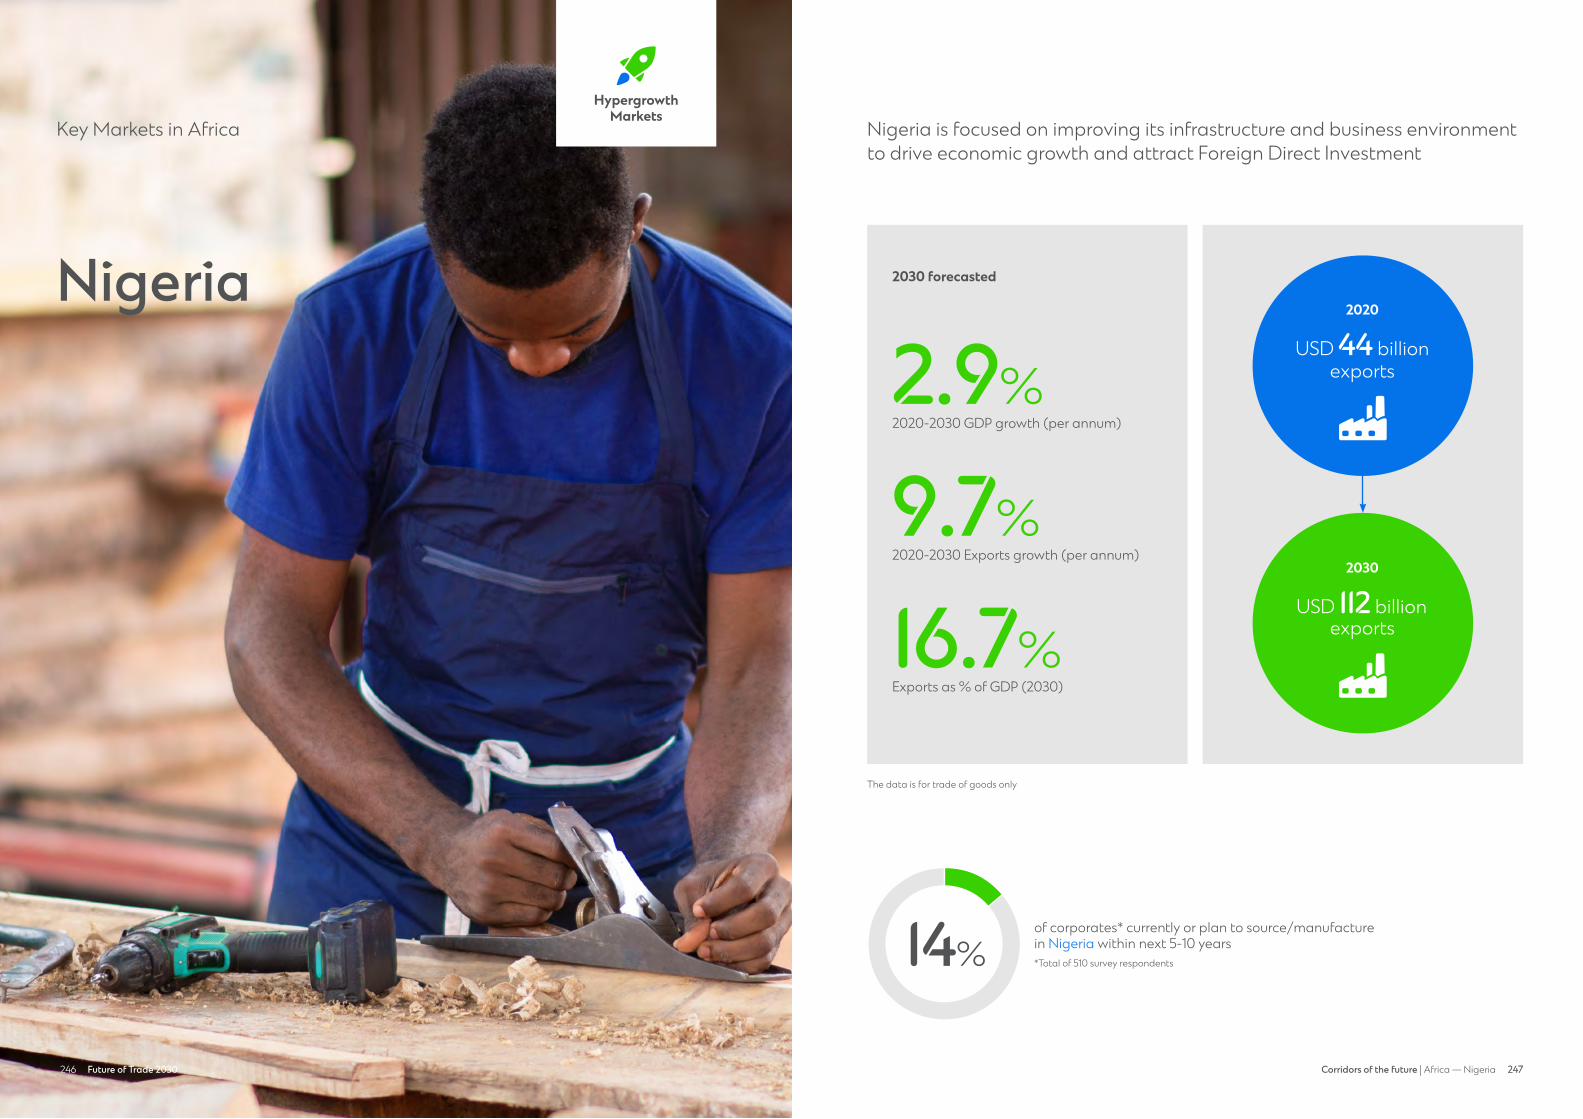
246 247247Corridors of the future | Africa — NigeriaFuture of Trade 2030246
Nigeria
Key Markets in Africa Nigeria is focused on improving its infrastructure and business environment to drive economic growth and attract Foreign Direct Investment
14%of corporates* currently or plan to source/manufacture in Nigeria within next 5-10 years*Total of 510 survey respondents
The data is for trade of goods only
Hypergrowth Markets
Hypergrowth markets
2030 forecasted
2020-2030 GDP growth (per annum)
2.9%
2020-2030 Exports growth (per annum)
9.7%
Exports as % of GDP (2030)
16.7%
2020
USD 44 billion exports
2030
USD 112 billion exports
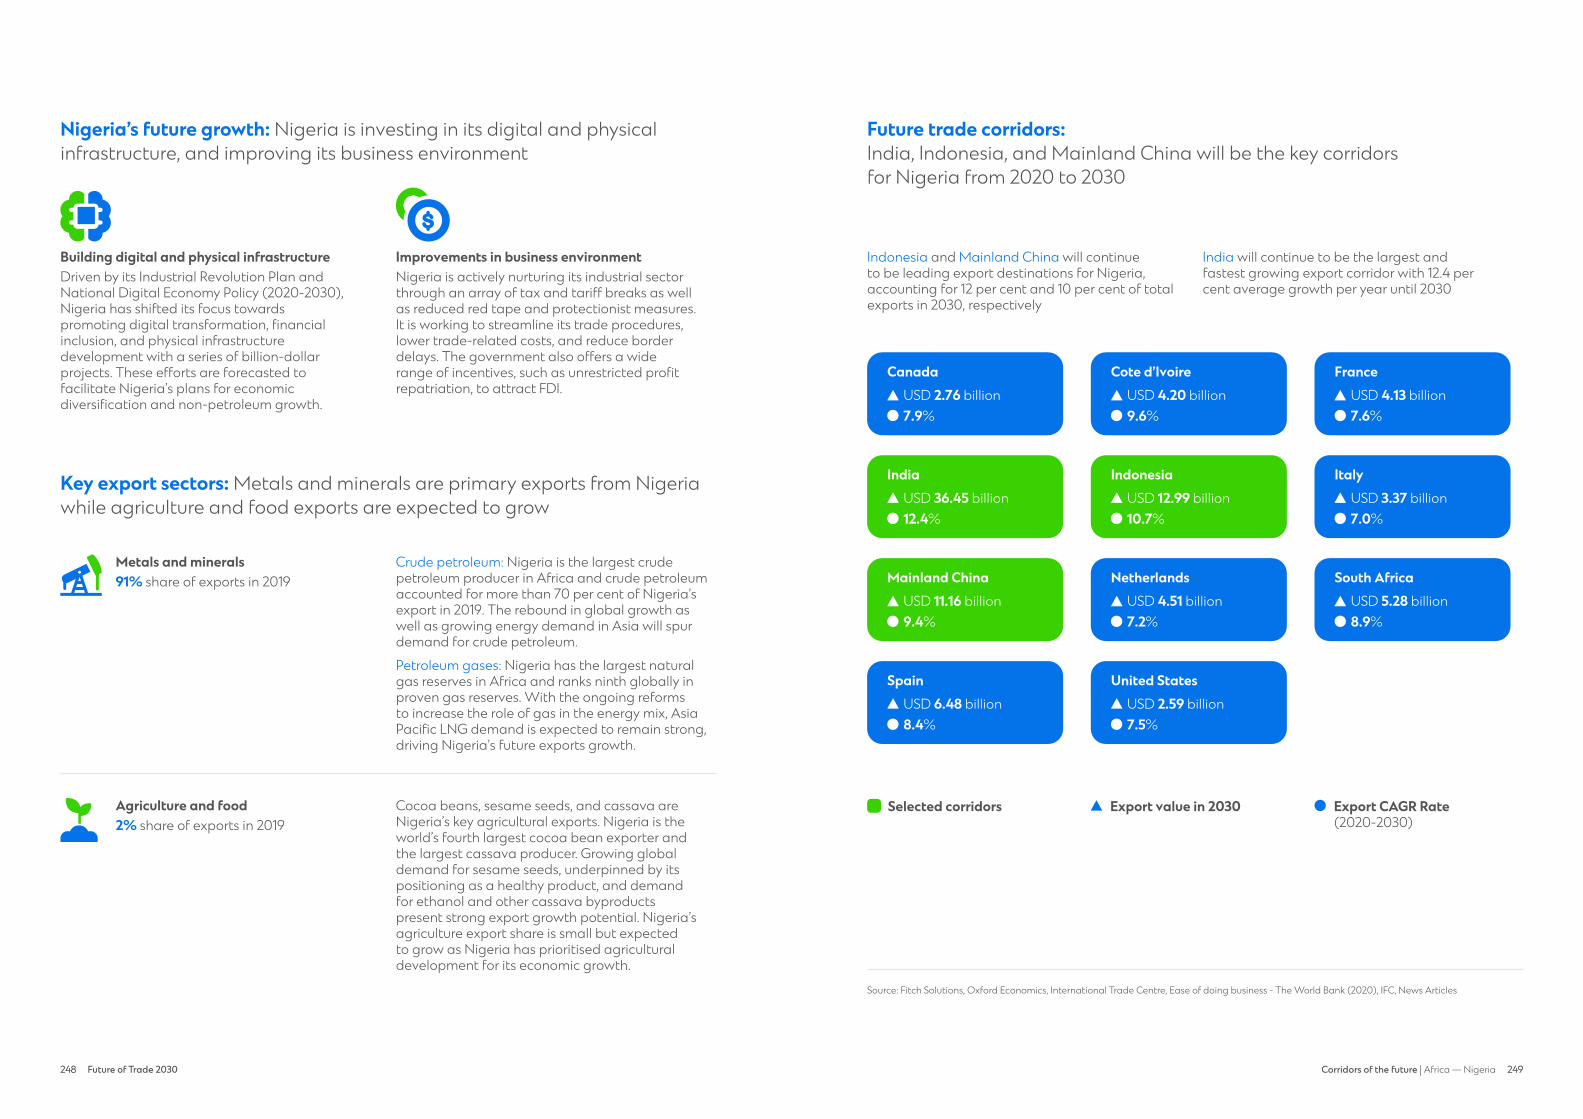
248 Future of Trade 2030 249248 249Corridors of the future | Africa — Nigeria
Nigeria’s future growth: Nigeria is investing in its digital and physicalinfrastructure, and improving its business environment
Building digital and physical infrastructureDriven by its Industrial Revolution Plan andNational Digital Economy Policy (2020-2030), Nigeria has shifted its focus towards promoting digital transformation, financial inclusion, and physical infrastructure development with a series of billion-dollar projects. These efforts are forecasted to facilitate Nigeria’s plans for economic diversification and non-petroleum growth.
Improvements in business environmentNigeria is actively nurturing its industrial sector through an array of tax and tariff breaks as well as reduced red tape and protectionist measures. It is working to streamline its trade procedures, lower trade-related costs, and reduce border delays. The government also offers a wide range of incentives, such as unrestricted profit repatriation, to attract FDI.
Key export sectors: Metals and minerals are primary exports from Nigeria while agriculture and food exports are expected to grow
Future trade corridors: India, Indonesia, and Mainland China will be the key corridors for Nigeria from 2020 to 2030
Metals and minerals Crude petroleum: Nigeria is the largest crude petroleum producer in Africa and crude petroleum accounted for more than 70 per cent of Nigeria’s export in 2019. The rebound in global growth as well as growing energy demand in Asia will spur demand for crude petroleum.
Petroleum gases: Nigeria has the largest natural gas reserves in Africa and ranks ninth globally in proven gas reserves. With the ongoing reforms to increase the role of gas in the energy mix, Asia Pacific LNG demand is expected to remain strong, driving Nigeria’s future exports growth.
91% share of exports in 2019Metals & Minerals
Indonesia and Mainland China will continue to be leading export destinations for Nigeria, accounting for 12 per cent and 10 per cent of total exports in 2030, respectively
India will continue to be the largest and fastest growing export corridor with 12.4 per cent average growth per year until 2030
Agriculture and food Cocoa beans, sesame seeds, and cassava are Nigeria’s key agricultural exports. Nigeria is the world’s fourth largest cocoa bean exporter and the largest cassava producer. Growing globaldemand for sesame seeds, underpinned by its positioning as a healthy product, and demand for ethanol and other cassava byproducts present strong export growth potential. Nigeria’s agriculture export share is small but expected to grow as Nigeria has prioritised agricultural development for its economic growth.
2% share of exports in 2019Agriculture & Food
Source: Fitch Solutions, Oxford Economics, International Trade Centre, Ease of doing business - The World Bank (2020), IFC, News Articles
Cote d’IvoireUSD 4.20 billion9.6%
FranceUSD 4.13 billion7.6%
CanadaUSD 2.76 billion7.9%
NetherlandsUSD 4.51 billion7.2%
South AfricaUSD 5.28 billion8.9%
Mainland ChinaUSD 11.16 billion9.4%
IndonesiaUSD 12.99 billion10.7%
ItalyUSD 3.37 billion7.0%
IndiaUSD 36.45 billion12.4%
United StatesUSD 2.59 billion7.5%
SpainUSD 6.48 billion8.4%
Export CAGR Rate (2020-2030)
Selected corridors Export value in 2030
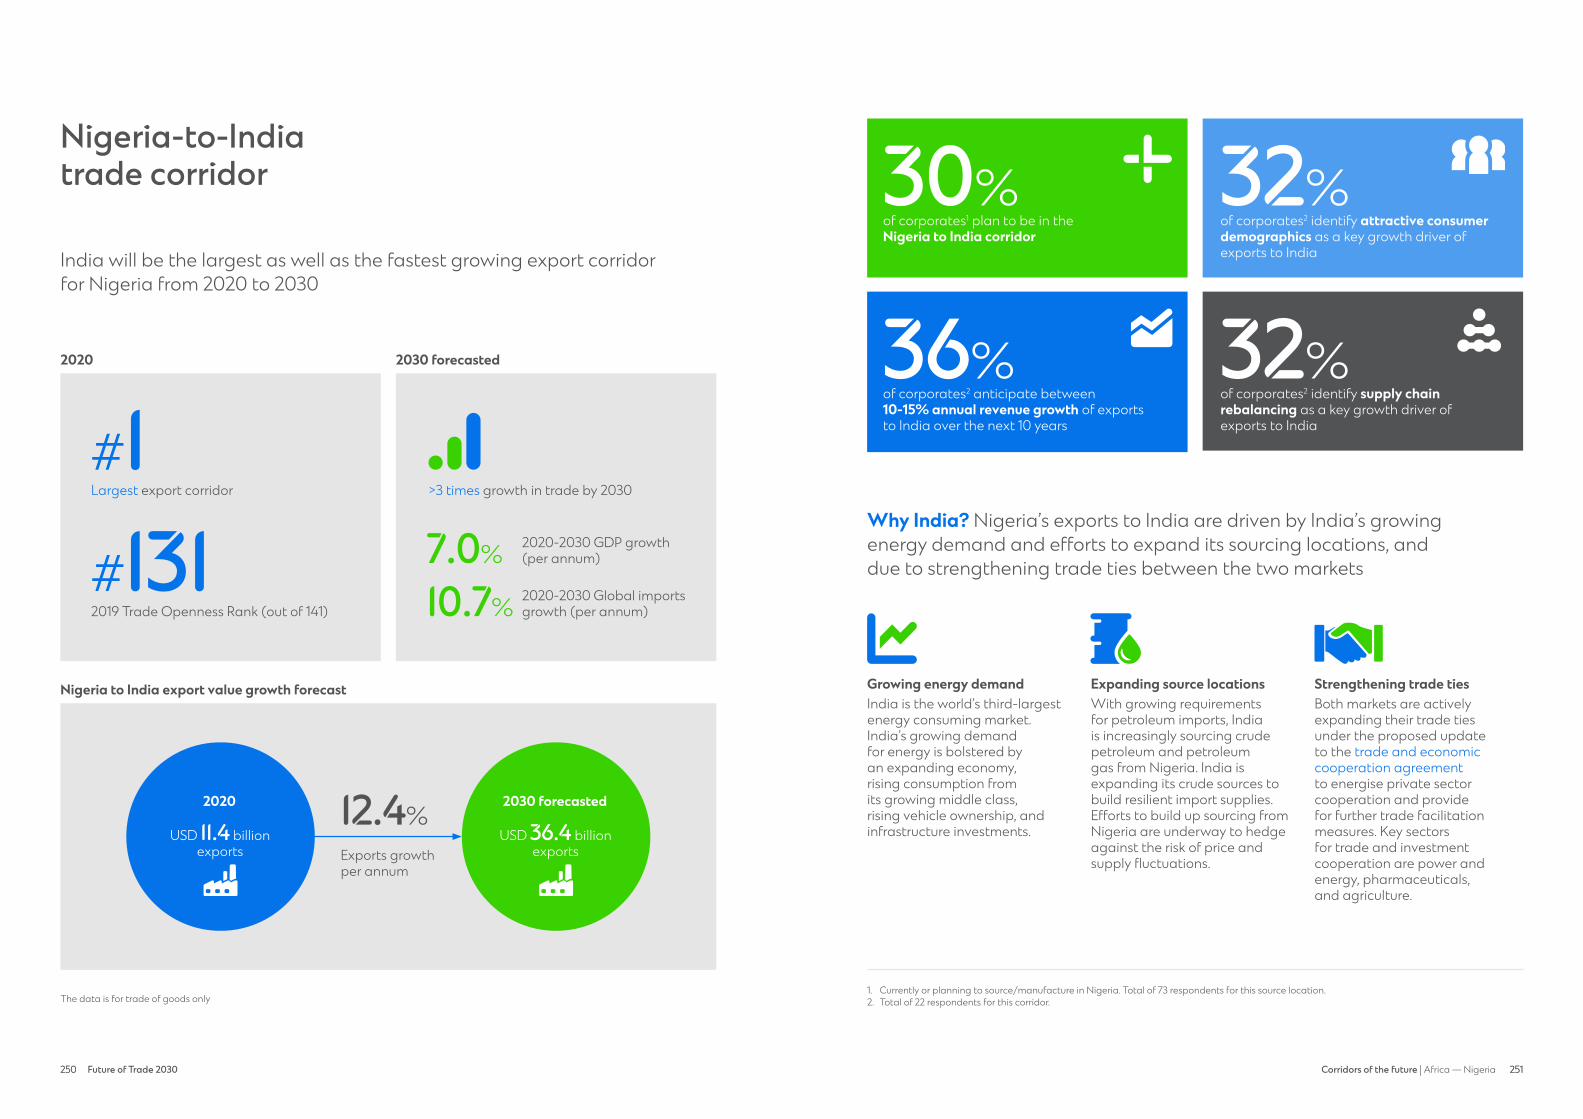
250 Future of Trade 2030 251250 251Corridors of the future | Africa — Nigeria
Nigeria-to-Indiatrade corridor
The data is for trade of goods only
Nigeria to India export value growth forecast
12.4%
Exports growth per annum
2030 forecasted
USD 36.4 billion exports
2020
USD 11.4 billion exports
1. Currently or planning to source/manufacture in Nigeria. Total of 73 respondents for this source location. 2. Total of 22 respondents for this corridor.
India will be the largest as well as the fastest growing export corridor for Nigeria from 2020 to 2030
Largest export corridor
2019 Trade Openness Rank (out of 141)
#131#1
2020 2030 forecasted
>3 times growth in trade by 2030
2020-2030 GDP growth (per annum)
2020-2030 Global imports growth (per annum)
7.0%
10.7%
of corporates2 identify supply chainrebalancing as a key growth driver of exports to India
32%
of corporates1 plan to be in the Nigeria to India corridor
of corporates2 anticipate between 10-15% annual revenue growth of exports to India over the next 10 years
30%
36%
of corporates2 identify attractive consumer demographics as a key growth driver of exports to India
32% consumer demographic
Why India? Nigeria’s exports to India are driven by India’s growingenergy demand and efforts to expand its sourcing locations, and due to strengthening trade ties between the two markets
Growing energy demandIndia is the world’s third-largest energy consuming market. India’s growing demand for energy is bolstered by an expanding economy, rising consumption from its growing middle class, rising vehicle ownership, and infrastructure investments.
Expanding source locationsWith growing requirements for petroleum imports, India is increasingly sourcing crude petroleum and petroleum gas from Nigeria. India is expanding its crude sources to build resilient import supplies. Efforts to build up sourcing from Nigeria are underway to hedge against the risk of price and supply fluctuations.
Strengthening trade tiesBoth markets are actively expanding their trade ties under the proposed update to the trade and economic cooperation agreement to energise private sector cooperation and provide for further trade facilitation measures. Key sectors for trade and investment cooperation are power and energy, pharmaceuticals, and agriculture.
supply chain rebalancing
plan to be in corridor

252 Future of Trade 2030 253252 253Corridors of the future | Africa — Nigeria
Key demand sectors in India: The metals and minerals sector accounts for most of the exports from Nigeria to India
Source: Fitch Solutions, Oxford Economics, International Trade Centre, World Economic Forum, News Articles
Crude petroleum: India is the largest export destination for Nigeria’s crude petroleum. India is encouraging its refineries to buy more from Nigeria due India’s rising demand for crude petroleum. The demand for Nigeria’s crude petroleum (which is largely light and sweet, rich in gasoline and diesel, and low in sulphur) is high amongst Indian state-owned refiners as it is wellsuited for their needs.
Petroleum gases: India imports liquified natural gas (LNG) from Nigeria. The consumption of natural gas in India is expected to increase by 25 billion cubic metres (bcm) from 2020 to 2024, a 9 per cent annual average growth rate. There is a growing demand for natural gas as a clean, eco-friendly fuel for use in the transportation sector. LNG imports will be crucial for India as there is limited potential for domestic production growth.
Metals: Nigeria exports raw, refined, and scrap metals to India, including aluminium, lead, and copper. Increasing construction, facilitated by expanding urbanisation, rural electrification, and growing industrialisation, is leading to a rise in demand for base metals.
Metals & Minerals
Metals and minerals99% share of exports in 2019

254 Future of Trade 2030 255254 255Corridors of the future | Africa — Nigeria
of corporates2 identify bilateral and regional trade agreements as a key growth driver of exports to Indonesia
21% trade agreement
Nigeria-to-Indonesiatrade corridor
Indonesia is projected to be the second largest export corridorfor Nigeria by 2030 due their strengthening bilateral ties
Second largest corridor
2019 Trade Openness Rank (out of 141)
#62#2
2020 2030 forecasted
The data is for trade of goods only
~3 times growth in trade by 2030
2020-2030 GDP growth (per annum)
2020-2030 Global imports growth (per annum)
5.1%
9.1%
Nigeria to Indonesia export value growth forecast
10.7%
Exports growth per annum
2030 forecasted
USD 13.0 billion exports
2020
USD 4.7 billion exports
of corporates1 plan to be in the Nigeria to Indonesia corridor
of corporates2 anticipate between 5-10% annual revenue growth of exports to Indonesia over the next 10 years
19%
43%
Why Indonesia? Nigeria’s exports to Indonesia are driven by collaborative investments, easing trade procedures, and Indonesia’s thriving economy, spurring energy demand growth
Thriving economyIndonesia is on its way to become the fourth largest economy globally by 2045, underpinned by its young and rapidly growing consumer class.As the largest ASEAN market, it is a key energy consumer with demand for electricity expected to triple by 2030.
Easing trade proceduresProposed in 2017, Indonesia-Nigeria Preferential Trade Agreement negotiations are underway. Once active, this will be a major boon for bilateral trade. Additionally, the two markets are actively exploring ways of facilitating enhanced and sustainable trade relations, including reduction of tariff and non-tariff barriers.
Collaborative investmentsNigeria is Indonesia’s largest trading partner in sub-Saharan Africa, with over 15 Indonesianowned companies currently operating in Nigeria Collaborative investments, such as the planned USD2.5 billion gas methanol and fertiliser plant in Nigeria with Pertamina of Indonesia and NNPC of Nigeria, will open new export opportunities.
1. Currently or planning to source/manufacture in Nigeria. Total of 73 respondents for this source location. 2. Total of 14 respondents for this corridor.
of corporates2 identify attractive consumer demographics as a key growth driver of exports to Indonesia
43% consumer demographicplan to be in
corridor
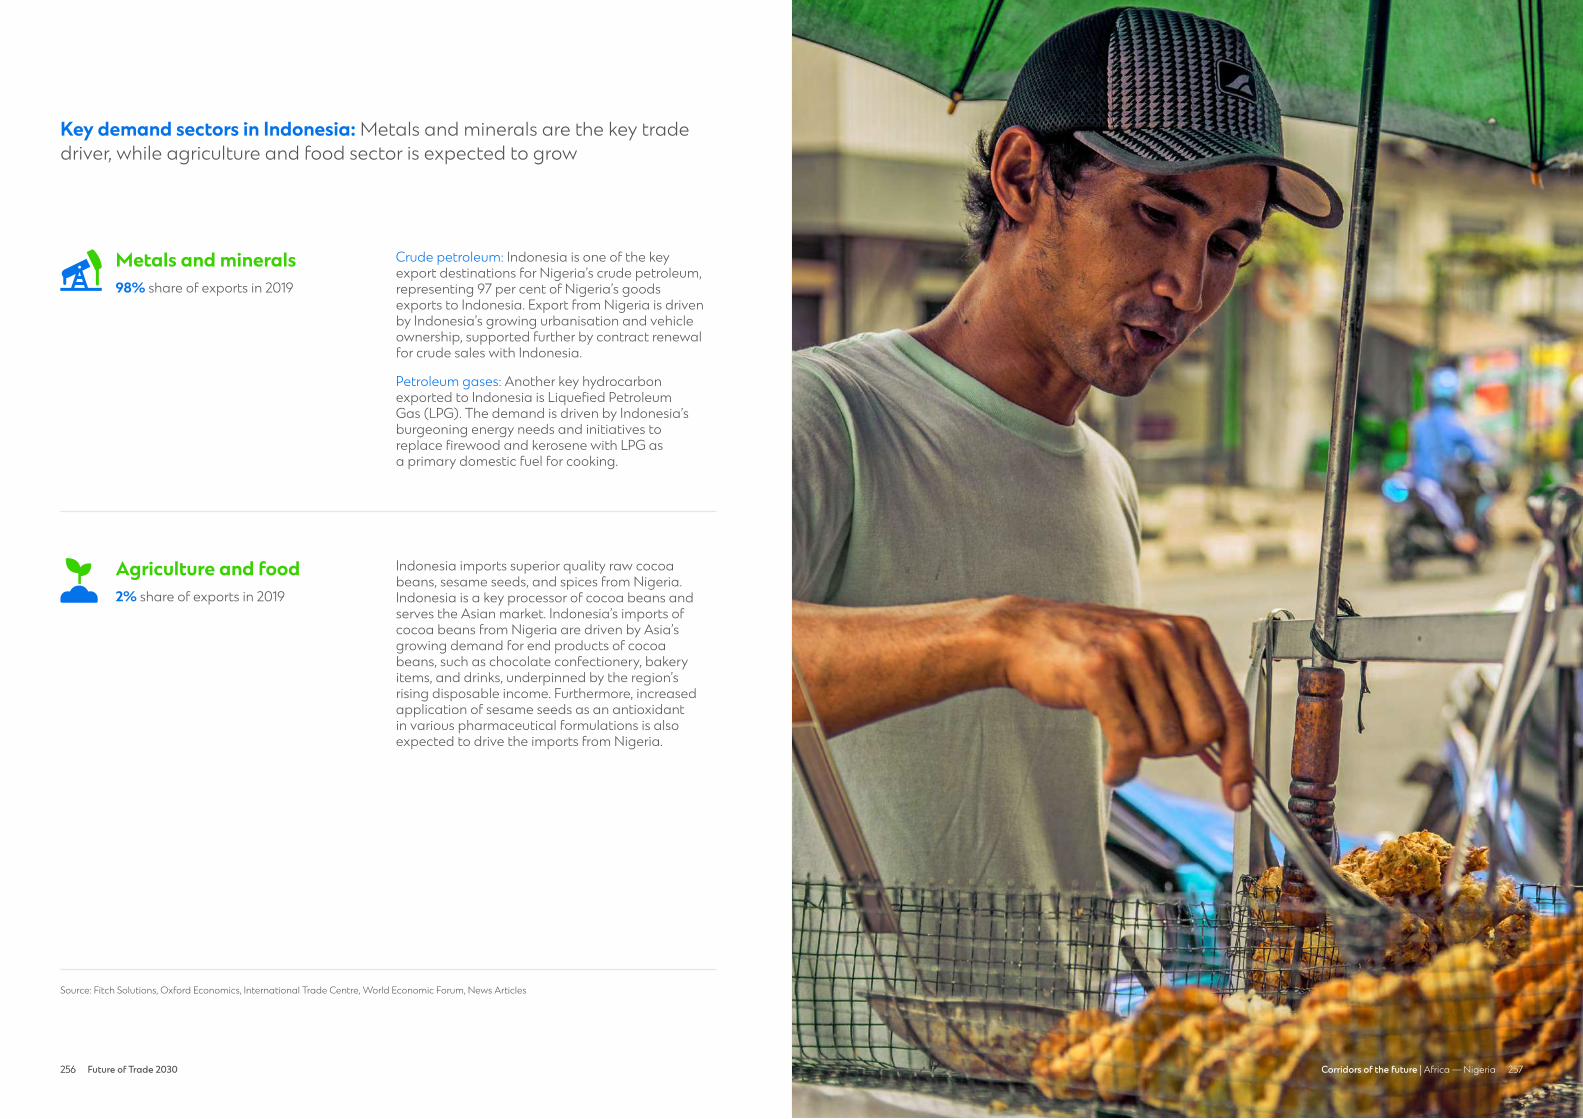
256 Future of Trade 2030 257256 257Corridors of the future | Africa — Nigeria
Key demand sectors in Indonesia: Metals and minerals are the key tradedriver, while agriculture and food sector is expected to grow
Crude petroleum: Indonesia is one of the key export destinations for Nigeria’s crude petroleum, representing 97 per cent of Nigeria’s goods exports to Indonesia. Export from Nigeria is driven by Indonesia’s growing urbanisation and vehicle ownership, supported further by contract renewal for crude sales with Indonesia.
Petroleum gases: Another key hydrocarbon exported to Indonesia is Liquefied Petroleum Gas (LPG). The demand is driven by Indonesia’s burgeoning energy needs and initiatives to replace firewood and kerosene with LPG as a primary domestic fuel for cooking.
Metals & Minerals
Indonesia imports superior quality raw cocoa beans, sesame seeds, and spices from Nigeria. Indonesia is a key processor of cocoa beans and serves the Asian market. Indonesia’s imports ofcocoa beans from Nigeria are driven by Asia’s growing demand for end products of cocoa beans, such as chocolate confectionery, bakery items, and drinks, underpinned by the region’s rising disposable income. Furthermore, increased application of sesame seeds as an antioxidant in various pharmaceutical formulations is also expected to drive the imports from Nigeria.
Agriculture & Food
Source: Fitch Solutions, Oxford Economics, International Trade Centre, World Economic Forum, News Articles
Metals and minerals98% share of exports in 2019
Agriculture and food2% share of exports in 2019
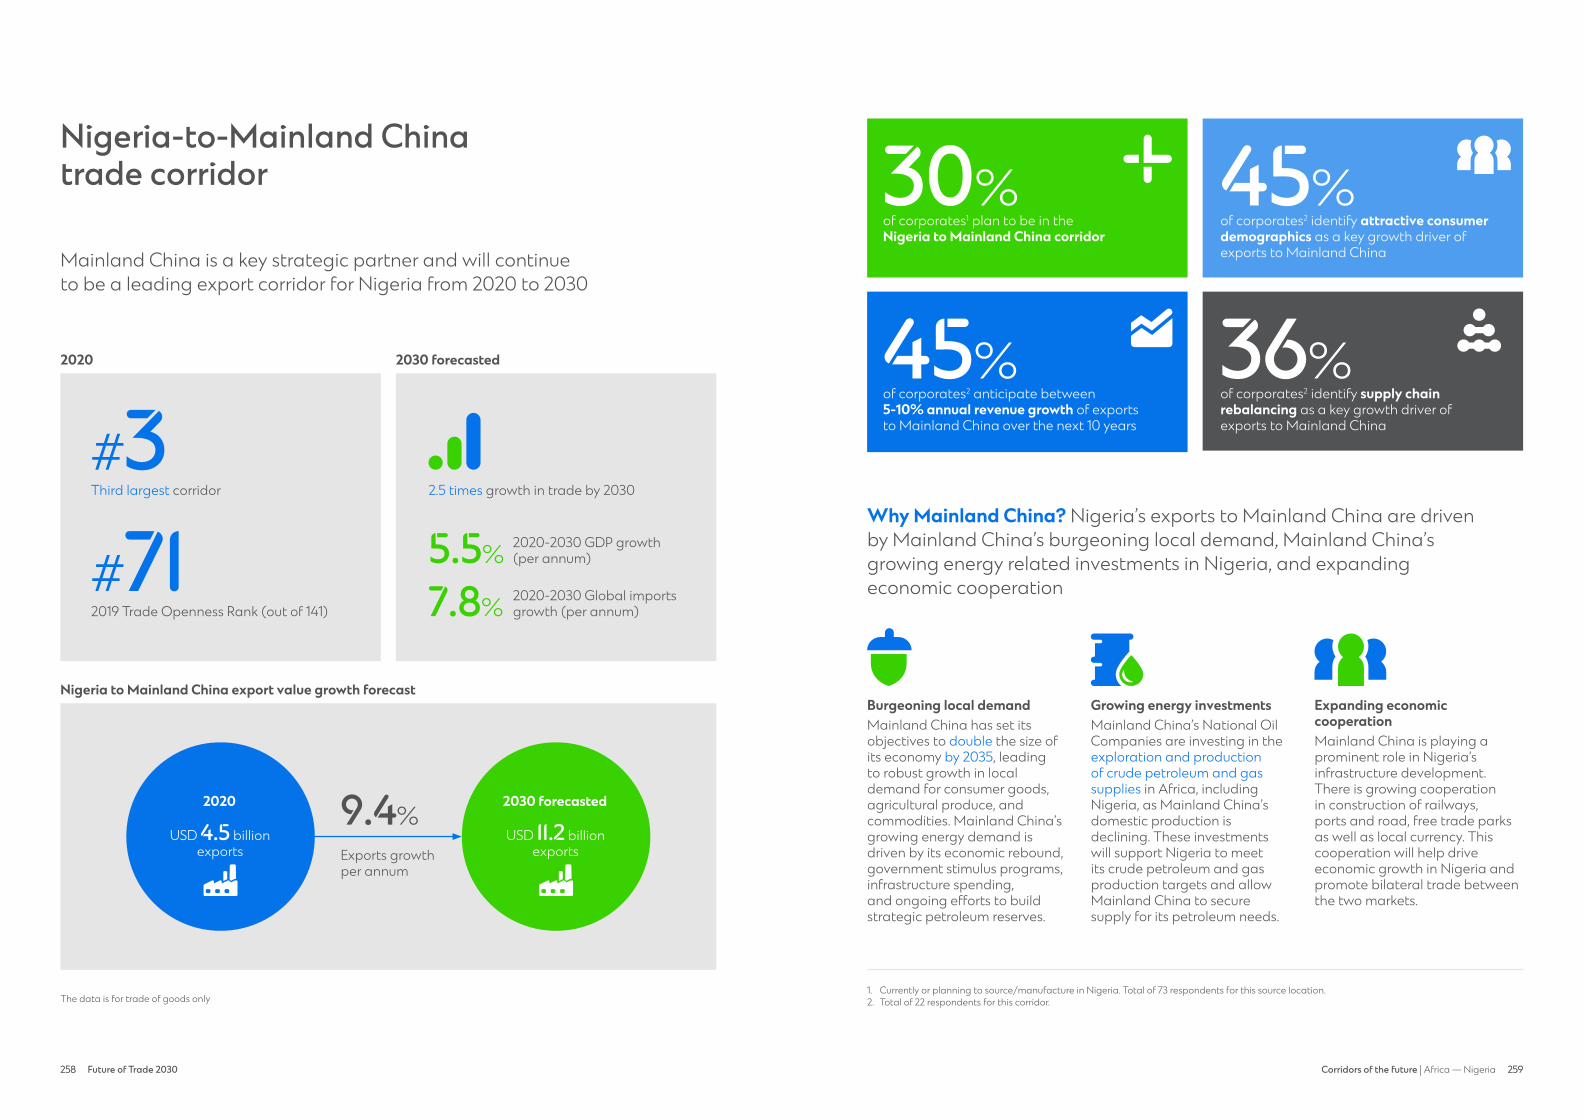
258 Future of Trade 2030 259258 259Corridors of the future | Africa — Nigeria
Nigeria-to-Mainland China trade corridor
The data is for trade of goods only
of corporates1 plan to be in the Nigeria to Mainland China corridor
of corporates2 identify attractive consumer demographics as a key growth driver of exports to Mainland China
of corporates2 anticipate between 5-10% annual revenue growth of exports to Mainland China over the next 10 years
30% 45%
45%
Nigeria to Mainland China export value growth forecast
9.4%
Exports growth per annum
Why Mainland China? Nigeria’s exports to Mainland China are driven by Mainland China’s burgeoning local demand, Mainland China’s growing energy related investments in Nigeria, and expanding economic cooperation
Burgeoning local demandMainland China has set its objectives to double the size of its economy by 2035, leading to robust growth in local demand for consumer goods, agricultural produce, and commodities. Mainland China’s growing energy demand is driven by its economic rebound, government stimulus programs, infrastructure spending, and ongoing efforts to build strategic petroleum reserves.
Growing energy investmentsMainland China’s National Oil Companies are investing in the exploration and production of crude petroleum and gas supplies in Africa, including Nigeria, as Mainland China’s domestic production isdeclining. These investments will support Nigeria to meet its crude petroleum and gas production targets and allow Mainland China to secure supply for its petroleum needs.
Expanding economic cooperationMainland China is playing a prominent role in Nigeria’s infrastructure development. There is growing cooperation in construction of railways, ports and road, free trade parks as well as local currency. This cooperation will help drive economic growth in Nigeria and promote bilateral trade between the two markets.
1. Currently or planning to source/manufacture in Nigeria. Total of 73 respondents for this source location. 2. Total of 22 respondents for this corridor.
2030 forecasted
USD 11.2 billion exports
2020
USD 4.5 billion exports
consumer demographic
Mainland China is a key strategic partner and will continue to be a leading export corridor for Nigeria from 2020 to 2030
Third largest corridor
2019 Trade Openness Rank (out of 141)
#71#3
2020 2030 forecasted
2.5 times growth in trade by 2030
2020-2030 GDP growth (per annum)
2020-2030 Global imports growth (per annum)
5.5%
7.8%
of corporates2 identify supply chainrebalancing as a key growth driver of exports to Mainland China
36% supply chain rebalancing
plan to be in corridor

260 Future of Trade 2030 261260 261Corridors of the future | Africa — Nigeria
Key demand sectors in Mainland China: The metals and minerals sector is the key trade driver while agriculture and food sector is also expected to grow
Source: Fitch Solutions, Oxford Economics, International Trade Centre, World Economic Forum, News Articles
Crude Petroleum: Crude petroleum is Nigeria’s largest export sector with Mainland China. A steady decline of Mainland China’s domestic crude petroleum production due to natural depletion and other geological challenges, coupled with increasing Chinese investments in Nigeria’s petroleum sector, will drive future exports growth.
Petroleum gases: Liquified natural gas (LNG) exports to Mainland China represent the second most important export sector for Nigeria. As Mainland China becomes the world’s largest LNG market and aims to boost the share of natural gas consumption in the total energy mix from almost 8 per cent in 2019 to 15 per cent by 2030, Nigeria’s LNG exports are forecasted to increase significantly.
Metals & Minerals
Mainland China is one of Nigeria’s largest agriculture export destinations, with sesame seeds accounting for most of the agriculture exports. Known for its numerous health and industrial benefits as well as wide applications in baking, medicine, cosmetics, and animal feeds, the surge in local demand is boosting Nigeria’s exports to Mainland China.
Agriculture & Food
Metals and minerals94% share of exports in 2019
Agriculture and food3% share of exports in 2019
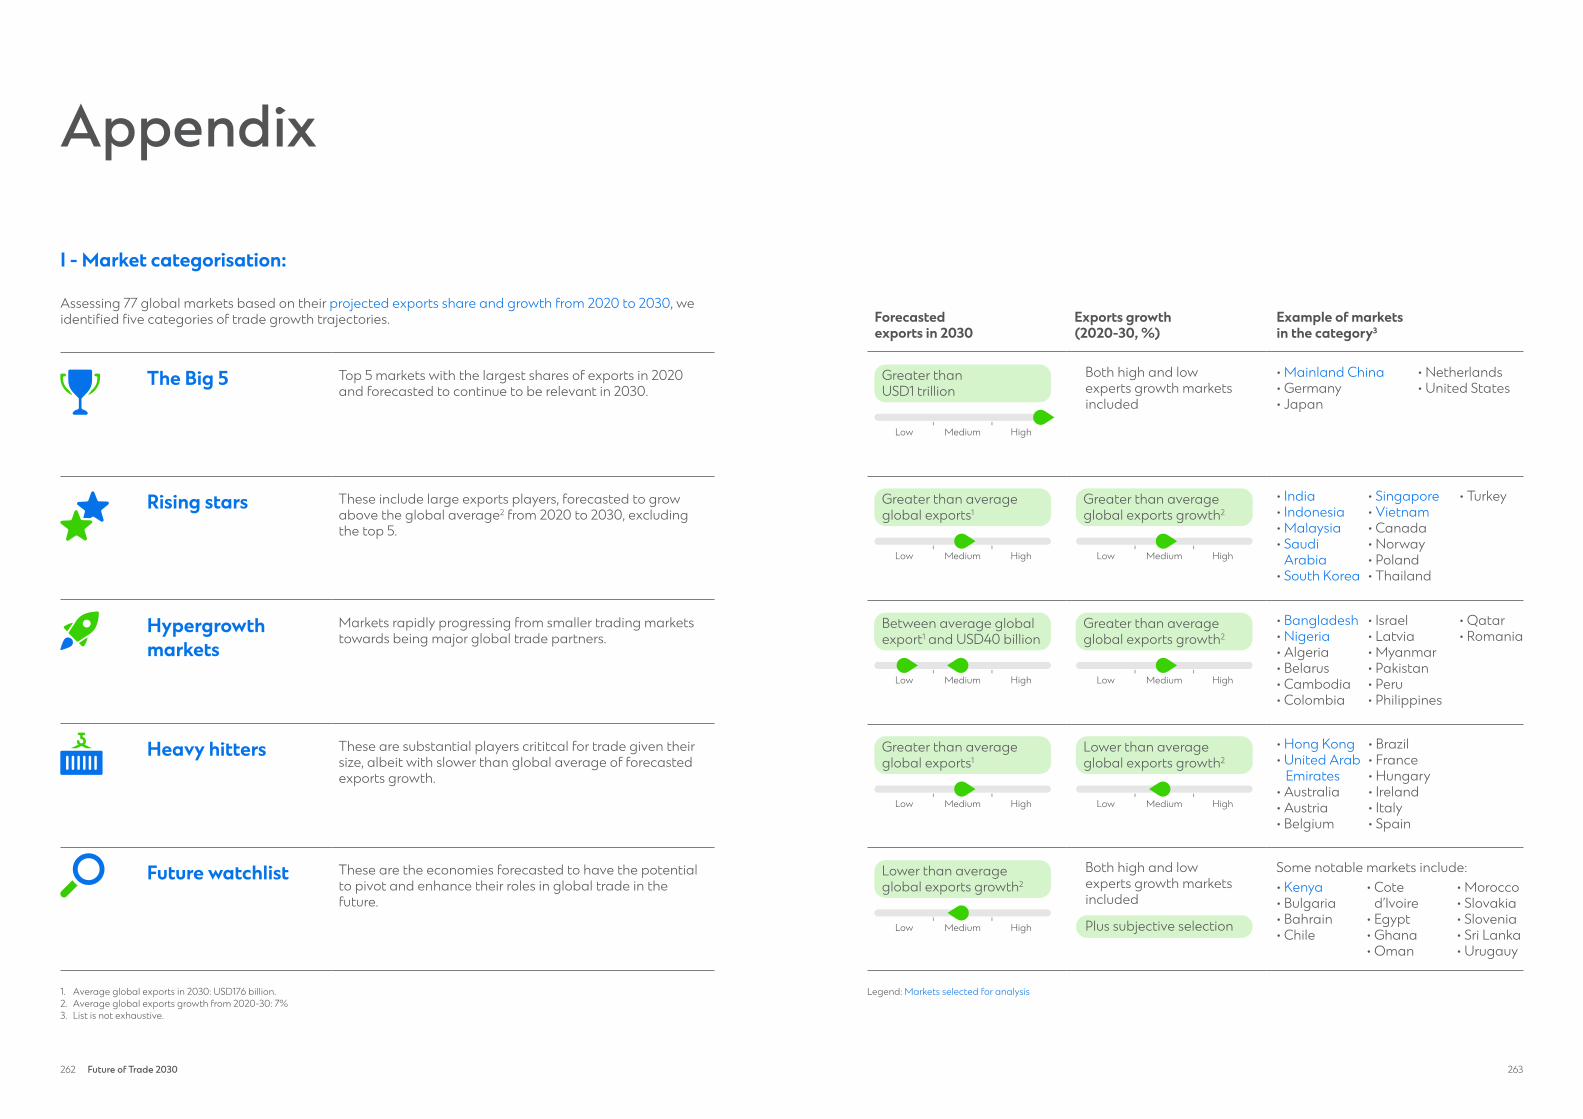
262 Future of Trade 2030 263
Forecasted exports in 2030
Exports growth (2020-30, %)
Example of markets in the category3
Appendix
I - Market categorisation:
Assessing 77 global markets based on their projected exports share and growth from 2020 to 2030, we identified five categories of trade growth trajectories.
1. Average global exports in 2030: USD176 billion.2. Average global exports growth from 2020-30: 7%3. List is not exhaustive.
Legend: Markets selected for analysis
The Big 5 Top 5 markets with the largest shares of exports in 2020 and forecasted to continue to be relevant in 2030.
Rising stars These include large exports players, forecasted to grow above the global average2 from 2020 to 2030, excluding the top 5.
Hypergrowth markets
Markets rapidly progressing from smaller trading markets towards being major global trade partners.
Heavy hitters These are substantial players crititcal for trade given their size, albeit with slower than global average of forecasted exports growth.
Future watchlist These are the economies forecasted to have the potential to pivot and enhance their roles in global trade in the future.
• India• Indonesia• Malaysia• Saudi
Arabia• South Korea
• Singapore• Vietnam• Canada• Norway• Poland• Thailand
• Turkey
• Mainland China• Germany• Japan
• Netherlands• United States
• Bangladesh• Nigeria• Algeria• Belarus• Cambodia• Colombia
• Israel• Latvia• Myanmar• Pakistan• Peru• Philippines
• Qatar• Romania
• Hong Kong• United Arab
Emirates• Australia• Austria• Belgium
• Brazil• France• Hungary• Ireland• Italy• Spain
Some notable markets include:• Kenya• Bulgaria• Bahrain• Chile
• Cote d’Ivoire
• Egypt• Ghana• Oman
• Morocco• Slovakia• Slovenia• Sri Lanka• Urugauy
Greater than USD1 trillion
Greater than average global exports1
Greater than average global exports1
Between average global export1 and USD40 billion
Greater than average global exports growth2
Lower than average global exports growth2
Lower than average global exports growth2
Greater than average global exports growth2
Both high and low experts growth markets included
Both high and low experts growth markets included
Plus subjective selection
Low HighMedium
Low HighMedium
Low HighMedium
Low HighMedium
Low HighMediumLow HighMedium
Low HighMedium
Low HighMedium
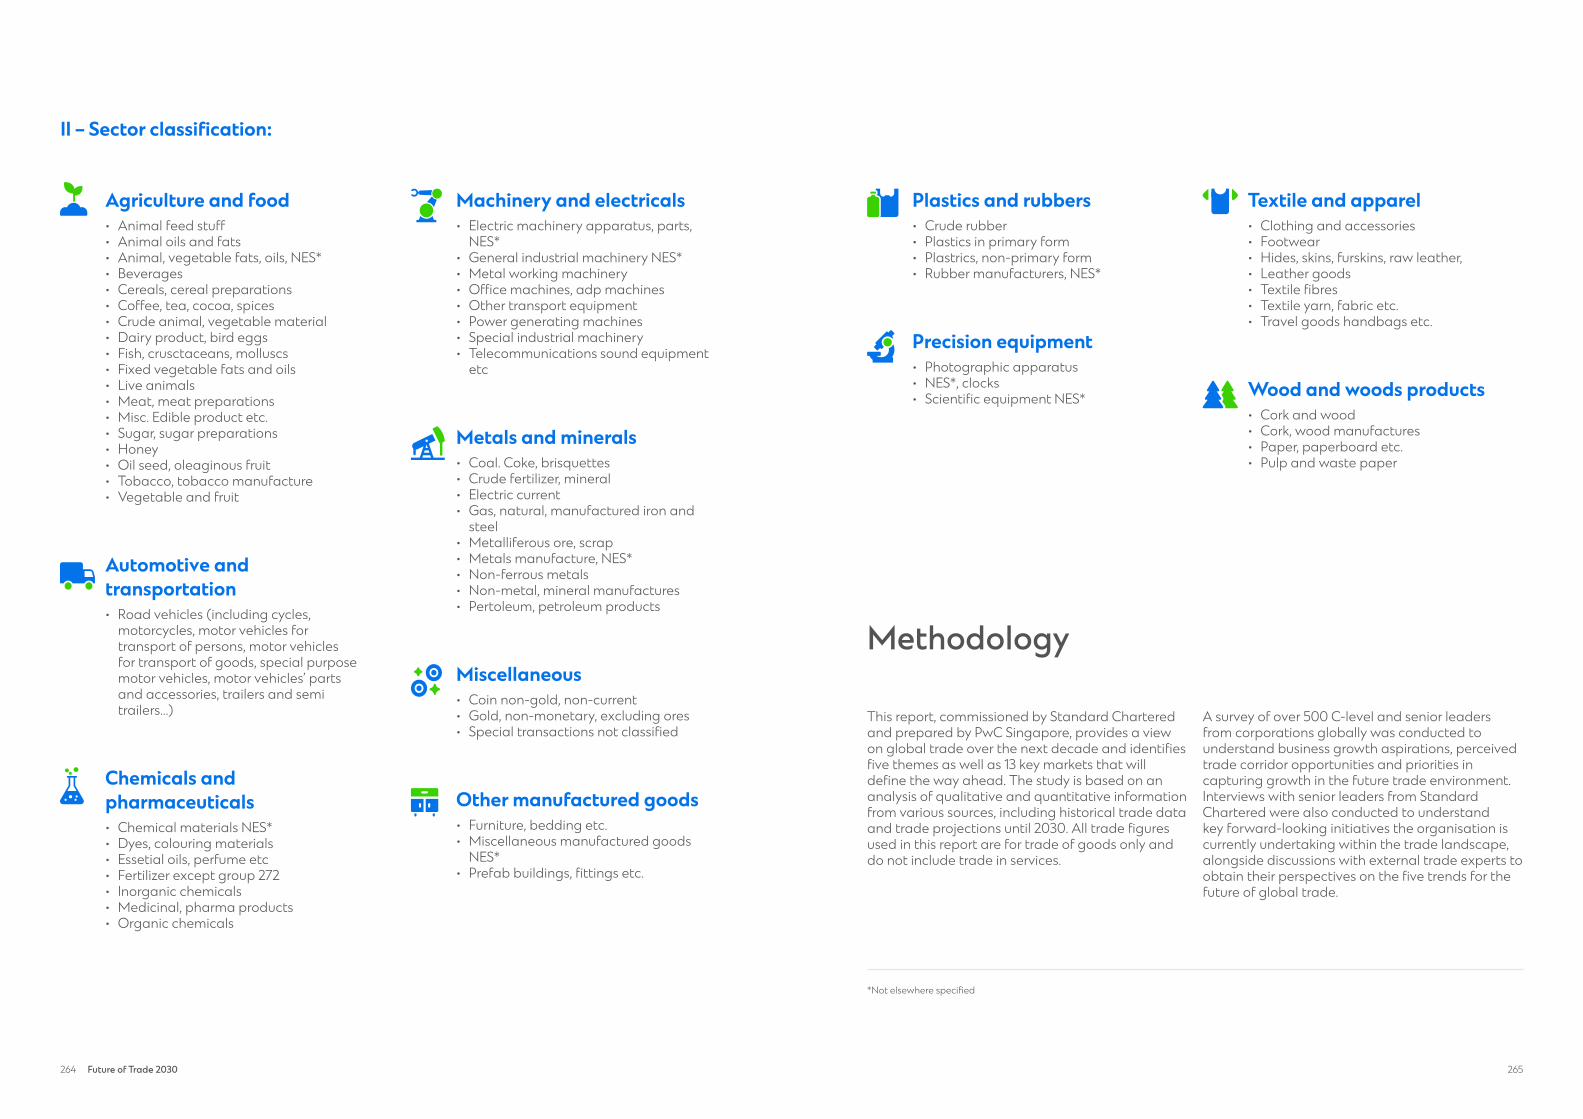
264 Future of Trade 2030 265
Plastics and rubbers• Crude rubber• Plastics in primary form• Plastrics, non-primary form• Rubber manufacturers, NES*
Precision equipment• Photographic apparatus • NES*, clocks• Scientific equipment NES*
Textile and apparel• Clothing and accessories• Footwear• Hides, skins, furskins, raw leather, • Leather goods• Textile fibres• Textile yarn, fabric etc.• Travel goods handbags etc.
Wood and woods products• Cork and wood• Cork, wood manufactures• Paper, paperboard etc.• Pulp and waste paper
II – Sector classification:
*Not elsewhere specified
Agriculture and food• Animal feed stuff• Animal oils and fats• Animal, vegetable fats, oils, NES* • Beverages• Cereals, cereal preparations• Coffee, tea, cocoa, spices • Crude animal, vegetable material• Dairy product, bird eggs• Fish, crusctaceans, molluscs• Fixed vegetable fats and oils• Live animals• Meat, meat preparations• Misc. Edible product etc.• Sugar, sugar preparations• Honey• Oil seed, oleaginous fruit• Tobacco, tobacco manufacture• Vegetable and fruit
Automotive and transportation• Road vehicles (including cycles,
motorcycles, motor vehicles for transport of persons, motor vehicles for transport of goods, special purpose motor vehicles, motor vehicles’ parts and accessories, trailers and semi trailers...)
Chemicals and pharmaceuticals• Chemical materials NES*• Dyes, colouring materials• Essetial oils, perfume etc• Fertilizer except group 272• Inorganic chemicals• Medicinal, pharma products• Organic chemicals
Machinery and electricals• Electric machinery apparatus, parts,
NES*• General industrial machinery NES*• Metal working machinery• Office machines, adp machines• Other transport equipment• Power generating machines• Special industrial machinery• Telecommunications sound equipment
etc
Metals and minerals• Coal. Coke, brisquettes• Crude fertilizer, mineral• Electric current• Gas, natural, manufactured iron and
steel• Metalliferous ore, scrap• Metals manufacture, NES*• Non-ferrous metals• Non-metal, mineral manufactures• Pertoleum, petroleum products
Miscellaneous• Coin non-gold, non-current• Gold, non-monetary, excluding ores• Special transactions not classified
Other manufactured goods• Furniture, bedding etc.• Miscellaneous manufactured goods
NES*• Prefab buildings, fittings etc.
Methodology
This report, commissioned by Standard Chartered and prepared by PwC Singapore, provides a view on global trade over the next decade and identifies five themes as well as 13 key markets that will define the way ahead. The study is based on an analysis of qualitative and quantitative information from various sources, including historical trade data and trade projections until 2030. All trade figures used in this report are for trade of goods only and do not include trade in services.
A survey of over 500 C-level and senior leaders from corporations globally was conducted to understand business growth aspirations, perceived trade corridor opportunities and priorities in capturing growth in the future trade environment. Interviews with senior leaders from Standard Chartered were also conducted to understand key forward-looking initiatives the organisation is currently undertaking within the trade landscape, alongside discussions with external trade experts to obtain their perspectives on the five trends for the future of global trade.

266 Future of Trade 2030 267
Disclaimer
This material has been prepared by PricewaterhouseCoopers Consulting (Singapore) Pte Ltd. (“PwC Singapore”) at the request of Standard Chartered PLC and its affiliates (“Standard Chartered Group”) in accordance with the agreement between PwC Singapore and Standard Chartered Group. Other than to Standard Chartered Group, PwC Singapore will not assume any duty of care to any third party for any consequence of acting or refraining to act, in reliance on the information contained in this report or for any decision based on it. PwC Singapore accepts no responsibility or liability for any use of this report by any third party, including any partial reproduction or extraction of this content.
It is not independent research material. This material has been produced for information and discussion purposes only and does not constitute advice or an invitation or recommendation to enter into any transaction or to subscribe for or purchase any products or services and should therefore not be relied upon as such. It is not directed at Retail Clients in the European Economic Area as defined by Directive 2004/39/EC, neither has it been prepared in accordance with legal requirements designed to promote the independence of investment research and is not subject to any prohibition on dealing ahead of the dissemination of investment research. The information herein may not be applicable or suitable to the specific investment objectives, financial situation or particular needs of recipients and should not be used in substitution for the exercise of independent judgment.
Some of the information appearing herein may have been obtained from public sources and while PwC Singapore and Standard Chartered Group believe such information to be reliable, it has not been independently verified by PwC Singapore or Standard Chartered Group. Information contained herein is subject to change without notice. Neither PwC Singapore nor Standard Chartered Group is under any obligation to update or revise the information contained herein. Any opinions or views of PwC Singapore or Standard Chartered Group or any other third parties expressed in this material are those of the parties identified. PwC Singapore and Standard Chartered Group do not provide financial, accounting, legal, regulatory or tax advice. This material does not provide any investment or tax advice. Please note that (i) any discussion of U.S. tax matters contained in this material (including any attachments) cannot be used by you for the purpose of avoiding tax penalties; (ii) this communication was written to support the promotion or marketing of the matters addressed herein; and (iii) you should seek advice based on your particular circumstances from an independent tax advisor.
While all reasonable care has been taken in preparing this material, PwC Singapore, Standard Chartered Group and each of their affiliates make no representation or warranty as to its accuracy or completeness, and no responsibility or liability is accepted for any errors of fact, omission or for any opinion expressed herein. You are advised to exercise your own independent judgment (with the advice of your professional advisers as necessary) with respect to the risks and consequences of any matter contained herein. PwC Singapore, Standard Chartered Group and each of their affiliates expressly disclaim any liability and responsibility for any damage or losses (including, without limitation, any indirect or consequential losses or damages) you may suffer from your use of or reliance on this material or as a result of any information being incorrect or omitted from this material.
Any financial projections or models included in this material are based on numerous assumptions regarding the present and future business strategy of the entities to which such projections or models relate and the environment in which such entities may operate in the future. These future events are not a guarantee of future performance and are subject to certain risks, uncertainties and assumptions.
Standard Chartered Group or its affiliates may not have the necessary licenses to provide services or offer products in all markets or such provision of services or offering of products may be subject to the regulatory requirements of each jurisdiction. This material is not for distribution to any person to which, or any jurisdiction in which, its distribution would be prohibited.
The Standard Chartered Group may be involved in transactions and services with clients or other persons who are, or may be, involved in the transactions that are referred to in this material or who may have conflicting interests with you or any other person. The Standard Chartered Group’s ability to enter into any transaction (or to provide any person with any services) will be subject to, among other things, internal approvals and conflicts clearance.
The distribution of this material in certain jurisdictions may be restricted by law and therefore persons who receive this document or any Information should inform themselves about, and observe, any such restrictions. Any failure to comply with these restrictions may constitute a violation of the laws of any such jurisdiction. No liability to any person is accepted by Standard Chartered Group or PwC Singapore in relation to the distribution of this document or the Information in such jurisdictions. The distribution of this material in any other market locations may require suitable disclosures to be made by the Standard Chartered Group. Should you receive this material in such other market location, please contact the relevant Standard Chartered Group member.
Copyright in this document and all materials, text, articles and information contained herein is the property of Standard Chartered Group or its licensors (save for any copyright in materials created by any identified third parties which remain vested with the respective third party), and may not be copied, distributed, adapted, translated or otherwise used (in whole or in part) without the prior written consent of Standard Chartered Group. Copyright © 2021. Standard Chartered Group. All rights reserved.
Key sources
1. All historical and forecasted trade data were obtained from Oxford Economics, Global Trade Database, 2021 and were extracted between May 7 and August 10 of 2021.
2. Sectoral data for Kenya and Nigeria were retrieved from the United Nations Commodity Trade Statistics Database (UN Comtrade).
• EMIS reports
• Fitch Solutions, Database and Reports, 2021
• IMF Direction of Trade Statistics (DOTS) database, 2021
• ITC, Trade Map Database, 2021
• Oxford Economics, Global Trade Database, 20211
• Standard Chartered
• The World Bank, Database, 2021
• UN COMTRADE, Database, 20212
• World Economic Forum