Embed Size (px)
Citation preview
Functionalization of Porous Carbon Materials with
Heteroatoms and Application as Supports in Industrial
Heterogeneous Catalysis
M. Sc. Sandy M. G. Lama
geboren am 04.05.1989 in Bethlehem, Palästina
University Dissertation
zur Erlangung des akademischen Grades
„doctor rerum naturalium“
(Dr. rer. nat.)
in der Wissenschaftsdisziplin „Kolloidchemie“
eingereicht an der
Mathematisch-Naturwissenschaftlichen Fakultät
Institut für Chemie
der Universität Potsdam
und
Kolloidchemie Abteilung
der Max-Planck-Institut für Kolloid-und Grenzflächenforschung
Potsdam-Golm, im April 2018

This work is licensed under a Creative Commons License: Attribution – Noncommercial – Share Alike 4.0 International To view a copy of this license visit https://creativecommons.org/licenses/by-nc-sa/4.0/ Published online at the Institutional Repository of the University of Potsdam: URN urn:nbn:de:kobv:517-opus4-415797 http://nbn-resolving.de/urn:nbn:de:kobv:517-opus4-415797


“If the result confirms the hypotheses, you’ve made a discovery.
If the result is contrary to the hypotheses, you’ve made a
discovery.”
(Enrico Fermi)

“A little science estranges man from God, but much science leads them back to him.” (Lewis Pasteur)
Dedication
I dedicate this work to God for keeping me under his protection and strengthening me to
keep on achieving.
Also, I dedicate this work to my beloved parents who have always loved me
unconditionally and whose good examples have taught me to work hard for the things
that I aspire to reach.
Finally, I dedicate this work to my soul that has gone through much on its own but still
faced everything and seeked to continue overcoming challenges and accomplishing in
science.
Acknowledgment
Although words alone are not enough to give the appropriate gratitude to all people
whom stood beside me and supported me all during my 2.5 years of Ph.D study, yet this
doctorate thesis will not be worth a value without at least acknowledging the efforts of
these people.
It is for the strength, the will, and the hope that God grant me that held me to continue
working and achieving despite all the worst circumstances that I had to face.
It is the encouragement, love, and support of my beloved and dear parents and family
that kept me triggered and focused to reach my goals as well as the support and prayers
of my one and only cherished Grandma 3aida. May god bless you all and keep you in
good health. The support of my aunts, my cousins (Oro, Jessie, Aniessa, Nivo, Nisso,
Nawal, Maro, Saloom, Micho, Muhannad, Josef, George) and friends (Renata, 3aysheh,
Tamara, Manar, Vida, Ruba, Mary, …) in Palestine whom made life funnier, prettier,
and easy to keep on moving forward.
Of course, it is also thanks to the great nice time I spent with you my international
friends whom I met in Germany (Li, Soo, Gila, Shubhamoy, Andrej, Wanquo, Pete,
Zhou, Wei, Eddie, Agnese, Lorena, Ana2, Steffen, Runyu, Qin, Batu, Sadra, Milena,
Ipek, Valentino, Jose, Hester, Majd, Alberto, Patri, Melis, David, Alina)
Liebe Familie Aßhauer, ohne euch wusste ich nichts was zu tun. Vielleicht ich war
jemand aus Bethlehem wem euch am Weihnachten besucht habe, aber euch wären
meine Weihnachts geschenk. Sie haben mir ein Zimmer zwichen euch gegeben, ein
ganz Liebe und freundliche Atmosphäre, Sie wären sehr geduldig an mir, und noch an
mir gekümmert und immer zu mir alles Gute gewünscht. Euch Sind wie meine Zweite
Familie, wirklich ganz herzlichen Dank.
To the carbon group leader and my great advisor Dr. Martin Oschatz, I am sincerely
thankful to your efforts, discussion, teaching, support and motivation towards
accomplishing my doctorate and performing high achievements whether in publishing,
presenting posters, presenting oral presentations, successful research and findings, and
attending the several interesting conferences. Thank you so much for your
encouragement and for pushing me to overcome my limits.
“The scientist only imposes two things, namely truth and sincerity, imposes them upon himself and upon other scientists.”
(Erwin Schrödinger)
I would like to extend my thanks to Dr. Klaus Tauer for his discussions, arguments and
ideas in regards to my research and other interesting topics, which supported me and
provided me with a pleasant time to give and do more.
Also, it is thanks to the efforts of the technicians of the mpikg colloids department
(Heike, Rona, Marlies, Regina, Irina, Ursula, Ms. Lubahn, Antje, Bodo, Ines, Katharina,
and Jessica) for their help and effort with sample analysis and laboratory assistance.
Moreover, deep thanks to the collaborators who provided the necessary analysis to
accomplish successful projects and extend the understanding regarding the research (Dr.
Tim Fellinger and Dr. Jonas Pampel, Carbon and energy group, MPIKG, Germany; Dr.
Daniel Varon Silva and Ankita Malik, Biomolecular systems group, MPIKG, Germany
University of Belgrade, Serbia; TU-Berlin and TU-Dresden, Germany; Assistant Prof.
Jan Philip Hoffmann TU-Eindhoven, Netherlands; Prof. Dr. Krijn de Jong, group of
inorganic chemistry and catalysis, Utrecht university, Netherlands).
Finally many thanks to the Max Planck Institute for funding my research projects and
the travel expenses for the different conferences. Thanks is extended to the supervision
of Prof. Dr. Dr. h. c. Markus Antonietti, Max Planck Institute- colloids department
director.
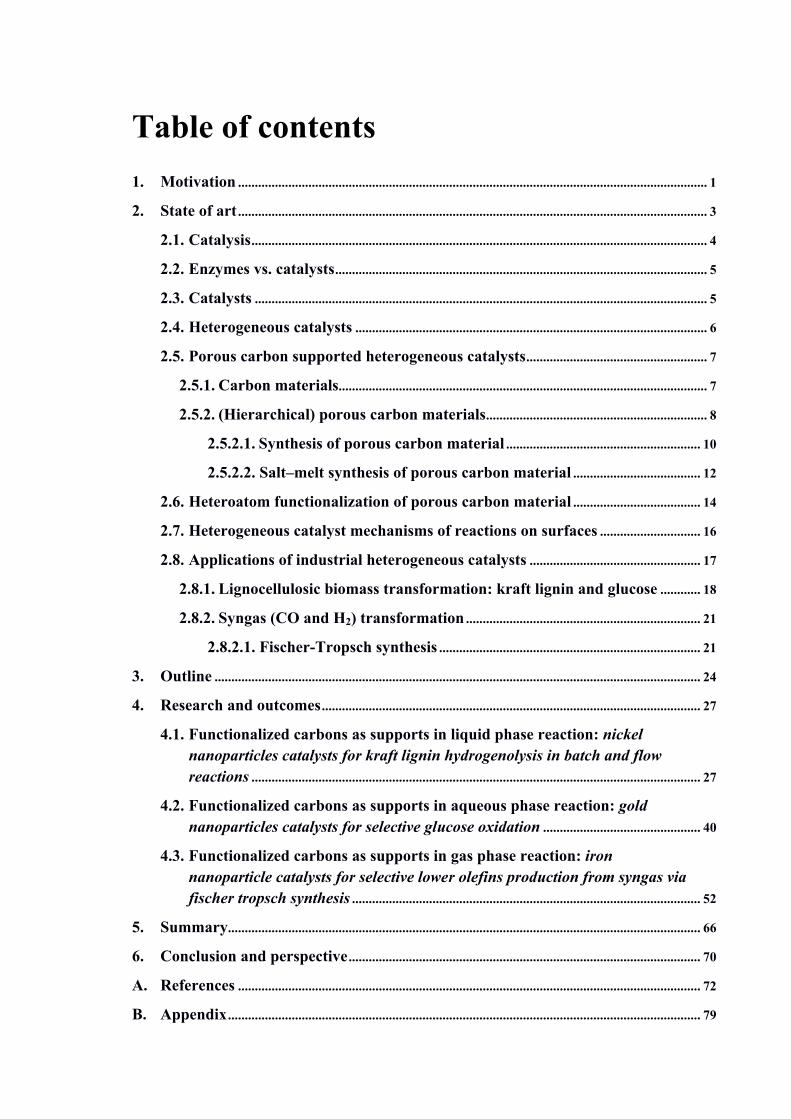
Table of contents
1. Motivation ............................................................................................................................................ 1
2. State of art ............................................................................................................................................ 3
2.1. Catalysis ........................................................................................................................................ 4
2.2. Enzymes vs. catalysts ............................................................................................................... 5
2.3. Catalysts ....................................................................................................................................... 5
2.4. Heterogeneous catalysts ......................................................................................................... 6
2.5. Porous carbon supported heterogeneous catalysts ...................................................... 7
2.5.1. Carbon materials.............................................................................................................. 7
2.5.2. (Hierarchical) porous carbon materials .................................................................. 8
2.5.2.1. Synthesis of porous carbon material .......................................................... 10
2.5.2.2. Salt–melt synthesis of porous carbon material ...................................... 12
2.6. Heteroatom functionalization of porous carbon material ...................................... 14
2.7. Heterogeneous catalyst mechanisms of reactions on surfaces .............................. 16
2.8. Applications of industrial heterogeneous catalysts ................................................... 17
2.8.1. Lignocellulosic biomass transformation: kraft lignin and glucose ............ 18
2.8.2. Syngas (CO and H2) transformation ...................................................................... 21
2.8.2.1. Fischer-Tropsch synthesis .............................................................................. 21
3. Outline ................................................................................................................................................. 24
4. Research and outcomes ................................................................................................................. 27
4.1. Functionalized carbons as supports in liquid phase reaction: nickel nanoparticles catalysts for kraft lignin hydrogenolysis in batch and flow reactions ...................................................................................................................................... 27
4.2. Functionalized carbons as supports in aqueous phase reaction: gold nanoparticles catalysts for selective glucose oxidation ............................................... 40
4.3. Functionalized carbons as supports in gas phase reaction: iron nanoparticle catalysts for selective lower olefins production from syngas via fischer tropsch synthesis ........................................................................................................ 52
5. Summary ............................................................................................................................................. 66
6. Conclusion and perspective ......................................................................................................... 70
A. References .......................................................................................................................................... 72
B. Appendix ............................................................................................................................................. 79
a. List of abbreviations ................................................................................................................... 79
b. List of materials ........................................................................................................................... 82
c. List of gases................................................................................................................................... 83
d. Characterization methods ........................................................................................................ 83
i. Characterization of nickel carbon modified catalysts for kraft lignin hydrogenolysis in liquid phase reaction ...................................................................... 83
ii. Characterization of gold carbon modified catalysts for glucose oxidation in aqueous phase reaction ............................................................................................... 85
iii. Characterization of iron carbon functionalized catalysts for synthetic gas conversion to hydrocarbons ............................................................................................ 87
e. Supporting information for chapter 4: research and outcomes.................................. 89
C. Achievements .................................................................................................................................. 124
a. List of publications ................................................................................................................... 124
b. List of conferences .................................................................................................................... 124
D. Declaration of authorship .......................................................................................................... 125

“Be less curious about people and more about ideas.” (Marie Curie)
Chapter 1
Motivation
Page 1 Motivation ||Chapter 1
1. Motivation Chemicals represent an essential part in our daily life. They are applied in almost every product whether in food such as preservative, in IT products as smart phones and computers, in transportation as fuel source, and many more. The
increase in global population means a high demand for energy and chemicals. Fossil
fuels- the main feedstock for energy and chemicals- is an unstable resource and
contributes to different matters (i.e. environmental, economical, and political); Hence,
the search for alternative renewable and environmentally friendly chemical feedstocks.
As these alternatives need different processing than petroleum fuels, industry is urged to
improve established heterogeneous catalytic systems. Most of the industrial productions
depend on heterogeneously catalyzed chemical conversions. The catalyst activity,
selectivity, stability, cost of preparation and recyclation, and the conditions required for
activation of the catalyst influence the production rate, quantity and quality, and cost of
the final product. The more selective, stable, active and easier to recycle the catalyst, the
better the production rate of the industry is; thus being capable of satisfying the rapid
demands and needs of our life. A heterogeneous catalyst provides the ease of separation
and recovery from the reaction component in contrast to a homogeneous one, and as a
heterogeneous catalyst mostly consists of metal nanoparticles as active sites deposited
on a support, the conventional focus to improve the catalytic system for a given reaction
was to utilize different supports, different metals (or a combination of metals),
nanoparticle sizes of active metals, and different methods of synthesis and deposition.
There have also been approaches to improve the catalyst via constructing hierarchical
porosity in the support when possible (as in metal organic frameworks (MOFs), Zeolites,
carbons) which increases the surface area and mass transfer; thus improves the activity
and stability. Amongst the many supports applied in industrial heterogeneous catalysis
such as zeolites, silica (SiO2), alumina (Al2O3), titania (TiO2) and many others, porous
carbons are considered a leading material by virtue of its unique properties such as
thermal and chemical stability, large surface areas, functionalizable surface, the
possibility to easily recover the active metal, and potentially low cost. Consequently,
carbons have been applied in several industries from medicine to catalysis and
electrochemistry. In order to achieve higher catalytic efficiency using carbons, several
synthesis methods have been applied where in each the focus was to tailor the pore
structure within the carbon material for a certain catalytic conversion. Those methods
include (but are not limited to) hard- and soft- templating and salt templating, by which
hierarchical porosity (micro-, meso-, and macro- pores) can be achieved. Such
Page 2 Motivation ||Chapter 1
hierarchical porosity can be advantageous especially in reactions where complex macro-
polymers are present as for example in the degradation of lignocellulosic biomass (LCB)
e.g. lignin. However, in catalysis the active metal deposited on the support plays the
main role in a reaction. So, a hierarchical porous carbon support can provide more
surface area for the metal to be dispersed and thus to be more exposed to the educt
which results in better activity. Nevertheless, the dispersion of active metal on porous
support can cause clogging of pores (especially micropores), agglomeration of active
metal around the pore (due to lowering of surface energy), or further growth of
crystallites of active metal to form larger particles and thus the ultimate active metal
activity can be outreached. Of this premise, an advanced industrial catalytic system is
required to overcome the previously mentioned challenges. A convenient solution is
modifying the porous carbon supports with heteroatoms before deposition of active
metal. Heteroatoms can influence the hydrophilicity/ hydrophobicity of the support and
the catalyst in general, improves the immobilization of active metal, influence the
particle size and distribution, and can enhance the properties of the active metal through
an electronic junction effect. Therefore, as carbons have a tunable surface and can be
modified with heteroatoms- which give them another advantage over the other industrial
supports- herein they have been studied for the development of advanced industrial
catalytic systems for different conversions (Hydrogenolysis, oxidation, and
hydrogenation) in liquid phase and gas phase, in the aim to provide profound
knowledge of heteroatoms’ effect on the catalyst properties. An illustration of the
concepts discussed during this research is given in (Figure 1).
Figure 1: Main concepts discussed in the given research.

“More the knowledge lesser the ego, lesser the knowledge more the ego.” (Albert Einstein)
Chapter 2
Introduction
Page 3 Introduction||Chapter 2
Preface
In this chapter the following questions are answered: What is the target issue of this
research? How can this matter be solved? And what has already been done in research?
Moreover, this chapter introduces the main concepts of catalysis and the industrial
applications related to this thesis work.
2. State of Art
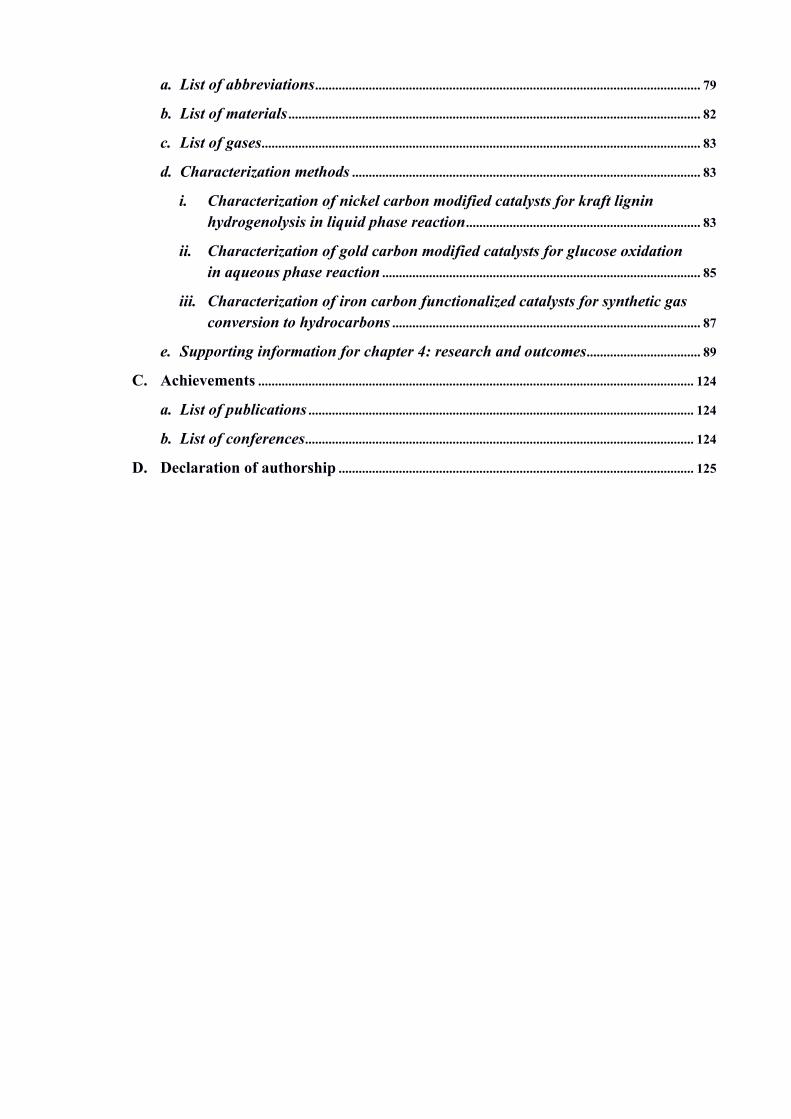
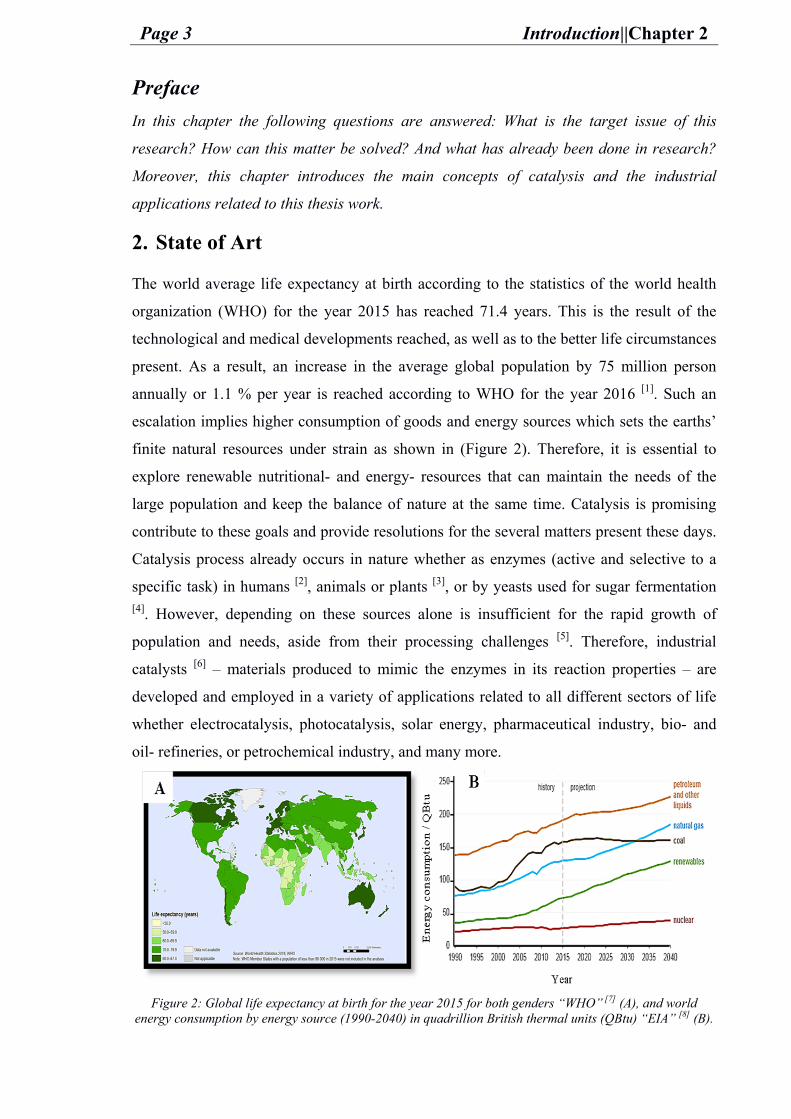
The world average life expectancy at birth according to the statistics of the world health
organization (WHO) for the year 2015 has reached 71.4 years. This is the result of the
technological and medical developments reached, as well as to the better life circumstances
present. As a result, an increase in the average global population by 75 million person
annually or 1.1 % per year is reached according to WHO for the year 2016 [1]. Such an
escalation implies higher consumption of goods and energy sources which sets the earths’
finite natural resources under strain as shown in (Figure 2). Therefore, it is essential to
explore renewable nutritional- and energy- resources that can maintain the needs of the
large population and keep the balance of nature at the same time. Catalysis is promising
contribute to these goals and provide resolutions for the several matters present these days.
Catalysis process already occurs in nature whether as enzymes (active and selective to a
specific task) in humans [2], animals or plants [3], or by yeasts used for sugar fermentation [4]. However, depending on these sources alone is insufficient for the rapid growth of
population and needs, aside from their processing challenges [5]. Therefore, industrial
catalysts [6] – materials produced to mimic the enzymes in its reaction properties – are
developed and employed in a variety of applications related to all different sectors of life
whether electrocatalysis, photocatalysis, solar energy, pharmaceutical industry, bio- and
oil- refineries, or petrochemical industry, and many more.
Figure 2: Global life expectancy at birth for the year 2015 for both genders “WHO” [7] (A), and world
energy consumption by energy source (1990-2040) in quadrillion British thermal units (QBtu) “EIA” [8] (B).
Page 4 Introduction||Chapter 2
2.1. Catalysis
Catalysis has been known since decades especially in fermentation; however, the term
catalyst was first noted by Jöns Jakob Berzelius in 1835 [9]. The term is first noted as
Kataluein, originates from the Greek language meaning Kata: down and Luein: loosen [10].
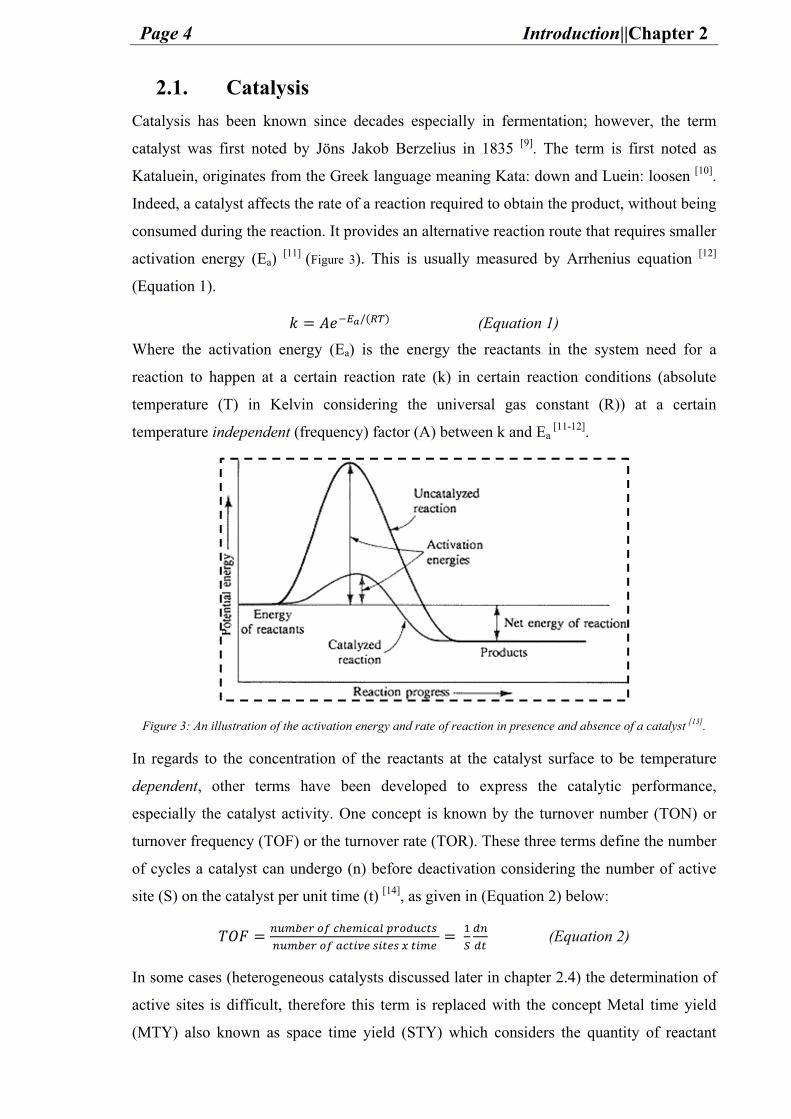
Indeed, a catalyst affects the rate of a reaction required to obtain the product, without being
consumed during the reaction. It provides an alternative reaction route that requires smaller
activation energy (Ea) [11] (Figure 3). This is usually measured by Arrhenius equation [12]
(Equation 1). = /( ) (Equation 1)
Where the activation energy (Ea) is the energy the reactants in the system need for a
reaction to happen at a certain reaction rate (k) in certain reaction conditions (absolute
temperature (T) in Kelvin considering the universal gas constant (R)) at a certain
temperature independent (frequency) factor (A) between k and Ea [11-12].
Figure 3: An illustration of the activation energy and rate of reaction in presence and absence of a catalyst [13].
In regards to the concentration of the reactants at the catalyst surface to be temperature
dependent, other terms have been developed to express the catalytic performance,
especially the catalyst activity. One concept is known by the turnover number (TON) or
turnover frequency (TOF) or the turnover rate (TOR). These three terms define the number
of cycles a catalyst can undergo (n) before deactivation considering the number of active
site (S) on the catalyst per unit time (t) [14], as given in (Equation 2) below: = = (Equation 2)
In some cases (heterogeneous catalysts discussed later in chapter 2.4) the determination of
active sites is difficult, therefore this term is replaced with the concept Metal time yield
(MTY) also known as space time yield (STY) which considers the quantity of reactant
Page 5 Introduction||Chapter 2
converted to products (mol or grams) per quantity of active metal used (mol or grams) per
unit time (seconds (s), minutes (min) or hours (h)) [14] as given in (Equation 3) = (Equation 3)
In catalysis not only the activity matters but also the selectivity (S) to the desired product
and the stability over time. The selectivity can be measured by considering the rate of the
desired product (d p) obtained among the rest of the products in the gathered solution (d ST)
after the catalytic reaction [6] as shown in (Equation 4) below: ( ) = (Equation 4)
A catalyst can be in a gaseous (e.g. Nitroxide), liquid (e.g. Sulfuric acid), or solid state.
Industrially, liquids and solids are mostly used and these can be either of organic and bio-
materials (e. g. yeast used in fermentation) and referred to as biocatalysis or enzymes, or
inorganic material (Sulfuric acid or platinum metal) known as catalysts [6, 11].
2.2. Enzymes vs. Catalysts
Despite the fact that enzymes were the first known catalysts and they can be applied in
varied interdisciplinary areas (such as detergents, pharmaceuticals, medicine, Agriculture,
Pulp and paper, and food), yet only a small fraction of enzymes is applied industrially (~ 1 %
of all known enzymes). They can be made through sustainable development and green
chemistry and tend to have unsurpassed selectivity towards specific product, very high
chemical conversions (turnover number), and operate under relatively mild conditions.
However, biocatalysts suffer from insufficient stability, a long development time, being
unstable under elevated temperature and pH conditions, have low specific activity, are only
available for selected reactions, and being often expensive [5-6, 11]. Such disadvantages can
be overcomed by the catalysts.
2.3. Catalysts
Catalysts can be classified according to the phase in which they operate into homogeneous
catalysts and heterogeneous catalysts. Among these, heterogeneous catalysts are
industrially more favored. The difference between a heterogeneous and a homogeneous
catalyst is the phase boundary where homogeneous catalysts are in the same phase as the
substrate and the product (most often dissolved in a liquid phase), but the heterogeneous
catalyst is in different phase (most often a solid catalyst in fluid phase). This potentially
provides the homogeneous catalysts, which are in most cases organometallic compounds, a
Page 6 Introduction||Chapter 2
higher degree of dispersion and thus better catalytical performance per active center.
However, their difficult separation from the product mixture, and thus limited reusability
and extra cost of scaling up or catalyst loss limits its industrial applicability [6, 15].
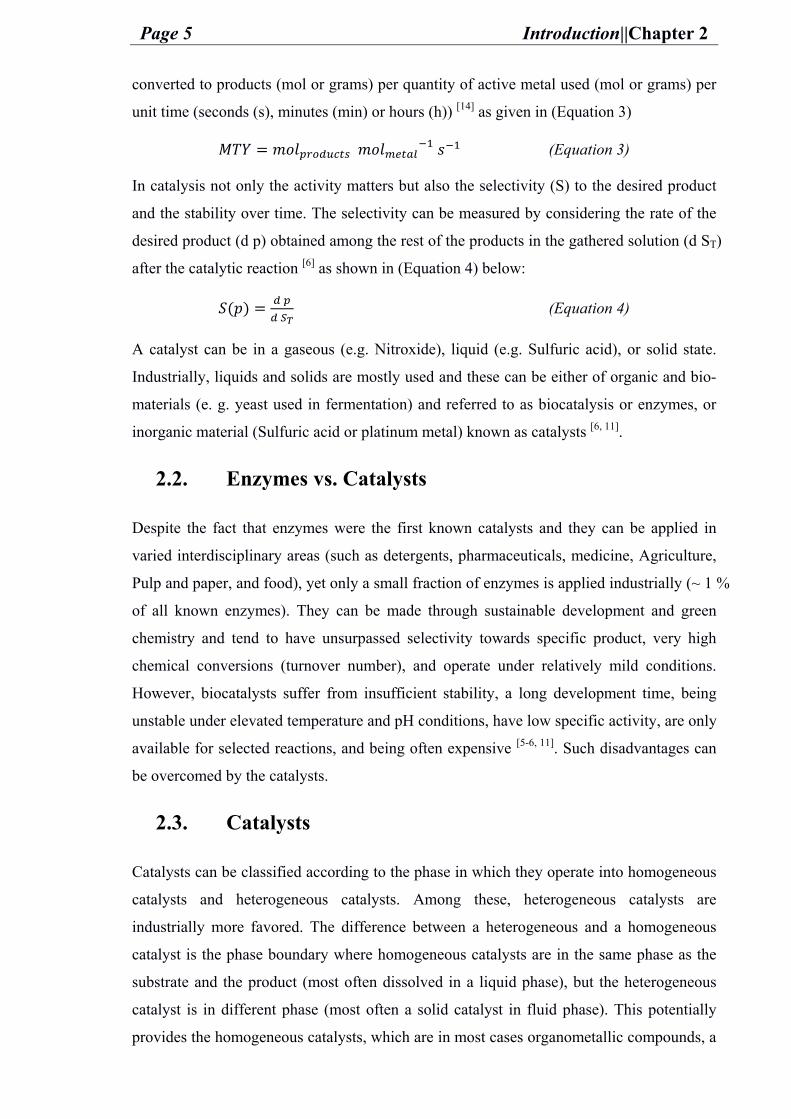
Therefore, as a heterogeneous catalyst can overcome the issues of an enzyme or a
homogeneous catalyst, it is widely applied in variable sections of industry [16]. A short
summary is illustrated in (Figure 4)
Figure 4: Schematic summary of catalysis in industry.
2.4. Heterogeneous Catalysts
A heterogeneous catalyst can be having the metal nanoparticles supported (e.g. platinum
on carbon) or unsupported (e.g. Raney nickel). The advantages of a supported
heterogeneous catalyst allows for a vast range of industrial applications. A support
provides a high surface area for effective dispersion of metal particles, induces high
activity of metal, maximizes the spatial distance between the metal nanoparticles (MNPs),
limits particle growth, facilitates the separation from the reaction medium (e.g. by simple
filtration), influences the catalytic performance of the metal, enhances the catalyst stability,
and thus can provide economical use of the active metal. Moreover, depending on the
structure of the support, the metal can be deposited not only on the surface but in the pores
as well. In other words, the textural and chemical properties of the support material impact
the catalytic performance of the active metal in a reaction. [11, 15-17].
Page 7 Introduction||Chapter 2
2.5. Porous Carbon Supported Heterogeneous Catalysts
2.5.1. Carbon Materials
Carbon materials have been known since prehistory (e.g. burning woods for warming and
cooking) and they are still used to our days for their unique characteristics and widespread
important applications. Carbon is the 6th element in the periodic table and ranks the 17th
among the rest abundant terrestrial elements. Its ability to bond with other atoms as well
with itself in plentiful fashion forming stable substances with less or more electronegative
partners, allows the formation of many chemical compounds [18]. Carbon atoms can bind
together depending on their electronic configuration to give allotropes of different physical
properties. Amongst these allotropes, the sp3 hybridized diamond for example is a 3-D
framework of cubic symmetry with high transparency and the properties of a wide band
gap semiconductor. At the same time, it is the hardest natural material (microhardness >
100 GPa). Graphite, on the other hand, is a carbon modification with sp2 hybridization
consisting of stacked planar sheets in hexagonal stacking making it highly electrically
conductive, non-transparent, and one of the softest materials (microhardness ~1 GPa).
Carbon nanotubes, another interesting allotrope, exhibit high tensile strength, high electric
and thermal conductivity, high ductility, and high thermal and chemical stability. Beside
these basic elemental modifications, plenty of other carbon materials (such as powders,
fibers, and foams) of varied mechanical, electrical, and chemical properties exist,
providing in general high surface area, high thermal stability, high chemical inertness, and
a tunable surface. Hence, carbons are useful for widespread applications ranging from
automobile to medicine industries, and catalysis to energy storage. Another indication of
how remarkable carbon materials are and how widespread carbon chemistry is, Elsevier
Science has dedicated and published a Journal called (Carbon) for this element. In addition
there exist a large number of books representing only the carbon element, its structure,
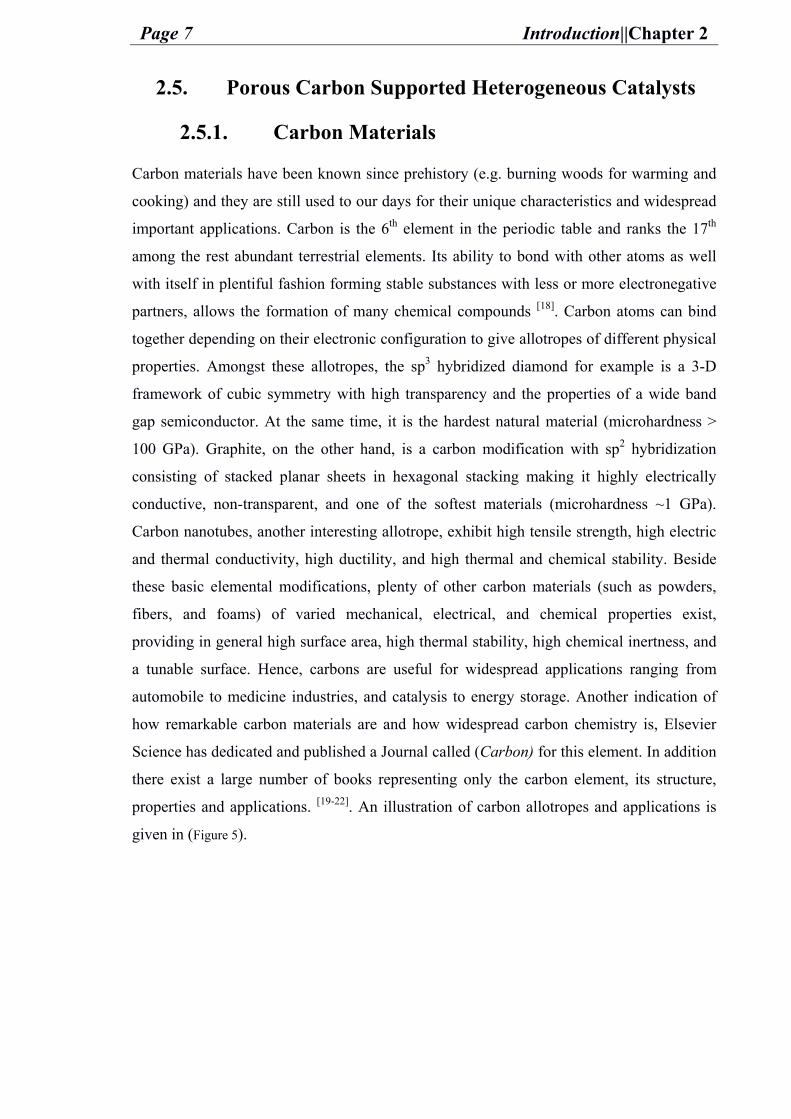
properties and applications. [19-22]. An illustration of carbon allotropes and applications is
given in (Figure 5).
Page 8 Introduction||Chapter 2
Figure 5: Different carbon allotropes (left) and the different industrial applications of carbon in industry (right).
2.5.2. (Hierarchical) Porous Carbon Materials
Porous solid materials are materials that contain voids in their internal surface area which
are deeper than they are wide. These voids are known as pores and they vary in geometry
(cylindrical, ink-bottle shaped/ spherical, slit, interstices, and funnel shaped/ conical) and
size. The pores can be opened (accessible) or closed (inaccessible). The open pores can be
blind (with a dead end), or inter-connected pores (connecting between the pores).
According to IUPAC the pores are size categorized by their diameter (d) into:
• Micro-pores: d < 2 nm
• Meso-pores: 2 nm < d < 50 nm
• Macro-pores: d > 50 nm.
Three parameters are measured to characterize the porosity of a material its specific
surface area (SSA), its total pore volume (TPV), and its pore size distribution (PSD) [23].
The importance of porosity in a material is not only to enhance its surface area by
providing more contact between the surface of the material (inner and outer surface) and
the surrounding phase, but by also providing efficient mass transfer. This can be possible
by tuning the porosity in the material in accordance to the application.
Although the material can contain each pore type alone with a certain size distribution, it
can also contain two or more pore sizes “hierarchical porosity” depending on the method to
prepare the material. In some applications e.g. catalysis, the presence of a hierarchical
porosity can improve the surface area of the material and the mass transfer within the
Page 9 Introduction||Chapter 2
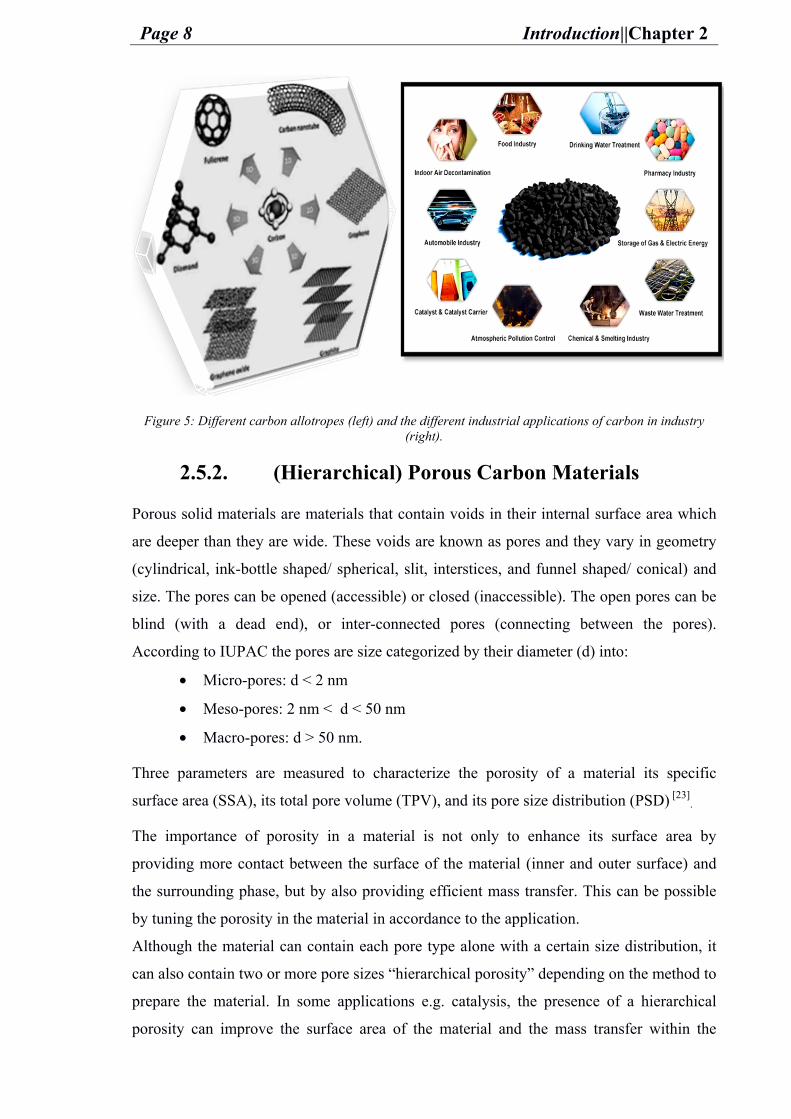
catalyst; hence influencing the catalytic performance [24-25]. A macropore system can
minimize diffusion distances by serving as a micro – reservoirs, and a mesopore can
provide larger accessible surface area and smaller ion-transport resistance, while a
micropore system is beneficial for shape-selectivity and size- selectivity for guest
molecules. Together as hierarchical system (for example macro-meso pores, or meso-micro
pores) they can provide higher surface area with strong adsorption ability and avoid the
mass transfer limitations resulting from the use of one pore system as micropores [26-27]. A
depiction for the porosity and mass transfer in shown in (Figure 6).
Figure 6: Depiction for the different porosity and its importance in mass transfer.
Hierarchical porosity already exists in nature whether in trees for transportation of water
and minerals to its upper parts, or even in human body in the lungs for example where
branched pores for the exchange of oxygen and carbon dioxide are present at the interface
between the lung and the air. Such accessible large surface area in a small space is
desirable in many applications especially in catalysis for the aforementioned reasons.
Carbons as supports stand out from other supports in being surface tunable and thermally
stable in addition to the preparation from several cheap raw precursors and their high
surface area. Therefore, improving its performance in catalysis is important and possible
by tuning its porosity for a higher surface area and better mass transfer. A typical porous
carbon such as activated carbons (ACs) can have up to 3000 m2 /g of surface area [28]
depending on the synthesis method and the size of its structural pores. Several synthesis
methods are known for designing and templating the pore size in regard to carbon material.
These methods vary according to the application intended. For example, in gas adsorption
applications, more microporous system is favored whereas in catalysis a hierarchical
porosity (meso– to macro–pores) are of an advantage especially for heterogeneous
supported catalysts; therefore different synthesis methods are developed [29].
Page 10 Introduction||Chapter 2
2.5.2.1. Synthesis of Porous Carbon Material
As aforementioned, the synthesis of carbon and tuning its porosity is relevant to the
intended application. In Industrial heterogeneous catalysis, carbons are mostly used as
supports. Therefore, the method of synthesis needs to be economic, provides scaling up,
and of course it has to provide the desired hierarchical porosity system for the above
mentioned reasons.
Industrially, physical and chemical activation methods are applied for porous carbon
synthesis. The physical activation is based on pyrolysis (temperatures above 500 °C) of
raw material (e.g. coal, wood, fruit shell, polymers) into char at an inert gas atmosphere
followed by the addition of activation agents (CO2 or H2O) which are inducing an etching
of the carbon thus introducing porosity (etching of carbon in presence of CO2 is a result of
Boudouard equilibrium as in (Equation 5), while in presence of steam a water gas shift
(WGS) takes place (Equation 6) followed by etching (Equation 7)). The disadvantages of
such a synthesis are the resultant of small pore sizes which result in limited mass transfer
of the molecules, the formation of undesirable defects and functional groups causing low in
conductivity, and the instability of pore structure at high temperatures (e,g, during
graphitization) [30]. ( ) + ( ) ⇌ 2 ( ) + ( ) (Equation 5) ( ) + ( ) ⇌ ( ) + ( ) + ( ) (Equation 6) ( ) + ( ) ⇌ ( ) + ( ) (Equation 7)
On the other hand, the chemical activation is carried out by impregnating a raw carbon
material with highly concentrated aqueous solution of a chemical activation agent such as
potassium hydroxide (KOH) or zinc chloride (ZnCl2) where dehydration for example with
KOH occurs yielding H2O (Equation 8) which by a steam activation process forms the
porosity which results with carbon dioxide (CO2) formation. This CO2 reacts with the
formed potassium oxide (K2O) to produce potassium carbonate (K2CO3) (Equation 9).
Moreover when pyrolyzing (Temperature >700 °C) the K2O can be reduced to elemental
potassium (K) by H2 or the carbon causing carbon etching (porosity formation) (Equations
10 and 11). At the same time the K can go mobile and intercalate between the carbon
layers causing layer separation which after washing the active agent forms a high internal
micro-porosity [24, 31-32]. 2 ( ) ⇌ ( ) + ( ) (Equation 8) ( ) + ( ) ⇌ ( ) (Equation 9) ( ) + ( ) ⇌ 2 ( ) + ( ) (Equation 10)
Page 11 Introduction||Chapter 2
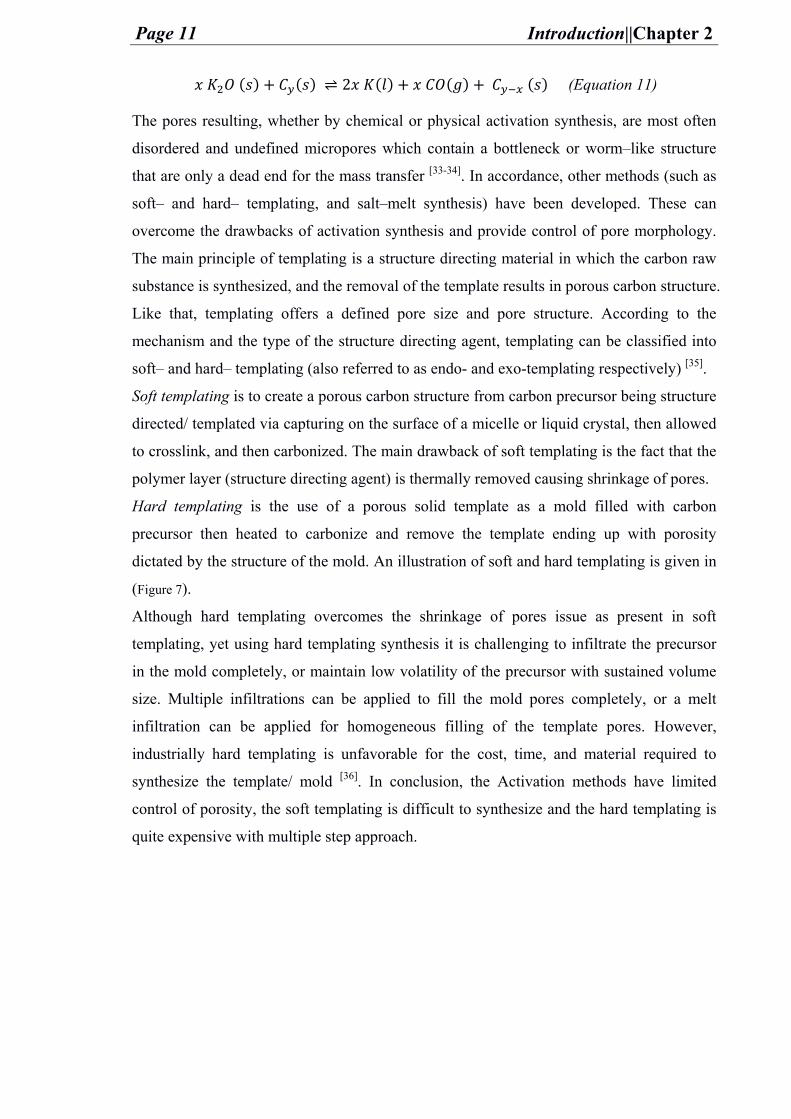
( ) + ( ) ⇌ 2 ( ) + ( ) + ( ) (Equation 11)
The pores resulting, whether by chemical or physical activation synthesis, are most often
disordered and undefined micropores which contain a bottleneck or worm–like structure
that are only a dead end for the mass transfer [33-34]. In accordance, other methods (such as
soft– and hard– templating, and salt–melt synthesis) have been developed. These can
overcome the drawbacks of activation synthesis and provide control of pore morphology.
The main principle of templating is a structure directing material in which the carbon raw
substance is synthesized, and the removal of the template results in porous carbon structure.
Like that, templating offers a defined pore size and pore structure. According to the
mechanism and the type of the structure directing agent, templating can be classified into
soft– and hard– templating (also referred to as endo- and exo-templating respectively) [35].
Soft templating is to create a porous carbon structure from carbon precursor being structure
directed/ templated via capturing on the surface of a micelle or liquid crystal, then allowed
to crosslink, and then carbonized. The main drawback of soft templating is the fact that the
polymer layer (structure directing agent) is thermally removed causing shrinkage of pores.
Hard templating is the use of a porous solid template as a mold filled with carbon
precursor then heated to carbonize and remove the template ending up with porosity
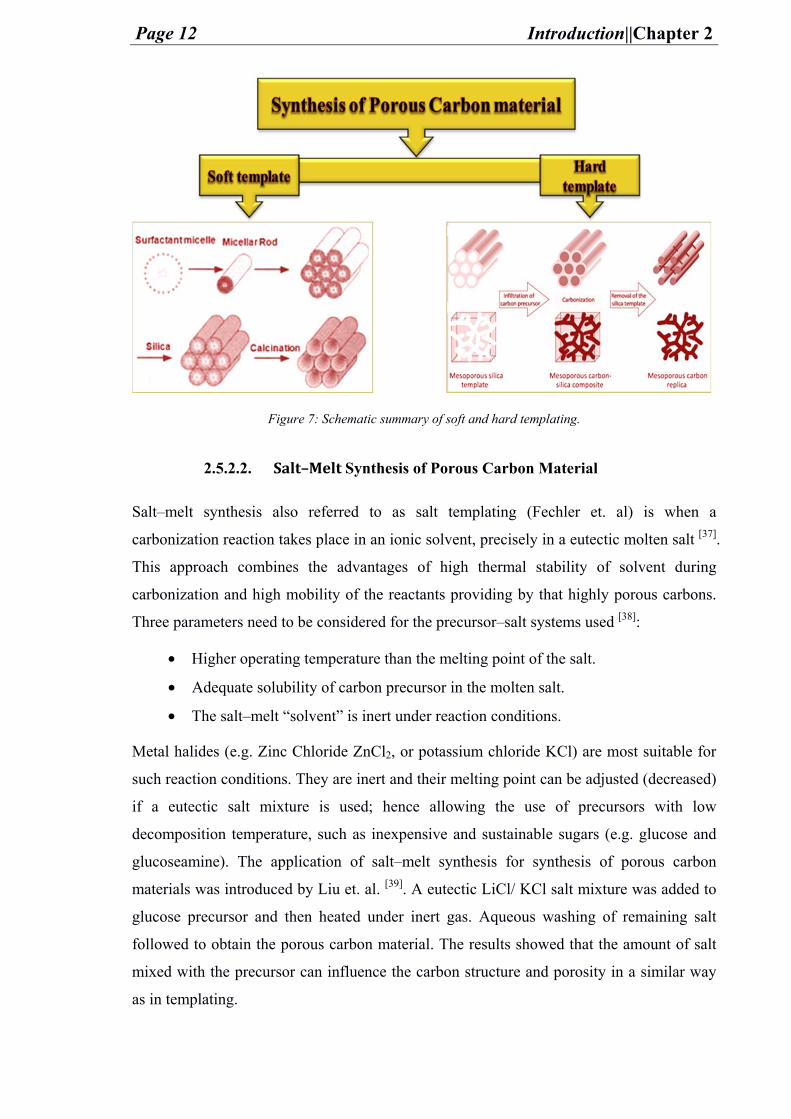
dictated by the structure of the mold. An illustration of soft and hard templating is given in
(Figure 7).
Although hard templating overcomes the shrinkage of pores issue as present in soft
templating, yet using hard templating synthesis it is challenging to infiltrate the precursor
in the mold completely, or maintain low volatility of the precursor with sustained volume
size. Multiple infiltrations can be applied to fill the mold pores completely, or a melt
infiltration can be applied for homogeneous filling of the template pores. However,
industrially hard templating is unfavorable for the cost, time, and material required to
synthesize the template/ mold [36]. In conclusion, the Activation methods have limited
control of porosity, the soft templating is difficult to synthesize and the hard templating is
quite expensive with multiple step approach.
Page 12 Introduction||Chapter 2
Figure 7: Schematic summary of soft and hard templating.
2.5.2.2. Salt–Melt Synthesis of Porous Carbon Material
Salt–melt synthesis also referred to as salt templating (Fechler et. al) is when a
carbonization reaction takes place in an ionic solvent, precisely in a eutectic molten salt [37].
This approach combines the advantages of high thermal stability of solvent during
carbonization and high mobility of the reactants providing by that highly porous carbons.
Three parameters need to be considered for the precursor–salt systems used [38]:
• Higher operating temperature than the melting point of the salt.
• Adequate solubility of carbon precursor in the molten salt.
• The salt–melt “solvent” is inert under reaction conditions.
Metal halides (e.g. Zinc Chloride ZnCl2, or potassium chloride KCl) are most suitable for
such reaction conditions. They are inert and their melting point can be adjusted (decreased)
if a eutectic salt mixture is used; hence allowing the use of precursors with low
decomposition temperature, such as inexpensive and sustainable sugars (e.g. glucose and
glucoseamine). The application of salt–melt synthesis for synthesis of porous carbon
materials was introduced by Liu et. al. [39]. A eutectic LiCl/ KCl salt mixture was added to
glucose precursor and then heated under inert gas. Aqueous washing of remaining salt
followed to obtain the porous carbon material. The results showed that the amount of salt
mixed with the precursor can influence the carbon structure and porosity in a similar way
as in templating.
Page 13 Introduction||Chapter 2
The investigation proceeded by applying different salt to precursor ratios and different
temperatures. The use of low salt to precursor ratio (10:1) resulted with irregular
hierarchical randomly interconnected microporous carbon. In contrast, at high salt to
precursor ratio (100:1) a graphene–like material of similar specific surface area (SSA) as
that with lower salt ratio was obtained. The difference in morphologies is explained with
different carbonization mechanism where the high ratio resulted in a solution process
giving graphene structure, and the low ratio is a mean of precipitation producing the
interconnected carbon morphology. The increase in temperature up to 700 °C led to an
increase in SSA reaching 600 m2 g-1, however further temperature increase led to an
opposite effect on SSA presumed to be a result of enhancing carbon layer stacking.
In the study related to salt–melt synthesis done by Fechler et. al. [37] They apply inorganic
ZnCl2 salt mixture mixed with carbonizable ionic liquids (ILs) in a 3:1 wt. ratio and treat
the mixture at 1000 °C in an inert gas atmosphere. Aqueous washing followed the
carbonization step to yield highly porous carbon material with SSA of 2000 m2 g-1. The
main finding of this work was that the morphology/-pore structure of carbon is dependent
on the salt mixture. The reason behind that lies in the different properties of the eutectic
salt mixtures such as melting point, viscosity and polarity. They showed that a LiCl/ZnCl2
salt mixture results mainly in microporous carbon, replacing the LiCl with NaCl resulted in
hierarchy in porosity of supermicropores and small mesopores. This effect was related to
the low melting point and the formation of large clusters of NaCl/ZnCl2 salt mixture when
the phase demixes at the later stage of carbon condensation in comparison to LiCl/ZnCl2.
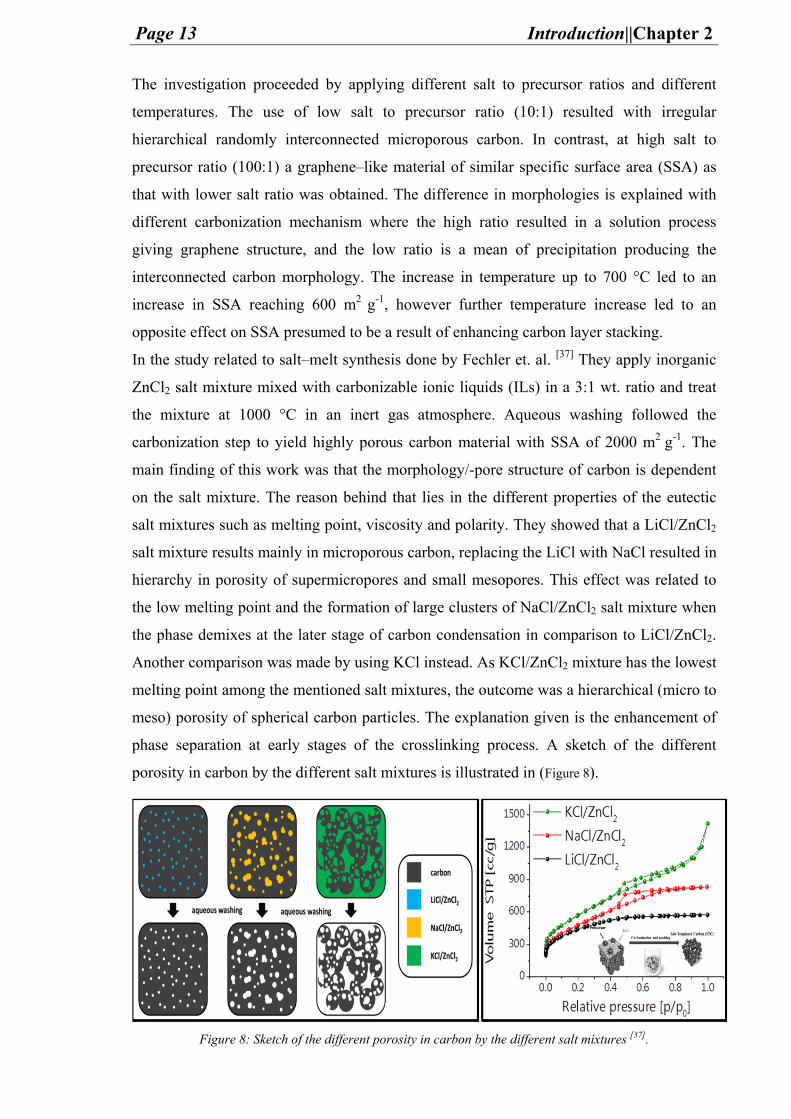
Another comparison was made by using KCl instead. As KCl/ZnCl2 mixture has the lowest
melting point among the mentioned salt mixtures, the outcome was a hierarchical (micro to
meso) porosity of spherical carbon particles. The explanation given is the enhancement of
phase separation at early stages of the crosslinking process. A sketch of the different
porosity in carbon by the different salt mixtures is illustrated in (Figure 8).
Figure 8: Sketch of the different porosity in carbon by the different salt mixtures [37].
Page 14 Introduction||Chapter 2
In conclusion to the discussed methods and results, the salt–melt synthesis can be
considered a promising method of synthesis for porous and even hierarchically porous
carbon materials. It overcomes the challenges present in previously mentioned processes
by providing better morphology control, facile “template” (salt-melt) removal, and possible
scale up of the production. It can in a one pot synthesis provide porous carbon with
functionalized surface if the carbon precursor contained functional groups. Accordingly,
the salt–templating synthesis process referred to as salt–melt synthesis here was adapted
for the research described in this thesis with the difference of using sugars instead of ILs
and reducing the temperature applied. Thus, KCl/ZnCl2 salt mixture is used as the solvent
medium along with sugar compounds such as glucose and glucoseamine as precursors at
low salt–precursor ratio 3:1 and at moderately high temperature of 900 °C.
2.6. Heteroatom Functionalization of Porous Carbon
Material
Catalysis has gone through so many developments and changes as well as discoveries.
Catalysts have been in continuous change and progress since ever discovered/ applied
around the 18th century. First, there was the metal discovery and understanding of its
properties then applying and comparing metals to each other to realize its oxidation/
reduction manners (development of catalytic performance concept). Later by the
development of analysis, synthesis and extraction methods and techniques, the need for
catalytic optimization commenced and the heterogeneous catalysts were applied.
Afterwards, nanotechnology and nanomaterial concepts evolved and the quest for new
preparation methods of nanoparticles of a metal (also referred to as metal nanoparticles
MNPs and represents particles sized between 1 and 100 nm) deposited on a support
emerged, followed by the porosity importance in a system and its tuning procedures. All
these changes and evolvements in the science of catalysis resulted not only due to new
technologies development and new chemical, physical and theoretical principles arising,
but also the challenges resulting of the request for energy resources and environmental
friendly chemistry, and of course reaching to the parameters of an economical industrial
production level [40].
Certain principles in regard of a heterogeneous catalyst cannot be overlooked for an
enhanced catalytic performance such as the nanoparticle size of the metal, the presence of
a support, and the porosity or structural properties of a support. These mentioned principles
are intensively studied for several materials even for carbon material. Nevertheless, surface
Page 15 Introduction||Chapter 2
functionalization of the support with heteroatoms, understanding its effect and applying it
for catalysis is only briefly discussed in literature. Heteroatoms can have a big influence on
the support properties and the catalyst performance as well as on the surrounding phase.
Ergo, introducing heteroatoms (e.g. N, O, or H) to the carbon materials prompts for new
approaches in tailoring the catalytic properties towards diverse applications. Heteroatoms
(e. g. N) doped in the semiconducting carbon materials alter not only its surface properties
but also its electronic structure. Mostly, the focus in research has been on N-doped carbons
(NDCs) which attributed to improving electrical conductivity, basicity and oxidation
stability for electrocatalysis applications. The introduction of N- heteroatoms to carbons
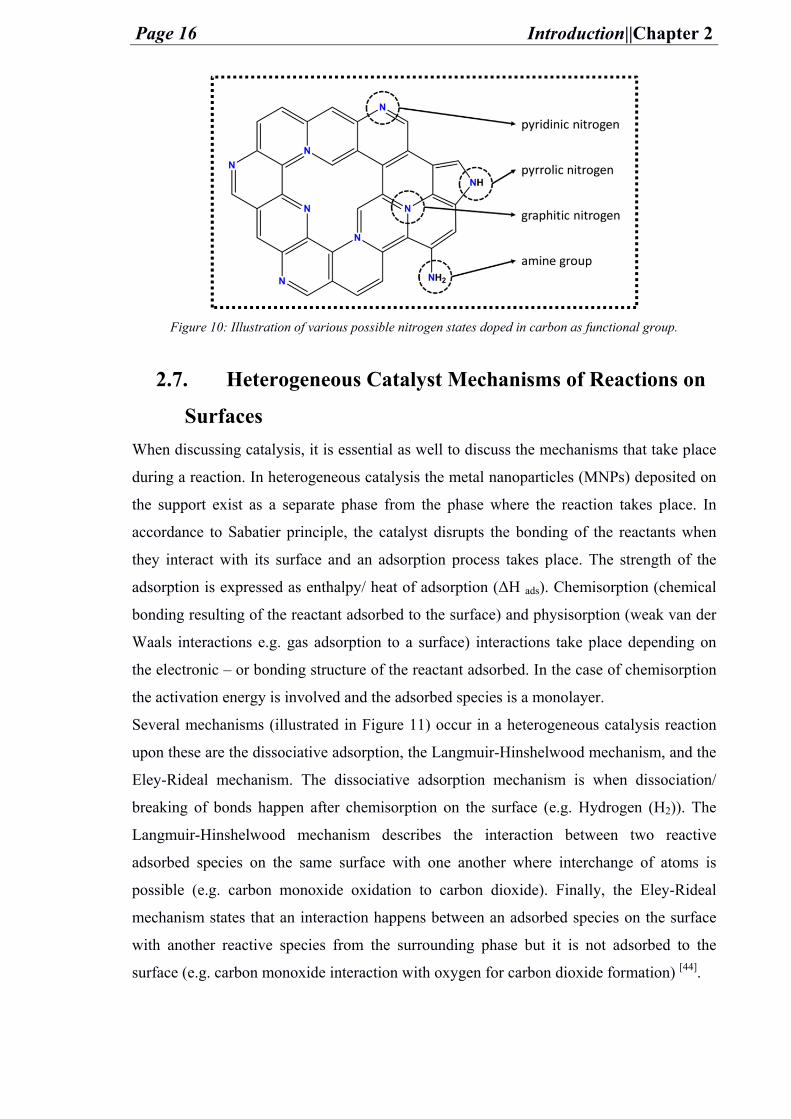
can be distinguished either as surface or structural modification. The surface
functionalization (e.g. amine) can hardly change the original properties of the carbon
framework significantly, while the structural modification (e.g. graphitic nitrogen) is
behind the difference in the physical properties if compared to non-doped materials [41] as
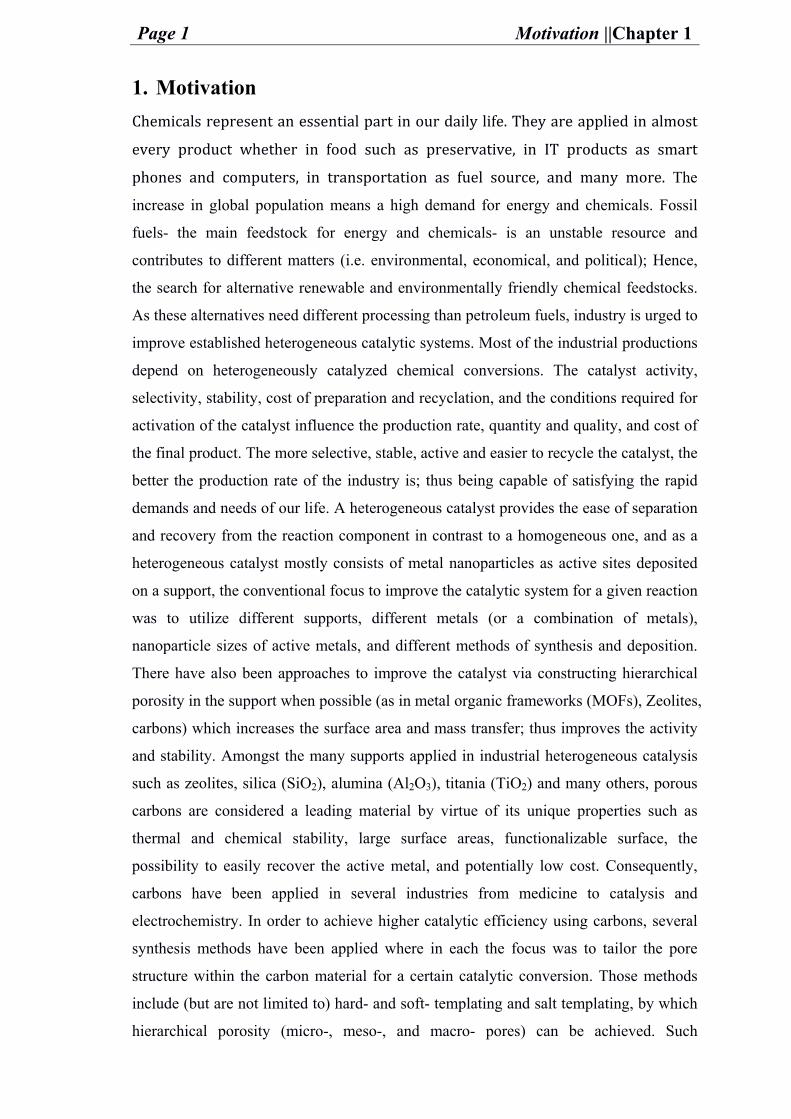
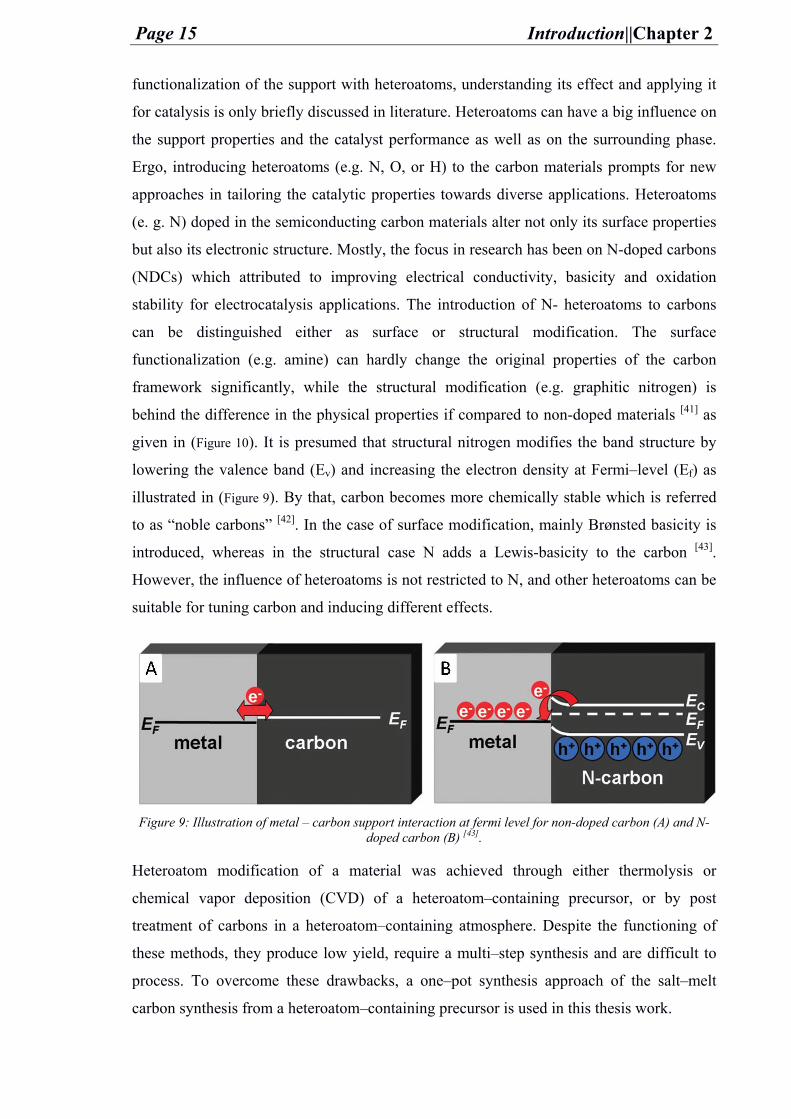
given in (Figure 10). It is presumed that structural nitrogen modifies the band structure by
lowering the valence band (Ev) and increasing the electron density at Fermi–level (Ef) as
illustrated in (Figure 9). By that, carbon becomes more chemically stable which is referred
to as “noble carbons” [42]. In the case of surface modification, mainly Brønsted basicity is
introduced, whereas in the structural case N adds a Lewis-basicity to the carbon [43].
However, the influence of heteroatoms is not restricted to N, and other heteroatoms can be
suitable for tuning carbon and inducing different effects.
Figure 9: Illustration of metal – carbon support interaction at fermi level for non-doped carbon (A) and N-
doped carbon (B) [43].
Heteroatom modification of a material was achieved through either thermolysis or
chemical vapor deposition (CVD) of a heteroatom–containing precursor, or by post
treatment of carbons in a heteroatom–containing atmosphere. Despite the functioning of
these methods, they produce low yield, require a multi–step synthesis and are difficult to
process. To overcome these drawbacks, a one–pot synthesis approach of the salt–melt
carbon synthesis from a heteroatom–containing precursor is used in this thesis work.
Page 16 Introduction||Chapter 2
Figure 10: Illustration of various possible nitrogen states doped in carbon as functional group.
2.7. Heterogeneous Catalyst Mechanisms of Reactions on
Surfaces
When discussing catalysis, it is essential as well to discuss the mechanisms that take place
during a reaction. In heterogeneous catalysis the metal nanoparticles (MNPs) deposited on
the support exist as a separate phase from the phase where the reaction takes place. In
accordance to Sabatier principle, the catalyst disrupts the bonding of the reactants when
they interact with its surface and an adsorption process takes place. The strength of the
adsorption is expressed as enthalpy/ heat of adsorption (ΔH ads). Chemisorption (chemical
bonding resulting of the reactant adsorbed to the surface) and physisorption (weak van der
Waals interactions e.g. gas adsorption to a surface) interactions take place depending on
the electronic – or bonding structure of the reactant adsorbed. In the case of chemisorption
the activation energy is involved and the adsorbed species is a monolayer.
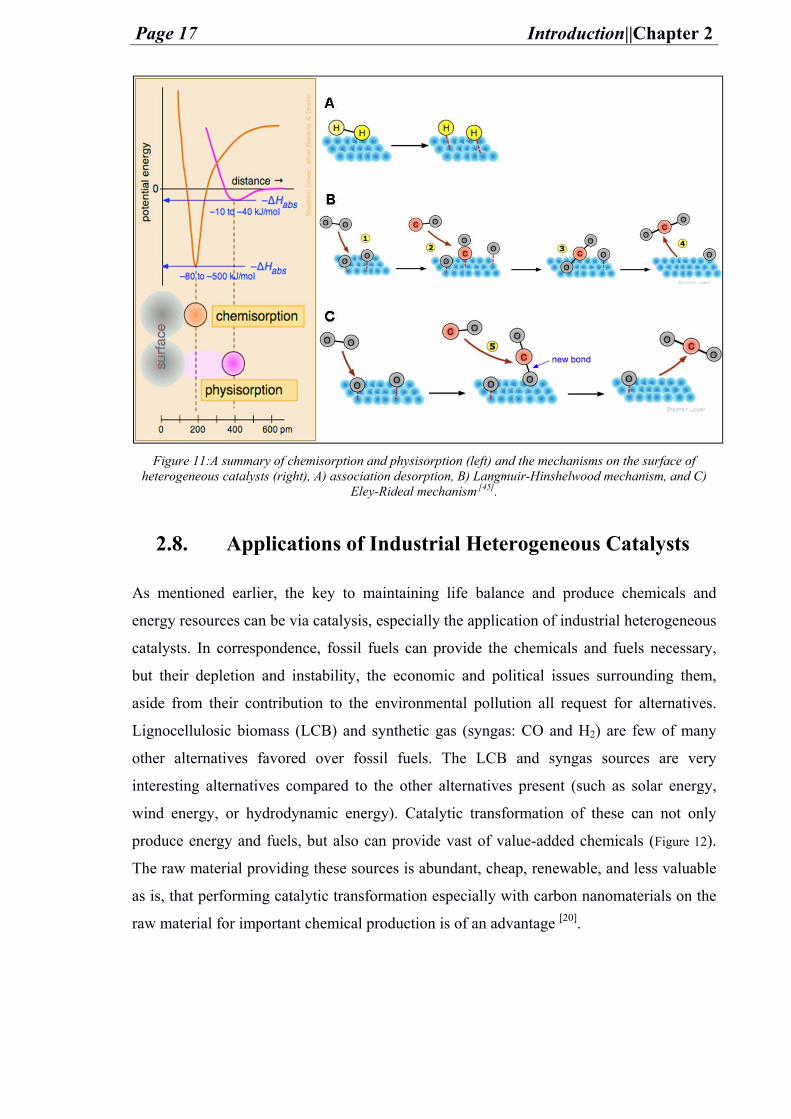
Several mechanisms (illustrated in Figure 11) occur in a heterogeneous catalysis reaction
upon these are the dissociative adsorption, the Langmuir-Hinshelwood mechanism, and the
Eley-Rideal mechanism. The dissociative adsorption mechanism is when dissociation/
breaking of bonds happen after chemisorption on the surface (e.g. Hydrogen (H2)). The
Langmuir-Hinshelwood mechanism describes the interaction between two reactive
adsorbed species on the same surface with one another where interchange of atoms is
possible (e.g. carbon monoxide oxidation to carbon dioxide). Finally, the Eley-Rideal
mechanism states that an interaction happens between an adsorbed species on the surface
with another reactive species from the surrounding phase but it is not adsorbed to the
surface (e.g. carbon monoxide interaction with oxygen for carbon dioxide formation) [44].
Page 17 Introduction||Chapter 2
Figure 11:A summary of chemisorption and physisorption (left) and the mechanisms on the surface of
heterogeneous catalysts (right), A) association desorption, B) Langmuir-Hinshelwood mechanism, and C) Eley-Rideal mechanism [45].
2.8. Applications of Industrial Heterogeneous Catalysts
As mentioned earlier, the key to maintaining life balance and produce chemicals and
energy resources can be via catalysis, especially the application of industrial heterogeneous
catalysts. In correspondence, fossil fuels can provide the chemicals and fuels necessary,
but their depletion and instability, the economic and political issues surrounding them,
aside from their contribution to the environmental pollution all request for alternatives.
Lignocellulosic biomass (LCB) and synthetic gas (syngas: CO and H2) are few of many
other alternatives favored over fossil fuels. The LCB and syngas sources are very
interesting alternatives compared to the other alternatives present (such as solar energy,
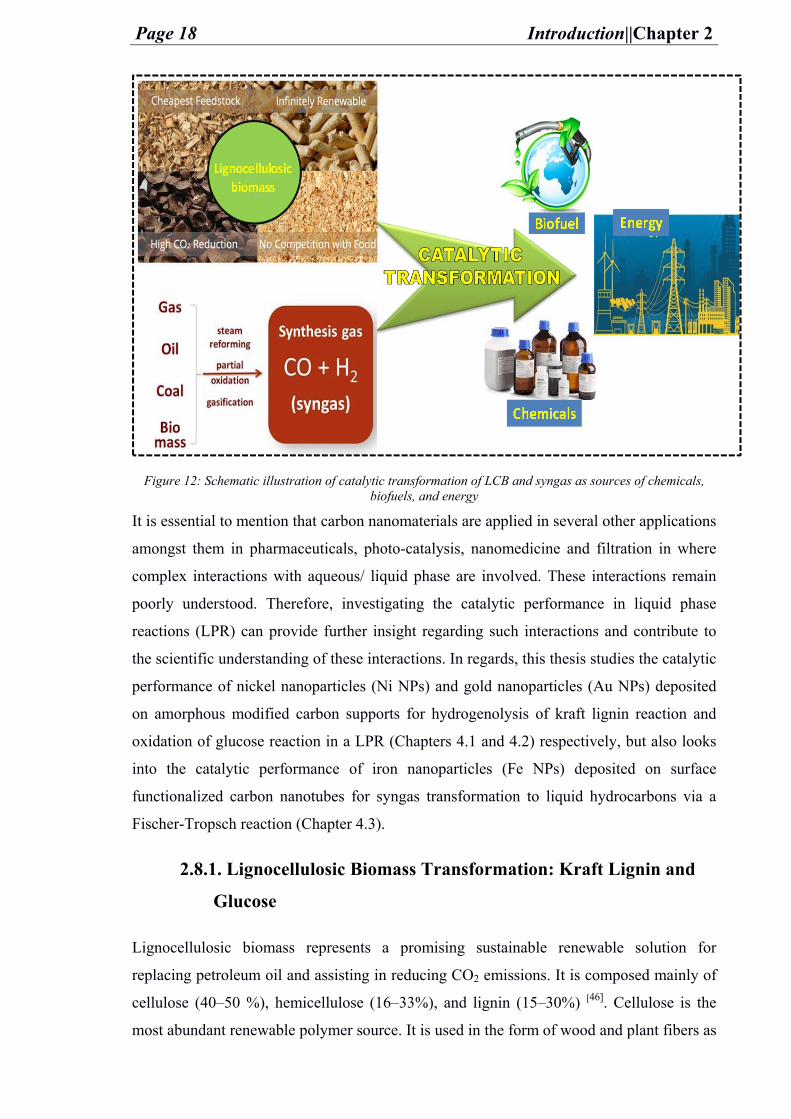
wind energy, or hydrodynamic energy). Catalytic transformation of these can not only
produce energy and fuels, but also can provide vast of value-added chemicals (Figure 12).
The raw material providing these sources is abundant, cheap, renewable, and less valuable
as is, that performing catalytic transformation especially with carbon nanomaterials on the
raw material for important chemical production is of an advantage [20].
Page 18 Introduction||Chapter 2
Figure 12: Schematic illustration of catalytic transformation of LCB and syngas as sources of chemicals, biofuels, and energy
It is essential to mention that carbon nanomaterials are applied in several other applications
amongst them in pharmaceuticals, photo-catalysis, nanomedicine and filtration in where
complex interactions with aqueous/ liquid phase are involved. These interactions remain
poorly understood. Therefore, investigating the catalytic performance in liquid phase
reactions (LPR) can provide further insight regarding such interactions and contribute to
the scientific understanding of these interactions. In regards, this thesis studies the catalytic
performance of nickel nanoparticles (Ni NPs) and gold nanoparticles (Au NPs) deposited
on amorphous modified carbon supports for hydrogenolysis of kraft lignin reaction and
oxidation of glucose reaction in a LPR (Chapters 4.1 and 4.2) respectively, but also looks
into the catalytic performance of iron nanoparticles (Fe NPs) deposited on surface
functionalized carbon nanotubes for syngas transformation to liquid hydrocarbons via a
Fischer-Tropsch reaction (Chapter 4.3).
2.8.1. Lignocellulosic Biomass Transformation: Kraft Lignin and
Glucose
Lignocellulosic biomass represents a promising sustainable renewable solution for
replacing petroleum oil and assisting in reducing CO2 emissions. It is composed mainly of
cellulose (40–50 %), hemicellulose (16–33%), and lignin (15–30%) [46]. Cellulose is the
most abundant renewable polymer source. It is used in the form of wood and plant fibers as
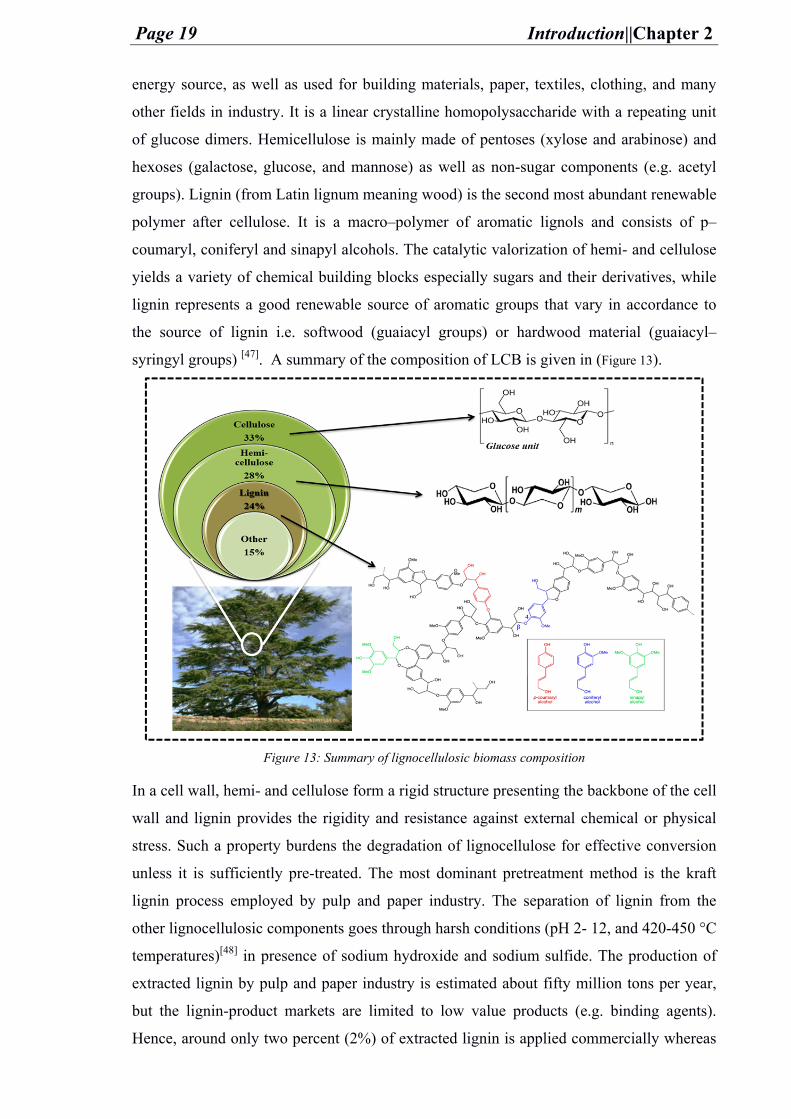
Page 19 Introduction||Chapter 2
energy source, as well as used for building materials, paper, textiles, clothing, and many
other fields in industry. It is a linear crystalline homopolysaccharide with a repeating unit
of glucose dimers. Hemicellulose is mainly made of pentoses (xylose and arabinose) and
hexoses (galactose, glucose, and mannose) as well as non-sugar components (e.g. acetyl
groups). Lignin (from Latin lignum meaning wood) is the second most abundant renewable
polymer after cellulose. It is a macro–polymer of aromatic lignols and consists of p–
coumaryl, coniferyl and sinapyl alcohols. The catalytic valorization of hemi- and cellulose
yields a variety of chemical building blocks especially sugars and their derivatives, while
lignin represents a good renewable source of aromatic groups that vary in accordance to
the source of lignin i.e. softwood (guaiacyl groups) or hardwood material (guaiacyl–
syringyl groups) [47]. A summary of the composition of LCB is given in (Figure 13).
Figure 13: Summary of lignocellulosic biomass composition
In a cell wall, hemi- and cellulose form a rigid structure presenting the backbone of the cell
wall and lignin provides the rigidity and resistance against external chemical or physical
stress. Such a property burdens the degradation of lignocellulose for effective conversion
unless it is sufficiently pre-treated. The most dominant pretreatment method is the kraft
lignin process employed by pulp and paper industry. The separation of lignin from the
other lignocellulosic components goes through harsh conditions (pH 2- 12, and 420-450 °C
temperatures)[48] in presence of sodium hydroxide and sodium sulfide. The production of
extracted lignin by pulp and paper industry is estimated about fifty million tons per year,
but the lignin-product markets are limited to low value products (e.g. binding agents).
Hence, around only two percent (2%) of extracted lignin is applied commercially whereas
Page 20 Introduction||Chapter 2
the rest is commonly being burnt as a low value fuel, which is a huge loss of chemicals.
The aromaticity of extracted lignin along with its abundancy and economic price in
presence of the petroleum oil issues has a significant potential to contribute to the
production of phenols that can be applied either as fuel sources or as chemical platforms
for variable applications [48]. By that, a lignin hydrogenolysis processes is necessary to be
developed. Hence, kraft lignin degradation via hydrogenolysis is studied here.
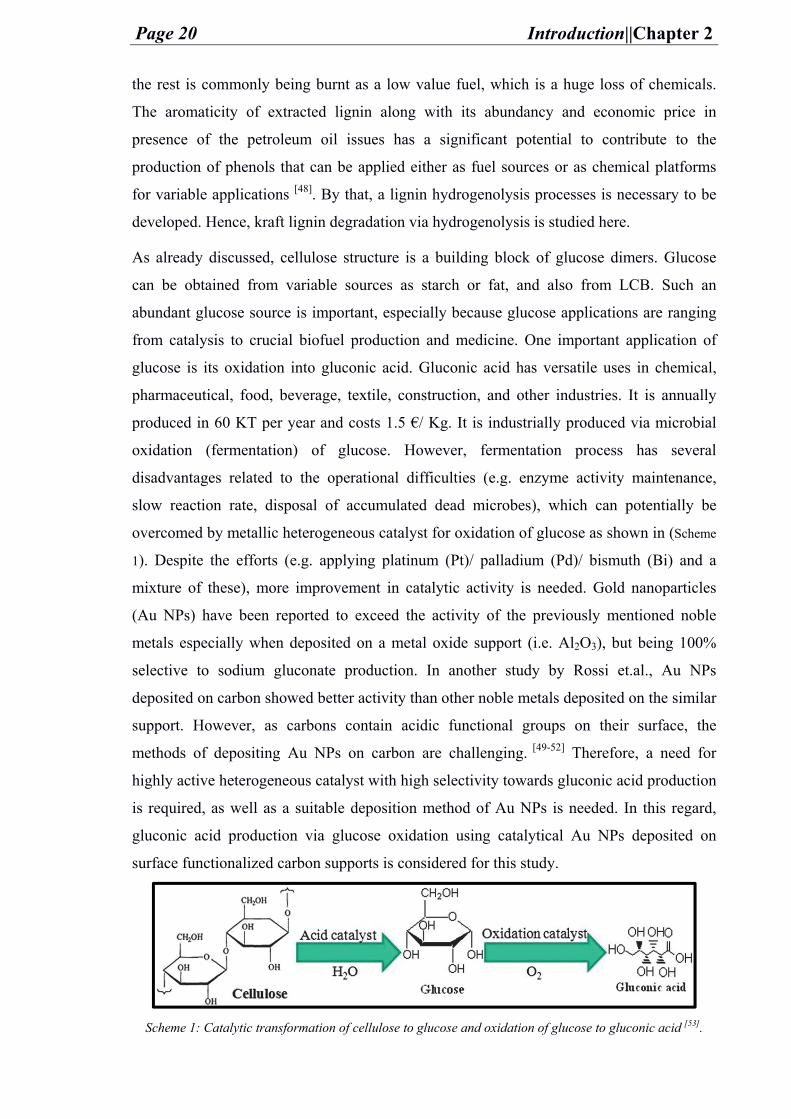
As already discussed, cellulose structure is a building block of glucose dimers. Glucose
can be obtained from variable sources as starch or fat, and also from LCB. Such an
abundant glucose source is important, especially because glucose applications are ranging
from catalysis to crucial biofuel production and medicine. One important application of
glucose is its oxidation into gluconic acid. Gluconic acid has versatile uses in chemical,
pharmaceutical, food, beverage, textile, construction, and other industries. It is annually
produced in 60 KT per year and costs 1.5 €/ Kg. It is industrially produced via microbial
oxidation (fermentation) of glucose. However, fermentation process has several
disadvantages related to the operational difficulties (e.g. enzyme activity maintenance,
slow reaction rate, disposal of accumulated dead microbes), which can potentially be
overcomed by metallic heterogeneous catalyst for oxidation of glucose as shown in (Scheme
1). Despite the efforts (e.g. applying platinum (Pt)/ palladium (Pd)/ bismuth (Bi) and a
mixture of these), more improvement in catalytic activity is needed. Gold nanoparticles
(Au NPs) have been reported to exceed the activity of the previously mentioned noble
metals especially when deposited on a metal oxide support (i.e. Al2O3), but being 100%
selective to sodium gluconate production. In another study by Rossi et.al., Au NPs
deposited on carbon showed better activity than other noble metals deposited on the similar
support. However, as carbons contain acidic functional groups on their surface, the
methods of depositing Au NPs on carbon are challenging. [49-52] Therefore, a need for
highly active heterogeneous catalyst with high selectivity towards gluconic acid production
is required, as well as a suitable deposition method of Au NPs is needed. In this regard,
gluconic acid production via glucose oxidation using catalytical Au NPs deposited on
surface functionalized carbon supports is considered for this study.
Scheme 1: Catalytic transformation of cellulose to glucose and oxidation of glucose to gluconic acid [53].
Page 21 Introduction||Chapter 2
2.8.2. Syngas (CO and H2) Transformation
The potential of lignocellulosic biomass lies not only in its degradation to obtain value
added chemicals, but also in its produced gaseous phase out of its degradation process.
After all, lignocellulosic biomass is made of carbohydrates that can be converted by
reforming processes to valuable gases (e.g. synthesis gas which is a mixture of CO and H2)
which are useful for the production of hydrocarbons with different chain lengths,
especially high value short olefins, and C5+ components such as fuel, diesel or waxes. The
process involved in production of hydrocarbons from carbon monoxide (CO)
hydrogenation is known as Fischer–Tropsch synthesis (FTS) discovered in the 1920s.
Usually the gaseous substrates (CO and hydrogen (H2)) for this process can also be
produced from coal or natural gas. This process is already widely applied in industry
because it provides an alternative way for the production of chemical compounds which
are commonly obtained from crude oil as the feedstock. The FTS yields high quality and
clean hydrocarbon–based transportation fuels (due to low aromaticity and low content of
impurities such as sulfur). Besides fuels, production of olefins and C5+ is highly desired
because they present essential building-blocks for high-value chemicals, which are mainly
obtained from petrochemical feedstocks, such as monomers for the production of plastics
(e.g. styrene, ethylene, or propylene). However, the selectivity in the production of
different chain length hydrocarbons via FTS is poor based on Anderson-Schulz-Flory
(ASF) distribution. The carbon number of hydrocarbons produced differs according to the
chain growth probability (α). Hence, adjustment to the probability (α) is required to
increase the selectivity towards lower olefins. This is possible by altering the conditions
that influence the (α) which are: the FTS conditions (e.g. temperature, pressure, and syngas
ratio), the active metal type, the support, and the promoters [54].
2.8.2.1. Fischer-Tropsch Synthesis
FTS is an exothermic catalytic process where a conversion of syngas (CO and H2) into
different molar mass hydrocarbons in presence of a metallic catalyst occurs, as given in
(Equation 12) below: (2 + 1) ( ) + ( ) → ( ) + ( ) (Equation 12)
Where n is an integer.
In addition, another reaction takes place during the synthesis process which is the water-
gas shift reaction (WGS) as given in (Equation 13) below: ( ) + ( ) → ( ) + ( ) (Equation 13)
Page 22 Introduction||Chapter 2
This reaction (WGS) is important to maintain the efficiency of a maximum conversion of
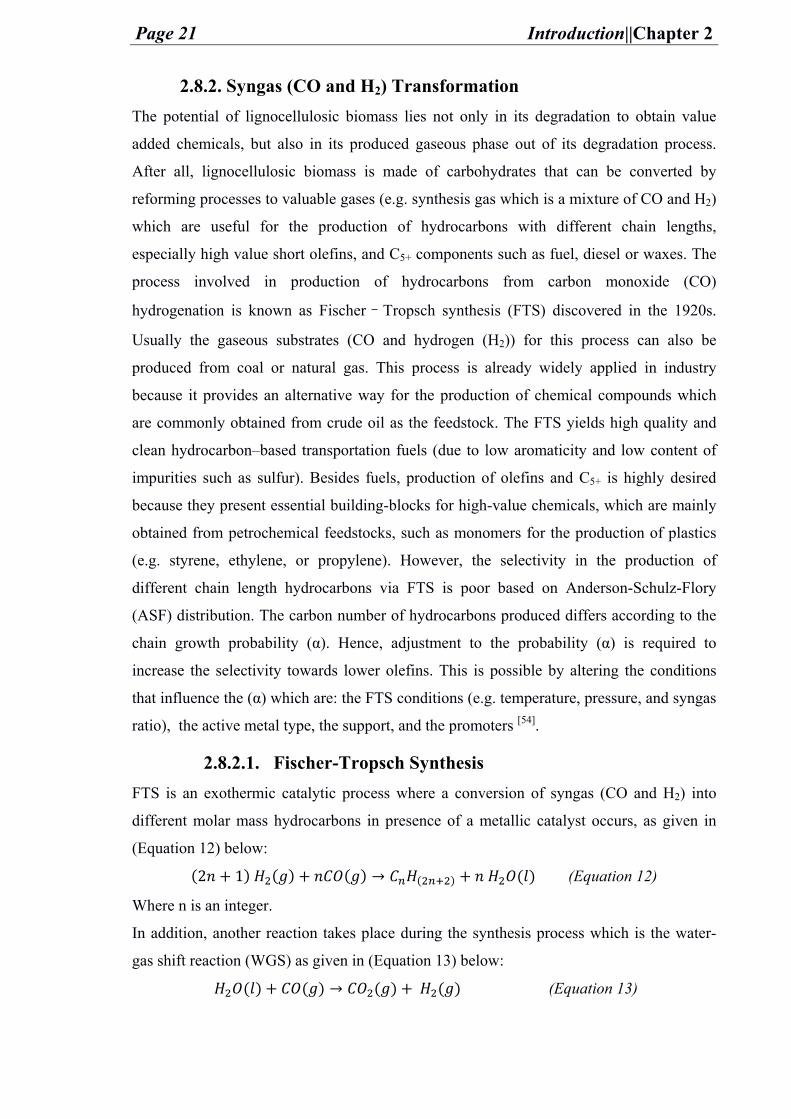
syngas by increasing the H2/CO ratio. The production of the different hydrocarbons as
aforementioned depends on ASF distribution in accordance to α. This can be summarized
by the given (Equations 14 -15) below: = ( )(1 ) (Equation 14) = ( )(1 ) (Equation 15)
Where Pn is the probability of producing a hydrocarbon of length n, Wn is the weight
fraction, n is an integer, and α is the probability chain growth, α (n-1) is the probability of
adding n-1 carbons and (1-α) is the probability of terminating the chain growth as
illustrated in (Figure 14).
Figure 14: Chain growth probability according to Anderson-Schulz-Flory distribution [55].
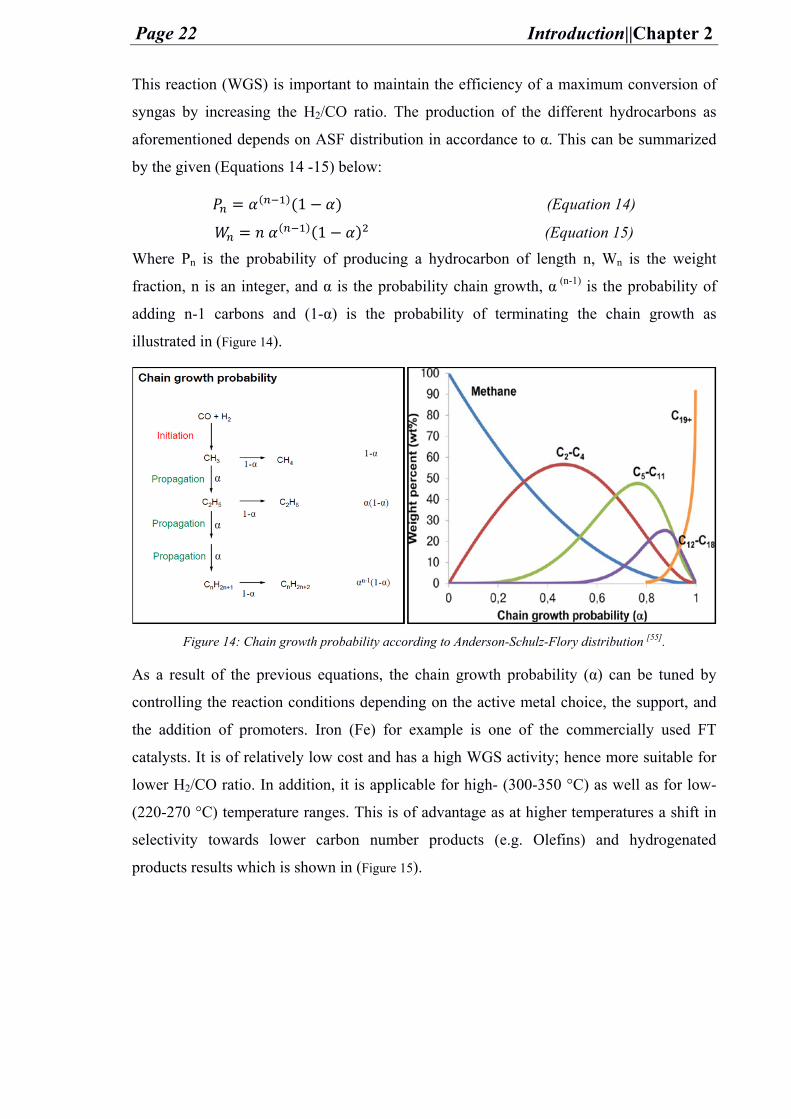
As a result of the previous equations, the chain growth probability (α) can be tuned by
controlling the reaction conditions depending on the active metal choice, the support, and
the addition of promoters. Iron (Fe) for example is one of the commercially used FT
catalysts. It is of relatively low cost and has a high WGS activity; hence more suitable for
lower H2/CO ratio. In addition, it is applicable for high- (300-350 °C) as well as for low-
(220-270 °C) temperature ranges. This is of advantage as at higher temperatures a shift in
selectivity towards lower carbon number products (e.g. Olefins) and hydrogenated
products results which is shown in (Figure 15).
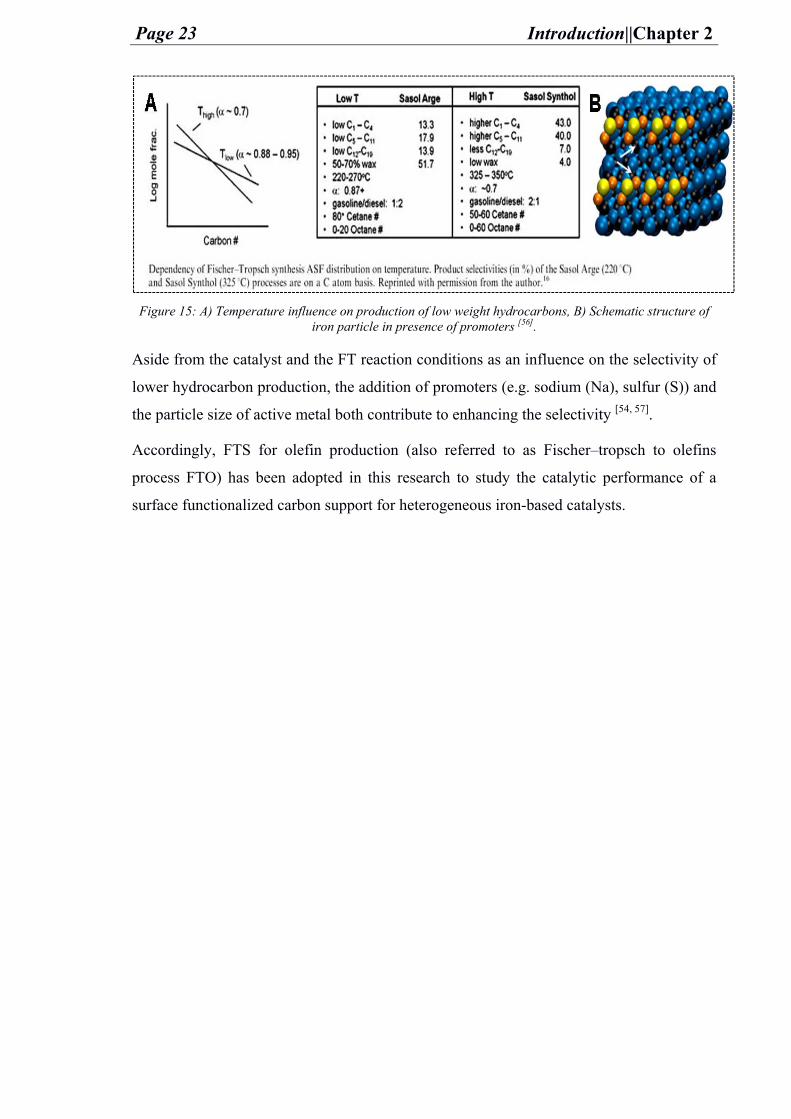
Page 23 Introduction||Chapter 2
Figure 15: A) Temperature influence on production of low weight hydrocarbons, B) Schematic structure of
iron particle in presence of promoters [56].
Aside from the catalyst and the FT reaction conditions as an influence on the selectivity of
lower hydrocarbon production, the addition of promoters (e.g. sodium (Na), sulfur (S)) and
the particle size of active metal both contribute to enhancing the selectivity [54, 57].
Accordingly, FTS for olefin production (also referred to as Fischer–tropsch to olefins
process FTO) has been adopted in this research to study the catalytic performance of a
surface functionalized carbon support for heterogeneous iron-based catalysts.

“Experimental investigation is a very great thief of time. It costs many days to determine a fact that can be stated in a line.”
(J. W. Draper)
Chapter 3
Outline
Page 24 Outline ||Chapter 3
3. Outline
In the quest for alternative sources of energy and value-added chemicals, lignocellulosic
biomass and syngas catalytic conversions can provide a green source and sustainable
replacement for the environmentally unfriendly and unstable fossil fuel sources.
Catalysis is therefore important to achieve high conversions and productivity of
chemicals and energy sources on an industrial level. Accordingly, research and industry
are striving for catalysts with ever-higher catalytic performance. Besides the use of an
ideal active metal, the choice of a good support is also essential with regard to achieving
this goal. Carbon materials make good candidates as supports for catalysts thanks to
their structural (different allotropes e.g. diamond and graphene) and physical properties
(for example hardness, conductivity, thermal and chemical stability, tunable surface)
which make them available for different industrial applications. Modification of carbons,
in peculiar its porosity, has proven higher efficiency and better catalytic performance
with the active metal. Several studies have indicated the importance of hierarchical
porosity in carbons as well as several methods to the synthesis and templating of the
porous carbon materials. However, the modification of the surface of carbon material
with heteroatoms is not well researched and it is rarely being applied to improve the
catalytic performance. Yet in regards to what is done, the results indicate an advantage
in using heteroatoms within the support along to the catalyst performance in general
especially in electrochemistry, but none is considering the effect of heteroatoms
functionalization of the support surface on the catalytic surrounding phase.
Consequently, this thesis research investigates the effect of chemically surface modified
porous carbon materials with different heteroatoms (H, O, and N) applied as supports
for industrial heterogeneous catalysts, aiming for improving the knowledge of the effect
of the heteroatoms, which may contribute to explaining certain catalytic behavior in
previous research literatures and can lead to discoveries of new application fields. The
synthesized heterogeneous catalysts with functionalized carbon supports were tested for
different catalytic conversions (hydrogenolysis, oxidation, and hydrogenation reactions)
in liquid and gaseous phases. The investigation takes place with nitrogen functionalized
hierarchical porous (micro-meso) sugar derived carbon support compared to another
similarly prepared porous carbon support material without heteroatom functionalization
to particularly investigate the effect of N on the catalytic system. Moreover, the two
sugar-based hierarchically porous carbons were compared to a comparably commercial
hierarchical porous carbon support to highlight the porosity influence on the reaction
and the catalytic performance. The reaction performed is a liquid phase hydrogenolysis
Page 25 Outline ||Chapter 3
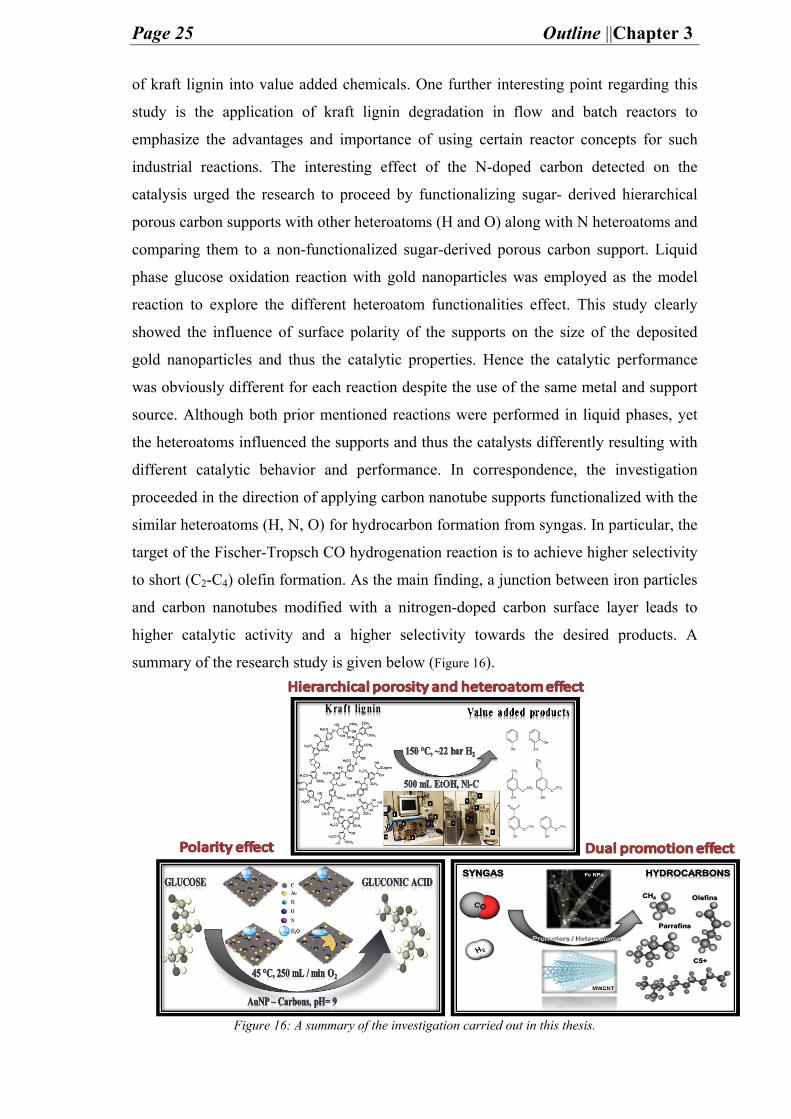
of kraft lignin into value added chemicals. One further interesting point regarding this
study is the application of kraft lignin degradation in flow and batch reactors to
emphasize the advantages and importance of using certain reactor concepts for such
industrial reactions. The interesting effect of the N-doped carbon detected on the
catalysis urged the research to proceed by functionalizing sugar- derived hierarchical
porous carbon supports with other heteroatoms (H and O) along with N heteroatoms and
comparing them to a non-functionalized sugar-derived porous carbon support. Liquid
phase glucose oxidation reaction with gold nanoparticles was employed as the model
reaction to explore the different heteroatom functionalities effect. This study clearly
showed the influence of surface polarity of the supports on the size of the deposited
gold nanoparticles and thus the catalytic properties. Hence the catalytic performance
was obviously different for each reaction despite the use of the same metal and support
source. Although both prior mentioned reactions were performed in liquid phases, yet
the heteroatoms influenced the supports and thus the catalysts differently resulting with
different catalytic behavior and performance. In correspondence, the investigation
proceeded in the direction of applying carbon nanotube supports functionalized with the
similar heteroatoms (H, N, O) for hydrocarbon formation from syngas. In particular, the
target of the Fischer-Tropsch CO hydrogenation reaction is to achieve higher selectivity
to short (C2-C4) olefin formation. As the main finding, a junction between iron particles
and carbon nanotubes modified with a nitrogen-doped carbon surface layer leads to
higher catalytic activity and a higher selectivity towards the desired products. A
summary of the research study is given below (Figure 16).
Figure 16: A summary of the investigation carried out in this thesis.
“During an intense period of lab work, the outside world vanishes and the obsession is total” (L.M. Lederman)
Chapter 4
Research and Outcomes
Page 26 Research and outcomes ||Chapter 4
Preface
This following chapter discusses the investigation made towards understanding the
heteroatoms influence on the carbon support and the catalytic performance for
industrial heterogeneous catalyst. The method of preparation, characterization,
reaction and the results of the different reactions performed in this study are given in
details. Starting from Nitrogen doped carbon (NDC) for kraft lignin hydrogenolysis,
continuing to selective glucose oxidation using functionalized sugar-derived carbons
and finally switching from liquid to gaseous phase reaction in a Fischer-Tropsch
selective olefin hydrocarbon synthesis.
Profound perceptions are introduced regarding advancements in catalysis as well as
interesting discoveries have been noted during this investigation which in turn can
contribute to the progress of the effort in finding an appropriate solution to the
previously discussed dilemmas (chapter 2).
Page 27 Research and outcomes ||Chapter 4
4. Research and Outcomes
4.1. Functionalized Carbons as Supports in Liquid
Phase Reaction: Nickel Nanoparticles Catalysts for Kraft
Lignin Hydrogenolysis in Batch and Flow Reactions
i. State of Art
In our everyday life, we use enormous amounts of chemicals in different applications.
Chemicals are used in medicine, devices, food, buildings, cosmetics, detergents and
more. They present an essential source of living. However, the increase in population
results with an increase in consumption of the feedstock of these chemicals which is
mainly fossil fuels. Rapid consumption of fossil fuels, economic and political
dependence on other countries to obtain these fuels, environmental pollution due to
industrial processing of these fuels are all reasons why it is convenient to switch to
renewable sources of energy [58]. As has been discussed in (chapter 2.8.1), one of these
promising sources is lignocellulosic biomass (LCB) as it is a renewable cheap source
and not only capable of providing energy and biofuels, but also value-added chemicals
for pharmaceutical or industrial use. Lignin (one of LCB main components) is a macro
molecule of phenolic and aromatic groups, bond by C-C and ether linkages. Pulp and
paper industries tend to produce large quantities (> 50 Mt/ year) of lignin after
separating it from the other components of LCB via addition of acids containing sulfur;
a procedure widely known as kraft process of which the resulting product is kraft lignin.
The complexity of kraft lignin structure makes it an undesirable byproduct. Therefore, it
is burnt as a low value fuel to produce energy and to recover any minerals. Only 2% of
kraft lignin production is used commercially [47].
The abundancy of kraft lignin and its high phenolic-structure trigger the interests of
scientists to investigate it for new applications. Catalytic hydrogenolysis of kraft lignin
is an efficient method [59] by which valuable low molar mass building blocks can be
obtained. Nickel (Ni) heterogeneous catalysts have been applied for hydrogenolysis of
kraft lignin, and especially Raney-Nickel (RaNi) -which is derived from nickel-
aluminum alloys- proved to be efficient for this reaction. Despite that, Ni metal is
relatively lower in activity in comparison to some other metals (platinum (Pt) and
ruthenium (Ru)). Yet it is more abundant, relatively cheap, and mainly selective to
cleavage of ether bonds [60-63]. Degradation of kraft lignin does not only count to the
Page 28 Research and outcomes ||Chapter 4
selectivity of certain bond cleavage, but also about overcoming the poisonous effect of
the sulfur present in kraft lignin (1-3 wt. %) [64]. Therefore, improvement of the catalyst
properties and structure (e.g. high surface area of the support, hierarchical porosity,
small-sized nanoparticles of metal) is required. This can be provided by using a support
material such as carbons. Carbon materials properties (as discussed in chapter 2.5.1) of
high surface area and chemical inertness as well as thermally stable makes them good
candidates for support application in catalysis [65-66]. Most importantly, their property of
being of tunable surface allows for carbon modification as a support with different
porosity and for functionalization with heteroatoms (e.g. N). The previously mentioned
modifications are presented in this work to explore the heteroatom- and the hierarchical
porosity effects on the catalytic performance of Ni nanoparticles deposited on modified
carbon catalysts for degrading kraft lignin.
ii. Catalytical systems
1. Sugar- and Sugar Amine-Derived Carbon Supports
In order to obtain a hierarchical porous carbon material, an inorganic eutectic salt melt
method is applied. In this method zinc chloride and potassium chloride are mixed with
the precursor and followed by calcination at temperature 900 °C. This procedure
allowed the formation of mesopores besides micropores in the carbon material; hence
hierarchical porosity and provided high surface area .Moreover, sugar precursor (as
glucose) is used for carbon material which is a cheap source, and decomposes at
relatively low temperatures. In addition, using glucoseamine with only slight difference
in chemical structure than glucose ensures the maximum possible comparability
between the two formed supports.
So, the synthesis of hierarchical porous carbon supports proceeded by using glucose and
glucoseamine hydrochloride as precursors to prepare unfunctionalized porous carbon
support (referred to here as C) and functionalized porous carbon with nitrogen (denoted
as NDC) respectively. The procedure of synthesis for these two supports is mixing
potassium chloride and zinc chloride in 1:2 ratio and adding the inorganic mixture to the
precursor in 1:3 ratio of precursor to the salts mixture. Later, the mixture is carbonized
and converted to carbon material at heating temperature of 900 °C for 1 h dwelling at a
heating rate of 2.5 K min -1 under N2 atmosphere. A last step is to grind the resulting
carbon and wash it with excess deionized water, then dry it in vacuum oven at 60 °C for
48 h. Along to these two in-house synthesized carbon supports, a third commercial
carbon support (Vulcan® carbon) with hierarchical porosity (macro-, meso-, micropores)
Page 29 Research and outcomes ||Chapter 4
is purchased (denoted here as C ref). The in-house carbon supports are compared to one
another to identify the nitrogen heteroatom effect and the hierarchical porosity influence
is studied by comparison with the commercial carbon support.
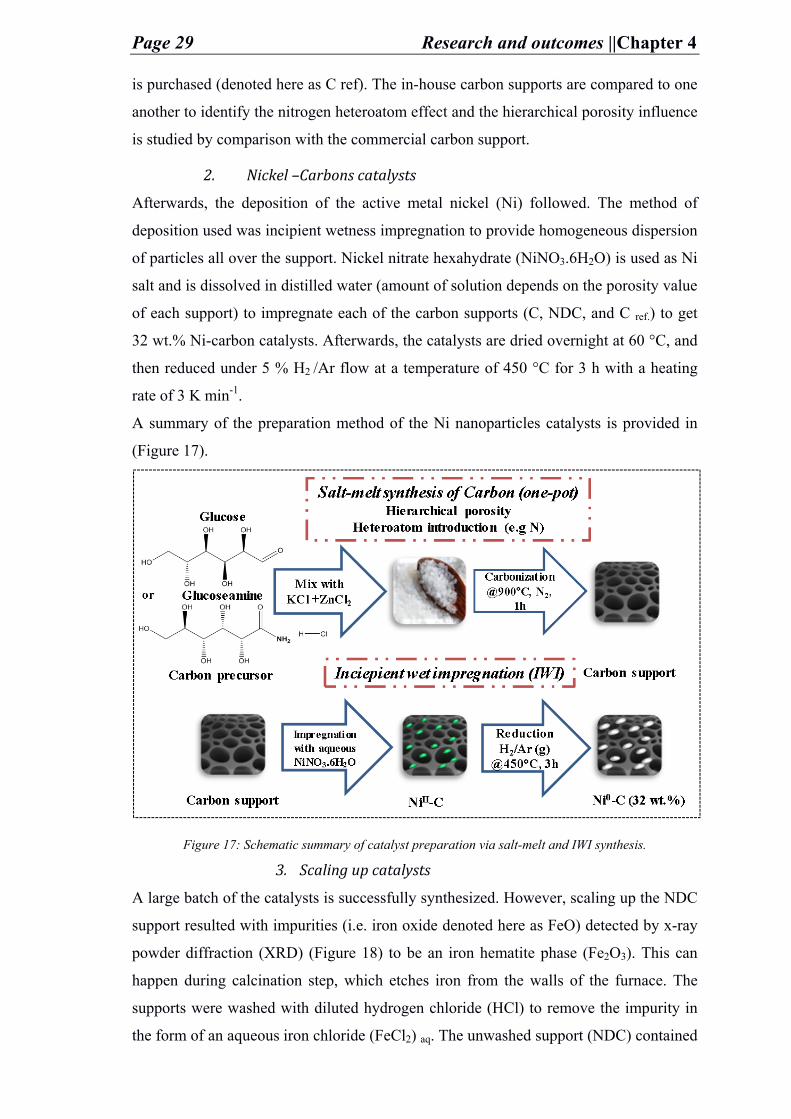
2. Nickel –Carbons catalysts
Afterwards, the deposition of the active metal nickel (Ni) followed. The method of
deposition used was incipient wetness impregnation to provide homogeneous dispersion
of particles all over the support. Nickel nitrate hexahydrate (NiNO3.6H2O) is used as Ni
salt and is dissolved in distilled water (amount of solution depends on the porosity value
of each support) to impregnate each of the carbon supports (C, NDC, and C ref.) to get
32 wt.% Ni-carbon catalysts. Afterwards, the catalysts are dried overnight at 60 °C, and
then reduced under 5 % H2 /Ar flow at a temperature of 450 °C for 3 h with a heating
rate of 3 K min-1.
A summary of the preparation method of the Ni nanoparticles catalysts is provided in
(Figure 17).
Figure 17: Schematic summary of catalyst preparation via salt-melt and IWI synthesis.
3. Scaling up catalysts
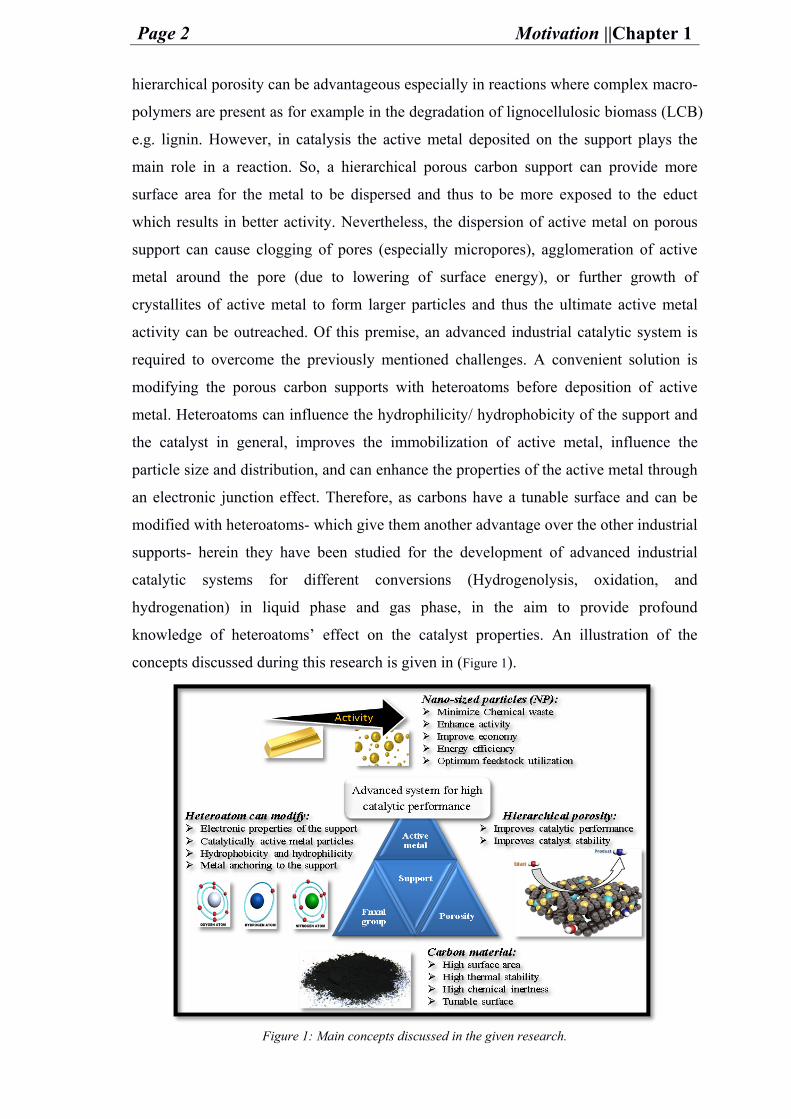
A large batch of the catalysts is successfully synthesized. However, scaling up the NDC
support resulted with impurities (i.e. iron oxide denoted here as FeO) detected by x-ray
powder diffraction (XRD) (Figure 18) to be an iron hematite phase (Fe2O3). This can
happen during calcination step, which etches iron from the walls of the furnace. The
supports were washed with diluted hydrogen chloride (HCl) to remove the impurity in
the form of an aqueous iron chloride (FeCl2) aq. The unwashed support (NDC) contained
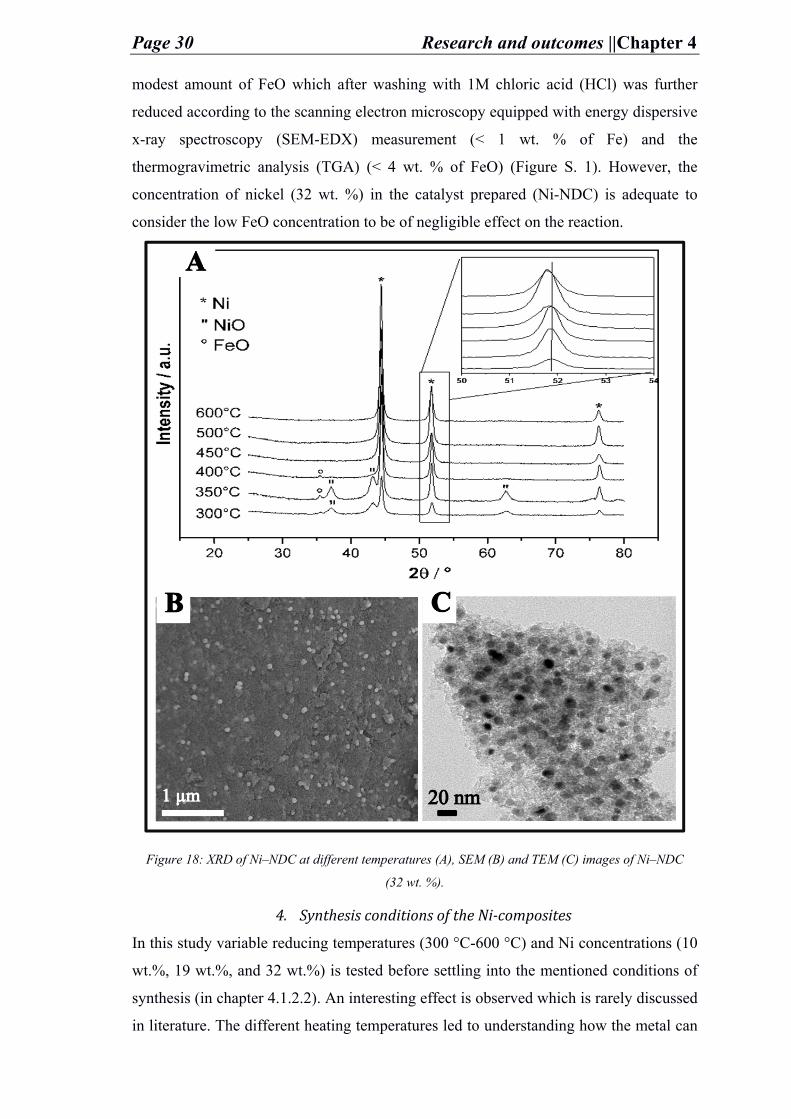
Page 30 Research and outcomes ||Chapter 4
modest amount of FeO which after washing with 1M chloric acid (HCl) was further
reduced according to the scanning electron microscopy equipped with energy dispersive
x-ray spectroscopy (SEM-EDX) measurement (< 1 wt. % of Fe) and the
thermogravimetric analysis (TGA) (< 4 wt. % of FeO) (Figure S. 1). However, the
concentration of nickel (32 wt. %) in the catalyst prepared (Ni-NDC) is adequate to
consider the low FeO concentration to be of negligible effect on the reaction.
Figure 18: XRD of Ni–NDC at different temperatures (A), SEM (B) and TEM (C) images of Ni–NDC
(32 wt. %).
4. Synthesis conditions of the Ni-composites
In this study variable reducing temperatures (300 °C-600 °C) and Ni concentrations (10
wt.%, 19 wt.%, and 32 wt.%) is tested before settling into the mentioned conditions of
synthesis (in chapter 4.1.2.2). An interesting effect is observed which is rarely discussed
in literature. The different heating temperatures led to understanding how the metal can
Page 31 Research and outcomes ||Chapter 4
affect the structure of the carbon support at certain temperatures. The concentration of
Ni as 32 wt. % is chosen as it allows a good distribution of particle on surface for better
catalytic performance as seen by SEM (Figure S. 2) and from the XRD (Figure S. 3)
analysis the temperature behavior is independent of the loading. The reduction
temperature of Ni-C catalysts was considered 450 °C as it is the temperature where no
nickel oxide (NiO) remains, similarly to the temperatures lower than 400 °C. At
temperatures > 450 °C the reflections of the oxidized species disappear and a slight shift
towards lower 2θ occurs in Ni reflections due to increase in the cell size; implying the
Fe blending to Ni and forming an alloy (FeNi) highly enriched with Ni. This is detected
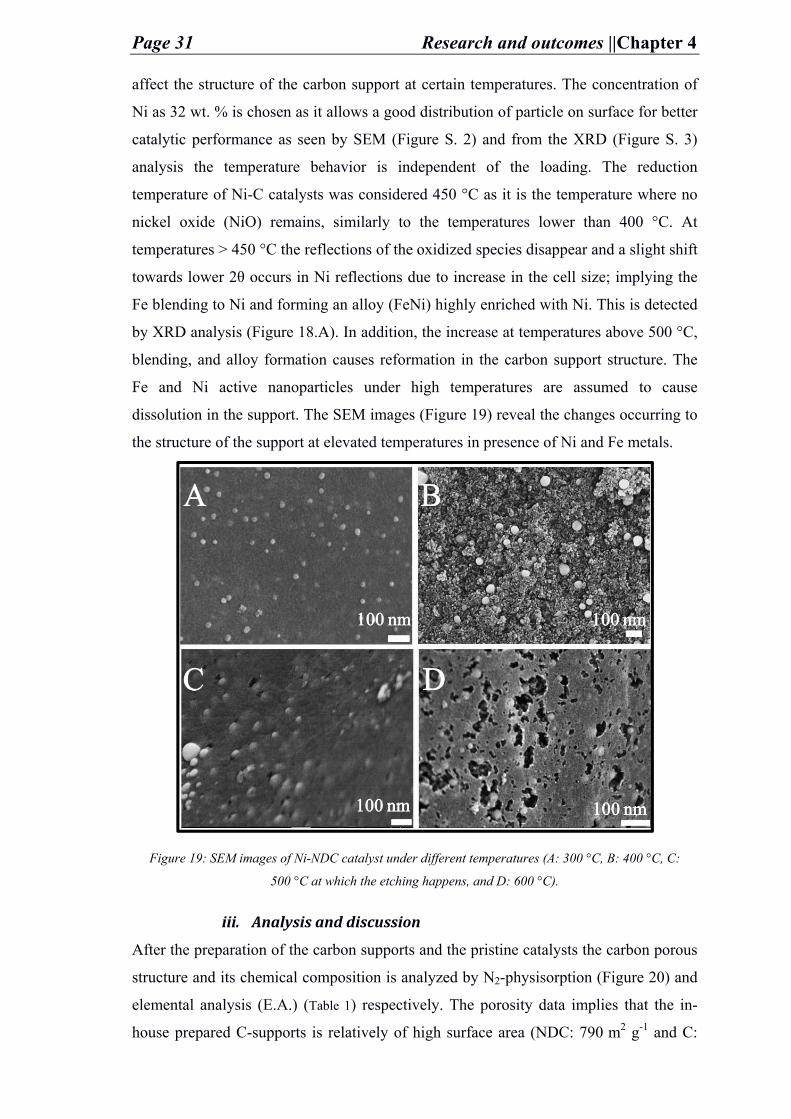
by XRD analysis (Figure 18.A). In addition, the increase at temperatures above 500 °C,
blending, and alloy formation causes reformation in the carbon support structure. The
Fe and Ni active nanoparticles under high temperatures are assumed to cause
dissolution in the support. The SEM images (Figure 19) reveal the changes occurring to
the structure of the support at elevated temperatures in presence of Ni and Fe metals.
Figure 19: SEM images of Ni-NDC catalyst under different temperatures (A: 300 °C, B: 400 °C, C:
500 °C at which the etching happens, and D: 600 °C).
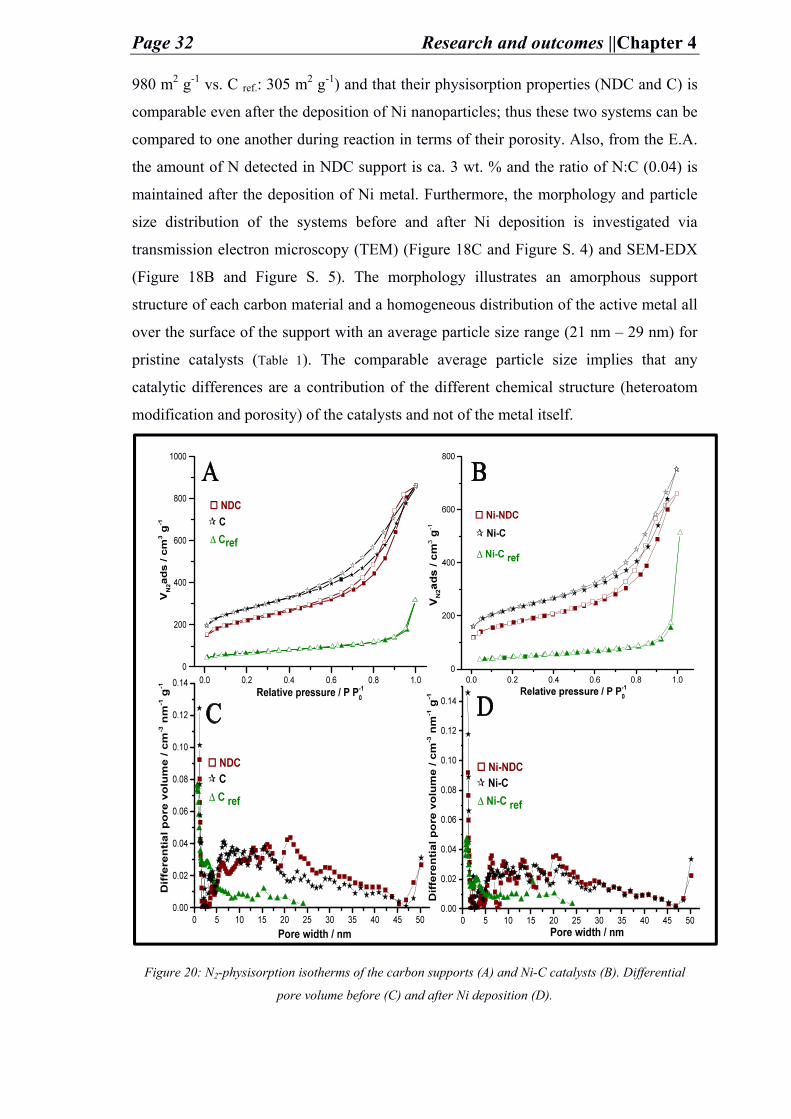
iii. Analysis and discussion
After the preparation of the carbon supports and the pristine catalysts the carbon porous
structure and its chemical composition is analyzed by N2-physisorption (Figure 20) and
elemental analysis (E.A.) (Table 1) respectively. The porosity data implies that the in-
house prepared C-supports is relatively of high surface area (NDC: 790 m2 g-1 and C:
Page 32 Research and outcomes ||Chapter 4
980 m2 g-1 vs. C ref.: 305 m2 g-1) and that their physisorption properties (NDC and C) is
comparable even after the deposition of Ni nanoparticles; thus these two systems can be
compared to one another during reaction in terms of their porosity. Also, from the E.A.
the amount of N detected in NDC support is ca. 3 wt. % and the ratio of N:C (0.04) is
maintained after the deposition of Ni metal. Furthermore, the morphology and particle
size distribution of the systems before and after Ni deposition is investigated via
transmission electron microscopy (TEM) (Figure 18C and Figure S. 4) and SEM-EDX
(Figure 18B and Figure S. 5). The morphology illustrates an amorphous support
structure of each carbon material and a homogeneous distribution of the active metal all
over the surface of the support with an average particle size range (21 nm – 29 nm) for
pristine catalysts (Table 1). The comparable average particle size implies that any
catalytic differences are a contribution of the different chemical structure (heteroatom
modification and porosity) of the catalysts and not of the metal itself.
Figure 20: N2-physisorption isotherms of the carbon supports (A) and Ni-C catalysts (B). Differential
pore volume before (C) and after Ni deposition (D).
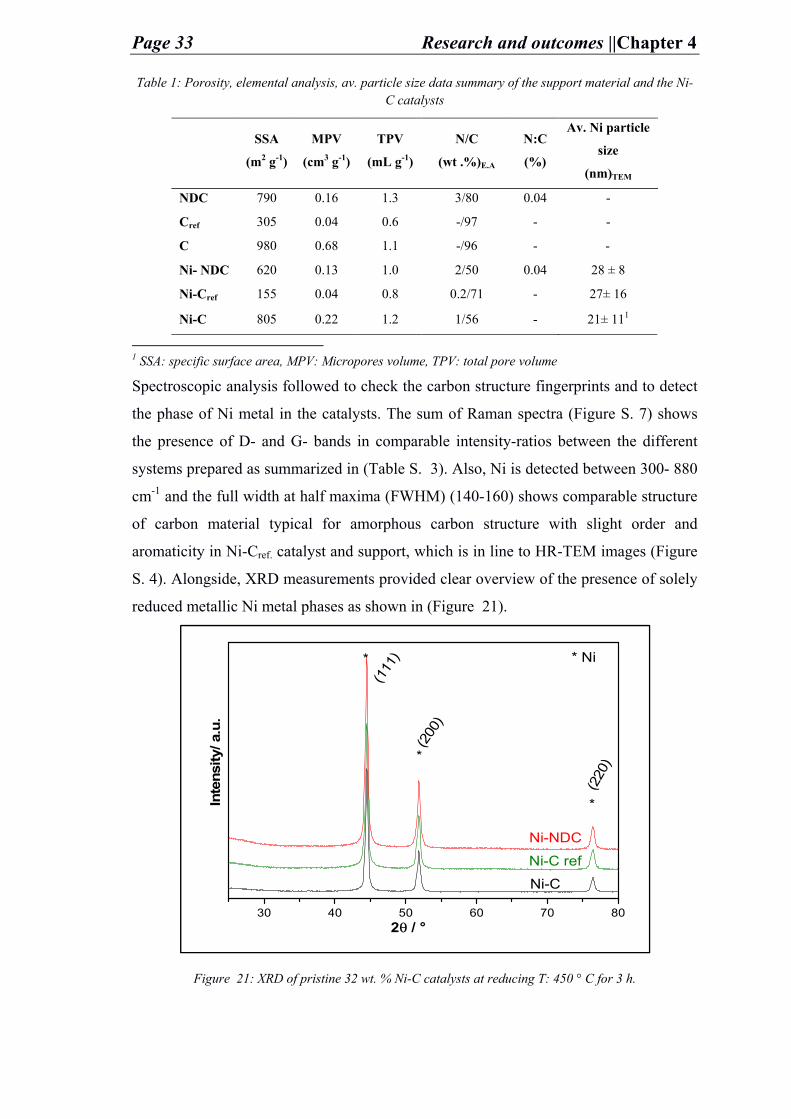
Page 33 Research and outcomes ||Chapter 4
Table 1: Porosity, elemental analysis, av. particle size data summary of the support material and the Ni-C catalysts
SSA
(m2 g-1)
MPV
(cm3 g-1)
TPV
(mL g-1)
N/C
(wt .%)E.A
N:C
(%)
Av. Ni particle
size
(nm)TEM
NDC 790 0.16 1.3 3/80 0.04 -
Cref 305 0.04 0.6 -/97 - -
C 980 0.68 1.1 -/96 - -
Ni- NDC 620 0.13 1.0 2/50 0.04 28 ± 8
Ni-Cref 155 0.04 0.8 0.2/71 - 27± 16
Ni-C 805 0.22 1.2 1/56 - 21± 111
1 SSA: specific surface area, MPV: Micropores volume, TPV: total pore volume
Spectroscopic analysis followed to check the carbon structure fingerprints and to detect
the phase of Ni metal in the catalysts. The sum of Raman spectra (Figure S. 7) shows
the presence of D- and G- bands in comparable intensity-ratios between the different
systems prepared as summarized in (Table S. 3). Also, Ni is detected between 300- 880
cm-1 and the full width at half maxima (FWHM) (140-160) shows comparable structure
of carbon material typical for amorphous carbon structure with slight order and
aromaticity in Ni-Cref. catalyst and support, which is in line to HR-TEM images (Figure
S. 4). Alongside, XRD measurements provided clear overview of the presence of solely
reduced metallic Ni metal phases as shown in (Figure 21).
Figure 21: XRD of pristine 32 wt. % Ni-C catalysts at reducing T: 450 ° C for 3 h.
30 40 50 60 70 80
(111
)
(220
)
*
*
* Ni
Ni-NDC
Ni-C ref
Inte
nsity
/ a.u
.
2θ / °
Ni-C
*
(200
)
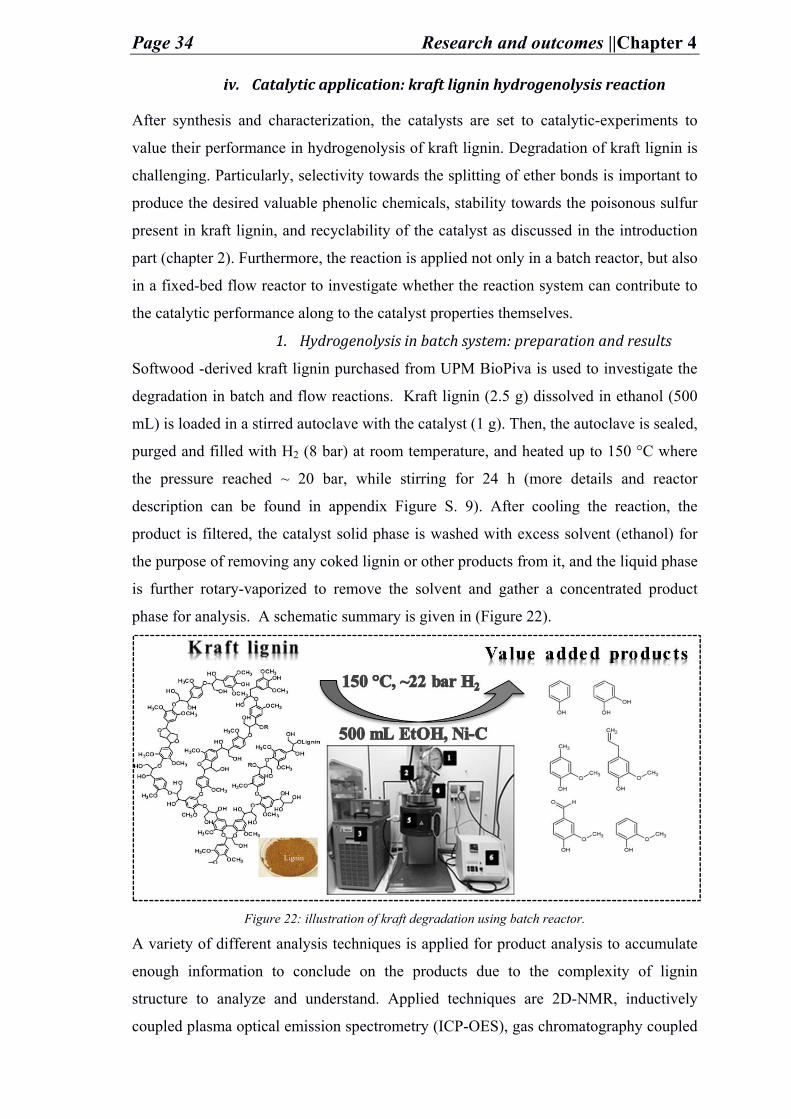
Page 34 Research and outcomes ||Chapter 4
iv. Catalytic application: kraft lignin hydrogenolysis reaction
After synthesis and characterization, the catalysts are set to catalytic-experiments to
value their performance in hydrogenolysis of kraft lignin. Degradation of kraft lignin is
challenging. Particularly, selectivity towards the splitting of ether bonds is important to
produce the desired valuable phenolic chemicals, stability towards the poisonous sulfur
present in kraft lignin, and recyclability of the catalyst as discussed in the introduction
part (chapter 2). Furthermore, the reaction is applied not only in a batch reactor, but also
in a fixed-bed flow reactor to investigate whether the reaction system can contribute to
the catalytic performance along to the catalyst properties themselves.
1. Hydrogenolysis in batch system: preparation and results
Softwood -derived kraft lignin purchased from UPM BioPiva is used to investigate the
degradation in batch and flow reactions. Kraft lignin (2.5 g) dissolved in ethanol (500
mL) is loaded in a stirred autoclave with the catalyst (1 g). Then, the autoclave is sealed,
purged and filled with H2 (8 bar) at room temperature, and heated up to 150 °C where
the pressure reached ~ 20 bar, while stirring for 24 h (more details and reactor
description can be found in appendix Figure S. 9). After cooling the reaction, the
product is filtered, the catalyst solid phase is washed with excess solvent (ethanol) for
the purpose of removing any coked lignin or other products from it, and the liquid phase
is further rotary-vaporized to remove the solvent and gather a concentrated product
phase for analysis. A schematic summary is given in (Figure 22).
Figure 22: illustration of kraft degradation using batch reactor.
A variety of different analysis techniques is applied for product analysis to accumulate
enough information to conclude on the products due to the complexity of lignin
structure to analyze and understand. Applied techniques are 2D-NMR, inductively
coupled plasma optical emission spectrometry (ICP-OES), gas chromatography coupled
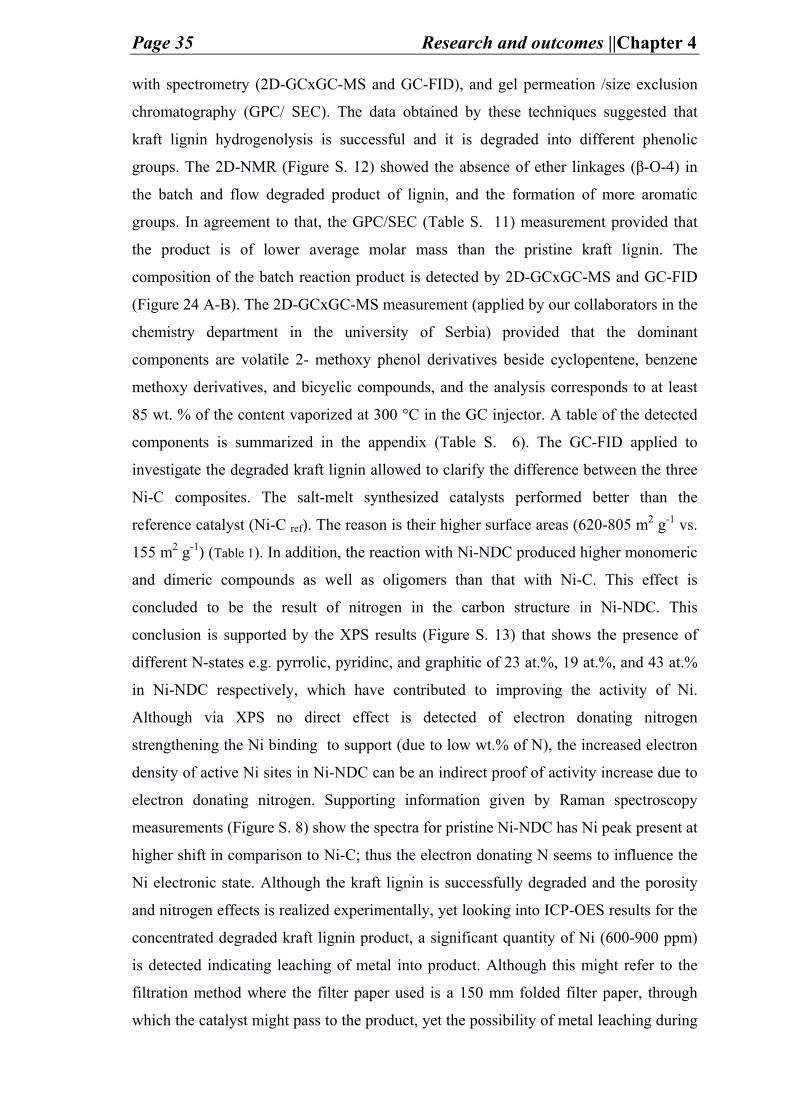
Page 35 Research and outcomes ||Chapter 4
with spectrometry (2D-GCxGC-MS and GC-FID), and gel permeation /size exclusion
chromatography (GPC/ SEC). The data obtained by these techniques suggested that
kraft lignin hydrogenolysis is successful and it is degraded into different phenolic
groups. The 2D-NMR (Figure S. 12) showed the absence of ether linkages (β-O-4) in
the batch and flow degraded product of lignin, and the formation of more aromatic
groups. In agreement to that, the GPC/SEC (Table S. 11) measurement provided that
the product is of lower average molar mass than the pristine kraft lignin. The
composition of the batch reaction product is detected by 2D-GCxGC-MS and GC-FID
(Figure 24 A-B). The 2D-GCxGC-MS measurement (applied by our collaborators in the
chemistry department in the university of Serbia) provided that the dominant
components are volatile 2- methoxy phenol derivatives beside cyclopentene, benzene
methoxy derivatives, and bicyclic compounds, and the analysis corresponds to at least
85 wt. % of the content vaporized at 300 °C in the GC injector. A table of the detected
components is summarized in the appendix (Table S. 6). The GC-FID applied to
investigate the degraded kraft lignin allowed to clarify the difference between the three
Ni-C composites. The salt-melt synthesized catalysts performed better than the
reference catalyst (Ni-C ref). The reason is their higher surface areas (620-805 m2 g-1 vs.
155 m2 g-1) (Table 1). In addition, the reaction with Ni-NDC produced higher monomeric
and dimeric compounds as well as oligomers than that with Ni-C. This effect is
concluded to be the result of nitrogen in the carbon structure in Ni-NDC. This
conclusion is supported by the XPS results (Figure S. 13) that shows the presence of
different N-states e.g. pyrrolic, pyridinc, and graphitic of 23 at.%, 19 at.%, and 43 at.%
in Ni-NDC respectively, which have contributed to improving the activity of Ni.
Although via XPS no direct effect is detected of electron donating nitrogen
strengthening the Ni binding to support (due to low wt.% of N), the increased electron
density of active Ni sites in Ni-NDC can be an indirect proof of activity increase due to
electron donating nitrogen. Supporting information given by Raman spectroscopy
measurements (Figure S. 8) show the spectra for pristine Ni-NDC has Ni peak present at
higher shift in comparison to Ni-C; thus the electron donating N seems to influence the
Ni electronic state. Although the kraft lignin is successfully degraded and the porosity
and nitrogen effects is realized experimentally, yet looking into ICP-OES results for the
concentrated degraded kraft lignin product, a significant quantity of Ni (600-900 ppm)
is detected indicating leaching of metal into product. Although this might refer to the
filtration method where the filter paper used is a 150 mm folded filter paper, through
which the catalyst might pass to the product, yet the possibility of metal leaching during
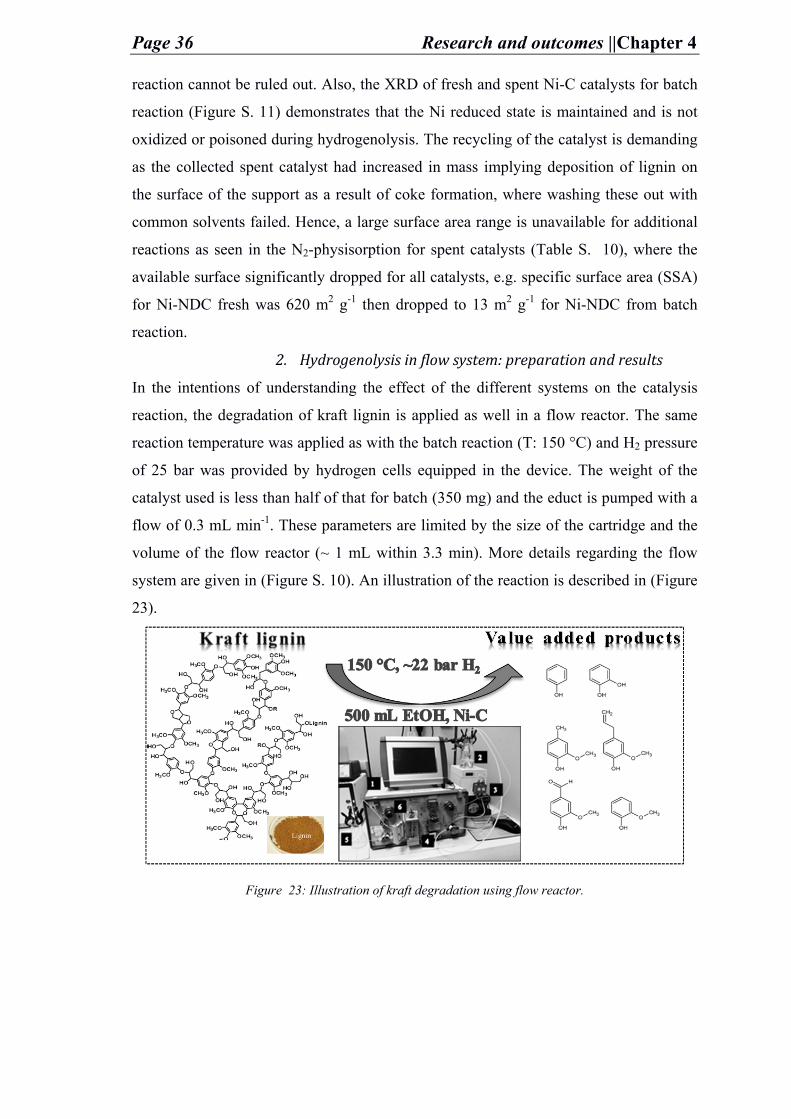
Page 36 Research and outcomes ||Chapter 4
reaction cannot be ruled out. Also, the XRD of fresh and spent Ni-C catalysts for batch
reaction (Figure S. 11) demonstrates that the Ni reduced state is maintained and is not
oxidized or poisoned during hydrogenolysis. The recycling of the catalyst is demanding
as the collected spent catalyst had increased in mass implying deposition of lignin on
the surface of the support as a result of coke formation, where washing these out with
common solvents failed. Hence, a large surface area range is unavailable for additional
reactions as seen in the N2-physisorption for spent catalysts (Table S. 10), where the
available surface significantly dropped for all catalysts, e.g. specific surface area (SSA)
for Ni-NDC fresh was 620 m2 g-1 then dropped to 13 m2 g-1 for Ni-NDC from batch
reaction.
2. Hydrogenolysis in flow system: preparation and results
In the intentions of understanding the effect of the different systems on the catalysis
reaction, the degradation of kraft lignin is applied as well in a flow reactor. The same
reaction temperature was applied as with the batch reaction (T: 150 °C) and H2 pressure
of 25 bar was provided by hydrogen cells equipped in the device. The weight of the
catalyst used is less than half of that for batch (350 mg) and the educt is pumped with a
flow of 0.3 mL min-1. These parameters are limited by the size of the cartridge and the
volume of the flow reactor (~ 1 mL within 3.3 min). More details regarding the flow
system are given in (Figure S. 10). An illustration of the reaction is described in (Figure
23).
Figure 23: Illustration of kraft degradation using flow reactor.
Page 37 Research and outcomes ||Chapter 4
Figure 24: Data obtained for kraft lignin degradation by GC-FID and 2D-GCxGC-MS for batch (A and B) and flow (C and D) reactions respectively.
The same concentration of kraft lignin in ethanol (5 mg mL-1) is streamed into the
catalyst cartridge, degraded, and collected in a product vessel to be later rotary
vaporized and concentrated for characterization. The 2D-NMR (Figure S. 12) indicates
the selectivity of the catalyst towards cleavage of the ether linkages as in batch reaction.
Also, the GC–FID and the 2D GCxGC – MS results imply the presence of small molar
mass molecules (Table S. 6) and the Ni–NDC catalyst has higher abundancy of
degraded lignin products compared to Ni–C (Figure 24 C-D). Noticeable, the intensity
of the signals from the products of the flow reaction compared to that of the batch
reaction for Ni-NDC is higher by 2 orders of a magnitude measured via using heptane
as the internal standard. The stability of Ni-NDC was retained for at least 50 h (Figure S.
14). Finally, the ICP technique detected negligible amounts of Ni leaching in degraded
lignin product (~ 8 ppm) (Table S. 7), which explains the decrease in activity over time
but also indicates a better control in flow reactor than in the batch. Also, after 100 h of
continuous reaction an ~ 83 wt. % of the initial content of the Ni on NDC was still
preserved. In contrast, Ni – NDC after the batch reaction preserved only 30 wt. % of its
initial content. This decrease is a result of deposition of coked lignin on the surface of
Page 38 Research and outcomes ||Chapter 4
the catalyst during reaction, causing an increase in the C value compared to that in the
fresh catalyst, by that affecting the wt. % of Ni on the carbon support. This is seen less
in flow reactor, because this system allows direct collection of product and shorter time
contact of lignin with the catalyst compared to the batch reactor.
Furthermore, ~ 99 wt. % of degraded kraft lignin was collected when applying the two
salt-melt catalysts even up to 50 h of reaction, providing less crosslinking and coking to
occur due to direct separation of the product from the catalyst before potential
condensation of reactive degraded lignin fragments. In addition, the flow reactor is
blocked whenever applying the reaction with Ni-Cref. causing the device to
automatically stop. The reason behind that is presumed to be the size of lignin
macromolecule (3.5 nm) [67] being blocked by the micropores of Ni-Cref.causing high
back-pressure and stopping the system. Further investigation regarding this matter is not
considered. This is due to the fact that this catalyst has a low surface area and performed
lower than the in-house prepared catalysts in the batch reaction. Thus, implicating the
importance of a higher surface area in catalysis and the effectiveness of the salt-melt
synthesis compared to a commercial synthesis method.
After recovering the catalysts, N2 – physisorption showed a decline in the SSA of Ni –
NDC after 100 h reaction from 620 m2 g-1 to ~ 225 m2 g-1 as well in the TPV from 1.02
cm3 to 0.42 cm3 (Table S. 10). This decrease occurs from sorption of degraded
molecules in the pore system of the support. Once saturated and filled no further
decrease in SSA can be reached even after 100 h.
The hydrogenolysis of kraft lignin in both batch and flow reactions formed a majority of
2 – Methoxy phenol derivatives such as guaiacols, benzene methoxy derivatives and
bicyclic compounds (Table S. 6). Among the resultant phenols, especially guaiacols,
are in dominance of the products as the origin of the used kraft lignin is softwood lignin
which guaiacyl units are its essential constituent along to syringol and hydroxyl phenols.
v. Summary and conclusion
In desire to contribute to the development of an industrial heterogeneous catalyst for
production of value-added chemicals, a hierarchical porous carbon support modified
with nitrogen heteroatom is synthesized. Ni nanoparticles are deposited on it and the
resulting catalyst is investigated for the hydrogenolysis of kraft lignin.
The hydrogenolysis of kraft lignin is a process of added value due to the difference in
price of kraft lignin (cheap and abundant) to the obtained phenols and molecules from
lignin degradation, aside from the important products formed that can be used as
Page 39 Research and outcomes ||Chapter 4
valuable chemicals and fuels. Therefore, lignin degradation is considered as a model
reaction.
Knowing that Ni metal is selective to the cleavage of ether linkages and thus active for
lignin hydrogenolysis, it was used as the active metal. The carbon supports have high
surface area, are thermally stable, and convenient to retrieve the metal thus good for
recyclation. A salt–melt synthesis method is used to prepare the carbon support of sugar
source (glucose and glucoseamine) to provide the hierarchical porosity and the
functionality (e.g. N) in one pot synthesis. Based on that, three Ni – C catalysts are
prepared. Ni–NDC prepared from glucoseamine and Ni–C prepared from glucose are
synthesized and compared to a Ni–C ref prepared from a commercial Vulcan® carbon.
The main aim is to understand the effect of the heteroatom on the metal activity,
selectivity and stability and to provide a deeper insight about the influence of the reactor
(continuous flow system vs. a batch autoclave system) on the catalytic performance.
The kraft lignin degradation is successful in both reactors and showed selectivity
towards the cleavage of the ether bonds (β–O–4 linkages) as observed via 2D–NMR,
2D GCxGC–MS, and GC–FID. A clear variation in the performance results of each
catalyst is also observed. Ni–NDC is of the highest performance in comparison to the
other prepared catalysts (Ni-C and Ni-Cref.). According to the several analysis
techniques applied to study the catalysts before and after flow and batch reaction, the
hierarchical porous salt-melt synthesized catalysts (Ni-NDC and Ni–C) performed
significantly better than a commercial catalyst (Ni–C ref) due to their higher surface
areas. Moreover, the nitrogen heteroatoms influencing the activity of the Ni metal is
detected via XPS and observed via the quantification of the spectra of GC–FID for
degraded lignin where Ni–NDC performed the highest signal magnitude (abundant
degraded lignin products) among the applied catalysts. In addition, considering the
batch and the flow reactions, the results of the quantification of the product and the
catalytic performance of the Ni–NDC catalyst provide that continuous flow reaction is
more convenient. The reason derives from the stability of Ni–NDC activity up to 50 h
and its production of similar phenolic molecules as in the batch reaction, but in a higher
signal magnitude of 2 orders. Moreover, the catalyst could maintain its structural
surface properties intact for up to 50 h before charring or crosslinking took place which
was in very low amounts at up to 100 h reaction. Finally, the conversion of kraft lignin
was ~ 99 wt. % in the flow reaction.
Despite the efficiency of Ni–NDC catalyst in degrading kraft lignin macromolecule in
presence of only ~ 3 wt. % N, and not get deactivated by sulfur, its ease of preparation
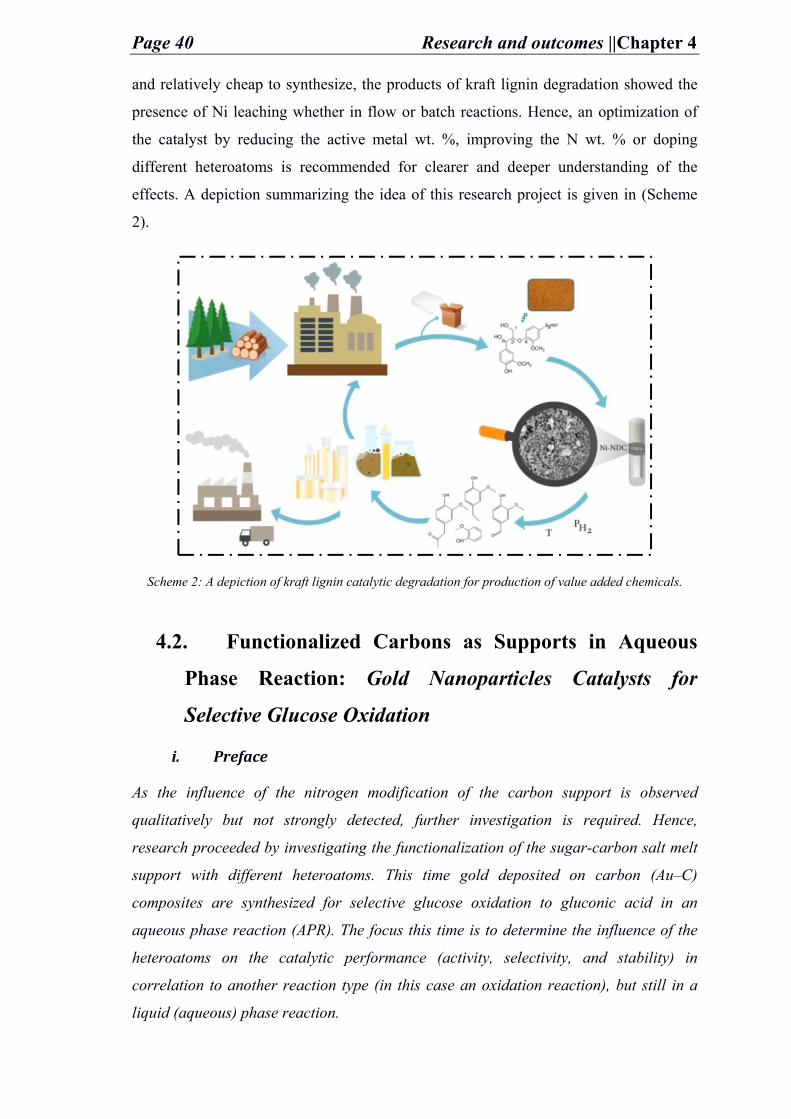
Page 40 Research and outcomes ||Chapter 4
and relatively cheap to synthesize, the products of kraft lignin degradation showed the
presence of Ni leaching whether in flow or batch reactions. Hence, an optimization of
the catalyst by reducing the active metal wt. %, improving the N wt. % or doping
different heteroatoms is recommended for clearer and deeper understanding of the
effects. A depiction summarizing the idea of this research project is given in (Scheme
2).
Scheme 2: A depiction of kraft lignin catalytic degradation for production of value added chemicals.
4.2. Functionalized Carbons as Supports in Aqueous
Phase Reaction: Gold Nanoparticles Catalysts for
Selective Glucose Oxidation
i. Preface
As the influence of the nitrogen modification of the carbon support is observed
qualitatively but not strongly detected, further investigation is required. Hence,
research proceeded by investigating the functionalization of the sugar-carbon salt melt
support with different heteroatoms. This time gold deposited on carbon (Au–C)
composites are synthesized for selective glucose oxidation to gluconic acid in an
aqueous phase reaction (APR). The focus this time is to determine the influence of the
heteroatoms on the catalytic performance (activity, selectivity, and stability) in
correlation to another reaction type (in this case an oxidation reaction), but still in a
liquid (aqueous) phase reaction.
Page 41 Research and outcomes ||Chapter 4
ii. State of art
Sugar–derived salt–melt carbon materials used as supports has many advantageous
properties, as mentioned in prior chapters, upon them the ability to tune their atomic
structure. The addition of heteroatoms or functional groups alters the surface and the
electronic properties of the carbons in particular and the catalytical performance in
general as can be concluded from (chapter 4.1)[68]. The doping of heteroatoms not only
influences the support or the metal and thus the catalytic performance, but it impacts the
interaction between the catalyst and the surrounding phase as well. The presence of
oxygen-functional groups such as carboxyl groups on the surface of the support for
example alters the tendency of the active metal to oxidize. It can also adjust the growth
of the metal particle size which is a known anchoring effect widely studied. Usually
such interaction is related to porosity effect, metal loading, or particle size, however less
is known about heteroatoms influencing the interaction with the surrounding phase [69-70].
In order to investigate that, modification of sugar–derived salt–melt carbon supports
with variable heteroatoms (O, N, and H) was carried out. Then a catalyst system was
prepared via deposition of gold (Au) on these supports to end up with Au–CGlucose–O,
Au– CGlucose–H, Au–CGlucoseamine, and Au–CGlucose, for comparison between heteroatom
doped versus heteroatom-free systems. As all catalysts synthesized of the same carbon
source (glucose) except Au–CGlucoseamine (glucoseamine precursor) which is comparable
in properties to Carbon from glucose according to (chapter 4.1.2), their carbon structure
is of similar porosity structure and the resultant of any difference would be of the
modification with the particular heteroatoms applied. The catalysts were used in the
liquid phase oxidation reaction of D-Glucose to D–gluconic acid in presence of oxygen
flow as oxidizing agent. This reaction has been chosen as a model reaction as it has
already been extensively used for investigating gold catalysts in liquid phase and thus
reference data is widely available [49, 71-74]. Moreover, the reaction was investigated for
economic reasons, because a large amount of gluconic acid of ~ 100000 t is annually
produced [75] and used as additives in food, pharmaceutical products, textiles, and in
constructions industry. Currently, it is manufactured by biotechnological processes
where fermentation is taking place [75-77]. However, gold catalysts show a promising
alternative source in means of reaction rate and high space time yield for gluconic acid
production (as given in Figure 25) [78].
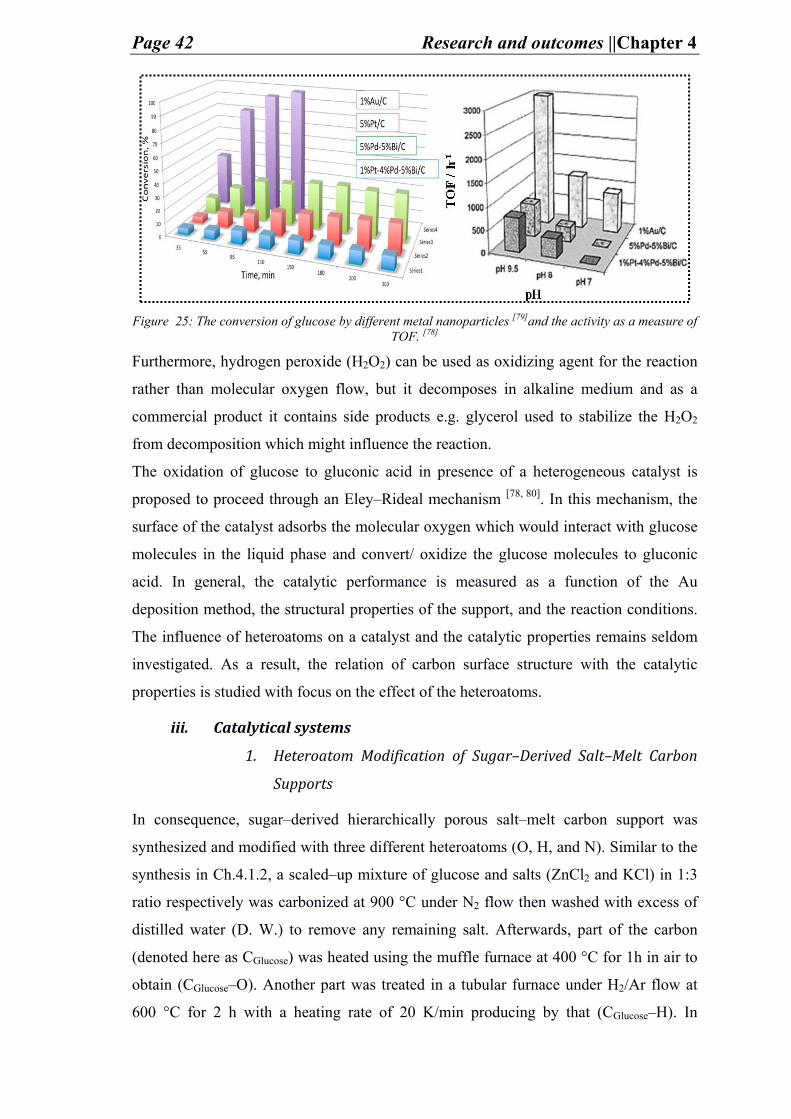
Page 42 Research and outcomes ||Chapter 4
Figure 25: The conversion of glucose by different metal nanoparticles [79]and the activity as a measure of
TOF. [78]
Furthermore, hydrogen peroxide (H2O2) can be used as oxidizing agent for the reaction
rather than molecular oxygen flow, but it decomposes in alkaline medium and as a
commercial product it contains side products e.g. glycerol used to stabilize the H2O2
from decomposition which might influence the reaction.
The oxidation of glucose to gluconic acid in presence of a heterogeneous catalyst is
proposed to proceed through an Eley–Rideal mechanism [78, 80]. In this mechanism, the
surface of the catalyst adsorbs the molecular oxygen which would interact with glucose
molecules in the liquid phase and convert/ oxidize the glucose molecules to gluconic
acid. In general, the catalytic performance is measured as a function of the Au
deposition method, the structural properties of the support, and the reaction conditions.
The influence of heteroatoms on a catalyst and the catalytic properties remains seldom
investigated. As a result, the relation of carbon surface structure with the catalytic
properties is studied with focus on the effect of the heteroatoms.
iii. Catalytical systems
1. Heteroatom Modification of Sugar–Derived Salt–Melt Carbon
Supports
In consequence, sugar–derived hierarchically porous salt–melt carbon support was
synthesized and modified with three different heteroatoms (O, H, and N). Similar to the
synthesis in Ch.4.1.2, a scaled–up mixture of glucose and salts (ZnCl2 and KCl) in 1:3
ratio respectively was carbonized at 900 °C under N2 flow then washed with excess of
distilled water (D. W.) to remove any remaining salt. Afterwards, part of the carbon
(denoted here as CGlucose) was heated using the muffle furnace at 400 °C for 1h in air to
obtain (CGlucose–O). Another part was treated in a tubular furnace under H2/Ar flow at
600 °C for 2 h with a heating rate of 20 K/min producing by that (CGlucose–H). In
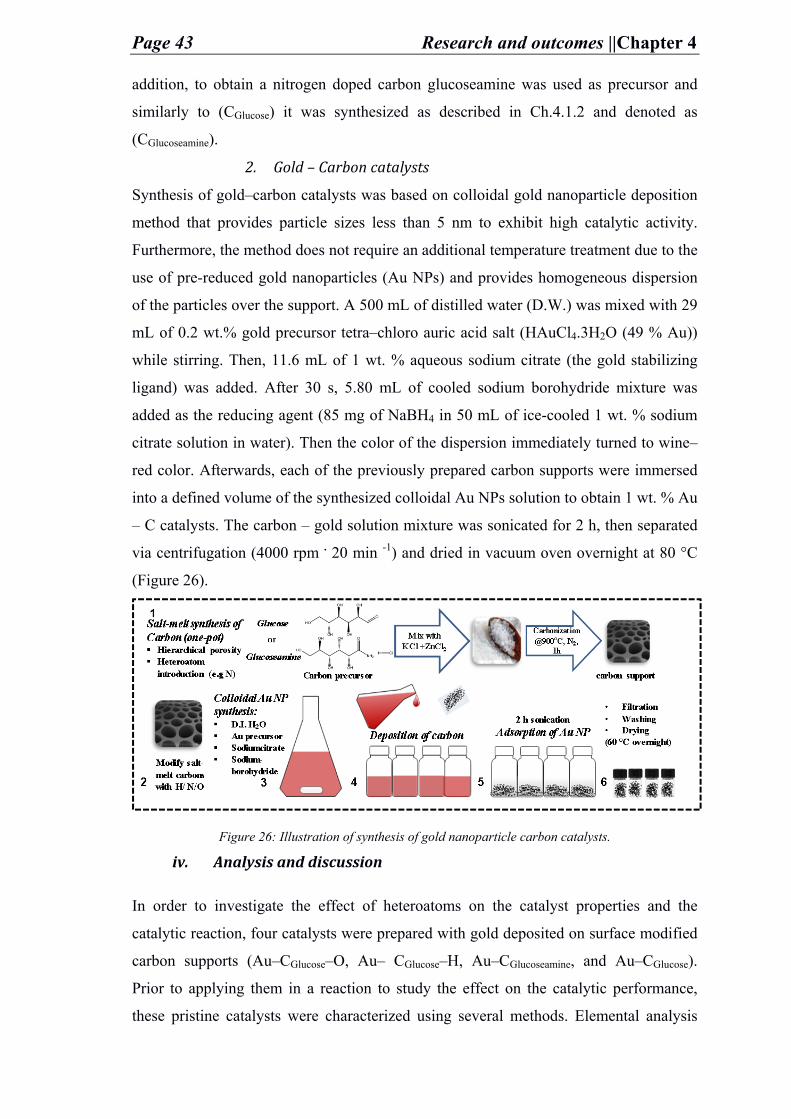
Page 43 Research and outcomes ||Chapter 4
addition, to obtain a nitrogen doped carbon glucoseamine was used as precursor and
similarly to (CGlucose) it was synthesized as described in Ch.4.1.2 and denoted as
(CGlucoseamine).
2. Gold – Carbon catalysts
Synthesis of gold–carbon catalysts was based on colloidal gold nanoparticle deposition
method that provides particle sizes less than 5 nm to exhibit high catalytic activity.
Furthermore, the method does not require an additional temperature treatment due to the
use of pre-reduced gold nanoparticles (Au NPs) and provides homogeneous dispersion
of the particles over the support. A 500 mL of distilled water (D.W.) was mixed with 29
mL of 0.2 wt.% gold precursor tetra–chloro auric acid salt (HAuCl4.3H2O (49 % Au))
while stirring. Then, 11.6 mL of 1 wt. % aqueous sodium citrate (the gold stabilizing
ligand) was added. After 30 s, 5.80 mL of cooled sodium borohydride mixture was
added as the reducing agent (85 mg of NaBH4 in 50 mL of ice-cooled 1 wt. % sodium
citrate solution in water). Then the color of the dispersion immediately turned to wine–
red color. Afterwards, each of the previously prepared carbon supports were immersed
into a defined volume of the synthesized colloidal Au NPs solution to obtain 1 wt. % Au
– C catalysts. The carbon – gold solution mixture was sonicated for 2 h, then separated
via centrifugation (4000 rpm . 20 min -1) and dried in vacuum oven overnight at 80 °C
(Figure 26).
Figure 26: Illustration of synthesis of gold nanoparticle carbon catalysts.
iv. Analysis and discussion
In order to investigate the effect of heteroatoms on the catalyst properties and the
catalytic reaction, four catalysts were prepared with gold deposited on surface modified
carbon supports (Au–CGlucose–O, Au– CGlucose–H, Au–CGlucoseamine, and Au–CGlucose).
Prior to applying them in a reaction to study the effect on the catalytic performance,
these pristine catalysts were characterized using several methods. Elemental analysis
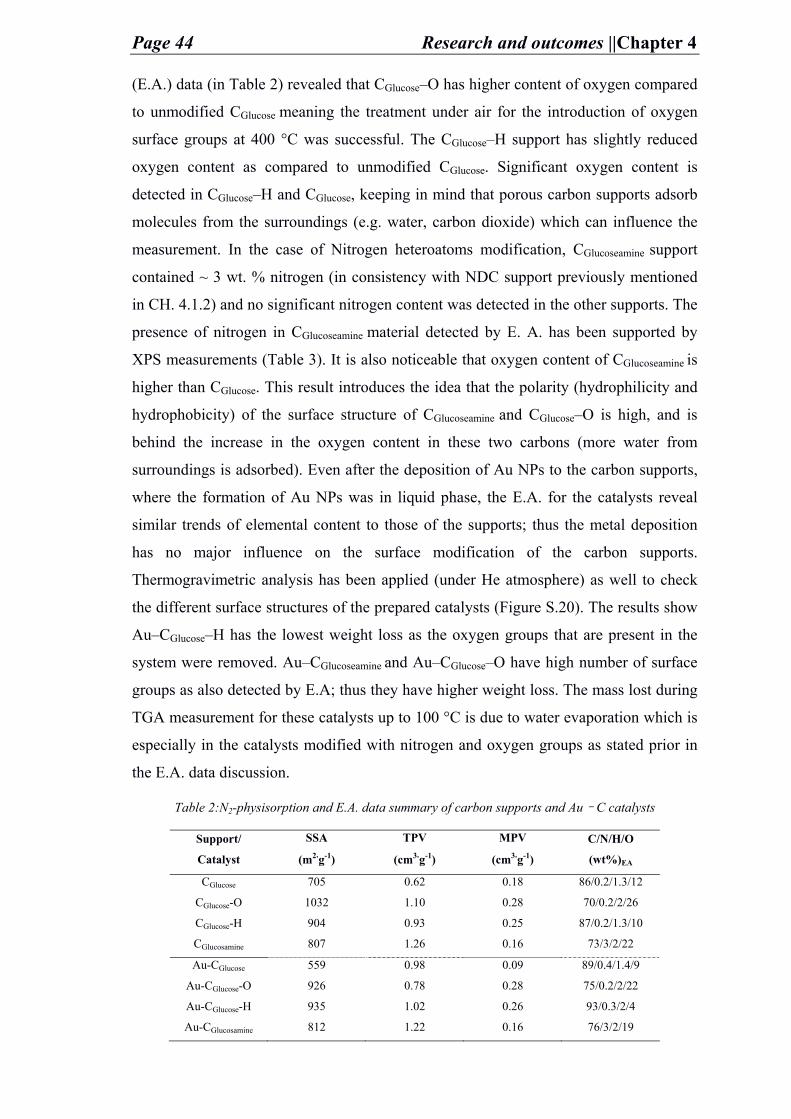
Page 44 Research and outcomes ||Chapter 4
(E.A.) data (in Table 2) revealed that CGlucose–O has higher content of oxygen compared
to unmodified CGlucose meaning the treatment under air for the introduction of oxygen
surface groups at 400 °C was successful. The CGlucose–H support has slightly reduced
oxygen content as compared to unmodified CGlucose. Significant oxygen content is
detected in CGlucose–H and CGlucose, keeping in mind that porous carbon supports adsorb
molecules from the surroundings (e.g. water, carbon dioxide) which can influence the
measurement. In the case of Nitrogen heteroatoms modification, CGlucoseamine support
contained ~ 3 wt. % nitrogen (in consistency with NDC support previously mentioned
in CH. 4.1.2) and no significant nitrogen content was detected in the other supports. The
presence of nitrogen in CGlucoseamine material detected by E. A. has been supported by
XPS measurements (Table 3). It is also noticeable that oxygen content of CGlucoseamine is
higher than CGlucose. This result introduces the idea that the polarity (hydrophilicity and
hydrophobicity) of the surface structure of CGlucoseamine and CGlucose–O is high, and is
behind the increase in the oxygen content in these two carbons (more water from
surroundings is adsorbed). Even after the deposition of Au NPs to the carbon supports,
where the formation of Au NPs was in liquid phase, the E.A. for the catalysts reveal
similar trends of elemental content to those of the supports; thus the metal deposition
has no major influence on the surface modification of the carbon supports.
Thermogravimetric analysis has been applied (under He atmosphere) as well to check
the different surface structures of the prepared catalysts (Figure S.20). The results show
Au–CGlucose–H has the lowest weight loss as the oxygen groups that are present in the
system were removed. Au–CGlucoseamine and Au–CGlucose–O have high number of surface
groups as also detected by E.A; thus they have higher weight loss. The mass lost during
TGA measurement for these catalysts up to 100 °C is due to water evaporation which is
especially in the catalysts modified with nitrogen and oxygen groups as stated prior in
the E.A. data discussion.
Table 2:N2-physisorption and E.A. data summary of carbon supports and Au–C catalysts
Support/
Catalyst
SSA
(m2.g-1)
TPV
(cm3.g-1)
MPV
(cm3.g-1)
C/N/H/O
(wt%)EA
CGlucose 705 0.62 0.18 86/0.2/1.3/12
CGlucose-O 1032 1.10 0.28 70/0.2/2/26
CGlucose-H 904 0.93 0.25 87/0.2/1.3/10
CGlucosamine 807 1.26 0.16 73/3/2/22
Au-CGlucose 559 0.98 0.09 89/0.4/1.4/9
Au-CGlucose-O 926 0.78 0.28 75/0.2/2/22
Au-CGlucose-H 935 1.02 0.26 93/0.3/2/4
Au-CGlucosamine 812 1.22 0.16 76/3/2/19
Page 45 Research and outcomes ||Chapter 4
According to the N2 physisorption results of the supports (Figure 27 A and C), the
isotherms illustrate the high nitrogen uptake at low relative pressure and the hysteresis
loop at P. Po-1 > 0.8. The quenched solid state density functional theory (QSDFT) was
applied to analyze the pore size distribution (Figure 27 C) and a broad distribution of
micro– to meso– pores of different sizes exist. The SSA for these carbon supports is
between 700 – 1000 m2.g-1 and the total pore volume (TPV) up to 50 nm is between 0.6
– 1.26 cm3.g-1 (Table 2). In the case of micropores, CGlucose–H and CGlucose–O (0.25
cm3.g-1 and 0.28 cm3.g-1 respectively) contain higher micropores than the two others.
despite these slight differences, the pore structure for the supports stay comparable.
TEM imaging for the carbon supports illustrate the homogeneous mesopore carbon
structure (Figure S.21) independent of the surface chemistry.
Similarly, Au–C catalysts have been analyzed by N2– physisorption, and their isotherms
indicated no significant difference than the supports, meaning the mesopore carbon
structure remained unaffected by the Au NPs. Similarly, the micropore volume for the
Au–C catalysts didn’t differ much compared to the carbons, except for Au–CGlucose
which had a slight decrease likely due to clogging of small pores by small particles in
the catalysts.
The modification of the support material with heteroatoms can influence the polarity
(hydrophilicity or hydrophobicity) of the material and thus will affect the interaction of
the catalyst while synthesis or in a reaction. Therefore, water physisorption of supports
and catalysts was tested at 25 °C. The isotherms (Figure 27 E and F) clearly state the
CGlucoseamine and CGlucose–O are more hydrophilic than CGlucose–H and CGlucose. The water
adsorption analysis is an indicator for the strength of the water–surface interaction. This
interaction strength in these carbon supports is determined according to their pore size
and the density of the heteroatom groups present on the surface of the carbon.
Considering the comparable pore size distribution of the supports the lower pressure for
water to bind with the surface of the support indicates more hydrophilic properties of
CGlucoseamine and CGlucose–O. Also, after the metal loading to the support similar trend of
water adsorption isotherm is observed. Interestingly, the water adsorption isotherms for
the Au–C catalysts can be comparable in shape and water uptake to their pristine
supports, except for Au–CGlucose–O which has a distinctive high water uptake of 0.5 –
0.9 P.Po-1. This attributes to the stronger surface attraction to water adsorption after
metal deposition. The water adsorption measurement provided sufficient information
regarding the surface wetting and dispersability in water for the salt–melt carbons as
well as for the catalyst synthesis and catalytic reaction in aqueous solution.
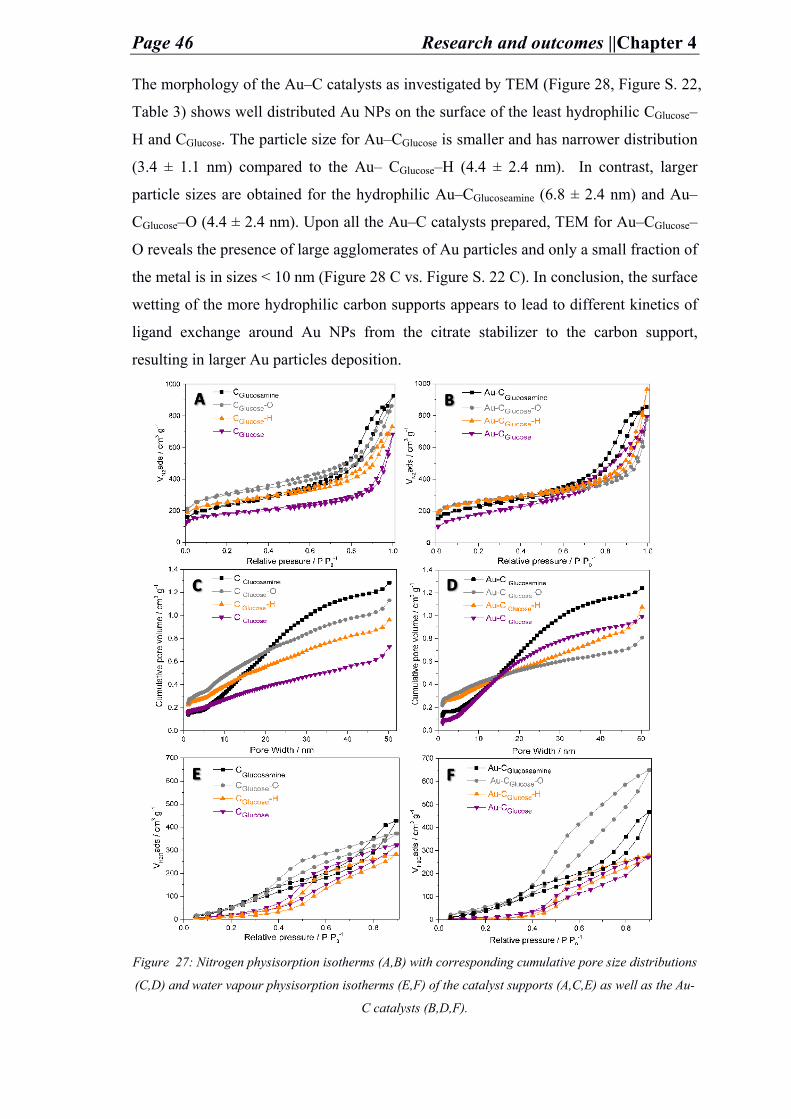
Page 46 Research and outcomes ||Chapter 4
The morphology of the Au–C catalysts as investigated by TEM (Figure 28, Figure S. 22,
Table 3) shows well distributed Au NPs on the surface of the least hydrophilic CGlucose–
H and CGlucose. The particle size for Au–CGlucose is smaller and has narrower distribution
(3.4 ± 1.1 nm) compared to the Au– CGlucose–H (4.4 ± 2.4 nm). In contrast, larger
particle sizes are obtained for the hydrophilic Au–CGlucoseamine (6.8 ± 2.4 nm) and Au–
CGlucose–O (4.4 ± 2.4 nm). Upon all the Au–C catalysts prepared, TEM for Au–CGlucose–
O reveals the presence of large agglomerates of Au particles and only a small fraction of
the metal is in sizes < 10 nm (Figure 28 C vs. Figure S. 22 C). In conclusion, the surface
wetting of the more hydrophilic carbon supports appears to lead to different kinetics of
ligand exchange around Au NPs from the citrate stabilizer to the carbon support,
resulting in larger Au particles deposition.
Figure 27: Nitrogen physisorption isotherms (A,B) with corresponding cumulative pore size distributions
(C,D) and water vapour physisorption isotherms (E,F) of the catalyst supports (A,C,E) as well as the Au-
C catalysts (B,D,F).
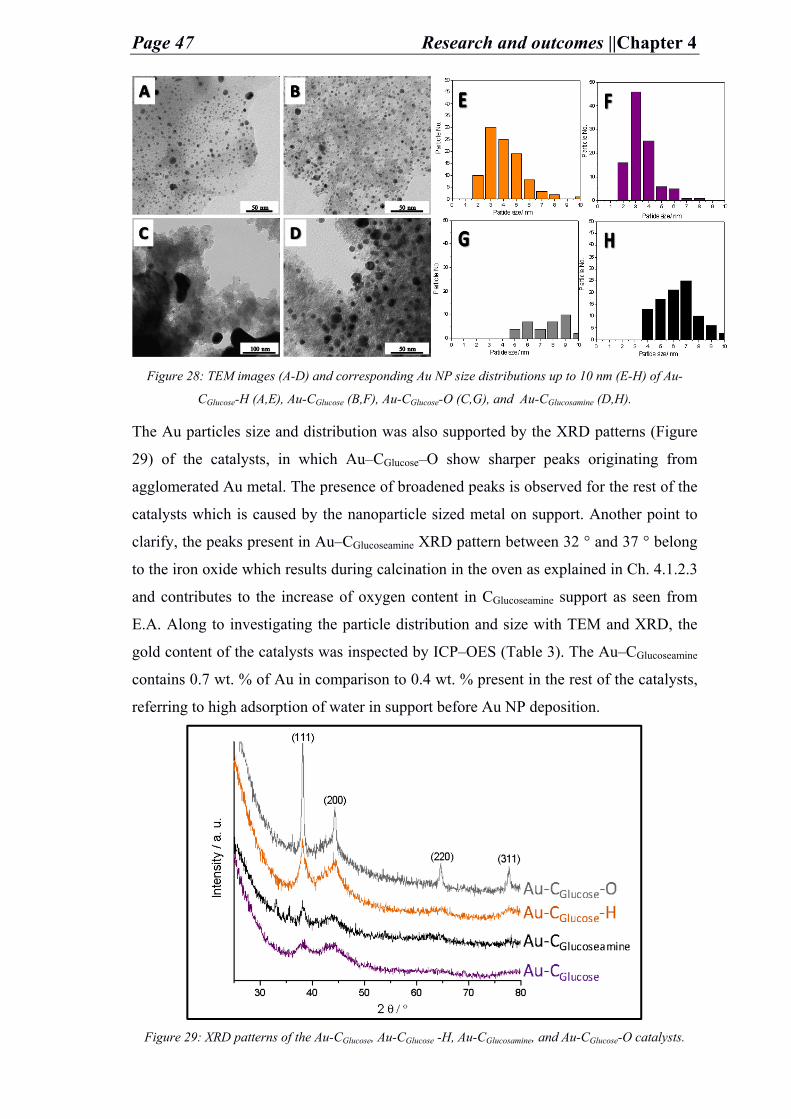
Page 47 Research and outcomes ||Chapter 4
Figure 28: TEM images (A-D) and corresponding Au NP size distributions up to 10 nm (E-H) of Au-
CGlucose-H (A,E), Au-CGlucose (B,F), Au-CGlucose-O (C,G), and Au-CGlucosamine (D,H).
The Au particles size and distribution was also supported by the XRD patterns (Figure
29) of the catalysts, in which Au–CGlucose–O show sharper peaks originating from
agglomerated Au metal. The presence of broadened peaks is observed for the rest of the
catalysts which is caused by the nanoparticle sized metal on support. Another point to
clarify, the peaks present in Au–CGlucoseamine XRD pattern between 32 ° and 37 ° belong
to the iron oxide which results during calcination in the oven as explained in Ch. 4.1.2.3
and contributes to the increase of oxygen content in CGlucoseamine support as seen from
E.A. Along to investigating the particle distribution and size with TEM and XRD, the
gold content of the catalysts was inspected by ICP–OES (Table 3). The Au–CGlucoseamine
contains 0.7 wt. % of Au in comparison to 0.4 wt. % present in the rest of the catalysts,
referring to high adsorption of water in support before Au NP deposition.
Figure 29: XRD patterns of the Au-CGlucose, Au-CGlucose -H, Au-CGlucosamine, and Au-CGlucose-O catalysts.
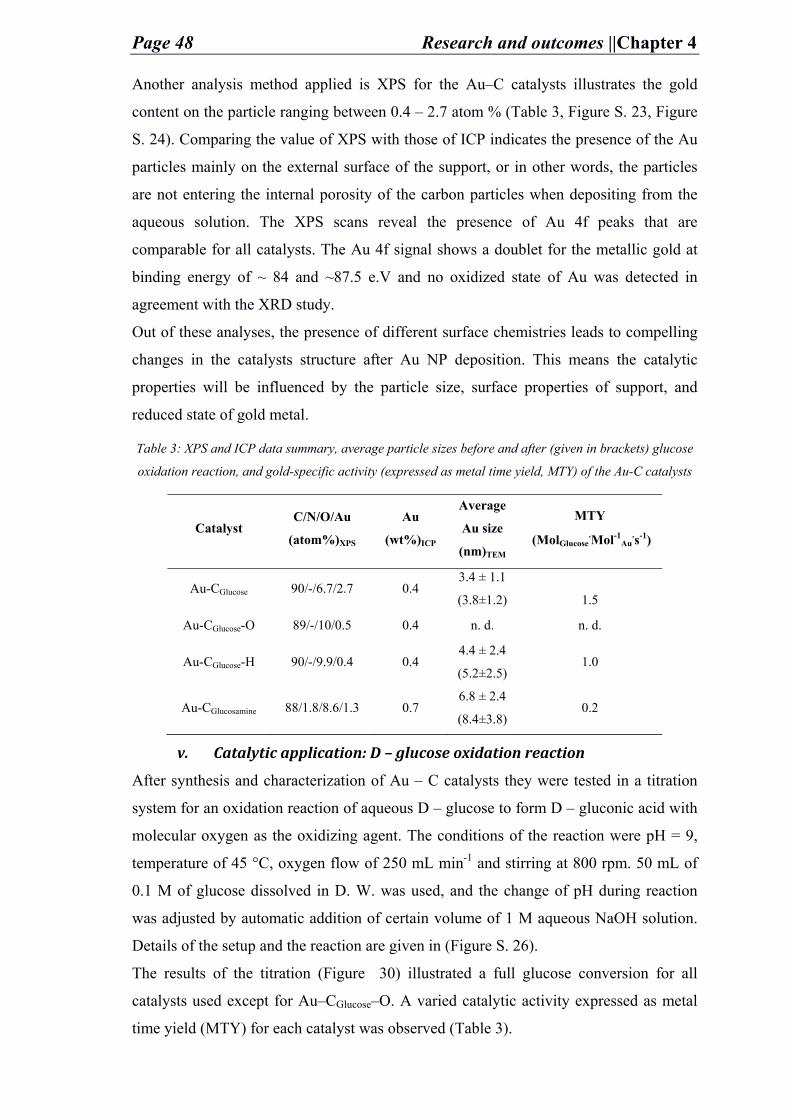
Page 48 Research and outcomes ||Chapter 4
Another analysis method applied is XPS for the Au–C catalysts illustrates the gold
content on the particle ranging between 0.4 – 2.7 atom % (Table 3, Figure S. 23, Figure
S. 24). Comparing the value of XPS with those of ICP indicates the presence of the Au
particles mainly on the external surface of the support, or in other words, the particles
are not entering the internal porosity of the carbon particles when depositing from the
aqueous solution. The XPS scans reveal the presence of Au 4f peaks that are
comparable for all catalysts. The Au 4f signal shows a doublet for the metallic gold at
binding energy of ~ 84 and ~87.5 e.V and no oxidized state of Au was detected in
agreement with the XRD study.
Out of these analyses, the presence of different surface chemistries leads to compelling
changes in the catalysts structure after Au NP deposition. This means the catalytic
properties will be influenced by the particle size, surface properties of support, and
reduced state of gold metal.
Table 3: XPS and ICP data summary, average particle sizes before and after (given in brackets) glucose
oxidation reaction, and gold-specific activity (expressed as metal time yield, MTY) of the Au-C catalysts
Catalyst C/N/O/Au
(atom%)XPS
Au
(wt%)ICP
Average
Au size
(nm)TEM
MTY
(MolGlucose.Mol-1
Au.s-1)
Au-CGlucose 90/-/6.7/2.7 0.4 3.4 ± 1.1
(3.8±1.2)
1.5
Au-CGlucose-O 89/-/10/0.5 0.4 n. d. n. d.
Au-CGlucose-H 90/-/9.9/0.4 0.4 4.4 ± 2.4
(5.2±2.5) 1.0
Au-CGlucosamine 88/1.8/8.6/1.3 0.7 6.8 ± 2.4
(8.4±3.8) 0.2
v. Catalytic application: D – glucose oxidation reaction
After synthesis and characterization of Au – C catalysts they were tested in a titration
system for an oxidation reaction of aqueous D – glucose to form D – gluconic acid with
molecular oxygen as the oxidizing agent. The conditions of the reaction were pH = 9,
temperature of 45 °C, oxygen flow of 250 mL min-1 and stirring at 800 rpm. 50 mL of
0.1 M of glucose dissolved in D. W. was used, and the change of pH during reaction
was adjusted by automatic addition of certain volume of 1 M aqueous NaOH solution.
Details of the setup and the reaction are given in (Figure S. 26).
The results of the titration (Figure 30) illustrated a full glucose conversion for all
catalysts used except for Au–CGlucose–O. A varied catalytic activity expressed as metal
time yield (MTY) for each catalyst was observed (Table 3).
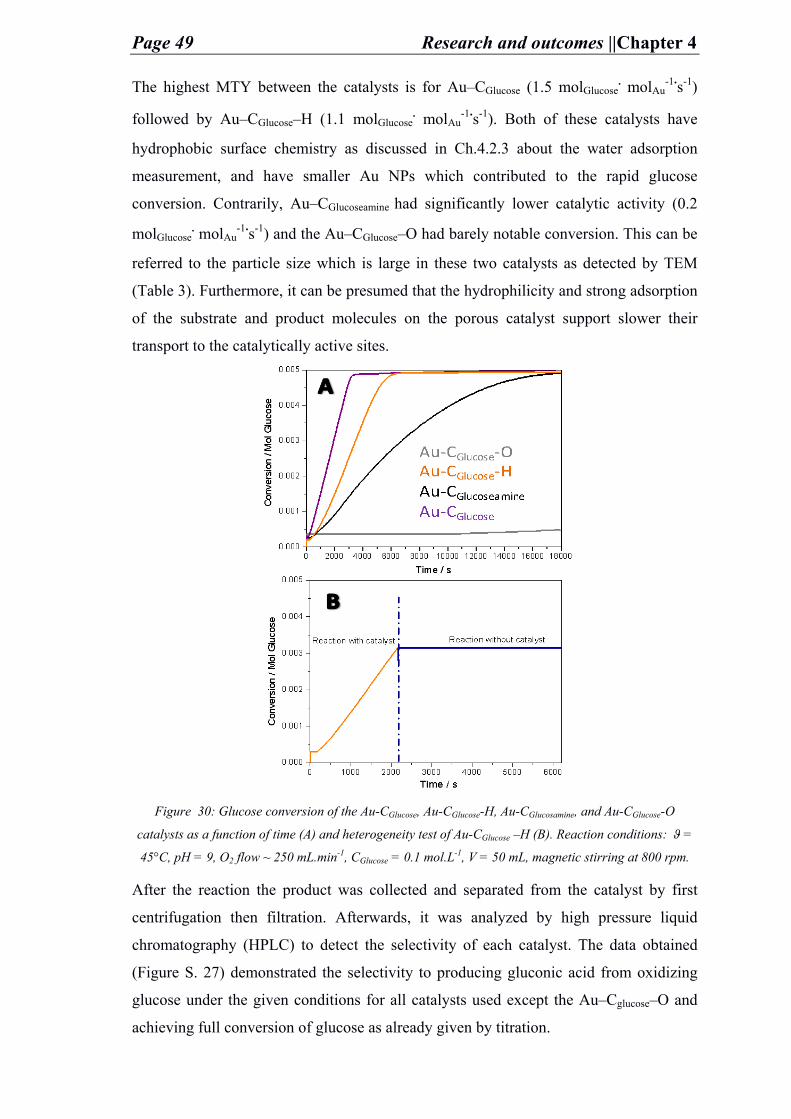
Page 49 Research and outcomes ||Chapter 4
The highest MTY between the catalysts is for Au–CGlucose (1.5 molGlucose. molAu
-1.s-1)
followed by Au–CGlucose–H (1.1 molGlucose. molAu
-1.s-1). Both of these catalysts have
hydrophobic surface chemistry as discussed in Ch.4.2.3 about the water adsorption
measurement, and have smaller Au NPs which contributed to the rapid glucose
conversion. Contrarily, Au–CGlucoseamine had significantly lower catalytic activity (0.2
molGlucose. molAu
-1.s-1) and the Au–CGlucose–O had barely notable conversion. This can be
referred to the particle size which is large in these two catalysts as detected by TEM
(Table 3). Furthermore, it can be presumed that the hydrophilicity and strong adsorption
of the substrate and product molecules on the porous catalyst support slower their
transport to the catalytically active sites.
Figure 30: Glucose conversion of the Au-CGlucose, Au-CGlucose-H, Au-CGlucosamine, and Au-CGlucose-O
catalysts as a function of time (A) and heterogeneity test of Au-CGlucose –H (B). Reaction conditions: ϑ =
45°C, pH = 9, O2 flow ~ 250 mL.min-1, CGlucose = 0.1 mol.L-1, V = 50 mL, magnetic stirring at 800 rpm.
After the reaction the product was collected and separated from the catalyst by first
centrifugation then filtration. Afterwards, it was analyzed by high pressure liquid
chromatography (HPLC) to detect the selectivity of each catalyst. The data obtained
(Figure S. 27) demonstrated the selectivity to producing gluconic acid from oxidizing
glucose under the given conditions for all catalysts used except the Au–Cglucose–O and
achieving full conversion of glucose as already given by titration.
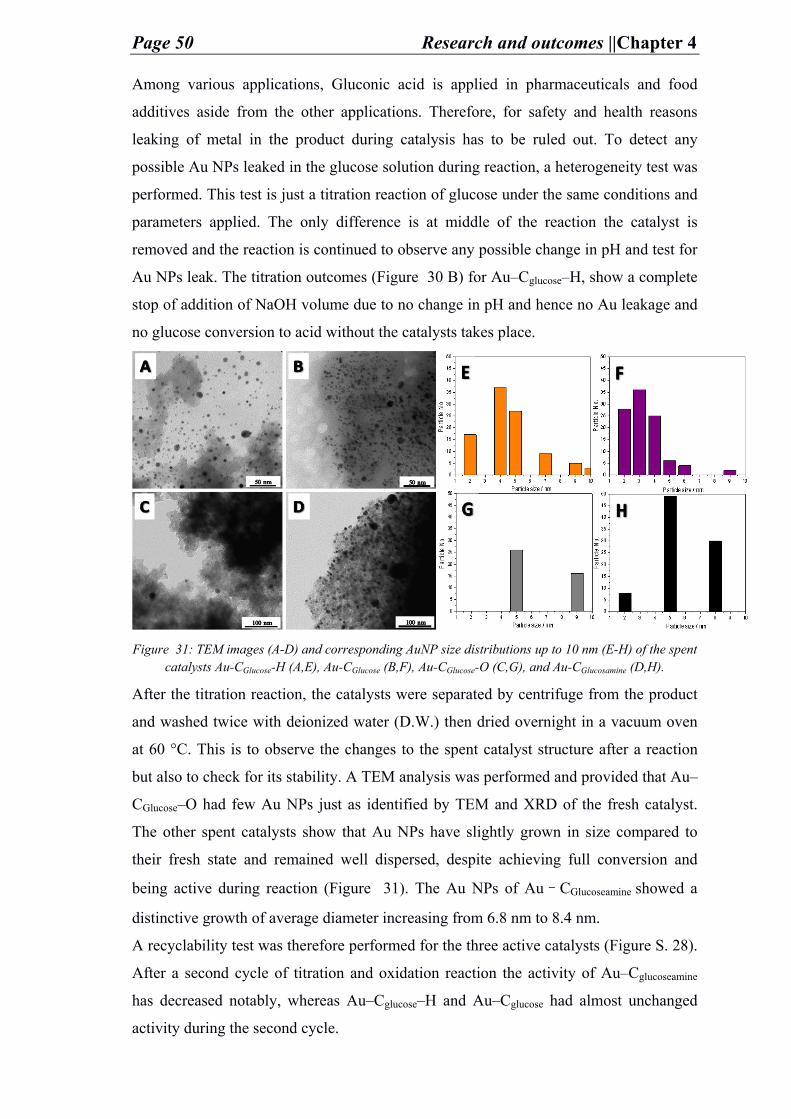
Page 50 Research and outcomes ||Chapter 4
Among various applications, Gluconic acid is applied in pharmaceuticals and food
additives aside from the other applications. Therefore, for safety and health reasons
leaking of metal in the product during catalysis has to be ruled out. To detect any
possible Au NPs leaked in the glucose solution during reaction, a heterogeneity test was
performed. This test is just a titration reaction of glucose under the same conditions and
parameters applied. The only difference is at middle of the reaction the catalyst is
removed and the reaction is continued to observe any possible change in pH and test for
Au NPs leak. The titration outcomes (Figure 30 B) for Au–Cglucose–H, show a complete
stop of addition of NaOH volume due to no change in pH and hence no Au leakage and
no glucose conversion to acid without the catalysts takes place.
Figure 31: TEM images (A-D) and corresponding AuNP size distributions up to 10 nm (E-H) of the spent
catalysts Au-CGlucose-H (A,E), Au-CGlucose (B,F), Au-CGlucose-O (C,G), and Au-CGlucosamine (D,H).
After the titration reaction, the catalysts were separated by centrifuge from the product
and washed twice with deionized water (D.W.) then dried overnight in a vacuum oven
at 60 °C. This is to observe the changes to the spent catalyst structure after a reaction
but also to check for its stability. A TEM analysis was performed and provided that Au–
CGlucose–O had few Au NPs just as identified by TEM and XRD of the fresh catalyst.
The other spent catalysts show that Au NPs have slightly grown in size compared to
their fresh state and remained well dispersed, despite achieving full conversion and
being active during reaction (Figure 31). The Au NPs of Au–CGlucoseamine showed a
distinctive growth of average diameter increasing from 6.8 nm to 8.4 nm.
A recyclability test was therefore performed for the three active catalysts (Figure S. 28).
After a second cycle of titration and oxidation reaction the activity of Au–Cglucoseamine
has decreased notably, whereas Au–Cglucose–H and Au–Cglucose had almost unchanged
activity during the second cycle.
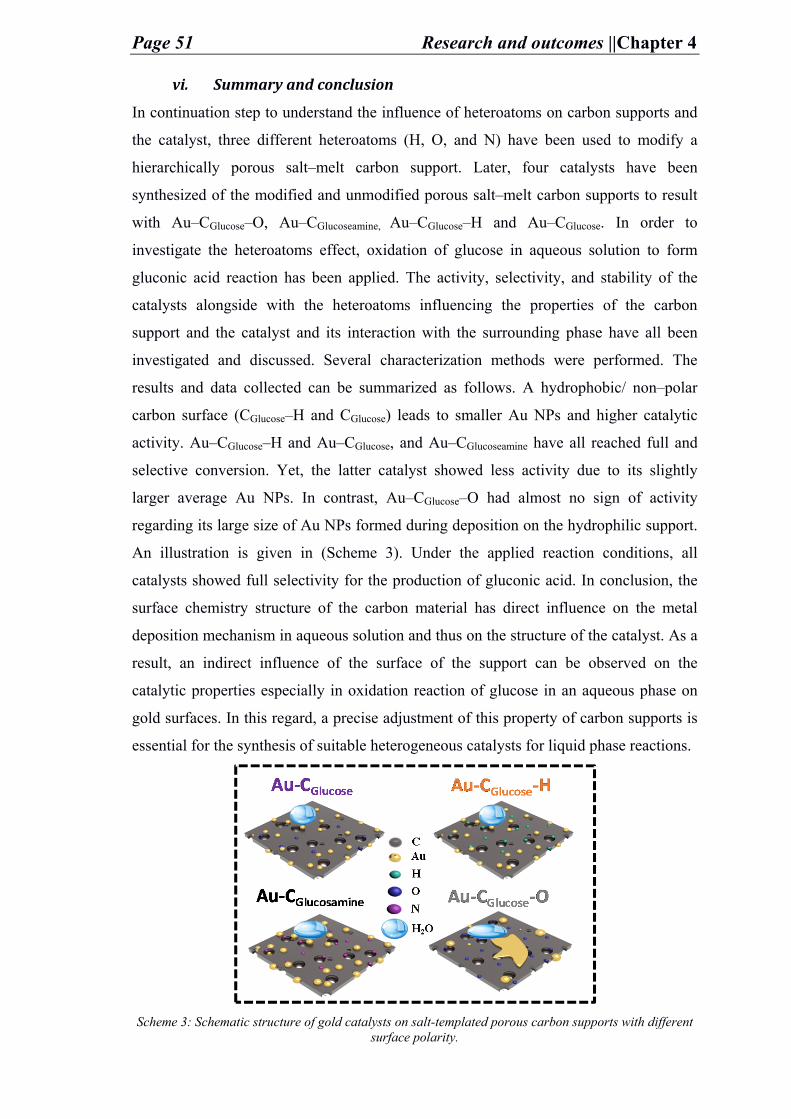
Page 51 Research and outcomes ||Chapter 4
vi. Summary and conclusion
In continuation step to understand the influence of heteroatoms on carbon supports and
the catalyst, three different heteroatoms (H, O, and N) have been used to modify a
hierarchically porous salt–melt carbon support. Later, four catalysts have been
synthesized of the modified and unmodified porous salt–melt carbon supports to result
with Au–CGlucose–O, Au–CGlucoseamine, Au–CGlucose–H and Au–CGlucose. In order to
investigate the heteroatoms effect, oxidation of glucose in aqueous solution to form
gluconic acid reaction has been applied. The activity, selectivity, and stability of the
catalysts alongside with the heteroatoms influencing the properties of the carbon
support and the catalyst and its interaction with the surrounding phase have all been
investigated and discussed. Several characterization methods were performed. The
results and data collected can be summarized as follows. A hydrophobic/ non–polar
carbon surface (CGlucose–H and CGlucose) leads to smaller Au NPs and higher catalytic
activity. Au–CGlucose–H and Au–CGlucose, and Au–CGlucoseamine have all reached full and
selective conversion. Yet, the latter catalyst showed less activity due to its slightly
larger average Au NPs. In contrast, Au–CGlucose–O had almost no sign of activity
regarding its large size of Au NPs formed during deposition on the hydrophilic support.
An illustration is given in (Scheme 3). Under the applied reaction conditions, all
catalysts showed full selectivity for the production of gluconic acid. In conclusion, the
surface chemistry structure of the carbon material has direct influence on the metal
deposition mechanism in aqueous solution and thus on the structure of the catalyst. As a
result, an indirect influence of the surface of the support can be observed on the
catalytic properties especially in oxidation reaction of glucose in an aqueous phase on
gold surfaces. In this regard, a precise adjustment of this property of carbon supports is
essential for the synthesis of suitable heterogeneous catalysts for liquid phase reactions.
Scheme 3: Schematic structure of gold catalysts on salt-templated porous carbon supports with different
surface polarity.
Page 52 Research and outcomes ||Chapter 4
4.3. Functionalized Carbons as Supports in Gas Phase
Reaction: Iron Nanoparticle Catalysts for Selective Lower
Olefins Production from Syngas via Fischer Tropsch
Synthesis
i. Preface
In this project a different carbon allotrope than salt-melt sugar- derived carbon is used.
As mentioned in previous chapters, carbon material has several allotropes each with
unique properties allowing it to advance in certain applications. Herein, salt-melt
synthesized carbons are replaced with multi-walled carbon nanotubes (CNTs). In a
process like Fischer-Tropsch, carbon nanotubes have better performance compared to
the salt-melt carbon supports, all due to the CNTs’ graphitic cylindrical layers shape
which provide it with advanced properties e.g. high surface area, high conductivity,
high thermal stability, good metal immobilization, and good mass transfer. Several
studies have been given regarding the properties of CNTs; however the
functionalization of CNTs’ chemical surface is shortly introduced. Therefore, CNTs
have been chosen for this study to provide more insights about CNTs functionalization
and the influence of these functionalities on the catalytic properties especially in a
gaseous phase.
ii. State of art
The increase in global population requires sustainable resources of chemicals and
energy that can comply with the rapid increase in demands [81-83]. The instability of
fossil fuel reserves and price trigger the need for alternative routes for the production of
chemical compounds that are so far produced from oil-based feedstock [84-85]. Carbon
monoxide (CO) hydrogenation process, also widely known as the Fischer-Tropsch
synthesis (FTS), is one possible strategy to provide various valuable chemicals. The
hydrogenation reaction is a mixture of hydrogen (H2) and CO known as synthesis gas/
syngas.[86-87] Syngas can be derived from biomass [88], coal [89], or natural gas [90] and can
be converted into various hydrocarbon fractions via FTS process, which is also
considered a surface polymerization reaction [54, 91]. Lower hydrocarbon chains as
olefins (C2-C4) are of particular interest since they are important building blocks in the
chemical industry [92]. The process involved for the direct transformation of syngas to
such molecules is known as Fischer-Tropsch to olefins (FTO) reaction [93]. While
metallic cobalt (Co) is the more attractive catalyst for the production of long-chain
Page 53 Research and outcomes ||Chapter 4
molecules at low temperatures [54, 91], iron (Fe) especially Fe(carbide) is known to be
selective to the production of low olefins (C2-C4) at relatively high-temperatures (300-
350 oC) and thus the most established FTO catalyst [54, 91, 93-96]. Promoters (e.g. sodium/
sulfur (Na/S) [56, 97-98], or potassium (K) [99]) [100-101] are added to the metal active sites to
enhance the selectivity and activity of FTO catalysts towards lower olefins production.
Such an addition provides more facile carbide formation (to maximize the CO
conversion), controls chain length distribution of the products (optimize C2-C4 yield and
minimize methane formation), and favors ß-hydride abstraction instead of α-
hydrogenation for chain growth termination (increase olefin/paraffin formation). In
most cases, porous supports (e.g. silica (SiO2) [102], alumina (Al2O3)
[103], porous carbon [97]) are used to stabilize Fe nanoparticles and avoid deactivation of the catalysts due to
particle growth. High surface area carbon supports have recently attracted considerable
attention as FTO catalyst, because the transition metal (of which typically an oxidized
phase is present after calcination) has only weak interaction with the carbon surface [66,
104]; Hence can be activated to the catalytically active Fe-carbide phase once exposed to
syngas. Besides the strength of interaction of the Fe species with the support surface,
other factors such as the carbon pore structure [102], surface chemical properties [105-106]
and the Fe particle size [56-57] influence their activation behavior and stability.
1-dimensional carbon materials like carbon nanofibers and carbon nanotubes (CNTs) [107-109] are attractive supports for FTO catalysts. They are capable of immobilizing the
active metal on their large external surface. Thus, the active sites are readily accessible
for carbide formation and conversion of the syngas without diffusion limitations.
Moreover, the inter-particular distance can be maximized allowing to a slow particle
growth during FTO operation [108, 110-111], maintaining catalyst stability and activity for a
longer time on stream.
The activation of Fe particles on carbon surfaces and the catalytic properties
dependence on the surface functional groups are practical indications that a strong
electronic communication is between the carbon support and the metal nanoparticles.
The Fermi energy in both systems adapt to each other by changing the electron density
in the interface layer [43, 112-113]. Besides the support geometry and the promoters’ effects,
this “junction”is another reason to further tune the properties of FTO catalysts.
In accordance, in this study, CNTs are modified with nitrogen doped carbon layer and
compared to the catalytic properties of CNTs functionalized with standard surface
functionalities. These functionalities are obtained after treatment in air (denoted as O),
Page 54 Research and outcomes ||Chapter 4
hydrogen (denoted as H), ammonia (denoted as NH3), or cyanamide solution (denoted
as CN and referred to in text as N-doped carbon layer). N-doping in the surface of the
carbon layer of the CNTs led to stabilization of small Fe particles up to ultra-small sub-
nm Fe agglomerates even before activation. Additionally, the promoters (Na and S) led
to enhancing the selectivity towards the production of low olefins chain (~47 %C), low
methane formation (8 %C), high catalytic metal time yield activity (up to 94 x10 ^-5
molCO gFe-1 s-1) as compared to the unpromoted catalysts. Despite the low overall N-
content (1 wt.%), the heterojunction effect between iron carbide and N-doped carbon
layer on CNTs led to improved catalytic properties of the FTO catalysts as compared to
the conventional surface functionalized CNTs.
iii. Catalytical systems
1. Treatment of carbon nanotube supports
A batch of multi-walled CNTs (MWCNTs) purchased from Sigma-Aldrich (CAS
308068-56-6) is first oxidized in a muffle oven under air at 400 oC for 1 h. The
corresponding support is denoted as CNT-O. Then, for CNT-H preparation, CNT-O
material is heated in 5 vol. % H2/Ar flow at a heating rate of 20 K min-1 up till 600 °C
and hold for 2 h. CNT-CN is prepared by dispersing CNT-O in aqueous cyanamide
(CN2H2) solution of 1 g. mL-1 with a CNT: CN2H2 ratio of 1:2. Then, the mixture is
dried under static air at 60 oC for 12 h followed by subsequent calcination at a heating
rate of 1 K min-1 up to 800 °C for 4 h under N2 flow. The CNT-NH3 is prepared through
amination in a tubular oven. CNT-O is heated to 400 °C with 2.5 K.min-1 (from 25 °C
to 350 °C within 2 h and 1 min hold followed by heating to 400 °C within 30 min to
avoid overshooting of temperature) in a flow of 1 mL min-1 of 10 vol.% NH3 in N2.
After 4 h at 400 °C the flow is changed to 900 mL min-1 N2 and the oven is cooled down
to room temperature.
2. Synthesis of Promoted and Unpromoted Iron Nanoparticles on
functionalized Carbon Nanotubes Catalysts
The Promoted catalysts are labelled as FeP-CNT-X and the unpromoted ones as Fe-
CNT-X where CNT-X is representing the respective support. 270 mg of each CNT-X
support is impregnated with the following solution to prepare FeP-CNT-X: 187.5 mg of
ammonium iron (III) citrate (Fluka, 14.5- 16 % iron) (iron precursor), 3.8 mg sodium
citrate dihydrate (Na precursor), and 2.6 mg of iron (II) sulfate heptahydrate (sulfur
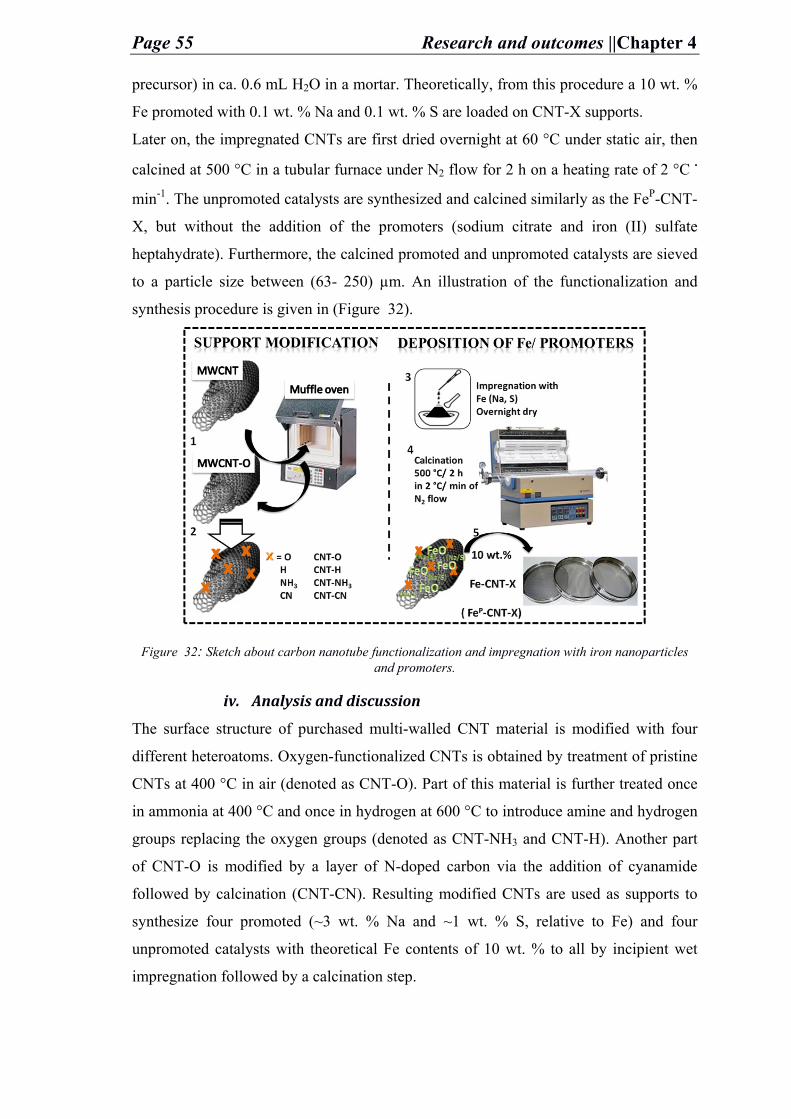
Page 55 Research and outcomes ||Chapter 4
precursor) in ca. 0.6 mL H2O in a mortar. Theoretically, from this procedure a 10 wt. %
Fe promoted with 0.1 wt. % Na and 0.1 wt. % S are loaded on CNT-X supports.
Later on, the impregnated CNTs are first dried overnight at 60 °C under static air, then
calcined at 500 °C in a tubular furnace under N2 flow for 2 h on a heating rate of 2 °C .
min-1. The unpromoted catalysts are synthesized and calcined similarly as the FeP-CNT-
X, but without the addition of the promoters (sodium citrate and iron (II) sulfate
heptahydrate). Furthermore, the calcined promoted and unpromoted catalysts are sieved
to a particle size between (63- 250) µm. An illustration of the functionalization and
synthesis procedure is given in (Figure 32).
Figure 32: Sketch about carbon nanotube functionalization and impregnation with iron nanoparticles and promoters.
iv. Analysis and discussion The surface structure of purchased multi-walled CNT material is modified with four
different heteroatoms. Oxygen-functionalized CNTs is obtained by treatment of pristine
CNTs at 400 °C in air (denoted as CNT-O). Part of this material is further treated once
in ammonia at 400 °C and once in hydrogen at 600 °C to introduce amine and hydrogen
groups replacing the oxygen groups (denoted as CNT-NH3 and CNT-H). Another part
of CNT-O is modified by a layer of N-doped carbon via the addition of cyanamide
followed by calcination (CNT-CN). Resulting modified CNTs are used as supports to
synthesize four promoted (~3 wt. % Na and ~1 wt. % S, relative to Fe) and four
unpromoted catalysts with theoretical Fe contents of 10 wt. % to all by incipient wet
impregnation followed by a calcination step.
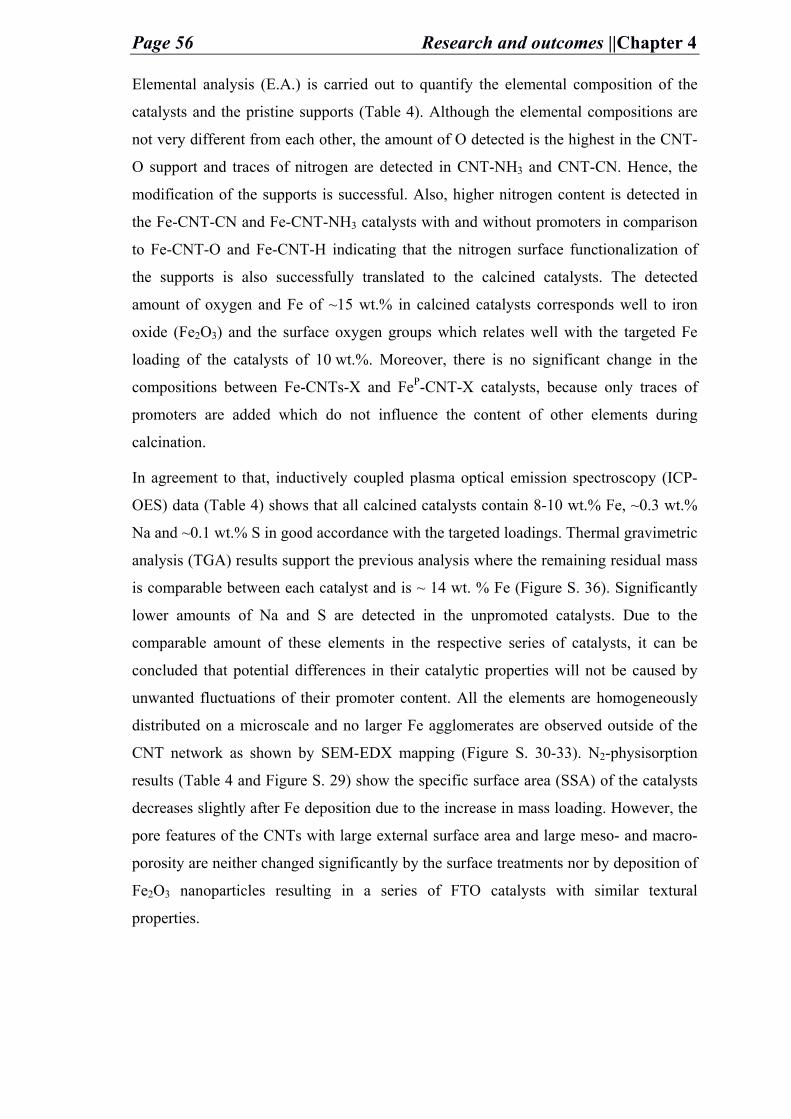
Page 56 Research and outcomes ||Chapter 4
Elemental analysis (E.A.) is carried out to quantify the elemental composition of the
catalysts and the pristine supports (Table 4). Although the elemental compositions are
not very different from each other, the amount of O detected is the highest in the CNT-
O support and traces of nitrogen are detected in CNT-NH3 and CNT-CN. Hence, the
modification of the supports is successful. Also, higher nitrogen content is detected in
the Fe-CNT-CN and Fe-CNT-NH3 catalysts with and without promoters in comparison
to Fe-CNT-O and Fe-CNT-H indicating that the nitrogen surface functionalization of
the supports is also successfully translated to the calcined catalysts. The detected
amount of oxygen and Fe of ~15 wt.% in calcined catalysts corresponds well to iron
oxide (Fe2O3) and the surface oxygen groups which relates well with the targeted Fe
loading of the catalysts of 10 wt.%. Moreover, there is no significant change in the
compositions between Fe-CNTs-X and FeP-CNT-X catalysts, because only traces of
promoters are added which do not influence the content of other elements during
calcination.
In agreement to that, inductively coupled plasma optical emission spectroscopy (ICP-
OES) data (Table 4) shows that all calcined catalysts contain 8-10 wt.% Fe, ~0.3 wt.%
Na and ~0.1 wt.% S in good accordance with the targeted loadings. Thermal gravimetric
analysis (TGA) results support the previous analysis where the remaining residual mass
is comparable between each catalyst and is ~ 14 wt. % Fe (Figure S. 36). Significantly
lower amounts of Na and S are detected in the unpromoted catalysts. Due to the
comparable amount of these elements in the respective series of catalysts, it can be
concluded that potential differences in their catalytic properties will not be caused by
unwanted fluctuations of their promoter content. All the elements are homogeneously
distributed on a microscale and no larger Fe agglomerates are observed outside of the
CNT network as shown by SEM-EDX mapping (Figure S. 30-33). N2-physisorption
results (Table 4 and Figure S. 29) show the specific surface area (SSA) of the catalysts
decreases slightly after Fe deposition due to the increase in mass loading. However, the
pore features of the CNTs with large external surface area and large meso- and macro-
porosity are neither changed significantly by the surface treatments nor by deposition of
Fe2O3 nanoparticles resulting in a series of FTO catalysts with similar textural
properties.
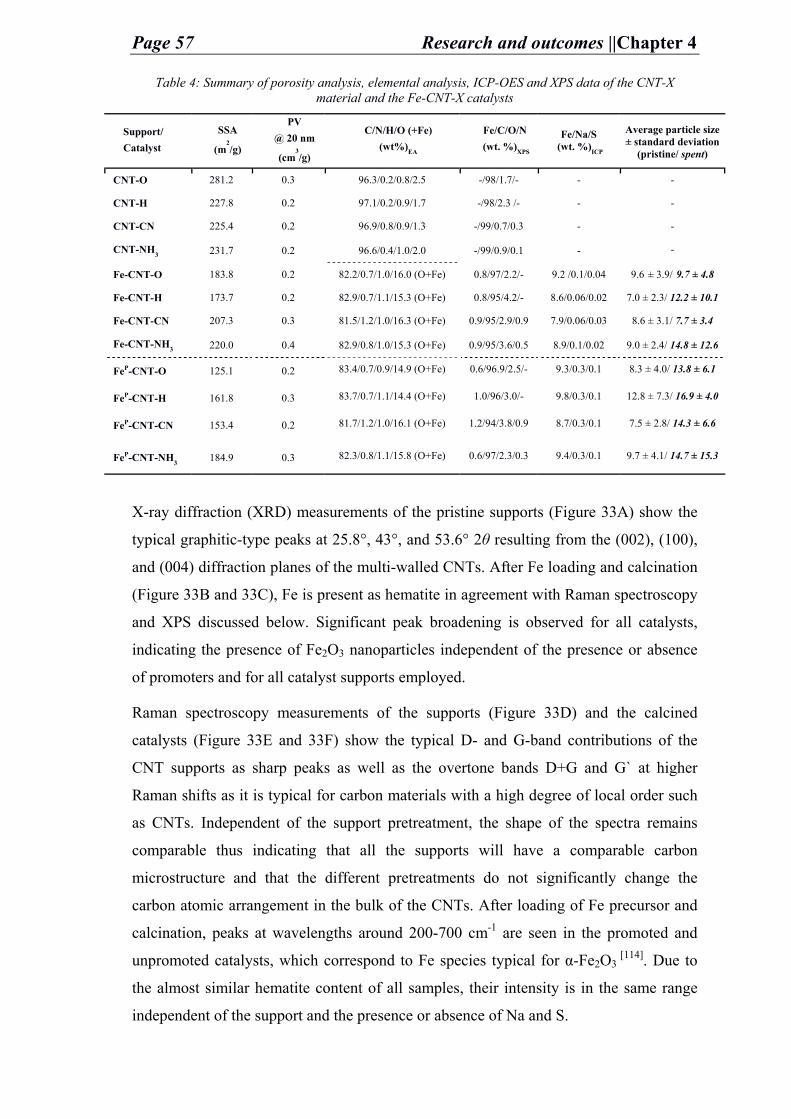
Page 57 Research and outcomes ||Chapter 4
Table 4: Summary of porosity analysis, elemental analysis, ICP-OES and XPS data of the CNT-X material and the Fe-CNT-X catalysts
Support/ Catalyst
SSA
(m2/g)
PV @ 20 nm (cm
3/g)
C/N/H/O (+Fe)
(wt%)EA
Fe/C/O/N
(wt. %)XPS
Fe/Na/S (wt. %)
ICP
Average particle size± standard deviation
(pristine/ spent)
CNT-O 281.2 0.3 96.3/0.2/0.8/2.5 -/98/1.7/- - -
CNT-H 227.8 0.2 97.1/0.2/0.9/1.7 -/98/2.3 /- - -
CNT-CN 225.4 0.2 96.9/0.8/0.9/1.3 -/99/0.7/0.3 - -
CNT-NH3 231.7 0.2 96.6/0.4/1.0/2.0 -/99/0.9/0.1 - -
Fe-CNT-O 183.8 0.2 82.2/0.7/1.0/16.0 (O+Fe) 0.8/97/2.2/- 9.2 /0.1/0.04 9.6 ± 3.9/ 9.7 ± 4.8
Fe-CNT-H 173.7 0.2 82.9/0.7/1.1/15.3 (O+Fe) 0.8/95/4.2/- 8.6/0.06/0.02 7.0 ± 2.3/ 12.2 ± 10.1
Fe-CNT-CN 207.3 0.3 81.5/1.2/1.0/16.3 (O+Fe) 0.9/95/2.9/0.9 7.9/0.06/0.03 8.6 ± 3.1/ 7.7 ± 3.4
Fe-CNT-NH3 220.0 0.4 82.9/0.8/1.0/15.3 (O+Fe) 0.9/95/3.6/0.5 8.9/0.1/0.02 9.0 ± 2.4/ 14.8 ± 12.6
FeP-CNT-O 125.1 0.2 83.4/0.7/0.9/14.9 (O+Fe) 0.6/96.9/2.5/- 9.3/0.3/0.1 8.3 ± 4.0/ 13.8 ± 6.1
FeP-CNT-H 161.8 0.3 83.7/0.7/1.1/14.4 (O+Fe) 1.0/96/3.0/- 9.8/0.3/0.1 12.8 ± 7.3/ 16.9 ± 4.0
FeP-CNT-CN 153.4 0.2 81.7/1.2/1.0/16.1 (O+Fe) 1.2/94/3.8/0.9 8.7/0.3/0.1 7.5 ± 2.8/ 14.3 ± 6.6
FeP-CNT-NH3 184.9 0.3 82.3/0.8/1.1/15.8 (O+Fe) 0.6/97/2.3/0.3 9.4/0.3/0.1 9.7 ± 4.1/ 14.7 ± 15.3
X-ray diffraction (XRD) measurements of the pristine supports (Figure 33A) show the
typical graphitic-type peaks at 25.8°, 43°, and 53.6° 2θ resulting from the (002), (100),
and (004) diffraction planes of the multi-walled CNTs. After Fe loading and calcination
(Figure 33B and 33C), Fe is present as hematite in agreement with Raman spectroscopy
and XPS discussed below. Significant peak broadening is observed for all catalysts,
indicating the presence of Fe2O3 nanoparticles independent of the presence or absence
of promoters and for all catalyst supports employed.
Raman spectroscopy measurements of the supports (Figure 33D) and the calcined
catalysts (Figure 33E and 33F) show the typical D- and G-band contributions of the
CNT supports as sharp peaks as well as the overtone bands D+G and G` at higher
Raman shifts as it is typical for carbon materials with a high degree of local order such
as CNTs. Independent of the support pretreatment, the shape of the spectra remains
comparable thus indicating that all the supports will have a comparable carbon
microstructure and that the different pretreatments do not significantly change the
carbon atomic arrangement in the bulk of the CNTs. After loading of Fe precursor and
calcination, peaks at wavelengths around 200-700 cm-1 are seen in the promoted and
unpromoted catalysts, which correspond to Fe species typical for α-Fe2O3 [114]. Due to
the almost similar hematite content of all samples, their intensity is in the same range
independent of the support and the presence or absence of Na and S.
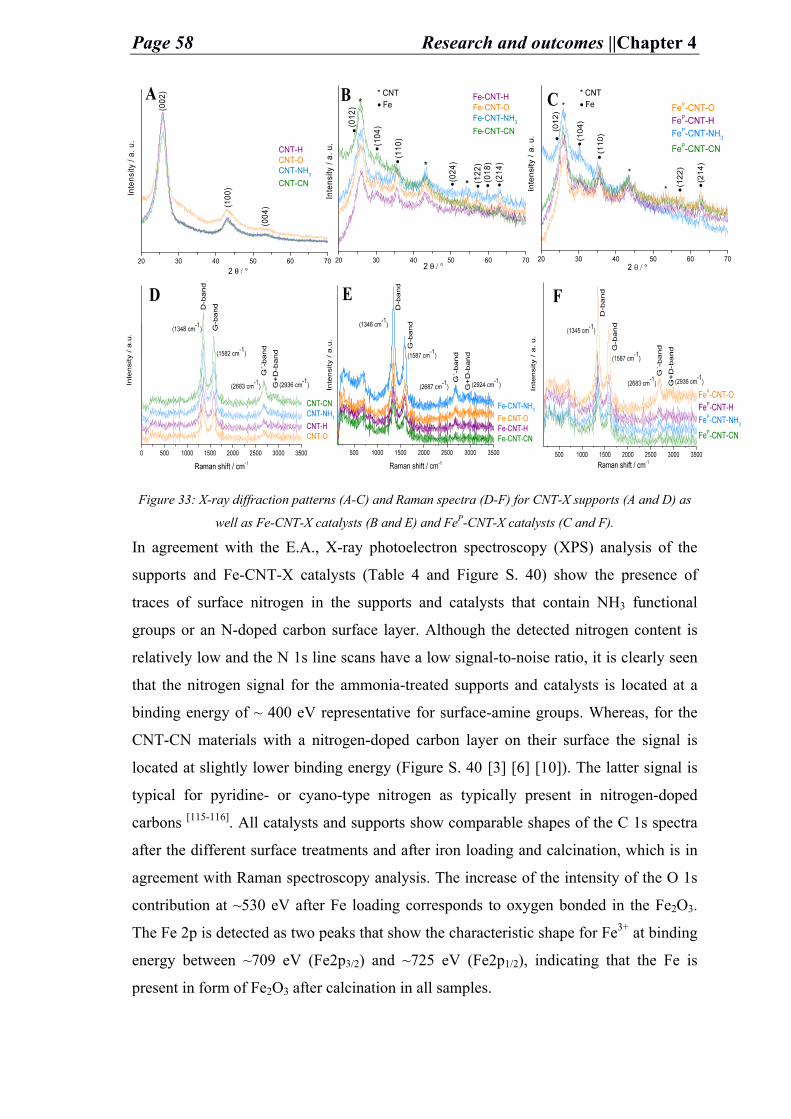
Page 58 Research and outcomes ||Chapter 4
Figure 33: X-ray diffraction patterns (A-C) and Raman spectra (D-F) for CNT-X supports (A and D) as
well as Fe-CNT-X catalysts (B and E) and FeP-CNT-X catalysts (C and F).
In agreement with the E.A., X-ray photoelectron spectroscopy (XPS) analysis of the
supports and Fe-CNT-X catalysts (Table 4 and Figure S. 40) show the presence of
traces of surface nitrogen in the supports and catalysts that contain NH3 functional
groups or an N-doped carbon surface layer. Although the detected nitrogen content is
relatively low and the N 1s line scans have a low signal-to-noise ratio, it is clearly seen
that the nitrogen signal for the ammonia-treated supports and catalysts is located at a
binding energy of ~ 400 eV representative for surface-amine groups. Whereas, for the
CNT-CN materials with a nitrogen-doped carbon layer on their surface the signal is
located at slightly lower binding energy (Figure S. 40 [3] [6] [10]). The latter signal is
typical for pyridine- or cyano-type nitrogen as typically present in nitrogen-doped
carbons [115-116]. All catalysts and supports show comparable shapes of the C 1s spectra
after the different surface treatments and after iron loading and calcination, which is in
agreement with Raman spectroscopy analysis. The increase of the intensity of the O 1s
contribution at ~530 eV after Fe loading corresponds to oxygen bonded in the Fe2O3.
The Fe 2p is detected as two peaks that show the characteristic shape for Fe3+ at binding
energy between ~709 eV (Fe2p3/2) and ~725 eV (Fe2p1/2), indicating that the Fe is
present in form of Fe2O3 after calcination in all samples.
A B C
D E F
20 30 40 50 60 70(0
04)
(002
)
Inte
nsity
/ a.
u.
2 θ / °
CNT-HCNT-OCNT-NH
3
CNT-CN
(100
)
20 30 40 50 60 70
(122
)(0
18)
(214
)
(024
)
(110
)
(104
)•
•
*
*
*• •• •
•
Fe-CNT-HFe-CNT-OFe-CNT-NH
3
Fe-CNT-CN
Inte
nsity
/ a.
u.
2 θ / °
* CNT• Fe
(012
)
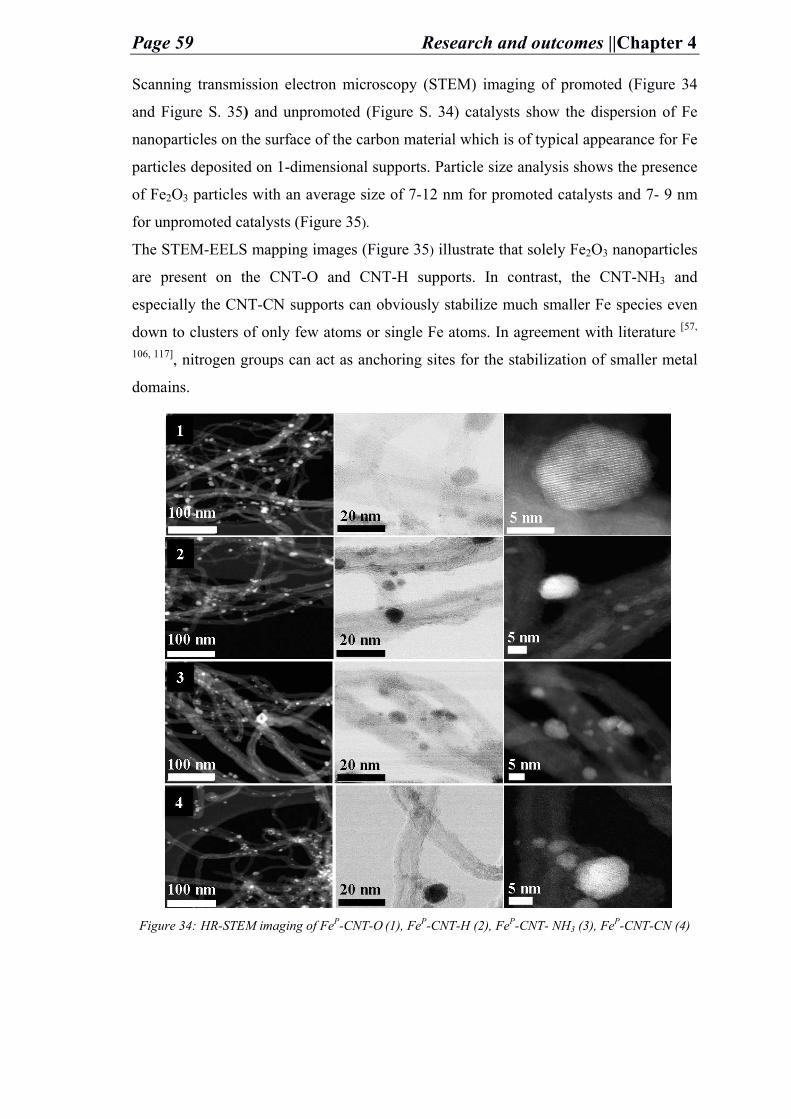
Page 59 Research and outcomes ||Chapter 4
Scanning transmission electron microscopy (STEM) imaging of promoted (Figure 34
and Figure S. 35) and unpromoted (Figure S. 34) catalysts show the dispersion of Fe
nanoparticles on the surface of the carbon material which is of typical appearance for Fe
particles deposited on 1-dimensional supports. Particle size analysis shows the presence
of Fe2O3 particles with an average size of 7-12 nm for promoted catalysts and 7- 9 nm
for unpromoted catalysts (Figure 35).
The STEM-EELS mapping images (Figure 35) illustrate that solely Fe2O3 nanoparticles
are present on the CNT-O and CNT-H supports. In contrast, the CNT-NH3 and
especially the CNT-CN supports can obviously stabilize much smaller Fe species even
down to clusters of only few atoms or single Fe atoms. In agreement with literature [57,
106, 117], nitrogen groups can act as anchoring sites for the stabilization of smaller metal
domains.
Figure 34: HR-STEM imaging of FeP-CNT-O (1), FeP-CNT-H (2), FeP-CNT- NH3 (3), FeP-CNT-CN (4)
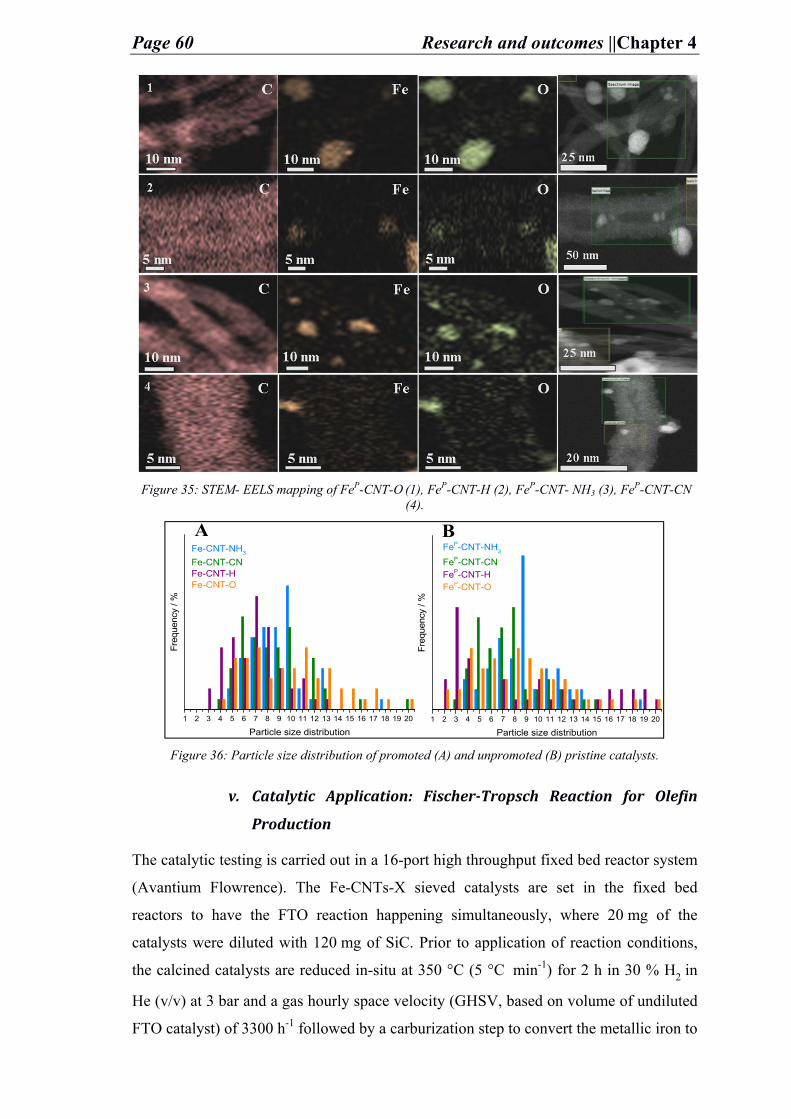
Page 60 Research and outcomes ||Chapter 4
Figure 35: STEM- EELS mapping of FeP-CNT-O (1), FeP-CNT-H (2), FeP-CNT- NH3 (3), FeP-CNT-CN
(4).
Figure 36: Particle size distribution of promoted (A) and unpromoted (B) pristine catalysts.
v. Catalytic Application: Fischer-Tropsch Reaction for Olefin
Production
The catalytic testing is carried out in a 16-port high throughput fixed bed reactor system
(Avantium Flowrence). The Fe-CNTs-X sieved catalysts are set in the fixed bed
reactors to have the FTO reaction happening simultaneously, where 20 mg of the
catalysts were diluted with 120 mg of SiC. Prior to application of reaction conditions,
the calcined catalysts are reduced in-situ at 350 °C (5 °C min-1) for 2 h in 30 % H2 in
He (v/v) at 3 bar and a gas hourly space velocity (GHSV, based on volume of undiluted
FTO catalyst) of 3300 h-1 followed by a carburization step to convert the metallic iron to
1 2 3 4 5 6 7 8 9 10 11 12 13 14 15 16 17 18 19 20
FeP-CNT-NH3
FeP-CNT-CNFeP-CNT-HFeP-CNT-O
Fre
que
ncy
/ %
Particle size distribution
1 2 3 4 5 6 7 8 9 10 11 12 13 14 15 16 17 18 19 20
Fe-CNT-NH3
Fe-CNT-CNFe-CNT-HFe-CNT-O
Fre
que
ncy
/ %
Particle size distribution
BA
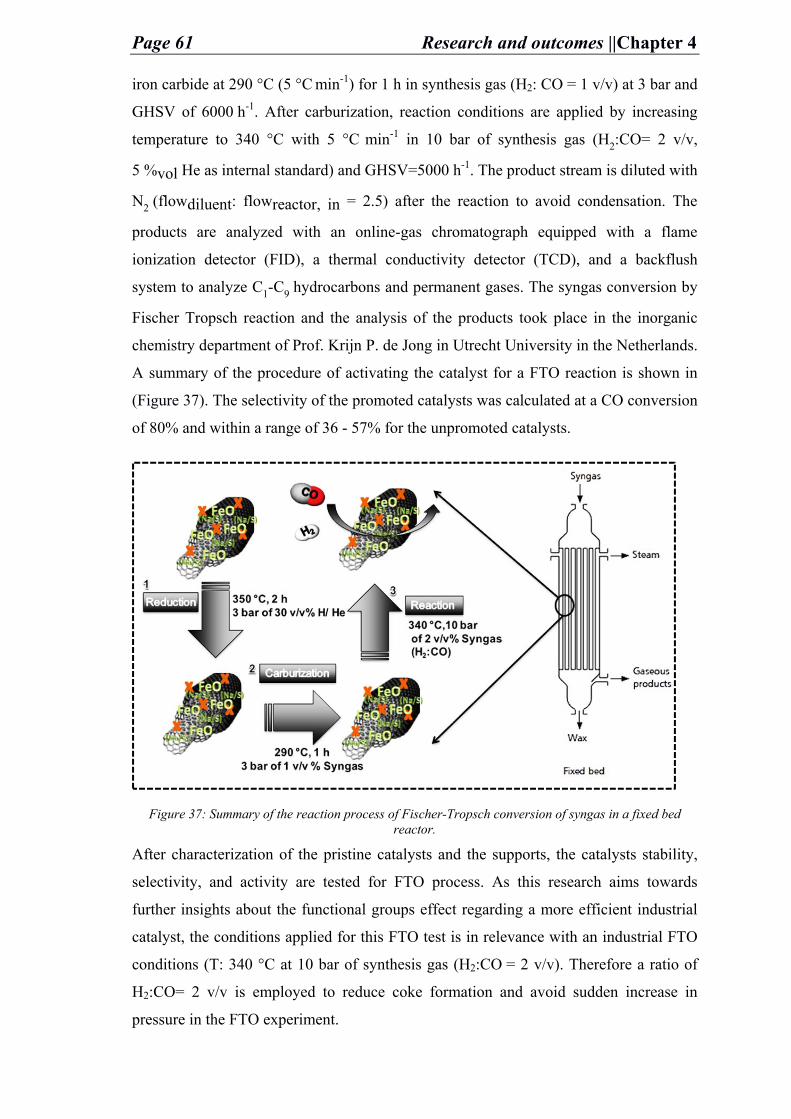
Page 61 Research and outcomes ||Chapter 4
iron carbide at 290 °C (5 °C min-1) for 1 h in synthesis gas (H2: CO = 1 v/v) at 3 bar and
GHSV of 6000 h-1. After carburization, reaction conditions are applied by increasing
temperature to 340 °C with 5 °C min-1 in 10 bar of synthesis gas (H2:CO= 2 v/v,
5 %vol He as internal standard) and GHSV=5000 h-1. The product stream is diluted with
N2 (flowdiluent: flowreactor, in = 2.5) after the reaction to avoid condensation. The
products are analyzed with an online-gas chromatograph equipped with a flame
ionization detector (FID), a thermal conductivity detector (TCD), and a backflush
system to analyze C1-C9 hydrocarbons and permanent gases. The syngas conversion by
Fischer Tropsch reaction and the analysis of the products took place in the inorganic
chemistry department of Prof. Krijn P. de Jong in Utrecht University in the Netherlands.
A summary of the procedure of activating the catalyst for a FTO reaction is shown in
(Figure 37). The selectivity of the promoted catalysts was calculated at a CO conversion
of 80% and within a range of 36 - 57% for the unpromoted catalysts.
Figure 37: Summary of the reaction process of Fischer-Tropsch conversion of syngas in a fixed bed reactor.
After characterization of the pristine catalysts and the supports, the catalysts stability,
selectivity, and activity are tested for FTO process. As this research aims towards
further insights about the functional groups effect regarding a more efficient industrial
catalyst, the conditions applied for this FTO test is in relevance with an industrial FTO
conditions (T: 340 °C at 10 bar of synthesis gas (H2:CO = 2 v/v). Therefore a ratio of
H2:CO= 2 v/v is employed to reduce coke formation and avoid sudden increase in
pressure in the FTO experiment.
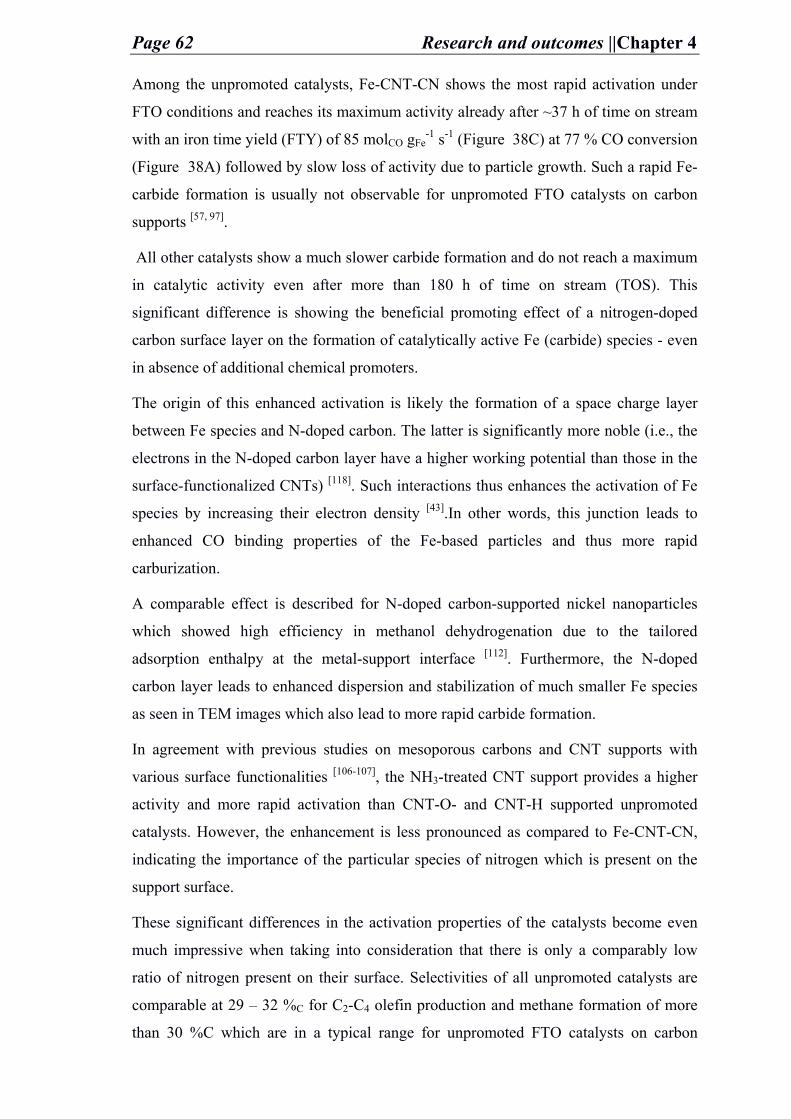
Page 62 Research and outcomes ||Chapter 4
Among the unpromoted catalysts, Fe-CNT-CN shows the most rapid activation under
FTO conditions and reaches its maximum activity already after ~37 h of time on stream
with an iron time yield (FTY) of 85 molCO gFe-1 s-1 (Figure 38C) at 77 % CO conversion
(Figure 38A) followed by slow loss of activity due to particle growth. Such a rapid Fe-
carbide formation is usually not observable for unpromoted FTO catalysts on carbon
supports [57, 97].
All other catalysts show a much slower carbide formation and do not reach a maximum
in catalytic activity even after more than 180 h of time on stream (TOS). This
significant difference is showing the beneficial promoting effect of a nitrogen-doped
carbon surface layer on the formation of catalytically active Fe (carbide) species - even
in absence of additional chemical promoters.
The origin of this enhanced activation is likely the formation of a space charge layer
between Fe species and N-doped carbon. The latter is significantly more noble (i.e., the
electrons in the N-doped carbon layer have a higher working potential than those in the
surface-functionalized CNTs) [118]. Such interactions thus enhances the activation of Fe
species by increasing their electron density [43].In other words, this junction leads to
enhanced CO binding properties of the Fe-based particles and thus more rapid
carburization.
A comparable effect is described for N-doped carbon-supported nickel nanoparticles
which showed high efficiency in methanol dehydrogenation due to the tailored
adsorption enthalpy at the metal-support interface [112]. Furthermore, the N-doped
carbon layer leads to enhanced dispersion and stabilization of much smaller Fe species
as seen in TEM images which also lead to more rapid carbide formation.
In agreement with previous studies on mesoporous carbons and CNT supports with
various surface functionalities [106-107], the NH3-treated CNT support provides a higher
activity and more rapid activation than CNT-O- and CNT-H supported unpromoted
catalysts. However, the enhancement is less pronounced as compared to Fe-CNT-CN,
indicating the importance of the particular species of nitrogen which is present on the
support surface.
These significant differences in the activation properties of the catalysts become even
much impressive when taking into consideration that there is only a comparably low
ratio of nitrogen present on their surface. Selectivities of all unpromoted catalysts are
comparable at 29 – 32 %C for C2-C4 olefin production and methane formation of more
than 30 %C which are in a typical range for unpromoted FTO catalysts on carbon
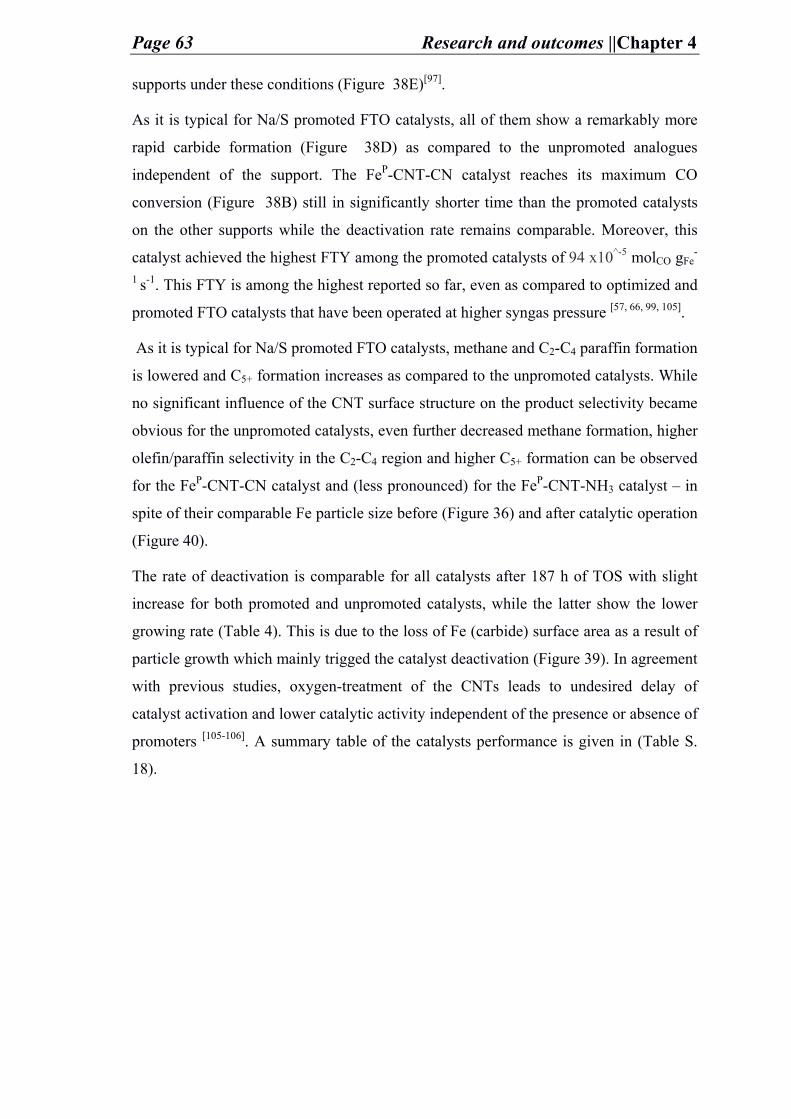
Page 63 Research and outcomes ||Chapter 4
supports under these conditions (Figure 38E)[97].
As it is typical for Na/S promoted FTO catalysts, all of them show a remarkably more
rapid carbide formation (Figure 38D) as compared to the unpromoted analogues
independent of the support. The FeP-CNT-CN catalyst reaches its maximum CO
conversion (Figure 38B) still in significantly shorter time than the promoted catalysts
on the other supports while the deactivation rate remains comparable. Moreover, this
catalyst achieved the highest FTY among the promoted catalysts of 94 x10^-5 molCO gFe-
1 s-1. This FTY is among the highest reported so far, even as compared to optimized and
promoted FTO catalysts that have been operated at higher syngas pressure [57, 66, 99, 105].
As it is typical for Na/S promoted FTO catalysts, methane and C2-C4 paraffin formation
is lowered and C5+ formation increases as compared to the unpromoted catalysts. While
no significant influence of the CNT surface structure on the product selectivity became
obvious for the unpromoted catalysts, even further decreased methane formation, higher
olefin/paraffin selectivity in the C2-C4 region and higher C5+ formation can be observed
for the FeP-CNT-CN catalyst and (less pronounced) for the FeP-CNT-NH3 catalyst – in
spite of their comparable Fe particle size before (Figure 36) and after catalytic operation
(Figure 40).
The rate of deactivation is comparable for all catalysts after 187 h of TOS with slight
increase for both promoted and unpromoted catalysts, while the latter show the lower
growing rate (Table 4). This is due to the loss of Fe (carbide) surface area as a result of
particle growth which mainly trigged the catalyst deactivation (Figure 39). In agreement
with previous studies, oxygen-treatment of the CNTs leads to undesired delay of
catalyst activation and lower catalytic activity independent of the presence or absence of
promoters [105-106]. A summary table of the catalysts performance is given in (Table S.
18).
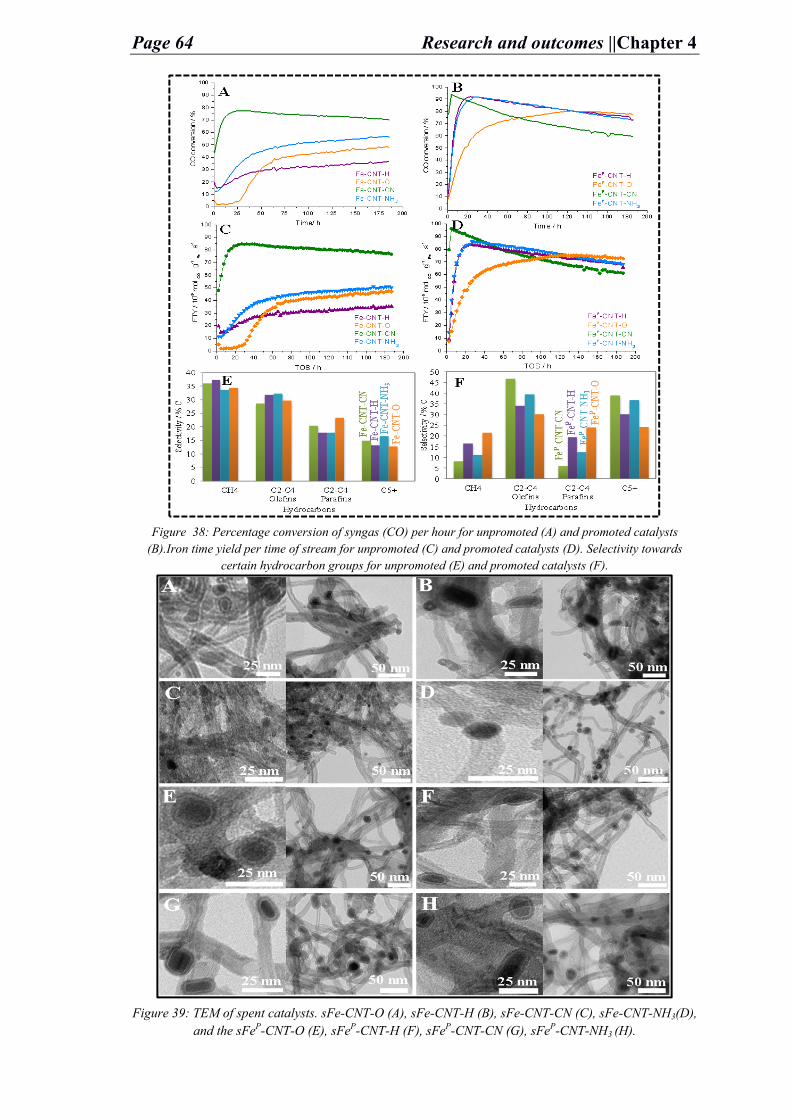
Page 64 Research and outcomes ||Chapter 4
Figure 38: Percentage conversion of syngas (CO) per hour for unpromoted (A) and promoted catalysts (B).Iron time yield per time of stream for unpromoted (C) and promoted catalysts (D). Selectivity towards
certain hydrocarbon groups for unpromoted (E) and promoted catalysts (F).
Figure 39: TEM of spent catalysts. sFe-CNT-O (A), sFe-CNT-H (B), sFe-CNT-CN (C), sFe-CNT-NH3(D), and the sFeP-CNT-O (E), sFeP-CNT-H (F), sFeP-CNT-CN (G), sFeP-CNT-NH3 (H).
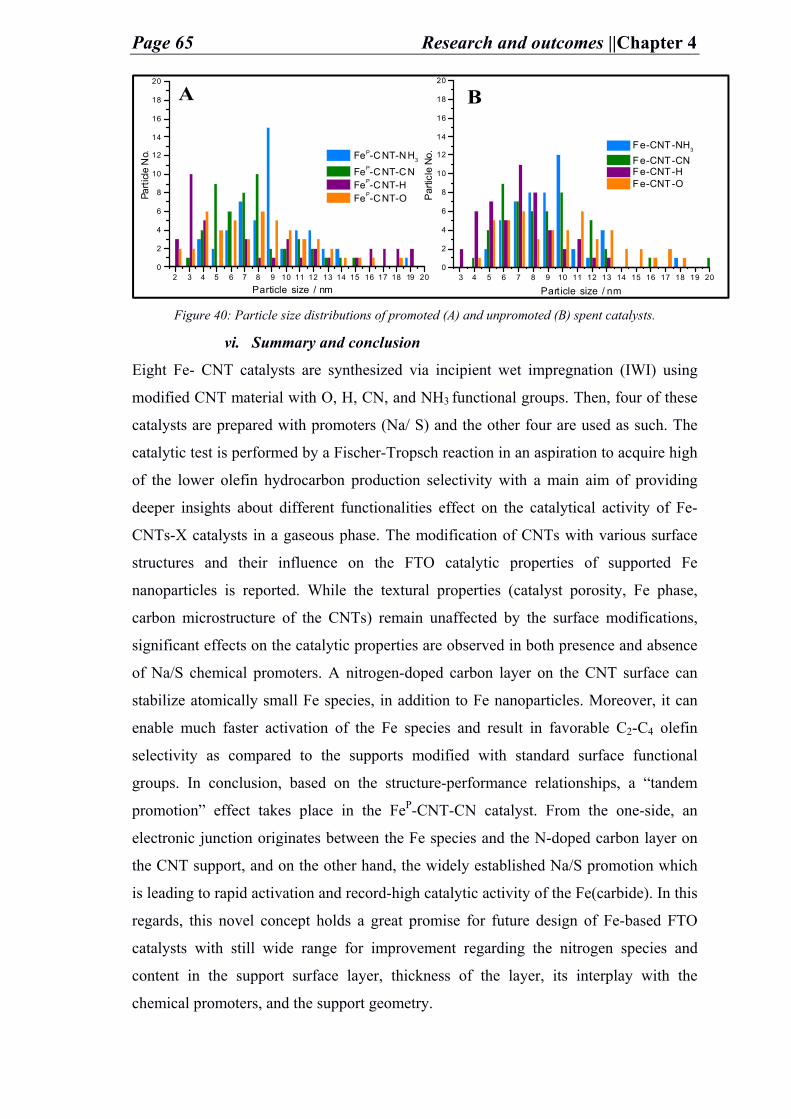
Page 65 Research and outcomes ||Chapter 4
Figure 40: Particle size distributions of promoted (A) and unpromoted (B) spent catalysts.
vi. Summary and conclusion
Eight Fe- CNT catalysts are synthesized via incipient wet impregnation (IWI) using
modified CNT material with O, H, CN, and NH3 functional groups. Then, four of these
catalysts are prepared with promoters (Na/ S) and the other four are used as such. The
catalytic test is performed by a Fischer-Tropsch reaction in an aspiration to acquire high
of the lower olefin hydrocarbon production selectivity with a main aim of providing
deeper insights about different functionalities effect on the catalytical activity of Fe-
CNTs-X catalysts in a gaseous phase. The modification of CNTs with various surface
structures and their influence on the FTO catalytic properties of supported Fe
nanoparticles is reported. While the textural properties (catalyst porosity, Fe phase,
carbon microstructure of the CNTs) remain unaffected by the surface modifications,
significant effects on the catalytic properties are observed in both presence and absence
of Na/S chemical promoters. A nitrogen-doped carbon layer on the CNT surface can
stabilize atomically small Fe species, in addition to Fe nanoparticles. Moreover, it can
enable much faster activation of the Fe species and result in favorable C2-C4 olefin
selectivity as compared to the supports modified with standard surface functional
groups. In conclusion, based on the structure-performance relationships, a “tandem
promotion” effect takes place in the FeP-CNT-CN catalyst. From the one-side, an
electronic junction originates between the Fe species and the N-doped carbon layer on
the CNT support, and on the other hand, the widely established Na/S promotion which
is leading to rapid activation and record-high catalytic activity of the Fe(carbide). In this
regards, this novel concept holds a great promise for future design of Fe-based FTO
catalysts with still wide range for improvement regarding the nitrogen species and
content in the support surface layer, thickness of the layer, its interplay with the
chemical promoters, and the support geometry.
2 3 4 5 6 7 8 9 10 11 12 13 14 15 16 17 18 19 200
2
4
6
8
10
12
14
16
18
20
Particle size / nm
FeP-C NT-N H3
FeP-C NT-C N FeP-C NT-H FeP-C NT-OPa
rtic
le N
o.
3 4 5 6 7 8 9 10 11 12 13 14 15 16 17 18 19 200
2
4
6
8
10
12
14
16
18
20
Fe-CNT-NH3
Fe-CNT-CN Fe-CNT-H Fe-CNT-O
Par
ticle
No.
Part icle size / nm
A B

„Nicht Kunst und Wissenschaft allein, Geduld will bei dem Werke sein.“ (Goethe)
Chapter 5
Summary
Page 66 Summary ||Chapter 5
5. Summary Chemicals represent an essential part in our daily life. They are applied in various products as for instance preservatives in food, in any kind of polymers, in IT products such as smart phones and computers, in transportation as fuel sources, and in many more. An increase in population number leads to an increase in the consumption of these chemicals resulting in an increase in demand for them. Fossil fuels, the main feedstock for energy and chemical production, are unstable resources and not renewable. Besides, they contribute to different environmental and political matters. Hence, the necessity for alternative sources for production of chemicals and energy raises. These feedstocks such as lignocellulosic biomass, coal, natural gas and others require different processing than fossil fuels, and thus industry needs to adapt its established systems and processes. Since industrially, heterogeneous catalytic conversions are the most applied process to obtain the chemicals from these feedstocks, the catalytic systems need further study and improvement. The catalyst activity, selectivity, stability, cost of preparation, and recyclation as
well as the conditions required for activation of the catalyst influence the production rate,
quantity, quality, and cost of the final product. Thus, optimization of these catalyst properties is
crucial for being capable of satisfying the increasing demands in the future. The development of a heterogeneous catalyst is investigated herein by modifying a
catalyst surface chemistry structure not only with a hierarchical porous system, but also
with surface functional heteroatom groups. The aim is to enhance the catalytic
performance but to also provide a deeper insight regarding the interaction between the
surface structure of catalyst and the surrounding phase. Such a study has rarely been
carried out, especially the application of surface structure-modified catalyst in different
phases (liquid and gaseous) and for different reactions (hydrogenation, oxidation, and
hydrogenolysis). The heteroatoms utilized for the modifications are H, O, and N. Their
effect on the metal particle size growth, polarity of the support (hence the catalyst), and
the catalytic performance (activity, selectivity, and stability) has been explored.
At first, hierarchical porous sugar– and sugar amine– derived carbon supports (C and
NDC) were synthesized via salt-melt method and compared to a commercially produced
support (C ref). Nickel (Ni) nanoparticles were deposited to produce Ni–NDC, Ni–C,
and Ni–C ref catalysts. To investigate the effect of the heteroatom and the different
porosity between these catalysts, hydrogenolysis of kraft lignin was chosen as a modal
reaction and was performed in batch and continuous reactors. This investigation brought
to sight the difference a heteroatom functionalized support can cause even when present
in low concentrations (3 wt. %), besides the importance of a hierarchical porosity and
Page 67 Summary ||Chapter 5
the surface area in a catalyst for higher performance. Moreover, deeper insights were
given into the importance of utilizing a continuous reaction whether for the upmost use
of the catalyst, or for the high product quality and quantity collection in comparison to a
batch reaction.
Ni–NDC catalyst preparation via one–pot salt-melt support synthesis and incipient wet
impregnation was successful. It performed efficiently compared to the other comparably
prepared catalysts (Ni–C and Ni–C ref) in means of activity, selectivity and stability. Its
performance in a continuous reaction showed qualitatively to be higher than in a batch
reaction. Eventually, complex kraft lignin structure degradation has been approved by
the several techniques and analyses applied into lower molar mass molecule product
mostly of guaiacol derivatives. Despite the successfulness, few drawbacks were present:
one, the use of a relatively high concentrated Ni active metal for the catalysis in
presence of low Nitrogen content making the Nitrogen effect less observable. Also, the
leakage of the active metal (Ni) into the product collected. Therefore, for this project it
is recommended to reduce the concentration of Ni metal, increase the density of the N-
heteroatoms, or apply different heteroatoms to improve the immobilization effect.
In correspondence, synthesis of gold on carbon (Au–C) composites followed by
exploring the functionalization of the sugar–derived carbon salt–melt support with
varied heteroatoms (N, O, and H), and depositing Au nanoparticles via pre-reduced
solution of Au. The functionalization of the heteroatoms was made without needing
harsh acids that would require post treatment and are expensive when scaling up. In
addition, impregnation method is replaced with pre-reduced Au nanoparticle solution
for the reason of less energy and time consumption compared to impregnated catalyst.
The catalysts were applied for the selective glucose oxidation to gluconic acid in a
liquid phase. The aim from this project is to determine the influence of these
heteroatoms on the catalytic performance (activity, selectivity, and stability), on the
particle size growth, and on the supports properties in correlation to another reaction
type (e.g. oxidation) which is still applied in a liquid phase reaction.
Therefore, four catalysts have been synthesized of the modified and unmodified porous
salt–melt carbon supports to result with Au–Cglucose–O, Au–Cglucoseamine, Au–Cglucose–H
and Au–Cglucose. As the same support and metal are used, similar reaction rates and
mechanism would take place. Hence, any different effect resulting for the catalytic
performance is due to the different heteroatom modification. Of the different techniques
performed, the heteroatoms showed direct effect on the supports polarity, and thus on
Page 68 Summary ||Chapter 5
the size of the Au-nanoparticles deposited. Hence, the catalytic performance varied
significantly. The results and data collected can be summarized as follows. A
hydrophobic non–polar carbon surface (Cglucose–H and Cglucose) led to a smaller size of
Au NPs and higher catalytic activity and selectivity. Au–Cglucose–H and Au–Cglucose, and
Au–Cglucoseamine have all reached full and selective conversion. Yet, the latter catalyst
showed less activity due to its slightly larger average Au NPs. Whereas, Au–Cglucose–O
had almost no sign of activity regarding its large size of Au NPs formed during
deposition on the hydrophilic support. Of this work, it was concluded that the surface
chemistry structure of the carbon material has direct influence on the metal deposition
mechanism in aqueous solution and on the structure of the catalyst. As a result, an
indirect influence of the surface of the support can be observed on the catalytic
properties especially in oxidation reaction of glucose in an aqueous phase. Accordingly,
a precise adjustment of such property in carbon material as supports is essential for the
synthesis of suitable heterogeneous catalyst for liquid phase reactions.
As heteroatoms effect was obvious for the previous investigations, the study of the
influence of these heteroatoms is further examined on a different allotrope of carbon
such as multi-walled carbon nanotubes (CNTs) in a gaseous phase. Previously,
heteroatoms were tested on amorphous and low ordered carbon supports and were
found influential, and therefore it is intriguing to learn of any effect of heteroatoms on
graphitically-layered and more ordered carbon support like CNTs. Furthermore, the
carbon structure functionalization was checked in liquid phase in oxidation and
hydrogenolysis processes, ergo exploring the effect in a gaseous phase would add a
valuable understanding and provide a complete inquiry for the influence of functional
modification of carbon surfaces in liquid and gas phases. In this regard, eight iron
deposited on CNTs (Fe–CNT) catalysts have been synthesized via Incipient wet
impregnation (IWI) using modified CNT supports with O, H, carbon nitride layer (CN),
and NH3 functional groups. As CNT is purchased, the incorporation of nitrogen
heteroatoms was via soaking with cyanamide to obtain a N-doped/ carbon nitride layer
on the CNT and via ammonia gasification to obtain amine functional group (NH3). As
these catalysts were used for a Fischer-Tropsch synthesis (FTS) process, and literature
shows that the addition of promoters is an advantage, four of these catalysts have been
prepared with promoters (Na/ S) and the other four have been used as such. The
catalytic test is performed in Fischer-Tropsch reaction in the aim to acquire higher
olefin- lower methane production selectivity. The results of this test show that promoted
catalysts with modified CNT surface has higher stability, activity, and selectivity
Page 69 Summary ||Chapter 5
compared to unpromoted ones. The N-groups are better heteroatoms in this case than
the O or H functionalities. Distinctively, nitrogen from cyanamide treatment is much
better than NH3 treatment due to the state of N-incorporated in the CNT surface as a
carbon nitride layer (CN) compared to that formed by NH3 according to XPS data.
Moreover, the combination of heteroatoms and promoters boosted the catalytic
performance. Additionally, the faster the active phase iron carbide (Fe3C) is formed
during activation step, the higher the activity leading to more production despite the
faster coking and reduced stability. Eventually for all the previous reasons, promoted
iron nanoparticles deposited on CN modified CNTs (FeP-CNT-CN) performed the
highest upon the rest of the catalysts with an activity of 94 x 10-5 molCO g Fe-1s-1,
selectivity to lower olefins production of 47 %, and a CO conversion reaching 92 %
within 37 h.

“Research is what I’m doing when I don’t know what I’m doing.” (W. von Braun)
Chapter 6
Conclusion
Page 70 Conclusion and Perspective ||Chapter 6
6. Conclusion and Perspective
The need for alternative sources of chemical feedstocks drives the quest for an
improvement of the present industrial catalytic systems. Previously, diverse known
approaches have been applied to improve the performance of a heterogeneous catalyst
amongst them the focus on studying different metals, different supports, different
methods of depositing the metal on the support, various preparation methods of nano-
sized active metal, and the hierarchical ordered- and templated porosity of the support.
However, very few is known regarding the influence of heteroatoms on the catalyst and
its interplay with the surrounding phase. Such an influence is of huge importance but
neglected by many literatures due to lack of information. Therefore, within the given
context, a deeper insight into the heteroatoms effect on the catalyst and its performance
has been achieved. The aim of the study was to expand the knowledge towards better
understanding of the catalyst system, as well as to improve the industrial catalytic
systems for the alternative feedstocks. From the discussed research in this thesis, it has
been experimentally proven that even at low concentrations of (1-3) wt.% the
heteroatoms clearly influenced the performance of the catalyst, regardless of the
different concentration of the active metals used, and the different phases (liquid/ gas)
and reactions (hydrogenolysis, oxidation, and hydrogenation/ polymerization) applied.
Several points could be concluded from these experiments:
Heteroatoms significantly influence the performance of the catalyst by effecting
the deposition, stabilization, and electronic properties of the metal particles and
the interaction of the catalyst with the surrounding phase as such.
The same heteroatom can enhance or depress the activity of the catalyst
depending on the phase and the type of the reaction applied.
The state of bonding of the heteroatom to the support (e.g Nitrogen can bond in
different states: such as amine, tertiary, or graphitic) influences the catalytic
properties of the metallic nanoparticles.
Different heteroatoms provide different influence on the catalyst performance
depending on their electronic configuration influencing the electronic transfer
between support and active metal.
In regards to the overall influence mentioned above, obviously precision in preparing
such systems is very important and thus every single catalytic system and reaction has
to be well controlled. Hence, in regards to the experimental results showing that
heteroatoms can enhance the catalyst performance and in regards to the aim to provide
Page 71 Conclusion and Perspective ||Chapter 6
an improved industrial catalytic system, more is needed to be studied. Incorporation of
other heteroatoms (e.g. sulfur and phosphorus) should be applied. This is important in
order to further understand the interaction of the heteroatoms with the support and the
active metal and how these interactions can be controlled. In addition, a study of
different concentration of heteroatoms modifications is recommended. The density of
the heteroatoms when functionalized in higher concentrations could reveal better and
clearer information about the interaction with the metal for example, or with the support.
The increase in the density of the heteroatoms may have a different effect on the
properties of the catalyst compared to low density of heteroatoms.
Finally, heteroatom functionalization of the support is one interesting approach to
achieve an advanced industrial heterogeneous catalyst. In this thesis few of the
questions related to the effects heteroatoms can make are answered and new realizations
have been given. However, more questions are raised. Such questions are how would an
increase in this heteroatom doping influence the characteristics of the catalyst? Would a
mixture of the heteroatoms be better or worse for the catalyst? What is the suitable ratio
of heteroatoms functionalized to support? Would the ratio make much difference? All
these questions and more are important to look into, to be able to provide an
optimization to the effect of these incorporated functionalities. The more information
given regarding this topic can open wide range of applications not only in catalysis, but
in other approaches as well.
A. References
Page 72 References || A
A. References
1. World Health Statistics 2015; WHO: 2015. 2. Komoda, T.; Matsunaga, T., Chapter 3 - Constituents of the Human Body. In
Biochemistry for Medical Professionals, Academic Press: Boston, 2015; pp 7-24. 3. Westfall, C. S.; Muehler, A. M.; Jez, J. M., Enzyme Action in the Regulation of
Plant Hormone Responses. The Journal of Biological Chemistry 2013, 288 (27), 19304-19311.
4. Anuj Kumar Chandel, G. C., Konakalla Radhika, Rudravaram Ravinder and Pogaku Ravindra, Bioconversion of pentose sugars into ethanol: A review and future directions. Biotechnology and Molecular Biology Reviews 6 2011, 1, 8-20.
5. Vijayaraghavan, P.; Raj, S. R. F.; Vincent, S. G. P., Chapter 4 - Industrial Enzymes: Recovery and Purification Challenges A2 - Dhillon, Gurpreet Singh. In Agro-Industrial Wastes as Feedstock for Enzyme Production, Kaur, S., Ed. Academic Press: San Diego, 2016; pp 95-110.
6. Hagen, J., Industrial Catalysis: A Practical Approach. 2 ed.; Wiley-VCH Verlag GmbH & Co. KGaA: Germany, 2006.
7. Life expectancy at birth (years), 2000-2015. http://gamapserver.who.int/gho/interactive_charts/mbd/life_expectancy/atlas.html.
8. International Energy Outlook. https://www.eia.gov/outlooks/ieo/exec_summ.php. 9. Lindström, B.; Pettersson, L. J., A Brief History of Catalysis. CATTECH 2003, 7
(4), 130-138. 10. Wisniak, J., The History of Catalysis: From the Beginning to Nobel Prizes.
Educación química 2010, 21, 60-69. 11. Gates, B. C., Catalytic chemistry. Wiley: New York, 1992; Vol. 38, p 458. 12. Skinner, G. B., Introduction to Chemical Kinetics. Academic Press: 1974. 13. The rate of a reaction.
http://www.chem.uiuc.edu/rogers/text13/tx133/tx133fr.html. 14. Boudart, M., Turnover Rates in Heterogeneous Catalysis. Chemical Reviews 1995,
95 (3), 661-666. 15. Beller, M. R., Albert & Santen, R. A. van (Rutger A.), Catalysis : from principles
to applications Weinheim Wiley-VCH: 2012. 16. Schmal, M., Heterogeneous Catalysis and its Industrial Applications. 1 ed.;
Springer International Publishing: 2016. 17. Handbook of Heterogeneous Catalysis. Wiley VCH: 1997; Vol. 1. 18. N. N. Greenwood , A. E., 2 ed.; Butterworth-Heinemann 1997; p 1600. 19. Carbon Materials for Catalysis. John Wiley & Sons: 2009. 20. Lam, E.; Luong, J. H. T., Carbon Materials as Catalyst Supports and Catalysts in
the Transformation of Biomass to Fuels and Chemicals. ACS Catalysis 2014, 4 (10), 3393-3410.
21. CHAPTER 1. Carbon (Nano)materials for Catalysis. In Nanostructured Carbon Materials for Catalysis, 2015; pp 1-45.
22. Anna, D., King of the elements? Nanotechnology 2010, 21 (30), 300201. 23. Boucher, E. A., Porous materials: structure, properties and capillary phenomena.
Journal of Materials Science 1976, 11 (9), 1734-1750. 24. Handbook of Porous solids. Wiley VCH: Weinheim, 2002. 25. Thommes, M.; Kaneko, K.; Neimark, A. V.; Olivier, J. P.; Rodriguez-Reinoso, F.;
Rouquerol, J.; Sing, K. S. W., Physisorption of gases, with special reference to the evaluation of surface area and pore size distribution (IUPAC Technical Report). Pure and Applied Chemistry 2015, 87 (9-10).
26. Wang, D. W.; Li, F.; Liu, M.; Lu, G. Q.; Cheng, H. M., 3D Aperiodic Hierarchical Porous Graphitic Carbon Material for High‐Rate Electrochemical
Page 73 References || A
Capacitive Energy Storage. Angewandte Chemie International Edition 2008, 47 (2), 373-376.
27. Ding, K.; Corma, A.; Maciá-Agulló, J. A.; Hu, J. G.; Krämer, S.; Stair, P. C.; Stucky, G. D., Constructing Hierarchical Porous Zeolites via Kinetic Regulation. Journal of the American Chemical Society 2015, 137 (35), 11238-11241.
28. Gamby, J.; Taberna, P. L.; Simon, P.; Fauvarque, J. F.; Chesneau, M., Studies and characterisations of various activated carbons used for carbon/carbon supercapacitors. Journal of Power Sources 2001, 101 (1), 109-116.
29. Liu, P. S.; Chen, G. F., Chapter One - General Introduction to Porous Materials. In Porous Materials, Butterworth-Heinemann: Boston, 2014; pp 1-20.
30. Liang, C.; Li, Z.; Dai, S., Mesoporous Carbon Materials: Synthesis and Modification. Angewandte Chemie International Edition 2008, 47 (20), 3696-3717.
31. Molina-Sabio, M.; Rodrı́guez-Reinoso, F., Role of chemical activation in the development of carbon porosity. Colloids and Surfaces A: Physicochemical and Engineering Aspects 2004, 241 (1), 15-25.
32. Ahmadpour, A.; Do, D. D., The preparation of active carbons from coal by chemical and physical activation. Carbon 1996, 34 (4), 471-479.
33. Kaneko, K., Determination of pore size and pore size distribution: 1. Adsorbents and catalysts. Journal of Membrane Science 1994, 96 (1), 59-89.
34. Kyotani, T., Control of pore structure in carbon. Carbon 2000, 38 (2), 269-286. 35. Schüth, F., Endo‐ and Exotemplating to Create High‐Surface‐Area Inorganic
Materials. Angewandte Chemie International Edition 2003, 42 (31), 3604-3622. 36. Xie, Y.; Kocaefe, D.; Chen, C.; Kocaefe, Y., Review of Research on Template
Methods in Preparation of Nanomaterials. Journal of Nanomaterials 2016, 2016, 10.
37. Fechler, N.; Fellinger, T. P.; Antonietti, M., “Salt Templating”: A Simple and Sustainable Pathway toward Highly Porous Functional Carbons from Ionic Liquids. Advanced Materials 2013, 25 (1), 75-79.
38. Liu, X.; Fechler, N.; Antonietti, M., Salt melt synthesis of ceramics, semiconductors and carbon nanostructures. Chemical Society Reviews 2013, 42 (21), 8237-8265.
39. Liu, X.; Giordano, C.; Antonietti, M., A Facile Molten‐Salt Route to Graphene Synthesis. Small 2014, 10 (1), 193-200.
40. Wisniak, J., The History of Catalysis. From the Beginning to Nobel Prizes. Educ. quím, Universidad Nacional Autónoma de México 2010, 21 (1), 60-69.
41. Yuan, J.; Giordano, C.; Antonietti, M., Ionic Liquid Monomers and Polymers as Precursors of Highly Conductive, Mesoporous, Graphitic Carbon Nanostructures. Chemistry of Materials 2010, 22 (17), 5003-5012.
42. Sakaushi, K.; Fellinger, T. P.; Antonietti, M., Bifunctional Metal‐Free Catalysis of Mesoporous Noble Carbons for Oxygen Reduction and Evolution Reactions. ChemSusChem 2015, 8 (7), 1156-1160.
43. Li, X.-H.; Antonietti, M., Metal nanoparticles at mesoporous N-doped carbons and carbon nitrides: functional Mott-Schottky heterojunctions for catalysis. Chemical Society Reviews 2013, 42 (16), 6593-6604.
44. Cornish-Bowden, A., Fundamentals of Enzyme Kinetics. 4 ed.; Wiley-VCH Verlag GmbH & Co.: 2012.
45. The Basics of Catalysis. In Catalysis. 46. Xia, Q.; Chen, Z.; Shao, Y.; Gong, X.; Wang, H.; Liu, X.; Parker, S. F.; Han, X.;
Yang, S.; Wang, Y., Direct hydrodeoxygenation of raw woody biomass into liquid alkanes. Nature Communications 2016, 7, 11162.
Page 74 References || A
47. Zakzeski, J.; Jongerius, A. L.; Bruijnincx, P. C.; Weckhuysen, B. M., Catalytic lignin valorization process for the production of aromatic chemicals and hydrogen. ChemSusChem 2012, 5 (8), 1602-9.
48. Zakzeski, J. B., P.; Jongerius, A.; Weckhuysen, B., The Catalytic Valorisation of Lignin for the production of Renewable Chemicals. Chem. Rev. 2010, 110, 3552-3599.
49. Biella, S.; Prati, L.; Rossi, M., Selective Oxidation of D-Glucose on Gold Catalyst. Journal of Catalysis 2002, 206 (2), 242-247.
50. Okatsu, H.; Kinoshita, N.; Akita, T.; Ishida, T.; Haruta, M., Deposition of gold nanoparticles on carbons for aerobic glucose oxidation. Applied Catalysis A: General 2009, 369 (1-2), 8-14.
51. Anastassiadis, S.; Morgunov, I. G., Gluconic acid production. Recent patents on biotechnology 2007, 1 (2), 167-80.
52. Alshammari, A.; Kalevaru, V. N., Supported Gold Nanoparticles as Promising Catalysts. In Catalytic Application of Nano-Gold Catalysts, 2016.
53. Colmenares, J. C.; Luque, R., Heterogeneous photocatalytic nanomaterials: prospects and challenges in selective transformations of biomass-derived compounds. Chemical Society Reviews 2014, 43 (3), 765-778.
54. Jahangiri, H.; Bennett, J.; Mahjoubi, P.; Wilson, K.; Gu, S., A review of advanced catalyst development for Fischer – Tropsch synthesis of hydrocarbons from biomass derived syn-gas. Catal. Sci. Technol. 2014, 4 (8), 2210-2229.
55. Chen, W.; Lin, T.; Dai, Y.; An, Y.; Yu, F.; Zhong, L.; Li, S.; Sun, Y., Recent advances in the investigation of nanoeffects of Fischer-Tropsch catalysts. Catalysis Today 2017.
56. Xie, J.; Yang, J.; Dugulan, A. I.; Holmen, A.; Chen, D.; de Jong, K. P.; Louwerse, M. J., Size and Promoter Effects in Supported Iron Fischer–Tropsch Catalysts: Insights from Experiment and Theory. ACS Catalysis 2016, 6 (5), 3147-3157.
57. Xie, J.; Torres Galvis, H. M.; Koeken, A. C. J.; Kirilin, A.; Dugulan, A. I.; Ruitenbeek, M.; de Jong, K. P., Size and Promoter Effects on Stability of Carbon-Nanofiber-Supported Iron-Based Fischer – Tropsch Catalysts. ACS Catalysis 2016, 6 (6), 4017-4024.
58. deLlano-Paz, F.; Calvo-Silvosa, A.; Iglesias Antelo, S.; Soares, I., The European low-carbon mix for 2030: The role of renewable energy sources in an environmentally and socially efficient approach. Renewable and Sustainable Energy Reviews 2015, 48, 49-61.
59. Anastas, P.; Eghbali, N., Green chemistry: principles and practice. Chem Soc Rev 2010, 39 (1), 301-12.
60. Wang, X.; Rinaldi, R., Solvent effects on the hydrogenolysis of diphenyl ether with Raney nickel and their implications for the conversion of lignin. ChemSusChem 2012, 5 (8), 1455-66.
61. Zhao, C.; Kou, Y.; Lemonidou, A. A.; Li, X.; Lercher, J. A., Highly selective catalytic conversion of phenolic bio-oil to alkanes. Angew Chem Int Ed Engl 2009, 48 (22), 3987-90.
62. Ohta, H.; Kobayashi, H.; Hara, K.; Fukuoka, A., Hydrodeoxygenation of phenols as lignin models under acid-free conditions with carbon-supported platinum catalysts. Chem Commun (Camb) 2011, 47 (44), 12209-11.
63. Cui, X.; Surkus, A. E.; Junge, K.; Topf, C.; Radnik, J.; Kreyenschulte, C.; Beller, M., Highly selective hydrogenation of arenes using nanostructured ruthenium catalysts modified with a carbon-nitrogen matrix. Nat Commun 2016, 7, 11326.
64. Christopher, L. P., CHAPTER 1. Integrated Forest Biorefineries: Current State and Development Potential. 2012, 1-66.
Page 75 References || A
65. Rodríguez-reinoso, F., The role of carbon materials in heterogeneous catalysis. Carbon 1998, 36 (3), 159-175.
66. Torres Galvis, H. M.; Bitter, J. H.; Khare, C. B.; Ruitenbeek, M.; Dugulan, A. I.; de Jong, K. P., Supported Iron Nanoparticles as Catalysts for Sustainable Production of Lower Olefins. Science 2012, 335 (6070), 835-838.
67. Vainio, U.; Maximova, N.; Hortling, B.; Laine, J.; Stenius, P.; Simola, L. K.; Gravitis, J.; Serimaa, R., Morphology of Dry Lignins and Size and Shape of Dissolved Kraft Lignin Particles by X-ray Scattering. Langmuir 2004, 20 (22), 9736-9744.
68. Lama, S. M. G.; Pampel, J.; Fellinger, T.-P.; Beškoski, V. P.; Slavković-Beškoski, L.; Antonietti, M.; Molinari, V., Efficiency of Ni Nanoparticles Supported on Hierarchical Porous Nitrogen-Doped Carbon for Hydrogenolysis of Kraft Lignin in Flow and Batch Systems. ACS Sustainable Chemistry & Engineering 2017.
69. Li, M.; Xu, F.; Li, H.; Wang, Y., Nitrogen-doped porous carbon materials: promising catalysts or catalyst supports for heterogeneous hydrogenation and oxidation. Catalysis Science & Technology 2016, 6 (11), 3670-3693.
70. Zhang, P.; Zhu, H.; Dai, S., Porous Carbon Supports: Recent Advances with Various Morphologies and Compositions. ChemCatChem 2015, 7 (18), 2788-2805.
71. Okatsu, H.; Kinoshita, N.; Akita, T.; Ishida, T.; Haruta, M., Deposition of gold nanoparticles on carbons for aerobic glucose oxidation. Applied Catalysis A: General 2009, 369 (1), 8-14.
72. Önal, Y.; Schimpf, S.; Claus, P., Structure sensitivity and kinetics of d-glucose oxidation to d-gluconic acid over carbon-supported gold catalysts. Journal of Catalysis 2004, 223 (1), 122-133.
73. Fischer, C.; Adam, M.; Mueller, A. C.; Sperling, E.; Wustmann, M.; van Pée, K.-H.; Kaskel, S.; Brunner, E., Gold Nanoparticle-Decorated Diatom Biosilica: A Favorable Catalyst for the Oxidation of d-Glucose. ACS Omega 2016, 1 (6), 1253-1261.
74. Ishida, T.; Kinoshita, N.; Okatsu, H.; Akita, T.; Takei, T.; Haruta, M., Influence of the Support and the Size of Gold Clusters on Catalytic Activity for Glucose Oxidation. Angewandte Chemie International Edition 2008, 47 (48), 9265-9268.
75. Cañete-Rodríguez, A. M.; Santos-Dueñas, I. M.; Jiménez-Hornero, J. E.; Ehrenreich, A.; Liebl, W.; Garc í a-Garc í a, I., Gluconic acid: Properties, production methods and applications — An excellent opportunity for agro-industrial by-products and waste bio-valorization. Process Biochemistry 2016, 51 (12), 1891-1903.
76. Singh, O. V.; Kumar, R., Biotechnological production of gluconic acid: future implications. Applied Microbiology and Biotechnology 2007, 75 (4), 713-722.
77. Beltrame, P.; Comotti, M.; Pina, C. D.; Rossi, M., Aerobic oxidation of glucose I. Enzymatic catalysis. Journal of Catalysis 2004, 228 (2), 282-287.
78. Beltrame, P.; Comotti, M.; Della Pina, C.; Rossi, M., Aerobic oxidation of glucose: II. Catalysis by colloidal gold. Applied Catalysis A: General 2006, 297 (1), 1-7.
79. Wojcieszak, R.; Ferraz, C.; Sha, J.; Houda, S.; Rossi, L.; Paul, S., Advances in Base-Free Oxidation of Bio-Based Compounds on Supported Gold Catalysts. Catalysts 2017, 7 (11), 352.
80. Della Pina, C.; Falletta, E.; Prati, L.; Rossi, M., Selective oxidation using gold. Chem Soc Rev 2008, 37 (9), 2077-95.
81. Sir David King, C. G. Energy Harnessing: New Solutions for Sustainability and Growing Demand; the University of Cambridge, United Kingdom, 2013.
Page 76 References || A
82. Nathalie Girouard, E. K., Cecilia Tam and Peter; Taylor, B. B., Debra Justus, William Blyth OECD Green Growth Studies: Energy; 2011.
83. Owusu, P. A.; Asumadu-Sarkodie, S.; Dubey, S., A review of renewable energy sources, sustainability issues and climate change mitigation. Cogent Engineering 2016, 3 (1).
84. Abas, N.; Kalair, A.; Khan, N., Review of fossil fuels and future energy technologies. Futures 2015, 69, 31-49.
85. Nelder, B. H. a. C., Profit from the Peak. John Wiley & Sons: Canada, 2008. 86. Schulz, H., Short history and present trends of Fischer–Tropsch synthesis.
Applied Catalysis A: General 1999, 186 (1), 3-12. 87. Dalai, A. K.; Davis, B. H., Fischer–Tropsch synthesis: A review of water effects
on the performances of unsupported and supported Co catalysts. Applied Catalysis A: General 2008, 348 (1), 1-15.
88. Lozano, F. J.; Lozano, R., Assessing the potential sustainability benefits of agricultural residues: Biomass conversion to syngas for energy generation or to chemicals production. Journal of Cleaner Production 2018, 172, 4162-4169.
89. Chen, Z.; Dun, Q.; Shi, Y.; Lai, D.; Zhou, Y.; Gao, S.; Xu, G., High quality syngas production from catalytic coal gasification using disposable Ca(OH)2 catalyst. Chemical Engineering Journal 2017, 316, 842-849.
90. Kathe, M.; Empfield, A.; Sandvik, P.; Fryer, C.; Zhang, Y.; Blair, E.; Fan, L.-S., Utilization of CO2 as a partial substitute for methane feedstock in chemical looping methane– steam redox processes for syngas production. Energy & Environmental Science 2017, 10 (6), 1345-1349.
91. Zhang, Q.; Kang, J.; Wang, Y., Development of Novel Catalysts for Fischer-Tropsch Synthesis: Tuning the Product Selectivity. ChemCatChem 2010, 2 (9), 1030-1058.
92. Corma, A.; Corresa, E.; Mathieu, Y.; Sauvanaud, L.; Al-Bogami, S.; Al-Ghrami, M. S.; Bourane, A., Crude oil to chemicals: light olefins from crude oil. Catalysis Science & Technology 2017, 7 (1), 12-46.
93. Torres Galvis, H. M.; de Jong, K. P., Catalysts for Production of Lower Olefins from Synthesis Gas: A Review. ACS Catalysis 2013, 3 (9), 2130-2149.
94. Wang, D.; Chen, B.; Duan, X.; Chen, D.; Zhou, X., Iron-based Fischer–Tropsch synthesis of lower olefins: The nature of χ-Fe5C2 catalyst and why and how to introduce promoters. Journal of Energy Chemistry 2016, 25 (6), 911-916.
95. Lu, Y.; Yan, Q.; Han, J.; Cao, B.; Street, J.; Yu, F., Fischer–Tropsch synthesis of olefin-rich liquid hydrocarbons from biomass-derived syngas over carbon-encapsulated iron carbide/iron nanoparticles catalyst. Fuel 2017, 193, 369-384.
96. Sun, B.; Xu, K.; Nguyen, L.; Qiao, M.; Tao, F., Preparation and Catalysis of Carbon ‐ Supported Iron Catalysts for Fischer – Tropsch Synthesis. ChemCatChem 2012, 4 (10), 1498-1511.
97. Oschatz, M.; Krans, N.; Xie, J.; de Jong, K. P., Systematic variation of the sodium/sulfur promoter content on carbon-supported iron catalysts for the Fischer–Tropsch to olefins reaction. Journal of Energy Chemistry 2016, 25 (6), 985-993.
98. Oschatz, M.; Krause, S.; Krans, N. A.; Hernandez Mejia, C.; Kaskel, S.; de Jong, K. P., Influence of precursor porosity on sodium and sulfur promoted iron/carbon Fischer-Tropsch catalysts derived from metal-organic frameworks. Chemical Communications 2017, 53 (73), 10204-10207.
99. Santos, V. P.; Wezendonk, T. A.; Jaén, J. J. D.; Dugulan, A. I.; Nasalevich, M. A.; Islam, H.-U.; Chojecki, A.; Sartipi, S.; Sun, X.; Hakeem, A. A.; Koeken, A. C. J.; Ruitenbeek, M.; Davidian, T.; Meima, G. R.; Sankar, G.; Kapteijn, F.; Makkee,
Page 77 References || A
M.; Gascon, J., Metal organic framework-mediated synthesis of highly active and stable Fischer-Tropsch catalysts. Nature Communications 2015, 6, 6451.
100. Zhai, P.; Xu, C.; Gao, R.; Liu, X.; Li, M.; Li, W.; Fu, X.; Jia, C.; Xie, J.; Zhao, M.; Wang, X.; Li, Y. W.; Zhang, Q.; Wen, X. D.; Ma, D., Highly Tunable Selectivity for Syngas‐Derived Alkenes over Zinc and Sodium‐Modulated Fe5C2 Catalyst. Angewandte Chemie International Edition 2016, 55 (34), 9902-9907.
101. An, X.; Wu, B.-s.; Wan, H.-J.; Li, T.-Z.; Tao, Z.-C.; Xiang, H.-W.; Li, Y.-W., Comparative study of iron-based Fischer–Tropsch synthesis catalyst promoted with potassium or sodium. Catalysis Communications 2007, 8 (12), 1957-1962.
102. Cheng, K.; Virginie, M.; Ordomsky, V. V.; Cordier, C.; Chernavskii, P. A.; Ivantsov, M. I.; Paul, S.; Wang, Y.; Khodakov, A. Y., Pore size effects in high-temperature Fischer–Tropsch synthesis over supported iron catalysts. Journal of Catalysis 2015, 328, 139-150.
103. Torres Galvis, H. M.; Koeken, A. C. J.; Bitter, J. H.; Davidian, T.; Ruitenbeek, M.; Dugulan, A. I.; de Jong, K. P., Effects of sodium and sulfur on catalytic performance of supported iron catalysts for the Fischer–Tropsch synthesis of lower olefins. Journal of Catalysis 2013, 303, 22-30.
104. Chen, W.; Pan, X.; Bao, X., Tuning of Redox Properties of Iron and Iron Oxides via Encapsulation within Carbon Nanotubes. Journal of the American Chemical Society 2007, 129 (23), 7421-7426.
105. Chew, L. M.; Xia, W.; Düdder, H.; Weide, P.; Ruland, H.; Muhler, M., On the role of the stability of functional groups in multi-walled carbon nanotubes applied as support in iron-based high-temperature Fischer–Tropsch synthesis. Catalysis Today 2016, 270, 85-92.
106. Oschatz, M.; Hofmann, J. P.; Deelen, T. W. v.; Lamme, W. S.; Krans, N. A.; Hensen, E. J. M.; Jong, K. P. d., Effects of the Functionalization of the Ordered Mesoporous Carbon Support Surface on Iron Catalysts for the Fischer–Tropsch Synthesis of Lower Olefins. ChemCatChem 2017, 9 (4), 620-628.
107. Schulte, H. J.; Graf, B.; Xia, W.; Muhler, M., Nitrogen‐ and Oxygen‐Functionalized Multiwalled Carbon Nanotubes Used as Support in Iron ‐
Catalyzed, High‐Temperature Fischer–Tropsch Synthesis. ChemCatChem 2012, 4 (3), 350-355.
108. Duan, X.; Wang, D.; Qian, G.; Walmsley, J. C.; Holmen, A.; Chen, D.; Zhou, X., Fabrication of K-promoted iron/carbon nanotubes composite catalysts for the Fischer–Tropsch synthesis of lower olefins. Journal of Energy Chemistry 2016, 25 (2), 311-317.
109. Lu, J.; Yang, L.; Xu, B.; Wu, Q.; Zhang, D.; Yuan, S.; Zhai, Y.; Wang, X.; Fan, Y.; Hu, Z., Promotion Effects of Nitrogen Doping into Carbon Nanotubes on Supported Iron Fischer–Tropsch Catalysts for Lower Olefins. ACS Catalysis 2014, 4 (2), 613-621.
110. Abbaslou, R. M. M.; Tavassoli, A.; Soltan, J.; Dalai, A. K., Iron catalysts supported on carbon nanotubes for Fischer–Tropsch synthesis: Effect of catalytic site position. Applied Catalysis A: General 2009, 367 (1-2), 47-52.
111. Bahome, M. C.; Jewell, L. L.; Hildebrandt, D.; Glasser, D.; Coville, N. J., Fischer–Tropsch synthesis over iron catalysts supported on carbon nanotubes. Applied Catalysis A: General 2005, 287 (1), 60-67.
112. Xue, Z. H.; Han, J. T.; Feng, W. J.; Yu, Q. Y.; Li, X. H.; Antonietti, M.; Chen, J. S., Tuning the Adsorption Energy of Methanol Molecules Along Ni‐N‐Doped Carbon Phase Boundaries by the Mott – Schottky Effect for Gas ‐ Phase
Page 78 References || A
Methanol Dehydrogenation. Angewandte Chemie International Edition 2018, 57 (10), 2697-2701.
113. Su, H.; Zhang, K.-X.; Zhang, B.; Wang, H.-H.; Yu, Q.-Y.; Li, X.-H.; Antonietti, M.; Chen, J.-S., Activating Cobalt Nanoparticles via the Mott–Schottky Effect in Nitrogen-Rich Carbon Shells for Base-Free Aerobic Oxidation of Alcohols to Esters. Journal of the American Chemical Society 2017, 139 (2), 811-818.
114. Fu, D.; Dai, W.; Xu, X.; Mao, W.; Su, J.; Zhang, Z.; Shi, B.; Smith, J.; Li, P.; Xu, J.; Han, Y. F., Probing The Structure Evolution of Iron‐Based Fischer–Tropsch to Produce Olefins by Operando Raman Spectroscopy. ChemCatChem 2015, 7 (5), 752-756.
115. Morant, C.; Andrey, J.; Prieto, P.; Mendiola, D.; Sanz, J. M.; Elizalde, E., XPS characterization of nitrogen‐doped carbon nanotubes. physica status solidi (a) 2006, 203 (6), 1069-1075.
116. Higgins, D. C.; Wu, J.; Li, W.; Chen, Z., Cyanamide derived thin film on carbon nanotubes as metal free oxygen reduction reaction electrocatalyst. Electrochimica Acta 2012, 59, 8-13.
117. J., S. H.; Barbara, G.; Wei, X.; Martin, M., Nitrogen- and Oxygen-Functionalized Multiwalled Carbon Nanotubes Used as Support in Iron-Catalyzed, High-Temperature Fischer–Tropsch Synthesis. ChemCatChem 2012, 4 (3), 350-355.
118. Antonietti, M.; Oschatz, M., The Concept of “Noble, Heteroatom‐Doped Carbons,” Their Directed Synthesis by Electronic Band Control of Carbonization, and Applications in Catalysis and Energy Materials. Advanced Materials 0 (0), 1706836.
B. Appendix
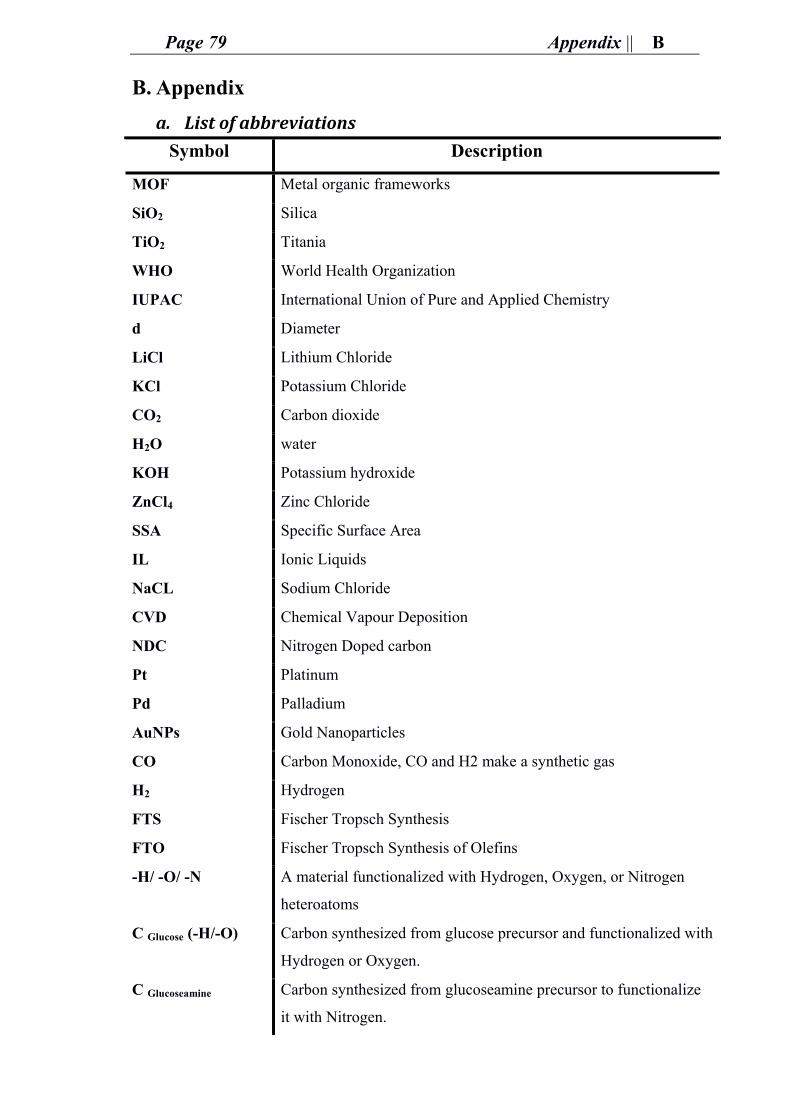
Page 79 Appendix || B
B. Appendix
a. List of abbreviations Symbol Description
MOF Metal organic frameworks
SiO2 Silica
TiO2 Titania
WHO World Health Organization
IUPAC International Union of Pure and Applied Chemistry
d Diameter
LiCl Lithium Chloride
KCl Potassium Chloride
CO2 Carbon dioxide
H2O water
KOH Potassium hydroxide
ZnCl4 Zinc Chloride
SSA Specific Surface Area
IL Ionic Liquids
NaCL Sodium Chloride
CVD Chemical Vapour Deposition
NDC Nitrogen Doped carbon
Pt Platinum
Pd Palladium
AuNPs Gold Nanoparticles
CO Carbon Monoxide, CO and H2 make a synthetic gas
H2 Hydrogen
FTS Fischer Tropsch Synthesis
FTO Fischer Tropsch Synthesis of Olefins
-H/ -O/ -N A material functionalized with Hydrogen, Oxygen, or Nitrogen
heteroatoms
C Glucose (-H/-O) Carbon synthesized from glucose precursor and functionalized with
Hydrogen or Oxygen.
C Glucoseamine Carbon synthesized from glucoseamine precursor to functionalize
it with Nitrogen.
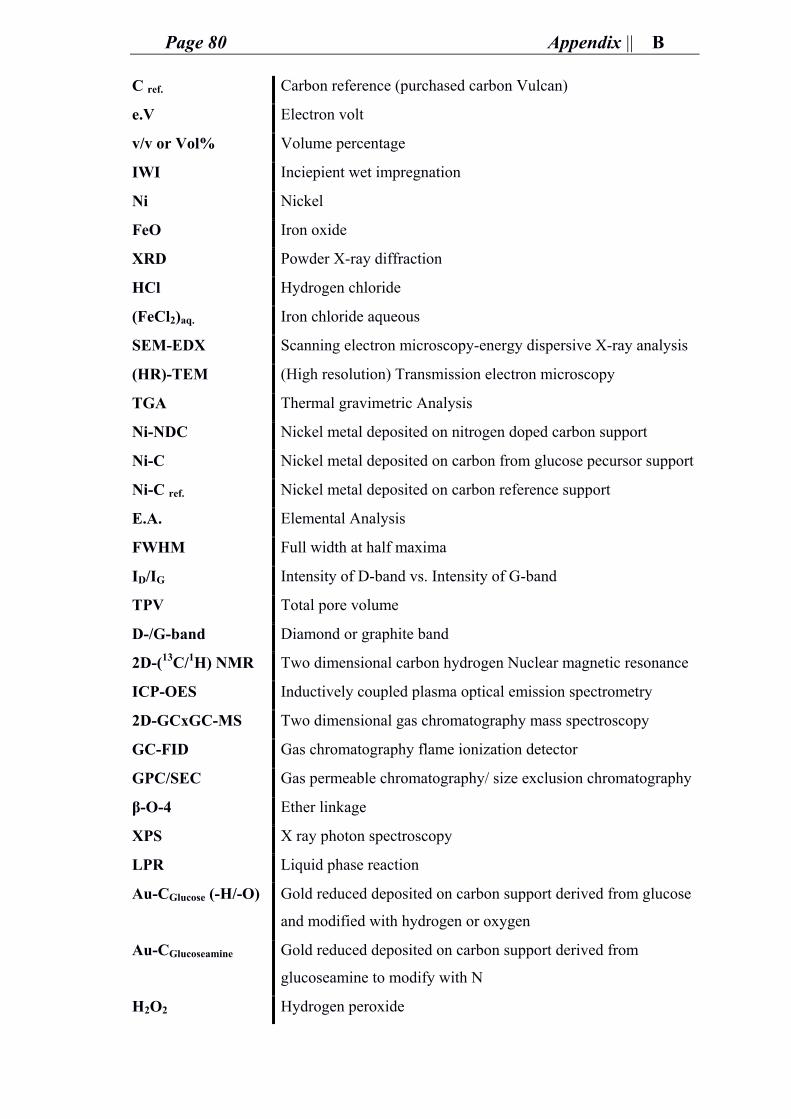
Page 80 Appendix || B
C ref. Carbon reference (purchased carbon Vulcan)
e.V Electron volt
v/v or Vol% Volume percentage
IWI Inciepient wet impregnation
Ni Nickel
FeO Iron oxide
XRD Powder X-ray diffraction
HCl Hydrogen chloride
(FeCl2)aq. Iron chloride aqueous
SEM-EDX Scanning electron microscopy-energy dispersive X-ray analysis
(HR)-TEM (High resolution) Transmission electron microscopy
TGA Thermal gravimetric Analysis
Ni-NDC Nickel metal deposited on nitrogen doped carbon support
Ni-C Nickel metal deposited on carbon from glucose pecursor support
Ni-C ref. Nickel metal deposited on carbon reference support
E.A. Elemental Analysis
FWHM Full width at half maxima
ID/IG Intensity of D-band vs. Intensity of G-band
TPV Total pore volume
D-/G-band Diamond or graphite band
2D-(13C/1H) NMR Two dimensional carbon hydrogen Nuclear magnetic resonance
ICP-OES Inductively coupled plasma optical emission spectrometry
2D-GCxGC-MS Two dimensional gas chromatography mass spectroscopy
GC-FID Gas chromatography flame ionization detector
GPC/SEC Gas permeable chromatography/ size exclusion chromatography
β-O-4 Ether linkage
XPS X ray photon spectroscopy
LPR Liquid phase reaction
Au-CGlucose (-H/-O) Gold reduced deposited on carbon support derived from glucose
and modified with hydrogen or oxygen
Au-CGlucoseamine Gold reduced deposited on carbon support derived from
glucoseamine to modify with N
H2O2 Hydrogen peroxide
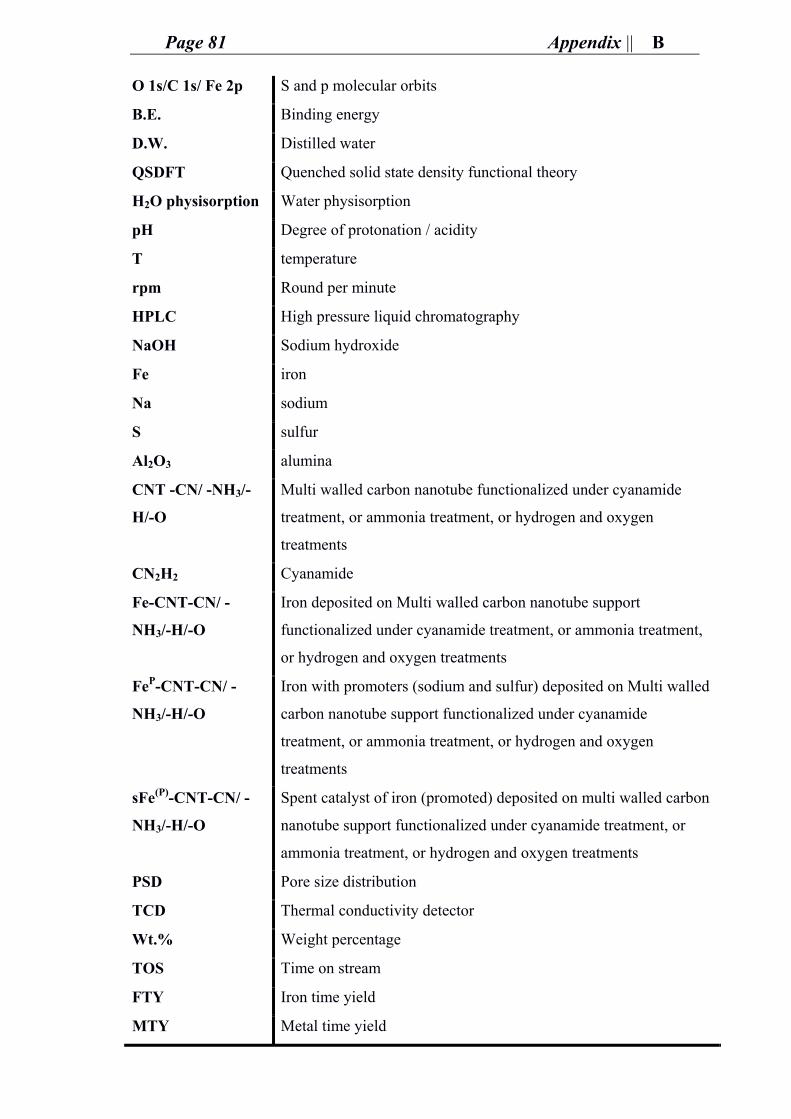
Page 81 Appendix || B
O 1s/C 1s/ Fe 2p S and p molecular orbits
B.E. Binding energy
D.W. Distilled water
QSDFT Quenched solid state density functional theory
H2O physisorption Water physisorption
pH Degree of protonation / acidity
T temperature
rpm Round per minute
HPLC High pressure liquid chromatography
NaOH Sodium hydroxide
Fe iron
Na sodium
S sulfur
Al2O3 alumina
CNT -CN/ -NH3/-
H/-O
Multi walled carbon nanotube functionalized under cyanamide
treatment, or ammonia treatment, or hydrogen and oxygen
treatments
CN2H2 Cyanamide
Fe-CNT-CN/ -
NH3/-H/-O
Iron deposited on Multi walled carbon nanotube support
functionalized under cyanamide treatment, or ammonia treatment,
or hydrogen and oxygen treatments
FeP-CNT-CN/ -
NH3/-H/-O
Iron with promoters (sodium and sulfur) deposited on Multi walled
carbon nanotube support functionalized under cyanamide
treatment, or ammonia treatment, or hydrogen and oxygen
treatments
sFe(P)-CNT-CN/ -
NH3/-H/-O
Spent catalyst of iron (promoted) deposited on multi walled carbon
nanotube support functionalized under cyanamide treatment, or
ammonia treatment, or hydrogen and oxygen treatments
PSD Pore size distribution
TCD Thermal conductivity detector
Wt.% Weight percentage
TOS Time on stream
FTY Iron time yield
MTY Metal time yield
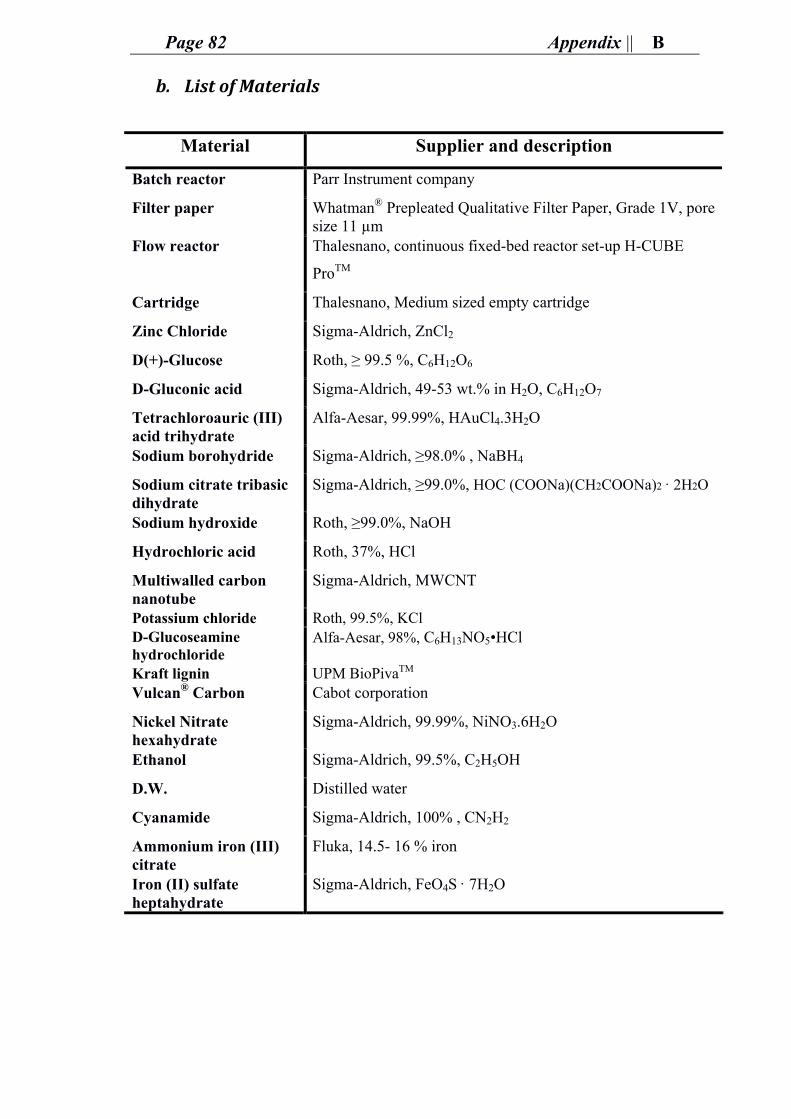
Page 82 Appendix || B
b. List of Materials
Material Supplier and description
Batch reactor Parr Instrument company
Filter paper Whatman® Prepleated Qualitative Filter Paper, Grade 1V, pore size 11 µm
Flow reactor Thalesnano, continuous fixed-bed reactor set-up H-CUBE
ProTM
Cartridge Thalesnano, Medium sized empty cartridge
Zinc Chloride Sigma-Aldrich, ZnCl2
D(+)-Glucose Roth, ≥ 99.5 %, C6H12O6
D-Gluconic acid Sigma-Aldrich, 49-53 wt.% in H2O, C6H12O7
Tetrachloroauric (III) acid trihydrate
Alfa-Aesar, 99.99%, HAuCl4.3H2O
Sodium borohydride Sigma-Aldrich, ≥98.0% , NaBH4
Sodium citrate tribasic dihydrate
Sigma-Aldrich, ≥99.0%, HOC (COONa)(CH2COONa)2 · 2H2O
Sodium hydroxide Roth, ≥99.0%, NaOH
Hydrochloric acid Roth, 37%, HCl
Multiwalled carbon nanotube
Sigma-Aldrich, MWCNT
Potassium chloride Roth, 99.5%, KCl D-Glucoseamine hydrochloride
Alfa-Aesar, 98%, C6H13NO5•HCl
Kraft lignin UPM BioPivaTM Vulcan® Carbon Cabot corporation
Nickel Nitrate hexahydrate
Sigma-Aldrich, 99.99%, NiNO3.6H2O
Ethanol Sigma-Aldrich, 99.5%, C2H5OH
D.W. Distilled water
Cyanamide Sigma-Aldrich, 100% , CN2H2
Ammonium iron (III) citrate
Fluka, 14.5- 16 % iron
Iron (II) sulfate heptahydrate
Sigma-Aldrich, FeO4S · 7H2O
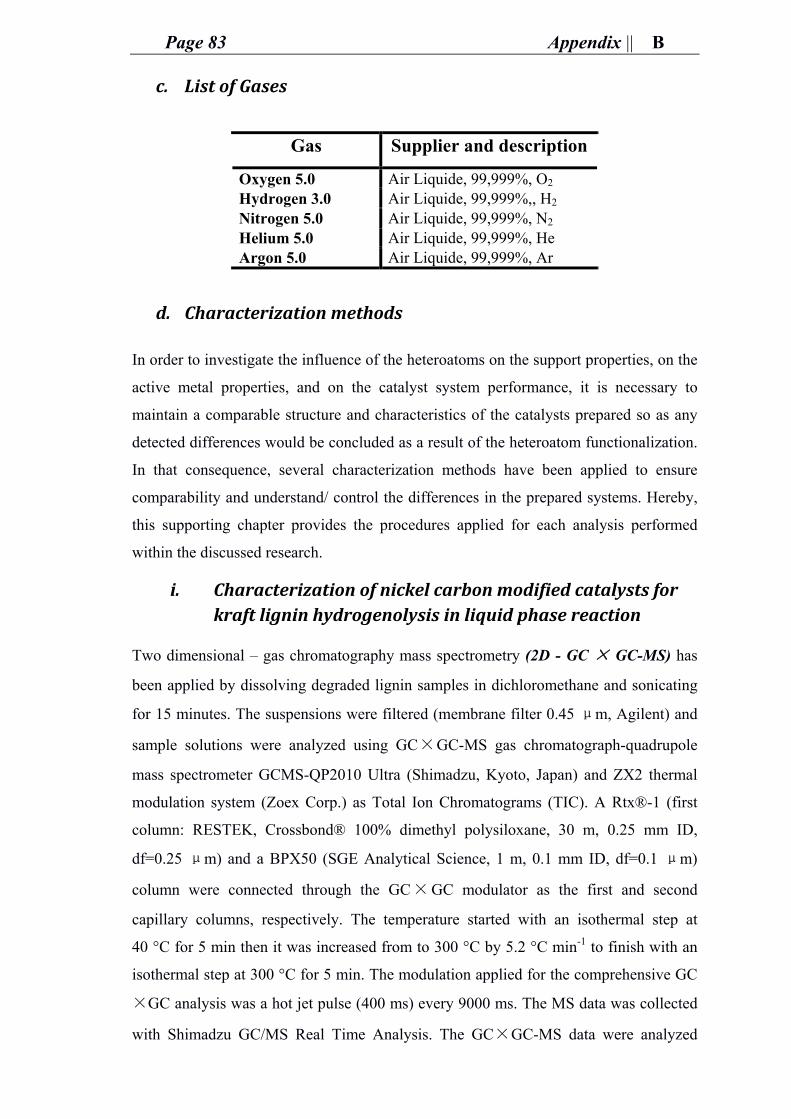
Page 83 Appendix || B
c. List of Gases
Gas Supplier and description
Oxygen 5.0 Air Liquide, 99,999%, O2 Hydrogen 3.0 Air Liquide, 99,999%,, H2 Nitrogen 5.0 Air Liquide, 99,999%, N2 Helium 5.0 Air Liquide, 99,999%, He Argon 5.0 Air Liquide, 99,999%, Ar
d. Characterization methods
In order to investigate the influence of the heteroatoms on the support properties, on the
active metal properties, and on the catalyst system performance, it is necessary to
maintain a comparable structure and characteristics of the catalysts prepared so as any
detected differences would be concluded as a result of the heteroatom functionalization.
In that consequence, several characterization methods have been applied to ensure
comparability and understand/ control the differences in the prepared systems. Hereby,
this supporting chapter provides the procedures applied for each analysis performed
within the discussed research.
i. Characterization of nickel carbon modified catalysts for kraft lignin hydrogenolysis in liquid phase reaction
Two dimensional – gas chromatography mass spectrometry (2D - GC × GC-MS) has
been applied by dissolving degraded lignin samples in dichloromethane and sonicating
for 15 minutes. The suspensions were filtered (membrane filter 0.45 μm, Agilent) and
sample solutions were analyzed using GC×GC-MS gas chromatograph-quadrupole
mass spectrometer GCMS-QP2010 Ultra (Shimadzu, Kyoto, Japan) and ZX2 thermal
modulation system (Zoex Corp.) as Total Ion Chromatograms (TIC). A Rtx®-1 (first
column: RESTEK, Crossbond® 100% dimethyl polysiloxane, 30 m, 0.25 mm ID,
df=0.25 μm) and a BPX50 (SGE Analytical Science, 1 m, 0.1 mm ID, df=0.1 μm)
column were connected through the GC×GC modulator as the first and second
capillary columns, respectively. The temperature started with an isothermal step at
40 °C for 5 min then it was increased from to 300 °C by 5.2 °C min-1 to finish with an
isothermal step at 300 °C for 5 min. The modulation applied for the comprehensive GC
×GC analysis was a hot jet pulse (400 ms) every 9000 ms. The MS data was collected
with Shimadzu GC/MS Real Time Analysis. The GC×GC-MS data were analyzed
Page 84 Appendix || B
using ChromeSquare 2.1 software, which is capable of directly reading GC×GC data
obtained with GC-MS solution, converting it to a 2-dimensional image. The degradation
products were identified by a search of the MS spectrum with the MS libraries NIST 11,
NIST 11s, and Wiley 8.
The X-ray diffraction measurements (XRD) are equipped with a Bruker D8
diffractometer with Cu-Kα
source (λ = 0.154 nm) and a scintillation counter. The
reference patterns are found in the ICDD PDF-4+ database (2014 edition).
The transmission electron microscopy (TEM) has a Zeiss EM 912Ω microscope used at
an acceleration voltage of 120 kV.
The scanning electron microscopy (SEM) device used has a LEO 1550 Gemini
microscope.
The Nitrogen gas sorption (N2-physisorption) applied used a Quantachrome Quadrasorb
apparatus. The analysis starts with degassing of each sample at 150 °C for 20 hours, and
then the results are shown via QuadraWin software (version 5.05). Pore size
distributions (PSDs), specific surface areas (SSAs), total pore volumes (TPVs) up to
50 nm, and micropore volumes (MPVs) were calculated from isotherm analysis with the
quenched solid density functional theory (QSDFT) method for nitrogen adsorbed on
carbon with slit/cylindrical/spherical pores at -196 °C (adsorption branch kernel).
The Elemental analysis (E.A) used a combustion analysis of a Vario Micro device.
The two dimensional nuclear magnetic resonance (2D-NMR 1H-13C HSQC) spectra
were obtained through an agilent 400 MHz spectrometer in deuterated solvents.
The Size exclusion chromatography (GPC/ SEC) with UV/RI detection performed via
N-methyl-2-pyrrolidone as eluent at 70°C using two PSS-GRAM columns (300 mm, 8
mm2). The average particle size used was of 7 μm and the porosity measured between
100–1000 Å. The Standard for the calibration was Polystyrene. Conversions and yields
for lignin reaction were calculated by mass difference after liquid chromatographic
separation.
The gas chromatography flame ionization detector (GC-FID) was performed using
Agilent technologies 5975 gas chromatograph equipped with an FID detector combined
Page 85 Appendix || B
with a second HP-5MS capillary column. The temperature program for degraded lignin
was set with an isothermal step to start at 50 °C for 2 min then it increases to 300 °C at a
rate of 10 °C min-1 for 20 min, where the temperature of the detector is kept at 280 °C.
The evaluation of small molecular weight molecules concentration, yielded after lignin
degradation was achieved with GC-FID measurements. The integration of the signals
derived from lignin derived products was compared to an internal standard (Heptane).
The Raman spectra was obtained using a Renishaw inVia Raman Microscope operating
with an objective (Nikon, 10x/0.25, ∞/− WD 6.1) and an excitation wavelength of 532
nm with a power of 4.0 mW. From the obtained Raman spectra the D and G bands were
fitted with a Lorentz function.
ii. Characterization of gold carbon modified catalysts for glucose oxidation in aqueous phase reaction
Transmission electron microscopy (TEM) images were obtained by using a Zeiss EM
912Ω TEM microscope at an acceleration voltage of 120 kV. The samples were
dropwise immobilized on the carbon-coated copper TEM grid after dispersing in
ethanol. The Particle size distributions were calculated manually using the Image J
software (v. 1.47).
The Nitrogen gas sorption (N2-physisorption) experiments were carried out at -196 °C
at a Quantachrome Quadrasorb apparatus. Before starting the analysis samples were
degassed at 150 °C for 20 h. Results were analyzed with the QuadraWin software
(version 5.05). Pore size distributions (PSDs), specific surface areas (SSAs), total pore
volumes (TPVs) up to 50 nm, and micropore volumes (MPVs) were calculated from
isotherm analysis with the quenched solid density functional theory (QSDFT) method
for nitrogen adsorbed on carbon with slit/cylindrical/spherical pores at -196 °C
(adsorption branch kernel).
Water vapor physisorption (H2O-physisorption) isotherms were measured with a
Quantachrome Autosorb IQ instrument at 25 °C.
The Elemental analysis (E.A) was carried out by combustion analysis in a Vario Micro
device.
X-ray photoelectron spectroscopy (XPS) measurements were performed using a Thermo
Scientific K-Alpha+ X-ray Photoelectron Spectrometer. All samples were analyzed
Page 86 Appendix || B
using a microfocused, monochromated Al Kα X-ray source (1486.68 eV; 400 μm spot
size). The K-Alpha+ charge compensation system was employed during analysis to
prevent any localized charge buildup. The samples were mounted on conductive carbon
tape and each sample was measured at 10 different spots. The spectra of the 10 spots
were averaged and the resulting spectra analyzed using the Avantage software from
Thermo Scientific.
Thermogravimetric analyses (TGA) were performed using a thermo microbalance TG
209 F1 Libra from Netzsch. A platinum crucible was used for the measurement of 10 ±
1 mg of samples in a nitrogen flow of 20 ml min-1 and a purge flow of 20 ml min-1. The
samples were heated with to 800 °C with 2.5 K min-1.
X-ray diffraction (XRD) experiments were carried out with a Bruker D8 diffractometer
and with a CuKα source (λ = 0.154 nm) and a scintillation counter. The reference
patterns were found in the ICDD PDF-4+ database (2014 edition).
Inductively coupled plasma-optical emission spectrometry (ICP-OES) was conducted
using a Horiba Ultra 2 instrument equipped with photomultiplier tube detection. Prior to
the measurements the carbon supports were burned off at 800 °C under air atmosphere
in a muffle furnace and the residual material was dissolved in aqua regia prior to the
measurements.
The Raman spectra was obtained using a Renishaw inVia Raman Microscope operating
with an objective (Nikon, 10x/0.25, ∞/− WD 6.1) and an excitation wavelength of 532
nm with a power of 4.0 mW. From the obtained Raman spectra the D and G bands were
fitted with a Lorentz function.
Dynamic light scattering (DLS) utilized using an ALV-7004 Multiple Tau Digital
Correlator in combination with a CGS-3 Compact Goniometer and a HeNe laser
(Polytec, 34 mW, λ = 633 nm at θ = 90° setup for DLS). Temperature applied isset to
25 °C. Toluene was used as immersion liquid. The hydrodynamic radii (Rapp) is
determined by fitting autocorrelation functions using REPES algorithms.
Page 87 Appendix || B
iii. Characterization of iron carbon functionalized catalysts for synthetic gas conversion to hydrocarbons
High resolution transmission electron microscopy (HR-TEM) images were obtained on
a double-corrected Jeol ARM200F microscope equipped with a cold field emission gun
utilizing a Gatan GIF Quantum. The acceleration voltage was set to 200kV. The particle
size distribution (PSD) was calculated manually using Image J software.
A Zeiss Gemini Leo 1550 with oxford energy dispersive X-ray (EDX) detector of 80
mm² with 15 kV was used for scanning electron microscopy (SEM) investigations and
determination of elemental compositions, respectively.
Nitrogen physisorption (N2-physisorption) experiments were carried out at -196 °C on a
Quantachrome Quadrasorb apparatus. Before starting the analysis samples were
degassed at 150 °C for 20 h. Results were analyzed with the Quadra Win software
(version 5.05). Pore size distributions (PSDs), specific surface areas (SSAs), total pore
volumes (TPVs) up to 50 nm, and micropore volumes (MPVs) were calculated from
isotherm analysis with the quenched solid density functional theory (QSDFT) method
for nitrogen adsorbed on carbon with slit/cylindrical pores at -196 °C (adsorption
branch kernel).
The Elemental analysis (E.A.) was carried out by combustion analysis in a Vario Micro
device.
X- ray Photoelectron Spectroscopy (XPS) was performed by using a Thermo Scientific
K-Alpha spectrometer equipped with a monochromatic small-spot X-ray source and a
180°double focusing hemispherical analyzer with a 128-channel delay line detector.
An aluminum anode (AlKα =1486.6 eV) operated at 72 W and a spot size of 400 μm is
used to obtain the spectra. The measurement of the survey scans was at constant pass
energy of 200 eV, and the measurement of high-resolution scans of the separate regions
was done at 50 eV. The background pressure of the ultra-high vacuum (UHV) chamber
was 2×10⁻⁸ mbar. No special precautions were considered to keep the sample under
an inert atmosphere during catalyst transfer and handling. Sample charging was
compensated for by the use of an electron flood gun, and binding energy calibration was
done by setting the peak of graphitic sp2 carbon to B.E.=284.0 eV.
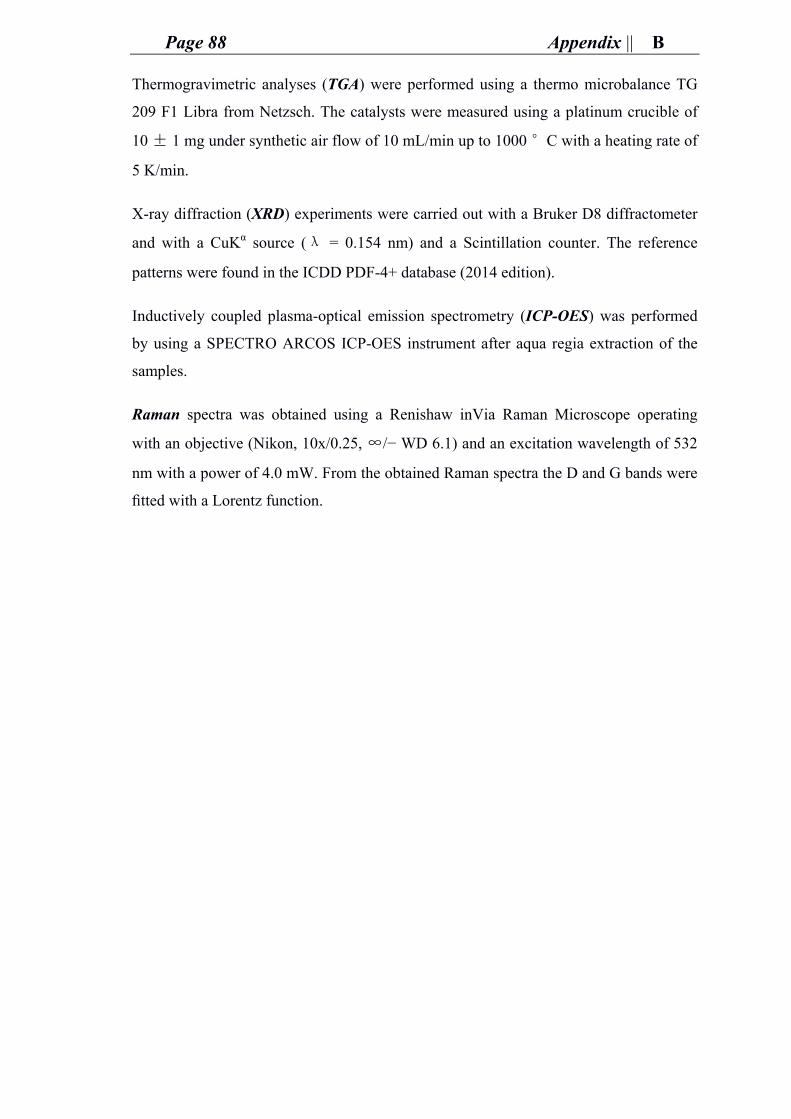
Page 88 Appendix || B
Thermogravimetric analyses (TGA) were performed using a thermo microbalance TG
209 F1 Libra from Netzsch. The catalysts were measured using a platinum crucible of
10 ± 1 mg under synthetic air flow of 10 mL/min up to 1000 °C with a heating rate of
5 K/min.
X-ray diffraction (XRD) experiments were carried out with a Bruker D8 diffractometer
and with a CuKα source (λ = 0.154 nm) and a Scintillation counter. The reference
patterns were found in the ICDD PDF-4+ database (2014 edition).
Inductively coupled plasma-optical emission spectrometry (ICP-OES) was performed
by using a SPECTRO ARCOS ICP-OES instrument after aqua regia extraction of the
samples.
Raman spectra was obtained using a Renishaw inVia Raman Microscope operating
with an objective (Nikon, 10x/0.25, ∞/− WD 6.1) and an excitation wavelength of 532
nm with a power of 4.0 mW. From the obtained Raman spectra the D and G bands were
fitted with a Lorentz function.
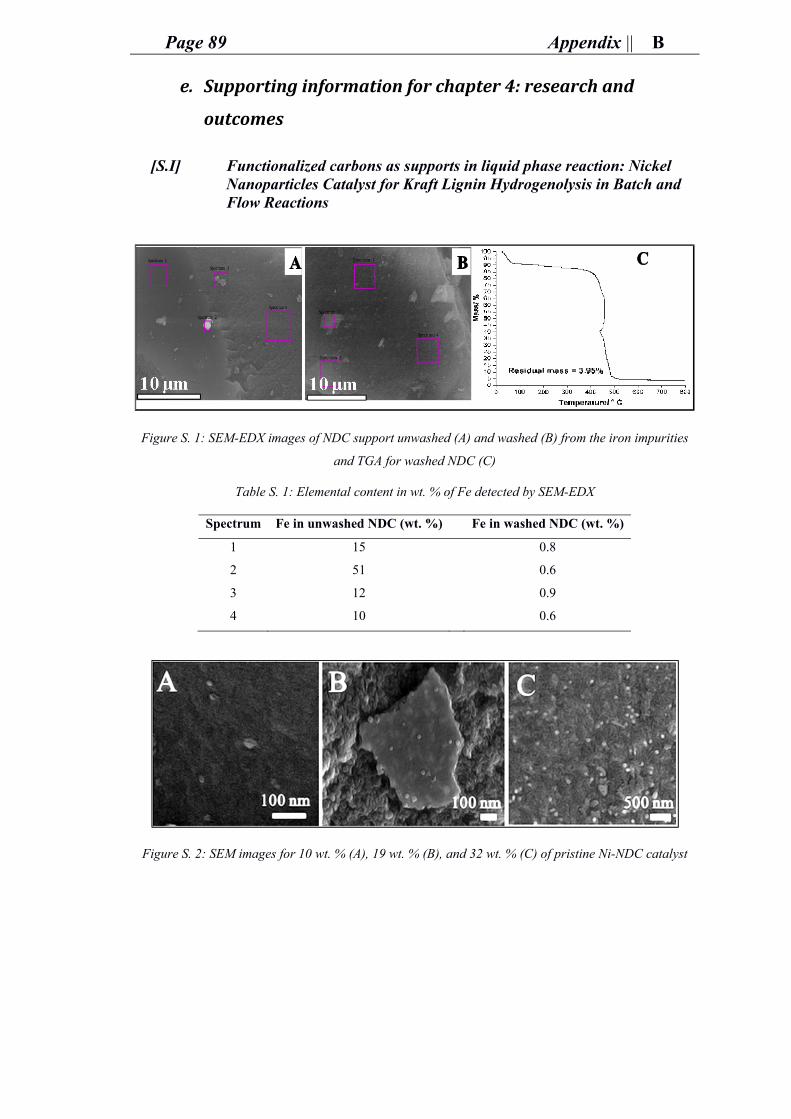
Page 89 Appendix || B
e. Supporting information for chapter 4: research and
outcomes
[S.I] Functionalized carbons as supports in liquid phase reaction: Nickel Nanoparticles Catalyst for Kraft Lignin Hydrogenolysis in Batch and Flow Reactions
Figure S. 1: SEM-EDX images of NDC support unwashed (A) and washed (B) from the iron impurities
and TGA for washed NDC (C)
Table S. 1: Elemental content in wt. % of Fe detected by SEM-EDX
Spectrum Fe in unwashed NDC (wt. %) Fe in washed NDC (wt. %)
1 15 0.8
2 51 0.6
3 12 0.9
4 10 0.6
Figure S. 2: SEM images for 10 wt. % (A), 19 wt. % (B), and 32 wt. % (C) of pristine Ni-NDC catalyst
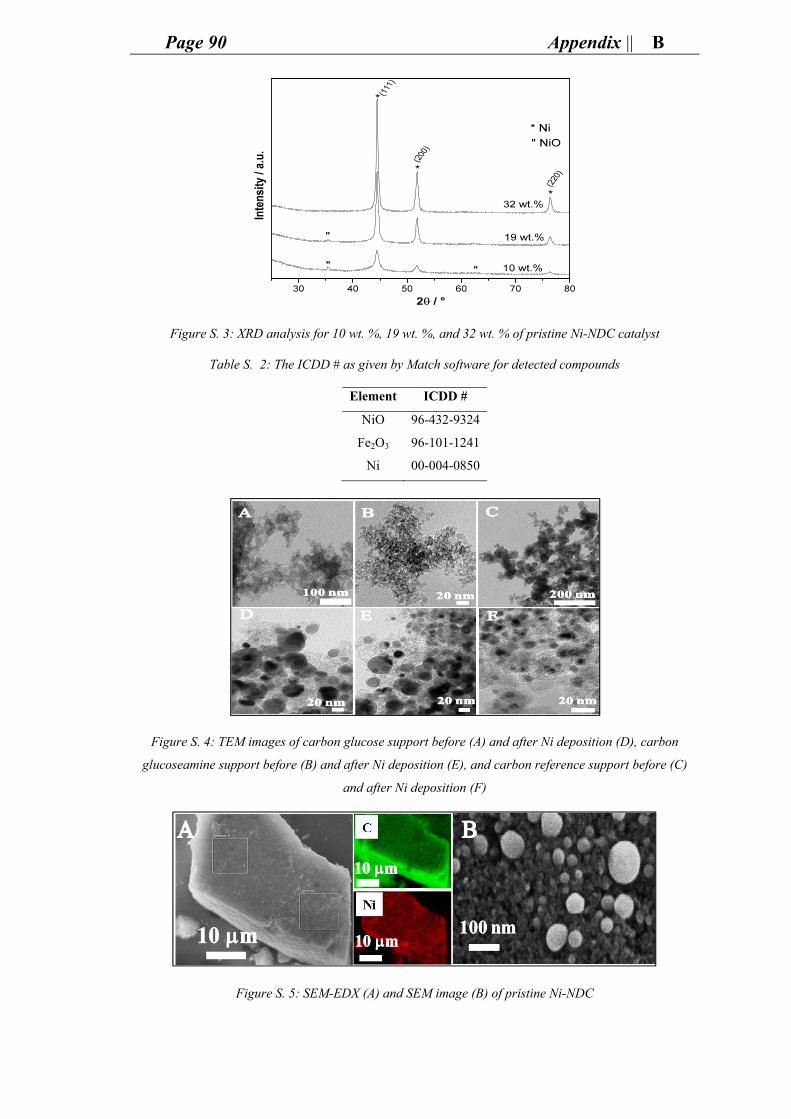
Page 90 Appendix || B
Figure S. 3: XRD analysis for 10 wt. %, 19 wt. %, and 32 wt. % of pristine Ni-NDC catalyst
Table S. 2: The ICDD # as given by Match software for detected compounds
Element ICDD #
NiO 96-432-9324
Fe2O3 96-101-1241
Ni 00-004-0850
Figure S. 4: TEM images of carbon glucose support before (A) and after Ni deposition (D), carbon
glucoseamine support before (B) and after Ni deposition (E), and carbon reference support before (C)
and after Ni deposition (F)
Figure S. 5: SEM-EDX (A) and SEM image (B) of pristine Ni-NDC
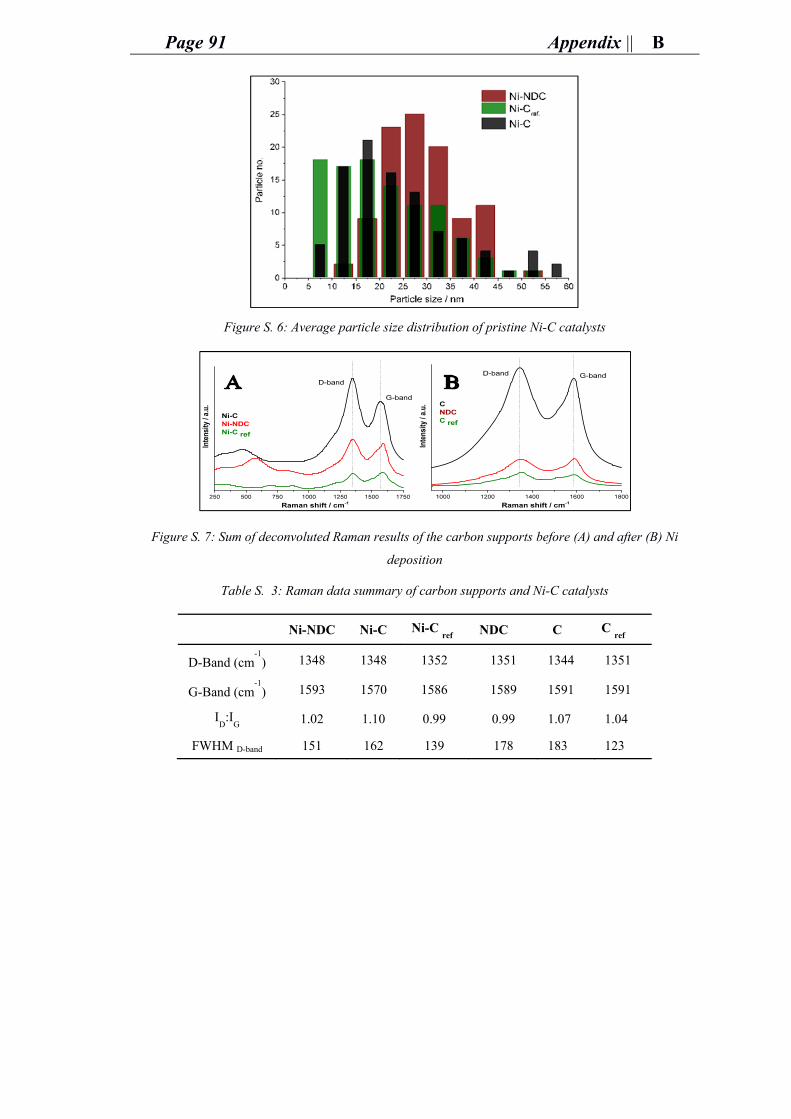
Page 91 Appendix || B
Figure S. 6: Average particle size distribution of pristine Ni-C catalysts
Figure S. 7: Sum of deconvoluted Raman results of the carbon supports before (A) and after (B) Ni
deposition
Table S. 3: Raman data summary of carbon supports and Ni-C catalysts
Ni-NDC Ni-C Ni-C ref
NDC C C ref
D-Band (cm-1
) 1348 1348 1352 1351 1344 1351
G-Band (cm-1
) 1593 1570 1586 1589 1591 1591
ID:I
G 1.02 1.10 0.99 0.99 1.07 1.04
FWHM D-band 151 162 139 178 183 123
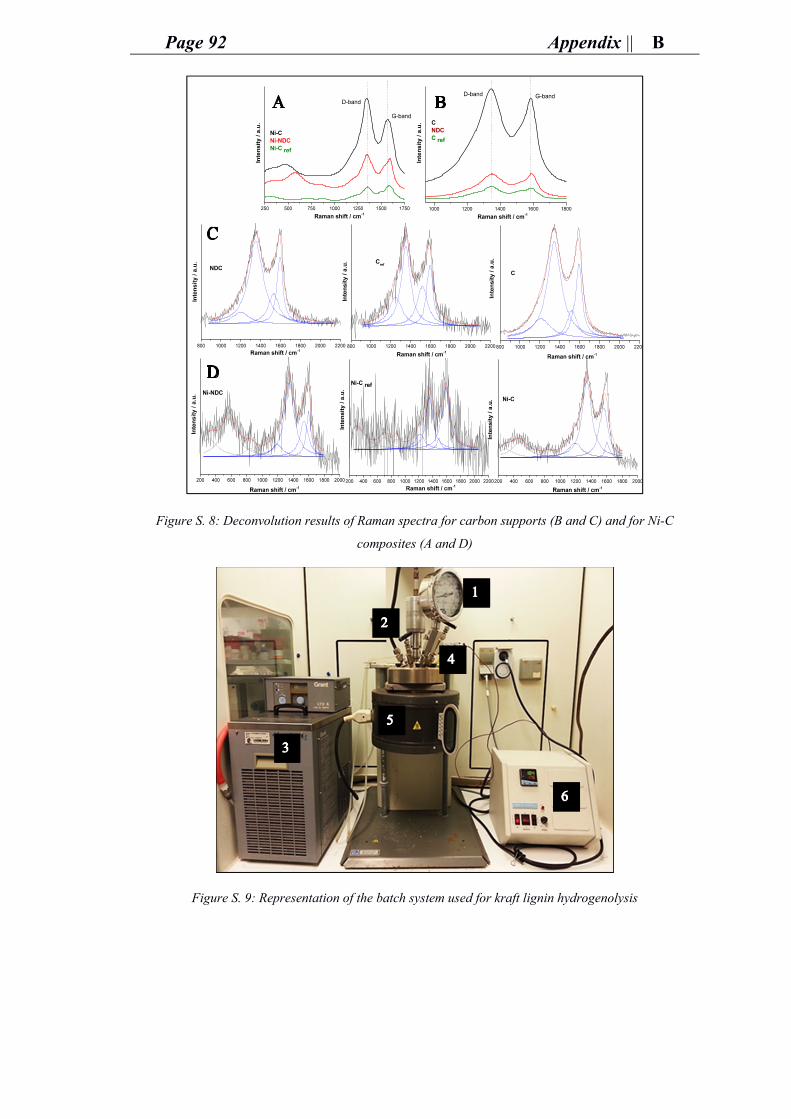
Page 92 Appendix || B
Figure S. 8: Deconvolution results of Raman spectra for carbon supports (B and C) and for Ni-C
composites (A and D)
Figure S. 9: Representation of the batch system used for kraft lignin hydrogenolysis
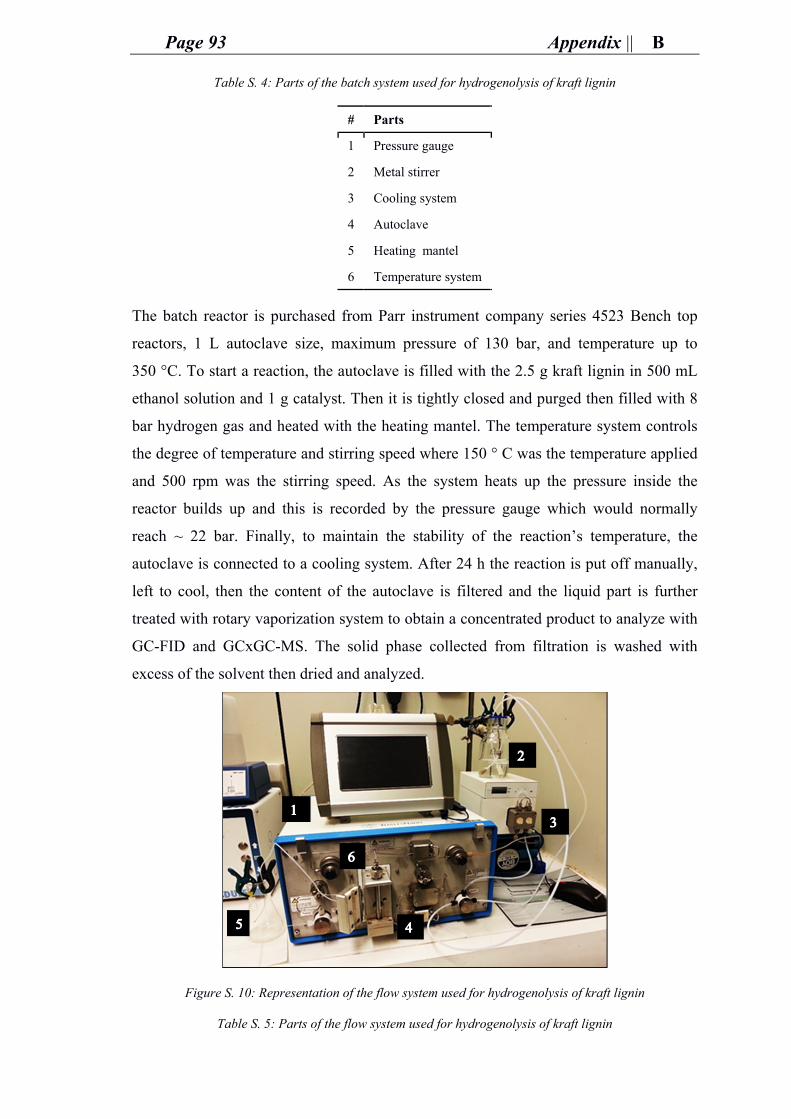
Page 93 Appendix || B
Table S. 4: Parts of the batch system used for hydrogenolysis of kraft lignin
# Parts
1 Pressure gauge
2 Metal stirrer
3 Cooling system
4 Autoclave
5 Heating mantel
6 Temperature system
The batch reactor is purchased from Parr instrument company series 4523 Bench top
reactors, 1 L autoclave size, maximum pressure of 130 bar, and temperature up to
350 °C. To start a reaction, the autoclave is filled with the 2.5 g kraft lignin in 500 mL
ethanol solution and 1 g catalyst. Then it is tightly closed and purged then filled with 8
bar hydrogen gas and heated with the heating mantel. The temperature system controls
the degree of temperature and stirring speed where 150 ° C was the temperature applied
and 500 rpm was the stirring speed. As the system heats up the pressure inside the
reactor builds up and this is recorded by the pressure gauge which would normally
reach ~ 22 bar. Finally, to maintain the stability of the reaction’s temperature, the
autoclave is connected to a cooling system. After 24 h the reaction is put off manually,
left to cool, then the content of the autoclave is filtered and the liquid part is further
treated with rotary vaporization system to obtain a concentrated product to analyze with
GC-FID and GCxGC-MS. The solid phase collected from filtration is washed with
excess of the solvent then dried and analyzed.
Figure S. 10: Representation of the flow system used for hydrogenolysis of kraft lignin
Table S. 5: Parts of the flow system used for hydrogenolysis of kraft lignin
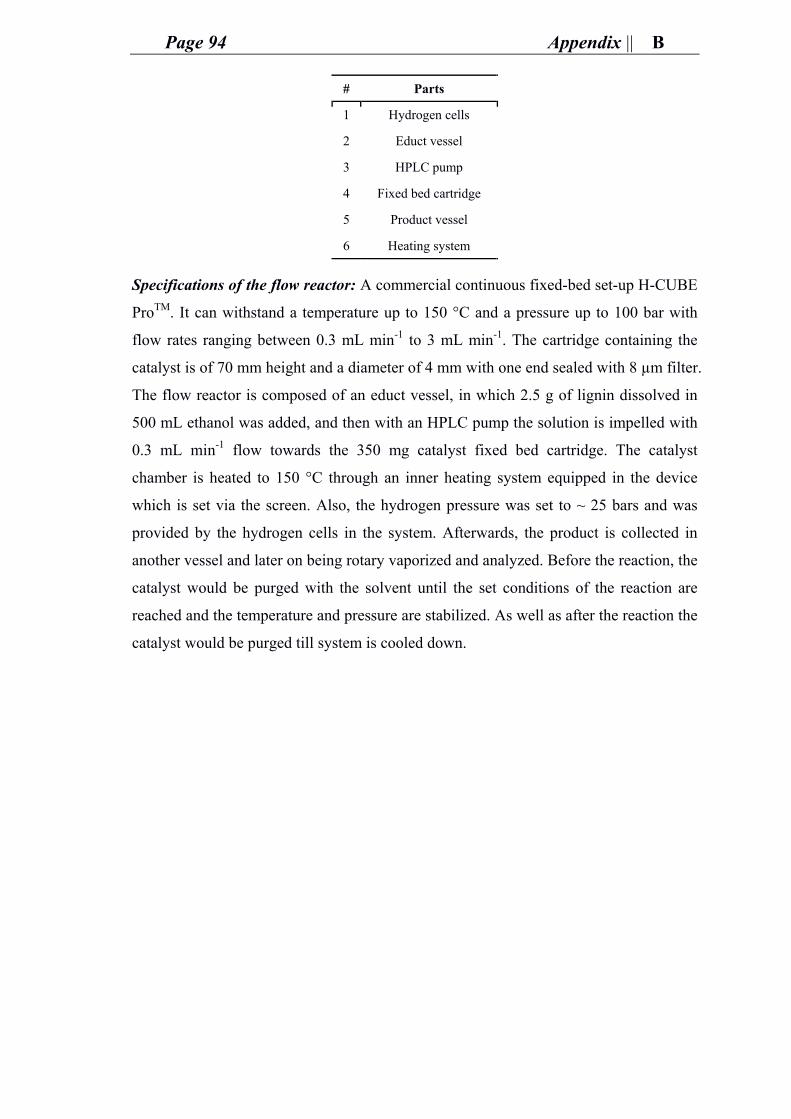
Page 94 Appendix || B
# Parts
1 Hydrogen cells
2 Educt vessel
3 HPLC pump
4 Fixed bed cartridge
5 Product vessel
6 Heating system
Specifications of the flow reactor: A commercial continuous fixed-bed set-up H-CUBE
ProTM. It can withstand a temperature up to 150 °C and a pressure up to 100 bar with
flow rates ranging between 0.3 mL min-1 to 3 mL min-1. The cartridge containing the
catalyst is of 70 mm height and a diameter of 4 mm with one end sealed with 8 µm filter.
The flow reactor is composed of an educt vessel, in which 2.5 g of lignin dissolved in
500 mL ethanol was added, and then with an HPLC pump the solution is impelled with
0.3 mL min-1 flow towards the 350 mg catalyst fixed bed cartridge. The catalyst
chamber is heated to 150 °C through an inner heating system equipped in the device
which is set via the screen. Also, the hydrogen pressure was set to ~ 25 bars and was
provided by the hydrogen cells in the system. Afterwards, the product is collected in
another vessel and later on being rotary vaporized and analyzed. Before the reaction, the
catalyst would be purged with the solvent until the set conditions of the reaction are
reached and the temperature and pressure are stabilized. As well as after the reaction the
catalyst would be purged till system is cooled down.
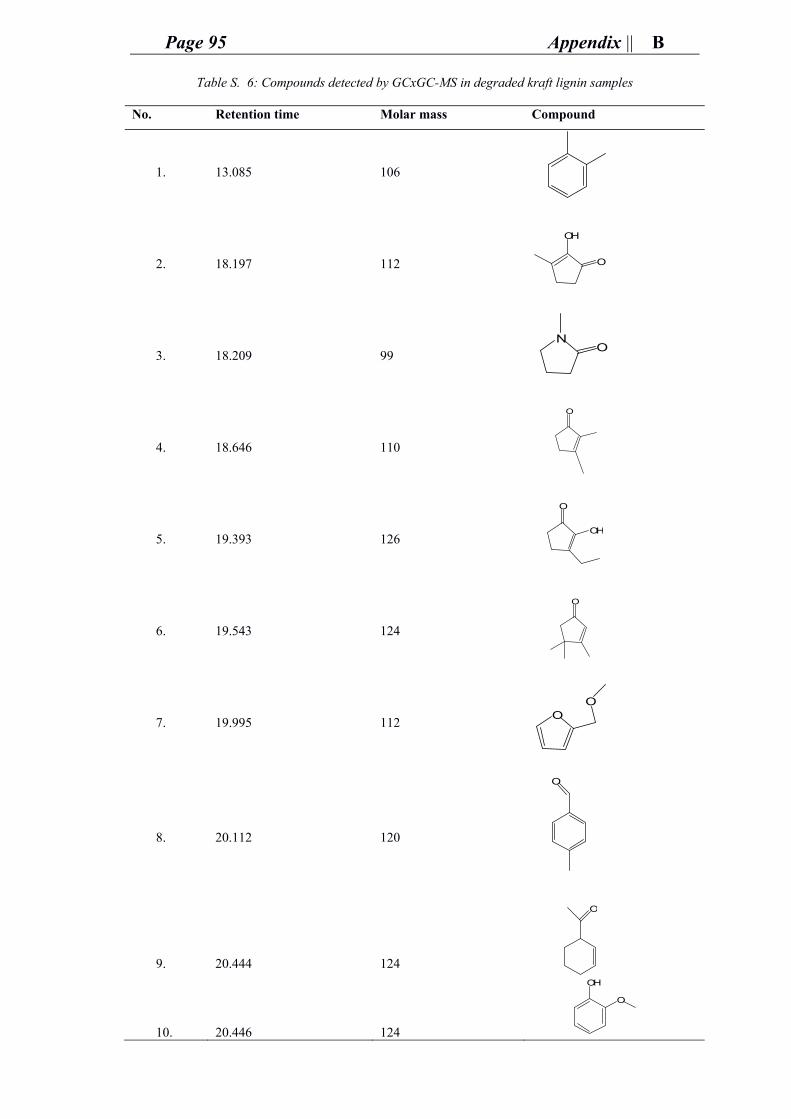
Page 95 Appendix || B
Table S. 6: Compounds detected by GCxGC-MS in degraded kraft lignin samples
No. Retention time Molar mass Compound
1. 13.085 106
2. 18.197 112
3. 18.209 99
4. 18.646 110
5. 19.393 126
6. 19.543 124
7. 19.995 112
8. 20.112 120
9. 20.444 124
10. 20.446 124
OH
O
NO
O
OH
O
O
OO
O
O
OH
O
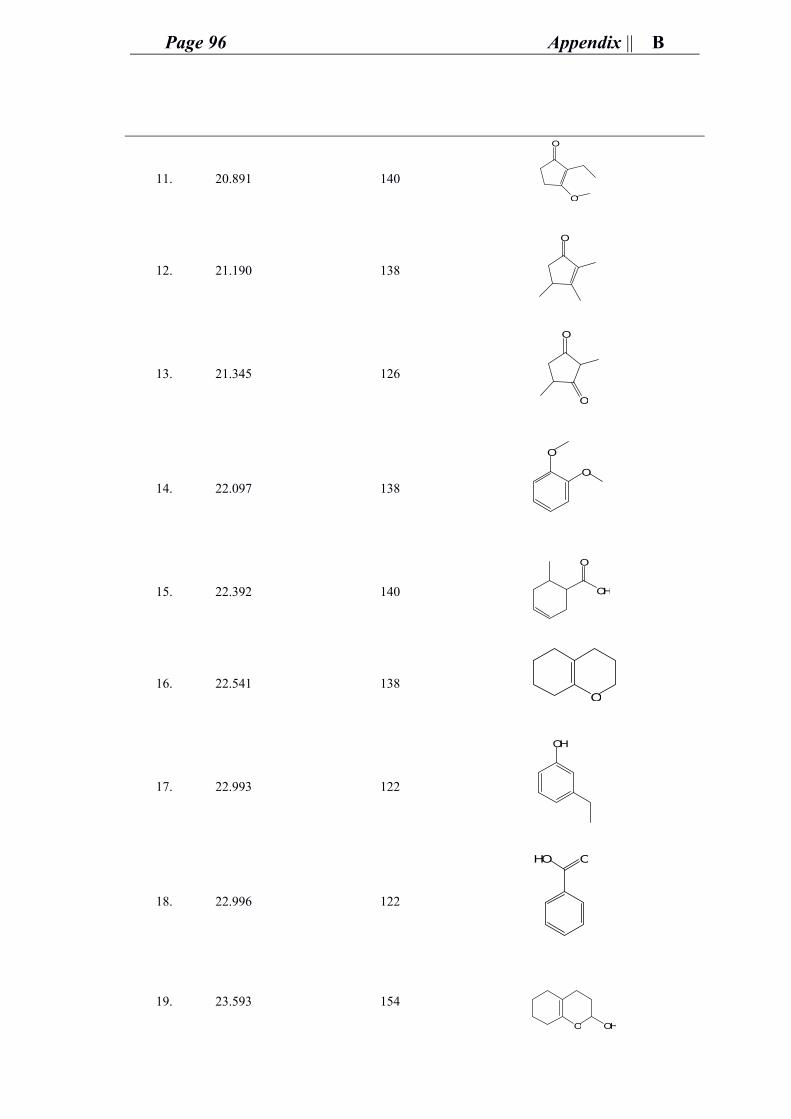
Page 96 Appendix || B
11. 20.891 140
12. 21.190 138
13. 21.345 126
14. 22.097 138
15. 22.392 140
16. 22.541 138
17. 22.993 122
18. 22.996 122
19. 23.593 154
O
O
O
O
O
O
O
OH
O
O
OH
HO O
O OH
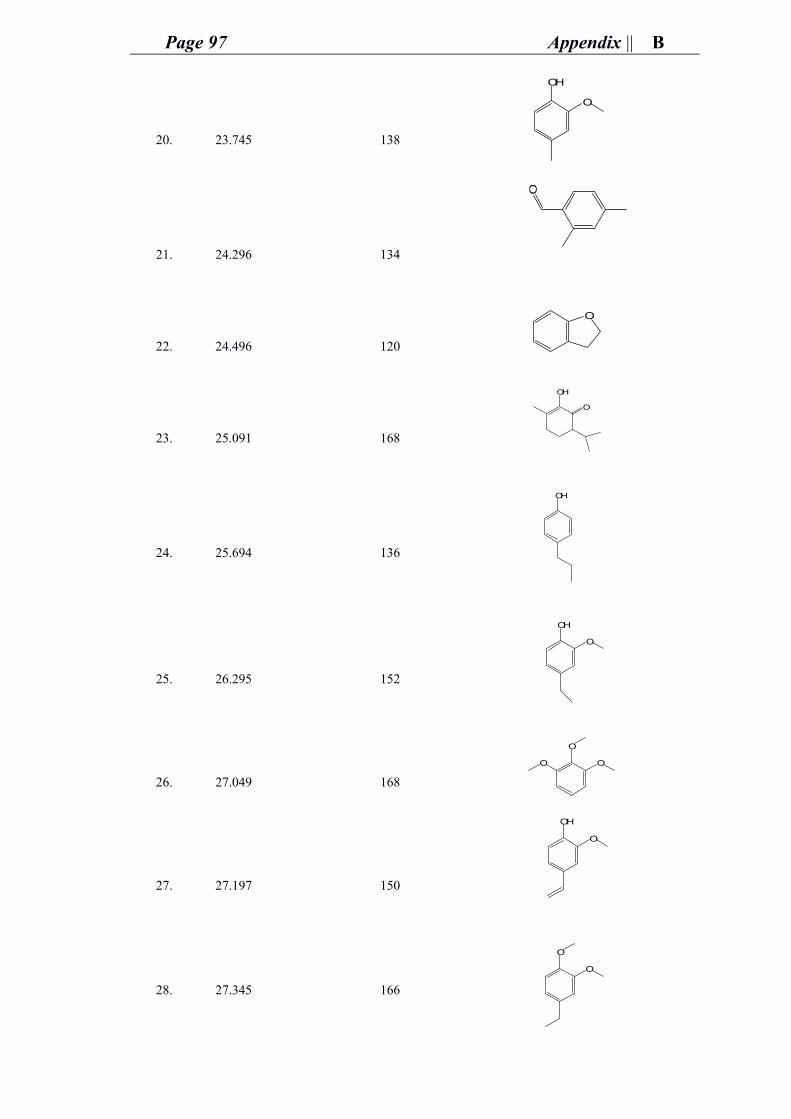
Page 97 Appendix || B
20. 23.745 138
21. 24.296 134
22. 24.496 120
23. 25.091 168
24. 25.694 136
25. 26.295 152
26. 27.049 168
27. 27.197 150
28. 27.345 166
OH
O
O
O
OH
O
OH
OH
O
O
OO
OH
O
O
O
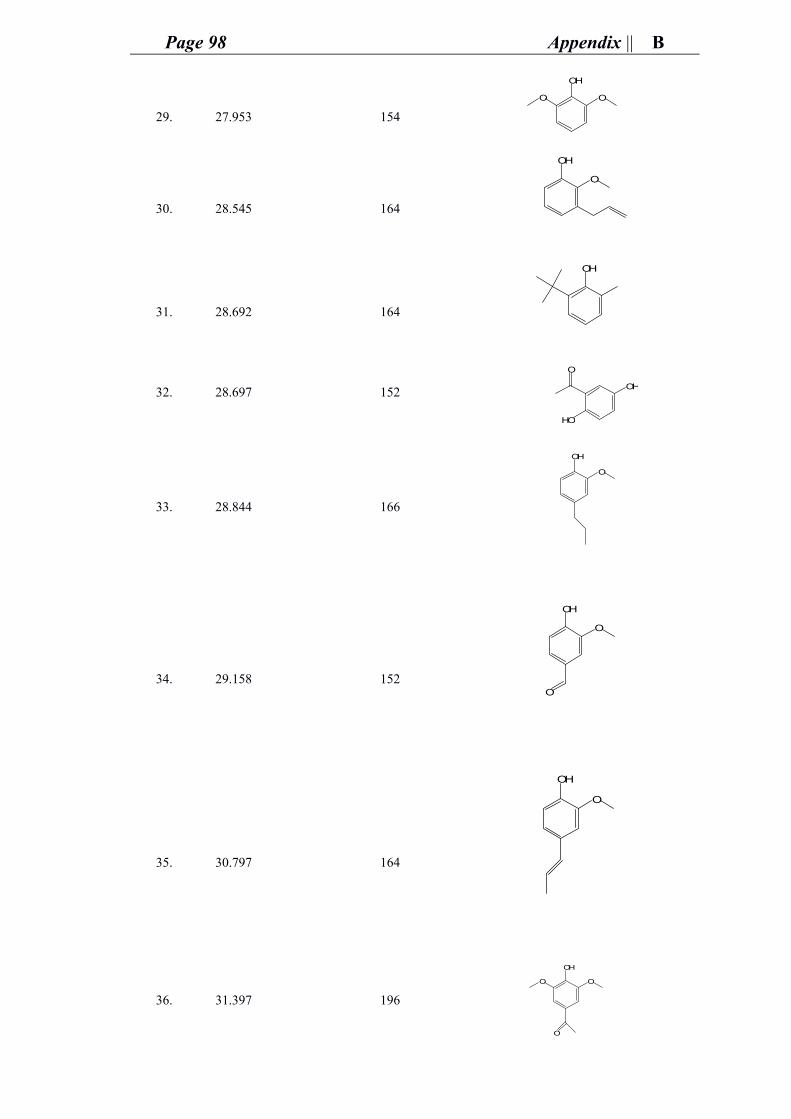
Page 98 Appendix || B
29. 27.953 154
30. 28.545 164
31. 28.692 164
32. 28.697 152
33. 28.844 166
34. 29.158 152
35. 30.797 164
36. 31.397 196
OH
OO
OH
O
OH
OH
HO
O
OH
O
OH
O
O
OH
O
OH
OO
O
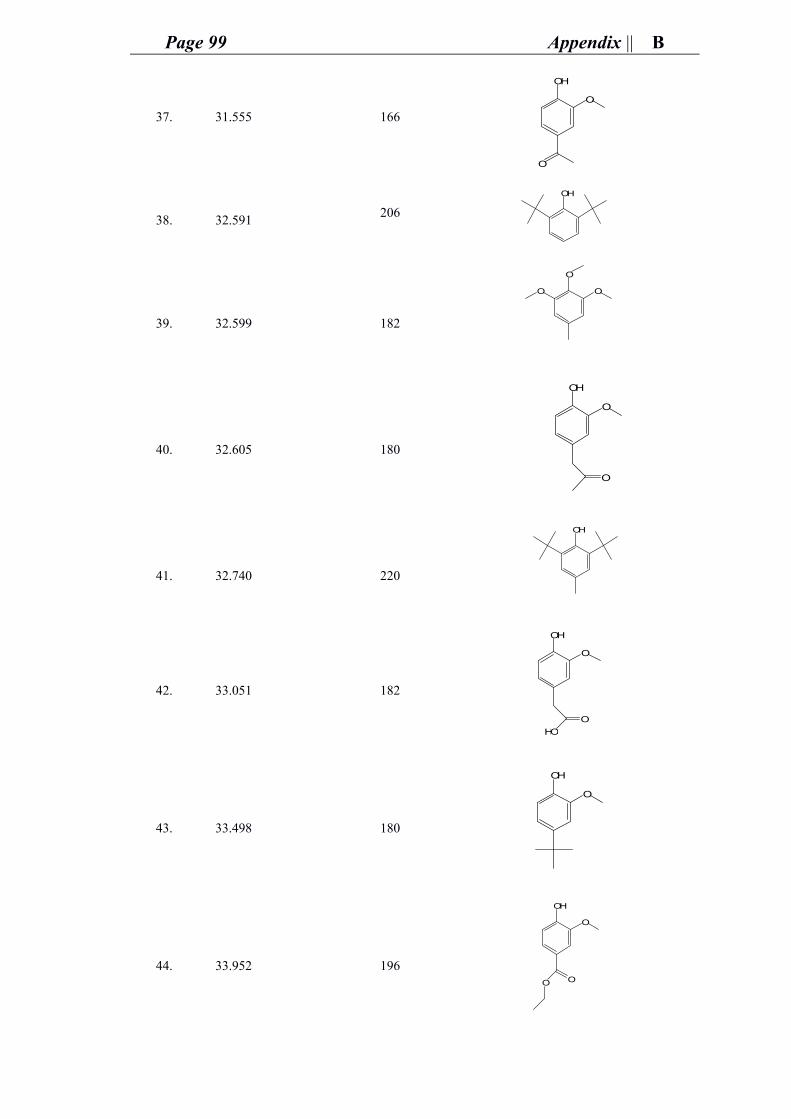
Page 99 Appendix || B
37. 31.555 166
38. 32.591 206
39. 32.599 182
40. 32.605 180
41. 32.740 220
42. 33.051 182
43. 33.498 180
44. 33.952 196
OH
O
O
OH
O
OO
OH
O
O
OH
OH
O
HO
O
OH
O
OH
O
O O
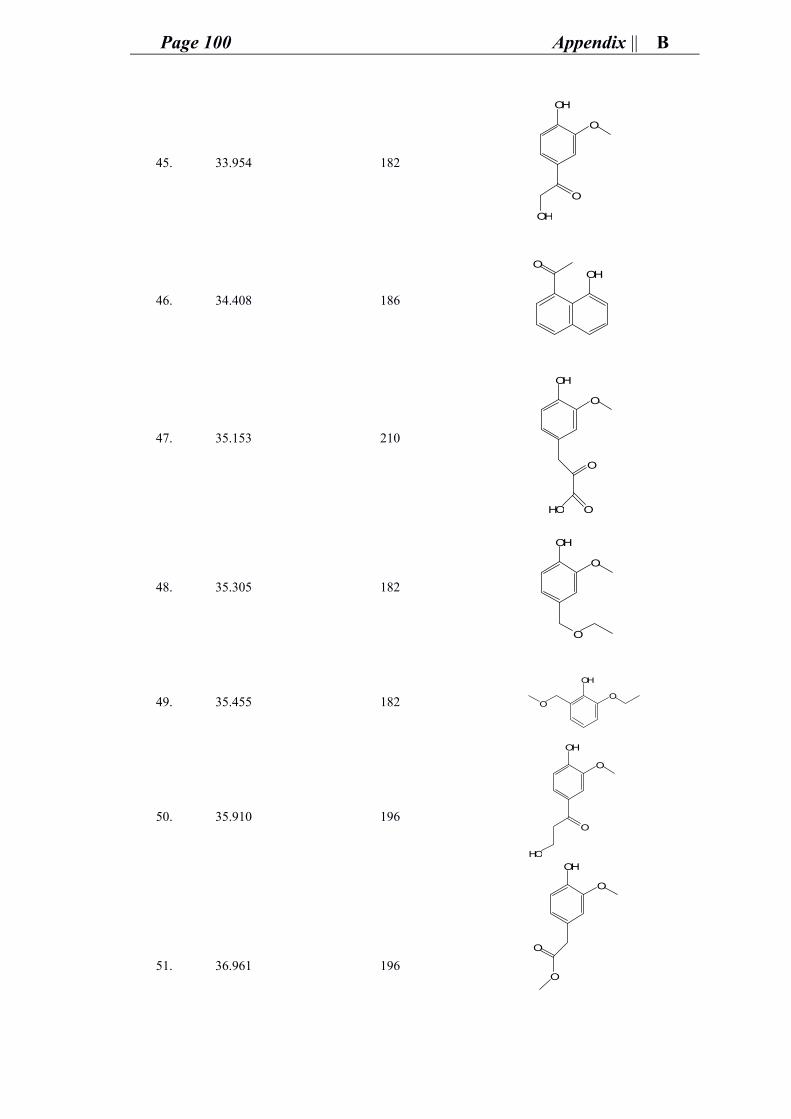
Page 100 Appendix || B
45. 33.954 182
46. 34.408 186
47. 35.153 210
48. 35.305 182
49. 35.455 182
50. 35.910 196
51. 36.961 196
OH
O
OH
O
OHO
OH
O
HO
O
O
OH
O
O
O
OH
O
OH
O
O
HO
OH
O
O
O
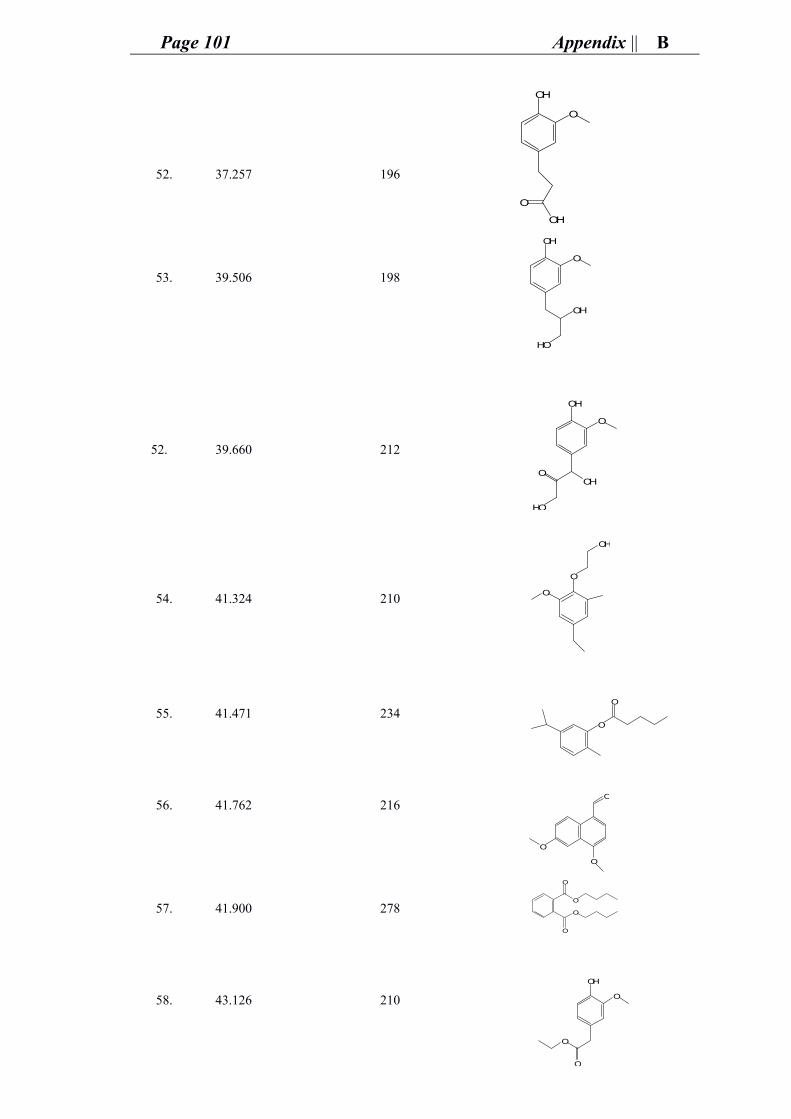
Page 101 Appendix || B
52. 37.257 196
53. 39.506 198
52. 39.660 212
54. 41.324 210
55. 41.471 234
56. 41.762 216
57. 41.900 278
58. 43.126 210
OH
O
OH
O
OH
O
HO
OH
OH
O
OH
HO
O
O
O
OH
O
O
O
O
O
O
O
O
O
OH
O
O
O
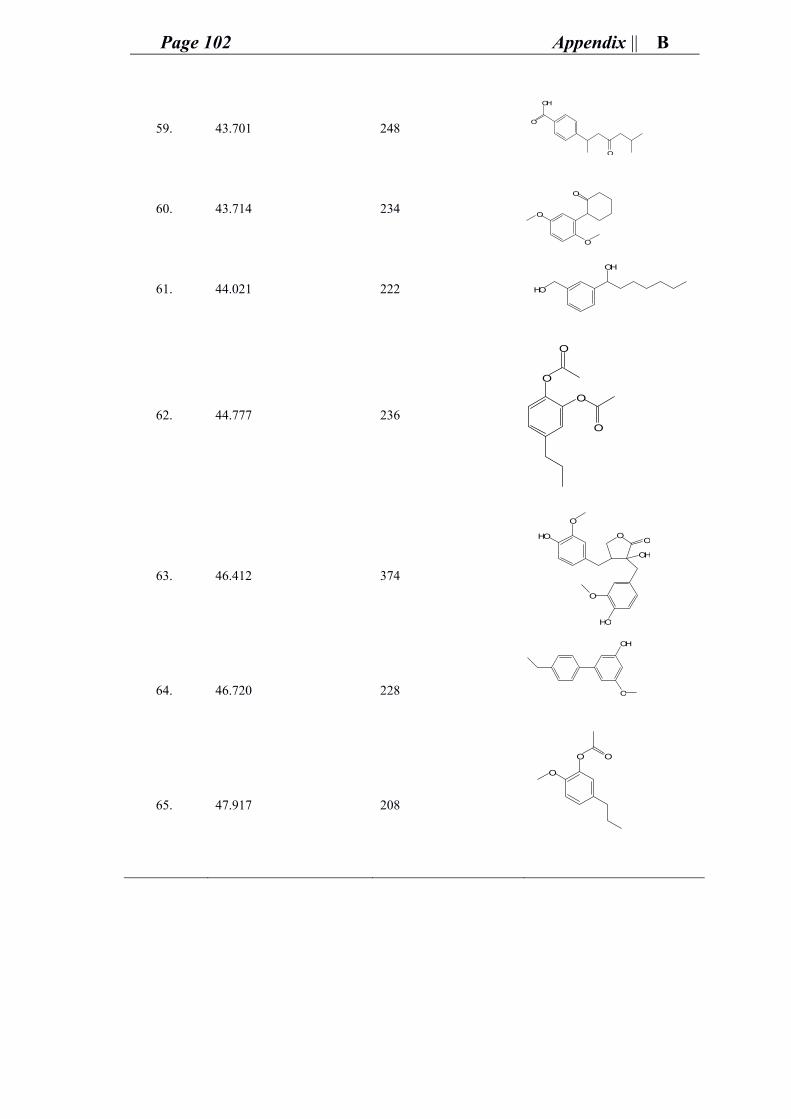
Page 102 Appendix || B
59. 43.701 248
60. 43.714 234
61. 44.021 222
62. 44.777 236
63. 46.412 374
64. 46.720 228
65. 47.917 208
OH
O
O
O
O
O
HO
OH
O
O
O
O
OHO
O
OH
O
HO
O
O
OH
O
O O
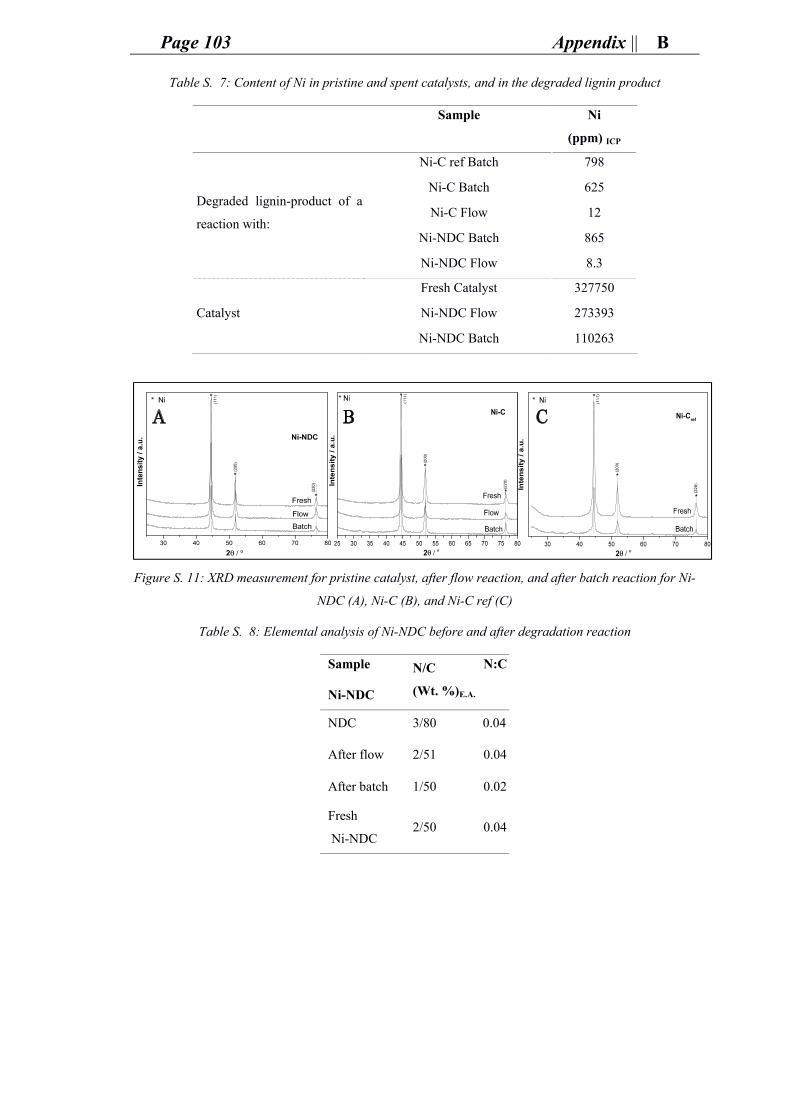
Page 103 Appendix || B
Table S. 7: Content of Ni in pristine and spent catalysts, and in the degraded lignin product
Sample Ni
(ppm) ICP
Degraded lignin-product of a
reaction with:
Ni-C ref Batch 798
Ni-C Batch 625
Ni-C Flow 12
Ni-NDC Batch 865
Ni-NDC Flow 8.3
Catalyst
Fresh Catalyst 327750
Ni-NDC Flow 273393
Ni-NDC Batch 110263
Figure S. 11: XRD measurement for pristine catalyst, after flow reaction, and after batch reaction for Ni-
NDC (A), Ni-C (B), and Ni-C ref (C)
Table S. 8: Elemental analysis of Ni-NDC before and after degradation reaction
Sample
Ni-NDC
N/C
(Wt. %)E.A.
N:C
NDC 3/80 0.04
After flow 2/51 0.04
After batch 1/50 0.02
Fresh
Ni-NDC 2/50 0.04
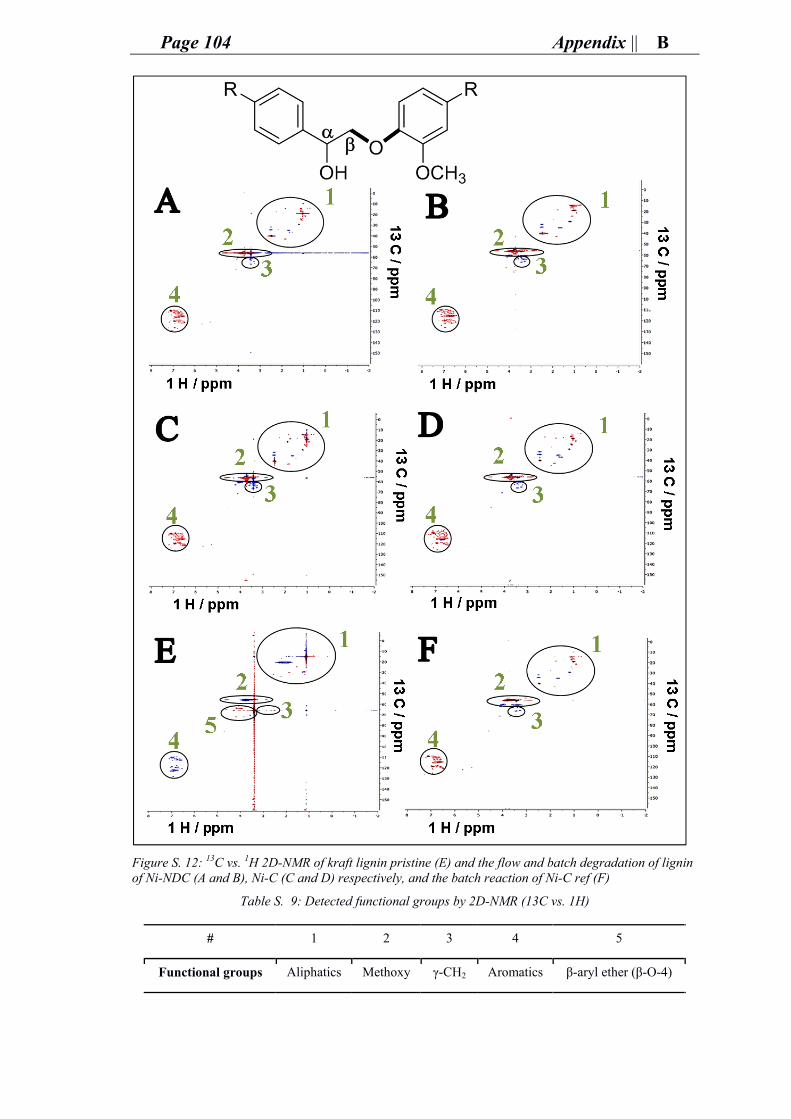
Page 104 Appendix || B
Figure S. 12: 13C vs. 1H 2D-NMR of kraft lignin pristine (E) and the flow and batch degradation of lignin of Ni-NDC (A and B), Ni-C (C and D) respectively, and the batch reaction of Ni-C ref (F)
Table S. 9: Detected functional groups by 2D-NMR (13C vs. 1H)
# 1 2 3 4 5
Functional groups Aliphatics Methoxy γ-CH2 Aromatics β-aryl ether (β-O-4)
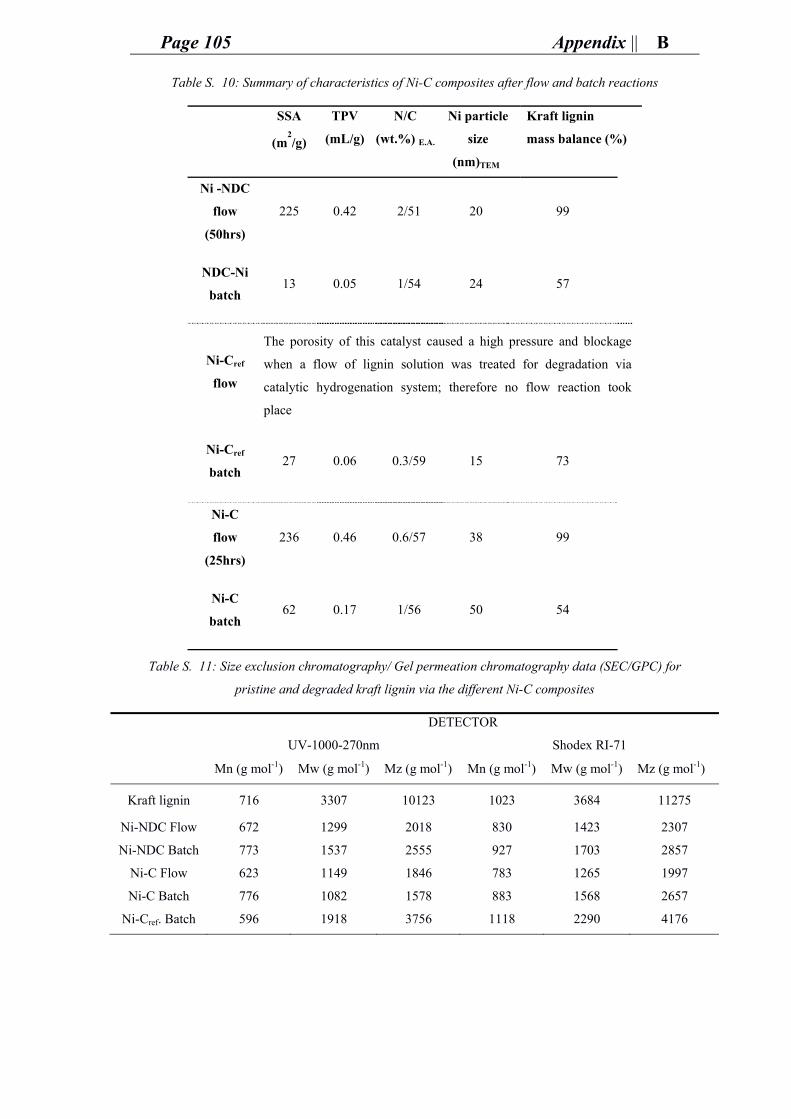
Page 105 Appendix || B
Table S. 10: Summary of characteristics of Ni-C composites after flow and batch reactions
SSA
(m2/g)
TPV
(mL/g)
N/C
(wt.%) E.A.
Ni particle
size
(nm)TEM
Kraft lignin
mass balance (%)
Ni -NDC
flow
(50hrs)
225 0.42 2/51 20 99
NDC-Ni
batch 13 0.05 1/54 24 57
Ni-Cref
flow
The porosity of this catalyst caused a high pressure and blockage
when a flow of lignin solution was treated for degradation via
catalytic hydrogenation system; therefore no flow reaction took
place
Ni-Cref
batch 27 0.06 0.3/59 15 73
Ni-C
flow
(25hrs)
236 0.46 0.6/57 38 99
Ni-C
batch 62 0.17 1/56 50 54
Table S. 11: Size exclusion chromatography/ Gel permeation chromatography data (SEC/GPC) for
pristine and degraded kraft lignin via the different Ni-C composites
DETECTOR
UV-1000-270nm Shodex RI-71
Mn (g mol-1) Mw (g mol-1) Mz (g mol-1) Mn (g mol-1) Mw (g mol-1) Mz (g mol-1)
Kraft lignin 716 3307 10123 1023 3684 11275
Ni-NDC Flow 672 1299 2018 830 1423 2307
Ni-NDC Batch 773 1537 2555 927 1703 2857
Ni-C Flow 623 1149 1846 783 1265 1997
Ni-C Batch 776 1082 1578 883 1568 2657
Ni-Cref. Batch 596 1918 3756 1118 2290 4176
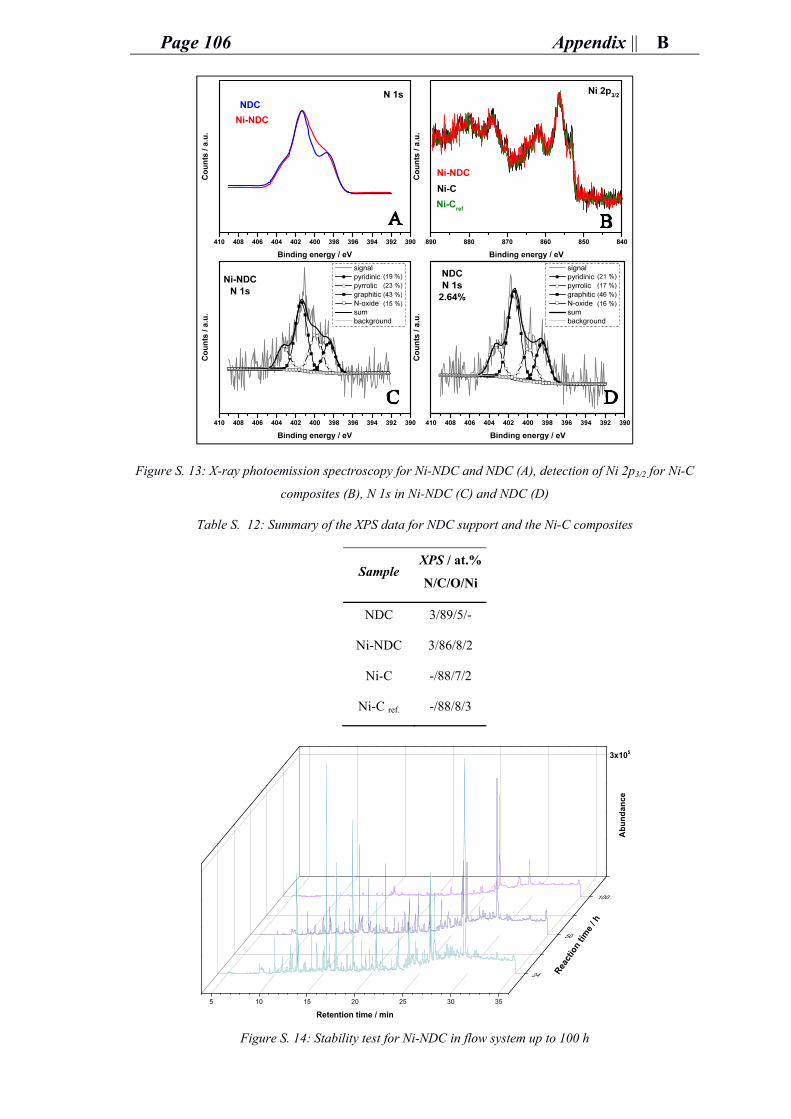
Page 106 Appendix || B
Figure S. 13: X-ray photoemission spectroscopy for Ni-NDC and NDC (A), detection of Ni 2p3/2 for Ni-C
composites (B), N 1s in Ni-NDC (C) and NDC (D)
Table S. 12: Summary of the XPS data for NDC support and the Ni-C composites
Sample XPS / at.%
N/C/O/Ni
NDC 3/89/5/-
Ni-NDC 3/86/8/2
Ni-C -/88/7/2
Ni-C ref. -/88/8/3
Figure S. 14: Stability test for Ni-NDC in flow system up to 100 h
5 10 15 20 25 30 35
3x10⁵
100
50
24
Retention time / min
Abu
ndan
ce
React
ion
time /
h
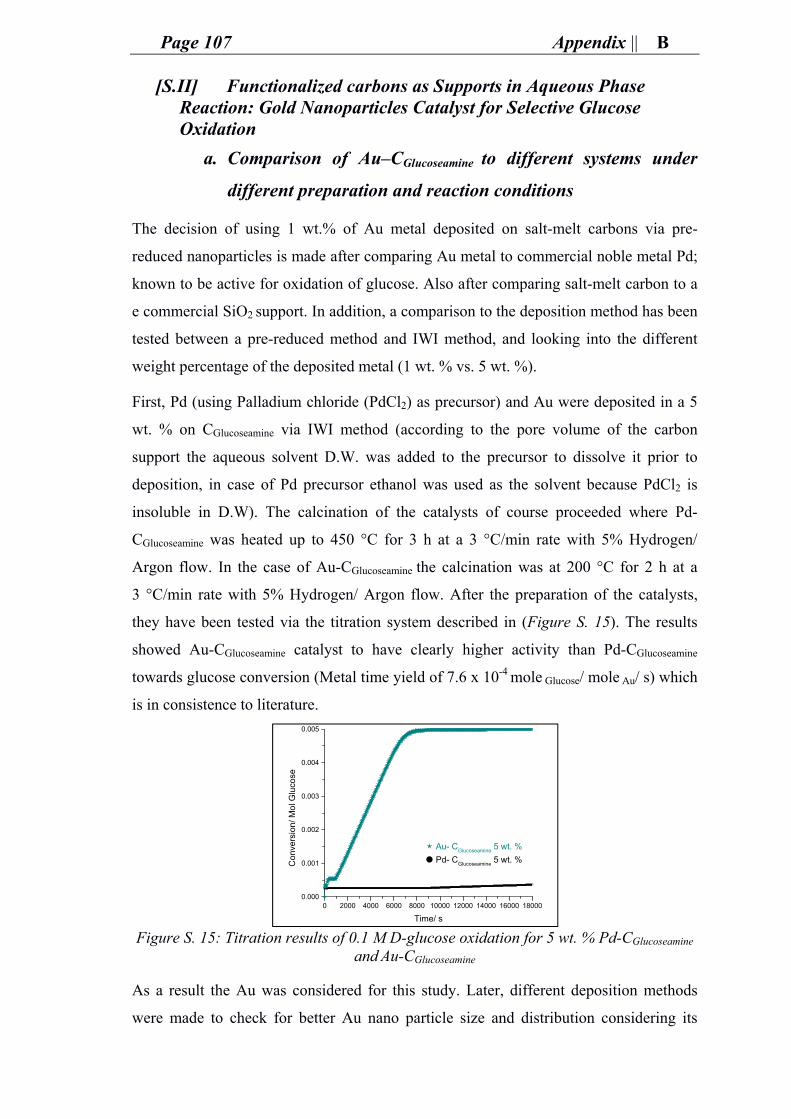
Page 107 Appendix || B
[S.II] Functionalized carbons as Supports in Aqueous Phase Reaction: Gold Nanoparticles Catalyst for Selective Glucose Oxidation
a. Comparison of Au–CGlucoseamine to different systems under
different preparation and reaction conditions
The decision of using 1 wt.% of Au metal deposited on salt-melt carbons via pre-
reduced nanoparticles is made after comparing Au metal to commercial noble metal Pd;
known to be active for oxidation of glucose. Also after comparing salt-melt carbon to a
e commercial SiO2 support. In addition, a comparison to the deposition method has been
tested between a pre-reduced method and IWI method, and looking into the different
weight percentage of the deposited metal (1 wt. % vs. 5 wt. %).
First, Pd (using Palladium chloride (PdCl2) as precursor) and Au were deposited in a 5
wt. % on CGlucoseamine via IWI method (according to the pore volume of the carbon
support the aqueous solvent D.W. was added to the precursor to dissolve it prior to
deposition, in case of Pd precursor ethanol was used as the solvent because PdCl2 is
insoluble in D.W). The calcination of the catalysts of course proceeded where Pd-
CGlucoseamine was heated up to 450 °C for 3 h at a 3 °C/min rate with 5% Hydrogen/
Argon flow. In the case of Au-CGlucoseamine the calcination was at 200 °C for 2 h at a
3 °C/min rate with 5% Hydrogen/ Argon flow. After the preparation of the catalysts,
they have been tested via the titration system described in (Figure S. 15). The results
showed Au-CGlucoseamine catalyst to have clearly higher activity than Pd-CGlucoseamine
towards glucose conversion (Metal time yield of 7.6 x 10⁻⁴ mole Glucose/ mole Au/ s) which
is in consistence to literature.
Figure S. 15: Titration results of 0.1 M D-glucose oxidation for 5 wt. % Pd-CGlucoseamine
and Au-CGlucoseamine
As a result the Au was considered for this study. Later, different deposition methods
were made to check for better Au nano particle size and distribution considering its
0 2000 4000 6000 8000 10000 12000 14000 16000 180000.000
0.001
0.002
0.003
0.004
0.005
Con
vers
ion/
Mol
Glu
cose
Au- CGlucoseamine
5 wt. %
Pd- CGlucoseamine
5 wt. %
Time/ s
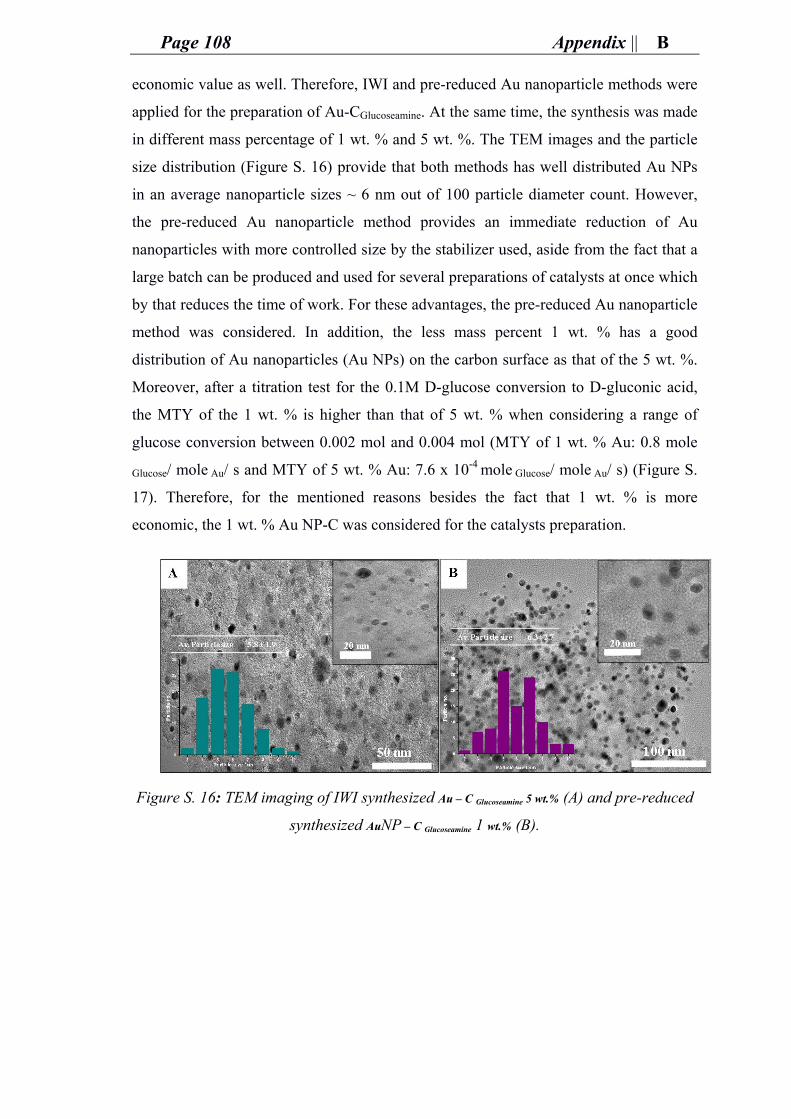
Page 108 Appendix || B
economic value as well. Therefore, IWI and pre-reduced Au nanoparticle methods were
applied for the preparation of Au-CGlucoseamine. At the same time, the synthesis was made
in different mass percentage of 1 wt. % and 5 wt. %. The TEM images and the particle
size distribution (Figure S. 16) provide that both methods has well distributed Au NPs
in an average nanoparticle sizes ~ 6 nm out of 100 particle diameter count. However,
the pre-reduced Au nanoparticle method provides an immediate reduction of Au
nanoparticles with more controlled size by the stabilizer used, aside from the fact that a
large batch can be produced and used for several preparations of catalysts at once which
by that reduces the time of work. For these advantages, the pre-reduced Au nanoparticle
method was considered. In addition, the less mass percent 1 wt. % has a good
distribution of Au nanoparticles (Au NPs) on the carbon surface as that of the 5 wt. %.
Moreover, after a titration test for the 0.1M D-glucose conversion to D-gluconic acid,
the MTY of the 1 wt. % is higher than that of 5 wt. % when considering a range of
glucose conversion between 0.002 mol and 0.004 mol (MTY of 1 wt. % Au: 0.8 mole
Glucose/ mole Au/ s and MTY of 5 wt. % Au: 7.6 x 10⁻⁴ mole Glucose/ mole Au/ s) (Figure S.
17). Therefore, for the mentioned reasons besides the fact that 1 wt. % is more
economic, the 1 wt. % Au NP-C was considered for the catalysts preparation.
Figure S. 16: TEM imaging of IWI synthesized Au – C Glucoseamine 5 wt.% (A) and pre-reduced
synthesized AuNP – C Glucoseamine 1 wt.% (B).
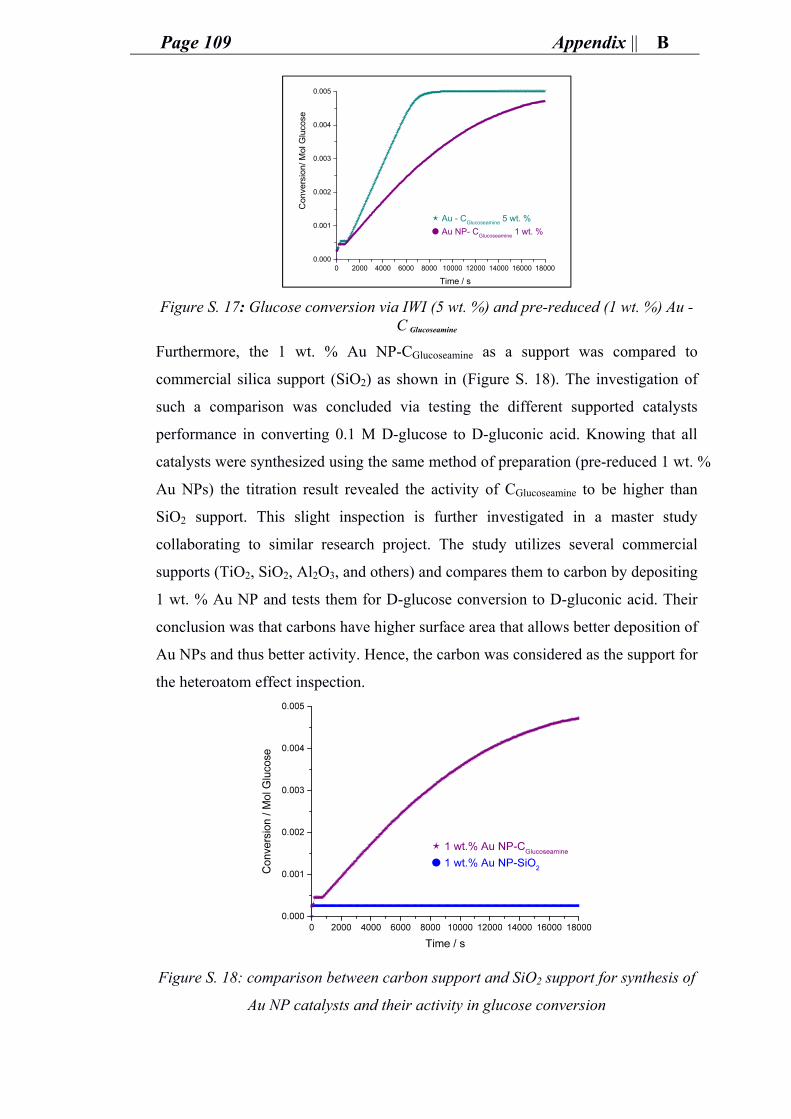
Page 109 Appendix || B
Figure S. 17: Glucose conversion via IWI (5 wt. %) and pre-reduced (1 wt. %) Au -C Glucoseamine
Furthermore, the 1 wt. % Au NP-CGlucoseamine as a support was compared to
commercial silica support (SiO2) as shown in (Figure S. 18). The investigation of
such a comparison was concluded via testing the different supported catalysts
performance in converting 0.1 M D-glucose to D-gluconic acid. Knowing that all
catalysts were synthesized using the same method of preparation (pre-reduced 1 wt. %
Au NPs) the titration result revealed the activity of CGlucoseamine to be higher than
SiO2 support. This slight inspection is further investigated in a master study
collaborating to similar research project. The study utilizes several commercial
supports (TiO2, SiO2, Al2O3, and others) and compares them to carbon by depositing
1 wt. % Au NP and tests them for D-glucose conversion to D-gluconic acid. Their
conclusion was that carbons have higher surface area that allows better deposition of
Au NPs and thus better activity. Hence, the carbon was considered as the support for
the heteroatom effect inspection.
Figure S. 18: comparison between carbon support and SiO2 support for synthesis of
Au NP catalysts and their activity in glucose conversion
0 2000 4000 6000 8000 10000 12000 14000 16000 180000.000
0.001
0.002
0.003
0.004
0.005
Au - CGlucoseamine
5 wt. %
Au NP- CGlucoseamine
1 wt. %
Con
vers
ion/
Mol
Glu
cose
Time / s
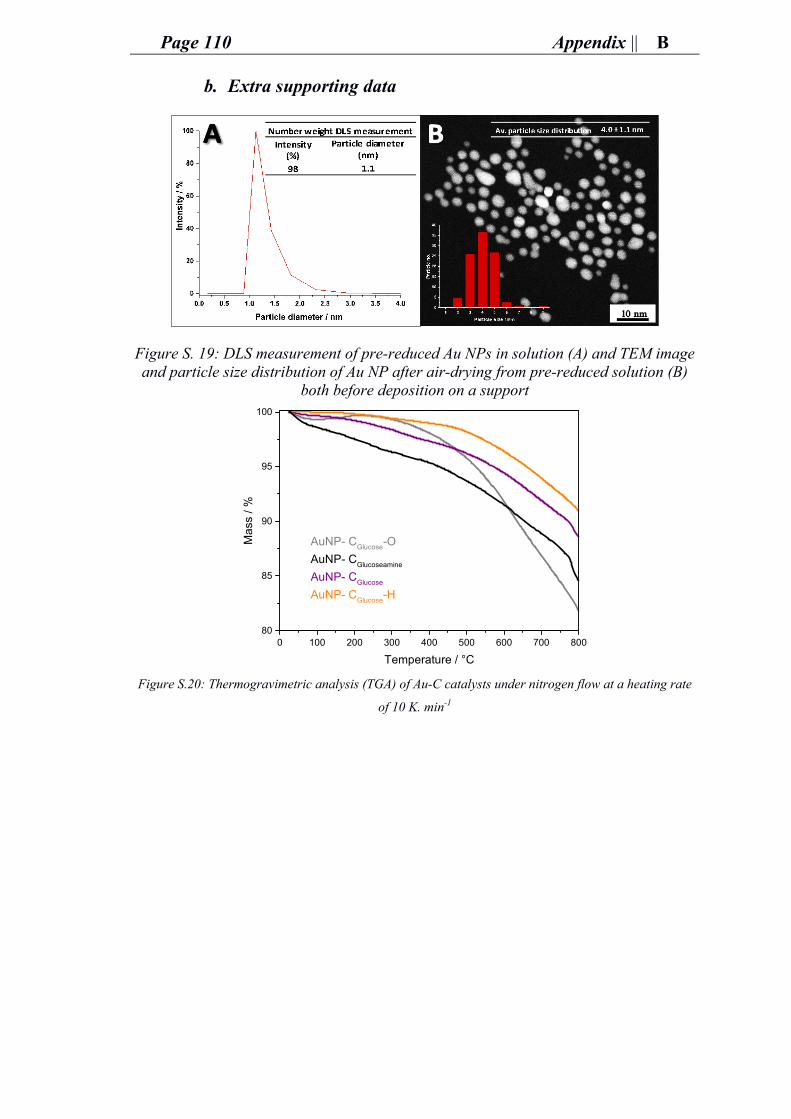
Page 110 Appendix || B
b. Extra supporting data
Figure S. 19: DLS measurement of pre-reduced Au NPs in solution (A) and TEM image and particle size distribution of Au NP after air-drying from pre-reduced solution (B)
both before deposition on a support
Figure S.20: Thermogravimetric analysis (TGA) of Au-C catalysts under nitrogen flow at a heating rate
of 10 K. min-1
0 100 200 300 400 500 600 700 80080
85
90
95
100
AuNP- CGlucose
-O
AuNP- CGlucoseamine
AuNP- CGlucose
AuNP- CGlucose
-H
Ma
ss /
%
Temperature / °C
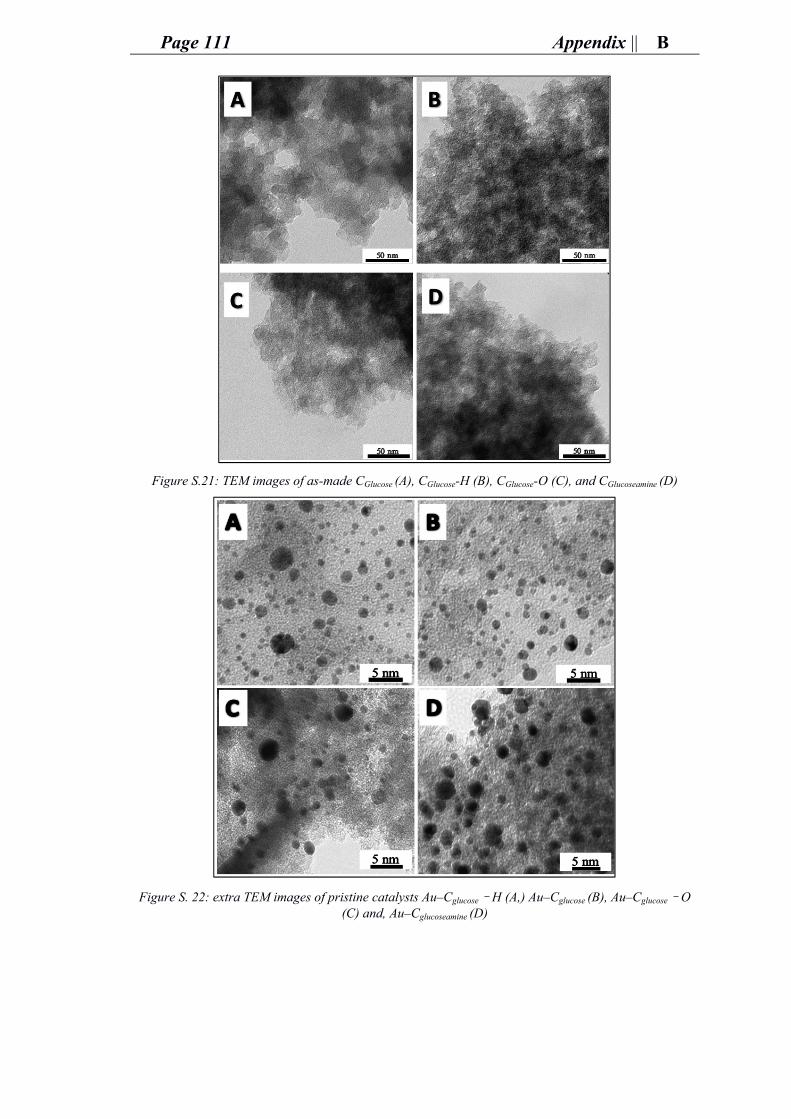
Page 111 Appendix || B
Figure S.21: TEM images of as-made CGlucose (A), CGlucose-H (B), CGlucose-O (C), and CGlucoseamine (D)
Figure S. 22: extra TEM images of pristine catalysts Au–Cglucose–H (A,) Au–Cglucose (B), Au–Cglucose–O (C) and, Au–Cglucoseamine (D)
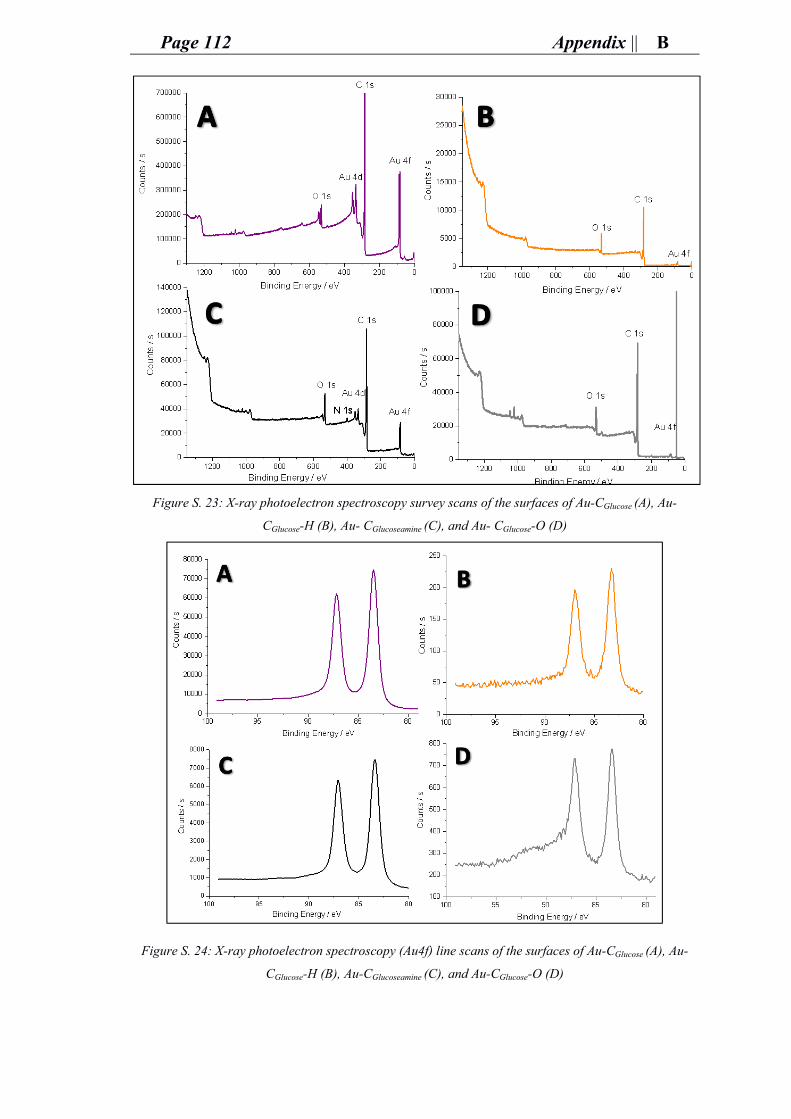
Page 112 Appendix || B
Figure S. 23: X-ray photoelectron spectroscopy survey scans of the surfaces of Au-CGlucose (A), Au-
CGlucose-H (B), Au- CGlucoseamine (C), and Au- CGlucose-O (D)
Figure S. 24: X-ray photoelectron spectroscopy (Au4f) line scans of the surfaces of Au-CGlucose (A), Au-
CGlucose-H (B), Au-CGlucoseamine (C), and Au-CGlucose-O (D)
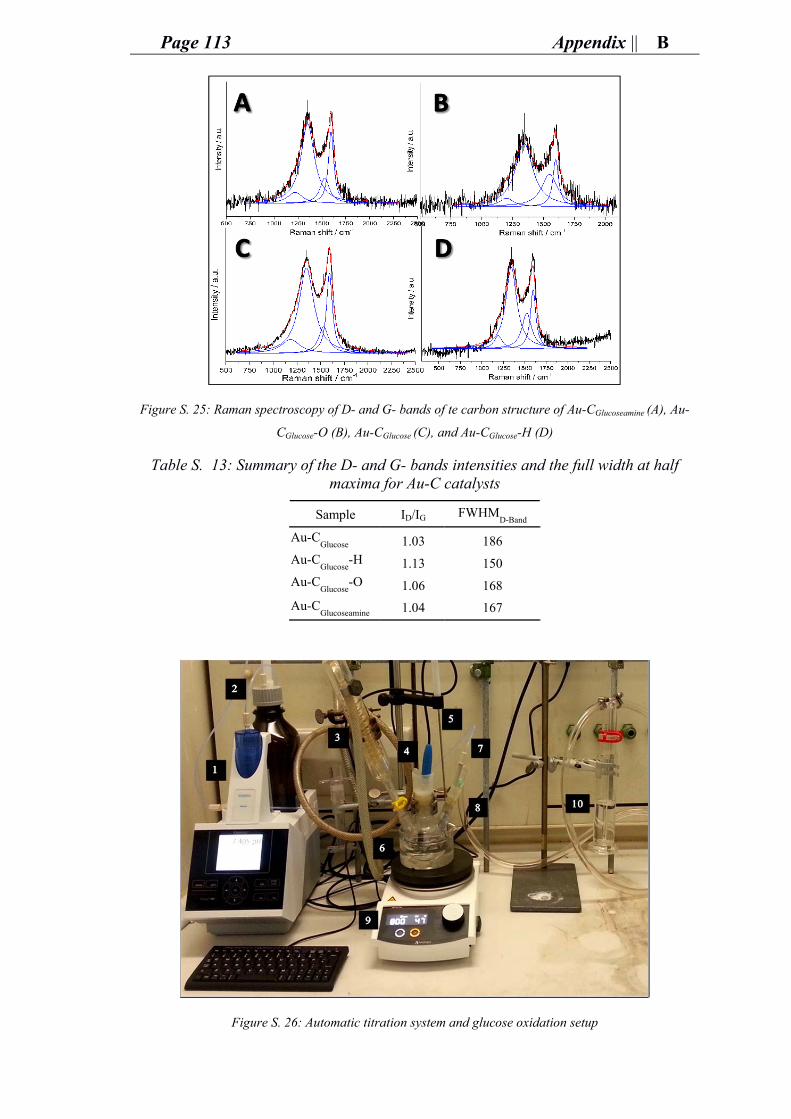
Page 113 Appendix || B
Figure S. 25: Raman spectroscopy of D- and G- bands of te carbon structure of Au-CGlucoseamine (A), Au-
CGlucose-O (B), Au-CGlucose (C), and Au-CGlucose-H (D)
Table S. 13: Summary of the D- and G- bands intensities and the full width at half maxima for Au-C catalysts
Sample ID/IG FWHMD-Band
Au-CGlucose
1.03 186 Au-C
Glucose-H 1.13 150
Au-CGlucose
-O 1.06 168
Au-CGlucoseamine
1.04 167
Figure S. 26: Automatic titration system and glucose oxidation setup
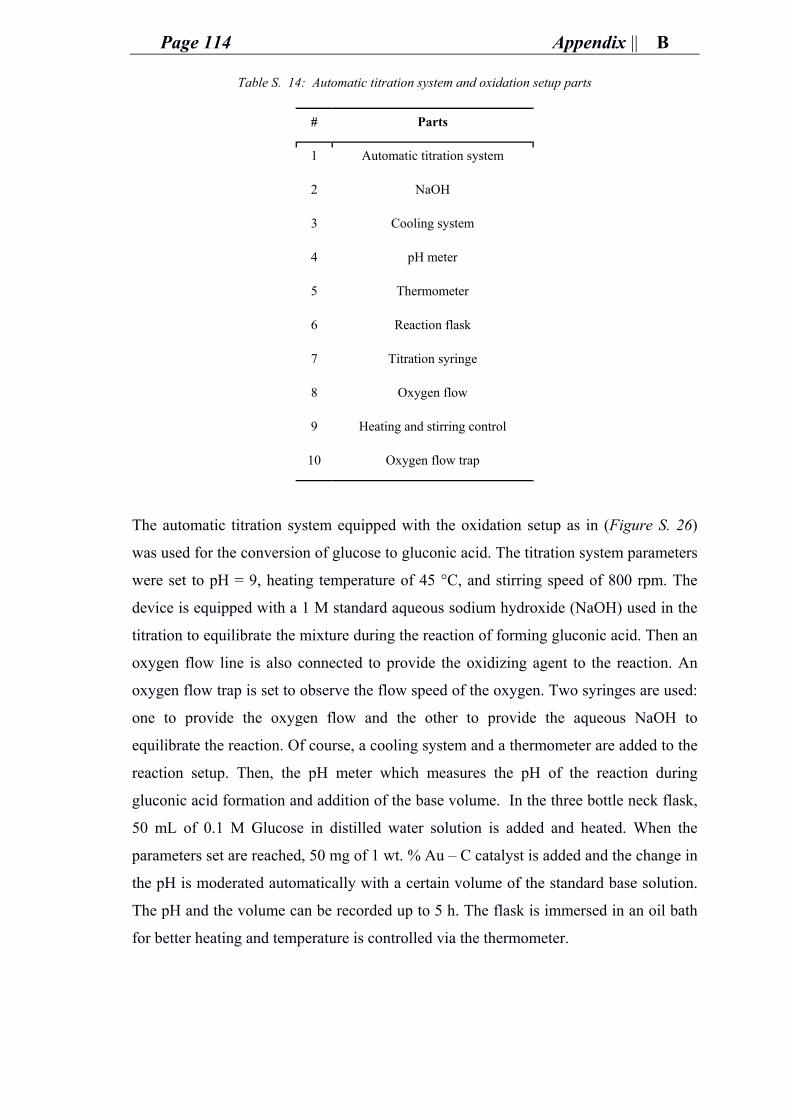
Page 114 Appendix || B
Table S. 14: Automatic titration system and oxidation setup parts
The automatic titration system equipped with the oxidation setup as in (Figure S. 26)
was used for the conversion of glucose to gluconic acid. The titration system parameters
were set to pH = 9, heating temperature of 45 °C, and stirring speed of 800 rpm. The
device is equipped with a 1 M standard aqueous sodium hydroxide (NaOH) used in the
titration to equilibrate the mixture during the reaction of forming gluconic acid. Then an
oxygen flow line is also connected to provide the oxidizing agent to the reaction. An
oxygen flow trap is set to observe the flow speed of the oxygen. Two syringes are used:
one to provide the oxygen flow and the other to provide the aqueous NaOH to
equilibrate the reaction. Of course, a cooling system and a thermometer are added to the
reaction setup. Then, the pH meter which measures the pH of the reaction during
gluconic acid formation and addition of the base volume. In the three bottle neck flask,
50 mL of 0.1 M Glucose in distilled water solution is added and heated. When the
parameters set are reached, 50 mg of 1 wt. % Au – C catalyst is added and the change in
the pH is moderated automatically with a certain volume of the standard base solution.
The pH and the volume can be recorded up to 5 h. The flask is immersed in an oil bath
for better heating and temperature is controlled via the thermometer.
# Parts
1 Automatic titration system
2 NaOH
3 Cooling system
4 pH meter
5 Thermometer
6 Reaction flask
7 Titration syringe
8 Oxygen flow
9 Heating and stirring control
10 Oxygen flow trap
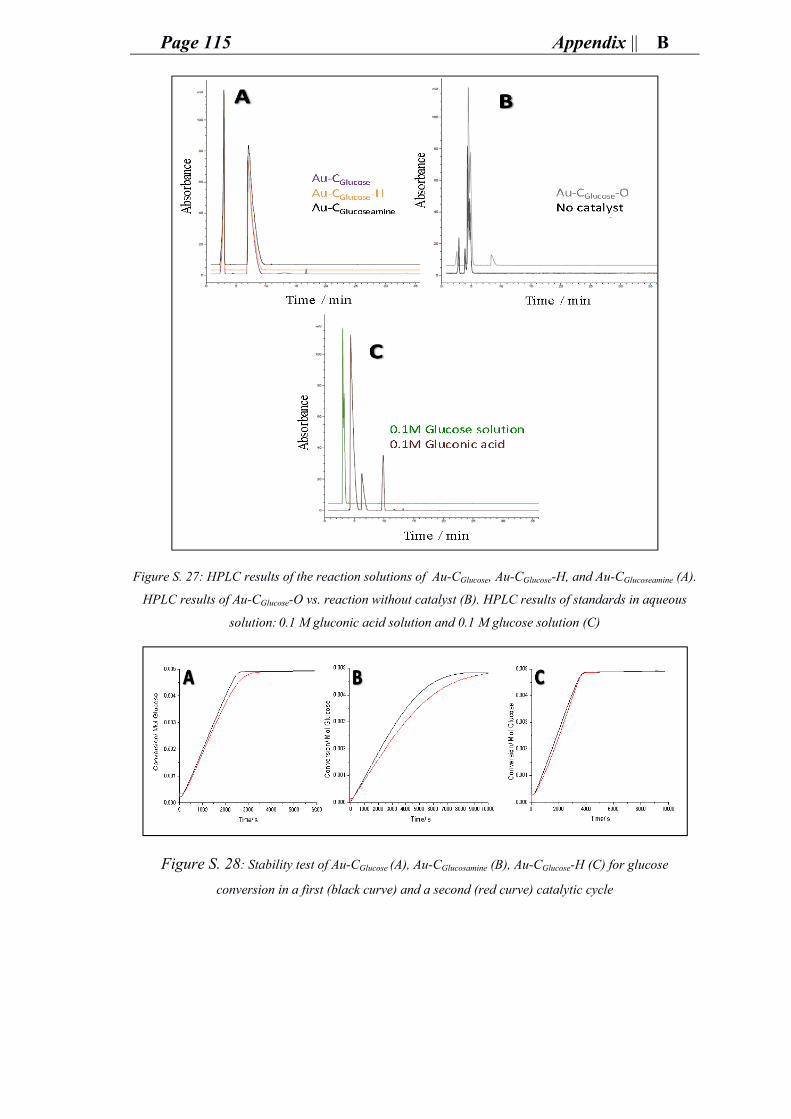
Page 115 Appendix || B
Figure S. 27: HPLC results of the reaction solutions of Au-CGlucose, Au-CGlucose-H, and Au-CGlucoseamine (A).
HPLC results of Au-CGlucose-O vs. reaction without catalyst (B). HPLC results of standards in aqueous
solution: 0.1 M gluconic acid solution and 0.1 M glucose solution (C)
Figure S. 28: Stability test of Au-CGlucose (A), Au-CGlucosamine (B), Au-CGlucose-H (C) for glucose
conversion in a first (black curve) and a second (red curve) catalytic cycle
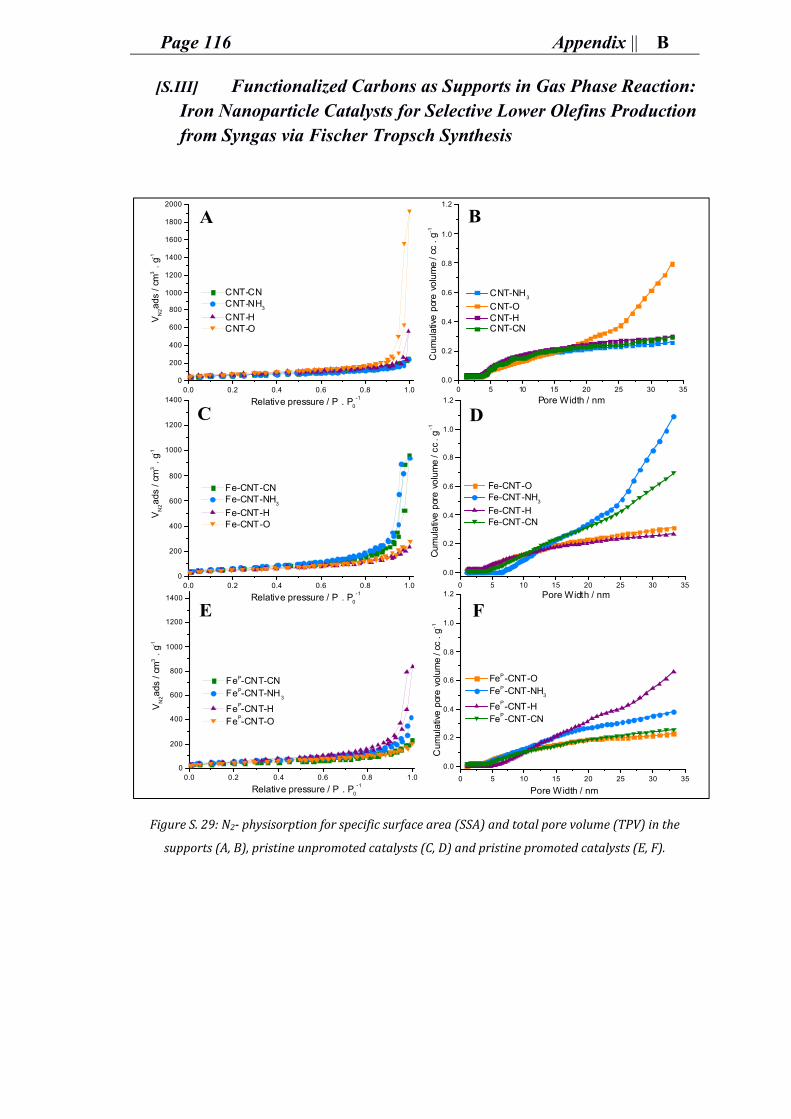
Page 116 Appendix || B
[S.III] Functionalized Carbons as Supports in Gas Phase Reaction: Iron Nanoparticle Catalysts for Selective Lower Olefins Production from Syngas via Fischer Tropsch Synthesis
Figure S. 29: N2- physisorption for specific surface area (SSA) and total pore volume (TPV) in the
supports (A, B), pristine unpromoted catalysts (C, D) and pristine promoted catalysts (E, F).
0.0 0.2 0.4 0.6 0.8 1.00
200
400
600
800
1000
1200
1400
1600
1800
2000
Relative pressure / P . P0
-1
VN
2a
ds /
cm
3 .
g-1
CNT-CN CNT-NH
3
CNT-H CNT-O
0.0 0.2 0.4 0.6 0.8 1.00
200
400
600
800
1000
1200
1400
Relative pressure / P . P0
-1
VN
2a
ds /
cm
3 .
g-1
Fe-CNT-CN Fe-CNT-NH
3
Fe-CNT-H Fe-CNT-O
0.0 0.2 0.4 0.6 0.8 1.00
200
400
600
800
1000
1200
1400
Relative pressure / P . P0
-1
VN
2a
ds /
cm
3 .
g-1
FeP-CNT-CN FeP-CNT-NH
3
FeP-CNT-H
FeP-CNT-O
0 5 10 15 20 25 30 35
0.0
0.2
0.4
0.6
0.8
1.0
1.2
Cum
ulat
ive
pore
vol
ume
/ cc
. g-1
Pore Width / nm
FeP-CNT-O FeP-CNT-NH
3
FeP-CNT-H FeP-CNT-CN
0 5 10 15 20 25 30 350.0
0.2
0.4
0.6
0.8
1.0
1.2
CNT-NH3
CNT-O CNT-H CNT-CN
Cum
ula
tive
por
e vo
lum
e / c
c .
g-1
Pore Width / nm
0 5 10 15 20 25 30 35
0.0
0.2
0.4
0.6
0.8
1.0
1.2
Cum
ula
tive
pore
vol
ume
/ cc
. g-1
Pore Width / nm
Fe-CNT-O Fe-CNT-NH
3
Fe-CNT-H Fe-CNT-CN
A B
C D
E F
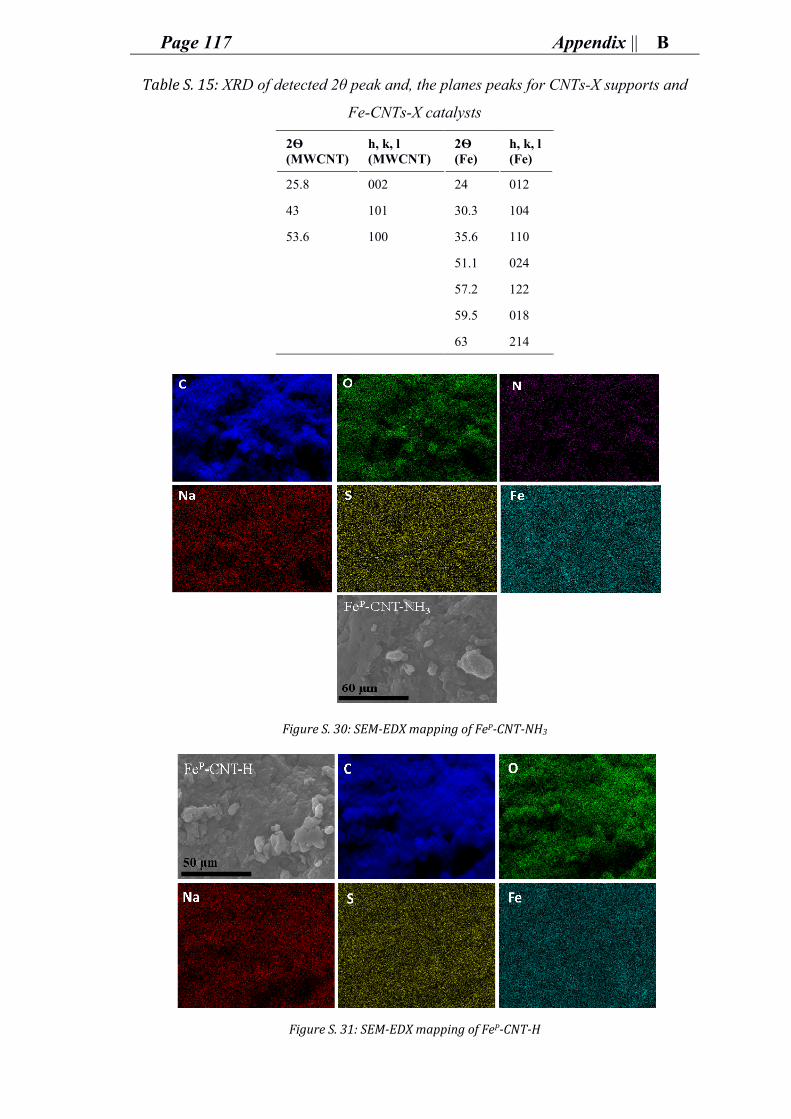
Page 117 Appendix || B
Table S. 15: XRD of detected 2θ peak and, the planes peaks for CNTs-X supports and
Fe-CNTs-X catalysts
2Ѳ (MWCNT)
h, k, l (MWCNT)
2Ѳ (Fe)
h, k, l (Fe)
25.8 002 24 012
43 101 30.3 104
53.6 100 35.6 110
51.1 024
57.2 122
59.5 018
63 214
Figure S. 30: SEM-EDX mapping of FeP-CNT-NH3
Figure S. 31: SEM-EDX mapping of FeP-CNT-H
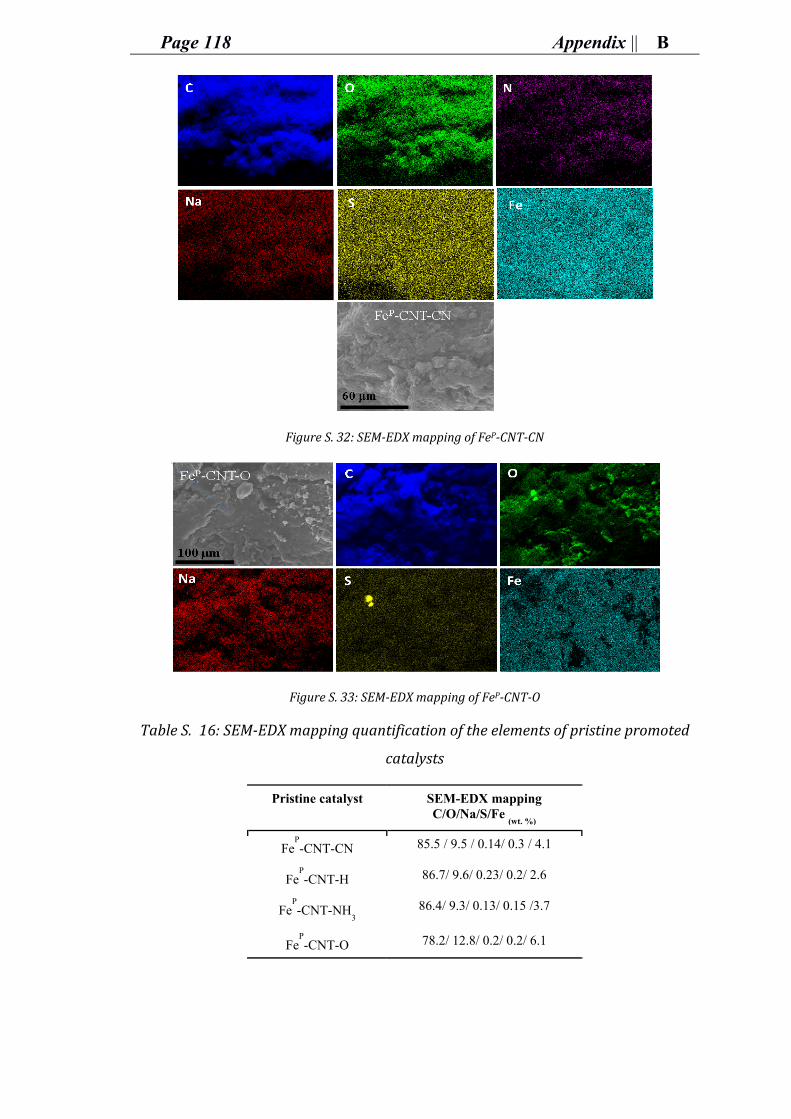
Page 118 Appendix || B
Figure S. 32: SEM-EDX mapping of FeP-CNT-CN
Figure S. 33: SEM-EDX mapping of FeP-CNT-O
Table S. 16: SEM-EDX mapping quantification of the elements of pristine promoted
catalysts
Pristine catalyst SEM-EDX mapping C/O/Na/S/Fe
(wt. %)
FeP-CNT-CN 85.5 / 9.5 / 0.14/ 0.3 / 4.1
FeP-CNT-H 86.7/ 9.6/ 0.23/ 0.2/ 2.6
FeP-CNT-NH
3 86.4/ 9.3/ 0.13/ 0.15 /3.7
FeP-CNT-O 78.2/ 12.8/ 0.2/ 0.2/ 6.1
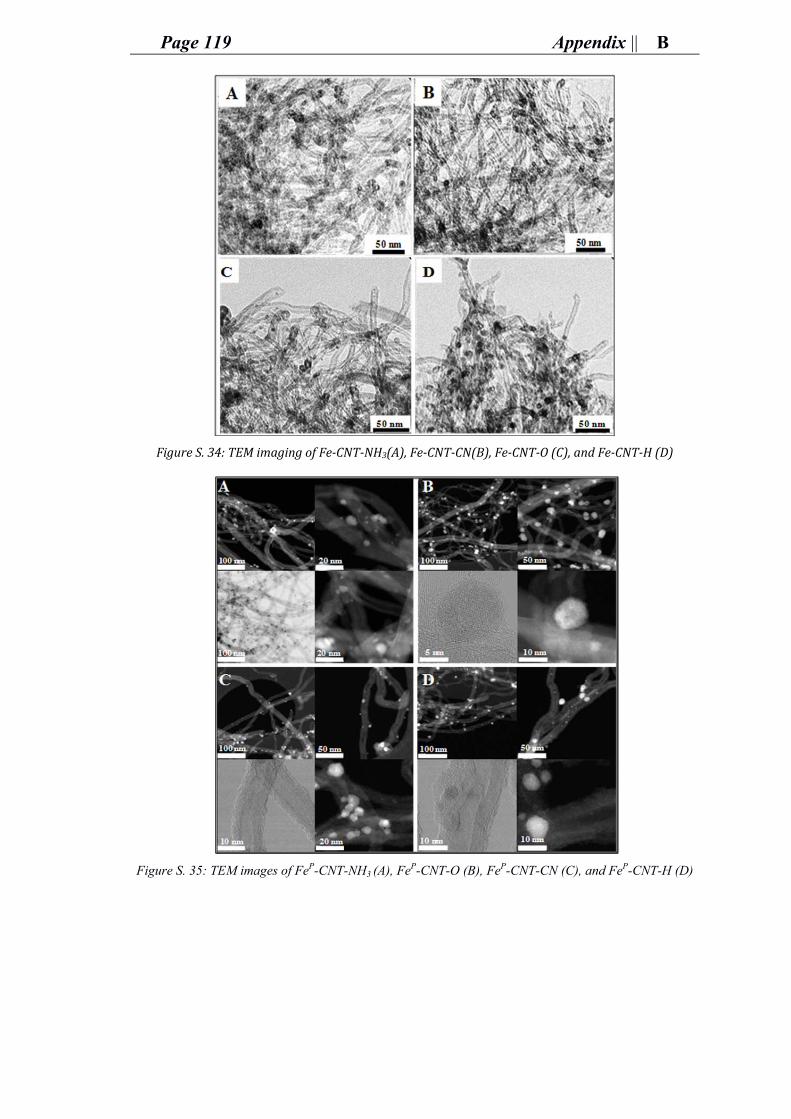
Page 119 Appendix || B
Figure S. 34: TEM imaging of Fe-CNT-NH3(A), Fe-CNT-CN(B), Fe-CNT-O (C), and Fe-CNT-H (D)
Figure S. 35: TEM images of FeP-CNT-NH3 (A), FeP-CNT-O (B), FeP-CNT-CN (C), and FeP-CNT-H (D)
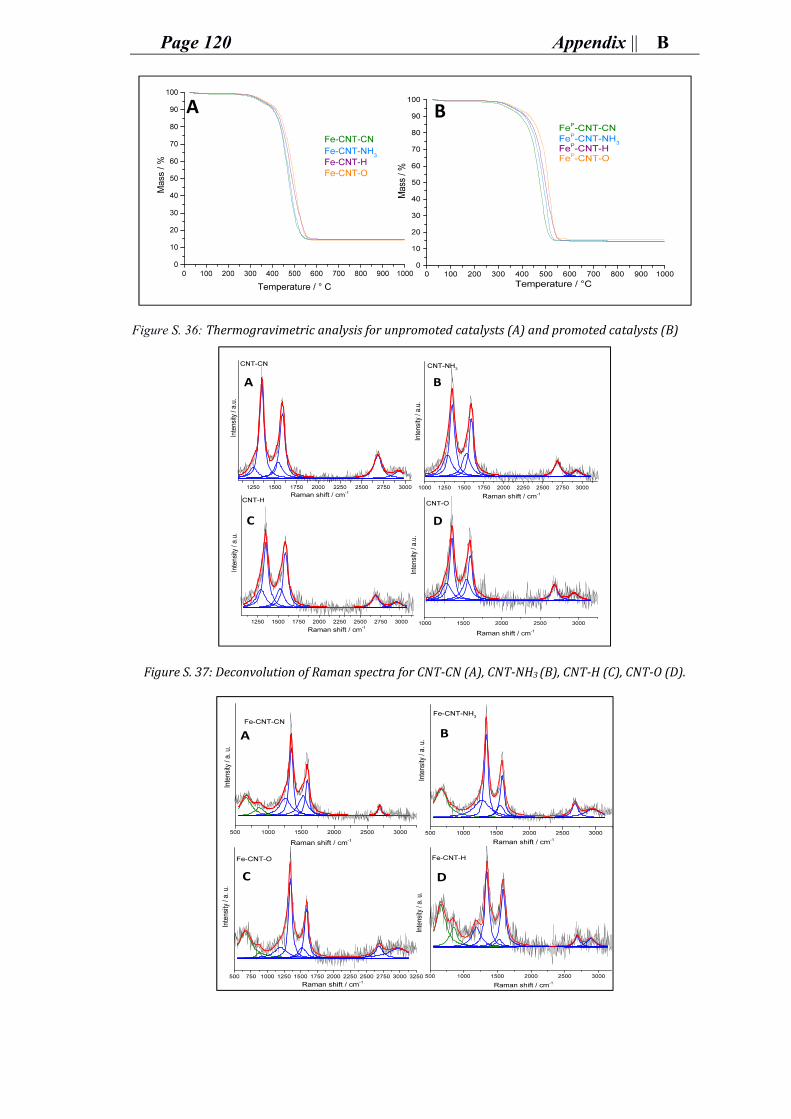
Page 120 Appendix || B
Figure S. 36: Thermogravimetric analysis for unpromoted catalysts (A) and promoted catalysts (B)
Figure S. 37: Deconvolution of Raman spectra for CNT-CN (A), CNT-NH3 (B), CNT-H (C), CNT-O (D).
A B
A B
DC
A B
DC
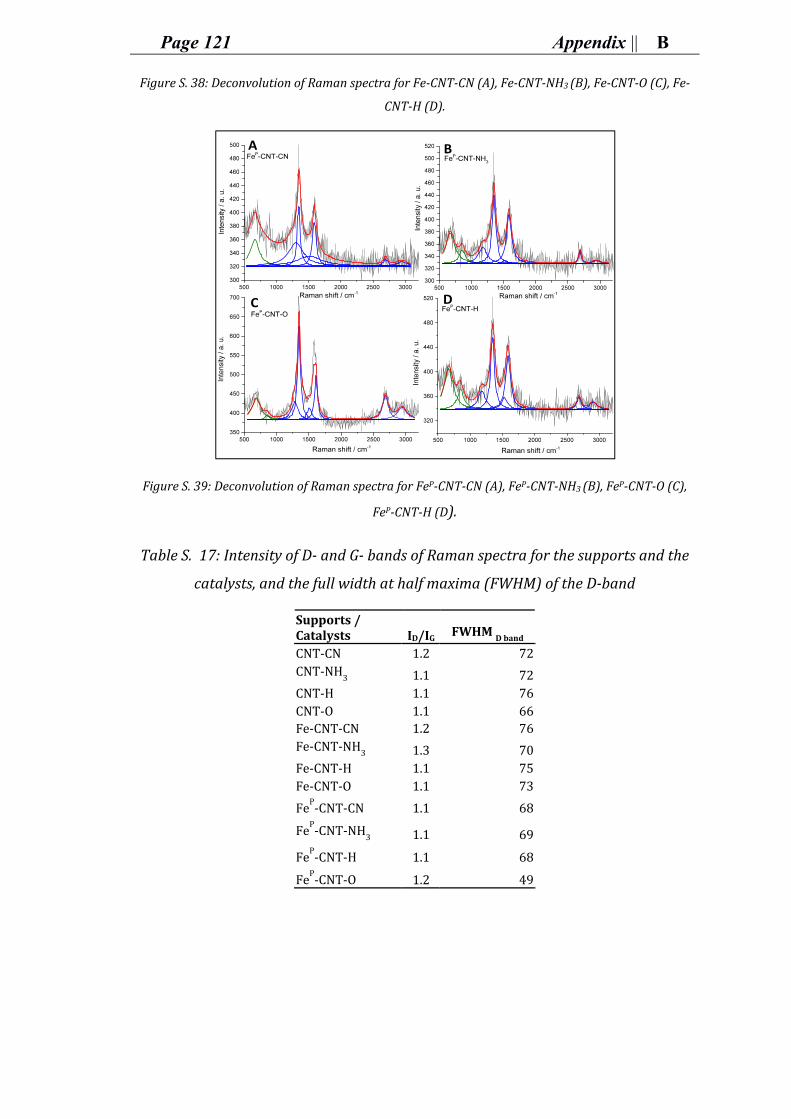
Page 121 Appendix || B
Figure S. 38: Deconvolution of Raman spectra for Fe-CNT-CN (A), Fe-CNT-NH3 (B), Fe-CNT-O (C), Fe-
CNT-H (D).
Figure S. 39: Deconvolution of Raman spectra for FeP-CNT-CN (A), FeP-CNT-NH3 (B), FeP-CNT-O (C),
FeP-CNT-H (D).
Table S. 17: Intensity of D- and G- bands of Raman spectra for the supports and the
catalysts, and the full width at half maxima (FWHM) of the D-band
Supports / Catalysts ID/IG FWHM D band CNT-CN 1.2 72CNT-NH3 1.1 72CNT-H 1.1 76CNT-O 1.1 66Fe-CNT-CN 1.2 76Fe-CNT-NH3 1.3 70Fe-CNT-H 1.1 75Fe-CNT-O 1.1 73FeP-CNT-CN 1.1 68FeP-CNT-NH3 1.1 69FeP-CNT-H 1.1 68FeP-CNT-O 1.2 49
A B
DC
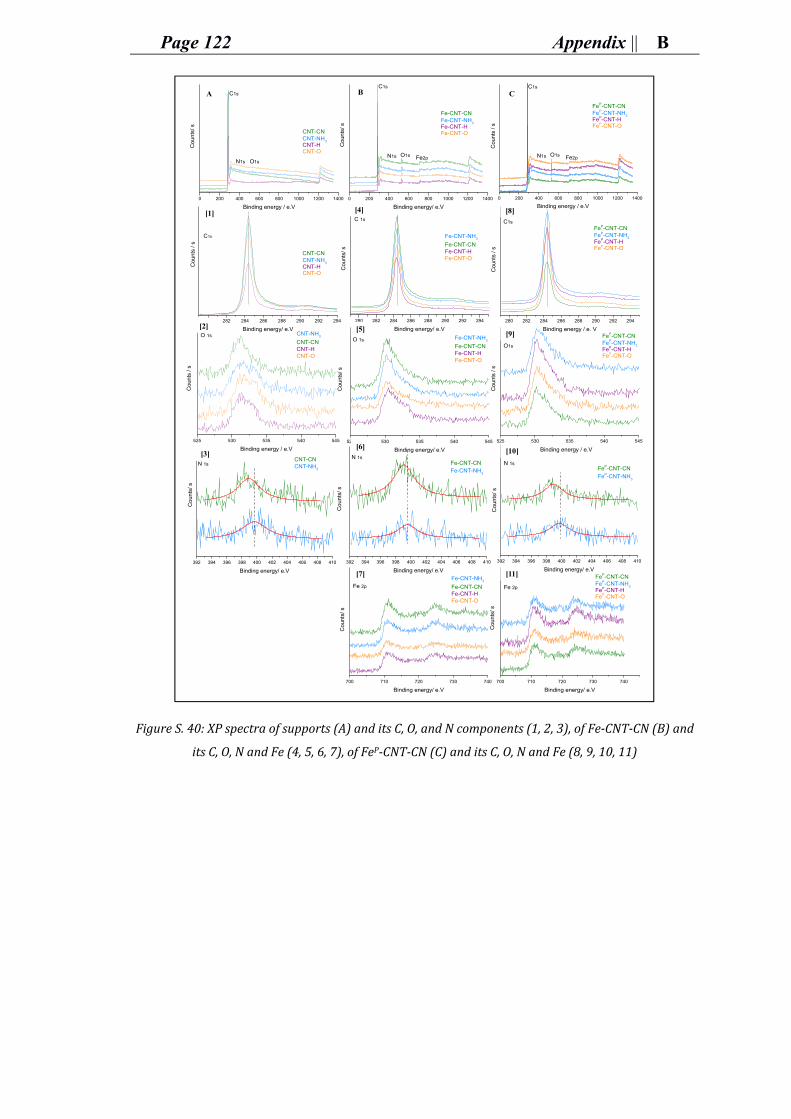
Page 122 Appendix || B
Figure S. 40: XP spectra of supports (A) and its C, O, and N components (1, 2, 3), of Fe-CNT-CN (B) and
its C, O, N and Fe (4, 5, 6, 7), of FeP-CNT-CN (C) and its C, O, N and Fe (8, 9, 10, 11)
0 200 400 600 800 1000 1200 1400
Cou
nts
/ s
Binding energy/ e.V
Fe-CNT-O
Fe-CNT-NH3
Fe-CNT-H
Fe-CNT-CN
Fe2pO1s
C1s
N1s
525 530 535 540 545
Fe-CNT-NH3
Fe-CNT-CNFe-CNT-HFe-CNT-O
Cou
nts/
s
Binding energy/ e.V
O 1s
280 282 284 286 288 290 292 294
Fe-CNT-NH3
Fe-CNT-CNFe-CNT-HFe-CNT-O
Cou
nts/
s
Binding energy/ e.V
C 1s
0 200 400 600 800 1000 1200 1400
Fe2pO1s
C1s
N1s
Cou
nts
/ s
Binding energy / e.V
FeP-CNT-O
FeP-CNT-NH3
FeP-CNT-H
FeP-CNT-CN
280 282 284 286 288 290 292 294
Cou
nts
/ s
Binding energy / e. V
C1s
FeP-CNT-O
FeP-CNT-NH3
FeP-CNT-H
FeP-CNT-CN
525 530 535 540 545
O1s
Cou
nts
/ s
Binding energy / e.V
FeP-CNT-O
FeP-CNT-NH3
FeP-CNT-H
FeP-CNT-CN
0 200 400 600 800 1000 1200 1400
Cou
nts
/ s
Binding energy / e.V
CNT-O
CNT-NH3
CNT-H
CNT-CN
O1s
C1s
N1s
700 710 720 730 740
Cou
nts
/ s
Binding energy/ e.V
Fe 2p
FeP-CNT-O
FeP-CNT-NH3
FeP-CNT-H
FeP-CNT-CN
700 710 720 730 740
Fe-CNT-NH3
Fe-CNT-CNFe-CNT-HFe-CNT-O
Coun
ts/ s
Binding energy/ e.V
Fe 2p
280 282 284 286 288 290 292 294
Coun
ts /
s
Binding energy/ e.V
CNT-O
CNT-NH3
CNT-H
CNT-CN
C1s
525 530 535 540 545
O 1s CNT-NH3
CNT-CNCNT-HCNT-O
Cou
nts
/ s
Binding energy / e.V
392 394 396 398 400 402 404 406 408 410
N 1sCNT-CNCNT-NH
3
Co
unts
/ s
Binding energy/ e.V
392 394 396 398 400 402 404 406 408 410
Fe-CNT-CNFe-CNT-NH
3
Cou
nts/
s
Binding energy/ e.V
N 1s
392 394 396 398 400 402 404 406 408 410
FeP-CNT-CNFeP-CNT-NH
3
Cou
nts/
s
Binding energy/ e.V
N 1s
A B C
[1] [4] [8]
[2]
[3]
[5]
[6]
[7]
[9]
[10]
[11]
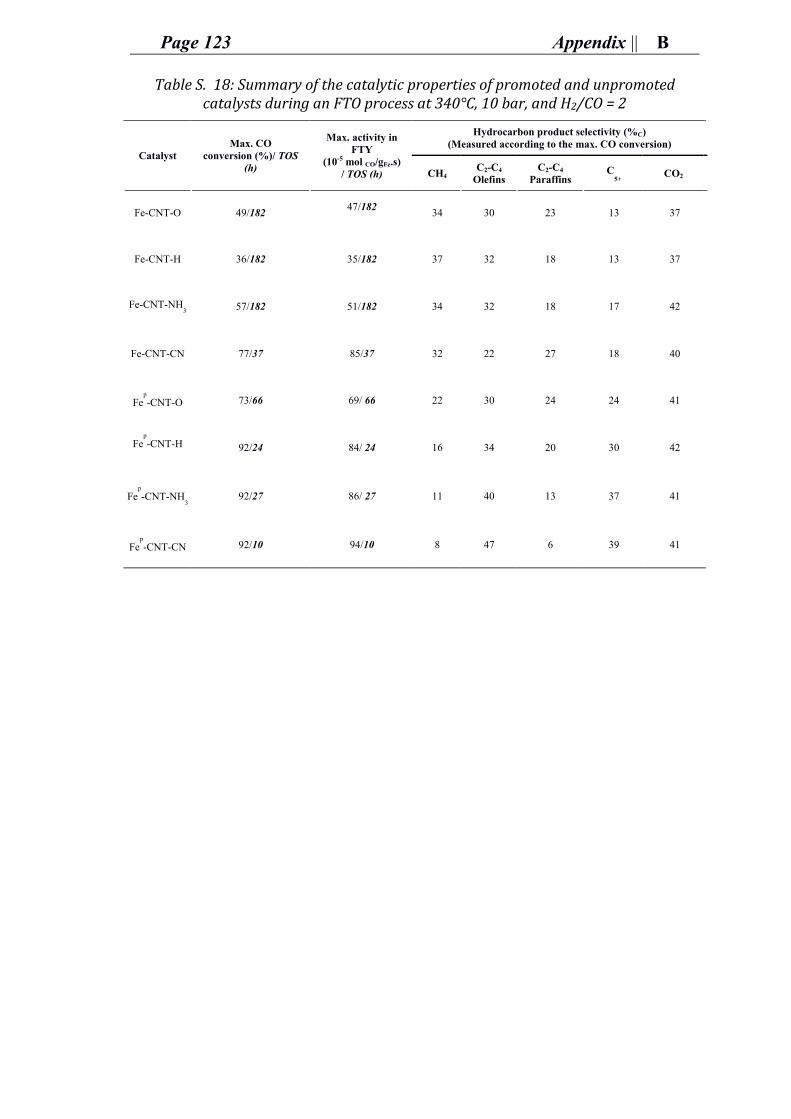
Page 123 Appendix || B
Table S. 18: Summary of the catalytic properties of promoted and unpromoted catalysts during an FTO process at 340°C, 10 bar, and H2/CO = 2
Catalyst Max. CO
conversion (%)/ TOS (h)
Max. activity in FTY
(10-5 mol CO/gFe.s) / TOS (h)
Hydrocarbon product selectivity (%C) (Measured according to the max. CO conversion)
CH4 C2-C4
Olefins C2-C4
Paraffins C
5+ CO2
Fe-CNT-O 49/182 47/182
34 30 23 13 37
Fe-CNT-H 36/182 35/182 37 32 18 13 37
Fe-CNT-NH3 57/182 51/182 34 32 18 17 42
Fe-CNT-CN 77/37 85/37 32 22 27 18 40
Fep
-CNT-O 73/66 69/ 66 22 30 24 24 41
Fep
-CNT-H
92/24 84/ 24 16 34 20 30 42
Fep
-CNT-NH3 92/27 86/ 27 11 40 13 37 41
Fep
-CNT-CN 92/10 94/10 8 47 6 39 41

C. Achievements
Page 124 Achievements || C
C. Achievements
a. List of Publications
[1] S. M. G. Lama, J. Pampel, T.-P. Fellinger, V. P. Beškoski, L. Slavković-Beškoski, M. Antonietti and V. Molinari. Efficiency of Ni Nanoparticles Supported on Hierarchical Porous Nitrogen-Doped Carbon for Hydrogenolysis of Kraft Lignin in Flow and Batch Systems, ACS Sustainable Chem. Eng., 2017, 5, 2415-2420
[2] S. M. G. Lama, J. Schmidt, A. Malik, R. Walczak, D. V. Silva, A. Völkel, and M. Oschatz. Modification of salt-templated carbon surface chemistry for efficient oxidation of glucose with supported gold catalysts, ChemCatChem,2018
[3] S. M. G. Lama, J. Lennard Weber, J. Philipp Hofmann, R. Yan, K.P. de Jong, T. Heil, and M. Oschatz. Tandem Promotion Fischer-Tropsch to Olefins Catalysts by Sodium and Sulfur in Combination with Nitrogen-doped Carbon layers on Carbon Nanotube Supports, 2018 ( submitted)
b. List of Conferences
List of Presentations
[1] 51. Jahrestreffen Deutscher Katalytiker Conference, 2018, Weimar (Accepted presentation)
[2] Cat Catalytic Center, RWTH Aachen University, 2017, Aachen (invited presentation)
[3] Jung Chemie Forschung–Ph.D Symposium, 2017, Golm-Potsdam, Germany (Accepted presentation)
[4] 2nd Green and Sustainable Chemistry conference, 2017, Berlin, Germany (Invited presentation)
List of Posters
[1] 1st Green and Sustainable Chemistry conference, 2016, Berlin, Germany (winning poster prize)
[2] Max Planck Institute of Colloids and Interfaces Alumni meeting, 2016, Golm–Potsdam, Germany (Poster)
[3] 253rd ACS National Meeting, 2017, San Francisco-California, USA, (Poster) [4] Max Planck Institute of Colloids and Interfaces Alumni meeting, 2017, Golm–
Potsdam, Germany (Poster) [5] GDCh–Wissenschaftsforum Chemie Conference, 2017, Berlin, Germany (Poster) [6] Evonik Meets Academia symposium in Max Planck Institute of Colloids and
Interfaces, 2017, Golm-Potsdam, Germany (Poster)
Page 125 Declaration of Authorship || D
D. Declaration of Authorship
Hiermit erkläre ich, dass die vorliegende Arbeit selbstständig angefertigt und keine
anderen als die angegebenen Hilfsmittel und Quellen verwendet habe.
Hereby, I declare that the work reported within this thesis was produced independently,
and nothing other than the referenced materials and sources was used.
Sandy M. G. Lama, Potsdam 25th April, 2018
Die vorliegende Dissertation entstand in der Zeit von Oktober 2015 bis März 2018 am
Max-Planck-Institut für Kolloid- und Grenzflächenforschung in Potsdam-Golm unter
der Betreuung von Prof. Dr. Markus Antonietti.

“I have not failed.
I have successfully discovered 10,000 things that won’t work.”
(Thomas Edison)

”This is not the end, but the key for a brighter beginning”


