Embed Size (px)
Citation preview

DEPARTAMENTO DE BIOLOGÍA
CELULAR, FISIOLOGÍA E INMUNOLOGÍA
Functional role and therapeutic
potential of the somatostatin and ghrelin
systems and their splicing variants in
prostate cancer.
PAPEL FUNCIONAL Y POTENCIAL TERAPÉUTICO DE LOS
SISTEMAS SOMATOSTATINA Y GHRELINA Y SUS VARIANTES DE
SPLICING EN TUMORES DE PRÓSTATA.
Daniel Hormaechea Agulla
Córdoba 2017

TITULO: Functional role and therapeutic potential of the somatostatin and ghrelinsystems and their splicing variants in prostate cancer
AUTOR: Daniel Hormaechea Agulla
© Edita: UCOPress. 2017 Campus de RabanalesCtra. Nacional IV, Km. 396 A14071 Córdoba
www.uco.es/[email protected]


DEPARTAMENTO DE BIOLOGÍA
CELULAR, FISIOLOGÍA E INMUNOLOGÍA
Functional role and therapeutic
potential of the somatostatin and ghrelin
systems and their splicing variants in
prostate cancer.
PAPEL FUNCIONAL Y POTENCIAL TERAPÉUTICO DE LOS
SISTEMA SOMATOSTATINA Y GHRELINA Y SUS VARIANTES DE
SPLICING EN TUMORES DE PRÓSTATA.
Memoria de Tesis Doctoral presentada por Daniel Hormaechea
Agulla, Licenciado en Biología, para optar al grado de Doctor en
Biomedicina.
Los directores
Dr. Raúl M. Luque Huertas y Dr. Justo P. Castaño Fuentes
Profesores del Departamento de Biología Celular de la
Universidad de Córdoba
En Córdoba, a 17 de abril de 2017


Esta Tesis Doctoral ha sido realizada en el Departamento de Biología
Celular, Fisiología e Inmunología de la Universidad de Córdoba, bajo la
dirección de los Dres. Raúl M. Luque Huertas y Justo P. Castaño Fuentes.
Dicho proyecto fue subvencionado mediante los Proyectos PI13/00651,
PI16/00264 (Proyectos de Investigación en Salud FIS, funded by Instituto de
Salud Carlos III and co-funded by European Union (ERDF/ESF, “Investing
in your future”), BFU2013-43282-R, BFU2016-80360-R (MINECO), BIO-
0139, CTS-1406, (Junta de Andalucía) and CIBERobn. CIBER is an
initiative of Instituto de Salud Carlos III, Ministerio de Sanidad, Servicios
Sociales e Igualdad, Spain.


LIST OF ABBREVIATIONS
aa= Amino acids
ADT= Androgen deprivation therapy
AR= Androgen receptor
BPH= Benign Prostatic Hypertrophy
CK= Cytokeratin
CORT= Cortistatin
CRPC= Castration-Resistant Prostate cancer
DHT= Dihydrotestosterone
DRE= Digital Rectal Exam
ER= Estrogen Receptor
ERG=ETS-related gene
ETS=E26 transformation-specific or E-twenty-six
FFPE= Formalin-Fixed, Paraffin-Embedded
GHRL=Ghrelin
GHS-R = Ghrelin receptor
GOAT = Ghrelin O-acyltransferase
GR= Glucocorticoid Receptor
GS= Gleason Score
MBOAT = Membrane-bound O-acyltransferase
miRNA= micro-RNA
SNPs= Single Nucleotide Polymorphisms
SSAs= Somatostatin analogs
SST= Somatostatin
sst= Somatostatin receptors
PCa= Prostate Cancer
PCA3=Prostate Cancer Antigen 3
PIN= Prostatic Intraepithelial Neoplasia
PSA= Prostate-Specific Antigen
PR= Progesterone
PGR= Progesterone Receptor


TABLE OF CONTENTS


TABLE OF CONTENTS
1. Summary/ Resumen………………………………………………………………...1
2. Introduction .............................................................................................................. 15
2.1. Prostate gland ........................................................................................................ 17
2.1.1. Physiological regulation of prostate by hormones and its dysregulation in
prostate cancer .............................................................................................................. 18
2.1.1.1. Androgens ...................................................................................... 19
2.1.1.2. Estrogens ....................................................................................... 20
2.1.1.3. Progesterone .................................................................................. 21
2.1.1.4. Glucocorticoids .............................................................................. 21
2.2. Clinical significance .............................................................................................. 22
2.2.1. Prostatitis ................................................................................................ 22
2.2.2. Benign prostatic hyperplasia (BPH) ....................................................... 22
2.2.3. PIN lesion ............................................................................................... 22
2.2.4. Prostate cancer ........................................................................................ 23
2.2.4.1. Epidemiology ................................................................................ 23
2.2.4.2. Symptoms ...................................................................................... 23
2.2.4.3. Risk factors .................................................................................... 23
2.2.4.4. Classification ................................................................................. 23
2.2.4.5. Types of prostate cancer ................................................................ 27
2.2.4.6. Pathophysiology ............................................................................ 28
2.2.4.6.1. Early events in PCa .............................................................. 30
2.2.4.6.1. Late events in PCa: the development of CRPC (Castration
Resistant Prostate Cancer) ............................................................................................ 34
2.2.4.7. Diagnosis ....................................................................................... 35
2.2.4.8. Treatment ....................................................................................... 36
2.3. Somatostatin system .............................................................................................. 37
2.3.1. Somatostatin system in prostate cancer .................................................. 44
2.4. Ghrelin system ....................................................................................................... 46
2.4.1. Ghrelin system in PCa ............................................................................ 48
3. Hypothesis and objectives ........................................................................................ 51
4. Materials and methods .............................................................................................. 55
4.1. Patients and samples .............................................................................................. 57
4.2. RNA, RT and qPCR analysis ................................................................................ 62

4.2.1. RNA isolation from FFPE samples ........................................................ 62
4.2.2. RNA isolation from fresh tissues (needle biopsies and normal prostate from
cystoprostatectomy) ..................................................................................................... 62
4.2.3. RNA isolation from cell lines ................................................................. 65
4.2.4. Quantification of RNA concentration and Reverse-Transcription (RT) 65
4.2.5. Conventional PCR and quantitative real-time PCR (qPCR) with SYBR
green ............................................................................................................................. 66
4.3. sst5TMD4 and GOAT IHQ analysis ..................................................................... 67
4.4. Analysis of Single Nucleotide Polymorphisms (SNPs) in the sst5 gene sequence
...................................................................................................................................... 68
4.5. Cultures: normal human prostate cells, normal-like prostate cell line and PCa cell
lines ............................................................................................................................... 68
4.5.1. Primary cell cultures from human prostate tissues ................................. 68
4.5.2. Cell lines ................................................................................................. 70
4.6. Peptides .................................................................................................................. 71
4.7. Transfections (plasmid and siRNA) ...................................................................... 71
4.7.1. Stable and transient transfection of ghrelin, In1-ghrelin, sst1 and sst5TMD4
...................................................................................................................................... 71
4.7.2. Silencing of ghrelin, In1-ghrelin and sst5TMD4 by specific siRNA ..... 72
4.8. Functional assays ................................................................................................... 73
4.8.1. Measurements of proliferation rate ........................................................ 73
4.8.2. Measurements of cell migration ............................................................. 74
4.9. Hormonal measurements (ELISA and RIA techniques) ....................................... 74
4.9.1. Measurement of PSA levels by ELISA .................................................. 74
4.9.2. Measurement of GOAT levels by ELISA .............................................. 75
4.9.3. Measurement of active ghrelin levels by ELISA.................................... 75
4.9.4. Measurement of active Prepro-In1-ghrelin levels by RIA ..................... 76
4.10. Mechanistic assays .............................................................................................. 78
4.10.1. Cancer pathway reporter assay ............................................................. 78
4.10.2. Measurement of free cytosolic calcium changes .................................. 79
4.10.2.1. Stable sst5TMD4-PC3 transfected cells treated with SST analogs
...................................................................................................................................... 80
4.10.2.2. Normal human primary prostate cell cultures treated with ghrelin or
In1-ghrelin .................................................................................................................... 80
4.10.3. RT2 Prostate Cancer PCR Array .......................................................... 80
4.10.4. Western blotting ................................................................................... 81
4.10.4.1. Validation of results from the cancer pathway reporter assay and
RT2 Prostate Cancer PCR Array by Western blotting ................................................. 82

4.10.4.2. Intracellular signaling pathways trigger after treatment with peptides
from the ghrelin, somatostatin and insulin/IGF-1 systems in PCa cell lines ................ 82
4.11. Xenograft model .................................................................................................. 83
4.12. Statistical analysis ............................................................................................... 83
5. Results ...................................................................................................................... 85
5.1. Analysis of the SST-system in PCa ....................................................................... 87
5.1.1. Presence of different components of the SST-system in human normal and
PCa tissues and cell lines .............................................................................................. 87
5.1.2. Presence and functional role of sst5TMD4 in PCa................................. 90
5.1.2.1. The truncated spliced receptor sst5TMD4 is overexpressed in PCa
...................................................................................................................................... 90
5.1.2.2. sst5TMD4 levels (mRNA and protein) correlate with clinical
aggressiveness features in PCa. .................................................................................... 91
5.1.2.3. sst5TMD4 is associated to two SNPs in PCa. ............................... 95
5.1.2.4. sst5TMD4 overexpression enhances pathophysiological features of
PCa cell lines and induces larger tumors in nude-mice ................................................ 95
5.1.2.4.1. Validation of sst5TMD4 overexpression in sst5TMD4-stably-
transfected PCa cell lines. ............................................................................................. 96
5.1.2.4.2. sst5TMD4 overexpression enhances cell proliferation and
migration of PCa cell lines ........................................................................................... 96
5.1.2.4.3. sst5TMD4-stably-transfected PC3-cells induce larger tumors
than control cells (mock cells) in a preclinical in vivo model. ..................................... 97
5.1.2.5. sst5TMD4 silencing reverts pathophysiological features of PCa cell
lines ............................................................................................................................... 98
5.1.2.6. sst5TMD4 overexpression modulates key cell signaling pathways and
dysregulates the expression of oncogenes and tumor suppressor genes involved in PCa
development and progression. ...................................................................................... 99
5.1.2.6.1. Use of the Cignal Finder Reporter Assay revealed that
sst5TMD4 overexpression enhances the activity of key cell signaling pathways.
Validation of the results by qPCR and Western blot .................................................... 100
5.1.2.6.2. Use of the RT2 Prostate Cancer PCR Array revealed that
sst5TMD4 overexpression alters the expression of key genes involved in PCa
development and progression. Validation of the results by qPCR and Western blot. .. 102
5.1.2.7. PCa cell lines transfected with sst5TMD4 do not respond to SSAs in
terms of changes in free-cytosolic Ca2+ concentration. .............................................. 103
5.2. Analysis of the ghrelin-system in PCa .................................................................. 106
5.2.1. Presence of different components of the ghrelin-system in human normal
and PCa tissues and cell lines ....................................................................................... 106
5.2.2. Presence and functional role of GOAT in PCa....................................... 108
5.2.2.1. GOAT enzyme is overexpressed in PCa tissues ............................ 108

5.2.2.2. GOAT expression levels correlate with metabolic factors (BMI,
bodyweight and presence of dyslipidemia) in patients with PCa ................................. 109
5.2.2.3. GOAT protein levels are also up-regulated in PCa tissues ........... 110
5.2.2.4. GOAT expression is higher in PCa cells vs. normal prostate cells and
it is secreted and regulated by metabolic factors in normal and tumoral prostate cells 111
5.2.2.5. Plasma GOAT levels are elevated in patients with PCa in comparison
with healthy control patients: association with pathophysiological parameters........... 114
5.2.2.6. Association with clinical-metabolic parameters of plasma GOAT
levels with metabolic parameters in patients with PCa ................................................ 115
5.2.2.7. Plasma GOAT levels as non-invasive diagnostic biomarker of PCa in
non-diabetic individuals ............................................................................................... 118
5.2.2.8. Urine GOAT levels are elevated in patients with PCa in comparison
to healthy-control patients: potential as non-invasive biomarker of PCa. .................... 119
5.2.3. Presence and functional role of In1-ghrelin variants in PCa .................. 121
5.2.3.1. In1-ghrelin, but not ghrelin, is overexpressed in PCa tissues and its
levels are associated with GOAT-enzyme and PSA levels. ......................................... 121
5.2.3.2. In1-ghrelin, but not ghrelin, expression is higher in castration-resistant
PCa cells compared with androgen-dependent PCa cells and normal prostate cells.... 123
5.2.3.3. Plasma levels of In1-ghrelin, but not ghrelin, are higher in patients
with PCa compared with healthy-control patients ........................................................ 124
5.2.3.4. Effects of In1-ghrelin and ghrelin treatment on normal prostate cell
function ......................................................................................................................... 125
5.2.3.5. Effects of In1-ghrelin and ghrelin treatment or overexpression on cell
viability/proliferation of normal primary prostate cell cultures and normal like prostate
cell line (RWPE-1) ....................................................................................................... 127
5.2.3.6. Effects of In1-ghrelin and ghrelin treatment on pathophysiological
features (cell proliferation and migration) of PCa cells ............................................... 127
5.2.3.7. In1-ghrelin, but not ghrelin, overexpression enhanced malignant
features (cell proliferation and migration) of PCa cells ............................................... 129
5.2.3.8. In1-ghrelin overexpression enhanced the growth rate of PC3-induced
xenografted tumors ....................................................................................................... 130
5.2.3.9. In1-ghrelin overexpression evoked a profound dysregulation of key
genes involved in PCa development and progression. ................................................. 132
5.2.3.10. In1-ghrelin silencing decreased cell proliferation and PSA secretion
...................................................................................................................................... 135
Results: Appendix .......................................................................................................... 137
Table 11. Prostate cancer finder RT2 Profiler PCR array data ...................................... 137
Table 12. Primers Sequences, product sizes obtained and GeneBank accession numbers of
the primers designed and validated in our laboratory................................................... 141
6. Discusion .................................................................................................................... 143

6.1. The truncated somatostatin receptor, sst5TMD4, is overexpressed in prostate cancer,
where it increases malignant features by altering key signaling pathways and tumor
suppressors/oncogenes ................................................................................................. 145
6.2. Ghrelin O-acyltransferase (GOAT) enzyme is overexpressed in prostate cancer
wherein it is associated with the metabolic status: potential value as a non-invasive
biomarker. ..................................................................................................................... 150
6.3. In1-ghrelin splicing variant is overexpressed in prostate cancer wherein it increases
aggressiveness features through regulation of key tumor suppressors/oncogenes ....... 155
7. Conclusions ................................................................................................................ 161
8. Bibliography ............................................................................................................... 165
9. Annex. Article: “Ghrelin O-acyltransferase (GOAT) enzyme is overexpressed in
prostate cancer, and its levels are associated with patient's metabolic status: Potential
value as a non-invasive biomarker”


1
SUMMARY

2

3
1. SUMMARY
Cancer is one of the most serious and complex threats to the health of the
population in the world. Specifically, prostate cancer is the second most common solid
tumor in men, causing 300,000 deaths each year around the world. Since its appearance
in the 1990s, the PSA ("Prostate Specific Antigen") test revolutionized the diagnosis of
prostate cancer by increasing the number of patients diagnosed at an early-stage of the
disease. However, due to the complex biology and heterogeneity of prostate cancer, most
of the tumors detected by the PSA test show a low aggressiveness and the likelihood of
the patient dying because of their development is also relatively low. Unfortunately, the
treatment of "low-aggressive" tumors can produce more side effects than the tumor itself.
In addition, because PSA can be elevated by benign causes (prostatitis, medication, etc.),
it presents a considerable ratio of false positives. Although other biomarkers are currently
being studied, none of them have shown enough clinical evidence to justify their use, and
therefore, new biomarkers are required to complement the use of the PSA test.
Prostate cancer is dependent on androgen stimulation for its survival and cell
proliferation. Two phases can be differentiated in the clinic of prostate cancer: a first
phase in which patients are treated hormonally with anti-androgens or with LHRH
analogs or antagonists, with the aim of blocking the production of androgens, and a
second phase known as "Castration-Resistant Prostate Cancer" (CRPC), in which tumors
become resistant to hormone therapy. Currently, it is well accepted that residual
androgens remaining after castration and the androgen receptor play vital roles in the
biology of the CRPC. In fact, the appearance of truncated forms of aberrant splicing from
the canonical androgen receptor gene (i.e. AR-V7) is one of the most important
phenomena of this phase, and currently, its presence is considered as a marker of
prognosis and an indicator of resistance to hormone therapy.
Numerous neuropeptides, such as those belonging to the family of factors
regulating the hypothalamic-pituitary axis, play multiple roles in various tissues under
normal conditions and in pathological situations, such as cancer. A common feature of
many of these altered endocrine-metabolic conditions is the atypical or ectopic presence,
alteration or the total or partial loss of molecules that, like neuropeptides and their

4
receptors, can control key cellular functions. In fact, numerous studies indicate that the
processes of alternative splicing, and in particular the appearance of forms of non-
canonical or aberrant splicing, contribute to the development of tumor pathologies, and
in many cases, are potential biomarkers of the disease, as it is the case of the androgen
receptor variants in prostate cancer. In this context, the objective of this Doctoral Thesis
has been to study the presence and functional role of two pleiotropic systems that control
body homeostasis; specifically, the system formed by somatostatin (SST), cortistatin
(CORT) and their receptors (sst1-5), including the sst5TMD4/5 splice variants, and the
ghrelin system and their receptors (GHSR1a/b), including the splice variant In1-ghrelin,
as well as the enzyme GOAT, in human samples of healthy prostate and prostate cancer.
In addition, we evaluated the usefulness of some of these molecules as new biomarkers
of diagnosis and/or prognosis of the disease, and their therapeutic potential in prostate
cancer.
Initial evaluation of somatostatin and ghrelin systems expression using the
quantitative real-time polymerase chain reaction (qPCR) demonstrated a profound
dysregulation of some of the components of both systems in prostate cancer. Specifically,
sst1 and sst5TMD4 receptors from somatostatin system, and GOAT enzyme and In1-
ghrelin alternative splicing variant from ghrelin system, were found to be significantly
overexpressed in prostatic tumor tissues compared to prostate healthy tissues.
Overexpression of the sst1 receptor has been previously reported and has been related to
the aggressiveness of the disease. On the contrary, our results are the first to demonstrate
the overexpression of sst5TMD4, In1-ghrelin, and GOAT in prostate cancer.
The overexpression of the truncated sst5TMD4 receptor was especially marked in
patients with metastases and with worse prognosis, and therefore could become a new
biomarker of aggressiveness. This result was first found with the qPCR technique and
was subsequently corroborated at the protein level in another cohort of patients using the
immunohistochemistry technique (IHC). Next, the consequences of sst5TMD4
overexpression in prostate cancer were analyzed. For this, in vitro models (androgen-
dependent and castration-resistant prostate cancer cell lines) and in vivo models
(xenografts in immunodeficient mice) were used to demonstrate that sst5TMD4
overexpression clearly increased the malignancy of prostatic tumor cells (i.e. cell
proliferation and cell migration), and that such effects were carried out through the
modulation of various key cellular signaling pathways in the biology of prostate cancer

5
(i.e. MAPK / ERK, MAPK / JNK, MYC / MAX, WNT, RB and TGF-β), and
dysregulation of the expression of oncogenes (i.e. CAV1, IL-6) and tumor suppressor
genes (i.e. CDKN2A, APC, SFRP1, NRIP1, RARB, LOXL1). Finally, with the aim of
demonstrating the therapeutic potential of sst5TMD4 in prostate cancer, endogenous
expression of sst5TMD4 was silenced by the design, validation and use of a siRNA
("small interfering RNA") specific for the sst5TMD4 sequence. Silencing decreased cell
proliferation and migration of these cells compared to control cells.
In the case of the enzyme GOAT, its expression was increased in prostate tumor
samples compared to controls, where it was correlated with metabolic parameters of the
patients, such as weight, BMI or presence of dyslipidemia. This result was corroborated
at the protein level by IHQ using a GOAT-specific antibody. GOAT overexpression was
also observed in prostate cancer-cell lines compared to normal prostate-like cell lines. In
addition, our results demonstrated, for the first time, that prostate tumor cells are able to
secrete GOAT, and that the treatment with different metabolic signals (i.e. insulin, IGF-
1, ghrelin and/or In1-ghrelin peptides) regulate its expression at the level of the prostate.
Interestingly, GOAT protein levels were increased in the plasma and urine of patients
with prostate cancer compared to controls, and correlated with aggressiveness factors of
the disease and with different metabolic parameters, such as the presence of diabetes and
dyslipidemia. In addition, we demonstrated that plasma levels of GOAT could serve as a
new non-invasive biomarker for the diagnosis of prostate cancer, especially in non-
diabetic patients in whom the sensitivity and specificity of plasma levels of GOAT to
detect the disease were particularly high.
Likewise, our results demonstrate that In1-ghrelin expression, but not native
ghrelin, is significantly elevated in prostate cancer biopsies and prostate cancer cell lines,
as well as in plasma and urine samples from patients with prostate cancer, in comparison
with normal tissue samples or from healthy patients. Given that both In1-ghrelin and
native ghrelin were expressed in healthy prostate tissue, we investigated the possible
functional role that both molecules could have in prostate physiology. For this, cell
cultures of healthy prostate cells treated with the acylated peptides of Inl-ghrelin or native
ghrelin were performed. It was interesting to note that the treatment with In1-ghrelin, but
not ghrelin, peptides increased PSA expression (mRNA) and secretion (protein). In
addition, overexpression of In1-ghrelin, but not ghrelin, increased the proliferation of
healthy prostate cells. Next, we analyzed the pathophysiological role that the

6
overexpression of In1-ghrelin could present in prostate cancer. We used different prostate
cancer-cell lines that represent the broad spectrum of the disease. Both, treatment with
In1-ghrelin peptides and transfection with an In1-ghrelin expression vector increased cell
proliferation and migration of the different prostate cancer cell lines. Moreover, this result
was corroborated in a preclinical model of in vivo xenograft in immunodefficient mice.
We demonstrate that the pathophysiological effects of In1-ghrelin are likely mediated
through the modulation of the ERK / kinase pathway activity, increased expression of
certain oncogenes (i.e. CAV1, CAV2, IGFBP-5, LOXL1) and a decrease in certain tumor
suppressor genes (i.e. APC, SFRP1, NRIP1). Finally, in order to demonstrate the
therapeutic potential of In1-ghrelin in prostate cancer, In-1 ghrelin expression was
silenced by the design, validation and use of two siRNAs ("small interfering RNA")
specific for the In1-ghrelin sequence in several prostate cancer cell lines; such silencing
decreased cell proliferation and PSA secretion from those cells in comparison to control
cells.
Therefore, the results obtained in this Doctoral Thesis on the expression,
regulation and the pathophysiological role of sst5TMD4 and In1-ghrelin variants and
GOAT enzyme in the context of prostate cancer, clearly support the relevance of the
somatostatin and ghrelin systems, especially their forms of alternative splicing, in the
development and progression of this cancer type. Specifically, our findings demonstrate
that the sst5TMD4 and In1-ghrelin splicing variants and the GOAT enzyme are
overexpressed in prostate cancer where they induce important alterations related to tumor
aggressiveness. Therefore, these molecules could serve as new diagnostic and/or
prognostic biomarkers and could represent new therapeutic targets for the treatment of
prostate cancer.

7
RESUMEN

8

9
1. RESUMEN
El cáncer es una de las amenazas más serias y complejas para la salud de la
población mundial. En concreto, el cáncer de próstata es el segundo tipo de tumor sólido
más frecuente entre los hombres, y causa 300.000 muertes al año en todo el mundo. Desde
su aparición en la década de los 90, el test del PSA (“antígeno prostático específico”)
revolucionó el diagnóstico del cáncer de próstata, incrementado el número de pacientes
diagnosticados en una fase temprana de la enfermedad. Sin embargo, debido a la compleja
biología y heterogeneidad de los tumores prostáticos, la mayoría de los tumores
detectados por el test del PSA presentan una baja agresividad, y la probabilidad de que el
paciente muera debido a su desarrollo también es relativamente baja.
Desafortunadamente, el tratamiento de tumores de “baja agresividad” puede producir por
sí mismo más efectos secundarios que el propio tumor. Además, debido a que el PSA se
puede elevar por causas benignas (prostatitis, toma de medicamentos, etc), presenta un
elevada proporción de falsos positivos. Aunque se están estudiando en la actualidad otros
biomarcadores, ninguno de ellos ha mostrado evidencia clínica suficiente como para
justificar su uso y, por tanto, se requieren nuevos biomarcadores que complementen y/o
mejoren el uso del test de PSA.
El cáncer de próstata depende de la estimulación androgénica para su
supervivencia y proliferación celular. En la clínica del cáncer de próstata se pueden
diferenciar dos fases: una primera fase en la cual los pacientes se tratan hormonalmente
con el objetivo de bloquear la producción de andrógenos mediante anti-andrógenos o con
análogos o antagonistas de LHRH, y una segunda fase conocida como “cáncer de próstata
resistente a la castración” (en inglés CRPC “Castration-Resistant Prostate Cancer”), en la
cual los tumores se vuelven resistentes a la terapia hormonal. Actualmente, se concede
un papel vital a los andrógenos residuales tras la castración y al receptor de andrógenos
en la biología del CRPC. De hecho, la aparición de formas truncadas de splicing aberrante
del receptor de andrógenos (AR-V7) es uno de los fenómenos más importantes de esta
fase, y su presencia se considera como un marcador de prognosis e indicador de
resistencia a la terapia hormonal.

10
Numerosos neuropéptidos, como los pertenecientes a la familia de factores
reguladores del eje hipotálamo-hipofisario, desempeñan multitud de funciones en
diversos tejidos bajo condiciones normales o en situaciones patológicas, como el cáncer.
Una característica común de muchas de estas situaciones endocrino-metabólicas es la
presencia atípica o ectópica, la alteración o la pérdida total o parcial de moléculas que,
como los neuropéptidos y sus receptores, pueden controlar funciones celulares clave. De
hecho, numerosos estudios indican que los procesos de splicing alternativo, y en
particular la aparición de formas de splicing no canónico o aberrante, contribuyen al
desarrollo de las patologías tumorales, y en muchos casos son potenciales biomarcadores
de la enfermedad, como es el caso de las variantes del receptor de andrógeno en cáncer
de próstata. En este sentido, el objetivo de la tesis doctoral se ha centrado en estudiar la
presencia y el papel funcional que ejercen dos sistemas pleiotrópicos de control del
organismo; en concreto, el sistema formado por la somatostatina (SST), la cortistatina
(CORT) y sus receptores (sst1-5), incluyendo las variantes de splicing sst5TMD4/5, y el
sistema de la ghrelina y sus receptores (GHSR1a/b), que incluye la variante de splicing
In1-ghrelina, y la enzima GOAT, en muestras humanas de próstata sana y de cáncer de
próstata. Asimismo, se evaluó la utilidad de algunas de estas moléculas como nuevos
biomarcadores de diagnosis y/o prognosis de la enfermedad, y su potencial terapéutico en
cáncer de próstata.
El análisis inicial mediante la técnica de PCR cuantitativa en tiempo real (qPCR)
de la expresión de los sistemas somatostatina y ghrelina demostró una profunda
desregulación de algunos de los componentes de ambos sistemas en cáncer de próstata.
Concretamente, se encontró que los receptores sst1 y sst5TMD4 del sistema
somatostatina, y la enzima GOAT y la forma de splicing alternativo In1-ghrelina del
sistema ghrelina, se encuentran significativamente sobreexpresados en tejidos tumorales
prostáticos. La sobreexpresión del receptor sst1 se ha publicado previamente y se
relaciona con la agresividad de la enfermedad. Por el contrario, nuestros resultados son
los primeros que demuestran la sobreexpresión de sst5TMD4, In1-ghrelina y GOAT en
cáncer de próstata.
La sobreexpresión del receptor truncado sst5TMD4 fue especialmente
significativa en los pacientes con presencia de metástasis y con peor prognosis, pudiendo
ser por ello un nuevo biomarcador de agresividad. Este resultado fue descubierto
inicialmente con la técnica de qPCR y se corroboró después a nivel proteico en otra

11
cohorte de pacientes mediante la técnica de inmunohistoquimica (IHQ). Posteriormente,
se analizaron las consecuencias que podría ejercer la sobreexpresión de sst5TMD4 en
cáncer de próstata. Para ello, se usaron modelos in vitro (líneas celulares de cáncer de
próstata andrógeno-dependientes y líneas resistentes a la castración) e in vivo
(xenotransplantes en ratones inmunodeprimidos) para demostrar que la sobreexpresión
de sst5TMD4 incrementa claramente la malignidad de las células prostáticas tumorales
(ej. proliferación y migración celular) y que dichos efectos se llevaban a cabo a través de
la modulación de diversas vías de señalización celular claves en la biología del cáncer de
próstata (ej. MAPK/ERK, MAPK/JNK, MYC/MAX, WNT, RB y TGF-β), y de la
desregulación de la expresión de oncogenes (ej. CAV1, IL-6) y genes supresores de
tumores (ej. CDKN2A, APC, SFRP1, NRIP1, RARB, LOXL1). Finalmente, y con el
objetivo de demostrar el potencial terapéutico de sst5TMD4 en cáncer de próstata, se
silenció la expresión endógena de sst5TMD4 mediante el diseño, validación y utilización
de un siRNA (“ARN pequeño de interferencia”) específico para la secuencia de
sst5TMD4. El silenciamiento disminuyó la proliferación y migración de las células en
comparación con células control.
Por su parte, la expresión de la enzima GOAT se encontró incrementada en
muestras tumorales prostáticas respecto a controles, y dicha expresión se correlacionó
con parámetros metabólicos de los pacientes tales como el peso, su índice de masa
corporal (IMC) o la presencia de dislipidemia. Este resultado se corroboró a nivel
proteico, mediante IHQ, con un anticuerpo específico de GOAT. La sobreexpresión de
GOAT se observó también al comparar líneas celulares de cáncer de próstata respecto a
líneas celulares de próstata normal. Además, por primera vez se demostró que las células
prostáticas tumorales son capaces de secretar enzima GOAT y que el tratamiento con
diferentes señales metabólicas (ej. insulina, IGF-1, ghrelina y/o In1-ghrelina) regulan su
expresión en la próstata. Mediante un ELISA específico se descubrió que los niveles de
esta enzima están aumentados en el plasma y orina de pacientes con cáncer de próstata
respecto a controles y que se correlacionan con factores de agresividad de la enfermedad,
así como con diferentes parámetros metabólicos, tales como la presencia de diabetes y
dislipidemia. Además, demostramos que los niveles plasmáticos de GOAT podrían servir
como un nuevo biomarcador no invasivo para el diagnóstico del cáncer de próstata,
especialmente en pacientes no diabéticos en los que la sensibilidad y especificidad de los
niveles plasmáticos de GOAT para detectar la enfermedad son particularmente elevadas.

12
Asimismo, nuestros resultados demuestran que los niveles de In1-ghrelina, pero
no los de ghrelina nativa, se encuentran significativamente elevados en muestras de tejido
y en líneas celulares de cáncer de próstata, así como en muestras de plasma y orina de
pacientes con cáncer de próstata en comparación con muestras de tejido normal o de
pacientes sanos. Dado que tanto In1-ghrelina como ghrelina nativa se expresan en tejido
sano prostático, investigamos el posible papel funcional que ambas moléculas podrían
presentar en la regulación de la función prostática. Para ello se realizaron cultivos
celulares de células prostáticas no tumorales, que se trataron con los péptidos acilados de
In1-ghrelina o ghrelina nativa. Resultó interesante observar que el tratamiento con los
péptidos de la In1-ghrelina, pero no con ghrelina aumenta la expresión (mRNA) y
secreción (proteína) de PSA. Además, la sobreexpresión de In1-ghrelina, pero no de
ghrelina, aumentó la proliferación de las células prostáticas sanas. Posteriormente
analizamos el papel patofisiológico de la sobreexpresión de In1-ghrelina en cáncer de
próstata. Para ello, utilizamos diferentes líneas celulares de cáncer de próstata que
representan el amplio espectro de la enfermedad. Tanto el tratamiento con péptidos In1-
ghrelina como la transfección con un vector de expresión de In1-ghrelina aumentó la
proliferación y migración celular de las diferentes líneas celulares de cáncer de próstata.
Más aún, este resultado se corroboró en un modelo preclínico in vivo de xenotransplante
en ratones inmunodeprimidos. Se comprobó que los efectos patológicos de la In1-ghrelina
se llevaban a cabo a través de la modulación de la actividad de la vía de las quinasas ERK,
de un aumento de expresión de ciertos oncogenes (ej. CAV1, CAV2, IGFBP-5, LOXL1)
y por una disminución de determinados genes supresores tumorales (ej. APC, SFRP1,
NRIP1). Finalmente, y con el objetivo de demostrar el potencial terapéutico de In1-
ghrelina en cáncer de próstata, se silenció la expresión endógena de In1-ghrelina mediante
el diseño, validación y aplicación de dos siRNAs (“ARN pequeño de interferencia”)
específicos para la secuencia de In1-ghrelina en varias líneas celulares de cáncer de
próstata; dicho silenciamiento disminuyó la proliferación celular y la secreción de PSA
de esas células en comparación con células control.
Por todo ello, los resultados obtenidos en la presente Tesis Doctoral sobre la
regulación de la expresión y el papel patofisiológico de las variantes de splicing
sst5TMD4 e In1-ghrelina y de la enzima GOAT en el contexto del cáncer de próstata,
apoyan claramente la relevancia de los sistemas somatostatina y ghrelina, especialmente
de sus formas de splicing alternativo, en el desarrollo y progresión tumoral de este tipo

13
de cáncer. Específicamente, nuestros hallazgos demuestran que las variantes de splicing
sst5TMD4 e In1-ghrelina y la enzima GOAT están sobreexpresadas en cáncer de próstata,
donde inducen importantes alteraciones relacionadas con la agresividad tumoral. Por
tanto, estas moléculas podrían servir como nuevos biomarcadores de diagnóstico y/o
pronóstico y podrían representar nuevas dianas terapéuticas para el tratamiento del cáncer
de próstata.

14

15
INTRODUCTION

16

17
2. INTRODUCTION
2.1. Prostate gland
The prostate is a gland about the size and shape of a walnut (20 g and 4 × 2.5 cm)
which is part of the male reproductive system [1, 2]. Its physiological function is the
production of a fluid that, along with sperm cells from the testicles and fluids from other
glands, makes up semen [3]. The muscles of the prostate ensure that the semen is
forcefully pressed into the urethra and then expelled outwards during ejaculation.
The prostate is located directly below the bladder and above the muscles of the
pelvic floor. The rectum is behind the prostate, making it possible to feel the gland from
the rectum using the finger. The ducts in the prostate gland flow into the urethra, which
passes through the prostate.
The adult human prostate is organized in three zones: central zone, transition zone,
and peripheral zone (70% of total volume), reflecting three distinct sets of ducts [4]
(Figure 1A). Most prostatic tumors (70%) start from the peripheral zone, whereas the
transition zone is the origin in 20% of total cases [5]. Prostatic ducts are lined by a
pseudostratified epithelium that contains three major cell types: luminal secretory
epithelial cells, basal epithelial cells, and rare neuroendocrine cells, which can be
distinguished by their patterns of expression of specific differentiation markers [2, 6]
(Figure 1B). These cells have an apical–basal polarity and secrete prostatic proteins and
fluids from their apical surface into the prostatic lumen. Finally, the stromal layer is
mainly formed by smooth muscle cells, and also contains fibroblastic, neuronal,
lymphatic, and vascular cell types [2]. Reciprocal interactions between the epithelium and
stroma are critical for maintaining prostate homeostasis and normal prostate function [7].

18
A.
B.
Figure 1: The human prostate gland . A) Sagittal view of the localization of prostate in
the body, and different zones (peripheral, transition and central) inside the organ. B)
Structure and cells of a prostatic duct. Each epithelial cell type (basal, luminal and
neuroendocrine cells) harbors specific markers (indicated below each cell type) that allow
its identification. Figure 1A is taken from https://www.fairview.org/healthlibrary/Article/87095
while Image 1B is taken from WebPatholohy website : http://webpathology.com/.
2.1.1. Physiological regulation of prostate by hormones and its dysregulation in
prostate cancer
Prostate development and function is regulated by multiple hormones [2, 3, 8].
Specifically, different classes of steroids hormones (androgens, estrogens, progesterone

19
and glucocorticoids) initiate distinct actions via binding to their cognate nuclear receptor
proteins [9]. However, clinical and laboratory data have shown clear evidence that
androgens are the most important hormones regulating the prostate gland [2].
2.1.1.1. Androgens
Androgens synthesis and secretion are under the physiological regulation of the
hypothalamic–pituitary–testicular axis, including the production of testosterone in testis
(which represents 95% of total testosterone) [10, 11], and the activity of adrenal glands,
which produce other androgens such as dehydroepiandrosterone sulfate and
androstenedione [12] (Figure 2). Androgens exert their action through binding to a
nuclear receptor called Androgen Receptor (AR), which controls the transcription of
hundreds of genes involved in prostate development, growth, and function [13] (Figure
2). Specifically, during development, AR drives luminal epithelial proliferation and
differentiation of the prostate [14]. Moreover, orchiectomy and/or chemical castration
produces a total inhibition of mice prostate fetal development [15]. Several studies have
also demonstrated that the Androgen/AR-axis is indispensable for prostate development
[8, 16, 17] In fact, it has been shown that mice and human with dysfunctional AR
expression do not develop a functional prostate [3, 16-18]. DHT (5α-dihydrotestosterone;
the reduced metabolite of testosterone) is the main androgen involved in prostate function
[19]. Intracellularly, testosterone is converted to DHT by the enzyme 5α-reductase;
indeed, DHT has 5-10 times higher affinity for the AR than testosterone [20]. In human,
the deficiency of 5α-reductase enzyme produces a complete absence of prostate
morphogenesis [21]. There are many genes whose expression is under the regulation of
AR but KLK3 (kallikrein related peptidase 3, commonly known as PSA; prostatic specific
antigen) is well-known for being one of the most important factors due to its critical
function and clinical application. Specifically, PSA is involved in the liquefaction of
seminal coagulum, presumably by the hydrolysis of semenogelin-1 and Galectin-3 [22-
24]. Remarkably, PSA is almost exclusively expressed in the prostate epithelium (luminal
cells) and clinically it is used as biomarker of PCa because its serum levels are generally
higher in patients with PCa [25].

20
Figure 2: Representative scheme of the association between the h ypothalamic-
pituitary-testicular axis and adrenal gland with prostate cell intrinsic factors . The
gonadotropin-releasing hormone (GnRH) is produced in the hypothalamus and stimulates
the secretion of the luteinizing hormone (LH) from gonadotrope cells of the pituitary gland.
Eventually, LH will reach the testes where it induces the secretion of testostero ne from
Leydig cells. When testosterone enters in the prostate , it is rapidly converted to
dihydrotestosterone (DHT) by the 5α -reductase enzyme (5α -DHT) and binds to androgen
receptor (AR). The AR-DHT complex enter in the nucleus and binds to AR -target gene
domains in the DNA in order to regulate their expression. Other source of androgens that
will be converted to DHT in prostate come from the adrenal glands which produce
dehydroepiandrosterone sulfate (DHEA-S) and androstenedione (AD).
2.1.1.2. Estrogens
The majority of estrogens present in men are derived from the peripheric
conversion, mainly in the adipose tissue, of androstenedione and testosterone to estrone
and estradiol [26]; however, small amounts are also produced in the testes and directly
secreted to blood [27]. Together with AR, ER (estrogen receptor) is also important to
drive luminal epithelial proliferation and differentiation of fetal prostate [28]. Moreover,
estrogens play a dual role in the regulation of adult prostate due to their antagonistic role,
increasing or decreasing proliferation depending on the receptor to which it binds to [13].
Specifically, it has been shown that estrogens increase proliferation after binding ERα but
decrease proliferation through ERβ [29]. In addition, there is a growing body of evidence
supporting the notion that estrogens play a pathophysiological role in PCa mainly by the
effects trigger binding to ERα, since this receptor is upregulated in PCa [30].

21
2.1.1.3. Progesterone
Progesterone (PR) is another steroid that controls prostate homeostasis [31]. PR
exerts its effects through its receptor, PGR, whose two isoforms (PGRA and PGRB) are
expressed in stromal cells] [31]. Several studies have shown that PR is able to decrease
cell growth and invasion of normal prostate cells and PCa cell lines by binding to both
PGR isoforms and through the modulation of different intracellular mechanisms [31, 32].
It has also been shown that PR protein levels are decreased in PCa stroma as compared
with benign tissue, suggesting a putative role of this system in the homeostatic control of
the prostate as well as in PCa progression [32].
2.1.1.4. Glucocorticoids
Glucocorticoids are produced in the adrenal gland and mediate systemic effects
through binding to the Glucocorticoid Receptor (GR) [9]. GR is expressed in normal
prostate, although its physiological role as regulator of prostatic biology is still unclear
[33]. Mice lacking endogenous expression of GR in prostate do not show any significant
change in cell growth or morphogenesis [34]. However, GR expression is decreased in
early stages of human PCa with only 30% of primary prostatic tumors showing GR
expression [35]. Moreover, some studies using in vitro models have shown a tumor-
suppressor role of GR in PCa in terms of cell proliferation or migration [35]. Additionally,
GR expression is upregulated in late phases of the disease (androgen ablation PCa/AR
blockade), and, therefore, it has been suggested that GR overexpression in the prostate
epithelia may be associated with the response to androgen deprivation therapy [36].
Recent studies have shown that AR and GR are capable of binding to the same sites on
chromatin [36, 37] and that genes induced by GR and DHT are highly overlapping [9].
Furthermore, the treatment with AR antagonist increases GR expression in few days [36],
a process called “Steroid receptor switch”. This observation might be very important from
a clinical point of view since hormone-refractory PCa patients are treated with
chemotherapeutic agents (i.e. docetaxel) and with glucocorticoids to ease side-effects by
chemotherapeutic agents [9]; therefore, the treatment with glucocorticoids could
represent a tumor alternative pathway to bypass the androgen blockade [9].

22
2.2. Clinical significance
2.2.1. Prostatitis
Prostatitis is a common inflammation of the prostate that usually occurs in men
under age 50 [38]. The cause can be due to an infection or other causes such as hormones
dysregulations (i.e. estradiol), physical trauma, urine reflux or dietary habits (i.e. charred
meat) [39]. Infiltration of immune cells (T cells, B cells, macrophages and mast cells,
mainly) and production of cytokines (IL-6, IL-1 or TNF-α) are typical features of
prostatitis [39].
Remarkably, some models reflect the possible relationship between inflammation
and early PCa-onset in which the inflammation caused by different agents would produce
a precursor lesion in the prostate called PIA (Proliferative Inflammatory Atrophy) that in
many cases will be healed, but sometimes could be the precursor of other lesions named
PIN (Prostatic Intraepithelial Neoplasia) and/or PCa [40-42]. In fact, morphological
transitions between PIA, PIN, and PCa have been reported and some of the genetic
alterations of prostate are shared with PIA and PIN lesions (i.e. loss of tumor suppressor
genes such as NKX3.1 and p27, promoter hypermethylation of GSTP1, etc.) [40, 41, 43].
2.2.2. Benign prostatic hyperplasia (BPH)
BPH is the most common urological disease in men after 50-year-old [44]. It
courses as an enlargement of the prostate associated with symptoms like poor urine flow,
intermittent stream or sensation of poor bladder emptying [44]. Age is the main risk factor
for developing BPH since 50% of men over 75 ages have this disease [44, 45].
Androgen/AR signaling plays key roles in increasing cell proliferation in both stromal
and epithelial cells, therefore boosting development of BPH [46]. Some patients present
increased PSA levels in serum due to enlarged organ volume, inflammation and AR
activity; however, BPH is not considered to be a premalignant lesion [47].
2.2.3 PIN
PIN is the most established precursor of PCa [48]. Indeed, both processes share
genetic and molecular markers, with PIN representing an intermediate stage between
benign epithelium and invasive malignant carcinoma [49]. As PCa, PIN is more common
with advanced age with higher rates of occurrence in the peripheral zone of the prostate.

23
The presence of PIN lesions is associated with 20%-25% of PCa risk in subsequent repeat
biopsies [49]. Based on how abnormal the patterns of cells look, PIN are classified as: 1)
Low-grade PIN (LG-PIN; the patterns of prostate cells appear almost normal), and 2)
High-grade PIN (HG-PIN; the patterns of cells look more abnormal).
Histologically, HG-PIN presents nuclear cell enlargement, hyperchromasia and
prominent nucleoli [49].
2.2.4. Prostate cancer
2.2.4.1. Epidemiology
PCa is the second most common cancer in the male population and the fourth most
common worldwide [50]. It is estimated that one of seven men will develop PCa in his
time life [51]. In 2013, 1.4 million of new cases and 293,000 deaths were reported around
the world, being the leading cause of cancer death for men in 24 countries [50]. The
incidence is higher in developed countries and in Western population (North America and
Europe) thanks to the PSA screening [50]. PCa is mainly diagnosed at old age (>60 years)
and usually when the tumor is localized (81% of the cases; regional lymph nodes: 12%;
distant: 4%) [51] (Figure 3). The 5-year relative survival is ≥ 99% when the tumor is
localized or regional lymph nodes but only of 24% when the tumor is already distant at
the diagnosis [51] (Figure 3).
Figure 3: PCa stage at primary diagnosis and 5 -year survival depending on stage at
diagnosis in all races and white and black individuals in EEUU . Adapted from Siegel
et al. [51] .

24
2.2.4.2. Symptoms
Not everyone experiences symptoms of PCa, especially in early-stages of the
disease. In many cases, the signs are first detected by a doctor during a routine check-up.
Some patients will experience changes in urinary or sexual function that might indicate
the presence of PCa. These symptoms include the need to urinate frequently (especially
at night), difficulty starting urination or holding back urine, weak or interrupted flow of
urine, difficulty in having an erection or painful ejaculation
(http://www.cancer.net/cancer-types/prostate-cancer/symptoms-and-signs). However,
these symptoms can also indicate the presence of other diseases or disorders (prostatitis
or BPH). Lymph nodes (LNs) and bones represent the most common locations of
metastatic disease so patients usually suffer of acute bone pain.
2.2.4.3. Risk factors
There are only three established risk factors for PCa: older age, ethnic origin
(African-American men have the highest incidence rate) [52] and heredity [53, 54]. The
risk for first-degree relatives is about two times higher than for men in the general
population [53]. More specifically, it has been shown that this familial risk is four times
higher for first-degree relatives of men with PCa diagnosed younger than 60 years than
for the general population [54]. In line with this, only one definite PCa predisposition
gene, the homeobox gene HOXB13, has been identified [55, 56]. More studies have
shown that PCa patients with BRCA2 mutations carriers present higher Gleason-score and
worse prognosis than do non-BRCA2 mutations carriers but the relationship between
BRCA2 in PCa development is not clear [57]. External factors that, in some ways, may
be also involved in the development of PCa are the type of diet, pattern of sexual behavior,
alcohol consumption, exposure to ultraviolet radiation, chronic inflammation, infection
for pathogens [58] and occupational exposure [59].
2.2.4.4. Classification
The classification of PCa is based on the TNM system (tumor–node–metastasis
cancer staging system; The Union Internationale Contre le Cancer, 2010;
http://www.uicc.org/resources/tnm), which is one of the most accepted cancer staging
systems. The TNM system is based on the size and/or extent (reach) of the primary tumor
(T), the amount of spread to nearby lymph nodes (N), and the presence of

25
metastasis (M) or secondary tumors formed by the spread of cancer cells to other
parts of the body. A number is added to each letter to indicate the size and/or extent of
the primary tumor and the degree of cancer spread (Table 1).
Table 1: TNM system classification of PCa tumors
PRIMARY TUMOR (T)
TX Primary tumor cannot be assessed
T0 No evidence of primary tumor
T1 Clinically in-apparent tumor not palpable or visible by imaging
T1a Tumor incidental histologic finding in ≤5% of tissue resected
T1b Tumor incidental histologic finding in >5% of tissue resected
T1c Tumor identified by needle biopsy (because of elevated prostate specific
antigen [PSA] level)
T2 Tumor confined within prostate; tumors found in 1 or both lobes by
needle biopsy but not palpable or reliably visible by imaging
T2a Tumor involves one-half of 1 lobe or less
T2b Tumor involves more than one-half of 1 lobe but not both lobes
T2c Tumor involves both lobes
T3 Tumor extends through the prostatic capsule; invasion into the prostatic
apex, or the prostatic capsule is classified not as T3 but as T2
T3a Extracapsular extension (unilateral or bilateral)
T3b Tumor invading seminal vesicle(s)
T4 Tumor fixed or invades adjacent structures other than seminal vesicles
(e.g., bladder, levator muscles, and/or pelvic wall)
Pathologic (pT)*
pT2 Organ confined
pT2a Unilateral, involving one-half of 1 lobe or less
pT2b Unilateral, involving more than one-half of 1 lobe but not both lobes
pT2c Bilateral disease
pT3 Extraprostatic extensión
pT3a Extraprostatic extension or microscopic invasion of the bladder neck
pT3b Seminal vesicle invasión
pT4 Invasion of the bladder and rectum
REGIONAL LYMPH NODES (N)
NX Regional lymph nodes were not assessed
N0 No regional lymph node metastasis
N1 Metastasis in regional lymph node(s)
Pathologic
pNX Regional nodes not sampled
pN0 No positive regional nodes
pN1 Metastases in regional nodes(s)
DISTANT METASTASIS (M)*

26
Pathologic evaluations of prostate cancer is based on Gleason grading [60]
(Figure 4). This system has evolved since 1966 and, recently, it has been modified with
a new system already accepted by the World Health Organization for the 2016 (WHO
2016) edition of Pathology and Genetics: Tumours of the Urinary System and Male
Genital Organs [61]. The Gleason system is based on the glandular pattern of the tumor
as identified at relatively low magnification. It comprises from 1 to 5, with 1 being the
most differentiated and 5 being the least differentiated (Figure 4).
Gleason score of biopsy-detected PCa comprises the Gleason grade or the most
extensive pattern (primary pattern), plus the second most common pattern (secondary
pattern), if two are present. If one pattern is present, it needs to be doubled to yield the
Gleason score. For three grades, the Gleason score comprises the most common grade
plus the highest grade, irrespective of its extent [62]. When reporting prostatectomy
specimens, the Gleason score is the sum of the most and second-most dominant (in terms
of volume) Gleason grade. If only one grade is present, the primary grade is doubled. If
a grade comprises < 5% of the cancer volume, it is not incorporated in the Gleason score
(5% rule). The primary and secondary grades are reported in addition to the Gleason
score. A global Gleason score is given for multiple tumours, but a separate tumour focus
with a higher Gleason score should also be mentioned [62].
Figure 4: Representative images of Gleason score classification . Gleason score 2 : The
glands have abundant pale cytoplasm and prominent nucleoli; Gleason score 3 : The glands
have well-formed round, oval, or distorted lumens. There is nuclea r enlargement and
M0 No distant metastasis
M1 Distant metastasis
M1a Nonregional lymph nodes(s)
M1b Bone(s)
M1c Other site(s) with or without bone disease

27
hyperchromasia with prominent nucleoli. Basal cells are not seen; Gleason score 4 :
Glandular fusion is the hallmark feature of Gleason pattern 4. The image shows fused
glands forming anastomosing irregular cords separated by moderate amou nt of stroma;
Gleason 5 score : Solid sheet of relatively uniform neoplastic cells diagnostic of Gleason
score 5+5=10. Images are taken from WebPatholohy website: http://webpathology.com/ .
Due to its misleading clinical implications, Gleason score of 1 + 1 = 2 should not
be rendered, regardless of the specimen type GS 2–4 should rarely be rendered in needle
biopsies, if ever (5,6). Therefore, from a practical standpoint, Gleason pattern in
contemporary practice starts at 3 and GS starts at 6 in prostate biopsy specimens and most
transurethral resection of the prostate (TURP) and radical prostatectomy (RP). specimens
[63, 64].
2.2.4.5. Types of prostate cancers
Most PCa tumors are adenocarcinomas (around 90%) with a typical luminal
phenotype common to other epithelial cancers (i.e. breast and colon cancer) with loss of
the basal layer [65]. Adenocarcinomas express AR and lack the expression of markers of
basal cells such as CK5, CK14 and p63 [66]. In the past, it was accepted that luminal cells
were the origin of PCa [67, 68], but nowadays that notion has been questioned since
multipotent stem and progenitor cells within the basal epithelial are able to give rise to
basal, luminal and neuroendocrine cells [67, 69]. In fact, with the appropriate oncogenic
input (i.e. ERG, AKT and AR overexpression), normal basal cells, but not normal luminal
cells, are able to produce adenocarcinomas [67], and even a mixture of adenocarcinoma
and neuroendocrine PCa (by means of N-Myc overexpression and constitutive activation
of AKT pathway) [70]. In addition, PCa origin is commonly multifocal, since about 80%
of tumors contains >1 disease focus [71], and each of those may harbor different
molecular alterations [72] which emphasize the intra-tumoral complexity and
heterogeneity of PCa.
Rare types of PCa are ductal carcinoma, mucinous PCa, prostate sarcomas, signet
ring cell PCa and neuroendocrine tumors (small- and large-cell PCa) [65]. The frequency
of neuroendocrine PCa tumors (NEPC) is low (<2% of total PCa) [73] but normally
behave very aggressively, since they cannot be detected by PSA screening (there is no
expression of AR or PSA in neuroendocrine cells), and, therefore, many patients are

28
diagnosed in an advanced stage of the disease [74, 75]. Loss of RB1 and TP53 tumor
suppressors and overexpression of MYCN and AURKA (Aurora Kinase A) commonly
occurs in NEPC [70, 72], and, potentially, can be PCa clinical targets (i.e. AURKA
inhibitors [70, 76]). Neuroendocrine cell differentiation is a process that helps the tumor
to keep growing and bypass the castration-hormonal therapy [75].
2.2.4.6. Pathophysiology
PCa evolves from benign tissue to malignant lesion by acquiring, over time,
several genetic alterations (DNA copy number variations, gene mutations, or
chromosomal rearrangements), alterations in intracellular signaling (i.e Phosphoinositide
3-kinase pathway, MAPK kinase pathway), epigenetic changes (DNA methylation,
histone modification or miRNA dysregulation) and other key molecular alterations (i.e.
aberrant alternative splicing) [77]. While structural lesions (such as genomic
rearrangements) are prevalent in PCa, point mutations occur less commonly compared to
other solid tumors (i.e. colorectal cancer) probably because PCa is not exposed to strong
exogenous mutagens [78, 79] (Figure 5). Somatic copy number alterations (SCNAs) are
common in PCa, and imply the gain or loss of segments of genomic DNA, leading to
amplification of oncogenes (i.e. AR, MYC) and/or deletion of tumor suppressor genes
(i.e. TP53, PTEN, CDKN1A or APC) [78, 80]. Chromosomal rearrangements can also
result in gene fusions, with aberrant function promoting oncogenesis (i.e. ETS gene
fusion).

29
Figure 5: Number of somatic mutations (in parentheses) in representative human
cancers, detected by genome wide sequencing studies. Adapted from Vogelstein et al.
[79].
Growth of adenocarcinomas is androgen-dependent, and therefore, endocrine-
based therapies are targeted towards lowering serum androgens and/or inhibiting AR
activity, normally known as androgen deprivation therapy (ADT) [81, 82] (Figure 6).
Due to the PCa complexity, it is necessary to differentiate between the events that occur
in an early phase of the disease (localized PCa), probably driving the development and
progression of the disease, and those events that occur in a late phase, which takes place
after the patient has gone through heavy ADT to control the progression of PCa [CRPC
(Castration Resistant PCa) or mCRPC (metastatic CRPC)] [78, 80, 82-84] (Figure 6).F

30
Figure 6: Clinical evolution of PCa with therapeutical options and molecular
mechanism behind the pathology. AR sig= AR signaling; Mut= Mutation; AR spl: AR
splicing (i.e. AR-V7); Amplif: Amplification; NE= Neuroendocrin ; Path=pathway.
Adapted from Prensner et al. [85] and Barbieri et al. [82]
2.2.4.6.1. Early events in PCa
The molecular complexity of primary PCa is remarkably high, and it has been
proposed that 74% of the primary PCa tumors fall into one of seven subtypes defined by
specific gene fusions (ETS genes with AR-regulated genes) or mutations (SPOP, FOXA1
and IDH1) [78]. In contrast, a significant subset of PCa tumors (26%) are driven by
unknown molecular alterations [78]. Androgen signaling is the most relevant pathway in
both primary and advanced PCa [78, 82, 83] and PCa tumor growth is androgen
dependent. Although in early stages of the disease the AR gene or its protein product are
not altered (mutations in AR, amplifications of the gene or appearance of AR splicing
variants, which are hallmarks of castration resistant PCa), many of its cofactors (i.e.
NCOA2, NRIP1) or AR-regulated genes are also involved in the appearance of PCa, and,
in addition, androgens and AR are essential in Early Onset PCa (EO-PCa)-driven ETS
fusion events [80, 84]. In line with this, Bacca et al. have proposed a ‘‘consensus path’’
of progression due to genetic events that could be similar to that in other solid tumors,
like colorectal tumors [86]. Specifically, this path leading to PCa would begin with the
deletion of NKX3-1 or FOXP1 and fusion of TMPRSS2 and ERG genes (due to an
Local disease
• Radical prostatectomy
• External beamradiation
• Brachytherapy
Biochemicalrelapse
• Radical prostatectomy
• Brachytherapy
• Observation
Castrationsensitive
• ADT (LHRH agonist/anti-androgen
• Orchiectomy
• Docetaxel
CRPC
• Abiraterone withprednisone
• Enzalutamide
• Docetaxel
• Other agents
KEY
processes
AR sig
ETS gene
fusion
PTEN deletion
TP53 deletion
NKX3 loss
CDH1 deletion
SPOP Mut
KEY processes
AR Mut
AR spl
AR gene amp
NE diff
MAPK path
MYC
amp
Rβpath
TGF-βpath
Early Prostate cancer Castration Resistant Prostate
Cancer (CRPC)

31
increase in AR activity), modifying normal prostate epithelial differentiation [87] and
promoting other oncogenic alterations [83]. Subsequently, lesions, or epigenetic silencing
in tumor suppressors such as PTEN, CDKN1A, RB or TP53 accumulate [88, 89]; these
alterations lead to increase cell growth, genomic instability and/or evasion of apoptosis
[83]. Nevertheless, this vision may be oversimplified, since some events in PCa are
exclusive (i.e. ETS fusion with presence of SPOP/CDH1 mutations) but others are
common in the different subtypes. In sum, the complexity of primary PCa reflects, and
probably underlies the wide range of patient response for established clinical treatments.
ETS gene fusions
The fusion between AR-regulated genes with members of the ETS family [78] is
the most common alteration in primary PCa [90]. The prevalence of those rearrangements
is 53% in primary PCa, being the fusion involving ERG the most common process
(occurring in 46% of primary PCa) [78]. Up to 10 androgen-regulated genes have been
found as 5’ fusion partner of ETS gene [82, 90]. TMPRSS2 is the most common gene
involve in this fusion, with the transcription factor ERG as 3’ partner, resulting in
activation of the TMPRSS2-ERG fusion oncogene [90]. Other members of the ETS
family that serves as 3’ partner included ETS variant 1, 4 and 5 (ETV1, ETV4, ETV5)
[90].
In vivo models shows that the expression of ERG in mice prostate epithelial cells,
at levels that are clinically relevant, is sufficient to cause the slow and partially penetrant
emergence of age-related prostate tumors, a mechanism that involves the activation of
Hippo pathway [91]. Consistent with this observation, in vitro experiments with forced
ERG-overexpression in PCa cell lines increases pathophysiological features (i.e. cell
migration) [92]. However, patients with ETS fusion tumors do not have a worse clinical
outcome compared with other subtypes [93]. Most of the ETS positive subclasses harbor
mutations or loss in PTEN but also in the tumor suppressor TP53 [78, 83]. However, other
alterations as SPOP mutations, CDH1 deletions or SPINK1 overexpression occur
exclusively in ETS-negative PCa showing again the molecular heterogeneity of PCa [78,
80, 83, 94].
PTEN

32
PTEN is as a tumor suppressor that negatively regulates intracellular levels of
phosphatidylinositol-3, 4, 5-trisphosphate, and acts by negatively regulating AKT/PKB
signaling pathway [95, 96]. It is mutated in a large number of cancers at high frequency;
in fact, deletions in PTEN occur in 30-60% of primary PCa, with inactivating mutations
in 5-10% of the cases [80]. Mostly, PTEN deletions occur in ERG-fusion cases [78, 80].
PTEN loss is often found in PIN lesions, which indicates that it is a common event in
early PCa development; however, loss of PTEN is even more acute in advanced disease
as it is shown in metastatic PCa [78, 94]. Moreover, a growing body of evidence shows
that deletion of PTEN is associated with PCa aggressiveness [97, 98].
TP53
TP53 is the most commonly mutated gene in human cancer [99]. It is a tumor
suppressor in many cancers, which induces cell growth arrest or apoptosis depending on
the physiological context and cell type [99]. Several studies show deletions at the TP53
locus in approximately 25–40% of PCa samples [82], with point mutations in 5–40% of
patients. Of note, about 25–30% of clinically localized PCa present alterations in TP53,
and it is also found in PIN lesions, suggesting that these alterations are common in early
events in the genomic history of the disease [82].
NKX3-1
NKX3-1 (NK3 Homeobox 1) is a transcription factor that acts as a negative
regulator of epithelial cell growth in prostate tissue [100]. Moreover, it is crucial in the
development of fetal prostate [101]. Deletion of NKX3-1 is a common event in early
phases of PCa and cooperates with the activation of TMPRSS2: ERG [102]. Remarkably,
in vivo models show that the loss of NKX3-1, in conjunction with the loss of PTEN,
produces a constitutive activation of PTEN-AKT pathway disrupting normal cellular
response to DNA damage and promoting PCa development [103].
SPOP mutations and CDH1 deletions
SPOP (E3 ubiquitin ligase adaptor speckle-type POZ protein) is one of the most
frequently mutated genes in PCa (about 6-15% of localized PCa patients harbor point
mutations in this gene) [78, 104]. PCa with mutant SPOP lacked ETS family gene
rearrangements and showed a distinct pattern of genomic alterations [104]. PCa cells lines
transfected with the most common SPOP mutant (the F133V variant) or with SPOP

33
siRNA showed increased invasion capacity compared to controls; however, cell
proliferation and migration was not significantly altered [104, 105]. Moreover, SPOP can
act as a tumor suppressor involved in AR signaling. Specifically, SPOP mutated protein
cannot interact with SRC-3 protein or promote its ubiquitination and degradation (SRC-
3 is a direct regulator of androgen receptor transcriptional activity, cell proliferation, and
resistance to androgen deprivation therapy) [105]. Therefore, SPOP mutations abrogate
its naive tumor suppressor role and control of SRC-3 in PCa.
CHD1 (Chromodomain-helicase-DNA-binding protein 1) is an enzyme that acts
to remodel chromatin structure [106]. CDH1 is often loss in PCa (about 10-25% of cases)
but exclusively in ETS negative tumors [78, 107]. Unfortunately, the role of CHD1 in
PCa is still unclear; however, there is some evidence that CHD1 can act as a tumor
suppressor, required for efficient recruitment of AR and for the regulation of expression
of known AR-responsive tumor suppressor genes (i.e. NKX3-1 or FOXO1) [108].
AR signaling
AR undergoes several changes leading to enhanced activity in PCa, such as gene
amplification, point mutations, and alterations in canonical splicing leading to
constitutively active, aberrantly spliced variants, but most of these alterations take place
in late stage metastatic CRPC [82]. Nevertheless, alterations in genes encoding proteins
that regulate AR are common in early PCa; these include transcriptional co-activators,
such as the nuclear receptor coactivator 2 gene (NCOA2), and E1A binding protein p300
gene (EP300), transcriptional co-repressors, like nuclear receptor repressor 2 gene
(NCOR2), or interacting transcription factors nuclear receptor interacting-protein 1
(NRIP1-RIP140) [109], and chromatin regulatory elements [82]. FOXA1 (Forkhead Box
A1), which is commonly overexpressed in PCa, binds to AR regulating its transcriptional
activity and function [104]. Moreover, point activating mutations are found in this gene,
and it has been demonstrated that FOXA1 mutants enhance cell growth and invasion in
the presence of androgens [104].
Although AR does not seems to be structurally modified in primary PCa, its
expression is higher in early onset PCa, an aggressive form of PCa diagnosed at age ≤55
years [84]. However, the most striking role of AR/androgens in early PCa comes from
the evidence that this system is able to promote aberrant structural rearrangements (i.e.
gene fusions), which are one of the first events in PCa [84]. In vitro experiments have

34
also demonstrated that the formation of ERG rearrangements with androgen-dependent
genes can be induced by serum androgen levels in prostate epithelial cells [84, 110].
Therefore, it has been proposed that the increase in androgen levels promote structural
rearrangements in the prostate (i.e. TMPRSS2: ERG), which initiate a cascade of genetic
changes (i.e. PTEN or TP53 loss) driving progression and aggressiveness of human PCa.
2.2.4.6.2. Late events in PCa; the development of CRPC (castration resistant-PCa)
ADT by using anti-androgens and/or GnRH analogs is the gold standard of
therapy for locally advanced PCa, metastatic PCa, and biochemically recurrent disease
after the lack of success of localized treatments [111-113]. ADT is known to provide
remission for a time (24-36 months) of the disease, accompanied with PSA decline [111].
However, the disease progresses despite continuous hormonal therapy and PSA levels
increase again eventually (biochemical recurrence) [111]. This type of cancer is then
known as castration-resistant PCa (CRPC) [113]. To date, there is no successful cure for
metastatic castration-resistant PCa (mCRPC), which presents a mean survival time of
only 16–18 months [111]. The molecular hallmarks of CRPC cancers are divided in I)
AR-related pathways (Table 2) and, II) Non-AR-related pathways [76, 114].
I) AR-related pathways: To date, it is widely accepted that AR signaling plays a
central role in this late phase of the disease, since the increase of PSA during ADT therapy
reflects the re-activation of AR transcriptional activity [76, 111, 114]. Recently, the
persistent significance of the AR axis in CRPC was pharmacologically validated by the
clinical efficacy of androgen synthesis inhibitors (Abiraterone) and novel second-
generation AR antagonist (Enzalutamide) [76, 111, 115-117]. In addition, other signaling
pathways involved in AR function such as MAPK kinase, PIK3/AKT, Retinoblastoma
(Rb), MYC/MAX or WNT pathways are dysregulated in CRPC, and contribute to the
progression of the disease [82, 94, 114, 118] . The main mechanisms involved in the AR-
axis maintenance in CRPC are summarized in Table 2.
Although not directly related with AR signaling, neuroendocrine differentiation
is a crucial process driven by ADT therapy, and represents a critical step in the
progression of PCa from adenocarcinoma to CRPC [70]. Neuroendocrine PCa cells only
represent 2% of total cells of all primary PCa cells; however, ADT therapy produces an

35
expansion of this cell population, which does not express AR or PSA, and, therefore, is
not a target for ADT therapy [70, 76]. Remarkably, it has been shown that some factors
induced by castration (i.e. IL-6) enhance the neuroendocrine phenotype [119].
Table 2: Molecular mechanisms that promote persistent activation of AR in CRPC
tumors.
II) Non-AR-related pathways. Some of the processes included in these pathways
include: 1) Overexpression of anti-apoptotic proteins that circumvent the AR pathway
(i.e. BLC-2[127]); 2) Tumor suppressor dysregulation (i.e. TP53 [128, 129]); 3)
Alteration in miRNAs expression (i.e. MiR-21, MiR-27a, MiR-141, MiR-375
[130],[131]); 4) epigenetic changes (i.e. PTEN loss of expression due to CpG islands
methylation); 5) alternative splicing [77, 132]; and, 6) gene fusions (i.e. ERG genes [10]).
2.2.4.7. Diagnosis
Most adenocarcinomas are diagnosed during PSA screening and/or digital rectal
exam (DRE) [53]. Thanks to the PSA screening, almost 80% of PCa patients have tumors
located in the prostate without metastasis at the time of the diagnosis [51]. If certain
Mechanisms that promote persistent AR
axis activation in CRPC cells Example
Persistence of intra-tumoral levels of
androgens
Up-regulation and stimulation of
enzymes involved in androgen synthesis
(AKR1C3) [120]
AR overexpression
AR gene amplification, missense
mutations in AR ligand-binding domain
(LBD) [121, 122]
Expression of AR truncated variants AR-v7, AR-v4 [123-125]
Changes in the coregulatory components
of the AR complex (coactivators and
corepressors)
SRC1, SRC2, SRC3, NRIP1 [109, 126]
Activation of the AR complex via cross-
talk with other signaling pathways
PI3K/AKT, RAS/MAPK, MYC/MAX,
Retinoblastoma (Rb), TGF-β

36
symptoms or the results of PSA detection test are clearly positive, then a prostate biopsy
is required. Accordingly, a core needle biopsy by transrectal ultrasound (TRUS)-guided
biopsy is the main method used to diagnose PCa [53]. In biopsy specimens,
adenocarcinoma diagnosis can be confirmed by the absence of immunostaining using p63
and cytokeratin 5/14 antibodies, both of which detect basal cells [133]. In addition, the
sample will be evaluated for the presence and grade of the tumor (according to the
Gleason system) and also diagnosed by the status of their primary tumors (T1-4, M0 and
1a-c, N0 or 1) [134].
Unlike most solid tumors, some biomarkers have been typically employed in PCa
detection. First, PAP (prostatic acid phosphatase) was investigated as a serum biomarker
of cancer in metastatic prostate patients [135]. In the 1980s, PAP was rapidly replaced by
PSA, which has become one of the standard marker for the diagnosis of PCa in clinical
routine. However, PSA value for the prognosis of PCa is controversial, and in many cases,
leads to overdiagnosis and treatment of indolent cancer that produces more harm than
good in the patient [136, 137]. Therefore, it is widely accepted that new PCa biomarkers
should be identified to target unmet clinical needs in PCa management, including: 1) risk
indicators for disease with low PSA values (<10 ng/ml); 2) prognostic markers to
distinguish indolent from aggressive disease; and 3) biomarkers for metastatic cancer
[85]. Therefore, new genetics test have been devised in the last years that may fulfill the
needs in PCa diagnosis (Figure 7).
Figure 7: New tests for PCa clinical detection and management . After the identification
of patients in whom a biopsy is requi red (based on results of specific tests such as PSA
levels), new tests have been proposed, which are thought to fill out some of the current
PCa clinical needs (represented as different buckets). The first bucket shows different
promising tests, such as PHI, PCA3 and 4KSCORE, which might add specificity and
sensitivity to PSA test in order to detect PCa patients. Prostate Health Index (PHI) , is a
mathematical formula that combines total PSA, free PSA and proPSA [138], while the
4KSCORE incorporates a panel of four kallikrein protein biomarkers (total PSA, free PSA,
intact PSA, and human kallikrein-related peptidase 2) and other clinical information in an

37
algorithm [139].. The second bucket shows new tests used to discern if the patient should
undergo or not re -biopsy on suspicion of false negative in first bi opsy. ConfirmMDx test
is based on altered epigenetics factors that occur in the primary tissue (i.e. GSTP1, APC,
RASSF1)[140]. PCA3 (Prostate cancer antigen 3) expression levels can be measured in
urine with a commercial kit (Promega ®) [141]. The third bucket shows new tests that give
information about if the patient should be treated or not when the tumor is localized and
the Gleason score of the piece is low. Oncotype DX test measures 12 genes from Androgen
receptor pathway (AZGP1, KLK2, SRDS12, FAM13C), cellular organization (FLNC, GSN,
TPM2, GSTM2), proliferation (TPX2) and stromal response (BGN, SFRP4, COL1A1)
[142]. Likewise, Prolaris test measures the expression of 46 genes (involved in cell cycle
progression) that correla te with prostate tumor cell proliferation, to assess the
aggressiveness of an individual patient’s cancer [143]. Finally, the fourth bucket shows
tests that inform which patient should be treated after p rostatectomy. Decipher test
measures the score obtained with the expression of 22 genes related with different cell
processes (i.e. cell structure, adhesion, motility, or immune response), and provides
information on tumors that will probably metastasize a fter radical prostatectomy. [144]
PSA and modifications
Kallikrein 3 (KLK3) is a gene that encodes PSA protein, a member of the tissue
kallikrein family, which are serine proteases with diverse physiological functions [145].
A growing body of evidence suggests that many kallikreins are implicated in
carcinogenesis and some have potential as novel biomarkers in cancer and other diseases
[145]. PSA is expressed almost exclusively by the prostate and, therefore, its expression
is tightly linked to the presence of prostatic cells [146]. Mature PSA is the result of
proteolytic cleavages of two inactive precursor peptides, pre-proenzyme PSA (pre-
proPSA) and proPSA [24], and it is secreted into semen in its final form. Under normal
conditions, only low levels of PSA can be detected in blood, while it is highly secreted in
urine, and the increase of serum PSA can represent the presence of PCa, because PSA is
released into the blood as a consequence of disruption of normal prostate architecture
[147]. As previously mentioned, the level of PSA is a continuous parameter for the
presence of PCa: the higher the value, the more likely is the existence of the disease [53].
The exact cut-off level for what is considered to be a normal PSA value has not been
universally and absolutely determined, but values of approximately <2-3 ng/ml are often
used for younger men [53, 148], although low levels can underrate the presence of the
disease [53] (Table 3). There is a high controversy with the specificity and sensitivity of
PSA test (i.e. from 20 to 40% and 70 to 90%, respectively), depending on the PSA cutoff
values used (for example, 2 vs. 3 ng/ml) with an area under the curve (ROC curve) of
0.55-0.70 for the ability of PSA to discern patients with PCa (1.0 is perfect discrimination
and 0.5 is a coin toss) [149]. More importantly, the overdiagnosis, mainly by the detection

38
of harmless early-stage tumors with low Gleason score (indolent tumors), and
consequently overtreatment, is accepted as the most important downside of PSA-test
[150]. Therefore, there is a global controversy regarding whether PSA test should be used
or not as a screening method for PCa. As an example, while the Prostate, Lung, Colorectal
and Ovarian (PLC0) study performed in USA did not find any overall survival benefit
using PSA-screening [151], the European Randomized Study of Screening for Prostate
Cancer showed a 21% reduction of mortality based on PSA screening [152].
Table 3: Risk of PCa presence upon PSA blood levels.
Modifications of PSA test have been reported and may improve PSA specificity
(Figure 8). These modifications include PSA density, PSA density of the transition zone,
age-specific reference ranges, and PSA molecular isoforms. One of the most promising
markers is the use of the percentage of free PSA (% fPSA) to reduce the number of
unnecessary biopsies and increase the rate of PC detected [153].

39
Figure 8: Use of PSA test and modifications through the different phases of the
disease . cPSA: Complexed PSA; fPSA: free PSA; PSADT= PSA Do ubling Time;
PSAV=PSA velocity. Modified from Prensner et al. [85]
Prostate cancer associated 3 (PCA3)
PCA3 is a non-coding RNA highly overexpressed in prostate cancer [154]. In
contrast to PSA, PCA3 is exclusively expressed by PCa cells [155]. Although its
functional role is not clear, it seems to modulate and be regulated by androgen signaling
[156]. PCA3 expression levels can be measured in urine with a commercial kit (Promega
®) [141]. The increased specificity of PCA3 is contrasted by a reduced sensitivity and, to
date, the main application in clinical management of PCA3 could be the measurement of
its levels in association with PSA levels, which might reduce the number of unnecessary
biopsies after a negative biopsy in men with suspicion of PCa [157, 158].
Other promising biomarkers
In addition to PSA and PCA3, other biomarkers are currently being investigated
[85]. As mentioned before, TMPRSS2-ERG fusion is one of the most common events in
PCa [82]. However, TMPRSS2-ERG is absent in about 50% of PCa cases, and therefore,
its use can be only suitable in multiplexed assays combined with other biomarkers (i.e. in
conjunction with PCA3 in urine assays) [159]. Use of SNPs associated with PCa [160-
162], metabolites [163], high-throughput approaches (RNA-Seq) [164], circulating tumor
cells (CTCs) [165], exosomes [166] and miRNAs [167] are new avenues in PCa diagnosis
and prognosis, although their use in clinical routine assays has not yet been well
U s e s o f P S A te s t a n d m o d if ic a tio n s
T im e (y e a rs )
PS
A l
ev
el
T O T A L P S A
c P S A a n d fP S A P S A D T + P S A V
P S A
d e n s ity
H o rm o n e n a ive H o rm o n a l th e ra p y C R P C

40
developed. Interestingly, Taylor et al. [80] found that the level of DNA copy-number
alterations can predict which group of patients will present biochemical recurrence while
other groups with lesser DNA copy-number alterations may not even require surgery.
Other independent study has corroborated this observation showing that the burden of
DNA copy-number alteration correlates with higher Gleason score and PSA levels [78].
Another promising avenue is the use of miRNA in PCa diagnosis [167], since these
molecules can be reproducibly extracted from a wide range of biological samples,
accurately quantified by a variety of standard techniques, and are stable under different
conditions (Table 4 shows some of the most extensively investigated miRNAs in the
serum of PCa patients) [167].
Table 4: Promising miRNA biomarkers in the detection of PCa.
2.2.4.8. Treatment
The type of treatment that is specifically selected for each individual depends on
several parameters such as the clinical stage, Gleason Grade, and patient preference [168]
(Table 5).
miR Trend Putative targets Pathway-Functional process
miR-141 Up SHP AR
miR-375 Up MYC, CCND2 Proliferation
miR-221 Up p27kip1 Cell cycle, AR
miR-181a Down LEF1, BCL2 EMT, apoptosis
miR-21 Up p57kip2, PTEN Proliferation
AR=androgen receptor; EMT=epithelial-mesenchymal transition

41
Table 5: Treatment options for prostate cancer.
http://www.cancer.gov/types/prostate/hp/prostate-treatment-pdq#section/_62.
2.3. Somatostatin system
Somatostatin (SST) is a neuropeptide expressed in the central nervous system and
peripheral tissues [169] with an inhibitory functional role in the regulation of endocrine
secretions in vertebrates [169] (Figure 9). Among others, SST inhibits the secretion of
growth hormone (GH), thyroid-stimulating hormone (TSH), gastrointestinal (GI)
hormones, pancreatic enzymes, and neuropeptides from different tissues, such as the
pituitary, thyroid, stomach or pancreas [169, 170] (Figure 9A). SST acts through binding
Stage (TNM Staging Criteria) Standard Treatment Options
Stage I PCa (T1a, N0, M0, G1 [G1 =
Well differentiated (slight anaplasia),
(Gleason score of 2–4)])
Watchful waiting or active surveillance
Radical prostatectomy
External-beam radiation therapy (EBRT)
Interstitial implantation of radioisotopes
Stage II PCa (T1b-d or T2, N0, M0,
any Gleason)
Watchful waiting or active surveillance
Radical prostatectomy
EBRT with or without hormonal therapy
Interstitial implantation of radioisotopes
Stage III PCa (T3, N0, M0, any
Gleason)
EBRT with or without hormonal therapy
Hormonal manipulations (orchiectomy or
luteinizing hormone-releasing hormone [LH-
RH] agonist)
Radical prostatectomy with or without EBRT
Watchful waiting or active surveillance
Stage IV PCa (T4, any N, M0-1, any
Gleason)
Hormonal manipulations
Bisphosphonates
EBRT with or without hormonal therapy
Palliative radiation therapy
Palliative surgery with transurethral resection
of the prostate (TURP)
Watchful waiting or active surveillance
Recurrent PCa
Hormone therapy
Chemotherapy for hormone-resistant prostate
cancer
Immunotherapy
Radiopharmaceutical therapy/alpha emitter
radiation
EBRT = external-beam radiation therapy; LH-RH = luteinizing hormone-releasing
hormone; TURP = transurethral resection of the prostate; T = Primary tumor; N =
Regional lymph nodes; M = Distant metastasis; G = Gleason score.

42
to a family of G-coupled receptors encoded by 5 distinct, intronless genes called
somatostatin receptors (ssts; sst1-5) (Figure 9B). The binding of SST to ssts triggers
inhibitory cascades that negatively regulate cell proliferation and migration by the
inhibition of downstream pathways, such as ERK and AKT [169]. SST is also able to
inhibit cell proliferation of tumoral cells [171]. In line with this, synthetics SST analogs
(SSAs; octreotide or pasireotide) with higher affinity for ssts and longer half-life than
natural SST peptide, are a valuable clinical option in the treatment of different tumoral
pathologies (i.e. pituitary and neuroendocrine tumors) and a new therapeutic avenue in
other cancer types such as breast cancer or PCa [169, 172-175].
Somatostatin gene gives rise to a precursor called preprosomatostatin, which
comprises about 120 aa [176]. After a process of proteolytic hydrolysis, two main
products arise, SST-28 and SST-14, with 28 and 14aa, respectively. SST-14 and SST-28
bind to sst1-5 with low nanomolar affinity, with SST-14 having a slightly higher affinity
for sst1-sst4, and SST-28 showing higher affinity for sst5 [177]. Although both peptides
present similar physiological functions, SST-14 is predominantly produced in the central
nervous system (CNS) but also in many peripheral organs, while SST-28 is mainly
synthesized by mucosal epithelial cells along the gastrointestinal tract (GIT) [178].
Figure 9: Somatostatin (SST) functional actions are mediate through binding to SST
receptor subtypes (sst1-sst5) . A. Multiple physiological actions of SST throughout the

43
body; B . sst receptors (sst1-5) are G-protein coupled receptor with seven transmembrane
domains (TMD); C. Newly identified non-canonically spliced variants from the sst5 gene
have recently been reported . Specifically, two variants with five and four TMDs (called
sst5TMD5 and sst5TMD4, respectively) are generated together with the canonical, full -
length sst5. sst5TMD4 spliced receptor has been associated with malignant features and
aggressiveness in different types of endocrine-related tumors and cancers.
The complexity of the SST system increased twenty years after the discovery of
SST, when a new SST-related peptide encoded by an independent gene was identified
and named Cortistatin (CORT) [179]. Similarly to the SST gene, a larger precursor of
105 aa called precortistatin is cleaved to generates cortistatin-17 and cortistatin-29 in
humans [180]. Interestingly, both peptides, SST and CORT, exhibit a strong structural,
functional and pharmacological similarity, which may help to explain the ability of CORT
to bind all canonical sst subtypes with comparable affinity to SST, and also the similar
capacity of both peptides to regulate a number of common endocrine and non-endocrine
relevant processes [179]. Nevertheless, it should also be emphasized that CORT actions
do not always overlap with those of SST, and that CORT, but not SST, also binds and
activates proadrenomedullin N-terminal peptide receptor (MrgX2) and shows binding
affinity to ghrelin receptor (GHS-R1a) [181].
In addition, the existence of new variants of the sst5 receptor subtype derived from
non-canonical splicing mechanisms has been recently described by our group in the
human and other species [182] In particular, two additional truncated spliced variants of
the human sst5 have been discovered, which display 4 and 5 transmembrane domains
(TMDs) and were therefore named sst5TMD4 and sst5TMD5, respectively. Of special
interest has been the study of the sst5TMD4 variant, which seems to play a relevant
pathophysiological role, for it is barely expressed in normal tissues but markedly
overexpressed in several endocrine-related tumors and cancers, including pituitary
adenomas (PAs) [183, 184], breast cancer [185], poorly differentiated cancer and
medullary thyroid carcinoma [186, 187], and neuroendocrine tumors NETs [188]. In these
pathologies, sst5TMD4 presence correlates with clinical parameters of aggressiveness or
bad prognosis, and promotes cell proliferation/migration/invasion and/or hormone
secretion in primary cell cultures and/or model cell lines [183, 185, 187, 188] (Figure
9C). In addition, the presence of sst5TMD4 seems to impair the physiological anti-
tumoral actions of SSAs in tumors. Specifically, studies from our group have proven that
sst5TMD4 expression is negatively correlated with the ability of SSAs to reduce GH-

44
secretion in PAs [184], and inhibits the ability of sst2-transfected cells to respond to
SST/SSAs [185].
2.3.1 Somatostatin system in PCa
ssts are expressed in PCa and PCa cell lines [189, 190]. sst1 has been shown to be
overexpressed in PCa [191-193] and correlates with aggressive prostate cancer phenotype
[192]. However, the expression of other ssts in normal vs. PCa tissues is more
controversial. Specifically, sst2 has been reported to be downregulated [194] and
upregulated [195] in primary PCa, and sst5 expression is expressed in a high proportion
of PCa tissues, but is also present in normal prostate, and its levels do not seem to
correspond to the grade of the disease [193, 196]. ssts are localized in secretory cells,
basal cells, smooth muscle stromal cells and endothelial cells, being the sst1 the more
frequently expressed in basal and endothelial cell compared with the other subtypes [197].
To date, the presence and localization of the truncated splicing variants sst5TMD4 and
sst5TMD5 in PCa has not been explored.
The potential pharmacological use of SSAs in PCa has been evaluated in both, in
vitro and in vivo studies. Specifically, in vitro treatment with SSAs targeting different ssts
decreases the growth rate and increases cell cycle arrest through p21 in PCa cell lines
[189]. Interestingly, the combined treatment of Lanreotide and Octreotide with Docetaxel
enhances the induction of cell death in the PC-3 cell line [198, 199], a cell line with
neuroendocrine differentiation features [200]. Thus, combining SSAs treatment with
other therapeutic drugs might decrease tumor growth and provide a potential new avenue
in PCa-treatment [172, 201], especially in those patients with neuroendocrine carcinoma
or neuroendocrine differentiation after resistance to ADT therapy. Interestingly, it has
been suggested that the imaging analysis of the presence of ssts on the cancer cell surface
may provide a readily available, noninvasive means to distinguish adenocarcinoma from
NEPC [202]. This distinction is important for therapeutic decision making and might
open the door for developing novel radionuclide targets for the treatment of this
aggressive subtype of PCa [202]. Indeed, a recent study focused on the combined used of
sst scintigraphy technique (a type of radionuclide scan used to find carcinoid tumors using
radioactive octreotide bound to ssts in the tumor) with docetaxel and octreotide treatment
in CRPC patient with neuroendocrine differentiation showed a drastic size reduction of a
lung metastasis with decreased in PSA level [174]. Moreover, SSAs reduces the plasmatic

45
levels of chromogranin A (CGA), a marker of neuroendocrine differentiation, in several
trials [201, 203]. Somatostatin receptor based radio receptor therapy for treating advanced
neuroendocrine tumors with somatostatin antagonist (vs. agonist) has been also shown to
improve the diagnosis of PCa vs. other techniques [204].
SSAs may mediate their antitumor actions by decreasing the growth of tumors
through two different mechanisms: 1) by directly targeting the membrane receptors (sst1-
5) at the tumor surface; or 2) through an indirect inhibitory effect on secretory products,
mainly exerted on growth-promoting factors such as growth hormone (GH) and insulin-
like growth factor I (IGF-I). In fact, some studies have shown that the treatment with
octreotide acetate significantly lowers IGF-1 levels and raises IGFBP-1 (its plasma
binding protein) levels in patients with CRPC, with no effect in total PSA levels [203,
205]. Although the treatment with SSAs alone or in combinations have found some
valuable clinical benefits (i.e. decrease in IGF-1 and CGA), other studies have not found
improved overall survival, and the mechanistic reasons for those clinical failures are still
completely unknown [205]. Therefore, although this system seems a plausible and
valuable option in the treatment of PCa (especially in neuroendocrine tumors and CRPC
patients with neuroendocrine differentiation), limited studies have been published
focusing in the presence and functional role of many of the components of the SST-
system in PCa. Accordingly, new studies focusing on the presence and regulation of the
components of all the SST-system (including the splicing variants sst5TMD4 and
sst5TMD5) in PCa are required.

46
2.4. Ghrelin system
Ghrelin is a hormone of 28-aa identified by reverse pharmacology as the
endogenous ligand for the growth hormone secretagogue receptor (GHSR) [206]. Ghrelin
was primarily found in the stomach, but is expressed in a wide range of tissues where it
exerts multiple endocrine and paracrine actions [207] (Figure 10). Ghrelin requires to be
acylated by the Ghrelin-o-acyl transferase (GOAT) enzyme [208] to exert most of its
known functions through the canonical binding to GHSR1a, including stimulation of
growth hormone release from the anterior pituitary, stimulation of appetite and gut
motility, regulation of glucose homeostasis, and regulation of memory and of
cardiovascular and immune systems [207, 209] (Figure 10).
Figure 10: Functional and pathophysio logical functions of ghrelin system through the
body. The information of the image is taken from Gahete et al. [207].
On the other hand, although unacylated ghrelin (Des-acyl ghrelin) is the most
common form of ghrelin in plasma, its functional roles are far from clear [210].
Interestingly, ghrelin and its receptor are expressed in a number of cancers and cancer
cell lines and may play a role in processes associated with cancer progression, including
cell proliferation, apoptosis, and cell invasion and migration; however, the precise roles
of each component of the complex ghrelin-receptor system are still to be clearly defined
(Figure 10) [207, 211, 212].

47
The mature ghrelin peptide results from proteolytic processing of a precursor
peptide named preproghrelin [207, 213]. In humans, preproghrelin is encoded by a single-
copy gene (GHRL) located on the 3p chromosome, which it is classically accepted to be
composed of four coding exons (exons 1–4) [213] (Figure 11A). However, recent studies
have shown the presence of upstream exons in the ghrelin gene (exon -1, exon 0, and
extended exon 1) that can act as alternative sites for transcription initiation, and therefore,
add complexity to the ghrelin gene regulation [214]. Indeed, some of these exons combine
through alternative splicing processes to produce several mRNAs, which are further
processed to generate functional peptides. In addition, a novel ghrelin variant generated
by retention of intron 1 (In1), and consequently named In1-ghrelin, has been recently
identified by our group [215] (Figure 11B). Interestingly, In1-ghrelin variant is
upregulated in several endocrine-related cancers such as breast, pituitary and NETs [215-
217]. In1-ghrelin variant shares the first 5-amino acids with native-ghrelin, which is the
minimum sequence required for ghrelin acylation by GOAT and for binding and
activation of GHSR1a [214] (Figure 11B); however, the amino acid sequence of In1-
ghrelin is further modified by the retention of the intron 1. In line with this, GOAT
expression has also been reported upregulated in some endocrine-related tumors [188,
215]. Remarkably, the expression of In1-ghrelin variant and GOAT, but not ghrelin, are
positively correlated in breast cancer and neuroendocrine tumors [215, 217]. Based on
these results (i.e. overexpression and correlations between In1-ghrelin, but not ghrelin,
and GOAT enzyme) it has been suggested that In1-ghrelin variant could be the main
substrate of GOAT in these endocrine-related tumors.
The originally orphan, growth hormone secretagogue receptor (GHSR) is encoded
by a conserved single-copy gene located on chromosome 3 in humans [218] (Figure
11C). Human GHSR gene is composed of two exons, whose alternative splicing can
generate two mRNA species, named GHSR1a and GHSR1b. GHSR1a mRNA, which
includes exons 1 and 2, encodes a 366-amino acid G protein-coupled receptor (GPCR)
with seven transmembrane domains (TMDs) (Figure 11C). In contrast, GHSR1b mRNA
results from retention of the intron located between exons 1 and 2, which generates a 289-
amino acid GPCR isoform with only five TMDs, and bearing a dissimilar 24-amino acid
sequence at the C-terminal region compared with the GHSR1a sequence (Figure 11C).
To date, the functional activity of truncated GHSR1b remains to be fully elucidated [207,
218, 219], while it is well-established that GHSR1a is the receptor responsible for

48
transducing the signal of acylated-ghrelin and the family of synthetic GH secretagogues.
Nevertheless, there is emerging evidence that GHSR1b may exert pathologically-relevant
actions, particularly by acting as a dominant-negative of its full-length partner GHSR1a
[219-221].
Figure 11: The ghrelin system . A. Ghrelin is found in plasma in two different forms:
desacyl-ghrelin and acyl-ghrelin (active). GOAT enzyme is responsible for adding the acyl
group in Serine 3 to ghrelin. Acyl -ghrelin is the only form able to bind to the growth
hormone secretagogue receptor (GHS-R1a) and exert the majority of its known
physiological and pathophysiological functions; B. Aberrant alternative splicing in the
GHRL gene generates ghrelin and the spliced form In1-ghrelin variant which is commonly
overexpressed and enhances malignant cancer features (i.e. cell proliferation, cell
migration, hormonal secretion) in different cancer models; C. Alternative splicing in the
GHSR gene generates the canonical GHSR1a but also an aberrant form called GHSR1b
with pathophysiological features in endocr ine tumors
2.4.1. Ghrelin system in PCa
Since 2002, several studies have reported the presence and investigated the
potential pathophysiological role of ghrelin system in PCa [222-235]. These studies have
shown that the majority of the components of the ghrelin system are locally expressed in
the prostate gland. Particularly, ghrelin mRNA and protein expression has been reported
in normal prostate, human benign hyperplasia, and prostate carcinoma [222] as well as in
PCa cell lines [222, 223, 225]. Ghrelin peptide seems to be secreted from the prostate

49
[225], as it has been detected in the medium of the PC-3 cell line. In line with this, one
study showed that “active” (acylated) ghrelin levels were higher in the blood of patients
with PCa [228], but this point is controversial since other reports found no differences
between patients with PCa and healthy individuals [226, 227]. In the prostate, ghrelin
peptide is localized in the cytoplasm of glandular epithelial cells with lower staining
intensity in the normal tissue compared with malignant epithelium [225].
There is much controversy on the putative physiological and pathological roles
that ghrelin may play in the normal prostate and in PCa. Specifically, one group (led by
Dr. L. Chopin) has reported that treatment with ghrelin peptide and/or overexpression of
the canonical preproghrelin enhanced the growth rate and cell migration of PCa cell lines
(PC-3 and LnCaP) [223, 225, 235], which could be mediated through the activation of
key signaling pathways such as MAPK/ERK and/or PI3K/AKT/mTOR [225]. However,
other studies from different and independent groups have shown opposite effects of
ghrelin in terms of cell growth [222, 229, 231]. Interestingly, additional reports have also
reported that other splicing variants generated from the ghrelin gene (i.e. exon 2- deleted
preproghrelin, exon 3- deleted preproghrelin, in2c-variant) are also present in PCa, where
they might be involved in controlling PCa malignancy features [225, 235, 236]. However,
to date no studies have been published focusing in the presence and functional role of
other components of the ghrelin-system in PCa, as is the case of the In1-ghrelin variant;
therefore, new studies aimed at establishing the presence, regulation and functional role
of some components of the ghrelin-system (including the splicing variant In1-ghrelin) in
PCa are still required.
GOAT enzyme levels have been reported to be similarly abundant (both mRNA
and protein) in normal and PCa tissues, although this study also demonstrated that its
expression was significantly higher in PCa cell lines compared with normal prostate
epithelial-derived cell lines [233]. This study also showed that acyl-ghrelin peptide
treatment, but not desacyl-ghrelin, was specifically able to decrease GOAT expression in
the normal-like RWPE1 cell line and in PC-3, but not in DU-145 or LnCaP, prostate
cancer cell lines. Although this study shows for the first time that GOAT is expressed in
PCa, many questions remains unanswered (i.e. the plasmatic expression of GOAT in
patients with PCa or the regulation of this enzyme by different ghrelin-gene derived
peptides or by other metabolic factors); Therefore, it is necessary to expand our
knowledge of the presence and regulation of GOAT in PCa.

50
The presence of ghrelin receptors (GHSR1a and GHSR1b) in prostate cells has
not been entirely defined, and the information published to date remains controversial
[222, 223, 234]. Specifically, it has been reported that GHSR1a and GHSR1b expression
was present in PCa cell lines (ALVA-41, LNCaP, DU145 and PC-3) [223], and that
GHSR1a, but not GHSR1b, expression was also detected in normal prostate [223].
Conversely, another independent study showed that GHS-R1a and GHSR1b were not
expressed in carcinomas, although GHS-R1b mRNA was present in 50% of hyperplasias
[222]; moreover, in contrast to that previously reported, this study also showed that GHS-
R1a and GHSR1b were expressed only in DU-145 cells. Recently, GHSR
hypermethylation at the promoter and first exon was shown to be a common process in
several cancers, including PCa, supporting the candidature of GHSR methylation as a
highly accurate pan-cancer marker [234]. Therefore, as mentioned above, new studies
focusing in the presence (in parallel), regulation and/or functional role of different
components of the ghrelin-system (including the splicing variant In1-ghrelin, ghrelin,
ghrelin-receptors and GOAT enzyme) using normal and PCa samples as well as normal
and PCa cell lines in PCa are still required.

51
HYPOTHESIS AND OBJECTIVES

52

53
3. HYPOTHESIS AND OBJECTIVES
During the last years, our research group has focused much of its efforts in
studying the role that two pleiotropic regulatory systems, those formed by somatostatin
(SST)/cortistatin (CORT)/receptors (sst1-5 and sst5TMD4 and sst5TMD5 splicing
variants), and by ghrelin/In1-ghrelin splicing variant/receptors (GHSR-1a and GHSR-1b)
and GOAT enzyme, play on different pathological conditions, including several tumors
and cancers. Although the presence of some receptors for SST/CORT and ghrelin in
human PCa has been previously described, few studies have examined in detail the
potential pathophysiological relevance of these regulatory systems. Based on this
preliminary findings and our prior experience in other cancers, the initial hypothesis of
this PhD Thesis was that the dysregulation of the SST/CORT and ghrelin systems, and,
especially, of their splicing variants (sst5TMD4/5 and In1-ghrelin) and GOAT enzyme
could directly and negatively influence PCa, and consequently, that their levels of
expression in tumor tissues could provide useful information to improve diagnosis and
prognosis of these tumors and/or to predict response to treatments. In addition, we thought
that such molecules might be potential targets for the identification of new drugs (e.g.
In1-ghrelin and sst5TMD4 receptor antagonists) and for the consequent development of
future therapeutic strategies to treat these pathologies.
Based on this hypothesis, the main objective of this thesis was to determine the
levels of expression and functional role of different components of the SST/CORT and
ghrelin systems in PCa, especially those of the splicing variants sst5TMD4/5 and In1-
ghrelin and GOAT enzyme, and to establish the possible association between their
expression levels and: 1) the expression of other components of the SST/CORT and
ghrelin systems (ligands, receptors and associated enzymes); 2) the expression of other
regulatory systems and tumoral biomarkers well-known for its potential
pathophysiological importance (e.g.: markers of proliferation, prognosis, etc.); and 3) the
clinical information of the patients (e.g. levels of PSA, presence of metastasis, Gleason
score, etc.).
Altogether, our ultimate aim was to establish the possible use of these splicing
variants or other components of the SST/CORT and ghrelin systems, especially the
GOAT-enzyme, as novel tumor biomarkers and promote their development as new
diagnostic, prognostic and therapeutic targets.

54
To achieve this main objective, we proposed the following specific objectives:
1) To determine and analyze the expression levels of the aberrant splicing variants
sst5TMD4, sst5TMD5 and In1-ghrelin, of GOAT-enzyme as well as others components
of the SST/CORT and ghrelin systems and molecules of particular pathophysiological
relevance (e.g. PSA, PCA3, etc.) in a wide, representative and clinically well-
characterized set of human PCa samples, as well as in different human androgen-
dependent and androgen-independent PCa cell lines (LnCAP, 22Rv1, PC-3, VCaP,
Du145), compared to the expression levels of normal human prostate samples and the
normal-like prostate cell line (RWPE-1), respectively.
2) To determine the association between the presence of the truncated receptors
sst5TMD4/5, In1-ghrelin splicing variant and GOAT-enzyme and the clinical and
pharmacological characteristics of patients with PCa, and to establish the possible
quantitative associations between the presence of these splicing variants or GOAT-
enzyme in PCa samples and the expression of other molecules of particular
pathophysiological relevance in PCa analyzed in the objective 1.
3) To evaluate the functional response to different peptides of the SST and ghrelin
systems (e.g. natural ligands, SSA and In1-ghrelin derived peptides) in primary human
normal prostate cell cultures and in normal and PCa cell lines, and evaluate if this in vitro
response on key functional processes associated with tumor progression and
aggressiveness (e.g. cell proliferation, migration, etc.) is associated with the
presence/absence of the aberrant splicing variants (sst5TMD4/5 and In1-ghrelin).
4) To explore the consequences of the overexpression/silencing of sst5TMD4/5,
In1-ghrelin variant and/or GOAT-enzyme and other molecules from the SST and ghrelin
systems on key functional processes associated with tumor progression and
aggressiveness (e.g. cell proliferation, migration, PSA secretion, signaling pathways, etc.)
in primary human normal prostate cell cultures, in normal and PCa cell lines, as well as
on in vivo pre-clinical models of PCa (immunodeficient mice) that
overexpressed/underexpressed sst5TMD4, sst5TMD5 or In1-ghrelin variant

55
MATERIALS AND METHODS

56

57
4. MATERIALS AND METHODS
4.1. Patients and samples
All the studies involving human samples were approved by the Hospital Ethics
Committee, conducted in accordance to the principles of the Declaration of Helsinki and
written informed consent was obtained from all patients. Samples were obtained through
the Andalusian Biobank (Servicio Andaluz de Salud). Different set of human samples
obtained from PCa patients and control patients were collected. These samples included:
1) Formalin-fixed paraffin-embedded (FFPE) PCa tissues (n=45) obtained from radical
prostatectomies of patient diagnosed with localized PCa (Gleason score 6-7 in final
pathological evaluation) and their non-tumoral adjacent tissues (N-TAR) used as
control. Available clinical parameters were collected from each patient (Table 6).
Table 6. Overall clinical and demographics data of patients from who formalin-fixed
paraffin-embedded (FFPE) prostate pieces with low-intermediate grade tumors were
obteined.
Parameter Overall
Patients n = 45
Age at diagnosis, Mean ± SD 62.27 ± 5.1
PSA level, ng/ml, Median (IQR) 4.8 (3.6-7.8)
Gleason score (%)
6 12/45 (27%)
7 33/45 (73%)
EE, no. (%) 22/45 (48%)
PI, no. (%) 34/45 (75%)
VI, no. (%) 8/45(17%)
No.=number; SD=standard deviation; EE=extraprostatic extension;
PI=perineural infiltration; VI=vascular invasion; FFPE= formalin fixed
paraffin embedded; IQR=interquartile range
2) Fresh prostate samples (n=52) obtained by core needle biopsies from patients
diagnosed with palpable high risk PCa [PSA>20.0 and/or Gleason 8-10 and/or cT3,
according to National Comprehensive Cancer Network (NCCN) guidelines
classification] (Table 7). Histology of PCa was always confirmed by a specialized

58
anatomo-pathologist. Several techniques, such as computerized tomography (CT scan)
and bone scan, were used to determine the presence of metastasis in these patients.
3) Normal prostate samples (NPs, n=14) from donor patients that underwent
cystoprostatectomy due to bladder cancer. Histology of the normal prostate samples was
always confirmed by a specialized anatomo-pathologist. Available clinical parameters
were collected from each of these control patients (Table 7).
Table 7. Overall clinical and demographic data of patients from whom fresh PCa and
normal prostate samples were obtained (by core needle biopsies or from
cystoprostatectomy, respectively).
4) Plasma and urine samples from patients with PCa (n=85) and healthy BMI-matched
controls (n=28) for the evaluation of GOAT as new PCa biomarker (Table 8).
Parameter Overall Control PCa PCa No Met PCa Met
Patients, no. 66 14 52 28 24
Age at diagnosis
Median (IQR) 76 (67.5-
81.25)
70 (62.2-
80.7)
78 (69-81.7) 79 (69-83) 76 (69-80)
PSA level, ng/mL
Median (IQR)
54.5 (37.2-212) 45 (22.5-61.5) 101.5 (51.2-
771)
Gleason score
7 - - 18/52 (35%) 15/28 (53%) 3/24 (12%)
>7 - - 34/52 (65%) 13/28 (47%) 21/24 (88%)
EE - - 17/52 (33%) 5/28 (18%) 13/24 (54%)
PI - - 27/52 (52%) 12/28 (43%) 15/24 (63%)
PCa=prostate cancer; No Met= no metastasis; Met= metastasis; nº= number; EE=extraprostatic
extension; PI= perineural infiltration

59
Table 8. Demographic and clinical characteristic of patients included in the study with
plasma and urine samples for the evaluation of GOAT as PCa biomarker.
Parameter Control (n=28) PCa (n=85) p value
Age, yr, mean (SD) 62.04 (9.6) 68.7 (8.3) 0.0005
Weight, kg, mean (SD) 84.56 (14.21) 81.5 (11.9) 0.27
Waist, cm, mean (SD) 105 (10.01) 105.5 (10.07) 0.83
BMI, mean (SD) 30.46 (4.4) 29.2 (3.8) 0.16
Ethnicity, (n) Caucasian (27);
Black (1)
Caucasian (84),
Black (1) -
Amylase 59 (52-75.3) 56 (46-75) 0.36
Albumin 4.16 (0.25) 4.20 (0.28) 0.54
Colesterol, mg/dL, mean (SD) 205.1 (34.69) 194.6 (38.93) 0.20
Triglycerides, mg/dL, median
(IQR) 125.5 (93.25-178.5) 112 (90-151) 0.24
HDL, mg/dL, median (IQR) 45 (38-51) 45 (38.5-49.5) 0.84
Glycated hemogobin, (%) 5.6% 5.6% 0.4
Glucose, mg/dL, median (IQR) 109 (97.25-130.8) 102 (92-121.5) 0.15
Insulin, m U/L, median (IQR) 6.2 (3.3-10.7) 8.9 (5.5-11.4) 0.045
Diabetes, n (%) 9/28 (32.12%) 25/85 (29.4%) 0.81
Dyslipidemia, n (%) 5/28 (17.85%) 20/85 (23.95%) 0.60
Testosterone 5.3 (4.1-6.7) 4.8 (3.7-5.8) 0.16
Total PSA, ng/ml, median
(IQR) 0,8 (0.4-1.1) 6.3 (3.8-9.5) <0.0001
Free PSA, ng/mL, median
(IQR) - 0.81 (0.5-1.1) -
Invasive tumors - 14/85 (16%)
Gleason score, n (%)
6 - 41/85 (48%)
7 - 38/85 (45%)
8 - 5/85 (6%)
9 - 1/85 (1%)
cyfra_211 1,2 (1-1,80) 1,4 (1.1-2.1) 0.18
ca15_3 12 (7-21.7) 19 (14-24) 0.046
GOAT, ng/mL, median (IQR) 1.07 (0.9-3.2) 2.26 (1.3-6.1) 0.0002
PCa: prostate cancer; Yr= year; SD=standard desviation; Kg=kilogram; cm=centimeter.
BMI=body mass index; n=number; IQR= interquartile range; Parameters with
significant difference between the groups are indicated in italic letter.
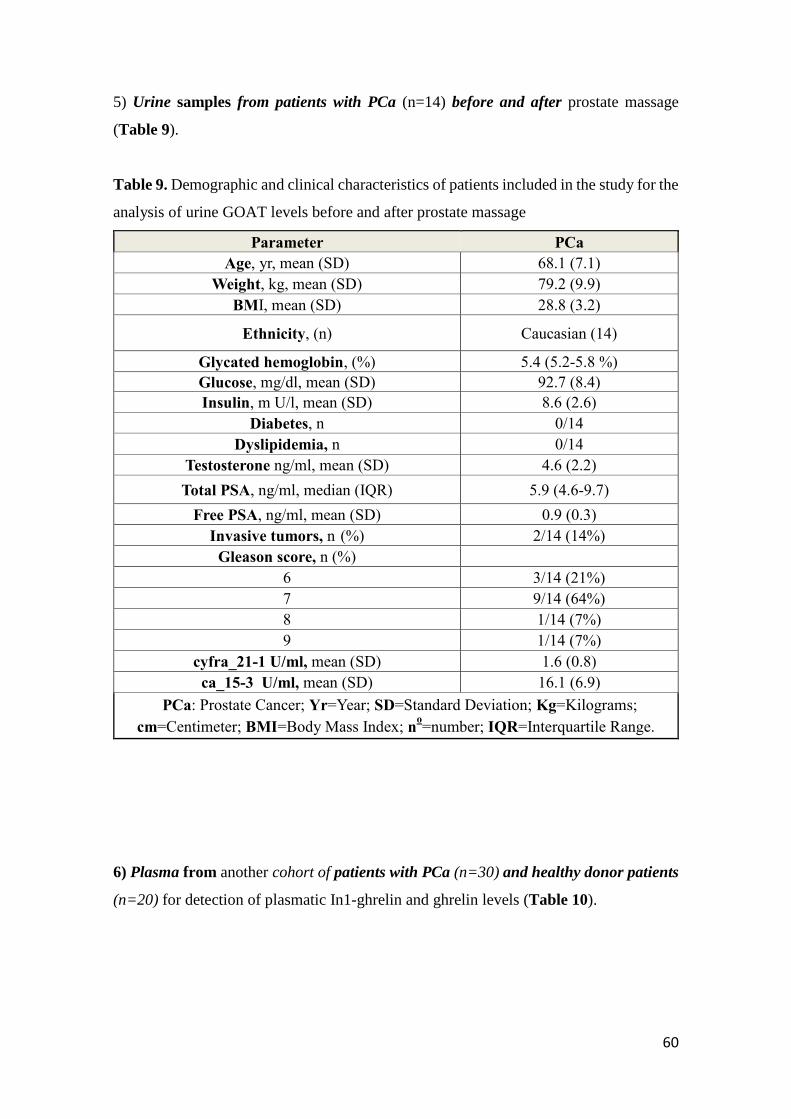
60
5) Urine samples from patients with PCa (n=14) before and after prostate massage
(Table 9).
Table 9. Demographic and clinical characteristics of patients included in the study for the
analysis of urine GOAT levels before and after prostate massage
Parameter PCa
Age, yr, mean (SD) 68.1 (7.1)
Weight, kg, mean (SD) 79.2 (9.9)
BMI, mean (SD) 28.8 (3.2)
Ethnicity, (n) Caucasian (14)
Glycated hemoglobin, (%) 5.4 (5.2-5.8 %)
Glucose, mg/dl, mean (SD) 92.7 (8.4)
Insulin, m U/l, mean (SD) 8.6 (2.6)
Diabetes, n 0/14
Dyslipidemia, n 0/14
Testosterone ng/ml, mean (SD) 4.6 (2.2)
Total PSA, ng/ml, median (IQR) 5.9 (4.6-9.7)
Free PSA, ng/ml, mean (SD) 0.9 (0.3)
Invasive tumors, n (%) 2/14 (14%)
Gleason score, n (%)
6 3/14 (21%)
7 9/14 (64%)
8 1/14 (7%)
9 1/14 (7%)
cyfra_21-1 U/ml, mean (SD) 1.6 (0.8)
ca_15-3 U/ml, mean (SD) 16.1 (6.9)
PCa: Prostate Cancer; Yr=Year; SD=Standard Deviation; Kg=Kilograms;
cm=Centimeter; BMI=Body Mass Index; no=number; IQR=Interquartile Range.
6) Plasma from another cohort of patients with PCa (n=30) and healthy donor patients
(n=20) for detection of plasmatic In1-ghrelin and ghrelin levels (Table 10).

61
Table 10. Demographic and clinical characteristic of patients included in the study for
the analysis of In1-ghrelin and ghrelin levels in the plasma.
Parameter Control (n=20) PCa (n=30) p value
Age, yr, mean (SD) 63.8 (9.9) 74.8 (8.1) < 0.0001
Weight, kg, mean (SD) 82.62 (12.8) 78.7 (12.3) 0.29
Waist, cm, mean (SD) 103.7 (10.7) 106 (10.9) 0.46
BMI, mean (SD) 29.8 (4.7) 28,8 (3.6) 0.54
Ethnicity, (n) Caucasian, n=20 Caucasian, n=30 -
Amylase, median, (IQR) 60.5 (52.5-72.5) 54.5 (46.7-77.5) 0.26
Albumin, mean, (SD) 4.1 (0.23) 4.1 (0.33) 0.93
Colesterol, mg/dL, median,
(IQR) 221 (184.3-244.8)
189.5 (163.5-
206.5) 0.053
Triglycerides, mg/dL, mean
(SD) 129.4 (39.2) 106.9 (41.5) 0.06
HDL, mg/dL, mean (SD) 45.8 (7.8) 48.2 (12.5) 0.44
Glycated hemogobin, (%) 5.5 (5.3-6.1) 5.7 (5.5-6.1) 0.59
Glucose, mg/dL, median (IQR) 107.5 (98.2-126.3) 97 (92-114) 0.06
Insulin, m U/L, mean (SD) 7.9 (6.9) 8.3 (3.1) 0.29
Testosterone 5.8 (1.6) 4.4 (2.1) 0.01
Total PSA, ng/ml, median
(IQR) 0.85 (0.44-1.1) 25 (11.1-83.9) < 0.0001
Free PSA, ng/mL, mean (SD) 0.74 (0.3) -
Invasive tumors 14/30 (46,6%) -
Gleason score, n (%)
6 8/30 (26,6%) -
7 9/30 (30%) -
8 7/30 (23,3%) -
9 6/30 (20%) -
cyfra_211, media, (IQR) 1.2 (1-1.8) 1.8 (1.2-2.8) 0.004
ca15_3, median, (IQR) 14 (7-25.5) 23 (18.7-27) 0.01
Prepro-In1-ghrelin, pg/mL,
median (IQR) 0 (0-0) 4.6 (0-18) 0.03
PCa: prostate cancer; Yr= year; SD=standard deviation; Kg=kilogram; cm=centimeter.
BMI=body mass index; n=number; IQR= interquartile range; Parameters with
significant difference between the groups are indicated in italic letter.

62
4.2. RNA, RT and qPCR assays
4.2.1. RNA isolation from FFPE samples
Total RNA from the FFPE samples was isolated using the RNeasy FFPE Kit
(Qiagen, Limburg, Netherlands) according to the manufacturer’s instructions.
Procedure:
- Place 4 FFPE cores (8µm sections) into a 2 ml microcentrifuge tube and close the lid.
- Add 1 ml limonene (xylene can also be used). Vortex vigorously for 10s, incubate at
56ºC for 5 min and centrifuge at full speed for 2 min. Repeat this step at least three times,
until the paraffin is dissolved.
- Carefully remove the supernatant by pipetting without disturbing the pellet.
- Add 1 ml ethanol (96–100%) to the pellet, mix by vortexing, and centrifuge at full speed
for 2 min.
- Carefully remove the supernatant by pipetting without disturbing the pellet. Carefully
remove any residual ethanol.
- Keep the lid open, and incubate at room temperature (15–25°C) or at up to 37°C.
Incubate for 10 min or until all residual ethanol has evaporated.
- Add 240μl Buffer PKD, and mix by vortexing.
- Add 10μl proteinase K. Mix gently by pipetting up and down.
- Incubate for 15 min at 56 ºC.
- Incubate for 15 min at 80 ºC.
- Place the sample on ice for 3 min and centrifuge for 15 min at full speed.
- Transfer the supernatant to a new microcentrifuge tube (not disturb the pellet).
- Mix 16μl DNase Booster Buffer and 10μl DNase I stock solution for sample. Mix by
inverting the tube. Add 26μl of the mix to the sample.
-Incubate at room temperature for 15 min.
- Add 320μl Buffer RBC to break red cells and mix the lysate thoroughly.
- Add 720μl ethanol (100%) to the sample, and mix well by pipetting. Do not centrifuge.
-Follow the manufacturers’ instructions for the next steps (column purification).
4.2.2. RNA isolation from fresh tissues (PCa samples by needle biopsies and normal
prostate from cystoprostatectomy)

63
Total RNA from fresh prostate samples (PCa or normal prostate samples) was
extracted using the AllPrep DNA/RNA/Protein Mini Kit followed by deoxyribonuclease
treatment using RNase-Free DNase Set (Qiagen, Limburg, Netherlands).
Procedure:
Before starting:
*Kit DNase:
- Prepare DNase I stock solution by dissolving the lyophilized DNase I in 550µl
RNase-free water.
*Kit extraction:
- Prepare a mix of β-mercapto + buffer RLT (10ul β-ME + 1ml RLT (this mix
can be stored 1 month a RT)
- Add dithiothreitol (DTT) to buffer ALO (8mg DTT for each ml of buffer).
- Add ethanol (96-100%) to RPE, AW1 and AW2 buffers.
- Preheat EB buffer at 70ºC.
Protocol:
- Add suitable volume of RLT buffer + B-ME and homogenize (360-600ul if sample
<20mg, or 600ul if sample >20mg)
- Centrifuge 3 min at full speed.
- Transfer to a DNA column (violet color)
- Centrifuge 30 sec at 10.000 rpm.
- Place column in a new 2ml tube.
- DNA is retained in the column while the liquid contains the RNA and proteins.
- Store column with DNA at 4ºC,
- Add ethanol 100% to the liquid in order to purify the RNA. Add 250ul if we started with
350ul, or 430ul if we used 600ul.
- Mix by pipetting, no vortex/centrifuge.
- Transfer up to 700ul to the RNA column (pink)
- Centrifuge 15 s at 10.000 rpm
- Transfer the liquid to a 2 ml tube and stored at 4ºC (Proteins).
- RNA is retained in the column.
RNA
- Add 350ul of RW1 buffer to the column.

64
- Centrifuge 15 sec at 10.000 rpm
- Discard the liquid
- Add 10ul DNase to 70ul RDD buffer, mix by inversion, spin.
- Add 80ul of this mix to the center of the column
- Incubate 15 min at RT
- Add 500ul of RPE buffer
- Centrifuge 15 sec at 10.000 rpm
- Discard the liquid
- Add 500ul RPE buffer
- Centrifuge 2 min at 10.000 rpm
- Place the column in a new 2-ml tube.
- Centrifuge 1 min at full speed.
- Place the column in a new 1.5-ml tube.
- Add 30-50ul of RNA-free water
- Centrifuge 1 min at 10.000 rpm
- Store RNA at -80ºC
Proteins
- Add 700ul of APP buffer to the liquid stored at 4ºC.
- Vortex and incubate 10 min at RT
- Centrifuge 10 min to full speed
- Discard supernatant with a pipette
- Add 500ul of 70% ethanol
- Centrifuge 1 min to full speed
- Discard supernatant with a pipette
- Incubate 5-10 min at RT in order to dry the protein-pellet.
- Add up to 100ul of ALO buffer and vortex
- Incubate 5 min at 95ºC
- Chill at RT
- Centrifuge 1min at full speed
- Transfer the supernatant into a new 1,5-ml tube.
- Store proteins at -20 ºC.
Genomic DNA
- Add 500ul of buffer AW1 to the column at 4 ºC

65
- Centrifuge 15 sec to 10.000 rpm
- Discard the liquid
- Add 500ul of AW2 buffer
- Centrifuge 2 min at full speed.
- Place column in a new 1.5-ml tube.
- Add 100ul of preheated-EB buffer
- Incubate 2 min at RT
- Centrifuge 1min at 10.000 rpm
- Store genomic DNA at 4ºC
4.2.3. RNA isolation from prostate cell lines
Total RNA from PCa and normal prostate cell lines was extracted with Trizol
reagent (Thermo Scientific, Wilmington, NC, USA). Briefly, cells were seeded until
confluence in 6 o 12-well-plates. Then, wells were washed two times with PBS buffer
and, subsequently, 0.6ml Trizol was added and collected with lysed cells. RNA isolation
was carried out by adding chloroform, centrifuging and collecting the aqueous phase.
RNA was recovered and concentrated with 2-propanol precipitation and 70% ethanol
washing steps. Finally, samples were dried and resuspended with 8μl of DEPC-treated
water. Subsequently, samples were treated with 1μl (1 unit) of DNase (Promega,
Barcelona, Spain) and incubated 30 min at 37°C, stopping the reaction by adding a Stop
Solution and incubating at 65°C for 5 min.
4.2.4. Quantification of RNA concentration and Reverse-Transcription (RT)
Total RNA concentration and purity was assessed using Nanodrop 2000
spectrophotometer (Thermo Scientific, Wilmington, NC, USA), and subsequently retro-
transcribed using random hexamer primers and the cDNA First Strand Synthesis kit (MRI
Fermentas, Hanover, MD, USA).
Procedure:
- Add the following reagents in the order indicate below (RNA-free tubes).
- Template RNA: from 0.1 ng to 2.0 µg.
- 1 µl of Random Hexamer primer
- Water nuclease-free up to a volume of 12 µl.

66
- Mix gently, spin down and incubate at 65°C for 5 min.
- Cool on ice for 3 min.
Prepare a mix the following components in each sample:
- 5X Reaction buffer: 4µl
- RiboLock RNase Inhibitor (Enzime 1): 1µl.
- 10 mM dNTP Mix: 2µl
- RevertAid M-MuLV RT (200 U/µL; Enzime 2): 1µl.
Total volume of 20 µl. Then:
- Mix gently and centrifuge briefly.
- Incubate for 5 min at RT and then 60 min at 42 ºC.
- Finish the reaction by heating the sample 5 min at 70 ºC.
4.2.5. Conventional PCR and quantitative real-time PCR (qPCR) with SYBR green
Primers were designed using the bioinformatics tool Primer Blast
(http://www.ncbi.nlm.nih.gov/tools/primer-blast/) or Primer3 online tool
(http://bioinfo.ut.ee/primer3-0.4.0/) with specific conditions to optimize the results in the
downstream applications:
- Melting temperature of 60 ºC.
- Primer size: 20 pair of bases (range from 18-24)
- Primer % GC: Min: 40; Max: 60.
- Max. Self. Complementary: 4 (Ideally 0)
- Max. 3’Self. Complementary: No more than 1 (Ideally 0)
- Amplified sequence of 75 to 200pb
- Primers designed between different exons to prevent genomic amplification
Each set of primers was always evaluated for specificity by BLAST alignment
(http://blast.ncbi.nlm.nih.gov/Blast.cgi?PROGRAM=blastn&PAGE_TYPE=BlastSearc
h&LINK_LOC=blasthome).
Conventional PCR has been routinely used along this work to validate qPCR
primers, using the “DreamTaq DNA Polymerase” (Thermo Scientific, Wilmington, NC,
USA) and the thermocycler “Supercycler Gradient Cycler” (Kyratec, Belgium).

67
In qPCR assays, cDNAs were amplified with the Brilliant III SYBR Green Master
Mix (Stratagene, La Jolla, CA, USA) using the Stratagene Mx3000p system. qPCR of
samples was always run in parallel with a standard curve to estimate the absolute mRNA
copy number. Thermal profile consisted of an initial step at 95ºC for 3 min, followed by
40 cycles of denaturation (95ºC for 20 seconds), annealing (60ºC for 20 sec) and finally,
a dissociation cycle to verify that only one product was amplified (by the melting curve).
Expression levels were reported as absolute mRNA copy number/50ng of sample. For
fresh samples a normalization factor was calculated with the expression levels of ACTB
and GAPDH using GeNorm 3.3. For in vitro assays (normal prostates cell cultures and
PCa cell lines) result were adjusted according to the value of ACTB.
4.3. sst5TMD4 and GOAT IHC analysis
sst5TMD4 immuno-histochemical staining was performed on 30 FFPE prostate
samples with regions of normal prostate tissue and PCa tissue using a custom-made and
previously validated polyclonal rabbit anti-human sst5TMD4 antibody (1:400) [188]
(clone name:66498) using standard procedures [183, 185, 188]. In the case of GOAT,
validation of IHC was implemented in formalin-fixed, FFPE prostate tissue samples
obtained from radical prostatectomies, which have normal and tumoral regions from
patients diagnosed with localized PCa (Gleason score 6-7 in final pathological
evaluation). Finally, GOAT IHC staining was performed on biopsies pieces obtained
from patients diagnosed with clinical high grade PCa (Gleason 7-10; n=16) and in
normal-benign prostate samples. GOAT staining was analyzed using a commercially
available human GOAT antibody that recognizes the middle region of the enzyme (AA
257-287; ABIN953340, Acris antibodies GmbH, Herford, Germany) using standard
procedures (1:400).
Deparaffinized sections were incubated with sst5TMD4 and GOAT antibodies
overnight at 37C, followed by incubation with the appropriate HRP-conjugated secondary
antibody (Envision system, Dako, Barcelona Spain). Finally, sections were developed
with 3,3´-diaminobenzidine (Envision system 2-Kit Solución DAB), contrasted with
hematoxylin and mounted in an automatic mounter (Tissue-Tek® Film®, Sakura, Japon).
A series of concentration-response tests were tested in order to determine the ideal
concentration of antibody that need to be used to perform these analyses in prostate
samples. For GOAT IHQ, pancreatic tissue was used as positive control. Two

68
independent pathologists performed the histopathological analysis of the tumors
following a blinded protocol. In the analysis, +, ++, +++ stand for low, moderate, and
high intensities of the tumoral region staining compared to the normal-adjacent region.
4.4. Analysis of Single Nucleotide Polymorphisms (SNPs) in the sst5 gene
sequence
As previously mentioned, genomic DNA (gDNA) from tumoral (n=41) and
control (normal prostates; n=9) samples were extracted using the AllPrep
DNA/RNA/Protein Mini Kit (Qiagen, Madrid, Spain) following manufacturer’s
instructions and subsequently quantified with Nanodrop 2000 spectrophotometer
(Thermo Scientific, Wilmington, NC, USA). In order to identify SNPs that could be
associated with the presence of sst5TMD4, specific primers to amplify the 5’ and 3’ ends
of the cryptic intron spliced to generate the sst5TMD4 variant were designed and
validated, and the resultant PCRs were further sequenced. Only variations located at the
3’ ends side of the genomic sequence of the cryptic intron spliced to generate the
sst5TMD4 were identified, where two previously reported SNPs were found among the
samples analyzed. These SNPs were previously described in PubMed database as
rs197055 [there are 3 different forms described for this SNP (A/C/T); however, in our
studies we only found C and A variant] and rs12599155 [there are 2 different forms
described (C and T); both of them were found in our samples].
4.5. Cultures: normal human prostate cells, normal-like prostate cell
line and PCa cell lines.
4.5.1 Primary cell cultures from human prostate tissues
Normal prostate tissue was resected from donor patients after radical
cytoprostatectomy surgery and transferred to the cell culture room in sterile cold (4ºC)
culture medium (S-MEM, Gibco, Madrid, Spain) supplemented with 0.1%, BSA, 0.01%
L-glutamine, 1% antibiotic-antimycotic solution, and 2.5% HEPES (Sigma-Aldrich,
Madrid, Spain). Then, the tissue was washed three times in sterile culture medium and
cut into small pieces. A portion of these pieces was rapidly frozen in liquid nitrogen ad
stored at -80 ºC for RNA extraction. The remaining tissue was dispersed into single cells
by enzymatic and mechanical disruption as previously reported [237] (see procedure

69
below). Dispersed cells were cultured onto tissue culture plates in PrEGM Prostate
Epithelial Cell Growth Medium (Clonetics, cc-3165).
Procedure of enzymatic and mechanical disruption of prostate tissue
1. Transfer the prostatic tissue to a Petri dish (recommended size: 100 mm x 20 mm)
with sterile culture medium.
2. Cut the tissue in small portions using sterile bladders and transfer to a sterile tube
with PBS.
3. Centrifuge for 5 min at 1800 rpm. Aspire the supernatant and resuspend the cell
pellet in 30 ml of PBS. Repeat this step one more time.
4. Discard the supernatant and resuspend the pellet in 20-30 ml of complete DMEM
medium (supplemented with 10% Fetal Bovine Serum, 4 mM glutamine and 1%
antibiotic-antimycotic solution). If the sample is collected in the morning, store at 4ºC
until late afternoon.
5. Centrifuge for 5 min at 1800 rpm. Discard the supernatant.
6. Add the collagenase/dispase digestion medium (final concentration of both
enzymes of 1mg/ml in complete DMEM medium). Incubate overnight at 37ºC in
rotational movement.
7. Early in the morning, centrifuge for 5 min at 1800 rpm.
8. Discard the supernatant, wash cells in PBS buffer and centrifuge for 5 min at 1800
rpm. Discard the supernatant, resuspend the cell in 5 ml of Trypsin/EDTA solution and
incubate for 5 min at 37ºC with occasional shaking.
9. Add 15 mL of DNase I solution (1 mg of recombinant DNase I in 50 mL of
DMEM medium). Mix with Trypsin/EDTA solution. Centrifuge 5 min at 1800 rpm.
10. Discard the supernatant and resuspend in 10 mL of DMEM. Pass the cells through
a sterile, siliconized glass pippete.
11. Pass the cells through a 100 µm filter. Centrifuge for 5 min at 1800 rpm.
12. Discard the supernatant and resupend the cells in 5 mL red blood cell lysis buffer.
Incubate for 5 min on ice. Next, add 25 mL of PBS and centrifuge for 5 min at 1800 rpm.
13. Discard the supernatant and resupend the cell pellet in 10 mL of complete DMEM
medium. Pass the solution through a 40 µm filter. Centrifuge for 5 min at 1800 rpm.
14. Discard the supernatant and resupend the cell pellet in 1-3 ml of complete PrEGM
(PrEGM medium is supplemented with bovine pituitary extract, Insulin, Hydrocortisone,
GA-1000, retinoic acid, transferrin, T3, Epinephrine and recombinant EGF).

70
15. Count the number of cells using the trypan blue method.
4.5.2. Cell lines
Normal-like prostate cell line (RWPE-1) as well as androgen dependent (22Rv1,
LnCaP, VCaP) and independent (C4-2b, PC-3, DU-145) PCa cell lines were used in
different assays. Each cell line was obtained from ATCC and cultured and maintained
following manufacturers’ instruction. All cell lines were validated by analysis of STRs
(GenePrint® 10 System, Promega, Barcelona, Spain) and checked for mycoplasma
contamination once a month by PCR as previously reported [238].
RWPE-1: Epithelial cells (markers cytokeratins 8 and 18) derived from the
peripheral zone of a histologically normal adult human prostate from a 54-year old man,
transfected with a single copy of the human papilloma virus 18 (HPV-18). This c ell line
does not develop tumors in nude mice, and expresses AR and PSA (mRNA and protein
levels) upon stimulation with DHT [239]. Doubling time: 58 h.
22Rv1: Human prostate carcinoma epithelial cell line derived from a xenograft
that was serially propagated in mice after castration-induced regression and relapse of the
parental. It develops tumors in nude mice, expresses AR (H874Y mutation) and PSA
(both at RNA and protein levels) [240]. Cells express the following CKs: CK-8, CK-18.
Other molecular markers: CD44, DD3 mRNA. Doubling time: 56 h.
LnCaP: Isolated from a needle aspiration biopsy of the left supraclavicular lymph
node of a 50-year old man with metastatic-PCa. It develops tumors in nude mice and
expresses high basal levels of PSA and AR (T877A mutation). Cells express the following
CKs: CK-8, CK-18. Other molecular markers: DD3 mRNA. Constitutive activation of
AKT pathway (inactivation of PTEN) [241]. Doubling time: 60 h.
VCaP: Cell line from a vertebral bone metastasis from a 59-year old patient with
hormone-refractory PCa. It expresses high basal levels of AR (without mutations) and
PSA (both at mRNA and protein levels), and develops tumors in nude mice. Cells express
the following CKs: CK-8, CK-18. Other molecular markers: Rb, p53, DD3 mRNA.
Double time: 5-6 days [242, 243].
PC-3: Cell line isolated from a bone metastasis of a grade IV prostatic
adenocarcinoma from a 62-year old male. It develops tumors in nude mice and lacks
expression of AR and PSA. Cells express the following CKs: CK-5, CK-8, CK-18. Other
molecular markers: vimentin, NSE, BA-16, b-catenin, g-catenin, CBP. It lacks PTEN

71
expression. Doubling time: 33 h. Reported as cell line with neuroendocrine differentiation
characteristics [200].
DU145: Derived from a metastatic brain lesion from a 69 years old Caucasian
man. Develop tumors in nude mice. Does not express AR or PSA. Cells express the
following CKs: CK-5, CK-8, CK-18. Other molecular markers: vimentin. Doubling time:
30 h [243].
4.6. Peptides
Human acylated ghrelin (SC1357, PolyPeptide Laboratories, Limhamn, Sweden),
octreotide (GP-Pharm, Barcelona, Spain), IGF-1, insulin, paclitaxel and Ionomycin
peptides (Sigma-Aldrich, Madrid, Spain) were purchased, while human acylated In1-
ghrelin derived peptides (In1-19 and In1-40) were synthesized in collaboration with Ipsen
Bioscience (Cambridge, MA, USA) and developed by CPC Scientific (Chinese Peptide
Company, Hangzhou, China; see below). Pasireotide was generously provided by Herbert
A. Schmid (Novartis Pharma AG, Basel, Switzerland).
4.7. Transfections (plasmid and siRNA)
4.7.1. Stable and transient transfection of ghrelin, In1-ghrelin, and sst5TMD4.
PC-3 and VCaP cell lines were stably transfected while DU145 was transiently
transfected with pCDNA3.1 vector (Life Technologies, Madrid, Spain) empty (mock) or
containing ghrelin, In1-ghrelin or sst5TMD4 transcripts and selected as previously
reported [185]. Transfection was confirmed in all cases by qPCR and also by Western
Blot (in the specific case of sst5TMD4).
Protocol
1. Seed the cells in a 6-well culture plate
2. When 70% of confluence is reached, change the medium for 500µl of Opti-
MEM.
3. Prepare 500 ng of each plasmid in a 1.5-ml Eppendorf.
4. Add 50 µl of Opti-MEM to each plasmid.
5. Prepare an additional mix of 50µl of optimum + 3µl of Lipofectamine-2000
(Gibco, Barcelona, Spain) for each transfection. Incubate the mix for 5 min at RT.

72
6. Add 50µl of the optimum-lipofectamine mix to the plasmid (with the 50µl of
optimum) for an approximate total volume of 100µl.
7. Incubate for 30 min at RT.
8. Add to the seeded cells and incubate for 6-8 h at 37ºC.
9. Change the medium for normal growth medium (supplemented with 10% FBS).
If a stable transfection is required, next day add genetic antibiotic (500μg/ml; Gibco,
Barcelona, Spain), which selectively eliminates non-transfected cells.
4.7.2. Silencing of ghrelin, In1-ghrelin and sst5TMD4 by specific siRNA
For silencing assays, LnCaP (In1-ghrelin), PC-3 (sst5TMD4, In1-ghrelin) and
DU-145 (sst5TMD4) cell lines were used. Cells were transfected with specific siRNAs
designed and previously validated against In1-ghrelin (siRNA-1: 5’-
GAGTCCTAAACAGACTGTT-3’; siRNA-2: 5’-CACUGUUUCUGGAAGGACATT-
3’) and sst5TMD4 (5’-CACAAAUCCUGGCAGGAGATT-3’), or scramble control
(Catalog # 4390843, Invitrogen) using Lipofectamine RNAiMAX (Invitrogen) following
the manufacturer’s instructions. After 48h, cells were collected for validation of the
transfection (mRNA and/or Western Blot) and seeded for proliferation assays.
Protocol
1. Seed 200.000 cells in a 6-well plate (duplicate or triplicate for each transfection)
2. Incubate cells until 70% of confluence is reached.
3. Transfect the cells with the desired siRNA concentration (25-100 nM).
4. Change the medium for 500µl of complete medium without antibiotics.
5. If the transfection is with 100 nM of siRNA, add 1 µl of siRNA (stock
concentration of 50µM) to 50 µL of Opti-MEM medium in a 1.5 ml Eppendorf tube for
each reaction.
6. Add 3,5µl of Lipofectamine RNAiMAX (Catalog # 13778-075, Thermo
Scientific, Wilmington, NC, USA) to 50µl of optimum medium in another 1,5 ml
Eppendorf tube for each reaction.
7. Add Lipofectamine mix to siRNA mix (dilution 1:1)
8. Incubate for 5 min at RT.
9. Add 100µl of this mix to the seeded cells.

73
10. Incubate for two days at 37ºC and 5% CO2.
4.8. Functional assays
4.8.1. Measurements of proliferation rate
Cell proliferation was measured by Alamar Blue reagent (Biosource International,
Camarillo, CA, USA), MTT tetrazolium salt colorimetric assay (Sigma-Aldrich, Madrid,
Spain), and/or Tripan blue growth assay. Results were expressed as percentage referred
to control (vehicle treated medium or mock transfected cells). All experiments were
performed at least with three independent cell preparations.
Protocol for Alamar blue reagent
1. Seed 3000 cells per well for each treatment (triplicate or quadruplicate) with
complete medium (10% of FBS). Incubate 1 day at 37ºC and 5% CO2.
2. Change medium for complete growth medium without FBS in order to
synchronize the cells. Incubate for 24 h.
3. Next day, dilute 10X Alamar blue stock with complete growth medium without
FBS. Change the cell medium for the mix of Alamar blue 1x with complete growth
medium without FBS for 3 h (100µl).
5. Read fluorescence at 560 nm (exciting) and 590 nm (reading) in a FlexStation
system plate reader (Molecular Devices). This measurement will be the time 0h
6. Change medium for complete fresh medium with 10% FBS immediately after
each measurement. In experiments using treatments, the medium will be changed
immediately after each measurement for complete fresh medium alone with 10% FBS
(control) or with different treatments at the selected concentration.
7. Repeat this process after 24 h, 48 h and 72 h.
Protocol for MTT assay
1. Seed 3000 cells per well for each treatment (triplicate or quadruplicate) with
complete medium (10% of FBS). Incubate 1 day at 37ºC and 5% CO2.
2. After the incubation, change medium for complete growth medium without FBS
in order to synchronize the cells. Incubate for 24 h.

74
3. Next day, remove the cell medium and add 0.25% MTT reagent (Sigma Aldrich)
resuspended in dPBS (Sigma Aldrich). Incubate for 3 h at 37ºC and 5% CO2.
4. Discard the MTT solution from each well, and add acid-SDS solution (1g SDS,
10ml DMSO, 57.2µl glacial acetic acid) to lysate the cells.
5. Read absorbance at 570 nm in a FlexStation system plate reader (Molecular
Devices).
6. Change medium for complete fresh medium with 10% FBS immediately after
each measurement.
4.8.2. Measurements of cell migration
Cell migration was evaluated by Wound Healing assay as previously described
[185]. Specifically, 500.000 cells were seeded in 6-well culture plates and incubate at
37ºC and 5% CO2. When cells were completely confluents, a scratch was made with a
sterile 200ul tip. Then, cells were incubated overnight at 37ºC and 5% CO2 in complete
medium without FBS in order to minimize cell proliferation effects on wound recovery.
Next day, cell medium was replaced for medium with the specific treatment (or only with
medium alone, used as control) and cells were incubating for 12h. At least, three
independent and different pictures of the scratch were taken at 0 and 12h to monitor the
wound healing. Wound healing was calculated as the area of a rectangle centered in the
picture 1 h after the wound vs. the area of the rectangle just after doing the wound.
4.9. Hormonal measurements (ELISA and RIA techniques)
4.9.1. Measurement of PSA levels by ELISA
PSA (in human plasma or cell culture medium) was measured by a commercial
ELISA kit (cat number: EIA-3719; Springfield, NJ, USA).
Protocol
1. Place all reagents and samples to RT
2. Format the required microplate wells.
3. Pipette 25 μL of standards, controls or samples into each well and incubate for 5 min
at RT.
4. Add 100μL of PSA conjugate into each well, mix by moving the plate

75
5. Incubate 1h at RT with moderate shaking
6. Remove solution from the wells by aspirating the liquid or by decanting it.
7. Wash wells with distilled water (repeat this process five or six times)
10. Pipette 100μL of TMB-substrate solution into each well in darkness and cover the
plate.
11. Incubate 20 min at RT (18 °C - 25 °C) with moderate shaking. At this point, it is
necessary to evaluate the changes in the color of the wells in order to stop the reaction
before if this is necessary (to avoid saturation).
12. Add 100 μL/well of the stop solution (same order as substrate solution).
13. Read absorbance (OD) at 450 nm (blanking 630 nm).
4.9.2. Measurement of GOAT levels by ELISA
For the determination of GOAT protein level (serum, urine or cell culture
medium), a commercial ELISA was used following the manufacturers’ instructions
(MyBioSource, San Diego, USA).
Protocol
1. Place all reagents, samples and standard at RT in order to pre-warm up all the
reactive.
2. Calculate the wells required for standard curve (7 wells from 50 ng/ml to 0.78 ng/ml),
blank and samples.
3. Add 100µl of standard or sample to each well. Protect from light. Incubate for 2h at
37 ºC in agitation.
4. Discard the liquid and add 100µl of the prepared Detection Reagent A. Incubate for
1h at 37 ºC.
5. Discard the liquid and wash for at least 3 times.
6. Add 100µl of the prepared Detection Reagent B. Incubate 30 min at 37ºC in agitation.
7. Discard the liquid and wash 5 times.
8. Add 90µl of the Substrate solution (in darkness). Protect from light. Incubate 10-20
min at 37 ºC in agitation.
9. Add 50µl of the Stop solution. Read at 450nm immediately.
4.9.3. Measurement of active ghrelin levels by ELISA

76
For the determination of active ghrelin (acylated at serine-3) protein level, a
commercial ELISA kit was used following the manufacturers’ instructions (Cat number:
EZGRA-88K; Millipore, Madrid, Spain).
Protocol
1. Pre-warm all reagents to RT immediately before setting up the assay.
2. Calculate the wells required for the ELISA.
3. Wash each well with 300µL of diluted Wash Buffer (repeat this step 2 more times)
4. Add 20µL of the Matrix Solution to Blank, Standards and Quality Control (QC)
wells
5. Add 30µL of the assay buffer to each of the Blank and sample wells
6. Add 10µL of the assay buffer to each of the Standard and QC wells.
7. Add in duplicate 20µL of Ghrelin Standards in the order of ascending
concentrations to the appropriate wells.
8. Add in duplicate 20µL of QC1 and QC2 to the appropriate wells.
9. Add sequentially 20µL of the unknown samples in duplicate to the remaining
wells.
10. Cover the plate with plate sealer and incubate at RT for 2 h with agitation
11. Remove plate sealer and decant solutions from the plate.
12. Wash wells 3 times with the diluted Wash Buffer (300 µL per well per wash).
13. Add 100 µL of the Enzyme Solution to each well. Cover plate with sealer and
incubate with moderate shaking at RT for 30 min on the micro-titer plate shaker.
14. Remove sealer, decant solutions from the plate and tap plate to remove the
residual fluid.
15. Wash wells 6 times with diluted Wash Buffer (300µL per well per wash). Decant
and tap after each wash to remove residual buffer.
16. Add 100µL of Substrate solution to each well, cover plate with sealer and shake
in the plate shaker for approximately 5-20 min.
17. Read absorbance at 450 nm (set 590 nm as control)
4.9.4. Measurement of active Prepro-In1-ghrelin levels by RIA
For the measurement of Prepro-In1-ghrelin levels, a competitive
radioimmunoassay (RIA) was used following the manufacturers’ instructions (cat

77
number: RK-032-42; Phoenix, Burlingame, CA, USA). Briefly, the assay is based upon
the competition of 125I-peptide and prepro-In1-ghrelin peptide binding to the limited
quantity of antibodies specific for prepro-In1-ghrelin peptide in each reaction mixture.
As the quantity of sample in the reaction increases, the amount of 125I-peptide able to
bind to the antibody is decreased. By measuring the amount of 125I-peptide bound as a
function of the concentration of prepro-In1-ghrelin peptide (in standard reaction
mixtures), it is possible to construct a “standard curve” from which the concentration of
prepro-In1-ghrelin in the unknown sample can be determined.
Protocol
1. Dilute the RIA buffer with distilled water.
2. Reconstitute the standard peptide with 1ml of RIA buffer. Mix well and keep
on ice.
3. Reconstitute the rabbit anti-peptide serum with 13ml of RIA buffer, mix well
and keep on ice.
4. Reconstitute the positive Controls with 1ml of RIA buffer. Mix well and keep
on ice.
5. Reconstitute samples with RIA buffer
6. Prepare dilutions of the standard as follows:
Tube Sample RIA Buffer Std. Conc. Stock Powder 1.0ml 12.8 µg/ml
0 10µl of Stock 990µl 128,000 pg/ml
A 10µl of 0 990µl 1,280 pg/ml
B 500µl of A 500µl 640 pg/ml
C 500µl of B 500µl 320 pg/ml
D 500µl of C 500µl 160 pg/ml
E 500µl of D 500µl 80 pg/ml
F 500µl of E 500µl 40 pg/ml
G 500µl of F 500µl 20 pg/ml
H 500µl of G 500µl 10 pg/ml
7. Set up initial RIA reactions in 12 x 75 mm polystyrene tubes.
a) Number tubes TC-1, TC-2, NSB-1, NSB-2, TB-1, TB-2 and #7 - #22 for
the standards.
b) Number tubes #23, #24 for the positive controls.
c) Number tubes #25 up to #125 for the unknown samples.

78
d) Pipette 200µl of RIA buffer into each NSB tube.
e) Pipette 100µl of RIA buffer into each TB tube.
f) Pipette 100µl of standards H through A into duplicate tubes #7-#22.
g) Pipette 100µl of positive control in tubes #23 & #24.
h) Pipette 100µl of unknown sample into duplicate tubes: tube #25 and up.
i) Pipette 100µl of primary antibody (rabbit anti-peptide serum) into all tubes
except TC and NSB tubes.
j) Vortex the contents of each tube.
k) Cover and incubate all tubes for 16-24 h at 4°C.
8. Reconstitute the 125I-peptide with 13ml of RIA buffer and mix well to make
tracer solution.
9. Add 100µl of the tracer solution to each tube.
10. Vortex the contents in each tube.
11. Cover and incubate all tubes for 16-24 h at 4°C.
12. Reconstitute the Goat Anti-Rabbit IgG serum (GAR) with 13ml of RIA buffer
13. Reconstitute the Normal Rabbit Serum (NRS) with 13ml of RIA buffer.
14. Add 100µl of GAR to each tube except the TC tubes.
15. Add 100µl of NRS to each tube except the TC tubes.
16. Vortex the contents of each tube. Incubate all tubes at RT for 90 min.
17. Add 500µl of RIA buffer to each tube except the TC tubes and vortex.
18. Centrifuge all tubes (except the TC tubes) at 3,000 rpm for 20 min at 4°C.
19. Aspirate the supernatant (without touching the pellet) immediately following
centrifugation.
20. Use a γ-counter to count the cpm of the pellet.
4.10. Mechanistic assays
4.10.1. Cancer pathway reporter assay
To evaluate the intracellular signaling pathways modulated by sst5TMD4
overexpression, a Cignal Finder 10-Pathway Reporter Array (Qiagen, Limburg,
Netherlands) was initially used to simultaneously analyze ten relevant pathways that are
critical regulators of cancer biology. Specifically, 40.000 sst5TMD4 stable-transfected
PC-3 or mock cells were seeded in duplicates in a 96 well-array plate with Opti-MEM
serum free medium and reverse transfected with the transcription factors-responsive

79
firefly luciferase construct specific for each pathway using Attractene Transfection
Reagent (Qiagen), following the manufacturer’s instructions. Cells were incubated for
24h at 37°C and 5% CO2, under sterile conditions. Next day, medium was changed to
complete growth medium (RPMI 1640 medium complemented with 10% fetal bovine
serum, 2mM L-glutamine, and 0.2% of antibiotic) and cells were grown for an additional
24h. Subsequently, a Dual-Glo Luciferase assay (Promega, Barcelona, Spain) was
performed under manufacturer’s recommendations to monitor the activity of the different
pathways. Relative firefly luciferase activity was measured and normalized to the
constitutively expressed Renilla luciferase.
4.10.2. Measurement of free cytosolic calcium changes
Changes in free cytosolic calcium concentration ([Ca2+]i) in single cells were
determined using fura-2AM dye (Molecular Probes, Eugene, OR).
Protocol
1. Seed 50,000 cells/coverslip (35-mm plates) in complete growth medium.
Incubate for 24-48h until cells are 70% confluent.
2. Prepare medium with fura-2AM: 2 ml of phenol red-free DMEM containing 20
mM NaHCO3 (pH 7.4) + 2µl of pluronic acid + 5µl of FURA.
3. Remove the medium from the wells (red phenol interferes with the reaction), and
add 1 ml of medium with FURA.
4. Incubate for 30 min at 37 ºC.
5. Remove the medium and add calcium medium.
6. Incubate for 15 min at RT.
7. Prepare treatments in this 15 min-incubation time.
8. Add 300µl of calcium medium. Set up the protocol in the computer.
9. Zoom with a 40X objective with Immersion Oil Type NF (Nikon, Tokyo, Japan)
with the inverted microscope Eclipse TE2000-E (Nikon, Tokyo, Japan) coupled to
a digital camera ORCA II BT (Hamamatsu Photonics, Hamamatsu, Japan).
10. Add 300µl of medium with the treatment.
11. Changes in free cytosolic calcium concentration ([Ca2+]i) are monitored over
time after exciting the cells at 340nm (excitation peak of FURA binding to Ca2+)

80
and 380nm (excitation peak of FURA Ca2+-free) and collecting the emission
intensity at 510nm in the MetaFluor software.
12. Ionomycin (Sigma-Aldrich, Madrid, Spain) was always used as positive control.
4.10.2.1. Stable sst5TMD4-transfected PC-3 cells treated with SST analogs.
Mock- or sst5TMD4-stably-transfected PC-3 cells were grown onto glass cover
slips and [Ca2+]i was evaluated in response to SSA treatment (octreotide and pasireotide).
4.10.2.2. Normal human primary prostate cell cultures treated with ghrelin or In1-
ghrelin.
[Ca2+]i was evaluated also in normal human primary prostate cell cultures in
response to ghrelin or In1-ghrelin peptides (In1-19 and In1-40).
4.10.3. RT2 Prostate Cancer PCR Array
Total RNA was extracted from 4 consecutive passages of mock, ghrelin, in1-
ghrelin or sst5TMD4-stably-transfected PC-3 cells using the Absolutely RNA RT-PCR
Miniprep Kit (Agilent, La Jolla, CA, USA). Total RNA quality was assessed using the
Agilent's 2100 Bioanalyzer (Agilent technologies).
Protocol
1. Total RNA (0.75µg, obtained from the mixture of RNA from 4 consecutive
passages) was incubated for 5 min at 42ºC with genomic DNA elimination mix (see
mix below) and cooled on ice for 1 min.
Genomic DNA elimination mix
Component Amount/volume for 1 reaction
RNA……………………………………………………………0.75 µg
Buffer GE (genomic DNA elimination) ……………………….….2 μl
RNase-free water…………………………………………...Variable μl
Total volume………………………………………...…………...10 μl
2. Next, first-strand cDNAs were synthesized using the RT2 First Strand kit (catalog
number 330401, Qiagen). The reaction mixtures (see below, total final reaction with
the genomic DNA elimination mix= 20μl) were incubated at 42°C for 15 min,

81
followed by incubation at 95°C for 5 min and 91 µl of water was added and then
cooled on ice.
Reverse transcription mix
Component Volume for 1 reaction
-5X Buffer BC3………………………………………………………4 μl
-Control P2…………………………………………………………...1 μl
-RE3 Reverse Transcription Mix…………………………………….2 μl
-RNase-free water……………………………………………………3 μl
Total volume………………………………………………………...10 μl
3. RT2 Prostate Cancer PCR array was used to simultaneously examine the mRNA
levels of 84 genes associated with PCa development, including five “control genes”
in a 96-well plate (catalog number 330231 PAHS-135ZA, Qiagen). A mix of 1350
µl of 2x RT2 SYBR Green Mastermix, 102µl of cDNA and 1,248µl of RNase-free
water (total volume=2700 µl) was prepared and 25µl of the mix was added into
each well in a 96-well PCR-array plate (containing a panel of 84 genes).
4. Thermal profile consisted of an initial step at 95ºC for 10 min, followed by 40
cycles of denaturation (95ºC for 15 seconds), annealing (60ºC for 1 min) and finally,
a dissociation cycle (melting curve) to verify that only one product was amplified.
5. Values from each gene were obtained for the threshold cycle (Ct) and normalized
using the average of five housekeeping genes on the same array (HPRT1, B2M,
RPLP0, GAPDH, and ACTB).
6. Relative amounts were calculated by the ΔΔCT method and further normalized
to the values of their corresponding mock samples. The resulting values were
reported as fold change; only genes showing a change of 2-fold or greater were
considered for further validation.
7. The negative controls ensured a lack of DNA contamination and set the threshold
for the absent/present calls.
8. The validation of the genes that showed some significant change in the array was
carried out by qPCR with a different set of custom-designed primers (see below)
4.10.4. Western blotting

82
4.10.4.1. Validation of results from the cancer pathway reporter assay and RT2
Prostate Cancer PCR Array by Western blotting
PC-3 cells overexpressing ghrelin, In1-ghrelin, sst5TMD4 and its respective
control (mock-cells) were cultured (500,000 cells/experimental condition) in 6-well
plates and incubated for 24h in complete growth medium (supplemented with 10% FBS).
Then, medium was removed and cells were washed and lysed with SDS-DTT buffer as
previously reported [185, 216]. Proteins were separated by SDS-PAGE and transferred to
nitrocellulose membranes (Millipore). Membranes were blocked with 5% non-fat dry
milk in Tris-buffered saline with 0.05% Tween-20 and incubated O/N at 4ºC with the
primary antibodies for phospho-ERK1/2 (ref: 4370), phospho-cRAF (ref: 9421),
phospho-AKT (ref: 9271), anti-DAXX (ref: 4533), anti-SFRP1 (ref:3534), anti-APC
(ref:2504) and anti-B-tubulin (ref:2128) from Cell Signaling (Danvers, MA, USA), anti-
ZNF185 (ref: ab83100), anti- IL-6 (ref:667) and anti-CDKN2A/p16INK4a (ref: ab81278)
from Abcam (Cambridge, UK); anti-LOXL1 (ref: sc-166632), anti-NRIP1 (ref: sc-8997)
and IGFBP5 (ref: sc-13093) from Santa Cruz (CA, USA); phospho-JNK from R&D
system (ref: AF1205, Minneapolis, USA) and c-myc (ref: CSB-MA000041M0m. Wuhan,
China). Secondary anti-rabbit (ref: 7074) and anti-mouse were purchased from Cell
Signaling (Danvers, MA, USA). Proteins were developed using an enhanced
chemiluminescence detection system (GE Healthcare, UK) with dyed molecular weight-
markers. A densitometry analysis of the bands was carried out with Image J software.
4.10.4.2. Intracellular signaling pathways trigger after treatment with peptides from
the ghrelin, somatostatin and insulin/IGF-1 systems in PCa cell lines.
LnCaP, 22Rv1 or PC-3 cells (250,000) were cultured in 6-well plates and
incubated for 24 h in complete growth medium (supplemented with 10% FBS). Then,
medium was removed and cells were starved overnight in HBSS medium (Gibco, Madrid,
Spain). Next day, medium was replaced with FBS-free growth medium and treated with
ghrelin and In1-ghrelin (In1-19/In1-40) peptides at 100nM concentration for 5-30 min,
or IGF1 and insulin peptides at 100nM for 24 h. Medium without treatment was used as
control vehicle. Then cells were washed and lysed with SDS-DTT buffer as previously
reported [13, 33]. In the specific cases of cells treated with ghrelin and In1-ghrelin
peptides, blots were incubated overnight at 4ºC with the primary antibodies for phospho-

83
ERK1/2, phospho-AKT, total ERK (ref: SC-154; Santa Cruz, CA, USA) and total AKT
(ref: 9272S; Cell Signaling; Danvers, MA, USA).
4.11. Xenograft model
All experiments with mice were carried out following the European Regulations
for Animal Care under the approval of the University of Cordoba Research Ethics
Committee. Ten-week-old male athymic BALB/cAnNRj-Foxn1nu mice (Janvier Labs,
Le Genest St Isle, France) were subcutaneously grafted in both flanks with 2x10⁶ of mock,
ghrelin, In1-ghrelin or sst5TMD4-stably-transfected PC-3 cells (n=4-5 mice per
condition) resuspended in 100µl of basement membrane extract (ref: 3432-005-001.
Trevigen, Maryland, USA). Tumor growth was measured once per week during 3 months
by using a digital caliper and calculating tumor volume. When the mouse was sacrificed,
each tumor was dissected, fixed and sectioned for histopathological examination after
hematoxylin–eosin staining and for necrosis and mitosis measurements. Another piece
from the tumor was kept at -80ºC for later RNA extraction using Trizol reagent (Thermo
Scientific, Wilmington, NC, USA).
4.12. Statistical analysis
Expression data obtained from fresh normal prostate samples and PCa biopsies
(mRNA and protein) as well as plasma and urine samples from control and PCa patients
(ELISA assays) were evaluated for heterogeneity of variance (if values had a Gaussian
distribution) using the Kolmogorov–Smirnov test. Statistical differences were assessed
by Mann–Whitney U test or by one-way or two-way ANOVA (comparison of tumor
growth in xenografts) followed by Fisher’s test. ROC curve was performed for evaluation
of sensibility and specificity of GOAT, In1-ghrelin and sst5TMD4 in the different tissues
and fluids analyzed [217]. Correlations between different molecules were studied using
Spearman correlation test. Chi-Square test was used to compare the differences between
the genomic frequencies of the different haplotypes of sst5 gene and the differences
between groups of PCa patients with low/high sst5TMD4 and GOAT expression (samples
were categorized in low and high sst5TMD4/GOAT levels according to median GOAT
levels). P-values <0.05 were considered statistically significant. When p-values ranged

84
between <0.1 and >0.05, a trend for significance was indicated where appropriate. All
statistical analyses were performed using the GraphPad Prism (La Jolla, CA, USA).

85
RESULTS

86

87
5. RESULTS
The results of this thesis have been subdivided in two main sections corresponding
to the presence of different components of the SST-system (section 5.1) and Ghrelin-
system (section 5.2) in human normal and PCa tissues and cell lines. Part of the results
included in these two sections has been included in three independent manuscripts. The
first one describing the presence and functional role of the truncated somatostatin
receptor, sst5TMD4, in PCa (Title: “The truncated somatostatin receptor, sst5TMD4, is
overexpressed in prostate cancer, where it increases malignant features by altering key
signaling pathways and tumor suppressors/oncogenes”; under review). The second
manuscript has been published in the journal “Cancer Letters” and it is focused on the
identification of Ghrelin-O-acyl transferase (GOAT) enzyme as a potential non-invasive
biomarker in PCa [Title: “Ghrelin O-acyltransferase (GOAT) enzyme is overexpressed
in prostate cancer wherein is associated with the metabolic status: potential value as
non-invasive biomarker”; Cancer Lett. 2016; 383(1):125-134]. The third manuscript is
focused on the presence and functional role of the splicing variant In1-ghrelin in PCa
(Title: “In1-ghrelin splicing variant is overexpressed in prostate cancer wherein it
increases aggressiveness features through regulation of key tumor
suppressors/oncogenes”; under review). It should also be mentioned that part of the
results included in this thesis have been already patented [Patent-1: Title: “Ghrelin-O-
acyl transferase (GOAT) and its uses” (registry number: PCT/ES2016/070844; Patent-2:
Title: “Non-invasive diagnostic method of cancer” (registry number: P201631606)].
5.1. Analysis of the SST-system in PCa
5.1.1. Presence of different components of the SST-system in human
normal and PCa tissues and cell lines
- Analyses in fresh prostate tissues (normal and PCa samples): The expression of the
different components of SST-system [ligands (SST and CORT) and receptors (sst1-sst5
and truncated sst5TMD4-5)] was evaluated in a battery of PCa biopsies from patients
with high risk PCa (n=52) and in a set of normal prostate biopsies from healthy donor

88
patients (n=12) (Table 7). Although, SST and CORT peptides were expressed in normal
(Figure 12A) and PCa samples (Figure 12B), CORT expression was higher than SST
both in normal and PCa samples. sst2 was the canonical sst receptor expressed at highest
levels in normal tissues, followed by sst5 and sst1 (Figure 12A), while sst1 was the most
expressed sst in PCa (significantly overexpressed compared to normal tissues) followed
by sst5 and sst2 (Figure 12B). The expression of sst3 and sst4 was not detectable in
normal or PCa samples. When we analyzed the truncated sst5 (sst5TMD4 and
sst5TMD5), only sst5TMD4 expression was significantly detected in prostate samples,
and, remarkably, its expression was upregulated in PCa samples compared to normal
prostate samples (Figure 12A-B). Interestingly, overexpression of sst1 in PCa samples
compared with normal prostate samples, and its association with the aggressiveness of
the disease has been already reported [192]. In contrast, it should be mentioned that this
is the first study that demonstrates the presence and overexpression of sst5TMD4 in PCa
compared with normal prostate tissues. Therefore, based on these results, we decided to
further analyze the presence and functional role of this truncated sst5TMD4 in PCa (see
below: section 4.1.2).
Figure 12: Expression of all the components of the SST-system in normal prostate and
PCa samples. Expression levels of the different SST components in a batter y of 52 fresh
PCa samples compared to the expression found in 14 fresh normal prostates (Control).
Absolute mRNA levels were determined by qPCR and adjusted by a normalization factor
(NF) calculated from the expression levels of two housekeeping genes (ACT B and
GAPDH). Data represent mean ± SEM. Asterisks (*p<0.05) indicate values that
significantly differ between PCa samples and normal samples.
N o rm a l t is s u e
mR
NA
ex
pre
ss
ion
ad
jus
ted
by
NF
SS
T
CS
T
SS
T1
SS
T2
SS
T3
SS
T4
SS
T5
sst5
TM
D4
sst5
TM
D5
0
5 0 0
1 0 0 0
1 5 0 0
L ig a n d s S S T re c e p to rs S S T tru n c a te d
re c e p to rs
P C a
mR
NA
ex
pre
ss
ion
ad
jus
ted
by
NF
SS
T
CS
T
SS
T1
SS
T2
SS
T3
SS
T4
SS
T5
sst5
TM
D4
sst5
TM
D5
0
1 0 0 0
2 0 0 0
3 0 0 0
*
*
L ig a n d s S S T re c e p to rs S S T tru n c a te d
re c e p to rs
A . B .

89
- Analyses in a normal prostate-like cell line and in different PCa cell lines: The
expression of the SST-system was also analyzed in the normal-like prostate cell line
(RWPE-1) and in different androgen-dependent (22Rv1, LnCaP, VCaP) and androgen-
independent (PC-3, DU-145) cell lines, which represent several stages of the disease
(Figure 13). While SST expression was barely detected in the different cell lines, CORT
expression was detected in normal and PCa cell lines (Figure 13). Only sst5 and sst2
receptors were expressed in RWPE-1 (low expression of sst2) and PCa cell lines, with
the exception of 22Rv1, which also expressed sst1. No expression was detected for
sst5TMD4 and sst5TMD5 in RWPE-1, while sst5TMD4 (but not sst5TMD5) was
expressed at low levels in all the PCa cell lines studied (Figure 13).
Figure 13: Expression of all the components of the SST-system in the normal-
like (RWPE-1) and PCa cell lines (androgen dependent: 22Rv1, VCaP, LnCaP;
androgen independent: PC-3, DU-145) . Absolute mRNA levels from different passages
(n≥3) were determined by qPCR and adjusted by ACTB. Data represents mean ± SEM.
V C a P
SS
T
CS
T
SS
T1
SS
T2
SS
T3
SS
T4
SS
T5
sst5
TM
D4
sst5
TM
D5
0 .0 0 0
0 .0 0 5
0 .0 1 0
L ig a n d s S S T re c e p to rs S S T tru n c a te d
re c e p to rs
P C 3
SS
T
CS
T
SS
T1
SS
T2
SS
T3
SS
T4
SS
T5
sst5
TM
D4
sst5
TM
D5
0 .0 0 0
0 .0 0 5
0 .0 1 0
L ig a n d s S S T re c e p to rs S S T tru n c a te d
re c e p to rs
D U -1 4 5
SS
T
CS
T
SS
T1
SS
T2
SS
T3
SS
T4
SS
T5
sst5
TM
D4
sst5
TM
D5
0 .0 0 0
0 .0 0 5
0 .0 1 0
L ig a n d s S S T re c e p to rs S S T tru n c a te d
re c e p to rs
L n C a P
mR
NA
ex
pre
ss
ion
ad
jus
ted
by
AC
TB
SS
T
CS
T
SS
T1
SS
T2
SS
T3
SS
T4
SS
T5
sst5
TM
D4
sst5
TM
D5
0 .0 0 0
0 .0 0 5
0 .0 1 0
L ig a n d s S S T re c e p to rs S S T tru n c a te d
re c e p to rs
2 2 R V 1
SS
T
CS
T
SS
T1
SS
T2
SS
T3
SS
T4
SS
T5
sst5
TM
D4
sst5
TM
D5
0 .0 0 0
0 .0 0 5
0 .0 1 0
0 .0 1 5
0 .0 2 0
0 .0 2 5
L ig a n d s S S T re c e p to rs S S T tru n c a te d
re c e p to rs
R W P E -1
mR
NA
ex
pre
ss
ion
ad
jus
ted
by
AC
TB
SS
T
CS
T
SS
T1
SS
T2
SS
T3
SS
T4
SS
T5
sst5
TM
D4
sst5
TM
D5
0 .0 0 0
0 .0 0 5
0 .0 1 0
L ig a n d s S S T re c e p to rs S S T tru n c a te d
re c e p to rs

90
5.1.2. Presence and functional role of sst5TMD4 in PCa
5.1.2.1. The truncated spliced receptor sst5TMD4 is overexpressed in PCa
sst5TMD4 expression was evaluated by qPCR technique in two independent
cohorts of samples from PCa patients in different clinical stages [Table-6 (FFPE samples)
and table-7 (fresh tissues; results previously indicated in Figure 12B)]. Specifically,
sst5TMD4 expression was firstly measured in a cohort of 45 FFPE prostate samples from
patients with low and intermediate grade tumours (Gleason Score 6-7) representing an
early-stage of the disease (Table 6). Importantly, FFPE prostatic pieces harbor a tumoral
region (PCa) and an adjacent free tumor region (N-TAR) defined by two expert anatomo-
pathologists, which allows to compare sst5TMD4 expression in both regions from the
same prostatic piece. These results revealed that sst5TMD4 expression was significantly
higher in tumoral vs. N-TAR (p= 0.003; Figure 14A).
Next, expression of sst5TMD4, and of sst2 and sst5 (the two main
pharmacological targets of SSA) was analyzed in a cohort of fresh PCa-biopsies collected
from patients with high risk PCa [according to D’ Amico classification (i.e. PSA > 20.0
and/or Gleason 8-10 and/or cT2c-T3); n=52)] representing a more aggressive and
advanced form of the disease, and in 14 fresh normal prostate (NP)-tissues from patients
that underwent cystoprostatectomy due to bladder cancer (absence of malignant glands
was classified by two expert anatomo-pathologists) (Table 7). Consistent with the results
obtained in FFPE samples, the overall expression of sst5TMD4 was higher in tumoral
fresh-samples compared to NP-tissues (p=0.017; Figure 14B) while sst2 and sst5
expression was not significantly altered. Of note, sst5TMD4 expression was detected in
more PCa-samples than sst2 or sst5 [88% (n=46/52) vs. 81% (n=42/52) or 77%
(n=40/52), respectively], and its mRNA levels were significantly higher than those of sst2
or sst5 (Figure 14C). Interestingly, sst5TMD4 expression correlated with sst2 and sst5
expression levels in PCa but not in normal tissues (Figure 14D).

91
Figure 14: sst5TMD4 expression in two different cohorts of samples from patients with
PCa. A. Paired analysis of sst5TMD4 expression in tumoral and non -tumoral adjacent
regions (N-TAR) of formalin-fixed paraffin-embedded (FFPE) prostate pieces (n=45) from
low/intermediate grade tumors (cohort-1). Absolute mRNA levels were dete rmined by
qPCR and adjusted by GAPDH (used as housekeeping gene); B. Expression levels of
sst5TMD4 in a battery of 52 fresh PCa samples compared to the expression found in 14
fresh normal prostates (Control) (Cohort-2). Absolute mRNA levels were determined by
qPCR and adjusted by a normalization factor (NF) calculated from the expression levels
of two housekeeping genes (ACTB and GAPDH); C. Comparison of sst2, sst5 and
sst5TMD4 expression in fresh PCa samples (n=52; cohort-2); D. Correlation of sst5TMD4
mRNA levels with sst5 and sst2 expression levels in fresh PCa samples (n=52; cohort-2).
Asterisks (*p<0.05; **p<0.01) indicate values that significantly differ from the
corresponding controls (A and B) or differences between the expression levels of
sst5TMD4 and sst2 or sst5 (C).
5.1.2.2. sst5TMD4 levels (mRNA and protein) correlate with clinical
aggressiveness features in PCa.
The mRNA levels of sst5TMD4, but not of sst2 or sst5 (Figure 15A-C), were
elevated in patients with higher Gleason-score, a marker of PCa aggressiveness [244].
ss
t5T
MD
4m
RN
A e
xp
re
ss
ion
ad
jus
ted
by
GA
PD
H
C O N T R O L P C a
0
5
1 0
1 5 * *
ss
t5T
MD
4 m
RN
A e
xp
re
ss
ion
ad
jus
ted
by
NF
C O N T R O L P C a
0
5 0
1 0 0
1 5 0
2 0 0
2 5 0
*
F F P E s a m p le sH ig h r is k P C a -
b io p s ie s
A . B .
s s t5 T M D 4
ss
t5
0 5 0 0 1 0 0 0
0
5 0 0
1 0 0 0
1 5 0 0
2 0 0 0
2 5 0 0
p < 0 .0 0 0 1
r= 0 .6 7
s s t5 T M D 4
ss
t2
0 5 0 0 1 0 0 0
0
1 0 0
2 0 0
3 0 0
4 0 0
5 0 0
p < 0 .0 0 0 1
r= 0 .5 5
C .
mR
NA
ex
pre
ss
ion
ad
jus
ted
by
NF
s s t2 s s t5 s s t5 T M D 4
0
5 0 0
1 0 0 0
1 5 0 0
*
* *
D .

92
Furthermore, sst5TMD4 (but not sst2 or sst5) expression was significantly higher in
metastatic vs. non-metastatic PCa or control samples (Figure 15A-C). Indeed, ROC-
analysis indicated that sst5TMD4, but not sst2 or sst5, expression significantly
discriminated between patients with and without metastasis (Figure 15A-C). When PCa
patients were divided according to low or high sst5TMD4 expression (based on median
expression), a greater proportion of patients with high sst5TMD4 expression presented
metastasis, higher Gleason-score and extraprostatic extension compared with patients
with low sst5TMD4 expression, while no such associations were observed for sst2 or sst5
expression (Figure 15A-C).
Figure 15: sst5TMD4 mRNA expression, but not sst5 -sst2, is higher in patients with
high Gleason score (GS) and metastasis (MET) . Expression levels of sst5TMD4 (A) , sst5
(B) and sst2 (C) in patients with intermediate (7) Gleason score (GS) compared with
patients with high GS (8-10); Comparison of sst5TMD4 (A), sst5 (B) and sst2 (C)
ss
t5T
MD
4 m
RN
A e
xp
re
ss
ion
ad
jus
ted
by
NF
7 8 -1 0
0
1 0 0
2 0 0
3 0 0 *
0
1 0 0
2 0 0
3 0 0
4 0 0
* *
* *
1 0 0 % - S p e c ific ity %
Se
ns
itiv
ity
%
0 2 0 4 0 6 0 8 0 1 0 0
0
2 0
4 0
6 0
8 0
1 0 0
A U C = 0 .7 8 6
p < 0 .0 0 10
2 0
4 0
6 0
8 0
1 0 0NO
M E T
M ET* * *
% o
f c
as
es
0
2 0
4 0
6 0
8 0
1 0 07
8 -1 0
***
0
2 0
4 0
6 0
8 0
1 0 0NO
Y E S
*
G S M E T R O C o f M E T
C T R L N O
M E T
M E T
G S M E T
A .
B .
E E
s s t5 T M D 4
s s t5
L L LH H H
ss
t5 m
RN
A e
xp
re
ss
ion
ad
jus
ted
by
NF
7 8 -1 0
0
2 0
4 0
6 0
8 0
1 0 0
G S
s s t2
ss
t2 m
RN
A e
xp
re
ss
ion
ad
jus
ted
by
NF
7 8 -1 0
0
2 0
4 0
6 0
G S
0
5 0
1 0 0
1 5 0
C T R L N O
M E T
M E T
M E T
0
5 0
1 0 0
1 5 0
C T R L N O
M E T
M E T
M E T
1 0 0 % - S p e c ific ity %
Se
ns
itiv
ity
%
0 2 0 4 0 6 0 8 0 1 0 0
0
2 0
4 0
6 0
8 0
1 0 0
A U C = 0 .6
p = 0 .2 5
R O C o f M E T
1 0 0 % - S p e c ific ity %
Se
ns
itiv
ity
%
0 2 0 4 0 6 0 8 0 1 0 0
0
2 0
4 0
6 0
8 0
1 0 0
A U C = 0 .6
p = 0 .1 8
R O C o f M E T
C .
%o
f c
as
es
0
2 0
4 0
6 0
8 0
1 0 07
8 -1 0
0
2 0
4 0
6 0
8 0
1 0 0NO
M ET
M ET
0
2 0
4 0
6 0
8 0
1 0 0NO
E E
p = 0 .1
G S M E T E E
L H L H L H
%o
f c
as
es
0
2 0
4 0
6 0
8 0
1 0 07
8 -1 0
0
2 0
4 0
6 0
8 0
1 0 0NO
M ET
M ET
0
2 0
4 0
6 0
8 0
1 0 0NO
E E
G S M E T E E
L H L H L H

93
expression levels found in fresh normal prostate samples (Control) and in PCa samples
from patients with and without presence o f metastasis (MET and NO MET, respectively);
Receiver operating characteristic (ROC) curve analysis to determine the accuracy of
sst5TMD4 (A) , sst5 (B) and sst2 (C) expression as diagnostic test to discriminate between
patients with presence of metastasis; Frequencies observed between two groups of PCa
patients with low (L) or high (H) sst5TMD4 ( A), sst5 (B) and sst2 (C) expression levels
in terms of presence of metastasis, Gleason score level and presence of extraprostatic
extension (EE). Asterisks (*p<0.05; *p<0.01; ***p<0.001) indicate values that
significantly differ from the corresponding controls (GS of 7 vs. 8 -10; MET samples vs.
control or NO MET samples; samples from patients with low vs. high sst5TMD4
expression) .
Additionally, sst5TMD4 immuno-histochemical staining was performed on 12
FFPE-prostate pieces from radical prostatectomy (Gleason score 6-7) and in 18 FFPE-
biopsies pieces obtained by needle biopsy (Figure 16). sst5TMD4 cell staining was
predominantly granular and located at or close to the apical membrane (Figure 16). The
analysis revealed that sst5TMD4 staining was always weaker in benign prostate-gland
epithelium (BG; Figure 16A; staining of stromal regions was negligible) than in
cancerous prostate-glands (BG vs. CG; Figure. 16C). Notably, although only one FFPE-
prostate harboring a high-grade prostatic intraepithelial neoplasia (HG-PIN) lesion was
available, sst5TMD4 staining was stronger in the pre-malignant lesion than the normal-
adjacent region (Figure 16B), which suggests that sst5TMD4 overexpression could be
associated with an early event in PCa. Consistent with sst5TMD4 mRNA results,
sst5TMD4 staining was significantly stronger in samples from patients with higher
Gleason-score pieces and in patients with metastasis (Figure 16D).

94
Figure 16: sst5TMD4 protein expression is higher in cancerous glands and correlates
with higher Gleason score (GS) and presence of metastasis (MET). A -C. IHC analysis
of sst5TMD4 in 12 FFPE prostate samples from patients w ith low-intermediate grade
tumors and 18 prostate samples from high-risk PCa patients. Images are representative
examples of sst5TMD4 staining in benign prostate glands (BG) ( A) high-grade prostatic
intraepithelial neoplasia (HG-PIN) (B) and prostates samples obtained from patients wi th
PCa which include areas with normal -benign and PCa glands (BG and CG, respectively)
(C) at 40X, 200X and 800X magnification. D. Correlation of sst5TMD4 IHC score (i.e.
low, moderate, and high sst5TMD4 staining) with Gleason score ( GS: 6, 7, 8-9 score; left-
panel) and with presence of metastasis (MET: no or yes; right -panel). Data represent
median (IQR) or mean ± SEM. Asterisks (*p<0.05; **p<0.01) indicate values that
significantly differ from the corresponding controls (i.e. GS of 6 vs. 7 vs. 8-9; MET
samples vs. NO MET samples) .
D

95
5.1.2.3. sst5TMD4 is associated to two SNPs in PCa.
To analyze the putative implication of certain SNPs in sst5 splicing regulation, we
sequenced the 5’- and 3’-ends of the cryptic intron spliced to generate sst5TMD4 and
compared the frequencies of the observed SNPs (rs197055/rs12599155; Figure 17). We
found significant differences in the frequencies observed for both SNPs between PCa vs.
control-samples (Figure 17A), and also between PCa-samples with high and low
sst5TMD4/sst5 mRNA ratio (Figure 17B). Indeed, two specific recessive homozygous
haplotypes (AA for rs197055 and TT for rs12599155) were only found in PCa-samples,
wherein they seem to be associated to a higher sst5TMD4/sst5 mRNA ratio (Figure 17B).
Figure 17: Analysis of SNPs in the sst5 gene sequence . Genomic DNA (gDNA) from PCa
tissues (n=41) and normal prostate tissues (control; n=9) were used to identify SNPs that
could be associated with the presence of sst5TMD4. A. Differences in the frequencies
observed for both SNPs between PCa vs. control -samples; B. Differences in the frequencies
observed for both SNPs between PCa-samples with high and low sst5TMD4/sst5 mRNA
ratio. Asterisks (*p<0.05; ***p<0.001) indicate values that significantly differ from the
corresponding controls (control normal vs PCa samples; samples with low vs. high
expression of sst5TMD4/sst5 ratio).
5.1.2.4. sst5TMD4 overexpression enhances pathophysiological features of
PCa cell lines and induces larger tumors in nude-mice.
Since sst5TMD4 expression was clearly increased in PCa tissues compared with
normal prostate tissues at the mRNA and protein level (Figures 14-16), we next sought
to determine the functional effects of sst5TMD4 overexpression on PCa
pathophysiological features (i.e. cell proliferation and cell migration) using in vitro cell
r s 1 9 7 0 5 5
Co
ntr
ol
PC
a
0
2 0
4 0
6 0
8 0
1 0 0
C C
C A
A A
0 .061
r s 1 2 5 9 9 1 5 5
Co
ntr
ol
PC
a
0
2 0
4 0
6 0
8 0
1 0 0
C C
C T
TT
* * *
r s 1 9 7 0 5 5
Lo
w r
at i
o
Hig
h r
at i
o
0
2 0
4 0
6 0
8 0
1 0 0
C C
C A
A A
* * *
r s 1 2 5 9 9 1 5 5
Lo
w r
at i
o
Hig
h r
at i
o
0
2 0
4 0
6 0
8 0
1 0 0
C C
C T
TT
*
A . B .

96
models (PCa cell lines stably transfected with sst5TMD4) and a preclinical in vivo model
(xenografts).
5.1.2.4.1. Validation of sst5TMD4 overexpression in sst5TMD4-stably-transfected
PCa cell lines.
As mentioned before, the expression level of sst5TMD4 was low in all prostate
cell lines studied, including the VCaP, DU-145 and PC-3 (Figure 18A). Therefore, these
cell lines represent adequate working models to analyze the effect of sst5TMD4
overexpression on PCa-associated pathophysiological processes. Successful
overexpression of sst5TMD4 in transfected cells was confirmed by qPCR and Western
Blot (Figure 18B).
Figure 18: sst5TMD4 presence and validation of stable transfection of sst5TMD4 in
PCa cell lines . A. sst5TMD4 mRNA levels in different PCa cell lines (VCaP, PC-3 and
DU145). Absolute mRNA levels were determined by qPCR and adjusted by ACTB. B .
Representative figures showing validation of sst5TMD4 overexpression in PC-3 cells (by
qPCR and western-blot; one cell-passage with 3-technical replicates). Data represent mean
± SEM. Asterisks (***p<0.001) indicate values that significantly differ from the
corresponding controls (mock-transfected cells) .
5.1.2.4.2. sst5TMD4 overexpression enhances cell proliferation and migration of
PCa cell lines.
ss
t5T
MD
4 m
RN
A e
xp
re
ss
ion
ad
jus
ted
by
AC
TB
0 .0 0 0 0 0
0 .0 0 0 0 1
0 .0 0 0 0 2
0 .0 0 0 0 3
0 .0 0 0 0 4
% s
st5
TM
D4
pro
tein
ad
jus
ted
by
-t
ub
uli
n
0
5 0 0
1 0 0 0
1 5 0 0 * * *
s s t5 T M D 4
- tu b u lin
0
5 0 0 0 0
1 0 0 0 0 0
1 5 0 0 0 0
2 0 0 0 0 0
* * *
V C a P D U -1 4 5 P C -3 M o c k s s t5 T M D 4 M o c k s s t5 T M D 4
A . B .
P r o te inm R N AP C a c e ll l in e s

97
sst5TMD4 stable overexpression increased cell proliferation in VCaP and PC-3
cell lines at 48h and/or 72h, and the results were further confirmed with a transient
transfection in the DU145 cell line in which cell proliferation was increased at 24h and
48h (Figure 19A). Moreover, the pathophysiological role of sst5TMD4 in PCa was
further analyzed by measuring the effect of sst5TMD4 overexpression on cell migration
by wound-healing assay in the PC-3 cell line (Figure 19B). sst5TMD4 overexpression
evoked a significant increase in the migration of PC-3 cells at 12h (Figure 19B).
Figure 19: Functional effects of sst5TMD4 overexpression on pathophysiological
parameters in PCa cell lines. A. Cell proliferation in sst5TMD4 stably -transfected-VCaP
and PC-3, and in sst5TMD4 transiently-transfected DU145 cells, compared with their
corresponding control (mock-transfected); B . Migration capacity level (Wound -healing)
observed in sst5TMD4-stably-transfected PC-3 cells compared with control-cells (mock-
transfected) (representative images showing the higher migration capacity of sst5TMD4 -
transfected cells 12h after the wound compared with mock -transfected cells are also
included). All experiments were repeated at least three -times (n≥3). Data represent mean
± SEM. Asterisks (*p<0.05; **p<0.01) indicate values that significantly differ from the
corresponding controls.
5.1.2.4.3. sst5TMD4-stably-transfected PC-3-cells induce larger tumors than control
cells (mock cells) in a preclinical in vivo model.
Pro
life
ra
tió
n r
ate
(%
of
co
ntr
ol)
0
5 0
1 0 0
1 5 0
2 4 h
4 8 h
7 2 h
** **
Pro
life
ra
tió
n r
ate
(%
of
co
ntr
ol)
0
5 0
1 0 0
1 5 0
2 4 h
4 8 h
7 2 h* **
Pro
life
ra
tió
n r
ate
(%
of
co
ntr
ol)
0
5 0
1 0 0
1 5 0
2 4 h
4 8 h
7 2 h*
0
5 0
1 0 0
1 5 0
2 0 0
*
% w
ou
nd
he
ale
d a
re
a
(m
oc
k i
s s
et
at
10
0%
)
M o c k M o c k M o c ks s t5 T M D 4 s s t5 T M D 4 s s t5 T M D 4
V C a P P C -3D U -1 4 5
P C -3
M o c k s s t5 T M D 4
Mock sst5TMD4
T0h
T12h
A .
B .

98
The effect of the presence of sst5TMD4 on cell-proliferation was further evaluated
on an in vivo model of subcutaneous xenograft induction in nude-mice (Figure 20). The
overall size of the subcutaneous tumors induced by sst5TMD4-transfected PC-3-cells
were significantly larger than those induced by mock-cells (p<0.001; Figure 20A).
Although all tumors exhibited similar histotypes, tumors derived from sst5TMD4-
transfected PC-3-cells showed a significantly higher necrosis, but not mitosis, grade
(Figure 20B).
Figure 20: sst5TMD4 stable overexpression enhances tumor growth in preclinical
models (NUDE mice). A. Growth-rate of subcutaneously inoculated mock - and sst5TMD4-
transfected PC-3-derived tumors in nude-mice followed up to 12 -weeks after inoculation.
Below, representative images of mock and sst5TMD4-derived tumors after 12 weeks of
growth. B. % of necrosis and number of mitosis (positive cells per 10 field) in mock - and
sst5TMD4-transfected PC-3-derived tumors. Representative -images of hematoxylin–eosin
(H/E) staining showing diffuse cell-proliferation and large areas of necrosis in sst5TMD4 -
trasfected PC-3-derived tumors compared with mock-derived tumors (with diffuse cell -
proliferation and lower % of necrosis). Data represent mean ± SEM. Asterisks (*p<0.05;
***p<0.001) indicate values that significantly differ from the mock group.
5.1.2.5. sst5TMD4 silencing reverts pathophysiological features of PCa cell
lines
Inasmuch as sst5TMD4 expression is upregulated in PCa and its overexpression
(in vitro and in vivo) increases aggressiveness features of PCa cells, we next evaluated
whether sst5TMD4 silencing could be a suitable clinical target in the disease (Figure 21).
To this end, a specific siRNA against the specific region of sst5TMD4 was designed and
T U M O R G R O W T H
0 2 w 3 w 4 w 5 w 6 w 7 w 8 w 9 w 1 0 w 1 1 w 1 2 w
0
5 0
1 0 0
1 5 0
2 0 0
2 5 0
M o ck
s s t5 T M D 4
T im e (w e e k s )
Tu
mo
r s
ize
(m
m3
)
* * *
M ito s is
nº o
f M
ito
sis
/10
fie
lds
M o c k s s t5 T M D 4
0
2 0
4 0
6 0
N e c r o s is
Ne
cro
sis
%
M o c k s s t5 T M D 4
0
2 0
4 0
6 0
*
Mock sst5TMD4
H/E
M o c k s s t5 T M D 4 M o c k s s t5 T M D 4
A . B .
T u m o r n e c ro s is

99
validated in our laboratory (successful silencing was validated by Western blot analysis;
Figure 21A). Remarkably, sst5TMD4 silencing decreased proliferation rate (Figure
21B) and migration (Figure 21C) in PC-3 and DU145 cells
Figure 21: sst5TMD4 silencing decreases cell prolife ration and migration of PCa cell
lines. A. Validation by western-blot of sst5TMD4 silencing in PC-3 cells and
representative-images showing this silencing (below). B. Proliferation of sst5TMD4-
silenced PC-3 and DU145 cells compared with control scramble -transfected cells; C.
Migration rates measured by the wound-healing technique of sst5TMD4 -silenced PC-3 and
DU145 cells compared with control scramble -transfected cells. Data represent mean ±
SEM. Asterisks (*p<0.05; **p<0.01; ***p<0.001) indicate values tha t significantly differ
from the mock groups.
5.1.2.6. sst5TMD4 overexpression modulates key cell signaling pathways and
dysregulates the expression of oncogenes and tumor suppressor genes
involved in PCa development and progression.
In order to determine the intracellular mechanisms involved in the
pathophysiological processes triggered by sst5TMD4 overexpression in PCa-cells (i.e.
% s
st5
TM
D4
pro
tein
ad
jus
ted
by
-t
ub
uli
n
0
5 0
1 0 0
1 5 0
*P
ro
life
ra
tio
n r
ate
(%
of
co
ntr
ol)
0
5 0
1 0 0
1 5 0 2 4 h
4 8 h
*
0
5 0
1 0 0
1 5 02 4 h
4 8 h
7 2 h
* *
0
5 0
1 0 0
1 5 0
% w
ou
nd
he
ale
d a
re
a
(m
oc
k i
s s
et
at
10
0%
)
* * *
s s t5 T M D 4
-T u b u l in
Mock sst5TMD4
T0h
T12h
M o ck M o ck M o cks s t5 T M D 4 -
s iR N A
s s t5 T M D 4 -
s iR N A
s s t5 T M D 4 -
s iR N A
M o ck s s t5 T M D 4 -
s iR N A
A . B .
C .
P C -3 D U -1 4 5P r o te in
P C -3
0
5 0
1 0 0
1 5 0
% w
ou
nd
he
ale
d a
re
a
(m
oc
k i
s s
et
at
10
0%
)
* * *
D U 1 4 5
M o c k s s t5 T M D 4
s iR N A

100
cell proliferation and cell migration), we next studied the consequences of sst5TMD4
overexpression on 10 key cancer-related pathways using a dual-luciferase reporter system
(Cignal Finder Reporter Assay, Qiagen) and the RT2 Prostate Cancer PCR Array
comprising 84 genes involved in PCa development and progression.
5.1.2.6.1. Use of the Cignal Finder Reporter Assay revealed that sst5TMD4
overexpression enhances the activity of key cell signaling pathways. Validation of
the results by qPCR and Western blot.
The differences in the relative expression of various key signaling pathway
between sst5TMD4-stably-transfected and mock-transfected PC-3 cells are shown in
Figure 22A. Specifically, the pathways more drastically activated in sst5TMD4-stably-
transfected PC-3 cells compared with mock cells were Myc/Max (2.81-fold), MAPK/c-
Jun (AP1; 2.61-fold), hypoxia (HIF1α; 2.51-fold), TGFβ (SMAD 2/3/4; 2.4-fold), pRB-
E2F (E2F/DP1; 2.38-fold), Wnt (TCF/LEF; 2.05-fold) and MAPK/ERK kinase (ELK-
1/SRF; 1.87-fold) with minor changes in the activation of Notch (RBP-Jk; 1.53-fold), p53
(1.23-fold) and NFKβ (1.08-fold). Remarkably, those pathways are usually dysregulated
in PCa and are crucial in the pathophysiology of the disease [82].
Consistent with the increased activation of ELK-1/SRF and AP-1 transcription
factors observed with the Cignal Finder Reporter Assay, several components from the
MEK/ERK signaling pathway such as ERK (p=0.026) and JNK (p=0.042) exhibited
increased basal phosphorylation (Figure 22B). Moreover, total protein level of the
protooncogene c-myc, was clearly increased in sst5TMD4-stably-transfected PC-3 cells
(p=0.0076, Figure 22B), which was in agreement with the activation of the transcription
factor MYC/MAX (Figure 22A). Additionally, sst5TMD4-transfected PC-3-cells
expressed higher TGF-β levels without changes in NOTCH (Figure 22C). In addition,
due to the close relationship of PI3K/AKT pathways with tumoral pathologies, we also

101
analyzed the basal phosphorylation of AKT but did not find any alteration in the
phosphorylation levels of this protein (data not shown).
Figure 22: sst5TMD4 overexpression activates key intracel lular signaling pathways in
PCa cells. A. Results from the dual -luciferase Cignal Finder reporter assay of 10 cancer -
related pathways. The ratio of bioluminisence (RLU) signal of sst5TMD4-stably-
transfected PC-3 cells adjusted to control -mock cells (set at a 100%) is shown as increased
fold change; B. Protein expression levels of total -myc, phospho-ERK1/2 and phospho-JNK
(adjusted by β-tubulin levels) in sst5TMD4-stably-transfected PC-3 cells compared with
control-mock PC-3 cells. A representative western blots image of all these proteins (one
passage with tree technical replicates) are also shown; C. Expression of TGF-β and
NOTCH in sst5TMD4-stably-transfected PC-3 cells. Absolute mRNA levels (% of
variation compared to control -mock transfected-PC-3 cells) of TGF-β and NOTCH were
measured in 4 consecutive passages (mock- and sst5TMD4-stably-transfected PC-3 cells).
Absolute mRNA levels were determined by qPCR and adjusted by ACTB (used as
C ig n a l a rray
Ad
jus
ted
bio
lum
inis
ce
nc
e (
RL
U)
% v
s m
oc
k
MA
PK
/ER
K
MA
PK
/JN
K
My
c/M
ax
Wn
t
TG
FB
pR
B-E
2F
Hy
po
xia
No
tch
p5
3
NF
KB
0
1 0 0
2 0 0
3 0 0
4 0 0m o c k
s s t5 T M D 4
M o c k s s t5 T M D 4
0
5 0
1 0 0
1 5 0
2 0 0
**
c-m
yc
/ -t
ub
uli
n
M o c k s s t5 T M D 4
0
1 0 0
2 0 0
3 0 0
**
M o c k s s t5 T M D 4
0
1 0 0
2 0 0
3 0 0
4 0 0
*
c -M Y C
T U B B
p -E R K
T U B B
p -J N K
T U B B
c -M Y C p -E R K p -J N K
A .
B .
Re
lati
ve
mR
NA
ex
pre
ss
ion
(%
of
co
ntr
ol)
M o c k s s t5 T M D 4
0
1 0 0
2 0 0
3 0 0
4 0 0
**
M o c k s s t5 T M D 4
0
5 0
1 0 0
1 5 0
2 0 0
T G F - N o tc h
C .

102
housekeeping gene). Values represent mean ± SEM. Asterisks (*p<0.05; **p<0.01)
indicate values that significantl y differ from the control.
5.1.2.6.2. Use of the RT2 Prostate Cancer PCR Array revealed that sst5TMD4
overexpression alters the expression of key genes involved in PCa development and
progression. Validation of the results by qPCR and Western blot.
To identify the downstream consequences of the changes in signaling-pathways
observed using the dual-luciferase Cignal Finder reporter assay, we performed a qPCR-
array comprising 84 genes involved in PCa (see Table 11 at the end of the results section).
The results showed a total of 10 genes whose expression was altered more than 2-fold in
sst5TMD4-stably-transfected PC-3 cells compared with control-mock (Figure 23A;
upregulated: GCA/CAV2/RASSF1; downregulated: SFRP1/NRIP1/LOXL1/
CDKN2A/RARB2/APC/IGFBP5). Further validation of these changes [i.e. genes found
heavily altered (>2-fold) and some showing smaller changes (i.e. CAV1/IL-
6/DAXX/ZNF185)] by qPCR using cDNA from several cell-passages and different
primers sets (see Table 12 at the end of the Results section) indicated that 5 genes were
significantly upregulated (GCA/CAV1/CAV2/IL-6/DAXX) and 8 genes downregulated
(SFRP/NRIP1/LOXL1/CDKN2A/RARB2/APC/IGFBP5/ZNF185) by sst5TMD4
overexpression (Figure 23B). Additionally, some of these changes were confirmed by
Western-Blot (IL-6/SFRP1/NRIP1/LOXL1/CDKN2A/IGFBP5/ZNF185; Figure 23C).
Interestingly, sst5TMD4-stably-transfected PC-3 cells-derived tumors (in vivo xenograft-
model; previously presented in section 4.1.2.5.3 and figure 20) exhibited increased IL-6
and decreased SFRP1/IGFPB5 expression compared to mock-induced tumors (Figure
23D), which further validates the results observed previously in the PCR array.

103
Figure 23: Mechanistic downstream consequences of sst5TMD4 overexpression in
PCa-cells. A. Results from the RT2 Prostate Cancer PCR Array showing changes in
expression levels of some of the 84 genes involved in PCa in sst5TMD4 -stably-transfected
PC-3 cells compared with control -mock PC-3 cells; B. Validation by qPCR of genes
dysregulated in the RT 2 Prostate Cancer PCR Array using different cell preparations and
new sets of specific primers designed and validated by our group; C. Confirmation at the
protein expression level (using Western Blot) of some of the changes observed in gene
expression using the RT 2 Prostate Cancer PCR Array in sst5TMD4 -stably-transfected PC-
3 cells compared with control -mock PC-3 cells. Representative western blots image of all
these proteins are also shown. Data are expressed as percent of control (“mock”, set at
100%) within experiment; D. IL-6, SFRP1 and IGFBP5 mRNA expression levels in mock -
and sst5TMD4-transfected PC-3-derived tumors ( in vivo xenograft model). Results were
normalized according to the value of ACTB (used as housekeeping gene). Asterisks
(*p<0.05; **p<0.01; ***p<0.01) indicate values that significantly differ from the control.
5.1.2.7. PCa cell lines transfected with sst5TMD4 do not respond to SSAs in
terms of changes in free-cytosolic Ca2+ concentration.
CAV2
G CA
R A SSF1
LO X L1
S FR P1
R A R B
APC N R IP1
C D K N 2A
IG FB P5
U p re g u la t e d
(2 o r > fo ld s )
D o w n r e g u la te d
(2 o r > fo ld s )
L o g 1 0 (M o c k 2 ^ -D e lta C t )
Lo
g1
0 (
ss
t5T
MD
4 2
^-D
elt
aC
t)
P ro s ta te C a n c e r R T 2 P C R A rra y
GC
A
CA
V1
CA
V2
IL6
DA
XX
SF
RP
1
NR
IP1
LO
XL
1
CD
KN
2A
RA
RB
AP
C
IGF
BP
5
ZN
F185
-2 0
-1 0
0
1 0
2 0
G e n e
Re
lati
ve
fo
ld c
ha
ng
e
( v
s.
mo
ck
)
q P C R V a lid a tio n
* * *
** *
* * *
** *
* * ** * *
* * *
* * *
* * *
A P C
D A X X
T U B B
Z N F 1 8 5
IG F B P 5
C D K N 2 A
L O X L 1
N R IP 1
S F R P 1
IL -6
M o c k s s t5 T M D 4
1 2 3 1 2 3
M o c k s s t5 T M D 4
0
5 0
1 0 0
1 5 0
*
M o c k s s t5 T M D 4
0
5 0
1 0 0
1 5 0
**
M o c k s s t5 T M D 4
0
5 0
1 0 0
1 5 0
**
M o c k s s t5 T M D 4
0
5 0
1 0 0
1 5 0
**
M o c k s s t5 T M D 4
0
5 0
1 0 0
1 5 0
***
M o c k s s t5 T M D 4
0
5 0
1 0 0
1 5 0
*
M o c k s s t5 T M D 4
0
5 0
1 0 0
1 5 0
*
M o c k s s t5 T M D 4
0
5 0
1 0 0
1 5 0
M o c k s s t5 T M D 4
0
5 0
1 0 0
1 5 0
Pro
tein
le
ve
ls e
xp
re
ss
ed
as
pe
rc
en
t
of
co
ntr
ol
(se
t a
t 1
00
%)
IL -6 S F R P 1 N R IP 1
L O X L 1 C D K N 2 A IG F B P 5
Z N F 1 85 A P C D A X X
A . B .
C .

104
Evaluation of changes in free-cytosolic Ca2+ concentration (pathway tightly
associated to SST-signaling) in PC-3 cells showed that whereas 21% and 28% of the cells
not expressing sst5TMD4 (control-mock PC-3 cells) responded to SSAs (octreotide and
pasireotide; Figure 24A-B), an evident blockade in this response was observed in
sst5TMD4-overexpressing PC-3 cells (0% and 5% of the cells responded to octreotide
and pasireotide, respectively). A similar response was found in the androgen-dependent
LnCaP cells transiently-transfected with sst5TMD4, in that 16% and 14% of the control-
mock cells responded to SSAs (Figure 24C), while sst5TMD4-overexpressing LnCaP
cells barely responded to SSAs (4% and 2%, respectively).
A.
B.
C.
Type of cell SST
analog
No.
responsive
cells
Total cells
(%)
responsive
cells
% Resp.
Max. Error
Time of
max.response Error
Mock Pasireotide 10 73 14% 110.69 3.29 46.50 12.23
Mock Octreotide 9 57 16% 147.03 23.87 38.33 17.78
sst5TMD4 Pasireotide 3 144 2% 110.79 7.01 8.33 2.72
sst5TMD4 Octreotide 5 132 4% 126.54 5.01 120.00 21.26
Figure 24: Effect of octreotide and pasireotide in kinetics of [Ca2 +] i in the presence
and absence of sst5TMD4 in stably-transfected PC-3 cells and in transient transfected
LnCaP cells (sst5TMD4 or mock-transfected, respectively; n≥3). A. Representative
profiles of changes in [Ca 2+] i in mock or sst5TMD4-stably-transfected PC-3 cell cultures
in response to octreotide (Oct), pasireotide (Pas) and Ionomycin (positive control)
Type of cell SST
analog
No.
responsive
cells
Total
cells
(%) responsive
cells
% Resp.
Max. Error
Time of
max.response Error
Mock Pasireotide 32 114 28.1% 166.58 45.32 11.56 5.38
Mock Octreotide 16 74 21.6% 150.67 19.83 8.44 2.18
sst5TMD4 Pasireotide 5 104 4.8% 185.30 18.72 8.00 0.68
sst5TMD4 Octreotide 0 74 0.0% - - - -

105
administration (arrows) are shown; B-C. The number of responsive cells, total number of
cells measured, percentage of responsive cells showing changes in [Ca 2 +] i in response to
octreotide and pasireotide, percentage of maximum response (±error) and time of maximal
response (±error) to octreotide or pasireotide administration are indicated in stably -
transfected PC-3 cells (B) and in transiently-transfected LnCaP cells (C) .

106
5.2. Analysis of the ghrelin-system in PCa
5.1.1. Presence of different components of the ghrelin-system in human
normal and PCa tissues and cell lines
- Analyses in fresh prostate tissues (normal and PCa samples): The expression of the
different components of ghrelin system [ligands (Ghrelin and In1-ghrelin), receptors
(GHSR-1a and GHSR-1b) and GOAT enzyme] was measured in a battery of PCa biopsies
from patients with high risk PCa (n=52) and in a set of normal prostate biopsies from
healthy donor patients (n=12) (Table 7). Specifically, ghrelin, In1-ghrelin and GOAT
were expressed both in normal and PCa samples (Figure 25A-B). Interestingly, In1-
ghrelin and GOAT levels were upregulated in PCa compared with normal tissues (Figure
25A-B). In contrast, the expression of ghrelin receptors (GHSR-1a and GHSR-1b) was
barely detected in both normal and tumor tissues (Figure 25). Based on these results, we
decided to further analyze the presence and functional role of GOAT enzyme and In1-
ghrelin variant in PCa (see below: sections 4.2.2 and 4.2.3).
Figure 25: Expression of the components of the ghrelin-system in normal prostate and
PCa samples. Expression levels of the different components of the ghrelin system in a
battery of 52 fresh PCa samples compared to the expression found in 14 fresh normal
prostates (Control). Absolute mRNA levels were determined by qPCR and adjusted by a
normalization factor (NF) calculated from the expression levels of two housekeeping genes
(ACTB and GAPDH). Data represent mean ± SEM. Asterisks (*p<0.05) indicate values
that significantly differ between PCa samples and normal samples.
- Analyses in a normal prostate-like cell line and in different PCa cell lines: The
expression of ghrelin-system was also analyzed in the normal-like prostate cell line
RWPE-1, and in different androgen-dependent (22Rv1, LnCaP, VCaP) and androgen-
N o rm a l t is s u e
mR
NA
ex
pre
ss
ion
ad
jus
ted
by
NF
Gh
relin
In1-g
hre
lin
GO
AT
GH
SR
1a
GH
SR
1b
0
5 0 0
1 0 0 0
1 5 0 0
P C a
mR
NA
ex
pre
ss
ion
ad
jus
ted
by
NF
Gh
relin
In1-g
hre
lin
GO
AT
GH
SR
1a
GH
SR
1b
0
2 0 0
4 0 0
6 0 0
8 0 0
1 0 0 0
*
*
A . B .

107
independent (PC-3, DU-145) PCa cell lines, which represent several stages of the disease
(Figure 26). Our results revealed that GOAT and In1-ghrelin were the most expressed
components of the ghrelin system in PCa cell lines (Figure 26). The expression of ghrelin
was low or absent in the majority of the PCa cell lines analyzed. Moreover, the expression
of the ghrelin receptors (GHSR1a and GHSR1b) was barely detected in both normal and
PCa cell lines.
Figure 26: Expression of different components of the ghrelin system in normal-like
(RWPE-1) and PCa cell lines (androgen dependent: 22Rv1, VCaP, LnCaP; androgen
independent: PC-3, DU-145) . Absolute mRNA levels from different passages (n≥3) were
determined by qPCR and adjusted by ACTB. Data represents mean ± SEM.
R W P E -1
mR
NA
ex
pre
ss
ion
ad
jus
ted
by
AC
TB
Gh
relin
In1-g
hre
lin
GO
AT
GH
SR
1a
GH
SR
1b
0 .0 0 0 0
0 .0 0 0 5
0 .0 0 1 0
0 .0 0 1 5
0 .0 0 2 0
2 2 r v 1
Gh
relin
In1-g
hre
lin
GO
AT
GH
SR
1a
GH
SR
1b
0 .0 0 0 0
0 .0 0 0 5
0 .0 0 1 0
0 .0 0 1 5
0 .0 0 2 0
V C a P
Gh
relin
In1-g
hre
lin
GO
AT
GH
SR
1a
GH
SR
1b
0 .0 0 0 0
0 .0 0 0 5
0 .0 0 1 0
0 .0 0 1 5
0 .0 0 2 0
P C -3
Gh
relin
In1-g
hre
lin
GO
AT
GH
SR
1a
GH
SR
1b
0 .0 0 0 0
0 .0 0 0 5
0 .0 0 1 0
0 .0 0 1 5
0 .0 0 2 0
D U -1 4 5
Gh
relin
In1-g
hre
lin
GO
AT
GH
SR
1a
GH
SR
1b
0 .0 0 0 0
0 .0 0 0 5
0 .0 0 1 0
0 .0 0 1 5
0 .0 0 2 0
L n C a P
mR
NA
ex
pre
ss
ion
ad
jus
ted
by
AC
TB
Gh
relin
In1-g
hre
lin
GO
AT
GH
SR
1a
GH
SR
1b
0 .0 0 0 0
0 .0 0 0 5
0 .0 0 1 0
0 .0 0 1 5
0 .0 0 2 0

108
5.2.2 Presence and functional role of GOAT in PCa
It should be mentioned that the results of this section have been published in the journal
“Cancer Letters” [Title: “Ghrelin O-acyltransferase (GOAT) enzyme is overexpressed
in prostate cancer wherein it is associated with the metabolic status: potential value as
non-invasive biomarker”; Cancer Lett. 2016; 383(1):125-134]. A copy of this manuscript
is included at the end of this thesis document.
5.2.2.1. GOAT enzyme is overexpressed in PCa tissues
Expression of GOAT enzyme was analyzed in a cohort of fresh PCa-biopsies
collected from patients with high risk PCa [according to D’ Amico classification (PSA >
20.0 and/or Gleason 8-10 and/or cT2c-T3); n=52)] and controls (n=12). Demographic and
clinical parameters of the patients are detailed in Table 6. GOAT expression was
increased in PCa tissues compared with normal tissues (p=0.047; Figure 27A).
Remarkably, GOAT expression was able to discern between patients with presence of
PCa and controls (ROC curve; p=0.028; Figure 27B).
Figure 27: GOAT expression is upregulated in PCa tissues. A. Expression levels of
GOAT in a battery of 52 fresh PCa samples compared to the expression found in 12 fresh
normal prostates (Control). Absolute mRNA levels were determined by qPCR and adjusted
by a normalization factor (NF) calculated from the expression levels of two housekeeping
genes (ACTB and GAPDH). B. Receiver operating characteristic (ROC) curve analysis to
determine the accuracy of GOAT expression as diagnostic test to discriminate between
patients with presence of PCa. Data represents mean ± SEM. Asterisks (*p<0.05) indicate
values that significantly differ from the control.
GO
AT
mR
NA
ex
pre
ss
ion
ad
jus
ted
by
NF
0
2 0 0
4 0 0
6 0 0
8 0 0
*
R O C c u r v e
1 0 0 % - S p e c if ic ity %
Se
ns
itiv
ity
%
0 2 0 4 0 6 0 8 0 1 0 0
0
2 0
4 0
6 0
8 0
1 0 0
p = 0 .0 2 1
A U C = 0 .7 1 4
H ig h r is k P C a b io p s ie s
C o n tro l P C a
A . B .

109
5.2.2.2. GOAT expression levels correlate with metabolic factors (BMI, body-
weight and presence of dyslipidemia) in patients with PCa
We found that GOAT expression was positively correlated with body weight and
BMI in PCa patients (Figure 28A) but not in controls (Figure 28B). In addition, GOAT
expression tended to be higher in PCa patients with dyslipidemia (p=0.084; Figure 28C),
and, a greater proportion of patients with high GOAT expression presented dyslipidemia
compared with patients with low GOAT expression (Figure 28D). No correlations were
found between GOAT expression and presence of metastasis, Gleason Score or
circulating PSA (Figure 28E).
Figure 28: GOAT expression correlates with metabolic factors in patients w ith PCa .
A. GOAT expression and BMI and body weight correlations in PCa patients; B. GOAT
expression and BMI and body weight correlations in control patients; C. GOAT expression
in patients without (NO) and with (YES) dyslipidemia; D. frequencies observed between
two groups of PCa patients with low or high GOAT expression levels in terms of
dyslipidemia; E. Comparison of GOAT expression in terms of presence of metastasis and
Gleason Score. Graphs represent mean ± SEM. Asterisks (***p<0.001) indicate values that
significantly differ from the corresponding controls. DL=dyslipidemia; NDL=non
dyslipidemia.
A . B .
L O W
G O A T
H IG H
G O A T
C . D . E .
N O Y E S 7 8 - 1 0
P C a
G O A T m R N A e x p re s s io n
a d ju s te d b y N F
BM
I
0 5 0 0 1 0 0 0 1 5 0 0 2 0 0 0
0
1 0
2 0
3 0
4 0
5 0
p = 0 ,0 3 3
r= 0 .4 0 2
P C a
G O A T m R N A e x p re s s io n
a d ju s te d b y N F
Bo
dy
we
igh
t (K
g)
0 5 0 0 1 0 0 0 1 5 0 0 2 0 0 0
0
5 0
1 0 0
1 5 0
p = 0 ,0 2 1
r= 0 .5 1 0
C O N T R O L S
G O A T m R N A e x p re s s io n
a d ju s te d b y N F
BM
I
0 1 0 0 2 0 0 3 0 0 4 0 0 5 0 0
2 0
2 5
3 0
3 5
4 0p = N .S
r= -0 .3 4 5
C O N T R O L S
G O A T m R N A e x p re s s io n
a d ju s te d b y N F
Bo
dy
we
igh
t (K
g)
0 1 0 0 2 0 0 3 0 0 4 0 0 5 0 0
5 0
6 0
7 0
8 0
9 0
1 0 0
1 1 0p = N .S
r= -0 .4 7 1
GO
AT
mR
NA
ex
pre
ss
ion
ad
jus
ted
by
NF
0
2 0 0
4 0 0
6 0 0
8 0 0
1 0 0 0 0 .0 8 4
nº o
f c
as
es
0
2 0
4 0
6 0
8 0
1 0 0N D L
D L* * *
GO
AT
mR
NA
ex
pre
ss
ion
ad
jus
ted
by
NF
0
2 0 0
4 0 0
6 0 0
8 0 0
M E T A S T A S IS
GO
AT
mR
NA
ex
pre
ss
ion
ad
jus
ted
by
NF
0
2 0 0
4 0 0
6 0 0
8 0 0
G L E A S O N S C O R ED Y S L IP ID E M IA
N O Y E S

110
5.2.2.3. GOAT protein levels are also upregulated in PCa tissues.
IHC for GOAT enzyme was also performed on FFPE-prostate samples harboring
normal and tumoral regions, obtained from radical prostatectomies (n=4) of patients
diagnosed with localized PCa (Gleason score 6-7), which revealed stronger GOAT
staining in the tumoral vs. benign glands (Figure-29A). Interestingly, high-magnification
images showed perineural-infiltration by tumoral prostate glands with high cytoplasmic
(granular) and nuclear GOAT-staining, suggesting that GOAT overexpression could be
associated with a malignant event in PCa. Due to the small set of FFPE samples available,
we next implemented IHC analyses in a subset of samples (biopsies) from a cohort of
clinically high-grade PCa samples already described above (n=16), which included PCa
and normal-benign prostate regions. These analyses revealed that GOAT staining was
very weak in normal-benign prostate samples (cytoplasmic-staining; Figure-29B)
compared with the intense staining found in PCa samples [staining located at cytoplasmic
(granular-staining) and nuclear level of the cancerous prostate-glands; Figure-29B-C).
This staining in PCa samples seems to be specific for tumoral regions since the staining
of the stromal cells within the tumor microenvironment was negative for GOAT (Figure-
29C). Moreover, the comparison between the mRNA expression levels of GOAT in
samples with moderate and high expression of GOAT by IHC suggests a relationship
between mRNA and protein levels since samples with high GOAT by IHC presented
higher (non-significant) levels of GOAT mRNA (data not shown). Interestingly, GOAT
staining tended to be stronger in patients with higher Gleason-score (p=0.088; Figure-
29D) and in patients with metastasis (p=0.079; Figure-29E).
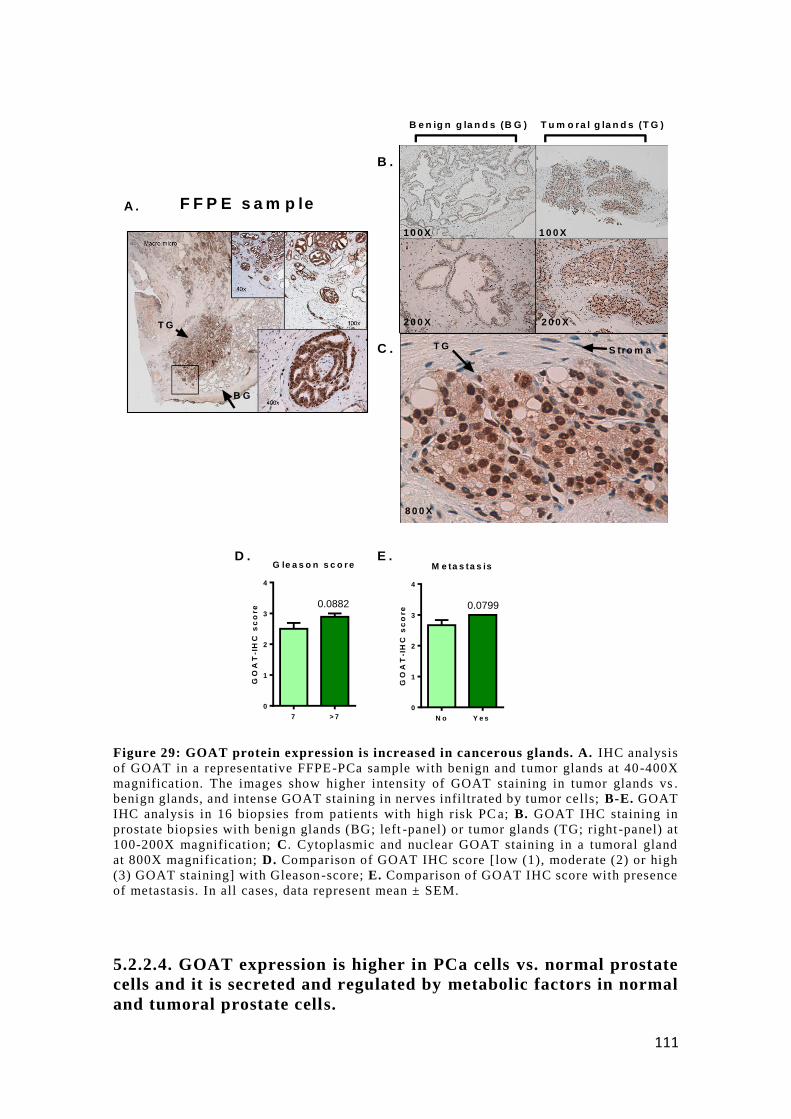
111
Figure 29: GOAT protein expression is increased in cancerous glands. A. IHC analysis
of GOAT in a representative FFPE-PCa sample with benign and tumor glands at 40-400X
magnification. The images show higher intensity of GOAT staining in tumor glands vs .
benign glands, and intense GOAT staining in nerves infiltrated by tumor cells; B-E. GOAT
IHC analysis in 16 biopsies from patients with high risk PC a; B. GOAT IHC staining in
prostate biopsies with benign glands (BG; left -panel) or tumor glands (TG; right -panel) at
100-200X magnification; C. Cytoplasmic and nuclear GOAT staining in a tumoral gland
at 800X magnification; D. Comparison of GOAT IHC score [low (1), moderate (2) or high
(3) GOAT staining] with Gleason-score; E. Comparison of GOAT IHC score with presence
of metastasis. In all cases, data represent mean ± SEM.
5.2.2.4. GOAT expression is higher in PCa cells vs. normal prostate
cells and it is secreted and regulated by metabolic factors in normal
and tumoral prostate cells.
B e n ig n g la n d s (B G ) T u m o ra l g la n d s (T G )
1 0 0 X 1 0 0 X
2 0 0 X 2 0 0 X
8 0 0 X
T G S tro m a
T G
B G
F F P E s a m p leA .
B .
C .
D . E .M e ta s ta s is
GO
AT
-IH
C s
co
re
N o Y e s
0
1
2
3
4
0.0799
G le a s o n s c o r e
GO
AT
-IH
C s
co
re
7 > 7
0
1
2
3
4
0.0882

112
GOAT expression was significantly higher in PCa cell lines (LnCaP, 22Rv1 and
DU145) compared with the normal-like prostate cell line RWPE-1, and with human
normal primary prostate cell cultures (Figure 30A). Remarkably, PCa cell lines were
capable to secrete GOAT protein into the media, being this secretion higher in 22Rv1 vs.
PC-3 cells (Figure 30B; 1.641 vs. 1.163 ng/ml, respectively; p=0.005, n> 3), which is in
agreement with the higher GOAT mRNA levels observed in 22Rv1 vs. PC-3 (Figure
30A). To determine whether the expression of GOAT could be directly regulated by
metabolic factors, normal human prostate cell cultures were treated with different
metabolic factors [including its endogenous targets (acylated-ghrelin peptides: ghrelin
and In1-ghrelin) and insulin and IGF1]. Particularly, In1-ghrelin peptide (In1-19), but not
ghrelin, significantly increased GOAT expression in 22Rv1, but not in PC-3 cells (Figure
30C), and in normal prostate primary cell cultures (Figure 30D). Conversely, treatment
with key metabolic factors such as insulin and IGF1, or their combination, significantly
reduced GOAT expression in PC-3 cells (p<0.001; Figure 30E).

113
Figure 30: Regulation of GOAT expression by metabolic factors in normal prostate and
PCa cell cultures . A. GOAT expression in normal -like prostate cell line (RWPE-1) or
prostate cancer cell lines (androgen-dependent: LnCaP, 22RV1 and VCaP , or androgen-
independent: PC-3 and DU145) from different passages (n≥3) . Asterisks (*p < 0.05)
indicate values that significantly differ between normal RWPE-1 cells and PCa cell lines,
while dashed (##p < 0.01; ### p < 0.001) indicate differences in GOAT expression between
normal prostate primary cell cultures and PCa cell lines; B. Basal GOAT protein secretion
measured by ELISA (after 24h-culture) in 22Rv1 and PC-3 cell lines (n=3). Asterisks
**p<0.01) indicate values that significantly differ from 22Rv1 cells; C-D. Regulation of
GOAT expression after treatment (10nM) with ghrelin or In1-ghrelin (In1-19) peptide in
22Rv1 or PC-3 PCa cell lines (C) and in normal prostate cell cultures (D) (24h, n≥3); E.
Regulation of GOAT expression after treatment (10 nM) with IGF-1, insulin or both (IGF-
1+insulin; n≥3). In these expression experiments in response to treatments, a sterisks (*p
< 0.05; ***p<0.001) indicate values that significantly differ fr om controls. Data represent
mean ± SEM. Absolute mRNA levels of GOAT were determined by qPCR and adjusted by
the expression levels of a housekeeping gene ( ACTB).

114
5.2.2.5. Plasma GOAT levels are elevated in patients with PCa in comparison
with healthy control patients: association with pathophysiological parameters
Since GOAT is overexpressed in PCa tissues, secreted from PCa cell lines and can
be detected in blood [245], we evaluated, for the first time, the presence of GOAT in
plasma of PCa patients (n=85) and compared with the levels in healthy control patients
(n=28) (Clinical/pathological features of this patient cohort are summarized in Table 8).
Remarkably, plasmatic GOAT levels were significantly elevated in PCa patients
compared with controls (Figure 31A). It should be noted that PCa-patients had similar
body-weight and BMI but presented a slightly higher age than control-patients (6 years;
Table 8). Nevertheless, we implemented general linear models, which demonstrated that
this difference was not responsible for the differences observed in plasmatic GOAT
levels. Furthermore, when plasma GOAT levels were corrected by age, higher GOAT
levels were clearly evident in PCa vs. control-patients (p-value=0.002; Figure 31A).
Moreover, ROC-analysis showed the diagnostic potential for GOAT at the plasma level
(p<0.0001; AUC=0.752; Figure 31B), wherein a value of 1.22ng/ml of GOAT plasma
levels could discriminate between PCa vs. control-patients with a specificity of 67,8 %
and a sensitivity of 81,1%.
Interestingly, plasmatic GOAT levels were associated with several
pathophysiological factors. Specifically, GOAT levels were directly associated with total
PSA levels and inversely correlated with free PSA (Figure 31C), and also associated
positively with two cancer biomarkers (ca_15-3 and cyfra_21-1; Figure 31D). Moreover,
a higher frequency of infiltrative tumors was found in patients with higher plasmatic
GOAT levels (Figure 31E).

115
Figure 31: Analysis of the presence of GOAT in the plasma of patients with PCa and
controls and association with pathophysiological parameters. A. GOAT plasmatic
levels were determined by ELISA in a cohort of 85 PCa patients and 28 controls ; B.
Receiver operating characteristic (ROC) curve analysis to determine the accuracy of GOAT
plasmatic levels as diagnostic test to discriminate between patients with PCa and controls ;
C. Correlation of plasma levels of GOAT and total PSA (tPSA) and free PSA (F PSA) levels
in PCa patients; D. Correlation of plasma levels of GOAT with ca_15 -3 and cyfra_21-1
tumor markers in PCa patients; E. Frequencies of infiltrative tumors observed in PCa
patients with low vs. high GOAT plasmatic levels (according to median GOAT levels;
IN=infiltrating tumors; NI=No infiltrating tumors). Values represent mean ± SEM.
Asterisk (*p < 0.05) indicate values that significantly differ between groups.
5.2.2.6. Association with clinical-metabolic parameters of plasma GOAT
levels with metabolic parameters in patients with PCa
We next analyzed the putative relationship between plasmatic levels of GOAT
and several metabolic parameters (i.e. BMI, diabetes, dyslipidemia, etc.). Although we
did not find correlations between GOAT plasma levels and BMI or body weight in control
and PCa patients (Figure 32A-B), we observed that GOAT levels of control-patients
(without PCa) were significantly higher in diabetic subjects compared with non-diabetic
patients (Figure 32C), whereas no differences were found in plasmatic GOAT levels in
control-patients with and without dyslipidemia (Figure 32D). Consistent with these
results, plasmatic GOAT levels in control-patients were positively correlated with the
levels of glycated hemoglobin (HbA1c; Figure 32E) and glucose (Figure 32F), two well-
known clinical markers of diabetes. Accordingly, a significantly higher proportion of
0
1
2
3
4
5
GO
AT
ng
/ml
pla
sm
a
p -v a lu e = 0 .0 0 2 (c o rre c te d b y a g e )
020
40
60
80
100
0
2 0
4 0
6 0
8 0
1 0 0
1 0 0 % - S p e c ific ity %
Se
ns
itiv
ity
%
p = 0 .0 0 0 2
A U C = 0 .7 5 2
0 5 1 0 1 5 2 0 2 5
0
2
4
6
8
1 0
G O A T n g /m l
cy
fra
_2
11
U/m
L
p = 0 .0 1 4
r= 0 .2 6 3
0 5 1 0 1 5 2 0 2 5
0
1 0
2 0
3 0
4 0
5 0
G O A T n g /m l
an
tig
en
ca
15
3 U
/mL
p = 0 .0 1 2
r= 0 .2 7
0 5 1 0 1 5 2 0 2 5
0
2 0
4 0
6 0
8 0
1 0 0
G O A T n g /m l
tPS
A n
g/m
L
p = 0 .0 0 9
r= 0 .2 8 1
0 5 1 0 1 5 2 0 2 5
0
1
2
3
G O A T n g /m l
FP
SA
ng
/mL
p = 0 .0 2 9
r= -0 .2 7 8
% o
f c
as
es
0
2 0
4 0
6 0
8 0
1 0 0
N I
IN
*
In f ilt ra t iv e tu m o rs
A .
C . E .
L O W
G O A T
H IG H
G O A T
C o n tro l P C a
B .
D .

116
patients with diabetes, but not with dyslipidemia, was found in control-patients with high
plasmatic GOAT levels compared to those with low GOAT levels (Figure 32G). In
contrast, plasmatic GOAT levels were similar in diabetic vs. non-diabetic patients with
PCa (Figure 32H). A trend for elevation in plasmatic GOAT levels was found in patients
with PCa that had dyslipidemia compared to those without dyslipidemia (p=0.06; Figure-
32I). A positive correlation between plasmatic GOAT levels was also found with HbA1c,
but not with glucose levels in PCa-patients (Figure 32J and 32K, respectively). Indeed,
a higher proportion of patients with diabetes as well as with dyslipidemia were found in
PCa-patients having high plasmatic GOAT levels vs. PCa-patients with low GOAT levels
(Figure-32L).

117
Figure 32: Association of GOAT levels with clinical-metabolic parameters in control and PCa
patients. A-B. Correlations of plasma GOAT levels with metabolic factors (BMI and body weight) of
control patients (A) and patients with PCa (B). C-D. Correlations of plasma GOAT levels with diabetes or
dyslipidemia in controls patients (C-NDM: Controls without diabetes mellitus; C-DM: Controls with
diabetes mellitus; C-NDL: Controls without dyslipidemia; C-DL: Controls with dyslipidemia). E-F.
Correlations of plasma GOAT levels with HbA1c (E) and glucose (F) levels in control patients. G.
Frequencies of diabetes and dyslipidemia observed in control patients with low vs. high GOAT plasmatic
levels (Low GOAT: patients with low plasmatic GOAT levels; High GOAT: patients with high plasmatic
GOAT levels). H-I. Correlations of plasma GOAT levels with diabetes or dyslipidemia in PCa patients
(PCa-NDM: PCa patients without diabetes mellitus; PCa-DM: PCa patients with diabetes mellitus; PCa-
NDL: PCa patients without dyslipidemia; PCa-DL: PCa patients with dyslipidemia). J-K. Correlations of
plasma GOAT levels with HbA1c (J) and glucose (K) levels in PCa patients. L. Frequencies of diabetes
and dyslipidemia observed in PCa patients with low vs. high GOAT plasmatic levels. Data represent mean
± SEM. Asterisks (**p < 0.01, ***p<0.001) indicate values that significantly differ between groups.
C O N T R O L P R O S T A T E C A N C E R
L O W
G O A T
H IG H
G O A T
L O W
G O A T
H IG H
G O A T
L O W
G O A T
H IG H
G O A T
L O W
G O A T
H IG H
G O A T
GO
AT
ng
/ml
pla
sm
a
C-N
DL
C-D
L
0
2
4
6
8
GO
AT
ng
/ml
pla
sm
a
C-N
DM
C-D
M
0
2
4
6 * *
GO
AT
ng
/ml
pla
sm
a
PC
a-N
DL
PC
a-D
L
0
2
4
6
8 0 .0 6 8
GO
AT
ng
/ml
pla
sm
aP
Ca-N
DM
PC
a-D
M
0
2
4
6
% o
f c
as
es
0
2 0
4 0
6 0
8 0
1 0 0
NO
D MD ia b e te s
* * *
% o
f c
as
es
0
2 0
4 0
6 0
8 0
1 0 0
NO
D L
% o
f c
as
es
0
2 0
4 0
6 0
8 0
1 0 0
N D
D M
**
% o
f c
as
es
0
2 0
4 0
6 0
8 0
1 0 0
N D
D L
**
G O A T n g /m l
% H
bA
1c
0 2 4 6 8
0
5
1 0
1 5
p = 0 .0 5 3
r= 0 .3 6 1
G O A T n g /m l
Glu
co
se
le
ve
l (m
g/d
L)
0 2 4 6 8
0
5 0
1 0 0
1 5 0
2 0 0
2 5 0 p = 0 .0 5 7
r= 0 .3 6 2
G O A T n g /m l
% H
bA
1c
0 5 1 0 1 5 2 0 2 5
0
2
4
6
8
1 0 p = 0 .0 2 3
r= 0 .2 4 5
G O A T n g /m l
Glu
co
se
le
ve
l (m
g/d
L)
0 5 1 0 1 5 2 0
0
5 0
1 0 0
1 5 0
p = 0 .9 1 1
r= 0 .0 1 2
G O A T n g /m l
BM
I
0 5 1 0 1 5 2 0 2 5
0
1 0
2 0
3 0
4 0
5 0 p = N .S .
r= 0 ,0 0 3
G O A T n g /m l
We
igh
t (k
g)
0 5 1 0 1 5 2 0 2 5
0
5 0
1 0 0
1 5 0p = N .S .
r= -0 ,0 0 9
G O A T n g /m l
BM
I
0 2 4 6 8
2 0
2 5
3 0
3 5
4 0
4 5
p = N .S .
r= -0 ,3 1
G O A T n g /m l
We
igh
t (k
g)
0 2 4 6 8
0
5 0
1 0 0
1 5 0p = N .S .
r= -0 ,2 4
A . B .
C . D .
E . F .E .
G .
H . I.
J . K .
L .D y s lip id e m ia D ia b e te s D y s lip id e m ia

118
5.2.2.7. Plasma GOAT levels as non-invasive diagnostic biomarker of PCa in
non-diabetic individuals
Based on the previous results, we next interrogated whether plasmatic GOAT
levels could be a more specific PCa marker in non-diabetic patients. In fact, we found
that plasmatic GOAT levels were higher in non-diabetic PCa-patients vs. control-patients
(p<0.001; Figure 33A). Indeed, the area under curve was considerably improved when
analyzing only non-diabetic PCa-patients [value of 0.854 (Figure 33B; only non-
diabetic) vs. 0.752 (Figure 31B; diabetic+non-diabetic)]. In addition, the
specificity/sensitivity to discriminate the presence of PCa was significantly higher when
only the non-diabetic individuals were considered [a cut-off value of 1.142 ng/ml
presented a specificity and sensitivity of 84.2% and 86.7% (Figure 33A/B) vs. 67.8% and
81.1% analyzing non-diabetic+diabetic patients (Figure 31A/B)]. Interestingly,
plasmatic GOAT levels also positively correlated with total PSA, negatively with free
PSA levels and positively with the cancer biomarker ca_15-3 (Figure-33C), and also
exhibited a similar positive tendency with HbA1c (p=0.080; Figure-33C).
Figure 33: GOAT plasmatic levels in non-diabetic PCa patients compared to non-
diabetic controls. A. GOAT plasmatic levels in non-diabetic PCa patients (n=60)
compared to non-diabetic controls (n=19) were determined by ELISA. B. Receiver
operating characteristic (ROC) curve analysis to determine the accuracy of GOAT
plasmatic levels as diagnostic test to discrimi nate between PCa and controls patients within
the population without diabetes. C. Correlations between plasma GOAT levels and total
GO
AT
ng
/ml
0
2
4
6
* * *
R O C c u r v e
1 0 0 % - S p e c if ic ity %
Se
ns
itiv
ity
%
0 2 0 4 0 6 0 8 0 1 0 0
0
2 0
4 0
6 0
8 0
1 0 0
A U C = 0 .8 5 4
p < 0 .0 0 0 1
P C a
G O A T n g /m l
PS
A n
g/m
L
0 5 1 0 1 5 2 0
0
2 0
4 0
6 0
8 0p = 0 .0 0 8
r= 0 .3 4 0
P C a
G O A T n g /m l
FP
SA
ng
/mL
0 5 1 0 1 5
0
1
2
3p = 0 .0 6 9
r= -0 .2 8 6
P C a
G O A T n g /m l
% H
bA
1c
0 5 1 0 1 5 2 0
4
5
6
7
8p = 0 .0 8 0
r= 0 .2 2 7
P C a
G O A T n g /m l
an
tig
en
ca
15
3 U
/mL
0 5 1 0 1 5 2 0
0
1 0
2 0
3 0
4 0
5 0 p = 0 .0 2 0
r= 0 .2 9 8
A . B .
C o n tro l P C a
C .

119
PSA, free PSA, ca-153 and HbA1c in non-diabetic patients with PCa. Data represent mean
± SEM. Asterisks (***p<0.001) indicate values that significantly differ between groups.
5.2.2.8. Urine GOAT levels are elevated in patients with PCa in comparison
to healthy-control patients: potential as non-invasive biomarker of PCa.
Urine GOAT levels were also significantly elevated in the same cohort of PCa-
patients vs. control-patients (Figure 34A; Table 8). Actually, ROC-curve analysis
showed that urine GOAT levels could discriminate between PCa vs. control-patients
(Figure 34B; p<0.001, AUC= 0.716; a cut-off value of 1.061 ng/ml presented a
sensitivity of 75% and specificity of 61%). Remarkably, this sensitivity/specificity was
lower than that found with plasmatic GOAT levels, and the underlying reasons (which
may involve sampling procedures, urine processing, etc.) are still not defined, and,
therefore, warrant further investigation. Interestingly, no correlations were found between
GOAT urine levels and metabolic parameters (BMI, body weight, diabetes or
dyslipidemia) in control (Figure 34C) or PCa patients (Figure 34D), suggesting that
GOAT urine levels are not relevantly influenced by these parameters Furthermore, urine
GOAT secretion was increased after a prostate-massage in an additional cohort of PCa-
patients (Table 9) compared to the same cohort of subjects before prostate-massage
(Figure 34E).
C o n tro l P C a
GO
AT
ng
/ml
0 .0
0 .5
1 .0
1 .5
2 .0
***
R o c o f G O A T u r in e
1 0 0 % - S p e c if ic ity %
Se
ns
itiv
ity
%
0 2 0 4 0 6 0 8 0 1 0 0
0
2 0
4 0
6 0
8 0
1 0 0
A U C = 0 .7 2 1
p < 0 .0 0 0 1
0
5 0
1 0 0
1 5 0
*
P ro s ta te m a s s a g e
A . B .
C .
P r e P o sG O A T n g /m l
BM
I
0 .8 1 .0 1 .2 1 .4 1 .6
2 0
2 5
3 0
3 5
4 0
4 5p = N .S .
r= 0 .2 5
G O A T n g /m l
We
igh
t (k
g)
0 .8 1 .0 1 .2 1 .4 1 .6
0
5 0
1 0 0
1 5 0p = N .S .
r= 0 .3 2
G O A T n g /m l
BM
I
0 2 4 6 8 1 0
0
1 0
2 0
3 0
4 0
5 0 p = N .S .
r= 0 ,0 0 3
G O A T n g /m l
We
igh
t (k
g)
0 2 4 6 8 1 0
0
5 0
1 0 0
1 5 0 p = N .S .
r= 0 .0 2
D . E .

120
Figure 34: Evaluation of GOAT levels as a non-invasive PCa diagnostic marker in
urine. A. GOAT urine levels in a population of 85 PCa patients compared to 28 normal
controls determined by ELISA. B. ROC curve analysis to determine the accurac y of GOAT
urine levels to discriminate between PCa and control patients; C-D. Correlations between
urine GOAT levels and BMI and body weight in control patients (C) and PCa patients (D).
E. Percentage of increase of urine GOAT secretion after prostate mass age in PCa patients.
Data represent Mean ±SEM. Asterisks (*p < 0.05; ***p<0 .001) indicate values that
significantly differ between groups.

121
5.2.3. Presence and functional role of In1-ghrelin variants in
PCa
5.2.3.1. In1-ghrelin, but not ghrelin, is overexpressed in PCa tissues and its
levels are associated with GOAT-enzyme and PSA levels.
Expression of the In1-ghrelin variant and ghrelin was analyzed in a cohort of
patients with high-risk PCa (n=52) and compared to normal prostate (NP) control samples
(n=12) (Figure 35). Demographic and clinical characteristics of these cohorts of patients
are included in Table 6. Specifically, ghrelin and In-ghrelin mRNA was detected in
83.3% and 66.6% of control patients and in 90% and 88.5% of PCa samples, respectively.
Remarkably, In1-ghrelin, but not ghrelin mRNA was significantly overexpressed in PCa
samples (Figure 35A). Indeed, ROC curve analysis demonstrated that In1-ghrelin, but
not ghrelin expression could significantly discriminate between patients with or without
PCa (Figure 35B). Moreover, In1-ghrelin, but not ghrelin expression was positively
correlated with GOAT-enzyme expression (Figure 35C) and with PSA expression
(Figure 35D). No further associations were found between In1-ghrelin or ghrelin and
other pathological features, such as Gleason score or presence of perineural infiltration
(data not shown). We also analyzed the expression levels of ghrelin receptor in this cohort
of patients and found that GHSR1a was only detected in one tumor sample, while
GHSR1b expression was detected in 6 control and 10 tumor samples, although its
expression levels were very low (Figure 35E).

122
Figure 35: mRNA expression of ghrelin system in PCa. A. Ghrelin and In1-ghrelin
expression in biopsies from patients with high -risk PCa (n=52) and normal prostates from
patients that underwent cystoprostatectomy (n=12). Expression levels were determined by
qPCR and adjusted by a normalization factor (NF) calculated from ACTB and GAPDH
expression levels; B. ROC curve analysis to determine the accuracy of ghrelin or In1 -
ghrelin expression as diagnostic test to discriminate between high -risk PCa patients and
controls using the same cohort; C. Correlations between ghrelin or In1 -ghrelin expression
with GOAT enzyme expression PCa samples (n=52); D. Correlations between ghrelin or
In1-ghrelin with PSA in PCa samples; E. GHSR-1a and GHSR-1b mRNA levels in the same
cohort of fresh samples. Values represent mean ± SEM. Asterisks (*p < 0.05) indicate
values that significantly differ between groups .
Gh
re
lin
mR
NA
ex
pre
ss
ion
ad
jus
ted
by
NF
N P P C a
0
5 0 0
1 0 0 0
1 5 0 0
In1
-gh
re
lin
mR
NA
ex
pre
ss
ion
ad
jus
ted
by
NF
N P P C a
0
5 0
1 0 0
1 5 0
2 0 0
2 5 0
*
1 0 0 % - S p e c if ic ity %
Se
ns
itiv
ity
%
0 2 0 4 0 6 0 8 0 1 0 0
0
2 0
4 0
6 0
8 0
1 0 0
p > 0 .0 5
1 0 0 % - S p e c if ic ity %
Se
ns
itiv
ity
%
0 2 0 4 0 6 0 8 0 1 0 0
0
2 0
4 0
6 0
8 0
1 0 0
p < 0 .0 5
A U C = 0 .6 8
A . B .
In 1 -g h re lin m R N A
GO
AT
mR
NA
0 2 0 0 4 0 0 6 0 0 8 0 0
0
5 0 0
1 0 0 0
1 5 0 0
2 0 0 0p = 0 .0 6
r= 0 .2 7
G h re lin m R N A
GO
AT
mR
NA
0 5 0 0 1 0 0 01 5 0 02 0 0 0
0
5 0 0
1 0 0 0
1 5 0 0
2 0 0 0
p = 0 .7 9
r= -0 .0 4
In 1 -g h re lin m R N A
PS
A m
RN
A
0 5 0 0 1 0 0 01 5 0 02 0 0 0
0
1 .01 0 6
2 .01 0 6
3 .01 0 6
4 .01 0 6
5 .01 0 6p = 0 .0 3 1
r= 0 .3 1 4
G h re lin m R N A
PS
A m
RN
A
0 1 0 0 0 2 0 0 0 3 0 0 0
0
1 .01 0 6
2 .01 0 6
3 .01 0 6
4 .01 0 6
5 .01 0 6
C . D .
GH
SR
1a
mR
NA
ex
pre
ss
ion
ad
jus
ted
by
NF
C o n tro l P C a
0
1
2
3
4
5
G H S R 1 a
GH
SR
1b
mR
NA
ex
pre
ss
ion
ad
jus
ted
by
NF
C o n tro l P C a
0
5
1 0
1 5
2 0
G H S R 1 b
E .
G H R E LIN IN 1 -G H R E LIN G H R E L IN IN 1 -G H R E LIN

123
5.2.3.2. In1-ghrelin, but not ghrelin expression is higher in castration-
resistant PCa cells compared with androgen-dependent PCa cells and normal
prostate cells.
Evaluation of mRNA expression of ghrelin-system in androgen-dependent and
castration-resistant PCa cell-lines compared with the normal-like prostate cell line
RWPE1 revealed that while native-ghrelin was expressed in normal RWPE1-cells and in
LNCaP and VCaP PCa-cells (Figure 36A), its expression was almost undetectable in the
other PCa cell-lines analyzed (Figure 36A). However, In1-ghrelin expression was
commonly higher in all PCa cell-lines compared with the normal RWPE1-cells (Figure
36B), which is consistent with the data obtained from fresh PCa samples (Figure 35A).
Moreover, In1-ghrelin expression was higher in castration-resistant cells (DU145/PC-3)
compared to androgen-dependent cells (LNCaP/22Rv1/VCaP), suggesting that In1-
ghrelin expression may vary through the different stages of PCa. Conversely, GHSR1a/b
were barely expressed in PCa cell lines (Figure 36C-D), which is in contrast with
previous studies showing the presence of GHSR1a in some of these PCa cell lines [223].
Therefore, in order to corroborate these data, we used different primers sets [designed
from our group and validated in other samples, including a primer set used in the
previously mentioned work [223], but again we did not find any evidence of detectable
GHSR1a expression in PCa cell lines (Figure 36E).

124
Figure 36: Study of the Ghrelin system expression in normal prostate and PCa cell
lines. Ghrelin (A), In1-ghrelin (B) and GHSR1a (C) and GHSR1b (D) expression levels in
normal-like prostate cell line (RWPE-1) and PCa cell lines (androgen-dependent: LnCaP,
22RV1 and VCaP or androgen-independent: PC-3 and DU145). Absolute mRNA levels
from different passages (n≥3) were determined by qPCR and adjusted by ACTB. Data
represents mean ± SEM. Asterisks (*p < 0.05; **p < 0.01) indicate values that significantly
differ between a PCa cell line vs. the normal-like prostate cel l line RWPE-1. E. Further
analysis of GHSR1a expression on different PCa cell lines (22Rv1, DU -145, LnCaP, PC-
3), normal-like prostate cell line (EPN) and PCa samples using several pairs of primers.
As positive control, cDNA from a pituitary tumor with GHS R1a expression was used.
5.2.3.3. Plasma levels of In1-ghrelin, but not ghrelin, are higher in patients
with PCa compared with healthy-control patients
We next studied the presence and regulation of circulating levels of native-ghrelin
and In1-ghrelin in an independent patient’s cohort. Demographic and clinical parameters
of the patients are detailed in Table 10. Specifically, we found for the first time that
P C a c e ll l in e s
Gh
re
lin
mR
NA
ex
pre
ss
ion
ad
jus
ted
by
AC
TB
RW
PE
-1
Ln
CaP
22R
v1
VC
aP
PC
-3
DU
-145
0 .0 0 0 0 0
0 .0 0 0 0 5
0 .0 0 0 1 0
0 .0 0 0 1 5
P C a c e ll l in e s
In1
-gh
re
lin
mR
NA
ex
pre
ss
ion
ad
jus
ted
by
AC
TB
RW
PE
-1
Ln
CaP
22R
v1
VC
aP
PC
-3
DU
-145
0 .0 0 0 0
0 .0 0 0 5
0 .0 0 1 0
0 .0 0 1 5
0 .0 0 2 0
**
***
*
A . B .
G H S -R 1 a G H S -R 1 b
C . D .
G H S R 1 a p r im e rs P C a
Sense:TGAAAATGCTGGCTGTAGTGG
Antisense:AGGACAAAGGACACGAGGTTG
P a ir u s e d in q P C R a n a ly z e d
Sense:GTGTGGGTGTCCAGCATCTT
Antisense:ACACCACTACAGCCAGCATTTT
A lte rn a tiv e p a ir 2
Sense: AGTCTGAACACTGCCACC
Antisense:TCTTCCTTCCTGTCTTCTGTC
A lte rn a tiv e p a ir 1
E .
GH
SR
1a
mR
NA
co
py
nu
mb
er a
dju
ste
d b
y A
CT
B
VC
aP
22R
v1
PC
-3
DU
-145
0 .0 0 0 0 0 0
0 .0 0 0 0 0 2
0 .0 0 0 0 0 4
0 .0 0 0 0 0 6
GH
SR
1b
mR
NA
co
py
nu
mb
er a
dju
ste
d b
y A
CT
B
VC
aP
22R
v1
PC
-3
DU
-145
0 .0 0 0 0 0
0 .0 0 0 0 2
0 .0 0 0 0 4
0 .0 0 0 0 6
0 .0 0 0 0 8

125
acylated In1-ghrelin was detected in plasma and its levels, but not those of native-ghrelin,
are significantly higher in PCa-patients (n=30) compared to controls (n=20) (Figure
37A). Remarkably, ROC-curve analysis demonstrated that only acylated In1-ghrelin
plasmatic levels could discriminate between patients with or without PCa (p=0.05;
Figure-37B).
Figure 37: Ghrelin and In1-ghrelin levels in plasma. A. Circulating plasmatic levels of
In1-ghrelin (by ELISA, n=30) and ghrelin (by RIA, n=20) in control -healthy patients
compared with patients with PCa; B. ROC curve analysis to determine the accuracy of
plasmatic acylated In1-ghrelin or acylated ghrelin levels as diagnostic test to discriminate
between PCa patients and controls . Data represent mean ± SEM. Asterisks (*p<0.05)
indicate values that significantly differ from controls patients .
5.2.3.4. Effects of In1-ghrelin and ghrelin treatment on normal prostate cell
function.
To test the capacity of In1-ghrelin derived peptides (In1-19 and In1-40) and ghrelin to
induce functional responses in normal prostate cells, we first measured the changes in
[Ca2+]i levels in single cells derived from primary normal prostate (NP) cell cultures (from
men that underwent cystoprostatectomy for bladder cancer; Figure 38). Specifically, we
found that ghrelin and In1-ghrelin could induce a stimulatory response in [Ca2+]i in NP
cell cultures; however, the percentage of responsive cells was different upon treatment
(i.e. whereas 36.5% of NP-cells responded to In1-19 treatment, only 8.6% and 7.1%
responded to ghrelin or to In1-40, respectively) (Figure 38). Moreover, In1-ghrelin
peptides evoked a higher stimulatory response compared with ghrelin (i.e. an increase of
58% and 59% in response to In1-19 and In1-40 vs. an increase of 28% with ghrelin).
Ac
yla
ted
gh
re
lin
(p
g/m
l)
C o n tro l P C a
0
2 0
4 0
6 0
8 0
1 0 0
Ac
yla
ted
In
1-g
hre
lin
(pg
/ml)
C o n tro l P C a
0
4
8
1 2 *
A . B .
1 0 0 % - S p e c if ic ity %
Se
ns
itiv
ity
%
0 2 0 4 0 6 0 8 0 1 0 0
0
2 0
4 0
6 0
8 0
1 0 0
p = 0 .8 8
A U C = 0 .5 1
1 0 0 % - S p e c if ic ity %
Se
ns
itiv
ity
%
0 2 0 4 0 6 0 8 0 1 0 0
0
2 0
4 0
6 0
8 0
1 0 0
p = 0 .0 5
A U C = 0 .6 2
In1 -gh re lin G hre lin In1 -gh re lin G h re lin

126
Cells analyzed % cell respond % Max Error T resp Error
Ghrelin 151 8.6 128.2 10.3 8.4 1.4
In1-19 252 36.5 159.8 9.4 11.8 1
In1-40 98 7.1 159.1 16.1 12.5 2
Figure 38: Effects of ghrelin and In1-ghrelin derived peptides (In1-19 and In1-40) on
the levels of [Ca2+] i in normal prostate cell cultures Total number of cells measured,
percentage of responsive cells (% of cells resp.), percentage of maximum response (±error)
and time of maximal response (±error) are indicated. Representative profiles of changes in
[Ca2 +] i in response to ghrelin, In1 -19 and In1-40 are also depicted. All treatments were
used at 10nM (n≥3).
We next evaluated whether In1-ghrelin peptides or ghrelin could regulate other
functional parameters such as PSA expression and secretion in primary NP cell cultures.
Remarkably, In1-ghrelin treatment, but not native-ghrelin, increased PSA expression and
secretion in NP-cell cultures at 4h and 24h, being In1-19 the most effective peptide (In1-
40 only increased PSA expression/secretion at 4h with a non-significant increase in
secretion) (Figure 39A-B).
Figure 39: PSA secretion (A) and expression (B) after 4h or 24h of treatment with
ghrelin or In1-ghrelin derived peptides (10nM) . Data represent mean ± SEM. Asterisks
(*p < 0.05; **p < 0.01) indicate values that significantly differ between normal prostate
cell cultures treated with vehicle -control and ghrelin or In1 -ghrelin derived peptides.
Co
ntr
ol
Gh
relin
In1-1
9
In1-4
0
0
2 0 0
4 0 0
6 0 0
* *
PS
A s
ec
re
tio
n (
% o
f c
on
tro
l)
4 h
*
Co
ntr
ol
Gh
relin
In1-1
9
In1-4
0
0
5 0
1 0 0
1 5 0
2 0 0
* *
PS
A s
ec
re
tio
n (
% o
f c
on
tro
l)
2 4 h
Co
ntr
ol
Gh
relin
In1-1
9
In1-4
0
0
1 0 0
2 0 0
3 0 0
4 0 0
5 0 0
**
PS
A e
xp
re
ss
ion
(%
of
co
ntr
ol)
4 h
Co
ntr
ol
Gh
relin
In1-1
9
In1-4
0
0
5 0
1 0 0
1 5 0
2 0 0
*
PS
A e
xp
re
ss
ion
(%
of
co
ntr
ol)
2 4 h
A . B .
T im e (s )
Flu
ore
sc
en
ce
34
0/3
80
0 2 0 4 0 6 0 8 0 1 0 0
0 .0 4
0 .0 5
0 .0 6
0 .0 7
0 .0 8
0 .0 9
G h re lin
T im e (s )
Flu
ore
sc
en
ce
34
0/3
80
0 2 0 4 0 6 0 8 0 1 0 0
0 .0 4
0 .0 5
0 .0 6
0 .0 7
0 .0 8
In 1 -1 9
T im e (s )
Flu
ore
sc
en
ce
34
0/3
80
0 2 0 4 0 6 0 8 0 1 0 0
0 .0 7
0 .0 8
0 .0 9
0 .1 0
In 1 -4 0

127
5.2.3.5. Effects of In1-ghrelin and ghrelin treatment or overexpression on cell
viability/proliferation of normal primary prostate cell cultures and normal-
like prostate cell line (RWPE-1)
Ghrelin or In1-ghrelin derived peptides treatment did not affect cell viability in
primary NP-cell cultures or cell proliferation in normal RWPE1-cells (Figure 40).
However, In1-ghrelin, but not native-ghrelin, overexpression increased the cell viability
of primary NP-cell cultures after 48 of culture compared to mock (control)-transfected
cell cultures (Figure 40).
Figure 40: Cell viability of normal prostate cell cultures in response to ghrelin or In1-
ghrelin treatment or overexpression . Cell viability of normal prostate cell cultures
transfected with empty (mock), ghrelin or In1 -ghrelin vectors and determined after 24 -48h
(left-panel; n≥3). Cell viability of normal prostate cell cultures (middle–panel) and cell
proliferation of normal-like prostate RWPE-1 cell line (right-panel) after treatment with
vehicle-control, ghrelin or In1 -ghrelin derived peptides (In1-19 and In1-40) for 4-24h
(n≥3). Asterisk represents significant differences (*p < 0.05; ***p < 0.001) between
control and ghrelin or In1 -ghrelin treatment or transfection. Values represent mean ± SEM.
5.2.3.6. Effects of In1-ghrelin and ghrelin treatment on pathophysiological
features (cell proliferation and migration) of PCa cells
We next examined the effect of the treatment with ghrelin or In1-ghrelin peptides
on cell proliferation of different PCa cell lines. Specifically, administration of native-
ghrelin only increased cell-proliferation of 22Rv1 (at 24h) and PC-3 (24-48h) cell-lines,
whereas it did not exert any significant effect in the rest of PCa cell-lines studied (i.e.
LNCaP, VCaP or DU145; Figure 41A-B). However, In1-ghrelin peptides were able to
increase cell-proliferation in several PCa cell-lines, both androgen-dependent
Co
ntr
ol
Gh
relin
In1-1
9
In1-4
0
IGF
-1
PC
X
Co
ntr
ol
Gh
relin
In1-1
9
In1-4
0
IGF
-1
PC
X
0
5 0
1 0 0
1 5 0
Ce
ll v
iab
ilit
y (
% o
f c
on
tro
l) 2 4 h 4 8 h
*
Ce
ll p
ro
life
ra
tio
n (
% o
f c
on
tro
l)
Co
ntr
ol
Gh
relin
In1-1
9
In1-4
0
IGF
-1
PC
X
Co
ntr
ol
Gh
relin
In1-1
9
In1-4
0
IGF
-1
PC
X
0
5 0
1 0 0
1 5 0
* * *
* * *
2 4 h 4 8 h
Ce
ll v
iab
ilit
y (
% o
f c
on
tro
l)
Mo
ck
Gh
relin
In1-g
hre
lin
Mo
ck
Gh
relin
In1-g
hre
lin
0
5 0
1 0 0
1 5 0
*
O V E R E X P R E S S IO N P E P T ID E -T R E A T M E N T
N O R M A L P R IM A R Y C U L T U R E S R W P E -1

128
(22Rv1/VCaP/LNCaP) and -castration resistant cells (PC-3/DU145) (Figure 41A-B).
Indeed, the effect of In1-ghrelin peptides treatment was more consistent and pronounced
in castration-resistant PCa cell-lines (PC-3/DU145), wherein both peptides significantly
increased cell-proliferation at 24-48h (Figure 41A-B). However, in androgen-dependent
PCa cell-lines, both peptides increased proliferation at 24h in 22Rv1-cells, while only
In1-40 increased proliferation at 48h in LNCaP/VCaP-cells (Figure 41A-B). In addition,
we found that In1-ghrelin peptides, but not native-ghrelin, were able to increase migration
of PC-3 cells (Figure 41C).
Figure 41: Effects of ghrelin and In1-ghrelin on PCa pathophysiological processes .
Cell proliferation of androgen dependent (22Rv1, LnCaP and VCaP) ( A), and androgen-
independent (PC-3 and DU-145) (B) PCa cell lines cell lines after treatment with ghrelin
or In1-ghrelin derived peptides (In1-19 and In1-40) for 4-24h (10nM; n≥3). Treatment with
IGF-1 and paclitaxel (PCX) were used as positive and negative controls, respectively. Data
represent mean ± SEM. Asterisks (*p < 0.05; **p < 0.01, ***p < 0.001) indicate differences
Ce
ll p
ro
life
ra
tio
n (
% o
f c
on
tro
l)
Co
ntr
ol
Gh
relin
In1-1
9
In1-4
0
IGF
-1
PC
X
Co
ntr
ol
Gh
relin
In1-1
9
In1-4
0
IGF
-1
PC
X
0
5 0
1 0 0
1 5 0 2 4 h 4 8 h
******
***
***
*******
Co
ntr
ol
Gh
relin
In1-1
9
In1-4
0
IGF
-1
PC
X
Co
ntr
ol
Gh
relin
In1-1
9
In1-4
0
IGF
-1
PC
X
0
5 0
1 0 0
1 5 0
2 0 0
Ce
ll p
ro
life
ra
tio
n (
% o
f c
on
tro
l) 2 4 h 4 8 h
*
*
**
Ce
ll p
ro
life
ra
tio
n (
% o
f c
on
tro
l)
Co
ntr
ol
Gh
relin
In1-1
9
In1-4
0
IGF
-1
PC
X
Co
ntr
ol
Gh
relin
In1-1
9
In1-4
0
IGF
-1
PC
X
0
5 0
1 0 0
1 5 0
2 0 0
*** * *
* * *
2 4 h 4 8 h
* * *
Ce
ll p
ro
life
ra
tio
n (
% o
f c
on
tro
l)
Co
ntr
ol
Gh
relin
In1-1
9
In1-4
0
IGF
-1
PC
X
Co
ntr
ol
Gh
relin
In1-1
9
In1-4
0
IGF
-1
PC
X
0
5 0
1 0 0
1 5 0
2 0 0
******
***
***
2 4 h 4 8 h
******
***
***
Ce
ll p
ro
life
ra
tio
n (
% o
f c
on
tro
l)
Co
ntr
ol
Gh
relin
In1-1
9
In1-4
0
IGF
-1
PC
X
Co
ntr
ol
Gh
relin
In1-1
9
In1-4
0
IGF
-1
PC
X
0
5 0
1 0 0
1 5 0
2 0 0
* ** * *
* *
* *
**** * *
**
2 4 h 4 8 h
* ** *
2 2 R v 1 L n C a P V C a P
D U -1 4 5 P C -3
A .
B .
Co
ntr
ol
Gh
relin
In1-1
9
In1-4
0
0
5 0
1 0 0
1 5 0
2 0 0
* *
% w
ou
nd
he
ale
d a
re
a
(m
oc
k i
s s
et
at
10
0%
)
*
C . M o c kP C -3

129
of a specific treatment with vehicle-treated controls within each time point. C. Migration
capacity on PC-3 cells in response to ghrelin and In1-ghrelin peptides treatment determined
by wound healing assay (12h; n≥3). Representative images showing the higher migration
capacity of PC-3 cells after treatment with In1-ghrelin peptides are shown. Data represent
mean ± SEM. Asterisks (*p < 0.05; **p < 0.01) indicate differences with vehicle -treated
controls.
Finally, we demonstrated that In1-ghrelin peptides induced the phosphorylation
on ERK1/2 in PC-3 and LNCaP cell-lines (Figure 42), with almost no detectable effect
on AKT-phosphorylation
Figure 42: Phospho-ERK and phospho-AKT time-course activation after treatment
with In1-ghrelin peptides (5-30 min) in LnCaP and PC-3 cell lines . Protein levels of
phospho-ERK and phospho-AKT were adjusted by total ERK and AKT, respectively. Data
represent mean ± SEM. Asterisks (**p < 0.01) indicate differences between In1 -19 and
vehicle-treated controls, and dashes (#< 0.05; ##p < 0.01) indicate differences between
In1-40 and vehicle control treatment . Representative blots in LnCaP cell line are shown.
5.2.3.7. In1-ghrelin, but not ghrelin overexpression enhanced malignant
features (cell proliferation and migration) of PCa cells
In order to examine the putative association between In1-ghrelin overexpression
and malignant features in PCa cells, we selected one androgen-dependent (VCaP) and
one independent (PC-3) cell line. First, we confirmed by qPCR the ghrelin or In1-ghrelin
stable transfection in these cells (Figure 43A). Interestingly, we found that In1-ghrelin,
but not ghrelin overexpression increased cell proliferation in VCaP and PC-3 cell lines at
48h (Figure 43B). Moreover, In1-ghrelin, but not ghrelin overexpression increased the
migration of PC-3 cells after 12h by wound-healing assay (Figure 43C). Strikingly, the
L n C a P
T im e (m in )
ph
os
ho
ER
K/T
ota
l E
RK
ra
tio
0 5 1 0 3 0
0
2 0 0
4 0 0
6 0 0
8 0 0
1 0 0 0
In 1 -1 9
In 1 -4 0
* *
* *
* *
# #
# #
#
P C -3
T im e (m in )
ph
os
ho
ER
K/T
ota
l E
RK
ra
tio
0 5 1 0 3 0
0
2 0 0
4 0 0
6 0 0
8 0 0
1 0 0 0
In 1 -1 9
In 1 -4 0
* *
# #
L n C a P
T im e (m in )
ph
os
ho
AK
T/T
ota
l A
KT
ra
tio
0 5 1 0 3 0
0
2 0 0
4 0 0
6 0 0
8 0 0
1 0 0 0
In 1 -1 9
In 1 -4 0
P C -3
T im e (m in )
ph
os
ho
AK
T/T
ota
l A
KT
ra
tio
0 5 1 0 3 0
0
2 0 0
4 0 0
6 0 0
8 0 0
1 0 0 0
In 1 -1 9
In 1 -4 0

130
overexpression of both ghrelin and In1-ghrelin variants increased the basal
phosphorylation state of ERK, with no changes in Akt phosphorylation (Figure 43D).
Figure 43: Effect of ghrelin and In1-ghrelin overexpression on PCa-cells
pathophysiological processes. A. Validation of ghrelin and In1 -ghrelin overexpression in
PC-3-cells by qPCR technique; B. Cell proliferation of empty (mock), ghrelin and In1 -
ghrelin vectors stably transfected PC-3 and VCaP cell lines for 24-48h (n≥3); C. Cell
migration of mock, ghrelin and In1 -ghrelin stably-transfected PC-3 cell line after 12h by
wound-healing assay (n≥3). Representative images showi ng the migration capacity of PC-
3 cells transfected with mock, ghreli n and In1-ghelin are also indicated. D. phospho-ERK
and phospho-AKT basal activation in PC-3 stably transfected cells (n≥3). Blots are
representative of one cell passage with three technical replicates Data represent mean ±
SEM (n≥3). Asterisks (*p<0.05 ; ***p<0.001) indicate values that significantly differ from
the mock control cells.
5.2.3.8. In1-ghrelin overexpression enhanced the growth rate of PC-3-induced
xenografted tumors
Mo
ck
Gh
relin
In1-g
hre
lin
Mo
ck
Gh
relin
In1-g
hre
lin
0
5 0
1 0 0
1 5 0
*
Ce
ll p
ro
life
ra
tio
n (
% o
f c
on
tro
l) 2 4 h 4 8 h
Mo
ck
Gh
relin
In1-g
hre
lin
Mo
ck
Gh
relin
In1-g
hre
lin
0
5 0
1 0 0
1 5 0
*
2 4 h 4 8 h
Mo
ck
Gh
relin
In1-g
hre
lin
0
5 0
1 0 0
1 5 0
2 0 0
*
% w
ou
nd
he
ale
d a
re
a
(m
oc
k i
s s
et
at
10
0%
)
pA
KT
/to
tal
AK
T r
ati
o
(%
of
co
ntr
ol)
Co
ntr
ol
Gh
relin
In1-g
hre
lin
0
5 0
1 0 0
1 5 0
P C -3 P C -3V C a P
M o c k
G h re lin
In 1 -g h r e l in
T 0 h T 1 2 h
B .A .
pE
RK
/to
tal
ER
K r
ati
o
(%
of
co
ntr
ol)
Co
ntr
ol
Gh
relin
In1-g
hre
lin
0
1 0 0
2 0 0
3 0 0
** * *
M o c k G h r e l in In 1 -g h r e l in
p -E R K
tE R K
M o c k G h r e l in In 1 -g h r e l in
p -A K T
tA K T
D .P C -3 P C -3
In 1 -G h re lin
Mo
ck
In1-G
hre
lin
0 .0 0 0
0 .0 0 2
0 .0 0 4
0 .0 0 6
0 .0 0 8
0 .0 1 0
mR
NA
co
py
nu
mb
ers
(ad
jus
ted
by
AC
TB
)
G h r e lin
Mo
ck
Gh
relin
0 .0 0
0 .0 5
0 .1 0
0 .1 5
mR
NA
co
py
nu
mb
ers
(ad
jus
ted
by
AC
TB
)
C .

131
To further interrogate the pathophysiological effect of In1-ghrelin overexpression
in PCa, an in vivo preclinical model was generated by subcutaneously inoculating ghrelin
and In1-ghrelin stably-transfected or mock-control-transfected PC-3 cells in the flanks of
immunodeficient mice and monitored the tumor growth for 12 weeks (Figure 44).
Consistent with in vitro data, subcutaneous tumors induced by In1-ghrelin overexpression
were larger than those induced with mock or ghrelin-transfected cells (p=0.0001 in both
cases; Figure 44A). Moreover, histological-analysis revealed that tumors with stably-
transfected ghrelin and In1-ghrelin cells showed a higher necrosis-grade (Figure 44B),
without changes in percentage of mitotic cells (Figure 44C), compared to mock-induced
tumors. Interestingly, tumors with stably-transfected ghrelin cells presented higher grade
of inflammation than mock or In1-ghrelin derived tumors (Figure 44D).
Figure 44: In1-ghrelin, but not ghrelin overexpression enhances tumor growth in NUDE mice. A.
Growth rate of subcutaneously inoculated mock, ghrelin and In1-ghrelin-transfected PC-3-derived tumors
2 w e e k 4 w e e k 6 w e e k 8 w e e k 1 0 w e e k 1 2 w e e k0
1 0 0
2 0 0
3 0 0
4 0 0M o ck
In 1 -g h re lin
Tu
mo
r s
ize
(m
m2
)
**
T U M O R G R O W T H
G h re lin
* * *# # #
% o
f N
ec
ro
sis
Mo
ck
Gh
relin
In1-g
hre
lin
0
2 0
4 0
6 0
8 0
* * *
M o c k G h r e lin In 1 -g h r e lin
A .
M o c k G h r e lin In 1 -g h r e lin
N e c r o s isB .
Mo
ck
Gh
relin
In1-g
hre
lin
0
1 0
2 0
3 0
0 .0 9
nº o
f M
ito
sis
/10
fie
lds
M ito s isC .
Sc
ore
(1
-3)
Mo
ck
Gh
relin
In1-g
hre
lin
0 .0
0 .5
1 .0
1 .5
2 .0
2 .5
*
In f la m m a tio nD .

132
in nude mice (n=5) followed up to 12 weeks after inoculation. Statistical significance was evaluated by
two-way ANOVA (***p<0.001 indicate differences between In1-ghrelin and mock, while #p<0.001
indicates differences between In1-ghrelin and ghrelin stably transfected cells). B. Percentage of necrosis in
xenografted PC-3-derived tumors. Representative images of hematoxylin–eosin (H/E) staining are shown
below. C. Number of mitosis/10 fields in xenografted PC-3-derived tumors. D. Grade of inflammation in
xenografted PC-3-derived tumors measured as score 1-3. Data represent mean ± SEM (n≥3). Asterisks
(**p<0.01; *p<0.05) indicate values that significantly differ from the mock control cells.
5.2.3.9. In1-ghrelin overexpression evoked a profound dysregulation of key
genes involved in PCa development and progression.
In order to discover the molecular changes induced by In1-ghrelin overexpression
in PCa, we performed a qPCR array comprising 84 key genes involved in PCa
development and progression (For details of this array see Table 11 at the end of the
Results section). Specifically, we found 18 genes whose expression was altered more than
1.5-fold in In1-ghrelin stably-transfected PC-3-cells (13 upregulated genes: CAV1,
CAV2, CDKN2A, DDX11, DLC1, FASN, GCA, IGFBP5, LOXL1, RASSF, SOX4,
TFPI2 and USP5; and 5 downregulated genes: APC, GNRH1, RARB, SFRP1 and SHBG;
Figure-45A), as well as 17 genes whose expression was altered in native-ghrelin stably-
transfected PC-3-cells (7 upregulated: CASP3, CAV1, CAV2, CCND2, GCA, IL6 and
VEGFA; and, 10 downregulated: CCNA1, CCND1, CDKN2A, DLC1, LOXL1, NRIP1,
SFRP1, SOX4, TIMP2 and ZNF185; Figure 45A).
Next, we used qPCR analysis using cDNA from different passages of native-
ghrelin and In1-ghrelin stably-transfected PC-3-cells and different sets of primers (for
details of the specific primers see Table 12 at the end of the Results section) to validate
the results of the array. Thus, we observed that CAV1, CAV2, CDKN2A, IGFBP5 and
LOXL1 were upregulated while APC, NRIP1 and SFRP1 were downregulated in In1-
ghrelin stably-transfected PC-3-cells (Figure 45B). Similarly, we confirmed that IL6 was
upregulated while CDKN2A, IGFBP5, LOXL1, NRIP1, SFRP1, SOX4 and ZNF185
were downregulated in native-ghrelin stably-transfected PC-3 (Figure 45B).
Additionally, we confirmed some of these changes at the protein level [i.e. up-regulation
of IGFBP5 and LOXL1 and downregulation of NRIP1 and SFRP1 in In1-ghrelin, and
upregulation of IL6 and downregulation of CDKN2A, IGFBP5, LOXL1, NRIP1, SFRP1
and ZNF185 in native-ghrelin stably-transfected PC-3-cells (Figure 45C)]. Remarkably,
some of the changes observed in the qPCR-array, real-time qPCR, and/or western-blot
analyses, such as those observed for CAV1, LOXL1, IL-6 and SFRP1 were also further

133
validated in the xenografted-tumors (Figure-45D). Interestingly, as mentioned before, we
also found a higher inflammatory cell-infiltration in the native-ghrelin, but not In1-
ghrelin, stably-transfected PC-3-tumors (Figure 44D) which, together with the increase
in IL-6 expression (Figure 45B-D), suggest a role of native-ghrelin in tumor
inflammation.
Interestingly, some of these changes in mRNA and protein expression were
similar in the In1-ghrelin and native-ghrelin stably-transfected PC-3-cells (e.g. SFRP1
and NRIP1 downregulation; Figure 45B-D); but, most noteworthy, some of the observed
changes were regulated oppositely in both PCa cell-models (i.e. downregulation in native-
ghrelin and up-regulation in In1-ghrelin stably-transfected PC-3-cells of LOXL1 and
IGFBP5; Figure 45B-D). Therefore, these findings are reminiscent of the similar vs.
disparate effects observed previously with native-ghrelin and In1-ghrelin in PCa-cells,
respectively.

134
Figure 45: Gene and protein expression effects of ghrelin and I n1-ghrelin
overexpression in PC-3-cells and derived xenografted tumors. A. Results from the RT 2
Prostate-Cancer PCR-Array, which evaluates the expression of 84 genes involved in PCa
development and progression performed in ghrelin and In1 -ghrelin-stably transfected PC-
3-cells compared with control -mock PC-3-cells. The tables indicate those genes whose
expression change ≥ 1.5 folds; B. Validation by qPCR of genes dysregulated in the RT 2
Prostate-Cancer PCR Array using different cell preparations (n≥3) and new sets of primers.
C. Validation by Western blot of the changes obs erved in the previous analysis. D. CAV1,
LOXL1, SFRP1 and IL-6 mRNA expression levels in mock, ghrelin and In1-ghrelin transfected PC-3-
Re
lati
ve
mR
NA
ex
pre
ss
ion
(%
of
co
ntr
ol)
Mo
ck
Gh
relin
In1-g
hre
lin
0
5 0
1 0 0
1 5 0
* * *
Mo
ck
Gh
relin
In1-g
hre
lin
0
5 0
1 0 0
1 5 0
2 0 0
2 5 0
*
Mo
ck
Gh
relin
In1-g
hre
lin
0
5 0
1 0 0
1 5 0
2 0 0
2 5 0 0 .0 6
Mo
ck
Gh
relin
In1-g
hre
lin
0
5 0
1 0 0
1 5 0
*
Mo
ck
Gh
relin
In1-g
hre
lin
0
5 0
1 0 0
1 5 0
* * * * * *
Mo
ck
Gh
relin
In1-g
hre
lin
0
5 0
1 0 0
1 5 0
* * * **
Mo
ck
Gh
relin
In1-g
hre
lin
0
2 0 0
4 0 0
6 0 0
*
Mo
ck
Gh
relin
In1-g
hre
lin
0
5 0
1 0 0
1 5 0
* * *
A .
B .
Mo
ck
Gh
relin
In1-g
hre
lin
0
1 0 0
2 0 0
3 0 0
4 0 0
5 0 0
* * *
0 .0 7
Mo
ck
Gh
relin
In1-g
hre
lin
0
5 0 0
1 0 0 0
1 5 0 0
* * *
**
Mo
ck
Gh
relin
In1-g
hre
lin
0
1 0 0
2 0 0
3 0 0
4 0 0
5 0 0
* * *
**
A P C C A V 1 C A V 2 IL -6S O X 4 Z N F 1 8 5
S F R P 1 N R IP 1 C D K N 2 A IG F B P 5 L O X L 1
NATIVE GHRELIN
Gene Fold Gene Fold
CASP3 1,67 CCNA1 -2,77
CAV1 1,66 CCND1 -1,66
CAV2 1,65 CDKN2A -10,2
CCND2 3,25 DLC1 -1,51
GCA 2,28 LOXL1 -5,9
IL-6 1,84 NRIP1 -4,26
VEGFA 1,6 SFRP1 -24,42
SOX4 -4,47
TIMP2 -1,58
ZNF185 -6,23
IN1-GHRELIN
Gene Fold Gene Fold
CAV1 1,83 APC -2,02
CAV2 1,7 GNRH1 -1,85
CDKN2A 7,75 RARB -1,6
DDX11 1,76 SFRP1 -5,16
DLC1 3,17 SHGG -1,64
FASN 1,87
GCA 2,65
IGFBP5 5,01
LOXL1 7,28
RASFF1 1,98
SOX4 2,5
TFIP2 2,88
USP5 1,61
R T 2 P C R P R O S T A T E C A N C E R A R R A Y
Mo
ck
Gh
relin
In1-g
hre
lin
0
5 0
1 0 0
1 5 0
*
*
L O X L 1
C .
C D K N 2A
M o c k In 1 -g h r e l in G h re lin
L O X L 1
IG FB P5
IL -6
N RIP1
S FR P1
Z N F 1 85
BTUB
Mo
ck
Gh
relin
In1-g
hre
lin
0
5 0
1 0 0
1 5 0
2 0 0
2 5 0
0 .0 5 6
Z N F 1 8 5
Mo
ck
Gh
relin
In1-g
hre
lin
0
5 0
1 0 0
1 5 0
**
C D K N 2 A
Mo
ck
Gh
relin
In1-g
hre
lin
0
5 0
1 0 0
1 5 0
*0 .0 8
S F R P 1
Mo
ck
Gh
relin
In1-g
hre
lin
0
5 0
1 0 0
1 5 0
* * *
*
IG F B P 5
Mo
ck
Gh
relin
In1-g
hre
lin
0
5 0
1 0 0
1 5 0
*
IL 6
Mo
ck
Gh
relin
In1-g
hre
lin
0
5 0
1 0 0
1 5 0
* * *
*
N R IP 1
Pro
te
in l
ev
els
ex
pre
ss
ed
as
pe
rc
en
t o
f c
on
tro
l
(se
t a
t 1
00
%)
Pro
te
in l
ev
els
ex
pre
ss
ed
as
pe
rc
en
t o
f c
on
tro
l
(s
et
at
10
0%
)
D . C A V 1 L O X L 1 IL -6S F R P 1
Mo
ck
Gh
relin
In1-g
hre
lin
0
5 0
1 0 0
1 5 0
2 0 0
2 5 0 *
Mo
ck
Gh
relin
In1-g
hre
lin
0
5 0
1 0 0
1 5 0
2 0 0
2 5 0
*
* *
Mo
ck
Gh
relin
In1-g
hre
lin
0
5 0
1 0 0
1 5 0
* *Re
lati
ve
mR
NA
ex
pre
ss
ion
(% o
f c
on
tro
l)
Mo
ck
Gh
relin
In1-g
hre
lin
0
5 0 0
1 0 0 0
1 5 0 0
2 0 0 0
*
*

135
derived xenografted tumors. Results were normalized with ACTB. All preparations were repeated at least
three times (n≥3). Values represent mean (±SEM). Asterisks (*p<0.05; **p<0.01;
***p<0.001) indicate values that significantly differ from the mock control.
It is also worth noting that In1-ghrelin stably-transfected PC-3-cells showed an
overall increase in the expression of proangiogenic-factors (i.e. ANG1/ANG2/HIF1) as
compared to mock- and native-ghrelin stably-transfected PC-3 cells (Figure 46A); being
these differences only statistically significant for ANG1). Similar results were observed
on the In1-ghrelin stably-transfected PC-3 derived xenografted-tumors (Figure 46B).
Figure 46: A. Expression of angiogenic factors in In1-ghrelin-stably transfected PC-3-cells and ghrelin-
stably transfected PC-3 cells compared with control-mock PC-3-cells; B. Expression of angiogenic factors
in xenografted tumors of stably transfected-PC-3 cells. Results were normalized with ACTB. All
preparations were repeated at least three times (n≥3). Values represent mean (±SEM). Asterisks (*p<0.05;
**p<0.01) indicate values that significantly differ from the mock control.
5.2.3.10. In1-ghrelin silencing decreased cell proliferation and PSA secretion
Downregulation of In1-ghrelin expression using two specific In1-ghrelin siRNAs
(validation of both siRNAs is shown in Figure-47A), decreased cell-proliferation in PC-
A .
B .
Mo
ck
Gh
relin
In1-g
hre
lin
0
2 0 0
4 0 0
6 0 0
8 0 0
1 0 0 0
* * *
Re
lati
ve
AN
G1
mR
NA
ex
pre
ss
ion
(%
of
co
ntr
ol)
A N G 1
Mo
ck
Gh
relin
In1-g
hre
lin
0
1 0 0
2 0 0
3 0 0R
ela
tiv
e A
NG
2 m
RN
A
ex
pre
ss
ion
(%
of
co
ntr
ol)
Mo
ck
Gh
relin
In1-g
hre
lin
0
5 0
1 0 0
1 5 0
Re
lati
ve
HIF
1 m
RN
A
ex
pre
ss
ion
(%
of
co
ntr
ol)
A N G 2 H IF 1
Re
lati
ve
AN
G1
mR
NA
ex
pre
ss
ion
Mo
ck
Gh
relin
In1-g
hre
lin
0
1 0 0
2 0 0
3 0 0
4 0 0
5 0 0
**
Mo
ck
Gh
relin
In1-g
hre
lin
0
5 0
1 0 0
1 5 0
2 0 0
2 5 0
0 .0 5 9
Re
lati
ve
AN
G1
mR
NA
ex
pre
ss
ion
Mo
ck
Gh
relin
In1-g
hre
lin
0
5 0
1 0 0
1 5 0
2 0 0
0 .0 7
Re
lati
ve
HIF
1 m
RN
A
ex
pre
ss
ion
A N G 1 A N G 2 H IF 1

136
3 and LnCaP cell lines at 24h and/or 48h [Figure-47B; siRNA-2 tended to decrease cell
proliferation at 48h (p=0.06) but this difference did not reach statistical significance].
Moreover, In1-ghrelin silencing significantly decreased PSA secretion in LnCaP cell line
using both siRNAs (Figure-47C).
Figure 47: Effect of In1-ghrelin silencing on cell proliferation and PSA secretion. A. Validation by
qPCR of In1-ghrelin silencing in PC-3 and LnCaP cells; expression levels were adjusted by a normalization
factor (NF) calculated from ACTH and GAPDH expression levels. B. Proliferation rates of In1-ghrelin-
silenced PC-3 and LnCaP cells compared with control scramble-transfected cells; C. PSA secretion of In1-
ghrelin-silenced LNCaP cells compared with control scramble-transfected cells. All experiments were
repeated at least three times (n≥3). Data represent mean ± SEM. Asterisks (*p<0.05; **p<0.01;
***p<0.001) indicate values that significantly differ from the scramble-control.
A .
mR
NA
co
py
nu
mb
er a
dju
ste
d b
y N
F
(% o
f c
on
tro
l)
0
5 0
1 0 0
1 5 0
* *
S c r a mb le
s iRN
A (1
)
In1 -g h r e l in
s iRN
A (2
)
In1 -g h r e l in
0
5 0
1 0 0
1 5 0
mR
NA
co
py
nu
mb
er a
dju
ste
d b
y N
F
(% o
f c
on
tro
l)
* * *
*
S c r a mb le
s iRN
A (1
)
In1 -g h r e l in
s iRN
A (2
)
In1 -g h r e l in
Scra
mb
le
siR
NA
(1)
In1-g
hre
lin
siR
NA
(2)
In1-g
hre
lin
Scra
mb
le
siR
NA
(1)
In1-g
hre
lin
siR
NA
(2)
In1-g
hre
lin
0
5 0
1 0 0
1 5 0
* * ** * *
Ce
ll p
ro
life
ra
tio
n (
% o
f c
on
tro
l)
2 4 h 4 8 h
**
Scra
mb
le
siR
NA
(1)
In1-g
hre
lin
siR
NA
(2)
In1-g
hre
lin
Scra
mb
le
siR
NA
(1)
In1-g
hre
lin
siR
NA
(2)
In1-g
hre
lin
0
5 0
1 0 0
1 5 0
** *
Ce
ll p
ro
life
ra
tio
n (
% o
f c
on
tro
l)
0 .0 6P
SA
se
cre
tio
n (
% o
f c
on
tro
l)
Scra
mb
le
siR
NA
(1)
In1-g
hre
lin
siR
NA
(2)
In1-g
hre
lin
0
5 0
1 0 0
1 5 0
* *
B . C .
P C 3
P C 3
L n C a P
L n C a P L n C a P

137
RESULTS: APPENDIX
Table 11. Prostate cancer finder RT2 Profiler PCR array data. In blue: gene
expression increased ≥1,5; in red: gene expression decreased ≥1.5; in orange: gene
expression increased 2 or more folds; in green: gene expression decreased 2 or more folds.
2^(-Avg.(Delta(Ct)) Fold change
Gene symbol Official full name Mock In1-
ghrelin Ghrelin sst5TMD4
In1-
ghrelin Ghrelin sst5TMD4
ACACA Acetyl-CoA
carboxylase alpha 0.0220 0.0179 0.0196 0.0228 -1.23 -1.13 1.04
AKT1
V-akt murine
thymoma viral
oncogene homolog 1
0.0260 0.0324 0.0250 0.0323 1.24 -1.04 1.24
APC Adenomatous
polyposis coli 0.0011 0.0005 0.0009 0.0005 -2.02 -1.22 -2.19
AR Androgen receptor 0.0000 0.0002 0.0001 0.0001 # # #
ARNTL
Aryl hydrocarbon
receptor nuclear
translocator-like
0.0040 0.0028 0.0054 0.0045 -1.45 1.34 1.13
BCL2 B-cell
CLL/lymphoma 2 0.0012 0.0014 0.0012 0.0015 1.13 1 1.25
CAMKK1
Calcium/calmodulin-
dependent protein
kinase kinase 1,
alpha
0.0009 0.0006 0.0007 0.0012 -1.48 -1.17 1.34
CAMSAP1
Calmodulin
regulated spectrin-
associated protein 1
0.0153 0.0148 0.0140 0.0144 -1.03 -1.09 -1.06
CASP3
Caspase 3,
apoptosis-related
cysteine peptidase
0.0191 0.0177 0.0318 0.0329 -1.08 1.67 1.73
CAV1 Caveolin 1, caveolae
protein, 22kDa 0.0397 0.0728 0.0659 0.0706 1.83 1.66 1.78
CAV2 Caveolin 2 0.0058 0.0099 0.0096 0.0121 1.7 1.65 2.07
CCNA1 Cyclin A1 0.0001 0.0002 0.0001 0.0001 1.72 -2.77 1
CCND1 Cyclin D1 0.0273 0.0252 0.0165 0.0204 -1.08 -1.66 -1.34
CCND2 Cyclin D2 0.0004 0.0003 0.0013 0.0006 -1.33 3.25 1.61
CDH1
Cadherin 1, type 1,
E-cadherin
(epithelial)
0.0000 0.0002 0.0001 0.0001 # # #
CDKN2A Cyclin-dependent
kinase inhibitor 2A 0.0024 0.0186 0.0002 0.0008 7.75 -10.2 -2.91
CLN3
Ceroid-
lipofuscinosis,
neuronal 3
0.0083 0.0089 0.0073 0.0077 1.07 -1.13 -1.07
CREB1
CAMP responsive
element binding
protein 1
0.0096 0.0127 0.0134 0.0127 1.32 1.39 1.33
DAXX Death-domain
associated protein 0.0131 0.0186 0.0148 0.0185 1.42 1.13 1.41
DDX11
DEAD/H (Asp-Glu-
Ala-Asp/His) box
polypeptide 11
0.0012 0.0022 0.0014 0.0019 1.76 1.12 1.54

138
DKK3 Dickkopf homolog 3 0.0000 0.0002 0.0001 0.0001 # # #
DLC1 Deleted in liver
cancer 1 0.0001 0.0002 0.0001 0.0001 # # #
ECT2
Epithelial cell
transforming
sequence 2 oncogene
0.0269 0.0404 0.0346 0.0406 1.5 1.28 1.51
EDNRB Endothelin receptor
type B 0.0000 0.0002 0.0001 0.0001 # # #
EGFR Epidermal growth
factor receptor 0.0236 0.0198 0.0239 0.0253 -1.19 1.01 1.07
EGR3 Early growth
response 3 0.0052 0.0049 0.0066 0.0040 -1.05 1.27 -1.29
ERG
V-ets
erythroblastosis
virus E26 oncogene
homolog (avian)
0.0000 0.0002 0.0001 0.0001 # # #
ETV1 Ets variant 1 0.0131 0.0093 0.0103 0.0106 -1.41 -1.27 -1.23
FASN Fatty acid synthase 0.0293 0.0529 0.0228 0.0426 1.81 -1.28 1.45
FOXO1 Forkhead box O1 0.0004 0.0003 0.0003 0.0002 -1.5 -1.48 -1.75
GCA Grancalcin 0.0010 0.0026 0.0023 0.0025 2.65 2.28 2.57
GNRH1 Gonadotropin-
releasing hormone 1 0.0013 0.0007 0.0013 0.0007 -1.85 1.04 -1.79
GPX3 Glutathione
peroxidase 3 0.0000 0.0002 0.0001 0.0001 # # #
GSTP1 Glutathione S-
transferase pi 1 0.7505 0.7320 0.8100 0.6625 -1.03 1.08 -1.13
HAL Histidine ammonia-
lyase 0.0000 0.0002 0.0001 0.0001 # # #
HMGCR
3-hydroxy-3-
methylglutaryl-CoA
reductase
0.0309 0.0278 0.0231 0.0266 -1.11 -1.34 -1.17
IGF1 Insulin-like growth
factor 1 0.0000 0.0002 0.0001 0.0001 # # #
IGFBP5
Insulin-like growth
factor binding
protein 5
0.0001 0.0003 0.0001 0.0001 5.01 -1.1 -2.14
IL6 Interleukin 6 0.0005 0.0004 0.0008 0.0003 -1.19 1.84 -1.39
KLHL13 Kelch-like 13 0.0008 0.0007 0.0004 0.0004 -1.11 -1.84 -1.88
KLK3 Kallikrein-related
peptidase 3 0.0000 0.0002 0.0001 0.0001 # # #
LGALS4 Lectin, galactoside-
binding, soluble, 4 0.0001 0.0002 0.0002 0.0001 2.12 1.39 -1.19
LOXL1 Lysyl oxidase-like 1 0.0003 0.0022 0.0001 0.0001 7.28 -5.9 -2.93
MAPK1 Mitogen-activated
protein kinase 1 0.0392 0.0396 0.0392 0.0486 1.01 -1 1.24
MAX MYC associated
factor X 0.0196 0.0195 0.0183 0.0188 -1 -1.07 1.04
MGMT
O-6-methylguanine-
DNA
methyltransferase
0.0146 0.0161 0.0147 0.0168 1.1 1.01 1.15

139
MKI67
Antigen identified by
monoclonal antibody
Ki-67
0.0619 0.0629 0.0546 0.0510 1.02 -1.13 -1.21
MSX1 Msh homeobox 1 0.0019 0.0025 0.0027 0.0024 1.31 1.4 1.25
MTO1
Mitochondrial
translation
optimization 1
homolog
0.0121 0.0110 0.0154 0.0135 -1.1 1.27 1.12
NDRG3 NDRG family
member 3 0.0155 0.0138 0.0124 0.0137 -1.12 -1.25 -1.13
NFKB1
Nuclear factor of
kappa light
polypeptide gene
enhancer in B-cells
1
0.0077 0.0071 0.0078 0.0080 -1.08 1.01 1.04
NKX3-1 NK3 homeobox 1 0.0018 0.0017 0.0024 0.0018 -1.05 1.29 -1.02
NRIP1 Nuclear receptor
interacting protein 1 0.0039 0.0031 0.0009 0.0005 -1.26 -4.26 -7.21
PDLIM4 PDZ and LIM
domain 4 0.0062 0.0092 0.0073 0.0102 1.5 1.18 1.66
PDPK1
3-phosphoinositide
dependent protein
kinase-1
0.0154 0.0160 0.0159 0.0118 1.04 1.04 -1.3
PES1 Pescadillo homolog
1 0.0164 0.0187 0.0165 0.0197 1.14 1.01 1.21
PPP2R1B
Protein phosphatase
2, regulatory subunit
A, beta
0.0145 0.0153 0.0143 0.0157 1.05 -1.01 1.08
PRKAB1
Protein kinase,
AMP-activated, beta
1 non-catalytic
subunit
0.0051 0.0048 0.0052 0.0066 -1.07 1.01 1.28
PTEN Phosphatase and
tensin homolog 0.0196 0.0115 0.0200 0.0160 -1.7 1.02 -1.22
PTGS1
Prostaglandin-
endoperoxide
synthase 1
0.0000 0.0002 0.0001 0.0001 # # #
PTGS2
Prostaglandin-
endoperoxide
synthase 2
0.0000 0.0002 0.0001 0.0001 # # #
RARB Retinoic acid
receptor, beta 0.0005 0.0003 0.0004 0.0002 -1.6 -1.35 -2.79
RASSF1
Ras association
(RalGDS/AF-6)
domain family
member 1
0.0006 0.0011 0.0008 0.0013 1.98 1.43 2.2
RBM39 RNA binding motif
protein 39 0.0610 0.0497 0.0574 0.0645 -1.23 -1.06 1.06
SCAF11 SR-related CTD-
associated factor 11 0.0227 0.0182 0.0184 0.0175 -1.24 -1.23 -1.29
SEP7 Septin 7 0.1027 0.0842 0.0900 0.1013 -1.22 -1.14 -1.01
SFRP1 Secreted frizzled-
related protein 1 0.0013 0.0002 0.0001 0.0001 -5.16 -24.42 -9.78
SHBG Sex hormone-
binding globulin 0.0004 0.0002 0.0003 0.0003 -1.64 -1.18 -1.53

140
SLC5A8
Solute carrier family
5 (iodide
transporter),
member 8
0.0000 0.0002 0.0001 0.0001 # # #
SOCS3 Suppressor of
cytokine signaling 3 0.0006 0.0005 0.0006 0.0010 -1.11 1.08 1.79
SOX4
SRY (sex
determining region
Y)-box 4
0.0002 0.0006 0.0001 0.0001 2.5 -4.47 -1.84
SREBF1
Sterol regulatory
element binding
transcription factor
1
0.0056 0.0080 0.0040 0.0078 1.43 -1.41 1.4
STK11 Serine/threonine
kinase 11 0.0026 0.0019 0.0032 0.0039 -1.4 1.2 1.47
SUPT7L Suppressor of Ty 7
(S. cerevisiae)-like 0.0258 0.0194 0.0258 0.0201 -1.33 1 1.28
TFPI2 Tissue factor
pathway inhibitor 2 0.0029 0.0083 0.0021 0.0021 2.88 -1.39 -1.37
TGFB1I1
Transforming
growth factor beta 1
induced transcript 1
0.0012 0.0012 0.0012 0.0020 -1.05 1 1.67
TIMP2
TIMP
metallopeptidase
inhibitor 2
0.1255 0.0947 0.0794 0.0789 -1.33 -1.58 -1.59
TIMP3
TIMP
metallopeptidase
inhibitor 3
0.0001 0.0002 0.0001 0.0001 # # #
TMPRSS2 Transmembrane
protease, serine 2 0.0000 0.0002 0.0001 0.0001 # # #
TNFRSF10D
Tumor necrosis
factor receptor
superfamily, member
10d, decoy with
truncated death
domain
0.0075 0.0067 0.0071 0.0088 -1.12 -1.06 1.18
TP53 Tumor protein p53 0.0894 0.0890 0.0999 0.1212 -1 1.12 1.36
USP5
Ubiquitin specific
peptidase 5
(isopeptidase T)
0.0099 0.0158 0.0099 0.0139 1.61 1.01 1.4
VEGFA Vascular endothelial
growth factor A 0.0273 0.0259 0.0438 0.0366 -1.05 1.6 1.34
ZNF185 Zinc finger protein
185 (LIM domain) 0.0009 0.0013 0.0001 0.0005 1.41 -6.23 -1.78

141
Table 12. Primers Sequences, product sizes obtained and GeneBank accession numbers
of the primers designed and validated in our laboratory.
Template GenBank
Accession Sense Antisense
Product
length
(bp)
ACTB NM_001101 ACTCTTCCAGCCTTCCTTCCT CAGTGATCTCCTTCTGCATCCT 176
ANG1 NM_001146.3 GACAGATGTTGAGACCCAGGTA TCTCTAGCTTGTAGGTGGATAATGAA 89
ANG2 NM_001147.2 GGATGGAGACAACGACAAATG GGACCACATGCATCAAACC 78
APC NM_000038 GAACCAAGGTGGAAATGGTG AAAGCTGGATGAGGAGAGGAA 153
AR NM_000044.3 GCAGGAAGCAGTATCCGAAG GTTGTCAGAAATGGTCGAAGTG 112
CAV1 NM_001753 CGACCCTAAACACCTCAACG CAGCAAGCGGTAAAACCAGT 148
CAV2 NM_001233 ACGACTCCTACAGCCACCAC CAGCTTGAGATGCGAGTTGA 107
CDKN2A NM_000077 ACCAGAGGCAGTAACCATGC ACCTTCGGTGACTGATGATCTAA 121
DAXX NM_001350 AAGCCTCCTTGGATTCTGGT CTGCTGCTGCTTCTTCCTCT 237
GAPDH NM_002046.5 AATCCCATCACCATCTTCCA AATCCCATCACCATCTTCCA 122
GCA NM_012198 ACAGCCAGTGCCAGAAACA TCCACTTCACCATCCTGTCC 138
GHRL NM_016362.3 CACCAGAGAGTCCAGCAGAGA CCGGACTTCCAGTTCATC 215
GHSR-1a NM_198407.2 TGAAAATGCTGGCTGTAGTGG AGGACAAAGGACACGAGGTTG 168
GHSR-1b NM_004122.2 GGACCAGAACCACAAGCAAA AGAGAGAAGGGAGAAGGCACA 107
HIF1A NM_001530.3 TTAGATTTTGGCAGCAACGAC GGGTGAGGGGAGCATTACA 87
IGFBP5 NM_000599 TGTGACCGCAAAGGATTCTAC AAAGTCCCCGTCAACGTACTC 129
IN1-GHRL GU942497.1 TCTGGGCTTCAGTCTTCTCC GCTTGGCTGGTGGCTTCTT 132
IL6 NM_000600 GGCAGAAAACAACCTGAACCT CTCAAACTCCAAAAGACCAGTGA 115
KLK3 NM_001030047 GTGCTTGTGGCCTCTCGT CAGCAAGATCACGCTTTTGT 108
LOXL1 NM_005576 CATTACCACAGCATGGACGA GCCCTGGGTATGAGAGGTG 159
MBOAT4 NM_001100916.1 TTGCTCTTTTTCCCTGCTCTC ACTGCCACGTTTAGGCATTCT 161
NRIP1 NM_003489 TCACAGGTCACAGCCAAAGA GGGCGAGAAGCATTATTTCC 110
PCA3 NR_015342.2 CAGAGGGGAGATTTGTGTGG TGTCATCTTGCTGTTTCTAGTGATG 172
RARB NM_000965 TGCCTGGACATCCTGATTCT GCATTGTGCATCTGAGTTCG 107
SFRP1 NM_003012 CATGCAGTTCTTCGGCTTCT GTTGTCACAGGGAGGACACAC 145
SST1 NM_001049 CACATTTCTCATGGGCTTCCT ACAAACACCATCACCACCATC 165
SST2 NM_001050 GGCATGTTTGACTTTGTGGTG GTCTCATTCAGCCGGGATTT 185
SST5 NM_001053.3 CTGGTGTTTGCGGGATGTT GAAGCTCTGGCGGAAGTTGT 183
sst5TMD4 DQ448304 TACCTGCAACCGTCTGCC AGCCTGGGCCTTTCTCCT 98
TGF-β NM_000660.5 CACGTGGAGCTGTACCAGAAA CAACTCCGGTGACATCAAAAG 112
VEGFA NM_001171623.1 TTAAACGAACGTACTTGCAGATG GAGAGATCTGGTTCCCGAAA 93
ZNF185 NM_007150 CTGGCTACAAGATGACCACTGA CCTCTGACCTCCGTTTCTGTT 144

142

143
DISCUSSION

144

145
6. DISCUSSION
6.1. The truncated somatostatin receptor, sst5TMD4, is
overexpressed in prostate cancer, where it increases malignant
features by altering key signaling pathways and tumor
suppressors/oncogenes
Substantial progress in PCa medical treatment has been possible in recent years,
owing to the emergence of novel therapies [246]. However, the available strategies are
still clearly limited, emphasizing the critical need to identify new molecular biomarkers
for PCa, to better diagnose, predict their prognosis and tumor behavior, and to provide
tools to develop novel therapeutic strategies. SST/ssts are involved in body homeostasis
regulation through inhibition of multiple cellular process, such as hormone secretion and
cell proliferation, migration, and invasion [169]. In PCa, ssts are expressed and are
capable of mediating such functions [189]; however, some initial, but limited, studies
using SSAs reported no benefits in overall survival in PCa patients [205, 247], and the
mechanistic reasons of this clinical failure are still unknown. Given that aberrant
alternative splicing is one emerging cancer hallmark [132, 248], and that our group has
demonstrated the presence and relevant pathological function of the spliced sst5TMD4
variant in other cancer types [183, 185, 187, 188, 249], we hypothesized that sst5TMD4
could be present and play a role in the development and progression of PCa or in the
response to SSAs in PCa.
Our results demonstrated, for the first time, that sst5TMD4, but not sst2 or sst5
(the two main pharmacological targets of SSA), is overexpressed (mRNA- and protein-
level) in PCa samples compared with non-tumoral adjacent regions (N-TAR) or normal
prostates (NPs) tissues, and, importantly, that sst5TMD4 is strikingly elevated in
patients with higher Gleason-Score, and in those with metastasis. Indeed, ROC curve
analysis revealed that only sst5TMD4 expression (but not sst2 or sst5) could discriminate
between patients that developed metastasis compared to those that did not develop them.
These results suggest that sst5TMD4 might represent a new biomarker of metastatic

146
risk and exert a functional role in PCa pathology. These observations compare
favorably with previous reports indicating that sst5TMD4 expression is consistently
increased in several endocrine-related tumors compared with control-tissues, including
neuroendocrine tumors (NETs) [188], breast [185] and pituitary [183] tumors. Indeed,
sst5TMD4 association with poor prognosis markers and/or aggressiveness is a common
observation in other tumors since sst5TMD4-expression was strongly correlated with
lymph-node metastasis in breast cancers [185], and was also higher in invasive pituitary
adenomas [183] and in lymph-node metastases of NETs compared with their
corresponding primary tumors [188]. Accordingly, our present results further
demonstrate that sst5TMD4 is the sst variant predominantly expressed in PCa-tissues
(compared with sst2 and sst5), both in terms of number of PCa samples and expression
levels (i.e. 2.2-fold higher). Thus, it is not unreasonable to suggest that sst5TMD4
overexpression might be a common cellular/molecular signature across various
endocrine-related tumors.
Genomic approaches implemented herein demonstrated the existence of two
SST5 gene SNPs strongly associated to PCa-risk and sst5TMD4 expression.
Specifically, rs197055 AA and rs12599155 TT SNPs were only observed in PCa-samples
(but not in NP-samples), wherein they correlated with higher sst5TMD4/sst5 ratio,
suggesting a putative relationship of these SNPs with PCa pathogenesis. Additionally, we
demonstrate, for the first time, that sst5TMD4-stably-transfected PC-3 cells and
transiently-transfected LnCaP cells were not responsive to SSA-treatment
(octreotide/pasireotide), while PC-3 and LnCaP cells without sst5TMD4 showed a clear
change of [Ca2+]i in response to these SSAs. This finding, together with the positive
association found between expression levels of sst2/sst5/sst5TMD4 in PCa-tissues, might
suggest a potential functional association between sst2/sst5/sst5TMD4 in PCa, and that
the high sst5TMD4-expression in PCa-cells could help, in part, to explain the
inefficiency of SSA-therapy in the scarce and limited PCa clinical trials implemented
hitherto. Indeed, the downregulation of tumor suppressor pathways (CDKN2A,
SFRP1/NRIP1/APC) elicited by sst5TMD4 overexpression (as will be discussed below)
is coherent with the inhibitory role of sst5TMD4 on the negative signals normally initiated
by SSAs through somatostatin receptors [250, 251]. Obviously, further work will be
required to evaluate if the presence of sst5TMD4 might interfere with the effect of SSA

147
and/or other drugs currently used for the treatment of PCa (i.e. abiraterone or
enzalutamide).
Based on these previous results, we further explored the functional role of
sst5TMD4 in PCa-cell models. sst5TMD4 overexpression evoked increased
proliferation and migration in PCa-cells, whereas, in contrast, sst5TMD4 silencing
decreased proliferation and migration in PC3-cells. This demonstrates that this splice
variant is functionally active in PCa-cells and that its presence is directly associated with
aggressiveness features. In support of this notion, sst5TMD4 overexpression promoted
tumor growth in an in vivo preclinical-model, wherein it increased tumor necrosis,
likely due to higher tumor-volume. These results support and extend previous data
showing that sst5TMD4 also influences aggressiveness features in other cancer cell
models [i.e. breast (MCF7-cells); pancreas (BON1-cells) [185, 188]], suggesting that
sst5TMD4 overexpression might be a common signature across different cancer types,
which is directly associated to their aggressiveness features.
To investigate the signaling-pathways and mediators involved on sst5TMD4
actions in PCa cells, we used PC-3 cells as a suitable model. This demonstrated that
sst5TMD4 likely exerts its oncogenic functions through modulation of several
pathways, including an increased activation (basal-phosphorylation) of MAPK-signaling
(ERK/JNK) pathways, which have been shown to cooperate in other tumoral pathologies
to promote malignancy [252]. Additionally, this is consistent with previous reports
showing that sst5TMD4 increases basal pERK/ERK-ratio in MCF7-cells [185].
Moreover, sst5TMD4 increased IL-6 expression, a positive regulator of ERK-activation
[253] (Figure 48), while decreasing APC and SFRP1 expression, which are negative
regulators of MAPK cascade [254, 255]. These results have special relevance because
25% of PCa cases have actionable lesions in MAPK pathway [256], and the biological
consequences of MAPK substrate phosphorylation include increased proliferation,
migration, differentiation, survival, angiogenesis, motility, and invasiveness [257].
sst5TMD4 overexpression also decreased the expression of some additional tumor
suppressor candidates, including ZNF185, LOXL1 and NRIP1/RIP140 [109, 258, 259].
The decrease in NRIP1 expression is especially relevant because this transcriptional
cofactor for nuclear receptors (i.e. androgen/estrogen/progesterone-receptors [109]) is a

148
negative regulator of androgen receptor expression in PCa [109], and, therefore, loss of
NRIP1 expression induced by sst5TMD4 in PCa cells could increase the activity of
androgen receptor in hormone-naïve but also in castration-resistant PCa, promoting the
progression of the disease and reducing the response to androgen-deprivation therapies
or AR-antagonists (i.e. enzalutamide). Moreover, NRIP1 is associated to WNT-pathway
regulation, by increasing the APC-protein expression in colorectal cancer [260]. Indeed,
sst5TMD4 overexpression decreased NRIP1 and APC and also SFRP1 (another candidate
tumor-suppressor from WNT-pathway) expression, and was associated to the increased
activation of TCF/LEF (a key WNT-pathway transcription factor), which altogether
indicates that sst5TMD4 might affect the function of the WNT-pathway in PCa (Figure
48). Accordingly, sst5TMD4 enhanced the activation of c-MYC, a proto-oncogene
associated to MEK/ERK [261] and WNT [262] pathways that control cell-cycle
progression, cell-survival, and tumorigenesis, which is commonly amplified as an
oncogene in PCa [80]. Finally, sst5TMD4 overexpression also enhanced the activation of
RB pathway and decreased expression of CDKN2A (Figure 48), which is involved in the
control of the RB pathway through the inhibition of cdk4/6, a kinase that ultimately
controls the phosphorylation status of RB protein, a known tumor suppressor commonly
lost in cancer [263]. Interestingly, sst5TMD4 overexpression has been associated to
increased activity of c-Myc and JNK, two of the main negative regulators of CDKN2A
[264], which could provide a plausible explanation for the drastic downregulation of
CDKN2A gene in sst5TMD4-overexpressing cells. Consequently, when CDKN2A is
down-regulated, cdk4/6 phosphorylates RB (an inactivating phosphorylation) leading to
the activation of E2F-regulated genes involved in cell-cycle progression [263]. Therefore,
since CDK4/6 inhibitors are being tested in PCa patients [76], this result should be
considered to appropriately evaluate the efficiency of these drugs in patients with reduced
CDKN2A and altered RB activity.

149
Figure 48: Working model summarizing the intracellular effects triggered by
sst5TMD4 in human PCa cells . The data presented herein using several in vivo and in
vitro PCa models suggest that the high expr ession of sst5TMD4 observed in human PCa,
especially in metastatic PCa samples, might enhance the activation of MAPK (ERK/JNK),
Myc/Max, WNT, TGF-β and retinoblastoma (RB) signaling pathways, which are known to
be critical regulators of cancer biology. Spe cifically, sst5TMD4 might act at different
regulatory levels by increasing the phosphorylation of proteins (i.e. MAPK cascade
elements), modifying gene expression levels (i.e. APC, SFRP1, CDKN2A, NRIP1) and
protein levels (i.e. MYC, SFRP1, CDKN2A, NRIP1) a nd/or by increasing the activation of
transcription factors from several signaling pathways (i.e. TCF/LEF, E2F -DP1). Our data
also indicate that the final impact of sst5TMD4 overexpression (and the regulation of the
signaling pathways associated to sst5TMD4) in human PCa cells resulted in a significant
promotion of aggressiveness features (i.e. increased proliferation, and migration) and also
in the hampering of the normal response to SSAs in PCa cells.
Altogether, our findings demonstrate that the spliced variant sst5TMD4 is
overexpressed in PCa, especially in metastatic-PCa, wherein it promotes in vitro and in
vivo aggressiveness features by dysregulating key PCa signaling pathways and hampering
the normal response to SSAs. Hence, these results suggest that sst5TMD4 could
represent a valuable tool to identify novel biomarkers to refine diagnosis and predict
prognosis, and a promising player in the future development of therapeutic
approaches involving SSAs (alone or in combination with other therapeutic drugs) in
PCa patients.

150
6.2. Ghrelin O-acyltransferase (GOAT) enzyme is
overexpressed in prostate cancer wherein it is associated with
the metabolic status: potential value as a non-invasive
biomarker.
The introduction of PSA as a routine clinical marker led to an improved early
detection of PCa and, thus, to an increase in PCa survival [50]. However, PSA-based
screening for PCa has generated considerable debate because its diagnostic performance
is relatively poor, considering that elevated PSA levels may be driven by benign
conditions (i.e. prostatic hyperplasia or prostatitis) [85]. Prostate cancer antigen 3 (PCA3)
has been proposed as the most prominent biomarker emerging as a non-PSA-based
diagnostic test for PCa; however, unfortunately, PCA3 has also serious limitations (i.e.
reduced sensitivity compared to PSA) [157]. Therefore, identification of novel,
alternative, biomarkers for clinical diagnosis of PCa (ideally non-invasive) is urgently
needed to improve and/or complement PSA/PCA3 screening.
Current evidence supports the necessity of implementing more personalized
diagnosis and management strategies for cancer patients, in that inter-individual
differences such as alterations in metabolic environment (i.e. diabetes and/or metabolic-
syndrome) could be key to identify and deploy novel diagnostic biomarkers [85]. In this
scenario, the enzyme GOAT might become of particular relevance in PCa [265, 266], for
its critical role in whole body metabolism [267], and its wide bodily expression, which is
finely regulated by changes in the metabolic environment in human tissues [215, 268],
and is clearly dysregulated in different tumoral tissue types (i.e. breast cancer) compared
with normal tissues [215-217]. In line with this, we demonstrate herein, for the first time,
that GOAT expression is markedly altered in PCa samples (at the mRNA and
protein level) compared with control prostate samples (normal/benign tissues).
Indeed, ROC curve analysis indicated that GOAT mRNA could predict PCa with a high
sensitivity and specificity, suggesting that GOAT levels might represent a novel,
promising PCa biomarker. GOAT protein expression showed a trend to be higher in
PCa tissues with high Gleason-score and with metastasis, suggesting that GOAT might
be associated to malignant features in PCa. These results partially differ from those
reported in a previous study where GOAT mRNA expression was not altered in PCa
151
tissues vs. control samples [233]. However, it is possible that such differences may be
related to the type of control sample used (i.e. healthy prostate-samples in our study vs.
adjacent non-tumoral region of adenocarcinomas of prostate used in the previous study,
which could be derived, at least in some cases, from prostates harboring high-grade
multifocal PCa), or to the different primer set used to amplify GOAT in the qPCR, and/or
to the precise characteristic of the primers (length, product-size, GC-content, etc.), which
were not fully reported in that study. Nevertheless, our current observations are also
partially consistent with this report [233] because both studies observed that GOAT
enzyme is significantly overexpressed in several PCa cell lines vs. normal prostate
cells, supporting the idea that GOAT expression might be up-regulated in different
stages of the PCa disease. Moreover, our data compares favorably with previous reports
indicating that GOAT is overexpressed in other tumoral tissues compared with normal
tissues, including human neuroendocrine [217], pituitary [216], and breast [215] tumors,
suggesting that GOAT overexpression could be a common cellular signature across
various endocrine-related tumors.
Interestingly, our data revealed that GOAT is secreted by PCa-cells, and that its
expression might be directly associated with its release, since GOAT secretion was
significantly higher in the culture medium of 22Rv1 vs. PC3-cells, in a manner consistent
with their expression levels (22Rv1>PC3). Indeed, IHC-analysis of GOAT in PCa
samples revealed that GOAT staining at the cytoplasmic level was granular,
supporting the idea that this enzyme could be associated to a secretory mechanism
in PCa cells. Importantly, GOAT expression was found to be specifically regulated
by endocrine/metabolic factors (i.e. In1-ghrelin, but not ghrelin) in PCa-cells and in
normal prostate cell cultures, suggesting that GOAT production could be
functionally linked to In1-ghrelin at the prostate level. In fact, this close relationship
between In1-ghrelin and GOAT expression has been reported previously in other cancers
[215, 217]. Hence, since In1-ghrelin is usually overexpressed in several endocrine-related
tumors [215-217], it is conceivable that In1-ghrelin, rather than ghrelin, could be the
main substrate of GOAT in these cancers, including PCa. Furthermore, other key
metabolic factors (i.e. insulin/IGF-1) also modulated GOAT expression levels in PCa-
cells, which might be associated with the positive correlation found in this study between
GOAT expression levels and body weight and BMI in PCa patients, a similar association
to that recently reported for circulating GOAT levels in normal weight, anorectic and

152
obese subjects [245]. Interestingly, GOAT expression was higher in PCa-patients with
dyslipidemia, and a greater proportion of PCa-patients with dyslipidemia presented high
GOAT mRNA levels compared with patients with low GOAT expression levels.
Altogether, our results suggest the existence of a clear association between changes in
GOAT expression levels and alterations in metabolic conditions in PCa-patients (i.e.
body-weight, BMI and dyslipidemia), an idea that is in accordance with previous studies
demonstrating the link between GOAT levels, lipid metabolism and whole body energy
balance [269-271].
The results obtained hitherto prompted us to question whether GOAT levels could
represent a suitable non-invasive biomarker for PCa under normal and/or altered
metabolic conditions (e.g. diabetes or dyslipidemia). In fact, plasmatic and urine GOAT
levels were higher in PCa patients compared with healthy control individuals.
Moreover, in PCa patients, plasma GOAT levels correlated positively with
circulating total PSA (and negatively with free PSA) as well as with other cancer
markers (ca_15-3/cyfra_21-1) used to monitor other tumors (breast and lung cancer,
respectively), and which have been proposed as possible PCa biomarkers in conjunction
with PSA [272, 273]. Therefore, although we could not unequivocally establish a direct
association between prostate and plasma/urine GOAT levels, due to the use of different
patient’s cohorts, the results presented herein indicate that prostate GOAT tissue-
expression (mRNA and protein) and plasma/urine GOAT protein levels are
consistently and concomitantly elevated in PCa samples. Indeed, ROC-curve analysis
demonstrated that GOAT mRNA levels could predict PCa with a high
sensitivity/specificity, and, most importantly, that plasma and urine GOAT levels also
showed a good sensitivity (81.1% and 75%, respectively) and specificity (67.8% and
61%, respectively) for PCa detection. Altogether, our data indicate that GOAT levels
could represent a promising novel diagnostic biomarker (invasive and non-invasive)
for PCa.
There is increasing evidence that the alterations in the endocrine/metabolic milieu
should be considered to appropriately stratify the patients, as well as to evaluate the
diagnostic, prognostic and therapeutic potential of novel biomarkers in tumoral
pathologies, including PCa. In this context, there is evidence that circulating GOAT levels
depend on the metabolic environment (e.g. low levels in anorexic and high levels in

153
obese-patients [245]), and, most importantly, as shown here, that GOAT expression is
directly associated with dysregulations in metabolic-conditions (i.e.
BMI/dyslipidemia) in PCa, an observation that is in line with reports showing that
altered endocrine/metabolic status (i.e. diabetes/metabolic-syndrome/BMI, etc.) is
associated with the development/progression of several cancer-types [274], including
PCa [275]. Accordingly, we hypothesized that plasmatic GOAT levels in PCa patients
could also be linked to the metabolic status. Interestingly, we did find that GOAT plasma
levels were higher in individuals with alterations in glucose-metabolism (i.e. diabetes
and/or dyslipidemia), and were positively correlated with the percentage of
glycated-hemoglobin, a gold standard for monitoring glycemic control [276], in both
control and PCa individuals. Actually, irrespective of the presence of PCa, high plasma
GOAT levels were associated with a higher proportion of diabetic and/or dyslipidemic
patients, suggesting that dysregulated glucose-metabolism (diabetes) might be a
confounding factor masking the potential of GOAT to discriminate between control and
PCa patients when the whole population (non-diabetic plus diabetic patients) is
considered. Therefore, we then sought to determine the potential of GOAT as a PCa
biomarker after stratification of the patient cohort based on the presence of diabetes.
Remarkably, when only non-diabetic individuals are considered, we discovered that
plasmatic GOAT levels are able to precisely discriminate the presence of PCa with
high sensitivity and specificity. These data clearly support the notion that alterations in
endocrine/metabolic milieu is a critical factor to ensure an adequate patient
stratification and to assess the diagnostic, prognostic and therapeutic potential of
novel biomarkers in cancer, including PCa, as it is strongly suggested by the data
presented herein for plasma GOAT levels as a novel, suitable complementary PCa
diagnostic test, especially for non-diabetic individuals.
A final point of interest relates to the presence of GOAT in urine. After the
discovery that prostate cells are able to secrete GOAT, being this secretion significantly
higher in PCa cell-lines, we posited whether there is a potential utility of GOAT urine
levels for the diagnosis of PCa, in that proteins in urine are mainly derived from epithelial
cells in the urinary-tract [277, 278]. Indeed, changes in urine protein can reflect a
dysfunction of cells within the urinary-tract better than those in blood samples, which are
deeply influenced by homeostatic mechanisms [277, 278]. In support to this notion, our
results demonstrate that urine GOAT levels were also higher in PCa-patients

154
compared with controls, showing a high specificity and sensitivity to diagnose PCa-
patients. Thus, the data presented herein indicate that GOAT might represent a novel
non-invasive PCa biomarker in urine (wherein it is not severely influenced by the
metabolic status).
In sum, to the best of our knowledge, the present data provides the first systematic
analysis of the presence of the enzyme GOAT in different types of human prostate
samples (invasive and non-invasive) obtained from patients with and without PCa, and in
relation to the clinical and metabolic parameters of the patients (i.e. presence of
metastasis, diabetes, dyslipidemia, etc.). Altogether, our results show, that GOAT can be
directly secreted by PCa cells and is consistently overexpressed in samples from PCa
patients (tissue, plasma and urine), where its expression is drastically conditioned
by the metabolic status. Since GOAT expression showed a high sensitivity/specificity
in PCa-detection, especially in non-diabetic patients, we propose that GOAT might be
considered as a novel non-invasive PCa biomarker alone or in combination with
other biomarkers to provide a better PCa diagnosis.
In fact, it should be mentioned that the results included in this section has been
already patented for this purpose [Title of the patent: “Ghrelin-O-acyl transferase
(GOAT) and its uses”; registry number: PCT/ES2016/070844] and also published in the
journal “Cancer Letters” [Title: “Ghrelin O-acyltransferase (GOAT) enzyme is
overexpressed in prostate cancer wherein is associated with the metabolic status:
potential value as non-invasive biomarker”; Cancer Lett. 2016; 383(1):125-134]. A copy
of this manuscript is included at the end of the Thesis document.

155
6.3. In1-ghrelin splicing variant is overexpressed in prostate
cancer, wherein it increases aggressiveness features through
regulation of key tumor suppressors/oncogenes
Previous studies have shown that ghrelin is expressed in both normal prostate (NP)
and PCa tissues and cell lines with an increased staining of ghrelin peptide in malignant
prostate epithelium compared with normal glandular tissue [225]. Interestingly,
additional reports have shown that other ghrelin gene derived splicing variants are also
present in PCa, where they could be involved in PCa malignancy [225, 235, 236]. Herein,
we have expanded those results by demonstrating, for the first time, that In1-ghrelin
mRNA levels are overexpressed in a battery of PCa biopsies from patients diagnosed
with high-risk PCa, compared to NP samples, which is consistent with previous results
indicating that In1-ghrelin overexpression is a common hallmark shared by other
endocrine-related tumors, such as breast-cancer, pituitary tumors and NETs [215-217].
Nevertheless, although the expression of ghrelin was higher than that of In1-ghrelin in
NPs, in our study cohort, ghrelin mRNA levels were not significantly elevated in PCa
samples. Indeed, ROC-curve analysis revealed that only In1-ghrelin expression (but not
ghrelin) could discriminate between patients with or without PCa, suggesting that In1-
ghrelin merits further study as a potential novel biomarker in PCa. Interestingly, In1-
ghrelin, but not ghrelin levels positively correlated with GOAT-expression in PCa,
an association that has also been previously found in other endocrine-related tumors [215-
217], and suggests that In1-ghrelin may be the main ghrelin-gene variant functionally
linked to GOAT in those tumors, which also reinforces the idea that an
autocrine/paracrine-circuit involving these two components of the ghrelin-system
may operate in PCa. Indeed, this association might be particularly relevant in PCa
pathology, as we have also demonstrated herein that GOAT is overexpressed in PCa
patients, that it can be secreted by PCa cells, and its levels exhibit high
specificity/sensitivity to predict PCa presence compared with other PCa biomarkers
[279].
Remarkably, analysis carried out in an additional cohort of PCa patients and controls
demonstrated that acylated In1-ghrelin peptide could be detected in plasma, and that
these levels, but not those of ghrelin are significantly higher in PCa patients than in

156
healthy controls, which again would suggest the possible utility of In1-ghrelin levels
as a novel biomarker for PCa patients by using non-invasive (liquid) biopsies.
Moreover, consistent with the results found in PCa-biopsies, In1-ghrelin mRNA
expression was higher in PCa cell lines compared with the NP cell line. Interestingly,
we observed that In1-ghrelin, but not ghrelin expression seemed to be higher in
castration-resistant than in androgen-dependent cell lines, which would suggest that
In1-ghrelin might play a role in the late PCa stages and/or in the progression of the
disease.
The fact that In1-ghrelin, and also ghrelin, were expressed at substantial levels in NP-
and PCa-cells suggested that they could be exerting a functional role in the normal and
pathological physiology of the prostate. Therefore, NP cell-cultures were used to test
whether In1-ghrelin peptides and ghrelin can modulate signaling and functional
parameters (such as PSA production and cell viability) in these cells. In1-ghrelin
peptides and ghrelin treatment evoked a signaling response in terms of changes in
[Ca2+]i, a key second messenger that has been previously linked to ghrelin system
signaling [216, 280], and is functionally associated to PCa pathophysiology. Specifically,
it has been shown that ion channel remodeling alters the nature of PCa cells Ca2+ influx,
switching from an apoptotic to a pro-proliferative stage [281]. Nevertheless, it should be
noted that the proportion of responsive cells and the magnitude of the stimulatory increase
were consistently higher after In1-ghrelin than after ghrelin treatment in all experiments
performed on primary NP cells. This observation suggests that In1-ghrelin variant could
be playing a more pronounced function than ghrelin in prostate cells. Nonetheless, our
results demonstrate a direct action of ghrelin-system splicing variants on NP-cells, which
would imply the existence of receptors for In1-ghrelin, but also for ghrelin, in these cells.
However, such putative receptors, likely, ought to be different from the classical
GHSR1a, as we found that GHSR1a expression is virtually absent in the human prostate
samples and PCa cell-lines analyzed herein. The existence of uncharacterized receptor(s)
that mediate some of the biological effects of ghrelin, and likely of In1-ghrelin, has also
been previously postulated in human prostate neoplasms and related cell-lines [222].
Interestingly, In1-ghrelin, but not ghrelin overexpression clearly increased cell-
viability, and In1-ghrelin treatment also increased PSA secretion and expression in
NP cell-cultures, which is consistent with data previously reported indicating that In1-
ghrelin treatment enhances hormone-secretion in other cell-types (i.e. serotonin in NET

157
cells [217], GH in somatotropinoma cells, and ACTH in corticotropinoma cells [216]),
and may suggest a relevant role of In1-ghrelin in the malignization of NP cells.
Ghrelin gene-derived variants, especially the In1-ghrelin variant, exerted a relevant
effect on the pathophysiology of PCa cells. In particular, In1-ghrelin treatment evoked
an increase in proliferation on most of the PCa cell-lines tested, being its effect
especially marked in castration-resistant cell-lines. Similarly, In1-ghrelin peptides
significantly enhanced the migration-capacity of PC-3 cells. The ability of In1-ghrelin
peptides to increase cell-proliferation has been previously reported in human pituitary
tumors (and in mouse AtT-20 cell-line) [216]. However, ghrelin administration only
increased cell proliferation in LNCaP and PC-3 cell lines, which is in agreement with
previous studies [225]. These actions of In1-ghrelin peptides may be mediated, at least
in part, through the activation of ERK signaling pathways, as previously reported in
other tumoral pathologies [216, 225]. Consistent with these data, stable overexpression
of In1-ghrelin, but not ghrelin enhanced cell proliferation, migration capacity and
basal phosphorylation levels of PCa cells (PC-3/VCaP cells). In line with this, In1-
ghrelin overexpression has been shown to increase the cell proliferation of pituitary
tumors [216], MDA-MB-231 breast cancer cell line [215] and BON-1 pancreatic cell line
[217], and the migration capacity of NETs cell lines [217]. Moreover, to further explore
this notion, we generated nude mice xenografted with In1-ghrelin or with ghrelin stably-
transfected PC-3 cells, and found that In1-ghrelin, but not ghrelin overexpression
enhanced tumor growth in this in vivo preclinical model (i.e. larger tumors), wherein
it increased tumor necrosis, likely due to higher tumor volume, supporting the idea
that In1-ghrelin would increase the malignant features of PCa-cells.
To gain further insight on the mechanisms underlying the actions of the ghrelin
variants on PCa cells, we explored changes in the expression of a set of selected genes
related to PCa. Specifically, In1-ghrelin increased malignant features of PCa cells by
altering the expression of key oncogenes, tumor-suppressor genes and genes
associated to PCa pathophysiology such as APC, CAV1, SFRP1, NRIP1, CDKN2A,
IGFBP5 and LOXL1 [89, 282-286], which could help to explain the functional changes
triggered by In1-ghrelin over-exposition (treatment and/or overexpression). Indeed, some
changes were further confirmed at the protein-level (i.e. SFRP1, NRIP1, IGFBP5 and
LOXL1) and in the In1-ghrelin stably-transfected PC-3-tumors, which showed an

158
increase in CAV1 and LOXL1, and a decrease in SFRP1 expression compared to mock
cell-induced tumors. Intriguingly, ghrelin treatment and/or overexpression elicited the
phosphorylation of ERK-pathway in PCa-cells and induced significant changes in the
expression of certain oncogenes, tumor-suppressor genes and in genes associated to PCa-
pathophysiology. Some of these changes were different (i.e. IL-6, SOX4 and ZNF185),
common (i.e. decreased in SFRP1 and NRIP1) or opposite (i.e. LOXL1 and IGFBP5) to
those observed by In1-ghrelin overexpression. However, our study demonstrates a
marginal effect of ghrelin on the functional endpoints measured (in vitro proliferation
and/or migration and in vivo proliferation and inflammation) compared to In1-ghrelin
effects, suggesting that ghrelin could be playing a role on other endpoints not measured
herein, and that In1-ghrelin splice variant has a more relevant role than ghrelin in
the aggressiveness of PCa-cells. In line with this, the increase in LOXL1 and IGFBP5
expression observed in PCa-cells overexpressing In1-ghrelin could be
pathophysiologically relevant and could be associated to the unique capacity of In1-
ghrelin to enhance the malignancy features in PCa cells, since both factors have been
shown to increase the aggressiveness of PCa cells [285-288]. Specifically, LOXL1 is able
to enhance tumorigenesis and metastasis through active remodeling of tumor
microenvironment [285, 287]. Moreover, IGFBP5 has been shown to play an important
role in the castration phase of the disease, since upregulation in its expression accelerates
progression to androgen-independence in PCa models [288], and enhances proliferation
of PCa cells [286]. Accordingly, it is tempting to speculate that the upregulation of
LOXL1 and IGFBP5 observed in PCa cells overexpressing In1-ghrelin might be
associated to the increased aggressiveness features observed in PCa cells (i.e. in vitro
and/or in vivo cell proliferation, migration, tumor growth and PSA secretion).
Finally, we further explored the utility of In1-ghrelin as a putative target to reduce
PCa progression by analyzing the effect of In1-ghrelin silencing on PCa cell lines
functional parameters. Remarkably, In1-ghrelin silencing decreased cell proliferation
of PC-3 and LNCaP cells, and PSA secretion from LNCaP cells, which, overall,
suggest that In1-ghrelin could be considered as a novel target for the development
of new and more specific therapies in PCa.
Thus, when viewed together, our results indicate that In1-ghrelin splicing
variant is overexpressed in PCa, where it can regulate cell proliferation, migration,

159
tumor growth and PSA secretion, through the modulation of the activation of
certain signaling pathways (ERK-phosphorylation) and the expression of several
oncogenes and tumor-suppressor genes, thereby suggesting a possible
pathophysiological role for this splice variant in human PCa. The fact that the ghrelin
system, particularly its In1-ghrelin variant, was strongly altered in PCa supports the idea
that this system could contribute to PCa tumorigenesis, and may provide novel tools to
explore diagnostic/therapeutic targets in this pathology.
In fact, it should be mentioned that the results included in this section, together
with other results obtained in other endocrine-related tumoral pathologies, are part of a
new patent recently presented by the research group [Title of the patent: “Non-invasive
diagnostic method of cancer”; registry number: P201631606)].

160

161
CONCLUSIONS

162

163
7. CONCLUSIONS
1) The splice variant sst5TMD4 is overexpressed in prostate cancer, especially in
patients with metastatic disease and high Gleason score, and promotes aggressiveness
features (e.g. cell proliferation, migration) in in vitro and in vivo models, through the
dysregulation of key prostate cancer signaling-pathways (e.g. ERK/JNK, MYC/MAX,
WNT and RB), tumor suppressors (e.g. APC, SFRP1, CDKN2A, ZNF185) and
oncogenes (e.g. CAV1, IL-6, DAXX).
2) The presence of sst5TMD4 hampers the normal response of prostate cancer cells to
SSAs (octreotide and pasireotide), which might be one of the mechanism underlying
the inefficiency of SSA therapy in the limited PCa clinical trials implemented hitherto.
3) Altogether, our results on sst5TMD4 suggest that it could represent a valuable tool
to identify novel biomarkers to refine diagnosis and predict prognosis, and a promising
player in the future development of therapeutic approaches involving SSAs in prostate
cancer.
4) GOAT can be directly secreted by prostate cancer cells and is consistently and
concomitantly elevated in samples from prostate cancer patients, including tumor
tissue, plasma and non-invasive fluids (urine) compared with healthy-control patients.
Elevated GOAT levels are associated to malignant features in prostate cancer and are
severely influenced by the metabolic status (e.g. BMI, diabetes and dyslipidemia).
5) GOAT levels showed high sensitivity and specificity in prostate cancer detection,
especially in non-diabetic patients. Thus, GOAT might represent a valuable novel
biomarker for prostate cancer, alone or in combination with other biomarkers (e.g.
PSA, PCA3), to improve prostate cancer diagnosis. Moreover, our data indicate that
alterations in endocrine/metabolic milieu is a critical factor to ensure an adequate
patient stratification and to assess the potential of novel biomarkers in prostate cancer.
6) The splice variant In1-ghrelin, but not ghrelin, mRNA levels are overexpressed, and
positively correlated with GOAT expression, in prostate cancer, thus reinforcing the
idea that an autocrine/paracrine-circuit involving these two components of the ghrelin-
system may operate in prostate cancer.

164
7) In1-ghrelin could play a pathological role in late prostate cancer stages and/or in the
progression of the disease, since its expression, but not that of ghrelin, is higher in
castration-resistant than in androgen-dependent prostate cancer cell lines, and In1-
ghrelin treatment or overexpression increases malignization of prostate cancer cells in
vitro and in vivo (e.g. cell proliferation, migration, and/or PSA expression/secretion).
These actions of In1-ghrelin are likely exerted by altering the expression of key
oncogenes, tumor suppressor genes, and genes associated to prostate cancer
pathophysiology (i.e. SFRP1, NRIP1, IGFBP5 and LOXL1).
8) Acylated In1-ghrelin peptide can be detected in plasma and its levels, but not those
of ghrelin, are significantly higher in patients with prostate cancer than in healthy-
controls, thus suggesting the possible utility of In1-ghrelin levels as a novel non-
invasive diagnostic and prognosis biomarker for prostate cancer patients.
9) Taken together, our results reveal the existence of a marked, concomitant
dysregulation of the expression of key components of the somatostatin and ghrelin
systems, specially their splicing variants, in prostate cancer, wherein they might play
a pivotal role in the regulation of pathophysiological processes associated with prostate
cancer malignancy, and provide new clinical tools in the diagnosis, prognosis, and
treatment of this tumoral pathology.

165
BIBLIOGRAPHY

166

167
8. BIBLIOGRAPHY
1. Leissner, K.H. and L.E. Tisell, The weight of the human prostate. Scand J Urol
Nephrol, 1979. 13(2): p. 137-42.
2. Shen, M.M. and C. Abate-Shen, Molecular genetics of prostate cancer: new
prospects for old challenges. Genes Dev, 2010. 24(18): p. 1967-2000.
3. Kumar, V.L. and P.K. Majumder, Prostate gland: structure, functions and
regulation. Int Urol Nephrol, 1995. 27(3): p. 231-43.
4. Timms, B.G., Prostate development: a historical perspective. Differentiation,
2008. 76(6): p. 565-77.
5. McNeal, J.E., et al., Zonal distribution of prostatic adenocarcinoma.
Correlation with histologic pattern and direction of spread. Am J Surg Pathol,
1988. 12(12): p. 897-906.
6. Foster, C.S., et al., Prostatic stem cells. J Pathol, 2002. 197(4): p. 551-65.
7. Cunha, G.R., S.W. Hayward, and Y.Z. Wang, Role of stroma in
carcinogenesis of the prostate. Differentiation, 2002. 70(9-10): p. 473-85.
8. Marker, P.C., et al., Hormonal, cellular, and molecular control of prostatic
development. Dev Biol, 2003. 253(2): p. 165-74.
9. Kach, J., S.D. Conzen, and R.Z. Szmulewitz, Targeting the glucocorticoid
receptor in breast and prostate cancers. Sci Transl Med, 2015. 7(305): p.
305ps19.
10. Watson, P.A., V.K. Arora, and C.L. Sawyers, Emerging mechanisms of
resistance to androgen receptor inhibitors in prostate cancer. Nat Rev Cancer,
2015. 15(12): p. 701-11.
11. Winters, S.J., Laboratory Assessment of Testicular Function. 2000.
12. Odell, W.D. and L.N. Parker, Control of adrenal androgen production.
Endocr Res, 1984. 10(3-4): p. 617-30.
13. Risbridger, G.P., et al., Breast and prostate cancer: more similar than different.
Nat Rev Cancer, 2010. 10(3): p. 205-12.
14. Lonergan, P.E. and D.J. Tindall, Androgen receptor signaling in prostate
cancer development and progression. J Carcinog, 2011. 10: p. 20.
15. Wilson, J.D., The critical role of androgens in prostate development.
Endocrinol Metab Clin North Am, 2011. 40(3): p. 577-90, ix.

168
16. Brown, T.R., et al., Deletion of the steroid-binding domain of the human
androgen receptor gene in one family with complete androgen insensitivity
syndrome: evidence for further genetic heterogeneity in this syndrome. Proc
Natl Acad Sci U S A, 1988. 85(21): p. 8151-5.
17. Charest, N.J., et al., A frameshift mutation destabilizes androgen receptor
messenger RNA in the Tfm mouse. Mol Endocrinol, 1991. 5(4): p. 573-81.
18. He, W.W., M.V. Kumar, and D.J. Tindall, A frame-shift mutation in the
androgen receptor gene causes complete androgen insensitivity in the
testicular-feminized mouse. Nucleic Acids Res, 1991. 19(9): p. 2373-8.
19. Wilson, J.D. and I. Lasnitzki, Dihydrotestosterone formation in fetal tissues of
the rabbit and rat. Endocrinology, 1971. 89(3): p. 659-68.
20. Bardin, C.W. and J.F. Catterall, Testosterone: a major determinant of
extragenital sexual dimorphism. Science, 1981. 211(4488): p. 1285-94.
21. Imperato-McGinley, J. and Y.S. Zhu, Androgens and male physiology the
syndrome of 5alpha-reductase-2 deficiency. Mol Cell Endocrinol, 2002. 198(1-
2): p. 51-9.
22. Robert, M., et al., Characterization of prostate-specific antigen proteolytic
activity on its major physiological substrate, the sperm motility inhibitor
precursor/semenogelin I. Biochemistry, 1997. 36(13): p. 3811-9.
23. Saraswati, S., et al., Galectin-3 is a substrate for prostate specific antigen (PSA)
in human seminal plasma. Prostate, 2011. 71(2): p. 197-208.
24. Balk, S.P., Y.J. Ko, and G.J. Bubley, Biology of prostate-specific antigen. J
Clin Oncol, 2003. 21(2): p. 383-91.
25. Ercole, C.J., et al., Prostatic specific antigen and prostatic acid phosphatase in
the monitoring and staging of patients with prostatic cancer. J Urol, 1987.
138(5): p. 1181-4.
26. Kirschner, M.A., F.B. Cohen, and D. Jespersen, Estrogen production and its
origin in men with gonadotropin-producing neoplasms. J Clin Endocrinol
Metab, 1974. 39(1): p. 112-8.
27. Dorrington JH, A.D., Follicle stimulating hormone stimulates estradiol-17
synthesis in cultured Sertoli cells. Proc Natl Acad Sci U S A, 1975. 72(2677).
28. Korach, K.S., et al., Estrogen receptor gene disruption: molecular
characterization and experimental and clinical phenotypes. Recent Prog Horm
Res, 1996. 51: p. 159-86; discussion 186-8.
29. Risbridger, G.P., S.J. Ellem, and S.J. McPherson, Estrogen action on the
prostate gland: a critical mix of endocrine and paracrine signaling. J Mol
Endocrinol, 2007. 39(3): p. 183-8.

169
30. Latil, A., et al., Evaluation of androgen, estrogen (ER alpha and ER beta), and
progesterone receptor expression in human prostate cancer by real-time
quantitative reverse transcription-polymerase chain reaction assays. Cancer
Res, 2001. 61(5): p. 1919-26.
31. Yu, Y., et al., Expression and function of the progesterone receptor in human
prostate stroma provide novel insights to cell proliferation control. J Clin
Endocrinol Metab, 2013. 98(7): p. 2887-96.
32. Yu, Y., et al., Progesterone receptor expression during prostate cancer
progression suggests a role of this receptor in stromal cell differentiation.
Prostate, 2015. 75(10): p. 1043-50.
33. Mohler, J.L., et al., Androgen and glucocorticoid receptors in the stroma and
epithelium of prostatic hyperplasia and carcinoma. Clin Cancer Res, 1996.
2(5): p. 889-95.
34. Zhao, B., et al., Glucocorticoid receptor in prostate epithelia is not required for
corticosteroid-induced epithelial hyperproliferation in the mouse prostate.
Prostate, 2014. 74(10): p. 1068-78.
35. Yemelyanov, A., et al., Tumor suppressor activity of glucocorticoid receptor in
the prostate. Oncogene, 2007. 26(13): p. 1885-96.
36. Arora, V.K., et al., Glucocorticoid receptor confers resistance to antiandrogens
by bypassing androgen receptor blockade. Cell, 2013. 155(6): p. 1309-22.
37. Sahu, B., et al., FoxA1 specifies unique androgen and glucocorticoid receptor
binding events in prostate cancer cells. Cancer Res, 2013. 73(5): p. 1570-80.
38. Jimenez-Cruz, J.F. and E. Broseta-Rico, [Classification, etiology, diagnosis
and treatment of prostatitis. Other types of prostatitis. Acute and chronic
prostatitis]. Enferm Infecc Microbiol Clin, 2005. 23 Suppl 4: p. 47-56.
39. Sfanos, K.S., H.A. Hempel, and A.M. De Marzo, The role of inflammation in
prostate cancer. Adv Exp Med Biol, 2014. 816: p. 153-81.
40. Putzi, M.J. and A.M. De Marzo, Morphologic transitions between proliferative
inflammatory atrophy and high-grade prostatic intraepithelial neoplasia.
Urology, 2000. 56(5): p. 828-32.
41. Nelson, W.G., A.M. De Marzo, and W.B. Isaacs, Prostate cancer. N Engl J
Med, 2003. 349(4): p. 366-81.
42. Kwon, O.J., et al., Prostatic inflammation enhances basal-to-luminal
differentiation and accelerates initiation of prostate cancer with a basal cell
origin. Proc Natl Acad Sci U S A, 2014. 111(5): p. E592-600.

170
43. Wang, W., A. Bergh, and J.E. Damber, Morphological transition of
proliferative inflammatory atrophy to high-grade intraepithelial neoplasia and
cancer in human prostate. Prostate, 2009. 69(13): p. 1378-86.
44. Garraway, W.M., G.N. Collins, and R.J. Lee, High prevalence of benign
prostatic hypertrophy in the community. Lancet, 1991. 338(8765): p. 469-71.
45. Rodriguez-Nieves, J.A. and J.A. Macoska, Prostatic fibrosis, lower urinary
tract symptoms, and BPH. Nat Rev Urol, 2013. 10(9): p. 546-50.
46. Wen, S., et al., Stromal androgen receptor roles in the development of normal
prostate, benign prostate hyperplasia, and prostate cancer. Am J Pathol, 2015.
185(2): p. 293-301.
47. Chang, R.T., R. Kirby, and B.J. Challacombe, Is there a link between BPH
and prostate cancer? Practitioner, 2012. 256(1750): p. 13-6, 2.
48. Patel, P., et al., Prostate cancer after initial high-grade prostatic intraepithelial
neoplasia and benign prostate biopsy. Can J Urol, 2015. 22(6): p. 8056-62.
49. Brawer, M.K., Prostatic intraepithelial neoplasia: an overview. Rev Urol,
2005. 7 Suppl 3: p. S11-8.
50. Ferlay, J., et al., Cancer incidence and mortality worldwide: sources, methods
and major patterns in GLOBOCAN 2012. Int J Cancer, 2015. 136(5): p. E359-
86.
51. Siegel, R.L., K.D. Miller, and A. Jemal, Cancer statistics, 2015. CA Cancer J
Clin, 2015. 65(1): p. 5-29.
52. Shenoy, D., et al., Do African-American men need separate prostate cancer
screening guidelines? BMC Urol, 2016. 16(1): p. 19.
53. Heidenreich, A., et al., EAU guidelines on prostate cancer. part 1: screening,
diagnosis, and local treatment with curative intent-update 2013. Eur Urol,
2014. 65(1): p. 124-37.
54. Bratt, O., Hereditary prostate cancer: clinical aspects. J Urol, 2002. 168(3): p.
906-13.
55. Ewing, C.M., et al., Germline mutations in HOXB13 and prostate-cancer risk.
N Engl J Med, 2012. 366(2): p. 141-9.
56. Shang, Z., et al., Germline homeobox B13 (HOXB13) G84E mutation and
prostate cancer risk in European descendants: a meta-analysis of 24,213 cases
and 73, 631 controls. Eur Urol, 2013. 64(1): p. 173-6.
57. Ostrander, E.A. and M.S. Udler, The role of the BRCA2 gene in susceptibility
to prostate cancer revisited. Cancer Epidemiol Biomarkers Prev, 2008. 17(8):
p. 1843-8.

171
58. Simons, B.W., et al., A human prostatic bacterial isolate alters the prostatic
microenvironment and accelerates prostate cancer progression. J Pathol, 2015.
235(3): p. 478-89.
59. Leitzmann, M.F. and S. Rohrmann, Risk factors for the onset of prostatic
cancer: age, location, and behavioral correlates. Clin Epidemiol, 2012. 4: p. 1-
11.
60. Gleason, D.F., Classification of prostatic carcinomas. Cancer Chemother Rep,
1966. 50(3): p. 125-8.
61. Epstein, J.I., et al., The 2014 International Society of Urological Pathology
(ISUP) Consensus Conference on Gleason Grading of Prostatic Carcinoma:
Definition of Grading Patterns and Proposal for a New Grading System. Am J
Surg Pathol, 2016. 40(2): p. 244-52.
62. Mottet, N., et al., EAU-ESTRO-SIOG Guidelines on Prostate Cancer. Part 1:
Screening, Diagnosis, and Local Treatment with Curative Intent. Eur Urol,
2017. 71(4): p. 618-629.
63. Epstein, J.I., et al., The 2005 International Society of Urological Pathology
(ISUP) Consensus Conference on Gleason Grading of Prostatic Carcinoma.
Am J Surg Pathol, 2005. 29(9): p. 1228-42.
64. Epstein, J.I., Gleason score 2-4 adenocarcinoma of the prostate on needle
biopsy: a diagnosis that should not be made. Am J Surg Pathol, 2000. 24(4): p.
477-8.
65. Marcus, D.M., et al., A comprehensive review of incidence and survival in
patients with rare histological variants of prostate cancer in the United States
from 1973 to 2008. Prostate Cancer Prostatic Dis, 2012. 15(3): p. 283-8.
66. Kirk, R., Prostate cancer from basal cells. Nat Rev Clin Oncol, 2010. 7(10): p.
550.
67. Goldstein, A.S., et al., Identification of a cell of origin for human prostate
cancer. Science, 2010. 329(5991): p. 568-71.
68. Wang, Z.A., et al., Luminal cells are favored as the cell of origin for prostate
cancer. Cell Rep, 2014. 8(5): p. 1339-46.
69. Goldstein, A.S., et al., Trop2 identifies a subpopulation of murine and human
prostate basal cells with stem cell characteristics. Proc Natl Acad Sci U S A,
2008. 105(52): p. 20882-7.
70. Lee, J.K., et al., N-Myc Drives Neuroendocrine Prostate Cancer Initiated from
Human Prostate Epithelial Cells. Cancer Cell, 2016. 29(4): p. 536-47.
71. Villers, A., et al., Multiple cancers in the prostate. Morphologic features of
clinically recognized versus incidental tumors. Cancer, 1992. 70(9): p. 2313-8.

172
72. Boutros, P.C., et al., Spatial genomic heterogeneity within localized, multifocal
prostate cancer. Nat Genet, 2015. 47(7): p. 736-45.
73. Grignon, D.J., Unusual subtypes of prostate cancer. Mod Pathol, 2004. 17(3):
p. 316-27.
74. Aggarwal, R., et al., Neuroendocrine prostate cancer: subtypes, biology, and
clinical outcomes. J Natl Compr Canc Netw, 2014. 12(5): p. 719-26.
75. Parimi, V., et al., Neuroendocrine differentiation of prostate cancer: a review.
Am J Clin Exp Urol, 2014. 2(4): p. 273-85.
76. Wyatt, A.W. and M.E. Gleave, Targeting the adaptive molecular landscape of
castration-resistant prostate cancer. EMBO Mol Med, 2015. 7(7): p. 878-94.
77. Zhang, C., et al., Profiling alternatively spliced mRNA isoforms for prostate
cancer classification. BMC Bioinformatics, 2006. 7: p. 202.
78. The Molecular Taxonomy of Primary Prostate Cancer. Cell, 2015. 163(4): p.
1011-25.
79. Vogelstein, B., et al., Cancer genome landscapes. Science, 2013. 339(6127): p.
1546-58.
80. Taylor, B.S., et al., Integrative genomic profiling of human prostate cancer.
Cancer Cell, 2010. 18(1): p. 11-22.
81. Kung, H.J. and C.P. Evans, Oncogenic activation of androgen receptor. Urol
Oncol, 2009. 27(1): p. 48-52.
82. Barbieri, C.E., et al., The mutational landscape of prostate cancer. Eur Urol,
2013. 64(4): p. 567-76.
83. Baca, S.C., et al., Punctuated evolution of prostate cancer genomes. Cell, 2013.
153(3): p. 666-77.
84. Weischenfeldt, J., et al., Integrative genomic analyses reveal an androgen-
driven somatic alteration landscape in early-onset prostate cancer. Cancer Cell,
2013. 23(2): p. 159-70.
85. Prensner, J.R., et al., Beyond PSA: the next generation of prostate cancer
biomarkers. Sci Transl Med, 2012. 4(127): p. 127rv3.
86. Jones, S., et al., Comparative lesion sequencing provides insights into tumor
evolution. Proc Natl Acad Sci U S A, 2008. 105(11): p. 4283-8.
87. Bhatia-Gaur, R., et al., Roles for Nkx3.1 in prostate development and cancer.
Genes Dev, 1999. 13(8): p. 966-77.

173
88. Li, L.C., P.R. Carroll, and R. Dahiya, Epigenetic changes in prostate cancer:
implication for diagnosis and treatment. J Natl Cancer Inst, 2005. 97(2): p.
103-15.
89. Zheng, L., et al., Diagnostic value of SFRP1 as a favorable predictive and
prognostic biomarker in patients with prostate cancer. PLoS One, 2015. 10(2):
p. e0118276.
90. Tomlins, S.A., et al., ETS gene fusions in prostate cancer: from discovery to
daily clinical practice. Eur Urol, 2009. 56(2): p. 275-86.
91. Nguyen, L.T., et al., ERG Activates the YAP1 Transcriptional Program and
Induces the Development of Age-Related Prostate Tumors. Cancer Cell, 2015.
27(6): p. 797-808.
92. Carver, B.S., et al., Aberrant ERG expression cooperates with loss of PTEN to
promote cancer progression in the prostate. Nat Genet, 2009. 41(5): p. 619-24.
93. Gopalan, A., et al., TMPRSS2-ERG gene fusion is not associated with outcome
in patients treated by prostatectomy. Cancer Res, 2009. 69(4): p. 1400-6.
94. Robinson, D., et al., Integrative clinical genomics of advanced prostate cancer.
Cell, 2015. 161(5): p. 1215-28.
95. Leslie, N.R., et al., The PTEN protein: cellular localization and post-
translational regulation. Biochem Soc Trans, 2016. 44(1): p. 273-8.
96. Leslie, N.R. and C.P. Downes, PTEN function: how normal cells control it and
tumour cells lose it. Biochem J, 2004. 382(Pt 1): p. 1-11.
97. Yue, S., et al., Cholesteryl ester accumulation induced by PTEN loss and
PI3K/AKT activation underlies human prostate cancer aggressiveness. Cell
Metab, 2014. 19(3): p. 393-406.
98. Ross, A.E., A.V. D'Amico, and S.J. Freedland, Which, when and why?
Rational use of tissue-based molecular testing in localized prostate cancer.
Prostate Cancer Prostatic Dis, 2016. 19(1): p. 1-6.
99. Goh, A.M., C.R. Coffill, and D.P. Lane, The role of mutant p53 in human
cancer. J Pathol, 2011. 223(2): p. 116-26.
100. Song, H., et al., Loss of Nkx3.1 leads to the activation of discrete downstream
target genes during prostate tumorigenesis. Oncogene, 2009. 28(37): p. 3307-
19.
101. Shen, M.M. and C. Abate-Shen, Roles of the Nkx3.1 homeobox gene in
prostate organogenesis and carcinogenesis. Dev Dyn, 2003. 228(4): p. 767-78.

174
102. Thangapazham, R., et al., Loss of the NKX3.1 tumorsuppressor promotes the
TMPRSS2-ERG fusion gene expression in prostate cancer. BMC Cancer,
2014. 14: p. 16.
103. Kim, M.J., et al., Cooperativity of Nkx3.1 and Pten loss of function in a mouse
model of prostate carcinogenesis. Proc Natl Acad Sci U S A, 2002. 99(5): p.
2884-9.
104. Barbieri, C.E., et al., Exome sequencing identifies recurrent SPOP, FOXA1
and MED12 mutations in prostate cancer. Nat Genet, 2012. 44(6): p. 685-9.
105. Geng, C., et al., Prostate cancer-associated mutations in speckle-type POZ
protein (SPOP) regulate steroid receptor coactivator 3 protein turnover. Proc
Natl Acad Sci U S A, 2013. 110(17): p. 6997-7002.
106. Gaspar-Maia, A., et al., Chd1 regulates open chromatin and pluripotency of
embryonic stem cells. Nature, 2009. 460(7257): p. 863-8.
107. Huang, S., et al., Recurrent deletion of CHD1 in prostate cancer with relevance
to cell invasiveness. Oncogene, 2012. 31(37): p. 4164-70.
108. Burkhardt, L., et al., CHD1 is a 5q21 tumor suppressor required for ERG
rearrangement in prostate cancer. Cancer Res, 2013. 73(9): p. 2795-805.
109. Carascossa, S., et al., Receptor-interacting protein 140 is a repressor of the
androgen receptor activity. Mol Endocrinol, 2006. 20(7): p. 1506-18.
110. Haffner, M.C., et al., Androgen-induced TOP2B-mediated double-strand
breaks and prostate cancer gene rearrangements. Nat Genet, 2010. 42(8): p.
668-75.
111. Heidenreich, A., et al., EAU guidelines on prostate cancer. Part II: Treatment
of advanced, relapsing, and castration-resistant prostate cancer. Eur Urol,
2014. 65(2): p. 467-79.
112. Imamura, Y. and M.D. Sadar, Androgen receptor targeted therapies in
castration-resistant prostate cancer: Bench to clinic. Int J Urol, 2016.
113. Shafi, A.A., A.E. Yen, and N.L. Weigel, Androgen receptors in hormone-
dependent and castration-resistant prostate cancer. Pharmacol Ther, 2013.
140(3): p. 223-38.
114. Katsogiannou, M., et al., The hallmarks of castration-resistant prostate
cancers. Cancer Treat Rev, 2015. 41(7): p. 588-97.
115. de Bono, J.S., et al., Abiraterone and increased survival in metastatic prostate
cancer. N Engl J Med, 2011. 364(21): p. 1995-2005.
116. Ryan, C.J., et al., Abiraterone in metastatic prostate cancer without previous
chemotherapy. N Engl J Med, 2013. 368(2): p. 138-48.

175
117. Scher, H.I., et al., Increased survival with enzalutamide in prostate cancer after
chemotherapy. N Engl J Med, 2012. 367(13): p. 1187-97.
118. Gundem, G., et al., The evolutionary history of lethal metastatic prostate
cancer. Nature, 2015. 520(7547): p. 353-7.
119. Lee, S.O., et al., Interleukin-6 promotes androgen-independent growth in
LNCaP human prostate cancer cells. Clin Cancer Res, 2003. 9(1): p. 370-6.
120. Locke, J.A., et al., Androgen levels increase by intratumoral de novo
steroidogenesis during progression of castration-resistant prostate cancer.
Cancer Res, 2008. 68(15): p. 6407-15.
121. Visakorpi, T., et al., In vivo amplification of the androgen receptor gene and
progression of human prostate cancer. Nat Genet, 1995. 9(4): p. 401-6.
122. Taplin, M.E., et al., Mutation of the androgen-receptor gene in metastatic
androgen-independent prostate cancer. N Engl J Med, 1995. 332(21): p. 1393-
8.
123. Sun, S., et al., Castration resistance in human prostate cancer is conferred by a
frequently occurring androgen receptor splice variant. J Clin Invest, 2010.
120(8): p. 2715-30.
124. Li, Y., et al., AR intragenic deletions linked to androgen receptor splice variant
expression and activity in models of prostate cancer progression. Oncogene,
2012. 31(45): p. 4759-67.
125. Li, Y., et al., Androgen receptor splice variants mediate enzalutamide resistance
in castration-resistant prostate cancer cell lines. Cancer Res, 2013. 73(2): p.
483-9.
126. Gregory, C.W., et al., A mechanism for androgen receptor-mediated prostate
cancer recurrence after androgen deprivation therapy. Cancer Res, 2001.
61(11): p. 4315-9.
127. McDonnell, T.J., et al., Expression of the protooncogene bcl-2 in the prostate
and its association with emergence of androgen-independent prostate cancer.
Cancer Res, 1992. 52(24): p. 6940-4.
128. Eastham, J.A., et al., In vivo gene therapy with p53 or p21 adenovirus for
prostate cancer. Cancer Res, 1995. 55(22): p. 5151-5.
129. Eastham, J.A., et al., Association of p53 mutations with metastatic prostate
cancer. Clin Cancer Res, 1995. 1(10): p. 1111-8.
130. Selth, L.A., et al., Discovery of circulating microRNAs associated with human
prostate cancer using a mouse model of disease. Int J Cancer, 2012. 131(3): p.
652-61.

176
131. Jackson, B.L., A. Grabowska, and H.L. Ratan, MicroRNA in prostate cancer:
functional importance and potential as circulating biomarkers. BMC Cancer,
2014. 14: p. 930.
132. Rajan, P., et al., Alternative splicing and biological heterogeneity in prostate
cancer. Nat Rev Urol, 2009. 6(8): p. 454-60.
133. Humphrey, P.A., Diagnosis of adenocarcinoma in prostate needle biopsy
tissue. J Clin Pathol, 2007. 60(1): p. 35-42.
134. Ohori, M., T.M. Wheeler, and P.T. Scardino, The New American Joint
Committee on Cancer and International Union Against Cancer TNM
classification of prostate cancer. Clinicopathologic correlations. Cancer, 1994.
74(1): p. 104-14.
135. Lowe, F.C. and S.J. Trauzzi, Prostatic acid phosphatase in 1993. Its limited
clinical utility. Urol Clin North Am, 1993. 20(4): p. 589-95.
136. Draisma, G., et al., Lead time and overdiagnosis in prostate-specific antigen
screening: importance of methods and context. J Natl Cancer Inst, 2009.
101(6): p. 374-83.
137. Etzioni, R., et al., Asymptomatic incidence and duration of prostate cancer. Am
J Epidemiol, 1998. 148(8): p. 775-85.
138. Loeb, S. and W.J. Catalona, The Prostate Health Index: a new test for the
detection of prostate cancer. Ther Adv Urol, 2014. 6(2): p. 74-7.
139. Punnen, S., N. Pavan, and D.J. Parekh, Finding the Wolf in Sheep's Clothing:
The 4Kscore Is a Novel Blood Test That Can Accurately Identify the Risk of
Aggressive Prostate Cancer. Rev Urol, 2015. 17(1): p. 3-13.
140. Partin, A.W., et al., Clinical validation of an epigenetic assay to predict
negative histopathological results in repeat prostate biopsies. J Urol, 2014.
192(4): p. 1081-7.
141. Auprich, M., et al., Contemporary role of prostate cancer antigen 3 in the
management of prostate cancer. Eur Urol, 2011. 60(5): p. 1045-54.
142. Klein, E.A., et al., A 17-gene assay to predict prostate cancer aggressiveness in
the context of Gleason grade heterogeneity, tumor multifocality, and biopsy
undersampling. Eur Urol, 2014. 66(3): p. 550-60.
143. Crawford, E.D., et al., Cell cycle progression score and treatment decisions in
prostate cancer: results from an ongoing registry. Curr Med Res Opin, 2014.
30(6): p. 1025-31.
144. Erho, N., et al., Discovery and validation of a prostate cancer genomic classifier
that predicts early metastasis following radical prostatectomy. PLoS One, 2013.
8(6): p. e66855.

177
145. Prassas, I., et al., Unleashing the therapeutic potential of human kallikrein-
related serine proteases. Nat Rev Drug Discov, 2015. 14(3): p. 183-202.
146. Amaro, A., et al., Validation of proposed prostate cancer biomarkers with gene
expression data: a long road to travel. Cancer Metastasis Rev, 2014. 33(2-3):
p. 657-71.
147. Lilja, H., D. Ulmert, and A.J. Vickers, Prostate-specific antigen and prostate
cancer: prediction, detection and monitoring. Nat Rev Cancer, 2008. 8(4): p.
268-78.
148. Crawford, E.D., et al., Prostate-specific antigen 1.5-4.0 ng/mL: a diagnostic
challenge and danger zone. BJU Int, 2011. 108(11): p. 1743-9.
149. Brawer, M.K., Prostate-specific antigen: current status. CA Cancer J Clin,
1999. 49(5): p. 264-81.
150. Shieh, Y., et al., Population-based screening for cancer: hope and hype. Nat
Rev Clin Oncol, 2016.
151. Andriole, G.L., et al., Mortality results from a randomized prostate-cancer
screening trial. N Engl J Med, 2009. 360(13): p. 1310-9.
152. Schroder, F.H., et al., Screening and prostate-cancer mortality in a randomized
European study. N Engl J Med, 2009. 360(13): p. 1320-8.
153. Kobori, Y., et al., Free-to-total prostate-specific antigen (PSA) ratio contributes
to an increased rate of prostate cancer detection in a Japanese population
screened using a PSA level of 2.1-10.0 ng/ml as a criterion. Int J Clin Oncol,
2008. 13(3): p. 229-32.
154. Bussemakers, M.J., et al., DD3: a new prostate-specific gene, highly
overexpressed in prostate cancer. Cancer Res, 1999. 59(23): p. 5975-9.
155. Deras, I.L., et al., PCA3: a molecular urine assay for predicting prostate biopsy
outcome. J Urol, 2008. 179(4): p. 1587-92.
156. Ferreira, L.B., et al., PCA3 noncoding RNA is involved in the control of
prostate-cancer cell survival and modulates androgen receptor signaling. BMC
Cancer, 2012. 12: p. 507.
157. Haese, A., et al., Clinical utility of the PCA3 urine assay in European men
scheduled for repeat biopsy. Eur Urol, 2008. 54(5): p. 1081-8.
158. Marks, L.S., et al., PCA3 molecular urine assay for prostate cancer in men
undergoing repeat biopsy. Urology, 2007. 69(3): p. 532-5.
159. Tomlins, S.A., et al., Urine TMPRSS2:ERG fusion transcript stratifies prostate
cancer risk in men with elevated serum PSA. Sci Transl Med, 2011. 3(94): p.
94ra72.

178
160. Liu, H., B. Wang, and C. Han, Meta-analysis of genome-wide and replication
association studies on prostate cancer. Prostate, 2011. 71(2): p. 209-24.
161. Zheng, S.L., et al., Cumulative association of five genetic variants with prostate
cancer. N Engl J Med, 2008. 358(9): p. 910-9.
162. Cao, Y., et al., Insulin-like growth factor pathway genetic polymorphisms,
circulating IGF1 and IGFBP3, and prostate cancer survival. J Natl Cancer
Inst, 2014. 106(6): p. dju085.
163. Zhao, L., et al., Identification of candidate biomarkers of therapeutic response
to docetaxel by proteomic profiling. Cancer Res, 2009. 69(19): p. 7696-703.
164. Leary, R.J., et al., Development of personalized tumor biomarkers using
massively parallel sequencing. Sci Transl Med, 2010. 2(20): p. 20ra14.
165. Attard, G., et al., Characterization of ERG, AR and PTEN gene status in
circulating tumor cells from patients with castration-resistant prostate cancer.
Cancer Res, 2009. 69(7): p. 2912-8.
166. Duijvesz, D., et al., Exosomes as biomarker treasure chests for prostate cancer.
Eur Urol, 2011. 59(5): p. 823-31.
167. Fabris, L., et al., The Potential of MicroRNAs as Prostate Cancer Biomarkers.
Eur Urol, 2016.
168. Crawford, E.D. and A. Barqawi, Targeted focal therapy: a minimally invasive
ablation technique for early prostate cancer. Oncology (Williston Park), 2007.
21(1): p. 27-32; discussion 33-4, 39.
169. Theodoropoulou, M. and G.K. Stalla, Somatostatin receptors: from signaling
to clinical practice. Front Neuroendocrinol, 2013. 34(3): p. 228-52.
170. Lamberts, S.W., et al., Development of resistance to a long-acting somatostatin
analogue during treatment of two patients with metastatic endocrine pancreatic
tumours. Acta Endocrinol (Copenh), 1988. 119(4): p. 561-6.
171. Bousquet, C., et al., Antiproliferative effect of somatostatin and analogs.
Chemotherapy, 2001. 47 Suppl 2: p. 30-9.
172. Sciarra, A., et al., Complete response to the combination therapy with androgen
blockade and somatostatin analogue in a patient with advanced prostate cancer:
magnetic resonance imaging with 1H-spectroscopy. Eur Urol, 2008. 53(3): p.
652-5.
173. Dolan, J.T., et al., Treatment of metastatic breast cancer with somatostatin
analogues--a meta-analysis. Ann Surg Oncol, 2001. 8(3): p. 227-33.
174. Priftakis, D., et al., Neuroendocrine differentiation in castration-resistant
prostate cancer: A case report. Mol Clin Oncol, 2015. 3(6): p. 1392-1394.

179
175. Savelli, G., et al., Somatostatin receptors over-expression in castration resistant
prostate cancer detected by PET/CT: preliminary report of in six patients. Ann
Transl Med, 2015. 3(10): p. 145.
176. Warren, T.G. and D. Shields, Expression of preprosomatostatin in
heterologous cells: biosynthesis, posttranslational processing, and secretion of
mature somatostatin. Cell, 1984. 39(3 Pt 2): p. 547-55.
177. Patel, Y.C., et al., All five cloned human somatostatin receptors (hSSTR1-5)
are functionally coupled to adenylyl cyclase. Biochem Biophys Res Commun,
1994. 198(2): p. 605-12.
178. Gahete, M.D., et al., Somatostatin and its receptors from fish to mammals. Ann
N Y Acad Sci, 2010. 1200: p. 43-52.
179. de Lecea, L., et al., A cortical neuropeptide with neuronal depressant and sleep-
modulating properties. Nature, 1996. 381(6579): p. 242-5.
180. Spier, A.D. and L. de Lecea, Cortistatin: a member of the somatostatin
neuropeptide family with distinct physiological functions. Brain Res Brain Res
Rev, 2000. 33(2-3): p. 228-41.
181. Broglio, F., et al., Endocrine actions of cortistatin: in vivo studies. Mol Cell
Endocrinol, 2008. 286(1-2): p. 123-7.
182. Cordoba-Chacon, J., et al., Truncated somatostatin receptors as new players in
somatostatin-cortistatin pathophysiology. Ann N Y Acad Sci, 2011. 1220: p. 6-
15.
183. Luque, R.M., et al., Truncated somatostatin receptor variant sst5TMD4 confers
aggressive features (proliferation, invasion and reduced octreotide response) to
somatotropinomas. Cancer Lett, 2015. 359(2): p. 299-306.
184. Duran-Prado, M., et al., A potential inhibitory role for the new truncated
variant of somatostatin receptor 5, sst5TMD4, in pituitary adenomas poorly
responsive to somatostatin analogs. J Clin Endocrinol Metab, 2010. 95(5): p.
2497-502.
185. Durán-Prado, M., et al., The new truncated somatostatin receptor variant
sst5TMD4 is associated to poor prognosis in breast cancer and increases
malignancy in MCF-7 cells. Oncogene, 2012. 31(16): p. 2049-61.
186. Mole, D., et al., The expression of the truncated isoform of somatostatin
receptor subtype 5 associates with aggressiveness in medullary thyroid
carcinoma cells. Endocrine, 2015.
187. Puig-Domingo, M., et al., The Truncated Isoform of Somatostatin Receptor5
(sst5TMD4) Is Associated with Poorly Differentiated Thyroid Cancer. PLoS
One, 2014. 9(1): p. e85527.

180
188. Sampedro-Núñez, M., et al., Presence of sst5TMD4, a truncated splice variant
of the somatostatin receptor subtype 5, is associated to features of increased
aggressiveness in pancreatic neuroendocrine tumors. Oncotarget, 2015.
189. Ruscica, M., et al., Characterization and sub-cellular localization of SS1R,
SS2R, and SS5R in human late-stage prostate cancer cells: effect of mono- and
bi-specific somatostatin analogs on cell growth. Mol Cell Endocrinol, 2014.
382(2): p. 860-70.
190. Reubi, J.C., et al., Somatostatin receptors in human prostate and prostate
cancer. J Clin Endocrinol Metab, 1995. 80(9): p. 2806-14.
191. Risk, M.C., et al., Differential gene expression in benign prostate epithelium of
men with and without prostate cancer: evidence for a prostate cancer field
effect. Clin Cancer Res, 2010. 16(22): p. 5414-23.
192. Kosari, F., et al., Identification of prognostic biomarkers for prostate cancer.
Clin Cancer Res, 2008. 14(6): p. 1734-43.
193. Halmos, G., et al., High expression of somatostatin receptors and messenger
ribonucleic acid for its receptor subtypes in organ-confined and locally
advanced human prostate cancers. J Clin Endocrinol Metab, 2000. 85(7): p.
2564-71.
194. Hennigs, J.K., et al., Loss of somatostatin receptor subtype 2 in prostate cancer
is linked to an aggressive cancer phenotype, high tumor cell proliferation and
predicts early metastatic and biochemical relapse. PLoS One, 2014. 9(7): p.
e100469.
195. Hansson, J., et al., Expression of somatostatin receptor subtypes 2 and 4 in
human benign prostatic hyperplasia and prostatic cancer. Prostate, 2002.
53(1): p. 50-9.
196. Sinisi, A.A., et al., Different expression patterns of somatostatin receptor
subtypes in cultured epithelial cells from human normal prostate and prostate
cancer. J Clin Endocrinol Metab, 1997. 82(8): p. 2566-9.
197. Morichetti, D., et al., Immunohistochemical expression of somatostatin
receptor subtypes in prostate tissue from cystoprostatectomies with incidental
prostate cancer. BJU Int, 2010. 106(7): p. 1072-80.
198. Lo Nigro, C., et al., The combination of docetaxel and the somatostatin
analogue lanreotide on androgen-independent docetaxel-resistant prostate
cancer: experimental data. BJU Int, 2008. 102(5): p. 622-7.
199. Zhu, S., et al., Synergistic antitumor activities of docetaxel and octreotide
associated with apoptotic-upregulation in castration-resistant prostate cancer.
PLoS One, 2014. 9(3): p. e91817.

181
200. Tai, S., et al., PC3 is a cell line characteristic of prostatic small cell carcinoma.
Prostate, 2011. 71(15): p. 1668-79.
201. D'Angelillo, R.M., et al., Somatostatin analogs and disease control in
castration-resistant prostate cancer: different biological behavior? Case series
and review of the literature. Tumori, 2014. 100(3): p. 249-53.
202. Hope, T.A., et al., Somatostatin imaging of neuroendocrine-differentiated
prostate cancer. Clin Nucl Med, 2015. 40(6): p. 540-1.
203. Berruti, A., et al., Effects of the somatostatin analog lanreotide on the
circulating levels of chromogranin-A, prostate-specific antigen, and insulin-
like growth factor-1 in advanced prostate cancer patients. Prostate, 2001. 47(3):
p. 205-11.
204. Buck, A. and C. Decristoforo, Highlights lecture EANM 2015: the search for
nuclear medicine's superheroes. Eur J Nucl Med Mol Imaging, 2016.
205. Friedlander, T.W., et al., Effect of the somatostatin analog octreotide acetate
on circulating insulin-like growth factor-1 and related peptides in patients with
non-metastatic castration-resistant prostate cancer: results of a phase II study.
Urol Oncol, 2012. 30(4): p. 408-14.
206. Kojima, M., et al., Ghrelin is a growth-hormone-releasing acylated peptide
from stomach. Nature, 1999. 402(6762): p. 656-60.
207. Gahete, M.D., et al., Ghrelin gene products, receptors, and GOAT enzyme:
biological and pathophysiological insight. J Endocrinol, 2014. 220(1): p. R1-
24.
208. Al Massadi, O., M.H. Tschop, and J. Tong, Ghrelin acylation and metabolic
control. Peptides, 2011. 32(11): p. 2301-8.
209. van der Lely, A.J., et al., Biological, physiological, pathophysiological, and
pharmacological aspects of ghrelin. Endocr Rev, 2004. 25(3): p. 426-57.
210. Delhanty, P.J., S.J. Neggers, and A.J. van der Lely, Des-acyl ghrelin: a
metabolically active peptide. Endocr Dev, 2013. 25: p. 112-21.
211. Sever, S., D.L. White, and J.M. Garcia, Is there an effect of ghrelin/ghrelin
analogs on cancer? A systematic review. Endocr Relat Cancer, 2016. 23(9): p.
R393-409.
212. Lin, T.C. and M. Hsiao, Ghrelin and cancer progression. Biochim Biophys
Acta, 2017. 1868(1): p. 51-57.
213. Sato, T., et al., Structure, regulation and function of ghrelin. J Biochem, 2012.
151(2): p. 119-28.

182
214. Seim, I., A.C. Herington, and L.K. Chopin, New insights into the molecular
complexity of the ghrelin gene locus. Cytokine Growth Factor Rev, 2009.
20(4): p. 297-304.
215. Gahete, M.D., et al., A novel human ghrelin variant (In1-ghrelin) and ghrelin-
O-acyltransferase are overexpressed in breast cancer: potential
pathophysiological relevance. PLoS One, 2011. 6(8): p. e23302.
216. Ibáñez-Costa, A., et al., In1-ghrelin splicing variant is overexpressed in
pituitary adenomas and increases their aggressive features. Sci Rep, 2015. 5: p.
8714.
217. Luque, R.M., et al., In1-ghrelin, a splice variant of ghrelin gene, is associated
with the evolution and aggressiveness of human neuroendocrine tumors:
Evidence from clinical, cellular and molecular parameters. Oncotarget, 2015.
6(23): p. 19619-33.
218. Camina, J.P., Cell biology of the ghrelin receptor. J Neuroendocrinol, 2006.
18(1): p. 65-76.
219. Chow, K.B., et al., The truncated ghrelin receptor polypeptide (GHS-R1b) is
localized in the endoplasmic reticulum where it forms heterodimers with ghrelin
receptors (GHS-R1a) to attenuate their cell surface expression. Mol Cell
Endocrinol, 2012. 348(1): p. 247-54.
220. Callaghan, B. and J.B. Furness, Novel and conventional receptors for ghrelin,
desacyl-ghrelin, and pharmacologically related compounds. Pharmacol Rev,
2014. 66(4): p. 984-1001.
221. Albarran-Zeckler, R.G. and R.G. Smith, The ghrelin receptors (GHS-R1a and
GHS-R1b). Endocr Dev, 2013. 25: p. 5-15.
222. Cassoni, P., et al., Expression of ghrelin and biological activity of specific
receptors for ghrelin and des-acyl ghrelin in human prostate neoplasms and
related cell lines. Eur J Endocrinol, 2004. 150(2): p. 173-84.
223. Jeffery, P.L., A.C. Herington, and L.K. Chopin, Expression and action of the
growth hormone releasing peptide ghrelin and its receptor in prostate cancer
cell lines. J Endocrinol, 2002. 172(3): p. R7-11.
224. Jeffery, P.L., A.C. Herington, and L.K. Chopin, The potential
autocrine/paracrine roles of ghrelin and its receptor in hormone-dependent
cancer. Cytokine Growth Factor Rev, 2003. 14(2): p. 113-22.
225. Yeh, A.H., et al., Ghrelin and a novel preproghrelin isoform are highly
expressed in prostate cancer and ghrelin activates mitogen-activated protein
kinase in prostate cancer. Clin Cancer Res, 2005. 11(23): p. 8295-303.
226. Mungan, N.A., et al., Diagnostic value of serum ghrelin levels in prostate
cancer. Urol Int, 2008. 80(3): p. 245-8.

183
227. Bertaccini, A., et al., Variations in blood ghrelin levels in prostate cancer
patients submitted to hormone suppressive treatment. Anticancer Res, 2009.
29(4): p. 1345-8.
228. Malendowicz, W., et al., Elevated blood active ghrelin and unaltered total
ghrelin and obestatin concentrations in prostate carcinoma. Urol Int, 2009.
83(4): p. 471-5.
229. Diaz-Lezama, N., et al., Ghrelin inhibits proliferation and increases T-type
Ca2+ channel expression in PC-3 human prostate carcinoma cells. Biochem
Biophys Res Commun, 2010. 403(1): p. 24-9.
230. Lu, C., et al., Ghrelin receptor as a novel imaging target for prostatic
neoplasms. Prostate, 2012. 72(8): p. 825-33.
231. Lawnicka, H., et al., Modulation of ghrelin axis influences the growth of
colonic and prostatic cancer cells in vitro. Pharmacol Rep, 2012. 64(4): p. 951-
9.
232. Seim, I., et al., Cloning of a novel insulin-regulated ghrelin transcript in
prostate cancer. J Mol Endocrinol, 2013. 50(2): p. 179-91.
233. Seim, I., et al., Ghrelin O-acyltransferase (GOAT) is expressed in prostate
cancer tissues and cell lines and expression is differentially regulated in vitro
by ghrelin. Reprod Biol Endocrinol, 2013. 11: p. 70.
234. Moskalev, E.A., et al., GHSR DNA hypermethylation is a common epigenetic
alteration of high diagnostic value in a broad spectrum of cancers. Oncotarget,
2015. 6(6): p. 4418-27.
235. Seim, I., et al., Multi-species sequence comparison reveals conservation of
ghrelin gene-derived splice variants encoding a truncated ghrelin peptide.
Endocrine, 2016.
236. Chopin, L.K., et al., The ghrelin axis--does it have an appetite for cancer
progression? Endocr Rev, 2012. 33(6): p. 849-91.
237. Goldstein, A.S., et al., Purification and direct transformation of epithelial
progenitor cells from primary human prostate. Nat Protoc, 2011. 6(5): p. 656-
67.
238. Uphoff, C.C. and H.G. Drexler, Detection of mycoplasma contaminations.
Methods Mol Biol, 2013. 946: p. 1-13.
239. Bello, D., et al., Androgen responsive adult human prostatic epithelial cell lines
immortalized by human papillomavirus 18. Carcinogenesis, 1997. 18(6): p.
1215-23.
240. Sramkoski, R.M., et al., A new human prostate carcinoma cell line, 22Rv1. In
Vitro Cell Dev Biol Anim, 1999. 35(7): p. 403-9.

184
241. Horoszewicz, J.S., et al., LNCaP model of human prostatic carcinoma. Cancer
Res, 1983. 43(4): p. 1809-18.
242. van Bokhoven, A., et al., Molecular characterization of human prostate
carcinoma cell lines. Prostate, 2003. 57(3): p. 205-25.
243. Sobel, R.E. and M.D. Sadar, Cell lines used in prostate cancer research: a
compendium of old and new lines--part 1. J Urol, 2005. 173(2): p. 342-59.
244. Humphrey, P.A., Gleason grading and prognostic factors in carcinoma of the
prostate. Mod Pathol, 2004. 17(3): p. 292-306.
245. Goebel-Stengel, M., et al., The ghrelin activating enzyme ghrelin-O-
acyltransferase (GOAT) is present in human plasma and expressed dependent
on body mass index. Peptides, 2013. 43: p. 13-9.
246. Sternberg, C.N., et al., Progress in the treatment of advanced prostate cancer.
Am Soc Clin Oncol Educ Book, 2014: p. 117-31.
247. Maulard, C., et al., Phase I-II study of the somatostatin analogue lanreotide in
hormone-refractory prostate cancer. Cancer Chemother Pharmacol, 1995.
36(3): p. 259-62.
248. Ladomery, M., Aberrant alternative splicing is another hallmark of cancer. Int
J Cell Biol, 2013. 2013: p. 463786.
249. Mole, D., et al., The expression of the truncated isoform of somatostatin
receptor subtype 5 associates with aggressiveness in medullary thyroid
carcinoma cells. Endocrine, 2015. 50(2): p. 442-52.
250. Fotouhi, O., et al., Proteomics Suggests a Role for APC-Survivin in Response
to Somatostatin Analog Treatment of Neuroendocrine Tumors. J Clin
Endocrinol Metab, 2016. 101(10): p. 3616-3627.
251. Cakir, M., D. Dworakowska, and A. Grossman, Somatostatin receptor biology
in neuroendocrine and pituitary tumours: part 1--molecular pathways. J Cell
Mol Med, 2010. 14(11): p. 2570-84.
252. Lopez-Bergami, P., et al., Rewired ERK-JNK signaling pathways in melanoma.
Cancer Cell, 2007. 11(5): p. 447-60.
253. Ogata, A., et al., IL-6 triggers cell growth via the Ras-dependent mitogen-
activated protein kinase cascade. J Immunol, 1997. 159(5): p. 2212-21.
254. Park, K.S., et al., APC inhibits ERK pathway activation and cellular
proliferation induced by RAS. J Cell Sci, 2006. 119(Pt 5): p. 819-27.
255. Hay, E., A. Nouraud, and P.J. Marie, N-cadherin negatively regulates
osteoblast proliferation and survival by antagonizing Wnt, ERK and PI3K/Akt
signalling. PLoS One, 2009. 4(12): p. e8284.

185
256. Network, T.C.G.A.R., The Molecular Taxonomy of Primary Prostate Cancer.
Cell, 2015. 163(4): p. 1011-25.
257. McCubrey, J.A., et al., Roles of the Raf/MEK/ERK pathway in cell growth,
malignant transformation and drug resistance. Biochim Biophys Acta, 2007.
1773(8): p. 1263-84.
258. Zhang, J.S., A. Gong, and C.Y. Young, ZNF185, an actin-cytoskeleton-
associated growth inhibitory LIM protein in prostate cancer. Oncogene, 2007.
26(1): p. 111-22.
259. Wu, G., et al., LOXL1 and LOXL4 are epigenetically silenced and can inhibit
ras/extracellular signal-regulated kinase signaling pathway in human bladder
cancer. Cancer Res, 2007. 67(9): p. 4123-9.
260. Lapierre, M., et al., RIP140 increases APC expression and controls intestinal
homeostasis and tumorigenesis. J Clin Invest, 2014. 124(5): p. 1899-913.
261. Sears, R., et al., Multiple Ras-dependent phosphorylation pathways regulate
Myc protein stability. Genes Dev, 2000. 14(19): p. 2501-14.
262. He, T.C., et al., Identification of c-MYC as a target of the APC pathway.
Science, 1998. 281(5382): p. 1509-12.
263. Knudsen, E.S. and J.Y. Wang, Targeting the RB-pathway in cancer therapy.
Clin Cancer Res, 2010. 16(4): p. 1094-9.
264. Kim, W.Y. and N.E. Sharpless, The regulation of INK4/ARF in cancer and
aging. Cell, 2006. 127(2): p. 265-75.
265. Yang, J., et al., Identification of the acyltransferase that octanoylates ghrelin,
an appetite-stimulating peptide hormone. Cell, 2008. 132(3): p. 387-96.
266. Gutierrez, J.A., et al., Ghrelin octanoylation mediated by an orphan lipid
transferase. Proc Natl Acad Sci U S A, 2008. 105(17): p. 6320-5.
267. Zhao, T.J., et al., Ghrelin O-acyltransferase (GOAT) is essential for growth
hormone-mediated survival of calorie-restricted mice. Proc Natl Acad Sci U S
A, 2010. 107(16): p. 7467-72.
268. Gahete, M.D., et al., Metabolic regulation of ghrelin O-acyl transferase
(GOAT) expression in the mouse hypothalamus, pituitary, and stomach. Mol
Cell Endocrinol, 2010. 317(1-2): p. 154-60.
269. Khatib, M.N., et al., Ghrelin O Acyl Transferase (GOAT) as a Novel Metabolic
Regulatory Enzyme. J Clin Diagn Res, 2015. 9(2): p. LE01-5.
270. Kirchner, H., et al., GOAT links dietary lipids with the endocrine control of
energy balance. Nat Med, 2009. 15(7): p. 741-5.

186
271. Heppner, K.M., et al., The ghrelin O-acyltransferase-ghrelin system: a novel
regulator of glucose metabolism. Curr Opin Endocrinol Diabetes Obes, 2011.
18(1): p. 50-5.
272. Falsaperla, M., et al., Role of Ca 15-3 in patients with biochemically suspected
prostate cancer and multiple negative ultrasound-guided prostate biopsies.
Prostate Cancer Prostatic Dis, 2003. 6(1): p. 45-9.
273. Theyer, G., et al., Measurements of free and total PSA, tissue polypeptide-
specific antigen (TPS), and CYFRA 21-1 in prostate cancer patients under
intermittent androgen suppression therapy. Prostate, 1999. 41(2): p. 71-7.
274. Gallagher, E.J. and D. LeRoith, Diabetes, cancer, and metformin: connections
of metabolism and cell proliferation. Ann N Y Acad Sci, 2011. 1243: p. 54-68.
275. Bhindi, B., et al., Dissecting the association between metabolic syndrome and
prostate cancer risk: analysis of a large clinical cohort. Eur Urol, 2015. 67(1):
p. 64-70.
276. Larsen, M.L., M. Horder, and E.F. Mogensen, Effect of long-term monitoring
of glycosylated hemoglobin levels in insulin-dependent diabetes mellitus. N
Engl J Med, 1990. 323(15): p. 1021-5.
277. Thomas, C.E., et al., Urine collection and processing for protein biomarker
discovery and quantification. Cancer Epidemiol Biomarkers Prev, 2010.
19(4): p. 953-9.
278. Barratt, J. and P. Topham, Urine proteomics: the present and future of
measuring urinary protein components in disease. CMAJ, 2007. 177(4): p. 361-
8.
279. Hormaechea-Agulla., D., et al., Ghrelin O-acyltransferase (GOAT) enzyme is
overexpressed in prostate cancer wherein is associated with the metabolic
status: potential value as non-invasive biomarker. Cancer letters; accepted.,
2016.
280. Schellekens, H., et al., Promiscuous dimerization of the growth hormone
secretagogue receptor (GHS-R1a) attenuates ghrelin-mediated signaling. J Biol
Chem, 2013. 288(1): p. 181-91.
281. Dubois, C., et al., Remodeling of channel-forming ORAI proteins determines
an oncogenic switch in prostate cancer. Cancer Cell, 2014. 26(1): p. 19-32.
282. Chakravarti, A., et al., Prognostic value of p16 in locally advanced prostate
cancer: a study based on Radiation Therapy Oncology Group Protocol 9202. J
Clin Oncol, 2007. 25(21): p. 3082-9.
283. Aoki, K. and M.M. Taketo, Adenomatous polyposis coli (APC): a multi-
functional tumor suppressor gene. J Cell Sci, 2007. 120(Pt 19): p. 3327-35.

187
284. Chen, P.H., et al., Nuclear receptor interaction protein, a coactivator of
androgen receptors (AR), is regulated by AR and Sp1 to feed forward and
activate its own gene expression through AR protein stability. Nucleic Acids
Res, 2008. 36(1): p. 51-66.
285. Xiao, Q. and G. Ge, Lysyl oxidase, extracellular matrix remodeling and cancer
metastasis. Cancer Microenviron, 2012. 5(3): p. 261-73.
286. Miyake, H., et al., Overexpression of insulin-like growth factor binding protein-
5 helps accelerate progression to androgen-independence in the human prostate
LNCaP tumor model through activation of phosphatidylinositol 3'-kinase
pathway. Endocrinology, 2000. 141(6): p. 2257-65.
287. Barker, H.E., T.R. Cox, and J.T. Erler, The rationale for targeting the LOX
family in cancer. Nat Rev Cancer, 2012. 12(8): p. 540-52.
288. Miyake, H., M. Pollak, and M.E. Gleave, Castration-induced up-regulation of
insulin-like growth factor binding protein-5 potentiates insulin-like growth
factor-I activity and accelerates progression to androgen independence in
prostate cancer models. Cancer Res, 2000. 60(11): p. 3058-64.

188

Original Article
Ghrelin O-acyltransferase (GOAT) enzyme is overexpressed in prostatecancer, and its levels are associated with patient's metabolic status:Potential value as a non-invasive biomarker
Daniel Hormaechea-Agulla a, b, c, d, e, Enrique G�omez-G�omez a, c, f,Alejandro Ib�a~nez-Costa a, b, c, d, e, Julia Carrasco-Valiente a, c, f, Esther Rivero-Cort�es a, b, c, d, e,Fernando L-L�opez a, b, c, d, e, Sergio Pedraza-Arevalo a, b, c, d, e, Jos�e Valero-Rosa a, c, f,Rafael S�anchez-S�anchez a, c, g, Rosa Ortega-Salas a, c, g, María M. Moreno a, c, g,Manuel D. Gahete a, b, c, d, e, Jos�e L�opez-Miranda a, c, d, h, María J. Requena a, c, f,Justo P. Casta~no a, b, c, d, e, **, Raúl M. Luque a, b, c, d, e, *
a Maimonides Institute of Biomedical Research of C�ordoba (IMIBIC), C�ordoba, Spainb Department of Cell Biology, Physiology and Immunology, University of C�ordoba, C�ordoba, Spainc Hospital Universitario Reina Sofía (HURS), C�ordoba, Spaind CIBERobn, C�ordoba, Spaine ceiA3, C�ordoba, Spainf Urology Service, HURS, C�ordoba, Spaing Anatomical Pathology Service, HURS, C�ordoba, Spainh Lipids and Atherosclerosis Unit, HURS, C�ordoba, Spain
a r t i c l e i n f o
Article history:Received 9 July 2016Received in revised form1 September 2016Accepted 2 September 2016
Keywords:GOAT-enzymeGhrelinProstate cancerBiomarkerDiagnosisDiabetes
a b s t r a c t
Ghrelin-O-acyltransferase (GOAT) is the key enzyme regulating ghrelin activity, and has been proposedas a potential therapeutic target for obesity/diabetes and as a biomarker in some endocrine-relatedcancers. However, GOAT presence and putative role in prostate-cancer (PCa) is largely unknown. Here,we demonstrate, for the first time, that GOAT is overexpressed (mRNA/protein-level) in prostatic tissues(n ¼ 52) and plasma/urine-samples (n ¼ 85) of PCa-patients, compared with matched controls [healthyprostate tissues (n ¼ 12) and plasma/urine-samples from BMI-matched controls (n ¼ 28), respectively].Interestingly, GOAT levels in PCa-patients correlated with aggressiveness and metabolic conditions (i.e.diabetes). Actually, GOAT expression was regulated by metabolic inputs (i.e. In1-ghrelin, insulin/IGF-I) incultured normal prostate cells and PCa-cell lines. Importantly, ROC-curve analysis unveiled a valuablediagnostic potential for GOAT to discriminate PCa at the tissue/plasma/urine-level with high sensitivity/specificity, particularly in non-diabetic individuals. Moreover, we discovered that GOAT is secreted byPCa-cells, and that its levels are higher in urine samples from a stimulated post-massage vs. pre-massageprostate-test. In conclusion, plasmatic GOAT levels exhibit high specificity/sensitivity to predict PCa-presence compared with other PCa-biomarkers, especially in non-diabetic individuals, suggesting thatGOAT holds potential as a novel non-invasive PCa-biomarker.
© 2016 Elsevier Ireland Ltd. All rights reserved.
Introduction
Prostate cancer (PCa) is the secondmost common cancer type inmen [1]. PCa detection and management is mainly based in the use
of circulating biomarkers. Specifically, prostate specific antigen(PSA) is the main biomarker used in clinical diagnosis of PCa; how-ever, its use is controversial because, in many cases, leads to over-diagnosis and unnecessary treatment of indolent cancers [2,3].Consequently, identification of novel, more specific and sensitivediagnostic/prognostic PCa biomarkers seem to be necessary [2].
There is now compelling evidence that severe metabolic alter-ations (i.e. metabolic-syndrome/diabetes/obesity) are tightly linkedto increased risk of cancer [4e7], including PCa [8]. Actually, recentstudies claim that presence of metabolic-syndrome should be
* Corresponding author. Maimonides Institute of Biomedical Research of C�ordoba(IMIBIC), C�ordoba, Spain.** Corresponding author. Maimonides Institute of Biomedical Research of C�ordoba(IMIBIC), C�ordoba, Spain.
E-mail addresses: [email protected] (J.P. Casta~no), [email protected] (R.M. Luque).
Contents lists available at ScienceDirect
Cancer Letters
journal homepage: www.elsevier .com/locate/canlet
http://dx.doi.org/10.1016/j.canlet.2016.09.0220304-3835/© 2016 Elsevier Ireland Ltd. All rights reserved.
Cancer Letters 383 (2016) 125e134

included in clinical assays for predicting PCa-risk, and diabetesshould be one of the main parameters to be considered [9]. In linewith this, several endocrine/metabolic factors known to be alteredin diabetes/obesity, such as some components of the ghrelin-system, have also been associated to PCa [10,11]; however, theirpotential utility as biomarkers in PCa management has not beenestablished hitherto.
The ghrelin system comprises a pleiotropic and complexnetwork composed of several peptides, including native-ghrelinand In1-ghrelin [12], and receptors (GHSR1a/b), involved in theregulation of multiple patho-physiological processes (i.e. glucose/insulin-homeostasis, hormonal-release, cell-proliferation, etc.)[13]. Native-ghrelin and In1-ghrelin peptides share the initial 13aminoacids (aa) sequence, which can be acylated (addition of anoctanoyl-group at the Ser-3) by the ghrelin-O-acyl-transferase(GOAT) enzyme [12,14,15]. This acylation is required for native-ghrelin to bind and activate GHSR1a, and to exert thereby many
of its functions [14,15]. Interestingly, several studies demonstratethat GOAT could play a key role in obesity/diabetes [16,17] [18e21],and may be relevant in coordinating the neuroendocrine responseto metabolic stress, in that its expression can be finely regulated bythe energy status (i.e. expression elevated in fasting and inhibitedin obesity [22]), and by key metabolic factors (i.e. leptin increases[22] while insulin decreases GOAT expression [23]).
GOAT is mainly expressed in stomach and pancreas, but also in anumber of additional tissues, including the prostate [24,25], and itslevels are directly correlated with body mass index (BMI) in plasma[26]. Of note, our group and others have demonstrated that GOAT isoverexpressed in some tumoral tissues, like breast [24], pituitary[12,27] and neuroendocrine tumors (NETs) [28], compared withnormal tissues. However, very limited data is still available on GOATin PCa [25]. Therefore, here we sought to analyze, for the first time:1) the presence of GOAT in selected PCa-samples [invasive (bi-opsies; mRNA and protein levels) and non-invasive (protein levels
Table 1Demographic, clinical, anatomopathological characteristics and qPCR data from patients with high-risk PCa (needle biopsies) and normal prostate controls(Cystoprostatectomy).
Overall Control PCa p-value
Patients, n� 64 12 52 e
Age at diagnosisMedian (IQR) 76 (68.2e81.7) 70 (61.5e81) 78 (69e81.7) 0.39
WeightMean (SD) 77.5 (12.6) 76.9 (12.4) 77.7 (13) 0.87
BMIMean (SD) 28.1 (4.7) 27.9 (4.5) 28.2 (4.9) 0.85
PSA level, ng/mlMedian (IQR) e e 54.5 (37.2e212) e
Dyslipidemia 17/64 (26%) 3/12 (25%) 14/52 (27%) 0.99Diabetes 15/64 (23%) 3/12 (25%) 12/52 (23%) 0.99Gleason score7 e e 18/52 (35%) e
>7 e e 34/52 (65%) e
Extraprostatic extension e e 17/52 (33%) e
Perineural infiltration e e 27/52 (52%) e
Metastasis e e 24/52 (46%) e
N� samples (%) in which GOAT was detected 60/64 (96%) 12/12 (100%) 48/52 (92%) 0.99
PCa ¼ prostate cancer; n� ¼ Number.
Table 2Demographic and clinical characteristic of patients included in the study of plasmatic and urine levels of GOAT.
Parameter Overall Control (n ¼ 28) PCa (n ¼ 85) p value
Age, yr, mean (SD) 67.11 (9.1) 62.04 (9.6) 68.7 (8.3) 0.0005Weight, kg, mean (SD) 82.31 (12.52) 84.56 (14.21) 81.5 (11.9) 0.27BMI, mean (SD) 29.52 (4.01) 30.46 (4.4) 29.2 (3.8) 0.16Ethnicity, (n�) Caucasian (111), Black (2) Caucasian (27), Black (1) Caucasian (84), Black (1) e
Glycated hemoglobin (%), median (IQR) 5.6 (5.3e6.1%) 5.6% (5.3e6.7%) 5.6% (5.2e6%) 0.4Glucose, mg/dl, median (IQR) 105 (93.5e125.5) 109 (97.25e130.8) 102 (92e121.5) 0.15Insulin, m U/l, median (IQR) 7.05 (4.8e11.3) 6.2 (3.3e10.7) 8.9 (5.5e11.4) 0.045Diabetes, n� (%) Non-diabetics (84), diabetics (34) 9/28 (32.12%) 25/85 (29.4%) 0.81Dyslipidemia, n� (%) Non-dislipidemic (88), dislipidemic (25) 5/28 (17.85%) 20/85 (23.95%) 0.60Testosterone ng/ml 5.14 (3.72e5.93) 5.3 (4.1e6.7) 4.8 (3.7e5.8) 0.16Total PSA, ng/ml, median (IQR) 5 (1.77e8.23) 0.8 (0.4e1.1) 6.3 (3.8e9.5) <0.0001Free PSA, ng/ml, median (IQR) e e 0,81 (0.5e1.1) e
Invasive tumors e e 14/85 (16%)Gleason score, n� (%) e
6 e e 41/85 (48%)7 e e 38/85 (45%)8 e e 5/85 (6%)9 e e 1/85 (1%)
cyfra_21-1 U/ml, mean (SD) 1.4 (1.1e1.9) 1.2 (1-1,80) 1,4 (1.1e2.1) 0.18ca_15-3 U/ml, mean (SD) 17 (12e23) 12 (7e21.7) 19 (14e24) 0.046
PCa: prostate cancer; Yr ¼ year; SD ¼ standard deviation; Kg ¼ kilograms; cm ¼ centimeter; BMI ¼ body mass index; n� ¼ number; IQR ¼ interquartile range.Italic values represent significant difference in the parameter between PCa patients and control patients.
D. Hormaechea-Agulla et al. / Cancer Letters 383 (2016) 125e134126

in plasma and urine)] compared with normal-control samples; 2) ifGOAT expression/levels correlated with clinical/metabolic status(body-weight, BMI, diabetes, etc.) and with aggressiveness features(PSA levels, metastasis, etc.) of the patients; and 3) if GOAT issecreted from prostate cells, and whether its expression levels inprostate can be regulated by relevant metabolic factors (i.e. ghrelin,insulin, IGF-I) by using primary normal prostate cell cultures and/orPCa cell lines as model.
Materials and methods
Patients and samples
Three different sets of samples were included in the study. First, fresh PCa pieces(n ¼ 52) obtained by core needle biopsies from patients diagnosed with clinicalhigh-grade PCa (NCNN-guidelines) and samples from control patients without PCa(n¼ 12), who underwent cystoprostatectomy due to bladder-cancer, were collected.Experienced pathologists classified all these samples as normal/tumoral (Table 1).Second, plasma and urine samples from PCa patients (n¼ 85) and from healthy BMI-matched controls (n ¼ 28) were collected (Table 2). Third, urine samples werecollected before and after prostate massage in another cohort of PCa-patients(n ¼ 14) (Table 3). In all cohorts, demographic/clinical parameters regarding tu-mor aggressiveness andmetabolic status were collected. The study was approved bythe Hospital/University Ethics-Committees and written informed consent frompatients was obtained. All samples were obtained through the Andalusian-Biobank(Servicio Andaluz de Salud).
For more details of this and others materials/methods used (Reagents; Primarynormal prostate cultures; GOAT IHC analysis; Normal-like prostate cell-line andprostate cancer cell-lines, Determination of GOAT expression in prostatic tissues byquantitative real-time RT-PCR (qPCR) and of plasma/urine levels by ELISA; Statis-tics), see Supplemental-Information [27e31].
Results
GOAT is overexpressed in PCa tissues in comparison to normaltissues wherein it is associated with metabolic-clinical parameters
qPCR analysis performed in PCa-tissues from patients diagnosedwith clinical high-grade PCa revealed that GOAT was expressed in92% (n¼ 48/52; Table 1) of the samples, and that its expressionwasmarkedly increased in PCa compared to non-tumor control tissues(p ¼ 0.024; Fig. 1A). ROC analysis showed that GOAT expressionsignificantly discriminated between PCa and controls subjects
(AUC ¼ 0.714; p ¼ 0.021; a cut-off of 262 mRNA copies/50 ng cDNApresented 70.59% sensitivity and 66.67% specificity; Fig. 1B). Theclinical/pathological features of this cohort of patients are includedin Table 1. No correlation was found between GOAT mRNA levelsand presence of metastasis, Gleason-score or circulating PSA levels(Supplemental Fig. S1A); in contrast, GOAT expression was directlycorrelated with some metabolic-clinical parameters, such as body-weight and BMI, in PCa-patients (Fig. 1CeD), but not in controls(Supplemental Fig. S1B). Moreover, GOAT expression tended to behigher in PCa patients with dyslipidemia (p ¼ 0.084; Fig. 1E) and infact, a significantly greater proportion of patients with high GOATexpression levels presented dyslipidemia (Fig. 1F).
Subsequently, GOAT-IHC was performed on FFPE-prostatesharboring normal and tumoral regions obtained from radicalprostatectomies (n ¼ 4) of patients diagnosed with localized PCa(Gleason score 6e7), which revealed stronger GOAT staining in thetumoral vs. benign glands (Fig. 1G). Interestingly, high-magnification images showed perineural-infiltration by tumoralprostate glands with high cytoplasmic (granular) and nuclearGOAT-staining, suggesting that GOAT overexpression could beassociated with a malignant event in PCa. Due to the small set ofFFPE samples available, we next implemented IHC analyses in asubset of the biopsies from the cohort of clinical high-grade PCasamples described above (n ¼ 16), which included normal-benignprostate regions. These analyses revealed that GOAT staining wasvery weak in normal-benign prostate samples (cytoplasmic-stain-ing; Fig. 1H) compared with the intense staining found in PCasamples [staining located at cytoplasmic (granular-staining) andnuclear level of the cancerous prostate-glands; Fig. 1HeI]. Thisstaining in PCa samples seems to be specific for tumoral regionssince the staining of the stromal cells within the tumor microen-vironment was negative for GOAT (Fig. 1I). Interestingly, GOATstaining appeared to be associated to GOAT mRNA levels and,tended to be stronger in patients with higher Gleason-score(p ¼ 0.088; Fig. 1J) and in patients with metastasis (p ¼ 0.079;Fig. 1K).
GOAT is expressed, secreted and regulated by metabolic factors innormal and tumoral prostate cells
GOAT mRNA expression was higher in PCa cell-lines (LnCaP/22Rv1/DU-145) compared with normal prostate cell line RWPE1 ornormal prostate primary cells (Fig. 2A; n � 3 from different cellpreparations), supporting our previous data indicating that GOAT isoverexpressed in PCa-tissues compared to normal-tissues (Fig. 1A).Moreover, PCa-cells (22Rv1 and PC3) were capable to secrete GOATprotein into the media (Fig. 2B), being this secretion higher in22Rv1 vs. PC3-cells (1.641 vs. 1.163 ng/ml, respectively; p ¼ 0.005;n > 3), which is in agreement with the higher GOAT mRNA levelsobserved in 22Rv1 vs. PC3 (Fig. 2A). Interestingly, treatment withIn1-ghrelin (In1-19) [27], but not native-ghrelin significantlyincreased GOAT expression in 22Rv1, but not in PC3 cells (Fig. 2C-D;n ¼ 3), and in normal prostate primary cell cultures (Fig. 2E; n ¼ 3).Conversely, treatment with key metabolic factors such as insulinand IGF-I, or their combination, decreased GOAT expression in PCa-cells (p < 0.001; Fig. 2F; n � 3).
Plasma GOAT levels are elevated in patients with PCa in comparisonto healthy controls: association with clinical-metabolic parameters
Plasmatic GOAT levels were elevated in PCa patients comparedwith controls (Fig. 3A). Clinical/pathological features of this patientcohort are summarized in Table 2. It should be noted that PCa-patients had similar body-weight and BMI but presented aslightly higher age than control-patients (~6 years; Table 2).
Table 3Demographic and clinical characteristic of patients included in the study ofurine GOAT levels after prostate massage.
Parameter PCa
Age, yr, mean (SD) 68.1 (7.1)Weight, kg, mean (SD) 79.2 (9.9)BMI, mean (SD) 28.8 (3.2)Ethnicity, (n�) Caucasian (14)Glycated hemoglobin, (%) 5,4 (5.2e5.8%)Glucose, mg/dl, mean (SD) 92.7 (8.4)Insulin, m U/l, mean (SD) 8,6 (2.6)Diabetes, n� 0/14Dyslipidemia, n� 0/14Testosterone ng/ml, mean (SD) 4.6 (2.2)Total PSA, ng/ml, median (IQR) 5.9 (4.6e9.7)Free PSA, ng/ml, mean (SD) 0.9 (0.3)Invasive tumors, n� (%) 2/14 (14%)Gleason score, n� (%)6 3/14 (21%)7 9/14 (64%)8 1/14 (7%)9 1/14 (7%)
cyfra_21-1 U/ml, mean (SD) 1.6 (0.8)ca_15-3 U/ml, mean (SD) 16.1 (6.9)
PCa: prostate cancer; Yr ¼ year; SD ¼ standard deviation; Kg ¼ kilograms;cm ¼ centimeter; BMI ¼ body mass index; n� ¼ number; IQR ¼ interquartilerange.
D. Hormaechea-Agulla et al. / Cancer Letters 383 (2016) 125e134 127

D. Hormaechea-Agulla et al. / Cancer Letters 383 (2016) 125e134128

Nevertheless, we implemented general linear models, whichdemonstrated that this difference was not responsible for the al-terations in plasmatic GOAT levels observed. Furthermore, whenplasma GOAT levels were corrected by age, higher GOAT levels wereclearly evident in PCa vs. control-patients (p ¼ 0.002). Moreover,ROC-analysis showed the diagnostic potential for GOAT at theplasma level (p < 0.0001; AUC ¼ 0.752; Fig. 3B), wherein a value of1.22 ng/ml of GOAT plasma levels could discriminate between PCavs. control-patients with a specificity of 67,8% and a sensitivity of81,1%.
Interestingly, plasmatic GOAT levels were associated withseveral pathophysiological factors. Specifically, GOAT levels weredirectly associated with total PSA levels and inversely correlatedwith free PSA (Fig. 3C), and also associated positively with twocancer biomarkers (ca_15-3 and cyfra_21-1; Fig. 3D). Moreover, ahigher frequency of infiltrative tumors was found in patients withhigher plasmatic GOAT levels (Fig. 3E).
We next analyzed the putative relationship between plasmaticlevels of GOAT and several metabolic parameters (i.e. BMI, diabetes,dyslipidemia, etc.). Although we did not find correlations betweenGOAT plasma levels and BMI or weight in control and PCa patients(Supplemental Fig. S2A), we observed that GOAT levels of control-patients (without PCa) were significantly higher in diabetic sub-jects compared with non-diabetic patients (Fig. 3F), whereas nodifferences were found in plasmatic GOAT levels in control-patientswith and without dyslipidemia (Fig. 3G). Consistent with theseresults, plasmatic GOAT levels in control-patients were positivelycorrelated with the levels of glycated hemoglobin (HbA1c; Fig. 3H)and glucose (Fig. 3I), two well-known clinical markers of diabetes.Accordingly, a significantly higher proportion of patients withdiabetes, but not with dyslipidemia, was found in control-patientswith high plasmatic GOAT levels compared to those with low GOATlevels (Fig. 3J). In contrast, plasmatic GOAT levels were similar indiabetic vs. non-diabetic patients with PCa (Fig. 3K). A trend forelevation in plasmatic GOAT levels was found in patients with PCathat had dyslipidemia compared to those without dyslipidemia(p ¼ 0.06; Fig. 3L). A positive correlation between plasmatic GOATlevels was also found with HbA1c, but not with glucose levels inPCa-patients (Fig. 3M and N, respectively). Indeed, a higher pro-portion of patients with diabetes as well as with dyslipidemia werefound in PCa-patients having high plasmatic GOAT levels vs. PCa-patients with low GOAT levels (Fig. 3O).
Plasma GOAT levels as a non-invasive diagnostic marker of PCa innon-diabetic individuals
Based on the previous results, we next interrogated whetherplasmatic GOAT levels could be a more specific PCa marker in non-diabetic patients. Plasmatic GOAT levels were higher in non-diabetic PCa-patients vs. control-patients (p < 0.001; Fig. 3P).Indeed, the area under curve was considerably improved whenanalyzing only non-diabetic PCa-patients [value of 0.854 (Fig. 3P/Q;only non-diabetic) vs. 0.752 (Fig. 3A/B; diabeticþ non-diabetic)]. In
addition, the specificity/sensitivity to discriminate the presence ofPCa was significantly higher when only the non-diabetic in-dividuals were considered [a cut-off value of 1.142 ng/ml presenteda specificity and sensitivity of 84.2% and 86.7% (Fig. 3Q/P) vs. 67.8%and 81.1% analyzing non-diabetic þ diabetic patients (Fig. 3A/B)].Interestingly, plasmatic GOAT levels also positively correlated withtotal PSA (Fig. 3R), negatively with free PSA levels (Fig. 3S) andpositively with the cancer biomarker ca_15-3 (Fig. 3T) and, alsoexhibited a similar positive tendency with HbA1c (p ¼ 0.080;Fig. 3U).
Urine GOAT levels are elevated in patients with PCa in comparison tohealthy-control patients: potential value as non-invasive biomarker
Urine GOAT levels were also significantly elevated in the samecohort of PCa-patients vs. control-patients (Fig. 4A; Table 2).Actually, ROC-curve analysis showed that urine GOAT levels coulddiscriminate between PCa vs. control-patients (Fig. 4B; p < 0.001,AUC ¼ 0,716; a cut-off value of 1.061 ng/ml presented a sensitivityof 75% and specificity of 61%). Remarkably, this sensitivity/speci-ficity was lower than that found with plasmatic GOAT levels and,although the underlying reasons (likely, sampling procedures,urine processing, etc.) are still not defined, and thus furtherinvestigation is warranted. Interestingly, no correlations werefound between GOAT urine levels and metabolic parameters (BMI,body weight, diabetes or dyslipidemia) in control or PCa patients(Supplemental Fig. S2B), suggesting that GOAT urine levels are notinfluenced by these parameters. Furthermore, urine GOAT secretionwas increased after a prostate-massage in an additional cohort ofPCa-patients (Table 3) compared to the same cohort of subjectsbefore prostate-massage (Fig. 4C).
Discussion
The introduction of PSA as a routine clinical marker led to animproved early detection of PCa and, thus, to an increment in PCasurvival [1]. However, PSA-based screening for PCa has generatedconsiderable debate because its diagnostic performance is poor,considering that elevated PSA levels may be driven by benignconditions (i.e. prostatic hyperplasia or prostatitis) [2]. Prostatecancer antigen 3 (PCA3) has been proposed as the most prominentbiomarker emerging as a non-PSA-based diagnostic test for PCa;however, unfortunately PCA3 has also serious limitations (i.e.reduced sensitivity than PSA) [32]. Therefore, identification ofnovel, alternative, biomarkers for clinical diagnosis of PCa (ideallynon-invasive) is urgently needed to improve and/or complementPSA/PCA3 screening.
Current evidence supports the necessity of implementingmore personalized diagnosis and management strategies forcancer patients, in that inter-individual differences such as al-terations in metabolic environment (i.e. diabetes and/ormetabolic-syndrome) could be key to identify and deploy noveldiagnostic biomarkers [2]. In this scenario, the enzyme GOAT
Fig. 1. Analyses of the presence of GOAT in PCa tissues. A. GOAT mRNA expression was determined in a battery of 52 PCa samples compared to 12 normal prostates (Control).Absolute mRNA levels were determined by qPCR and adjusted by a normalization factor (NF) calculated from the expression levels of two housekeeping genes (ACTB and GAPDH);B. Receiver operating characteristic (ROC) curve analysis to determine the accuracy of GOAT expression as diagnostic test to discriminate between patients with PCa and controls; C.GOAT mRNA expression and body weight correlation in patients with PCa; D. GOAT mRNA expression and BMI correlation in patients with PCa; E. GOAT mRNA expression inpatients with dyslipidemia; F. Frequencies of dyslipidemia observed in two groups of PCa patients with low or high GOAT expression levels (according to median GOAT levels)(DL ¼ patients with dyslipidemia, NDL ¼ Patients without dyslipidemia); G. IHC analysis of GOAT in a representative FFPE-PCa sample with benign and tumor glands at 40e400�magnification. The image shows higher intensity of GOAT staining in tumor glands vs benign glands, and intense GOAT staining in nerves infiltrated by tumor cells. HeK. GOAT IHCanalysis in 16 biopsies from patients with high risk PCa; H. GOAT IHC staining in prostate biopsies with benign glands (BG; left-panel) or tumor glands (TG; right-panel) at100e200� magnification; I. Cytoplasmic and nuclear GOAT staining in a tumoral gland at 800� magnification; J. Comparison of GOAT IHC score [low (1), moderate (2) or high (3)GOAT staining] with Gleason-score; K. Comparison of GOAT IHC score with presence of metastasis. In all cases, data represent mean ± SEM. Asterisks (*p < 0.05; **p < 0.01;***p < 0.001) indicate values that significantly differ from the corresponding controls.
D. Hormaechea-Agulla et al. / Cancer Letters 383 (2016) 125e134 129

Fig. 2. Regulation of GOAT expression by metabolic factors. A. GOAT mRNA expression in normal prostate primary cell cultures, normal-like prostate cell line (RWPE-1) or PCa celllines (androgen-dependent: LnCaP, 22Rv1 and VCaP or androgen-independent: PC3 and DU-145). Asterisks (*, p < 0.05) indicate differences in GOAT mRNA expression betweenRWPE-1 and PCa cell lines, while dashes (##, p < 0.01; ###, p < 0.001) indicate differences in GOAT mRNA expression between normal prostate primary cell cultures and PCa celllines; B. GOAT protein secretion from 22Rv1 and PC3 cell lines (after 24 h-culture) determined by a specific ELISA kit (n ¼ 3). Asterisks (**, p < 0.01) indicate values that significantlydiffer from 22Rv1; C. Regulation of GOAT mRNA expression after treatment (10 nM) with ghrelin or In1-ghrelin (In1-19) peptides in 22Rv1 (n ¼ 3); D. Regulation of GOAT mRNAexpression after treatment (10 nM) with ghrelin or In1-ghrelin (In1-19) peptides in PC3 (n ¼ 3); E. Regulation of GOAT mRNA expression after treatment (10 nM) with ghrelin orIn1-ghrelin (In1-19) peptides in normal prostate primary cell cultures, (n ¼ 3); F. Regulation of GOAT mRNA expression after treatment (10 nM) with IGF-1, Insulin or both (IGF-1 þ Insulin; n � 3). Absolute mRNA levels of GOAT were determined by qPCR and adjusted by the expression levels of a housekeeping gene (ACTB). In expression experiments inresponse to treatment, asterisks (*, p < 0.05; ***, p < 0.001) indicate values that significantly differ from controls. In all cases, data represent mean ± SEM of n � 3 independentexperiments.
D. Hormaechea-Agulla et al. / Cancer Letters 383 (2016) 125e134130

might become of particular relevance in PCa [14,15], for itscritical role in whole body metabolism [18], and its wide bodilyexpression, which is finely regulated by changes in the metabolicenvironment in human-tissues [22,24], and is clearly dysregu-lated in different tumoral-tissue types (i.e. breast cancer)compared with normal-tissues [24,27,28]. In line with this, wedemonstrate herein, for the first time, that GOAT expression ismarkedly altered in PCa-samples (mRNA/protein) comparedwith control prostate samples (normal/benign-tissues). Indeed,ROC curve analysis indicated that GOAT mRNA could predict PCawith a high sensitivity and specificity, suggesting that GOATlevels might represent a novel, promising PCa biomarker. GOATprotein expression showed a trend to be higher in PCa-tissueswith high Gleason-score and with metastasis, suggesting thatGOAT might be associated to malignant features in PCa. Theseresults partially differ from those reported in a previous studywhere GOAT mRNA expression was not altered in PCa-tissues vs.control-samples [25]; however, it is possible that such differ-ences may be related to the type of control sample used (i.e.healthy prostate-samples in our study vs. adjacent non-tumoralregion of adenocarcinomas of prostate used in the previousstudy, which could be derived, at least in some cases, fromprostates harboring high-grade multifocal PCa), or to thedifferent primer set used to amplify GOAT in the qPCR, and/or tothe precise characteristic of the primers (length/product-size/GC-content, etc.), which were not fully reported in that study.Nevertheless, our current observations are also partially consis-tent with this report [25] because both studies observed thatGOAT-enzyme is significantly overexpressed in several PCa cell-lines vs. normal prostate cells, supporting the idea that GOATexpression might be up-regulated in different stages of the PCa-disease. Moreover, our data compares favorably with previousreports indicating that GOAT is overexpressed in other tumoral-tissues compared with normal-tissues, including human neuro-endocrine [28], pituitary [27] and breast [24] tumors, suggestingthat GOAT overexpression could be a common cellular signatureacross various endocrine-related tumors.
Interestingly, our data shows that GOAT is secreted by PCa-cells, and that its expression might be directly associated withits release, since GOAT secretion was significantly higher in theculture medium of 22Rv1 vs. PC3-cells, in a manner consistentwith their expression levels (22Rv1 > PC3). Indeed, IHC-analysisof GOAT in PCa-samples revealed that GOAT-staining at thecytoplasmic level was granular, supporting the idea that thisenzyme could be associated to a secretory mechanism in PCa-cells. Importantly, GOAT expression was found to be specificallyregulated by key endocrine/metabolic factors (i.e. In1-ghrelin,but not native-ghrelin) in PCa-cells and in normal prostate cell-cultures, suggesting that GOAT production could be functionallylinked to In1-ghrelin at the prostate level. In fact, this closerelationship between In1-ghrelin and GOAT expression has beenreported previously in other cancers [24,28]. Hence, since In1-ghrelin is usually overexpressed in several endocrine-relatedtumors [24,27,28], it is conceivable that In1-ghrelin, ratherthan native-ghrelin, could be the main substrate of GOAT-enzyme in these cancers, including PCa. Furthermore, otherkey metabolic factors (i.e. insulin/IGF-1) also modulated GOATexpression levels in PCa-cells, which might be associated withthe positive correlation found in this study between GOATexpression levels and body-weight/BMI in PCa patients, a similarassociation to that recently reported for circulating GOAT levelsin normal weight, anorexic and obese subjects [26].
Interestingly, GOAT expression was higher in PCa-patients withdyslipidemia, and a greater proportion of PCa-patients withdyslipidemia presented high-GOAT mRNA levels compared withpatients with low-GOAT expression levels. Altogether, our resultssuggest the existence of a clear association between changes inGOAT expression levels and alterations in metabolic conditionsin PCa-patients (i.e. body-weight/BMI/dyslipidemia), an idea thatis in accordance with previous studies demonstrating the linkbetween GOAT levels, lipid-metabolism and whole body-energybalance [21,33,34].
The results obtained hitherto prompted us to questionwhetherGOAT levels could represent a suitable non-invasive biomarker forPCa under normal and/or altered metabolic conditions (i.e. dia-betes or dyslipidemia). In fact, plasmatic and urine GOAT levelswere higher in PCa-patients compared with healthy-control in-dividuals. Moreover, in PCa-patients, plasma GOAT levels corre-lated positively with circulating total-PSA (and negatively withfree-PSA) as well as with other cancer markers (ca_15-3/cyfra_21-1) used to monitor other tumors (breast and lung cancer,respectively), and which have been proposed as possible PCabiomarkers in conjunction with PSA [35,36]. Therefore, althoughwe could not unequivocally determine a direct association be-tween prostate and plasma/urine GOAT levels, due to the use ofdifferent patient's cohorts, the results presented herein indicatethat prostate GOAT tissue-expression (mRNA/protein) andplasma/urine GOAT protein levels are consistently and concomi-tantly elevated in PCa samples. Indeed, ROC-curve analysisdemonstrated that GOAT mRNA levels could predict PCa with ahigh sensitivity/specificity and, most importantly, that plasma andurine GOAT levels also showed a good sensitivity (81.1% and 75%,respectively) and specificity (67.8% and 61%, respectively) for PCa-detection. Altogether, our data indicate that GOAT levels couldrepresent a promising novel diagnostic biomarker (invasive andnon-invasive) for PCa.
There is increasing evidence that the alterations in theendocrine/metabolic milieu should be considered to appropri-ately stratify the patients, as well as to evaluate the diagnostic,prognostic and therapeutic potential of novel biomarkers in tu-moral pathologies, including PCa. In this context, there is evi-dence that circulating GOAT levels depend on the metabolicenvironment (i.e. low levels in anorexic and high levels in obese-patients [26]), and, most importantly, as shown here, that GOATexpression is directly associated with dysregulations inmetabolic-conditions (i.e. BMI/dyslipidemia) in PCa, an observa-tion that is in line with reports showing that altered endocrine/metabolic status (i.e. diabetes/metabolic-syndrome/BMI, etc.) isassociated with the development/progression of several cancer-types [8], including PCa [9]. Accordingly, we hypothesized thatplasmatic GOAT levels in PCa-patients would also be linked to themetabolic status. Interestingly, we did find that GOAT plasmalevels were higher in individuals with alterations in glucose-metabolism (i.e. diabetes and/or dyslipidemia), and were posi-tively correlated with the percentage of glycated-hemoglobin, agold standard for monitoring glycemic control [37], in bothcontrol and PCa-individuals. Actually, irrespective of the pres-ence of PCa, high plasma GOAT levels were associated with ahigher proportion of diabetic and/or dyslipidemic patients, sug-gesting that dysregulated glucose-metabolism (diabetes) mightbe a confounding factor masking the potential of GOAT todiscriminate between control and PCa-patients when the wholepopulation (non-diabetic/diabetic-patients) is considered.Therefore, we then sought to determine the potential of GOAT as
D. Hormaechea-Agulla et al. / Cancer Letters 383 (2016) 125e134 131

D. Hormaechea-Agulla et al. / Cancer Letters 383 (2016) 125e134132

PCa-biomarker after stratification of the patient cohort based onthe presence of diabetes. Remarkably, when only non-diabeticindividuals are considered, we discovered that plasmatic GOATlevels are able to precisely discriminate the presence of PCa withhigh sensitivity and specificity. These data clearly support thenotion that alterations in endocrine/metabolic milieu is a criticalfactor to ensure an adequate patient stratification and to assessthe diagnostic, prognostic and therapeutic potential of novelbiomarkers in cancer, including PCa, as it is strongly suggested bythe data presented herein for plasma GOAT levels as a novel,suitable complementary PCa diagnostic test, especially for non-diabetic individuals.
A final point of interest relates to the presence of GOAT in urine.The discovery that prostate cells are able to secrete GOAT, being thissecretion significantly higher in PCa cell-lines, we posited whetherthere is a potential utility of GOAT urine levels for the diagnosis ofPCa, in that proteins in urine are mainly derived from epithelialcells in the urinary-tract [38,39]. Indeed, changes in urine proteincan reflect a dysfunction of cells within the urinary-tract betterthan those in blood samples, which are deeply influenced by ho-meostatic mechanisms [38,39]. In support to this notion, our resultsdemonstrate that urine GOAT levels were also higher in PCa-patients compared with controls, showing a high specificity andsensitivity to diagnose PCa-patients. Thus, the data presentedherein indicate that GOAT might represent a novel non-invasivePCa-biomarker in urine (wherein it is not severely influenced bythe metabolic status).
To the best of our knowledge, the present report provides thefirst systematic analysis of the presence of the enzyme GOAT indifferent types of human prostate samples (invasive and non-invasive) obtained from patients with and without PCa, and in
relation to the clinical andmetabolic parameters of the patients (i.e.presence of metastasis, diabetes, dyslipidemia, etc.). Altogether, ourresults show, for the first time, that GOAT-enzyme can be directlysecreted by PCa-cells and is consistently overexpressed in samplesfrom PCa-patients (tissue/plasma/urine), where its expression isdrastically conditioned by the metabolic-status. Since GOATexpression showed a high sensitivity/specificity in PCa-detection,especially in non-diabetic patients, we propose that it might beconsidered as a novel non-invasive PCa-biomarker alone or incombination with other biomarkers to provide a better PCa-diagnosis.
Fundings
This work was funded by Instituto de Salud Carlos III and FondosFEDER (PI13-00651, PI14/00005; co-funded by European RegionalDevelopment Fund/European Social Fund “investing in yourfutute”) MINECO (BFU2013-43282-R), Junta de Andalucía (BIO-0139, CTS-1406, PI-0639-2012, PI-0541-2013), and CIBERobn. CIBERis an initiative of Instituto de Salud Carlos III, Ministerio de Sanidad,Servicios Sociales e Igualdad, Spain.
Statement of author contributions
R.M.L and D.H conceived and designed the project. D.H, E.G, A.I,J.C.V, E.R, F.L, S.P, J.V.R, M.D.G and R.M.L acquired the data. D.H, E.G,A.I, J.C.V, E.R, F.L, S.P, J.V.R, R.S, R.O, M.M.M, M.D.G, J.L.M, M.J.R, J.P.Cand R.M.L performed the analysis and interpretation of data. D.Hand R.M.L wrote themanuscript. E.G, A.I, S.P, M.D.G and J.P.C revisedthe manuscript for important intellectual content. D.H, E.G, A.I,M.D.G and R.M.L performed the statistical analysis. R.M.L, M.D.G
Fig. 3. Analysis of the presence of GOAT in the plasma of patients with PCa and controls. A. GOAT plasmatic levels were determined by ELISA in a cohort of 85 PCa patients and 28controls; B. Receiver operating characteristic (ROC) curve analysis to determine the accuracy of GOAT plasmatic levels as diagnostic test to discriminate between patients with PCaand controls; C. Correlation of plasma levels of GOAT and total PSA (tPSA) and free PSA (FPSA) levels in PCa patients; D. Correlation of plasma levels of GOAT with ca_15-3 andcyfra_21-1 tumor markers in PCa patients; E. Frequencies of infiltrative tumors observed in PCa patients with low vs. high GOAT plasmatic levels (according to median GOAT levels;IN ¼ infiltrating tumors; NI ¼ No infiltrating tumors); FeJ. Correlations of plasma GOAT levels with metabolic factors in controls; KeO. Correlations of plasma GOAT levels withmetabolic factors in PCa patients (C-NDM: Controls without diabetes mellitus; C-DM: Controls with diabetes mellitus; PCa-NDM: PCa patients without diabetes mellitus; PCa-DM:PCa patients with diabetes mellitus; C-NDL: Controls without dyslipidemia; C-DL: Controls with dyslipidemia; PCa-NDL: PCa patients without dyslipidemia; PCa-DL: PCa patientswith dyslipidemia; Low GOAT: patients with low plasmatic GOAT levels; High GOAT: patients with high plasmatic GOAT levels); P. GOAT plasmatic levels in non-diabetic PCapatients (n ¼ 60) compared to non-diabetic (n ¼ 19) controls measured by ELISA; Q. Receiver operating characteristic (ROC) curve analysis to determine the accuracy of plasmaGOAT levels as diagnostic test to discriminate between PCa and controls patients within the population without diabetes; R. Correlations between plasma GOAT levels and total PSAin non-diabetic patients with PCa; S. Correlations between plasma GOAT levels and free PSA in non-diabetic patients with PCa; T. Correlations between plasma GOAT levels andca_15-3 in non-diabetic patients with PCa; U. Correlations between plasma GOAT levels and HbA1c in non-diabetic patients with PCa. In all cases, data represent mean ± SEM.Asterisks (*, p < 0.05; **, p < 0.01, ***, p < 0.001) indicate values that significantly differ between groups.
Fig. 4. Evaluation of GOAT levels as a non-invasive PCa diagnostic marker in urine. A. GOAT urine levels in a population of 85 PCa patients compared to 28 normal controlsdetermined by ELISA; B. ROC curve analysis to determine the accuracy of GOAT urine levels to discriminate between PCa and control patients; C. Percentage of the increase of GOATurine secretion after prostate massage in PCa patients (n ¼ 14) from an additional cohort of patients. In all cases, data represent mean ± SEM. Asterisks (*p < 0.05; **p < 0.01,***p < 0,001) indicate values that significantly differ between groups.
D. Hormaechea-Agulla et al. / Cancer Letters 383 (2016) 125e134 133

and J.P.C obtained funding's. F.L, E.R, R.S, R.O, M.M.M, J.L.M andM.J.Rprovided technical and material support. J.P.C and R.M.L supervisedthe work.
Disclosure statement
The authors have nothing to disclose.
Appendix A. Supplementary data
Supplementary data related to this article can be found at http://dx.doi.org/10.1016/j.canlet.2016.09.022.
Conflict of interest statement
The authors have nothing to disclose.
References
[1] J. Ferlay, I. Soerjomataram, R. Dikshit, S. Eser, C. Mathers, M. Rebelo, et al.,Cancer incidence and mortality worldwide: sources, methods and majorpatterns in GLOBOCAN 2012, Int. J. Cancer 136 (2015) E359eE386.
[2] J.R. Prensner, M.A. Rubin, J.T. Wei, A.M. Chinnaiyan, Beyond PSA: the nextgeneration of prostate cancer biomarkers, Sci. Transl. Med. 4 (2012) 127rv123.
[3] L. Esserman, Y. Shieh, I. Thompson, Rethinking screening for breast cancer andprostate cancer, J. Am. Med. Assoc. 302 (2009) 1685e1692.
[4] G. De Pergola, F. Silvestris, Obesity as a major risk factor for cancer, J. Obes.2013 (2013) 291546.
[5] D. Fukumura, J. Incio, R.C. Shankaraiah, R.K. Jain, Obesity and cancer: anangiogenic and inflammatory link, Microcirculation 23 (2016) 191e206.
[6] E.H. Allott, S.D. Hursting, Obesity and cancer: mechanistic insights fromtransdisciplinary studies, Endocr. Relat. Cancer 22 (2015) R365eR386.
[7] E.H. Allott, E.M. Masko, S.J. Freedland, Obesity and prostate cancer: weighingthe evidence, Eur. Urol. 63 (2013) 800e809.
[8] E.J. Gallagher, D. LeRoith, Diabetes, cancer, and metformin: connections ofmetabolism and cell proliferation, Ann. N. Y. Acad. Sci. 1243 (2011) 54e68.
[9] B. Bhindi, J. Locke, S.M. Alibhai, G.S. Kulkarni, D.S. Margel, R.J. Hamilton, et al.,Dissecting the association between metabolic syndrome and prostate cancerrisk: analysis of a large clinical cohort, Eur. Urol. 67 (2015) 64e70.
[10] R.C. Travis, P.N. Appleby, R.M. Martin, J.M. Holly, D. Albanes, A. Black, et al.,A meta-analysis of individual participant data reveals an association betweencirculating levels of IGF-I and prostate cancer risk, Cancer Res. 76 (8) (2016April 15) 2288e2300.
[11] L.K. Chopin, I. Seim, C.M. Walpole, A.C. Herington, The ghrelin axisedoes ithave an appetite for cancer progression? Endocr. Rev. 33 (2012) 849e891.
[12] M.D. Gahete, D. Rincon-Fernandez, A. Villa-Osaba, D. Hormaechea-Agulla,A. Ibanez-Costa, A.J. Martinez-Fuentes, et al., Ghrelin gene products, receptors,and GOAT enzyme: biological and pathophysiological insight, J. Endocrinol.220 (2014) R1eR24.
[13] T.D. Muller, R. Nogueiras, M.L. Andermann, Z.B. Andrews, S.D. Anker,J. Argente, et al., Ghrelin, Mol. Metab. 4 (2015) 437e460.
[14] J. Yang, M.S. Brown, G. Liang, N.V. Grishin, J.L. Goldstein, Identification of theacyltransferase that octanoylates ghrelin, an appetite-stimulating peptidehormone, Cell 132 (2008) 387e396.
[15] J.A. Gutierrez, P.J. Solenberg, D.R. Perkins, J.A. Willency, M.D. Knierman, Z. Jin,et al., Ghrelin octanoylation mediated by an orphan lipid transferase, Proc.Natl. Acad. Sci. U. S. A. 105 (2008) 6320e6325.
[16] O. Gualillo, F. Lago, C. Dieguez, Introducing GOAT: a target for obesity andanti-diabetic drugs? Trends Pharmacol. Sci. 29 (2008) 398e401.
[17] B.P. Barnett, Y. Hwang, M.S. Taylor, H. Kirchner, P.T. Pfluger, V. Bernard, et al.,Glucose and weight control in mice with a designed ghrelin O-acyltransferaseinhibitor, Science 330 (2010) 1689e1692.
[18] T.J. Zhao, G. Liang, R.L. Li, X. Xie, M.W. Sleeman, A.J. Murphy, et al., Ghrelin O-acyltransferase (GOAT) is essential for growth hormone-mediated survival ofcalorie-restricted mice, Proc. Natl. Acad. Sci. U. S. A. 107 (2010) 7467e7472.
[19] C.X. Yi, K.M. Heppner, H. Kirchner, J. Tong, M. Bielohuby, B.D. Gaylinn, et al.,The GOAT-ghrelin system is not essential for hypoglycemia prevention duringprolonged calorie restriction, PLoS One 7 (2012) e32100.
[20] G. Yamada, H. Ariyasu, H. Iwakura, H. Hosoda, T. Akamizu, K. Nakao, et al.,Generation of transgenic mice overexpressing a ghrelin analog, Endocrinology151 (2010) 5935e5940.
[21] H. Kirchner, J.A. Gutierrez, P.J. Solenberg, P.T. Pfluger, T.A. Czyzyk,J.A. Willency, et al., GOAT links dietary lipids with the endocrine control ofenergy balance, Nat. Med. 15 (2009) 741e745.
[22] M.D. Gahete, J. Cordoba-Chacon, R. Salvatori, J.P. Castano, R.D. Kineman,R.M. Luque, Metabolic regulation of ghrelin O-acyl transferase (GOAT)expression in the mouse hypothalamus, pituitary, and stomach, Mol. CellEndocrinol. 317 (2010) 154e160.
[23] W. An, Y. Li, G. Xu, J. Zhao, X. Xiang, L. Ding, et al., Modulation of ghrelin O-acyltransferase expression in pancreatic islets, Cell Physiol. Biochem. 26(2010) 707e716.
[24] M.D. Gahete, J. Cordoba-Chacon, M. Hergueta-Redondo, A.J. Martinez-Fuentes, R.D. Kineman, G. Moreno-Bueno, et al., A novel human ghrelinvariant (In1-ghrelin) and ghrelin-O-acyltransferase are overexpressed inbreast cancer: potential pathophysiological relevance, PLoS One 6 (2011)e23302.
[25] I. Seim, P.L. Jeffery, L. de Amorim, C.M. Walpole, J. Fung, E.J. Whiteside, et al.,Ghrelin O-acyltransferase (GOAT) is expressed in prostate cancer tissues andcell lines and expression is differentially regulated in vitro by ghrelin, Reprod.Biol. Endocrinol. 11 (2013) 70.
[26] M. Goebel-Stengel, T. Hofmann, U. Elbelt, P. Teuffel, A. Ahnis, P. Kobelt, et al.,The ghrelin activating enzyme ghrelin-O-acyltransferase (GOAT) is present inhuman plasma and expressed dependent on body mass index, Peptides 43(2013) 13e19.
[27] A. Ib�a~nez-Costa, M.D. Gahete, E. Rivero-Cort�es, D. Rincon-Fernandez, R. Nelson,M. Beltran, et al., In1-ghrelin splicing variant is overexpressed in pituitary ad-enomas and increases their aggressive features, Sci. Rep. 5 (2015) 8714.
[28] R.M. Luque, M. Sampedro-Nunez, M.D. Gahete, A. Ramos-Levi, A. Ibanez-Costa,E. Rivero-Cortes, et al., In1-ghrelin, a splice variant of ghrelin gene, is asso-ciated with the evolution and aggressiveness of human neuroendocrine tu-mors: evidence from clinical, cellular and molecular parameters, Oncotarget 6(2015) 19619e19633.
[29] J. Vandesompele, K. De Preter, F. Pattyn, B. Poppe, N. Van Roy, A. De Paepe, etal., Accurate normalization of real-time quantitative RT-PCR data by geo-metric averaging of multiple internal control genes, Genome Biol. 3 (2002).RESEARCH0034.
[30] A.S. Goldstein, J.M. Drake, D.L. Burnes, D.S. Finley, H. Zhang, R.E. Reiter, et al.,Purification and direct transformation of epithelial progenitor cells fromprimary human prostate, Nat. Protoc. 6 (2011) 656e667.
[31] C.C. Uphoff, H.G. Drexler, Detection of mycoplasma contaminations, MethodsMol. Biol. 946 (2013) 1e13.
[32] A. Haese, A. de la Taille, H. van Poppel, M. Marberger, A. Stenzl, P.F. Mulders, etal., Clinical utility of the PCA3 urine assay in European men scheduled forrepeat biopsy, Eur. Urol. 54 (2008) 1081e1088.
[33] M.N. Khatib, S. Gaidhane, A.M. Gaidhane, P. Simkhada, Q.S. Zahiruddin,Ghrelin O acyl transferase (GOAT) as a novel metabolic regulatory enzyme,J. Clin. Diagn Res. 9 (2015) LE01e05.
[34] K.M. Heppner, J. Tong, H. Kirchner, R. Nass, M.H. Tschop, The ghrelin O-acyltransferase-ghrelin system: a novel regulator of glucose metabolism, Curr.Opin. Endocrinol. Diabetes Obes. 18 (2011) 50e55.
[35] M. Falsaperla, G. Morgia, B. Giammusso, S.V. Condorelli, A. Saita, F. Marchese,et al., Role of Ca 15-3 in patients with biochemically suspected prostate cancerand multiple negative ultrasound-guided prostate biopsies, Prostate CancerProstatic Dis. 6 (2003) 45e49.
[36] G. Theyer, A. Durer, U. Theyer, I. Haberl, E. Ulsperger, G. Baumgartner, et al.,Measurements of free and total PSA, tissue polypeptide-specific antigen (TPS),and CYFRA 21-1 in prostate cancer patients under intermittent androgensuppression therapy, Prostate 41 (1999) 71e77.
[37] M.L. Larsen, M. Horder, E.F. Mogensen, Effect of long-term monitoring ofglycosylated hemoglobin levels in insulin-dependent diabetes mellitus,N. Engl. J. Med. 323 (1990) 1021e1025.
[38] C.E. Thomas, W. Sexton, K. Benson, R. Sutphen, J. Koomen, Urine collection andprocessing for protein biomarker discovery and quantification, Cancer Epi-demiol. Biomarkers Prev. 19 (2010) 953e959.
[39] J. Barratt, P. Topham, Urine proteomics: the present and future of measuringurinary protein components in disease, CMAJ 177 (2007) 361e368.
D. Hormaechea-Agulla et al. / Cancer Letters 383 (2016) 125e134134


![Mediation and Therapeutic Jurisprudence: Looking at Mediation through the Therapeutic Lens [Hebrew]](https://img.dokumen.tips/doc/110x75/631a7948bb40f9952b020595/mediation-and-therapeutic-jurisprudence-looking-at-mediation-through-the-therapeutic.jpg)


