Embed Size (px)
Citation preview

Centre for Financial Analysis & Policy
Working Paper no. 36:
From Trade-to-Trade in US Treasuries
Mardi DUNGEY, Olan HENRY & Michael MCKENZIE May 2010

The Working Paper is intended as a mean whereby researchers’ thoughts and findings may be
communicated to interested readers for their comments. The paper should be considered
preliminary in nature and may require substantial revision. Accordingly, a Working Paper should
not be quoted nor the data referred to without the written consent of the author(s). All rights
reserved.
© 2010 Mardi Dungey, Olan Henry & Michael McKenzie
Comments and suggestions would be welcomed by the author(s).

From Trade-to-Trade in US Treasuries∗
Mardi Dungey∗N, Olan Henry+ and Michael McKenzie¨N
∗ University of TasmaniaNCFAP, University of Cambridge+ University of Melbourne
¨ University of Sydney
May 2010
Abstract
The aim of this paper is to model the trading intensity of the US Treasury
bond market which has a unique expandable limit order book which distinguishes
its structure from other asset markets. An analysis of tick data from the eSpeed
database suggests that the US bond market displays a greater degree of clustering
in trade durations than is evident in other asset markets. Duration is affected by
the presence of news particularly in the hour following the release of scheduled
news to the markets. Finally, the length of time taken to complete a given
transaction, or ‘workup’, has a measurable impact on the trade duration.
Keywords: US Treasuries, trade duration, workups, news.
JEL Classification: C22, G14.
∗We are grateful to two anonymous referees and the editor for constructive comments, RossAdams for managing the database and comments from Charlotte Christiansen, Ingrid Lo and
participants at INFINITI 2008 and the 4th Central Banking Conference on Market Microstruc-
ture in Hong Kong 2008. The authors acknowledge funding support from ARC Discovery Grant
DP0984994. Author contacts: Dungey, [email protected]; Henry, [email protected];
McKenzie, [email protected].
1

1 Introduction
The intensity of the trading process in stock and foreign exchange markets has received
considerable attention in the literature. In general, trade durations are characterised by
clustering; short (long) durations between transactions follow short (long) durations.
Market microstructure explanations for autocorrelation in durations may be found in
Easley and O’Hara (1992), Admati and Pfleiderer (1988) and Foster and Viswanathan
(1990).
The intensity of trading in US bond markets is, to the best of the authors’ knowl-
edge, undocumented. This is surprising on two fronts: first, the US bond market
is a major provider of global liquidity and an important benchmark referenced by
many market participants making it arguably the most important financial market
(see Goodhart and O’Hara, 1997). Second, the US bond market possesses unique trad-
ing arrangements which mean that characterizing its behaviour in transaction time
provides an interesting extension to the trade duration literature. Specifically, the
secondary market for US Treasuries operates under a unique expandable limit order
book whereby the volume for each trade is individually negotiated (called the ‘workup’
phase - see Section 1.1 for details). Studying the superseded voice-over protocol, Boni
and Leach (2004) examine depth discovery and price improvement, arguing that when
the order book is expandable, informed traders will use small limit orders to search
for trading counter parties. Once they have identified a dealer who has indicated a
willingness to trade, they will enter into quantity negotiations, i.e. a workup will take
place. This process affords greater anonymity to informed traders in comparison to a
conventional order book. The placement of a large limit order may signal information
to the market.1 Thus, Boni and Leach (2004) assign an informational role to workup
in that the average workup time will increase and stay high for as long as the private
signal has value. They use this in examining price and depth discovery, but do not
model trade duration or its interaction with workup.
To examine trade duration in the market for US Treasury bonds, this paper de-
velops a threshold Autoregressive Conditional Duration model (ACD). The ACD was
introduced by Engle and Russell (1998). 2 High frequency US Treasury data sampled
1An alternative strategy would be to engage in stealth trading, whereby trades are broken up into
smaller and less conspicuous lots (see Barclay and Warner, 1993).2Other applications of ACD models may be found in Engle and Russell (1997, 1998), Engle (2000),
2
over the period January 3, 2006 to October 10, 2006 is used to estimate an ACD( )
model which is then extended to include the workup period as an additional source of
information.
The threshold ACDmodel is also extended to incorporate information on the arrival
of news and the size of the news surprise, particularly around the 8.30am period, when
the majority of the important news releases occur. Regularly scheduled macroeconomic
news has been shown to have significant impact on the behaviour of agents in the bond
markets (see Fleming and Remolona, 1999, Balduzzi, Elton and Green, 2001, Green,
2004, Simpson and Ramchander, 2004, Pasquariello and Vega, 2007 for spot markets
and Kuttner, 2001 and Andersen, Bollerslev, Diebold and Vega, 2007 inter alia for
Treasury futures).
The results of this paper may be summarised as follows; We find that trade dura-
tion for US Treasuries display different properties to those documented for other asset
markets. Specifically, the US bond market displays a far greater degree of persistence
in trade durations. Further, duration is affected by the presence of news on any given
day and particularly in the hour following the scheduled release of news to the markets,
although the size of the news surprise is not found to be significant. Finally, the length
of time taken to complete a given transaction has a measurable impact on the time
between transactions. Specifically, we find that a long workup tends to be associated
with a shorter time to the next transaction. Further, the time taken to workup a trade
has a greater impact on reducing the expected adjusted duration than does the arrival
of news in the form of scheduled macroeconomic news announcements.
The remainder of this paper proceeds as follows. Section 1.1 provides a detailed
description of the trading process in the US bond market. Section 2 introduces the
dataset and characterises the data in terms of transaction size, intensity and workups.
A comprehensive examination of the data is undertaken and the analysis suggests that
the information content of news arrival, volume and workup time each have a role to
play in understanding the duration of transactions in the US Treasury market, while
news surprises do not. Building on this preliminary analysis, Section 3 proceeds to
develop and estimate a formal model of US bond market trade durations. We modify
Bauwens and Giot (2000), Zhang, Russell, and Tsay, 2001, Bauwens and Veredas (2004), Xu, Chen
and Wu (2005) and Bauwens (2006). A survey of the ACD literature may be found in Engle and
Russell (2004) and Bauwens and Hautsch (2007).
3
this model to incorporate the workups that are unique to the US Treasury market.
In the fourth section we examine a number of testable hypotheses from the literature.
Section 5 uses the estimates to build a profile of the expected duration of trades in the
market in scenarios involving news releases and workups. Finally, Section 6 concludes
the paper.
1.1 The Trading Process
Trading in US Treasury bonds begins by participants committing to trade a given
volume at a stated price by placing orders on the electronic system. Typically, orders
are for a minimum of US$1 million and the posting trader does not incur transaction
costs. When a trader hits (takes) a passive bid (ask) displayed on the system, the two
participants are committed to trade at least the posted volume at that price. They
also have a short exclusive period to negotiate additional volume, after which other
market participants may enter into the active trade to expand volume. Hence, the
volume traded is ‘expandable’ and only one trade is ever in progress at one time. A
trade ends when there is a sufficient time of inactivity, that is nobody expands volume
at the current active price. This means it is still possible to observe distinct trades at
the same price.
This electronic trade system evolved to replace the voice over protocol arrangement
of the GovPX system described for data from the 1990s in Boni and Leach (2004). In
the voice over protocol system, a single trader responded to the posted opportunity
and the two participants individually negotiated any increase in total volume at the
agreed price by phone. A number of these pairs of trading opportunities could occur
contemporaneously and thus overlapping trades and workups occurred, which Boni and
Leach (2004) use as a measure of impatience. While the voice over protocol platform
still exists, it carries negligible volume.
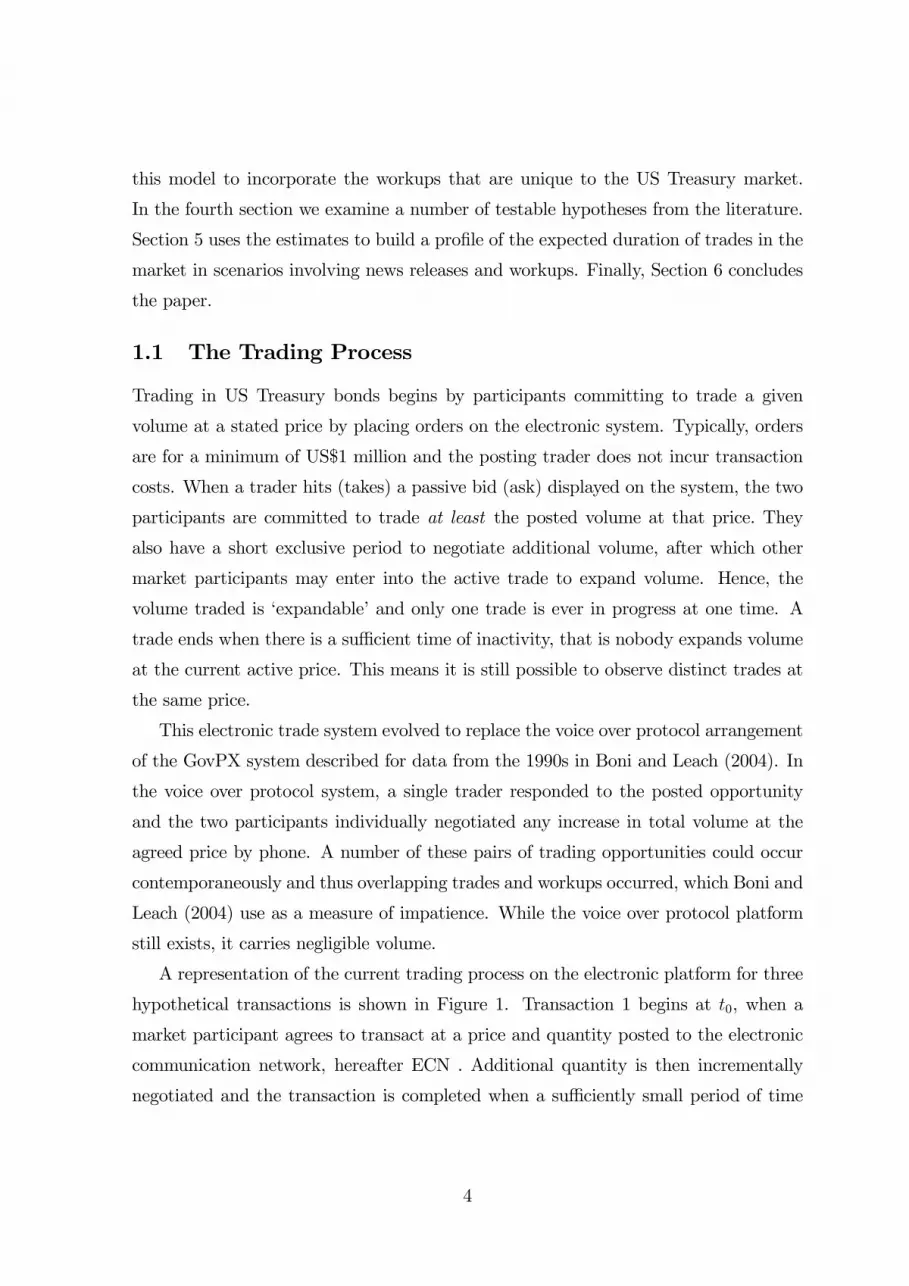
A representation of the current trading process on the electronic platform for three
hypothetical transactions is shown in Figure 1. Transaction 1 begins at 0, when a
market participant agrees to transact at a price and quantity posted to the electronic
communication network, hereafter ECN . Additional quantity is then incrementally
negotiated and the transaction is completed when a sufficiently small period of time
4

has elapsed without further deals being struck (0).3 The workup, = − is
the time between the start and finish of the transaction and may differ for every
transaction depending on the length of the negotiations over additional volume. For the
hypothetical transactions shown in the figure, the first and third transactions contain
workup, while the second transaction is for the posted volume only, with no subsequent
workup. Further, the first transaction has a shorter workup than the third transaction.
Note that the length of the workup does not necessarily reflect the size of the traded
volume and this relationship is considered more fully in Section 2.2.
Trade duration is defined in the existing foreign exchange and equity market ap-
plications as the time between initiations of sequential transactions. For consistency
this is the definition adopted here for the bond market. There are other potentially
interesting time measures in this market: the time between the ends of transactions or
the end of the previous trade and the beginning of the next. Modelling the interaction
between the different time processes is an interesting avenue for future research.
2 Descriptive Statistics
One of the most significant difficulties facing high frequency studies of US bond mar-
kets, has been obtaining a suitable sample of data. Until recently, the GovPX database
was the main source of data. The use of GovPX data however, brought with it a num-
ber of problems related to identifying trades, matching the actual bid-ask spread to
trades and, most importantly, correctly calculating the volume of trade. Since 2000
however, US bond market trading has changed significantly and is now dominated by
the ECNs of Cantor Fitzgerald and ICAP. The eSpeed (now BGCantor) and BrokerTec
databases provide trading information for each of these markets and Mizrach and Neely
(2006) find that there are qualitatively few differences between the two.4
In this paper, we draw on the eSpeed dataset, which provides 10 millisecond shots of
the transaction process (the maximum updating frequency that the traders using this
platform see in real time). We consider trading in the 2, 5 10 and 30 year benchmark
3Note that consecutive trades may be negotiated at the same price as in some circumstances it is
advantageous for a market participant to wait to initiate a new trade at the same price.4Mizrach and Neely (2006) provide details of these two US ECN bond markets. They report that
the market is split 60/40 in favour of the ICAP ECN. The more recent evidence of Jiang et al (2007)
and Dungey et al (2009) however, suggests the market is more evenly split.
5

on-the-run Treasuries over the sample period January 3, 2006 to October 10, 2006. This
yields a minimum of 116,479 observations for the 2 year maturity and a maximum of
273,898 observations for the 10 year maturity.5 The trading day is defined as beginning
at 7:30am New York time and ending at 5:30pm.
Insights into the nature of our dataset may be obtained by considering the average
total trading volume and average trade size for trades in half hour periods across the
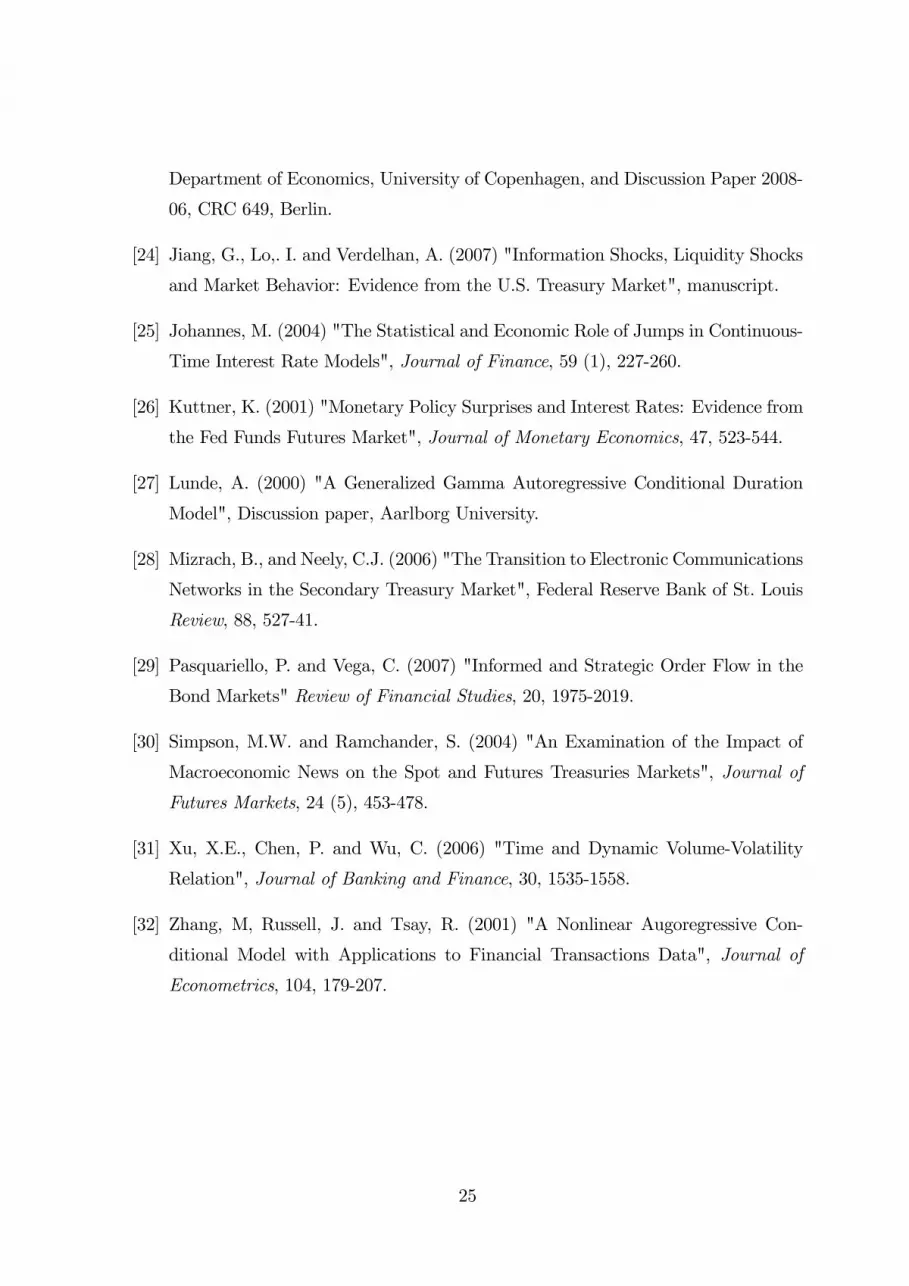
trading day (see Figures 2 and 3). The total volume traded and average trade size
both increase substantially from the open to peak at 8:30am for all maturities, with
a smaller and less pronounced peak at 10:00am. These peaks coincide with the two
scheduled major US macroeconomic news announcement times, which the previous
literature has linked to higher transaction volume and even disruptions to the pricing
process; see for example Fleming and Remolona (1997), Balduzzi et al (2001), Simpson
and Ramchander (2004), Pasquariello and Vega (2007), Andersen et al (2007) and
Dungey, McKenzie and Smith (2009).
2.1 Durations
While the eSpeed database records a great deal of information, our focus is specifically
on the time between transactions. A basic description of the trading intensity in this
dataset is given in Table 1. In the sample period, the number of trades per day averages
between 623 for the 2 year maturity to 1465 for the 10 year.6 The largest trades are
reported in the shorter 2 year maturity, where both the average and the maximum are
substantially greater than for other maturities. The smallest average and maximum
volumes are reported for the 30 year. Average and maximum trade size tend to decrease
as the term to maturity increases.
Table 1 also summarises the raw durations associated with each maturity. The 5 and
10 year bond contracts have the shortest average duration (around 24 seconds), while
the 2 year maturity exhibits the longest average duration (55.86 seconds). The average
duration for trades in half hour periods across the trading day is presented in Figure
4. From the beginning of the trading day, durations fall until 8.30am and subsequently
5Previous ACD models have been estimated with 3 months of data, see Engle and Russell (1998),
Zhang, Russell and Tsay (2001) and Bauwens and Veredas (2004).6Although Cantor-Fitzgerald’s reputation is as a long end specialist, Jiang et al (2007) compares
the total turnover by maturity across the two electronic platforms and find that any difference is
marginal.
6
lengthen as the trading day progresses, with a slight deviation at 10.00am. As has
been previously discussed, the 8.30am and 10.00am periods are the two scheduled
major macroeconomic news announcement times in the US.
The IBM equity data in Engle and Russell (1998) reveals the commonly observed
hump shape in duration across the 9:30am to 4pm period. The bond data reveals the
same diurnality in this interval. What distinguishes the bond data from the standard
trading pattern of stocks is the low trading intensity (longer durations) in the periods
prior to the stock market opening and after the stock market closing. These differences
are apparent in Figure 4.
Intradaily data is typically characterised by strong diurnality (see Engle and Russell,
2004), which may bias any estimation results. Such patterns are a clear feature of the
bond durations data. To account for these intradaily effects, we follow the approach
of, inter alia, Engle and Russell (1998, 2004) and Zhang, Russell and Tsay (2001) by
constructing diurnalised estimates of duration (and workup times). Defining the raw
duration between the and − 1 transactions as = − −1 then the adjusted
duration is:
∗ =
Φ (−1) (1)
The deterministic effect on trade durations due to the time of day is defined as the
expected duration conditioned on time-of-day Φ (−1) = (|−1). This expectationis obtained by averaging the durations over thirty minutes intervals for the trading
day. A cubic spline is employed to smooth the time of day function across the thirty
minutes intervals. By construction, the mean of ∗ is approximately 1.
A brief summary of the diurnalised duration for each maturity is presented in Table
1, and the average daily pattern of half hour adjusted duration for each maturity is
plotted in Figure 5. Figure 5 shows that the diurnal pattern in the raw durations
is removed by smoothing process described above. Table 2 presents a more detailed
summary of the adjusted durations for the 2, 5, 10 and 30 year maturities including
the number of trades (), sample average (), p-value for a test of the null of a sample
average of zero (in parenthesis) and standard deviation (2). The results of a battery
of Ljung-Box tests for order serial correlation in ∗ and the corresponding squares
are also presented in Table 2 and the results uniformly reject the null hypothesis of no
serial correlation. Thus, there is clear evidence of significant persistence in the filtered
7

data and the results show considerable structure in the adjusted durations.
2.2 Workups
For each transaction, there is potentially a period of workup. Table 1 presents a
summary of the average workup. Unlike the average of the raw durations which are
distinctly higher for the 2 and 30 year maturities, the average of the raw workup times
is similar across all maturities (approximately 2 seconds). Differences do exist however,
when comparing the range of raw workup times. The 5 and 30 year contracts have
maximum workup values that are approximately five times larger than those of the 2
and 10 year bonds. Similar to total traded volume and average trade size, the average
workup (Figure 6) increases from the open to peak at 8:30am for all maturities and then
proceeds to decline throughout the rest of the day, with the exception of a smaller and
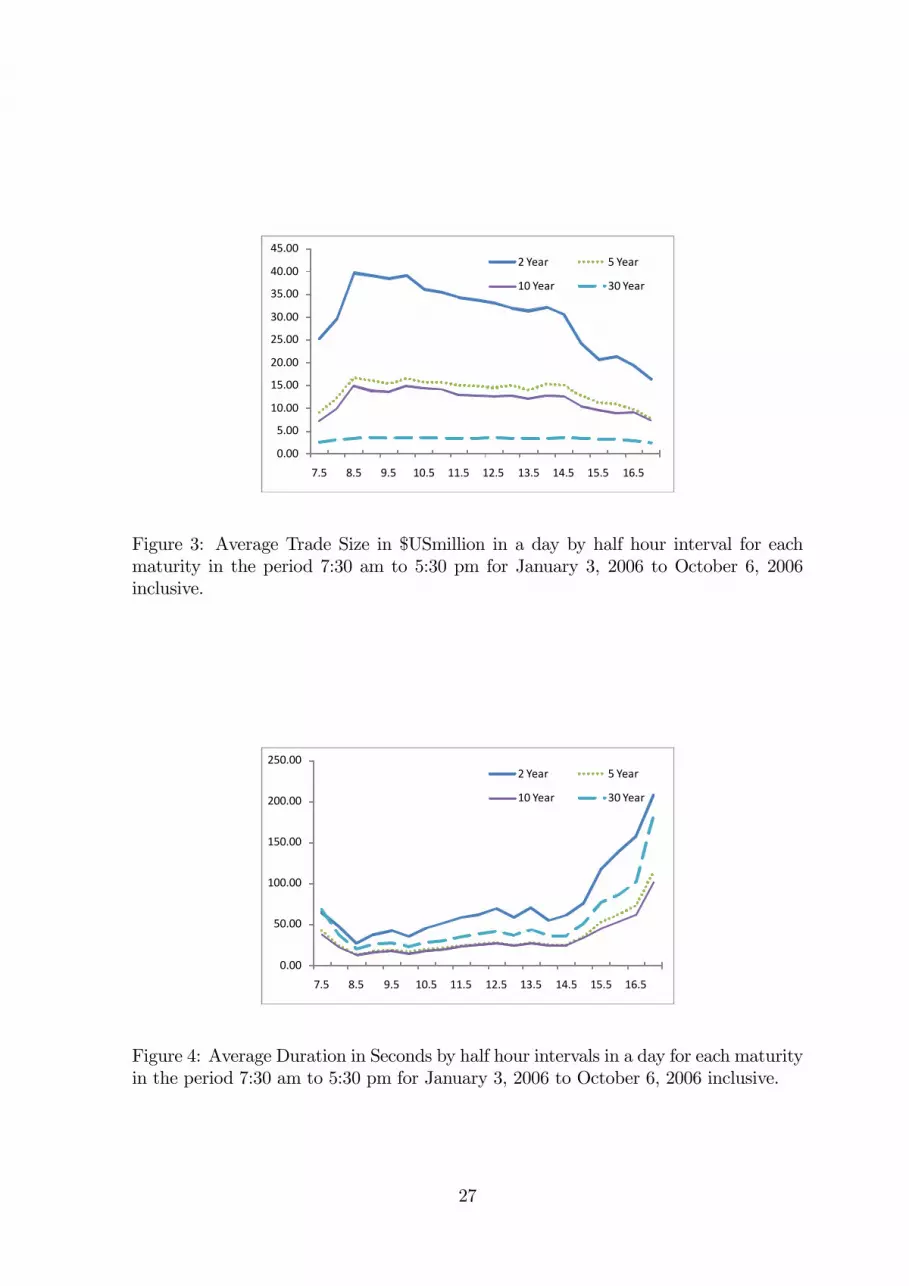
less pronounced peak at 10:00am. To account for this time dependency, we construct
diurnalised workup times, denoted ∗ . Plots of the daily average of the half hour
values of adjusted workups for each maturity are presented in Figure 7. The variation
in the adjusted workup is greatly reduced from the raw workup data, but there remains
minor visible diurnality around the end of the trading day.
Table 3 presents a detailed summary of the workup process, distinguishing between
transactions with and without a workup. The majority of trades occur without any
workup - over 60% of the transactions for the 2 and 30 year bonds and around 54%
for the 5 and 10 year bonds. Trades without workup however, are typically for small
volumes - the average size of a trade with no workup is less than half the average
trade size for the 2, 5 and 10 year notes, and under 60% of that for the 30 year bonds.
Table 3 shows that up to 76.5% of dollar volume is discovered in trades which involve
some workup. Boni and Leach (2004) report that 56.5% of the dollar volume in the
superseded voice protocol trading system, GovPX, is discovered via the workup process.
The data also suggest that larger volume does not necessarily result in more steps in
the workup process. Recall that the average length of raw workup is two and a half
seconds or less across all maturities (Table 1). When the large number of no workup
transactions are accounted for, this figure rises by only around 1 second for any given
maturity. By way of comparison, the fastest average workup time reported in Boni and
Leach (2004) using GovPX data for 1997, is over four times greater.
8

The speed at which orders are filled in the ECN is substantially faster when com-
pared to the voice protocol GovPX system. The eSpeed system does not allow over-
lapping transactions, hence the measure of impatience proposed by Boni and Leach is
not applicable in this new architecture. Boni and Leach (2004) considered overlapping
transactions (Boni and Leach, 2004, Table 2) and found substantial evidence of im-
patience with the queuing process that may result from the workup period. In their
results, they find that one third of all transactions in their 5 year bond sample have
overlap with the previous transaction, comprising some 18 percent of the total volume
traded. Further, in the event that a new transaction begins before the completion of
the previous transaction, a price improvement is likely to result.
The diurnality in workup times in Figure 6 shows a peak at 8:30am, which is the
period of greatest market activity - both in terms of total volume and average trade
size - and the lowest time between trades. An important question is the extent to
which workup is proxying for volume. It is possible that a transaction that is twice
as big may take twice a long to negotiate, in which case workup is not providing any
additional information beyond that already contained in volume. Figure 8 records the
number of transactions (log linearised vertical scale) for each trade size (measured in
$US million on the horizontal axis) for all maturities. It is immediately obvious that
the greatest number of transactions are for relatively small trade sizes and the number
of transactions generally declines as the size of transaction increases in value. There are
distinct spikes in number of transactions observed at trade sizes of $5m, $10m, $25m,
$50m, each $50m increment from $100m to $300m and then at $400m and $500m. For
larger volumes there are no further standard package sizes (Figure 8 is truncated at
$500m). These relatively standard package sizes exhibit a workup time that is generally
faster than similar sized, yet nonstandard trade volumes. For example, some of the
longer workup periods recorded in the sample are for transactions of size $219m and
$322m in the 5 year and $417m in the 30 year. In both cases there are higher volume
transactions with lower workup times.
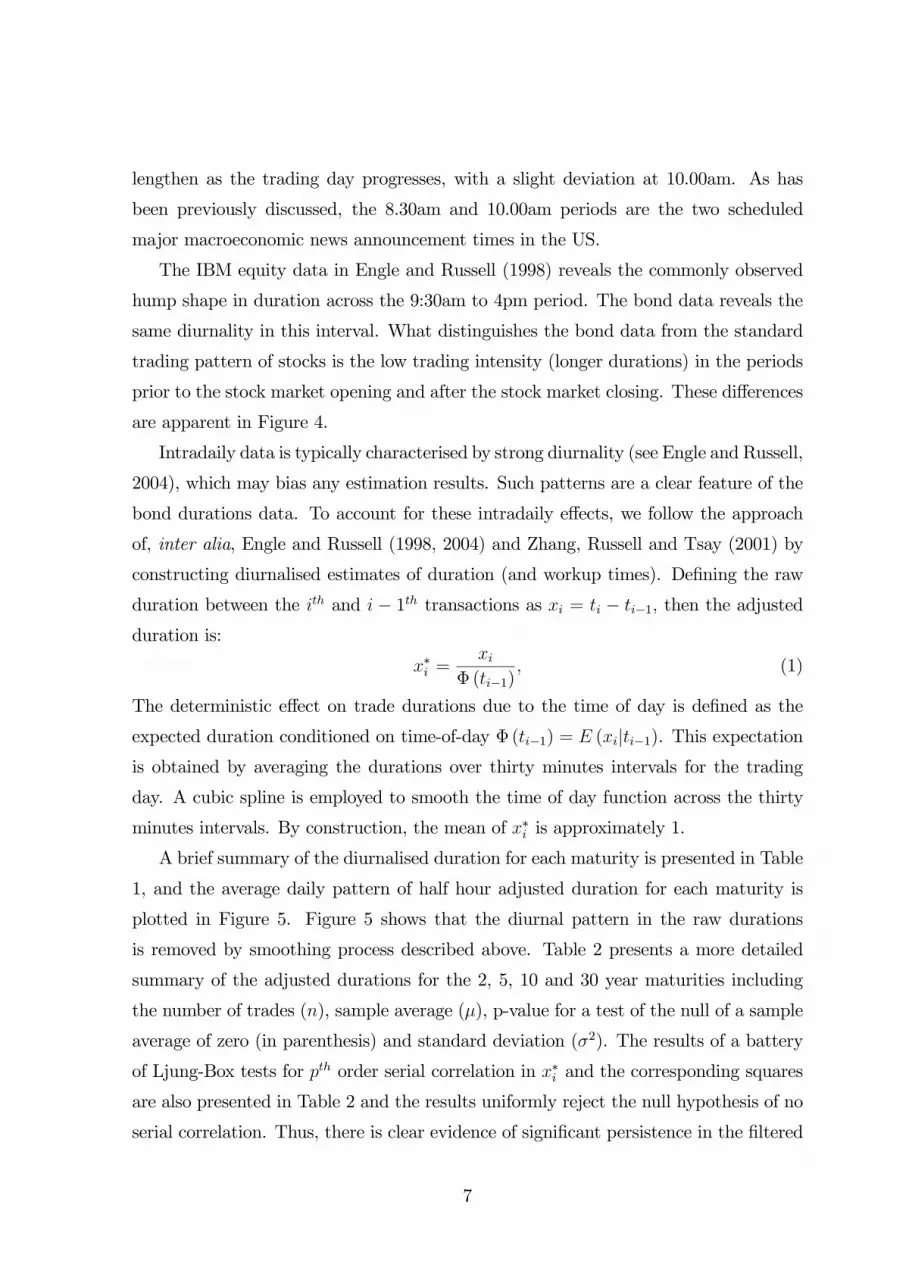
To highlight the diversity of the volume and workup relationship, we present some
illustrative examples for the 5 year maturity. Figure 9 presents the distribution of
observed workup times for transactions of different sizes - $5m, $10m, $25m and $100m
(excluding those transactions with no workup), which Figure 8 identified as being
9

common transaction sizes and represent a substantial number of trades in the database.
These histograms highlight a surprising diversity of workup times given that each
figure represents a homogenous trade size. For example, consider the histogram for
$25m transactions presented in the lower left hand panel of Figure 9. There is a clear
clustering of transactions at the 2 second mark, but there are many transactions that
take less time to negotiate and also a substantial number of $25m dollar transactions
that take longer, including a large clustering at the 4 second mark, with some taking
over 10 seconds to negotiate. The same broad characterization of the data applies to
all maturities and all transaction sizes. Based on the evidence there is enough variation
from the workup time variable after controlling for trade size to suggest that workups
may be informative about market conditions beyond measures of volume.
2.3 News Effects
A substantial body of literature exists that has focussed on the effect of presched-
uled news releases on the US Treasury market using intradaily data. Fleming and
Remolona (1997, 1999), Balduzzi et al (2001), Simpson and Ramchander (2004) and
Green (2004) all look directly at the impact of news releases on price in this market.
Johannes (2004), Andersen et al (2007) and Dungey et al (2009), inter alia, specif-
ically consider the relationship of pricing discontinuities (jumps) with news releases.
The general consensus across these papers is that these prescheduled announcements
contain important information which moves the market. Further, the sensitivity of the
bond market to an announcement is related to the size of the surprise component of
the news, which is usually measured as the difference between the anticipated value of
the economic indicator and the actual estimate. These papers also conclude that the
most important releases impacting the US Treasury markets are the 8:30am releases
of the US CPI, PPI, retail sales, housing starts, GDP, durable goods and non-farm
payrolls.
The previous analysis of durations and workups has presented clear evidence of
diurnality at 8:30am (and to a lesser extent 10.00am), which coincide with the time at
which the majority of news releases occur. This raises questions around () the extent
to which these differences are driven by the existence of news, and () whether this
seasonality is deterministic and so may be exploited for modeling purposes (we consider
10

this latter issue in the following section).
To begin the analysis, Figures 10 and 11 give the diurnal picture of the average
duration and workup time (in seconds) for the 5 year maturity Treasury for all days,
no news days and news days, where the news announcements are those listed previously.
The results for the other maturities are qualitatively consistent with those presented
and are not presented to conserve space. Figures 10 and 11 highlight the difference
between a news release day and a non-news release day in terms of trading intensity,
in particular around the 8.30am period. For news release days, the average workup
(duration) is greater (lower) at 8.30am than for any other time of the day. Where
the day does not contain a regularly scheduled release of news however, the average
workup increases at the open and is fairly constant until lunch time, at which point it
declines toward the close where the lowest average values are observed. The average
time between trades on the other hand, decreases at the open, is fairly constant until
lunch time and then progressively increases to record its highest levels at the close.
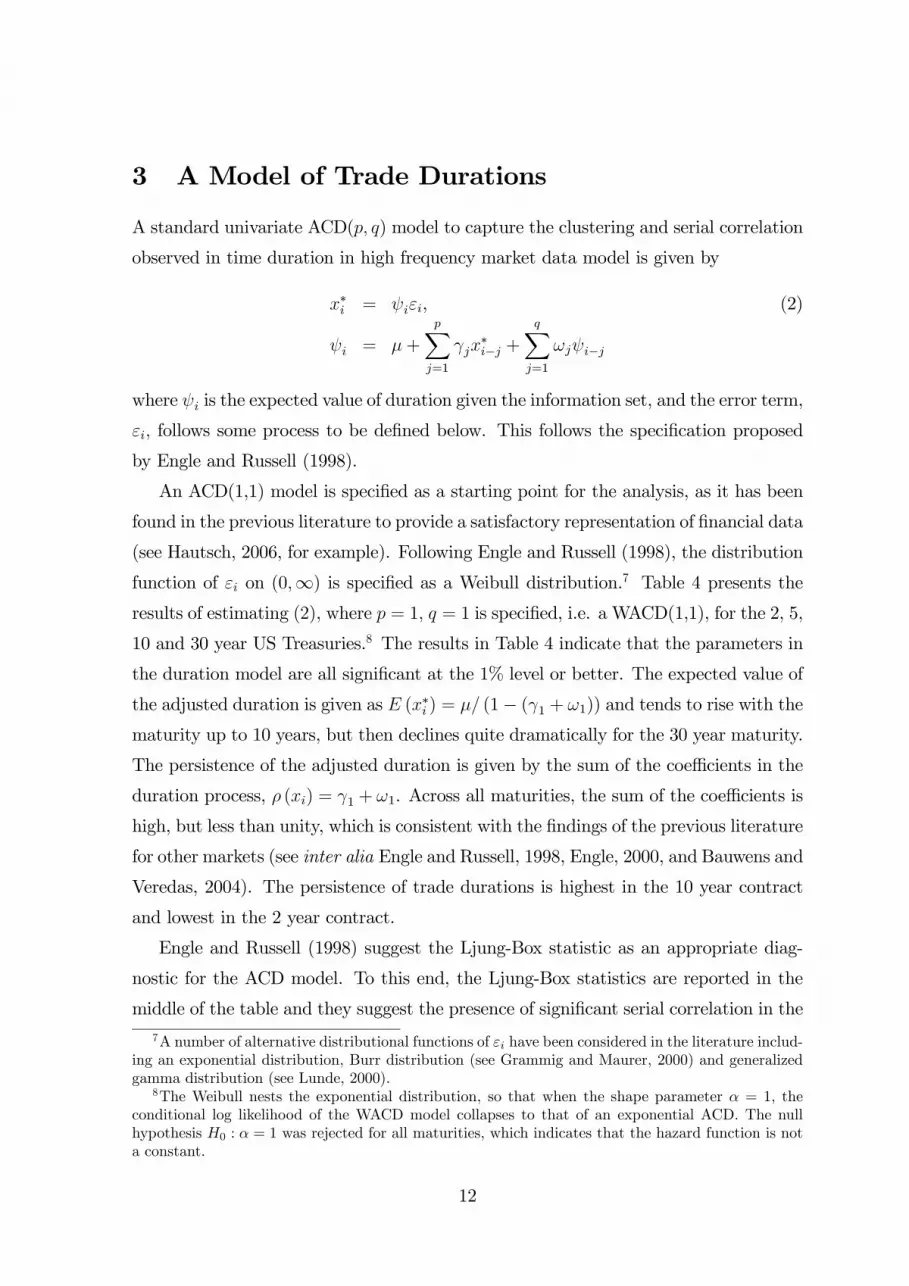
Insights into the impact of macroeconomic news announcements on bond market
trading behaviour can be garnered by considering Figure 12, which presents the dis-
tribution of workups for 5 year maturity US Treasury bond transactions on non-news
(column 1) and news (column 2) days, grouped by transaction size (rows 1 corresponds
to a transaction volume of between $5m and $10m, row 2 from $10m up to $20m, and
row 3, greater than $20m). The data for the other maturities are qualitatively similar
and are not presented to conserve space. This figure illustrates some general character-
istics of the data. First, the clustering of workup length at around 2 and 4 seconds is a
feature of both news and non-news days. Second, although the number of trades differs
across news and non-news days, there is no obvious change in the distribution of the
workup. Thus, while the earlier results suggest that news days are characterised by a
higher volume and intensity of trading, these results show that this does not translate
into any discernible difference in the characterization of the workup process across all
trades.
11
3 A Model of Trade Durations
A standard univariate ACD( ) model to capture the clustering and serial correlation
observed in time duration in high frequency market data model is given by
∗ = , (2)
= +
X=1
∗− +
X=1
−
where is the expected value of duration given the information set, and the error term,
follows some process to be defined below. This follows the specification proposed
by Engle and Russell (1998).
An ACD(1,1) model is specified as a starting point for the analysis, as it has been
found in the previous literature to provide a satisfactory representation of financial data
(see Hautsch, 2006, for example). Following Engle and Russell (1998), the distribution
function of on (0∞) is specified as a Weibull distribution.7 Table 4 presents theresults of estimating (2), where = 1 = 1 is specified, i.e. a WACD(1,1), for the 2, 5,
10 and 30 year US Treasuries.8 The results in Table 4 indicate that the parameters in
the duration model are all significant at the 1% level or better. The expected value of
the adjusted duration is given as (∗ ) = (1− (1 + 1)) and tends to rise with the
maturity up to 10 years, but then declines quite dramatically for the 30 year maturity.
The persistence of the adjusted duration is given by the sum of the coefficients in the
duration process, () = 1 + 1. Across all maturities, the sum of the coefficients is
high, but less than unity, which is consistent with the findings of the previous literature
for other markets (see inter alia Engle and Russell, 1998, Engle, 2000, and Bauwens and
Veredas, 2004). The persistence of trade durations is highest in the 10 year contract
and lowest in the 2 year contract.
Engle and Russell (1998) suggest the Ljung-Box statistic as an appropriate diag-
nostic for the ACD model. To this end, the Ljung-Box statistics are reported in the
middle of the table and they suggest the presence of significant serial correlation in the
7A number of alternative distributional functions of have been considered in the literature includ-
ing an exponential distribution, Burr distribution (see Grammig and Maurer, 2000) and generalized
gamma distribution (see Lunde, 2000).8The Weibull nests the exponential distribution, so that when the shape parameter = 1 the
conditional log likelihood of the WACD model collapses to that of an exponential ACD. The null
hypothesis 0 : = 1 was rejected for all maturities, which indicates that the hazard function is not
a constant.
12

standardised innovations and their corresponding squares. This is a common feature of
ACD modelling as several authors (Engle and Russell, 1998; Engle, 2000; Zhang, Rus-
sell, and Tsay, 2001; Fernandes and Grammig, 2006 among others) report substantial
difficulties in completely removing dependence in the residual series.
To control for the excess serial correlation in the WACDmodel, we consider a higher
order specification. The use of higher order autocorrelation structures is not unusual
as Engle and Russell (1998), for example, specified an ACD(2,2) process when mod-
eling their IBM transactions data. In the case of the bond market data, even longer
lag lengths are required to obtain a satisfactory fit. Table 5 presents the estimation
results for a WACD(5,5) model. In terms of the coefficient estimates, the WACD(5,5)
model shows an increase in the sum of the autoregressive parameters,P5
=1 when
compared to the single AR(1) parameter 1 reported in Table 4. By way of contrast
however, the clustering effects given byP5
=1 in the WACD(5,5) model are gener-
ally slightly smaller than the single clustering effects in the WACD(1,1). The expected
value of the adjusted duration, given by () = ³1−
³P5
=1 +P5
=1
´´for
the WACD(5,5) is about 25% lower than the WACD(1,1). The exception is the 30
year maturity, where the expected adjusted duration has risen by almost 4 times when
compared to the previously discussed estimate. In this case, the expected adjusted
duration for the 30 year maturity is somewhat greater than that of the other maturi-
ties. The persistence of the adjusted duration, given by the sum of all the and
parameters is not substantially different to the earlier estimates, remaining high and
tending to increase with maturity.
An examination of the diagnostics for this WACD(5,5) model reveals that, while
the Ljung-Box statistics are improved, at conventional statistical levels they continue
to reject the null of no serial correlation. Despite this rejection of the null, the test
scores are nevertheless consistent with those reported in other studies for models that
are deemed to have relatively ‘good’ performance (see Engle and Russell, 1998, inter
alia).
The analysis of the previous sections suggests that workup and the information
content of news arrival may each have a role to play in understanding the duration of
transactions in the US Treasury market. The WACD(5,5) model may be extended to
consider the impact of news arrival and the workup process on transaction duration
13

using the threshold ACD model:
∗ = , (3)
= + 1 + 2 + 3∗−1 + 4∗−1∗−1 + 5∗−1
+
X=1
∗− +
X=1
− +X
=1
¡
∗−¢
where takes the value 1 if ∗ occurs on a day with a prescheduled news announce-
ment, and zero otherwise. is a dummy variable that takes the value of 1 if ∗ occurs
between 8:30am and 9:30am on a news day. ∗−1 is a dummy variable that identifies
the presence of a workup in the previous transaction, while ∗−1 ∗−1 will take the
value of the last adjusted workup time, or zero. ∗−1 is an interaction of the
two dummy variables, identifying the impact of a workup in the previous transaction
during the news announcement period. Finally the terms in ∗− capture changes in
the persistence of a shock to trade intensity around the news announcement time.9
The period 8:30 to 9:30am is specified as it encompasses the period over which the
market responds to news - Andersen et al (2007) find that the majority of the price
impact has dissipated within 5 minutes, although volatility impact is present for 30
minutes. Balduzzi et al (2001) however, record volume and volatility responding to
news releases for up to 60 minutes. Thus, this model allows for durations to have a
different dynamic process on days with a scheduled macroeconomic news announce-
ment. The announcements used are the 8:30am releases of the US CPI, PPI, retail
sales, housing starts, GDP, durable goods and non-farm payrolls.
Equation (3) is estimated and the results are presented in Table 6 and 7. The es-
timated intercept ̂ increases with maturity. The coefficient sumsP5
=1 P5
=1
andP5
=1 are all significant indicating that the persistence of a shock to trade du-
rations may vary depending on whether the shock arrives between 8:30am and 9:30am
on a news announcement day. The Ljung-Box statistics presented in Table 7 are vastly
improved over those estimated for the standard ACD models reported earlier and there
is no evidence of misspecification. The implication of these results is that the ACD(1,1)
and ACD(5,5) models are potentially misspecified conditional characterisations of the
data. The only model that passes the diagnostic tests is the threshold ACD model
9Note that we control for end of day effects in that workups on previous transactions refer to
workups on the same day. In preliminary work, terms in ∗− and ∗−1∗− were also included
but were nowhere significant. In the interests of brevity and clarity we omit these results.
14

(3) It follows that the release of new information to the market may have significant
impact on trading intensity, causing the expected trade duration to vary systemati-
cally around the time of a scheduled news announcement. In the next section we test
a series of hypotheses about the relationship between trade durations, workups and
news announcements. Moreover, we expand (3) to consider whether surprises, and not
just announcement effects, are important determinants of the expected time interval
between trades.
4 Hypothesis Tests
Equation (3) represents a richer dynamic characterisation of trading duration than
the typical ACD( ) model. Drawing on the existing literature, we add a potential
role for announcement days, workup effects and a time of day impact associated with
the 8:30-9:30am period each day when most macroeconomic news announcements are
scheduled. In this section we test for the significance of these effects.
4.1 The joint importance of workup and news in determining
trade duration
The ACD( ) implies that the adjusted trade duration, ∗ is solely determined by
past realisations of ∗ and lags of the expected value of the trade duration, The first
test considers whether the strong implications of the ACD( ) are satisfied for our
data. To do this we conduct a test on the null hypothesis of:
10 : The correct model is a simple ACD( )
Under 10 there are no possible impacts on trade durations from either the announce-
ment of news or the presence of a workup or both. Given the results reported in Section
3 we anticipate that the null is likely to be rejected. This hypothesis is tested using a
Wald test of the restriction 10 : = = 0∀ and is distributed as 2 (10)
The calculated test statistics for each maturity reported in Table 7 are strongly sta-
tistically significant at all usual levels of confidence (marginal significance level 0.0000).
This implies that the WACD(5,5) model obtained under the restrictions would repre-
sent a misspecified conditional characterization of the data; durations are affected by
15

the presence of a workup or the announcement of news or both. We now proceed to
test each of these components separately.
4.2 The importance of workup
4.2.1 The presence of workup
The presence of workup indicates that greater volume than that initially posted at
the bid or offer is being transacted. In the first instance, we wish to test whether the
simple presence of workup is informative in modelling the trade duration. Specifically,
whether the duration between trade and the previous trade is affected by the presence
of a workup in trade −1. Green (2004) suggests that the delay imposed by the workupprocess may decrease the time to the next transaction. To this end, we examine the
null hypothesis:
20 : The presence of a workup is irrelevant
using a t-test on the significance of the coefficient 3 Rejection of the null 20 : 3 = 0
implies that the presence of a workup impacts on the duration of a trade. Table 7
reports that, with the exception of the 2 year maturity, the null hypothesis 20 is re-
jected; the presence of a workup in the previous transaction is a significant determinant
of the trade duration. For the 5, 10 and 30 year maturities a workup in the previous
transaction tends to reduce the trade duration as ̂3 is negative and significant, im-
plying that the observation of increased volume over that initially posted significantly
decreases the time to the next trade. This is consistent with the hypothesis in Green
(2004).
4.2.2 The time taken to workup
The time taken to workup may also have an effect on the interval between trades.
Extrapolating fromGreen (2004), a longer workup may cause impatience in the market,
leading to a shorter duration to the next transaction. The influence of workup time is
tested using the null hypothesis:
30 : The length of the workup time is irrelevant
16

with a t-test for the significance of the coefficient 30 : 4 = 0 For each maturity the
null hypothesis is rejected, see Table 7. There is a negative and significant relationship
between the trade duration and the workup time in the − 1 transaction. Thisevidence suggests that a longer time to finish the previous transaction via workup is
associated with a shorter duration to the current transaction.
4.2.3 The joint significance of workup
Finally we test whether there is evidence for any workup effects in total, under the null
hypothesis of:
40 : There are no workup effects
using a 2 (3) distributed Wald test of 40 : 3 = 4 = 5 = 0. This test, reported
in Table 7, also allows for the possibility of an interaction between news arrival and
workups impacting upon the duration between trades. This hypothesis of no workup
effects on duration is rejected for each maturity for all usual levels of confidence.
4.3 The importance of news announcements
There is substantial evidence of the significant impact of news announcements on
other aspects of bond market data, particularly returns and price behaviour; see Green
(2004), Fleming and Remolona (1999), Dungey et al (2009), inter alia. To date, there
has been no evidence on its effect on trading intensity. Here we conduct a number of
tests for the impact of news on the time between trades.
4.3.1 Announcement day effects
The first test for whether duration is affected by the presence of a prescheduled macro-
economic news announcement on that day is stated as the null hypothesis:
50 : News announcement days are irrelevant
Failure to reject 50 implies that the scheduled news announcement days are not un-
usual. This hypothesis is tested using a t-ratio test of the restriction 50 : 1 = 0. The
results reported in Table 7 fail to reject this null hypothesis for all maturities - there is
17

no evidence that trade durations are different for days with and without a scheduled
news announcement.
4.3.2 Announcement time effects
Prescheduled macroeconomic news announcements in the US market occur primarily
at 8:30am. Estimates of the length of the impact of this news on price discovery in
the bond market vary and may be as long as 60 minutes (Balduzzi et al, 2001). A
diurnality effect is observed in Figure 4 in the period around 8:30am, and here we test
whether the 60 minute period following the news announcement time in the market
has a significant effect on trade duration using the null hypothesis of:
60 : News announcement time is irrelevant
The restriction 60 : 1 = 2 = = 0∀ is tested with a Wald test distributed as
2 (7). The results reported in Table 7 suggest 60 is rejected for all but the 5 year
maturity at the 5% level of confidence.
4.4 The effects of News Surprises
The results presented in the previous section, suggest that the time of a news an-
nouncement is a significant determinant of trade duration. We now proceed to consider
whether the degree to which new information has been anticipated by the market is
an important determinant of the expected duration between transactions. Much of the
existing literature on macroeconomic news and the bond market relates the market
response to the extent of surprise in the news release, for example Dungey et al (2009)
inter alia.
Define as the standardised surprise associated with any scheduled news an-
nouncement. Surprises are taken as the deviation of the actual announced value for
the scheduled statistic from the expectation, which is collated from Bloomberg. As each
news release has different units of measurement the usual approach is to standardise
the surprises by the standard deviation of that particular release over the sample pe-
riod. The relatively short (in macro news time) sample of high frequency data makes
this less than satisfactory. Consequently, we have standardised the news releases with
the standard deviation of each of the surprises collated for the period January 2002 to
18

the end of our sample period. If the size of the surprise is a significant determinant of
then 6 will be significant in
∗ = , (4)
= + 1 + 2 + 3∗−1 + 4∗−1∗−1 + 5∗−1 + 6
+
X=1
∗− +
X=1
− +X
=1
¡
∗−¢
Table 8 presents the results from the estimation of (4). The evidence strongly
suggests that is not a significant determinant of . The estimated standard errors
obtained for ̂6 are all larger in magnitude than the coefficient estimate, meaning
that the -ratios are very small. This implies that while trading intensity appears to
fluctuate around scheduled news announcement events, there is no evidence to suggest
that the degree to which the market is surprised by the announcement impacts on
the time between trades. Furthermore, Table 9 presents diagnostic statistics for (4)
suggesting that (4) may be a less than adequate conditional characterisation of ∗ as
compared with (3).
5 Expected Durations
Using the results from our preferred model with workup and news terms given in (3)
an estimate of the expected trade duration under various scenarios can be derived,
and are reported in Table 10. The baseline estimate is the expected duration between
transactions with no workup occurring at times other than 8:30-9:30 on a non-news
announcement day. This can be calculated as
(∗ ) =
1−³P5
=1 +P5
=1
´ (5)
At 1.8187 seconds the baseline expected duration between trades is shortest for the
2 year maturity. The expected durations are longer for the longer maturities but
interestingly the expected duration between trades for the 10 year maturity is less
than the expected duration for the 5 year maturity. The 30 year maturity displays the
highest expected trade duration of 8.12 seconds.
19

The expected duration occurring between 8:30 and 9:30 am on news announcement
days is given by
(∗ ) =(+ 1 + 2)
1−³P5
=1 +P5
=1 +P5
=1
´ (6)
and this turns out to be longer than the benchmark for all maturities. Given that ̂1
and/or ̂2 are statistically significant for the 2 and 30 year maturities this implies that
the differences between (∗ ) and (∗ ) are significant.
The expected duration with workup on non-news days, given by
(∗ ) =( + 3 + 4)³
1−³P5
=1 +P5
=1 +P5
=1
´´ (7)
is, in contrast, shorter than the benchmark for all maturities. Table 10 shows that
expected durations following workups are 37% (5 year maturity), 27% (10 year matu-
rity) and 45% (30 year maturity) of the corresponding baseline values. Given that the
null hypothesis 40 : 3 = 4 = 5 = 0 is rejected for all maturities at all usual levels
of confidence, we can conclude that the workup of volume in the previous transaction
of a given maturity is associated with a shorter duration to the current transaction.
Accounting for the information induced by the workup process results in a substantial
decrease in the estimated expected adjusted duration.
In the case of news, announcement times and workup the expected duration is given
by
(∗ ) =
³ +
P5
=1
´³1−
³P5
=1 +P5
=1 +P5
=1
´´ (8)
The dominance of the workup effect over the announcement period effect is evident in
all but the 2 year maturity. In that case the statistically insignificant point estimate of
the presence of workups 3 does not act in the same direction as for other maturities.
For the 5 and 10 year maturities the expected durations with all effects accounted for
are shorter than the benchmark, reflecting the importance of workup in understanding
trade intensity in these instruments.
The results of the battery of tests and estimations undertaken in this paper strongly
support the hypothesis that the trade duration in the US Treasury market is charac-
terised by a relatively high degree of clustering, necessitating longer lag lengths in the
20

ACD specification than in previously studied markets. Additionally, consistent with
existing work on the impact of news announcements on other aspects of the bond
market, such as jumps and price impact, trade duration is significantly affected by
the presence of news. The evidence suggests that trade intensity is not statistically
significantly determined by the extent of news surprises. In this case the presence of
news tends to shorten the expected duration between trades. In a new addition to the
literature, we also quantify the impact of the workup process on the trade duration.
The expandable limit order book is a unique feature of this market, and we find that
both the presence and length of workup reduce trade durations in US Treasuries. This
provides an important empirical evaluation of the untested hypotheses of Boni and
Leach (2004) and Green (2004).
6 Conclusion
This paper focuses on modelling the trading process in the US bond market. Unlike
other asset markets, the US Treasury market operates under an expandable limit order
book. The unique microstructure of this market raises an interesting question about the
role of workup as a important conduit of information that may impact on the trading
process. Further, this market is also distinguished by the importance of regularly
scheduled macroeconomic news announcements, which have been shown to impact
on the bond market. In this paper, we consider the role of both workup and news
announcements when modelling the time between transactions in the US Treasury
market.
The results of our analysis suggest that the duration between trades for US Trea-
suries displays a number of unique properties. First, bond markets require a model
with much longer lag specifications than other markets; a WACD(5,5) specification
provided a superior fit to a first order lag model. Second, news effects are shown to be
an important variable for the period immediately surrounding scheduled news release
times, although the extent of surprise in the news has no significant effect. Finally,
the length of time taken to complete a given transaction has a measurable impact on
the time between transactions. A long time to complete tends to be associated with
a shorter time to the next transaction. This feature turns out to have a greater im-
pact on reducing the expected adjusted duration than that of the presence of news
21

announcements, and suggests that the microstructure of the market has an important
impact on its functioning during times of particularly high activity. These results have
implications for our understanding of how bond markets work and the construction of
theoretical models of the behaviour of market participants. The results add to our body
of understanding of the impact of market architecture on market behaviour, something
of value to those emerging markets attempting to initiate bond trading platforms.
22

References
[1] Admati, A. and Pfleiderer, P. (1988) "A Theory of Intraday Patterns: Volume and
Price Variability", Review of Financial Studies, 1, 3-40.
[2] Andersen, T.G. and Bollerslev, T., Diebold, X. and Vega, C. (2007) "Real-Time
Price Discovery in Global Stock, Bond and Foreign Exchange Markets", Journal
of International Economics, 73, 251-277.
[3] Balduzzi, P., Elton, E.J., and Green, T.C. (2001) "Economic News and Bond
Prices: Evidence from the U.S. Treasury Market", Journal of Financial and Quan-
titative Analysis, 36 (4), 523-543.
[4] Barclay, M.J. and Warner, J.B. (1993) "Stealth Trading and Volatility", Journal
of Financial Economics, 34, 281-305.
[5] Bauwens, L. (2006) "Econometric Analysis of Intra-Daily Activity on Tokyo Stock
Exchange", Monetary and Economic Studies, 24 (1), 1-24.
[6] Bauwens, L. and Hautsch, N. (2007) "Modelling Financial High Frequency Data
Using Point Processes", SFB Discussion Paper 2007-066.
[7] Bauwens, L. and Giot, P. (2000) "The Logarithmic ACD Model: An Application
to the Bid-Ask Quote Process of three NYSE Stocks", Annales d’Economie et de
Statistique, 60, 117-149.
[8] Bauwens, L. and Veredas, D. (2004) "The Stochastic Conditional Duration model:
A Latent Variable Model for the Analysis of Financial Durations", Journal of
Econometrics, 119, 381-412.
[9] Boni, L. and Leach, C. (2004), "Expandable Limit Order Markets", Journal of
Financial Markets, 7, 145-185.
[10] Dungey, M., McKenzie, M. and Smith, L.V. (2009) "Empirical Evidence on Jumps
in the Term Structure of the US Treasury Market", Journal of Empirical Finance,
16, 430-445.
[11] Easley, D. and O’Hara, M. (1992) "Time and the Process of Security Price Ad-
justment", Journal of Finance, 47, 567-607.
23
[12] Engle, R.F. (2000) "The Econometrics of Ultra High Frequency Data", Econo-
metrica, 68, 1-22.
[13] Engle, R.F. and Russell, J. (2004) “Analysis of High Frequency Financial Data”,
Handbook of Financial Econometrics, Y Ait-Sahalia (ed), forthcoming.
[14] Engle, R.F. and Russell, J. (1998) “Autoregressive Conditional Duration: A New
Model for Irregulary Spaced Transaction Data”, Econometrica, 66, 1127-1162.
[15] Engle, R.F. and Russell, J. (1997) “Forecasting the Frequency of Changes in
Quoted Foreign Exhange Prices with the Autoregressive Conditional Duration
Model”, Journal of Empirical Finance, 4, 187-212.
[16] Fernandes, M. and Grammig, J. (2006) "A Family of Autoregressive Conditional
Duration Models", Journal of Econometrics, 130, 1-23.
[17] Fleming, M.J., and Remolona, E.M. (1999) "Price Formation and Liquidity in the
U.S. Treasury Market: The Response to Public Information", Journal of Finance,
54, 1901-1915.
[18] Fleming, M.J. and Remolona, E. (1997) "What Moves the Bond Market?", Federal
Reserve Bank of New York Economic Policy Review, 3, 31-50.
[19] Foster, F.D. and Viswanathan, S. (1990) "A Theory of Interday Variations in Vol-
ume, Variance, and Trading Costs in Securities Markets", The Review of Financial
Studies, 3, 593-624.
[20] Goodhart, C.A.E., and O’Hara, M. (1997) "High Frequency Data in Financial
Markets: Issues and Applications", Journal of Empirical Finance, 4, 73-114.
[21] Grammig, J. and K.-O. Maurer, (2000), “Non-monotonic Hazard Functions and
the Autoregressive Conditional Duration Model”, Econometrics Journal, 3, 16—38.
[22] Green, T.C. (2004) "Economic News and the Impact of Trading on Bond Prices",
The Journal of Finance, 59 (3), 1201-1233.
[23] Hautsch, N. (2006) "Testing the Conditional Mean Function of Autoregressive
Conditional DurationModels", Discussion Paper, 2006-06, Finance Research Unit,
24
Department of Economics, University of Copenhagen, and Discussion Paper 2008-
06, CRC 649, Berlin.
[24] Jiang, G., Lo,. I. and Verdelhan, A. (2007) "Information Shocks, Liquidity Shocks
and Market Behavior: Evidence from the U.S. Treasury Market", manuscript.
[25] Johannes, M. (2004) "The Statistical and Economic Role of Jumps in Continuous-
Time Interest Rate Models", Journal of Finance, 59 (1), 227-260.
[26] Kuttner, K. (2001) "Monetary Policy Surprises and Interest Rates: Evidence from
the Fed Funds Futures Market", Journal of Monetary Economics, 47, 523-544.
[27] Lunde, A. (2000) "A Generalized Gamma Autoregressive Conditional Duration
Model", Discussion paper, Aarlborg University.
[28] Mizrach, B., and Neely, C.J. (2006) "The Transition to Electronic Communications
Networks in the Secondary Treasury Market", Federal Reserve Bank of St. Louis
Review, 88, 527-41.
[29] Pasquariello, P. and Vega, C. (2007) "Informed and Strategic Order Flow in the
Bond Markets" Review of Financial Studies, 20, 1975-2019.
[30] Simpson, M.W. and Ramchander, S. (2004) "An Examination of the Impact of
Macroeconomic News on the Spot and Futures Treasuries Markets", Journal of
Futures Markets, 24 (5), 453-478.
[31] Xu, X.E., Chen, P. and Wu, C. (2006) "Time and Dynamic Volume-Volatility
Relation", Journal of Banking and Finance, 30, 1535-1558.
[32] Zhang, M, Russell, J. and Tsay, R. (2001) "A Nonlinear Augoregressive Con-
ditional Model with Applications to Financial Transactions Data", Journal of
Econometrics, 104, 179-207.
25

W0 = f0 – t0 W1 = f1 – t1 (= 0) W2 = f2 – t2
t0 f0 t1= f1 t2 f2 t3
x1 = t1 - t0 x2 = t1 - t2 x3 = t3 - t2
Figure 1: Stylised Representation of the Bond Trading Process
0
100000
200000
300000
400000
500000
600000
7.5 8.5 9.5 10.5 11.5 12.5 13.5 14.5 15.5 16.5
2 Year 5 Year
10 Year 30 Year
Figure 2: Average Total Trading Volume in a day ($USmil) by half hour interval for
each maturity in the period 7:30 am to 5:30 pm for January 3, 2006 to October 6, 2006
inclusive.
26
0.00
5.00
10.00
15.00
20.00
25.00
30.00
35.00
40.00
45.00
7.5 8.5 9.5 10.5 11.5 12.5 13.5 14.5 15.5 16.5
2 Year 5 Year
10 Year 30 Year
Figure 3: Average Trade Size in $USmillion in a day by half hour interval for each
maturity in the period 7:30 am to 5:30 pm for January 3, 2006 to October 6, 2006
inclusive.
0.00
50.00
100.00
150.00
200.00
250.00
7.5 8.5 9.5 10.5 11.5 12.5 13.5 14.5 15.5 16.5
2 Year 5 Year
10 Year 30 Year
Figure 4: Average Duration in Seconds by half hour intervals in a day for each maturity
in the period 7:30 am to 5:30 pm for January 3, 2006 to October 6, 2006 inclusive.
27

0.70
0.80
0.90
1.00
1.10
1.20
7.5 8.5 9.5 10.5 11.5 12.5 13.5 14.5 15.5 16.5
2 Year 5 Year
10 Year 30 Year
Figure 5: Average Adjusted Duration by half hour intervals in a day for each maturity
in the period 7:30 am to 5:30 pm for January 3, 2006 to October 6, 2006 inclusive.
0.00
0.50
1.00
1.50
2.00
2.50
3.00
3.50
7.5 8.5 9.5 10.5 11.5 12.5 13.5 14.5 15.5 16.5
2 Year 5 Year
10 Year 30 Year
Figure 6: Average Workup Time in Seconds by half hour intervals in a day for each
maturity in the period 7:30 am to 5:30 pm for January 3, 2006 to October 6, 2006
inclusive.
28
0.60
0.80
1.00
1.20
1.40
1.60
1.80
7.5 8.5 9.5 10.5 11.5 12.5 13.5 14.5 15.5 16.5
2 Year 5 Year
10 Year 30 Year
Figure 7: Average Adjusted Workup Time by half hour intervals in a day for each
maturity in the period 7:30 am to 5:30 pm for January 3, 2006 to October 6, 2006
inclusive.
510
25
50
100
150 200250
300
400
500
1
10
100
1000
10000
100000
1000000
50 100 150 200 250 300 350 400 450 500
no. transactionslog scale
Figure 8: Number of transactions in the 2,5,10 and 30 year maturities transacted by
volume of transaction in $USmil, using a logarithmic vertical scale.
29
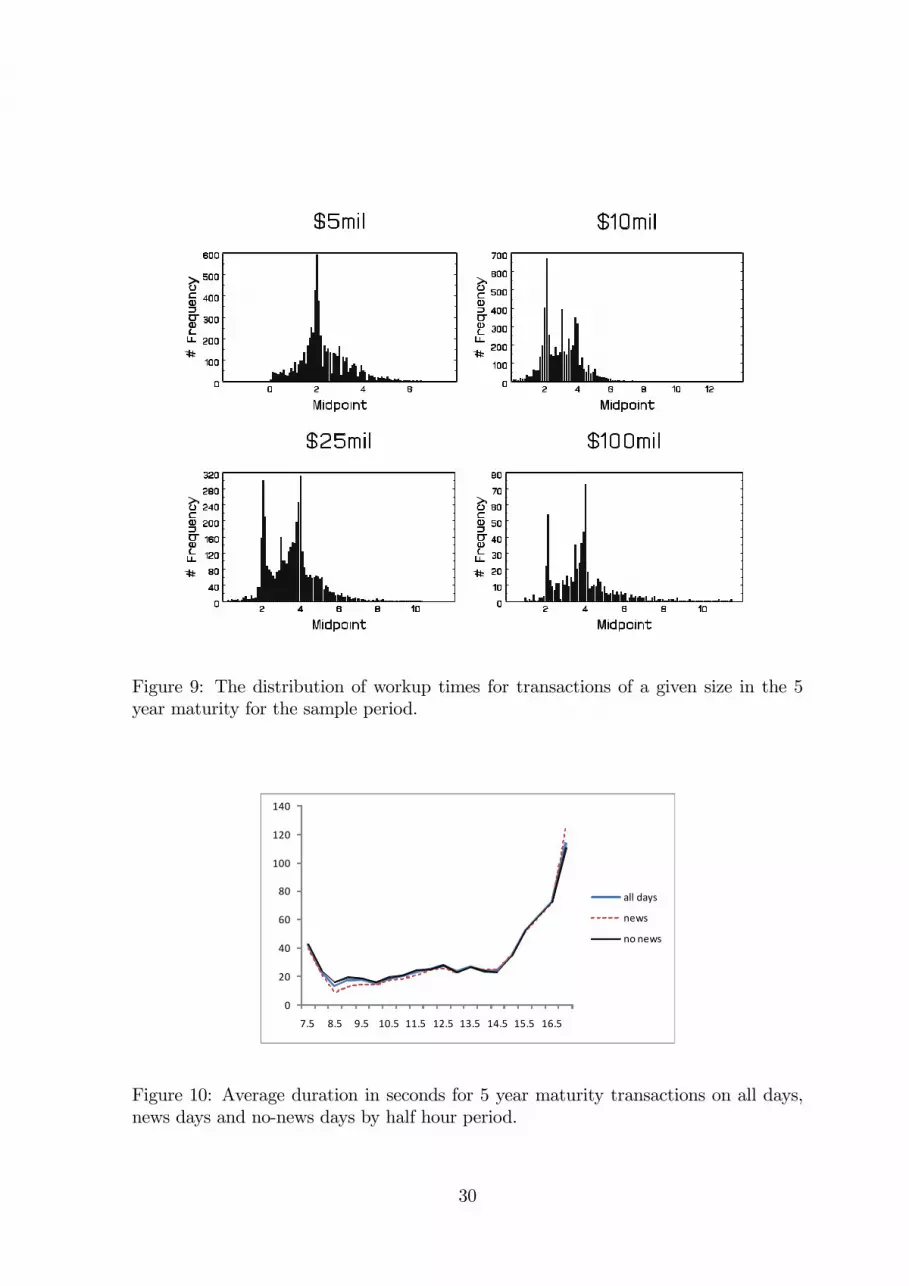
Figure 9: The distribution of workup times for transactions of a given size in the 5
year maturity for the sample period.
0
20
40
60
80
100
120
140
7.5 8.5 9.5 10.5 11.5 12.5 13.5 14.5 15.5 16.5
all days
news
no news
Figure 10: Average duration in seconds for 5 year maturity transactions on all days,
news days and no-news days by half hour period.
30
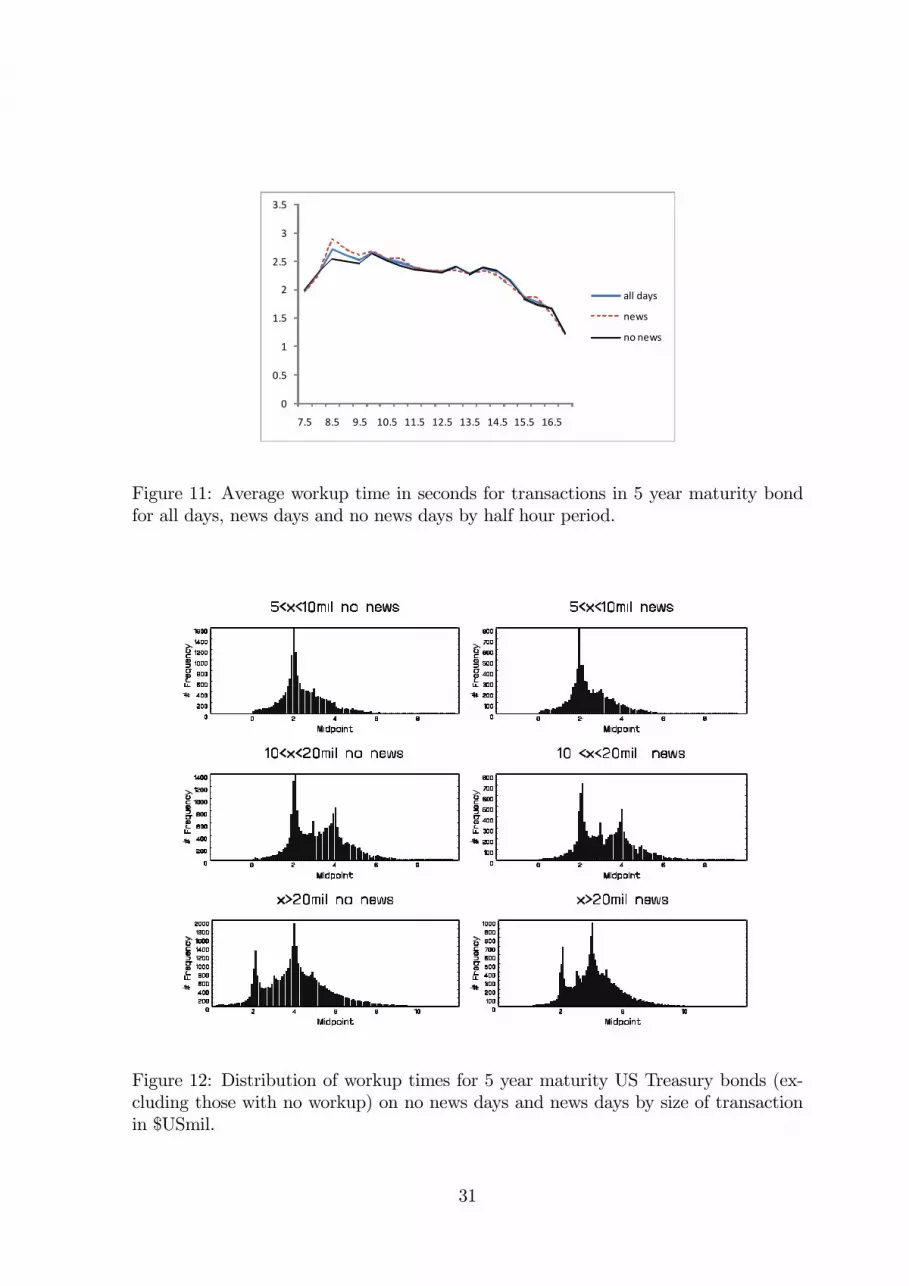
0
0.5
1
1.5
2
2.5
3
3.5
7.5 8.5 9.5 10.5 11.5 12.5 13.5 14.5 15.5 16.5
all days
news
no news
Figure 11: Average workup time in seconds for transactions in 5 year maturity bond
for all days, news days and no news days by half hour period.
Figure 12: Distribution of workup times for 5 year maturity US Treasury bonds (ex-
cluding those with no workup) on no news days and news days by size of transaction
in $USmil.
31
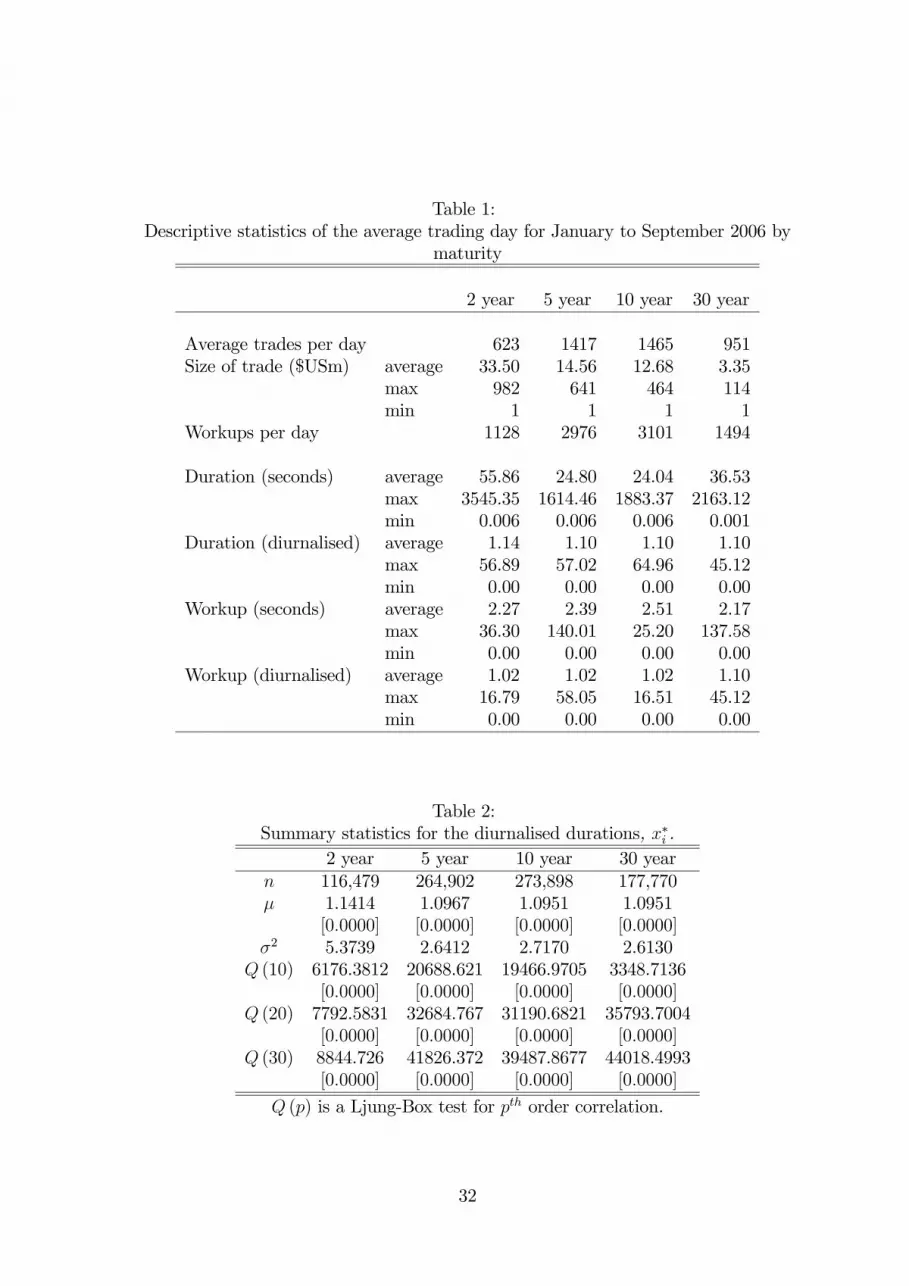
Table 1:
Descriptive statistics of the average trading day for January to September 2006 by
maturity
2 year 5 year 10 year 30 year
Average trades per day 623 1417 1465 951
Size of trade ($USm) average 33.50 14.56 12.68 3.35
max 982 641 464 114
min 1 1 1 1
Workups per day 1128 2976 3101 1494
Duration (seconds) average 55.86 24.80 24.04 36.53
max 3545.35 1614.46 1883.37 2163.12
min 0.006 0.006 0.006 0.001
Duration (diurnalised) average 1.14 1.10 1.10 1.10
max 56.89 57.02 64.96 45.12
min 0.00 0.00 0.00 0.00
Workup (seconds) average 2.27 2.39 2.51 2.17
max 36.30 140.01 25.20 137.58
min 0.00 0.00 0.00 0.00
Workup (diurnalised) average 1.02 1.02 1.02 1.10
max 16.79 58.05 16.51 45.12
min 0.00 0.00 0.00 0.00
Table 2:
Summary statistics for the diurnalised durations, ∗ .2 year 5 year 10 year 30 year
116,479 264,902 273,898 177,770
1.1414 1.0967 1.0951 1.0951
[00000] [00000] [00000] [00000]
2 5.3739 2.6412 2.7170 2.6130
(10) 6176.3812 20688.621 19466.9705 3348.7136
[00000] [00000] [00000] [00000]
(20) 7792.5831 32684.767 31190.6821 35793.7004
[00000] [00000] [00000] [00000]
(30) 8844.726 41826.372 39487.8677 44018.4993
[00000] [00000] [00000] [00000]
() is a Ljung-Box test for order correlation.
32

Table 3:
Descriptive statistics for transactions with and without workup by maturity for
January to September 2006.
2 year 5 year 10 year 30 year
Transactions with no workup
Proportion of total trades (%) 63.4 53.9 54.8 64.0
Average size of trade ($USm) 18.22 6.35 5.80 2.00
Transactions with workup
Average workup time 3.59 3.36 3.58 2.97
Volume of trade discovered with workup (%) 65.5 76.5 74.9 61.8
33

Table 4:
WACD(1,1) model estimates by maturity. 10
= = 0 + 1−1 + 1−1
2 year 5 year 10 year 30 year
0 0.0657 0.0143 0.0140 0.0211
(00095) (00012) (00008) (00010)
1 0.0960 0.0575 0.0567 0.0846
(00082) (00024) (00016) (00021)
1 0.8414 0.9299 0.9310 0.8969
(00168) (00031) (00020) (00027)
0.7255 0.9752 0.9555 0.9026
(00016) (00024) (00014) (00016)
(10) 509.1707 121.6699 609.7800 250.9219
[00000] [00000] [00000] [00000]
(20) 523.8488 691.4006 174.3761 327.5845
[00000] [00000] [00000] [00000]
(30) 560.9178 174.3761 735.9692 343.5661
[00000] [00000] [00000] [00000]
2 (10) 73.7984 16.6681 48.2440 39.0051
[00000] [00822] [00000] [00000]
2 (20) 97.0448 28.5084 66.5963 53.9125
[00000] [00964] [00000] [00000]
2 (30) 153.1990 56.8736 86.8946 59.0098
[00000] [00022] [00000] [00012]
() 1.0495 1.1349 1.1382 0.4637
() 0.9374 0.9874 0.9877 0.9545
Notes: is the shape parameter in the Weibull distribution. () and 2 () are
tests for order serial correlation in and 2 , respectively. Standard errors are
displayed as (). Marginal significance levels are displayed as []
() = 0 (1− (1 + 1)) is the expected adjusted duration. The expected
persistence of the adjusted durations is () = 1 + 1.
34
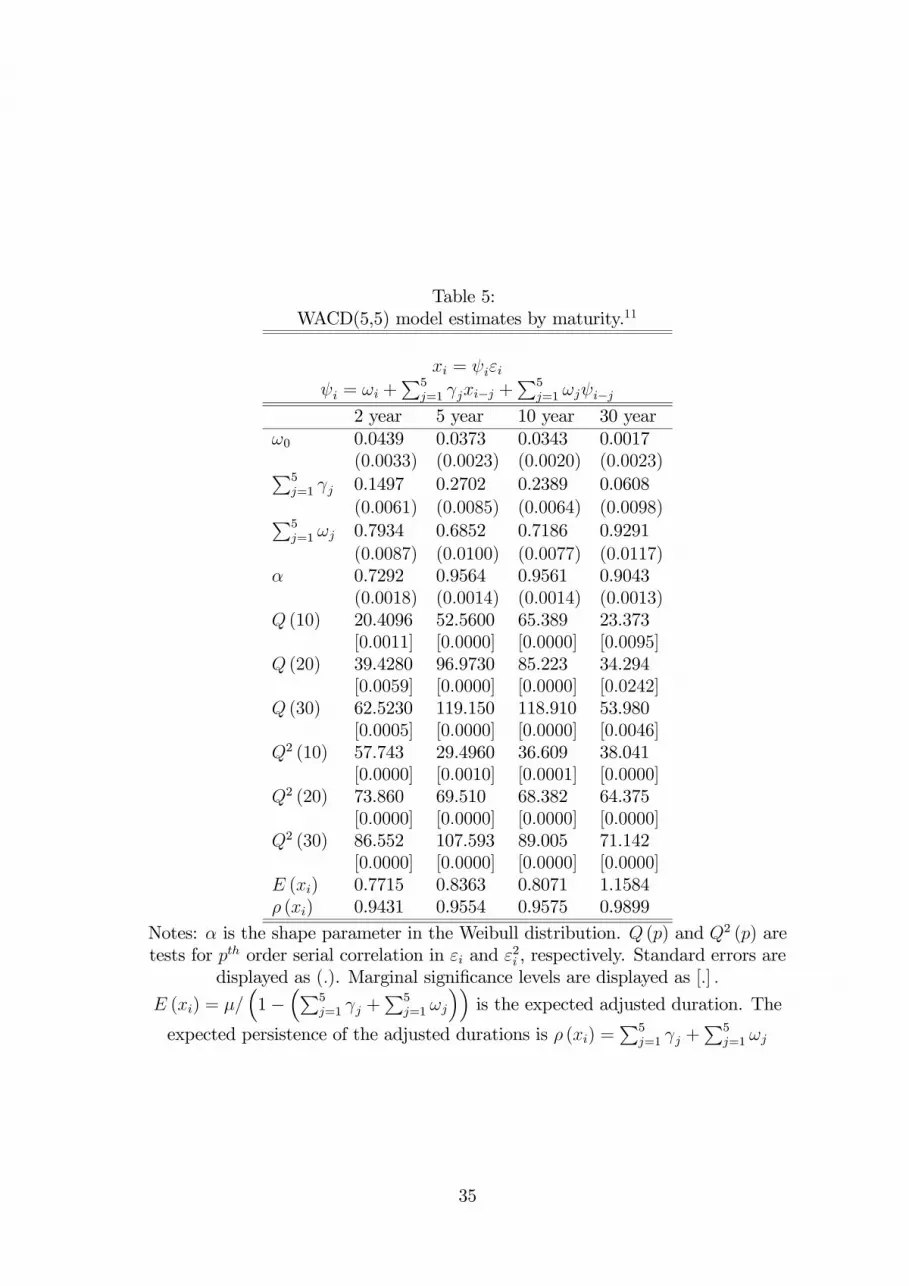
Table 5:
WACD(5,5) model estimates by maturity.11
= = +
P5
=1 − +P5
=1 −2 year 5 year 10 year 30 year
0 0.0439 0.0373 0.0343 0.0017
(00033) (00023) (00020) (00023)P5
=1 0.1497 0.2702 0.2389 0.0608
(00061) (00085) (00064) (00098)P5
=1 0.7934 0.6852 0.7186 0.9291
(00087) (00100) (00077) (00117)
0.7292 0.9564 0.9561 0.9043
(00018) (00014) (00014) (00013)
(10) 20.4096 52.5600 65.389 23.373
[00011] [00000] [00000] [00095]
(20) 39.4280 96.9730 85.223 34.294
[00059] [00000] [00000] [00242]
(30) 62.5230 119.150 118.910 53.980
[00005] [00000] [00000] [00046]
2 (10) 57.743 29.4960 36.609 38.041
[00000] [00010] [00001] [00000]
2 (20) 73.860 69.510 68.382 64.375
[00000] [00000] [00000] [00000]
2 (30) 86.552 107.593 89.005 71.142
[00000] [00000] [00000] [00000]
() 0.7715 0.8363 0.8071 1.1584
() 0.9431 0.9554 0.9575 0.9899
Notes: is the shape parameter in the Weibull distribution. () and 2 () are
tests for order serial correlation in and 2 , respectively. Standard errors are
displayed as (). Marginal significance levels are displayed as []
() = ³1−
³P5
=1 +P5
=1
´´is the expected adjusted duration. The
expected persistence of the adjusted durations is () =P5
=1 +P5
=1
35

Table 6:
Threshold WACD(5,5) estimates.
2 year 5 year 10 year 30 year
0.0482 0.0483 0.0522 0.0658
(00081) (00059) (00063) (00054)
1 -0.0023 -0.0002 -0.0008 0.0003
(00008) (00004) (00004) (00004)
2 -0.0363 0.0006 0.0001 0.0030
(00557) (00015) (00015) (00013)
3 0.0022 -0.0025 -0.0023 -0.0073
(00058) (00010) (00010) (00011)
4 -0.0218 -0.0239 -0.0248 -0.0454
(00022) (00054) (00057) (00049)
5 0.0271 -0.0091 -0.0133 -0.0043
(00470) (00009) (00008) (00008)P5
=1 0.0490 0.0336 0.0371 0.0701
(00043) (00013) (00016) (00037)P5
=1 0.9244 09586 0.9498 0.9218
(00071) (00018) (00023) (00047)P5
=1 0.0173 0.0021 0.0027 0.0048
(00030) (00016) (00014) (00013)
0.7319 0.9604 0.9607 0.9055
(00017) (00034) (00015) (00016)
Notes: is the shape parameter in the Weibull distribution. Standard errors are
displayed as ().
36
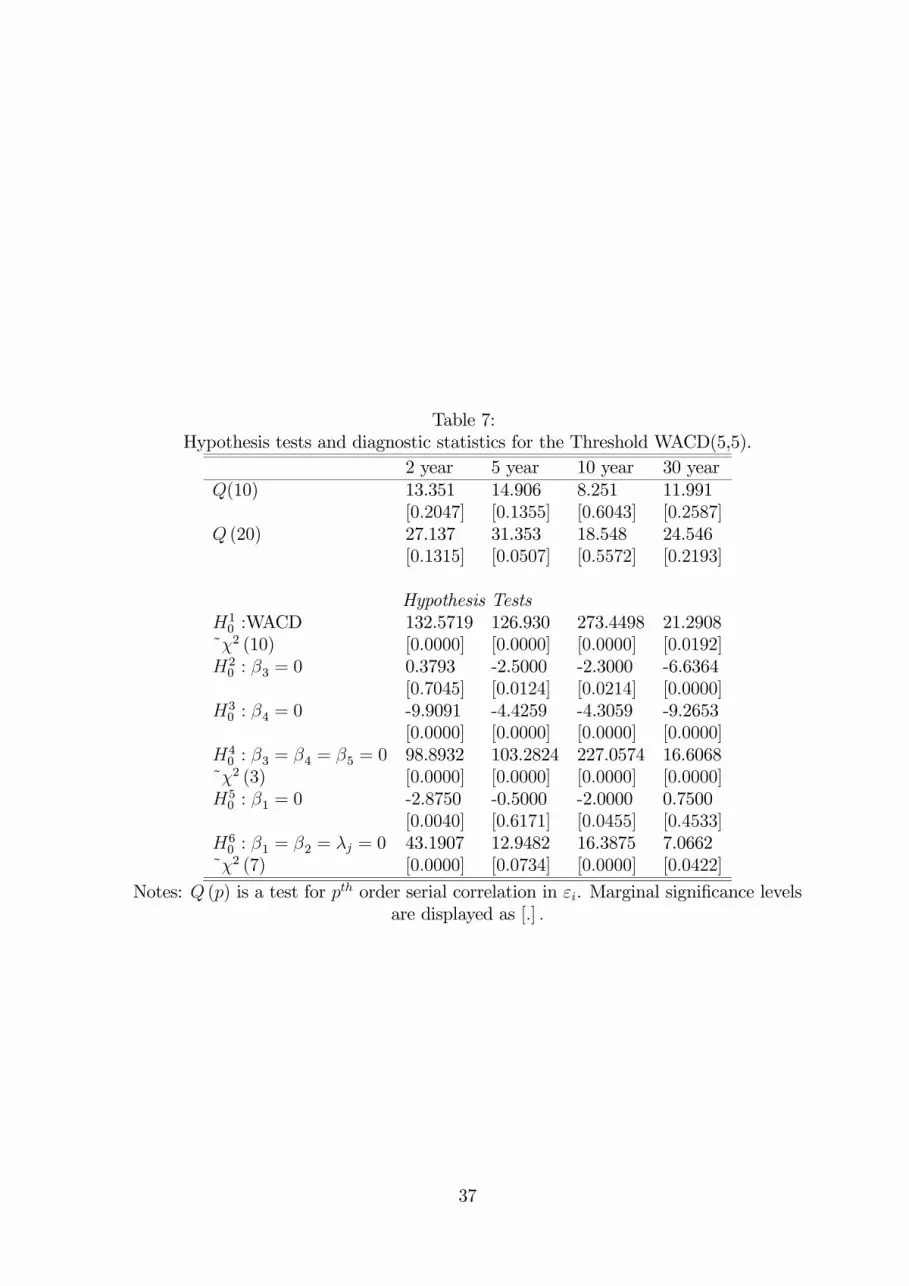
Table 7:
Hypothesis tests and diagnostic statistics for the Threshold WACD(5,5).
2 year 5 year 10 year 30 year
(10) 13.351 14.906 8.251 11.991
[02047] [01355] [06043] [02587]
(20) 27.137 31.353 18.548 24.546
[01315] [00507] [05572] [02193]
Hypothesis Tests
10 :WACD 132.5719 126.930 273.4498 21.2908
˜2 (10) [00000] [00000] [00000] [00192]
20 : 3 = 0 0.3793 -2.5000 -2.3000 -6.6364
[07045] [00124] [00214] [00000]
30 : 4 = 0 -9.9091 -4.4259 -4.3059 -9.2653
[00000] [00000] [00000] [00000]
40 : 3 = 4 = 5 = 0 98.8932 103.2824 227.0574 16.6068
˜2 (3) [00000] [00000] [00000] [00000]
50 : 1 = 0 -2.8750 -0.5000 -2.0000 0.7500
[00040] [06171] [00455] [04533]
60 : 1 = 2 = = 0 43.1907 12.9482 16.3875 7.0662
˜2 (7) [00000] [00734] [00000] [00422]
Notes: () is a test for order serial correlation in . Marginal significance levels
are displayed as []
37

Table 8:
Threshold WACD(5,5) estimates with standardised surprises.
2 year 5 year 10 year 30 year
0.0419 0.0626 0.0829 0.0487
(00123) (00094) (00018) (00105)
1 -0.0016 -0.0008 -0.0016 -0.0006
(00011) (00003) (00004) (00005)
2 0.0679 -0.0212 -0.0400 0.0087
(00322) (00193) (00054) (00168)
3 -0.0012 -0.0386 -0.0455 -0.0325
(00092) (00085) (00023) (00085)
4 -0.0176 -0.0113 -0.0178 -0.0039
(00317) (00009) (00007) (00014)
5 -0.0697 0.0187 0.0362 -0.0116
(00320) (00193) (00054) (00168)
6 -0.0003 -0.0002 -0.0002 -0.0001
(00008) (00003) (00003) (00003)P5
=1 0.0398 0.0430 0.0527 0.0525
(00061) (00037) (00016) (00077)P5
=1 0.9374 09450 0.9287 0.9349
(00105) (00048) (00021) (00098)P5
=1 0.0075 0.0047 0.0067 0.0060
(00039) (00014) (00018) (00018)
0.7317 0.9603 0.9614 0.9054
(00014) (00010) (00012) (00014)
Notes: is the shape parameter in the Weibull distribution. Standard errors are
displayed as ().
Table 9:
Diagnostic statistics for the Threshold WACD(5,5) with standardised surprises.
2 year 5 year 10 year 30 year
(10) 17.126 41.855 19.515 17.450
[00716] [00000] [00342] [00650]
(20) 30.124 66.959 28.266 30.212
[00678] [00000] [01033] [00665]
Notes: () is a test for order serial correlation in . Marginal significance levels
are displayed as []
38

Table 10:
Expected Durations from the Threshold WACD(5,5).
2 year 5 year 10 year 30 year
() 1.8120 6.1923 3.9847 8.1235
() 1.0323 8.5436 4.9519 20.8485
() 1.0752 2.8077 1.9160 1.6173
() 1.8387 2.3158 1.0674 3.6667
() 0.9874 0.9922 0.9869 0.9919
() 0.9907 0.9943 0.9896 0.9967
Notes: ()is the expected adjusted duration. The expected persistence of the
adjusted durations is ()
39

The Centre for Financial Analysis and Policy Cambridge Judge Business School University of Cambridge Trumpington Street Cambridge, CB2 1AG www.cfap.jbs.cam.ac.uk [email protected]


