Embed Size (px)
Citation preview

TINS-1062; No. of Pages 12
From molecule to mind: an integrativeperspective on odor intensityJoel D. Mainland1,2, Johan N. Lundstro m1,3,4, Johannes Reisert1, andGraeme Lowe1
1 Monell Chemical Senses Center, Philadelphia, PA, USA2 Department of Neuroscience, University of Pennsylvania, Philadelphia, PA, USA3 Department of Clinical Neuroscience, Karolinska Institutet, Stockholm, Sweden4 Department of Psychology, University of Pennsylvania, Philadelphia, PA, USA
Review
Glossary
Amodal neural network: a network that is not primarily dedicated to the
processing of information from a specific sensory modality, such as vision,
audition, or olfaction.
GCaMP2 imaging: GCaMP2 is a genetically encoded reporter protein whose
fluorescence increases as intracellular calcium levels rise when neurons fire
action potentials. In the olfactory system, mouse strains expressing GCaMP2 in
OSNs, and in mitral/tufted cells, have been used to map patterns of glomerular
activity encoding different odorants.
Lateral inhibition: the process whereby an excited neuron reduces the activity
of parallel neurons through inhibitory synaptic connections. In the olfactory
bulb, parallel mitral/tufted cells affiliated with different glomeruli can laterally
inhibit each other via local interneuron circuits composed of periglomerular,
short axon, and granule cells.
Presynaptic calcium imaging: a method for optical detection of neural activity
based on localizing a fluorescent calcium-sensitive probes into presynaptic
nerve terminals. In the olfactory system, synthetic dextran-conjugated calcium
indicator dyes are loaded into OSNs by intranasal perfusion, and are
A fundamental problem in systems neuroscience is map-ping the physical properties of a stimulus to perceptualcharacteristics. In vision, wavelength translates into col-or; in audition, frequency translates into pitch. Althoughodorant concentration is a key feature of olfactory sti-muli, we do not know how concentration is translatedinto perceived intensity by the olfactory system. A vari-ety of neural responses at several levels of processinghave been reported to vary with odorant concentration,suggesting specific coding models. However, it remainsunclear which, if any, of these phenomena underlie theperception of odor intensity. Here, we provide an over-view of current models at different stages of olfactoryprocessing, and identify promising avenues for futureresearch.
Deciphering the neural code for odor intensity‘I want to create a cologne that smells like a whisper. It’ll befor all the secret admirers out there.’ Jarod Kintz
Some odors whisper like a secret admirer, others blarelike a megaphone. How does the brain encode such a broadspectrum of olfactory intensities? Most research in thefield has focused on concentration, rather than intensity.Whereas the intensity of an odorant is clearly related to itsconcentration [1], odorant concentration also correlateswith odor valence [2] and quality [3]. Disentangling theseperceptual dimensions is essential to understanding howintensity is encoded. This is particularly difficult in non-human model systems, where the neural code is mostaccessible, due to the inherent challenges of determiningwhether a mouse has sensed the odor quality shift of amolecule (e.g., from floral to fecal at higher concentrations).However, recent work suggests that rats use a singleintensity scale to discriminate concentrations of differentodors [4] and points the way forward for examining inten-sity perception in animal models by dissociating concen-tration from intensity. Similarly, human lesion studiessuggest that intensity and quality judgments are localiz-able to anatomically separate areas; lesions to the medialtemporal lobe, formed by either resection or reoccurring
0166-2236/
� 2014 Elsevier Ltd. All rights reserved. http://dx.doi.org/10.1016/j.tins.2014.05.005
Corresponding author: Mainland, J.D. ([email protected]).
epileptic activity, impair humans’ ability to assess theidentity or quality of odors, while leaving the ability todetect odors and perform odor intensity-scaling tasksintact [5,6]. Together, these results suggest that thereis a common neural representation underlying intensityperception.
Several recent models have attempted to explain in-tensity coding at different levels in the olfactory system.Here, we trace candidate intensity codes through ascend-ing neural pathways from odor molecule detection byolfactory sensory neurons (OSNs) to signal integrationin the olfactory bulb and processing in higher brainareas, focusing on mammalian model systems unlessotherwise stated (Box 1). These models of intensity cod-ing are speculative and we still lack a basic understand-ing of how odor intensity percepts are formed. It is ourhope that this review can provide a useful overview ofcurrent thinking about a fundamental perceptual dimen-sion of the sense of smell, and suggest further avenues ofresearch. In the near future, we expect that technicalinnovations in imaging and optogenetics will enable thefield to better test various hypotheses about intensitycoding.
transported through axons to olfactory nerve terminals in glomeruli. This
allows visualization of odor-encoding glomerular activity maps by fluorescent
imaging. The method is also implemented by driving expression of a
genetically encoded calcium indicator (e.g., GCaMP2) in OSNs using a
promoter for olfactory marker protein (OMP), which is expressed in all mature
OSNs.
Trends in Neurosciences xx (2014) 1–12 1

Box 1. Major ascending neural pathways in the mammalian olfactory system
Sensory pathways in the main olfactory system of mammals are
illustrated for mouse (Figure I, upper image) and human (Figure I,
lower images), two species in which odor intensity coding has been
investigated. Airborne odorants, drawn into nasal passages by phasic
sniffing, adsorb to mucosal surfaces lining the main olfactory
epithelium (MOE) and septal organ (SO, present in many nonhuman
mammals). Odorant molecules are detected by OSNs that send
primary afferents to the main olfactory bulb (MOB). Each OSN
expresses a single type of olfactory receptor chosen from a large
family of approximately 102 to 103 receptor genes. All OSNs
expressing the same receptor send convergent projections to a few
discrete glomeruli in the bulb, such that activated sets of glomeruli
form stereotypic spatial maps (see also Figure 4, main text). Each
glomerulus integrates afferent signals from thousands of OSNs, and
relays output via several dozen mitral/tufted cells. Mitral/tufted
projections are distributed via the lateral olfactory tract (LOT) to a
heterogeneous assemblage of secondary structures collectively
labeled as olfactory cortex. Major recipients of bulb input include
piriform cortex (PC) with anterior (APC) and posterior (PPC) subdivi-
sions, and the anterior and posterolateral cortical amygdala (Am).
Diffuse odor maps and widespread association fibers in the PC
suggest a role in olfactory perceptual learning, whereas stereotypic
projections to the amygdala may mediate innate odor-driven
behaviors. From here, odor information is routed to tertiary centers
[111,112] with the caudal area of orbitofrontal cortex (OFC) receiving
the majority of projections from the PC [111].
Piriform cortex(PC )
Anterior olfactorynucleus (AO )
Olfactorytubercle (Tu )
Entorhinalcortex (EC )
Anterior cor�calamygdala
Posterolateralcor�cal amygdala
nLOT
Insular cortex Lateralhypothalamus HippocampusOrbitofrontal
cortex (OFC)
Lateral olfactory tract (LOT)
Main olfactorybulb (MOB)
Main olfactoryepithelium
(MOE)
Periamygdaloidcortex
Olfactorycortex
Airborneodorants
OFC
AO
MOB
APC
AmEC
PPC
LOTTuOSN MOB
MOE Sniffing
Odorant
MOB
MOE
SO
OFC
AOTu
APCPPC EC
Am
OSN
TRENDS in Neurosciences
Figure I. The mammalian olfactory system. Abbreviations not detailed in box text: AO, anterior olfactory nucleus; EC, entorhinal cortex; nLOT, nucleus of the lateral
olfactory tract; Tu, olfactory tubercle.
Review Trends in Neurosciences xxx xxxx, Vol. xxx, No. x
TINS-1062; No. of Pages 12
Intensity–concentration relationEmpirically, the perceived intensity of an odorant is amonotonic, sigmoidal function of the logarithm of odor-ant concentration, although most early observationscaptured only the linear portion over a middle range
2
of concentrations. In fact, many odorants fail to attainsufficiently high vapor concentrations to saturate thepsychophysical function [7], so linear [8] and exponential[9] functions can indeed approximate the intensity–concentration function. However, a comparison of models
Review Trends in Neurosciences xxx xxxx, Vol. xxx, No. x
TINS-1062; No. of Pages 12
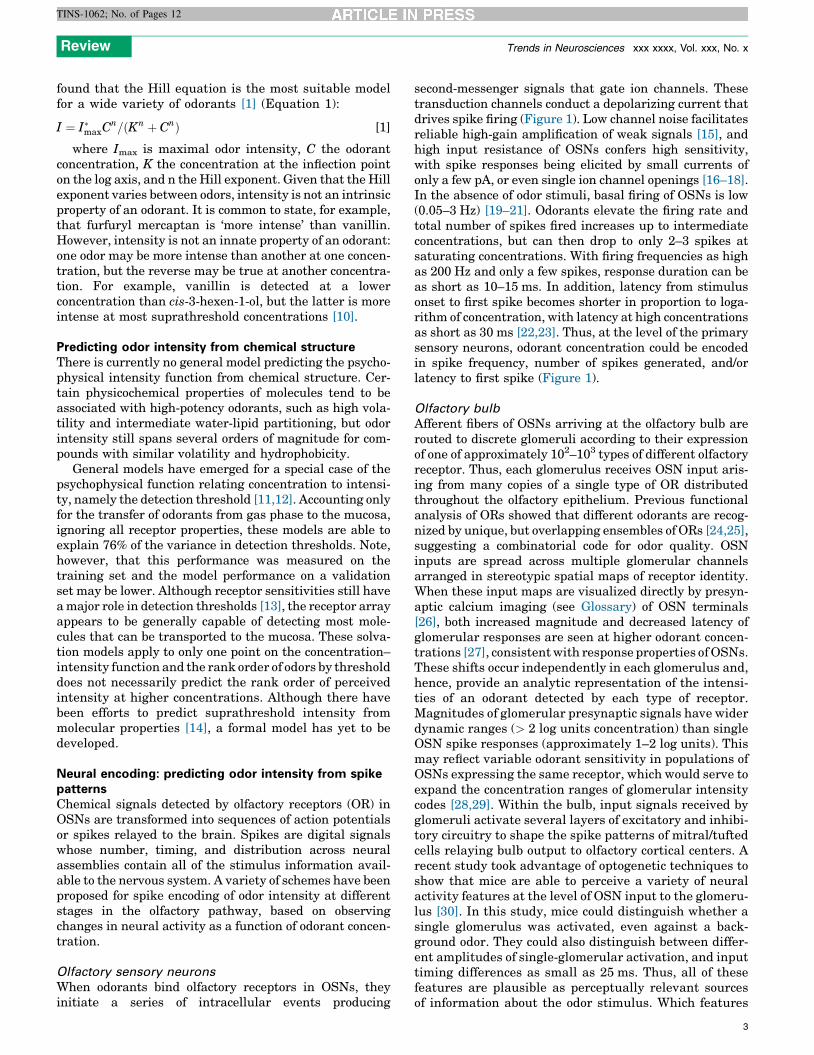
found that the Hill equation is the most suitable modelfor a wide variety of odorants [1] (Equation 1):
I ¼ I�maxCn=ðKn þ CnÞ [1]
where Imax is maximal odor intensity, C the odorantconcentration, K the concentration at the inflection pointon the log axis, and n the Hill exponent. Given that the Hillexponent varies between odors, intensity is not an intrinsicproperty of an odorant. It is common to state, for example,that furfuryl mercaptan is ‘more intense’ than vanillin.However, intensity is not an innate property of an odorant:one odor may be more intense than another at one concen-tration, but the reverse may be true at another concentra-tion. For example, vanillin is detected at a lowerconcentration than cis-3-hexen-1-ol, but the latter is moreintense at most suprathreshold concentrations [10].
Predicting odor intensity from chemical structureThere is currently no general model predicting the psycho-physical intensity function from chemical structure. Cer-tain physicochemical properties of molecules tend to beassociated with high-potency odorants, such as high vola-tility and intermediate water-lipid partitioning, but odorintensity still spans several orders of magnitude for com-pounds with similar volatility and hydrophobicity.
General models have emerged for a special case of thepsychophysical function relating concentration to intensi-ty, namely the detection threshold [11,12]. Accounting onlyfor the transfer of odorants from gas phase to the mucosa,ignoring all receptor properties, these models are able toexplain 76% of the variance in detection thresholds. Note,however, that this performance was measured on thetraining set and the model performance on a validationset may be lower. Although receptor sensitivities still havea major role in detection thresholds [13], the receptor arrayappears to be generally capable of detecting most mole-cules that can be transported to the mucosa. These solva-tion models apply to only one point on the concentration–intensity function and the rank order of odors by thresholddoes not necessarily predict the rank order of perceivedintensity at higher concentrations. Although there havebeen efforts to predict suprathreshold intensity frommolecular properties [14], a formal model has yet to bedeveloped.
Neural encoding: predicting odor intensity from spikepatternsChemical signals detected by olfactory receptors (OR) inOSNs are transformed into sequences of action potentialsor spikes relayed to the brain. Spikes are digital signalswhose number, timing, and distribution across neuralassemblies contain all of the stimulus information avail-able to the nervous system. A variety of schemes have beenproposed for spike encoding of odor intensity at differentstages in the olfactory pathway, based on observingchanges in neural activity as a function of odorant concen-tration.
Olfactory sensory neurons
When odorants bind olfactory receptors in OSNs, theyinitiate a series of intracellular events producing
second-messenger signals that gate ion channels. Thesetransduction channels conduct a depolarizing current thatdrives spike firing (Figure 1). Low channel noise facilitatesreliable high-gain amplification of weak signals [15], andhigh input resistance of OSNs confers high sensitivity,with spike responses being elicited by small currents ofonly a few pA, or even single ion channel openings [16–18].In the absence of odor stimuli, basal firing of OSNs is low(0.05–3 Hz) [19–21]. Odorants elevate the firing rate andtotal number of spikes fired increases up to intermediateconcentrations, but can then drop to only 2–3 spikes atsaturating concentrations. With firing frequencies as highas 200 Hz and only a few spikes, response duration can beas short as 10–15 ms. In addition, latency from stimulusonset to first spike becomes shorter in proportion to loga-rithm of concentration, with latency at high concentrationsas short as 30 ms [22,23]. Thus, at the level of the primarysensory neurons, odorant concentration could be encodedin spike frequency, number of spikes generated, and/orlatency to first spike (Figure 1).
Olfactory bulb
Afferent fibers of OSNs arriving at the olfactory bulb arerouted to discrete glomeruli according to their expressionof one of approximately 102–103 types of different olfactoryreceptor. Thus, each glomerulus receives OSN input aris-ing from many copies of a single type of OR distributedthroughout the olfactory epithelium. Previous functionalanalysis of ORs showed that different odorants are recog-nized by unique, but overlapping ensembles of ORs [24,25],suggesting a combinatorial code for odor quality. OSNinputs are spread across multiple glomerular channelsarranged in stereotypic spatial maps of receptor identity.When these input maps are visualized directly by presyn-aptic calcium imaging (see Glossary) of OSN terminals[26], both increased magnitude and decreased latency ofglomerular responses are seen at higher odorant concen-trations [27], consistent with response properties of OSNs.These shifts occur independently in each glomerulus and,hence, provide an analytic representation of the intensi-ties of an odorant detected by each type of receptor.Magnitudes of glomerular presynaptic signals have widerdynamic ranges (> 2 log units concentration) than singleOSN spike responses (approximately 1–2 log units). Thismay reflect variable odorant sensitivity in populations ofOSNs expressing the same receptor, which would serve toexpand the concentration ranges of glomerular intensitycodes [28,29]. Within the bulb, input signals received byglomeruli activate several layers of excitatory and inhibi-tory circuitry to shape the spike patterns of mitral/tuftedcells relaying bulb output to olfactory cortical centers. Arecent study took advantage of optogenetic techniques toshow that mice are able to perceive a variety of neuralactivity features at the level of OSN input to the glomeru-lus [30]. In this study, mice could distinguish whether asingle glomerulus was activated, even against a back-ground odor. They could also distinguish between differ-ent amplitudes of single-glomerular activation, and inputtiming differences as small as 25 ms. Thus, all of thesefeatures are plausible as perceptually relevant sourcesof information about the odor stimulus. Which features
3

Golfα GolfαAC3
GDP GTP
ATP
1.0
0.5
0.0
1.0
0.5
0.0
1E-3 0.01 0.1 1
1E-3 0.01 0.1 1
cAMPCa2+
Cl–
R
OH
Odorant
Transduc�oncurrent
R*
Transduc�oncurrent
Spike firing
Firin
g ra
teTr
ansd
uc�o
ncu
rren
tAc
�vat
ed re
cept
or(R
*)
Log [odorant]
Log [odorant]
[Odorant]
(A) (B)
(C)
(D)
Low
High
[Odorant]
β
γ
TRENDS in Neurosciences
Figure 1. Odorant concentration coding in olfactory sensory neurons (OSNs). During sensory transduction (A), odorant molecules bind and stabilize the active states of
olfactory receptors (R) in ciliary membranes of OSNs. The activated receptors (R*) couple to G proteins (Golf) and increase synthesis of cyclic AMP (cAMP) by type III
adenylyl cyclase (AC3). The cAMP opens cyclic nucleotide-gated channels that conduct calcium ions into the cilia and, in turn, open a channel (ANO2) mediating a
depolarizing efflux of chloride ions. The resulting transduction current is passed to the OSN cell body, where it drives a train of action potentials (spikes). The concentration
of detected odorant is encoded nonlinearly at each step of transduction: by a hyperbolic dependence of the number of activated receptors (R*) in the cilia (B), a strongly
cooperative variation in amplitude of the transduction current (C), and similar sigmoidal variation of spike firing rate relayed by OSN axons (D). Data from [113] (C,D):
response of normalized currents and firing rates of frog OSN to cineole; mammalian OSNs exhibit similar dose–response profiles.
Review Trends in Neurosciences xxx xxxx, Vol. xxx, No. x
TINS-1062; No. of Pages 12
represent odor intensity, and which represent other infor-mation, such as odor quality?
We consider several models of odor intensity coding atthis level. Are they compatible with physiological data? Dothey predict stable perception of odor quality over a rangeof concentrations?
Although the neural code in the olfactory bulb mustrepresent both odor concentration and identity it is crucialfor the brain to disambiguate the two kinds of information.For olfactory navigation tasks, stimulus concentrationvaries with distance from a target odor source; animals
4
must be able to maintain a concentration-invariant repre-sentation of odor quality over biologically relevant concen-tration ranges to track the source. Although odors aregenerally thought to retain their quality over a range ofconcentrations, concentration changes greater than twoorders of magnitude may yield changes in odor qualityfor some odorants [3,31] but not others [32].
Spike rate coding
Given that odorant concentration is correlated with spikerates of OSN inputs to glomeruli, we may ask if this rate

Review Trends in Neurosciences xxx xxxx, Vol. xxx, No. x
TINS-1062; No. of Pages 12
code is copied by synaptic excitation to ensembles of mitral/tufted cells linked to these glomeruli. Such a scheme allowsstraightforward coding of intensity (as firing rate) whilemaintaining concentration invariance of the odor qualitycode (as pattern of active glomeruli). However, it may beincompatible with widespread synaptic inhibition in bulbcircuits. Indeed, although some mitral/tufted cells do re-spond to odor stimuli with increased spike excitation athigher odorant concentration, others are inhibited, or re-spond with more complex temporal patterns of mixedexcitation and inhibition that may change with concentra-tion. This variability in responses was first observed inrodents using odorant stimuli delivered to anesthetizedanimals by steady airflow [33,34], and was confirmed inboth anesthetized and awake animals under more naturalperiodic stimulation or sniffing [35–37]. Inhaled odorantselicit sniff-locked rhythmic spike bursting and/or spikeinhibition with a diverse phase distribution over the sniffcycle. Cells that display immediate excitatory responsescould selectively convey rate codes of intensity. However,cells that are excited by some odorants may be inhibited by
ON input
M
Odorant
Ca2+ S(A) (B)
MC
GC
PGET
SA
1 2 3 4
1
2
3
4
Figure 2. Spatial and temporal coding of odorant concentration in the olfactory bulb. (A
to odorant stimuli sampled by a single sniff, olfactory nerve (ON) spike inputs to diffe
indicator fluorescence signals). This reflects the diversity of olfactory receptor molecu
neural circuits, including excitatory external tufted (ET), as well as inhibitory periglome
mitral cells (MC) for relay to olfactory cortex. SA cells have widespread interglomerular p
patterns vary with odorant concentration (cf. Figure 5B). A second layer of signal fil
interneurons inhibit MCs. (B) As odorant concentration is increased from low (blue) to h
have shorter latencies (cf. red ON traces). MC spike output may track these latency shifts
and 4). Such phase shifts of spike latency over sniff cycles may encode odor concentrat
(which can encode odor quality, because latencies will vary with different sensitivities of
coding of odor concentration versus odor quality, but may be complicated by lateral inh
to an odor, which may be followed by rebound spiking whose latency becomes longe
glomerular channel 3). (C) Example of excitatory MC response in a glomerular coding
concentration, which provides an immediate readout of intensity (upper panel). MC s
therefore, spike rate coding of concentration is possible if readouts have longer integra
[114]; (ii) mean spikes per sniff cycle for rat mitral/tufted cell response to cineole [41];
olfactory receptor I7 (mean of eight cells, spike rate increment over baseline rate, norm
other odorants via lateral inhibition, complicating thereadout. In awake rodents, mitral/tufted cells have highmean rates of spontaneous discharge (approximately30 Hz) [38], which would reduce the available dynamicrange for elevations in spike rate, while increasing it forsuppression. Furthermore, mitral cell membrane biophys-ics favors a resonant frequency of approximately 40 Hz forintraburst firing rates [39], and the rates are not verysensitive to odorant concentration [40,41].
Spike latency coding
Glomerular inputs also carry a latency code of odorantconcentration that could be transferred to bulb neurons[27]. Indeed, at higher odorant concentration, spike laten-cies of mitral cell excitatory responses are clearly reduced[41]. If these reductions occur uniformly across inputs,then patterns of relative latency between glomeruli couldact as concentration-invariant codes for odor quality(Figure 2) [42–44]. This scheme can account for fast dis-crimination of odors in single sniffs <200 ms in duration.As in rate models, coding may be complicated by lateral
C outputs
Low
High
[Odorant]
ON Ca2+
MC
Spik
e ra
te
Spik
e co
unt
Late
ncy
(ms)
niff (C)(i)
(ii)
(iii)
1000
100
6
4
2
0
0.8
0.4
0.0
1E-8 1E-5
0.1 1
1E-3 0.01 0.1
Log [odorant]
Log [odorant]
Log [odorant]
TRENDS in Neurosciences
) Schematic of four parallel glomerular odor-encoding channels. During responses
rent glomeruli exhibit different latencies and time courses (monitored by calcium
lar tunings. These spatiotemporal patterns of input are processed by glomerular
rular (PG) and short axon (SA) cells, before being encoded into spiking patterns of
rojections that could act to normalize spatial patterns of glomerular output as input
tering and pattern transformation occurs when granule cells (GC) or other local
igh (red), OSNs are activated more rapidly and presynaptic glomerular responses
over the sniff cycle (cf. left-shifted red spike responses in glomerular channels 1, 2,
ion, while leaving invariant overall patterns of relative latencies between glomeruli
receptors to different odorants). This simple scheme allows early separation of the
ibition between glomeruli. Some MCs exhibit suppressed basal spiking in response
r as odorant concentration is increased (due to stronger inhibition) (as pictured in
channel. Data show a logarithmic decrement of MC spike latency with increasing
pike count and mean spike rate over a sniff (middle and lower panels) increase;
tion times. (i) salamander mitral/tufted cell excitatory response to isoamyl acetate
and (iii) mouse mitral/tufted cell spike response evoked by heptanal activation of
alized to maximum rate) [115].
5

Review Trends in Neurosciences xxx xxxx, Vol. xxx, No. x
TINS-1062; No. of Pages 12
inhibition. Stronger sensory input can increase spike la-tency in some mitral cells by strengthening inhibition,which would violate pattern invariance. This could beresolved by prioritizing readout of the code to emphasizeearlier excitatory responses that only show latency reduc-tions. Lateral inhibition could sharpen this temporal win-dow of readout by allowing earlier stronger responses todelay or block later, weaker responses [43]. High sponta-neous firing of mitral/tufted cells in awake animals alsoposes a problem for latency coding. In more active cells, thefirst spike of a response is harder to distinguish frombackground spikes and firing must be analyzed over finitetime windows, repeated sniff cycles, or across many cells ofan ensemble to identify responses and measure latencies.The first two strategies would tend to negate the speedadvantage of latency coding.
Latency-coding models require a reference time frame tocompute spike delays. The periodic inhalation cycle of sniff-ing was suggested to serve this purpose. This may work insmall animals, such as mice, whose short sniff cycles(<200 ms) may sample odor stimuli in discrete packets.However, in larger species with slower sniff rates, theremay be variability in odorant arrival time at the olfactoryepithelium during a sniff, which would cause errors inlatency. Timing signals directly locked to odorant stimula-tion would be more reliable. Such signals may be generatedin each glomerulus by the tufted cells, which receive direct
Lo
Hig
[Odorant]
TC
MC
ON input
Sniff
Log [odorant]
Phas
e
TC + MC
TC
[Odorant]
Num
ber o
f ac�
vesi
ster
cel
ls
TC
3π2 MC
(A) (B)
(C)
π2
1E-4 1E-3 0.01 0.1
Figure 3. Odorant concentration coding in glomerular circuits. (A) Each glomerulus tran
receptor into the spike activities of several dozen or more mitral cells (MC) and tufted
connectivity and regulation by local circuits. Various subtypes of TC are located more s
are more easily excited. MC are located deeper, receive mostly indirect ON input [via exte
Coding of odorant concentration by the number or fraction of responding ‘sister’ MC/TC
stronger afferent ON input to the glomerulus can recruit a greater proportion of sis
concentration by shift in spike latency between MC and TC. When odorant concentra
responses decreases, whereas that of TC remains approximately invariant. (D) Coding o
glomeruli corresponding to the same olfactory receptor. Inhaled odorant gains access
sooner than OSNs in lateral olfactory epithelium (in recesses of nasal turbinates). This r
maps in medial and lateral halves of the olfactory bulb. (E) Mediolateral gradient in co
depend on sorption properties of the odorant. (F) As odorant concentration is increased
versus lateral glomeruli. Data from [46] (C) (average spike phase of mouse MC versus TC
in medial versus lateral olfactory bulb of transgenic mice with expression of olfactory
6
monosynaptic excitation from OSNs [45] and respond toodorants with short latencies nearly independent of concen-tration. By contrast, mitral cells receive polysynaptic exci-tation via external tufted (ET) cells [45] and have longerlatencies that decrease with increasing concentration [46].Thus, the relative sniff phase of responses of ‘sister’ mitraland tufted cells connected to the same glomerulus couldencode intensity for each glomerular channel (Figure 3C).Tufted cells receive less lateral inhibition than mitral cells,have lower firing thresholds, and their odorant responsesspan a broader range of spike frequencies (approximately<400 Hz) [47,116], and they could transmit a parallel ratecode of concentration.
Recently, a novel latency-coding model was proposedbased on a different stimulus-locked timing signal. Inrodents, each OR is mapped to a pair of glomeruli, locatedin the medial and lateral halves of the bulb. These glomerulireceive inputs from OSNs in medial and lateral regions ofthe nasal cavity, respectively [48]. Inhaled odorants aretransported more rapidly to medial OSNs, and mitral cellsconnected to medial glomeruli have shorter latencyresponses that can be used for timing reference. Slowerpenetration of odorants into lateral recesses of the nasalcavity increases the relative latencies of lateral glomerulusmitral cells by approximately 60 ms [49]. These mediolat-eral timing differences are systematically decreased athigher odorant concentrations and, therefore, could be
w
h
Log [odorant]1E-6
150
100
50
0
1E-4 0.01
Late
ncy
(ms)
Loca
l [od
oran
t]
Sniff
Medial
Lateral
MedialLateral
MedialLateral
Med
ial
Late
ral
Odorant
Medial
Lateral
Low High
(D) (E)
(F)
Epithelium
Bulb
MC MC
TRENDS in Neurosciences
sforms the afferent olfactory nerve (ON) signals transduced by one type of olfactory
cells (TC). The two classes (MC and TC) of olfactory bulb output neurons differ in
uperficially, receive more direct ON input and less granule cell (GC) inhibition, and
rnal tufted (ET) cells] and more GC inhibition, and have higher spike thresholds. (B)
(i.e., connected to the same glomerulus). When odorant concentration is increased,
ter MC/TC, including those with higher spike thresholds. (C) Coding of odorant
tion is increased (blue to red traces), latency and sniff cycle phase of MC spike
f odorant concentration by mediolateral timing difference in activation of pairs of
to olfactory sensory neurons (OSNs) in medial olfactory epithelium (on septum)
esults in a latency difference between inputs to glomeruli of mirror image receptor
ncentration at fixed time due to relative lag in odorant access. This gradient may
, the latency of spike responses drops at different rates for MC connected to medial
response to various odorants) and [49] (F) (onset latencies of MC spike responses
receptor I7 in all OSNs activated by octanal).

Review Trends in Neurosciences xxx xxxx, Vol. xxx, No. x
TINS-1062; No. of Pages 12
utilized for receptor-specific intensity coding (Figure 3D,E).Optogenetic stimulation of multiple glomeruli has shownthat downstream neurons in piriform cortex may able toread this kind of temporal code. Cortical neurons weresensitive to interglomerular optical stimulus delays in therange of approximately 0–50 ms, which is well matched tomediolateral delays, and could discriminate the order ofactivation[50].
Thus far, we have discussed analytic representations ofintensity divided among many glomerular data channels.However, our odor perceptions are largely synthetic andexpressed in terms of odor ‘objects’ constructed at highercortical levels (e.g., the smell of ‘rose’ or ‘coffee’). We attachto an odor object a single intensity value rather thanhundreds of low-level intensity codes of receptors andglomeruli. A fundamental problem then is to determinewhere and how a single intensity is computed. Somemodels have proposed that overall odor intensity mayalready be encoded in the olfactory bulb.
spH
O
ON input
Low
[Odora
(A)
(B)
Figure 4. Odorant concentration coding in olfactory bulb glomeruli. (A) Thousands o
convergent synaptic input via the olfactory nerve (ON) to one or a few glomeruli at stere
can be quantified by optical measurements of odorant responses using presynaptic in
synaptopHluorin, spH). This reveals coding of odorant concentration by a weakly coop
receptor out of a diverse population of approximately 102–103 different receptors, with d
increases, a larger set of receptors (and, hence, glomeruli) is recruited. This spatial expan
to serve as a concentration code at the system level.
Spatial extent coding
An increase in odorant concentration is accompanied by anincrease in the number of types of activated receptor[24,51] and OSN [52], and a corresponding expansion ofpresynaptic activity maps due to recruitment of additionalglomerular inputs detected by imaging in anesthetizedanimals [26,53] (Figure 4). Glomerular recruitment wasalso detected by other measurements of glomerular re-sponse with postsynaptic signal components [54–56],and also occurs in awake animals [57]. The recruitmentrate approximately matches the Weber ratio of just no-ticeable relative concentration change in humans [58],suggesting that the total number of activated glomeruli,or spatial extent of bulb activity, constitutes an ensemblecode for intensity. Assuming that odor quality is encodedby a glomerular identity code, a large change in spatialextent could confuse odor intensity and quality codes.However, awake rats were shown to recognize stableodor percepts as the extent of glomerular input maps
dorant
High
nt]
spH
sign
allog [odorant]
TRENDS in Neurosciences
f olfactory sensory neurons (OSNs) expressing the same olfactory receptor relay
otypic locations in the olfactory bulb. The collective inputs to individual glomeruli
dicators of calcium signaling, or transmitter release (e.g., the exocytosis reporter
erative dose–response curve. (B) Each glomerulus receives input from one type of
ifferent odorant tunings. This means that, as concentration of a particular odorant
sion of the number of activated glomeruli (shown here in blue) has been suggested
7

Review Trends in Neurosciences xxx xxxx, Vol. xxx, No. x
TINS-1062; No. of Pages 12
varied greatly with concentration [59]. A few studieshave reported relative stability in patterns of activeglomeruli across concentrations. This might be due todifferences in sensitivity or thresholding of detected sig-nals (fMRI), or variation in OR tuning between species(turtle) [60,61].
Glomerular recruitment has thus far been observedmostly in anesthetized preparations. Awake animalsmight be able to adjust sniffing rate and depth to stabilizeglomerular representations as concentration is increased(although this did not seem to occur in a mouse study [57]).Concentration invariance could also be achieved by post-synaptic processing in the bulb. Computer models havepredicted that wide-ranging recurrent excitation of shortaxon (SA) cells that connect many glomeruli, in conjunctionwith mitral/tufted cell inhibition by periglomerular cells,may normalize postsynaptic spatial activity patternsevoked by different odorant concentrations [62]. In theprocess, SA networks would compute a global meanstrength of input that might serve as a single readout ofstimulus intensity. Such computations are implemented inzebrafish bulb by an interneuron network that uses elec-trical coupling to boost weak responses and GABAergicinhibition to attenuate strong responses [63]. However,this normalization mechanism does not seem to operatein the mouse, because glomerular recruitment is stilldetectable postsynaptically in patterns of mitral/tufted cellresponse mapped by GCaMP2 imaging of calcium in den-dritic tufts [64]. Perceptual invariance may rely on proces-sing and decoding of mitral/tufted cell spike outputs at theensemble level. During each sniff cycle, multielectroderecordings in anesthetized mice reveal shifting patternsof odor-evoked activity sweeping through mitral cell popu-lations. The dynamics are odorant specific and their tra-jectories are clustered more coarsely by odorant, and morefinely by concentration and, thus, permit a separation ofquality versus intensity [36]. Similar separation of odorintensity versus quality by ensemble dynamics is observedin widely differing species; for example, zebrafish mitralcells [65] and locust antennal lobe projection neurons[117,118]. Zebrafish bulb circuits also appear to be wiredso that time-dependent decorrelation of input patternsselectively amplifies differences between patterns evokedby different odorants, but not those evoked by the sameodorant at different concentrations [65]. In addition to thisprocessing in the OB, downstream pattern completionnetworks in piriform cortex might be trained to recognizethe same odor object even if glomerular response patternsvary with odorant concentration [66]. Spatial extent mod-els of intensity coding might seem inconsistent with arecent study showing that mice can discriminate differentstimulus intensities delivered optogenetically to a singleglomerulus [30]. However, it is not known whether thisoptogenetic intensity is perceptually equivalent to odorintensity in these animals.
Coding by dedicated intensity channels
A family of broadly tuned low-affinity receptors has beenhypothesized to function as simple intensity detectors [67].The septal organ (Organ of Masera) is an isolated patch ofolfactory epithelium expressing a small repertoire of less
8
than a dozen ORs in 95% of its OSNs [68]. One dominantreceptor, SR1, occurring in approximately 50% of OSNs inthe septal organ, is broadly tuned and may function as ageneral transducer of concentration for a variety of odor-ants [69]. Cells expressing SR1 can respond to odorantconcentrations spanning 4 log units, a 100-fold greaterrange than many other OSNs. Although this is still lessthan the psychophysical dynamic ranges of olfaction (e.g.,approximately 6 log units for humans and approximately10 log units for dogs), it may be sufficient to encodeintensity for a subset of odorants over biologically relevantconcentration ranges. In the main olfactory epithelium,there are additional broadly tuned receptors detectingother classes of odorant [25]. Together, these could covera wider range of concentrations and encode intensity formore odorants. This model implies the existence of broadlytuned glomeruli with specialized projections for conveyingintensity information. The septal organ projects heavily toa few glomeruli in the posterior, ventromedial area of themain olfactory bulb [70]. It will be interesting to seewhether mice with genetic disruption [71] or lesions ofthese glomeruli can learn odor intensity discriminations.Dedicated intensity readouts may help regulate low-levelsensory mechanisms independent of conscious perceptionof stimulus intensity in higher brain centers. For example,in vision, the pupillary light reflex at high-light intensitiesis mediated by photosensitive melanopsin-expressing reti-nal ganglion cells [72]. One might imagine specializedpathways also exist for controlling olfactomotor reflexes[73].
The above models of intensity coding attempt to identifysimple neural schemes based on observing and correlatingresponses with changing concentrations of a series ofmonomolecular odorant stimuli delivered in controlledlaboratory settings. Although each has its strengths andweaknesses, there are currently insufficient data to distin-guish between them clearly. Moreover, they provide littleinsight into how perceived intensity might vary for struc-turally diverse odorants presented in simple or complexmixtures, or when olfactory adaptation occurs in real-world situations. A better understanding of these issuesmay require bridging the gap between low-level analyticcoding by receptors and glomeruli, and high-level syntheticcoding of odor objects in cortical areas.
Odor intensity from cortical activationTo date, few studies have directly assessed the centralneural network responsible for the processing of perceivedodor intensity or odor concentration. A major reason forthis dearth of knowledge is the aforementioned inherentlyconfounding co-dependency between the three perceptualodor dimensions: intensity, valence, and quality. This in-terdependence among dimensions renders the task of iso-lating cognitive processing of intensity perceptioninherently difficult. Nonetheless, increased attention haslately been devoted to higher-order processing areas inanimal and human models alike.
Intensity-dependent processing in the murine cortex
Odor representations in the murine piriform cortex (PC),one of the main components of primary olfactory cortex,

Review Trends in Neurosciences xxx xxxx, Vol. xxx, No. x
TINS-1062; No. of Pages 12
differ profoundly from the stereotypic glomerular mapsencoding odorant molecular features in the olfactory bulb.Calcium imaging revealed that odorant stimulation elicitsdiffuse activation of PC neural ensembles without clearspatial patterning [74]. Increasing odorant concentrationrecruited additional cells in a sublinear manner, with atmost 20% of PC cells activated at higher concentrations.Individual responses increased sublinearly in two-thirds ofcells, and decreased in the remaining third, suggestingengagement of inhibitory pathways. Recruitment of PCneurons is consistent with recruitment of additionalreceptors/glomeruli in bulbar odor maps at higher concen-trations. Glomeruli send diffuse overlapping mitral/tuftedprojections across the PC [75–77] and PC pyramidal neu-ron responses are determined by threshold integration ofexcitatory inputs from multiple glomeruli [78–80]. Addingmore glomeruli to bulbar maps is expected to bring morepyramidal neurons above threshold. Both the change incomposition of the active PC ensemble, and its differentialexcitation/inhibition, are possible encoders of stimulusintensity. PC neurons are sensitive to timing differencesof bulbar inputs, and may transform latency codes ofmitral/tufted cells into firing rate intensity codes [50].Mitral cells have wide-ranging projections to most of theolfactory cortex, whereas tufted cells target more restrictedrostral areas [76,77]. These differences could map activa-tion differences between mitral and tufted cells intoconcentration-dependent response patterns across PC neu-rons. Indeed, intrinsic optical imaging of dorsal anteriorPC showed that increasing odorant concentration expandsthe area of cortical activation along the rostrocaudal axis[81,82]. Single-unit recordings revealed a gradient inresponse thresholds, with lower thresholds at the rostralend where tufted cells have more projections [81].
Intensity-dependent processing in the human cortex
Initial studies assessing cerebral processing of perceivedodor intensity in humans using event-related potentials(ERP), derived from electroencephalography (EEG) record-ings, demonstrated that odor intensity and/or concentra-tion is negatively correlated with response latencies andpositively correlated with response amplitudes in foremostthe early perceptually related components [83,84]; that is,a more intense odor is processed faster and producesstronger responses compared with a weaker odor. This isin accordance with the aforementioned data obtained inperipheral recordings from animal models. Although amethod with superior temporal resolution, EEG and/orERP studies have not been able to provide a deeper under-standing of the underlying neural mechanisms due to thelack of reliable spatial information. More recently, studiesassessing judgments of odor intensity using fMRI, a meth-od with better spatial resolution, have consistently indi-cated that areas within the temporal lobes, such as theentorhinal cortex (EC) [85,86], the PC [85,87], and theamygdala [88], correlate with odor intensity perception.Several of these studies used a simple contrast betweenhigh- and low-intensity odors, which fails to dissociateintensity from a variety of confounding psychological con-structs (e.g., valence and quality). Moreover, these areasare located close to each other and, in most of these studies,
activations occur in overlapping anatomical regions, thusrendering it difficult to define primary areas of processing.However, subsequent studies using analyses dependent oncontinuous relations with the psychological intensity per-cept have indicated that judgments of odor intensities arelinearly correlated with activity within the PC [85] anddemonstrated dissociation between the temporal and fron-tal portion of the PC in an attention-dependent manner(B. Johnson, PhD thesis, University of California, Berkeleywith the University of California, San Francisco, 2006).Early studies frequently implicated intensity-dependentprocessing within the caudal areas of the orbitofrontalcortex (OFC) [85,87,89]. However, more recent studiessuggest that the main role of these areas is to form thefinal conscious percept of odor quality [90–92] by acting asan integrator of convergent signals from olfactory andother sensory and cognitive systems [93–95]. Given theheterogeneous nature of many of the areas within theolfactory network and the likely dependency of multipleamodal neural networks, it is difficult to isolate processingof intensity from other cognitive or perceptual activities.Some studies have attempted to isolate intensity by in-cluding several qualities with a spread among the valenceaxis to factor out valence-dependent activity, but the cog-nitive processing of the odor quality may induce confound-ing activity unrelated to intensity processing, such asmemory retrieval. For example, whereas the EC is com-monly implicated in odor processing [96], recent studiessuggest that the main role of this structure in the temporalcortex is related to memory or identity retrieval ratherthan directly involved in odor intensity processing per se[97,98].
In summary, these studies suggest that the PC is one ofthe key nodes in the neural network processing odor inten-sity judgments. The lack of significant involvement fromhigher order cognitive processing areas supports the viewthat basic intensity processing in the olfactory sense is to alarge extent dependent on peripheral signal processing withrather limited cognitive modulation. However, studiesassessing intensity processing in human participants arescarce and, due to methodological limitations, have yet toconnect directly with more recent studies in animal modelsbeyond mapping of cerebral processing areas.
How quickly is intensity computed?In land-based vertebrates, olfactory perception begins withthe inhalation (sniffing) of odorous air into the nasal cavity.A sniff begins with a stimulus-independent inhalation, butis rapidly modulated in response to sniff content. Sniffs ofdifferent odorant concentrations are uniform for the first160–260 ms following sniff onset, but then diverge such thatsniffs of a concentrated odorant will have a smaller volumethan sniffs of a diluted odorant [73]. This relation is suffi-ciently robust to serve as a nonverbal test of odorant detec-tion [99]. Adding OSN response delays following onset ofstimulation and efferent nasal airflow [22,21,100] yields anoverall peripheral response delay of approximately 50 ms,which is roughly matched by the response delay of mitralcells in the bulb following the onset of inhalation [46,101].Several groups found that both rats and mice could performsimple odor discrimination tasks within a single sniff in less
9

Review Trends in Neurosciences xxx xxxx, Vol. xxx, No. x
TINS-1062; No. of Pages 12
than 200 ms [102–104]. This suggests that the neural com-putation time for odor identification and decision making ison the timescale of 150 ms. The rapid adjustment of airflowin response to odor concentration implies that at least onerepresentation of intensity is likely subcortical, becausehuman olfactory cortical evoked potentials are not typicallyseen until 150–400 ms following stimulus onset [105–107].
Concluding remarksMost olfactory stimuli encountered in nature are complexmixtures of odorant molecules. When the intensities of thecomponent odorants are known, what is the intensity of themixture? The intensity of an odorant mixture is rarely asimple linear sum of the intensities of individual compo-nents [108], but as noted above, nonlinear models, such asthe Hill equation, are often a better fit to the concentration–intensity relation. Thus, mixture interactions that deviatefrom a linear sum of components may be an inherent prop-erty of the nonlinear, sigmoidal psychophysical function,rather than interactions between the odorants at the recep-tor level. Indeed, work at the glomerular level indicatedthat, for some odorants, a simple competitive binding modelis sufficient to account for mixture responses of OSN inputs[109]. Given the current lack of a model for predicting theintensity of a complex mixture, standard practice for deter-mining the intensity of a mixture in regulatory agencies andindustrial settings is to use a human sensory panel trainedin the use of a dynamic-dilution olfactometer.
A major obstacle in the field has been the inability toassess perceived intensity in animal models. Traininganimals to perform a concentration–discrimination taskis straightforward; obtaining an accurate readout of per-ceived intensity is not. This has led most researchers tobase their models on concentration and focus on within-odor manipulations where concentration and intensitychanges are closely related. To distinguish between themodels reviewed here, future experiments must dissociateconcentration from intensity (Box 2). A valid model ofintensity perception must be able to predict intensityacross odors, as odors are mixed and as adaptation occurs.For example, which neural feature is consistent acrossstimulation with the 144 odors that have been intensitybalanced in humans [110] or the 12 odor pairs that havebeen intensity balanced in rats [4]? In rats, adaptation toan odor for 300 ms was perceived as equivalent in intensityto a three- to ten-times dilution of the odor [4]. Whichneural feature is consistent across the diluted and adapted
Box 2. Outstanding questions
� Can perceived intensity be predicted from molecular structure?
� Can any models predict mixture intensity, when the component
concentration–intensity functions are known? If mixture compo-
nents (or subqualities) are identifiable, do they have independent
intensities (i.e., is intensity multichannel data?)
� Can any models predict intensity across odors?
� Can any models predict perceptual adaptation, that is, how
perceived intensity decreases over time with continuous stimulus
presentation?
� How is intensity ultimately represented, computed, or read by
neural circuits, at the level of perceived odor sensation? Do any of
the concentration codes generated in earlier or later stages of the
pathway contribute to this final intensity representation?
10
stimuli? In addition, a model of intensity must disentangleconfounding factors, such as odorant quality and valence.
AcknowledgmentsJ.D.M. is supported by National Institutes of Health (NIH) grantDC013339. J.N.L. is supported by the Knut and Alice WallenbergFoundation (KAW 2012.0141). J.R. is supported by NIH grantDC009613. G.L. is supported by NIH grant DC04208.
References1 Chastrette, M. et al. (1998) Modelling the human olfactory stimulus-
response function. Chem. Senses 23, 181–1962 Henion, K.E. (1971) Odor pleasantness and intensity: a single
dimension? J. Exp. Psychol. 90, 275–2793 Gross-Isseroff, R. and Lancet, D. (1988) Concentration-dependent
changes of perceived odor quality. Chem. Senses 13, 1914 Wojcik, P.T. and Sirotin, Y.B. (2014) Single scale for odor intensity in
rat olfaction. Curr. Biol. 24, 568–5735 Eichenbaum, H. et al. (1983) Selective olfactory deficits in case H.M.
Brain 106, 459–4726 Jones-Gotman, M. and Zatorre, R.J. (1988) Olfactory identification
deficits in patients with focal cerebral excision. Neuropsychologia 26,387–400
7 Moskowitz, H.R. et al. (1976) Odor intensity and pleasantness for adiverse set of odorants. Percept. Psychophysiol. 19, 122–128
8 Fechner, G.T. (1860) Elemente der Psychophysik, Breitkopf & Hartel9 Stevens, S.S. (1957) On the psychophysical law. Psychol. Rev. 64,
153–18110 Audouin, V. et al. (2001) Limitations in the use of odor activity values
to determine important odorants in foods. In Gas Chromatography:Olfactometry, ACS Symposium Series (Vol. 782) (Leland, J.V. et al.,eds), pp. 156–171, American Chemical Society
11 Abraham, M.H. et al. (2012) An algorithm for 353 odor detectionthresholds in humans. Chem. Senses 37, 207–218
12 Hau, K.M. and Connell, D.W. (1998) Quantitative structure-activityrelationships (QSARs) for odor thresholds of volatile organiccompounds (VOCs). Indoor Air 8, 23–33
13 Keller, A. et al. (2007) Genetic variation in a human odorant receptoralters odour perception. Nature 449, 468–472
14 Cain, W.S. (1969) Odor intensity: differences in the exponent of thepsychophysical function. Percept. Psychophys. 6, 349–354
15 Kleene, S.J. (1997) High-gain, low-noise amplification in olfactorytransduction. Biophys. J. 73, 1110–1117
16 Maue, R.A. and Dionne, V.E. (1987) Patch-clamp studies of isolatedmouse olfactory receptor neurons. J. Gen. Physiol. 90, 95–125
17 Lynch, J.W. and Barry, P.H. (1989) Action potentials initiated bysingle channels opening in a small neuron (rat olfactory receptor).Biophys. J. 55, 755–768
18 Reisert, J. and Matthews, H.R. (1999) Adaptation of the odour-induced response in frog olfactory receptor cells. J. Physiol. 519,801–813
19 O’Connell, R.J. and Mozell, M.M. (1969) Quantitative stimulation offrog olfactory receptors. J. Neurophysiol. 32, 51–63
20 Reisert, J. (2010) Origin of basal activity in mammalian olfactoryreceptor neurons. J. Gen. Physiol. 136, 529–540
21 Duchamp-Viret, P. et al. (2000) Peripheral odor coding in the rat andfrog: quality and intensity specification. J. Neurosci. 20, 2383–2390
22 Ghatpande, A.S. and Reisert, J. (2011) Olfactory receptor neuronresponses coding for rapid odour sampling. J. Physiol. 589, 2261–2273
23 Rospars, J.P. et al. (2000) Spiking frequency versus odorantconcentration in olfactory receptor neurons. Biosystems 58, 133–141
24 Malnic, B. et al. (1999) Combinatorial receptor codes for odors. Cell 96,713–723
25 Nara, K. et al. (2011) A large-scale analysis of odor coding in theolfactory epithelium. J. Neurosci. 31, 9179–9191
26 Wachowiak, M. and Cohen, L.B. (2001) Representation of odorantsby receptor neuron input to the mouse olfactory bulb. Neuron 32,723–735
27 Spors, H. et al. (2006) Temporal dynamics and latency patterns ofreceptor neuron input to the olfactory bulb. J. Neurosci. 26, 1247–1259
28 Bozza, T. et al. (2002) Odorant receptor expression defines functionalunits in the mouse olfactory system. J. Neurosci. 22, 3033–3043

Review Trends in Neurosciences xxx xxxx, Vol. xxx, No. x
TINS-1062; No. of Pages 12
29 Grosmaitre, X. et al. (2006) Odorant responses of olfactory sensoryneurons expressing the odorant receptor MOR23: a patch clampanalysis in gene-targeted mice. Proc. Natl. Acad. Sci. U.S.A. 103,1970–1975
30 Smear, M. et al. (2013) Multiple perceptible signals from a singleolfactory glomerulus. Nat. Neurosci. 16, 1687–1691
31 Laing, D.G. et al. (2003) Relationship between molecular structure,concentration and odor qualities of oxygenated aliphatic molecules.Chem. Senses 28, 57–69
32 Krone, D. et al. (2001) Qualitative and quantitative olfactometricevaluation of different concentrations of ethanol peppermint oilsolutions. Phytother. Res. 15, 135–138
33 Mair, R.G. (1982) Adaptation of rat olfactory bulb neurones. J.Physiol. 326, 361–369
34 Meredith, M. (1986) Patterned response to odor in mammalianolfactory bulb: the influence of intensity. J. Neurophysiol. 56, 572–597
35 Wellis, D.P. et al. (1989) Discrimination among odorants by singleneurons of the rat olfactory-bulb. J. Neurophysiol. 61, 1161–1177
36 Bathellier, B. et al. (2008) Dynamic ensemble odor coding in themammalian olfactory bulb: sensory information at differenttimescales. Neuron 57, 586–598
37 Cury, K.M. and Uchida, N. (2010) Robust odor coding via inhalation-coupled transient activity in the mammalian olfactory bulb. Neuron68, 570–585
38 Rinberg, D. et al. (2006) Sparse odor coding in awake behaving mice. J.Neurosci. 26, 8857–8865
39 Desmaisons, D. et al. (1999) Control of action potential timing byintrinsic subthreshold oscillations in olfactory bulb output neurons. J.Neurosci. 19, 10727–10737
40 Chalansonnet, M. and Chaput, M.A. (1998) Olfactory bulb output celltemporal response patterns to increasing odor concentrations in freelybreathing rats. Chem. Senses 23, 1–9
41 Cang, J. and Isaacson, J.S. (2003) In vivo whole-cell recording of odor-evoked synaptic transmission in the rat olfactory bulb. J. Neurosci. 23,4108–4116
42 Hopfield, J.J. (1995) Pattern-recognition computation using action-potential timing for stimulus representation. Nature 376, 33–36
43 Schaefer, A.T. and Margrie, T.W. (2007) Spatiotemporalrepresentations in the olfactory system. Trends Neurosci. 30, 92–100
44 Schaefer, A.T. and Margrie, T.W. (2012) Psychophysical properties ofodor processing can be quantitatively described by relative actionpotential latency patterns in mitral and tufted cells. Front. Syst.Neurosci. 6, 30
45 Gire, D.H. et al. (2012) Mitral cells in the olfactory bulb are mainlyexcited through a multistep signaling path. J. Neurosci. 32, 2964–2975
46 Fukunaga, I. et al. (2012) Two distinct channels of olfactory bulboutput. Neuron 75, 320–329
47 Nagayama, S. et al. (2004) Mitral and tufted cells differ in thedecoding manner of odor maps in the rat olfactory bulb. J.Neurophysiol. 91, 2532–2540
48 Schoenfeld, T.A. and Cleland, T.A. (2005) The anatomical logic ofsmell. Trends Neurosci. 28, 620–627
49 Zhou, Z. and Belluscio, L. (2012) Coding odorant concentrationthrough activation timing between the medial and lateral olfactorybulb. Cell Rep. 2, 1143–1150
50 Haddad, R. et al. (2013) Olfactory cortical neurons read out a relativetime code in the olfactory bulb. Nat. Neurosci. 16, 949–957
51 Kajiya, K. et al. (2001) Molecular bases of odor discrimination:reconstitution of olfactory receptors that recognize overlapping setsof odorants. J. Neurosci. 21, 6018–6025
52 Ma, M. and Shepherd, G.M. (2000) Functional mosaic organization ofmouse olfactory receptor neurons. Proc. Natl. Acad. Sci. U.S.A. 97,12869–12874
53 Bozza, T. et al. (2004) In vivo imaging of neuronal activity by targetedexpression of a genetically encoded probe in the mouse. Neuron 42, 9–21
54 Rubin, B.D. and Katz, L.C. (1999) Optical imaging of odorantrepresentations in the mammalian olfactory bulb. Neuron 23, 499–511
55 Meister, M. and Bonhoeffer, T. (2001) Tuning and topography in anodor map on the rat olfactory bulb. J. Neurosci. 21, 1351–1360
56 Spors, H. and Grinvald, A. (2002) Spatio-temporal dynamics of odorrepresentations in the mammalian olfactory bulb. Neuron 34,301–315
57 Vincis, R. et al. (2012) Dense representation of natural odorants in themouse olfactory bulb. Nat. Neurosci. 15, 537–539
58 Koulakov, A. et al. (2007) Olfactory coding with all-or-nothingglomeruli. J. Neurophysiol. 98, 3134–3142
59 Homma, R. et al. (2009) Perceptual stability during dramatic changesin olfactory bulb activation maps and dramatic declines in activationamplitudes. Eur. J. Neurosci. 29, 1027–1034
60 Xu, F. et al. (2000) Assessment and discrimination of odor stimuli inrat olfactory bulb by dynamic functional MRI. Proc. Natl. Acad. Sci.U.S.A. 97, 10601–10606
61 Wachowiak, M. et al. (2002) Distributed and concentration-invariantspatial representations of odorants by receptor neuron input to theturtle olfactory bulb. J. Neurophysiol. 87, 1035–1045
62 Cleland, T.A. et al. (2007) Relational representation in the olfactorysystem. Proc. Natl. Acad. Sci. U.S.A. 104, 1953–1958
63 Zhu, P. et al. (2013) Equalization of odor representations by a networkof electrically coupled inhibitory interneurons. Nat. Neurosci. 16,1678–1686
64 Fletcher, M.L. et al. (2009) Optical imaging of postsynaptic odorrepresentation in the glomerular layer of the mouse olfactory bulb.J. Neurophysiol. 102, 817–830
65 Niessing, J. and Friedrich, R.W. (2010) Olfactory patternclassification by discrete neuronal network states. Nature 465, 47–52
66 Wilson, D.A. (2009) Pattern separation and completion in olfaction.Ann. N. Y. Acad. Sci. 1170, 306–312
67 Firestein, S. (2001) How the olfactory system makes sense of scents.Nature 413, 211–218
68 Ma, M. (2010) Multiple olfactory subsystems convey various sensorysignals. In The Neurobiology of Olfaction (Menini, A., ed.), pp. 225–240, CRC Press
69 Grosmaitre, X. et al. (2009) SR1, a mouse odorant receptor with anunusually broad response profile. J. Neurosci. 29, 14545–14552
70 Levai, O. and Strotmann, J. (2003) Projection pattern of nerve fibersfrom the septal organ: DiI-tracing studies with transgenic OMP mice.Histochem. Cell Biol. 120, 483–492
71 Fuss, S.H. et al. (2013) Odorant receptor gene choice and axonalwiring in mice with deletion mutations in the odorant receptorgene SR1. Mol. Cell. Neurosci. 56, 212–224
72 Do, M.T. and Yau, K.W. (2010) Intrinsically photosensitive retinalganglion cells. Physiol. Rev. 90, 1547–1581
73 Johnson, B.N. et al. (2003) Rapid olfactory processing implicatessubcortical control of an olfactomotor system. J. Neurophysiol. 90,1084–1094
74 Stettler, D.D. and Axel, R. (2009) Representations of odor in thepiriform cortex. Neuron 63, 854–864
75 Sosulski, D.L. et al. (2011) Distinct representations of olfactoryinformation in different cortical centres. Nature 472, 213–216
76 Igarashi, K.M. et al. (2012) Parallel mitral and tufted cell pathwaysroute distinct odor information to different targets in the olfactorycortex. J. Neurosci. 32, 7970–7985
77 Nagayama, S. et al. (2010) Differential axonal projection of mitral andtufted cells in the mouse main olfactory system. Front. Neural Circuits4, Pages 1–8, Article 120
78 Apicella, A. et al. (2010) Pyramidal cells in piriform cortex receiveconvergent input from distinct olfactory bulb glomeruli. J. Neurosci.30, 14255–14260
79 Davison, I.G. and Ehlers, M.D. (2011) Neural circuit mechanisms forpattern detection and feature combination in olfactory cortex. Neuron70, 82–94
80 Miyamichi, K. et al. (2011) Cortical representations of olfactory inputby trans-synaptic tracing. Nature 472, 191–196
81 Onoda, N. et al. (2005) Odor-intensity coding in the anterior piriformcortex. Chem. Senses 30 (Suppl. 1), i162–i163
82 Sugai, T. et al. (2005) Odor-concentration coding in the guinea-pigpiriform cortex. Neuroscience 130, 769–781
83 Pause, B.M. et al. (1997) Central processing of odor concentration is atemporal phenomenon as revealed by chemosensory event-relatedpotentials (CSERP). Chem. Senses 22, 9–26
84 Tateyama, T. et al. (1998) Relation of olfactory event-related potentialsto changes in stimulus concentration. Electroencephalogr. Clin.Neurophysiol. 108, 449–455
85 Rolls, E.T. et al. (2003) Different representations of pleasant andunpleasant odours in the human brain. Eur. J. Neurosci. 18, 695–703
11

Review Trends in Neurosciences xxx xxxx, Vol. xxx, No. x
TINS-1062; No. of Pages 12
86 Bensafi, M. et al. (2008) Neural coding of stimulus concentration in thehuman olfactory and intranasal trigeminal systems. Neuroscience154, 832–838
87 Winston, J.S. et al. (2005) Integrated neural representations of odorintensity and affective valence in human amygdala. J. Neurosci. 25,8903–8907
88 Anderson, A.K. et al. (2003) Dissociated neural representationsof intensity and valence in human olfaction. Nat. Neurosci. 6,196–202
89 Zatorre, R.J. et al. (2000) Neural mechanisms involved in odorpleasantness and intensity judgments. Neuroreport 11, 2711–2716
90 Li, W. et al. (2010) Right orbitofrontal cortex mediates consciousolfactory perception. Psychol. Sci. 21, 1454–1463
91 Bowman, N.E. et al. (2012) Temporal integration of olfactoryperceptual evidence in human orbitofrontal cortex. Neuron 75,916–927
92 Seubert, J. et al. (2012) Orbitofrontal cortex and olfactory bulb volumepredict distinct aspects of olfactory performance in healthy subjects.Cereb. Cortex 23, 2448–2456
93 Gottfried, J.A. et al. (2004) Remembrance of odors past: human olfactorycortex in cross-modal recognition memory. Neuron 42, 687–695
94 Price, J.L. (2008) Multisensory convergence in the orbital andventrolateral prefrontal cortex. Chemosens. Percept. 1, 103–109
95 Lundstrom, J.N. et al. (2011) Central processing of the chemicalsenses: an overview. ACS Chem. Neurosci. 2, 5–16
96 Frasnelli, J. et al. (2010) Neuroanatomical correlates of olfactoryperformance. Exp. Brain Res. 201, 1–11
97 Kjelvik, G. et al. (2012) The human brain representation of odoridentification. J. Neurophysiol. 108, 645–657
98 Igarashi, K.M. et al. (2014) Coordination of entorhinal–hippocampalensemble activity during associative learning. Nature http://dx.doi.org/10.1038/nature13162
99 Frank, R.A. et al. (2003) Assessment of the Sniff Magnitude Test as aclinical test of olfactory function. Physiol. Behav. 78, 195–204
100 Batsel, H.L. and Lines, A.J., Jr (1973) Bulbar respiratory neuronsparticipating in the sniff reflex in the cat. Exp. Neurol. 39, 469–481
101 Shusterman, R. et al. (2011) Precise olfactory responses tile the sniffcycle. Nat. Neurosci. 14, 1039–1044
102 Uchida, N. and Mainen, Z.F. (2003) Speed and accuracy of olfactorydiscrimination in the rat. Nat. Neurosci. 6, 1224–1229
12
103 Rinberg, D. et al. (2006) Speed-accuracy tradeoff in olfaction. Neuron51, 351–358
104 Abraham, N.M. et al. (2004) Maintaining accuracy at the expense ofspeed: stimulus similarity defines odor discrimination time in mice.Neuron 44, 865–876
105 Hummel, T. and Kobal, G. (1992) Differences in human evokedpotentials related to olfactory or trigeminal chemosensoryactivation. Electroencephalogr. Clin. Neurophysiol. 84, 84–89
106 Livermore, A. et al. (1992) Chemosensory event-related potentialsin the investigation of interactions between the olfactory andthe somatosensory (trigeminal) systems. Electroencephalogr. Clin.Neurophysiol. 83, 201–210
107 Murphy, C. et al. (2000) Olfactory event-related potentials and aging:normative data. Int. J. Psychophysiol. 36, 133–145
108 Jones, F.N. and Woskow, M.H. (1964) On the intensity of odormixtures. Ann. N. Y. Acad. Sci. 30, 484–494
109 Cruz, G. and Lowe, G. (2013) Neural coding of binary mixtures in astructurally related odorant pair. Sci. Rep. 3, 1220
110 Weiss, T. et al. (2012) Perceptual convergence of multi-componentmixtures in olfaction implies an olfactory white. Proc. Natl. Acad. Sci.U.S.A. 109, 19959–19964
111 Carmichael, S.T. et al. (1994) Central olfactory connections in themacaque monkey. J. Comp. Neurol. 346, 403–434
112 Price, J.L. (2003) The olfactory system. In The Human NervousSystem (Paxinos, G., ed.), pp. 1198–1212, Academic Press
113 Reisert, J. and Matthews, H.R. (1999) Adaptation of the odour-induced response in frog olfactory receptor cells. J. Physiol. 519 (Pt3), 801–813
114 Hamilton, K.A. and Kauer, J.S. (1989) Patterns of intracellular-potentials in salamander mitral tufted cells in response to odorstimulation. J. Neurophysiol. 62, 609–625
115 Tan, J. et al. (2010) Odor information processing by the olfactory bulbanalyzed in gene-targeted mice. Neuron 65, 912–926
116 Burton, S.D. and Urban, N.N. (2014) Greater excitability and firingirregularity of tufted cells underlies distinct afferent-evoked activityof olfactory bulb mitral and tufted cells. J. Physiol. 592, 2097–2118
117 Stopfer, M. et al. (2003) Intensity versus identity coding in anolfactory system. Neuron. 39, 991–1004
118 Shen, K. et al. (2013) Encoding of mixtures in a simple olfactorysystem. Neuron. 80, 1246–1262


