Embed Size (px)
Citation preview

D 11 t- -a ooc ' o f E. Chemistry and Physics. 53 Bulletin No. 325 Series < n' ^^ g
DEPARTMENT OF THE INTERIOR .
UNITED STATES GEOLOGICAL SURVEY
GEORGE OTIS SMITH, DIRECTOR
A STUDY OF
FOUR HUNDRED STEAMING TESTS
MADE AT THE FUEL-TESTING PLANT, ST, LOUIS, 10, IN 1904,1905, AND 1906,
BY
LESTER P. BRECKENRIDGE
WASHINGTONGOVERNMENT PRINTING OFFICE
1907

CONTENTS.
Page. Preface, by L. P. Breckenridge............................................. 7Introduction, by Walter T. Ray............................................ 9Relations of test data. ...................................................... ̂ 11
Rate of combustion.................................................... 11Supposed rate of heat evolution......................................... 13Combustion-chamber temperature......'................................. 18A. S. M. E. code boiler efficiency (72*)................................. 26Moisture in coal....................................................... 32Ash and clinker..................................................'..... 32Average diameter of coal............................................... 45Per cent of rated capacity developed ..............'..................... 51Pyrometry.................^........................................... 52Smoke................................................................. 56
Combustion and coal...................................................... 58On "volatile matter," "fixed carbon," "water of Composition," and
1 ' combustible "........................................................ 58Grate and combustion space......................'....................... 59Velocity of combustion at various points along the flame.................. 60Combustion-chamber baffle wall........................................ 62Combustion-chamber temperature...................................... 63Attempts to explain unaccounted-for loss in heat balance................. 64Relation of nitrogen in flue gases to efficiency 72* and to size of coal, and
of per cent of CO to efficiency 72*...................................... 64Relation of C02 in flue gases to per cent of completeness of combustion
(E3)................................................................. 65Relation of differences of draft to pounds of dry chimney gases per pound
of "combustible".................................................... 66Classification of coals....................................................... 68
Carbon-hydrogen ratio in air-dried coal.................................. 68Carbon-hydrogen ratio in coal as received............................... 70Carbon-hydrogen ratio in dry coal....:.................................... 77Carbon-hydrogen ratio in coal as fired as affecting efficiency 72*........... 82Relation of ratio of carbon to available hydrogen and of per cent of avail
able hydrogen to efficiency 72*....................................... 83Ratio of hydrogen to available hydrogen................................ 85
. Per cent of "volatile matter" in the "combustible"..................... 89Fixed carbon (proximate analysis)...................................... 90Relation of efficiency 72* to per cent of oxygen in "combustible"........ 92British thermal units per pound of dry coal............................. 93Ratio of ash to sulphur in dry coal...................................... 94

4 . CONTENTS.
Page.Suggested'steam-turbine cycles, heat absorption, .and boiler efficiencies.... 95
The boiler and the furnace and their .efficiencies.......................... 95High initial furnace temperature and its effect on economy..,.............. 100Low steam pressure and its effect on economy............................ 102Heat transmission through boiler tubes, and true boiler and furnace effi
ciencies...-. ............:......................;......;.............. 105Theoretical considerations............................................... 109True boiler efficiencies dependent only on physical size, shape, and ar
rangement of boiler.................................................. 112Influence of velocity of gases on heat absorption......................... 113Practical application of theory of heat absorption to a fire-tube boiler...... 118Water circulation as affecting heat absorption............................ 120Calculation of heat absorption along a fire tube. ............................ 121Higher initial temperature means higher final 'temperature when heat
absorption is by convection only........... '..........................' 124Modifying factors of the theory of heat transmission...................... 125Temperature test of Perry's equation...............'.................... 132Ratio modified in practice by initial temperature......................... 134A conception of boiler and furnace efficiency. ...........................:. 137
The code form and a revised form of heat balance..................... 137Derivation of the constant-capacity curves of fig. 65................... 141Derivation of boiler efficiency (E5).................................. 142Derivation of true boiler efficiency (E4)............................. 143Method of estimating radiation. ................................... 143Plotting of probability curves...................................... 146
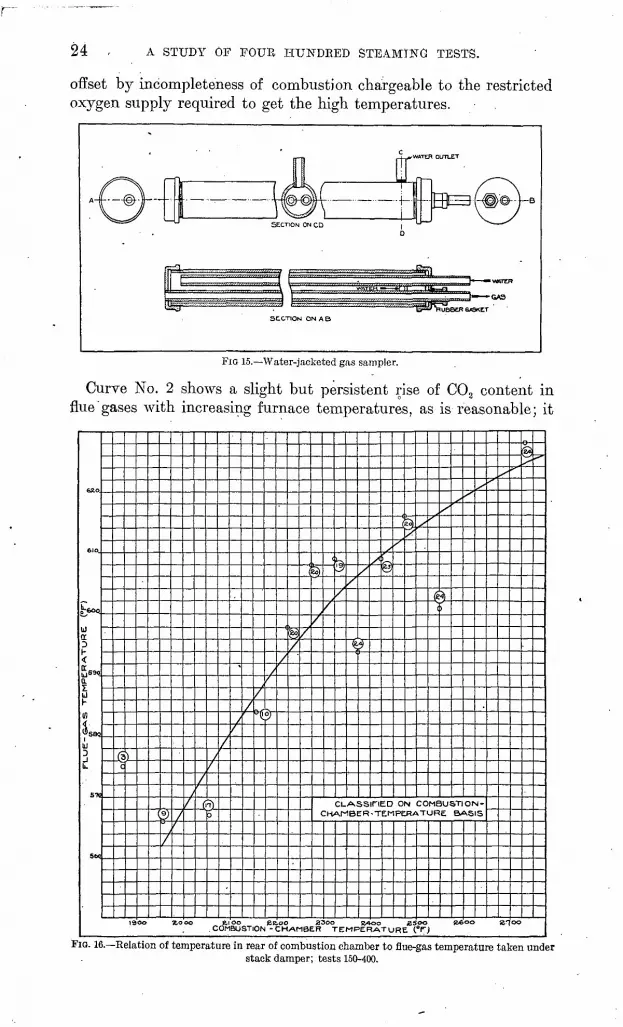
Miscellaneous.............................................................. 149Reliability of observation and data..................................... 149Computations of a steaming test........................................ 151Dissociation curves of carbon dioxide and water vapor. .1................. 153Water-jacketed gas sampler............................................ 154Comparison of readings of certain gas samplers............................ 155Flue-gas sampler.................................^.................... 156Unaccounted-for percentages probably too high........................... 156Probability curves..................................................... 158Relation of temperature of products of combustion to pounds of air used.. 159Circulation indicator................................................... 160C-shaped v. flat-bottomed tube tiles..................................... 164Orsat totals............................................................. 164
Per cent of CO in combustion chamber.......................... '. ....... 166Pounds of dry chimney gas per pound of '' combustible "................. 167Effect of direction, velocity, relative humidity, and temperature of wind
on efficiency 72*..................................................... 167Relation of unaccounted-for loss to ash passing over bridge wall.......... 168The law of mass action.................................................. 170Dimensions of boilers and settings....................................... 173True boiler efficiency................................................... 174
General conclusions....................................................... 174Commercial considerations..........:....................................... 177Bibliography. .............................................................. 179Glossary................................................................... 180Index.................................................................... 185

ILLUSTRATIONS.
Page. FIG . 1. Relations of rate of combustion to three stated factors................. 12
2. Relations of rate of combustion to three stated factors taken from heatbalance..................:................................-........ 12
3. Relations of rate of heat evolution to three stated factors.............. 134. Relations of rate of heat evolution to four stated factors................ 135. Relations of rate of heat evolution to two stated factors................ 146. Theoretical curves of factors affecting heat absorption.................. 157. Velocity of water circulation in boiler as affected by rate of steaming... 168. Relations of coal burned to rated capacity and to efficiency 72*....... 179. Variation of temperature with firing in Heine furnace.................. 18
10. Wanner optical pyrometer in position for standardizing............... 1911. Combustion-chamber temperature as a function of two stated factors... 2012. Relations of combustion-chamber temperature to three stated factors.. 2113. Relation of flue-gas composition to combustion-chamber temperature.. 2214. Relation of gas composition to temperature in rear of combustion
chamber........................................................... 2315. Water-jacketed gas sampler. .......................... % ............... 2416. Relation of combustion-chamber temperature to flue-gas temperature.. 2417. Relations of combustion-chamber temperature to three stated factors.;. 2518. Relations of efficiency 72* to CO and Cp2 , and of C02 to efficiency 72*.. . 2719. Relations of nitrogen to efficiency 72* and to size of coal, and of CO to
efficiency 72*.................................................... 2820. Theoretical curves of heat absorption as affected by air supply.......... '2921. Classifications on bases of efficiency. 72* and of clinker................. 3022. Relation of moisture in coal to efficiency 72*, and of efficiency 72* to ash. 3323. Relation between ratio of iron in coal to ash in coal and boiler efficiency
72*.............................................................. 3524. Relations of clinker in refuse to four stated factors.................... 3625. Coal classification based on carbon-hydrogen ratio in dry coal......... 3726. Relation of per cent.of ash in dry coal to efficiency 73................ 4027. Relations of per cent of ash to seven stated factors..................... 4128. Relations of sulphtfr in coal to four stated factors...................... 4329. Relations,of size of coal to eight stated factors: ....................... 4630. Relations of size of .coal to seven stated factors....................... 4831. Relation of C02 in flue gases to completeness of .combustion............ 5132 Comparison of pyrometer and water-jacket temperatures in; combustion
chamber......................................................... 5533. Smoke classification on basis of black smoke as 100 per cent........... 5634. Gas-mixing wall built in the Heine safety water-tube boiler..;........ 6235. Relations of combustion-chamber temperature to three stated heat-
balance factors................................................... 63

6 ILLUSTRATIONS.
. Page. FIG. 36. Relations of differences of draft to pounds of dry chimney gases per
pound of "combustible"......................................... 6637. Coal classification based on carbon-hydrogen ratio from analysis of air-
dried samples................................................... . 6938. Coal classification based on carbon-hydrogen ratio.................... 7139. Coal classification, Group K......................................... 7440. Coal classification, Group M....................................... 7541. Coal classification, Group 0................................ ̂ ...... 7642. Coal classification, Group A ....................................... 7943. Coal' classification, Group B....................................... 8044. Coal classification, Group D........................................ 8145. Coal classification, Group Y........................................ 8246. Efficiency curves of coal classified according to the per cent of rating.. 8347. Classification of tests based on available hydrogen................:.. 8448. Relation'between the ratio of volatile carbon to total carbon and effi
ciency 72*..................................................... 8649. Coal classification based on ratio of hydrogen to available hydrogen... 8750. Relations of "volatile matter" in the "combustible" to two stated-
factors ........................................................ 8951. Relations of "fixed carbon " to six stated factors..................... 9152. Relations of efficiency 72* to per cent oxygen in '' combustible "...... 9253. Relations of B. t. \i. value of coal to five stated factors................ 9354. Temperature-entropy diagrams for boiler............................ 9655. Availability to a boiler of heat of combustion of carbon............... 10256. Temperature-entropy diagrams for steam-turbine cy*cles............. 10557. Diagram illustrating the theory of the dislodgment of adhering gaseous
molecules....................................................... 11058. Relative B. t. u. absorbed at different points in a boiler tube......... 12359. Relative temperatures of the products of combustion passing through a
boiler tube....................................................... 12560. Diagrams illustrating temperature gradients of moving gases......... 12761. Relations of pounds of gas to-heat transmitted and of hea,t radiation to
actual temperature............................................... 13162. Classification based on ratio of certain stated temperatures........... 13363. Relation of ratio of certain stated temperatures to rated capacity...... 13664. Relation of boiler efficiency to unaccounted-for heat; availability of
heat to boiler...................................................... 13865. Curves of constant boiler efficiency (E5 ) and of constant capacity devel-
oped.......................................................... 14166. Curves of constant true boiler efficiency (E4 ) and of constant capacity
developed....................................................... 14467. Probability curves (approximate)..............'.................... 14768. Relation of unaccounted-for loss to CO loss..: ..................... 15169. Dissociation curves of water vapor and carbon dioxide................ 15470. Comparison of readings of multitubular gas sampler and of single tube
in stack....................................................... 15571. Flue-gas sampler installed to replace A. S. M. E. multitubular sampler. 15772. Diagram illustrating probability curve............................. 15873. Theoretical curves showing relation of temperature to pounds of air
used .......................................................... 16074. Circulation indicator mounted in'boiler............................ 16175. Result of observations with circulation counter..................... 16276. Dimensions and details of boiler setting............................. 174

PREFACE.
The fuel tests discussed in this paper were made under two Heine water-tube boilers by the boiler division of the United States Geolog ical Survey fuel-testing plant at St. Louis, Mo. These tests began during the Louisiana Purchase Exposition, in 1903, and have been in progress since that time. The coals tested have been collected from all the prominent fields of the United States.
It has been the object to compare fuels by determining the evapo rative performance of the boilers when using the various coals. Care ful and complete observations have been made with each coal, so that it should be possible for engineers to determine from an examination of the records whether the conditions of the tests were favorable or unfavorable for the character of the coals tested.
The results of tests by the several divisions of the fuel-testing plant that have been published thus far appear in (a) Bulletins Nos. 261 and 290 of the United States Geological Survey, giving preliminary reports of the operations of the plant; (&) Professional Paper No. 48 of the Survey, giving complete and detailed information of the tests made during the Exposition.
The steaming tests were in charge of D. T. Randall during the Expo sition period and of Walter T. Ray since that time. These men have been ably assisted by a corps of trained observers and computers, who have been alert, patient, and painstaking.
As soon as a considerable number of tests were available, it seemed desirable to begin a comparison of the various tests on the basis of such usual factors as over-all efficiency, rate of combustion, tempera ture of escaping gases, evaporation per square foot of heating surface, etc. It soon developed that many interesting and apparently valua ble results were brought out by these comparisons, and hence they were extended. The discussions of facts led to a search for theories, and the men of the division sought out available literature bearing on the various subjects under discussion. Thus has accumulated the material here presented. It is not the work of any one, but of all.
To Messrs. Walter T. Ray, Henry Kreisinger, and Harry W. Weeks should be accorded especial credit for preparing the larger part of this material. Except for the cooperation and careful work of the chem ical division, under the supervision of Dr. N. W. Lord, much of the work here reported would not have been possible.
7

O PREFACE.
Many of the relations submitted have been worked out a't the sug gestion of different engineers who were interested in particular phases of the work. Some repetition in the matter presented is perhaps unavoidable on account of the nature of the subject. Possibly much that is new has developed during the discussion, because never before have 400 boiler tests been made under two boilers (exactly alike) with coals and lignites from all sections of the United States and with all tests fired by the same expert fireman.
Acknowledgment is gratefully made to the many engineers of the country for helpful suggestions and kind criticisms that have come to me while endeavoring to direct the tests of this division so that they would prove of the greatest value to the industries of the nation, and to those engineers whose problem is still to furnish boilers of greater capacity and furnaces of higher economy. It must not be forgotten that all discussion is based.on the results obtained in a sin gle furnace with one type of boiler, but many of the results should have wide application in any furnace and under any type of boiler. Helpful suggestions or criticisms from manufacturers or engineers are" again invited.
In submitting this paper I desire to thank Dr. Joseph A. Holmes, expert in charge of the fuel-testing plant, for his uniformly courteous .consideration of the plans and needs of the boiler division and for the freedom which he has always allowed us in carrying on the work. We have appreciated his confidence and can only hope that it has been merited.
L. P. BRECKENRIDGE, Engineer in Charge of the Boiler Division.
URBANA, ILL., January 14, 1'907.

A STUDY OF FOUR HUNDRED STEAMING TESTS.
By LESTER P. BRECKENRIDGE.
INTRODUCTION.
By WALTER T. BAY.
Origin of the bulletin. As the so-called "boiler tests," made by the fuel-testing plant at St. Louis, gradually accumulated, it became evi dent to the men making them that a great deal of incidental work was assuming the shape of a considerable compilation of plottings and calculations of various matters pertaining to the tests, and that cer tain details of the work were beginning to shed light on the inner reasons for the unreliability of tests of coals made under steam boilers. Much research work was being done in the boiler room simultaneously with the steaming tests proper, and of this work also certain details shed light on the same unreliabilities.
It was originally intended to insert these results in the regular bulle tins of the fuel-testing plant, but the further the work went the less of a basis for general conclusions it seemed to be. For this reason publication was postponed until a-large amount of matter was on hand. In order to avoid undue bulk, no account of most of the work itself is given. Many of the negative results obtained are presented, however, on the general principle that negative results are usually worth as much as positive results.
Scope of the work. An especially striking instance of the value of negative results was noted in an attempt to check up the readings of an optical pyrometer used on the combustion chamber by calculating the initial temperatures of the gases entering the boiler in each test, so as to find whether the pyrometer read too high or too low when sighted on flame. The basis used for the calculation was the effi ciency noted as "72*, efficiency of boiler, per cent" in the code of the American Society of Mechanical Engineers. The calculated tem peratures of combustion were ridiculous, and were very puzzling for some weeks. Meanwhile a study was made of some chapters in John Perry's book, "The Steam Engine and Gas and Oil Engines," relat ing to the manner in which fluids give up heat and momentum, 'and
10 A STUDY OF FOUR HUNDRED STEAMING TESTS.
making application of these principles to steam boilers. A develop ment of these ideas and their application to the apparatus used in these tests constitutes what is believed to be the most valuable part of this bulletin. It is thought that a fairly trustworthy separation has been effected for most tests of the true boiler efficiency and the percentage of completeness of combustion. Apparently the former is constant, as the theory indicates, and the "practical" boiler efficiency differs from it by only a very few per cent, the main cause of the differ ence apparently being that as a rule all of the fuel is not burned.
All of this work has been done with the hope of discovering new guiding principles for use in forecasting the results of burning any given fuel more accurately than can now be done from chemical analy ses and observation of physical characteristics. It is true that at present the choice of coals in any market for any given use can be narrowed down to perhaps 20 per. cent of the coals considered by a consideration of market price, freight charges, chemical analysis, heat ing value, and physical characteristics; but the ambition of the boiler division is to work toward that completeness of knowledege whereby about three-fourths of the 20 per cent can also be discarded after laboratory investigations.
It is also the intention of the boiler division to study the principles of fuel combustion to such advantage that much coal can"be saved, and that cheap fuels can be used in certain operations where higher- priced ones are now considered necessary. Such savings will really redound to the benefit of producers of the best fuels of all grades quite as much as to the benefit of consumers. A number of new lines of work are suggested in the text; several of these it is planned to take up soon, and some of them may give data for determining the burning qualities of fuels independently of the apparatus in which the process takes place.
Perhaps the most important reason for doing the research work, and for making so many comparisons of the data obtained from all tests, was the feeling that the testing of fuels under boilers is at best only approximately .comparative. In short, it was the feeling that we were on the wrong track, without knowing of a better one, which led us to do the research work.
This work was performed and the results were prepared for publi cation under the direction of Prof. L. P. Breckenridge, engineer in charge of the boiler division, by the following men located at St. Louis: Walter T. Ray. Henry Kreisinger, Harry W. Weeks, Charles H. Green, Robert H. Kuss, Loyd R. Stowe, William M. Park, Ralph Gait, Fred 0. Pahmeyer, Raeburn H. Post, George S. Pope, 'Gilbert E.. Ryder, Fred J. Bird, Carl J. Fletcher, and Perry Barker.
Many of the opinions given in this volume are not shared by all the authors; some of them represent a compromise. The responsibility of selecting materials and deciding what views should be taken on many points naturally fell on Mr. Ray, who was the engineer locally

KELATIONS'OF TEST DATA. 11
in charge of steaming tests at St. Louis, and to him is to be charged the fault of any unjustified expressions of opinion or mistakes in text or figures.
It is realized that future work may show that some of the opinions advanced herein are faulty, and consequently the right is reserved to change them. Nevertheless, this work as a whole expresses the best present knowledge of the boiler division, and is given out for others to think about. It should be distinctly stated that the chemical division of this plant is in no way responsible for anything herein, although its members .have been consulted on some points and have very kindly made many suggestions.
Special attention is called to the "General conclusions/' page 174, and to the paragraphs entitled "Commercial considerations," page 177.
RELATIONS OF TEST DATA.
BATE OF COMBUSTION.
Fig. 1 should be considered in connection with fig. 2, the same tests being classified in both charts according to the pounds of dry coal burned per square foot of grate per hour. The figures in the small circles indicate the number of tests considered in determining the position of the points near which they are placed. In fig. 1 curve No. 1 is high for low rates of coal consumption, because it is hard to keep down the air supply. Curve No. 2 shows the per cent of stack loss. It drops at first because the air supply increases. (See curve No. 1.) It rises on the right because the gases leave the boiler at higher temperature, as shown by curve No. 3. The coals of the tests averaged on the left of the chart are in general of good quality and slower burning than those in the center; those on the right are some what lignitic in character. This perhaps explains why curve No. 3 is low in the center; the combustion-chamber temperatures were lower there, hence the flue temperatures were also lower. But, after all is said, the reason is in doubt, because the maximum flue-temperature range is only 50° F.
On comparing the flue-temperature curves of figs. 1 land 3 a differ ence will be seen in the left-hand ends. With reference to this curve in fig. 1, the coals toward the left end become better in quality and higher in "fixed carbon," so that although they burned slowly the combustion-chamber temperatures were fairly high, and consequently the stack temperatures were higher than in the center of the curve. With reference to the analogous curve of fig. 3, the coals to the left are both poorer and slower burning, and a larger air excess was used, relatively, which made the combustion-chamber temperature lower; consequently the flue temperature was lower. Further, the lower curve of fig. 1 is perhaps drawn a little too high at the left end, and that of fig. 3 a little too low.

12 A STUDY OF FOUR HUNDRED STEAMING TESTS.
Fig. 2 should be considered in connection with fig. 1. Little can be said of curve No. 1 (fig. 2), except that it rises slightly with increasing rates of combustion about three to five times as much
POUNDS. OF DRY COAL. BURNED PER SQUARE FOOT OF GAATE PER HOUR
PIG. 1. Relations of rate of combustion to pounds of dry chimney gases per pound of "combustible" (curve No. 1); per cent of loss up the stack, from heat balance (curve No. 2); and flue-gas tempera ture (°F.) taken under stack damper (curve No. 3). Classified on rate of combustion as basis; tests 126-355. ' '
as the broken line just below, connecting the CO averages. The ris ing of both is perhaps a consequence of decreasing air supply per
POUNDS Of DRY COAL BURNED PER SQUARE FOOT OF GRATE PER HOUR.
PIG. 2. Relations of rate of combustion to per cent unaccounted-for loss (curve No. 1); per cent of CO loss (curve No. 2); and per cent of loss up the stack (curve No: 3). Classified on rate of com bustion as basis; tests 120-355.
RELATIONS OF TEST DATA. 13
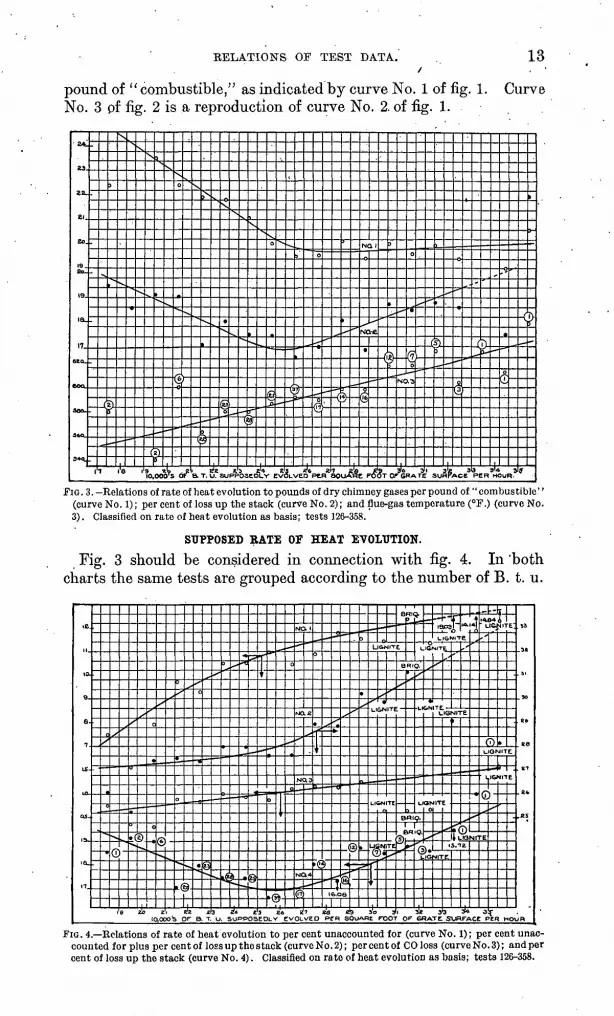
pound of " combustible/ 5 as indicated by curve No. 1 of fig. 1. Curve No. 3 of fig. 2 is a reproduction of curve No. 2. of fig. 1.
e ez KJ R4 £5 ?6 ;OF a T. U. SUPPOSEDLY EVOLVED PER 5T OC GRATE SURFACE PER HOUR.
FIG. 3. -Relations of rate of heat evolution to pounds of dry chimney gases per pound of" combustible" (curve No. 1); per cent of loss up the stack (curve No. 2); and flue-gas temperature (°F.) (curve No. 3). Classified on rate of heat evolution as basis; tests 126-358.
SUPPOSED RATE OF HEAT EVOLUTION.
Fig. 3 should be considered in connection with. fig. 4. In 'both charts the same tests are grouped according to the number of B. t. u.
aoooa OF a T. u. SUPPOSEDLY EVOLVED PER SQUARE FOOT OP GOATE SURFACE PER HOUR
FIG. 4. Relations of rate of heat evolution to per cent unaccounted for (curve No. 1); per cent unac counted for plus per cent of loss up the stack (curve No. 2); per cent of CO loss (curve No. 3); and per cent of loss up the stack (curve No. 4). Classified on rate of heat evolution as basis; tests 126-358.
14 A STUDY OF FOUR HUNDRED STEAMING TESTS.
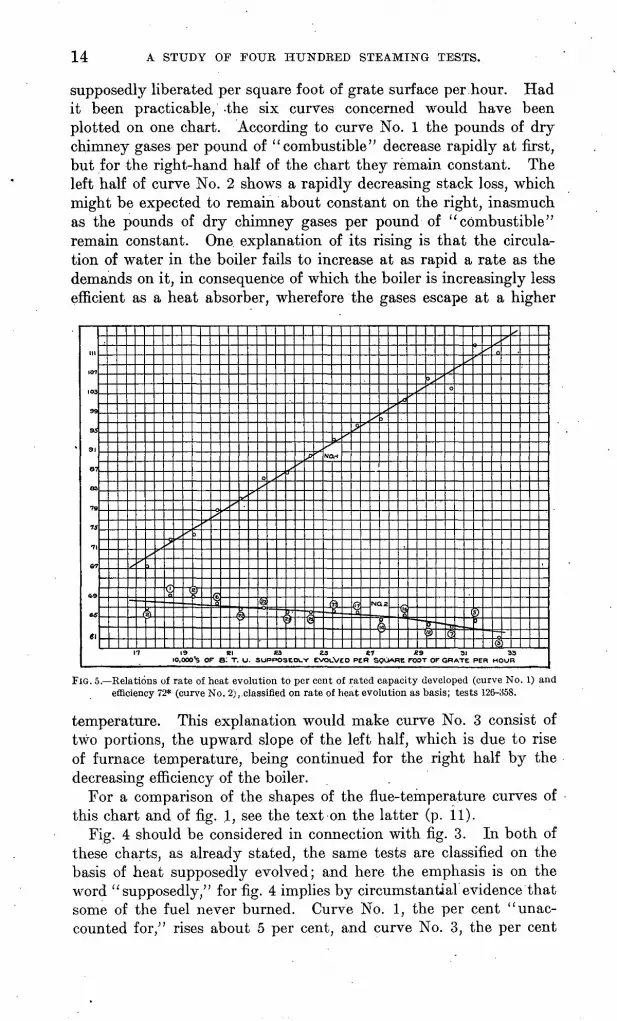
supposedly liberated per square foot of grate surface per hour. Had it been practicable, -the six curves concerned would have been plotted on one chart. According to curve No. 1 the pounds of dry chimney gases per pound of "combustible" decrease rapidly at first, but for the right-hand half of the chart they remain constant. The left half of curve No. 2 shows a rapidly decreasing stack loss, which might be expected to remain about constant on the right, inasmuch as the pounds of dry chimney gases per pound of "combustible" remain constant. One explanation of its rising is that the circula tion of water in the boiler fails to increase at as rapid a rate as the demands on it, in consequence of which the boiler is increasingly less efficient as a heat absorber, wherefore the gases escape at a higher
iQ.ooo's OF a: T. o. SUPPOSEDLY EVOL.VEO PER SQUARE FOOT OF GRATE PER HOUR
FIG. 5. Relations of rate of heat evolution to per cent of rated capacity developed (curve No. 1) and efficiency 72* (curve No. 2),.classified on rate of heat evolution as basis; tests 126-358.
temperature. This explanation would make curve No. 3 consist of two portions, the upward slope of the left half, which is due to rise of furnace temperature, being continued for the right half by the decreasing efficiency of the boiler.
For a comparison of the shapes of the flue-temperature curves of this chart and of fig. .1, see the text on the latter (p. il).
Fig. 4 should be considered in connection with fig. 3. In both of these charts, as already stated, the same tests are classified on the basis of heat supposedly evolved; and here the emphasis is on the word "supposedly," for fig. 4 implies by circumstantial evidence that some of the fuel never burned. Curve No. 1, the per cent "unac counted for," rises about 5 per cent, and curve No. 3, the per cent

RELATIONS OF TEST DATA. 15
of CO loss, rises nearly 0.5 per cent along the same range of heat supposedly evolved. The implication is that the rise of CO loss is merely an indication of greater losses not ascertained, due probably to incomplete combustion.
Curve No. 4 in this figure, is the same as curve No. 2 of fig. 3, a tentative explanation of which is given in the text relating to that figure (p. 13). The arrows on the curves indicate which coordinate scales are to be used with each curve.
Fig. 5 is based on about two hundred tests of coals from all parts of the country. It is not true to any great extent .that the better coals are represented more in some parts of the curves than in others; therefore the following deductions are fairly reliable. The 10,000's
110
8
6
4
I
a
1
\\
IJ
J'
,
\
J1
\^
u
.
\
fi
*
\/(t
4
ff
\
^l
s
'f
1
^
5>
^
^
II
5̂>
>
^
V;
C ABOVE STEAM TEHP.V
FURNACE
TEMP'3.
9
[^1
1
^
&
^
-C»)
^
t
II
-
;
f<
^
Vj
^
Lo o(
'fy
.N
IV
:
SO
*f
:
l-<Y
t -
ftxtV^
0(~N
-
5*
,)
y
W
-<
TOOUCTS OF COMBUSTlW
000 in II
500ii
000
i
01
r~
U
~<3e r
Mt
WITH
II
=w
u-2^00
>JCR£AJ
-
o
111
II
6
t
jdoo
A
~
=3
R S-
JP
||
=;
PLV
1500
-<
3
T
D
5"
|4000
1 OR£CN$IV TEMP^'00 I5to° '*"" !*°° 3t>°° 3i °° *0'00
\
lO'OO U'OO ZO'OO Z5"00 3obo J5bO 40^0 4^00
500 1000 15 bO 2dOO Obi ORDINARV T£M^
FIG. 6. Theoretical curves of factors affecting heat absorption, based on furnace temperature.
of B. t. u. supposedly evolved per square foot of grate surface per hour was calculated by deducting the heat loss in CO and in com bustible dropping through the grate from the heat value of the coal fired. Curve No. 1 shows that- within the usual working range the capacity is very nearly a straight-line function of the heat supposedly evolved in the furnace. Curve No. 2 is especially significant, show ing a decided falling off in efficiency 72*,a as the amount of heat sup posedly evolved increases. By reference to the lower curve of fig. 6 it will be seen that the volume of the gases of combustion from 1 pound of carbon is nearly constant whatever the air excess used, pro viding this excess is within reasonable limits of operation. Therefore the volume of gases passing through the combustion chamber per
oFor definition of efficiency 72* see " Efficiencies" in the glossary (p. 181).

16 A STUDY OF FOUR HUNDRED STEAMING TESTS.
second is almost entirely a function of the coal burned, or, as given here, of the number of B. t. u. supposedly evolved per hour; whence the velocity of the gases as they pass from the fuel bed to the boiler entrance is proportional to the number of B. t. u. supposedly evolved. The emphasis is on the word "supposedly," for it is likely that the incompleteness of combustion increases as the time occupied by the gases in traveling from fuel bed to boiler decreases. This reduction of time for combustion is perhaps the reason for the common remark that when a combustion chamber is " worked too hard" its efficiency decreases; it may mix a large volume of gases as thoroughly as it does a fraction of the volume, but the time available for combustion is less.
FIG. 7. Velocity of water circulation in boiler as affected by rate of steaming: Curve No. 1, determined by classifying on revolutions per minute; curve No. 2, determined by classifying on per cent of rated capacity developed. Instrument for measuring circulation placed in first tube left of center in second row from bottom at rear of boiler.
Another probable cause of the drop of over-all efficiency (efficiency of furnace and boiler) is the fact that the circulation of the water inside of the boiler does not keep up with the capacity. Fig. 7 shows that the circulation of water does not increase in proportion to the capacity as it should. The consequence is that the water does not take the heat fast enough from the metal of the boiler, which therefore remains hotter at the higher capacities. When the heat-absorbing surface is at higher temperature less heat is avail able for the boiler, and hence the over-all efficiency drops. (§ee p. 137.) .

RELATIONS OF TEST DATA. 17
On comparing the curves of. capacity rise of figs. 5 and 8 it will be noticed that a given percentage change in B. t. u. supposedly evolved is accompanied by a much greater change in capacity than is the same percentage change in pounds of dry coal burned. The explanation is that as the pounds of dry coal burned per square foot of grate become less, the B. t. u. evolved do not on the average become much less, because some high-grade coals burn slowly; vice versa, some coals low in heating value burn rapidly. The capacity curve of fig. 8 may well have less slope than that of fig. 5. In study ing the curves of fig. 8 it will also be noticed that when the pounds of dry coal burned per hour are doubled, efficiency 72* falls 5 per cent;
POUNDS OF DRV COAL. BURNE.O PER SOJARE POOT OF GRATE SURFACE PER HOUR.
FIG. 8. Relation of pounds of dry coal burned per square foot of grate to per cent'of rated capacity developed (curve No. 1) and efficiency 72* (curve No. 2). Tests 120-355.
whereas, referring to fig. 5, when the number of B. t. u. supposedly evolved is doubled, efficiency 72* falls 7 per cent, indicating both more incompleteness of combustion and poorer heat absorption.
Curves determined by classification of various coals on the basis of pounds of dry coal burned per square foot of grate per hour are only approximate; those based on the heat supposed^ (or osten sibly) evolved are of more value. The only correct classification would be on heat actually evolved as a basis. However, this involves the determination of the losses due to incomplete combustion of hydrocarbons and of solid particles of carbon escaping in smoke, and such determinations are very difficult to .make, perhaps impossible.
8400 Bull. 325 07 2

18 A STUDY OF POUR HUNDRED STEAMING TESTS.
COMBUSTION-CHAMBER TEMPERATURE.
Fig. 9 shows variation of. temperature with firing in the Heine furnace. Variations of the temperatures in the fuel bed, over the fire, and in the combustion chamber are given with two very differ ent coals. These temperatures were taken with the Wanner optical pyrometer (fig, 10), which was standardized before and after each series of observations. Every series of readings was taken without
2300-'
MPERATURE IN COMBUSTION CHAMBER
II 13 IS 17 19 21 23 25 27 29 31 33 35 37
TEMPERATURE N FUEL BEQ
li:54 56 53 1200
fEMPERATURE IN COMBUSTION CHAMBER
10 12 14 16 IB 20 22 24 26 2S 3O 32 34
TEMPERATURE ABOVE FIRE
30 22 24 26 2S 3O 32 34 36 3B 40 42
TEMPERATURE IN FUEL BED! ill i I I i I
' 11:04' 6^8' I'D ' 12 I i__________TIME MINUTE5
FIG. 9. Variation of temperature with firing in Heine furnace.
disconnecting the pyrometer from the battery after the standardiza tion. Owing to the fact that only one pyrometer was available the temperatures were not taken simultaneously. The chart (fig. 9) shows clearly the three things following:
1. During and shortly after each firing the temperature over the fire and to some extent the temperature in 'the fuel bed drops, and the temperature in the combustion chamber rises. The explana-

RELATIONS OF TEST DATA. 19
tion of this variation is that the distillation of "volatile matter" is a cooling process and is undoubtedly a partial cause of the drop of temperature in the fuel bed and over the fire, but the volatile matter distilled is carried into the combustion chamber, where it burns, causing a rise of temperature there.
2. The peaks in the curve for combustion-chamber temperature and the depressions in the curve for over-fire temperature are wider for Ohio No. 8, a coal high in volatile matter, than for West Vir ginia No. 19, a coal low in volatile matter, indicating that the vola tile matter is distilled off and burned in shorter time in the West. Virginia coal than in the Ohio coal.
3. Combustion-chamber temperature is much higher with Ohio No. 8 than with West Virginia. No. 19, while, fuel-bed and over-fire temperatures are higher with West Virginia No. 19 than with Oh'^
MAT GLASS SCREEN
AMYL ACETATE
LAMP
FIG. 10. Wanner optical pyrometer in position for standardizing.
No. 8. This contrast indicates that most of the West Virginia No. 19 coal burns on the grate and only a little in the combustion cham ber, while the opposite is true of Ohio No. 8.
The two similar curves of fig. 11 are based on. all tests (126-355) having combustion-chamber temperatures as read by the Wanner optical pyrometers. Coals from all parts of the country are included. To obtain the upper curve the tests were grouped according to pounds of dry coal burned per square foot of grate per hour; to obtain the lower curve they were grouped on 10,000's of B. t. u. sup posedly evolved per square foot of grate per hour, the supposition being that all of the potential heat is liberated, after deducting for the loss of combustible in ash and for CO loss.
The rise in temperature throughout the whole range, for a doub ling of the base values, is very nearly the same in the two curves. A significant feature of both curves is that the combustion-chamber

20 A STUDY OF FOUR HUNDRED STEAMING TESTS.
temperature rises with, the amount of heat liberated in the furnace; perhaps because conditions of combustion grow better at first, on advancing from poor coals at the left to the better ones in the center.
Curves No. 1 in fig. 1 and No. 1 in fig. 3 show the direct cause of the decreasing rise in combustion-chamber temperature.
a.
5
a.mZ <
ofc:>Z ZOOQO
13
/
3
/
®f 7*
\
y>
IS.
9/
5
A®>\ ^
ff
n
V
5
^-
§0-
(
1
IS
- -
>r
5
***
(ft
y. t
21
)r}^
5
. - ---
O
®
(!^
23
?)*^
5
fD
-
:-4
K
i)X.
uPOUNDS OF DRV COAL BURNED PER SQUARE. FOOT OF GRATE PER HOUR
£uc2 2300
R TEMPERA!
8 i3N-CHAMBE.
n>iCOMBUSTI
I
_(
^
/
,^_&_Y
XX
3-f
(2S
/
\~
,
((,
X
ITiS /9l5 fil
10,000'S OF B.T. U SUP
$I/
^C
xV
.
(I
1
IT" ?3 =>OSEOLV
/
)
i
^C
X
^~ >x<s)
^
\r~ 25EVOLVE
" c ~(f f
(T1
)
<b5)
(T <L
")*
T
1_0
J ?JI5 ^alS' 3/ 5 3315
D PER SQUARE FOOT OF GRATE PER HO(JH
FIG. 11. Combustion-chamber temperature as a function of pounds of dry coal burned per square foot of grate per hour, classified on basis of pounds of dry coal burned (upper curve); and 10,000's of B.t.u. supposedly evolved per square foot of grate per hour, classified on basis of 10,000's of B. t. u. supposedly evolved (lower curve). Tests 126-355.
The curves of fig. 12 are based on one class of coals those from Illinois and Indiana. The only striking showing is that the code "boiler efficiency" (72*) is practically constant throughout the whole range of furnace temperature. All these coals are apt to evolve compounds difficult to burn, and thus it is that the lower the

RELATIONS OF TEST DATA. 21
percentage of oxygen present the less complete the combustion, not withstanding the higher temperature resulting. With these coals, therefore, the decreasing completeness of combustion in our appa ratus with rise of temperature seems to offset the increasing efficiency of the boiler as a heat absorber, which is only about 10 or 12 per cent within the range 1,850° to 2,850° F., according to the chart on page 141.
In this chart, as in all others, where capacity is shown as a function of furnace temperature, the two rise together. This relation will be clear on remembering that much heat is absorbed through the tile roof of the furnace; and the greater the amount of coal burned the less in percentage will this absorption amount to, so that the tem perature at the last point of combustion is higher.
COMBUSTION-CHAHBEP TEMPERATURC (,"C)
FIG. 12. Relations of combustion-chamber temperature to per cent of rated capacity developed (curve No. 1); efficiency 72* (curve No. 2); and per cent unaccounted for plus per cent of loss up the stack (curve No. 3). Classified on basis of combustion-chamber temperature (°F.), Illinois and Indiana coals being used.
Fig. 13 is a companion to fig. 14, both charts being based on combustion-chamber temperature.
The arrows on the curves of fig. 13 indicate which coordinate scales are to be used with each. These thirty analyses were made at inter vals of twenty minutes, on flue gases from the base of the stack, the combustion-chamber gases having been diluted with air by infiltra tion after entering the boiler. The curves of fig. .14 were computed on analyses of samples (taken half-hourly during about sixty tests) from the rear of the combustion chamber, through the water-jacketed gas sampler (fig. 15) described on page 154, so that these samples were probably undiluted.

22 A STUDY OF FOUR HUNDRED STEAMING TESTS.
As the temperature of combustion rises the oxygen percentage drops in a straight-line ratio and the C03 curve rises in nearly the same way; but the CO curve rises sharply after about 2,500° F. (1,370° C. ; the temperature indicated by curve No. 4 of fig. 14) has been reached. Of course the composition of the gases as affected by temperature probably varies from coal to coal. It should be remembered that on the whole the optical pyrometer probably indi cated considerably lower temperatures than actually existed, because when burning short-flaming coals, or when running at' the lower capacities, little flame was visible, and the instrument was pointed at a side wall visibly cooler than even the clay-tube tiles forming the furnace roof.
JV0.4/
TEMPERATURE IN COMBUSTION CMAMBC.R f F)
FIG. 13. Relation of flue-gas composition to combustion-chamber temperature: Curve No. 1, 0$;. No. 2, COa; No. 3, CO. Determined by averaging individual readings; tests 151-181.
Curve No. 1 of fig. 14 shows a gradual decrease in the Orsat totals as the temperature is raised, accompanied by reduced air supply. As the temperature rises the volume of hydrocarbons might be expected to increase, but their proportional volume would be so small that they would not affect this curve.
Fig. 16 is a graphic representation of the relation, in our apparatus, of combustion-chamber temperature to flue temperature for 212 tests, certain tests having doubtful readings being omitted. Both temperatures rise together. It is noticeable that the curve is less steep in the upper portion, which may be accidental, but indicates that at higher furnace temperatures the boiler absorbs a slightly

RELATIONS OF TEST DATA. 23
greater percentage of the heat available to it above steam tempera ture than at the lower furnace temperatures; that is, the true boiler efficiencies are not always the same. But no reliable conclusion, can be drawn. The significance of the curve is general only. "
Fig. 17 shows a classification of 217 tests on many coals from all parts of the United States based on temperature in the rear of the combustion chamber. In general the poorer coals fall at the left of
COMBUSTION-CHAMBER TEMPERATURE fp)
FIG. 14. Eolation of gas composition to temperature, both in rear of combustion chamber: Curve No. 1, COs+Os+CO; No. 2, 0 2 ; No. 3, CO-;; No. 4, CO. Samples of gas taken through water-jacketed iron pipe;.tests 318-382.
the chart. .The most interesting showing (curve No. 1) is that the code "boiler efficiency" (72*) rises only 2 per cent as the combustion- chamber temperature rises from 1,800° to 2,700° F. This showing is in accordance with other charts and with the theory of boilers deduced on page 114, all being to the effect that a rise of about 1,000° F. in furnace temperature improves the efficiency of the boiler as a heat absorber only about 10 per cent. Most of this gain, however, is
24 A STUDY OF FOUR HUNDRED STEAMING TESTS.
offset by incompleteness of combustion chargeable to the restricted oxygen supply required to get the high temperatures.
SECTION ON AB
FIG 15. Water-jacketed gas sampler.
Curve No. 2 shows a slight but persistent rise of C03 content in flue "gases with increasing furnace temperatures, as is reasonable; it
:RATURE (
ISXVS TEMPE
S
FLUE-
in
* __,
J|\
9)
/
/
/
/
r
//
?)D
/
1900 -tOOO R.COM
^/
//
vj^
^/
r
/
(^/
(
f
fc)
/
<
/
^y
//
^
/
$
^(^
f
'X
CLASSIFIED ON
/ ^
J
X
^
^-^ /
COM8USTION-CHAMBER-TEMPERATURE BASIS
'/
SA
oo e.e.00 2300 a4oo esoo e^'oo 8*700 BUSTiON -CHAMBER TEMPERATURE ("f)
FIG. 16. Relation of temperature in rear of combustion chamber to flue-gas temperature taken understack damper; tests 150-400.

RELATIONS OF TEST DATA. 25
ought .to be more marked. Air infiltration through the settings reduced the C02 percentage by 10 to 35 per cent in extreme cases.
Curve No. 3 shows a decided increase in the amount of steam made as the temperature rises. Since capacity is the comparative rate of absorption of heat by the boiler, it must necessarily increase with the rise of combustion-chamber temperature, if the equation
fet
fc5
64
11.0
10.0
9.0
a.o
105.
100
95
90.
65.
er
0-
/
</
..
'
-
. *"
,-
/
^
-
/
---
^
,/
^
^>
\^
\
s
...
\11)
-a
^o
\
...
'
s
s
\/20
'
/
s>-
h
,
/
ia/
y/to
NO. I
/
*-
/
a-:
~~
/1
-
^^.
ft 8A
-o--
s\
'
* '
S,t
^0
/.5
t» 0 MOO tZ 0 4500 Z4 COMBUSTION -CHAMBER TEMPERATURE , DEGRE
/
...
^
X47
-
^
0-
V
...
,** .--
^ - ^
<R> ty o zt E.5 FAHRE.NHEIT
i-
i-49
--- )
00
FIG. 17. Relations of combustion-chamber temperature to efficiency 72* (curve No. 1); C02 in flue gases, samples taken in hood (curve No. 2); and per cent of rated capacity of boiler developed (curve No. 3). Classified on combustion-chamber temperature as basis; tests 150-400.
used in the derivation of Perry's equation for true boiler efficiency, given on page 110, is. true. The heat absorbed per second per unit of heating surface is
H-Cpv (T.-TJ.
Expressing the values of p and v in terms of T\, we have

26 A STUDY OF POUR HUNDRED STEAMING TESTS.
The latter equation states that the capacity varies directly as the difference of the temperature of the furnace gases and the tempera ture of the steam.
As stated in the description of the baffle wall (p. 62), the con struction and location were so chosen as to have the stream of gases leaving the furnace impinge against a solid part of the wall and break into many smaller streams, thus effecting mixing. It was intended to obtain a splashing effect, similar to that seen when a stream of water is directed against a solid wall. That some such effect was attained was indicated by the high temperature taken through the opening just at the base of the bridge wall. This was invariably the highest temperature in the whole combustion space. Each of the temperatures given in the second column of the follow ing table is the average of ten readings taken with the Wanner pyrometer at five different places in the furnace. Theco readings were taken successively through the side-wall openings from front to rear, so that, the averages may be considered to represent simul taneous temperatures at all five places. Twenty-four readings were also taken in the same way by an exposed platinum and platinum- rhodium couple, connected to a galvanometer reading in degrees centigrade, giving the average temperatures at four places, as shown in the third column of the table.
Furnace temperature readings (test 359}.
Place.
Fuel bed. ........................................................................
Base of bridge wall .......................................Rear of combustion chamber. .........
Wanner pyrometer.
°.F. 2,4702,5862,8260 QQQ
2,447
Galva nometer.
°C. 913
1,0751,2801,035
The temperatures taken with the thermoelectric couple have only relative value, and are in fact much too low, the galvanometer hav ing been recently repaired so that the divisions on the scale were not true degrees centigrade. The couple used had an exposed junc tion projecting from the end of a f-inch iron pipe.
A. S. M. E. CODE BOILER EFFICIENCY (72*).
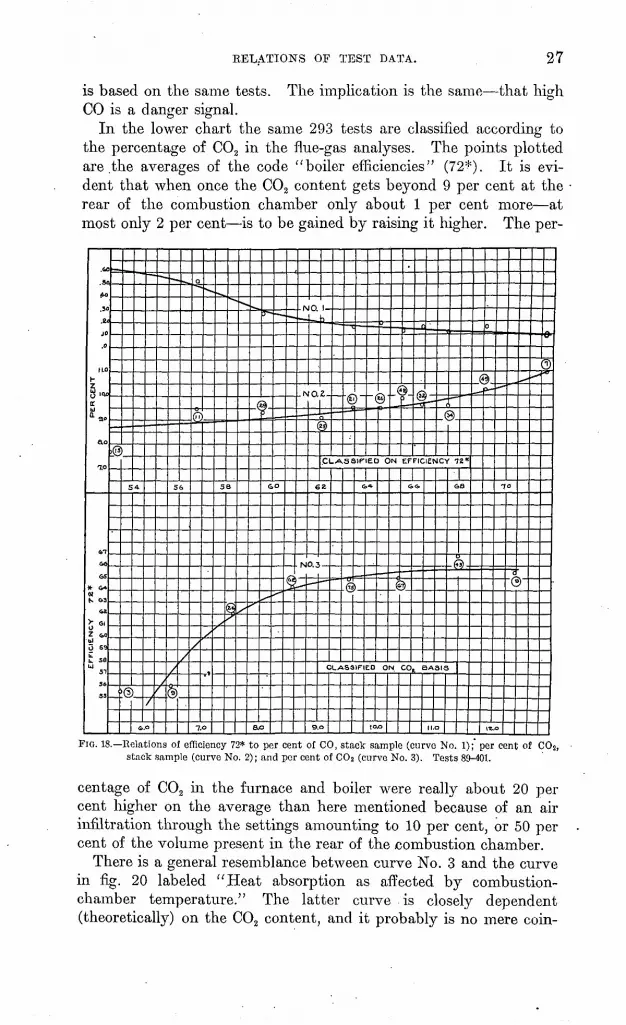
Fig. 18 consists of two charts. In the upper chart 293 tests are grouped according to efficiency 72*, the averages being plotted for each group of the percentages of CO and C02 . All the higher efficiencies have low CO values and the lower efficiencies high CO values. The higher efficiencies have higher C02 values than the lower efficiencies, of course, though not much higher. The CO curve (No. 1) should be compared with curve No. 3 of fig. 19, which
KELATIONS OF TEST DATA. 27
The implication is the same- that highis based on the same tests. CO is a danger signal.
In the lower chart the same 293 tests are classified according to the percentage of C02 in the flue-gas analyses. The points plotted are .the averages of the code "boiler efficiencies" (72*). It is evi dent that when once the C02 content gets beyond 9 per cent at the rear of the combustion chamber only about 1 per cent more at most only 2 per cent is to be gained by raising it higher. The per-
FIG. 18. Relations of efficiency 72* to per cent of CO, stack sample (curve No. 1);" per cent of C0 2, stack sample (curve No. 2); and per cent of CO 2 (curve No. 3). Tests 89-401.
centage of C02 in the furnace and boiler were really about 20 per cent higher on the average than here mentioned because of an air infiltration through the settings amounting to 10 per cent, or 50 per cent of the volume present in the rear of the combustion chamber.
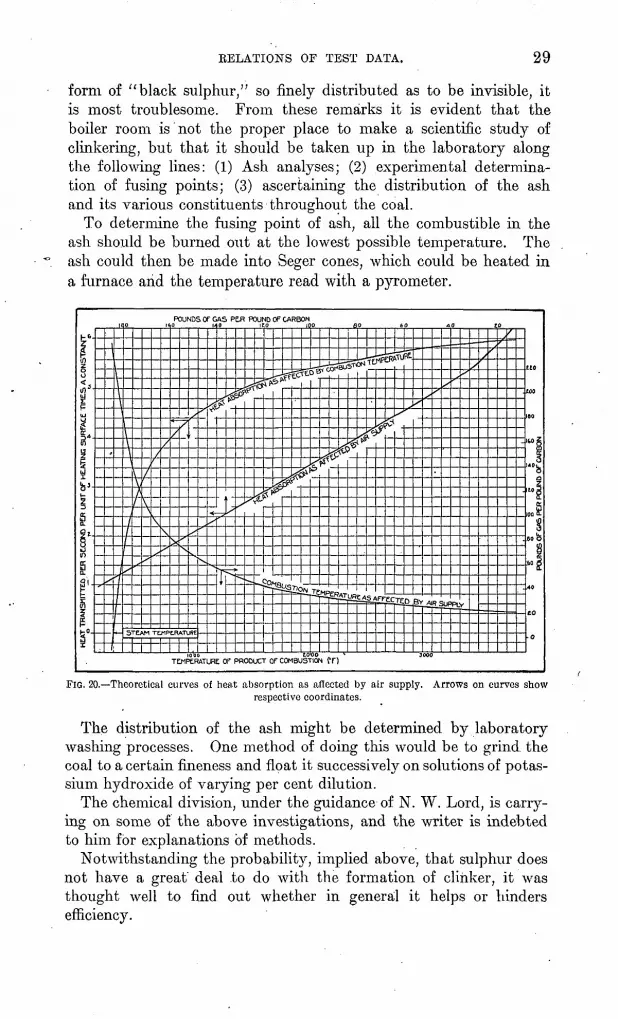
There is a general resemblance between curve No. 3 and the curve in fig. 20 labeled ".Heat absorption as affected by combustion- chamber temperature." The latter curve is closely dependent (theoretically) on the CO2 content, and it probably is no mere coin-
28 A STUDY OF FOUR HUNDRED STEAMING TESTS.
cidence that the two curves have much the same shape. The same remark applies to the analogous curve of fig. 6 (p. 15).
Fig. 21 represents an attempt to find relations between per cent of sulphur in coal (separately determined), per cent of clinker in refuse, and "boiler efficiency" (72*). It is agreed that clinkering is a consequence of the effects of high fuel-bed temperature on such
(U
OZ
o"" a*
10 U
Z
o ,1L
DC U
yr<8p.
Q
LI loIS
tts.o.U
(p *)o
fl
/
x
//
xi
X
-(
/
/
f
'
f/
/
/
/
^ft^~
/>
*
/
N
0
(s
/
O.
)
MO
^
\
2, ^
(si*^ -~.
s>-
^>
s^
c
\
LA
"-.
Q"*
\
ss
^
\
Fl
^v
^
ID
x
c
5*
u
N NlTROGE.N B>VSIS
ei.o eas 81.0 si.s 82.0 ez.s PER CENT OF NITROGEN IN FLUE GASE.S
w ,. ,
s-n «.
-M
JT)
CL,
6l)
^^
AS
..
SI
I
@-
-IED orJ C
^ *,
o a/
.10 .*p
f(>flX
6k
s^
NO
\
.3
SL$x
V 3?^ -d
n £*^ ^
~> ^«
0 f»o .50 .60 /70 .80 .90 l!°0 PER CENT OF CO IN FLUE GA3ES
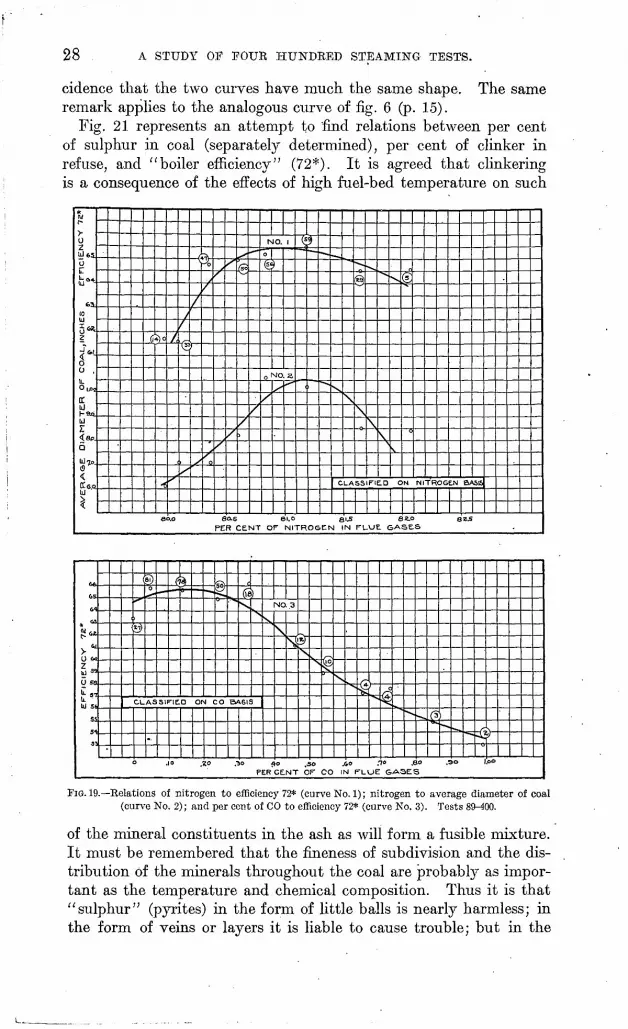
FIG. 19. Relations of nitrogen to efficiency 72* (curve No. 1); nitrogen to average diameter of coal (curve No. 2); and per cer.t of CO to efficiency 72* (curve No. 3). Tests 89-400.
of the mineral constituents in the ash as will form a fusible mixture. It must be remembered that the fineness of subdivision and the dis tribution of the minerals throughout the coal are probably as impor tant as the temperature and chemical composition. Thus it is that "sulphur" (pyrites) in the form of little balls is nearly harmless; in the form of veins or layers it is liable to cause trouble; but in the
BELATIOJSTS OF TEST DATA. 29
form of "black sulphur/' so finely distributed as to be invisible, it is most troublesome. From these remarks it is evident that the boiler room is not the proper place to make a scientific study of clinkering, but that it should be taken up in the laboratory along the following lines: (1) Ash analyses; (2) experimental determina tion of fusing points; (3) ascertaining the distribution of the ash and its various constituents throughout the coal.
To determine the fusing point of ash, all the combustible in the ash should be burned out at the lowest possible temperature. The ash could then be made into Seger cones, which could be heated in a furnace arid the temperature read with a pyrometer.
POUNDS OF GAS PER POUND OF CARBON
TEMPERATURE OF PRODUCT OF COMBUSTION
FIG. 20. Theoretical curves of heat absorption as afiected by air supply. Arrows on curves showrespective coordinates.
The distribution of the ash might be determined by laboratory washing processes. One method of doing this would be to grind the coal to a certain fineness and float it successively on solutions of potas sium hydroxide of varying per cent dilution.
The chemical division, under the guidance of N. W. Lord, is carry ing on some of the above investigations, and the writer is indebted to him for explanations of methods.
Notwithstanding the probability, implied above, that sulphur does not have a great' deal .to do with the formation of clinker, it was thought well to find out whether in general it helps or hinders efficiency.

30 A STUDY OF FOUR HUNDRED STEAMING TESTS.
The upper half of fig. 21 contains tests classified according to "boiler efficiency" (72*). In curve No. 1 each point is the average of the per cent of clinker in refuse for each group and in curve No. 2 of the per cent of sulphur in coal. According to curve No. 1, the coals giving high efficiencies are apt to form a very slightly smaller
ETFFICIENCY
310Ii 3H !Z
PERCENT CLINKER IN REFUSE
FIG. 21. Relations of efficiency 72* to per cent of clinker in refuse (curve No. 1); efficiency 72* to per cent of sulphur in coal (curve No. 2); per cent of clinker in refuse to efficiency 72* (curve No. 3); and per cent of clinker in refuse to per cent of sulphur in coal (curve No. 4) Curves Nos. 1 and 2 classi fied on efficiency 72* basis; Nos. 3 and 4 on clinker basis. Tests 89-401.
percentage of clinker, and according to curve No. 2 the high-efficiency tests are likely to be made on coals low in sulphur, this relation being rather marked. However, it must be remembered that high-sulphur coals are usually high in ash also.
BELATIONS OF TEST DATA. 31
The indications of the curves of fig. 21, regarding the effect of sulphur, are at slight variance with those of fig. 28 (p. 43).
Careful records were kept regarding the appearance and distribu tion of the asli of each coal, but time has not been found to study and classify the information.
The lower half of fig. 21 was obtained by classifying the same tests according to the per cent of clinker in the refuse, which was done in order to determine the effect of clinker on efficiency. In curve No. 3 the heavy line gives full weight to 16 tests on coals, some of which were of lignitic character and formed no clinker, but gave rather low efficiencies. Even considering this full portion of the-line, instead of the dotted portion above it, the clinker hardly affects efficiency until it reaches about 45 per cent, above which there is a rapid drop. Curve No. 4 indicates that high percentage of clinker accompanies high sulphur content; but it must be borne in mind that perhaps sulphur of itself has little to do with fusibility of ash and that the iron which is combined with a part of the sulphur is onty one of the factors in clinkering.
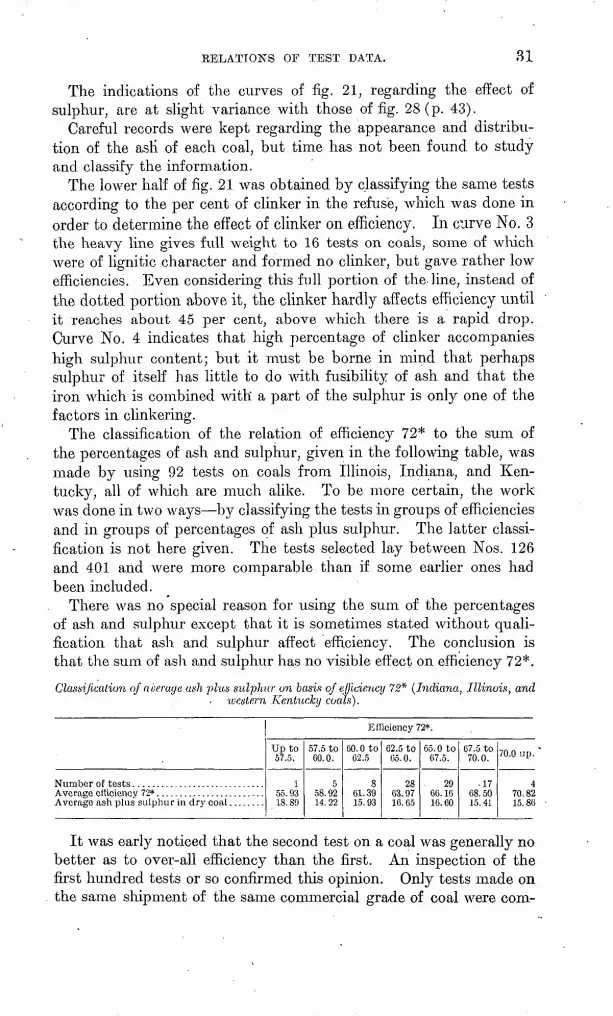
The classification of the relation of efficiency 72* to the sum of the percentages of ash and sulphur, given in the following table, was made by using 92 tests on coals from Illinois, Indiana, and Ken tucky, all of which are much alike. To be more certain, the work was done in two ways by classifying the tests in groups of efficiencies and in groups of percentages of ash plus sulphur. The latter classi fication is not here given. The tests selected lay between Nos. 126 and 401 and were more comparable than if some earlier ones had been included.
There was no special reason for using the sum of the percentages of ash and sulphur except that it is sometimes stated without cmali- fication. that ash and sulphur affect efficiency. The conclusion is that the sum of ash and sulphur has no visible effect on efficiency 72*.
Classification of average ash plus sulphur on basis of efficiency 72* (Indiana, Illinois, andwestern Kentucky coals).
Efficiency 72*.
Up to 57.5.
1
18. 80
57.5 to 60.0.
58. 92 14.22
60. 0 to 02.5
8 61.39 15.93
62.5 to 05.0.
28 63.97 16. 65
65.0 to 67.5.
29 66.16 16.60
67.5 to 70.0.
17 68. 50 15. 41
70.0 up.
4 70.82 15.86
It was early noticed that the second test on a coal was generally no better as to over-all efficiency than the first. An inspection of the first hundred tests or so confirmed this opinion. Only tests made on the same shipment of the same commercial grade of coal were com-
32 A STUDY OF FOUR HUNDRED STEAMING TESTS.
pared; for instance, if the first test was run on a nut size and the second on screenings, these tests were not used.
It was usually the case that the man running the fire learned much the first day which was beneficial to the later tests, 'but which was more than offset by other factors. For instance, owing to the posi tion of the chutes that discharge coal into the boiler-room bins and to the sloping bottoms of the bins the largest coal is obtained the first day.
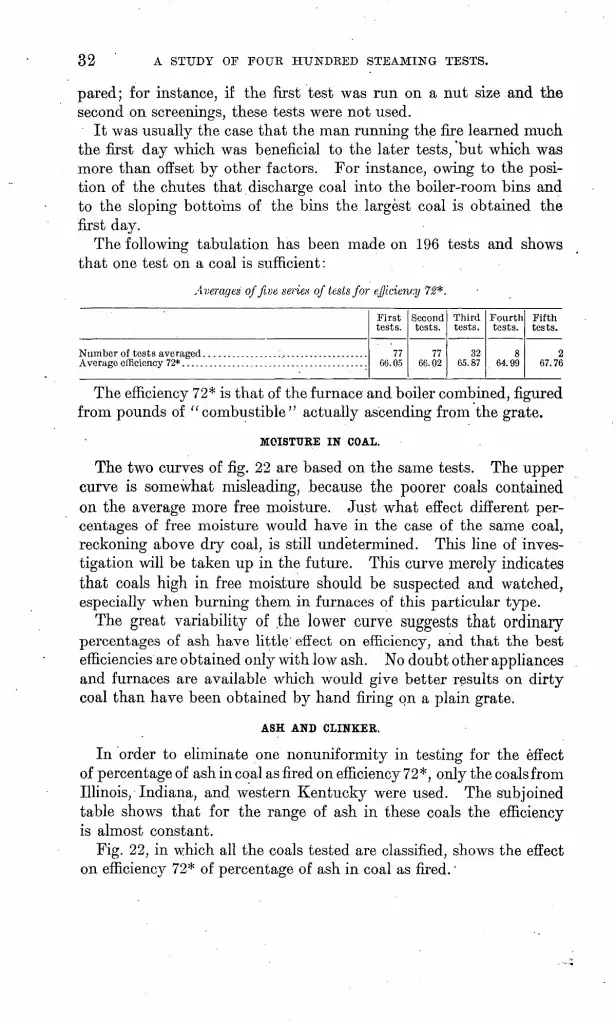
The following tabulation has been made on 196 tests and shows that one test on a coal is sufficient:
Averages of five series of tests for efficiency 72*.
First tests.
7766.05
Second tests.
7766.02
Third tests.
3265.87
Fourth tests.
864.99
Fifth tests.
267.76
The efficiency 72* is that of the furnace and boiler combined, figured from pounds of "combustible" actually ascending from the grate.
MOISTURE IN COAL.
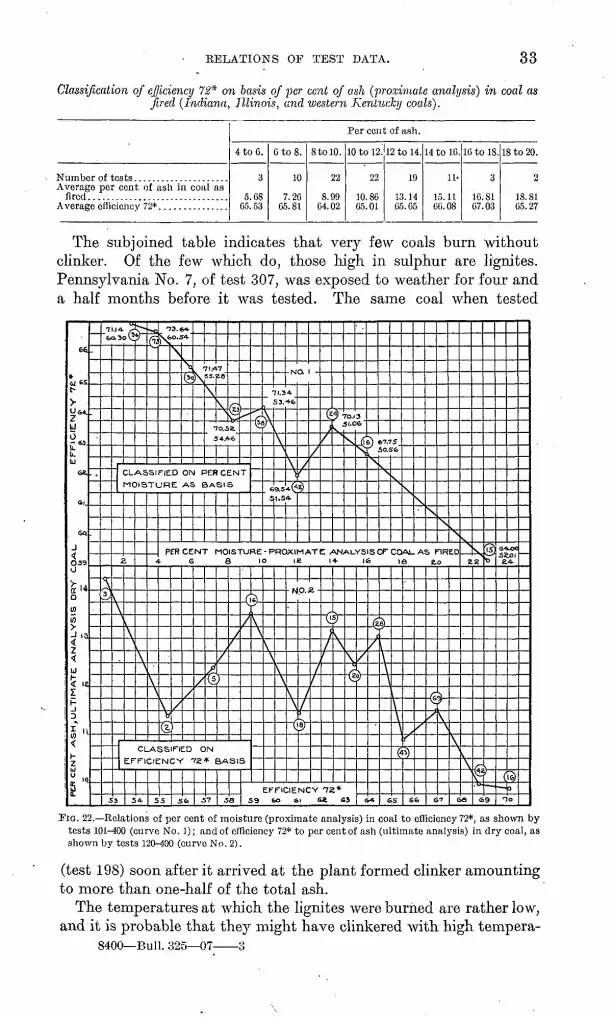
The two curves of fig. 22 are based on the same tests. The upper curve is somewhat misleading, because the poorer coals contained on the average more free moisture. Just what effect different per centages of free moisture would have in the case of the same coal, reckoning above dry coal, is still undetermined. This line of inves tigation will be taken up in the future. This curve merely indicates that coals high in free moiature should be suspected and watched, especially when burning them in furnaces of this particular type.
The great variability of the lower curve suggests that ordinary percentages of ash have little effect on efficiency, and that the best efficiencies are obtained only with low ash. No doubt other appliances and furnaces are available which would give better results on dirty coal than have been obtained by hand firing on a plain grate.
ASH AND CLINKER.
In order to eliminate one nonuniformity in testing for the effect of percentage of ash in coal as fired on efficiency 72*, only the coals from Illinois, Indiana, and western Kentucky were used. The subjoined table shows that for the range of ash in these coals the efficiency is almost constant.
Fig. 22, in which all the coals tested are classified, shows the effect on efficiency 72* of percentage of ash in coal as fired.'
EELATIONS OF TEST DATA. 33
Classification of efficiency 72* on basis of 'per cent of ash (proximate analysis) in coal as Jired (Indiana, Illinois, and western Kentucky coals}.
Average per cent of asli in coal as firod. ..............................
Percent of ash.
4 to 6.
3
5.68 C5.53
6 to 8.
10
7.20 05.81
8 to 10.
22
8.99 04.02
10 to 12.
22
10.86 05.01
12 to 14.
19
13. 14 0.5.05
14 to 10.
ll-
lS. 11 00.08
10 to IS.
3
10.81 07.03
18 to 20.
2
18. 81 05.27
The subjoined table indicates that very few coals burn without clinker. Of the few which do, those high in sulphur are lignites. Pennsylvania No. 7, of test 307, was exposed to weather for four and a half months before it was tested. The same coal when tested
66
*F.I 6S
IGIENCY Tl
8 J
U. U
«.
SI.
&0
JO39o
Q
in(0
2
U
JH,ULTIM
CENT AJ
0
S
T 1* r60.30^
\Jj
fe= .J 13.6*ra^v0
S-A
S,(30 |\
71.^ 55.
\
7SS
\ ^
V^70.5E.
34.46
^
CLASSIFIED ON PERCENT
MOISTURE AS BASIS
i
\
\
53
\\\\
.
\\
PER CENT MO S f
\a/
(s)
/
iCLASSIFED
EFFICIENCY '
54 55 se,
/jl
(1
^
/
)
1
n.353.
^T
65
\y
asI.S
4
46
\
\
4(1
4.
Q
/^
z)
/
(z
,(/
^-^s,
ro.iJ/.C
s
3<0
(fs
STURE- PROXIMATE ANAL.Y5 i 10 ie 14- 1
/t
ON
72* BASI
57 58
i7
s
V
\s^\
\\
\
r
P.-
/
f-
r
11
Lff'
i>
^\\
^-
EFFICIENCY 7S* 59 60 61 Si 6}
/
?)e7, ^ so.;
S^
5"6
<
s\
\
sj ^SOFCOA1-AS FIRED
'° is ao
(?.
/
G4
n)
,\\\
*(4
GS
f<
^^
66
7*r\\
61
\
^
z
\\
&a
s g.
Ts10
rG>9
e< 5< e
(
kOO
4-
^~=t^o
TIG. 22. Relations of per cent of moisture (proximate analysis) in coal to efficiency 72*, as shown by tests 101-400 (curve No. 1); and of efficiency 72* to per cent of ash (ultimate analysis) in dry coal, as shown by tests 120-400 (curve No. 2).
(test 198) soon after it arrived at the plant formed clinker amounting to more than one-half of the total ash.
The temperatures at which the lignites were burned are rather low, and it is probable that they might have clinkered with high tempera-
8400 Bull. 325 07 3

34 A STUDY OF FOTJK HUNDKED STEAMING TESTS.
tures. The conclusion must not be drawn that some coals repre sented in this table did not clinker because they were'low in sulphur.
Coals burned without producing clinker.
TestNo.
172173196210213290291298307
Coal.
Brazil No. 1 ................do.................
.....do.................
.....do.................Washington No. IB..
.....do.................
Combustion-
chambertempera
ture.
°F.1,9001,8581,9502,2002, 1422,0472,1192,2692,220
Sulphur,separately deter
mined incoal asfired.
Per cent.3.024.534.784.375.52.69.80.79
2.36
!
TestNo.
387389391392
396397398
Coal.
.....do.................
New Mexico No. 3 A. . .
Combustion-
chambertempera
ture.
°F.2,3712,2252,432
' 2,4202, 3332,330
2,534
Sulphur,separately deter
mined incoal asfired.
Per cent.0.81
.74
.09
.75
.74
.61
.00
The curves of fig. 21 (p. 30) show that the efficiency as based on the coal ascending from the grate (72*) is not influenced by the per cent of clinker in refuse until the latter exceeds 45 per cent, after which the efficiency drops 3 or 4 per cent. Inasmuch as clinker may prevent fine coal from falling through the grate, the same classifica tion was made to learn how per cent of clinker in refuse affected code item 73, which is the over-all efficiency of boiler and grate. This classification is given in the following table. There is only a slight tendency for efficiency to decrease at.the high clinker values, whence the deduction can be made that although clinker may hinder com bustion it saves almost enough fine coal .to compensate for its bad effects. However, it should be noted that the tests showing extremely high clinker were few in number.
Classification of efficiency 73 on basis of per cent of clinker in refuse.
Per cent of clinker.
Average per cent of clinker in
Average efficiency (item 73). .
Under 30.
30
1162.95
30 to 35.
13
3365.19
35 to 40.
12
3703.57
40 to 45.
44
4263.96
45 to 50.
47
4764.65-
50 to 55.
55
5264.31
55 to 00.
36
5762.95
60 to 65.
. 26
6163.16
65 up.
7
6762.45
Clinker is an interesting item, as it gets the blame for many things. Figs. 21 and 23 treat some phases of the subject, but the subjoined table has not been plotted. -
The impression is general that iron causes clinkering. The tabu lation partially confirms the impression, as the percentage of iron in dry coal increases in general with the clinker. Nevertheless iron is only one cause of clinker, and its presence in considerable quantity does not necessarily mean that a coal will clinker.

RELATIONS OF TEST DATA. 35
Classification of per cent of iron on basis of per cent of clinker in refuse.
Average per cent of clinker in refuse. .Average per cent of iron in dry coal. .
Per cent of clinker in refuse.
Under 30.
312
1.01
30 to 35.
532
0.95
35 to 40.
23S
1.7(5
40 to 45.
042
1.54
45 to 50.
471.02
50 to 55.
1752
1.69
55 to 60.
7,57
1.81
Over 60.
563
2.34
The curves of fig. 24 present a classification of tests on the basis of per cent of clinker in refuse. (See also discussion of fig. 28, p. 43.) The table on page 41 was compiled with the object of ascertaining whether any relation exists between the amount of clinker and the
PERCENT OF IRON IN COAL DIVIDED BY PERCENT Or ASI-
FIG. 23. Relation between ratio of per cent of iron in coal to per cent of ash in coal (proximate analysis)and boiler efficiency 72*.
average size of the coal and shows that there is very little such relation. One significant feature shown is that the highest value of average size of coal is grouped with the highest value of per cent of clinker, and vice versa.
The curves of fig. 25 show a classification of coals on the basis of carbon-hydrogen ratio. It may be noted that as the per cent of clinker decreases the per cent of CO loss decreases; in fact, the two curves are nearly parallel. The efficiency 72* curve varies inversely with the CO loss and clinker curves. The curve of average diameter on this chart shows that the largest sizes of coal and highest values of clinker are grouped together. The pounds of dry chimney gases per

36 A STUDY OF FOUR HUNDRED STEAMING TESTS.
pound of ' 'combustible'' are almost of constant value. This relation is a corroboration of the text relating to fig. 28 (p. 43) regarding incom plete combustion and the decrease of efficiency 72* by the formation of clinker.
It is also likely that although the size of coal burned can not be determined by the amount of clinker formed, it is possible to esti mate the amount of clinker that will.result from burning different
tl.
W-
19 .
Z400
uoa
Zioo
2IOQ
100
85
90
9Z_
69
88
-1,4
\k.
^
\
'
v
\
/
''
X,
\
/
*
^
\
s
**
~v
0
ys
/
^
i
f~
-^
Xr
/
^
\
/
/
'~-
s\
S*
1/
*-*
\
/
- .
\
s"
4-
A
b
~\
i;
\
\
\
V
N
/
j
/'
V
M
\
^
1
0- 1 _
0.
0.
\
a
i/
1W
^
-^^
1
' tf
IA
M
J
-J1-
V
/
V\
^
f*'
\
.
-̂4
^
.
%
s/r
o* 47
-o-
^
«=
_
,.
* ~5
x
<*
i .
^
\
^ct^-' 46
\
\
^
-cv
-X
- '
y//
13
/>
^
/
\
~.
\
^
^
N
-0
8
So
"°.
V
0 2.0 JO 40 )0 fcO PER CENT OT CLINKER IN REfUSE
FIG. 24. Relations of per cent of clinker in refuse to pounds of dry chimney gases per pound of "com bustible" (curve No. 1); combustion-cbamber temperature (°F.) (curve No. 2); per cent of rated capacity developed (curve No. 3); and per cent of completeness of combustion (Ea) (curve No. 4). Tests 89-400.
sizes of the same kind of coal. With any one kind of coal the amount of clinker formed is related to the distribution and the nature of the ash. Generally the ash is distributed through the coal in thin or thick layers. In coal which is crushed to small sizes these layers become separated from the coal; and when such crushed coal is thrown into the furnace, the particles of ash, being heavier than the coal, soon pass down into the colder layers of ash and fuel near the

RELATIONS OF TEST DATA. 37
grate and are therefore not heated to a temperature high enough to melt. In large-sized coal, on the other hand, the ash remains more in the lumps of coal and is held near the top of the fuel b'ed, 'where the temperature is usually above the melting point of the ash.
In plotting the curves of fig. 23 (p. 35) an attempt was made to determine the effect on efficiency 72* of per cent of iron in coal as fired. The ratio of iron in coal to ash in coal was taken as a basis,
AT £=,9.3,
"6501
95 129
90 >
as eo
2500
2400
2300
2200
III
.4S_..--~ -9J*
ATs-19-31
CARBON-HYDROGEN RAT 0 IN DRY COAL
FIG. 25. Classification based on carbon-hydrogen ratio in dry coal: Curve No. 1, theoretical efficiency of boiler as a heat absorber at various temperatures; No. 2, per cent of CO loss; No. 3, efficiency /2*; No. 4, per cent of rated capacity developed; No. 5, combustion-chamber temperature (°F.); No. C, pounds of dry chimney gases per pound of' 'combustible;" No. 7, average diameter of coal; No. 8, per cent of clinker in refuse. Tests 120-380.
because it seemed that there was a close relation between the two; for instance, a large amount of ash and a high iron value would not be expected to cause as much trouble as a high iron value and a low percentage of ash.
Since only about 60 iron determinations were available, it seemed best to plot the individual points instead of average points. The

38 A STUDY OF FOUR HUNDRED STEAMING TESTS.
slope of the band inclosing the points shows that the ratio of iron in coal to ash in coal has perhaps a slight effect on efficiency 72*. This effect is probably due to the formation of nonporous clinker.
The relation of iron in dry coal to clinker in refuse was ascertained by classifying the data on the basis of per cent of clinker, the results showing a large increase in per cent of iron as the per cent of clinker increased. See text relating to figs. 24 and 28 (pp. 43-44) and table on page 35.
L. H. Hartley Smith, writing to Power in 1905, called attention to the fact that the refuse drawn from the ash pit and off the grate when cleaning fires seemed to contain less carbon when the percentage of clinker was high. An inspection of the data of a few of our tests confirmed the observation, and later the following tabulation was made on about 370 tests. The probable explanation is that when clinker forms on .the grate it keeps fine coal from falling through.
Classification of per cent of combustible on basis of per cent of clinker in refuse.
Per cent of clinker.
Average per cent of clinker . . . Average per cent of combus-
Under 30.
3810.9
25.65
30 to 35
1632.4
OQ OQ
35 to 40.
1637.0
24.10
40 to 45.
5642.1
23.70
45 to 50.
5947.1
21.75
50 to 55.
7052.0
on 4^
55 to 60.
5057. G
18.53
60to 65.
4561.3
19 40
65 up.
1166.9
1 C CO
Sulphur is an undesirable element in coal. It generally occurs in combination with iron, as iron pyrites, and in combination with cal cium, as calcium sulphate or gypsum. Pyrites can readily be recog nized by its heavy weight, bright brass!ike color, and crystalline structure. The calcium sulphate occurs in small, thin, white flakes, more or less transparent. Of the two sulphur compounds, the py rites is generally contained in larger quantity in coal, and is harmful because it increases the tendency of the coal to clinker. The clinker- ing is especially bad if the percentage of ash is small in proportion to the sulphur. In such coals the pyrites and the ash fuse together and form a thin la}rer of solid clinker, which effectively stops the passage of air through the grate, thereby permitting the grate bars to become heated from the hot fuel bed just above. The clinker then melts down into the spaces between the bars and the sulphur seems to combine with the iron of the grate. The heat warps the grate bars, and the clinker has such corrosive action on the hot iron that a set of grate bars is destroyed in the course of a few days. When such clinkering occurs, any attempt to slice the fire fails, and only slow and very difficult cleaning of the fires will remove the clinkers. Ordinarily, with coals forming loose clinkers, the cleaning of the fires took from seven to twelve minutes.
Virginia No. 4, West Virginia Nos. 14 and 15, and most of the Kansas coals clinker badly because the ash is low in proportion to

RELATIONS OF TEST DATA. - 39
the sulphur content 0.3 to 6 per cent of sulphur and 3.5 to 10 per cent of ash. When such coals are burned on a plain or a rocking grate trouble with clinkers may generally be prevented by blowing steam under the grate. The usually assigned cause of this effect is that as the steam passes through the hot clinkers it is decomposed into hydrogen and oxygen. This decomposition is a cooling process and the heat needed to effect it is taken from the grate and the hot clinker, thus keeping the latter cool and preventing the fusing of the clinker into the grate.
The use of steam to prevent the clinkers from melting into the grate was found to work satisfactorily with all the coals high in sul phur and ash. However, for coals very low in ash this method sometimes proved to be insufficient. In such cases crushed lime stone spread over the thin, clean fire bed immediately on startingthe test, prevented the clinkers from adhering to the grate, and was used for the second tests on West Virginia No. 14 and Virginia No. 4 coals. The cleaning of the fires after the first tests on these coals, when limestone was not used, took forty-five and thirty minutes, respectively. On the second tests, when limestone was used, the cleaning took eight and ten minutes, respectively.
To make a general statement, it may be loosely said that the tend ency of a coal to clinker varies directly with the sulphur (iron pyrites) and inversely with the ash in the "coal.
The statements of this paragraph regarding the effect of sulphur are at slight variance with those on page 34.
The curves of fig. 26 are based on 286 reliable tests, classified according to each of the two items, per cent of ash (ultimate analy sis) in dry coal and over-all efficiency (item 73), the latter being the ratio of "the heat'put into the water to the potential heat in the coal put on the grate. Examination of the upper curve shows that the ash affects the efficiency by only 2 or 3 per cent until the ash cojitent rises above 20 per cent,-when the efficiency falls rapidly; however, not so many tests are represented in the last two points of the curve as in the others.
The lower curve shows the same fact inversely that is, the high- efficiency tests are on coals low in ash. It indicates that an ash in crease of 1 per cent causes a drop in efficiency of about 2 per cent, whereas the upper curve indicates a general drop of about 0.5 per cent in efficiency for each per cent of ash, or only one-fourth as much. The average, then, is about 1 per cent decrease in efficiency for 1 per cent increase in ash. The five points at the left end of the lower curve contain tests on clean lignites, and are therefore really not comparable with the other points. These five tests are indi vidually given in the subjoined table.

40 A STUDY OF POUR HUNDRED STEAMING TESTS.
The two curves show that ash is undesirable; but even so, the com mercial choice of coals, so far as ash is concerned, is more a question of market price, freight rates, labor costs, and storage capacity, and of whether or not the present boiler plant is crowded.
t*.
&s.
?<* -rkuh
<«.
OZ «. Uo
L U
59
38
J <57.
O
ff
bB
Ul-
h
W g
H
Z a
LJ O
a.
4-a ^
£>,
;*
1
48
®\
c
/'
\
L>
,'
1
=>.S
,
,
CL
3O
^
^
Slf
-
/
AS
.
V,
IE.
f
D
a
/
s
/
FIE
sz
**~
ON
PE
h».
^
0
A
-~
SM
? CEN
10
^fal_
>
O^
\
>! E
54
(*^c
E
T
x,
»
s
1AI
s
s
ASM
lit1
J^_^
FFC
2
\
EN
NK
\
IN
N
CY
X 1
5S>
DRY
U
\
B
N
^
^
AJ
* .
C
a
IS
(S -^
S)K
3AL.
l<3
f^^ >̂
^
~~
E.FFCENCY TEM
6 ss <io
^
1
^
(^
a
J
73.
C.X.
s s
*-.
e o
r*\
& »
\
5s
s
z
^
\
a
H
^
G6
N
s
\
z
\
s\
*
J9)
s
£>S
\
.
\
\
\
_fe
fo
O
FIG. 26. Relation of per cent of ash (ultimate analysis) in dry coal to efficiency 73, classified on eachas a basis; tests 120-410.
Coals classed in first group of classification on basis of orer-all efficiency (item 73}.
Test No.
303298401400402
Coal.
Texas No. 4 ......do.............. ..... .........Rhode Island No. 1 .......Wyoming No. 6.... ......Utah No. 2........ " ----------------
Efficiency . 73.
49.0051.1640 9152 7444.18
Per cent of ash (ulti mate anal
ysis) in dry coal.
12. 9512. 8016.87
The table which follows shows that size has no evident influence on clinkering, which is the same finding as stated under "Classification on basis of average diameter of coal" (p. 47). These two tables are' the converse of each other.

RELATIONS OF TEST DATA. 41
Classification of average diameter of coal on basis of per cent of clinker in refuse.
Average per cent of
Average of average di ameter of coal, inches.
Per cent of clinker.
Up to 10.
15
0
0.89
10 to20.
4
13
0.83
20 to 25.
4
23
0.50
25 to 30.
G
28
o.co
30 to 35.
14
33
0.89
35 to 40.
13
37
0.85
40 to 45.
40
42
0.76
45 to 50.
43
47
0.78
50 to 55.
53
52
0.83
55 to 60.
42
57
0.82
Over 60.
28
62
1.20
The curves of fig. 27 are plotted from the results of about 300'tests, and differ from those of fig. 26 in being based on the per-cent of ash in coal as fired instead of in dry coal. Thus the ash is always less than
fi
V
S)
81. Z500. 1400.
«00.
tlOO.
fclO. 600. 590
580 5 TO, 5 to.
IS F6Sn IZ'O
PER CENT OT A3H IN COM- j PROXIMATE ANALV35.
FIG. 27. Relations .of per cent of ash in coal (proximate analysis) to: Efficiency 72* (curve No. 1); per cent of rated capacity developed (curve No. 2); combustion-chamber temperatures (°F.) (curve No. 3); flue-gas temperature (°F.) (curve No. 4); pounds of dry chimney gases per pound of " combustible " (curve No. 5); carbon-hydrogen ratio in dry coal (curve No. 6); and per cent of completeness of com bustion (K 3) (curve No. 7). Tests 89-401.
in the dry-coal percentage, but by -varying amounts, which perhaps explains the greater irregularity of the code "boiler-efficiency" line (72*), compared with the analogous line of fig. 26, based on over-all
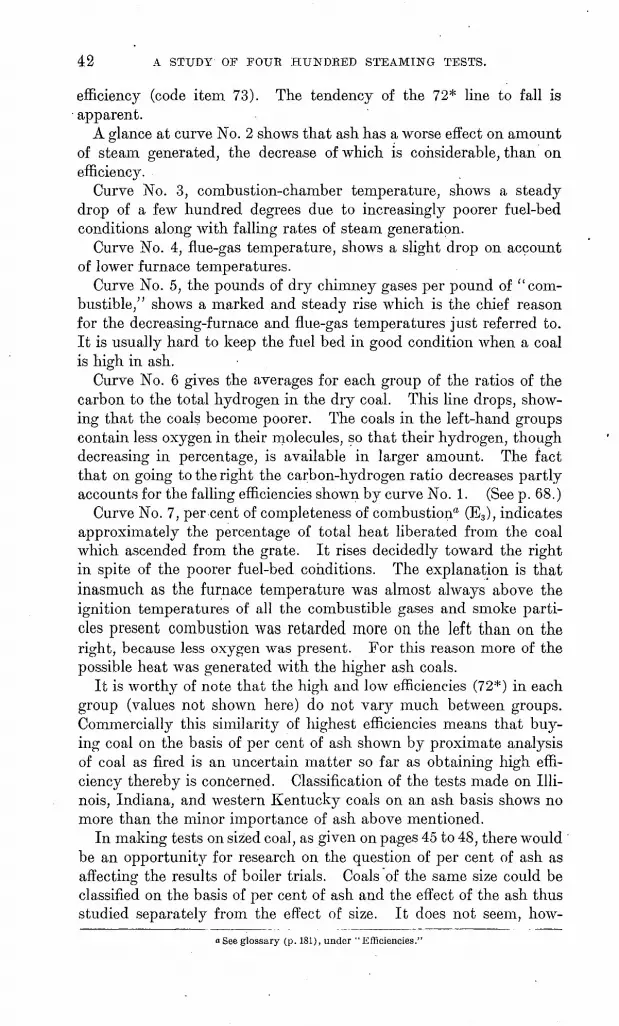
42 A STUDY OF FOUR HUNDEED STEAMING TESTS.
efficiency (code item 73). The tendency of the 72* line to fall is apparent.
A glance at curve No. 2 shows that ash has a worse effect on amount of steam generated, the decrease of which is considerable, than on efficiency.
Curve No. 3, combustion-chamber temperature, shows a steady drop of a few hundred degrees due to increasingly poorer fuel-bed conditions along with falling rates of steam generation.
Curve No. 4, flue-gas temperature, shows a slight drop on account of lower furnace temperatures.
Curve No. 5, the pounds of dry chimney gases per pound of "com bustible/' shows a marked and steady rise which is the chief reason for the decreasing-furnace and flue-gas temperatures just referred to. It is usually hard to keep the fuel bed in good condition when a coal is high in ash.
Curve No. 6 gives the averages for each group of the ratios of the carbon to the total hydrogen in the dry coal. This line drops, show ing that the coals become poorer. The coals in the left-hand groups contain less oxygen in their molecules, so that their hydrogen, though decreasing in percentage, is available in larger amount. The fact that on going to the right the carbon-hydrogen ratio decreases partly accounts for the falling efficiencies shown by curve No. 1. (See p. 68.)
Curve No. 7, per cent of completeness of combustion* (E3 ), indicates approximately the percentage of total heat liberated from the coal which ascended from the grate. It rises decidedly toward the right in spite of the poorer fuel-bed conditions. The explanation is that inasmuch as the furnace temperature was almost always above the ignition temperatures of all the combustible gases and smoke parti cles present combustion was retarded more on the left than on the right, because less oxygen was present. For this reason more of the possible heat was generated with the higher ash coals.
It is worthy of note that the high and low efficiencies (72*) in each group (values not shown here) do not vary much between groups. Commercially this similarity of highest efficiencies means that buy ing coal on the basis of per cent of ash shown by proximate analysis of coal as fired is an uncertain matter so far as obtaining high effi ciency thereby is concerned. Classification of the tests made on Illi nois, Indiana, and western Kentucky coals on an ash basis shows no more than the minor importance of ash above mentioned.
In making tests on sized coal, as given on pages 45 to 48, there would be an opportunity for research on the question of per cent of ash as affecting the results of boiler trials. Coals of the same size could be classified on the basis of per cent of ash and the effect of the ash thus studied separately from the effect of size. It does not seem, how-
aSee glossary (p. 181), under "Efficiencies."
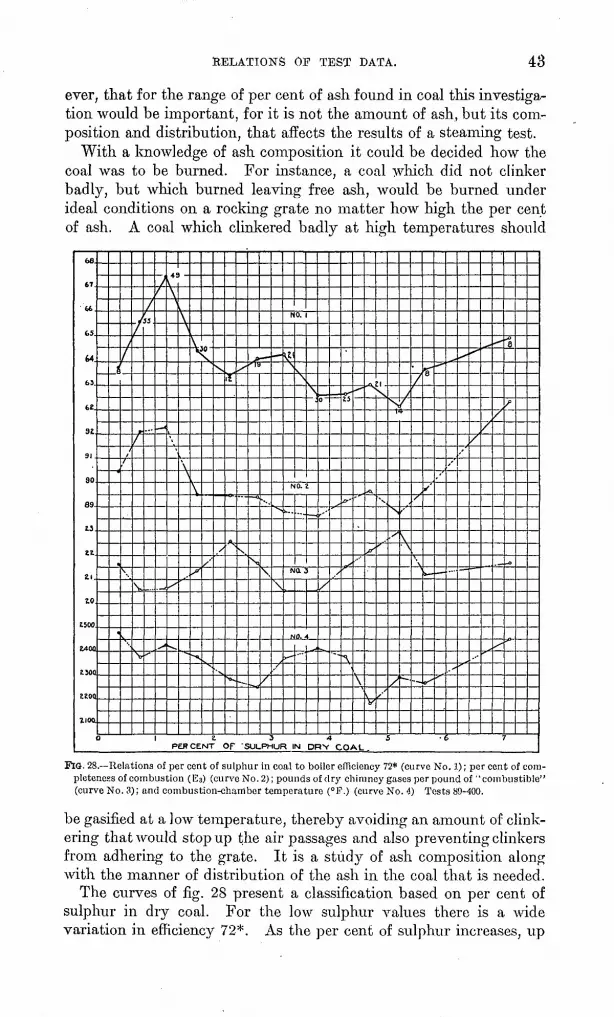
RELATIONS OF TEST DATA. 43
ever, that for the range of per cent of ash found in coal this investiga tion would be important, for it is not the amount of ash, but its com position and distribution, that affects the results of a steaming test.
With a knowledge of ash composition it could be decided how the coal was to be burned. For instance, a coal which did not clinker badly, but which burned leaving free ash, would be burned under ideal conditions on a rocking grate no matter how high the per cent of ash. A coal which clinkered badly at high temperatures should
60.
W,
0,5.
M
63
fc£.
3i
30
U
zz.
21.
to
1500
Z400
iSOQ
ZJOQ
ZIOQJ
J
«
/
/
/
f
\^
':
f
\
\
I
//
>
i4S
iS
'
X
>».
\
\
V
\
s
~^.
s
^
^
/
.
I
Nv.
/
\
*~.
J>
N
-..
\
/
*i~
\
/
NO. 1
*s
S
\
NO. e
NQt 3
h
>---
0 f
0
y
,
S
*^
&'
rfS
~\
**
'''
\
^
A
^
kt'
S
*s
^
^'
S/
/IH-
s
s
/
^
/
'
\
-~
^i
<s
^
'
*
>
.'
*s
/
X"
//
^
/
x
*>
/>
_o
'
0 £ 3 A 5 6 7 PERCENT Op SULPHUR IN DRV COAL.
FlQ. 28. Relations of per cent of sulphur in coal to boiler efficiency 72* (curve No. 1); per cent of com pleteness of combustion (E 3) (curve No. 2); pounds of dry chimney gases per pound of "combustible" (curve No. 3); and combustion-chamber temperature (°P.) (curve No. 4) Tests 89-400.
be gasified at a low temperature, ering that would stop up the air from adhering to the grate. It with the manner of distribution
The curves of fig. 28 present sulphur in dry coal. For the variation in efficiency 72*. As
thereby avoiding an amount of clink- passages and also preventing clinkers is a study of ash composition along of the ash in the coal that is needed, a classification based on per cent of low sulphur values there is a wide the per cent of sulphur increases, up
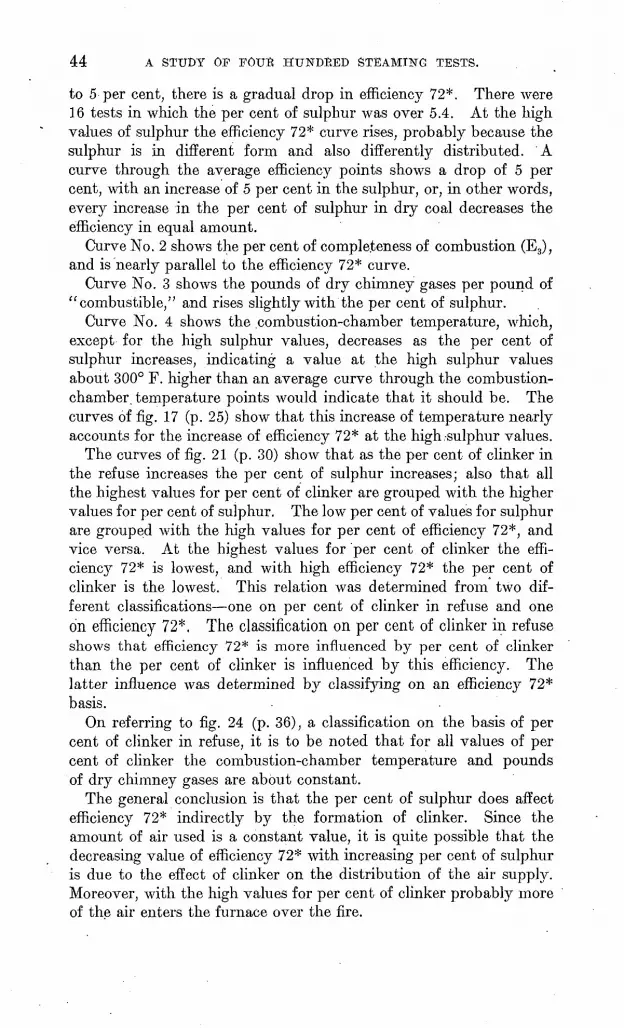
44 A STUDY OF FOUR HUNDRED STEAMING TESTS.
to 5 per cent, there is a gradual drop in efficiency 72*. There were 16 tests in which the per cent of sulphur was over 5.4. At the high values of sulphur the efficiency 72* curve rises, probably because the sulphur is in different form and also differently distributed. A curve through the average efficiency points shows a drop of 5 per cent, with an increase of 5 per cent in the sulphur, or, in other words, every increase in the per cent of sulphur in dry coal decreases the efficiency in equal amount.
Curve No. 2 shows the per cent of completeness of combustion (E3), and is nearly parallel to the efficiency 72* curve.
Curve No. 3 shows the pounds of dry chimney gases per pound of "combustible," and rises slightly with the per cent of sulphur.
Curve No. 4 shows the combustion-chamber temperature, which, except for the high sulphur values, decreases as the per cent of sulphur increases, indicating a value at the high sulphur values about 300° F. higher than an average curve through the combustion- chamber, temperature points would indicate that it should be. The curves of fig. 17 (p. 25) show that this increase of temperature nearly accounts for the increase of efficiency 72* at the high-sulphur values.
The curves of fig. 21 (p. 30) show that as the per cent of clinker in the refuse increases the per cent of sulphur increases; also that all the highest values for per cent of clinker are grouped with the higher values for per cent of sulphur. The low per cent of values for sulphur are grouped with the high values for per cent of efficiency 72*, and vice versa. At the highest values for "per cent of clinker the effi ciency 72* is lowest, and with high efficiency 72* the per cent of clinker is the lowest. This relation was determined from two dif ferent classifications one on per cent of clinker in refuse and one on efficiency 72*. The classification on per cent of clinker in refuse shows that efficiency 72* is more influenced by per cent of clinker than the per cent of clinker is influenced by this efficiency. The latter influence was determined by classifying on an efficiency 72* basis.
On referring to fig. 24 (p. 36), a classification on the basis of per cent of clinker in refuse, it is to be noted that for all values of per cent of clinker the combustion-chamber temperature and pounds of dry chimney gases are about constant.
The general conclusion is that the per cent of sulphur does affect efficiency 72* indirectly by the formation of clinker. Since the amount of air used is a constant value, it is quite possible that the decreasing value of efficiency 72* with increasing per cent of sulphur is due to the effect of clinker on the distribution of the air supply. Moreover, with the high values for per cent of clinker probably more of the air enters the furnace over the fire.

RELATIONS OF TEST DATA. 45
AVERAGE DIAMETER OF COAL.
Preliminary to the discussion of the results produced by using coal of different sizes it may be of value to state how the coal is received at the fuel-testing plant and how the size is determined, and to sug gest how further research work.might be done on the influence of size.
Nearly all of the coal tested was passed through a crusher, and consequently coals of widely varying characteristics were reduced to the same size. Therefore by classifying coals on a size basis, as we have done, we have averaged a good eastern coal with a poor-grade western coal. While size shows, on the average, some few general relations, it would seem that the best comparable data could be obtained by taking one coal, say, run of mine, and after separating the various sizes, making a series of tests on each size. Even such tests would not be made on the same grade of coal, as the smaller sizes are sure to be higher in ash; but nevertheless this side of the problem is of commercial importance.
After the sample of the coal tested has been.quartered and a part sent to the chemist for analysis, the remainder is passed through a revolving screen perforated its entire length with round holes ranging from one-eighth to 1 inch in diameter, These holes are arranged in strips or sets of rows, the width of which decreases as the size of hole increases. The coal passing through each set of holes is weighed separately and the data from the boiler room are reported, as follows:
Determination of average diameter of coal samples.
Diameter of holes (inches).
Pounds of coal through each set of holes.
Actual.
1. 2.
J
4 i i
li
20 14 18 1227
43
98
Reduced to 100-pound
basis.
2
20.4 14.3 18.4 12.2 27.6
4.1 3.0
Weight of coal, determining average size.
4.
2.0 3.6 6.9 6.1
20.7 4.1 4.5
100.0 , R , i 4=Ld =0.49 ! 100.0
Column 2 shows that 98 pounds of coal was sized. No attempt is ever made to weigh out exactly 100 pounds, so the weights must be reduced to 100, as has been done in column 3, thereby obtaining the percentages of the various sizes of coal. From the construction of the revolving screen it follows that in an average diameter each of the percentages has a "weight of observation" proportional to the

46 A STUDY OF FOUR HUNDRED STEAMING TESTS.
diameter which it represents. In getting average diameter, then, column 3 is multiplied by column 1, obtaining column 4, and the sum of this column of products divided by 100, therefore, gives the weighted average size of the coal.
The classification plotted in the curves of fig. 29 was made on the coals tested in tests 89 to 401, and shows that as the average diameter increased from 0.35 to 1.26 inches (1) the capacity increased about 15
25002400ZZOQ23002100600590580570100959085QO
22
21
665 66. 65.S 65. 64.5
93929190
ia
3>
(7.16.51615.5
SOS
so i asi%18.5
55 AS S75AVERAGE DIAMETER OF COAL , INCHES.
FIG. 29. Relations of size of coal to combustion-chamber temperature (°F.) (curve Nc. 1); flue-gas temperature (°F.) (curve No. 2); per cent of rated capacity developed (curve No. 3); pounds of dry chimney gases per pound of "combustible" (curve No. 4); efficiency 72* (curve No.5); percent of completeness of combustion (Es) (curve No. C); carbon-hydrogen ratio in dry coal (curve No. 7); and ratio of carbon to available hydrogen (curve No. 8). Tests 89-401.
per cent (curve No. 3); (2) the highest efficiency 72* values were obtained with the smallest sizes (curve No. 5); (3) there was practi cally no change in the per cent of completeness of combustion (curve No. 6); (4) there was a slight decrease in the pounds of dry chimney gases per pound of "combustible" (curve No. 4); and (5) the carbon- hydrogen ratio figured from the dry coal decreased considerably (curve No. 7), showing that the good coals fall in the groups of small-
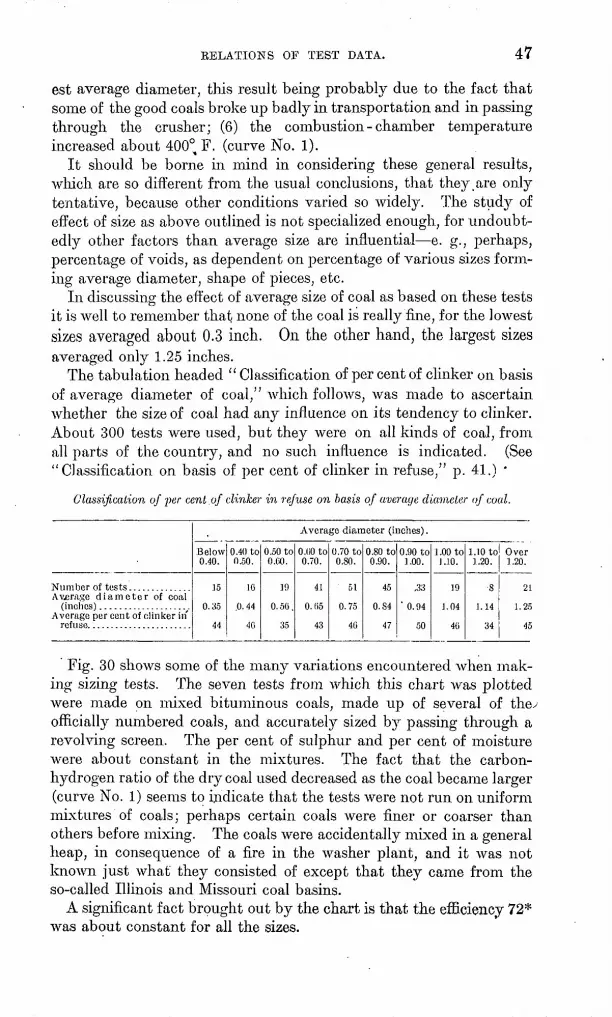
EELATIONS OF TEST DATA. 47
est average diameter, this result being probably due to the fact that some of the good coals broke up badly in transportation and in passing through the crusher; (6) the combustion - chamber temperature increased about 400° F. (curve No. 1).
It should be borne in mind in considering these general results, which are so different from the usual conclusions, that they .are only tentative, because other conditions varied so widely. The study of effect of size as above outlined is not specialized enough, for undoubt edly other factors than average size are influential e. g., perhaps, percentage of voids, as dependent on percentage of various sizes form ing average diameter, shape of pieces, etc.
In discussing the effect of average size of coal as based on these tests it is well to remember that none of the coal is really fine, for the lowest sizes averaged about 0.3 inch. On the other hand, the largest sizes averaged only 1.25 inches.
The tabulation headed " Classification of per cent of clinker on basis of average diameter of coal," which follows, was made to ascertain whether the size of coal had any influence on its tendency to clinker. About 300 tests were used, but they were on all kinds of coal, from all parts of the country, and no such influence is indicated. (See "Classification on basis of per cent of clinker in refuse/' p. 41.) '
Classification of per cent of clinker in refuse on basis of average diameter of coal.
Average diameter of coal (inches) .................. v
Average per cent of clinker in'
Average diameter (inches) .
Below 0.40.
.15
0.35
44
0.40 to 0.50.
16
.0.44
40
0.50 to 0.00.
19
0. 50 .
35
O.liO to 0.70.
41
0.65
43
0.70 to 0.80.
r i
0.75
40
0.80 to 0.90.
45
0.84
47
0.90 to 1.00.
,33
' 0.94
50
1.00 to J.10.
19
1.04
40
1.10 to 1.20.
8
1.14
34
Over 1.20.
21
1.25
45
Fig. 30 shows some of the many variations encountered when mak ing sizing tests. The seven tests from which this chart was plotted were made on mixed bituminous coals, made up of several of they officially numbered coals, and accurately sized by passing through a revolving screen. The per cent of sulphur and per cent of moisture were about constant in the mixtures. The fact that the carbon- hydrogen ratio of the dry coal used decreased as the coal became larger (curve No. 1) seems to indicate that the tests were not run on uniform mixtures of coals; perhaps certain coals were finer or coarser than others before mixing. The coals were accidentally mixed in a general heap, in consecjuence of a fire in the washer plant, and it was not known just what they consisted of except that they came from the so-called Illinois and Missouri coal basins.
A significant fact brought out by the chart is that the efficiency 72* was about constant for all the sizes.

48 A STUDY OF FOUR HUNDRED "STEAMING TESTS.
Certain values varied as the size of the coal increased. Curve No. 1 shows that the carbon-hydrogen ratio in dry coal decreased, and thereby tended to lower efficiency 72*. Curve No. 2 shows a slight rise of efficiency 72*. Curve No. 3 shows a steady increase in the dif ference between the draft in the stack and that over the fire, for which no explanation is offered. Curve No. 4 shows an irregular but decided increase in pounds of coal burned per square foot of grate per hour a
6160
S3
se u>55
50 43
40 3S '
13
10
69£1.5
150
ZM20.0
1413
SIZE.. OF COAL
FIG. 30. Relations developed on accurately sizing mixed bituminous coal: Curve No. 1, carbon-hydro gen ratio in dry coal; No. 2, efficiency 72*; No. 3, difference between draft in stack and draft over fire; No. 4, pounds of dry coal burned per square foot of grate surface per hour; No. 5, per cent of rated capacity developed; No.6, pounds of dry chimney gases per pound of "combustible;" No.7,percent of ash in coal (proximate analysis).
direct consequence of the increase in size of the coal. It should be borne in mind that the stack draft available was always about the same. Curve No. 5 is of the same shape in detail as No. 4, and shows an increase in the rate of steam production. Curve No. 6 is practi cally level, except-at the left end, where it is high perhaps because the coal was so fine that it caked and allowed cracks to form in the

RELATIONS OP TEST DATA. 49
fuel bed, or because the ash contained was high. Curve No. 7 shows that much of the ash went into the fine coal. It is worthy of remark that the finer and dirtier sizes gave nearly as high efficiency as the larger sizes.
The sole advantage of the larger sizes of coal over the smaller, so far as shown by these few tests, was that a higher rate of steam production was attained.
An attempt was made to determine the effect of £-inch size (in Indiana, Illinois, and western Kentucky coals) on efficiency 72*, per cent of CO loss, and combustion-chamber temperature; but the results were negative, and emphasize the statements made on page 47, that the study of the effects of the various elements of size of coal has not been made in sufficient detail. It is also likely that the effects of size are obscured greatly by other factors, such as cak ing, moisture, etc. The following table of results does not seem to indicate much:
Classification of efficiency 72*, per cent of CO in jlue gas, and combustion-chamber tem perature on basis of per cent of %-inch coal (Illinois, Indiana, and western Kentucky coals).
Average combustion-chamber temperature («F.). ....................:................
Average combustion-chamber temperature (°F7>. .....................................
Per cent of J-inch coal.
Oto5.
4 4.0
05.02 0.11
3
2,612
5 to 10.
13 8.2
63.74 0.27
8
2,483
10 to 12.
9 11.1
66.18 0.19
7
2,367
12 to 14.
4 12.2
68.05 0.19
3
2,302
14 to 1C.
4 14.9
05. 57 0.30
2
2,240
16 to 17.
7 16.2
65. 88 0.18
6
2, 370
17 to 18.
7 17.6
63.88 0.17
2
2,393
Per cent of £-inch coal.
18 to 19.
4 18.4
66.74 0.24
2
2,371
19 to 21.
9 19.9
04.98 0.26
4
2,299
21 to 23!
6 22.0
65.84 0.16
3
2, .104
23 to 25.
6 24.0
65.920:13
5
2,245
25 to 30.
6 20.2
06.67 0.14
4
2,245
30 to 40.
5 32.7
65. 84 0.27
4
2,378
a Fewer tests were used to obtain the average combustion-chamber temperature than for the other averages, owing to the fact that the questionable results were eliminated.
The coals used for sizing came from Illinois, Indiana, and western Kentucky. Not many tests are used here and the results would not be expected to convey much information even had the coals come from one locality; because, for example, from the State of Illinois it is possible.to obtain about as good and as poor bituminous coal as is mined. The results, given in the table on the following page, show a small increase in efficiency 72* and a large increase in combus tion-chamber temperature as the size of coal increases.
8400 Bull. 325 07 4

50 A STUDY OF FOUR HUNDRED STEAMING TESTS.
Classification of efficiency 7%*, per cent of CO in flue gas, and combustion-chamber tem perature on basis of average diameter of coal (Illinois, Indiana, and western Ken tucky coals).
Averages of average diameter (inches)
Average per cent of CO in Hue gas. . .
Average combustion-chamber tern-
Average diameter (inches).
Up to 0.5.
9 0.39
64.83 0.18
7
2,080
0.5 to 0.6.
4 0.58
07. 69 0.31
2
2,406
0.6 to 0.7.
16 0.60
65.75 0.16
7
2,258
0.7 to 0.8.
22 0.74
65.19 0.23
14
2,357
0.8 to 0.9.
15 0.83
65.00 0.20
11
2,405
0.9 to 1.0.
7 0.95
66. 88 0.34
5
2; 412
1.0 to 1.2.
3 1.04
68.50 0.15
3
2,542
1.2 up.
8 2.51
63.68 0.11
4
2, 576
o Fewer tests were used to obtain the average combustion-chamber temperature than for the other averages, owing to the fact that the questionable results were eliminated.
Increasing the size of fuel by briquetting would seem from theoretical reasoning to be a move in the wrong direction. Other things being equal, it is self-evident that the more nearly the size of a particle of coal approaches that of an atom the better, for then each particle will burn instantly on coming in contact with two atoms of oxygen. It is also self-evident that the-smaller the indi vidual particles of coal put into a furnace or gas producer the less will, be the protecting effect of the surface coating of ash formed b}^ the burning away of the outer portions of the grains. From a mathe matical standpoint it can be seen that the volume of a body increases proportionately to the cube of its diameter, but the exposed surface increases only as the square of its diameter, and in combustion it is exposed surface that counts for rapidity. Therefore, to repeat, it would seem that on this basis alone, artificially increasing the size of fuels is, to speak generally, working in the wrong direction. It is recognized that improved results are obtained by briquetting some fuels, but that probably still better results can and will be obtained in the future by devising furnaces and gas producers of such types as will utilize fine coal better than coarse. So far the only step made in this direction has been the burning of pulverized coal in furnaces. Perhaps the slowness of development in this field is attributable to the expense of grinding the coal, which has never had a fair trial on a large scale, and also indirectly to the softening of the fire-brick lining due to the fact that pulverized-coal furnaces are customarily run too hot. The work done by the boiler division, and set forth on pages 20, 23, 56, shows the error of the general impression that very high furnace temperatures are necessary for very high over-all effi ciencies. Viewed from this standpoint, it is not improbable that in the future the burning of fine and pulverized coal, perhaps even without extreme pulverization, will increase largely. In cement kilns, for instance, such coal has been a great success for the reason that the lining of the kiln is protected by the material itself which it is desired to melt. One reason for the nonutilization of slack coal is because too little attention has been given to this general subject.
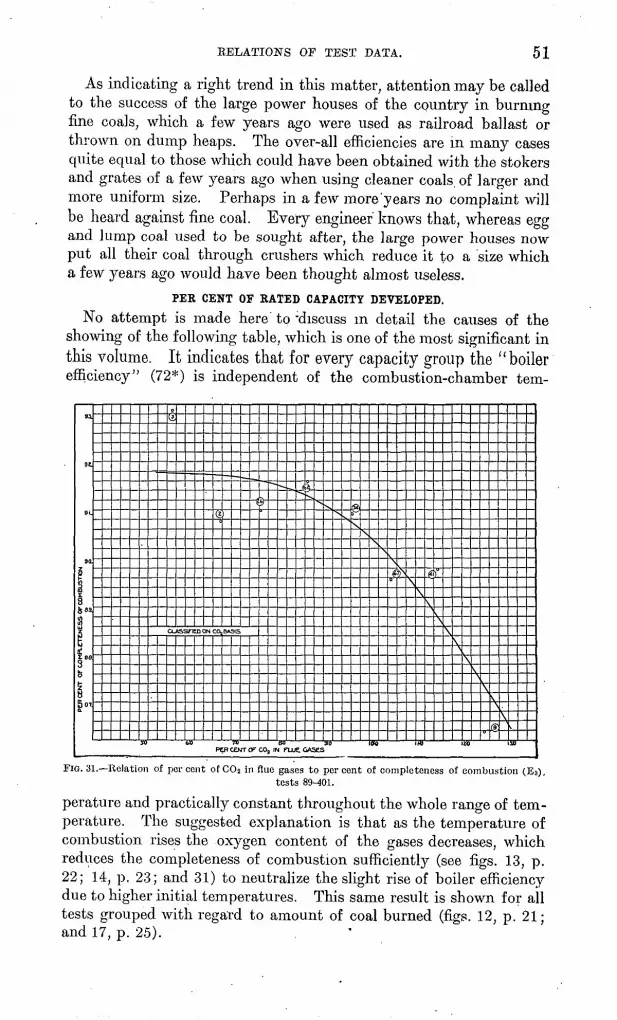
KELATIONS OF TEST DATA. 51
As indicating a right trend in this matter, attention may be called to the success of the large power houses of the country in burning fine coals, which a few years ago were used as railroad ballast or thrown on dump heaps. The over-all efficiencies are in many cases quite equal to those which could have been obtained with the stokers and grates of a few years ago when using cleaner coals, of larger and more uniform size. Perhaps in a few more'years no complaint will be heard against fine coal. Every engineer knows that, whereas egg and lump coal used to be sought after, the large power houses now put all their coal through crushers which reduce it to a size which a few years ago would have been thought almost useless.
PER CENT OF RATED CAPACITY DEVELOPED.
No attempt is made here to -discuss in detail the causes of the showing of the following table, which is one of the most significant in this volume. It indicates that for every capacity group the "boiler efficiency" (72*) is independent of the combustion-chamber tern-
PER CENT OF C0a IN FUUE OASES
FIG. 31. Relation of percent of CO 2 in flue gases to percent of completeness of combustion (Ea),tests 89-401.
perature and practically constant throughout the whole range of tem perature. The suggested explanation is that as the temperature of combustion rises the oxygen content of the gases decreases, which reduces the completeness of combustion sufficiently (see figs. 13, p. 22; 14, p. 23; and 31) to neutralize the slight rise of boiler efficiency due to higher initial temperatures. This same result is shown for all tests grouped with regard to amount of coal burned (figs. 12, p. 21; and 17, p. 25).
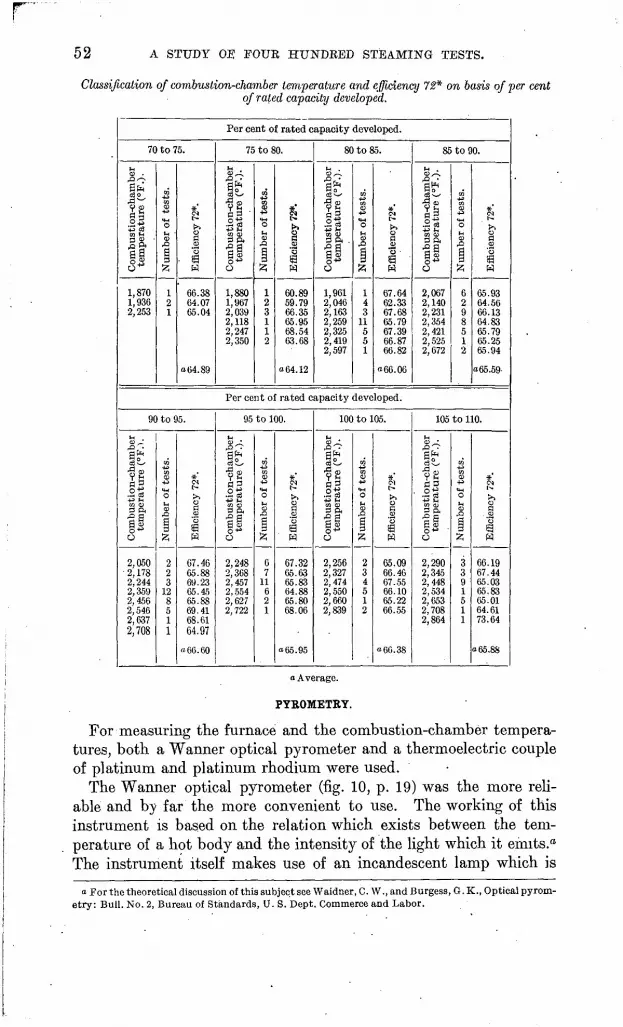
r52 A STUDY OE FOUR HUNDRED STEAMING TESTS.
Classification of combustion-chamber temperature and efficiency 12* on basis of per cent of rated capacity developed.
Per cent of rated capacity developed.
70 to 75.
H
*ta
2ft -fj
1,8701,9362,253
w
0)
oIH
rO
S
fc
1
21
*'(N
^
H0)o
W
66.3864.0765.04
o64.89
75 to 80.
fs*s-
S §o
1,8801,9672,0392,1182,2472,350
»
1o
§fc
123112
£(^
§
1
60.8959.7966.3565.9568.5463.68
o64.12
80 to 85.
n .
iH*.2 a3 ft .
a So
1,9612,0462,1632,2592,3252,4192,597
0}
oH0)
£1
ti
fc143
11551
£(^
§1' '
67.6462.3367.6865.7967.3966.8766.82
a66.06
85 to 90.
n .
|?
d 3.2 oj3 ft^2 aa §o
2,0672,1402,2312,3542,4212,5252,672
1oHO fl
|
fc
6298512
£j^ sosdW
65.9364.5666.1364.8365.7965.2565.94
o65.59
Per cent of rated capacity developed.
90 to 95.
»H .
bustion-ch nperature
gsO
2,0502, 1782,2442,3592,4562,5462,6372,708
iber of test
*fc
223
128511
iency 72*.
tSH
67.4665.8869.2365.4565.8869.4168.6164.97
"66.60
95 to 100.
t-i
bustion-ch nperature
a so
2,2482,3682,4572,5542,6272,722
iber of test
s
67
11621
iency 72*.
W
67.3265.6365.8364.8865.8068.06
"65.95
100 to 105.
1?
bustion-ch nperature
0.®o
2,2562,3272,4742,5502,6602,839
iber of test
*
234512
iency 72*.
65.0966.4667.5566.1065.2266.55
"66.38
105 to 110.
n
bustion-ch nperature
II o
2,2902,3452,4482,5342,6532,7082,864
ra
iber of test
S
3391511
#'
0a
W
66.1967.4465.0365.8365.0164.6173.64
"65.88
a Average.
PYROMETRY.
For measuring the furnace and the combustion-chamber tempera tures, both a Wanner optical pyrometer and a thermoelectric couple of platinum and platinum rhodium were used.
The Wanner optical pyrometer (fig. 10, p. 19) was the more reli able and by far the more convenient to use. The working of this instrument is based on the relation which exists between the tem perature of a hot body and the intensity of the light which it emits.a The instrument itself makes use of an incandescent lamp which is
a. For the theoretical discussion of this subject see Waidner, C. W., and Burgess, O.K., Optical pyrom- etry: Bull. No. 2, Bureau of Standards, U. S. Dept. Commerce and Labor.

RELATIONS OF TEST DATA. 53
standardized by comparison with an amyl-acetate standard lamp, and consists of a photometer for comparing the light emitted by the body whose temperature is to be measured with a steady light of known intensity. The comparison light is a 6-volt incandescent lamp, supplied by a storage battery, illuminating a ground-glass surface. A beam of monochromatic (red) light from this source produced by-means of a direct-vision spectroscope and a screen, cut ting out all but a narrow band in the red and a similar beam from the hot body are passed into a photometric telescope, each beam illuminating one-half of the telescopic field. The photometric com parison is made by adjusting to equal brightness both halves of the telescopic field by means of a polarizing arrangement.
One of the advantages of the optical pyrometer is that it is more apt to take the average temperature of a strip across the furnace from wall to wall. Furthermore, it gives temperature changes instantane ously and in absolute measure, which, even in case the flames appear hotter than they really are, can hardly be in error more than 150° F. This error is probably more than offset by the fact that the furnace is not a perfect "black body."
The most serious source of error, except when special precautions are taken, is the variation in brightness of the electric comparison lamp due to variation in the current furnished by the three-cell stor age battery, the percentage of change in light being of the order of six times the percentage of change in current through the lamp. Break ing the circuit and then making it again may cause an apparent change of more than 20° C. It has been found that for a series of observations lasting from one-half hour to two hours it is better to take all readings, after once standardizing the instrument, without breaking the lamp circuit, instead of breaking it after every single reading.
Before standardizing the instrument the amyl-acetate standard lamp should be allowed to burn from five to ten minutes to get a steady flame. To supply the incandescent lamp a 20-ampere-hour storage battery was used for most of the readings recorded in this work.
The thermoelectric couple used for pyrometric tests was connected either to a millivoltmeter equipped with a scale of temperatures or to a Callendar recording instrument. There were two of the latter instruments; one was to be used with the thermoelectric-couple pyrometer and the other with an electric-resistance pyrometer. Owing to the fact that these pyrometers, as sold, do not stand the furnace temperatures for any great length of time there was no opportunity to give the recording instruments a fair trial, and there fore they are not considered in detail in this report.
54 A STUDY OF FOUR HUNDRED STEAMING TESTS.
The thermoelectric couple as it came from the maker consisted of a platinum and platinum-rhodium junction inclosed in a porcelain tube of f-inch bore and f inch outside diameter. However, this porcelain tube could not stand the high temperature, and particularly the slagging action of the furnace gases. The slag accumulated on the surface of the tube and seemed to change the composition of the porcelain. The tube partly melted, and then, after it had been in the combustion chamber for two hours, broke off, although there was nothing in the chamber to strike it. A water-jacketed iron pipe, similar to the gas sampler shown in fig. 15 (p. 24), was tried instead of the porcelain tube, the two wires being insulated from each other and from the pipe by pieces of small glass tubing. The thermoelectric junction projected 3 inches from the end of the iron pipe, and was held in two. stems of penny clay pipes. This arrangement lasted over a week in the combustion chamber and gave fairly satisfactory results. During this time the couple was con tinually connected to the Callendar recording instrument.
The records obtained with the thermoelectric apparatus had a value only so far as the relative temperatures were concerned. For abso lute temperature the apparatus could not be depended on, because it was impossible to apply any scale or rule to the record when the mass around the junction of the couple was one fused mass of slag. It was also found that the variations in temperature shown by this couple were lagging from six to eight minutes. A couple fitted with a water- jacketed iron pipe had to be rigidly connected to a water supply. On that account such an arrangement could not be used for measur ing temperatures in different parts of the furnace, and for this pur pose a plain ^-inch iron pipe was used. The junction of the wires was, as before, held in two clay pipestems, which projected about 2 inches from the end of the iron pipe. Clay pipestems had to be used also for insulating the wires inside of the iron pipe for a length of about a foot back from the end, on account of the high temperature to which the end was subjected. Even with this special arrangement the thermoelectric couple could be exposed to the high temperature of the furnace only long enough to get the projecting junction hot and take the reading. This exposure usually lasted fifteen to twenty seconds, after which the instrument had to be withdrawn and cooled off. Even with this care the iron pipe lasted for only thirty to fifty single readings, after which it became so burned that it had to be replaced by a new one. This instrument also could be depended on only for relative temperatures in different parts of the furnace.
After all the difficulties that are encountered in using a thermo electric couple for measuring furnace temperatures, this apparatus measures only the temperature of a very small part of the furnace,
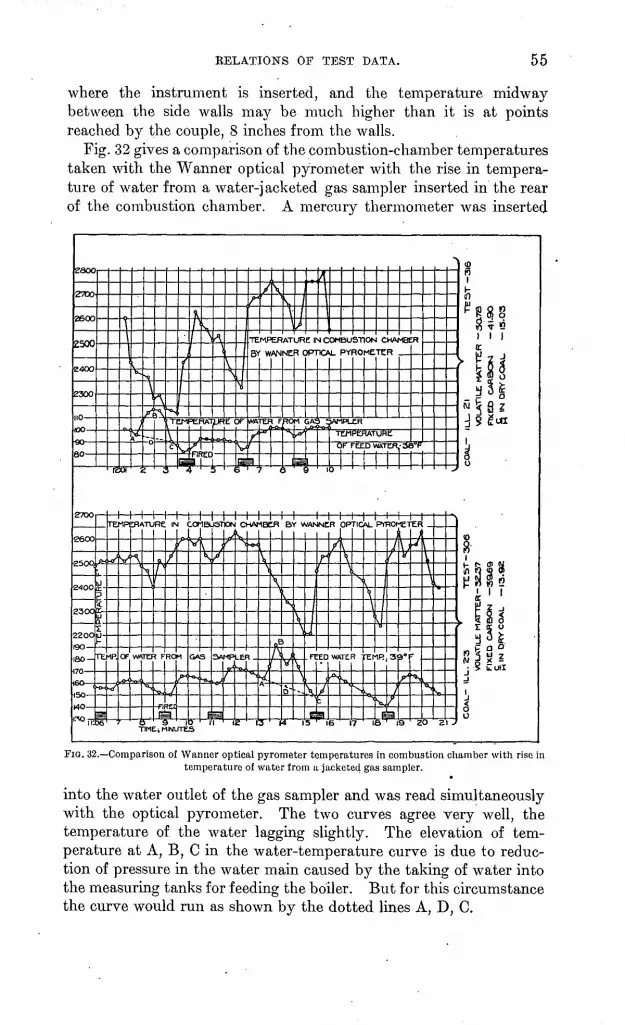
RELATIONS OF TEST DATA. 55
where the instrument is inserted, and the temperature midway between the side walls may be much higher than it is at points reached by the couple, 8 inches from the walls.
Fig. 32 gives a comparison of the combustion-chamber temperatures taken with the Wanner optical pyrometer with the rise in tempera ture of water from a water-jacketed gas sampler inserted in the rear of the combustion chamber. A mercury thermometer was inserted
2500
110-
100-
90
80-
^;
-TEMPERATURE OF
UTEMPERATURC IN COMBUSTION CHAMBER PYROMETER
iAJi liAMPLCR
OF FEEDWM,T
3
P s$88'? e i i t
L.U Z\
VOLATILE MA FTXED CARB §IN DRY CO
FIG. 32. Comparison of Wanner optical pyrometer temperatures in combustion chamber with rise in temperature of water from a jacketed gas sampler.
into the water outlet of the gas sampler and was read simultaneously with the optical pyrometer. The two curves agree very well, the temperature of the water lagging slightly. The elevation of tem perature at A, B, C in the water-temperature curve is due to reduc tion of pressure in the water main caused by the taking of water into the measuring tanks for feeding the boiler. But for this circumstance the curve would run as shown by the dotted lines A, D, C.

56 A STUDY OF FOUR HUNDRED STEAMING TESTS.
SMOKE.
The curves of fig. 33 are plotted on the basis of per cent of black smoke. Curve No. 1 indicates that the efficiency 72* rises a little more than 1 per cent until about 20 per cent of black smoke is reached, and then gradually drops. This drop in efficiency amounts 'to about 2.5 per cent within the range of 20 to 50 per cent of black smoke. The drop in efficiency when there is little or no smoke can be explained by noting that a greater amount of air was used for combustion of
NOT
£.£00.
AO.M.4
SMOKE-, PERCENT BU<VCK
FIG. 33. Relations of smoke per cent to boiler efficiency 72* (curve No. 1); per cent of unaccounted for loss taken from heat balance (curve No. 2); combustion-chamber temperature (°F.) (curve No. 3); per cent of CO in flue gases (curve No. 4); per cent of oxygen (ultimate analysis) in dry coal (curve No. 5); per cent of available hydrogen in "combustible" (curve No. 6); and per cent; of fixed carbon (proximate analysis) (curve No. 7). Series of 1905-6; black smoke taken as 100 per cent.
the coals producing little smoke, probably owing to the fact that many lignites were included in these groups, the excess of air reduc ing the heat available for the boiler and causing a greater loss of heat up the stack. The loss up the stack decreases and the efficiency 72* rises with reduction in the supply of air until the point is reached at which the loss due to incomplete combustion becomes larger than

KELATIONS OF TEST DATA. 57
the gain obtained by reducing the loss up the stack. Curves Nos. 3 and 4 support this explanation.
Curve No. 3 shows that the combustion-chamber temperature rises in direct proportion with the per cent of black smoke. Rise in com bustion-chamber temperature always indicates a decrease in airsupply-
Curve No. 4 shows a gradual increase in CO in the flue gases. Theunaccounted-for loss, represented by curve No. 2, also rises as the smoke increases. It is reasonable to say that the greater part of the increase in the unaccounted-for loss is due to incomplete combustion of hydrocarbon gases and to the escape of solid particles of carbon- forming smoke.
Curve No. 5 shows but a small increase in oxygen in coal, and there fore does not indicate that oxygen in coal is a direct cause of smoke.
Curves Nos. 6 and 7 indicate that, excepting the first point at the extreme left, good or bad coals have not been prevalent in any one group.
The direct cause of the smoke seems to be shown in curve No. 3, which indicates increased rate of combustion and decreased supply of air.
The table which follows indicates that eastern coals are about as apt to smoke as western. It should be stated here that if these coals had been handled as suggested below most of them would probably have burned entirely without smoke, and the remainder with less smoke than they produced as actually handled.
Average per cent of black smoke produced by burning coals from certain localities under aHeine boiler.
Locality.
Brazil........................
New Afexico
Number of tests.
8
21
3530
2
378
Average per cent of black smoke.
10.200
54.8182622.718.5'5.2
1717.0
Locality.
North Dakota. ...............
Texas ........................
Number of tests.
12518
1293
104
238
Average per cent of black smoke.
032.218.30
14.08.72.8
1922.914.7
The following table includes coals from many localities; some of them are usually called "smoky coals." It is quite probable.that most other coals which produced smoke could have been burned smokelessly if the boiler division had not worked for the greater part of 1905 under trio idea that.very high temperatures are needed to get good over-all efficiencies. As shown elsewhere, extremely high furnace temperatures and a high degree of completeness of combus tion in the furnace are incompatible. More air should usually have

58 A STUDY OF POUK HUNDRED STEAMING TESTS.
been admitted through the smoke-preventer openings to the space over the fire; this precaution might have prevented almost wholly in most cases the formation of the smoke without affecting the over all efficiency of the outfit.
Coals burned under Heine boiler without producing smoke.
Test No.390378
;.. 293,294 . .. 308, 309
340
Alabama No. 3.............Alabama No. 4.....:.......Arkansas No. 7 A..........Arkansas No. 8 (washed).....Arkansas No. 10. ..........Brazil No. 1. ................... 172,173Illinois No. 6 B (briquets) ..... 313Illinois No. 11 C (briquets) ..... 312Illinois No. 20.................. 292Illinois No. 21.................. 316Illinois No. 21 (briquets) ....... 318Illinois No. 23 A (washed)...... 317Illinois No. 25.................. 338,339Indiana No. 7 B (briquets) .... 288Maryland No. 1 (washed)....... 231Missouri No. 5.................. 320New Mexico No. 3 B........... 389
North Dakota No. 3............Pennsylvania No. 8.............Pennsylvania No. 8 (dried).....Rhode Island No. 1.............Tennessee No. 5................Tennessee No. 6................Tennessee Nos. 8 A and 8 B
(washed).....................Tennessee No. 9 (washed, bri
quets) .......................Texas No. 4....... ...........West Virginia No. 19...........West Virginia No. 19 (briquets) .West Virginia No. 21...........Wyoming No. 2 B..............'.Wyoming No. 3.................
Test No. 206
236, 237 242 401 352
379, 381
388
393291
285, 289331297210211
COMBUSTION AND COAL.
"VOLATILE MATTER," "FIXED CARBON," "WATER OF COMPOSITION,'^ AND"COMBUSTIBLE."
There still lingers a trace of an old idea that coal consists of parti cles of carbon cemented together with a sort of natural bitumen. The present tendency is to regard bituminous coal as a mixture of dozens, or even hundreds, of organic compounds, most of them de rived from cellulose and many of them containing nitrogen and sul phur organically combined. It is true that for most kinds of coal group formulas can be devised which represent very closely the chemical compositions of the respective groups as shown by ulti mate analyses; but it must be distinctly borne in mind that the devisers of these formulas do not mean that any one coal under con sideration consists of one compound expressed by the formula pro posed. Such formulas are meant as collective only; in exactly the same way as physiologists speak of the normal or average man, whose height, weight, etc., bear certain accurate relations to each other, although there is not in the world any one man who fits the description exactly.
When coal is heated, some or most of its constituent compounds are always broken down more or less, but are broken down differently, according to the particulars of the distillation method. That por-
o For definition of " water of composition," see the glossary, p. 183.

COMBUSTION AND COAL. 59
tion which is distilled ofl' from coal when it is heated under certain " standard" conditions is called "volatile matter." But inasmuch as the "standard" conditions are seldom exactly alike, and inasmuch as "volatile matter" is the product of a change, it is a mistake to say that coal contains any stated percentage of "volatile matter," or even that it contains "volatile matter" at all. The terms "fixed carbon/' "volatile carbon," and "water of composition" are equally misleading. Coals do not literally contain these constituents in any more exact sense than cane sugar consists of "water" and "char coal," although hydrogen and oxygen are contained in cane sugar in exactly such proportions as form water and leave carbon when the sugar is heated.
GKATE AND COMBUSTION SPACE.
Any furnace consists of the grate and the combustion space. The combustion space extends from the top of the fuel bed to the opening into the tube chamber, and its rear portion is termed the "combustion chamber." The function of the grate and fuel bed is to distill the "volatile matter" and partly to burn the "fixed carbon" of the coal. The function of the combustion space is to burn the "volatile matter." With coals high in "fixed carbon" combustion is nearly complete a short distance from the top of the fuel bed; with highly volatile coals the combustion is incomplete, even at the rear of the combustion chamber.
Samples of furnace gas collected at the top of the fuel bed are very commonly rich in combustible ingredients In the subjoined table is given the chemical composition of gas collected at the top of the fuel bed and also from the combustion chamber, determined from samples collected with the water-jacketed sampler. The samplers projected about 10 inches into the furnace, both being inserted through holes in the side wall, the first sampler resting oh the sur face of the fuel bed.
Analyses of samples of'gas collected at top of fuel bed and rear of combustion chamber.
Collections:
Tost 302:
Test 304:
Test 307:
Rear of combustion chamber..
Time.
/ 8.40\ 10.40 f 8.301 10.30
/ 8.15
\ 8.30\ 12.30
( 7.30 { 9.30( 11.20 [ 7.30\ 9.30
11.30
C0 2 .
C.I10.8 11.414.4
8.4
12.012.0
4.4
5.2 13.315.514.0
0 2 .
05.0
1 7.73.0
8.90 05.0
7.4 0
.2 0
.0
.2
CO.
17.92.2 00
'2
20.3 00
9.5 23 (j23.8
.9
.71
II 2.
7.80
0
1.27 Q
5.4
CH4 .
3.00
02.7
2.4 1.21.8
CnH 2 n+2.
0.2.0
00
.8
.20
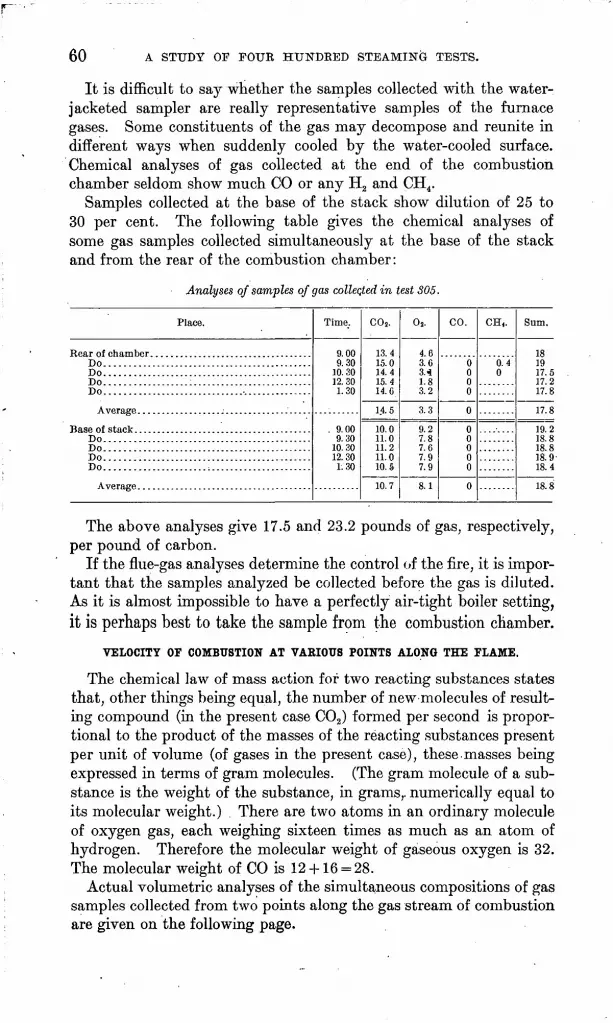
60 A STUDY OF FOUR HUNDRED STEAMING TESTS.
It is difficult to say whether the samples collected with the water- jacketed sampler are really representative samples of the furnace gases. Some constituents of the gas may decompose and reunite in different ways when suddenly cooled by the water-cooled surface. Chemical analyses of gas collected at the end of the combustion chamber seldom show much CO or any H2 and CH4 .
Samples collected at the base of the stack show dilution of 25 to 30 per cent. The following table gives the chemical analyses of some gas samples collected simultaneously at the base of the stack and from the rear of the combustion chamber:
Analyses of samples of gas collected in test 805.
Place.
Do.............................................Do.............................................Do..................:..........................Do.............................................
AverOifirG6
Do.............................................Do.............................................Do.............................................DO......................:......................
Time.
9.009.30
10.3012.301.30
. 9.009.30
10.3012.301.30
C0 2 .
13.415.014.415.414. C
14.5
10.011.011.211.010.5
10.7
02 .
4.63.63.41.83.2
3.3
9.27.87.67.97.9
8.1
CO.
0000
0
00000
0
CH4 .
0.40
Sum.
181917.517.217.8
17.8
19.218.818.818.9-18.4
18.8
The above analyses give 17.5 and 23.2 pounds of gas, respectively, per pound of carbon.
If the flue-gas analyses determine the control (if the fire, it is impor tant that the samples analyzed be collected before the gas is diluted. As it is almost impossible to have a perfectly air-tight boiler setting, it is perhaps best to take the sample from the combustion chamber.
VELOCITY OF COMBUSTION AT VARIOUS POINTS ALONG THE FLAME.
The chemical law of mass action for two reacting substances states that, other things being equal, the number of new molecules of result ing compound (in the present case C02 ) formed per second is propor tional to the product of the masses of the reacting substances present per unit of volume (of gases in the present case), these masses being expressed in terms of gram molecules. (The gram molecule of a sub stance is the weight of the substance, in grams,, numerically equal to its molecular weight.) . There are two atoms in an ordinary molecule of oxygen gas, each weighing sixteen times as much as an atom of hydrogen. Therefore the molecular weight of gaseous oxygen is 32. The molecular weight of CO is 12 +16 = 28.
Actual volumetric analyses of the simultaneous compositions of gas samples collected from two points along the gas stream of combustion are given on the following page.
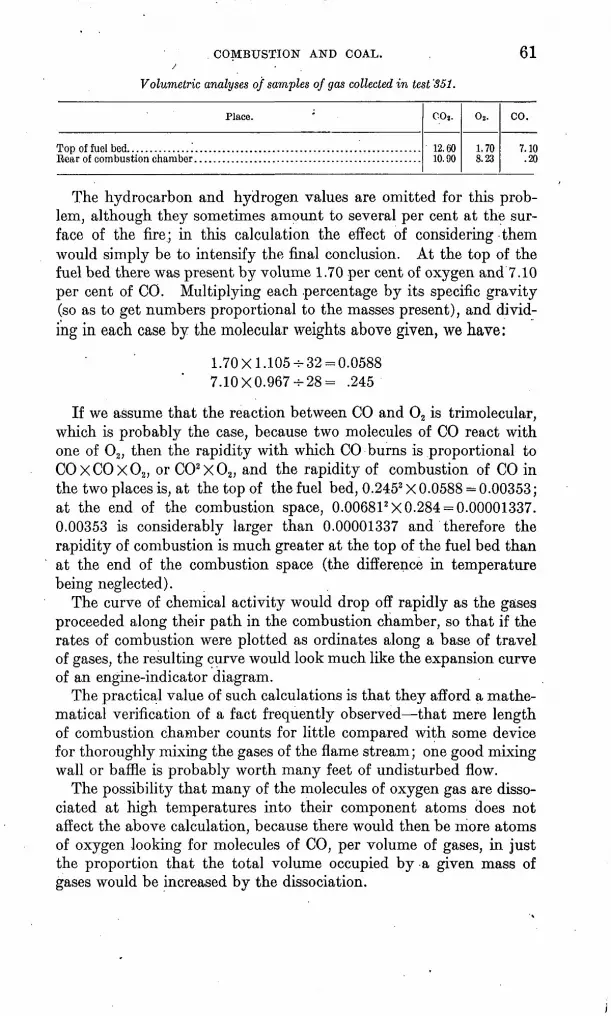
COMBUSTION AND COAL. . 61/
Volumetric analyses of samples of gas collected in test '851.
Place.
Top of fuel bed. ................................................................
CO2 .
12.6010.90
02 .
1.708.23
CO.
7.10.20
The hydrocarbon and hydrogen values are omitted for this prob lem, although they sometimes amount to several per cent at the sur face of the fire; in this calculation the effect of considering -them would simply be to intensify the final conclusion. At the top of the fuel bed there was present by volume 1.70 per cent of oxygen and 7.10 per cent of CO. Multiplying each .percentage by its specific gravity (so as to get numbers proportional to the masses present), and divid ing in each case by the molecular weights above given, we have:
1.70X1.105-^32 = 0.0588 7.10 X 0.967 H-28 = .245
If we assume that the reaction between CO and O2 is trimolecular, which is probably the case, because two molecules of CO react with one of 02 , then the rapidity with which CO burns is proportional to COxCOx02 , or C02 X02 , and the rapidity of combustion of CO in the two places is, at the top of the fuel bed, 0.2452 X 0.0588 = 0.00353; at the end of the combustion space, 0.00681 2 X 0.284 = 0.00001337. 0.00353 is considerably larger than 0.00001337 and therefore the rapidity of combustion is much greater at the top of the fuel bed than at the end of the combustion space (the difference in temperature being neglected).
The curve of chemical activity would drop off rapidly as the gases proceeded along their path in the combustion chamber, so that if the rates of combustion were plotted as ordinates along a base of travel of gases, the resulting curve would look much like the expansion curve of an engine-indicator diagram.
The practical value of such calculations is that they afford a mathe matical verification of a fact frequently observed that mere length of combustion chamber counts for little compared with some device for thoroughly mixing the gases of the flame stream; one good mixing wall or baffle is probably worth many feet of undisturbed flow.
The possibility that many of the molecules of oxygen gas are disso ciated at high temperatures into their component atoms does not affect the above calculation, because there would then be more atoms of oxygen looking for molecules of CO, per volume of gases, in just the proportion that the total volume occupied by a given mass of gases would be increased by the dissociation.

62 A STUDY OF FOUR HUNDRED STEAMING TESTS.
COMBUSTION-CHAMBER BAFFLE WALL.
A baffle wall, constructed of special fire brick, was built in the com bustion chamber. The object of this wall was to divert the gases from their straight course in order to mix the free oxygen more thoroughly with the unburnt volatile matter of the coal. It was also intended to act as a heat regenerator, absorbing heat when the temperature of the gases was high, and giving. it out when the temperature was low, thus keeping the temperature above the ignition temperature of the distilled gases.
It was learned by experiment that only large blocks made of the best material could stand the high temperature and the slagging action
StCTION A-B.
FIG. 34. Gas-mixing wall built in the Heine safety water-tube boiler.
of the gases for any length of time. The baffle wall shown in fig. 34 was built of large fire brick, 18 by 12 by 6 inches, said to be of the best material that could be obtained. The wall was built in three sections. The bottom consisted of seven blocks set on end, forming pillars, on top of which six similar blocks were laid diagonally across. The space between the baffle thus formed and the tile roof was filled with small bricks of good material, so that the spaces between the pil lars gave the only passage left for the gases. The object of this con struction was to divert the stream of furnace gases, which struck the upper portion of the baffle, and break it into many smaller streams,

COMBUSTION AND COAL. 63
thus mixing the distilled gases and the free oxygen. It is probable that eddies caused by the obstacles in the path of the gases greatly aided the mixing. The first baffle wall of this construction lasted just six months, but later ones were not so durable, and such walls were finally abandoned, at least temporarily, and replaced by three small piers set on the bridge wall. The first baffles, however, were far more efficient as smoke preventers and heat regenerators, although they absorbed considerably more draft.
COMBUSTION-CHAMBER TEMPERATURE.
Fig.' 35 shows the manner in which the "unaccounted-for" and flue losses of about 260 tests vary to some extent inversely. The encircled
FIG. 35. Relations of combustion-chamber temperature (°F.) to heat balance (with Illinois and Indiana coals): Curve No. 1, per cent of unaccounted-for loss plus per cent of loss up stack; curve No. 2, per cent of loss up stack; curve No. 3, per cent of unaccounted-for loss.
numbers near the points indicate the number of tests falling within each .temperature group. The inverse variation of these curves is a consequence of the facts that the flue-gas analyses, though accurate in themselves, were misleading because of air infiltration, and that the flue temperatures obtained were unreliable because of inherent difficulties; both these causes are discussed in the section devoted to accuracy and reliability of data (pp. 149-151). It is noticeable on this chart that the sum of the flue loss and unaccounted-for loss in creases slightly with rise of temperature, notwithstanding the fact that the efficiency of the boiler as a heat absorber increases several per cent with the rise of temperature; thus again the indication is that higher temperatures accompany less complete combustion.

64 A STUDY OP FOUR HUNDRED STEAMING TESTS.
ATTEMPTS TO EXPLAIN UNACCOUNTED-FOR LOSS IN HEAT BALANCE.
The large percentage of "unaccounted-for" loss appearing in the heat balances of the many tests made by the boiler division has long been a cause of discussion.
The settings of the boilers used for testing the various coals have been, even with the utmost diligence, in a very unsatisfactory con dition. There were numerous air leaks, so that the furnace gases were always diluted when they reached the base of the stack. It was thought that this dilution of gases introduced error in the calcu lation of heat loss up the stack. It also seemed that the radiation loss was larger than it should be.
Recently a new setting has been built and completely inclosed by a sheet-iron casing made with air-tight joints, so that the leakage was reduced to a minimum. The walls of the new setting were built of hollow tiles and this with the addition of a sheet-metal casing should have reduced the radiation loss; at least this loss could not be greater than formerly. Still the unaccounted-for loss continues.
A great many classifications have been made on the data and results obtained from our tests. In all cases a few relations con tinually appear. The important one in this discussion is that low efficiency is always accompanied by the highest per cent of CO in the flue-gas analysis, and the highest efficiency by the lowest per cent of CO. Moreover, the high CO values always go with the highest combustion-chamber temperatures. It is also found that as the com bustion-chamber temperature increases the per cent of black smoke increases.
It is not possible to account for very much of the loss in burning coal by the amount of CO found in the gas analysis. Therefore it seems that this appearance of CO in the gas analysis is indicative ofbad conditions, such as an irregular fuel bed or the escape of hydro carbons unburned.
RELATION OF' NITROGEN IN FLUE GASES TO EFFICIENCY 72* AND TO SIZE OF COAL, AND OF PER CENT OF CO TO EFFICIENCY 72*.
The curves of fig. 19 (p. 28), based on tests 89 to 401, inclusive, present a combination of two charts. The upper one classifies the tests on a nitrogen basis. This nitrogen is presumably what is left in the flue gases after subtracting from 100 the sum of the percent ages by volume of carbon dioxide, oxygen, and carbon monoxide, neglecting any small traces of hydrocarbons which may have been present and were not determined. Curve No. 1 indicates that the code "boiler efficiency" (72*) increases markedly when the nitrogen content rises from 80 to 81 per cent that is, when Orsat gas- analysis totals decrease from 20 to 19 per cent. The reacter. can
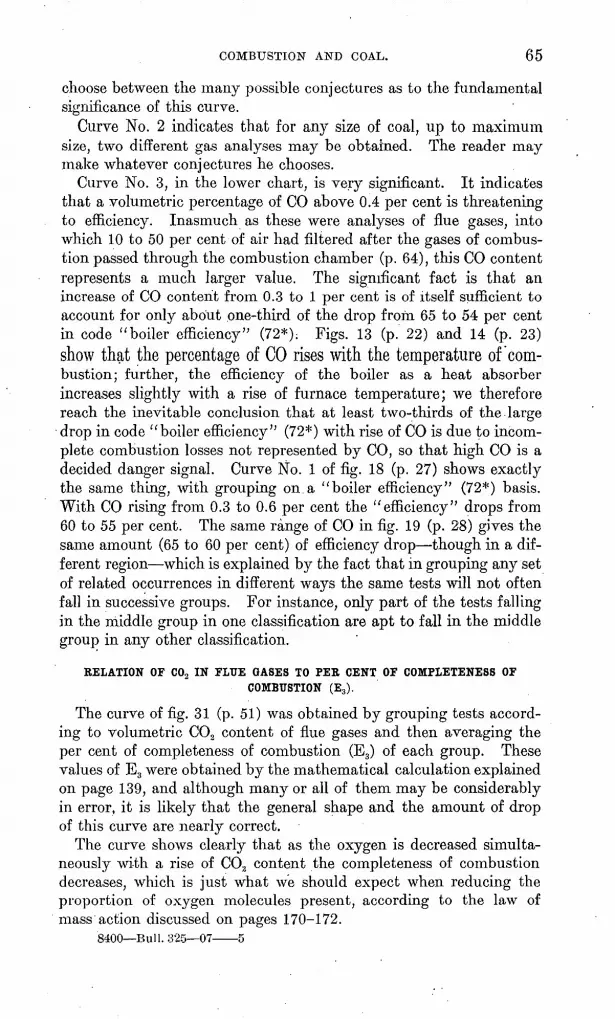
COMBUSTION AND COAL. 65
choose between the many possible conjectures as to the fundamental significance of this curve.
Curve No. 2 indicates that for any size of coal, up to maximum size, two different gas analyses may be obtained. The reader may make whatever conjectures he chooses.
Curve No. 3, in the lower chart, is very significant. It indicates that a volumetric percentage of CO above 0.4 per cent is threatening to efficiency. Inasmuch as these were analyses of flue gases, into which 10 to 50 per cent of air had filtered after the gases of combus tion passed through the combustion chamber (p. 64), this CO content represents a much larger value. The significant fact is that an increase of CO content from 0.3 to 1 per cent is of itself sufficient to account for only about .one-third of the drop from 65 to 54 per cent in code "boiler efficiency" (72*); Figs. 13 (p. 22) and 14 (p. 23) show that the percentage of CO rises with the temperature of com bustion; further, the efficiency of the boiler as a heat absorber increases slightly with a rise of furnace temperature; we therefore reach the inevitable conclusion that at least two-thirds of the large drop in code "boiler efficiency'' (72*) with rise of CO is due to incom plete combustion losses not represented by CO, so that high CO is a decided danger signal. Curve No. 1 of fig. 18 (p. 27) shows exactly the same thing, with grouping on a "boiler efficiency" (72*) basis. With CO rising from 0.3 to 0.6 per cent the "efficiency" drops from 60 to 55 per cent. The same range of CO in fig. 19 (p. 28) gives the same amount (65 to 60 per cent) of efficiency drop though in a dif ferent region which is explained by the fact that in grouping any set of related occurrences in different ways the same tests will not often fall in successive groups. For instance, only part of the tests falling in the middle group in one classification are apt to fall in the middle group in any other classification.
RELATION OF C02 IN FLUE OASES TO PEE CENT OF COMPLETENESS OF COMBUSTION (E3).
The curve of fig. 31 (p. 51) was obtained by grouping tests accord ing to volumetric CO2 content of flue gases and then averaging the per cent of completeness of combustion (E3) of each group. These values of E3 were obtained by the mathematical calculation explained on page 139, and although many or all of them may be considerably in error, it is likely that the general shape and the amount of drop of this curve are nearly correct.
The curve shows clearly that as the oxygen is decreased simulta neously with a rise of C02 content the completeness of combustion decreases, which is just what we should expect when reducing the proportion of oxygen molecules present, according to the law of mass action discussed on pages 170-172.
8400 Bull. 325 07 5
66 A STUDY OF FOUR HUNDRED STEAMING TESTS.
Thus even in furnaces as long as those of the boilers used in the work of the boiler division the increasing incompleteness of combus tion with rising temperature is practically sufficient to offset an increase of a few per-cent in the efficiency of the fyoiler as a heat absorber after the furnace temperature has reached about 2,400° F.
EELATION OF DIFFEEENCES OF DRAFT TO POUNDS OF DRY CHIMNEY GASES PER POUND OF "COMBUSTIBLE."
The curves of fig. 36 were determined by plotting differences between draft in stack and draft over fire with pounds of dry chim ney gases per pound of "combustible." Curve No. 1 represents
u
EC.
zo
aSnia.
" COMBU
J.R POUND Of
a
iiX,,
u. 0I"
18
n
(I1)
-
^.//
A
0
^S^
t)
(
^(
10
4
/
(ll
-c
0^/
)
>
4
--N
,,-
/
N
\
a
^~ ^
0. i
-t
/
, Q)
r/j
1'
//
'n*
^jb)
/
^
I
J'
^
(i
.x-
£l*^
>) **
fi
^
)1
s
»
S\
**
\
*>.
^
\
^
\
""*-
li
s
fr-
s
15 30 35 40 -45 70 7 DRAFT UNDER STACK DAMPER MINUS DRAFT OVER FIRE., INCHES OF WOTER.
j
FIG. 36. Relation of differences between draft in stack and draft over fire to pounds of dry chimney gases per pound of "combustible:" Curve No. 1, figured from analysis of gas in stack, tests 120-400; curve No. 2, figured from analysis of gas in rear of combustion chamber, tests 318-380.
about 200 tests. The values for pounds of dry chimney gases per pound of'' combustible'' were figured from stack samples. Curve No. 2 is the average of only a few points. The values for pounds of dry

COMBUSTION AND COAL. 67
chimney gases per pound of " combustible " were figured from samples taken in the combustion chamber. The general direction of the curve was determined by curve No. 1.
Low difference of draft readings occurs in two ways by carrying a low-stack draft accompanied by a thin fire or by carrying a high- stack draft and a thick fire. On most of these tests the stack draft is comparatively high as regards the amount of draft obtainable, hence the average points on the low difference of draft may be assumed to result from thick fires.
The use of a thick fire causes resistance to the passage of air through the fuel bed. When high-stack draft is used the difference between the pressure of the gases on the inside of the boiler setting and the atmospheric pressure outside is large, and thereby the abso lute amount of leakage of air into the setting is increased. How ever, since, in general, high-stack draft has been carried, it followsthat on the chart the per cent of leakage is a maximum at the points of low-draft differences. That is to say, as the draft differ ence increases the pounds of dry chimney gases per pound of com bustible increase, the per cent of air leakage decreases, and more of the air comes through the fuel bed. This condition holds up to a point where the fire is thin, as indicated by a high-draft difference. The air now enters more freely through the fuel bed, increasing the rate of combustion, thereby decreasing the pounds of dry chimney gases per pound of " combustible." Another cause for the decrease of the pounds of dry chimney gases at the high-draft difference points is the very low per cent of air leakage. Thus it is shown that with two widely varying conditions we may obtain the same weight of dry chimney gases per pound of " combustible."
The curves have no bearing on efficiency. The variation in the slope of curves Nos. 1 and 2 is probably due to air leakage.

68 A STUDY OP FOUR HUNDRED STEAMING TESTS.
The following table gives figures on pounds of dry gases per pound of carbon, calculated from gas analyses taken simultaneously at different parts of the boiler:
Infiltration of air through setting.
Test No.
SIS- 319 320 321 323 324 325 326 327 328 329 330 332 334 344 347 348 349 349 350 351 352 353 354
Pounds of gas per pound of car bon.
Over fire.
10.22 12.12 7.77
11.15 10.54 12.73
15.17
Combus tion
chamber.
18.38 24.02 23.76
. 16. 85 16.17 19.93 19.44 20.38 23.21 17.96
21.7019.40 17.53 14.76 15. 78 16.31 22.91 20.51 22.15 25.27
Front water
leg.
19.20 27.89 25.31 19.64 17.88 23.75 22.40 23.83 25.50 21.00 23.38 21.51 18.62 21.09
24.25 26.87 20.61 27.83
Stack.
23.34 32.42 28.37 23.20 21.60 26.51 27.30 31.45 28.87 24.42 26.90 25.09 23.60
' 24. 26 27.85 26.80 24.52 20.86
23.41 30. 25 27! 21 25.57 32.00
Per cent of leak
age, com bustion
chain ber to stack.
27.0 34.9 21.5 37.7 33.6 33.0 40.4 54.3 24.3 35.9
27.7 38.1 39.9 41.3
43.5 32.0 32.6 15.3 26.6
Test No.
355 356 357 359 360 361 362 363 364 365 366 367 369370 371 372 375 376 377378 379 380 381
Pounds of gas per pound of car bon.
Over fire.
15.29 18.22 13.65
.,
13.27
12.45
11.77
Combus tion
chamber.
20.90 19.84 20.68 21.8820.5019.0422.48 21.8119.15 21.1022.29 18.44 21.8922.2230.9019.1420.0222.4826.26 30.4825.02 25.8028.21
Front water
leg.
25.42 22.50'
18.38
19.89
18.14
16.85
Stack.
26.78 25.28 29.12 26.78 25. 16 25.49 29.70 27.17 25.30 29.18 26.02 26.40 27. 73 27.78 37.05 24.54 26.48 30.05 34.48 32.05 27.72 30.70 32.20
Per cent of leak
age, com bustion
chamber to stack.
28.0 27.3 40.8 22.4 22.7 33.8 32.2 24.4 32.1 38.3 16.8 43.2 26.7 24.9 19.9 28.2 32.1 33.7 31.3 5.1
10.8 19.0 14.2
Average per cent increase from surface of fire to combustion chamber, 52.33; from combustion cham ber to front leg, 8.43; from front leg to stack, 21.25; from combustion chamber to stack, 28.48.
CLASSIFICATION OF COALS.
CARBON-HYDROGEN RATIO IN AIR-DRIED COAL.
In the belief that coals of approximately the -same proportions of constituents, as shown by chemical analysis, should behave morenearly alike when subjected to similar treatment than coals in which the proportions of the constituents vary widely, the following attempts have been made to classify the coals burned by the boiler division, according to their performance under a boiler.
In accordance with the method proposed by Marius R. Campbell,a the ratios of carbon to hydrogen in the ultimate analyses of air- dried car samples were computed. One hundred and seventy-four tests on about 75 different coals were employed for this purpose, washed, dried, and briquetted coals being rejected. It was not expected that this classification (fig. 37) would be of as much service as one based on the same ratio of either coal as received or dry coal, since the amount of drying to which a sample is subjected is depend ent on the local conditions, which vary from day to day. The state ment just made seems to be borne out by the fact that the average
a Prof. Paper U. S. Geol. Survey No. 48,1906, pp. 156-173.

CLASSIFICATION OF COALS.'69
points from which the general efficiency curve (No. 1) is derived fall farther from such a curve than is the case with general curves derived from the ratio of carbon to hydrogen, based on either coal as received or dry coal.
The ratio of carbon to hydrogen should have been obtained from the ultimate analysis of the boiler-test sample after air drying, but these data were not available. The ratio used is calculated on the
/t>
M.
W
.z «! H «i» 3
CARBON-HYDROQCN RATIO IN A R-DRIC.D COAL.
110Jt.
FIG. 37. Coal classification based on carbon-hydrogen ratio from ultimate analysis of air-dried car samples as related to efficiency 72*, tests 120-401 (curve No. 1); per cent of rated capacity developed (curve No. 2); and efficiency 72*-at about rated capacity, tests 1-78 (curve No. 3). General curves, omitting tests of washed, dried, and briquetted coals.
air-dried coal of the car sample a fact which might account for some of the variations of some of the points from the curve.
The broken line, curve No. 2, is drawn through the average per cent ratings for all tests coming in each group. The per cent rating attained does not seem to influence the efficiency, as it does in other classifications which follow.
70 A. STUDY OF FOUR HUNDRED STEAMING TESTS.
Curve No. 3 shows the relations between carbon-hydrogen ratios on air-dried coal and efficiency from boiler tests conducted during 1904. The tests in which washed and briquetted coals were burned are omitted. It was decided to abandon this classification and to use the ratio of carbon to hydrogen of coal, as received, and of dry coal. The curves and conclusions on classifications based on carbon-hydrogen ratios of coal, as received, and of dry coal, were derived from approxi mately 250 boiler tests run in one series. The tests included raw, washed, briquetted, and a few mixed coals. The relative values of the classifications were based on the uniformity of the general effi ciency curves, efficiency here meaning the efficiency of the boiler on the combustible basis (the combustible consumed, as shown by proximate analysis, less the combustible lost through the grate, as determined by an analysis of the refuse). The item used for the efficiency is 72* of the A. S. M. E. code.
CARBON-HYDROGEN RATIO IN COAL AS RECEIVED.
The carbon-hydrogen ratios of fig. 38 were computed from the ulti mate analyses made by the chemical division on boiler-test samples. These ratios were divided into six groups, as follows: Group K, including all values up to 11.2; group L, from 11.2 to 12.5; group M, from 12.5 to 14.5; group N, from 14.5 to 15.5; group 0, from 15.5 to 17.0, and group P, all values over 17.0. The several items in each group were then averaged and curves plotted on the basis of (1) effi ciency 72*; (2) per cent of CO loss; (3) combustion-chamber tempera ture (by Wanner optical pyrometer); (4) per cent of rated capacity of boiler; (5) pounds of dry chimney gases per pound of "combustible' 7 (coal free from ash and moisture), and (6) B. t. u. per pound of dry coal.
A comparison of the averages just mentioned shows that no one item was maintained, even approximately, constant, so that what ever conclusions may be drawn therefrom must necessarily be con sidered anything but absolute. Particular mention should be made of the per cent of rated capacity attained in the trials, which, if maintained constant, might have aided materially in defining more closely the relative causes and effects as indicated by the other items, although it is believed that these items are as much dependent on the kind of coal as on the per cent of rated capacity attained.
The averages of all of the like items of each group are graphically represented on the accompanying charts (figs. 39-45), on which the ratio of carbon to hydrogen appears as an abscissa.
The curves of efficiency 72* in figs. 38 and 39 do not agree; but it is hardly to be expected that items should vary alike when tests are classified on such an illogical basis as the carbon-hydrogen ratio in coal as fired, inasmuch as the hydrogen of the free moisture is also included.

CLASSIFICATION OF COALS. 71
w- u It
UO
we£0 .60
AQ
AO
0
66
61
t>b
5
b*
93
9109
81
es2350
ZJOO
lisa1000
13100
13200
11100
IZZOO
21.0
tos20.0
19.5
~ -1
<
70-1
pja
itsft*
-Q
1^/
.4pi
^
/
~~
^
.
7"
.
-
63.15 6OB9-i^
X1
' -.
f.
^
y^
-<? fc.tM
ft *r
*o^
__.
s
*
..
X
...
*
X-
'
**
~~
^
X
"
^
L-
, »u
12
X
"'
*^-
^"
is*91 J4
49 Ai
<gJV
J>-
«.
^ a-i
a-:
.^
N
N
N
N
-"
a-^
a-J
0.-
n,
>̂
t
" .
b^
i^
"
f
"«v.
^^*
-,
^^.
H4 £91
^
19-. 15.pii
"***
t**1
?-
T.^
-o".X*
w
S
's,
s^
s ..
X
...
~~
-<
^<-IL30.feiOT
V
(10)'
1W
*
X
_
^^"
0) JC 61
1e
-(
nt.10
5.30-1
!>
*_
103 11.0 115 IZP 113 110 13.5 144 (4.5 ISO 1*5 Ifefl Its fW 115 |AO 183 K ,A» 1, .X M «±.N,4»0 JU P
CARBON-HYDROGEN RATIO IN COAL AS RECEJVE.O
FIG. 38. Coal classification based on carbon-hydrogen ratio as related to theoretical relative elTiciency of boiler as a heat absorber at various temperatures (curve No. 1); per cent of CO loss (curve No. 2); efficiency 72* (curve No. 3); per cent of rated capacity developed (curve No. 4); combustion-chamber temperature (°F.) (curve No. 5); B. t. u. per pound of dry coal (curve No. C); and pounds of dry chim ney gases per pound of "combustible" (curve No. 7). General curves, samples as received, tests 120-380.
The following list gives the coals appearing in each group and their respective carbon-hydrogen ratios:
Average carbon-hydrogen ratios determined from analysis of boiler-test samples of coal asfired, including moisture.
Group P (all values over 17.0):Arkansas No. 8 .............. 20. 32Maryland No. 1 ............. 19.13Maryland No. 1 (washed) .... 18.28Pennsylvania No. 8 ......... 18.02West Virginia No. 19......... 17.16
Group 0 (from 15.5 to 17.0):West Virginia No. 19......... 16. 93Arkansas No. 7 A ............ 16. 79West Virginia No. 17......... 16. 27West Virginia No. 17 (washed) 16.15
Group 0 (from 15.5'to 37.0) Continued. Virginia No. 3 ............... 16.02Pennsylvania No. 7 ......... 15. 65West Virginia No. 18......... 15. 63
Group N (from 14.5 to ]5.5):Virginia No. 3 ............... 15.46West Virginia No. 14......... 15.45Pennsylvania No. 4 ......... 15.27Pennsylvania No. 7 (washed). 15.10 Ohio No. 5 .................. 15.15Pennsylvania No. 6 ......... 15.10

A STUDY OF FOUR HUNDRED STEAMING TESTS.
Group N (from 14.5 to 15.5) Continued.West Virginia No. 13......... 15.04West Virginia No. 20......... 14. 97Virginia No. 4 ............... 14. 86West Virginia No. 15......... 14. 84Virginia No. 2 ............... 14. 83Tennessee No. 6 ............. 14. 78Kentucky No. 5 ............. 14. 77Pennsylvania No. 10 ........ 14. 74Pennsylvania No. 7 ......... 14. 72West Virginia No. 20 (washed) 14. 72 Tennessee No. 9 .............. 14. 70Pennsylvania No.-5 (washed). 14. 66West Virginia No. 21......... 14. 57
Group M (from 12.5 to 14.5):West Virginia No. 21......... 14.43Tennessee No. 9 ............. 14.40West Virginia No. 21 (washed). 14. 36Pennsylvania No. 5 ......... 14. 25Kentucky No. 1 C ........... 14.17Kentucky No. 6 ............. 14.16Virginia No. 1 B............. 14.14Ohio No. 9 A ............... 14.11Ohio No. 9 B (washed and
dried) .................... 13.98. Ohio No. 5 .................. 13. 89
Ohio No. 4 .................. 13. 89Ohio No. 4 (washed)......... 13. 76Tennessee No. 7 A-! ......... 13. 73Ohio No. 6 (washed) ......... 13. 73Tennessee No. 2 ............. 13.70
. Alabama No. 4 ..'............ 13. 63Tennessee No. 1............. 13. 62Ohio No. 6 ................... 13. 55Washington No. 2 ........... 13.38Tennessee No. 5 ............. 13.24Tennessee No. 4 ............. 13.04Tennessee No. 3 ............. 13.01Illinois No. 11 A ............ 12. 92Ohio No. 7 .................. 12.76Illinois No. 16 .............. 12.73Illinois No. 19 B ............ 12.73Ohio No. 9 B (washed)...... 12. 52
Group L (from 11.2 to 12.5):Kansas No. 6 ................ 12.41Ohio No. 3 (washed)......... 12. 33Ohio No. 9 B ............... 12. 31Illinois No. 13' (washed). .... 12.27Kentucky No. 7 ............. 12. 22Illinois No. 13 .............. 12. 22Illinois No. 19 A ............ 12.11Indiana No. 11 .............. 12.00Illinois No. 12 . . ............ 11. 95Ohio No. 8 ................ A 11. 91
Group L (from -11.2 to 12.5) Continued.Illinois No. 12 (washed)..... 11. 85Ohio No. 2 (washed) . -. ...... 11. 77Indiana No. 7 A ...... .'...... 11. 71Ohio No. 2 .................. 11. 62Kansas No. 6 (washed)....... 11. 61Indiana No. 8 ............... 11. 49Ohio No. 1.................. 11.47Indiana No. 7 B ............. 11.43Indiana No. 7 B (briquetted). 11. 38Ohio No. 1 (washed) . ....... 11. 38Illinois No. 22 A ............ 11. 35Indiana No. 5 ............... 11. 32Illinois No. 15 . . ............ 11. 25Indiana No. 6 ............... 11. 21
Group K (all values .up to 11.2):Indiana No. 6 (washed) ...... 11.18Indiana No. 8 (washed) ...... 11.13Indiana No. 5 ............... 11.12Illinois No. 15 (washed)..... 11. 07Illinois No. 22 A ............ 10. 98Illinois No. 9 B ............. 10. 95Illinois No. 24 B ............ 10. 92Illinois No. 7 D . ............ 10. 91Indiana No. 12 (washed) ..... 10. 87Indiana No. 10 (washed) ..... 10. 86Indiana No.. 9 A ............. 10. 84Illinois No. 14.............. 10. 83Indiana No. 9 B ............. 10. 80
' Indiana No. 10 ....... f...... 10. 79Wyoming No. 2 B ............ 10. 79Indiana No. 4 (washed) ...... 10. 75Illinois No. 18 .............. 10. 70Indiana No. 12 .............. 10. 68Missouri No. 6.............. 10. 67Illinois No. 22 A (washed).... 10.65Indiana No. 4 ............... 10. 52Illinois No. 25.............. 10.51Missouri No. 5 . .°............ 10. 4.7Illinois-No. 21. . .......'..... 10.46Illinois No. 26 .............. 10.43Indiana No. 3 ............... 10. 38Illinois No. 20 . . ............ 10.15Illinois No. 23 A (washed).... 10.10Illinois No. 14 (washed)..... 10.09Illinois No. 18 (washed)..... 10.03Illinois No. 20 (washed)..... 9. 96Mixed coal.................. 9.95Illinois No. 23 A ............ 9. 90Illinois No. 7 C (washed).... 9. 82Illinois No. 27. ............. 9,71Missouri No. 7 (washed)..... 9. 67Washington No. 1 B ......... 9. 61Wyoming No. 3 ............. 9. 44Wyoming No. 3 (washed) .... 8. 94

CLASSIFICATION OF COALS. 73
The curve drawn along the average-efficiency points on the chart is so uniform that the conclusion might easily be reached that a classi fication such as the ratio of carbon to hydrogen is of great value. If an individual group is selected there is no such close agreement, as is shown by the range of efficiencies noted at each point of the general- efficiency curve. The curve shows a gradual increase of efficiency as the ratio of carbon to hydrogen increases, becoming horizontal for the high ratios.
A comparison of the highest efficiencies of the groups shows a marked uniformity. The range of efficiencies in each group (not shown on the chart) decreases as the ratio of carbon to hydrogen increases, seeming to indicate that efficient burning of coals of a lower carbon-hydrogen ratio is a matter of much greater uncertainty than when the ratio is high.
The curve of per cent of CO loss indicates maximum incomplete combustion in the low-ratio groups, decreasing to nearly zero in the high-ratio groups. This is in accord with the statement made regard ing the uncertainty of burning coals of a low carbon-hydrogen ratio.
The B. t. u. curve, No. 6, rises as the carbon-hydrogen ratio increases.
A broken line connecting the averages of the per cent of rated capacity of each group is shown, curve No. 4. This line points out a wide variation in capacity attained. The figures given with each point on the general curve show a much wider range of the same item as between the different trials of each group than between groups. The variation of per cent of rating tended to remove the average effi ciency from a uniform efficiency curve; the average efficiency increased, in general, as the average per cent of rating decreased.
From the points showing combustion-chamber temperature we obtain a broken line which is very nearly parallel to the line of per cent of rated capacity, as on many other charts. The highest tem peratures were obtained in the middle groups, the lowest tempera tures in the highest groups.
The line representing the number of pounds of dry chimney gases per pound of combustible (curve No. 7) Can best be studied on the charts of the separate groups; on the general chart it is difficult to arrive at conclusions so far as this one. item is concerned.
Curve No. 1 in the chart is merely tentative and is put on to show relatively the theoretical efficiency of the boiler as an absorber of heat generated, the calculation being based on the theory, developed on pages 107-108, that the heat absorption is a function varying slightly with combustion-chamber temperature; for this purpose the temper atures used are those on the line of combustion-chamber temperatures. It will be noticed that the line of theoretical boiler efficiencies varies less than 2 per cent; it may be too high or too low at every point by 2 per cent, but it does show that in the lower groups the distance is

A STUDY OP FOUE HUNDBED STEAMING TESTS.
greater between this line and that of efficiency 72*. This fact seems to indicate that in the lower groups there was more incomplete combustion an indication which is verified by curve No. 2, giving per cent of CO loss. It is noteworthy that the best actual efficiencies 72* in all groups were about the same (a fact which is not shown on the chart), indicating that when enough is known about combustion and when special grates, stokers, furnaces, etc., are applied, it will
Z3W
ztoo1 100
900 >^ 1
\
*M
MX* ms 104.CARBOCW-IYDROSEN RATIO IN COM- A3 RKOVEO.
FIG. 39. Coal classification based on carbon-hydrogen ratio as related to per cent of CO loss (curve No. 1); efficiency 72* (curve No. 2); per cent of rated capacity developed (curve No. 3); combustion- chamber temperature (°F) (curve No. 4); and pounds of dry chimney gases per pound of ' 'combusti ble "(curve No. 5). Group K, all values up to 11.2, samples as fired.
be possible to burn very poor coals with nearly the same efficiencies as good ones.
In order to discover the variations within the individual groups three charts have been plotted involving the same items as shown on the general chart.
Since the general curve shows a gradual increase in efficiency with an increase of the ratio of carbon to hydrogen, one would naturally
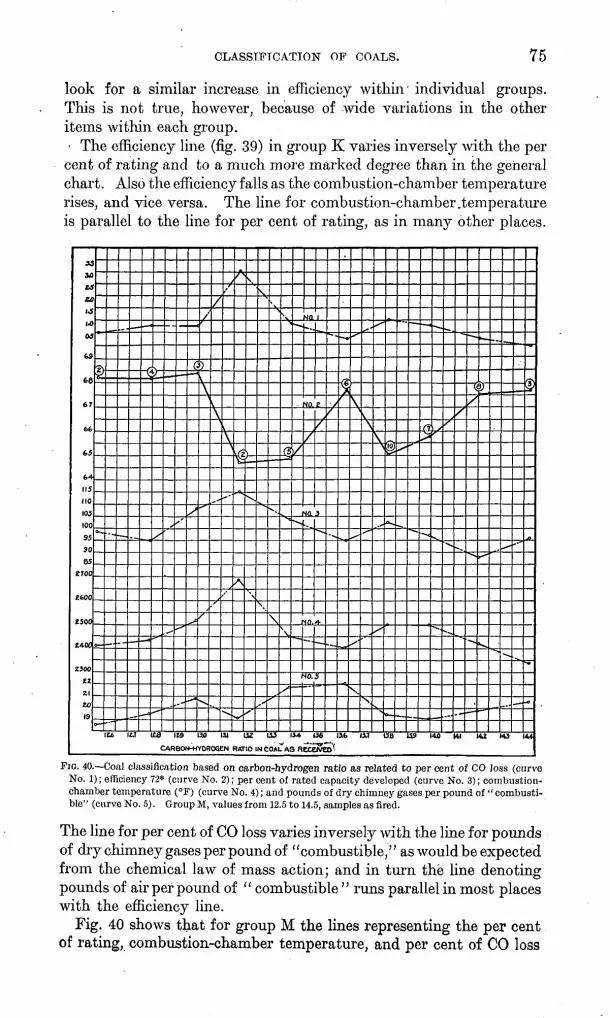
CLASSIFICATION OF COALS. 75
look for a similar increase in efficiency within' individual groups. This is not true, however, because of wide variations in the other items within each group.
The efficiency line (fig. 39) in group K varies inversely with the per cent of rating and to a much more marked degree than in the general chart. Also the efficiency falls as the combustion-chamber temperature rises, and vice versa. The line for combustion-chamber .temperature is parallel to the line for per cent of rating, as in many other places.
35
IS
tta
66
67
66
65
6-4
115
MO
105
100
95
90
85
£700
2600
Z500
240C
Z300
£2
21
20
19
o-~
_.
p.
.,
_
c
a
^^
/
^*
^
^,
,'
**
.-
^
r
_/
^
^
.
\\\
t/
^
/
\
,^
^
/
\
"
^
^
f
A
^
v
"V
\
x
^
^
\
_,x
^.,
\
\
(1
N
X
*^
X1
NO..
/
^*N
^
Lv
in.
NO.
.
/
,1^-
4
-*»
i
*
y^
-^
^.
~»
^'
^
Ss
^
x
X.
-
^^
*"
^
^"
\
.,
s
"
JX,
^
^*
-^
rrx
-*^
-^
~-
^
^
^
**«v
...
/
*^».
-^
c.
**>
^^,
»
^-^ .
2>IM
,^
^«
^
r=.
^
^
_.
^''"
^ "*
_--»
iu i2.i ita na tao m uz ii? 1*4. 136 tat 0.1 o.b us M.O MI MZ MJ 144CARBON-HYDROGEN RATIO INCOMES RECEIVED
FIG. 40. Coal classification based on carbon-hydrogen ratio as related to per cent of CO loss (curve No. 1); efficiency 72* (curve No. 2); per cent of rated capacity developed (curve No. 3); combustion- chamber temperature (°F) (curve No. 4); and pounds of dry chimney gases per pound of " combusti ble" (curve No. 5). G roup M, values from 12.5 to 14.5, samples as fired.
The line for per cent of CO loss varies inversely with the line for pounds of dry chimney gases per pound of "combustible," as would be expected from the chemical law of mass action; and in turn the line denoting pounds of air per pound of " combustible " runs parallel in most places with the efficiency line.
Fig. 40 shows that for group M the lines representing the per cent of rating, combustion-chamber temperature, and per cent of CO loss

76 A STUDY O.F FOUR HUNDRED STEAMING TESTS.
run parallel to one another and vary inversely with the line giving pounds of dry chimney gases per pound of combustible and also in a general way, inversely with the efficiency line; all of which interrela tions are much the same as in group K (fig. 39). Relations between variables are brought out very clearly in fig. 40. The general chart shows that group M was the one in which the highest combustion-
Itsuo.15
JC
15
am
use
not
10
69
66
61
66
105
100
95
39
85
eo2600
2500
Z400
Z300
ttoc1 100
toocZb
u **w
..!?
-t
/
f'
*
&
/
/
*».
f
S
(
/
/
...
»»
'*
)
\
\J
^J
-..
S S,
N
-"'
^
\
s,
""-
\
\
***
"^
-.
S
s
»_
vi
^*«
^
^
,
AV
»-
v
^^
.
i
--
^
NO.I
2rw
nn
(/
no**
X
*
1If?
*-
Vj
na 6V ^
..
***
**
-^^-
-.
-
"
*-»
""
-
».
««.
-"
''
**^,
--
*~~
...
_
~«.
^
-.
^M
--
._
"^
^
-^
*
©
>s=C
;
-
1I
* '
*,
i
. *
^
f
sw
-
T)
154 155 l%6 15.1 156 S3 IW» W IW I6J I6y»- IC£ It* 16.1 16.8 l& ITP
CARBON-HYDROGEN RAT O IN COAL AS RECEIVED
FIG. 41. Coal classification based on carbon-hydrogen ratio as related to per cent of CO loss (curve No. 1); ratio of hydrogen to available hydrogen (curve No. 2); efficiency 72* (curve No. 3); per cent of rated capacity developed (curve No. 4); combustion-chamber temperature (°F) (curve No. 5); and pounds of dry chimney gases per pound of " combustible" (curve No. 6). Group 0, values from 15.5 to 17.0, samples as fired.
chamber temperatures and the highest per cent of rating were obtained.
In group O (fig. 41) the lines of combustion-chamber temperature and per cent of rating are shown parallel with the efficiency line. The per cent of CO loss is small at all times in this group, so little effect could be expected from this cause. The additional curve showing the ratio of hydrogen to available hydrogen is parallel to

CLASSIFICATION OF COALS. 77
the efficiency line. The line for pounds of dry chimney gases, instead of being parallel with the efficiency line, as in other groups, varies inversely with that line, a variation that is concordant with the fact that the small CO loss indicates very little incomplete combustion.
CARBON-HYDKOGEN EATIO IN DKY COAL.
Another classification has been made (fig. 25, p. 37) by using the ratio of carbon to total hydrogen, as determined by the ultimate anal ysis of dry coal. By this method that portion of the hydrogen which appears in the moisture determined by the proximate analyses is eliminated, and consequently there should result a more nearly con stant carbon-hydrogen ratio for any given coal. The ratios were divided into seven groups, as follows: Group A, including all values up to 14.5; group B, from 14.5 to 15.0; group C, from 15.0 to 15.5; group D, from 15.5 to 16.0; group E, from 16.0 to 16.5; group X, from 16.5 to 17.5; group Y, all values of 17.5 and over.
As in the previous classification (p. 70) all the values in each group were averaged and each average was plotted with its corresponding average of carbon-hydrogen ratio. The following list shows the coals in each group and their corresponding carbon-hydrogen ratios:
Average carbons-hydrogen ratios determined from ultimate analysis of dry coal.
Group Y (all values of 17.5 and over): Arkansas No. 8 .............. 22. 60.Maryland No. 1............... 20.16Maryland No. 1 (washed)..... 20.14Arkansas No. 7 A ............ 19. 50Pennsylvania No. 8........... 19.37West Virginia No. 19......... 18. 23West Virginia No. 17......... 17. 92West Virginia No. 17 (washed)! 17.91
Group X (from 16.5 to 17.5):Pennsylvania No. 7........... 17.04Pennsylvania No. 7 (washed). 17.03 West Virginia No. 18......... 16. 71Illinois No. 19 A.............. 16. 67Virginia No. 3 ............... 16. 64Kentucky No. 5.............. 16. 56
Group E (from 16 to 16.5):West Virginia No. 14......... 16.45West Virginia No. 13......... 16.44Ohio No. 9 A.................. 16.38Illinois No. 19 B.............. 16.21Virginia No. 4....:.........! 16.13Pennsylvania No. 4........... 16.11Pennsylvania No. 6........... 16.07Tennessee No. 9.............. 16.01
Group D (from 15.5 to 16.0):Virginia No. 2 ............... 15.96Tennessee No. 6.............. 15. 90
Group D (from 15.5 to 16.0) Continued. Illinois No. 16................ 15.85West Virginia No. 20......... 15. 85West Virginia No. 20 (washed). 15.81 Indiana No. 11..:........... 15. 78Virginia No. 1 B............. 15. 73Kentucky No. 6.............. 15. 72West Virginia No. 21......... 15. 71West Virginia No. 21 (washed). 15. 71 Pennsylvania No. 10.......... 15. 65Pennsylvania No. 5........... 15. 64Pennsylvania No. 5 (washed). 15. 63 West Virginia No. 15......... 15. 58Illinois No. 11 A.............. 15.57Kentucky No. 1 C............. 15. 54
Group C (from 15 to 15.5):Illinois No: 13................ 15.46Illinois No. 13 (washed)...... 15.43Ohio No. 5................... 15.37Alabama No. 4................ 15. 29Kentucky No. 7.............. 15.29Tennessee No. 2.............. 15.26Kansas No. 6................ 15. 21Kansas No. 6 (washed)....... 15. 20Tennessee No. 5......'........ 15.17Ohio No. 3 (washed).....:.... 15.09
- Ohio No. 4................... 15.08Ohio No. 4 (washed).......... 15.07

78 A STUDY OF FOUR HUNDRED STEAMING TESTS.
Group C (from 15 to 15.5) Continued. Tennessee No. 1.............. 15.04Illinois No. 21................ 15.03Indiana No. 4 ............... 15.01Indiana No. 4 (washed)...... 15.01Illinois No. 12................ 15.00
Group B (from 14.5 to 15.0):Indiana No. 4 ............... 14. 99Illinois No. 12................ 14.97Illinois No. 12 (washed)....... 14. 94Tennessee No. 4.............. 14. 94Ohio No. 9 B (washed)........ 14. 94Ohio No. 9B...............:. 14.93Mixed coal.................. 14. 92Illinois No. 26................ 14.86Illinois No. 22 A.............. 14. 77Tennessee No. 3.............. 14.77Tennessee No. 7 A............ 14. 77Illinois No. 22 A (washed).... 14. 76Ohio No. 7.................... 14.76Ohio No. 6................... 14.74Ohio No. 6 (washed).......... 14. 71Missouri No. 6.................. 14. 70Illinois No. 20................ 14. 63Illinois No. 20 (washed)....... 14.61Indiana No. 5 ............... 14.59Illinois No. 24 B.............. 14. 56Missouri No. 7 (washed)....... 14.51
Group A (all values up to 14.5): Ohio No. 9 B (washed and
dried).-................... 14.48Indiana No. 8 (washed)...... 14.48Indiana No. 8............... 14.46Indiana No. 12.............. 14.46Indiana No. 12 (washed)..... 14.45
Group A (all values up to 14.5) Cont'd. Illinois No. 14................ 14.45Washington No. 2............. 14.45Mixed coal.................. 14.43Indiana No. 9 A ............. 14.42Ohio No. 8.............'...... 14.42Illinois No. 14 (washed)....... 14.42Illinois No. 15 (washed)....... 14.40Indiana No. 7 B (briq.)...... 14.40Illinois No. 15................ 14. 39Indiana No. 7 B ............. 14.36Missouri No. 5................ 14.34Ohio No. 2................... 14.32Ohio No. 2 (washed).......... 14. 30Illinois No. 27................ 14.30Indiana No. 6............... 14.30Indiana No. 6 (washed)...... 14. 29Indiana No. 7 A ............. 14.18Illinois No. 7 C (washed)...... 14.14Illinois No. 7 D.............. 14.11Indiana No. 3 ............... 14.01Illinois No. 9 B............... 13.96Indiana No. 9 B ............. 13. 95Illinois No. 23 A (washed).... 13. 93Illinois No. 23 A.............. 13.92Washington No. 1 B........... 13. 85Illinois No. 25................ 13. 81Ohio No. 1 (washed).......... 13. 75Ohio No. 1................... 13.73Illinois No. 18 (washed)....... 13. 71Wyoming No. 2 B............. 13.71Wyoming No. 3............... 13. 69Wyoming No. 3 (washed)..... 13. 68
. Illinois No. 18................ 13.67Indiana No. 10 (washed)..... 13. 61Indiana No. 10.............. 13.58
There is no particular difference in the general curves as derived from the two classifications based on dry coal and coal as received. To the general chart (p. 37) two more curves have been added one for average diameter of coal (No. 7), and one for per cent of clinker in refuse (No. 8). The curve of average diameter of coal as fired shows that as the ratios of carbon to hydrogen increase there is a gradual reduction in average diameter. Nearly all the coals used in the tests passed through the same crusher. It is not to be assumed that the ratio of carbon to hydrogen influences the ease with which the coal breaks, for this can be accounted for in other ways. The coals of low carbon-hydrogen ratio give the highest per cent of clinker in refuse.
Curve No. 1, theoretical efficiency of boiler as a heat absorber at temperature below, is relative only; it is probably as a whole either too high or too low, and the various points of it may be high or low
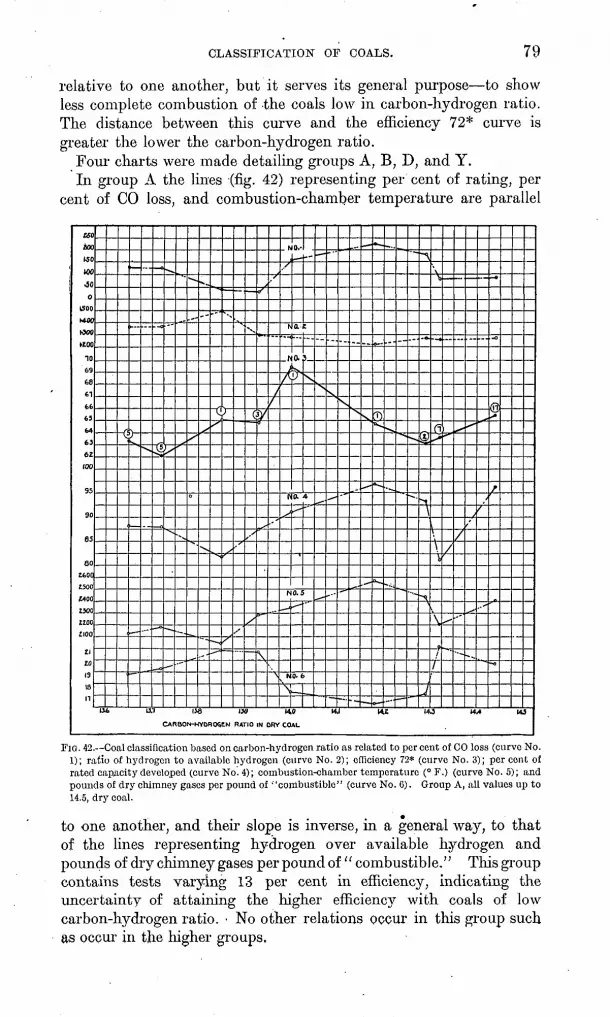
CLASSIFICATION OF COALS. 79
relative to one another, but it serves its general purpose to show less complete combustion of -the coals low in carbon-hydrogen ratio. The distance between this curve and the efficiency 72* curve is greater the lower the carbon-hydrogen ratio.
Four charts were made detailing groups A, B, D, and Y.In group A the lines (fig. 42) representing per cent of rating, per
cent of CO loss, and combustion-chamber temperature are parallel
MO
1500
hWO
(000
«00
10 .NO. 3.
2
MOO
«00
(ZOO
2100
£1
14,1 I4Z I4J 14,4 MJ
CARBOKl-HYDROCCN RATIO IN ORY COAL
I'lG. 42. Coal classification based on carbon-hydrogen ratio as related to per cent of CO loss (curve No. 1); ratio of hydrogen to available hydrogen (curve No. 2); efficiency 72* (curve No. 3); per cent of rated capacity developed (curve No. 4); combustion-chamber temperature (° F.) (curve No. 5); and pounds of dry chimney gases per pound of "combustible" (curve No. 6). Group A, all values up to 14.5, dry coal.
to one another, and their slope is inverse, in a general way, to that of the lines representing hydrogen over available hydrogen and pounds of dry chimney gases per pound of " combustible." This group contains tests varying 13 per cent in efficiency, indicating the uncertainty of attaining the higher efficiency with coals of low carbon-hydrogen ratio. No other relations occur in this group such as occur in the higher groups.

80 A STUDY OF FOUR HUNDRED STEAMING TESTS.
Group B gives very marked relations. The lines (fig. 43) repre senting the per cent of rating, combustion-chamber temperature, per cent of CO loss, efficiency 72*, and per cent of clinker in refuse run in the same general direction and the values vary inversely with the pounds of dry chimney gases per pound of "combustible" and hydrogen over available hydrogen. Why the line for efficiency 7.2* should parallel the line of CO loss is not clear, especially as the latter
1.2.0
LIO
MO
90
30
.10
jbO
SO
1300
U15
HIS
61
Ik
63
64
100
95
90
61
titOO
tsooMOO
1300HOT
Z«
CM)
tos ;ooJO
30
*v
^
,2
o.
o*
0.
\
-
\
_.
-
.-
"^
X 1
\
--
x
s^
^^
^1
J*-
a*.
'
--.
_..
t/Ui M&O 14
. CARBON-HYDI
,-
.^
««
X
.^
s'
~-
*~
^
^
-
-~
^
~^
1^
" "
X
*^
^
"s^
~~
^^
NO. 1
s
N-.
\
0..-'
^S.
N
r^
»J
'x
"'
)
^
a 4X,
0.
">,
a-="0.
-»
b
v
«^
.
.-
^
^
X,
-
^
v
--
X
^
s
,.
^
^.
^,
\
-'
.^
'N,
("
x.
^0
**»
^o
x
"
^
r
^
x
"
/
, '
.--
^
-.
f
s
' "
._
/
'
,..
x
/
.X
.-
/
_-.
...
/'
--
A
X1
_^
D"
A5 I4>10 1*15 MOO (485 M90 l*3i
FfOGCN RATIO IN CflY COAL
FIG. 43. Coal classification based on carbon-hydrogen ratio as related to percent of CO loss (curve No. 1); ratio of hydrogen to available hydrogen (curve No. 2); efficiency 72* (curve No. 3); per cent of rated capacity developed (curve No. 4); combustion-chamber temperature (° F.) (curve No. 5); pounds of dry chimney gases per pound of "combustible" (curve No. 6); and per cent of clinker in refuse (curve No. 7). Group B, values from 14.5 to 15.0, dry coal.
is high and the combustion-chamber temperature varies but little; however, not many .tests are considered.
In group D (fig. 44) the lines representing the per cent of rating, combustion-chamber temperature, per cent of CO loss, and per cent of clinker in refuse are parallel to one another, and for the most part
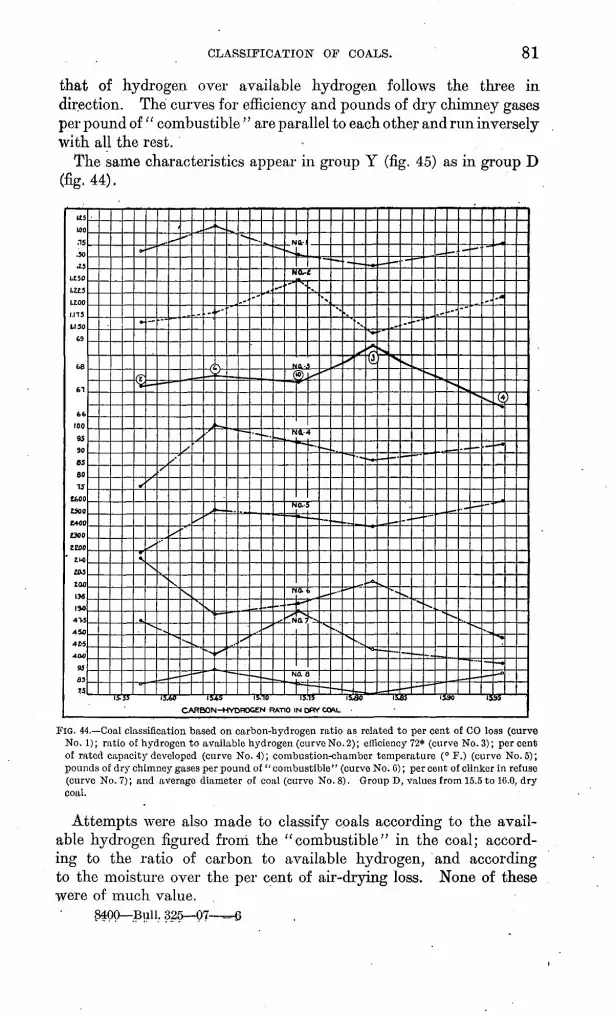
CLASSIFICATION OF COALS. 81
that of hydrogen over available hydrogen follows the three in direction. The curves for efficiency and pounds of dry chimney gases per pound of " combustible " are parallel to each other and run inversely with all the rest.
The same characteristics appear in group Y (fig. 45) as in group D (fig. 44).
FIG. 44. Coal classification based on carbon-hydrogen ratio as related to per cent of CO loss (curve No. 1); ratio of hydrogen to available hydrogen (curve No. 2); efficiency 72* (curve No. 3); per cent of rated capacity developed (curve No. 4); combustion-chamber temperature (° F.) (curve No. 5); pounds of dry chimney gases per pound of" combustible" (curve No. 6); per cent of clinker in refuse (curve No. 7); and average diameter of coal (curve No. 8). Group D, values from 15.5 to 16.0, dry coal.
Attempts were also made to classify coals according to the avail able hydrogen figured froni the "combustible" in the coal; accord ing to the ratio of carbon to available hydrogen, and according to the moisture over the per cent of air-drying loss. None of these were of much value.
3400 Bull. 325 07 6

82 A STUDY OF FOUR HUNDRED STEAMING TESTS.
CARBON-HYDROGEN RATIO IN COAL AS FIRED AS AFFECTING EFFICIENCY 72*.
Fig. 46 shows the effect of the carbon-hydrogen ratio of coal as received (fired) on efficiency 72* for each of three capacity groups. The curves determined by plotting efficiency 72* with carbon-hydro gen ratio for a nearly constant per cent of rating are very uniform.
CARBON-HYDROGEN RATIO IN DRY COAL
FIG. 45. Coal classification based on carbon-hydrogen ratio as related to per cent of CO loss (curve No. 1); ratio of hydrogen to available hydrogen (curve No. 2); efficiency 72* (curve No. 3); per cent of rated capacity developed (curve No. 4); combustion-chamber temperature (° F.) (curve No. 5); and pounds of dry chimney gases per pound of "combustible" (curve No. 6). Group Y, values of 17.5 and over, dry coal.
Three curves were plotted, Nos. 1, 2, and 3, at capacities of 95 to 105, 85 to 95, and 75 to 85, respectively. The efficiency 72* range on any one curve decreases as the per cent of rated capacity decreases. A probable explanation of this chart is that, with the low carbon- hydrogen ratios, the efficient burning of coal is rather uncertain. As the capacity is increased the combustion-chamber temperature is raised; therefore the high-rating curves are the high-temperature curves. This relation probably has considerable to do with the

CLASSIFICATION OF COALS. 83
efficiency ranges, on the three curves. It is also evident from this chart that the high capacities were obtained with the coals of low and medium carbon-hydrogen ratios.
£^ ^
= 5*
Sfft
W^L
S?
/
CARBON-HYDROGEN RATIO IN CC*L A3 RC.CCIVCO.
FIG. 46. Coal classification based on per cent of rating. Efficiency curves: No. 1, from 95 to 105 per cent; No. 2, from 85 to 95 per cent; No. 3, from 75 to 85 percent.
RELATION OF RATIO OF CARBON TO AVAILABLE HYDROGEN AND OF PER CENT OF AVAILABLE HYDROGEN TO EFFICIENCY 72*.
Fig. 47 is a graphic representation of efficiency 72* on the basis of ratio of carbon to available hydrogen. As this ratio increases there is a considerable increase in efficiency 72* ; but the curve is very irregular. Curves Nos. 1 and 2 are similar, but are from two differ ent series of tests. Curve No. 3 is a representation of efficiency 72* on an available hydrogen basis. The efficiency varies but little over the entire range of available hydrogen ratio.
The subjoined table shows two classifications based on the ratio of per cent of "volatile carbon"" to per cent of total carbon. The
oFor definition of "volatile carbon" see glossary (p. 183). For information on the " volatile car bon" of coals see Parr, S. W., Bull. Illinois Geol. Survey No. 3, Urbana, 111.

84 A STUDY OP FOUR HUNDRED STEAMING TESTS.
first (column 1) gives average efficiency 72* for .average ratio of volatile carbon to total carbon values, showing that for the low ratio values we have the high efficiency 72* values and vice versa. There is, however, as the chart (fig. 48) shows, no uniformity of drop in efficiency as the value of the ratio increases. The second classi fication (columns 2-7) gives the values of average efficiency 72*
fix
bhC
6*6
ttO
6*5
MO
6SO
645
MO
ni s
m
.£1
&
(&/
Qeaob-
b
&.NO.-3.
liblA -&
Z
430 A50
FIG. 47. General curves showing classification of tests: No. 1 (tests 120-380) and No. 2 (tests 1-78), based on ratio of carbon to available hydrogen; No. 3 (tests 120-380), based on available hydrogen.
for the average values of the volatile carbon to total carbon, group ing them according to the number of B. t. u. supposedly evolved per square foot of grate surface per hour, and shows the same gen eral relations as the preceding classification. The explanation may be that coals high in the ratio of volatile carbon to total carbon are harder to burn than those in which that ratio is low.
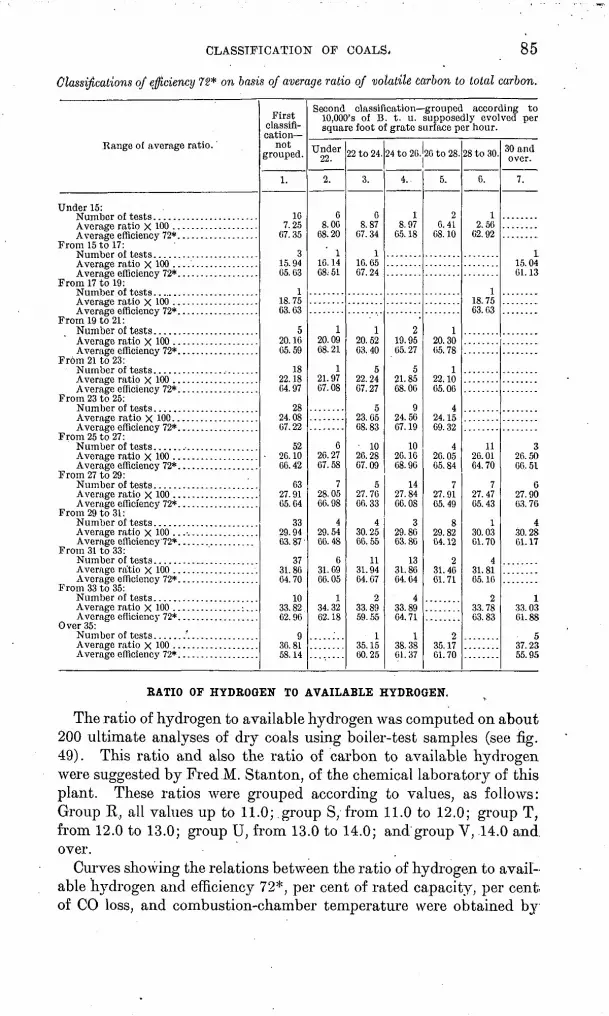
CLASSIFICATION OF COALS- 85
Classifications of efficiency 72* on basis of average ratio of volatile carbon to total carbon.
Range of average ratio. '
Under 15:
From 15 to 17:
Averase efficiency 72*From 17 to 19:
From 19 to 21: Number of tests. ......................
From 21 to 23:
From 23 to 25:
From 25 to 27: Number of tests........ ......... .Average ratio X 100 ...................
From 27 to 29:
Average ratio X 100 ............... . .Average efficiency 72*. ............... .
From 29 to 31: Number of tests ............. .
From 31 to 33: Number of tests ................. .Average ratio X 100 ........... .Average efficiency 72*.............. . .
From 33 to 35: Number of tests. .............. .Average ratio X 100 ............... : ...Average efficiency 72*. ......... .
Over 35:
Average ratio X 100 ................... Average efficiency 72*. .................
First classifi cation
not grouped.
1.
10 7.25
C7. 35
3 15.94 05. G3
1 18.75 03. C3
520.10 05. 59
18 22.18 04.97
28 24.0807.22
52 20. 10
00.42
03 27.91 05.04
33 29.94 03. 87 '
37 31.86 04.70
10 33.82 02.90
9 30.81 58.14
Second classification grouped according to 10,000's of B. t. u. supposedly evolved per square foot of grate surface per hour.
Under22.
2.
6 8.00
08.20
1 10.14 08.51
1 20.09 08.21
1 21.97 07.08
6 20.27 07.58
7 28.05 60.98
4 29.54 00.48
6 31.09 00. 05
1 34.3202.18
22 to 24.
3.
0 8.87
67.34
1 10.65 67.24
1 20.52 03.40
522.24 07.27
5 23.05 08.83
10 20.28 07.09
5 27.70 60. 33
4 30.25 06.55
11 31.94 04.07
2 33.89 59.55
1 35.15 00.25
24 to 26.
4.
18.97
05.18
2 19.95 05.27
5 21.85 08.00
9 24.50 07.19
10 20.16 68.96
14 27.84 00.08
329.86 63.86
13 31.86 04.64
4 33.89 64.71
1 38.38 61.37
26 to 28.
5.
2 6. 41
68. 1.0
1 20.30 65. 78
1 22.10 05. 00
4 24.15 09.32
4 20. 05 05.84
7 27.91 65.49
8 29.82 04.12
2 31.40 61.71
2 35.17 61.70
28 to 30.
0.
1 2.50
62.92
118. 7563. 03
11 26.01 64.70
7 27.47 65.43
1 30. 03 01.70
4 31.81 65.10
2 33.78 63.83
30 and over.
7.
1. 15.04 61. 13
320. 50 00, 51
0 27.90 03. 76
4 30. 28 01. 17
133.03 01.88
5 37.23 55.95
RATIO OF HYDROGEN TO AVAILABLE HYDROGEN.
The ratio of hydrogen to available hydrogen was computed on about 200 ultimate analyses of dry coals using boiler-test samples (see fig. 49). This ratio and also the ratio of carbon to available hydrogen were suggested by Fred M. Stanton, of the chemical laboratory of this plant. These ratios were grouped according to values, as follows: Group R, all values up to 11.0; .group S, from 11.0 to 12.0; group T, from 12.0 to 13.0; group U, from 13.0 to 14.0; and group V, 14.0 and over.
Curves showing the relations between the ratio of hydrogen to avail able hydrogen and efficiency 72*, per cent of rated capacity, per cent of CO loss, and combustion-chamber temperature were obtained by

86 A STUDY OF FOUR HUNDRED STEAMING TESTS.
averaging the total number of values for each of these ratio groups and plotting this average against the average of the ratios for the cor responding groups. The resulting efficiency line shows a gradual fall with an increase of the ratio of hydrogen to available hydrogen. The per cent of CO loss shows a gradual increase in value. The lines for per cent of rated capacity and combustion-chamber temperature are parallel and have maximum points where the ratio of hydrogen to available hydrogen has a value of about 1.25, this being the middle of the values for ratio of hydrogen to available hydrogen. The efficiency seems to be independent of both per cent of rating attained arid com bustion-chamber temperature. The range of efficiency for each group is shown by the figures near each point of the efficiency line. The range decreases, as in the other classifications, as the region of better coals is approached; likewise the best tests of all groups are about equally good.
RATIO OF VOLATILE CARBON IN COMBUSTIBLE TO TOTAL CARBON IN COMBUSTIBLE
FIG. 48. Eelation between the ratio of volatile carbon to total carbon and efficiency 72*; tests 120-400.
Classifications have also been made on the following bases:Per cent of sulphur from ultimate analysis of dry coal. (See fig. 28, p. 43.) Per cent of ash in coal as fired. (See fig. 27, p. 41.) Per cent of volatile matter in the "combustible." (See fig. 50, p. 89.) Per cent of "fixed carbon," proximate analysis of coal as fired. (See fig. 51, p. 91.) Per cent of free moisture, proximate analysis of coal as fired. (See fig. 22, p. 33.)
. Per cent of ash, ultimate analysis of dry coal. (See fig. 26, p. 40.) Per cent of oxygen in "combustible." (See"fig. 52, p. 92.) B. t. u. per pound of dry coal. (See fig. 53, p. 93.)
A study of the classifications of the ratios of carbon to hydrogen and hydrogen to available hydrogen and of single items from the proximate analysis of coal as fired and also the ultimate analysis of dry coal reveals the fact that while the points determining the curves
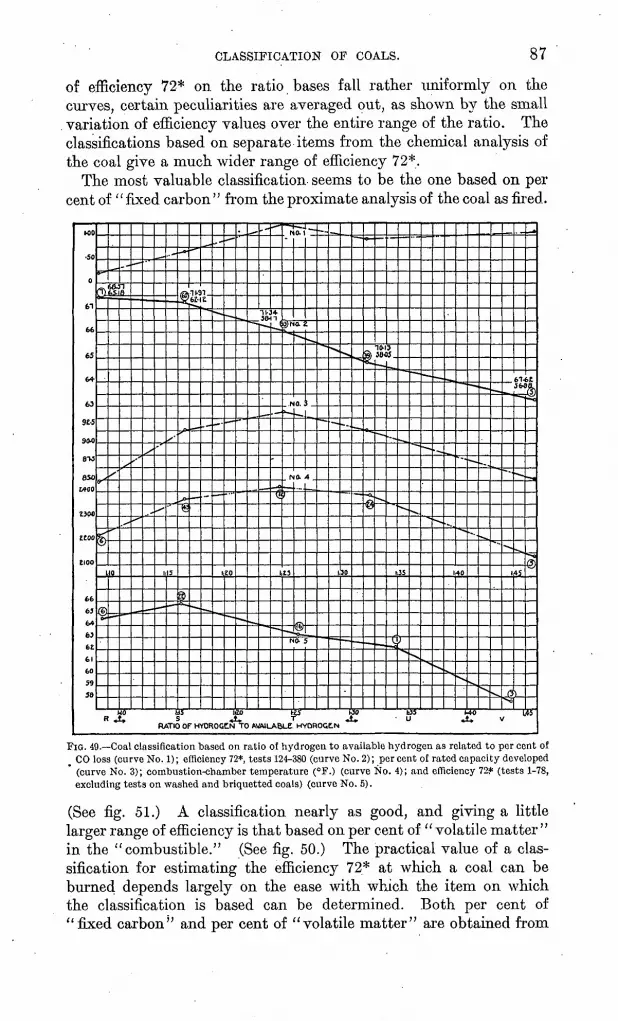
CLASSIFICATION OF COALS. 87
of efficiency 72* on the ratio bases fall rather uniformly on the curves, certain peculiarities are averaged out, as shown by the small variation of efficiency values over the entire range of the ratio. The classifications based on separate items from the chemical analysis of the coal give a much wider range of efficiency 72*.
The most valuable classification seems to be the one based on per cent of "fixed carbon" from the proximate analysis of the coal as fired.
( yna. z
63
92-5
9OO
BV
850
WOO
Z300
ItOO
EIOO
RATIO OF HYOROGCN TO W/MLABLE HYDBOGtN
FIG. 49. Coal classification based on ratio of hydrogen to available hydrogen as related to per cent of CO loss (curve No. 1); efficiency 72*, tests 124-380 (curve No. 2); per cent of rated capacity developed (curve No. 3); combustion-chamber temperature (°F.) (curve No. 4); and efficiency 72-1= (tests 1-78, excluding tests on washed and briquetted coals) (curve No. 5).
(See fig. 51.) A classification nearly as good, and giving a little larger range of efficiency is that based 011 per cent of " volatile matter " in the " combustible." (See fig. 50.) The practical value of a clas sification for estimating the efficiency 72* at which a coal can be burned depends largely on the ease with which the item on which the classification is based can be determined. Both per cent of "fixed carbon" and per cent of "volatile matter" are obtained from
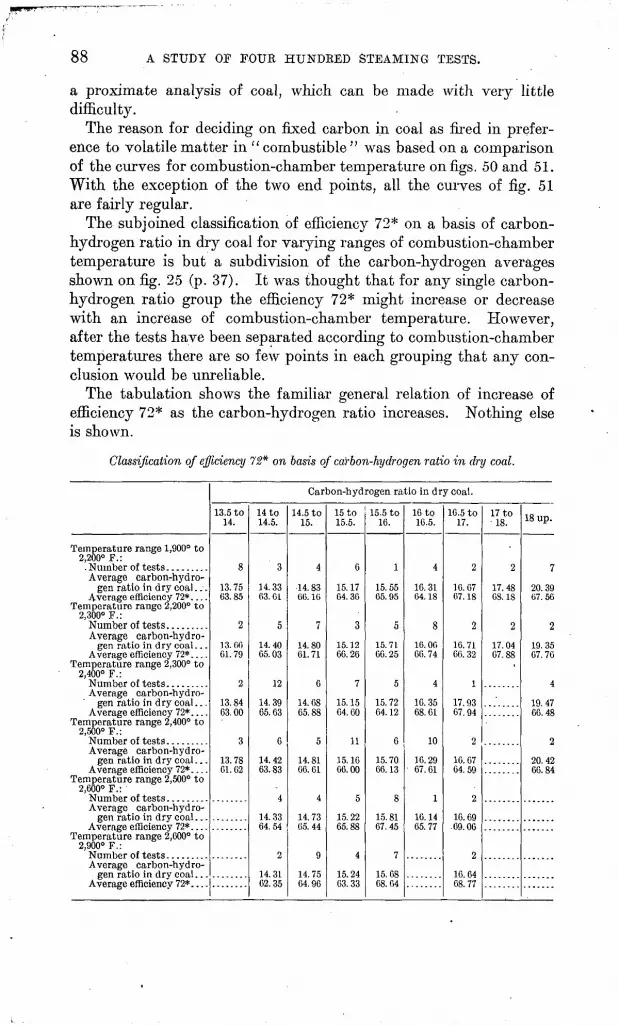
A STUDY OF FOUR HUNDRED STEAMING TESTS.
a proximate analysis of coal, which can be made with very little difficulty.
The reason for deciding on fixed carbon in coal as fired in prefer ence to volatile matter in " combustible " was based on a comparison of the curves for combustion-chamber temperature on figs. 50 and 51. With the exception of the two end points, all the curves of fig. 51 are fairly regular.
The subjoined classification of efficiency 72* on a basis of carbon- hydrogen ratio in dry coal for varying ranges of combustion-chamber temperature is but a subdivision of the carbon-hydrogen averages shown on fig. 25 (p. 37). It was thought that for any single carbon- hydrogen ratio group the efficiency 72* might increase or decrease with an increase of combustion-chamber temperature. However, after the tests have been separated according to combustion-chamber temperatures there are so few points in each grouping that any con clusion would be unreliable.
The tabulation shows the familiar general relation of increase of efficiency 72* as the carbon-hydrogen ratio increases. Nothing else is shown.
Classification of efficiency 72* on basis of carbon-hydrogen ratio in dry coal.
Temperature range 1,900° to 2,200° F.:
Average carbon-hydro gen ratio in dry coal .
Average efficiency 72*. . . . Temperature range 2,200° to
2,300° F.:
Average carbon-hydro gen ratio in dry coal . . .
Average efficiency 72*. . . . Temperature range 2,300° to
2,400° F.:
Average carbon-hydro gen ratio in dry coal . . .
Average efficiency 72*. ... Temperature range 2,400° to
2,500° F.:
Average carbon-hydro gen ratio in dry coal . . .
Average efficiency 72*. . . . Temperature range 2,500° to
2,600° F.:
Average carbon-hyd ro-
Temperature range 2,600° to 2,900° F.:
Average carbon-hyd ro-
Carbon-hydrogen ratio in dry coal.
13.5 to 14.
8
13.75 63.85
2
13. 60 61.79
2
13.84 63.00
3
13.78 61.62
14 to 14.5.
3
14.33 63. Cl
5
14.40 65.03
12
14. 39 65.63
6
14.42 63.83
4
14.33 64.54
2
14.31 62.35
14.5 to 15.
4
14.83 66.16
7
14.80 61.71
6
14. 68 65.88
5
14.81 66.61
4
14.73 65.44
9
14.75 64.96
15 to 15.5.
6
15.17 64.36
3
15.12 66.26
7
15.15 64. 60
11
15.16 66.00
5
15.22 65.88
4
15.24 63.33
15-5 to 16.
1
15.55 65.95
5
15.71 66.25
5
15.72 64. 12
6
15.70 66.13
8
15.81 67.45
7
15.68 68. 64
16 to 16.5.
4
16.31 64.18
8
16.06 66. 74
4
16.35 68.61
10
16.29 67.61
1
16.1465.77
16.5 to 17.
2
16.67 67. 18
2
16.71 66.32
1
17.93 67.94
2
16.67 64.59
2
16.69 .69.06
2
16.6468. 77
17 to 18.
2
17.48 OS. 18
2
17. 0467.88
18 up.
7
20.39 07.56
2
19.3567.76
4
19.47 66.48
2
20.42 66.84
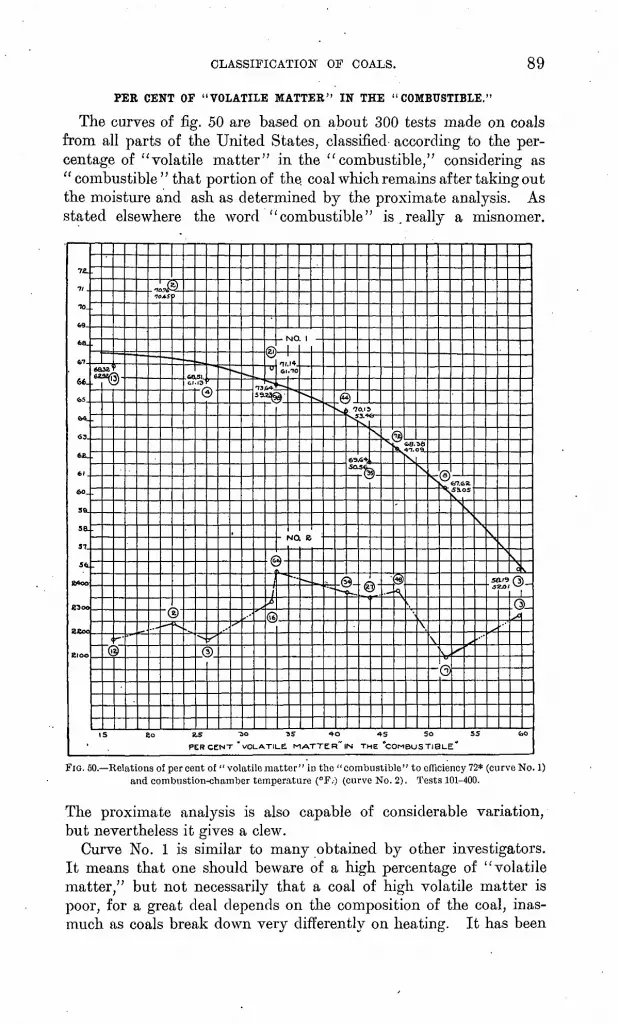
CLASSIFICATION OF COALS. 89
PER CENT OF "VOLATILE MATTER" IN THE "COMBUSTIBLE."
The curves of fig. 50 are based on about 300 tests made on coals from all parts of the United States, classified according to the per centage of "volatile matter" in the " combustible," considering as " combustible " that portion of the coal which remains after taking out the moisture and ash as determined by the proximate analysis. As stated elsewhere the word "combustible" is.really a misnomer.
FIG. 50. Relations of percent of "volatile matter" in the "combustible" to efficiency 72* (curve No. 1) and combustion-chamber temperature (°F.-) (curve No. 2). Tests 101-400.
The proximate analysis is also capable of considerable variation, but nevertheless it gives a clew.
Curve No. 1 is similar to many obtained by other investigators. It means that one should beware of a high percentage of " volatile matter," but not necessarily that a coal of high volatile matter is poor, for a great deal depends on the composition of the coal, inas much as coals break down very differently on heating. It has been

90 A STUDY OP FOUR HUNDRED STEAMING TESTS.
noted that, in general, the coals of high volatile matter have some other undesirable features, such as high ash content. The most important thing to emphasize is that even with a good furnace the coals high in volatile matter are at a slight disadvantage.
Curve No. 2 shows that the combustion-chamber temperature rises with the volatile matter of coal up to about 38 per cent and then drops. The rise of the temperature is due to the fact that the volatile matter of the coal is driven off the fuel bed and burns in the combus tion chamber, so that the temperature of the gases of combustion is measured before the heat is dissipated from them. The rise is also due to the increased rate of combustion. As the volatile matter increases the coal burns more rapidly and less air is used to burn 1 -pound of combustible. Beyond 38 per cent of volatile matter the coals become high in ash and moisture; in fact all the lignites are classed among the coals at the right-hand end. Both the ash and moisture reduce the combustion-chamber temperature. The high ash causes a slower rate of combustion and consequently more air is used per pound of combustible. The moisture lowers the tempera ture directly by its high specific heat. Work on the constitution of the cellulose derivatives of coals, now being prosecuted at this plant and at several other places, should give some valuable information on such practical questions as these. The customary "proximate analysis" is only an empirical method and can be expected to give nothing more than clews; much more is to be expected from ultimate analyses.
As in all other curves of this bulletin the small numbers, by the points, indicate the number of tests and the four-place numbers indi cate the highest and lowest efficiencies of each group.
FIXED CARBON (PROXIMATE ANALYSIS).
The chart shown in fig. 51 (p. 91) is one of a series based on the "proximate analysis" of "coal as fired." It is realized that such an analysis is purely empirical and capable of giving results varying considerably; nevertheless it is of some value.
Curve No. 1 shows a general rise of efficiency up.to a "fixed car bon" content of 60 per cent and perhaps an inclination to fall off past that point. This 60 per cent point is roughly the place of maximum B. t. u. value per pound of moist coal. The numbers inclosed in circles show the number of tests falling in each group.
Curve No. 2, per cent of rated capacity developed, is practically uninfluenced.
Curve No. 3, combustion-chamber temperature, shows a general tendency to rise and has a hump in the middle. This is perhaps explained by the fact that the coals low in fixed carbon are of poor grade high in ash and moisture and for that reason it is difficult

CLASSIFICATION OF COALS. 91
to get a hot fire with these coals. With coals high in fixed carbon nearly all of the combustion takes place in the fuel bed, so that the gases have cooled considerably by the time they reach the rear of the furnace. These coals also burn slowly and therefore require more air for combustion. The coals of moderate fixed carbon give a long, hot, luminous flame.
It is stated elsewhere in this bulletin that the capacity is a function
ea67
66
65
C4.
61
60S9
sa100
90
as 80
SEOO
B4OO
£100
XIOO
625
605
ses
S«S
545
tA
Z?
22
aiza
. 19
10
91
90
69
60
a^
fi
o
0
^
\
\
^
S,.
X
N
s
/
\
^v
*-
v
/
*
S
\
^
\
/
.
/
(k̂
ff
f>*.
d
*
s'
'
/'
.(9
/
/
s
^c
^
f
/
/
*.
\
'o/
0)
x>-
fr
ff
\t~
^
< '
..
N>
-*"
a
15J **
a.
a;
a^
Q^^
*
a
is
k>§
XX.
fr-
-
V
""^
y
x
^.
_,
v.
^
©^
u
o
^>
*
;/
*
^.
«..
V
^
**
k*
.-
X
©
0
Q,
r^
^
,
^
/y
^^-''
.«.
^
^
/
r.
^«.o
-O-l
^
^
^
/
/
'
-^
f
^
.--
-c
^
^
L.
x-~.
V'
» .
b§)-
0
o
3
as 'as -*5 ss es is 'FIXED CARBON", PROXIMATE ANALYSIS
FIG. 51. Relations of "fixed carbon" to efficiency 72* (curve No. 1); percent of rated capacity devel oped (curve No. 2); combustion-chamber temperature (°F.) (curve No. 3); Uue-gas temperature (°F.) (curve No. 4); pounds of dry chimney gases per pound of "combustible" (curve No. 5); and per cent completeness of combustion (Es) (curve No. 6). Tests 89-401.
of initial temperature of the furnace gases. This is plainly shown by curves Nos. 2 and 3, which are parallel.
Curve No. 4, flue-gas temperature, is closely parallel to No. 3. This is only another illustration of the fact that with the boilers of this plant flue temperatures increase with furnace temperatures, and, so far as the authors can see, it must be so with all boilers, even when liberating the same quantity of heat in the furnace per second with various percentages of air excess. (See p. 24.)
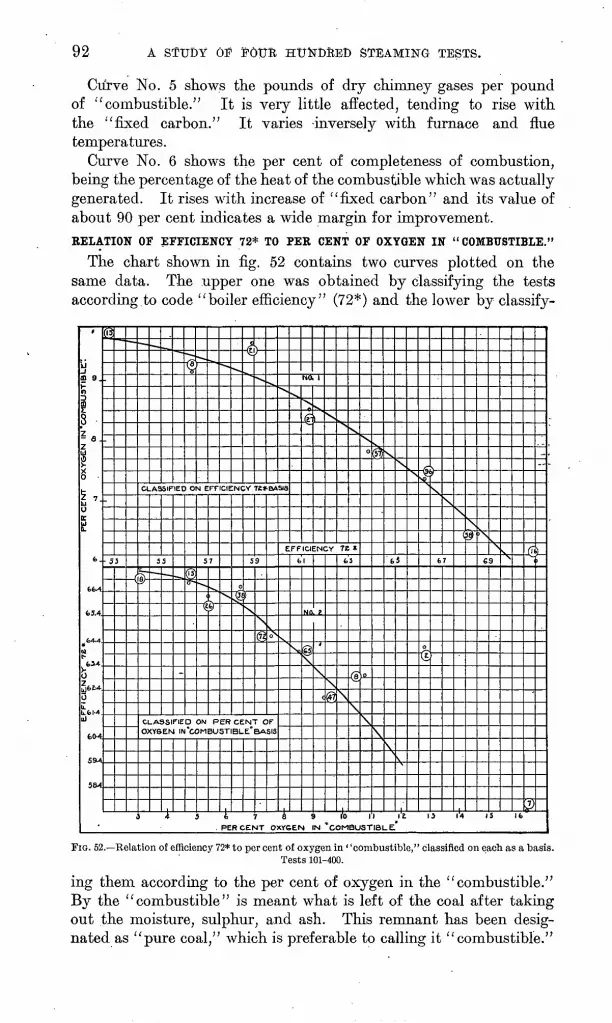
92 A STUDY OF FOtiR HUNDRED STEAMING TESTS.
Curve No. 5 shows the pounds of dry chimney gases per pound of ''combustible." It is very little affected, tending to rise with the "fixed carbon." It varies -inversely with furnace and flue temperatures.
Curve No. 6 shows the per cent of completeness of combustion, being the percentage of the heat of the combustible which was actually generated. It rises with increase of "fixed carbon" and its value of about 90 per cent indicates a wide margin for improvement.BELATION OF EFFICIENCY 72* TO PEE CENT OF OXYGEN IN "COMBUSTIBLE."
The chart shown in fig. 52 contains two curves plotted on the same data. The upper one was obtained by classifying the tests according.to code "boiler efficiency" (72*) and the lower by classify-
PER CEtsfT OXY&EN IN "COMBUSTIBLE".
f f -J . to "I *:
fc5.4
^{,4-4
?
rSfe**0IL.fcl-4 111
60-4
59-4
03
5 3
-4
^^
CL
?T
*^
A9
s
SIP
s
IEC
-
***
^
0
(i S)cS
"
N E FF
57
^
1r
~~.
CIE
X
CLASSIFIED ON PER
OXYSEN IN "COMBUST
>v.
N
0
£
4-4^-i
,Y
5
5)
X
v
72*
9
sft
BA
soN
CENT OFBLE'BASIS
^.
SIS
E
s
NO. 1
XX
(R"
FF Cl
fel
\
NO
S)
\
s^
:N
!
\
c
X
;Y
\ft
[N
78*
fc3
\
r«
\
NS.
O
\
("5
\
t
s s
SJ
s
\ k
'
^ f *
t|
7
\
b
\
7
ss^
>\
e
s\
9 X
_-
fi
$4 3 1 7 6 9 I'D II I'l 0 l'4 IS Ifc
.PERCENT OXYGEN IN 'COMBUSTIBLE.'
FIG. 52. Relation of efficiency 72* to per cent of oxygen in' 'combustible," classified on each as a basis.Tests 101-400.
ing them according to the per cent of oxygen in the " combustible." By the ' ' combustible" is meant what is left of the coal after taking out the moisture, sulphur, and ash. This remnant has been desig nated as "pure coal/' which is preferable to calling it "combustible."

CLASSIFICATION- OF COALS. 93
Both curves show unmistakably that somehow the oxygen of the coal, which is chemically combined, exerts a harmful influence. It seems plausible that there is nothing inherent in the presence of oxy gen in a coal molecule which makes it impossible to break it down and burn it as well as any molecule lacking oxygen. This assump tion puts the blame on our furnaces.
This chart is in agreement with that of fig. 33 (p. 56), which pre sents a classification of several items on a smoke basis. The "unac counted-for" loss, CO loss, and per cent of oxygen all rise with the increase of smoke and the efficiency falls very slightly.
BRITISH THERMAL UNITS PER POUND OF DRY COAL.
The curves of fig. 53 are based on 296 tests made on coals from all parts of the country. In general, the eastern coals fall on the
11000 12000B. T. U. PER POUND OF DRY COAL.
VIG. 53. Relations of B. t. u. value of dry coal to boiler efficiency 72* (curve No. 1); per cent rated capacity developed (curve No. 2); combustion-chamber temperature (°F.) (curve No. 3); pounds of dry chimney gases per pound of "combustible" (curve No. 4); per cent completeness of combustion (E 3 ) (curve No. 5). Tests 89-400.
right and the lignites on the left part of the curve. On curve No. 1 the small number near each point gives the number of- tests

94 A STUDY OF FOUR HUNDRED. STEAMING TESTS.
falling in that B. t. u. group. Each of the o^her four curves below is based on the same number of tests in the various groups. The four-place numbers in pairs on curve No. 1 indicate the highest and lowest efficiencies 72 * falling in each group. It will be noted that the highest efficiencies are nearly as good in the left groups as in the right, indicating that it is possible to burn coals of low heating value as efficiently as high-grade coals. The increase of average efficiencies is only about 7 per cent for the range of 5,000 B. t. u.
The average capacity, as shown by curve No. 2, rises considerably as the coal improves in heating value. Perhaps most of the low B. t. u. coals could be made to furnish as much steam if burned on a larger grate. If the coal did not clinker seriously, the use of a rocking grate would increase the- capacity. On some coals the use of the automatic stoker might give better results.
Curve No. 4, pounds of dry chimney gases per pound of "combus tible," descends with the better coals', partly because they are usually more manageable on the fuel bed and because they seem to break down on heating with evolution of gaseous compounds easier to burn, on which account the air supply can be reduced with safety.
Curve No. 5 gives the average "furnace efficiency," or, better, the per cent of completeness of combustion. These calculated efficiencies are only approximate.
RATIO OF ASH TO SULPHUR IN DRY COAL.
It is sometimes said that although sulphur in coal does not of itself materially reduce the value of the coal for steam making, a low percentage of ash with a high percentage of sulphur is apt to make trouble. To test this possibility a classification was made of many tests on many coals, the tests being grouped according to .the ratio of total ash to sulphur. The corresponding values of the aver ages of efficiencies 72* are practically constant.
As a check on this work a classification was also made of the ratio of ash to sulphur in dry coal on an efficiency 72* basis. As the efficiency 72* increases there is practically no change in the value of the ash to sulphur ratio. (See figs. 21, p. 30, and 28, p. 43.)
A table of efficiencies 72* classified on the basis of per cent of ash plus sulphur in dry coal shows little variation between the average efficiency values for the several groups. Tables showing the three classifications follow:
Classification of efficiency 72* on basis of ratio of ash to sulphur in dry coal.
Average ratio of ash to sul-
Ratio of ash to sulphur.
0 to 2.5.
27
2.23 04.83
2.5 to 5.0.
106
3.39 64.57
5.0 to7.5.
73
6.06 66.45
7.5 to 10.
' 27
8.69 66. 09
10 to 15.
8
12.10 05.76
15 to 20.
17
17.11 64.67
20 to 25.
9
22.64 64.90
25 to 30.
4
26.46 65.98
Over 30.
4
33.29 66.26
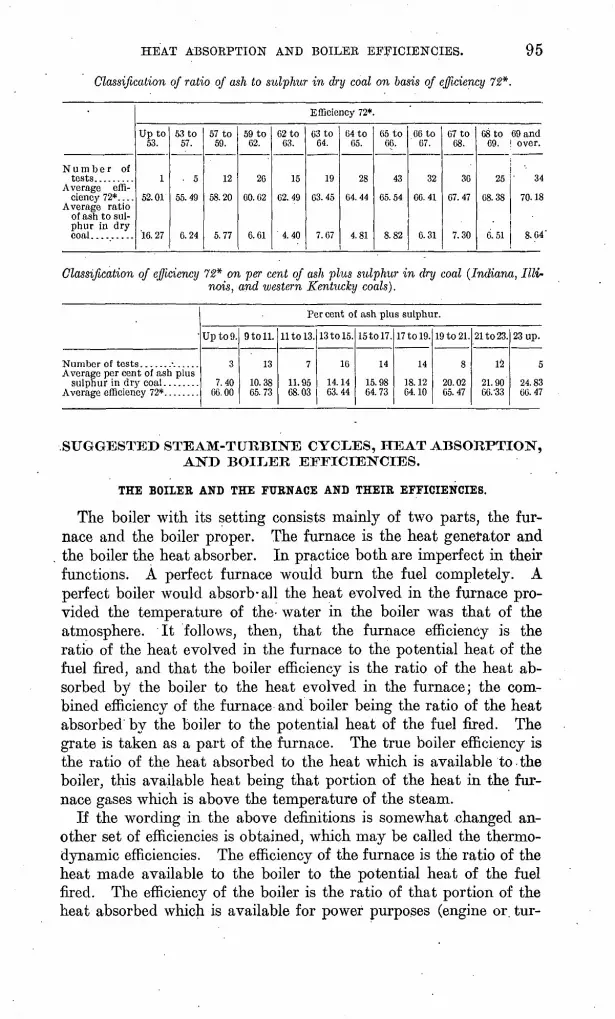
HEAT ABSORPTION AND BOILER EFFICIENCIES. 95
Classification of ratio of ash to sulphur in dry coal on basis of efficiency 72*.
Number oftests.........
Average efficiency 72*. . . .
Average ratioof ash to sulphur in drycoal.........
Efficiency 72*.
Up to53.
1
52.01
'16. 27
53 to57.
. 5
55.49
6.24
57 to59.
12
58.20
5.77
59 to62.
26
CO. 62
6.61
62 to63.
15
62.49
4.40
63 to64.
19
63.45
7.67
64 to65.
28
64.44
4.81
65 to66.
43
65.54
8.82
66 to67.
32
66.41
6.31
67 to68.
36
67.47
7.30
68 to 69 and69.
25
68.38
6.51
over.
34
70. 18
8.64'
Classification of efficiency 72* on per cent of ash plus sulphur in dry coal (Indiana, Illi nois, and western Kentucky coals).
Percent of ash plus sulphur.
Average per cent of ash plus
Up to 9.
3
7.4066. 00
9 to 11.
13
10.3865.73
11 to 13.
11.9568.03
13 to 15.
16
14.1463.44
15 to 17.
14
15.9864.73
17 to 19.
14
18.1264.10
19 to 21.
8
20.0265.47
21 to 23.
12
21.9066. '33
23 up.
5
24.8366.47
SUGGESTED STEAM-TURBINE CYCLES, HEAT ABSORPTION, AND BOILER EFFICIENCIES.
THE BOIIEE AND THE FURNACE AND THEIR EFFICIENCIES.
The boiler with its setting consists mainly of two parts, the fur nace and the boiler proper. The furnace is the heat generator and the boiler the heat absorber. In practice both are imperfect in their functions. A perfect furnace would burn the fuel completely. A perfect boiler would absorb-all the heat evolved in the furnace pro vided the temperature of the- water in the boiler was that of the atmosphere. It follows, then, that the furnace efficiency is the ratio of the heat evolved in the furnace to the potential heat of the fuel fired, and that the boiler efficiency is the ratio of the heat ab sorbed by the boiler to the heat evolved in the furnace; the com bined efficiency of the furnace and boiler being the ratio of the heat absorbed by the boiler to the potential heat of the fuel fired. The grate is taken as a part of the furnace. The true boiler efficiency is the ratio of the heat absorbed to the heat which is available to the boiler, this available heat being that portion of the heat in the fur nace gases which is above the temperature of the steam.
If the wording in the above definitions is somewhat changed an other set of efficiencies is obtained, which may be called the thermo- dynamic efficiencies. The efficiency of the furnace is the ratio of the heat made available to the boiler to the potential heat of the fuel fired. The efficiency of the boiler is the ratio of that portion of the heat absorbed which is available for power purposes (engine or. tur-

96 A STUDY OF POUR HUNDRED STEAMING TESTS.
bine) to the heat available to the boiler. The combined efficiency of the furnace and boiler is the ratio of the heat made available for power purposes to the heat value of the fuel fired. The fact is that the steam engine is usually blamed for wasting heat which is not available to it.
To illustrate the above definitions let the various heat values be represented by diagrams. For the representation of the heat in the furnace a diagram such as given in A, fig. 54, can be used. This diagram has absolute temperature for the ordinates, and a factor proportional to the specific heat of the furnace gases multiplied by their weight as abscissas. In the same chart (fig. 54, B] is an ideal cycle of a steam engine or turbine plotted on temperature-entropy
3000
Z500
1
ABSOLUTE TCMPtRCTURC, E_
~ o 8 8 8 §
-
B LBr-
El«
.1
0
"
3T
A-
~'
CA
~
M
MOS ^
'
TF
E.
4
MF
3IC
""
TF
T
AT
-"
UR
IMP
F
i 1-1
!r-
Ft\
V
li
*v} ~
f.pXVI -SPE.CIF C HEAT OF GASES AT CONSTANT
PR ESSURE. TIMES WEIGHT OF GASES
5
f
XX
*" XT
-13-
0->- ENTROPY
w
FIG. 54. Temperature-entropy diagrams for boiler: A, For air and coal; B, for water and steam.
plane. It must be understood that the abscissas of these two dia grams are in different units. The abscissa in B is taken in entropy units because the adiabatic expansion and the availability of heat to the steam engine or turbine can be best shown' by temperature- entropy diagrams.
On the assumption that 1 pound of combustible is completely burned, the various quantities of heat in the furnace are represented in A as follows: The areaABCD represents the potential heat in the fuel and also the heat developed in the furnace. The heat available for the boiler, represented in the diagram by the area OBCP, is the heat above the temperature of the steam and is the limit of the heat which the boiler can absorb. The remainder of the heat, repre-

HEAT ABSORPTION AND BOILER EFFICIENCIES. 97
sented by the area AOPD, is below the temperature of the steam and therefore can not be absorbed by the boiler.
In B the area RSTUW represents the heat absorbed by the boiler and delivered to the engine. Of this heat only a portion, repre sented by the area STTJV, is available for the engine to be con verted into mechanical energy. The remainder of the heat, repre sented by the area RSVW, is below the atmospheric temperature and can not be converted by the steam engine into mechanical en ergy. It may be said here that the limit for adiabatic expansion of steam in a steam engine or turbine is set by the temperature of the cooling water in the condenser. However, as the cooling water is nearly at the temperature of the atmosphere, the atmospheric tem perature may be taken as the limit. It is entirely out of the ques tion to obtain lower pressure in a condenser than that correspondingto the steam temperature equal to the temperature of the cooling water, no matter how perfect the air pump may be. For this reason it is said that the heat which is left in steam after it has been ex panded adiabatically to the temperature of the atmosphere is below the atmospheric temperature. Of course this reasoning does not apply to a case where the steam is used for heating purposes.
During the process of transmitting the heat from the boiler fur nace to the engine, the heat loses much of its availability, the greatest drop being in the transmission of the heat from the furnace gases into the boiler water. During this transmission there is a great drop in temperature, and with it drops the availability.
To show what efficiency could be obtained from an ideal steam- generating outfit and a steam engine working on a perfect cycle, as shown in B, fig. 54, an example is given below:
Suppose that 1 pound of " combustible" of the coal of test No. 204 is burned with 18.3 pounds of .air in a perfect furnace. The heat value of 1 pound of this "combustible " is 14,660 B. t. u., and if we assume the atmospheric temperature to be 50° F. and the steam pressure 80 pounds by gage,' the various heat quantities are as fol lows: Heat evolved in furnace, 14,660 B. t. u.; heat available for boiler, 13,320 B. t. u. The remaining portion of the heat evolved in the furnace is below 324° F., the temperature of the steam, and is either in the gases or in the moisture formed by burning the hydro gen of the "combustible." As this is an ideal case, all the heat which is available to the boiler is absorbed by it. On the assumption that there is no radiation from the boiler and the pipe connections, the heat delivered to the engine is 13,320 B. t. u. Of this heat only 4,056 B. t. u. is available for the engine. This last quantity can be ob tained from a steam table (such as Reeve's) in the following manner:
The total heat of 1 pound of saturated steam at 80 pounds gage press ure is 1,180.3 B. t. u., and the entropy is 1.5976. Within the limit this
8400 Bull. 325 07 7
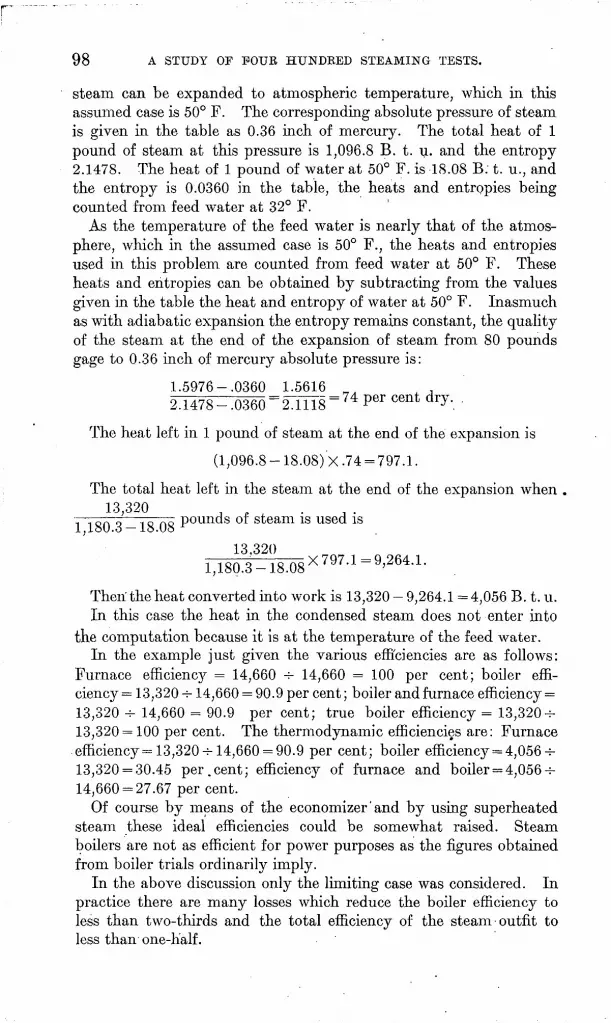
98 A STUDY OF FOUR HUNDRED STEAMING TESTS.
steam can be expanded to atmospheric temperature, which in this assumed case is 50° F. The corresponding absolute pressure of steam, is given in the table as 0.36 inch of mercury. The total heat of 1 pound of steam at this pressure is 1,096.8 B. t. u. and the entropy 2.1478. The heat of 1 pound of water at 50° F. is 18.08 B. t. u., and the entropy is 0.0360 in the table, the heats and entropies being counted from feed water at 32° F.
As the temperature of the feed water is nearly that of the atmos phere, which in the assumed case is 50° F., the heats and entropies used in this problem are counted from feed water at 50° F. These heats and entropies can be obtained by subtracting from the values given in the table the heat and entropy of water at 50° F. Inasmuch as with adiabatic expansion the entropy remains constant, the quality of the steam at the end of the expansion of steam from 80 pounds gage to 0.36 inch of mercury absolute pressure is:
1.5976-.0360 1.5616 n= 74 er cent2.1478-.0360 2.1118
The heat left in 1 pound of steam at the end of the expansion is
(1,096.8 - 18.08) X .74 = 797.1.
The total heat left in the steam at the end of the expansion when13,320 ,
;. QA 0 1Q no pounds or steam is used isIjloU.o lo.Uo
13,320 ' v 7Q7 1 Q 9R4 11,180.3-18.08 A ' y ' y ' D* -i<
Then the heat converted into work is 13,320 - 9,264.1 =4,056 B. t. u.In this case the heat in the condensed steam does not enter into
the computation because it is at the temperature of the feed water.In the example just given the various efficiencies are as follows:
Furnace efficienc}^ = 14,660 -f- 14,660 = 100 per cent; boiler effi ciency = 13,320 -T- 14,660 = 90.9 per cent; boiler and furnace efficiency = 13,320 -- 14,660 = 90.9 per cent; true boiler efficiency = 13,320-r- 13,320 = 100 per cent. The thermodynamic efficiencies are: Furnace efficiency =13,320-7-14,660 = 90.9 per cent; boiler efficiency = 4,056-=- 13,320 = 30.45 per.cent; efficiency of furnace and boiler = 4,056-r- 14,660 = 27.67 per cent.
Of course by means of the economizer' and by using superheated steam these ideal efficiencies could be somewhat raised. Steam boilers are not as efficient for power purposes as the figures obtained from boiler trials ordinarily imply.
In the above discussion only the limiting case was considered. In practice there are many losses which reduce the boiler efficiency to less than two-thirds and the total efficiency of the steam-outfit to less than one-lialf.
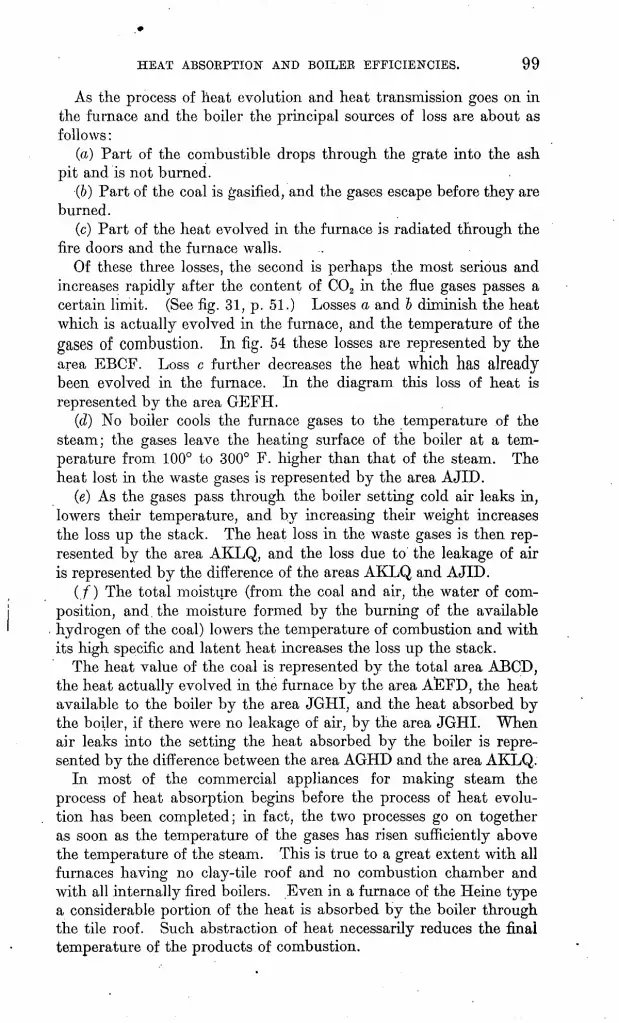
HEAT ABSORPTION AND BOILER EFFICIENCIES. 99
As the process of heat evolution and heat transmission goes on in the furnace and the boiler the principal sources of loss are about as follows:
(a) Part of the combustible drops through the grate into the ash pit and is not burned.
(6) Part of the coal is gasified, and the gases escape before they are burned.
(c) Part of the heat evolved in the furnace is radiated through the fire doors and the furnace walls.
Of these three losses, the second is perhaps the most serious and increases rapidly after the content of C02 in the flue gases passes a certain limit. (See fig. 31, p. 51.) Losses a and Z> diminish the heat which is actually evolved in the furnace, and the temperature of the gases of combustion. In fig. 54 these losses are represented by the area EBCF. Loss c further decreases the heat which has already been evolved in the furnace. In the diagram this loss of heat is represented by the area GEFH.
(d) No boiler cools the furnace gases to the temperature of the steam; the gases leave the heating surface of the boiler at a tem perature from 100° to 300° F. higher than that of the steam. The heat lost in the waste gases is represented by the area AJID.
(e) As the gases pass through the boiler setting cold air leaks in, lowers their temperature, and by increasing their weight increases the loss up the stack. The heat loss in the waste gases is then rep resented by the area AKLQ, and the loss due to the leakage of air is represented by the difference of the areas AKLQ and AJID.
(/) The total moisture (from the coal and air, the water of com position, and the moisture formed by the burning of the available hydrogen of the coal) lowers the temperature of combustion and with its high specific and latent heat increases the loss up the stack.
The heat value of the coal is represented by the total area ABCD, the heat actually evolved in the furnace by the area AEFD, the heat available to the boiler by the area JGHI, and the heat absorbed by the boiler, if there were no leakage of air, by the area JGHL When air leaks into the setting the heat absorbed by the boiler is repre sented by the difference between the area AGHD and the area AKLQ.
In most of the commercial appliances for making steam the process of heat absorption begins before the process of heat evolu tion has been completed; in fact, the two processes go on together as soon as the temperature of the gases has risen sufficiently above the temperature of the steam. This is true to a great extent with all furnaces having no clay-tile roof and no combustion chamber and with all internally fired boilers. Even in a furnace of the Heine type a considerable portion of the heat is absorbed by the boiler through the tile roof. Such abstraction of heat necessarily reduces the final temperature of the products of combustion.
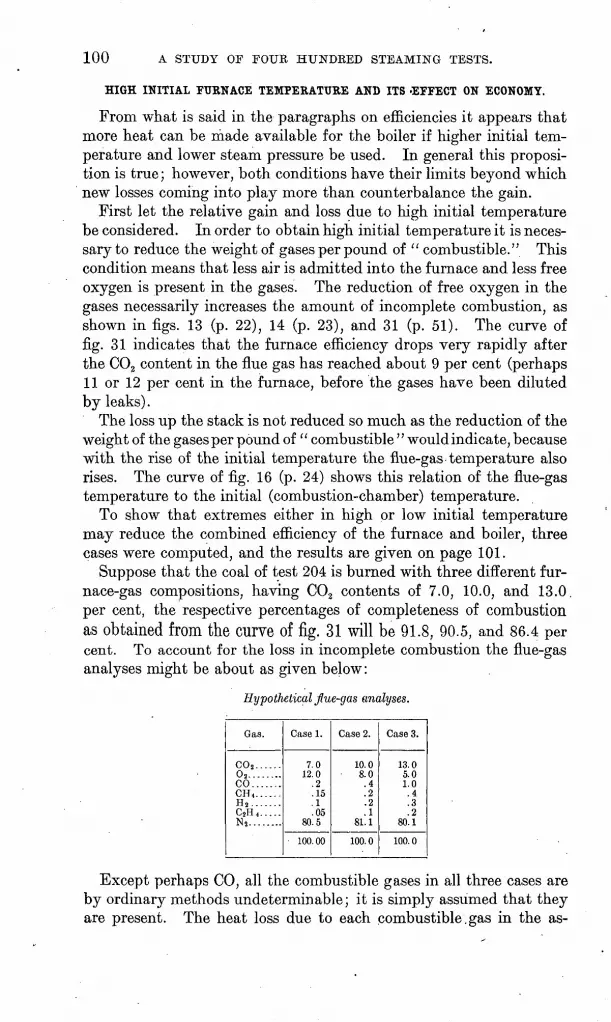
100 A STUDY OF FOUR HUNDRED STEAMING TESTS.
HIGH INITIAL FURNACE TEMPEEATURE AND ITS 'EFFECT ON ECONOMY.
From what is said in the paragraphs on efficiencies it appears that more heat can be made available for the boiler if higher initial tem perature and lower steam pressure be used. In general this proposi tion is true; however, both conditions have their limits beyond which new losses coming into play more than counterbalance the gain.
First let the relative gain and loss due to high initial temperature be considered. In order to obtain high initial temperature it is neces sary to reduce the weight of gases per pound of " combustible." This condition means that less air is admitted into the furnace and less free oxygen is present in the gases. The reduction of free oxygen in the gases necessarily increases the amount of incomplete combustion, as shown in figs. 13 (p. 22), 14 (p. 23), and 31 (p. 51). The curve of fig. 31 indicates that the furnace efficiency drops very rapidly after the C02 content in the flue gas has reached about 9 per cent (perhaps 11 or 12 per cent in the furnace, before the gases have been diluted by leaks).
The loss up the stack is not reduced so much as the reduction of the weight of the gases per pound of " combustible " would indicate, because with the rise of the initial temperature the flue-gas temperature also rises. The curve of fig. 16 (p. 24) shows this relation of the flue-gas temperature to the initial (combustion-chamber) temperature.
To show that extremes either in high or low initial temperature may reduce the combined efficiency of the furnace and boiler, three cases were computed, and the results are given on page 101.
Suppose that the coal of test 204 is burned with three different fur nace-gas compositions, having C02 contents of 7.0, 10.0, and 13.0. per cent, the respective percentages of completeness of combustion as obtained from the curve of fig. 31 will be 91.8, 90.5, and 86.4 per cent. To account for the loss in incomplete combustion the flue-gas analyses might be about as given below:
Hypothetical fue-gas analyses.
Gas.
C0 2 ...... 0.........CO.......CH«...... H, .......CjH<..... Ni.. ......
Case 1.
7.0 12.0
.2
.15
.1
.05 80.5
100.00
Case 2.
10.0 8.0.4.2 .2.1
81.1
100.0
Case 3.
13.0 5.01.0.4 .3.2
80.1
100.0
Except perhaps CO, all the combustible gases in all three cases are by ordinary methods undeterminable; it is simply assumed that they are present. The heat loss due to each combustible.gas in the as-

HEAT ABSORPTION AND BOILER EFFICIENCIES. 101
sumed composition of flue gases is computed by the following general formulas: .
(a) Loss due to CO =_______2SCO______ (per cent of carbon 1 v 409 K
12 (CO, + CO + CH4 + 2C2H4) x \ in " combustible "} x *'^°'
(&) Loss clue to CH4 =_______16CH4_____vlPer ceQk °^ cai>bonl oq Kin 12 (C02 + CO+ CH4 + 2C2H4) X I in "combustible"} x ^OJU v
(c) Loss due to H2 = ._________ 2H2 ______ vlPer cent °f carbon 1 R0 nqn12 (C02 + CO + CH4 + 2C2H4) X 1 in "combustible"} x oz 'Ut5U "
cent of carbonlvper cen o caronl 4 + 2C2H4) X 1 in "combustible"} x
($} Loss due to C2H4 = _____ 28C2H4
12 (C02 + CO + O
The number at the end of each formula is the heat value of 1 pound of that particular gas. The results obtained are in B. t. u.
The loss due to the presence of each gas in each of the three cases, together with the calculated results, is shown below.
Calculated losses and results due to the presence of combustible gases in the flue gases in the three cases (steam pressure taken to be 80 pounds gage).
Loss clue to co ...............:...................................CH<... ................................................Hi....................................:...............CjI-I...................................................
Total loss .................................'..........
Calculated results:" Heat value of 1 pound of ' ' combustible " ............. ......B. t. u..
........do....
doTemperature of product of combustion (if completeness of combus
tion were 100 per cent) . . ....... °Va
........ ..°F..
........do....
......B.t.u..
Case 1.
227 529 110 280
1,152
14.060 13, 460 14.23
0.5887
2,075 91.8
1,903 543
9,424 69.9 64.2
Case 2.
313487 ICO 387
1,347
14, 660 13, 270
19.3 0.5887
2,900 90.5
2,624 598
10,053 75.9 68.7
Case 3.
572 710 176 564
2,022
14,660 . 12,670
27.71 0.5887
3.850 86.4
3, 310 039
9,875 77.8 67.3
o Specific heats assumed to be constant.
The diagrams giving the representation of the various quantities of heat of the three cases discussed are presented in fig. 55. Each of the areas ABCD is the potential heat in the coal; the areas BCFE are the incomplete combustion losses; each of the areas AEFD is the heat actually evolved in the furnace. Of the heat evolved in the furnace only the area GEFH in each diagram is the heat absorbed by the boiler. The minor losses are not represented in detail.

102 A STUDY OF FOUR HUNDRED STEAMING TESTS.
The over-all efficiency indicates that it is better to burn the coal with the initial temperature given in case II than with the high initial temperature given in case HI, although the latter gives much better results than the low temperature in case I. On account of the increased radiation at high temperature, the actual results in case III might not show so much advantage over case I as the calculated results.
Another disadvantage of high initial temperature is the deteriora tion of the furnace. When high furnace temperatures are used the bridge wall has to be rebuilt often and the side walls lined. A hot fuel bed melts the refuse on the grate and causes the formation of clinkers. Hot clinker warps and destroys the grate bars, besides
3950
3450
E TEMPERATURE °F
AB50LUT
j~~rt~ K 36
. FURNACE T
-F
AT
T-l
,.
Mf
JE
f
GA
Sf=H
-A
3
IF: AE| |iS -
EMP.' 2
5E
TEjn
I.
3
RMf
rq"1
364° F.
X>
>
f"
-
<\R
&
HH-SIC EX
S
i.-
K1-
- i-
= 1
.. ._)&57.15AE&
1SOSSTAB
( />
0^
£>
q.
E'
~A
I
Be
S-
-).
..
H
q-'1
[T-
o -
Ol 23456? '01 234 0 CpX W-SPECIFIC HEAT OF GASES AT CONSTANT PRESSURE TIMES WEIGHT OF GASES.
431
a-
\
BM
71 T
^S:
30 f
i&
m
TAG
2
s
3
c
H._
FIG. 55. Availability to a boiler of heat of combustion of carbon in three different cases.
making the fires very hard to clean and disturbing the evenness of the air supply through the fuel bed.
Fig. 17 shows that in general the capacity of the boiler increases as the combustion-chamber or initial temperature rises. The advan tages and disadvantages of high initial temperature may be summa rized as follows: Advantages (a) Increase in boiler efficiency; (6) increase in capacity. Disadvantages (a) More loss by incomplete combustion; (6) increased radiation; (c) deterioration of furnace.
LOW STEAM PRESSURE AND ITS EFFECT ON ECONOMY.
It has been said that more heat could be made available and more heat would be absorbed by the boiler if lower steam pressure were used. For power purposes, however, the gain in boiler efficiency

HEAT ABSOKPTION AND BOILEK EFFICIENCIES. 103
would be more than offset, by the loss in availability of the heat for the engine. If, however, the steam, at low pressure be highly super heated and used in a steam turbine specially designed, an increase of 1 to 4 per cent in the thermodynamic efficiency of the outfit might be
' expected.In the following paragraph is a conservative computation of the
probable increase of the efficiencies of a boiler and a steam turbine resulting from the reduction of steam pressure and the superheating- of the steam. In the computation of the steam-turbine efficiencies it has been assumed that the friction of the steam through the nozzles and the turbine blades would decrease as the pressure dropped, and. that the expansion of the steam would therefore be more nearly adiabatic. This reduction of friction can be reasonably expected, because the friction of fluids against a solid increases directly as the density of the fluid. Furthermore, the expansion of highly super heated steam at low pressure will take place entirely in the super heated region, and thus friction due to condensed steam, which is a serious item in .steam turbines as ordinarily built and operated, will be avoided.
Let four cases be considered case 4, gage pressure 200 pounds, superheat 200° to 587.5° F.; case 3, gage pressure 100 pounds, super heat to 800° F.; case 2, gage pressure 25 pounds, superheat to 800° F.; case 1, gage pressure 15 pounds, superheat to 800° F.; temperature of feed water, 82° F.; condenser vacuum, 1.2 pounds absolute pres sure (28 inches mercury below an atmospheric pressure of 14.7 pounds). Assume the coal of test 204 to be burned with the resulting product of combustion equal to 19.3 pounds of dry chimney gases per pound of " combustible." The heat in chimney gases .per 1° F. per pound of combustible is, in dry gases, 19.3 X 0.24 = 4.63 B. t. u.; in moisture, 0.5887 X 0.48 '= 0.28 B. t. u.; total, 4.91 B. t. u. The heating value of 1 pound of combustible is 14,660 B. t. u. About 83 per cent of the increase in the heat available for the boiler due to the drop of steam temperature will be absorbed (the true boiler efficiency being taken at about 83 per cent).
Calculated increase of boiler efficiency due to drop in steam temperature.
Drop of steam pressure (pounds) from 200 to
100.
244 1,00
25.
491 3.35
15.
504 3.85
This increase in boiler efficiency may seem small. However, the great reduction of the first cost of installation of a plant makes the reduction in steam pressure appear more practicable for instance,

104 A STUDY OF FOUR HUNDRED STEAMING TESTS.
multitubular boilers would then be as safe as water-tube boilers. Further, 83 per cent true boiler efficiency should be far surpassed in the future.
Quantities used in calculation and probable results of the use of steam of low pressure and high superheat in steam turbines.
Total heat of superheated steam above 82 °F. (Ai) . ..B, t. u. . Total heat in steam at 28-inch vacuum above 82 °F. (As). .do. .
Assumed coefficient of friction of steam in nozzle and blades (see p. 103) ..................................................
Coefficient of friction calculated from the law of friction of
Heat converted intov work, Hw, calculated with the assumed
Combined thermodynamic efficiency of boiler and turbine. . . . Gain in combined thermodynamic efficiency of boiler and tur-
Case 1.
15 29.7
249.5 800
1,200.3 1,372.5
1,035 337.5
0.10
. 0. 084
303.0 22.1
08.85 15.2
16.1
Case 2.
25 39.7
267.0 800
1,260.8 1,369.0
1,031 338
0.12
0.10
297.5 21.7
68.35 14.8
13.0
Case 3.
100 114.7 327.0
800 '1260.8 1357. 0
978 379
0.24
0.22
288.0 21.2
66.66 14.1
7.6
Case 4.
200 214.7
387.5 587.5
1,048.3 1,245.0
888 357
0.30
250.0 20.1 65.0 13.1
The coefficient of friction of steam in nozzles and blades was assumed to be 0.3 for case 4, which is in close agreement with practice. The coefficients of friction for the other three cases were taken somewhat larger than those calculated from the law of friction of fluids, in order to be safe.
The over-all efficiency of a steam-generating outfit in case 4 was assumed to be 65.0, which can be attained in a well-operated boiler room. The over-all boiler efficiencies in the other three cases were obtained by adding to 65 the increase in efficiency as calculated in the preceding paragraphs.
Fig. 56 shows the cycle of thermodynamic processes of each of the four cases. In the chart the subscripts 1, 2, 3, and 4 of the letters refer to cases 1, 2, 3, and 4, respectively; letters having no subscripts are applicable to all cases.
Take case 4 for example: The area under AB4 represents the sen sible heat of the water, the area under B4C4 the latent heat of steam, and the area under C4D4 the heat in the steam due to superheat at constant pressure; the total heat in the superheated steam as it reaches the steam turbine is then represented by the area under AB4C4D4 . If there were no friction of steam during the expansion in the steam nozzle and the blades the expansion would be purely adiabatic, and in the diagram it would be represented by'a vertical line from the point D4 . However, since friction comes into play during the expansion and changes part of the velocity of steam back into heat, the expansion is a combination of the processes of adia batic expansion and heating at constant pressure, and is represented

HEAT ABSORPTION" AND BOILER EFFICIENCIES. 105
in the chart by the curve D4F4 . The heat rejected to the condenser is the heat under AEF4 . In cases 1 and 2 the heat rejected is the heat under AEEnE\ and AEITF2 , respectively, since the steam reaches the condenser in a slightly superheated state. The difference between the heat delivered to the turbine and the heat rejected to the con denser is the heat which has been transformed into the velocity of steam which is represented by the area under AB4C4D4 minus the area under AEF4 . It must be understood that the heat changed into motion is not represented by the area inclosed by EB4C4D4F4 .
12606. .
1800.
. PRESSURE
100 LB. PRESSURE.
o «>oa
TIT25-LB. PRESSURE
5 IB. PRESSURE
FIG. 56. Temperature-entropy diagrams for steam-turbine cycles.
HEAT TRANSMISSION THROUGH BOILER TUBES, AND TRUE BOILER AND FURNACE EFFICIENCIES.
From the very start of the steaming tests those conducting them sought to separate the performance of the boiler as a heat absorber from the performance of the fuel bed and furnace as a heat producer. In writing up the stages through which opinions progressed it seems best to adopt the historical method and outline all attempts, up to the last calculations, which are both theoretical and practical, being determined from about 400 tests. This last work must be taken as
106 A STUDY OF FOUR HUNDRED STEAMING TESTS.
neither final nor even necessarily correct; it is simply the best we know at present. All opinions expressed or deductions drawn must be understood as merely tentative, and the right is reserved to change part or all of them at any future time.
The first definite calculations on boiler efficiency were made in January, 1906, in an attempt to check the temperature indications of a Wanner optical pyrometer, which had been used to ascertain the temperatures in the rear of the combustion chamber. Some times the observation was taken by looking at flame, in which case it was postulated that the flames of various coals differ in brightness at the same temperature; and, perhaps, although the particles of incandescent carbon from which the pyrometer received its light were really at the temperature as read off the scale, such a likely condition was no assurance that the molecules of gas between were as hot; the reasonable assumption would be that they were cooler. Or, worse yet, when a coal and the conditions of a test were such as to give short flames, or none, in the rear of the combustion chamber, and the pyrometer received its light from the opposite side wall, it was plainly evident on observation that the temperature as read from the instrument- was too low, because the side wall was cooler than the tile furnace roof, on account of its radiating heat to the bare water tubes near by, which the tile roof could not do. Even the tiles of the roof were conducting heat through to the tubes which they protected. These and other considerations put the indications of the optical pyrometer in question, through no fault of its own. Attempts were made to check the pyrometer with a platinum and platinum-rhodium thermoelectric couple, but the porcelain tubes slagged and melted away within an hour or so under the high tem peratures used, and a satisfactory protection for the junction was not made to work reliably until too late for this purpose. By this time it had been learned that the ascertainment of the temperature of the gases entering the boiler was not, after all, of such overwhelm ing importance. So this tedious checking of the optical pyrometer was dropped for more fruitful work. There is a general impression among the observers that the pyrometer when used on such fur naces as these is usually correct within 50° C. or 100° F. (For a description of the method of protecting the thermoelectric couple with a water jacket and cheap clay pipestems see p. 54.)
These calculations on boiler efficiency were made because an attempt to obtain any curve of relationship between combustion- chamber temperatures (obtained by the Wanner optical pyrometer) and over-all efficiency of the furnace and boiler combined resulted in a failure, the points falling all over the sheet of coordinate paper. At that time the impression of the staff was that the following formula
HEAT ABSORPTION AND BOILER EFFICIENCIES. 107
applied to boilers as well as to condensers, and. so it does, but that is only one-third of the story:
Efficiency of boiler as a heat absorber = ~1~^-J where tL = initial
temperature of gases above atmosphere, and t2 = final temperature of gases above atmosphere.
Many of the staff believed at that time that if the air supply per pound of coal were reduced, without decreasing the completeness of combustion (in consequence, of which the initial temperature tx would rise), the final temperature t2 would fall, or at least not rise proportionately with tr It is frequently stated by authorities on boiler testing that if the same number of heat units be liberated in a furnace per second in two cases first, with a small air excess, and second, with a large air excess the final or flue temperature in the first case will be the lower. This assumption may be true with some boilers,.or with most boilers, or even with those of this plant, but after careful investigation 'of large numbers of actual simultaneous readings, the staff has become convinced that such a theory is both practically and theoretically untrue; and that, on the contrary, a rise of furnace temperature usually causes a proportionate rise of flue temperature, the ratio between these temperatures being almost independent of the mass of gases passing. For a long time this conclusion was hard to believe, for on closing the stack damper a little, at times, the combustion-chamber temperature rose and the stack temperature fell; yet nothing appears more certain on obser vation than that the sun moves around the earth.
It seemed almost axiomatic that the higher the initial temperature the greater the amount of heat which would pass into the boiler because of the greater temperature difference between gases and water, yet this proposition is only slightly true. Likewise it seemed axiomatic that a high combustion temperature would certainly aid combustion of smoke and hydrocarbons, which it would do if other accompany ing conditions were not usually adverse enough to neutralize all gain. Because of these two propositions, which were apparently axio matic, it was concluded that when the optical-pyrometer tempera tures and the over-all efficiencies of the fuel bed, furnace, and boiler (72*) failed to agree, the pyrometer was given unreliable indications, through no fault of its own. So the first calculation was inciden tally made of what was then called true boiler efficiency, in order to figure backward to the combustion-chamber temperatures, by means
of the above formula, 1 + 2 - The so-called true boiler efficiency
was calculated for each of about 125 tests by means of the formula.True boiler efficiency =_____________ Efficiency 72*_______________100 [CO loss in p. ct. + (unaccounted-for item in p. ct. 3 p. ct.)]'
108 A STUDY OF FOUR HUNDRED STEAMING TESTS.
All the above percentages were taken from the tests as calculated by the A. S. M. E. code. It will be noticed that the incomplete- combustion loss was taken as being the unaccounted-for item minus 3 per cent radiation. This was very crude, but the. best we knew. The results were disappointing and not clear, but as negative results they were very instructive. Eighty-eight per cent of the so-called true boiler efficiencies fell between 70 and 75 per cent, and such uniformity surprised everyone. The combustion-chamber tempera tures, calculated backward by equating these efficiencies to the ex
pression l , 2| in which t2 was known, turned out ridiculously low *iand the individual temperatures were very' erratic. On leaving out a few abnormal tests, more than 90 per cent of those remaining had a so-called "true boiler efficiency" between 70 and 75 per cent. These calculations took much hard work, the details of which are- omitted, inasmuch as it gave only negative and prophetic results that were of little value in themselves.
The great value of the work lay in the result that it shook previously conceived ideas, some of which were widely believed. The consequent inquiry took two forms (a) a general mathematical study of the impartation of heat from fluids (including gases) to solids and vice versa, a and (&) a routine analysis of samples of gases from the rear of the combustion chamber and the stack for minute traces of hydro gen and hydrocarbons.
An ordinary Hemple pipette and absorption bulbs for analysis of illuminating gas are accurate only to about 0.2 or 0.3 per cent when very carefully manipulated. Unfortunately a mere trace of meth ane for instance, to the extent of 0.1 per cent by volume in the flue gases is sufficient to represent ordinarily a loss of 2 per cent of the coal due to incomplete combustion. (See p. 100.) Nevertheless, for some weeks several analyses were made daily for traces of hydrogen and hydrocarbons, and on several days these constituents occurred persistently and very appreciably, so as to indicate losses of many per cent due to incomplete combustion. On account of the well-known difficulty of obtaining accuracy in determinations of this kind, due to the small volumes of these gases that are ordinarily present, this work will not be published. It has, however, along with many kinds of cir cumstantial evidence, strengthened the belief that the losses due to incomplete combustion generally amount to several per cent of the potential heat in the coal burned. This presumptive loss will also be investigated in one or two other ways.
Incidentally it may be remarked that, if developed, such methods of measuring minute traces of hydrogen and hydrocarbons will be
a It was fortunately found that John Perry had done much excellent, but mathematically involved, work on this subject; an account of it is given in his book "Steam Engines and Gas and Oil Engines."

HEAT ABSOBPTION AND BOILER EFFICIENCIES. 109
useful when applied to gas-engine exhaust gases. The mere analysis of exhaust gases for C02; 02 , and CO, resulting in no trace of CO, does not prove complete combustion by any means.
THEORETICAL CONSIDERATIONS.
The tentative formulas developed by Perry are so significant and so important that a general outline of them is here given. According to his theory the rate of heat impartation to a boiler tube is, for ordi nary gases, proportional to (1) temperature differences of the gases and the metallic surface; (2) density of the gas; (3) velocity of the gas parallel to the metallic surface, and (4) specific heat, of the gases at constant pressure. The first of these factors is the only one usually thought of, and its applicability is perhaps self-evident.
In. considering factor 2 it is plain that the individual molecules of gas give up their heat by vibrating against the metal. The greater the number of molecular impacts per second against a unit area of the tube the greater the amount of vibration (heat) imparted to the molecules of the metal. But the number of impacts is directly pro portional to the density, or weight per liter or cubic foot. At a con stant pressure (a little less than atmospheric in boiler practice), the density is inversely proportional to the absolute temperature, and at high-furnace temperature it is almost inversely proportional even to the temperature reckoned above steam temperature. Oh this account there is a direct neutralization of gain when striving for high temper ature in steam-boiler practice, for as the temperature is raised the number of molecules in action against any portion of the heating sur face is reduced.
In considering factor 3 a mental image should be formed of the appearance of a cross section of intensely magnified heating surface. The. molecules of the metal would probably appear to be in an ex tremely rapid state of vibration, with spaces between them much larger than the molecules. Entangled among the outer molecules there would be comparatively stationary molecules of gas held close together in a dense film next to the metal. Farther out normal gas is reached, where the molecules are widely scattered. All these gas eous molecules, from those entangled among the surface molecules of metal to those in the gas of normal density, would be in an invisibly rapid state of vibration, but those close to the metal would be more or less "bound" by the attraction of the metal. Now, this layer of condensed gas, so to speak, is very adherent to the metal, and conser- quently a very poor conductor of heat (since heat in material bodies is a matter of the vibration of their molecules), so that the hope of getting heat through it lies in the possibility. of dislodging slowly vibrating (cold) molecules from this layer and replacing them with rapidly vibrating (hot) ones. It can be imagined that as a stream
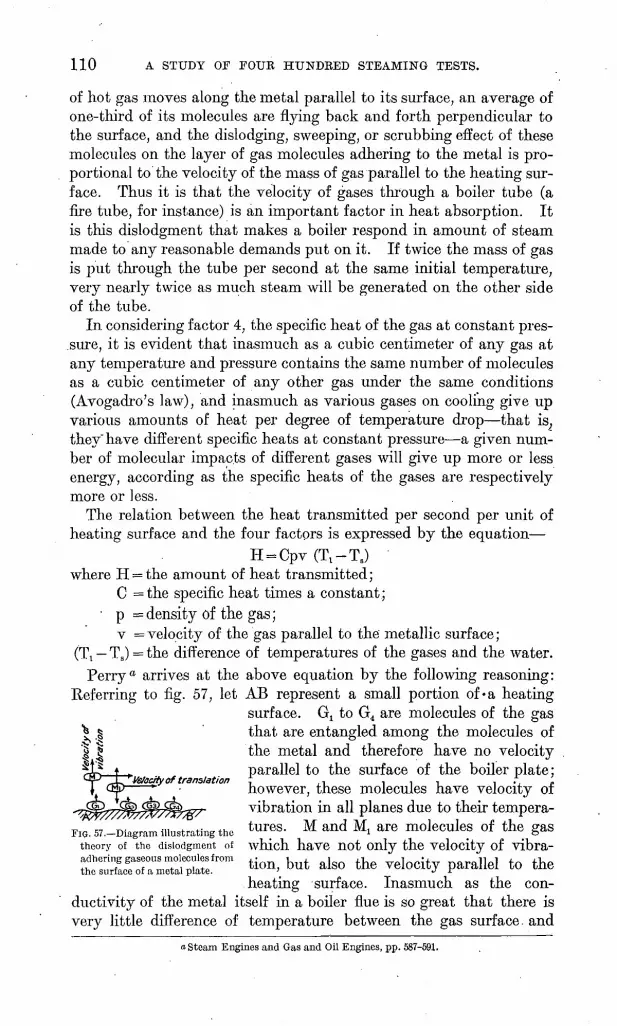
110 A STUDY OF FOUK HUNDEED STEAMING TESTS.
of hot gas moves along the metal parallel to its surface, an average of one-third of its molecules are flying back and forth perpendicular to the surface, and the dislodging, sweeping, or scrubbing effect of these molecules on the layer of gas molecules adhering to the metal is pro portional to the velocity of the mass of gas parallel to the heating sur face. Thus it is that the velocity of gases through a boiler tube (a fire tube, for instance) is an important factor in heat absorption. It is this dislodgment that makes a boiler respond in amount of steam made to any reasonable demands put on it. If twice the mass of gas is put through the tube per second at the same initial temperature, very nearly twice as much steam will be generated on the other side of the tube.
In considering factor 4, the specific heat of the gas at constant pres- .sure, it is evident that inasmuch as a cubic centimeter of any gas at any temperature and pressure contains the same number of molecules as a cubic centimeter of any other gas under the same conditions (Avogadro's law), and inasmuch as various gases on cooling give up various amounts of heat per degree of temperature drop that is, they" have different specific heats at constant pressure a given num ber of molecular impacts of different gases will give up more or less energy, according as the specific heats of the gases are respectively more or less.
The relation between the heat transmitted per second per unit of heating surface and the four factors is expressed by the equation
H = CPv (Tt-T.)where H = the amount of heat transmitted;
C =the specific heat times a constant; p = density of the gas;
v = velocity of the gas parallel to the metallic surface ; (T\ Ts ) = the difference of temperatures of the gases and the water.
Perry* arrives at the above equation by the following reasoning: Referring to fig. 57, let AB represent a small portion of «a heating
surface. Gl to G4 are molecules of the gas that are entangled among the molecules of the metal and therefore have no velocity parallel to the surface of the boiler plate;
Velocity of translation , ;1 111 i , < however, these molecules have velocity or vibration in all planes due to their tempera tures. M and M: are molecules of the gas which have not only the velocity of vibra-theory of the dislodgment of
heating surface. Inasmuch as the con ductivity of the metal itself in a boiler flue is so great that there is very little difference of temperature between the gas surface, and
o Steam Engines and Gas and Oil Engines, pp. 587-591.

HEAT ABSORPTION AND BOILEE EFFICIENCIES. Ill
the water surface, the heat transmitted through the metal may be taken to be equal to the heat imparted to the film of the gas adhering to the metal. This assumption makes the temper ature of the film equal to the temperature of the metal and also to that of the .water. Now, suppose n represents the number of the molecules (M) which'enter the adhering film of the gas, and also the number of molecules (G) which leave the film of the elementary sur face AB per unit of gas. Let T\ be the average temperature of the entering molecules, and Ts the temperature of the film and of the leaving molecules. The molecules enter and leave the film with an average momentum in the axial direction that is proportional to the axial velocity (v) of the gases through the flue. The force of friction (F) is the axially directed momentum given .to the adhering layer of molecules, so that per unit area the friction (F) is proportional to HV (as the momentum of a body is the product of its weight and its velocity). The heat (H) given to the film per second per unit sur face AB is proportional to n (T1 T8 ), or
(1) H = Cn (T! Ts), where C is a constant.(2) ButasF = Cnv,
T^ /m _ rr\ \
(3) Then. H = K. , where K is another constant.
Now, the friction of fluids against a solid varies directly as the density and the square of the velocity of the fluid, or
(4) F = Cpv2 , where p is the density of the fluid.By substituting for F in equation 3 its value in equation 4, the
fundamental equation as given before is obtained:'(5) H = Cpv (T.-Ts).In the foregoing equations the C and K are constants employed
so that the sign of equality could be used.Equation 5 gives the amount of heat transmitted per second per
elementary area of heating surface. If the amounts of heat trans mitted by every elementary area are added, the heat transmitted by the entire heating surface per second can be obtained. This can be done by the use of calculus, as follows:
Take Tx Ts =@; Tj being the absolute temperature of the gases at the distance x from the furnace end of a flue of a total length 1 and diameter D, and Ts being the temperature of the steam. Let W pounds of gases flow through the flue per second and let the specific heat be a constant:
p = -, andv = CT1 v'
where C and C' are temporary constants.C"
(6) Then p = TFT, where C" is a consolidation of C and C' just above.W 7rD 2v
Also volume per second = = r , where D is the diameter of
the fire tube and 7r = 3.1416.

112 A STUDY OF FOUK HUNDRED STEAMING TESTS.
KW K'WT(7) Whence v = ̂ = T\T~, where K and K' are constants.
Equations 6 and 7 are derived also from the laws that (1) the density of the gases varies inversely as the absolute temperature and (2) the velocity varies directly as the weight of the gas that passes through the flue in a second and as the absolute temperature, and inversely as the square of the diameter of the flue. By substituting the values of p and v from equations 6 and 7, equation 5 becomes
Cv©_ C'W0 T ~~ D2
Hence in a short length (dx) of the boiler flue the heat transmitted to the boiler is
n _ , _ C'W® _ _ CW&dx - CpWd& = p2 X D ndx = £
. Cd9 rCdx T ^ Cx _ But J -Q- = - / -jj- . Integrating, loge @ = - ̂ j + K.
Cl When x = 0, K = loge©0 - When x = 1, loge®i = - + loge@0 and
' (8) .'. 0,= 00e"-The heat absorbed by the whole flue of the boiler per second is
.(9) H = Cp and the true efficiency of the flue is
TRUE BOILER EFFICIENCIES DEPENDENT ONLY . ON PHYSICAL SIZE, SHAPE, AND ARRANGEMENT OF BOILER.
Equation 10 states that the true efficiency of the boiler flue depends only on its length and diameter and not on the initial temperature of the gases. What is true about one flue holds good for all together.
The efficiency expressed by equation 10 is the- true boiler-flue effi ciency that is, it is the ratio of the heat absorbed by the boiler flue to the heat available for absorption.
It must be remembered that in this discussion only the heat that is imparted to the boiler flue by convection and conduction has been considered. In reality the boilers receive heat also by radiation directly from the fire and from the hot walls of the furnace. Accord ing to the law of Stefan and Boltzmann the amount of energy radiated by a black-body surface to another body is proportional to the differ ence of the fourth powers of their absolute temperatures. The boiler furnace radiating heat to the boiler is nearly a black-body surface, so
HEAT ABSORPTION AND BOILEE EFFICIENCIES. 113
that the heat received by the boiler by radiation may be expressed by the equation
H = C (TV-T.4 ) 'where T1 is the absolute temperature of the furnace, T8 the absolute temperature of the boiler tubes, and C a constant.
INFLUENCE OF VELOCITY OF GASES ON HEAT ABSOEPTION.
The influence of the velocity of gases on the heat absorption may appear at first somewhat improbable. However, inasmuch as high capacities of all types of boilers are obtained simply by burning more coal, which means making more hot gases and passing them over the heating surface at a higher velocity, it must be admitted that such an influence exists. Thus, for example, in locomotive practice the capac ity is increased two or three times by doubling or tripling the rate of combustion and therefore doubling or tripling the velocity through the boiler flues. Of course the rate of heat absorption by the fire box is affected principally by the initial temperature.
In fig. 6 (p. 15) the following three factors in heat absorption are shown, with their product, for the gas mixtures resulting when 1 pound of carbon is burned with various amounts of excess air: (1) Temperature difference, (2) density of gases; (3) volume of gases, which is proportional to velocity parallel to the heating surfaces.
The specific heats of products of combustion with the various air excesses are nearly constant at 0.24, and therefore any errors intro duced by neglecting to consider such varying compositions would be less than about 1 per cent. In the case of some wet lignites the error might be more, because of the presence of considerable percentages of water vapor with a specific heat of 0.48 or higher. The temperatures of combustion were calculated on the assumptions that complete com bustion is possible, and that the specific heats of oxygen, nitrogen, and carbon dioxide remain constant, which is not likely. Any error thus introduced into .the calculated temperature is neutralized, by an oppo site and very nearly proportionate secondary error, introduced into the calculated density as a consequence of the primary error. On account of these compensating errors the uppermost "products" curve is as reliable as the whole theory.
The assumption was made that 1 pound of carbon was always burned in the same length of time, with various air excesses, and the resulting temperatures were calculated in degrees Fahrenheit. On the same data the relative densities of the resulting gaseous mixtures were calculated, each at its respective temperature, taking as unit density that of the gases at 320° F. (the temperature of the boiler water in this plant).
The lower curve, relative volume of products of combustion with increasing air supply, indicates that with large air excesses that is,
8400 Bull. 325 07 8

114 A STUDY OF FOUK HUNDKED STEAMING TESTS.
with low furnace temperatures the actual volumes are compara tively high, but within the reasonable working range of even poor and good firing the volume of the products is nearly constant; as the air excess is reduced the temperature rises almost as fast and the effect on the resulting total volume is to decrease it very slightly.
Relative volume was used because the velocity of passage of the gases through the boiler is directly proportional to it, other things being equal, and, as already stated, velocity is one of the three most important factors determining the amount of heat imparted to the metal of the boiler tube.
It is assumed that in each case the products of combustion, gen erated always in the same length of time, are passed through a boiler fire tube. The upper ("products") curve gives by its ordinate the amount of heat absorbed by the first small portion of the tube during that length of time. On page 110 it is shown that this curve represents not only the amount of heat absorbed by the first short length of a tube but by the whole tube, so that this curve can be applied to the whole heat absorption of a boiler so far as absorption by convection is concerned; but it can not be applied to heat absorption due to radiation from fuel bed or hot brickwork.
The upper and final curve was obtained by multiplying together, for each of several temperatures along the whole range, the three factors (1) relative density of gases, (2) temperature of gases minus temperature of steam (T^ Ts), (3) relative volume. The curve starts at zero heat absorption, because, although the density and vol ume are high, the temperature difference at 320° F. is zero, conse quently the product of the three is zero. The ordinate figures at the left have no specific names, but merely furnish a scale on which to indicate relative magnitudes of volume, density, and products of these two, and temperature excess above that of boiler water. As applied to the upper curve these ordinates on the vertical scale do not mean B. t. u., though they are proportional to actual numbers of B. t. u. absorbed in any specific case.
On inspecting the upper curve the striking fact is its rapid approach to the horizontal, beginning at comparatively low furnace tempera tures. For instance, at a furnace temperature of 2,000° F. (1,100° C.) ordinary temperature scale; see second temperature scale at foot of chart a temperature very easy to attain even with poor coals, the ordinate at the left is 9.0. At a furnace temperature of 3,000° F. (1,650° C.) second temperature scale at bottom of chart a temperature rather hard to attain and destructive to good fire bricks, the ordinate at the left is 9.5, only 5.5 per cent more than 9.0. Thus for all the extra trouble and expense of attaining the higher furnace temperature there is a gain in the efficiency of the boiler as a heat absorber of only 5.5 per cent, reckoning the efficiency calcula-

HEAT ABSORPTION AND BOILER EFFICIENCIES. 115
tion above atmospheric temperature. This gain is often largely neu tralized by less complete combustion. The fact that the efficiency 72* is not improved by high combustion-chamber temperature is well illustrated in fig. 12 (p. 21), which is compiled from actual tests on coals of the same class from Illinois and Indiana.
It must be understood that this whole chart refers only to that part of a boiler which absorbs heat by contact with the hot gases. In a locomotive boiler this includes the tubes and to some extent the fire box. For a water-tube boiler of the Heine type, with the lower row of tubes inclosed in clay tiles, the chart includes all of the boiler except the lower row of tubes, which are exposed in the rear to radia tion and are analogous to the fire box of a locomotive.
The following table gives a laborious method of calculating the relative amount of heat absorbed by the boiler when 1 pound of car bon is burned with various amounts of excess air. The table wascalculated by first figuring the relative volume, the relative density, and the temperature elevation of the gases; then by multiplying these three together the relative heat absorption was obtained for the cor responding excesses" of air. The curves of fig. 6 (p. 15) were plotted from the values "given in this table:
Arithmetical calculation of relative amounts of heat absorbed by a hypothetical boiler.
Excess of air. .... .per cent. . 1. Pounds of O 2 per pound
2. Pounds of airper pound of carbon (4 parts N, 1
3. Cp of products of com-
4. Temperature rise clue to cornbustion=
14,000 oFCp (pounds of air+1)
5. Temperature rise + 50 (which is atmospheric temperature) ..... °F. .
6. Absolute temperature of
7. Relative volume of unit mass of gases at tem perature of line C when volume at 401° F. ab-
8. Relative total volumes of products of combus tion, each at its final temperature of com- bustion=line 7Xline 2..
Elevation of temperature of combustion above steam temperature:
9. At 320° F., 75 poundson ftftfff* O V
10. At390° F., 205 poundsr»n fffi PY* ° R
11. Density of products of combustion, each at its final temperature of combustion when den sity at 320° F.= 1 ......
12. Line HXline OXline 8=HO.....................
1.
0
2.67
13.33
0.2360
4,325
4,375
4,836
10.49
1, 139. 8
4,055
3,985
0. 1615
916
2.
25
3.33
16.67
3,486
3,536
3 997
8.67
144.5
3,216
0. 1956
909
3.
50
4.00
20.00
0. 2373
9 W\
2,980
3,441
7.47
149.4
2,660
2,590
0. 2269
902
4.
75
4.67
23.33
0. 2375
2,526
2,576
3,037
6.59
153.5
2,256
2,186
0. 2568
889
5.
100
5.33
26.67
0. 2376
2,220
2,270
2,731
5.92
157. 88
1,950
1,880
0. 2856
879
6.
150
6.67
33.33
0. 2378
1,788
1,738
9 9QQ
4.98
165.9
1,518
1,448
0. 3397
855
7.
200
8.00
40.00
0. 2380
1,496
1,546
9 nn?
4.35
174.0
1,226
1,156
0. 3891
830
8.
300
10.67
53.33
0. 2385
1 127
1,177
1,638
3.55
189.3
787
0. 4768
774
9.
1,595
d<\ on
226 00
O oonn
270
320
7fi1
1 69
382.0
0
0
1. 000
0
oThis H is merely a number proportional to the heat absorbed.
116 A STUDY OF FOUE HTJNDEED STEAMING TESTS.
The relative amount of heat absorbed by a boiler when various percentages of excess of air are used for combustion can be easily obtained by the following formula:
(11) H = CW(^^fwhich is obtained as follows:
Let C = a constant, having a fixed value for each case.p = the density of the gases, relative to any standard.V = velocity past'any small portion of heating surface under
consideration, in any units.T = absolute temperature of gases at any point under considera
tion, on any thermometric scale. t = absolute temperature of boiler water on the same scale
asT. W = weight of gases resulting from combustion of 1 pound of
carbon, expressed in any units of any system. W 1 = weight of air used per pound of carbon.
K= Ta (temperature of atmosphere) -ft.According to our fundamental assumption (equation 5, p. Ill), the
heat transmitted per second per unit of heating surface is (5) H = CpV (T-t).
C' /" W ~N But p = rp ( TTT 7 \ where C' is a new temporary constant. Also
V = C" TW, where C" is a new temporary constant.The last two equations are derived from the fundamental proper-
'ties of gases; the first one states that when 1 pound of carbon is burned with air the density of the resulting gases approaches that of air as the amount of air increases, which increase reduces the influ ence of the amount of C02 present; and the second, that the density decreases directly as the absolute temperature (T) of the resulting mixture increases. C' is some constant, whose value will not be determined because all these results are relative only. This state ment applies to all the C's used. Substituting the values of p and V in equation 5, we have
W \ C' CW2* ' » ^ ft" rpTlT /rr\ j.\ _ ^ '' /rr\ j\ J.VV \ i. \j) -TTT -, \JL 1 1
on arbitrarily assuming that all constants, C, C', and C", are con solidated into a new C, as the result sought is to be relative only.
14,600 60,900 i ~ ia ~6.24W~ W
hence60,900
i = ^ + ia
in which 14,600 = B. t. u. value of 1 pound of carbon and 0.24==
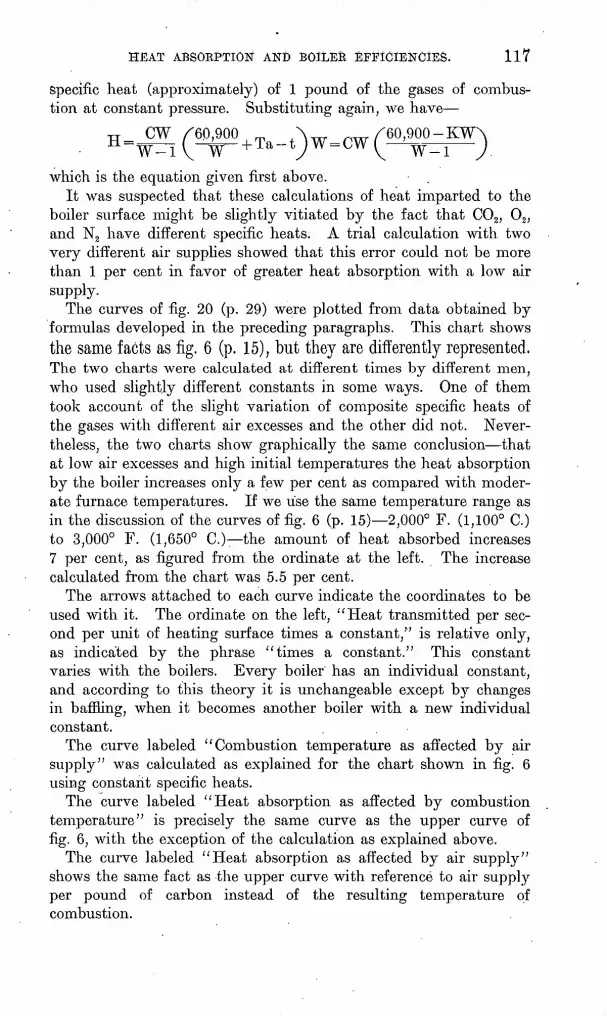
HEAT ABSOKPTION AND BOILEB EFFICIENCIES. 11 7
specific heat (approximately) of 1 pound of the gases of combus tion at constant pressure. Substituting again, we have
which is the equation given first above.It was suspected that these calculations of heat imparted to the
boiler surface might be slightly vitiated by the fact that C02 , 02 , and N2 have different specific heats. A trial calculation with two very different air supplies showed that this error could not be more than 1 per cent in favor of greater heat absorption with a low air supply.
The curves of fig. 20 (p. 29) were plotted from data obtained by formulas developed in the preceding paragraphs. This chart shows the same facts as fig. 6 (p. 15), but they are differently represented.The two charts were calculated at different times by different men, who used slightly different constants in some ways. One of them took account of the slight variation of composite specific heats of the gases with different air excesses and the other did not. Never theless, the two charts show graphically the same conclusion that at low air excesses and high initial temperatures the heat absorption by the boiler increases only a few per cent as compared with moder ate furnace temperatures. If we use the same temperature range as in the discussion of the curves of fig. 6 (p. 15) 2,000° F. (1,100° C.) to 3,000° F. (1,650° C.) the amount of heat absorbed increases 7 per cent, as figured from the ordinate at the left. The increase calculated from the chart was 5.5 per cent.
The arrows attached to each curve indicate the coordinates to be used with it. The ordinate on the left, "Heat transmitted per sec ond per unit of heating surface times a constant," is relative only, as indicated by the phrase "times a constant." This constant varies with the boilers. Every boiler has an individual constant, and according to this theory it is unchangeable except by changes in baffling, when it becomes another boiler with a new individual constant.
The curve labeled "Combustion temperature as affected by air supply" was calculated as explained for the chart shown in fig. 6 using constant specific heats.
The curve labeled "Heat absorption as affected by combustion temperature" is precisely the same curve as the upper curve of fig. 6, with the exception of the calculation as explained above.
The curve labeled "Heat absorption as affected by air supply" shows the same fact as the upper curve with reference to air supply per pound of carbon instead of the resulting temperature of combustion.
118 A STUDY OF FOTTB HtJNDftED STEAMING TESTS.
With 14 pounds of air per pound of carbon the ordinate at the left is 6.2. With 28 pounds of air the ordinate is 5.55 a decrease of about 10.4 per cent. The latter amount of air is high in practice. To reduce the heat absorption to 50 per cent of what it would be if the carbon were completely burned with the theoretical amount of air (11.50 pounds) would require 108 pounds of air per pound of carbon an enormous excess.
In all such calculations of heat absorption it is plain that the more nearly the temperature of the absorbing medium approaches that of the atmosphere that is, the lower the steam pressure the less the harm done by excessive amounts of air and the larger the percentage of total heat absorbed. This is an argument in favor of low steam pressures with high superheats, as suggested-tentatively on pages 102-105.
PRACTICAL APPLICATION OF THEORY OF HEAT ABSORPTION TO A FIRE-TUBEBOILER.
As a practical illustration of the meaning of these theoretical prin ciples, several calculations were made in the case of a fire-tube boiler assumed to consist of a single tube 0.1 foot in internal diameter and 10 feet long.
From the work of page 112 is taken the equation, which expresses the quantity of heat passing through any given portion of the tube.
(9) ( _ CXi _ CX2 \
D D JX0.24e -e /
in which H = heat absorbed in B. t. u.@0 . = elevation of initial temperatures above boiler-water
temperature.@Xl = elevation of temperature of gases above that of boiler
water at a point xx feet from the entrance end of the tube.
@X2 = elevation of temperature of gases above that of boiler water at a point x2 feet from the entrance end of the tube (x2 is farther along the tube than xj.
W = pounds of gases per pound of carbon. e = base of hyperbolic system of logarithms = 2.718.
D = internal diameter of tube in feet, c = a constant for any particular tube.
0.24 = the approximate specific heat of gases of combustion at constant pressure. This factor might well have been omitted and its effect on the equation accom plished by giving the constant "c," in the exponents of e, another value.
The following calculations assume that the metal of the tube is always kept at the water temperature, which is not true, inasmuch
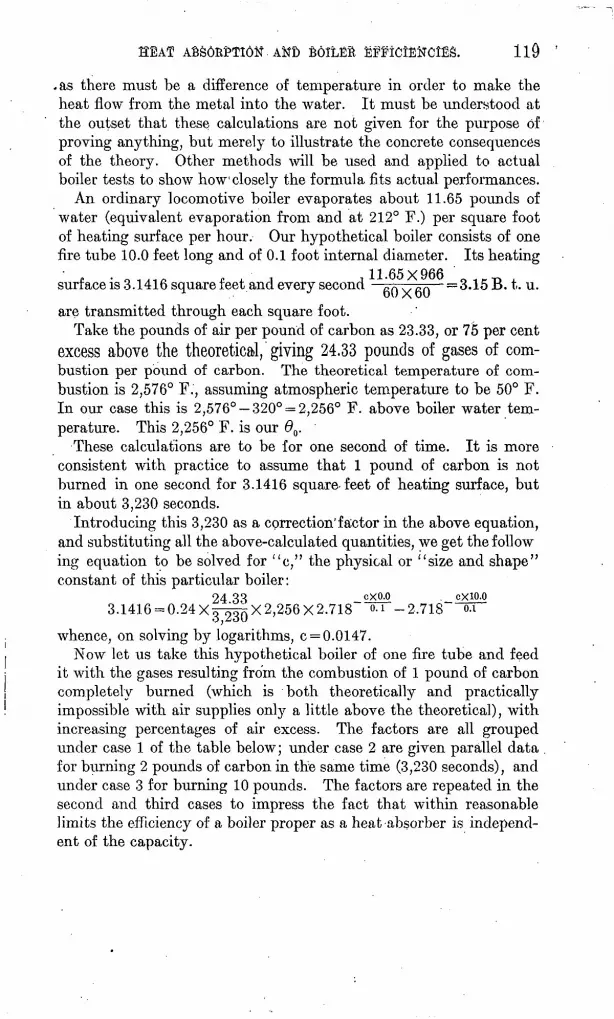
lid
.as there must be a difference of temperature in order to make the heat flow from the metal into the water. It must be understood at the outset that these calculations are not given for the purpose of proving anything, but merely to illustrate the concrete consequences of the theory. Other methods will be used and applied to actual boiler tests to show how closely the formula fits actual performances.
An ordinary locomotive boiler evaporates about 11.65 pounds of water (equivalent evaporation from and at 212° F.) per square foot of heating surface per hour. Our hypothetical boiler consists of one fire tube 10.0 feet long and of 0.1 foot internal diameter. Its heating
surface is 3.1416 square feet and every second Any fin = 3.15 B. t. u.
are transmitted through each square foot.Take the pounds of air per pound of carbon as 23.33, or 75 per cent
excess above the theoretical, giving 24.33 pounds of gases of com bustion per pound of carbon. The theoretical temperature of com bustion is 2,576° F., assuming atmospheric temperature to be 50° F. In our case this is 2,576°-320° = 2,256° F. above boiler water tem perature. This 2,256° F. is our 00 .
These calculations are to be for one second of time. It is more consistent with practice to assume that 1 pound of carbon is not burned in one second for 3.1416 square-feet of heating surface, but in about 3,230 seconds.
Introducing this 3,230 as a correction'factor in the above equation, and substituting all the above-calculated quantities, we get the follow ing equation to be solved for "c," the physical or "size and shape" constant of this particular boiler:
04 33 cxQ-o cxio-Q 3.1416 = 0.24X^-^X2,256X2.718 o- 1 -2,718 0.1
whence, on solving by logarithms, c = 0.0147.Now let us take this hypothetical boiler of one fire tube and feed
it with the gases resulting from the combustion of 1 pound of carbon completely burned (which is both theoretically and practically impossible with air supplies only a little above the theoretical), with increasing percentages of air excess. The factors are all grouped under case 1 of the table below; under case 2 are given parallel data for burning 2 pounds of carbon in the same time (3,230 seconds), and under case 3 for burning 10 pounds. The factors are repeated in the second and third cases to impress the fact that within reasonable limits the efficiency of a boiler proper as a heat absorber is independ ent of the capacity.
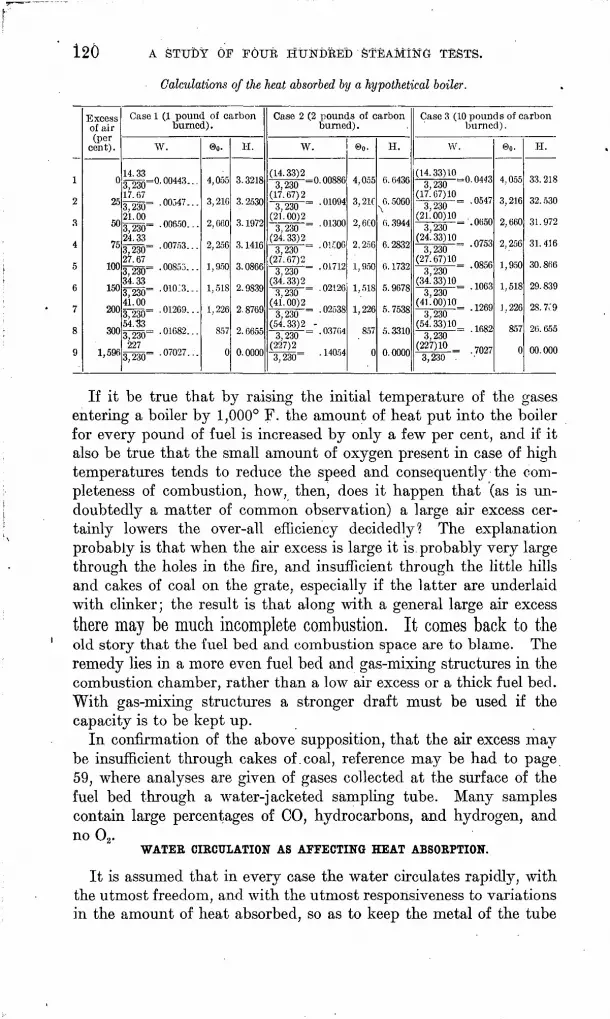
120 A STUDY OF FOUR HUNDRED STEAMING TESTS.
Calculations of the heat absorbed by a hypothetical boiler.
Excess of air (per
cent) .
0
25
50
75
100
150
200
300
1,596
Case 1 (1 pound of carbon burned) .
W.
14' 33 nnn44T3,230 °- 00443--- 17.673,230- -«K47... 21.003,230 - OOKi0--- 24.333,230 °°'"3--- 27.673,230 O08"-'--- 34.333,230- - 010 - 3 --- 41.003,230- - Oim -- 54.^33,230 - 01082---
2273,230" -O'O^7 ---
®o-
4,055
3,216
2,660
2,25C
1,950
1, 518
1,226
857
0
H.
3. 3218
3.2530
3. 1972
3. 1416
3.0866
2. 9839
2. 8769
2. 6655
0.0000
Case 2 (2 pounds of carbon burned) .
W.
(14-33)23,230 ^°- 00880
(17-67)23,230 - - 01094
(21-00)23,230 - - UMUU
(24' 33)2 0"OG3,230 - - U "-°l
(27.67)23,230 '" '
(34.33)23,230 Uz' Ub
(41-00)2 3,230 ~ ' U""J6
(54.33)2 -3,230 - - 037<14
(227)2 , jn _.3,230- 140°4
©o.
4,055
3,21C
2, 6CO
2,256
1, 950
1,518
1,226
857
0
H.
6. 6436
6. 5060
6. 3944
6.2832
6. 1732
5. 9678
5. 7538
5. 3310
0.0000
Case 3 (10 pounds of carbon burned).
W.
(14-33)103,230 U ' U44u
(17-67)103,230 - 0517
(2LOO)1° ' 06503,230 - 0h5U
(24.33)103,230 '°753
(27.67)103,230 -°85t)
(34.33)103 230 '
(4i!oo)ia 10ffl)3,230 ' U69 (54.33)10_
3,230 ^ (227)10 700?
3,230 . '
©0-
4,055
3,216
2,660
2,256
1,950
1,518
] . 226
857
0
H.
33. 218
32. 530
31.972
31. 416
30. 8fi6
29. 839
28. 7>" 9
26. 655
00.000
If it be true that by raising the initial temperature of the gases entering a boiler by 1,000° F. the amount of heat put into the boiler for every pound of fuel is increased by only a few per cent, and if it also be true that the small amount of oxygen present in case of high temperatures tends to reduce the speed and consequently the com pleteness of combustion, how, then, does it happen that (as is un doubtedly a matter of common observation) a large air excess cer tainly lowers the over-all efficiency decidedly? The explanation probably is that when the air excess is large it is probably very large through the holes in the fire, and insufficient through the little hills and cakes of coal on the grate, especially if the latter are underlaid with clinker; the result is that along with a general large air excessthere may be much incomplete combustion. It comes back to theold story that the fuel bed and combustion space are to blame. The remedy lies in a more even fuel bed and gas-mixing structures in the combustion chamber, rather than a low air excess or a thick fuel bed. With gas-mixing structures a stronger draft must be used if the capacity is to be kept up.
In confirmation of the above supposition, that the air excess may be insufficient through cakes of.coal, reference may be had to page 59, where analyses are given of gases collected at the surface of the fuel bed through a water-jacketed sampling tube. Many samples contain large percentages of CO, hydrocarbons, and hydrogen, andno02 .
WATER CIRCULATION AS AFFECTING HEAT ABSORPTION.
It is assumed that in every case the water circulates rapidly, with the utmost freedom, and with the utmost responsiveness to variations in the amount of heat absorbed, so as to keep the metal of the tube

HEAT ABSOKPTlOtf AM) BOlLEfi EFFICIENCIES. l2l
always at water temperature. In practice this would not be true, if for no other reason than because twice the rate of heat absorption would perhaps require twice the speed of circulation; but, whereas the forces impelling circulation may, perhaps, increase directly with the increase in steam production, the retarding forces of friction increase as the square of the speed of circulation. The latter sug gestions, however, are as yet only suppositions.
In each of the several calculations in the preceding table the £?! . _cxj
quantity e fi reduces to 1.0 because xt = 0; also the quantity e D has the constant value of 0.2295 because c and D are always the same and x2 is taken in the table always as 10.0 feet. Therefore, the quantity in the parenthesis reduces to (1-0.2295) = (0.7705). This constant is fixed once for all by the builder of the boiler when he chooses the length and diameter of the tubes. Consequently the heat absorbed by the tubes is directly proportional to the product of W and ©0 , which represent respectively the weight of gases flowing per second and their initial elevation in temperature above that of the boiler water. All the calculations made in the case of this hypothetical boiler are for the purpose of giving specific instances showing that the product of W and & is very nearly constant for all reasonable conditions of good firing.
It has been stated before that the heat absorbed by a boiler is proportional to the initial temperature elevation above that of boiler water, times initial density relative to any (fixed) standard, times velocity of translation over the heating surface. A moment's reflection will make it clear that the product of the last two factors is at all times proportional to the mass (or weight) of gases passing per unit of time.
CALCULATION OF HEAT ABSORPTION ALONG A FIBE TUBE.
As an illustration of the method of-using formula 9, a numerical example applied to the hypothetical boiler having a single tube of 0.1 feet internal diameter and 10 feet long is given below.
Assume that 1 pound of carbon is burned in 3,230 seconds with 25 per cent of excess of air. This is the same condition as given by the second line in the preceding table, case 1:
W = 0.00547 pound. @0 = 3,216° "F.
_dSubstituting these values, and also the value of (1 e D)for this
particular boiler as calculated above, in equation 9, H = W 00cl
(1 e ~ D )X0.24, the heat absorbed becomes
H = 0.00547 X 3,216 X 0.7705 X 0.24-3,253 B. t. u.

A STUDY OF POUR HUNDRED STEAMING TESTS.
Instead of using formula 9, which has been derived by calculus, the amount of heat absorbed by the single- tube boiler can be approxi mately obtained by applying in steps the fundamental principle expressed by equation 5, H = Cvp (T t). Let the length of the tube be divided into twenty parts, and the heat absorbed by each part calculated by the above equation. Before these calculations can be made the constant C must be determined. This can be done by substituting in equation 9 the value of 0.5 for 1, the already calcu lated .value 0.0147 for c; and also the values of W and & of case 2 in the table (p. 120) and solving for H. This will be the heat absorbed by the first half foot of the tube. Substituting this value for H in equation 5 and also the calculated values for velocity, density, and the excess of temperature of the gases from tables on pages 115 and 120, and solving, we determine the value. of C:
0.0147X0-5(9) H = 0.00547X3,216 (l-e~ 1 )X0.24 = 0.291 (5) 0.291=3,216X19.45X0.1955X0,
and hence0 = 0.0000238.
This procedure of determining the value of C had to be employed in order to put the two methods of calculating the heat absorbed on the same basis, making them comparable.
As 0.291 B. t. u. was absorbed from the gases by the first half foot.0 291 the temperature was reduced Q 24 x Q QQ547 = 222° F.; the elevation
of temperature above that of boiler water at the entrance to the next or second half foot of the tube = (3,216° -222°) =2,994° F.
The absolute temperature corresponding to 3,216° above steam temperature = 3,216 + 320 + 461 = 3,997° F. Likewise the absolute temperature corresponding to 2,994° F. above steam temperature = 2,994° + 320° + 461° = 3,775° F. Therefore the new velocity of the
3 775 gas at entrance on the second half foot of the tube is e/nny X 19.45 =
18.38 feet per second, inasmuch as the velocities are directly pro portional to the volumes. Likewise the new relative density is3 9970 ' _ x 0.1956 = 0.2070. It will be noticed that the simultaneous3,775changes in velocity and density neutralize each other, but both are carried through the calculations for the sake of the principle.
To go back to the fundamental principle, the amount of heat absorbed by the second half foot is equal to 2,994 X 18.38 X 0.2070 X 0.0000238 = 0.272 B. t. u.; and so on for each of the remaining eighteen half feet of the tube. On adding together all the partial H's the sum is 3.214 B. t. u., which is close to the value 3.253 obtained
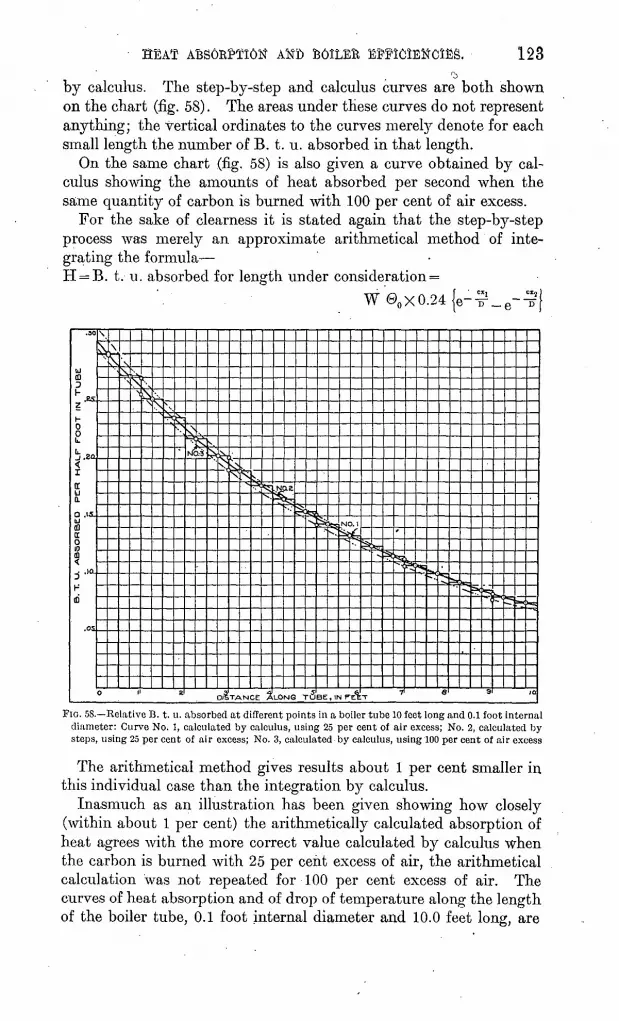
HEAT ABS6B£»±I6ff Atfft SOILED 123o
by calculus. The step-by-step and calculus curves are both shown on the chart (fig. 58). The areas under these curves do not represent anything; the vertical ordinates to the curves merely denote for each small length the number of B. t. u. absorbed in that length.
On the same chart (fig. 58) is also given a curve obtained by cal culus showing the amounts of heat absorbed per second when the same quantity of carbon is burned with 100 per cent of air excess.
For the sake of clearness it is stated again that the step-by-step process was merely an approximate arithmetical method of inte grating the formula H = B. t. u. absorbed for length under consideration ='
*fc
Mas
ILSfe
.TANCE AL-ONS TUBE, IN rAT
FIG. 58. Relative B. t. u. absorbed at different points in a boiler tube 10 feet long and 0.1 foot internal diameter: Curve No. 1, calculated by calculus, using 25 per cent of air excess; No. 2, calculated by steps, using 25 per cent of air excess; No. 3, calculated by calculus, using 100 per cent of air excess
The arithmetical method gives results about 1 per cent smaller in this individual case than the integration by calculus.
Inasmuch as an illustration has been given showing how closely (within about 1 per cent) the arithmetically calculated absorption of heat agrees with the more correct value calculated by calculus when the carbon is burned with 25 per cent excess of air, the arithmetical calculation was not repeated for 100 per cent excess of air. The curves of heat absorption and of drop of temperature along the length of the boiler tube, 0.1 foot internal diameter and 10.0 feet long, are

A STUDY OF FOUB HUNDBED STEAMING TESTS.
given in figs. 58 and 59. It will be noticed that the total heat ab sorbed is 3.0866 B. t. u., which is only 5.2 per cent less than with the smaller air supply. This result is an illustration of the statement that a boiler will absorb about the same percentage of the heat of a pound of fuel completely burned, whatever the air supply per pound of fuel, if the variation is within reasonable limits.
The curves of temperatures along the tube, when using 25 and 100 per cent excess of air, shown on fig. 59 (p. 125), were obtained as follows: Those on the step-by-step curve were taken directly from the column headed " @0 " in the following table:
Heat absorption along a hypothetical boiler tube, by sections, at 25 per cent of air excess.
Half foot:
Third......................................
Fifth......................................
Eighth ....................................
Twelfth ...................................- Thirteenth ................................
Initial minus boiler-water temperature
<°F.). ®o
3,2162,9942,7872, 5952,4162,2502,0951,9511,8611,6911,5741,4651,3641,2701,1831,1021,026
955890829
772
Velocity of gas at en trance to
each section (feet per second)."
V
19.4518.3817.3816.4515.5914.8014.0613.3612.7012.1211.5511.0210.5410.099.659.268.898.548.267.97
Density of gas at en trance to
each section. Gas at 320°= 1.
P
0. 1956.2070.2189.2312.2440.2571.2709.2850.3000. 3149.3301.3460.3620.3780.3950.4110.4290.4460.4590.4760
Partial heat absorbed (B. t. u.).
H=®xvX PXC.6
0.291.272.252.236.218.203.190.177.165.154.143.133.124.115.107.100.093.086.080.075
3.214
« Weight of gases per second in pounds= 3030 =0-00547.
» Constant=0.0000238.
The five points on the curves obtained by calculus were located by using formula 8 for five lengths of tube, 0 to 2 feet, 0 to 4 feet, 0 to 6 feet, 0 to 8 feet, .and 0 to 10 feet.
HIGHER INITIAL TEMPERATURE MEANS HIGHER FINAL TEMPERATURE WHEN HEAT ABSORPTION IS BY CONVECTION ONLY.
Regarding the two curves of temperature changes along the length of the hypothetical boiler tube when using 25 per cent and 100 per cent excess of air, it appears that however long the tube might be, the upper temperature line would never meet the lower one, and would never cross it. This statement is also borne out by a consideration of the mathematical equation on which the curves are based. It is in direct contradiction to a statement often made that the higher the initial temperature the lower the final, provided the amount of heat liberated

HEAT ABSORPTION AND BOILER EFFICIENCIES. 125
per unit of time is the same in every case. For many months most of the authors of this bulletin thoroughly believed this idea, and it was only when they took many cases and tried to plot the relations between combustion-chamber and stack temperature that they saw the two rise and fall together. Later on the work of Perry on the boiler as a heat absorber was developed and it was realized that the facts, at the testing plant at least, agreed somewhat with the theory and pointed in the right direction. In this connection it must be remembered that a lower flue temperature does not always indicate a lower B. t. u. loss, but generally a larger one, because the mass of gases is more than enough larger to make up the difference; but in any one boiler the net difference is usually within 5 to 15 per cent.
390
U
3b«
L
-iezo
>WC
8 to
^
bj p^&SOQDCu
L
J
<n j
Jisoo
L
ua
Fr
\^
s
^
s
^v
s>
\
.
s.
N
V
k
^
\
V
^
^
^
^
s^ k-
^
V
*
k
^1
v
fcs" ^
"^
V
^
^
X
m̂s.
a's -^
if. . HO. <^^^
" NO a^
~* "~^
K
^*,
^ ^̂s^
^
^
>, ^^^
~-
'
V; -^~̂
~^^0. U3 ft£ 30 4/> 5P 6.0 1A Qp d.o IO.O
OI3TANCC XVl-ONG TUBE IN FCBT
FIG. 59. Relative temperatures of the products of combustion passing through a boiler tube 10 feet long and 0.1-foot internal diameter: Curve No. 1, calculated by steps, using 25 per cent of air excess; No. 2, calculated by calculus, using 25 per cent of air excess; No. 3, calculated by calculus, using 100 per cent of air excess.
MODIFYING FACTORS OF THE THEORY OF HEAT TRANSMISSION.
In the section on the theory of heat transmission the assumption was made that the gas comes directly into contact with the metal surface of the boiler flue, and also that the water in the boiler absorbs the heat as fast as the metal can transmit it. In a commercially operated boiler neither of these assumptions is true. The metal of the boiler flue is insulated from the gas with a layer of soot, and from the water with a layer of scale and, perhaps, a layer of steam. As these layers of soot, scale, and steam are very poor conductors, a resist ance many times greater than that of the metal of the boiler tube itself is offered to the passage of heat. It is evident that under such condi tions the difference of temperature between the first layer of gas and
126 A STUDY OF FOUR HUNDRED STEAMING. TESTS.
that of the first layer of water must be greater than it would have to be if the insulating layer of soot, scale, and steam were not present, in order that the heat should flow from the gas to the water at a cer tain desired rate. This temperature difference must, be larger the greater the required rates of heat transmission and the thicker .the insulating scales. Inasmuch as capacity is the rate of heat absorp tion, this explains why at higher capacities the gases leave the heat ing surface of a boiler at higher temperatures than they do at lower capacities. It is clear, then, that in order to have the heating surface efficient it must be kept free from soot and scale, and the bubbles of steam must be removed from the surface as fast as they form, so that the water can come directly into contact with the metal. This last- requirement emphasizes the importance of water circulation in the boiler. The faster the circulation of water the faster are the bubbles of steam carried away and the better is the contact between the metal and the water.
It is reasonable to expect that in the Heine boiler when the capac ity is increased the rate of circulation of water should be increased in about the same proportion, in order that the metal surface maybe kept free from steam bubbles. To what extent this is true is shown in the chart (fig. 7, p. 16) that gives the relation between the circu lation of water in a water tube boiler and the capacity.
The effect of the above-named modifying factors that is, the resistance offered to heat passage by soot, metal, scale, and steam is to increase the temperature difference between the outside surface of the adhering gas film and the film of water coming into contact with the steam layer when the rate of heat transmission that is, the capacity increases. By taking into consideration these factors, and also the fact that the adhering film of gas does not consist of a layer 1 molecule thick, but has a sufficient thickness to offer an appreciable resistance to the passage of heat through it, a formula similar to that whose derivation is shown on pages 110 to 112 can be obtained that .will agree very closely with the actual peiformances. Fig. 60 gives the temperature gradient of the moving gases and also the temperature gradients along the surfaces of contact of the different resistance- producing layers. Let dl be any elementary length of the heating surface; T tl the temperature difference between the moving gases and the outside surface of the adhering film of the gas, and tx t the temperature difference between the latter and the water film coming into contact with the layer of steam. The temperature differences between the individual layers are expressed by a b, b Cj etc., as shown in the figure. The heat transmission from the moving gases at the temperature T to the adhering immovable film at the temper ature tj occurs by convection, according to the relation expressed by equation 1, H = Cpv (T tx), and the heat transmission from the

HEAT ABSORPTION AND BOILER EFFICIENCIES. 127
gas film through the layers of gas, soot, metal, scale, and steam into the water at temperature t occurs purely by conduction, and follows the law expressed by equation 12:
I= k(t -t)
where k is the average conductivity for heat of the materials compris-k .
ing the layers and b their total thickness. As r- is a constant, H
varies only with the value of (tt t).If the rate of heat impartation by convection is higher than the rate
of transmission by conduction, the heat will accumulate in the resist-
THICKNESS OF LAYERS »
abcdef- TEMPERATURE
FIG. 00. Diagrams illustrating temperature gradients of moving gases. The diagram at the left rep resents qualitatively the successive temperatures along the line of travel of gases through a boiler (ire tube. The diagram at the right shows, qualitatively, the temperature gradients between gases and water at point T of the left diagram.
ing layers on the gas side and tj will rise. The rise of ti will decrease the rate of heat impartation by convection and increase the rate of heat transmission by conduction. The opposite will occur if the rate by convection is lower than the rate by conduction. There is a con stant equalization of the two rates, so that equations 1 and 12 can be written as follows:
The heat transmitted per second by any portion of the heating surface is then expressed by equation 1, H = Cpv(T tj, in which T and tt are variables, T depending on the conditions of combustion

128 A STUDY OF FOUR HUNDRED STEAMING TESTS.
and the rate of heat impartation, whereas tt depends on the rate of heat impartation only. From equation 12
Substituting this value for ^ inequation 1, and simplifying, we get equation 14:- cp(T-t)
Let W be the weight of gases passing the heating surface perC'
second, then as p = ~ and v = C" W T; C p v = C: W, where C^ is a new
constant.
Let Cx j- = K, and (T t)=©; on substituting these values in.K
equation 14 it becomes f! Wf)
(15) H = '{ } 1+KW.
and the heat absorbed by any elementary length of heating surfaceP W@
per second is Wd@ = 1 TT W dl, or
(16) d@ - Oi dl ^ ; @ i + KWOn integrating equation 16, there results
When 1 = O, loge @0 = K. Hence
loge ©-loge@o= ~
whence Gil
(17) @=00 e I+KW
The heat absorbed by the length of heating surface equal to 1 is di
(18) H = 0.24W00 l-e I+KW
and the true efficiency of the heating surface is Gil
(19) E = l-e I+KW.
Equation 19 states that the true efficiency of the heating surface is independent of the initial temperature of the gases so far as heat absorption by convection is concerned and that it decreases when the weight of gases passing over the heating surface increases that is, when the capacity increases. The constant K depends on the condi-

HEAT ABSORPTION AND BOILER EFFICIENCIES. 129
tion as regards cleanliness of both sides of the heating surface. If there were no resistance to the passage of heat, K would be equal to 0, the denominator would reduce to 1, and equation 19 would be the same as equation 10, D being constant in any one boiler, fixed once for all by the maker.
It is probable that the film of gas which is -entangled in the rough sooty surface is of considerable thickness and that rather a large part of the resistance to the passage of heat is perhaps clue to this film. It is also very likely that as the velocity of the gases increases their scrubbing action reduces the thickness of this film. This probably again adds to the importance of the velocity of gases along the heating surface.
The influence of the velocity of gases on the thickness of the film has not been taken into consideration in the derivation of equation 18. It would somewhat lessen the effect of W on the true efficiency; that is, it would make the true boiler efficiency more nearly constant for all rates of working.
The velocity of circulation of water in the boiler is equal in impor tance to the velocity of the gases on the outside of the heating surface. The same mathematical reasoning can be applied to the influence of velocity of gases on the impartation of heat. The amount of steam formed increases directly with the rate of heat transmission, and if the scrubbing action of the circulation of water is insufficient to remove it from the heating surface the resistance due to the layer of steam formed will rise with the rate of making steam. Lack of adequate circulation of water in a boiler is a check to capacity. The fact is becoming well known that small automobile boilers are making steam ten to twenty (or even more) times as fast per unit of heating surface as stationary boilers in power plants, and at better efficiency. This increased rate of steaming is attained purely by high velocit}r of water and steam circulation over the heating surface.
Formulas 17, 18, and 19 apply only to heat imparted to the boiler by convection and conduction. The heat which is received by radia tion perhaps follows nearly the radiation law of Stefan and Boltz- mann, expressed by equation 20,
(20) H = C (T4 -V),where T is the absolute temperature of the heat-radiating body, tt the absolute temperature of the heat-receiving body, and C a constant.
In the case of a boiler, tj is the temperature of the outside layer of soot on the heating surface, and is a variable, depending on the rate of heat transmission through the sooted and scaled boiler plate. The heat transmitted through the boiler plate is given by equation 12,
H=i-(t1 t). As the heat transmitted through the boiler plate is
§400 Bull, 32o 07 9

130 A STUDY OF FOUR HUNDRED STEAMING TESTS.
equal to the heat received by the surface of the plate by radiation, equations 12 and 20 can be written as follows:
C (T*-t1 *) = H = ̂ (t1 -t).
On substituting the value of tj from equation 12 in equation 20, the latter becomes
(20) H = C[~T4 - (H
This is an equation of the fourth degree, and the value of H can be obtained by the method of approximation.
By the use of equations 18 and 20 it is possible to obtain the total heat absorbed by any boiler and its true efficiency. However, before the equations can be used the constants in them must be deter mined for any particular boiler. The four constants in the two equa tions were determined for the Heine boilers at the fuel-testing plant in this way : Four specific cases were selected from the results of boiler trials and from the resulting equations ,the values of the con stants were approximated. The two equations applied to these Heine boilers are
(18) HC = 0,24W@0 (i- e ~ i+5:^iw), and
H = __ FT4 -r 540 + 101
where t at 80 pounds gage pressure is 785° F. absolute and @0 is T t, T being the actual absolute temperature in the furnace in degrees Fahrenheit; Hc the heat received per second by the boiler by con vection and conduction; Hr the heat received per second by radia tion from the brickwork, etc., of the combustion chamber; and W the weight of gases in pounds passing over the heating surface persecond. Within the workable temperature range from 2,461° to 3,361° F. absolute, Hr is obtained with fair accuracy by the simple straight-line equation
(21) Hr = 0.14.41-294.The per cent of heat received by radiation referred to total heat
available is .OON -a (0.144T-294)X100{ } r 0.144l-294 + 0.24W00
and the per cent of heat received by convection referred to total heat available is
2.7(23) Ec = 100 (1-e 1+0- 1524W )X(l-Er).
The true boiler efficiency is then expressed by equation 24:(24) E4 = Er + Ec . Heat which is radiated to the boiler during the combustion of fuel
is not sensible heat, because it does not raise the temperature of the gases. This is the reason why the heat radiated is added to the

HEAT ABSOKPTION AND BOILEK EFFICIENCIES. 131
heat in the gases at the temperature T to obtain the total heat avail able for the boiler. Er has been calculated by formula 22 for five values of W and the results are plotted on the lower part of fig. 61.E \ ' '
^has been calculated by equation 23 and the results are plot-
ted on the upper part of fig. 61. The true efficiency of tnese par-
77 79 81 63 BS
PER CENT OF HEAT RECEIVED BV CONVECTION
£561 Z76I 2961 3161AVERAGE ACTUAL. TEMPERATURE. IN FURNACE (°AB6.).
FIG. 01. Relation of pounds of gases passing through boiler per second to per cent of heat received by convection (upper curve); also the relation between ratio of per cent of heat received by radiation to total heat available and the average actual temperature (degrees F. absolute) in furnace (flvc lower curves).
ticular Heine boilers can be obtained for any condition within the practice of operation by a simple multiplication and addition.
Example 1. Let 5 pounds of gases pass over the heating surface in a second, and let the actual furnace temperature be 2,961° F. abso-

132 A STUDY OF FOUR HUNDRED STEAMING TESTS.
lute. In fig. 61 (lower part), where W = 5 pounds and T = 2,961° F. absolute, Er = 4.85. In the upper curve of fig. 61, where W = 5 pounds,
E° =78.15. Then E4 = Er + Ec = 4.85 + 78.15 X (100-4.85) =100 -li/r
79.15.Example 2. Let W = 3 and T = 3,261° F. absolute. Then Er = 9
and ^c =84.2. E4 = Er '+ Ec = 9 + 84.2 X (100 - 9) = 85.62.100 Ji/r
Example 3. Let .W = 5 pounds, and T = 3,261 ° F. . absolute. Then
Er = 5.6and- T, =78.15. E4 = Er + Ec = 5.6 + 78.15 X (100-5.6) = 100 sLT
80.4. .In examples 2 and 3 the capacities are to each other very nearly
as 3 is to 5; that is, if .the capacity is 90 per cent in example 2 it is nearly 150 per cent in example 3.
Equations 18 to 24 are rational formulas, and are interesting because they are derived purely by mathematical reasoning from the fundamental laws of . physics that is, the laws of convection, conduction, and radiation of heat. It is gratifying that the actual performance of two individual boilers throughout wide ranges of furnace temperature and rates of combustion has been very closely approximated by a formula based on fundamental principles of phys ics the laws of the kinetic theory of gases and liquids and of the transfer of heat by conduction and radiation.
TEMPERATURE TEST OF PERRY'S EQUATION.
For the purpose of testing Perry's equation, that "The temperature above boiler water of the gases entering a boiler = the temperature above boiler water of gases leaving the boiler, times a constant," all tests on which approximate combustion-chamber temperatures were taken by a Wanner optical pyrometer were used a total of 215 tests. For convenience, the temperature of the water in the boiler was assumed to have been always 317° F. This temperature varied 5° or 6° in different tests. The resulting constants, which ranged from 4 to 14, were collected in groups, showing that two fall between 4.5 and 5, six between 5 and 5.5, nineteen between 5.5 and 6, etc. These relations, plotted on the chart (fig. 62) , show that the peak comes at 7.25; the arithmetical average of all the values is 7.43. It will be noticed on the curve that there are more high values than low values, whereas a true probability curve is symmetrical on both sides of the vertical axis.
On looking up the high values, especially those between 10 and 10.5, the average point of which is rather high, it is found that they belong to tests having flue temperatures that are suspiciously low for various reasons. But leaving in this point and casting out the six tests hav-
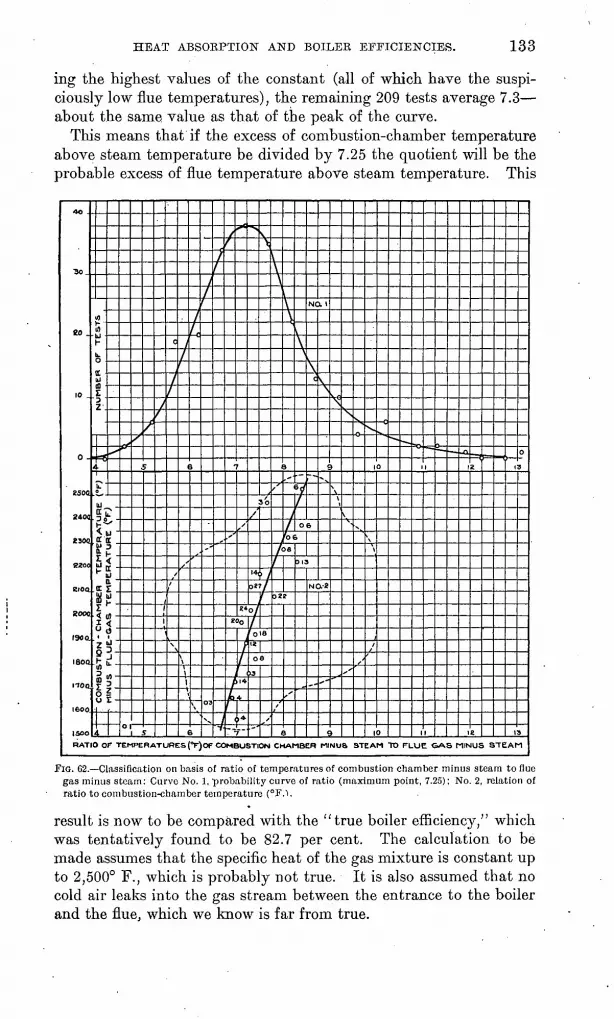
HEAT ABSORPTION AND BOILER EFFICIENCIES. 133
ing the highest values of the constant (all of which have the suspi ciously low flue temperatures), the remaining 209 tests average 7.3 about the same value as that of the peak of the curve.
This means that if the excess of combustion-chamber temperature above steam temperature be divided by 7.25 the quotient will be the probable excess of flue temperature above steam temperature. This
30.
eo .
10 .
2500
2400
230Q
8200
eioo
KOOO
1900.
I80Q
ITOtt
ieoo
ISOO
RAT
II)& hh.
tt111
4.1u.
~ COMBUSTION - CHAMBER TEMPERATURE
4
**
ks
r 3
<\iT,j
4
J
D
(t//
J
-/-
\
1
0
/
//
\
i
s
\
\\
/
3
\
6
i
-'
xx
t
_
4
/r
-
S
/
X*
200
/
Ph .4
-t. "T"
*>
/
14,
\\
30
f 1o.»/
tO
18
1
a
08
>3
''s
\
''
/32
'
\
j
1-a
?
,'
a
\
?o
313
NC
\C
--
6
NC
.
X 1
\
s^
V2
* '
^
>
sV
9
\
V
,'
^
^
~^.
,
\\
/
0
10
^ «,
1
1
1
1
.n
i
i
Z
e
o
13
13
O OF TEMPERATURES (°F)OF COMBUSTION CHAMBER MINUS STEAM TO FLUE GAS MINUS STEAM
FIG. 62. Classification on basis of ratio of temperatures of combustion chamber minus stearn to flue gas minus stearn: Curve No. 1, probability curve of ratio (maximum point, 7.25); No. 2, relation of ratio to combustion-chamber temperature (°F.1.
result is now to be compared with the "true boiler efficiency/' which was tentatively found to be 82.7 per cent. The calculation to be made assumes that the specific heat of the gas mixture is constant up to 2,500° F., which is probably not true. It is also assumed that no cold air leaks into the gas stream between the entrance to the boiler and the flue, which we know is far from true.

1.34 A STUDY OF FOUR HUNDRED STEAMING TESTS.
On the assumption that the initial temperature of the gases is 2,500° F., this is 2,500°-317° = 2,183° F. above steam temperature; 2,183° divided by 7.25 = 301° F. the probable excess of flue temperature over boiler-water temperature. Now, out of the maximum possible 2,183 B. t. u. that might be absorbed by a boiler from each 4.15 or CoiT ) pound of furnace gases, this boiler absorbed 2,183 301 = 1,882 B. t. u., which is 86.2 per cent of 2,183. That is, the true boiler efficiency cal culated from initial and final temperature of gases is 8.6.2 per cent, which is fairly close to the 82.7 per cent found above.
Into this method of calculating the "true boiler-efficiency constant" there enter two errors, which will be roughly corrected in a specific calculation. The combustion-chamber temperature, as read by the optical pyrometer, is known to have been usually low. In this calcu lation it will be assumed that the pyrometer read 100° low, making the true initial temperature 2,600° F.; also it will be assumed that the air which leaked through the r etting amounted to 20 per cent in mass of the gases which entered the boiler, which is an approximately true average, and that all of this air entered the stream of gas after leaving the boiler and before reaching the flue thermometer, which is not true.
The initial temperature is 2,600°-317° = 2,283° F above steam temperature. If we use the old constant, 7.25, the flue temperature should be 2,283° F. -T- 7.25 = 315° F. above steam temperature, which would make the flue temperature 632° F., say 630°. Remembering that this 630° is the result of the cooling of the gases by the boiler and also of the addition of cold air at 60° F. to the extent of 20 per cent, we can calculate that the flue temperature would have been about 768° F. had this admixture not occurred. Subtracting 317° from 768°, we have left 451° F. Thus out of the maximum 2,283 B. t. u., which a boiler might possibly be built to absorb from every 4.16 pounds'of gases, this boiler absorbs 2,283 451 = 1,832 B. t. u., which is 80.3 per cent of 2,283. That is, the true boiler efficiency thus approximated by initial and final temperature of furnace gases is 80.3 per cent; before correction it was 86.3 per cent. The mean is close to the value 82.7 found by the entirely different heat-balance method.
RATIO MODIFIED IN PRACTICE BY INITIAL TEMPERATURE.
The lower curve of fig. 62 (p. 133) was formed for all the individual tests from the same ratios as the. upper curve! The ratios of excess of furnace temperature to excess of flue-gas temperature were all plotted preliminarily on a sheet of coordinate paper, and the average value of the ratios falling in each horizontal temperature strip 50° wide was determined. These average values are given by the posi tions of the small circles, the number beside each giving the number of tests falling in that horizontal temperature strip. It will be noticed that the heavy line, drawn through the points from these averages
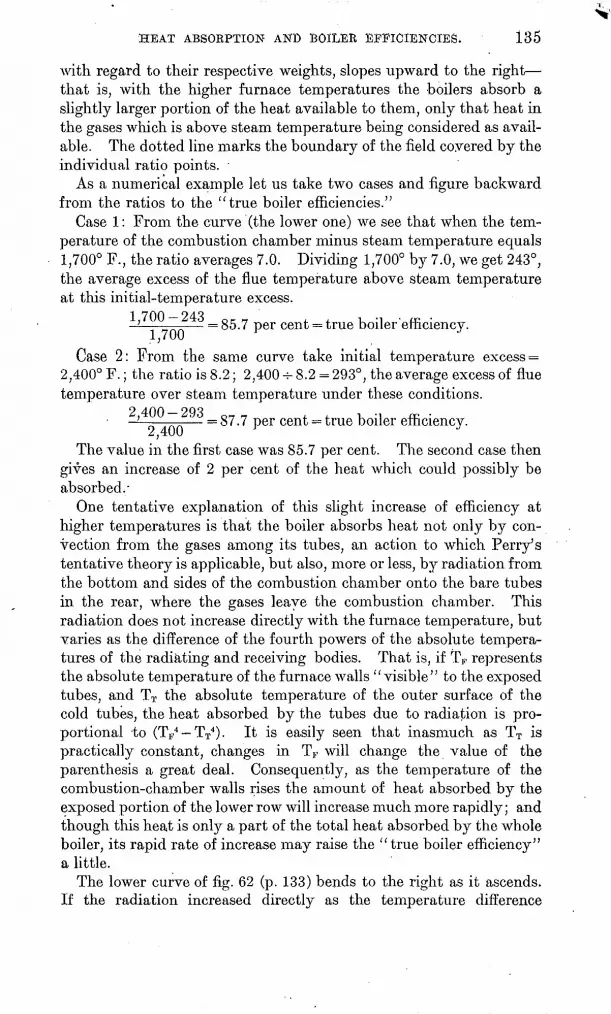
HEAT ABSORPTION AND BOILER EFFICIENCIES. 135
with regard to their respective weights, slopes upward to the right that is, with the higher furnace temperatures the boilers absorb a slightly larger portion of the heat available to them, only that heat in the gases which is above steam temperature being considered as avail able. The dotted line marks the boundary of the field covered by the individual ratio points.
As a numerical example let us take two cases and figure backward from the ratios to the "true boiler efficiencies."
Case 1: From the curve (the lower one) we see that when the tem perature of the combustion chamber minus steam temperature equals 1,700° F., the ratio averages 7.0. Dividing 1,700° by 7.0, we get 243°, the average excess of the flue temperature above steam temperature at this initial-temperature excess.
1.700-243 oc ' , . i -i a, ' = 85.7 per cent = true boiler efficiency.
Case 2: From the same curve take initial temperature excess = 2,400° F.; the ratio is 8.2; 2,400 -v- 8.2 = 293°, the average excess of flue temperature over steam temperature under these conditions.
' ~, ' = 87.7 per cent = true boiler efficiency.
The value in the first case was 85.7 per cent. The second case then gives an increase of 2 per cent of the heat which could possibly be absorbed.-
One tentative explanation of this slight increase of efficiency at higher temperatures is that the boiler absorbs heat not only by con vection from the gases among its tubes, an action to which Perry's tentative theory is applicable, but also, more or less, by radiation from the bottom and sides of the combustion chamber onto the bare tubes in the rear, where the gases leave the combustion chamber. This radiation does not increase directly with the furnace temperature, but varies as the difference of the fourth powers of the absolute tempera tures of the radiating and receiving bodies. That is, if TF represents the absolute temperature of the furnace walls "visible" to the exposed tubes, and TT the absolute temperature of the outer surface of the cold tubes, the heat absorbed by the tubes due to radiation is pro portional lo (TF4 TT4 ). It is easily seen that inasmuch as TT is practically constant, changes in TF will change the value of the parenthesis a great deal. Consequently, as the temperature of the combustion-chamber walls rises the amount of heat absorbed by the exposed portion of the lower row will increase much more rapidly; and though this heat is only a part of the total heat absorbed by the whole boiler, its rapid rate of increase may raise the "true boiler efficiency" a little.
The lower curve of fig. 62 (p. 133) bends to the right as it ascends. If the radiation increased directly as the temperature difference
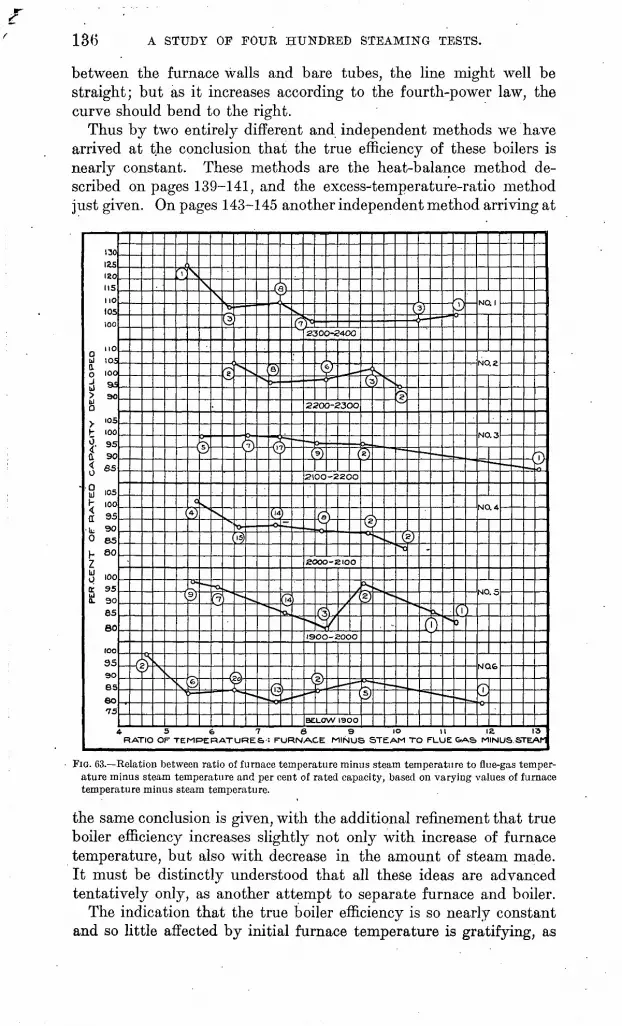
136 A STUDY OP FOUR HUNDRED STEAMING TESTS.
between the furnace walls and bare tubes, the line might well be straight; but as it increases according to the fourth-power law, the curve should bend to the right.
Thus by two entirely different and independent methods we have arrived at the conclusion that the true efficiency of these boilers is nearly constant. These methods are the heat-balance method de scribed on pages 139-141, and the excess-temperature-ratio method just given. On pages 143-145 another independent method arriving at
FIG. 63. Relation between ratio of furnace temperature minus steam temperature to flue-gas temper ature minus steam temperature and per cent of rated capacity, based on varying values of furnace temperature minus steam temperature.
the same conclusion is given, with the additional refinement that true boiler efficiency increases slightly not only with increase of furnace temperature, but also with decrease in the amount of steam made. It must be distinctly understood that all these ideas are advanced tentatively only, as another attempt to separate furnace and boiler.
The indication that the true boiler efficiency is so nearly constant and so little affected by initial furnace temperature is gratifying, as

HEAT ABSORPTION AND BOILER EFFICIENCIES. 137
suggesting that some such formula as Perry's must be nearly correct. Thus encouragement is given to the hope that there is a way to deter mine once for all one constant boiler efficiency, from which we can calculate backward and obtain the combustion efficiency or per cent of completeness of combustion the vital point in fuel testing. This applies only to boilers obtaining their heat by convection, not by radiation.
Fig. 63 is based on exactly the same data as those of fig. 62 (p. 133), which are elsewhere explained. It is intended to show the rela tion of flue-gas temperature to capacity when the furnace tempera ture remains nearly constant. The tests were arranged in six groups in such a way that the variation of the furnace temperature was less than 100° F. in each group.
The tests in each of these groups were then classified on the basis of the ratio of temperature of furnace minus that "of steam to tem perature of flue gas minus that of steam, and this ratio was plotted against the average capacity of each class.
The curves show a general tendency of the capacity to rise with the low-temperature ratios. This is in accordance with equation 17; as the furnace temperature remains nearly constant, higher capaci ties are obtained by increasing the weight of gases passing over, the heating surface-per second. The. increase of the weight of gases causes, according to equation 17, the rise in flue-gas temperature.
In other words, this rise, of flue-gas temperature is probably due to two causes: (1) When more heat is put through the outer gas film, soot, metal, scale, and inner steam film or bubbles the tempera ture gradient must necessarily be steeper, and since the conductivity of all these layers except the metal is low, the rise of temperature of the outer soot layer and its entangled gases may be several hundred degrees, whence it becomes a less active heat absorber, and conse quently the gas escapes at a higher temperature, so that the effi ciency of the boiler is less. (2) As shown in fig. 7 (p. 16), the circu lation of water does not keep up to requirements, so that the steam film on the scale becomes thicker, or more of the surface is covered with bubbles, which again makes the boiler a poorer heat absorber.
A CONCEPTION OF BOILER AND FURNACE EFFICIENCY.
THE CODE FORM AND A REVISED FORM OF HEAT BALANCE.
The "boiler efficiency" given in the A. S. M. E. code as item 72* is the ratio of the heat absorbed in the boiler and carried away in the steam to the highest possible amount of heat that could be generated in the furnace. The denominator of this ratio is calculated by sub tracting from the total pounds of "combustible" fired the number of pounds of combustible in the ash and multiplying this difference by the calorific value of 1 pound of "combustible."

138 A STUDY OF FOUR HUNDRED STEAMING TESTS.
The efficiency represented by code item 72* is, then, the over-all efficiency of the whole steam-generating apparatus, as combustible found in the ash is considered as if it had never been fired. It often happens that, on account of incomplete combustion, the quantity of heat represented by the denominator of the above ratio is not really developed in the furnace. Carbon monoxide in the analysis of the stack gases is one indication of this incomplete combustion.
73
12
71
I 68
£ 67~~ 6S UlO 65 0 O 64
63
G 62
I '
O 60
fc 59
U 58
K 57 U 3I
CD 55s
2^4J
s^
^
C5^
"s,
u
X
0
&
^ "*>
,2d
[^
U
xj^*s.
(?Xd)J
*x
^
13'
<X
29
v.1
^>
27
NX
(li)
CURVE SHOV/ NG THE R OF ITEM NO. 1 OF HEAT TO ITEM NO; 6 OF HEAT
EACH TEST USED FOR HAO AN AVERAGE OF r MORE PER CENT OF C<
^- § -Tv-X ' ||
^is-o-^.^«^
^s.
~®V /^N*^T^
4 5 6 7 O 9 IO 1 12 13 14 13 16 17 IS 1 PER CENT OF HEAT UNACCOUNTED FOR, INCLUDING RAOIATl
B.T U. AVAILABLE FOR RAISING THE 'TEMPERATURE OF ONE
POUND OF' GAS FROM ATMOSPHERIC
TEMPERATURE TO THE INITIAL
N FURNAOE; TEMRERATUR.E
LATENT.P OF
ERO
y^
A" B\
G H TEMPERATURE OF STEAM IN BOILER
E F TEMPERATURE OF ATMOSPHERE
D C
K -S
'ERATURE TO WHICH THE
kJK
7O-T
ELATION BALANCE BALANCE
THIS CURN, vllNE OR 3«
U
"^
(2)
^^
^
3^
'E
-
^>
B 20 21 DN LOSS
MINUS THE LATENT HEAT WILL
RAISE THE GASES
POUNDS OF SAS PASSING OVER WATER- HEATING SURFACE PER HOUR.
FIG. 64. Relation of unaccounted-for loss, including radiation loss (upper curve) to boiler efficiency (code item 72*); and availability of heat to a boiler, as affected by changes in air supply to fuel (lower curve).
The ratio of the heat that is actually generated in the furnace to the maximum amount of heat that could be developed may be called the efficiency of the furnace or the furnace efficiency. The ratio of the heat absorbed by the boiler and carried away in steam to the heat actually generated from the burning of the fuel may be termed the boiler efficiency, and represents the ability of the boiler to absorb heat under given conditions. The efficiency given by code item 72* is the product of the boiler and furnace efficiencies as above denned.

HEAT ABSORPTION AND BOILER EFFICIENCIES. 139
Carbon monoxide is not the only resultant of incomplete combus tion, although the heat lost by it is the only loss due to incomplete combustion that has been taken account of in the heat balance. The remainder of the incomplete combustion losses appear in the " unaccounted for." A high unaccounted-for loss, then, should be an indication of low furnace efficiency.
The upper curve of fig. 64 shows the relation between "boiler effi ciency" (code item 72*) and the unaccounted-for loss plus radiation loss (heat balance, item 6). All the tests chosen for this chart have an average of 9 per cent or more of carbon dioxide in the escaping gases, which indicates that they must all have had comparatively high furnace temperatures. It has always been thought that when a high furnace temperature is maintained the boiler would absorb a high per cent of the heat developed in the furnace; therefore, the boiler efficiency as defined above must have been relatively high for all the tests of this chart.
It will be noticed that the sum of the ordinate and abscissa for any point of this curve* is constant at 77 per cent. For instance, when item 72* is 73 per cent the unaccounted-for loss is 4 per cent; sum, 77 per cent. When item 72* is 57 per cent, the unaccounted- for loss is 20 per cent; sum, 77 per cent. The curve should have been drawn more nearly horizontal for the low unaccounted-for values.
The decrease of the combined efficiency of boiler and furnace (code item 72*) with the increase of the unaccounted-for loss must then be due to the decrease of furnace efficiency.
With this idea of furnace efficiency in mind, a new form of heat balance, shown below, is compared with the heat balance given in the A. S. M. E. code.
Heat balance as given in the code.0 Per cent.
1. Heat absorbed by boiler................................................ 60.302. Loss due to moisture in coal............................................ . 20 '3. Loss due to moisture formed by burning of hydrogen..................... 4.094. Loss due to heat carried away in dry chimney gases...................... 14. 965. Loss due to incomplete combustion of carbon (CO loss)................... 2.176. Loss due to unconsumed hydrogen and hydrocarbons, to heating the mois
ture in the air, to radiation, and unaccounted for...'................... 18.22
A revised form of heat balance.
1. Heat absorbed by boiler................................................ 60. 302. Loss due to moisture in coal............................................ .263. Loss due to moisture formed by burning of hydrogen..................... 3. 264. Loss due to heat carried away in dry chimney gases..................... 11. 935. Loss due to radiation .................................................. 3. 97
Total heat generated ................................................ 79. 726. Loss clue to incomplete combustion of carbon '(CO loss)................... 2.177. Loss due to other forms of incomplete combustion....................... 18.11

140 A STUDY OF FOUR HUNDRED STEAMING TESTS.
In the new heat balance the subtotal 79.72 represents the per cent of the calorific value of the fuel that has been generated. It may be taken as the efficiency of the furnace, or, to speak more properly, the per cent of completeness of combustion. The latter phrase will be used in this discussion for this subtotal, which is denned as the ratio of the heat generated by burning a unit weight of combustible in the furnace to the heat obtained by burning the same weight of combustible in the calorimeter. This efficiency is designated else where in this bulletin by the symbol E3 .
The method of determining the radiation loss is given on page 143. It is noticed that items 3 and 4 are smaller in the revised heat bal ance than in .the heat balance of the code. This is because they have been multiplied by the per cent of completeness of combustion. This correction was made on the assumption that if only 79.72 per cent of the calorific value of tne fuel was realized, only 79.72 per cent of each constituent of the moisture and ash-free coal was burned. This may not be the state of affairs in incomplete 'com bustion, but the assumption furnishes a ba'sis for calculations and perhaps the correction made on this assumption reduces the error of the calculation within the limits of accuracy of the analysis of the escaping gases.
In the revised heat balance the ratio of 60.30 to 79.72 is the boiler efficiency, which may be defined as the ratio of the heat absorbed by the boiler and carried away in the steam to the heat actually generated by the burning of the fuel. This ratio is elsewhere in this bulletin designated by the symbol E5 . The product of the furnace and boiler efficiencies is the efficiency of the boiler and furnace com bined and is the same as that given in the code as item 72*. As explained above, this combined efficiency may be considered as the over-all efficiency of the steam-generating apparatus if the combus tible in the ash is considered as not being fired.
As the calculations for these charts are somewhat lengthy, one test has been taken as an example and the calculations for it are given at the end of this discussion. The number of pounds of gas passing over the water-heating surface per hour and also the theo retical initial temperature of the gas have been calculated for each test. The term initial temperature is used in this paper to mean that temperature to which the gases would rise if it were possible to prevent loss of heat from them by either conduction or radiation until all combustion had ceased. In figuring the initial temperature it was assumed that the specific heat remains constant.
All the steaming tests made at the testing plant were arranged in groups according to per cent of rated capacity, as follows: 65 to 75, 75 to 85, 85 to 95, etc. Then the tests of each of these groups were rearranged according to their'Calculated initial temperatures into the

HEAT ABSORPTION AND BOILER EFFICIENCIES. 141
following-groups: 1,600° to 1,800° F., 1,800° to 2,000° F., 2,000° to 2,200° F., etc. Each of these 40 smaller groups was averaged for (1) initial temperature (calculated); (2) pounds of gas passing over the water-heating surface per hour; (3) percentage of rated capacity developed; (4) boiler efficiency (E5), and (5) true boiler efficiency (E4 ). The first four averages for each group were considered as
FIG. 05 Curves cf constant boiler efficiency (Es) and of constant capacity developed.
data of one representative test and were plotted on the chart shown in fig. 65, and the first three and the fifth in fig. 66.
DERIVATION OF THE CONSTANT-CAPACITY CURVES OF FIG. 65.
Each of the above forty representative tests was plotted on rec-. tangular axes, the theoretical temperatures being used as ordinates (see fig. 65) and the number of pounds of gas passing over the water-
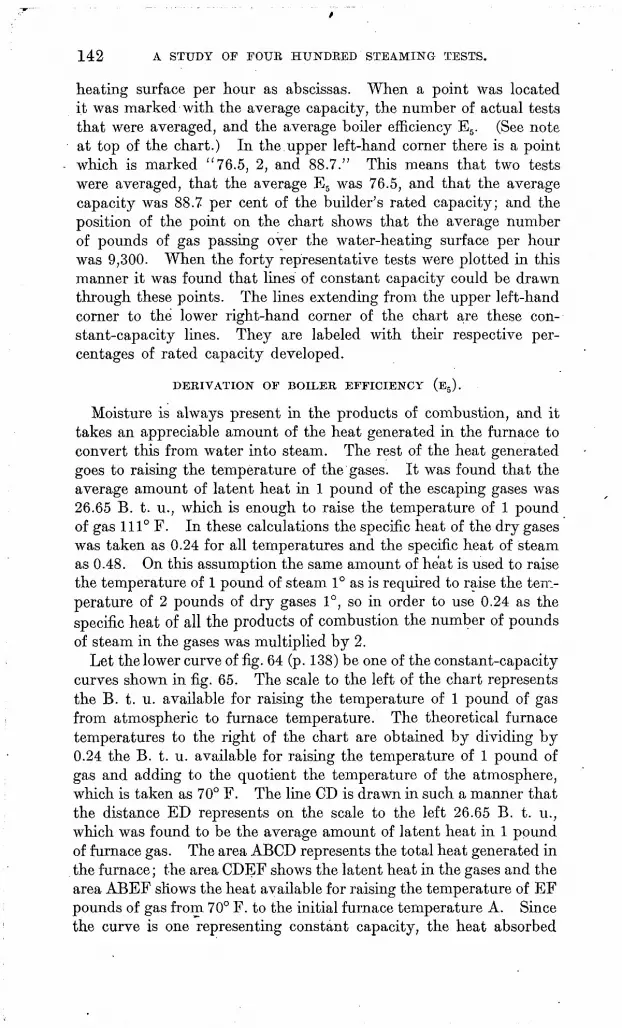
142 A STUDY OF FOUR HUNDRED STEAMING TESTS.
heating surface per hour as abscissas. When a point was located it was marked with the average capacity, the number of actual testa that were averaged, and the average boiler efficiency E5 . (See note at top of the chart.) In the.upper left-hand corner there is a point which is marked "76.5, 2, and 88.7." This means that two tests were averaged, that the average E5 was 76.5, and that the average capacity was 88.7 per cent of the builder's rated capacity; and the position of the point on the chart shows that the average number of pounds of gas passing over the water-heating surface per hour was 9,300. When the forty representative tests were plotted in this manner it was found that lines of constant capacity could be drawn through these points. The lines extending from the upper left-hand corner to the lower right-hand corner of the chart are these con stant-capacity lines. They are labeled with their respective per centages of rated capacity developed.
DERIVATION OF BOILER EFFICIENCY (E5 ).
Moisture is always present in the products of combustion, and it takes an appreciable amount of the heat generated in the furnace to convert this from water into steam. The rest of the heat generated goes to raising the temperature of the gases. It was found that the average amount of latent heat in 1 pound of the escaping gases was 26.65 B. t. u. ; which is enough to raise the temperature of 1 pound of gas 111° F. In these calculations the specific heat of the dry gases was taken as 0.24 for all temperatures and the specific heat of steam as 0.48. On this assumption the same amount of he'at is used to raise the temperature of 1 pound of steam 1° as is required to raise the tem perature of 2 pounds of dry gases 1°, so in order to use 0.24 as the specific heat of all the products of combustion the number of pounds of steam in the gases was multiplied by 2.
Let the lower curve of fig. 64 (p. 138) be one of the constant-capacity curves shown in fig. 65. The scale to the left of the chart represents the B. t. u. available for raising the temperature of 1 pound of gas from atmospheric to furnace temperature. The theoretical furnace temperatures to the right of the chart are obtained by dividing by 0.24 the B. t. u. available for raising the temperature of 1 pound of gas and adding to the quotient the temperature of the atmosphere, which is taken as 70° F. The line CD is drawn in such a manner that the distance ED represents on the scale to the left 26.65 B. t. u., which was found to be the average amount of latent heat in 1 pound of furnace gas. The area ABCD represents the total heat generated in the furnace; the area CDEF shows the latent heat in the gases and the area ABEF shows the heat available for raising the temperature of EF pounds of gas from 70° F. to the initial furnace temperature A. Since the curve is one representing constant capacity, the heat absorbed

HEAT ABSORPTION AND BOILEE EFFICIENCIES. 148
by the boiler in all tests on this curve will be a constant and this constant divided by the area ABCD will be the boiler efficiency E5 for the point B. 'By using the ratio of the constant heat' absorbed by the boiler to the area ABCD, those positions of B which represent efficiencies 61,62, and 63 per cent, etc., were found. By this means lines of constant-boiler efficiency (E5 ) were found and drawn on the chart (fig. 65). It will be noticed that the efficiency of the plotted points generally falls within about 1 per cent of their allotted position as determined by these constant-efficiency lines.
DERIVATION OF TRUE BOILER EFFICIENCY (E4 ).
The constant-capacity lines are of the form xyn = constant, where x = number of pounds of gas passing over the water-heating surface per hour and y = the calculated initial temperature. The curves are all asymptotic to the lines x = 0 and y = 325° F. (See fig. 64.) The temperature of the steam in the boiler at about 80 pounds pres sure is 325° F. Now, if the boiler were infinitely long and there were no heat lost in radiation, the boiler could never cool the gases below a temperature of 325° F. In other words, only the heat repre sented by the area ABGH is available to the boiler. The ratio of the heat absorbed by the boiler and carried away in the steam (which is constant for any point on the constant-capacity line) to the heat available for the boiler, area ABHG, has been termed the true- boiler efficiency (E4). (This definition of E4 differs very slightly from the one finally chosen, for which see glossary, p. 182.)
This efficiency E4 has been calculated for each test and the method used is shown with the other calculations on page 145. The chart shown in fig. 66 is similar to that of fig. 65 in every respect except that E4 is used instead of E5 .
METHOD OF ESTIMATING RADIATION.
It was necessary to devise some method for estimating the radia tion losses in order to calculate the per cent of completeness of com bustion (E3 ). The method used was very crude and was based on the following reasoning:
The radiation from the top of the boiler drum and the front and rear water legs is very nearly constant and was determined as follows: With no fire under the boiler the uptake was closed by laying boards across the opening at the base of the stack and covering them with cement. This prevented any air from going up the stack. The fire doors and ash pit were bricked up to prevent air from entering the setting. After drawing the water out of the boiler it was filled with steam from another boiler carrying 80 pounds pressure. This pres sure was maintained until the temperature in the combustion cham ber became constant. The amount of condensed steam per hour was

144 A STUDY OF POUR HUNDRED STEAMING TESTS.
then weighed and was taken as a measure of the heat radiated per hour. The radiation from the brick setting and fire doors was con sidered to increase with the capacity. When the boiler developed 90 per cent of its rated capacity the variable radiation was taken as three- fifths and the constant radiation as two-fifths of the total heat radiated. The increase of the variable radiation with capacity was such as to
NOTE THE NUMBERS BY THE POINTS AffE ARRANGED IN THE, FOLLOWINOORDER:
TSUE BOILER EFFICIENCY "NUMBER OF TESTS. AVERAOED
FIG. 66. Curves of constant true boiler efficiency (BO and of constant capacity developed.
make the total B. t. u. radiated per hour 395,000 at 50 per cent of the rated capacity and 500,000 B. t. u. at 120 per cent of the-rated capac ity. A chart (not given here) was drawn having B. t. u. radiated per hour as ordinates and per cent of the rated capacity developed as abscissas, and the two above points were plotted on it. By connect-

HEAT ABSORPTION AND BOILER EFFICIENCIES. 145
ing these points with a straight line the B. t. u. radiated per hour could be estimated for any capacity.
The heat required to change 1 pound of water at 70° F. to steam at 212° F. = (212 - 70) X1 + 966 = 142 (0.48 + 0.52) + 966 = (0.48 X142) + (0.52 X142) + 966 = 68 + 74 4- 966 = 68 +1,040.
The heat required to raise 2 pounds of dry gas from 70° F. to 212° F. = (212-70)X0.24X2 = 68.
It is evident from the above that 1,040 more B. t. u. are required to change 1 pound of water from 70° F. to steam at 212° F. than are required to raise 2 pounds of gas through the same range of tempera ture. However, at any temperature above 212° F. the same amount of heat is required to raise the temperature of 2 pounds of gas 1° F. as is required to raise the temperature of 1 pound of steam 1° F. Therefore in calculating the total heat and the initial temperature of the gases, 1 pound of water may be considered as the equivalent of 2 pounds of dry gas, provided that in the case of the 1 pound of water account is taken of the 1,040 B. t. u. which are not available for rais ing temperature.
The following calculations were made on test 216, the heat balance of which is given on page 139:
Calculations based on test 216 to deduce a better heat balance.
Per cent of completeness of combustion (E3): Per cent. Per cent of rated capacity developed................................. 103.Calorific value of 1 pound of "combustible" taken as................... 100A. Heat absorbed by boiler (heat-balance item 1)...................... 60. 30B. Heat carried away in moisture of coal (heat-balance item 2)......... .26C. Heat carried away in moisture formed by burning hydrogen (heat-
balance item 3)......................................... (4. 09 H-100XE3)D. Heat carried away in dry gases (heat-balance item 4)....... (14. 96-^100xE3 )E. Heat lost in radiation............................................ 3. 97E3 (per cent of calorific value of fuel that has been generated.)=A+B-|-
C+D+E....................................................... 79.72Boiler efficiency (E5)=AXlOO-^-E3 ................................ 75. 64
Total pounds of equivalent dry gas passing over water-heating surface perhour: Pounds.
F. Moisture in coal for every pound of "combustible" (figured fromproximate analysis)........................................... 0. 03
Hydrogen per pound of '' combustible " (ultimate analysis)........; . 0543G. Moisture formed by burning of hydrogen=9X0.0543XE3 .. ..'.....'.. ,39H. Total moisture in gases formed from 1 pound of " combustible " =
F+G......................................................... .42Dry gas per pound of "combustible," assuming E3 =100 (figured
from gas analysis)............................................. 18. 35I. Actual dry gas per pound of "combustible" as fired=18.35XE3 ^... 14. 63 J. "Equivalent" dry gas per pound of "combustible" as fired =
I+(2XH) (see discussion of calculations)........................ 15. 47Total combustible ascending from grate per hour (code item 47*).... 775. 0Total equivalent dry gas passing over the water-heating surface per
hour=15.47X775.0............................................. 11, 990
8400 Bull. 325 07 10

146 A STUDY OF FOUR HUNDRED STEAMING TESTS.
Heat in gases below 325° F. (steam temperature): B. t. u. K. Heat in the gases, from 1 pound of "combustible," which is unavailable
for raising temperature=HXl,040 (see discussion of calculation).. 437 L. Heat required to raise the temperature of gases formed from 1 pound
of'' combustible " taken from 70° F. to 325° F. = J X 612.......... 947M. Total heat below 325° F. in the gases from 1 pound of "combusti
ble " =K+L........................................:.......... 1, 384Heat above 325° F. in the gases from 1 pound of "combustible" that is, heat
available to the boiler:Calorific value of 1 pound of "combustible" (item 51) ............. 15,423
N. B. t. u. generated from 1 pound of " combustible " = E3 X 15,423.... 12, 2950. Heat available for the boiler per pound of " combustible "=N M... 10,911
True boiler efficiency (E4):P. Heat absorbed by the boiler per pound of "combustible" (from heat «
balance)....................................................... 9,300E4=P-r-0=85.23 per cent.
Theoretical initial temperature:Heat above.325° F. in 1 pound of gas=0-4-J............................ 705.3705.3 B. t. u. will raise the temperature of 1 pound of gas 705.3-^-0.24, or
2,939° F. Initial temperature = 2,939°+ 325°= 3,264° F.
As explained in the discussion on page 140, the calculated initial temperature as given by the scale to the left of figs. 65 (p. 141) and 66 (p. 144) is that temperature to which the gases would rise provided no heat were lost by conduction or radiation until combustion had ceased, 0.24 being used as the specific heat of the gases at all tem peratures. However, these conditions never exist in practice. A large amount of heat is lost from the gases by both conduction and radiation before combustion ceases; furthermore, the specific heat of the gases at high temperature may be higher than 0.24. For these reasons the calculated furnace temperature is much higher than that actually attained.
In order to obtain a calculated initial temperature of 3,480° F., it is necessary to have an average of about 12.5 per cent of C02 in the escaping gases and to burn a coal of about 14,000 B. t. u. per pound of dry coal. This temperature is about the highest that could be obtained by a hand-fired furnace. If it were possible to maintain a completeness of combustion of 100 per cent at this temperature the efficiency of the boiler (72*) would be 76 per cent, which is the highest over-all efficiency attainable. (See fig. 65.)
PLOTTING OF PROBABILITY CURVES.
After having obtained the values of furnace and true boiler effi ciencies as explained on pages 143-145, the true boiler efficiencies were arranged in groups according to their values, and the number of each group was plotted according to its magnitude as shown in the upper curve of fig. 67, called the probability curve. (See p. 158.) If a line be drawn through these points a curve results quite as sym-
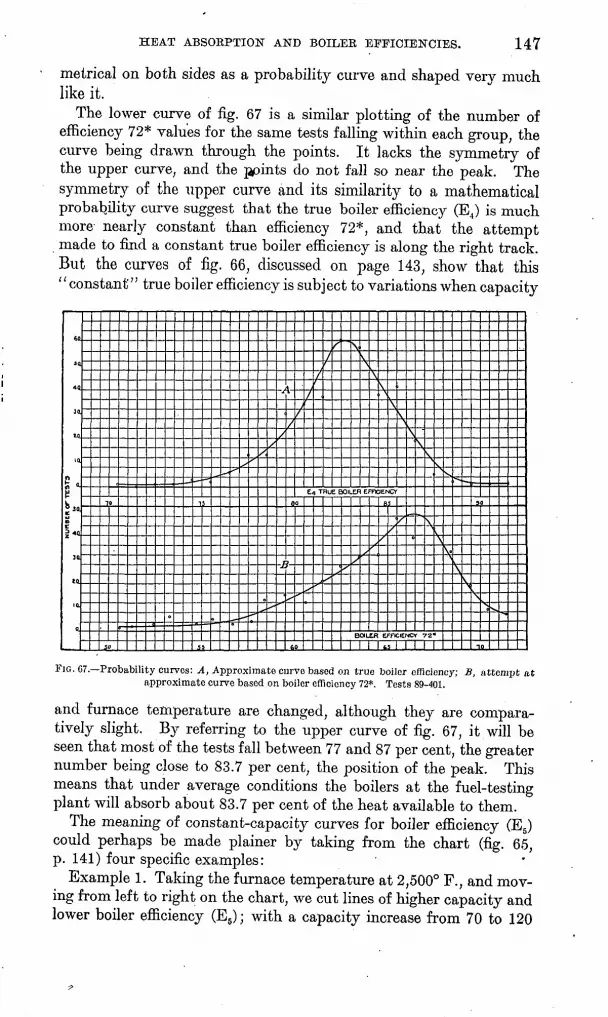
HEAT ABSORPTION AND BOILER EFFICIENCIES. 147
metrical on both sides as a probability curve and shaped very much like it.
The lower curve of fig. 67 is a similar plotting of the number of efficiency 72* values for the same tests falling within each group, the curve being drawn through the points. It lacks the symmetry of the upper curve, and the joints do not fall so near the peak. The symmetry of the upper curve and its similarity to a mathematical probability curve suggest that the true boiler efficiency (E.,) is much more nearly constant than efficiency 72*, and that the attempt made to find a constant true boiler efficiency is along the right track. But the curves of fig. 66, discussed on page 143, show that this "constant0 ' true boiler efficiency is subject to variations when capacity
ftft
>a
"a
Jo.
to.
p
unotnorTCS
3Q
10
1
jo
°
,
-,-,
-* ^
..-
S
^
'/
/
L
/
-L
\-
/
fl
f-
^
y
a
fio
i
E
S
1
*T
/
RU
/
f
EE
^
101
s
\
EF
/
B
sV
E
}
OIL
S
FFX
'
LR
NS
3ENCY
05
/
EJFm45
N
/
cie
s
1C
s
c
s
\
7Z
s
N
1
s
VsS
v 11
V
0
a
no
^,
..
PIG. C7. Probability curves: A, Approximate curve based on true boiler efficiency; B, attempt at approximate curve based on boiler efficiency 72*. Tests 89-401.
and furnace temperature are changed, although they are compara tively slight. By referring to the upper curve of fig. 67, it will be seen that most of the tests fall between 77 and 87 per cent, the greater number being close to 83.7 per cent, the position of the peak. This means that under average conditions the boilers at the fuel-testing plant will absorb about 83.7 per cent of the heat available to them.
The meaning of constant-capacity curves for boiler efficiency (E5) could perhaps be made plainer by taking from the chart (fig. 65, p. 141) four specific examples:
Example 1. Taking the furnace temperature at 2,500° F., and mov ing from left to right on the chart, we cut lines of higher capacity and lower boiler efficiency (E5); with a capacity increase from 70 to 120

148 A STUDY OF FOUR HUNDRED STEAMING TESTS.
per cent, the boiler efficiency drops from 71 to 67 per cent. Inas much as the furnace temperature remains constant the quantity of heat received by the lower row of tubes by conduction through the encircling tiles and by radiation from the hot brickwork is perhaps the same. Therefore the decrease in boiler efficiency must be charged to the tubes which are farther from the furnace and receive their heat from the gases by convection and conduction.
A possible explanation of lower boiler efficiencies with "higher capacities is that a steeper temperature gradient is required to trans mit more heat through the soot, metal, and scale. There is also a thicker layer of steam bubbles on the heating surface, which increases the resistance to the passage of heat. These effects cause the flue gases to leave the heating surface of the boiler at higher temperatures as the capacity increases.
Example 2. Using the scale at the foot of the chart and following the line of 15,000 pounds of gas passing over the heating surface per hour, we find that with a calculated furnace temperature of 2,100° F. the boiler efficiency (E5) is about 67 per cent and the capacity about 70 per cent. Moving vertically upward the pounds of air must be slightly reduced and more coal burned in order to obtain higher furnace temperature and at the same time keep the pounds of gas per hour constant. By doing this more heat becomes avail able for raising the temperature of the gases, as shown by the ordinate on the right of the chart. At a furnace temperature of 3,300° F., the capacity is 130 per cent and the boiler efficiency (E5) 75 per cent, an increase of 8 per cent over the efficiency with a temperature of 2,100° F.
Example 3. Taking the curve of 100 per cent rated capacity we find that rated capacity can be obtained with many conditions. The first extreme is with a furnace temperature of 2,100° F., when passing 21,000 pounds of gas through the boiler per hour; obtaining a boiler efficiency (E5) of 64 per cent. The second extreme is with a furnace temperature of about 3,500° F., and a boiler efficiency of 76 per cent, when passing about 11,000 pound of gas through the boiler per hour.
Example 4. A boiler efficiency of 70 per cent can be attained under many conditions. The lowest temperature on the chart with which this efficiency can be obtained is 2,400° F. at a capacity of 70 per cent, when passing about 12,000 pounds of gas through the boiler per hour. In order to maintain this high efficiency when working at 130 per cent of rated capacity, it is necessary to increase the furnace tempera ture to 2,800° F. by burning more coal with decreased air supply.
The curves of fig. 66 (p. 144) differ from those of fig. 65 (p. 141) in that true boiler efficiency (E4 ) is used instead of boiler efficiency (E5). The true boiler efficiency is based on the heat available to the boiler,

KELIABILITY OF OBSERVATIONS AND DATA. 149
considering only that part of the heat in the gases as available which is above the temperature of the steam. If the steam and water in the boiler were at atmospheric temperature, the two efficiencies, E5 and E4, would be the same; but as the temperature of the water in the boilers is always from 150° to 200° F. above the atmospheric temperature less heat is available for the boiler.
The general significance of the chart is (1) that true boiler effi ciency increases with initial temperature, perhaps because an increas ing amount of heat is absorbed by the lower row of tubes on account of conduction through the encircling tiles and of radiation on them, where they are bare in the rear, from the brickwork of the combustion chamber, and also because the higher temperature of the gases causes a steeper temperature gradient through the soot, metal, and scale, so as to cause a higher rate of flow of heat. All thesecauses are apart from the simplest statement of Perry's suggested theory of constant true boiler efficiency and are modifying factors of it in practice. The further general significance of this chart is (2) that at the same initial temperature the true boiler efficiency decreases as the mass of gases passed over the heating surface increases that is, as the capacity increases. The explanation of the fact that the true boiler efficiency (EJ is lower with these conditions is that inasmuch as capacity is proportional to the rate of heat absorption by the boiler the temperature difference between the water in the boiler and the first layer of gases on the outside must be greater in order that more heat be transmitted into the water in the same length of time. This increase in the temperature gradient causes the gases to leave the heating surface of the boiler at a higher temperature than in the cases of low capacity. The efficiency range of this chart is not very large only from 77 to 85 per cent and few points are near the extremes.
MISCELLANEOUS.
RELIABILITY OF OBSERVATIONS AND DATA.
The following remarks are given to facilitate the utilization of the actual data of the tests which are discussed in this volume:
Item 2: Duration of trial. This item is important for its effect on the water level in the boiler, which is easily changed several inches by opening or closing the steam valve, or by starting or stopping a large engine. Perhaps the usual error on this account was a fraction of 1 per cent of the evaporation. The item also enters into the errors of estimating the amount of fuel on the grate at starting and stopping. This estimating was always done with care, but the error on ten-hour tests may have been sometimes as much as 1 per cent of the coal burned, especially if the amount was small. As regards the fuel, when estimating accuracy, the real question is, How much coal was burned? not, How long did the test last?
Item 3: Grate surface, square feet. Boiler No. 1 was equipped with a plain grate, having an area of 40.55 square feet. Boiler No. 2 was equipped with a McClave rock-

150 A STUDY OF FOUB HUNDRED STEAMING TESTS.
ing grate, having an area of 36.4 square feet. These areas were maintained constant during the 1905 tests.
Item 11: Barometer, inches of mercury. This observation was always obtained from the Weather Bureau, and no correction was made for difference in elevation between the Weather Bureau station and the fuel-testing plant, which was only a few feet.
Item 11.1: Steam pressure. This reading was sometimes taken from a calibrated steam gage and sometimes from a recording-instrument chart. It is correct within a pound.
Items 12 and 13: Draft readings. These readings are accurate to 0.02 inch.Item 16: Temperature of fireroom. Correct within 2°.Item 17: Temperature of steam, calculated.Item 18: Correct unless otherwise noted.Item 20: Correct unless otherwise noted.Item 21: Generally low, owing to air leakage, and apt to be in error in extreme
instances, as much as 100° F., this error being the aggregate of the thermometer error and the greater error due to the difficulty of obtaining a true average temperature in the stack by the use of a single thermometer. Large errors are noted in their respective tests.
Item 21.1: Average temperature of furnace. Read by means of a Wanner optical pyrometer. All observations were made looking into the combustion chamber, about 2 feet from the rear end, 1 foot below the tile roof. When looking at flame, as was gen erally the case, the indications were perhaps well within 200° F. of the right value, generally perhaps within 100° F., although this is merely an estimate based on circum stantial evidence. In the absence of flame, light was received from the opposite wall, which was plainly cooler than the gases, as was evident on comparing it by eye with the tile roof near by; and even this latter was cooler than the gases which heated it, because heat was constantly passing upward through the tile into the. water tubes. How much too low such readings are is only a guess perhaps 100° to 200° F. In gen eral, the tests on coals high in "fixed carbon" have combustion-chamber temperatures too low.
Item 28: Total weight of ash and refuse. Refuse was taken to mean everything which fell through the grate plus the ash and clinker pulled out of the furnace during cleaning of fire. It is noteworthy that the weight of earthy matter in the refuse froma test is usually 15 or 20 per cent short of the amount that the chemical analysis indi cates; the difference undoubtedly goes over into the combustion chamber and up the stack.
Item 32: Fixed carbon of proximate analysis.Item 33: Volatile matter of proximate analysis.The preceding two items are based on arbitrary methods of driving off the so-called
"volatile matter" and weighing the remainder to get ash and fixed carbon. By varying the standard of conditions under which the distillation is effected very differ ent results can be obtained, and thus it may be seen that care should be exercised in deducing results of practical trials from the purely arbitrary results obtained from proximate analyses of dry or moist coal. A greater number of ultimate analyses should customarily be made, inasmuch as they furnish absolute data. Coal molecules are probably complex,.and although little is known on the subject it is likely that the products and even the amounts of products of destructive distillation vary widely with the method followed, as to temperature, rapidity of heating, etc.
Item 34: Percentage of moisture in coal. This item is uncertain at best. It is probable that on warm, dry, and windy days the coal lost some moisture while being quartered on the floor of the boiler room, so that the coal fired was really lower in heating value than the chemical analysis indicates.
Items 37, 38, 39, 40, 41, and 42: Ultimate analysis of dry coal. Furnished by the chemical division.

COMPUTATIONS OF A STEAMING TEST. 151
Items 50 and 51: Furnished by the chemical division. These items were used in test calculations in preference to items 52 and 53.
Items 54 and 56: These items are untrustworthy in these tests; concordant results were never obtained. All the investigational work done on the matter pointed to the possibility that eddies vitiated the readings, because the vertical section of pipe in which the sampling nipples were placed was only 2 feet long. These items are prob ably not reliable within 50 per cent of the values given.
Item 77: Percentage of smoke. Dense black (so estimated) taken as1 100 per cent.Item 81: Average thickness of fire. Only approximate, because of difficulties of
measurement when flame is present. It also varies with the personal equation of the observer.
Items 84, 85, 86, 87, and 88: These items are somewhat in error, owing to air dilution.Heat balance: Items 2 and 3, very nearly correct; item 4, usually doubtful, owing
to inaccurate flue-gas temperatures; item 5, only approximate; item 6, doubtful results of. our tests show that the unaccounted-for loss and the flue-gas loss up the stack take and give reciprocally. (See fig. 35, p. 63.)
The chart shown in fig, 68 indicates that in general terms the unaccounted-for heat increases in percentage with the loss due to CO.
PER CENT C O LOSS
FIG. 68. Relation of unaccounted-for loss to CO loss (tests grouped on basis of per cent of CO loss).
COMPUTATIONS OF A STEAMING TEST.
The data necessary for complete results of a steaming test come from three sources: (1) The boiler room, (2) the chemical laboratory, and (3) the United States Weather Bureau.
After a coal has been tested, from ten days to two weeks are required for the chemical work to be completed before definite results are known. The state of weather, the barometric pressure, and the relative humidity for the day of the test are obtained from the Weather Bureau.
The computed results given in this report have been calculated according to the methods indicated in the A. S. M. E. code for making boiler trials. However, it has been thought advisable to explain how several of the items were obtained or determined, and in doing this, for brevity, code numbers will be used.
Item 23: See explanation under " Average diameter of coal,", p. 45. Item 27=item 25X(100 item 34).Item 28=total ash and refuse from test. This includes the coal which falls through
the grate.

152 A STUDY OP FOUR HUNDRED STEAMING TESTS.
Item 29: In most tests the ash which was pulled from the grate when cleaning fires was called clinker unless the ash which formed on the grate was all free ash. Then the per cent of clinker is this weight figured as a percentage of item 28.
Item 30=item 27 item 28.Item 30*=itein 25X(item 32+item 33) (item 28Xitem 44).Item 31=item 28-r-item 27.Item 32a=item 32-5-(item 32+item 33).Item 33a=item 33-j-(item 32+item 33).Items 37a, 38a, 39a, 40a, 41a are determined by dividing items 37, 38, 39, 40, and
41 by (100 item 42).Item 46=item 27^-item 2.Item 47=item 30-r-item 2.Item 47*=item 30*-j-item 2.Item 48=item 46-^item 3.Item 49=item 47-s-(item 7=2,031).Item 49*=item 47*-=-(itein 7=2,031).Item 51=item 50-s-(100 item 42).Item 54, obtained by separating calorimeter.Item 56, "quality of steam," found by subtracting item 54 from 100. In boiler
use this value must be corrected, and it is the corrected value that we have used for this item.
Extract from the A. S. M. E. code for making boiler trials: "The factor of correc tion for quality of steam in a boiler test differs from the quality itself from the fact that the temperature of the feed water is lower than that of steam." In using quality of steam, as given by the calorimeter, therefore we lose the heat required to raise the temperature of the moisture in steam to steam temperature. The method of determining the factor of correction for quality of steam is given below:
Q=quality of moist steam as given by calorimeter.P=the proportion of moisture in steam.F=the factor of correction for the quality of the steam when the steam is moist.H=the total heat of the steam due to the steam pressure.Tt =the total heat in the water at the temperature due to the steam pressure.,T 1 =the total heat in the feed water due to the temperature. F_Q (H-JQ+P (T.-Jt )
Item 57: This is corrected for iTiequality of water level and of steam pressure at beginning and end of test.
TT__1
Item 60= , in which H and hare, respectively, the total heat in steam of the
average observed pressure, and in water of the average observed temperature of the feed. The difference between H and h gives the heat absorbed. The 965.7 is the^ heat of vaporization at 212° F. Dividing H h by 965.7, we obtain a factor which we can use as a multiplier to reduce pounds of water fed to boiler to pounds of equiva lent water.
Item 61=item 57 X item 56 X item 60.Item 65=item 63-^-34.5 (34.5 pounds water evaporated per hour into dry steam from
and at 212°, equals 1 boiler horsepower).Item 68=itein 57-^-item 25.Item 69=itein 61n-itern 25.Item 70=item 61-s-item 27.Item 71=item 61-r-itern 30.Item 71*=item Gin-item 30*.Item 72=item 71X965.7-^item 51. This is the efficiency of the furnace and boiler
combined, figured from pounds of combustible apparently ascending from the grate.

CARBON DIOXIDE AND WATER VAPOE. 153
Item 72* item 7 1*X 965*7-7- item 51. This is the efficiency of the furnace and boiler combined, figured from pounds of combustible actually ascending from the grate.
Item 73=item 70x965.7-M.tem 50. This is the efficiency of the furnace, boiler, and grate. It is usually styled over-all efficiency.
Item 77: Smoke readings were taken by using the Ringelmann charts. To obtain this item the sum of the readings was multiplied by 20 and this result divided by the total number of readings.
Item 81: Estimated by expert in charge of fire.Item 82: The fire was considered to be in normal condition from the start of the
test until the close, except during cleanings. The time for cleaning is subtracted from the length of the test and the result divided by the number of firings.
Item 83: This is the interval between raking, slicing, and cleaning the fire.The following items are from the heat balance or distribution of the heating value
of the combustible:Total heat value of 1 pound of "combustible," B. t. u. item 51.Item 1= item 71*X 965.7 (evaporation from and at 212° F. per pound of " combustible-'
ascending from the grateX965.7).Item 2=item 34-i-(item 32+item 33)-s-100X[(212-t)+965.7+0.48 (T-212)]. This
operation consists in referring the moisture to "combustible," raising the temperature to 21.2° F., evaporating it, and then superheating to stack temperature.- The specific heat of superheated steam was taken as 0.48. t=temperature of air in the boiler room, T=temperature of the flue gases.
Item 3= item 38a-^100X9X[(212-t)+965.7+0.48 (T-212)]. This operation as sumes all the hydrogen burned to water. The temperature of the water is raised to 212° F. and the water is evaporated and then superheated to stack temperature.
,, HXitem. 84+8Xitem 85+7 (item 86+item 88) item37altem4- 3 (item 84+item 86) X 100 X0.24X(l-t).
t=temperature of air in boiler room; T=temperature of the flue gases. The above operation consists in figuring the pounds of dry chimney gases per pound of carbon ; this value, multiplied by the per cent of total carbon in the combustible, gives pounds of dry chimney gas per pound of combustible; this number of pounds of gas is then heated from the temperature of inside air .to stack temperature at a constant specific heat of 0.24.
Item .5= item 86-5-(item 84+item 86) X pX 10,150.- The quantity 10,150 is
the number of B. t. u. generated by burning to carbonic acid 1 pound, of carbon con tained in carbonic oxide.
Item 6=100-(items 1+2+3+4+5).
DISSOCIATION CURVES OF CARBON DIOXIDE AND WATER VAPOR.
The curves of fig. 69 are probably self-explanatory. It should be stated that the data were experimentally obtained and calculated in 1905 or 1906 by Professors Nernst and Wartenberg, two men of the highest competency. As an example, using curve No. 1, 0.051 per cent of water vapor (about 0.05 per cent) at atmospheric pres sure is dissociated into hydrogen and oxygen. These data are probably the most reliable extant. They indicate that many fears heretofore widely held, as to limitations in high-temperature work due to dissociation, are almost groundless.
It will be -noticed that the per cent dissociation of CO2 increases more sharply at about 1 ; 300° C. than anywhere else. On referring to fig. 14 (p. 23), giving the percentage of CO as a function of com-

154 A STUDY OF FOUR HUNDRED STEAMING TESTS.
bustion-chamber temperature, it will be noticed that the sharpest curvature of the CO curve is at about 2,600° F. (about 1,420° C.), which is not far from 1,300° C.
Now comes in the vital factor of furnace practice. In order to get higher temperatures the air supply must be reduced; and less
77
PER CENT DISSOCIATION
FIG. 69. Dissociation curves of water vapor and carbon dioxide: Curve No. 1, H20 at atmospheric pressure; No. 2, CO2 at atmospheric pressure; No. 3, H2O at 0.1 atmospheric pressure; No. 4, CO 2 at 0.1 atmospheric pressure. Data from Zeitschrift fur physikalische Chemie, vol. 56, No. 5,1906.
oxygen means poorer combustion, as discussed under "Mass action" (p. 170). Thus high temperatures are .associated with incomplete ness of combustion, shown in figs. 14 (p. 23) and 31 (p. 51).-
WATER-JACKETED GAS SAMPLER.
Fig. 15 (p. 24) shows a water-jacketed gas sampler, consisting of a IJ-inch pipe closed at each end with a cap and two J-inch pipes. The gas is drawn through one of the J-inch pipes, which passes through both the caps as indicated in the figure. The other £-inch pipe brings cold water into the large pipe. The |-inch nipple, fitted into the same end of the large pipe as that at which the water enters, serves as a water outlet. The water used for cooling the sampler is obtained from the city mains. The only difficulty ever experienced in the use of the sampler was when the city pressure was suddenly reduced.
Probably the gas drawn through this sampler would be more truly representative of the actual composition of the hot gases in the furnace if the opening from the furnace into the water-jacketed
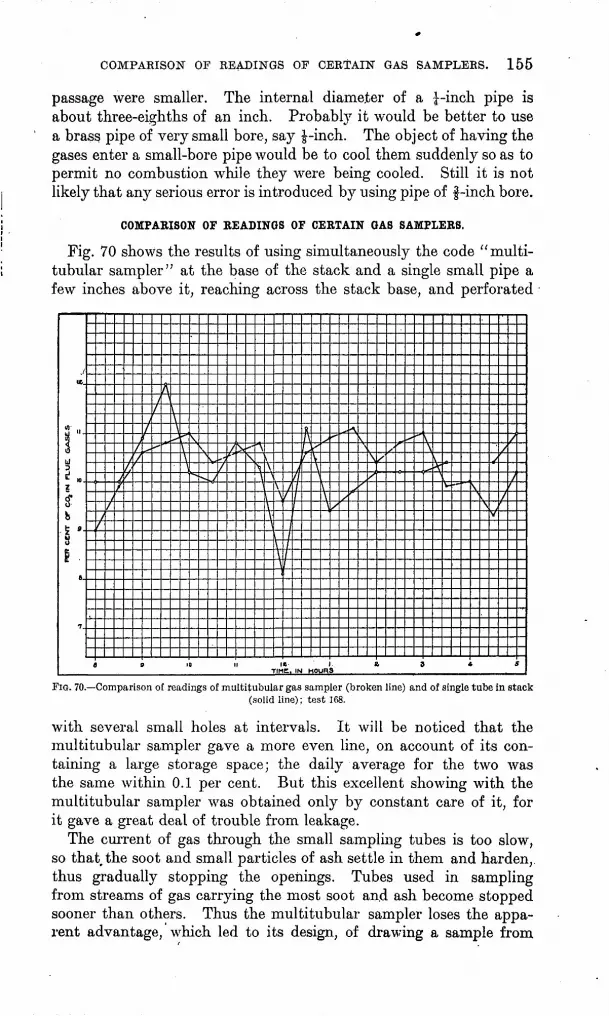
COMPARISON OF READINGS OF CERTAIN GAS SAMPLERS. 155
passage were smaller. The internal diameter of a |-inch pipe is about three-eighths of an inch. Probably it would be better to use a brass pipe of very small bore, say |-inch. The object of having the gases enter a small-bore pipe would be to cool them suddenly so as to permit no combustion while they were being cooled. Still it is not likely that any serious error is introduced by using pipe of f-inch bore.
COMPARISON OF READINGS OF CERTAIN GAS SAMPLERS.
Fig. 70 shows the results of using simultaneously the code "multi- tubular sampler" at the base of the stack and a single small pipe a few inches above it, reaching across the stack base, and perforated
TIME. IN HOURS
FIG. 70. Comparison of readings of multitubular gas sampler (broken line) and of single tube in stack(solid line); test 168.
with several small holes at intervals. It will be noticed that the multitubular sampler gave a more even line, on account of its con taining a large storage space; the daily average for the two was the same within 0.1 per cent. But this excellent showing with the multitubular sampler was obtained only by constant care of it, for it gave a great deal of trouble from leakage.
The current of gas through the small sampling tubes is too slow, so that, the soot and small particles of ash settle in them and harden,, thus gradually stopping the openings. Tubes used in sampling from streams of gas carrying the most soot an.d ash become stopped sooner than others. Thus the multitubular sampler loses the appa rent advantage, which led to its design, of drawing a sample from

156 A STUDY OF FOUB HUKDBED STEAMING TESTS.
every portion of cross section of the gas passage, and thereby loses also its value as a flue-gas sampler. It may be stated here that when the sampler was taken out, after two years of usage,-about three-fourths of the sampling tubes were found to be stopped up, although the sampler had been often blown out with steam. Its worst disadvantage lay in its leveling all readings considerably, so that the man running the fire could not depend on it for guidance so much as the single-tube sampler. For these reasons the A. S. M. E. multitubular sampler was permanently discarded.
The above-described faults of the multitubular sampler would not be so serious when using coals high in "fixed carbon."
FLUE-GAS SAMPLER.
Fig. 71 shows a design of a different form of flue-gas sampler which has been installed at the fuel-testing plant. The purpose of this design of collector is to obtain gas from various portions of the stack and- mix it before its temperature is taken and a sample drawn for analysis. This sampler is built of No. 16 sheet iron, and consists of a cylinder 5 inches in diameter to which are connected, by means of a double cone-shaped body, six scoops making an angle of 45° with the axis of the cylinder. The area of the cross se6tion of these scoops is 2.25 by 3 inches. In the bottom of each of the scoops is an opening which diminishes in width toward the center of the sam pler, making the opening proportional at all points to the respective distances of the points from the center. The openings are shown in the bottom view of the sampler (fig. 71). The sampler is placed in the round portion of the stack about 2 feet below the damper, the ends of the scoops being about 4 inches above the top of the hood. The largest diameter across the scoops is about 6 inches smaller thanthe diameter of the stack.
The sample of gas is drawn through a J-inch pipe, the end of which is inserted to the center of the 5-inch cylinder, as shown. The bulb of a flue-gas thermometer is also placed at the center of the cylinder near the £-inch pipe, so that the temperature of the flue gas and the sample of gas for analysis are taken at the same place. It is very probable that by this design of the sampler and location of the ther mometer and sampling tube the average temperature and composition of the flue gas are obtained. To prevent the cooling of the gases by radiation after they have left the heating surface of the boiler the base of the stack was covered with asbestos. On close examination at the end of five months' constant use this sampler was found in per fect order in every respect and free from soot, both inside and out.
UNACCOUNTED-FOE PERCENTAGES PEOBABLY TOO HIGH.
Of late years the opinion has been gaining ground that all gases increase in specific heat as their temperatures are raised. If this is

UNACCOUNTED-FOB PEBCENTAGES PEOBABLY TOO HIGH. 157
true, more heat is lost up the flue than has been calculated on the basis that the specific heats of dry flue gases and steam were respec tively constant at 0.24 and 0.48 under constant pressure.
If we assume, for instance, that the data given in E. Damour's Industrial Furnaces are correct, at an average flue temperature of 662° F. (350° C.) the true amount of heat lost up the flue was roughly
FIG.'71. Flue-gas sampler installed to replace A. S. M. E. multitubular sampler.
5 per cent more than the amount regularly calculated about 1 per cent of the heating value of the fuel. This loss would be subtracted directly from the unaccounted-for heat; for instance, if the latter is given as 15 per cent it may really be about 14 per cent. But in con sideration of the fact that in the last few years little work has been

158 A STUDY OF FOUR HUNDRED STEAMING TESTS.
done by physicists on the specific heats of gases at high temperatures the values given by Damour are probably not final, and so the calcu lations here given are subject to withdrawal.
PROBABILITY CURVES.
It is stated on pages 132 and 146 that when the calculated values of certain "constants" sought for are plotted according to the number of constants falling in each narrow group the free-hand curve drawn
through the points resembles a probability curve, and the peak is at a certain value of the constant. This relation makes it probable that the true value of the constant is the peak value, especially if the curve is narrow and symmetrical on the two sides and if the arithmetical av erage of all the points falls close to the peak of the curve. Perhaps the explana tion can be best stated by reference to fig. 72.
When shot are dropped into the funnel they ought to fall into a vertical column the width of the funnel, but they will actually spread out, owing to obstructions. The curve drawn through the tops of the piles is a proba bility curve.
If a man were measuring a length carefully (as with a tape or with a micrometer), while very few of his read ings would coincide if a large number of readings were used, the arithmetical aver-r age would be closely correct.
If all his readings were sorted according to lengths as read and plotted with the
vertical ordinate as the number of readings falling in each group and the horizontal ordinate as the average length of the readings in the groups a curve would result much like a probability curve. But
FIG. 72. Diagram illustrating probability curve.

EELATION OF TEMPEEATUEE TO POUNDS OF ATE USED. 159
suppose it was questionable whether or not the measured object changed length in unknown ways, if many measurements were taken the width of the curve would give a clew as to whether or not there really was any constant length. If a large number of readings formed a curve close to a theoretical probability curve the presumption of constant length would be nearly justifiable.
. Perhaps the best treatment of this subject for engineers is in J. W. Mellor's Higher Mathematics for Students of Chemistry and Physics, a very helpful book to the chemical engineer.
The equation to this curve is
in which y = height of vertical ordinate at any point.x = "horizontal distance of any point on the curve from the
center line passing up and down through the peak. e = base of hyperbolic system of logarithms, = 2.7183. h = a constant for each curve, which determines its width;
the larger h the narrower .the curve, and hence the more reliable as an indicator of the probable value sought.
k = a constant for each curve, determining its height. The boiler division has plotted a number of curves of this equation,
one or another of which is used to fit over any curve to which it bears a strong resemblance. But even if the fit is perfect no more is proved than that there is a strong probability that the figure sought is con stant at the peak value. However, even this use of the equation and curves will serve to indicate whether a guess is along the right path, and in this way their use is sure to increase when they are generally known among engineers.
RELATION OF TEMPERATLRE OF PRODUCTS OF COMBUSTION TO POUNDS OF AIR, USED.
Fig. 73 was prepared as a graphic illustration to show the different comparative temperature elevations attainable by completely burn ing various fuels, on the assumption that the specific heats of gases at constant pressure do not change with increase of temperature. It was thought that this assumption was wrong, but in the absence of more definite values it was decided to use constants. The general effect of this assumption is probably to make the temperatures with small air excesses too high; thus all the curves are somewhat too steep. In calculating the temperature the specific and latent heat of moisture in fuel and moisture formed by combustion have been considered.
The main object of the chart is to show that some Illinois coals are capable of use in high-temperature work, as in making malleable- iron castings. In fact, by preheating the air used for combustion, Illinois coals are now burned in reverberatory furnaces in Chicago

160 A STUDY OF FOUR HUNDRED STEAMING TESTS.
and St. Louis. The curve shows that lignites could be used with preheating, especially as some lignites are very low in sulphur and burn freely with a long, hot flame.
POUNDS Of AIR PER POUND OF FUEL MAXIMUM ATTAINABLE TEMPERATURE. WHEN BURNING. FUELS WITH AIR
FIG. 73. Theoretical curves showing relation of temperature of products of combustion to pounds of air used per pound of various fuels.
CIRCULATION INDICATOR.
The construction of the circulation indicator is shown in fig. 74, which is a view of the instrument as mounted in the boiler. There are six essential parts which go to make up the indicator, as follows: The wheel or propeller, the contact strip, the brush that rests on it, the shaft, the supports or bearings of the shaft, and the receiving instrument (which may be a telephone).
The wheel is made up of four copper blades, secured to spokes by copper rivets and set at an angle of 30° with the axis of the shaft. The spokes are attached to a piece of brass tubing that acts as a hub and also as a support for the contact strip.
The contact strip is mounted on an insulating drum consisting of a glass tube about 1£ inches long slipped on the brass hub, which it fits tightly. A strip of copper about one-eighth inch wide and one thirty-second inch thick is bound to the glass tube with copper wire, and is electrically connected to the hub of the wheel by a copper-wire bond.

CIRCULATION INDICATOR. 161
The brush is a piece of watch spring, supported on a copper bar that is insulated from the remainder of the instrument by mica washers. It is arranged at right angles to the contact strip, with its end resting lightly thereon so as to make and break contact with the copper strip once every revolution of the wheel. A copper wire, that connects to a telephone receiver on the outside of the boiler through a 2-volt battery, is bonded to the brush support and insu lated by means of rubber tubing at the point where it passes out of the boiler between the hand-hole cover and the water leg. The other wire from the telephone receiver is grounded to the boiler, as shown. By using a low voltage on the line the current is not short circuited much through the water in the boiler.
INSULATED FROM BOILER
FIG. 74. Circulation indicator mounted in boiler.
The shaft on which this instrument turns is a piece of brass wire about one-eighth inch in diameter and about 16 inches long. Two collars attached to the shaft close to the wheel, one on each side of the support, serve to keep the shaft from moving back and forth, and one of them, in conjunction Avith a cotter pin in the end of the shaft, holds the propeller in place.
One support for the shaft, at the end nearest the wheel, is a bar of brass with a hole in the center for the shaft and a slot on each end. These slots, which engage on the outside edge of the boiler tube, as shown, facilitate the centering of the instrument and chang ing from one tube to another. The other support for the shaft was
8400 Bull. 325 07 11

162 A STUDY OF. FOUR HUNDRED STEAMING TESTS.
obtained by drilling a hole through, the center of a hand-hole cover and adding a small stuffing box made from the gland of a valve.
In the operation of this instrument the flow of water in any tube of the boiler in which the circulation indicator might be placed causes the wheel to rotate at a rate of speed proportional to the rate of flow. By placing the receiver to the ear a click is heard for each revolution, and one revolution of the indicator means the passage of approximately 1 foot of water. As the speed of rotation in all trials up to date has not been too high for an observer to count the clicks, no difficulty was encountered in keeping a record of the rate of flow in any boiler tube under observation under varying conditions of operation of the boiler.
Several instruments were built and tried before success was attained with this one. The instrument has lately been used to work an automatic counter through a couple of telegraph relays.
FIG. 75. Result of observations with circulation counter (propeller in back of boiler, middle tube, third row from bottom); test 379. Revolutions per minute calculated from averages of two read ings of revolutions per fifteen seconds.
For information obtained see figs. 7 (p. 16) and 75 and pages 163 and 164.
Fig. 75 shows the effect of cleaning fires, and of firing, on the speed of water circulation in a tube of the boiler, as measured rela tively by the circulation indicator illustrated in fig. 74 and described on pages 160-2. The circulation is prompt in its changes and the values obtained vary considerably. The readings were taken by recording the number of revolutions in a fifteen-second interval opposite time figures, and from such data the temporary rate in revolutions per minute was calculated and plotted on this chart.
The curves of fig. 7 (p. 16) are based on readings taken for several days with the circulation indicator. The data from which the two curves were plotted were obtained by counting the total number of

CIRCULATION" INDICATOR. 163
revolutions of the indicator for each half-hourly period, and by calculating the percentage of builder's rated horsepower of boiler developed for each such period, respectively. The small circles give the positions of points and the numbers in the large circles near by give the number of half-hours fulfilling the coordinate values of the points. After plotting, the points were averaged in value in both horizontal and vertical strips, each point being included for averag ing as many times as indicated by the number in the circle near by. Thus the two curves were determined. It will be noticed that they are very close together, indicating the reliability of the method of working up the data.
The important point is that the circulation rapidly drops behind the amount of steam made (per cent of rated capacity developed), especially at high rates of working. Thus at 70 per cent of rated capacity the average speed of rotation of the indicator was 80 revolu tions per minute. At 105 per cent of rated capacity the rate of revo lution was 102, whereas to be proportional it should have been 120; the speed of circulation fell about 15 per cent short.
This result is reasonable when we consider that, so far as one can make any speculations, the circulating forces are perhaps roughly proportional to the amount of steam which is generated and entrained with the rising water, whereas the frictional resistance to circulation is perhaps proportional to the square of the average velocity of circulation.
This failure of circulation to keep up proportionally with demands on it must decrease the efficiency of the boiler at higher rates of working, by allowing a proportionally larger percentage of the water-heating surface to be covered with steam bubbles, thus virtually reducing the heating surface. That this condition does supervene is indicated on a-number of charts, for instance those shown in figs. 5 (p. 14) and 8 (p. 17), which.should be noted in this connection.
At a later date the circulation indicator was put in the middle tube of the lowest row of tubes, this being one of the tubes inclosed in clay tiles except at the rear end. The revolutions per minute for various capacities are given in the following table:
Readings of circulation indicator showing revolutions per minute for various capacities.
Capacity.
.58.2.
78 217
01.4.
8 257
118.2.
7 273
. 92.2.
12 291
The number of revolutions at any capacity is approximately three times as great as the number shown in fig. 7 for the second row of tubes just above.

164 A STUDY OF FOUR HUNDRED STEAMING TESTS.
In an earlier experiment the same circulation indicator was placed in the third row of tubes from the top of the boiler, and it was found that the rate of revolution was very slow indeed. This result indi cates that the bottom row of tubes is doing far more work than any other row, and that as we go from the bottom row up the amount of work done decreases .very rapidly.
The probability that the bottom row of tubes absorbs so large a portion of the total heat, absorbed mostly on account of conduction through the clay tiles and radiation to the exposed portion of the tubes in the rear over the hot brickwork, makes it easy to realize that the efficiency of the boiler as a heat absorber may well rise far more rapidly with increasing furnace temperature than is indicated by the equation for heat absorption from the gases due to convection only, as developed on pages 129 and 130.
C-SHAPED v. FLAT-BOTTOMED TUBE TILES.
In boilers of the Heine furnace type the bottom row of tubes is incased in clay tiles. Such an installation is advantageous when coals break down, evolving gases difficult to burn, for the clay tiles serve a far better cause in protecting the burning gases from sudden cool ing, and in acting as a small heat reservoir, than in protecting the tubes from burning. .
The first tiles used by the testing plant were of a C shape inside and out, and although they were made of excellent material they were so easily damaged by fire tools, and cracked so often from sudden temperature changes, that a new set had to be put in every two or three months. Later, both boilers were fitted with tiles which are flat on the bottom, giving the furnace roof the appearance of a ceiling. They are only 15 per cent heavier than the old C tiles, and could easily be made as light as the old tiles by cutting off the upper outside corners, above the tubes. The new tiles ha.ve withstood hot fires for over a year and are still good. They are among the most satisfactory parts of the boiler equipment. The difficulty referred to has been experienced at several power houses, and overcome in the same way, with equal satisfaction.
OBSAT TOTALS.
The sum of the percentages of C02 , 02 , and CO of an Orsat gas analysis is not at all constant. The sum is usually low at the start of a test and gradually rises during the first two hours. It also varies from day to day and from coal to coal. The first explanation suggested was that the available hydrogen of the coal burned to water that condensed before the gas sample arrived at the Orsat measuring tube, so. that out of every hundred volumes of air which entered the furnace one or two volumes might well be missing in the
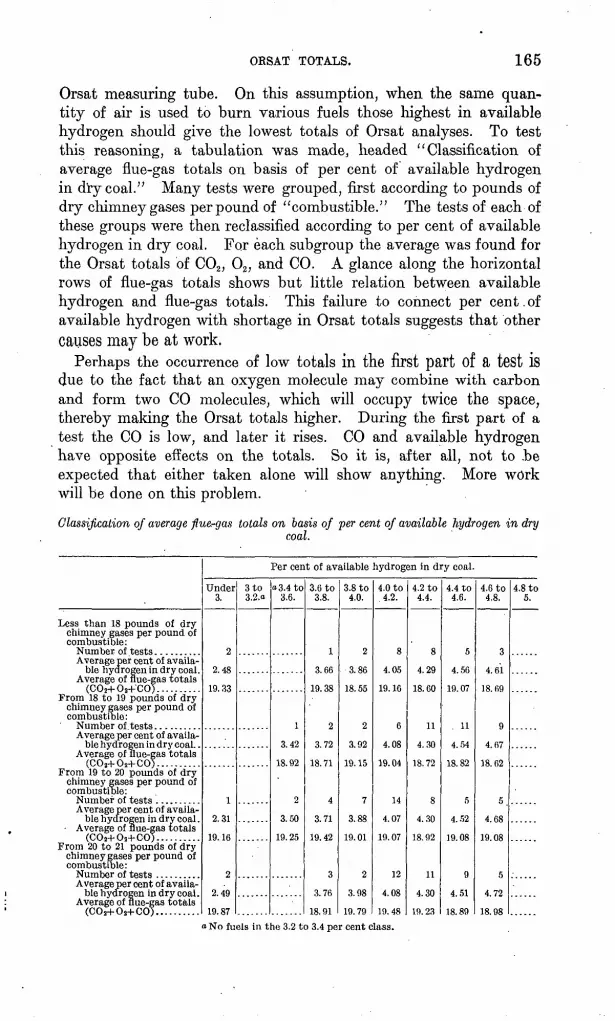
ORSAT TOTALS. 165
Orsat measuring tube. On this assumption, when the same quan tity of air is used to burn various fuels those highest in available hydrogen should give the lowest totals of Orsat analyses. To test this reasoning, a tabulation was made, headed "Classification of average flue-gas totals on basis of per cent of available hydrogen in dry coal." Many tests were grouped, first according to pounds of dry chimney gases per pound of "combustible." The tests of each of these groups were then reclassified according to per cent of available hydrogen in dry coal. For each subgroup the average was found for the Orsat totals of C02 , 02 , and CO. A glance along the horizontal rows of flue-gas totals shows but little relation between available hydrogen and flue-gas totals. This failure to connect per cent.of available hydrogen with shortage in Orsat totals suggests that other causes may be at work.
Perhaps the occurrence of low totals in the first part of ft test is due to the fact that an oxygen molecule may combine with carbon and form two CO molecules, which will occupy twice the space, thereby making the Orsat totals higher. During the first part of a test the CO is low, and later it rises. CO and available hydrogen have opposite effects on the totals. So it is, after all, not to .be expected that either taken alone will show anything. More work will be done on this problem.
Classification of average flue-gas totals on basis of per cent of available hydrogen in drycoal.
Less than 18 pounds of dry chimney gases per pound of combustible:
Average per cent of availa ble hydrogen in dry coal.
Average of flue-gas totals (COz+Oa+'CO). .........
From 18 to 19 pounds of dry chimney gases per pound of combustible:
Average per cent of availa ble hydrogen in dry coal. .
Average of flue-gas totals (C0 2+O2+CO). .........
From 19 to 20 pounds of dry chimney gases per pound of combustible:
Average per cent of availa ble hydrogen in dry coal .
Average of flue-gas totals (COa+Oa+CO)... .......
From 20 to 21 pounds of dry chimney gases per pound of combustible:
Average per cent of availa ble hydrogen in dry coal.
Average of flue-gas totals (COa+Os+CO)... .......
Per cent of available hydrogen in dry coal.
Under 3.
2
2.48
19. 33
1
2.31
19.16
2
2.49
19.87
3 to 3.2.o
o 3.4 to 3.6.
1
3.42
18.92
2
3.50
19.25
3.6 to 3.8.
1
3.66
19.38
2
3.72
18.71
4
3.71
19.42
3
3.76
18.91
3.8 to 4.0.
2
3.86
18.55
2
3.92
19.15
7
3.88
19.01
2
3.98
19.79
4.0 to 4.2.
8
4.05
19.16
6
4.08
19.04
14
4.07
19.07
12
4.08
19.48
4.2 to 4.4.
8
4.29
18.60
11
4.30
18.72
8
4.30
18. 92
11
4.30
19. 23
4.4 to 4.6.
5
4.56
19.07
. 11
4.54
18.82
5
4.52
9
4.51
18.89
4.6 to 4.8.
3
4.61
18. 69
9
4.67
18. 62
5.
4.68
19.08
5
4.72
18. 98
4.8 to 5.
No fuels in the 3.2 to 3.4 per cent class.
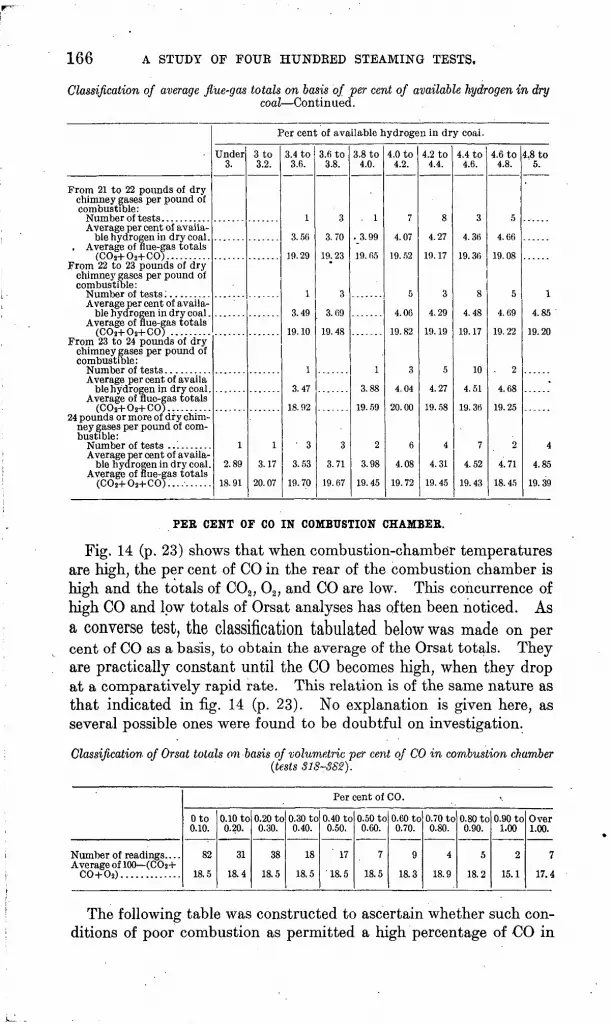
166 A STUDY OF FOUR HUNDRED STEAMING TESTS.
Classification of average flue-gas totals on basis of per cent of available hydrogen in drycoal Continued.
From 21 to 22 pounds of dry chimney gases per pound of combustible:
Average per cent of availa ble hydrogen in dry coal.
, Average of flue-gas totals (COri-Oa+CO). .........
From 22 to 23 pounds of dry chimney gases per pound of combustible:
Average per cent of availa ble hydrogen in dry coal .
Average of flue-gas totals
From 23 to 24 pounds of dry chimney gases per pound of combustible:
Average per cent of availa ble hydrogen in dry coal.
Average of flue-gas totals (COa+OH-CO)..........
24 pounds or more of dry chim ney gases per pound of com bustible:
Average per cent of availa ble hydrogen in dry coal.
Average of flue-gas totals
Per cent of available hydrogen in dry coal.
Under 3.
1
2.89
18.91
3 to 3.2.
1
3.17
20.07
3.4 to 3.6.
1
3.56
19.29
1
3.49
19.10
1
3.47
18.92
' 3
3.53
19. 70
3.6 to 3.8.
3
3.70
19.23
3
3.69
19.48
3
3.71
19. 67
3.8 to 4.0.
. 1
. 3.99
19. 65
1
3.88
19. 59
2
3.98
19.45
4.0 to 4.2.
7
4.07
19. 52
5
4.06
19.82
3
4.04
20.00
6
4.08
19.72
4.2 to 4.4.
8
4.27
19.17
3
4.29
19.19
5
4.27
19. 58
4
4.31
19.45
4.4 to 4.6.
3
4.36
19. 36
8
4.48
19.17
10
4.51
19.36
7
4.52
19. 43
4.6 to 4.8.
5
4.66
19.08
5
4.69
19.22
. 2
4.68
19.25
2
4.71
18. 45
4.8 to 5.
1
4.85
19.20
4
4.85
19.39
PEE CENT OF CO IN COMBUSTION CHAMBER.
Fig. 14 (p. 23) shows that when combustion-chamber temperatures are high, the per cent of CO in the rear of the combustion chamber is high and the totals of C02 , 02 , and CO are low. This concurrence of high CO and low totals of Orsat analyses has often been noticed. As a converse test, the classification tabulated below was made on percent of CO as a basis, to obtain the average of the Orsat totals. They are practically constant until the CO becomes high, when they drop at a comparatively rapid rate. This relation is of the same nature as that indicated in fig. 14 (p. 23). No explanation is given here, as several possible ones were found to be doubtful on investigation.
Classification of Orsat totals on basis of volumetric per cent of CO in combustion chamber(tests 318-382).
Per cent of CO.
Number of readings.. . . Average of 100 (C0a+
CO+Os). ............
Oto 0.10.
82
18.5
0.10 to 0.20.
31
18.4
0.20 to 0.30.
38
18.5
0.30 to 0.40.
18
18.5
0.40 to 0.50.
' 17
'18.5
0.50 to 0.60.
7
18.5
0.60 to 0.70.
9
18.3
0.70 to 0.80.
4
18.9
0.80 to 0.90.
5
18.2
0.90 to 1.00
2
15.1
Over 1.00.
7
17.4
The following table was constructed to ascertain whether such con ditions of poor combustion as permitted a high percentage of OO in

RELATION OF WIND TO EFFICIENCY. 167
the rear of the combustion chamber also conduced to smoke produc tion. The finding is in the affirmative. See also the chart shown in fig. 33 (p. 56), based on per cent of black smoke, in which the per cent of CO rises rapidly with the per cent of smoke.Classification of smoke production on basis of volumetric per cent of CO in combustion
chamber.
Average per cent of CO in combus:
Average per cent of black smoke. . . .
Per cent of CO.
Oto 0.10.
9
0.03 13.8
0.10 to 0.20.
8
0.14 19.9
0.20 to 0.30.
4
0.23 21.8
0.30 to 0.40.
4
0.34 18.1
0.40 to 0.50.
4
0.44 20.3
0.50 to 0.60.
1
0.58 38.5
0.60 to 0.90.
1
0.83 40.0
0.90 up.
1
1.10 39.0
POUNDS OF DEY CHIMNEY GASES PEE POUND OF "COMBUSTIBLE."
The sub j oined tabulation of pounds of dry chimney gases per pound of "combustible" is based on intensity of draft under stack damper and difference of draft under stack damper and draft over fire. This table was made to ascertain whether the pounds of air used could be approxi mated by draft readings. As there was also air leakage, which varied with the amount of draft carried, it seemed best to average out the error by using separate readings for different values of stack draft. However, such a classification seems to be so greatly influenced by rate of combustion and air leakage as to make it of little value. The table shows a small increase of pounds of dry chimney gases per pound of "combustible/' as the difference of draft increases.
Classification of dry chimney gases per pound of "combustible" on basis of stack draft ana difference of draft under stack damper and draft over fire.
Average difference of stack draft and draft
Average pounds of dry chimney gases per
Average difference of stack draft and draft
Average pounds of dry chimney gases per
Stack draft.
Under 0.40.
18
0.25
19.75
0.40 to 0.425.
23
0.29
19.04
0.425 to 0.45.
12
0.32
18.25
0.45 to 0.475.
25
0.32
19.79
0.475 to 0.50.
23
0.34
20.02
0.50 to 0.525.
17
0.35
19.52
0.525 to 0.55.
14
0.37
21.09
Stack draft.
0.55 to 0.575.
21
0.38
21.18
0.575 to 0.60.
1C
0.41
22.08
O.GO to 0.625.
28
0.41
22.16
0.625 to 0.65.
18
0.44
22.92
0.65 to 0.675.
10
0.47
21.86
0.675 up.
32
0.54
21.91
EFFECT OF DIRECTION, VELOCITY, EELATIVE HUMIDITY, AND TEMPERATURE OF AIR ON EFFICIENCY 72*.
Inasmuch as the boilers stood in a poorly built wooden structure, near two large doors, which were always open in summer and some times in winter, it was thought that the cooling of the boiler room by
168 A STUDY OF FOUR HUNDEED STEAMING TESTS. -
winds might have some appreciable tendency to lower the efficiency 72*. ,_ .
With the data from about 305 tests, the problem was attacked in several ways, as given below: .
1. The winds were classified in four groups, (a) from the north and northeast, (&) from the east and southeast, (c) from the south and southwest, (d) from the west and northwest and then all tests were classified according to the prevailing direction of the wind for that day, and the individual tests falling in each of the four wind groups were plotted by means of the two ordinates, efficiency 72* and velocity of wind in miles per hour. It was found that there was no appreciable effect on efficiency due to wind velocity. In the above-mentioned subdivisions the tests of all groups (a, I, c, and d) were arranged in subgroups according to the outside air temperatures for instance, the tests falling under wind from the east and southeast were divided into three subgroups, in which the ranges of outside air temperature were "below 40° F.," "40° to 50° F.," and "50° to 60° F."
2. With the same four groups of wind directions (a, Z>, c, and d) the item 72* (so-called " boiler efficiency") was plotted in each group with the items: (e) velocity of wind in miles per hour, (/) relative humidity of outside atmosphere, (g] outside air temperature, and (fi) average diameter of coal. In group 2 (e) the velocity of wind again had no noticeable effect. For all directions of wind excepting from the north and northeast, high relative humidity (/) of the out side atmosphere appeared to lower the efficiency, somewhat. A rise of outside-air temperature (g) appeared .to cause a slight rise in efficiency, but not any more than results from an equal reduction in stack temperature, so that the effect on radiation is not noticeable. The outside doors were generally closed in winter, however. The average diameter of the coal (Ji) varied only .slightly, and it appar ently had no influence in disguising any of the other curves (e, f, and g).
The general conclusion is that calculations of radiation are not likely to be appreciably in error owing to changes in weather con ditions, unless it is substantiated on further investigation that the relative humidity influences the amount of heat lost by convection or else retards the combustion of coal. Efficiency 72* was used because the* " unaccounted-for" item is not reliable.
RELATION OF UNACCOUNTED-FOE LOSS TO ASH PASSING OVER BRIDGE WALL.
It was thought that possibly all the coal which was blown up from the fuel bed and carried away with the gases did not burn, and that a clew to incomplete combustion might be obtained by comparing. the unaccounted-for items of the heat balance with the ash lost over

UNACCOUNTED-FOE LOSS. 169
the bridge wall. The opposite from the relation expected appears in the accompanying table, which shows that the greater the per cent of ash. carried away the less the unaccounted-for loss that a high percentage loss of ash does not mean a high unaccounted-for loss. As the average difference of draft under stack damper and
. draft over fire increases the ash lost over the bridge wall increases, as might be expected.
The following is offered as an explanation of.the table: With higher draft there is an increased rate of combustion; the temperature of combustion^is increased; the pounds of dry chimney gases per pound of "combustible" are decreased; a higher initial temperature and increased rate of combustion will give a higher stack temperature, and this increased temperature will increase the loss up the stack and subtract almost directly from the unaccounted-for loss; andwith increased rate of combustion the per cent of radiation loss for each pound of coal burned will be less and this reduction will enter directly into the unaccounted-for loss. These factors tend to decrease the unaccounted-for loss. On the other hand, with higher rate of combustion and higher temperatures the gases are carried through the furnace faster and there is a greater amount of incomplete com bustion owing to the fact that less time is taken in passing through the furnace. Moreover, as there is less excess of air and a higher temperature, the unaccounted-for loss will directly increase because hydrocarbon losses are not determined. There is necessarily a bal ancing of these losses and gains. The table shows their average effect only.
Three classifications showing relation between "unaccounted-for" loss and ash passingover bridge wall.
Per cent of ash lost over bridge wall, referred to combustible burned ........
Average per cent of unac counted-for loss from heat balance .....................
Average difference of draft under stack damper and draft over fire, inch of wa-
Average per cent of ash lost over bridge wall ............
Average per cent of unac counted-for loss from heat
Average per cent of unac-
Per cent of ash lost over bridge wall, referred to
Average per cent of ash lost
0.27 13
10.01
5. 6920
3.81
3.04
0.58 24
9.83
0.35
0.79 20
7.5924
2.80
2.24
1.24 26
11.74
0.35
1.24 34
12.12
8.5422
3.10
2.45
1.73 30
11.23
0.34
.1.78 29
10.78
9.4829
2.64
2.10
2.26'
28
11.24
0.36
2.25 33
10.4820
2.51
1.99
2.69 19
9.73
'0.38
2.80 20
9.53
30
2.88'
2.26
3.26 18
9.40
3.20 23
9 08
19 ^
22
2:83
2.21
3.72 20
10.49
0.37
3.72 14
9 40
13.3812
2.81
2.19
4.42 25
9.52
0.39
4. 50 10
7.99
1.44
7.01 19
8.45
0.43
5.90 9
9.01
10.7015
2.10
1.75

170 A STUDY OF FOUR HUNDRED STEAMING TESTS.
THE LAW OF MASS ACTION.
Although not yet very old, the law of mass action is already one of the most firmly established and useful of the laws of physical chem istry. Its operation is a matter of daily intuition in other fields; e.g., the more water one uses the easier it is to dissolve sugar, salt, etc. ' But only recently has the law been mathematically formulated in chem istry, and even yet it is often so hard to learn what the reactions are that one does not know which mass-action formula to use; still, the path of some reactions has been determined by finding what for mula fitted the observed facts.
To take the simple case of combustion of carbon, it is an observa tion as old as the art of boiler practice that considerable excess of air is needed above the theoretical amount. Mathematically the situa tion is as follows:
As soon as some of the oxygen of the air has united with carbon or CO it is no longer available for oxidation of the remaining com bustible; worse yet, the molecules formed are in the way, so that the combinations become less and less frequent. All this, of course, is on the supposition that the temperature is kept constant, so as to eliminate other variables. Now, as the above reaction proceeds the masses of oxygen and carbon, as compared with the total masses present, become less and less, whence the name, mass action; they, soon become nearly zero.
The above illustration is faulty in one respect it does not say in what terms the masses are to be measured. Elementary* chemistry states that CO and 0, for example, combine in just one proportion 28 parts by weight of CO (its molecular weight) and 16 parts by weight of 0 (its atomic weight). The molecular weight of the oxygen is not taken (it is 32, as there are ordinarily two atoms in amolecule) as the combining weight, because the molecule must first divide. Thus we should really consider 2 molecules of CO and 1 of O2 . For these reasons both combining substances must be consid ered according to the numbers of gram molecules present that is, the number of grams of each present divided by its respective molecular weight. Luckily this trouble disappears when working with gases analyzed volumetrically, as with an Orsat apparatus, because the volumetric weights of gases are directly proportional to their molecu lar weights, as all gases at the same temperature and pressure contain the same number of molecules per unit volume. Even dissociation, eijbher of molecules of H20 and C02 or of molecules of H2 and 02 and N2 into 2H, 2O, and 2N, would not trouble us, because volumes would increase proportionately. All we need to do is to substitute the volumetric percentages of 02 and of CO or CH4 , for example, of the analysis in the equation corresponding to the particular reaction and

THE LAW OF MASS ACTION. 171
obtain the relative indication of the rate of combustion, assuming, of course, the same temperature and pressure in every case.
Example: An analysis of gas from the rear of a combustion cham ber through a small opening in a water-jacketed gas sampler showed the two following results, the combustion-chamber temperature in each case being 2,600° F. : (1) 02 , 4 per cent; CO, 0.5 per cent. (2) 02 , 7 per cent; CO, 0.4 per cent. The rest of the volume con sisted of nitrogen, water vapor, carbon dioxide, and other gases for eign to this calculation. If the formula of the reaction is 2CO + 02^ 2C02 ,° and if at 2,600° F. the dissociation of C02 is only about 0.01 per cent, we may say with very close accuracy that the reaction is not a balanced one, but proceeds to a finish. It can be then written
= 2C02 ./7 'y*
If the rate of disappearance of CO in the gas is given by -=- = const.(MI
(CO) 2 (O2), the rates of burning CO in the two cases given are'(l) 4X(0.5) 2 = 1.00; (2) 7X (0.4) 2 = 1.12.
Thus the net velocity of combustion in the second case is consider ably greater-^-with more oxygen. It would take an almost impos sible rise in the CO percentage in the second case to neutralize the effect of 75 per cent more free oxygen. In such calculations care must be taken to include the volume of the steam gas present in the 100 per cent total (not the 100 per cent total of the Orsat analysis). This volume can be roughly calculated, and is considerable in per centage and very variable.
It must be constantly borne in mind that calculations of velocity reactions based on the laws of mass action, are liable to be seriously in error owing to disturbing side reactions, catalysis, etc. ; but prob ably less is to be feared here with simple gases at high temperatures than with more complex substances at ordinary temperatures. At any rate, these laws of mass action are a very valuable guide in such problems, and if the facts do not fit proved formulas well we have applied too little theory; some refining corollaries must be added.
On page 61 is given a calculation based on actual data obtained, and the conclusion is reached that the velocity of combustion decreases enormously from the surface of the fire to the rear of the combustion chamber, where it is relatively very small; the practical application is that little is to be gained by adding further length of smooth com bustion chamber, which would be commercially as poor an invest ment of capital as to add to the length of a Corliss engine cylinder and stroke; we must resort to thorough mixing.
o The sign ^ indicates that a chemical reaction and a reversing decomposition are going on side by side. The composition of the mixture changes according as combination or dissociation is the more rapid.

172 A STUDY OF FOUR HUNDRED STEAMING TESTS.
The question may arise, How are we to treat cases in which more than one combustible gas is present? Simply by adding the two effects together, as when we say that the pressure of a mixture of gases on the walls of a containing vessel is the sum of the pressures of the constituent gases; the two reactions go on independently side by side. Care must be taken not to add these velocity products without having first multiplied each by its proper reduction factor, which for most substances is imperfectly known at present for high temperatures. For the present, therefore, it is not feasible to get an expression for the comparative total velocities of combustion of all constituents taken together at several points along the flame.
Fig. 31 (p. 51) presents an excellent illustration of decrease of com pleteness of combustion because of decreasing oxygen mass action.
"Furnace efficiency" should more correctly be called "per cent of completeness of combustion," inasmuch as furnaces are usually fixed in size and shape, and so exert about the same mixing effect in all cases.
In the commercial combustion of fuels, where speed of coal con sumption is important, so as to get high capacity, the operator must determine whether he will be most benefited by high temperatures or by a close approach to perfection of combustion. If he must put the heat into material at a high temperature, as in melting pig iron or clinkering cement, he must cut down the air supply even at the cost of a large fall in completeness of combustion due to decreased oxygen mass action, so as to have the temperature of the gases as far as possible above that of the material to be worked. If the tem perature of his material is low, as is the water in a boiler, it will not make much difference how much air he uses so far as heat absorption is concerned, within reasonable limits; and larger porportions of airmean larger oxygen mass action and more complete combustion. As a general rule the air supply per pound of fuel must be decreased, at a sacrifice of completeness of combustion, when the temperature of the material into which heat is to be put is high.
The only method of alleviating this condition is by making com bustion chambers longer, or, much better yet, by putting some fire brick mixing structure in the path of the gases. As such a structure is damaged more by high than by low temperatures, it should be placed in the first part of the path of the gases to be mixed.
The most economical burning of various fuels for various purposes is largely dependent on proper adjustment of oxygen mass action, assisted by good stream-mixing structures.

DIMENSIONS OF BOILEES AND SETTINGS. 173
DIMENSIONS OF BOILEKS AND SETTINGS.
T*ne following is a statement of the dimensions of the boilers and settings at the fuel-testing plant:
,^i :.- Dimensions of Heine, water-tube boilers and settings used'in steaming tesls.^
Length of drum...................................................feet.. 21T|Inside diameter of drum........................................ .inches.. 42Number of tubes....:.................................................. 116Internal diameter of tubes.'.....................................inches.. 3.26Outside diameter of tubes.........................................do.... 3.5Length of tubes exposed ..........................................feet.. 17-^Plain grate:
Width of furnace..............................................do.... 6.16Length .of furnace.............................................do.... 6.58Mean height of furnace..................................... .inches.. 26Air space..................................................per cent.. 45Area of grate surface....................................square feet.. 40.55
Rocking grate:Width of furnace.............................................feet.. 6Length of furnace.............................................do.... 6.07Area of grate surface....................................square feet.. 36.4
Depth of ash pit below grate....................................inches.. 25Height of stack above grate.................................:...... .feet.. 113. 25Diameter of stack...............................................inches.. 37.5Area of gas passages:
Stack................................................square inches.. 1,104Draft passage over bridge wall.................................do.... 888Aggregate between lower entrance tubes to boiler..............do.... 1,070Aggregate between tubes in boiler..............................do.... 1, 612Aggregate between upper tubes from boiler....................do;... 640
Area of water-heating surface:Tubes..................................................square feet.. 1, 897Water legs....................................................do.... 91Shell........................................................do.... 43Total........................................................ do.... 2, 031
Superheating area....................................................... None.Total water space............................................ cubic feet.. 287Steam space. .................................................... .do.... 73Ratio of heating surface to grate surface.................................. 50.1 to 1Ratio of smallest draft area to grate area................................. 1 to 9.1
The boilers were erected by the Heine Boiler Company, and were similar to those in commercial use. a When the water stood at 3 inches in the gage glass, boiler No. 1 contained 16,850 pounds of water, and boiler No. 2, 16,755 pounds of water, at 75° F. Each inch of water, as shown by the glass, represented 340 pounds in the boiler. This figure was determined by calibrating the boilers with cold water at about 75° F., by noting the height of water in the gage glass as the water was drawn from the blow-off and weighed.
oFor further description of apparatus see Prof. Paper U. S. Geol. Survey No. 48,1906, pp. 302-314.

174 A STUDY OF FOUR HUNDRED STEAMING TESTS.
TRUE BOILEE EFFICIENCY.
In confirmation of the ideas on boiler efficiency and heat absorption advanced in this study, and of the probability of being able so to construct boilers as to evaporate several times as much water per unit .of heating surface, the boiler division has recently begun some accurate experiments on heat transmission through the tubes of
small multitubular boilers and finds that the results answer to Professor Perry's theory very closely.
An account of the first few experiments will be found in a paper read by Prof. L. P. Breckenridge before the Western Society of Engi neers, Chicago, March 20, 1907.
A STUDY OF FOUE HUNDRED STEAMING TESTS. 175
GENERAL CONCLUSIONS.
All the tests that are discussed in this bulletin were made under a Heine boiler with a hand-fired furnace. The principal object of these tests was to determine the relative value of coals for steaming purposes. With this in view each coal was burned to its best advan tage for hand firing.
All the tests were made^.at about the rated capacity of the boiler, carrying a steam pressure of about 80 pounds. The average length of a test was about ten hours. The only variable conditions were thickness of fire and intensity of draft.
While the average efficiencies are fairly high, better efficiency could be obtained with furnaces and other conditions more especially adapted to particular coals. The average efficiency obtained at the fuel-testing plant is about 10 per cent higher than is obtained in good commercial plants. This is true for all coals.
The efficiency used as a basis for comparison of coal tests under a boiler is code item 72*. This is the ratio of the heat carried away in the steam to the calorific value of the " combustible." In determin ing the amount of "combustible" burned it was considered that the coal which fell through the grate was never fired. This efficiency 72* ' is the product of boiler and furnace efficiencies.
Per cent of completeness of combustion is the ratio of heat evolved in the furnace to the potential heat in the coal ascending from the grate.
The efficiency of the boiler proper is the ratio of the heat absorbed by the boiler to the heat evolved in the furnace. Efficiency 72* is not commonly subdivided into furnace and boiler efficiency on account of the difficulty of determining the actual heat evolved in the furnace.
The true boiler efficiency is the ratio of the heat absorbed by the boiler to the heat available for absorption. This is the true measure of the ability of a boiler to absorb heat.
Inasmuch as efficiency 72* is the product of furnace and boiler effi ciency, it increases with an increase of furnace efficiency, which means that efficiency 72* is higher with coals which are more easily and completely burned. Except in extreme cases it is very little affected by the temperature of combustion. High C02 content in the gas analysis is not a definite indication of high efficiency, although some high 72* efficiencies were obtained with high C02 content in the gas. The best efficiencies of tests recorded in this paper were obtained with about 10 per cent of C02 . High CO is always an indication of low 72* efficiency. It does not by itself account for all of the incom plete combustion, but merely indicates poor conditions in the fur nace. The other combustible gases which probably pass up the stack, though occurring in very small quantities, will account for heat loss many times as great as the CO loss.

176 A STUDY OF FOUR HUNDRED STEAMING TESTS.
The true boiler efficiency (E4 ) is not of constant value in commer cial boilers, but varies somewhat with temperature of combustion and capacity. This variation with temperature is due to the heat absorbed by radiation from the fire and the hot brick walls. To increase capacity there must be a proportionate increase in tempera ture difference between the first layer of water and the film of gas adhering to the tube. Since the temperature of the water is in most cases constant, the temperature of the adhering film of gases will be raised and the flue gases will leave the boiler at a higher temperature.
In general the efficiency is affected by the formation of soot and scale on the heating surface and by defective circulation of water in the boiler. These conditions cause poor absorption of heat and higher flue-gas temperature.
The rate of combustion is affected by the chemical composition of the coal, the size of the coal, the intensity of the draft, and to some extent by the thickness of the fire 'and the formation of clinker. Bituminous coals high in "volatile matter" burn more quickly than those high in "fixed carbon." Coals ranging in size from one-fourth inch to H inches burn much more rapidly than either very small or very large sizes. This is undoubtedly due to a better distribution of air with these sizes. Fine coal, the formation of clinker, and thick fires hinder the passage of air and reduce the rate of combustion. By increasing the draft, more air is drawn through the fuel bed, causing the coal to' burn more rapidly.
With higher rates of combustion less air is used per pound of com bustible, the temperature of combustion rises, the gases pass through the boiler faster, and after a certain rate of combustion is reached black smoke is produced. Capacity varies almost directly with the rate of combustion. Extremely high or low rates of combustion reduce efficiency.
The presence of ash in dry coal up to about 15 per cent has very little effect on efficiency and capacity. Above this percentage, how ever, the efficiency drops.
Moisture reduces efficiency and capacity, perhaps, by hindering combustion.
The presence of sulphur in coal is not detrimental to the value of coal as fuel for steaming purposes except where it exists in certain combinations with other constituents of the ash so as to form fusible clinker which may adhere to the grate.
If there are no other reasons for washing coal than for efficient burning, coal need not be washed, as the efficiency of the furnace and boiler are not increased by washing except with coals of high ash or considerable free pyrites. Washed coal can usually be burned at a higher rate of combustion. The washing of coal does not decrease the per cent of black smoke produced.

COMMERCIAL CONSIDERATIONS. 177'
Most coals when briquetted can be burned at a higher rate'of combustion. As a rule briquetted coals burn with little or no smoke.
Bituminous coal should be fired in small quantities every three or four minutes. It is best to fire only on one-half of the grate area at a' time. When burning bituminous coal, up to a medium rate of combustion, the production of smoke may be entirely avoided by leaving the furnace doors partly open for a short time immediately after firing. The best thickness of fire ranges from 5 to 10 inches, varying with the intensity of draft of 0.5 to 0.7 inch under the stack damper.
Most of the eastern semibituminous coals, especially the small sizes, cake badly in the fire. When using these coals the fire must be raked frequently. Coal of this class can be fired every five or six minutes and more can be fired at a time than of bituminous coal. Either the spreading or alternate method of firing, may be used. Owing to its tendency to crumble, coal of this class usually reaches the boiler room as fine as slack, which reduces its value as a. steam ing coal. It can be improved for steaming purposes by briquetting.
Good results can be obtained with lignites if a difference of draft of 1£ to 2 inches of water is carried between the ash pit and the stack. With this draft these fuels may be fired in large quantities every six or eight minutes, the spreading method of firing being \ised. Rocking grates may be used to good advantage in burning lignites.
For hand firing a furnace with a tile roof and large combustion chamber containing good mixing structures is well adapted for burn ing bituminous and lignitic coals. The mixing structures cause resistance to the passage of furnace gases, and consequently a higher stack draft must be carried to maintain capacity.
COMMERCIAL CONSIDERATIONS.
General. Inasmuch as the boiler plant is at present the expen sive portion of a steaming outfit, and as it probably is possible to cut its cost down to a fraction of the present cost and at the same time obtain a higher efficiency, it is felt that there is good ground for anticipating an enormous improvement in the production of steam power within the next few years. If so, it will not be the first time that a new arrival in a field has spurred on older forms of enterprise to a higher prosperity than they ever dreamed of before. The competition of the gas engine may be the best thing that ever happened to steam engines and turbines.
The statements, theories, and proposals made in this study are widely scattered and may not have been plain because they are mathematically involved. For this reason a short summary wi!l be
8400 Bull. 325 07 12

178 A STUDY OF FOUR HUNDRED STEAMING TESTS.
made here of the possibility of so improving the system of working steam-turbine plants that they may be permanently kept above commercial competition from gas-producer and engine plants in large powers. Of course there is little doubt that a great field immediately awaits the gas engine in smaller plants, say under 5,000 horsepower. All these suggestions are tentative only.
Boilers. The authors see no reason why boilers can not be con structed, and probably operated with entire satisfaction, which will produce about ten times the amount of steam now obtained per square foot of heating surface, and with no difficulty in obtaining dry steam. The efficiency from coal to steam should easily be made considerably higher than that of- a good performance of to-day. Such a plant would require only a fraction of the present investment in steam plants, buildings, and real estate. Perry states in his book, The Steam Engine and Gas and Oil Engines, that he thinks boilers should be made to do ten and possibly twenty times the work they do at present.
Furnaces. It will probably be found on attempting this reduc tion of dimensions and cost that the limit will be not in the boiler as such, but in the combustion chamber. Burning a large amount of coal on a small grate area is largely a question of draft and con tinual riddance of ash, but the rate of travel of gases, through a. combustion chamber is dependent, practically, only on the amount of carbon burned per unit of time, the rate being about the same no matter what the air supply per pound of carbon. As combus tion chambers are now constructed for western coals they are too small, but "small" is a word not to be understood in this con nection as referring to volume or length alone. By a "small com bustion chamber" is meant a chamber in which either the time spent by the gas in traveling from the front to the rear of the boiler is short or the mixing devices are inefficient or absent. In the dis cussion of mass action it was stated that mere length of combustion chamber counts for little that mixing is what counts and thus there is. a possibility of enormously increasing the efficiency of a com bustion chamber as a burner of volatile matter. Effort in com pleting a steam-generating outfit of small dimensions must be largely concerned with the construction of a combustion chamber contain ing many gas-mixing appliances.
Turbines. The work on turbines is provisional only, but it is believed that all the assumptions made are on the side of safety; that is, that the over-all efficiency of the turbines working with high superheat and low pressure would probably be greater than estimated.

A STUDY OF FOUR HUNDRED STEAMING TESTS. 179
BIBLIOGRAPHY.
BARR, William M. Combustion of coal and the prevention of smoke. The Norman W. Henley Publishing Company, New York.
A practical catechism for engineers.BARRUS, George H. Boiler tests. D. Van Nostrand, New York.BOOTH, William H., and KERSHAW, John B. C. Smoke prevention and fuel economy.
The Norman W. Henley Publishing Company, New York. DAMOTJR, E. Industrial furnaces and methods of control. Translated by A. L.
Quereau, 1906. Eng. and Min. Jour.DUHEM, P. Thermodynamics and chemistry. Translated by George K. Burgess.
Should receive careful study by the chemical engineer.
HOFF, Dr. J. H. van't. Lectures on theoretical and physical chemistry. Trans lated by'Dr. R. A. Lehfeldt. Part 1, chemical dynamics; part 2, chemical statics. Edward Arnold, 37 Bedford street, Strand, London.
JONES, Harry C. Elements of physical chemistry. Macmillan Company.KENT, William. Steam boiler economy. John Wiley & Sons, New York.KERSHAW, John B. C., and BOOTH, William H. Smoke prevention and fuel economy.
The Norman W. Henley Publishing Company.MELLOR, J. W. Chemical statics and dynamics. Longmans, Green & Co., New York,
1904.MELLOR, J. W. Higher mathematics for students of physics and chemistry. Long
mans, Green & Co.An exceedingly helpful book to engineers, but very poorly indexed. Deserves much deep study
by applied scientists. . "
MEYER, Dr. Oskar Ernil. The kinetic theory of gases. Translated' by Robert E. Baynes, M. A. Longmans, Green & Co.
A simple and clearly written book on an intricate subject, by an authority. Should be carefully studied by every engineer who deals with gases in any way.
NERN'ST, Dr. Walther. Theoretical chemistry from the standpoint of Avogadro's rule and thermodynamics. Translated from fourth German edition. Macmil lan Company.
NERNST, W., and WARTENBERG. H. v. Die Dissociation von Wasserdampf. Zeitsch. f. prakt. Chemie, vol. 56, No. 5, 1906.
NERNST, W., and WARTENBERG, H. v. Ueber die Dissociation der Kohlensaure. Zeitsch. f. prakt. Chemie,'vol. 56, No. 5, 1906.
PARR, S. W. The classification of coals. Jour. Am. Chern. Soc., vol. 28, No. 10, 1906.PARSONS, H. de B. Steam boilers, their theory and design. A. C. McClurg & Co.,
Chicago.PENNSYLVANIA RAILROAD COMPANY. Locomotive tests and exhibits of Pennsylvania
Railroad system at Louisiana Purchase Exposition, St. Louis, 1904. Published by the company, Philadelphia, Pa.
PERRY, John. The steam engine and gas and oil engines. Macmillan Company, 1902. A splendid book; chapters 26, 30. and 33, concerning boilers, are especially good; gist of most
matter on true boiler efificiency in footnote of page 591.
ROWAN, F. J. The practical physics of the modem steam boiler. A. C. McClurg &. Co., Chicago.
SMITH, Robert H. Commercial economy in steam and other thermal power plants.J. B. Lippincott Company', Philadelphia, Pa.
VAN DEVENTER, Dr. Charles M. Physical chemistry for beginners. Translated byDr. R. A. Lehfeldt. Edward Arnold, 37 Bedford street, Strand, London.
WALKER, James. Introduction to physical chemistry. Macmillan Company. WARTENBERG, H. v., and NERNST, W. Die Dissociation von Wasserdampf. Zeitsch.
f. prakt. Chemie, vol. 56, No. 5, 1906. WARTENBERG, H. v., and NERNST, W. Ueber die 'Dissociation der Kohlensaure.
Zeitsch. f. prakt. Chemie, vol. 56, No. 5, 1906.

180 A STUDY OF FOUR HUNDRED STEAMING TESTS.
GLOSSARY.
ABSOLUTE TEMPERATURE. The temperature of a substance reckoned from that tem perature 461° below the zero on the Fahrenheit scale and 273° below the zero on the centigrade scale at which all heat is supposedly absent.
AIR-DRIED COAL. A term applied to coal that has been prepared for chemical analysis. The coal is dried at a temperature somewhat above that of the room in which it is to be analyzed, in the atmospheric conditions prevailing in the room, so that the sample will not vary in weight while being handled. No coal has a constant air-drying loss, since its loss in weight varies according to conditions, such as size of coal analyzed, air currents, and weather conditions. Air-drying results are of value only to the chemist who figures them back to coal as received and to dry coal.
AVAILABLE HEAT. The portion of the heat supplied to the boiler over and above the amount required to raise the gases from atmospheric to steam temperature.
AVAILABLE HYDROGEN. The excess of hydrogen in coal over and above that which is required to unite completely with the oxygen in the coal to form water (H/)). It is found by subtracting one-eighth of the total oxygen from the total hydrogen.
AVOGADRO'S LAW. The temperature and pressure being the same, the number of molecules in a unit volume is the same for all gases.
BAFFLE. A term applied to partitions designed to change the course of moving gases in the combustion chamber or among the boiler tubes.
BASE VALUES. A term used to designate the abscissa value of any point on a curve- that is, the horizontal distance of that point from the left side of the chart.
BLACK BODY, A term used to designate a hollow body whose walls are all at the same temperature. If an extremely small hole were made in such a body, heat would be radiated through the hole in proportion to the difference of the fourth powers of the absolute temperatures of the black body and the surrounding objects.
BOLTZMANN AND STEFAN'S LAW. See Stefan and Boltzmann's law.BRITISH THERMAL UNIT. That quantity of heat which is required to raise the tem
perature of 1 pound of pure water through 1° F. at or near 39.1° F., the tem perature of maximum density of water. The abbreviation B. t. u. is used in this volume.
CAKING COAL. A term applied to coal which fuses together when burning a coal that is not free burning.
CAPACITY. A term rather loosely used to denote the percentage of steam made, taking as the basis (100 per cent) the rated evaporation designated by the boiler builder.
CARBON AVAILABLE-HYDROGEN RATIO. The total carbon content of coal divided by the available hydrogen (q. v.).
CARBON, FIXED. See Fixed carbon.CARBON HYDROGEN RATIO OF DRY COAL. The total carbon content divided by the
total hydrogen content.CARBON HYDROGEN RATIO OF COAL "AS FIRED," OR "AS RECEIVED" (MOIST COAL).
The total carbon content divided by the total hydrogen content, including the hydrogen of the free moisture present.
CATALYZER. A substance whose presence, among the substances participating in a chemical reaction, hastens or retards the speed of the reaction, although the nature and total amount of catalyzer present is always the same at the end as at the beginning of the reaction, so far as can be detected.
CELLULOSE. A substance represented chemically by the expression C6H 1005 . It is the basis of wood structure, excluding a slight amount of mineral ash in the cell walls.
CLINKER. A term used herein to designate the more or less molten portions of ash (including some carbon) drawn from the grate and ash pit.
CO. Abbreviation for carbon monoxide.

GLOSSAEY. 181
C02 . Abbreviation for carbon dioxide.COAL, AIR-DRIED. See Air-dried coal. COAL, DRY. See Dry coal.COAL, FREE-BURNING. See Free-burning coal.COMBUSTIBLE. A loose expression and misnomer for the phrase "coal free from mois
ture and ash," sometimes called "pure coal." The pounds of "combustible" used in every steam test have been computed in two ways, as follows: '
1. Item 30: Obtained by subtracting from the total pounds of dry coal fired the pounds of ash and combustible drawn out of the ash pit and through the fire doors in cleaning the fire.
2. Item 30*: The weight of the coal fired is corrected for moisture and ash as given by the proximate analysis, thereby giving the pounds of "combustible" fired. From this amount is subtracted the pounds of "combustible" lost in the refuse, giving the total pounds of "combustible" actually ascending from the grate during the test.
Two efficiencies have been figured from these weights of "combustible" items 72 and 72*.
In this bulletin there are many references to '' code item 72*.'' In reality there is no such item. This 72* item is the one given in the code as item 72, and is the comparable efficiency, because with different grates different amounts-of coal might drop into the ash pit and in figuring 72* corrections have been made for this loss. (See 72* under "Computations of a steaming test," p1. 151.)
Whenever the word "combustible" in this bulletin is in quotation marks it means "coal free from moisture and ash." Quotation marks are employed because the word used in this sense is a misnomer, inasmuch as the oxygen and nitrogen, and -perhaps part of the sulphur, do not burn.
COMBUSTION CHAMBER. Strictly, the entire space between the surface of the fuel bed and the area at which the gases enter the boiler; term usually applied, how ever, to designate the space between the bridge wall and that area.
CONDUCTION. The process of transferring heat by direct contact; as when heat travels along a rod, or from a hot stove lid to a flatiron resting on it.
CONVECTION. The addition to, or removal from, .a body of heat, by gases or liquids circulating in direct contact with the body; as the removal of heat from a steam radiator by the circulation of air.
CONES, SEGER. See Seger cones.DISSOCIATION. The state of separation of the molecules of a substance into two or
more parts. A term used herein to denote effects due to high temperatures.DRY CHIMNEY GASES. In all calculations in this bulletin this term includes C02,
02 , CO, and N2 gases.DRY COAL. Coal which has been dried in a very finely powdered condition for one
hour at a constant temperature of 105° C. In the expression "B. t. u. per pound of dry coal as fired," however, the "dry coal" is computed from a determination of the moisture in the coal sample.
EFFICIENCIES:Boiler and grate ("over-all"} efficiency, code item 73, denoted by E 1; is the ratio
of the heat absorbed by boiler to the potential heat of dry coal fired.Boiler efficiency, code item 72*, denoted by E2 , is the ratio of the heat absorbed
by the boiler to the potential heat of combustible ascending from grate. The combustible in this item is equal to the total dry coal fired, minus the ash by analysis of dry coal, minus the combustible in refuse.
Boiler efficiency, code item 72 (seldom referred to in this bulletin), is the same as 72*, except that the combustible is taken to be equal to total dry coal fired minus the total refuse determined by actual weighing, this total refuse being combustible and ash.
Furnace efficiency, or per cent of completeness of combustion, denoted by E3 , is the ratio of the heat actually evolved in the furnace to the potential heat of the combustible ascending from the grate.

182 A STUDY OF FOUK HUNDRED STEAMING TESTS.
EFFICIENCIES Continued.True boiler efficiency, denoted by E4 , is the ratio of the heat absorbed by the
boiler to the heat in the gases which is available to the boiler, counting only that part of the heat in the gases as available to the boiler which remains after subtracting from the total heat actually generated the amount which is used in heating the gases from atmospheric to steam temperature.
Boiler efficiency corrected, denoted by E5 , is the ratio of the heat absorbed by the boiler to the heat actually evolved in the furnace.
Tliermodynamic furnace efficiency is the ratio of the heat made available to the boiler to the potential heat of coal fired.
Thcrmodynamic efficiency of boiler is the ratio of the heat made available for engine or turbine to the heat available to the boiler.
EMPIRICAL FORMULA. A formula expressing the actual relations between two or more variables and constants, but not founded on known laws. Cf. " Rational formula.''
ENDOTHERMIC. An adjective describing a chemical reaction which can take place only by absorbing heat from the surroundings or by reducing the temperature of the reacting matter. The opposite of exothermic.
EXOTHERMIC. An adjective describing a chemical reaction which evolves heat. The opposite of endothermic.
FIXED CARBON. A term applied to that portion of the carbon in a coal left after the "volatilization" process of the proximate analysis. It is obtained by subtracting from 100 the percentages of ash, moisture, and volatile matter.
FREE-BURNING COAL. A term applied to coal which when thrown in the'fire burns without the separate pieces of coal fusing together. A noncaking coal.
"FREE" MOISTURE. Moisture which is driven off from coal when subjected to a temperature of 105° C. (221° F.) for one hour. t
GRAM MOLECULE. An amount of a substance, in granis, numerically equal to the molecular weight of the substance. For instance,'a gram molecule of water is 18 grams, the molecular weight of water being 18 (2 of hydrogen and 16 of oxygen).
HEAT, AVAILABLE. See Available heat:HOOD. The inverted funnel, usually about 4 feet high, between the top of the brick
setting and the bottom of the cylindrical smokestack. The flue temperatures and gas samples are taken at the top of the hood, and the stack damper is just above this point.
HYDROGEN, AVAILABLE. See Available hydrogen.HYDROCARBON GASES (HYDROCARBONS). Gases which are distilled from coal when
it is heated. They are high in heating value, approximately 1£ times as high in B. t. u. per pound as pure carbon. They usually occur in three forms, expressed by the formulas: C,,Hn , CnH2n , and GnH2n+2 .
IGNITION TEMPERATURE. The ignition temperature of a substance is that tempera ture to which it must be raised in the presence of oxygen to cause the two to unite by combustion. This temperature is rather indefinite, as extremely, slow union begins far below the point of rapid union. For any one substance there are gener ally two temperatures, within perhaps 200° F. 'of each other, at the lower of which the rate of combustion is inappreciable and at the higher of which it is almost infinite. " '
KINETIC THEORY OF GASES. This theory postulates that gases consist of immense numbers of individual molecules moving among each other with enormous velocities. The sum of the molecular impacts against the sides of a containing vessel constitutes the pressure of a gas. Raising the temperature of a gas increases the molecular speed, and consequently the force of impact.
MASS ACTION., LAW OF. The speed of a chemical reaction is-proportional to the prod uct of the weights of reacting substances present, in unit volume, the weight of each substance being expressed in gram molecules.
MOISTURE, "FREE." See "Free" moisture.

GLOSS AEY. 183
O2 . Abbreviation for oxygen (one gaseous molecule).ORSAT APPARATUS. An instrument for determining the percentages of carbon dioxide,
oxygen, and carbon monoxide by absorbing them successively in certain solutions. (See text-books on gas analysis.)
POTENTIAL HEAT. A. term applied to the heat in coal as determined by a calorimeter.PROBABILITY CURVE. The graphic plotting of a certain mathematical equation
expressing the likelihood of a quantity being more or less different from what it "ought" to be. (Seep. 158.)
PROXIMATE ANALYSIS OF COAL. An empirical method of determining the percentage of "free" moisture, of "volatile matter," of "fixed carbon," and of ash in coal. The method of determination varies somewhat with different chemists.
PYROMETER. An instrument for measuring high temperatures.RADIATION. The process of transferring heat through space from one body to another
without the aid of tangible substance for example, the transfer of heat from the sun to the earth.
RATIONAL FORMULA. A formula deduced from fundamental laws, as of physics. Of. "Empirical formula."
REFUSE. Clinker, ash, and unconsumed coal taken from the ash pit and pulled out of the furnace when cleaning fire.
SEGER CONES. Small pyramids made of various chemicals variously mixed. The temperatures of softening of the different cones are fairly well known. Sdveral of them are put into a furnace in a row, each having a melting point intermediate between its neighbors. By watching the curling over of the tips one.can form a fairly correct estimate of the average temperature.
STEFAN AND BOLTZMANN'S LAW. The amount of energy radiated by a black-body surface to another body is proportional to the difference of the fourth powers of their absolute temperatures.
STRAIGHT-LINE FUNCTION. A value changing directly or inversely with a variable, so that if simultaneous values are plotted on coordinate paper the points would lie in a straight line.
TEMPERATURE, ABSOLUTE. See Absolute temperature.TEMPERATURE, IGNITION. See Ignition temperature.TEMPERATURE GRADIENT. As used in this bulletin, any continuous change of tem
perature along a body actively conducting heat.ULTIMATE ANALYSIS OF COAL. A chemical analysis^so made as to give, in percentages,
the amounts of carbon, hydrogen, oxygen, nitrogen, and ash in a dry coal. The sulphur is separately determined.
"UNACCOUNTED-FOR LOSS." That percentage of the potential heat of a combustible which, remains after deducting all the known expenditures of heat.
VELOCITY. A term loosely applied to the speed of a chemical reaction for example, combustion. It is proportional at any instant to the rate of formation of new sub stance by the reaction. '
VOLATILE MATTER FROM PROXIMATE ANALYSIS, or "volatile combustible matter," as it is often incorrectly termed, is the mixture of gases, together with some particles of carbon, driven off when a sample of finely ground coal is heated in a closed vessel. This is an arbitrary determination, dependent on the operator and the conditions under which it is made. A committee from the American Chemical Society has suggested a method of volatilization which is generally followed. This method gives fairly concordant results when the same operator, using the same apparatus, makes duplicate determinations on the same sample of coal.
VOLATILE CARBON. A. name given to that part of the carbon in coal which is expelled in the process of volatilization by the "standard method" of proximate analysis.
It exists in the "volatile matter" resulting from distillation, largely in combina tion with hydrogen as gaseous hydrocarbons.
WATER OF COMPOSITION. A fictitious value determined by uniting the total oxygen in dry coal with such a part of the hydrogen as would be required to form water.


INDEX.
A. Page.
Absorption. See Boiler, absorptionby.
Absolute temperature, definition of_ 180 Acknowledgments to those aiding _ 7-8 Air-dried coal, definition-of_____ 180
See also Coal, air-dried. Air leakage, data on__________ 67-68 Air supply. See Draft. Alabama coal, smoke test of____ 57
No. 3, smoke test of__________ 58No. .4, carbon-hydrogen ratio of_ 72, 77
smoke test of__________ 58 Arkansas coal, smoke test of____ 57
No. 7, smoke test of ___ __ 58 No. 7 A, carbon-hydrogen ratio of_ 71, 77 No. 8, carbon-hydrogen ratio of_ 71, 77
smoke test of___-______ 58 No. 10, smoke test of_______ 58
Ash, amount of, carried over wall, re lation of, to unaccount ed for loss______ 168-169
discussion of _______ 31-33, 38-44 distribution of __________ 29, 36 fusing point of, determination of_ 29 relation of, to method of burn
ing . ____________ 43to carbon-hydrogen ratio _ 42
figure showing ____ 41 to combustion-chamber tem
peratures ______ 42 figure showing ____ 41
to completeness of combus tion__________ 42
figure showing _ _ 41 to dry-chimney-gas evolu
tion____________ 42 figure showing_____ 41
to efficiency 72*_______ 41-42 figure showing_ __ 41
to flue-gas temperatures__ 42 figure showing.____ 41
to rated capacity_____ 42 figure showing_ _ 41
relation of clinkers and____ 36, 39 figure showing ____ . 40
relation of efficiency 72* to__ 31,32-33, 176
figure showing________ 33relation of efficiency 73 and__ 39, 176 relation of size of .coal to__ 42-43, 49
figure showing_.._____ 48 See also Coal, dry, ash plus sul
phur in. Ash-sulphur ratio, relation of, to
clinkering ________ 38-39 relation of efficiency 72* and__ 93-94
Page.Available hea't, definition of_____ 180 Available hydrogen, definition .of__ 180
See also Coal, hydrogen in ; Hy drogen.
Avogadro's law, statement of ___ 110-180
B.
Baffle, definition of__________ 180 description of_____ ___ 62figure showing _ 62use of ____________ 20,62-63
Barker, Perry, work of__ _ 10Base values, definition of__ _ 180Bibliography ______ _________ 179Bird, F. J., work of __ - 10 Black body, definition of_______ 180Boiler and grate efficiency Ei, defini
tion of__________ 181 Boiler efficiency E4 , calculation of__ ISO-
136, 143,147-149, 174 conclusions on_ __ 176 constant-capacity curves of__ 143-
144,147-149figure showing-__ ' 144
curve of_ _ 146-149 figure showing. _ __ .147
definition of ________ 95,141,182 relation of, to initial tempera
ture __________ 112-113 relation of efficiency 72* and__ 147
figure showing _______ 147relation of probability curve
to ____.______ 146-149^ figure showing _______ 147
Boiler efficiency corrected Er,, calcu lation of __ 130-132, 142-143
constant-capacity curves of___ 141- 143, 147-149
figure showing__ ___ 141definition of ______ 95, 138, 140, 182discussion of ____________ 95-99,
103-109, 134-149relation of, to ratio of velocity /
of gas to combustion- chamber temperature 140-141
figure showing________ 14.1relation of carbon-hydrogen ra
tio to_______ 73-74, 78-79 figures showing ______ 37, 71
relation of combustion-chambertemperature and ___ 51
relation of heat evolution to__ 93-94-figure showing _ _______ 93
relation of smoke to______ 56figure showing :__ 56

186 INDEX.
Page. Boiler efficiency 72, definition of____ 181Boiler efficiency 72,* classification by 40
conclusions on__________ 175definition of ______ 137-138, 181relation of, to ash______ 31, 32-33
to ash, figure showing___ 33to ash-sulphur basis_____ 93, 94to carbon dioxide in flue
gases _:___1__ 26-27, 35 figure showing_ _ 27
to carbon monoxide in fluegases _______ 26-27, 65
figure showing ____ 27to clinker in refuse____ 28,
29, 31, 35, 44figure showing_____ - 30
to sulphur_________ 28-31,44figure showing_____ 30
to unaccounted for loss_ 139figure showing __ 138
relation of ash to______ 41-42, 176figure showing-_______ 41
relation of ash plus sulphur to_ 94, 95 relation of ash-sulphur ratio to_ 94 relation of carbon available
hydrogen ratio to_____ 83-84figure showing________ 84
relation of carbon (volatile)- carbon (total) ratio to ______________ 83-85'
figure showing_______- 86 relation of carbon-hydrogen
ratio to __ 70-76, 79-83, 88 figure showing _ 37,
69, 71, 74, 75, 76, 79, 80, 81, 82, 83
.relation of carbon monoxide influe gases to_____ 27, 65
figure showing ________ 28 relation of clinker in refuse to_ 44 relation of combustion-chamber
temperature to___- 22-24, 50 figure showing __.______ 25
relation of fixed carbon to__ 90 figure showing ___ _ 91
relation of hydrogen to____ 83 figure showing _ 84
relation of hydrogen-avail able hydrogen ratio to_ 85-86
figure showing ___ 87 relation of iron-ash ratio to__ 34-35,
'37-38figure showing ______ 35
relation of moisture to_____ 32,176 figure showing _ _ 33
relation of nitrogen in flue gasesto ____________ 64-65
figure showing.____ -. 28 relation of oxygen in combust
ible and ________ 92-93 figure showing ______ 92
relation of probability curve and146-149
figure showing ____ 147
Page. Boiler efficiency 72*, relation of rate
of combustion to___ 16-17 relation of rate of combustion
to, figure showing__ 17 relation of rate of heat evolu
tion to _________ 15-17 figure showing _______ 14
relation of rated capacity to__ 52relation of size of coal to___ 46 51
figure showing ________ 46, 48relation of sulphur in coal to_ 43-44,
176figures showing __ 43
relation of true boiler efficiency(E4 ) and ________ 147
figure showing ________ 147relation of volatile matter to__ 89-90
figure showing _________ 90relation of washing to_____ 176 relation of wind to______ 167-168 test of ______________ 26-32
Boiler efficiency 72* at about rated capacity, relation of carbon-hydrogen ratio to_____________ 70
figure showing ______ 69Boiler efficiency 73, definition of__ 181
relation of ash and_____ 39-40, 176 figure showing ______ 40
Boiler tubes. See Tubes. Boilers, air leakage of, data on___ 67-68
cost of ______________ 177 dimensions of ___________ 173
figure showing ______ 174 efficiency of. Sec Boiler effi
ciency.heat absorption by__ -.___ 105-112
factors of, relation of, to fur nace temperature- 113-114
relation of, to furnace temperature, figure- showing ______._ 15
Perry's theory of ____ 109-112 test of ________ 132-134
relation of, to physical at tributes ______ 112-113
to total available heat 130- 131,137
figure showing __ 131 relation of carbon-hydrogen
ratio to ________ 37 figure showing _ 37
relation of density of gasto ________ 109, 113-114
figure showing _____ 15relation of gas velocity to 109-
110,113-118, 130-132figure showing ___ 131
relation of specific heat ofgases to __ 110-112,132-137.
relation of water circula tion and _______ 120-121
theoretical curves of____ 27-28 figure showing ___ 29

INDEX. 187
"Page. Boilers, heat absorption by, theory
of _______ 109-112 heat absorption by, theory of,
application of__ 118-120 theory of, modifications of- 125-
132,134-137 variation in, along a fire
tube _______ 121-125 along a fire 'tube, fig
ures showing _ 123-124 See also Heat balance,
heat losses of _______ 99 improvement of ____ ____ 177 insulation of, by soot, etc___ 125-132 low pressure in, effect of, on
economy _____ _ 102-105 parts of ______________ 95 rated capacity of. See Capacity,
rated.type of :_____________ 8 water circulation in, effect of
firing and cleaning fires on _____________ 162
effect of. firing and clean ing fires on, figure showing _________ 162
indicator for, descriptionof___________ 160-162 figure showing ______ 161
rate of, relation of rate ofsteaming to______ 16, 163
figure showing ___ 16 relation of heat absorption
and __________ 120-121 Boltzman and Stephan's law, state
ment of _______ 112, 183 Brazil coal, smoke test of______ 57
No. 1, clinker in_________'_. 34 smoke test of_____,_____ 58
Brcckenridge, L. P., work of____ 10,174 Briquetting, effects of________ 50, 177 British thermal units, definition of__ 180
See also Heat.
Caking, definition of _________ 180 Calcium sulphate, occurrence of _ 38
Sea also Sulphur. Campbell, M. R., carbon-hydrogen
classification by_:__ 68 Capacity,'rated, definition of____ 180
discussion of__________ 51 52 relation of, to combustion-cham
ber temperature ___ 52 to efficiency.________ 52 to ratio of combustion-
chamber temperature minus steam to flue gas minus steam__ 137
figure showing____ 136 relation of ash to__'______ 42
figure showing _ _ 41 relation of carbon-hydrogen ra
tio to ___________ 69, 73
Page.Capacity, rated, relation of ^arbon-
drogen ratio to, figure showing _____ _ 37, 69,
71, 74, 75, 76,79, 80, 81, 82 relation of .clinker in refuse to,
figure showiug_!_________ 36relation of combustion-chamber
temperature to__20-21, 25-26figures showing____ _ 21, 25
relation .of fixed carbon to_ 90figure showing ___ --- 91
relation of heat evolution to___ 15, 94figure showing ____ 14, 93
relation of hydrogen-availablehydrogen ratio to___ 86
figure showing.________ 87relation of rate of combustion
.to_____________ 17,176 figure showing _______ 17
relation of revolutions per min ute and___.___ _ 1G, 103
figure showing ^._________ 16relation of size of coabto_:_ _ 46, 48
figure showing _-__:__ ___ 46, 48Carbon, fixed, classification by____ 87-88
definition of -- - _____________ 180nature of______:___ __ 59relation -of, 'to completeness of
combustion ___ _ _ 92 to completeness of combus
tion, figure showing__ 91 to combustion-chamber tem
perature _________ 90-91 figure showing 91
to efficiency 72*______ 90 figure showing ____ 91
to flue-gas temperature___ 91 figure showing _____ 91
to gas evolution___ ___ 92 figure showing ____ 91
to rated capacity______ 90 figure showing _ 9.1
relation of-smoke to_______ 57 figure showing ________ _ 56
Carbon, volatile, definition of____ 59,183 Carbon (volatile) total carbon ratio,
relation of, to efficiency 72* __!__________ 83-85
relation of, to efficiency 72*,figure showing_____ 86
CarbonTavailable hydrogen ratio,definition of _1_____ 180
Sec also Coal, dry; Coal as re-i. ceived.
Carbon dioxide. See Gases, carbondioxide in.''
Carbon-hydrogen ratio, basis of___ 68-69 classification by__________ 68-81 definition of__________.__ 180 Sec also Coal as received ; Coal,
dry.Carbon monoxide, definition of___ 180
Sec also Gases, carbon monoxide in.

188 INDEX.
Page.Carbon monoxide loss, relation of
carbon-hydrogen ratio to __________ 73, 74-80
relation of carbon-hydrogen ra tio to, figures show ing ________ 37, 71, 74, 75,
76, 79, 80, 81, 82relation of clinker and__: __ 35 relation of hydrogen available
hydrogen ratio to____ 86 figure showing- _ . 87
relation of rate of combustionto _____________ 12
figure showing . 12 relation of heat evolution to 14-15
figure showing _ . 13 Catalyzer, definition of_________ 180 Cellulose, definition of________ 180 Chimney gases. See Gases. Circulation, water. See Boiler, wa
ter circulation in. Cleaning fires, effect of, on water
circulation _______ 162 effect of, on water circulation,
figure showing . 162time required for________ 38, 39
Clinker, definition of__________ 180See also Refuse, clinker in.
CO. See Carbon monoxide. C02 . See Carbon dioxide. Coal, ash in. See Ash.
ash-sulphur ratio of, relation ofefficiency and ____ 93-94
burning of, relation of ash andclinkers to_______ 43
classification of ________ 17, 68-94 clinker from. See Refuse, clink- .
ers in.combustion of, forecasting of__ 10 crushing of, advantage .of____ 50-51 distillation of___________ 58-59 iron in, relation of, to clinkers- 35, 38nature of______________ 58size of, effects of________.__ 45-51
relation of ash and_____ 42 43relation of clinkers and__ 35 37,
40-41, 47relation of nitrogen in flue
gases to _______ 65 figure showing____ 28
See also Coal, dry. sizing of _______________ 45-46 sulphur in. See Sulphur, washing of, relation of, to effi
ciency 72*_______ 176 See also Combustible.
Coal, air dried, classification of, oncarbon-hydrogen ratio. 68-70
definition of ____________ 180 Coal as received, ash in. See Ash.
carbon-available- carbon ratio' of, definition of ___ 180
relation of, to efficiency72* ___________. 83
figure showing_____ 84
Page. Coal as received, carbon-hydrogen
ratio of ________ 70-72carbon-hydrogen ratio of, rela
tion of, to CO loss-
relation of, to CO loss, fig ure showing ___ _
71, 74,to combustion-chamber
temperature-_____figures showing-__
74,to completeness of com
bustion________ to efficiency 72*_____
figures showing___ 69, 71, 74, 75,
73, 74-77
37,75, 76
75-7671,
75, 76
8270-76, 82-83
37, 76,83
to efficiency 72* atabout rated capacity 70
figure showing__ 69to gases evolved _ 73
figures showing._ 37,71, 74, 75, 76
to heat evolved____ 73 figures showing __ 71
to rated capacity---_ 69, 73 figures showing__ 69,
71, 74, 75, 76 to hydrogen-available
hydrogen ratio 76-77 figures showing-_ 76
to theoretical boilerefficiency _______ 73-74
figures showing__ 71 See also Carbon-hydrogen
ratio; Coal, dry.classification of __________ 70-77 hydrogen in. See Hydrogen, hydrogen - available hydrogen
ratio of, relation of, to carbon-hydrogen ratio _ 76-77
relation of, to carbon-hy- . drogen ratio, figure
showing ____ _ 76moisture in ____________ 32
relation of efficiency and__ 32,176figure showing ____ 33
Coal, dry, ash in. - See Ash.ash plus sulphur in, relation of,
to efficiency 72* ___ 95 ash-sulphur ratio of, relation of
efficiency 72* and__ 93, 94 carbon-hydrogen ratio of____ 77-78
relation of, to CO loss_^__ 79-80 to CO loss, figure show
ing ____ 37, 79, 80, 81, 82 to chimney-gas evolu
tion___________79-81 figure showing __ 37,
79, 80, 81, 82to clinker in refuse___ 78
figure showing__ 37

INDEX. 189
Page.Coal, dry, carbon-hydrogen ratio of,
relation of, to combus tion-chamber tempera ture _____i___ 79-80, 88
carbon-hydrogen ratio of, rela tion of, to combustion- chamber temperature, fig ures showing.. 37, 79, 80, 81, 82
relation of, to efficiency72*________ 79-81, 88
to efficiency 72', figuresshowing __ ___ 87,
79, 80, 81, 82 to gases,- evolved, ' fig
ures showing ___ 79, 80, 81, 82
to hydrogen - availablehydrogen ratio___ 77 81
figures showing-. 79, 80,81, 82
to rated capacity, fig ures showing 37,
79, 80, 81, 82 to theoretical boiler effi
ciency ________ 78-79 figure showing__ 37
relation of ash to_ __ 42 figure showing. ___ 41
relations of size of coaland________ 46-48, 78
figure showing___ 37, 46, 48 See also Carbon-hydrogen
ratio ; Coal as received, classification of, on carbon-hy
drogen ratio 77-82 on efficiency basis_____ 40
definition of ____________ 181 hydrogen in. See Hydrogen, hydrogen - available hydrogen
ratio of __________ 85-88 relation of, to CO loss___ 86
to CO loss, figure show ing __________ 87
to combustion-chambertemperature __ 85-86
figure showing __ 87 to rated capacity 86
figure showing __ 87 to efficiency 72*____ 85-86
figure showing __ 87 to carbon-hydrogen ra
tio ________ 79-81 figure showing __ 37.
80, 81, 82 iron-ash ratio of, relation of,
to efficiency__ 34-35, 37-38 relation of, to efficiency, fig
ure showing _____ 35 oxygen in, relation of smoke to_ 57
relation of smoke to, figureshowing _________ 56
size of,-relation of, to ash____ 49 relation of, to ash, figure
showing-_______ 48 to carbon - hydrogen
ratio_______ 46-48 'figures showing __ 46, 48
Page.Coal, size of, relation of, to chimney-
gas evolution ___ 46, 48-49 size of, relation of, to chimney-
gas evolution, figure showing ___J____ 46, 48
relation of, to combustion- c h a m b e r tempera ture _._______ .46, 47, 50
to combustion-chamber temperature, figure showing ______ 46
to completeness of com bustion __ ____ 46
figure showing ___ 46 to draft_________ 48, 176
figure showing _ 48 to efficiency 72*_____ 46-51
figure showing _:._ 46, 48 to flue-gas temperature 40
figure showing _ 46 to rated capacity___ 46, 48
figure showing. 48 to rate of combustion- 48, 176
figure showing___ 46, 48 See also Coal,
sulphur in. See Sulphur. Coal, pulverized, burning of- ___ 50-51 Combustible, computation of____ 181
definition of ___________ 181 hydrogen in. See Hydrogen, oxygen in. See Oxygen, relation of, to gas evolution__ 167 volatile matter in, classification
by ______'_____ 87-90 relation of, to combustion-
. chamber temperature 90 to combustion-chamber
temperature, figure showing ______ 89
relation of, to efficiency72*___________ 89-90
figure showing ___ 89 Combustible in refuse, relation of
clinkers to___i___ 38 Combustion, completeness of, defini
tion of_________ 172,181 completeness of. _ _ _ 10
relation of ash to __ 42 figure showing___ 41
relation of COo in flue gasesto ___________ 65-66
figure showing _____ 51 relation of carbon-hydrogen
ratio to__________ 82-relation of draft and____ 172relation of fixed carbon to^ 92
figure . showing ____ 91relation of heat evolution
to ___________ 94 figure showing __ 93
relation of size of coal to_ 46 figure showing___ 46
relation of sulphur to____ 44 figure showing _____ 43
relation of-temperature and- 172 See also Furnace efficiency
' E3 .

190 INDEX.
Page. Combustion, products of, relation of,
to draft__________ 15-16 products of, relation of, to draft,
figure showing _____ 15 temperature of, relation of,
to draft______ 159-160 figure showing _____ 160
rate of__-__________ 60-61,176 relation of, to draft____ 176
to rated capacity- 16-17,176 figure showing___ 17
to flue-gas temperature 11 figure showing __ 12
to various losses--__ 11-13 figure showing _ 12
relation of combustiou- chamber temperature to____________ 19-20
figure showing_____ 20 relation of size of coal to_ 48,176
figure showing_____ 48 results of, forecasting of__ 10 temperatures of, calcula
tion of-:-_________ 9-10 relation of draft and
completeness of com bustion and_____ 172
Combustion chamber, baffle wall in.Sec Baffle.
carbon monoxide in_______ 166-167relation of smoke and__ 166-167
definition of___________ 181description of___________ 59gases in, analyses of_______ 59-60
volumetric composition of_ 61See also Gases.
temperature of, discussion of__ 18-26 relation of, to carbon diox
ide in flue gas___ 24-25 to carbon dioxide in
flue gas, figure show ing 25
to efficiency 72*____ 20-21, 23-24, 50, 51
. figures showing__ 21,25to flue-gas temperature- 22-23
figure showing__ 24to heat balance_____ 63
figure showing^ 63to losses ______ 20-21,'63
figure showing__ 21, 63to rate of combustion- 19-20
figure showing-__ 20to rated capacity___ 20-21,
25-26figure showing __ 21, 25
to theoretical heat evo lution_________ 19-20
figure showing 20 . relation of ash to_l_____ 42
figure showing_____ 41 relation of CO2 to_____ 21-22
figure showing _____ 22, 23
Page.Combustion chamber, temperature of,
relation of carbon- , hydrogen ratio to _ 75-
76, 79, 80, 88temperature of, relation of car
bon-hydrogen ratio to, figure'"showing_ 37,71,
74, 75, 76, 79, 80, 81, 82 relation of CO to____ 21-22, 65
figure showing___ 22, 23 relation of clinkers in re
fuse to________ 44 figure showing ____ 36-
relation of fixed carbon to_ 90-91 figure showing_____ 91
relation of flue-gas compo sition to_______ 21-22
figures showing-____ 22,23 relation of heat evolution to,
figure showing____ 93. relation of hydrogen-avail
able hydrogen ratio to __________ 85-86
figure showing _____ 87 relation of oxygen in flue
gas to_________ 21-22 figures showing ____ 22, 23
relation of rated capacityto _______ __'_ 52
relation of size of coal to_ 46, ' 47, 50
figure showing : 46relation of smoke to_ _ 57
figure showing __ _ 56relation of sulphur to___ . 44
figure showing _____ 43relation of volatile matter
. to ____________ 90 figure showing _ 89
temperature of, minus steam,relation of, to flue gas minus steam ____ 132-134
minus steam, relation of, to flue gas minus steam, figure showing ___ 133
relation of, to flue gas minus steam, modifi cations of_____ 134-137
Combustion space, description of 59 function of__ _____ 59
Conduction, definition of__ __ 181 Cones, Seger, definition of 183 Convection, definition of^___ 181
D.
Data, reliability of _________ 149-153 Density. See Gases, density of.' Dissociation. See Gases, dissociation
of.
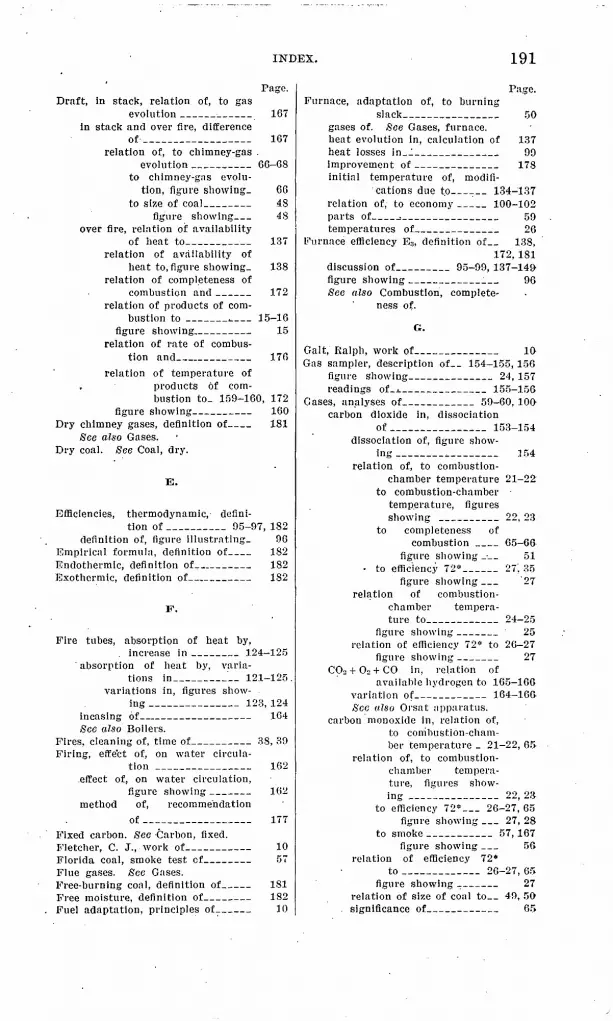
INDEX. 191
Page. Draft, In stack, relation of, to gas
evolution____ :____ 167 in stack and over fire, difference
of_____________ 167 relation of, to chimney-gas .
evolution _______ 66-68 to chimney-gas evolu
tion, figure showing. 6G to size of coal_____ 48
figure showing__ 48 over fire, relation of availability
of heat to_______ 137 relation of availability of
heat to, figure showing. 138 relation of completeness of
combustion and ____ 172 relation of products of com
bustion to _____-__ 15-16 figure showing.______ 15
relation of rate of combus tion and__.______ 176
relation of temperature of products of com bustion to_ 159-160, 172
figure showing 160 Dry chimney gases, definition of__ 181
See also Gases. Dry coal. See Coal, dry.
Efficiencies, thermodynamic, defini tion of _______ 95-97, 182
definition of, figure illustrating- 96 Empirical formula, definition of _ 182 Endothermic, definition of______ 182 Exothermic, definition of_______ 182
F.
Fire tubes, absorption of heat by,. increase in ___ 124 125
absorption of heat by, varia tions in________ 121-125
variations in, figures show ing ___________ 123,124
incasing of_____ _-_ 164 See also Boilers.
Fires, cleaning of, time of_______ 38, 39 Firing, effect of, on water circula
tion ____________ 162 .effect of, on water circulation,
figure showing-__ 162 method of, recommendation
of______________ 177 Fixed carbon. See Carbon, fixed. Fletcher, C. J., work of- ___ 10 Florida coal, smoke test cf 57 Flue gases. See Gases. Free-burning coal, definition of__ 181 Free moisture, definition of__ 182 Fuel adaptation, principles of__ _ 10
Page. Furnace, adaptation of, to burning
slack___________ 50 gases of. See Gases, furnace, heat evolution in, calculation of 137 heat losses in__l_________ 99 improvement of __________ 178 initial temperature of, modifi
cations due to_-__ 134-137 relation of, to economy ___ 100-102 parts of___ _________ 59 temperatures of__________ 26
Furnace efficiency E3, definition of_ 138,172,181
discussion of______ 95-99, 137-14& figure showing ________ 96 See also Combustion, complete
ness of.
G.
Gait, Ralph, work of_________ 10Gas sampler, description of_ 154-155,156
figure Showing__________ 24, 157readings of-^ ________ 155-156
Gases, analyses of________ 59-60, 100carbon dioxide in, dissociation
of ___________ 153-154 dissociation of, figure show
ing______^______ 154 relation of, to combustion-
chamber temperature 21-22 to combustion-chamber
temperature, figures showing _______ 22, 23
to completeness ofcombustion __ 65-66
figure showing _ _ 51 to efficiency 72*____ 27'. 35
figure showing__ '27 relation of combustion-
chamber tempera ture to_________ 24-25
figure showing ____ 25 relation of efficiency 72* to 26-27
figure showing ____ 27 C02 + O2 + CO in, relation of
available hydrogen to 165-166 variation of________ 164-166 See also Orsat apparatus,
carbon monoxide in, relation of, to combustion-cham ber temperature _ 21-22, 65
relation of, to combustion- chamber tempera ture, figures show ing __"________ 22, 2*
to efficiency 72*__ 26-27, 65 figure showing __ 27, 28
to smoke _______ 57, 167 figure showing __ 5ft
relation of efficiency 72*to__________ 26-27,65
figure showing ___ 27relation of size of coal to_ 49, 50
. significance of_____ __ 65

192 INDEX.
Page.Gases, composition of_____ 61,100-101
composition of, relation of, to combustion-c h a m b e r temperature ______ 21 22
relation of, to combustion- chamber temperature, figures showing ____ 22, 23
density of, relation of heat ab sorption to___ 109, 113-114
relation of heat absorptionto, figure showing ___ 15
dislodgment of from boiler sur face __________ 109-111
figure showing ___ _ ^_ 110 dissociation of, definition of__ 181
processes of____I___ 153-154 figure showing_.____ 154
evolution of, relation of ash to_ 42 relation of ash to, figure
showing _______ 41 relation of carbon-hydrogen
ratio to ______ 73, 79-81 figure showing_____ 37, 71,
74, 75, 76, 79, 80, 81, 82 relation of clinker in refuse
to ____________ 44figure showing_ . 36
relation of draft to__ 66-68, 167figure showing___ _ 66
relation of fixed carbon to_ 92figure showing_____ 91
relation of heat evolutionto ___________ 94
figure showing 93 relation of, rate of com
bustion to ___ .figure showing___
relation of rate ofevolution to _______
figure showing________relation of size of coal to_
1112
heat.___ 14 _____ 13
46, 48-49
figure showing_____ 46, 48 relation of sulphur to___ 44
figure showing_____ 4.3 losses in__ ___ _____ 142
relation of, to initial tem perature____.__ 100-102
to initial temperature,figure showing___ 102
See also CO loss; C02 loss, mixing of. See Mass action, law
of.nitrogen in, relation of, to effi
ciency ________ 64-65 relation of, to efficiency,
figure showing ___ 28 to size of coal_____ 65
figure showing ^__ 28 oxygen in, relation of, to com
bustion - chamber tem perature _________ 21-22
Page.Gases, oxygen in. relation of, to com
bustion-chamber tem perature, figures show ing_____________ 22, 23
specific heat of, relation of, toheat absorption___ 110-112
temperature-gradients of__ 126-127 figure showing_______ 127
temperature of, relation of, toheat absorption__ 110-112,
132-137relation of ash to______ 42
figure showing_____ 41 relation of combustion-
chamber temperature to __________- 22-23
figure showing_____ 24 relation of fixed carbon to_ 91
figure showing_____ 91 relation of rate of com
bustion to, figure show ing ___________. 12
relation of rate of heat evolution to, figure showing _________ 13
relation of size of coal to_ 46 figure showing.____ 46
temperature ofj minus steam, ratio of combustion- chamber temperature to __ _________. 132-134
figure showing___ 133 modification of 134-137
minus steam, relation of,to rated capacity___ 137
velocity of, ratio of, to com bustion-chamber tem perature, relation of, efliciency E5 to___ 141-142
ratio of, to combustion- chamber temperature, relation of efficiency E5 to, figure showing__ 141
relation of, to heat absorp tion _________ 109-110,
113-118, 130-132 to heat absorption, fig
ure showing_:__ 131 volumetric composition of___ 61
Glossary ________________ 180-183 Gram molecule, definition of____ 182 Grate, function of________.__ 59 Green, C. I-L, work of_________ 10
H.
Heat, absorption of__ ______ 95-149 absorption of. See also Boiler,
absorption-of heat by; Boiler efficiency,
availability of, relation of, todraft __________ 139
relation of, to draft, figure. showing ________ 138

INDEX. 193:
Page.Heat, evolution of___________ 93-94
rate cf_____________ 13-18 relation of, to efficiency
72* _______,_ 15-17 to efficiency 72*,
figure showing 14 to flue-gas tem
perature ____ 14 figure showing 13
to various losses_ 13-15 figure showing 13
to rated capacity- 13 figure showing 14
relation of combustion- chamber temper ature to_____ 10-20
figure showing__ 20 relation of carbon-hy
drogen .ratio to_ 73 figure showing__ 7.1
relation of, to completenessof combustion____ 04
to completeness of com bustion,'figure show ing _______ ___ 93
Sec also Cornbus- . tion, complete
ness of; Furnace efficiency E3.
to combustion-chamber temperature, figure
showing ___ 93 to efficiency 72*____ 93-94
figure showing-_ 9;} to gas evolution____ 94
figure showing__ 93 to rated capacity___ 94
figure showing___. 03 loss of. unaccounted for, defini
tion of_________ 183 unaccounted for, estimation
of _________ 156-158 explanation of _ 64 relation of, to ash
passing over wall- 168-160 relation of combustion-
chamber temperature to_____-______ 63
figure showing__ 63 relation of . efficiency
72* to_________ 137 figure showing__ 138
relation of rate of combustion to__:_ 12
figure showing__ 12 relation of rate of
heat evolution to__ 14 figure showing__ 13
relation of smoke to_ 56-57 figure showing- 56
plus loss up stack, re lation of combus tion-chamber temper ature to______ 20-21. 63
Page..Meat, loss of, unaccounted for, plus
loss up stack, relation of combustion-chamber temperature to, figure showing_________ 21-6."..
loss of, unaccounted for, plusloss up stack, relation of heat evolution to_ 14
unaccounted for, plus loss up stack, relation of heat evolution to, figure showing___ 13'.
up stack, relations of, torate of combustion. 11-13.
relations of, to rate of combustion, figure showing _______ 12-
to rate of heat evolution____ 14-15-
figure show ing _______ .1.",
relation of combustion- chamber temperature to ___________ 63:
figure showing- 63. relation of rate of heat
evolution to _____ 14-15. figure showing__ .13.
transmission of. See Boilers, absorption of heat by.
Meat, available, definition of____ ISO- Heat balance, forms of________ 139-
forms of, discussion of____ 139-141 Hood, definition of_____._______ 182;Hydrogen, available, definition of__ ISO,
relation of, to efficiency 72*__ 8-".: to efficiency 72*, figure
showing _______ 84to flue-gas total_____ 165-166.
relation of smoke to______ 57figure showing________ 56;
iS'cc also Coal as received ; Coal, dry.
Hydrogen-available hydrogen ratip. . K<x Coal, as . received ;
Coal, dry.
I.
Ignition temperature, definition of_ 182: Illinois coal, smoke test of_I_____ 57
tests on_ _________ 49-50' use of, in high - temperature
work __________ 159-160- No. OB, smoke test of________ 58: No. 7C, carbon-hydrogen ratio of_ 72, 78. No. 7D, carbon-hydrogen .ratip.of- JJ'2. 78, No. 9B, carbon-hydrogen ratio of- 7-2; .78: No. 11 A, carbon-hydrogen ratio of- 72, 77 No. 11C, smoke test of _!___'___ 5$. No. 12, carbon-hydrogen ratio of_ 72, 78: No. 13, carbon-hydrogen ratio of-- .72,-77'
8400 Bull. 325 07- -13

194 INDEX.
Page.Illinois coal, No. 14, carbon-hydro
gen ratio of______ 72, 78 No. 15, carbon-hydrogen ratio of__ 72, 78 No. 16, carbon-hydrogen ratio of _ 72, 77 ATo. 18, carbon-hydrogen ratio of_ 72, 78 No. 19A, carbon-hydrogen ratio of_ 72, 77 No. 19B, carbon-hydrogen ratio of_ 72, 77 No. 20, carbon-hydrogen ratio of_ 72, 78
smoke test of _-_ ______ 58No. 21, carbon-hydrogen ratio of_ 72, 78
smoke test of ________.___ 58No. 22A, carbon-hydrogen ratio of_ 72, 78No. 23A, carbon-hydrogen ratio of_ 72, 78
smoke test of __________ 58No. 24B, carbon-hydrogen ratio of_ 72, 78No. 25, carbon-hydrogen ratio of _ 72, 78
smoke test of ___________ 58No. 26, carbon-hydrogen ratio of _ 72, 78No. 27, carbon-hydrogen ratio of_ 72, 78
Indiana coal, smoke test of_____ 57tests on __ _ ____ _ 49-50
No. 3,-carbon-hydrogen ratio of _ 72,78No. 4, carbon-hydrogen ratio of _ 72, 78No. 5, carbon-hydrogen ratio of__ 72, 78No. 6, carbon-hydrogen ratio of __ 72, 78No. 7A, carbon-hydrogen ratio of_ 72, 78No. 7B, carbon-hydrogen ratio of _ 72, 78
smoke test of ___ _______ 58No. 8, carbon-hydrogen ratio of __ 72, 78No. 9, carbon-hydrogen ratio of___ 72, 78No. 9B, carbon-hydrogen ratio of_ 78No. 10, carbon-hydrogen ratio of_ 72, 78No. 11, carbon-hydrogen ratio of_ 72No. 12, carbon-hydrogen ratio of _ 72, 78
Initial temperature, definition of__ 140Sec Furnace, initial temperature
of.Iron in coal, cliukeriug due to _ 34
See also Coal, iron in.
K.
Kansas coals, clinkering of______ 38-39smoke test of--__--________ 57
No. 6, carbon-hydrogen ratio of__ 72, 77Kentucky coal, smoke test of____ 57
tests on__________-.____ 49-50No. 1C, carbon-hydrogen ratio of_ 72, 77No. 5, carbon-hydrogen ratio of___ 72, 77No. 6, carbon-hydrogen ratio of__ 72, 77No. 7, carbon-hydrogen ratio of___ 77
Kinetic theory, statement of____ 182Kreisinger, Henry, work of_-__---_ 7, 10Kuss, R. II., work of ____ 10
1,.
Lignites, firing of _ __ 177 Lord, N. W., work in charge of ___ 7, 29 Loss unaccounted for, definition of_ 183
Sec also Heat, loss of, unac counted for.
Loss up stack. Sec Heat, loss of, upstack.
Low-pressure steam, use of____ 102-104
Page.M.
Maryland coal, smoke test of____No. 1, carbon-hydrogen ratio of__
smoke test of_________________Mass action, law of______ 170-17 Missouri coal, smoke test of____._
No. 5, carbon-hydrogen ratio of___ smoke test of___________
No. 6, carbon-hydrogen ratio of_l- No. 7, carbon-hydrogen ratio of__
Moisture. Sec Coal, moisture in : Free moisture.
Negative results, value of_______.Nerst, Walther, on dissociation__.New Mexico coal, smoke test of__.
No. 3A, clinker in_________ No. 3B, clinker in________ No. 4A, clinker in_________No. 5, clinker in________.
smoke test of ____________Nitrogen. .Sec Gases, nitrogen in.North Dakota coal, smoke test of_-
No. 3, smoke .test of ____________
1,7758
2.182
72, 7858
72, 7872,78
9-10 153
57 34 34 34 34 58
5758
O.
1872,77
Observations, reliability of____ 149-153 Ohio coal, smoke test of_______ 57
No. 1, carbon-hydrogen ratio of _ 72, 78 No. 2, carbon-hydrogen ratio of_ 72, 78 No. 3, carbon-hydrogen ratio of_ 72, 77 No. 4, carbon-hydrogen ratio of 72, 77 No. 5, carbon-hydrogen ratio of_ 71,
72, 77No. 6, carbon-hydrogen ratio of__ 72 No. 7, carbon-hydrogen ratio of 72, 78 No. 8, carbon-hydrogen ratio of 72, 78 No. 8, test of, temperature of, fig
ure showing__________No. 9A, carbon-hydrogen ratio of_ No. 9B, carbon-hydrogen ratio of_ 72, 78
Optical pycijmeter. See Pyrometer. Orsat apparatus, definition of____ 183
totals in_____________ 164-166 Oxygen in coal, relation of efficiency
72* and__________ 92-93 relation of efficiency 72* and,
figure showing ____ 93 relation of smoke to_______ 57
figure showing________ 56 See also Gases, oxygen in.
P.
Pahmeyer, F. 0., work of-_____ 10Park, W. W., work of________ 10Pennsylvania coal, smoke test of_ 57
No. 4, carbon-hydrogen ratio of__ 71,77No. 5, carbon-hydrogen ratio of-_ 72, 77No. 6, carbon-hydrogen ratio of_- 71, 77No. 7, carbon-hydrogen ratio of_ 71, 72, 77
clinker in_____________ 33, 34

INDEX. 195
Pennsylvania coal No. 8, carbou-hydrogeu ratio of _ 71,77
smoke test of___ _.. _ 58No. 10, carbon-hydrogen ratio of_ 72, 77
Perry, -John, formulas of._____ 108-112formulas of, temperature test
of ___________ 132-184 Pope, G. S.,. work of ___^____ 10 Post, U. H., work of__________ 10 Potential heat, definition of_____ 183 Probability curves, definition of___ 158-
159,183figure showing . _ 158 relation of, to efficiency 72*__ 146-149
to. efficiency 72*, figureshowing ________ 147
to true boiler efficiencyE4 __________ 140-149
figure showing____ _ 147Proximate analysis, definition of 183 Pyrites, nature and occurrence of 38
Sec also Sulphur.Pyrometer, optical, check by___ 132-134
check ou_____ 1_ 9description of________ 52-53, 183 figure showing__.__ _______ 19temperatures by, check on____ 55, 106
check on, figure showing__ 55 Pyrometry, discussion of ._ _ _ 52, 55
K.
Radiation, definition of________ 183 estimation of__^________ 143-146
Kandall, D. T., work of________ 7 Rated capacity developed. Sec Ca
pacity, rated.Rational formula, definition of____ 183 Ray, W. S., introduction by._____ 9-11
work of____-__________ 7,30-11 Refuse, clinker and combustible in,
relations of _ ___ 38clinker in__.__ ____ 28-38, 40-41
causes of____________ 34prevention of, by method of
burning ________ 43by limestone_______ 39by steam jet__.____ 38-39
relation of, to chimneygases produced.!--_ 44
to chimney gases pro duced, figure show ing ___________ 36
to combustion-chambertemperature __ 44
figure showing__ 36 to efficiency 72*____ 44 to rated capacity, fig
ure showing..___ 30 to size of coal____ 40-41
relation of ash and____ 36, 39relation of ash-sulphur ra-
-tio to _________ 38 relation of carbon-hydro
gen ratio to, figure showing _ 37
Pasrc. Refuse, clinker in, relation of carbon
monoxide and._____ 35 clinker in, relation of efficiency
to _____________ 28-29, 31,35
relation of efficiency to, fig ure showing______ l>0
relation of iron to_____ .'55, 38 relation of size of coal and- 35-
30, 47. figure showing_____
relation ot sulphur to___ 39, 44 combustible in, relation of clink
ers to__________ 38 definition of ____________ 1X.°>
Re-volutions per minute, relation ofrated capacity and 10, 103
.relation of rated capacity and,figure showing___. _ 163
Rhode Island coal, smoke test of___ 57No. 1, smoke test of__ _.__ 58
Ryder, G. E., work of__ ., ______ 10
Scale, insulation of water in boilerby ________.___ 325-126
Seger cones, definition of--____ 183 Slack coal, utilization of_______ 50-51 Smith, L. H. H., on clinkers_____ 38 Smoke, discussion of_______ 50-58
relation of, to efficiency 72*__ f>0 to efficiency 72*, figure
showing _ ___ 50 to CO in combustion cham
ber ____________._ 107 to CO in flue gases____ 57
figure showing _____ 56 to combustion-chamber tem
perature------ _ 57figure showing-___ 56
to fixed carbon______ 57figure showing__.__ 56
to hydrogen in combustible 57figure showing 56
to oxygen in coal________ 57figure showing____ 50
to rate of combustion__ .176to unaccounted-for loss__ 50-57
figure showing _.___ 50Soot, insulation by____.__ 125-126,170.Stack loss. Sec Heat, loss of, up
stack.Steam, bubbles of, formation _ of,
effect of, on heat transmission _____ 125-120
Steam, low pressure, use of____'_ 102-105Steam jet, prevention of clinkers by_ 38-39 Steaming, rate of, effect of, on circu
lation of water____ 10. 103. rate of, effect of, on circulation
of .water, figure show ing______--____ 10
-Stephan and Bolzmann's law, state ment of_________. 112. IS.",
Stowe, L. K., work of___________ 1OStraight-Hue function, definition of_ 183.

196 INDEX.
Page. Sulphur, relation of, to chimney-gas
evolution________ 44 relation of, to chimney-gas evo
lution, figure showing__ 43 relation of, to clinkering__ 38-89, 44
to combustion-chamber tem perature-__-____ 44
figure showing.___. _ 37 to completeness of combus
tion____________ 44 figure showing--____. 43
relation of efficiency 72* and 28-31, 43-44, 176
figure showing.______:__ 30, 43
T.
Temperature. Sec Furnace; Com bustion c h a m her; Gases; etc.
Temperature, absolute, definition of_ .1.80 Temperature, ignition, definition of_ 182 Temperature, initial. See Furnace,
initial temperature of.'Temperature gradient, definition of 183 'Tennessee coal, smoke test of_____ 57
No. 1, carbon-hydrogen ratio of_ 72, 78 No. 2, carbon-hydrogen ratio of_ 72, 77 No. 3, carbon-hydrogen ratio of__ 72, 78 No. 4, carbon-hydrogen ratio of__ 72, 78 No. 5, carbon-hydrogen ratio of_ 72, 77
smoke test of______ ______ 58No. 6, carbon-hydrogen ratio of__ 72, 77
smoke test of___________ 58No. 7 A, carbon-hydrogen ratio of_ 72, 78No. 8 A, smoke test of_______ 58No. 8 B, smoke test of______ 58No. 0, carbon-hydrogen ratio of_ 72 ; 77
smoke test of_______ 58Tests, data of, relations'of _____ .11-58
object of__________________ 7repetition of, effect of^_______ 31-32unreliability of__-__^.______ 0
Texas coal, smoke test of_______ 57No. 4, clinker in___________ 34
smoke test of____l___________ 58Thermodynamic efficiencies, definition
of_:_________. 05-07, 182 figure showing. _________ OG
Thermoelectric couple, descriptionof ________1_J__ 5.3-55
Tiles, tube, forms of_____ __ 164Tubes, boiler, absorption of heat by,
increase in_________ 124-125absorption of heat by, variation
in___________. 121-125 variation in, figures show
ing_____"___ ____. 123, 124incasing of___i_________ 164Sec also Boilers.
Turbines, low-pressure steam in____ 103-105, 178
Turbines, low-pressure steam in.figure showing ______
True boiler efficiency. Sec Boilerefficiency E4 .
U.
Ultimate analysis, definition of_____ Unaccounted for loss. Sec Heat, loss
of, unaccounted for. Utah coal, smoke test of_________
183
V.
Velocity, definition of_________ 183Virginia coal, smoke test of_____ 57
No. 1 B, carbon-hydrogen ratio-_ 72No. 2, carbon-hydrogen ratio of_ 72,77No. 3, carbon-hydrogen ratio of__ 71, 77No. 4, carbon-hydrogen ratio__ 72
clinkering of____________ 38-39Volatile carbon, definition of____ 50, 183 Volatile matter, definition of____ 183
nature of___^__________ 59 See also CaVbon, volatile ; Com
bustible.
W.
Wanner pyrometer. Sec Pyrometer. Wartenberg, Doctor, on dissociation
of gases_______ 153-154Washington coal, smoke test of___ 57
No. 1 B, carbon-hydrogen ratio of- 78clinker in_____________ 34
No. 2, carbon-hydrogen ratio of__ 72. 78Water circulation. Sec Boilers, water
circulation in.Water of composition, definition of__ 183Weeks, H. W., work of________ 7, 10West Virginia coal, smoke test of__ 57
No. 13. carbon-hydrogen ratio of__ 72. 77No. 14, carbon-hydrogen ratio of__ 71, 77
clinkering of __ __________ 38-39No. 15, carbon-hydrogen ratio of__ 72, 77
clinkering of____________ 38-39No. 17, carbon-hydrogen ratio of_ 71, 77No. 18, carbon-hydrogen ratio of__ 71, 77No. 19, carbon-hydrogen ratio of _ 71, 77
test of, temperature of, figureshowing_____ _______ IS
smoke test of___________ 58 No. 20, carbon-hydrogen ratio__ No. 21, carbon-hydrogen ratio of_
smoke test of_________ 58Wind, effect of, on efficiency 72*_ 107-108Wyoming coal, smoke test of____ 57
No. 2 B, clinker in__________ 34carbon-hydrogen ratio of ___ 72. 78smoke test of ___________ 58
No. 3, carbon-hydrogen ratio___ 72, 78smoke test of__________. 58

CLASSIFICATION OF THE PUBLICATIONS OF THE UNITED STATES GEOLOGICAL.SURVEY.
[Bulletin No. 325.1
The ^publications of the United States Geological Survey consist of (1) Annual Reports, (2) Monographs, (3) Professional Papers, (4) Bulletins, (5) Mineral Resources, (6) Water-Supply and Irrigation Papers, (7) Topographic Atlas of United States folios and separate sheets thereof, (8) Geologic Atlas of United States- folios thereof. The classes numbered 2, 7, and 8 are sold at cost of publication; the others are distributed free. A circular giving complete lists can be had on application.
Most of the above publications can be obtained or consulted in the following ways:1. A limited number are delivered to the Director of the Survey, from whom they
can be obtained, free of charge (except classes 2, 7, and 8), on application.2. A certain number are delivered to Senators and Representatives in Congress
or distribution.3. Other copies are deposited with the Superintendent of Documents, Washington,
D. C., from whom they can be had at prices slightly above cost.4. Copies of all Government publications are furnished to the principal public
libraries in the large cities throughout the United States, where they can be consulted by those interested.
The Professional Papers, Bulletins, and Water-Supply Papers treat of a variety of subjects, and the total number issued is large. They have therefore been classified into the following series: A, Economic geology; B, Descriptive geology; C, System atic geology and paleontology; D, Petrography and mineralogy; E, Chemistry and physics; F, Geography; G, Miscellaneous; H, Forestry; I, Irrigation; J, Water stor age; K, Pumping water; L, Quality of water; M, General hydrographic investiga tions; N, Water power; 0, Underground waters; P, Hydrographic progress reports, Q, Fuels; R, Structural materials. This paper is the fifty-third in Series E, and the fifth in Series Q, the complete lists of which follow (PP=Professional Paper; B=Bulletin):
SERIES E, CHEMISTRY AND PHYSICS.
B 0. Report of work clone in the Washington laboratory during the fiscal year 1883-8-1, by P. W. Clurkeand T. M. Chatartl. 1884. 40pp. (Out of stock.)
B 14. Electrical and magnetic properties of the iron carburets, by Carl Barns and Vincent Strouhal.1885. 238pp. (Out of stock.)
K 27. Report of work done in the Division of Chemistry and Physics, mainly during the year 1884-85.1886. 80pp.
B ;J2. Lists and analyses of the mineral springs of the United States (a preliminary study), by AlbertC. Peale. 18S6. 235pp. (Out of stock.)
B 35. Physical properties of the iron carburets, by Carl Barus and Vencent Strouhal. 188C. 62 pp. B 36. Subsidence of fine solid particles in liquids, by Carl Barus. 1886. 58 pp. (Out of stock.) B 42. Report of work done in the Division of Chemistry and Physics, mainly during the fiscal year
1885-86, by F. W. Clarke. 1887. 152 pp., 1 pi. (Out of stock.) B47. Analyses of waters of the Yellowstone National Park, with an account of. the methods of
analyses employed, by F. A. Gooch and J. E. Whitfield. 1888. 84pp. (Out of stock.) B 52. Subaerial decay of rocks and origin of the red color of certain formations, by I.' C. Russell.
1889. 65 pp., 5 pis. (Out of stock.) Bf>.|. On the thermoelectric measurement of high temperatures, by Carl Barus. 1889. 313 pp., 11
pis. (Out of stock.) B 55. Report of work done in the Division of Chemistry and Physics, mainly during the fiscal year
1886-87, by F. W. Clarke. 1889. 96pp. (Out of stock.)
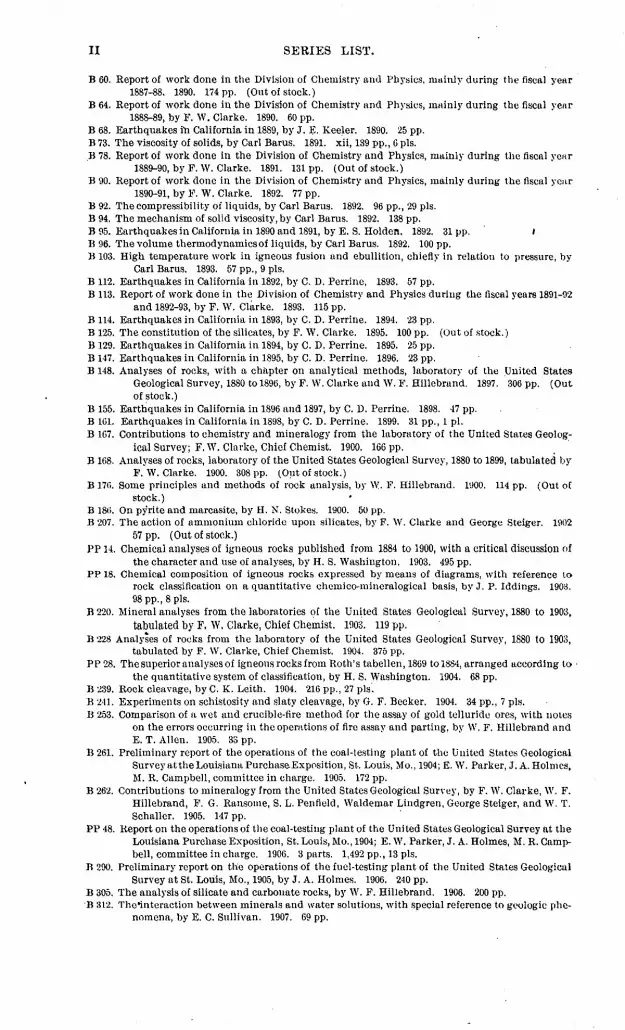
II SERIES LIST.
B 60. Report of work done in the Division of Chemistry and Physics, mainly during the fiscal year1887-S8. 1890. 174pp. (Out of stock.)
B 64. Report of work done iu the Division of Chemistry und Physics, mainly during the fiscal year1888-89, by F. \V. Clarke. 1890. 60 pp.
B 68. Earthquakes iri California in 1889, by J. E. Keeler. 1890. 25 pp. B 73. The viscosity of solids, by Carl Barus. 1891. xii, 139pp., 6 pis. .B 78. Report of work done in the Division of Chemistry and Physics, mainly during the fiscal year
1889-90, by F. W. Clarke. 1891. 131pp. (Out of stock.) B 90. Report of work done in the Division of Chemistry and Physics, mainly during the fiscal year
1890-91, by F. W. Clarke. 1892. 77 pp.B 92. The compressibility of liquids, by Carl Barus. 1892. 96 pp., 29 pis. B 94. The mechanism of solid viscosity, by Carl Barus. 1892. 138 pp.B 95. Earthquakes in California in 1890 and 1891, by E. S. Holden. 1892. 31 pp. I B 96. The volume thermodynamics of liquids, by Carl Barus. 1892. 100 pp. B 103. High temperature work in igneous fusion and ebullition, chiefly in relation to pressure, by
Carl Barus. 1893. 57 pp. ,9 pis.B 112. Earthquakes in California in 1892, by C. D. Perrine, 1893. 57 pp. B 113. Report of work done in the Division of Chemistry and Physics during the fiscal years 1891-92
and 1892-93, by F. W. Clarke. 1893. 115 pp.B 114. Earthquakes in California in 1893, by C. D. Perrine. 1894. 23 pp. B 125. The constitution of the silicates, by F. W. Clarke. 1895. 100pp. (Out of stock.) B 129. Earthquakes in California in 1894, by C. D. Perrine. 1895. 25 pp. B 147. Earthquakes in California in 1895, by C. D. Perrine. 1896. 23 pp. B 148. Analyses of rocks, with a chapter on analytical methods, laboratory of the United States
Geological Survey, 1880 to 1896, by F. W. Clarke and W. F. Hillebrand. 1897. 306 pp. (Outof stock.)
B 155. Earthquakes in California in 1896 and 1897, by C. D. Perrine. 1898. 47 pp. Bid. Earthquakes in California in 1898, by C. D. Perrine. 1899. 31 pp., 1 pi. B 167. Contributions to chemistry and mineralogy from the laboratory of the United States Geolog
ical Survey; F. W. Clarke, Chief Chemist. 1900. 166 pp. B 168. Analyses of rocks, laboratory of the United States Geological Survey, 1880 to 1899, tabulated by
F. W. Clarke. 1900. 308pp. (Out of stock.) B 170. Some principles and methods of rock analysis, by \Y. F. Hillebrand. 1900. 114 pp. (Out of
stock.)B 186. On pyrite and marcasite, by H. N. Stokes. 1900. 50 pp. B 207. The action of ammonium chloride upon silicates, by F. W. Clarke and George Steiger. 1902
57pp. (Out of stock.) PP14. Chemical analyses of igneous rocks published from 1884 to 1900, with a critical discussion of
the character and use of analyses, by H. S. Washington. 1903. 495 pp. PP 18. Chemical composition of igneous rocks expressed by means of diagrams, with reference to
rock classification on a quantitative chcmico-mineralogical basis, by J. P. Iddings. 1903.98pp., 8 pis.
B 220. Mineral analyses from the laboratories of the United States Geological Survey, 1880 to 1903,tabulated by F. W. Clarke, Chief Chemist. 1903. 119 pp.
B 228 Analyses of rocks from the laboratory of the United States Geological Survey, 1880 to 1903,tabulated by F. W. Clarke, Chief Chemist. 1904. 375 pp.
PP 28. The superior analyses of igneous rocks from Roth's tabellen, 1869 to 1884, arranged according to the quantitative system of classification, by H. S. Washington. 1904. 68 pp.
B 239. Rock cleavage, by C. K. Leith. 1904. 216 pp., 27 pis.B 241. Experiments on schistosity and slaty cleavage, by G. F. Becker. 1904. 34 pp., 7 pis. B 253. Comparison of a wet and crucible-fire method for the assay of gold telluride ores, with notes
on the errors occurring in the operations of fire assay and parting, by W. F. Hillebrand andE. T. Alien. 1905. 33 pp.
B 261. Preliminary report of the operations of the coal-testing plant of the United States GeologicalSurvey at the Louisiana PurchaseExposition, St. Louis, Mo., 1904; E. W. Parker, J. A. Holmes,M. R. Campbell, committee in charge. 1905. 172 pp.
B 262. Contributions to mineralogy from the United States Geological Survey, by F. W. Clarke, W. F.Hillebrand, F. G. Ransome, S. L. Penfield, Waldemar Lindgren, George Steiger, and W. T.Schaller. 1905. 147pp.
PP 48. Report on the operations of the coal-testing plant of the United States Geological Survey at theLouisiana Purchase Exposition, St. Louis, Mo., 1904; E. W. Parker, J. A. Holmes, M. R. Camp bell, committee in charge. 1906. 3 parts. 1,492 pp., 13 pis.
B 290. Preliminary report on the operations of the fuel-testing plant of the United States GeologicalSurvey at St. Louis, Mo., 1905, by J. A. Holmes. 1906. 240 pp.
B 305. The analysis of silicate and carbonate rocks, by W. F. Hillebrand. 1906. 200 pp. B 312. The*interaction between minerals and water solutions, with special reference to geologic phe
nomena, by E. C. Sullivan. 1907. 69 pp.
SEEIES LIST. Ill
B 316. Contributions to economic geology, 1906, Part II: Coal, lignite, and peat; M. R. Campbellgeologist in charge. 1907. pp., 23 pis.
B 323. Experimental work conducted in the chemical laboratory of the United States fuel-testingplant at St. Louis, Mo., January 1,1905, to July 31,1906, by N. W. Lord. 1907. 49 pp.
B 325. A study of four hundred steaming tests made at the fuel-testing plant, St. Louis, Mo., in 1904,1905, and 1906, by L. P. Breckenridge, 1907. 190 pp.
SERIES Q, FUELS.
B 261. Preliminary report of the operations of the coal-testing plant of the United States Geological Survey at the Louisiana Purchase Exposition, St. Louis, Mo., 1904; E. W. Parker, J. A.Holmes, M. R. Campbell, committee in charge. 1905. 172 pp.
PP 48. Report on the operations of the coal-testing plant of the United States Geological Survey at the Louisiana Purchase Exposition, St. Louis, Mo., 1904; E. W. Parker, J. A. Holmes, M.R. Camp bell, committee in charge. 1906. 3 parts. 1,492 pp., 13 pis.
B 290. Preliminary report on the operations of the fuel-testing plant of the United States Geological Survey at St. Louis, Mo., 1905, by J. A. Holmes. 1906. 240 pp.
B 323. .Experimental work conducted in the chemical laboratory of the United States fuel-testing plant at St. Louis, Mo., January 1,1905, to July 31,1906, by N. W. Lord. 1907. 49 pp.
B 325. A study of four hundred steaming tests made at the fuel-testing plant, St. Louis, Mo., in 1904, 1905, and 1906, by L. P. Breckenridge, 1907. 196 pp.
Correspondence should be addressed toTHE DIRECTOR,
UNITED STATES GEOLOGICAL SUKVKY,WASHINGTON, I). G.
OCTOBER, 1907.
o


