Embed Size (px)
Citation preview
Vol. 11(4) pp. 112-123, April 2017
DOI: 10.5897/AJFS2016.1523
Article Number: 591752763530
ISSN 1996-0794
Copyright © 2017
Author(s) retain the copyright of this article
http://www.academicjournals.org/AJFS
African Journal of Food Science
Full Length Research Paper
Fortification of kununzaki drink with cocoa powder
Abidoye Olawumi Abidemi*, Taiwo Kehinde and Adeniran Hezekiah
Department of Food Science and Technology, Obafemi Awolowo University, Ile-Ife, Osun State, Nigeria.
Received 28 September 2016, Accepted 19 December, 2016.
The aim of this work is to improve the nutritional properties of kununzaki drink with the addition of cocoa powder and also increasing the utilization of cocoa powder because of its antioxidants activities (anti-ageing). Kununzaki was prepared using sorghum as the base and supplemented with cocoa powder as varied levels. The most preferred sample (80/20%) was chosen following sensory evaluation for further analysis. The effect of cocoa powder on the proximate composition, physico-chemical properties, minerals, antioxidant and the sensory characteristics of the enriched drink were assessed. The added cocoa powder increased the protein, ash, fat and moisture content from 1.40 to 3.12%, 0.16 to 0.38%, 0.38 to 0.93% and 84.95 to 91.20%, respectively and decreased the carbohydrate and energy content from 12.26 to 5.75% and 61.10 to 39.11 kJ, respectively. The pH and titratable acidity had an inverse relationship and were within limit. The results also showed that enrichment of kununzaki with cocoa powder increased the mineral contents significantly (P>0.05). The antioxidant activities in the drink increased from 40 to 50%. There were significant differences in the assessed sensory qualities. The addition of cocoa powder increased the nutritional properties of kununzaki drink thereby making it more suitable for all ages. Key words: Kununzaki, cocoa powder, proximate, antioxidant, sensory.
INTRODUCTION Beverages are liquid foods that serve as a source of both fluids and nutrients that refresh and nourish the body (Ihekoronye and Ngoddy, 1985). They provide energy for daily manual work. There are different types of traditional beverages, alcoholic and non-alcoholic. Most beverages are made up of about 90% water, sugar, flavouring agents and sometimes preservatives (Onuorah et al., 1987). An alcoholic beverage is a drink containing ethanol (alcohol). Alcoholic beverages, such as wine, beer, and liquor have been part of human culture and development for more than 8,000 years (Wikipedia,
2016). A beverage such as kununzaki contains no alcohol and plays a very important role in the dietary pattern of people in developing countries like Nigeria. Kununzaki is a cereal based non-alcoholic drink. It is a locally produced beverage which of recent has become popular among the various non-alcoholic drinks in the northern part of Nigeria (Ayo, 1998; Gaffa, 2002). It is made from millet, sorghum and maize grains and flavoured with such spices as ginger, black pepper and tamarind for improvement in its taste and aroma, which also serve as purgative and cure for flatulent conditions
* Corresponding author. E-mail: [email protected]. Tel: +2348060221602.
Author(s) agree that this article remains permanently open access under the terms of the Creative Commons Attribution
License 4.0 International License
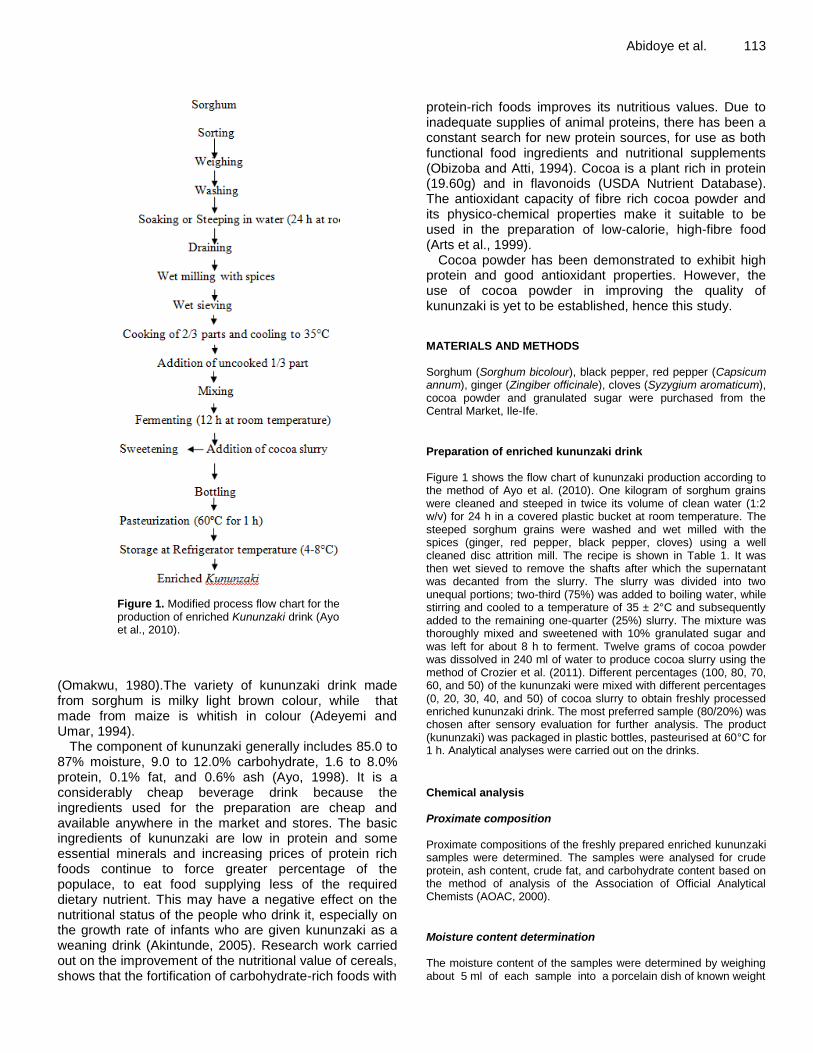
Figure 1. Modified process flow chart for the production of enriched Kununzaki drink (Ayo et al., 2010).
(Omakwu, 1980).The variety of kununzaki drink made from sorghum is milky light brown colour, while that made from maize is whitish in colour (Adeyemi and Umar, 1994).
The component of kununzaki generally includes 85.0 to 87% moisture, 9.0 to 12.0% carbohydrate, 1.6 to 8.0% protein, 0.1% fat, and 0.6% ash (Ayo, 1998). It is a considerably cheap beverage drink because the ingredients used for the preparation are cheap and available anywhere in the market and stores. The basic ingredients of kununzaki are low in protein and some essential minerals and increasing prices of protein rich foods continue to force greater percentage of the populace, to eat food supplying less of the required dietary nutrient. This may have a negative effect on the nutritional status of the people who drink it, especially on the growth rate of infants who are given kununzaki as a weaning drink (Akintunde, 2005). Research work carried out on the improvement of the nutritional value of cereals, shows that the fortification of carbohydrate-rich foods with
Abidoye et al. 113 protein-rich foods improves its nutritious values. Due to inadequate supplies of animal proteins, there has been a constant search for new protein sources, for use as both functional food ingredients and nutritional supplements (Obizoba and Atti, 1994). Cocoa is a plant rich in protein (19.60g) and in flavonoids (USDA Nutrient Database). The antioxidant capacity of fibre rich cocoa powder and its physico-chemical properties make it suitable to be used in the preparation of low-calorie, high-fibre food (Arts et al., 1999).
Cocoa powder has been demonstrated to exhibit high protein and good antioxidant properties. However, the use of cocoa powder in improving the quality of kununzaki is yet to be established, hence this study. MATERIALS AND METHODS Sorghum (Sorghum bicolour), black pepper, red pepper (Capsicum annum), ginger (Zingiber officinale), cloves (Syzygium aromaticum), cocoa powder and granulated sugar were purchased from the Central Market, Ile-Ife.
Preparation of enriched kununzaki drink Figure 1 shows the flow chart of kununzaki production according to the method of Ayo et al. (2010). One kilogram of sorghum grains were cleaned and steeped in twice its volume of clean water (1:2 w/v) for 24 h in a covered plastic bucket at room temperature. The steeped sorghum grains were washed and wet milled with the spices (ginger, red pepper, black pepper, cloves) using a well cleaned disc attrition mill. The recipe is shown in Table 1. It was then wet sieved to remove the shafts after which the supernatant was decanted from the slurry. The slurry was divided into two unequal portions; two-third (75%) was added to boiling water, while stirring and cooled to a temperature of 35 ± 2°C and subsequently added to the remaining one-quarter (25%) slurry. The mixture was thoroughly mixed and sweetened with 10% granulated sugar and was left for about 8 h to ferment. Twelve grams of cocoa powder was dissolved in 240 ml of water to produce cocoa slurry using the method of Crozier et al. (2011). Different percentages (100, 80, 70, 60, and 50) of the kununzaki were mixed with different percentages (0, 20, 30, 40, and 50) of cocoa slurry to obtain freshly processed enriched kununzaki drink. The most preferred sample (80/20%) was chosen after sensory evaluation for further analysis. The product (kununzaki) was packaged in plastic bottles, pasteurised at 60°C for 1 h. Analytical analyses were carried out on the drinks.
Chemical analysis Proximate composition Proximate compositions of the freshly prepared enriched kununzaki samples were determined. The samples were analysed for crude protein, ash content, crude fat, and carbohydrate content based on the method of analysis of the Association of Official Analytical Chemists (AOAC, 2000).
Moisture content determination The moisture content of the samples were determined by weighing about 5 ml of each sample into a porcelain dish of known weight
114 Afr. J. Food Sci.
Table 1. Recipe for the production of enriched Kununzaki
drink (Crozier et al., 2011; Obadina et al., 2008).
Ingredients Kununzaki Kununzaki+Cocoa
Sorghum (g) 500 500
Cloves (g) 0.5 0.5
Ginger (g) 6.5 6.5
Black pepper (g) 0.5 0.5
Red pepper (g) 2.5 2.5
Sugar (g) 50 50
Cocoa powder (g) - 12
and heated in a Gallenkamp hot air oven at 105°C for 3 h. The samples were cooled in the desiccator and weighed. The samples were consequently heated, weighed and cooled until a constant weight was attained.
Moisture content (%) = × 100
Ash content determination Five grams of the samples (5 g) was weighed into already weighed ash crucible. The samples were then charred in an oven at 200°C. The crucibles were transferred into a muffle furnace chambers set at 700°C until the samples turn into white grey ash. The crucibles were thereafter removed, cooled in a desiccator and weighed. Ash content was expressed as the percentage of the original sample. The experiment was carried out in triplicate and the mean was calculated for each sample.
Ash (%) = × 100
Crude protein determination The micro-Kjeldahl method was used in determining the protein content. The sample (2 g) was weighed into a kjeldahl digestion flask. Kjeldahl catalyst tablet was added to the flask with 10 ml of concentrated sulphuric acid and it was heated on preheated digester set at 420°C for about 30 min in a fume cupboard. It was then digested until a clear homogenous mixture was obtained. After digestion, the flask was removed from the heater, cooled and the content was diluted with about 50 ml of distilled water. The flask was placed in the micro-Kjedahl analyzer (Kjeltec-Auto 1030 Analyser, USA) distillation unit where 50 ml of 40% NaOH was dispensed automatically. The mixture was heated up to release ammonia which distilled into a conical flask containing 25 ml of 2% boric acid for about 4 min. During the distillation process, the ammonia combined with boric acid to form ammonium borate solution titrated against 0.1 M sulphuric acid until a purplish-grey end point was attained. The % nitrogen in the sample was calculated and the % protein was obtained by multiplying % Nitrogen by a factor of 6.25.
Nitrogen (%) =
Where A = volume (ml) of 0.1 M H2SO4.
Crude fat determination Ether extraction method was used for the samples. Five grams of the sample was weighed into a fat extraction flask or tube of known weight. Sample was diluted with 7 ml water to make volume of 12 ml and shaken with slight warming until sample was completely dispersed. Two milliliters of NH4OH was added and mixed gently, 10 ml alcohol and 25 ml ether were added. The flasks were stoppered with cork unaffected by usual fat solvent and shake vigorously for 10 min. This was then cooled and 25 ml petroleum ether (30 to 50°C) was added and shaked vigorously again, then centrifuged at about 600 rpm. The ether solution was decanted into a suitable flask. After extraction, the solvent was evaporated completely on steam bath at a temperature that did not cause splattering. The fat was dried in an oven at 102°C, cooled in a dessicator and reweighed. Loss in weight = weight of fat. Weight of fat was corrected by blank determination on reagents used. % Crude fat =
× 100
Carbohydrate determination The carbohydrate content of each sample was calculated by difference. The total of all determined proximate compositions were deducted from 100. Carbohydrate (%) = 100 - (Protein (%) + Moisture (%) + Ash (%) + Fat (%) Energy value determination The energy value was obtained using the method of Osborne and Voogt (1978). This was calculated by multiplying the values of crude protein, fat and carbohydrate by factors of 4, 9 and 4, respectively. The sum of their product was expressed in kilojoules.
Physicochemical properties of the Enriched kununzaki drinks These analyses were carried out after production of the enriched kununzaki. Determination of pH The pH (hydrogen ion concentration) of the enriched kununzaki samples was determined using a standard pH meter (ATC, Model HI-8915). Sample was taken in a conical flask and electrode was directly inserted into the solution. After each reading, the electrode was wiped with distilled water and dried-up with tissue paper (AOAC, 2000). Determination of total titratable acidity (TTA)
The production of lactic acid was determined by titrating 10 ml of the sample diluted with 10 ml distilled water against 0.1 N NaOH using 0.5 ml of phenolphthalein indicator (0.5% in 50% alcohol). The mixture was shaken thoroughly and titration was carried out until a faint pink colour was observed in each sample. The titratable acidity was calculated as percentage of lactic acid (v/v). Each
millilitre of 0.1 N NaOH is equivalent to 0.009 g of lactic acid (AOAC, 2000).
1 ml of 0.1 N NaOH 0.009 g of lactic acid
Lactic acid (mg/g)
Determination of total solids
Twenty five milliliters of the enriched kununzaki samples were evaporated to dryness on boiling water bath which was followed by drying until constant weight was obtained in an oven maintained at 130°C for 3 h (Makinde and Oyeleke, 2012).
% Total solid = × 100%
Determination of minerals
The analyses for essential mineral elements were investigated using Atomic Absorption Spectrophotometric method (Fashakin et al., 1991). The sample 0.5 ml was weighed into 75 ml digestion flask and 5 ml digestion mixture was added and left overnight in a hood. It was then digested for 2 h at 150°C, then left to cool for 10 min; thereafter, 3 ml of 6 M hydrochloric acid was added and digested for another 1½ h.
It was then cooled and 30 ml of distilled water was added. The tube was vigorously stirred. A sample aliquot was then transferred to the Autoanalyser (Technicon AAU model) for total mineral analysis at 420 nm. The digest was used to determine the elements (calcium, magnesium, iron and zinc) on the Atomic Absorption Spectrophotometer (Perkin Elmer, model 402) while potassium was determined by flame photometry.
Determination of antinutritional contents of the enriched kununzaki drink
The enriched kununzaki samples were examined for the following antinutritional components: Tanins, Oxalates and Saponin.
Determination of tannins
The modified vanillin-hydrochloric acid (MV-HCl) method of Price et al. (1978) was used.
Preparation of calibration curve
Various concentrations (0.0, 0.1, 0.2, 0.4, 0.6, 0.8 and 1.0 mg/ml) of the catechin standard solution was pipette into clean dried test tubes in duplicate. To one set was added 5.0 ml of freshly prepared vanillin-HCl reagent prepared by mixing equal volume of 4% (w/v) vanillin/MeOH and 8% (v/v) HCl/MeOH and to the second set was added 5.0 ml of 4% (v/v) HCl/methanol to serve as blank. The solutions were left for 20 min before the absorbance was taken at 500 nm. The absorbance of the blank was subtracted from that of the standards. The difference was used to plot a standard curve of absorbance against concentration.
Abidoye et al. 115 Procedure
Kununzaki was dried and flour was extracted separately with 10 ml of 1.0% (v/v) HCl-MeOH. The extraction time was 1 h with continuous shaking. The mixture was filtered and made up to 10 ml mark with extracting solvent. Filtrate (1 ml) was reacted with 5.0 ml vanillin-HCl reagent and another with 5.0 ml of 4% (v/v) HCl-MeOH solution to serve as blank. The mixture was left to stand for 20 min before the absorbance was taken at 500 nm.
Calculation
Tannin (mg/g) = = 50 × (mg/g)
Where x is the value obtained from standard catechin graph.
Determination of oxalate
Oxalate was determined by the method of Oke (1966) with slight modification by Falade et al. (2005). About 4 g of the sample was weighed in quadruplicate into conical flasks and extracted with a 190 ml distilled water and 10 ml 6 M HCl. The suspension was placed in boiling water for 2 h and filtered and made up to 250 ml with water in a volumetric flask. To 50 ml aliquot was added 10 ml 6 M HCl and filtered and the precipitate washed with hot water. The filtrate and the wash water combined and titrated against conc. NH4OH until the salmon pink colour of the methyl red indicator changed to faint yellow. The solution was heated to 90°C and 10 ml 5% (w/v) CaCl2 solution was added to precipitate the oxalate overnight. The precipitate was washed free of calcium with distilled water and then washed into 100 ml conical flask with 10 ml hot 25% (v/v) H2SO4 and then with 15 ml distilled water. The final solution was heated to 90°C and titrated against a standard 0.05 M KmnO4 until a faint purple solution persisted for 30 s. The oxalate was then calculated as the sodium oxalate equivalent.
1 ml of 0.05 M KMnO4 = 2 mg sodium oxalate equivalent/g of sample
Determination of saponin
The spectrophotometric method of Brunner (1984) was used for saponin analysis. 1 g of finely ground sample was weighed into 250 ml beaker and 100 ml of isobutyl alcohol was added. The mixture was shaken on a UDY shaker for 2 h to ensure uniform mixing. Thereafter, the mixture was filtered through a Whatman No. 1 filter paper into a 100 ml beaker and 20 ml of 40% saturated solution of magnesium carbonate was added and the mixture made up to 250 ml. The mixture obtained with saturated MgCO3 was again filtered through a Whatman No. 1 filter paper to obtain a clear colourless solution. 1 ml of the colourless solution was pipette into a 50 ml volumetric flask and 2 ml of 5% FeCl3 solution was added and made up to mark with distilled water. It was allowed to stand for 30 min for blood red colour to develop. 0 to 10 ppm standard saponin solutions were prepared from saponin stock solution. The standard solution was treated similarly with 5% of FeCl3 solution as done for 1 ml of aforementioned sample. The absorbances of the sample as well as the standard solution were read after colour development in a Jenway V6300 Spectrophotometer at a wavelength of 380 nm.
116 Afr. J. Food Sci. Determination of antioxidant properties of enriched Kununzaki
Extraction of antioxidant
Extraction of antioxidant was carried out on dried kununzaki following the method of Yurttas et al. (2000) with minor modifications. About 5 g of each of the sample were separately mixed with 200 ml of 80% methanol (methanol:water, 80:20 v/v) in a conical flask and the extraction was done on a magnetic stirrer for 8 h at room temperature. The mixture was concentrated to dryness on a rotary evaporator. The crude concentrated extract was used for the analyses.
DPPH assay
The radical scavenging ability of the extract was determined using the stable radical DPPH (2,2-diphenyl-2-picrylhydrazyl hydrate) as described by Pownall et al. (2010). The reaction of DPPH with an antioxidant compound which can donate hydrogen, leads to its reduction. The change in colour from deep violet to light yellow was measured spectrophotometrically at 517 nm.
To 1 ml of different concentrations (0.5, 1.0, 1.5, 2.0, and 2.5 mg/ml) of the sample or standard (vitamin C) in a test tube was added 1 ml of 0.3 mM DPPH in methanol. The mixture was mixed and incubated in the dark for 30 min after which the absorbance was read at 517 nm against a DPPH control containing only 1 ml methanol in place of the extract.
The percentage of inhibition was calculated as shown in the equation:
where Acontrol is the absorbance of the control reaction (containing all reagents except the test compound) and Asample is the absorbance of the test compound. Sample concentration was calculated from the graph plotting inhibition percentage against extract concentration.
Metal chelating ability assay
The metal-chelating assay was carried out according to the method of Singh and Rajini (2004) with some modifications. Solutions of 2 mM FeCl2·4H2O and 5 mM ferrozine were separately diluted 20 times. Briefly, an aliquot (1 ml) of different concentrations (6.25, 12.5, 25.0, 50.0 and 100.0 mg/ml) of the sample was mixed with 1 ml of diluted FeCl2·4H2O. After 5 min incubation, the reaction was initiated by the addition of 1 ml of diluted ferrozine. The mixture was shaken vigorously and after a further 10 min incubation period, the absorbance of the solution was measured spectrophotometrically at 562 nm. The percentage inhibition of ferrozine-Fe+2 complex formations was calculated as shown in the equation:
Where Acontrol = absorbance of control sample (the control contains mixture of FeCl2 and ferrozine) and Asample = absorbance of a tested samples.
Ferric reducing antioxidant power (FRAP)
The FRAP assay uses antioxidants as reductants in a redox-linked
colorimetric method with absorbance measured with a spectrophotometer (Benzie and Strain, 1999). The principle of this method is based on the reduction of a colourless ferric-tripyridyltriazine complex to its blue ferrous coloured form due to the donation of electron by antioxidant compounds.
Procedure: A 300 mmol/L acetate buffer of pH 3.6, 10 mmol/L 2, 4, 6-tri-(2-pyridyl)-1, 3, 5-triazine and 20 mmol/L FeCl3.6H2O were mixed together in the ratio of 10:1:1, respectively, to give the working FRAP reagent. A 50 μl aliquot of the sample at 1 mg/ml and 50 μl of standard solutions of ascorbic acid (20, 40, 60, 80, and 100 µg/ml) were separately added to 1 ml of FRAP reagent. The mixture was well mixed and absorbance measurement at 593 nm against reagent blank (50 µl of distilled water and 1 ml of FRAP reagent) after allowing reaction to complete at exactly 10 min. The reducing power was expressed as equivalent concentration (EC) which is defined as the concentration of antioxidant that gave a ferric reducing ability equivalent to that of the ascorbic acid standard. This was done by plotting the graph of the absorbance of ascorbic acid (standard) against concentration. The equation of the graph obtained was used to calculate the equivalent concentration based on the absorbance obtained for the extracts, and this is expressed as ascorbic acid equivalent per gram of the extract (AAE µg/g of the extract).
Sensory evaluation
The 9-point hedonic scale assessment as described by Larmond (1977) was used. Panelists from the Department of Food Science and Technology were selected based on their familiarity with kununzaki beverage. The panelists scored the coded drinks in terms of degree of liking to taste, colour, texture and aroma. The 9-point hedonic scale used by the panelists for the evaluation ranged from 1 to 9 representing “extremely dislike” to “extremely like”. The coded samples were served in clean, transparent cups at room temperature 25°C. Water was given to each panelist for oral rinsing in between tasting of the samples. The results obtained were analysed using statistical methods of analysis.
Statistical analysis
The values obtained from each of the analyses were means of duplicate readings. The data obtained from physicochemical and sensory analysis were subjected to analysis of variance (ANOVA) and the mean were separated by Duncan multiple range test (SPSS, version 16). Significance was determined at 5% level.
RESULTS AND DISCUSSION
Proximate
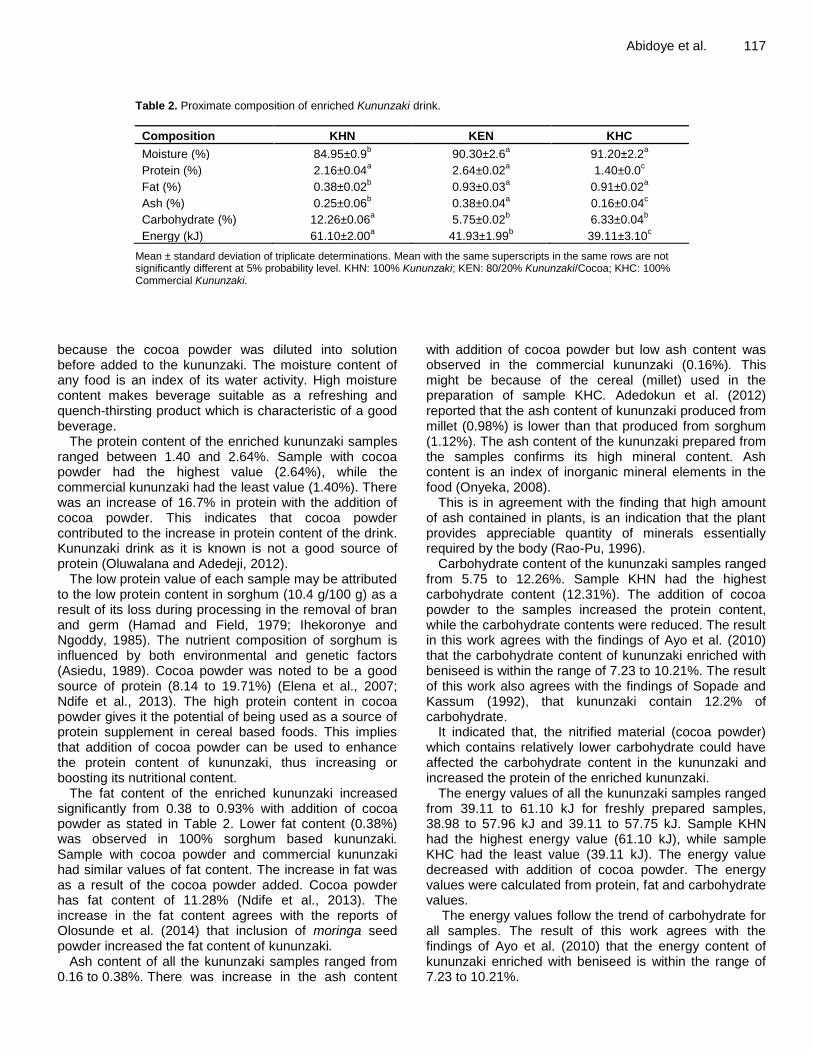
The proximate composition of the enriched kununzaki drink is presented in Table 2. The moisture content of the enriched kununzaki samples ranged from 84.95 to 91.20% with sample KHC (100% Commercial kununzaki) having the highest value (91.20%) and sample KHN (100% kununzaki laboratory, kununzaki prepared from 100% sorghum) having the lowest value (84.95%). There was an increase in the moisture content of the kununzaki drink because of the added cocoa powder. This might be
Abidoye et al. 117
Table 2. Proximate composition of enriched Kununzaki drink.
Composition KHN KEN KHC
Moisture (%) 84.95±0.9b
90.30±2.6a
91.20±2.2a
Protein (%) 2.16±0.04a
2.64±0.02a
1.40±0.0c
Fat (%) 0.38±0.02b
0.93±0.03a
0.91±0.02a
Ash (%) 0.25±0.06b
0.38±0.04a
0.16±0.04c
Carbohydrate (%) 12.26±0.06a
5.75±0.02b
6.33±0.04b
Energy (kJ) 61.10±2.00a
41.93±1.99b
39.11±3.10c
Mean ± standard deviation of triplicate determinations. Mean with the same superscripts in the same rows are not significantly different at 5% probability level. KHN: 100% Kununzaki; KEN: 80/20% Kununzaki/Cocoa; KHC: 100% Commercial Kununzaki.
because the cocoa powder was diluted into solution before added to the kununzaki. The moisture content of any food is an index of its water activity. High moisture content makes beverage suitable as a refreshing and quench-thirsting product which is characteristic of a good beverage.
The protein content of the enriched kununzaki samples ranged between 1.40 and 2.64%. Sample with cocoa powder had the highest value (2.64%), while the commercial kununzaki had the least value (1.40%). There was an increase of 16.7% in protein with the addition of cocoa powder. This indicates that cocoa powder contributed to the increase in protein content of the drink. Kununzaki drink as it is known is not a good source of protein (Oluwalana and Adedeji, 2012).
The low protein value of each sample may be attributed to the low protein content in sorghum (10.4 g/100 g) as a result of its loss during processing in the removal of bran and germ (Hamad and Field, 1979; Ihekoronye and Ngoddy, 1985). The nutrient composition of sorghum is influenced by both environmental and genetic factors (Asiedu, 1989). Cocoa powder was noted to be a good source of protein (8.14 to 19.71%) (Elena et al., 2007; Ndife et al., 2013). The high protein content in cocoa powder gives it the potential of being used as a source of protein supplement in cereal based foods. This implies that addition of cocoa powder can be used to enhance the protein content of kununzaki, thus increasing or boosting its nutritional content.
The fat content of the enriched kununzaki increased significantly from 0.38 to 0.93% with addition of cocoa powder as stated in Table 2. Lower fat content (0.38%) was observed in 100% sorghum based kununzaki. Sample with cocoa powder and commercial kununzaki had similar values of fat content. The increase in fat was as a result of the cocoa powder added. Cocoa powder has fat content of 11.28% (Ndife et al., 2013). The increase in the fat content agrees with the reports of Olosunde et al. (2014) that inclusion of moringa seed powder increased the fat content of kununzaki.
Ash content of all the kununzaki samples ranged from 0.16 to 0.38%. There was increase in the ash content
with addition of cocoa powder but low ash content was observed in the commercial kununzaki (0.16%). This might be because of the cereal (millet) used in the preparation of sample KHC. Adedokun et al. (2012) reported that the ash content of kununzaki produced from millet (0.98%) is lower than that produced from sorghum (1.12%). The ash content of the kununzaki prepared from the samples confirms its high mineral content. Ash content is an index of inorganic mineral elements in the food (Onyeka, 2008).
This is in agreement with the finding that high amount of ash contained in plants, is an indication that the plant provides appreciable quantity of minerals essentially required by the body (Rao-Pu, 1996).
Carbohydrate content of the kununzaki samples ranged from 5.75 to 12.26%. Sample KHN had the highest carbohydrate content (12.31%). The addition of cocoa powder to the samples increased the protein content, while the carbohydrate contents were reduced. The result in this work agrees with the findings of Ayo et al. (2010) that the carbohydrate content of kununzaki enriched with beniseed is within the range of 7.23 to 10.21%. The result of this work also agrees with the findings of Sopade and Kassum (1992), that kununzaki contain 12.2% of carbohydrate.
It indicated that, the nitrified material (cocoa powder) which contains relatively lower carbohydrate could have affected the carbohydrate content in the kununzaki and increased the protein of the enriched kununzaki.
The energy values of all the kununzaki samples ranged from 39.11 to 61.10 kJ for freshly prepared samples, 38.98 to 57.96 kJ and 39.11 to 57.75 kJ. Sample KHN had the highest energy value (61.10 kJ), while sample KHC had the least value (39.11 kJ). The energy value decreased with addition of cocoa powder. The energy values were calculated from protein, fat and carbohydrate values.
The energy values follow the trend of carbohydrate for all samples. The result of this work agrees with the findings of Ayo et al. (2010) that the energy content of kununzaki enriched with beniseed is within the range of 7.23 to 10.21%.
118 Afr. J. Food Sci.
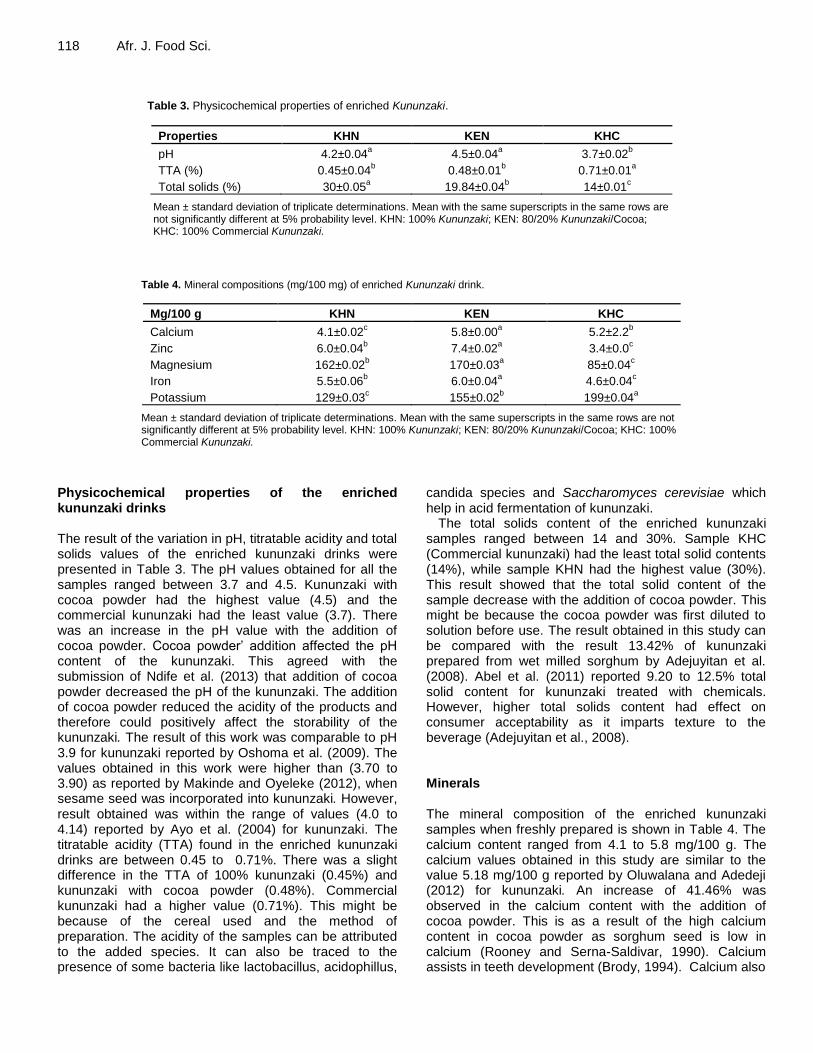
Table 3. Physicochemical properties of enriched Kununzaki.
Properties KHN KEN KHC
pH 4.2±0.04a
4.5±0.04a
3.7±0.02b
TTA (%) 0.45±0.04b
0.48±0.01b
0.71±0.01a
Total solids (%) 30±0.05a
19.84±0.04b
14±0.01c
Mean ± standard deviation of triplicate determinations. Mean with the same superscripts in the same rows are not significantly different at 5% probability level. KHN: 100% Kununzaki; KEN: 80/20% Kununzaki/Cocoa; KHC: 100% Commercial Kununzaki.
Table 4. Mineral compositions (mg/100 mg) of enriched Kununzaki drink.
Mg/100 g KHN KEN KHC
Calcium 4.1±0.02c
5.8±0.00a
5.2±2.2b
Zinc 6.0±0.04b
7.4±0.02a
3.4±0.0c
Magnesium 162±0.02b
170±0.03a
85±0.04c
Iron 5.5±0.06b
6.0±0.04a
4.6±0.04c
Potassium 129±0.03c
155±0.02b
199±0.04a
Mean ± standard deviation of triplicate determinations. Mean with the same superscripts in the same rows are not significantly different at 5% probability level. KHN: 100% Kununzaki; KEN: 80/20% Kununzaki/Cocoa; KHC: 100% Commercial Kununzaki.
Physicochemical properties of the enriched kununzaki drinks The result of the variation in pH, titratable acidity and total solids values of the enriched kununzaki drinks were presented in Table 3. The pH values obtained for all the samples ranged between 3.7 and 4.5. Kununzaki with cocoa powder had the highest value (4.5) and the commercial kununzaki had the least value (3.7). There was an increase in the pH value with the addition of cocoa powder. Cocoa powder’ addition affected the pH content of the kununzaki. This agreed with the submission of Ndife et al. (2013) that addition of cocoa powder decreased the pH of the kununzaki. The addition of cocoa powder reduced the acidity of the products and therefore could positively affect the storability of the kununzaki. The result of this work was comparable to pH 3.9 for kununzaki reported by Oshoma et al. (2009). The values obtained in this work were higher than (3.70 to 3.90) as reported by Makinde and Oyeleke (2012), when sesame seed was incorporated into kununzaki. However, result obtained was within the range of values (4.0 to 4.14) reported by Ayo et al. (2004) for kununzaki. The titratable acidity (TTA) found in the enriched kununzaki drinks are between 0.45 to 0.71%. There was a slight difference in the TTA of 100% kununzaki (0.45%) and kununzaki with cocoa powder (0.48%). Commercial kununzaki had a higher value (0.71%). This might be because of the cereal used and the method of preparation. The acidity of the samples can be attributed to the added species. It can also be traced to the presence of some bacteria like lactobacillus, acidophillus,
candida species and Saccharomyces cerevisiae which help in acid fermentation of kununzaki.
The total solids content of the enriched kununzaki samples ranged between 14 and 30%. Sample KHC (Commercial kununzaki) had the least total solid contents (14%), while sample KHN had the highest value (30%). This result showed that the total solid content of the sample decrease with the addition of cocoa powder. This might be because the cocoa powder was first diluted to solution before use. The result obtained in this study can be compared with the result 13.42% of kununzaki prepared from wet milled sorghum by Adejuyitan et al. (2008). Abel et al. (2011) reported 9.20 to 12.5% total solid content for kununzaki treated with chemicals. However, higher total solids content had effect on consumer acceptability as it imparts texture to the beverage (Adejuyitan et al., 2008). Minerals The mineral composition of the enriched kununzaki samples when freshly prepared is shown in Table 4. The calcium content ranged from 4.1 to 5.8 mg/100 g. The calcium values obtained in this study are similar to the value 5.18 mg/100 g reported by Oluwalana and Adedeji (2012) for kununzaki. An increase of 41.46% was observed in the calcium content with the addition of cocoa powder. This is as a result of the high calcium content in cocoa powder as sorghum seed is low in calcium (Rooney and Serna-Saldivar, 1990). Calcium assists in teeth development (Brody, 1994). Calcium also
Abidoye et al. 119
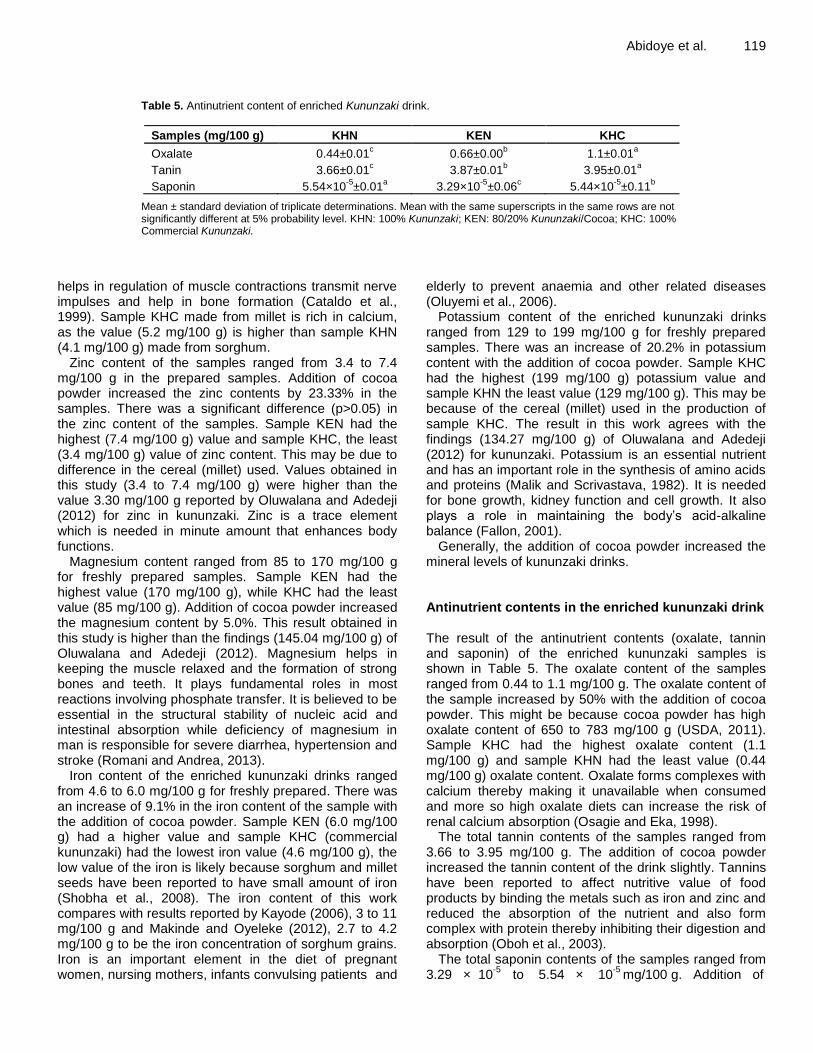
Table 5. Antinutrient content of enriched Kununzaki drink.
Samples (mg/100 g) KHN KEN KHC
Oxalate 0.44±0.01c 0.66±0.00
b 1.1±0.01
a
Tanin 3.66±0.01c
3.87±0.01b
3.95±0.01a
Saponin 5.54×10⁻⁵
±0.01a
3.29×10⁻⁵
±0.06c
5.44×10⁻⁵
±0.11b
Mean ± standard deviation of triplicate determinations. Mean with the same superscripts in the same rows are not significantly different at 5% probability level. KHN: 100% Kununzaki; KEN: 80/20% Kununzaki/Cocoa; KHC: 100% Commercial Kununzaki.
helps in regulation of muscle contractions transmit nerve impulses and help in bone formation (Cataldo et al., 1999). Sample KHC made from millet is rich in calcium, as the value (5.2 mg/100 g) is higher than sample KHN (4.1 mg/100 g) made from sorghum.
Zinc content of the samples ranged from 3.4 to 7.4 mg/100 g in the prepared samples. Addition of cocoa powder increased the zinc contents by 23.33% in the samples. There was a significant difference (p>0.05) in the zinc content of the samples. Sample KEN had the highest (7.4 mg/100 g) value and sample KHC, the least (3.4 mg/100 g) value of zinc content. This may be due to difference in the cereal (millet) used. Values obtained in this study (3.4 to 7.4 mg/100 g) were higher than the value 3.30 mg/100 g reported by Oluwalana and Adedeji (2012) for zinc in kununzaki. Zinc is a trace element which is needed in minute amount that enhances body functions.
Magnesium content ranged from 85 to 170 mg/100 g for freshly prepared samples. Sample KEN had the highest value (170 mg/100 g), while KHC had the least value (85 mg/100 g). Addition of cocoa powder increased the magnesium content by 5.0%. This result obtained in this study is higher than the findings (145.04 mg/100 g) of Oluwalana and Adedeji (2012). Magnesium helps in keeping the muscle relaxed and the formation of strong bones and teeth. It plays fundamental roles in most reactions involving phosphate transfer. It is believed to be essential in the structural stability of nucleic acid and intestinal absorption while deficiency of magnesium in man is responsible for severe diarrhea, hypertension and stroke (Romani and Andrea, 2013).
Iron content of the enriched kununzaki drinks ranged from 4.6 to 6.0 mg/100 g for freshly prepared. There was an increase of 9.1% in the iron content of the sample with the addition of cocoa powder. Sample KEN (6.0 mg/100 g) had a higher value and sample KHC (commercial kununzaki) had the lowest iron value (4.6 mg/100 g), the low value of the iron is likely because sorghum and millet seeds have been reported to have small amount of iron (Shobha et al., 2008). The iron content of this work compares with results reported by Kayode (2006), 3 to 11 mg/100 g and Makinde and Oyeleke (2012), 2.7 to 4.2 mg/100 g to be the iron concentration of sorghum grains. Iron is an important element in the diet of pregnant women, nursing mothers, infants convulsing patients and
elderly to prevent anaemia and other related diseases (Oluyemi et al., 2006).
Potassium content of the enriched kununzaki drinks ranged from 129 to 199 mg/100 g for freshly prepared samples. There was an increase of 20.2% in potassium content with the addition of cocoa powder. Sample KHC had the highest (199 mg/100 g) potassium value and sample KHN the least value (129 mg/100 g). This may be because of the cereal (millet) used in the production of sample KHC. The result in this work agrees with the findings (134.27 mg/100 g) of Oluwalana and Adedeji (2012) for kununzaki. Potassium is an essential nutrient and has an important role in the synthesis of amino acids and proteins (Malik and Scrivastava, 1982). It is needed for bone growth, kidney function and cell growth. It also plays a role in maintaining the body’s acid-alkaline balance (Fallon, 2001).
Generally, the addition of cocoa powder increased the mineral levels of kununzaki drinks. Antinutrient contents in the enriched kununzaki drink The result of the antinutrient contents (oxalate, tannin and saponin) of the enriched kununzaki samples is shown in Table 5. The oxalate content of the samples ranged from 0.44 to 1.1 mg/100 g. The oxalate content of the sample increased by 50% with the addition of cocoa powder. This might be because cocoa powder has high oxalate content of 650 to 783 mg/100 g (USDA, 2011). Sample KHC had the highest oxalate content (1.1 mg/100 g) and sample KHN had the least value (0.44 mg/100 g) oxalate content. Oxalate forms complexes with calcium thereby making it unavailable when consumed and more so high oxalate diets can increase the risk of renal calcium absorption (Osagie and Eka, 1998).
The total tannin contents of the samples ranged from 3.66 to 3.95 mg/100 g. The addition of cocoa powder increased the tannin content of the drink slightly. Tannins have been reported to affect nutritive value of food products by binding the metals such as iron and zinc and reduced the absorption of the nutrient and also form complex with protein thereby inhibiting their digestion and absorption (Oboh et al., 2003).
The total saponin contents of the samples ranged from 3.29 × 10
-5 to 5.54 × 10
-5 mg/100 g. Addition of
120 Afr. J. Food Sci.
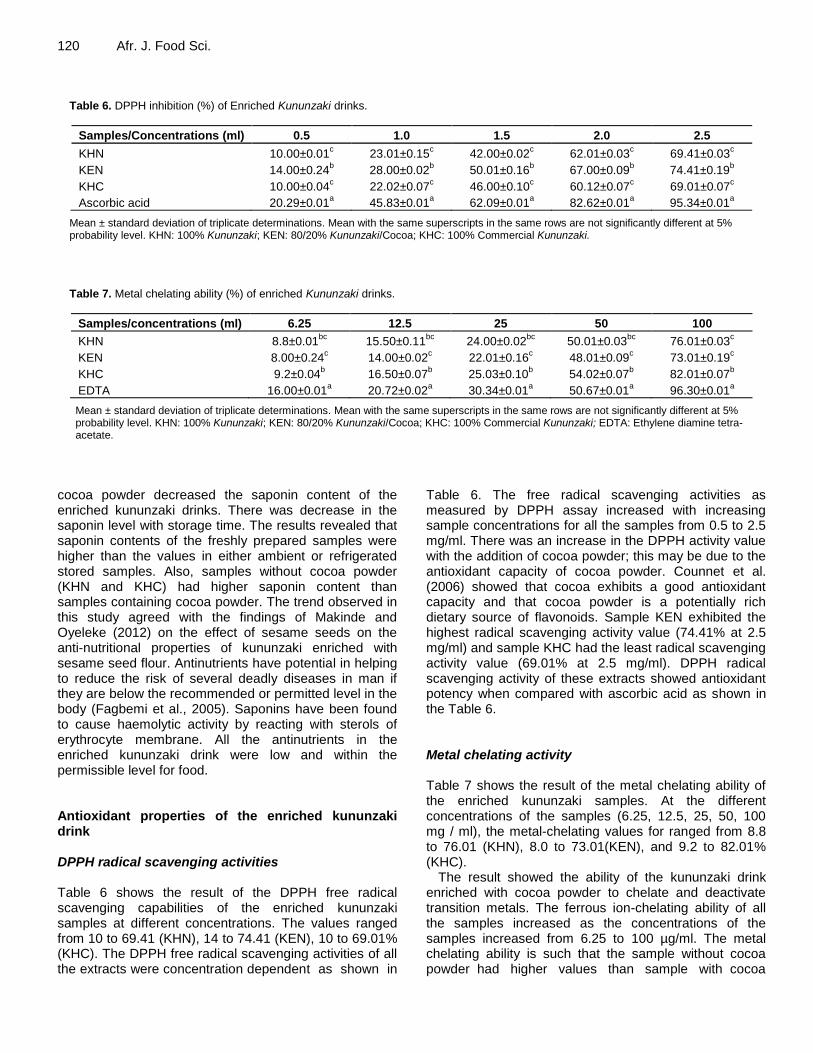
Table 6. DPPH inhibition (%) of Enriched Kununzaki drinks.
Samples/Concentrations (ml) 0.5 1.0 1.5 2.0 2.5
KHN 10.00±0.01c
23.01±0.15c
42.00±0.02c
62.01±0.03c
69.41±0.03c
KEN 14.00±0.24b
28.00±0.02b
50.01±0.16b
67.00±0.09b
74.41±0.19b
KHC 10.00±0.04c
22.02±0.07c
46.00±0.10c
60.12±0.07c
69.01±0.07c
Ascorbic acid 20.29±0.01a
45.83±0.01a
62.09±0.01a
82.62±0.01a
95.34±0.01a
Mean ± standard deviation of triplicate determinations. Mean with the same superscripts in the same rows are not significantly different at 5% probability level. KHN: 100% Kununzaki; KEN: 80/20% Kununzaki/Cocoa; KHC: 100% Commercial Kununzaki.
Table 7. Metal chelating ability (%) of enriched Kununzaki drinks.
Samples/concentrations (ml) 6.25 12.5 25 50 100
KHN 8.8±0.01bc
15.50±0.11bc
24.00±0.02bc
50.01±0.03bc
76.01±0.03c
KEN 8.00±0.24c
14.00±0.02c
22.01±0.16c
48.01±0.09c
73.01±0.19c
KHC 9.2±0.04b
16.50±0.07b
25.03±0.10b
54.02±0.07b
82.01±0.07b
EDTA 16.00±0.01a
20.72±0.02a
30.34±0.01a
50.67±0.01a
96.30±0.01a
Mean ± standard deviation of triplicate determinations. Mean with the same superscripts in the same rows are not significantly different at 5% probability level. KHN: 100% Kununzaki; KEN: 80/20% Kununzaki/Cocoa; KHC: 100% Commercial Kununzaki; EDTA: Ethylene diamine tetra-acetate.
cocoa powder decreased the saponin content of the enriched kununzaki drinks. There was decrease in the saponin level with storage time. The results revealed that saponin contents of the freshly prepared samples were higher than the values in either ambient or refrigerated stored samples. Also, samples without cocoa powder (KHN and KHC) had higher saponin content than samples containing cocoa powder. The trend observed in this study agreed with the findings of Makinde and Oyeleke (2012) on the effect of sesame seeds on the anti-nutritional properties of kununzaki enriched with sesame seed flour. Antinutrients have potential in helping to reduce the risk of several deadly diseases in man if they are below the recommended or permitted level in the body (Fagbemi et al., 2005). Saponins have been found to cause haemolytic activity by reacting with sterols of erythrocyte membrane. All the antinutrients in the enriched kununzaki drink were low and within the permissible level for food. Antioxidant properties of the enriched kununzaki drink DPPH radical scavenging activities Table 6 shows the result of the DPPH free radical scavenging capabilities of the enriched kununzaki samples at different concentrations. The values ranged from 10 to 69.41 (KHN), 14 to 74.41 (KEN), 10 to 69.01% (KHC). The DPPH free radical scavenging activities of all the extracts were concentration dependent as shown in
Table 6. The free radical scavenging activities as measured by DPPH assay increased with increasing sample concentrations for all the samples from 0.5 to 2.5 mg/ml. There was an increase in the DPPH activity value with the addition of cocoa powder; this may be due to the antioxidant capacity of cocoa powder. Counnet et al. (2006) showed that cocoa exhibits a good antioxidant capacity and that cocoa powder is a potentially rich dietary source of flavonoids. Sample KEN exhibited the highest radical scavenging activity value (74.41% at 2.5 mg/ml) and sample KHC had the least radical scavenging activity value (69.01% at 2.5 mg/ml). DPPH radical scavenging activity of these extracts showed antioxidant potency when compared with ascorbic acid as shown in the Table 6. Metal chelating activity Table 7 shows the result of the metal chelating ability of the enriched kununzaki samples. At the different concentrations of the samples (6.25, 12.5, 25, 50, 100 mg / ml), the metal-chelating values for ranged from 8.8 to 76.01 (KHN), 8.0 to 73.01(KEN), and 9.2 to 82.01% (KHC).
The result showed the ability of the kununzaki drink enriched with cocoa powder to chelate and deactivate transition metals. The ferrous ion-chelating ability of all the samples increased as the concentrations of the samples increased from 6.25 to 100 µg/ml. The metal chelating ability is such that the sample without cocoa powder had higher values than sample with cocoa
Abidoye et al. 121
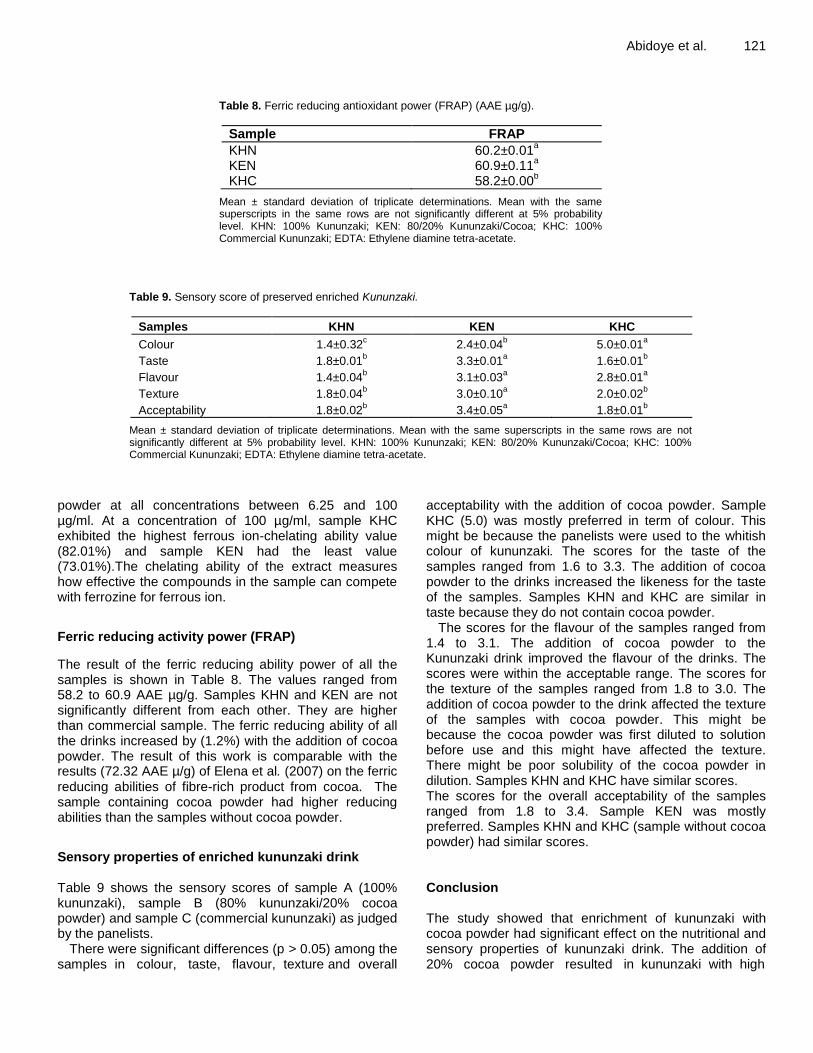
Table 8. Ferric reducing antioxidant power (FRAP) (AAE µg/g).
Sample FRAP
KHN 60.2±0.01a
KEN 60.9±0.11a
KHC 58.2±0.00b
Mean ± standard deviation of triplicate determinations. Mean with the same superscripts in the same rows are not significantly different at 5% probability level. KHN: 100% Kununzaki; KEN: 80/20% Kununzaki/Cocoa; KHC: 100% Commercial Kununzaki; EDTA: Ethylene diamine tetra-acetate.
Table 9. Sensory score of preserved enriched Kununzaki.
Samples KHN KEN KHC
Colour 1.4±0.32c
2.4±0.04b
5.0±0.01a
Taste 1.8±0.01b
3.3±0.01a
1.6±0.01b
Flavour 1.4±0.04b
3.1±0.03a
2.8±0.01a
Texture 1.8±0.04b
3.0±0.10a
2.0±0.02b
Acceptability 1.8±0.02b
3.4±0.05a
1.8±0.01b
Mean ± standard deviation of triplicate determinations. Mean with the same superscripts in the same rows are not significantly different at 5% probability level. KHN: 100% Kununzaki; KEN: 80/20% Kununzaki/Cocoa; KHC: 100% Commercial Kununzaki; EDTA: Ethylene diamine tetra-acetate.
powder at all concentrations between 6.25 and 100 µg/ml. At a concentration of 100 µg/ml, sample KHC exhibited the highest ferrous ion-chelating ability value (82.01%) and sample KEN had the least value (73.01%).The chelating ability of the extract measures how effective the compounds in the sample can compete with ferrozine for ferrous ion.
Ferric reducing activity power (FRAP)
The result of the ferric reducing ability power of all the samples is shown in Table 8. The values ranged from 58.2 to 60.9 AAE µg/g. Samples KHN and KEN are not significantly different from each other. They are higher than commercial sample. The ferric reducing ability of all the drinks increased by (1.2%) with the addition of cocoa powder. The result of this work is comparable with the results (72.32 AAE µ/g) of Elena et al. (2007) on the ferric reducing abilities of fibre-rich product from cocoa. The sample containing cocoa powder had higher reducing abilities than the samples without cocoa powder.
Sensory properties of enriched kununzaki drink Table 9 shows the sensory scores of sample A (100% kununzaki), sample B (80% kununzaki/20% cocoa powder) and sample C (commercial kununzaki) as judged by the panelists.
There were significant differences (p > 0.05) among the samples in colour, taste, flavour, texture and overall
acceptability with the addition of cocoa powder. Sample KHC (5.0) was mostly preferred in term of colour. This might be because the panelists were used to the whitish colour of kununzaki. The scores for the taste of the samples ranged from 1.6 to 3.3. The addition of cocoa powder to the drinks increased the likeness for the taste of the samples. Samples KHN and KHC are similar in taste because they do not contain cocoa powder.
The scores for the flavour of the samples ranged from 1.4 to 3.1. The addition of cocoa powder to the Kununzaki drink improved the flavour of the drinks. The scores were within the acceptable range. The scores for the texture of the samples ranged from 1.8 to 3.0. The addition of cocoa powder to the drink affected the texture of the samples with cocoa powder. This might be because the cocoa powder was first diluted to solution before use and this might have affected the texture. There might be poor solubility of the cocoa powder in dilution. Samples KHN and KHC have similar scores. The scores for the overall acceptability of the samples ranged from 1.8 to 3.4. Sample KEN was mostly preferred. Samples KHN and KHC (sample without cocoa powder) had similar scores. Conclusion The study showed that enrichment of kununzaki with cocoa powder had significant effect on the nutritional and sensory properties of kununzaki drink. The addition of 20% cocoa powder resulted in kununzaki with high
122 Afr. J. Food Sci. nutritional value and it was highly acceptable by panelists over the ones with high percentages of cocoa powder. . CONFLICT OF INTERESTS
The authors have not declared any conflict of interests. REFERENCES Abel AM, Omale J, Okoli, EC (2011). Effect of Chemical Treatment and
Pasteurization on the shelf life of Kununzaki (Sorghum and Maize Gruel). Euro. J. Food Res. Rev. 1(2):61-70.
Adeyemi IA, Umar S (1994). Effect of method of manufacture on the quality characteristics of Kunun zaki. Niger. Food J. 12:34-40.
Adejuyitan JA, Adelakun OE, Olaniyan SA, Popoola FI (2008). Evaluating the quality characteristics of kunun produced from dry-milled sorghum. Afr. J. Biotechnol. 7(13):2244-2247.
Akintunde TY (2005). Nutritional and sensory qualities of soymilk-kunnu blends. African J. of Food Agric, Nutrition and Development. 5:2.
Arts IC, Hollman PC, Kromhout D (1999). Chocolate as a source of tea flavonoids. Lancet 354(9177):488.
Asiedu JJ (1989). Processing Tropical Crops- a Technological Approach. Macmillan Education Ltd, London and Basingstoke, pp. 24-42.
Association of Official Analytical Chemists AOAC (2000). Official Methods of Analysis. Washington, DC 8:2-25.
Ayo JA (1998). Effect of C. Farinose crude extract on the quality of Kunun zaki. M.Sc Thesis. Department of Food Science and Technology, University of Science and Technology, Enugu, Nigeria.
Ayo JA, Umaianze G, Gaffa T (2004). Microbiological evaluation of kunun zaki and Zoborodo drink (beverage) locally produced and sold in a polytechnic community in Nigeria. Nigerian Food J. 22(1):119-126.
Ayo JA, Onuoha OG, Ikuomola DS, Esan YO, Ayo VA, Oigiangbe, JG (2010). Nutritional Evaluation of Millet-beniseed Composite Based Kunun-zaki. Pak. J. Nutr. 9(10):1034-1038.
Benzie IF, Strain JJ (1999). Ferric reducing ability of plasma (FRAP) as a measure of antioxidant power: The FRAP assay. Anal. Biochem. 239:70-76.
Brody T (1994). Nutritional Biochemistry, San Diego, CA: Academic Press. 2nd Edn., pp.761-794.
Brunner JH (1984). Direct spectrophotometric determination of saponin. Anal. Chem. 34:1314-1326.
Cataldo CB, DeBruyne LK, Whitney EN (1999). Nutrition and diet therapy principles and practise 5th edition. Wadsworth PublishingCompany and International Thomason Publishing Company. USA, pp. 35-204.
Counnet C, Callemien D, Collins S (2006). Chocolate and Cocoa: New sources of transresveratrol and trans-piceid. F Chem. 98:649-657.
Crozier SJ, Preston AG, Hurst JW, Payne MJ, Mann J, Hainly L, Miller DL (2011).Cocoa seeds are a” super fruits”. A comparative analysis of various fruits powders and products. Chem. Central J. 5:5.
Elena L, Raquel M, Maria I, Pilar R, Luis G, Laura B (2007). Dietary fibre composition, antioxidant capacity and physic-chemical properties of a fibre rich product from cocoa (Theobroma cacao.L.). Food Chem, 104:948- 954.
Fagbemi TN, Oshodi AA, Impinmoroti KO (2005). Processing effects on some antinutritional factors and in vitro multi enzyme protein digestibility (IVPD) of three tropical seeds Breadnut, Cashew nut and fluted pumpkin (Telferia occidentalis). Pak. J. Nutr. 4(4):250-256.
Falade MSO, Owoyomi CE, Adewusi SRA (2005). Chemical Composition and starch hydrolysis of acacia colei and acacia tumida seeds. Cereal Chem. 2(5):479-484.
Fallon S, Enig MG (2001). Nourishing Traditions. The Cookbook that Challenges Policitally Correct Nutrition and the Diet Dictocrats. Revised 2nd Edn., pp. 40-45.
Fashakin JB, Ilori MO, Olarewaju I (1991). Cost and Quality Optimization of a complementary diet from plant protein and corn
flour using a computer aided linear programming model. Niger. Food J. 9:123-126.
Gaffa T, Jideani IA, Nkama I (2002). Traditional production, consumption and storage of kunu- a non alcoholic cereal beverage
Plant F Human Nutri. 57:73-81 Hamad A, Fields ML (1979). Evaluation of protein quality and available
lysine of germinated and fermented cereals. J. Food Sci. 44:456. Ihekoronye AI, Ngoddy PO (1985). Integrated Food Science and
Technology for the tropics. Macmillian Publishers Limited, p. 250. Kayode APP (2006). Diversity, Users’ Perception and Food Processing
of Sorghum:Implications for Dietary Iron and Zinc Supply. Ph.D. Thesis, Wageningen Univ., Netherlands, Wageningen, p151.
Larmond E (1977). Laboratory Methods for Sensory Evaluation of Foods, Department of Agriculture Ottawa, pp.18-46.
Makinde F, Oyeleke O (2012).Effect of Sesame seed addition on the Chemical and Sensory qualities of Sorghum based Kunun-Zaki drink. Afr. J. Food Sci. Technol. 3(9):204-212.
Malik CP, Scrivastava AK (1982).Text Book of Plant Physiology. Ludhiana, New Delhi, pp. 351-352.
Ndife J, Bolaji P, Atoyebi D, Umezuruike C (2013). Production and quality evaluation of cocoa products (plain cocoa powder and chocolate). Am. J. Food Nutr. 410:401-404.
Obadina AO, Oyewole OB, Awojobi TM (2008). Effect of steeping time of milled grains on the quality of kununzaki (A Nigerian beverage). Afr. J. Food Sci. 2:33-36.
Obizoba IC, Atti JV (1994). Evaluation of the effect of processing techniques on the nutrient and anti-nutrient contents of pearl millet Pennisetum glaucum seeds. Plant Food Hum. Nutr. 45:23-24.
Oboh G, Akindahunsi AA, Oshodi AA (2003). Dynamics of Phytate-Zn balance of Fungi Fermented Cassava products (Flour and Gari). Plant Foods Hum. Nutr. 58(3):1-7.
Olosunde OO, Abiodun OA., Amanyunose, A. A. and Adepeju, A.B. (2014). Quality of Kununzaki enriched with Moringa oleifera seed flour. Am. J Exp. Agric. 4:1027-1035.
Oluwalana IB, Adedeji TO (2012). Nutritional Composition of a Non-Alcoholic Beverage Spiced with Zingiber officinale Extract Produced from Sorghum bicolour Stem Sheath. Int. J. Food Sci. Nutr. Eng. 3(3):21-27.
Oluyemi EA, Akinlua AA, Adenuga AA, Adebayo MB (2006). Mineral contents of some commonly consumed Nigerian Foods. Sci. Focus 11(1):153-157.
Omakwu J (1980). The preservation effect of spices in Kunnu-samiya. AB. Sc. dissertation in the Department of Microbiology, Ahmadu Bello University, Zaria, Nigeria.
Onuorah SI, Adesiyun AA, Adekeye JO (1987). Survival and multiplication of Staphylococcus aureus and Escherichia coli in a Nigerian cereal drink (kunun-zaki): Effect of spices, pH and temperature. J. Food Agric. 1:31-34.
Onyeka EU (2008). Food and Nutrition. 2nd Edition., Charismatic Forum Publisher, Owerri, Nigeria, pp.151-184.
Pownall TL, Udenigwe CC, Aluko RE (2010). Amino acid composition and antioxidant properties of pea seed (Pisum sativumL.) enzymatic protein hydrolysate fractions. J. Agric. Food Chem. 58:4712-4718.
Price ML, Van S, Butler LG (1978). A critical evaluation of vanillin reaction as an assay for tannin in sorghum grain. J. Agric. Food Chem. 26:1214-1218.
Rao-pu (1996). Nutrient composition and biological evaluation of Mesta (Hibiscus sabdariffa) seeds. Plant Food Human Nutr. 49:34-37.
Romani, Andrea MP (2013). "Magnesium in Health and Disease". Interrelations between Essential Metal Ions and Human Diseases. Metal Ions in Life Sciences 13, Springer, pp.49-79.
Rooney LW, Serna-Saldivar ET (1990). Sorghum. In: Lorenz.K.L andKulp.K (Eds). Handbook of Cereal Science and Technology. Marcel Dekker, New York.
Singh N, Rajini PS (2004). Free radical scavenging activity of an aqueous extract of potato peel. Food Chem. 85:611.
Sopade PA, Kassum AL (1992). Rheological characterization of Nigerian liquid and semi- liquid foods. Kunun zaki and kunun gyada. Nig. Food J. 10:23-33.
United States Department of Agriculture, (2011). International Network of Food Data Systems; United Nations University; Food and Agriculture Organization of the United Nations, Elsevier. Wikipedia,

2016. List of beverages. Available online at https://en.wikipedia.org/wiki/list of beverages. (Accessed 12/12/2016).
Yurttas HC, Schafer HW, Warthesen JJ (2000). Antioxidant activity of non-tocopherol hazelnut (Corylus spp.) phenolics. J. Food Sci. 2(65):276.
Abidoye et al. 123