Embed Size (px)
Citation preview

UNITED STATESSECURITIES AND EXCHANGE COMMISSION
Washington, D.C. 20549
FORM 10-K(Mark One)
ANNUAL REPORT PURSUANT TO SECTION 13 OR 15(d) OF THE SECURITIES EXCHANGE ACT OF 1934
For the fiscal year ended December 31, 2007or
¨̈ TRANSITION REPORT PURSUANT TO SECTION 13 OR 15(d) OF THE SECURITIES EXCHANGE ACT OF 1934
For the transition period from _________ to_________
Commission file number 1-16095
Aetna Inc.(Exact name of registrant as specified in its charter)
Pennsylvania(State or other jurisdiction of incorporation or organization)
23-2229683(I.R.S. Employer Identification No.)
151 Farmington Avenue, Hartford, CT(Address of principal executive offices)
06156(Zip Code)
Registrant’s telephone number, including area code (860) 273-0123
Securities registered pursuant to Section 12(b) of the Act:Title of each classCommon Shares, $.01 par value
Name of each exchange on which registered
New York Stock Exchange Securities registered pursuant to Section 12(g) of the Act:
None
Indicate by check mark if the registrant is a well-known seasoned issuer, as defined in Rule 405 of the Securities Act. Yes ̈̈ No
Indicate by check mark if the registrant is not required to file reports pursuant to Section 13 or Section 15(d) of the Act. ¨̈ Yes No
Indicate by check mark whether the registrant (1) has filed all reports required to be filed by Section 13 or 15(d) of the Securities Exchange Act of 1934 duringthe preceding 12 months (or for such shorter period that the registrant was required to file such reports), and (2) has been subject to such filing requirementsfor the past 90 days. Yes ̈̈ No
Indicate by check mark if disclosure of delinquent filers pursuant to Item 405 of Regulation S-K is not contained herein, and will not be contained, to the bestof registrant’s knowledge, in definitive proxy or information statements incorporated by reference in Part III of this Form 10-K or any amendment to this Form10-K. ¨̈
Indicate by check mark whether the registrant is a large accelerated filer, an accelerated filer, a non-accelerated filer, or a smaller reporting company. Seedefinitions of “large accelerated filer,” “accelerated filer” and “smaller reporting company” in Rule 12b-2 of the Exchange Act. (Check one):
Large accelerated filer Accelerated filer ¨̈ Non-accelerated filer ¨̈ Smaller reporting company ¨̈
Indicated by check mark whether the registrant is a shell company (as defined in Rule 12b-2 of the Act). ¨̈ Yes No
The aggregate market value of the outstanding common equity of the registrant held by non-affiliates as of the last business day of the registrant’s mostrecently completed second fiscal quarter (June 30, 2007) was $24.6 billion.
There were 496.6 million shares of voting common stock with a par value of $.01 outstanding at January 31, 2008.
DOCUMENTS INCORPORATED BY REFERENCE
The 2007 Annual Report, Financial Report to Shareholders (the “Annual Report”) is incorporated by reference in Parts I, II and IV to the extent describedtherein. The definitive proxy statement related to Aetna Inc.’s 2008 Annual Meeting of Shareholders, to be filed on or about April 21, 2008 (the “ProxyStatement”), is incorporated by reference in Parts III and IV to the extent described therein.

Aetna Inc.Annual Report on Form 10-K
For the Fiscal Year Ended December 31, 2007
Unless the context otherwise requires, references to the terms “we,” “our” or “us” used throughout this Annual Report on Form 10-K refer to Aetna Inc. (a Pennsylvania corporation) (“Aetna”) and its subsidiaries (collectively, the “Company”).
Table of Contents Page
Part I Item 1. Business 1Item 1A. Risk Factors 10Item 1B. Unresolved Staff Comments 10Item 2. Properties 11Item 3. Legal Proceedings 11Item 4. Submission of Matters to a Vote of Security Holders 11 Executive Officers Of The Registrant 11 Part II Item 5. Market for Registrant’s Common Equity, Related Stockholder Matters and
Issuer Purchases of Equity Securities12
Item 6. Selected Financial Data 13Item 7. Management’s Discussion and Analysis of Financial Condition and Results of
Operations13
Item 7A. Quantitative and Qualitative Disclosures About Market Risk 13Item 8. Financial Statements and Supplementary Data 13Item 9. Changes in and Disagreements With Accountants on Accounting and Financial Disclosure 13Item 9A. Controls and Procedures 13Item 9B. Other Information 14 Part III Item 10. Directors, Executive Officers and Corporate Governance 14Item 11. Executive Compensation 14Item 12. Security Ownership of Certain Beneficial Owners and Management and Related Stockholder Matters 14Item 13. Certain Relationships and Related Transactions, and Director Independence 15Item 14. Principal Accounting Fees and Services 15 Part IV Item 15. Exhibits, Financial Statement Schedules 15 Signatures 26Index to Exhibits 27

Part I
Item 1. Business
We are one of the nation’s leading diversified health care benefits companies, serving approximately 36.7 million people with information andresources to help them make better informed decisions about their health care. We offer a broad range of traditional and consumer-directed healthinsurance products and related services, including medical, pharmacy, dental, behavioral health, group life and disability plans, and medicalmanagement capabilities and health care management services for Medicaid plans. Our customers include employer groups, individuals, collegestudents, part-time and hourly workers, health plans, governmental units, government-sponsored plans, labor groups and expatriates.
We are dedicated to helping people achieve health and financial security by providing easy access to safe, cost-effective, quality health care andprotecting their finances against health-related risks. We seek to achieve superior customer satisfaction through innovative products, comprehensivehealth and related benefits choices, effective service and easy-to-understand information.
The health insurance and related benefits industry continues to experience significant change. Employers, consumers and the federal and stategovernments have increased their focus on health care costs, which continue to drive changes in the structure of health insurance and related benefitsproducts and services. Product features continue to evolve that are directed at containing rising health care costs, enhancing access to quality healthcare services and giving members greater control and responsibility in directing their benefit dollars. For employer-based health coverage, employersare continuing to require covered employee members to assume a greater portion of the cost of their health care and/or coverage. These economicfactors and greater consumer awareness are leading to increased popularity of products that offer flexibility in design features such as deductibles andco-payments, health savings accounts, more consumer choice of health care providers and quality-based physician networks. The industry is alsosubject to other forces including federal and state legislative and regulatory reforms, advances in pharmaceutical and medical technology, theincreasing convergence of health and wealth considerations and industry consolidation. All of these factors can affect the competitiveness of productand service offerings, the range of industry competitors and the bases of competition.
We believe that these factors will exist for some time and will drive a continuing evolution in the health insurance and related benefits industry. Weplace significant emphasis on developing and maintaining our product and service offerings to serve existing and new customer markets and havedone so through organic growth and acquisitions. Over the last five years, this focus has led to the introduction of new products, such as ourPersonal Health Record (which provides members with online access to personal information to help them make better informed decisions about theirhealth care), Aetna Health ConnectionsSM, Health Savings Account (“HSA”) and Aetna HealthFund® plans (consumer-directed health plans thatcombine traditional health plan and/or dental coverage, subject to a deductible, with an accumulating benefit account), Medicare Part D prescriptiondrug plans, and private fee-for-service Medicare plans (“PFFS”). We continue to develop and enhance our existing products, such as our AexcelSM
physician networks, which are comprised of specialist providers who have demonstrated effectiveness in the delivery of care based on measures ofclinical performance and efficiency. We are also expanding our transparency initiative by utilizing our Aetna Navigator on-line tool to give ourmembers access to physician-specific cost, clinical quality and efficiency information in select markets.
During 2007, we continued to invest in the development of our business by acquiring companies that support our strategy as well as continuing tointroduce or enhance our own new products and services. We expanded our Health Care product offerings by acquiring a leading provider of healthcare management services for Medicaid plans and a leading managing general underwriter (or underwriting agent) for international private medicalinsurance that offers expatriate benefits to individuals, small and medium enterprises, and large multinational clients around the world. More detailsabout these acquisitions are included in Note 3 on page 54 of Notes to Consolidated Financial Statements of the Annual Report which is incorporatedherein by reference.
Page 1

During 2007, our emphasis on introducing, developing and enhancing new products and services through organic growth and acquisitions led to theexpansion and diversification of both the geographic reach of our operations and the customer markets we serve. Our significant expansions anddiversifications during 2007 included:
· expanding our individual and small group marketing into additional states;· expanding our capabilities to serve Government and labor customers;· expanding our Medicaid offerings to a total of 10 states, mostly through acquisition;· expanding our capabilities to serve retirees, particularly through our relationships with AARP and the HR Policy Association and our
enhanced individual and group Medicare offerings; and· expanding our expatriate offerings and global capabilities and reach, also through acquisition.
As we enhance our product capabilities and geographic presence, we continually evaluate acquisitions and other transactions that present strategicgrowth opportunities.
Our operations are conducted in three business segments: Health Care, Group Insurance and Large Case Pensions.We derive our revenues primarily from premiums earned on insured products (i.e., arrangements under which we assume all or a majority of thefinancial risk for health care costs or other risks covered by the plan, hereinafter referred to as “Insured”), fees (comprised of administrativeservices contract (“ASC”) and other fees), investments and other revenue. Refer to Management’s Discussion and Analysis of Financial Conditionand Results of Operations (“MD&A”) and Note 19 of Notes to Consolidated Financial Statements beginning on pages 2 and 76, respectively, ofthe Annual Report, which are incorporated herein by reference, regarding revenue and profit information for each of our business segments. Thefollowing is a description of each of our business segments.
Health CareProducts and ServicesHealth Care products consist of medical, pharmacy benefits management, dental and vision plans offered on both an Insured basis and an employer-funded basis (i.e., arrangements under which the employer or other plan sponsor under an ASC assumes all or a majority of the financial risk forhealth care costs or other risks covered by the plan). Medical products include point of service (“POS”), preferred provider organization (“PPO”),health maintenance organization (“HMO”) and indemnity benefit (“Indemnity”) plans. Medical products also include HSAs and AetnaHealthFund®, consumer-directed health plans that combine traditional POS or PPO and/or dental coverage, subject to a deductible, with anaccumulating benefit account (which may be funded by the plan sponsor and/or the member in the case of HSAs). We also offer Medicare andMedicaid products and services and specialty products, such as medical management and data analytics services, behavioral health plans and stoploss insurance, as well as products that provide access to our provider networks in select markets.
Our principal products and services are targeted specifically to small, mid-sized and large multi-site national employers. We also serve individualinsureds, expatriates and, in certain markets, Medicare and Medicaid beneficiaries. Medicare and Medicaid products and services are categorizedseparately from our other Health Care products and services, which we refer to as Commercial.
The primary Commercial products we offer are POS, PPO, HMO and indemnity plans. We also offer other products and services. Our otherCommercial products and services include:
ActiveHealth ManagementThrough the use of our patented Care Engine ® system, our ActiveHealth Management business provides evidence-based medicalmanagement and data analytics products and services to a broad range of customers, including health plans, employers and others.
Personal Health RecordOur Personal Health Record provides members with online access to personal information, including individual personalized messages andalerts, detailed health history based on available claims data and voluntarily submitted information and integrated information and resourcesto help members make informed decisions about their health care.
Page 2

Network AccessWe also maintain a regional health care network with operations in Michigan, Colorado and other states. We provide access to this networkto a broad range of customers, including other health plans and employers, for a fee.
Stop LossWe offer stop loss insurance coverage for certain employers. Under this product, we assume the costs associated with large individualclaims and/or aggregate loss experience within the employer’s plan above a pre-set annual threshold.
PharmacyWe offer pharmacy benefit management and specialty and mail order pharmacy services to our members. Our pharmacy fulfillmentservices are delivered by Aetna Specialty Pharmacy (“ASP”) and Aetna Rx Home Delivery ®. ASP compounds and dispenses specialtymedications and offers disease management programs associated with certain specialty medications. Specialty medications are generallyinjectable or infused medications that may not be readily available at local pharmacies. Aetna Rx Home Delivery ® complements ASP byoffering a mail order prescription drug service. Our pharmacy operations are located primarily in Missouri and Florida.
Behavioral HealthOur behavioral health products provide members who experience mental health issues with integrated behavioral health benefitadministration, access to a network of providers and innovative wellness programs.
Other Commercial Products and ServicesWe offer a variety of other health care coverage products either as supplements to health products or as stand-alone products. Suchproducts, which may be offered on an Insured or an ASC basis, include indemnity and managed dental plans and vision programs. We areone of the nation’s largest providers of dental coverage, based on membership at December 31, 2007.
In addition to Commercial health products, in select markets we also offer HMO, PPO, PFFS and prescription drug coverage for Medicarebeneficiaries and participate in Medicaid and subsidized State Children’s Health Insurance Programs (“SCHIP”). SCHIP are state-subsidizedinsurance programs that provide benefits for families with uninsured children. Our Medicare and Medicaid products include:
MedicareThrough annual contracts with the Centers for Medicare & Medicaid Services (“CMS”), we offer HMO and PPO plans for Medicare-eligible individuals in certain geographic areas through the Medicare Advantage program. Members typically receive enhanced benefitsover standard Medicare fee-for-service coverage, including reduced cost-sharing for preventive care, vision and other non-Medicareservices. As a result of the changes in Medicare resulting from the Medicare Prescription Drug Improvement and Modernization Act of2003, we continue to expand our Medicare Advantage program into select markets. We offered these plans in 205 counties in 16 states andWashington, D.C. in 2007 and are expanding to 214 counties in 18 states and Washington, D.C. in 2008.
We are a national provider of the Medicare Part D Prescription Drug Program (“PDP”) in all 50 states to both individuals and employergroups. All Medicare eligible individuals are eligible to participate in this voluntary prescription drug plan. Members typically receivecoverage for certain prescription drugs, usually subject to a deductible, co-insurance and/or co-payment.
We offer PFFS in select markets for individuals and nationally for employer groups. PFFS complements our PDP product, forming anintegrated national fully insured Medicare product.
Page 3

Medicaid and SCHIPThrough primarily annual contracts with states, we offer healthcare management services for Medicaid-eligible individuals on an ASC andInsured basis. We significantly expanded our Medicaid offerings in 2007 by acquiring Schaller Anderson, Incorporated (refer to Note 3of Notes to Consolidated Financial Statements, on page 54 of the Annual Report, which is incorporated herein by reference). We participate on an Insured basis in an SCHIP contract in Pennsylvania and an SCHIP contract in Texas, and provide administrativeservices in connection with a hospital-based SCHIP contract in Texas. We now offer ASC Medicaid services in 8 states and InsuredMedicaid services in 4 states.
Provider NetworksWe contract with physicians, hospitals and other health care providers for services provided to our health plan members and the members of ourcustomers. The providers who participate in our networks are independent contractors and are neither our employees nor our agents, except forproviders who work in our mail-order and specialty pharmacy facilities.
We use a variety of techniques designed to help encourage appropriate utilization of health care resources and maintain affordability of qualitycoverage. In addition to contracts with health care providers for negotiated rates of reimbursement, these techniques include the development andimplementation of guidelines for the appropriate utilization of health care resources and providing health care providers with data in order to helpthem improve consistency and quality. We also offer, directly or in cooperation with third parties, our Aetna Health Connections SM diseasemanagement program, which addresses 30 chronic conditions, including asthma, diabetes, congestive heart failure and lower back pain.
At December 31, 2007, we had extensive nationwide provider networks of more than 820,000 participating health care providers, including over478,000 primary care and specialist physicians and over 4,700 hospitals.
PCPsWe compensate primary care physicians (“PCPs”) on both a fee-for-service and capitated basis, with capitation generally limited to HMOproducts in certain geographic areas. In a fee-for-service arrangement, network physicians are paid for health care services provided to themember based upon a fee schedule. Under a capitation arrangement, physicians receive a monthly fixed fee for each member, regardlessof the medical services provided to the member. During 2007 we continued to eliminate or reduce the use of capitation arrangements inmany areas. The percentage of health care costs related to capitation arrangements was 5.5% for the year ended December 31, 2007compared to 5.9% and 7.9% for the years ended December 31, 2006 and 2005, respectively.
Specialist PhysiciansSpecialist physicians participating in our networks are generally reimbursed at contracted rates per visit or per procedure.
HospitalsWe typically enter into contracts with hospitals that provide for per day and/or per case rates, often with fixed rates for ambulatory, surgeryand emergency room services. We also have hospital contracts that provide for reimbursement based on a percentage of the charges billedby the hospital.
Our medical plans generally require notification of elective hospital admissions, and we monitor the length of hospital stays. Physicianswho participate in our networks generally admit their HMO and POS patients to participating hospitals using referral procedures that directthe hospital to contact our patient management unit, which confirms the patient’s membership status while obtaining pertinent data. Thisunit also assists members and providers with related activities, including, if necessary, the subsequent transition to the home environmentand home care. Case management assistance for complex cases is provided by a special case unit.
Page 4

Other ProvidersLaboratory, imaging, urgent care and other freestanding health facility providers are generally paid under fee-for-service arrangements.
Quality AssessmentWe seek accreditation for most of our HMO plans from the National Committee for Quality Assurance (“NCQA”), a national organizationestablished to review the quality and medical management systems of health care plans. NCQA accreditation is a nationally recognized standard. AtDecember 31, 2007, approximately 99% of our HMO members participated in HMOs that had received accreditation by the NCQA.
We also seek accreditation and certification for our PPO-based and other products from NCQA and URAC, national organizations founded toestablish standards for the health care industry. Purchasers and consumers look to URAC’s and NCQA’s accreditation and certification as anindication that a health care organization has the necessary structures and processes to promote high quality care and preserve patient rights. Inaddition, regulators in over half of the states recognize URAC’s and NCQA’s accreditation and certification standards in the regulatoryprocess. Aetna Life Insurance Company (“ALIC”), a wholly-owned subsidiary of Aetna that offers our PPO-based products, has received NCQAPPO Full Accreditation through December 11, 2010. ALIC also has received NCQA Utilization Management Certification through March 6, 2008and NCQA Credentials Verification Organization Certification through January 29, 2009. Certain of our other subsidiaries, in addition to ourHMOs, have additional NCQA and/or URAC accreditations.
Our quality assessment programs for contracted providers who participate in our networks begin with the initial review of health carepractitioners. Practitioners’ licenses and education are verified, and their work history is collected by us or in some cases by the practitioner’saffiliated group or organization. Our credentialing and recredentialing practices are in accordance with applicable URAC and NCQA requirementsand state and federal regulations. We generally require participating hospitals to be certified by CMS or accredited by the Joint Commission or theAmerican Osteopathic Association.
We also offer quality and outcome measurement programs, quality improvement programs and health care data analysis systems to providers andpurchasers of health care services.
Principal Markets and SalesOur medical membership generally is dispersed throughout the United States, although we serve a limited number of members in countries outsidethe United States. We offer a broad range of traditional and consumer-directed health insurance products and related services, many of which areavailable in all 50 states. Depending on the product, we market to a range of customers including employer groups (small, mid-sized and largemulti-site national accounts), individuals, college students, part-time and hourly workers, health plans, governmental units, government-sponsoredplans, labor groups and expatriates.
The following table presents total medical membership by geographic region and funding arrangement at December 31, 2007, 2006 and 2005:
2007 2006 2005(Thousands) Risk ASC Total Risk ASC Total Risk ASC TotalNortheast 1,154 1,471 2,625 1,159 1,443 2,602 1,205 1,365 2,570Mid-Atlantic 1,074 1,767 2,841 1,007 1,642 2,649 1,122 1,505 2,627Southeast 949 1,726 2,675 906 1,681 2,587 894 1,565 2,459North Central 783 2,271 3,054 571 2,284 2,855 542 2,173 2,715Southwest 669 1,880 2,549 655 1,719 2,374 596 1,554 2,150West 987 1,852 2,839 811 1,364 2,175 748 1,312 2,060Other 133 137 270 124 67 191 109 65 174Total medical membership 5,749 11,104 16,853 5,233 10,200 15,433 5,216 9,539 14,755
Page 5

Additional information on Health Care’s membership is included in the “Membership” section of the MD&A, on page 8 of the Annual Report,which is incorporated herein by reference.
We market both Insured and ASC products and services primarily to employers that sponsor our products (or “plan sponsors”) for the benefit oftheir employees and their employees’ dependents. Frequently, larger employers offer employees a choice among coverage options, from which theemployee makes his or her selection during a designated annual open enrollment period. Typically, employers pay all of the monthly premiums to usand, through payroll deductions, obtain reimbursement from employees for a percentage, as determined by the employer. Some Health Careproducts are sold on a fully employee-paid basis. In some cases, we bill the covered individual directly. We also sell Insured plans directly toindividual consumers in a number of states.
We sell Insured Medicare coverage on an individual basis as well as through employer groups to their retirees. Medicaid and SCHIP members areenrolled on an individual basis.
Health Care products are sold through our sales personnel, as well as independent brokers, agents and consultants who assist in the production andservicing of business. For large plan sponsors, independent consultants and brokers are frequently involved in employer health plan selectiondecisions and sales. We pay commissions, fees and other amounts to brokers, agents, consultants and sales representatives who place business withus. We support our marketing and sales efforts with an advertising program that may include television, radio, billboards and print media,supplemented by market research and direct marketing efforts.
PricingFor Commercial Insured plans, employer group contracts containing the pricing and other terms of the relationship are generally established inadvance of the policy period, typically for a duration of one year. We use prospective rating methodologies in determining the premium ratescharged to the majority of employer groups, and we also use retrospective rating methodologies for some groups. Premium rates for customers withmore than 125 employees generally take into consideration the individual plan sponsor’s historical and anticipated claim experience. Some statesmay prohibit the use of one or more of these rating methods for some customers, such as small employer groups, or all customers.
Under prospective rating, a fixed premium rate is determined at the beginning of the policy period. We cannot recover unanticipated increases inmedical costs in the current policy year; however, we may consider prior experience for a product in the aggregate or for a specific customer,among other factors, in determining premium rates for future policy periods. Where required by state laws, premium rates are filed and approvedprior to contract inception. Our future results could be adversely affected if the premium rates we request are not approved or are adjusteddownward by state regulators.
Under retrospective rating, we determine a premium rate at the beginning of the policy period. After the policy period has ended, the actual claimand cost experience is reviewed. If the experience is favorable (i.e., actual claim costs and other expenses are less than expected), we may issue arefund to the plan sponsor. If the experience is unfavorable, we may, in certain instances, recover the resulting deficit through contractualprovisions or consider the deficit in setting future premium levels. We may not recover the deficit if a plan sponsor elects to terminatecoverage. Retrospective rating may be used for Commercial Insured plans that cover more than 300 lives.
We have Medicare Advantage and PDP contracts with CMS to provide HMO, PPO, PFFS and prescription drug coverage to Medicare beneficiariesin certain geographic areas. Under these annual contracts, CMS pays us a fixed capitation payment and/or a portion of the premium, both of whichare based on membership and adjusted for demographic and health risk factors. CMS also considers inflation, changes in utilization patterns andaverage per capita fee-for-service Medicare costs in the calculation of the fixed capitation payment or premium. Our PDP contracts also provide arisk sharing arrangement with CMS to limit our exposure to unexpected expenses. Amounts payable under the Medicare arrangements are subject toannual revision by CMS, and we elect to participate in each Medicare service area or region on an annual basis. In addition to payments receivedfrom CMS, most of our Medicare Advantage products and all of our PDP products require a supplemental premium to be paid by the member orsponsoring employer. In some cases these supplemental premiums are adjusted based on the member’s income and asset levels. Compared tocommercial products, Medicare contracts generate higher per member per month revenues and medical expenses.
Page 6

Under our Insured Medicaid contracts with states, government agencies pay us fixed monthly rates per member that vary by state, line of businessand demographics, and we arrange, pay for and manage health care services provided to Medicaid beneficiaries. These rates are subject to changeby each state, however CMS requires these rates to be actuarially sound. We also receive fee income from our clients where we provide servicesunder ASC Medicaid contracts. Our ASC Medicaid contracts generally are for periods of more than one year, and certain of them containguarantees with respect to certain functions such as customer service response time, claim processing accuracy and claim processing turnaroundtime, as well as certain performance guarantees regarding reduction of the claim expenses incurred by the plan sponsor. Under these guarantees, weare financially at risk if the conditions of the arrangements are not met. Payments to us under each of these Medicaid contracts are subject to theannual appropriation process in the applicable state.
We also serve a variety of federal government employee groups under the Federal Employees Health Benefit Program under HMO and consumer-directed plans. Premium rates are subject to federal government review and audit, which can result and have resulted in retroactive and prospectivepremium adjustments.
Our ASC plans are generally for a period of one year. Some of our ASC contracts include performance guarantees with respect to certain functionssuch as customer service response time, claim processing accuracy and claim processing turnaround time, as well as certain performanceguarantees that claim expenses to be incurred by plan sponsors will fall within a specified range. Under these guarantees, we are financially at riskif the conditions of the arrangements are not met, although the maximum amount at risk is typically 10% - 30% of fees paid by the customerinvolved.
CompetitionThe health care industry is highly competitive, primarily due to a large number of competitors, our competitors’ marketing and pricing, and aproliferation of competing products, including new products that are continually being introduced into the market. New entrants into themarketplace as well as significant consolidation within the industry have contributed to the competitive environment.
We believe that the significant factors that distinguish competing health plans are perceived overall quality (including accreditation status), quality ofservice, comprehensiveness of coverage, cost (including both premium and member out-of-pocket costs), product design, financial stability,geographic scope of provider networks, providers available in such networks, and quality of member support and care management programs. Webelieve that we are competitive on each of these factors. Our ability to increase the number of persons covered by our plans or to increase ourrevenues is affected by our ability to differentiate ourselves from our competitors on these factors. In addition, our ability to increase the number ofpersons enrolled in our Insured products is affected by the desire and ability of employers to self fund their health coverage. Competition may alsoaffect the availability of services from health care providers, including primary care physicians, specialists and hospitals.
Our Insured products compete with local and regional health care benefits plans, in addition to health care benefits and other plans sponsored byother large commercial health benefit insurance companies and Blue Cross/Blue Shield plans. Additional competitors include other types of medicaland dental provider organizations, various specialty service providers (including pharmacy benefit providers), integrated health care deliveryorganizations, and, for certain plans, programs sponsored by the federal or state governments.
Our ASC plans compete primarily with other large commercial health benefit insurance companies, Blue Cross/Blue Shield plans and third partyadministrators.
Factors Affecting Forward-Looking InformationInformation regarding certain important factors that may materially affect Health Care’s business and our statements concerning future events isincluded in the “Outlook for 2008” and “Forward-Looking Information/Risk Factors” sections of the MD&A, beginning on pages 3 and 30 of theAnnual Report, respectively, which are incorporated herein by reference.
Page 7

Group InsurancePrincipal ProductsGroup Insurance products consist primarily of the following:
· Life Insurance Products consist principally of renewable group term life insurance coverage, the amounts of which may be fixed orlinked to individual employee wage levels. We also offer basic, supplemental or voluntary spouse and dependent term life coverage, andgroup universal life and accidental death and dismemberment coverage. We offer life products on an Insured basis.
· Disability Insurance Products provide employee income replacement benefits for both short-term and long-term disability. We also offerdisability products with additional case management features. Similar to Health Care products, we offer disability benefits on both anInsured and employer-funded basis. We also provide absence management services, including short-term and long-term disabilityadministration and leave management, to employers.
· Long-Term Care Insurance Products provide benefits to cover the cost of care in private home settings, adult day care, assisted living ornursing facilities. Long-term care benefits were offered primarily on an Insured basis. The product was available on both a servicereimbursement and disability basis. We no longer solicit or accept new long-term care customers, and we are working with our customers onan orderly transition of this product to other carriers.
Group Insurance members may utilize more than one of our products, and multi-product cases have been counted in membership totals for eachapplicable product.
Principal Markets and SalesWe offer our Group Insurance products in 49 states (Group Insurance products will be offered in New Mexico in 2008) as well as the District ofColumbia, Guam, Puerto Rico, the United States Virgin Islands and Canada. Depending on the product, we market to a range of customers fromsmall employer groups to large, multi-site and/or multi-state employer programs.
We market Group Insurance products and services primarily to employers that sponsor our products for the benefit of their employees and theiremployees’ dependents. Frequently, employers offer employees a choice of benefits, from which the employee makes his or her selection during adesignated annual open enrollment period. Typically, employers pay all of the monthly premiums to us and, through payroll deductions, obtainreimbursement from employees for a percentage, as determined by the employer. Some Group Insurance products are sold directly to employees ofemployer groups on a fully employee-paid basis. In some cases, we bill the covered individual directly.
Group Insurance products are sold through our sales personnel, as well as independent brokers, agents and consultants who assist in the productionand servicing of business. For large plan sponsors, independent consultants and brokers are frequently involved in employer plan selection decisionsand sales. We pay commissions, fees and other amounts to brokers, agents, consultants and sales representatives who place business with us. Wesupport our marketing and sales efforts with an advertising program that may include television, radio, billboards and print media, supplemented bymarket research and direct marketing efforts.
PricingFor Insured Group Insurance plans, employer group contracts containing the pricing and other terms of the relationship are generally established inadvance of the policy period. We use prospective and retrospective rating methodologies to determine the premium rates charged to employer groups.
Under prospective rating, a fixed premium rate is determined at the beginning of the policy period. We cannot recover unanticipated increases inmortality or morbidity costs in the current policy period; however, we may consider prior experience for a product in aggregate or a specificcustomer, among other factors, in determining premium rates for future policy periods.
Page 8

Under retrospective rating, we determine a premium rate at the beginning of the policy period. After the policy period has ended, the actual claim andcost experience is reviewed. If the experience is favorable (i.e., actual claim costs and other expenses are less than expected), we may issue a refundto the plan sponsor. If the experience is unfavorable, we consider the deficit in setting future premium levels, and in certain circumstances, we mayrecover the deficit through contractual provisions such as offsets against refund credits that develop for future policy periods. However, we may notrecover the deficit if a plan sponsor elects to terminate coverage. Retrospective rating is most often used for Insured employer funded plans thatcover more than 3,000 lives and pay more than $500,000 in annual premiums.
CompetitionFor the group insurance industry, we believe that the significant factors that distinguish competing companies are cost, quality of service,comprehensiveness of coverage, and product array and design. We believe we are competitive on each of these factors. The group life marketremains highly competitive.
ReinsuranceWe currently have several reinsurance agreements with nonaffiliated insurers that relate to both group life and long-term disability products, althoughthese agreements do not reduce our exposure to life insurance claims resulting from terrorist attacks or other extreme events. Most reinsurancearrangements are quota share treaties (where a percentage of the insured claims are subject to reinsurance) on large, in force customers and areestablished on a case by case basis, but our current agreements also cover closed blocks of business and cancelled cases. We frequently evaluatereinsurance opportunities and refine our reinsurance and risk management strategies on a regular basis.
Group Life Insurance In Force and Other Statistical DataThe following table summarizes changes in group life insurance in force before deductions for reinsurance ceded to other companies for the yearsindicated:
(Dollars in Millions) 2007 2006 2005 In force, end of year $ 461,952 $ 438,303 $ 559,979 Terminations (lapses and all other) $ 67,793 $ 184,154 $ 64,768 Number of policies and contracts in force, end of year: Group Life Contracts (1) 21,963 19,813 18,292 Group Conversion Policies (2) 20,439 21,405 22,277 (1) Due to the diversity of coverages and size of covered groups, statistics are not provided for average size of policies in force.(2) Reflects conversion privileges exercised by insureds under group life policies to replace those policies with individual life policies.
Factors Affecting Forward-Looking InformationInformation regarding certain important factors that may materially affect Group Insurance’s business and our statements concerning future events isincluded in the “Outlook for 2008” and “Forward-Looking Information/Risk Factors” sections of the MD&A, beginning on pages 3 and 30,respectively, of the Annual Report, which are incorporated herein by reference.
Large Case PensionsPrincipal ProductsLarge Case Pensions manages a variety of retirement products (including pension and annuity products) primarily for tax qualified pensionplans. Contracts provide non-guaranteed, experience-rated and guaranteed investment options through general and separate account products. LargeCase Pensions’ products that use separate accounts provide contract holders with a vehicle for investments under which the contract holders assumethe investment risk. Large Case Pensions earns a management fee on these separate accounts.
In 1993, we discontinued our fully guaranteed Large Case Pensions products. Information regarding these products is incorporated herein byreference to Note 20 of Notes to Consolidated Financial Statements beginning on page 78 in the Annual Report. We do not actively market our otherLarge Case Pensions products, but continue to manage the run-off of existing business.
Page 9

Factors Affecting Forward-Looking InformationInformation regarding certain important factors that may materially affect Large Case Pensions’ business and our statements concerning future eventsis included in the “Outlook for 2008” and “Forward-Looking Information/Risk Factors” sections of the MD&A, beginning on pages 3 and 30,respectively, of the Annual Report, which are incorporated herein by reference.
Other Matters
Access to ReportsOur reports to the United States Securities and Exchange Commission (“SEC”), including our Annual Report on Form 10-K, Quarterly Reportson Form 10-Q, Current Reports on Form 8-K and amendments to those reports, if any, are available without charge on our website athttp://www.aetna.com as soon as practicable after they are electronically filed with or furnished to the SEC. The information on our website is notincorporated by reference in this Form 10-K. Copies of these reports are also available, without charge, from Aetna’s Investor RelationsDepartment, 151 Farmington Avenue, Hartford, CT 06156.
RegulationInformation regarding significant regulations affecting us is included in the “Regulatory Environment” and “Forward-Looking Information/RiskFactors” sections of the MD&A, beginning on pages 24 and 30, respectively, of the Annual Report, which are incorporated herein by reference.
Patents and TrademarksThe patent on our CareEngine® expires in 2021. We own the trademarks Aetna®, Aetna Rx Home Delivery® and CareEngine®, together with thecorresponding Aetna design logo. We consider our CareEngine® and these trademarks and our other trademarks and trade names important in theoperation of our business. However, our business, including that of each of our individual segments, is not dependent on any individual patent,trademark or trade name.
RatingsInformation regarding our ratings is included in the “Ratings” section of the MD&A, on page 17 of the Annual Report, which is incorporatedherein by reference.
MiscellaneousWe had approximately 35,200 employees at December 31, 2007.
The federal government is a significant customer of both the Health Care segment and the Company. Premiums and fees and other revenue paid bythe federal government accounted for approximately 15% of the Health Care segment’s revenue and 14% of our total consolidated revenue in2007. Contracts with CMS for coverage of Medicare-eligible individuals accounted for 69% of our federal government premiums and fees andother revenue, with the balance coming from federal employee related benefit programs. No other individual customer, in any of our segments,accounted for 10% or more of our consolidated revenues in 2007. Our segments are not dependent upon a single customer or a few customers, theloss of which would have a significant effect on the earnings of a segment. The loss of business from any one, or a few, independent brokers oragents would not have a material adverse effect on our earnings or the earnings of any of our segments. Refer to Note 19 of Notes to ConsolidatedFinancial Statements, beginning on page 76 of the Annual Report, which is incorporated herein by reference, regarding segment information.
Item 1A. Risk Factors
The information contained in the “Forward-Looking Information/Risk Factors” section of the MD&A, which begins on page 30 of the AnnualReport, is incorporated herein by reference.
Item 1B. Unresolved Staff Comments
None.
Page 10

Item 2. Properties
Our principal office is a building complex located at 151 Farmington Avenue, Hartford, Connecticut that is approximately 1.7 million square feetin size. Our principal office is used by all of our business segments. We also own or lease other space in the greater Hartford area; Blue Bell,Pennsylvania; and various field locations in the United States and several foreign countries. Such properties are primarily used by our Health Caresegment. We believe our properties are adequate and suitable for our business as presently conducted.
The foregoing does not include numerous investment properties that we hold in our general and separate accounts.
Item 3. Legal Proceedings
The information contained under Litigation and Regulatory Proceedings in Note 18 of Notes to Consolidated Financial Statements, which begins onpage 74 of the Annual Report, is incorporated herein by reference.
Item 4. Submission of Matters to a Vote of Security Holders
None.
EXECUTIVE OFFICERS OF THE REGISTRANT
Aetna’s Chairman is elected by Aetna’s Board of Directors (the “Board”) and all of Aetna’s other executive officers listed below are appointed bythe Board at its Annual Meeting, and such persons hold office until the next Annual Meeting of the Board or until their successors are elected orappointed. None of these officers has a family relationship with any other executive officer or Director. In addition, there exist no arrangements orunderstandings, other than those with Directors or officers acting solely in their capacities as such, pursuant to which these executive officers wereappointed.
Name of Executive Officer Position* Age * Ronald A. Williams Chairman and Chief Executive Officer 58 Mark T. Bertolini President 51 Joseph M. Zubretsky Executive Vice President and Chief Financial Officer 51 Troyen A. Brennan, M.D. Senior Vice President and Chief Medical Officer 53 William J. Casazza Senior Vice President and General Counsel 52
*As of February 29, 2008
Executive Officers’ Business Experience During Past Five Years
Ronald A. Williams became Chairman on October 1, 2006, has served as Chief Executive Officer since February 14, 2006 and served asPresident from May 27, 2002 to July 24, 2007. Mr. Williams is a Director of American Express Company (financial services) and is a trustee ofThe Conference Board. He also serves on the Dean’s Advisory Council at the Massachusetts Institute of Technology and is a member of MIT’sAlfred P. Sloan Management Society.
Mark T. Bertolini became President on July 24, 2007 having served as Executive Vice President and Head of Business Operations since May 3,2007. Prior to that, he had served as Executive Vice President, Regional Businesses from February 1, 2006 and as Senior Vice President, RegionalBusinesses from September 2005 to February 1, 2006. He served as Senior Vice President, Specialty Group from April 2005 to September 2005and as Senior Vice President, Specialty Products from February 2003 to April 2005. Prior to joining Aetna, Mr. Bertolini served as Senior VicePresident, Regional Segment and Middle Market Growth of CIGNA Corporation (“CIGNA”) from November 2002 to February 2003.
Page 11

Joseph M. Zubretsky became Executive Vice President and Chief Financial Officer on April 20, 2007 having served as Executive Vice President,Finance since February 28, 2007. Mr. Zubretsky also has served as the Company’s Chief Enterprise Risk Officer since April 27, 2007. Prior tojoining Aetna, Mr. Zubretsky served as Senior Executive Vice President for Finance, Investments and Corporate Development at UnumProvidentCorporation, a position he assumed in March 2005. Prior to that, Mr. Zubretsky was Chairman and Chief Executive Officer of GAB Robins Group,a global insurance services company, as well as a partner specializing in insurance industry investments with Brera Capital Partners, a New York-based private equity firm, since 1999.
Troyen A. Brennan, M.D., became Senior Vice President and Chief Medical Officer on February 21, 2006. Prior to joining Aetna, Dr. Brennanserved as President and Chief Executive Officer of Brigham and Women’s Physician Organization, a position he assumed in January 2000, asProfessor of Medicine, Harvard Medical School, since July 1995 and as Professor of Law and Public Health, Harvard School of Public Health,since July 1992.
William J. Casazza became Senior Vice President and General Counsel on September 6, 2005. He served as Senior Vice President and DeputyGeneral Counsel from July 6, 2004 to September 6, 2005. Prior to that, he served as Vice President and Deputy General Counsel from December 2000to July 6, 2004. Mr. Casazza also served as Corporate Secretary from October 2000 to January 27, 2006.
Part II
Item 5. Market for Registrant’s Common Equity, Related Stockholder Matters and Issuer Purchases of Equity Securities
Our common shares (“common stock”) are listed on the New York Stock Exchange, where they trade under the symbol AET. As of January 31,2008, there were 10,579 record holders of our common stock.
During each of 2006 and 2005, our common stock split two-for-one. All share and per share amounts in this Form 10-K have been adjusted toreflect both stock splits. Refer to Note 1 of Notes to Consolidated Financial Statements, on page 45 of the Annual Report, which is incorporatedherein by reference, for additional information about these two stock splits.
On April 27, 2007 and September 28, 2007, we announced that our Board authorized two share repurchase programs for the repurchase of up to$750 million and $1.25 billion, respectively, of common stock ($2.0 billion in aggregate). During the three months ended December 31, 2007, werepurchased approximately 6 million shares of common stock at a cost of $348 million, completing the April 27, 2007 authorization and utilizing aportion of the September 28, 2007 authorization. At December 31, 2007, we had authorization to repurchase up to $902 million of common stockremaining under the September 28, 2007 authorization. On February 29, 2008, the Board authorized an additional $750 million share repurchaseprogram which will commence upon completion of the September 28, 2007 authorization.
The following table provides information about our monthly share repurchases all of which were purchased as part of publicly announced programsfor the three months ended December 31, 2007:
Issuer Purchases of Equity Securities Total Number of Approximate Dollar Shares Purchased Value of Shares as Part of Publicly that May Yet Be Total Number of Average Price Announced Purchased Under the(Millions, except per share amounts) Shares Purchased Paid Per Share Plans or Programs Plans or ProgramsOctober 1, 2007 - October 31, 2007 .5 $ 55.58 .5 $ 1,225.0November 1, 2007 - November 30, 2007 .9 54.96 .9 1,173.3December 1, 2007 - December 31, 2007 4.7 58.21 4.7 901.9Total 6.1 $ 57.51 6.1 N/A
Page 12

We declared, and subsequently paid, an annual cash dividend in the amount of $.04 per share of common stock in each of 2007 and2006. Information regarding restrictions on our present and future ability to pay dividends is included in the “Liquidity and Capital Resources”section of the MD&A and Note 16 of Notes to Consolidated Financial Statements, beginning on pages 14 and 72, respectively, of the AnnualReport which are incorporated herein by reference. Information regarding quarterly common stock prices is incorporated herein by reference to theQuarterly Data (unaudited) included on page 86 of the Annual Report.
Item 6. Selected Financial Data
The information contained in Selected Financial Data on page 40 of the Annual Report is incorporated herein by reference.
Item 7. Management’s Discussion and Analysis of Financial Condition and Results of Operations
The information contained in the MD&A, beginning on page 2 of the Annual Report, is incorporated herein by reference.
Item 7A. Quantitative and Qualitative Disclosures About Market Risk
The information contained in the “Risk Management and Market-Sensitive Instruments” section of the MD&A, on page 14 of the Annual Report,is incorporated herein by reference.
Item 8. Financial Statements and Supplementary Data
The information contained in Consolidated Financial Statements, Notes to Consolidated Financial Statements, Report of Independent RegisteredPublic Accounting Firm and Quarterly Data (unaudited), beginning on page 41 of the Annual Report, is incorporated herein by reference.
Item 9. Changes in and Disagreements With Accountants on Accounting and Financial Disclosure
None.
Item 9A. Controls and Procedures
Disclosure Controls and ProceduresWe maintain disclosure controls and procedures, which are designed to ensure that information that we are required to disclose in the reports we file orsubmit under the Securities Exchange Act of 1934, as amended (the “Exchange Act”), is recorded, processed, summarized and reported within thetime periods specified in the SEC’s rules and forms, and that such information is accumulated and communicated to our management, including ourChief Executive Officer and Chief Financial Officer, as appropriate to allow timely decisions regarding required disclosure.
An evaluation of the effectiveness of our disclosure controls and procedures as of December 31, 2007 was conducted under the supervision and withthe participation of our Chief Executive Officer and Chief Financial Officer. Based on that evaluation, our Chief Executive Officer and ChiefFinancial Officer have concluded that our disclosure controls and procedures as of December 31, 2007 were effective and designed to ensure thatmaterial information relating to Aetna Inc. and its consolidated subsidiaries would be made known to the Chief Executive Officer and Chief FinancialOfficer by others within those entities, particularly during the periods when periodic reports under the Exchange Act are being prepared. Refer to theCertifications by our Chief Executive Officer and Chief Financial Officer filed as Exhibits 31.1 and 31.2 to this Form 10-K.
Management’s Report on Internal Control Over Financial ReportingManagement’s Report on Internal Control Over Financial Reporting and the Report of Independent Registered Public Accounting Firm, which beginon pages 83 and 84, respectively, of the Annual Report, are incorporated herein by reference.
Page 13

Changes in Internal Control over Financial ReportingThere has been no change in our internal control over financial reporting, identified in connection with the evaluation of such control, that occurredduring our fourth fiscal quarter that has materially affected, or is reasonably likely to materially affect, our internal control over financial reporting.
Item 9B. Other Information
None.
Part III
Item 10. Directors, Executive Officers and Corporate Governance
Information concerning the Executive Officers of Aetna Inc. is included in Part I pursuant to General Instruction G to Form 10-K.
Information concerning our Directors, our Directors’ and certain of our executives’ compliance with Section 16(a) of the Exchange Act, our Codeof Conduct (our written code of ethics) and our audit committee and audit committee financial experts is incorporated herein by reference to theinformation under the captions “Nominees for Directorships,” “Section 16(a) Beneficial Ownership Reporting Compliance,” “Aetna’s Code ofConduct” and “Board and Committee Membership; Committee Descriptions” in the Proxy Statement.
Item 11. Executive Compensation
The information under the captions “Compensation Discussion and Analysis,” “Director Compensation Philosophy and Elements,” “2007Nonmanagement Director Compensation,” “2007 Director Compensation Table,” “Additional Director Compensation Information,” “ExecutiveCompensation,” “Compensation Committee Interlocks and Insider Participation” and “Report of the Committee on Compensation and Organization”in the Proxy Statement is incorporated herein by reference.
Item 12. Security Ownership of Certain Beneficial Owners and Management and Related Stockholder Matters
The information under the caption “Security Ownership of Certain Beneficial Owners, Directors, Nominees and Executive Officers” in the ProxyStatement is incorporated herein by reference.
The following table gives information about our common shares that may be issued upon the exercise of options, warrants and rights under all ofour equity compensation plans as of December 31, 2007:
Equity Compensation Plan Information Number of securities remaining available Number of securities for future issuance to be issued upon Weighted-average under equity exercise of exercise price of compensation plans outstanding options, outstanding options, (excluding securitiesPlan Category warrants and rights warrants and rights reflected in column (a)) (a) (b) (c)
Equity compensation plans approved by security holders (1) 34,619,271 $ 25.79 33,719,044
Equity compensation plans not approved by security holders (2) 8,093,063 17.93 11,272,995Total 42,712,334 N/A 44,992,039(1) Includes the 2000 Stock Incentive Plan and the Employee Stock Purchase Plan.(2) Includes the 2002 Stock Incentive Plan and the Non-Employee Director Compensation Plan.
Page 14

2002 Stock Incentive PlanThe 2002 Stock Incentive Plan is designed to promote our interests and those of our shareholders and to further align the interests of shareholders andemployees by tying awards to total return to shareholders, enabling plan participants to acquire additional equity interests in Aetna and providingcompensation opportunities dependent upon our performance. The plan has not been submitted to shareholders for approval.
Under the plan, eligible participants may be granted stock options to purchase shares of common stock, stock appreciation rights, time vesting and/orperformance vesting incentive stock or incentive units and other stock-based awards. The maximum number of shares of common stock that may beissued under the plan was approximately 18 million shares at December 31, 2007, subject to adjustment for corporate transactions. If an award ispaid solely in cash, no shares are deducted from the number of shares available for issuance.
Non-Employee Director Compensation PlanThe Non-Employee Director Compensation Plan permits Aetna’s eligible Directors to receive shares of common stock in recognition of theircontributions. The maximum number of shares of common stock that may be issued under the plan was approximately 1 million shares at December31, 2007, subject to adjustment for corporate transactions. The plan has not been submitted to shareholders for approval.
Item 13. Certain Relationships and Related Transactions, and Director Independence
The information under the captions “Director Independence” and “Related Party Transaction Policy” in the Proxy Statement is incorporated hereinby reference.
Item 14. Principal Accounting Fees and Services
The information under the captions “Fees Incurred for 2007 and 2006 Services Performed by the Independent Registered Public Accounting Firm”and “Nonaudit Services and Other Relationships Between the Company and the Independent Registered Public Accounting Firm” in the ProxyStatement is incorporated herein by reference.
Part IV
Item 15. Exhibits and Financial Statement Schedules
The following documents are filed as part of this Form 10-K:
F Financial statementsThe Consolidated Financial Statements, Notes to Consolidated Financial Statements and Report of Independent Registered Public Accounting Firm,which begin on pages 41, 45 and 84, respectively, of the Annual Report, are incorporated herein by reference.
F Financial statement scheduleThe Condensed Financial Information of Aetna Inc. (Parent Company Only) is included in this Item 15. Refer to Index to Financial StatementSchedules below.
Exhibits*Exhibits to this Form 10-K are as follows: 3 Articles of Incorporation and By-Laws3.1 Amended and Restated Articles of Incorporation of Aetna Inc., incorporated herein by reference to Exhibit 99.1 to Aetna Inc.’s Form 8-K
filed on May 2, 2007. 3.2 Amended and Restated By-Laws of Aetna Inc., incorporated herein by reference to Exhibit 99.2 to Aetna Inc.’s Form 8-K filed on May
2, 2007. 4 Instruments defining the rights of security holders, including indentures4.1 Form of Aetna Inc. Common Share certificate, incorporated herein by reference to Exhibit 4.1 to Aetna Inc.’s Amendment No. 2 to
Registration Statement on Form 10 filed on December 1, 2000.
Page 15

4.2 Senior Indenture between Aetna Inc. and U. S. Bank National Association, successor in interest to State Street Bank and Trust Company,
incorporated herein by reference to Exhibit 4.1 to Aetna Inc.’s Form 10-Q filed on May 10, 2001. 4.3 Form of Subordinated Indenture between Aetna Inc. and U. S. Bank National Association, successor in interest to State Street Bank and
Trust Company, incorporated herein by reference to Exhibit 4.2 to Aetna Inc.’s Registration Statement on Form S-3 filed on January 19,2001.
10 Material contracts10.1 Form of Distribution Agreement between Aetna’s former parent company and Aetna Inc., incorporated herein by reference to Annex C to
Aetna’s former parent company’s definitive proxy statement on Schedule 14A filed on October 18, 2000. 10.2 Term Sheet for Agreement between Aetna’s former parent company and Aetna Inc. in respect of the CityPlace property, situated at 185
Asylum Avenue, Hartford, Connecticut 06103, incorporated herein by reference to Exhibit 10.10 to Aetna Inc.’s Registration Statementon Form 10 filed on September 1, 2000.
10.3 $1,000,000,000 Amended and Restated Five-Year Credit Agreement dated as of January 20, 2006, incorporated herein by reference to
Exhibit 99.1 to Aetna Inc.’s Form 8-K filed on January 23, 2006. 10.4 First Amendment to the Amended and Restated Five-Year Credit Agreement, incorporated herein by reference to Exhibit 99.1 to Aetna
Inc.’s Form 8-K filed on December 19, 2006. 10.5 Extension of the Maturity Date of the Amended and Restated Five-Year Credit Agreement, incorporated herein by reference to Exhibits
99.1 through 99.22 to Aetna Inc.’s Form 8-K filed on January 24, 2007. 10.6 Amended and Restated Aetna Inc. 2000 Stock Incentive Plan, incorporated herein by reference to Exhibit 10.1 to Aetna Inc.’s Form 10-Q
filed on April 27, 2006. ** 10.7 Form of Aetna Inc. 2000 Stock Incentive Plan - Stock Appreciation Right Terms Of Award, incorporated herein by reference to Exhibit
10.1 to Aetna Inc.’s Form 10-Q filed on October 26, 2006. ** 10.8 Form of Aetna Inc. 2000 Stock Incentive Plan - Restricted Stock Unit Terms Of Award, incorporated herein by reference to Exhibit 10.2
to Aetna Inc.’s Form 10-Q filed on October 26, 2006. ** 10.9 Form of Aetna Inc. 2000 Stock Incentive Plan - Aetna Performance Unit Award Agreement, incorporated herein by reference to Exhibit
10.3 to Aetna Inc.’s Form 10-Q filed on October 26, 2006. ** 10.10 Form of Aetna Inc. 2000 Stock Incentive Plan - Aetna Performance Stock Unit Terms of Award. ** 10.11 Amended and Restated Aetna Inc. 2002 Stock Incentive Plan, incorporated herein by reference to Exhibit 10.1 to Aetna Inc.’s Form 10-Q
filed on October 30, 2003. ** 10.12 Form of Aetna Inc. 2001 Annual Incentive Plan, incorporated herein by reference to Annex H to Aetna’s former parent company’s
definitive proxy statement on Schedule 14A filed on October 18, 2000. ** 10.13 Aetna Inc. Non-Employee Director Compensation Plan as Amended through March 30, 2007, incorporated herein by reference to Exhibit
10.1 to Aetna Inc.’s Form 10-Q filed on April 26, 2007. ** 10.14 Form of Aetna Inc. Non-Employee Director Compensation Plan - Restricted Stock Unit Agreement, incorporated herein by reference to
Exhibit 10.4 to Aetna Inc.’s Form 10-Q filed on October 26, 2006. ** 10.15 1999 Director Charitable Award Program, as Amended and Restated on January 25, 2008. ** 10.16 Amended and Restated Employment Agreement dated as of December 5, 2003 by and between Aetna Inc. and Ronald A. Williams,
incorporated herein by reference to Exhibit 10.24 to Aetna Inc.’s Form 10-K filed on February 27, 2004. **
Page 16

10.17 Amendment to Employment Agreement dated as of January 27, 2006 between Aetna Inc. and Ronald A. Williams, incorporated herein byreference to Exhibit 10.14 to Aetna Inc.’s Form 10-K filed on March 1, 2006. **
10.18 Incentive Stock Unit Agreement between Aetna Inc. and Ronald A. Williams dated as of February 14, 2006, pursuant to the Aetna Inc.
2000 Stock Incentive Plan, incorporated herein by reference to Exhibit 10.15 to Aetna Inc.’s Form 10-K filed on March 1, 2006. ** 10.19 Employment Agreement dated as of September 28, 2001 between Aetna Inc. and Alan M. Bennett, incorporated herein by reference to
Exhibit 10.12 to Aetna Inc.’s Form 10-K filed on February 28, 2003.** 10.20 Letter agreement dated September 22, 2004 between Aetna Inc. and Alan M. Bennett, incorporated herein by reference to Exhibit 99.1 of
Aetna Inc.’s Form 8-K filed on September 24, 2004. ** 10.21 Letter agreement dated February 22, 2007 between Aetna Inc. and Alan M. Bennett, incorporated herein by reference to Exhibit 10.25 to
Aetna Inc.’s Form 10-K filed on February 27, 2007. ** 10.22 Employment Agreement dated as of July 24, 2007, between Aetna Inc. and Mark T. Bertolini, incorporated herein by reference to Exhibit
10.1 to Aetna Inc.’s Form 10-Q filed on July 26, 2007. ** 10.23 Letter agreement dated April 23, 2004 between Aetna Inc. and Craig R. Callen, incorporated herein by reference to Exhibit 10.14 to Aetna
Inc.’s Form 10-K filed on March 1, 2005. ** 10.24 Letter agreement dated August 6, 2007 between Aetna Inc. and Craig R. Callen, incorporated herein by reference to Exhibit 10.1 to Aetna
Inc.’s Form 10-Q filed on October 25, 2007. ** 10.25 Memorandum dated January 6, 1997 from Mary Ann Champlin to Timothy A. Holt, incorporated herein by reference to Exhibit 10.14 to
Aetna Inc.’s Form 10-K filed on February 27, 2004. ** 10.26 Memorandum dated July 20, 2000 from Elease E. Wright to Timothy A. Holt, incorporated herein by reference to Exhibit 10.15 to Aetna
Inc.’s Form 10-K filed on February 27, 2004. ** 10.27 Letter agreement dated January 25, 2007 between Aetna Inc. and Joseph M. Zubretsky, incorporated herein by reference to Exhibit 10.29
to Aetna Inc.’s Form 10-K filed on February 27, 2007. ** 10.28 Employment Agreement dated as of September 6, 2000 by and between Aetna’s former parent company and John W. Rowe, M.D.,
incorporated herein by reference to Exhibit 10.23 to Aetna Inc.’s Amendment No. 1 to Registration Statement on Form 10 filed onOctober 18, 2000. **
10.29 Memorandum dated December 6, 2002, from Elease E. Wright to John W. Rowe, M.D., incorporated herein by reference to Exhibit
10.11 to Aetna Inc.’s Form 10-K filed on February 28, 2003. ** 10.30 Amendment to Employment Agreement dated as of June 27, 2003 between Aetna Inc. and John W. Rowe, M.D., incorporated herein by
referenced to Exhibit 10.1 to Aetna Inc.’s Form 10-Q filed on July 31, 2003. **
10.31 Amendment 2 to Employment Agreement dated as of January 3, 2006 between Aetna Inc. and John W. Rowe, M.D., incorporated hereinby reference to Exhibit 10.12 to Aetna Inc.’s Form 10-K filed on March 1, 2006. **
10.32 Consulting Agreement made as of October 1, 2006 between Aetna Inc. and John W. Rowe, M.D., incorporated herein by reference to
Exhibit 10.5 to Aetna Inc.’s Form 10-Q filed on October 26, 2006. ** 10.33 Description of certain arrangements not embodied in formal documents, as described under the headings “2007 Nonmanagement Director
Compensation” and “Additional Director Compensation Information” are incorporated herein by reference to the Proxy Statement. ** * Copies of exhibits will be furnished without charge upon written request to the Office of the Corporate Secretary, Aetna Inc., 151
Farmington Avenue, Hartford, Connecticut 06156.** Management contract or compensatory plan or arrangement.
Page 17

11 Statement re: computation of per share earnings11.1 Computation of per share earnings is incorporated herein by reference to Note 4 of Notes to Consolidated Financial Statements, on page 54 of
the Annual Report. 12 Statement re: computation of ratios12.1 Computation of ratio of earnings to fixed charges. 13 Annual report to security holders13.1 Management’s Discussion and Analysis of Financial Condition and Results of Operations, Selected Financial Data, Consolidated Financial
Statements, Notes to Consolidated Financial Statements, Management’s Report on Internal Control Over Financial Reporting, Management’sResponsibility for Financial Statements, Audit Committee Oversight, Report of Independent Registered Public Accounting Firm andQuarterly Data (unaudited) are incorporated herein by reference to the Annual Report and filed herewith in electronic format.
14 Code of Ethics14.1 Aetna Inc. Code of Conduct, as amended on December 1, 2006, incorporated herein by reference to Exhibit 14.1 to Aetna Inc.’s Form 8-K
filed on December 6, 2006. 18 Letter re change in accounting principles18.1 Letter from the Independent Registered Public Accounting Firm Regarding Change in Accounting Principle. 21 Subsidiaries of the registrant21.1 Subsidiaries of Aetna Inc. 23 Consents of experts and counsel23.1 Consent of Independent Registered Public Accounting Firm. 24 Power of Attorney24.1 Power of Attorney. 31 Rule 13a – 14(a)/15d – 14(e) Certifications31.1 Certification. 31.2 Certification. 32 Section 1350 Certifications32.1 Certification. 32.2 Certification.
Page 18

Index to Financial Statement Schedule
Page Report of Independent Registered Public Accounting Firm 20 Schedule I: Financial Information of Aetna Inc. (Parent Company Only): Statements of Income 21Balance Sheets 22Statements of Shareholders’ Equity 23Statements of Cash Flows 24Notes to Financial Statements 25
Page 19

Report of Independent Registered Public Accounting Firm The Board of Directors and ShareholdersAetna Inc.:
Under date of February 28, 2008, we reported on the consolidated balance sheets of Aetna Inc. and subsidiaries (the “Company”) as of December31, 2007 and 2006, and the related consolidated statements of income, shareholders’ equity and cash flows for each of the years in the three-yearperiod ended December 31, 2007, as contained in the Annual Report on Form 10-K for the year ended December 31, 2007. In connection with ouraudits of the aforementioned consolidated financial statements, we also audited the related financial statement schedule listed in the accompanyingindex. The financial statement schedule is the responsibility of the Company’s management. Our responsibility is to express an opinion on thefinancial statement schedule based on our audits.
In our opinion, such financial statement schedule, when considered in relation to the basic consolidated financial statements taken as a whole,presents fairly, in all material respects, the information set forth therein.
As discussed in Notes 2 and 12 to the consolidated financial statements, effective December 31, 2006, the Company adopted the initial recognitionprovision of Statement of Financial Accounting Standards No. 158, “Employers’ Accounting for Defined Benefit Pension and Other Post-retirement Plans” and effective January 1, 2007, they adopted the change in measurement date provision in the standard. Also, as discussed in Notes2 and 11 to the consolidated financial statements, effective January 1, 2007, the Company adopted FASB Interpretation No. 48, “Accounting forUncertainty in Income Taxes.” Also, as discussed in Note 2 of the consolidated financial statements the Company changed its method ofclassifying investments in 2007.
/s/ KPMG LLP
Hartford, ConnecticutFebruary 28, 2008
Page 20

Schedule I –Financial Information of Aetna Inc.
Aetna Inc. (Parent Company Only)Statements of Income For the Years Ended December 31, (Millions) 2007 2006 2005 Service fees-affiliates * $ - $ - $ 51.7 Net investment income 26.0 29.2 26.2 Net realized capital (losses) gains (.9) 5.5 - Total revenue 25.1 34.7 77.9 Operating expenses 112.7 133.5 184.9 Interest expense 180.3 148.1 122.8 Total expenses 293.0 281.6 307.7 Loss before income tax benefit and equity in earnings of affiliates, net (267.9) (246.9) (229.8)Income tax benefit 97.1 78.3 78.8 Equity in earnings of affiliates, net ** 2,001.8 1,854.2 1,724.3 Income from continuing operations 1,831.0 1,685.6 1,573.3 Income from discontinued operations - 16.1 - Net income $ 1,831.0 $ 1,701.7 $ 1,573.3 * During 2005, Aetna Inc. (the “Parent Company”) had a service agreement with an affiliate under which the Parent Company provided certain administrative services. This
agreement was terminated effective January 1, 2006.** Includes amortization of other acquired intangible assets after tax of $63.4 million for 2007, $55.6 million for 2006 and $37.3 million for 2005.
Refer to accompanying Notes to Financial Statements.
Page 21

Aetna Inc. (Parent Company Only)Balance Sheets At December 31, (Millions) 2007 2006 Assets Current assets: Cash and cash equivalents $ 12.3 $ 12.4 Investments 91.3 75.2 Other receivables 114.3 134.0 Income taxes receivable 16.2 22.0 Deferred income taxes 65.2 60.0 Other current assets 38.6 5.7 Total current assets 337.9 309.3 Investment in affiliates * 12,689.3 11,539.7 Long-term investments 67.4 65.4 Deferred income taxes - 121.4 Other long-term assets 1,184.7 494.0 Total assets $ 14,279.3 $ 12,529.8 Liabilities and shareholders' equity Current liabilities: Short-term debt $ 99.7 $ - Accrued expenses and other current liabilities 258.8 267.5 Total current liabilities 358.5 267.5 Long-term debt 3,138.5 2,442.3 Employee benefit liabilities 601.0 651.4 Deferred income taxes 112.9 - Income taxes payable 1.1 - Other long-term liabilities 28.9 23.5 Total liabilities 4,240.9 3,384.7 Shareholders' equity: Common stock and additional paid-in capital ($.01 par value, 2.8 billion shares authorized; 496.3 million and 516.0 million shares issued and outstanding in 2007 and 2006, respectively) 188.8 366.2 Retained earnings 10,138.0 9,404.6 Accumulated other comprehensive loss (288.4) (625.7)
Total shareholders' equity 10,038.4 9,145.1 Total liabilities and shareholders' equity $ 14,279.3 $ 12,529.8 * Includes goodwill and other acquired intangible assets of $5.8 billion as of December 31, 2007 and $5.3 billion as of December 31, 2006.
Refer to accompanying Notes to Financial Statements.
Page 22
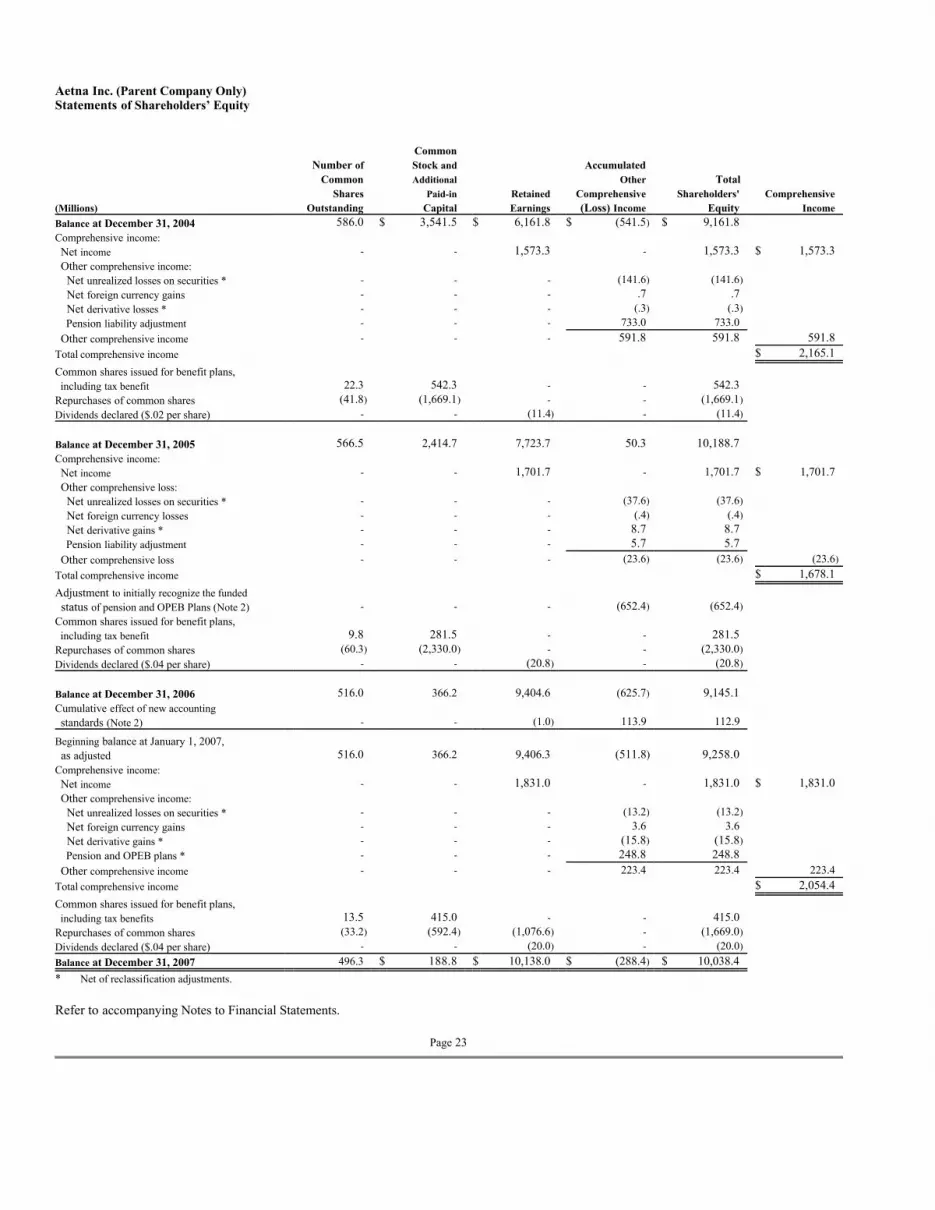
Aetna Inc. (Parent Company Only)Statements of Shareholders’ Equity Common Number of Stock and Accumulated Common Additional Other Total Shares Paid-in Retained Comprehensive Shareholders' Comprehensive (Millions) Outstanding Capital Earnings (Loss) Income Equity Income Balance at December 31, 2004 586.0 $ 3,541.5 $ 6,161.8 $ (541.5) $ 9,161.8 Comprehensive income: Net income - - 1,573.3 - 1,573.3 $ 1,573.3 Other comprehensive income: Net unrealized losses on securities * - - - (141.6) (141.6) Net foreign currency gains - - - .7 .7 Net derivative losses * - - - (.3) (.3) Pension liability adjustment - - - 733.0 733.0 Other comprehensive income - - - 591.8 591.8 591.8 Total comprehensive income $ 2,165.1 Common shares issued for benefit plans, including tax benefit 22.3 542.3 - - 542.3 Repurchases of common shares (41.8) (1,669.1) - - (1,669.1) Dividends declared ($.02 per share) - - (11.4) - (11.4) Balance at December 31, 2005 566.5 2,414.7 7,723.7 50.3 10,188.7 Comprehensive income: Net income - - 1,701.7 - 1,701.7 $ 1,701.7 Other comprehensive loss: Net unrealized losses on securities * - - - (37.6) (37.6) Net foreign currency losses - - - (.4) (.4) Net derivative gains * - - - 8.7 8.7 Pension liability adjustment - - - 5.7 5.7 Other comprehensive loss - - - (23.6) (23.6) (23.6)
Total comprehensive income $ 1,678.1 Adjustment to initially recognize the funded status of pension and OPEB Plans (Note 2) - - - (652.4) (652.4) Common shares issued for benefit plans, including tax benefit 9.8 281.5 - - 281.5 Repurchases of common shares (60.3) (2,330.0) - - (2,330.0) Dividends declared ($.04 per share) - - (20.8) - (20.8) Balance at December 31, 2006 516.0 366.2 9,404.6 (625.7) 9,145.1 Cumulative effect of new accounting standards (Note 2) - - (1.0) 113.9 112.9 Beginning balance at January 1, 2007, as adjusted 516.0 366.2 9,406.3 (511.8) 9,258.0 Comprehensive income: Net income - - 1,831.0 - 1,831.0 $ 1,831.0 Other comprehensive income: Net unrealized losses on securities * - - - (13.2) (13.2) Net foreign currency gains - - - 3.6 3.6 Net derivative gains * - - - (15.8) (15.8) Pension and OPEB plans * - - - 248.8 248.8 Other comprehensive income - - - 223.4 223.4 223.4 Total comprehensive income $ 2,054.4 Common shares issued for benefit plans, including tax benefits 13.5 415.0 - - 415.0 Repurchases of common shares (33.2) (592.4) (1,076.6) - (1,669.0) Dividends declared ($.04 per share) - - (20.0) - (20.0) Balance at December 31, 2007 496.3 $ 188.8 $ 10,138.0 $ (288.4) $ 10,038.4 * Net of reclassification adjustments. Refer to accompanying Notes to Financial Statements.
Page 23

Aetna Inc. (Parent Company Only)Statements of Cash Flows For the Years Ended December 31, (Millions) 2007 2006 2005 Cash flows from operating activities: Net income $ 1,831.0 $ 1,701.7 $ 1,573.3 Adjustments to reconcile net income to net cash used for operating activities: Equity earnings of affiliates * (2,001.8) (1,854.2) (1,724.3) Stock-based compensation expense 89.4 73.7 94.1 Physician class action settlement insurance-related charge - 72.4 - Net realized capital losses (gains) .9 (5.5) - Discontinued operations - (16.1) - Net change in other assets and other liabilities (119.3) (294.9) (77.9)
Net cash used for operating activities of continuing operations (199.8) (322.9) (134.8) Discontinued operations, net - 49.7 68.8 Net cash used for operating activities (199.8) (273.2) (66.0) Cash flows from investing activities: Proceeds from sales and maturities of investments - 46.1 550.4 Cost of investments (14.5) (85.3) (92.3) Dividends received from affiliates, net 842.4 1,577.8 1,085.2 Cash used for acquisitions, net of cash acquired - (2.2) (395.4)
Net cash provided by investing activities 827.9 1,536.4 1,147.9 Cash flows from financing activities: Proceeds from issuance of long-term debt, net of issuance costs 663.9 1,978.9 - Net issuance of short-term debt 99.5 - - Repayment of long-term debt - (1,150.0) - Common shares issued under benefit plans 170.8 115.8 271.3 Stock-based compensation tax benefits 153.2 89.6 173.1 Common shares repurchased (1,695.6) (2,322.5) (1,650.0) Dividends paid to shareholders (20.0) (20.8) (11.4)
Net cash used for financing activities (628.2) (1,309.0) (1,217.0) Net decrease in cash and cash equivalents (.1) (45.8) (135.1)Cash and cash equivalents, beginning of period 12.4 58.2 193.3 Cash and cash equivalents, end of period $ 12.3 $ 12.4 $ 58.2 Supplemental cash flow information: Interest paid $ 177.6 $ 159.2 $ 121.0 Income taxes paid 783.2 731.7 246.6 * Includes amortization of other acquired intangible assets after tax of $63.4 million, $55.6 million and $37.3 million for the years ended December 31, 2007, 2006 and
2005, respectively.
Refer to accompanying Notes to Financial Statements.
Page 24

Aetna Inc. (Parent Company Only)Notes to Financial Statements
1. Organization
The financial statements reflect financial information for Aetna Inc. (a Pennsylvania corporation) only (the “Parent Company”). The financialinformation presented herein includes the balance sheet of Aetna Inc. as of December 31, 2007 and 2006 and the related statements of income,shareholders’ equity and cash flows for the years ended December 31, 2007, 2006 and 2005. The accompanying financial statements should beread in conjunction with the consolidated financial statements and notes thereto in the Annual Report.
All share and per share amounts in the accompanying financial statements have been adjusted to reflect a 2005 and a 2006 two-for-one stock splitfor all periods presented. Refer to Note 1 of Notes to Consolidated Financial Statements, on page 45 of the Annual Report, for additionalinformation on these stock splits.
2. Summary of Significant Accounting Policies
ReclassificationsCertain reclassifications have been made to the 2006 financial information to conform with the 2007 presentation. These reclassifications include areclassification of $65 million of certain debt securities to long-term investments that were previously reported in current investments at December31, 2006. The reclassifications resulted from a change in the accounting method by which debt securities are classified on the Parent Company’sbalance sheets, which previously did not consider contractual maturities and classified all available for sale debt securities as current assets. AtDecember 31, 2007, we changed our accounting method by which debt securities are classified as current or long-term investments based on theircontractual maturities, unless we intend to sell an investment within the next twelve months, in which case it is classified as current. We believe thismethod is a preferable accounting method as it better reflects when cash will be realized and is more consistent with how we manage the investmentportfolio given the duration of the liabilities that the investments support. At December 31, 2007, $66 million of debt securities were reclassified tolong-term. Also, in connection with this reclassification, current deferred tax assets of $.4 million and $.2 million at December 31, 2007 and 2006,respectively, have been reclassified to long-term. There have been no changes in our investment management policies or practices associated with thischange in accounting method.
Refer to Note 2 of Notes to Consolidated Financial Statements, beginning on page 45 of the Annual Report, for the summary of significantaccounting policies.
3. Acquisitions and Dispositions
Refer to Note 3 of Notes to Consolidated Financial Statements, on page 54 of the Annual Report, for a description of acquisitions and dispositions.
4. Other Comprehensive Income (Loss)
Refer to Note 10 of Notes to Consolidated Financial Statements, beginning on page 60 of the Annual Report, for a description of accumulated othercomprehensive income (loss).
5. Debt
Refer to Note 13 of Notes to Consolidated Financial Statements, on page 69 of the Annual Report, for a description of debt.
Page 25

SIGNATURES
Pursuant to the requirements of Section 13 or 15(d) of the Securities Exchange Act of 1934, the registrant has duly caused this report to be signedon its behalf by the undersigned, thereunto duly authorized.
Date: February 29, 2008 Aetna Inc.
By: /s/ Ronald M. Olejniczak Ronald M. Olejniczak
Vice President and Controller
Pursuant to the requirements of the Securities Exchange Act of 1934, this report has been signed below by the following persons on behalf of theregistrant and in the capacities and on the dates indicated.
Signer Title Date /s/ Ronald A. Williams Chairman and Chief February 29, 2008Ronald A. Williams Executive Officer (Principal Executive Officer) /s/ Joseph M. Zubretsky Executive Vice President and February 29, 2008Joseph M. Zubretsky Chief Financial Officer (Principal Financial Officer) /s/ Ronald M. Olejniczak Vice President and Controller February 29, 2008Ronald M. Olejniczak (Principal Accounting Officer) Frank M. Clark * Director Betsy Z. Cohen * Director Molly J. Coye, M.D. * Director Roger N. Farah * Director Barbara Hackman Franklin * Director Jeffrey E. Garten * Director Earl G. Graves * Director Gerald Greenwald * Director Ellen M. Hancock * Director Edward J. Ludwig * Director Joseph P. Newhouse * Director * By: /s/ Ronald M. Olejniczak Ronald M. Olejniczak Attorney-in-fact February 29, 2008
Page 26

INDEX TO EXHIBITS
Exhibit FilingNumber Description of Exhibit Method 10 Material Contracts 10.10 Form of Aetna Inc. 2000 Stock Incentive Plan - Aetna Performance Stock Unit Terms of Award. Electronic 10.15 1999 Director Charitable Award Program, as Amended and Restated on January 25, 2008. Electronic 12 Statement re: computation of ratios 12.1 Computation of ratio of earnings to fixed charges. Electronic 13 Annual report to security holders 13.1 Management’s Discussion and Analysis of Financial Condition and Results of Operations, Selected Financial
Data, Consolidated Financial Statements, Notes to Consolidated Financial Statements, Management’s Report onInternal Control Over Financial Reporting, Management’s Responsibility for Financial Statements, AuditCommittee Oversight, Report of Independent Registered Public Accounting Firm and Quarterly Data (unaudited)sections of the Annual Report.
Electronic
18 Letter re change in accounting principles 18.1 Letter from the Independent Registered Public Accounting Firm Regarding Change in Accounting Principle. Electronic 21 Subsidiaries of the registrant 21.1 Subsidiaries of Aetna Inc. Electronic 23 Consents of experts and counsel 23.1 Consent of Independent Registered Public Accounting Firm. Electronic 24 Power of Attorney 24.1 Power of Attorney. Electronic 31 Rule 13a – 14(a)/15d – 14(e) Certifications 31.1 Certification. Electronic 31.2 Certification. Electronic 32 Section 1350 Certifications 32.1 Certification. Electronic 32.2 Certification. Electronic
Page 27


EXHIBIT 10.10
AETNA INC.2000 STOCK INCENTIVE PLAN
PERFORMANCE STOCK UNIT TERMS OF AWARD
Performance Period January 1, 2008 through December 31, 2009
Pursuant to its 2000 Stock Incentive Plan (the "Plan"), Aetna Inc. (the "Company") hereby grants Performance Stock Units on the terms andconditions hereinafter set forth. The number of Performance Stock Units awarded is included in the website of the designated broker, currently UBSFinancial Services, Inc., and in the Notice of the Performance Stock Unit Grant Acknowledgement and Acceptance Form. All capitalized terms usedherein which are not otherwise defined herein shall have the meaning specified in the Plan.
ARTICLE I
DEFINITIONS
(a) “Affiliate" means an entity at least a majority of the total voting power of the then-outstanding voting securities of which is held, directly orindirectly, by the Company and/or one or more other Affiliates.
(b) "Board" means the Board of Directors of Aetna Inc.
(c) "Change in Control" means the happening of any of the following:
(i) When any "person" as defined in Section 3(a)(9) of the Securities Exchange Act of 1934, as amended (the "Exchange Act") andas used in Sections 13(d) and 14(d) thereof, including a "group" as defined in Section 13(d) of the Exchange Act but excludingthe Company and any Subsidiary thereof and any employee benefit plan sponsored or maintained by the Company or any Subsidiary(including any trustee of such plan acting as trustee), directly or indirectly, becomes the "beneficial owner" (as defined in Rule13d-3 under the Exchange Act, as amended from time to time), of securities of the Company representing 20 percent or more ofthe combined voting power of the Company's then outstanding securities;
(ii) When, during any period of 24 consecutive months, the individuals who, at the beginning of such period, constitute the Board (the"Incumbent Directors") cease for any reason other than death to constitute at least a majority thereof, provided that a director whowas not a director at the beginning of such 24-month period shall be deemed to have satisfied such 24-month requirement (and bean Incumbent Director) if such director was elected by, or on the recommendation of or with the approval of, at least two-thirds ofthe directors who then qualified as Incumbent Directors either actually (because they were directors at the beginning of such 24-month period) or by prior operation of this paragraph (ii); or
1

(iii) The occurrence of a transaction requiring stockholder approval for the acquisition of the Company by an entity other than theCompany or a Subsidiary through purchase of assets, or by merger, or otherwise.
Notwithstanding the foregoing, in no event shall a “Change in Control” be deemed to have occurred (i) as a result of the formationof a Holding Company, or (ii) with respect to Grantee, if Grantee is part of a “group,” within the meaning of Section 13(d)(3) ofthe Exchange Act as in effect on the effective date, which consummates the Change in Control transaction. In addition, forpurposes of the definition of “Change in Control” a person engaged in business as an underwriter of securities shall not be deemedto be the “Beneficial Owner” of, or to “beneficially own,” any securities acquired through such person’s participation in good faithin a firm commitment underwriting until the expiration of forty days after the date of such acquisition.
(d) "Committee" means the Board's Committee on Compensation and Organization or any successor thereto.
(e) "Common Stock" means the Company's Common Shares, $.01 par value per share.
(f) "Company" means Aetna Inc.
(g) "Effective Date" means the date of grant of this award of Performance Stock Units.
(h) “Fair Market Value" means the closing price of the Common Stock as reported by the Consolidated Tape of the New York Stock ExchangeListed Shares on the date such value is to be determined, or, if no shares were traded on such date, on the next day on which the CommonStock is traded.
(i) “Fundamental Corporate Event” shall mean any stock dividend, extraordinary cash dividend, recapitalization, reorganization, merger,consolidation, split-up, spin-off, combination, exchange of shares, warrants or rights offering to purchase Common Stock at a pricesubstantially below fair market value, or similar event.
(j) "Grantee" means the person to whom this award has been granted.
(k) “Holding Company” means an entity that becomes a holding company for the Company or its businesses as a part of any reorganization,merger, consolidation or other transaction, provided that the outstanding shares of common stock of such entity and the combined votingpower of the then outstanding voting securities of such entity entitled to vote generally in the election of directors is, immediately after suchreorganization, merger, consolidation or other transaction, beneficially owned, directly or indirectly, by all or substantially all of theindividuals and entities who were the beneficial owners, respectively, of the voting stock outstanding immediately prior to suchreorganization, merger, consolidation or other transaction in substantially the same proportions as their ownership, immediately prior to suchreorganization, merger, consolidation or other transaction, of such outstanding voting stock.
2

(l) "Long Term Disability" means long-term disability as defined under the terms of the Company's applicable long-term disability plans orpolicies.
(m) “Net Shares” means the number of shares of Common Stock which will be deposited in a brokerage account in the Grantee’s name at theCompany’s designated broker after shares have been withheld to satisfy applicable tax and withholding requirements upon vesting of thePerformance Stock Units.
(n) “Performance Period” means the two-year period ending December 31, 2009.
(o) “Performance Stock Units” means the number of shares of Common Stock represented by the number of units awarded or such otheramount as may result by operation of Article III of this Agreement.
(p) “Plan” means the Aetna Inc. 2000 Stock Incentive Plan.
(q) "Retirement" means the termination of employment of a Grantee from active service with the Company, a Subsidiary or Affiliate provided theGrantee’s age and completed years of service total 65 or more points at termination of employment.
(r) “Shares of Stock” or “Stock” means the Common Stock.
(s) "Subsidiary" means an entity of which, at the time such subsidiary status is to be determined, at least 50% of the total combined voting powerof all classes of stock of such entity is held by the Company and/or one or more other subsidiaries.
(t) "Successor" means the legal representative of the estate of a deceased Grantee or the person or persons who shall acquire the right to thePerformance Stock Units by bequest or inheritance or by reason of the death of the Grantee.
(u) “Vest Date” means the date on which the Committee determines that the performance goal established for the Performance Period has beenachieved in accordance with the terms of this Agreement, if at all.
3

ARTICLE II
PERFORMANCE PERIOD
Subject to the terms of this Agreement, the Performance Stock Units will vest, as of the Vest Date, in accordance with the terms of the Plan andthis Terms of Award Agreement, or on such earlier date as provided in Article IV. If the Committee determines that the performance goal set forthon Exhibit A is met, on the Vest Date the Grantee shall vest to one share of Common Stock for each vested Performance Stock Unit net ofapplicable taxes and withholding (or such greater or lessor amount based on performance, as set forth on Exhibit A). Such Net Shares will bedelivered to the Company’s designated broker, in a brokerage account established in the Grantee’s name, as soon as administratively possible afterthe Vest Date. If the Committee determines that the performance goal set forth on Exhibit A is not met at the minimum level, no shares will vest.
Any social security calculation or other adjustments discovered after the payment of Net Shares will be settled in cash not in Common Stock.
ARTICLE III
CAPITAL CHANGES
In the event that the Committee shall determine that any Fundamental Corporate Event affects the Common Stock such that an adjustment is required topreserve, or to prevent enlargement of, the benefits or potential benefits made available under this Plan, then the Committee shall, in such manner asthe Committee may deem equitable, adjust the number and kind of shares subject to the award of Performance Stock Units. Additionally, theCommittee may make provision for cash payment to a Grantee or the Successor of the Grantee. However, the number of Performance Stock Unitsshall always be a whole number.
ARTICLE IV
CHANGE IN CONTROL
Notwithstanding any other provision of this Agreement to the contrary, upon the occurrence of a Change in Control, the Performance Stock Units notpreviously forfeited pursuant to this Terms of Award Agreement shall become immediately vested at a level which equals the greater of the number ofPerformance Stock Units that would have vested (x) at target-level 100% vesting, or (y) based on the Company’s actual performance level using thedate on which the Change in Control occurs as the end of the Performance Period. Net Shares shall be delivered as of the date of the Change inControl. If an award is deferred pursuant to Article VII(i), the Change in Control will not accelerate the payment of the deferred Performance StockUnits unless the Change in Control meets the definition of change in control set forth in Treasury Regulation Section 1.409A-3(i)(5).
4

ARTICLE V
TERMINATION OF EMPLOYMENT
(a) Except as provided in (c) below, if, during the Performance Period, Grantee shall cease to be employed by the Company, its Subsidiaries or
Affiliates, for reason of death, Long-term Disability, Retirement or involuntary termination of employment by the Company, the portion of thePerformance Stock Units that may vest on the Vest Date, if any, shall be calculated in accordance with the following formula: (i) the numberof completed days employed after the Effective Date divided by 731; multiplied by (ii) the number of Performance Stock Units, that otherwisewould have vested.
(b) Except as provided in (a) above, any Performance Stock Unit not vested as of the date Grantee terminates employment shall be forfeited at thetime of cessation of employment; provided, however, that if Grantee’s employment is terminated by the Company other than for cause andGrantee has not previously, or does not subsequently, vest to any portion of the Performance Stock Unit in accordance with its terms, thenupon the forfeiture of the entire Performance Stock Unit, the Company will pay Grantee an amount equal to the value of a single share ofCommon Stock, whether or not the forfeited Performance Stock Unit related to more than a single share of Common Stock, calculated as ofthe cessation of employment, if requested by Grantee, within 30 days of such cessation of employment.
(c) No Performance Stock Unit will vest after the Company has terminated the employment of the Grantee for cause, unless the Committee, in its
sole discretion, deems a payment to be warranted under the particular circumstances. In addition, the Performance Stock Units will not vest ifGrantee if Grantee has willfully engaged in gross misconduct or other serious impropriety which the Company determines is likely to bedamaging or detrimental to the Company, any Subsidiary or Affiliate.
(d) Employment for purposes of determining the vesting rights of the Grantee and the expiration of the grant under this Article V shall mean
continuous active full-time salaried employment with the Company, a Subsidiary or an Affiliate, except that the period during which theGrantee is on vacation, sick leave, or other pre-approved leave of absence (provided there is no actual termination of employment), shall notinterrupt the continuous employment of the Grantee. Notwithstanding any period during which Grantee receives salary continuation orseverance shall not be considered as part of the continuous employment of the Grantee.
5

ARTICLE VI
EMPLOYEE COVENANTS
(a) As consideration for this grant of Performance Stock Units, without prior written consent of the Company:
(i) Grantee will not (except to the extent required by an order of a court having competent jurisdiction or under subpoena from anappropriate government agency) use or disclose to any third person, whether during or subsequent to Grantee’s employment, any tradesecrets, confidential information and proprietary materials, which may include, but are not limited to, the following categories ofinformation and materials: customer lists and identities; provider lists and identities; employee lists and identities; product developmentand related information; marketing plans and related information; sales plans and related information; premium or other pricinginformation; operating policies and manuals; research; payment rates; methodologies; procedures; contractual forms; business plans;financial records; computer programs; database; or other financial, commercial, business or technical information related to theCompany or any Subsidiary or Affiliate unless such information has been previously disclosed to the public by the Company or hasbecome public knowledge other than by a breach of this Agreement; provided, however, that this limitation shall not apply to any suchuse or disclosure made while Grantee is employed by the Company, any Subsidiary or Affiliate if such disclosure occurred inconnection with the performance of Grantee’s job as an employee of the Company, any Subsidiary or Affiliate;
(ii) Grantee will not, during and for a period of 12 months or 24 months for executive tier employees (the executive tier statusdetermined as of the effective date of this grant) following Grantee’s termination of Employment, directly or indirectly induce orattempt to induce any employee to be employed by or to perform services elsewhere;
(iii) Grantee will not, during and for a period of 12 months or 24 months for executive tier employees (the executive tier status
determined as of the effective date of this grant) following Grantee's termination of Employment, directly or indirectly, induce orattempt to induce any agent or agency, broker, supplier or health care provider of the Company or any Subsidiary to cease or curtailproviding services to the Company or any Subsidiary; and
(iv) Grantee will not, during and for a period of 12 months or 24 months for executive tier employees (the executive tier statusdetermined as of the effective date of this grant) following Grantee’s termination of Employment, directly or indirectly solicit orattempt to solicit the trade of any individual or entity which, at the time of such solicitation, is a customer of the Company, anySubsidiary or Affiliate, or which the Company, any Subsidiary or Affiliate is undertaking reasonable steps to procure as a customerat the time of or immediately preceding termination of Employment; provided, however, that this limitation shall only apply to anyproduct or service which is in competition with a product or service of the Company, any Subsidiary or Affiliate and shall apply onlywith respect to a customer or prospective customer with whom the Grantee has been directly or indirectly involved.
6

In addition:
(v) Following the termination of Grantee’s Employment, Grantee shall provide assistance to and shall cooperate with the Company or aSubsidiary or Affiliate, upon its reasonable request and without additional compensation, with respect to matters within the scope ofGrantee’s duties and responsibilities during Employment, provided that any reasonable out-of-pocket expenses Grantee incurs inconnection with any assistance Grantee has been requested to provide under this provision for items including, but not limited to,transportation, meals, lodging and telephone, shall be reimbursed by the Company. The Company agrees and acknowledges that itshall, to the maximum extent possible under the then prevailing circumstances, coordinate, or cause a Subsidiary or Affiliate tocoordinate, any such request with Grantee’s other commitments and responsibilities to minimize the degree to which such requestinterferes with such commitments and responsibilities; and
(vi) Grantee shall promptly notify the Company’s General Counsel if Grantee is contacted by a regulatory or self-regulatory agency withrespect to matters pertaining to the Company or by an attorney or other individual who informs the Grantee that he/she has filed,intends to file, or is considering filing a claim or complaint against the Company.
(vii) Grantee acknowledges that all original works of authorship that are created by Grantee (solely or jointly with others) within the scopeof Grantee’s employment which are protectable by copyright are “works made for hire” as that term is defined in the United StatesCopyright Act (17 U.S.C., Section 101). Grantee further acknowledges that while employed by the Company, Grantee may developideas, inventions, discoveries, innovations, procedures, methods, know-how or other works which relate to the Company’s currentor are reasonably expected to relate to the Company’s future business that may be patentable or subject to trade secretprotection. Grantee agrees that all such works of authorship, ideas, inventions, discoveries, innovations, procedures, methods,know-how and other works shall belong exclusively to the Company, and the Grantee hereby assigns all right, title, and interesttherein to the Company.
To the extent any of the foregoing works may be patentable, Grantee agrees that the Company may file and prosecute anyapplication for patents for such works and that the Grantee will, on request, execute assignments to the Company relating to (and take all such furthersteps as may be reasonably necessary to perfect the Company’s sole and exclusive ownership of) any such application and any patents resultingtherefrom.
(b) If any provision of Article VI (a) is determined by a court of competent jurisdiction not to be enforceable in the manner set forth herein, theCompany and Grantee agree that it is the intention of the parties that such provision should be enforceable to the maximum extent possibleunder applicable law and that such court shall reform such provision to make it enforceable in accordance with the intent of the parties.
7

(c) Grantee acknowledges that a material part of the inducement for the Company to grant the Performance Stock Units is Grantee’s covenants setforth in Article VI (a) and that the covenants and obligations of Grantee with respect to nondisclosure, non-solicitation and cooperation relate tospecial, unique and extraordinary matters and that a violation of any of the terms of such covenants and obligations will cause the Companyirreparable injury for which adequate remedies are not available at law. Therefore, Grantee agrees that, if Grantee shall breach any of thosecovenants or obligations, Grantee shall not be entitled to vest in the Performance Stock or be entitled to retain any income therefrom and theCompany shall be entitled to an injunction, restraining order or such other equitable relief (without the requirement to post bond) restrainingGrantee from committing any violation of the covenants and obligations contained in Article VI. The remedies in the preceding sentence arecumulative and are in addition to any other rights and remedies the Company may have at law or in equity as a court or arbitrator shall reasonablydetermine.
(d) Employment Dispute Arbitration Program - Mandatory Binding Arbitration of Employment Disputes.
(i) Except as otherwise specified in this Agreement, the Grantee and the Company agree that all employment-related legal disputes betweenthem will be submitted to and resolved by binding arbitration, and neither the Grantee nor the Company will file or participate as anindividual party or member of a class in a lawsuit in any court against the other with respect to such matters. This shall apply to claimsbrought on or after the date the Grantee accepts this Agreement, even if the facts and circumstances relating to the claim occurred priorto that date and regardless of whether the Grantee or the Company previously filed a complaint/charge with a government agencyconcerning the claim.
For purposes of Article VI (d) of this Agreement, “the Company” includes Aetna Inc., its Subsidiaries and Affiliates, theirpredecessors, successors and assigns, and those acting as representatives or agents of those entities. THE GRANTEEUNDERSTANDS THAT, WITH RESPECT TO CLAIMS SUBJECT TO THE ARBITRATION REQUIREMENT,ARBITRATION REPLACES THE RIGHT OF THE GRANTEE AND THE COMPANY TO SUE OR PARTICIPATE IN ALAWSUIT. THE GRANTEE ALSO UNDERSTANDS THAT IN ARBITRATION, A DISPUTE IS RESOLVED BY ANARBITRATOR INSTEAD OF A JUDGE OR JURY, AND THE DECISION OF THE ARBITRATOR IS FINAL ANDBINDING.
(ii) THE GRANTEE UNDERSTANDS THAT THE ARBITRATION PROVISIONS OF THIS AGREEMENT AFFECT THELEGAL RIGHTS OF THE GRANTEE AND THE COMPANY AND ACKNOWLEDGES THAT THE GRANTEE HAS BEENADVISED TO, AND HAS BEEN GIVEN THE OPPORTUNITY TO, OBTAIN LEGAL ADVICE BEFORE SIGNING THISAGREEMENT.
(iii) Article VI (d) of this Agreement does not apply to workers’ compensation claims, unemployment compensation claims, and claimsunder the Employee Retirement Income Security Act of 1974 (“ERISA”) for employee benefits. A dispute as to whether Article VI(d) of this Agreement applies must be submitted to the binding arbitration process set forth in this Agreement.
8

(iv) The Grantee and/or the Company may seek emergency or temporary injunctive relief from a court (including with respect to claimsarising out of Article VI (a) in accordance with applicable law). However, except as provided in Article VI (c) of this Agreement, afterthe court has issued a ruling concerning the emergency or temporary injunctive relief, the Grantee and the Company shall be required tosubmit the dispute to binding arbitration pursuant to this Agreement.
(v) Unless otherwise agreed, the arbitration will be administered by the American Arbitration Association (the “AAA”) and will beconducted pursuant to the AAA’s Employment Arbitration Rules and Mediation Procedures (the “Rules”), as modified in thisAgreement, in effect at the time the request for arbitration is filed. The AAA’s Rules are available on the AAA’s website at www.adr.org.THE GRANTEE ACKNOWLEDGES THAT THE COMPANY HAS ENCOURAGED THE GRANTEE TO READ THESERULES PROMPTLY AND CAREFULLY AND THAT THE GRANTEE HAS BEEN AFFORDED SUFFICIENTOPPORTUNITY TO DO SO.
(vi) If the Company initiates a request for arbitration, the Company will pay all of the administrative fees and costs charged by the AAA,including the arbitrator’s compensation and charges for hearing room rentals, etc. If the Grantee initiates a request for arbitration orsubmits a counterclaim to the Company’s request for arbitration, the Grantee shall be required to contribute One Hundred Dollars($100.00) to those administrative fees and costs, payable to the AAA at the time the Grantee's request for arbitration or counterclaim issubmitted. The Company may increase the contribution amount in the future without amending this Agreement, but not to exceed themaximum permitted under the AAA rules then in effect. In all cases, the Grantee and the Company shall be responsible for payment ofany fees assessed by the arbitrator as a result of that party’s delay, request for postponement, failure to comply with the arbitrator’srulings and for other similar reasons.
(vii) The Grantee and the Company may choose to be represented by legal counsel in the arbitration process and shall be responsible for theirown legal fees, expenses and costs. However, the arbitrator shall have the same authority as a court to order the Grantee or the Companyto pay some or all of the other’s legal fees, expenses and costs, in accordance with applicable law.
(viii) Unless otherwise agreed, there shall be a single arbitrator, selected by the Grantee and the Company from a list of qualified neutralsfurnished by the AAA. If the Grantee and the Company cannot agree on an arbitrator, one will be selected by the AAA.
(ix) Unless otherwise agreed, the arbitration hearing will take place in the city where the Grantee works or last worked for the Company. Ifthe Grantee and the Company disagree as to the proper locale, the AAA will decide.
9

(x) The Grantee and the Company shall be entitled to conduct limited pre-hearing discovery. Each may take the deposition of one personand anyone designated by the other as an expert witness. The party taking the deposition shall be responsible for all associated costs,such as the cost of a court reporter and the cost of an original transcript. Each party also has the right to submit one set of ten writtenquestions (including subparts) to the other party, which must be answered under oath, and to request and obtain all documents on whichthe other party relies in support of its answers to the written questions. Additional discovery may be permitted by the arbitrator upon ashowing that it is necessary for that party to have a fair opportunity to present a claim or defense.
(xi) The arbitrator shall apply the same substantive law that would apply if the matter were heard by a court and shall have the authority toorder the same remedies (but no others) as would be available in a court proceeding. The time limits for requesting arbitration orsubmitting a counterclaim and the administrative prerequisites for filing an arbitration claim or counterclaim are the same as they wouldbe in a court proceeding. The arbitrator shall consider and decide any dispositive motions (motions seeking a decision on some or all ofthe claims or counterclaims without an arbitration hearing) filed by any party.
(xii) All proceedings, including the arbitration hearing and decision, are private and confidential, unless otherwise required bylaw. Arbitration decisions may not be published or publicized without the consent of both the Grantee and the Company.
(xiii) Unless otherwise agreed, the arbitrator’s decision will be in writing with a brief summary of the arbitrator’s opinion.
(xiv) The arbitrator’s decision is final and binding on the Grantee and the Company. After the arbitrator’s decision is issued, the Grantee or theCompany may obtain an order of judgment from a court and may obtain a court order enforcing the decision. The arbitrator’s decisionmay be appealed to the courts only under the limited circumstances provided by law.
(xv) If the Grantee previously signed an agreement, including but not limited to an employment agreement, containing arbitration provisions,those provisions are superseded by the arbitration provisions of this Agreement.
(xvi) If any provision of Article VI (d) is found to be void or otherwise unenforceable, in whole or in part, this shall not affect the validity ofthe remainder of Article VI (d) and the remainder of the Agreement. All other provisions shall remain in full force and effect.
For purposes of this Article VI, the term “Employment” shall refer to active employment with the Company, any Subsidiary or Affiliate, and shall notinclude salary continuation or severance periods.
10

ARTICLE VII
OTHER TERMS
(a) Nothing in this Agreement shall interfere with or limit in any way the right of the Company or any Subsidiary or Affiliate to terminate theGrantee’s employment at any time. Neither the execution and delivery hereof nor the granting of the Award shall constitute or be evidence ofany agreement or understanding, express or implied, on the part of the Company or any of its Subsidiaries to employ or continue theemployment of the Grantee for any period.
(b) Until the Performance Stock Units have become vested, Grantee shall not have any rights as a stockholder (including the right to payment ofdividends) by virtue of this grant of Performance Stock Units.
(c) During the Performance Period, the Performance Stock Units shall be nontransferable and non-assignable except by will or the laws ofdescent and distribution.
(d) The award, when vested, will be settled on a net basis. Prior to issuing any Common Shares, the Company will withhold an amountsufficient to satisfy federal, state, local, social security and Medicare withholding tax requirements relating to award. Any social securitycalculation or other adjustments discovered after net share payment will be settled in cash, not in Shares of Common Stock. Vesting willresult in taxable compensation reportable on the Grantee’s W-2 in year of vesting.
(e) This Performance Stock Unit is an unfunded obligation of the Company and nothing in this Agreement shall be construed to create any claimagainst particular assets or require the Company to segregate or otherwise set aside any assets or create any fund to meet its obligationshereunder.
(f) Anything herein to the contrary notwithstanding, a Grantee whose Performance Stock Units have been forfeited as a result of termination ofemployment due to U.S. Military Service and who is later re-employed (in a full-time active status) after discharge within the time period setin 38 U.S.C. Section 4312 will be eligible to have the forfeited Performance Stock Units reinstated as follows: (i) if such Grantee is re-employed during the Performance Period, all forfeited Performance Stock Units shall be reinstated; or (ii) if such Grantee is re-employedafter the Performance Period, a cash payment will be made to the Grantee, minus applicable taxes, for the value of the forfeited PerformanceStock Units on the Vest Date pursuant to procedures established by the Company for this purpose.
(g) It is the intention of the Company and Grantee that this Agreement not result in unfavorable tax consequences to Grantee under Section 409Aof the Code, and the regulations and guidance promulgated thereunder (“Section 409A”) and the Agreement shall be interpreted as to socomply. Notwithstanding anything to the contrary herein, the Company and Grantee agree to the provisions set forth below in order tocomply with the requirements of Section 409A.
(i) If Grantee is a “specified employee” (within the meaning of Section 409A) with respect to the Company, any non-qualifieddeferred compensation otherwise payable to or in respect of Grantee in connection with Grantee’s termination of employment shallbe delayed until the earliest date upon which such amounts may be paid without being subject to taxation under Section 409A. Anyamount, the payment or benefit of which is delayed by application of the preceding sentence, shall be paid as soon as possiblefollowing the expiration of such period.
11

(ii) Unless deferred pursuant to this agreement, all payments shall be paid to Grantee, to the extent earned, in no event later than the lastday of the “applicable 2 ½ month period,” as such term is defined in Treasury Regulation Section 1.409A-1(b)(4)(i)(A) withrespect to such payment’s treatment as a “short-term deferral” for purposes of Section 409A.
(iii) The Company and Grantee agree to cooperate in good faith in an effort to comply with Section 409A. Under no circumstancesshall the Company be responsible for any taxes, penalties, interest or other losses or expenses incurred by the Grantee due to anyfailure to comply with Section 409A.
(h) This Agreement is subject to the 2000 Stock Incentive Plan heretofore adopted by the Company and approved by its shareholders. The termsand provisions of the Plan (including any subsequent amendments thereto) are hereby incorporated herein by reference. In the event of aconflict between any term or provision contained herein and a term or provision of the Plan, the applicable terms and provisions of the Planwill govern and prevail.
(i) At such times and upon such terms and conditions as the Company shall determine, the Company may permit eligible Grantees to elect todefer the distribution of an Award otherwise payable to the Grantee under this Agreement until termination of the Grantee’s Employment orsuch other date Company shall permit.
12


Exhibit 10.15
Amended andRestated on
January 25, 2008
AETNA INC.
1999 DIRECTOR CHARITABLE AWARD PROGRAM
1. PURPOSE OF THE PROGRAM
The Aetna Inc. Director Charitable Award Program (the “Program”) allows each eligible Director (“Director”) of Aetna Inc. (the“Corporation”) to recommend that the Corporation make a donation of $1,000,000 to the eligible tax-exempt organization(s) (the “Donee(s)”)selected by the Director, with the donation to be made, in the Director’s name, in ten equal annual installments, with the first installment to bemade following the Director’s retirement. The purpose of the Program is to recognize the interest of the Corporation and its outside Directors insupporting worthy educational institutions and other charitable organizations.
2. ELIGIBILITY
All persons serving as outside Directors of the Corporation as of February 1, 1999, shall be eligible to participate in the Program. All outside
Directors who join the Corporation’s Board of Directors after that date and before January 26, 2008 are eligible to participate in the Programupon election to the Board. An outside Director who first joins the Corporation’s Board of Directors after January 25, 2008 shall not be eligibleto participate in the Program.
3. RECOMMENDATION OF DONATION
When a Director becomes eligible to participate in the Program, he or she may make a written recommendation to the Corporation, on a form
approved by the Corporation for this purpose, designating the Donee(s) which he or she intends to be the recipient(s) of the corporate donationto be made on his or her behalf. A participating Director may revise or revoke any such recommendation by signing a new recommendationform and submitting it to the Corporation.
4. AMOUNT AND TIMING OF DONATION
Each eligible Director may choose one organization to receive a donation of $1,000,000, or up to five organizations to receive donations
aggregating $1,000,000. Each recommended organization must be recommended to receive a donation of at least $100,000. The donation willbe made by the Corporation in ten equal annual installments, with the first installment to be made shortly after the Director’s termination ofservice as a Director on account of the Corporation’s mandatory director retirement policy in effect on the date of such termination of service(“Retirement”). In the event of a Director’s earlier termination of service, provided he or she has satisfied the vesting requirements, the firstinstallment of the donation will be made when the Director otherwise would have reached his or her Retirement date. Notwithstanding theforegoing, provided that the other provisions of the Program are satisfied, with regard to any Director currently serving as such on January 26,2007, the first installment shall commence shortly after the Director reaches age 72 (or a later time if requested by the Director), regardless ofwhether the Director has terminated service as a Director at that time. If a Director recommends more than one organization to receive adonation, each will receive a prorated portion of each annual installment. Each annual installment payment will be divided among therecommended organizations in the same proportions as the total donation amount has been allocated among the organizations by the Director.
1

5. DONEES
In order to be eligible to receive a donation, a recommended organization must initially, and at the time each donation installment is to be made,(a) qualify to receive tax-deductible donations by the Corporation under the Internal Revenue Code and (b) meet the then current criteriaestablished by the Aetna Foundation, Inc. for its matching grant program; provided, however, that United Way, the Combined Health Appealand any other organization conducting a workplace campaign at Aetna not eligible for the Aetna Foundation, Inc. matching grant program willbe permitted Donees if otherwise eligible. Upon the request of the Corporation’s Chief Executive Officer, or in the event Aetna Foundation,Inc. or a successor foundation is dormant or not in existence, a recommended organization must be reviewed and approved by the Nominatingand Corporate Governance Committee. A recommendation will be approved unless it is determined that a donation to the organization would notbe in the best interests of the Corporation. A Director’s private foundation will not be an eligible Donee. If an organization recommended by aparticipating Director ceases to qualify as a Donee, and if the Director does not submit a form to change the recommendation, the amountrecommended to be donated to the organization will instead be donated to the Director’s remaining recommended qualified Donee(s) on aprorated basis. If none of the recommended organizations qualify, the donation will be made to the organization(s) selected by the Corporation.
6. VESTING
A participating Director will be vested in the Program: (a) when he or she completes five years of Board service as an outside Director, or (b)
in the event he or she terminates service prior to the completion of five years of service as a Director, by reason of death or disability, or (c) ifthere is a Change of Control of the Corporation while he or she is actively serving on the Board. The term “Change of Control” shall have thesame meaning as is defined for that term in the Aetna Inc. Non-Employee Director Deferred Stock and Deferred Compensation Plan. Forpersons serving as outside Directors on February 1, 1999, Board service as an outside Director prior to that date will count as vesting service(including service on the Boards of Aetna Life and Casualty Company and U. S. Healthcare, Inc.). If a participating Director terminates Boardservice (other than due to death or disability) before becoming vested, no donation will be made on his or her behalf, provided, however, that inthe event a participating Director terminates service prior to the completion of five years of service as a Director by reason of acceptance of aposition in government service or any other reason, all years of service will be counted towards the vesting requirement in the event of suchDirector’s return to the Board.
7. FUNDING AND PROGRAM ASSETS
The Corporation may fund the Program or it may choose not to fund the Program. If the Corporation elects to fund the Program in any manner,
neither the participating Directors nor their recommended Donee(s) shall have any rights or interests in any assets of the Corporation identifiedfor such purpose. Nothing contained in the Program shall create, or be deemed to create, a trust, actual or constructive, for the benefit of aDirector or any Donee recommended by a Director to receive a donation, or shall give, or be deemed to give, any Director or recommendedDonee any interest in any assets of the Program or the Corporation. If the Corporation elects to fund the
2

Program through life insurance policies, a participating Director must cooperate and fulfill the enrollment requirements necessary to obtaininsurance on his or her life in order to be eligible to participate or continue to participate in the Program. In the event a Director has cooperatedand fulfilled such requirements, but is considered to be uninsurable, such Director shall still be permitted to participate in the Program.
8. AMENDMENT OR TERMINATION
The Board of Directors of the Corporation may, at any time, without the consent of the Directors participating in the Program, amend, suspend,
or terminate the Program. However, once a participating Director becomes vested in the Program, the Program may not be amended, suspendedor terminated with respect to such Director by lengthening such Director’s vesting period or by reducing the amount or timing of a donation tobe made in the name of such Director without his or her consent, unless there has been an adverse change in laws or regulations affecting theProgram (e.g., reduction or elimination of the tax deductibility of the donation by the Corporation).
9. ADMINISTRATION
The Program shall be administered by the Nominating and Corporate Governance Committee. The Committee shall have plenary authority in its
discretion, but subject to the provisions of the Program, to prescribe, amend, and rescind rules, regulations and procedures relating to theProgram. The determinations of the Committee on the foregoing matters shall be conclusive and binding on all interested parties.
10. NON-ASSIGNMENT
A Director’s rights and interests under the Program may not be assigned or transferred.
11. GOVERNING LAW
The Program shall be construed and enforced according to the laws of the State of Connecticut, and all provisions thereof shall be administered
according to the laws of said state.
12. EFFECTIVE DATE
The Program effective date is February 1, 1999. The recommendation of an eligible Director will not be effective until he or she completesthe Program enrollment requirements.
3


Exhibit 12.1
Computation of Ratio of Earnings to Fixed Charges
The computation of the ratio of earnings to fixed charges for the years ended December 31, 2007, 2006, 2005, 2004 and 2003 are as follows:
Years Ended December 31,(Millions) 2007 2006 2005 2004 2003 Pretax income from continuing operations $ 2,796.4 $ 2,586.6 $ 2,453.3 $ 1,760.0 $ 1,378.7 Add back fixed charges 234.3 199.5 177.5 165.5 161.1 Income as adjusted $ 3,030.7 $ 2,786.1 $ 2,630.8 $ 1,925.5 $ 1,539.8 Fixed charges: Interest on indebtedness $ 180.6 $ 148.3 $ 122.8 $ 104.7 $ 102.9 Portion of rents representative of interest factor 53.7 51.2 54.7 60.8 58.2 Total fixed charges $ 234.3 $ 199.5 $ 177.5 $ 165.5 $ 161.1 Ratio of earnings to fixed charges 12.94 13.97 14.82 11.63 9.56

Exhibit 13.1
2007 Aetna Annual Report,Financial Report to Shareholders
Unless the context otherwise requires, references to the terms “we,” “our” or “us” used throughout this 2007 Annual Report,Financial Report to Shareholders (the “Annual Report”) refer to Aetna Inc. (a Pennsylvania corporation) (“Aetna”) and itssubsidiaries.
For your reference, we provide the following index to our 2007 Annual Report:
Page Description2 - 39 Management’s Discussion and Analysis of Financial Condition and Results of Operations (“MD&A”) – The MD&A
provides a review of our operating results for the years 2005 through 2007, as well as our financial condition at December 31, 2007and 2006. The MD&A should be read in conjunction with our consolidated financial statements and notes thereto. The MD&A iscomprised of the following:
2 Overview – We begin our MD&A with an overview of earnings and cash flows for the years 2005 through 2007,
as well as our outlook for 2008. In this section, we also discuss significant changes to our management andBoard of Directors.
5 Health Care – We provide a quantitative and qualitative discussion about the factors affecting Health Care
revenues and operating earnings in this section.
9 Group Insurance – We provide a quantitative and qualitative discussion about the factors affecting Group
Insurance revenues and operating earnings in this section.
10 Large Case Pensions – We provide a quantitative and qualitative discussion about the factors affecting Large
Case Pensions operating earnings, including the results of discontinued products, in this section.
12 Investments – As an insurer, we have substantial investment portfolios that support our liabilities. In this
section, we provide a quantitative and qualitative discussion of our investments and realized capital gains andlosses and describe our evaluation of the risk of our market-sensitive instruments.
14 Liquidity and Capital Resources – In this section, we discuss our cash flows, financing resources, contractual
obligations and other key matters that may affect our liquidity and cash flows.
18 Critical Accounting Estimates – In this section, we discuss the accounting estimates we consider critical in
preparing our financial statements, including why we consider them critical and the key assumptions used inmaking these estimates.
24 Regulatory Environment – In this section, we provide a discussion of the regulatory environment in which we
operate.
30 Forward-Looking Information/Risk Factors – We conclude MD&A with a discussion of certain risks and
uncertainties that, if developed into actual events, could have a material adverse impact on our business,financial condition or results of operations.
40 Selected Financial Data – We provide selected annual financial data for the most recent five years.
41 Consolidated Financial Statements – Includes our consolidated balance sheets at December 31, 2007 and 2006 and the related
consolidated statements of income, shareholders’ equity and cash flows for each of the years in the three-year period endedDecember 31, 2007. These financial statements should be read in conjunction with the accompanying Notes to ConsolidatedFinancial Statements.
45 Notes to Consolidated Financial Statements
83 Reports of Management and our Independent Registered Public Accounting Firm – We include a report from management on
its responsibilities for internal control over financial reporting and financial statements, the oversight of our Audit Committee andKPMG LLP’s opinion on our consolidated financial statements and internal control over financial reporting.
86 Quarterly Data (unaudited) – We provide selected quarterly financial data for each of the quarters in 2007 and 2006.
86 Corporate Performance Graph – We provide a graph comparing the cumulative total shareholder return on our common stock to
the cumulative total return on certain published indexes from December 31, 2002 through December 31, 2007.
Page 1

Management’s Discussion and Analysis of Financial Condition and Results of Operations (“MD&A”)
OVERVIEW
We are one of the nation’s leading diversified health care benefits companies, serving approximately 36.7 million people with information andresources to help them make better informed decisions about their health care. We offer a broad range of traditional and consumer-directed healthinsurance products and related services, including medical, pharmacy, dental, behavioral health, group life and disability plans, and medicalmanagement capabilities and health care management services for Medicaid plans. Our customers include employer groups, individuals, collegestudents, part-time and hourly workers, health plans, governmental units, government-sponsored plans, labor groups and expatriates. Our operationsare conducted in three business segments: Health Care, Group Insurance and Large Case Pensions.
Summarized Results (Millions) 2007 2006 2005 Revenue: Health Care $ 24,768.6 $ 22,240.5 $ 19,616.1 Group Insurance 2,139.5 2,152.1 2,141.8 Large Case Pensions 691.5 753.1 734.0 Total revenue 27,599.6 25,145.7 22,491.9 Net income 1,831.0 1,701.7 1,573.3 Operating earnings: (1) Health Care 1,770.9 1,572.7 1,427.7 Group Insurance 145.5 132.7 127.7 Large Case Pensions 38.1 38.9 33.2 Cash flows from operations 2,065.5 1,688.3 1,720.3 (1) Our discussion of operating results for our reportable business segments is based on operating earnings, which is a non-GAAP measure of net income (the term
“GAAP” refers to U.S. generally accepted accounting principles). Refer to Segment Results and Use of Non-GAAP Measures in this MD&A on page 4 for a discussionof non-GAAP measures. Refer to pages 5, 9 and 10 for a reconciliation of operating earnings to net income for Health Care, Group Insurance and Large Case Pensions,respectively.
During 2007 and 2006, our Health Care medical membership grew, increasing by 1.4 million in 2007 (including members from our acquisitions (referto Health Care – Membership on page 8)) and .7 million in 2006. This growth occurred in both Insured (where we assume all or a majority of risk formedical and dental care costs) and our administrative services contract (“ASC”) products in 2007 and primarily in our ASC products in 2006. Inaddition, during 2006 and 2007 we had growth in our pharmacy products. At December 31, 2007, we served approximately 16.9 million medicalmembers, 13.4 million dental members and 10.7 million pharmacy members.
During 2006 and 2007, premium and fee rates increased as well. Together with the growth in membership, these rate increases contributed to theexpansion of our total revenue, which increased approximately $2.5 billion in 2007 and $2.7 billion in 2006.
Underwriting margins in our Health Care segment, which represent the amount of premiums in excess of health care costs, improved in 2007 and2006 on a total dollar basis, when compared to the prior periods, reflecting membership growth and premium rate increases as well as our focus onmedical cost management.
The combination of total revenue growth, higher underwriting margins and continued operating expense efficiencies (operating expenses divided bytotal revenue) contributed to an improvement in our operating earnings. These efforts have also contributed to strong cash flows from operations in2007 and 2006 (refer to Liquidity and Capital Resources beginning on page 14).
During 2007 and 2006, we managed our capital in support of both new and ongoing initiatives.During 2007 and 2006, we used substantial capital to repurchase our common stock, fund targeted acquisitions in support of our strategy and makevoluntary contributions to our tax qualified pension plan.
Page 2

In 2007 and 2006, we repurchased approximately 33 million and 60 million shares of common stock at a cost of approximately $1.7 billion and $2.3billion, respectively, under share repurchase programs authorized by Aetna’s Board of Directors (the “Board”).
Over the past two years, we have continued to invest in the development of our business by acquiring companies that support our strategy as well ascontinuing the introduction or enhancement of new products and services. In 2007, we completed two acquisitions for an aggregate of approximately$613 million, expanding our Health Care product offerings by acquiring a leading provider of health care management services for Medicaid plansand a leading managing general underwriter (or underwriting agent) for international private medical insurance that offers expatriate benefits toindividuals, small and medium enterprises, and large multinational clients around the world. In 2006, we acquired a disability and leave managementbusiness for approximately $156 million. Refer to Note 3 of Notes to Consolidated Financial Statements on page 54 for additional information onour recent acquisition activity.
Also during 2007 and 2006, we continued development of our consumer-directed health care plan products and our web based tools to supportconsumerism and transparency. We also made changes to our other health products and medical management programs, including the launch of ournew private-fee-for-service Medicare plans (“PFFS”) beginning in 2007 and our Medicare Part D Prescription Drug Program (“PDP”) beginning in2006.
In addition, during 2007 and 2006 we made $45 million and $245 million, respectively, of voluntary cash contributions to our tax qualified pensionplan.
In 2007 and 2006, we issued $700 million and $2.0 billion of senior notes, respectively. Refer to Liquidity and Capital Resources beginning on page14 and Note 13 of Notes to Consolidated Financial Statements on page 69 for additional information.
Outlook for 2008Our goals for 2008 are to profitably grow membership in targeted geographic areas and customer bases; to profitably grow operating earnings; todemonstrate superior medical cost, quality and clinical integration for our customers; to achieve our targeted operating expenses; to use technology toenhance our competitive position; and to deliver best-in-class service for all our members and customers. Our 2008 outlook is as follows:
Health Care membership is targeted for growth in 2008. We continue to take actions to increase membership in 2008, includingefforts to reach customers via an integrated product approach in order to generate sales to new customers, as well as increased cross-sellpenetration within our existing membership base and via targeted geographic marketing. We expect this membership growth to be acombination of both ASC and Insured medical members. If we achieve these projected membership increases combined with priceincreases, it would contribute to higher revenue in our Health Care segment.
Group Insurance operating earnings are expected to remain generally level with 2007. We expect Group Insurance operatingearnings in 2008 to be generally level with those of 2007.
Large Case Pensions earnings are expected to reflect continued run-off of the business. We expect operating earnings in ourLarge Case Pensions segment to be lower than in 2007, consistent with the continued run-off of the underlying liabilities andassets. However, operating earnings for Large Case Pensions can vary from current expectations depending on, among other factors, futureinvestment performance of the assets supporting existing liabilities.
Corporate interest expense is expected to increase in 2008. We expect corporate interest expense to increase due to the increase inaverage debt outstanding resulting from our 2007 financing activities. Refer to Liquidity and Capital Resources beginning on page 14 andNote 13 of Notes to Consolidated Financial Statements on page 69 for additional information.
Operating expense ratio (operating expenses divided by revenue) is targeted to improve. We continue to take actions to improvethe efficiency of our operations, including efforts to leverage existing infrastructure to support additional growth as well as improvements insystems and processes. We will continue to focus 2008 spending on operational improvements, including self-service and administrativetechnologies that will yield future benefits.
Page 3

Capital deployment. In 2008, we intend to continue to pursue strategic acquisitions and other business development activities that supportour strategy for growth and profitability. We also intend to continue to deploy our capital through share repurchases.
Refer to Forward-Looking Information/Risk Factors beginning on page 30 for information regarding other important factors that may materiallyaffect us.
Executive Management and Board UpdatesDuring 2007, we announced the following changes to Aetna’s Board of Directors and our management team:
· Joseph M. Zubretsky joined Aetna in February. Mr. Zubretsky is our Executive Vice President and Chief Financial Officer, succeeding AlanM. Bennett, who retired in April.
· Roger N. Farah was appointed to our Board in June. Mr. Farah is President, Chief Operating Officer and a Director of Polo Ralph LaurenCorporation. He also serves on our Board’s Committee on Compensation and Organization as well as its Investment and FinanceCommittee. With the addition of Mr. Farah, the Board consists of twelve members.
· Mark T. Bertolini was appointed President of Aetna in July. In May, Mr. Bertolini was appointed Executive Vice President and Head ofBusiness Operations.
· We also announced the following resignations in 2007: James K. Foreman, Executive Vice President, National Businesses (May) and CraigR. Callen, Senior Vice President of Strategic Planning and Business Development (August).
· Additionally, Timothy A. Holt, Senior Vice President and Chief Investment Officer, retired in February 2008. Mr. Holt’s successor, JeanLaTorre, reports to Mr. Zubretsky.
Segment Results and Use of Non-GAAP Measures in this DocumentThe discussion of our results of operations that follows is presented based on our reportable segments in accordance with FAS No. 131,“Disclosures about Segments of an Enterprise and Related Information,” and is consistent with our segment disclosure included in Note 19of Notes to Consolidated Financial Statements beginning on page 76. Each segment’s discussion of results is based on operating earnings, which isthe measure reported to our Chief Executive Officer for purposes of assessing the segment’s financial performance and making operating decisions,such as allocating resources to the segment. Our operations are conducted in three business segments: Health Care, Group Insurance and Large CasePensions.
Our discussion of the results of operations of each business segment is based on operating earnings, which exclude net realized capital gains andlosses as well as other items, if any, from net income reported in accordance with GAAP. We believe excluding net realized capital gains and lossesfrom net income to arrive at operating earnings provides more useful information about our underlying business performance. Net realized capitalgains and losses arise from various types of transactions, primarily in the course of managing a portfolio of assets that support the payment ofliabilities; however these transactions do not directly relate to the underwriting or servicing of products for our customers and are not directly relatedto the core performance of our business operations. We also may exclude other items that do not relate to the ordinary course of our business fromnet income to arrive at operating earnings. In each segment discussion below, we present a table that reconciles operating earnings to net incomereported in accordance with GAAP. Each table details the net realized capital gains and losses and any other items excluded from net income, and thefootnotes to each table describe the nature of each other item and why we believe it is appropriate to exclude that item from net income.
Page 4

HEALTH CARE
Health Care consists of medical, pharmacy benefits management, dental and vision plans offered on both an Insured basis and an ASC basis. Medicalproducts include point-of-service (“POS”), preferred provider organization (“PPO”), health maintenance organization (“HMO”) and indemnitybenefit plans. Medical products also include health savings accounts (“HSAs”) and Aetna HealthFund®, consumer-directed health plans thatcombine traditional POS or PPO and/or dental coverage, subject to a deductible, with an accumulating benefit account. We also offer Medicare andMedicaid products and services and specialty products, such as medical management and data analytics services, behavioral health plans and stop lossinsurance, as well as products that provide access to our provider network in select markets.
Operating Summary (Millions) 2007 2006 2005 Premiums: Commercial (1) $ 18,656.8 $ 17,356.5 $ 15,919.6 Medicare 2,598.3 1,787.7 1,005.1 Medicaid 245.0 9.3 - Total premiums 21,500.1 19,153.5 16,924.7 Fees and other revenue 2,931.3 2,743.7 2,385.8 Net investment income 370.9 334.2 295.0 Net realized capital (losses) gains (33.7) 9.1 10.6 Total revenue 24,768.6 22,240.5 19,616.1 Health care costs (2) 17,294.8 15,301.0 13,107.9 Operating expenses: Selling expenses 966.6 867.4 763.3 General and administrative expenses (3) 3,708.3 3,618.6 3,424.9 Total operating expenses 4,674.9 4,486.0 4,188.2 Amortization of other acquired intangible assets 90.7 80.4 57.4 Total benefits and expenses 22,060.4 19,867.4 17,353.5 Income before income taxes 2,708.2 2,373.1 2,262.6 Income taxes 959.2 847.6 827.9 Net income $ 1,749.0 $ 1,525.5 $ 1,434.7 (1) Commercial includes all medical, dental and other insured products, except Medicare and Medicaid.(2) The percentage of health care costs related to capitated arrangements with primary care physicians (a fee arrangement where we pay providers a monthly fixed fee for each
member, regardless of the medical services provided to the member) was 5.5% for 2007 compared to 5.9% for 2006 and 7.9% for 2005.(3) Includes salaries and related benefit expenses of $2.2 billion in both 2007 and 2006, and $2.1 billion in 2005.
The table presented below reconciles operating earnings to net income reported in accordance with GAAP: (Millions) 2007 2006 2005 Net income $ 1,749.0 $ 1,525.5 $ 1,434.7 Net realized capital losses (gains) 21.9 (8.0) (7.0)
Physician class action settlement insurance-related charge (1) - 47.1 - Debt refinancing charge (2) - 8.1 - Operating earnings $ 1,770.9 $ 1,572.7 $ 1,427.7 (1) As a result of a trial court’s ruling in 2006, we concluded that a $47.1 million ($72.4 million pretax) receivable from third party insurers related to certain litigation we
settled in 2003 was no longer probable of collection for accounting purposes. As a result, we wrote-off this receivable in 2006. We believe this charge neither relates to theordinary course of our business nor reflects our underlying business performance, and therefore, we have excluded it from operating earnings in 2006.
(2) In connection with the issuance of $2.0 billion of our senior notes in 2006, we redeemed all $700 million of our 8.5% senior notes due 2041. In connection with thisredemption, we wrote-off debt issuance costs associated with the 8.5% senior notes due 2041 and recognized the deferred gain from the interest rate swaps that had hedgedthe 8.5% senior notes due 2041 (in May 2005, we sold these interest rate swaps; the resulting gain from which was to be amortized over the remaining life of the 8.5%senior notes due 2041). As a result of the foregoing, we recorded an $8.1 million ($12.4 million pretax) net charge in 2006. We believe this charge neither relates to theordinary course of our business nor reflects our underlying business performance, and therefore, we have excluded it from operating earnings in 2006.
Page 5

Higher revenue and underwriting margins as well as operating expense efficiencies contributed to earnings growth in 2007 and 2006Operating earnings for 2007 increased $198 million from 2006, which had increased $145 million from 2005. These increases in operating earningsreflect growth in premiums and fees and other revenue, as well as higher underwriting margins and improved operating expense efficiencies (totaloperating expenses divided by total revenue). The growth in premiums and fees and other revenue resulted from increases in membership levels (referto Membership on page 8) and rate increases for renewing membership. Furthermore, growth in premiums and fees and other revenue reflects ourrecent acquisitions. Refer to Note 3 of Notes to Consolidated Financial Statements on page 54 for a discussion of our acquisitions. Our growth inpremiums in 2007 and 2006 also benefited from our new PFFS product, which we began offering effective January 1, 2007, and our PDP product,which we began offering effective January 1, 2006.
Underwriting margins (premiums less health care costs) increased in 2007 and to a lesser extent in 2006 over the prior year, reflecting growth inpremiums (as discussed above) partially offset by higher health care costs. Our underwriting margin for 2005 reflects favorable development of priorperiod health care cost estimates (discussed in Commercial and Medicare results below).
Although we became more efficient based on our operating expenses as a percentage of revenue, our total operating expenses increased in 2007 and2006 over the prior years primarily due to expenses related to the growth in our membership. Total operating expenses increased due to higher sellingexpenses (reflecting an increase in commissionable premiums from membership growth) and increases in general and administrative expenses due tohigher employee related costs, outside services and other expenses associated with higher membership. Total operating expenses in 2006 also reflect a$27 million pretax severance charge as well as the write off of an insurance recoverable and a net charge related to our 2006 debt issuance noted in ourreconciliation of operating earnings to net income on page 5.
We calculate our medical benefit ratio (“MBR”) by dividing health care costs by premiums. Our MBRs by product for the years ended December31, 2007, 2006 and 2005 were as follows: 2007 2006 2005 Commercial 79.5% 79.3% 76.9% Medicare 86.8% 85.2% 86.0% Medicaid 88.4% n/m (1) n/m (1)
Total 80.4% 79.9% 77.4% (1) Our Medicaid results were not meaningful prior to the 2007 acquisition of Schaller Anderson, Incorporated.
Refer to the following discussion of Commercial and Medicare results for an explanation of the changes in our MBR.
The operating results of our Commercial products continued to grow in 2007 and 2006Commercial premiums increased approximately $1.3 billion in 2007 compared to 2006, and increased approximately $1.4 billion in 2006 compared to2005. The increase in 2007 reflects premium rate increases on renewing business and increases in membership levels (refer to Membership on page8). The increase in 2006 primarily reflects increases in premium rates on renewing business.
Our Commercial MBRs were 79.5% for 2007, 79.3% for 2006 and 76.9% for 2005. The Commercial MBRs in 2007 and 2006 increased whencompared to the prior year MBRs reflecting a percentage increase in our per member health care costs that outpaced the percentage increase in permember premiums. Increases in per member health care costs in 2007 were due to increases across all medical categories, with larger increases ininpatient and outpatient costs than other categories. Increases in per member health care costs in 2006 were due to increases across all medical costcategories, with larger increases in outpatient costs than other categories.
Page 6

We had no significant development of prior period health care cost estimates that affected results of operations in 2007 or 2006. Our incurredCommercial health care costs for 2005 reflect favorable development of prior period health care cost estimates of approximately $233 million,comprised of approximately $103 million related to a release of reserves associated with the New York Market Stabilization Pool as discussed belowand $130 million related to favorable development of prior period health care cost estimates. In 2005, after entering an agreement with the New YorkState Insurance Department, we released $103 million of reserves held for the New York Market Stabilization Pool no longer deemednecessary. Additionally, as a result of an acceleration in claim submission times in 2004 that became evident in 2005, the estimated volume of claimsincurred but not reported at December 31, 2004 was higher than we actually experienced. Also, with the benefit of hindsight, our health care costtrend rate in 2004 was lower than we anticipated in determining our health care costs payable at December 31, 2004. These factors became evident in2005, resulting in approximately $130 million of favorable development of prior period health care estimates recognized in results of operations in2005, which had the effect of lowering our Commercial MBR for 2005. The calculation of Health Care Costs Payable is a critical accountingestimate (refer to Critical Accounting Estimates – Health Care Costs Payable beginning on page 18 for additional information).
Medicare results reflects growth in 2007 and 2006Our Medicare Advantage contracts with the federal government are renewable for a one-year period on a calendar-year basis. In 2006, we offered aMedicare Advantage option in all of the markets we served in 2005. We expanded into select additional markets in 2007 and now offer MedicareAdvantage in 205 counties in 16 states and Washington, D.C. Also, we were a national provider of PDP in 2007 and 2006. In 2007, we beganoffering PFFS in select markets for individuals and nationally for employer groups. PFFS complements our PDP product, forming an integratednational fully insured Medicare product. We intend to continue providing Medicare Advantage, PDP and PFFS products in 2008.
Medicare premiums increased approximately $811 million in 2007, compared to 2006, and increased approximately $783 million in 2006 comparedto 2005. The increase in 2007 primarily reflects the introduction of our new PFFS product, which was effective January 1, 2007, and increases inpremiums due to higher membership levels in both our Medicare Advantage and PDP products, as well as premium rate increases by the Centers forMedicare & Medicaid Services (“CMS”). The increase in 2006 reflects the introduction of our new PDP product, which was effective January 1,2006, as well as increased premiums due to higher membership levels and CMS rate increases for our Medicare Advantage products.
Our Medicare MBRs were 86.8% for 2007, 85.2% for 2006 and 86.0% for 2005. We had no significant development of prior period health carecost estimates that affected results of operations in 2007 or 2006, but Medicare health care costs for 2005 reflect favorable development of priorperiod health care cost estimates of approximately $17 million. The increase in our Medicare MBR in 2007 compared to 2006 reflects a change in ourproduct mix as a result of the introduction of PFFS as well as a percentage increase in our per member health care costs that outpaced the percentageincrease in per member premiums. The increases in our per member health care costs during 2007 were primarily due to increases in pharmaceuticalcosts. The decrease in our Medicare MBR in 2006 compared to 2005 reflects a change in our product mix as a result of the introduction of PDP.
Other Sources of RevenueFees and other revenue for 2007 increased $188 million compared to 2006, reflecting growth in ASC membership and rate increases, as well asrevenue from our recent acquisitions of Schaller Anderson, Incorporated (“Schaller Anderson”) and Goodhealth Worldwide (Bermuda) Limited(“Goodhealth”). Fees and other revenue for 2006 increased $358 million compared to 2005, reflecting growth in ASC membership and ASC rateincreases and other revenue from our HMS Healthcare, Inc. and Active Health Management, Inc. acquisitions in 2005.
Net investment income for 2007 increased $37 million compared to 2006, primarily reflecting higher average asset levels and higher average yields ondebt securities. Net investment income for 2006 increased $39 million compared to 2005, primarily reflecting higher average yields in our portfolio ofdebt securities.
Net realized capital losses of $34 million for 2007 were due primarily to other-than-temporary impairment of debt securities due to rising interest rates(refer to our discussion of Investments beginning on page 12 for additional information).
Page 7

MembershipHealth Care’s membership at December 31, 2007 and 2006 was as follows:
2007 2006(Thousands) Insured ASC Total Insured ASC TotalMedical: Commercial 5,418 10,453 15,871 5,088 10,053 15,141 Medicare Advantage 193 - 193 123 - 123 Medicare Health Support Program (1) - 14 14 - 17 17 Medicaid 138 637 775 22 130 152 Total Medical Membership 5,749 11,104 16,853 (2) 5,233 10,200 15,433
Consumer-Directed Health Plans (3) 994 676
Dental: Commercial 5,199 7,269 12,468 5,057 7,205 12,262 Network Access (4) - 938 938 - 1,210 1,210Total Dental Membership 5,199 8,207 13,406 5,057 8,415 13,472Pharmacy: Commercial 9,634 9,161 Medicare PDP (stand-alone) 311 314 Medicare Advantage PDP 151 115 Total Pharmacy Benefit Management Services 10,096 9,590 Mail Order (5) 636 625Total Pharmacy Membership 10,732 10,215(1) Represents members who participated in a CMS pilot program under which we provided disease and case management services to selected Medicare fee-for-service
beneficiaries in exchange for a fee.(2) Includes approximately 600,000 Medicaid (112,000 Insured and 488,000 ASC) and 44,000 Commercial ASC members from the Schaller Anderson acquisition and
approximately 58,000 Commercial members (1,000 Insured and 57,000 ASC) from the Goodhealth acquisition.(3) Represents members in consumer-directed health plans included in Commercial medical membership above.(4) Represents members in products that allow these members access to our dental provider network for a nominal fee.(5) Represents members who purchased medications through our mail order pharmacy operations during the fourth quarter of 2007 and 2006, respectively, and are included in
pharmacy membership above.
Total medical membership at December 31, 2007 increased compared to 2006. The increase in medical membership was primarily due to growth inour Commercial and Medicaid products. Growth in Commercial membership was driven by membership growth within existing plan sponsors andnew customers, net of lapses. Growth in Medicaid membership was primarily due to our acquisition of Schaller Anderson in July 2007, leading to theexpansion of our Medicaid plans. Additionally, our Medicare Advantage membership increased during the same period predominantly due to theintroduction of our new PFFS plans effective January 1, 2007.
Total dental membership at December 31, 2007 decreased compared to 2006 primarily due to the loss of a customer with network access to our dentalproviders, which resulted in a nominal impact on fees and other revenue.
Total pharmacy membership increased at December 31, 2007 compared to 2006 primarily due to growth in our pharmacy benefit managementservices. Our pharmacy benefit management services growth was due in part to an increase in Commercial pharmacy membership reflecting strongcross selling success to existing medical plan customers. Mail order operations reflected an increase in member utilization during this time period dueto sales efforts as well as an increase in the preference by our members to use this form of delivery.
Page 8

GROUP INSURANCE
Group Insurance primarily includes group life insurance products offered on an Insured basis, including basic group term life insurance, groupuniversal life, supplemental or voluntary programs and accidental death and dismemberment coverage. Group Insurance also includes (i) groupdisability products offered to employers on both an Insured and an ASC basis, which consist primarily of short-term and long-term disabilityinsurance (and products which combine both), (ii) absence management services offered to employers, which include short-term and long-termdisability administration and leave management, and (iii) long-term care products that were offered primarily on an Insured basis, which providebenefits covering the cost of care in private home settings, adult day care, assisted living or nursing facilities. We no longer solicit or accept newlong-term care customers, and we are working with our customers on an orderly transition of this product to other carriers.
Operating Summary (Millions) 2007 2006 2005 Premiums: Life $ 1,201.4 $ 1,257.6 $ 1,329.1 Disability 478.8 401.5 379.7 Long-term care 93.8 102.8 94.9 Total premiums 1,774.0 1,761.9 1,803.7 Fees and other revenue 101.1 84.6 31.6 Net investment income 303.0 294.1 293.1 Net realized capital (losses) gains (38.6) 11.5 13.4 Total revenue 2,139.5 2,152.1 2,141.8 Current and future benefits 1,619.2 1,646.8 1,708.0 Operating expenses: Selling expenses 94.3 85.3 80.2 General and administrative expenses (1) 261.9 232.3 166.2 Total operating expenses 356.2 317.6 246.4 Amortization of other acquired intangible assets 6.9 5.2 - Total benefits and expenses 1,982.3 1,969.6 1,954.4 Income before income taxes 157.2 182.5 187.4 Income taxes 36.8 48.6 51.0 Net income $ 120.4 $ 133.9 $ 136.4 (1) Includes salaries and related benefit expenses of $157.3 million in 2007, $132.8 million in 2006 and $106.6 million in 2005.
The table presented below reconciles operating earnings to net income reported in accordance with GAAP:
(Millions) 2007 2006 2005 Net income $ 120.4 $ 133.9 $ 136.4 Net realized capital losses (gains) 25.1 (7.4) (8.7)
Acquisition-related software charge (1) - 6.2 - Operating earnings $ 145.5 $ 132.7 $ 127.7 (1) As a result of the acquisition of Broadspire Disability in 2006, we acquired certain software which eliminated the need for similar software we had been developing
internally. As a result, we ceased our own software development and impaired amounts previously capitalized, resulting in a $6.2 million ($8.3 million pretax) charge to netincome, reflected in general and administrative expenses for 2006. This charge does not reflect the underlying business performance of Group Insurance, and therefore, wehave excluded it from operating earnings in 2006.
Operating earnings for 2007 increased $13 million when compared to 2006, reflecting a lower group benefit ratio and higher net investment incomepartially offset by higher general and administrative expenses. Operating earnings for 2006 increased $5 million compared to 2005, reflecting higherfees and other revenue and a lower benefit cost ratio partially offset by higher general and administrative expenses. The 2007 and 2006 growth in feesand other revenue and general and administrative expenses primarily related to the March 2006 acquisition of Broadspire Disability (refer to Note 3 ofNotes to Consolidated Financial Statements on page 54).
Page 9

Our group benefit ratios were 91.3% for 2007, 93.5% for 2006 and 94.7% for 2005. The decrease in our group benefit ratio for 2007 was primarilydue to a decrease in our life and disability group benefit ratios due to favorable experience. The decrease in our group benefit ratio in 2006 wasprimarily due to a decrease in our disability benefit ratio due to favorable experience.
Net realized capital losses of $39 million for 2007 were due primarily to losses on other-than-temporary impairments of debt securities due to risinginterest rates (refer to our discussion of Investments beginning on page 12 for additional information).
LARGE CASE PENSIONS
Large Case Pensions manages a variety of retirement products (including pension and annuity products) primarily for tax qualified pensionplans. These products provide a variety of funding and benefit payment distribution options and other services. The Large Case Pensions segmentincludes certain discontinued products.
Operating Summary
(Millions) 2007 2006 2005 Premiums $ 205.3 $ 194.1 $ 199.3 Net investment income 476.0 536.4 514.9 Other revenue 11.6 11.0 11.5 Net realized capital (losses) gains (1.4) 11.6 8.3 Total revenue 691.5 753.1 734.0 Current and future benefits 628.9 672.2 656.5 General and administrative expenses (1) 15.3 17.0 18.1 Reduction of reserve for anticipated future losses on discontinued products (64.3) (115.4) (66.7)
Total benefits and expenses 579.9 573.8 607.9 Income before income taxes 111.6 179.3 126.1 Income taxes 32.6 56.7 44.1 Net income $ 79.0 $ 122.6 $ 82.0 (1) Includes salaries and related benefit expenses of $11.6 million in 2007, $13.7 million in 2006 and $14.6 million in 2005. At December 31, (Millions) 2007 2006 Assets under management: (1) Fully guaranteed discontinued products $ 4,225.1 $ 4,352.3 Experience-rated 4,554.3 4,752.7 Non-guaranteed (2) 15,376.2 14,857.0 Total assets under management $ 24,155.6 $ 23,962.0 (1) Excludes net unrealized capital gains of $143.4 million and $200.2 million at December 31, 2007 and 2006, respectively.(2) The increase in non-guaranteed assets under management in 2007 primarily reflects investment appreciation and additional deposits. Refer to Note 2 of Notes to
Consolidated Financial Statements beginning on page 45 for information on expected future reductions in these assets.
The table presented below reconciles operating earnings to net income reported in accordance with GAAP: (Millions) 2007 2006 2005 Net income $ 79.0 $ 122.6 $ 82.0 Net realized capital losses (gains) .9 (8.7) (5.4)
Reduction of reserve for anticipated future losses on discontinued products (1) (41.8) (75.0) (43.4)
Operating earnings $ 38.1 $ 38.9 $ 33.2 (1) In 1993, we discontinued the sale of our fully guaranteed large case pension products and established a reserve for anticipated future losses on these products, which we
review quarterly. Changes in this reserve are recognized when deemed appropriate. We reduced the reserve for anticipated future losses on discontinued products by$41.8 million ($64.3 million pretax) in 2007, $75.0 million ($115.4 million pretax) in 2006 and $43.4 million ($66.7 million pretax) in 2005. We believe excluding anychanges to the reserve for anticipated future losses on discontinued products provides more useful information as to our continuing products and is consistent with thetreatment of the results of operations of these discontinued products, which are credited or charged to the reserve and do not affect our results of operations.
Page 10

Operating earnings in 2006 increased $6 million compared to 2005. The increase in operating earnings in 2006 reflects an increase in net investmentincome in continuing products primarily due to higher income from the receipt of mortgage loan equity participation income, higher yields and higherlimited partnership income. Large Case Pensions’ operating earnings are expected to decline in the future in keeping with the run-off nature of thebusiness.
The reductions of the reserve for anticipated future losses on discontinued products in 2007, 2006 and 2005 were primarily due to favorableinvestment performance and favorable mortality and retirement experience compared to assumptions we previously made in estimating the reserve.
General account assets supporting experience-rated products (where the contract holder, not us, assumes investment and other risks subject to, amongother things, certain minimum guarantees) may be subject to contract holder or participant withdrawals. For the years ended December 31, 2007, 2006and 2005, experience-rated contract holder and participant-directed withdrawals were as follows:
(Millions) 2007 2006 2005 Scheduled contract maturities and benefit payments (1) $ 353.6 $ 361.3 $ 379.6 Contract holder withdrawals other than scheduled contract maturities and benefit payments (2) 39.4 202.2 45.6 Participant-directed withdrawals (2) 6.0 16.9 18.4 (1) Includes payments made upon contract maturity and other amounts distributed in accordance with contract schedules.(2) Approximately $534.9 million, $515.5 million and $674.4 million at December 31, 2007, 2006 and 2005, respectively, of experience-rated pension contracts allowed for
unscheduled contract holder withdrawals, subject to timing restrictions and formula-based market value adjustments. Further, approximately $118.7 million, $127.8 millionand $312.4 million at December 31, 2007, 2006 and 2005, respectively, of experience-rated pension contracts supported by general account assets could be withdrawn ortransferred to other plan investment options at the direction of plan participants, without market value adjustment, subject to plan, contractual and income tax provisions.
Discontinued ProductsWe discontinued the sale of our fully guaranteed large case pension products (single-premium annuities (“SPAs”) and guaranteed investmentcontracts) in 1993. We established a reserve for anticipated future losses on these products based on the present value of the difference between theexpected cash flows from the assets supporting these products and the cash flows expected to be required to meet our obligations under theseproducts.
Results of operations of discontinued products, including net realized capital gains (losses), are credited (charged) to the reserve for anticipatedfuture losses. Our results of operations would be adversely affected to the extent that future losses on discontinued products are greater thananticipated and favorably affected to the extent future losses are less than anticipated.
The factors contributing to changes in the reserve for anticipated future losses are: operating income or loss (including investment income andmortality and retirement gains or losses) and realized capital gains or losses. Operating income or loss is equal to revenue less expenses. Realizedcapital gains or losses reflect the excess (deficit) of sales price over (below) the carrying value of assets sold and other-than-temporaryimpairments. Mortality and retirement gains or losses reflect our experience related to SPAs. A mortality gain (loss) occurs when an annuitant or abeneficiary dies sooner (later) than expected. A retirement gain (loss) occurs when an annuitant retires later (earlier) than expected.
The results of discontinued products for the years ended December 31, 2007, 2006 and 2005 were as follows:
(Millions) 2007 2006 2005 Interest (deficit) margin (1) $ (11.7) $ 6.3 $ (12.1)Net realized capital gains 17.5 25.1 14.3 Interest earned on receivable from continuing products 17.6 18.8 19.9 Other, net 16.0 9.7 9.2 Results of discontinued products, after tax $ 39.4 $ 59.9 $ 31.3 Results of discontinued products, pretax $ 45.6 $ 80.6 $ 39.1 Net realized capital (losses) gains from bond sales and other-than-temporary impairments, after tax (included above) $ (10.2) $ 14.7 $ 6.4 (1) The interest (deficit) margin is the difference between earnings on invested assets and interest credited to the reserves.
Page 11

The interest deficit for 2007 compared to the interest margin in 2006 was primarily due to lower net investment income. The interest margin for 2006compared to the interest deficit for 2005 was primarily due to higher limited partnership income in 2006.
Net realized capital gains for 2007 were due primarily to gains on the sale of real estate and net gains on the sale of debt securities partially offset bylosses on other-than-temporary impairments of debt securities due to rising interest rates (refer to our discussion of Investments below for additionalinformation). Net realized capital gains for 2006 were due primarily to net gains on the sale of debt securities, real estate and equity securities partiallyoffset by losses on the write-down of other investments and losses on futures contracts. Net realized capital gains for 2005 reflect net gains on thesale of debt and equity securities as well as gains on futures contracts.
The activity in the reserve for anticipated future losses on discontinued products in 2007, 2006 and 2005 was as follows (pretax): (Millions) 2007 2006 2005 Reserve for anticipated future losses on discontinued products, beginning of period $ 1,061.1 $ 1,052.2 $ 1,079.8 Operating income 10.0 38.6 12.4 Net realized capital gains 27.0 38.6 22.0 Mortality and other 8.6 3.4 4.7 Tax benefits 9.9 43.7 - Reserve reduction (64.3) (115.4) (66.7)
Reserve for anticipated future losses on discontinued products, end of period $ 1,052.3 $ 1,061.1 $ 1,052.2
Management reviews the adequacy of the discontinued products reserve quarterly and, as a result, $64 million ($42 million after tax), $115 million($75 million after tax) and $67 million ($43 million after tax) was released in 2007, 2006 and 2005, respectively. The reserve releases were primarilydue to favorable investment performance and favorable mortality and retirement experience compared to assumptions we previously made in estimatingthe reserve. The current reserve reflects management’s best estimate of anticipated future losses.
Refer to Note 20 of Notes to Consolidated Financial Statements beginning on page 78 for additional information on the assets and liabilities supportingdiscontinued products at December 31, 2007 and 2006 as well as a discussion of the reserve for anticipated future losses on discontinued products.
INVESTMENTS
At December 31, 2007 and 2006, our investment portfolio consisted of the following: (Millions) 2007 2006 Debt and equity securities $ 14,995.3 $ 14,938.0 Mortgage loans 1,512.6 1,588.2 Short-term and other investments 1,383.7 1,360.9 Total investments $ 17,891.6 $ 17,887.1
Our investment portfolio has not experienced material losses from the sub-prime market. We have evaluated the composition of our investmentportfolio at December 31, 2007 and do not believe it has significant exposure to the sub-prime market.
The risks associated with investments supporting experience-rated pension and annuity products in our Large Case Pensions business are assumed bythe contract holders and not by us (subject to, among other things, certain minimum guarantees). Anticipated future losses associated withinvestments supporting discontinued fully guaranteed Large Case Pensions products are provided for in the reserve for anticipated future losses ondiscontinued products.
Page 12

As a result of the foregoing, investment risks associated with our experience-rated and discontinued products generally do not impact our results ofoperations (refer to Note 2 of Notes to Consolidated Financial Statements beginning on page 45 for additional information). Our total investmentssupported the following products at December 31, 2007 and 2006:
(Millions) 2007 2006 Supporting experience-rated products $ 1,854.9 $ 1,989.3 Supporting discontinued products 4,184.3 4,401.5 Supporting remaining products 11,852.4 11,496.3 Total investments $ 17,891.6 $ 17,887.1
Debt and Equity SecuritiesThe debt securities in our portfolio had an average quality rating of A+ at December 31, 2007 and 2006, with approximately $5.3 billion at bothDecember 31, 2007 and 2006 rated AAA. Total debt securities that were rated below investment grade (that is, having a quality rating below BBB-/Baa3) at December 31, 2007 and 2006 were $791 million and $925 million, respectively (of which 24% at December 31, 2007 and 23% atDecember 31, 2006 supported our discontinued and experience-rated products).
We classify our debt and equity securities as available for sale, carrying them at fair value on our balance sheet. Fair values are determined based onquoted market prices when available, market prices provided by a third party vendor (including matrix pricing) or dealer quotes. Approximately $154million and $192 million of our debt and equity securities at December 31, 2007 and 2006, respectively, are not actively traded. For these securitieswe determine fair value using an internal analysis of each investment’s financial statements and cash flow projections.
At December 31, 2007 and 2006, our debt and equity securities had net unrealized gains of $209 million and $282 million, respectively, of which$145 million and $197 million, respectively, related to our experience-rated and discontinued products. We had no material unrealized capital losseson individual debt or equity securities at December 31, 2007 or 2006.
Refer to Note 8 of Notes to Consolidated Financial Statements beginning on page 57 for details of net unrealized capital gains and losses by majorsecurity type, as well as details on our debt and equity securities with unrealized losses at December 31, 2007 and 2006. We regularly review our debtand equity securities to determine if a decline in fair value below the carrying value is other-than-temporary. If we determine a decline in fair value isother-than-temporary, the carrying amount of the security is written down, and the amount of the write down is included in our results ofoperations. Accounting for other-than-temporary impairments of our investment securities is considered a critical accounting estimate. Refer toCritical Accounting Estimates – Other-Than-Temporary Impairment of Investment Securities beginning on page 23 for additional information.
Net realized capital (losses) gains were ($74) million (($48) million after tax) in 2007, $32 million ($24 million after tax) in 2006 and $32 million($21 million after tax) in 2005. Included in net realized capital losses for 2007 were $125 million ($81 million after tax) of other-than-temporaryimpairment charges on debt securities that were in an unrealized loss position due to interest rate increases rather than unfavorable changes in the creditquality of such securities. Since we could not positively assert our intention to hold such securities until recovery in value, these securities werewritten down to fair value in accordance with our accounting policy. There were no significant investment write-downs from other-than-temporaryimpairments in 2006 or 2005. We had no individually material realized capital losses on debt or equity securities that impacted our results of operationsin 2007, 2006 or 2005.
Mortgage LoansOur mortgage loan portfolio (which is primarily secured by commercial real estate) represented 8% and 9% of our total invested assets at December31, 2007 and 2006, respectively. In accordance with our accounting policies, there were no specific impairment reserves on these loans at December31, 2007 or 2006. Refer to Notes 2 and 8 of Notes to Consolidated Financial Statements beginning on pages 45 and 57, respectively, for additionalinformation.
Page 13

Risk Management and Market-Sensitive InstrumentsWe manage interest rate risk by seeking to maintain a tight match between the durations of our assets and liabilities where appropriate. We managecredit risk by seeking to maintain high average quality ratings and diversified sector exposure within our debt securities portfolio. In connection withour investment and risk management objectives, we also use derivative financial instruments whose market value is at least partially determined by,among other things, levels of or changes in interest rates (short-term or long-term), duration, prepayment rates, equity markets or creditratings/spreads. Our use of these derivatives is generally limited to hedging purposes and has principally consisted of using interest rate swapagreements, warrants, forward contracts and futures contracts. These instruments, viewed separately, subject us to varying degrees of interest rate,equity price and credit risk. However, when used for hedging, we expect these instruments to reduce overall risk.
We regularly evaluate our risk from market-sensitive instruments by examining, among other things, levels of or changes in interest rates (short-termor long-term), duration, prepayment rates, equity markets or credit ratings/spreads. We also regularly evaluate the appropriateness of investmentsrelative to our management-approved investment guidelines (and operate within those guidelines) and the business objectives of our portfolios.
On a quarterly basis, we review the impact of hypothetical net losses in our investment portfolio on our consolidated near-term financial position,results of operations and cash flows assuming the occurrence of certain reasonably possible changes in near-term market rates and prices. Wedetermine the potential effect of interest rate risk on near-term net income, cash flow and fair value based on commonly used models. The modelsproject the impact of interest rate changes on a wide range of factors, including duration, prepayment, put options and call options. We also estimatethe impact on fair value based on the net present value of cash flows using a representative set of likely future interest rate scenarios. The assumptionsused were as follows: an immediate increase of 100 basis points in interest rates (which we believe represents a moderately adverse scenario and isapproximately equal to the historical annual volatility of interest rate movements for our intermediate-term available-for-sale debt securities) and animmediate decrease of 25% in prices for domestic equity securities.
Based on our overall exposure to interest rate risk and equity price risk, we believe that these changes in market rates and prices would not materiallyaffect our consolidated near-term financial position, results of operations or cash flows as of December 31, 2007.
LIQUIDITY AND CAPITAL RESOURCES
Cash FlowsGenerally, we meet our operating requirements by maintaining appropriate levels of liquidity in our investment portfolio and using overall cash flowsfrom premiums, deposits and income received on investments. We monitor the duration of our portfolio of debt securities (which is highlymarketable) and mortgage loans, and execute purchases and sales of these investments with the objective of having adequate funds available to satisfyour maturing liabilities. Overall cash flows are used primarily for claim and benefit payments, operating expenses and contract withdrawals.
Presented below is a condensed statement of cash flows for the years ended December 31, 2007, 2006 and 2005. We present net cash flows used foroperating activities of continuing operations and net cash flows provided by investing activities separately for our Large Case Pensions segmentbecause changes in the insurance reserves for the Large Case Pensions segment (which are reported as cash used for operating activities) are fundedfrom the sale of investments (which are reported as cash provided by investing activities). Refer to the Consolidated Statements of Cash Flows onpage 44 for additional information.
Page 14

(Millions) 2007 2006 2005 Cash flows from operating activities Health Care and Group Insurance (including corporate interest) $ 2,367.7 $ 1,917.6 $ 1,894.4 Large Case Pensions (302.2) (279.0) (242.9)
Net cash provided by operating activities of continuing operations 2,065.5 1,638.6 1,651.5 Discontinued operations - 49.7 68.8 Net cash provided by operating activities 2,065.5 1,688.3 1,720.3 Cash flows from investing activities Health Care and Group Insurance (1,391.5) (931.3) (1,009.3)Large Case Pensions 353.7 378.0 299.2 Net cash used for investing activities (1,037.8) (553.3) (710.1) Net cash used for financing activities (653.7) (1,447.6) (1,213.6)
Net increase (decrease) in cash and cash equivalents $ 374.0 $ (312.6) $ (203.4)
Cash Flow AnalysisCash flows provided by operating activities for Health Care and Group Insurance were approximately $2.4 billion in 2007 and $1.9 billion in each of2006 and 2005. Included in these amounts were payments of approximately $45 million pretax in 2007 and $245 million pretax in each of 2006 and2005 in voluntary contributions to our tax-qualified pension plan. The cash flows from operating activities also reflect the receipt of approximately$50 million in 2006 and $69 million in 2005 resulting from the completion of certain Internal Revenue Service audits associated with businessespreviously sold by our former parent company (refer to Note 21 of Notes to Consolidated Financial Statements on page 82 for additionalinformation). The cash flows provided by operating activities for 2005 also include payments of approximately $150 million pretax related to a prioryear class action lawsuit settlement.
As discussed in Note 3 of Notes to Consolidated Financial Statements on page 54, during 2007 and 2006, we spent $613 million and $156 millionon acquisitions we expect to enhance our existing product capabilities and future growth opportunities. This use of cash was reported as cash flowsused in investing activities.
Cash flows used for financing activities primarily reflect share repurchases partially offset by higher debt levels during 2007 compared to 2006, and2006 compared to 2005. Refer to Short and Long-Term Debt below for additional information. During the period 2005 through 2007, werepurchased common stock under various repurchase programs authorized by our Board. In 2007, we repurchased approximately 33 million sharesof common stock at a cost of $1.7 billion. In 2006, we repurchased approximately 60 million shares of common stock at a cost of $2.3 billion. In2005, we repurchased approximately 42 million shares of common stock at a cost of $1.7 billion. At December 31, 2007, the capacity remainingunder our Board–approved share repurchase program was approximately $902 million. The Board authorized an additional $750 million sharerepurchase program on February 29, 2008.
On September 28, 2007, our Board declared an annual cash dividend of $.04 per common share to shareholders of record at the close of business onNovember 15, 2007. The dividend was paid on November 30, 2007. While our Board reviews our common stock dividend annually, we currentlyintend to maintain an annual dividend of $.04 per common share. Among the factors considered by our Board in determining the amount of thedividend are our results of operations and the capital requirements, growth and other characteristics of our businesses.
Short and Long-Term DebtIn December 2007, we issued $700 million of our senior notes and used the proceeds to repay commercial paper borrowings. In June 2006, we issued$2 billion of our senior notes and used the proceeds to redeem the entire $700 million aggregate principal amount of our 8.5% senior notes due 2041,repay approximately $400 million of commercial paper borrowings and for general corporate purposes, including share repurchases.
We use short-term borrowings from time to time to address timing differences between cash receipts and disbursements. Our committed short-termborrowing capacity consists of a $1 billion revolving credit facility which terminates in January 2012 and a one-year credit program for certain of oursubsidiaries with a borrowing capacity of up to $45 million. The $1 billion revolving credit facility also provides for the issuance of letters of creditat our request, up to $150 million, which count as usage of the available commitments under the facility. The credit facility permits the aggregatecommitments under the facility to be expanded to a maximum of $1.35 billion upon our agreement with one or more financial institutions. Themaximum amount of commercial paper that was outstanding during 2007 was approximately $767 million.
Page 15

Our total debt to total capital ratio (total debt divided by the sum of shareholders’ equity plus total debt) was approximately 25% and 21% at December31, 2007 and 2006, respectively. We continually monitor existing and alternative financing sources to support our capital and liquidity needs,including, but not limited to, debt issuance, preferred or common stock issuance and pledging or selling of assets.
Refer to Note 13 of Notes to Consolidated Financial Statements on page 69 for additional information on our short-term and long-term debt.
After-tax interest expense was $117 million for 2007, $96 million for 2006 and $80 million for 2005. The increase in interest expense for 2007compared to 2006 was related to higher overall average debt levels as a result of our issuance of senior notes in 2007 and 2006. The increase in interestexpense for 2006 compared to 2005 was related to higher overall average long-term debt levels as a result of our issuance of senior notes in 2006 andthe sale of interest rate swap agreements in 2005. Refer to Notes 13 and 15 of Notes to Consolidated Financial Statements beginning on pages 69 and70, respectively, for additional information.
Other Common Stock TransactionsDuring each of 2006 and 2005, our common stock split two-for-one. All share and per share amounts in this MD&A and the accompanyingConsolidated Financial Statements and related notes have been adjusted to reflect both stock splits. Refer to Note 1 of Notes to Consolidated FinancialStatements on page 45 for additional information about these two stock splits.
Restrictions on Certain PaymentsIn addition to general state law restrictions on payments of dividends and other distributions to shareholders applicable to all corporations, HMOs andinsurance companies are subject to further regulations that, among other things, may require those companies to maintain certain levels of equity(referred to as surplus) and restrict the amount of dividends and other distributions that may be paid to their equity holders. These regulations are notdirectly applicable to Aetna as a holding company, since Aetna is not an HMO or an insurance company. The additional regulations applicable to ourHMO and insurance company subsidiaries are not expected to affect our ability to service our debt, meet our other financing obligations or paydividends, or the ability of any of our subsidiaries to service other financing obligations, if any. Under regulatory requirements, at December 31,2007, the amount of dividends that our insurance and HMO subsidiaries could pay to Aetna without prior approval by regulatory authorities wasapproximately $1.7 billion in the aggregate.
We use dividends from our subsidiaries to meet our liquidity requirements, which include the payment of interest on debt, shareholder dividends,share repurchase programs, investments in new businesses, maintaining appropriate levels of capitalization in our operating subsidiaries and otherpurposes we consider necessary. Excess capital at operating subsidiaries above targeted and/or required capital levels is periodically remitted to us aspermitted by regulatory requirements.
Off-Balance Sheet ArrangementsWe do not have guarantees or other off-balance sheet arrangements that we believe, based on historical experience and current business plans, arereasonably likely to have a material impact on our current or future results of operations, financial condition or cash flows. Refer to Notes 8 and 18of Notes to Consolidated Financial Statements beginning on page 57 and 73, respectively, for additional detail of our variable interest entities andguarantee arrangements, respectively, at December 31, 2007.
Contractual ObligationsThe following table summarizes certain estimated future obligations by period at December 31, 2007, under our various contractual obligations. Thetable below does not include future payments of claims to health care providers or pharmacies because certain terms are not determinable at December31, 2007 (for example, the timing and volume of future services provided under fee-for-service arrangements and future membership levels forcapitated arrangements). We believe that funds from future operating cash flows, together with cash, investments and other funds available under ourcredit agreements or from public or private financing sources, will be sufficient to meet our existing commitments as well as our liquidity needsassociated with future operations, including strategic transactions.
Page 16

(Millions) 2008 2009 - 2010 2011 - 2012 Thereafter Total Long-term debt obligations, including interest $ 208.8 $ 413.1 $ 1,208.3 $ 4,828.2 $ 6,658.4 Operating lease obligations (1) 176.5 241.1 80.6 100.5 598.7 Purchase obligations 372.8 235.8 64.5 18.6 691.7 Other liabilities reflected on our balance sheet: (2) Future policy benefits (3) 750.8 1,250.7 1,008.7 3,932.4 6,942.6 Unpaid claims (3) 619.9 385.4 262.0 537.1 1,804.4 Policyholders' funds (3) (4) 630.5 117.0 101.4 462.4 1,311.3 Other liabilities (5) 1,859.7 155.7 116.1 255.8 2,387.3 Total $ 4,619.0 $ 2,798.8 $ 2,841.6 $ 10,135.0 $ 20,394.4 (1) We did not have any material capital lease obligations at December 31, 2007.(2) Payments of other long-term liabilities exclude Separate Account liabilities of approximately $19.2 billion because these liabilities are supported by assets that are legally
segregated (i.e., Separate Account assets) and are not subject to claims that arise out of our business.(3) Payments of future policy benefits, unpaid claims and policyholders’ funds exclude approximately $1.1 billion, $56 million and $187 million, respectively, of reserves for
contracts subject to reinsurance, because the reinsurance carrier, not us, is responsible for cash flows.(4) Customer funds associated with group life and health contracts of approximately $358 million have been excluded from the table above because such funds may be used
primarily at the customer’s discretion to offset future premiums and/or refunds, and the timing of the related cash flows cannot be determined. Additionally, netunrealized capital gains on debt and equity securities supporting experience-rated products of $38 million have been excluded from the table above.
(5) Other liabilities in the table above include general expense accruals and other related payables and exclude the following:· Employee-related benefit obligations of approximately $656 million including our pension, other postretirement and post-employment benefit obligations and certain
deferred compensation arrangements. These liabilities do not necessarily represent future cash payments we will be required to make, or such payment patterns cannot be
determined. However, other long-term liabilities include anticipated voluntary pension contributions to our tax-qualified defined pension plan of approximately $45 million in 2008 and expected benefit
payments of approximately $505 million over the next ten years for our nonqualified pension plan and our postretirement benefit plans, which we primarily fund when paid by the
plans.
· Deferred gains of approximately $80 million related to prior cash payments which will be recognized in our earnings in the future in accordance with GAAP.· Net unrealized capital gains of approximately $106 million supporting discontinued products.· Minority interests of approximately $35 million consisting of subsidiaries less than 100% owned by us. This amount does not represent future cash payments we
will be required to make.
RatingsAs of February 28, 2008, the credit ratings of Aetna and Aetna Life Insurance Company (“ALIC”) from the respective nationally recognizedstatistical rating organizations (“Rating Agencies”) were as follows: Moody's Investors Standard A.M. Best Fitch Service & Poor'sAetna (senior debt) (1) bbb+ A- A3 A- Aetna (commercial paper) AMB-2 F1 P-2 A-2 ALIC (financial strength) (1) A AA- Aa3 A+(1) All rating agencies have stated the outlook of Aetna’s senior debt and ALIC’s financial strength is stable.
Solvency RegulationThe National Association of Insurance Commissioners (“NAIC”) utilizes risk-based capital (“RBC”) standards for insurance companies that aredesigned to identify weakly capitalized companies by comparing each company’s adjusted surplus to its required surplus (“RBC Ratio”). The RBCRatio is designed to reflect the risk profile of insurance companies. Within certain ratio ranges, regulators have increasing authority to take action asthe RBC Ratio decreases. There are four levels of regulatory action, ranging from requiring insurers to submit a comprehensive plan to the stateinsurance commissioner to requiring the state insurance commissioner to place the insurer under regulatory control. At December 31, 2007, the RBCRatio of each of our primary insurance subsidiaries was above the level that would require regulatory action. The RBC framework described abovefor insurers has been extended by the NAIC to health organizations, including HMOs. Although not all states had adopted these rules at December31, 2007, at that date, each of our active HMOs had a surplus that exceeded either the applicable state net worth requirements or, where adopted, thelevels that would require regulatory action under the NAIC’s RBC rules. External rating agencies use their own RBC standards when they determine acompany’s rating.
Page 17

CRITICAL ACCOUNTING ESTIMATES
We prepare our consolidated financial statements in accordance with GAAP. The application of GAAP requires management to make estimates andassumptions that affect our consolidated financial statements and related notes. The accounting estimates described below are those we considercritical in preparing our consolidated financial statements. We use information available to us at the time the estimates are made; however, as describedbelow, these estimates could change materially if different information or assumptions were used. Also, these estimates may not ultimately reflect theactual amounts of the final transactions that occur.
Health Care Costs PayableHealth care costs payable include estimates of the ultimate cost of claims that have been incurred but not yet reported to us and of those which havebeen reported to us but not yet paid (collectively “IBNR”). At December 31, 2007 and 2006, our IBNR reserves represented approximately 80% and78%, respectively, of total health care costs payable. The remainder of health care costs payable is primarily comprised of pharmacy and capitationpayables and accruals for state assessments. We develop our IBNR estimates using actuarial principles and assumptions that consider numerousfactors. Of those factors, we consider the analysis of historical and projected claim payment patterns (including claims submission and processingpatterns) and the assumed health care cost trend rate to be the most critical assumptions. In developing our estimate of health care costs payable, weconsistently apply these actuarial principles and assumptions each period, with consideration to the variability of related factors.
We analyze historical claim payment patterns by comparing claim incurred dates (i.e., the date services were provided) to claim payment dates toestimate “completion factors.” We estimate completion factors by aggregating claim data based on the month of service and month of claim paymentand estimating the percentage of claims incurred for a given month that are complete by each month thereafter. For any given month, substantially allclaims are paid within six months of the date of service, but it can take up to 48 months or longer before all of the claims are completely resolved andpaid. These historically derived completion factors are then applied to claims paid through the financial statement date to estimate the ultimate claimcost for a given month’s incurred claim activity. The difference between the estimated ultimate claim cost and the claims paid through the financialstatement date represents our estimate of claims remaining to be paid as of the financial statement date and is included in our health care costs payable.
We use completion factors predominantly to estimate reserves for claims with claim incurred dates greater than three months prior to the financialstatement date. The completion factors we use reflect judgments and possible adjustments based on data such as claim inventory levels, claimsubmission and processing patterns and, to a lesser extent, other factors such as changes in health care cost trend rates, changes in membership andproduct mix. If claims are submitted or processed on a faster (slower) pace than prior periods, the actual claims may be more (less) complete thanoriginally estimated using our completion factors, which may result in reserves that are higher (lower) than the ultimate cost of claims.
Because claims incurred within three months prior to the financial statement date have less activity (i.e., a large portion of health care claims are notsubmitted to us and/or processed until after the end of the quarter in which services are rendered by providers to our members), estimates of theultimate cost of claims incurred for these months are not based primarily on the historically derived completion factors. Rather, the estimates for thesemonths also reflect increased emphasis on the assumed health care cost trend rate, which may be influenced by seasonal patterns, and changes inmembership and product mix.
Our health care cost trend rate is affected by changes in per member utilization of medical services as well as changes in the unit cost of suchservices. Many factors influence the health care cost trend rate, including our ability to manage health care costs through underwriting criteria,product design, negotiation of favorable provider contracts and medical management programs. The aging of the population and other demographiccharacteristics, advances in medical technology and other factors continue to contribute to rising per member utilization and unit costs. Changes inhealth care practices, inflation, new technologies, increases in the cost of prescription drugs, direct-to-consumer marketing by pharmaceuticalcompanies, clusters of high cost cases, changes in the regulatory environment, health care provider or member fraud and numerous other factors alsocontribute to the cost of health care and our health care cost trend rate.
Page 18

For each reporting period, we use an extensive degree of judgment in the process of estimating our health care costs payable, and as a result,considerable variability and uncertainty is inherent in such estimates, and the adequacy of such estimates is highly sensitive to changes in assumedcompletion factors and the assumed health care cost trend rates. For each reporting period we recognize our best estimate of health care costs payableconsidering the potential volatility in assumed completion factors and health care cost trend rates, as well as other factors. We believe our estimate ofhealth care costs payable is reasonable and adequate to cover our obligations at December 31, 2007; however, actual claim payments may differ fromour estimates. A worsening (or improvement) of our health care cost trend rates or changes in completion factors from those that we assumed inestimating health care costs payable at December 31, 2007 would cause these estimates to change in the near term, and such a change could bematerial.
Each quarter, we re-examine previously established health care costs payable estimates based on actual claim payments for prior periods and otherchanges in facts and circumstances. Given the extensive degree of judgment in this estimate, it is possible that our estimates of health care costspayable could develop either favorably (i.e., our actual health care costs for the period were less than we estimated) or unfavorably. The changes inour estimate of health care costs payable may relate to a prior fiscal quarter, prior fiscal year or earlier periods. We also consider the results of thesere-examinations when we determine our current year liabilities. Because of the uncertainty involved in establishing estimates of health care costspayable each period, changes in prior period health care cost estimates may be offset by current period health care costs when we establish ourestimate of current period health care costs. Our reserving practice is to consistently recognize the actuarial best estimate of our ultimate liability forhealth care costs payable. When significant decreases (increases) in prior periods’ health care cost estimates occur that we believe significantlyimpact our current period results of operations, we disclose that amount as favorable (unfavorable) development of prior period health care costestimates. We had no significant amount of favorable (unfavorable) development of prior period health care cost estimates that affected our results ofoperations in 2007 or 2006 (refer to Health Care beginning on page 5 and Note 6 of Notes to Consolidated Financial Statements on page 55 foradditional information).
During 2007 and 2006, we have observed an increase in our completion factors as a result of an increase in the speed of our claim submission andprocessing times. After considering the claims paid in 2007 and 2006 with dates of service prior to the fourth quarter of the previous year, weobserved the assumed weighted average completion factors were approximately .5% and .7%, respectively, higher than previously estimated, resultingin a reduction of approximately $66 million in 2007 and $103 million in 2006 in health care costs payable that related to the prior year. We haveconsidered this continued increase in completion factors when determining the completion factors used in our estimates of IBNR at December 31,2007. However, based on our historical claim experience, it is reasonably possible that our assumed completion factors may vary by plus or minus.50% from our assumed rates, which could impact health care costs payable by approximately $42 million pretax.
Also during 2007 and 2006, we observed that our health care cost trend rates for claims with dates of service three months or less before the financialstatement date were slightly lower than previously estimated. Specifically, after considering the claims paid in 2007 and 2006 with dates of service forthe fourth quarter of the previous year, we observed health care cost trend rates that were approximately 4.5% and 3.2%, respectively, lower thanpreviously estimated for claims associated with combined Commercial and Medicare IBNR, resulting in a reduction of approximately $111 million in2007 and $91 million in 2006 in health care costs payable that related to the prior year. The lower than anticipated health care cost trend rates weobserved in 2007 for claims incurred in 2006 were due to moderating outpatient and physician trends, and lower pharmacy trends. The lower thananticipated health care cost trend rates we observed in 2006 for claims incurred in 2005 were due to moderating inpatient, outpatient and primary carephysician service trends. Historical health care cost trend rates are not necessarily representative of current trends. Therefore, we consider historicaltrend rates together with our knowledge of recent events that may impact current trends when developing our estimates of current trend rates. Whenestablishing our reserves at December 31, 2007, we decreased our assumed health care cost trend rates to account for the lower than anticipated healthcare cost trend rates recently observed. However, based on our historical claim experience, it is reasonably possible that our estimated health care costtrend rates may vary by plus or minus 4.0 percentage points from our assumed rates, which could impact health care costs payable by approximately$127 million pretax.
Page 19

Health care costs payable as of December 31, 2007 and 2006 consisted of the following:
(Millions) 2007 2006 Commercial Risk $ 1,881.8 $ 1,793.1 Medicare 227.9 128.7 Medicaid 67.7 5.7 Total health care costs payable $ 2,177.4 $ 1,927.5
Premium Deficiency ReservesWe recognize a premium deficiency loss when it is probable that expected future health care costs will exceed our existing reserves plus anticipatedfuture premiums and reinsurance recoveries. Anticipated investment income is considered in the calculation of expected losses for certaincontracts. Any such reserves established would normally cover expected losses until the next policy renewal dates for the related policies. We did nothave any material premium deficiency reserves for our Health Care business at December 31, 2007.
Other Insurance LiabilitiesWe establish insurance liabilities other than health care costs payable for benefit claims related to our Group Insurance segment. We refer to theseliabilities as other insurance liabilities. These liabilities relate to our life, disability and long-term care products.
Life and DisabilityThe liabilities for our life and disability products reflect benefit claims that have been reported to us but not yet paid, estimates of claims that have beenincurred but not yet reported to us and future policy benefits earned under insurance contracts. We develop these reserves and the related benefitexpenses using actuarial principles and assumptions that consider, among other things, discount, recovery and mortality rates (each discussedbelow). Completion factors are also evaluated when estimating our reserves for claims incurred but not yet reported for life products. We alsoconsider the benefit payments from the U.S. Social Security Administration for which our disability members may be eligible and which may offsetour liability for disability claims (this is known as the Social Security offset). Each period, we estimate these factors, to the extent relevant, basedprimarily on historical data, and use these estimates to determine the assumptions underlying our reserve calculations. Given the extensive degree ofjudgment and uncertainty used in developing these estimates, it is possible that our estimates could develop either favorably or unfavorably.
The discount rate is the interest rate at which future benefit cash flows are discounted to determine the present value of those cash flows. Thediscount rate we select is a critical estimate, because higher discount rates result in lower reserves. We determine the discount rate based on thecurrent and estimated future yield of the asset portfolio supporting our life and disability reserves. If the discount rate we select in estimating ourreserves is lower (higher) than our actual future portfolio returns, our reserves may be higher (lower) than necessary. Our discount rates for life anddisability reserves at December 31, 2007 increased by .06% and .12%, respectively, when compared to the rates used at December 31, 2006, and therates at December 31, 2006 decreased by .22% and .01%, respectively, when compared to the rates used at December 31, 2005. The discount rateswe selected for disability and life reserves at December 31, 2007 were higher than the rates we selected in the previous year as a result of increasinginvestment yields on the portfolio of assets supporting these reserves. The discount rates we selected for disability and life reserves at December 31,2006 were lower than the rates we selected in the previous year as a result of declining investment yields on the portfolio of assets supporting thesereserves. Based on our historical experience, it is reasonably possible that the assumed discount rates for our life and disability reserves may vary byplus or minus .25% from year to year. A .25% decrease in the discount rates selected for both our life and disability reserves would have increasedcurrent and future life and disability benefit costs by approximately $13 million pretax for 2007.
Page 20

For disability claims and a portion of our life claims, we must estimate the timing of benefit payments, which takes into consideration the maximumbenefit period and the probabilities of recovery (i.e., recovery rate) or death (i.e., mortality rate) of the member. Benefit payments may also be affectedby a change in employment status of a disabled member, for example if the member returns to work on a part-time basis. Estimating the recovery andmortality rates of our members is complex. Our actuaries evaluate our current and historical claim patterns, the timing and amount of any SocialSecurity offset (for disability only), as well as other factors including the relative ages of covered members and the duration of each member’sdisability when developing these assumptions. For disability reserves, if our actual recovery and mortality rates are lower (higher) than our estimates,our reserves will be lower (higher) than required to cover future disability benefit payments. For certain life reserves, if the actual recovery rates arelower (higher) than our estimates or the actual mortality rates are higher (lower) than our estimates, our reserves will be lower (higher) than required tocover future life benefit payments. We use standard industry tables and our historical claim experience to develop our estimated recovery and mortalityrates. Claim reserves for our disability and life claims are sensitive to these assumptions. Our historical experience has been that our recovery ormortality rates for our life and disability reserves vary by less than one percent during the course of a year. A one percent less (more) favorableassumption for our recovery or mortality rates would have increased (decreased) current and future life and disability benefit costs by approximately$5 million pretax for 2007. When establishing our reserves at December 31, 2007, we have adjusted our estimates of these rates based on recentexperience.
We estimate our reserve for claims incurred but not yet reported to us for life products largely based on completion factors. The completion factorswe use are based on our historical experience and reflect judgments and possible adjustments based on data such as claim inventory levels, claimpayment patterns, changes in business volume and other factors. If claims are submitted or processed on a faster (slower) pace than historicalperiods, the actual claims may be more (less) complete than originally estimated using our completion factors, which may result in reserves that arehigher (lower) than required to cover future life benefit payments. At December 31, 2007, we held approximately $233 million in reserves for lifeclaims incurred but not yet reported to us.
Long-term CareWe establish a reserve for future policy benefits for our long-term care products at the time each policy is issued based on the present value ofestimated future benefit payments less the present value of estimated future premiums. In establishing this reserve, we must evaluate assumptionsabout mortality, morbidity, lapse rates and the rate at which new claims are submitted to us. We estimate the future policy benefits reserve for long-term care products using these assumptions and actuarial principles. For long-duration insurance contracts, we use our original assumptionsthroughout the life of the policy and do not subsequently modify them unless we deem the reserves to be inadequate. A portion of our reserves forlong-term care products also reflect our estimates relating to future payments to members currently receiving benefits. These reserves are estimatedprimarily using recovery and mortality rates, as described above.
Premium Deficiency ReservesWe recognize a premium deficiency loss when it is probable that expected future policy benefit costs will exceed our existing reserves plusanticipated future premiums and reinsurance recoveries. Anticipated investment income is considered in the calculation of expected losses for certaincontracts. Any such reserves established would normally cover expected losses until the next policy renewal dates for the related policies. We did nothave any material premium deficiency reserves for our Group Insurance business at December 31, 2007.
Large Case Pensions Discontinued Products ReserveWe discontinued certain Large Case Pensions products in 1993 and established a reserve to cover losses expected during the run-off period. Since1993, we have made several adjustments to reduce this reserve that have increased our net income. These adjustments occurred primarily because ourinvestment experience as well as our mortality and retirement experience have been better than the experience we projected at the time we discontinuedthe products. In 2007, 2006 and 2005, $64 million ($42 million after tax), $115 million ($75 million after tax) and $67 million ($43 million aftertax), respectively, of reserves were released for these reasons. There can be no assurance that adjustments to the discontinued products reserve willoccur in the future or that they will increase net income. Future adjustments could negatively impact our operating results.
Page 21

Recoverability of Goodwill and Other Acquired Intangible AssetsWe have made acquisitions that included a significant amount of goodwill and other intangible assets. Goodwill is subject to an annual (or undercertain circumstances more frequent) impairment test based on its estimated fair value. Other intangible assets that meet certain criteria continue to beamortized over their useful lives and are also subject to a periodic impairment test. For these impairment evaluations, we use an implied fair valueapproach, which uses a discounted cash flow analysis and other valuation methodologies. These impairment evaluations use many assumptions andestimates in determining an impairment loss, including certain assumptions and estimates related to future earnings. If we do not achieve our earningsobjectives, the assumptions and estimates underlying these impairment evaluations could be adversely affected, which could result in an assetimpairment charge that would negatively impact our operating results.
Measurement of Defined Benefit Pension and Other Postretirement Benefit PlansWe sponsor defined benefit pension (“pension”) and other postretirement benefit (“OPEB”) plans. Refer to Note 12 of Notes to ConsolidatedFinancial Statements beginning on page 62 for additional information. Major assumptions used in the accounting for these plans include the expectedreturn on plan assets and the discount rate. We select our assumptions based on our information and market indicators, and we evaluate ourassumptions at each annual measurement date (currently December 31). A change in any of our assumptions would have an effect on our pensionand OPEB plan costs.
Our expected return on plan assets assumption is based on many factors, including forecasted capital market real returns over a long-term horizon,forecasted inflation rates, historical compounded asset returns and patterns and correlations on those returns. Expectations for modest increases ininterest rates, normal inflation trends and average capital market real returns led us to an expected return on pension plan assets assumption of 8.5%for 2007 and 2006 and an expected return on OPEB plan assets assumption of 5.5% for 2007 and 5.7% for 2006. Our expected return on pensionplan assets is based on asset range allocations assumptions of 55% – 75% U.S. and international public and private equity securities, 10% – 30%fixed income securities and 5% – 25% real estate and other assets. We regularly review actual asset allocations and periodically rebalance ourinvestments to the mid-point of our targeted allocation ranges when we consider it appropriate. At December 31, 2007, our actual asset allocationswere consistent with our asset allocation assumptions. A one-percentage point increase/decrease in our expected return on plan assets assumptionwould decrease/increase our annual pension costs by approximately $38 million after tax and would decrease/increase our annual OPEB costs byapproximately $.5 million after tax.
The discount rates we used in accounting for our pension and OPEB plans were calculated using a yield curve as of our annual measurementdate. The yield curve consists of a series of individual discount rates, with each discount rate corresponding to a single point-in-time, based on highquality bonds (that is, bonds with a rating of Aa or better from Moody’s Investors Service or a rating of AA or better from Standard and Poor’s). Weproject the benefits expected to be paid from each plan at each point in the future based on each participant’s current service (but reflecting expectedfuture pay increases). These projected benefit payments are then discounted to the measurement date using the corresponding rate from the yieldcurve. A lower discount rate increases the present value of benefit obligations and increases costs. In 2007, we increased our assumed discount rateto 6.56% and 6.35% for our pension and OPEB plans, respectively, up from 5.98% and 5.85%, respectively, at the previous measurement date in2006. A one-percentage point decrease in the assumed discount rate would increase our annual pension costs by approximately $37 million after taxand would have a negligible effect on our annual OPEB costs.
At December 31, 2007, the pension and OPEB plans had aggregate actuarial losses of $609 million. These losses are primarily due to increases inplan liabilities attributable to lower than expected interest rates from 2000 to 2005. The accumulated actuarial loss is amortized over the remainingservice life of pension plan participants (estimated at 9.6 years at December 31, 2007) and the expected life of OPEB plan participants (estimated atup to 16.2 years at December 31, 2007) to the extent the loss is outside of a corridor established in accordance with GAAP. The corridor isestablished based on the greater of 10% of the plan assets or 10% of the projected benefit obligation. At December 31, 2007, $100 million of theactuarial loss was outside of the corridor, resulting in amortization of approximately $6 million after tax in our 2008 pension and OPEB expense.
Page 22

Our expected return on plan assets and discount rate discussed above will not affect the cash contributions we are required to make to our pension andOPEB plans because we have met all minimum funding requirements set forth by the Employee Retirement Income Security Act of 1974(“ERISA”). We will not have a minimum funding requirement for our pension and OPEB plans in 2008. However, we currently intend to make avoluntary pension contribution of approximately $45 million in 2008.
Other-Than-Temporary Impairment of Investment SecuritiesWe regularly review our debt and equity securities to determine whether a decline in fair value below the carrying value is other-than-temporary. If adecline in fair value is considered other-than-temporary, the cost basis/carrying amount of the security is written down, and the amount of the write-down is included in our results of operations. This analysis requires significant diligence and involves judgment. We analyze all facts andcircumstances we believe are relevant for each investment when performing this analysis, in accordance with the guidance of FAS No. 115,“Accounting for Certain Investments in Debt and Equity Securities,” FASB Staff Position FAS 115-1 and FAS 124-1, “The Meaning ofOther-Than-Temporary Impairment and its Application to Certain Investments” and the Securities and Exchange Commission’s StaffAccounting Bulletin No. 59, “Accounting for Noncurrent Marketable & Equities Securities.”
Among the factors considered in evaluating whether a decline is other-than-temporary, we consider whether the decline in fair value results from achange in the quality of the investment security itself, whether the decline results from a downward movement in the market as a whole, the prospectsfor realizing the carrying value of the security based on the investment’s current and short-term prospects for recovery and other factors. Forunrealized losses deemed to be the result of market conditions (for example, increasing interest rates and volatility due to conditions in the overallmarket) or industry-related events, we determine if sufficient market recovery can occur within a reasonable period of time and whether we have theintent and ability to hold the investment until market recovery, which may be until maturity. In such a case, an other-than-temporary impairment is notrecognized. Securities in an unrealized loss position for which we believe the decline is a result of the quality of the security or the credit-worthinessof the issuer, or which we do not have the intent and ability to hold until recovery in value, are considered other-than-temporarily impaired, and wewrite down their carrying value to fair value.
In determining our ability to hold a security until full recovery of value, we consider the following factors, among others:· forecasted recovery period, based on our internal credit analysts’ expectations, as well as research performed by external rating agencies;· whether the expected investment return is sufficient relative to other funding sources; and· our projected cash flow and capital requirements.
We have the ability and intent to hold the securities that were in an unrealized loss position at December 31, 2007 until such securities recover in value.
The risks inherent in assessing the impairment of an investment include the risk that market factors may differ from our expectations and the risk thatfacts and circumstances factored into our assessment may change with the passage of time. Unexpected changes to market factors and circumstancesthat were not present in past reporting periods may result in a current period decision to sell securities that were not impaired in prior reporting periods.
Revenue Recognition (Allowance for Estimated Terminations and Uncollectable Accounts)Our revenue is principally derived from premiums and fees billed to customers in the Health Care and Group Insurance businesses. In Health Care,revenue is recognized based on customer billings, which reflect contracted rates per employee and the number of covered employees recorded in ourrecords at the time the billings are prepared. Billings are generally sent monthly for coverage during the following month. In Group Insurance,premium for group life and disability products is recognized as revenue, net of allowances for uncollectable accounts, over the term ofcoverage. Amounts received before the period of coverage begins are recorded as unearned premiums.
Page 23

Health Care billings may be subsequently adjusted to reflect changes in the number of covered employees due to terminations or other factors. Theseadjustments are known as retroactivity adjustments. We estimate the amount of future retroactivity each period and adjust the recorded revenueaccordingly. We also estimate the amount of uncollectable receivables each period and establish an allowance for uncollectable amounts. We basesuch estimates on historical trends, premiums billed, the amount of contract renewal activity during the period and other relevant information. Asinformation regarding actual retroactivity and uncollectable amounts becomes known, we refine our estimates and record any required adjustments torevenues in the period they arise. A significant difference in the actual level of retroactivity or uncollectable amounts when compared to our estimatedlevels would have a significant effect on Health Care’s results of operations.
NEW ACCOUNTING STANDARDSRefer to Note 2 of Notes to Consolidated Financial Statements, beginning on page 45, for a discussion of recently issued accounting standards.
REGULATORY ENVIRONMENT
General
Our operations are subject to comprehensive federal, state, local and international regulation in the jurisdictions in which we do business. The lawsand rules governing our business and interpretations of those laws and rules are subject to frequent change. Further we must obtain and maintainregulatory approvals to market many of our products. Supervisory agencies, including state health, insurance and managed care departments and stateboards of pharmacy, have broad authority to:
· Grant, suspend and revoke our licenses to transact business;· Regulate many aspects of the products and services we offer;· Assess fines, penalties and/or sanctions;· Monitor our solvency and reserve adequacy; and· Regulate our investment activities on the basis of quality, diversification and other quantitative criteria.
Our operations and accounts and other books and records are subject to examination at regular intervals by these agencies. In addition, our currentand past business practices are subject to review by, and we from time to time receive subpoenas and other requests for information from, theseagencies and other state and federal authorities. These reviews may result, and have resulted, in changes to or clarifications of our business practices,as well as fines, penalties or other sanctions.
The federal and state governments continue to enact and seriously consider many legislative and regulatory proposals that have or could materiallyimpact various aspects of the health care system. For example, proposals that would address the issues of affordability and availability of healthinsurance, including ways to reduce the number of uninsured, are currently pending in many states and have been advanced by a number ofpresidential candidates. The proposals vary, and include individual insurance requirements, the expansion of eligibility under existing Medicaidprograms, minimum medical benefit ratios for health plans, mandatory issuance of insurance coverage and requiring health plans and insurers to setpremiums based only on age and home address. While certain of these measures would adversely affect us, at this time we cannot predict the extentof this impact.
Health Care Regulation
GeneralThe federal and state governments have adopted laws and regulations that govern our business activities in various ways. These laws and regulationsrestrict how we conduct our business and result in additional burdens and costs to us. Areas of governmental regulation include:· Licensure· Policy forms, including plan design and disclosures· Premium rates and rating methodologies· Medical benefit ratios· Underwriting rules and procedures
Page 24

· Benefit mandates· Market conduct· Utilization review activities· Payment of claims, including timeliness and accuracy of payment· Member rights and responsibilities· Sales and marketing activities· Quality assurance procedures· Disclosure of medical and other information· In network and out-of-network provider rates of payment· General assessments· Provider contract forms· Pharmacy and pharmacy benefit management operations· Required participation in coverage arrangements for high-risk insureds, either directly or through an assessment or other risk pooling mechanism· Delegation of risk and other financial arrangements· Producer licensing and compensation· Financial condition (including reserves) and · Corporate governance. These laws and regulations are different in each jurisdiction.
States generally require health insurers and HMOs to obtain a certificate of authority prior to commencing operations. To establish a new insurancecompany or an HMO in a state, we generally would have to obtain such a certificate. The time necessary to obtain such a certificate varies from stateto state. Each health insurer and HMO must file periodic financial and operating reports with the states in which it does business. In addition, healthinsurers and HMOs are subject to state examination and periodic license renewal. These laws also restrict the ability of our regulated subsidiaries topay dividends. In addition, some of our business and related activities may be subject to PPO, managed care organization, utilization review or third-party administrator-related regulations and licensure requirements. These regulations differ from state to state, but may contain network, contracting,product and rate, financial and reporting requirements. There also are laws and regulations that set specific standards for our delivery of services,payment of claims, fraud prevention, protection of consumer health information and covered benefits and services.
Pricing and Underwriting RestrictionsPricing and underwriting regulation by states limits our underwriting and rating practices and that of other health insurers, particularly for smallemployer groups and individuals. These laws and regulations vary by state. In general, they apply to certain business segments and limit our ability toset prices or renew business, or both, based on specific characteristics of the group or the group’s prior claim experience. In some states, these lawsand regulations restrict our ability to price for the risk we assume and/or reflect reasonable costs in our pricing, including by specifying minimummedical benefit ratios or requiring us to issue policies at specific prices to certain members.
Many of these laws and regulations limit the differentials in rates insurers and other carriers may charge between new and renewal business, and/orbetween groups based on differing characteristics. They may also require that carriers disclose to customers the basis on which the carrier establishesnew business and renewal rates, restrict the application of pre-existing condition exclusions and limit the ability of a carrier to terminate coverage ofan employer group.
The federal Health Insurance Portability and Accountability Act of 1996 (“HIPAA”) generally requires insurers and other carriers that cover smallemployer groups in any market to accept for coverage any small employer group applying for a basic and standard plan of benefits. HIPAA alsomandates guaranteed renewal of health care coverage for most employer groups, subject to certain defined exceptions, and provides for specifiedemployer notice periods in connection with product and market withdrawals. The law further limits exclusions based on pre-existing conditions forindividuals covered under group policies to the extent the individuals had prior creditable coverage within a specified time frame. HIPAA is structuredas a “floor” requirement, allowing states latitude to enact more stringent rules governing each of these restrictions. For example, certain states havemodified HIPAA’s definition of a small group (2-50 employees) to include groups of one employee.
Page 25

In addition, a number of states provide for a voluntary reinsurance mechanism to spread small group risk among participating insurers and othercarriers. In a small number of states, participation in this pooling mechanism is mandatory for all small group carriers. In general, we have elected notto participate in voluntary pools, but even in the voluntary pool states, we may be subject to certain supplemental assessments related to the state’ssmall group experience.
HIPAA Administrative Simplification and Privacy; Gramm-Leach-Bliley ActThe regulations under the administrative simplification provisions of HIPAA also impose a number of additional obligations on issuers of healthinsurance coverage and health benefit plan sponsors. The law authorizes the U.S. Department of Health and Human Services (“HHS”) to issuestandards for electronic transactions, as well as privacy and security of medical records and other individually identifiable health information(“Administrative Simplification”).
Administrative Simplification requirements apply to self-funded group health plans, health insurers and HMOs, health care clearinghouses and healthcare providers who transmit health information electronically (“Covered Entities”). Regulations adopted to implement Administrative Simplificationalso require that business associates acting for or on behalf of these Covered Entities be contractually obligated to meet HIPAA standards. TheAdministrative Simplification regulations establish significant criminal penalties and civil sanctions for noncompliance.
Under Administrative Simplification, HHS has released rules mandating the use of standard formats in electronic health care transactions (forexample, health care claims submission and payment, plan eligibility, precertification, claims status, plan enrollment and disenrollment, payment andremittance advice, plan premium payments and coordination of benefits). HHS also has published rules requiring the use of standardized code setsand unique identifiers for employers and providers. We have met all applicable Administrative Simplification requirements to date. We are required tocomply with provider identifier rules by May 2008.
The HIPAA privacy regulations adopted by HHS established limits on the use and disclosure of medical records and other individually identifiablehealth information by Covered Entities. In addition, the HIPAA privacy regulations provide patients with new rights to understand and control howtheir health information is used. The HIPAA privacy regulations do not preempt more stringent state laws and regulations that may apply to us andother Covered Entities, and complying with additional state requirements could require us to make additional investments beyond those we have madeto comply with the HIPAA regulations. HHS has also adopted security regulations designed to protect member health information from unauthorizeduse or disclosure.
In addition, states have adopted regulations to implement provisions of the Financial Modernization Act of 1999 (also known as Gramm-Leach-Bliley Act (“GLBA”)) which generally require insurers to provide customers with notice regarding how their non-public personal health and financialinformation is used and the opportunity to “opt out” of certain disclosures before the insurer shares such information with a non-affiliated thirdparty. In addition to health insurance, the GLBA regulations apply to life and disability insurance. Like HIPAA, this law sets a “floor” standard,allowing states to adopt more stringent requirements governing privacy protection. GLBA also gives banks and other financial institutions the abilityto affiliate with insurance companies, which may lead to new competitors in the insurance and health benefits businesses.
Legislative and Regulatory InitiativesThere has been a continuing trend of increased legislative activity concerning health care reform and regulation at both the federal and state levels. Forexample, Massachusetts has enacted comprehensive reform, including an individual health coverage mandate. A number of other state legislatures,including California, Connecticut, Illinois, Ohio and Pennsylvania, recently contemplated but have not enacted significant reform of their healthinsurance markets. Other states are expected to consider these types of reforms as well as more modest reforms aimed at expanding Medicaid andSCHIP eligibility. These proposals include provisions affecting both public programs and privately-financed health insurance arrangements. Broadlystated, these proposals attempt to increase the number of insured by expanding eligibility for Medicaid and other public programs and compellingindividuals and employers to purchase health insurance coverage. At the same time, these proposals would reform the underwriting and marketingpractices of health plans, for example by placing restrictions on pricing and mandating minimum medical benefit ratios.
Page 26

Legislation, regulation and initiatives relating to this continuing trend include among other things, the following:· Amending or supplementing ERISA to impose greater requirements on the administration of employer-funded benefit plans or limit the scope of
current ERISA pre-emption, which would among other things expose us and other health plans to expanded liability for punitive and other extra-contractual damages and additional state regulation.
· Imposing assessments on (or to be collected by) health plans or health carriers, which may or may not be passed onto their customers. Theseassessments may include assessments for insolvency, assessments for uninsured or high-risk pools, assessments for uncompensated care, orassessments to defray provider medical malpractice insurance costs.
· Reducing government funding of government-sponsored health programs in which we participate.
· Mandating minimum medical benefit ratios or otherwise restricting health plans’ profitability.
· Extending malpractice and other liability exposure for decisions made by health plans.
· Mandating coverage for certain conditions and/or specified procedures, drugs or devices (for example, infertility treatment and experimentalpharmaceuticals).
· Mandating expanded employer and consumer disclosures and notices.
· Regulating e-connectivity.
· Mandating health insurance access and/or affordability.
· Mandating or regulating the disclosure of provider fee schedules and other data about our payments to providers.
· Mandating or regulating disclosure of provider outcome and/or efficiency information.
· Imposing substantial penalties for our failure to pay claims within specified time periods.
· Imposing payment levels for services rendered to our members by providers who do not have contracts with us.
· Exempting physicians from the antitrust laws that prohibit price fixing, group boycotts and other horizontal restraints on competition.
· Restricting health plan claim processing, review, payment and related procedures.
· Mandating internal and external grievance and appeal procedures (including expedited decision making and access to external claim review).
· Enabling the creation of new types of health plans or health carriers, which in some instances would not be subject to the regulations orrestrictions that govern our operations.
· Allowing individuals and small groups to collectively purchase health care coverage without any other affiliations.
· Imposing requirements and restrictions on operations of pharmacy benefit managers, including restricting or eliminating the use of formulariesfor prescription drugs.
· Creating or expanding state-sponsored health benefit purchasing pools, in which we may be required to participate.
· Creating a single payer system where the government oversees or manages the provision of health care coverage.
· Imposing requirements and restrictions on consumer-driven health plans and/or health savings accounts.· Restricting the ability of health plans to establish member financial responsibility.
· Regulating the individual coverage market by restricting or mandating premium levels, restricting our underwriting discretion or restricting ourability to rescind coverage based on a member’s misrepresentations or omissions.
· Requiring employers to provide health care coverage for their employees.
· Requiring individuals to purchase health care coverage.
Page 27

It is uncertain whether we can counter the potential adverse effects of such potential legislation or regulation, including whether we can recoup,through higher premiums or other measures, the increased costs of mandated benefits, assessments or other increased costs.
We also may be adversely impacted by court and regulatory decisions that expand the interpretations of existing statutes and regulations or imposemedical malpractice or bad faith liability. Among other issues, federal and state courts continue to consider cases addressing the pre-emptive effect ofERISA on state laws. In general, limitations to this pre-emption have the effect of increasing our costs, liability exposures, or both. The legislativeinitiatives discussed above include proposals in the U.S. Congress to restrict the pre-emptive effect of ERISA and state legislative activity in severalstates that, should it result in enacted legislation that is not pre-empted by ERISA, could increase our liability exposure and could result in greater stateregulation of our operations.
ERISAThe provision of services to certain employee benefit plans, including certain Health Care, Group Insurance and Large Case Pensions benefit plans, issubject to ERISA, a complex set of laws and regulations subject to interpretation and enforcement by the Internal Revenue Service and theDepartment of Labor (the “DOL”). ERISA regulates certain aspects of the relationships between us and employers who maintain employee benefitplans subject to ERISA. Some of our administrative services and other activities may also be subject to regulation under ERISA.
DOL regulations under ERISA set standards for claim payment and member appeals along with associated notice and disclosure requirements. Wehave invested significant resources to comply with these standards, which represent an additional regulatory burden for us.
Certain Large Case Pensions and Group Insurance products and services are also subject to potential issues raised by certain judicial interpretationsrelating to ERISA. Under those interpretations, together with DOL regulations, we may have ERISA fiduciary duties with respect to certain generalaccount assets held under contracts that are not guaranteed benefit policies. As a result, certain transactions related to those assets are subject toconflict of interest and other restrictions, and we must provide certain disclosures to policyholders annually. We must comply with these restrictionsor face substantial penalties.
MedicareOur Medicare products are regulated by CMS. CMS has the right to audit our performance to determine compliance with CMS contracts andregulations and the quality of care being given to Medicare beneficiaries. The regulations and contractual requirements applicable to us and otherparticipants in Medicare programs are complex and subject to change. Although we have invested significant resources to comply with thesestandards and believe our compliance efforts are adequate, our Medicare compliance efforts will continue to require significant resources.
As a result of funding and other reforms contained in the Medicare Prescription Drug, Improvement, and Modernization Act of 2003 (the “MedicareAct”):
· In 2005, 2006, 2007 and 2008 we elected to expand our participation in the Medicare Advantage program in selected markets;· In September 2005, we began participating in a three year CMS-sponsored pilot program in the Chicago, Illinois metropolitan area to provide
disease management and case management services to members in the Medicare fee-for-service program;· In January 2006, we began offering PDP products in all 34 CMS designated regions; and· In 2007, we began to offer PFFS plans in select markets for individuals and PFFS plans for employer groups that can cover retirees
nationwide.
This expansion of the Medicare markets we serve and Medicare products we offer increases our exposure to changes in government policy withrespect to and/or regulation of the Medicare programs in which we participate, including changes in the amounts payable to us under thoseprograms. Although it is not possible to predict the longer term adequacy of payments we receive under these programs and there are economic andpolitical pressures to reduce spending on these programs, we currently believe that the payments we receive are adequate to justify our continuedparticipation in these programs.
Page 28

Going forward, we expect the U.S. Congress to closely scrutinize each component of the Medicare program (including PDP) and possibly seek tolimit the private insurers’ role. For example, the federal government may seek to negotiate drug prices for the PDP, a function we currently perform asa PDP sponsor. It is not possible to predict the outcome of this Congressional oversight or any legislative activity, either of which could adverselyaffect us.
MedicaidIn 2007, we substantially increased our Medicaid product offerings through our acquisition of Schaller Anderson. As a result, we also increased ourexposure to changes in government policy with respect to and/or regulation of the various Medicaid programs in which we participate, including theamounts payable to us under those programs. Medicaid premiums are paid by each state and differ from state to state. The federal government and thestates in which we have Medicaid business are presently considering proposals and legislation that would implement certain Medicaid reforms orredesigns, including changes to reimbursement or payment levels or eligibility criteria. Future levels of Medicaid funding and premium rates may beaffected by continuing government efforts to contain health care costs and may be further affected by state and federal budgetary constraints. Inaddition, our Medicaid contracts with states are subject to cancellation by the state after a short notice period without cause or in the event ofinsufficient state funding. Our Medicaid products are also regulated by CMS, which has the right to audit our performance to determine compliancewith CMS contracts and regulations. In addition, our Medicaid products and State Children’s Health Insurance Program contracts are subject tofederal and state regulations and oversight by state Medicaid agencies regarding the services provided to Medicaid enrollees, payment for thoseservices and other aspects of these programs. The regulations and contractual requirements applicable to us and other participants in Medicaidprograms are complex and subject to change. Although we have invested significant resources to comply with these standards and believe ourcompliance efforts are adequate, our Medicaid compliance efforts will continue to require significant resources.
HMO and Insurance Holding Company LawsA number of states, including Pennsylvania and Connecticut, regulate affiliated groups of HMOs and insurers such as the Company under holdingcompany statutes. These laws may require us and our subsidiaries to maintain certain levels of equity. Holding company laws and regulationsgenerally require insurance companies and HMOs within an insurance holding company system to register with the insurance department of each statewhere they are domiciled and to file reports with those states’ insurance departments regarding capital structure, ownership, financial condition,intercompany transactions and general business operations. In addition, various notice or prior regulatory approval requirements apply to transactionsbetween insurance companies, HMOs and their affiliates within an insurance holding company system, depending on the size and nature of thetransactions. For information regarding restrictions on certain payments of dividends or other distributions by HMO and insurance companysubsidiaries of our company, refer to Note 16 of Notes to Consolidated Financial Statements on page 72.
The holding company laws for the states of domicile of Aetna and certain of its subsidiaries also restrict the ability of any person to obtain control ofan insurance company or HMO without prior regulatory approval. Under those statutes, without such approval (or an exemption), no person mayacquire any voting security of an insurance holding company (such as our parent company, Aetna Inc.) that controls an insurance company or HMO,or merge with such a holding company, if as a result of such transaction such person would control the insurance holding company. Control isgenerally defined as the direct or indirect power to direct or cause the direction of the management and policies of a person and is presumed to exist ifa person directly or indirectly owns or controls 10% or more of the voting securities of another person.
Audits and Investigations; Fraud and Abuse Laws
We typically have been and are currently involved in various governmental investigations, audits and reviews. These include routine, regular andspecial investigations, audits and reviews by CMS, state insurance and health and welfare departments, state attorneys general, the Office of theInspector General, the Office of Personnel Management, U.S. Congressional committees, the U.S. Department of Justice and U.S. Attorneys. Suchgovernment actions can result in assessment of damages, civil or criminal fines or penalties, or other sanctions, including the loss of licensure orexclusion from participation in government programs. Refer to “Litigation and Regulatory Proceedings” in Note 18 of Notes to ConsolidatedFinancial Statements beginning on page 74 for more information.
Page 29

Federal and state governments have made investigating and prosecuting health care fraud and abuse a priority. Fraud and abuse prohibitionsencompass a wide range of activities, including kickbacks for referral of members, billing for unnecessary medical services, improper marketing,and violations of patient privacy rights. Companies involved in public health care programs such as Medicare and Medicaid are often the subject offraud and abuse investigations. The regulations and contractual requirements applicable to us and other participants in these public-sector programsare complex and subject to change. Although we believe our compliance efforts are adequate, ongoing vigorous law enforcement and the highlytechnical regulatory scheme mean that our compliance efforts in this area will continue to require significant resources.
Guaranty Fund AssessmentsUnder guaranty fund laws existing in all states, insurers doing business in those states can be assessed (up to prescribed limits) for certain obligationsof insolvent insurance companies to policyholders and claimants. Assessments generally are based on a formula relating to our premiums in the statecompared to the premiums of other insurers. While we historically have recovered more than half of guaranty fund assessments through statutorilypermitted premium tax offsets, significant increases in assessments could jeopardize future recovery of these assessments. Some states have similarlaws relating to HMOs.
Regulation of Pharmacy OperationsWe own two mail-order pharmacy facilities and one specialty pharmacy facility. One mail order pharmacy is located in Missouri and the specialtypharmacy and our second mail order pharmacy are located in Florida. These facilities dispense pharmaceuticals throughout the U.S. The pharmacypractice is generally regulated at the state level by state boards of pharmacy. Each of our pharmacies is licensed in the state where it is located, as wellas in the states that require registration or licensure with the state’s board of pharmacy or similar regulatory body. Loss or suspension of any suchlicenses could have a material effect on our pharmacy business and/operating results.
Regulation of Pharmacy Benefit Management OperationOur pharmacy benefit management (“PBM”) operation is regulated directly and indirectly at the federal and state levels. These laws and regulationsgovern, and proposed legislation may govern, critical PBM practices, including disclosure, receipt and retention of rebates and other paymentsreceived from pharmaceutical manufacturers, drug utilization management practices, the level of duty a PBM owes its customers and registration orlicensing of PBMs. Failure to comply with these laws or regulations could have a material effect on our PBM operation and/or operating results.
International RegulationCertain of our Health Care operations are conducted in foreign countries. These international operations are subject to different legal and regulatoryrequirements in different jurisdictions, including various privacy, insurance, tax, tariff and trade laws and regulations, as well as corporate,employment, intellectual property and investment laws and regulations.
FORWARD-LOOKING INFORMATION/RISK FACTORS
The Private Securities Litigation Reform Act of 1995 (the “1995 Act”) provides a “safe harbor” for forward-looking statements, so long as (1)those statements are identified as forward-looking, and (2) the statements are accompanied by meaningful cautionary statements that identify importantfactors that could cause actual results to differ materially from those discussed in the statement. We want to take advantage of these safe harborprovisions.
Certain information contained in this MD&A is forward-looking within the meaning of the 1995 Act or Securities and Exchange Commissionrules. This information includes, but is not limited to: the Outlook for 2008 beginning on page 3 and Risk Management and Market-SensitiveInstruments on page 14. In addition, throughout this MD&A, we use the following words, or variations or negatives of these words and similarexpressions, when we intend to identify forward-looking statements:
Page 30

· Expects · Intends · Seeks · Will · Potential
· Projects · Plans · Estimates · Should · Continue· Anticipates · Believes · May
Forward-looking statements rely on a number of assumptions concerning future events, and are subject to a number of significant uncertainties andother factors, many of which are outside our control, that could cause actual results to differ materially from those statements. You should not putundue reliance on forward-looking statements. We disclaim any intention or obligation to update or revise forward-looking statements, whether as aresult of new information, future events or otherwise.
Risk FactorsYou should carefully consider each of the following risks and all of the other information set forth in this MD&A or elsewhere in our Annual Reportor our Annual Report on Form 10-K. These risks and other factors may affect forward-looking statements, including those we make in this MD&Aor elsewhere, such as in news releases or investor or analyst calls, meetings or presentations. The risks and uncertainties described below are not theonly ones we face. Additional risks and uncertainties not presently known to us or that we currently believe to be immaterial may also adversely affectour business. Any of these risks or uncertainties could cause our actual results to differ materially from our expectations and the expected resultsdiscussed in our forward-looking statements. You should not consider past results to be an indication of future performance.
If any of the following risks or uncertainties develops into actual events, this could have a material adverse effect on our business, financial conditionor results of operations. In that case, the trading price of our common stock could decline materially.
We must continue to differentiate our products and services from those of our competitors; we operate in an evolving industry that requiresus to anticipate changes in customer preferences and deliver products and services that demonstrate value to our customers.We operate in a highly competitive environment and in an industry that is subject to significant ongoing changes from market pressures brought aboutby customer demands, as well as business consolidations, strategic alliances, legislative and regulatory changes and marketing practices. In addition,our customers generally, and our larger customers particularly, are well informed and organized and have significant flexibility in moving between usand our competitors. These factors require us to differentiate our products and services by anticipating changes in customer preferences anddelivering products and services that demonstrate value to our customers. Failure to anticipate changes in customer preferences or deliver productsand services that demonstrate value to our customers can affect our ability to retain or grow profitable membership which can adversely affect ouroperating results.
Our ability to forecast and detect medical cost trends and achieve appropriate pricing affects our profitability.Premium revenues from our Insured Health Care products comprised approximately 78% of our total consolidated revenues for the year endedDecember 31, 2007. We continue to be vigilant in our pricing and have generally increased our premium rates for Insured business that prices orreprices in 2008. Our health care premiums are generally fixed for one-year periods. Accordingly, future cost increases in excess of health care orother benefit cost projections reflected in our pricing cannot be recovered in the contract year through higher premiums. As a result, our profits areparticularly sensitive to the accuracy of our forecasts of the increases in health care and other benefit costs that we expect to occur during the fixedpremium period. Those forecasts typically are made several months before the fixed premium period begins and are dependent on our ability toanticipate and detect medical cost trends. There can be no assurance regarding the accuracy of the health care or other benefit cost projectionsreflected in our pricing, and our health care and other benefit costs can be affected by external events over which we have no control. Relativelysmall differences between predicted and actual health care costs as a percentage of premium revenues can result in significant changes in our resultsof operations. If the rate of increase in our health care or other benefit costs in 2008 were to exceed the levels reflected in our pricing or if we are notable to obtain appropriate pricing on new or renewal business, our operating results would be adversely affected.
Page 31

Our ability to manage health care costs affects our profitability.Our profitability depends in large part on our ability to appropriately manage future health care costs through underwriting criteria, product design,negotiation of favorable provider contracts and medical management programs. The aging of the population and other demographic characteristics,advances in medical technology and other factors continue to contribute to rising health care costs. Changes in health care practices, generaleconomic conditions such as inflation and employment levels, new technologies, increases in the cost of prescription drugs, direct-to-consumermarketing by pharmaceutical companies, clusters of high cost cases, changes in the regulatory environment, health care provider or member fraud andnumerous other factors affecting the cost of health care can be beyond any health plan’s control and may adversely affect our ability to manage healthcare costs, our operating results and our financial condition.
Our business success and profitability depend in part on effective information technology systems and on continuing to develop andimplement improvements in technology; we have several significant multiyear strategic information technology projects in process.Our businesses depend in large part on our information and other technology systems to adequately price our products and services, estimate ourhealth care costs payable, process claims and interact with providers, employer plan sponsors and members, and we have many different informationsystems supporting our businesses. Our business strategy involves providing customers with easy to use products that leverage information to meetthe needs of those customers. Our success therefore is dependent in large part on maintaining the effectiveness of existing technology systems andon continuing to develop and enhance technology systems that support our business processes in a cost and resource efficient manner, includingthrough technology outsourcing, within the context of a limited budget of human resources and capital. Certain of our technology systems (includingsoftware) are older, legacy systems that are less efficient and require an ongoing commitment of significant capital and human resources tomaintain. We also need to develop new systems to meet current and expected standards and keep pace with continuing changes in informationprocessing technology, evolving industry and regulatory standards and customer demands. We have several significant multiyear strategic informationtechnology projects in process. System development and other information technology projects are long-term in nature and may take longer and costmore than we expect to complete and may not deliver the benefits we project once they are complete. If we do not effectively and efficiently manageand upgrade our technology portfolio, we could, among other things, have problems determining health care cost estimates and/or establishingappropriate pricing, meeting the needs of providers, employer plan sponsors and members, or keeping pace with industry and regulatory standards,and our operating results may be adversely affected.
We must continue to provide quality service to our customers that meets their expectations.Our ability to attract and retain membership is dependent upon providing quality customer service operations (such as call center operations, claimprocessing, mail order pharmacy prescription delivery, specialty pharmacy prescription delivery and customer case installation) that meet or exceedour customers’ expectations. Failure to provide service that meets our customers’ expectations, including failures resulting from operationalperformance issues, can affect our ability to retain or grow profitable membership which may adversely affect our operating results.
In order to remain competitive, we must further integrate our businesses and processes; significant acquisitions and/or our ability tomanage multiple multi-year strategic projects could make this integration more challenging; we expect to continue to pursue acquisitions.Ineffective integration of our businesses and processes may adversely affect our ability to compete by, among other things, increasing our costsrelative to competitors. This integration task may be made more complex by significant acquisitions and multi-year strategic projects. For example,as a result of our acquisition activities, we have acquired a number of information technology systems that we must effectively and efficientlyconsolidate with our own systems. Our strategy includes effectively investing our capital in appropriate acquisitions, strategic projects and currentoperations in addition to share repurchases.
Page 32

Our strategic projects include, among other things, addressing rising health care costs, achieving profitable membership growth, further improving theefficiency of our operations, managing certain significant technology projects, further improving relations with health care providers, negotiatingcontract changes with customers and providers, and implementing other business process improvements. The future performance of our businesseswill depend in large part on our ability to design and implement these initiatives, some of which will occur over several years. If these initiatives resultin increased health care costs or do not achieve their objectives, our operating results could be adversely affected.
We have completed a number of acquisitions over the last several years, and we expect to continue to pursue acquisitions as part of our growthstrategy. In addition to integration risks, some additional risks we face with respect to acquisitions include:
· The acquired business may not perform as projected;· We may assume liabilities that we do not anticipate, including those that were not disclosed to us;· We may be unable to successfully integrate acquired businesses and other processes to realize anticipated economic and other benefits on a
timely basis, which could result in substantial costs or delays or other operational or financial problems;· Acquisitions could disrupt our ongoing business, distract management, divert resources and make it difficult to maintain our current business
standards, controls and procedures;· We may finance future acquisitions by issuing common stock for some or all of the purchase price, which could dilute the ownership interests
of our shareholders;· We may incur additional debt related to future acquisitions; and· We frequently compete with other firms, some of which may have greater financial and other resources and a greater tolerance for risk, to
acquire attractive companies.
We face risks from industry and economic forces that can change the fundamentals of the health and related benefits industry and adverselyaffect our business and operating results.Various factors particular to the health and related benefits industry may affect our business model. Those factors include, among others, the rapidevolution of the business model, shifts in public policy, consumerism, pricing actions by competitors, competitor and supplier consolidation and ashrinking number of commercially insured people. We also face the potential of competition from existing or new companies that have nothistorically been in the health or group insurance industries. For example, the GLBA gives banks and other financial institutions the ability to affiliatewith insurance companies, which may lead to new competitors with significant financial resources in the insurance and health benefits fields. If weare unable to anticipate, detect and deploy meaningful responses to these external factors, our business and operating results may be adverselyaffected.
Our ability to manage general and administrative expenses affects our profitability.Our profitability depends in part on our ability to drive our general and administrative expenses to competitive levels through controlling salaries andrelated benefits and information technology and other general and administrative costs, while being able to attract and retain key employees, maintainrobust management practices and controls and implement improvements in technology.
We are subject to potential changes in public policy that can adversely affect the markets for our products and our profitability.It is not possible to predict with certainty or eliminate the impact of fundamental public policy changes that could adversely affect us. Examples ofthese changes include policy changes that would fundamentally change the dynamics of our industry, such as the federal or one or more stategovernments assuming a larger role in the health care industry or reducing the funding available for Medicare or Medicaid programs. Legislativeproposals that would significantly reform the health care system are currently pending in many states and have been advanced by a number ofcandidates running for president in 2008. Our operating results could be adversely affected by such changes even if we correctly predict theiroccurrence. For more information on these matters, refer to Regulatory Environment – Legislative and Regulatory Initiatives beginning on page 26.
Page 33

We are subject to funding and other risks with respect to revenue received from our participation in Medicare and Medicaid programs andsubject to retroactive adjustments to certain premiums.We are increasing our focus on the non-Commercial part of our Health Care segment as part of our business diversification efforts. In government-funded health programs such as Medicare and Medicaid, our revenues are dependent on annual funding from the federal government and/orapplicable state governments, and state governments have the right to cancel their contracts with us on short notice if funds are not available. Fundingfor these programs is dependent on many factors outside our control, including general economic conditions at the federal or applicable state level andgeneral political issues and priorities. Our government customers also determine the premium levels and other aspects of these programs that affect thenumber of persons eligible or enrolled in these programs and our administrative and health care costs under these programs. In the past, determinationsof this type have adversely affected our financial results from and willingness to participate in such programs, and similar conditions may exist in thefuture. For example, if a government customer reduces the premium levels or increases premiums by less than our costs increase and we cannotoffset the impact of these actions with supplemental premiums and/or changes in benefit plans, then our business and operating results could beadversely affected. In addition, premiums for certain federal government employee groups, Medicare members and Medicaid beneficiaries aresubject to retroactive adjustments by the federal and applicable state governments, and during 2008 we will bear more risk with respect to ourMedicare PDP members’ use of prescription drugs. Any such adjustments could materially adversely affect our business and results of operations.
Loss of membership or failure to achieve profitable membership growth and diversify geographic concentrations in our core Insuredmembership (including strategies to increase membership for targeted product types and customers, such as commercial or public sectorbusiness) could materially adversely affect our results of operations.Competitive factors (including our customers’ flexibility in moving between us and our competitors) and ongoing changes in the health benefitsindustry create pressure to contain premium price increases despite being faced with increasing health care costs. Our customer contracts are subjectto negotiation as customers seek to contain their benefit costs, and customers may elect to self-insure or to reduce benefits in order to limit increases intheir benefit costs. Such elections may result in reduced membership in our more profitable Insured products and/or lower premiums for our Insuredproducts, although such elections also may reduce our health care costs. Alternatively, our customers may purchase different types of products fromus that are less profitable, or move to a competitor to obtain more favorable pricing. Our membership is also concentrated in certain geographic areas,and increased competition in those geographic areas could therefore have a disproportionate adverse effect on our operating results. Among otherfactors, we compete on the basis of overall cost, plan design, customer service, quality and sufficiency of medical provider networks and quality ofmedical management programs. In addition to competitive pressures affecting our ability to obtain new customers or retain existing customers, ourmembership can be affected by reductions in workforce by existing customers due to soft general economic conditions, especially in the geographieswhere our membership is concentrated. Failure to profitably grow and diversify our membership geographically or by product type may adverselyaffect our revenue and operating results.
Our business activities are highly regulated; new laws or regulations or changes in existing laws or regulations or their enforcement could alsomaterially adversely affect our business and profitability.Our business is subject to extensive regulation and oversight by state, federal and international governmental authorities. The laws and regulationsgoverning our operations change frequently and generally are designed to benefit and protect members and providers rather than our investors. Thefederal and many state governments have enacted and continue to consider legislative and regulatory changes related to health products and changes inthe interpretation and/or enforcement of existing laws and regulations. We must monitor these changes and timely implement any revisions to ourbusiness processes that these changes require. At this time, we are unable to predict the impact of future changes, although we anticipate that some ofthese measures, if enacted, could adversely affect our health operations and/or operating results including:
· Restricting our ability to price for the risk we assume and/or reflect reasonable costs or profits in our pricing, including mandating minimummedical benefit ratios,
· Affecting premium rates,· Reducing our ability to manage health care costs,· Increasing health care costs and operating expenses,· Increasing our exposure to lawsuits and other adverse legal proceedings,· Regulating levels and permitted lines of business,
Page 34

· Restricting our ability to underwrite and operate our individual health business,· Imposing financial assessments, and/or· Regulating business practices.
For example, decisions by health plans to rescind coverage and decline payment to treating providers after a member has received medical serviceshave generated public attention, particularly in California. As a result, there has been both legislative and regulatory action in connection with thisissue. On October 14, 2007, the governor of California signed legislation that, effective January 1, 2008, required us and other health plans andinsurers, under certain defined circumstances, to pay providers for services they have rendered despite the rescission of the member’s policy. OnOctober 23, 2007, the California Department of Managed Health Care (“DMHC”) and the California Department of Insurance (the “CaliforniaDOI”) announced that they would be issuing joint regulations that would restrict the ability of health plans and insurers, including us, to rescind amember’s coverage and deny payment to treating providers. The DMHC has issued draft proposed regulations, and the California DOI is expected todo so as well in the near future.
In addition, our Medicare, Medicaid and specialty and mail order pharmacy products are more highly regulated than our Commercial products.
There continues to be a heightened review by federal and state regulators of the health care insurance industry’s business and reporting practices,including utilization management, payment of providers with whom the payor does not have contracts and other claim payment practices, as well asheightened review of the general insurance industry’s brokerage practices. As one of the largest national health insurers, we are regularly the subjectof regulatory market conduct and other reviews, audits and investigations by state insurance and health and welfare departments and attorneys general,CMS, the Office of the Inspector General, the Office of Personnel Management, the U.S. Department of Justice and U.S. Attorneys. Several suchreviews, audits and investigations currently are pending, some of which may be resolved during 2008. These regulatory reviews, audits andinvestigations could result in changes to or clarifications of our business practices, and also could result in significant or material fines, penalties,civil liabilities, criminal liabilities or other sanctions, including exclusion from participation in government programs. Our business also may beadversely impacted by judicial and regulatory decisions that change and/or expand the interpretations of existing statutes and regulations, imposemedical or bad faith liability, increase our responsibilities under ERISA, or reduce the scope of ERISA pre-emption of state law claims.
For more information regarding these matters, refer to Regulatory Environment beginning on page 24 and “Litigation and Regulatory Proceedings” inNote 18 of Notes to Consolidated Financial Statements beginning on page 74.
Our products providing pharmacy benefit management services face regulatory and other risks and uncertainties associated with thepharmacy benefits management industry that may differ from the risks of our core business of providing managed care and healthinsurance products.The following are some of the PBM and pharmacy related risks that could have a material adverse effect on our business, financial condition orresults of operations:
· federal and state anti-kickback and other laws that govern our PBM and mail order and specialty mail order pharmacies’ relationship withpharmaceutical manufacturers, customers and consumers.
· compliance requirements for PBM fiduciaries under ERISA, including compliance with fiduciary obligations under ERISA in connectionwith the development and implementation of items such as drug formularies and preferred drug listings.
· a number of federal and state legislative proposals are being considered that could adversely affect a variety of pharmacy benefit industrypractices, including without limitation the receipt or required disclosure of rebates from pharmaceutical manufacturers, the regulation of thedevelopment and use of formularies, and legislation imposing additional rights to access to drugs for individuals enrolled in health carebenefits plans.
· the application of federal, state and local laws and regulations to the operation of our mail order pharmacy and mail order specialty pharmacyproducts.
· the risks inherent in the dispensing, packaging and distribution of pharmaceuticals and other health care products, including claims related topurported dispensing errors.
Page 35

The failure to adhere to the laws and regulations that apply to our PBM and/or pharmacies’ products could expose our PBM and/or pharmacysubsidiaries to civil and criminal penalties and/or have a material adverse effect on our business, financial condition and results of operations.
We would be adversely affected if our prevention, detection or control systems fail to detect and implement required changes to maintainregulatory compliance.Failure of our prevention, detection or control systems related to regulatory compliance and/or compliance with our internal policies, including datasystems security and/or unethical conduct by managers and/or employees, could adversely affect our reputation and also expose us to litigation andother proceedings, fines and/or penalties, any of which could adversely affect our business, operating results or financial condition.
We face risks related to litigation.We are growing by expanding into certain segments and subsegments of the health care marketplace. Some of the segments and subsegments we havetargeted for growth include Medicare, Medicaid, individual, public sector and labor customers who are not subject to ERISA’s limits on state lawremedies. In addition, we have entered product lines in which we previously did not participate, including Insured Medicaid, Medicaid planmanagement, international managing general underwriting, Medicare PDP, mail order pharmacy, specialty pharmacy and ActiveHealth. Theseproducts may subject us to regulatory and other risks that are different from the risks of providing Commercial managed care and health insuranceproducts and may increase the risks we face from litigation, regulatory reviews, audits and investigations and other adverse legal proceedings. Forexample, our Medicaid products are more highly regulated than our Commercial products, and we are dispensing medications at our mail order andspecialty pharmacies directly to members. In addition to the risks of purported dispensing and other operational errors, failure to adhere to the lawsand regulations applicable to the dispensing of pharmaceuticals could subject our pharmacy subsidiaries to civil and criminal penalties.
In addition, we are party to a number of lawsuits, certain of which are purported to be class actions. The majority of these cases relate to the conductof our health care operations and allege various violations of law. Many of these cases seek substantial damages (including non-economic or punitivedamages and treble damages) and may also seek changes in our business practices. We may also be subject to additional litigation and other adverselegal proceedings in the future. Litigation and other adverse legal proceedings could materially adversely affect our business or operating resultsbecause of reputational harm to us caused by such proceedings, the costs of defending such proceedings, the costs of settlement or judgments againstus, or the changes in our operations that could result from such proceedings. For example, we made certain changes to our business practices inconnection with the settlement in 2003 of a large provider class action that we must continue to implement effectively. Refer to “Litigation andRegulatory Proceedings” in Note 18 of Notes to Consolidated Financial Statements beginning on page 74 for more information.
We would be adversely affected if we fail to adequately protect member health related and other sensitive information.The use and disclosure of personal health and other sensitive information is regulated at the federal, state and international levels, and we collect,process and maintain large amounts of personal health and financial information and other sensitive data about our members in the ordinary course ofour business. Our business therefore depends substantially on our members’ and customers’ willingness to entrust us with their health related andother sensitive information. Events that negatively affect that trust, including failing to maintain appropriate safeguards to keep sensitive informationsecure, whether as a result of our action or inaction or that of one of our vendors, could adversely affect our reputation and also expose us tolitigation and other proceedings, fines and/or penalties, any of which could adversely affect our business, operating results or financial condition.
We would be adversely affected if we do not effectively deploy our capital .Our operations have generated significant capital in recent periods, and we have the ability to raise additional capital. In deploying our capital to fundour investments in operations (including information technology and other strategic projects), share repurchases, potential acquisitions or other capitaluses, we would be adversely affected if we do not appropriately balance the risks and opportunities that are inherent in each method of deploying ourcapital.
Page 36

We face a wide range of risks, and our success depends on our ability to identify, prioritize and appropriately manage our enterprise riskexposures.As a large company operating in a complex industry, we encounter a variety of risks. The risks we face include, among other matters, the range ofindustry, competitive, regulatory, financial, operational or external risks identified in this Risk Factors discussion. In recent periods, we have devotedadditional resources to developing and integrating enterprise-wide risk management processes. Failure to identify, prioritize and appropriately manageor mitigate these risks, including risk concentrations across different industries, segments and geographies, can affect our profitability, our ability toretain or grow business, or, in the event of extreme circumstances, our financial condition or viability.
Sales of our products and services are dependent on our ability to attract, retain and provide support to a network of internal sales personneland third party brokers, consultants and agents.Our products are sold primarily through our sales personnel, who frequently work with independent brokers, consultants and agents who assist in theproduction and servicing of business. The independent brokers, consultants and agents generally are not dedicated to us and may frequently alsorecommend and/or market health care products of our competitors, and we must compete intensely for their services and allegiance. Our sales wouldbe adversely affected if we are unable to attract or retain sales personnel or if we do not adequately provide support, training and education to this salesnetwork regarding our product portfolio, which is complex, or if our sales strategy is not appropriately aligned across distribution channels.
Managing key executive succession is critical to our success.We would be adversely affected if we fail to adequately plan for succession of our senior management and other key executives. While we havesuccession plans in place and we have employment arrangements with certain key executives, these do not guarantee that the services of theseexecutives will continue to be available to us.
Our profitability may be adversely affected if we are unable to contract with providers on favorable terms and otherwise maintainfavorable provider relationships.Our profitability is dependent in part upon our ability to contract competitively while maintaining favorable relationships with hospitals, physicians,pharmaceutical benefit service providers, pharmaceutical manufacturers and other health benefits providers. That ability is affected by the rates wepay providers for services rendered to our members, our business practices and processes and our provider payment and other provider relationspractices, as well as factors not associated with us that impact these providers. The sufficiency and quality of our networks of available providers isalso an important factor when customers consider our products and services. Our contracts with providers generally may be terminated by either partywithout cause on short notice. The failure to maintain or to secure new cost-effective health care provider contracts may result in a loss inmembership, higher health care costs, less desirable products for our customers and/or difficulty in meeting regulatory or accreditation requirements,any of which could adversely affect our operating results.
In addition, some providers that render services to our members do not have contracts with us. In those cases, we do not have a pre-establishedunderstanding with the provider about the amount of compensation that is due to the provider for services rendered to our members. In some states,the amount of compensation due to these non-participating providers is defined by law or regulation, but in most instances it is either not defined or itis established by a standard that is not clearly translatable into dollar terms. In such instances providers may believe that they are underpaid for theirservices and may either litigate or arbitrate their dispute with us or try to recover from our members the difference between what we have paid themand the amount they charged us. For example, we are currently involved in litigation with non-participating providers that is described in more detailin “Litigation and Regulatory Proceedings” in Note 18 of Notes to Consolidated Financial Statements beginning on page 74.
Our reputation is one of our most important assets; negative public perception of the health benefits industry, or of the industry’s or ourpractices, can adversely affect our profitability.The health benefits industry is subject to negative publicity, which can arise either from actual or perceived shortfalls regarding the industry’s or ourown business practices and/or products. The risk of negative publicity is particularly high in an election year. This risk may be increased as we offernew products, such as products with limited benefits, targeted at market segments, such as the uninsured, part time and hourly workers and thoseeligible for Medicaid, beyond those in which we traditionally have operated. Negative publicity may further increase our costs of doing business andadversely affect our profitability by:
Page 37

· Adversely affecting the Aetna brand particularly;· Adversely affecting our ability to market and sell our products and/or services;· Requiring us to change our products and/or services; and/or· Increasing the regulatory and legislative requirements with which we must comply.
We hold reserves for expected claims, which are estimated, and these estimates involve an extensive degree of judgment; if actual claimsexceed reserve estimates, our operating results could be materially adversely affected; moreover any requirement to restate financial resultsdue to the inappropriate application of accounting principles or other matters could also have a material adverse effect on us.Our reported health care costs payable for any particular period reflect our estimates of the ultimate cost of claims that have been incurred by ourmembers but not yet reported to us and claims that have been reported to us but not yet paid. We estimate health care costs payable periodically, andany resulting adjustments are reflected in current-period operating results within health care costs. Our estimates of health care costs payable are basedon a number of factors, including those derived from historical claim experience. A large portion of health care claims are not submitted to us untilafter the end of the quarter in which services are rendered by providers to our members. As a result, an extensive degree of judgment is used in thisestimation process, considerable variability is inherent in such estimates, and the adequacy of the estimate is highly sensitive to changes in medicalclaims payment patterns and changes in medical cost trends. A worsening (or improvement) of medical cost trend or changes in claim paymentpatterns from those that were assumed in estimating health care costs payable at December 31, 2007 would cause these estimates to change in the nearterm, and such a change could be material. Furthermore, if we are not able to accurately estimate the cost of incurred but not yet reported claims orreported claims that have not been paid, our ability to take timely corrective actions may be limited, which would further exacerbate the extent of anynegative impact on our results of operations. Refer to our discussion of Critical Accounting Estimates – Health Care Costs Payable beginning on page18 for more information.
The appropriate application of accounting principles in accordance with GAAP is required to ensure the soundness and accuracy of our financialstatements. An inappropriate application of these principles may lead to a restatement of our financial results and/or a deterioration in the soundnessand accuracy of our reported financial results. If we experienced such a deterioration, users of our financial statements may lose confidence in ourreported results, which could adversely affect our access to capital markets.
We are dependent on our ability to manage and engage a very large workforce.Our products and services and our operations require a large number of employees. We would be adversely affected if our retention, development,succession and other human resource management techniques are not aligned with our strategic objectives.
Epidemics, pandemics, terrorist attack, natural disasters or other extreme events or the continued threat of these extreme events couldmaterially increase health care utilization, pharmacy costs and/or life and disability claims and impact our business continuity, although wecannot predict with certainty whether any such events will occur.Extreme events, including terrorism, can affect the U.S. economy in general, our industry and us specifically. Such events could adversely affectour business and operating results, and in the event of extreme circumstances, our financial condition or viability. Other than obtaining insurancecoverage for our facilities, there are few, if any, commercial options through which to transfer the exposure from terrorism away from us. Inparticular, in the event of bioterrorism attacks, epidemics or other extreme events, we could face significant health care (including behavioral health)and disability costs depending on the government’s actions and the responsiveness of public health agencies and other insurers. In addition, our lifeinsurance members and our employees and those of our vendors are concentrated in certain large, metropolitan areas which may be exposed to theseevents. We could also be adversely affected if we do not maintain adequate procedures to ensure disaster recovery and business continuity during andafter such events.
Page 38

We must demonstrate that our products and processes lead to access by our members to quality care by their providers, or delivery of careby us.Failure to demonstrate that our products and processes (such as disease management and patient safety programs, provider credentialing and otherquality of care and information management initiatives) lead to access by our members to quality care by providers or delivery of quality care by uswould adversely affect our ability to differentiate our product and/or service offerings from those of competitors and could adversely affect ourresults of operations.
General market conditions affect our investments in debt and equity securities, mortgage loans and other investments and our income onthose investments.As an insurer, we have substantial investment portfolios of assets that support our policy liabilities. The investment income we earn from ourinvestment portfolios is largely driven by the level of interest rates in the U.S., and to a lesser extent the overseas, financial markets. Generallyspeaking, lower interest rates, such as those experienced in the U.S. financial markets in late 2007 and early 2008, will reduce our investmentincome. Although we seek, within guidelines we deem appropriate, to match the duration of our assets and liabilities and to manage our creditexposures, a failure to adequately do so could adversely affect our results of operations and our financial condition. Financial market conditions alsoaffect our capital gains or losses from investments.
We outsource and obtain certain information technology systems or other services from independent third parties, and also delegate selectedfunctions to independent practice associations and specialty service providers; portions of our operations are subject to their performance.Although we take steps to monitor and regulate the performance of independent third parties who provide services to us or to whom we delegateselected functions, these arrangements may make our operations vulnerable if those third parties fail to satisfy their obligations to us, whether becauseof our failure to adequately monitor and regulate their performance, or changes in their own financial condition or other matters outside ourcontrol. In recent years, certain third parties to whom we delegated selected functions, such as independent practice associations and specialtyservices providers, have experienced financial difficulties, including bankruptcy, which may subject us to increased costs and potential healthbenefits provider network disruptions, and in some cases cause us to incur duplicative claims expense. Certain legislative authorities have in recentyears also discussed or proposed legislation that would restrict outsourcing and, if enacted, could materially increase our costs. We also couldbecome overly dependent on key vendors, which could cause us to lose core competencies if not properly monitored.
Our pension plan expenses are affected by general market conditions, interest rates and the accuracy of actuarial estimates of future benefitcosts.We have pension plans that cover a large number of current employees and retirees. Unfavorable investment performance, interest rate changes orchanges in estimates of benefit costs, if significant, could adversely affect our operating results or financial condition by significantly increasing ourpension plan expense and obligations.
We also face other risks that could adversely affect our business, results of operations or financial condition, which include:· Health benefits provider fraud that is not prevented or detected and impacts our medical costs or those of our self-insured customers;· Financial loss from inadequate insurance coverage due to self insurance levels or unavailability of insurance and reinsurance coverage for credit
or other reasons;· A significant failure of internal control over financial reporting;· Failure to protect our proprietary information; and· Failure of our corporate governance policies or procedures, for example significant financial decisions being made at an inappropriate level in
our organization.
Page 39

Selected Financial Data For the Years Ended December 31,(Millions, except per common share data) 2007 2006 2005 2004 2003 Revenue $ 27,599.6 $ 25,145.7 $ 22,491.9 $ 19,904.1 $ 17,976.4 Income from continuing operations 1,831.0 1,685.6 1,573.3 1,124.8 892.9 Net income 1,831.0 1,701.7 1,573.3 2,154.8 892.9 Net realized capital (losses) gains, net of tax (47.9) 24.1 21.1 45.9 42.0 Assets 50,724.7 47,626.4 44,433.3 42,214.1 41,018.2 Short-term debt 130.7 45.0 - - - Long-term debt 3,138.5 2,442.3 1,605.7 1,609.7 1,613.7 Shareholders' equity 10,038.4 9,145.1 10,188.7 9,161.8 7,992.0 Per common share data: Dividends declared $ .04 $ .04 $ .02 $ .01 $ .01 Income from continuing operations: Basic 3.60 3.09 2.72 1.86 1.46 Diluted 3.47 2.96 2.60 1.79 1.41 Net income: Basic 3.60 3.12 2.72 3.56 1.46 Diluted 3.47 2.99 2.60 3.43 1.41
See Notes to Consolidated Financial Statements and MD&A for significant events affecting the comparability of results as well as materialuncertainties.
Page 40

Consolidated Statements of Income For the Years Ended December 31, (Millions, except per common share data) 2007 2006 2005 Revenue: Health care premiums $ 21,500.1 $ 19,153.5 $ 16,924.7 Other premiums 1,979.3 1,956.0 2,003.0 Fees and other revenue * 3,044.0 2,839.3 2,428.9 Net investment income 1,149.9 1,164.7 1,103.0 Net realized capital (losses) gains (73.7) 32.2 32.3 Total revenue 27,599.6 25,145.7 22,491.9 Benefits and expenses: Health care costs ** 17,294.8 15,301.0 13,107.9 Current and future benefits 2,248.1 2,319.0 2,364.5 Operating expenses: Selling expenses 1,060.9 952.7 843.5 General and administrative expenses 3,985.5 3,867.9 3,609.2 Total operating expenses 5,046.4 4,820.6 4,452.7 Interest expense 180.6 148.3 122.8 Amortization of other acquired intangible assets 97.6 85.6 57.4 Reduction of reserve for anticipated future losses on discontinued products (64.3) (115.4) (66.7)
Total benefits and expenses 24,803.2 22,559.1 20,038.6 Income from continuing operations before income taxes 2,796.4 2,586.6 2,453.3 Income taxes 965.4 901.0 880.0 Income from continuing operations 1,831.0 1,685.6 1,573.3 Discontinued operations, net of tax (Note 21) - 16.1 - Net income $ 1,831.0 $ 1,701.7 $ 1,573.3 Earnings per common share: Basic: Income from continuing operations $ 3.60 $ 3.09 $ 2.72 Discontinued operations, net of tax - .03 - Net income $ 3.60 $ 3.12 $ 2.72 Diluted: Income from continuing operations $ 3.47 $ 2.96 $ 2.60 Discontinued operations, net of tax - .03 - Net income $ 3.47 $ 2.99 $ 2.60 * Fees and other revenue include administrative services contract member co-payments and plan sponsor reimbursements related to our mail order and specialty pharmacy
operations of $51.9 million, $38.0 million and $21.3 million (net of pharmaceutical and processing costs of $1.4 billion, $1.4 billion and $884.5 million) for 2007, 2006 and 2005, respectively.
** Health care costs have been reduced by fully insured member co-payments related to our mail order and specialty pharmacy operations of $102.0 million, $96.2 million and$78.5 million for 2007, 2006 and 2005, respectively.
Refer to accompanying Notes to Consolidated Financial Statements.
Page 41

Consolidated Balance Sheets At December 31, (Millions) 2007 2006 Assets Current assets: Cash and cash equivalents $ 1,254.0 $ 880.0 Investments 851.5 1,008.0 Premiums receivable, net 479.8 363.1 Other receivables, net 589.1 530.1 Accrued investment income 189.2 183.1 Collateral received under securities loan agreements 1,142.4 1,054.3 Deferred income taxes 321.7 293.2 Other current assets 460.7 326.3 Total current assets 5,288.4 4,638.1 Long-term investments 17,040.1 16,879.1 Reinsurance recoverables 1,093.2 1,107.4 Goodwill 5,059.0 4,603.6 Other acquired intangible assets, net 780.4 691.6 Property and equipment, net 364.0 283.6 Deferred income taxes - 170.0 Other long-term assets 1,850.2 1,049.1 Separate Accounts assets 19,249.4 18,203.9 Total assets $ 50,724.7 $ 47,626.4 Liabilities and shareholders' equity Current liabilities: Health care costs payable $ 2,177.4 $ 1,927.5 Future policy benefits 763.8 786.0 Unpaid claims 625.9 598.3 Unearned premiums 198.4 185.6 Policyholders' funds 668.2 567.6 Collateral payable under securities loan agreements 1,142.4 1,054.3 Short-term debt 130.7 45.0 Income taxes payable 5.9 42.6 Accrued expenses and other current liabilities 1,962.0 1,896.1 Total current liabilities 7,674.7 7,103.0 Future policy benefits 7,253.2 7,463.7 Unpaid claims 1,234.1 1,174.6 Policyholders' funds 1,225.7 1,296.4 Long-term debt 3,138.5 2,442.3 Income taxes payable 13.0 - Deferred income taxes 146.4 - Other long-term liabilities 751.3 797.4 Separate Accounts liabilities 19,249.4 18,203.9 Total liabilities 40,686.3 38,481.3 Commitments and contingencies (Note 18) Shareholders' equity: Common stock and additional paid-in capital ($.01 par value; 2.8 billion shares authorized; 496.3 million and 516.0 million shares issued and outstanding in 2007 and 2006, respectively) 188.8 366.2 Retained earnings 10,138.0 9,404.6 Accumulated other comprehensive loss (288.4) (625.7)
Total shareholders' equity 10,038.4 9,145.1 Total liabilities and shareholders' equity $ 50,724.7 $ 47,626.4
Refer to accompanying Notes to Consolidated Financial Statements.
Page 42

Consolidated Statements of Shareholders’ Equity Common Number of Stock and Accumulated Common Additional Other Total Shares Paid-in Retained Comprehensive Shareholders' Comprehensive (Millions) Outstanding Capital Earnings (Loss) Income Equity Income Balance at December 31, 2004 586.0 $ 3,541.5 $ 6,161.8 $ (541.5) $ 9,161.8 Comprehensive income: Net income - - 1,573.3 - 1,573.3 $ 1,573.3 Other comprehensive income (Note 10): Net unrealized losses on securities - - - (141.6) (141.6) Net foreign currency gains - - - .7 .7 Net derivative losses - - - (.3) (.3) Pension liability adjustment - - - 733.0 733.0 Other comprehensive income - - - 591.8 591.8 591.8 Total comprehensive income $ 2,165.1 Common shares issued for benefit plans, including tax benefit 22.3 542.3 - - 542.3 Repurchases of common shares (41.8) (1,669.1) - - (1,669.1) Dividends declared ($.02 per share) - - (11.4) - (11.4) Balance at December 31, 2005 566.5 2,414.7 7,723.7 50.3 10,188.7 Comprehensive income: Net income - - 1,701.7 - 1,701.7 $ 1,701.7 Other comprehensive loss (Note 10): Net unrealized losses on securities - - - (37.6) (37.6) Net foreign currency losses - - - (.4) (.4) Net derivative gains - - - 8.7 8.7 Pension liability adjustment - - - 5.7 5.7 Other comprehensive loss - - - (23.6) (23.6) (23.6)
Total comprehensive income $ 1,678.1 Adjustment to initially recognize the funded status of pension and OPEB plans (Note 2) - - - (652.4) (652.4) Common shares issued for benefit plans, including tax benefit 9.8 281.5 - - 281.5 Repurchases of common shares (60.3) (2,330.0) - - (2,330.0) Dividends declared ($.04 per share) - - (20.8) - (20.8) Balance at December 31, 2006 516.0 366.2 9,404.6 (625.7) 9,145.1 Cumulative effect of new accounting standards (Note 2) - - (1.0) 113.9 112.9 Beginning balance at January 1, 2007, as adjusted 516.0 366.2 9,403.6 (511.8) 9,258.0 Comprehensive income: Net income - - 1,831.0 - 1,831.0 $ 1,831.0 Other comprehensive income (Note 10): Net unrealized losses on securities - - - (13.2) (13.2) Net foreign currency gains - - - 3.6 3.6 Net derivative losses - - - (15.8) (15.8) Pension and OPEB plans - - - 248.8 248.8 Other comprehensive income - - - 223.4 223.4 223.4 Total comprehensive income $ 2,054.4 Common shares issued for benefit plans, including tax benefit 13.5 415.0 - - 415.0 Repurchases of common shares (33.2) (592.4) (1,076.6) - (1,669.0) Dividends declared ($.04 per share) - - (20.0) - (20.0) Balance at December 31, 2007 496.3 $ 188.8 $ 10,138.0 $ (288.4) $ 10,038.4
Refer to accompanying Notes to Consolidated Financial Statements.
Page 43

Consolidated Statements of Cash Flows For the Years Ended December 31, (Millions) 2007 2006 2005 Cash flows from operating activities: Net income $ 1,831.0 $ 1,701.7 $ 1,573.3 Adjustments to reconcile net income to net cash provided by operating activities: Depreciation and amortization 321.5 270.4 204.4 Stock-based compensation expense 89.4 73.7 94.1 Equity in earnings of affiliates, net (88.3) (102.2) (44.2) Net realized capital losses (gains) 73.7 (32.2) (32.3) Amortization of net investment premium 3.6 18.7 22.6 Physician class action settlement insurance-related charge - 72.4 - Discontinued operations - (16.1) - Changes in assets and liabilities: Accrued investment income (6.1) 1.8 13.7 Premiums due and other receivables (91.7) (61.2) (95.6) Income taxes 28.8 29.9 390.5 Other assets and other liabilities (119.0) (205.7) (251.6) Health care and insurance liabilities 23.8 (106.1) (223.7) Other, net (1.2) (6.5) .3 Net cash provided by operating activities of continuing operations 2,065.5 1,638.6 1,651.5 Discontinued operations (Note 21) - 49.7 68.8 Net cash provided by operating activities 2,065.5 1,688.3 1,720.3 Cash flows from investing activities: Proceeds from sales and maturities of investments 10,577.0 11,837.6 11,907.6 Cost of investments (10,642.2) (11,939.5) (11,238.5) Increase in property, equipment and software (400.4) (290.5) (271.6) Cash used for acquisitions, net of cash acquired (572.2) (160.9) (1,107.6)
Net cash used for investing activities (1,037.8) (553.3) (710.1) Cash flows from financing activities: Proceeds from issuance of long-term debt, net of issuance costs 663.9 1,978.9 - Net issuance of short-term debt 85.5 45.0 - Repayment of long-term debt - (1,150.0) - Deposits and interest credited for investment contracts 9.7 28.2 41.6 Withdrawals of investment contracts (21.2) (211.8) (54.5) Common shares issued under benefit plans 170.8 115.8 271.3 Stock-based compensation tax benefits 153.2 89.6 173.1 Common shares repurchased (1,695.6) (2,322.5) (1,650.0) Dividends paid to shareholders (20.0) (20.8) (11.4) Other, net - - 16.3 Net cash used for financing activities (653.7) (1,447.6) (1,213.6) Net increase (decrease) in cash and cash equivalents 374.0 (312.6) (203.4)Cash and cash equivalents, beginning of period 880.0 1,192.6 1,396.0 Cash and cash equivalents, end of period $ 1,254.0 $ 880.0 $ 1,192.6
Refer to accompanying Notes to Consolidated Financial Statements.
Page 44

Notes to Consolidated Financial Statements
1. Organization
Our operations are conducted in the following three business segments:
· Health Care consists of medical, pharmacy benefits management, dental and vision plans offered on both an Insured basis (where weassume all or a majority of the risk for medical and dental care costs) and an employer-funded basis (where the plan sponsor under anadministrative services contract (“ASC”) assumes all or a majority of this risk). Medical products include point-of-service (“POS”),preferred provider organization (“PPO”), health maintenance organization (“HMO”) and indemnity benefit plans. Medical products alsoinclude health savings accounts (“HSAs”) and Aetna HealthFund®, consumer-directed health plans that combine traditional POS or PPOand/or dental coverage, subject to a deductible, with an accumulating benefit account (which may be funded by the plan sponsor and/or themember in the case of HSAs). We also offer Medicare and Medicaid products and services and specialty products, such as medicalmanagement and data analytics services, behavioral health plans and stop loss insurance, as well as products that provide access to ourprovider network in select markets.
· Group Insurance primarily includes group life insurance products offered on an Insured basis, including basic group term life insurance,group universal life, supplemental or voluntary programs and accidental death and dismemberment coverage. Group Insurance also includes(i) group disability products offered to employers on both an Insured and an ASC basis which consist primarily of short-term and long-termdisability insurance (and products which combine both), (ii) absence management services offered to employers, which include short-termand long-term disability administration and leave management, and (iii) long-term care products that were offered primarily on an Insuredbasis, which provide benefits covering the cost of care in private home settings, adult day care, assisted living or nursing facilities. We nolonger solicit or accept new long-term care customers, and we are working with our customers on an orderly transition of this product toother carriers.
· Large Case Pensions manages a variety of retirement products (including pension and annuity products) primarily for tax qualified pensionplans. These products provide a variety of funding and benefit payment distribution options and other services. The Large Case Pensionssegment includes certain discontinued products (refer to Note 20 beginning on page 78 for additional information).
Our three business segments are distinct businesses that offer different products and services. Our Chief Executive Officer evaluates financialperformance and makes resource allocation decisions at these segment levels. The accounting policies of the segments are the same as thosedescribed in the summary of significant accounting policies in Note 2 beginning on page 45. We evaluate the performance of these businesssegments based on operating earnings (net income or loss, excluding net realized capital gains and losses and certain other items) (refer to Note 19beginning on page 76 for segment financial information).
In 2005 and 2006, Aetna’s Board of Directors (the “Board”) declared two-for-one splits of our common stock, each of which was effected in theform of a 100% common stock dividend. All share and per share amounts in the accompanying consolidated financial statements and related noteshave been adjusted to reflect these two stock splits for all periods presented. In connection with the stock splits, the Board approved two amendmentsto our Articles of Incorporation. The amendments increased the number of our authorized common shares to 1.5 billion shares effective March 11,2005 and to 2.9 billion shares effective February 17, 2006. These increases are in the same proportion that the shares distributed in the stock dividendincreased the number of issued common shares.
2. Summary of Significant Accounting Policies
Principles of ConsolidationThe accompanying consolidated financial statements have been prepared in accordance with U.S. generally accepted accounting principles(“GAAP”) and include the accounts of Aetna and the subsidiaries that we control. All significant intercompany balances have been eliminated inconsolidation.
Page 45

ReclassificationsCertain reclassifications have been made to the 2006 financial information to conform with the 2007 presentation. These reclassifications include areclassification of $13.7 billion of certain debt securities to long-term investments that were previously reported in current investments at December31, 2006. The reclassifications resulted from a change in the accounting method by which debt securities are classified on our balance sheets, whichpreviously did not consider contractual maturities and classified most available for sale debt securities as current assets. At December 31, 2007, wechanged our accounting method by which debt securities are classified as current or long-term investments based on their contractual maturities,unless we intend to sell an investment within the next twelve months, in which case it is classified as current. We believe this method is a preferableaccounting method as it better reflects when cash will be realized and is more consistent with how we manage the investment portfolio given theduration of the liabilities that the investments support. At December 31, 2007, $13.7 billion of debt securities were reclassified to long-term,substantially all of which were reclassified due to this change in accounting method. Also in connection with this reclassification, current deferredtax assets of $48.8 million and $112.5 million at December 31, 2007 and 2006, respectively, have been reclassified to long-term. With this changein accounting method, there have been no changes in our investment management policies or practices, including the methodology used to valueinvestments, recognize investment income or our process for assessing the impairment of investment securities.
New Accounting StandardsPensions and Other Postretirement Benefit Plans – Measurement Date ChangeEffective December 31, 2006, we adopted certain provisions of Statement of Financial Accounting Standards (“FAS”) No. 158, “Employers’Accounting for Defined Benefit Pension and Other Postretirement Plans,” that required the recognition of an asset or liability for each ofour pension and other postretirement benefit (“OPEB”) plans equal to the difference between the fair value of plan assets and the plan’s benefitobligation as of the latest measurement date, which we refer to as the plan’s funded status. Pursuant to FAS 158, the unrecognized net actuarial gains(losses) and unrecognized prior service cost of our plans, which represent the difference between the plan’s funded status and its existing balancesheet position, were recognized, net of tax, as a component of accumulated other comprehensive income.
FAS 158 also requires the measurement of the funded status of pension and OPEB plans to occur at the end of our fiscal year, which is December31. This represents a change for us; we previously used September 30 as our measurement date, as permitted under GAAP. We adopted thisprovision of FAS 158 in 2007. The effect of adopting the measurement date provisions of FAS 158 on the opening balances of retained earningsand accumulated other comprehensive income is illustrated in the table on page 47 under the caption Cumulative Effect of New AccountingStandards in 2007.
Uncertain Tax PositionsEffective January 1, 2007, we adopted the provisions of Financial Accounting Standards Board (“FASB”) Interpretation (“FIN”) No. 48,“Accounting for Uncertainty in Income Taxes.” FIN 48 defines criteria that must be evaluated before a tax position is recognized in thefinancial statements. FIN 48 requires, among other things, an assessment of whether the position is more likely than not of being sustained uponexamination by taxing authorities. Additionally, FIN 48 provides guidance on measurement, derecognition, classification, interest and penalties,interim period accounting, disclosures and transition.
As illustrated in the table on page 47 under the caption Cumulative Effect of New Accounting Standards in 2007, the adoption of FIN 48 resulted in acumulative effect adjustment to the opening balance of retained earnings at January 1, 2007 of $5 million. This adjustment represented our estimateof interest (after tax) on certain previously recognized tax benefits of $111 million that were considered uncertain tax positions in accordance withFIN 48, as the timing of these deductions was subject to examination by taxing authorities. During 2007, we settled these uncertain tax positions withtaxing authorities. Refer to Note 11 beginning on page 61 for additional information on our uncertain tax positions.
Page 46

Certain Financial InstrumentsIn February 2006, the FASB issued FAS 155, “Accounting for Certain Hybrid Financial Instruments ,” which clarifies when certainfinancial instruments and features of financial instruments must be treated as derivatives and reported on the balance sheet at fair value with changes infair value reported in net income. Also, in January 2007, the FASB released FAS 133 Implementation Issue B40, “Embedded Derivatives:Application of Paragraph 13(b) to Securitized Interests In Prepayable Financial Assets ” (“DIG B40”). DIG B40 provides a narrowexception to the provisions of FAS 155 specific to financial instruments that contain embedded derivatives related to underlying prepayable financialassets. The adoption of FAS 155 on January 1, 2007 did not affect our financial position or results of operations.
Cumulative Effect of New Accounting Standards in 2007As described above, effective January 1, 2007, we adopted the measurement date provisions of FAS 158 and the provisions of FIN 48, whichresulted in the cumulative effect on our shareholders’ equity illustrated below:
(Millions, after tax)
RetainedEarnings
AccumulatedOther
ComprehensiveLoss
Balance at December 31, 2006 $ 9,404.6 $ (625.7)Effect of changing measurement date of pension and OPEB plans pursuant to FAS 158: Transition net periodic benefit income, net of tax: Amortization of net actuarial losses (9.0) 9.0 Amortization of prior service cost (.2) .2 Other components of net periodic benefit income 13.6 - Unrecognized actuarial gains arising due to change in measurement date - 104.7 Net effect of changing measurement date of pension and OPEB plans 4.4 113.9 Cumulative effect of FIN 48 (5.4) - Cumulative effect of new accounting standards in 2007 (1.0) 113.9 Beginning balance at January 1, 2007, as adjusted $ 9,403.6 $ (511.8)
Future Application of Accounting StandardsFair Value MeasurementsIn September 2006, the FASB issued FAS 157, “Fair Value Measurements.” FAS 157 defines fair value, establishes a framework for measuringfair value and expands disclosures about fair value measurements. FAS 157 does not require new fair value measurements. In February 2008, theFASB released FASB Staff Position No. FAS 157-2, “Effective Date of FASB Statement No. 157,” which delays the effective date of FAS157 for nonfinancial assets and liabilities until January 2009. For financial assets and liabilities, FAS 157 became effective on January 1, 2008. Wedo not expect the adoption of FAS 157 to have a material impact on our financial position or results of operations.
Business Combinations and Noncontrolling InterestsIn December 2007, the FASB released FAS 141R, “Business Combinations” and FAS 160, “Noncontrolling Interests in ConsolidatedFinancial Statements.” Both standards will be effective for transactions that occur after January 1, 2009.
FAS 141R applies to all business combinations and will require the acquiring entity to recognize the assets and liabilities acquired at their respectivefair value. This standard changes the accounting for business combinations in several areas. Some of these changes will result in increased volatilityin our results of operations and financial position. For example, transaction costs, which are currently capitalized in a business combination, will beexpensed as incurred. Additionally, pre-acquisition contingencies (such as in-process lawsuits acquired) and contingent consideration (such asadditional consideration contingent on specified events in the future) will be recorded at fair value at the acquisition date, with subsequent changes infair value reflected in our results of operations. Under current accounting guidance, adjustments to these contingencies are reflected in the allocationof purchase price if they occur within a certain period of time from the acquisition date.
FAS 160 amends previous guidance and establishes accounting and reporting standards for the noncontrolling interest in a subsidiary (often otherwisereferred to as minority interests) and for deconsolidation of the subsidiary.
Page 47

Use of EstimatesThe preparation of the accompanying consolidated financial statements in conformity with GAAP requires our management to make estimates andassumptions that affect the amounts reported in the accompanying consolidated financial statements and notes. We consider the following accountingestimates critical in the preparation of the accompanying consolidated financial statements: health care costs payable, other insurance liabilities,recoverability of goodwill and other acquired intangible assets, measurement of defined benefit pension and other postretirement benefit plans, other-than-temporary impairment of investment securities and revenue recognition. We use information available to us at the time estimates are made;however, these estimates could change materially if different information or assumptions were used. Additionally, these estimates may not ultimatelyreflect the actual amounts of the final transactions that occur.
Cash and Cash EquivalentsCash and cash equivalents include cash on hand and other debt securities with a maturity of three months or less when purchased. The carrying valueof cash equivalents approximates fair value due to the short-term maturity of these investments.
InvestmentsDebt and Equity SecuritiesDebt and equity securities consist primarily of U.S. Treasury and agency securities, mortgage-backed securities, corporate and foreign bonds andother debt and equity securities. Debt securities are classified as either current or long-term investments based on their contractual maturities unlesswe intend to sell an investment within the next twelve months, in which case it is classified as current (refer to Reclassifications on page 46 formore information on our change in accounting method for debt securities in 2007). We have classified our debt and equity securities as available forsale and carry them at fair value. Refer to Note 15 beginning on page 70 for additional information on how we estimate the fair value of our debt andequity securities. The cost for mortgage-backed and other asset-backed securities is adjusted for unamortized premiums and discounts, which areamortized using the interest method over the estimated remaining term of the securities, adjusted for anticipated prepayments. We regularly reviewour debt and equity securities to determine whether a decline in fair value below the carrying value is other-than-temporary. If a decline in fair value isconsidered other-than-temporary, the carrying amount of the security is written down to fair value through our results of operations. We do notaccrue interest on debt securities when management believes the collection of interest is unlikely.
We engage in securities lending by lending certain debt and equity securities from our investment portfolio to other institutions for short periods oftime. We require collateral from borrowers, primarily cash in the amount of 102% to 105% of the fair value of the loaned security. The fair value ofthe loaned securities is monitored on a daily basis, with additional collateral obtained or refunded as the fair value of the loaned securitiesfluctuates. The collateral is retained and invested by a lending agent according to our guidelines to generate additional income for us.
Mortgage LoansWe carry the value of our mortgage loan investments on our balance sheet at the unpaid principal balance, net of impairment reserves. A mortgageloan may be impaired when it is a problem loan (i.e., more than 60 days delinquent, in bankruptcy or in process of foreclosure), a potential problemloan (i.e., high probability of default within 3 years) or a restructured loan. For impaired loans, a specific impairment reserve is established for thedifference between the recorded investment in the loan and the estimated fair value of the collateral. We apply our loan impairment policyindividually to all loans in our portfolio. We record full or partial charge-offs of loans at the time an event occurs affecting the legal status of theloan, typically at the time of foreclosure or upon a loan modification giving rise to forgiveness of debt. Interest income on an impaired loan isaccrued to the extent we deem it collectable and the loan continues to perform under its original or restructured terms. Interest income on problemloans is recognized on a cash basis. Cash payments on loans in the process of foreclosure are treated as a return of principal. Mortgage loans with amaturity date or a committed prepayment date of less than one year from the balance sheet date are reported in current assets on our balance sheets.
Page 48

Other InvestmentsOther investments consist primarily of equity securities subject to restrictions on disposition, alternative investments (which are comprised of privateequity and hedge fund limited partnerships) restricted assets and investment real estate. Restricted assets consist of debt securities on deposit asrequired by regulatory authorities. Alternative investments are accounted for under the equity method unless we control the entity, in which case weconsolidate the entity. We invest in real estate for the production of income. We carry the value of our investment real estate on our balance sheet atdepreciated cost, including capital additions, net of write-downs for other-than-temporary declines in fair value. Depreciation is calculated using thestraight-line method based on the estimated useful life of each asset. If any of our real estate investments is considered held-for-sale, we carry it atthe lower of its carrying value or fair value less estimated selling costs. We generally estimate fair value using a discounted future cash flow analysisin conjunction with comparable sales information. At the time of the sale, we record the difference between the sales price and the carrying value asa realized capital gain or loss.
Derivative InstrumentsWe make limited use of derivatives in order to manage interest rate, foreign exchange and price risk. The derivatives we use consist primarily offutures contracts, forward contracts, interest rate swaps and warrants. Derivatives are reflected at fair value on our balance sheets. The fair value ofderivatives is based on quoted market prices, dealer quotes or internal price estimates believed to be comparable to dealer quotes.
When we enter into a derivative contract, if certain criteria are met, we may designate the derivative as one of the following: a hedge of the fair valueof a recognized asset or liability or of an unrecognized firm commitment; a hedge of a forecasted transaction or of the variability of cash flows to bereceived or paid related to a recognized asset or liability; or a foreign currency fair value or cash flow hedge.
Net Investment Income and Realized Capital Gains and LossesNet investment income and realized capital gains and losses on investments supporting Health Care’s and Group Insurance’s liabilities and Large CasePensions’ products (other than experience-rated and discontinued products) are reflected in our results of operations. Realized capital gains andlosses are determined on a specific identification basis. Unrealized capital gains and losses are reflected in shareholders’ equity, net of tax, as acomponent of accumulated other comprehensive income. We reflect purchases and sales of debt and equity securities on the trade date. We reflectpurchases and sales of mortgage loans and investment real estate on the closing date.
Experience-rated products are products in the Large Case Pensions business where the contract holder, not us, assumes investment (including realizedcapital gains and losses) and other risks, subject to, among other things, minimum guarantees provided by us. The effect of investment performanceis allocated to contract holders’ accounts daily, based on the underlying investment’s experience and, therefore, does not impact our results ofoperations (as long as minimum guarantees are not triggered). Realized and unrealized capital gains and losses on investments supporting experience-rated products in the Large Case Pensions business are reflected in policyholders’ funds in our balance sheets. Net investment income supportingLarge Case Pensions’ experience-rated products is included in net investment income in our statements of income and is credited to contract holdersin current and future benefits.
When we discontinued the sale of our fully guaranteed Large Case Pensions products, we established a reserve for anticipated future losses fromthese products and segregated the related investments. These investments are managed as a separate portfolio. Investment income and net realizedcapital gains and losses on this separate portfolio are ultimately credited/charged to the reserve and, therefore, do not impact our results ofoperations. Unrealized capital gains or losses on this separate portfolio are reflected in other current liabilities in our balance sheets. Refer to Note 20beginning on page 78 for additional information on our discontinued products.
Page 49

ReinsuranceWe utilize reinsurance agreements primarily to facilitate the acquisition or disposition of certain insurance contracts. Ceded reinsurance agreementspermit us to recover a portion of our losses from reinsurers, although they do not discharge our primary liability as direct insurer of the risksreinsured. Failure of reinsurers to indemnify us could result in losses, however we do not expect charges for unrecoverable reinsurance to have amaterial effect on our results of operations or financial position. We evaluate the financial position of our reinsurers and monitor concentrations ofcredit risk arising from similar geographic regions, activities or economic characteristics of our reinsurers. At December 31, 2007, our reinsurancerecoverables consisted primarily of amounts due from third parties that maintain independent agency ratings that are consistent with those companiesthat are considered to have the ability to meet their obligations.
In the normal course of business, we enter into agreements with other insurance companies under which we assume reinsurance, primarily related toour group life and health products (refer to Note 17 on page 72 for additional information). We do not transfer any portion of the financial riskassociated with our HMO products to third parties, except in areas that we participate in state-mandated health insurance pools. We did not havematerial premiums ceded to or assumed from other insurance companies in 2007, 2006 or 2005.
GoodwillWe evaluate goodwill for impairment (at the reporting unit level) annually, or more frequently if circumstances indicate a possible impairment, bycomparing an estimate of the fair value of the applicable reporting unit to its carrying value, including goodwill. If the carrying value exceeds fairvalue, we compare the implied fair value of the applicable goodwill with the carrying amount of that goodwill to measure the amount of goodwillimpairment, if any. Our reporting units with goodwill are our Health Care and Group Insurance segments. Impairments, if any, would be classified asan operating expense. During the fourth quarter of 2007, 2006 and 2005, we performed annual impairment tests, in conjunction with our annualplanning process, and determined there were no impairment losses related to goodwill.
Our annual impairment tests were based on an evaluation of future discounted cash flows. These evaluations utilized the best information available tous at the time, including supportable assumptions and projections we believe are reasonable. Collectively, these evaluations were our best estimates ofprojected future cash flows. Our discounted cash flow evaluations used a range of discount rates that corresponds to our weighted-average cost ofcapital. This discount rate range is consistent with that used for investment decisions and takes into account the specific and detailed operating plansand strategies of the Health Care and Group Insurance reporting units. Certain other key assumptions utilized, including changes in membership,revenue, health care costs, operating expenses and effective tax rates, are based on estimates consistent with those utilized in our annual planningprocess that we believe are reasonable. If we do not achieve our earnings objectives, the assumptions and estimates underlying these goodwillimpairment evaluations could be adversely affected, and we may impair a portion of our goodwill, which would adversely affect our operating resultsin the period of impairment.
Property and Equipment and Other Acquired Intangible AssetsWe report property and equipment and other acquired intangible assets at historical cost, net of accumulated depreciation or amortization. AtDecember 31, 2007 and 2006, the historical cost of property and equipment was approximately $983 million and $898 million, respectively, andthe related accumulated depreciation was approximately $619 million and $614 million, respectively. We calculate depreciation and amortizationprimarily using the straight-line method over the estimated useful lives of the respective assets ranging from three to forty years.
We regularly evaluate whether events or changes in circumstances indicate that the carrying value of property and equipment or other acquiredintangible assets may not be recoverable. If we determine that an asset may not be recoverable, we estimate the future undiscounted cash flowsexpected to result from future use of the asset and its eventual disposition. If the sum of the expected undiscounted future cash flows is less than thecarrying value of the asset, we recognize an impairment loss for the amount by which the carrying value of the asset exceeds its fair value.
Page 50

Separate AccountsSeparate Account assets and liabilities in the Large Case Pensions business represent funds maintained to meet specific objectives of contract holderswho bear the investment risk. These assets and liabilities are carried at fair value. Investment income and capital gains and losses accrue directly tosuch contract holders. The assets of each account are legally segregated and are not subject to claims arising from our other businesses. Deposits,withdrawals, net investment income and realized and unrealized capital gains and losses on Separate Account assets are not reflected in our statementsof income or cash flows. Management fees charged to contract holders are included in fees and other revenue and recognized over the periodearned.
In 1996, we entered into a contract with UBS Realty Investors, LLC (formerly known as Allegis Realty Investors, LLC) under which mortgage loanand real estate Separate Account assets would transition out of our business. A majority of this transition is expected to occur prior to the end of thefirst quarter of 2008. The impact of this transition will be a reduction of Separate Account assets and corresponding liabilities as shown in our balancesheets. While the value of these Separate Account assets was approximately $13.1 billion at December 31, 2007, their value at the time of transitioncannot be predicted. This transition will not impact our shareholders’ equity, results of operations or cash flows.
Health Care and Other Insurance LiabilitiesHealth care costs payable consist principally of unpaid fee-for-service medical, dental and pharmacy claims, capitation costs and other amounts dueto health care providers pursuant to risk-sharing arrangements related to Health Care’s POS, PPO, HMO, indemnity, Medicare and Medicaidproducts. Unpaid health care claims include our estimate of payments we will make on claims reported to us but not yet paid and for health careservices rendered to members but not yet reported to us as of the balance sheet date. Also included in these estimates is the cost of services that willcontinue to be rendered after the balance sheet date if we are obligated to pay for such services in accordance with contractual or regulatoryrequirements. Such estimates are developed using actuarial principles and assumptions which consider, among other things, historical and projectedclaim submission and processing patterns, medical cost trends, historical utilization of health care services, claim inventory levels, changes inmembership and product mix, seasonality and other relevant factors. We reflect changes in estimates in health care costs in our results of operationsin the period they are determined. Capitation costs represent contractual monthly fees paid to participating physicians and other medical providers forproviding medical care, regardless of the medical services provided to the member. Amounts due under risk-sharing arrangements are based on theterms of the underlying contracts with the providers and consider claims experience under the contracts through the balance sheet date.
Future policy benefits consist primarily of reserves for limited payment pension and annuity contracts in the Large Case Pensions business and long-duration group life and long-term care insurance contracts in the Group Insurance business. Reserves for limited payment contracts are computed inaccordance with GAAP, with consideration given to actuarial principles and are based upon assumptions reflecting anticipated mortality, retirement,expense and interest rate experience. Such assumptions generally vary by plan, year of issue and policy duration. Assumed interest rates on suchcontracts ranged from 2.0% to 11.3% in both 2007 and 2006. We periodically review mortality assumptions against both industry standards and ourexperience. Reserves for long-duration group life and long-term care contracts represent our estimate of the present value of future benefits to bepaid to or on behalf of policyholders less the present value of future net premiums. Assumed interest rates on such contracts ranged from 2.5% to8.8% in both 2007 and 2006. Our estimate of the present value of future benefits under such contracts is based upon mortality, morbidity and interestrate assumptions.
Unpaid claims consist primarily of reserves associated with certain short-duration group disability and term life insurance contracts in the GroupInsurance business, including an estimate for claims incurred but not yet reported to us as of the balance sheet date. Reserves associated with certainshort-duration group disability and term life insurance contracts are based upon our estimate of the present value of future benefits, which is basedon assumed investment yields and assumptions regarding mortality, morbidity and recoveries from government programs (e.g., social security). Wedevelop our reserves for claims incurred but not yet reported to us using actuarial principles and assumptions which consider, among other things,contractual requirements, claim incidence rates, claim recovery rates, seasonality and other relevant factors. We discount certain claim liabilitiesrelated to group long-term disability and premium waiver contracts. The discounted unpaid claim liabilities were $1.5 billion and $1.4 billion atDecember 31, 2007 and 2006, respectively. The undiscounted value of these unpaid claim liabilities was $2.4 billion and $2.1 billion
Page 51

at December 31, 2007 and 2006, respectively. The discount rates generally reflect our expected investment returns for the investments supportingthese liabilities and ranged from 6.0% to 6.2% in 2007 and 6.0% to 6.1% in 2006. The discount rates for retrospectively-rated contracts are set atcontractually specified levels. Our estimates of unpaid claims are subject to change due to changes in the underlying experience of the insurancecontracts, changes in investment yields or other factors, and these changes are recorded in current and future benefits in our statements of income inthe period they are determined. Policyholders’ funds consist primarily of reserves for pension and annuity investment contracts in the Large Case Pensions business and customerfunds associated with group life and health contracts in the Health Care and Group Insurance businesses. Reserves for such contracts are equal tocumulative deposits less withdrawals and charges plus credited interest thereon, net of experience-rated adjustments. In 2007, interest rates forpension and annuity investment contracts ranged from 3.3% to 9.6% and interest rates for group life and health contracts ranged from 1.5% to4.9%. In 2006, interest rates for pension and annuity investment contracts ranged from 3.3% to 9.6% and interest rates for group life and healthcontracts ranged from 1.0% to 4.5%. Reserves for contracts subject to experience rating reflect our rights as well as the rights of policyholders andplan participants.
We review health care and insurance liabilities periodically. We reflect any necessary adjustments during the current period in results ofoperations. While the ultimate amount of claims and related expenses are dependent on future developments, it is our management’s opinion that theliabilities that have been established are adequate to cover such costs. The health care and insurance liabilities that are expected to be paid within oneyear from the balance sheet date are classified as current liabilities in our balance sheets.
Health Care Contract Acquisition CostsHealth care products included in the Health Care segment are cancelable by either the customer or the member monthly upon writtennotice. Acquisition costs related to our prepaid health care and health indemnity contracts are expensed as incurred.
Premium Deficiency ReservesWe evaluate our health care and group insurance contracts to determine if it is probable that a loss will be incurred. We would recognize a premiumdeficiency loss when it is probable that expected future claims, including maintenance costs (for example, claim processing costs), will exceedexisting reserves plus anticipated future premiums and reinsurance recoveries on existing contracts. Anticipated investment income is considered inthe calculation of premium deficiency losses for short-duration contracts. For purposes of determining premium deficiency losses, contracts aregrouped in a manner consistent with our method of acquiring, servicing and measuring the profitability of such contracts. We did not have anymaterial premium deficiency reserves at December 31, 2007 or 2006.
Revenue RecognitionHealth care premiums associated with our prepaid and other health care plans are recognized as income in the month in which the enrollee is entitled toreceive health care services. Health care premiums are reported net of an allowance for estimated terminations and uncollectable amounts. Otherpremium revenue for group life, long-term care and disability products is recognized as income, net of allowances for termination and uncollectableaccounts, over the term of the coverage. Other premium revenue for Large Case Pensions’ limited payment pension and annuity contracts isrecognized as revenue in the period received. Premiums related to unexpired contractual coverage periods are reported as unearned premiums in ourbalance sheets.
The balance of the allowance for estimated terminations and uncollectable accounts on premiums receivable was $76 million and $90 million atDecember 31, 2007 and 2006, respectively, and is reflected as a reduction of premiums receivable in our balance sheets. The balance of theallowance for uncollectable accounts on other receivables was $78 million and $66 million at December 31, 2007 and 2006, respectively, and isreflected as a reduction of other receivables in our balance sheets.
Some of our contracts allow for premiums to be adjusted to reflect actual experience. Such adjustments are reasonably estimable (based on actualexperience of the customer emerging under the contract and the terms of the underlying contract) and are recognized as the experience emerges.
Page 52

Fees and other revenue consists primarily of ASC fees which are received in exchange for performing certain claims processing and member servicesfor health and disability members and are recognized as revenue over the period the service is provided. Some of our contracts include guaranteeswith respect to certain functions such as customer service response time, claim processing accuracy and claim processing turnaround time, as well ascertain guarantees that claim expenses to be incurred by plan sponsors will fall within a certain range. With any of these guarantees, we are financiallyat risk if the conditions of the arrangements are not met, although the maximum amount at risk is typically limited to a percentage of the fees otherwisepayable to us by the customer involved. We accrue for any such exposure upon occurrence.
In addition, fees and other revenue includes charges assessed against contract holders’ funds for contract fees, participant fees and asset chargesrelated to pension and annuity products in the Large Case Pensions business. Other amounts received on pension and annuity investment-typecontracts are reflected as deposits and are not recorded as revenue. When annuities with life contingencies are purchased under contracts that wereinitially investment contracts, the accumulated balance related to the purchase is treated as a single premium and reflected as an offsetting amount inboth other premiums and current and future benefits in our statements of income. Fees and other revenue also includes co-payments and ASC plansponsor reimbursements related to our mail order and specialty pharmacies, network access fees and other fees charged for health care data analytics.
Accounting for the Medicare Part D Prescription Drug Program (“PDP”)On December 8, 2003, the Medicare Prescription Drug, Improvement and Modernization Act of 2003 (the “Act”) was signed into law. The Actexpanded Medicare, primarily by adding a voluntary prescription drug benefit for Medicare eligible individuals beginning in 2006. We were selectedby the Centers for Medicare & Medicaid Services (“CMS”) to be a national provider of PDP in all 50 states to both individuals and employergroups in 2006 and 2007 and again in 2008. Under these annual contracts, CMS pays us a portion of the premium, a portion of, or a capitated feefor, catastrophic drug costs and a portion of the health care costs for low-income Medicare beneficiaries and provides a risk sharing arrangement tolimit our exposure to unexpected expenses.
We recognize premiums received from, or on behalf of, members or CMS and capitated fees as premium revenue ratably over the contract period. Weexpense the cost of covered prescription drugs as incurred. Costs associated with low-income Medicare beneficiaries (deductible, coinsurance, etc.)and the catastrophic drug costs paid in advance by CMS are recorded as a liability and offset health care costs when incurred. For individual PDPcoverage, the risk sharing arrangement provides a risk corridor whereby the target amount (what we received in premiums from members and CMSbased on our annual bid amount less administrative expenses) is compared to our actual drug costs incurred during the contract year. Based on the riskcorridor provision and PDP activity to date, an estimated risk sharing receivable or payable is recorded on a quarterly basis as an adjustment topremium revenue. We perform a reconciliation of the final risk sharing, low-income subsidy and catastrophic amounts after the end of each contractyear.
Allocation of Operating ExpensesWe allocate to the business segments centrally incurred costs associated with specific internal goods or services provided to us, such as employeeservices, technology services and rent, based on a reasonable method for each specific cost (such as membership, usage, headcount, compensationor square footage occupied). Interest expense on third-party borrowings is not allocated to the reporting segments, since it is not used as a basis formeasuring the operating performance of the segments. Such amounts are reflected in Corporate Interest in our segment financial information. (Referto Note 19 beginning on page 76 for additional information.)
Income TaxesWe are taxed at regular corporate rates after adjusting income reported for financial statement purposes for certain items. We recognize deferredincome tax assets and liabilities for the differences between the financial and income tax reporting basis of assets and liabilities based on enacted taxrates and laws. Valuation allowances are provided when it is considered more likely than not that deferred tax assets will not be realized. Deferredincome tax expense or benefit primarily reflects the net change in deferred income tax assets and liabilities during the year. Our current income taxprovision reflects the tax results of revenues and expenses currently taxable or deductible. Penalties and interest on our tax positions are classified asa component of our income tax provision.
Page 53

3. Acquisitions
During 2007 and 2006, we spent approximately $613 million and $156 million, respectively, on the following transactions, which we believe willenhance our existing product capabilities and future growth opportunities. All acquisitions were funded with available cash.
· Broadspire Disability operates as a third party administrator, offering absence management services, including short and long-term disabilityadministration and leave management, to employers. We acquired Broadspire Disability from Broadspire Services, Inc. and BroadspireManagement Services, Inc. for approximately $156 million in March 2006.
· Schaller Anderson, Incorporated (“Schaller Anderson”) is a leading provider of health care management services for Medicaid plans that weacquired in July 2007 for approximately $535 million. The goodwill associated with this acquisition is subject to adjustment upon completionof a purchase accounting valuation.
· Goodhealth Worldwide (Bermuda) Limited (“Goodhealth”) is a leading managing general underwriter (or underwriting agent) forinternational private medical insurance that offers expatriate benefits to individuals, small and medium-sized enterprises, and large multinationalclients around the world. We acquired Goodhealth in October 2007 for approximately $78 million. The intangible assets and goodwillassociated with this acquisition are subject to adjustment upon completion of a purchase accounting valuation.
We recorded goodwill related to these transactions of approximately $455 million and $99 million in 2007 and 2006, respectively, of whichapproximately $104 million related to our acquisition of Broadspire Disability is expected to be fully deductible for tax purposes and was assigned toour Group Insurance segment. All other goodwill recorded in 2007 and 2006 was assigned to our Health Care segment. Refer to Note 7 on page 56for additional information.
4. Earnings Per Common Share
Basic earnings per share (“EPS”) is computed by dividing income available to common shareholders (i.e., the numerator) by the weighted averagenumber of common shares outstanding (i.e., the denominator) during the period. Diluted EPS is computed in a manner similar to basic EPS, exceptthat the weighted average number of common shares outstanding are adjusted for the dilutive effects of stock options, stock appreciation rights andother dilutive financial instruments, but only in the periods in which such effect is dilutive.
The computations for basic and diluted EPS from continuing operations for 2007, 2006 and 2005 were as follows:
(Millions, except per common share data) 2007 Income from continuing operations $ 1,831.0 $Weighted average shares used to compute basic EPS 509.2 Dilutive effect of outstanding stock-based compensation awards (1) 17.8 Weighted average shares used to compute diluted EPS 527.0 Basic EPS $ 3.60 $Diluted EPS $ 3.47 $(1) Approximately 2.6 million stock appreciation rights (“SARs”) (with exercise prices ranging from $44.22 to $59.76) and 5.3 million SARs (with exercise prices ranging
from $38.43 to $52.11) were not included in the calculation of diluted earnings per common share for 2007 and 2006, respectively, because their exercise prices weregreater than the average market price during each period.
Page 54

5. Operating Expenses
For 2007, 2006 and 2005, selling expenses (which include broker commissions, the variable component of our internal sales force compensation andpremium taxes) and general and administrative expenses were as follows: (Millions) 2007 2006 2005 Selling expenses $ 1,060.9 $ 952.7 $ 843.5 General and administrative expenses: Salaries and related benefits 2,343.6 2,305.3(1) 2,247.2 Other general and administrative expenses 1,641.9 1,562.6(2) 1,362.0 Total general and administrative expenses 3,985.5 3,867.9 3,609.2 Total operating expenses $ 5,046.4 $ 4,820.6 $ 4,452.7 (1) Salaries and related benefits for 2006 include a severance charge of $27.1 million related to ongoing initiatives to streamline our organization, align our resources and reduce
general and administrative expenses.(2) Other general and administrative expenses for 2006 includes the following charges: a physician class action settlement insurance-related charge of $72.4 million pretax; a debt
refinancing charge of $12.4 million pretax and an acquisition-related software charge of $8.3 million pretax. Refer to the reconciliation of operating earnings to income fromcontinuing operations in Note 19 on page 77 for additional information.
6. Health Care Costs Payable
The following table shows the components of the change in health care costs payable in 2007, 2006 and 2005:
(Millions) 2007 2006 2005 Health care costs payable, beginning of the period $ 1,927.5 $ 1,817.0 $ 1,927.1 Less: Reinsurance recoverables 3.7 5.5 5.6 Health care costs payable, beginning of the period - net 1,923.8 1,811.5 1,921.5 Acquisition of businesses 58.1 - 18.6 Add: Components of incurred health care costs Current year 17,472.0 15,495.4 13,534.6 Prior years (1) (177.2) (194.4) (426.7)
Total incurred health care costs 17,294.8 15,301.0 13,107.9 Less: Claims paid Current year 15,528.5 13,761.9 11,745.8 Prior years 1,573.7 1,426.8 1,490.7 Total claims paid 17,102.2 15,188.7 13,236.5 Health care costs payable, end of period - net 2,174.5 1,923.8 1,811.5 Add: Reinsurance recoverables 2.9 3.7 5.5 Health care costs payable, end of the period $ 2,177.4 $ 1,927.5 $ 1,817.0 (1) Includes $250 million for 2005 (including $103 million related to the release of reserves related to the New York Market Stabilization Pool (refer to Note 18 beginning on
page 73 for additional information)) of favorable development of prior period health care cost estimates that affected results of operations. The favorable development ofprior period health care cost estimates was primarily the result of the actual claim submission time being shorter than we anticipated as well as lower than expected health carecost trends. We had no significant development of prior period health care cost estimates that affected results of operations in 2007 or 2006.
Page 5 5

7. Goodwill and Other Acquired Intangible Assets
As a result of the acquisitions described in Note 3 on page 54, we increased the carrying value of goodwill in 2007 and 2006 as follows: (Millions) 2007 2006 Balance, beginning of the period $ 4,603.6 $ 4,523.2 Goodwill acquired: Schaller Anderson (1) 377.0 - Goodhealth (1) 73.4 - Broadspire Disability 5.0 99.0 Other - (18.6) (2)
Balance, end of the period (3) $ 5,059.0 $ 4,603.6 (1) Goodwill related to the acquisition of Schaller Anderson and Goodhealth is considered preliminary, pending the finalization of purchase accounting valuations (refer to Note 3
on page 54 for additional information).(2) Includes approximately $19.2 million of additional net operating loss carry forwards that were available to us from prior acquisitions. As a result, goodwill was reduced in
2006 as we recognized deferred tax assets for these net operating loss carry forwards.(3) Approximately $5.0 billion and $4.5 billion of goodwill was assigned to the Health Care segment at December 31, 2007 and 2006, respectively. Approximately $104 million
and $99 million of goodwill was assigned to the Group Insurance segment at December 31, 2007 and 2006, respectively.
Other acquired intangible assets at December 31, 2007 and 2006 were comprised of the following:
Accumulated Amortization (Millions) Cost Amortization Net Balance Period (Years) 2007 Other acquired intangible assets: Provider networks $ 701.0(1) $ 310.8 $ 390.2 12-25 Customer lists 384.4(1) 93.6 290.8 4-10 Technology 61.8(1) 37.9 23.9 3-5 Other 71.0(1) 17.8 53.2 3-15 Trademarks 22.3 - 22.3 Indefinite Total other acquired intangible assets (2) $ 1,240.5 $ 460.1 $ 780.4 2006 Other acquired intangible assets: Provider networks $ 696.2 $ 282.0 $ 414.2 12-25 Customer lists 250.6(3) 51.3 199.3 4-10 Technology 56.5(3) 21.3 35.2 3-5 Other 31.4(3) 10.8 20.6 3-12 Trademarks 22.3 - 22.3 Indefinite Total other acquired intangible assets $ 1,057.0 $ 365.4 $ 691.6 (1) As a result of our acquisitions in 2007, we assigned $133.8 million to customer list assets, $42.5 million to other assets, $5.3 million to technology assets and $4.8 million
to provider network assets.(2) Other acquired intangible assets of $23.7 million related to the acquisition of Goodhealth is considered preliminary, pending the finalization of a purchase accounting valuation
(refer to Note 3 on page 54 for additional information).(3) As a result of our acquisitions in 2006, we assigned $37.2 million to customer list assets, $12.4 million to technology assets and $2.7 million to other assets.
We estimate annual pretax amortization for other acquired intangible assets over the next five calendar years to be as follows:
(Millions) 2008 $ 105.5 2009 94.5 2010 89.4 2011 83.0 2012 74.4
Page 5 6

8. Investments
Total investments at December 31, 2007 and 2006 were as follows: 2007 2006 (Millions) Current Long-term Total Current Long-term Total Debt and equity securities available for sale $ 686.3 $ 14,309.0 $ 14,995.3 $ 687.0 $ 14,251.0 $ 14,938.0 Mortgage loans 27.3 1,485.3 1,512.6 207.4 1,380.8 1,588.2 Other investments 137.9 1,245.8 1,383.7 113.6 1,247.3 1,360.9 Total investments $ 851.5 $ 17,040.1 $ 17,891.6 $ 1,008.0 $ 16,879.1 $ 17,887.1 Our investment portfolio has not experienced material losses from the sub-prime market. We have evaluated the composition of our investmentportfolio at December 31, 2007 and do not believe it has significant exposure to the sub-prime market.
Debt and Equity SecuritiesDebt and equity securities available for sale at December 31, 2007 and 2006 were as follows: Gross Gross Amortized Unrealized Unrealized Fair (Millions) Cost Gains Losses Value 2007 Debt securities: U.S. government securities $ 1,369.8 $ 63.4 $ .5 $ 1,432.7 States, municipalities and political subdivisions 1,656.5 22.0 5.3 1,673.2 U.S. corporate securities 6,206.7 157.1 98.4 6,265.4 Foreign securities 2,187.1 92.1 18.5 2,260.7 Mortgage-backed and other asset-backed securities 2,818.0 37.0 28.4 2,826.6 Redeemable preferred securities 509.6 9.2 27.2 491.6 Total debt securities 14,747.7 380.8 178.3 14,950.2 Equity securities 38.7 6.8 .4 45.1 Total debt and equity securities (1) $ 14,786.4 $ 387.6 $ 178.7 $ 14,995.3 2006 Debt securities: U.S. government securities $ 1,506.7 $ 24.0 $ 10.4 $ 1,520.3 States, municipalities and political subdivisions 1,613.2 17.3 8.7 1,621.8 U.S. corporate securities 5,937.0 188.0 59.0 6,066.0 Foreign securities 2,054.0 107.7 20.1 2,141.6 Mortgage-backed and other asset-backed securities (2) 2,950.8 52.8 36.9 2,966.7 Redeemable preferred securities 528.8 25.1 3.4 550.5 Total debt securities 14,590.5 414.9 138.5 14,866.9 Equity securities 65.5 5.7 .1 71.1 Total debt and equity securities (3) $ 14,656.0 $ 420.6 $ 138.6 $ 14,938.0 (1) Includes investments with a fair value of $4.7 billion, gross unrealized gains of $205.6 million and gross unrealized losses of $60.9 million that support our experience-rated
and discontinued products at December 31, 2007. Changes in net unrealized capital gains (losses) on these securities are not reflected in accumulated other comprehensiveloss. Refer to Note 2 beginning on page 45 for additional information.
(2) Includes approximately $148.7 million of subordinate and residual certificates at December 31, 2006 from a 1997 commercial mortgage loan securitization that we retained.(3) Includes investments with a fair value of $4.8 billion, gross unrealized gains of $239.1 million and gross unrealized losses of $42.1 million that support our experience-related
and discontinued products at December 31, 2006. Changes in net unrealized capital gains (losses) on these securities are not reflected in accumulated other comprehensiveloss. Refer to Note 2 beginning on page 45 for additional information.
The fair value of debt securities at December 31, 2007 is shown on the following page by contractual maturity. Actual maturities may differ fromcontractual maturities because securities may be restructured, called or prepaid.
Page 57

Fair (Millions) Value Due to mature: One year or less $ 663.3 After one year, through five years 3,217.2 After five years, through ten years 3,714.2 After ten years 4,528.9 Mortgage-backed securities 2,325.0 Other asset-backed securities 501.6 Total $ 14,950.2 The maturity dates for debt securities in an unrealized loss position at December 31, 2007 were as follows: Supporting discontinued Supporting remaining and experience-rated products products Total Fair Unrealized Fair Unrealized Fair Unrealized (Millions) Value Losses Value Losses Value Losses Due to mature: Less than one year $ 46.6 $ 5.2 $ 99.6 $ .3 $ 146.2 $ 5.5 One year through five years (1) 125.6 2.2 826.8 30.3 952.4 32.5 After five years through ten years (1) 523.7 16.3 936.1 25.7 1,459.8 42.0 Greater than ten years (1) 624.6 36.1 1,278.8 54.5 1,903.4 90.6 Mortgage-backed securities (1) 46.5 .7 467.8 7.0 514.3 7.7 Total $ 1,367.0 $ 60.5 $ 3,609.1 $ 117.8 $ 4,976.1 $ 178.3 (1) Debt securities in an unrealized loss position that are not due to mature in less than one year are classified as long-term investments on our consolidated balance sheets.
Summarized below are our debt and equity securities with unrealized losses at December 31, 2007 and 2006, along with the related fair value,aggregated by the length of time the investments have been in an unrealized loss position: Less than 12 months Greater than 12 months Total (1)
Fair Unrealized Fair Unrealized Fair Unrealized(Millions) Value Losses Value Losses Value Losses2007 Debt securities: U.S. government securities $ 41.7 $ .4 $ 5.3 $ .1 $ 47.0 $ .5 State, municipalities and political subdivisions 246.4 3.1 130.5 2.2 376.9 5.3 U.S. corporate securities 1,699.8 60.5 787.6 37.9 2,487.4 98.4 Foreign securities 278.2 4.7 262.5 13.8 540.7 18.5 Mortgage-backed and other asset-backed securities 330.0 10.1 977.4 18.3 1,307.4 28.4 Redeemable preferred securities 116.4 11.9 100.3 15.3 216.7 27.2Total debt securities 2,712.5 90.7 2,263.6 87.6 4,976.1 178.3Equity securities .3 .4 - - .3 .4Total debt and equity securities $ 2,712.8 $ 91.1 $ 2,263.6 $ 87.6 $ 4,976.4 $ 178.7 2006 Debt securities: U.S. government securities $ 721.5 $ 5.2 $ 269.8 $ 5.2 $ 991.3 $ 10.4 State, municipalities and political subdivisions 329.8 2.4 321.6 6.3 651.4 8.7 U.S. corporate securities 1,127.7 13.6 1,219.1 45.4 2,346.8 59.0 Foreign securities 278.0 4.5 376.0 15.6 654.0 20.1 Mortgage-backed and other asset-backed securities 406.5 2.6 1,246.9 34.3 1,653.4 36.9 Redeemable preferred securities 166.6 3.4 - - 166.6 3.4Total debt securities 3,030.1 31.7 3,433.4 106.8 6,463.5 138.5Equity securities 2.6 .1 1.0 - 3.6 .1Total debt and equity securities $ 3,032.7 $ 31.8 $ 3,434.4 $ 106.8 $ 6,467.1 $ 138.6(1) At December 31, 2007 and 2006, debt and equity securities in an unrealized loss position of $60.9 million and $42.1 million, respectively, and related fair value of $1.4 billion
related to discontinued and experience-rated products.
Page 58

Unrealized losses at December 31, 2007 and 2006 were generally caused by current interest rates that were higher than the stated interest rates. Inaccordance with our accounting policy, we record an other-than-temporary impairment unless we determine that sufficient market recovery canoccur within a reasonable period of time and that we have the intent and ability to hold the investment until market recovery, which may be untilmaturity. In determining our ability to hold a security until full recovery of value, we consider the forecasted recovery period, expected investmentreturns relative to other funding sources, the credit quality of the investment, our projected cash flow and capital requirements and otherfactors. We have the ability and intent to hold the securities in the table above until their cost can be recovered, which we expect will occur atmaturity, if not sooner. Therefore, no other-than-temporary impairment was determined to have occurred on these investments.
Mortgage LoansOur mortgage loans are primarily secured by commercial real estate. We had no material problem, restructured or potential problem loans includedin mortgage loans at December 31, 2007 or 2006. We had no reserves on our mortgage loans at December 31, 2007 or 2006.
At December 31, 2007 scheduled mortgage loan principal repayments were as follows: (Millions) 2008 $ 21.4 2009 81.5 2010 102.1 2011 110.0 2012 84.7 Thereafter 1,112.9
Variable Interest Entities (“VIEs”)We do not have any material relationships with VIEs which would require consolidation. We have relationships with certain real estate and hedge fundpartnerships that are considered VIEs. However, we would not be considered the primary beneficiary of these investments. We record the amount ofour investment in these partnerships as investment real estate and other long-term assets on our balance sheets and recognize our share of partnershipincome or losses in earnings. Our maximum exposure to loss as a result of our investment in these partnerships is our investment balance atDecember 31, 2007 and 2006 of approximately $89 million and $96 million, respectively, and the risk of recapture of tax credits related to the realestate partnerships previously recognized, which we do not believe is significant. The real estate partnerships construct, own and manage low-incomehousing developments and had total assets of approximately $2.5 billion and $1.9 billion at December 31, 2007 and 2006, respectively. The hedgefund partnerships had total assets of approximately $7.2 billion and $70 billion at December 31, 2007 and 2006, respectively.
Net Investment IncomeSources of net investment income in 2007, 2006 and 2005 were as follows: (Millions) 2007 2006 2005 Debt securities $ 820.4 $ 811.0 $ 838.2 Mortgage loans 123.5 136.9 136.8 Cash equivalents and other short-term investments 124.1 112.7 59.2 Other 121.3 139.1 107.0 Gross investment income 1,189.3 1,199.7 1,141.2 Less: Investment expenses (39.4) (35.0) (38.2)
Net investment income (1) $ 1,149.9 $ 1,164.7 $ 1,103.0 (1) Includes amounts related to experience-rated contract holders of $ 118.9 million, $135.1 million and $143.6 million in 2007, 2006 and 2005, respectively. Interest credited
to experience-related contract holders is included in current and future benefits in our statements of income.
Page 5 9

9. Capital Gains and Losses on Investments and Other Activities
Net realized capital (losses) gains were $(74) million in 2007 and $32 million in each of 2006 and 2005. Included in net realized capital losses for2007 were $125 million of other-than-temporary impairment charges on debt securities that were in an unrealized loss position due to interest rateincreases rather than unfavorable changes in the credit quality of such securities. Since we could not positively assert our intention to hold suchsecurities until recovery in value, these securities were written down to fair value in accordance with our accounting policy. There were nosignificant investment write-downs from other-than-temporary impairments in 2006 or 2005.
Excluding amounts related to experience-rated and discontinued products, proceeds from the sale of debt securities and the related gross realizedcapital gains and losses in 2007, 2006 and 2005 were as follows: (Millions) 2007 2006 2005 Proceeds on sales $ 8,370.6 $ 10,057.6 $ 10,324.9 Gross realized capital gains 80.0 88.0 66.5 Gross realized capital losses 28.1 70.9 53.8
10. Other Comprehensive Income (Loss)
Shareholders’ equity included the following activity in accumulated other comprehensive income (loss) (excluding amounts related to experience-rated contract holders and discontinued products) in 2007, 2006 and 2005: Net Unrealized Gains (Losses) Foreign Pension (Millions) Securities Currency Derivatives OPEB Balance at December 31, 2004 $ 245.7 $ 11.3 $ (.8) $Net unrealized losses on securities ($(223.9) pretax) (145.5) - - Net foreign currency gains ($1.1 pretax) - .7 - Net derivative losses ($(4.0) pretax) - - (2.6) Pension liability adjustment ($1,127.7 pretax) - - - Reclassification to earnings ($9.6 pretax) 3.9 - 2.3 Balance at December 31, 2005 104.1 12.0 (1.1) Net unrealized losses on securities ($(53.7) pretax) (34.9) - - Net foreign currency losses ($(.6) pretax) - (.4) - Net derivative gains ($24.9 pretax) - - 16.2
Pension liability adjustment ($8.8 pretax) - - - Reclassification to earnings ($(15.7) pretax) (2.7) - (7.5) Adjustment to initially recognize the funded status
of pension and OPEB plans - - - Balance at December 31, 2006 66.5 11.6 7.6 Effect of changing measurement date of pension and OPEB plans pursuant to FAS 158 (3) - - - Balance at January 1, 2007, as adjusted 66.5 11.6 7.6 Net unrealized (losses) gains ($250.0 pretax) (64.3) - - Net foreign currency gains ($5.5 pretax) - 3.6 - Net derivative losses ($(19.2) pretax) - - (12.5) Reclassification to earnings ($107.4 pretax) 51.1 - (3.3) Balance at December 31, 2007 $ 53.3 $ 15.2 $ (8.2) $(1) The amount recognized reflects the $8.8 million pretax charge to record the minimum pension liability adjustment of the pension plan in accordance with the provisions of
FAS 87, “Employers’ Accounting for Pensions” (“FAS 87”), prior to the adoption of FAS 158.(2) The amount recognized reflects the $943.5 million pretax and $60.2 million pretax adjustment to reflect the funded status of our pension and OPEB plans, respectively, in
accordance with FAS 158 (refer to Note 2 beginning on page 45 for additional information on FAS 158).(3) We elected to adopt the measurement date provisions of FAS 158 in 2007. The transition provisions of FAS 158 required us to recognize the effects of this change as an
adjustment to the opening balance of accumulated other comprehensive loss on January 1, 2007. Refer to Note 2 beginning on page 45 for additional details.
Page 60

The components of our pension and OPEB plans included the following activity in accumulated other comprehensive (loss) income in 2007: Pension Plans OPEB Plans
UnrecognizedNet Actuarial
UnrecognizedPrior Service
UnrecognizedNet Actuarial
Unrecognized Prior Service
(Millions) Losses Costs Losses Costs Total Balance at December 31, 2006 $ (657.9) $ (14.4) $ (75.8) $ 36.7 $ (711.4)Effect of changing measurement date of pension and OPEB plans pursuant to FAS 158 (1) 115.3 .8 (1.6) (.6) 113.9 Balance at January 1, 2007, as adjusted (542.6) (13.6) (77.4) 36.1 (597.5)Unrealized net gains (losses) arising during the period ($348.9 pretax) 176.0 23.9 26.9 - 226.8 Reclassification to earnings ($34.0 pretax) 17.9 3.1 3.4 (2.4) 22.0 Balance at December 31, 2007 $ (348.7) $ 13.4 $ (47.1) $ 33.7 $ (348.7)(1) We elected to adopt the measurement date provisions of FAS 158 in 2007. The transition provisions of FAS 158 required us to recognize the effects of this change as an
adjustment to the opening balance of accumulated other comprehensive loss on January 1, 2007. Refer to Note 2 beginning on page 45 for additional details.
11. Income Taxes
The components of our income tax provision in 2007, 2006 and 2005 were as follows:
(Millions) 2007 2006 2005 Current taxes: Federal $ 742.1 $ 798.1 $ 645.0 State 63.8 50.8 52.1 Total current taxes 805.9 848.9 697.1 Deferred taxes (benefits): Federal 161.0 50.5 184.0 State (1.5) 1.6 (1.1)
Total deferred income taxes 159.5 52.1 182.9 Total income taxes $ 965.4 $ 901.0 $ 880.0
Income taxes were not materially different than the amount computed by applying the federal income tax rate to income from continuing operationsbefore income taxes in 2007, 2006 or 2005.
The significant components of our net deferred tax assets at December 31, 2007 and 2006 were as follows:
(Millions) 2007 2006 Deferred tax assets: Reserve for anticipated future losses on discontinued products $ 292.4 $ 286.1 Employee and postretirement benefits - 191.8 Deferred policy acquisition costs 55.0 51.8 Investments, net 158.2 101.5 Net operating loss carry forwards 27.4 54.5 Insurance reserves 96.0 62.5 Other 79.9 73.1 Gross deferred tax assets 708.9 821.3 Less: Valuation allowance 25.3 20.1 Deferred tax assets, net of valuation allowance 683.6 801.2 Deferred tax liabilities: Goodwill and other acquired intangible assets 240.6 171.4 Accumulated other comprehensive income 32.5 46.1 Depreciation and amortization 183.4 120.5 Employee and postretirement benefits 51.8 - Total gross deferred tax liabilities 508.3 338.0 Net deferred tax asset (1) $ 175.3 $ 463.2 (1) Includes $321.7 million and $293.2 million classified as current assets at December 31, 2007 and 2006, respectively, and $(146.4) million and $170.0 million classified as
noncurrent (liabilities) assets at December 31, 2007 and 2006, respectively.
Page 61

Valuation allowances are provided when we estimate that it is more likely than not that deferred tax assets will not be realized. A valuation allowancehas been established on certain acquired net operating losses and state net operating losses, which are subject to limitations as to future utilization. Webase our estimates of the future realization of deferred tax assets on historic and anticipated taxable income. However, the amount of the deferred taxasset considered realizable could be adjusted in the future if we revise our estimates of anticipated taxable income. The IRS is currently auditing our 2006 tax return. Beginning with the 2007 tax year, we entered into the Compliance Assurance Process (the “CAP”)with the IRS. Under the CAP, the IRS undertakes audit procedures during the tax year and as the return is prepared for filing. Within 90 days offiling the return, the IRS intends to issue a letter with respect to its acceptance of the filed return. Unless we disagree with the IRS on the treatment ofa material tax matter, this letter will conclude the IRS’s examination of the tax year.
We are also subject to audits by state taxing authorities for tax years from 1995 through 2006. We believe we carry appropriate reserves for anyexposure to state tax issues.
We paid net income taxes of $783 million, $732 million and $247 million in 2007, 2006 and 2005, respectively.
Uncertain Tax PositionsAs described in Note 2 beginning on page 45, we adopted FIN 48 on January 1, 2007. The following table reconciles the changes in ouruncertain tax positions during 2007, since our adoption of FIN 48: (Millions) 2007 Balance at January 1, 2007 $ 159.1 Additions based on tax positions taken in the: Current year 1.1 Prior years 3.9 Settlements of tax positions taken in prior years (134.8)
Balance at December 31, 2007 $ 29.3
Additionally, at December 31, 2007, approximately $10 million of income taxes payable related to potential interest and penaltypayments. During the year ended December 31, 2007, we recognized approximately $9 million of interest and penalties as a componentof our income tax provision.
It is reasonably possible that the uncertain tax position at December 31, 2007 will increase or decrease in 2008. These changes could increase ordecrease our uncertain tax positions by a range of zero to $15 million, which could be triggered by the completion of tax authority audits, settlementsor the expiration of the statute of limitations. Additionally, some of our uncertain tax positions could increase due to examination activity or tax lawdevelopments, but it is not possible to provide an estimate of a range at this time.
At December 31, 2007, we do not have any uncertain tax positions that, if recognized, would materially affect our future effective tax rate.
12. Employee Benefit Plans
Defined Benefit Retirement PlansWe sponsor various noncontributory defined benefit plans, including two pension plans that cover substantially all employees and other postretirementbenefit plans (“OPEB”) that provide certain health care and life insurance benefits for retired employees, including those of our former parentcompany.
We provide for certain of our employees a noncontributory, defined benefit pension benefit under two plans, the Aetna Pension Plan, a tax-qualifiedpension plan, and the Supplemental Pension Plan, which provides benefits for wages above the Internal Revenue Code wage limits applicable to taxqualified pension plans and benefits not paid under the qualified plan for special pension arrangements. The pension benefits accrued by employeesare based on formulas which are dependant on the employee’s effective date of hire. Employees hired or rehired after December 31, 1998 accruebenefits based on a cash balance formula, which credits employees annually with an amount equal to eligible pay based on age and years of service, aswell as an interest credit based on individual account balances. Employees hired before December 31, 1998 accrued benefits using the greater of afinal average pay formula or our cash balance formula, until December 31, 2006.
Page 62

Effective January 1, 2007, all pension plan participants accrue future benefits under the same cash balance formula, and no new benefits accrueunder the Supplemental Pension Plan. Interest will continue to be credited on outstanding supplemental cash balance accounts, and the SupplementalPension Plan may continue to be used to credit special pension arrangements. All Supplemental Pension Plan participants will continue to participate inthe Aetna Pension Plan, up to the applicable wage limits each year.
In addition, we currently provide certain medical and life insurance benefits for retired employees, including those of our former parent company. Acomprehensive medical plan is offered to all full-time employees who terminate employment at age 45 or later with at least five years of service. Weprovide subsidized health benefits to certain employees as of December 31, 2002 whose sum of age and service is at least equal to 65 (due to a planamendment, employees hired after January 1, 2002 and all employees under the age of 35 at that date are not eligible for subsidized retiree healthbenefits). There is a cap on our portion of the cost of providing medical and dental benefits to our retirees. Plan assets for our OPEB plan are held intrust and administered by an affiliated company, Aetna Life Insurance Company.
On January 1, 2004, we began phasing-out the retiree medical subsidy for active employees (and eligible dependents) who terminated employmentafter December 31, 2004. The subsidy decreased 25% each year until it was eliminated for employees terminating employment on or after January 1,2007. All current and future retirees and employees who terminate employment at age 45 or later with at least five years of service are eligible toparticipate in our group health plans at their own cost.
In accordance with FAS 158 (refer to Note 2 beginning on page 45 for additional information), during 2007 we changed our measurement date fordetermining benefit obligations and the fair value of plan assets of our pension and OPEB plans to December 31 (the end of our fiscal year). Wepreviously used September 30 as our measurement date.
The following table shows the changes in the benefit obligations during 2007 and 2006 for our pension and OPEB plans. For the pension plans, thebenefit obligation is the projected benefit obligation (which does not differ materially from the accumulated benefit obligation). For the OPEB plans,the benefit obligation is the accumulated postretirement benefit obligation. Pension Plans OPEB Plans (Millions) 2007 2006 2007 2006 Benefit obligation, beginning of year $ 5,121.5 $ 5,044.4 $ 393.2 $ 476.4 Net effect of changing measurement date pursuant to FAS 158 69.6 - (2.6) - Service cost 44.4 97.8 .3 .3 Interest cost 299.1 283.1 21.7 25.4 Actuarial (gain) loss (291.2) (26.1) (42.5) (34.6)Plan amendments (36.7) - - (26.5)Benefits paid (300.5) (277.7) (38.0) (47.8)
Benefit obligation, end of year $ 4,906.2 $ 5,121.5 $ 332.1 $ 393.2 We used the following weighted average assumptions to determine the benefit obligations of our pension and OPEB plans at our measurement date for2007 (December 31) and 2006 (September 30): Pension Plans OPEB Plans 2007 2006 2007 2006 Discount rate 6.56% 5.98% 6.35% 5.85%Rate of increase in future compensation levels 4.51 4.51 - -
Page 63

The discount rates used to determine the benefit obligation of our pension and OPEB plans at our December 31, 2007 measurement date andSeptember 30, 2006 measurement date were calculated using a yield curve at that date. The yield curve consisted of a series of individual discountrates, with each discount rate corresponding to a single point-in-time, based on high quality bonds. Projected benefit payments are discounted to themeasurement date using the corresponding rate from the yield curve. The discount rates differ for our pension and OPEB plans due to the nature ofthe projected benefit payments for each plan.
The following table reconciles the beginning and ending balances of the fair value of plan assets during 2007 and 2006 for the pension and OPEBplans:
Pension Plans OPEB Plans (Millions) 2007 2006 2007 2006 Fair value of plan assets, beginning of year $ 5,336.4 $ 4,821.7 $ 70.8 $ 70.9 Net effect of changing measurement date pursuant to FAS 158 265.3 - (.1) - Actual return of plan assets 444.9 523.4 2.6 3.3 Employer contributions 73.1 269.0 35.4 44.4 Benefits paid (300.5) (277.7) (38.0) (47.8)
Fair value of plan assets, end of year $ 5,819.2 $ 5,336.4 $ 70.7 $ 70.8 The difference between the fair value of plan assets and the plan’s benefit obligation at the latest measurement date is referred to as the plan’s fundedstatus. The funded status of our pension and OPEB plans at the measurement date for 2007 (December 31) and 2006 (September 30) were asfollows: Pension Plans OPEB Plans (Millions) 2007 2006 2007 2006 Benefit obligation $ (4,906.2) $ (5,121.5) $ (332.1) $ (393.2)Fair value of plan assets 5,819.2 5,336.4 70.7 70.8 Funded status $ 913.0 $ 214.9 $ (261.4) $ (322.4)
A reconciliation of the funded status at the measurement date for 2007 (December 31) and 2006 (September 30) of our pension and OPEB plans tothe net amounts recognized as assets or liabilities on our balance sheets at December 31, 2007 and 2006 were as follows: Pension Plans OPEB Plans (Millions) 2007 2006 2007 2006 Funded status $ 913.0 $ 214.9 $ (261.4) $ (322.4)Unrecognized net actuarial losses 536.5 1,012.1 72.4 116.7 Unrecognized prior service (credit) cost (20.6) 22.1 (51.8) (56.5)Contributions made in the fourth quarter - 5.3 - 10.8 Amount recognized in accumulated other comprehensive loss (515.9) (1,034.2) (20.6) (60.2)
Net amount of assets and liabilities recognized at December 31 $ 913.0 $ 220.2 $ (261.4) $ (311.6)
The assets and liabilities recognized on our balance sheets at December 31, 2007 and 2006 for our pension and OPEB plans were comprised of thefollowing: Pension Plans OPEB Plans (Millions) 2007 2006 2007 2006 Prepaid pension asset (1) $ 1,164.1 $ 478.5 $ - $ - Accrued benefit liabilities (2) (251.1) (258.3) (261.4) (311.6)
Net amount of assets and liabilities recognized at December 31 $ 913.0 $ 220.2 $ (261.4) $ (311.6)(1) Included in other long-term assets on our balance sheets.(2) Includes $21.5 million and $28.0 million for the pension and OPEB plans, respectively, that are reflected in other current liabilities and $229.6 million and $233.4 million for
the pension and OPEB plans, respectively, that are reflected in long-term liabilities on our balance sheets at December 31, 2007. Includes $21.5 million and $32.3 million forthe pension and OPEB plans, respectively, that are reflected in other current liabilities and $236.8 million and $279.3 million for the pension and OPEB plans, respectively,that are reflected in long-term liabilities on our balance sheets at December 31, 2006.
Page 64

At December 31, 2007, we had approximately $537 million and $72 million of net actuarial losses for our pension and OPEB plans, respectively,and approximately $21 million and $52 million of prior service credits for our pension and OPEB plans, respectively, that have not been recognizedas components of net periodic benefit costs. We expect to recognize approximately $6 million and $3 million in amortization of net actuarial lossesfor our pension and OPEB plans, respectively, and approximately $(2) million and $(4) million in accretion of prior service credits for our pensionand OPEB plans, respectively, in 2008.
Components of the net periodic benefit (income) cost in 2007, 2006 and 2005 for the pension and OPEB plans were as follows: Pension Plans OPEB Plans (Millions) 2007 2006 2005 2007 2006 2005 Service cost $ 44.4 $ 97.8 $ 92.7 $ .3 $ .3 $ .4 Interest cost 299.1 283.1 273.9 21.7 25.4 28.2 Expected return on plan assets (465.5) (410.7) (370.2) (3.8) (4.0) (4.5)Amortization (accretion) of prior service cost 4.8 5.7 5.3 (3.7) (2.1) (1.3)Recognized net actuarial loss 27.6 77.3 74.5 5.3 7.1 5.8 Curtailment benefit - - (2.3) - - - Net periodic benefit (income) cost $ (89.6) $ 53.2 $ 73.9 $ 19.8 $ 26.7 $ 28.6
The weighted average assumptions used to determine net periodic benefit (income) cost in 2007, 2006 and 2005 for the pension and OPEB plans wereas follows: Pension Plans OPEB Plans 2007 2006 2005 2007 2006 2005 Discount rate 5.91% 5.77% 6.00% 5.82% 5.59% 6.00%Expected long-term return on plan assets 8.50 8.50 8.75 5.50 5.70 6.50 Rate of increase in future compensation levels 4.51 4.51 3.00 - - -
We assume different health care cost trend rates for medical costs and prescription drug costs in estimating the expected costs of our OPEBplans. The assumed medical cost trend rate for 2008 is 7%, decreasing gradually to 5% by 2010. The assumed prescription drug cost trend rate for2008 is 12%, decreasing gradually to 5% by 2015. These assumptions reflect our historical as well as expected future trends for retirees. Inaddition, the trend assumptions reflect factors specific to our retiree medical plan, such as plan design, cost-sharing provisions, benefits covered andthe presence of subsidy caps. An increase in the health care cost trend rate of one percentage point would increase the postretirement benefitobligation at December 31, 2007 by approximately $10 million and would increase service and interest costs by approximately$1 million. Conversely, a decrease in the assumed health care cost trend rate of one percentage point would decrease the postretirement benefitobligation at December 31, 2007 by approximately $9 million and would decrease service and interest costs by approximately $1 million.
The asset allocation of the pension and OPEB plans at the measurement date for 2007 (December 31) and 2006 (September 30) and the target assetallocation at December 31, 2007, presented as a percentage of the total plan assets, were as follows : Pension Plans OPEB Plans Target Target (Millions) 2007 2006 Allocation 2007 2006 Allocation Equity securities 66% 66% 55-75% 11% 11% 5-15%Debt securities 24 26 10-30 87 87 80-90 Real estate/other 10 8 5-25 2 2 2-10 Total 100% 100% 100% 100%
Our pension plans invest in a diversified mix of assets intended to maximize long-term returns while recognizing the need for adequate liquidity tomeet on-going benefit and administrative obligations. Risk of unexpected investment and actuarial outcomes is regularly evaluated. This evaluation isperformed through forecasting and assessing ranges of investment outcomes over short and long-term horizons, and by assessing the pension plan’sliability characteristics, our financial condition and our future potential obligations from both the pension and general corporateperspectives. Complementary investment styles and techniques are utilized by multiple professional investment firms to further improve portfolio andoperational risk characteristics. Public and private equity investments are used primarily to increase overall plan returns. Real estate investments areviewed favorably for their diversification benefits and above-average dividend generation. Fixed income investments provide diversification benefitsand liability hedging attributes that are desirable, especially in falling interest rate environments.
Page 6 5

Asset allocations and investment performance are formally reviewed quarterly by the plan’s Benefit Finance Committee. Forecasting of asset andliability growth is performed at least annually. More thorough analysis of assets and liabilities are also performed periodically.
We have several benefit plans for retired employees currently supported by the OPEB plan assets. OPEB plan assets are directly and indirectlyinvested in a diversified mix of traditional asset classes, primarily high-quality fixed income securities.
The expected long-term rate of return is estimated based on many factors including the expected forecast for inflation, risk premiums for each assetclass, expected asset allocation, current and future financial market conditions, and diversification and rebalancing strategies. Historical returnpatterns and correlations, consensus return forecasts and other relevant financial factors are analyzed to check for reasonability and appropriateness.
Our current funding strategy is to fund an amount at least equal to the minimum funding requirement as determined under applicable regulatoryrequirements with consideration of factors such as the maximum tax deductibility of such amounts. We may elect to voluntarily contribute amountsto our tax-qualified pension plan. We do not have any regulatory contribution requirements for 2008; however, we intend to make a voluntarycontribution of approximately $45 million to the Aetna Pension Plan in 2008. Employer contributions related to the Supplemental Pension Plan andOPEB plans represent payments to retirees for current benefits. We have no plans to return any pension or OPEB plan assets to the Company in 2008.
Expected benefit payments, which reflect future employee service, as appropriate, of the pension and OPEB plans to be paid for each of the next fiveyears and in the aggregate for the next five years thereafter, at December 31, 2007 were as follows:
(Millions) Pension Plans OPEB Plans2008 $ 294.6 $ 32.22009 300.2 31.32010 305.4 30.52011 311.7 29.62012 428.1 28.12013-2017 1,809.1 125.3
401(k) PlanSubstantially all of our employees are eligible to participate in a defined contribution retirement savings plan under which designated contributions,which may be invested in our common stock or certain other investments, are matched by us. We provide for a match of up to 50% of the first 6% ofeligible pay contributed to the plan. The matching contributions are made in cash and invested according to each participant’s investmentelections. During 2007, 2006 and 2005, we made $42 million, $40 million and $36 million, respectively, in matching contributions. The plan trusteeheld approximately 11 million shares of our common stock for plan participants at December 31, 2007. At December 31, 2007, approximately 34million shares of our common stock were reserved for issuance under our 401(k) plan.
Employee Incentive PlansStock-Based Compensation Plans - Our stock-based compensation plans (collectively, the “Plans”) provide for awards of stock options, stockappreciation rights (“SARs”), restricted stock units (“RSUs”), performance stock units (“PSUs”) deferred contingent common stock and theability for employees to purchase common stock at a discount. At December 31, 2007, approximately 88 million common shares were availablefor issuance under the Plans.
Page 6 6

Executive, middle management and non-management employees may be granted stock options, SARs, RSUs and PSUs. Stock options are grantedto purchase our common stock at or above the market price on the date of grant. SARs granted will be settled in stock, net of taxes, based on theappreciation of our stock price on the exercise date over the market price on the date of grant. SARs and stock options generally become 100%vested three years after the grant is made, with one-third vesting each year. From time to time, we have issued SARs and stock options with differentvesting provisions. Vested SARs and stock options may be exercised at any time during the 10 years after grant, except in certain circumstances,generally related to employment termination or retirement. At the end of the 10-year period, any unexercised SARs and stock options expire. Foreach RSU granted, employees receive one share of common stock, net of taxes, at the end of the vesting period. The RSUs granted in 2006 willgenerally vest in a single installment on the third anniversary of the grant date. The RSUs granted in 2007 will generally become 100% vested threeyears after the grant is made, with one-third vesting each year.
We estimate the fair value of stock options and awards of SARs using a modified Black-Scholes option pricing model. The fair value of RSUs isbased on the market price of our common stock on the date of grant. Stock options and SARs granted in 2007, 2006 and 2005 had a weightedaverage per share fair value of $15.10, $16.41 and $10.83, respectively, using the assumptions noted in the following table: 2007 2006 2005 Dividend yield .1% .1% .1%Expected volatility 31.7% 30.9% 31.3%Risk-free interest rate 4.7% 4.6% 3.7%Expected term 4.7 years 4.5 years 4.5 years
We use historical data to estimate the period of time that stock options or SARs are expected to be outstanding. Expected volatilities are based on aweighted average of the historical volatility of our stock price and implied volatility from traded options on our stock. The risk-free interest rate forperiods within the expected life of the stock option or SAR is based on the benchmark five-year U.S. Treasury rate in effect on the date ofgrant. The dividend yield assumption is based on our historical dividends declared.
The stock option and SAR transactions in 2007, 2006 and 2005 were as follows:
Number of Stock
Weighted
Average
WeightedAverage
Remaining Aggregate
Intrinsic
(Millions, except exercise price) Options and SARs
(1) Exercise Price Contractual Life Value 2005 Outstanding, beginning of year 67.6 $ 11.22 6.6 $ 1,350.9 Granted 8.9 33.61 - - Exercised (21.6) 11.34 - 573.5 Expired or forfeited (1.1) 14.49 - - Outstanding, end of year 53.8 $ 14.78 6.2 $ 1,742.2 Exercisable, end of year 43.0 $ 12.77 5.8 $ 1,480.3 2006 Outstanding, beginning of year 53.8 $ 14.78 6.2 $ 1,742.2 Granted 5.5 49.84 - - Exercised (9.5) 11.17 - 309.2 Expired or forfeited (.7) 28.72 - - Outstanding, end of year 49.1 $ 19.22 5.5 $ 1,213.5 Exercisable, end of year 38.8 $ 13.27 4.9 $ 1,161.3 2007 Outstanding, beginning of year 49.1 $ 19.22 5.5 $ 1,213.5 Granted 5.7 43.26 - - Exercised (13.3) 12.55 - 494.1 Expired or forfeited (1.0) 37.31 - - Outstanding, end of year 40.5 $ 24.31 5.3 $ 1,352.6 Exercisable, end of year 30.6 $ 18.49 4.4 $ 1,201.5 (1) There were no SARs transactions prior to January 1, 2006.
Page 67

During 2007, 2006 and 2005, the following activity occurred under the Plans: (Millions) 2007 2006 2005 Cash received from stock option exercises $ 163.1 $ 105.8 $ 253.0 Intrinsic value (the excess of stock price on the date of exercise over the exercise price) 494.1 309.2 573.5 Tax benefits realized for the tax deductions from stock options and SARs exercised 172.9 108.2 202.5 Fair value of stock options and SARs vested 18.0 71.0 63.5 We settle employee stock options with newly issued common stock and generally utilize the proceeds to repurchase common stock in the openmarket in the same period.
The following is a summary of information regarding stock options and SARs outstanding and exercisable at December 31, 2007 (number of stockoptions and SARs and aggregate intrinsic values in millions):
Outstanding Exercisable Weighted Average Weighted Weighted Remaining Average Aggregate Average Aggregate Number Contractual Exercise Intrinsic Number Exercise Intrinsic Range of Exercise Prices Outstanding Life (Years) Price Value Exercisable Price Value $0.00-$5.98 .8 2.0 $ 4.95 $ 39.8 .8 $ 4.95 $ 39.8 5.98-11.95 15.8 3.6 9.40 765.2 15.8 9.40 765.2 11.95-17.93 .5 3.6 12.76 21.8 .5 12.76 21.8 17.93-29.88 6.5 5.3 19.39 250.1 6.5 19.39 250.1 29.88-35.86 6.4 6.0 33.38 155.7 4.0 33.38 98.1 35.86-41.83 .4 7.9 39.57 6.6 .2 39.42 3.0 41.83-47.81 4.9 8.8 42.68 73.4 .3 42.57 4.4 47.81-53.78 5.2 7.0 50.08 39.9 2.5 50.20 19.1 53.78-59.76 - (1) 9.9 55.74 .1 - - - $0.00-$59.76 40.5 5.3 $ 24.31 $ 1,352.6 30.6 $ 18.49 $ 1,201.5 (1) Amounts rounded to zero.
RSU transactions in 2007 and 2006 were as follows (number of units in millions): 2007 2006 Weighted Weighted Average Average Grant Date Grant Date RSUs Fair Value RSUs Fair Value RSUs at beginning of year .8 $ 49.52 -(1) (2) $ 34.18 Granted .8 43.15 .8 50.05 Vested (.1) 47.70 -(1) 40.29 Forfeited (.1) 46.36 -(1) 50.21 RSUs at end of year 1.4 $ 46.15 .8 $ 49.52 (1) Amounts rounded to zero.(2) There were no material RSU transactions prior to January 1, 2006.
In 2007, 2006 and 2005 we recorded pretax share-based compensation expense of $89 million, $74 million and $94 million, respectively, in generaland administrative expenses. We also recorded related tax benefits of $32 million, $26 million and $33 million in 2007, 2006 and 2005,respectively. At December 31, 2007, $100 million of total unrecognized compensation costs related to stock options, SARs and RSUs are expectedto be recognized over a weighted-average period of 1.7 years.
We also have an Employee Stock Purchase Plan (the “ESPP”). Activity related to the ESPP was not material to us in 2007, 2006 or 2005.
Page 68

Performance Units – During 2005 and 2004, we granted performance unit awards to certain executives as part of a long-term incentiveprogram. The value of the performance units was equal to $100. The performance units granted in 2004 vested on December 31, 2005, and theperformance units granted in 2005 vested on December 31, 2006. The number of vested performance units at December 31, 2005 and 2006 wasdependent upon the degree to which we achieved performance goals as determined by the Board’s Committee on Compensation and Organization(the “Compensation Committee”). In January 2007 and 2006, the Compensation Committee determined that the 2005 and 2004 grants vested at180.0% and 158.7% of target, respectively, and approved the payment of the awards. The costs associated with our performance units for 2006and 2005 were $14 million and $43 million, respectively. There was no performance units costs in 2007.
13. Debt
In December 2007, we issued $700 million of 6.75% senior notes due 2037; the proceeds of which were used to repay commercial paperborrowings.
In June 2006, we issued $2.0 billion of senior notes comprised of $450 million of 5.75% senior notes due 2011, $750 million of 6.0% senior notesdue 2016 and $800 million of 6.625% senior notes due 2036. The proceeds from this issuance were used to redeem the entire $700 millionaggregate principal amount of our 8.5% senior notes due 2041 and to repay approximately $400 million of commercial paper borrowings,outstanding since the March 1, 2006 maturity of the entire $450 million aggregate principal amount of our 7.375% senior notes. The remainder ofthe net proceeds were used for general corporate purposes, including share repurchases.
The carrying value of our long-term debt at December 31, 2007 and 2006 was as follows:
(Millions) 2007 Senior notes, 5.75%, due 2011 $ 449.7 Senior notes, 7.875%, due 2011 448.8 Senior notes, 6.0%, due 2016 746.2 Senior notes, 6.625%, due 2036 798.5 Senior notes, 6.75%, due 2037 695.3 Total long-term debt $ 3,138.5
At December 31, 2007, we had $100 million of commercial paper outstanding with a weighted average interest rate of 5.44%. We had nocommercial paper outstanding at December 31, 2006. In addition, at December 31, 2007, certain of our subsidiaries had a one-year $45 millionshort term credit program with a bank to provide short-term liquidity to those subsidiaries. Borrowings under this program are secured by certainassets of those subsidiaries. At December 31, 2007 and 2006, there was $31 million and $45 million, respectively, outstanding under thisprogram at an interest rate of 5.19% and 6.10%, respectively.
We paid $178 million, $159 million and $121 million in interest in 2007, 2006 and 2005, respectively.
At December 31, 2007, we had an unsecured $1 billion, five-year revolving credit agreement (the “Facility”) with several financial institutionswhich terminates in January 2012. The Facility provides for up to $150 million of letters of credit to be issued at our request, which count as usageof the available commitments under the Facility. Upon our agreement with one or more financial institutions, we may expand the aggregatecommitments under the Facility to a maximum of $1.35 billion. Various interest rate options are available under the Facility. Any revolvingborrowings mature on the termination date of the Facility. We pay facility fees on the Facility ranging from .05% to .175% per annum, dependingupon our long-term senior unsecured debt rating. The facility fee was .07% at December 31, 2007. The Facility contains a financial covenant thatrequires us to maintain a ratio of total debt to consolidated capitalization as of the end of each fiscal quarter ending on or after December 31, 2005 ator below .4 to 1.0. For this purpose, consolidated capitalization equals the sum of shareholders’ equity, excluding any overfunded or underfundedstatus of our pension and OPEB plans in accordance with FAS 158 and any net unrealized capital gains and losses, and total debt (as defined in theFacility). We met this requirement at December 31, 2007.
Page 6 9

14. Capital Stock
From time to time, the Board authorizes us to repurchase our common stock. Our activity under Board authorized share repurchase programs in 2007,2006 and 2005 was as follows: Shares Purchased 2007 2006 2005
(Millions) Purchase Not to
Exceed Shares Cost Shares Cost Shares Cost Authorization date: September 28, 2007 $ 1,250.0 6.1 $ 348.1 - $ - - $ - April 27, 2007 750.0 15.0 750.0 - - - - September 29, 2006 750.0 12.1 570.9 4.2 179.1 - - April 28, 2006 820.0 - - 21.7 820.0 - - January 27, 2006 750.0 - - 20.4 750.0 - - September 29, 2005 750.0 - - 14.0 580.9 3.6 169.1 February 25, 2005 750.0 - - - - 17.8 750.0 September 24, 2004 750.0 - - - - 20.4 750.0 Total repurchases N/A 33.2 $ 1,669.0 60.3 $ 2,330.0 41.8 $ 1,669.1 Repurchase authorization remaining at December31, N/A $ 901.9 N/A $ 570.9 N/A $ 580.9
On February 29, 2008, the Board authorized an additional $750 million share repurchase program which will commence upon completion of theSeptember 28, 2007 authorization. On September 28, 2007, the Board declared an annual cash dividend of $.04 per common share to shareholders of record at the close of business onNovember 15, 2007. The $20 million dividend was paid on November 30, 2007.
In addition to the capital stock disclosed on our balance sheets, we have authorized 7.6 million shares of Class A voting preferred stock, $.01 parvalue per share. At December 31, 2007, there were also 198 million undesignated shares that the Board has the power to divide into such classes andseries, with such voting rights, designations, preferences, limitations and special rights as the Board determines.
15. Financial Instruments
Estimated Fair ValueThe carrying value and estimated fair value of certain of our financial instruments at December 31, 2007 and 2006 were as follows: 2007 2006 Estimated Estimated Carrying Fair Carrying Fair (Millions) Value Value Value Value Assets: Debt securities $ 14,950.2 $ 14,950.2 $ 14,866.9 $ 14,866.9 Equity securities 45.1 45.1 71.1 71.1 Mortgage loans 1,512.6 1,530.2 1,588.2 1,618.6 Derivatives 2.5 4.6 3.1 4.6 Liabilities: Investment contract liabilities: With a fixed maturity 70.8 71.8 81.7 82.2 Without a fixed maturity 546.9 502.3 549.8 481.9 Derivatives - - - 3.8 Long-term debt 3,138.5 3,193.8 2,442.3 2,575.2
Page 70

We made our estimates of fair value made at a specific point in time, based on available market information and judgments about a given financialinstrument, such as estimates of the timing and amount of future cash flows. Such estimates do not reflect any premium or discount that couldresult from offering for sale at one time our entire holdings of a particular financial instrument and do not consider the tax impact of the realizationof unrealized capital gains or losses. In many cases our fair value estimates cannot be substantiated by comparison to independent markets, and thedisclosed value may not be realized upon immediate settlement of the instrument. We take the fair values of all financial instruments intoconsideration when we evaluate our management of interest rate, price and liquidity risks.
We used the following valuation methods and assumptions in estimating the fair value of the financial instruments included in the table above:
Debt and equity securities: Fair values are determined based on quoted market prices when available, market prices provided by a third partyvendor (including matrix pricing) or dealer quotes. Fair values of non-traded debt and equity securities are determined based on our internal analysisof each investment’s financial statements and cash flow projections.
Mortgage loans: Fair values are estimated by discounting expected mortgage loan cash flows at market rates that reflect the rates at which similarloans would be made to similar borrowers. These rates reflect management’s assessment of the credit quality and the remaining duration of theloans. Our fair value estimates of mortgage loans of lower credit quality, including problem and restructured loans, are based on the estimated fairvalue of the underlying collateral.
Derivatives: Fair values are estimated based on quoted market prices, dealer quotes or our internal price estimates that we believe are comparable todealer quotes.
Investment contract liabilities:· With a fixed maturity: Fair value is estimated by discounting cash flows at interest rates currently being offered by, or available to, us for
similar contracts.
· Without a fixed maturity: Fair value is estimated as the amount payable to the contract holder upon demand. However, we have the right undersuch contracts to delay payment of withdrawals that may ultimately result in paying an amount different than that determined to be payable ondemand.
Long-term debt: Fair values are based on quoted market prices for the same or similar issued debt or, if no quoted market prices are available,on the current rates estimated to be available to us for debt of similar terms and remaining maturities.
Derivative Financial InstrumentsWe are using interest rate swap agreements to manage certain exposures related to changes in interest rates on investments supporting experience-ratedand discontinued products in the Large Case Pensions business. The use of these derivatives does not impact our results of operations.
During 2007, we entered into two forward starting swaps (with an aggregate notional value of $300 million) in order to hedge the change in cashflows associated with interest payments generated by the forecasted issuance of senior notes. These transactions qualified as cash flow hedges. Inconnection with our 2007 debt issuance (refer to Note 13 on page 69), we terminated the two forward starting swaps in 2007. As a result, we paidapproximately $25 million, which was recorded as other comprehensive loss and is being amortized as an increase to interest expense over the life ofthe applicable senior notes issued in 2007.
During 2005 and 2006, we entered into five forward starting swaps (with an aggregate notional value of $1.0 billion) in order to hedge the change incash flows associated with interest payments generated by the forecasted issuance of senior notes. These transactions qualified as cash flowhedges. In connection with our 2006 debt issuance (refer to Note 13 on page 69), we terminated the five forward starting swaps during 2006. As aresult, we received approximately $15 million, which was recorded as other comprehensive income and is being amortized as a reduction of interestexpense over the life of the applicable senior notes issued in 2006.
Page 71

In December 2002, we entered into an interest rate swap agreement to convert the fixed rate of 8.5% on $200 million of our senior notes to a variablerate of three-month LIBOR plus 254.0 basis points. In December 2001, we entered into an interest rate swap agreement to convert the fixed rate of8.5% on $350 million of our senior notes to a variable rate of three-month LIBOR plus 159.5 basis points. Based on the terms of the swapagreements, they qualified as fair value hedges. In May 2005, we sold both of these interest rate swap agreements. At the time of the sale of theinterest rate swap agreements, the cumulative fair value adjustment of the debt on our balance sheet was a gain of $7.8 million. As a result of the sale,we were amortizing the cumulative fair value adjustment over the life of the applicable senior notes as a reduction of interest expense until werecognized the remaining deferred gain in 2006 in connection with the redemption of the $700 million, 8.5% senior notes (refer to Note 13 on page69).
16. Dividend Restrictions and Statutory Surplus
Our business operations are conducted through subsidiaries that principally consist of HMOs and insurance companies. In addition to general statelaw restrictions on payments of dividends and other distributions to shareholders applicable to all corporations, HMOs and insurance companies aresubject to further regulations that, among other things, may require such companies to maintain certain levels of equity, and restrict the amount ofdividends and other distributions that may be paid to their parent corporations. These regulations generally are not directly applicable to Aetna, as aholding company, since Aetna is not an HMO or insurance company. The additional regulations applicable to our HMO and insurance companysubsidiaries are not expected to affect our ability to service our debt or to pay dividends or the ability of any of our subsidiaries to service its debt orother financing obligations.
Under regulatory requirements, the amount of dividends that may be paid to Aetna by our insurance and HMO subsidiaries without prior approval byregulatory authorities as calculated at December 31, 2007 is approximately $1.7 billion in the aggregate. There are no such restrictions ondistributions from Aetna to its shareholders.
The combined statutory net income for the years ended and combined statutory capital and surplus at December 31, 2007, 2006 and 2005 for ourinsurance and HMO subsidiaries, were as follows: (Millions) 2007 2006 2005 Statutory net income $ 1,901.9 $ 1,500.9 $ 1,568.3 Statutory capital and surplus 5,316.0 4,704.0 4,547.3
17. Reinsurance
Effective November 1, 1999, we reinsured certain policyholder liabilities and obligations related to paid-up group life insurance. Effective October1, 1998, we reinsured certain policyholder liabilities and obligations related to individual life insurance (in conjunction with our former parentcompany’s sale of this business). These transactions were in the form of indemnity reinsurance arrangements, whereby the assuming companiescontractually assumed certain policyholder liabilities and obligations, although we remain directly obligated to policyholders. The liability related toour obligation is recorded in future policy benefits and policyholders’ funds on our balance sheets. Assets related to and supporting these policieswere transferred to the assuming companies, and we recorded a reinsurance recoverable. Reinsurance recoverables related to these obligations wereapproximately $1.1 billion at December 31, 2007, 2006 and 2005.
There is not a material difference between premiums on a written basis versus an earned basis. Reinsurance recoveries were approximately $62million, $83 million and $72 million in 2007, 2006 and 2005, respectively. At December 31, 2007, reinsurance recoverables with a carrying valueof approximately $1.1 billion were associated with three reinsurers.
Page 72

18. Commitments and Contingent Liabilities
In March 2005, we entered into an agreement with certain other carriers and the New York State Insurance Department as to our participation in theNew York State Market Stabilization Pool under New York Regulation 146 (“Regulation 146”) for the years 1999 through 2004. Regulation 146requires all carriers with small group and/or individual business in New York State to participate in a market stabilization pooling mechanism underwhich carriers that experience higher than average cost factors in providing services to members with specified medical conditions receive paymentsfrom the pool, and carriers that experience lower than average cost factors make payments to the pool. From 1999 through 2004, in the absence ofany pool data regarding relative average cost factors of the carriers doing business in New York State, we made provisions for our estimate ofliabilities incurred in this pool based on discussions with the New York State Insurance Department and historical experience. At December 31, 2004we had recorded reserves (included in health care costs payable on our balance sheet) of approximately $89 million based on these estimates.
In June 2005, we entered into an agreement with the New York State Insurance Department and other carriers participating in the pool that modifiedthe mechanism by which the amounts due to (or receivable from) the pool were to be settled. Under this agreement, we were a net receiver ofapproximately $14 million in cash from the pool in satisfaction of all our remaining obligations relating to the pool for the years 1999 through2004. Accordingly, in 2005 we released the $89 million liability recorded at December 31, 2004, which combined with the $14 million cash receivedto result in a $103 million pretax favorable development of prior period health care costs. This agreement also eliminated any further paymentobligation we had for 2005. We were not subject to a pooling mechanism for 2006. The New York State Insurance Department has promulgated anew pooling mechanism for years subsequent to 2006, but this new mechanism will not involve potential payments or recoveries until 2008.
GuaranteesWe have the following guarantee arrangements at December 31, 2007.
· ASC Claim Funding Accounts - We have arrangements with certain banks for the processing of claim payments for our ASC customers. Thebanks maintain accounts to fund claims of our ASC customers. The customer is responsible for funding the amount paid by the bank eachday. In these arrangements, we guarantee that the banks will not sustain losses if the responsible ASC customer does not properly fund itsaccount. The aggregate maximum exposure under these arrangements is $250 million. We could limit our exposure to this guarantee bysuspending the payment of claims for ASC customers that have not adequately funded the amount paid by the bank.
· Indemnification Agreements - In connection with certain acquisitions and dispositions of assets and/or businesses, we have incurred certaincustomary indemnification obligations to the applicable seller or purchaser, respectively. In general, we have agreed to indemnify the other partyfor certain losses relating to the assets or business that we purchased or sold. Certain portions of our indemnification obligations are capped at theapplicable purchase price, while other arrangements are not subject to such a limit. At December 31, 2007, we do not believe that our futureobligations under any of these agreements will be material to us.
· Separate Account assets - Certain Separate Account assets associated with the Large Case Pensions business represent funds maintained as acontractual requirement to fund specific pension annuities that we have guaranteed. Contractual obligations in these Separate Accounts were $4.5billion and $4.6 billion at December 31, 2007 and 2006, respectively. Refer to Note 2 beginning on page 45 for additional information onSeparate Accounts. Contract holders assume all investment and mortality risk and are required to maintain Separate Account balances at or abovea specified level. The level of required funds is a function of the risk underlying the Separate Accounts' investment strategy. If contract holdersdo not maintain the required level of Separate Account assets to meet the annuity guarantees, we would establish an additional liability. Contractholders' balances in the Separate Accounts at December 31, 2007 exceeded the value of the guaranteed benefit obligation. As a result, we werenot required to maintain any additional liability for our related guarantees at December 31, 2007.
Page 73

Guaranty Fund Assessments, Market Stabilization and Other Non-Voluntary Risk Sharing PoolsUnder guaranty fund laws existing in all states, insurers doing business in those states can be assessed (up to prescribed limits) for certain obligationsof insolvent insurance companies to policyholders and claimants. Our assessments generally are based on a formula relating to our premiums in thestate compared to the premiums of other insurers. Certain states allow recoverability of assessments as offsets to premium taxes. While we havehistorically recovered more than half of guaranty fund assessments through statutorily permitted premium tax offsets, significant increases inassessments could jeopardize future recovery of these assessments. Some states have similar laws relating to HMOs. HMOs in certain states inwhich we do business are subject to assessments, including market stabilization and other risk sharing pools for which we are assessed charges basedon incurred claims, demographic membership mix and other factors. We establish liabilities for these assessments based on applicable laws andregulations. In certain states, the ultimate assessments we pay are dependent upon our experience relative to other entities subject to the assessment andthe ultimate liability is not known at the balance sheet date. While the ultimate amount of the assessment is dependent upon the experience of all poolparticipants, we believe we have adequate reserves to cover such assessments.
Litigation and Regulatory ProceedingsMichele Cooper, et al. v. Aetna Life Insurance Company, et al.This purported nationwide class action lawsuit (the “Cooper Case”) was filed in the United States District Court for the District of New Jersey (the“New Jersey Federal Court”) on July 30, 2007 and subsequently amended. The plaintiffs allege that we violated state law, the Employee RetirementIncome Security Act of 1974, as amended (“ERISA”), and the Racketeer Influenced and Corrupt Organizations Act (“RICO”) in connection withvarious practices related to the payment of claims for services rendered to our members by providers with whom we do not have a contract (“out-of-network providers”), resulting in increased out-of-pocket payments by our members. The purported classes together consist of all members insubstantially all of our health benefit plans who received services from out-of-network providers from 2001 to date for which we allowed less thanthe full amount billed by the provider. The plaintiffs seek reimbursement of all unpaid benefits, recalculation and repayment of deductible andcoinsurance amounts, unspecified damages and treble damages, statutory penalties, injunctive and declaratory relief, plus interest, costs and attorneys’fees, and to disqualify us from acting as a fiduciary of any benefit plan that is subject to ERISA. This case is similar to other actions pending in theNew Jersey Federal Court and elsewhere against several of our competitors. We intend to defend this case vigorously.
Healthcare Payor Industry Class Action LitigationFrom 1999 through early 2003, we were involved in purported class action lawsuits as part of a wave of similar actions targeting the health care payorindustry and, in particular, the conduct of business by managed care companies. These cases, brought on behalf of health care providers (the“Provider Cases”), alleged generally that we and other defendant managed care organizations engaged in coercive behavior or a variety of improperbusiness practices in dealing with health care providers and conspired with one another regarding this purported wrongful conduct.
Effective May 21, 2003, we and representatives of over 900,000 physicians, state and other medical societies entered into an agreement (the“Physician Settlement Agreement”) settling the lead physician Provider Case, which was pending in the United States District Court for the SouthernDistrict of Florida (the “Florida Federal Court”). We believe that the Physician Settlement Agreement, which received final court approval, resolvedall then pending Provider Cases filed on behalf of physicians that did not opt out of the settlement. In 2003, we recorded a charge of $75 million($115 million pretax) in connection with the Physician Settlement Agreement, net of an estimated insurance receivable of $72 million pretax. Webelieve our insurance policies with third party insurers apply to this matter and have been vigorously pursuing recovery from those insurers inPennsylvania state court (the “Coverage Litigation”). In May 2006, the Philadelphia, Pennsylvania state trial court issued a summary judgment rulingdismissing all of our claims in the Coverage Litigation. We have appealed that ruling, and the oral argument was held on September 18, 2007. Weintend to continue to vigorously pursue recovery from our third party insurers. However, as a result of that ruling, we concluded that the estimatedinsurance receivable of $72 million pretax that was recorded in connection with the Physician Settlement Agreement is no longer probable ofcollection for accounting purposes, and therefore, in 2006, we wrote-off that recoverable. We continue to work with plaintiffs’ representatives toaddress the issues covered by the Physician Settlement Agreement.
Page 74

Several Provider Cases filed in 2003 on behalf of purported classes of chiropractors and/or all non-physician health care providers also make factualand legal allegations similar to those contained in the other Provider Cases, including allegations of violations of RICO. These Provider Cases seekvarious forms of relief, including unspecified damages, treble damages, punitive damages and injunctive relief. These Provider Cases have beentransferred to the Florida Federal Court for consolidated pretrial proceedings. We intend to defend each of these cases vigorously.
Securities Class Action LitigationTwo purported class action lawsuits (collectively, the “Securities Class Action Litigation”) are pending in the United States District Court for theEastern District of Pennsylvania. On October 24, 2007, the Southeastern Pennsylvania Transportation Authority filed suit on behalf of all purchasersof Aetna common stock between October 27, 2005 and April 27, 2006. The plaintiff alleges that Aetna and three of its former officers and/ordirectors, John W. Rowe, M.D., Alan M. Bennett and Craig R. Callen (collectively, the “SPTA Defendants”), violated federal and state securitieslaws and applicable common law. The plaintiff alleges misrepresentations and omissions regarding, among other things, our medical benefit ratiosand health plan pricing policies, as well as insider trading by Dr. Rowe and Messrs. Bennett and Callen. The plaintiff seeks compensatory damagesplus interest and attorneys’ fees, among other remedies.
The second lawsuit was filed on November 27, 2007, by the Plumbers and Pipefitters Local 51 Pension Fund on behalf of all purchasers of Aetnacommon stock between July 28, 2005 and July 27, 2006. The plaintiff alleges that Aetna and four of its current or former officers and/or directors,John W. Rowe, M.D., Ronald A. Williams, Alan M. Bennett and Timothy A. Holt (collectively, the “Plumbers Defendants,” and together with theSPTA Defendants, the “Defendants”), violated federal securities laws. The plaintiff alleges misrepresentations and omissions regarding, among otherthings, our medical benefit ratios, health plan pricing policies and reserves for incurred but not reported claims, as well as insider trading by Dr. Roweand Messrs. Bennett and Holt. The plaintiff seeks compensatory damages plus interest and attorneys’ fees, among other remedies.
The Defendants intend to vigorously defend these cases, both of which are in their preliminary stages.
Other Litigation and Regulatory ProceedingsWe are involved in numerous other lawsuits arising, for the most part, in the ordinary course of our business operations, including employmentlitigation and claims of bad faith, medical malpractice, non-compliance with state and federal regulatory regimes, marketing misconduct, failure totimely or appropriately pay medical claims, investment activities, patent infringement and other intellectual property litigation and other litigation in ourHealth Care and Group Insurance businesses. Some of these other lawsuits are or are purported to be class actions. We intend to defend these mattersvigorously.
In addition, our current and past business practices are subject to review by, and from time to time we receive subpoenas and other requests forinformation from, various state insurance and health care regulatory authorities and attorneys general and other state and federal authorities. Forexample, we have received subpoenas from the New York Attorney General (the “NYAG”) with respect to an industry-wide investigation into certainpayment practices with respect to out-of-network providers. The NYAG has stated that he intends to initiate litigation against one of our competitorsin connection with this investigation. It is reasonably possible that the NYAG or others could initiate litigation or additional regulatory action againstus and/or one or more of our competitors with respect to provider payment practices. There also continues to be heightened review by regulatoryauthorities of and increased litigation regarding the health care benefits industry’s business and reporting practices, including utilization management,complaint and grievance processing, information privacy, provider network structure (including the use of performance-based networks), delegatedarrangements and claim payment practices (including payments to out-of-network providers). As a leading national health care benefits organization,we regularly are the subject of such reviews. These reviews may result, and have resulted, in changes to or clarifications of our business practices,as well as fines, penalties or other sanctions.
We are unable to predict at this time the ultimate outcome of the Cooper Case, the remaining Provider Cases, the Securities Class Action Litigation orthe matters described under “Other Litigation and Regulatory Proceedings,” and it is reasonably possible that their outcome could be material to us.
Page 75

Other ObligationsWe have operating leases for office space and certain computer and other equipment. Rental expenses for these items were $153 million, $146million and $156 million in 2007, 2006 and 2005, respectively. The future net minimum payments under noncancelable leases for 2008 through 2012are estimated to be $177 million, $144 million, $98 million, $47 million and $34 million, respectively.
We also have funding obligations relating to equity limited partnership investments and commercial mortgage loans. The funding requirements forequity limited partnership investments and commercial mortgage loans for 2008 through 2012 are estimated to be $188 million, $55 million, $46million, $28 million and $18 million, respectively.
19. Segment InformationSummarized financial information for our segment operations in 2007, 2006 and 2005 were as follows: Health Group Large Case Corporate Total (Millions) Care Insurance Pensions Interest Company 2007 Revenue from external customers (1) $ 24,431.4 $ 1,875.1 $ 216.9 $ - $ 26,523.4 Net investment income 370.9 303.0 476.0 - 1,149.9 Interest expense - - - 180.6 180.6 Depreciation and amortization expense 314.6 6.9 - - 321.5 Income taxes (benefits) 959.2 36.8 32.6 (63.2) 965.4 Operating earnings (loss) (2) 1,770.9 145.5 38.1 (117.4) 1,837.1 Segment assets (3) 18,223.4 5,469.7 27,031.6 - 50,724.7 2006 Revenue from external customers (1) $ 21,897.2 $ 1,846.5 $ 205.1 $ - $ 23,948.8 Net investment income 334.2 294.1 536.4 - 1,164.7 Interest expense - - - 148.3 148.3 Depreciation and amortization expense 256.9 13.5 - - 270.4 Income taxes (benefits) 847.6 48.6 56.7 (51.9) 901.0 Operating earnings (loss) (2) 1,572.7 132.7 38.9 (96.4) 1,647.9 Segment assets (3) 15,904.5 5,327.4 26,394.5 - 47,626.4 2005 Revenue from external customers (1) $ 19,310.5 $ 1,835.3 $ 210.8 $ - $ 21,356.6 Net investment income 295.0 293.1 514.9 - 1,103.0 Interest expense - - - 122.8 122.8 Depreciation and amortization expense 204.4 - - - 204.4 Income taxes (benefits) 827.9 51.0 44.1 (43.0) 880.0 Operating earnings (loss) (2) 1,427.7 127.7 33.2 (79.8) 1,508.8 Segment assets (3) 15,476.7 5,720.8 23,235.8 - 44,433.3 (1) Revenue from the federal government was ten percent or more of our total revenue from external customers in 2007, 2006 and 2005. We earned $3.8 billion, $3.0 billion
and $2.1 billion of revenue from this customer in 2007, 2006 and 2005, respectively, in the Health Care and Group Insurance segments.(2) Operating earnings (loss) excludes net realized capital gains or losses and the other items described in the reconciliation below.(3) Large Case Pensions assets include $4.8 billion, $4.8 billion and $5.1 billion attributable to discontinued products at December 31, 2007, 2006 and 2005, respectively
(excluding the receivable from Large Case Pensions’ continuing products which is eliminated in consolidation).
Page 76

A reconciliation of operating earnings to income from continuing operations in our statements of income in 2007, 2006 and 2005 was as follows: (Millions) 2007 2006 2005 Operating earnings $ 1,837.1 $ 1,647.9 $ 1,508.8 Net realized capital (losses) gains, net of tax (47.9) 24.1 21.1 Reduction of reserve for anticipated future losses on discontinued products (1) 41.8 75.0 43.4 Physician class action settlement insurance-related charge (2) - (47.1) - Debt refinancing charge (3) - (8.1) - Acquisition-related software charge (4) - (6.2) - Income from continuing operations $ 1,831.0 $ 1,685.6 $ 1,573.3 (1) We reduced the reserve for anticipated future losses on discontinued products by $41.8 million ($64.3 million pretax), $75.0 million ($115.4 million pretax) and $43.4
million ($66.7 million pretax) in 2007, 2006 and 2005, respectively. We believe excluding any changes to the reserve for anticipated future losses on discontinued productsprovides more useful information as to our continuing products and is consistent with the treatment of the results of operations of these discontinued products, which arecredited/charged to the reserve and do not affect our results of operations. Refer to Note 20 beginning on page 78 for additional information on the reduction of the reservefor anticipated future losses on discontinued products.
(2) As a result of a trial court’s ruling in 2006, we concluded that a $72.4 million pretax receivable from third party insurers related to certain litigation we settled in 2003 wasno longer probable of collection for accounting purposes. As a result, we wrote-off this receivable in 2006. We believe this charge neither relates to the ordinary course ofour business nor reflects our underlying business performance, and therefore, we have excluded it from operating earnings in 2006 (refer to Note 18 beginning on page73).
(3) In connection with the issuance of $2.0 billion of our senior notes in 2006, we redeemed all $700 million of our 8.5% senior notes due 2041. In connection with thisredemption, we wrote-off debt issuance costs associated with the 8.5% senior notes due 2041 and recognized the deferred gain from the interest rate swaps that had hedgedthe 8.5% senior notes due 2041 (in May 2005, we sold these interest rate swaps; the resulting gain from which was to be amortized over the remaining life of the 8.5%senior notes due 2041). As a result of the foregoing, we recorded an $8.1 million ($12.4 million pretax) net charge in 2006. We believe this charge neither relates to theordinary course of our business nor reflects our underlying business performance, and therefore, we have excluded it from operating earnings in 2006 (refer to Notes 13and 15 on pages 69 and 70, respectively).
(4) As a result of the acquisition of Broadspire Disability in 2006, we acquired certain software which eliminated the need for similar software that we had been developinginternally. As a result, we ceased our own software development and impaired amounts previously capitalized, resulting in a $6.2 million ($8.3 million pretax) charge to netincome, reflected in general and administrative expenses in 2006. This charge does not reflect the underlying business performance of Group Insurance, and therefore, wehave excluded it from operating earnings in 2006.
Revenues from external customers by product in 2007, 2006 and 2005 were as follows: (Millions) 2007 2006 2005 Health risk $ 21,500.1 $ 19,153.5 $ 16,924.7 Health fees and other revenue 2,931.3 2,743.7 2,385.8 Group life 1,204.2 1,260.4 1,332.2 Group disability 577.1 483.3 408.1 Group long-term care 93.8 102.8 95.0 Large case pensions 216.9 205.1 210.8 Total revenue from external customers (1) $ 26,523.4 $ 23,948.8 $ 21,356.6 (1) All within the United States, except approximately $ 7 million, $4 million and $6 million in 2007, 2006 and 2005, respectively, which were derived from foreign customers.
The following is a reconciliation of reportable segment revenues to total revenues included in our statements of income in 2007, 2006 and 2005: (Millions) 2007 2006 2005 Revenue from external customers $ 26,523.4 $ 23,948.8 $ 21,356.6 Net investment income 1,149.9 1,164.7 1,103.0 Net realized capital (losses) gains (73.7) 32.2 32.3 Total revenue $ 27,599.6 $ 25,145.7 $ 22,491.9
Long-lived assets, principally within the United States, were $364 million and $284 million at December 31, 2007 and 2006, respectively.
Page 77

20. Discontinued Products
We discontinued the sale of our fully guaranteed large case pension products (single-premium annuities (“SPAs”) and guaranteed investmentcontracts (“GICs”)) in 1993. Under our accounting for these discontinued products, we established a reserve for anticipated future losses fromthese products, and we review it quarterly. As long as the reserve continues to represent our then best estimate of expected future losses, results ofoperations of the discontinued products, including net realized capital gains and losses, are credited/charged to the reserve and do not affect ourresults of operations. Our results of operations would be adversely affected to the extent that future losses on the discontinued products are greaterthan anticipated and positively affected to the extent future losses are less than anticipated. The current reserve reflects our best estimate ofanticipated future losses.
The factors contributing to changes in the reserve for anticipated future losses are: operating income or loss (including investment income andmortality and retirement gains or losses) and realized capital gains or losses. Operating income or loss is equal to revenue less expenses. Realizedcapital gains or losses reflect the excess (deficit) of sales price over (below) the carrying value of assets sold and other-than-temporaryimpairments. Mortality gains or losses reflect the mortality and retirement experience related to SPAs. A mortality gain (loss) occurs when anannuitant or a beneficiary dies sooner (later) than expected. A retirement gain (loss) occurs when an annuitant retires later (earlier) than expected.
At the time of discontinuance, a receivable from Large Case Pensions’ continuing products equivalent to the net present value of the anticipated cashflow shortfalls was established for the discontinued products. Interest on the receivable is accrued at the discount rate that was used to calculate thereserve. The offsetting payable, on which interest is similarly accrued, is reflected in continuing products. Interest on the payable generally offsetsthe investment income on the assets available to fund the shortfall. At December 31, 2007, the receivable from continuing products, net of relateddeferred taxes payable of $147 million on the accrued interest income, was $291 million. At December 31, 2006, the receivable from continuingproducts, net of the related deferred taxes payable of $138 million on the accrued interest income, was $315 million. These amounts wereeliminated in consolidation.
Results of discontinued products in 2007 and 2006 were as follows (pretax):
Charged
(Credited) to Reserve for (Millions) Results Future Losses Net (1) 2007 Net investment income $ 300.5 $ - $ 300.5 Net realized capital gains 27.0 (27.0) - Interest earned on receivable from continuing products 27.0 - 27.0 Other revenue 20.1 - 20.1 Total revenue 374.6 (27.0) 347.6 Current and future benefits 318.5 18.6 337.1 Operating expenses 10.5 - 10.5 Total benefits and expenses 329.0 18.6 347.6 Results of discontinued products $ 45.6 $ (45.6) $ - 2006 Net investment income $ 340.4 $ - $ 340.4 Net realized capital gains 38.6 (38.6) - Interest earned on receivable from continuing products 28.9 - 28.9 Other revenue 15.0 - 15.0 Total revenue 422.9 (38.6) 384.3 Current and future benefits 330.7 42.0 372.7 Operating expenses 11.6 - 11.6 Total benefits and expenses 342.3 42.0 384.3 Results of discontinued products $ 80.6 $ (80.6) $ - (1) Amounts are reflected in our statements of income, except for interest earned on the receivable from continuing products, which was eliminated in consolidation.
Page 78

Results of discontinued products in 2005 were as follows (pretax):
Charged
(Credited) to Reserve for (Millions) Results Future Losses Net (1) 2005 Net investment income $ 324.2 $ - $ 324.2 Net realized capital gains 22.0 (22.0) - Interest earned on receivable from continuing products 30.6 - 30.6 Other revenue 16.3 - 16.3 Total revenue 393.1 (22.0) 371.1 Current and future benefits 342.8 17.1 359.9 Operating expenses 11.2 - 11.2 Total benefits and expenses 354.0 17.1 371.1 Results of discontinued products $ 39.1 $ (39.1) $ - (1) Amounts are reflected in our statements of income, except for interest earned on the receivable from continuing products, which was eliminated in consolidation.
Net realized capital (losses) gains from the sale of bonds supporting discontinued products were $(16) million, $23 million and $10 million (pretax)for 2007, 2006 and 2005, respectively.
Assets and liabilities supporting discontinued products at December 31, 2007 and 2006 were as follows: (1)
(Millions) 2007 2006 Assets: Debt and equity securities available for sale $ 3,025.2 $ 3,140.5 Mortgage loans 554.0 650.6 Other investments (2) 605.1 610.4 Total investments 4,184.3 4,401.5 Other assets 142.6 92.8 Collateral received under securities loan agreements 309.6 236.4 Current and deferred income taxes 121.4 110.3 Receivable from continuing products (3) 437.9 452.7 Total assets $ 5,195.8 $ 5,293.7 Liabilities: Future policy benefits $ 3,614.5 $ 3,771.1 Policyholders' funds 21.0 23.4 Reserve for anticipated future losses on discontinued products 1,052.3 1,061.1 Collateral payable under securities loan agreements 309.6 236.4 Other liabilities 198.4 201.7 Total liabilities $ 5,195.8 $ 5,293.7 (1) Assets supporting the discontinued products are distinguished from assets supporting continuing products.(2) Includes debt securities on deposit as required by regulatory authorities of $ 24.1 million and $22.0 million at December 31, 2007 and 2006, respectively. These securities
are considered restricted assets and were included in long-term investments on our balance sheets.(3) The receivable from continuing products is eliminated in consolidation.
The discontinued products investment portfolio has changed since inception. Mortgage loans have decreased from $5.4 billion (37% of theinvestment portfolio) at December 31, 1993 to $554 million (13% of the investment portfolio) at December 31, 2007. This was a result ofmaturities, prepayments and the securitization and sale of commercial mortgages. Also, real estate decreased from $.5 billion (4% of the investmentportfolio) at December 31, 1993 to $76 million (2% of the investment portfolio) at December 31, 2007, primarily as a result of sales. The resultingproceeds were primarily reinvested in debt and equity securities.
Page 79

The change in the composition of the overall investment portfolio resulted in a change in the quality of the portfolio since 1993. As our exposure tocommercial mortgage loans and real estate has diminished, additional investment return has been achieved by increasing the risk in the bond portfolio. AtDecember 31, 1993, 60% of the debt securities had a quality rating of AAA or AA, and at December 31, 2007, 31% of the debt securities had aquality rating of AAA or AA. However, management believes the level of risk in the total portfolio of assets supporting discontinued products waslower at December 31, 2007 than at December 31, 1993 due to the reduction of the portfolio’s exposure to mortgage loan and real estate investments.
At December 31, 2007 and 2006, net unrealized capital gains on debt securities available-for-sale are included above in other liabilities and are notreflected in consolidated shareholders’ equity. The reserve for anticipated future losses is included in future policy benefits on our balance sheets.
The reserve for anticipated future losses on discontinued products represents the present value (at the risk-free rate of return at the time ofdiscontinuance, consistent with the duration of the liabilities) of the difference between the expected cash flows from the assets supportingdiscontinued products and the cash flows expected to be required to meet the obligations of the outstanding contracts. Calculation of the reserve foranticipated future losses requires projection of both the amount and the timing of cash flows over approximately the next 30 years, includingconsideration of, among other things, future investment results, participant withdrawal and mortality rates and the cost of asset management andcustomer service. Since 1993, there have been no significant changes to the assumptions underlying the calculation of the reserve related to theprojection of the amount and timing of cash flows, except as noted below.
The projection of future investment results considers assumptions for interest rates, bond discount rates and performance of mortgage loans and realestate. Mortgage loan cash flow assumptions represent management’s best estimate of current and future levels of rent growth, vacancy andexpenses based upon market conditions at each reporting date. The performance of real estate assets has been consistently estimated using the mostrecent forecasts available. Since 1997, a bond default assumption has been included to reflect historical default experience, since the bondportfolio increased as a percentage of the overall investment portfolio and reflected more bond credit risk, concurrent with the decline in thecommercial mortgage loan and real estate portfolios.
The previous years’ actual participant withdrawal experience is used for the current year assumption. Prior to 1995, we used the 1983 GroupAnnuitant Mortality table published by the Society of Actuaries (the “Society”). In 1995, the Society published the 1994 Uninsured Pensioner’sMortality table which we have used since then.
Our assumptions about the cost of asset management and customer service reflect actual investment and general expenses allocated over investedassets.
The activity in the reserve for anticipated future losses on discontinued products in 2007, 2006 and 2005 was as follows (pretax):
(Millions) 2007 2006 2005 Reserve for anticipated future losses on discontinued products, beginning of period $ 1,061.1 $ 1,052.2 $ 1,079.8 Operating income 10.0 38.6 12.4 Net realized capital gains 27.0 38.6 22.0 Mortality and other 8.6 3.4 4.7 Tax benefits 9.9 43.7 - Reserve reduction (64.3) (115.4) (66.7)
Reserve for anticipated future losses on discontinued products, end of period $ 1,052.3 $ 1,061.1 $ 1,052.2
Management reviews the adequacy of the discontinued products reserve quarterly and, as a result, $64 million ($42 million after tax), $115 million($75 million after tax) and $67 million ($43 million after tax) of the reserve was released in 2007, 2006 and 2005, respectively, primarily due tofavorable investment performance and favorable mortality and retirement experience compared to assumptions we previously made in estimating thereserve. The current reserve reflects management’s best estimate of anticipated future losses.
Page 80

The anticipated run-off of the discontinued products reserve balance at December 31, 2007 (assuming that assets are held until maturity and that thereserve run-off is proportional to the liability run-off) is as follows:
(Millions) 2008 $ 46.3 2009 46.4 2010 46.2 2011 45.9 2012 45.5 2013-2017 216.1 2018-2022 184.5 2023-2027 144.8 2028-2032 108.5 Thereafter 168.1
At December 31, 2007, scheduled contract maturities, future benefit payments and other expected payments, including future interest, were as follows:
(Millions) 2008 $ 479.4 2009 464.8 2010 447.5 2011 432.5 2012 417.0 2013-2017 1,841.7 2018-2022 1,418.1 2023-2027 1,028.6 2028-2032 709.0 Thereafter 933.9
The liability expected at December 31, 1993 and actual liability balances at December 31, 2007, 2006 and 2005 for the GIC and SPA liabilities wereas follows:
Expected Actual (Millions) GIC SPA GIC SPA 2005 $ 30.0 $ 3,708.6 $ 23.5 $ 3,908.4 2006 28.2 3,563.8 23.4 3,771.1 2007 26.4 3,414.7 21.0 3,614.5
The GIC balances were lower than expected in each period because several contract holders redeemed their contracts prior to contract maturity. TheSPA balances in each period were higher than expected because of additional amounts received under existing contracts.
Distributions on discontinued products in 2007, 2006 and 2005 were as follows: (Millions) 2007 2006 2005 Scheduled contract maturities, settlements and benefit payments $ 468.0 $ 481.0 $ 492.2 Participant-directed withdrawals .3 .4 .2
Cash required to fund these distributions was provided by earnings and scheduled payments on, and sales of, invested assets.
Page 81

21. Discontinued Operations
In 2004, the IRS completed the audit of our former parent company’s 1984 through 2000 (prior to December 13, 2000) tax returns and our 2000(subsequent to December 13, 2000) and 2001 tax returns. On July 8, 2004, we were notified that the Congressional Joint Committee on Taxationapproved a tax refund of approximately $740 million, including interest, relating to businesses that our former parent company sold in the1990s. Also in 2004, we filed for, and were approved for, an additional $35 million tax refund related to other businesses that our former parentcompany sold. The tax refunds were recorded as income from discontinued operations in 2004. As a result of the resolution of these audits, werecorded favorable adjustments of approximately $255 million to existing tax liabilities in 2004 as income from discontinued operations, for a total of$1.03 billion of income from discontinued operations in 2004. We received approximately $666 million of the tax refunds during 2004 and $69million in 2005. We received the final approximately $50 million payment of these refunds in 2006, which resulted in an additional $16 million ofincome from discontinued operations in 2006.
Page 82

Management’s Report on Internal Control Over Financial ReportingManagement is responsible for establishing and maintaining adequate internal control over financial reporting for the Company. Internal control overfinancial reporting is defined as a process designed to provide reasonable assurance regarding the reliability of financial reporting and the preparationof financial statements for external purposes in accordance with U.S. generally accepted accounting principles (“GAAP”).
Our internal control over financial reporting process includes those policies and procedures that (i) pertain to the maintenance of records that, inreasonable detail, accurately and fairly reflect the transactions and dispositions of our assets; (ii) provide reasonable assurance that transactions arerecorded as necessary to permit preparation of consolidated financial statements in accordance with GAAP, and that our receipts and expenditures arebeing made only in accordance with authorizations of our management and directors; and (iii) provide reasonable assurance regarding prevention ortimely detection of unauthorized acquisition, use or disposition of our assets that could have a material effect on our consolidated financial statements.
Because of its inherent limitations, internal control over financial reporting may not prevent or detect misstatements. Further, projections of anyevaluation of effectiveness to future periods are subject to the risk that controls may become inadequate because of changes in conditions, or that thedegree of compliance with policies or procedures may deteriorate.
Under the supervision and with the participation of management, including our Chief Executive and Chief Financial Officers, management assessedthe effectiveness of our internal control over financial reporting at December 31, 2007. In making this assessment, management used the frameworkset forth by the Committee of Sponsoring Organizations of the Treadway Commission in “Internal Control – Integrated Framework.” Basedon this assessment, management concluded that our internal control over financial reporting was effective at December 31, 2007. Our internal controlover financial reporting as well as our consolidated financial statements have been audited by KPMG LLP, an independent registered publicaccounting firm, as stated in their report which is included on page 84.
Management’s Responsibility for Financial StatementsManagement is responsible for our consolidated financial statements, which have been prepared in accordance with GAAP. Management believes theconsolidated financial statements, and other financial information included in this report, fairly present in all material respects our financial position,results of operations and cash flows as of and for the periods presented in this report.
The financial statements are the product of a number of processes that include the gathering of financial data developed from the records of our day-to-day business transactions. Informed judgments and estimates are used for those transactions not yet complete or for which the ultimate effectscannot be measured precisely. We emphasize the selection and training of personnel who are qualified to perform these functions. In addition, ourpersonnel are subject to rigorous standards of ethical conduct that are widely communicated throughout the organization.
The Audit Committee of Aetna’s Board of Directors engages KPMG LLP, an independent registered public accounting firm, to audit our consolidatedfinancial statements and express their opinion thereon. Members of that firm also have the right of full access to each member of management inconducting their audits. The report of KPMG LLP on their audit of our consolidated financial statements appears below.
Audit Committee OversightThe Audit Committee of Aetna’s Board of Directors is comprised solely of independent directors. The Audit Committee meets regularly withmanagement, our internal auditors and KPMG LLP to oversee and monitor the work of each and to inquire of each as to their assessment of theperformance of the others in their work relating to our consolidated financial statements and internal control over financial reporting. Both KPMGLLP and our internal auditors have, at all times, the right of full access to the Audit Committee, without management present, to discuss any matterthey believe should be brought to the attention of the Audit Committee.
Page 83

Report of Independent Registered Public Accounting Firm
The Board of Directors and ShareholdersAetna Inc.
We have audited the accompanying consolidated balance sheets of Aetna Inc. and subsidiaries (the “Company”) as of December 31, 2007 and 2006,and the related consolidated statements of income, shareholders' equity, and cash flows for each of the years in the three-year period ended December31, 2007. We also have audited the Company’s internal control over financial reporting as of December 31, 2007, based on criteria established inInternal Control - Integrated Framework issued by the Committee of Sponsoring Organizations of the Treadway Commission (“COSO”). TheCompany’s management is responsible for these consolidated financial statements, for maintaining effective internal control over financial reporting,and for its assessment of the effectiveness of internal control over financial reporting, included in the accompanying Management’s Report onInternal Control Over Financial Reporting. Our responsibility is to express an opinion on these financial statements and an opinion on the Company'sinternal control over financial reporting based on our audits.
We conducted our audits in accordance with the standards of the Public Company Accounting Oversight Board (United States). Those standardsrequire that we plan and perform the audits to obtain reasonable assurance about whether the financial statements are free of material misstatement andwhether effective internal control over financial reporting was maintained in all material respects. Our audits of the consolidated financial statementsincluded examining, on a test basis, evidence supporting the amounts and disclosures in the financial statements, assessing the accounting principlesused and significant estimates made by management, and evaluating the overall financial statement presentation. Our audit of internal control overfinancial reporting included obtaining an understanding of internal control over financial reporting, assessing the risk that a material weakness exists,and testing and evaluating the design and operating effectiveness of internal control based on the assessed risk. Our audits also included performingsuch other procedures as we considered necessary in the circumstances. We believe that our audits provide a reasonable basis for our opinions.
A company's internal control over financial reporting is a process designed to provide reasonable assurance regarding the reliability of financialreporting and the preparation of financial statements for external purposes in accordance with generally accepted accounting principles. A company'sinternal control over financial reporting includes those policies and procedures that (1) pertain to the maintenance of records that, in reasonable detail,accurately and fairly reflect the transactions and dispositions of the assets of the company; (2) provide reasonable assurance that transactions arerecorded as necessary to permit preparation of financial statements in accordance with generally accepted accounting principles, and that receipts andexpenditures of the company are being made only in accordance with authorizations of management and directors of the company; and (3) providereasonable assurance regarding prevention or timely detection of unauthorized acquisition, use, or disposition of the company's assets that could havea material effect on the financial statements.
Because of its inherent limitations, internal control over financial reporting may not prevent or detect misstatements. Also, projections of anyevaluation of effectiveness to future periods are subject to the risk that controls may become inadequate because of changes in conditions, or that thedegree of compliance with the policies or procedures may deteriorate.
In our opinion, the consolidated financial statements referred to above present fairly, in all material respects, the financial position of the Company asof December 31, 2007 and 2006, and the results of its operations and its cash flows for each of the years in the three-year period ended December31, 2007, in conformity with accounting principles generally accepted in the United States of America. Also in our opinion, the Companymaintained, in all material respects, effective internal control over financial reporting as of December 31, 2007, based on criteria established inInternal Control - Integrated Framework issued by COSO.
Page 84

As discussed in Notes 2 and 12 to the consolidated financial statements, effective December 31, 2006, the Company adopted the initial recognitionprovision of Statement of Financial Accounting Standards No. 158, “Employers’ Accounting for Defined Benefit Pension and Other Post-retirement Plans” and effective January 1, 2007, they adopted the change in measurement date provision in the standard. Also, as discussed in Notes2 and 11 to the consolidated financial statements, effective January 1, 2007, the Company adopted FASB Interpretation No. 48, “Accounting forUncertainty in Income Taxes.” Also, as discussed in Note 2 of the consolidated financial statements the Company changed its method ofclassifying investments in 2007.
/s/ KPMG LLP
Hartford, ConnecticutFebruary 28, 2008
Page 85

Quarterly Data (Unaudited) (Millions, except per share and common stock data) First Second Third Fourth 2007 Total revenue $ 6,700.0 $ 6,793.9 $ 6,961.3 $ 7,144.4 Income from continuing operations before income taxes $ 663.9 $ 688.6 $ 759.3 $ 684.6 Income taxes (229.3) (237.3) (262.6) (236.2)
Net income $ 434.6 $ 451.3 $ 496.7 $ 448.4 Net income per share - basic (1) $ .84 $ .88 $ .98 $ .90 Net income per share - diluted (1) .81 .85 .95 .87 Dividends declared per share $ - $ - $ .04 $ - Common stock prices, high 46.32 53.27 54.27 59.76 Common stock prices, low 40.89 44.19 46.95 52.85 2006 Total revenue $ 6,234.7 $ 6,252.0 $ 6,299.5 $ 6,359.5 Income from continuing operations before income taxes $ 597.3 $ 597.5 $ 728.8 $ 663.0 Income taxes (211.7) (208.0) (252.4) (228.9)Income from discontinued operations, net of tax 16.1 - - - Net income $ 401.7 $ 389.5 $ 476.4 $ 434.1 Net income per share - basic (1) $ .71 $ .69 $ .89 $ .83 Net income per share - diluted (1) .68 .67 .85 .80 Dividends declared per share $ - $ - $ .04 $ - Common stock prices, high 52.32 49.33 41.26 43.71 Common stock prices, low 44.54 36.93 30.99 38.53 (1) Calculation of net income per share is based on weighted average shares outstanding during each quarter and, accordingly, the sum may not equal the total for the year.
Corporate Performance Graph
The following graph compares the cumulative total shareholder return on our common stock (assuming reinvestment of dividends) with thecumulative total return on the published Standard & Poor’s 500 Stock Index (“S&P 500”) and the cumulative total return on the published MorganStanley Healthcare Payors Index (“MSHPI”) from December 31, 2002 through December 31, 2007. The graph assumes a $100 investment in sharesof our common stock on December 31, 2002.
(1) At December 31, 2007, the companies included in the MSHPI were: Aetna Inc., Amerigroup Corporation, Centene Corporation, CIGNA Corporation, CoventryHealth Care, Inc., Health Net, Inc., Humana Inc., Molina Healthcare, Inc., Sierra Health Services, Inc., UnitedHealth Group Incorporated and Wellpoint, Inc.
SHAREHOLDER RETURNS OVER THE PERIOD SHOWN ON THE CORPORATE PERFORMANCE GRAPH SHOULD NOT BECONSIDERED INDICATIVE OF FUTURE SHAREHOLDER RETURNS
Page 86


Exhibit 18.1
Letter from the Independent Registered Public Accounting Firm Regarding Change in Accounting Principle
February 28, 2008
Board of DirectorsAetna Inc.151 Farmington AvenueHartford, CT 06156
Ladies and Gentlemen:
We have audited the consolidated balance sheets of Aetna Inc. and subsidiaries (the “Company”) as of December 31, 2007 and 2006, and relatedconsolidated statements of income, shareholders’ equity and cash flows for each of the years in the three-year period ended December 31, 2007,and have reported thereon under date of February 28, 2008. The aforementioned consolidated financial statements and our report thereon areincluded in the Company’s Annual Report on Form 10-K for the year ended December 31, 2007. As stated in Note 2 to those consolidated financialstatements, the Company changed its method of classification for certain of its investment securities previously classified as current assets to non-current assets. In connection with this change in accounting principle, certain deferred taxes have been reclassified from current to non-current. The Company states that the newly adopted accounting principle is preferable as it better reflects when cash will be realized and is moreconsistent with how the Company manages the investment portfolio given the duration of the liabilities that the investments support. In accordancewith your request, we have reviewed and discussed with Company officials the circumstances and business judgment and planning upon which thedecision to make this change in the method of accounting was based.
With regard to the aforementioned accounting change, authoritative criteria have not been established for evaluating the preferability of oneacceptable method of accounting over another acceptable method. However, for purposes of the Company’s compliance with the requirements ofthe Securities and Exchange Commission, we are furnishing this letter.
Based on our review and discussion, with reliance on management’s business judgment and planning, we concur that the newly adopted method ofaccounting is preferable in the Company’s circumstances.
Very truly yours,
/s/ KPMG LLP

Exhibit 21.1
Subsidiaries of Aetna Inc.
Listed below are subsidiaries of Aetna Inc. at December 31, 2007 with their jurisdictions of organization shown in parentheses. Subsidiariesexcluded from the list below would not, in the aggregate, constitute a “significant subsidiary” of Aetna Inc., as that term is defined in Rule 1-02(w)of Regulation S-X.
· Aetna Health Holdings, LLC (Delaware) o Aetna Health Inc. (Arizona)
o Aetna Health of California Inc. (California)o Aetna Health Inc. (Colorado)o Aetna Health Inc. (Connecticut)o Aetna Health Inc. (Delaware)o Aetna Health Inc. (Florida)o Aetna Health Inc. (Georgia)o Aetna Health of Illinois Inc. (Illinois)o Aetna Health Inc. (Maryland)o Aetna Health Inc. (Michigan)o Aetna Health Inc. (Missouri)o Aetna Health Inc. (New Jersey)o Aetna Health Inc. (New York)o Aetna Health of the Carolinas Inc. (North Carolina)o Aetna Health Inc. (Oklahoma)o Aetna Health Inc. (Pennsylvania)o Aetna Health Inc. (Tennessee)o Aetna Health Inc. (Texas)o AET Health Care Plan, Inc. (Texas)o Aetna Family Plans of Georgia Inc. (Georgia)o Aetna Family Plans of Pennsylvania Inc. (Pennsylvania)o Aetna Dental of California Inc. (California)o Aetna Dental Inc. (New Jersey)o Aetna Dental Inc. (Texas)o Aetna RX Home Delivery, LLC (Delaware)o Aetna Health Management, LLC (Delaware)o NYLCare Health Plans, Inc. (Delaware)
- Aetna Health Inc. (Washington)- Aetna Health Inc. (Maine)
o Chickering Claims Administrators, Inc. (Massachusetts)o Aetna Specialty Pharmacy, LLC (Delaware)o AET Health Care Plan of California, Inc. (California)
o Cofinity, Inc. (Delaware)- Sloan’s Lake Management Corp (Colorado)¨ PPOM, L.L.C. (Delaware)
o Strategic Resource Company (South Carolina)o Chickering Benefit Planning Insurance Agency, Inc. (Massachusetts)o Schaller Anderson, Incorporated (Arizona)
- Schaller Anderson of Arizona, L.L.C. (Arizona)- Schaller Anderson Healthcare, L.L.C. (Arizona)- Schaller Anderson Medical Administrators, Incorporated (Delaware)- Schaller Anderson of Missouri, L.L.C. (Missouri)- Missouri Care, Incorporated (Missouri)- Schaller Anderson of Maryland, L.L.C. (Maryland)- Schaller Anderson of California, L.L.C. (California)- Schaller Anderson of Tennessee, L.L.C. (Tennessee)- Schaller Anderson of Texas Management, L.L.C. (Texas)

Page 1

- Schaller Anderson Behavioral Health, Incorporated (Arizona)
¨ SABH of Arizona, Incorporated (Arizona)- Delaware Physicians Care, Incorporated (Delaware)- Delaware Physicians Care-Medicare, Incorporated (Delaware)- Schaller Anderson of Delaware, Incorporated (Delaware)- Schaller Anderson of Texas, L.P. (Texas)- Schaller Anderson Health Plans, L.L.C. (Delaware)
· Aetna Life Insurance Company (Connecticut)o AHP Holdings, Inc. (Connecticut)
- Aetna Insurance Company of Connecticut (Connecticut)- AE Fourteen, Incorporated (Connecticut)- Aetna Life Assignment Company (Connecticut)- Aetna/Area Corporation (Connecticut)
o Aetna InteliHealth Inc. (Delaware)o PE Holdings, LLC (Connecticut)o Tanker Six, LLC (Delaware)o Azalea Mall, L.L.C. (Delaware)o BPC Equity, Inc. (Delaware)o Canal Place, LLC (Delaware)o Aetna Ventures, LLC (Delaware)o Aetna Government Health Plans, LLC (Delaware)o Trumbull One, Inc. (Connecticut)o Trumbull Four, Inc. (Connecticut)o Broadspire National Services, Inc. (Florida)
· Aetna Financial Holdings, LLC (Delaware)o Aetna Behavioral Health of Delaware, LLC (Delaware)o Aetna Health Information Solutions, Inc. (Delaware)o @Credentials Inc. (Delaware)o U.S. Healthcare Properties, Inc. (Pennsylvania)o Integrated Pharmacy Solutions, Inc. (Florida)o Aetna Capital Management, LLC (Delaware)
- Aetna Partners Diversified Fund, LLC (Delaware)- Aetna Partners Diversified Fund (Cayman), Limited (Cayman)
o Aetna Workers’ Comp Access, LLC (Delaware)o Aetna Behavioral Health, LLC (Delaware)o Managed Care Coordinators, Inc. (Delaware)o Aetna Integrated Informatics, Inc. (Pennsylvania)o Aetna Provider Solutions, LLC (Delaware)
· Aetna Health and Life Insurance Company (Connecticut) · Corporate Health Insurance Company (Pennsylvania) · Aetna Health Insurance Company of New York (New York) · Aetna Risk Indemnity Company Limited (Bermuda) · Aelan Inc. (Connecticut)
o Aetna Life & Casualty (Bermuda) Limited (Bermuda)o Aetna Global Benefits (UK) Limited (England and Wales)
- Aetna Health Services (UK) Limited (England and Wales)- Goodhealth Worldwide (Bermuda) Limited (Bermuda)¨ Goodhealth Worldwide (Global) Limited (Bermuda)¨ Goodhealth Worldwide (Europe) Limited (England and Wales)¨ Goodhealth Worldwide (Asia Pacific) Limited (Hong Kong)¨ Goodhealth Worldwide (Asia) Limited (Hong Kong)¨ GWL (UK) Limited (England and Wales)¨ Goodhealth Worldwide Limited (DIFC) (DIFC-UAE)¨ Goodhealth Worldwide Management FZ-LLC (DOZ-UAE)

Page 2

o Aetna Health Insurance Company of Europe Limited (Ireland)
o Goodhealth Worldwide Administrators Inc. (Florida) · AUSHC Holdings, Inc. (Connecticut)
o PHPSNE Parent Corporation (Delaware) · Active Health Management, Inc. (Delaware)
o Health Cost Consultants, Inc. (Delaware)o Health Data & Management Solutions, Inc. (Delaware)
· Aetna Criterion Communications, Inc. (Delaware) · ASI Wings, L.L.C. (Delaware) · Luettgens Limited (Connecticut)
Page 3


Exhibit 23.1
Consent of Independent Registered Public Accounting Firm
The Board of DirectorsAetna Inc.: We consent to the incorporation by reference in the registration statements (No. 333-54046 and 333-130126) on Form S-3 and the registrationstatements (No. 333-52120, 52122, 52124, 73052, 87722, 87726, 124619, 124620, 136176, 136177) on Form S-8 of Aetna Inc. of ourreports dated February 28, 2008 with respect to the consolidated balance sheets of Aetna Inc. and subsidiaries (the “Company”) as of December 31,2007 and 2006 and the related consolidated statements of income, shareholders’ equity and cash flows for each of the years in the three-year periodended December 31, 2007 and the related financial statement schedule, and the effectiveness of internal control over financial reporting as ofDecember 31, 2007, which reports appear in the Company’s Annual Report on Form 10-K for the year ended December 31, 2007.
Our reports with respect to the consolidated financial statements, and the related financial statement schedule, and the effectiveness of internal controlover financial reporting refers to changes in accounting for employee benefit plans in 2006 and 2007 and uncertainty in income taxes and theCompany's method of classifying investments in 2007. /s/ KPMG LLP Hartford, ConnecticutFebruary 28, 2008

Exhibit 24.1
Power of Attorney
We, the undersigned Directors of Aetna Inc. (the "Company"), hereby severally constitute and appoint Joseph M. Zubretsky, Ronald M. Olejniczakand Christopher M. Todoroff, and each of them individually, our true and lawful attorneys-in-fact, with full power to them and each of them to signfor us, and in our names and in the capacities indicated below, the Company’s 2007 Annual Report on Form 10-K and any and all amendmentsthereto to be filed with the Securities and Exchange Commission under the Securities Exchange Act of 1934, hereby ratifying and confirming oursignatures as they may be signed by any of our said attorneys to such Form 10-K and to any and all amendments thereto.
Dated February 29, 2008
/s/ Frank M. ClarkFrank M. Clark, Director /s/ Betsy Z. CohenBetsy Z. Cohen, Director /s/ Molly J. Coye, M.D.Molly J. Coye, M.D., Director /s/ Roger N. FarahRoger N. Farah, Director /s/ Barbara H. FranklinBarbara Hackman Franklin, Director /s/ Jeffrey E. GartenJeffrey E. Garten, Director /s/ Earl G. GravesEarl G. Graves, Director /s/ Gerald GreenwaldGerald Greenwald, Director
/s/ Ellen M. HancockEllen M. Hancock, Director /s/ Edward J. LudwigEdward J. Ludwig, Director /s/ Joseph P. NewhouseJoseph P. Newhouse, Director

Exhibit 31.1Certification
I, Ronald A. Williams, certify that:
1. I have reviewed this annual report on Form 10-K of Aetna Inc.;
2. Based on my knowledge, this report does not contain any untrue statement of a material fact or omit to state a material fact necessary to makethe statements made, in light of the circumstances under which such statements were made, not misleading with respect to the period coveredby this report;
3. Based on my knowledge, the financial statements, and other financial information included in this report, fairly present in all material respectsthe financial condition, results of operations and cash flows of the registrant as of, and for, the periods presented in this report;
4. The registrant’s other certifying officer(s) and I are responsible for establishing and maintaining disclosure controls and procedures (as definedin Exchange Act Rules 13a-15(e) and 15d-15(e)) and internal control over financial reporting (as defined in Exchange Act Rules 13a-15(f)and 15d-15(f)) for the registrant and have:
(a) Designed such disclosure controls and procedures, or caused such disclosure controls and procedures to be designed under oursupervision, to ensure that material information relating to the registrant, including its consolidated subsidiaries, is made known to us byothers within those entities, particularly during the period in which this report is being prepared;
(b) Designed such internal control over financial reporting, or caused such internal control over financial reporting to be designed under oursupervision, to provide reasonable assurance regarding the reliability of financial reporting and the preparation of financial statements forexternal purposes in accordance with generally accepted accounting principles;
(c) Evaluated the effectiveness of the registrant’s disclosure controls and procedures and presented in this report our conclusions about theeffectiveness of the disclosure controls and procedures, as of the end of the period covered by this report based on such evaluation; and
(d) Disclosed in this report any change in the registrant’s internal control over financial reporting that occurred during the registrant’s mostrecent fiscal quarter (the registrant’s fourth fiscal quarter in the case of an annual report) that has materially affected, or is reasonablylikely to materially affect, the registrant’s internal control over financial reporting; and
5. The registrant’s other certifying officer(s) and I have disclosed, based on our most recent evaluation of internal control over financialreporting, to the registrant’s auditors and the audit committee of the registrant’s board of directors (or persons performing the equivalentfunctions):
(a) All significant deficiencies and material weaknesses in the design or operation of internal control over financial reporting which arereasonably likely to adversely affect the registrant’s ability to record, process, summarize and report financial information; and
(b) Any fraud, whether or not material, that involves management or other employees who have a significant role in the registrant’s internalcontrol over financial reporting.
Date: February 29, 2008 /s/ Ronald A. Williams Ronald A. Williams Chairman and Chief Executive Officer

Exhibit 31.2Certification
I, Joseph M. Zubretsky, certify that:
1. I have reviewed this annual report on Form 10-K of Aetna Inc.;
2. Based on my knowledge, this report does not contain any untrue statement of a material fact or omit to state a material fact necessary to makethe statements made, in light of the circumstances under which such statements were made, not misleading with respect to the period coveredby this report;
3. Based on my knowledge, the financial statements, and other financial information included in this report, fairly present in all material respectsthe financial condition, results of operations and cash flows of the registrant as of, and for, the periods presented in this report;
4. The registrant’s other certifying officer(s) and I are responsible for establishing and maintaining disclosure controls and procedures (as definedin Exchange Act Rules 13a-15(e) and 15d-15(e)) and internal control over financial reporting (as defined in Exchange Act Rules 13a-15(f)and 15d-15(f)) for the registrant and have:
(a) Designed such disclosure controls and procedures, or caused such disclosure controls and procedures to be designed under oursupervision, to ensure that material information relating to the registrant, including its consolidated subsidiaries, is made known to us byothers within those entities, particularly during the period in which this report is being prepared;
(b) Designed such internal control over financial reporting, or caused such internal control over financial reporting to be designed under oursupervision, to provide reasonable assurance regarding the reliability of financial reporting and the preparation of financial statements forexternal purposes in accordance with generally accepted accounting principles;
(c) Evaluated the effectiveness of the registrant’s disclosure controls and procedures and presented in this report our conclusions about theeffectiveness of the disclosure controls and procedures, as of the end of the period covered by this report based on such evaluation; and
(d) Disclosed in this report any change in the registrant’s internal control over financial reporting that occurred during the registrant’s mostrecent fiscal quarter (the registrant’s fourth fiscal quarter in the case of an annual report) that has materially affected, or is reasonablylikely to materially affect, the registrant’s internal control over financial reporting; and
5. The registrant’s other certifying officer(s) and I have disclosed, based on our most recent evaluation of internal control over financialreporting, to the registrant’s auditors and the audit committee of the registrant’s board of directors (or persons performing the equivalentfunctions):
(a) All significant deficiencies and material weaknesses in the design or operation of internal control over financial reporting which arereasonably likely to adversely affect the registrant’s ability to record, process, summarize and report financial information; and
(b) Any fraud, whether or not material, that involves management or other employees who have a significant role in the registrant’s internalcontrol over financial reporting.
Date: February 29, 2008 /s/ Joseph M. Zubretsky Joseph M. Zubretsky Executive Vice President and Chief Financial Officer

Exhibit 32.1
Certification
The certification set forth below is being submitted to the Securities and Exchange Commission in connection with the Annual Report on Form 10-Kof Aetna Inc. for the period ended December 31, 2007 (the “Report”) solely for the purpose of complying with Rule 13a-14(b) of the SecuritiesExchange Act of 1934 (the “Exchange Act”) and Section 1350 of Chapter 63 of Title 18 of the United States Code.
Ronald A. Williams, the Chairman and Chief Executive Officer of Aetna Inc., certifies that, to the best of his knowledge:
1. the Report fully complies with the requirements of Section 13(a) of the Exchange Act; and2. the information contained in the Report fairly presents, in all material respects, the financial condition and results of operations of Aetna Inc.
Date: February 29, 2008 /s/ Ronald A. Williams Ronald A. Williams Chairman and Chief Executive Officer

Exhibit 32.2
Certification
The certification set forth below is being submitted to the Securities and Exchange Commission in connection with the Annual Report on Form 10-Kof Aetna Inc. for the period ended December 31, 2007 (the “Report”) solely for the purpose of complying with Rule 13a-14(b) of the SecuritiesExchange Act of 1934 (the “Exchange Act”) and Section 1350 of Chapter 63 of Title 18 of the United States Code.
Joseph M. Zubretsky, the Executive Vice President and Chief Financial Officer of Aetna Inc., certifies that, to the best of his knowledge:
1. the Report fully complies with the requirements of Section 13(a) of the Exchange Act; and2. the information contained in the Report fairly presents, in all material respects, the financial condition and results of operations of Aetna Inc.
Date: February 29, 2008 /s/ Joseph M. Zubretsky Joseph M. Zubretsky Executive Vice President and Chief Financial Officer


