Embed Size (px)
Citation preview
FORECLOSURE IS NOT AN EQUAL OPPORTUNITYSTRESSOR: HOW INEQUALITY FUELS THE ADVERSE
HEALTH IMPLICATIONS OF THE NATION’SFINANCIAL CRISIS
Antwan Jones and Gregory D. SquiresThe George Washington University
Cynthia RonzioHealth Policy Initiatives
ABSTRACT: Foreclosure rates persist at high levels, segregation remains a central organizing featureof metropolitan regions, and a variety of health problems continue to plague metropolitan regions acrossthe United States. Each of these issues is the subject of much policy debate and scholarly research.Missing from most of this discussion, however, is the intersection of these social forces. In recent years,a connection between foreclosures and health has been documented. A question that arises and isexplored in this research is whether the impact of foreclosures on health is exacerbated by variousmeasures of inequality. This article examines the emerging impact of foreclosures on health and thelongstanding effects of racial and socioeconomic inequality (e.g., racial segregation, concentration ofpoverty, and income inequality) on health in major metropolitan areas. More importantly, multivariatestatistical analyses are conducted to determine whether, and the extent to which, these indicators ofinequality mediate the impact of foreclosures on health. The findings suggest policy implications forthe development, expansion, and allocation of health care and financial services to address challengesposed by the ongoing foreclosure crises facing the nation’s metropolitan areas.
“Foreclosures are killing us.” Pollack and Lynch (2011)
According to RealtyTrac, a company with the leading foreclosure database, more than 10.5 millionproperties went into foreclosure between 2007 and the first half of 2011 (Carr, Anacker, & Mulcahy,2011). The Center for Responsible Lending recently reported that, among homeowners who receivedhome loans between 2004 and 2008, 2.7 million (6.4%) lost their homes by February 2011 withan additional 3.6 million (8.3%) at serious risk of losing their homes (Bocian, Li, & Ernst, 2010).Equity lost by families entering foreclosure is estimated at $5.6 trillion (New York Times, 2012).The economic spillover from the housing crisis has reduced household wealth by approximately $17trillion between 2007 and 2009 (Heflin, 2010). Among borrowers who received loans between 2004and 2008, 11% of blacks and 14% of Hispanics have lost their homes compared to 8% of Asiansand 6% of non-Hispanic whites (Bocian, Davis, Garrison, & Sermons, 2012). As a result of theforeclosure crisis and the economic recession that followed, median wealth declined by 66% amongHispanic households and 53% for blacks compared to 16% among whites. The median wealth of
Direct correspondence to: Antwan Jones, Department of Sociology, The George Washington University, 801 22nd Street NW,Suite 409C, Washington DC 20052. E-mail: [email protected].
JOURNAL OF URBAN AFFAIRS, Volume 00, Number 0, pages 1–25.Copyright C© 2014 Urban Affairs AssociationAll rights of reproduction in any form reserved.ISSN: 0735-2166. DOI: 10.1111/juaf.12171
2 II JOURNAL OF URBAN AFFAIRS II Vol. 00/No. 0/2014
white households is now 20 times that of blacks and 18 times that of Hispanics, twice the ratio thatprevailed in the 80s and 90s (Taylor, Kochhar, Fry, Velasco, & Motel, 2011).
Households experiencing foreclosures are not the only entities that pay a price. Property valuesof neighboring homes are adversely affected when a home enters foreclosure, particularly in non-white communities (Bocian, Smith, & Li, 2012; Immergluck & Smith, 2006). Property tax revenuesare reduced at a time when the demand for a range of municipal services increases (e.g., policeand fire protection, demolition, inspections, legal services, property management), resulting in directcosts estimated to be over $34,000 per foreclosure (Apgar, Duda, & Gorey, 2005). There are alsoindirect costs: social capital and the attractiveness of neighborhoods decline, undercutting efforts toattract new businesses and residents (Apgar et al., 2005). Foreclosures are devastating to families,local communities, and the national economy.
While the number of foreclosures has recently spiked, socioeconomic inequality has also surgedin recent years. To illustrate, the top 1% increased their income by 275% between 1979 and 2007compared to a 65% increase for others in the top 20% and just an 18% increase for those inthe bottom 20% (Congressional Budget Office, 2011). Extreme concentrated poverty, measured asthe percent of people living in census tracts where the official poverty rate is at least 40%, also roseby one-third during the 2000s after dropping by 25% in the 1990s (Kneebone, Nadeau, & Berube,2011). Also, as a key measure of inequality, racial segregation persists into the 21st century. Althoughblack/white segregation has declined since it peaked in the 1970s, extreme forms of segregation (i.e.,hypersegregation) remain the norm in large cities where black populations are concentrated. Atthe same time, levels of Hispanic and Asian segregation have increased (Logan & Stults, 2011).Research also suggests that racial segregation is a critical predictor of high-priced lending andsubsequent foreclosures (Been, Ellen, & Madar, 2009; Rugh & Massey, 2010; Squires, 2011).
Several health problems have been traced to foreclosures among adults particularly in non-whitecommunities (Alley et al., 2011; Currie & Tekin, 2011; Ross & Squires, 2011). For example, in astudy of zip codes in four states, Currie and Tekin (2011) used data from the Healthcare Cost andUtilization Project and foreclosure data to examine trends in working-age adult and senior hospital-ization and emergency department visit rates by area foreclosure rates. The authors hypothesized thatavoidable hospitalizations, where adequate primary care would have prevented emergency medicalcare, would be more frequent in areas with high levels of foreclosure. To compare hospitaliza-tion rates hypothesized to be independent of foreclosure activity, they also analyzed cancer-basedhospitalizations. The avoidable hospitalizations and emergency department visit rates were highestamong zip codes with the highest foreclosure rates. Adult hospitalizations due to prevention qual-ity indicators, developed by the Agency for Healthcare Research and Quality (AHRQ), were alsoexamined. For preventable hospitalizations, the foreclosure effect was prominent for those underage 65. For those who are over 65, Medicare coverage appears to be an important mediator of thehealth consequences for communities experiencing high rates of foreclosure, even after adjustingfor median income and poverty rate at the zip code level. Nonetheless, in a separate, nationallyrepresentative sample of Americans aged 50 and above, mortgage delinquency was found to increasethe odds of having elevated depression symptoms to 8.6 and the odds of newly stopping medicationdue to costs increased to 8.7; both models controlled for individual income, age, and race/ethnicity(Alley et al., 2011).
SOCIAL ECOLOGICAL MODELS FOR CONTEXTUALIZING INEQUALITY,FORECLOSURES, AND HEALTH
A social ecological approach (Davison & Birch, 2001; Galvez, Pearl, & Yen, 2010) is used tounderstand how the prevalence of metro-level health problems is linked to foreclosures and inequality.This approach focuses on a range of social forces instead of a singular emphasis on individual riskfactors to model population health disparities. There are two pathways through which foreclosurescan shape population health. First, foreclosures can influence health through the loss of materialwealth (particularly among individuals with few means to pay their mortgage in the first place)which influences health status via increased stress (Schootman, Deshpande, Pruitt, & Jeffe, 2011),
II Foreclosures, Inequality, and Metropolitan Health II 3
changed health behaviors (Bennett, Scharoun-Lee, & Tucker-Seeley, 2009; Colby, Linsky, & Straus,1994), and reduced access to preventive and primary care either through loss of insurance or reducedability to afford healthcare services and medication (Pollack & Lynch, 2009).
Second, and more important in its application to this current research, is the physical and socialcontext of specific populations. This suggests that structural dimensions of inequality within anarea operate independently from any individual-level pathways that link foreclosures and health.In general, health, along with economic and social policies, are societal factors that create con-ditions leading to the geographically uneven impacts of foreclosure, reinforcing inequality andits consequences (Dahlberg & Krug, 2002). In this case, the lending practices leading to foreclo-sures reflect and reinforce several trajectories of inequality, thus contributing to subsequent healthproblems (Rugh & Massey, 2010; Squires, 2011; Thaker & Williamson, 2012). Thus, we theo-rize that community health is influenced by two interrelated factors associated with foreclosure:1) the health problems that certain individuals confront as a result of their position in a highlystratified society and 2) the structural forces, including policies, that generate those patterns ofinequality.
SOCIOECONOMIC AND RACIAL INEQUALITY PERSPECTIVES ON HEALTH
Community-level income inequality has been associated with an array of primary care indicatorsin the United States at the state, metropolitan, and county levels of analysis. Even after adjustingfor poverty and family income, income inequality is associated with health outcomes such as theproportion of preterm births, the proportion of infants with low birth weight, and infant mortalityrate (Olson, Diekema, Elliott, & Renier, 2010). In fact, the effect of income inequality on infanthealth increases after controlling for the proportion of higher-income families, which suggests thatthe effect is felt more keenly among the least well-off (Olson et al., 2010). At the county level,income inequality is associated with preterm birth, even after adjusting for individual-level income,while inequality is associated with post-neonatal mortality for non-Hispanic black women (Huynh,Parker, Harper, Pamuk, & Schoendorf, 2005).
The effects of racial and ethnic inequality reinforce the notion that the health consequences ofarea income inequality are experienced most acutely by those without personal resources to bufferagainst the material deprivations found in areas of high inequality (Huynh et al., 2005). Racial andethnic minorities and people with low socioeconomic status generally have less access to healthcare.However, substantial research has demonstrated that socioeconomic disparities alone do not fullyaccount for prevailing race/ethnic disparities in health (Williams, Mohammed, Leavell, & Collins,2010). One cause of the persistent health disparities experienced by racial and ethnic minorities isresidential segregation. Segregation limits access to resources, both physical and social, that promotehealth (Schulz, Williams, Israel, & Lempert, 2002). Specifically, segregation limits access to socialresources such as quality education and job opportunities (Dickerson, 2007) and physical resourcessuch as grocery stores selling fresh produce (Moore & Diez Roux, 2006; Morland, Wing, DiezRoux, & Poole, 2002), safe walking routes (Loukaitou-Sideris, 2006), and primary care providers(Richardson & Norris, 2010). Infant mortality, a robust indicator of access to primary care, wasfirst linked to residential segregation over twenty years ago (LaVeist, 1989). Since then, researchhas consistently demonstrated a relationship between segregation and adult health disparities, evencontrolling for individual level factors. Analysis of national data showed that for black young adults(aged 24–45), segregation was positively associated with age-adjusted all-cause mortality, controllingfor family income (Jackson, Anderson, Johnson, & Sorlie, 2000). For the elderly, results are moreambiguous. One study of age-adjusted all-cause and cardiovascular-related mortality in New YorkCity found that being a majority within a community (i.e., being black in a predominantly blackcommunity) was protective (LeClere, Rogers, & Peters., 1997). A study of Medicare data on black,white, and Hispanic women (ages 66–85) with breast cancer revealed that residential segregationexplained some of the relationship with poorer breast cancer care experienced by black women, butsegregation did not explain higher mortality (Haas et al., 2008).
4 II JOURNAL OF URBAN AFFAIRS II Vol. 00/No. 0/2014
EMERGENT FRAMEWORK LINKING INEQUALITY, FORECLOSURES, AND HEALTH
This research suggests a new set of frameworks for understanding vulnerability to health problemsand additional metrics for assessing where health care facilities and other services, including financialservices, should be developed or expanded. That both health care challenges and foreclosure-relatedcrises are disproportionately played out in low-income and minority neighborhoods is not news. Butthe impact of foreclosures on health and the critical role of various measures of inequality on thecauses and consequences of the foreclosure–health nexus have received little attention. Our findingsmay yield insights for policy that go beyond previous research which has heretofore addressedforeclosures and health problems as separate issues without addressing their interaction or themediating effects of inequality.
Both health care and financial problems have often been explained away in individualistic terms.Decisions that people make regarding their diet, exercise (or the lack thereof), personal hygiene,and other behaviors are frequently pointed to as the cause of many health and health care problems(Cummins & Macintyre, 2006; Koplan, Liverman, & Kraak, 2005). Similarly, it is argued that theforeclosure crisis was largely the result of ignorance and/or greed on the part of some householdswhich led them to take out larger loans to buy homes that families could not afford. Some observersfurther argue that federal fair lending policy required lenders to make loans to unqualified minorityborrowers (Holden, 2008; Wallison, 2008). But in recent years, a range of social, economic, andother contextual factors have been identified as contributing to these problems. For example, theunavailability of fresh fruits and vegetables in low-income neighborhoods, the absence of health carefacilities in those same communities, along with persisting high levels of joblessness and the decliningshare of available jobs that offer health insurance and other benefits for area residents are recognizedas contributors to health problems in urban communities (Hendrickson, Smith, & Eikenberry, 2006;Powell, Chaloupka, & Bao, 2007; Powell, Slater, Mirtcheva, Bao, & Chaloupka, 2007). Foreclosureshave been identified as another contextual factor affecting health in some communities, thoughthe extent of this relationship across all of the nation’s major metropolitan areas is an empiricalquestion that this research addresses. Moreover, foreclosures themselves have structural as wellas individual underpinnings. Research has demonstrated that the presence of predatory lenderswho target low-income communities and minority borrowers, the failure of financial regulatoryagencies, and the increasing riskiness of mortgage related investments are the primary causes ofthe foreclosure crises (Aalbers, 2011; Immergluck, 2009b; McLean & Nocera, 2010). Again, littleattention is paid to how structural inequality in metropolitan areas shapes the current foreclosure crisis(c.f. Aalbers, 2011; Rugh and Massey, 2010).
Evidence is now surfacing that a wide range of social problems may be more closely associated withlevels of economic inequality than overall rates of poverty or average income. It could be the unequaldistribution of valued resources, not the absolute level, that is potentially problematic (Wilkinson &Pickett, 2011). Indicators of income inequality (e.g., the Gini coefficient), concentrated poverty (i.e.,the share of a metropolitan area’s population residing in neighborhoods with high poverty rates), andracial and ethnic segregation (e.g., indices of dissimilarity and exposure) are among the tools that areused to operationalize inequality and examine the impact of inequality on vulnerability to varioushealth problems along with the impact of foreclosures specifically on health. Foreclosures, healthchallenges, and an array of social problems have long been concentrated in communities with highrates of poverty, low incomes, and large minority populations. The focus of this research, however,is on measures of inequality rather than traditional absolute measures of distress. Consequently, thisstudy focuses on income inequality (instead of average income), the concentration of poverty amongmetropolitan areas (as opposed to poverty rate), and racial and ethnic segregation (not the racial andethnic composition of a metropolitan area). All of these factors matter, and are accounted for in thisstudy, but it is the impact of the various measures of inequality on the foreclosure–health connectionthat is focus of this research.
II Foreclosures, Inequality, and Metropolitan Health II 5
HYPOTHESES
Based on the literature review conducted, we acknowledge substantive and theoretical connectionsamong foreclosures, metropolitan inequality, and health. Based on these connections, we test threehypotheses: First, we hypothesize that there will be a negative relationship between foreclosures andhealth as well as between inequality (i.e., segregation, concentrated poverty and income inequality)and health (H1). Second, while we hypothesize links among foreclosures, metropolitan inequality,and health, we also expect disadvantage associated with foreclosures and inequality to predictmetropolitan health. That is, we hypothesize that foreclosures, residential segregation, concentratedpoverty, and income inequality independently predict poor health in metropolitan areas (H2). Third,we expect that this relationship between foreclosures and metropolitan health will be stronger incommunities that exhibit greater levels of social inequality, as measured by residential segregation,concentrated poverty and income inequality (H3).
DATA AND MEASURES
Data
This research presents analyses from several sources of data. Health data come from the SelectedMetropolitan/Micropolitan Area Risk Trends (SMART) project, which relies on information from theBehavioral Risk Factor Surveillance System (BRFSS). Managed by the Centers for Disease Controland Prevention, SMART data select metropolitan and micropolitan statistical areas (MMSAs) withat least 500 respondents to the BRFSS. The BRFSS is a cross-sectional telephone-based surveyconducted by state health departments in all 50 states. Even though all 50 states are measured in theBRFSS, not all metropolitan or micropolitan areas are identified in the SMART data. The data areideal because they can produce some local area estimates that are used to identify health problems,and evaluate health policies and programs in a given geographic area. These health data come from2009, when the BRFSS collected data on 432,607 noninstitutionalized adults (Centers for DiseaseControl and Prevention, 2009).
Foreclosure data are derived from RealtyTrac, a leading foreclosure monitoring and marketingcompany that collects data from public records at the local level. The company accesses legaldocuments which contain information about the actual foreclosure auction. It includes filings ofa notice of trustee sales (NTS) and/or a notice of foreclosure sale (NFS) and about real-estateowned (REO) properties, which are properties that have gone back to the mortgage lender after anunsuccessful foreclosure auction. REOs reflect the cumulative impact of the foreclosure crisis on theneighborhood. Correlated with neighborhood vacancies, the presence of many REO properties in theneighborhood may indicate that property values have been severely damaged, so that other familiesin the neighborhood are more likely to find themselves owing more on their mortgage loans thantheir property is worth. This research focuses on 2006 to 2008, since the foreclosure epidemic tookform in late 2006 (Quercia & Ratcliffe, 2008).
Other metropolitan data come from the American Community Survey (ACS), which is a monthlyhousehold survey developed by the U.S. Census Bureau to provide data users with annual estimatesof household, social, and economic characteristics for geographies and populations of at least 65,000people. In addition, the ACS annually updates its multiyear demographic estimates for geographiesdown to the block group. We use publicly available ACS data on inequality which are available for 69of the largest 100 metropolitan areas. Since the BRFSS SMART data set does not provide estimatesof their health indicators for all metropolitan areas, we use those MSAs that are in the top 100 largestmetropolitan areas because they are greatly impacted by the foreclosure crisis (Rugh & Massey,2010), are more spatially unequal (Iceland,Weinberg, & Steinmetz, 2002) and have some of the mostsevere health problems (Andrulis & Duchon, 2005) compared to the remaining 281 metropolitanareas.
6 II JOURNAL OF URBAN AFFAIRS II Vol. 00/No. 0/2014
Measures
Metropolitan Health
The dependent variable for this study is the prevalence of high blood pressure in each metropolitanarea. This is calculated by taking the number of people in 2009 who have ever been told by amedical professional that they have high blood pressure (HBP) and dividing that number by the totalpopulation. We focus on HBP as one measure of metropolitan health because of its link to stress(James & Brown, 1997; Vrijkotte, van Doornen, & de Geus, 2000) and its ability to be managed viaaccess to quality primary care and medication (Chobanian et al., 2003). We also include metropolitanhealth behaviors linked to HBP. Because HBP can manifest as a result of poor health behaviors suchas smoking and low levels of physical activity, these indicators could also be affected by foreclosureand inequality in a metropolitan area. Thus, within each MSA, the percent of current smokers andthe percent of residents with no physical activity in the past 30 days of interview date are also usedin the analyses as dependent measures.
Foreclosure Rate
Following prior work using these data (Rugh & Massey, 2010), we compute the number ofproperties with at least 1 foreclosure in 69 of the nation’s 100 largest metropolitan statistical areasand divisions (MSAs) using RealtyTrac data. We then divide this number by the total number ofhousing units in a given MSA in the previous year to derive a foreclosure rate that is sensitive to thehousing stock. Relying on the housing units of the prior year yields a denominator that accuratelycaptures homes that had the same risk of being in foreclosure. It is extremely rare, for instance, thatnew housing units built in 2006 would be in foreclosure in that same year. Prior work using the samedata also employs this rate calculation (e.g., Grover, Smith, & Todd, 2008; Wardrip & Pelletiere, 2008)or has used these two components as separate control variables in regression models (Gilderbloom,Ambrosius, Squires, Hanka, & Kenitzer, 2012). This measure reflects the impact of foreclosure onhousing units and households in a metropolitan area.
Social Inequality
Three indicators of inequality are examined: segregation, concentrated poverty, and income in-equality. These measures are calculated from 2000 Census data. Each indicator is operationalized asdiscussed below.
Following Massey and Denton (1989) and Iceland and Nelson (2008), we utilize two differentmeasures of segregation. The Dissimilarity Index measures the degree to which a minority group isdistributed differently than whites across census tracts. The index ranges from 0 (complete integration)to 100 (compete segregation), and the value indicates the percentage of individuals of a racial groupthat would need to move to be distributed exactly like another racial group in a given metropolitanarea. The equation to calculate the Dissimilarity Index is
D = 1
2
n∑
i−1
∣∣∣∣P1i
P1− P2i
P2
∣∣∣∣
where P1 is the MSA population of racial group 1, P2 is the MSA population of racial group 2, P1i isthe population of racial group 1 within census tract i, P2i is the population of racial group 2 withincensus tract i and n is the number of census tracts in the MSA.
A complementary measure of segregation is the Exposure Index. This index measures the shareof residents in a neighborhood that are of a different race than the typical resident of a given race.For example, the exposure index of whites to blacks would be very low if there were few blacks andvery high if there were several blacks in the neighborhood of the typical white resident. It serves asa unique measure of segregation because it expresses the degree of spatial isolation of one group in
II Foreclosures, Inequality, and Metropolitan Health II 7
a metropolitan area, while the dissimilarity index can be interpreted as a measure of the distributionof groups across a metropolitan area, or how the racial composition of a given area compares to thatof the MSA in total. The equation to calculate the Exposure Index is
E =n∑
i=1
P1i
P1× P2i
Ti
where P1i is the population of racial group 1 within census tract i, P2i is the population of racialgroup 2 within census tract i, P1 is the MSA population of racial group 1, Ti is the total populationof census tract i, and n is the number of census tracts in the MSA.
Concentrated poverty captures the share of census tracts within an MSA in which at least 20% ofthe population have annual incomes below the federal poverty level. Some researchers use 40% asa threshold, but recent work (Kneebone et al., 2011) suggests that these areas are characterized ashaving extreme concentrated poverty. Twenty percent has been consistently used to indicate areasof concentrated poverty (Bishaw, 2005; Wilson, 1987). This measure differs from the poverty ratebecause it incorporates space in its calculation. The concentration of poverty reflects the geographiclocation where poor families reside whereas the poverty rate is the overall proportion of the MSAthat is poor (Jargowsky, 2002). While the shortcomings of the official poverty measure have beenwell documented (Citro & Michael, 1995), this measure provides a stable benchmark that accountsfor the spatial organization of the poor over time (Kneebone et al., 2011).
The Gini coefficient measures the degree of social inequality in the distribution of family incomein a given metropolitan area. Calculated from a Lorenz curve, the Gini coefficient varies between 0(which reflects complete equality) and 1 (which indicates complete inequality, where one group hasall the income or consumption while the remaining groups have none).
Metropolitan Control Measures
All of the control measures are derived from the American Community Survey. MSA Populationis the total number of people within each MSA. In the analyses, this variable is logged for statisticalnormality purposes. Percent Minority Presence is the number of minorities (black, Hispanic, Asian)in a metropolitan area divided by the total population. This measure is distinct from segregation,since it relies on a compositional approach rather than a spatial approach to areas. That is, segregationoccurs as a process whereby one group is physically and socially isolated from another group in thesame geographic area. However, the percentage of a racial group refers to only the share of the totalpopulation that the racial group represents. Recent research indicates that metropolitan areas withthe greatest proportion of minority residents were by far the most diverse, but the greater presence ofa non-white population did not necessarily translate into less segregation (Iceland, 2004). As such,minority presence is distinctly different from racial residential segregation.
This research also uses various metropolitan socioeconomic measures. Median Household Incomeis logged in the analyses to adjust for statistical non-normality. In addition, MSA Poverty Rate andMSA Unemployment Rate are used in the analyses. Also, the percentage of people aged 25 and olderwith a college degree is a variable used in the analyses. We measure the percentage of working-age(18–64) persons in a given MSA who are insured as a control measure, since there is geographicvariation in the kinds of policies for and laws governing health insurance acquisition. Lastly, inorder to account for large-scale spatial variability in both foreclosures and illness (Fisher, Bynum,& Skinner, 2009), we include region as a control variable. We use the U.S. Bureau of the Censusdefinitions of four geographic regions (Midwest, South, West, and North).
Analytic Strategy
Because the dependent variable is the proportion of a metropolitan population with a specific healthcondition, this research relies on generalized linear modeling to assess the effects of foreclosure and
8 II JOURNAL OF URBAN AFFAIRS II Vol. 00/No. 0/2014
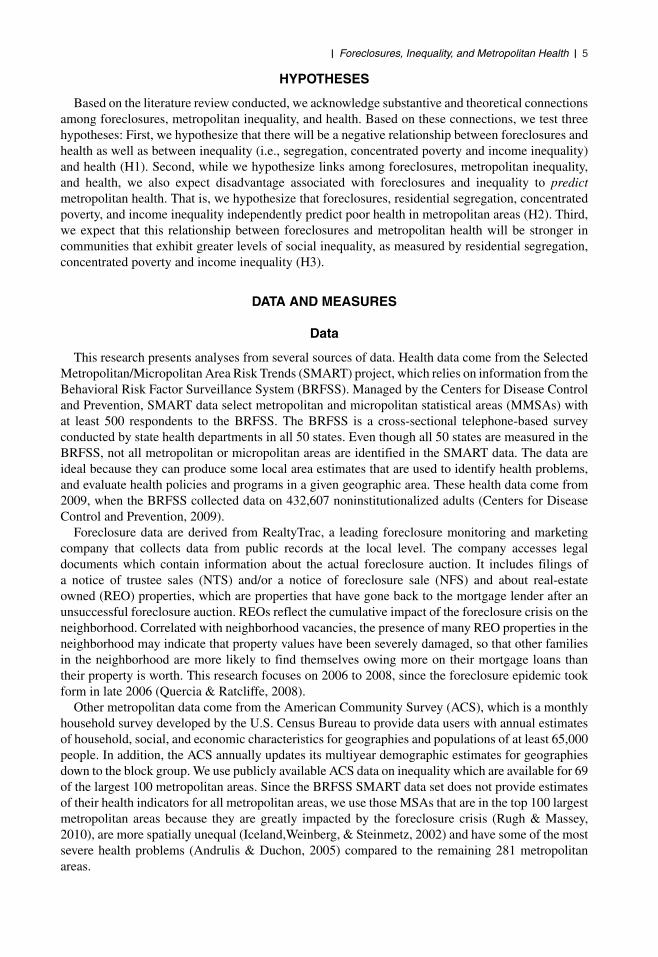
TABLE 1
Description of Variables
Mean or % SD
Percent of High Blood Pressure in MSA 30.08%Percent of Current Smokers in MSA 17.74%Percent of Residents with No Physical Activity in MSA 23.58%
Segregation IndexDissimilarity Index
Black-White 0.58 0.12Hispanic-White 0.44 0.10Asian-White 0.38 0.07
Exposure IndexBlack-White 0.46 0.19Hispanic-White 0.29 0.22Asian-White 0.11 0.12
Socioeconomic InequalityPercent Tracts in MSA with 20%+ Poverty 21.61%Gini Coefficient 41.50 2.68
Foreclosure Rate (Foreclosures per 100 MSA Houses)2006 0.68 0.472007 2.14 0.862008 2.94 1.62
Control VariablesMSA Population 1,712,168 1,318,294Percent Black Population in MSA 14.35%Percent Hispanic Population in MSA 12.82%Percent Asian Population in MSA 4.16%Median Household Income $54,411.16 $9,293.93MSA Poverty Rate 12.66%MSA Unemployment Rate 4.52%Percent Persons 25+ with College Degree 28.50%Percent Working Age Population With Health Insurance 83.94%Region
Northeast‡ 15.94%Midwest 23.19%South 42.03%West 18.84%
N = 69; ‡ Used in analyses as the contrast category.
inequality on metropolitan health in 69 of the top 100 MSAs. Analyses are performed in Stata 12.1(StataCorp, 2011) using the GLM command. Based on a kernel density of the dependent measure,we applied a logit link as the functional form that best fits the data, and we specified the distributionof the dependent variable as being in the binomial family. We also obtain robust standard errors as aprotective measure against any potential misspecification of the functional form (Institute for DigitalResearch and Education, 2013).
The modeling strategy is consistent across all measures of inequality, which had to be modeledseparately due to multicollinearity. Model 1 is the zero-order model with the measure of inequalityunder scrutiny. Model 2 adds the foreclosure rates for 2006, 2007, and 2008 to the previous model.Model 3 is the full model, which has all measures including the metropolitan controls.
RESULTS
Sample Description
Table 1 presents an overview of the variables used for this study. Across all 69 metropolitanstatistical areas (MSAs), 30.1% of people within these MSAs were diagnosed with HBP in 2009.
II Foreclosures, Inequality, and Metropolitan Health II 9
The prevalence of hypertension in this sample is very close to the national average of 28.6%, asreported by the Centers for Disease Control and Prevention (Yoon, Burt, Louis, & Carroll, 2012).Moreover, the average percentage of current smokers within these metropolitan areas is 17.7, whileon average 23.6% of residents in these MSAs engaged in no physical activity in the past month.
Segregation levels for these MSAs are consistently moderate for blacks, and low to moderate forHispanics and Asians. Specifically, the average dissimilarity index is about 0.6 for blacks, 0.4 forHispanics and 0.4 for Asians. Likewise, the mean exposure index is 0.5 for blacks, 0.3 for Hispanicsand 0.1 for Asians. Using the standard ranges for low (0.0–0.2), moderate (0.3–0.6) and high (0.7–1.0) levels of segregation, it is apparent that black segregation is moderate in this sample. Dependingon the measure, Hispanic and Asian segregation is, on average, low to moderate.
The two measures of socioeconomic inequality used in the analysis suggest that this sample closelymirrors national estimates. Concentrated poverty is assessed by the percentage of tracts within anMSA that has more than 20% of the residents below the federal poverty line. In this sample, theaverage percentage of tracts with concentrated poverty is 21.6. The national estimate from the U.S.Bureau of the Census is 22.6% (Bishaw, 2011), so this sample is very close to the national average.Likewise, this sample has an average Gini coefficient value of 41.5. Reliable estimates from theWorld Bank suggest that the overall U.S. average is 45 (World Bank Group, 2013).
The foreclosure rates in this sample of 69 of the largest metropolitan areas are also very closeto national estimates. It is important to note that from 2006 to 2008, there is a monotonic increasein the foreclosure rate, suggesting that during this critical 3-year time period, foreclosures continueto rise. In this sample, 0.7% of housing units in these metropolitan areas experienced a foreclosurein 2006. Likewise, in 2007, 2.1% of homes in this sample experienced a foreclosure. In 2008,the foreclosure rate was 2.9% in these metropolitan areas. To compare, according to Realty Trac,these figures, which represent the largest metropolitan areas, slightly overestimate the level offoreclosures that occurs in the United States. From 2006 to 2008, the foreclosure rates were 0.6%,1.0%, and 1.8% (RealtyTrac, 2008, 2009).
Across the 69 MSAs, the average population in 2000 was around 1.7 million. In this sample,blacks constituted 14.4% of the population compared to 12.8% for Hispanics and 4.2% for Asians.The median household income in 2006 across these MSAs was $54,411. The poverty rate averaged12.7% in 2006 in this sample. Nearly 5% (4.5%) of people on average in each MSA were unemployedin 2006. The average percentage of people with a college degree who were at least 25 years of agewas 28.5. An overwhelming majority of persons (83.9%) aged 18–64 had health insurance in 2006.Finally, for this sample, 15.9% lived in the Northeast, 23.2% lived in the Midwest, 42.0% lived inthe South, and 18.8% resided in the West.
Linking Foreclosures, Inequality, and Health
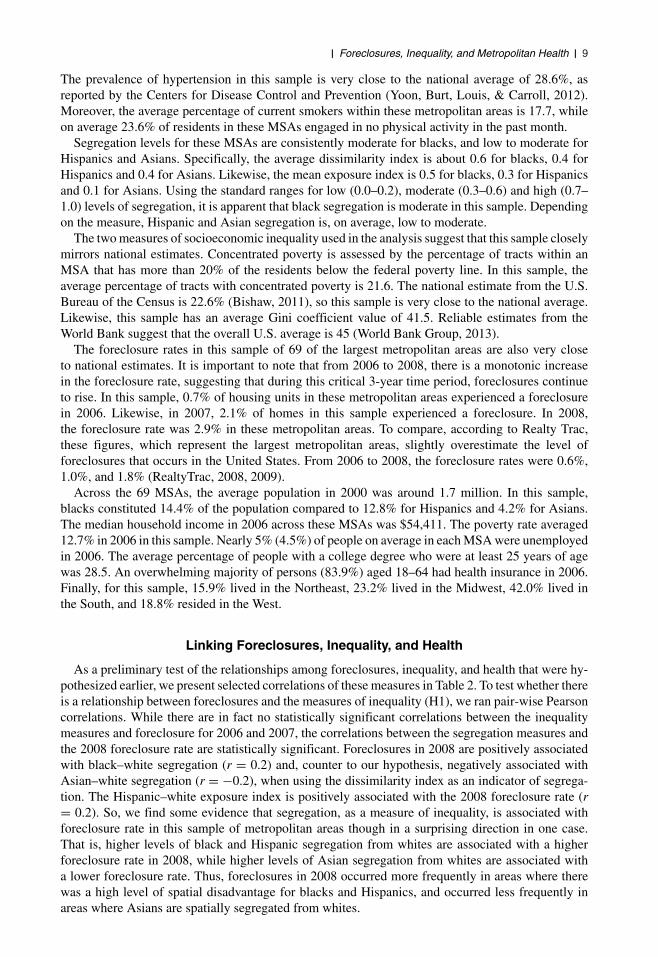
As a preliminary test of the relationships among foreclosures, inequality, and health that were hy-pothesized earlier, we present selected correlations of these measures in Table 2. To test whether thereis a relationship between foreclosures and the measures of inequality (H1), we ran pair-wise Pearsoncorrelations. While there are in fact no statistically significant correlations between the inequalitymeasures and foreclosure for 2006 and 2007, the correlations between the segregation measures andthe 2008 foreclosure rate are statistically significant. Foreclosures in 2008 are positively associatedwith black–white segregation (r = 0.2) and, counter to our hypothesis, negatively associated withAsian–white segregation (r = −0.2), when using the dissimilarity index as an indicator of segrega-tion. The Hispanic–white exposure index is positively associated with the 2008 foreclosure rate (r= 0.2). So, we find some evidence that segregation, as a measure of inequality, is associated withforeclosure rate in this sample of metropolitan areas though in a surprising direction in one case.That is, higher levels of black and Hispanic segregation from whites are associated with a higherforeclosure rate in 2008, while higher levels of Asian segregation from whites are associated witha lower foreclosure rate. Thus, foreclosures in 2008 occurred more frequently in areas where therewas a high level of spatial disadvantage for blacks and Hispanics, and occurred less frequently inareas where Asians are spatially segregated from whites.
10 II JOURNAL OF URBAN AFFAIRS II Vol. 00/No. 0/2014
TAB
LE
2
Pai
rwis
eC
orr
elat
ion
sA
mo
ng
Ineq
ual
ity
Mea
sure
s,H
igh
Blo
od
Pre
ssu
reP
reva
len
ce,a
nd
Fo
recl
osu
reR
ates
2006
For
eclo
sure
Rat
e20
07F
orec
losu
reR
ate
2008
For
eclo
sure
Rat
eH
BP
Pre
vale
nce,
2009
Seg
reg
atio
nIn
dex
,200
0D
issi
mila
rity
Inde
xB
lack
-Whi
te0.
060.
030.
15†
0.23
∗H
ispa
nic-
Whi
te−0
.08
−0.0
2−0
.01
−0.3
1∗∗∗
Asi
an-W
hite
−0.1
4−0
.12
−0.1
9†0.
26∗
Exp
osur
eIn
dex
Bla
ck-W
hite
0.11
0.03
−0.1
40.
42∗∗
∗H
ispa
nic-
Whi
te0.
060.
160.
24∗
−0.3
6∗∗∗
Asi
an-W
hite
−0.1
10.
090.
16−0
.15
So
cio
eco
no
mic
Ineq
ual
ity,
2000
Per
cent
Trac
tsin
MS
Aw
ith20
%+
Pov
erty
−0.0
10.
020.
010.
31∗∗
∗G
iniC
oeffi
cien
t−0
.16
−0.0
8−0
.07
0.15
HB
PP
reva
lenc
e,20
090.
130.
080.
23†
–
N=
69.†
p<
0.10
;∗p
<0.
05;∗
∗ p<
0.01
;∗∗∗
p<
0.00
1.
II Foreclosures, Inequality, and Metropolitan Health II 11
We also ran correlations between HBP prevalence and inequality. All measures of inequalityare statistically related to the prevalence of HBP except our measure of income inequality (Ginicoefficient). The segregation measures are fairly consistent in their relationship with HBP prevalence.Black–white dissimilarity (r = 0.2) and exposure (r = 0.4) are positively associated with HBPprevalence. Conversely, Hispanic–white dissimilarity (r = −0.3) and exposure (r = −0.4) arenegatively associated with HBP prevalence. Asian–white dissimilarity is positively associated withHBP prevalence (r = 0.3). The measure of concentrated poverty, i.e., the percentage of tracts withinan MSA with 20% or higher poverty is positively associated (r = 0.3) with the prevalence of HBP.To summarize, higher levels of black and Asian segregation from whites and greater concentration ofpoverty are associated with a higher prevalence of HBP, while higher levels of Hispanic segregationfrom whites are associated with a lower prevalence of HBP.
We also test for whether there is a statistically significant correlation between foreclosure rates andthe HBP prevalence across these metropolitan areas. While there is no significant correlation whenviewing the 2006 and 2007 foreclosure rates with HBP prevalence, there is a statistically positiverelationship between the 2008 foreclosure rate and the prevalence of HBP (r = 0.2). Here, we findthat as foreclosures in 2008 increase, there is an increase in the HBP prevalence.
These findings are suggestive. However, in order to provide stronger statistical evidence of theassociation between foreclosures, inequality, and health, we conduct multivariate analyses to de-termine if these relationships hold after taking into consideration relevant control variables (H2).These multivariate analyses also explore the final hypothesis that the foreclosure/health relationshipis stronger in communities exhibiting higher levels of inequality (H3). The results are presented inthe next section.
The Effects of Foreclosures and Inequality on High Blood Pressure
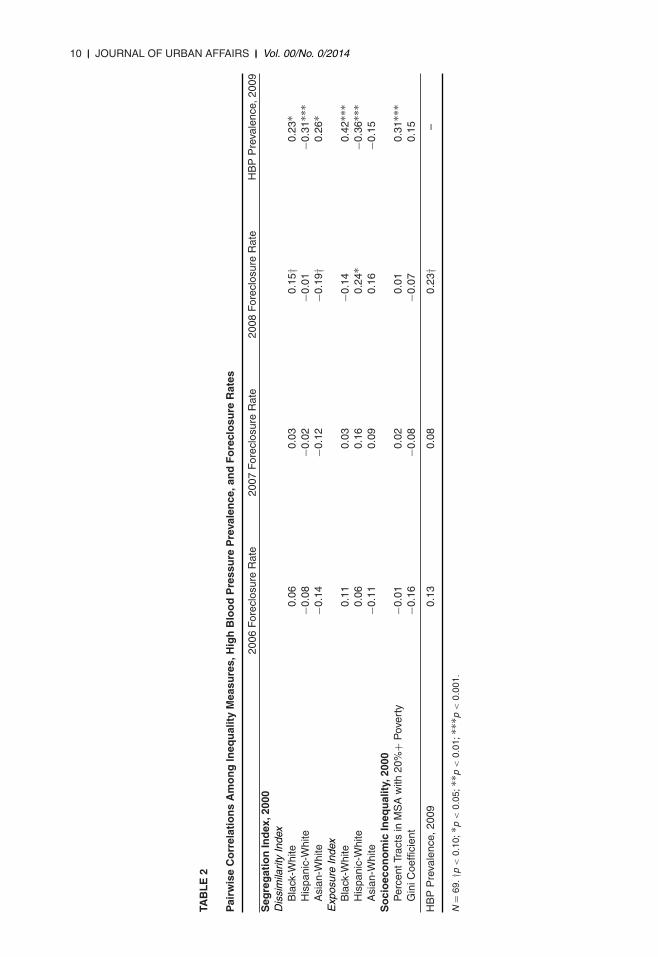
Tables 3 and 4 present the coefficients from the generalized linear model predicting theprevalence of HBP in the 69 metropolitan areas with the segregation or socioeconomic in-equality measures. Model 1 is the base model with only the selected inequality measure.Model 2 adds the foreclosure measures. Model 3 is the full model with all of the variablesentered.
Racial Inequality
Table 3 predicts HBP prevalence using the dissimilarity and exposure indices of segregation, whichpartially tests the second hypothesis. For the base model, segregation significantly predicts HBPprevalence. A 0.1 unit increase in the black dissimilarity index corresponds to a 0.3 percentage pointincrease in HBP prevalence. Likewise, increasing the Hispanic dissimilarity index by 0.1 decreasesHBP prevalence by 0.6 percentage points. For the Asian dissimilarity index, a 0.1 unit increasecorrespondents to a 0.5 percentage point increase in HBP prevalence (p = 0.049). These statisticalestimates suggest that black and Asian segregation from whites is associated with relatively poormetropolitan health, while Hispanic segregation from whites is associated with better metropolitanhealth.
When controlling for foreclosure rates across metropolitan areas, the marginally significant effectof Asian dissimilarity disappears, due to the addition of the 2006 foreclosure rate (p = 0.051) inthe model. However, the same effects seen in the base model remain. That is, black segregationfrom whites is associated with poorer metropolitan health, while Hispanic segregation from whites isassociated with better metropolitan health. Foreclosure rates are also statistically significant predictorsof metropolitan health. Specifically, a 1 unit increase in the 2006 foreclosure rate corresponds to a0.1 percentage point increase in HBP prevalence.
Interestingly, the segregation and foreclosure rate effects disappear when the control variables areentered into the model. Sensitivity analyses indicate that the effects are attenuated by the percentblack MSA population and percent persons with a college degree. Some of the control variables also
12 II JOURNAL OF URBAN AFFAIRS II Vol. 00/No. 0/2014
TABLE 3
Generalized Linear Model Estimates for Racial Residential Segregation and Foreclosure on High BloodPressure MSA Prevalence
Dissimilarity Index Exposure Index
Model 1 Model 2 Model 3 Model 1 Model 2 Model 3
Segregation IndexBlack-White 0.30∗∗ 0.23∗ 0.28 0.30∗∗∗ 0.31∗∗∗ 0.22Hispanic-White −0.56∗∗∗ −0.51∗∗∗ 0.02 −0.20∗∗ −0.17∗∗ 0.02Asian-White 0.45∗ 0.42 −0.05 −0.02 −0.08 −0.08
Foreclosure Rate2006 0.12∗ 0.07 0.13∗ 0.07∗∗2007 0.01 0.04 0.05 0.042008 −0.03 −0.05 0.02 0.01
Control VariablesLog MSA Population 0.00 0.01Percent Black Population in MSA 0.34∗ 0.13∗Percent Hispanic Population in MSA −0.30∗ −0.40∗Percent Asian Population in MSA 0.59 0.60Log Median Household Income −0.28∗ −0.21∗MSA Poverty Rate 0.00 0.00MSA Unemployment Rate 0.03 0.03Percent Persons 25+ with College Degree −1.13∗ −1.21∗Percent Persons 18-64 with Health Insurance 0.00 0.00Region
Midwest −0.03 −0.04South 0.09 0.07West 0.06 0.05
Constant −0.94∗∗∗ −0.91∗∗∗ 2.04 −.92∗∗∗ 0.95∗∗∗ 1.39
R2 0.21 0.31 0.67 0.24 0.33 0.67−2 Pseudo Loglikelihood 56.27 53.01 52.87 56.26 53.00 −26.44
N = 69. ∗p < 0.05; ∗∗p < 0.01; ∗∗∗p < 0.001.
have significant predictive power in determining HBP prevalence. Every 1% increase in the blackpopulation translates to a 0.34 percentage point increase in HBP prevalence. However, a 1% increasein the Hispanic population is associated with a 0.3 percentage point decrease in HBP prevalence.Increases in the median household income correspond to a decrease in the metropolitan prevalenceof HBP by 0.3 points. Also, the percentage of people 25 years and older with a college degree isassociated with a decrease in the prevalence of HBP. That is, for every 1% increase of people who havea college degree, there is a 1.2 percentage point decrease in the HBP prevalence in these metropolitanareas.
While the dissimilarity and exposure indices measure different components to segregation, theeffects for the exposure index are similar to the ones that are found in models with the dissimilarityindex. Specifically, black segregation levels increase HBP prevalence while Hispanic segregationlevels decrease the rate of prevalence. This effect remains when metropolitan foreclosure rate isincluded in the model, but is explained away when the control variables are entered into the model.Specifically, the effects are attenuated by the percent black MSA population and percent persons witha college degree. In addition, the coefficients for the control variables also follow the same patternas previously described: the percent black population increases HBP prevalence while the percentHispanic population, median household income, and percentage of individuals with a college degreeall decrease HBP prevalence. However, these effects do not explain the effect of the foreclosurerate—it is still statistically significant (α = 0.01) after controlling for metropolitan characteristics.Net of other variables, a 1-unit increase in the foreclosure rate in 2006 is associated with a 0.1increase in HBP prevalence.
II Foreclosures, Inequality, and Metropolitan Health II 13
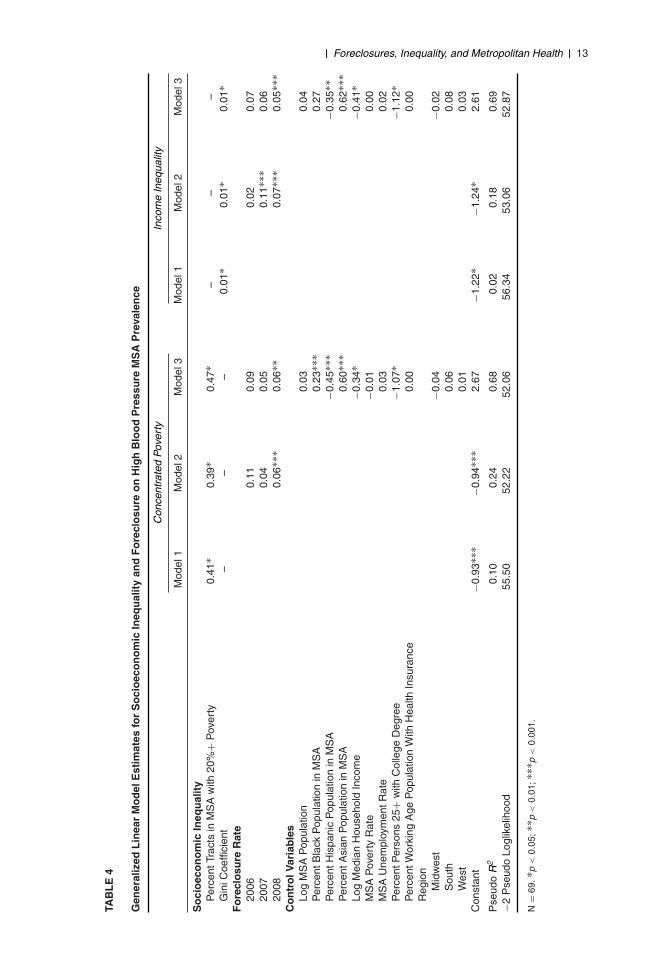
TAB
LE
4
Gen
eral
ized
Lin
ear
Mo
del
Est
imat
esfo
rS
oci
oec
on
om
icIn
equ
alit
yan
dF
ore
clo
sure
on
Hig
hB
loo
dP
ress
ure
MS
AP
reva
len
ce
Con
cent
rate
dP
over
tyIn
com
eIn
equa
lity
Mod
el1
Mod
el2
Mod
el3
Mod
el1
Mod
el2
Mod
el3
So
cio
eco
no
mic
Ineq
ual
ity
Per
cent
Trac
tsin
MS
Aw
ith20
%+
Pov
erty
0.41
∗0.
39∗
0.47
∗–
––
Gin
iCoe
ffici
ent
––
–0.
01∗
0.01
∗0.
01∗
Fo
recl
osu
reR
ate
2006
0.11
0.09
0.02
0.07
2007
0.04
0.05
0.11
∗∗∗
0.06
2008
0.06
∗∗∗
0.06
∗∗0.
07∗∗
∗0.
05∗∗
∗C
on
tro
lVar
iab
les
Log
MS
AP
opul
atio
n0.
030.
04P
erce
ntB
lack
Pop
ulat
ion
inM
SA
0.23
∗∗∗
0.27
Per
cent
His
pani
cP
opul
atio
nin
MS
A−0
.45∗
∗∗−0
.35∗
∗P
erce
ntA
sian
Pop
ulat
ion
inM
SA
0.60
∗∗∗
0.62
∗∗∗
Log
Med
ian
Hou
seho
ldIn
com
e−0
.34∗
−0.4
1∗M
SA
Pov
erty
Rat
e−0
.01
0.00
MS
AU
nem
ploy
men
tRat
e0.
030.
02P
erce
ntP
erso
ns25
+w
ithC
olle
geD
egre
e−1
.07∗
−1.1
2∗P
erce
ntW
orki
ngA
geP
opul
atio
nW
ithH
ealth
Insu
ranc
e0.
000.
00R
egio
nM
idw
est
−0.0
4−0
.02
Sou
th0.
060.
08W
est
0.01
0.03
Con
stan
t−0
.93∗
∗∗−0
.94∗
∗∗2.
67−1
.22∗
−1.2
4∗2.
61
Pse
udo
R2
0.10
0.24
0.68
0.02
0.18
0.69
−2P
seud
oLo
glik
elih
ood
55.5
052
.22
52.0
656
.34
53.0
652
.87
N=
69.∗
p<
0.05
;∗∗ p
<0.
01;∗
∗∗p
<0.
001.
14 II JOURNAL OF URBAN AFFAIRS II Vol. 00/No. 0/2014
These models suggest that foreclosures are associated with poor metropolitan health, even whenadjusting for the exposure index of segregation. Moreover, while the dissimilarity and exposuresegregation indices seem to predict metropolitan health even after accounting for the foreclosurerate, this effect diminishes when characteristics associated with segregation are accounted for. Thus,foreclosures seem to be linked to metropolitan health more so than segregation.
Socioeconomic Inequality
Table 4 shows results predicting HBP prevalence using the measure of concentrated poverty (tractswith at least 20% poverty) and the Gini coefficient of metropolitan income inequality. For concen-trated poverty, for every 1% increase in the tracts with high poverty concentration, the prevalenceof HBP increases by 0.4. This effect remains after controlling for metropolitan foreclosure rate. Inaddition, a 1-unit increase in the 2008 foreclosure rate corresponds to a 0.1 percentage point increasein HBP prevalence. Both effects remain after controlling for the metropolitan characteristics, andsome of the metropolitan control variables also statistically predict HBP prevalence. For every 1%increase in the black population in these metropolitan areas, the prevalence of HBP increases by0.2. Conversely, a 1% increase in the Hispanic population decreases the prevalence of HBP by 0.5.Increasing the Asian population by 1% corresponds to a 0.6 increase in the HBP prevalence in thesemetropolitan areas. Increases in the median household income correspond to a 0.3 percentage pointdecrease in HBP prevalence. Lastly, for every 1% increase of people who have a college degree,there is a 1.2 percentage point decrease in the HBP in these metropolitan areas.
The models with income inequality (i.e., the Gini coefficient) show a similar pattern to theprevious models. That is, the Gini coefficient is statistically predictive of HBP prevalence. A 1-unit increase in the Gini coefficient (or income inequality) corresponds to a 0.01 percentage pointincrease in the prevalence of HBP. Foreclosures are also significant. A 1-unit increase in the 2007 and2008 foreclosure rate corresponds to a 0.1 percentage point increase in HBP prevalence. However,when adding the metropolitan controls, the 2007 foreclosure rate coefficient becomes statisticallynonsignificant. In addition, some of the controls also predict HBP prevalence similar to the modelswith concentrated poverty as the key inequality measure. The percent Asian population increasesHBP prevalence while the percent Hispanic population, median household income, and percentageof individuals with a college degree all decrease HBP prevalence.
Foreclosures are associated with poor metropolitan health, even after adjusting for socioeconomicinequality, and the effect remains when controlling for poverty. High levels of concentrated povertyalso predict poor metropolitan health. So, it appears that both the absolute level of poverty and therelative income inequality in metropolitan areas are predictive of metropolitan health. Foreclosures,concentrated poverty, and income inequality are important and significant predictors of metropolitanhealth, which support our second hypothesis. We now test whether the effect of foreclosure differsdepending on how much poverty is concentrated. That test is further discussed in the next section.
Foreclosures and the Inequality–Health Link
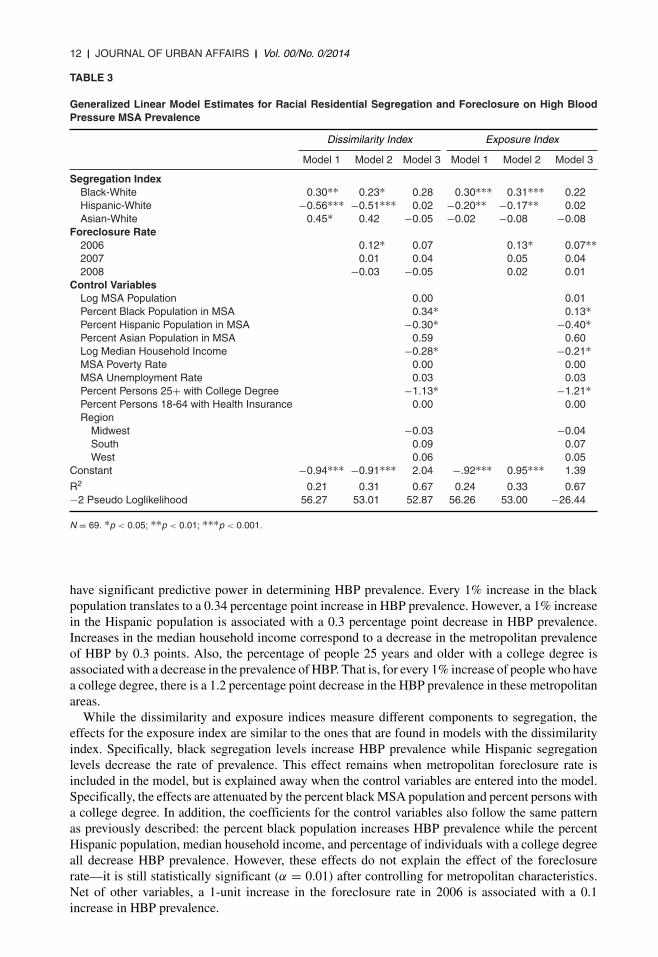
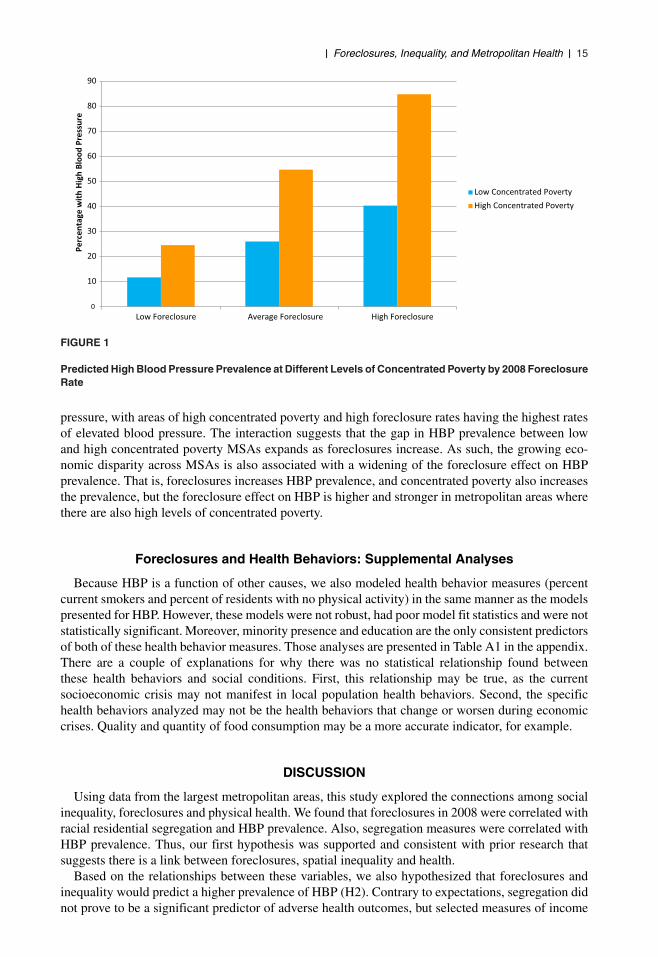
Of the four measures of social inequality used in this research (dissimilarity index, exposureindex, concentrated poverty, and Gini coefficient), concentrated poverty and income inequality hadstatistically significant effects in predicting cardiovascular prevalence after controlling for metropoli-tan characteristics. Consequently, it is important to test whether there was a statistically significantinteraction among these variables. While there is no statistically significant interaction betweenforeclosure and income inequality in predicting HBP prevalence, there is a significant interaction offoreclosure and concentrated poverty (β = 0.20; α < 0.01). This significance also remains whenthe variables are centered around the grand mean in the interaction model. Figure 1 displays theinteraction between the foreclosure rates in 2008 and low (2 standard deviations below mean) andhigh (2 standard deviations above mean) levels of concentrated poverty as a bar graph. There isa significant interaction effect between concentrated poverty, foreclosure rate, and elevated blood
II Foreclosures, Inequality, and Metropolitan Health II 15
0
10
20
30
40
50
60
70
80
90
Low Foreclosure Average Foreclosure High Foreclosure
Perc
enta
ge w
ith H
igh
Bloo
d Pr
essu
re
Low Concentrated PovertyHigh Concentrated Poverty
FIGURE 1
Predicted High Blood Pressure Prevalence at Different Levels of Concentrated Poverty by 2008 ForeclosureRate
pressure, with areas of high concentrated poverty and high foreclosure rates having the highest ratesof elevated blood pressure. The interaction suggests that the gap in HBP prevalence between lowand high concentrated poverty MSAs expands as foreclosures increase. As such, the growing eco-nomic disparity across MSAs is also associated with a widening of the foreclosure effect on HBPprevalence. That is, foreclosures increases HBP prevalence, and concentrated poverty also increasesthe prevalence, but the foreclosure effect on HBP is higher and stronger in metropolitan areas wherethere are also high levels of concentrated poverty.
Foreclosures and Health Behaviors: Supplemental Analyses
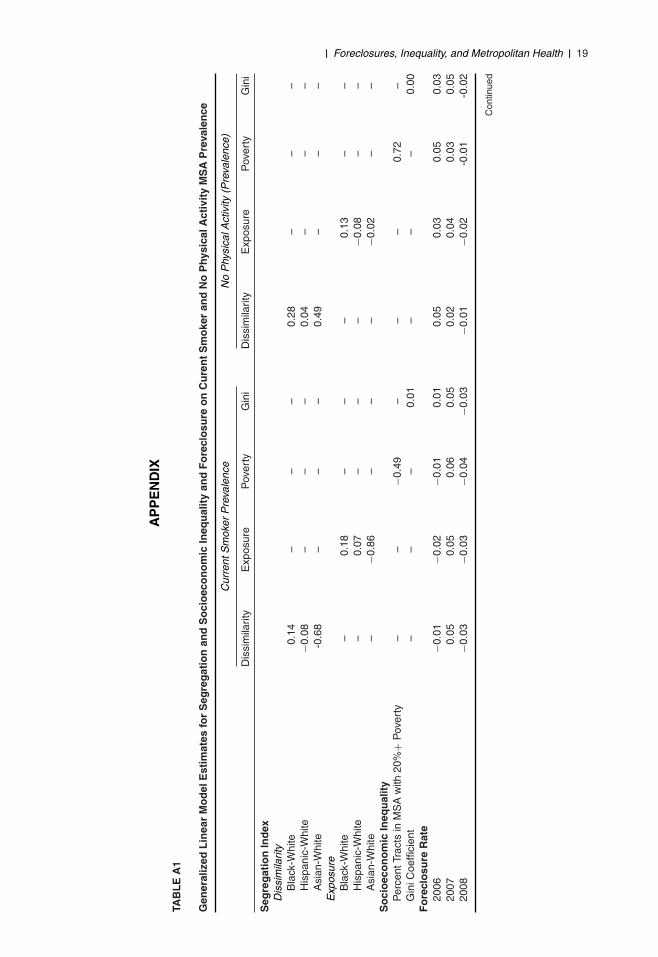
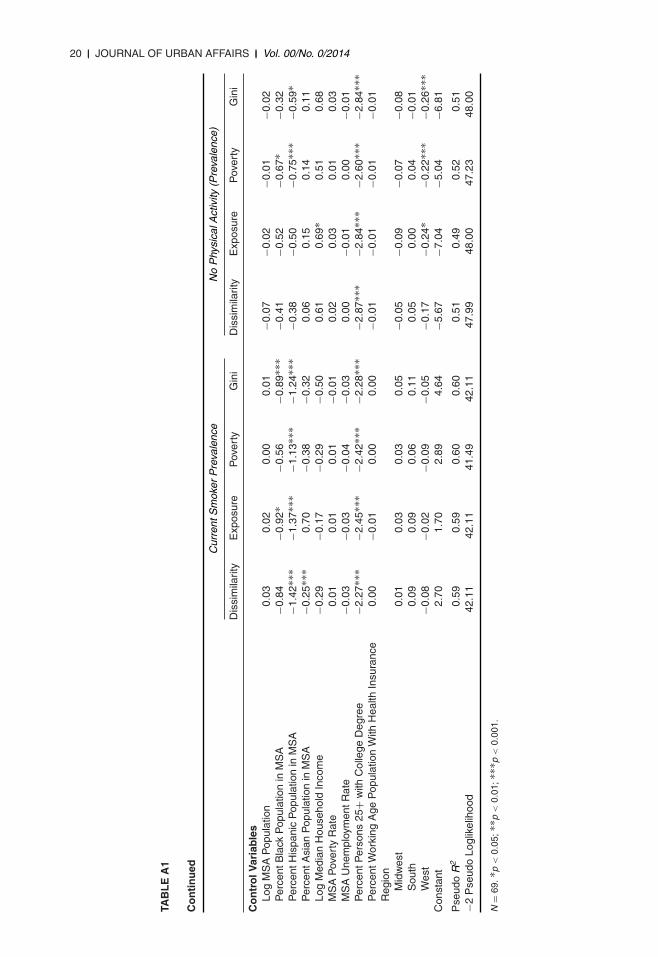
Because HBP is a function of other causes, we also modeled health behavior measures (percentcurrent smokers and percent of residents with no physical activity) in the same manner as the modelspresented for HBP. However, these models were not robust, had poor model fit statistics and were notstatistically significant. Moreover, minority presence and education are the only consistent predictorsof both of these health behavior measures. Those analyses are presented in Table A1 in the appendix.There are a couple of explanations for why there was no statistical relationship found betweenthese health behaviors and social conditions. First, this relationship may be true, as the currentsocioeconomic crisis may not manifest in local population health behaviors. Second, the specifichealth behaviors analyzed may not be the health behaviors that change or worsen during economiccrises. Quality and quantity of food consumption may be a more accurate indicator, for example.
DISCUSSION
Using data from the largest metropolitan areas, this study explored the connections among socialinequality, foreclosures and physical health. We found that foreclosures in 2008 were correlated withracial residential segregation and HBP prevalence. Also, segregation measures were correlated withHBP prevalence. Thus, our first hypothesis was supported and consistent with prior research thatsuggests there is a link between foreclosures, spatial inequality and health.
Based on the relationships between these variables, we also hypothesized that foreclosures andinequality would predict a higher prevalence of HBP (H2). Contrary to expectations, segregation didnot prove to be a significant predictor of adverse health outcomes, but selected measures of income
16 II JOURNAL OF URBAN AFFAIRS II Vol. 00/No. 0/2014
inequality and foreclosure rates did. While previous research has found that segregation is associatedwith adverse health outcomes, segregation was not a significant predictor once the controls wereentered in our models. It may well be that these variables are highly correlated, making it difficultto disentangle the underlying causal effects of each. Further research on different health outcomescould yield different findings.
In contrast, selected income inequality measures were significant predictors of adverse healthoutcomes. Both concentrated poverty and income inequality were associated with poor metropolitanhealth in all models. The effects of poverty and concentrated poverty on health have been found inprevious research. Our results reinforce these findings (Wen, Browning, & Cagney, 2003). Whileincome inequality has been associated with poorer health across countries (Subramanian & Kawachi,2004), much less research has shown that inequality within a country is associated with poor health.However, our research adds to the paucity of research that explores within-country income inequalityand health. Indeed, the growing income inequality in the United States that other researchers havesuggested (Lopez, 2004; OECD, 2011) is predictive of cardiovascular illness. Some research hassuggested that income inequality, a persistent indicator of health, had a stronger association amongyounger ages (up to 15 years) than with older ages (greater than 45 years) from 1979 to 1997(Blakely, Kennedy, Glass, & Kawachi, 2000). While this research explores different time points,future research will need to rely on longitudinal health data to see if the effect of income inequalityis predictive of cardiovascular illness over time.
Our basic but profound conclusion is that foreclosures, health, and income inequality are intri-cately interrelated. In our last hypothesis, we expected that the relationship between foreclosuresand metropolitan health would be stronger for MSAs with greater levels of segregation, concen-trated poverty, and income inequality. The interaction between concentrated poverty and fore-closure rates on HBP suggests that vulnerable populations increase their health vulnerability intimes of economic instability; economic policies that enabled the foreclosure crisis had the mostdeleterious health consequences in metro areas already struggling with concentrated poverty. Ourfindings support most of the hypotheses that guided this research. That is, foreclosure rates arehigher in metropolitan areas that exhibit higher levels of spatial inequality, health problems interms of HBP are greater in those areas as well, foreclosure rates are associated with HBP, andthe link between foreclosure and HBP is stronger in communities where concentrated poverty isgreater.
There are important limitations to our research. The use of self-reported hypertension as a proxy foractual hypertension could be biased (Newell, Girgis, Sanson-Fisher, & Savolainen, 1999). Assumingthat individuals accurately report their morbidities based on a doctor’s evaluation, it may also bepossible that the people who do not have the means to visit a physician would not be able toassess their health accurately or answer the question of having HBP without error. The BRFSS is atelephone-based survey. As a result, it could be possible that houses that have already gone throughforeclosure are absent from the sample since they would have changed residences at the survey date,or alternatively, individuals who have telephones may have skewed the sample to disproportionatelyreflect more well-off or more stable households. The BRFSS SMART data are not able to captureall metropolitan areas or communities outside of metropolitan areas. While this research includedseveral health behavior measures in addition to a health outcome, we did not explore the myriad ofother health measures that the BRFSS provides. Because we were examining metropolitan areas, wewere unable to draw specific conclusions about the impact of these social forces on individuals orhouseholds.
Also, aggregating individual-level variables to the group level via contextual analysis increasesthe possibility of committing an ecological fallacy (de Leeuw & Meijer, 2008). However, becausewe are not attributing characteristics of the metropolitan area to the individual, we reducethe risk of committing this fallacy. Due to multicollinearity, each of the inequality measureshad to be modeled independently from each other. Consequently, we were unable to test forinteraction among these variables or explore the cumulative spatial disadvantage that maywell be present in metropolitan areas. Lastly, the effects of the foreclosure crisis may have a
II Foreclosures, Inequality, and Metropolitan Health II 17
lagged effect on health behaviors; however, our models cannot adequately control for a laggedeffect.
Perhaps the most important limitation is that we do not know which families and family mem-bers are affected by these forces in MSAs experiencing high levels of foreclosure including thosemetropolitan areas where poverty is highly concentrated. Families that have lost their homes due toforeclosure or who are going through the foreclosure process may well experience a range of mentaland physical health problems. But so might neighboring families who are in no danger of losing theirhomes but who fear their property values may be adversely affected by nearby foreclosures. Otherswho reside in more distant and currently stable locations but watching local news reports may bedisquieted by the loss of property tax revenue and public services that could eventually affect entireregions. More likely, some combination of these families, and more, may suffer. Only more detailedcase studies can overcome these limitations.
Still, there are implications for what might be done to address what are often treated as the separateproblems of foreclosure, health and inequality. Perhaps the most important implication is to reinforcethe wisdom of many current federal urban policies that attempt to break down traditional silos and pro-vide comprehensive responses to the wide range of issues confronting the nation’s metropolitan areas.The Obama Administration’s “health in all policies” tenet is one of the key public health initiativeswithin the Affordable Care Act and is a change in the systems that determine how policy decisionsare made and implemented by local, state, and federal government to ensure that policy decisionshave neutral or beneficial impacts on the determinants of health (National Association of Countyand City Health Officials, 2013). This new standard requires federal efforts that ameliorate the socialand economic antecedents to health disparities to be multisectoral and involve multiple agencies.Demonstration projects incorporating multiple approaches (e.g., education and housing) to economicgrowth and improved community health include Promise Neighborhoods, Choice Neighborhoods;the Neighborhood Revitalization Initiative; Strong Cities, Strong Communities and Promise Zoneinitiatives (Donovan, 2014; Donovan, Duncan, & Sebelius, 2012). Specifically, “health in all poli-cies” can be targeted to metropolitan areas with relatively high levels of concentrated poverty foreconomic redevelopment, health promotion activities and maintenance of healthy and safe environ-ments (Bostic, Thornton, Rudd, & Sternthal, 2012). Similarly, such communities might benefit fromhealth services infrastructure and financial services like credit counseling, credit management, andinvestment education. No doubt there are underserved neighborhoods in virtually all metropolitanareas that should be identified for such assistance. This simply suggests one additional screen forallocating scarce resources.
We propose a new framework, one that explicitly incorporates selected trajectories of inequality,to inform decisions about economic and healthcare investment. If in fact the impact of foreclosureson health is exacerbated by various measures of inequality, this would suggest areas where a rangeof health care services along with financial services (e.g., mortgage finance counselors) should betargeted. In addition, metrics for assessing where these services should be placed or expanded would,therefore, include measures of inequality. Keeping in mind that the unit of analysis for this studyis the metropolitan area, such findings reinforce the importance of taking a regional perspectivein fully understanding these issues and, perhaps more importantly, developing appropriate policyresponses. A wealth of research has demonstrated the importance of regional dynamics for the socialand economic development of all neighborhoods throughout metropolitan areas (Dreier, Mollenkopf,& Swanstrom, 2014; Orfield, 2002; Pastor, Benner, & Matsuoka, 2009; Rusk, 1999). That is, bothprosperous and distressed neighborhoods are affected by regional and national forces beyond thereach of any individual community or city. Consequently, regional responses (e.g., regional tax-basesharing, regional fair share or inclusionary housing ordinances) may be necessary to complementpolicy initiatives directed at specific (usually inner city) distressed neighborhoods. The NationalPrevention Council, also established by the Affordable Care Act, is a convening of federal agencyleaders charged with strategizing on disease prevention using a “health in all policies” approach.The council advocates for health impact assessments to evaluate the impact of policies and programs(National Prevention Council, 2011). Health impact assessments in metro areas with high rates of
18 II JOURNAL OF URBAN AFFAIRS II Vol. 00/No. 0/2014
foreclosures would be an important first step in documenting the physical and mental impact of afiscal crisis.
Breaking down traditional silos, developing more comprehensive and coordinated responses tohealth care and financial challenges (and probably virtually any other social problem), and doing soat regional as well as local levels may be far more effective if such initiatives focus on preventionrather than reaction. Preventing foreclosures offers more promise than responding after the fact.Credit counseling and related financial literacy education programs have, in fact, had mixed results.But having a discrete focus and offering services before consumers engage in financial transactionsenhances the success of such programs and helps families maintain a mortgage (Braunstein &Welch, 2002). Perhaps more important than educational programs are policies designed to obtainbetter outcomes for consumers (Willis, 2009). For example, the Dodd- Frank Wall Street Reformand Consumer Protection Act signed into law in 2010 requires mortgage loan originators to make agood faith effort to document that consumers are likely to be able to repay their loans. At the heightof the foreclosure crisis many originators failed to conduct proper underwriting because they soldtheir loans on the secondary mortgage market, making their profits from origination fees. Investorswho purchased the loans often did not do their due diligence when they made those purchasesand then combined those loans into mortgage-backed securities that they sold to other investors.As long as home values continued to increase, all involved could profit even if the homeownerfailed to make the mortgage payments since the homes could be foreclosed and resold. Whenthe bubble burst, however, homeowners along with originators and investors lost out (Engel &McCoy, 2011; Immergluck, 2009a). Responsible underwriting, of course, would result in far fewerforeclosures, and the health and other costs associated with them. While Dodd-Frank calls for moreeffective underwriting, many of the regulations implementing this provision of the law have yet to bewritten.
Foreclosures are hardly the only social force creating hardships for residents of metropolitan areasacross the country. It is increasingly evident that a range of contextual factors (including place) mattersand that individual characteristics alone cannot account for the myriad issues that dominate local andnational news shows, scholarly research, and public policy debates (Sampson, 2012; Sharkey, 2013).Few issues have dominated scholarly and policy debates like recent and sudden spikes in foreclosurerates, various trajectories of surging inequality, and what to do about health care. No doubt thesewill be contested issues for years, if not decades, to come. Recognizing the intersection of these andrelated social forces will advance our understanding of these critical issues and, perhaps our abilityto do something about them.
ACKNOWLEDGEMENTS
A previous version of this article was presented at the July 2013 International Sociological Associ-ation (RC43) conference, “Being at Home in the Housing Market,” at the University of Amsterdam’sCentre for Urban Studies. The authors would like to thank Paul Jargowsky, Douglas Massey, andJacob Rugh for providing much of the data utilized in this research. The authors would also liketo thank Margarita Alegrı́a, Nicholas Carson, and Benjamin Cook for insightful comments on aprevious draft.
II Foreclosures, Inequality, and Metropolitan Health II 19
AP
PE
ND
IX
TAB
LE
A1
Gen
eral
ized
Lin
ear
Mo
del
Est
imat
esfo
rS
egre
gat
ion
and
So
cio
eco
no
mic
Ineq
ual
ity
and
Fo
recl
osu
reo
nC
ure
nt
Sm
oke
ran
dN
oP
hysi
calA
ctiv
ity
MS
AP
reva
len
ce
Cur
rent
Sm
oker
Pre
vale
nce
No
Phy
sica
lAct
ivity
(Pre
vale
nce)
Dis
sim
ilarit
yE
xpos
ure
Pov
erty
Gin
iD
issi
mila
rity
Exp
osur
eP
over
tyG
ini
Seg
reg
atio
nIn
dex
Dis
sim
ilarit
yB
lack
-Whi
te0.
14–
––
0.28
––
–H
ispa
nic-
Whi
te−0
.08
––
–0.
04–
––
Asi
an-W
hite
-0.6
8–
––
0.49
––
–E
xpos
ure
Bla
ck-W
hite
–0.
18–
––
0.13
––
His
pani
c-W
hite
–0.
07–
––
−0.0
8–
–A
sian
-Whi
te–
−0.8
6–
––
−0.0
2–
–S
oci
oec
on
om
icIn
equ
alit
yP
erce
ntTr
acts
inM
SA
with
20%
+P
over
ty–
–−0
.49
––
–0.
72–
Gin
iCoe
ffici
ent
––
–0.
01–
––
0.00
Fo
recl
osu
reR
ate
2006
−0.0
1−0
.02
−0.0
10.
010.
050.
030.
050.
0320
070.
050.
050.
060.
050.
020.
040.
030.
0520
08−0
.03
−0.0
3−0
.04
−0.0
3−0
.01
−0.0
2-0
.01
-0.0
2
Con
tinue
d
20 II JOURNAL OF URBAN AFFAIRS II Vol. 00/No. 0/2014
TAB
LE
A1
Co
nti
nu
ed
Cur
rent
Sm
oker
Pre
vale
nce
No
Phy
sica
lAct
ivity
(Pre
vale
nce)
Dis
sim
ilarit
yE
xpos
ure
Pov
erty
Gin
iD
issi
mila
rity
Exp
osur
eP
over
tyG
ini
Co
ntr
olV
aria
ble
sLo
gM
SA
Pop
ulat
ion
0.03
0.02
0.00
0.01
−0.0
7−0
.02
−0.0
1−0
.02
Per
cent
Bla
ckP
opul
atio
nin
MS
A−0
.84
−0.9
2∗−0
.56
−0.8
9∗∗∗
−0.4
1−0
.52
−0.6
7∗−0
.32
Per
cent
His
pani
cP
opul
atio
nin
MS
A−1
.42∗
∗∗−1
.37∗
∗∗−1
.13∗
∗∗−1
.24∗
∗∗−0
.38
−0.5
0−0
.75∗
∗∗−0
.59∗
Per
cent
Asi
anP
opul
atio
nin
MS
A−0
.25∗
∗∗0.
70−0
.38
−0.3
20.
060.
150.
140.
11Lo
gM
edia
nH
ouse
hold
Inco
me
−0.2
9−0
.17
−0.2
9−0
.50
0.61
0.69
∗0.
510.
68M
SA
Pov
erty
Rat
e0.
010.
010.
01−0
.01
0.02
0.03
0.01
0.03
MS
AU
nem
ploy
men
tRat
e−0
.03
−0.0
3−0
.04
−0.0
30.
00−0
.01
0.00
−0.0
1P
erce
ntP
erso
ns25
+w
ithC
olle
geD
egre
e−2
.27∗
∗∗−2
.45∗
∗∗−2
.42∗
∗∗−2
.28∗
∗∗−2
.87∗
∗∗−2
.84∗
∗∗−2
.60∗
∗∗−2
.84∗
∗∗P
erce
ntW
orki
ngA
geP
opul
atio
nW
ithH
ealth
Insu
ranc
e0.
00−0
.01
0.00
0.00
−0.0
1−0
.01
−0.0
1−0
.01
Reg
ion
Mid
wes
t0.
010.
030.
030.
05−0
.05
−0.0
9−0
.07
−0.0
8S
outh
0.09
0.09
0.06
0.11
0.05
0.00
0.04
−0.0
1W
est
−0.0
8−0
.02
−0.0
9−0
.05
−0.1
7−0
.24∗
−0.2
2∗∗∗
−0.2
6∗∗∗
Con
stan
t2.
701.
702.
894.
64−5
.67
−7.0
4−5
.04
−6.8
1
Pse
udo
R2
0.59
0.59
0.60
0.60
0.51
0.49
0.52
0.51
−2P
seud
oLo
glik
elih
ood
42.1
142
.11
41.4
942
.11
47.9
948
.00
47.2
348
.00
N=
69.∗
p<
0.05
;∗∗ p
<0.
01;∗
∗∗p
<0.
001.
II Foreclosures, Inequality, and Metropolitan Health II 21
REFERENCES
Aalbers, M. B. (2011). Place, exclusion and mortgage markets. Chichester, UK: Wiley-Blackwell.Alley, D. E., Lloyd, J., Pagan, J. A., Pollack, C. E., Shardell, M., & Cannuscio, C. (2011). Mortgage delinquency
and changes in access to health resources and depressive symptoms in a nationally representative cohort ofAmericans older than 50 years. American Journal of Public Health, 101, 2293–2298.
Andrulis, D. P., & Duchon, L. M. (2005). Hospital care in the 100 largest cities and their suburbs, 1996–2002:Implications for the future of the hospital safety net in metropolitan America. New York: State University ofNew York Downstate Medical Center.
Apgar, W. C., Duda, M., & Gorey, R. N. (2005). The municipal cost of foreclosures: A Chicago case study. HousingFinance Policy Research Paper No. 2005–1. Minneapolis, MN: Homeownership Preservation Foundation.
Been, V., Ellen, I., & Madar, J. (2009). High cost of segregation: Exploring racial disparities in high-cost lending.Fordham Urban Law Journal, 36, 361–393.
Bennett, G. G., Scharoun-Lee, M., & Tucker-Seeley, R. (2009). Will the public’s health fall victim to the homeforeclosure epidemic? PLoS Medicine, 6(6), e1000087.
Bishaw, A. (2005). Areas with concentrated poverty, 1999. Retrieved from http://www.census.gov/prod/2005pubs/censr-16.pdf. Accessed on January 10, 2014.
Bishaw, A. (2011). Areas with concentrated poverty, 2006–2010. Hyattsville, MD: U.S. Census Bureau.Blakely, T. A., Kennedy, B. P., Glass, R., & Kawachi, I. (2000). What is the lag time between income inequality and
health status? Journal of Epidemiology and Community Health, 54, 318–319.Bocian, D. G., Davis, D., Garrison, S., & Sermons, B. (2012). The state of lending in America and its impact
on U.S. households. Retrieved from http://www.responsiblelending.org/state-of-lending/state-of-lending.html.Accessed on May 18, 2013.
Bocian, D. G., Li, W., & Ernst, K. S. (2010). Foreclosures by race and ethnicity: The demographics of a crisis.Washington, DC: Center for Responsible Lending.
Bocian, D. G., Smith, P., & Li, W. (2012). Collateral damage: The spillover costs of foreclosures. Washington, DC:Center for Responsible Lending.
Bostic, R. W., Thornton, R. L., Rudd, E. C., & Sternthal, M. J. (2012). Health in all policies: The role of theU.S. Department of Housing and Urban Development and present and future challenges. Health Affairs, 31,2130–2137.
Braunstein, S., & Welch, C. (2002). Financial literacy: An overview of practice, research, and policy. Federal ReserveBulletin, 88, 445–457.
Carr, J. H., Anacker, K. B., & Mulcahy, M. L. (2011). The foreclosure crisis and its impact on communities ofcolor: Research and solutions. Washington, DC: National Community Reinvestment Coalition, Annie E. CaseyFoundation.
Centers for Disease Control and Prevention. (2009). Behavioral risk factor surveillance system survey data. Atlanta,GA: U.S. Department of Health and Human Services.
Chobanian, A. V., Bakris, G. L., Black, H. R., Cushman, W. C., Green, L. A., Izzo, J. L., . . . Wright, J. T. (2003).Seventh report of the Joint National Committee on Prevention, Detection, Evaluation, and Treatment of HighBlood Pressure. Hypertension, 42, 1206–1252.
Citro, C. F., & Michael, R. T. (1995). Measuring poverty: A new approach. Washington, DC: National AcademiesPress.
Colby, J. P., Jr., Linsky, A. S., & Straus, M. A. (1994). Social stress and state-to-state differences in smoking andsmoking related mortality in the United States. Social Science and Medicine, 38, 373–381.
Congressional Budget Office. (2011). Trends in the distribution of household income between 1979 and 2007: CBOsummary. Washington, DC: Congressional Budget Office.
Cummins, S., & Macintyre, S. (2006). Food environments and obesity: Neighbourhood or nation? InternationalJournal of Epidemiology, 35, 100–104.
Currie, J., & Tekin, E. (2011). Is the foreclosure crisis making us sick? Working Paper 17310. Cambridge, MA:National Bureau of Economic Research.
Dahlberg, L. L., & Krug, E. G. (2002). Violence: A global public health problem. In E. Krug, L. L. Dahlberg, J.A. Mercy, & R. Lozano (Eds.), World report on violence and health (pp. 1–22). Geneva, Switzerland: WorldHealth Organization. Retrieved from http://whqlibdoc.who.int/publications/2002/9241545615_eng.pdf?ua=1.Accessed on November 17, 2014.
Davison, K. K., & Birch, L. L. (2001). Childhood overweight: A contextual model and recommendations for futureresearch. Obesity Reviews, 2(3), 159–171.
de Leeuw, J., & Meijer, E. (Eds.). (2008). Handbook of multilevel analysis. New York, NY: Springer.
22 II JOURNAL OF URBAN AFFAIRS II Vol. 00/No. 0/2014
Dickerson, N. T. (2007). Black employment, segregation, and the social organization of metropolitan labor markets.Economic Geography, 83, 283–307.
Donovan, S. (2014). Promise zones. Retrieved from http://portal.hud.gov/hudportal/HUD?src=/program_offices/comm_planning/economicdevelopment/programs/pz. Accessed on January 21, 2014.
Donovan, S., Duncan, A., & Sebelius, K. (2012). Fighting poverty through community development. In N. O. Andrews& D. J. Erickson (Eds.), Investing in what works for America’s communities: Essays on people, place andpurpose (pp. 107–131). San Francisco, CA: Federal Reserve Bank of San Francisco & Low Income InvestmentFund.
Dreier, P., Mollenkopf, J., & Swanstrom, T. (2014). Place matters: Metropolitics for the twenty-first century, 3rdedition. Lawrence: University Press of Kansas.
Engel, K. C., & McCoy, P. A. (2011). The subprime virus: Reckless credit, regulatory failure, and next steps. NewYork, NY: Oxford University Press.
Fisher, E. S., Bynum, J. P., & Skinner, J. S. (2009). Slowing the growth of health care costs: Lessons from regionalvariation. New England Journal of Medicine, 360, 849–852.
Galvez, M. P., Pearl, M., & Yen, I. H. (2010). Childhood obesity and the built environment. Current Opinion inPediatrics, 22, 202�207.
Gilderbloom, J. I., Ambrosius, J. D., Squires, G. D., Hanka, M. J., & Kenitzer, Z. E. (2012). Investors: The missingpiece in the foreclosure racial gap debate. Journal of Urban Affairs, 34, 559–582.
Grover, M., Smith, L., & Todd, R. M. (2008). Targeting foreclosure interventions: An analysis of neighborhoodcharacteristics associated with high foreclosure rates in two Minnesota counties. Journal of Economics andBusiness, 60, 91–109.
Haas, J. S., Earle, C. C., Orav, J. E., Brawarsky, P., Keohane, M., Neville, B. A., & Williams, D. R. (2008). Racialsegregation and disparities in breast cancer care and mortality. Cancer, 113, 2166–2172.
Heflin, J. (2010). Financial crisis cost households $17 trillion, Treasury official says. On the Money: The Hill’s Financeand Economy Blog. Retrieved from http://thehill.com/policy/finance/95689-financial-crisis-cost-households-17-trillion-treasury-official-says. Accessed on November 17, 2014.
Hendrickson, D., Smith, C., & Eikenberry, N. (2006). Fruit and vegetable access in four low-income food desertscommunities in Minnesota. Agriculture and Human Values, 23, 371–383.
Holden, J. (2008). Cavuto suggests Congress should have warned that “loaning to minorities and risky folks isa disaster.” Media Matters For America. Retrieved from http://mediamatters.org/video/2008/09/19/cavuto-suggests-congress-should-have-warned-tha/145132. Accessed on January 15, 2014.
Huynh, M., Parker, J. D., Harper, S., Pamuk, E., & Schoendorf, K. C. (2005). Contextual effect of income inequalityon birth outcomes. International Journal of Epidemiology, 34, 888–895.
Iceland, J. (2004). Beyond black and white: Metropolitan residential segregation in multi-ethnic America. SocialScience Research, 33, 248–271.
Iceland, J., & Nelson, K. A. (2008). Hispanic segregation in metropolitan America: Exploring the multiple forms ofspatial assimilation. American Sociological Review, 73, 741–765.
Iceland, J., Weinberg, D. H., & Steinmetz, E. (2002). Racial and ethnic residential segregation in the United States,1980–2000. Washington, DC: U.S. Bureau of the Census.
Immergluck, D. (2009a). Foreclosed: High-risk lending, deregulation, and the undermining of America’s mortgagemarket. Ithaca, NY: Cornell University Press.
Immergluck, D. (2009b). The foreclosure crisis, foreclosed properties, and federal policy: Some implications forhousing and community development planning. Journal of the American Planning Association, 75, 406–423.
Immergluck, D., & Smith, G. (2006). The external costs of foreclosure: The impact of single-family mortgageforeclosures on property values. Housing Policy Debate, 17, 57–79.
Institute for Digital Research and Education. (2013). Stata FAQ: How does one do regression when the dependentvariable is a proportion? Retrieved from http://www.ats.ucla.edu/stat/stata/faq/proportion.htm. Accessed onMay 18, 2013.
Jackson, S. A., Anderson, R. T., Johnson, N. J., & Sorlie, P. D. (2000). The relation of residential segregation toall-cause mortality: A study in black and white. American Journal of Public Health, 90, 615–617.
James, G. D., & Brown, D. E. (1997). The biological stress response and lifestyle: Catecholamines and blood pressure.Annual Review of Anthropology, 26, 313–335.
Jargowsky, P. A. (2002). Sprawl, concentration of poverty, and urban inequality. In G. D. Squires (Ed.), Urban sprawl:Causes, consequences, and policy responses (pp. 39–72). Washington, DC: Urban Institute Press.
Kneebone, E., Nadeau, C., & Berube, A. (2011). The re-emergence of concentrated poverty: Metropolitan trends inthe 2000s. Washington, DC: Metropolitan Policy Program at Brookings.
II Foreclosures, Inequality, and Metropolitan Health II 23
Koplan, J. P., Liverman, C. T., & Kraak, V. I. (2005). Preventing childhood obesity: The nation must act now, orit will watch its children grow into adults with excessive levels of diabetes, heart disease, cancer, and otherweight-related ailments. Issues in Science and Technology, 21, 57–64.
LaVeist, T. A. (1989). Linking residential segregation to the infant mortality race disparity in U. S. cities. Sociologyand Social Research, 73(2), 90–94.
LeClere, F. B., Rogers, R. G., & Peters, K. D. (1997). Ethnicity and mortality in the United States: Individual andcommunity correlates. Social Forces, 76, 169–198.
Logan, J. R., & Stults, B. J. (2011). The persistence of segregation in the metropolis: New findings from the 2010Census Project. US2010 Census Brief: American Communities Project, Russell Sage Foundation. Retrievedfrom http://www.s4.brown.edu/us2010/Data/Report/report2.pdf. Accessed on January 11, 2014.
Lopez, R. (2004). Income inequality and self-rated health in U.S. metropolitan areas: A multi-level analysis. SocialScience and Medicine, 59, 2409–2419.
Loukaitou-Sideris, A. (2006). Is it safe to walk? Neighborhood safety and security considerations and their effects onwalking. Journal of Planning Literature, 20, 219–232.
Massey, D. S., & Denton, N. A. (1989). Hypersegregation in U.S. metropolitan areas: Black and Hispanic segregationalong five dimensions. Demography, 26, 373–391.
McLean, B., & Nocera, J. (2010). All the devils are here: The hidden history of the financial crisis, 5th edition. NewYork, NY: Portfolio.
Moore, L. V., & Diez Roux, A. V. (2006). Associations of neighborhood characteristics with the location and type offood stores. American Journal of Public Health, 96, 325–331.
Morland, K., Wing, S., Diez Roux, A., & Poole, C. (2002). Neighborhood characteristics associated with the locationof food stores and food service places. American Journal of Preventive Medicine, 22, 23–29.
National Association of County and City Health Officials. (2013). Health in all policies. Retrieved fromhttp://www.naccho.org/topics/environmental/HiAP/. Accessed on October 24, 2013.
National Prevention Council. (2011). National prevention strategy: America’s plan for better health and wellness. Re-trieved from http://www.surgeongeneral.gov/initiatives/prevention/strategy/report.pdf. Accessed on December18, 2013.
New York Times. (2012, February 6). Banks are off the hook again. New York Times.Newell, S. A., Girgis, A., Sanson-Fisher, R. W., & Savolainen, N. J. (1999). The accuracy of self-reported health
behaviors and risk factors relating to cancer and cardiovascular disease in the general population: A criticalreview. American Journal of Preventive Medicine, 17, 211–229.
Olson, M. E., Diekema, D., Elliott, B. A., & Renier, C. M. (2010). Impact of income and income inequality on infanthealth outcomes in the United States. Pediatrics, 126, 1165–1173.
Orfield, M. (2002). American metropolitics: The new suburban reality. Washington, DC: Brookings Institution Press.Organization for Economic Cooperation and Development (OECD). (2011). Economic policy reforms 2011: Going
for growth. Washington, DC: OECD Publishing.Pastor, M., Benner, C., & Matsuoka, M. (2009). This could be the start of something big: How social movements for
regional equity are reshaping metropolitan America. Ithaca, NY: Cornell University Press.Pollack, C. E., & Lynch, J. (2009). Health status of people undergoing foreclosure in the Philadelphia region. American
Journal of Public Health, 99, 1833–1839.Pollack, C. E., & Lynch, J. (2011). Foreclosures are killing us. The New York Times. Retrieved from http://
www.nytimes.com/2011/10/03/opinion/foreclosures-are-killing-us.html?_r=0. Accessed on November 17,2014.
Powell, L. M., Chaloupka, F. J., & Bao, Y. (2007). The availability of fast-food and full-service restaurants in theUnited States: Associations with neighborhood characteristics. American Journal of Preventive Medicine, 33,S240–S245.
Powell, L. M., Slater, S., Mirtcheva, D., Bao, Y., & Chaloupka, F. J. (2007). Food store availability and neighborhoodcharacteristics in the United States. Preventive Medicine, 44, 189–195.
Quercia, R. G., & Ratcliffe, J. (2008). The preventable foreclosure crisis. Housing Policy Debate, 19, 775–783.RealtyTrac. (2008). U.S. foreclosure activity increases 75 percent in 2007. Retrieved from http://www.realtytrac.
com/content/press-releases/us-foreclosure-activity-increases-75-percent-in-2007--3604. Accessed on May 18,2013.
RealtyTrac. (2009). Foreclosure activity increases 81 percent in 2008. Retrieved from http://www.realtytrac.com/content/press-releases/foreclosure-activity-increases-81-percent-in-2008--4551. Accessed on May 18,2013.
Richardson, L. D., & Norris, M. (2010). Access to health and health care: How race and ethnicity matter. Mount SinaiJournal of Medicine: A Journal of Translational and Personalized Medicine, 77, 166–177.
24 II JOURNAL OF URBAN AFFAIRS II Vol. 00/No. 0/2014
Ross, L. M., & Squires, G. D. (2011). The personal costs of subprime lending and the foreclosure crisis: A matter oftrust, insecurity, and institutional deception. Social Science Quarterly, 92, 140–163.
Rugh, J. S., & Massey, D. S. (2010). Racial segregation and the American foreclosure crisis. American SociologicalReview, 75, 629–651.
Rusk, D. (1999). Inside game/outside game: Winning strategies for saving urban America. Washington, DC: BrookingsInstitution Press.
Sampson, R. (2012). Great American city: Chicago and the enduring neighborhood effect. Chicago, IL: University ofChicago Press.
Schootman, M., Deshpande, A. D., Pruitt, S. L., & Jeffe, D. B. (2011). Neighborhood foreclosures and self-rated healthamong breast cancer survivors. Quality of Life Research, 21(1), 133–141.
Schulz, A. J., Williams, D. R., Israel, B. A., & Lempert, L. B. (2002). Racial and spatial relations as fundamentaldeterminants of health in Detroit. Milbank Quarterly, 80, 677–707.
Sharkey, P. (2013). Stuck in place: Urban neighborhoods and the end of progress toward racial inequality. Chicago,IL: University of Chicago Press.
Squires, G. D. (2011). Segregation as a driver of subprime lending and the ensuing economic fallout. In R. Silverman(Ed.), Fair and affordable housing in the U.S.: Trends, outcomes, future directions (pp. 277–288). Boston, MA:Brill.
StataCorp. (2011). Stata statistical software: Release 12. College Station, TX: StataCorp LP.Subramanian, S. V., & Kawachi, I. (2004). Income inequality and health: What have we learned so far? Epidemiologic
Reviews, 26(1), 78–91.Taylor, P., Kochhar, R., Fry, R., Velasco, G., & Motel, S. (2011). Twenty-to-one: Wealth gaps rise to record highs
between whites, blacks and Hispanics. Washington, DC: Pew Research Center.Thaker, A. A., & Williamson, E. C. (2012). Unequal and unstable: The relationship between inequality and financial
crises. Washington, DC: New America Foundation.Vrijkotte, T. G. M., van Doornen, L. J. P., & de Geus, E. J. (2000). Effects of work stress on ambulatory blood pressure,
heart rate, and heart rate variability. Hypertension, 35, 880–886.Wallison, P. J. (2008). Cause and effect: Government policies and the financial crisis. Washington, DC: American
Enterprise Institute for Public Policy Research.Wardrip, K. E., & Pelletiere, D. (2008). Neighborhood poverty and tenure characteristics and the incidence of
foreclosure in New England. Washington, DC: National Low Income Housing Coalition.Wen, M., Browning, C. R., & Cagney, K. A. (2003). Poverty, affluence, and income inequality: Neighborhood economic
structure and its implications for health. Social Science and Medicine, 57, 843–860.Wilkinson, R. G., & Pickett, K. (2011). The spirit level: Why greater equality makes societies stronger. New York,
NY: Bloomsbury Press.Williams, D. R., Mohammed, S. A., Leavell, J., & Collins, C. (2010). Race, socioeconomic status, and health:
Complexities, ongoing challenges, and research opportunities. Annals of the New York Academy of Sciences,1186(1), 69–101.
Willis, L. (2009). Evidence and ideology in assessing the effectiveness of financial literacy education. San Diego LawReview, 46, 415–458.
Wilson, W. J. (1987). The truly disadvantaged: The inner city, the underclass, and public policy. Chicago, IL: Universityof Chicago Press.
World Bank Group. (2013). Data: GINI Index. Washington, DC: World Bank, Development Research Group.Yoon, S. S., Burt, V., Louis, T., & Carroll, M. D. (2012). Hypertension among adults in the United States, 2009–2010.
NCHS Data Brief No. 107. Hyattsville, MD: National Center for Health Statistics.
ABOUT THE AUTHORS
Antwan Jones is an Assistant Professor of Sociology at The George Washington University. Hefocuses his research on the residential and neighborhood context in which individuals live as away to understand health disparities among marginalized populations. Engaged in national andinternational research, he has located himself in the field of urban sociology by elucidating howresidential processes and neighborhood contexts are essential to the study of adult cardiovasculardisease, child obesity, and disability among the elderly. Currently, he serves on the board of directorsfor the Society for the Study of Social Problems as well as the Capital City Area Health EducationCenter, Inc.
II Foreclosures, Inequality, and Metropolitan Health II 25
Gregory D. Squires is a Professor of Sociology and of Public Policy and Public Administration at TheGeorge Washington University. His research has focused on housing-related financial services andthe uneven development of cities and metropolitan areas. Currently he is a member of the AdvisoryBoard of the John Marshall Law School Fair Housing Legal Support Center in Chicago, Illinois, theFair Housing Task Force of the Leadership Conference on Civil and Human Rights, and the SocialScience Advisory Board of the Poverty and Race Research Action Council in Washington, D.C. Hehas written for several academic journals and general interest publications including Housing PolicyDebate, Urban Studies, Social Science Quarterly, Urban Affairs Review, Journal of Urban Affairs,The New York Times, and The Washington Post. With co-editor Chester Hartman, his most recentbook is the edited volume From Foreclosure to Fair Lending: Organizing, Advocacy, Occupy andthe Pursuit of Equitable Credit (2013).
Cynthia Ronzio is Principal and Founder of Health Policy Initiatives, a consulting practice thatconducts policy analysis and research in the areas of mental health, the social environment, andfamily systems. At the time this research was conducted, Dr. Ronzio was a faculty member at theSheikh Zayed Institute for Pediatric Surgical Innovation at Children’s National Medical Center withjoint appointments in the Department of Epidemiology and Biostatistics and Pediatrics at The GeorgeWashington University School of Public Health and Health Services. She has published extensivelyin the field of social determinants of maternal and child health.


