Embed Size (px)
Citation preview

Forage fish, their fisheries, and their predators: who drives whom?
Georg H. Engelhard1*, Myron A. Peck2, Anna Rindorf3, Sophie C. Smout4, Mikael van Deurs3,Kristina Raab5,6, Ken H. Andersen3, Stefan Garthe7, Rebecca A.M. Lauerburg2, Finlay Scott1,8,Thomas Brunel5, Geert Aarts5, Tobias van Kooten5, and Mark Dickey-Collas5,9
1Centre for Environment, Fisheries and Aquaculture Science (Cefas), Pakefield Road, Lowestoft NR33 0HT, UK2Institute of Hydrobiology and Fisheries Science (IHF), University of Hamburg, Olbersweg 24, D-22767 Hamburg, Germany3National Institute of Aquatic Resources (DTU-Aqua), Technical University of Denmark, Jægersborg Alle 1, 2920 Charlottenlund, Denmark4Sea Mammal Research Unit (SMRU) and Centre for Research into Ecological and Environmental Modelling (CREEM), University of St Andrews,St Andrews KY16 8LB, UK5Wageningen Institute for Marine Resources and Ecosystem Studies (IMARES), PO Box 68, 1970 AB IJmuiden, The Netherlands6Aquaculture and Fisheries Group, Wageningen University, PO Box 338, 6700 AH Wageningen, The Netherlands7Research and Technology Centre (FTZ), University of Kiel, Hafentorn 1, D-25761 Busum, Germany8Institute for the Protection and Security of the Citizen, Joint Research Centre (JRC), European Commission, I-21020 Ispra, Italy9International Council for Exploration of the Sea (ICES), H. C. Andersens Boulevard 44–46, 1553 Copenhagen, Denmark
*Corresponding author: tel: +44 1502 527747; fax: +44 1502 513865; e-mail: [email protected]
Engelhard, G. H., Peck, M. A., Rindorf, A., Smout, S. C., van Deurs, M., Raab, K., Andersen, K. H., Garthe, S., Lauerburg, R. A. M., Scott, F., Brunel, T., Aarts,G., van Kooten, T., and Dickey-Collas, M. Forage fish, their fisheries, and their predators: who drives whom? – ICES Journal of Marine Science,doi:10.1093/icesjms/fst087.
Received 15 December 2012; accepted 14 May 2013.
The North Sea has a diverse forage fish assemblage, including herring, targeted for human consumption; sandeel, sprat, and Norway pout,exploited by industrial fisheries; and some sardine and anchovy, supporting small-scale fisheries. All show large abundance fluctuations,impacting on fisheries and predators. We review field, laboratory, and modelling studies to investigate the drivers of this complexsystem of forage fish. Climate clearly influences forage fish productivity; however, any single-species considerations of the influence ofclimate might fail if strong interactions between forage fish exist, as in the North Sea. Sandeel appears to be the most important preyforage fish. Seabirds are most dependent on forage fish, due to specialized diet and distributional constraints (breeding colonies).Other than fisheries, key predators of forage fish are a few piscivorous fish species including saithe, whiting, mackerel, and horse-mackerel,exploited in turn by fisheries; seabirds and seals have a more modest impact. Size-based foodweb modelling suggests that reducing fishingmortality may not necessarily lead to larger stocks of piscivorous fish, especially if their early life stages compete with forage fish for zoo-plankton resources. In complex systems, changes in the impact of fisheries on forage fish may have potentially complex (and perhaps un-anticipated) consequences on other commercially and/or ecologically important species.
Keywords: climatic drivers, fishing impacts, forage fish, intraguild interactions, pelagic fish, predator–prey interactions.
IntroductionForage fish are planktivorous pelagic species that often form themajor avenue for transforming zooplankton production into foodavailable to higher trophic levels (Cury et al., 2000; Alder et al.,2008; Bakun et al., 2010). They are typically obligate schoolers andrespond strongly to climatic changes (Corten, 1999; Tourre et al.,2007; Rijnsdorp et al., 2010). As they all feed mainly on zooplankton,forage fish may compete with each other for food leading to poten-tially complex interactions. Apparent mutualism may also arise
where forage fish share common predators, and predators arelikely to compete for forage fish leading to possible effects of onepredator on other predators. Humans are often among the most im-portant “predators” of forage fish and forage fish catches for fish-meal, fishoil, and human consumption across the world make up30% of all landed capture fisheries (Tacon and Metian, 2009).This paper uses examples from the North Sea to examine the inter-relationships between different forage fish species and their environ-ment, predators, and fisheries. This is of interest because many
#Crown copyright
ICES Journal of
Marine ScienceICES Journal of Marine Science; doi:10.1093/icesjms/fst087
ICES Journal of Marine Science Advance Access published June 25, 2013

studies to date have focused on simpler systems dominated by one ortwo forage fish species, but the North Sea offers a wider portfolio ofinteracting species whose productivity oscillates in response to boththe environment and each others’ dynamics.
Here, we highlight six species in the North Sea’s forage fish port-folio. One of these (herring Clupea harengus) supports an importanttargeted fishery for human consumption; three (sandeel Ammodytesmarinus, sprat Sprattus sprattus, and Norway pout Trisopterusesmarkii) that support a substantial industrial fishery for fishmealand fishoil; and two (European sardine Sardina pilchardus andEuropean anchovy Engraulis encrasicolus) that exist at low abun-dance and have only been recently exploited (Dickey-Collas et al.,2010; Engelhard et al., 2011). All the six forage fish are planktivor-ous, feeding mostly on zooplankton and ichthyoplankton (includ-ing fish eggs and larvae), and to some extent on phytoplankton.They are fairly short-lived, mostly maturing at ages of 1 or 2 years(less often 3 years) and with a longevity of �3–5 years (Boulcottet al., 2007; Petitgas, 2010); within the North Sea, herring are thelongest living (up to 20 years), maturing after 2 or 3 winters(Petitgas, 2010). Sprat, sandeel, and anchovy are spring orsummer spawning, with Norway pout, sandeel, and herring spawn-ing in autumn and winter (Daan et al., 1990; Lambert et al., 2009;Petitgas, 2010; Rijnsdorp et al., 2010). Sprat, sardine, Norwaypout, and anchovy all spawn pelagic eggs, whereas the eggs ofherring and sandeel are demersal (Russell, 1976; Sparholt et al.,2002).
The North Sea has displayed rapid rates of warming over the lasthalf century and the temperature has increased .18C over the past100 years (Belkin, 2009). The period since the late 1980s has beenassociated with a sustained positive phase of the North AtlanticOscillation index (Beaugrand, 2004) which is associated with awarmer winter climate, stronger winds, and more oceanic inflowsfrom the North Atlantic into the North Sea, both resulting inwarmer sea temperature, especially in winter (Pingree, 2005).These changing climatic conditions were associated with a strong in-crease in annual primary production at the end of the 1980s in thesouthern North Sea (Reid et al., 1998; Beaugrand and Reid, 2003;McQuatters-Gollop et al., 2007) and a change in phytoplanktonspecies composition (Edwards et al., 2001, 2006a; Leterme et al.,2005). Furthermore, the dominant members of the zooplanktoncommunity have shifted from copepod species with cold-temperatewater affinities before the late 1980s to warm-temperate species(Beaugrand, 2004). The decrease in the cold-water calanoidcopepod Calanus finmarchicus in the North Sea has led to a 70% de-crease of total zooplankton biomass between the 1960s and thepost-1990s (Edwards et al., 2006b). The number and the abundanceof warm-temperate zooplankton species have increased (e.g. Johnset al., 2005) along with meroplankton (Kirby et al., 2007). Hence, itis likely that there have been substantial changes in forage fish prod-uctivity as a result of changes in prey composition and availability.
There is often a perceived conflict between the demands of theecosystem for prey fish and fisheries exploiting those forage fishpopulations. Various studies in the North Sea suggest that, withthe reduction in fishing pressure in recent years, populations ofpelagic fish are now regulated through bottom-up mechanisms(Kenny et al., 2009; Fauchald et al., 2011). In contrast, Mackinsonet al. (2009) reported that populations of both pelagics and demer-sals are still forced primarily by fisheries. The total abundance ofpelagic or planktivorous fish has increased since 1990 and therehave been suggestions of a shift from a demersal- to a pelagic-dominated fish community (Heath, 2005; Engelhard et al., 2011).
There has been little consideration of how other top predators(such as seabirds and marine mammals) impact forage fish popula-tions in the North Sea system.
This paper synthesizes our current understanding of the factorsdriving the dynamics of forage fish populations in the North Sea. Itdescribes (i) climatic and environmental drivers, (ii) interactionsbetween different forage fish, (iii) predator–prey interactions, and(iv) the dynamics of the fisheries. It also briefly considers the roleof forage fish on ecosystem stability and energy flow. This synthesisattempts to answer the question: “when many forage fish species arepresent, who drives whom?” in the North Sea and, by doing so, pro-vides information for the development of management objectives ofNorth Sea forage fisheries (Dickey-Collas et al., 2013).
Climatic and environmental driversForage fish populations typically respond strongly to climate-drivenchanges in marine systems, owing to the short lifespans and rapidreproductive turnover of these species, and strong coupling tophytoplankton and zooplankton production. Previous studieshave detected global synchrony in the low frequency (20–30years) cycles in commercially important small pelagic species ofanchovy and sardine within upwelling and oceanic systems(Lluch-Belda et al., 1993; Schwartzlose et al., 1999; Tourre et al.,2007). Similarly, it has been suggested that cycles in the strengthof North Sea herring recruitment co-vary with the AtlanticMultidecadal Oscillation (Groger et al., 2010) and that recruitmentvariations in Norwegian spring-spawning herring are related to thetemperature fluctuations of Atlantic water masses flowing into theBarents Sea (Toresen and Østvedt, 2000). There may be somedegree of recruitment synchrony in North Sea forage fish, as sug-gested by synchronous serial poor recruitments in the early 2000sin herring, sandeel, and Norway pout; however, the evidence isbased on a short time-series only and is not fully conclusive(ICES, 2007).
Of the North Sea forage fish, herring has been most extensivelystudied with respect to drivers of productivity, which seems to belinked to temperature (Corten, 1999; Groger et al., 2010).Time-series analyses have suggested that herring year-class strengthis determined by differences in mortality rates occurring betweenthe early to late larval stages (Nash and Dickey-Collas, 2005;Payne et al., 2009). During the critical, early larval phase, colder tem-peratures have been linked to increased productivity (Fassler et al.,2011). Physiological modelling also indicated that climate-drivenchanges in bottom-up factors will affect the survival and growthof herring larvae, by delaying the timing of autumn spawning result-ing in less favourable conditions for larval growth and survivalduring the following months (Hufnagl and Peck, 2011). In juveniles,warmer temperatures promote faster growth rates up to �15–168Cin the laboratory (Bernreuther et al., 2012) and likewise are corre-lated with faster growth and higher weight-at-age in the field(Brunel and Dickey-Collas, 2010). In adults, the growth rate andthe asymptotic weight are both reduced at warmer temperatures(Brunel and Dickey-Collas, 2010), patterns that evidently reflectboth direct (physiological) and indirect (trophodynamic) climaticimpacts. Thus, the environmental needs change with the age ofthe fish and can even be contradictory, with the eggs and larvaeneeding rather cold and productive waters, juvenile growth ratebenefiting from warmer temperatures, and adults requiring givenconditions to trigger spawning, which can be delayed by climaticchange and result in larvae living in unfavourable conditions. The
Page 2 of 15 G. H. Engelhard et al.
temperature of the North Sea in the last 3 years has reduced to theaverage of the late 20th century.
In sprat, likewise, environmental requirements change betweenconsecutive life stages (Peck et al., 2012). Coupled biophysical mod-elling of the early life stages highlighted that the first feeding successof larvae is influenced by the interrelationships between tempera-ture, prey biomass, and turbulence (Daewel et al., 2008). Still,model-based estimates of larval survival in relatively warm andcold years were similar (Daewel et al., 2011). This finding agreeswith a previous field investigation where no relationships werefound between sprat larval growth rate and either food availabilityor oceanographic conditions (Valenzuela and Vargas, 2002), butnot with earlier fieldwork where larval growth was positively corre-lated with primary production (chlorophyll content) and vicinity toa tidal front (Munk, 1993). Combined field and laboratory data onsprat ecophysiology suggest that optimal thermal windows forgrowth and survival are wider for eggs (5–178C) than for youngearly-feeding larvae (5–128C); later on as larvae become able tocapture larger prey, thermal windows expand again to includewarmer temperatures, and early juveniles display highest rates offeeding and growth at 18–228C (Peck et al., 2012). With awarming temperature regime, sprat are therefore expected (at leasttowards the north of the species’ range) to accelerate growth ratesbut also to show a more density-dependent regulation of recruit-ment (through top-down control of zooplankton resources)acting during the late-larval and juvenile stages, particularly whensprat stocks are at high levels (Peck et al., 2012).
In sandeels, recruitment strength has been positively correlatedwith the abundance of adult C. finmarchicus (Arnott and Ruxton,2002; van Deurs et al., 2009); the mechanism suggested to explainthis covariance is through the importance of copepod eggs as foodfor larval sandeels, and a reduction in C. finmarchicus that mayhave resulted from climate-driven warming. In contrast to sandeels,evidence from biophysical modelling, genetics, and time-series ana-lyses suggested that warming has increased the productivity of relictpopulations of North Sea anchovy (Petitgas et al., 2012). Little isknown about the recruitment processes in Norway pout andsardine, although warming temperatures appear to be associatedwith an increased abundance of sardine, which has southern biogeo-graphical affinity, and a decrease in the northerly species, Norwaypout (Engelhard et al., 2011).
In summary, climate variability and changes in physical(bottom-up) forcing are demonstrated drivers of the dynamics offorage fish in the North Sea. This is to be expected as other examplesfrom around the world confirm the strong coupling between foragefish populations and the spatial and temporal dynamics of phyto-and zooplankton production, and confirm the direct effect of tem-perature on rates of growth, reproduction, and survival.
Interactions between forage fishDifferent forage fish species or specific life stages can strongly influ-ence each other through trophic interactions. These include (i)density-dependent competition for the same food resources, bothbetween and within species; (ii) cannibalism; and (iii) intraguildpredation (IGP), defined as a species not only competing for foodbut also preying upon another species. For IGP, growth and survivalchances of the predatory forage fish species may either be positivelyor negatively correlated with the abundance of the prey species,because both must share the same food resources but one maybenefit from the other by preying upon it (Polis and Holt, 1992).Apart from trophic interactions, forage fish may also influence
each other through (iv) parasitism or disease, in specific caseswhere parasites or pathogens are shared between species; andthrough (v) behavioural interactions, not discussed here owing toa paucity of information. Various factors influence the strength oftrophic interactions between forage fish: degree of habitat overlapin space and time, degree of diet overlap, intensity of IGP, and popu-lation density.
Within temperate systems such as the North Sea, strong season-ality in phyto- and zooplankton production often limits the growthseason of forage fish to short time windows during a year (Sydemanand Bograd, 2009; Varpe and Fiksen, 2010). Thus, to understand thedegree of food competition among forage fish, it is critical toexamine the degree of spatial overlap in feeding areas during thegrowth season. However, caution is necessary when interpreting alack of spatial overlap as a lack of interaction, as spatial displacementmay be a result of intraguild interactions, if the degree of competi-tion and levels of IGP are severe enough.
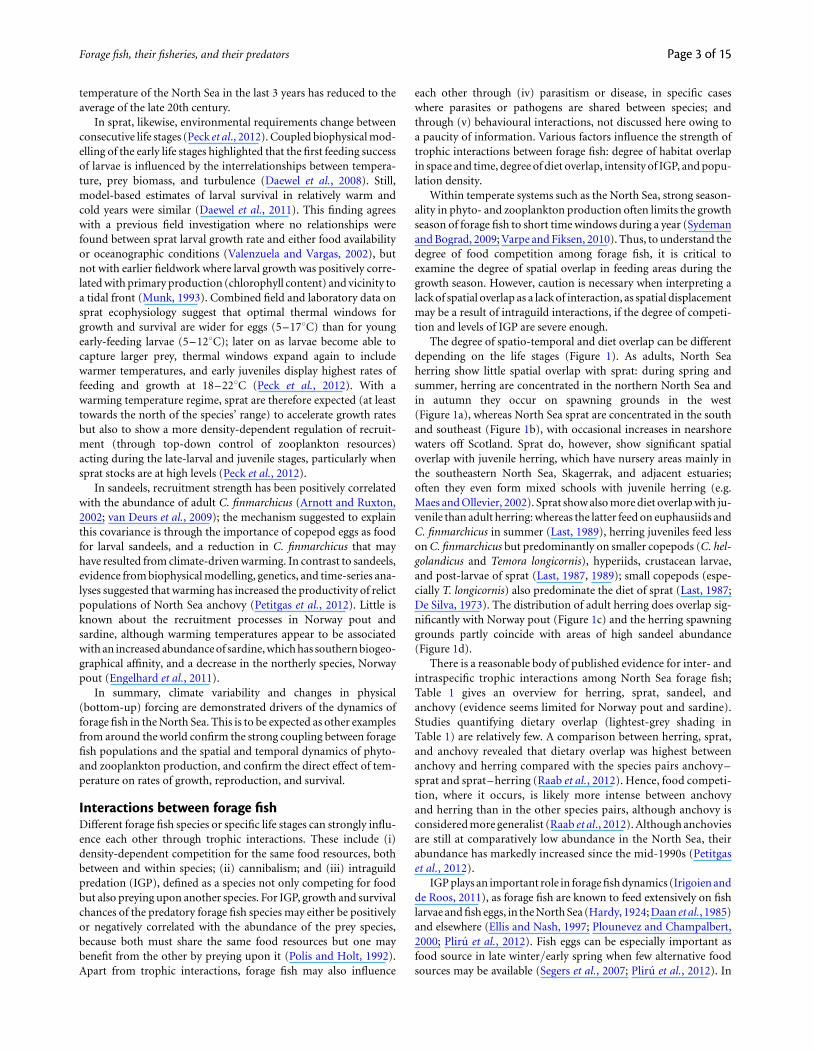
The degree of spatio-temporal and diet overlap can be differentdepending on the life stages (Figure 1). As adults, North Seaherring show little spatial overlap with sprat: during spring andsummer, herring are concentrated in the northern North Sea andin autumn they occur on spawning grounds in the west(Figure 1a), whereas North Sea sprat are concentrated in the southand southeast (Figure 1b), with occasional increases in nearshorewaters off Scotland. Sprat do, however, show significant spatialoverlap with juvenile herring, which have nursery areas mainly inthe southeastern North Sea, Skagerrak, and adjacent estuaries;often they even form mixed schools with juvenile herring (e.g.Maes and Ollevier, 2002). Sprat show also more diet overlap with ju-venile than adult herring: whereas the latter feed on euphausiids andC. finmarchicus in summer (Last, 1989), herring juveniles feed lesson C. finmarchicus but predominantly on smaller copepods (C. hel-golandicus and Temora longicornis), hyperiids, crustacean larvae,and post-larvae of sprat (Last, 1987, 1989); small copepods (espe-cially T. longicornis) also predominate the diet of sprat (Last, 1987;De Silva, 1973). The distribution of adult herring does overlap sig-nificantly with Norway pout (Figure 1c) and the herring spawninggrounds partly coincide with areas of high sandeel abundance(Figure 1d).
There is a reasonable body of published evidence for inter- andintraspecific trophic interactions among North Sea forage fish;Table 1 gives an overview for herring, sprat, sandeel, andanchovy (evidence seems limited for Norway pout and sardine).Studies quantifying dietary overlap (lightest-grey shading inTable 1) are relatively few. A comparison between herring, sprat,and anchovy revealed that dietary overlap was highest betweenanchovy and herring compared with the species pairs anchovy–sprat and sprat–herring (Raab et al., 2012). Hence, food competi-tion, where it occurs, is likely more intense between anchovyand herring than in the other species pairs, although anchovy isconsidered more generalist (Raab et al., 2012). Although anchoviesare still at comparatively low abundance in the North Sea, theirabundance has markedly increased since the mid-1990s (Petitgaset al., 2012).
IGP plays an important role in forage fish dynamics (Irigoien andde Roos, 2011), as forage fish are known to feed extensively on fishlarvae and fish eggs, in the North Sea (Hardy, 1924; Daan et al., 1985)and elsewhere (Ellis and Nash, 1997; Plounevez and Champalbert,2000; Pliru et al., 2012). Fish eggs can be especially important asfood source in late winter/early spring when few alternative foodsources may be available (Segers et al., 2007; Pliru et al., 2012). In
Forage fish, their fisheries, and their predators Page 3 of 15

the North Sea, herring and anchovy feed on eggs and larvae of otherforage fish species (see darkest-shaded cells in Table 1). In someyears, herring prey extensively on sandeel larvae and post-larvaeduring spring (Hardy, 1924; Pommeranz, 1981; Hopkins, 1989),when sandeel larvae may form the second-most important fooditem to herring in the southern North Sea (Savage, 1937), but inother years, sandeel forms a small proportion of the diet. Severalauthors have speculated that intraguild interactions betweenherring, gadoids, and possibly sandeels might explain the beginningand the end of the gadoid outburst in the North Sea, because the veryhigh recruitment levels of gadoids in the late 1960s–1970s partlycoincided with the depletion and collapse of North Sea herring;
similarly, sandeels increased when herring collapsed (Cushing,1980; Hislop, 1996). Other studies suggest links between populationdynamics of fish in the North Sea, but often using a correlative ap-proach and their findings should be interpreted with care (Waltersand Collie, 1988; Myers, 1998).
Cannibalism occurs in the herring- and anchovy-like fish (fam-ilies Clupeidae and Engraulididae; Smith and Reay, 1991) but hasmainly been described for other regions than the North Sea, e.g. an-chovies Engraulis spp. off South Africa, California, and Japan(Hunter and Kimbrell, 1980; Valdes et al., 1987; Takasuka et al.,2004). The evidence is limited for North Sea forage fish, although2- and 3-year-old herring consumed eggs and occasionally larvae
Figure 1. Schematic distribution maps showing the areas of highest concentrations within the North Sea for four forage fish species. (a) Herring,distinguishing between juveniles (dark grey), adult herring during summer (light grey), and autumn spawning areas (hatched). (b) Sprat. (c) Norwaypout. (d) Sandeel. The sketches are based on a combination of data from the International Bottom Trawl Surveys (IBTS), acoustics, and commercialcatches.
Page 4 of 15 G. H. Engelhard et al.

of herring, but much more substantially those of plaice Pleuronectesplatessa (Daan et al., 1985). North Sea clupeids, in general, commonlyconsume fish eggsand larvae (see above section on IGP) so unless theydiscriminate between their own species’ and other species’ larvae,cannibalism is likely to occur frequently.
Intraspecific density-dependence is known for various North Seaforage fish stocks (mid-grey shaded cells in Table 1). Density-dependent growth has been suggested for North Sea herring(Heath et al., 1997; Nash et al., 2009; but see Brunel and Dickey-Collas, 2010) and has been attributed to both habitat and food limi-tation. Sprat and herring in the central Baltic Sea appear to be subjectto both intra- and interspecific density-dependence: body conditionof these two species was strongly influenced by density of sprat, andto a lesser extent, to density of herring, apart from abiotic factorssuch as salinity (Casini et al., 2011).
A further mechanism linking the dynamics of different foragefish species is through the transfer of shared parasites and disease.The protist Ichthyophonus hoferi is an important internal parasitein herring but is also prevalent in sprat; an epizootic from 1991–1993 contributed to a drop in herring biomass in the 1990s(Mellergaard and Spanggaard, 1997) and may have also affectedsprat (Rahimian, 1998). A flatworm, Pseudanthocotyloides heteroco-tyle, likewise occurs internally in herring and sprat and possibly inanchovy (Rahimian et al., 1999). Ectoparasites often have severalhost species (e.g. the sea louse Caligus elongatus) but pelagic fishtend to have fewer ectoparasites than benthic fish, possibly limitingtheir impact on forage fish (Rohde et al., 1995). Fish mortalitiescaused directly by parasites are seldom observed, probablybecause a heavy parasite load leads to starvation or disorientationbefore the fish dies from the parasite itself (Moller, 1987). The im-portance of parasitism and pathogens in forage fish dynamics isprobably highly underestimated; marine viruses, in particular, areubiquitous in the marine environment and are currently considered
to form a major source of mortality in populations of marine organ-isms (review, Suttle, 2007).
Dependencies of predators on forage fishTop predators consuming forage fish in the North Sea include pis-civorous fish, seabirds, and marine mammals and a range ofstudies have shown that forage fish can exert bottom-up controlon top predators (e.g. Cury et al., 2011; Smith et al., 2011). Thesebottom-up effects can be expected to be strongest in cases where apredator is a specialist relying to a great extent on the availabilityof the particular forage fish. Specialization in some cases onlyapplies to part of the predator’s life history or to certain times ofthe year, e.g. for kittiwakes Rissa tridactyla where a shortage of ap-propriately sized prey during the breeding season may result inbreeding failures due to high chick mortality (Wanless et al., 1998;Frederiksen et al., 2004). Even where predators appear to be general-ists because their diet contains a variety of prey species, their condi-tion can be strongly influenced by one prey type if this is of highcalorific value (Wanless et al., 2005). For example, the availabilityof sandeels (a high energy prey; Hislop et al., 1991) appears to belinked to better body condition of fish predators (whitingMerlangius merlangus, grey gurnard Eutrigla gurnardus, andweever Echiichthys vipera) and also grey seals Halichoerus grypus(Engelhard et al., 2013a, b). In some cases, the predator requires a“balanced diet” that includes several different prey types(Onthank and Cowles, 2011).
Some predators have a restricted spatial distribution for all orpart of their life history. This may be due to the limited availabilityof suitable habitat, and restrictions may operate differently accord-ing to age, size, or season (Martin et al., 2010). Restricted spatialusage is especially the case for those marine mammals and seabirdsthat are central-place foragers and must return to land to restor provision their offspring, such as grey seals and harbour seals
Table 1. Overview of studies on intra- and interspecific trophic interactions between North Sea forage fish.
Predator: Herring Sprat Sandeel AnchovyPrey:
Herring Density-dependence (Heathet al., 1997; Nash et al.,2009); absence ofdensity-dependence(Brunel and Dickey-Collas,2010)
Similar diets of crustaceansand copepods (De Silva,1973); however, herringmay be more specialisedon copepods (Raab et al.,2012)
– IGP by anchovy on herringeggs and larvae (NorthSea: Raab et al., 2012;Mediterranean Sea:Plounevez andChampalbert, 2000)
Sprat IGP by herring on sprat(Savage, 1937; Pommeranz,1981; Hopkins, 1989; Last,1989)
Density-dependence (Maeset al., 2005)
– IGP by anchovy on sprat eggsand larvae (North Sea:Raab et al., 2012;Mediterranean Sea:Plounevez andChampalbert, 2000)
Sandeel Herring can prey extensivelyon sandeel (Hardy, 1924;Savage, 1937; Pommeranz,1981; Hopkins, 1989; Last,1989)
– Density-dependence (Arnottand Ruxton, 2002)
IGP by anchovy on sandeeleggs and larvae (NorthSea: Raab et al., 2012;Mediterranean Sea:Plounevez andChampalbert, 2000)
Anchovy Similar diets of copepods andcrustacans, but anchovyare more generalist thanherring (Raab et al., 2012)
Similar diets of copepods andcrustacans, but anchovyare more generalist thansprat (Raab et al., 2012)
– Cannibalism (observed incongener Engraulisjaponicus off Japan:Takasuka et al., 2004)
Lightest shading, interspecific trophic competition or diet overlap; mid-grey shading, intraspecific density-dependence or cannibalism; darkest shading, IGP. Notethat white cells reveal absence of evidence, not evidence of absence.
Forage fish, their fisheries, and their predators Page 5 of 15

Table 2. Documented evidence on dependencies of North Sea top predators on forage fish.
Predator name Mobility
Proportion of forage fish in diet
Reported effects of low forage fish abundanceHerring Sprat SandeelNorway
poutForage fish
totalMarine mammals
Minke whale Balaeonoptera acutorostrata M 6% 0% 56% 0% 62% [1] No evidence reported for the North SeaHarbour seal Phoca vitulina IB 6% 0% 37% 6% 49% [2,3] Later pupping dates [4], which in turn are associated with higher likelihood of
breeding failure and lower pup weights [20]Grey seal Halichoerus grypus IB 0% 0% 41% 1% 42% [5] Condition of breeding females linked to sandeel abundance [6]Striped dolphin Stenella coeruleoalba M 0% 0% 3% 13% 16% [7] No evidence reportedHarbour porpoise Phocoena phocoena M 3% 0% 2% 1% 6% [5] Poor nutritional status of stranded animals [8].
SeabirdsSandwich tern Sterna sandvicensis I High High High Low 99% [9,10] Highly vulnerable to changes in local food supply (especially clupeids): reproductive
performance, breeding numbers and breeding distribution [12]Shag Phalacrocorax aristotelis I Low Low High Low 98% [9,10,11] Reproductive output probably limited by local sandeel availability at Isle of May
[13]Great skua Catharacta skua IB Low Low 10–95% Low 10–95% [9,10] Reproductive success influenced by local sandeel availability [14]Puffin Fratercula arctica IB 8% 8% 55% 0% 71% [5] No evidence reported for the North SeaGuillemot Uria aalge IB 14% 15% 42% 0% 70% [5] Provisioning of chicks influenced by local abundance and quality of sandeel and
sprat [15]Razorbill Alca torda IB 9% 22% 37% 1% 68% [5] Reproductive output probably limited by local sandeel availability at Isle of May
[16]Kittiwake Rissa tridactyla IB 2% 6% 28% 0% 36% [5] Reproductive performance strongly dependent on local sandeel availability [17]Gannet Morus bassanus IB 11% 4% 18% 0% 34% [5] No evidence reportedLesser black-backed gull Larus fuscus M High Low Low Low 7–25% [9,10] No evidence reportedNorthern fulmar Fulmarus glacialis M 0% 2% 11% 2% 15% [5] No evidence reported
Predatory fishSaithe Pollachius virens M 17% 0% 5% 19% 41% [5] No evidence reportedHorse-mackerel Trachurus trachurus M 3% 13% 17% 0% 34% [5] No evidence reportedWhiting Merlangius merlangus M 6% 6% 7% 10% 30% [5] Positive correlations between local sandeel abundance and condition [18]Starry ray Amblyraja radiata M 0% 0% 18% 5% 24% [5] No evidence reportedGrey gurnard Eutrigla gurnardus M 0% 2% 12% 9% 23% [5] Positive correlations between local sandeel abundance and condition [18]
Cod Gadus morhua M 8% 2% 4% 7% 21% [5] Positive correlation between overlap with sandeel and growth in the North Sea [19]Haddock Melanogrammus aeglefinus M 0% 0% 15% 5% 20% [5] No evidence reportedMackerel Scomber scombrus M 2% 3% 10% 3% 18% [5] No evidence reported
Table shows, for each predator species, the levels of mobility; proportion of diet made up by each of four forage fish species, and all species combined; and documented cases of effects of low forage fish abundance ontop predators. Mobility describes the potential of the predator to relocate to different feeding areas in response to localized prey shortages: I, immobile year-round; IB, immobile during the breeding season only; M,mobile year-round. Diet proportions refer to the percentage composition by mass of a particular prey type, averaged over 1 year and over the North Sea: note that local and seasonal percentages can be substantiallyhigher or lower. Shading of species cells indicates high likelihood of effects of low forage fish availability, resulting from both a low potential to relocate and a high (.20%) proportion of forage fish in the diet. Shading ofdiet indicates .20% (light grey) or .50% (dark grey), and shading of reported effects indicates those on condition or growth (light grey) and on reproductive success (dark grey). Literature sources: [1] Windsland et al.(2007); [2] Sharples et al. (2009); [3] Cunningham et al. (2004); [4] Reijnders et al. (2010); [5] ICES (2011); [6] Engelhard et al. (2013b); [7] Santos et al. (2008); [8] MacLeod et al. (2007); [9] BWPi (2004); [10] Mendel et al.(2008); [11] Harris and Wanless (1991); [12] Stienen (2006); [13] Rindorf et al. (2000); [14] Furness (2007); [15] Wanless et al. (2005); [16] Mitchell et al. (2004); [17] Frederiksen et al. (2004); [18] Engelhard et al. (2013a);[19] Rindorf et al. (2008); [20] Pomeroy et al. (1999).
Page6
of15G
.H.E
ngelh
ardet
al.

Phoca vitulina and all seabird species during the breeding season(e.g. Wanless et al., 1988; Matthiopoulos et al., 2004). Such restric-tions may limit the size of predator populations through intraspecif-ic competition for space and local resources (Matthiopoulos et al.,2008). The accessibility of prey that is far from the forager’s baseof operations may also be very much reduced, because the predatorsmay be unable to adaptively move to areas where prey is more plen-tiful or extend their foraging range to increase their harvest when theoverall density of prey is low (Daunt et al., 2002). Therefore, spatiallyrestricted foragers are particularly sensitive to fluctuations in thelocal food supply on which they rely, which might arise fromglobal changes in the stock or from the activities of a local fishery(Furness, 2002; Wanless et al., 2005; Matthiopoulos et al., 2008).
In Table 2, we summarize information about predatory species inthe North Sea, identifying those that are potentially most sensitiveto variations in the availability of forage fish, as species where (i)the range of the predator is spatially restricted and (ii) forage fishform more than 20% of predator diet. Further, the table highlightscases where effects on growth, condition, or reproductive successhave been documented. Typically, documented effects apply tospecies also found to be most sensitive based on the above criteria(Table 2), indicating that the sensitivity rating here reflects theactual sensitivity of the species and can be used to predict whereeffects are likely though relationships have not yet been documen-ted. In general, seabirds tend to show the greatest sensitivity, withlarge proportions of forage fish in the diet and restricted foragingranges during breeding when birds are often highly concentrated(see also Furness, 2002, 2007; Frederiksen et al., 2004; Wanlesset al., 2005; Cury et al., 2011). They are followed by the two sealspecies, while predatory fish and cetaceans are probably less sensitiveto local forage fish abundance. Unfortunately, sufficient informa-tion on diet is lacking for a long list of species, and hence their sen-sitivity cannot be evaluated.
Of the forage fish species examined here, sandeel is clearly themost important to seabirds, of which only a single species, lesserblack-backed gull Larus fuscus, does not have sandeel as most im-portant forage fish species in the diet (Harris and Wanless, 1991;BWPi, 2004; Mendel et al., 2008; ICES, 2011). The same is true forboth seal species (Cunningham et al., 2004; Sharples et al., 2009),whereas the importance of sandeel to cetaceans varies (MacLeodet al., 2007; Windsland et al., 2007; Santos et al., 2008). The import-ance of forage fish to predatory fish is more variable, with sandeelbeing the most important forage fish in the diet of five predatoryfish species; herring and Norway pout of about equal importanceto cod and saithe; and herring, sprat, sandeel, and Norway poutall about equally important to whiting (Engelhard et al., 2008;ICES, 2011). However, the diet of the predatory fish species generallydoes not contain more than 20% of any “single” forage fish species,and hence their sensitivity is substantially lower than in the case ofseabirds (Table 2).
Impacts of predators on forage fishForage fish are heavily impacted by predation, often by multiplepredator species. Their natural mortality is substantially higherthan the value of 0.2 often assumed in fish stock assessments(Table 3). Hence, though some of the species are also subject to sub-stantial fishing mortality, the ratio of fishing mortality F to naturalmortality M, often used as an indication of overexploitation whenvalues exceed 1, has been in the range of 0.46–0.77 in the pastdecade, except Norway pout which has been extremely lightlyexploited in recent years.
For predators to exert top-down control over their prey, theymust be responsible for a large part of the variation in prey mortality.This is likely to occur only in the most predominant predator species(in terms of biomass) and only if their predation impact is substan-tial. Defining potential top-down controllers as any predators (in-cluding humans) that on average are responsible for at least 20%of the removals of a prey species, only three predators remain:saithe predating herring and Norway pout, and horse mackereland mackerel both predating sprat (Figure 2, based on ICES,2011). Whiting and saithe approach 20% of predation mortalityon Norway pout. Though several predators predate heavily onsandeel, none of them is singly responsible for at least 20% of thebiomass removals, and hence any change in predation mortalityfrom one source is likely to be dampened by variation in thatinduced by other sources. The fishery is currently, based on theabove definition, not listed as likely to induce a strong top-downcontrol on the four forage fish species; in the recent past, however,removals by the fishery have exceeded 20% for long periods, in par-ticular for herring (Figure 2) where F has also historically exceededM by more than 100% (Dickey-Collas et al., 2010).
Although at the larger North Sea-wide scale, no single predatorspecies appears to exert significant top-down control over foragefish, evidence suggests that at localized scales, predators can havesubstantial impact. This is especially likely when predators exhibitso-called “aggregative responses” (Temming et al., 2007), definedas many individuals aggregating at sites where prey is locally moreconcentrated. On the Dogger Bank, three predators (whiting,lesser weever, grey gurnard) showed aggregative responses topatches of high sandeel density, where they were responsible forover 80% of observed sandeel predation events (Engelhard et al.,2008); likewise, aggregative responses by whiting and haddock tosandeel concentrations, and significant predation, were observedoff the Scottish coast (Temming et al., 2004).
Commercial importance of forage fishFor over five centuries, forage fish have been a key element in thecommercial fisheries of the North Sea. During the previous sixdecades, the total forage fish landings (consisting almost entirelyof only four species) have almost consistently been higher thanthose for all demersal fish combined (representing well over 30species; Figure 3). Herring has played an especially important rolein the economic and political development of Northern Europe,with countries going to war over access to the fishery; it is saidthat Amsterdam was “built on herring bones” (Poulsen, 2006).
Table 3. Contrasting fishing and natural mortality in North Seaforage fish during the last decade: removals by fishing as % of totalremovals (natural and fishing combined); natural mortality (M );fishing mortality (F ); and ratio of F/M (index of exploitation level,with values .1 considered to signify overexploitation)
Removals by fishingas % of total M F F/M
Herring 16% 0.41 0.19 0.46Norway pout 4.5% 1.70 0.14 0.08Sandeel 19% 0.89 0.49 0.56Sprat 19% 1.23 0.95 0.77
The figures shown are averages over a ten-year period (2001–2010) ofannually estimated values (source: ICES, 2011). Removals in % include fish ofall ages; M, F, and F/M are averaged for 1-year olds and older to avoid theeffect of extremely high 0-group mortality in all species.
Forage fish, their fisheries, and their predators Page 7 of 15

Four forage fish species have been considered economically import-ant, and the landings of each of these have fluctuated over the past 60years (Figure 4).
Herring was the most important forage fish fishery before the1970s, when the population collapsed due to unsustainable fishingduring a time of reduced productivity (Figure 4a). As previouslymentioned, it is the only forage fish that is predominantly takenfor the human consumption market; this was also the case historic-ally but not during the 1950s–1960s when adults were fished forhuman consumption and juveniles for reduction to fishmeal andfishoil. In this period, the majority of all industrial landings fromthe North Sea was comprised by herring (Madsen, 1978), and thebiomass removals of herring by the fisheries well exceeded thoseby other mortality sources (Figure 2a). The stock has recoveredsince the 1980s as a result of a fisheries closure followed by closemonitoring and enforcement of management advice and is current-ly considered to be sustainably fished, now supporting a fisherycarried out mainly by Norway, Denmark, the Netherlands, andScotland (Dickey-Collas et al., 2010, 2013).
In the 1960s and 1970s when herring declined, industrial fisheriesfor other forage fish species increased. There was rapid growth in theindustrial fishery for sprat, although the high landings statistics forthe 1970s and the 1980s (Figure 4a) should be taken cum grano salis,
Figure 2. North Sea forage fish: biomass removals by different sources of predation, including the dominant predatory fish, seabirds, and the fishery(data from ICES, 2011). Only predators accounting for more than 5% of the total removals in at least 1 year are included.
Figure 3. Total international landings of forage fish taken from theNorth Sea, compared with those for all demersal fish species combined.Forage fish include herring, sprat, sardine, anchovy, sandeel, andNorway pout; demersal fish include human consumption species only.Source: ICES catch statistics (ICES, 2011; Lassen et al., 2012) extractedusing FishStat Plus software (FAO, 2012).
Page 8 of 15 G. H. Engelhard et al.

as it is suspected that large amounts of juvenile herring were misre-ported as sprat at that time (Dickey-Collas et al., 2013). Monitoringof the species composition of the sprat fishery was greatly improvedin the early 1990s. Since 1991, between 100 and 200 kt of sprat havebeen landed in most years.
In recent years, the largest, single-species fishery has been onsandeel; in the 1990s, landings in some years exceeded 1 milliontonnes (Figure 4b). The industrial sandeel fishery in the North Searapidly expanded in the 1950s when both Denmark, Germany,and, slightly later, the UK were involved. However, this has beenan essentially Danish and Norwegian fishery since the 1990s with�75 and 20% of sandeel catches landed in Denmark and Norway,respectively (ICES, 2012). Landings peaked in 1997, but havedecreased since then primarily due to a reduction in the productivityof sandeel in the northern North Sea where recruitment hasdecreased to less than half the average of earlier years. Reductionsin catches in the central and southern North Sea have been less upto 2011, when the fishery was given a minimal catch owing to twoconsecutive years of historically low recruitment, although spawn-ing biomasses were above the level thought to impair recruitment(ICES, 2012). Despite the substantial reduction in the fishery, land-ings of sandeel in 2009 were still higher than those for all demersalfish species combined (Figure 4b).
The Norway pout fishery exploits a population in the northern,relatively deeper region of the North Sea. The fishery grew rapidly inthe 1960s–1970s, with landings exceeding those of herring andsandeel in some years (Figure 4b). Since that time, the fishery hasgreatly reduced, especially after a series of low recruitment yearsafter 2000 when, despite a reduction in fishing mortality, the stockcontinued to decline. Following some years of particularly smalllandings compared with other species, the landings have started toincrease again in response to a recent increase in recruitment. Incontrast to the other exploited North Sea forage fish, fisheries for
sardine and anchovy are much smaller. Their landings are almostnegligible compared with the other four species (Figure 4a). If theNorth Sea continues to warm, these two species are expected toplay an increased role in the fisheries (Alheit et al., 2012; Petitgaset al., 2012).
In conclusion, different forage fish species have each dominatedfisheries catches at different periods: from historical times until the1950s, human consumption fisheries for herring; 1950s–1960s, in-dustrial fisheries for young herring; 1970s–1980s following herringcollapse, industrial fisheries for Norway pout, sandeel, and sprat;1990s–2000s, industrial fishery predominated by sandeel andhuman consumption fishery for herring reinstated. The changesin the relative importance of each species reflect not only changesin the abundance of the fish, but also changes in management mea-sures taken to sustain populations and economic considerationssuch as the price and availability of markets as reviewed byDickey-Collas et al. (2013).
Energy flows and ecological services of forage fishPopulation dynamics of forage fish are affected by trophic cascades,induced by the exploitation of predator species (Frank et al., 2005;Casini et al., 2008). Such trophic cascades caused by the removalof top predators act by releasing forage fish from predation pressure,which may lead to an increase in forage fish abundance.
Foodweb models provide one way of assessing to what extent pre-dators rely on forage fish as a food source, and/or how changes in theforage fish community (potentially driven by fisheries) might influ-ence top predators. Most pelagic fish species grow several orders ofmagnitude over ontogeny, changing their ecological role as theygrow, so that prey fish may compete, for example, with juvenilestages of their predators, possibly preventing them from reachingpredatory size (Mylius et al., 2001). Hence, to study the transfer ofenergy through a pelagic foodweb in a model, it needs not only to
Figure 4. Trends in the international landings of six forage fish species from the North Sea (ICES Subarea IV). (a) Herring, sprat, sardine, and anchovy.(b) Norway pout and sandeel. For comparison, the total international landings of demersal (non-forage) fish species are also shown in Figure 4b(dotted line). Source: ICES catch statistics (ICES, 2011) extracted using FishStat Plus software (FAO, 2012).
Forage fish, their fisheries, and their predators Page 9 of 15

capture the size-based nature of the feeding interactions, but also thefood-dependent growth of individuals. Generic models based onthese principles have demonstrated how reductions in predatorpopulations can lead to trophic cascades, with benefits for foragefish populations (Andersen and Pedersen, 2010). They have alsodemonstrated how fairly large changes in forage fish populationsmay have only modest effects on the productivity and size of preda-tory fish populations (Houle et al., in press).
To illustrate the interconnectedness of the North Sea foodweband the trophodynamic importance of the forage fish ensemble,we employed a size-based foodweb model parameterized and cali-brated for the North Sea (Piet, 2010). The model is based on thesame principles as the general model in Houle et al. (in press).The model describes the feeding interactions between individuals,as the combined results of not only the size of the individual fish(size-based function: Ursin, 1973) but also a species-specificspatial overlap matrix, derived from the co-occurrence of speciesin trawl survey catches. Consumed food is used for somaticgrowth in juveniles and partitioned between growth and reproduc-tion in adults; growth and reproduction therefore depend on foodintake and availability. Each species has a Beverton–Holt-typestock–recruitment relationship where the maximum recruitmentwas estimated by fitting the predicted spawning-stock biomassand yield of each species against the values reported by ICES(2012). The forage fish included in the model are herring, sprat,sandeel, and Norway pout, and the predators included arewhiting, haddock, and cod. The outputs of the model are size-basedpatterns of growth, reproduction, and mortality for each species.
Simulations using this size-based foodweb model confirm thatthe general patterns observed by Houle et al. (in press) are borneout in the North Sea. The results suggest that forage fish constitutea significant fraction of the food for adult predators; on average�50%, but as much as 75%, depending on the body size of thepredator (Figure 5), with whiting being most reliant on foragefish, followed by cod and haddock. It should be noted that the pro-portion of forage fish in predator diet is probably overestimated
slightly here, since the model does not include benthic foodsources. Nevertheless, the simulation results imply that both adultgrowth and egg production of individual predators rely to a largedegree on forage fish. Reductions in forage fish stock will thereforelead to smaller sizes of predatory fish and lower fecundity. However,as will be shown, some of these individual-level effects are counteredat the population level by changes in the abundance of predators.
To examine how changes in the stock sizes of forage fish influencepredator species, we calculated three scenarios with the model: abase scenario with current levels of fishing on all species (foragefish and predators), and two alternative scenarios where we eitherdouble, or halve, the fishing mortality on the forage fish. These scen-arios reveal an emergent negative relationship between forage fishbiomass and predator biomass, induced by the competitionbetween forage fish and young predators. A change in forage fishmortality F has a direct impact on the biomass of forage fish andhence on total fish biomass: an increase in F leads to a decrease inthe biomass of each of the four forage fish species, and a reductionin F to an increase in forage fish (Figure 6a). Intuitively, an increase
Figure 5. The fraction of diet consisting of forage fish as a function ofbody weight, for three predatory fish species: whiting (open circles), cod(triangles), and haddock (closed circles).
Figure 6. Modelled responses of a fish community to either doublingor halving the fishing mortality on four forage fish species (herring,sprat, sandeel, Norway pout), relative to a base case with F ¼ 1 year– 1.Three scenarios are shown in each panel: a base case (horizontal dashedlines), halved fishing mortality (continuous lines), and doubled fishingmortality (dotted). Panel (a) shows, for each forage fish species, thechange in biomass relative to the base case (proportion increase ordecrease), as a function of individual fish size (x-axis). Panel (b) showsthe change in biomass of the three predator species (open circles,whiting; triangles, cod; closed circles, haddock) relative to the base case,if F on forage fish is halved (continuous lines) or doubled (dotted).Notice that the changes in the biomass of the predatory fish are smallerthan 5%. Panel (c) shows the change in growth rate of the predatorspecies relative to the base case.
Page 10 of 15 G. H. Engelhard et al.

in the forage fish biomass (which could result from reduced F onforage fish) would be expected to lead to an increase in thebiomass of the predator species. That, however, is not the case(Figure 6b). Conversely, the higher biomass of forage fish causes afairly modest decrease in the biomass of cod, whiting, andhaddock at most body sizes, with only the largest individuals ofcod displaying an increase in biomass. This counterintuitive resultcan be understood by examining the growth rate of the predators(Figure 6c). When forage fish abundance is high, the growth rateis decreased for juvenile predators due to increased competitionfor food, resulting in slower growth, higher cumulative mortality,and therefore reduced numbers of larger predators. Even thoughin larger individual predators the growth rate is increased at highforage fish abundances (Figure 6c), leading to better growth atthese sizes and a higher total egg production, these changes aremore modest and not sufficient to offset the strong competitiveeffects acting upon the predators at the juvenile stages (Andersenand Pedersen, 2010). A reduction in fishing mortality on foragefish results in similar effects on predator populations as describedfor the increased fishing mortality, just with the opposite sign.Finally, it should be noted that the effects on the predator speciesare quite small (roughly �25%) compared with the direct effectson the forage fish. In summary, these foodweb models predict thatin response to decreased forage fishing mortality, forage fishstocks will show comparatively strong increases, the biomass ofsmaller predators will decline moderately, whereas the biomassand growth rates of larger predators will increase slightly.
Synthesizing the evidence: who drives whom?Our review of the results of field, laboratory, and modelling studieshelps reveal the multitude of ways in which North Sea forage fishpopulations are linked to climatic and planktonic drivers, to otherforage fish species, and to predators and forage fish fisheries. Thisstudy has considered in a mostly qualitative manner the productiv-ity and dynamics of a forage fish assemblage that is made up of sixdifferent species. By necessity and for brevity, we have excludedsome factors that may also be important drivers of forage fish popu-lations. Nevertheless, the broad evidence-base presented is the firstto highlight the degree of interconnectedness of forage fish in theNorth Sea foodweb and the potential range in processes that willaffect the productivity of specific populations.
The following issues became apparent when considering theforage fish, their fisheries, and their predators.
1. Climate-driven changes in North Sea forage fish populations viadirect (abiotic) and indirect (trophodynamic/prey species)routes are clear and are exemplified most clearly in herring,anchovy, and sardine (e.g. Groger et al., 2010; Petitgas et al.,2012). These three species also serve to highlight that, at the re-gional scale, there will be winners and losers expected from pro-jected climatic warming (Rijnsdorp et al., 2010; Petitgas et al.,2013), the North Sea being close to the southern boundary inherring (hence negative effects of climate change), to the north-ern boundary in anchovy and sardine (hence positive effects).
2. Any single species consideration of climatic drivers is likely to failif there are strong interactions between the forage fish species.Evidence of interactions among North Sea forage fish species isplentiful and we highlight both interspecific (competition,IGP) and intraspecific mechanisms (density-dependence andcannibalism) mechanisms, with some suggestion for
interactions through shared parasites or disease. Most correlativeinvestigations of time-series fail to account for these potentialchanges in drivers and any hysteresis in the system. Alternativeoutcomes are possible. When considering interactions, overlapsin space, time, and diet and the potential for IGP need to be con-sidered either through process-based studies or field campaignsthat simultaneously sample forage fish, predators, and spatio-temporal patterns in forage fish prey (including phyto-, zoo-,and ichthyoplankton).
3. Trophic dependence of (top) predators on forage fish is well publi-cized (e.g. Cury et al., 2011; Smith et al., 2011). We rank the depend-ence on forage fish for a range of seabirds, marine mammals, andpredatory fish species in the North Sea. Seabirds were the most sen-sitive to variations in forage fish because of their specialized dietsand limited foraging range (particularly at breeding colonies), fol-lowed by marine mammals, then predatory fish (which oftendisplay generalist diets). Among the forage fish species, sandeelwas most “universally important” as a prey to predators.
4. The importance of top-down control of forage fish by predatorswas evidenced from the estimates from different foodwebmodels. The North Sea multispecies assessment clearly suggeststhat predators are predominant sources of mortality for foragefish (ICES, 2011). Key predators are a relatively small numberof fish species including saithe, whiting, mackerel, and horsemackerel, whereas seabirds and seals have a far more modesteffect on forage fish. Importantly, each of the key forage fish pre-dators also support major human consumption fisheries (ICES,2012), so that the removal of forage fish biomass by these speciesindirectly benefits society (Dickey-Collas et al., 2013).
5. There is little doubt that fishing has been a major driver of foragefish dynamics in the North Sea, especially during the 1960s–1970s when industrial fisheries grew rapidly and the herringstock collapsed (Madsen, 1978) and during the 1980s–1990swhen forage fish removals by the fisheries were substantial.Fortunately, sound management has contributed to the recoveryof herring, and evidence indicates that, in recent years, fishingmortality on the different forage fish stocks has been in declineand is now relatively low (well below M). Foodweb modelssuggest that the increased biomass of forage fish stocks resultingfrom reducing fishing mortality may not necessarily lead to largerstocks of piscivorous fish; the reverse may be true if early lifestages of predator fish compete with forage fish for limited zoo-plankton resources. This highlights that changes in the magni-tude of fisheries removal of forage fish may have potentiallycomplex (and perhaps unanticipated) consequences on othercommercially and/or ecologically important species.
In conclusion, there is no simple answer to the question: “who driveswhom?” for forage fish in the North Sea. The effective managementof North Sea forage fish (Dickey-Collas et al., 2013) will need to takeinto account climate-driven variations in productivity and thevariety of interactions and trophic pathways highlighted in thisstudy.
AcknowledgementsThis study was supported by the European Union (FP7 projectFACTS “Forage Fish Interactions”) with matched funding by theDepartment for the Environment, Food and Rural Affairs of theUK (project MF1112 “Poseidon”). It was initiated duringthe FACTS North Sea Case Study Workshop (21–25 November
Forage fish, their fisheries, and their predators Page 11 of 15
2011, IJmuiden) and presented during the Forage Fish InteractionsSymposium (12–14 November 2012, Nantes). The manuscript bene-fited from constructive feedback by three anonymous referees andfrom discussions with Sidney J. Holt, Jason S. Link, JohnK. Pinnegar, Jeroen van der Kooij, Stefan Neuenfeldt, and Jake Rice.
ReferencesAlder, J., Campbell, B., Karpouzi, V., Kaschner, K., and Pauly, D. 2008.
Forage fish: from ecosystems to markets. Annual Review ofEnvironment and Resources, 33: 153–166.
Alheit, J., Pohlmann, T., Casini, M., Greve, W., Hinrichs, R., Mathis, M.,O’Driscoll, K., et al. 2012. Climate variability drives anchovies andsardines into the North and Baltic Seas. Progress in Oceanography,96: 128–139.
Andersen, K. H., and Pedersen, M. 2010. Damped trophic cascadesdriven by fishing in model marine ecosystems. Proceedings of theRoyal Society of London, Series B, 277: 795–802.
Arnott, S. A., and Ruxton, G. D. 2002. Sandeel recruitment in the NorthSea: demographic, climatic and trophic effects. Marine EcologyProgress Series, 238: 199–210.
Bakun, A., Babcock, E. A., Lluch-Cota, S. E., Santora, C., and Salvadeo,C. J. 2010. Issues of ecosystem-based management of forage fisheriesin “open” non-stationary ecosystems: the example of the sardinefishery in the Gulf of California. Reviews in Fish Biology andFisheries, 20: 9–29.
Beaugrand, G. 2004. The North Sea regime shift: evidence, causes,mechanisms and consequences. Progress in Oceanography, 60:245–262.
Beaugrand, G., and Reid, P. C. 2003. Long-term changes in phytoplank-ton, zooplankton and salmon related to climate. Global ChangeBiology, 9: 801–817.
Belkin, I. M. 2009. Rapid warming of Large Marine Ecosystems. Progressin Oceanography, 81: 207–213.
Bernreuther, M., Herrmann, J-P., Peck, M. A., and Temming, A. 2012.Growth energetics of juvenile herring, Clupea harengus L.: food con-version efficiency and temperature dependency of metabolic rate.Journal of Applied Ichthyology, 29: 331–340. doi:10.1111/jai.12045
Boulcott, P., Wright, P. J., Gibb, F. M., Jensen, H., and Gibb, I. M. 2007.Regional variation in maturation of sandeels in the North Sea. ICESJournal of Marine Science, 64: 369–376.
Brunel, T., and Dickey-Collas, M. 2010. Effects of temperature andpopulation density on von Bertalanffy growth parameters inAtlantic herring: a macro-ecological analysis. Marine EcologyProgress Series, 405: 15–28.
BWPi. 2004. Birds of the Western Palearctic Interactive. InteractiveDVD Birdguides, Shrewsbury, UK.
Casini, M., Kornilovs, G., Cardinale, M., Mollmann, C., Grygiel, W.,Jonsson, P., Raid, T., et al. 2011. Spatial and temporal density de-pendence regulates the condition of central Baltic Sea clupeids: com-pelling evidence using an extensive international acoustic survey.Population Ecology, 53: 511–523.
Casini, M., Lovgren, J., Hjelm, J., Cardinale, M., Molinero, J. C., andKornilovs, G. 2008. Multi-level trophic cascades in a heavilyexploited open marine ecosystem. Proceedings of the RoyalSociety of London, Series B, 275: 1793–1801.
Corten, A. 1999. The reappearance of spawning Atlantic herring (Clupeaharengus) on Aberdeen Bank (North Sea) in 1983 and its relationshipto environmental conditions. Canadian Journal of Fisheries andAquatic Sciences, 56: 2051–2061.
Cunningham, L., Sharples, R. J., and Hammond, P. S. 2004. Harbourseal diet in the UK. SCOS Briefing Paper 04/11, Sea MammalResearch Unit, University of St Andrews. pp. 88–90.
Cury, P., Bakun, A., Crawford, R. J. M., Jarre, A., Quinones, R. A.,Shannon, L. J., and Verheye, H. M. 2000. Small pelagics in upwellingsystems: patterns of interaction and structural changes in “wasp-
waist” ecosystems. ICES Journal of Marine Science, 57: 603–618.doi:10.1006/jmsc.2000.0712
Cury, P. M., Boyd, I. L., Bonhommeau, S., Anker-Nilssen, T., Crawford,R. J. M., Furness, R. W., Mills, J. A., et al. 2011. Global seabird re-sponse to forage fish depletion—one-third for the birds. Science,334: 1703–1706.
Cushing, D. H. 1980. The decline of the herring stocks and the gadoidoutburst. Journal du Conseil International pour l’Exploration dela Mer, 39: 70–81.
Daan, N., Bromley, P. J., Hislop, J. R. G., and Nielsen, N. A. 1990. Ecologyof North Sea fish. Netherlands Journal of Sea Research, 26: 343–386.
Daan, N., Rijnsdorp, A. D., and van Overbeeke, G. R. 1985. Predation byNorth Sea herring Clupea harengus on eggs of plaice Pleuronectes pla-tessa and cod Gadus morhua. Transactions of the American FisheriesSociety, 114: 499–506.
Daewel, U., Peck, M. A., Kuhn, W., St. John, M. A., Alekseeva, I., andSchrum, C. 2008. Coupling ecosystem and individual-basedmodels to simulate the influence of environmental variability on po-tential growth and survival of larval sprat (Sprattus sprattus L.) in theNorth Sea. Fisheries Oceanography, 17: 333–351.
Daewel, U., Peck, M. A., and Schrum, C. 2011. Life history strategy andimpacts of environmental variability on early life stages of twomarine fishes in the North Sea: an individual-based modelling ap-proach. Canadian Journal of Fisheries and Aquatic Sciences, 68:426–443.
Daunt, F., Benvenuti, S., Harris, M. P., Dall’Antonia, L., Elston, D. A.,and Wanless, S. 2002. Foraging strategies of the black-legged kitti-wake Rissa tridactyla at a North Sea colony: evidence for amaximum foraging range. Marine Ecology Progress Series, 245:239–247.
De Silva, S. S. 1973. Food and feeding habits of the herring Clupea har-engus and the sprat C. sprattus in inshore waters of the West ofScotland. Marine Biology, 20: 282–290.
Dickey-Collas, M., Engelhard, G. H., Rindorf, A., Raab, K., Smout, S.,Aarts, G., van Deurs, M., et al. 2013. Ecosystem-based managementobjectives for the North Sea: riding the forage fish rollercoaster. ICESJournal of Marine Science, doi:10.1093/icesjms/fst075.
Dickey-Collas, M., Nash, R. D. M., Brunel, T., van Damme, C. J. G.,Marshall, C. T., Payne, M. R., Corten, A., et al. 2010. Lessonslearned from stock collapse and recovery of North Sea herring: areview. ICES Journal of Marine Science, 67: 1875–1886.
Edwards, M., John, A. W. G., Johns, D. G., and Reid, P. C. 2001. Casehistory and persistence of the non-indigenous diatom Coscinodiscuswailesii in the North-east Atlantic. Journal of the Marine BiologyAssociation of the UK, 81: 207–211.
Edwards, M., Johns, D. G., Leterme, S. C., Svendsen, E., and Richardson,A. J. 2006a. Regional climate change and harmful algal blooms in theNortheast Atlantic. Limnology and Oceanography, 51: 820–829.
Edwards, M., Johns, D. G., Licandro, P., John, A. W. G., and Stevens, D.P. 2006b. Ecological status report: results from the CPR survey 2004/2005. SAHFOS Technical Report, 3. 8 pp.
Ellis, T., and Nash, R. D. M. 1997. Predation by sprat and herring onpelagic fish eggs in a plaice spawning area in the Irish Sea. Journalof Fish Biology, 50: 1195–1202.
Engelhard, G. H., Blanchard, J. L., Pinnegar, J. K., van der Kooij, J., Bell,E. D., Mackinson, S., and Righton, D. A. 2013a. Body condition ofpredatory fishes linked to the availability of sandeels. MarineBiology, 160: 299–308. doi:10.1007/s00227-012-2088-1
Engelhard, G. H., Ellis, J. R., Payne, M. R., ter Hofstede, R., and Pinnegar,J. K. 2011. Ecotypes as a concept for exploring responses to climatechange in fish assemblages. ICES Journal of Marine Science, 68:1090–1104.
Engelhard, G. H., Smout, S. C., Matthiopoulos, J., Rindorf, A., andPomeroy, P. P. 2013b. More sandeels mean heavier mums: the linkbetween forage fish and the condition of grey seals breeding in theNorth Sea. ICES Journal of Marine Science, this volume.
Page 12 of 15 G. H. Engelhard et al.

Engelhard, G. H., van der Kooij, J., Bell, E. D., Pinnegar, J. K., Blanchard,J. L., Mackinson, S., and Righton, D. A. 2008. Fishing mortalityversus natural predation on diurnally migrating sandeelsAmmodytes marinus. Marine Ecology Progress Series, 369: 213–227.
FAO. 2012. FishStat Plus—Universal software for fishery statistical timeseries. Retrieved May 1, 2012 from www.fao.org/fishery/statistics/software/fishstat/en.
Fassler, S. M. M., Payne, M. R., Brunel, T., and Dickey-Collas, M. 2011.Does larval mortality influence population dynamics? An analysis ofNorth Sea herring (Clupea harengus) time series. FisheriesOceanography, 20: 530–543.
Fauchald, P., Skov, H., Skern-Mauritzen, M., Johns, D., and Tveraa, T.2011. Wasp-waist interactions in the North Sea ecosystem. PLoSOne, 6: e22729. doi:10.1371/journal.pone.0022729
Frank, K. T., Petrie, B., Choi, J. S., and Leggett, W. C. 2005. Trophic cas-cades in a formerly cod-dominated ecosystem. Science, 308:1621–1623.
Frederiksen, M., Wanless, S., Harris, M. P., Rothery, P., and Wilson, L. J.2004. The role of industrial fisheries and oceanographic change inthe decline of North Sea black-legged kittiwakes. Journal ofApplied Ecology, 41: 1129–1139.
Furness, R. W. 2002. Management implications of interactions betweenfisheries and sandeel-dependent seabirds and seals in the North Sea.ICES Journal of Marine Science, 59: 261–269.
Furness, R. W. 2007. Responses of seabirds to depletion of food fishstocks. Journal of Ornithology, 148 (Suppl. 2): S247–S252.
Groger, J. P., Kruse, G. H., and Rohlf, N. 2010. Slave to the rhythm: howlarge-scale climate cycles trigger herring (Clupea harengus) regener-ation in the North Sea. ICES Journal of Marine Science, 67: 454–465.
Hardy, A. C. 1924. The herring in relation to its animate environment.Part 1. The food and feeding habits of the herring with special refer-ence to the east coast of England. Fishery Investigations Series II, 7:1–53.
Harris, M. P., and Wanless, S. 1991. The importance of the lesser sandeelAmmodytes marinus in the diet of the Shag Phalacrocorax aristotelis.Ornis Scandinavica, 22: 375–382.
Heath, M. R. 2005. Changes in the structure and function of the NorthSea fish foodweb, 1973–2000, and the impacts of fishing and climate.ICES Journal of Marine Science, 62: 847–868.
Heath, M. R., Scott, B., and Bryant, A. D. 1997. Modelling the growth offour different herring stocks in the North Sea. Journal of SeaResearch, 38: 413–436.
Hislop, J. R. G. 1996. Changes in North Sea gadoid stocks. ICES Journalof Marine Science, 53: 1146–1156.
Hislop, J. R. G., Harris, M. P., and Smith, J. G. M. 1991. Variation in thecalorific value and total energy content of the lesser sandeel(Ammodytes marinus) and other fish preyed on by seabirds.Journal of Zoology, London, 224: 501–517.
Hopkins, P. J. 1989. Herring predation on fish eggs and larvae in theNorth Sea. Rapports et Proces-Verbaux des Reunions du Conseilpour l’Exploration de la Mer, 191: 459.
Houle, J. E., Andersen, K. H., Farnsworth, K. D., and Reid, D. G. (inpress). Emerging asymmetric interactions between forage andpredator fisheries impose management trade-offs. Journal of FishBiology.
Hufnagl, M., and Peck, M. A. 2011. Physiological individual-basedmodelling of larval Atlantic herring (Clupea harengus) foragingand growth: insights on climate-driven life-history scheduling.ICES Journal of Marine Science, 68: 1170–1188.
Hunter, J. R., and Kimbrell, C. A. 1980. Egg cannibalism in the northernanchovy, Engraulis mordax. Fishery Bulletin US, 78: 811–816.
ICES. 2007. Report of the Study Group on Recruitment Variability inNorth Sea Planktivorous Fish (SGRECVAP). ICES Document CM2007/LRC: 07. 65 pp.
ICES. 2011. Report of the Working Group on Multispecies AssessmentMethods (WGSAM), 10–14 October 2011, Woods Hole, USA. ICESDocument CM 2011/SSGSUE: 10.
ICES. 2012. Report of the Working Group on the Assessment ofDemersal Stocks in the North Sea and Skagerrak (WGNSSK), 27April–3 May 2012, ICES Headquarters, Copenhagen. ICESDocument CM 2012/ACOM: 13.
Irigoien, X., and de Roos, A. 2011. The role of intraguild predation in thepopulation dynamics of small pelagic fish. Marine Biology, 158:1683–1690.
Johns, D. G., Edwards, M., Greve, W., and John, A. W. G. 2005. Increasingprevalence of the marine cladoceran Penilia avirostris (Dana, 1852) inthe North Sea. Helgoland Marine Research, 59: 214–218.
Kenny, A. J., Skjoldal, H. R., Engelhard, G. H., Kershaw, P. J., and Reid,J. B. 2009. An integrated approach for assessing the relative signifi-cance of human pressures and environmental forcing on the statusof Large Marine Ecosystems. Progress in Oceanography, 81:132–148.
Kirby, R. R., Beaugrand, G., Lindley, J. A., Richardson, A. J., Edwards,M., and Reid, P. C. 2007. Climate effects and benthic–pelagic coup-ling in the North Sea. Marine Ecology Progress Series, 330: 31–38.
Lambert, G., Nielsen, J. R., Larsen, L. I., and Sparholt, H. 2009. Maturityand growth population dynamics of Norway pout (Trisopterusesmarkii) in the North Sea, Skagerrak, and Kattegat. ICES Journalof Marine Science, 66: 1899–1914.
Lassen, H., Cross, D., and Christiansen, E. 2012. One hundred years ofcatch statistics for the Northeast Atlantic. ICES CooperativeResearch Report, 311. 21 pp.
Last, J. M. 1987. The food of immature sprat (Sprattus sprattus (L.)) andherring (Clupea harengus L.) in coastal waters of the North Sea. ICESJournal of Marine Science, 44: 73–79.
Last, J. M. 1989. The food of herring, harengus, in the North Sea, 1983–1986. Journal of Fish Biology, 34: 489–501.
Leterme, S. C., Edwards, M., Seuront, L., Attrill, M. J., Reid, P. C., andJohn, A. W. G. 2005. Decadal basin-scale changes in diatoms, dino-flagellates, and phytoplankton color across the North Atlantic.Limnology and Oceanography, 50: 1244–1253.
Lluch-Belda, D., Schwartzlose, R. A., Serra, R., Parrish, R., Kawasaki, T.,Hedgecock, D., and Crawford, R. J. M. 1993. Sardine and anchovyregime fluctuations of abundance in four regions of the worldoceans: a workshop report. Fisheries Oceanography, 1: 339–347.
Mackinson, S., Daskalov, G., Heymans, J. J., Neira, S., Arancibia, H.,Zetina-Rejon, M., Jiang, H., et al. 2009. Which forcing factors fit?Using ecosystem models to investigate the relative influence offishing and changes in primary productivity on the dynamics ofmarine ecosystems. Ecological Modelling, 220: 2972–2987.
MacLeod, C. D., Pierce, G. J., and Santos, M. B. 2007. Starvation andsandeel consumption in harbour porpoises in the Scottish NorthSea. Biology Letters, 3: 535–536.
Madsen, K. P. 1978. The industrial fisheries in the North Sea. Rapports etProces-Verbaux des Reunions du Conseil pour l’Exploration de laMer, 172: 27–30.
Maes, J., and Ollevier, F. 2002. Size structure and feeding dynamics inestuarine clupeoid fish schools: field evidence for the school trap hy-pothesis. Aquatic Living Resources, 15: 211–216.
Maes, J., Tackx, M., and Soetaert, K. 2005. The predation impact of ju-venile herring Clupea harengus and sprat Sprattus sprattus on estuar-ine zooplankton. Hydrobiologia, 540: 225–235.
Martin, C. S., Vaz, S., Koubbi, P., Meaden, G. J., Engelhard, G. H., Lauria,V., Gardel, L., et al. 2010. A digital atlas to link ontogenic shifts in fishspatial distribution to the environment of the eastern EnglishChannel. Dab, Limanda limanda as a case study. Cybium, 34: 59–71.
Matthiopoulos, J., McConnell, B., Duck, C., and Fedak, M. 2004. Usingsatellite telemetry and aerial counts to estimate space use by grey sealsaround the British Isles. Journal of Applied Ecology, 41: 476–491.
Matthiopoulos, J., Smout, S., Winship, A. J., Thompson, D., Boyd, I. L.,and Harwood, J. 2008. Getting beneath the surface of marinemammal–fisheries competition. Mammal Review, 38: 167–188.
McQuatters-Gollop, A., Raitsos, D. E., Edwards, M., Pradhan, Y., Mee,L. D., Lavender, S. J., and Attril, M. J. 2007. A long-term chlorophyll
Forage fish, their fisheries, and their predators Page 13 of 15

dataset reveals regime shift in North Sea phytoplankton biomass un-connected to increasing nutrient levels. Limnology andOceanography, 52: 635–648.
Mellergaard, S., and Spanggaard, B. 1997. An Ichthyophonus hoferi epi-zootic in herring in the North Sea, the Skagerrak, the Kattegat and theBaltic Sea. Diseases of Aquatic Organisms, 28: 191–199.
Mendel, B., Sonntag, N., Wahl, J., Schwemmer, P., Dries, H., Guse, N.,Muller, S., et al. 2008. Profiles of seabirds and waterbirds of theGerman North and Baltic Seas. Distribution, ecology and sensitiv-ities to human activities within the marine enviroment.Naturschutz und Biologische Vielfalt 61. Bundesamt furNaturschutz, Bonn- Bad Godesberg.
Mitchell, P. I., Ratcliffe, N., Newton, S. F., and Dunn, T. E. 2004. SeabirdPopulations of Britain and Ireland. Results of the Seabirds 2000Census. Poyser, London.
Moller, H. 1987. Pollution and parasitism in the aquatic environment.International Journal for Parasitology, 17: 353–361.
Munk, P. 1993. Differential growth of larval sprat Sprattus sprattus acrossa tidal front in the eastern North Sea. Marine Ecology Progress Series,99: 17–27.
Myers, R. A. 1998. When do environment–recruitment correlationswork? Reviews in Fish Biology and Fisheries, 8: 285–305.
Mylius, S. D., Klumpers, K., de Roos, A. M., and Persson, L. 2001. Impactof intraguild predation and stage structure on simple communitiesalong a productivity gradient. The American Naturalist, 158:259–276.
Nash, R. D. M., and Dickey-Collas, M. 2005. The influence of life historydynamics and environment on the determination of year classstrength in North Sea herring (Clupea harengus L.). FisheriesOceanography, 14: 279–291.
Nash, R. D. M., Dickey-Collas, M., and Kell, L. T. 2009. Stock and re-cruitment in North Sea herring (Clupea harengus); compensationand dispensation in the population dynamics. Fisheries Research,95: 88–97.
Onthank, K. L., and Cowles, D. L. 2011. Prey selection in Octopus rubes-cens: possible roles of energy budgeting and prey nutritional com-position. Marine Biology, 158: 2795–2804.
Payne, M. R., Hatfield, E. M. C., Dickey-Collas, M., Falkenhaug, T.,Gallego, A., Groger, J., Licandro, P., et al. 2009. Recruitment in achanging environment: the 2000s North Sea herring recruitmentfailure. ICES Journal of Marine Science, 66: 272–277.
Peck, M. A., Baumann, H., Bernreuther, M., Clemmesen, C., Herrmann,J-P., Haslob, H., Huwer, B., et al. 2012. The ecophysiology of Sprattussprattus in the Baltic and North Seas. Progress in Oceanography, 103:42–57.
Petitgas, P. (Ed.) 2010. Life cycle spatial patterns of small pelagic fish in theNortheast Atlantic. ICES Cooperative Research Report, 306. 93 pp.
Petitgas, P., Alheit, J., Peck, M. A., Raab, K., Irigoien, X., Huret, M., vander Kooij, J., et al. 2012. Anchovy population expansion in the NorthSea. Marine Ecology Progress Series, 444: 1–13.
Petitgas, P., Rijnsdorp, A. D., Dickey-Collas, M., Engelhard, G. H., Peck,M. A., Pinnegar, J. K., Drinkwater, K., et al. 2013. Impacts of climatechange on the complex life cycles of fish. Fisheries Oceanography, 22:122–139.
Piet, G. (Ed.) 2010. IMAGE: Indicators for Fisheries Management inEurope. Final Report, EU FP6 project 044227. www.cordis.europa.eu/documents/documentlibrary/126792031EN6.pdf.
Pingree, R. 2005. North Atlantic and North Sea climate change: curl up,shut down, NAO and ocean colour. Journal of the Marine BiologicalAssociation of the UK, 85: 1301–1315.
Pliru, A., van der Kooij, J., Engelhard, G. H., Fox, C. J., Milligan, S. P.,and Hunter, E. 2012. Sprat feeding behaviour, selective predationand impact on plaice egg mortality. ICES Journal of MarineScience, 69: 1019–1029.
Plounevez, S., and Champalbert, G. 2000. Diet, feeding behaviour andtrophic activity of the anchovy (Engraulis encrasicolus L.) in theGulf of Lions (Mediterranean Sea). Oceanologica Acta, 23: 175–192.
Polis, G. A., and Holt, R. D. 1992. Intraguild predation: the dynamics ofcomplex trophic interactions. Trends in Ecology and Evolution, 7:151–154.
Pomeroy, P. P., Fedak, M. A., Rothery, P., and Anderson, S. 1999.Consequences of maternal size for reproductive expenditure andpupping success of grey seals at North Rona, Scotland. Journal ofAnimal Ecology, 68: 235–253.
Pommeranz, T. 1981. Observations on the predation of herring (Clupeaharengus L.) and sprat (Sprattus sprattus L.) on fish eggs and larvae inthe southern North Sea. Rapports et Proces-Verbaux des Reunionsdu Conseil International pour l’Exploration de la Mer, 178: 402–404.
Poulsen, B. 2006. Historical exploitation of the North Sea herring stock:an environmental history of the Dutch herring fisheries, c. 1600–1860. PhD thesis, University of Southern Denmark. 272 pp.
Raab, K., Nagelkerke, L. A. J., Boeree, C., Rijnsdorp, A. D., Temming, A.,and Dickey-Collas, M. 2012. Dietary overlap between the potentialcompetitors herring, sprat and anchovy in the North Sea. MarineEcology Progress Series, 470: 101–111.
Rahimian, H. 1998. Pathology and morphology of Ichthyophonus hoferiin naturally infected fishes off the Swedish west coast. Diseases ofAquatic Organisms, 34: 109–123.
Rahimian, H., Longshaw, M., MacKenzie, K., and Thulin, J. 1999.Pseudanthocotyloides heterocotyle (van Beneden, 1871) Euzet &Prost, 1969 (Monogenea: Polyopisthocotylea: Mazocraeidae), aparasite of herring Clupea harengus L. and sprat Sprattus sprattusL. (Teleostei: Clupeidae). Systematic Parasitology, 42: 193–201.
Reid, P. C., Edwards, M., Hunt, H. G., and Warner, A. J. 1998.Phytoplankton change in the North Atlantic. Nature, 391: 546.
Reijnders, P. J. H., Brasseur, S. M. J. M., and Meesters, E. H. W. G. 2010.Earlier pupping in harbour seals, Phoca vitulina. Biology Letters, 6:854–857.
Rijnsdorp, A. D., Peck, M. A., Engelhard, G. H., Mollmann, C., andPinnegar, J. K. (Eds.). 2010. Resolving climate impacts on fishstocks. ICES Cooperative Research Report, 301. 371 pp.
Rindorf, A., Jensen, H., and Schrum, C. 2008. Growth, temperature anddensity relationships of North Sea cod (Gadus morhua). CanadianJournal of Fisheries and Aquatic Sciences, 65: 456–470.
Rindorf, A., Wanless, S., and Harris, M. P. 2000. Effects of changes insandeel availability on the reproductive output of seabirds. MarineEcology Progress Series, 202: 241–252.
Rohde, K., Hayward, C., and Heap, M. 1995. Aspects of the ecology ofmetazoan ectoparasites of marine fishes. International Journal ofParasitology, 25: 945–970.
Russell, F. S. 1976. The Eggs and Planktonic Stages of British MarineFishes. Academic Press, London, UK.
Santos, M. B., Pierce, G. J., Learmonth, J. A., Reid, R. J., Sacau, M.,Patterson, I. A. P., and Ross, H. M. 2008. Strandings of stripeddolphin Stenella coeruleoalba in Scottish waters (1992–2003) withnotes on the diet of this species. Journal of the Marine BiologicalAssociation of the UK, 88: 1175–1183.
Savage, R. E. 1937. The food of North Sea herring 1930–1934. FisheryInvestigations Series II, 15: 1–60.
Schwartzlose, R. A., Alheit, J., Bakun, A., Baumgartner, T. R., Cloete, R.,Crawford, R. J. M., Fletcher, W. J., et al. 1999. Worldwide large-scalefluctuations of sardine and anchovy populations. South AfricanJournal of Marine Science, 21: 289–347.
Segers, F. H. I. D., Dickey-Collas, M., and Rijnsdorp, A. D. 2007. Preyselection by North Sea herring (Clupea harengus L.), with specialregard to fish eggs. ICES Journal of Marine Science, 64: 60–68.
Sharples, R. J., Arrizabalaga, B., and Hammond, P. S. 2009. Seals, san-deels and salmon: diet of harbour seals in St. Andrews Bay and theTay Estuary, southeast Scotland. Marine Ecology Progress Series,390: 265–276.
Smith, A. D. M., Brown, C. J., Bulman, C. M., Fulton, E. A., Johnson, P.,Kaplan, I. C., Lozano-Montes, H., et al. 2011. Impacts of fishinglow–trophic level species on marine ecosystems. Science, 333:1147–1150.
Page 14 of 15 G. H. Engelhard et al.

Smith, C., and Reay, P. 1991. Cannibalism in teleost fish. Reviews in FishBiology and Fisheries, 1: 41–64.
Sparholt, H., Larsen, L. I., and Nielsen, J. R. 2002. Non-predationnatural mortality of Norway pout (Trisopterus esmarkii) in theNorth Sea. ICES Journal of Marine Science, 59: 1276–1284.
Stienen, E. 2006. Living with gulls: trading off food and predation in theSandwich Tern Sterna sandvicensis. PhD Thesis, University ofGroningen.
Suttle, C. A. 2007. Marine viruses—major players in the global ecosys-tem. Nature Reviews Microbiology, 5: 801–812.
Sydeman, W. J., and Bograd, S. J. 2009. Marine ecosystems, climate andphenology: introduction. Marine Ecology Progress Series, 393:185–188.
Tacon, A. G. J., and Metian, M. 2009. Fishing for feed or fishing for food:increasing global competition for small pelagic forage fish. Ambio,38: 294–302.
Takasuka, A., Oozeki, Y., Kimura, R., Kubota, H., and Aoki, I. 2004.Growth-selective predation hypothesis revisited for larval anchovyin offshore waters: cannibalism by juveniles versus predation by skip-jack tunas. Marine Ecology Progress Series, 278: 297–302.
Temming, A., Floeter, J., and Ehrich, S. 2007. Predation hot spots: largescale impact of local aggregations. Ecosystems, 10: 865–876.
Temming, A., Gotz, S., Mergardt, N., and Ehrich, S. 2004. Predation ofwhiting and haddock on sandeel: aggregative response, competitionand diel periodicity. Journal of Fish Biology, 64: 1351–1372.
Toresen, R., and Østvedt, O. J. 2000. Variation in abundance ofNorwegian spring-spawning herring (Clupea harengus, Clupeidae)throughout the 20th century and the influence of climatic fluctua-tions. Fish and Fisheries, 1: 231–256.
Tourre, Y. M., Lluch-Cota, S. E., and White, W. B. 2007. Global multi-decadal ocean climate and small-pelagic fish population.Environmental Research Letters, 2: 1–9.
Ursin, E. 1973. On the prey size preferences of cod and dab. Meddelelserfra Danmarks Fiskeri- og Havundersøgelser, 7: 85–98.
Valdes, E. S., Shelton, P. A., Armstrong, M. J., and Field, J. G. 1987.Cannibalism in South African anchovy: egg mortality and egg con-sumption rates. South African Journal of Marine Science, 5:613–622.
Valenzuela, G. S., and Vargas, C. A. 2002. Comparative larval growth rateof Sprattus sprattus in relation to physical and biological oceano-graphic features in the North Sea. Archive of Fishery and MarineResearch, 49: 213–230.
van Deurs, M., van Hal, R., Tomczak, M. T., Jonasdottir, S. H., andDolmer, P. 2009. Recruitment of lesser sandeel Ammodytesmarinus in relation to density dependence and zooplankton com-position. Marine Ecology Progress Series, 381: 249–258.
Varpe, Ø., and Fiksen, Ø. 2010. Seasonal plankton-fish interactions:light regime, prey phenology, and herring foraging. Ecology, 91:311–318.
Walters, C. I., and Collie, J. S. 1988. Is research on environmental factorsuseful to fisheries management? Canadian Journal of Fisheries andAquatic Sciences, 45: 1848–1854.
Wanless, S., Harris, M. P., and Greenstreet, S. P. R. 1998. Summersandeel consumption by seabirds breeding in the Firth of Forth,south-east Scotland. ICES Journal of Marine Science, 55:1141–1151.
Wanless, S., Harris, M. P., Redman, P., and Speakman, J. R. 2005. Lowenergy values of fish as a probable cause of a major seabird breedingfailure in the North Sea. Marine Ecology Progress Series, 294: 1–8.
Wanless, S., Morris, J. A., and Harris, M. P. 1988. Diving behaviour ofguillemot Uria aalge, puffin Fratercula arctica and razorbill Alcatorda as shown by radio-telemetry. Journal of Zoology, 216: 73–81.
Windsland, K., Lindstrom, U., Nilssen, K. T., and Haug, T. 2007. Relativeabundance and size composition of prey in the common minkewhale diet in selected areas of the northeastern Atlantic during2000–04. Journal of Cetacean Research and Management, 9:167–178.
Handling editor: Francis Juanes
Forage fish, their fisheries, and their predators Page 15 of 15


