Embed Size (px)
Citation preview

May 2012 Agbaou Gold Project Page 1-1 NI 43-101 Technical Report
For
per
sona
l use
onl
y

May 2012 Agbaou Gold Project Page I NI 43-101 Technical Report
Agbaou Gold Mine NI 43-101 Technical Report Effective Date: 25 May 2012 Author’s Signatory Page
SRK Authors: Mark Wanless Principal Geologist Pr.Sci.Nat
Mark Sturgeon Principal Mining Engineer Pr Eng
Hendrik Theart Professional Geoscientist Pr.Sci.Nat
Date: 25 May, 2012
_______________ _______________
Mark Wanless Hendrik Theart Principal Geologist Professional Geoscientist
_______________ Mark Sturgeon Principal Mining Engineer
SENET Authors: Neil Senior Corporate Sponsor FSAIMM
Philemon Bundo Process Manager MSAIMM
Thilo Naidoo Studies Manager MSAIMM
John Naismith Project Sponsor
Kevin Miles Project Manager
Date: 25 May, 2012
For
per
sona
l use
onl
y

May 2012
Knight Piésold Authors:
Date: 25 May, 2012
Agbaou Gold Project NI 43-101
Technical Report
Duncan Grant-Stuart Director
Douglas Dorren Snr Geotech Eng
Angus Rowland Snr Hydrogeologist
Brett Garland Snr Civil Eng
Page II
Pr. Eng
Pr. Eng
Pr.Sci.Nat
Pr. Eng (O.R)
For
per
sona
l use
onl
y

May 2012 Agbaou Gold Project Page III NI 43-101 Technical Report
CERTIFICATE OF QUALIFIED PERSON
Mark Wanless Pr.Sci.Nat
265 Oxford Road,
Illovo,
2196,
Johannesburg, South Africa
I, Mark Wanless am a Professional Geoscientist, employed as a Principal Geologist within SRK Consulting South
Africa (Pty) Ltd.
This certificate applies to the technical report entitled Agbaou Gold Mine NI 43-101 Technical Report dated 25
May 2012.
I am a member of the South African Council for Natural Scientific Professionals, 400178/05. I graduated from the
University of Cape Town with a BSc (Hons) degree in Geochemistry in 1995.
I have practiced my profession continuously for 16 years. I have been directly involved in the Mineral Resource
estimation of the Agbaou Gold Project.
As a result of my experience and qualifications, I am a Qualified Person as defined in National Instrument 43-101
Standards of Disclosure of Mineral Projects (NI 43-101).
I did not visit the Agbaou Gold Project.
I am responsible for sections 14, 25 and 26 of the Agbaou Gold Mine NI 43-101 Technical Report.
I am independent of Endeavour Mining Corporation as independence is described by Section 1.4 of NI 43-101.
I have had no previous involvement with the Agbaou Gold Project.
I have read NI 43-101 and this report has been prepared in compliance with that Instrument.
As of the date of this certificate, to the best of my knowledge, information and belief, the technical report contains
all scientific and technical information that is required to be disclosed to make the technical report not misleading.
I consent to the filing of the Technical Report with any Canadian stock exchange and other Canadian regulatory
authorities and publication by them for regulatory purposes, including electronic publication in the public company
files on their websites accessible by the public, of the Technical Report.
“Signed and sealed”
Mark Wanless, Pr.Sci.Nat
Dated at Illovo, Johannesburg, South Africa, this 10th
day of July 2012.
For
per
sona
l use
onl
y

May 2012 Agbaou Gold Project Page IV NI 43-101 Technical Report
CERTIFICATE OF QUALIFIED PERSON
Hendrik Frederik Johannes Theart Pr.Sci.Nat
265 Oxford Road,
Illovo,
2196,
Johannesburg, South Africa
I, Hendrik Frederik Johannes Theart, am a Professional Geoscientist, employed as a Corporate Consultant within
SRK Consulting South Africa (Pty) Ltd.
This certificate applies to the technical report entitled Agbaou Gold Mine NI 43-101 Technical Report dated 25
May 2012.
I am registered as a Professional Natural Scientist in the Geological Science field of practice, with the South
African Council for Natural Scientific Professionals, Registration Number 400069/88. I graduated from the
University of Stellenbosch with a Ph.D. degree in Geochemistry in 1985 and also have a M.Sc. (Geology) 1974
degree from the University of Cape Town and a B.Sc. (Hons) (Geology) 1977 degree from the University of
Stellenbosch.
I have practiced my profession continuously for 35 years. I have been directly involved in the review of the
exploration programme, the geological interpretation, the sampling and quality assurance and quality control of
the analytical results of the Agbaou Gold Project.
As a result of my experience and qualifications, I am a Qualified Person as defined in National Instrument 43-101
Standards of Disclosure of Mineral Projects (NI 43-101).
I visited the Agbaou Gold Project in Côte d’Ivoire from the 3rd
October to the 7th
October 2011.
I am responsible for sections 4 to 12, 23 and contributed to 25 and 26 of the Agbaou Gold Mine NI 43-101
Technical Report.
I am independent of Endeavour Mining Corporation as independence is described by Section 1.4 of NI 43-101.
I have had no previous involvement with the Agbaou Gold Project.
I have read NI 43-101 and this report has been prepared in compliance with that Instrument.
As of the date of this certificate, to the best of my knowledge, information and belief, the technical report contains
all scientific and technical information that is required to be disclosed to make the technical report not misleading.
I consent to the filing of the Technical Report with any Canadian stock exchange and other Canadian regulatory
authorities and publication by them for regulatory purposes, including electronic publication in the public company
files on their websites accessible by the public, of the Technical Report.
“Signed and sealed”
H. F. J. Theart, Pr.Sci.Nat
Dated at Illovo, Johannesburg, South Africa, this 10th
day of July 2012.
For
per
sona
l use
onl
y

May 2012 Agbaou Gold Project Page V NI 43-101 Technical Report
CERTIFICATE OF QUALIFIED PERSON
Mark Sturgeon Pr Eng
265 Oxford Road,
Illovo,
2196,
Johannesburg, South Africa
I, Mark Sturgeon am a Professional Engineer, employed as a Principal Mining Engineer within SRK Consulting
South Africa (Pty) Ltd.
This certificate applies to the technical report entitled Agbaou Gold Mine NI 43-101 Technical Report dated 25
May 2012.
I am a member of the Engineering Council of South Africa 20040276. I graduated from the University of the
Witwatersrand with a BSc degree in Mining Engineering in 1975.
I have practiced my profession continuously for 36 years. I have been directly involved in the Mineral Reserve
estimation of the Agbaou Gold Project.
As a result of my experience and qualifications, I am a Qualified Person as defined in National Instrument 43-101
Standards of Disclosure of Mineral Projects (NI 43-101).
I visited the Agbaou Gold Project in Côte d’Ivoire from the 5th October to the 7
th October 2011.
I am responsible for sections 15, 16, 25 and 26 of the Agbaou Gold Mine NI 43-101 Technical Report.
I am independent of Endeavour Mining Corporation as independence is described by Section 1.4 of NI 43-101.
I have had no previous involvement with the Agbaou Gold Project.
I have read NI 43-101 and this report has been prepared in compliance with that Instrument.
As of the date of this certificate, to the best of my knowledge, information and belief, the technical report contains
all scientific and technical information that is required to be disclosed to make the technical report not misleading.
I consent to the filing of the Technical Report with any Canadian stock exchange and other Canadian regulatory
authorities and publication by them for regulatory purposes, including electronic publication in the public company
files on their websites accessible by the public, of the Technical Report.
“Signed and sealed”
Mark Sturgeon, Pr Eng
Dated at Illovo, Johannesburg, South Africa, this 10th
day of July 2012.
For
per
sona
l use
onl
y

May 2012 Agbaou Gold Project Page VI NI 43-101 Technical Report
CERTIFICATE OF QUALIFIED PERSON
Neil Senior Pr.Eng. FSAIMM
No.1 High Street, Moddercrest office Park,
Modderfontein,
1609,
Gauteng, South Africa
I, Neil senior am a Professional Engineer, employed as a Joint Managing Director of SENET.
This certificate applies to the technical report entitled Agbaou Gold Mine NI 43-101 Technical Report dated 25th
May 2012.
I am a fellow of the South African Institute of Mining and Metallurgy (SAIMM) and a registered Professional
Engineer (registration number 800284). I graduated from Cranfield University, United Kingdom with an MSc.
Engineering (mechanical) in 1972.
I have practiced my profession for 35 years. I have been directly involved as the Sponsor of the Agbaou Gold
Project and reviewer of the report on behalf of SENET.
As a result of my experience and qualifications, I am a Qualified Person as defined in National Instrument 43-101
Standards of Disclosure of Mineral Projects (NI 43-101).
I did not visit the Agbaou Gold Project site in Côte d’Ivoire.
I am responsible for Sections 1, 2, 3, 13, 17 to 22, 24 to 27 of the Agbaou Gold Mine NI 43-101 Technical Report.
I am independent of Endeavour Mining Corporation as independence is described by Section 1.4 of NI 43-101.
I have had no previous involvement with the Agbaou Gold Project.
I have read NI 43-101 and this report has been prepared in compliance with that Instrument.
As of the date of this certificate, to the best of my knowledge, information and belief, the technical report contains
all scientific and technical information that is required to be disclosed to make the technical report not misleading.
I consent to the filing of the Technical Report with any Canadian stock exchange and other Canadian regulatory
authorities and publication by them for regulatory purposes, including electronic publication in the public company
files on their websites accessible by the public, of the Technical Report.
“Signed and sealed”
Neil Senior, Msc Mech. Eng. FSAIMM
Dated at Modderfontein, Gauteng, South Africa, this 10th
day of July 2012.
For
per
sona
l use
onl
y

May 2012 Agbaou Gold Project Page VII NI 43-101 Technical Report
CERTIFICATE OF QUALIFIED PERSON
Duncan Grant-Stuart Pr.Eng.
4 De La Rey Road
Rivonia
2128
Gauteng, South Africa
I, Duncan Grant-Stuart am a Professional Engineer, employed as a Director within Knight Piésold (Pty) Ltd.
This certificate applies to the technical report entitled Agbaou Gold Mine NI 43-101 Technical Report dated 25th
May 2012.
I am a member of South African Institute of Civil Engineers and a registered Professional Engineer (registration
number 900014). I graduated from the University of the Witwatersrand in 1976 with B.Sc. Engineering (civil).
I have practiced my profession for 36 years. I have been directly involved in the management, conceptual design
and report on the Tailings Storage Facility (TSF) portion of the Engineering Optimisation Study.
As a result of my experience and qualifications, I am a Qualified Person as defined in National Instrument 43-101
Standards of Disclosure of Mineral Projects (NI 43-101).
I visited the Agbaou Gold Project site in Côte d’Ivoire between the 9th
October and 14th
October 2011.
I am responsible for the Tailings Storage Facility aspects of the Agbaou Gold Mine NI 43-101 Technical Report.
I am independent of Endeavour Mining Corporation as independence is described by Section 1.4 of NI 43-101.
I have been involved with the Agbaou Gold Project in preparation of the conceptual design and report for the
Tailings Storage Facility, as part of the Engineering Optimisation Study intermittently from 2007 when the project
was run by Etruscan Resources.
I have read NI 43-101 and this report has been prepared in compliance with that Instrument.
As of the date of this certificate, to the best of my knowledge, information and belief, the technical report contains
all scientific and technical information that is required to be disclosed to make the technical report not misleading.
I consent to the filing of the Technical Report with any Canadian stock exchange and other Canadian regulatory
authorities and publication by them for regulatory purposes, including electronic publication in the public company
files on their websites accessible by the public, of the Technical Report.
For
per
sona
l use
onl
y

May 2012 Agbaou Gold Project Page VIII NI 43-101 Technical Report
CERTIFICATE OF QUALIFIED PERSON
Angus Rowland, Pr.sci.Nat.
4 De La Rey Road
Rivonia
2128
Gauteng, South Africa
I, Angus Rowland am a Professional Natural Scientist, employed as a Senior Hydrogeologist within Knight
Piésold (Pty) Ltd.
This certificate applies to the technical report entitled Agbaou Gold Mine NI 43-101 Technical Report dated 25th
May 2012.
I am a member of South African Council for Natural Scientific Professions (SACNASP), registration number
400240/10. I graduated from the University of the Free State with an MSc in Geohydrology in 2010.
I have practiced my profession for 5 years. I have been directly involved in the management and compilation of
the hydrogeological feasibility study and report for the Agbaou Gold Project.
As a result of my experience and qualifications, I am a Qualified Person as defined in National Instrument 43-101
Standards of Disclosure of Mineral Projects (NI 43-101).
I visited the Agbaou Gold Project site in Côte d’Ivoire between the 9th
October and 14th
October 2011.
I am responsible for the hydrogeological aspects of the Agbaou Gold Mine NI 43-101 Technical Report.
I am independent of Endeavour Mining Corporation as independence is described by Section 1.4 of NI 43-101.
I have been involved with the Agbaou Gold Project as part of the preliminary Hydrogeological Feasibility Study
between November 2007 and October 2008 for Etruscan Resources.
I have read NI 43-101 and this report has been prepared in compliance with that Instrument.
As of the date of this certificate, to the best of my knowledge, information and belief, the technical report contains
all scientific and technical information that is required to be disclosed to make the technical report not misleading.
I consent to the filing of the Technical Report with any Canadian stock exchange and other Canadian regulatory
authorities and publication by them for regulatory purposes, including electronic publication in the public company
files on their websites accessible by the public, of the Technical Report.
For
per
sona
l use
onl
y

May 2012 Agbaou Gold Project Page IX NI 43-101 Technical Report
TABLE OF CONTENTS
AUTHOR’S SIGNATORY PAGE ................................................................................ I
CERTIFICATE OF QUALIFIED PERSON ................................................................ III
TABLE OF CONTENTS ............................................................................................ IX
LIST OF TABLES ................................................................................................ XVIII
LIST OF FIGURES................................................................................................. XXI
LIST OF APPENDICES ....................................................................................... XXIII
SECTION 1. SUMMARY ................................................................................... 1-1
1.1 Introduction ............................................................................................................................ 1-1
1.2 Tenure, Underlying Agreements, Permits and Rights ....................................................... 1-1
1.3 Project History ........................................................................................................................ 1-1
1.4 Geology and Mineralization .................................................................................................. 1-2
1.5 Exploration, Drilling and Sampling ...................................................................................... 1-2
1.6 Data Verification ..................................................................................................................... 1-3
1.7 Mineral Processing and Metallurgical Testing .................................................................... 1-3
1.8 Mineral Resource Estimates ................................................................................................. 1-7
1.9 Mineral Reserve Estimates and Mining Methods.............................................................. 1-11
1.10 Recovery Methods ............................................................................................................... 1-13
1.11 Environmental Studies and Social Impacts ...................................................................... 1-13
1.12 Infrastructure, Water Supply, Tailings Storage and Logistics ........................................ 1-14
1.13 Capital and Operating Costs ............................................................................................... 1-15
1.14 Economic Analysis .............................................................................................................. 1-17
1.15 Interpretation and Conclusions .......................................................................................... 1-18
1.16 Recommendations ............................................................................................................... 1-20
For
per
sona
l use
onl
y

May 2012 Agbaou Gold Project Page X NI 43-101 Technical Report
SECTION 2. INTRODUCTION........................................................................... 2-1
2.1 Project Overview .................................................................................................................... 2-1
2.2 Purpose of Technical Report ................................................................................................ 2-1
2.3 Scope of Services .................................................................................................................. 2-2
2.3.1 SRK’s Scope of Services ................................................................................................. 2-2
2.3.2 SENET’s Scope of Services ............................................................................................. 2-2
2.3.3 Knight Piésold’s Scope of Services.................................................................................. 2-4
SECTION 3. RELIANCE ON OTHER EXPERTS .............................................. 3-1
SECTION 4. PROPERTY DESCRIPTION AND LOCATION............................. 4-1
4.1 Mineral Tenure ........................................................................................................................ 4-2
4.2 Underlying Agreements ......................................................................................................... 4-4
4.3 Permits and Authorization .................................................................................................... 4-5
4.4 Environmental and Social Considerations .......................................................................... 4-5
4.5 Mining Rights in Côte d'Ivoire .............................................................................................. 4-6
SECTION 5. ACCESSIBILITY, CLIMATE, LOCAL RESOURCES, INFRASTRUCTURE AND PHYSIOGRAPHY ......................................................... 5-1
5.1 Accessibility ........................................................................................................................... 5-1
5.2 Local Resources and Infrastructure .................................................................................... 5-1
5.3 Climate .................................................................................................................................... 5-1
5.4 Physiography.......................................................................................................................... 5-1
SECTION 6. HISTORY ...................................................................................... 6-1
6.1 Prior Ownership of the Property and Exploration .............................................................. 6-1
6.2 Historical Mineral Resource and Mineral Reserve Estimates ........................................... 6-1
SECTION 7. GEOLOGICAL SETTING AND MINERALIZATION ..................... 7-1
7.1 Regional Geology ................................................................................................................... 7-1
7.2 Property Geology ................................................................................................................... 7-3
SECTION 8. DEPOSIT TYPES.......................................................................... 8-1
For
per
sona
l use
onl
y

May 2012 Agbaou Gold Project Page XI NI 43-101 Technical Report
SECTION 9. EXPLORATION ............................................................................ 9-1
9.1 SRK Comments ...................................................................................................................... 9-2
SECTION 10. DRILLING ................................................................................... 10-1
10.1 Introduction .......................................................................................................................... 10-1
10.2 Drilling Procedures .............................................................................................................. 10-2
10.2.1 Drillhole Collar Location ................................................................................................. 10-2
10.2.2 Down-hole Surveying Procedures.................................................................................. 10-2
10.2.3 Reverse Circulation Procedures .................................................................................... 10-2
10.2.4 Diamond Drilling Procedures ......................................................................................... 10-2
10.2.5 RC and Core Sampling Procedures ............................................................................... 10-2
10.2.6 Drilling Orientation Procedures ...................................................................................... 10-3
10.3 Trenching and Pitting .......................................................................................................... 10-3
10.4 Drilling ................................................................................................................................... 10-3
10.5 Drilling Pattern and Density ................................................................................................ 10-3
10.6 SRK Comments .................................................................................................................... 10-3
SECTION 11. SAMPLE PREPARATION, ANALYSES AND SECURITY ......... 11-1
11.1 Sampling and Logging Procedures ................................................................................... 11-1
11.1.1 Sampling and Logging for Reverse Circulation Drilling.................................................. 11-1
11.1.2 Sampling and Logging for Diamond Drilling ................................................................... 11-1
11.2 Sample Recovery ................................................................................................................. 11-2
11.3 Sample Quality ..................................................................................................................... 11-2
11.4 Specific Gravity Data ........................................................................................................... 11-3
11.5 Quality Assurance and Quality Control Programs ........................................................... 11-4
SECTION 12. DATA VERIFICATION ................................................................ 12-1
12.1 ENDEAVOUR Field Duplicates............................................................................................ 12-1
12.2 Certified Reference Materials.............................................................................................. 12-5
12.3 Blanks .................................................................................................................................... 12-5
12.4 Umpire Laboratory Results ................................................................................................. 12-6
12.4.1 Duplicate Samples Referee Laboratory 1 ...................................................................... 12-6
12.4.2 Certified Reference Materials Submitted to SGS Ghana ............................................. 12-10
12.4.3 Duplicate Samples Referee Laboratory 2 .................................................................... 12-10
12.4.4 Certified Reference Materials Submitted to SGS Canada ........................................... 12-11
For
per
sona
l use
onl
y

May 2012 Agbaou Gold Project Page XII NI 43-101 Technical Report
12.5 SRK Comments .................................................................................................................. 12-15
SECTION 13. MINERAL PROCESSING AND METALLURGICAL TESTING .. 13-1
13.1 Background .......................................................................................................................... 13-1
13.2 Review of the Initial Feasibility Metallurgical Testwork ................................................... 13-2
13.3 Limitations of the Initial Feasibility Study ......................................................................... 13-4
13.4 Comminution Circuit Review .............................................................................................. 13-4
13.5 EOS Metallurgical Testwork Sample Selection ................................................................. 13-6
13.6 Metallurgical Test Program (EOS) ...................................................................................... 13-7
13.7 EOS Metallurgical Results ................................................................................................... 13-7
13.7.1 Head Analysis ................................................................................................................ 13-8
13.7.2 Gravity Recoverable Gold .............................................................................................. 13-8
13.7.3 High Shear Reactors (HSR) Testwork ........................................................................... 13-8
13.7.4 Oxygenation Testwork ................................................................................................. 13-11
13.7.5 Composite Leach Kinetic Results by Percentage Solids (w/w) ................................... 13-11
13.7.6 Preg- Robbing Testwork .............................................................................................. 13-12
13.7.7 Variability Preg-Robbing Testwork ............................................................................... 13-13
13.7.8 Thickening and Rheology Testwork ............................................................................. 13-14
13.7.9 Recommendations for Design Values .......................................................................... 13-17
13.7.10 Recommendations for Further Testwork (Post EOS Testwork) ............................... 13-17
SECTION 14. MINERAL RESOURCE ESTIMATES ......................................... 14-1
14.1 Introduction .......................................................................................................................... 14-1
14.2 Resource Estimation Procedures ...................................................................................... 14-1
14.3 Resource Database .............................................................................................................. 14-2
14.4 Solid Body Modelling ........................................................................................................... 14-2
14.4.1 Primary Mineralisation .................................................................................................... 14-2
14.4.2 Surface Mineralisation .................................................................................................... 14-5
14.4.3 Weathering Zones .......................................................................................................... 14-5
14.5 Compositing ......................................................................................................................... 14-5
14.6 Evaluation of Outliers .......................................................................................................... 14-8
14.7 Statistical Analysis and Variography ............................................................................... 14-10
14.8 Block Model and Grade Estimation .................................................................................. 14-19
14.8.1 Block Size Optimization ............................................................................................... 14-19
14.8.2 Sample Number Optimization ...................................................................................... 14-23
14.8.3 Search Orientation Optimization .................................................................................. 14-29
For
per
sona
l use
onl
y

May 2012 Agbaou Gold Project Page XIII NI 43-101 Technical Report
14.8.4 Kriging Parameters....................................................................................................... 14-32
14.8.5 Model Validation ........................................................................................................... 14-32
14.9 Recoverable Resource Modelling..................................................................................... 14-38
14.9.1 Uniform Conditioning .................................................................................................... 14-39
14.9.2 Multiple Indicator Kriging .............................................................................................. 14-46
14.10 Mineral Resource Classification ................................................................................... 14-57
14.11 Mineral Resource Statement ......................................................................................... 14-58
SECTION 15. MINERAL RESERVE ESTIMATES ............................................ 15-1
15.1 Mining Approach .................................................................................................................. 15-1
15.1.1 Resource Block Model ................................................................................................... 15-1
15.1.2 Geotechnical Investigation ............................................................................................. 15-1
15.1.3 Gap Analysis for Pit Slope Design ................................................................................. 15-2
15.2 Open Pit Optimisation ......................................................................................................... 15-2
15.2.1 Slope Angles .................................................................................................................. 15-3
15.2.2 Mining Costs ................................................................................................................... 15-3
15.2.3 Processing and General Administration Cost ................................................................ 15-3
15.2.4 Mining Factors ................................................................................................................ 15-4
15.2.5 Gold Price and Royalties ................................................................................................ 15-4
15.3 Optimisation Results ........................................................................................................... 15-4
15.3.1 Cut-off Grade Calculation ............................................................................................... 15-4
15.3.2 Optimisation Results – Mining Contractor Option .......................................................... 15-4
15.3.3 Selection of Optimum Pit Shell ....................................................................................... 15-6
15.3.4 Sensitivity Analysis ......................................................................................................... 15-6
15.4 Practical Pit Design .............................................................................................................. 15-7
15.4.1 Description ..................................................................................................................... 15-7
15.4.2 Mineral Reserves ......................................................................................................... 15-12
15.4.3 Comparison with Whittle Results ................................................................................. 15-12
15.5 Waste Dump Design .......................................................................................................... 15-12
15.6 Mine Production Schedule ................................................................................................ 15-14
15.6.1 Description ................................................................................................................... 15-14
SECTION 16. MINING METHODS .................................................................... 16-1
16.1 Introduction .......................................................................................................................... 16-1
16.1.1 Mining Equipment Requirements ................................................................................... 16-1
16.1.2 Mine Work Schedule ...................................................................................................... 16-2
16.1.3 Open Pit Dewatering ...................................................................................................... 16-3
16.1.4 Mine Infrastructure ......................................................................................................... 16-4
16.1.5 Mining Manpower ........................................................................................................... 16-6
For
per
sona
l use
onl
y

May 2012 Agbaou Gold Project Page XIV NI 43-101 Technical Report
SECTION 17. RECOVERY METHODS ............................................................. 17-1
17.1 Process Design Criteria ....................................................................................................... 17-1
17.1.1 Introduction ..................................................................................................................... 17-1
17.1.2 Ore Characteristics......................................................................................................... 17-1
17.1.3 Operating Schedule ....................................................................................................... 17-2
17.1.4 Plant Recovery ............................................................................................................... 17-3
17.1.5 Air Services and Oxygen .............................................................................................. 17-12
17.2 Process Plant...................................................................................................................... 17-14
17.2.1 Process Plant Description ............................................................................................ 17-14
SECTION 18. PROJECT INFRASTRUCTURE ................................................. 18-1
18.1 Introduction .......................................................................................................................... 18-1
18.2 Mining Facilities ................................................................................................................... 18-3
18.2.1 Mining Administrative Building ....................................................................................... 18-3
18.2.2 Mining Equipment Workshop ......................................................................................... 18-3
18.2.3 Mining Equipment Refueling Facility .............................................................................. 18-3
18.2.4 Explosive Magazine ....................................................................................................... 18-4
18.3 Processing Plant & Administration Facilities ................................................................... 18-4
18.3.1 In-Plant Access Roads ................................................................................................... 18-4
18.3.2 Plant and Administration Buildings................................................................................. 18-4
18.3.3 Plant and Administration Warehousing .......................................................................... 18-5
18.3.4 Process Plant Site Drainage .......................................................................................... 18-6
18.3.5 Sewage Disposal............................................................................................................ 18-6
18.4 Access Road ......................................................................................................................... 18-6
18.5 Water Supply ........................................................................................................................ 18-6
18.5.1 Water Supply Dam ......................................................................................................... 18-6
18.5.2 Potable Water Distribution ........................................................................................... 18-10
18.5.3 Fire Water Distribution ................................................................................................. 18-10
18.6 Communications ................................................................................................................ 18-10
18.7 Security ............................................................................................................................... 18-10
18.8 Accommodation (Main Camp) .......................................................................................... 18-11
18.9 Power Supply (GRID) ......................................................................................................... 18-11
18.9.1 Standby Power Plant .................................................................................................... 18-12
18.9.2 Power Distribution ........................................................................................................ 18-12
18.9.3 Fuel Storage ................................................................................................................. 18-13
18.10 Tailings Storage Facility ................................................................................................ 18-13
18.10.1 Introduction and Design Criteria ............................................................................... 18-13
18.10.2 Site Selection and Access to the Site ...................................................................... 18-15
For
per
sona
l use
onl
y

May 2012 Agbaou Gold Project Page XV NI 43-101 Technical Report
18.10.3 TSF Construction and Wall Raising Procedure ....................................................... 18-15
18.10.4 Stability Analysis ...................................................................................................... 18-19
18.10.5 Tailings Distribution and Deposition ......................................................................... 18-20
18.10.6 Tailings Disposal Method ......................................................................................... 18-21
18.10.7 Hydrology and Water Management ......................................................................... 18-21
18.10.8 Geotechnical Conditions at the TSF Site ................................................................. 18-22
18.10.9 Water Balance .......................................................................................................... 18-22
18.10.10 Return Water System ............................................................................................... 18-22
18.10.11 Safety Classification ................................................................................................. 18-22
18.11 Country Infrastructure ................................................................................................... 18-23
18.11.1 Road ......................................................................................................................... 18-23
18.11.2 Port Facilities ............................................................................................................ 18-23
18.11.3 Rail ........................................................................................................................... 18-24
18.11.4 Air ............................................................................................................................. 18-24
18.12 Logistics and Transport ................................................................................................ 18-25
18.12.1 Logistics Transit Time .............................................................................................. 18-25
18.12.2 Routing Abidjan to Agbaou Village........................................................................... 18-25
18.12.3 Documentation ......................................................................................................... 18-26
SECTION 19. MARKET STUDIES AND CONTRACTS .................................... 19-1
SECTION 20. ENVIRONMENTAL STUDIES, PERMITTING AND SOCIAL OR COMMUNITY IMPACT ......................................................................................... 20-1
20.1 Introduction .......................................................................................................................... 20-1
SECTION 21. CAPITAL AND OPERATING COSTS ........................................ 21-1
21.1 Project Requirements .......................................................................................................... 21-1
21.1.1 Introduction ..................................................................................................................... 21-1
21.1.2 Scope of the Estimate .................................................................................................... 21-1
21.1.3 Responsibilities .............................................................................................................. 21-1
21.1.4 Estimate Accuracy.......................................................................................................... 21-1
21.1.5 Exclusions ...................................................................................................................... 21-1
21.1.6 Escalation ....................................................................................................................... 21-2
21.1.7 Exchange Rates ............................................................................................................. 21-2
21.1.8 Taxes, Duties and Fees ................................................................................................. 21-2
21.2 Capital Cost Estimate .......................................................................................................... 21-2
21.2.1 Capital Cost Summary ................................................................................................... 21-2
21.2.2 Mining Capital Estimate ................................................................................................. 21-4
21.2.3 Process Plant and Infrastructure .................................................................................... 21-4
21.3 Sustaining, Rehabilitation and Closure Costs ................................................................ 21-12
21.3.1 Mining Rehabilitation, Mining Contractor Demobilization and Closure Costs .............. 21-12
21.3.2 Tailings Sustaining, Rehabilitation and Closure Costs ................................................ 21-14
21.3.3 General Sustaining Capital .......................................................................................... 21-15
For
per
sona
l use
onl
y

May 2012 Agbaou Gold Project Page XVI NI 43-101 Technical Report
21.4 Operating Cost Estimate ................................................................................................... 21-15
21.4.1 Introduction ................................................................................................................... 21-15
21.4.2 Processing Plant Operating Costs ............................................................................... 21-16
21.4.3 General and Administration Costs ............................................................................... 21-20
21.4.4 Assay Laboratory Costs ............................................................................................... 21-23
21.4.5 Refining & Royalties ..................................................................................................... 21-24
SECTION 22. ECONOMIC ANALYSIS ............................................................. 22-1
22.1 Marketing .............................................................................................................................. 22-1
22.1.1 Refining Charges, Gold Pricing & Revenue ................................................................... 22-1
22.2 Financial Analysis ................................................................................................................ 22-1
22.2.1 Evaluation Method.......................................................................................................... 22-1
22.2.2 Assumptions ................................................................................................................... 22-1
22.2.3 Financial Analysis Results ............................................................................................. 22-2
22.3 Discussion ............................................................................................................................ 22-7
SECTION 23. ADJACENT PROPERTIES ........................................................ 23-1
SECTION 24. OTHER RELEVANT DATA AND INFORMATION ..................... 24-1
24.1 Implementation ..................................................................................................................... 24-1
24.1.1 Introduction ..................................................................................................................... 24-1
24.1.2 ENDEAVOUR Execution Strategy ................................................................................. 24-1
24.1.3 EPCM ............................................................................................................................. 24-4
24.1.4 Construction ................................................................................................................... 24-5
24.1.5 Commissioning ............................................................................................................... 24-5
24.1.6 Project Schedule ............................................................................................................ 24-5
24.2 Design Criteria ...................................................................................................................... 24-7
24.2.1 Engineering Design Criteria ........................................................................................... 24-7
24.2.2 Electrical Design Criteria ................................................................................................ 24-9
SECTION 25. INTERPRETATION AND CONCLUSIONS ................................ 25-1
25.1 Mineral Resource ................................................................................................................. 25-1
25.2 Mining .................................................................................................................................... 25-3
25.3 Process Plant and Economic Evaluation .......................................................................... 25-4
SECTION 26. RECOMMENDATIONS ............................................................... 26-1
26.1 Mineral Resource ................................................................................................................. 26-1
26.2 Mining .................................................................................................................................... 26-1
For
per
sona
l use
onl
y

May 2012 Agbaou Gold Project Page XVII NI 43-101 Technical Report
26.3 Metallurgical Testwork ........................................................................................................ 26-1
SECTION 27. REFERENCES ........................................................................... 27-1
For
per
sona
l use
onl
y

May 2012 Agbaou Gold Project Page XVIII NI 43-101 Technical Report
LIST OF TABLES Table 1.1: Summary of Initial Feasibility Metallurgical Testwork ............................................................... 1-4
Table 1.2: Summary of Head Assays and SG ........................................................................................... 1-5
Table 1.3: Summary of Gravity Recoveries ............................................................................................... 1-5
Table 1.4: Optimum Leach Parameters ..................................................................................................... 1-6
Table 1.5: Selected Design Values ........................................................................................................... 1-7
Table 1.6: Mineral Resource Statement, Agbaou Project, SRK Consulting (Pty) Ltd., 30th March 2012
using MIK at a 0.3 g/t cut-off ................................................................................................... 1-10
Table 1.7: Summary of Agbaou Mineral Reserves .................................................................................. 1-12
Table 1.8: Capital Cost Summary ........................................................................................................... 1-16
Table 1.9: Overall Operating LOM Costs ................................................................................................ 1-17
Table 1.10: Assumptions Used in the Financial Evaluation ....................................................................... 1-17
Table 1.11: Summary of Financial Analysis Results .................................................................................. 1-18
Table 4.1: Corner Co-ordinates for Proposed Agbaou Exploitation Permit Area ....................................... 4-2
Table 6.1: Goldivoire, Resource Estimate (ID2. July, 1998) ...................................................................... 6-2
Table 6.2: Goldivoire, Resource Estimate (MIK. February, 1999) ............................................................. 6-2
Table 6.3: DRD, Resource Estimate (April, 2000) ..................................................................................... 6-2
Table 6.4: Coffey Mining, Resource Estimate (February, 2008) ................................................................ 6-3
Table 10.1: Summary of Drilling and Sampling at the Agbaou Gold Project .............................................. 10-1
Table 11.1: Average Densities Applied per Weathering Zone in the Tonnage Calculation ........................ 11-4
Table 12.1: Summary Statistics for Field Duplicate Samples. .................................................................... 12-1
Table 12.2: Summary Statistics for Field Duplicate Samples ..................................................................... 12-2
Table 12.3: Summary Statistics of CRM’s Analysed by BV Laboratory ..................................................... 12-5
Table 12.4: Summary Statistics of Blank Materials Analysed by BV Laboratory ........................................ 12-5
Table 12.5: Summary Statistics for Umpire Laboratory Duplicate Samples ............................................... 12-6
Table 12.6: Descriptive Statistics of Final Dataset of Umpire Laboratory Duplicates ................................. 12-6
Table 12.7: Summary of CRM Results Submitted to Referee Laboratory 1 ............................................. 12-10
Table 12.8: Summary Statistics for Referee Laboratory 2 Duplicate Pulp Samples ................................ 12-10
Table 12.9: Descriptive Statistics of Referee Laboratory 2 Duplicate Pulp Samples (<20g/t) .................. 12-11
Table 12.10: Summary of CRM Results Submitted to Referee Laboratory 2 ............................................. 12-11
Table 13.1: Head Assays ........................................................................................................................... 13-2
Table 13.2: Comminution Results .............................................................................................................. 13-3
Table 13.3: Recovery Results .................................................................................................................... 13-4
Table 13.4: Comminution Results Summary .............................................................................................. 13-5
Table 13.5: Viscosity & Shear Rate Summary ........................................................................................... 13-5
Table 13.6: Head Assays ........................................................................................................................... 13-8
Table 13.7: Gravity Gold Recovery ............................................................................................................ 13-8
Table 13.8: Summary Results: Effect of using a HSR ............................................................................... 13-9
Table 13.9: Effect of Sparging Air / Oxygen on Gold Extraction .............................................................. 13-11
Table 13.10: Saprolite Leach Kinetics at Varied Percent Solids. ............................................................... 13-12
Table 13.11: Bedrock Leach Kinetics at Varied Percent Solids ................................................................. 13-12
Table 13.12: Effect of Preg-Robbing .......................................................................................................... 13-13
Table 13.13: Variability Preg-Robbing Results Summary .......................................................................... 13-14
Table 13.14: Thickening and Rheology Results......................................................................................... 13-14
Table 13.15: Variability Leach Results on Middles and Tails ..................................................................... 13-16
For
per
sona
l use
onl
y

May 2012 Agbaou Gold Project Page XIX NI 43-101 Technical Report
Table 13.16: Optimum Leach Parameters ................................................................................................. 13-17
Table 13.17: Selected Design Values ........................................................................................................ 13-17
Table 14.1: Gold Grade and Sample Length Statistics for Samples Within Mineralised Zones ................. 14-6
Table 14.2: Statistics of Standard and Non-Standard Length Composites ................................................ 14-8
Table 14.3: Statistics of Composites for Gold by Mineralised Zone ........................................................... 14-8
Table 14.4: Summary of Capping Applied in Ordinary Kriged Estimate Per Zone ................................... 14-10
Table 14.5: Statistics of Gaussian Gold Variables per Zone .................................................................... 14-16
Table 14.6: Modelled Semi-Variogram Parameters per Zone .................................................................. 14-17
Table 14.7: Block Size Optimisation Scenarios ....................................................................................... 14-20
Table 14.8: Summary of Search Neighbourhood Parameters ................................................................. 14-31
Table 14.9: Samples and Composites Versus Kriged Means Per Zone .................................................. 14-33
Table 14.10: Declustering Statistics for Gaussian Anamorphosis Modelling ............................................. 14-39
Table 14.11: Statistics of the Gaussian Variables ...................................................................................... 14-40
Table 14.12: Support Correction Parameters ............................................................................................ 14-40
Table 14.13: Comparison of the OK and UC Estimation Results at a 0.5 g/t Cut-Off ................................ 14-46
Table 14.14: Comparison of the OK and UC Estimation Results at a 1.0 g/t Cut-Off ................................ 14-46
Table 14.15: Zone 1 Semi-Variogram Model Parameters .......................................................................... 14-51
Table 14.16: Zone 2 Semi-Variogram Model Parameters .......................................................................... 14-52
Table 14.17: Zone 9 Semi-Variogram Model Parameters .......................................................................... 14-53
Table 14.18: Volume Variance Ratios for Each MIK Zone ......................................................................... 14-54
Table 14.19: Statistics of OK Estimates and MIK e-type Means ................................................................ 14-55
Table 14.20: Assumptions Considered for Conceptual Open Pit Optimization .......................................... 14-59
Table 14.21: Mineral Resource Statement, Agbaou Project, SRK Consulting (Pty) Ltd., 30th March 2012 using
MIK at a 0.3 g/t cut-off ........................................................................................................... 14-60
Table 14.22: Mineral Resource Reported at Incremental Cut-off Grades, Agbaou Project, SRK Consulting
(Pty) Ltd, 30th
March 2012 using MIK .................................................................................... 14-61
Table 15.1: Mineral Resource Input for Optimisation (Using a 0.5g/t Au cut-off). ...................................... 15-1
Table 15.2: Processing Operating Cost for the Open Pit Optimization ...................................................... 15-3
Table 15.3: Whittle Optimisation Results (Contractor Option) .................................................................... 15-5
Table 15.4: Summary of Agbaou Mineral Reserves ................................................................................ 15-12
Table 15.5: Comparison of Practical Pit with Whittle Shell....................................................................... 15-12
Table 15.6: Details of Waste Dumps ....................................................................................................... 15-13
Table 15.7: Waste Dumping Volumes ..................................................................................................... 15-14
Table 16.1: Equipment Selection for Mine Operation by Contractor .......................................................... 16-2
Table 16.2: Scheduled Working Periods .................................................................................................... 16-3
Table 17.1: Design Criteria – Ore Characteristics ...................................................................................... 17-2
Table 17.2: Design Criteria – Operating Schedule ..................................................................................... 17-2
Table 17.3: Design Criteria – Recovery ..................................................................................................... 17-3
Table 17.4: Design Criteria – Crushing and Ore Stockpiling ...................................................................... 17-4
Table 17.5: Design Criteria – Milling .......................................................................................................... 17-5
Table 17.6: Design Criteria – Classification and Trash Handling ............................................................... 17-6
Table 17.7: Design Criteria – Gravity ......................................................................................................... 17-6
Table 17.8: Design Criteria – CIL ............................................................................................................... 17-7
Table 17.9: Design Criteria – Cyanide Detoxification ................................................................................. 17-8
Table 17.10: Design Criteria – Acid Wash, Elution and Regeneration ......................................................... 17-9
For
per
sona
l use
onl
y

May 2012 Agbaou Gold Project Page XX NI 43-101 Technical Report
Table 17.11: Design Criteria – Electrowinning and Smelting ..................................................................... 17-10
Table 17.12: Design Criteria – Lime .......................................................................................................... 17-10
Table 17.13: Design Criteria – Sodium Cyanide ........................................................................................ 17-11
Table 17.14 Design Criteria – Caustic ...................................................................................................... 17-11
Table 17.15: Design Criteria – Sodium Metabisulphite .............................................................................. 17-11
Table 17.16: Design Criteria – Copper Sulphate ....................................................................................... 17-11
Table 17.17: Design Criteria – Hydrochloric Acid ...................................................................................... 17-12
Table 17.18: Design Criteria – Activated Carbon ....................................................................................... 17-12
Table 17.19: Design Criteria – Water Services .......................................................................................... 17-13
Table 18.1: Water Storage Dams – Catchment and Storage Capacities ................................................... 18-7
Table 18.2: Design Criteria – Tailings Storage Facility ............................................................................ 18-14
Table 18.3: TSF Available Capacity per Ore Feed Type ......................................................................... 18-16
Table 18.4: TSF Construction Sequencing .............................................................................................. 18-16
Table 18.5: Material Properties ................................................................................................................ 18-19
Table 18.6: Definitions of the Analyses Scenarios ................................................................................... 18-19
Table 18.7: Results of Analysis ................................................................................................................ 18-20
Table 18.8: Abidjan Port Facilities / Storage Capacities .......................................................................... 18-24
Table 21.1: Exchange Rates ...................................................................................................................... 21-2
Table 21.2: Capital Cost Summary ............................................................................................................ 21-3
Table 21.3: Summarised Construction Quantities ...................................................................................... 21-5
Table 21.4: Structural Steel and Platework Masses .................................................................................. 21-6
Table 21.5: Typical Shipping Costs of Container Types ............................................................................ 21-7
Table 21.6 : Cost Breakdown Summary ..................................................................................................... 21-8
Table 21.7: Cost of Drilling, Pump Installation and Aquifer Testing at the Agbaou Camp ......................... 21-8
Table 21.8: Water Supply and Storage Capital Cost Summary ................................................................. 21-9
Table 21.9: Mining Rehabilitation and Closure Costs .............................................................................. 21-13
Table 21.10: Rehabilitation and Closures Costs ........................................................................................ 21-15
Table 21.11: Overall Operating LOM Costs ............................................................................................... 21-15
Table 21.12: Overall Mining LOM Operating Cost ..................................................................................... 21-16
Table 21.13: Overall Process Plant LOM Operating Costs ........................................................................ 21-16
Table 21.14: LOM Reagents and Consumables Costs .............................................................................. 21-18
Table 21.15: LOM Power Costs ................................................................................................................. 21-19
Table 21.16: LOM Tailings Operating Costs .............................................................................................. 21-20
Table 21.17: LOM G&A Costs ................................................................................................................... 21-21
Table 21.18: LOM Assay Cost Summary ................................................................................................... 21-23
Table 21.19: Refining and Royalty Cost Summary .................................................................................... 21-24
Table 22.1: Assumptions Used in the Financial Evaluation ....................................................................... 22-2
Table 22.2: Summary of LOM Production, Capital and Operating Costs ................................................... 22-3
Table 22.3: Summary of Financial Analysis Results .................................................................................. 22-3
Table 22.4: LOM Project Cashflow ............................................................................................................ 22-5
Table 22.5: Gold Price Sensitivity .............................................................................................................. 22-6
Table 22.6: Capex Sensitivity .................................................................................................................... 22-6
Table 22.7: Operating Costs Sensitivity ..................................................................................................... 22-6
For
per
sona
l use
onl
y

May 2012 Agbaou Gold Project Page XXI NI 43-101 Technical Report
LIST OF FIGURES Figure 4.1: Map Showing the Location of the Agbaou Project .................................................................... 4-1
Figure 4.2: Mineral Tenure ......................................................................................................................... 4-3
Figure 5.1: Topography of the Project Area ................................................................................................ 5-2
Figure 7.1: Regional Geology ..................................................................................................................... 7-2
Figure 7.2: Local Geology .......................................................................................................................... 7-4
Figure 8.1: Mottled Quartz Vein in Drill Core in Fresh Rock ....................................................................... 8-1
Figure 8.2: Results of the Down-hole Sereoscopic Structural Analysis ...................................................... 8-2
Figure 8.3: Chipboard from RC Drilling Intersection of a Mineralized Quartz Vein ..................................... 8-3
Figure 8.4: Mineralized Quartz Vein Intersected by Diamond Drilling in Saprolite ...................................... 8-4
Figure 9.1: Distribution of Gold in Soil Samples ......................................................................................... 9-2
Figure 10.1: Distribution of Drilling by BHP and Goldivoire ......................................................................... 10-4
Figure 10.2: Distribution of Drilling by ERCI (2005 to 2008) ....................................................................... 10-5
Figure 10.3: Distribution of Drilling by ENDEAVOUR (2010 to 2011) ......................................................... 10-6
Figure 10.4: Final Distribution of Drilling Relative to the Designed Main Pit Outline ................................... 10-7
Figure 12.1: Scatter Plot of Field Duplicates in Reduced Dataset ............................................................... 12-3
Figure 12.2: H.A.R.D Plot of Field Duplicates in Reduced Dataset ............................................................. 12-4
Figure 12.3: Scatter Plot of Umpire Laboratory Duplicate Analyses in the Reduced Dataset ..................... 12-7
Figure 12.4: H.A.R.D Plot of Umpire Laboratory Duplicate Analyses in the Reduced Dataset ................... 12-8
Figure 12.5: QQ Plot of Umpire Laboratory Duplicate Analyses in the Reduced Dataset ........................... 12-9
Figure 12.6: Scatter Plot of the Original Analyses Versus the Results of Referee Laboratory 2 ............... 12-12
Figure 12.7: H.A.R.D Plot of the Original Analyses Versus the Results of Referee Laboratory 2 ............. 12-13
Figure 12.8: QQ Plot of Original and Referee Laboratory 2 Results (<20 g/t Au) ..................................... 12-14
Figure 13.1: EOS Testwork Flowsheet ....................................................................................................... 13-7
Figure 13.2: Bedrock Rate of Gold Dissolution With and Without High Shear Reactor ............................. 13-10
Figure 13.3: Saprolite Rate of Gold Dissolution With and Without High Shear Reactor ............................ 13-10
Figure 13.4: Slurry Yield Stress vs. Percent Solids Curves....................................................................... 13-15
Figure 14.1: Primary Mineralisation Wireframe Models .............................................................................. 14-4
Figure 14.2: Zone 1 Capping Analysis Charts ............................................................................................. 14-9
Figure 14.3: Histograms of Gold Grade for the Zone 1 Group of Zones ................................................... 14-12
Figure 14.4: Histograms of Gold Grade for the Zone 2 Group of Zones ................................................... 14-13
Figure 14.5: Histograms of Gold Grade for the Individual Zones .............................................................. 14-14
Figure 14.6: Histograms of Gold Grade for the Western Area Zones ....................................................... 14-15
Figure 14.7: Gaussian Semi-variograms for Modelled Zones ................................................................... 14-18
Figure 14.8: QKNA Results for Block Size Selection on Zone 1 ............................................................... 14-21
Figure 14.9: QKNA Results for Block Size Selection on Zone 2 ............................................................... 14-22
Figure 14.10: QKNA Results for Sample Number Selection on Zone 1 ...................................................... 14-25
Figure 14.11: QKNA Results for Sample Number Selection on Zone 2 ...................................................... 14-26
Figure 14.12: QKNA Results for Sample Number Selection on Zone 3 and 9 ............................................ 14-27
Figure 14.13: QKNA Results for Sample Number Selection on Zone 11 and 51 ........................................ 14-28
Figure 14.14: Search Domains Main, Main/Central, South/Central and South for Zones 1 to 10 ............... 14-30
Figure 14.15: Search Domains West for Zones 51 to 53 ............................................................................ 14-30
Figure 14.16: Swath Plots of the Main and South Areas for Zones 1 – 10 .................................................. 14-35
Figure 14.17: Swath Plots of the Main and South Areas for Zone 1 ........................................................... 14-36
Figure 14.18: Swath Plots of the Main and South Areas for Zone 2 ........................................................... 14-37
For
per
sona
l use
onl
y

May 2012 Agbaou Gold Project Page XXII NI 43-101 Technical Report
Figure 14.19: Swath Plots of the Laterite (Zone 11) .................................................................................... 14-38
Figure 14.20: Grade Tonnage Curves for Zone 1 and Zone 2 .................................................................... 14-42
Figure 14.21: Grade Tonnage Curves for Zone 3 and Zone 4 .................................................................... 14-43
Figure 14.22: Grade Tonnage Curves for Zone 7 and Zone 9 .................................................................... 14-44
Figure 14.23: Zone 1 Indicator Semi-Variograms for Indicators up to 3 g/t ................................................. 14-48
Figure 14.24: Zone 2 Indicator Semi-Variograms for Indicators up to 3 g/t ................................................. 14-49
Figure 14.25: Zone 9 Indicator Semi-Variograms for Indicators up to 3 g/t ................................................. 14-50
Figure 14.26: Grade Tonnage Curves Comparison Between MIK and UC for Zones 1 and 2 .................... 14-56
Figure 15.1: Whittle Pit by Pit Graph Optimisation Results (Contractor Option).......................................... 15-5
Figure 15.2: Optimised Pit Shell Selected for Practical Pit Design .............................................................. 15-6
Figure 15.3: Sensitivity Analysis Graph ...................................................................................................... 15-7
Figure 15.4: Haul Road Widths ................................................................................................................... 15-8
Figure 15.5: View of the Agbaou Intermediate Pits ..................................................................................... 15-9
Figure 15.6: View of the Agbaou Final Pits ............................................................................................... 15-10
Figure 15.7: View of the Agbaou Final Pits Showing the Plant Area and the Waste Dump ...................... 15-11
Figure 15.8: Vertical Sections Through Waste Dumps ............................................................................. 15-13
Figure 16.1: Layout of Surface Access Roads, Explosive Magazine and ROM Stockpile Location ............ 16-5
Figure 17.1: Process Flow Diagram .......................................................................................................... 17-14
Figure 17.2: Plant General Layout ............................................................................................................ 17-15
Figure 18.1: Site General Layout ................................................................................................................ 18-2
Figure 18.2: Water Storage Dams – Options 1 to 5 .................................................................................... 18-8
Figure 18.3: Water Storage Dam Option 3 Capacity Curves....................................................................... 18-9
Figure 18.4: TSF Phase 1 ......................................................................................................................... 18-18
Figure 18.5: Map of Country ..................................................................................................................... 18-23
Figure 18.6: Abidjan Port Map .................................................................................................................. 18-24
Figure 18.7: Logistics Transit Time Summary ........................................................................................... 18-25
Figure 18.8: Map Showing Travel Route Options to Agbaou .................................................................... 18-25
Figure 22.1: NPV Sensitivity at 5% Discount Rate ...................................................................................... 22-7
Figure 22.2: IRR Sensitivity at 5% Discount Rate ....................................................................................... 22-7
Figure 24.1: Owner’s Project Implementation Team ................................................................................... 24-3
Figure 24.2: Project Execution Schedule .................................................................................................... 24-6
For
per
sona
l use
onl
y

May 2012 Agbaou Gold Project Page XXIII NI 43-101 Technical Report
LIST OF APPENDICES Appendix 3-A: Opinion from Theodore Heogan and Michel Ette Advocates Associes.
Appendix 4-A: Decree and Exploitation License
For
per
sona
l use
onl
y

May 2012 Agbaou Gold Project Page 1-1 NI 43-101
Technical Report
SECTION 1. SUMMARY
1.1 INTRODUCTION Endeavour Mining (ENDEAVOUR) commissioned the following entities to review the
following aspects and optimize the previous feasibility study conducted in September 2009:
• SRK Consulting (South Africa) – Mineral Resource, Mineral Reserve and Mining; • SENET (South Africa) – Process Plant, Infrastructure, Economic Evaluation, and
overall study management; • Knight Piésold (South Africa) – Tailings Management Facility and Water Storage
Dam; • Metallurgical Testwork Consultants – Mintek (South Africa), Maelgwyn Mineral
Services (South Africa), Paterson & Cooke (South Africa), Knelson Africa (South Africa);
• Orway Mineral Consultants (Australia) – Comminution Circuit Design.
The purpose of this study is to demonstrate the viability of the Agbaou Project through:
• Updated mineral resources and reserves; • Economic evaluation taking into account improved resources/reserves and updated
capital and operating costs.
This technical report is a complete summary of the full study as prepared by SRK
Consulting, SENET, Knight Piésold Consulting (2012).
The Agbaou Gold Project is located in Côte d’Ivoire, West Africa on a property 200km north-
west of Abidjan. The concession is reached by tarred and secondary gravel roads and within
10km from the national electrical power grid. The small town of Agbahou is located 12km
north-east of the regional town of Didoko.
1.2 TENURE, UNDERLYING AGREEMENTS, PERMITS AND RIGHTS The mineral right to the project, in the form of a renewable exploration permit, is registered in
the name of Etruscan Resources Côte d’Ivoire SARL, a fully owned subsidiary of
ENDEAVOUR. The current exploration permit expired on 22nd March 2007, but in terms of a
legal opinion (19th August 2011) the permit remains valid since renewal applications have
been submitted and recognized on 22nd March 2007 and 6th October 2009 and with a
Modified Map submitted in October 2009. A ministerial approval to commence with the
development of the mine was given on 16th August 2010.
1.3 PROJECT HISTORY Alluvial gold has been known for some time in this area. Gold mineralisation in bedrock was
first reported in the Agbaou area during the late 1980’s, while the ground was held by a joint-
venture between BHP Minerals and SODEMI. The joint-venture conducted exploration
between 1988 and 1994
Between 1996 and 2000 the property was held by Goldivoire S.A.R.L., controlled by Jandera
For
per
sona
l use
onl
y

May 2012 Agbaou Gold Project Page 1-2 NI 43-101
Technical Report
Resources NL (88.4%), a wholly owned subsidiary of Diversified Mineral Resources NL
which was taken over by Hargraves Resources NL in mid-1999. Hargraves Resources were
in turn taken over by Durban Roodepoort Deeps of South Africa in December 1999.
Goldivoire undertook exploration during the period 1996 to 2000. The government of Côte
d’Ivoire withdrew the Agbaou permit and on 27th November 2003, the Ministry of Mines and
Energy for Côte d’Ivoire subsequently granted the Agbaou exploration permit to Etruscan
Resources Côte d’Ivoire (Etruscan) as (Decree Number 2003-464).
After obtaining the project in 2003, Etruscan drilled an additional 179 boreholes and
conducted various studies. The combination of this information with the historic information
formed the basis for a Feasibility Study in 2009. Following this, Etruscan continued with a
sterilization and infill drilling programme from 2010 to 2011 by drilling an additional 85 holes
(7063 m), which required the redefinition of the Mineral Resources.
1.4 GEOLOGY AND MINERALIZATION The shear-zone hosted gold mineralization at the Agbaou deposit is within a sheared
volcano-sedimentary succession that was subjected to lower green-schist facies
metamorphism, forming the Birimian age Oumé Fetekro Greenstone Belt, surrounded by
granodioritic intrusions.
Gold occurs in a mesothermal auriferous sulphide (pyrite + pyrrhotite) assemblage
associated with quartz veins. The quartz veins are characterized by a wide range of quartz-
vein types, brecciation, boudinage, sericitic and carbonate alteration.
The mineralised quartz veins have a very distinctive texture that has been described as
“mottled”. These veins are easily identifiable in the diamond drilling core intersections from
the fresh rock.
1.5 EXPLORATION, DRILLING AND SAMPLING Etruscan’s evaluation of the Agbaou project area began in 2003 with the acquisition of the
Agbaou permit. Exploration has been carried out under the supervision of technically
qualified personnel applying standard industry approaches. Geochemical data quality has
routinely been assessed as part of on-going exploration procedures. All data acquired meets
or exceeds industry standards. All exploration work has been carried out by, or supervised
by technical personnel of the operator. Consultants and contractors have been engaged by
Etruscan for various activities including; sample collection, drilling and assaying.
Etruscan conducted detailed and regional soil geochemical surveys which identified the gold
mineralization at areas known as Agbaou, Agbaou South, Mbazo, Zehiri and Niafouta.
A total of 876 pits and 4 trenches were dug to explore the laterite resource but these results
were not used in the resource estimation.
A total of 514 holes (diamond and reverse circulation) were drilled at the Agbaou Project,
totalling 58,444m.
For
per
sona
l use
onl
y

May 2012 Agbaou Gold Project Page 1-3 NI 43-101
Technical Report
Only limited sample preparation was done on site and this pertains mainly to the splitting by
diamond saw of the core samples and the splitting of the percussion drilling chips with two
way riffle splitters. All crushing and milling was completed by independent commercial
laboratories and following standard industry practice. The samples of the last campaign were
submitted to the Bureau Veritas Mineral Laboratory Côte d’Ivoire (BV Laboratory), in Abidjan
for gold analyses using the fire assay method with an atomic absorption finish. An auditable
chain of custody was established for the sample handling, data reporting and database
capturing.
1.6 DATA VERIFICATION The reliability of the gold assay results was based on a well designed and implemented
quality assurance and quality control protocol that entail the analysis of blind blanks,
duplicates and certified reference materials. In addition, samples were also submitted to
umpire laboratories. The apparent coarse nature of the gold results in a high variability in the
field duplicate set. The laboratory returned very good results for the certified reference
materials. Similarly blank material returned acceptable results and SRK accepts the BV
Laboratory results.
The variation in results of the duplicate pulp samples submitted to the SGS laboratory in
Ghana and to the accredited SGS Laboratory in Canada indicates poor but acceptable
replication at the Umpire Laboratories.
SRK believes that the current quality systems in place at Agbaou to monitor the precision
and accuracy of the sampling and assaying, is adequate and that the laboratory returned
acceptable results for use in resource estimation.
1.7 MINERAL PROCESSING AND METALLURGICAL TESTING
Background In 2009, comminution and recovery metallurgical testwork was performed by Mintek in South
Africa on ore samples from the Agbaou deposits. The results were used in the initial
feasibility study to develop the process flowsheet.
In 2011 SENET reviewed the results from the initial feasibility study and with ENDEAVOUR
proposed a metallurgical test program whose results would support the process flowsheet
selection required for an Engineering Optimization Study (EOS).
Review of the Initial Feasibility Metallurgical Testwork The table below includes a summary of the initial feasibility metallurgical results generated
by Mintek in 2009.
For
per
sona
l use
onl
y

May 2012 Agbaou Gold Project Page 1-4 NI 43-101
Technical Report
Table 1.1: Summary of Initial Feasibility Metallurgical Testwork
Saprolite Bedrock
Units South North South North
HEAD ASSAY RESULTS
Ore grade g/t 1.88 1.69 1.09 3.67
Moisture content % 5 5 5 5
Specific gravity t/m3 1.69 1.69 2.79 2.83
Bulk density t/m3 1.01 1.01 1.67 1.7
COMMINUTION RESULTS
UCS-Average Mpa - - 102.9 100.5
BBWi(106µm)-Max kWh/t - - 12.54 15.22
BRWi-Max kWh/t - - 16.48 19.22
Ai-Max kWh/t - - 0.1729 0.1851
JK
A × B - - 23.3 22.9
Ta - - 0.40 0.46
RECOVERY RESULTS
Gravity recoverable gold % 23.2 20 22.7 31.4
CIL dissolution (no oxygen) % 90 83.8 90.8 90.6
CIL dissolution (with oxygen) % 92.2 93.1 - -
Overall gold recovery % 94.01 94.48 92.89 93.55
Cyanide consumptions
No oxygen kg/t 0.22 0.18 0.23 0.26
With oxygen kg/t 0.24 0.18 - -
Lime consumptions
No oxygen kg/t 3.01 2.97 0.52 0.53
With oxygen kg/t 2.99 2.97 - -
Comminution Circuit Review In 2011, OMC was requested to review the comminution results produced by Mintek during
the initial feasibility study and make recommendations for a suitable comminution circuit to
treat the Agbaou ore.
From OMC analysis, ENDEAVOUR selected a SAG milling, ball milling and pebble crushing
(SABC) circuit for treating the Agbaou ore based on the following:
• Power is relatively inexpensive in Côte d’Ivoire;
• The SABC circuit has a simple mode of operation, with advantages on operability
and maintenance.
Aim of EOS Metallurgical Testwork Following a review of the initial feasibility metallurgical test results, it was found that there
were limitations to this testwork therefore SENET and ENDEAVOUR proposed a test
program for the EOS. The aims of this testwork program were to:
• Look at areas where the plant design can be improved; • Conduct testwork to address the shortfalls of the initial feasibility study;
For
per
sona
l use
onl
y

May 2012 Agbaou Gold Project Page 1-5 NI 43-101
Technical Report
• Complete testwork required to satisfy a final feasibility study.
Saprolite and bedrock samples from the north and south deposit were received for the EOS
metallurgical testwork.
EOS Testwork Results
Head Assays and Specific Gravity (SG) Full elemental analysis and SG determination was conducted on the saprolite and bedrock
composites. The table below shows a summary of the head assays and SG.
Table 1.2: Summary of Head Assays and SG
Testwork Units Saprolite Bedrock
HEAD ASSAYS
Au-composite g/t 2.36 2.99
Au-variability g/t 2.61 2.08
SG-composite
2.79 2.85
SG-variability
2.80 2.89
Gravity Recoverable Gold GRG tests were conducted and plant GRG recoveries were predicted as shown in the table
below.
Table 1.3: Summary of Gravity Recoveries
Testwork Units Saprolite Bedrock
GRAVITY RECOVERY
GRG (lab) % 44.1 31.1
Mass pull % 0.73 0.85
Conc. grade g/t Au 127.1 90.7
GRG (plant predicted) % 30 20
High Shear Reactor (HSR) and Oxygenation Testwork HSR testwork was conducted to evaluate whether a High Shear Reactor could be used to
lower residence time, improve gold recovery and reduce reagent consumptions.
The results indicated that the HSR does lower cyanide consumptions and improve leach
kinetics but does not improve overall gold extraction. When air and oxygen sparging was
investigated to access the effect on gold recovery in was found that oxygen sparging
produced the best gold extraction. Oxygen sparging was therefore selected as part of the
plant design.
For
per
sona
l use
onl
y

May 2012 Agbaou Gold Project Page 1-6 NI 43-101
Technical Report
Composite Leach Kinetic Results by Percentage Solids (w/w) Saprolite and bedrock leach kinetic tests were performed at time intervals between 2hrs and
48hrs at varying percentage solids (w/w) to assess the leach kinetics of saprolite and
bedrock ores types.
The testwork indicated the following optimum leach conditions for saprolite and bedrock:
• Saprolite: 24hrs leach time at 40% solids;
• Bedrock: 32hrs leach time at 42% solids. (42% was selected for design
purposes as it is easily achievable with densifying cyclones)
Preg-Robbing Rate and Preg-Robbing Variability Tests Preg-robbing rate test were performed on the composite saprolite and composite bedrock
samples. The results indicated that the preg-robbers are most active in the initial stages of
leach. 28.12% and 15.92% gold was lost to preg-robbers in the first 2hrs of leach for the
saprolite and bedrock ore respectively.
Since the pre-robbing test on the composite sample showed that both ore types have high
preg-robbing characteristic, variability preg-robbing tests were conducted to see if the preg-
robbing issue occurred throughout the ore body. All the variability samples tested showed
the presence of preg-robbers.
Variability Leach Results on Middlings and Tails Variability leach tests were performed at optimum conditions to determine the dissolutions
and reagent consumptions. This was then compared to the optimum results to determine the
ores variability and it was observed that the ore was not highly variable.
Optimum Leach Parameters Selected leach parameters were varied to obtain optimum conditions for the design of the
leach circuit, including the following:
• Effect of cyanide addition.
• Effect of oxygen and air sparging
• Effect of percentage solids.
The table below is a summary of the optimum leach parameters selected.
Table 1.4: Optimum Leach Parameters
Optimum Leach Conditions
Saprolite Bedrock
Cyanide Addition 0.7kg/t 0.7kg/t
Residence Time 24hrs with oxygen sparging 32hrs with oxygen sparging
pH 10.50 10.50
Solids ( m/m) 40% 42%
Gravity Recovery (Lab) 44.1% 31.1%
Au Dissolution (CIL) (Midds and Tails) 97.14% 92.86
Overall Lab Au Recovery - Gravity & CIL 98.40% 95.08%
For
per
sona
l use
onl
y

May 2012 Agbaou Gold Project Page 1-7 NI 43-101
Technical Report
Thickening, Rheology and Viscosity Testwork Thickening testwork conducted on the saprolite and bedrock ore indicated that both post
leach slurries can be effectively thickened.
During the initial feasibility study it was observed on Saprolite ore that viscosity issues may
be encountered. In order to possibly increase cyclone overflow densities to higher values,
viscosity modifier testwork were conducted during this phase. The results showed that
viscosity modifiers did reduce the viscosity of the saprolite slurry.
Recommendations for Design Values Design values were selected from the testwork results for the treatment of the Agbaou ore
and are summarized below.
Table 1.5: Selected Design Values Units Saprolite Bedrock
Grind
80%-75µm 80%-75µm
Selected Milling Circuit
SABC SABC
Solids SG
2.79 2.82
Final Residue (Gravity-CIL) g/t Au 0.10 0.16
Cyanide Consumption kg/t 0.33 0.18
Lime Consumption kg/t 3.23 1.50
Leach Time Hrs. 24 32
Oxygen Sparge During Leach
yes yes
CIL Percent Solids % m/m 40 42
Thickening Flux Rate t/(m2.h) 0.2 0.3
1.8 MINERAL RESOURCE ESTIMATES SRK generated a new resource estimate as an update of the previous estimate by Coffey
Mining, completed in 2008, including additional drilling data acquired since then and revised
interpretations. SRK compiled a new database from the source information supplied by
ENDEAVOUR, and generated a new drill hole database independent from that used by
Coffey. SRK used the Coffey wireframes as a guide to the original interpretation of the
mineralized zones. The SRK interpretation, however, honors all the additional drilling
information, aimed to select a higher grade zone within the drill holes (i.e. is less tolerant of
internal dilution), and in places revised the interpretation of the position and continuity of
certain zones based on new information and matching of the gold tenor in the intersections.
SRK conducted a composite optimisation to select the 2m composite length used for all
data. From the 2m composites SRK modelled semi-variograms for six of the total of fourteen
zones, where there was sufficient data to obtain a reasonably structured semi-variogram.
The zones with insufficient data to generate robust semi-variograms borrowed semi-
variograms from zones with similar grade characteristics. SRK completed a Quantitative
Kriging Neighbourhood analysis to select the optimal search and estimation parameters for
each zone.
For
per
sona
l use
onl
y

May 2012 Agbaou Gold Project Page 1-8 NI 43-101
Technical Report
An initial Ordinary Kriged estimate was done, and followed by recoverable resource
estimation using two techniques. SRK were requested to use Uniform Conditioning (“UC”)
and Multiple Indicator Kriging (“MIK”) estimates to model the recoverable resources above a
range of cut-off values. The UC estimate was completed using a global change of support
based on the Discrete Gaussian Model and using the Information Effect. Only zones with
sufficient data and their own semi-variograms were subject to the UC.
For the same zones, SRK conducted a MIK estimate, defining semi-variograms for a range
of indicator cut-off’s, and then Kriging the indicators using the same search parameters as
used in the original Ordinary Kriged estimate. The Kriging of the indicators generated
conditional probabilities for a restricted set of specified cut-offs. In order to transform the
probability estimates into grade and tonnage proportions, the local conditional cumulative
density function (ccfd) is rebuilt for each block, using the Indirect Correction through
Permanence of Lognormal Distribution approach. To be consistent with the previous Coffey
MIK estimate no Information Effect was applied in the support correction, however the same
Selective Mining Unit (SMU) size was used in both the MIK and UC estimates (2.5m cubes).
The Ordinary Kriged, UC and MIK models were compared against each other, and also
validated against the source data at zero cut-off. The OK and UC estimates showed good
agreement both globally and locally when compared to the source data. The MIK results
showed very slightly elevated grades at zero cut-off for some zones, but showed good
agreement when compared to the Ordinary Kriged and UC estimates at zero cut-off.
The mineral resources have been classified considering the quality of data, including drilling,
logging, sampling and analytical quality. The slope of regression was used to measure the
quality of the estimates, and blocks with a slope of regression of greater than 0.7, typically in
the densely drilled areas the resource is classified in the measured category. The blocks
estimated in the first search pass, which approximated the semi-variogram range, and
satisfies the search parameter requirements in terms of number of samples, has been
classified in the indicated category. The blocks estimated in the second and third search
passes are classified in the inferred category.
CIM Definition Standards for Mineral Resources and Mineral Reserves (27th November
2010) defines a mineral resource as:
“A Mineral Resource is a concentration or occurrence of diamonds, natural solid inorganic
material, or natural solid fossilized organic material including base and precious metals, coal,
and industrial minerals in or on the Earth’s crust in such form and quantity and of such a
grade or quality that it has reasonable prospects for economic extraction. The location,
quantity, grade, geological characteristics and continuity of a Mineral Resource are known,
estimated or interpreted from specific geological evidence and knowledge.”
The “reasonable prospects for eventual economic extraction” requirement generally implies
that the quantity and grade estimates meet certain economic thresholds and that the mineral
resources are reported at an appropriate cut-off grade taking into account extraction
scenarios and processing recoveries.
For
per
sona
l use
onl
y

May 2012 Agbaou Gold Project Page 1-9 NI 43-101
Technical Report
In order to determine the quantities of material offering “reasonable prospects for economic
extraction” by an open pit, SRK used a pit optimizer and reasonable mining assumptions to
evaluate the proportions of the block model (Measured, Indicated and Inferred blocks) that
could be “reasonably expected” to be mined from an open pit.
The optimization parameters were selected based on the parameters defined for the reserve
pit optimisation using contractor mining, aside from the gold price, which was increased from
the US$1,200/t used for the reserve open pit to an intentionally optimistic US$2,000/oz. The
reader is cautioned that the results from this pit optimization are used solely for the purpose
of testing the “reasonable prospects for economic extraction” by an open pit and do not
represent an attempt to estimate mineral reserves. The results were used as a guide to
assist in the preparation of a mineral resource statement and to select an appropriate
resource reporting cut-off grade. From these parameters, a cut-off value of 0.3 g/t was
calculated, and this has been applied in the reporting of the mineral resources. The MIK
mineral resource estimate is summarised in and a range of cut-off grades in tables below.
For
per
sona
l use
onl
y

May 2012 Agbaou Gold Project Page 1-10 NI 43-101
Technical Report
Table 1.6: Mineral Resource Statement, Agbaou Project, SRK Consulting (Pty) Ltd., 30th March 2012 using MIK at a 0.3 g/t cut-off
Classification Zone kt Grade (Au (g/t) kozs
Measured 1 1,681 3.60 194
2 870 2.26 63
3 62 2.04 4
4 287 1.44 13
9 687 1.54 34
11 2,989 0.86 83
51 1,384 1.53 68
Total Measured 7,959 1.80 460
Indicated 1 2,318 2.71 202
2 2,369 2.20 168
3 504 1.51 25
4 882 1.24 35
5 617 6.18 123
6 326 3.77 40
7 969 2.28 71
9 325 1.14 12
10 267 1.59 14
11 503 1.23 20
51 313 1.25 13
52 236 0.99 8
53 146 0.94 4
Total Indicated 9,774 2.33 732
Total Measured and Indicated 17,733 2.09 1,192
Inferred 1 54 2.30 4
2 562 1.59 29
3 102 3.22 11
4 110 0.97 3
7 257 1.44 12
8 497 0.61 10
9 232 1.16 9
10 16 1.34 1
Total Inferred 1,830 1.32 78
For
per
sona
l use
onl
y

May 2012 Agbaou Gold Project Page 1-11 NI 43-101
Technical Report
Table 1.7: Mineral Resource Statement at a Range of Cut-off Grades, Agbaou Project, SRK Consulting (Pty) Ltd, March 2012 using MIK
Classification Cut-Off Grade (Au
g/t)
kt Grade (Au g/t) kozs
Measured 0.3 7,959 1.8 460
0.5 6,262 2.2 438
0.8 4,570 2.7 403
1.0 3,797 3.1 381
2.0 1,939 4.8 298
Indicated 0.3 9,774 2.3 732
0.5 8,708 2.6 719
0.8 6,981 3.0 683
1.0 6,114 3.3 658
2.0 3,428 4.8 533
Measured and Indicated 0.3 17,733 2.08 1,193
0.5 14,970 2.43 1,157
0.8 11,551 2.88 1,086
1.0 9,911 3.22 1,039
2.0 5,367 4.80 831
Inferred 0.3 1,830 1.3 78
0.5 1,473 1.5 73
0.8 996 2.0 63
1.0 770 2.3 57
2.0 236 4.3 33
The mineral resources are reported in a manner that is consistent with CIM Definition
Standards as set out in NI43-101.
1.9 MINERAL RESERVE ESTIMATES AND MINING METHODS The mining section of the report includes discussion on the open pit optimisation, practical
pit design, scheduling process, options investigated and the reasons behind selections
made. The mineral reserves, the results of the mine design process in terms of production
schedules as well as capital and operating cost estimates are presented.
A block model estimated by MIK (Multiple Indicator Kriging) was used as the basic resource
model for the pit optimization study. The amount of mineral resource using a 0.5g/t Au cut-off
was 15 Mt with a gold content of 1.2Moz. Only mineralized material in the measured and
indicated categories was taken into account.
The Whittle/Gemcom Four-X Analyser software provides guidance to the potential economic
final pit geometries. Whittle-4X was used to identify the optimum pit shell in terms of value
and tonnage. Mining by contractor has been selected by ENDEAVOUR for the mining
operations. This has been the basis cost estimations. For comparison, an owner operated
option has also been prepared. The optimum pit shell in the contractor option contains
approximately 11.4Mt of ore with average Au grade of 2.55g/t. A gold price of US$1200/oz
was selected by ENDEAVOUR which corresponds to other mining studies being undertaken
elsewhere at this time. The cut-off grade determined to be 0.53 g/t for oxide and 0.51 g/t for
For
per
sona
l use
onl
y

May 2012 Agbaou Gold Project Page 1-12 NI 43-101
Technical Report
fresh ore within the Whittle algorithm. A sensitivity analysis was prepared by varying the unit
mining cost, process and administration and the gold price by ±10%. The sensitivity results
on cashflow showed the gold price is the most sensitive followed by the mining cost then
process and administration cost.
The practical pit designs were prepared using the optimised pit shells as templates. Surpac
software was used to prepare the practical pit, and to incorporate the haul roads and ramps
together with the appropriate inter-ramp slope angles. A total of five pits have been designed
for North and South parts of Main orebody (interim and final pit) and West orebody. The
Proven and Probable mineral reserves estimated to be contained within the practical pits
(and by SAMREC definition) was approximately 11.1Mt with contained gold of about 0.905
Moz. The mineral reserves are reported in a manner that is consistent with CIM Definition
Standards as set out in NI43-101.
The total amount of waste to be mined and hauled to the waste dumps is 83.9Mt. Three
positions have been provided by ENDEAVOUR for waste dumping. The waste dumps have
been design based on the practical parameters to contain a total of approximately 50 million
cubic meters. Table 1.7 summarizes the Proven and Probable Reserves estimated for the
project.
Table 1.7: Summary of Agbaou Mineral Reserves Reserve Category
Deposit
Tonnes Grade Ounces
(Million) (g/t Au) (Million)
Proven Agbaou 5.407 2.25 0.390
Probable Agbaou 5.668 2.82 0.515
Total Proven and Probable Mineral Reserves 11.075 2.54 0.905
Mine production scheduling also adjusted to meet plant feed criteria. The proposed Agbaou
process plant is based on a 1.6 million tonnes per annum (Mtpa) for saprolite and 1.34Mtpa
for bedrock. The upper portion of the orebody consists of relatively soft rock (Laterite and
Saprolite) and the majority of ore mined in the first 4 years will be soft rock. The proportion
of hard rock will then increase.
The mining operations are based on the use of hydraulic excavators and haul trucks suitable
for conventional open pit mining techniques. The main arterial roads where necessary will be
constructed to a minimum 20 m width, including berms and drainage areas.
Topsoil in mining areas will be recovered during the pit preparation phase and stockpiled for
future use with progressive waste dumps and possible pit rehabilitation. The in-situ materials
in hard and semi-hard rock will require drilling and blasting to assist fragmentation and
subsequent loading. Based upon the information supplied, and experience in similar
operations, it has been assumed that that oxide portion of the orebody is suitable for free
digging but may require light blasting in certain areas.
The mining equipment and infrastructure has been selected based upon the mine production
schedule. This has been prepared by the mining contractor. An owner option in capital and
operating cost was also included as an alternative in the study (SRK Consulting, SENET,
For
per
sona
l use
onl
y

May 2012 Agbaou Gold Project Page 1-13 NI 43-101
Technical Report
Knight Piésold Consulting, 2012). The total operating costs for the life of mine, estimated by
contractor are shown to be approximately 335 M$. ENDEAVOUR’s management including
labour costs based on the manpower requirements, administration cost of 0.25$/t.ore and
grade control costs of 1.2$/t.ore are to be to be added to this value.
Based on the Hydrogeological study conducted by Knight Piésold, estimations of the impact
that the proposed mining activities could have on the groundwater environment at various
phases of these activities, as well as recommendations on possible mitigation methods to
contain or minimize these impacts were provided. Additionally, an assessment as to the
magnitude of groundwater inflows to the proposed open pit was conducted along with a
determination of the feasibility of groundwater for process and potable water supply.
1.10 RECOVERY METHODS This section outlines the design criteria and the process description for the Agbaou process
plant. The design criteria were developed on the basis of metallurgical testwork results
obtained from both the previous study and the current EOS. Several references that include
information from ENDEAVOUR, calculations, industry practices and assumptions have been
used to derive data used in the design criteria.
The comminution circuit of the process plant will comprise a primary jaw crusher, followed by
the SAG and ball mills. The milling circuit will include crushing of the pebbles generated from
the SAG mill. A dedicated gravity circuit consisting of a concentrator, intensive cyanidation
package and an electrowinning cell will recover free gold from a portion of the milled product.
The rest of the milled product will be processed in the Carbon in Leach (CIL) circuit where
gold contained in the ore will be leached and adsorbed onto activated carbon. The CIL tails
slurry will undergo cyanide destruction prior to disposal in the tailings dam. Loaded carbon
will be acid washed and rinsed prior to elution. The electrolyte leaving the Anglo American
Research Laboratory (AARL) elution circuit will undergo electrowinning where gold sludge
will be produced. The sludge will be dewatered using a pot filter and dried in a drying oven
ahead of smelting. Fluxes will be added to the dried gold sludge and the mixture placed in
the smelting furnace. After smelting the furnace crucible contents will be poured into
cascading moulds. The gold bars will be cleaned, sampled, labelled and prepared for
shipping.
1.11 ENVIRONMENTAL STUDIES AND SOCIAL IMPACTS An Environmental Impact Assessment (EIA) was undertaken from December 2007 to July
2008 to investigate the local environmental and social situation existing prior to the
development of the Project and to determine the likely positive and negative impacts of the
Project. The timing, extent, intensity and cumulative effects of these impacts were
investigated. The EIA identifies the necessary management measures required to mitigate
the identified impacts. These form the basis of the Environmental Management Plan (EMP)
and the Relocation Action Plan (RAP).
For
per
sona
l use
onl
y

May 2012 Agbaou Gold Project Page 1-14 NI 43-101
Technical Report
1.12 INFRASTRUCTURE, WATER SUPPLY, TAILINGS STORAGE AND LOGISTICS
The selected Agbaou site is a greenfields site without any infrastructure except for the
existing Agbaou Exploration Camp. The proposed infrastructure will support the mining,
plant and construction operations. The main infrastructure required for the development of
the project will be:
• Raw water supply system; • New access road of 9.17km to the plant site facilities, as well as 2.47km to the main
camp; • Site roads; • Camp accommodation and catering facilities for 200 people, including: kitchen,
messing, laundry, potable water supply system and sewage disposal unit; • Mining workshops with internal offices, change house, wash bay, refueling station
(external contract), tire change, and explosives storage. Potable water piped form the from process plant;
• Plant workshop; • Warehouses and lay down yards; • Plant administration buildings and medical facilities; • Assay laboratory; • Reagents storage building; • Change house; • Stand-by power plant providing 2.4MW; • Communications; • Security; • Sewage treatment and disposal; • Plant laundry.
Materials and goods will be trucked to the process plant, camp and mining facilities from the
port of Abidjan.
Tailings Storage Facility (TSF) A suitable location for the TSF was identified by considering the general topography, water
course locations, the required size of the TSF based on capacity requirements and the
general geology of the site.
The proposed construction method utilizes a downstream construction method consisting of
three phases utilizing earth fill from local borrow areas for the initial phase and overburden
material from the open pits during the final two phases.
The TSF does not incorporate an HDPE liner as the process plant includes a cyanide
destruction facility. Since seepage through the basin and dams foundations needs to be
controlled, several key elements have been incorporated into the design. All design
considerations of the tailing storage facility have been based on meeting or exceeding the
agreed design criteria which comply with World Bank Standards, Côte d’Ivoire and other
international standards.
The TSF has been designed to retain water from rainwater and from the tailings. To remove
water from the TSF and return the water to the plant, a floating barge will be utilized.
For
per
sona
l use
onl
y

May 2012 Agbaou Gold Project Page 1-15 NI 43-101
Technical Report
Water Storage Dam (WSD) During plant start-up a significant water source will be required as reclaim water from the
Tailings Storage Facility will not be available. Also the water balance for the plant operations
indicates that make-up water will be required as the TSF will not be capable of providing
sufficient water during the dry season to meet the plant requirements. Two suitable storage
locations were identified.
1.13 CAPITAL AND OPERATING COSTS The aim of the capital and operating cost estimates (excluding WSD) is to provide costs to
an accuracy level, in the opinion of those listed in Section 1.1, of ±10%. These costs
excluding escalation, financing costs and schedule changes can be utilized to evaluate the
economics of the Agbaou Project when treating 1.6Mtpa. All costs are presented in United
States Dollars (US$).
Capital Cost Estimate The total estimated cost of bringing the Project into production is US$158,939,551 and is
inclusive of US$11,777,985 contingency and US$5,039,749 working capital. Table below
gives a summary of the life of mine capital requirements.
For
per
sona
l use
onl
y

May 2012 Agbaou Gold Project Page 1-16 NI 43-101
Technical Report
Table 1.8: Capital Cost Summary US$ % US$
Process Plant Direct Costs
Machinery & Equipment 17 732 002 5% 18 618 603
Civils & Earthworks 11 556 402 12% 12 887 449
Structural Steel & Platework 5 803 972 10% 6 384 369
Piping & Valves 1 433 928 10% 1 577 321
Electrical & Instrumentation 5 094 739 12% 5 686 298
Transportation 5 554 000 15% 6 387 100
Subtotal 47 175 044 51 541 140
Infrastructure Costs
Tailings (Start-up only) 5 622 127 10% 6 184 340
Standby Power Plant 1 283 884 5% 1 348 078
OHL Grid Power to Plant 6 500 000 0% 6 500 000
Access Roads 2 467 329 20% 2 960 795
Main Camp 4 951 394 5% 5 198 964
Onsite Infrastructure Buildings etc 2 649 174 15% 3 046 550
Raw Water Supply 1 565 642 10% 1 722 207
Mining Facilities 727 079 10% 799 787
Communications 53 989 5% 56 689
Vehicles 1 564 400 5% 1 642 620
Mobile Plant 2 308 820 10% 2 539 702
Subtotal 29 693 838 31 999 730
Plant Pre-production
Plant First Fill 899 952 5% 944 950
Spares 3 712 670 5% 3 898 303
Subtotal 4 612 622 4 843 253
Mining Capital Costs
Mining Contractor
Mobilisation 10 372 000 0% 10 372 000
Mining Pre-Strip 4 384 749 0% 4 384 749
Mining Management - Pre-Strip
Period 1 500 000 0% 1 500 000
Subtotal 16 256 749 16 256 749
Other
Insurances 1 511 760 10% 1 662 936
Relocation Cost 5 600 000 7% 6 000 000
Import Tax 1 146 763 0% 1 146 763
Vendor Services 756 553 10% 832 208
Subtotal 9 015 076 9 641 907
Management Costs
Project Management 15 500 000 15% 17 825 000
Owner's Preproduction Costs 11 345 774 5% 11 913 063
Working Capital 5 039 749 10% 5 543 724
Steel, Plate, Mech & Piping
Construction 3 763 419 10% 4 139 761
Electrical Construction 1 757 895 10% 1 933 685
Instrumentation Construction 282 373 10% 310 611
Infrastructure Construction 200 201 10% 220 221
Construction Equipment Hire &
Power 2 518 825 10% 2 770 708
Subtotal 40 408 237 44 656 772
GRAND TOTAL 147 161 567 158 939 551
For
per
sona
l use
onl
y

May 2012 Agbaou Gold Project Page 1-17 NI 43-101
Technical Report
Operating Cost Estimate The annual operating costs for the life of the mine (LOM) were estimated for mining,
processing, general and administration (G&A), royalties and refining charges and are
summarized in the table below.
Table 1.9: Overall Operating LOM Costs
1.14 ECONOMIC ANALYSIS The Agbaou Project economic assessment was prepared with the input from ENDEAVOUR,
SRK Consulting, (mining and geology), SENET (processing plant, general administration
and infrastructure) and Knight Piésold (tailings management facility & water storage dam).
The assumptions used in the financial analysis were provided by ENDEAVOUR and are
summarized in the table below.
Table 1.10: Assumptions Used in the Financial Evaluation Parameter Units Assumption
Gold Price US$/oz 1,250
Discount Rate % 5.0
Government Royalty % 3
Tax Rate after 5 years % 25
Fixed Equipment Residual Value % 10
Depreciation % 12.5
A financial analysis was carried out based on the above assumptions, the production
schedule, capital costs and operating costs. The results from the financial analysis are
summarized in the table below.
Unit Yr 1 Yr 2 Yr 3 Yr 4 Yr 5 Yr 6 Yr 7 Yr 8 LOM
Mining US$/t 21.79 27.33 29.87 29.70 48.18 35.60 28.66 29.54 30.94
Plant US$/t 9.26 9.37 9.35 9.59 9.76 9.61 9.69 9.61 9.51
Tailings Storage Facility (TSF) US$/t 0.14 0.15 0.15 0.17 0.15 0.15 0.15 0.15 0.15
G&A US$/t 4.91 5.19 4.97 5.62 6.16 5.72 5.83 5.76 5.46
Assay US$/t 1.01 1.06 1.06 1.20 1.31 0.79 0.81 1.55 1.06
Refining US$/t 0.26 0.35 0.43 0.45 0.32 0.39 0.37 0.48 0.37
Government Royalties US$/t 1.97 2.58 3.22 3.36 2.38 2.88 2.75 3.58 2.77
Total Operating Costs US$/t 39.33 46.03 49.05 50.08 68.27 55.14 48.25 50.67 50.26
For
per
sona
l use
onl
y

May 2012 Agbaou Gold Project Page 1-18 NI 43-101
Technical Report
Table 1.11: Summary of Financial Analysis Results
Financial Summary Units 2nd
Q 2012
LOM Tonnage Ore Processed t 11 074,927
LOM Feed Grade Processed g/t 2.50
LOM Gold Recovery % 92.5%
LOM Strip Ratio
7.87
LOM Gold Production oz 821,728
Production Period years 8.00
Gold Annual Production- LOM oz 102,716
LOM Direct Operating Costs US$/oz 635
LOM Total Cash Operating Costs US$/oz 677
LOM Total Cash Operating Costs US$/t 50.3
Total Capital Costs US$/oz 217.8
Total Production Costs US$/oz 895
Post Tax NPV US$ million 184.3
IRR % 27.7%
UnDiscounted Payback Period years 2.53
Project Nett Cash Flow after Tax and Capex US$ million 273.8
LOM cashflow's were calculated and project sensitivity analysis was conducted. These are
shown in Section 22. When sensitivities were ranked, the sensitivity analysis indicated that
the project is most sensitive to gold price fluctuations followed by operating costs and then
capital expenditure.
1.15 INTERPRETATION AND CONCLUSIONS
Mineral Resource The currently defined Mineral Resources coincides with the areas within the original
Exploration License area where the best mineralization was detected in soil samples.
However, recent sterilization drilling has indicated that the potential exists to discover more
mineralization outside the currently modeled areas and also in those areas not explored
during the soil surveys.
In the opinion of SRK the sampling preparation, security and analytical procedures used by
ENDEAVOUR were consistent with generally accepted industry best practices and are
therefore considered satisfactory.
SRK believes that the current QAQC systems in place at Agbaou to monitor the precision
and accuracy of the sampling and assaying is adequate and the BV Laboratory returned
acceptable results for use in resource estimation.
The 2012 mineral resource estimate is an update of the mineral resources estimated by
Coffey Mining in 2008, following the completion of an additional phase of drilling on the
project. The mineralization has been re-modeled to include the new intersections, but the
Coffey interpretation was also revised as follows:
For
per
sona
l use
onl
y

May 2012 Agbaou Gold Project Page 1-19 NI 43-101
Technical Report
• Additional zones were modeled parallel to the main mineralized zones where sufficient continuity along strike and down dip was observed;
• The major zones were extended along strike where additional drilling had intersected the mineralization.
The SRK interpretation reduced the low grade dilution within the mineralized envelopes and
this resulted in a trend towards decreased tonnes at a higher grade with some isolated high
grade samples no longer included in the mineralized envelopes.
Following a composite optimization exercise, SRK composited all samples within the
mineralized envelopes to 2m lengths, forcing all samples to be included in the composites by
adjusting the composite length at the base of the mineralisation. Nine of the fourteen zones
required capping of high grade outlier values before estimation to limit the impact of the
unusually high values.
SRK was able to generate robust semi-variograms for the better informed zones, however
for some of the smaller modelled zones there was insufficient data available to generate
reliable experimental semi-variograms. In zones where it was not possible to generate
robust semi-variograms they were grouped together along with better informed zones with
robust semi-variograms, thus borrowing the semi-variograms from the well informed zones.
For the well informed zones the semi-variograms show robust structures with long ranges
between 50m and 100m, which is in excess of the drill hole spacing in the densely drilled
areas.
All zones were estimated by Ordinary Kriging using the optimized search parameters, with a
three phase search strategy. The first pass estimates used the semi-variogram ranges to
define the search. The second and third passes using expanded search ranges were
designed to ensure the best estimates possible beyond the semi-variogram range, but also
ensure that all blocks were estimated. This was required as in some areas the interpreted
mineralization showed abrupt changes in orientation, possibly related to smaller scale
faulting.
In addition to the Ordinary Kriged estimates for the zones with sufficient information and
reliable semi-variograms, SRK generated a UC and MIK estimate. These zones are zones 1,
2, 3, 4, 7, and 9, which (excluding the laterite) make up 90% of the volume of the
North/Central/South area. The UC and MIK estimates were validated against the Ordinary
Kriged estimates at 0g/t cut off and against each other at a range of cut off values. As the
UC estimate is based on the Ordinary Kriged estimate, the estimates correlate exactly, while
the MIK estimates show a higher grade without applying a cut off. The MIK estimates also
typically show a higher grade at cut-off values with the recoverable grades converging at
higher cut-off values. The MIK estimate therefore estimates that a greater degree of
selectivity will be achievable than is estimated by the UC method. The MIK estimate was
selected for the final resource reporting to be consistent with previous resource estimates,
however there is a risk that the selectivity modeled using MIK is over estimated and that the
recoverable tonnes above the selected cut off may be greater than estimated at a lower
grade.
For
per
sona
l use
onl
y

May 2012 Agbaou Gold Project Page 1-20 NI 43-101
Technical Report
A number of validations were complete on the Ordinary Kriged, UC and MIK estimates which
indicated relatively good agreement with the source data and the estimates. The mineral
resources are reported above a 0.3g/t cut off value which was calculated using the operation
parameters used in the Reserve calculations and an optimistic gold price of US$2,000/oz.
Mining The updated Geohydrology report and Geotechnical review were not assessed by SRK.
Based on the previous, earlier report there are no reasons that the Agbaou deposits cannot
be mined successfully.
Process Plant and Economic Evaluation Based on the results of all testwork conducted, the Agbaou Gold Plant has been designed to
treat 1.6Mtpa saprolite ore or 1.34Mtpa bedrock ore. The plant design incorporates a
conventional gravity and CIL circuit design.
The key project features are:
• Processed tonnage 11.1 million tonnes • Grade 2.5 g/t • Recovery 92.5% • Life of Mine (LOM) 8 years • Annual gold production 102,716 oz per annum • Total cash costs US$677 per oz. • Capital cost US$159 million
It is in the opinion of SENET that the capital costs provided are within the 10% accuracy
required for this level of study. The operating costs were derived from accepted industry
standards, first principle calculations, SENET in-house database and input from
ENDEAVOUR.
The results of the financial analysis indicate the viability of the Agbaou Gold Project. The
expected after-tax NPV, IRR and payback period based on a gold price of US$1,250 per
ounce are indicated below:
• NPV at 0% discount rate is US$273.8 million; • NPV at 5% discount rate is US$184.3 million; • IRR 27.7%; • Payback period 2.53 years.
1.16 RECOMMENDATIONS
Mineral Resource The current mineral resource estimates contain sufficient material to support reserves for
seven years of mining. No additional exploration is required to support the mining plan at this
time. Peripheral to the reported resources, additional potential mineralization targets have
been intersected in condemnation drilling holes.
It is recommended that an alternative accredited commercial laboratory is selected for the
Umpire Laboratory function to confirm or improve the poor repeatability in the results
For
per
sona
l use
onl
y

May 2012 Agbaou Gold Project Page 1-21 NI 43-101
Technical Report
obtained from both SGS Laboratories in Ghana and Canada.
Mining It is recommended that the location of the waste dumps be given more attention. In addition
to this more detailed quotes should be obtained from potential mining contractors in order to
completely evaluate the option of owner mining versus contractor mining.
Metallurgical Testwork Additional testwork is recommended on saprolite samples to ensure the expected recovery
and comminution results used are accurate. Viscosity modifier testwork on the thickener
underflow product is also recommended.
For
per
sona
l use
onl
y

May 2012 Agbaou Gold Project Page 2-1 NI 43-101
Technical Report
SECTION 2. INTRODUCTION
2.1 PROJECT OVERVIEW The Agbaou Project is an advanced stage gold project, located in Côte d’Ivoire, West Africa.
The property is 200km north-west of Abidjan, the country’s former capital and major port city.
The exploration permit for the Agbaou Project is fully owned by Etruscan Resources Côte
d’Ivoire SARL (“ERCI”). Endeavour Mining Corporation (Cayman Islands), a TSX-listed and
ASX-listed company, owns 100% of ERCI through its subsidiary companies.
A feasibility study was completed in September 2009 by MDM and Coffey. In September
2011, ENDEAVOUR commissioned various consultants (SRK Consulting, SENET and
Knight Piésold) to review the previous feasibility study and conduct an Engineering
Optimization Study (EOS) incorporating updated resource and reserve estimates and taking
into account some of the limitations that had been noted in the previous study. The findings
of the EOS are summarized this technical report and are valid with an effective date of 25th
May 2012.
This report was prepared following the guidelines of the Canadian Securities Administrators’
National Instrument 43-101, 43-101CP and Form 43-101F1. This technical report documents
a mineral resource and reserves statement for the Agbaou Project prepared by SRK. The
mineral resource and reserves statement reported herein was prepared in conformity with
generally accepted CIM “Estimation of Mineral Resources and Mineral Reserves Best
Practice Guidelines” dated 23 November 2003 and “Definition Standards on Mineral
Resources and Mineral Reserves” dated 27 November 2010.
This report summarizes the technical information available on the Agbaou Project and
demonstrates that the Agbaou Project clearly qualifies as an “Advanced Property” as defined
by the Toronto Stock Exchange. In the opinion of the authors of this report, this property has
merit warranting additional development expenditures. This report summarizes the capital
expenditures required to construct the project. Operating costs and other project parameters
that were used to derive the mineral reserves are summarized within this report.
2.2 PURPOSE OF TECHNICAL REPORT The purpose of this study is to demonstrate the viability of the Agbaou Project through:
• Updated mineral resources and reserves; • Economic evaluation taking into account improved resources/reserves and updated
capital and operating costs.
This technical report is a complete summary of the full study as prepared by SRK
Consulting, SENET, Knight Piésold Consulting (2012).
For
per
sona
l use
onl
y

May 2012 Agbaou Gold Project Page 2-2 NI 43-101
Technical Report
2.3 SCOPE OF SERVICES
2.3.1 SRK’s Scope of Services The scope of work, as defined in a letter of engagement executed on 17th November 2011
between ENDEAVOUR and SRK includes the construction of a mineral resource model for
the gold mineralization delineated by drilling on the Agbaou Exploration Permit and the
preparation of an independent technical report in compliance with National Instrument 43-
101 and Form 43-101F1 guidelines.
SRK is responsible for all or part of sections 1 to 12, 14 to 16, 18, 21 to 23, 25 to 27 of this
technical report.
The SRK work included the assessment of the following aspects of the project:
• Topography, landscape, access; • Regional and local geology; • Exploration history; • Audit of exploration work carried out on the project; • Geological modeling; • Mineral resource estimation and validation; • Preparation of a mineral resource statement; • Recommendations for additional work.
The mineral reserve estimates were also prepared by SRK. The preparation of the mining
and reserve estimation portion of the study includes the following activities:
• Mining approach and methods; • Geotechnical data; • Hydrological data; • Open pit optimization and design; • Waste dumps design; • Fleet and haulage requirements; • Scheduling and production schedule; • Manpower requirements; • Mine capital costs; • Mine operating costs.
2.3.2 SENET’s Scope of Services SENET is responsible for all or part of sections 1, 2, 3, 13, 17 to 22, 24 to 27 of this technical
report. The SENET scope of work included the following:
Process Design Review and Optimization
• Review the existing testwork and identify any shortfalls; • Manage the additional testwork program; • Produce a design criteria; • Produce revised datasheets, calculations and schedules (pump/valve/line); • Compare the SENET datasheets, calculations and schedules to the existing process
design datasheets, equipment specifications and schedules, and flag any major differences;
• Review the differences with ENDEAVOUR, and depending on the severity and
For
per
sona
l use
onl
y

May 2012 Agbaou Gold Project Page 2-3 NI 43-101
Technical Report
potential impact on other disciplines, amend the process design; • Oversee a comminution specialist to review comminution circuit design with a view to
evaluate and optimise the specified circuit; • Review and update process flow diagrams (PFD) and piping & instrumentation
diagrams (P&ID); • Review and update the process plant operating cost estimate with updated reagent
costs and changes to reagent consumptions where changes to the process circuits were made as a result of the review and optimisation process.
Engineering Design Review and Optimization (Process Plant) The engineering design associated with the process plant was reviewed and optimized
(where deemed necessary). The level of completeness of the existing engineering design
was evaluated against the requirements of the estimating accuracy associated with a
feasibility study. All identified shortcomings were discussed with ENDEAVOUR, and any
additional work associated with addressing these shortcomings was addressed.
The following activities formed the basis of the engineering design review and optimization:
• Review of plant layout and general arrangement drawing; • Review of plant-wide electrical single-line diagrams; • Review of civil/structural bulk earthworks and surface infrastructure drawings; • Review of civil design and civil quantities associated with the process plant; • Review of primary steelwork / structural designs and quantities.
Infrastructure, Utilities and Services Review and Optimization SENET reviewed the existing specified process plant infrastructure and optimized the
infrastructure where possible. This review was characterized by the following key activities:
• Revision of the existing material take-offs for earthworks, civil design and roads based on the existing process plant capacity of 1.2Mtpa, previous geotechnical reports and previous work carried out;
• Revision of process plant infrastructure layout drawings; • Assessment of local availability of bulk construction materials.
Revalidation of the Capital Cost Estimate The capital cost estimate associated with the processing plant and associated infrastructure
was revalidated, generally in accordance with the following activities:
• Re-pricing of the existing material take-offs and schedules for civil works, earthworks, buildings, structural steel, piping, valves and major electrical items;
• Obtaining a minimum of 3 written quotations for all major mechanical equipment and single quotations for minor mechanical equipment;
• Reviewing and updating (re-price only) of existing estimates for freight and construction/installation costs for mechanical, civil, structural, piping and electrical disciplines;
• Estimating EPCM costs including engineering, procurement, construction management and insurances.
Additional Inclusions – To Scope of Work Any activity or work associated with the overall coordination, assembly, formatting and filing
of the NI43-101 report or any press releases associated with the study.
For
per
sona
l use
onl
y

May 2012 Agbaou Gold Project Page 2-4 NI 43-101
Technical Report
Development of a Project Implementation Plan A project implementation plan was prepared which included critical activities and labour
resources for the completion of the project for:
• Detailed design; • Procurement – long lead items; • Construction; • Commissioning.
2.3.3 Knight Piésold’s Scope of Services Knight Piésold is responsible for all or part of sections 1, 3, 18, 21, 25 to 27 of this technical
report.
Knight Piésold was retained to complete a Hydrogeological Bankable Feasibility Study
(HBFS) of the Agbaou Project to estimate the impact of the proposed mining activities and
an Engineering Optimization Study (EOS) of the Tailings Storage Facility (TSF) for the
Agbaou Project.
2.3.3.1 Hydrogeological Study (HS)
The following scope of work for the HBFS was included in Purchase Order No. C010401-01 /
E0002 / 2011 that was executed on 30th September 2011 between Endeavour Mining
Corporation and Knight Piésold:
Site Related Tasks
• Site visit; • Drilling supervision; • Aquifer testing;
Office Related Tasks
• Desktop study; • Appointment of drilling subcontractor; • Aquifer test analysis; • Data coding and computerization; • Define conceptual hydrogeological model; • Source and liner optimization modeling (TSF); • Unsaturated zone modeling (TSF); • Saturated zone aquifer characterization modeling; • Contaminant transport modelling; • Preliminary dewatering design.
2.3.3.2 Engineering Optimization Study of Tailing Storage Facility and Water Supply Dam
The following scope of work for the EOS was included in Purchase Order No. C010401-02 /
E0004 / 2011 that was executed on 29th November 2011 between Endeavour Mining
Corporation and Knight Piésold:
Tailings Storage Facility
• Site selection and confirmation of design criteria; • Complete capacity analysis according to design criteria; • Preliminary geotechnical investigation at the TSF site;
For
per
sona
l use
onl
y

May 2012 Agbaou Gold Project Page 2-5 NI 43-101
Technical Report
• Hydrology analysis; • Water balance according to hydrology analysis; • Preliminary design including seepage analysis and stability analysis; • Risk assessment; • Closure design; • TSF Capital and operating cost estimates; • Gap analysis of open pit:
o Review of 2008 report produced by Golder Associates Inc.; o Report on review findings.
In addition to the scope of work outlined in the purchase order, ENDEAVOUR requested KP
to identify site locations for potential water storage sites. Five sites were located with two
locations identified as suitable sites by ENDEAVOUR. This of work entailed:
Water Supply Dam (WSD)
• Identify suitable locations and provide estimated water storage capacities; • Preliminary WSD capital
The work for the WSD did not include specific design elements required for the water dams
or any piping facilities to or from the WSD.
For
per
sona
l use
onl
y

May 2012 Agbaou Gold Project Page 3-1 NI 43-101
Technical Report
SECTION 3. RELIANCE ON OTHER EXPERTS
SENET, SRK and Knight Piésold have not performed an independent verification of land title
and tenure as summarized in Section 4 of this report. The authors of this report did not verify
the legality of any underlying agreement(s) that may exist concerning the permits or other
agreement(s) between third parties, but have relied on an opinion dated 20th August 2010,
from Theodore Hoegan of Theodore Hoegan and Michel Ette, Advocates Associes
(Appendix 3-A).
The authors were informed by ENDEAVOUR that there are no known litigations potentially
affecting the Agbaou Project.
For
per
sona
l use
onl
y

May 2012 Agbaou Gold Project Page 4-1 NI 43-101
Technical Report
SECTION 4. PROPERTY DESCRIPTION AND LOCATION The Agbaou Project is located in Côte d’Ivoire, West Africa, approximately 200km north-west
of the port city of Abidjan. Travelling time between Abidjan and the Agbaou Project area is
approximately 3 hours by car. The concession is reached by tarred and secondary gravel
roads and is within 10km of the national electrical power grid. The small town of Agbahou is
located approximately 12km north-east of the regional town of Divo (Figure 4.1).
Figure 4.1: Map Showing the Location of the Agbaou Project
Agbaou Gold Project Locality Map
Project
No.
439430
For
per
sona
l use
onl
y

May 2012 Agbaou Gold Project Page 4-2 NI 43-101
Technical Report
4.1 MINERAL TENURE Figure 4.2 shows the original Agbaou Exploration Permit outline and the subsequent
decrease in the total area to the current Agbaou Exploration Permit after first renewal. The
corner co-ordinates of the area applied for in the application for an Exploitation Permit are
given in Table 4.1.
The project falls within the Agbaou Exploration Permit 177 of 939km2, which was reduced in
the subsequent application for renewal to 469km2. These permit areas refer to the granted
exploration permits whereas the area of the exploitation permit application is 334km2. The
Exploration Permits were granted for all minerals. The permit holder is not entitled to surface
rights and is required to pay compensation for crop damage and other losses to land
holders.
In terms of known royalties, back-in rights, payments, or other agreements and
encumbrances to which the property is subject SRK is only aware of a 10% free carried
interest of the Ivorian government and a 5% free carried interest held by Société pour la
Development Minier de la Côte d’Ivoire (SODEMI).
Table 4.1: Corner Co-ordinates for Proposed Agbaou Exploitation Permit Area Corner UTM Co-ordinates, Zone 30 ,WGS 84
X Y
I 249,349 675,523
II 252,629 680,119
III 252,666 688,907
IV 263,736 688,861
V 267,999 686,002
VI 262,526 678,419
VII 262,465 663,055
VIII 249,298 663,108
For
per
sona
l use
onl
y

May 2012 Agbaou Gold Project Page 4-3 NI 43-101
Technical Report
Figure 4.2: Mineral Tenure
Agbaou Gold Project
License Areas
Project No.
439430
For
per
sona
l use
onl
y

May 2012 Agbaou Gold Project Page 4-4 NI 43-101
Technical Report
4.2 UNDERLYING AGREEMENTS The security of tenure for the Agbaou Project is based on the legal opinion, provided as a
letter to SRK, by Theodore Hoegan of Theodore Hoegan and Michel Ette, Advocates
Associes, on a Ministerial (Ministere Des Mines et de L’Energie) authorization (No 1625) to
commence with the development work for the project, dated 20th August 2010 (Appendix 4-
A).
The different licenses are discussed above and shown in Figure 4.1 and Figure 4.2 with
corner coordinates of the exploitation permit area listed in Table 4.1. Due to the fact that the
licenses expired and as yet none of the new licenses have been awarded, SRK is reliant on
the legal opinion expressed by Theodore Hoegan in the following terms:
• “Under the provisions of article 2 of the Mining Code all minerals contained in the ground and bedrock are the property of the State de Côte d'Ivoire. The State may, however, authorize any person or entity, to carry out exploration or exploitation of minerals. This authorization is granted under a mining title (exploration or exploitation permit), and this pursuant to the provisions of article 4 of the Mining Code;
• Pursuant to the provisions of article 4 referred to above, the State of Côte d'Ivoire awarded to ERCI, the exploration Permit 177 (Agbaou), listed on the special register of the land conservation of the State of Côte d'Ivoire under number 177, and relates to a surface area of nine hundred and thirty-nine (939) km2;
• The Exploration Permit 177 (Agbaou) was renewed, by decree n0011/MME/DM on 22nd March 2007, by the minister for the Mines and Energy for a period of two (2) years, beginning on November 27, 2006 and ending on 27th November 2008. The surface area was supposed to be reduced by half to equal 469km2, in accordance with the provisions of article 13 of the mining Code. However it was maintained with 939km2, in the First Decree of Renewal;
• In order to conform to the provisions of the Mining Code, ERCI communicated to the director of the Mines, in a letter dated 17th March 2008 new coordinates of the Exploration Permit 177 (Agbaou), reducing its surface to 469km2. The Exploration Permit 177 (Agbaou) coming to expiry, on 26th November 2008, ERCI lodged a request for second renewal of the permit relating to 469km2, which was received and accepted at the same time as it payment of the fixed rights of renewal;
• The decree for the second renewal of Exploration Permit 177 (Agbaou) has not, at present, been issued by the minister of Mines and Energy;
• The provisions of article 25, subparagraph 3 of the Mining Code provides, in such circumstances, that a request for renewal of a mining title, made before the expiry of its period of validity, extends the validity of this mining title automatically, without formality. In addition, under the provisions of article 22 of the Decree of the Mining Code, the renewal of the exploration permit shall be effective on the date of the original validity of the permit. The decree specifies the original date of renewal;
• Exploration work carried out on the Exploration Permit 177 (Agbaou) having identified an economically viable deposit, ERCI filed by letter dated 25th October 2009, an application for an exploitation permit which was attached to a file containing the documents specified by the provisions of article 28 of the Decree of the Mining Code;
• It should be noted that the exploration permit holder is entitled to the exploitation permit granted by Council of Ministers decree on a proposal from the Minister of Mines, after the exploration permit holder provided evidence of the existence of a deposit within its exploration permit. This evidence is furnished with a feasibility study;
• The feasibility study was carried out by ERCI, and was filed with the mining administration, on 30th September 2009. The application for an exploitation permit
For
per
sona
l use
onl
y

May 2012 Agbaou Gold Project Page 4-5 NI 43-101
Technical Report
was examined by the Commission Mine Interministérielle (COMINE), which approved the feasibility study, at its meeting of 7th September 2010. ERCI is now awaiting the Decree from the Council of Ministers granting it the exploitation permit;
• The exploitation permit, once granted, will confer on ERCI, the exclusive right of exploration and exploitation of the deposits within, with all rights attached therein including, transport or to cause the transport of extracted minerals, and disposal of extracted minerals on domestic or export markets, and to export them;
• Possession of a land title or ownership of the land, subject of the exploitation permit is not necessary to conduct exploitation operations. However, if the conduct of the exploitation operations requires the occupation of land belonging to third parties, the latter will be entitled to compensation under conditions fixed by the provisions of decree 95-817 of 29th September 1995 establishing the rules of compensation for destruction for cultures and the inter-ministerial decree Na 028 MINAGRNMEF of bearing 12th March 1996 fixing the scale of compensation for destroyed crops.”
The owner of the Agbaou Exploration Permit and, if converted, the Agbaou Exploitation
Permit is ERCI. Although, ERCI has applied for the Exploitation Permit, it has given its
consent for another subsidiary of Endeavour Mining Corporation, Agbaou Gold Operations
SA, to be granted the Exploitation Permit. Endeavour Mining Corporation (Cayman Islands),
a TSX-listed and ASX-listed company, owns 100% of ERCI through its subsidiary companies
and will own 84.8% of Agbaou Gold Operations SA through its subsidiary companies. The
remaining 15.2% of Agbaou Gold Operations SA will be held by the State of Côte d’Ivoire
(10% free carried interest), Société pour le Dévelopement Minier de la Côte d’Ivoire
(“SODEMI”; 5% free carried interest) and two individual shareholders holding each one
qualifying share (0.2%). The two individual shareholders are not free carried interest.
4.3 PERMITS AND AUTHORIZATION The following documents are included in Appendix 4-A:
• The original decree awarding Agbaou to ENDEAVOUR; • Application for the amended Exploitation License.
4.4 ENVIRONMENTAL AND SOCIAL CONSIDERATIONS An environmental and social impact assessment has been undertaken from December 2007
to July 2008 to investigate the local environmental and social situation existing prior to the
development of the project and to determine the likely positive and negative impacts of the
project. The timing, extent, intensity and cumulative effects of these impacts have also been
investigated.
The potential negative environmental and social impacts of the project include: land clearing
that will result in the loss of natural habitat for local flora and fauna; displaced local
subsistence agriculture; contamination and degradation of soils through exposure and land
clearance; contamination and degradation of surface waters through industrial spills; siltation
and flow modifications to local streams will impact aquatic life; dewatering activities around
open pits will impact local groundwater levels; degradation of local air quality resulting from
increased vehicle presence, increased noise associated with mining and processing;
increased traffic volumes; mine blasting in open pits may generate vibrations that could
negatively impact local infrastructure; potential for acid mine drainage; increased prevalence
of HIV and AIDS through the changes in the demography of the local populations, possible
For
per
sona
l use
onl
y

May 2012 Agbaou Gold Project Page 4-6 NI 43-101
Technical Report
conflicts between immigrants and local communities for mine jobs; relocation of the affected
communities in the project area to Agbahou Village may lead to economic upheaval,
hardships and tensions between the relocated population and their host communities. The
loss of agricultural land in the project area is expected to impact on 76 farmers whom will
require compensation.
Other significant factors and risks that may affect access, title, or the right or ability to
perform work on the property are:
• Côte d’Ivoire has been experiencing a period of political unrest; • ENDEAVOUR management continues to believe that the political situation in Côte
d’Ivoire will not have a significant impact on the long-term of the project or the recoverability of its investments in the Agbaou property; should the current political unrest continue or worsen, it may have a negative effect on the recoverability of this investment.
4.5 MINING RIGHTS IN CÔTE D'IVOIRE A mining right was applied for on 6th October 2008 as stated above but has not yet been
awarded.
For
per
sona
l use
onl
y

May 2012 Agbaou Gold Project Page 5-1 NI 43-101
Technical Report
SECTION 5. ACCESSIBILITY, CLIMATE, LOCAL RESOURCES, INFRASTRUCTURE AND PHYSIOGRAPHY
5.1 ACCESSIBILITY The nearest town to the Agbaou site is Divo. Divo has a population of approximately 128,000
and is located 200km from Abidjan on highway A2. The permit is accessed from Divo by
taking an asphalt road north approximately 25km to the village of Didoko and then an
unpaved secondary road east for 12km to the village of Agbahou. The Agbaou gold project
is adjacent to the Agbahou village and is accessed by a series of dirt roads, tracks and
footpaths (Figure 4.2).
5.2 LOCAL RESOURCES AND INFRASTRUCTURE The national electrical grid runs along the main road that connects the town of Divo to
Didoko. A secondary, high voltage electrical line branches off the national grid at Didoko and
passes through the village of Agbahou. Mobile phone coverage has increased significantly in
recent years and a telecommunications tower has been located adjacent to the
ENDEAVOUR Mining Exploration Camp. The nearest medical clinic and police station are
located in Divo, where food and general supplies can be purchased.
5.3 CLIMATE Agbaou is within the Sud Bandama climate region. The Sud Bandama region is located
within the Southern tropical zone which runs inland from the coastline and is characterized
by three seasons; hot and dry (November to February), hot and wet (March to May) and
warm and wet (June to October). The average temperature range in the region is between
21°C and 33°C.
The precipitation estimate was taken from data at Gagnoa, about 80km west of the Agbaou
permit area. The data indicates there are two, distinct wet seasons March to June, and
September to October. June is the wettest month where rainfall can reach 300mm and the
average annual rainfall is estimated at between 950mm and 1,900mm per annum (Canty
and Associates LLC, 2012).
The area is predominantly subsistence farmland producing mainly food crops such as
plantain, corn, cassava, yam, tomatoes and some cash crop such as coffee, cocoa and palm
oil.
5.4 PHYSIOGRAPHY The general topography of the Agbaou permit is undulating hills that range from 130m to
420m above mean sea-level.
For
per
sona
l use
onl
y

May 2012 Agbaou Gold Project Page 5-2 NI 43-101
Technical Report
Figure 5.1: Topography of the Project Area
Agbaou Gold Project
General Topography
Project No.
439430
For
per
sona
l use
onl
y

May 2012 Agbaou Gold Project Page 6-1 NI 43-101
Technical Report
SECTION 6. HISTORY
6.1 PRIOR OWNERSHIP OF THE PROPERTY AND EXPLORATION Alluvial gold has been known and exploited by local “orpailleur” (artisanal miners) for some
time. Gold mineralization in bedrock was first reported in the Agbaou area during the late
1980’s, while the ground was held by a joint-venture between BHP Minerals and SODEMI.
The joint-venture controlled the ground between 1988 and 1994 and significant exploration
was undertaken during this period including regional and detailed soil sampling, pit sampling,
ground geophysics and a program of eight diamond drillholes (1,680 meters). Based on this
work BHP outlined an unclassified resource of 125,000 ounces and recommended no further
work.
Between 1996 and 2000 the property was held by Goldivoire S.A.R.L. (“Goldivoire”).
Goldivoire was an Australian - Ivoirian owned company controlled by Jandera Resources NL
(88.4%) which was a wholly owned subsidiary of Diversified Mineral Resources NL (“DMR”).
DMR was subsequently taken over by Hargraves Resources NL in mid-1999. Hargraves
Resources were in turn taken over by Durban Roodepoort Deeps (“DRD”) of South Africa in
December 1999. During the period 1996 to 2000, Goldivoire undertook an exploration
program that included semi-regional soil sampling, pit sampling, 36 Rotary-Air-Blast (“RAB”)
drillholes (1,682 meters) and a program of 203 Reverse Circulation (“RC”) drillholes (22,149
meters) of which 25 were extended with a diamond drill hole tail (1,535 meters).
Internal difficulties within DRD subsequently resulted in funds not being available for
Goldivoire to complete further work on the permit and as a result, the government of Côte
d’Ivoire withdrew the Agbaou permit. On 27th November 2003, after the completion of a
bidding process, the Ministry of Mines and Energy for Côte d’Ivoire granted the Agbaou
exploration permit to Etruscan Resources Côte d’Ivoire (Decree Number 2003-464).
6.2 HISTORICAL MINERAL RESOURCE AND MINERAL RESERVE ESTIMATES
A number of resource estimations have been completed on the Agbaou Gold deposit since
1998. The initial resource estimate carried out by Resource Services Group (“RSG”) in July
1998 was based on the BHP drilling plus 42 RC drill holes completed by Goldivoire. An
inverse distance squared method (“ID2”) was used and resulted in an estimate totalling
6.229 Mt at a grade of 2.8g/t Au for 564 Koz Au being outlined based on a 1.0 g/t Au cut-off
grade (Table 6.1). This grade estimate was unclassified. Note that in SRK’s opinion the
tonnage and grade estimates and the quantity of gold should be rounded to an appropriate
level of confidence.
For
per
sona
l use
onl
y

May 2012 Agbaou Gold Project Page 6-2 NI 43-101
Technical Report
Table 6.1: Goldivoire, Resource Estimate (ID2. July, 1998) Lower Cut-off Grade Unclassified Mineral Inventory
g/t Au Tonnage (Mt) Grade Au g/t Koz Au
1 6.229 2.8 564
A second grade estimate was carried out by RSG in February 1999 and included an
additional 106 RC drill holes (some with diamond tails) completed by Goldivoire. The
Multiple Indicator Kriging (“MIK”) method was used for estimation and resulted in an
Indicated resource of 2.538 Mt at a grade of 2.9g/t Au for 237 Koz Au plus an Inferred
resource of 6.397Mt at 2.3g/t Au for 515 Koz Au being outlined based on a 1.0g/t Au cut-off
grade (Table 6.2). A block size of 10m E x 20m N x 5m RL was selected to reflect the
Selective Mining Unit. This historic resource estimate is not compliant with CIM Definition
Standards or NI43-101 requirements. These numbers should be rounded off to an
appropriate level of confidence.
Table 6.2: Goldivoire, Resource Estimate (MIK. February, 1999) Lower Cut-off Grade Indicated Inferred
Au g/t Tonnage (Mt) Au g/t k oz Au Tonnage (Mt) Au g/t k oz Au
0.5 3.750 2.2 265 11.23 1.7 614
0.8 2.984 2.6 249 8.381 2.1 565
1.0 2.538 2.9 237 6.397 2.3 515
1.5 1.857 3.5 209 4.666 2.9 435
DRD commissioned a resource estimate through RSG in 2000. A total resource was
reported at a 1g/t cut-off of Indicated 9.684Mt at an in-situ grade of 2.1g/t Au for 654Koz Au
plus Inferred 2.562Mt at an in-situ grade of 2.3 for 189Koz Au (Table 6.3). This historic
resource estimate is also not compliant with CIM Definition Standards or NI43-101
requirements. The numbers should be rounded off to an appropriate level of confidence.
Table 6.3: DRD, Resource Estimate (April, 2000) Lower Cut-off Grade Indicated Inferred
Au g/t Tonnage (Mt) Au g/t k oz Au Tonnage (Mt) Au g/t k oz Au
0.5 18.22 1.5 879 5.214 1.5 251
0.8 12.23 1.9 747 3.340 2.0 215
1.0 9.684 2.1 654 2.562 2.3 189
1.5 5.950 2.7 517 1.540 3.0 149
These estimates are considered historic and are not current and should not be relied upon.
The issuer is not treating the historical estimates as current mineral resources or mineral
reserves. No verification of the historical resource estimates was undertaken.
More recently an estimate of the Agbaou Mineral Resources was completed by Coffey
Mining Pty Ltd (“Coffey”) 21st February 2008 for ERCI. The Ordinary Kriging method was
used for estimating the laterite resources and Multiple Indicator Kriging was used for
saprolite, sap-rock and fresh rock. A total resource was reported at a 1g/t cut-off of Indicated
10.489Mt at an in-situ grade of 2.6g/t Au for 871koz Au plus Inferred 2.754Mt at an in-situ
For
per
sona
l use
onl
y

May 2012 Agbaou Gold Project Page 6-3 NI 43-101
Technical Report
grade of 2.5 for 248Koz Au (Table 6.3). A block size of 5m E x 10m N x 5m RL was selected
to best reflect the Selective Mining Unit. The results of this exercise are presented as a
grade tonnage report in Table 6.4. These numbers should be rounded off in SRK’s opinion.
Table 6.4: Coffey Mining, Resource Estimate (February, 2008) Lower Cut-off Grade Indicated Inferred
Au g/t Tonnage (Mt) Au g/t k oz Au Tonnage (Mt) Au g/t k oz Au
0.4 17.785 1.8 1,032 5.514 1.6 278
0.5 16.590 1.9 1,015 5.072 1.7 272
0.6 15.221 2.0 991 4.552 1.8 263
0.7 13.945 2.2 965 3.995 2.0 251
0.8 12.697 2.3 935 3.526 2.1 240
1.0 10.489 2.6 871 2.754 2.5 248
1.2 8.747 2.9 810 2.222 2.8 199
1.5 6.807 3.3 727 1.682 3.3 176
2.0 4.700 4.0 610 1.085 4.1 143
This estimate by Coffey was previously reported under NI43-101 but is no longer current and
should not be relied upon. This report provides a current update of the resource estimate as
prepared by SRK and presented in Section 14.
So far the only gold produced from the area is the small amounts recovered from artisanal
workings on the streambeds draining the Agbaou deposit.
For
per
sona
l use
onl
y

May 2012 Agbaou Gold Project Page 7-1 NI 43-101
Technical Report
SECTION 7. GEOLOGICAL SETTING AND MINERALIZATION
7.1 REGIONAL GEOLOGY Coffey (2008) states that the Côte d’Ivoire is largely underlain by a Paleoproterozoic Early
Eburnean plutonic and anatectic granite gneiss terrain with enclosed tectonic fragments of
older Birimian sedimentary and volcano-sedimentary rock types, forming greenstone belts
(Figure 7.1). Collectively these greenstone belts and surrounding granite gneisses form part
of the Man Shield (also known as the Leo Shield), which in turn forms the Southern half of
the larger West African Craton.
The Birimian Supergroup in Côte d’Ivoire have been sub-divided into an older, thick
sequence of metasedimentary basins and a series of greenstone belts consisting of meta-
volcanic rocks with intercalated meta-sediments (Junner, 1946). The greenstone belts occur
as relatively narrow (15-40km wide) but often long (< 200km) features with generally a
NE/SW trend. The effect of the Eburnean Orogeny on the Birimian Supergroup is best
described from studies undertaken in Ghana by Blenkinsop et al. (1984), Eisenlohr (1989),
and Eisenlohr & Hirdes (1992). Here a protracted event initially formed a regionally
penetrative S1 foliation which was followed by formation of high strain shear zones (S2)
along basin/belt contacts. Stress analysis suggests the direction of maximum compression
was sub-horizontal in a NW/SE direction and minimum compressive stress was vertical.
The metamorphic grade of the greenstone belts ranges from lower greenschist to
amphibolite facies, depending on the distance from the enveloping granitoids. Extensive
recent weathering has produced large areas of laterite over the region, which effectively
masks the underlying geology of these areas. As a result of the deep weathering, outcrop is
rare and even when it occurs is often difficult to characterize (Coffey, 2008).
For
per
sona
l use
onl
y

May 2012 Agbaou Gold Project Page 7-2 NI 43-101
Technical Report
Figure 7.1: Regional Geology
Agbaou Gold Project
Structural Analysis
Project No.
439430 For
per
sona
l use
onl
y

May 2012 Agbaou Gold Project Page 7-3 NI 43-101
Technical Report
7.2 PROPERTY GEOLOGY The Agbaou gold deposit is hosted within the Birimian, Oumé-Fetekro Greenstone Belt and
the rocks within the permit are dominantly deformed, mafic volcanic rocks, metamorphosed
to greenschist to lower amphibolite facies (Figure 7.2). The greenstone belt is folded into an
anticline and the Agbaou deposit lies near the hinge of the fold on the eastern limb
(Eisenlohr, 1998). Bedding, foliation and the dominant vein-set are oriented along the strike
of the fold (roughly north-east/south-west) and dip to the south-east at a moderate to steep
attitude.
Because of the very poor outcrop, a geological map based on a magnetic survey has been
done and the results are shown in Figure 7.2.
For
per
sona
l use
onl
y

May 2012 Agbaou Gold Project Page 7-4 NI 43-101
Technical Report
Figure 7.2: Local Geology
Agbaou Gold Project
Local Geology
Project No.
439430 For
per
sona
l use
onl
y

May 2012 Agbaou Gold Project Page 8-1 NI 43-101
Technical Report
SECTION 8. DEPOSIT TYPES
The target deposit type being explored for is the mesothermal auriferous sulphide (pyrite
+pyrrhotite) and quartz vein style mineralization. The gold mineralization within Agbaou
deposit is hosted within a specific quartz vein type that occurs along a broad area and can
be characterized by a wide range of quartz-vein types, brecciation, boudinage, sericitic and
carbonate alteration.
The mineralized quartz veins have a very distinctive texture that has been described as
“mottled” (Figure 8.1). Gold mineralization is also associated with variable amounts of
sulphides, mainly pyrrhotite and pyrite. These veins are easily identifiable in the diamond
drilling core intersections from the fresh rock below the saprolite/fresh rock boundary.
Figure 8.1: Mottled Quartz Vein in Drill Core in Fresh Rock
Agbaou Gold Project Mottled Quartz Vein Material
Project No.
439430
A down-hole stereoscopic structural analysis (Terratec Borehole Scanning) of the lithological
layering, foliation, fractures and veins indicate that all these features have a sub-parallel
attitude. The results of the Borehole Scanning analysis are illustrated in Figure 8.2. This
illustrates the sub-parallel nature of all structural features with a predominant north-east to
south-west strike, dipping to the south-east. The fractures and veins appear to have a
shallower average dip than the lithology and foliation. For
per
sona
l use
onl
y

May 2012 Agbaou Gold Project Page 8-2 NI 43-101
Technical Report
Figure 8.2: Results of the Down-hole Stereoscopic Structural Analysis
Agbaou Gold Project
Structural Analysis
Project No.
439430
For
per
sona
l use
onl
y

May 2012 Agbaou Gold Project Page 8-3 NI 43-101
Technical Report
The gold mineralization at Agbaou has been overprinted by strongly developed saprolitic
weathering. Within the saprolite zone even the quartz veins are highly weathered and all
sulphides replaced by iron oxides, seen as limonite stains. However gold was retained in situ
and does not appear to have been redistributed. This is illustrated in reverse circulation
chips and fines as preserved on chip boards that are kept for reference purposes (Figure
8.3) and in the remaining half core of diamond drilling core (Figure 8.4).
Figure 8.3: Chipboard from RC Drilling Intersection of a Mineralized Quartz Vein
Agbaou Gold Project
Quartz Vein Material
Project No.
439430
For
per
sona
l use
onl
y

May 2012 Agbaou Gold Project Page 8-4 NI 43-101
Technical Report
Figure 8.4: Mineralized Quartz Vein Intersected by Diamond Drilling in Saprolite
Agbaou Gold Project Quartz Vein Intersection in Saprolite
Project No.
439430
During a paleo weathering event, most probably related to the formation of a paleo land
surface, a ferricrete / laterite cap developed in the soil profile overlying the gold deposits.
Gold derived from the saprolite zone was redistributed in the laterite, but largely retained in
close proximity to the underlying mineralized zones. Subsequent uplift resulted in the most
recent erosion with valleys incised into the earlier land surface. Erosion of the laterite cap
resulted in the redistribution of material derived from the laterite cap and the concentration of
gold in the local streambeds. Gold bearing laterite has been identified in many drill hole
intersections of this zone and the corresponding mineralized zone is delineated
independently of the underlying mineralized zones in the saprolite.
The secondary concentration of gold in the laterite zone is also controlling the gold
distribution observed in soil samples as is shown in Figure 9.1.
For
per
sona
l use
onl
y

May 2012 Agbaou Gold Project Page 9-1 NI 43-101
Technical Report
SECTION 9. EXPLORATION
The evaluation by ENDEAVOUR (as Etruscan) of the Agbaou project area began in 2003
with the acquisition of the Agbaou permit. Exploration has been carried out under the
supervision of technically qualified personnel applying standard industry approaches.
Geochemical data quality has routinely been assessed as part of ongoing exploration
procedures. All data acquired meets or exceeds industry standards. All exploration work has
been carried out by, or supervised by technical personnel of the operator (e.g.
ENDEAVOUR, Etruscan, BHP, etc). Consultants and contractors have been engaged by
ENDEAVOUR (or Etruscan) for various activities including; sample collection, drilling and
assaying.
ENDEAVOUR (as Etruscan) conducted detailed (5,911 samples) and regional (1,831
samples) soil geochemical surveys which identified the gold mineralization at Agbaou,
Agbaou South, Mbazo, Zehiri and Niafouta (Figure 9.1).
Detailed pit sampling was completed to aid in the definition of the lateritic cap resource
which was identified and modelled in earlier campaigns. The pitting program covered an
area of approximately 400m2 on all sides of the deposits. The results of this program
indicated anomalous gold values in the laterite along the west flank of the Main deposit, and
to a lesser extent some anomalies were observed along the east flank of the Main deposit.
Pit samples were collected from “hand-dug” pits, 0.2 to 7.5 meters deep, depth being
controlled by the base of the laterite. Pits were systematically completed on a 50 meter by
75 meter grid over the Main and South mineralized zones. Samples are collected from
narrow channels chipped in the floor and wall of the pit and comprise a maximum of 1.5
meters of channel length. Samples were assayed using 50 gram charge fire assay gold
analyses completed by Transworld of Tarkwa, Ghana.
Some 876 Pits (4,056 samples) and 4 trenches (924 samples) were dug to explore the
laterite resource. The pit and trench sampling and analyses were not subjected to the same
QAQC protocol as was used for the drilling samples and as a result this data is not used in
the resource estimation.
During 2008 further studies were conducted to examine the lithology and the structural
geology of the deposit.
For
per
sona
l use
onl
y

May 2012 Agbaou Gold Project Page 9-2 NI 43-101
Technical Report
Figure 9.1: Distribution of Gold in Soil Samples
Agbaou Gold Project Soil Geochemical Anomalies in the Original
License Area
Project No.
123456
9.1 SRK COMMENTS The currently defined Mineral Resource coincides with the areas where the best
mineralization was detected in soil samples as can be seen in Figure 9.1. However, recent
sterilization drilling has indicated that the potential exists to discover more mineralization
outside the currently modeled areas, and also in those areas not explored during the soil
surveys.
For
per
sona
l use
onl
y

May 2012 Agbaou Gold Project Page 10-1 NI 43-101
Technical Report
SECTION 10. DRILLING
10.1 INTRODUCTION Drilling targets in the license area were identified during the soil surveys and were confirmed
by pitting and trenching. These targets were subsequently subjected to a systematic drilling
program, decreasing the between hole spacing following the identification of the mineralized
zones. A summary of drilling and sampling on the Agbaou Project is provided in Table 10.1.
The drilling methods used are reverse circulation (“RC”), diamond drill coring (“diamond”),
and a combination referred to as diamond tails, where the upper part of the hole is drilled by
RC and thereafter by diamond drilling.
Table 10.1: Summary of Drilling and Sampling at the Agbaou Gold Project Campaign/Company Contractor Type Number Metres Range
BHP 1988 - 1994 - Diamond 8 1680 BC-01 to BC-08
Goldivoire 1997 - 1999 - RC 175 20537 ARC001 to ARC175D
Goldivoire 1997 – 1999
- Diamond Tails
25
1535
ARC002D, ARC016D, ARC037D,
ARC049D, ARC079D, ARC082D,
ARC086D, ARC104D, ARC105D,
ARC115D, ARC116D, ARC118D,
ARC123D, ARC124D, ARC128D,
ARC137D, ARC142D, ARC143D,
ARC163D, ARC168D, ARC169D,
ARC170D, ARC171D, ARC172D,
ARC175D
Etruscan 2005 Foraco RC 42 4572 ARC176 to ARC217D
Etruscan 2005 Foraco Diamond Tails 13 649 ARC194D, ARC196D, ARC197D,
ARC202D, ARC203D, ARC207D,
ARC208D, ARC210D, ARC212D,
ARC213D, ARC215D, ARC216D,
ARC217D
Etruscan 2006 - 2007 Boart
Longyear
Diamond 166 22409 ADD218 to ADD383G
ENDEAVOUR 2010 -
2011
Global
Exploration
Services
RC 85 7062 AGBRC421 to AGBRC505
Total 514 58444
Drilling at the Agbaou Gold Project has been managed by both company and contract
geologists since ERCI acquired the project. Successive drilling programs were designed to
increase confidence of grade and continuity within the mineralisation envelopes.
Between 1988 and 1994, BHP drilled 8 diamond drillholes for a total of 1,680m. Goldivoire
(under various ownerships) subsequently drilled 175 drillholes (20,537.4m RC and 1,535.4m
diamond) between 1997 and 1999.
ERCI has completed three drilling campaigns since acquiring the property in 2003. Table
10.1 outlines the drilling prior to the cut-off date of 28th November 2011 for this study (Coffey,
2008).
For
per
sona
l use
onl
y

May 2012 Agbaou Gold Project Page 10-2 NI 43-101
Technical Report
10.2 DRILLING PROCEDURES
10.2.1 Drillhole Collar Location Collar surveys were originally completed using an Ashtech (THALES) differential global
positioning system (“DGPS”) and co-ordinates reported in WGS84, UTM Zone 30 North. In
order to improve the accuracy all drill collars have subsequently been independently
surveyed by Envitech using total-station survey techniques. Envitech conducted a traverse
from the nearest control point (RGIR 13) to the Agbaou camp base station. The control point
was provided by the National Cartography Center, and is located in Tiassale some 105km
south-east of Agbaou. The base station was used to set up two field stations within the limits
of the deposit, ST1 and ST2, from which all survey points were measured. A LEICA total
station instrument, with an accuracy of 2mm – 5mm, was used by Envitech. Both UTM and
local grid co-ordinates were recorded. When the previous DGPS coordinates are compared
to total station survey data, some substantial differences are noted. This results in
differences of -9.7m to +8.2m in the easting and northing and +12m to +22.3m in the
elevation. While the total station coordinates are considered extremely accurate in a relative
sense, the differential between it and the previous DGPS data has not been adequately
explained.
10.2.2 Down-hole Surveying Procedures All drillholes completed by ERCI were down-hole surveyed using either a Terratec or a
Flexit© down-hole instrument at a minimum of every 30m and measured relative to magnetic
North. These measurements have been converted from magnetic to UTM Zone 30 North
values. The factor used to convert between the two grids is -6 degrees. No significant hole
deviation is evident in plan or section although a very unusual path has been captured in the
database for one of the holes drilled during an earlier campaign namely Drillhole ARC016D.
10.2.3 Reverse Circulation Procedures The initial ERCI supervised Reverse Circulation (“RC”) drilling was completed by Foraco
International of France using a Reska 30 truck mounted rig. RC rods were 4½ inch diameter
and the drill bit used was a standard 5½ inch diameter. During the last phase of drilling a 450
Schramm rig was used. The Schramm rig has a 350/900 compressor and 4½ inch rods and
the hammer bits are between 5 and 5¼ inch diameter. The rig is capable of drilling to 200
meters depth.
10.2.4 Diamond Drilling Procedures ERCI supervised diamond drilling was completed by Foraco International of France and
Boart Longyear of Canada. Foraco International used a Reska 30 truck mounted rig. Boart
Longyear used an SRS 850-03 skid mounted rig. HQ and NQ drilling was completed and the
core was oriented by a combination of the spear technique and both Flexit and Reflex multi
shot devices.
10.2.5 RC and Core Sampling Procedures The sampling procedures followed during RC and diamond drilling is detailed in Section 11
as is the sample quality assessment.
For
per
sona
l use
onl
y

May 2012 Agbaou Gold Project Page 10-3 NI 43-101
Technical Report
10.2.6 Drilling Orientation Procedures The vast majority of drillholes in the Agbaou project were collared with an azimuth of
approximately 300° (UTM). A small number of holes were drilled towards an azimuth of
approximately 120°.
10.3 TRENCHING AND PITTING Trenching and pitting were used to confirm the soil geochemical anomalies, but since the
data does not meet the quality requirements for inclusion in the resources, this data was not
considered any further for estimation purposes.
10.4 DRILLING Both the results of RC and diamond drilling are used in the Mineral Resource estimation.
The increased density of drill hole intersections, with each successive campaign, is shown in
Figure 10.1 to 10-4. The drilling, relative to the latest outline of the main pit, during the first
two campaigns by BHP and Goldivoire is shown in Figure 10.1. Figure 10.2 shows the collar
positions of infill holes drilled during two campaigns in 2005 and in the period 2006-2008 by
ERCI. Infill drilling and sterilization drilling done in the period 2010 to 2011 by ENDEAVOUR
is shown in Figure 10.3.
10.5 DRILLING PATTERN AND DENSITY The final density of drilling achieved in the area of the Main and South deposits and
enclosed in the pit outlines is shown in Figure 10.4. The effect of the drilling density on the
resource classification is discussed in Section 14.
10.6 SRK COMMENTS Considering the statistical and geostatistical analysis alone, for the purposes of assessing
the density of drilling with regards to Mineral Resource confidence classification, the areas of
dense drilling (approximately 20m grid) are typically on a significantly tighter grid than the
ranges of the semi-variograms modeled for most zones. Infill drilling has resulted in an
increased classification of resource in the Main and South zones.
For
per
sona
l use
onl
y

May 2012 Agbaou Gold Project Page 10-4 NI 43-101
Technical Report
Figure 10.1: Distribution of Drilling by BHP and Goldivoire
Agbaou Gold Project Drill Hole Collar Positions
Project No.
439430
253020
E
253020
E
253520
E
253520
E
254020
E
254020
E
673600 N 673600 N
674100 N 674100 N
674600 N 674600 N
0 100 200 300
[ABSENT]
[DDH]
[RC]
[RC/DDH]
For
per
sona
l use
onl
y

May 2012 Agbaou Gold Project Page 10-5 NI 43-101
Technical Report
Figure 10.2: Distribution of Drilling by ERCI (2005 to 2008)
Agbaou Gold Project Drill Hole Collar Positions
Project No.
439430
253020
E
253020
E
253520
E
253520
E
254020
E
254020
E
673400 N 673400 N
673900 N 673900 N
674400 N 674400 N
674900 N 674900 N
0 100 200 300
[ABSENT]
[DDH]
[RC]
[RC/DDH]
For
per
sona
l use
onl
y

May 2012 Agbaou Gold Project Page 10-6 NI 43-101
Technical Report
Figure 10.3: Distribution of Drilling by ENDEAVOUR (2010 to 2011)
Agbaou Gold Project Drill Hole Collar Positions
Project No.
439430
252100
E
252100 E
253100
E
253100 E
254100
E
254100 E
674000 N 674000 N
675000 N 675000 N
0 150 300
[ABSENT]
[DDH]
[RC]
[RC/DDH]For
per
sona
l use
onl
y

May 2012 Agbaou Gold Project Page 10-7 NI 43-101
Technical Report
Figure 10.4: Final Distribution of Drilling Relative to the Designed Main Pit Outline
Agbaou Gold Project Drill Hole Collar Positions
Project No.
439430
253020 E
253020
E
253520 E
253520
E
254020 E
254020
E
673600 N 673600 N
674100 N 674100 N
674600 N 674600 N
0 100 200 300
[ABSENT]
[DDH]
[RC]
[RC/DDH]For
per
sona
l use
onl
y

May 2012 Agbaou Gold Project Page 11-1 NI 43-101
Technical Report
SECTION 11. SAMPLE PREPARATION, ANALYSES AND SECURITY
Only methods applied by ERCI are considered in this section. Documentation of previous
sampling methodologies prior to ERCI’s involvement is not available. The sampling method
has not changed since ENDEAVOUR became the owner of the exploration permit.
11.1 SAMPLING AND LOGGING PROCEDURES Only RC holes were drilled during the most recent drilling campaigns and SRK provides a
description of the sampling and logging procedures used by ENDEAVOUR for that program.
Diamond drilling completed prior to the current study was described by Coffey (2008) and
although it was not observed by SRK it is repeated here.
11.1.1 Sampling and Logging for Reverse Circulation Drilling During the last campaign, RC drill chips were collected as 1m intervals down-hole via a
cyclone into PVC bags, and then weighed prior to splitting. The collected samples were riffle
split using a three tier Jones riffle splitter. A final sample of approximately 2kg was collected
for submission to the laboratory for analysis. The splitter and boxes were cleaned with
compressed air between samples. If the sample was wet, the entire sample was placed in a
large rice bag and allowed to dry in the core shed before the weight was recorded and the
sample was split off. The geologist records the sample number, total weight, if water was
present, and a number of characteristics of the cuttings on a log sheet. RC drilling completed
by ENDEAVOUR has been geologically logged during the drilling program; however the
logging methodology was reviewed at the end of the previous drilling campaign with the
identification of the important association of mottled quartz with the gold mineralization. A re-
logging program was completed and the database updated. Drill cuttings from each sample
interval have been glued onto an A3 size chip-board as a permanent record. The chip
boards are stored at the ENDEAVOUR exploration camp in Agbaou.
11.1.2 Sampling and Logging for Diamond Drilling ERCI supervised diamond drilling was completed by Foraco International of France and
Boart Longyear of Canada. The following description of the diamond drilling sampling is an
excerpt from the Coffey (2008) report:
All drillholes were collared with HQ size single tube core (77.8mm) and once competent rock
is encountered the hole was reduced to NQ size core (60.3mm).
The current core handling procedures are as follows:
• Core laid out into core boxes on the drill site. • Core transported from the drill site, in a specifically designed core tray transport
device, to the logging yard where core is laid out in sequence. • Core marked–up, geotechnically logged, recoveries and RQD’s measured. (RQD’s
are not recorded in the saprolitic segments of the core). • Core geologically logged. • Core photographed with a digital camera.
For
per
sona
l use
onl
y

May 2012 Agbaou Gold Project Page 11-2 NI 43-101
Technical Report
• Core marked up for cutting and cut with a conventional diamond core saw. Strongly oxidised core is split using a spatula.
• Bulk density samples are selected and determinations performed on site. Previously, samples were dispatched to TWL in Ghana for the measurements of bulk densities.
Industry standard core sampling methods are used throughout. The orientation mark is
accurately transferred to the side of the core, representing the bottom of the core. The core
is then matched up in the core trays and the orientation line propagated along the length of
the core. The core is then marked off for sampling on a geological basis or to a maximum of
1.5m sample intervals.
Core sampling is undertaken using a diamond saw to cut the core lengthways, ensuring that
the orientation line is preserved on the half of the core that is retained for reference. When
no orientation line can be drawn, a cut line is drawn. Core orientation stubs are clearly
marked and not sampled unless absolutely necessary. The core samples are bagged and
tagged ready for sample preparation as per a prepared cut sheet which is generated from
excel. For best practice, Etruscan endeavors to sample the same half core throughout all
holes.
All core is logged wet by experienced geologists using a simple and consistent code system.
In addition, basic structural and geotechnical information is routinely collected, as this will
reduce the scope of specialist geotechnical consultants and the number of dedicated
geotechnical drillholes, as well as enhancing the quality of the geological interpretations.
However, the quality of the spear generated orientations is not high, and this affects the
quality and the quantity of structural data that can be recorded from such orientated core.
Core is photographed when wet and when dry, two trays at the time.
Upon arrival at the core processing facility, the core is matched up, oriented, logged and
recoveries calculated prior to marking off for sampling and cutting.
11.2 SAMPLE RECOVERY Sample recovery for RC drilling was noted as very good and averages approximately 23.3kg
per metre drilled. Bulk sample weights have been systematically recorded for each metre
drilled. Sample recovery in diamond drill holes was very good although recoveries for core
from the moderate to highly weathered saprolite and highly fractured and brecciated zones
returned poor recoveries. ENDEAVOUR utilized HQ drilling to minimize the core loss in the
weathered zones.
11.3 SAMPLE QUALITY The sampling procedures adopted for drilling are consistent with current industry practise.
Samples collected by diamond drilling within the highly weathered zones are of moderate
quality, with the remainder being high quality. Sample recoveries and quality for the RC
drilling are high.
Coffey (2008) reports on nine sets of twinned holes, but presented data for only eight sets,
For
per
sona
l use
onl
y

May 2012 Agbaou Gold Project Page 11-3 NI 43-101
Technical Report
as the data of one set are duplicated. In SRK’s opinion, 3 sets are not true twins as the drill
holes are separated too much in depth. None the less, only one set is rejected as the
repetition is less than 50% and two sets show about 60% agreement. Five sets display
greater than 80% agreement, indicating a strong correlation between RC and diamond
drilling intersections notwithstanding the fact that some of the holes deviated significantly
away from each other
It is difficult to determine if any negative bias has resulted in the diamond drilling due to the
use of water. A number of the diamond drill holes had poor recovery in the highly weathered
zone and there exists potential to wash out the fine gold associated with the fractures and
veining and therefore underestimate the gold content. The proportion of diamond drilling in
the weathered zones is, however, low and the potential for underestimation associated with
this type of negative bias are considered commensurately low.
RC field duplicate samples are routinely collected to allow assessment of the field sampling
error (or bias) once the laboratory error, determined from analysis of pulp duplicates, has
been subtracted. Acceptable reproducibility has been identified during an assessment of RC
field duplicate data (Section 12.1) generated and no distinct bias is evident.
During the latest RC drilling campaign all sampling was done by ENDEAVOUR staff. The
samples were sun dried, bagged, sealed and submitted together with the independent
Quality Assurance and Quality Control (“QAQC”) samples to the Bureau Veritas Mineral
Laboratory Côte d’Ivoire (“BV”), in Abidjan.
At the BV Laboratory the samples are sorted and entered into the laboratory control system.
Sample preparation at the BV Laboratory entails:
• Drying in an oven at 100ºC to 110ºC for 12 hours; • Crushed in a Jaw Crusher to 90% less than 2mm; • The entire sample is then milled in an LM5 mill to 85% less or equal to 75
micrometres; • The gold in the sample is then analyzed by the fire assay method:
o The fire assay uses 40 g of the pulverised sample, fused with fluxing reagents at 1100ºC for one hour;
o The lead button is then separated from the slag; o Cupellation of the sample is done at 990ºC for 45min – 50min in a muffle
furnace; o The silver-gold prill is collected and then digested in aqua regia; o The finish is done by Atomic Absorption Spectroscopy (“AAS”).
SRK visited the BV Laboratory in Abidjan during October 2011 and at that time the
laboratory was not fully accredited in terms of ISO 17025 for the gold analyses, although
parts of the sample preparation was already accredited.
11.4 SPECIFIC GRAVITY DATA All densities used by SRK are based on core from the diamond drilling campaigns. Coffey
(2008) reported as follows on the density measurements. A total of 654 bulk density
determinations have been collected from the Agbaou deposit. A total of 277 determinations
For
per
sona
l use
onl
y

May 2012 Agbaou Gold Project Page 11-4 NI 43-101
Technical Report
have been completed by TWL Laboratories, 363 were completed by ENDEAVOUR (of
these, some have been also determined by TWL) and 48 were completed prior to Etruscan’s
involvement. Only determinations completed since Etruscan’s involvement are considered.
All readings were taken over a range of lithological and weathered profiles.
The procedure used by both ENDEAVOUR and TWL is detailed below and is based on the
Archimedes Principle as follows:
• 10cm billet of clean core is weighed (note the core is not oven dried prior to bulk density determination);
• Core is immersed in paraffin wax then reweighed to establish weight of the wax; • Core is then suspended and weighed in water to determine the volume; • The Bulk Density is then calculated using the equation
Bulk Density core = [Mass core] / [(Mass air – Mass water) – (Mass wax / 0.99)].
Only bulk density determinations carried out by ENDEAVOUR (363) were used for the
resource estimation. Results are presented in Table 11.1.
Table 11.1: Average Densities Applied per Weathering Zone in the Tonnage Calculation Weathering Zone Number of measurements Average Value
Laterite 19.0 2.10
Saprolite 274 1.66
Transitional 127 2.00
Fresh 207 2.65
Coffey (2008) recommended that the core should be oven dried to a maximum of 60ºC for a
6 hour period prior to bulk density determination. ENDEAVOUR is of the opinion that the
difference in density between the air dried and oven dried samples would not be significant.
SRK accepts the ENDEAVOUR’s opinion but recommends that when the opportunity
presents itself again the density of especially the saprolitic and lateritic material be tested
before and after oven drying.
11.5 QUALITY ASSURANCE AND QUALITY CONTROL PROGRAMS Coffey (2008) provided a comprehensive review of the QAQC measures employed prior to
the last drilling campaign, and accepted the values in the database and concluded as
follows:
• Use of Certified Standard Reference material has shown a range of relative bias for
TWL, Ghana, which varies between -8.9% to +5.6%. This requires monitoring on an
on-going basis to determine the reason for the range of bias;
• Repeat analyses have confirmed that the precision of sampling and assaying is
within acceptable limits for sampling of gold deposits;
• Umpire assaying at SGS Lakefield, Canada returned a significantly lower mean
grade than the original assaying. This is based on one batch and should be
monitored on an on-going basis to identify the reason why;
• The use of Certified Standard Reference material as blank material is recommended
For
per
sona
l use
onl
y

May 2012 Agbaou Gold Project Page 11-5 NI 43-101
Technical Report
at Agbaou.
In Section 12, SRK will review the results of an analysis of the QAQC data for the 2010-2011
drilling campaign.
For
per
sona
l use
onl
y

May 2012 Agbaou Gold Project Page 12-1 NI 43-101
Technical Report
SECTION 12. DATA VERIFICATION
During the current exercise no additional samples were collected by SRK for verification
purposes. In the following paragraphs SRK will review the results of an analysis of the
QAQC data for the last drilling campaign.
12.1 ENDEAVOUR FIELD DUPLICATES During the 2010-2011 RC drilling campaign at the Agbaou Gold Project, coarse material
duplicate samples were submitted to the BV laboratory as blind field duplicates. SRK
reviewed the results reported and found a significant scatter between individual duplicate
samples but an overall similarity and no significant bias. In order to explore the scatter the
following subsets of data were investigated:
• The dataset without obvious outliers; • The dataset without the outliers and without samples that returned gold contents of
less than 0.1 g/t gold.
The results of these repeated investigations are summarised in Table 12.1 below.
Table 12.1: Summary Statistics for Field Duplicate Samples.
Subset Number of
Samples
Mean for
Primary
Samples
Mean for
Duplicate
Samples
Error
RMSE%
Full dataset 205 0.87 0.88 73%
Less Outliers 203 0.82 0.81 65%
Greater Than 0.1g/t 75.0 2.08 2.08 41%
In this table the error, as measured by the Root Mean Square Error Percentage (“RMSE %”),
is an indication of the scatter and decreases with each successive exclusion.
Table 12.2 summarises the descriptive statistics for the final dataset, which excludes the two
high grade outliers and the samples with grades less than 0.1g/t gold.
For
per
sona
l use
onl
y

May 2012 Agbaou Gold Project Page 12-2 NI 43-101
Technical Report
Table 12.2: Summary Statistics for Field Duplicate Samples Regression statistics
Correlation Coefficient: 0.975
Pearson Product Moment Correlation Coefficient: 0.975
Slope of RMA Line (Reduced Major Axis): 0.958
Error on the slope of RMA Line: 0.025
Rank Correlation Coefficient: 0.932
Univariate Statistics
Original Assay Duplicate Assay
Count 75 75
Arithmetic Mean 2.083 2.082
Minimum 0.1 0.1
Maximum 28.75 26.94
Standard Deviation 3.80186 3.64225
Coefficient of Variation 1.82489 1.74962
Notwithstanding the good general correlation between the original and duplicate sample sets
the scatter is high as is well illustrated by the scatter plot (Figure 12.1) and in the Half
Absolute Relative Difference (H.A.R.D) plot (Figure 12.2).
For
per
sona
l use
onl
y

May 2012 Agbaou Gold Project Page 12-3 NI 43-101
Technical Report
Figure 12.1: Scatter Plot of Field Duplicates in Reduced Dataset
Agbaou Gold Project
Field Duplicate Samples
Project No.
439430
0.00
5.00
10.00
15.00
20.00
25.00
30.00
35.00
40.00
0.00 5.00 10.00 15.00 20.00 25.00 30.00 35.00 40.00
Du
plic
ate
Ass
ay
Original Assay
Scatter Plot of Au
Au_Scatter
RMA Line
Ideal Correlation
Upper 10% Limit
Lower 10% Limit
Slope = 0.958
Y axis Intercept = 0.086
Error on slope = 0.025
Error on Y axis Intercept = 0.107
y = 0.958x +0.086
Corellation co-efficient = 0.975
Number of Pairs = 75
For
per
sona
l use
onl
y

May 2012 Agbaou Gold Project Page 12-4 NI 43-101
Technical Report
Figure 12.2: H.A.R.D Plot of Field Duplicates in Reduced Dataset
Agbaou Gold Project
Field Duplicate Samples
Project No.
439430
0
0.5
1
1.5
2
2.5
3
3.5
0%
10%
20%
30%
40%
50%
60%
70%
80%
0% 10% 20% 30% 40% 50% 60% 70% 80% 90% 100%
30
pt
Mo
vin
g A
ve
rag
e o
f A
u
Ha
lf A
bso
lute
Re
lati
ve
Dif
fere
nce
Rank Percentile
Half Absolute Relative Difference Plot
HARD Value Moving Average
For
per
sona
l use
onl
y

May 2012 Agbaou Gold Project Page 12-5 NI 43-101
Technical Report
12.2 CERTIFIED REFERENCE MATERIALS Samples of six Certified Reference Materials (“CRM’s”) were added as blind samples by
ENDEAVOUR to the batches of samples submitted to the BV Laboratory during the last
campaign (2010 to 2011). The results of the analyses of these CRM’s are summarised in
Table 12.3.
Table 12.3: Summary Statistics of CRM’s Analysed by BV Laboratory
Standard
Certified
Value
No of
Analyses
Minimum
Maximum
Mean
% Diff
Number
Outside
Range
% Out
OxA71 0.085 6 0.07 0.08 0.08 11.76 0 0
OxF68 0.805 52 0.77 0.84 0.80 0.00 0 0
OxI54 1.868 37 1.74 1.97 1.83 1.61 0 0
OxI67 1.817 35 1.77 1.89 1.84 1.10 0 0
OxJ67 2.366 32 2.19 2.46 2.36 0.42 0 0
OxK79 3.532 34 3.50 3.62 3.57 1.13 0 0
As can be expected the analytical error is significantly larger for the low grade CRM (OxA71)
although the results are still acceptable. This provides additional support for the decision in
Section 12.1 above to consider only coarse field duplicates with grades in excess of 0.1g/t
gold. The very good results obtained for the other CRM’s provides confidence in the BV
Laboratory although they are not accredited in terms of ISO 17025.
12.3 BLANKS ENDEAVOUR submitted blank material to the BV Laboratory as part of the QAQC protocol.
When SRK visited the field operations, sand obtained from a granitic terrain distant from the
project were used as a blank. In addition following the recommendation by Coffey (2008)
certified blank material was also inserted in the sample batches. The results of the analyses
of the blank material are summarized in Table 12.4.
Table 12.4: Summary Statistics of Blank Materials Analysed by BV Laboratory Material No of
analyses Minimum Maximum Mean >0.05 g/t Au %
Field Blank 212 0.005 0.12 0.007 1 0.5
Blank Standard 34B 11 0.005 0.005 0.005 0 0
Only one incident of potential contamination was reported (0.5% of blanks submitted) and
this sample returned a value of 0.12g/t. The field blank in SRK’s opinion provides a better
indication of contamination during the milling stage and are therefore a better indication of
between sample contaminations than the certified blank material. The data is therefore
accepted as no significant contamination was detected.
For
per
sona
l use
onl
y

May 2012 Agbaou Gold Project Page 12-6 NI 43-101
Technical Report
12.4 UMPIRE LABORATORY RESULTS Because the BV Laboratory is not ISO 17025 accredited a batch of duplicate pulp samples
were submitted to an unaccredited SGS Lakefield (“SGS”) laboratory in Tarkwa, Ghana
(Referee Laboratory 1). The results of this umpire laboratory comparison will be discussed
below. Following this exercise pulp duplicates were also submitted to an accredited
laboratory, SGS Canada in Lakefield, Ontario (Referee Laboratory 2). The results of this
second umpire laboratory will also be discussed in the subsequent sections.
12.4.1 Duplicate Samples Referee Laboratory 1 The results of a review of the results are summarised in the Table 12.5. The dataset
(excluding QAQC samples) was investigated and two additional subsets were created. The
first of these excludes one outlier that may indicate an entry mistake. The second subset, in
addition, excludes all samples that contain less than 0.1 g/t gold as determined by either of
the laboratories. The statistical comparison of the two laboratories in the reduced dataset is
given in Table 12.6.
Table 12.5: Summary Statistics for Umpire Laboratory Duplicate Samples
Subset Number of
Samples BV Mean
SGS
Mean
∑
Differences Error RMSE%
Full Dataset 347 0.81 0.74 23.31 150.83
Less Outlier 346 0.75 0.74 2.43 63.7
Greater / Equal to 0.1 135 1.87 1.81 6.99 39.25
Table 12.6: Descriptive Statistics of Final Dataset of Umpire Laboratory Duplicates Regression statistics
Correlation Coefficient: 0.958
Pearson Product Moment Correlation Coefficient: 0.958
Slope of RMA Line (Reduced Major Axis): 1
Error on the Slope of RMA Line: 0.025
Rank Correlation Coefficient: 0.879
Univariate Statistics
Original Assay Duplicate Assay
Count 135 135
Arithmetic Mean 1.866 1.814
Minimum 0.1 0.1
Maximum 13.31 14.1
Standard Deviation 2.54439 2.54322
Coefficient of Variation 1.36345 1.40171
Even after the removal of the low-grade samples the analytical scatter is still very high as
can be seen in the RMSE%, the Scatter plot (Figure 12.3) and the H.A.R.D plot (Figure
12.4). The Quartile – Quartile (“QQ”) plot (Figure 12.5) indicates a slight bias in the range
3g/t to 7g/t gold and this is also reflected in the positive sum of differences (Table 12.5). The
bias for the entire dataset is insignificant as can be seen in the slope and intercept of the
regression line (Figure 12.1 and Table 12.6).
For
per
sona
l use
onl
y

May 2012 Agbaou Gold Project Page 12-7 NI 43-101
Technical Report
Figure 12.3: Scatter Plot of Umpire Laboratory Duplicate Analyses in the Reduced Dataset
Agbaou Gold Project Umpire Laboratory Analyses
Project No.
439430
0.00
2.00
4.00
6.00
8.00
10.00
12.00
14.00
16.00
18.00
0.00 2.00 4.00 6.00 8.00 10.00 12.00 14.00 16.00 18.00
Du
pli
cate
Ass
ay
Original Assay
Scatter Plot of Au excl OL
Au excl OL_Scatter
RMA Line
Ideal Correlation
Upper 10% Limit
Lower 10% Limit
Slope = 0.989
Y axis Intercept = 0.001
Error on slope = 0.014
Error on Y axis Intercept = 0.028
y = 0.989x +0.001
Corellation co-efficient = 0.965
Number of Pairs = 346
For
per
sona
l use
onl
y

May 2012 Agbaou Gold Project Page 12-8 NI 43-101
Technical Report
Figure 12.4: H.A.R.D Plot of Umpire Laboratory Duplicate Analyses in the Reduced Dataset
Agbaou Gold Project Umpire Laboratory Analyses
Project No.
439430
0
0.5
1
1.5
2
2.5
3
3.5
0%
10%
20%
30%
40%
50%
60%
70%
80%
90%
100%
0% 10% 20% 30% 40% 50% 60% 70% 80% 90% 100%
30
pt
Mo
vin
g A
vera
ge o
f A
u
Ha
lf A
bso
lute
Re
lati
ve D
iffe
ren
ce
Rank Percentile
Half Absolute Relative Difference Plot
HARD Value Moving Average
For
per
sona
l use
onl
y

May 2012 Agbaou Gold Project Page 12-9 NI 43-101
Technical Report
Figure 12.5: QQ Plot of Umpire Laboratory Duplicate Analyses in the Reduced Dataset
Agbaou Gold Project Umpire Laboratory Analyses
Project No.
439430
0
2
4
6
8
10
12
14
0 2 4 6 8 10 12 14
Du
pli
cate
Ass
ay
Original Assay
QQ Plot of Au Data
For
per
sona
l use
onl
y

May 2012 Agbaou Gold Project Page 12-10 NI 43-101
Technical Report
12.4.2 Certified Reference Materials Submitted to SGS Ghana ENDEAVOUR submitted a set of CRM’s as blind samples within the batch that was
submitted to SGS Ghana. The results of these analyses are summarized in Table 12.7.
Unfortunately an inadequate number of any specific CRM was submitted to justify a
statistical assessment of the quality of the SGS analyses. The CRM results received meets
the certified acceptance criteria.
Table 12.7: Summary of CRM Results Submitted to Referee Laboratory 1 CRM No analysed Certified Values Measured Range
Minimum Maximum
OxA 71 2 0.080 0.07 0.08
OxF65 4 0.805 0.77 0.80
OxI54 6 1.868 1.75 1.97
OxI67 1 1.817 1.78 -
OxJ64 6 2.366 2.30 2.42
OxK79 1 3.532 3.60 -
12.4.3 Duplicate Samples Referee Laboratory 2 A second batch of pulp sample duplicates were specifically selected to span the range of
gold values seen in the Agbaou samples. The objective with this was to verify the results of
the primary laboratory and not to inspect the quality of the SGS laboratory in Ghana
(Referee Laboratory 1). The results obtained from this comparison between the primary
laboratory (BV laboratory in Abidjan) and Referee Laboratory 2 (SGS Canada) are
summarized in Table 12.8. The dataset (excluding QAQC samples) was investigated and an
additional subset was created to exclude the very high grade samples where physical
particulate gold distribution may play a role. The statistical comparison of the two
laboratories in the reduced dataset is given in Table 12.6.
Table 12.8: Summary Statistics for Referee Laboratory 2 Duplicate Pulp Samples Subset Number of
Samples BV Mean
Ref Lab 2
Mean
∑
Differences
Error
RMSE%
Full dataset 190 4.38 4.01 70.19 122.2
Less than 20 g/t 181 2.08 1.96 21.14 43.43
For
per
sona
l use
onl
y

May 2012 Agbaou Gold Project Page 12-11 NI 43-101
Technical Report
Table 12.9: Descriptive Statistics of Referee Laboratory 2 Duplicate Pulp Samples (<20g/t) Regression statistics
Correlation Coefficient 0.958
Pearson Product Moment Correlation Coefficient 0.958
Slope of RMA Line (Reduced Major Axis) 0.927
Error on the Slope of RMA Line 0.020
Rank Correlation Coefficient 0.966
Univariate Statistics
Original Assay Ref Lab 2
Count 181 181
Arithmetic Mean 2.08 1.96
Minimum <.01 0.1
Maximum 18.35 16.10
Standard Deviation 2.54439 2.54322
Coefficient of Variation 1.500 1.470
The scatter plot showing the results of the two laboratories is given in Figure 12.3. The
results show approximately 10 (5 %) outliers of variable severity. The analytical scatter is still
very high as can also be seen in the RMSE% and the H.A.R.D plot (Figure 12.4). The
Quartile – Quartile (“QQ”) plot (Figure 12.5) indicates a slight bias in the range 4 g/t to 8 g/t
gold and this is also reflected in the positive sum of differences (Table 12.5).
The bias for the entire dataset is regarded as insignificant and support for this is also evident
when the slope and intercept of the regression line are considered (Figure 12.1, Table 12.6).
12.4.4 Certified Reference Materials Submitted to SGS Canada ENDEAVOUR submitted CRM’s as blind samples with the batch that was submitted to SGS
Canada (Referee Laboratory 2). The results of these analyses are summarized in Table
12.7. Unfortunately an inadequate number of any specific CRM was submitted to justify a
statistical assessment of the quality of the SGS analyses. The CRM results received meets
the certified acceptance criteria although the measured range indicates a bias with the SGS
results consistently lower than the Certified Value, which confirms the bias noted above
although it also appears in values lower than 4g/t Au.
Table 12.10: Summary of CRM Results Submitted to Referee Laboratory 2 CRM No analysed Certified Values Measured Range
Minimum Maximum
OxJ64 3 3.562 3.13 3.49
OxI54 3 1.807 1.69 1.80
STD34B 1 0.613 0.59 For
per
sona
l use
onl
y

May 2012 Agbaou Gold Project Page 12-12 NI 43-101
Technical Report
Figure 12.6: Scatter Plot of the Original Analyses Versus the Results of Referee Laboratory 2
Agbaou Gold Project
Comparison with Referee Laboratory 2
Project No.
439430
-20
0
20
40
60
80
100
120
140
160
180
0 20 40 60 80 100 120 140 160 180
Du
pli
cate
Ass
ay
Original Assay
Scatter Plot of Au
Au_Scatter
RMA Line
Ideal Correlation
Upper 10% Limit
Lower 10% Limit
Slope = 1.064
Y axis Intercept = -0.65
Error on slope = 0.032
Error on Y axis Intercept = 0.42
y = 1.064x -0.65
Corellation co-efficient = 0.912
Number of Pairs = 190
For
per
sona
l use
onl
y

May 2012 Agbaou Gold Project Page 12-13 NI 43-101
Technical Report
Figure 12.7: H.A.R.D Plot of the Original Analyses Versus the Results of Referee Laboratory 2
Agbaou Gold Project
Original and Referee Laboratory 2 Comparison
Project No.
439430
0
0.5
1
1.5
2
2.5
3
3.5
4
0%
10%
20%
30%
40%
50%
60%
70%
80%
90%
0% 10% 20% 30% 40% 50% 60% 70% 80% 90% 100%
30
pt
Mo
vin
g A
vera
ge o
f A
u<
20
pp
m
Ha
lf A
bso
lute
Re
lati
ve D
iffe
ren
ce
Rank Percentile
Half Absolute Relative Difference Plot
HARD Value Moving AverageFor
per
sona
l use
onl
y

May 2012 Agbaou Gold Project Page 12-14 NI 43-101
Technical Report
Figure 12.8: QQ Plot of Original and Referee Laboratory 2 Results (<20 g/t Au)
Agbaou Gold Project
Original and Referee Laboratory 2 Comparison
Project No.
439430
0
5
10
15
20
0 5 10 15 20
Du
pli
cate
Ass
ay
Original Assay
QQ Plot of Au<20ppm Data
For
per
sona
l use
onl
y

May 2012 Agbaou Gold Project Page 12-15 NI 43-101
Technical Report
12.5 SRK COMMENTS In the opinion of SRK the sampling preparation, security and analytical procedures used by
ENDEAVOUR are consistent with generally accepted industry best practices and are
therefore adequate.
The apparent coarse nature of the gold results in a high variability in the field duplicate set.
The BV laboratory results of the blind CRM’s inserted by ENDEAVOUR in the field returned
very good results. Similarly blank material returned acceptable results and SRK accepts the
BV Laboratory results.
The relatively poor results of the duplicate pulp samples submitted to the SGS laboratory in
Ghana (Referee Laboratory 1) and to the accredited SGS Laboratory in Canada (Referee
Laboratory 2) indicate poor but acceptable replication. It has to be concluded that the scatter
observed although less in the second referee laboratory, is partly caused by the particle
distribution of the gold, although the same should have been evident in the pulp duplicates
analyzed by the BV laboratory if this was the only cause. The results of the second set of
replicate pulp analyses (Referee Laboratory 2) are however very similar to that of the
independent field coarse duplicates and a slight improvement on the results from the
unaccredited laboratory in Ghana (Referee Laboratory 1).
SRK believes that the current QAQC systems in place at Agbaou to monitor the precision
and accuracy of the sampling and assaying, is adequate and the BV laboratory returned
acceptable results for use in resource estimation.
For
per
sona
l use
onl
y

May 2012 Agbaou Gold Project Page 13-1 NI 43-101
Technical Report
SECTION 13. MINERAL PROCESSING AND METALLURGICAL
TESTING
13.1 BACKGROUND Comminution and recovery metallurgical tests were performed on ore samples from the
Agbaou deposit and the results used to develop the process flowsheet are summarized in
this section. Initial feasibility testwork was carried out in 2007 by Mintek under the
supervision of MDM.
SENET reviewed the results from the initial feasibility study and together with ENDEAVOUR,
proposed a metallurgical test program whose results would support the process flowsheet
selection required for the EOS. Various laboratories and or vendors were selected to carry
out these tests, namely:
• Maelgwyn Mineral Services (MMS) - Aachen (high shear reactor-HSR) testwork, gravity and leach tests, cyanide detox testwork;
• Knelson Africa – Gravity (GRG) testwork; • Mintek - Comminution testwork - note that all the samples received were too fine to
carry out any comminution test and even though the comminution testwork was planned for, no comminution tests were conducted;
• Patterson and Cooke - Thickening and rheology testwork and viscosity modifier tests; • OMC - Interpretation of comminution results, design and modelling of the
comminution circuit. The initial feasibility results summarized in the review of the initial testwork section are
contained in the following reports:
• November 2007, Mintek, ˝Laboratory testwork to evaluate processing options for the Agbaou gold deposit” report number 4835;
• May 2008, JK. Tech,˝ Agbaou project” report number 07002; • January 2009, Mintek,” Comminution testwork on drill core samples from Agbaou
deposit” report number 5197; • January 2009, MDM,” Etruscan resources Agbaou gold mine-feasibility study”.
Flowsheet development and process design criteria used in the EOS utilized the results
obtained from tests conducted by various laboratories that were carried out under SENET
supervision. A list of the reports from these various laboratories is provided below and the
reports are available in the Appendices of the EOS (SRK Consulting, SENET, Knight Piésold
Consulting, 2012).
• August 2011, OMC “Agbaou Gold project: comminution testwork and circuit design review” Report number: 8819.30.
• December 2011, OMC “Agbaou Gold project: comminution testwork and circuit design review” Report number: 8857.30.
• December 2011, Patterson & Cooke “Endeavour Corporation’s Agbaou project: Slurry test report” Report number: SEN-AGB 8284 RO1 Rev 1.
• January 2012, BSFSA, “Bulk solids flow report” Report number BSFSA-535. • February 2012, Patterson & Cooke, “Bench–top thickening test report” Report
For
per
sona
l use
onl
y

May 2012 Agbaou Gold Project Page 13-2 NI 43-101
Technical Report
number SEN-AGB 8284 RO3, Rev 1. • February 2012, Patterson & Cooke, “Slurry test report” Report number SEN-AGB
8284 RO2, Rev 1. • March 2012, Maelgwyn Mineral Services “Leachox and cyanide detox test on gold
bearing ore samples from Agbaou” Report number: 11/93. • January 2012, Knelson Concentrators Africa, “Gravity Recovery Testwork on
Samples from SENET” Report number SENET 01/12 January 2012.
A list of the samples and the design values selection are also provided in the EOS (SRK Consulting, SENET, Knight Piésold Consulting, 2012 Appendix 13-I and Appendix 13-J respectively).
13.2 REVIEW OF THE INITIAL FEASIBILITY METALLURGICAL TESTWORK This section gives a summary of the feasibility metallurgical results conducted by Mintek in
2009. Details of the origin of samples, test methods and detailed results are contained in the
feasibility study document produced by MDM in January 2009 entitled “Etruscan Resources
Agbaou Gold Mine-Feasibility Study”.
The results obtained from this testwork phase are summarized in Table 13.1:, Table 13.2:
and Table 13.3:.
Table 13.1: Head Assays
Units Saprolite Bedrock
South North South North
Ore grade g/t 1.88 1.69 1.09 3.67
Moisture content % 5 5 5 5
Specific gravity t/m3 1.69 1.69 2.79 2.83
Bulk density t/m3 1.01 1.01 1.67 1.7
For
per
sona
l use
onl
y

May 2012 Agbaou Gold Project Page 13-3 NI 43-101
Technical Report
Table 13.2: Comminution Results Saprolite Bedrock
South North South North
UCS
Min MPa - - 82.2 55.5
Max MPa - - 129.1 194.9
CWi kWh/t - - 10.4 14.16
BBWi(75µm)
Min kWh/t - - 9.99 9.11
Max kWh/t - - 11.79 14.94
BBWi (106µm)
Min kWh/t - - 10.43 9.44
Max kWh/t - - 12.54 15.22
BRWi
Min kWh/t - - 9.99 9.11
Max kWh/t - - 16.48 19.22
Ai
Min - - 0.0544 0.0729
Max - - 0.1729 0.1851
JK Drop Weight
A - - 50.7 58.7
B - - 0.46 0.39
A×B 23.32 22.89
Ta - - 0.40 0.46
Note – saprolite samples were too fine/ friable to allow comminution testing. Typical data was provided by OMC for modeling and circuit design purposes.
Bond Ball indices on the bedrock ore at a limiting screen size of 75µm varied from 9.11 to
14.94kWh/t. At a limiting screen size of 106µm, the BBWi varied from 9.44kWh/t to
15.22kWh/t. indicating that the bedrock ore can be classified in the soft to medium hard
category.
Abrasion indices ranged from 0.0544 to 0.1851 indicating that the bedrock ore has a low
abrasive tendency. Therefore liner wear and ball consumptions are not expected to be
significant.
For
per
sona
l use
onl
y

May 2012 Agbaou Gold Project Page 13-4 NI 43-101
Technical Report
Table 13.3: Recovery Results Units
Saprolite Bedrock
South North South North
Gravity Recovery
Gravity Recoverable Gold % 23.2 20 22.7 31.4
Mass Pull % 0.1 0.1 0.2 0.3
CIL on Gravity Tails
CIL Dissolution (No Oxygen) % 90 83.8 90.8 90.6
CIL Dissolution (With Oxygen) % 92.2 93.1 - -
Cyanide Consumption
No Oxygen kg/t 0.22 0.18 0.23 0.26
With Oxygen kg/t 0.24 0.18 - -
Lime Consumption
No Oxygen kg/t 3.01 2.97 0.52 0.53
With Oxygen kg/t 2.99 2.97 - -
13.3 LIMITATIONS OF THE INITIAL FEASIBILITY STUDY
• No materials handling testwork was conducted on the saprolite ore. The saprolite ore being viscous may present materials handling problems which could hinder production or lower gold recovery.
• No comminution tests were performed on the saprolite ore. • In the milling section, only one circuit option was modelled. The milling section is the
highest energy consumer in the entire plant and therefore warrants proper investigation in selecting a circuit configuration.
• No EGRG tests were performed with the accompanying simulation of the expected plant gravity gold recovery.
• No cyanide detox tests were carried out. • No viscosity modifier tests were performed in light of the saprolite ore being very
viscous. 13.4 COMMINUTION CIRCUIT REVIEW In 2011, OMC was requested to review the comminution results produced by Mintek (as part
of the initial feasibility study) and make recommendations for a suitable comminution circuit
to treat the Agbaou ore.
The tables below show a summary of the testwork results used by OMC in the circuit design.
For
per
sona
l use
onl
y

May 2012 Agbaou Gold Project Page 13-5 NI 43-101
Technical Report
Table 13.4: Comminution Results Summary
Ore Type Units
Bed Rock
Saprolite ADD269-
N1U ADDN1L
ADD270-
N2U
ADD270-
N2L
ADD301-
S1U ADD303S2U
ADD303-
S2L
UCS
Average Mpa 97.7 110.8 107 86.4 97.6 104.8 108.2
Range Mpa 79-116 60.-162 41-173 70-103 79-116 95-115 92-125
Abrasion Index 0.110 0.082 0.096 0.174 0.169 0.060 0.133
Crushing Work Index
CWi kWh/t 7 9.8 6.9 6.6 7.5 6.5 7
Rod Mill Work Index
P80 mm 765 738 738 747 735 740 724
Wi kWh/t 19.2 15.7 12.9 13.7 15.6 16.5 15.0 4.5
Ball Mill Work Index
P80 mm 54 56 53 58 53 52 57
Wi kWh/t 14.9 12.3 9.1 11.0 10.0 11.1 11.8 3.5
Rwi : Bwi 1.29 1.27 1.42 1.25 1.56 1.48 1.27
SG
2.73 2.76
2.81 2.82
1.69
SMC
A
69.4 58.7
62.5 50.7
b
0.39 0.67
0.46 0.59
A× b
27.1 39.3
28.8 29.9
ta
0.46 0.53
0.5 0.4
Table 13.5: Viscosity & Shear Rate Summary
Unit Bed Rock Saprolite
North South North South
Viscosity cP/mPa.s 14.04 14.34 900.0 886.8
Shear rate (s-1
) 22.0 22.0 21.2 21.1
Following the review and analysis of the above results, OMC made the following
conclusions:
• There is significant variance in comminution parameters between the saprolite and
bedrock ores. The bedrock ore showed high competency but lower than average
resistance to grinding;
• The saprolite ore was seen to be of high viscosity. As such, all modelling of the
saprolite was carried out at 50% solids;
• The SABC circuit was considered inefficient from a power draw perspective;
• Design of the comminution circuit was primarily based on the competent bedrock ore.
Although the SABC circuit was seen to be inefficient from a power draw perspective, this
option was still selected based on the following:
• Power is relatively cheap in Cote d’Ivoire;
For
per
sona
l use
onl
y

May 2012 Agbaou Gold Project Page 13-6 NI 43-101
Technical Report
• The SABC circuit has a simple mode of operation, with advantages on operability
and maintenance.
13.5 EOS METALLURGICAL TESTWORK SAMPLE SELECTION
13.5.1.1 Introduction
Following a review of the initial feasibility metallurgical test results, SENET together with
ENDEAVOUR proposed a test program and the aims were to:
• Look at areas where the plant design can be improved; • Conduct testwork required to satisfy a bankable feasibility study.
13.5.1.2 Samples Received and Sample Compositing
The following samples for the EOS were selected from the North and South deposits:
• Saprolite - South zone and North zone; • Bedrock - North zone. (no samples were available for South zone)
Saprolite South zone and North zone samples were combined to form one composite
saprolite sample for optimisation testwork.
Details of the received samples including depth, where the samples were taken, gold grades
and compositing included in the EOS (SRK Consulting, SENET, Knight Piésold Consulting,
2012 Appendix 13-I).
For
per
sona
l use
onl
y

May 2012 Agbaou Gold Project Page 13-7 NI 43-101
Technical Report
13.6 METALLURGICAL TEST PROGRAM (EOS) Testwork conducted during the EOS is shown in Figure 13.1:. Note that no comminution
testwork was conducted on North and South saprolite zones as the samples received were
too fine for any comminution testwork. Therefore only the comminution results obtained for
the bedrock (North zone) in the initial feasibility study were used for the plant design. For
the saprolite ore, assumed values were used by OMC from their data base.
Figure 13.1: EOS Testwork Flowsheet
13.7 EOS METALLURGICAL RESULTS The following tests were completed:
• Head analysis; • Gravity; • Effect of air & sparging of oxygen; • Effect of preg-robbing; • Optimum leach conditions established; • Variability leach;
For
per
sona
l use
onl
y

May 2012 Agbaou Gold Project Page 13-8 NI 43-101
Technical Report
• Thickening and rheology.
Details of these results are included in Appendices 13-A to 13-H listed in the background
and described in the sections to follow.
13.7.1 Head Analysis Full elemental analysis was conducted on the saprolite and bedrock composites. A summary
showing Au, Ag, As assays and the specific gravity (SG) is shown in the table below and
detailed results are included in the EOS (SRK Consulting, SENET, Knight Piésold
Consulting, 2012 Appendix 13-G).
Table 13.6: Head Assays
Saprolite Bedrock
Au(g/t) Ag (ppm) As(ppm) SG Au(g/t) Ag (ppm) As(%) SG
Composite 2.36 <1 111 2.79 2.99 <1 0.02 2.85
Variability
Max 3.65 <1 347 2.85 2.57 <1 0.02 2.99
Min 1.71 <1 39 2.75 1.62 <1 0.01 2.77
Average 2.61 <1 148 2.80 2.08 <1 0.02 2.89
P85 3.14 <1 186 2.85 2.45 <1 0.02 2.98
13.7.2 Gravity Recoverable Gold No EGRG testwork was performed because the samples received were too fine for EGRG
testwork. However, GRG tests were conducted and plant GRG recoveries were predicted as
shown in the table below.
Table 13.7: Gravity Gold Recovery
Saprolite Bedrock
Lab
Results
GRG 44.1 31.1
Mass pull (%) 0.73 0.85
Conc grade (g/t Au) 127.1 90.7
GRG
Modelling
GRG (%) – Predicted Plant 30 20
Mass pull (%) 0.02 to 0.03 0.02 to 0.03
13.7.3 High Shear Reactors (HSR) Testwork HSR testwork was conducted to evaluate the following potential benefits:
• Lower leach residence time;
• Improvement in gold recovery; • Reduction in reagent consumptions.
The table below includes a summary of the rate results with and without HSR.
For
per
sona
l use
onl
y

May 2012 Agbaou Gold Project Page 13-9 NI 43-101
Technical Report
Table 13.8: Summary Results: Effect of using a HSR
Time
Bedrock Saprolite
Residue DO Reagent
Consumption Dissolution Residue DO
Reagent
Consumption Dissolution
Au NaCN CaO Solid Au NaCN CaO Solid
g/t mg/l kg/t kg/t Au % g/t mg/l kg/t kg/t Au %
HSR 2hr 0.92 8 0.09 0.72 63.72 0.20 32 0.04 3.95 83.37
HSR 4hr 0.82 9 0.10 0.69 67.63 0.16 28 0.02 3.88 86.24
HSR 6hr 0.54 8 0.15 0.69 79.33 0.10 28 0.03 3.96 91.34
HSR 8hr 0.39 8 0.16 0.72 85.15 0.10 25 0.05 3.97 91.25
HSR 12hr 0.29 7 0.24 0.69 88.62 0.11 24 0.08 3.99 91.13
HSR 16hr 0.25 6 0.24 0.75 90.30 0.09 21 0.12 4.16 92.19
HSR 24hr 0.19 6 0.31 0.74 92.52 0.06 18 0.15 4.18 94.58
HSR 32hr 0.14 6 0.37 0.75 94.54 0.06 17 0.15 4.14 94.72
HSR 48hr 0.12 6 0.40 0.74 95.63 0.05 12 0.15 4.17 95.71
No HSR - 2hr 1.16 30 0.18 0.68 54.27 0.45 11 0.09 3.82 61.72
No HSR- 4hr 1.06 28 0.20 0.66 58.41 0.30 11 0.12 3.71 73.63
No HSR - 6hr 0.79 27 0.22 0.65 70.05 0.19 11 0.13 3.83 84.26
No HSR - 8hr 0.71 26 0.23 0.66 73.85 0.17 10 0.15 3.84 85.68
No HSR - 12hr 0.36 26 0.24 0.68 86.29 0.15 10 0.18 3.88 87.78
No HSR - 16hr 0.21 22 0.31 0.68 91.96 0.11 10 0.24 3.83 90.68
No HSR - 24hr 0.19 20 0.41 0.66 93.22 0.06 10 0.26 3.85 94.54
No HSR - 32hr 0.18 18 0.44 0.65 93.46 0.04 9 0.29 3.79 96.58
No HSR - 48hr 0.15 15 0.48 0.64 94.55 0.04 9 0.32 3.84 96.47
The results showed a reduction in the cyanide consumption when HSR was used. This is
shown in the table above.
The results indicate that using a HSR does improve the initial leach kinetics. Figures 13.2
and 13.3 show the leach curves for the bedrock and saprolite ore respectively with and
without use of a HSR. It should be noted that after 20hrs, leach results with and without HSR
were similar to conventional leaching.
Even though the HSR had the benefits as indicated above, it was not included in the design
because oxygenation test described in the next sub section indicated that sparging oxygen
gives comparable gold extraction. Using oxygen spargers requires less capital outlay in
comparison with HSR and would therefore be the preferred method for oxygen introduction.
For
per
sona
l use
onl
y

May 2012 Agbaou Gold Project Page 13-10 NI 43-101
Technical Report
Figure 13.2: Bedrock Rate of Gold Dissolution With and Without High Shear Reactor
Figure 13.3: Saprolite Rate of Gold Dissolution With and Without High Shear Reactor
0
10
20
30
40
50
60
70
80
90
100
0 10 20 30 40 50 60
% A
u D
isso
luti
on
Leach Time (hrs)
Au dissolution without HSR Au dissolution with HSR
0
10
20
30
40
50
60
70
80
90
100
0 10 20 30 40 50 60
% A
u d
isso
luti
on
Leach time (hrs)
Au dissoltion without HSR Au dissolution with HSRFor
per
sona
l use
onl
y

May 2012 Agbaou Gold Project Page 13-11 NI 43-101
Technical Report
13.7.4 Oxygenation Testwork Leach tests were performed to assess the use of oxygen or air for improved gold recovery
and included the following tests:
• Without air or oxygen sparging as a base case; • With air sparging; • With oxygen sparging.
The table below shows a summary of the effect of air and oxygen on gold extraction results.
Table 13.9: Effect of Sparging Air / Oxygen on Gold Extraction
Saprolite Bedrock
Gold
Extraction
DO
Level
Final Residue
Value
Gold
Extraction
DO
Level
Final Residue
Value
% mg/l g/t Au % mg/l g/t Au
No Air/Oxygen Sparging 93.08 10 0.08 89.06 7 0.29
With Air Sparging 95.03 10 0.06 90.79 8 0.25
With Oxygen Sparging 97.14 20 0.04 92.86 19 0.20
The results showed that oxygen sparging produced the best gold extraction and was
therefore used in the process design.
The tests indicated that sparging oxygen gives the better gold extraction. Tests to use a High
Shear Reactor (HSR) for oxygen injection showed an improvement in leach kinetics but no
improvement in the final gold extraction. Therefore a HSR was not selected as part of the
plant design. Added to this is the fact that the HSR is high in Capital and Operating cost.
13.7.5 Composite Leach Kinetic Results by Percentage Solids (w/w) Saprolite and bedrock leach kinetic tests were performed at time intervals between 2hrs and
48hrs at the following percentage solids (w/w) to assess the leach kinetics of saprolite and
bedrock ores types:
• 30% (saprolite only);
• 35% (saprolite only);
• 40%;
• 45%.
For
per
sona
l use
onl
y

May 2012 Agbaou Gold Project Page 13-12 NI 43-101
Technical Report
Table 13.10: Saprolite Leach Kinetics at Varied Percent Solids.
Residence
Time
30 % solids 35 % solids 40 % solids 45 % solids
Reagent
consumption Au dissolution
Reagent
consumption Au dissolution
Reagent
consumption Au dissolution
Reagent
consumption Au dissolution
NaCN CaO Solid NaCN CaO Solid NaCN CaO Solid NaCN CaO Solid
kg/t kg/t Au % kg/t kg/t Au % kg/t kg/t Au % kg/t kg/t Au %
2hrs 0.13 4.06 65.12 0.12 4.02 68.25 0.09 3.82 61.72 0.06 3.73 56.56
4hrs 0.18 4.07 76.10 0.15 4.02 71.15 0.12 3.71 73.63 0.08 3.72 61.79
6hrs 0.20 4.06 80.06 0.19 3.96 82.15 0.13 3.83 84.26 0.10 3.72 79.70
8hrs 0.20 4.05 85.82 0.23 4.01 84.89 0.15 3.84 85.68 0.14 3.73 84.87
12hrs 0.29 4.04 88.49 0.25 4.04 85.61 0.18 3.88 87.78 0.17 3.73 90.19
16hrs 0.32 4.05 90.45 0.28 3.96 89.79 0.24 3.83 90.68 0.20 3.72 91.23
24hrs 0.41 4.03 92.87 0.30 3.95 90.91 0.26 3.85 94.54 0.22 3.74 93.10
32hrs 0.43 4.04 95.64 0.31 4.03 95.43 0.29 3.79 96.58 0.28 3.74 95.62
48hrs 0.45 4.03 96.51 0.31 3.96 96.46 0.32 3.84 96.47 0.32 3.74 95.50
Table 13.11: Bedrock Leach Kinetics at Varied Percent Solids
Residence
Time
40 % Solids 45 % Solids
Reagent
consumption Au dissolution
Reagent
consumption Au dissolution
NaCN CaO Solid NaCN CaO Solid
kg/t kg/t Au % kg/t kg/t Au %
2hrs 0.18 0.68 54.27 0.11 0.53 52.73
4hrs 0.20 0.66 58.41 0.20 0.55 65.31
6hrs 0.22 0.65 70.05 0.23 0.55 67.03
8hrs 0.23 0.66 73.85 0.26 0.54 75.13
12hrs 0.24 0.68 86.29 0.33 0.58 77.78
16hrs 0.31 0.68 91.96 0.37 0.57 83.31
24hrs 0.41 0.66 93.22 0.42 0.56 89.56
32hrs 0.44 0.65 93.46 0.44 0.58 91.26
48hrs 0.48 0.64 94.55 0.49 0.56 94.69
The testwork indicated the following optimum leach conditions for saprolite and bedrock:
• Saprolite: 24hrs leach time at 40% solids;
• Bedrock: 32hrs leach time at 42% solids. (42% was selected for design
purposes as it is easily achievable with densifying cyclones)
13.7.6 Preg- Robbing Testwork Preg-robbing tests were performed using leach rate tests with and without carbon addition
on the saprolite composite and bedrock composite samples. The preg-robbing results are
summarized in Table 13.12. The results indicate significant preg robbing tendencies for both
the saprolite and bedrock ore. The effect of pre-robbing was performed using rate tests with
and without carbon addition at the following leach times:
• 2hrs; • 4hrs; • 6hrs; • 8hrs; • 24hrs.
For
per
sona
l use
onl
y

May 2012 Agbaou Gold Project Page 13-13 NI 43-101
Technical Report
The results indicated that the preg-robbers were most active during the initial stages of leach
with 28.12% and 15.92% gold lost to preg-robbers in the first two hours for the saprolite and
bedrock ores respectively. Due to the high preg-robbing tendency of the ore, a CIL circuit
was selected in the process design and cyanide detox was included to minimize cyanide
contact with the gold prior to activated carbon being present.
Table 13.12: Effect of Preg-Robbing
Time
Saprolite Bedrock
Au Dissolution (%) Au Dissolution (%)
With
Carbon Without Carbon
Preg-
Robbing
With
Carbon Without Carbon
Preg-
Robbing
2hrs 55.16 27.04 28.12 58.70 42.78 15.92
4hrs 76.34 65.00 11.34 63.77 51.86 11.91
6hrs 81.41 69.62 11.79 69.70 62.61 7.09
8hrs 84.75 72.84 11.91 76.59 70.99 5.60
24hrs 92.47 75.32 17.15 91.36 78.82 12.55
Average 16.06 10.61
13.7.7 Variability Preg-Robbing Testwork Since preg-robbing test on the composite samples indicated that the bedrock and saprolite
ores contain high pre-robbers, variability preg-robbing tests were conducted on the variability
samples to identify if the preg-robing tendency is across the entire ore body. The variability
preg-robbing tests were performed at a residence time of 2hrs since the initial rate tests
indicated that the preg-robbers are most active in the first 2hrs.
The table below includes the variability preg-robbing results on the saprolite and bedrock ore
and the results indicate the following:
• Preg-robbing on the variability saprolite samples ranged from 8.45% to 26.72% with an average of 17.28%;
• Preg-robbing on the variability bedrock samples ranged from 17.25% to 34.55% with an average of 25.02%.
The results confirmed the presence of preg-robbers and showed that the preg-robbing tendency of the ore is variable in nature.
For
per
sona
l use
onl
y

May 2012 Agbaou Gold Project Page 13-14 NI 43-101
Technical Report
Table 13.13: Variability Preg-Robbing Results Summary
Au Dissolution (%) Preg-robbing
(%) With carbon Without carbon
Bedrock
Var 1 North 62.83 28.28 34.55
Var 2 North 44.30 24.87 19.43
Var 3 North 47.61 18.74 28.87
Var 4 North 37.94 20.69 17.25
Min 17.25
Max 34.55
Average 25.02
Saprolite
Var 1 South 70.82 48.00 22.82
Var 2 South 58.02 39.41 18.62
Var 3 South 55.59 41.52 14.07
Var 4 South 65.25 56.79 8.45
Var 5 North 58.42 44.86 13.56
Var 6 North 81.90 61.20 20.70
Var 7 North 53.88 27.17 26.72
Var 8 North 73.14 59.81 13.33
Min 8.45
Max 26.72
Average 17.28
13.7.8 Thickening and Rheology Testwork Thickening testwork conducted on the saprolite and bedrock ore indicated that both post
leach slurries can be effectively thickened. However for the bedrock slurry, when raw water
was used to dilute the slurry, the ionic strength changed causing poor settling properties and
higher flocculant consumptions. When the ionic strength was altered back to the original
values as received from leach, the settling properties and flocculant consumptions improved.
This indicates that the bedrock ore is sensitive to changes in ionic strength i.e. pH. A
summary of the thickening and rheology results are shown in the table below.
Table 13.14: Thickening and Rheology Results
Units Saprolite Bedrock
Solid SG
2.78 2.90
Flocculation Type
Magnafloc 6260 Magnafloc 6261
Dosing Concentration % 0.025 0.025
Flocculation Dosage Rate g/t 40 40*
Feed slurry Solid Concentration % m/m 3 7.5
Critical Solids Flux Rate t/(m2.h) 0.2 0.3
Estimated U/F Solids Concentration % m/m 40# 60
*This is provided the slurry is in a coagulated state prior to the flocculation stage. #
The saprolite compacted to a 52% (m/m) solid concentration after a period of 24hrs picket racking.
For
per
sona
l use
onl
y

May 2012 Agbaou Gold Project Page 13-15 NI 43-101
Technical Report
13.7.8.1 Rheology and Viscosity Modifier Test
During the initial feasibility study, it was observed on Saprolite ore that viscosity issues may
be encountered. In order to possibly increase cyclone overflow densities to higher values,
viscosity modifier testwork was conducted during this phase.
Viscosity tests were conducted on the saprolite ore at natural and at an elevated pH of 10.5
at various percentage solids. Refer to figure below for the viscosity versus percent solids
relationship.
It was found from the graph that the yield stress at natural and at pH 10.5 was similar.
Viscosity modifiers Antiprex D and DP 725 were investigated to assess if they could reduce
the viscosity issues. The results showed that viscosity modifiers did reduce the viscosity of
the saprolite slurry and at this stage was not included as part of the design as insufficient
tests were performed. In addition to this, the tests were performed on the milled product only
and not on the thickener underflow. Additional viscosity modifier tests have been included in
the recommendations.
Tests were conducted at varied concentrations of the viscosity modifier. From the tests, the
following optimum viscosity additions were selected:
• Antiprex D: 0.3ml of Antiprex D per litre of slurry which translates to 354ml per tonne of dry ore.
• DP 725: 0.9ml of DP 725 per litre of slurry which translates to 1,063ml per tonne of dry ore.
Figure 13.4: Slurry Yield Stress vs. Percent Solids Curves
Reference – Figure 11: Comparison of Yield Stress versus Mass Solids Concentration. (Patterson & Cooke Consulting Engineers, Pty. Ltd., 2012 “Endeavour Corporation’s Agbaou Project: Slurry Test Report” Report number: SEN-AGB 8284 RO1 Rev 1.)
For
per
sona
l use
onl
y

May 2012 Agbaou Gold Project Page 13-16 NI 43-101
Technical Report
13.7.8.2 Variability Leach Results on Middlings and Tails
Variability leach tests were performed at optimum conditions to determine the dissolutions
and reagent consumptions. This was then compared to the optimum results to determine the
ores variability and it was observed that the ore was not highly variable.
Table 13.15: Variability Leach Results on Middles and Tails Variability Leach on Midds & Tails
Saprolite Bedrock
Final Residue Au Dissolution Reagent Consumptions Final Residue Au Dissolution Reagent Consumptions
Solid (g/t Au) % Cyanide (kg/t) Lime (kg/t) Solid (g/t Au) % Cyanide (kg/t) Lime (kg/t)
Max 0.12 95.75 0.40 4.86 0.18 93.64 0.21 1.68
Min 0.05 89.06 0.16 2.11 0.09 89.70 0.14 1.03
Ave 0.08 92.42 0.26 2.81 0.13 91.94 0.16 1.31
P85 0.10 93.53 0.33 3.23 0.16 93.53 0.18 1.50
13.7.8.3 Optimum Leach Parameters
Selected leach parameters were varied to obtain optimum conditions for the design of the
leach circuit.
The effect of cyanide addition test was performed by conducting leach tests at the following
cyanide additions:
• 0.3kg/t NaCN;
• 0.5kg/t NaCN;
• 0.7kg/t NaCN;
• 1.0kg/t NaCN.
The effect of sparging oxygen test was performed at the following conditions:
• Without air or oxygen sparging as a base case;
• With air sparging;
• With oxygen sparging;
• With oxygen injection via a High Shear Reactor.
The effect of percent solids test was performed as rate test at the following percent solids:
Saprolite
• 30%;
• 35%;
• 40%;
• 45%;
Bedrock
• 40%;
• 45%.
The table below is a summary of the optimum leach parameters selected.
For
per
sona
l use
onl
y

May 2012 Agbaou Gold Project Page 13-17 NI 43-101
Technical Report
Table 13.16: Optimum Leach Parameters Optimum Leach Conditions
Saprolite Bedrock
Cyanide Addition 0.7kg/t 0.7kg/t
Residence Time 24hrs with oxygen sparging 24hrs with oxygen sparging
pH 10.50 10.50
Solids (% m/m) 40 42
13.7.9 Recommendations for Design Values Design values were selected from the testwork results for the treatment of the Agbaou ore
and are summarized below. All the testwork results from the initial feasibility testwork and
the EOS testwork were populated and analyzed to determine the following values:
• Average;
• Maximum;
• Minimum;
• 85th Percentile.
The 85th percentile values for reagent consumptions and dissolution and SG from Paterson
& Cooke results were used as the design values (SRK Consulting, SENET, Knight Piésold
Consulting, 2012 Appendix 13-J).
The table below shows the selected design values used for the process flowsheet
development.
Table 13.17: Selected Design Values Units Saprolite Bedrock
Grind
80%-75µm 80%-75µm
Selected Milling Circuit
SABC SABC
Solids SG
2.79 2.82
Final Residue (Gravity-CIL) g/t Au 0.10 0.16
Cyanide Consumption kg/t 0.33 0.18
Lime Consumption kg/t 3.23 1.50
Leach Time Hrs. 24 32
Oxygen Sparge During Leach
yes yes
CIL Percent Solids % m/m 40 42
Thickening Flux Rate t/(m2.h) 0.2 0.3
13.7.10 Recommendations for Further Testwork (Post EOS Testwork) The following additional testwork is recommended to confirm the assumptions made in the
design:
• Comminution tests on the saprolite ore - the samples received during the EOS were too fine for any comminution testwork. Assumptions in the design were made for the saprolite comminution parameters and therefore need verification;
• EGRG testwork - the samples received during the EOS were too fine for EGRG testwork. It is therefore recommended to perform EGRG and modelling to determine the actual plant gravity recoveries;
• Viscosity modifier testwork on thickener underflow - the viscosity modifier testwork
For
per
sona
l use
onl
y

May 2012 Agbaou Gold Project Page 13-18 NI 43-101
Technical Report
performed during the EOS was limited and was only done on the milled product but not on the thickener underflow product;
• Variability viscosity testwork - variability viscosity testwork is recommended to assess the extent of the viscosity concerns across the ore body.
For
per
sona
l use
onl
y

May 2012 Agbaou Gold Project Page 14-1 NI 43-101
Technical Report
SECTION 14. MINERAL RESOURCE ESTIMATES
14.1 INTRODUCTION The Mineral Resource Statement presented herein represents an update of the Mineral
Resources prepared for the Agbaou Project by Coffey Mining on behalf of Etruscan
Resources Inc. in March 2008 in accordance with the Canadian Securities Administrators’
National Instrument 43-101.
The mineral resource model prepared by SRK considers 698 RC and core boreholes drilled
by ENDEAVOUR and other owners of the property during the period of 2003 to 2011. The
resource estimation work was completed by Mark Wanless, Pr.Sci.Nat (SACNASP -
400178/05) an appropriate “independent qualified person” as this term is defined in National
Instrument 43-101. The effective date of the resource statement is 25th May 2012.
This section describes the resource estimation methodology and summarizes the key
assumptions considered by SRK. In the opinion of SRK, the resource evaluation reported
herein is a reasonable representation of the recoverable gold mineral resources found in the
Agbaou Project at the current level of sampling. The mineral resources have been estimated
in conformity with generally accepted CIM “Estimation of Mineral Resource and Mineral
Reserves Best Practices” guidelines and are reported in accordance with CIM “Definition
Standards For Mineral Resources and Mineral Reserves” as referenced by the Canadian
Securities Administrators’ National Instrument 43-101. Mineral resources are not mineral
reserves and do not have demonstrated economic viability. There is no certainty that all or
any part of the mineral resource will be converted into mineral reserve.
The database used to estimate the Agbaou Project mineral resources was audited by SRK.
SRK is of the opinion that the current drilling information is sufficiently reliable to interpret
with confidence the boundaries for vein hosted gold mineralization and that the assay data
are sufficiently reliable to support mineral resource estimation.
Datamine Studio Version 3.20 was used to construct the geological solids, prepare assay
data for geostatistical analysis, and construct the block model. The Isatis (version 11.03)
software was used for geostatistical analysis, variography, estimate metal grades and
estimate the recoverable resources using a global change of support and Uniform
Conditioning (“UC”) and Multiple Indicator Kriging (“MIK”). Block models were constructed in
Datamine for Mineral Resource reporting, and replicated in Surpac software, for use in
mineral reserve estimation.
14.2 RESOURCE ESTIMATION PROCEDURES The resource evaluation methodology involved the following procedures:
• Database compilation and verification; • Construction of wireframe models for the boundaries of the gold mineralization; • Definition of resource domains;
For
per
sona
l use
onl
y

May 2012 Agbaou Gold Project Page 14-2 NI 43-101
Technical Report
• Data conditioning (compositing and capping) for geostatistical analysis and variography;
• Block modeling and grade interpolation; • Recoverable resource estimation; • Resource classification and validation; • Assessment of “reasonable prospects for economic extraction” and selection of
appropriate cut-off grades; • Preparation of the Mineral Resource Statement.
14.3 RESOURCE DATABASE The exploration data supplied to SRK by ENDEAVOUR was in the form of a Microsoft
Access Database with the following tables included:
• Collar – containing the drill hole collar ID and surveyed co-ordinates, and planned drill hole orientations;
• Survey – containing the down hole orientation survey results; • Geology – containing the geological logs of the drill holes, including fields describing:
o Rock type; o Silicification; o Quartz Veining; o Pyrite; o Oxidation; o Weathering.
• Assay – containing sample ID and gold grade in g/t; and • Geotech – containing geotechnical measurements, and core recovery percentage.
In addition to the drilling database, SRK were supplied with surveyed contours of the surface
topography for the majority of the area surrounding the resources.
The database used in the estimation contained both diamond drill and reverse circulation
drilling results. The data was validated during the import into Datamine to ensure that there
were no unexplained gaps in the data, no overlapping intervals, unusual collar elevations,
survey data was present at the start of each hole and there was consistency of hole names
between input tables. For samples where the analytical laboratory returned a result of less
than detection limit, the value was replaced with half of the detection limit. Datamine
automatically assigns a ‘missing value’ where no assay results are present.
14.4 SOLID BODY MODELLING
14.4.1 Primary Mineralisation The modeling of the mineralized body solids was undertaken in Datamine, using
conventional sectional interpretations. String outlines of the mineralized zones were digitised
on screen along drill lines, and ‘snapped’ onto drill holes to ensure that the mineralized
boundaries were accurately honored.
SRK initially used the wireframes previously generated by Coffey Mining as a reference as
this provided a useful starting point to the interpretation. The approach to the modeling of the
zones was to outline continuously developed zones with an average grade of greater than
0.3 g/t.
For
per
sona
l use
onl
y

May 2012 Agbaou Gold Project Page 14-3 NI 43-101
Technical Report
Based on the preference of the ENDEAVOUR geologists and the outcomes of an
independent review of the Coffey Mining estimate by R. Marinho of AMEC Americas Limited
(“AMEC”), the SRK approach was less tolerant of internal dilution at the expense of a
reduction in tonnes. In other words, SRK selected shorter mineralized intervals as the
mineralized zone, and excluded some relatively isolated high grade intersections in order to
reduce dilution and therefore increase the grade of the modeled zones. In many areas the
SRK and Coffey Mining interpretation of the ore zones are near identical, however in other
areas SRK either selected a shorter interval, or revised the interpretation of the mineralized
zones completely. SRK have interpreted some zones differently to Coffey Mining, based on
the mineralization character of the zones and additional information available from the infill
drilling program.
The sectional interpretations along all drill lines linked to form a solid wireframe envelope.
Wireframes were typically extended half the distance between drill hole lines where the
drilling terminated along strike, or where the mineralization was interpreted to terminate.
Plan views at stepped elevations were used as a verification of the interpretation of the
mineralized zones.
A total of ten zones were interpreted in the Main and Southern areas of the project, and an
additional three zones were interpreted in satellite mineralization in the west of the project.
An additional zone of mineralization constrained to the laterite developed at or near surface
was also modeled and is described in section 14.4.2. In the Main and Southern zones, only
two zones are present over the total strike of the interpreted ore body.
The mineralization is displaced by a major fault at the approximate center of the exploration
area, striking close to north-east to south-west, and with a sinistral lateral displacement
which separates the Main area from the Southern area. It is unclear whether or not there is
any component of vertical displacement. The main mineralized zones are interpreted to be
developed on both sides of the fault, and the mineralized zones have been correlated across
the fault. The primary mineralization wireframe models are presented in
Figure 14.1.
For
per
sona
l use
onl
y
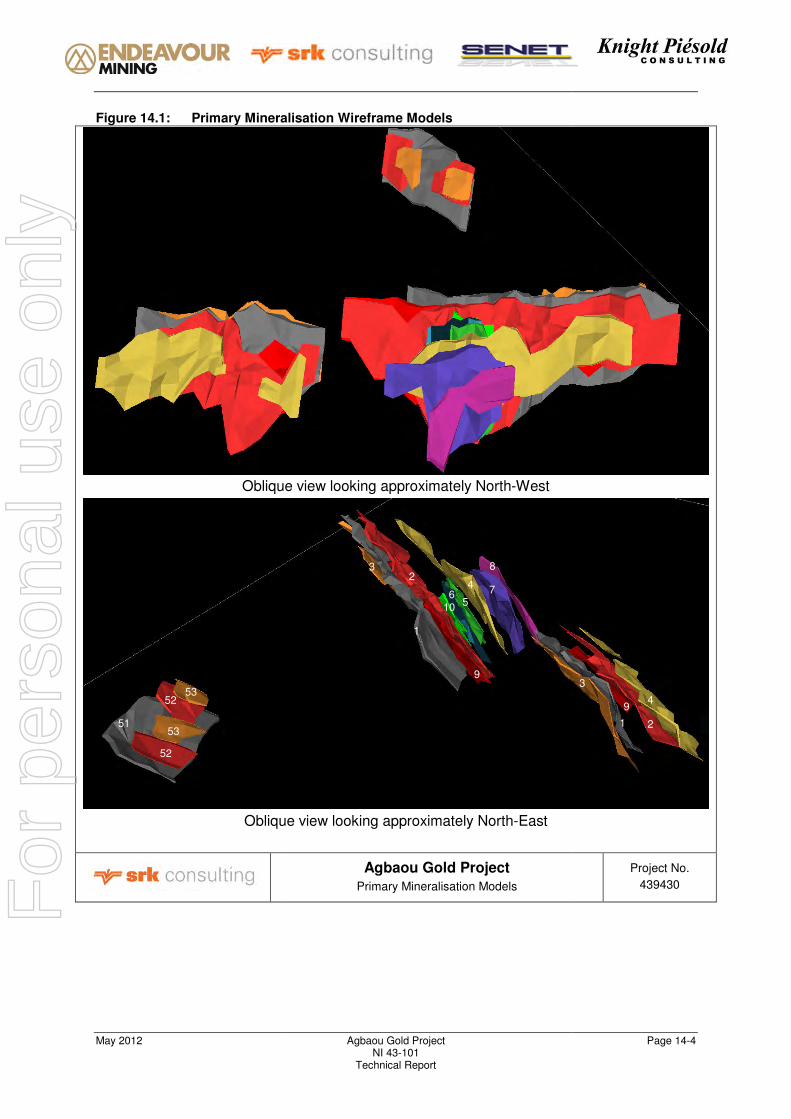
May 2012
Figure 14.1: Primary Mineralisation Wireframe Models
Oblique view looking approximately North
Oblique v
5153
52
5253
Agbaou Gold Project NI 43-101
Technical Report
Primary Mineralisation Wireframe Models
Oblique view looking approximately North-West
Oblique view looking approximately North-East
Agbaou Gold Project Primary Mineralisation Models
1
3
6
9
5
24 7
8
10
Page 14-4
Project No.
439430
1
3
2
49
For
per
sona
l use
onl
y

May 2012 Agbaou Gold Project Page 14-5 NI 43-101
Technical Report
14.4.2 Surface Mineralisation Mineralization has also been modeled in the laterite that overlies most of the project. The
mineralization is not limited to the sub-crop position of the primary mineralized zones;
however the tenor of the laterite mineralization above the primary mineralization is generally
enhanced. The laterite unit was modeled as a whole, without grade selectivity. The top and
bottom surface of the laterite intersections were modeled using Leapfrog software, which
enables the derivation of a smoother surface, which, while honoring the location of the
intersections, is extrapolated between data locations using a trend function. The top and
bottom surfaces intersect each other, and this is interpreted as the limit of the laterite
development.
14.4.3 Weathering Zones Composites were also coded by the weathering profile. The profile has been modeled from
drill data and comprises of laterite, saprolite, transition material and fresh units. Weathering
surfaces generally parallel the topographical profile, although weathering can be deeper
within zones of mineralization. The interfaces between weathering zones were modeled in a
similar fashion to the laterite unit, using Leapfrog software. In some drill holes the weathering
layers are more complicated than the simple sequence of saprolite, transitional and fresh, as
there may be intersections of fresh surrounded by transitional material. In these instances,
SRK selected the position which best matched the surrounding intersections. The surface
was also forced to honor intersection points.
14.5 COMPOSITING SRK analyzed the sample lengths before starting a composite optimization analysis for each
zone. Although the sample lengths are variable within the ore zones, the majority of the
samples are 1m lengths, with a second peak of samples at 2m lengths. Approximately 51%
of the samples within the mineralized zones are at 1m lengths, while about 17% are at 2m
lengths. The majority of the irregular length samples are less than 1m, while a small number
are greater than 2m.
The statistics of grade and sample length of samples within each mineralized zone are
reported in Table 14.1. The gold grade values are length weighted.
For
per
sona
l use
onl
y

May 2012 Agbaou Gold Project Page 14-6 NI 43-101
Technical Report
Table 14.1: Gold Grade and Sample Length Statistics for Samples Within Mineralised Zones
Variable Zone Count Min Max Mean Std.dev Variance Cov
Au (g/t) 1 2,290 0.0005 74.97 3.01 5.77 33.2 1.92
2 2,060 0.005 74.21 2.09 4.90 24.0 2.34
3 307 0.005 24.90 1.41 2.91 8.50 2.06
4 638 0.005 32.09 1.05 3.01 9.00 2.85
5 282 0.005 94.90 6.75 12.51 156.5 1.85
6 257 0.005 54.27 4.40 7.68 59.0 1.75
7 693 0.005 25.40 1.55 3.07 9.40 1.99
8 76 0.005 4.360 0.64 1.03 1.10 1.60
9 615 0.002 27.97 0.99 2.33 5.50 2.36
10 179 0.005 29.18 2.14 4.94 24.4 2.31
11 1,665 0.005 109.8 0.77 4.15 17.2 5.36
51 353 0.005 25.54 1.64 3.32 11.0 1.91
52 58 0.01 13.63 0.82 1.83 3.40 1.98
53 42 0.03 6.810 0.80 1.18 1.40 1.61
Variable Zone Count Min Max Mean Std.dev Variance
Total
Length
Length
(m)
1 2,290 0.01 3.1 0.52 0.27 2410.2 2,410
2 2,060 0.01 9.0 0.57 0.33 2039.5 2,039
3 307 0.01 2.0 0.60 0.36 310.8 311
4 638 0.01 2.0 0.61 0.37 664.3 664
5 282 0.01 2.0 0.47 0.22 324.7 325
6 257 0.05 2.0 0.36 0.13 264.3 264
7 693 0.01 2.0 0.55 0.30 641.4 641
8 76 0.05 2.0 0.37 0.14 54.7 55.0
9 615 0.01 2.0 0.54 0.29 562.8 563
10 179 0.10 2.0 0.55 0.31 220.3 220
11 1,665 0.10 5.0 1.26 0.54 0.3 2,100
51 353 0.10 2.0 1.17 0.64 0.4 415
52 58 0.15 2.0 1.40 0.63 0.4 81.0
53 42 0.10 2.0 1.49 0.60 0.4 62.0
SRK created composites at a range of lengths from 1m to 5m, and compared the impact on
the grade and variance for each zone. The composites were created at a specific length, but
allowed to vary from the specified length to ensure that all samples were included in the
composites. The adjustment is typically at the base of a mineralized zone. The composites
were allowed to be from half the ideal composite length to 1.5 times the ideal composite
length. For example, for the 2m composite length, the minimum composite length would be
1m and the maximum would be 3m.
The composite optimization was undertaken on data from the Main and Southern areas, and
the final composite length selected from the optimization was applied to the West area
resource estimation. The analysis of the composites showed for most zones, that the grade
of the composites was relatively insensitive to composite length, but for longer composites,
For
per
sona
l use
onl
y

May 2012 Agbaou Gold Project Page 14-7 NI 43-101
Technical Report
the grade became more variable. In addition, for some of the narrower zones the average
composite length started to deviate from the standard composite length, indicating that the
zone thickness is close to the composite length. The Coefficient of Variation (“CoV”) of most
of the zones is typically between 2 and 3 on the original sample lengths. Compositing to
longer lengths reduced this value in all zones, however even for relatively long composite
lengths (up to 5m) the CoV remained well above 1. For estimation using Kriging a CoV of
less than 1 is optimal, however not even very long composite lengths achieved this.
SRK elected to retain the 2m composite length used in the previous estimate by Coffey
Mining, as this provided the best balance between regular lengths (i.e. equal support),
retaining the detailed information within the thinner zones, and reducing the variance to
improve the estimation. Considering the eventual estimation block size of 10m by 10m
parallel to the drilling direction, a 1m composite was considered to be too small.
An analysis of the non-standard composite lengths shows that the exclusion of the shorter
lengths was likely to increase the grade of the samples. The statistics of gold grade and
length, of subsets of the composites within the Main and South mineralized zones are
presented in Table 14.2. In Table 14.2 the category “Standard” refers to 2m composites,
“Non-Standard” referred to all composites that are longer or shorter than 2m. “Shorter” and
“Longer” refer to composites shorter and longer than 2m, while “All” includes all composites
regardless of length.
The mean grade of the 2m composites is higher than the mean of all the composites, and
also higher than the mean grades of all the composites that are longer or shorter than 2m.
Excluding the non-standard length composites would therefore most likely have created a
slight high bias in the datasets.
For
per
sona
l use
onl
y

May 2012 Agbaou Gold Project Page 14-8 NI 43-101
Technical Report
Table 14.2: Statistics of Standard and Non-Standard Length Composites Domain Variable Count Minimum Maximum Mean Std. Dev. Variance CoV
Standard AU 2833 0.005 109.83 2.31 5.64 31.79 2.44
Non-Standard AU 1983 0.005 59.55 1.77 3.76 14.16 2.12
Longer AU 496 0.005 15.96 1.26 2.06 4.260 1.64
Shorter AU 1487 0.005 59.55 1.94 4.17 17.35 2.14
All AU 4816 0.005 109.83 2.09 4.96 24.60 2.38
Standard LENGTH 2833 2.00 2.000 2.00 0.00 0.000 0.00
Non-Standard LENGTH 1983 1.00 2.950 1.86 0.25 0.060 0.14
Longer LENGTH 496 2.00 2.950 2.13 0.14 0.020 0.06
Shorter LENGTH 1487 1.00 1.990 1.77 0.22 0.050 0.12
All LENGTH 4816 1.00 2.950 1.94 0.18 0.030 0.09
14.6 EVALUATION OF OUTLIERS SRK conducted an analysis of the data for each zone, and assessed the need for capping of
high grade outlier values. The statistics of the raw gold grades (weighted by length) are
presented in Table 14.3 for each zone. The mineralized zones in the Main and Southern
areas are interpreted to be continuous (aside from the fault displacement discussed in
section 14.4) and therefore are grouped into zones named 1 to 10. The laterite is called zone
11, and the West area zones are called zones 51 to 53.
Table 14.3: Statistics of Composites for Gold by Mineralised Zone Zone Count Minimum Maximum Mean Std. Dev. Variance CoV
1 1228 0.005 66.38 3.00 5.11 26.06 1.70
2 1041 0.005 62.83 2.11 4.28 18.36 2.05
3 163 0.005 24.90 1.41 2.66 7.10 1.88
4 338 0.005 17.10 1.03 1.89 3.56 1.83
5 165 0.005 94.90 6.75 13.25 175.67 1.96
6 136 0.005 49.70 4.42 7.66 58.66 1.74
7 325 0.005 25.40 1.63 3.06 9.36 1.98
8 28 0.005 3.85 0.78 1.13 1.27 1.73
9 286 0.005 17.88 0.99 1.89 3.57 1.92
10 115 0.005 29.18 2.14 4.48 20.11 2.10
11 991 0.005 109.83 0.77 3.78 14.27 4.44
51 236 0.005 25.54 1.69 3.17 10.04 1.88
52 48 0.010 13.63 0.83 2.00 4.01 2.42
53 30 0.030 6.81 0.90 1.38 1.91 1.53
The SRK outlier analysis included a visual assessment of the histograms of each zone,
along with a set of charts which assist in determining an appropriate capping level.
Examples of these plots are presented in Figure 14.2. For the first three plots, the samples
are sorted on their gold grade, and then statistics calculated on samples, starting with the
lowest grade two samples, and then repetitively adding samples and recalculating the
statistics. The aim of these charts is to assess the impact on the dataset of individual
samples on the data mean, standard deviation and the CoV. The last two plots are
For
per
sona
l use
onl
y

May 2012 Agbaou Gold Project Page 14-9 NI 43-101
Technical Report
histograms of the contribution to the metal content of samples (in 10% bins for the fourth
plot, and in 1% bins from 90% upwards in the last plot). The charts are used to assess the
impact of high grade samples to the statistics of each dataset.
Figure 14.2: Zone 1 Capping Analysis Charts
Agbaou Gold Project Zone 1 Capping Analysis Charts
Project No.
439430
For
per
sona
l use
onl
y

May 2012 Agbaou Gold Project Page 14-10 NI 43-101
Technical Report
On the basis of the analysis for each zone, the capping presented in Table 14.4 was applied
to the data for estimation. The capping tried to limit loss of metal to less than 5%.
Table 14.4: Summary of Capping Applied in Ordinary Kriged Estimate Per Zone Uncapped Capped
Zone No.
Comps Mean
Std.
Dev CoV
Cap
Value
No.
Capped Mean
Std.
Dev CoV
Metal
Loss
1 1228 3.00 5.11 1.70 30 6 2.90 4.32 1.48 3.20%
2 1041 2.11 4.28 2.05 28 5 2.04 3.52 1.74 3.26%
3 163 1.41 2.66 1.88 15 1 1.35 2.20 1.63 4.52%
4 338 1.03 1.89 1.83 - 0 1.03 1.89 1.83 0.00%
5 165 6.75 13.25 1.96 40 5 6.12 10.26 1.68 9.44%
6 136 4.42 7.66 1.74 30 2 4.27 6.95 1.63 3.40%
7 325 1.63 3.06 1.98 20 3 1.60 2.87 1.89 1.82%
8 28 0.78 1.13 1.73 - 0 0.78 1.13 1.73 0.00%
9 286 0.99 1.89 1.92 10 2 0.94 1.49 1.58 4.49%
10 115 2.14 4.48 2.10 20 3 1.96 3.55 1.81 8.33%
11 1159 0.77 3.48 4.58 20 2 0.72 1.43 2.10 11.3%
51 236 1.69 3.17 1.88 - 0 1.69 3.17 1.88 0.00%
52 48 0.83 2.00 2.42 - 0 0.83 2.00 2.42 0.00%
53 30 0.90 1.38 1.53 - 0 0.90 1.38 1.53 0.00%
For most zones, the metal loss from capping is relatively small, with less than 5% considered
an acceptable value. For zones 5, 10 and 11 there is a relatively high metal loss. For Zone
5, this is a result of the capping of some very high grade samples (some over 90 g/t) and the
generally high grade of the zone, and the capping of five high grade outliers out of a
relatively small population of samples. Similarly for zone 11 the highest grade samples
capped were over 100 g/t, which has a significant impact on the metal content (and hence
the need for capping). For zone 10, although the capping was relatively conservative, the
small population of composites (115) means that the impact in terms of metal loss is
relatively high.
14.7 STATISTICAL ANALYSIS AND VARIOGRAPHY The summary statistics of the grade of the 2m composites are presented in Table 14.3 for
each mineralized zone. Zones 1 and 2 have a large number of composites, and along with
the laterite zone (Zone 11) are the best informed zones. Zones such as 4, 7 and 9 also have
a significant number of composites, while zones such as zone 8 have too few samples to be
able to characterize the grade population adequately.
The initial testing done by SRK indicated that for the zones with few samples, it was not
possible to generate a semi-variogram with an interpretable structure. Based on an
assessment of the grade characteristics and the geometry and character of the mineralized
zones, and any indication of continuity within the experimental semi-variograms, SRK
grouped some of the sparsely sampled zones together. The estimation has then used a
common semi-variogram for the group, which is calculated on the best sampled zone, and
scaled to the variance of the data within each zone.
For
per
sona
l use
onl
y

May 2012 Agbaou Gold Project Page 14-11 NI 43-101
Technical Report
Zone 1 and 2 were used as the primary zones for the grouping in the Main and South areas,
and zone 51 in the West area. The laterite (zone 11), zone 3 and zone 9 has sufficient data
to generate their own semi-variograms. The zones grouped with zone 1 (and sharing the
zone 1 semi-variogram) are zones 4, 5, and 6. The zones grouped with zone 2 (sharing the
zone 2 semi-variogram) are zone 7, 8, and 10. In the West area, only zone 51 had sufficient
data to generate a semi-variogram, and zone 52 and 53 are grouped along with zone 51.
The histograms of the composites for all zones are displayed, (grouped in the same manner
as the semi-variograms) in Figure 14.3 to Figure 14.6 for the Zone 1 group, Zone 2 group,
individual zones, and the western zones respectively. For the laterite (zone 11) two
histograms are presented, one displaying all data, and one restricted to samples below 20
g/t as the high grade outliers in this zone make the histogram display with all data relatively
uninformative.
For
per
sona
l use
onl
y

May 2012 Agbaou Gold Project Page 14-12 NI 43-101
Technical Report
Figure 14.3: Histograms of Gold Grade for the Zone 1 Group of Zones
Zone 1 Zone 4
Zone 5 Zone 6
Agbaou Feasibility Study Histogram of Gold Grades for Zone 1 Group of
Zones
Project No.
439430
0
0
10
10
20
20
30
30
40
40
50
50
60
60
70
70
AU
AU
0.0 0.0
0.1 0.1
0.2 0.2
0.3 0.3
0.4 0.4
0.5 0.5
Frequencies
Frequencies
Nb Samples: 1228
Minimum: 0.0040
Maximum: 66.3800
Mean: 3.0024
Std. Dev.: 5.1032
0
0
5
5
10
10
15
15
AU
AU
0.0 0.0
0.1 0.1
0.2 0.2
0.3 0.3
0.4 0.4
Frequencies
Frequencies
Nb Samples: 338
Minimum: 0.0050
Maximum: 17.1000
Mean: 1.0387
Std. Dev.: 1.8837
0
0
50
50
100
100
AU
AU
0.0 0.0
0.1 0.1
0.2 0.2
0.3 0.3
0.4 0.4
0.5 0.5
0.6 0.6
Frequencies
Frequencies
Nb Samples: 165
Minimum: 0.0050
Maximum: 94.9000
Mean: 6.7573
Std. Dev.: 13.2139
0
0
10
10
20
20
30
30
40
40
50
50
AU
AU
0.0 0.0
0.1 0.1
0.2 0.2
0.3 0.3
0.4 0.4
Frequencies
Frequencies
Nb Samples: 136
Minimum: 0.0050
Maximum: 49.7000
Mean: 4.3796
Std. Dev.: 7.6309
For
per
sona
l use
onl
y

May 2012 Agbaou Gold Project Page 14-13 NI 43-101
Technical Report
Figure 14.4: Histograms of Gold Grade for the Zone 2 Group of Zones
Zone 2 Zone 7
Zone 8 Zone 10
Agbaou Gold Project Histogram of Gold Grades for Zone 2 Group of
Zones
Project No.
439430
0
0
10
10
20
20
30
30
40
40
50
50
60
60
AU
AU
0.0 0.0
0.1 0.1
0.2 0.2
0.3 0.3
0.4 0.4
0.5 0.5
0.6 0.6
Frequencies
Frequencies
Nb Samples: 1041
Minimum: 0.0050
Maximum: 62.8300
Mean: 2.0988
Std. Dev.: 4.2826
0
0
10
10
20
20
AU
AU
0.0 0.0
0.1 0.1
0.2 0.2
0.3 0.3
0.4 0.4
Frequencies
Frequencies
Nb Samples: 325
Minimum: 0.0050
Maximum: 25.4000
Mean: 1.5424
Std. Dev.: 3.0554
0
0
1
1
2
2
3
3
4
4
AU
AU
0.0 0.0
0.1 0.1
0.2 0.2
0.3 0.3
0.4 0.4
Frequencies
Frequencies
Nb Samples: 28
Minimum: 0.0050
Maximum: 3.8457
Mean: 0.6793
Std. Dev.: 1.1060
0
0
10
10
20
20
30
30
AU
AU
0.0 0.0
0.1 0.1
0.2 0.2
0.3 0.3
0.4 0.4
Frequencies
Frequencies
Nb Samples: 115
Minimum: 0.0050
Maximum: 29.1800
Mean: 2.0822
Std. Dev.: 4.4653
For
per
sona
l use
onl
y

May 2012 Agbaou Gold Project Page 14-14 NI 43-101
Technical Report
Figure 14.5: Histograms of Gold Grade for the Individual Zones
Zone 3 Zone 9
Zone 11 All Zone 11 Below 20
Agbaou Feasibility Study Histogram of Gold Grades for Individual Zones
Project No.
439430
0
0
5
5
10
10
15
15
AU
AU
0.00 0.00
0.05 0.05
0.10 0.10
0.15 0.15
0.20 0.20
0.25 0.25
Frequencies
Frequencies
Nb Samples: 163
Minimum: 0.0050
Maximum: 15.0000
Mean: 1.3611
Std. Dev.: 2.1914
0
0
5
5
10
10
15
15
AU
AU
0.0 0.0
0.1 0.1
0.2 0.2
0.3 0.3
0.4 0.4
Frequencies
Frequencies
Nb Samples: 286
Minimum: 0.0025
Maximum: 17.8777
Mean: 0.9904
Std. Dev.: 1.8873
0
0
50
50
100
100
AU
AU
0.00 0.00
0.25 0.25
0.50 0.50
0.75 0.75
1.00 1.00
Frequencies
Frequencies
Nb Samples: 1087
Minimum: 0.00
Maximum: 109.83
Mean: 0.83
Std. Dev.: 3.75
0
0
10
10
20
20
AU
AU
0.0 0.0
0.1 0.1
0.2 0.2
0.3 0.3
0.4 0.4
Frequencies
Frequencies
Nb Samples: 1087
Minimum: 0.00
Maximum: 109.83
Mean: 0.83
Std. Dev.: 3.75
For
per
sona
l use
onl
y

May 2012 Agbaou Gold Project Page 14-15 NI 43-101
Technical Report
Figure 14.6: Histograms of Gold Grade for the Western Area Zones
Zone 51 Zone 52
Zone 53
Agbaou Gold Project Histogram of Gold Grades for the Western Area
Zones
Project No.
439430
The semi-variograms on the raw data showed poor or no structure in all cases, and SRK
elected to transform the raw gold grade variables to a Gaussian distribution, with a normal
score transformation, using hermite polynomials. The data were declustered using a rotated
block configuration before transformation. A range of block sizes were tested for each zone,
between 2.5m and 20m in the plane of the mineralization, and between 0.5m and 5m across
the ore bodies. The resulting Gaussian variable statistics have a normal or Gaussian
distribution whereby the minimum and maximum should be very similar in the positive and
negative; the mean should be close to zero; the variance and standard deviation close to
one.
The declustered block size was selected to achieve the closest to the ideal distribution for
the Gaussian variable. The statistics of the Gaussian variables used to generate the
0
0
10
10
20
20
AU
AU
0.0 0.0
0.1 0.1
0.2 0.2
0.3 0.3
0.4 0.4
0.5 0.5
Frequencies
Frequencies
Nb Samples: 236
Minimum: 0.0050
Maximum: 25.5400
Mean: 1.6899
Std. Dev.: 3.0646
0
0
5
5
10
10
15
15
AU
AU
0.0 0.0
0.1 0.1
0.2 0.2
0.3 0.3
Frequencies
Frequencies
Nb Samples: 48
Minimum: 0.0100
Maximum: 13.6300
Mean: 0.8279
Std. Dev.: 1.5945
0
0
1
1
2
2
3
3
4
4
5
5
6
6
7
7
AU
AU
0.0 0.0
0.1 0.1
0.2 0.2
0.3 0.3
Frequencies
Frequencies
Nb Samples: 30
Minimum: 0.0300
Maximum: 6.8100
Mean: 0.9030
Std. Dev.: 1.2851
For
per
sona
l use
onl
y

May 2012 Agbaou Gold Project Page 14-16 NI 43-101
Technical Report
experimental semi-variograms are presented in Table 14.5.
Table 14.5: Statistics of Gaussian Gold Variables per Zone Zone Count Minimum Maximum Mean Std. Dev. Variance
1 1,228 -3.25 3.28 0.0000 0.999 0.998
2 1,041 -3.23 3.12 -0.0001 0.999 0.998
3 163 -2.66 2.33 -0.0025 0.989 0.978
4 338 -2.79 2.76 -0.0001 0.996 0.991
5 165 -2.68 2.72 0.0002 0.995 0.989
6 136 -2.17 2.47 0.0029 0.981 0.963
7 325 -2.84 2.84 0.0000 0.996 0.993
8 28 -1.53 1.87 0.0161 0.920 0.846
9 286 -2.90 2.88 0.0002 0.998 0.995
10 115 -2.46 2.60 0.0008 0.991 0.981
11 1,087 -3.18 3.18 0.0000 0.999 0.997
51 236 -2.51 5.57 0.0409 1.246 1.553
The semi-variograms for zones 1, 2, 3, 9, 11 and 51 were modeled in Gaussian space. The
experimental semi-variograms were oriented such that the X and Y axes approximated the
dip and strike directions of the ore bodies. The Z direction is close to the drill hole direction,
and the experimental semi-variogram search parameters were selected such that the Z
direction approximates a true down hole semi-variogram.
The modeled semi-variograms in Gaussian space were scaled to the population variance of
each zone, according to the groupings, retaining the directional ranges and the ratios of
each of the structures. The modeled semi-variograms in Gaussian space are presented in
Figure 14.7, and the semi-variogram parameters used in the estimates (scaled to normal
space) are presented in Table 14.6.
All semi-variograms were modeled with two spherical structures, except the Western area
which was modeled with only one.
As the Zone 3 and 9 experimental semi-variograms have reached a (relatively) stable sill
which is lower than the population variance. SRK have therefore added a very long range
structure to ensure that the total sill of the semi-variogram model matches the population
variance, while still matching the inherent structure in the experimental data. The longer
range portion of the semi-variogram is not accessed for the shorter range estimates. The
very long range ensures that the Kriging weights of any estimates that do access portions of
the semi-variogram beyond the first modeled ranges will not be meaningfully impacted by
the second range.
Zone 1 (and the zones grouped with zone 1) shows a low nugget (modeled on the down hole
semi-variogram) and a short range structure that account for approximately 90% of the
variance. The semi-variogram stabilizes at the population variance at a range of just greater
than 100m. The down hole semi-variogram does not reach stability. This is to be expected
where the mineralization relates to fractures which are approximately perpendicular to the
For
per
sona
l use
onl
y

May 2012 Agbaou Gold Project Page 14-17 NI 43-101
Technical Report
direction of drilling.
The zone 2 semi-variogram group shows a similar structure to the zone 1 semi-variogram;
however the range of continuity is significantly shorter, at just over 30 m.
Table 14.6: Modelled Semi-Variogram Parameters per Zone Zone Rotation (Isatis)
Nugget
C(0)
Structure 1 Structure 2
Z Y X
Range (m)
Range (m)
Strike Dip
Down
hole
Sill
(C1) Strike Dip
Down
hole
Sill
(C2)
1 40 45 0 7.687 35 35 4 15.025 105 105 12 6.049
2 30 45 0 4.166 5 5 4 7.137 32 32 15 4.166
3 40 45 0 2.083 56 56 7 2.376 5000 5000 5000 0.343
4 40 45 0 0.951 35 35 4 1.859 105 105 12 0.749
5 40 45 0 43.603 35 35 4 85.227 105 105 12 34.315
6 30 45 0 13.190 35 35 4 25.781 105 105 12 10.380
7 30 45 0 2.560 5 5 4 4.386 32 32 15 1.878
8 30 45 0 0.265 5 5 4 0.453 32 32 15 0.194
9 30 45 0 2.809 60 60 10 2.100 5000 5000 5000 0.546
10 30 45 0 3.904 5 5 4 6.689 32 32 15 2.863
11 30 0 0 1.438 10 10 9 1.926 270 270 22 9.475
51 60 35 0 4.330 135 135 11 0.5670
52 60 35 0 1.702 135 135 11 2.228
53 60 35 0 0.801 135 135 11 1.094
SRK tested for evidence of anisotropy in the plane of mineralization for Zones 1 to 10 and
51, and none of the zones where a meaningful semi-variogram could be modeled showed
any material anisotropy. As a result, the semi-variogram in the plane of the ore body is
isotropic. The down hole direction has a significantly shorter range of continuity however,
and the experimental semi-variograms and models reflect this.
The Zone 11 (laterite) data are strongly affected by topography, within the range of the semi-
variogram. The data were therefore leveled in order to remove the effect of topography. This
was achieved simply by using the top of the laterite in each drill hole as a reference point,
and translating that reference point vertically to a common elevation. In this manner, the
effect of topography on the location of samples in space was reduced, allowing for an
improved analysis of the spatial grade relationships. The experimental semi-variograms
were then calculated on the leveled dataset, with the horizontal plane representing the
direction of best continuity. This resulted in a relatively robust semi-variogram over distances
of over 200m. No significant lateral anisotropy was found in the laterite experimental semi-
variogram, and as such the lateral semi-variogram was modeled isotropically. For
per
sona
l use
onl
y

May 2012 Agbaou Gold Project Page 14-18 NI 43-101
Technical Report
Figure 14.7: Gaussian Semi-variograms for Modelled Zones
Zone 1 Zone 2
Zone 3 Zone 9
Zone 11 Zone 53
Agbaou Gold Project Gaussian Semi-Variograms for Modeled Zones
Project No.
439430
N40
N130
0
0
50
50
100
100
150
150
200
200
250
250
Distance (m)
Distance (m)
0.00 0.00
0.25 0.25
0.50 0.50
0.75 0.75
1.00 1.00
Variogram : Au_Gauss_F
Variogram : Au_Gauss_F
N40
N130
0
0
50
50
100
100
150
150
200
200
250
250
Distance (m)
Distance (m)
0.00 0.00
0.25 0.25
0.50 0.50
0.75 0.75
1.00 1.00
Variogram : Au_Gauss_F
Variogram : Au_Gauss_F
N40
N130
0
0
50
50
100
100
150
150
200
200
250
250
Distance (m)
Distance (m)
0.00 0.00
0.25 0.25
0.50 0.50
0.75 0.75
1.00 1.00
1.25 1.25
Variogram : Au_Gauss_F
Variogram : Au_Gauss_F
N40
N130
0
0
50
50
100
100
150
150
200
200
250
250
Distance (m)
Distance (m)
0.00 0.00
0.25 0.25
0.50 0.50
0.75 0.75
1.00 1.00
1.25 1.25
Variogram : Au_Gauss_F
Variogram : Au_Gauss_F
N3014
8921
13046
14209
14600
14047
1306911872
117371111511023
1048010579
9618
1045411007128131216199327854
D-90
84
4
8
424
4
1
N0
76
8
8
424
4
1
0
0
100
100
200
200
300
300
400
400
500
500
600
600
700
700
800
800
900
900
1000
1000
Distance (m)
Distance (m)
0.0 0.0
0.5 0.5
1.0 1.0
1.5 1.5
Variogram : GAU_Au
Variogram : GAU_Au
str
8 501
502
372297
19
dip4
880
5537
199
5
1
0
0
50
50
100
100
150
150
200
200
Distance (m)
Distance (m)
0.0 0.0
0.5 0.5
1.0 1.0
1.5 1.5
Variogram : Gau_Au
Variogram : Gau_Au
For
per
sona
l use
onl
y

May 2012 Agbaou Gold Project Page 14-19 NI 43-101
Technical Report
14.8 BLOCK MODEL AND GRADE ESTIMATION After the modeling of the semi-variograms, the next step is to determine the parameters to
be used in the estimation. Quantitative Kriging Neighborhood Analysis (“QKNA”) can used to
optimize the search ranges, block sizes and number samples for Ordinary Kriging. The
QKNA methodology is discussed in Vann et al, 2003, and monitors the sensitivity of the
estimates to Kriging parameters, specifically the Slope of Regression (“SoR”), Kriging
Efficiency (“KE”), and negative weights.
The SoR is a theoretical measure of the correlation between an estimated block value and
the “actual” value. Values will be between 0 and 1, with the ideal being a slope of 1 (no
Conditional Bias). The KE is another theoretical measure calculated during the Kriging
process which indicates the degree of smoothing in the estimation. Values close to 1 are not
smoothed while those close to zero indicate a high degree of smoothing. In the case of
negative values, the global (declustered) mean of the samples is considered more reliable
than Kriging. Ordinary Kriging is based on an algorithm whereby the sum of the weights is
equal to 1 (to minimize error). In certain cases this requires negative weights to meet that
condition. A few small negative weights are acceptable but these should never exceed 5%.
14.8.1 Block Size Optimization The QKNA procedure involves iteratively Kriging selected blocks and varying selected
parameters (block size, sample numbers, search distances etc.), and then monitoring the
selected Kriging statistics and selecting the optimal parameters. SRK used QKNA to
optimize the block size and maximum number of samples. The optimization was undertaken
for zones 1 and 2, as these represent the best informed zones, for which there is a robust
semi-variogram model, and which represent a significant proportion of the volume of the
resources.
Generally a block size of less than half the grid spacing will produce unacceptable QKNA
results and there are numerous of references in the literature to the dangers of Kriging into
small blocks relative to the sample grid. In contrast Kriging into large blocks will reduce the
estimation variance; it also implies very low selectivity, which is often an unrealistic
assumption. Six block sizes were tested with QKNA, which were selected on the basis of the
ore body dimensions, drill hole spacing, and the Smallest Mining Unit (“SMU”) dimension of
2.5m3 indicated by the SRK and ENDEAVOUR Engineers. The block model was not rotated
at the request of the Mining Engineers and remains orthogonal to the main geographical
axes. The block dimensions tested are presented in Table 14.7.
For
per
sona
l use
onl
y

May 2012 Agbaou Gold Project Page 14-20 NI 43-101
Technical Report
Table 14.7: Block Size Optimisation Scenarios Block option X size (m) Y size (m) Z size (m) Volume (m
3)
1 5 20 10 1000
2 5 25 10 1250
3 10 20 10 2000
4 15 20 10 3000
5 15 25 10 3750
6 10 40 10 4000
Blocks were tested for four sites in each of zone 1 and 2. The blocks were in densely and poorly samples areas of both the North and South areas of zone 1 and 2. The block Kriged for each block size was located in a similar position in each of the four scenarios, in both zones. The results of the QKNA testing for block size are presented in Figure 14.8 for zone 1 and Figure 14.9 for zone 2. The absolute values of each of the
statistics are not material for this exercise, but rather the comparison of how the block sizes
affect the statistics in each of the four zones. In these figures the values on the X axis
correspond to the ‘Block Option’ in Table 14.7.
For
per
sona
l use
onl
y

May 2012 Agbaou Gold Project Page 14-21 NI 43-101
Technical Report
Figure 14.8: QKNA Results for Block Size Selection on Zone 1
Agbaou Gold Project QKNA Results for Block Size Selection on Zone 1
Project No.
439430
0.5
0.6
0.7
0.8
0.9
1
1.1
1 2 3 4 5 6
Slo
pe
of
Rre
gre
ssio
nSlope of Regression
Site 1
Site 2
Site 3
Site 4
-0.1000
0.0000
0.1000
0.2000
0.3000
0.4000
0.5000
1 2 3 4 5 6
Kri
gin
g E
ffic
ien
cy
Kriging Efficiency
Site 1
Site 2
Site 3
Site 4
0
0.5
1
1.5
2
2.5
3
3.5
4
4.5
5
1 2 3 4 5 6
Va
ria
nce
Variance
Site 1
Site 2
Site 3
Site 4
For
per
sona
l use
onl
y

May 2012 Agbaou Gold Project Page 14-22 NI 43-101
Technical Report
Figure 14.9: QKNA Results for Block Size Selection on Zone 2
Agbaou Gold Project QKNA Results for Block Size Selection on Zone 2
Project No.
439430
0.5
0.6
0.7
0.8
0.9
1
1.1
1 2 3 4 5 6
Slo
pe
of
Rre
gre
ssio
n
Slope of Regression
Site 1
Site 2
Site 3
Site 4
-0.1000
0.0000
0.1000
0.2000
0.3000
0.4000
0.5000
1 2 3 4 5 6
Kri
gin
g Ef
fici
en
cy
Kriging Efficiency
Site 1
Site 2
Site 3
Site 4
0
0.5
1
1.5
2
2.5
3
3.5
4
4.5
5
1 2 3 4 5 6
Var
ian
ce
Variance
Site 1
Site 2
Site 3
Site 4
For
per
sona
l use
onl
y

May 2012 Agbaou Gold Project Page 14-23 NI 43-101
Technical Report
While there is no clear optimal size, the option 3 was selected as a consistently good result
for all sites. In addition, the size of 10m (X) x 20m (Y) x 10m (Z) is a suitable size when
considering the dimensions of the ore bodies, and the typical drill hole spacing.
14.8.2 Sample Number Optimization Using a similar approach to the block size optimization, the number of composites to be
used in the search neighborhood was analyzed. Several sites selected for each of Zones 1,
2, 3, 9, 11 and 51 (for which semi-variograms could be modeled) were estimated and the
results plotted.
For all test sites in all zones tested the pattern of the Kriging statistics was similar, showing
improved SoR and KE as the maximum number of samples increased. In only one site were
there any negative weights recorded, and these were for a high number of samples in the
neighborhood in Zone 1. The results of the optimization testes are plotted in Figure 14.10 to
Figure 14.13.
In selecting the optimum number of samples, one needs to find a balance between
maximizing the Kriging statistics (SoR and the KE), which are shown in the plots in Figure
14.10 to Figure 14.13 to increase consistently with the increase in sample numbers, and
avoiding over-smoothing of the estimate, which tends to occur if too many samples are
selected in the search. A measure of the degree of smoothing is the Kriging variance, which
is also plotted on the sample optimization charts.
The Zone 1 results in Figure 14.10 indicate that using upwards of 40 composites in the
estimate would provide the best estimate for a block, with negative weights only being
returned in one instance. The Kriging variance with this number of samples is low, and SRK
consider that this represents too high a number, which would result in over smoothing of the
estimate. SRK therefore selected 20 samples as the optimum number of samples in the
search, as this represented a good balance between estimation quality and retaining the
inherent variability in the estimate. Twenty composites in all cases returned a SoR of greater
than 0.8.
The Zone 2 results in Figure 14.11 show poorer quality estimation results than Zone 1 using
similar parameters, which is a result of the significantly shorter semi-variogram range (see
section 14.6). SRK selected an optimum number of samples of 15 for this zone as the
shorter search distance will limit the number of samples available in the search
neighborhood, and the reduction in the Kriging variance at sample numbers greater than this
was considered too high.
Zone 3 and Zone 9 results in Figure 14.12 show a similar pattern to the Zone 2 results,
where selecting more than 15 samples in the neighborhood would result in over smoothing,
with little improvement in the Kriging statistics. The Zone 3 and Zone 9 results reflect the
typically wider drill hole spacing in the modeled areas of these zones compared to Zone 1
and Zone 2.
For the remaining zones in the Main and Southern area, which were grouped together with
For
per
sona
l use
onl
y

May 2012 Agbaou Gold Project Page 14-24 NI 43-101
Technical Report
one of the four zones discussed above, for which there is not an independent semi-
variogram model, the same parameters were used as the best developed zone in the group.
For zones 11 and 51 in Figure 14.13 an optimum number of samples of 25 was selected as
providing the best estimates.
For
per
sona
l use
onl
y

May 2012 Agbaou Gold Project Page 14-25 NI 43-101
Technical Report
Figure 14.10: QKNA Results for Sample Number Selection on Zone 1
Agbaou Gold Project QKNA Results for Sample Number Selection on Zone 1
Project No.
439430
0
1
2
3
4
5
6
0
0.2
0.4
0.6
0.8
1
1.2
6 8 10 12 14 16 20 25 30 35 40 45 50
Est
imte
d v
alu
e a
nd
va
ria
nce
Kri
gin
g e
ffic
ien
cy a
nd
slo
pe
of
reg
ress
ion
Maximum number of samples
Sample number optimisation For Zone 1 North Central
Slope of the regression Z | Z* Kriging Efficiency Negative Weights Estimation variance Estimated value
0
2
4
6
8
10
12
14
16
18
0
0.1
0.2
0.3
0.4
0.5
0.6
0.7
0.8
0.9
1
6 8 10 12 14 16 20 25 30 35 40 45 50
Est
imte
d v
alu
e a
nd
va
ria
nce
Kri
gin
g e
ffic
ien
cy a
nd
slo
pe
of
reg
ress
ion
Maximum number of samples
Sample number optimisation For Zone 1 North Dense
Slope of the regression Z | Z* Kriging Efficiency Negative Weights Estimation variance Estimated value
0
0.5
1
1.5
2
2.5
3
3.5
4
0
0.2
0.4
0.6
0.8
1
1.2
5 10 15 20 25 30 35 40 45 50 55 60 65
Est
imte
d v
alu
e a
nd
va
ria
nce
Kri
gin
g e
ffic
ien
cy a
nd
slo
pe
of
reg
ress
ion
Maximum number of samples
Sample number optimisation For Zone 1 South
Slope of the regression Z | Z* Kriging Efficiency Negative Weights Estimation variance Estimated valueFor
per
sona
l use
onl
y

May 2012 Agbaou Gold Project Page 14-26 NI 43-101
Technical Report
Figure 14.11: QKNA Results for Sample Number Selection on Zone 2
Agbaou Gold Project QKNA Results for Sample Number Selection on Zone 2
Project No.
439430
0
1
2
3
4
5
6
7
8
9
10
-2
-1.5
-1
-0.5
0
0.5
1
5 10 15 20 25 30 35 36
Est
imte
d v
alu
e a
nd
va
ria
nce
Kri
gin
g e
ffic
ien
cy a
nd
slo
pe
of
reg
ress
ion
Maximum number of samples
Sample number optimisation For Zone 2 South
Slope of the regression Z | Z* Kriging Efficiency Negative Weights Estimation variance Estimated value
0
1
2
3
4
5
6
0
0.1
0.2
0.3
0.4
0.5
0.6
0.7
0.8
0.9
5 10 15 20 25 30 35 40 45 50 55 60 65
Est
imte
d v
alu
e a
nd
va
ria
nce
Kri
gin
g e
ffic
ien
cy,
slo
pe
of
reg
ress
ion
an
d P
erc
en
t o
f n
ega
tive
we
igh
ts
Maximum number of samples
Sample number optimisation For Zone 2 South Dense
Slope of the regression Z | Z* Kriging Efficiency Negative Weights Estimation variance Estimated value
0
1
2
3
4
5
6
7
0
0.1
0.2
0.3
0.4
0.5
0.6
0.7
0.8
5 10 15 20 25 30 35 40 45 50 55 56
Est
imte
d v
alu
e a
nd
va
ria
nce
Kri
gin
g e
ffic
ien
cy,
slo
pe
of
regr
ess
ion
an
d P
erc
en
t o
f n
ega
tive
we
igh
ts
Maximum number of samples
Sample number optimisation For Zone 2 North
Slope of the regression Z | Z* Kriging Efficiency Negative Weights Estimation variance Estimated valueFor
per
sona
l use
onl
y

May 2012 Agbaou Gold Project Page 14-27 NI 43-101
Technical Report
Figure 14.12: QKNA Results for Sample Number Selection on Zone 3 and 9
Agbaou Gold Project QKNA Results for Sample Number Selection on Zone 3 and Zone 9
Project No.
439430
0
0.2
0.4
0.6
0.8
1
1.2
1.4
1.6
1.8
2
0
0.1
0.2
0.3
0.4
0.5
0.6
5 10 15 20 20
Est
imte
d v
alu
e a
nd
va
ria
nce
Kri
gin
g e
ffic
ien
cy,
slo
pe
of
reg
ress
ion
an
d P
erc
en
t o
f n
ega
tive
we
igh
ts
Maximum number of samples
Sample number optimisation For Zone 3 North
Slope of the regression Z | Z* Kriging Efficiency Negative Weights Estimation variance Estimated value
0
1
2
3
4
5
6
7
0
0.1
0.2
0.3
0.4
0.5
0.6
0.7
0.8
5 10 15 20 25 30 35 40 45 50 55 56
Est
imte
d v
alu
e a
nd
va
ria
nce
Kri
gin
g e
ffic
ien
cy,
slo
pe
of
reg
ress
ion
an
d P
erc
en
t o
f n
ega
tive
we
igh
ts
Maximum number of samples
Sample number optimisation For Zone 3 South
Slope of the regression Z | Z* Kriging Efficiency Negative Weights Estimation variance Estimated value
0
0.2
0.4
0.6
0.8
1
1.2
0
0.1
0.2
0.3
0.4
0.5
0.6
0.7
0.8
0.9
5 10 15 20 25 30 30
Est
imte
d v
alu
e a
nd
va
ria
nce
Kri
gin
g e
ffic
ien
cy,
slo
pe
of
regr
ess
ion
an
d P
erc
en
t o
f n
ega
tive
we
igh
ts
Maximum number of samples
Sample number optimisation For Zone 9 South
Slope of the regression Z | Z* Kriging Efficiency Negative Weights Estimation variance Estimated value
0
0.2
0.4
0.6
0.8
1
1.2
1.4
1.6
0
0.1
0.2
0.3
0.4
0.5
0.6
0.7
0.8
0.9
1
5 10 15 20 25 30 35 37
Est
imte
d v
alu
e a
nd
var
ian
ce
Kri
gin
g e
ffic
ien
cy,
slo
pe
of
regr
ess
ion
an
d P
erc
en
t o
f n
ega
tive
we
igh
ts
Maximum number of samples
Sample number optimisation For Zone 9 North
Slope of the regression Z | Z* Kriging Efficiency Negative Weights Estimation variance Estimated valueFor
per
sona
l use
onl
y

May 2012 Agbaou Gold Project Page 14-28 NI 43-101
Technical Report
Figure 14.13: QKNA Results for Sample Number Selection on Zone 11 and 51
Agbaou Gold Project QKNA Results for Sample Number Selection on Zone 11 and Zone 51
Project No.
439430
-0.25
-0.2
-0.15
-0.1
-0.05
0
0
0.2
0.4
0.6
0.8
1
1.2
5 10 15 20 25 30 35 40 45 50 55 60
Kri
gin
g S
tati
stic
s
Number of Samples
Sample Number optimisation for Zone 11 dense
Estimation Variance Slope of Regression Kriging efficiency Negative weight
Kri
gin
g e
ffic
ien
cy
-0.16
-0.14
-0.12
-0.1
-0.08
-0.06
-0.04
-0.02
0
0.02
0.04
0
0.2
0.4
0.6
0.8
1
1.2
5 10 15 20 25 30 35 40 45 50 55 60
Kri
gin
g S
tati
stic
s
Number of Samples
Sample Number optimisation for Zone 11 sparse
Estimation Variance Slope of Regression Kriging efficiency Negative weight
Kri
gin
g e
ffic
ien
cy
-0.1
0
0.1
0.2
0.3
0.4
0.5
0
0.2
0.4
0.6
0.8
1
1.2
5 10 15 20 25 30 35 40 45 50 55 60
Kri
gin
g S
tati
stic
s
Number of Samples
Sample Number optimisation for Zone 51 Dense
Estimation Variance Slope of Regression Kriging efficiency Negative weight
Kri
gin
g e
ffic
ien
cy
-0.2
-0.1
0
0.1
0.2
0.3
0.4
0.5
0.6
0.7
0.8
0
0.1
0.2
0.3
0.4
0.5
0.6
0.7
0.8
0.9
1
5 10 15 20 25 30 35 40 45 50 55 60K
rig
ing
Sta
tist
ics
Number of Samples
Sample Number optimisation for Zone 51 sparse
Estimation Variance Slope of Regression Kriging efficiency Negative weight
Kri
gin
g e
ffic
ien
cy
For
per
sona
l use
onl
y

May 2012 Agbaou Gold Project Page 14-29 NI 43-101
Technical Report
14.8.3 Search Orientation Optimization Initial testing of the search parameters based on the testing above and the semi-variogram
ranges modeled in section 14.7 revealed that the semi-variogram orientations, while
appropriate as an average for the entire zone, produced sub-optimal results in some areas,
because of local changes in dip and strike. SRK identified a location in the North and
Southern areas the dip and strike of most zones showed some change. Likewise in the
western area two locations were identified where there was a change in the orientation of the
ore body.
In
Figure 14.14 the search domains identified in the Main and South areas are illustrated. Two
polygons are drawn around the Southernmost search area (south end of the South area),
and around the central portion of the Main area. The areas outside the polygons are also
treated as separate search domains, termed the Main domain (North end of the Main area),
and South/Central domains. For each of the four domains, for each of the zones which exist
within the domain, an average ore body orientation was approximated and applied to the
estimates within this search domain. Within a zone, no restrictions were placed on the
composites available to estimate within a search domain (i.e. composites within the Main
domain could be used to estimate samples in the North end of the Main area search
domain) however blocks within a search domain were estimated with the search orientation
for that domain.
After the first estimation, using the optimized parameters, and search ranges which are
based on the semi-variogram range, parts of the ore bodies remained un-estimated,
particularly in the zones with short range semi-variograms such as the Zone 2 group. A
second and third search pass were designed, with longer search ranges, to ensure that all
blocks within the ore bodies were informed.
In Figure 14.15, the search domains used for the West area are illustrated. The three
polygons shown represent the three search domains and as with the North, Central and
South areas the search orientations were optimized for each zone within each search
domain. The three zones are identified as East, West and Central. A second search pass
was necessary to inform all blocks.
The laterite in Zone 11 is strongly affected by the topography, and SRK elected to use a
Datamine feature termed ‘dynamic anisotropy’ which allows the search orientation to be
dynamically altered for each block according to the local orientation of the ore body. The top
surface of the laterite is used to calculate a local orientation for the ore body. This orientation
is then estimated into the block model using inverse distance, and the orientation is used to
rotate the search ellipse and the semi-variograms used in the estimates of each block. Only
one search pass was required to inform all blocks within the zone.
The final search neighborhood parameters used in the Ordinary Kriging estimate, based on
the semi-variogram models and the testing described above are summarized in
Table 14.8. For all estimates, a discretization pattern of 5 (X) by 10 (Y) by 5 (Z) points was
used.
For
per
sona
l use
onl
y

May 2012
Figure 14.14: Search Domains
Figure 14.15: Search Domains
Agbaou Gold Project NI 43-101
Technical Report
Search Domains Main, Main/Central, South/Central and South
Not to scale
Agbaou Gold Project Search Domains Main, Main/Central, South/Central
and South
Search Domains West for Zones 51 to 53
Agbaou Gold Project Search Domains West
Page 14-30
and South for Zones 1 to 10
Search Domains Main, Main/Central, South/Central Project No.
439430
Project No.
439430
For
per
sona
l use
onl
y

May 2012 Agbaou Gold Project Page 14-31 NI 43-101
Technical Report
Table 14.8: Summary of Search Neighbourhood Parameters
First Search pass Second Search pass Third Search pass
Rotation (Degrees
clockwise) Search Range (m)
Number of
samples Search Range (m)
Number of
samples Search Range (m)
Number of
samples
Zone Search Domain Z Y X X Y Z Min Max X Y Z Min Max X Y Z Min Max
Zone1 North 50 45 0 110 110 15 5 25 200 200 30 5 20 250 250 30 5 20
Zone1 North/Central 30 60 0 110 110 15 5 25 200 200 30 5 20 250 250 30 5 20
Zone1 South 35 65 0 110 110 15 5 25 200 200 30 5 20 250 250 30 5 20
Zone1 South/Central 55 55 0 110 110 15 5 25 200 200 30 5 20 250 250 30 5 20
Zone2 North 50 55 0 38 38 18 5 20 70 70 40 5 15 200 200 40 5 15
Zone2 North/Central 50 55 0 38 38 18 5 20 70 70 40 5 15 200 200 40 5 15
Zone2 South 40 45 0 38 38 18 5 20 70 70 40 5 15 200 200 40 5 15
Zone2 South/Central 45 45 0 38 38 18 5 20 70 70 40 5 15 200 200 40 5 15
Zone3 North 45 50 0 60 60 10 5 20 120 120 20 5 15 200 200 40 5 15
Zone3 South 40 60 0 60 60 10 5 20 120 120 20 5 15 200 200 40 5 15
Zone3 South/Central 55 55 0 60 60 10 5 20 120 120 20 5 15 120 120 20 5 15
Zone4 North 50 50 0 110 110 15 5 25 200 200 30 5 20 120 120 20 5 15
Zone4 North/Central 45 65 0 110 110 15 5 25 200 200 30 5 20 120 120 20 5 15
Zone4 South 45 45 0 110 110 15 5 25 200 200 30 5 20 250 250 30 5 20
Zone4 South/Central 50 40 0 38 38 15 5 25 200 200 30 5 20 250 250 30 5 20
Zone5 North 50 60 0 110 110 15 5 25 200 200 30 5 20 250 250 30 5 20
Zone6 North 50 65 0 110 110 15 5 25 200 200 30 5 20 250 250 30 5 20
Zone6 North/Central 50 65 0 110 110 15 5 25 200 200 30 5 20 250 250 30 5 20
Zone7 North 50 65 0 38 38 18 5 20 70 70 40 5 15 250 250 30 5 20
Zone7 North/Central 40 70 0 38 38 18 5 20 70 70 40 5 15 250 250 30 5 20
Zone8 North 65 75 0 38 38 18 5 20 70 70 40 5 15 200 200 40 5 15
Zone9 North 50 55 0 65 65 15 5 20 130 130 30 5 15 200 200 40 5 15
Zone9 North/Central 50 55 0 65 65 15 5 20 130 130 30 5 15 200 200 40 5 15
Zone9 South/Central 50 50 0 65 65 15 5 20 130 130 30 5 15 200 200 30 5 15
Zone 10 North 55 55 0 38 38 18 5 20 70 70 40 5 15 200 200 30 5 15
Zone 10 North/Central 55 55 0 38 38 18 5 20 70 70 40 5 15 200 200 30 5 15
Zone 11 Dynamic 280 280 10 5 25 - - - - - - - - - -
Zone 51 East 38 42 0 140 140 11 5 25 200 200 30 5 25 - - - - -
Zone 51 Central 68 35 0 140 140 11 5 25 200 200 30 5 25 - - - - -
Zone 51 West 45 35 0 140 140 11 5 25 200 200 30 5 25 - - - - -
Zone 52 East 38 42 0 140 140 11 5 25 200 200 30 5 25 - - - - -
Zone 52 Central 68 35 0 140 140 11 5 25 200 200 30 5 25 - - - - -
Zone 52 West 45 35 0 140 140 11 5 25 200 200 30 5 25 - - - - -
Zone 53 East 38 42 0 140 140 11 5 25 200 200 30 5 25 - - - - -
Zone 53 Central 68 35 0 140 140 11 5 25 200 200 30 5 25 - - - - -
Zone 53 West 45 35 0 140 140 11 5 25 200 200 30 5 25 - - - - -
For
per
sona
l use
onl
y

May 2012 Agbaou Gold Project Page 14-32 NI 43-101
Technical Report
14.8.4 Kriging Parameters Ordinary Kriging was used as the interpolation method for all zones at Agbaou. The search
neighborhood used was determined as described in section 14.8.3 and detailed in
Table 14.8. Kriging was done into the full parent cells, of 10m (X) and 20m (Y) and 1m (Z).
Sub-celling of the block model was done to a minimum size of 2.5m in all directions, to honor
the mineralization boundaries, and to best approximate the mineralized volume.
The 2m composites were used for the estimate, with high values capped as described in
section 14.6, and no restriction of samples within each Zone. Separate search domains were
used to best honor the local orientation of the ore bodies for the North/Central/South and the
West areas. The laterite (Zone 11) used dynamic anisotropy to optimize the local search
orientation. Up to three search passes were required to ensure that all blocks within a
domain were estimated. The search pass used to inform the blocks was coded into the block
model and used as one of the inputs during the resource classification process.
14.8.5 Model Validation A number of checks were conducted on the Kriging results to validate the estimates. These
include visual validations of the estimates on a section by section basis, global statistical
comparisons of the data on a zone by zone basis, as well as swath analyses which compare
the estimates in slices of the ore body with the data within the slice. The checks done are
summarized in this section (section plots are included in SRK Consulting, SENET, Knight
Piésold Consulting, 2012 Appendix 14-A).
14.8.5.1 Input Grades Versus Estimated Grades
The Ordinary Kriged means from the block model were compared to the length weighted
means of the sample grade within each zone, the composite grade and capped composite
grades within each zone. The statistics and comparisons are summarized in Table 14.9.
For
per
sona
l use
onl
y

May 2012 Agbaou Gold Project Page 14-33 NI 43-101
Technical Report
Table 14.9: Samples and Composites Versus Kriged Means Per Zone Zone No.
Samples
Sample
Grade
No.
Comps
Comp
Grade
Capped
Grade
Estimate
Grade
Sample
vs. Comp
Comp vs.
Cap
Cap vs.
Estimate
1 2,279 3.00 1,225 3.00 2.90 2.65 0% 3% 9%
2 2,033 2.10 1,028 2.11 2.04 1.80 0% 3% 12%
3 307 1.41 163 1.41 1.35 1.28 0% 5% 5%
4 638 1.05 338 1.03 1.03 0.98 2% 0% 5%
5 282 6.75 165 6.75 6.12 6.18 0% 9% -1%
6 256 4.42 135 4.42 4.27 3.78 0% 3% 12%
7 584 1.63 292 1.63 1.60 1.52 0% 2% 5%
8 67 0.77 23 0.78 0.78 0.59 -2% 0% 24%
9 614 0.99 285 0.99 0.94 1.08 1% 4% -15%
10 179 2.14 115 2.14 1.96 1.53 0% 8% 22%
11 1,665 0.77 1,109 0.77 0.72 0.54 0% 6% 25%
51 353 1.64 236 1.69 1.69 1.63 -3% 0% 4%
52 58 0.82 48 0.83 0.83 0.98 -1% 0% -18%
53 42 0.80 30 0.90 0.90 0.90 -13% 0% 0%
All 7239 2.43 3769 2.43 2.33 2.00 0% 4% 14%
For most zones the compositing has little effect on the mean grade, aside from the West
zone, where the composite grade is slightly higher than the original sample grade. The effect
of capping (where it was applied) is generally less than 5% aside from zones 5, 10 and 11,
which is discussed in detail in section 14.6.
The estimated grade is in all but a few cases lower than the capped composite grade. The
zone 5 estimate is marginally higher than the capped composite grade; however for Zone 9
and Zone 52 the estimated grade is significantly higher than the capped composite grade.
For Zone 52 this is attributed to the very small number of composites, which is insufficient to
adequately inform the estimate. For Zone 9 the drilling spacing is relatively wide, and there is
a large high grade zone in the main area of the zone, which is leading to the higher grade.
In Zone 2, the estimated grade is lower than the capped composite grades by approximately
12%. SRK interpret this to result from the higher grade in the most densely drilled area at the
core of the deposit, and the lower grades on the more poorly drilled periphery. For the other
zones which have a significant underestimate, it is a result of a similar pattern, combined
with a small number of composites, such as Zone 8.
14.8.5.2 Swath Analysis
The swath analysis plots are generated by slicing the composite and block model files in
50m increments along strike, along dip and along the Z elevation per zone, as well as
globally. The strike and dip plots are based on a rotated co-ordinate system in order to align
the slices with the orientation of the ore body. In the plots, the Y axis is equivalent to the
strike direction and the X axis is equivalent to the dip direction.
Swath plots are presented in
Figure 14.16 to 14.20 for all zones in the Main and South areas, for Zones 1 and 2 and for
For
per
sona
l use
onl
y

May 2012 Agbaou Gold Project Page 14-34 NI 43-101
Technical Report
Zone 11 as examples, but swath plots were generated and analyzed for all zones. In the
swath plots, the average grade of the 2m composites, before and after capping are plotted
as g/t and g/t_Cap, the estimated grade is plotted as g/t*, along with the total tonnage
(in Mt) and the number of composites in each slice.
The Kriged estimates are by their nature expected to be smoother than the composite
values, however the general trend of the composite grade are expected to be matched by
the estimates. In all zones, the estimate never matches the peaks and troughs of the
composite grades; however the general trend of the estimates is honored. In some of the
relatively poorly sampled zones the correlation is poorer, however the trends are honored,
and the correlation is in line with what is expected given the number of composites available
in the estimate.
SRK consider that overall the estimates are consistent with the source data and adequately
model the grade distributions.
For
per
sona
l use
onl
y

May 2012 Agbaou Gold Project Page 14-35 NI 43-101
Technical Report
Figure 14.16: Swath Plots of the Main and South Areas for Zones 1 – 10
Agbaou Gold Project Main and South Area Swath Plots – All Zones
Project No.
439430
858
548
709
378 374
484447
566
205
48
0
200
400
600
800
1000
1200
1400
0.00
0.50
1.00
1.50
2.00
2.50
3.00
3.50
4.00
253400 253450 253500 253550 253600 253650 253700 253750 253800 253850 253900 253950
Nu
mb
er
of
Co
mp
osi
tes
Au
g/t
an
d M
t
On Dip Swath analysis
Mt g/t* g/t g/t_Cap No. Composites
1
31
33
54
73 56
23
3
32
2
14
7
14
4
51 48 13
28 25
76
15
7
37
4
41
6
54
3
17
8
19
7 15
2
11
2 83 68
11
0 70 2
2 8
0
200
400
600
800
1000
1200
1400
0.00
0.50
1.00
1.50
2.00
2.50
3.00
3.50
4.00
67
32
00
67
32
50
67
33
00
67
33
50
67
34
00
67
34
50
67
35
00
67
35
50
67
36
00
67
36
50
67
37
00
67
37
50
67
38
00
67
38
50
67
39
00
67
39
50
67
40
00
67
40
50
67
41
00
67
41
50
67
42
00
67
42
50
67
43
00
67
43
50
67
44
00
67
44
50
67
45
00
67
45
50
67
46
00
67
46
50
67
47
00
Nu
mb
er
of
Co
mp
osi
tes
Au
g/t
an
d M
t
On Strike Swath analysis
Mt g/t* g/t g/t_Cap No. Composites
2 8 2
11
13
19
36
53
88
89
11
8
12
2
19
3
25
5
35
4
50
3
56
6
57
2
42
4
19
3
96 5
0 41 14 3
0
200
400
600
800
1000
1200
1400
0.00
0.50
1.00
1.50
2.00
2.50
3.00
3.50
4.00
0 15 30 45 60 75 90 105 120 135 150 165 180 195 210 225 240 255 270 285 300 315 330 345 360
Nu
mb
er
of
Co
mp
osi
tes
Au
g/t
an
d M
t
Elevation Swath analysis
Mt g/t* g/t g/t_Cap No. Composites
For
per
sona
l use
onl
y

May 2012 Agbaou Gold Project Page 14-36 NI 43-101
Technical Report
Figure 14.17: Swath Plots of the Main and South Areas for Zone 1
Agbaou Gold Project Main and South Area Swath Plots – Zone 1
Project No.
439430
8
51
40
7
21
7
63 34
20
7
21
3
28
0
200
400
600
800
1000
1200
1400
0.00
0.50
1.00
1.50
2.00
2.50
3.00
3.50
4.00
4.50
5.00
253400 253450 253500 253550 253600 253650 253700 253750 253800
Nu
mb
er
of
Co
mp
osi
tes
Au
g/t
an
d M
tOn Dip Swath analysis
Mt g/t* g/t g/t_Cap No. Composites
2 2
29 1
2
21
93
13
7
42
70
16
34 32 29
42 1
8
14
5
10
1
11
6
83
53 3
7 28
38 27 20
1
0
50
100
150
200
250
300
350
400
450
500
0.00
1.00
2.00
3.00
4.00
5.00
6.00
7.00
67
32
00
67
32
50
67
33
00
67
33
50
67
34
00
67
34
50
67
35
00
67
35
50
67
36
00
67
36
50
67
37
00
67
37
50
67
38
00
67
38
50
67
39
00
67
39
50
67
40
00
67
40
50
67
41
00
67
41
50
67
42
00
67
42
50
67
43
00
67
43
50
67
44
00
67
44
50
67
45
00
67
45
50
67
46
00
67
46
50
67
47
00
67
47
50
Nu
mb
er
of
Co
mp
osi
tes
Au
g/t
an
d M
t
On Strike Swath analysis
Mt g/t* g/t g/t_Cap No. Composites
2 8 1 3 9 5
21
2
13
14
16
27
50
55
96
20
3
22
5 19
8
15
8
49 3
3 16
19
5
0
50
100
150
200
250
300
350
400
450
500
0.00
0.50
1.00
1.50
2.00
2.50
3.00
3.50
4.00
4.50
0 15 30 45 60 75 90 105 120 135 150 165 180 195 210 225 240 255 270 285 300 315 330 345 360
Nu
mb
er
of
Co
mp
osi
tes
Au
g/t
an
d M
t
Elevation Swath analysis
Mt g/t* g/t g/t_Cap No. CompositesFor
per
sona
l use
onl
y

May 2012 Agbaou Gold Project Page 14-37 NI 43-101
Technical Report
Figure 14.18: Swath Plots of the Main and South Areas for Zone 2
Agbaou Gold Project Main and South Area Swath Plots – Zone 2
Project No.
439430
64
36
1
13
4
54
5
96
19
9 10
1
27
0
200
400
600
800
1000
1200
1400
0.00
0.50
1.00
1.50
2.00
2.50
3.00
3.50
4.00
4.50
5.00
253400 253450 253500 253550 253600 253650 253700 253750 253800 253850 253900
Nu
mb
er
of
Co
mp
osi
tes
Au
g/t
an
d M
tOn Dip Swath analysis
Mt g/t* g/t g/t_Cap No. Composites
2 5
11
23
31
11
1
14
9
50 39
1 3
10
23
9 9
75
95
54
68 4
2
48
55
24 15 13
40 2
7
2 7
0
50
100
150
200
250
300
350
400
450
500
0.00
0.50
1.00
1.50
2.00
2.50
3.00
3.50
4.00
67
32
00
67
32
50
67
33
00
67
33
50
67
34
00
67
34
50
67
35
00
67
35
50
67
36
00
67
36
50
67
37
00
67
37
50
67
38
00
67
38
50
67
39
00
67
39
50
67
40
00
67
40
50
67
41
00
67
41
50
67
42
00
67
42
50
67
43
00
67
43
50
67
44
00
67
44
50
67
45
00
67
45
50
67
46
00
67
46
50
67
47
00
67
47
50
Nu
mb
er
of
Co
mp
osi
tes
Au
g/t
an
d M
t
On Strike Swath analysis
Mt g/t* g/t g/t_Cap No. Composites
6 3 6 1
24 1
2
30 1
3
35
49
51
97
11
2
15
3
15
3 11
8 99
45
18 11 5
0
50
100
150
200
250
300
350
400
450
500
0.00
0.50
1.00
1.50
2.00
2.50
3.00
3.50
4.00
4.50
5.00
0 15 30 45 60 75 90 105 120 135 150 165 180 195 210 225 240 255 270 285 300 315 330 345 360
Nu
mb
er
of
Co
mp
osi
tes
Au
g/t
an
d M
t
Elevation Swath analysis
Mt g/t* g/t g/t_Cap No. CompositesFor
per
sona
l use
onl
y

May 2012 Agbaou Gold Project Page 14-38 NI 43-101
Technical Report
Figure 14.19: Swath Plots of the Laterite (Zone 11)
Agbaou Gold Project Laterite Swath Plots – Zone 11
Project No.
439430
14.9 RECOVERABLE RESOURCE MODELLING Recoverable resource calculations were completed for zones that were sufficiently well
informed, and for which there was sufficient confidence in the estimates to allow this. This
includes zones 1, 2, 3, 4, 7, and 9, which (excluding the laterite) make up 90% of the volume
of the Main and South area. The remaining domains were too small and/or had a Kriged
1 3 1 2 5 3 4 2 1 3 2
95 7 5 4 3 6
11
6 7
3 2
7 5 4 2 15
19
35
45
54
77
70
82
86
10
98
4
46
48
51
58
47
39
18 1
4
2 4 2
0
50
100
150
200
250
300
0.00
1.00
2.00
3.00
4.00
5.00
6.00
7.00
Nu
me
r o
f C
om
po
site
s
Au
g/t
an
d M
t
X Axis Swath analysis
Mt g/t g/t_Cap g/t* No. Composites
2 2 3
14
19
31
34
51
65
34
24
18
18
4
23
10
24
27 2
4 20
45
37
55
84
53
40
28
28
20
46
22
28
46
46
32
20
12
8
4 4 2 2
0
50
100
150
200
250
300
0.00
0.50
1.00
1.50
2.00
2.50
3.00
67
32
00
67
32
40
67
32
80
67
33
20
67
33
60
67
34
00
67
34
40
67
34
80
67
35
20
67
35
60
67
36
00
67
36
40
67
36
80
67
37
20
67
37
60
67
38
00
67
38
40
67
38
80
67
39
20
67
39
60
67
40
00
67
40
40
67
40
80
67
41
20
67
41
60
67
42
00
67
42
40
67
42
80
67
43
20
67
43
60
67
44
00
67
44
40
67
44
80
67
45
20
67
45
60
67
46
00
67
46
40
67
46
80
67
47
20
67
47
60
67
48
00
67
48
40
67
48
80
67
49
20
67
49
60
67
50
00
67
50
40
67
50
80
67
51
20
67
51
60
67
52
00
67
52
40
67
52
80
67
53
20
Tit
le
Au
g/t
an
d M
t
Y axis Swath analysis
Mt g/t g/t_Cap g/t* No. Composites
For
per
sona
l use
onl
y

May 2012 Agbaou Gold Project Page 14-39 NI 43-101
Technical Report
estimate that was too poor to be used. The SMU used is 2.5m by 2.5m by 2.5m. Two
methods of recoverable resource estimation were used; Uniform Conditioning (“UC”) and
Multiple Indicator Kriging (”MIK”). Ultimately the MIK estimate was selected for reporting as
this was consistent with the previous mineral resource estimates of the Agbaou deposit done
by Coffey Mining.
14.9.1 Uniform Conditioning Geostatistics provide some powerful methods to achieve change of support, i.e. calculate
the block grades distribution from the sample grades distribution. The global grade-tonnage
curves can then be calculated for any SMU support. UC aims to condition the local grade-
tonnage curves for each panel. The discrete Gaussian model is then applied, basically
assuming, first, that the SMUs constitute a partition of the panels, and second, the Gaussian
values (after normal score transform) for SMUs and panels have a bivariate normal
distribution, only depending on change of support coefficients.
The steps undertaken in Isatis to achieve the uniform conditioning are as follows:
• Decluster the domain drill hole samples to the Kriged mean; • Gaussian anamorphosis of the domain drill hole samples; • Rescale variogram model using declustered weights to the domain sample variance; • Support correction calculation using information effect; • Uniform conditioning; • Export files to Surpac for mine planning and pit optimization.
Support correction was repeated for the panel and the block without information effect for
comparison of the theoretical curves in Isatis, though only the ‘block with information effect’
was used in the UC.
14.9.1.1 Declustering
Gaussian anamorphosis modeling requires that the composites have been declustered, as
the declustered weights are needed to correctly reproduce the underlying distribution.
Declustering was undertaken for each zone, aiming to generate a declustered mean that
matches the Kriged mean of the domain. The declustering grid was selected to approximate
the Kriged grade for the zone. The declustering results are presented in Table 14.10.
Table 14.10: Declustering Statistics for Gaussian Anamorphosis Modelling Zone
Kriged mean Declustered mean Declustered
Standard Dev.
Declustered
Variance Declustering grid
1 2.72 2.7247 5.3629 28.7607 100 x 100 x 20
2 1.83 1.8344 3.7893 14.3588 50 x 50 x 12
3 1.33 1.3611 2.1914 4.8022 5 x 5 x 0.7
4 0.98 1.0311 1.8865 3.5589 5 x 5 x 1
7 1.56 1.5298 2.9706 8.8245 10 x 10 x 2
9 1.16 1.1619 2.3356 5.4550 70 x 70 x 15
For
per
sona
l use
onl
y

May 2012 Agbaou Gold Project Page 14-40 NI 43-101
Technical Report
14.9.1.2 Gaussian Anamorphosis Modeling
The Gaussian anamorphosis modeling in Isatis transforms the raw gold grade variable into a
gaussian variable using a normal score transformation. The transformation is achieved using
hermite polynomials to model the grade distribution. The Gaussian variables are tested to
ensure that they approximate a Gaussian distribution whereby the mean should be close to
zero; the variance and standard deviation close to one; and the minimum and maximum
should be very similar in the positive and negative. The statistics of the Gaussian variables
are presented in Table 14.11, along with the number of polynomials used in the
transformation. In all cases the attributes of a Gaussian distribution have been approximately
achieved.
Table 14.11: Statistics of the Gaussian Variables
Zone Number of Statistics on the Gaussian Variable
polynomials Min Max Mean Variance Std. Dev.
1 30 -3.70737 3.305584 -0.000051 1.001077 1.000538
2 30 -3.26988 3.102155 -0.000265 0.998151 0.999075
3 30 -2.58464 2.584637 0.000000 0.984066 0.992001
4 30 -2.82041 2.820412 0.000000 0.992113 0.996049
7 30 -2.83822 2.838221 0.000005 0.992546 0.996266
9 30 -2.86427 3.140847 0.002880 1.008022 1.004003
14.9.1.3 Support Correction
The Support Correction functionality is designed to model the histogram of blocks from a
point anamorphosis and a variogram model. The method is based on the Gaussian Discrete
Model, and in this case, the information effect has also been used. The information effect
takes into account the number and spacing of drill holes (grade control drilling or blast holes)
that will be available at the time of mining. The grade control grid assumed for this study is
on a 5m (strike) x 8m (dip) x 1m sample length, which is based on the current grade control
drilling at an operating mine nearby to Agbaou. Seven holes in the X and Y axes, and 15
samples in the Z direction were assumed for the study.
The support correction parameters are presented in Table 14.12.
Table 14.12: Support Correction Parameters
Zone Gamma
(v,v)
Real Block
Variance
Real Block
Support
Correction (r)
Used Kriged
Block
Variance
Kriged Block
Support
Correction (s)
Used
Kriged-Real
Block
Covariance
Kriged-Real Block
Support
Correction
1 12.594 15.791 0.8377 14.717 0.8183 14.740 0.9779
2 7.4934 6.6694 0.8148 5.6880 0.7746 5.6861 0.9504
3 2.4893 2.2935 0.7724 2.1279 0.7504 2.1311 0.9727
4 1.5737 1.9732 0.8311 1.8452 0.8121 1.8456 0.9773
7 4.9407 3.8410 0.7682 3.1628 0.7160 3.1614 0.9317
9 2.9733 2.3010 0.7890 2.1276 0.7681 2.1314 0.9747
For
per
sona
l use
onl
y

May 2012 Agbaou Gold Project Page 14-41 NI 43-101
Technical Report
14.9.1.4 Change of Support Grade Tonnage Curves
The change of support grade-tonnage curves for each domain can be calculated within Isatis
to check the relationship between the actual Kriged panel estimates, the Gaussian
anamorphosis of the panel, block and block with information effect. The Ordinary Kriged
panel estimates and the theoretical grade tonnage curves are presented in
Figure 14.20 to
Figure 14.22 for the six UC zones.
For
per
sona
l use
onl
y

May 2012 Agbaou Gold Project Page 14-42 NI 43-101
Technical Report
Figure 14.20: Grade Tonnage Curves for Zone 1 and Zone 2
Zone 1
Zone 2
Agbaou Gold Project Grade Tonnage Curves
Project No.
439430
0.0
0.0
0.5
0.5
1.0
1.0
1.5
1.5
Cutoff
Cutoff
0 0
1 1
2 2
3 3
4 4
5 5
6 6
7 7
Mean Grade
Mean Grade
0.0
0.0
0.5
0.5
1.0
1.0
1.5
1.5
Cutoff
Cutoff
0 0
10 10
20 20
30 30
40 40
50 50
60 60
70 70
80 80
90 90
100 100
Total Tonnage
Total Tonnage
0.0
0.0
0.5
0.5
1.0
1.0
1.5
1.5
Cutoff
Cutoff
0 0
1 1
2 2
3 3
4 4
5 5
Mean Grade
Mean Grade
0.0
0.0
0.5
0.5
1.0
1.0
1.5
1.5
Cutoff
Cutoff
0 0
10 10
20 20
30 30
40 40
50 50
60 60
70 70
80 80
90 90
100 100
Total Tonnage
Total Tonnage
Zone_OK
Gauss_Panel
Gauss_Block
Gauss_Block_ie
For
per
sona
l use
onl
y

May 2012 Agbaou Gold Project Page 14-43 NI 43-101
Technical Report
Figure 14.21: Grade Tonnage Curves for Zone 3 and Zone 4
Zone 3
Zone 4
Agbaou Gold Project Grade Tonnage Curves
Project No.
439430
0.0
0.0
0.5
0.5
1.0
1.0
1.5
1.5
Cutoff
Cutoff
0 0
1 1
2 2
3 3
4 4
Mean Grade
Mean Grade
0.0
0.0
0.5
0.5
1.0
1.0
1.5
1.5
Cutoff
Cutoff
0 0
10 10
20 20
30 30
40 40
50 50
60 60
70 70
80 80
90 90
100 100
Total Tonnage
Total Tonnage
0.0
0.0
0.5
0.5
1.0
1.0
1.5
1.5
Cutoff
Cutoff
0 0
1 1
2 2
3 3
4 4
Mean Grade
Mean Grade
0.0
0.0
0.5
0.5
1.0
1.0
1.5
1.5
Cutoff
Cutoff
0 0
10 10
20 20
30 30
40 40
50 50
60 60
70 70
80 80
90 90
100 100
Total Tonnage
Total Tonnage
Zone_OK
Gauss_Panel
Gauss_Block
Gauss_Block_ie
For
per
sona
l use
onl
y

May 2012 Agbaou Gold Project Page 14-44 NI 43-101
Technical Report
Figure 14.22: Grade Tonnage Curves for Zone 7 and Zone 9
Zone 7
Zone 9
Agbaou Gold Project Grade Tonnage Curves
Project No.
439430
0.0
0.0
0.5
0.5
1.0
1.0
1.5
1.5
Cutoff
Cutoff
0 0
1 1
2 2
3 3
4 4
5 5
Mean Grade
Mean Grade
0.0
0.0
0.5
0.5
1.0
1.0
1.5
1.5
Cutoff
Cutoff
0 0
10 10
20 20
30 30
40 40
50 50
60 60
70 70
80 80
90 90
100 100
Total Tonnage
Total Tonnage
0.0
0.0
0.5
0.5
1.0
1.0
1.5
1.5
Cutoff
Cutoff
0 0
1 1
2 2
3 3
4 4
Mean Grade
Mean Grade
0.0
0.0
0.5
0.5
1.0
1.0
1.5
1.5
Cutoff
Cutoff
0 0
10 10
20 20
30 30
40 40
50 50
60 60
70 70
80 80
90 90
100 100
Total Tonnage
Total Tonnage
Zone_OK
Gauss_Panel
Gauss_Block
Gauss_Block_ie
For
per
sona
l use
onl
y

May 2012 Agbaou Gold Project Page 14-45 NI 43-101
Technical Report
The grade tonnage curves show that the OK estimate generally underestimates the selective
grade, but also overestimates the selective tonnage at low grades, and underestimates the
selective tonnage at higher grades. The Information Effect has a small influence in all cases.
14.9.1.5 Uniform conditioning
The Uniform Conditioning was undertaken with a SMU size of 2.5m x 2.5m x 2.5m, at
fourteen cut-off grades: 0.1; 0.2; 0.3; 0.4; 0.5; 0.6; 0.7; 0.8; 1.0; 1.2; 1.4; 1.6; 1.8; and 2.0.
Block anamorphosis with information effect was used and no tonnage corrections were
applied. No tonnage correction was applied in the calculation of the UC, however the results
were post processed to take account of small tonnage proportions within panels. The aim of
this is to provide some practicality to the final block model, which contains small blocks
(minimum block size allowed in the sub-celling of the parent blocks to model the volume
correctly was 2.5m square; this is coincident with the SMU size). Parent blocks which have
small proportions of their tonnes inside the wireframes will still have a UC estimate; however
the practical selectivity that can be applied to these small tonnages is likely to be
overestimated.
In order to correct for this, the UC selectivity of any panel (parent block in Datamine) which
has less than 20% of its volume within the wireframe, was reset. Simply, the proportion of
the panel above the cut-off threshold was set to either one or zero, if the OK grade was
respectively above or below the cut-off, and the grade above cut-off was set to the OK
grade. For the zones that did not have a UC estimate (Zones 5, 6, 8, 10, 11, and 51 to 53) a
similar process was undertaken, whereby the grades and tonnage proportion at each cut-off
were set to the OK grades and to one or zero if the OK grades were above or below the cut-
off. All zones could therefore be reported and processed on a like for like basis, at each cut
off.
14.9.1.6 Uniform Conditioning Validation
In addition to the cut-offs detailed in the section above, the UC was calculated at 0 g/t but
not used in the final model, to determine if there are any inconsistencies between the UC
and the OK estimate. The 0 g/t UC estimates were plotted against the OK estimates in a
scatter plot to test for this. All the UC estimates at 0 g/t were identical to the OK estimates,
for all zones, and no corrections had to be applied.
For
per
sona
l use
onl
y

May 2012 Agbaou Gold Project Page 14-46 NI 43-101
Technical Report
Table 14.13: Comparison of the OK and UC Estimation Results at a 0.5 g/t Cut-Off OK Model UC Model Percentage Difference
Zone Mt Au (g/t) Au (kOz) Mt Au (g/t) Au (kOz) Mt Au (g/t) Au (kOz)
1 4.52 2.66 386.2 3.86 3.06 379.9 -14.5% 15.1% -1.6%
2 4.29 1.85 255.7 3.75 2.08 250.5 -12.7% 12.2% -2.0%
3 0.59 1.61 30.4 0.54 1.74 30.5 -7.1% 8.4% 0.6%
4 1.48 1.03 48.8 1.03 1.36 45.3 -30.1% 32.8% -7.2%
7 1.42 1.70 77.8 1.17 2.02 76.1 -17.3% 18.3% -2.2%
9 1.24 1.24 49.5 1.04 1.44 48.3 -16.1% 16.3% -2.4%
Total 13.54 1.95 848.4 11.41 2.27 830.7 -15.8% 16.2% -2.1%
Table 14.14: Comparison of the OK and UC Estimation Results at a 1.0 g/t Cut-Off
14.9.2 Multiple Indicator Kriging MIK works on a probabilistic basis to define the distribution of the grades of samples within
each search window, providing a discrete approximation to the cumulative density function
(“cdf”) for each block. As this distribution is based on the samples found within the search
window centered on any given point, it changes from block to block to reflect local grade
variability.
A series of binary indicator values is calculated for a set of cut-offs for each composite within
the wireframe. The indicator value is one if the grade of the composite is greater than or
equal to the indicator cut-off value, and zero if it is less than that value.
The Kriging of the indicators generates conditional probabilities for a restricted set of
specified cut-offs. Starting from these probabilities, the conditional cdf for each grid node can
be re-built, in order to derive the tonnage and metal quantity for a new set of cut-offs. One
can then calculate the probability for the variable to exceed any cut-off or to calculate the
average value of the variable above or below this cut-off, accounting for a possible change
of support.
OK Model UC Model Percentage Difference
Zone Mt Au (g/t) Au (kOz) Mt Au (g/t) Au (kOz) Mt Au (g/t) Au (kOz)
1 4.18 2.81 377.0 3.05 3.67 360.6 -26.9% 30.8% -4.3%
2 3.24 2.22 231.2 2.67 2.62 225.0 -17.4% 17.8% -2.7%
3 0.34 2.25 24.6 0.33 2.40 25.6 -2.2% 6.4% 4.1%
4 0.60 1.41 27.2 0.52 1.98 33.1 -13.3% 40.3% 21.6%
7 0.92 2.23 65.9 0.76 2.73 66.4 -17.8% 22.6% 0.7%
9 0.70 1.62 36.5 0.57 2.03 37.3 -18.2% 25.0% 2.3%
Total 9.97 2.38 762.4 7.91 2.94 748.0 -20.7% 23.7% -1.9%
For
per
sona
l use
onl
y

May 2012 Agbaou Gold Project Page 14-47 NI 43-101
Technical Report
The steps followed in the MIK estimate were as follows:
• Calculate the indicator variables for each cut-off; • Calculate and model the semi-variograms for each indicator for each zone; • Krige each of the indicator variables for each zone; • Post process the estimates to model the conditional cdf and apply the change of
support correction; and • Export files to Surpac for mine planning and pit optimization.
14.9.2.1 Statistical Analysis and Variography
A set of nineteen cut-off indicators were generated in the composite file and these were used
as the basis of the MIK estimation. Experimental semi-variograms were calculated for each
indicator, in each zone and these were modeled, with reference to the grade semi-
variograms modeled for the OK estimate. For Zones 3, 4, and 7 the experimental semi-
variograms did not show an easily interpretable structure for most of the indicators, and after
comparison with the experimental semi-variograms for zones 1, 2 and 9, SRK elected to use
the indicator semi-variograms from better informed zones, in a similar manner to the OK
estimate. Zone 3 was found to be most similar to Zone 9, while Zone 7 was matched with
Zone 2 and Zone 4 with Zone 1.
The modeled semi-variogram parameters are detailed in Table 14.15, Table 14.16 and Table
14.17 and the semi-variograms are presented in Figure 14.23, Figure 14.24 and Figure
14.25. Note that only the semi-variograms for indicators ranging from 0.1 to 3 g/t are
displayed in these figures, for presentation reasons. The remaining semi-variograms show
similar structures, and the models are detailed in Table 14.15, Table 14.16 and Table 14.17.
For
per
sona
l use
onl
y

May 2012 Agbaou Gold Project Page 14-48 NI 43-101
Technical Report
Figure 14.23: Zone 1 Indicator Semi-Variograms for Indicators up to 3 g/t
Agbaou Gold Project Zone 1 Indicator Semi-Variograms for Indicators up to 3 g/t
Project No.
439430
N40
93
8419
12951
1136388247981
59135317
4545
3357
N130
30
5171591578
684
659
727
1123
0
0
50
50
100
100
150
150
200
200
250
250
Distance (m)
Distance (m)
0.00 0.00
0.01 0.01
0.02 0.02
0.03 0.03
0.04 0.04
0.05 0.05
0.06 0.06
0.07 0.07
0.08 0.08
Variogram : Au_MIK{0.100000}
Variogram : Au_MIK{0.100000}
N40
93
8419
12951
11363
88247981
5913
5317
4545
3357
N130
30
5171
591578
684
659
7271123
0
0
50
50
100
100
150
150
200
200
250
250
Distance (m)
Distance (m)
0.000 0.000
0.025 0.025
0.050 0.050
0.075 0.075
0.100 0.100
0.125 0.125
Variogram : Au_MIK{0.200000}
Variogram : Au_MIK{0.200000}
N40
93
8419
12951
11363
88247981
5913
5317
4545
3357
N130
30
5171
591
578
684
6597271123
0
0
50
50
100
100
150
150
200
200
250
250
Distance (m)
Distance (m)
0.00 0.00
0.05 0.05
0.10 0.10
0.15 0.15
Variogram : Au_MIK{0.300000}
Variogram : Au_MIK{0.300000}
N40
93
8419
12951
11363
88247981
5913
531745453357
N130
30
5171591578
684
6597271123
0
0
50
50
100
100
150
150
200
200
250
250
Distance (m)
Distance (m)
0.00 0.00
0.05 0.05
0.10 0.10
0.15 0.15
Variogram : Au_MIK{0.400000}
Variogram : Au_MIK{0.400000}
N40
938419
12951
11363
8824
79815913
531745453357
N130
30
5171591578684
659
7271123
0
0
50
50
100
100
150
150
200
200
250
250
Distance (m)
Distance (m)
0.00 0.00
0.05 0.05
0.10 0.10
0.15 0.15
0.20 0.20
Variogram : Au_MIK{0.500000}
Variogram : Au_MIK{0.500000}
N40
93841912951
113638824
79815913
531745453357
N130
30
5171591578
684
659
7271123
0
0
50
50
100
100
150
150
200
200
250
250
Distance (m)
Distance (m)
0.00 0.00
0.05 0.05
0.10 0.10
0.15 0.15
0.20 0.20
Variogram : Au_MIK{0.600000}
Variogram : Au_MIK{0.600000}
N40
93841912951
113638824
7981591353174545
3357
N130
30
5171591578
684
6597271123
0
0
50
50
100
100
150
150
200
200
250
250
Distance (m)
Distance (m)
0.00 0.00
0.05 0.05
0.10 0.10
0.15 0.15
0.20 0.20
0.25 0.25
Variogram : Au_MIK{0.700000}
Variogram : Au_MIK{0.700000}
N40
938419
1295111363
88247981591353174545
3357
N130
30
5171
591578
684
6597271123
0
0
50
50
100
100
150
150
200
200
250
250
Distance (m)
Distance (m)
0.00 0.00
0.05 0.05
0.10 0.10
0.15 0.15
0.20 0.20
0.25 0.25
Variogram : Au_MIK{0.800000}
Variogram : Au_MIK{0.800000}
N40
93
841912951
113638824798159135317
45453357
N130
30
5171591578
684
6597271123
0
0
50
50
100
100
150
150
200
200
250
250
Distance (m)
Distance (m)
0.00 0.00
0.05 0.05
0.10 0.10
0.15 0.15
0.20 0.20
0.25 0.25
Variogram : Au_MIK{1.000000}
Variogram : Au_MIK{1.000000}
N40
93
841912951
113638824798159135317
4545
3357
N130
30
5171591578
684659
7271123
0
0
50
50
100
100
150
150
200
200
250
250
Distance (m)
Distance (m)
0.00 0.00
0.05 0.05
0.10 0.10
0.15 0.15
0.20 0.20
0.25 0.25
Variogram : Au_MIK{1.200000}
Variogram : Au_MIK{1.200000}
N40
93
841912951
113638824798159135317
4545
3357
N130
30
5171591578
684
659
7271123
0
0
50
50
100
100
150
150
200
200
250
250
Distance (m)
Distance (m)
0.00 0.00
0.05 0.05
0.10 0.10
0.15 0.15
0.20 0.20
0.25 0.25
Variogram : Au_MIK{1.400000}
Variogram : Au_MIK{1.400000}
N4093
841912951
113638824798159135317
4545
3357
N130
30
5171
591578684659
727
1123
0
0
50
50
100
100
150
150
200
200
250
250
Distance (m)
Distance (m)
0.00 0.00
0.05 0.05
0.10 0.10
0.15 0.15
0.20 0.20
0.25 0.25
Variogram : Au_MIK{1.600000}
Variogram : Au_MIK{1.600000}
N4093
841912951
113638824798159135317
4545
3357
N130
30
5171
591578684659727
1123
0
0
50
50
100
100
150
150
200
200
250
250
Distance (m)
Distance (m)
0.00 0.00
0.05 0.05
0.10 0.10
0.15 0.15
0.20 0.20
0.25 0.25
Variogram : Au_MIK{1.800000}
Variogram : Au_MIK{1.800000}
N4093
841912951
1136388247981591353174545
3357
N130
30
5171591578684659727
1123
0
0
50
50
100
100
150
150
200
200
250
250
Distance (m)
Distance (m)
0.00 0.00
0.05 0.05
0.10 0.10
0.15 0.15
0.20 0.20
0.25 0.25
Variogram : Au_MIK{2.000000}
Variogram : Au_MIK{2.000000}
N4093
841912951
11363
8824798159135317
45453357
N130
30
5171591578684659
727
1123
0
0
50
50
100
100
150
150
200
200
250
250
Distance (m)
Distance (m)
0.00 0.00
0.05 0.05
0.10 0.10
0.15 0.15
0.20 0.20
0.25 0.25
Variogram : Au_MIK{3.000000}
Variogram : Au_MIK{3.000000}
For
per
sona
l use
onl
y

May 2012 Agbaou Gold Project Page 14-49 NI 43-101
Technical Report
Figure 14.24: Zone 2 Indicator Semi-Variograms for Indicators up to 3 g/t
Agbaou Gold Project Zone 2 Indicator Semi-Variograms for Indicators up to 3 g/t
Project No.
439430
N30
69
1248920648
2108718681
1627713250107597956
5020
N120
8
3
0282451372313375
599866
0
0
50
50
100
100
150
150
200
200
250
250
Distance (m)
Distance (m)
0.00 0.00
0.05 0.05
0.10 0.10
0.15 0.15
0.20 0.20
0.25 0.25
Variogram : Au_MIK{0.100000}
Variogram : Au_MIK{0.100000}
N3069
124892064821087
18681
1627713250
107597956
5020
N120
8
3
0282451
372313
375
599
866
0
0
50
50
100
100
150
150
200
200
250
250
Distance (m)
Distance (m)
0.00 0.00
0.05 0.05
0.10 0.10
0.15 0.15
0.20 0.20
Variogram : Au_MIK{0.200000}
Variogram : Au_MIK{0.200000}
N30
69
12489206482108718681
1627713250
107597956
5020
N120
8
3
02
82
451
372313
375
599866
0
0
50
50
100
100
150
150
200
200
250
250
Distance (m)
Distance (m)
0.00 0.00
0.05 0.05
0.10 0.10
0.15 0.15
0.20 0.20
Variogram : Au_MIK{0.300000}
Variogram : Au_MIK{0.300000}
N30
69
12489206482108718681
162771325010759
79565020
N120
8
3
02
82
451372
313
375599
866
0
0
50
50
100
100
150
150
200
200
250
250
Distance (m)
Distance (m)
0.00 0.00
0.05 0.05
0.10 0.10
0.15 0.15
0.20 0.20
Variogram : Au_MIK{0.400000}
Variogram : Au_MIK{0.400000}
N30
6912489206482108718681
1627713250
10759
79565020
N120
8
3
02
82451372313
375599866
0
0
50
50
100
100
150
150
200
200
250
250
Distance (m)
Distance (m)
0.00 0.00
0.05 0.05
0.10 0.10
0.15 0.15
0.20 0.20
0.25 0.25
Variogram : Au_MIK{0.500000}
Variogram : Au_MIK{0.500000}
N30
6912489206482108718681
1627713250
10759
79565020
N120
8
3
02
82451372313
375599
866
0
0
50
50
100
100
150
150
200
200
250
250
Distance (m)
Distance (m)
0.00 0.00
0.05 0.05
0.10 0.10
0.15 0.15
0.20 0.20
0.25 0.25
Variogram : Au_MIK{0.600000}
Variogram : Au_MIK{0.600000}
N30
6912489
20648210871868116277
1325010759
79565020
N120
8
3
02
82451372313375
599
866
0
0
50
50
100
100
150
150
200
200
250
250
Distance (m)
Distance (m)
0.00 0.00
0.05 0.05
0.10 0.10
0.15 0.15
0.20 0.20
0.25 0.25
Variogram : Au_MIK{0.700000}
Variogram : Au_MIK{0.700000}
N30
69
12489206482108718681
1627713250
10759
79565020
N120
8
3
02
82451372313375
599
866
0
0
50
50
100
100
150
150
200
200
250
250
Distance (m)
Distance (m)
0.00 0.00
0.05 0.05
0.10 0.10
0.15 0.15
0.20 0.20
0.25 0.25
Variogram : Au_MIK{0.800000}
Variogram : Au_MIK{0.800000}
N30
69
1248920648
2108718681
16277
13250
107597956
5020
N120
8
3
02
82451372313375
599866
0
0
50
50
100
100
150
150
200
200
250
250
Distance (m)
Distance (m)
0.00 0.00
0.05 0.05
0.10 0.10
0.15 0.15
0.20 0.20
0.25 0.25
Variogram : Au_MIK{1.000000}
Variogram : Au_MIK{1.000000}
N30
69
1248920648
210871868116277
13250
1075979565020
N120
8
3
02
82451372313375599866
0
0
50
50
100
100
150
150
200
200
250
250
Distance (m)
Distance (m)
0.00 0.00
0.05 0.05
0.10 0.10
0.15 0.15
0.20 0.20
0.25 0.25
Variogram : Au_MIK{1.200000}
Variogram : Au_MIK{1.200000}
N30
69
1248920648
210871868116277
13250
1075979565020
N120
8
3
02
82
451372313375
599866
0
0
50
50
100
100
150
150
200
200
250
250
Distance (m)
Distance (m)
0.00 0.00
0.05 0.05
0.10 0.10
0.15 0.15
0.20 0.20
0.25 0.25
Variogram : Au_MIK{1.400000}
Variogram : Au_MIK{1.400000}
N30
69
1248920648
210871868116277
1325010759
79565020
N120
8
3
02
82451372313375
599
866
0
0
50
50
100
100
150
150
200
200
250
250
Distance (m)
Distance (m)
0.00 0.00
0.05 0.05
0.10 0.10
0.15 0.15
0.20 0.20
0.25 0.25
Variogram : Au_MIK{1.600000}
Variogram : Au_MIK{1.600000}
N30
69
12489
20648210871868116277
1325010759
79565020
N120
8
3
02
82451
372
313
375
599866
0
0
50
50
100
100
150
150
200
200
250
250
Distance (m)
Distance (m)
0.00 0.00
0.05 0.05
0.10 0.10
0.15 0.15
0.20 0.20
Variogram : Au_MIK{1.800000}
Variogram : Au_MIK{1.800000}
N30
69
12489
20648210871868116277
1325010759
79565020
N120
8
3
0282451
372
313
375
599866
0
0
50
50
100
100
150
150
200
200
250
250
Distance (m)
Distance (m)
0.00 0.00
0.05 0.05
0.10 0.10
0.15 0.15
0.20 0.20
Variogram : Au_MIK{2.000000}
Variogram : Au_MIK{2.000000}
N30
69
12489
20648210871868116277
1325010759
79565020
N120
8
3
0282451372
313375
599866
0
0
50
50
100
100
150
150
200
200
250
250
Distance (m)
Distance (m)
0.00 0.00
0.05 0.05
0.10 0.10
0.15 0.15
Variogram : Au_MIK{3.000000}
Variogram : Au_MIK{3.000000}
For
per
sona
l use
onl
y

May 2012 Agbaou Gold Project Page 14-50 NI 43-101
Technical Report
Figure 14.25: Zone 9 Indicator Semi-Variograms for Indicators up to 3 g/t
Agbaou Gold Project Zone 9 Indicator Semi-Variograms for Indicators up to 3 g/t
Project No.
439430
N40
95
837
19912124
2016
2232
1622
1154
860
705
N130
7
32
02
70
73
34
23
26
21
0
0
50
50
100
100
150
150
200
200
250
250
Distance (m)
Distance (m)
0.00 0.00
0.05 0.05
0.10 0.10
0.15 0.15
Variogram : Au_MIK{0.100000}
Variogram : Au_MIK{0.100000}
N40
95837
19912124
20162232
1622
1154
860
705
N1307
32
02
70
7334
23
2621
0
0
50
50
100
100
150
150
200
200
250
250
Distance (m)
Distance (m)
0.00 0.00
0.05 0.05
0.10 0.10
0.15 0.15
0.20 0.20
Variogram : Au_MIK{0.200000}
Variogram : Au_MIK{0.200000}
N4095837
19912124
2016
2232
1622
1154860
705
N130
7
32
02
70
73
34
23
26
21
0
0
50
50
100
100
150
150
200
200
250
250
Distance (m)
Distance (m)
0.0 0.0
0.1 0.1
0.2 0.2
0.3 0.3
Variogram : Au_MIK{0.300000}
Variogram : Au_MIK{0.300000}
N4095837
19912124
2016
223216221154
860
705
N130
7
32
02
70
73
34
23
2621
0
0
50
50
100
100
150
150
200
200
250
250
Distance (m)
Distance (m)
0.0 0.0
0.1 0.1
0.2 0.2
0.3 0.3
Variogram : Au_MIK{0.400000}
Variogram : Au_MIK{0.400000}
N4095837
19912124
20162232
16221154
860
705
N130
732
02
70
73
34
2326
21
0
0
50
50
100
100
150
150
200
200
250
250
Distance (m)
Distance (m)
0.0 0.0
0.1 0.1
0.2 0.2
0.3 0.3 Variogram : Au_MIK{0.500000}
Variogram : Au_MIK{0.500000}
N4095837
19912124
201622321622
1154
860
705
N130
732
02
70
73
34
2326
21
0
0
50
50
100
100
150
150
200
200
250
250
Distance (m)
Distance (m)
0.0 0.0
0.1 0.1
0.2 0.2
0.3 0.3
Variogram : Au_MIK{0.600000}
Variogram : Au_MIK{0.600000}
N4095837
1991
212420162232
16221154
860
705
N130
732
02
70
73
34
23
26
21
0
0
50
50
100
100
150
150
200
200
250
250
Distance (m)
Distance (m)
0.0 0.0
0.1 0.1
0.2 0.2
0.3 0.3
Variogram : Au_MIK{0.700000}
Variogram : Au_MIK{0.700000}
N40
95837
1991
2124201622321622
1154
860
705
N130
732
02
70
73
34
23
2621
0
0
50
50
100
100
150
150
200
200
250
250
Distance (m)
Distance (m)
0.0 0.0
0.1 0.1
0.2 0.2
0.3 0.3
Variogram : Au_MIK{0.800000}
Variogram : Au_MIK{0.800000}
N4095837
19912124
2016223216221154
860
705
N130
7
32
02
70
73
3423
2621
0
0
50
50
100
100
150
150
200
200
250
250
Distance (m)
Distance (m)
0.00 0.00
0.05 0.05
0.10 0.10
0.15 0.15
0.20 0.20
0.25 0.25
Variogram : Au_MIK{1.000000}
Variogram : Au_MIK{1.000000}
N4095837
199121242016
22321622
1154860
705
N130
7
32
02
70
7334
23
2621
0
0
50
50
100
100
150
150
200
200
250
250
Distance (m)
Distance (m)
0.00 0.00
0.05 0.05
0.10 0.10
0.15 0.15
0.20 0.20
Variogram : Au_MIK{1.200000}
Variogram : Au_MIK{1.200000}
N4095
837
19912124
20162232
1622
1154860
705
N130
732
02
70
7334
23
26
21
0
0
50
50
100
100
150
150
200
200
250
250
Distance (m)
Distance (m)
0.00 0.00
0.05 0.05
0.10 0.10
0.15 0.15
0.20 0.20
Variogram : Au_MIK{1.400000}
Variogram : Au_MIK{1.400000}
N4095837
19912124
20162232
1622
1154
860
705
N130
732
02
7073
34
23
26
21
0
0
50
50
100
100
150
150
200
200
250
250
Distance (m)
Distance (m)
0.00 0.00
0.05 0.05
0.10 0.10
0.15 0.15
Variogram : Au_MIK{1.600000}
Variogram : Au_MIK{1.600000}
N4095837
1991
2124
20162232
16221154
860
705
N130
7
32
02
70
73
34
23
26
21
0
0
50
50
100
100
150
150
200
200
250
250
Distance (m)
Distance (m)
0.000 0.000
0.025 0.025
0.050 0.050
0.075 0.075
0.100 0.100
0.125 0.125
Variogram : Au_MIK{1.800000}
Variogram : Au_MIK{1.800000}
N4095
837
199121242016
2232
1622
1154
860
705
N130
7
32
02
70
73
34
23
26
21
0
0
50
50
100
100
150
150
200
200
250
250
Distance (m)
Distance (m)
0.000 0.000
0.025 0.025
0.050 0.050
0.075 0.075
0.100 0.100
Variogram : Au_MIK{2.000000}
Variogram : Au_MIK{2.000000}
N3095
831
1727
14831157
1106
647
341295
201
N120
7
32
027073
34
2326
21
0
0
50
50
100
100
150
150
200
200
250
250
Distance (m)
Distance (m)
0.00 0.00
0.01 0.01
0.02 0.02
0.03 0.03
0.04 0.04
0.05 0.05
0.06 0.06
0.07 0.07
0.08 0.08
Variogram : Au_MIK{3.000000}
Variogram : Au_MIK{3.000000}
For
per
sona
l use
onl
y

May 2012 Agbaou Gold Project Page 14-51 NI 43-101
Technical Report
Table 14.15: Zone 1 Semi-Variogram Model Parameters C
ut-
off
Rotation (Isatis)
Nugget
C(0)
Structure 1 Structure 2
Z Y X
Range (m)
Range (m)
Strike Dip Down
hole
Sill
(C1) Strike Dip
Down
hole
Sill
(C2)
Grade Variography
- 40 45 0 7.687 35 35 4 15.025 105 105 12 6.049
Indicator Variography
0.1 40 45 0 0.034 115 115 5 0.037
0.2 40 45 0 0.061 115 115 5 0.049
0.3 40 45 0 0.084 115 115 4 0.051
0.4 40 45 0 0.113 120 120 4 0.061
0.5 40 45 0 0.144 120 120 5 0.061
0.6 40 45 0 0.165 136 136 6 0.054
0.7 40 45 0 0.182 136 136 6 0.049
0.8 40 45 0 0.193 139 139 21 0.045
1.0 40 45 0 0.203 119 119 18 0.042
1.2 40 45 0 0.203 69 69 18 0.047
1.4 40 45 0 0.203 69 69 18 0.047
1.6 40 45 0 0.194 55 55 22 0.051
1.8 40 45 0 0.181 45 45 18 0.061
2.0 40 45 0 0.175 37 37 15 0.061
3.0 40 45 0 0.158 37 37 15 0.061
5.0 40 45 0 0.111 32 32 13 0.047
7.0 40 45 0 0.094 32 32 13 0.022
10 40 45 0 0.094 32 32 13 0.022
15 40 45 0 0.094 32 32 13 0.022
All the zone 1 semi-variograms have been fitted with a single structured spherical semi-
variogram. The ranges of continuity are best for the lower grade indicators, below 1g/t, and
the ranges decrease to 32m for the highest grade indictors. The low grade indicators have a
reasonable nugget proportion of approximately 50% to 70%, while the higher grade
indicators have high nuggets at up to 83% of the total sill.
For
per
sona
l use
onl
y

May 2012 Agbaou Gold Project Page 14-52 NI 43-101
Technical Report
Table 14.16: Zone 2 Semi-Variogram Model Parameters C
ut-
off
Rotation (Isatis)
Nugget
C(0)
Structure 1 Structure 2
Z Y X
Range (m)
Range (m)
Strike Dip Down
hole Sill (C1) Strike Dip
Down
hole
Sill
(C2)
Grade Variography
- 30 45 0 4.166 5 5 4 7.137 32 32 15 4.166
Indicator Variography
0.1 30 45 0 7.687 8 8 4 0.059 35 35 12 0.012
0.2 30 45 0 4.166 3 3 5 0.087 61 61 15 0.023
0.3 30 45 0 2.083 5 5 6 0.070 81 81 13 0.023
0.4 30 45 0 0.951 3 3 7 0.055 97 97 16 0.037
0.5 30 45 0 43.60 6 6 6 0.079 250 250 18 0.033
0.6 30 45 0 13.19 6 6 7 0.071 263 263 25 0.031
0.7 30 45 0 2.560 6 6 7 0.067 185 185 18 0.033
0.8 30 45 0 0.265 8 8 7 0.095 231 231 22 0.031
1.0 30 45 0 2.809 8 8 8 0.100 150 150 14 0.029
1.2 30 45 0 3.904 8 8 8 0.088 110 110 15 0.035
1.4 30 45 0 1.438 9 9 7 0.094 93 93 21 0.031
1.6 30 45 0 1.438 10 10 8 0.086 73 73 17 0.026
1.8 30 45 0 1.438 9 9 6 0.073 58 58 34 0.042
2.0 30 45 0 1.438 7 7 5 0.079 50 50 30 0.044
3.0 30 45 0 1.438 7 7 5 0.079 51 51 30 0.040
5.0 30 45 0 1.438 7 7 5 0.020 44 44 30 0.040
7.0 30 45 0 1.438 7 7 5 0.002 31 31 21 0.032
10 30 45 0 1.438 7 7 5 0.002 28 28 19 0.023
15 30 45 0 1.438 5 5 3 0.002 35 35 23 0.012
All the zone 2 semi-variograms have been fitted with two structured spherical semi-
variograms. The ranges of continuity are best for the indicators between 0.5 and 1 g/t, and
the high grade indicators again have relatively low ranges of continuity. All the fitted semi-
variograms have a very short first range which accounts for a significant proportion of the
total variance above the nugget. The low grade indicators have a relatively low nugget
proportion of approximately 30% to 50%, while the higher grade indicators have high
nuggets at up to 98% of the total sill for the 10 and 15 g/t indicators, which is a result of
having fewer than ten composites greater than 5 g/t in the zone dataset.
For
per
sona
l use
onl
y

May 2012 Agbaou Gold Project Page 14-53 NI 43-101
Technical Report
Table 14.17: Zone 9 Semi-Variogram Model Parameters C
ut-
off
Rotation (Isatis)
Nugget
C(0)
Structure 1 Structure 2
Z Y X
Range (m)
Range (m)
Strike Dip Down
hole Sill (C1) Strike Dip
Down
hole
Sill
(C2)
Grade Variography
- 30 45 0 2.809 60 60 10 2.100 5000 5000 5000 0.546
Indicator Variography
0.1 30 45 0 7.687 13 13 8 0.060 103 103 18 0.032
0.2 30 45 0 4.166 4 4 6 0.068 134 134 6 0.032
0.3 30 45 0 2.083 5 5 7 0.070 115 115 7 0.034
0.4 30 45 0 0.951 15 15 9 0.049 95 95 10 0.078
0.5 30 45 0 43.60 14 14 8 0.048 108 108 12 0.071
0.6 30 45 0 13.19 14 14 8 0.048 108 108 12 0.066
0.7 30 45 0 2.560 14 14 8 0.038 105 105 11 0.069
0.8 30 45 0 0.265 14 14 8 0.031 95 95 10 0.069
1.0 30 45 0 2.809 14 14 8 0.031 89 89 9 0.070
1.2 30 45 0 3.904 14 14 8 0.031 59 59 6 0.069
1.4 30 45 0 1.438 23 23 4 0.007 60 60 10 0.095
1.6 30 45 0 1.438 19 19 3 0.016 62 62 8 0.068
1.8 30 45 0 1.438 19 19 6 0.016 65 65 8 0.054
2.0 30 45 0 1.438 19 19 6 0.016 65 65 8 0.054
3.0 30 45 0 1.438 5 5 7 0.008 80 80 12 0.013
5.0 30 45 0 1.438 5 5 7 0.008 80 80 12 0.013
7.0 30 45 0 1.438 5 5 7 0.008 80 80 12 0.013
10 30 45 0 1.438 5 5 7 0.008 80 80 12 0.013
15 30 45 0 1.438 5 5 7 0.008 80 80 12 0.013
All the Zone 9 semi-variograms have been fitted with two structured spherical semi-
variograms. The ranges of continuity are best for the lowest grade indicators below 1 g/t,
while the higher grade indicators show reasonable ranges of continuity. All the fitted semi-
variograms have a very short first range which accounts for a significant proportion of the
total variance above the nugget. The low grade indicators have a relatively high nugget
proportion of approximately 50% to 80%, while the higher grade indicators have high
nuggets at up to 98% of the total sill for the above 3 g/t indicators, which is a result of the
paucity of composites with grades of greater than 5 g/t in the zone dataset.
14.9.2.2 MIK Estimation
The block optimization exercise described in section 14.8.1 was used as the basis of the
selection of the block size. The block size is therefore the same as used in the OK and UC
estimates. Similarly, the search strategy and sample number optimization results described
in sections 14.8.3 and 14.8.2 respectively were considered in selecting the same parameters
as the OK and UC estimates. The search parameters used in each of the six MIK zones are
listed in
Table 14.8. The same search was used for all indicators in order to minimize the
inconsistencies which can arise from using different search strategies for each indicator. As
For
per
sona
l use
onl
y

May 2012 Agbaou Gold Project Page 14-54 NI 43-101
Technical Report
with the OK estimate, a three pass search strategy was required to estimate all blocks.
The Kriging of the indicators generates conditional probabilities for a restricted set of
specified cut-offs. In order to transform the probability estimates into grade and tonnage
proportions, the local conditional cfd must be rebuilt for each block. The conditional cdf will
allow the calculation of the probability for the estimated block grade to exceed any cut-off or
to calculate the average value of the variable above or below this cut-off, accounting for a
possible change of support.
Two methods of modeling the conditional cdf are available in Isatis, the Affine correction and
the Indirect Correction through Permanence of Lognormal Distribution. The Affine correction
uses a linear relationship to transform a value of one distribution to a value of another
distribution, and the variance of the initial distribution is reduced as the mean value remains
unchanged. The data distribution is then squashed towards the mean value, but its global
shape is kept unchanged. SRK used the Indirect Correction through Permanence of
Lognormal Distribution approach (which is suitable for positively skewed distributions such
as a typical gold distribution), where the values are transformed from one distribution to a
value of a lognormal distribution using an exponential relationship. The variance of the initial
distribution is reduced as the mean value remains unchanged. The extreme values are
squashed towards the mean value more than the median values, the skewness of the
distribution decreasing and the symmetry increasing.
Two methods for processing the estimates were used for comparative purposes; an e-type
estimate which calculates the mean grade for each block, and does not allow for selectivity
which is proposed for production at Agbaou; and an adjustment of the histogram variance by
a variance adjustment factor. The variance adjustment factor is calculated from the
dispersion variance, which is derived from the semi-variogram models. The variance
adjustment ratios calculated for each zone are presented Table 14.18. To be consistent with
the Coffey MIK estimate, no information effect was applied in the support correction. The
same SMU size of 2.5m x 2.5m x 2.5m used in the UC estimate was applied in the MIK
change of support calculation.
Table 14.18: Volume Variance Ratios for Each MIK Zone Zone Zone1 Zone2 Zone3 Zone4 Zone7 Zone9
Volume Variance Reduction Factor 0.5431 0.3800 0.4728 0.5485 0.4189 0.4010
14.9.2.3 Model Validation
The MIK e-type estimates were compared to the OK grades on a block by block basis for the
estimated zones. The MIK e-type means generally show a good correlation with the OK
estimates, however the MIK means are higher than the OK estimates in all zones. In three of
the zones there are also anomalous values in some of the peripheral blocks estimated with
the second and third search passes, in which the MIK estimate at all cut-off values has been
calculated to the maximum grade defined in the indicator post-processing.
These blocks are all on the margins of the ore bodies, and are poorly informed. The MIK
estimates of these blocks are not considered reliable as the indicators estimated are greater
For
per
sona
l use
onl
y

May 2012 Agbaou Gold Project Page 14-55 NI 43-101
Technical Report
than 1 (all indicators should be between one and zero), and the values in these blocks have
been reset to the OK values, with no selectivity applied. These blocks have been masked in
order to calculate the statistics presented in Table 14.19. Zones 2 and 3 were principally
affected by this correction, and this results in a minor decrease in the average grade of these
zones.
In addition, and in a similar manner to the processing of the UC estimates, the blocks which
have only a small proportion (<20%) of the parent block inside the wireframes have had the
MIK estimates reset to the OK grades, and only whole panel selectivity is applied.
Table 14.19: Statistics of OK Estimates and MIK e-type Means Zone Estimate Count Minimum Maximum Mean Variance Correlations
1 OK 4529 0.24 12.91 2.51 2.321 0.968
MIK e-type 4529 0.26 12.87 2.76 3.176
2 OK 3956 0.02 11.18 1.72 1.519 0.964
MIK e-type 3956 0.08 12.53 1.79 1.842
3 OK 1247 0.01 6.110 1.25 1.184 0.958
MIK e-type 1247 0.08 8.650 1.42 1.683
4 OK 1861 0.06 5.660 1.05 0.319 0.903
MIK e-type 1861 0.12 5.660 1.15 0.416
7 OK 1047 0.09 6.780 1.42 1.075 0.979
MIK e-type 1047 0.13 7.820 1.51 1.473
9 OK 1745 0.08 3.600 1.08 0.374 0.834
MIK e-type 1745 0.13 7.010 1.35 1.145
The MIK estimates were compared to the UC estimates for each zone, and grade tonnage
curves calculated for all zones. The MIK estimate typically models a greater degree of
selectivity in most zones, returning a lower tonnage and higher grade than the UC estimates.
At higher cut-off values (over 1g/t) the UC estimate at times reported a lower tonnage than
the MIK estimate, but still at a lower grade. The shape of the grade tonnage curves was
generally similar between the MIK and UC estimates. Grade tonnage curves for zones 1 and
2 are presented in Figure 14.26 for the MIK and UC estimates. They reflect the trends seen
in all zones, with the MIK returning higher grades and lower tonnages.
For
per
sona
l use
onl
y

May 2012 Agbaou Gold Project Page 14-56 NI 43-101
Technical Report
Figure 14.26: Grade Tonnage Curves Comparison Between MIK and UC for Zones 1 and 2
Agbaou Gold Project Grade Tonnage Curve Comparisons
Project No.
439430
0.00
1.00
2.00
3.00
4.00
5.00
6.00
0
500,000
1,000,000
1,500,000
2,000,000
2,500,000
3,000,000
3,500,000
4,000,000
4,500,000
5,000,000
0 0.1 0.2 0.3 0.4 0.5 0.6 0.7 0.8 1 1.2 1.4 1.6 1.8 2
Gra
de
To
nn
es
Cut_Off
Zone 1
Tonnes MIK
Tonnes UC
Grade MIK
Grade UC
0.00
0.50
1.00
1.50
2.00
2.50
3.00
3.50
4.00
4.50
0
500,000
1,000,000
1,500,000
2,000,000
2,500,000
3,000,000
3,500,000
4,000,000
4,500,000
5,000,000
0 0.1 0.2 0.3 0.4 0.5 0.6 0.7 0.8 1 1.2 1.4 1.6 1.8 2
Gra
de
To
nn
es
Cut_Off
Zone 2
Tonnes MIK
Tonnes UC
Grade MIK
Grade UC
For
per
sona
l use
onl
y

May 2012 Agbaou Gold Project Page 14-57 NI 43-101
Technical Report
14.10 MINERAL RESOURCE CLASSIFICATION Block model quantities and grade estimates for the Agbaou Project were classified according
to the CIM Definition Standards for Mineral Resources and Mineral Reserves (27th
November 2010) by Mark Wanless, Pr.Sci.Nat (SACNASP - 400178/05), an appropriate
independent qualified person for the purpose of National Instrument 43-101.
Mineral resource classification is typically a subjective concept, industry best practices
suggest that resource classification should consider both the confidence in the geological
continuity of the mineralized structures, the quality and quantity of exploration data
supporting the estimates and the geostatistical confidence in the tonnage and grade
estimates. Appropriate classification criteria should aim at integrating both concepts to
delineate regular areas at similar resource classification.
SRK is satisfied that the geological modeling honors the current geological information and
knowledge. The location of the samples and the assay data are sufficiently reliable to
support resource evaluation. The sampling information was acquired primarily by core and
RC drilling on sections spaced at twenty to forty meters along strike. The range of continuity
of the grades is represented by the semi-variograms developed for each zone. For the zones
with well-structured semi-variograms and relatively long ranges such as zones 1, 2, 3, 4, and
9, the quality of the estimates in the densely drilled portions of the ore body is considered
sufficient to be classified in the Measured category within the meaning of the CIM Definition
Standards for Mineral Resources and Mineral Reserves (27th November 2010). Ordinary
Kriging allows a theoretical comparison to be made of actual block estimates and a
theoretically unbiased block estimate as a qualitative way of assessing the robustness of a
Kriged block estimate. This comparison is expressed in terms of slope of regression
between estimated blocks z*(v) and theoretical true blocks z(v), and SRK used this statistic
to select the areas to be classified in the Measured category. Areas where the block
estimates typically have a Slope of Regression of greater than 0.7 were considered as high
quality estimates, and classified in the Measured category.
Generally, for mineralization exhibiting good geological continuity investigated at an
adequate spacing with reliable sampling information accurately located, SRK considers that
blocks estimated during the first estimation run considering full variogram ranges can be
classified in the Indicated category. For the Measured and Indicated blocks, SRK considers
that the level of confidence is sufficient to allow appropriate application of technical and
economic parameters to support mine planning and to allow evaluation of the economic
viability of the deposit. Those blocks can be appropriately classified as Indicated.
Conversely, blocks estimated during the second and third pass considering search
neighborhoods set at twice or more than the variogram ranges should be appropriately
classified in the Inferred category because the confidence in the estimate is insufficient to
allow for the meaningful application of technical and economic parameters or to enable an
evaluation of economic viability.
For
per
sona
l use
onl
y

May 2012 Agbaou Gold Project Page 14-58 NI 43-101
Technical Report
14.11 MINERAL RESOURCE STATEMENT CIM Definition Standards for Mineral Resources and Mineral Reserves (27th November
2010) defines a mineral resource as:
“A Mineral Resource is a concentration or occurrence of diamonds, natural solid inorganic
material, or natural solid fossilized organic material including base and precious metals, coal,
and industrial minerals in or on the Earth’s crust in such form and quantity and of such a
grade or quality that it has reasonable prospects for economic extraction. The location,
quantity, grade, geological characteristics and continuity of a Mineral Resource are known,
estimated or interpreted from specific geological evidence and knowledge.”
The “reasonable prospects for eventual economic extraction” requirement generally implies
that the quantity and grade estimates meet certain economic thresholds and that the mineral
resources are reported at an appropriate cut-off grade taking into account extraction
scenarios and processing recoveries.
In order to determine the quantities of material offering “reasonable prospects for economic
extraction” by an open pit, SRK used a pit optimizer and reasonable mining assumptions to
evaluate the proportions of the block model (Measured, Indicated and Inferred blocks) that
could be “reasonably expected” to be mined from an open pit.
The optimization parameters were selected based on the parameters defined for the reserve
pit optimization using contractor mining, aside from the gold price, which was increased from
the US$1,200/t used for the reserve open pit to an intentionally optimistic US$2,000/oz. The
reserve open pit optimization parameters are summarized in Table 14.20. The reader is
cautioned that the results from this pit optimization are used solely for the purpose of testing
the “reasonable prospects for economic extraction” by an open pit and do not represent an
attempt to estimate mineral reserves. The results are used as a guide to assist in the
preparation of a mineral resource statement and to select an appropriate resource reporting
cut-off grade.
For
per
sona
l use
onl
y

May 2012 Agbaou Gold Project Page 14-59 NI 43-101
Technical Report
Table 14.20: Assumptions Considered for Conceptual Open Pit Optimization Parameter Value Unit
Gold Price 2,000 US$ per ounce
Mining Cost 3.3 US$ per tonne mined
Processing, General and
Administrative
Oxide: 17.22
Fresh: 16.89 US$ per tonne of feed
Mining Dilution 5 Percent
Mining Loss 3 Percent
Overall Pit Slope
Oxide: 30
Transitional: 45
Fresh: 50
Degrees
Process Rate Oxide: 1.60
Fresh: 1.30 Million tonne feed per year
Gold Process Recovery Oxide: 90.7
Fresh: 91.8 Percent
In Situ Cut-Off-Grade Oxide: 0.32
Fresh: 0.31 Grams per tonne
SRK considers that the blocks located above the maximum depth of the conceptual pit
envelope show “reasonable prospects for economic extraction” and can be reported as a
mineral resource. At Agbaou, the optimistic pit shell using the US$2,000/oz gold price
extends to the approximate depth of the deepest modeled portions of the ore body in Zones
1 and 2. As such, all the modeled mineralized material within the mineralized envelopes,
using a MIK cut-off of 0.3g/t has been reported as a mineral resource. The Mineral
Resources are presented in Table 14.21.
For
per
sona
l use
onl
y

May 2012 Agbaou Gold Project Page 14-60 NI 43-101
Technical Report
Table 14.21: Mineral Resource Statement, Agbaou Project, SRK Consulting (Pty) Ltd., 30th March 2012 using MIK at a 0.3 g/t cut-off
Classification Zone Kt Grade (Au (g/t) Kozs
Measured 1 1,681 3.60 194
2 870 2.26 63
3 62 2.04 4
4 287 1.44 13
9 687 1.54 34
11 2,989 0.86 83
51 1,384 1.53 68
Total Measured 7,959 1.80 460
Indicated 1 2,318 2.71 202
2 2,369 2.20 168
3 504 1.51 25
4 882 1.24 35
5 617 6.18 123
6 326 3.77 40
7 969 2.28 71
9 325 1.14 12
10 267 1.59 14
11 503 1.23 20
51 313 1.25 13
52 236 0.99 8
53 146 0.94 4
Total Indicated 9,774 2.33 732
Total Measured and Indicated 17,733 2.09 1,192
Inferred 1 54 1.25 2
2 562 0.99 18
3 102 0.94 3
4 110 1.32 5
7 257 2.30 19
8 497 1.59 25
9 232 3.22 24
10 16 0.97 0.5
Total Inferred 1,830 1.64 97
For the purposes of comparison with the previous mineral resource estimate, the resources
have been reported at a range of grade cut-offs per resource classification in Table 14.22.
For
per
sona
l use
onl
y

May 2012 Agbaou Gold Project Page 14-61 NI 43-101
Technical Report
Table 14.22: Mineral Resource Reported at Incremental Cut-off Grades, Agbaou Project, SRK Consulting (Pty) Ltd, 30th March 2012 using MIK
Lower Cut-off
Grade Mt
Average
Grade Kozs
(g/t Au) (g/t Au)
Measured
0.3 7.959 1.8 460.1
0.4 7.119 2.0 450.6
0.5 6.262 2.2 438.2
0.6 5.624 2.4 427.0
0.7 5.060 2.6 415.2
0.8 4.570 2.7 403.4
1.0 3.797 3.1 381.2
1.2 3.234 3.5 361.3
1.4 2.783 3.8 342.6
1.6 2.414 4.2 324.8
1.8 2.159 4.5 310.9
2.0 1.939 4.8 297.5
Indicated
0.3 9.774 2.3 732.3
0.4 9.270 2.4 726.7
0.5 8.708 2.6 718.5
0.6 8.025 2.7 706.3
0.7 7.489 2.9 695.1
0.8 6.981 3.0 682.9
1.0 6.114 3.3 658.0
1.2 5.456 3.6 634.7
1.4 4.843 3.9 609.1
1.6 4.266 4.2 581.3
1.8 3.812 4.5 556.5
2.0 3.428 4.8 533.1
Inferred
0.3 1.830 1.3 77.7
0.4 1.749 1.4 76.8
0.5 1.473 1.5 72.9
0.6 1.246 1.7 68.9
0.7 1.112 1.8 66.1
0.8 0.996 2.0 63.3
1.0 0.770 2.3 56.8
1.2 0.611 2.6 51.2
1.4 0.504 2.9 46.7
1.6 0.370 3.4 40.3
1.8 0.295 3.8 36.2
2.0 0.236 4.3 32.7
For
per
sona
l use
onl
y

May 2012 Agbaou Gold Project Page 15-1 NI 43-101
Technical Report
SECTION 15. MINERAL RESERVE ESTIMATES
15.1 MINING APPROACH The following addresses the mining components of the feasibility study and is based on the
geological block model generated by SRK. This section of the report includes discussion on
the open pit optimisation, practical pit design, scheduling process, options investigated and
the reasons behind selections made. The mineral reserves, the results of the mine design
process in terms of production schedules as well as capital and operating cost estimates are
presented.
The proposed Agbaou process plant is based on a 1.6 million tonnes per annum (Mtpa) for
the oxide portion of orebody (Saprolite and Laterite) and followed by 1.34Mtpa in the
transition and fresh (Saprock and bedrock) zones. It has been assumed that a conventional
open pit shovel and truck method will be used over a Life of Mine (LOM) of approximately 8
years. Mining by contractor has been selected by ENDEAVOUR for the mining operations.
This has been the basis of the cost estimations. For comparison, an owner operated option
has also been prepared.
The design methodology involved two processes. In the first, Whittle-4X was used to identify
the optimum pit shell in terms of value and tonnage. In the second, using agreed mining
parameters, a practical pit has been designed to determine general mining requirements
such as dumping capacity, equipment requirements, operating costs and a mineable
tonnage profile that can be considered as a mineral reserve.
15.1.1 Resource Block Model A block model estimated by MIK (Multiple Indicator Kriging) was used as the basic resource
model for the pit optimization study. This resource model was imported to Surpac where the
majority of the mining design was prepared. Only mineralized material in the measured and
indicated categories was taken into account. Table 15.1 shows the Mineral Resource
classifications that have been used for the optimisation process.
Table 15.1: Mineral Resource Input for Optimisation (Using a 0.5g/t Au cut-off).
15.1.2 Geotechnical Investigation The geotechnical investigation and slope stability analysis was prepared by Golder
Associates (“Golder”), September 2008. Recommended slope designs by Golder, were
Mineral Resource category Tonnes
(Million)
Grade
(g/t Au) Ounces (Million)
Measured 6.267 2.2 0.438
Indicated 8.708 2.6 0.718
Total: Measured & indicated 14.975 2.4 1.156
Inferred 1.473 1.5 0.073 For
per
sona
l use
onl
y

May 2012 Agbaou Gold Project Page 15-2 NI 43-101
Technical Report
based on the de-pressurized slopes by inter-ramp angles (SRK Consulting, SENET, Knight
Piésold Consulting, 2012 Appendix 15-A).
15.1.3 Gap Analysis for Pit Slope Design The Nevada offices of Golder Associates (Golder), completed a pit slope design in 2008, in
support of a feasibility study for Etruscan’s Agbaou gold project in Côte d’Ivoire, Africa.
Knight Piésold Ltd. (KPL) was requested to conduct a gap analysis on the September 2008
Golder Report titled “Pit Slope Recommendations – Agbaou Project, Ivory Coast” reference
number 08059. Observations and comments were strictly with regards to the report text
provided. The reviewer was not provided with additional information, nor was any site visit
made.
It should be noted that no check analyses were carried out as part of this review to verify pit
slope design angles presented in the Golder report. Rather, this is a high-level review to
check the compliance of the current feasibility level pit slope design for the Agbaou Project.
The pit slope design report is well written and comprehensive, with a reasonable discussion
of assumptions, expected failure modes, sensitivity analyses, water management issues,
and pit slope controlling factors. However, it is difficult to endorse the validity of the pit slope
design and some conclusions, as the level of data is not consistent with what would be
expected of a feasibility pit slope geotechnical assessment. In some areas, the analyses are
acceptable only for pre-feasibility level design and scoping but may also be lacking
information in several key areas. This is opposite to the report’s conclusion that “the factual
data collected to characterize the strengths of the saprolite, saprock, and bedrock is
sufficient for feasibility-level pit slope design”.
The complete report on the gap analysis review by Knight Piésold can be found in the
Engineering Optimization Study Report (SRK Consulting, SENET, Knight Piésold
Consulting, 2012 Appendix 15-B).
15.2 OPEN PIT OPTIMISATION The ore body model was exported from Surpac to Whittle/Gemcom Four-X where the open-
pit optimization studies were performed. The Whittle/Gemcom Four-X Analyser software
provides guidance to the potential economic final pit geometries. Whittle 4X compares the
estimated value of the individual mining blocks at the pit boundary versus the cost for waste
stripping. It establishes the pit walls where the ore revenue and waste stripping cost balance
for maximum net revenue.
The selected optimum pit shell is then engineered to generate practical pit designs that
incorporate the design slope angles and access ramps / haul roads for operating open pits.
The ore / waste tonnages in the practical pits are estimated and scheduled to determine the
ore production and the waste stripping requirements.
The Whittle process requires various input data including the resource block model, unit
costs and other physical parameters such as the slope angles at which the pit can be mined.
For
per
sona
l use
onl
y

May 2012 Agbaou Gold Project Page 15-3 NI 43-101
Technical Report
Appropriate unit costs specific to the Agbaou operation were provided by ENDEAVOUR or
by other relevant parties. For the purpose of the Whittle optimization, capital costs,
depreciation, amortisation and other interest / finance charges have been excluded.
The following sections describe the methodology and derivation of the initial Whittle input
parameters and assumptions.
15.2.1 Slope Angles Based on the slope parameters derived by Golder, the following overall slope angles were
used for the pit optimization:
• Overall slope angle in Oxide material of 30°; • Overall slope angle in Transition material of 45°; • Overall slope angle in fresh material of 50°.
15.2.2 Mining Costs Two options for the mining cost have been prepared. The base case is for Mining
Contractors to carry out the operation with an Owner Operated option for comparison.
The base case contractor unit mining cost used is US$3.30/t. Various mining contractors
were approached for quotes based on schedules provided. The above unit cost provided by
one of the contractors was selected in conjunction with ENDEAVOUR. After optimizations
and initial scheduling were completed by SRK, detailed unit costs by rock type were received
from the contractor. The updated costs provided were tested in a subsequent optimisation
which showed minimal changes to the optimum pit shell (SRK Consulting, SENET, Knight
Piésold Consulting, 2012 Appendix 15-C). The owner operated unit mining cost used for
optimization purposes was US$2.25/t. This cost was originally provided by ENDEAVOUR.
15.2.3 Processing and General Administration Cost ENDEAVOUR provided the metallurgical processing recovery factors and costs for ore, and
the overall General and Administration (G&A) costs based on a throughput of 1.6Mtpa oxide
ore and 1.34Mtpa fresh ore thereafter. A breakdown of the costs and parameters used in the
Whittle optimization runs is shown in the table below.
Table 15.2: Processing Operating Cost for the Open Pit Optimization Type Oxide Fresh
Recovery 90.7% 91.8%
Processing 12.07 11.74
Dewatering 0.40 0.40
Rehandling 0.30 0.30
Grade control 0.20 0.20
Mine Supervision 1.25 1.25
Administration 3.00 3.00
Total 17.22 16.89
Royalty Oxide - US$ 5/oz Oxide - US$ 5/oz
For
per
sona
l use
onl
y

May 2012 Agbaou Gold Project Page 15-4 NI 43-101
Technical Report
SENET provided updated processing parameters after optimisations and mining schedules
were completed. A comparative optimisation was prepared using these updated parameters.
Details of the parameters and results are discussed in the EOS (SRK Consulting, SENET,
Knight Piésold Consulting, 2012 Appendix 15-C).
15.2.4 Mining Factors Considering the nature of the geological contacts and the mining equipment selection, it was
decided that the mining dilution factor be set at 5% (at 0g/t grade) and mining recovery set at
97%. These factors were similar to those used in previous studies.
15.2.5 Gold Price and Royalties A gold price of US$1200/oz was selected by ENDEAVOUR which corresponds to other
mining studies being undertaken elsewhere at this time. An US$5.00/oz Royalty also was
included by ENDEAVOUR.
15.3 OPTIMISATION RESULTS
15.3.1 Cut-off Grade Calculation The metallurgical Cut-off Grade (“COG”) was derived calculating the overall cost of
producing one tonne of ore divided by the recovered value of the gold contained therein
[(process cost + Additional Ore Mining Cost)/(Process Recovery * (Price – Royalty))] . This is
calculated within the Whittle algorithm. This was determined to be 0.53 g/t for oxide and 0.51
g/t for fresh ore.
15.3.2 Optimisation Results – Mining Contractor Option The results of the open pit optimization using mining contractor option unit costs are shown
in Table 15.3 and Figure 15.1.
For
per
sona
l use
onl
y

May 2012 Agbaou Gold Project Page 15-5 NI 43-101
Technical Report
Table 15.3: Whittle Optimisation Results (Contractor Option) Whittle
Pit Revenue RoM Inferred Rejected Waste Total Strip
Undiscounted
CashFlow
Au
OutPut
Number Factor Kt Au g/t kt Au g/t kt Au g/t kt kt Ratio M$ koz
1 0.3 1,118 2.75 1.0 1.11 8.0 0.51 1,339 2,466 1.20 79.1 89.7
2 0.4 1,961 2.66 3.0 1.00 13.0 0.51 3,947 5,924 2.01 126.8 152.2
3 0.5 5,108 2.72 23.0 5.37 71.0 0.46 24,278 29,480 4.75 291.1 406.2
4 0.6 6,174 2.65 47.0 3.62 87.0 0.45 30,751 37,059 4.98 329.3 477.1
5 0.7 9,357 2.63 152 1.82 115 0.46 60,817 70,441 6.50 437.9 719.6
6 0.8 10,144 2.60 187 1.68 122 0.46 69,046 79,499 6.81 453.7 773.2
7 0.9 10,819 2.57 227 1.58 125 0.46 76,096 87,267 7.03 460.8 814.1
8 1 11,384 2.55 248 1.56 126 0.46 83,931 95,689 7.37 463.3 851.9
9 1.1 11,965 2.54 272 1.56 143 0.46 93,361 105,741 7.80 460.4 890.7
10 1.2 12,582 2.49 291 1.55 145 0.46 100,436 113,454 7.98 455.3 920.3
11 1.3 12,811 2.47 299 1.53 161 0.46 102,639 115,910 8.01 452.7 929.4
12 1.4 13,032 2.46 302 1.53 184 0.45 105,789 119,307 8.12 448.3 939.8
13 1.5 13,330 2.44 316 1.52 191 0.45 110,950 124,787 8.32 440.0 955.0
14 1.6 13,595 2.43 323 1.54 197 0.45 115,687 129,802 8.51 431.5 967.8
15 1.7 13,932 2.40 337 1.52 237 0.45 119,870 134,376 8.60 422.0 979.6
16 1.8 14,085 2.39 337 1.51 241 0.45 122,540 137,203 8.70 416.1 986.0
17 1.9 14,216 2.38 342 1.50 255 0.45 124,814 139,627 8.78 410.7 991.2
18 2 14,335 2.37 344 1.50 258 0.45 126,684 141,621 8.84 406.0 995.4
The Inferred mineralised material shown lies within the particular pit shell and has not been
used as a revenue source in the optimisation.
Figure 15.1: Whittle Pit by Pit Graph Optimisation Results (Contractor Option)
Agbaou Gold Project Project No.
439430
0
20 000
40 000
60 000
80 000
100 000
120 000
140 000
0
50
100
150
200
250
300
350
400
450
500
1 2 3 4 5 6 7 8 9 10 11 12 13 14 15 16 17 18
Kt
MU
S$
RoM Ore Waste UndisCashflow
For
per
sona
l use
onl
y

May 2012 Agbaou Gold Project Page 15-6 NI 43-101
Technical Report
The amount of ore inside the optimum shell is approximately 11.4Mt at a grade of 2.55g/t.
The total material moved is 95.6Mt giving a stripping ratio of 7.4. This includes the Main and
West ore body.
15.3.3 Selection of Optimum Pit Shell As stated, the selection of the optimized final pit shell was based on maximum undiscounted
cash flow. In this instance, pit shell 08 for the Contractor option was selected to be used as a
template for the practical pit design, as shown in Figure 15.2.
Figure 15.2: Optimised Pit Shell Selected for Practical Pit Design
Agbaou Gold Project Pit Shells
Project No. 439430
Maximum undiscounted cash flow is used as an indicator for the optimum pit because
discounted cash flow (NPV) essentially penalises higher grade blocks which are scheduled
to be mined towards the end of the mine life. Depending on the discount rate used, the first
five years of the mining schedule have the greatest influence when NPV is used as an
indicator for the selection of the optimum pit shell. Generally optimum shells selected by
discounted cash flow are smaller than those selected by undiscounted cash flow.
15.3.4 Sensitivity Analysis A sensitivity analysis has been prepared by varying the unit mining cost, process and
administration and the gold price by +-10%. These sensitivities were carried using Whittle
FourX. Undiscounted cash flow was used to demonstrate the sensitivities. Figure 15.3
shows the results of this analysis.
For
per
sona
l use
onl
y

May 2012
Figure 15.3: Sensitivity Analysis G
As can be seen the gold price is the
and administration cost. An additional
well as sensitivity of contained ounces to changes in key variables
SENET, Knight Piésold Consulting, 2012
15.4 PRACTICAL PIT DESIGN
15.4.1 Description The practical pit designs were
software was used to prepare the practical pit, and to incorporate the haul roads
together with the appropriate i
The open pit design criteria were:
• A nominal bench height of 10• The bench height was selected based on the optimum shovel size that can be
assumed for the nominal mining production rates;• Inter-ramp slope angles of
material. In the fresh material 49Inclusion of the ramping systems results in the approximate overbeing achieved;
• Haul road widths of 25traffic for the 90t capacity truck fleetis considered based on the manufactures recommendation as shown in Figure 15The recommendation indicates a min
Agbaou Gold Project NI 43-101
Technical Report
Sensitivity Analysis Graph
Agbaou Gold Project Mining Report
rice is the most sensitive followed by the mining
An additional analysis was prepared using NPV as
well as sensitivity of contained ounces to changes in key variables
SENET, Knight Piésold Consulting, 2012 Appendix 15-C).
DESIGN
The practical pit designs were prepared using the optimised pit shells as templates.
software was used to prepare the practical pit, and to incorporate the haul roads
together with the appropriate inter-ramp slope angles.
The open pit design criteria were:
A nominal bench height of 10m; The bench height was selected based on the optimum shovel size that can be assumed for the nominal mining production rates;
ramp slope angles of 32º in North pit and 39⁰ in South and West pitmaterial. In the fresh material 49º was used in the North pit and 45nclusion of the ramping systems results in the approximate over
25m including safety berms providing sufficient room for twot capacity truck fleet that was preferred by the contractors
is considered based on the manufactures recommendation as shown in Figure 15The recommendation indicates a minimum of 3.0 - 3.5 truck widths two
Page 15-7
Project No. 439430
ining cost then process
nalysis was prepared using NPV as an indicator, as
(SRK Consulting,
using the optimised pit shells as templates. Surpac
software was used to prepare the practical pit, and to incorporate the haul roads and ramps
The bench height was selected based on the optimum shovel size that can be
in South and West pit in the oxide was used in the North pit and 45⁰ in the South pit.
nclusion of the ramping systems results in the approximate overall slope angles
safety berms providing sufficient room for two-way that was preferred by the contractors. This width
is considered based on the manufactures recommendation as shown in Figure 15-4. 3.5 truck widths two-way traffic in
For
per
sona
l use
onl
y

May 2012
straights and 3.5 - 4.0 truck widths in corners. Therefore the road width should be 20m on straights and 26m Minor ramps at the lower elevations otraffic density will be lower
Figure 15.4: Haul Road Widths
A haul road gradient of 10% ha
A total of five pits have been designed as follows:
• North, and South IntermediateWhittle pit number 04 as a template. constructed before mining commences. the initial scheduled stripping ratio. are shown in Figure 15
• North, South and WestWhittle pit number 08 are shown in Figure 15working areas to the primary crusher and the waste dumps. The view of these is shown in Figure 15-7.
Agbaou Gold Project NI 43-101
Technical Report
4.0 truck widths in corners. Therefore the road width should be and 26m on corners for this truck size (refer to the figure below)
Minor ramps at the lower elevations of the pits have been reduced in width where ower.
idths
Agbaou Gold Project Pit Design’s Road Widths
has been used throughout.
pits have been designed as follows:
Intermediate Pits – exploiting the upper sectionsWhittle pit number 04 as a template. Initial access to the upper elevations will be
ed before mining commences. These pits have been designed to minimise the initial scheduled stripping ratio. Two and three dimensional views of these cuts
Figure 15-5; , South and West Final Pits – exploiting the lower sections
as a template. Two and three dimensional views of these cuts Figure 15-6. Principal haul roads have been designed to connect the
working areas to the primary crusher and the waste dumps. The view of these is
Page 15-8
4.0 truck widths in corners. Therefore the road width should be (refer to the figure below).
f the pits have been reduced in width where
Project No. 439430
upper sections of ore body using Initial access to the upper elevations will be
been designed to minimise Two and three dimensional views of these cuts
lower sections of ore body using Two and three dimensional views of these cuts
Principal haul roads have been designed to connect the working areas to the primary crusher and the waste dumps. The view of these is
For
per
sona
l use
onl
y

May 2012
Figure 15.5: View of the Agbaou
Agbaou Gold Project NI 43-101
Technical Report
View of the Agbaou Intermediate Pits
Agbaou Gold Project Interim Pit Design
Agbaou Gold Project Pit Interim 3D View
Page 15-9
Project No. 439430
Project No. 439430
For
per
sona
l use
onl
y

May 2012
Figure 15.6: View of the Agbaou Final P
Agbaou Gold Project NI 43-101
Technical Report
View of the Agbaou Final Pits
Agbaou Gold Project Final Pit Design
Agbaou Gold Project Final Pit 3D View
Page 15-10
Project No. 439430
Project No. 439430 F
or p
erso
nal u
se o
nly

May 2012 Agbaou Gold Project Page 15-11 NI 43-101
Technical Report
Figure 15.7: View of the Agbaou Final Pits Showing the Plant Area and the Waste Dump
Agbaou Gold Project Mine Surface Plan
Project No. 439430
For
per
sona
l use
onl
y

May 2012 Agbaou Gold Project Page 15-12 NI 43-101
Technical Report
15.4.2 Mineral Reserves The practical pits have been used to generate the mineral reserves. The mineral reserve
statement uses the definitions and guidelines given in SAMVAL Definition on Mineral
Resources and Mineral Reserves and is reported in accordance with National Instrument 43-
101 requirements. Table 15.4 shows the mineral reserves estimated to be contained in the
Agbaou practical pit designs and the production schedule.
Table 15.4: Summary of Agbaou Mineral Reserves
Reserve Category Deposit Tonnes Grade Ounces
(Million) (g/t Au) (Million)
Proven Agbaou 5.407 2.25 0.390
Probable Agbaou 5.668 2.82 0.515
Total Proven and Probable Mineral Reserves 11.075 2.54 0.905
The three practical pits at Agbaou are mined simultaneously to provide 11 million tonnes of
ore to the processing plant (SRK Consulting, SENET, Knight Piésold Consulting, 2012
Appendix 15-D).
15.4.3 Comparison with Whittle Results The table below represents a comparison of practical pit design with the Whittle Shell.
Table 15.5: Comparison of Practical Pit with Whittle Shell
ROM
(kt)
Au
(g/t)
Inferred
(kt)
Waste
(kt) Total (kt)
Practical Pit 11,075 2.54 260 86,936 98,271
Whittle Shell 11,384 2.55 248 83,931 95,689
15.5 WASTE DUMP DESIGN The waste dumps have been designed using the following parameters:
• Face slope angle – 27o; • Bench height – 20m-30m; • Berm width – 15m-20m; • Overall slope – approximately 20o.
The waste dump capacities have been based on swell factors of 15% for saprolite and 20%
for fresh rock. No allowance has been made for back-filling of exhausted pits. The positions
of the three waste dumps are shown in
Figure 15.7. These positions have been provided by ENDEAVOUR and have been based on
prospectively sterile ground and take into account existing drainage patterns and proposed
infrastructure. Details of the three waste dumps are shown in
Figure 15.7.
For
per
sona
l use
onl
y

May 2012
Table 15.6: Details of Waste
Waste Dump Average Height (m)
1
2
3
Figure 15.8: Vertical Sections Through Waste D
Figure 15-8 shows sections through the waste dumps showing the configuration. As waste
dump 1 is positioned on relatively steeply dipping terrain, a set sequence of dumping has
been planned. Initially dumping will start at the 340m elevation (upper) followed by the 300m
elevation (mid) then the 20m elevation (lower). This will enable the planned dump profile to
be achieved with minimal additional shaping. Waste dumps 2 and 3 are located on relatively
flat ground and will be constructed conventionally.
Agbaou Gold Project NI 43-101
Technical Report
aste Dumps
Average Height (m) Area Covered (ha) Capacity (Mm³)
70 65
60 35
60 41
Vertical Sections Through Waste Dumps
Agbaou Gold Project Waste Dumps
8 shows sections through the waste dumps showing the configuration. As waste
dump 1 is positioned on relatively steeply dipping terrain, a set sequence of dumping has
y dumping will start at the 340m elevation (upper) followed by the 300m
elevation (mid) then the 20m elevation (lower). This will enable the planned dump profile to
be achieved with minimal additional shaping. Waste dumps 2 and 3 are located on relatively
flat ground and will be constructed conventionally.
Page 15-13
Capacity (Mm³)
24
10
17
Project No. 439430
8 shows sections through the waste dumps showing the configuration. As waste
dump 1 is positioned on relatively steeply dipping terrain, a set sequence of dumping has
y dumping will start at the 340m elevation (upper) followed by the 300m
elevation (mid) then the 20m elevation (lower). This will enable the planned dump profile to
be achieved with minimal additional shaping. Waste dumps 2 and 3 are located on relatively
For
per
sona
l use
onl
y

May 2012 Agbaou Gold Project Page 15-14 NI 43-101
Technical Report
Initially waste will be hauled and dumped on waste dump 3 which is closest to the North pit.
Table 15.7 shows the annual dumping volumes. This table shows the volumes of waste (in
m³) dumped, and the key displayed below the table indicates the corresponding waste
dump.
Table 15.7: Waste Dumping Volumes
Year 1 Year 2 Year 3 Year 4 Year 5 Year 6 Year 7 Year 8 Grand
Total (m3)
MNorth1 2 874 326 3 583 543 3 720 034 1 779 039 1 248 843 1 054 920 - - 14 260 705
MNorth2 - 918 360 1 204 940 1 196 304 3 691 765 4 063 315 4 381 620 2 876 733 18 333 037
MSouth1 - 2 554 143 2 026 266 790 064 - - - - 5 370 473
MSouth2 - - - 2 812 114 2 374 912 506 997 - - 5 694 023
West Pit 1 913 309 98 045 - - - - - - 2 011 354
Grand
Total (m3)
4 787 635 7 154 091 6 951 240 6 577 521 7 315 520 5 625 232 4 381 620 2 876 733 45 669 592
Key: Waste dump 1 Waste dump 2 Waste dump 3
15.6 MINE PRODUCTION SCHEDULE
15.6.1 Description The scheduling process consists of developing a mine plan and using the inventory included
in the practical pits. Scheduling also adjusted for plant feed criteria. The proposed Agbaou
process plant is based on a 1.6Mtpa in the oxide portion of the ore body (Saprolite and
Laterite) and 1.34Mtpa in the transition and fresh (Saprock and bedrock) zones. An amount
of three weeks feed ore (about 75% of one month capacity) as a ramp-up production plus
two months quantity of plant feed ore that have to be stockpiled near the plant are also
considered as pre-production schedule.
The mining schedule has been generated monthly for year 1, quarterly for year 2 and
annually for the remaining of the life of the operation. Four months pre-production before
gold pour is also considered in year zero to maintain a 4 week plant ramp-up as well as
stockpiling a quantity of 2 months plant feed. In this year mining will be started on outcrops
in the western parts of the North, South and West pits. Preparing access roads and
vegetation removal have to be done before the four months pre-production.
The schedule has been based on the sequential mining of ore and waste blocks in a
practical manner. Scheduling of waste material has been based on hauling to the dumping
area having the lowest cycle time. Growth of waste dumps is taken into account.
A maximum vertical advance rate of 60m per year has been applied to the scheduling. This
is considered by SRK to be the upper practical limit for open pits of this nature.
All mineralized material below the cut-off grade of 0.5g/t has been considered to be waste.
Only ore in the Measured and Indicated category is scheduled to the plant. Some Inferred
mineralised material occurs within the practical pits, which has been accounted for
separately.
For
per
sona
l use
onl
y

May 2012 Agbaou Gold Project Page 15-15 NI 43-101
Technical Report
The upper portion of the ore body consists of relatively soft rock (Laterite and saprolite).
Therefore the majority of ore mined in the first 4 years will be soft rock. The amount of hard
rock portion (Saprock and bedrock) will then increase. Table 15-8 presents the proposed
Life-of-Mine (LOM) schedule (SRK Consulting, SENET, Knight Piésold Consulting, 2012
Appendix 15-D).
Table 15-8: LOM Production Schedule
YEAR/period Date Total
Ore (t) Au(g/t) Inferred (t) Au(g/t) Waste (t) Total (t)
Pre-Product (PP)
01/09/2013 93,193 1.21 159 20.0 433,196 526,547
01/10/2013 96,299 1.27 301 13.8 364,106 460,706
01/11/2013 93,193 1.55 543 20.5 348,965 442,700
PP Total
282,685 1.34 1,002
1,146,267 1,429,953
Commissioning 01/12/2013 96,299 1.47 1,393 11.4 192,681 290,373
Y1M1* 01/01/2014 138,923 1.81 264 1.0 515,961 655,148
Y1M2 01/02/2014 125,479 1.88 3,360 11.4 345,087 473,926
Y1M3 01/03/2014 138,923 1.69 684 1.4 553,658 693,266
Y1M4 01/04/2014 134,442 1.64 1,717 1.1 424,155 560,314
Y1M5 01/05/2014 138,923 1.35 0
572,530 711,453
Y1M6 01/06/2014 134,442 1.79 5,632 5.5 960,292 1,100,365
Y1M7 01/07/2014 138,923 1.80 2,154 1.5 1,106,285 1,247,362
Y1M8 01/08/2014 138,923 1.47 26 0.7 974,270 1,113,220
Y1M9 01/09/2014 134,442 2.11 3,105 1.2 1,161,853 1,299,400
Y1M10 01/10/2014 138,923 1.67 850 1.2 921,460 1,061,233
Y1M11 01/11/2014 134,442 1.44 0
753,285 887,727
Y1M12 01/12/2014 138,923 2.76 988 1.1 991,400 1,131,312
Y1 Total
1,635,711 1.78 18,780
9,280,236 10,934,727
Y2Q1 01/01/2015 403,359 2.28 793 1.3 2,601,365 3,005,517
Y2Q2 01/04/2015 407,807 2.14 2,238 1.6 2,896,802 3,306,848
Y2Q3 01/07/2015 412,289 2.41 2,620 4.4 3,453,844 3,868,753
Y2Q4 01/10/2015 412,289 2.39 5,958 3.0 3,308,731 3,726,979
Y2 Total
1,635,744 2.31 11,609
12,260,743 13,908,097
Y3 01/01/2016 1,644,002 2.89 23,214 0.9 12,664,611 14,331,827
Y4 01/01/2017 1,454,229 3.02 12,003 1.4 11,803,451 13,269,684
Y5 01/01/2018 1,326,569 2.14 95,326 1.0 17,951,845 19,373,740
Y6 01/01/2019 1,348,689 2.62 36,175 1.1 11,761,638 13,146,502
Y7 01/01/2020 1,040,651 2.81 32,268 0.9 7,578,532 8,651,451
Y8 01/01/2021 610,347 3.27 41,028 1.1 3,240,502 3,891,877
GRAND TOTAL**
11,074,927 2.50 272,799 1.5 87,880,505 99,228,231
*Y1M1 refers to Year 1, Month 1. This nomenclature follows throughout the table above.
**Grand Total is the added amount of: Pre-Product; Commissioning, and Y1 – Y8.
For
per
sona
l use
onl
y

May 2012 Agbaou Gold Project Page 15-16 NI 43-101
Technical Report
An investigation was carried out using a raised cut-off in order to process higher grade ore
initially and stockpile the lower grade ore for processing towards the end of the life of the
operation. The limiting factor to this was that the vertical advance rate was exceeded in the
initial years of operation. This was not considered in the scheduling process for this study.
For
per
sona
l use
onl
y

May 2012 Agbaou Gold Project Page 16-1 NI 43-101
Technical Report
SECTION 16. MINING METHODS
16.1 INTRODUCTION SRK understands that contractor-based mining is preferred by ENDEAVOUR. The selected
mining contractor will thus be responsible for the site preparation (including removal of
vegetation) haul road construction, excavation and haulage of ore to the Run of Mine (ROM)
pad and waste to the waste dumps, oversize breakage and equipment maintenance.
The mining operations are based on the use of a hydraulic excavator and haul truck fleet
engaged in conventional open pit mining techniques. The excavators load the
blasted/broken material into the haul trucks, with the ore being transported to the processing
area and the waste to the designated local waste dumps. Access roads will be developed as
required for access into new areas. The main arterial roads where necessary will be
constructed to a minimum 20m width, including berms and drainage areas.
Topsoil in mining areas will be recovered during the pit preparation phase and stockpiled for
future use with progressive waste dumps and possible pit rehabilitation.
The majority of the gold mineralised material will be transported to the ROM area, and
discharged directly into the feed hopper. An ROM stockpile will be available for surplus
material at the ROM pad area.
All of the waste material from the excavation area will be hauled to the external waste dump,
adjacent to the operational pits. The total waste to be moved is about 87Mt, which
approximates to 50 million cubic meters of dumping volume.
The in-situ materials in hard and semi-hard rock will require drilling and blasting to assist
fragmentation and subsequent loading. Based upon the information supplied, and
experience in similar operations, it has been assumed that that oxide portion of the ore body
is free digging or may be in need of light blasting in certain areas. It has also been assumed
that in the owner-operated option, on-site staff at Agbaou will also undertake mine planning,
mine scheduling, grade control and performance monitoring.
Four local and internationally experienced mining contractors were requested to submit an
estimate of the cost of mining based upon the annual mine production schedule. One of
these submissions was suited to the operation. This submission was used as a basis to
generate operating and capital costs.
16.1.1 Mining Equipment Requirements The mining equipment shown in Table 16.1has been selected based upon the annual mine
production schedule. This has been prepared by the mining contractor.
For
per
sona
l use
onl
y

May 2012 Agbaou Gold Project Page 16-2 NI 43-101
Technical Report
Table 16.1: Equipment Selection for Mine Operation by Contractor Equipment Type & Model Quantity
Drill Rig ATLAS COPCO ROCL8 1
Breaker MONTABERT BRV65 1
Excavator
CAT 390c 1
CAT 336DL 1
LIEBHERR R9250 1
LIEBHERR R984 4
Dozer CAT D8R 4
Grader CAT 14G 1
Wheel Dozer CAT 824H 1
Truck CAT 777G 8 5 8-12
CAT DUMP BOX 1 1
Water Tank CAT 773+MTT13 1
Wheel Loader CAT 988H 1 1
CAT 966H 1 1
Compactor BOMAG BW219 1 1
Water Tank CLAAS 1
Mobile Crane GROOVE RT890 1 1
Tyrehandler CAT 966TH 1 1
Service truck RVI SERVICE 9 9
Telehandler CAT TH414 1 2
Lowbed 1
16.1.2 Mine Work Schedule Table 16.2 summarises the working schedule, the scheduled shifts per year and the
expected shifts available, accounting for holidays (based on data received by
ENDEAVOUR). The mine is initially scheduled to work 329 days per year, less time for
holidays and inclement weather. It will operate two shifts per day for ore and three shifts per
day for waste, 8 hours per shift for 658 available shifts each year for ore and 987 shifts for
waste for the mine life. A 3-crew roster system will be required to maintain this schedule.
For
per
sona
l use
onl
y

May 2012 Agbaou Gold Project Page 16-3 NI 43-101
Technical Report
Table 16.2: Scheduled Working Periods
Parameter Units Value
Calendar Days Days 365
Days per Week Days 7
Holidays Days 15
Weather Days 21
Scheduled Days Days 329
Shifts/Day-Ore Shifts 2
Shifts/Day-Waste Shifts 3
Annual Work Shifts-Ore Shifts 658
Annual Work Shifts-Waste Shifts 987
Hours per Shift-Ore Hours 8
Hours per Shift-Waste Hours 8
Scheduled Hours_Ore Hours 5,264
Scheduled Hours_Waste Hours 7,896
The operating time per shift will be the actual time during the shift that the equipment is
“productively” working at its capacity. This is equal to total scheduled time less all scheduled
and unscheduled delays.
16.1.3 Open Pit Dewatering The mine planning/schedule information obtained from ENDEAVOUR indicates that the
open pits will reach a maximum depth of 150m to 175m deep at the end of the life of mine.
The maximum inflow to the proposed open pits is expected to be approximately 27L/s.
However, it should be noted that significantly increased inflows could be encountered during
mining owing to the presence of previously unmapped structural features which may be
water bearing.
As a result of the groundwater conditions present on site, open pit dewatering is
recommended through the use of sub-horizontal gravity drainage boreholes (drains) drilled
into the walls of the pit in areas where seepage is observed. These drains are recommended
to be 50m in length and drilled at an upward angle of ±5° perpendicular to the pit wall in
every stage of the pit at 20m – 30m apart. The first 15m - 20m of each hole should be cased
with plain PVC casing to prevent collapse. The drains can be drilled by the blasting rig thus
decreasing the cost of drilling and could be even more effective for the dewatering of
vertical/subvertical faults. Water drained from these boreholes will be collected in sumps at
the base of the pit and be pumped out using a centrifugal pump.
In the event that dewatering through the use of drains is not effective, or inflow rates are
higher than expected, it is recommended that a number of dewatering boreholes are drilled
along structural features which have been shown to contribute to inflow. This can reduce the
groundwater inflow to the pits by intersecting the flows before they reach the walls.
Groundwater abstracted from the open pits should be discharged to the raw water supply
dam to avoid release to the environment. As such, the abstracted groundwater will augment
to process water supply requirement to some degree, although it is not sufficient to meet all
For
per
sona
l use
onl
y

May 2012 Agbaou Gold Project Page 16-4 NI 43-101
Technical Report
of the process water requirements.
Dewatering of the open pits will affect the groundwater quantity by lowering the water table
elevation and this influence has to be monitored so that there is minimal or no impact on
nearby boreholes and surface water (such as dams and base flow in streams). Groundwater
quality should also be monitored to control any impact of mining activities such as leakage
from the TSF, WRD, the discharged water, and the storage and handling of chemicals, such
as reagents and fuels.
If a significant groundwater quantity and/or quality impact is detected outside of the site
boundary and this impact results in significant de-watering of the water supply boreholes of
adjacent landowners, provision should be made to provide alternative water supplies to
affected parties. This is likely to consist mainly of the drilling of deeper boreholes in order to
provide alternative water supplies.
A comprehensive network of monitoring boreholes should be established at strategic
locations around the site to monitor pit dewatering impact on groundwater quantity and
quality.
16.1.4 Mine Infrastructure The mining infrastructure is covered in Section 18.2.
A layout of surface access roads has been shown in Figure 16.1. These roads allow access
between the pits, plant, explosive magazine, ROM Stockpile and waste dumps. The total
distance amounts to approximately 5km. These roads will be constructed by the mining
contractor under ENDEAVOUR’s supervision.
For
per
sona
l use
onl
y

May 2012 Agbaou Gold Project Page 16-5 NI 43-101
Technical Report
Figure 16.1: Layout of Surface Access Roads, Explosive Magazine and ROM Stockpile Location
Agbaou Gold Project Surface Access Road
Project No. 439430 F
or p
erso
nal u
se o
nly

May 2012 Agbaou Gold Project Page 16-6 NI 43-101
Technical Report
The bulk explosives facility will be located away from the mining facilities, at a location to be
decided during the construction phase. Figure 16.1 shows a location suggested by SRK. A
safety aspect of the site will need to be investigated.
A detonator magazine either of concrete construction or with double brick thickness and
surrounded by earthen screening mounds and security fencing, and a small industrial
explosive magazine will be required as separate units situated within close proximity of the
main magazine complex, but all within an enclosed security fencing and managed
accordingly.
An allowance has been made in the mining costs for an adequate supply of hand held and
vehicle mounted radio sets. SRK recommends the fitting of in-vehicle radios to all of the
hydraulic excavators, drill rigs, graders and wheel loaders, to the haul trucks and to the
service vehicles and supervisors transport.
16.1.5 Mining Manpower The ENDEAVOUR mining personal includes mining manager and technical services (survey,
geology/grade control and mine planning) as per below:
• Manager – 2 persons; • Mining supervisor – 5 persons; • Geology and planning engineers – 3 persons; • Surveyor – 2 persons; • Artisans – 5 persons.
The remainder of the mining operational labour will be provided by the mining contractor.
For
per
sona
l use
onl
y

May 2012 Agbaou Gold Project Page 17-1 NI 43-101
Technical Report
SECTION 17. RECOVERY METHODS
17.1 PROCESS DESIGN CRITERIA
17.1.1 Introduction Metallurgical testwork results and industry norms, where necessary, were used to define the
process design criteria for the Agbaou Gold Project. The process plant is designed to treat
either 1.6 million tonnes per annum of saprolite ore or 1.34 million tonnes of bedrock ore, or
a combination of the two ore types if required.
The proposed process design criteria consist of crushing, ore stockpiling, milling and
classification, gravity and ILR, CIL, cyanide detoxification, tailings disposal, acid wash,
elution, electrowinning and gold room, carbon regeneration, consumables, oxygen and air
services; and water services.
Several references have been used to derive data used in the process design criteria and
are:
• ENDEAVOUR; • Metallurgical testwork; • Calculated data; • Vendor data or recommendations; • SENET; • Industry standards or practices; • Handbook (engineering handbook); • Assumptions based on experience; • External consultants.
17.1.2 Ore Characteristics The comminution testwork results (obtained from the previous study), specific gravity
determinations (obtained from the current study’s testwork) and information obtained from
ENDEAVOUR were used to characterise the ore as shown in the table below.
For
per
sona
l use
onl
y

May 2012 Agbaou Gold Project Page 17-2 NI 43-101
Technical Report
Table 17.1: Design Criteria – Ore Characteristics
* The saprolite samples were too fine to have been subjected to comminution testing.
17.1.3 Operating Schedule The primary crushing circuit will be operated on a 16-hour basis for bedrock and 18-hour
basis for saprolite, with overall utilisation of 83% and 85%, respectively. The remaining hours
in both cases will be set aside for maintenance. The table below summarises the operating
schedule.
Table 17.2: Design Criteria – Operating Schedule
ORE CHARACTERISTICS Units Saprolite Bedrock Source
Ore Source Open Pit Open Pit Client
Max Lump Size mm 800 800 Client
Ore Head Grades (Au) g/t 2.10 2.40 Client
Moisture Content % 18% 5% Client
Specific Gravity 2.79 2.82 Testwork
Bulk Density of Crushed Ore t/m³ 1.40 1.69 Calculated
Rod Mill Work Index: Mpa Not tested * 15.5 Testwork
Ball Mil l Work Index: kWh/t Not tested * 11.8 Testwork
Abrasion Index: kWh/t Not tested * 0.185 Testwork
JK Tech Parameters
A Not tested * 62.3 Testwork
b Not tested * 0.54 Testwork
A x b Not tested * 33.8 Calculated
Ta Not tested * 0.48 Testwork
OPERATING SCHEDULE Units Saprolite Bedrock Source
General
Annual Tonnage Treated Mtpa 1 610 000 1 340 280 Client
Ore Processing Tonnes per Month t/month 134 167 111 690 Calculated
Primary Crushing
Operating Hours per Day hrs 18 16 Client
Scheduled Maintenance per Week hrs 12 12 Client
Scheduled Maintenance per Annum hrs 720 720 Calculated
Operating Hours per Annum hrs 5 558 4 864 Calculated
Util isation % 95% 95% SENET
Overall Utilization % 85% 83% SENET
Selected Crushing Throughput t/hr 290 290 SENET/Client
Milling
Operating Hours per Day hrs 24 24 Client
Scheduled Maintenance per Week hrs 7 7 Industry Practice
Scheduled Maintenance per Annum hrs 364 364 Calculated
Number of Mill Relines per Anuum # 2 2 Industry Practice
Time Required per Mil l Reline hrs 24 24 Industry Practice
Time Lost per Annum due to Rel ines hrs 96 96 Calculated
Operating Hours per Annum hrs 7 885 7 885 Calculated
Util isation % 95% 95% SENET
Overall Utilization % 90% 90% SENET
Selected Milling Throughput t/hr 205 170 SENETFor
per
sona
l use
onl
y

May 2012 Agbaou Gold Project Page 17-3 NI 43-101
Technical Report
17.1.4 Plant Recovery The overall plant recoveries are shown in the table below. In the metallurgy section the
gravity recoveries obtained from testwork are 30% for saprolite and 20% for bedrock. Taking
these recoveries into account the CIL feed grade was calculated. The CIL laboratory
dissolutions were calculated using this feed grade and the CIL tails grade. A confidence level
of 98.5% was applied to the laboratory dissolutions to obtain the CIL plant dissolutions of
91.9% for saprolite and 90.4% for bedrock. Ultimately the total overall recoveries were
obtained as 93.2% for saprolite and 91.4% for bedrock.
Table 17.3: Design Criteria – Recovery
17.1.4.1 Crushing and Ore Stockpiling
There will be one crushing circuit for both saprolite and bedrock ores. The circuit will produce
a SAG mill feed of 100% passing 240mm that will be stockpiled prior to milling. The
maximum lump size of the feed to the crushing plant will be 800mm.
The bedrock comminution testwork results, from the previous feasibility study, were
reviewed by OMC and the outcomes of that review were used as a basis for the design of
the crushing circuit. The crushing design criteria are shown in the table below.
RECOVERY Units Saprolite Bedrock Source
Gold (Au) Recovery
Head Grade g/t head 2.10 2.40 Client
Gravity
Gravity Recovery % head grade 30.0% 20.0% Testwork
Gravity Recovery g/t 0.61 0.46 Calculated
CIL
CIL Feed Grade g/t head feed 1.49 1.94 Calculated
CIL Laboratory Dissolution % 93.3% 91.7% Calculated
Confidence Level % 98.5% 98.5% Industry Practice
CIL Plant Dissolution% of CIL Feed
Grade91.9% 90.4% Calculated
CIL Dissolution g/t head feed 1.37 1.75 Calculated
CIL Solution Tai ls ppm 0.015 0.015 Industry Practice
CIL Solids % m/m % 40.0% 43.0% Testwork
CIL Solution Tai ls g/t head feed 0.023 0.020 Calculated
CIL Solid Tails g/t head feed 0.100 0.160 Testwork
Combined CIL Tails g/t head feed 0.123 0.180 Calculated
CIL Overal l Recovery % head grade 65.3% 72.9% Testwork
Total Overal l Recovery % head grade 93.2% 91.4% Calculated
For
per
sona
l use
onl
y

May 2012 Agbaou Gold Project Page 17-4 NI 43-101
Technical Report
Table 17.4: Design Criteria – Crushing and Ore Stockpiling
* The dry crusher feed rate shown in the table above is that of the vibrating grizzly feeder oversize material.
17.1.4.2 Milling
The milling circuit will comprise a single stage SAG mill and a ball mill, as well as a pebble
crusher for the SAG mill oversize. The circuit will produce the CIL feed of 80% passing
75µm. The SAG mill discharge slurry will have a solids density of 55% w/w solids for
saprolite and 70% w/w solids for bedrock. The oversize from the SAG mill, with a top size of
60mm will be crushed further in a pebble crusher with a closed side setting of 15mm.
The bedrock ore characteristics and comminution testwork results were used as a basis for
the design of the milling and classification circuit as summarized in the two tables below.
Comminution characteristics for saprolite were estimated from the OMC database as the
material was too fine to support the required testing and no further testwork has been
conducted at the time of producing this report.
The comminution testwork results were sent to OMC, who modelled several mill
configurations to determine the most suitable and cost effective installation. OMC’s
interpretation for mill configuration and sizing of both mills can be found in the following
report – December 2011, OMC, “Agbaou Gold Project Comminution Testwork and Circuit
Design Review”, Report No. 8857.30 Rev 0 these are included in Appendices 13-A and 13-
B.
The milling and classification design criteria are shown in the table below.
CRUSHING & ORE STOCKPILING Units Saprolite Bedrock Source
ROM Bin
Maximum Lump Size mm 800 800 Client
Selected Grizzly Spacing mm x mm 800 800 Industry Practice
Method of Feeding ROM Bin Truck & FEL Truck & FEL Client
Truck Type CAT 777 CAT 777
Rom Bin Capacity m³ 100 100 Calculated
Withdrawal Method from Bin APRF & GRIZ APRF & GRIZ Client
Apron Feeder Nominal Capacity t/hr 290 290 SENET/Client
Primary Crusher
Type of Crusher Jaw Jaw Industry Practice
Dry Feed Tonnage t/hr 181 * 181 * Calculated
Vibrating Grizzly Undersize as % of ROM Feed % 38% 38% Handbook
Crusher Closed Side Setting mm 150 150 OMC
Primary Crusher P80 mm 148 148 OMC
Primary Crusher P100 mm 240 240 OMC
Stockpile
Design Live Capacity days 1.0 1.0 Industry Practice
Selected Stockpile Live Capacity tonnes 5 000 5 000 Calculated
Reclaim Method Apron Feeders Apron Feeders Client
Number of Reclaim Feeders # 2.0 2.0 Industry Practice
Reclaim Feeder Withdrawal Rate t/hr 205 170 SENET/Client
For
per
sona
l use
onl
y

May 2012 Agbaou Gold Project Page 17-5 NI 43-101
Technical Report
Table 17.5: Design Criteria – Milling
* The OMC report has a SAG mill discharge density of 50% solids. However, when the milling circuit water balance was done for saprolite
ore at this density a surplus of water was encountered. Thus, a density of 55% was selected. This will be confirmed during the post-study
testwork campaign.
**Ball loads 12% and 15% for the SAG as per OMC report.
MILLLING Units Saprolite Bedrock Source
Milling Circuit Selection
Circuit type SABC SABC SENET/Client
SAG Milling
Number of Mills # 1.0 1.0 OMC
Wet or Dry Mill ing Wet Wet OMC
Open or Closed Circuit Open Open OMC
Overflow or Grate Grate Grate OMC
Feed Size (F80) mm 148 148 OMC
Product Size (P80) µm 857 857 OMC
Discharge Slurry % Solids % 55% * 75% SENET
Selected SAG Mill Size:
Diameter (Inside Shell) m 6.71 6.71 OMC
Effective Grinding Length (EGL) m 3.54 3.54 OMC
Mill Speed as % of Critical Speed % 75% 75% OMC
Drive Type Variable Speed Variable Speed OMC
Operating SAG Mill Bal l Load % TBC 12% ** OMC
Maximum SAG Mill Bal l Load % TBC 15% ** OMC
Ball Material (High Cr, Cast or Forged) High Cr High Cr SENET/Client
Mill Liner Material (Steel, Rubber, Polymet) Steel/Composite Steel/Composite Client
Ball Solids Density t/m³ 7.82 7.82 Supplier
Selected Bal l Size mm TBC 125 OMC
SAG Mill Discharge Screen
Screen Type Vibrating Vibrating Client
Screen Sol ids Flowrate t/hr 236 196 Calculated
Type of Screen Panels PU Slotted PU Slotted Industry Practice
Screen Aperture mm x mm 12 x 55 12 x 55 Industry Practice
Screen Draining Rate m³/m²/h 250 250 Supplier
Selected Screen Area m² 4.65 4.65 Supplier
Ball Milling
Number of Mills # 1.0 1.0 OMC
Wet or Dry Mill ing Wet Wet OMC
Open or Closed Circuit Closed Closed OMC
Overflow or Grate Overflow Overflow OMC
Feed Size (F80) mm 12 12 SENET
Product Size (P80) µm 75 75 Testwork/Client
Discharge Slurry % Solids % 55% 75% SENET
Selected Ball Mill Size:
Diameter (Inside Shell) m 4.50 4.50 OMC
Effective Grinding Length (EGL) m 6.75 6.75 OMC
Mill Speed as % of Critical Speed % 75% 75% OMC
Drive Type Fixed Speed Fixed Speed OMC
Operating Ball Mil l Ball Load % TBC 30% OMC
Maximum Ball Mil l Ball Load % TBC 35% OMC
Ball Material (High Cr, Cast or Forged) High Cr High Cr Industry Practice
Mill Liner Material (Steel, Rubber, Polymet) Composite Composite Client
Selected Bal l Size mm TBC 65 OMC
Ball Mill Trommel Screen
Screen Type Trommel Trommel SENT/Client
Screen Sol ids Flowrate t/hr 200 365 Calculated
Type of Screen Panels PU Slotted PU Slotted Industry Practice
Screen Aperture mm x mm 12 x 55 12 x 55 Industry Practice
Screen Draining Rate m³/m²/h 170 340 Handbook
Required Screen Area m² 1.37 1.26 Calculated
For
per
sona
l use
onl
y

May 2012 Agbaou Gold Project Page 17-6 NI 43-101
Technical Report
17.1.4.3 Classification and Trash Handling
A cyclone cluster will classify the mill product to produce an overflow of 40% w/w solids
(saprolite) and 43% w/w solids (bedrock). Testwork results showed that viscosity issues will
not be encountered at a cyclone overflow density of 40% for saprolite. The overflow will be
screened and directed to the CIL circuit for recovery of gold.
The cyclone overflow will gravitate onto a vibrating trash screen where any trash material
present in the ore will be removed as screen overflow. The screen underflow will be
channeled into a leach feed splitter box.
Table 17.6: Design Criteria – Classification and Trash Handling
17.1.4.4 Gravity
Batch laboratory GRG tests that were conducted indicated both ore types contain free gold.
The testwork results were used to predict the plant GRG recoveries. The design criteria for
the gravity circuit are shown in the table below.
Table 17.7: Design Criteria – Gravity
CLASSIFICATION AND TRASH HANDLING Units Saprolite Bedrock Source
Mill Discharge Sump
Cyclone Feed Slurry Flowrate m³/hr 623 618 Calculated
Residence Time mins 2.0 2.0 Industry Practice
Selected Sump Volume m³ 20 20 Calculated
Classification
Type of Classification Cluster Cluster Industry Practice
Number of Clusters # 1.0 1.0 SENET
Circulating Load % 150% 250% Industry Practice
Cyclone Feed Slurry Flowrate m³/hr 623 618 Calculated
% Solids in Cyclones Overflow % 40% 43% Testwork/SENET
Cyclone Overflow Slurry Flowrate m³/hr 381 286 Calculated
% Solids in Cyclones Underflow % 70% 70% Industry Practice
Cyclone Underflow Slurry Flowrate m³/hr 242 333 Calculated
Overflow Product Size (P₈₀) µm 75 75 Industry Practice
Trash Screening
Type of Screen Vibrating Vibrating Client
Aperture Size µm 0.63 x 8.8 0.63 x 8.8 Industry Practice
GRAVITY Units Saprolite Bedrock Source
Scalping Screen
Type of Screen Vibrating Vibrating Industry Practice
Aperture Size mm 2.0 2.0 Industry Practice
Screen Dry Solids Feed Rate t/hr 120 66.6 Calculated
% Solids in Screen Feed % 70% 70% Industry Practice
Feed Slurry Flowrate m³/hr 94.4 52.1 Calculated
Dilution Flowrate m³/hr 39.9 33.0 Calculated
Gravity Concentrator
Type of Gravity Unit Centrifugal Centrifugal Industry Practice
Number of Units # 1.0 1.0 SENET
% Solids in Concentrator Feed % 55% 50% Calculated
Gravity Feed Grade g/t 2.10 2.40 Client
Gravity Recovery (% Au of Head grade) % 30% 20% Testwork/SENET
Concentrate Mass as % of Feed to Conc % 0.03% 0.03% Industry Practice
Gravity Concentrate Treatment Type Intense Leaching Intense Leaching SENET/Client
Concentrate Batches Treated per Day # 1.0 1.0 SENET
Gravity Electrowinning
Number of Gravity Electrowinning Cells # 1.0 1.0 SENET/Client
Number of Electrowinning Cycles per Month # 30 30 Industry Practice
For
per
sona
l use
onl
y

May 2012 Agbaou Gold Project Page 17-7 NI 43-101
Technical Report
17.1.4.5 Carbon-in-Leach (CIL)
Pre-leaching ahead of the CIL was excluded because the testwork results indicated that
there is a significant presence of preg-robbers in both saprolite and bedrock ores.
A conditioning or oxidation stage has been included in the design for the introduction of
oxygen in the ore prior to leaching with sodium cyanide. This step helps increase the leach
kinetics. The pH adjustment is also fine tuned in the oxidation tank prior to leaching.
The cyanidation tests that were conducted resulted in a leach residence time of 24hrs for
saprolite and 32 hours for bedrock. As discussed in Section 13.1.5 these leach residence
times were selected as optimal. The design criteria for the CIL circuit are shown in the table
below.
Table 17.8: Design Criteria – CIL
17.1.4.6 Cyanide Detoxification
Batch laboratory tests conducted indicated that cyanide destruction could be achieved by
using the Inco process (i.e. using sodium metabisulphite, and copper sulphate as a catalyst).
A residence time of 2 hours (including redundancy) in this circuit was initially assumed prior
to conducting testwork. This resulted in a residence time of 1 hour per detox tank. The
testwork results revealed an optimum detox residence time of 45 minutes. Post study
options, each having the same effect, for optimizing the circuit are:
CARBON IN LEACH (CIL) Units Saprolite Bedrock Source
Leach
Solids Flow to CIL t/hr 205 170 Calculated
CIL Feed Grade - Design Only % 2.10 2.40 Client
% Solids in Leach Feed % 38.8% 41.3% Calculated
Feed Slurry Flowrate m³/hr 397 302 SENET
CIL Tank Residence Time hrs 24 32 Testwork
Air/O₂ Hold-up % 8.0% 8.0% Industry Practice
Number of Oxidation Tanks # 1.0 1.0 SENET/Client
Number of CIL Stages/Tanks # 7.0 7.0 SENET/Client
Total Number of Tanks # 8.0 8.0 Calculated
Leach Dissolution (Au) % 91.9% 90.4% Testwork/SENET
CIL Solution Tai ls Grade g/t 0.023 0.020 Calculated
CIL Solids Tai l Grade g/t 0.100 0.160 Testwork
Design Carbon Concentration in Slurry g/L 10.0 10.0 SENET
Carbon to Gold loading Ratio 1 000 1 000 Industry Practice
Design Incremental Carbon Loading g/t 1 253 1 564 Calculated
Carbon Batch Size t 6.0 6.0 SENET
Eluted Carbon Value g/t 100 100 Industry Practice
Loaded Carbon Value g/t 1 353 1 664 Calculated
Interstage Screens
Interstage Screen Type MPS (P) MPS (P) Industry Practice
Aperture Size µm 800 800 Industry Practice
Loaded Carbon Screen
Type of Screen Vibrating Vibrating Client
Aperture Size mm 0.63 x 8.8 0.63 x 8.8 SENET
Carbon Safety Screen m³/hr Calculated
Type of Screen Vibrating Vibrating Client
Aperture Size µm 0.8 x 8.8 0.8 x 8.8 SENET
For
per
sona
l use
onl
y

May 2012 Agbaou Gold Project Page 17-8 NI 43-101
Technical Report
• Reduce tanks sizing by half;
• Remove one of the tanks
Lime slurry will be added into the circuit to neutralise sulphuric acid that is generated during
the detoxification process, thus maintaining the pH within the desired range of 8 – 10.
The residual WAD cyanide concentration in the post leach tails was assumed to be 100
ppm. The detoxification process has been designed to decrease the WAD cyanide
concentration in the final tailings to 10 ppm. These assumptions will be reviewed in the next
project phase. The design criteria for the cyanide detoxification circuit are shown in the two
tables below.
Table 17.9: Design Criteria – Cyanide Detoxification
17.1.4.7 Acid Wash, Elution and Carbon Regeneration
An acid wash column will be used and a batch tank will also be provided to facilitate the measurement of a loaded carbon batch to acid wash and elution. The Anglo American Research Laboratories (AARL) method has been selected as the elution method due to the high number of elution cycles per month predicted for a 6 t carbon batch elution size. A horizontal regeneration kiln will be used. Carbon transfer from acid wash column to elution column and elution column to regeneration
CYANIDE DETOXIFICATION Units Saprolite Bedrock Source
Detox method
Sodium
Metabisulphite &
Copper Sulphate
Sodium
Metabisulphite &
Copper Sulphate
Client
Required Residence Time hrs 2.0 2.0 Assumption
Residual Cyanide in Tail ings (before Detox) ppm 100 100 Assumption
Cyanide in Final Detoxified Tails ppm 10 10 Industry Practice
Solids Flow from CIL tph 205 170 Calculated
Solids Density in Detox Feed % 37.6% 39.8% Calculated
Feed Slurry Flowrate m3/hr 413 318 Calculated
Calculated Detox Volume m3 826 635 Calculated
Number of Tanks # 2.0 2.0 Industry Practice
Calculated Volume per Tank m3 413 318 Calculated
Air Hold-up % 10% 10% Industry Practice
Calculated Tank Volume (incl. Air Hold-up) m3 459 353 Calculated
Selected Volume per Tank m3 500 500 SENET
Detox Sump
Required Residence Time mins 4.0 4.0 Industry Practice
Calculated Sump Volume m3 27.5 21.2 Calculated
Selected Sump Volume m3 30 30 SENET
Detox Air Requirements
Volume of Air Required per TankNm3/h/1000m3
tank vol1000 1000 Industry Practice
Number of Tanks to be Aerated # 2.0 2.0 Industry Practice
Slurry Volume per Tank m3 500 500 Calculated
Total Volume of Air Required Nm3/h 1000 1000 Calculated
Excess Return Water Detox
Method H₂O₂/HCl H₂O₂/HCl Testwork
Catalyst Used CuSO₄ CuSO₄ Testwork
For
per
sona
l use
onl
y

May 2012 Agbaou Gold Project Page 17-9 NI 43-101
Technical Report
facility will be via hydraulic means.
Due to the price of power in Cote d’Iviore being relatively low, it was considered
economically viable to use electric heaters for the elution and regeneration heating systems.
Table 17.10: Design Criteria – Acid Wash, Elution and Regeneration
17.1.4.8 Electrowinning and Smelting
Gold will be recovered from the pregnant eluate via conventional electrowinning in a single
20-cathode electrowinning cell. Stainless steel cathodes will be utilized. Gold sludge washed
from the cell will be dewatered using a pot filter and dried in a drying oven prior to smelting.
Fluxes will form a slag which removes various metal oxides from the gold sludge. A mixture
of molten gold and slag will be poured into cascade moulds where gold will be retained in the
initial moulds due to its higher density.
Gold bullion bars will be cleaned, assayed, labelled and readied for shipping. The design
criteria for electrowinning and smelting are shown in the table below.
ACID WASH, ELUTION & REGENERATION Units Saprolite Bedrock Source
Type of Acid Wash Vessel Column Column SENET
Material of Construction FRP FRP Industry Practice
Flow Through the Vessel BV/hr 2 2 Industry Practice
Acid Wash Tank
Minimum Tank Volume BV 1.0 1.0 Industry Practice
Minimum Tank Volume m³ 13.3 13.3 Industry Practice
Acid Wash Solution Strength % 3.0% 3.0% Industry Practice
Rinsing
Rinse Volume BV 2.0 2.0 Industry Practice
Rinse Time hrs 1.5 1.5 Industry Practice
Acid Wash Vessel Emptying Method Hydraulic Hydraulic Calculated
Elution
Elution Method AARL AARL Industry Practice
Operating Temperature 0C 130 130 Industry Practice
Operating Pressure kPa 350 350 Industry Practice
Carbon Transfer Method Hydraulic Hydraulic Industry Practice
Number of Elutions per Month - Design # 40 30 Industry Practice
Total Elution Cycle Time hrs 10 10 Calculated
Carbon Batch Size t 6.0 6.0 SENET
Design Barren Carbon Loading g/t 100 100 Industry Practice
Flow Through the Column 2.0 2.0 Industry Practice
Eluant Tank
Minimum Eluant Tank Volume BV 1.0 1.0 Industry Practice
Cyanide Strength in Eluant % 2.0% 2.0% Industry Practice
Caustic Strength in Eluant % 3.0% 3.0% Industry Practice
Elution Heating
Elution Heating Type Thermic Oil Thermic Oil Industry Practice
Elution Heaters Type Electric Electric Client
Kiln Feed Hopper
Dewatering Means Strainers Strainers Calculated
Hopper Capacity m³ 2 Strip Batches 2 Strip Batches Calculated
Regeneration Kiln
Type of Kiln Horizontal Horizontal Vendor
Type of Kiln Heating Electric Electric Client
Temperature Control Automatic Automatic Vendor
Regeneration Temperature deg C 750 750 Industry Practice
Regeneration Time per Day hrs 20 20 Industry Practice
Quench Tank Type Pan Pan Industry Practice
Type of Regenerated Carbon Storage Tank Eductor Eductor Industry Practice
Carbon Transfer Method Hydraulic Hydraulic Industry Practice
For
per
sona
l use
onl
y

May 2012 Agbaou Gold Project Page 17-10 NI 43-101
Technical Report
Table 17.11: Design Criteria – Electrowinning and Smelting
17.1.4.9 Consumables
Consumptions derived from testwork were used as a basis for sizing make-up and dosing
facilities for reagents and consumables. The design criteria for the reagents are summarised
in the tables below. Major reagents and consumables considered are jaw crusher liners, mill
liners, grinding media, lime, sodium cyanide, caustic, sodium metabisulphite, copper
sulphate, hydrochloric acid, activated carbon, smelting fluxes, hydrogen peroxide and
flocculant. Various lubricant and minor consumables have been costed by factoring or as a
nominal sum only.
Lime The bulk of the lime required in the CIL will be provided by the screw conveyor and the ring
main will serve a fine tune control function for lime dosage. The ring main will be capable of
delivering the full CIL dosage. The required detox lime dosage will be supplied from the ring
main.
Table 17.12: Design Criteria – Lime
ELECTROWINNING & SMELTING Units Saprolite Bedrock Source
Electrowinning
Flash Tank Residence Time min 0.50 0.50 Industry Practice
Cell Type Atm Sludging Atm Sludging Industry Practice
Number of CIL Cells # 1.0 1.0 Client
Cell Solution Temperature deg C 85.0 85.0 Industry Practice
Type of Cathode S/Steel Mesh S/Steel Mesh Industry Practice
Type of Anode S/Steel S/Steel Industry Practice
Barren Solution Grade ppm 5.0 5.0 Industry Practice
Percentage Gold Recovery 98% 98% Industry Practice
Cathode Sludge RemovalHigh Pressure
Wash
High Pressure
WashIndustry Practice
Sludge Handling
Fi lter Type Pot Fi lter Pot Filter Client
Fi lter Cake Moisture % 20% 20% Assumption
Fi lter Capacity litres 60.0 60.0 Assumption
Drying & Smelting
Drying Oven Type Electric Electric SENET
Number of Drying Ovens # 1.0 1.0 SENET
Number of Trays # 6.0 6.0 Industry Practice
Smelting Furnace Type Induction Induction SENET
Bull ion Mould Capacity kg 25 25 Supplier
Type of Crucible TPX 400 TPX 400 Industry Practice
LIME Units Saprolite Bedrock Source
Lime Silo Sizing
Delivery Method Truck Truck Client
Type of Lime Hydrated Lime Hydrated Lime Client
Bulk Storage Silo Silo Industry Practice
Bulk Storage Capacity days 4.0 4.0 Client
Lime Make-up Tank
CIL Consumption as 100% kg/t head 3.23 1.50 Testwork
Detox Consumption as 100% kg/t head 0.30 0.13 Testwork
Combined Consumption as 100% kg/t CaO 3.53 1.63 Testwork
Lime Make-up System Lime Mixing Lime Mixing Industry Practice
Number of Make-ups per Day # 4.0 4.0 SENET
Make-up Tank Capacity hrs 8.0 8.0 SENET
Dosing Tank Capacity days 1.0 1.0 SENET
Lime Dosing Method Ring Main Ring Main Industry Practice
For
per
sona
l use
onl
y

May 2012 Agbaou Gold Project Page 17-11 NI 43-101
Technical Report
Sodium Cyanide
Table 17.13: Design Criteria – Sodium Cyanide
Caustic Table 17.14 Design Criteria – Caustic
Sodium Metabisulphite
Table 17.15: Design Criteria – Sodium Metabisulphite
Copper Sulphate
Table 17.16: Design Criteria – Copper Sulphate
SODIUM CYANIDE (NaCN) Units Saprolite Bedrock Source
Delivery Method Bag in Box Bag in Box Supplier
Delivery Size kg/box 1000 1000 Supplier
Physical Form Briquettes Briquettes Supplier
Cyanide Consumption - ILR kg/t 0.01 0.01 Calculated
Cyanide Consumption - CIL kg/t 0.37 0.20 Calculated
Cyanide Consumption - Elution kg/t 0.02 0.02 Calculated
Total Cyanide Consumption kg/t 0.41 0.24 Testwork
Make-up & Dosing Tank Capacity days 3.0 3.0 Industry Practice
Number of Make-up & Dosing Tanks # 1.0 1.0 SENET
Cyanide Make-up Strength % m/m 25% 25% Industry Practice
Cyanide Dosing Method Ring Main Ring Main Industry Practice
CAUSTIC SODA (NaOH) Units Saprolite Bedrock Source
Delivery Method Bags Bags Supplier
Delivery Size kg 25.0 25.0 Supplier
Physical Form Pearls Pearls Supplier
Total Caustic Consumption kg/t 0.13 486 Calculated
Caustic Solution Storage Capacity days 3.0 3.0 SENET
Number of Caustic Tanks # 1.0 1.0 SENET
Caustic Solution Strength % m/m 20% 20% Industry Practice
COPPER SULPHATE (CuSO4) Units Saprolite Bedrock Source
Delivery Method Bags Bags Supplier
Delivery Size kg 25 25 Supplier
Physical Form Crystals Crystals Supplier
Usage Rate per Residual Cyanide g/g WAD 0.465 0.277 Testwork
Number of Make-up &Dosing taxTanks # 1.0 1.0 SENET
Make-up Strength % 15% 15% Industry Practice
Copper Sulphate Solution Storage Capacity days 4.0 4.0 SENET
For
per
sona
l use
onl
y

May 2012 Agbaou Gold Project Page 17-12 NI 43-101
Technical Report
Hydrochloric Acid
Table 17.17: Design Criteria – Hydrochloric Acid
Activated Carbon
Table 17.18: Design Criteria – Activated Carbon
17.1.5 Air Services and Oxygen
Compressed Air and Instrument Air Two duty/standby compressors have been sized to provide compressed air requirements for
the following:
• Instrument air; • Plant air.
Oxygen Two 2.5 tpd oxygen plants will be installed to provide oxygen required for the leaching of
gold in the CIL Both oxygen plants will be running at the same time. Oxygen will be
produced at a purity of at least 96% v/v.
HYDROCHLORIC ACID (HCl) Units Saprolite Bedrock Source
Delivery Method IBC IBC Supplier
Delivery Size litres 290 290 Supplier
Physical Form Solution Solution Supplier
HCl Delivered Strength % 33% 33% Supplier
Average Acid Consumption kg/t 0.102 0.098 Calculated
Average Acid Consumption per Carbon Batch kg/batch C 341 364 Calculated
ACTIVATED CARBON Units Saprolite Bedrock Source
Delivery Method Bags Bags Supplier
Delivery Size kg/bag 500 500 Supplier
Type of Carbon in Use Mesh 8x16 8x16 Supplier
Type of Carbon in Use mm 1.68 x 2.38 1.68 x 2.38 Supplier
Carbon Bulk Density t/m³ 0.45 0.45 Handbook
Carbon Dry SG 0.80 0.80 Industry Practice
Carbon Wet SG 1.37 1.37 Industry Practice
Carbon Consumption Rate g/t 25 25 SENET
For
per
sona
l use
onl
y

May 2012 Agbaou Gold Project Page 17-13 NI 43-101
Technical Report
17.1.5.1 Water Services
Table 17.19: Design Criteria – Water Services
* The raw water demand during the dry season is based on the assumption that 40% of water to the tailings dam will be
returned to the plant.
WATER SERVICES Units Saprolite Bedrock Source
Plant Raw Water Supply (incl. Fire Water)
Type of Storage Tank Tank Client/SENET
Average Raw Water Demand - Commissioning m3/hr 65 - Calculated
Average Process Water Top-up - Commissioning m3/hr 278 - Calculated
Average Raw Water Demand - Dry Season m3/hr 65 * 64 * Calculated
Average Process Water Top-up - Dry Season m3/hr 129 * 118 * Calculated
Average Raw Water Demand - Wet Season m3/hr 65 63 Calculated
Average Process Water Top-up - Wet Season m3/hr 0 0 Calculated
Residence Time hr 3.2 3.2 Assumed
Selected Raw Water Tank Volume m3 1 500 1 500 SENET
Process Water
Type of Storage Pond Pond Client/SENET
Average Return Water Flowrate - Commissioning m³/hr 0 - Calculated
Average Return Water Flowrate - Dry Season m³/hr 149 116 Calculated
Average Return Water Flowrate - Wet Season m³/hr 278 234 Calculated
Total Instantaneous Process Water Flowrate m³/hr 315 271 Calculated
Residence Time hr 21 21 Client/SENET
Selected Process Water Tank Volume m³ 6 500 6 500 Calculated
Plant Potable Water
Average Potable Water Usage m3/hr 3.0 3.0 SENET
Storage Capacity hrs 48 48 SENET
Selected Tank Volume m³ 150 150 SENET
For
per
sona
l use
onl
y

May 2012
17.2 PROCESS PLANT
17.2.1 Process Plant Description17.2.1.1 Introduction
The Agbaou gold process plant
dry saprolite ore or 1.34 million tonnes per annum of dry bedrock ore. It will comprise
crushing, ore stockpiling, grinding, classification, gravity gold
tails screening, cyanide detox, tailings handling and disposal, acid wash, elution,
electrowinning, carbon regeneration, gold room, consumables, oxygen, air services and
water services. Gold will be produced as bullion bar
to the overall process flow diagram shown below.
Figure 17.1: Process Flow D
The process plant general layout drawing is show
Agbaou Gold Project NI 43-101
Technical Report
PLANT
Plant Description
The Agbaou gold process plant will be capable of treating 1.6 million tonnes per annum of
1.34 million tonnes per annum of dry bedrock ore. It will comprise
crushing, ore stockpiling, grinding, classification, gravity gold recovery, carbon in leach (CIL),
tails screening, cyanide detox, tailings handling and disposal, acid wash, elution,
electrowinning, carbon regeneration, gold room, consumables, oxygen, air services and
water services. Gold will be produced as bullion bars ready for shipment to a refinery.
to the overall process flow diagram shown below.
Process Flow Diagram
The process plant general layout drawing is shown below.
Page 17-14
million tonnes per annum of
1.34 million tonnes per annum of dry bedrock ore. It will comprise
recovery, carbon in leach (CIL),
tails screening, cyanide detox, tailings handling and disposal, acid wash, elution,
electrowinning, carbon regeneration, gold room, consumables, oxygen, air services and
s ready for shipment to a refinery. Refer
For
per
sona
l use
onl
y

May 2012 Agbaou Gold Project Page 17-15 NI 43-101
Technical Report
Figure 17.2: Plant General Layout
For
per
sona
l use
onl
y

May 2012 Agbaou Gold Project Page 17-16 NI 43-101
Technical Report
17.2.1.2 Crushing and Ore Stockpiling
The crushing plant will treat both saprolite and bedrock ore at a rate of 290 tonnes per hour
to a product size of 100% passing 240mm through a primary jaw crusher. When treating the
bedrock ore the crushing circuit will operate for a period of 16 hours per day and 18 hours
per day when treating the saprolite ore. The balance of the hours in a day will be used for
maintenance.
ROM ore will be trucked and tipped directly into a 100m³ ROM bin equipped with an 800mm
x 800mm static grizzly to scalp off any oversize material. Ore will be reclaimed from the bin
by an apron feeder that will discharge onto a vibrating grizzly feeder with 150mm spacings.
The vibrating grizzly feeder oversize will be routed to the primary jaw crusher that will reduce
the ore size to 80% passing 148mm. The crusher product and the vibrating grizzly undersize
will be conveyed to a 5,000 tonne live capacity stockpile. The total stockpile capacity is
approximately 60,000 tonnes. Crushed ore will be reclaimed from the stockpile using two
apron feeders and transferred to the SAG mill. Each stockpile reclaim apron feeder will be
sized to reclaim 205tph.
Pebbles (with a top size of 60mm) recycled from the SAG mill discharge screen will report to
the pebble crusher which will have a closed side setting of 15mm. The pebble crusher
discharge will join the SAG mill feed stream as mill feed material.
17.2.1.3 Milling and Classification
The milling circuit will comprise a SAG mill, ball mill and pebble crusher that will be capable
of treating 205 tph of saprolite ore and 170tph of bedrock ore. The SAG mill will operate in
open circuit while the ball mill will run in closed circuit with a cyclone cluster.
Crushed ore reclaimed from the stockpile will be conveyed to the SAG mill. Dilution water
will be added to the SAG mill to achieve the required 55% w/w solids density for saprolite
and 75% for bedrock in the SAG mill discharge for optimum milling efficiency. The mill feed
dilution water will be added and controlled as a ratio of the SAG mill solids feed rate. The
ratio control constant can be adjusted from the relevant SCADA screen to account for
varying mill feed rate and ore moistures.
The 6.71m diameter x 3.54m long (inside liners) SAG mill will be fitted with a 2900kW motor
and will have a grate discharge. The mill is designed to operate at 75% critical speed but can
be varied to optimise operation for the different ore types. The ball load will be 12% by
volume, while the total load will be 25%.
Lime will be added to the SAG mill feed conveyor for pH adjustment in the downstream CIL
circuit. The SAG mill will discharge onto a single deck vibrating screen that will remove
pebbles as oversize (with a maximum lump size of 60mm). The screen will be equipped with
polyurethane panels with 12x55mm apertures. The dewatered pebbles will be recycled to
the pebble crusher, before returning to the SAG mill.
The SAG mill discharge screen undersize will gravitate into the mill discharge sump, where it
will combine with the ball mill discharge slurry. The combined slurry will be diluted with
For
per
sona
l use
onl
y

May 2012 Agbaou Gold Project Page 17-17 NI 43-101
Technical Report
process water to a solids density of 54% for saprolite and 59% for bedrock, and pumped to a
cyclone cluster for classification. The cyclone cluster will classify the slurry to produce an
overflow of 80% passing 75µm at 40% for saprolite and 43% for bedrock that will gravitate
onto a vibrating trash screen for removal of any trash material.
A portion of the cyclone underflow, at a solids density of 70% for both saprolite and bedrock,
will be routed to the gravity concentration and intensive cyanidation circuit for recovery of
free gold. The remainder of the cyclone underflow will return to the ball mill, where further
grinding will take place. The 4.50m diameter x 6.75m long (EGL) ball mill with 2100kW of
installed power will operate at a ball charge of 30% and total charge of 35% by volume. It will
operate in closed circuit with the cyclone cluster. The ball mill will be equipped with a
trommel screen (fitted with 12x55mm polyurethane panels) to remove any grinding media
that may escape from the ball mill. The trommel screen undersize will report to the mill
discharge sump where it be mixed with the SAG mill discharge screen undersize as
mentioned above.
17.2.1.4 Gravity Gold Recovery
The feed to the gravity circuit will gravitate onto a gravity scalping screen to remove the
+2mm material. Dilution water will be added to the scalping screen feed box to decrease the
concentrator feed solids density to 55% for saprolite ore and 50% for bedrock ore. The
screen oversize will return to the ball mill feed while the screen undersize will be fed to a
gravity concentrator to recover the free gold. Concentrator tails will gravitate back to the mill
discharge sump.
The leaching of gravity concentrates will be a batch-wise process using an In-line Leach
Reactor (ILR150BA). The leach solution will be prepared by first adding caustic to water for
pH adjustment and then sodium cyanide to a 2% concentration. The leaching of gold will be
effected by circulating the 2% cyanide solution through the rotating reactor drum. Oxygen
will be added to the circulating electrolyte during the leach.
At the end of the leach cycle, which will range between 14 – 16 hrs, the drum will be stopped
and the solution in will gravitate to the ILR sump. The solution in the sump will be pumped
into the solution storage tank where it will be clarified by adding flocculant. The clarified
solution will be pumped to a gravity electrowinning tank. Wash water will be added to the
drum to wash entrained solution from the solids and allowed to clarify in the solution tank
before being pumped to the electrowinning tank.
The pregnant solution stored in gravity electrowinning tank will be pumped to a dedicated
electrowinning cell for the recovery of gold. Loaded cathodes will be periodically removed
from the gravity electrowinning cell to a wash tank, where the gold sludge will be washed off
the cathodes using high-pressure spray water. Gold sludge will be decanted filtered and
transferred to a calcining furnace.
17.2.1.5 Carbon-in-Leach (CIL)
The screened cyclone underflow will be sampled (for metallurgical accounting and process
control) prior to reporting to a leach feed splitter box in the CIL section. The slurry will
For
per
sona
l use
onl
y

May 2012 Agbaou Gold Project Page 17-18 NI 43-101
Technical Report
overflow from the splitter box into the oxidation tank, where oxygen will be added through the
agitator shafts and dispersed at the bottom of the tanks for enhanced mass transfer. Oxygen
will be added throughout the CIL train. Lime slurry from a ring main will also be added to the
oxidation tank via the splitter box to fine tune the pH adjustment prior to the addition of
sodium cyanide solution in the CIL train.
The CIL circuit will consist of seven tanks, each with a live volume of 1500m³, resulting in a
total retention time of 24 hours for saprolite ore and 32 hours for bedrock ore. The oxidation
tank and seven CIL tanks will all be equipped with dual impeller agitators to keep the slurry
and carbon particles in suspension during the leach process.
Sodium cyanide solution from a ring main, will be automatically dosed into the first CIL tank.
Manual addition of cyanide solution into the first three CIL tanks will also be provided and
can be used in the event where the determined cyanide concentrations are low.
Each CIL tank will be fitted with one interstage wedge wire cylindrical screen which will
prevent the migration of activated carbon during slurry transfer. The pumping action of the
internal impeller mechanism of the interstage screens will drive the flow of slurry from one
CIL tank to another. In the case of an interstage screen becoming silted, it will be lifted with a
tower crane from the tank and placed onto a wash frame. A spare screen will be used to
replace the silted screens. High pressure low volume wash sprays will be used to clean
blocked screen holes.
Regenerated, eluted or virgin carbon will be added to the last CIL tank. Recessed impeller
vertical spindle pumps will be installed in the CIL tanks to periodically transfer carbon
upstream from CIL tank 7 all the way to CIL tank 1. Loaded carbon in CIL tank 1 will be
pumped onto a vibrating loaded carbon screen. The slurry will return to CIL tank 1. High
pressure water will be sprayed on the screen to ensure that clean carbon reports as screen
oversize to the acid wash batch tank. The tails slurry leaving the last CIL tank will be
pumped to a tails screen prior to cyanide detoxification.
17.2.1.6 Tails Screening and Cyanide Detox
The CIL tails slurry will be screened to recover any carbon that escapes from the CIL. The
screen oversize (carbon) will gravitate to a basket that will periodically be lifted using the CIL
tower crane and emptied into the last CIL tank. The screen undersize will gravitate to the
detox feed splitter box. The splitter box will feed the slurry to the first of two detox tanks
operating in series. If required, one tank can be online with the other bypassed. Each detox
tank will have a live volume of 500m³, thus resulting in a total residence time of 2 hours in
the detox circuit.
Sodium metabisulphite, copper sulphate and blower air will be added to the circuit to provide
sulphur dioxide, copper catalyst and oxygen, respectively. The free cyanide and/or weakly
bound metal cyanide complexes present in the tailings slurry will be oxidized to the less toxic
cyanate (OCN⁻) according to the reaction:
CN⁻WAD + SO₂ + O₂ + H₂O = OCN⁻ + H₂SO₄
For
per
sona
l use
onl
y

May 2012 Agbaou Gold Project Page 17-19 NI 43-101
Technical Report
Lime slurry will be added into the circuit to neutralise the generated sulphuric acid, and thus
maintain the pH within a range of 8 – 10.
The detoxified slurry exiting the second detox tank will overflow into a final tails sump. An in-
line two stage sampler will take the tails slurry samples in the launder at regular intervals.
The final tails pumps will pump the detoxified tails slurry into the tailings dam.
17.2.1.7 Tailings Handling and Disposal
As mentioned above, the final tails pumps will pump the detoxified tails slurry into the tailings
dam. The return water pumps will pump supernatant water from the tailings dam to the
process water pond in the plant. This water will serve as process water to be used in the
plant.
A facility will be installed at the return water pond to destroy cyanide in the excess return
water prior to discharge into the environment. This will consist of a copper sulphate make-up
and dosing system, as well as storage and dosing systems for hydrochloric acid and
hydrogen peroxide.
Hydrogen peroxide will be used for the destruction of residual cyanide. It will be supplied at a
concentration of 60% in intermediate bulk containers (IBC’s), from where it will be pumped to
a 5m³ dosing tank. Copper sulphate will be used to as a catalyst. It will be supplied in 25kg
bags and made up to a solution of 15% concentration by weight. Hydrochloric acid will be
used for pH adjustment. It will be supplied at a concentration of 33% in 210L drums and
transferred to a 5m³ dosing tank. All these reagents will be dosed into the excess return
water pond prior to discharge of water into the environment.
17.2.1.8 Acid Wash
Loaded carbon will be discharged from the loaded carbon screen into an acid wash batch
tank. The batch tank will be sized to accommodate 12 tonnes of loaded carbon (i.e. 2
batches of 6 tonnes each). Loaded carbon will gravitate to the acid wash column.
During the acid wash cycle the dilute hydrochloric acid solution (3% HCl) will be circulated
from the acid wash tank through the acid wash column at a rate of 2 bed volumes per hour
for a period of 1 hour. The solution exiting the column will return to the acid wash tank via
the external strainers that will prevent any carryover of carbon from the column to the tank.
At the end of one hour of acid washing, the acid wash pump will be stopped. The contents of
the acid wash column will be rinsed with a volume of raw water equivalent to 2 bed volumes
in order to remove the residual acid from the loaded carbon. The chlorides may result in
reduced strip efficiencies and stainless steel corrosion, especially that of the elution column.
The rinse effluent exiting the acid wash column will be directed to the cyanide detox circuit
for disposal into the tailings dam. Rinsed carbon will be hydraulically transferred to the
elution column.
After about 4 acid wash cycles the dilute acid in the acid wash tank will be too contaminated
For
per
sona
l use
onl
y

May 2012 Agbaou Gold Project Page 17-20 NI 43-101
Technical Report
for further use. Caustic solution will be added to the tank to neutralise the acid. The
neutralized solution will be pumped to the cyanide detox circuit for disposal into the tailings
dam.
A fresh dilute hydrochloric acid solution will be made up by adding approximately 1186 litres
of 33% hydrochloric acid to raw water make up dilute hydrochloric acid solution of 3%
strength.
17.2.1.9 Elution
The elution of gold from loaded carbon will be done using the Anglo American Research
Laboratories (AARL) method. The eluant (3% caustic, 2% cyanide solution) will be pumped
at a flowrate of 2 bed volumes per hour from the eluant tank via the recovery and primary
heat exchangers into the elution column. In the column gold adsorbed onto the carbon will
be removed by washing with a number of bed volumes of hot water. This will result in the
stripping of gold from the carbon into the eluate solution.
Heat for the elution circuit will be provided by two electrical elution heaters. The heater
elements will heat up thermic oil, which will be pumped into the primary shell and tube heat
exchanger. Heat will be transferred from the thermic oil to the eluant solution entering the
primary heat exchanger. The hot eluate leaving the elution column will be cooled down in the
recovery heat exchanger by contacting with fresh eluant solution that is going into the elution
column. Both the primary and recovery heat exchangers will be shell and tube type.
The eluate will flow out of the elution column as pregnant electrolyte and into the pregnant
electrolyte tank in the electrowinning circuit.
Each elution cycle will run for a period of 12 hours, and the heating cycle will be in operation
for approximately 10 hours of that 12-hour cycle. At the end of each elution cycle, eluted
carbon will be hydraulically transferred to the eluted carbon holding tank in the regeneration
circuit. Alternatively, if regeneration is not required eluted carbon will be transferred into the
last CIL tank.
17.2.1.10 Electrowinning
The eluate from the elution column will be directed to fill the pregnant tank. When the tank is
sufficiently full of eluate and the electrowinning circuit is available, the pregnant solution will
be pumped to the CIL electrowinning cell. Excess solution in the cell feed tank will overflow,
bypassing the cells, and join the cell outlet solution that returns to the selected pregnant
tank. The nominal electrolyte flow rate to the cell is 30m3/h.
Sludging type stainless steel mesh cathodes will be utilized to electrowin gold from the
eluate solution. Gold will be deposited as a loosely adhering fine sludge onto the pad of
stainless steel knit mesh cathodes contained in the baskets. The electrowinning cycle will
run for a period of approximately 10 hours. Once an electrowinning batch is complete i.e. the
gold grade of the solution has reduced to a stipulated level (5 ppm and below), the spent
electrolyte will be directed to the barren electrolyte tank, from where it will be pumped to the
eluant tank or the leach feed splitter box in the CIL circuit.
For
per
sona
l use
onl
y

May 2012 Agbaou Gold Project Page 17-21 NI 43-101
Technical Report
The loaded cathodes will periodically be harvested and placed inside a wash tank, where
they will be washed with high pressure low volume sprays of raw water to remove the gold
sludge from the cathodes into the wash tank. The clean cathodes will be returned to the
cells. The resultant gold sludge will be collected in a sludge tank, and dewatered using a
batch type pot filter. Compressed air will be utilized in the pot filter to assist in dewatering the
sludge. The filter cake will be packed into trays and placed in the calcining oven for drying.
A fume extraction fan will be installed to collect potentially poisonous and explosive gases
that evolve from the cells during electrowinning. The fan will discharge through the gold
room roof into the atmosphere.
17.2.1.11 Carbon Regeneration
At the end of the elution cycle eluted carbon will be hydraulically transferred to a carbon
holding tank in the regeneration circuit. The tank, sized to handle two barren carbon batches,
(12 tonnes) will be fitted with strainers at the bottom to help drain off excess water. A
provision will be made for carbon to bypass the regeneration facility and be transferred
directly to the last CIL tank.
Eluted carbon will be withdrawn from the holding tank at a rate of 600kg/hr by a screw feeder
and discharged to an electric rotary kiln for thermal regeneration. This rate will allow for two
regeneration cycles per day. Excess water which might not have drained through the carbon
holding tank strainers will be drained through the wedge wire screen mounted on the screw
feeder. On entering the kiln, the wet carbon, which will still contain about 50% moisture; will
be dried and heated to the required regeneration temperature of 750°C. Regenerated
carbon exiting the kiln will be quenched and screened to remove carbon fines. The screen
oversize will gravitate into a carbon transfer vessel, from where it will be hydraulically
transferred to the last CIL tank.
17.2.1.12 Gold Room
The filter cake from the pot filter will be poured onto stainless steel trays and loaded in an
electric drying oven that will operate at 150 - 200°C. At the end of calcining the trays will be
removed from the oven and allowed to cool down.
When the dried sludge has cooled down, fluxes will be added in determined proportions. The
mixture of the sludge and fluxes will be poured into a smelting crucible which will, in turn, be
placed in an electric smelting furnace operated between 1200⁰C and 1400⁰C. The furnace
will be placed under a fume hood with an exhaust duct connected to an extraction fan.
During smelting, metal oxides will report to the slag. At the end of smelting the furnace
crucible contents will be poured into cascading moulds mounted on a trolley. The bullion will
collect in the bullion bar moulds while slag will flow and collect in slag moulds. The heavy
metallic phase will sink to the bottom of the moulds whilst the light slag phase will float on
top of the metallic phase. When both phases cool down and solidify the glassy slag phase
will be easily broken away from the metallic phase, leaving a relatively pure gold bar.
For
per
sona
l use
onl
y

May 2012 Agbaou Gold Project Page 17-22 NI 43-101
Technical Report
When the gold bars have cooled down, they will be cleaned by hammering to remove any
traces of adhering slag. Then they will be sampled, labeled, weighed and stored in a safe
prior to dispatch to the refinery.
17.2.1.13 Consumables
Mill Balls Grinding media of sizes 125mm and 65mm will be used in the SAG and ball mills,
respectively. For ease of transportation, grinding media will be delivered in drums (200L) and
stored in separate concrete bunkers. Grinding media balls will be charged to the mills using
a bottom discharge kibble.
Hydrochloric Acid Hydrochloric acid will be delivered in 210L plastic drums at a concentration of 33% w/w.
During make-up the acid will be pumped from the drums into the acid wash tank. The weak
acid will be pumped to the acid wash column during acid wash cycle as described above.
Lime Hydrated lime will be delivered to the plant in trucks. It will be pneumatically offloaded into a
storage silo. The bottom cone of the silo will have a dual mechanical transfer arrangement
comprising two screw feeders. The first screw feeder will supply lime to a make-up tank,
where the slurry of 20% w/w will be made up. The second feeder will transfer lime to the
SAG mill feed conveyor. Both screw feeders will be sized to be able to supply the full
demand of hydrated lime in the plant.
The lime silo will also be equipped with a vibrator in order to enhance the discharge of lime
from the silo. The silo will also be fitted with a filter to render the top of the silo dust free
during periods when lime is being transferred.
After make-up, lime slurry will be transferred to a dosing tank. Lime dosing pumps will
distribute lime slurry to the CIL for fine tune pH control and cyanide detox circuits by means
of a ring main. Unused lime slurry will be returned to the dosing tank through the ring main
return line.
Caustic Soda (Sodium Hydroxide) Caustic will be delivered to site in 25kg bags packed into wooden pallets. During caustic
make-up, a hoist will lift the caustic pallet to a platform on top of the caustic tank. An
operator will manually lift one 25kg bag at a time from the platform to the bag breaker.
Caustic pearls will be discharged into the caustic tank to be mixed with raw water to form a
20% w/w caustic solution. The tank mixer will ensure complete dissolution of caustic.
The caustic dosing pumps will only be run for the time required to deliver the various
quantities of the caustic solution to various distribution points, including the cyanide make-
up, acid wash, elution, pregnant tanks and intense leach reactor.
For
per
sona
l use
onl
y

May 2012 Agbaou Gold Project Page 17-23 NI 43-101
Technical Report
Sodium Cyanide Sodium cyanide will be delivered to site in 1 tonne bulk bags, packed into wooden crates to
minimise any possible cyanide spillages during transportation. The dissolution of sodium
cyanide briquettes will take place in a covered cyanide make-up tank. This tank will have two
compartments, with the mixer installed in the larger compartment. The larger compartment
will be used for the make-up and dosing of cyanide solution. The smaller compartment will
be used for the dosing of cyanide solution during periods when a batch of fresh cyanide
solution is being made up.
Prior to the addition of cyanide briquettes in the cyanide tank, the larger compartment will be
filled with water to a predetermined level. A reagents hoist will be used to lift the cyanide
bags onto a bag breaker, from where they will be discharged into the larger compartment of
the cyanide make-up tank to form a 25% cyanide solution. The tank mixer will ensure
complete dissolution of cyanide briquettes during the make-up process. The cyanide solution
will be distributed in a ring main to the intensive cyanidation circuit, CIL circuit and elution
circuit.
Sodium Metabisulphite Sodium metabisulphite powder will be delivered to site in 1 tonne bulk bags. The dissolution
of sodium metabisulphite will take place in a partitioned tank with two. The larger
compartment will be used for the make-up and dosing of sodium metabisulphite solution.
The smaller compartment will be used for the dosing of sodium metabisulphite solution
during periods when a batch of fresh solution is being made up.
When the bags have been delivered to the make-up area, they will be lifted onto a bag
breaker by means of a hoist. They will be discharged into the larger compartment of the
make-up tank and dissolved in water to form a 25% sodium metabisulphite solution. The
tank mixer, installed in the larger compartment, will ensure complete dissolution of the
sodium metabisulphite powder during the make-up process. The variable speed peristaltic
pumps will be used to transfer sodium metabisulphite solution to the cyanide detox circuit at
a controlled rate.
Copper Sulphate Copper sulphate crystals will be delivered to site in 1 tonne bulk bags. The dissolution of
crystals will take place in a partitioned tank with two compartments. The larger compartment
will be used for the make-up and dosing of copper sulphate solution. The smaller
compartment will be used for the dosing of copper sulphate solution during periods when a
batch of fresh solution is being made up.
When the bags have been delivered to the make-up area, they will be lifted onto a bag
breaker by means of a hoist. They will be discharged into the larger compartment of the
make-up tank and dissolved in water to form a 15% copper sulphate solution. The tank
mixer, installed in the larger compartment, will ensure complete dissolution of the copper
sulphate crystals during the make-up process. The variable speed peristaltic pumps will be
used to transfer copper sulphate solution to the cyanide detox circuit at a controlled rate.
For
per
sona
l use
onl
y

May 2012 Agbaou Gold Project Page 17-24 NI 43-101
Technical Report
Hydrogen Peroxide Hydrogen Peroxide will be delivered to site in 1.2 tonne intermediate bulk containers at a
concentration of 60%. It will be pumped into the excess return water pond, together with
copper sulphate and hydrochloric acid, to aid in the destruction of residual cyanide prior to
discharge into the environment.
Activated Carbon Activated carbon will be delivered to site in 500kg bulk bags. A forklift will be used to
transport the bags from the storage area to the carbon attritioning area located in the carbon
regeneration circuit.
17.2.1.14 Oxygen and Air Services
Oxygen Two bought-out oxygen plants will be installed to supply a total oxygen demand of 5 tonnes
per day, as required for leaching of gold in the CIL circuit. Oxygen will be produced at a
pressure of 700kPa and a purity of least 96% v/v.
Air services Two air compressors, one duty and one standby, will deliver 1400Nm3/h of plant
compressed air and 300Nm3/h of instrument air at a pressure of 750kPa. Plant air will be
filtered and stored in a receiver, from where it will be distributed to mainly the cyanide detox
circuit and other areas in the plant for general usage. Instrument air will be distributed from
its receiver to all instruments throughout the plant.
17.2.1.15 Water Services
Water supply Rain run-off, a bore field and pit dewatering make up the raw water supply. Raw water will
be stored in a dam and pumped by two duty/standby submersible pumps, mounted on a raft,
to a pump station tank. Water will be transferred into a raw water tank, located in the plant.
Process Water Return water from the tailings storage facility and a top-up stream from the raw water tank
will constitute process water and will be stored in a pond located close to the processing
plant. A pair of duty/standby low pressure pumps will transfer process water from the pond to
the milling circuit and the gravity scalping screen for dilution. A pair of duty/standby high
pressure pumps will supply spray and hosing water throughout the plant.
Raw Water A 1500m³ raw water tank, situated in the plant, will be used to provide raw water to the plant.
The bottom part of the tank will be dedicated storage facility for the fire water. The fire water
system will consist of an electric jockey pump to maintain the desired pressure in the fire
reticulation system, an electric fire water supply pump and a diesel driven standby pump that
will start automatically when a power failure occurs.
For
per
sona
l use
onl
y

May 2012 Agbaou Gold Project Page 17-25 NI 43-101
Technical Report
Other sets of pumps will distribute raw water throughout the plant for several uses, including
dust suppression in the crushing area, fluidizing water for the gravity concentrator, mill
cooling water, carbon transfer water, cathode wash in electrowinning, reagents make-up,
and gland water service. This water will be supplied from the top part of the raw water tank.
Potable Water Raw water will be treated in the potable water treatment plant to a drinking water quality and
will be stored in a potable water storage tank. Potable water will be pumped to a
hydrosphere, from where it will be distributed to the safety shower and potable water
headers. The hydrosphere will help maintain the required pressure in the respective
headers. In the event of a power failure the diesel driven potable water pump will fill up the
hydrosphere and thus ensure the availability of safety shower water and potable water.
For
per
sona
l use
onl
y

May 2012 Agbaou Gold Project Page 18-1 NI 43-101
Technical Report
SECTION 18. PROJECT INFRASTRUCTURE
18.1 INTRODUCTION The selected Agbaou site is a greenfields site without any infrastructure except for the
existing Agbaou Exploration Camp. An existing access road currently passes through the
Agbaou village. The proposed infrastructure will support the mining, plant and construction
operations. The main infrastructure required for the development of the project will be:
• Raw water dam; • Raw water supply system; • Tailings storage facility; • New access road to the mining and plant site facilities, as well as the camp; • Site roads; • Camp accommodation and catering facilities, including laundry, potable water supply
system and sewage disposal unit; • Mining workshops, wash bay, refueling station and explosives storage; • Plant workshops; • Warehouses and lay down yards; • Plant administration buildings and medical facilities; • Assay laboratory; • Reagents storage building; • Change house; • Stand-by power plant; • Communications; • Security; • Sewage disposal; • Plant laundry.
This section details the facilities that are envisaged for the development.
The below site layout shows the position of the process plant, tailing storage and potential
water storage dams relative to each other and the surrounding topography.
For
per
sona
l use
onl
y

May 2012 Agbaou Gold Project Page 18-2 NI 43-101
Technical Report
Figure 18.1: Site General Layout
For
per
sona
l use
onl
y

May 2012 Agbaou Gold Project Page 18-3 NI 43-101
Technical Report
18.2 MINING FACILITIES The design of the mining facilities has been driven by the need to minimize costs, yet
provide substantial support systems for the life of mine.
The following will be allowed for in the mining facilities:
• Main workshop and repair facilities, to maintain the fleet of haul trucks and major mining equipment, complete with admin buildings alongside;
• Tyre repair and replacement bay; • Mining equipment re-fuelling centre; • Explosive storage, which will be located away from the main facilities; • Change house and security office; • Messing facility for mining personnel are provided in a separate building.
Raw materials, such as ammonium nitrate and/or explosive emulsions, primary explosives
used in the explosive manufacturing process will be brought to site by road, and stored until
required.
18.2.1 Mining Administrative Building The mining administration will have offices located within the mining workshop building. A
separate building will include the security offices as well as change house and all ablutions.
A separate building has been provided for a tyre bay office.
18.2.2 Mining Equipment Workshop A suitable workshop, which will have the capability of servicing the type and size of mining
equipment selected, will be constructed. A steel framed sheet clad building, 30m wide x
40m long x 7m high will be constructed with an initial configuration consisting of five front
bays:
• Two bays (8m wide x 10m long) for access of the trucks, one of the bays will be fitted with inspection pits;
• The remaining three bays will be utilized for heavy earthmoving equipment servicing such as the motor graders, wheel dozer, bulldozers and service trucks;
• A monorail electric overhead crane to traverse the 3 working bays and capable of lifting 5 tonne will be installed;
• Smaller bays to the rear of the building (8m wide x 5m long) will be utilized as a welding area, machine shop, drill rig repair and tyre repair services area;
• The mining maintenance offices will be placed beyond these; • A concrete wash down pad to ensure the equipment can be cleaned prior to
maintenance operations.
A smaller office has been included for drill rig repair and tyre repair services.
18.2.3 Mining Equipment Refueling Facility Fuel storage and refueling facility will be providing by an external contractor as well as the
necessary fire prevention system. The refueling bay will be supplied by a contracted fuel
supplier.
For
per
sona
l use
onl
y

May 2012 Agbaou Gold Project Page 18-4 NI 43-101
Technical Report
18.2.4 Explosive Magazine The bulk explosives facility will be located adjacent to the mining facilities. The explosives
facility will consist of 2 used marine shipping containers as the store and surrounded by
earthen screening mounds and security fencing.
18.3 PROCESSING PLANT & ADMINISTRATION FACILITIES The following will be allowed for in the processing plant and administration facilities:
• In-plant access roads; • Plant administration buildings such as the security office, change house, workshop,
main administration offices, medical facility, assay laboratory and warehouses; • Sewerage treatment and disposal; • Water services inclusive of raw water abstraction, potable water and fire water; • Communications; • Security; • Vehicles to provide transport of staff from the accommodation areas; • Accommodation; • Power supply and distribution.
18.3.1 In-Plant Access Roads Plant roads will be stripped of organic material and compacted, allowing access to the
required plant areas. Drainage ditches and culverts will be placed in accordance with the site
drainage requirements.
18.3.2 Plant and Administration Buildings Buildings located in the plant area will consist of security offices, change house, plant mess,
process plant equipment workshop, control room, general administration offices, medical
facility, assay laboratory, reagent warehouses and spares warehouse.
18.3.2.1 Security Office and Change House
A security office and change house will be constructed at the access to the plant which will
have male and female change rooms fitted with lockers, showers and ablutions. There will
be a security search zone located next to the change house. The security search zone will
provide the security personnel with the means to conduct individual body searches, isolation
rooms and general scanning. The main access gate to the plant will have a low security
office for the control of vehicle access to the plant.
18.3.2.2 Plant Control Room
A dedicated plant control room is to be located on top of the CIL tanks. The control room will
house the SCADA system and provide operators with an elevated view of the entire plant.
The plant control room will be constructed using a modified used marine shipping container.
18.3.2.3 Plant Mess
A plant mess will be centrally located near the administration building and will be of a single-
story, prefabricated panel construction. This will be utilized by the process plant personnel.
Meals will be brought in from the camp kitchen.
For
per
sona
l use
onl
y

May 2012 Agbaou Gold Project Page 18-5 NI 43-101
Technical Report
18.3.2.4 Process Plant Equipment Workshop
A suitable workshop will be established adjacent to the process plant to enable repair of
plant equipment. The workshop will be a steel frame building. Offices for warehouse,
maintenance and planning personnel will be provided in the form of a prefabricated building
housed within the steel framed building.
18.3.2.5 Administration Buildings
The administration building will be of a single-storey prefabricated panel construction. The
building will include general areas for engineering, administration personnel and offices for
the general manager, mining manager, plant superintendent, administration superintendent,
chief geologist, plant maintenance superintendent and chief security officer.
18.3.2.6 Assay Laboratory
SGS has submitted a proposal to manage the laboratory on ENDEAVOUR’s behalf. If
awarded the contract, SGS will provide laboratory design and engineering services. The
laboratory building will be of a single-storey prefabricated panel construction. The laboratory
will be fitted with equipment that will form part of SGS’s supply.
18.3.2.7 Medical Facilities
The equipped medical facility will allow for the treatment of any injuries during construction
and operation, as well as treatment of sick personnel. Medical services and administration
will be outsourced to a subcontractor.
18.3.3 Plant and Administration Warehousing A total of 3 warehousing facilities for storage of general spares, cyanide, reagents and
consumables will be provided.
18.3.3.1 General Plant Warehousing
This will be used to store all general items including mining and process plant spares. It will
consist of a 40m x 30m covered main store. Half the floor area will include heavy duty
racking evenly spaced across its width. Spacing between the individual racks has been
allowed such that a 5 ton forklift will be able to turn between them. The remainder of the
store floor area has been left open to store items of larger size and mass. The 30m x 40m
covered structure will include a personnel access door, prefabricated interior offices and
manually operated service door.
18.3.3.2 Plant Reagents & Consumables Warehouses
Due to the bulk nature of most reagents used in the plant, 2 dedicated warehouses will be
supplied to store these. Hydrated lime will be stored in the lime silo only.
Cyanide consumption was estimated to be 55 tonnes per month and due to the remote
location of Agbaou Project, independent covered warehouse facilities to store 3 months
cyanide stockholding will be provided.
The cyanide warehouse facility with a length of 13m x 13m width and will be located in the
plant area. The cyanide storage area will comprise of a concrete floor and will be located
For
per
sona
l use
onl
y

May 2012 Agbaou Gold Project Page 18-6 NI 43-101
Technical Report
within the fenced, gated and locked high security area.
The balance of the reagents used in the process plant such as carbon, cyanide detoxification
reagents, hydrochloric acid, smelting fluxes, hydrogen peroxide, will be stored in a dedicated
warehouse with dimensions 15m x 28m.
18.3.4 Process Plant Site Drainage There are no permanent creeks or rivers on the site; however, during periods of rains, there
will be some surface runoff, open channel flow and standing water in low areas. Nominal
grading and ditching will be adequate to maintain a well-drained site. Culverts will be
installed where required, to ensure proper drainage and to maintain good road condition.
Surface runoff will be housed in sediment ponds.
18.3.5 Sewage Disposal The sewage plant is of the extended aeration activated sludge process type. Both the camp
and plant sites for the Agbaou Project will each have a totally independent sewage treatment
facility capable of handling the waterborne waste generated by about 200 persons per site.
Each of the sewerage treatment plants will be contained in a 15m x 15m fenced off area and
will be capable of producing final effluent discharge into the environment
18.4 ACCESS ROAD An allowance has been made for two access roads. The first road links the plant to the main
provincial road between the towns of Hire and Divo and is 9.17km whilst the second road
links the plant and the main camp and is 2.47km. Horizontal alignment of the roads was
based on the topographical survey. The route was plotted based on the shortest distances
from each of the respective destinations and points of departure while aiming to maintain
gradients of no more than 10% where possible. The roads were based on a 5.5m wide
gravel carriageway.
18.5 WATER SUPPLY
18.5.1 Water Supply Dam The design of this facility is based on meeting or exceeding agreed design criteria which
comply with World Bank and other international standards.
A water balance was developed and was used as the basis for sizing the water storage dam
and the raw water requirements. Raw water stored in the water supply dam will be pumped
to the process plant for make-up operations during the plant start-up and during periods
where the return water from the tailings storage facility is insufficient to meet plant
requirements. Groundwater abstracted from the open pits will also be discharged to the
water supply dam to augment the process water supply and avoid release to the
environment. The maximum inflow to the proposed open pits is expected to be
approximately 27L/s.
Knight Piésold identified five potential locations for the water supply dam, as indicated in
For
per
sona
l use
onl
y

May 2012 Agbaou Gold Project Page 18-7 NI 43-101
Technical Report
Figure 18.2 below. The potential storage capacities, catchment areas and dam crest
elevations have been listed below in Table 18.1.
Table 18.1: Water Storage Dams – Catchment and Storage Capacities
Catchment Storage
Capacity
Dam Foundation
Elevation Dam Crest Elevation
(ha) (Mm3) (m) (m)
WSD Option 1 303 3.44 176 188
WSD Option 2 127 3.01 201 221
WSD Option 3 337 7.85 175 193
WSD Option 4 7605 3.68 139 161
WSD Option 5 332 3.55 155 175
Of the five options it was determined that 3 of the 5 locations were not suitable. Option 1 was
dismissed as it was located within a major drainage channel while options 4 and 5 were
considered too far from the open pit and plant site. With options 2 and 3 remaining, the dams
were modelled to identify fill quantities to be used in the cost estimate. The storage
capacities of the two viable options significantly exceed the storage requirements; therefore
the dams could be reduced to lower construction costs. Of the two viable options, Option 3 is
the preferred location as a smaller dam is required to store significantly larger volumes of
water. The storage capacity curves for the preferred option have been provided below in
Figure 2. From the information provided in Figure 18.3, the dam could be reduced to a crest
elevation of 183mamsl a dam height reduction of 10 meters. This will provide an estimated
storage of 1.4Mm3 with a 1m freeboard.
Two pumps mounted on pontoons will be utilized to recover water directly off the WSD,
pumping water to an intermediate pumping station and from there, into the process water
pond and raw water tank located in the plant. These pumps will be sized to cater for the
commissioning, dry and wet seasons where raw water demands vary.
For
per
sona
l use
onl
y

May 2012 Agbaou Gold Project Page 18-8 NI 43-101
Technical Report
Figure 18.2: Water Storage Dams – Options 1 to 5
For
per
sona
l use
onl
y

May 2012 Agbaou Gold Project Page 18-9 NI 43-101
Technical Report
Figure 18.3: Water Storage Dam Option 3 Capacity Curves
For
per
sona
l use
onl
y

May 2012 Agbaou Gold Project Page 18-10 NI 43-101
Technical Report
18.5.2 Potable Water Distribution Raw water will be supplied to the potable water treatment plant from the plant raw water tank
and in turn through a pipe line from the raw water dam. There will be a separate water
treatment plant at the process plant to the one at the mine village. The plant is designed to
supply 5m3/h of potable water.
Potable water will be reticulated to all areas of the plant including a safety shower header
tank.
The total volume of groundwater available from dewatering of the open pits will not be
sufficient to meet the process water requirements of the operating plant. As a result,
additional sources of process water supply will be required.
Sufficient groundwater resources are available from dedicated potable water supply
boreholes in the area to provide potable water for human consumption. Current groundwater
quality indicates that the resource is suitable for potable use according to the WHO
Guidelines for Human Consumption.
Open pit dewatering during mine operation will have negative impact on Agbahou village
water system and augmentation of supply may be required.
18.5.3 Fire Water Distribution There will be an electric and diesel powered fire water pumping system. The electric
powered pump will be used in the event of a fire. The diesel pump will be used in the event
of a fire where electrical supply is unavailable. A jockey pump will be provided to maintain
the pressure in the fire water header during normal plant operation. An alarm will be
sounded at the plant site for low system pressure.
The fire water system will consist of a fire water distribution system with hydrants located
within the plant site and ancillary building areas. Hose cabinets will be placed at the fire
hydrant locations and the system supplemented with portable fire extinguishers placed within
the process facilities.
18.6 COMMUNICATIONS A satellite communication system will be provided for the initial phases of the project,
following which ENDEAVOUR will install a system according to their needs.
18.7 SECURITY The entire Agbaou plant site will be encompassed by a 2.5m x 75mm x 75mm diamond
mesh wire fence. Plant access will be via gates located on access roads to the site.
Additional fencing will be provided for further safety and security within process plant areas,
such as ponds, power plant, fuel storage, gold room area, transformers and substations, as
required.
Furthermore, the plant will be fitted with CCTV cameras installed at strategic locations to
For
per
sona
l use
onl
y

May 2012 Agbaou Gold Project Page 18-11 NI 43-101
Technical Report
provide for monitored surveillance. The cameras will be integrated with the plant’s overall
network. Views from the cameras will be fed to the security control room and the security
manager’s office.
18.8 ACCOMMODATION (MAIN CAMP) A mine camp will be constructed to accommodate approximately 200 people.
A permanent camp will be constructed to house senior and junior staff members. Staff
accommodation will consist of the following pre-fabricated modular buildings:
• Six off 2 bedroom senior staff units; • Eighteen off 10 room units. Each unit will have its own bathroom.
A prefabricated panel construction will be utilized for all the structures. In addition to the
above mentioned facilities provision will also be made for the following:
• Kitchen and camp dining room; • An entertainment area consisting of a bar and TV room; • Laundry; • Potable water plant; • Sewage disposal plant.
18.9 POWER SUPPLY (GRID) The electrical power supply will be from the national grid.
Three options were considered. Making reference to the plant load list document number
SP462 1000 1E8 001, and document number AGB-AP001-PP (prepared by BEC for
ENDEAVOUR) the selected option meets the required level of electrical power estimated for
the plant at Agbaou in accordance to the grid operating criteria. For further details regarding
the BEC report and load list refer to Appendices 18-A and 18-B.
Selected option - Proposed power supply includes the following:
• New 90/33kV – 20MVA Transformer bay at the hire substation; • Dedicated 15km OHL feed to Agbaou; • Terminal substation with 33/11kV – 15MVA transformer; • Installation of reactive energy compensation 5 steps 2.4MVAR a maximum of
18.63MW can be achieved compared to the available 13.48MW; • All civil work in the delivery substation, overhead line foundations, transformer bay
foundation and cable trenching. The SENET battery limit is the incoming terminals of the incomer.
Final routing of overhead line routing is dependent on the topographic evaluation of the final
routing of the overhead line.
For
per
sona
l use
onl
y

May 2012 Agbaou Gold Project Page 18-12 NI 43-101
Technical Report
18.9.1 Standby Power Plant Two options were considered:
Option 1: Provide a full estimate for the supply and installation of a power plant. The loads were
estimated using the peak power excluding standby. This option was not economically viable
and a second option was considered.
Option 2: 2.4MW of standby power was allocated to the plant critical infrastructure equipment. The
option of connecting the 400V generator sets to the 400V motor control centres (MCC’s) was
considered, i.e. suitable for emergency backup or assistance during brown out periods
On the operating principle, our proposal is based on automatic synchronization and load
transfer after the grid comes back in a stable mode. Final detail list of critical load will be
defined at execution phase of the project.
The fully containerized solution offered by Africa Power Systems is as follows:
• Two off 1200kW CAT SR5 Generators selected for the application.
This solution will be supplied without a day fuel tank, electrical distribution switchgear and
other requirements associated with such a plant. The generator sets will be designed to
supply a total of 2.4kW of prime power at PF of 0.8 for the shutdown of plant during a power
outage and to sustain all critical loads for the full duration of the power outage if required.
Final standby plant design will be confirmed at execution phase.
Design criteria are as follows:
• Generator cooling method - Radiator; • Power per engine(Prime) - 1200kW; • Generator voltage - 400V; • Frequency - 50Hz; • Power factor - 0.80; • Service voltage - 400V; • Fuel system - Electronic Unit Injection; • Lower heating value liquid fuel - 42,780KJ/kg.
18.9.2 Power Distribution An 11kV supply cable from the main intake substation at Agbaou will feed power to the main
11kV distribution panel (SRK Consulting, SENET, Knight Piésold Consulting, 2012 Appendix
18-C). Power distribution to the SAG mill motor and ball mill motor will be done at 11kV.
The process building and power system modules will generally include outdoor oil-filled
transformers, MCC’s, main distribution boards (MDB’s), local circuitry at 400V, distribution
panels and local control devices. All electrical distribution will be in cable trays using steel
wired armoured PVC sheet cables.
For
per
sona
l use
onl
y

May 2012 Agbaou Gold Project Page 18-13 NI 43-101
Technical Report
The process plant, site ancillary facilities switchgear and electrical equipment will be installed
in a dedicated substation. Remote MCC’s will be containerised.
In non-process areas, such as the administration building, sewage treatment plant, fuel
storage facility, water tanks and workshop complex, a combination of armoured-type cable
and rigid galvanized steel conduit and wire system will be used in exposed areas.
MCC’s will be complete with motor management system, motor starters, contactors,
transformers, panels and circuit breakers.
Final routing of overhead line to the camp, mining workshop, tailing return water and raw
water is dependent on the topographic evaluation at execution phase.
18.9.3 Fuel Storage Design of the plant and camp fuel storage facility will be based on providing power for back-
up purposes only.
Plant power is based on a fuel consumption of 230 litres per hour for a 1,500kVA generator.
Thus assuming plant standby power of 2 generators we would have a full draw of 11kl/day.
Two options exist for refilling the fuel storage facility at the plant. Firstly fuel can be moved
by the diesel bowser from the diesel facility at the mining workshop/filling facility. Secondly
tankers can the bring fuel in from Abidjan. Based on this fuel provision of 5.5 days will be
allowed, with a further 12hrs being provided by the individual tanks integral to each
generator container.
Storage facility will include:
• 1 x 60m3 Diesel storage tank; • Bulk lubes storage; • All civils - concrete bund; • Distribution piping.
In addition to the plant fuel storage facility a similar 60m³ diesel storage tank will be installed
at the mining/construction camp. Based on the usage here the fuel will be able to run the full
camp for 10 days before requiring refilling.
Please note that fire prevention system in respect of diesel storage has not been provided.
The design and provision of such a system will need to done with consultation with
specialists in this field.
18.10 TAILINGS STORAGE FACILITY
18.10.1 Introduction and Design Criteria
The design of tailings storage facility (TSF) is based on meeting or exceeding agreed design
criteria which comply with World Bank Standards and other international standards.
For
per
sona
l use
onl
y

May 2012 Agbaou Gold Project Page 18-14 NI 43-101
Technical Report
The design criteria are summarised in Table 18.1 below.
Table 18.2: Design Criteria – Tailings Storage Facility
Description Criteria Comment
Capacity 12.1 million tones
(8,963,000 m3)
Life of mine (LOM) 8.1 years
Average tailings throughput 1.2x10⁶ tpa LOM average
Tailings throughput -
Saprolites 1.6x10
6 tpa
SENET material balance (for
operational years 0 to 4.35)
Tailings throughput -
Bedrock 1.34x10
6 tpa
SENET material balance (for
operational years 4.35 to 8.1)
In-Situ dry density 1.35 t/m3
Assumption based on numerous
gold tailings samples tested in
South Africa
Average calculated rate of
rise: 2.2 m per year
Based on available
topography and option 2
layout
In this case it is proposed that the
impoundment is downstream
constructed rockfill. Rate of rise
will not affect overall stability.
Downstream slopes 1V : 3H Facilitates rehabilitation and
meets stability requirements
Individual upstream slopes 1V : 2H Meets stability requirements
Overall upstream slopes 1V : 2.4H 4 meter bench at each phase
Area of footprint 1.0km2
(100 Ha)
Tailings Particle Size
Distribution 80%<75micron SENET mass balance
Slurry density (Saprolites) 1.296 t/m
3 (35.6 %solids by
mass) Slurry calculation
Slurry density (Bedrock) 1.315 t/m
3 (37.1 %solids by
mass) Slurry calculation
Particle SG (Saprolites) 2.79 SENET mass balance
Particle SG (Bedrock) 2.82 SENET mass balance
Slurry delivery rate 318 m3/hr to 404 m
3/hr MDME / Slurry calculation
Slurry distribution line 315mm OD HDPE, SDR 17
Based on approximate minimum
settling velocities. To be confirm
during detailed design
Maximum wall height 18.5m Volumetric and rate of rise
analysis
Water removal Pumping barge (2 pumps) Common practice – minimal &
maximum volumes monitored
Downstream construction –
rockfill / random fill Good practice
Waste rock available from open
pit overburden
Upstream construction –
select fill
Lateritic material
Select fill (Lateritic material)
available from borrow pits or
from open pit overburden
Minimum Factor of Safety :
1.5 (Static)
1.0 (With 1:1000 year
seismic event)
World Bank Standards /
Good practice
Analysis of embankment walls
required
Design flood
1 : 100 Year recurrence
interval 24 hr duration.
163mm
Adequate freeboard to be
provided by providing a minimum
1 metre freeboard above the
normal pool operating level at all
times. Additional water will be
removed via TSF pump barge.
Spillway Good practice
For
per
sona
l use
onl
y

May 2012 Agbaou Gold Project Page 18-15 NI 43-101
Technical Report
18.10.2 Site Selection and Access to the Site Two TSF locations were identified for the EOS. Both sites differ from the original location
selected for the 2008 Bankable Feasibility Study. For the purpose of this report the sites
have been labelled as Option 1 and Option 2. Condemnation drilling was undertaken to
determine that both sites were free of mineralisation. Condemnation drilling results were
received in January 2012 for Option 1 and drilling for Option 2 was completed in mid-March
2012.
The selected TSF site (Option 2) is located directly north of the proposed plant site, where
the southernmost embankment wall is less than 300 metres from the nearest plant structure,
thereby presenting a high risk situation. The topography drains to the east and is enclosed
by hills located on the South West and North East corners of the proposed TSF. Access to
the TSF from the proposed plant site currently exists with the road passing by the South-
West corner of the TSF. Due to the close proximity of the TSF to the plant site a second
road would be recommended from the plant site to the South-East corner of the TSF as this
is the proposed route for the tailings slurry pipeline. This road would provide a pipe route for
the tailings delivery and return water pipes.
Site selection for the Option 1 TSF location was based on a site visit in October 2011. This
site selection took into account the following parameters:
• General topography; • Distance from the plant; • Surface geotechnical conditions in the footprint zone; • Watercourse locations; • Position in relation to other mine infrastructure; • Geology of the site.
The site selection for Option 2 was based on additional review of the topography and the
revised capacity requirements for the TSF. This option also considered the parameters
indicated for Option 1.
As the Agbaou project progresses to the next phase of development, it is highly
recommended that a new topographic survey be completed even though a site specific
ground survey was completed for Option 2. The new survey would highlight drainage paths
more thoroughly, correctly identify elevations and allow for the site selection to be improved.
As it stands, the preferred option based on the topographic survey and the recent ground
survey provided to Knight Piésold is the second option. Option 2 utilises the existing terrain
more efficiently, thereby significantly reducing the volume of fill required to develop the TSF.
18.10.3 TSF Construction and Wall Raising Procedure The TSF will be constructed in three phases. The first phase has been sized to provide
capacity for roughly two years of the saprolite ore feed while maintaining a supernatant pond
capacity of 150,000m3 after approximately 1.4 years and 1.5 meters of freeboard plus
spillway capacity. The succeeding phases (Phase 2 and Phase 3) will provide the capacity
for the remainder of the 8.1 years life of mine (LOM) when the ore feed is from bedrock.
For
per
sona
l use
onl
y

May 2012 Agbaou Gold Project Page 18-16 NI 43-101
Technical Report
Table 18.3 identifies the intended ore feed, duration, tonnage, expected volume and Phase.
Table 18.3: TSF Available Capacity per Ore Feed Type
Ore Feed Duration
(years)
Expected Tonnage
(tonnes)
Equivalent Volume
(m3)
Phase
Saprolite 2.05 3,292,850 2,464,800 1
2.30 3,703,000 2,683,300 2
Bedrock 3.75 5,146,250 3,722,200 2 & 3
Totals 8.1 12,096,250 8,890,200 Final
The Phase 1 starter embankment will be constructed to elevation 249.5mamsl starting from
a low point of 243mamsl. The Phase 1 embankment will provide capacity allowance of
3.29Mm3 (2.44Mt) of tailings storage, 150,000m3 of supernatant pond and 589,000m3 of
freeboard for various storm events plus 1.5m. The large capacity of the freeboard is to
ensure multiple large event storms can be stored within the TSF without discharge to the
environment. It is expected that the 150,000m3 capacity of the pond is the preferred
operating volume and that this volume should be maintained to ensure sufficient distance is
maintained between the pond and the embankment walls. Additional volume will be present
at certain times. This will typically occur during the rainy seasons; therefore the pond
volume will potentially be reduced during the dry months. The minimum that must be
maintained will be dependent on the tailings beach development, pond location and the
return water pump requirements. Construction sequencing is provided in Table 18.4 below.
Table 18.4: TSF Construction Sequencing
TSF
Phase
Construction
Start(2)
Durati
on
(years)
Crest
Elevation (m)
TSF
Raise(1)
(m)
Maximum
Capacity (tonnes)
Phase 1 Year: -1 2.05 249.5 6.5 3,292,850
Phase 2 Year: 1.0 3.45 255 5.5 5,288,600
Phase 3 Year: 4.5 2.6 258 3.0 3,514,800
LOM 8.1 211.5 18.5 12,096,250 (1) The TSF is developed by constructing 4 perimeter dams; the TSF raise is for largest dam only as each dam starts at a
different elevation.
(2) Assume construction for each phase requires a maximum of one year to complete.
To reduce CAPEX costs it is intended to construct Phase 1 using material from localised
borrow pits that reduce the haul distance. Once the mine is operating under OPEX
conditions, the intent is to construct the TSF using overburden material from the open pits.
The difficulty will be to provide sufficient lateritic material for the 3 metre wide strip located on
the upstream slope of all phases. The geotechnical investigation during the design phase will
identify and confirm suitable material. Alterations to the preliminary design would be required
if certain materials are not available.
The preliminary design has assumed suitable material will be available from local borrow pits
inside the TSF basin for Phase 1 and that the overburden will be available for use during the
later phases. If additional overburden material (random fill of non-lateritic type) is available,
construction of the Phase 2 and 3 random fill sections can commence earlier than currently
For
per
sona
l use
onl
y

May 2012 Agbaou Gold Project Page 18-17 NI 43-101
Technical Report
proposed.
The impounding embankments will be comprised of either waste rock overburden from the
open pit (Phase 2 & 3), with a zone of selected, finer, well graded, low permeable material
on the upstream face of the embankment. The crest will vary from 14 m wide for Phase 1 to
10m wide for the later phases. The downstream slope will be 1 vertical: 3 horizontal. The
upstream face of the embankment will be constructed at a slope of 1:1.5 with 4 m wide
intermediate bench between phases with individual slopes between benches at 1:2.5
The area covered by tailings at the end of phase 1 is shown in Figure 18.4 along with the
supernatant pond location. Similar figures for phase 2 and 3 can be found in the EOS (SRK
Consulting, SENET, Knight Piésold Consulting, 2012 Appendix 18-D). Stage /capacity and
Rate of Rise Curves can also be found in the EOS (SRK Consulting, SENET, Knight Piésold
Consulting, 2012 Appendix 18-E).
For
per
sona
l use
onl
y

May 2012 Agbaou Gold Project Page 18-18 NI 43-101
Technical Report
Figure 18.4: TSF Phase 1
For
per
sona
l use
onl
y

May 2012 Agbaou Gold Project Page 18-19 NI 43-101
Technical Report
18.10.4 Stability Analysis The computer program Slide, version 5.029, from Rocscience was used to determine the
stability of the TSF. The Bishop Simplified method was used to determine the factor of
safety (FOS) for a circular slip surface. The current information suggests that the area of the
TSF is relatively flat; therefore no wedge type failures were investigated at this time. The
wedge type failure plane will be investigated once more topographical information and more
accurate material properties are available. A further analysis was conducted to investigate
the effect of including pore water pressure by means of the B-bar method. The pore water
pressure was obtained from the seepage analyses and converted to B-bar factors and
added into the analyses. In general it is expected that adding in a B-bar factor will lower the
factor of safety.
Table 18.5 presents the material properties that were used during the analysis. An
additional analysis was conducted with a horizontal and vertical seismic loading of 0.1g,
which was expanded to investigate the influence of only a horizontal seismic loading. Table
18.6 presents the summary of the different scenarios that were investigated and Table 18.7
presents the results that were obtained from the analyses. The analyses were based on the
current dam design where the dam will be constructed in three phases.
Table 18.5: Material Properties
Material Cohesion c
(kPa)
Friction Angle
(Degrees)
Unit Weight
(kN/m3)
Tailings 0 31 13.5
Random Fill 0 36 18.0
Silty Gravel 0 31 15.0
Laterite 16 30 16.0
Select Fill 16 30 16.0
Table 18.6: Definitions of the Analyses Scenarios Scenario Definition
Rev 1 Downstream slope, no additional seismic loadings (tailings at final height for that
particular phase, 1m freeboard)
Rev 2a Downstream slope, horizontal and vertical seismic loading (tailings at final height
for that particular phase, 1m freeboard)
Rev 2b Downstream slope, horizontal seismic loading (tailings at final height for that
particular phase, 1 m freeboard)
Rev 3 Upstream slope, no additional seismic loadings (tailings at final height for previous
phase, )
Rev 4a Upstream slope, horizontal and vertical seismic loading (tailings at final height for
previous phase)
Rev 4b Upstream slope, horizontal seismic loading (tailings at final height for previous
phase)
Rev 5 Downstream slope, no additional seismic loadings (tailings at final height for
previous phase)
Rev 6a Downstream slope, horizontal and vertical seismic loading (tailings at final height
for previous phase)
Rev 6b Downstream slope, horizontal seismic loading (tailings at final height for previous
phase)
For
per
sona
l use
onl
y

May 2012 Agbaou Gold Project Page 18-20 NI 43-101
Technical Report
Table 18.7: Results of Analysis
Scenario Factor of Safety
Phase 1
Factor of Safety
Phase 2
Factor of Safety
Phase 3
Rev 1 2.23 2.04 2.27
Rev 1 (B-bar) 2.29 2.02 2.07
Rev 2a 1.68 1.57 1.73
Rev 2b 1.60 1.49 1.68
Rev 2b (B-bar) 1.66 1.46 1.47
Rev 3 1.69 5.02 5.51
Rev 4a 1.37 3.13 3.39
Rev 4b 1.35 2.93 3.14
Rev 5 2.31 2.21 2.27
Rev 6a 1.75 1.69 1.72
Rev 6b 1.71 1.63 1.67
The factors of safety that were obtained during the analysis are all above 1.3 which is the
minimum FOS over the short term (during operation) and above 1.5 which is the minimum
for the long-term or after closure. The minimum FOS for seismic loading is 1. The minimum
FOS that was obtained for the analyses was 1.69 for Phase 1 Rev 3 (Upstream face storing
no tailings) and 1.35 for Phase 1 Rev 4b (upstream face storing no tailings and adding only a
horizontal seismic load). On average the horizontal seismic loading returned lower FOSs
than for the combination of horizontal and vertical loadings.
The FOSs obtained from the two scenarios that were analysed utilising the B-bar method are
very similar to the FOSs obtained from the standard analyses. Usually one would expect the
inclusion of pore pressures to result in lower FOSs but in this case the location of the
phreatic surface played a role in obtaining similar FOS values. The standard analyses were
conducted using very high phreatic levels to simulate an event where the precautions to
lower the phreatic surface proved inadequate. The phreatic level utilising the B-bar method
was located at the level obtained from the seepage analyses which were considerably lower
than for the standard analyses. This implies that the TSF is very sensitive to the phreatic
level and therefore care must be taken to implement and sustain good water management
practices.
18.10.5 Tailings Distribution and Deposition The average slurry flow rate from the plant for saprolite ore feed will be approximately
404m3/h at a slurry mass concentration of 35.6% once full production is achieved. The
average slurry flow rate from the plant for bedrock ore feed is expected to be slightly less at
318m3/h at a slurry mass concentration of 37.1%. Both rates are based on an average
yearly operation of 360 days per year – 24 hours per day. The pumping distance from the
plant to the valve slab at the South corner of the TSF is less than 1000m dependant on the
final plant arrangement and location in relation to the TSF. There is very little (less than 5 m)
to no static head to pump against initially with the plant situated between 245mamsl and
250mamsl and the Phase 1 crest at 249.5mamsl, but this will increase to a maximum of 13m
when the TSF embankment is raised to its final elevation of 258mamsl. The pipeline length
from the valve slab to the furthest point on the distribution ring mains is 2000m. The
elevation difference between the valve slab and the crest of the impounding embankment
(Phase 3) is approximately between 9m and 14m.
For
per
sona
l use
onl
y

May 2012 Agbaou Gold Project Page 18-21 NI 43-101
Technical Report
18.10.6 Tailings Disposal Method The method of tailings discharge will be sub-aerial deposition. This will allow the tailings to
form a beach above the water level, sloping gently towards the supernatant pond. As the
tailings discharge onto the beach, small streams will develop that allow the tailings to settle
and segregate from the water. The general practice for subaerial deposition is to have
multiple discharge points that break the flow energy and promote gravitational settling.
Maintaining a lower discharge velocity will be beneficial to the water quality and tailings as
the low velocity will expose beached tailings to oxygen and water thereby helping in the
degradation of cyanide compounds that will be used in the ore extraction process. Multiple
spigots and a well-managed rotational deposition cycle around the dam perimeter will help
control the geometry of the embankments and location of the supernatant pond. This can
also reduce the risk of loss of freeboard by preventing the pond from encroaching on the
embankments. Controlling the location of discharge can also be used to position the pond to
the required location. Multiple spigots around the facility will also allow the deposition of
tailings to be rotated between different locations, which will allow the newly discharged
tailings to bleed, dry and consolidate while tailings slurry continues to be discharged to other
zones. The frequency of discharge point rotation and the number of zones will depend on
the how the tailings reacts to the deposition cycle, the season (wet season versus dry
season), the tailings production rate, tailings drying characteristics (saprolite versus bedrock
ore feed) and the tailings storage facility’s overall shape.
The general process that will be used for multiple sub-aerial deposition of tailings slurry is as
follows:
• Tailings will be discharged onto a portion of the gently sloping beach creating low energy braided flows towards the supernatant pond;
• Once a proper beach has formed, the discharge point(s) are moved to another location of the facility on a managed rotational cycle to re-establish the beach and to maintain the pond location. By moving the discharge locations the newly established beach is allowed to drain, bleed and dry;
• The upstream under-drainage systems will intercept and convey the seepage out of the tailings and reintroduce it back into the facility to the pond for use in the plant. This process will promote faster drying of the tailings by removing water from covered tailings in the zone near the outer wall;
• The cycle is repeated with new tailings deposited on the dried tailings beach. It will be important to identify a deposition plan early on to develop the TSF appropriately;
• The supernatant ponds location will be established by the tailings deposition and the size (volume) will be adjusted and maintained by the pump barge that feeds the plant processes.
18.10.7 Hydrology and Water Management The mean annual precipitation (MAP) at Agbaou is 1259mm, and the average annual
evaporation is 1363mm. The TSF has been designed to contain the net storm water runoff
from the tailings storage facility arising from the 1:100 year storm (163mm in 24 hrs, as
derived from the rainfall records).
Rain water will be retained on the TSF, which by virtue of the rock fill impoundment will have
For
per
sona
l use
onl
y

May 2012 Agbaou Gold Project Page 18-22 NI 43-101
Technical Report
adequate freeboard to store multiple storm events and the required volume based on proper
operation of the TSF. The preliminary design includes a spillway on the northern end of the
dam that is located on the South-West side of the TSF. The spillway has been included in
the preliminary design as it is considered a good engineering practice. Additionally the
spillway will be constructed in in-situ soil rather than fill, which is also generally accepted
practice.
Diversion canals will divert any clean runoff from the catchment upstream of the facility
around the TSF to either the South-East or South-West depending on the location.
18.10.8 Geotechnical Conditions at the TSF Site The TSF occupies a low lying area north of the proposed plant with high hillsides located on
all corners of the facility. A geotechnical investigation was not completed for the EOS due to
time constraints. Therefore the study has developed a preliminary design based on a grid of
30 test pits that were excavated by hand over an area identified in the 2008 Feasibility
Study. The 2008 TSF location is approximately 1500m east of the TSF location proposed
within this study. The test pits showed a reasonable degree of uniformity across the
designated area, and comprise typically of either a silty sand or silty gravel (in a few cases
silty clay) overlying hard laterite at depths between 1m and 3m. In most cases refusal was in
the laterite. A full geotechnical investigation will be required during the design phase.
Where the test pits were able to penetrate through the laterite, a low plasticity clay was
encountered below it.
18.10.9 Water Balance A monthly water balance for the tailings circuit was carried out using tailings behaviour
characteristics typical of South African gold tailings since data was not available locally. The
water balance was calculated for the situation of average rainfall years at the end of phases
1, 2 and 3 of development of the facility. The detailed water balance can be found in the
EOS (SRK Consulting, SENET, Knight Piésold Consulting, 2012 Appendix 18-F).
18.10.10 Return Water System A return water pump station located on a barge inside the TSF with both duty and standby
pumps will be capable of pumping water at a rate of 400m3/h to meet the plant requirements.
The return water pipeline will have a cross connection with the tailings slurry pipeline to be
used for flushing and cleaning the slurry line.
18.10.11 Safety Classification A safety classification in accordance with SANS 10286 Clause 7.4.1 has rated the TSF as a
“Moderate Hazard” because the Zone of Influence of the TSF could affect nearby residents,
but not the plant based on its proposed location. For
per
sona
l use
onl
y

May 2012 Agbaou Gold Project Page 18-23 NI 43-101
Technical Report
18.11 COUNTRY INFRASTRUCTURE Figure 18.5: Map of Country
18.11.1 Road National road conditions between Abidjan and Agbahou village are described with
photographic representation in the road survey by Bollore Africa Logistics (SRK Consulting,
SENET, Knight Piésold Consulting, 2012 Appendix 18-G). Bridges found on route as well as
clearance dimensions are also included in the Bollore Africa logistics report.
18.11.2 Port Facilities Port facilities are as follows:
• The Port of Abidjan is the main port in Côte d’Ivoire. San Pedro also has a port
facility;
• With a total of six kilometers of quay, the Port of Abidjan has 34 berths including
berths dedicated for timber, cereals, fruits, petroleum products, and containers.
• The Port of Abidjan can accommodate vessels up to 260m long;
• The port contains 407.6 thousand square meters of open storage and 143.5m2 of
covered warehouses and sheds;
• Three berths specialize in container-handling, and one berth is devoted to roll-on/roll-
off cargoes. All of the port’s wharves are connected to the rail network.
For
per
sona
l use
onl
y

May 2012 Agbaou Gold Project Page 18-24 NI 43-101
Technical Report
Figure 18.6: Abidjan Port Map
Labels to figure above are: 1 – North Quay; 2 – West Quay; 3 – South Quay; 4 – Container Terminal; 5 – Container Terminal; 6
– Fishing Quay; 7 – Banana Carrier Wharf; 8 – Fertilizer Factory “Sieving” Quay; 9 – Ro/Ro Quay; 10 – Mineral Berth; 12 –
Fertilizer Factory “Sieving” Quay; 13 – Oil Berths.
Table 18.8: Abidjan Port Facilities / Storage Capacities Item Capacity
Bonded warehouses 134,614 m2
Container storage area 70,000 m2
General cargo storage yard 250,000 m2
Plugs for reefer containers 350
Free storage zone for cargo in transit to Burkina Faso 3,204 m2
18.11.3 Rail There is no rail infrastructure that the project can benefit from.
18.11.4 Air The Abidjan International Airport (the Port Bouet or Félix Houphouët-Boigny airport) is
located in Abidjan and is operated by the civil government. Although the airport does not
offer flights to and from the United States, it does offer flights throughout Africa, Europe and
the Middle East. Airlines serving the airport are: Air Algerie; Air Burkina; Air France; Air
Ivoire; Air Mauritanie; Air Senegal International; Brussels Airlines; Cargolux; Egyptair;
Ethiopian Airlines; GIB; MEA; Panaf; Royal Air Maroc; South African Airways, and Tunisair.
For
per
sona
l use
onl
y

May 2012 Agbaou Gold Project Page 18-25 NI 43-101
Technical Report
18.12 LOGISTICS AND TRANSPORT
18.12.1 Logistics Transit Time With a large portion of cargo being shipped out of South Africa the below time line was used
for project scheduling purposes.
Figure 18.7: Logistics Transit Time Summary
18.12.2 Routing Abidjan to Agbaou Village A route survey was conducted by Bolloré Africa Logistics (SRK Consulting, SENET, Knight
Piésold Consulting, 2012 Appendix 18-G).
Two different routes were surveyed between Abidjan and Agbaou (as shown in Figure 18-5),
these being:
• Route 1 – Abidjan to Agbaou (D) via Toumodi (B) with a distance of 305.5km; • Route 2 – Abidjan to Agbaou (D) via Divo (E) with a distance of 216.2km.
Figure 18.8: Map Showing Travel Route Options to Agbaou
Key: B – Toumodi
C – Oumé
D – Agbahou
E – Divo
F – Tiassale
G – Abidjan
For
per
sona
l use
onl
y

May 2012 Agbaou Gold Project Page 18-26 NI 43-101
Technical Report
Route 1: From Abidjan to Agbaou via Toumodi (points G, B, C, D) there is a double highway for
141km, then 55.5km of main road all in good condition. The maximum size of freight for this
section is: 4.90m (height) x 7.00m (width) x 250tonnes (weight).
For the 52.3km section from Toumodi to Oumé (points B – C) the road has sections in a
poor state with missing asphalt. Poorly installed electrical and phone cable crossings in
urban areas would require specialized services for the dismantling when transporting
larger loads. The maximum size of freight: 4.90m (height) x 7.00m (width) x 250tonnes
(weight).
From Oumé to Agbaou, which is 56.7km, the road deteriorates further with repairs required
to sections of laterite where the asphalt is missing.
Route 2: From Abidjan to Agbaou via Divo (points G, F, E, D) there is a double highway for 109km,
then 85km of main road to Divo, all in good condition, bar a few potholes.
The 16.1km section from Divo to Didoko the road deteriorates further with a particularly bad
section in Didoko. Approximately 5km outside Didoko is the turnoff to Agbaou. Both routes
would require an escort for any freight with a width greater than 3m.
18.12.3 Documentation In order to ensure effective management of logistics and for all parties’ expectations of the
project to be met, a written guide and plan will be a requisite to enable better understanding
of how the logistics will be performed. This logistics execution plan will outline the
responsibilities of all stakeholders (contractor / company / suppliers / other interested
parties) and will indicate how cargo management and control from time of receipt by the
contractor to time of delivery is to be achieved.
For
per
sona
l use
onl
y

May 2012 Agbaou Gold Project Page 19-1 NI 43-101
Technical Report
SECTION 19. MARKET STUDIES AND CONTRACTS This section is not applicable to this technical document.
For
per
sona
l use
onl
y

May 2012 Agbaou Gold Project Page 20-1 NI 43-101
Technical Report
SECTION 20. ENVIRONMENTAL STUDIES, PERMITTING AND
SOCIAL OR COMMUNITY IMPACT
20.1 INTRODUCTION An Environmental Impact Assessment (EIA) and an Environmental Management Plan (EMP)
was conducted for the Agbaou Project by African Mining Consultants (AMC) in 2008 (SRK
Consulting, SENET, Knight Piésold Consulting, 2012 Appendix 20-A). The report was
compiled in line with applicable international standards and in accordance with Côte d’Ivoire
legislation.
The EIA covered the social and local environment prior to project development and the
potential impacts, positive and negative, the project would have on the environment.
Some of the potential positive impacts include, but are not limited to:
• Creation of approximately 300 jobs; • Local infrastructure development and increased standard of living; • Economic growth in local areas and Côte d’Ivoire through the service construction
and manufacturing sectors; • Increased national income through taxes, royalties and fees; • Training and essential skills to increase the contingent of local employees; • Social development projects.
Some of the potential negative impacts include, but are not limited to:
• Land clearing of approximately 410ha and the resultant loss of natural habitats of the affected flora and fauna;
• Changes to natural drainage patterns; • Contamination of soils, surface water and ground water; • Localized lowering of the ground water levels; • Degradation of local air quality through dust generation and vehicle fumes; • Increased noise in the local; • Increased traffic volumes and the potential safety implications of this on local
communities; • Generation of acid mine drainage; • Increase in HIV and AIDS prevalence; • Increased immigration into the area could lead to conflicts resulting from competition
for jobs and resources; • Loss of agricultural land and the subsequent loss of financial security for the affected
farmers.
The EIA identifies the necessary management measures required to mitigate the identified
environmental and social impacts. These form part of the EMP. In addition a Relocation
Action Plant (RAP) was developed along with the budget to cover the relocation costs of the
affected communities.
The detailed report is as per the previous NI 43-101 submission compiled by MDM for the
For
per
sona
l use
onl
y

May 2012 Agbaou Gold Project Page 20-2 NI 43-101
Technical Report
Agbaou Project on behalf of Etruscan Resources, submitted in September 2009.
For
per
sona
l use
onl
y

May 2012 Agbaou Gold Project Page 21-1 NI 43-101
Technical Report
SECTION 21. CAPITAL AND OPERATING COSTS
21.1 PROJECT REQUIREMENTS
21.1.1 Introduction The aim of the capital and operating cost estimates is to provide costs to an accuracy level
in the opinion of those listed in 21.1.3, of ± 10% that can be utilized to evaluate the
economics of the Agbaou Project when treating 1.6Mtpa. All costs are presented in United
States Dollars (US$).
21.1.2 Scope of the Estimate The capital and operating cost estimates were developed for a conventional open pit mining,
carbon-in-leach process plant and support infrastructure for an operation capable of treating
1.6 million tonnes of ore per annum.
21.1.3 Responsibilities The responsibilities for the estimate are listed below, but in broad terms the following
applied:
• Plant and infrastructure – SENET; • Mining capital and operating cost – SRK; • Tailings management facility – Knight Piésold; • Raw water storage facility – Knight Piésold; • Camp water supply Knight Piésold.
21.1.4 Estimate Accuracy The level of accuracy of the capital cost estimate (excluding the raw water storage facility) is
in the opinion of the responsible companies listed in 21.1.3 within the ±10% of the overall
project costs as of the 1st Quarter 2012. It does not include any escalation factors.
Since a preliminary level design was not completed on the raw water storage facility the level
of accuracy cannot be considered within +10%.
21.1.5 Exclusions The following were not included in this estimate:
• Scope changes; • Escalation beyond the 1st Quarter of 2012; • Financing costs; • Schedule delays such as those caused by:
o Scope changes; o Unidentified ground conditions; o Labour disputes; o Environmental permitting activities; o Receipt of information beyond the control of the EPCM contractors.
• Permits;
For
per
sona
l use
onl
y

May 2012 Agbaou Gold Project Page 21-2 NI 43-101
Technical Report
• Sunk costs; • Force majeure.
21.1.6 Escalation No escalation has been allowed for in the estimate. The EPCM contractor’s rates reflect
rates expected in 1st Quarter of 2012.
21.1.7 Exchange Rates The exchange rates used are shown in the table below:
Table 21.1: Exchange Rates Exchange Rates Rate of Exchange
EUR : ZAR 10.50
GBP : ZAR 12.00
USD : ZAR 7.50
CA$ : ZAR 7.50
AU$ : ZAR 7.50
CFA : US$ 515.00
AU$ : US$ 1.03
21.1.8 Taxes, Duties and Fees This section describes the applicable taxes and duties in Côte d’Ivoire and how they would
be applied to the Agbaou Project.
21.1.8.1 Tax and Duty Rates for Importation of Equipment and Materials into Côte d’Ivoire
All mining, process plant and construction equipment, materials and spares will be
exonerated from import duties during the construction phase prior to production as per
document “Law No.95-553”, dated 18th July 1995 pertaining to the mining code that is
administered by the Ministry of Mines and Energy. A provision is also made for VAT
exoneration; however this does not extend to any goods purchased locally. An import tax
(regional statistical tax and two community / solidarity taxes) of 2.5% does apply to all
imported items and was taken into account during initial capital calculations.
21.2 CAPITAL COST ESTIMATE
21.2.1 Capital Cost Summary The total estimated cost of bringing the Project into production is US$158,939,551 and is
inclusive of US$11,777,985 contingency and US$5,039,749 working capital. Table below
gives a summary of capital requirements.
For
per
sona
l use
onl
y

May 2012 Agbaou Gold Project Page 21-3 NI 43-101
Technical Report
Table 21.2: Capital Cost Summary US$ % US$
Process Plant Direct Costs
Machinery & Equipment 17 732 002 5% 18 618 603
Civils & Earthworks 11 556 402 12% 12 887 449
Structural Steel & Platework 5 803 972 10% 6 384 369
Piping & Valves 1 433 928 10% 1 577 321
Electrical & Instrumentation 5 094 739 12% 5 686 298
Transportation 5 554 000 15% 6 387 100
Subtotal 47 175 044 51 541 140
Infrastructure Costs
Tailings (Start-up only) 5 622 127 10% 6 184 340
Standby Power Plant 1 283 884 5% 1 348 078
OHL Grid Power to Plant 6 500 000 0% 6 500 000
Access Roads 2 467 329 20% 2 960 795
Main Camp 4 951 394 5% 5 198 964
Onsite Infrastructure Buildings
etc 2 649 174 15% 3 046 550
Raw Water Supply 1 565 642 10% 1 722 207
Mining Facilities 727 079 10% 799 787
Communications 53 989 5% 56 689
Vehicles 1 564 400 5% 1 642 620
Mobile Plant 2 308 820 10% 2 539 702
Subtotal 29 693 838 31 999 730
Plant Pre-Production
Plant First Fill 899 952 5% 944 950
Spares 3 712 670 5% 3 898 303
Subtotal 4 612 622 4 843 253
Mining Capital Costs
Mining Contractor
Mobilisation 10 372 000 0% 10 372 000
Mining Pre-Strip 4 384 749 0% 4 384 749
Mining Management - Pre-Strip
Period 1 500 000 0% 1 500 000
Subtotal 16 256 749 16 256 749
Other
Insurances 1 511 760 10% 1 662 936
Relocation Cost 5 600 000 7% 6 000 000
Import Tax 1 146 763 0% 1 146 763
Vendor Services 756 553 10% 832 208
Subtotal 9 015 076 9 641 907
Management Costs
Project Management 15 500 000 15% 17 825 000
Owner's Preproduction Costs 11 345 774 5% 11 913 063
Working Capital 5 039 749 10% 5 543 724
Steel, Plate, Mech & Piping
Construction 3 763 419 10% 4 139 761
Electrical Construction 1 757 895 10% 1 933 685
Instrumentation Construction 282 373 10% 310 611
Infrastructure Construction 200 201 10% 220 221
Construction Equipment Hire &
Power 2 518 825 10% 2 770 708
Subtotal 40 408 237 44 656 772
GRAND TOTAL 147 161 567 158 939 551
For
per
sona
l use
onl
y

May 2012 Agbaou Gold Project Page 21-4 NI 43-101
Technical Report
21.2.2 Mining Capital Estimate The cost of mining infrastructure has been accounted for under Section 21.2.3.3 below. With
the philosophy of using a mining contractor, the mining equipment has been included as an
operating cost.
Mining capital estimate include the following capital cost items:
• Mobilization costs of the contractor – US$10,372,000;
• Three months of pre-strip and stock-piling prior to the first gold pour – US$4,384,749;
• Mining management cost during pre-strip and stockpiling period – US$1,500,000.
21.2.3 Process Plant and Infrastructure The initial process plant and infrastructure capital costs required for construction are
summarised in the sections below.
21.2.3.1 Basis of Estimate and Assumptions
The capital cost estimate was based on the following technical documents:
• Process plant design information; • General layouts of the process plant; • Process flow diagrams; • Process plant equipment lists; • Piping and Instrument diagrams; • Line lists; • Valve lists; • Instrument lists; • Various discipline material take-offs; • Electrical single line diagrams; • Quotations from vendors on major mechanical process equipment; • EPCM schedule; • In-house historical database.
The following assumptions were made in the preparation of this estimate:
• Executing the work as a single EPCM contract; • Site work being continuous and not constrained by the Owner, war, riots, terrorism or
political interference; • The construction schedule running approximately 19 months; • The chosen site being suitable for shallow foundations and that there are no specific
problems arising from excessive precipitation or ground water, dramatic changes in site geology across the plant area and excessive settlement;
• As a result of the above, no allowances have been made for geotechnical soil improvements of any kind;
• No substantial river crossings were to be encountered for the access road from site to the camp and from the plant to the main road from Hire & Divo. As a consequence only minimum of 5 culverts were allowed for in the road drainage works;
• No blasting operations will be required anywhere during excavations for all earthworks;
• The area does not fall in a seismic zone and an acceleration of 0.02g has been assumed.
For
per
sona
l use
onl
y

May 2012 Agbaou Gold Project Page 21-5 NI 43-101
Technical Report
21.2.3.2 Plant Direct Costs
Mechanical Equipment Equipment required was derived from the equipment lists and process flow diagrams. Three
competitive quotes were obtained for major equipment and these were adjudicated on the
technical and commercial aspects. The total cost for mechanical equipment is
US$17,732,002 (SRK Consulting, SENET, Knight Piésold Consulting, 2012 Appendix 21-A).
Earthworks and Civils Earthworks and civil costs were determined by using material take-offs from general
arrangement drawings. Certain items in the bill of quantities (BOQ) were considered as
bought out materials and thus would have to be supplied to the Contractor by the Engineer.
Costs for these items were obtained from the suppliers which were adjudicated commercially
and the resulting costs then populated into the civils and earthworks BOQ’s.
Separate bills of quantities for both the civils and earthworks were prepared based on the
South African National Standards (SANS 1200) in order to obtain rates-based fixed price
“contract values”.
The table below provides a summary of the concrete quantities obtained from the civils
material take-offs for the process plant.
Table 21.3: Summarised Construction Quantities Area Unit Concrete Quantities
Camp m3 1940
Light Industrial Area m3 689
Plant Building & Other Plant Infrastructure m3 1716
Process Plant Structural Concrete m3 4389
Totals m3 8734
The total cost for earthworks is US$1,754,062 and civil works US$9,802,341. Detailed cost
estimate inclusive of BOQ’s are included in the EOS (SRK Consulting, SENET, Knight
Piésold Consulting, 2012 Appendix 21-B).
Structural Steel and Platework Quantities were based on material take-offs (MTO’s) obtained from General Arrangement
Drawings. Quantities from similar jobs were used as a further guide. Unit rates for platework,
tanks and structural steel were obtained from quotes from fabricators. The CIL tanks were
quoted on independently.
The total cost for structural steel and platework is US$5,803,972. The detailed cost estimate
is included in the EOS (SRK Consulting, SENET, Knight Piésold Consulting, 2012 Appendix
21-C).
A summary of the structural steel and platework masses is shown below.
For
per
sona
l use
onl
y

May 2012 Agbaou Gold Project Page 21-6 NI 43-101
Technical Report
Table 21.4: Structural Steel and Platework Masses
Description Mass
(Tonnes)
Plate work 256
Tanks 661
Structural Steel 791
Total 1708
Piping and Valves Quantities were based on MTO’s that were obtained from Piping & Instrumentation
Diagrams (P&ID’s) and General Arrangement Drawings (GA). Quantities from similar jobs
were used as a further guide. Fabricators quoted for each material spec (e.g. carbon steel,
stainless steel, HDPE) using the piping quantities and specifications supplied.
A valve list that was compiled from P&ID’s and was submitted to vendors for quotations on
each valve type.
The total cost for piping and valves is US$1,433,928 (SRK Consulting, SENET, Knight
Piésold Consulting, 2012 Appendix 21-D).
Electrical and Instrumentation Electrical equipment quantities were calculated based on PFD’s, P&ID’s, equipment lists,
plant layout drawings and single line diagrams. Quotes were obtained for the design and
supply of the motor control centres (MCC’s), transformers, cable racking, cabling, lighting,
etc.
The PLC and SCADA costs were based on a typical plant configuration with required plant
control from a central control room. The instrumentation costs were based on instrument and
actuated valve lists that were derived from P&ID’s.
Electrical and instrumentation costs are US$5,094,739. The detailed cost estimate is in the
EOS (SRK Consulting, SENET, Knight Piésold Consulting, 2012 Appendix 21-E).
21.2.3.3 Infrastructure costs
Camp and Site Access Roads An allowance has been made for two access roads. One links the plant to the main
provincial road between the towns of Hire and Divo and the other links the process plant and
the main camp. The roads were based on a 5.5m wide gravel carriageway of 9.17km and
2.47km respectively.
The total cost for the access roads is US$2,467,329. The detailed cost estimate is in the
EOS (SRK Consulting, SENET, Knight Piésold Consulting, 2012 Appendix 21-F).
Transport The cost of the total project transport was determined by taking the following into account:
For
per
sona
l use
onl
y

May 2012 Agbaou Gold Project Page 21-7 NI 43-101
Technical Report
• The weight/volume restrictions associated with the roads and bridges both in country of manufacture and in Côte d’Ivoire;
• Size, mass and volume of cargo that will be moved. To obtain optimum ratio of weight to volume the cargo would be packed as a mixture of high volume and high weight which will optimize the number of containers to be shipped and hence lower the transport costs;
• Transport costs associated with moving cargo by road from Abidjan Port to site; • Method of containment to be applied in order to reduce the number of containers to
be moved while adhering to the weight restrictions. In coming up with project cargo schedules, it was noted that due to the weight/volume ratio
the most cost effective form of transport would be to combine the transportation of civils with
mechanical equipment that has a high volume ratio. The same concept applies for the
balance of disciplines.
The majority of the cargo will be shipped in 40 foot general purpose containers and 40 foot
open top containers. The mills and the crusher will require breakbulk shipment from country
of manufacture. A charter vessel will be required and indicative global freight rates have
been used for the purpose of the EOS.
Typical shipping costs per container type are given in table below:
Table 21.5: Typical Shipping Costs of Container Types
JHB-FCA
Durban
(US$)
Durban-
Abidjan
(US$)
Port Clearance &
Handling (US$)
Abidjan to
Site (US$)
Abidjan
Customs
(US$)
Total
(US$)
20 foot 1,617.06 1,614.31 2,193.37 1,150.80 179.47 6,755.01
40 foot 1,915.89 2,784.31 2,879.74 1,986.50 179.47 9,745.91
The total project transport costs amounted to US$5,554,000.
An estimate by type of equipment moved is included in the EOS (SRK Consulting, SENET,
Knight Piésold Consulting, 2012 Appendix 21-G).
Tailings Capital Costs
The capital cost estimates included in this report have been prepared on the following basis:
Phase 1
• Construction of two earthfill starter walls to crest level 249.5 mamsl;
• Construction of a permanent return water system;
• Construction of filters on the upstream face of the earthfill embankment, and
installation of housing pipes for submersible pumps;
• Excavation of diversion channels to avoid rain water from entering the TSF;
• Installation of a filter drain located within the embankment for removing seepage
through the dams;
For
per
sona
l use
onl
y

May 2012 Agbaou Gold Project Page 21-8 NI 43-101
Technical Report
• Supply and installation of toe drains to remove seepage collected in the filter drains;
• Supply and installation of collection sumps downstream of TSF embankments;
• Supply and installation of sump pumps and piping to discharge back into TSF;
• Supply and installation of tailings distribution pipeline with spigot offtakes around the
TSF;
• TSF perimeter roads and fencing.
The start-up cost for the TSF is US$5,622,127. This includes an allowance for contractors
P&Gs, Engineering and Supervision fees. The cost breakdown is summarised in the table
below. The detailed cost estimate is in the EOS (SRK Consulting, SENET, Knight Piésold
Consulting, 2012 Appendix 21-H).
Table 21.6 : Cost Breakdown Summary
Section Description Amount (US$)
3 Main Impoundment 3,000,159.50
4 Underdrain System Sump Sections & Filter Drain 430,498.00
5 Slurry Distribution Pipework 573,355.75
SUB TOTAL MEASURED ITEMS 4,004,013.25
1 Preliminary & General 1,119,700.00
2 Engineering and Design Costs 498,414.12
Total 5,622,127.37
Water Supply Knight Piésold was asked to identify potential locations to store water to be used during plant
start-up when the tailings pond cannot provide return water back to the plant. The water
storage dams will also be used to store dewatering from the open pit.
The coast of drilling, pump installation and aquifer testing for two water supply boreholes at
the Agbaou camp is given in the table below. This includes the cost of drilling two water
supply boreholes and equipping them with suitable submersible electric borehole pumps.
Table 21.7: Cost of Drilling, Pump Installation and Aquifer Testing at the Agbaou Camp Item Sub-Total, US$
Drilling and aquifer testing 40,000
Supply and install submersible pumps 11,300
Total 51,300
For abstraction from the water supply dam, allowance was made for two pumps mounted on
pontoons, an intermediate pumping station and the 4.3km pipeline to the plant. In addition to
this an access road and an overhead line was included in the costing.
A summary of the water supply costs is included in the table below.
The cost breakdown of water supply from the preferred dam location is in the EOS (SRK
Consulting, SENET, Knight Piésold Consulting, 2012 Appendix 21-I).
For
per
sona
l use
onl
y

May 2012 Agbaou Gold Project Page 21-9 NI 43-101
Technical Report
Table 21.8: Water Supply and Storage Capital Cost Summary DESCRIPTION - WATER SUPPLY COST (US$)
Pipe Line 506,646
Pumps and Tank 161,684
OHL, Transformer and Switchgear Cost 314,933
Access Road Cost 148,120
Water Storage Dam 434,257
Total 1,565,642
Power Supply Power will be provided from the Côte d’Ivoire national grid. The cost of the overhead line
installation was provided by ENDEAVOUR, and is US$6,500,000 and is inclusive of
contingency.
Two off 1.5MVA diesel generators have been allowed for as standby power in the cost
estimate this at a cost of US$1,283,884.
Plant Administration Buildings and Warehousing Buildings located in the plant area will consist of security offices, change house, plant
messing, process plant equipment workshop, control room, general administration offices,
medical facility, substation, assay laboratory, reagent warehouses and spares warehouse.
A total of 3 warehousing facilities for storage of general spares, cyanide, reagents and
consumables will be provided.
The total cost for the above in plant infrastructure including all civil costs amounts to
US$2,649,174. The detailed cost estimate is attached in the EOS (SRK Consulting, SENET,
Knight Piésold Consulting, 2012 Appendix 21-J).
Main Camp The main camp was sized to accommodate 200 people. Quotes were obtained from
suppliers who have provided similar camp materials in Africa for prefabricated type housing.
The capital costs of the main camp include:
• Six (6), 2 bed roomed manager’s houses; • Eighteen (18), 10 bed housing units each with its own bathroom; • A laundry unit; • A guard-house; • A centrally located camp kitchen & dining room; • An entertainment/bar area; • Potable water, sewage disposal units and piping reticulation; • Associated civils; • All furniture, catering and laundry equipment.
The capital cost for the main camp is US$4,951,394 and includes civils and earthworks. The
detailed estimate for the main camp is in the EOS (SRK Consulting, SENET, Knight Piésold
Consulting, 2012 Appendix 21-K).
For
per
sona
l use
onl
y

May 2012 Agbaou Gold Project Page 21-10 NI 43-101
Technical Report
There is no capital expenditure associated with accommodation in nearby villages.
Mining Infrastructure The following will be allowed for in the mining facilities:
• Main workshop and repair facilities, to maintain the fleet of haul trucks and major mining equipment, complete with admin buildings housed within;
• Tyre repair and replacement bay; • Mining equipment re-fuelling centre; • Explosive storage, which will be located away from the main facilities; • Change house and security office; • Messing facility for the mining personnel.
Capital cost for mining infrastructure is US$727,079. The breakdown for mining
infrastructure is in the EOS (SRK Consulting, SENET, Knight Piésold Consulting, 2012
Appendix 21-L).
Communications, Security, Networking and Radios Capital costs for the communication system, networking (VSAT) and radios were allowed for.
The CCTV cost is included in the instrumentation costs.
The capital cost for communications is US$53,989.
Vehicles and Mobile Equipment A vehicle and mobile equipment list was drawn up and was submitted to suppliers for
quotations that were then used in the estimate. The capital cost for vehicles is
US$1,564,400 and US$2,308,820 for mobile plant. The breakdown for vehicles and mobile
plant equipment are in the EOS (SRK Consulting, SENET, Knight Piésold Consulting, 2012
Appendix 21-M).
21.2.3.4 Plant Pre-Production Costs
First Fills The first fill costs were defined as those costs incurred prior to commissioning in preparing
the circuit to accept ore. These costs included the initial charge of steel balls, at various
sizes to the SAG and Ball Mills, carbon in the CIL circuit and thermic oil for the elution
heaters.
The quantities were developed from first principles. The capital cost for first fills is
US$899,952. Detail regarding the build-up of the first fill costs, is in the EOS (SRK
Consulting, SENET, Knight Piésold Consulting, 2012 Appendix 21-N).
Spares Spares costs cover commissioning, strategic and two year spares. Spares quantities and
costs were supplied by the respective vendors.
The capital cost of spares required is US$3,712,670. Detailed costs are in the EOS (SRK
Consulting, SENET, Knight Piésold Consulting, 2012 Appendix 21-O).
For
per
sona
l use
onl
y

May 2012 Agbaou Gold Project Page 21-11 NI 43-101
Technical Report
21.2.3.5 Other Costs
Insurances Insurances were estimated to cover contractor’s all risk, public liability, professional
indemnity, marine insurance, motor vehicle third party insurance and employee’s liability.
The insurance capital cost is US$1,511,760.
Relocation An allowance of US$5,600,000 was made and covers relocation of local farmers and
villagers in the vicinity of the mine.
Import Taxes An import tax (regional statistical tax and two community / solidarity taxes) of 2.5% applies to
all imported items. This cost is US$1,146,763.
Vendor Services The cost for vendor services includes items where the equipment is of sufficient complexity
to require the presence of the vendor in order for equipment to be installed. The costs are
based on quotes obtained from the respective vendors. The capital cost for vendor services
is US$756,553. The detailed cost breakdown of vendor services cost is in the EOS (SRK
Consulting, SENET, Knight Piésold Consulting, 2012 Appendix 21-P).
21.2.3.6 Management Costs
Engineering, Procurement and Construction Management (EPCM) EPCM cost was estimated as 10% of total project costs. This total will cover design,
procurement, project management, construction management and disbursement costs. The
estimate for EPCM is US$15,500,000.
Construction Labour Structural, mechanical, platework, piping, electrical & instrumentation installation and
erection will be performed by contractors. Civils and earthworks construction labour costs
including P&G’s are contained in the civil and earthworks capital costs. Pricing was based on
rates based quotations where all work and P&G’s (including their own camp) was supplied
as part of the pricing. The independent contractors would work under the supervision of the
EPCM contractor.
The cost for construction labour is US$6,003,888. The detailed construction labour costs are
in the EOS (SRK Consulting, SENET, Knight Piésold Consulting, 2012 Appendix 21-Q).
Construction Equipment and Associated Costs Construction equipment and its associated costs include construction power, construction
fuel, vehicles, rental of crane and lifting equipment hire. The cost is US$2,518,825 (SRK
Consulting, SENET, Knight Piésold Consulting, 2012 Appendix 21-R).
For
per
sona
l use
onl
y

May 2012 Agbaou Gold Project Page 21-12 NI 43-101
Technical Report
Owner’s Preproduction Costs Owner’s preproduction cost is the cost incurred prior to the commencement of the project.
This cost includes owner’s construction team costs, all labour costs inclusive of salaries,
recruiting fees, accommodation and messing, training, assay and offsite offices.
This also allows for the gradual ramp-up of the production staff during the construction
phase in preparation for plant production.
This cost excludes study and exploration costs. The owner’s cost is US$11,345,774 (SRK
Consulting, SENET, Knight Piésold Consulting, 2012 Appendix 21-S).
Working Capital Working capital is the costs incurred from commissioning until the revenue from gold sales
can pay for the total operating costs. The operating costs include mining, plant, G&A, assay
and refining. Certain assumptions were made i.e., tonnage ramp up, gold inventory ramp-
up, bullion shipment, price of gold, reagents and consumables stockholding period.
Using these assumptions, the calculated working capital is US$5,039,749.
21.2.3.7 Contingency
An effective contingency of 8% has been included to cover items included in the scope of
work, but cannot be adequately defined at this time due to lack of accurate detailed design
information. This cost is US$11,777,985.
21.3 SUSTAINING, REHABILITATION AND CLOSURE COSTS
21.3.1 Mining Rehabilitation, Mining Contractor Demobilization and Closure Costs
The basis of the costing is the assumption that mine equipment (as opposed to third party
equipment) will be utilised to undertake the earth moving activities required to place the
cover material. Therefore the plant rates that are used in the liability assessment are those
derived by SRK during the feasibility assessment for the Project.
No local information on vegetation, fertiliser and mulch costs was available at the time of
preparing this assessment. Therefore the rates that have been used in this assessment are
an average of rates that SRK have collected in other African states (excluding South Africa).
A provision has been made to undertake post closure management and monitoring for a
period of three years after closure on all of the facilities. This is required to repair any erosion
that may occur as vegetation becomes established as well as to monitor the effectiveness of
the rehabilitation measures.
An amount of US$249,300 has been allowed for demobilization of the mining contractor.
The closure costs for the three waste rock dumps (WRD) are presented in the table below.
For
per
sona
l use
onl
y

May 2012 Agbaou Gold Project Page 21-13 NI 43-101
Technical Report
Table 21.9: Mining Rehabilitation and Closure Costs DESCRIPTION OF PROPOSED WORK TO BE UNDERTAKEN ON WRD 1, 2 AN 3:
• Load and haul soils
• Place soils
• Mulch, fertilise and vegetate
WASTE ROCK DUMP 1 – BILL OF QUANTITIES
Item
No Unit
Rate
(US$/unit) Quantity
Total
(US$)
1 Load and haul soil m3 1.18 196,000 231,280
2 Placement of cover material m3 0.86 196,000 168,560
3 Fertilise and mulch Ha 4,105 65 266,825
4 Seed Ha 900 65 58,500
Maintenance
4 Maintain vegetated areas m2 0.05 650,000 32,500
CAPITAL COST TO REHABILITATE (carried to summary) 725,165
MAINTENANCE COSTS 32,500
TOTAL COST 757,665
WASTE ROCK DUMP 2 – BILL OF QUANTITIES
Item
No Unit
Rate
(US$/unit) Quantity
Total
(US$)
1 Load and haul soil m3 1.18 105,000 123,900
2 Placement of cover material m3 0.86 105,000 90,300
3 Fertilise and mulch Ha 4,105 35 143,675
4 Seed Ha 900 35 31,500
Maintenance
4 Maintain vegetated areas m2 0.05 350,000 17,500
CAPITAL COST TO REHABILITATE (carried to summary) 389,375
MAINTENANCE COSTS 17,500
TOTAL COST 406,875
WASTE ROCK DUMP 3 – BILL OF QUANTITIES
Item
No Unit
Rate
(US$/unit) Quantity
Total
(US$)
1 Load and haul soil m3 1.18 125,000 147,500
2 Placement of cover material m3 0.86 15,000 12,900
3 Fertilise and mulch Ha 4,105 42 172,410
4 Seed Ha 900 42 37,800
Maintenance
4 Maintain vegetated areas m2 0.05 420,000 21,000
CAPITAL COST TO REHABILITATE (carried to summary) 370,610
MAINTENANCE COSTS 21,000
TOTAL COST 391,610
For
per
sona
l use
onl
y

May 2012 Agbaou Gold Project Page 21-14 NI 43-101
Technical Report
21.3.2 Tailings Sustaining, Rehabilitation and Closure Costs
21.3.2.1 Sustaining Capital
Sustaining capital is US$10,837,622 and includes the following TMF costs in years 3 and 6:
• Main impoundment; • Under drain system sump sections and filter drain; • Slurry distribution pipework; • P&G’s; • Engineering and design costs.
21.3.2.2 Rehabilitation and Closure Costs
Rehabilitation and closure works that will take place concurrently with the construction of the
facility will include stripping and stockpiling of topsoil from the site for use in the rehabilitation
and closure process. Being a downstream constructed rockfill embankment, no rehabilitation
work will be able to be carried out on the outer slopes of the facility until the Phase 3 wall
raise has been completed. The overall outer slope will be 1V:3H. The slope surface will be
top soiled and vegetated. It is expected that decommissioning, rehabilitation and closure of
the facility at the cessation of operations will include the following:
• Removal of the slurry delivery and return water pumps and pipelines and all associated works;
• Ridge ploughing for dust control; • Construction of dividing paddocks into 100 x 100m grids on the top surface of the
TSF, so as to hold rainwater evenly over the entire footprint of the TSF, thereby enhancing water evaporation and reducing the volume of water collecting in the central pool zone.
Grassing of the area will lead to a significant reduction in surface erosion.
Monitoring of surface and groundwater quality in the area is likely to be required to continue
for a period of up to 30 years. This will be achieved by installing collection chambers and
sampling points in order to monitor water quality both for underground seepage and surface
water drainage.
Annual rehabilitation costs and closure costs have been estimated and are shown in Table
21.10 below.
For
per
sona
l use
onl
y

May 2012 Agbaou Gold Project Page 21-15 NI 43-101
Technical Report
Table 21.10: Rehabilitation and Closures Costs
Year no.
Concurrent Closure
Costs
(US$)
Total
(US$) Rehabilitation
(US$)
0
1 140,625 140,625
2 140,625 140,625
3 140,625 140,625
4 140,625 140,625
5 140,625 140,625
6 140,625 140,625
7 140,625 140,625
8 70,313 70,313
9 4,855,305 4,855,305
Total
(US$) 1,054,688 4,855,305 5,909,993
21.3.3 General Sustaining Capital An allowance of US$250,000 per year has been included to cover minor sustaining capital
items.
21.4 OPERATING COST ESTIMATE
21.4.1 Introduction The annual operating costs for the life of the mine (LOM) were estimated for mining,
processing, general and administration (G&A), royalties and refining charges and are
summarized in the table below and described in detail in the sections that follow.
The operating costs (which are exclusive of duties and taxation) were developed by:
• Mining – SRK; • Process plant – SENET; • Tailings storage facility – Knight Piésold; • G&A – SENET and ENDEAVOUR; • Assay laboratory – SENET (SGS).
A summary of the overall operating costs are presented in the table below.
Table 21.11: Overall Operating LOM Costs
Mining Operating Costs In conjunction with ENDEAVOUR a mining contractor was selected. The annual operating
costs estimated by this contractor as well as mining management costs supplied by SRK are
shown in Table 21.12.
Unit Yr 1 Yr 2 Yr 3 Yr 4 Yr 5 Yr 6 Yr 7 Yr 8 LOM
Mining US$/t 21.79 27.33 29.87 29.70 48.18 35.60 28.66 29.54 30.94
Plant US$/t 9.26 9.37 9.35 9.59 9.76 9.61 9.69 9.61 9.51
Tailings Storage Facility (TSF) US$/t 0.14 0.15 0.15 0.17 0.15 0.15 0.15 0.15 0.15
G&A US$/t 4.91 5.19 4.97 5.62 6.16 5.72 5.83 5.76 5.46
Assay US$/t 1.01 1.06 1.06 1.20 1.31 0.79 0.81 1.55 1.06
Refining US$/t 0.26 0.35 0.43 0.45 0.32 0.39 0.37 0.48 0.37
Government Royalties US$/t 1.97 2.58 3.22 3.36 2.38 2.88 2.75 3.58 2.77
Total Operating Costs US$/t 39.33 46.03 49.05 50.08 68.27 55.14 48.25 50.67 50.26For
per
sona
l use
onl
y

May 2012 Agbaou Gold Project Page 21-16 NI 43-101
Technical Report
Table 21.12: Overall Mining LOM Operating Cost
Year Haul & Load
(US$)
Drilling &
Blasting (US$)
Management
Contractor (US$)
Rehandling
(US$)
Mine Management
ENDEAVOUR (US$) Sum (US$)
1 25 378 055 0 8 855 840 186 284 3 322 000 37 742 179
2 30 954 209 0 9 888 969 542 062 3 322 000 44 707 240
3 35 267 273 685 116 9 302 246 509 901 3 334 000 49 098 536
4 31 145 298 1 118 825 7 526 010 345 949 3 059 000 43 195 082
5 40 047 726 9 576 723 10 978 453 442 197 2 874 000 63 919 099
6 30 558 918 6 879 607 7 449 684 216 593 2 906 000 48 010 804
7 22 054 292 7 306 678 5 865 157 239 341 2 459 000 37 924 467
8 9 042 510 3 475 961 3 529 388 149 460 1 835 000 18 032 319
Total (US$) 224 448 281 29 042 911 63 395 747 2 631 787 23 111 000 342 629 725
The mine management costs in the table above include ENDEAVOUR management costs,
administration costs estimated to be US$0.25/t ore and grade control costs estimated to be
US$1.2/t ore.
21.4.2 Processing Plant Operating Costs
21.4.2.1 Summary
The annual process plant operating costs for the life of the mine of US$9.66/t of ore
processed for the Agbaou Project are presented in the table below.
Table 21.13: Overall Process Plant LOM Operating Costs
Unit Yr. 1 Yr. 2 Yr. 3 Yr. 4 Yr. 5 Yr. 6 Yr. 7 Yr. 8 LOM Plant & Maintenance Labour
US$/t 1.43 1.51 1.51 1.70 1.87 1.84 1.87 1.85 1.67
Consumables & Reagents US$/t 4.83 4.83 4.80 4.64 4.42 3.92 4.05 3.84 4.49
Maintenance Supplies US$/t 0.51 0.54 0.54 0.61 0.67 0.66 0.67 0.66 0.60
Power US$/t 2.48 2.49 2.51 2.63 2.81 3.20 3.09 3.26 2.75
TSF US$/t 0.14 0.15 0.15 0.17 0.15 0.15 0.15 0.15 0.15
Total Process Plant Costs
US$/t 9.40 9.52 9.50 9.75 9.91 9.76 9.84 9.76 9.66
21.4.2.2 Basis of Estimate
The plant operating costs were compiled from a variety of sources, namely:
• ENDEAVOUR’s database; • First principles; • Supplier quotations for reagents and consumables; • SENET’s experience on similar sized plants.
The major cost centres of the plant that were covered in this estimate were:
• Process plant operating labour; • Plant maintenance labour; • Reagents and consumables; • Maintenance supplies; • Power.
For
per
sona
l use
onl
y

May 2012 Agbaou Gold Project Page 21-17 NI 43-101
Technical Report
21.4.2.4 Plant Operating and Maintenance Labour
The combined plant and maintenance labour cost, is estimated to be US$1.67/t for the life of
the mine. These costs are inclusive of:
• Plant operating labour; • Plant maintenance labour; • Expatriate labour travel and accommodation; • Safety supplies; • Training.
A detailed cost breakdown of each cost associated with plant operating and maintenance
labour are in the EOS (SRK Consulting, SENET, Knight Piésold Consulting, 2012 Appendix
21-T).
The plant operating and maintenance labour costs were derived from first principles where
the actual labour complement was drawn up in conjunction with ENDEAVOUR. The
expatriate labour is broken down into two categories; Expat 1 and Expat 2. It was assumed
that Expat 1 are the expats from outside West Africa and Expat 2 are from West Africa.
The labour schedule has been drawn up assuming a roster of 8 weeks on and 3 weeks off
for the expatriates and three by 8 hour shifts for the local labour.
The labour schedule was prepared with estimated costs associated with each position
including the employer remittance to the government of 12% for expatriate labour and 2.8%
for local labour (SRK Consulting, SENET, Knight Piésold Consulting, 2012 Appendix 21-T).
The travel and accommodation costs for expatriates were determined by using the roster
mentioned above, number of expatriates, the number of flights per annum, costs per flight
and food costs.
The annual cost of the plant personnel’s safety supplies was determined using a safety gear
list and its costs and the number of employees in the plant.
An allowance of 2% of the total plant salaries has been allocated to cater for any external
training consultants that might be hired for ongoing training of labour.
21.4.2.5 Process Plant Reagents and Consumables
The estimated LOM plant reagents and consumable costs equated to US$4.49/t. A
combination of projected reagent consumptions and unit costs were used to obtain these
costs. The costs were then weighted based on the combination of types of ores being
treated and are summarized in the table below (SRK Consulting, SENET, Knight Piésold
Consulting, 2012 Appendix 21-U).
For
per
sona
l use
onl
y

May 2012 Agbaou Gold Project Page 21-18 NI 43-101
Technical Report
Table 21.14: LOM Reagents and Consumables Costs
Unit Cost
(US$/unit)
LOM Weighted
Consumption
(kg/t)
LOM Cost
(US$)
LOM Cost
(US$/t)
Tonnage Processed - - - 11 074 927
Crusher Liners set 14 202 - 793 333 0.072
Mill Liners set 687 542 - 5 468 444 0.494
SAG Mill Grinding
Media t 1 388 0.33 5 146 308 0.465
Ball Mill Grinding Media t 1 165 0.40 5 161 131 0.466
Cyanide t 2 282 0.35 8 810 706 0.796
Lime t 330 4.24 15 517 144 1.401
Caustic t 845 0.13 1 233 972 0.111
Hydrochloric Acid (33 %
HCl) t 476 0.10 528 416 0.048
Carbon t 3 592 0.03 994 593 0.090
Sodium Metabisulphite t 617 0.59 4 014 285 0.362
Copper Sulphate t 2 726 0.07 1 964 907 0.177
Hydrogen Peroxide t 717 0.01 114 356 0.010
Smelting Reagents t 871 0.001 11 913 0.001
Total 49 759 508 4.49
21.4.2.6 Plant Maintenance Costs and Supplies
Maintenance costs refer to the costs of operating spares and lubricants for the plant. It has
been assumed that the plant will experience a moderate amount of wear. A provision has
been made to allow maintenance costs at an annual cost of 5% of the mechanical
equipment cost. This equates to a LOM cost of US$0.60/t.
21.4.2.7 Power
The power usage for the LOM calculated to 380,530,572kWh and at a power cost of
US$0.08/kWh, a LOM power cost of US$2.75/t was determined. A summary of the LOM
power costs are shown in the table below (SRK Consulting, SENET, Knight Piésold
Consulting, 2012 Appendix 21-V).
For
per
sona
l use
onl
y

May 2012 Agbaou Gold Project Page 21-19 NI 43-101
Technical Report
Table 21.15: LOM Power Costs Unit Yr 1 Yr 2 Yr 3 Yr 4 Yr 5 Yr 6 Yr 7 Yr 8 LOM
Tonnage Processed
Saprolite
Tonnage tpa 1,732,010 1,623,809 1,569,528 1,073,867 650,225 18,437 282,685 0 6,950,560
Transition
Tonnage tpa 0 11,936 62,069 209,236 261,705 187,026 12,366 0 744,338
Bedrock
Tonnage tpa 0 0 12,406 171,127 414,639 1,143,225 1,028,285 610,347 3,380,029
Combined
Tonnage
Processed
tpa 1,732,010 1,635,744 1,644,002 1,454,229 1,326,569 1,348,689 1,323,336 610,347 11,074,927
Variable Power Usage
Saprolite
Tonnage kWh/t 18.16 18.16 18.16 18.16 18.16 18.16 18.16 18.16 18.16
Transition
Tonnage kWh/t 21.73 21.73 21.73 21.73 21.73 21.73 21.73 21.73 21.73
Bedrock
Tonnage kWh/t 25.30 25.30 25.30 25.30 25.30 25.30 25.30 25.30 25.30
Weighted
Power kWh/t 18.16 18.19 18.35 19.51 21.10 24.71 23.74 25.30 20.58
Total Variable
Power kWh/a 31,453,305 29,747,729 30,165,244 28,377,622 27,985,308 33,322,498 31,417,880 15,441,789 227,911,374
Fixed Power Usage
Saprolite
Tonnage kWh/t 12.90 12.90 12.90 12.90 12.90 12.90 12.90 12.90 12.90
Transition
Tonnage kWh/t 14.20 14.20 14.20 14.20 14.20 14.20 14.20 14.20 14.20
Bedrock
Tonnage kWh/t 15.50 15.50 15.50 15.50 15.50 15.50 15.50 15.50 15.50
Weighted
Power kWh/t 12.90 12.91 12.97 13.39 13.97 15.28 14.93 15.50 13.78
Total Fixed
Power kWh/a 22,344,667 21,118,236 21,322,056 19,476,909 18,530,288 20,610,277 19,758,062 9,458,687 152,619,180
Total Power Usage
Total Power kWh/t 31.06 31.10 31.32 32.91 35.06 39.99 38.67 40.80 34.36
Total Power kWh/a 53,797,971 50,865,964 51,487,300 47,854,531 46,515,596 53,932,775 51,175,941 24,900,476 380,530,554
Power Costs
Grid Power
Costs US$/kWh 0.08 0.08 0.08 0.08 0.08 0.08 0.08 0.08 0.08
Annual Power
Costs US$/a 4,303,838 4,069,277 4,118,984 3,828,362 3,721,248 4,314,622 4,094,075 1,992,038 30,442,444
Power Costs US$/t 2.48 2.49 2.51 2.63 2.81 3.20 3.09 3.26 2.75
21.4.2.8 Tailings Operating Costs
Current operating costs on similar sized tailings dams in South Africa are approximately
US$0.15/t of solids deposited. The estimate of operating costs allows for the operation of
the facility by a recognised tailings facility operator on a rate per ton basis and will include for
management, supervision, labour, equipment and materials required for:
• Operation of the slurry delivery system; • Operation of the pump barge return water system; • Routine inspections and maintenance of the facility and associated infrastructure,
including general housekeeping functions such as grass cutting, changing spigot discharge locations, etc.
The table below shows the estimated LOM tailing operating costs.
For
per
sona
l use
onl
y

May 2012 Agbaou Gold Project Page 21-20 NI 43-101
Technical Report
Table 21.16: LOM Tailings Operating Costs Year no. Operating Operating
Cost (US$) Costs (US$/t)
1 241,500 0.14
2 241,500 0.15
3 241,500 0.15
4 241,500 0.17
5 201,000 0.15
6 201,000 0.15
7 201,000 0.15
8 201,000 0.15
Ave LOM 221,250 0.15
21.4.3 General and Administration Costs G&A LOM costs were determined to be US$5.46/t, with input from SENET and
ENDEAVOUR. The major G&A cost items that were included are as follows:
• Labour (includes salaries, security and training & recruiting); • Camp food & local messing; • Maintenance; • Offsite offices and travel; • Environmental; • Other costs.
A summary of the G&A costs is shown in the table and sub-sections below and details of
each cost item are included in the EOS (SRK Consulting, SENET, Knight Piésold
Consulting, 2012 Appendix 21-W).
For
per
sona
l use
onl
y

May 2012 Agbaou Gold Project Page 21-21 NI 43-101
Technical Report
Table 21.17: LOM G&A Costs
21.4.3.1 General and Administration Labour Costs
The G&A labour costs were derived from first principles where the actual labour complement
was drawn up in conjunction with ENDEAVOUR. The expatriate labour is broken down into
two categories namely Expat 1 and Expat 2. It was assumed that Expat 1 are the expats
from outside West Africa and Expat 2 are from West Africa.
The labour schedule has been drawn up assuming a roster of 8 weeks on and 3 weeks off
for the expatriates and three by 8 hour shifts for the local labour.
A labour schedule was prepared with estimated costs associated with each position
including the employer remittance to the government of 12% for expatriate labour and 2.8%
for local labour (SRK Consulting, SENET, Knight Piésold Consulting, 2012 Appendix 21-W).
An allowance of 2% of the total G&A salaries has been allocated to cater for any external
Item Unit Yr 1 Yr 2 Yr 3 Yr 4 Yr 5 Yr 6 Yr 7 Yr 8 LOM
Salaries & Wages
General & Administration Salaries Expat US$pa 1 799 680 1 799 680 1 669 319 1 669 319 1 669 319 1 669 319 1 669 319 760 188 12 706 143
General & Administration Salaries Local US$pa 857 719 857 719 857 719 857 719 857 719 857 719 857 719 390 595 6 394 626
General Maintenance Salaries Expat US$pa 708 729 708 729 515 498 515 498 515 498 515 498 515 498 234 751 4 229 697
General Maintenance Salaries Local US$pa 744 038 744 038 744 038 744 038 744 038 744 038 744 038 338 826 5 547 089
Total Salaries & Wages US$pa 4 110 165 4 110 165 3 786 573 3 786 573 3 786 573 3 786 573 3 786 573 1 724 360 28 877 555
Security
Staff US$pa 217 135 217 135 217 135 217 135 217 135 217 135 217 135 98 880 1 618 823
Vehicles US$pa 149 748 149 748 149 748 149 748 149 748 149 748 149 748 68 193 1 116 429
Total Security US$pa 366 883 366 883 366 883 366 883 366 883 366 883 366 883 167 074 2 735 252
Training and Recruiting
Training US$pa 82 203 82 203 82 203 82 203 82 203 82 203 82 203 37 434 612 858
Recruiting US$pa 36 033 36 033 36 033 36 033 36 033 36 033 36 033 16 409 268 642
Total Training & Recruiting US$pa 118 237 118 237 118 237 118 237 118 237 118 237 118 237 53 844 881 500
Camp Food and Local Messing
Camp Food US$pa 508 638 508 638 508 638 508 638 508 638 508 638 508 638 231 628 3 792 096
Local Messing US$pa 310 004 310 004 310 004 310 004 310 004 310 004 310 004 141 172 2 311 200
Total Camp Food & Local Messing US$pa 818 642 818 642 818 642 818 642 818 642 818 642 818 642 372 800 6 103 296
Maintenance
Main Camp and In-plant Roads US$pa 200 000 200 000 200 000 200 000 200 000 200 000 200 000 91 078 1 491 078
Infrastructure Plant Buildings US$pa 200 000 200 000 200 000 200 000 200 000 200 000 200 000 91 078 1 491 078
Local Village US$pa 100 000 100 000 100 000 100 000 100 000 100 000 100 000 45 539 745 539
Vehicle Running Costs US$pa 489 290 489 290 489 290 489 290 489 290 489 290 489 290 222 817 3 647 845
Total Maintenance US$pa 989 290 989 290 989 290 989 290 989 290 989 290 989 290 450 511 7 375 539
Offsite Offices & Travel
Abidjan Off ice US$pa 80 000 80 000 80 000 80 000 80 000 80 000 80 000 36 431 596 431
Expatriates Flight Costs - Admin US$pa 278 348 278 348 278 348 278 348 278 348 278 348 278 348 126 756 2 075 192
Additional camp visitors cost US$pa 10 770 10 770 10 770 10 770 10 770 10 770 10 770 4 905 80 295
Total Offsite Office & Travel US$pa 369 118 369 118 369 118 369 118 369 118 369 118 369 118 168 092 2 751 918
Environmental
Consultants US$pa 150 000 150 000 150 000 150 000 150 000 150 000 150 000 68 308 1 118 308
Consumables US$pa 50 000 50 000 50 000 50 000 50 000 50 000 50 000 22 769 372 769
Field Supplies US$pa 20 000 20 000 20 000 20 000 20 000 20 000 20 000 9 108 149 108
Waste Disposal US$pa 100 000 100 000 100 000 100 000 100 000 100 000 100 000 45 539 745 539
Total Environmental US$pa 320 000 320 000 320 000 320 000 320 000 320 000 320 000 145 724 2 385 724
Other Admin Costs
Amortisation of Fuel Farm US$pa 456 000 456 000 456 000 456 000 456 000 0 0 0 2 280 000
Office Consumables US$pa 60 000 60 000 60 000 60 000 60 000 60 000 60 000 27 323 447 323
Community Affairs US$pa 100 000 100 000 100 000 100 000 100 000 100 000 100 000 45 539 745 539
Insurances US$pa 600 000 600 000 600 000 600 000 600 000 600 000 600 000 273 233 4 473 233
License Fees for Softw are US$pa 20 000 20 000 20 000 20 000 20 000 20 000 20 000 9 108 149 108
Computer Hardw are Update US$pa 20 000 20 000 20 000 20 000 20 000 20 000 20 000 9 108 149 108
Annual Surface Fee US$pa 47 369 47 369 47 369 47 369 47 369 47 369 47 369 21 571 353 154
Accounting Tax Audit & Legal US$pa 100 000 100 000 100 000 100 000 100 000 100 000 100 000 45 539 745 539
Total Other Admin Costs US$pa 1 403 369 1 403 369 1 403 369 1 403 369 1 403 369 947 369 947 369 431 420 9 343 003
Total G &A US$pa 8 495 704 8 495 704 8 172 111 8 172 111 8 172 111 7 716 111 7 716 111 3 513 824 60 453 788
Tonnage Treated tpa 1 732 010 1 635 744 1 644 002 1 454 229 1 326 569 1 348 689 1 323 336 610 347 11 074 927
G & A Cost US$/t 4.91 5.19 4.97 5.62 6.16 5.72 5.83 5.76 5.46
For
per
sona
l use
onl
y

May 2012 Agbaou Gold Project Page 21-22 NI 43-101
Technical Report
training consultants that might be hired for ongoing training of labour. Recruitment cost was
determined by assuming a 10% staff turnover and a recruitment fee of 12.5% of annual
salary.
21.4.3.2 Camp Food and Local Messing
All expatriates will be expected to be on an 11 week roster (8 weeks on and 3 weeks off
duty). During the 8-week period on duty, the expatriates will be accommodated in the main
camp where food, cleaning and laundering services will be provided at a cost of US$27.00
per person per day.
A detailed roster for the LOM was developed by taking into account the number of days on
and off for each expat from which the estimated camp food and catering costs were
developed.
Local labour will be expected to be at work for about 240 days per annum. Catering costs of
US$5.00/person/day for local staff on was used together with the number of local staff on
duty and the days per annum to determine the messing costs.
21.4.3.3 Maintenance
G&A maintenance costs will cover the following main items:
• Main camp and in-plant roads; • Infrastructure plant buildings; • Local village; • Vehicle running costs.
Allowances were made for all the costs except the vehicle running costs. This was estimated
by taking into account the running costs per hour per vehicle and the estimated annual
running time for each type of vehicle (SRK Consulting, SENET, Knight Piésold Consulting,
2012 Appendix 21-W).
21.4.3.4 Offsite Offices & Travel
A provision made to cover the Abidjan office costs and additional camp visitors. The travel
costs for expatriates were determined by using the expat labour roster (8 weeks on and 3
weeks off), number of expatriates, the number of flights per annum, costs per flight and food
costs.
21.4.3.5 Environmental
Estimated annual allowances were made for the following environmental cost items:
• Consultants; • Consumables; • Field Supplies; • Waste Disposal.
21.4.3.6 Other Administration Costs
Estimated annual allowances were made for the following other admin costs:
For
per
sona
l use
onl
y

May 2012 Agbaou Gold Project Page 21-23 NI 43-101
Technical Report
• Communication; • Insurances; • Licence fees for software; • Computer hardware update; • Accounting tax audit and legal; • Annual surface fee.
21.4.4 Assay Laboratory Costs The LOM assay costs summarized in table below are based on the assumption that:
• SGS will provide equipment and manage the on-site laboratory for the first 5 years during which assay costs will be paid to SGS;
• ENDEAVOUR will own and operate the equipment and laboratory modules after Year 5.
Table 21.18: LOM Assay Cost Summary
During the first 5 years SGS will provide a total compliment of lab staff that will run and
manage the laboratory and all costs associated with this will be part of SGS fixed costs.
From year 6 onwards, the laboratory will be run by the mine operations and ENDEAVOUR
will take over the staff compliment from SGS.
A schedule of the LOM flights for each expat was developed along the same principles as
process plant expatriate schedule and will be allowed for from Year 5. Travel costs
associated with expatriates during years 1 to 5 from country of origin to site have been
assumed to be included in the SGS quote.
The annual cost of the plant personnel’s safety supplies was determined using a safety gear
list and its costs and the number of employees in the plant and varied from year 5 onward.
Training has been allowed at 2% of the total labour costs from Year 5.
SGS will be paid all assay costs during the first 5 years of operation in order to enable them
to supply the laboratory equipment and modules. They will manage a laboratory capable of
assaying 26,240 sample equivalents per month.
From Year 6 ENDEAVOUR will operate the laboratory and the following will be the
associated costs:
• Labour costs; • Safety supplies; • Training; • Expatriate flights; • Lab assay costs;
Units Years 1 Years 2 Years 3 Years 4 Years 5 Year 6 Year 7 Year 8 LOMLabour Costs US$ $215 627 $215 627 $125 722 $556 977
Flights and Accommodation US$ $22 948 $22 948 $9 057 $54 954
Safety US$ $1 456 $1 456 $1 456 $1 456 $1 456 $7 642 $7 642 $3 480 $26 041
Training US$ $0 $0 $0 $0 $0 $4 313 $4 313 $1 145 $9 770
Fixed Costs US$ $944 184 $944 184 $944 184 $944 184 $944 184 $0 $0 $0 $4 720 920
Variable Costs US$ $795 055 $795 055 $795 055 $795 055 $795 055 $795 055 $795 055 $795 055 $6 360 439
Spares US$ $0 $0 $0 $0 $0 $20 365 $20 365 $9 274 $50 004
Total Lab Costs US$ $1 740 694 $1 740 694 $1 740 694 $1 740 694 $1 740 694 $1 065 950 $1 065 950 $943 733 $11 779 104Lab Costs US$/t $1.01 $1.06 $1.06 $1.20 $1.31 $0.79 $0.81 $1.55 $1.06
For
per
sona
l use
onl
y

May 2012 Agbaou Gold Project Page 21-24 NI 43-101
Technical Report
• Spares.
21.4.5 Refining & Royalties The refining process will be completed within 3 working days after receipt of bullion. The
refiner will charge “refining costs” to cover for melting, assaying and refining.
Generally 99.8% to 99.95% (for the purposes of this study this was assumed to be 99.90%)
of the gold contained in the bullion will be payable to Agbaou and the sale price will be fixed
on the day of the refinery outrun with a settlement of 2 business days.
Bullion transport, insurance and refining costs used were assumed at US$5/oz.
The Mining Code provides for a 3% royalty payable to the State of Côte d’Ivoire on all gold
production. The royalty is calculated less refining and bullion transportation costs. The cost
breakdown of refining and royalties is shown in the table below.
Table 21.19: Refining and Royalty Cost Summary Unit Year 1 Year 2 Year 3 Year 4 Year 5 Year 6 Year 7 Year 8 LOM
Combined Production Combined Ore Processed (t) 1 732 010 1 635 744 1 644 002 1 454 229 1 326 569 1 348 689 1 323 336 610 347 11 074 927
Combined Plant Feed Grade (g/t) 1.76 2.31 2.89 3.02 2.14 2.62 2.50 3.27 2.50
Combined Recovery % 93.17% 93.17% 93.13% 92.84% 92.44% 91.54% 91.78% 91.39% 92.57%
Contained Gold (kg) 3 056 3 774 4 744 4 387 2 845 3 538 3 302 1 996 27 644
Total Gold Produced (kg) 2 848 3 516 4 418 4 072 2 630 3 239 3 031 1 824 25 579
Total Gold Produced oz 91 557 113 054 142 038 130 929 84 565 104 135 97 448 58 641 822 367
Total Payable Gold (99.90%) oz 91 465 112 941 141 896 130 798 84 480 104 031 97 350 58 582 821 544
Gold Price US$/oz 1 250 1 250 1 250 1 250 1 250 1 250 1 250 1 250 1 250
Gross Revenue US$ M 114.3 141.2 177.4 163.5 105.6 130.0 121.7 73.2 1 026.9
Refining Charges
Refining Charges US$/oz 5.00 5.00 5.00 5.00 5.00 5.00 5.00 5.00 5.00
Refining Costs US$ 457 327 564 706 709 479 653 992 422 401 520 153 486 752 292 912 4 107 722
Refining Costs US$/t ore 0.26 0.35 0.43 0.45 0.32 0.39 0.37 0.48 0.37
Government Royalties
Government Royalties % 3.00% 3.00% 3.00% 3.00% 3.00% 3.00% 3.00% 3.00% 3.00%
Government Royalties US$ 3 416 232 4 218 356 5 299 805 4 885 319 3 155 333 3 885 545 3 636 040 2 188 053 30 684 683
Government Royalties US$/t ore 1.97 2.58 3.22 3.36 2.38 2.88 2.75 3.58 2.77
Government Royalties US$/oz produced 37.31 37.31 37.31 37.31 37.31 37.31 37.31 37.31 37.31
For
per
sona
l use
onl
y

May 2012 Agbaou Gold Project Page 22-1 NI 43-101
Technical Report
SECTION 22. ECONOMIC ANALYSIS
22.1 MARKETING The gold bullion bars typically no greater than 30kg each, produced at the Agbaou Project
site may be sent to any of the active gold refiners in the world for toll refining. ENDEAVOUR
is already operating two gold mines and thus gold produced from Agbaou Project will also be
shipped to the same refiners.
22.1.1 Refining Charges, Gold Pricing & Revenue The refining process will be completed within 3 working days after receipt of bullion. The
refiner will charge “refining costs” to cover for melting, assaying and refining.
Generally 99.8% to 99.95% (for the purposes of this study this was assumed to be 99.90%)
of the gold contained in the bullion will be returned to Agbaou Mine and the sale price will be
fixed on the day of the refinery outrun with a settlement of 2 business days.
Bullion transport, insurance and refining costs used were assumed at US$5/oz.
22.2 FINANCIAL ANALYSIS The Agbaou Project economic assessment has been prepared with the input from
ENDEAVOUR, SRK Consulting, (mining and geology), SENET (processing plant, general
administration and infrastructure) and Knight Piésold (tailings management facility & water
storage dam). SENET also undertook the economic evaluation and report compilation.
22.2.1 Evaluation Method Agbaou Project economics has been evaluated using the discounted cashflow method, by
taking into account year on year milled tonnages and grades for the ore and the associated
recoveries, gold price (revenue), operating costs, bullion transport and refining charges,
government royalties and capital expenditure (both initial and sustaining). The project has
been evaluated as stand-alone and 100% equity financed, with no debt financing and the
detailed model.
22.2.2 Assumptions The assumptions used in the financial analysis were provided by ENDEAVOUR and are
summarized in the Table 22.1 and explained below.
For
per
sona
l use
onl
y

May 2012 Agbaou Gold Project Page 22-2 NI 43-101
Technical Report
Table 22.1: Assumptions Used in the Financial Evaluation Parameter Units Assumption
Gold Price US$/oz 1,250
Discount Rate % 5.0
Government Royalty % 3
Tax Rate after 5 years % 25
Fixed Equipment Residual Value % 10
Depreciation % 12.5
Gold Price: A gold price of US$1,250 per ounce was assumed.
Construction Capital Expenditure: Capital expenditure payments have been assumed to
be 60% and 40% in Project Years 0 and 1 respectively that is 60% in the first 12 months and
the balance in the following 7 months for the 19 month project duration.
Government Royalties: The Mining Code provides for a 3% royalty payable to the State of
Côte d’Ivoire on all gold production. The royalty is calculated less refining and bullion
transportation costs.
Tax: Corporate Tax of 25% of gross profit will only be applicable after 5 years of production
Depreciation: A straight line method over 8 years was used as the basis for depreciation
from the time production commences for all mechanical equipment.
Inflation: In line with the practice in the mineral industry, no inflation was applied to the
cashflow analysis.
Currency: Cashflow analysis is reported in United States Dollars and where applicable the
exchange rates shown in Table 21.1 were used.
Working Capital: This has been returned at the end of mine life.
Equipment Resale Value: The plant equipment resale value has been assumed at 10% of
the plant equipment costs.
Refining Costs: Bullion transport, insurance and refining costs used were assumed at
US$5/oz
Payable Gold: Only 99.90% of the gold contained in the bullion will be seen as payable gold
(due to non-gold elements)
22.2.3 Financial Analysis Results Using the assumptions shown in Table 22.1 and the production schedules, capital and
operating costs summarized in Table 22.2, a financial analysis was carried out. Sunk costs
were excluded from this analysis.
For
per
sona
l use
onl
y

May 2012 Agbaou Gold Project Page 22-3 NI 43-101
Technical Report
Table 22.2: Summary of LOM Production, Capital and Operating Costs
22.2.3.1 Summary of Financial Analysis
Financial analysis results are summarized in Table 22.3.
Table 22.3: Summary of Financial Analysis Results
Financial Summary Units 2nd
Q 2012
LOM Tonnage Ore Processed t 11 074,927
LOM Feed Grade Processed g/t 2.50
LOM Gold Recovery % 92.5%
LOM Strip Ratio
7.87
LOM Gold Production oz 821,728
Production Period years 8.00
Gold Annual Production- LOM oz 102,716
LOM Direct Operating Costs US$/oz 635
LOM Total Cash Operating Costs US$/oz 677
LOM Total Cash Operating Costs US$/t 50.3
Total Capital Costs US$/oz 217.8
Total Production Costs US$/oz 895
Post Tax NPV US$ million 184.3
IRR % 27.7%
UnDiscounted Payback Period years 2.53
Project Net Cash Flow after Tax and Capex US$ million 273.8
Major highlights of the financial analysis are as follows:
Gold Production: Life of mine average production of 102,716 ounces per annum.
Direct Operating Costs: Life of mine average cash operating costs of US$635 per troy
ounce is inclusive of mining, processing, assay, general and administration.
Total Cash Operating Costs: Life of mine total costs of US$677 per troy ounce is inclusive
of direct operating cost, refining and royalty charges. Total Project Costs: Total project costs of US$895 per troy ounce are inclusive of
construction capital, life of mine operating costs and sustaining capital. This cost represents
the break even gold price for the project from commencement of production until after
payback is achieved; thereafter the breakeven price drops to US$677 per troy ounce.
Unit Construction Year 1 Year 2 Year 3 Year 4 Year 5 Year 6 Year 7 Year 8 LOM
Tonnes Milled tpa 1 732 010 1 635 744 1 644 002 1 454 229 1 326 569 1 348 689 1 323 336 610 347 11 074 927
Plant Feed Grade g/t 1.76 2.31 2.89 3.02 2.14 2.62 2.50 3.27 2.50
Overall Plant Recovery % 93.17% 93.16% 93.08% 92.68% 92.29% 91.50% 91.60% 91.39% 92.46%
Recovered Gold oz 91 558 113 051 141 978 130 718 84 428 104 092 97 261 58 642 821 728
Mining Costs US$/t 21.79 27.33 29.87 29.70 48.18 35.60 28.66 29.54 30.94
Processing Costs US$/t 9.40 9.52 9.50 9.75 9.91 9.76 9.84 9.94 9.67
G&A and Assay Costs US$/t 5.91 6.26 6.03 6.82 7.47 6.51 6.64 7.30 6.52
Refining Costs US$/oz 5.00 5.00 5.00 5.00 5.00 5.00 5.00 5.00 5.00
Government Royalties US$/oz 37.31 37.31 37.31 37.31 37.31 37.31 37.31 37.31 37.31
Capital Costs (Including Sustaining) US$ 000 158 940 3 436 391 391 8 183 391 391 141 6 731 178 993
For
per
sona
l use
onl
y

May 2012 Agbaou Gold Project Page 22-4 NI 43-101
Technical Report
Net Present Value (NPV): The project will realize a post-tax NPV of US$184 million on a
discount rate of 5% and a gold price of US$1,250 per troy ounce.
Nett Cashflow: Net cashflow of US$274 million will be realized at a gold price of US$1,250
per troy ounce.
Internal Rate of Return (IRR) & Payback Period: Project IRR of 27.7% with a 2.53 year
payback period will be realized for the assumed production and capital expenditure.
22.2.3.2 Project Life Cashflow
The project LOM cashflow's by year are given in Table 22.4.
For
per
sona
l use
onl
y

May 2012 Agbaou Gold Project Page 22-5 NI 43-101
Technical Report
Table 22.4: LOM Project Cashflow LOM Totals Preproduction 1 2 3 4 5 6 7 8
Gold Production & Revenue
Tonnes Treated 11 074 927 - 1 732 010 1 635 744 1 644 002 1 454 229 1 326 569 1 348 689 1 323 336 610 347
Grade 2.50 - 1.76 2.31 2.89 3.02 2.14 2.62 2.50 3.27
Recovery 0.92 - 0.93 0.93 0.93 0.93 0.92 0.92 0.92 0.91
Gold Production oz 821 728 - 91 558 113 051 141 978 130 718 84 428 104 092 97 261 58 642
Payable Gold % 99.90% 99.90% 99.90% 99.90% 99.90% 99.90% 99.90% 99.90% 99.90%
Gold Price US$/oz 1 250 - 1250 1250 1250 1250 1250 1250 1250 1250
Gross Revenue US$ 000 1 026 133 - 114 334 141 173 177 295 163 234 105 429 129 985 121 454 73 229
Operating Costs
Mining US$ 000 342 630 - 37 742 44 707 49 099 43 195 63 919 48 011 37 924 18 032
Plant US$ 000 107 048 - 16 274 15 569 15 621 14 183 13 151 13 163 13 022 6 066
G & A and Assaying US$ 000 72 233 - 10 236 10 236 9 913 9 913 9 913 8 782 8 782 4 458
Total Opex (Direct) US$ 000 521 911 - 64 253 70 512 74 632 67 291 86 982 69 956 59 728 28 556
Royalties & Refining Charges
Government Royalties US$ 000 30 661 - 3 416 4 218 5 298 4 877 3 150 3 884 3 629 2 188
Refining Charges US$/oz 5.0 - 5.00 5.00 5.00 5.00 5.00 5.00 5.00 5.00
Refining Charges US$ 000 4 109 - 458 565 710 654 422 520 486 293
Total Cash Costs US$ 000 556 680 - 68 127 75 296 80 640 72 822 90 555 74 361 63 843 31 037
Total Cash Costs US$/oz 677 - 744 666 568 557 1 073 714 656 529
After Tax Cashflow
National Reconstruction Tax US$ 000 0 0 0 0 0 0 0 0 0
Operating Benefit US$ 000 469 453 46 207 65 877 96 655 90 412 14 874 55 624 57 611 42 192
Initial Capital Expenditure (Excl WC) US$ 000 (153 900) (153 900)
Deferred Capital US$ 000 0
Sustaining Capital US$ 000 (20 053) (3 436) (391) (391) (8 183) (391) (391) (141) (6 731)
Working Capital US$ 000 0 0 0 0 0 0 0 0 0
Return on WC 0 0 0 0 0 0 0 5 040
Plant Residual Value-Mining US$ 000 0 0 0 0 0 0 0 0 0
Process Plant Residual Value-Process US$ 000 2 426 0 0 0 0 0 0 0 2 426
Profit Before Tax US$ 000 302 966 (153 900) 42 771 65 486 96 265 82 229 14 483 55 233 57 470 42 927
Depreciation US$ 000 (153 900) (19 237) (19 237) (19 237) (19 237) (19 237) (19 237) (19 237) (19 237)
Taxable Income US$ 000 98 434 0 0 0 0 0 35 996 38 233 24 205
Tax Rate % 0% 0% 0% 0% 0% 25% 25% 25%
Tax US$ 000 (24 608) 0 0 0 0 0 (8 999) (9 558) (6 051)
After Tax Profit US$ 000 273 833 (158 940) 42 771 65 486 96 265 82 229 14 483 46 234 47 912 37 391
Undiscounted Cumulative Cashflow After Tax (US$'000) (158 940) (116 169) (50 682) 45 583 127 812 142 295 188 530 236 442 273 833
Discount Rate % 5%
Discounted Cashflow after Tax 184 284 (154 903) 38 795 56 570 79 197 64 429 10 808 32 858 32 429 24 103
Cumulative Discounted Cashflow after Tax (154 903) (116 108) (59 539) 19 658 84 087 94 895 127 753 160 182 184 284
Discount Rate % 5%
Post Tax NPV (US$'000) 184 284
Post Tax IRR (%) 27.7%
UnDiscounted Payback Period years 2.53
For
per
sona
l use
onl
y

May 2012 Agbaou Gold Project Page 22-6 NI 43-101
Technical Report
22.2.3.3 Sensitivity Analysis
A sensitivity analysis was performed on the after tax profits by varying the major key
variables (gold price, capex and opex) to ± 30% of the base case cashflow and each
sensitivity was performed independent of the other.
The results of the sensitivities are summarized in Table 22.5, Table 22.6 and
Table 22.7, which show gold price varying from US$875 to US$1,625 per troy ounce, capex
and opex variations.
Figure 22.1 and Figure 22.2 show the detailed sensitivity analysis of changing the key
variables to ± 30%.
Table 22.5: Gold Price Sensitivity
Gold Price
(USD/oz) IRR (%)
NPV (USD 000)
0% 5% 10%
875 -0.2% -1 609 -32 669 -54 116
1063 15.4% 136 340 75 970 33 176
1250 27.7% 273 833 184 284 120 234
1438 38.3% 411 326 292 599 207 291
1625 47.7% 548 818 400 913 294 348
Table 22.6: Capex Sensitivity
CAPEX Change (%) IRR (%) NPV (USD 000)
0% 5% 10%
-30% 41.7% 322 658 232 027 166 891
-15% 33.8% 298 245 208 156 143 562
0% 27.7% 273 833 184 284 120 234
+15% 22.9% 249 421 160 413 96 905
+30% 19.0% 225 008 136 542 73 576
Table 22.7: Operating Costs Sensitivity OPEX Change (%) IRR (%) NPV (USD 000)
0% 5% 10%
-30% 38.8% 418 538 298 175 211 685
-15% 33.4% 346 186 241 230 165 959
0% 27.7% 273 833 184 284 120 234
+15% 21.6% 201 480 127 339 74 508
+30% 14.7% 129 128 70 394 28 782
For
per
sona
l use
onl
y

May 2012 Agbaou Gold Project Page 22-7 NI 43-101
Technical Report
Figure 22.1: NPV Sensitivity at 5% Discount Rate
Figure 22.2: IRR Sensitivity at 5% Discount Rate
22.3 DISCUSSION When ranked, the sensitivity analysis indicates that the project is most sensitive to gold price
followed by operating costs and then capital expenditure.
-$100 000
-$50 000
$0
$50 000
$100 000
$150 000
$200 000
$250 000
$300 000
$350 000
$400 000
$450 000
-40% -30% -20% -10% 0% 10% 20% 30% 40%
NP
V U
S$
(0
00
)
Percentage Change
NPV SensitivitiesNPV Gold Price NPV CAPEX NPV OPEX
-10%
0%
10%
20%
30%
40%
50%
60%
-40% -30% -20% -10% 0% 10% 20% 30% 40%
IRR
Pe
rce
nta
ge
Percentage Change
IRR SensistivitiesGold Price Sensitivity Capex Sensitivity Opex Sensitivity
For
per
sona
l use
onl
y

May 2012 Agbaou Gold Project Page 23-1 NI 43-101
Technical Report
SECTION 23. ADJACENT PROPERTIES
ENDEAVOUR has no adjacent properties to the Agbaou Exploration Permit area.
Newcrest Mining Limited’s Bonikro Mine is located approximately 30km north-west of the
Agbaou Project (Newcrest Mining Limited, 2006). Commercial production at Bonikro
commenced in August 2008.
Newcrest holds 85% of the shares in Equigold Mines CI SA which in turn holds a 100%
interest in the Bonikro gold project. The Côte d'Ivoire Government holds a 10% interest in
Equigold Mines CI SA, with the remaining 5% held by minority shareholders.
For
per
sona
l use
onl
y

May 2012 Agbaou Gold Project Page 24-1 NI 43-101
Technical Report
SECTION 24. OTHER RELEVANT DATA AND INFORMATION
24.1 IMPLEMENTATION
24.1.1 Introduction The Agbaou Project implementation schedule is based on the requirement of producing first
gold by the end of the 4th Quarter 2013. The project execution schedule reflects the work
required from detailed engineering, construction through to commissioning. The schedule
assumes that there is a seamless advancement of the project between the various project
phases.
The project major milestones include the following:
• EPCM contract award – May 2012; • Commencement of construction (earthworks) - August 2012; • The first gold pour will be 19 months after the start of detailed engineering -
December 2013.
It is envisaged that ENDEAVOUR will appoint an independent engineering company to
execute the project on an EPCM basis.
24.1.2 ENDEAVOUR Execution Strategy The strategy for the execution of ENDEAVOUR’s Agbaou Project includes the major roles
and responsibilities mentioned below.
24.1.2.1 Project Manager
Overall responsibility for the execution of the project will fall under the control of the
ENDEAVOUR project manager and his team, to whom the appointed EPCM contractor’s
project manager will report to.
24.1.2.2 Owner’s Team
The project manager will draw on the specialist technical and project execution expertise of
an owner’s team that will typically comprise (and summarized in organogram below):
• Specialists in engineering disciplines essential to the successful execution of the Agbaou project, including a design and technical manager with a team consisting of a project engineer and a mining engineer. The technical specialists will be responsible for ensuring that appropriate standards are applied to all engineering work on the project and approving design and engineering work undertaken by the EPCM consultant;
• An in-country project manager with a team consisting of electrical, construction and earthworks supervisors, surveyors, procurement officers and an administrative team;
• A manager responsible for all matters relating to the environmental, health and safety aspects of the project execution;
• A manager responsible for all community relations pertaining to the execution of the project;
• An accounts manager;
For
per
sona
l use
onl
y

May 2012 Agbaou Gold Project Page 24-2 NI 43-101
Technical Report
• A government relations manager responsible for dealing and communicating with government officials on all permitting and legislative matters;
• Legal counsel dealing with the Ivorian mining and corporate legislation.
For
per
sona
l use
onl
y

May 2012 Agbaou Gold Project Page 24-3 NI 43-101
Technical Report
Figure 24.1: Owner’s Project Implementation Team
For
per
sona
l use
onl
y

May 2012 Agbaou Gold Project Page 24-4 NI 43-101
Technical Report
The design and technical team would be based in Perth, Australia, whilst the rest of the team
would be based in Abidjan or on site, in Côte d’Ivoire.
24.1.2.3 EPCM Consultant
An EPCM consultant will be appointed to manage the engineering, procurement, contract
management and construction management of the Agbaou Project on behalf of
ENDEAVOUR. The EPCM contractor’s project manager will report to the ENDEAVOUR
project manager.
24.1.3 EPCM
24.1.3.1 Engineering
The EPCM Contractor will establish a project specific team to produce the following to
execute the project:
• Project specifications; • Design criteria; • Plant and infrastructure designs; • Data sheets; • Drawings; • Technical reports; • Engineering schedules (equipment lists, motor lists, etc.).
The EPCM contractor will establish design and engineering control functions through a
system of review and approval by the owner’s engineering team.
The EPCM contractor’s standard specifications, design criteria and basis for design will
generally be adopted for the Project. Changes to the standard specifications and design
criteria will be approved by ENDEAVOUR.
24.1.3.2 Procurement
The EPCM contractor will provide all necessary procurement services for the timely
completion of the Project, including:
• Generation of enquiry documents; • Obtaining and control of quotations; • Preparation of commercial adjudications; • Bid clarification and negotiations; • Preparation of orders and contract documentation and any modifications; • Expediting; • Delivery; • Quality assurance and inspections; • Freight forwarding control; • Preparation of control documents and schedules.
24.1.3.3 Construction Management
The construction team will implement and control all aspects of the site work within their
scope, interfacing with ENDEAVOUR as required to satisfy the required scope of work within
the required duration.
For
per
sona
l use
onl
y

May 2012 Agbaou Gold Project Page 24-5 NI 43-101
Technical Report
The construction manager will be responsible for ensuring that the work proceeds according
to specifications and project schedules, and that quality and workmanship standards are
maintained. He will also be responsible for the day-to-day site activities, including
maintenance of occupational health, safety and environmental procedures.
24.1.4 Construction The EPCM contractor will ensure that all contractors are mobilized to site in such a time
frame to facilitate the start of their respective responsibilities in line with the execution
schedule. The construction management team will oversee all contractors within their scope.
Construction will also include the following responsibilities:
• Site material control; • Construction planning; • Human resource functions; • SHEQ; • Contract management; • Progress reporting.
24.1.5 Commissioning The commissioning approach will be based on four basic phases as described in a typical
enquiry document:
• Pre-commissioning; • Cold commissioning; • Hot commissioning; • Training and operational assistance period.
The completion of each phase will be signified by appropriate documentation and will be
completed before progressing to the next phase.
The EPCM Contractor will prepare a detailed commissioning manual identifying the
commissioning procedure, all test data and record sheets to be used, the commissioning
team and program.
24.1.6 Project Schedule In the development off the implementation schedule, the following assumptions were made:
• Commencement of detailed engineering, procurement and contracts administration in June 2012;
• Placing orders for long lead delivery items will be in month 1 from start of detailed engineering;
• Bulk Earthworks will commence within 4 months from start of detailed engineering. • The First Gold Pour will be 19 months after the start of Detailed Engineering
(December 2013).
The summarized project schedule is provided in Figure 24.2.
For
per
sona
l use
onl
y

May 2012 Agbaou Gold Project Page 24-6 NI 43-101
Technical Report
Figure 24.2: Project Execution Schedule
For
per
sona
l use
onl
y

May 2012 Agbaou Gold Project Page 24-7 NI 43-101
Technical Report
24.2 DESIGN CRITERIA
24.2.1 Engineering Design Criteria The proposed engineering design criteria consist of the following sections:
• Civil work; • Structural; • Platework; • Mechanical equipment; • Piping; • Valves; • Painting; • Vendor equipment; • Hand, knee railing, stanchions and stair treads; • Rubber lining.
The following engineering design criteria shown above will apply to the various engineering
disciplines. However, the over-riding basis is that all engineering, designs and construction
will be based on sound engineering principles and good practical applications.
Safety must be considered as a prime objective and all equipment supply and installation
shall comply with recognised international practice.
In all instances, equipment manufacturers’ installation, maintenance and operation
recommendation will be complied with.
The design criteria will at all times take into account ease of maintenance and the capital
expenditure will not be reduced at the expense of operating cost.
24.2.1.1 Civil Work
• Civil design and construction will conform to the relevant sections of SABS 0100. Design will be approved by a registered professional engineer.
• Concrete strengths at 28 days will be: o 25MPa for foundations, slabs and walls; o 10MPa for mass concrete and blinding.
• Concrete finishes will be wood float on all floors. • Walls and bunds will receive smooth off-shutter finish above ground, tolerance class
II. • Slump and cube tests will be performed as required to SABS 0100. • All wet area floor slabs will slope at 1:500 at the valley to a central sump area.
24.2.1.2 Structural
• Structural steel will be supplied in accordance with SABS 1431 or equivalent. • Where installed, roof and side sheeting will be IBR, hot-dip galvanised and 0.6mm
thick. • Flooring will be 30mm x 4.5mm bearer bars and 7.6mm diameter round transversal
bars. Bearer bars 43mm centres and transverse at 50mm centres, bitumen open grid type.
• Where applicable, wind loading will be allowed in accordance with the prevailing
For
per
sona
l use
onl
y

May 2012 Agbaou Gold Project Page 24-8 NI 43-101
Technical Report
winds in the area. 24.2.1.3 Platework
• Platework will be predominantly mild steel and painted on all non-process contact surfaces.
• Liners will be installed in wear areas as follows: o Creusabro or similar suitable wear resistant / impact resistant steel, minimum
6mm thick. All steel liners shall be man-handable and fixed with countersunk bolts.
24.2.1.4 Mechanical Equipment
The broader mechanical equipment scope is as specified in the equipment lists provided in
this document.
Conveyors will be fitted with the following:
• Belt slip detectors; • Belt cleaning equipment; • Belt alignment switches, start sirens; • Blocked chute detectors, trip wires and pull switches; • Belt speed sensors; • Sequence switches; • Interlocking devices.
24.2.1.5 Piping
Piping will be supplied and installed to the following specifications:
• Up to 150mm NB: SABS 62 or equivalent, “medium” grade, flanged, screwed or welded connections;
• 200mm NB and larger: SABS 719 or equivalent, grade B, wall thickness 4.5mm minimum or thicker to suit operating duty, flanged or welded connections;
• Flanges: SABS 1123, 600/3 or 1000/3 etc. depending on line operating pressure. Conversion of the design and supply of flanges to ANSI – 16.5 ASA could be provided with minimal material and limited design cost increase;
• Materials of construction: mild steel for all applications, unless otherwise specified; • Connections in piping of diameter 40mm NB and less will be screwed connections; • Piping with a nominal bore exceeding 40mm will be screwed or flanged or welded,
depending on the physical installation, provided that all lines, regardless of size, have adequate flanged connections to ensure ease of removal / maintenance / unblocking.
24.2.1.6 Valves
• Process water, raw water and other clear solution isolation and control valves to be butterfly type.
• Slurry isolation valves to be either knife gate or diaphragm Saunders type “KB”. • All slurry pump suction lines will be fitted with a manual Saunders type KB dump
valve. • Diaphragm Saunders type “A” valves will be used on water hosing and compressed
air points. • All compressed air points will be equipped with an Atlas Copco, or equivalent, type
25 mm quick release coupling.
For
per
sona
l use
onl
y

May 2012 Agbaou Gold Project Page 24-9 NI 43-101
Technical Report
24.2.1.7 Painting
The following painting and / or corrosion protection will be applied as a minimum to structural
steel, platework and aboveground piping:
• Abrasive blast clean to Sa 2 ½ (Blast Profile 45-70 µm); • Primer and final coat in fabricators / supplied works is one coat high build zinc
phosphate polyurethane; • Final total D.F.T to be 120µm; • All touch-up work on site and paint repair work will be carried out in accordance with
SABS 630; • All floor grating will be thoroughly cleaned, rust and/or scale and/or grease removed
and bitumen dipped prior to delivery to site. 24.2.1.8 Vendor Equipment
Vendor equipment will be supplied to vendor standard paint specifications and colour,
provided that the above specification as a minimum is met.
24.2.1.9 Hand, Knee Railing, Stanchions and Stair Treads
Tubular hand, knee railing and stanchions will be supplied to site painted as per with
vendor’s zinc chromate finish. A final coat will be supplied once hand railing has been
installed.
24.2.1.10 Rubber lining
• Abrasive blast to clean the mild steel surface in accordance with ISO 8501-01 Grade SA2½ and such that the profile depth is 40-70 microns.
• All rubber lining will be 6 mm thick, apart from flanges where the lining is to be 3mm thick.
• Rubber lining will be done in accordance with SABS 1198 or equivalent. • Rubber lining will be natural rubber to 40 - 50 Shore. • Mill discharge launders & mill sump high wear areas will be lined with either SKEGA,
Solidur low friction liner or ceramic tiles or equivalents.
24.2.2 Electrical Design Criteria
24.2.2.1 Safety
Equipment design, specification and selection have been chosen such that the highest
attention is paid to personnel and equipment safety. For this reason equipment is
conservatively rated and selected on the basis of proven design. Equipment has been
adequately selected to perform in accordance with the manufacturer's ratings where
applicable.
Equipment was selected and specified so as to provide safe enclosures for the environment
that it will be required to operate under. In general all equipment enclosures provide at least
IP41 degree of protection when closed and IP2x classification when normal access doors
are open.
Where enclosures are likely to be subjected to direct hosing down, the enclosure
classification suitable for the duty was chosen as IP65 degree of protection.
For
per
sona
l use
onl
y

May 2012 Agbaou Gold Project Page 24-10 NI 43-101
Technical Report
24.2.2.2 Applicable Standards, Regulations and Code of Practice
The following standards and codes have been considered in the design criteria:
General
• The South African Institute of Electrical Engineers; • South African Bureau of Standards (in particular SANS 10142-1); • British Standards Institute; • International Electro technical Commission (IEC); • ESKOM Code of Practice.
Obligatory Standards and Regulations
The applicable obligatory standards and regulations as practised in the Côte d’Ivoire,
Western Africa will be considered during the execution of the project and the specifications
will be updated should they deviate from these requirements.
24.2.2.3 Power Supplies and Power Distribution Philosophy
Equipment Standard Voltages Equipment is specified for the following standard voltages:
• System Voltage Equipment Voltage BIL; • 11kV 17.5kV 95kV (Medium Voltage); • 400V and less 460V 2,5kV (Low Voltage).
Lighting and Small Power Installations Lighting and small power distribution (normal) 400 volts, 3 phase 4 wire system - neutral
solidly earthed. Emergency lighting will be available from an uninterruptable power source.
Control Voltages The following standards will apply:
• 110 Volts AC single phase (Low voltage); • 110 Volts DC derived from a battery tripping unit (Medium voltage); • PLC Input and outputs, 24 volts DC.
Quality of Power Supply The following criteria have been taken into consideration for the electrical equipment and
plant:
All MV and LV equipment will operate within a ±5% voltage drop of the operating voltage,
frequency of 50Hz within a ±2% tolerance and harmonic distortion limited to 3% THD.
Low Voltage Distribution Suitably rated transformers to feed each of the MCC’s will be provided.
Lighting and Small Power Lighting and small power distribution for the plant will be from a dedicated essential and non
– essential lighting distribution board.
For
per
sona
l use
onl
y

May 2012 Agbaou Gold Project Page 24-11 NI 43-101
Technical Report
Instrumentation and Control Power Supplies Control and instrumentation voltages will be a combination of 110V, 1-phase, 50Hz and 24V DC 24.2.2.4 Equipment Specification
Standby Plant The power requirements for the proposed standby plant will be 2.4MW at a proposed low
voltage of 400V and frequency of 50Hz (SRK Consulting, SENET, Knight Piésold
Consulting, 2012 Appendix 18-C Refer to drawing number: SP462 9000 E0101 overall single
line diagram). The standby plant will provide power to the critical loads of the plant. Critical
loads to be finalised during execution phase of the project..
The generators will be powered with diesel.
Medium Voltage Switchgear One medium voltage switchgear panel is proposed at 11kV (SRK Consulting, SENET,
Knight Piésold Consulting, 2012 Appendix 18-C).
Suitably rated indoor switchgear equipped with overcurrent earth fault protection schemes
for the incomers and feeders will be provided. Details of protection schemes to be provided
during execution phase of the project.
Transformers Distribution and power transformers will be oil insulated (ONAN), double wound, 3 phase,
50Hz and Dyn11 complying with SANS 780.
Transformers will be designed using the following temperature indicators:
• Oil temperature: o (80-82oC) – Alarm; o (94-95oC) – Trip.
Transformer installations in the vicinity of plant structures or other transformers will be
provided with secure pens and firewalls between transformers and other structures. Cable
routing will run external to transformer pens or as short as possible within the pen.
Single transformers remote from structures will be installed on a slab with a fence around the
transformer.
Provision is made for a number of pole mounted transformers as well. This will be applicable
for all the overhead line supply areas with transformers not exceeding 400kVA (500kVA
transformers will be placed on the ground).
For more detail regarding the layout, refer to the overall single line diagram: SP462 9000
E0101. Transformer sizing to finalised during execution phase of the project.
For
per
sona
l use
onl
y

May 2012 Agbaou Gold Project Page 24-12 NI 43-101
Technical Report
24.2.2.5 Motor Control Centres (MCC’s) and Distribution Boards (DB’s)
Eight MCC’s is proposed for the Agbaou Gold Mine plant infrastructure (SRK Consulting,
SENET, Knight Piésold Consulting, 2012 Appendix 18-A describes load list for starter
allocation SP462 1000 1E8 001 and MCC line). Three of which will be containerised due to
remote location and large cables sizes distribution.
MCC’s will be of the compartmentalised non-withdrawable type with moulded case circuit
breakers, magnetic contactors and earth bus, and will comply with the relevant SANS
specification on MCC’s.
The MCC’s will have the following features:
• All enclosures, MCCB’s, busbars and control transformers will be suitably rated for the application and load requirements;
• Front and bottom entry with separate cable ways; • Form 3b design.
24.2.2.6 Electric Motors Low Voltage
Electrical motors have been specified under the mechanical portion of the document.
The control of the motors can be summarised with the following:
• START-STOP or STOP push-button stations will be located at each motor location; • Stations located in wet process areas or outdoors will be of watertight construction; • STOP push-buttons will be of the stay-put type.
24.2.2.7 Electric Cables (HT, LT and Instrumentation)
All cables supplied will be suitably rated for their application considering the environment
and de-rated accordingly. All cables supplied comply to the SANS specification. Suitably
rated joint and termination kits will be provided accordingly.
Cable Racking Cables racking will be used were cables are running on structures, indoors or where cable
support is required. All cable racking have been suitably specified for their application.
Variable speed drives, rectifiers and soft starters VSD’s above 110kW will be housed in their own panel enclosures with an incoming isolator
and door mount handle.
Soft starters are incorporated in the MCC’s designs for motor above 110kW.
Overhead Lines Overhead lines are used for remote loads external to plant areas like the tailing return water,
raw water supply, camp and mining workshop. The overhead lines will be designed and
constructed in accordance with ESKOM code of practice and Côte d’Ivoire code of practice.
Materials, methods of construction and requirements stated here are for 11kV overhead line.
Conductor sizing to be finalised once the project is in the execution phase and layout have
been frozen. Conductors will be large enough to limit voltage drop to 5% of nominal.
For
per
sona
l use
onl
y

May 2012 Agbaou Gold Project Page 24-13 NI 43-101
Technical Report
Earthing and Site Lighting Provision has been made for earthing of all electrical equipment and buildings where
applicable. Earthing readings will be conducted to finalise the design during the execution
phase.
Lighting of all buildings has been provided for. Site lighting will make use of pole mounted
lamps and a number of 15m high masts. Storage and workshops will make use of high bay
and low bay type fittings.
Instrumentation and PLC system Provision has been made all the instrumentation as per the process flow diagrams (PFD’s).
The programmable logic controllers (PLC’s) will be housed in the MCC panels and will
communicate on a fibre optic network.
Provision has been made for a supervisory, control and data acquisition (SCADA) system as
well that will be housed in the plant control room.
All drives will be dependent on the PLC for control due to the number of interlocks and
parameters that need to be monitored for safe operation.
The control of the plant will be defined in the process control specification document which
will form the basis for the functional specification.
24.2.2.8 Substation Design
• 400V MCC’s will be installed in block brick buildings with two doors, steel roof trusses, insulation and IBR sheeted.
• Sub-station buildings will be air-conditioned.
For
per
sona
l use
onl
y

May 2012 Agbaou Gold Project Page 25-1 NI 43-101
Technical Report
SECTION 25. INTERPRETATION AND CONCLUSIONS
25.1 MINERAL RESOURCE The currently defined Mineral Resources coincides with the areas within the original
Exploration License area where the best mineralization was detected in soil samples.
However, recent sterilization drilling has indicated that the potential exists to discover more
mineralization outside the currently modeled areas, and also in those areas not explored
during the soil surveys.
In the opinion of SRK the sampling preparation, security and analytical procedures used by
ENDEAVOUR are consistent with generally accepted industry best practices and are
therefore adequate.
The apparent course nature of the gold results in a high variability in the field duplicate set.
The BV laboratory results of the blind CRM’s inserted by ENDEAVOUR in the field returned
very good results. Similarly blank material retuned acceptable results and SRK accepts the
BV Laboratory results.
The relatively poor results of the duplicate pulp samples submitted to SGS Laboratory in
Ghana (Referee Laboratory 1) and to the accredited SGS Laboratory in Canada (Referee
Laboratory 2) indicate poor but acceptable replication. It has to be concluded that the scatter
observed although less in the second referee laboratory, is partly caused by the particle
distribution of the gold, although the same should have been evident in the pulp duplicates
analyzed by the BV Laboratory if this was the only cause. The results of the second set of
replicate pulp analyses (Referee Laboratory 2) are however very similar to that of the
independent field coarse duplicates and a slight improvement on the results from the
unaccredited laboratory in Ghana (Referee Laboratory 1).
SRK believes that the current QAQC systems in place at Agbaou to monitor the precision
and accuracy of the sampling and assaying, is adequate and the BV Laboratory returned
acceptable results for use in resource estimation.
The resource evaluation methodology involved the following procedures:
• Database compilation and verification; • Construction of wireframe models for the boundaries of the gold mineralization; • Definition of resource domains; • Data conditioning (compositing and capping) for geostatistical analysis and
variography; • Block modeling and grade interpolation; • Recoverable resource estimation; • Resource classification and validation; • Assessment of “reasonable prospects for economic extraction” and selection of
appropriate cut-off grades; • Preparation of the Mineral Resource Statement.
For
per
sona
l use
onl
y

May 2012 Agbaou Gold Project Page 25-2 NI 43-101
Technical Report
The database supplied to SRK was in a Microsoft Access database, and the SRK validations
returned a small number of errors which were corrected through communication with the
ENDEAVOUR database manager. The small number of errors indicates that the database is
well maintained, and the quality of the data is considered to be good.
The 2012 mineral resource estimate is an update of the mineral resources estimated by
Coffey Mining in 2008, following the completion of an additional phase of drilling on the
project. The mineralization has been re-modeled to honor the new intersections, but the
Coffey interpretation was also revised as follows:
• Additional zones were modeled parallel to the main mineralized zones where sufficient continuity along strike and down dip was observed;
• The major zones were extended along strike where additional drilling had intersected the mineralization;
• The SRK interpretation attempted to reduce the low grade dilution within the mineralized envelopes, and this resulted in a trend towards decreased tonnes, at a higher grade, with some isolated high grade samples no longer included in the mineralized envelopes.
A total of ten quartz vein mineralized zones were modeled in the Main, Central and Southern
areas and three zones in the Western area. In addition the mineralized areas in the laterite
cap were modeled as a separate overlying zone. In contrast to the Coffey interpretation,
SRK excluded all laterite material from the quartz vein zones, where Coffey extended the
quartz vein zones into the laterite where the mineralization was elevated. SRK consider the
potential for lateral re-distribution of the gold in the laterite is significant, considering that
there is evidence of lateral transport of the lateritic material in places, and that this material is
better modeled as a single unit.
The weathering zones were modeled in a similar manner to the Coffey interpretation,
defining laterite, saprolite, transitional and fresh domains which formed the basis of the
density assignment.
Following a composite optimization exercise SRK composited all samples within the
mineralized envelopes to 2m lengths, forcing all samples to be included in the composites by
adjusting the composite length at the base of the mineralisation. Nine of the fourteen zones
required capping of high grade outlier values before estimation to limit the impact of the
unusually high values.
SRK was able to generate robust semi-variograms for the better informed zones, however
for some of the smaller modelled zones there was insufficient data available to generate
reliable experimental semi-variograms. The zones for which it was not possible to generate
robust semi-variograms were grouped together with better informed zones with robust semi-
variograms, and borrowed the semi-variograms from the well informed zones. For the well
informed zones the semi-variograms show robust strictures with long ranges between 50m
and 100m, which is in excess of the drill hole spacing in the densely drilled areas.
The QKNA block size optimization exercise indicated an optimal block size of 10m (X) x 20m
For
per
sona
l use
onl
y

May 2012 Agbaou Gold Project Page 25-3 NI 43-101
Technical Report
(Y) x 10m (Z) considering both the dimensions of the ore body, the typical intersection
spacing, composite length, and the Kriging statistics for the block sizes tested.
A similar exercise completed to optimize the search neighborhood resulted in the selection
of an optimal number of samples of between 20 and 25 dependent on the zone. Four
separate search orientations were defined for the Main, Central and Southern area to best
match the variable ore body orientation is parts of the ore body. In the West area three
search domains were used. For the laterite estimate, where the mineralized envelope follows
the topography, and has a variable orientation, the search ellipse orientation was
dynamically rotated, based on the orientation of the base of the laterite, to optimally match
the orientation of the mineralized envelope.
All zones were estimated using Ordinary Kriging using the optimized search parameters,
using a three phase search strategy. The first pass estimates used the semi-variogram
ranges to define the search. The second and third passes used expanded search ranges
were designed to ensure the best estimates possible beyond the semi-variogram range, but
also to ensure that all blocks were estimated. This was required as in some areas the
interpreted mineralization showed some abrupt changes in orientation, possibly related to
smaller scale faulting.
In addition to the Ordinary Kriged estimates, for the zones with sufficient information and
reliable semi-variograms SRK generated a UC and MIK estimate. These zones are zones 1,
2, 3, 4, 7, and 9, which (excluding the laterite) make up 90% of the volume of the
North/Central/South area. The UC and MIK estimates were validated against the Ordinary
Kriged estimates at 0g/t cut off, and against each other at a range of cut off values. As the
UC estimate is based on the Ordinary Kriged estimate, the estimates correlate exactly, while
the MIK estimates show a higher grade without applying a cut off. The MIK estimates also
typically show a higher grade at cut-off values with the recoverable grades converging at
higher cut-off values. The MIK estimate therefore estimates that a greater degree of
selectivity will be achievable, than is estimated by the UC method. The MIK estimate was
selected for the final resource reporting to be consistent with previous resource estimates,
however there is a risk that the selectivity modeled using MIK is over estimated, and that the
recoverable tonnes above the selected cut off may be greater than estimated, at a lower
grade.
A number of validations were done on the Ordinary Kriged, UC and MIK estimates which
indicated relatively good agreement with the source data, and the estimates. The mineral
resources are reported above a 0.3g/t cut off value which was calculated using the operation
parameters used in the Reserve calculations, and an optimistic gold price of US$2,000/oz.
25.2 MINING SRK have not seen any updated studies regarding the geohydrology and geotechnical
aspects of the Agbaou deposits. Assuming that these parameters have not changed
adversely there are no reasons that the Agbaou deposits cannot be mined successfully.
For
per
sona
l use
onl
y

May 2012 Agbaou Gold Project Page 25-4 NI 43-101
Technical Report
25.3 PROCESS PLANT AND ECONOMIC EVALUATION Based on the results of the previously conducted testwork and the results of the testwork
conducted as part of the EOS, SENET produced a process plant design capable of treating
1.6Mtpa saprolite ore or 1.34Mtpa bedrock ore. The plant design is based on proven
technologies and processes and incorporates a conventional gravity and CIL circuit design.
The key project features are:
• Processed tonnage 11.1 million tonnes • Grade 2.5 g/t • Recovery 92.5% • Life of Mine (LOM) 8 years • Annual gold production 102,716 oz per annum • Total cash costs US$677 per oz. • Capital cost US$159 million
It is in the opinion of SENET that the capital costs provided are within the 10% accuracy
required for this level of study. The operating costs were derived from accepted industry
standards, first principle calculations, SENET in-house database and input from
ENDEAVOUR.
The results of the financial analysis indicate the viability of the Agbaou Gold Project. The
expected NPV, IRR and payback period based on a gold price of US$1,250 per ounce are
indicated below:
• NPV at 0% discount rate is US$273.8 million; • NPV at 5% discount rate is US$184.3 million; • IRR 27.7%; • Payback period 2.53 years.
For
per
sona
l use
onl
y

May 2012 Agbaou Gold Project Page 26-1 NI 43-101
Technical Report
SECTION 26. RECOMMENDATIONS
26.1 MINERAL RESOURCE The assay results obtained from the BV laboratory in Abidjan is of a good quality but due to
the poor repeatability in the results obtained from both the SGS laboratories in Ghana and in
Canada it is recommended that an alternative accredited commercial laboratory is selected
for the umpire laboratory function in future.
The current mineral resource estimates contain sufficient material to support the first five
years of mining in the measured and indicated categories. No additional exploration is
required to support the mining plan at this time. Peripheral to the reported resources,
additional potential mineralization targets have been intersected in condemnation drilling
holes. ENDEAVOUR is currently conducting a drilling program to evaluate and better define
these targets.
26.2 MINING The following are mining recommendations for Agbaou (in no particular order):
• More attention should be given to locating waste dumps (based on sterilization drilling) as this will effect mining operating costs;
• More accurate Mining contractors quotes should be obtained; • The comparison between Mining Contractors versus Owner Operated should be
investigated further.
26.3 METALLURGICAL TESTWORK Due to saprolite ore samples being too fine to conduct comminution testwork and EGRG
testwork, it is recommended that this testwork be conducted post EOS. In addition to this it is
recommended that the following testwork be carried out post EOS:
• Recovery testwork on saprolite ore; • Comminution testwork on saprolite ore; • Viscosity modifier testwork on thickener underflow product; • Variability viscosity testwork.
For
per
sona
l use
onl
y

May 2012 Agbaou Gold Project Page 27-1 NI 43-101
Technical Report
SECTION 27. REFERENCES
• African Mining Consultants, 2008. Agbaou Gold Process PR177 Environmental Impact Assessment. African Mining Consultants: Kitwe, Zambia.
• Bessoles, B., (1977). Geologie de l'Afrique. Le Craton Ouest Africain; Mem. Bur.
Rech. Geol. Min. Paris, p. 88.
• Blenkinsop, B. Cahen, L. Snelling, N.J. Delhal, J. & Vail, J.R., (1984). The
Geochronology and Evolution of Africa. Oxford University Press: Toronto. pp. 512.
• Canty and Associates LLC, 2012. Weatherbase.[online] Available at:
<http://www.weatherbase.com> [Accessed 2012].
• Coffey Mining Pty Ltd., 2008. Agbaou Gold Deposit Resource Estimation. Coffey
Mining Pty Ltd.: Perth, WA, Australia. Prepared for Etruscan Resources Inc., March
2008 Project Number PAGB05.
• Deijs, W. A. H., 2012. Bulk Solids Flow Report Agbaou Gold Project. Bulk Solids Flow SA cc.: Kempton Park, South Africa. Report no. BSFSA-535.
• Eisenlohr, B.N. and Hirdes, W., 1992. The Structural Development of the Early
Proterozoic Birimian and Tarkwaian Rocks of Southwest Ghana, West Africa. Journal
of African Earth Sciences and the Middle East, pp. 313-325.
• Eisenlohr, B.N., 1989. The Structural Geology of Birimian and Tarkwaian Rocks of
Southwest Ghana. BGR rep. No. 106 448. (unpublished).
• Garland, B., 2012. Agbaou Project Tailings Storage Facility Engineering
Optimisation Study. Knight Piésold Consulting: Johannesburg, South Africa. Report
No. 301-00167/04. Rev 0 (April 2012)
• Gossage, B., Warries, H., 1998. Agbaou Project-Summary-Ore Body Modelling and
Pit Optimisation. Resource Service Group:
• Hillcoat, H., 1999. Agbaou Modelling, Resource Estimation and Pit Optimisation.
Resource Service Group:
• Junner, N.R. and Hirst, T., 1946. The Geology and Hydrology of the Voltaian Basin.
Mem. Geol. Survey Gold Coast, No. 7.
• Knelson Concentrators Africa, 2012. Gravity Recovery Testwork on Samples from SENET (Agbaou Project) Saprolite and Bedrock. Knelson Concentrators Africa: North Riding, South Africa. Report no. SENET 01/12.
For
per
sona
l use
onl
y

May 2012 Agbaou Gold Project Page 27-2 NI 43-101
Technical Report
• Knight Piésold Ltd., 2012. Agbaou Gold Project – Gap Analysis for Pit Slope. Knight Piésold Ltd.: Vancouver, BC Canada. File no.: RI301-167/5 .01.
• Newcrest Mining Limited, 2006. Weatherbase.[online] Available at:
<http://www.newcrest.com.au/operations.asp> [Accessed April 2012].
• Orway Mineral Consultants, 2011. Agbaou Gold Project Comminution Testwork Circuit Design Review. Orway Mineral Consultants: Perth. Australia. Report no. 8819.30.
• Orway Mineral Consultants, 2011. Agbaou Gold Project Comminution Testwork Circuit Design Review. Orway Mineral Consultants: Perth. Australia. Report no. 8857.30.
• Patterson & Cooke Consulting Engineers, Pty. Ltd., 2012. Bench-top Thickening Test Report. Patterson & Cooke Consulting Engineers, Pty. Ltd.: Woodlands, South Africa. Report no. SEN-AGB 8284 RO3, Rev 1.
• Patterson & Cooke Consulting Engineers, Pty. Ltd., 2012. Slurry Test Report. Patterson & Cooke Consulting Engineers, Pty. Ltd.: Cape Town, South Africa. Report no. SEN-AGB 8284 RO2, Rev 1.
• Patterson & Cooke Consulting Engineers, Pty. Ltd., 2011. Endeavour Corporation’s Agbaou Project Slurry Test Report. Patterson & Cooke Consulting Engineers, Pty. Ltd.: Cape Town, South Africa. Report no. SEN-AGB 8284 RO1. Rev 1.
• SRK Consulting, SENET, Knight Piésold Consulting, 2012. Agbaou Gold Mine, Cote d’Ivoire, Engineering Optimization Study. SRK Consulting South Africa (Pty) Ltd., SENET, Knight Piésold (Pty) Ltd.: Johannesburg, South Africa. Report prepared for Endeavour Mining.
• Van der Merwe, J., Lotz P., 2012. Leachox and Cyanide Detox Test on Gold Bearing Ore Samples from Agbaou. Maelgwyn Mineral Services Africa: Roodepoort, South Africa. Report no. MMSA Report no. 11/93, Rev 3.
• Vann, J. Jackson, S. & Bertoll, O., 2003. Quantitative Kriging Neighbourhood
Analysis for the Mining Geologist. Australasian Institute of Mining and Metallurgy: Vic
3053 Australia. pp 215-223.
For
per
sona
l use
onl
y

May 2012 Agbaou Gold Project Appendix 3-A NI 43-101
Technical Report
Appendix 3-A:
Opinion from Theodore Heogan and Michel Ette Advocates Associes
For
per
sona
l use
onl
y

May 2012 Agbaou Gold Project Appendix 3-A NI 43-101
Technical Report
For
per
sona
l use
onl
y

May 2012 Agbaou Gold Project Appendix 3-A NI 43-101
Technical Report
For
per
sona
l use
onl
y

May 2012 Agbaou Gold Project Appendix 3-A NI 43-101
Technical Report
For
per
sona
l use
onl
y

May 2012 Agbaou Gold Project Appendix 3-A NI 43-101
Technical Report
For
per
sona
l use
onl
y

May 2012 Agbaou Gold Project Appendix 3-A NI 43-101
Technical Report
For
per
sona
l use
onl
y

May 2012 Agbaou Gold Project Appendix 3-A NI 43-101
Technical Report
For
per
sona
l use
onl
y

May 2012 Agbaou Gold Project Appendix 3-A NI 43-101
Technical Report
For
per
sona
l use
onl
y

May 2012 Agbaou Gold Project Appendix 4-A NI 43-101
Technical Report
Appendix 4-A: Decree and Exploitation License
For
per
sona
l use
onl
y

May 2012 Agbaou Gold Project Appendix 4-A NI 43-101
Technical Report
For
per
sona
l use
onl
y

May 2012 Agbaou Gold Project Appendix 4-A NI 43-101
Technical Report
For
per
sona
l use
onl
y

May 2012 Agbaou Gold Project Appendix 4-A NI 43-101
Technical Report
For
per
sona
l use
onl
y

May 2012 Agbaou Gold Project Appendix 4-A NI 43-101
Technical Report
For
per
sona
l use
onl
y

May 2012 Agbaou Gold Project Appendix 4-A NI 43-101
Technical Report
For
per
sona
l use
onl
y

May 2012 Agbaou Gold Project Appendix 4-A NI 43-101
Technical Report
For
per
sona
l use
onl
y


