Embed Size (px)
Citation preview
TR22 REGION(Balıkesir, Çanakkale)
FOOD INDUSTRYANALYSIS REPORT
AND GUIDE
COVID-19 Crisis Response
and Resilience Project
FOOD SECTOR ANALYSIS REPORT AND GUIDETR22 Region (Balıkesir, Çanakkale)
ISBN:© All rights reserved. R.T. Ministry of Industry and Technology General Directorate of Development Agencies, June 2021, Ankara.Reproduction of this publication for educational or other non-commercial purposes is authorized without prior written permission from the copyright holder provided the source is fully acknowledged. Reproduction of this publication for resale or other commercial purposes is prohibited without prior written permission of the copyright holders.
R.T. Ministry of Industry and Technology General Directorate of Development AgenciesAdress: Mustafa Kemal Mahallesi Dumlupınar Bulvarı, 2151. Cad. No: 154/A, 06510 Çankaya,AnkaraTel: 0 (312) 201 50 00www.sanayi.gov.tr
Project Team:R.T. Ministry of Industry and Technology General Directorate of Development AgenciesAhmet Şimşek, Head of DepartmentDr. Mehmet Emin Özsan, ExpertDr. Onur Karakurt, ExpertEda Doğan, ExpertAhmet Alıcı, ExpertFatma Avşar, MARKA, ExpertCandan Umut Özden, MARKA, Head of Unit
UNDP TurkeyMustafa Ali Yurdupak, Inclusive and Sustainable Growth Portfolio ManagerArzu Karaarslan Azizoğlu, Local Economic Development Projects ManagerAslı Aygün Gürsoy, Project AssistantZeynepsu Gülek, Project InternDeniz Şilliler Tapan, Project Communication Expert
Development Agencies Working Group Members for Food Sector:Emir Olcay SayınBerk Oğuzİsmail ÇelikOzan GündüzDoğan Ali OnuralpElif ÖztüfekçiVahit AkyolSinan Çırpan
Prepared by: Salim Tahhan
Design: Carnavale Ad&Pr
For citation: Food Sector Analysis Report and Guide TR22 Region (Balıkesir, Çanakkale) ; R.T. Ministry of Industry and Technology General Directorate of Development Agencies, 2021, Ankara, TurkeyFood Sector Analysis Report and Guide was prepared within the scope of the "COVID-19 Resilience and Response Project" financed by the Government of Japan, carried out by the United Nations Development Program (UNDP) in cooperation with the General Directorate of Development Agencies of the Ministry of Industry and Technology. This report is one of the 25 Region-Based Fragile Sector Reports prepared within the scope of the project.

TR22 BÖLGESİ(Balıkesir, Çanakkale)
FOOD INDUSTRYANALYSIS REPORT
AND GUIDE
COVID-19 Crisis Response and Resilience Project

4

i
TABLE OF CONTENTSTable List iii
Figure List iv
Abbreviations v
Foreword vi
Executive Summary ix
1. Introduction
2. Methodology 2
3. Profile of the Food Industry 4
3.1. General View of the Food Sector in the World 4
3.2. General View of the Food Sector in Turkey 10
3.3. General View of the Food Sector in TR22 Region 28
4. Effects of the COVID-19 Pandemic on the Food Industry 33
4.1. Comparison of Before and After the Pandemic 33
4.2. Possible Changes in the Post-Pandemic Sector 40
5. Trends Specific to the Food Industry 42
5.1. Trends in Food Sector in the World 42
5.2. Trends in Food Sector in Turkey 45
5.3. Trends in Food Sector in the TR22 Region 46
6. Current Status of the Food Industry 47
6.1. Primary Research Results 47
6.1.1. Survey Study 47
6.1.2. Focus Group Meetings 53
6.2. Industry Analyses 56
6.2.1. Food Industry Value Chain Analysis of TR22 Region 56
6.2.2. Food Industry PESTLE Analysis of TR22 Region 65
6.2.3. Food Industry SWOT Analysis of TR22 Region 66
6.2.4. Food Industry Five Forces Analysis of TR22 Region 67
6.2.5. Food Industry Gap Analysis of TR22 Region 68
7. Horizontal Subjects 70
7.1. Crisis Management 70
7.2. Resource Efficiency 70
7.3. Climate Change 71
7.4. Gender Equality 72
8. Policy Recommendations 76
9. Short,Medium and Long Term Strategies 78
9.1. Strategies within the Economical Scope 78
9.2. Strategies within the Social Scope 80
9.3. Strategies within the Environmental Scope 81
10. Industrial Action Plan and Draft Budget 83
ii
10.1. Actions within the Economical Scope 84
10.2. Actions within the Social Scope 102
10.3. Actions within the Environmental Scope 104
11. Conclusion and Evaluation 108
References 114
Annexes 117
Annex 1: Data on Added Value and Analysis with Factor Cost for Food Production Industry 117
Annex 2: TR22 Region – Food Industry Focus Group Meeting Participant List 119
Annex 3: Statistical Data Sources 119
iii
Table 1 Food Industry NACE Classification 1
Table 2 World Agri-Food Products – Export and Import – Billion USD - (SITC REV3 [0, 1, 22, 4]) 18
Table 3 World Agri-Food Products Export (HS CODE 01-24) (1.000 USD) 21
Table 4 Turkey Food and Manufacturing Industry Enterprise Number and Sizes (2018) 22
Table 5 Turkey – Plant Production Quantities 31
Table 6 Turkey – Number of Bovine and Ovine Animals 31
Table 7 Turkey – Poultry Data 31
Table 8 Turkey – Beekeeping Data 32
Table 9 Turkey – Aquaculture Production 32
Table 10 Turkey - Agri-Food Foreign Trade according to Economic Classes (Import-Export-Foreign Trade Balance) 33
Table 11 Agri-Food Products Total Foreign Trade according to Turkey HS CODE Classification (1000 USD) 34
Table 12 Agri-Food Products Exports of Turkey by Chapter (1,000 USD) 34
Table 13 Turkey - Export Volume of Selected Products, Its Share and Ranking in Global Exports 36
Table 14 Agri-Food Products Exports of Turkey by Chapter (1,000 USD) 37
Table 15 Turkey - Agri-Food Items That Have Foreign Trade Surplus by Chapters (1,000 US dollars) 38
Table 16 Turkey- Agri-Food Items That Have Foreign Trade Deficit by Chapters (1,000 US dollars) 39
Table 17 Turkey's Agri-Food Products Import and Export by Country (1,000 US dollars) 40
Table 18 Number of Workplaces and Employees in TR22 Region 42
Table 19 Distribution of Workplaces and Employees by Sectors in TR22 Region 42
Table 20 Total Import-Export of Agri-Food Products in TR22 Region 43
Table 21 Export according to TR22 Region Agri-Food Products HS Codes 44
Table 22 Import according to TR22 Region Agri-Food Products HS Codes 45
Table 23 Distribution of the Firms Participating in the Survey in TR22 Region 61
Table 24 Yield in Cereal and Some Herbal Products (kg/decare - 2019) 70
Table 25 Distribution of Turkey's Land Area 70
Table 26 Land Planted, Production Amount and Yield Data on Selected Crops in Turkey 70
Table 27 Analysis of Turkey's Imports to Meet Domestic Production in Cereals and Other Herbal Products 71
Table 28 Meat and Milk Yield (Comparison of Turkey and EU) 72
Table 29 Turkey's Food Loss and Waste Rate 73
Table 30 Food Industry PESTLE Analysis of TR22 Region 76
Table 31 Food Industry SWOT Analysis of TR22 Region 78
Table 32 Food Industry Gap Analysis of TR22 Region 80
Table 33 Gender Equality Index in Turkey and TR22 Provinces 86
TABLES

iv
Figure 1 Methodology Work Flow Diagram 14
Figure 2 Foreign Trade Balances in Continents 19
Figure 3 World Processed Food Products Turnover 20
Figure 4 Shares of Sectors in Manufacturing Industry (by Turnover) 22
Figure 5 Food Industry - Distribution of Employees by Sub-Sectors 24
Figure 6 Average Number of Employees per Enterprise 24
Figure 7 Food Industry - Turnover, Value Added at Factor Cost, Enterprise, Employee Data (2010, 2014, 2018) 25
Figure 8 Food Industry - its Share in the Manufacturing Sector and Change in Added Value per Employee 26
Figure 9 Food Industry - Added Value in Sub-Sectors with Factor Costs 28
Figure 10 Food Industry - Added Value per Employee in Sub-Sectors 29
Figure 11 Food Industry - Change of Added Value per Employee according to Sub-Sectors 30
Figure 12 Problems Experienced in the COVID-19 Pandemic 51
Figure 13 Turnover (TL) and Export (USD) Change of Firms 2019-2020 51
Figure 14 Food Industry - Turnover Change Between 2019-2020 According to Sub-Sectors (TL) 52
Figure 15 Factors That Negatively Affect the Sustainability of Companies 52
Figure 16 Contractual Planting Firms 62
Figure 17 Enterprises’ Production Competence and Systematicity of Quality Control Activities 62
Figure 18 Enterprises’ Product Tracking System and Ability to Retain Qualified Personnel 63
Figure 19 Enterprises’ R&D Management and Intensity of Information Sharing with Stakeholders 64
Figure 20 Enterprises’ Marketing Competence and Export/Brand Data 64
Figure 21 Quality Control- Branding Relationship in Enterprises 65
Figure 22 Turkey- The Reasons of Enterprises’ Not Being Able to Export and Work Full Capacity 65
Figure 23 Bottlenecks Affecting Enterprises and the Supports Expected from the Public 66
Figure 24 Simplified Food Industry Value Chain 68
Figure 25 Turkey Food Industry Porter’s Five Forces Analysis 79
Figure 26 Agricultural Land Amount per Capita (hectares)- World, Europe, Asia and Turkey 83
Figure 27 Turkey's Food Industry - Distribution of Employees by Gender and Collar Colors (Survey Results) 85
Figure 28 Turkey's Food Industry – Gender Distribution of Employees by Collar Colors (Survey Results) 85
Figure 29 Distribution of Employees in TR22 Region by Gender and Economic Activities 87
Figure 30 Distribution Comparison of Employees in Turkey and TR22 Region by Gender and Economic Activities 87
FIGURES
v
BAKA West Mediterranean Development AgencyCEC Continuing Education CenterCCO Chamber of Commerce and IndustryCOVID-19 Coronavirus DiseaseCRA Credit Reference AgencyDA Development AgenciesDİKA Dicle Development AgencyDSİ State Hydraulic WorksERP Enterprise Resource PlanningEU European UnionFAO United Nations Food and Agriculture OrganizationFCC FAO Food Chain Crisis Management FrameworkGMKA Southern Marmara Development AgencyGMO Genetically Modified OrganismGPS Global Positioning SystemHa HectareHACCP Hazard Analyses and Critical Control Points (Product reliability system for healthy food
production in food premises)HS Harmonized System (World Customs Organization Coding System)INTRACEN International Trade CenterIPCC Intergovernmental Panel on Climate Change IPR Intellectual Property RightsKg KilogramKOP Konya Plain ProjectKUDAKA North East Anatolia Development AgencyMEVKA Mevlana Development AgencyMoNE Republic of Turkey Ministry of National EducationNACE Statistical Classification of Economic Activities in the European CommunityNGO Non-Governmental OrganizationOECD Organisation for Economic Co-operation and DevelopmentOIZ: Organized Industrial Zone (Special Economic Zone)P&D Product DevelopmentPESTLE Political, Economic, Social, Technological, Legal and EnvironmentalR&D Research and DevelopmentRFID Radio Frequency IdentificationSME Small and Medium Sized EnterpriseSSI TR Social Security InstitutionSTB TR Ministry of Industry and TechnologySTIC Standard International Trade ClassificationSWOT Strengths, Weaknesses, Opportunities and ThreatsTARMAKBİR The Turkish Association of Agricultural Machinery & Equipment ManufacturersTGDF Federation of Food and Drink Industry Associations of TurkeyTKDK Agriculture and Rural Development Support InstitutionTL Turkish LiraTRAKYAKA Trakya Development AgencyTÜBİTAK The Scientific and Technological Research Council of TurkeyTÜBİTAK-MAM Scientific and Technological Research Council of Turkey - Marmara Research Center TURKSTAT Turkish Statistical InstituteTÜSİAD Turkish Industry and Business AssociationUAE United Arab EmiratesUN United NationsUNDP United Nations Development ProgrammeUSA United States of AmericaZAFER Zafer Development AgencyWTO World Trade Organization
ABBREVIATIONS

vi
The COVID-19 pandemic has gone beyond a health crisis and turned into a global problem, due to its impacts felt in all areas of life and all over the world. It is obvious that the problems caused by the pandemic, which has turned into a serious threat to all humanity, can be solved with a sustainable and fair understanding that requires international solidarity, cooperation, and common solution ideas.
The restrictions applied as a necessity of the pandemic led to slowdown in production, decrease in labor supply, delay in the supply
of intermediate goods and raw materials, and increased logistics costs in our country as well as all over the world. Therefore, it is essential for sustainable development that policies should focus on the fragile sectors most affected by the pandemic in order to ensure the continuity of economic activities and accelerate the recovery.
By closely following the changes observed in the global system, Turkey carries out a comprehensive transformation in every field from education to health, from manufacturing industry to tourism, from industrial zones to research infrastructures.
Our development agencies, which perform their activities under the coordination of the Ministry of Industry and Technology, carry out studies at the regional level in order to reduce the negative impacts of COVID-19 on the national and regional economies and to identify the sectors most affected by the pandemic. One of our works in this field is the Government of Japan funded COVID-19 Resilience and Response Project, which we have implemented together with the United Nations Development Program (UNDP), the General Directorate of Development Agencies, and our development agencies.
Within the scope of the project, 25 region-based “fragile sector analysis reports” were prepared in the textile, logistics, food, machinery, and automotive sectors, which are of key importance for the Turkish economy. These reports, taking into account global developments and trends, offer new policy recommendations that will increase the resilience of the relevant sectors against crises. In addition, the “New Market Analysis” and “Product Space Analysis” reports, which cover studies to increase the export potential of enterprises operating in fragile sectors, were also completed within the project. These reports aimed to create road maps to support the business continuity of fragile sectors and to prevent supply chain disruptions.
We believe that the policy recommendations in these reports, which are in line with the targets within the framework of our national technology move, will support inclusive and sustainable development; it will carry Turkey to a more strategic point in the international trade and investment decisions that will be reshaped in the post-COVID-19 period and will contribute to our country's 2023 goals.
I would like to thank the Government of Japan for their generous contribution to mitigating the economic impact of the COVID-19 crisis, ensuring economic recovery, strengthening sectors, and transforming SMEs in this process.
I congratulate all our stakeholders, particularly UNDP Turkey management and project team, and the employees of the Development Agencies General Directorate and development agencies, who have made these studies realised and turn them into concrete outputs, and I hope that the reports will contribute to the future of our country.
Mustafa Varank
Republic of Turkey Minister of Industry and Technology
FOREWORD
vii
The global context for development has fundamentally changed with the COVID-19 pandemic. The pandemic created many new obstacles to overcome as well as new problems to be solved. Although COVID-19 started as a health crisis, it has turned into both a humanitarian crisis and a development crisis. This unprecedented crisis is pushing millions of people into extreme poverty, changing and widening existing inequalities, and disrupting progress towards the Sustainable Development Goals (SDGs). Therefore, the SDGs are now more important than ever. The 2030 Agenda remains the only option for a more prosperous future for people and planet.The COVID-19 pandemic has also shaken the global trade and development landscape. The global health emergency turned into a global economic shock with its impacts on growth, international trade, investments, global production, value chains, employment and eventually livelihoods of people. UNDP is responding to a growing volume of requests from countries to help them prepare for, respond to, and recover from the COVID-19 pandemic with a particular focus on the most vulnerable. As of now our focus is to help decision-makers look beyond COVID-19 recovery, towards 2030, making choices and managing complexity and uncertainty in four key areas: governance, social protection, green economy, and digital disruption. UNDP’s COVID-19 Resilience and Response Project, which is funded by the Government of Japan is a part of our rapidly developed integrated response to the COVID-19 health, humanitarian, and development crisis. Being complementary with the efforts of the Government of Turkey and other development partners and fully aligned with the country-specific needs, UNDP aims to tackle the impacts of the pandemic under three priority areas: Health system support; Inclusive and integrated crisis management and response; Social and economic impact needs assessment and response.I am pleased to present these 25 region-based sectoral analysis reports that provide policy recommendations and action plans for key economic sectors in Turkey that are most impacted by COVID-19 pandemic. These reports, which were developed within the COVID-19 Resilience and Response Project in cooperation with Ministry of Industry and Technology and Development Agencies, formulated in the light of recent global context and trends as well as UNDP’s response to COVID-19 crisis. Through this work, our aim is to support national capacities for an integrated and inclusive crisis management, ensure business continuity and prevent supply chain disruptions and speed up the development of the key economic sectors -automotive, textile, food, machinery, and logistics in different regions of Turkey and to increase competitiveness on a regional basis.Our recovery efforts focus on rebuilding more inclusive economies and societies, moving towards a low-carbon and climate-resilient world where no one is left behind. We believe that these reports will provide a pathway for economic recovery of sectors and development of regional competitiveness. In the reports the review of the pandemic crisis impact is accompanied by a set of policy recommendations targeting both the interventions in response to the negative effects of the pandemic and the post-COVID-19 social and economic recovery support measures. Overcoming the challenges faced by the sectors and society and ensuring better recovery can only be possible with joint efforts of the entire private sector, authorities, and the society as a whole. In this regard, we appreciate the cooperation of Ministry of Industry and Technology, Development Agencies, and all experts for the preparation of these reports. We believe that these reports will also enable better cooperation in key economic sectors and help to accelerate the implementation of the Sustainable Development Goals in Turkey.
Louisa Vinton
UNDP Turkey Resident Representative
FOREWORD

viii
FOOD INDUSTRY ANALYSIS REPORT AND GUIDETR22 REGION (Balıkesir, Çanakkale)
ix
EXECUTIVE SUMMARYFollowing the COVID-19 pandemic, a study was conducted where current situation analyses, short, medium, and long-term strategies, and policy recommendations in sectoral, national, and regional terms were defined in order to contribute to SME's development of more inclusive and sustainable business models aimed at the food sector, in cooperation with the Turkish Ministry of Industry and Technology and Development Agencies, within the scope of "COVID-19 Crisis Response and Resilience Project" financed by the Japanese Government and conducted by the United Nations Development Program (UNDP), specific to 5 fragile sectors (Food, Machinery, Automotive, Textile and Logistics Industries), which are of key importance for the economy of Turkey and are expected to be highly influenced by the pandemic effects.
In the Food Sector analysis and guideline study, the triple sub-groups of Code No.10 (Processing of Food Products), which is the dual group of NACE classification used in the European Union, were taken as a basis. In the analysis study specific to the food sector in the TR22 Region, statistical and categorical data obtained from secondary sources, the results of the survey study, and focus group meeting were used. In this context, strategy and policy recommendations were planned for the sector.
Present SituationThe food industry, developing on a labor-intensive system, is directly related to the utilization of agricultural products, the supply of raw materials to the industry, its contribution to employment and the balanced nutrition of the people, and it has strategic importance in socio-economic terms in all countries in the world.
Global agri-food trade is around 1.5 trillion USD. The share of agri-food trade in total commodity trade is on average over 7.5%. The share of upper-middle and lower-middle-income countries in global agri-food export increased from approximately 25% in 2001 to 36% in 2018. In the same period, the share of low-income countries in global agri-food export (1.1%) remained almost unchanged. Whereas the share of food in total agri-food export was about 70% in 2000, it reached up to 76% in 2018. In the period between 1995-2018, whereas food export grew by an average of 3.40% per year, agricultural commodity products increased by an annual average of 1.90%. Foreign trade balances in the continents contain significant differences. While the American continent increased its foreign trade surplus from 2000 to 2018, the foreign trade deficit in the Asian continent increased rapidly.
As for Turkey, according to 2018 data, 49.025 enterprises operate in the Food Industry. Micro enterprises constitute the largest segment with a total share of 86.8%. The share of Food Manufacturing Sector enterprises in manufacturing sectors is 12.4%. In the breakdowns of the Food Manufacturing Sector, it is seen that most of the employees (39.6%) are in the "Manufacture of bakery and farinaceous products " sector according to 2018 data. This is followed by "Manufacture of other food product " with 15.8% and "Processing and preserving of fruit and vegetables " with 13%. The majority of the enterprises (69%) operate in the " Manufacture of bakery and farinaceous products " sector. This sector has a great share in the increase in the rate of micro-enterprises in the food sector. The Food Industry had a turnover of 59 billion USD in 2010. This value increased by 30.4% to 76 billion Dollars in 2014 and declined to 61 billion Dollars in 2018. In addition to exchange rate fluctuations, the decline in "10.7: Manufacture of bakery and farinaceous products " and "10.1: Processing and preserving of meat and production of meat products " sectors had a significant effect on this decline. In the same period, "10.2: Processing and preserving of fish, crustaceans and molluscs ", "10.3: Processing and preserving of fruit and vegetables ", "10.4: Manufacture of vegetable and animal oils and fats " and "10.9 Manufacture of prepared animal feeds " sectors showed an increase in the amounts of both "total added value" and "added value per employee”.
"Fruit" (Edible fruit and edible nuts) and "Processed Fruits and Vegetables" (Vegetables, fruits, nuts, and preparations obtained from other parts of vegetables) have the largest share in Turkey's export. These are followed by the articles "Milling products, malt, starch, inulin" and "Preparations of cereals, flour, starch or milk; pastrycooks’ products," whose export has greatly increased in

x
recent years, including the product "wheat flour," in which Turkey takes the lead and "pasta," in which Turkey comes in fourth regarding export in the world. Regarding the exports between 2010-2018, there was a significant decrease in the world export share of "Fruit", "Vegetables" (Edible vegetables and some roots and tubers) and "Miscallaneous edible preparations." On the other hand, the world export shares of the products "Wheat flour", "Pasta, cake/biscuit, bulgur", "Fish and Aquaculture" and "Vegetable Oils," have increased significantly. Although the shares of "Poultry" and "Eggs" in world export have increased significantly, the price-oriented competitive efficiency (added value per employee) in these sectors has decreased considerably.
The biggest share in imports is the raw materials of exports (flour, pasta, biscuits, vegetable oil) and feed (cereals, oilseeds, residues and waste of the food industry, vegetable oils). Import of "Livestock" has also increased significantly in recent years.
The countries to which Turkey exports the most agri-food products are Iraq, Germany, the USA, Russia, and Italy respectively. As for imports, Russia, Brazil, Ukraine, the USA, and Malaysia are respectively the countries with the highest shares. Economic and political uncertainties in Iraq cause unstable and volatile exports to this country, making it difficult for exporters to plan.
According to 2019 data, 1,596 companies operate in Food Products Manufacturing in the TR22 Region. The TR22 Region, which is located at the intersection of metropolises (Istanbul, Kocaeli, Tekirdağ, İzmir, Manisa, Bursa) and hosts important mountains, plains, rivers, underground water resources, and lakes, has an important share in agricultural production in Turkey. It has a rich product range with the production of cereals (wheat, rice), forage crops, vegetables (especially tomato paste, pepper paste), and fruit (nectarine, peach, olive for oil, apple). Merino sheep, dairy cattle, broiler chickens, and laying hens cultivation has also developed in the region. The share of the food industry in the manufacturing industry in the region is high (36.2% according to the number of employees). It also takes an important place in Turkey (4.6%). Modern animal husbandry is common in the region. It has the capacity to compete with the world in the technology and the production of poultry. The food industry has developed in parallel with agricultural production in the region. There are two Food Industry Specialization Zones. Olive and olive oil, fruit and vegetable processing, dairy products, oil-fat production, feed production, meat processing, poultry farming, fish and aquaculture processing, cereal processing sectors constitute the main sectors of the food industry in the region.
Within the scope of circular economy, all of the whey is utilized in TR22 Region, and there are biogas/biomass facilities in the region. However, biogas/biomass facilities for electricity generation do not meet the need. It is expected that climate change will cause an increase in temperatures in the TR22 Region, albeit at a slower rate compared to other regions, and therefore, heatwaves, together with drought, and heat stress are anticipated to cause significant yield losses in agriculture. The high water stress in the region increases the importance of the measures to be taken against global climate change.
BulgularWhen the companies are analyzed, it is seen that the companies participating in the survey (156 enterprises) across the country and the companies in the region are similar, although they are not representative in general due to the limited participation (11 enterprises) from the region. The competencies of companies in Quality Management are higher compared to other subjects. Priority areas to be developed stand out as access to the market/export, R&D / innovation activities that contribute to differentiated and value-added products. In this respect, the ability to increase and retain qualified personnel (human resources management), developing university-industry cooperation, and enriching information resources are the competencies that should be brought in companies. Difficulties in accessing finance constitute the bottleneck that forces companies the most.
The COVID-19 pandemic has impacted all links of food supply chains, simultaneously affecting field production, food processing, shipping and logistics, and final demand. Naturally, not all sectors and products are equally affected, but each product has been found to be disrupted at different stages of the supply chain:

FOOD INDUSTRY ANALYSIS REPORT AND GUIDETR22 REGION (Balıkesir, Çanakkale)
xi
a. Production in the field faced bottlenecks in terms of some inputs, and limitations on the mobility of the workforce have negatively affected the availability of seasonal workers for planting and harvesting in the fruit and vegetable sector in many countries.b. Food processing has been interrupted by labor shortages and shutdowns. COVID-19 has created disruptions in food processing industries due to rules regarding social distancing, labor shortages stemming from the disease, and measures taken to contain the spread of the virus.c. Bottlenecks in shipping and logistics have disrupted the movement of products through supply chains. Air transport in particular has been severely interrupted. The disruptions in container and truck transportation have also created problems, although less often. Transport and logistics problems were most prominent for perishable high-value products such as fruit and vegetables. The grain supply did not encounter major disruptions.d. COVID-19 has led to a dramatic shift in consumer demand, ranging from restaurants, catering, and other "food-away-from-home" types to food consumed at home, making significant changes in the way food supply chains operate. There has been a significant increase in e-commerce.e. Retail food demand has increased. Frozen and packaged food sales in particular increased dramatically. There has been an increase in demand for foods considered to be healthy and immune-boosting.f. Those who were deprived of the opportunity to eat at the university were adversely affected. The severity of the difficulties in low-income families' access to food has increased over the course of the pandemic. Despite various problems experienced after COVID-19, it has been observed that the main problem does not stem from production but the distribution of the product to the needy.
In the survey study, it was seen that the declines in turnover, production, and profitability of companies were the most prominent effects of COVID-19. Some companies reported that their turnover increased. Although turnover trends vary by sector and companies, among the enterprises surveyed, a decline was observed in most companies, excluding the Vegetable Oil sector. The perceived severity of the adversities caused by COVID-19 in companies was respectively stated as "Demand Fluctuations", "Key Workforce Loss" and "Temporary Factory Closures". However, according to the survey, firms think that “Exchange rate fluctuations” and “lack of funding” are factors affecting businesses more severely.
There was a shrinkage in the food market because of the cessation of tourism due to COVID-19 in the TR61 Region, which hosted 12 million tourists. With the closure of hotels, restaurants, and cafes in the region, these businesses and those who sell to these points ended the period with a loss. Fruit and vegetable exporters went through a difficult period due to the cessation of exports at the beginning of the pandemic, and product prices decreased. The problem went away as a result of the opening of borders, but sales to Russia, which is one of the largest markets, have turned to groceries rather than marketplaces.
In this context, the main threats originating from COVID-19 are classified below:• Import's getting difficult and disruptions in input supply rendering production difficult• Supply risk ensuing especially due to the export restriction of grain and oilseed exporting countries• Difficulties in procuring agricultural workers• Difficulties in logistics and distribution of food• Vulnerable groups (elderly, poor, etc.) having difficulty in accessing food• With the cessation of exports, the risk of deterioration of the products that cannot be exported, such as fruits and vegetables• With the closure of hotels, restaurants, and cafes, decline in the sales of these businesses and those who sell products (meat, milk, fish, etc.) to these businesses

xii
RecommendationsThe result of the analysis suggests that the main problem in Turkey's agricultural production is low productivity. In order to increase efficiency, many methods such as scale economy, use of technology, access to up-to-date information and application of knowledge, R&D activities aimed at innovativeness, and the generation of new knowledge should be used.
It is thought that mechanisms should be designed for the actualization of these factors in the development of policies in the agri-food sector. In this context, the difficulties in accessing data and information constitute one of the most important gaps. Data and information flow between all stakeholders in the value chain extending from agricultural inputs to the end consumer must be provided without interruption. Access to information by individuals and small businesses is particularly costly due to time constraints. This problem can be solved with institutional structures. Collaborations such as cooperatives and clusters may contribute to the elimination of the information asymmetry between them and other actors in the value chain by enabling agricultural producers and enterprises to access information from a single center. Likewise, productivity can be increased by providing the opportunity to act jointly (joint planning, production, purchasing, etc.) and scale asymmetry between them and other stakeholders in the value chain (such as suppliers and customers) is also decreased and the sanction power is increased. Information and scale asymmetry improvement will also contribute to the prevention of oligopolistic structures and cartel behavior. Establishing databases and providing transparent, fast, and uninterrupted information to stakeholders, developing cooperation with universities and research institutions stand out as other necessary mechanisms for access to information.
Although productivity is not considered as the main problem in the food products processing sector, the improvement in agricultural production will contribute to the reduction of enterprises' procurement risks in terms of supply, price, and quality. The proposed mechanisms will also contribute to solving the problem of information and scale asymmetry, creating market diversity and increasing value-added production. Ensuring the flow of information will support effective planning of the central authority and its rapid intervention in the problems and crises experienced in the market.
It becomes important to implement a market pull model for both agricultural producers and businesses. (That the seller/exporter closely follows the needs and demands of the customers and conveys the information to the producer/business, that the industry experts and universities provide the know-how information to the investor/producer to enable production in line with these, that the investor is provided with investment supports in this direction, that the investor/producer develops cooperations with universities aimed at R&D etc.). In this context, it becomes important to establish mechanisms/supports for the establishment of cooperation for investment, financing, know-how, production, marketing, and R&D activities aimed at agricultural producers and food enterprises. When developing strategies, the concepts that should be considered as the top priority are thought to be productivity, innovation and ensuring uninterrupted flow of information in the value chain.
The main short, medium, and long term, national and regional strategy recommendations, aimed at providing solutions to the various problems in the Agri-Food Sector (e.g. inefficiency in agricultural production, wrong practices in agriculture, agricultural labor shortage, water scarcity, climate change, weak cooperation among sector stakeholders, price-oriented competition, lack of market diversity, low R&D and innovation activities) and the changes and problems caused by COVID-19 are as follows:
• Providing central planning and coordination• Supporting cooperation• Increasing productivity and Added Value in agricultural production and Food Businesses• Developing market access mechanisms• Improving financing support mechanisms• Increasing the skills and competencies of Human Resources• Increasing the level of social life in the countryside
FOOD INDUSTRY ANALYSIS REPORT AND GUIDETR22 REGION (Balıkesir, Çanakkale)
xiii
• Strengthening the Food Safety and Security System• Ensuring social equality• Ensuring efficient use of water resources• Ensuring the recycling of wastes• Ensuring adaptation to climate change• Reducing food losses
Measures, the main of which are indicated below are directly related to COVID-19 and are covered in the subheadings of the main strategies and actions:
• The City Agri-Food Council and the Crisis Committee within the Council will accelerate the flow of information and communication between stakeholders in the value chain, ensure cooperation, increase the effectiveness of the measures, and contribute to the making of crisis period planning and the prevention of panic. • Negotiations with international stakeholders (foremost being neighboring countries and countries with which intense food trade is plied) regarding crisis periods will support the solution of supply and export problems and contribute to effective planning. • It is considered that the measures to set up a Digital Logistics Center, Food Banks, Neighborhood Bazaars design taking into account the risk of contamination, supporting the Cold Distribution Chain, and supporting Licensed Warehouses will ensure efficient distribution planning. The development of e-commerce infrastructures will also support the process.• The Agricultural Information Platform and Consumer Information Platform will contribute to the access of institutions, producers, and enterprises to data and information, and contribute to effective planning and prevention of panic.• By creating a crisis fund, it is aimed to prevent social damage by supporting those who suffered from the crisis, to financially support agricultural producers and workers, and to ensure production by meeting the agricultural workforce needs through directing migrants to agricultural work.• Supporting R&D and investment projects for the production and development of packaged and shelf-stable products, whose importance was understood in the pandemic, will both help prevention of panic and accessing healthy products.• Supporting R&D and investment projects for the domestic production of agricultural inputs will reduce the supply risk in agricultural production, and ensuring the efficient use of water resources will contribute to the sustainability of agricultural production. Climate change adaptation fund will be used to support projects needed for the sustainability of agriculture.
Meat and meat products, fish and aquaculture, processed fruits and vegetables, dairy products, and animal and vegetable oils are the main export items of the region. It has been observed that the region with high production capacity has deficiencies in product differentiation and branding, and marketing competencies and R&D activities are at a low level among its sub-reasons. It is considered that branding activities should be the main strategy of the region and R&D and innovation activities should be increased to support this strategy. That the islands in the region are organic product production centers and/or animal husbandry is carried out in the islands declared "disease-free zone", that strategies of increasing added value and differentiation are implemented by foregrounding the superiorities and/or differences of the region, which affect quality such as the "North Aegean" slogan will probably make significant contributions to the region.
xiv
FOOD INDUSTRY ANALYSIS REPORT AND GUIDETR22 REGION (Balıkesir, Çanakkale)
1
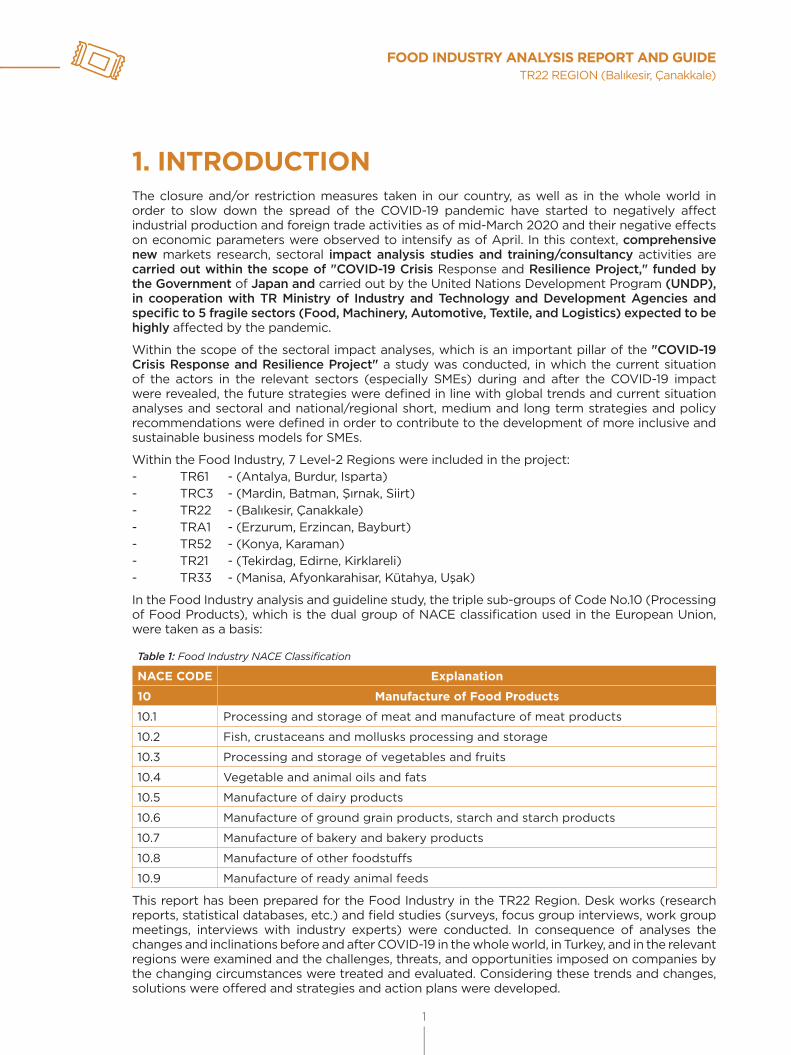
1. INTRODUCTIONThe closure and/or restriction measures taken in our country, as well as in the whole world in order to slow down the spread of the COVID-19 pandemic have started to negatively affect industrial production and foreign trade activities as of mid-March 2020 and their negative effects on economic parameters were observed to intensify as of April. In this context, comprehensive new markets research, sectoral impact analysis studies and training/consultancy activities are carried out within the scope of "COVID-19 Crisis Response and Resilience Project," funded by the Government of Japan and carried out by the United Nations Development Program (UNDP), in cooperation with TR Ministry of Industry and Technology and Development Agencies and specific to 5 fragile sectors (Food, Machinery, Automotive, Textile, and Logistics) expected to be highly affected by the pandemic.
Within the scope of the sectoral impact analyses, which is an important pillar of the "COVID-19 Crisis Response and Resilience Project" a study was conducted, in which the current situation of the actors in the relevant sectors (especially SMEs) during and after the COVID-19 impact were revealed, the future strategies were defined in line with global trends and current situation analyses and sectoral and national/regional short, medium and long term strategies and policy recommendations were defined in order to contribute to the development of more inclusive and sustainable business models for SMEs.
Within the Food Industry, 7 Level-2 Regions were included in the project:- TR61 - (Antalya, Burdur, Isparta)- TRC3 - (Mardin, Batman, Şırnak, Siirt)- TR22 - (Balıkesir, Çanakkale)- TRA1 - (Erzurum, Erzincan, Bayburt)- TR52 - (Konya, Karaman)- TR21 - (Tekirdag, Edirne, Kirklareli)- TR33 - (Manisa, Afyonkarahisar, Kütahya, Uşak)
In the Food Industry analysis and guideline study, the triple sub-groups of Code No.10 (Processing of Food Products), which is the dual group of NACE classification used in the European Union, were taken as a basis:
Table 1: Food Industry NACE Classification
NACE CODE Explanation
10 Manufacture of Food Products
10.1 Processing and storage of meat and manufacture of meat products
10.2 Fish, crustaceans and mollusks processing and storage
10.3 Processing and storage of vegetables and fruits
10.4 Vegetable and animal oils and fats
10.5 Manufacture of dairy products
10.6 Manufacture of ground grain products, starch and starch products
10.7 Manufacture of bakery and bakery products
10.8 Manufacture of other foodstuffs
10.9 Manufacture of ready animal feeds
This report has been prepared for the Food Industry in the TR22 Region. Desk works (research reports, statistical databases, etc.) and field studies (surveys, focus group interviews, work group meetings, interviews with industry experts) were conducted. In consequence of analyses the changes and inclinations before and after COVID-19 in the whole world, in Turkey, and in the relevant regions were examined and the challenges, threats, and opportunities imposed on companies by the changing circumstances were treated and evaluated. Considering these trends and changes, solutions were offered and strategies and action plans were developed.

2
2. METHODOLOGYThe workflow diagram used in the work carried out within the scope of the project was shared in Figure 1.
DATA COLLECTION ANALYSIS VERIFICATION RESULT
PRIMARY DATA *Survey
*Study Group *Focus Groups
*Expert Opinions
Simplified Value Chain
*Sector Expert*Team Leader
*Sector Analysis
Study Group
STBUNDP
25 Reports and Manual
SWOT
PESTLE
Five Forces
Gap
SECONDARY DATA *Institutional
*STB, DKA Reports*Other Researches, etc.
Figure 1: Methodology Work Flow Diagram
The preparation process of the content of the regional Food Industry evaluation report prepared within the scope of the project was carried out under three main activities. These are respectively;
A. Data CollectionAll meetings held during the data collection processes were held online due to pandemic conditions, and the opinions and suggestions of selected large-scale companies, which are the current/potential customers of many SMEs and experience at first hand all the components in the value chain specific to SMEs were also considered. Both primary and secondary research methods were used in the data collection process.
1. Primary Research Methods
i) Survey Study: Sector-specific up-to-date data, which could not be collected from secondary sources, were obtained through surveys. With the online survey study prepared for "Fragile Sectors Analysis", it was announced to the relevant sector stakeholders by different institutions and organizations, foremost being Development Agents. Since the announcements were made through many channels in order to increase the participation of SMEs in the relevant sectors in the survey, the sample selection of the companies to fill out the survey was not possible during the implementation phase of the survey. However, after the survey was carried out, the answers obtained from the questions were filtered in line with a sample, and their details were shared in the 6.1.1 Section of the report.
ii) Work Groups: Regarding 7 reports to be prepared for the food industry, 7 experts from 7 Development Agencies (BAKA, DİKA, GMKA, KUDAKA, MEVKA, TRAKYAKA, ZAFER) operating in the relevant regions were added to the work group, they examined the studies made by the sector expert and gave support in the validation processes of the prepared analyze, inferences

FOOD INDUSTRY ANALYSIS REPORT AND GUIDETR22 REGION (Balıkesir, Çanakkale)
3
and policy/strategy proposals. During the 14-week work period following the preparation of the inception report, the work group meetings were held every two weeks, six times in total.
iii) Focus Group Meetings: One of the important qualitative information sources of the primary research was considered as focus group meetings and leading decision-makers (OIZs, CCOs, clusters, key main and sub-industry manufacturers, NGOs) in determining and prioritizing policy/strategy recommendations for the sector, etc.) were included in the process and their opinions were collected. Detailed participant list of the relevant focus group meetings is shared in Appendix-2.
iv) Expert Opinions: In addition to the issues expressed by the participants at the meetings, the opinions of experts from different institutions and organizations who know the sector/region well were also evaluated.
3. Secondary Research Datai) Institutional Data Sources: Data collected from institutions such as FAO, World Bank, OECD, UNDP, INTRACEN, World Trade Organization, SSI, TURKSTAT, TR Ministry of Commerce were used (Annex-4).ii) Reports Prepared by the Ministry of Industry and Technology and Development Agencies: The reports prepared within the Ministry of Industry and Technology and by Development Agencies on the development of the food sector and examining the effects of COVID-19 were examined and used as a reference document.iii) Other Researches, Publications, Reports: The reports prepared by professional organizations, umbrella organizations, etc. were examined. For example, the reports and studies prepared by professional institutions such as TÜSİAD, TGDF, TARMAKBİR were used. The sectoral reports prepared by international consultancy firms such as Deloitte were also utilized.
B. Analysis and Interpretation of DataIn the studies carried out to determine the methodology and working method of the reports, the current situation analysis of the Food sector operating in the TR22 Region was carried out using the following analysis methods:
» Simplified Value Chain Analysis » SWOT Analysis» PESTLE Analysis» Michael Porter's Five Forces Analysis» Gap Analysis
Short, medium, and long-term strategy/action and policy recommendations were prepared in order to reduce and manage the risks and threats arising in the current situation analysis and to support and develop opportunities and positive practices using the primary and secondary data sources included in the data collection section. While some of the proposals prepared are macro-level issues that fall under the jurisdiction/responsibility of different institutions and organizations, some of them will be emphasized at the regional level and will serve as inputs to the studies of the Development Agency and other regional structures.
In addition, in the light of sustainable development goals declared by the UN, horizontal issues (resource efficiency, climate change, gender equality, crisis management) that cut the food sector were examined in detail and shared in the report.
C. Assessment and Reporting
After the food sector analysis prepared by considering regional dynamics, the effects of COVID-19 (Crisis Management) and other horizontal issues were examined, short, medium, and long term strategies and policy recommendations were presented in the report, and the steps to be taken were tried to be budgeted within the framework of certain assumptions.
4
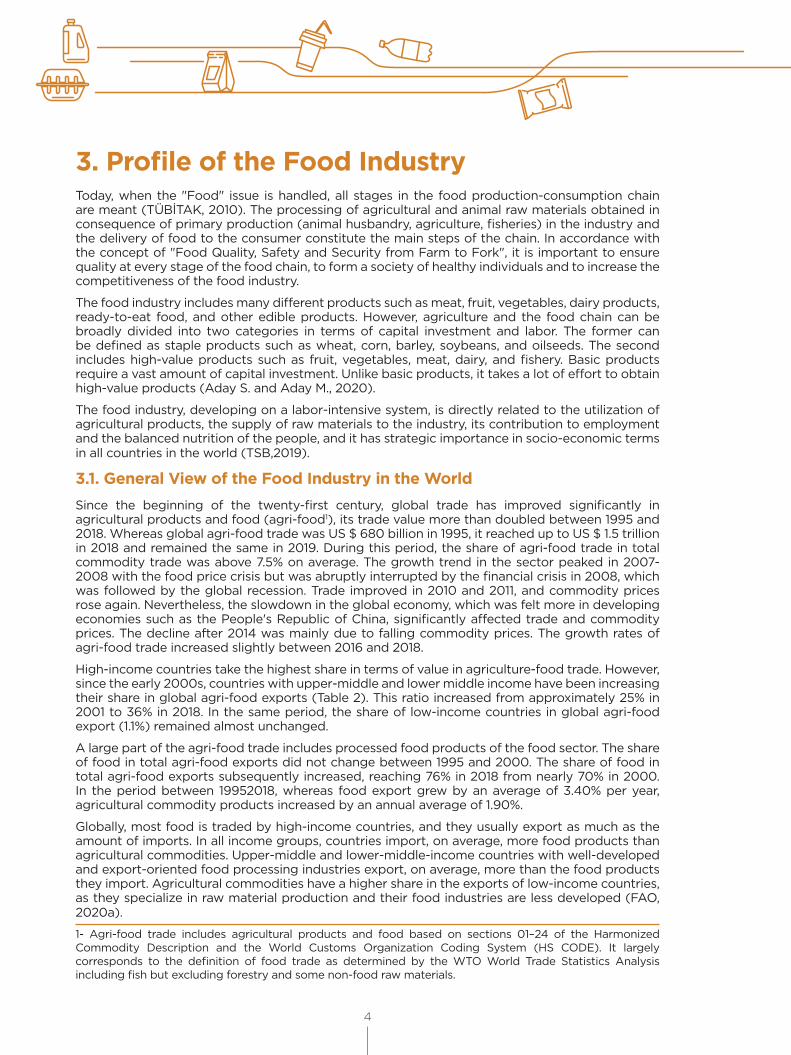
3. Profile of the Food IndustryToday, when the "Food" issue is handled, all stages in the food production-consumption chain are meant (TÜBİTAK, 2010). The processing of agricultural and animal raw materials obtained in consequence of primary production (animal husbandry, agriculture, fisheries) in the industry and the delivery of food to the consumer constitute the main steps of the chain. In accordance with the concept of "Food Quality, Safety and Security from Farm to Fork", it is important to ensure quality at every stage of the food chain, to form a society of healthy individuals and to increase the competitiveness of the food industry.
The food industry includes many different products such as meat, fruit, vegetables, dairy products, ready-to-eat food, and other edible products. However, agriculture and the food chain can be broadly divided into two categories in terms of capital investment and labor. The former can be defined as staple products such as wheat, corn, barley, soybeans, and oilseeds. The second includes high-value products such as fruit, vegetables, meat, dairy, and fishery. Basic products require a vast amount of capital investment. Unlike basic products, it takes a lot of effort to obtain high-value products (Aday S. and Aday M., 2020).
The food industry, developing on a labor-intensive system, is directly related to the utilization of agricultural products, the supply of raw materials to the industry, its contribution to employment and the balanced nutrition of the people, and it has strategic importance in socio-economic terms in all countries in the world (TSB,2019).
3.1. General View of the Food Industry in the WorldSince the beginning of the twenty-first century, global trade has improved significantly in agricultural products and food (agri-food1), its trade value more than doubled between 1995 and 2018. Whereas global agri-food trade was US $ 680 billion in 1995, it reached up to US $ 1.5 trillion in 2018 and remained the same in 2019. During this period, the share of agri-food trade in total commodity trade was above 7.5% on average. The growth trend in the sector peaked in 2007-2008 with the food price crisis but was abruptly interrupted by the financial crisis in 2008, which was followed by the global recession. Trade improved in 2010 and 2011, and commodity prices rose again. Nevertheless, the slowdown in the global economy, which was felt more in developing economies such as the People's Republic of China, significantly affected trade and commodity prices. The decline after 2014 was mainly due to falling commodity prices. The growth rates of agri-food trade increased slightly between 2016 and 2018.
High-income countries take the highest share in terms of value in agriculture-food trade. However, since the early 2000s, countries with upper-middle and lower middle income have been increasing their share in global agri-food exports (Table 2). This ratio increased from approximately 25% in 2001 to 36% in 2018. In the same period, the share of low-income countries in global agri-food export (1.1%) remained almost unchanged.
A large part of the agri-food trade includes processed food products of the food sector. The share of food in total agri-food exports did not change between 1995 and 2000. The share of food in total agri-food exports subsequently increased, reaching 76% in 2018 from nearly 70% in 2000. In the period between 19952018, whereas food export grew by an average of 3.40% per year, agricultural commodity products increased by an annual average of 1.90%.
Globally, most food is traded by high-income countries, and they usually export as much as the amount of imports. In all income groups, countries import, on average, more food products than agricultural commodities. Upper-middle and lower-middle-income countries with well-developed and export-oriented food processing industries export, on average, more than the food products they import. Agricultural commodities have a higher share in the exports of low-income countries, as they specialize in raw material production and their food industries are less developed (FAO, 2020a).
1- Agri-food trade includes agricultural products and food based on sections 01–24 of the Harmonized Commodity Description and the World Customs Organization Coding System (HS CODE). It largely corresponds to the definition of food trade as determined by the WTO World Trade Statistics Analysis including fish but excluding forestry and some non-food raw materials.

FOOD INDUSTRY ANALYSIS REPORT AND GUIDETR22 REGION (Balıkesir, Çanakkale)
5
Table 2: World Agri-Food Products - Export and Import - Billion USD - (SITC REV3 [0, 1, 22, 4])
Export(Million $) 2019
World Share
2000 2019 Tendency
World 1.528.267 430.043 1.528.267
EU 553.999 40,58% 36,25% ←
1 USA 135.950 12,64% 8,90% ←
2 Netherlands 91.993 7,68% 6,02% ←
3 Germany 80.664 5,77% 5,28% ←
4 Brazil 76.346 2,98% 5,00%
←
5 China 70.944 3,15% 4,64%
←
6 France 69.347 7,73% 4,54% ←
7 Spain 57.481 3,68% 3,76%
←
8 Canada 49.793 4,10% 3,26% ←
9 Italy 48.099 3,41% 3,15% ←
10 Belgium 44.075 3,94% 2,88% ←
11 Argentina 38.265 2,67% 2,50% ←
12 Mexico 36.507 1,90% 2,39%
←
13 Poland 34.082 0,59% 2,23%
←
14 Thailand 33.983 2,31% 2,22%←
15 Indonesia 33.802 1,28% 2,21%
←
16 India 33.665 1,26% 2,20%
←
17 England 31.043 3,62% 2,03% ←
18 Australia 29.497 2,93% 1,93% ←
19 New Zeland 24.930 1,35% 1,63%
←
20 Vietnam 24.917 0,85% 1,63%
←
21 Russia 24.567 0,30% 1,61%
←
22 Ukraine 22.029 0,31% 1,44%
←
23 Malaysia 21.930 1,26% 1,43%
←
24 Denmark 20.140 2,39% 1,32% ←
25 Turkey 19.394 0,82% 1,27%
←
26 Chile 18.252 1,03% 1,19%
←

6
İmport(Million $) 2019
World Share
2000 2019 Tendency
World 1.547.817 459.918 1.547.817
EU 513.921 36,69% 33,20% ←
1 USA 158.677 11,14% 10,25% ←
2 China 136.684 1,97% 8,83%
←
3 Germany 98.326 7,77% 6,35% ←
4 Japan 70.802 10,56% 4,57% ←
5 Netherlands 67.005 4,60% 4,33% ←
6 England 62.896 6,28% 4,06% ←
7 France 60.670 5,28% 3,92% ←
8 Italy 47.568 4,41% 3,07% ←
9 Spain 41.801 3,08% 2,70% ←
10 Belgium 38.033 3,25% 2,46% ←
11 Canada 36.978 2,62% 2,39% ←
12 South Korea 31.100 1,68% 2,01%
←
13 Russia 28.911 1,49% 1,87%
←
14 Hong Kong 27.372 1,99% 1,77% ←
15 Mexico 25.672 1,84% 1,66% ←
16 Poland 22.278 0,65% 1,44%
←
17 Vietnam 19.093 0,18% 1,23%
←
18 India 19.026 0,50% 1,23%
←
19 Indonesia 18.143 0,73% 1,17%
←
20 UAE 17.838 0,66% 1,15%
←
21 Saudi Arabia 17.587 1,17% 1,14%
←
22 Sweden 17.346 0,95% 1,12%
←
23 Malaysia 15.852 0,77% 1,02%
←
24 Australia 15.848 0,71% 1,02%
←
25 Denmark 14.382 1,20% 0,93% ←
26 Turkey 14.373 0,46% 0,93%
←
Source: World Trade Organization (WTO) https://data.wto.org/
FOOD INDUSTRY ANALYSIS REPORT AND GUIDETR22 REGION (Balıkesir, Çanakkale)
7
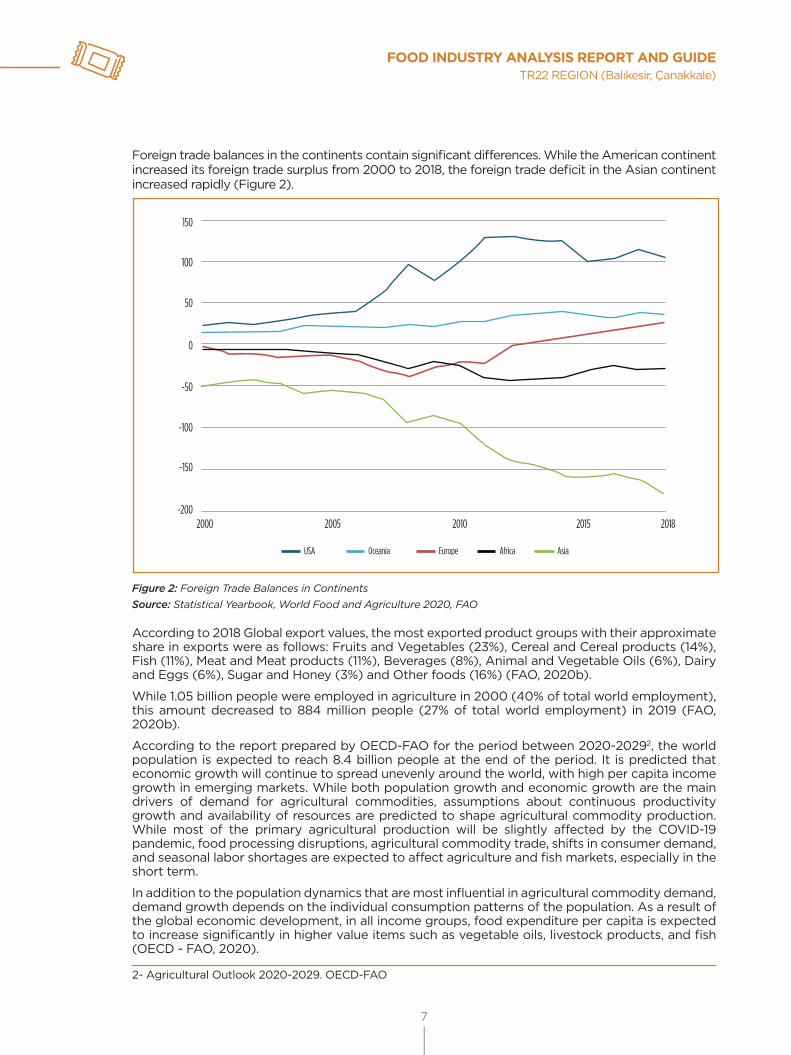
Foreign trade balances in the continents contain significant differences. While the American continent increased its foreign trade surplus from 2000 to 2018, the foreign trade deficit in the Asian continent increased rapidly (Figure 2).
-2002000 2005 2010 2015 2018
-150
-100
-50
0
50
100
150
USA Oceania Europe Africa Asia
Figure 2: Foreign Trade Balances in Continents Source: Statistical Yearbook, World Food and Agriculture 2020, FAO
According to 2018 Global export values, the most exported product groups with their approximate share in exports were as follows: Fruits and Vegetables (23%), Cereal and Cereal products (14%), Fish (11%), Meat and Meat products (11%), Beverages (8%), Animal and Vegetable Oils (6%), Dairy and Eggs (6%), Sugar and Honey (3%) and Other foods (16%) (FAO, 2020b).
While 1.05 billion people were employed in agriculture in 2000 (40% of total world employment), this amount decreased to 884 million people (27% of total world employment) in 2019 (FAO, 2020b).
According to the report prepared by OECD-FAO for the period between 2020-20292, the world population is expected to reach 8.4 billion people at the end of the period. It is predicted that economic growth will continue to spread unevenly around the world, with high per capita income growth in emerging markets. While both population growth and economic growth are the main drivers of demand for agricultural commodities, assumptions about continuous productivity growth and availability of resources are predicted to shape agricultural commodity production. While most of the primary agricultural production will be slightly affected by the COVID-19 pandemic, food processing disruptions, agricultural commodity trade, shifts in consumer demand, and seasonal labor shortages are expected to affect agriculture and fish markets, especially in the short term.
In addition to the population dynamics that are most influential in agricultural commodity demand, demand growth depends on the individual consumption patterns of the population. As a result of the global economic development, in all income groups, food expenditure per capita is expected to increase significantly in higher value items such as vegetable oils, livestock products, and fish (OECD - FAO, 2020).
2- Agricultural Outlook 2020-2029. OECD-FAO

8
Expectations regarding Food Products Global Market are as follows:
Gıda Ürünleri Küresel Pazarı ile ilgili beklentiler aşağıda verilmiştir:» That global turnover reaches 8 trillion USD in 2021,» That turnover grows at an average annual rate of 3.14% between 2021 and 2025,» That Confectionery and Snacks constitute the largest part of the market with 1.4 trillion USD in 2021,» That China creates the largest market with a turnover of 1.3 trillion US dollars,» Considering the total population, that per capita turnover is $ 1,067, and per capita consumption is 339 kg (Statista, 2021).
Food Sector Turnover (Processed Product), 2019 (Million USD)1.130.002
860.362462.727
412.607241.925
218.877205.677
191.156175.327
158.289146.118
134.781132.636132.569
102.625102.035
94.47588.01386.250
0 200.000 400.000 600.000 800.000 1.000.000 1.200.000
81.790
ChinaUSA
IndiaJapanRussia
IndonesiaBrazil
GermanyFrance
ItalyNigeria
EnglandPakistan
MexicoTurkey
S.KoreaEgyptSpain
BangladeshCanada
Figure 3: World Processed Food Products Turnover
Source: Statista
When the world 2019 export data are analyzed, it is seen that the USA, the Netherlands, Germany, Brazil, China and France share the first places in export amounts. In terms of imports, the USA, China, Germany, Japan, the Netherlands, and the UK made the highest amount of purchases. As mentioned above, the tendency of increase in the share of developing countries in international trade also applies to Turkey. Turkey's share in exports of world agri-food trade between the years 2000-2019 increased from 0.82% to 1.27%, and its share in imports increased from 0.46% to 0.93% (Table 2). The biggest share in the increase in exports and imports was the imported wheat's processing and being sold as flour and pasta.
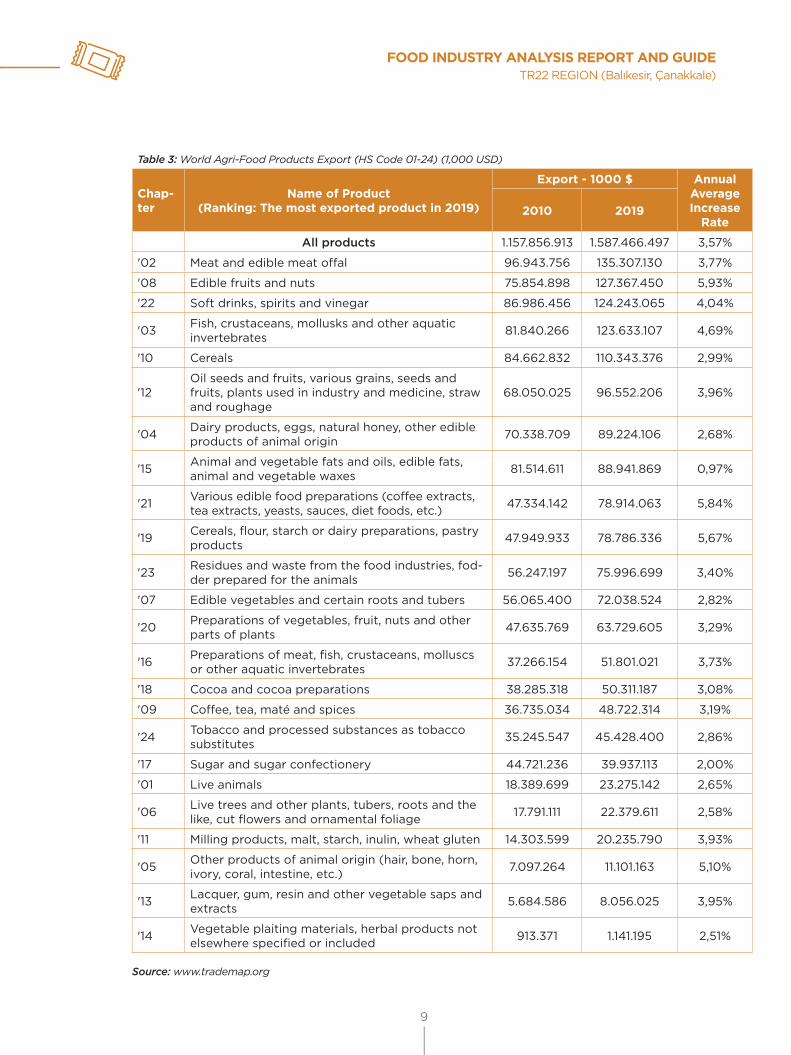
The top five most exported products in the world according to the HS Code classification in 2019 are as follows (Table 3):
» Meat and edible meat offal : $ 135 Billion» Edible fruits and nuts : $ 127 Billion » Soft drinks, spirits and vinegar : $ 124 Billion» Fish and Aquaculture : $ 123 Billion» Cereals : $ 110 Billion
FOOD INDUSTRY ANALYSIS REPORT AND GUIDETR22 REGION (Balıkesir, Çanakkale)
9
Table 3: World Agri-Food Products Export (HS Code 01-24) (1,000 USD)
Chap-ter
Name of Product(Ranking: The most exported product in 2019)
Export - 1000 $ Annual Average Increase
Rate2010 2019
All products 1.157.856.913 1.587.466.497 3,57%
'02 Meat and edible meat offal 96.943.756 135.307.130 3,77%
'08 Edible fruits and nuts 75.854.898 127.367.450 5,93%
'22 Soft drinks, spirits and vinegar 86.986.456 124.243.065 4,04%
'03 Fish, crustaceans, mollusks and other aquatic invertebrates 81.840.266 123.633.107 4,69%
'10 Cereals 84.662.832 110.343.376 2,99%
'12Oil seeds and fruits, various grains, seeds and fruits, plants used in industry and medicine, straw and roughage
68.050.025 96.552.206 3,96%
'04 Dairy products, eggs, natural honey, other edible products of animal origin 70.338.709 89.224.106 2,68%
'15 Animal and vegetable fats and oils, edible fats, animal and vegetable waxes 81.514.611 88.941.869 0,97%
'21 Various edible food preparations (coffee extracts, tea extracts, yeasts, sauces, diet foods, etc.) 47.334.142 78.914.063 5,84%
'19 Cereals, flour, starch or dairy preparations, pastry products 47.949.933 78.786.336 5,67%
'23 Residues and waste from the food industries, fod-der prepared for the animals 56.247.197 75.996.699 3,40%
'07 Edible vegetables and certain roots and tubers 56.065.400 72.038.524 2,82%
'20 Preparations of vegetables, fruit, nuts and other parts of plants 47.635.769 63.729.605 3,29%
'16 Preparations of meat, fish, crustaceans, molluscs or other aquatic invertebrates 37.266.154 51.801.021 3,73%
'18 Cocoa and cocoa preparations 38.285.318 50.311.187 3,08%
'09 Coffee, tea, maté and spices 36.735.034 48.722.314 3,19%
'24 Tobacco and processed substances as tobacco substitutes 35.245.547 45.428.400 2,86%
'17 Sugar and sugar confectionery 44.721.236 39.937.113 2,00%
'01 Live animals 18.389.699 23.275.142 2,65%
'06 Live trees and other plants, tubers, roots and the like, cut flowers and ornamental foliage 17.791.111 22.379.611 2,58%
'11 Milling products, malt, starch, inulin, wheat gluten 14.303.599 20.235.790 3,93%
'05 Other products of animal origin (hair, bone, horn, ivory, coral, intestine, etc.) 7.097.264 11.101.163 5,10%
'13 Lacquer, gum, resin and other vegetable saps and extracts 5.684.586 8.056.025 3,95%
'14 Vegetable plaiting materials, herbal products not elsewhere specified or included 913.371 1.141.195 2,51%
Source: www.trademap.org

10
In this period, the sections with the highest export volume among the products with high trade volumes are as follows (Table 3).
• Edible fruits and nuts : 5.93%
• Various food preparations eaten : 5.84%
• Cereals, flour, starch or milk preparations, pastry products : 5.67%
• Fish and aquaculture : 4.69%
• Soft drinks, spirits and vinegar : 4.04%
3.2.General View of the Food Sector in TurkeyIn Turkey, Food Products Manufacturing industry is one of the industries with the highest share in manufacturing industry. While it was in the second place according to the share it received in the manufacturing industry in 2018, according to the data of 2019, the Food Products Manufacturing Industry (Food Industry) made the highest turnover and took place in the manufacturing industry with a share of 13.6 %.(Figure 4).
2015 2018 2017 2018 2019024681012141618(%)
15,6
13,6
12,0
9,68,0
7,9
8,8
11,3
Manufacture of food products Manufacture of basic metals Manufacture of motor vehicles,trailers and semi-trailers
Manufacture of textile
Figure 4: Shares of Sectors in Manufacturing Industry (by Turnover)Source: TURKSTAT
As for Turkey, according to 2018 data, 49.025 enterprises operate in the Food Industry. Micro enterprises constitute the largest segment with a total share of 86.8%. The share of enterprises in manufacturing sectors is 12.4%. The total number of employees is 514,971 and its share in the manufacturing sectors is 12.5% (Table 4).

FOOD INDUSTRY ANALYSIS REPORT AND GUIDETR22 REGION (Balıkesir, Çanakkale)
11
Table 4: Turkey Food and Manufacturing Industry Enterprise Number and Sizes (2018)
Food industry Manufacturing Sectors Turkey Total
Number of attempts Total 49.025 100,0% 396.118 100,0% 3.160.371 100,0%
Number of Employees 1-9 42.557 86,8% 343.324 86,7% 2.956.224 93,54%
10-49 5.249 10,7% 40.899 10,3% 170.666 5,40%
50-249 963 2,0% 9.842 2,5% 28.274 0,89%
250+ 256 0,5% 2.053 0,5% 5.207 0,16%
Number of Employees Total 514.971 4.133.611 16.156.378
Number of Employees per Enterprise 10,5 10,4 5,1
Source: TURKSTAT (Excluding Agriculture, Forestry, Fisheries, Finance, and Insurance Sectors)
In the breakdowns of the Food Manufacturing Sector, it is seen that most of the employees (39.6%) are in the "Bakery and flour products processing" sector according to 2018 data. This is followed by "Processing of other foodstuffs" with 15.8% and "Vegetable and fruit processing" with 13% (Figure 5). The majority of enterprises in the sector (69%) are those in the "bakery and bakery products manufacturing" sector, followed by "Manufacture of other foodstuffs" with 7.3% and "milled grain products" with 6.4%. According to the number of employees per enterprise, the smallest sized enterprises are "Bakery and bakery products production" with 6 employees per enterprise, and the largest is "Meat and meat products production" with 38 employees per enterprise (Figure 6). It is seen that most of the micro-enterprises consist of the "Bakery and Bakery Products" sector.
2010 2018
0,0%
101 102 103 104 105 106 107 108 109
5,0%
10,0% 9,0%9,4%
1,8%
12,4% 13,0%
3,7%2,9%
9,2% 9,5%
6,9%5,3%
36,3%
39,6%
18,1%
15,8%
3,1% 2,7%
15,0%
20,0%
25,0%
30,0%
35,0%
40,0%
45,0%
1,4%
Processing of meat and meat
products
Fish and aquaculture
Processing of vegetables and
fruits
Manufacturing of vegetable
and animal oils and fats
Manufacture ofdairy products
Manufacture of grain mill products,
starches and starch products
Manufacture of bakery and farinaceous
products
Manufacture of other food
products
Manufacture of prepared
animal feeds
Figure 5: Food Industry - Distribution of Employees by Sub-SectorsSource: Calculated based on TURKSTAT data

12
2010 2018
0
101 102 103 104 105 106 107 108 109
5
10
44
3836
25 26
11 11
1921
6
9
6 6
32
23 2224
15
20
25
30
35
40
45
50
36
Processing of meat and meat
products
Fish and aquaculture
Processing of vegetables and fruits
Manufacture of vegetable and animal oils and fats
Manufacture of dairy products
Manufacture of grain mill
products, starches and
starch products
Manufacture of bakery and
farinaceous products
Manufacture of other food
products
Manufacture of prepared animal feeds
Figure 6: Average Number of Employees per Enterprise Source: Calculated based on TURKSTAT data
The Food Industry had a turnover of 59 billion USD in 2010. This value increased by 30.4% to 76 billion Dollars in 2014 and declined to 61 billion Dollars in 2018. Factor Cost and Added Value amounts also showed a similar trend. In terms of TL, the turnover was 88 billion TL, 167 billion TL and 296 billion TL, respectively, in 2010, 2014 and 2018.
There has been a significant increase in the number of enterprises and employees in the Food Industry in the period between 2010-2018. In this period, the number of enterprises increased by 15,298 (increase rate 45.3%), and the number of employees increased by 161,380 (increase rate 45.6%) (Figure 7).

FOOD INDUSTRY ANALYSIS REPORT AND GUIDETR22 REGION (Balıkesir, Çanakkale)
13
20142010 2018 20142010 2018
0
10.000
20.000
30.000
40.000
50.000
60.00058.387
76.127
61.260
7.747 10.078 9.289
70.000
80.000
Turnover (million $) Added Value (million $)
33.727 44.977 49.025
353.591
473.895514.971
0
100.000
200.000
300.000
400.000
500.000
600.000
Number of Enterprises Number of Employees
Figure 7: Food Industry - Turnover, Value Added at Factor Cost, Enterprise, Employee Data (2010, 2014, 2018)Source: Calculated based on TURKSTAT data
While the share of the number of enterprises in the Food Industry in the Manufacturing Sector increased in the period of 2010-2018, the share of the number of employees remained the same (between 12.3-12.5%). This indicates that the sizes of newly established businesses are much smaller than the average of other sectors. When TURKSTAT data are analyzed, it is seen that the share of micro-enterprises in the increase in the number of enterprises in the period of 2010-2018 is 91%. Although the share of "number of employees" in the manufacturing sector of the food industry remained the same, the shares of "turnover" and "added value with factor cost" decreased. In parallel with this, in the 2010-2018 period, while the "added value per employee" increased at a low rate (0.8%) in the manufacturing sector, there was a high rate of decline, being 17.7% in the Food Industry. This data indicated a decline in productivity in the Food Industry sector relative to other sectors involved in manufacturing. However, it can be seen in the analyzes made based on sub-sectors that this situation is not valid for all sub-sectors.
20142010 2018
0,0%
2,0%
4,0%
6,0%
8,0%
10,0%
12,0%
14,0%
16,0% 15,2%15,5%
13,3%
11,8% 11,4%
9,7% 10,3%
12,1% 12,4% 12,3% 12,5%
12,4%
18,0%
-20,0%
-15,0%
-10,0%
-5,0%
0,0%
5,0%
-3,9%
0,5%
-2,9%
-12,7%
-15,2%-16,1%
-17,7%
0,3% 0,8%
2010 - 2014 2014 - 2018 2010 - 2018
Turnover Added Value Enterprise Employee
Manufacturing IndustryTurkey Food Industry
Figure 8: Food Industry - its Share in the Manufacturing Sector and Change in Added Value per EmployeeSource: Calculated based on TURKSTAT data
14
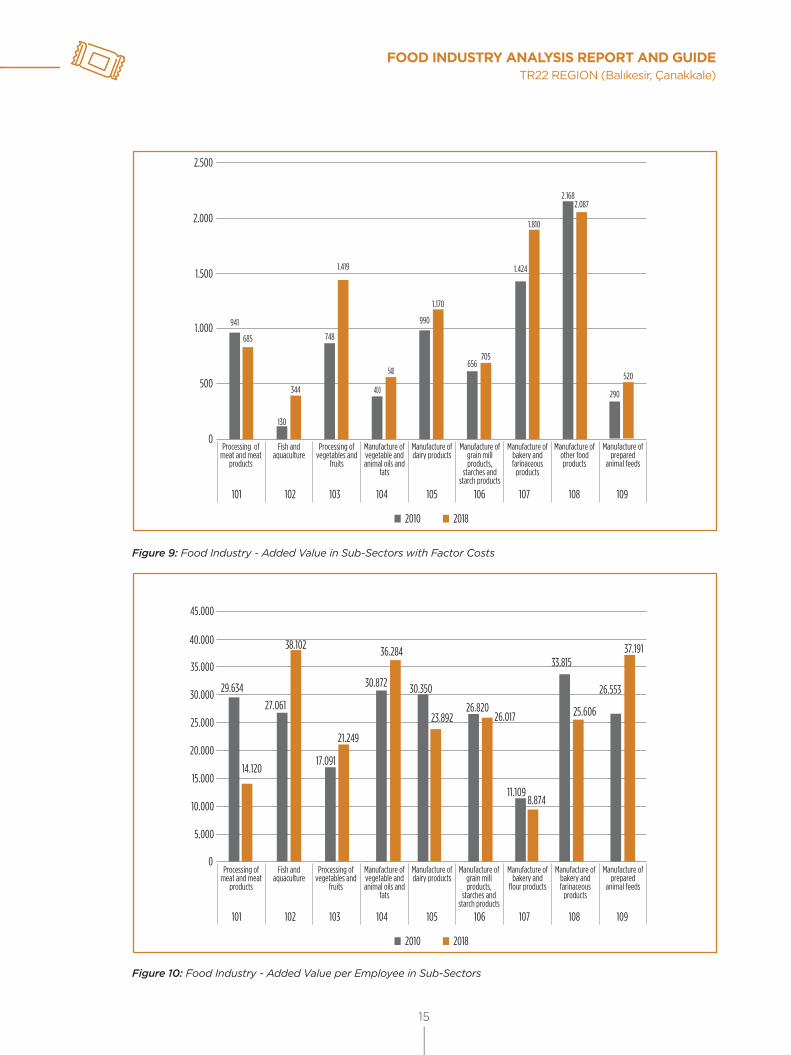
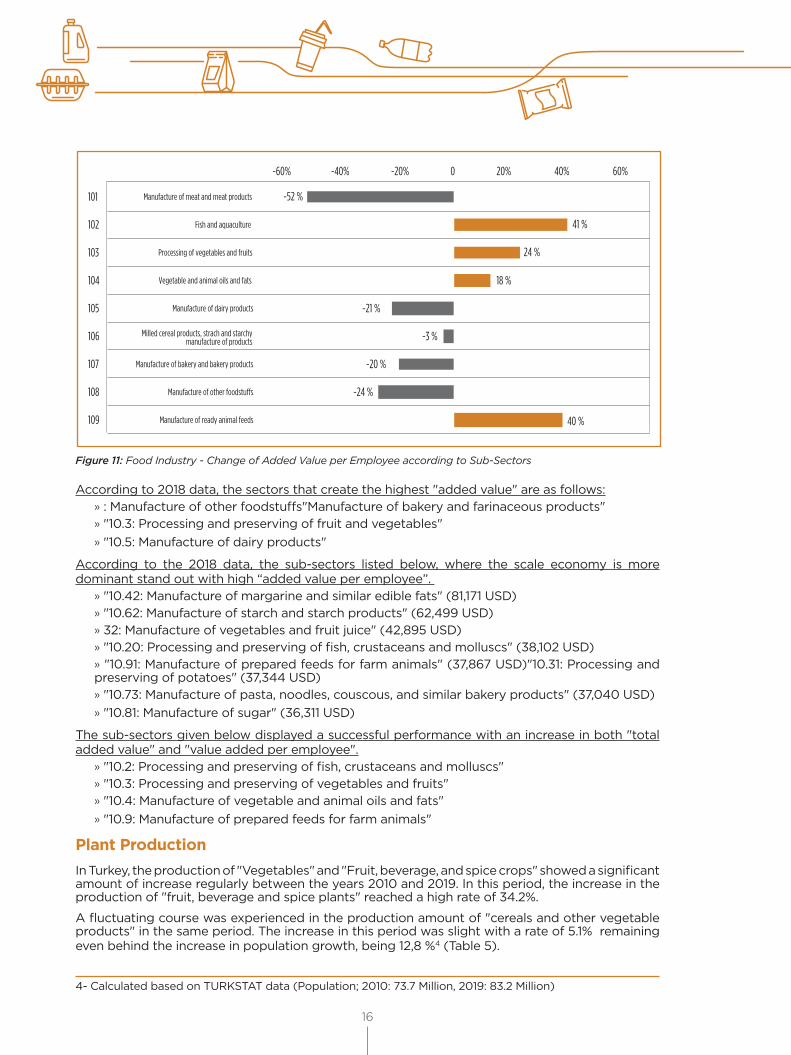
In the Food Manufacturing Sector in 2018, 69.1% of 49,025 enterprises and 39.6% of 514,971 employees operated in the “10.7: Bakery and Bakery Products” sub-sector. A large part of the 15,298 increase in the number of enterprises in the Food Industry between 2010 and 2018 (12,145 enterprises) was also in this sub-sector. The "added value per employee" of this sector, which has a significant contribution to employment and total added value, is very low compared to other sub-sectors and decreased from 11.1 thousand USD to 8.9 thousand USD in the 2010-2018 period (Figure 9, Figure 10). Although there is an increase (31%) in the "added value per employee" in the "10.73 Pasta and similar bakery products manufacturing" sector, which is one of the subcategories of the industry, a significant decrease was observed in the other two subclasses (23%, 29%) (Annex 1). The classes that decreased the added value per employee are found to be “10.71: Bread, fresh pastry products and fresh cake production” and “10.72 Rusks and biscuits production, long-lasting pastry products and long-lasting cake production. Although the total added value created by these classes increased in US dollars, the decrease in the "added value per employee" played a major role in the decrease in the average of the Food Manufacturing Sector in this parameter (Figure 11).
It is thought that the increase in informal sales may also have been effective in the occurrence of this situation. That the increase in the number of enterprises between 2010-2014 (33.4%) compared to 2014-2018 (9%) is very high gives the impression that the Syrian migrants3 who came to the country together with the start of the war in Syria in 2011 were effective. The fact that most of the entrepreneurs are interested in these low added-value sectors also shows that the entrepreneurs turn to business branches that do not need high-quality information and that can be established with low capital, as a consequence of the ongoing lack of vocational training mechanisms in the country and the difficulties in accessing finance.
In the "10.1: Meat processing and storage and production of meat products" sector, the radical decline in "Added Value" and "added value per employee" created between 2010 and 2018 in US dollars, had a significantly negative effect on the Food Sector average like the "10.7 Bakery and bakery products" sector. Among the sub-sectors of this sector, “10.12: Processing and storage of poultry” and “10.13: Manufacture of products made from meat and poultry” experienced the sharpest decline. When the export data of "Poultry meat and edible meat offal", with HS Code 0207 related to this sector (Trademap, 2021) are examined, it is seen that the country's largest export market for this product is Iraq with a share of 60%. Sales to Iraq have increased significantly in the last decade. However, as sales follow a fluctuating course, they pose a risk. At the same time, Turkey exported this product at a lower price compared to many of its competitors, even though it increased its share of world exports regarding this product in the last ten years. For example, while Turkey's export price per kg is 1,25 US Dollars in "Poultry meat" according to the data of 2019, the export price per kg of Brazil, which has the biggest share of world exports is 1,63 US Dollars, the export price per kg of Poland, which is among the top exporting countries among the EU countries is 2,01 US Dollars and the export price per kg of Holland is 1,76 US Dollars. The export price per kg of Ukraine, whose export amount is closer to that of Turkey's was 1,40 US Dollars. Similar conditions are also valid for "Egg" with HS Code 0407.
These data indicate that Turkey's competition strategy in export is price-oriented in "Poultry" and "Egg" product groups, which coincides with the views of industry representatives in focus group meetings. It is thought that a detailed analysis of the sector and the preparation of a national strategic plan are needed in order to create market diversity, for the goal of products with high added value and the sustainability of the sector, to be able to increase competitiveness and take measures specific to the sector.
3- According to the 2019 data of Directorate General of Migration Management there are about 3,6 Million Syrians within the scope of temporary protection living in Turkey.
FOOD INDUSTRY ANALYSIS REPORT AND GUIDETR22 REGION (Balıkesir, Çanakkale)
15
2010 2018
0
101 102 103 104 105 106 107 108 109
500
941
685
130
344
748
1.419
26
400
548
990
1.17021
656705
1.424
1.810
2.1682.087
290
520
1.000
1.500
2.000
2.500
Processing of meat and meat
products
Fish and aquaculture
Processing of vegetables and
fruits
Manufacture of vegetable and animal oils and
fats
Manufacture of dairy products
Manufacture of grain mill products,
starches and starch products
Manufacture of bakery and farinaceous
products
Manufacture of other food products
Manufacture of prepared
animal feeds
Figure 9: Food Industry - Added Value in Sub-Sectors with Factor Costs
2010 2018
0
5.000
10.000
15.000
20.000
25.000
30.00029.634
35.000
40.000
45.000
14.120
27.061
38.102
101 102 103 104 105 106 107 108 109
17.091
21.249
30.350
23.89226.820
26.017
11.1098.874
33.815
25.606
26.553
37.191
30.872
36.284
Processing of meat and meat
products
Fish and aquaculture
Processing of vegetables and
fruits
Manufacture of vegetable and animal oils and
fats
Manufacture of dairy products
Manufacture of grain mill products,
starches and starch products
Manufacture of bakery and
flour products
Manufacture of bakery andfarinaceous
products
Manufacture of prepared
animal feeds
Figure 10: Food Industry - Added Value per Employee in Sub-Sectors
16
101
102
-52 %
-21 %
-3 %
-20 %
-24 %
41 %
24 %
18 %
40 %
103
104
105
106
107
108
109
-60% -40% 40%-20% 0 20% 60%
Manufacture of ready animal feeds
Manufacture of other foodstu�s
Manufacture of bakery and bakery products
Milled cereal products, strach and starchymanufacture of products
Manufacture of dairy products
Vegetable and animal oils and fats
Processing of vegetables and fruits
Fish and aquaculture
Manufacture of meat and meat products
Figure 11: Food Industry - Change of Added Value per Employee according to Sub-Sectors
According to 2018 data, the sectors that create the highest "added value" are as follows:» : Manufacture of other foodstuffs"Manufacture of bakery and farinaceous products"» "10.3: Processing and preserving of fruit and vegetables"» "10.5: Manufacture of dairy products"
According to the 2018 data, the sub-sectors listed below, where the scale economy is more dominant stand out with high “added value per employee”.
» "10.42: Manufacture of margarine and similar edible fats" (81,171 USD)» "10.62: Manufacture of starch and starch products" (62,499 USD)» 32: Manufacture of vegetables and fruit juice" (42,895 USD)» "10.20: Processing and preserving of fish, crustaceans and molluscs" (38,102 USD)» "10.91: Manufacture of prepared feeds for farm animals" (37,867 USD)"10.31: Processing and preserving of potatoes" (37,344 USD)» "10.73: Manufacture of pasta, noodles, couscous, and similar bakery products" (37,040 USD)» "10.81: Manufacture of sugar" (36,311 USD)
The sub-sectors given below displayed a successful performance with an increase in both "total added value" and "value added per employee".
» "10.2: Processing and preserving of fish, crustaceans and molluscs"» "10.3: Processing and preserving of vegetables and fruits"» "10.4: Manufacture of vegetable and animal oils and fats"» "10.9: Manufacture of prepared feeds for farm animals"
Plant ProductionIn Turkey, the production of "Vegetables" and "Fruit, beverage, and spice crops" showed a significant amount of increase regularly between the years 2010 and 2019. In this period, the increase in the production of "fruit, beverage and spice plants" reached a high rate of 34.2%.
A fluctuating course was experienced in the production amount of "cereals and other vegetable products" in the same period. The increase in this period was slight with a rate of 5.1% remaining even behind the increase in population growth, being 12,8 %4 (Table 5).
4- Calculated based on TURKSTAT data (Population; 2010: 73.7 Million, 2019: 83.2 Million)

FOOD INDUSTRY ANALYSIS REPORT AND GUIDETR22 REGION (Balıkesir, Çanakkale)
17
Table 5: Turkey - Plant Production Quantities
Herbal Production (Thousand Tons)
2010 2015 2019 Amount of
Change(2010- 2019)
Rate of Change
(2010-2019)
Cereals and other herbal products
60.689.356 65.077.326 63.802.117 3.112.761 5,1%
Vegetables 25.997.195 29.552.290 31.089.644 5.092.449 19,6%
Fruits, beverage and spice herbs
16.609.786 17.772.057 22.292.580 5.682.794 34,2%
Total 103.296.337 112.401.673 117.184.341 13.888.004 13,4%
Source: TURKSTAT
Animal ProductionThe number of bovine and ovine animals increased by 56% and 52% respectively between 2010 and 2019 (Table 6). The same trend is observed in eggs, poultry meat, and beekeeping (Table 7, Table 8)
Table 6: Turkey - Number of Bovine and Ovine Animals
Number of Animals
2010 2015 2019 Variation Amount
(2010-2019)
Variation Ratio (2010-2019)
Bovine Total 11.454.526 14.127.837 17.872.331 6.417.805 56%
Cattle 11.369.800 13.994.071 17.688.139 6.318.339 56%
Cow 84.726 133.766 184.192 99.466 117%
Small cattle
Total 31.821.789 29.382.924 48.481.479 16.659.690 52%
Sheep 25.304.325 23.089.691 37.276.050 11.971.725 47%
Goat 6.517.464 6.293.233 11.205.429 4.687.965 72%
Source: TURKSTAT
Table 7: Turkey - Poultry Data
Poultry Data
2010 2015 2019 Amount of
Change (2010-2019)
Rate of Change
(2010-2019)
Egg (Million pieces) 11.841 16.726 19.898 8.057 68%
Poultry Meat (tons) 1.444.059 1.909.276 2.138.451 694.392 48%
Source: TURKSTAT
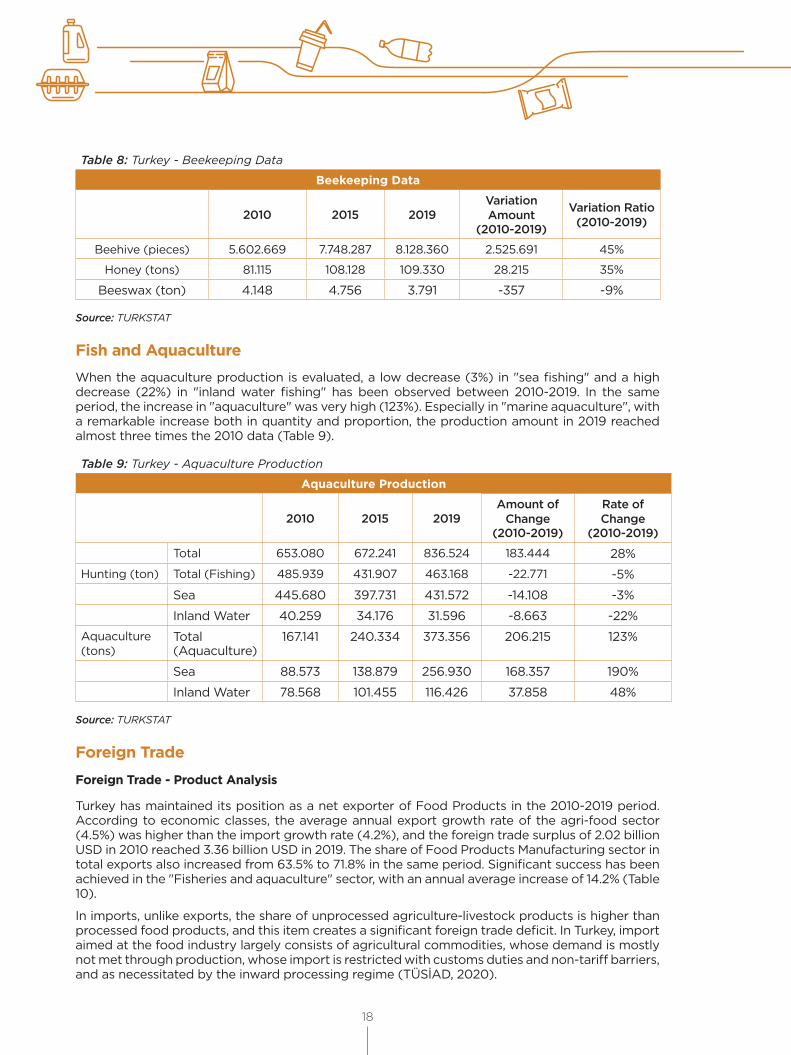
18
Table 8: Turkey - Beekeeping Data
Beekeeping Data
2010 2015 2019 Variation Amount
(2010-2019)
Variation Ratio (2010-2019)
Beehive (pieces) 5.602.669 7.748.287 8.128.360 2.525.691 45%
Honey (tons) 81.115 108.128 109.330 28.215 35%
Beeswax (ton) 4.148 4.756 3.791 -357 -9%
Source: TURKSTAT
Fish and AquacultureWhen the aquaculture production is evaluated, a low decrease (3%) in "sea fishing" and a high decrease (22%) in "inland water fishing" has been observed between 2010-2019. In the same period, the increase in "aquaculture" was very high (123%). Especially in "marine aquaculture", with a remarkable increase both in quantity and proportion, the production amount in 2019 reached almost three times the 2010 data (Table 9).
Table 9: Turkey - Aquaculture Production
Aquaculture Production
2010 2015 2019 Amount of
Change(2010-2019)
Rate of Change
(2010-2019)
Total 653.080 672.241 836.524 183.444 28%
Hunting (ton) Total (Fishing) 485.939 431.907 463.168 -22.771 -5%
Sea 445.680 397.731 431.572 -14.108 -3%
Inland Water 40.259 34.176 31.596 -8.663 -22%
Aquaculture (tons)
Total (Aquaculture)
167.141 240.334 373.356 206.215 123%
Sea 88.573 138.879 256.930 168.357 190%
Inland Water 78.568 101.455 116.426 37.858 48%
Source: TURKSTAT
Foreign Trade
Foreign Trade - Product Analysis
Turkey has maintained its position as a net exporter of Food Products in the 2010-2019 period. According to economic classes, the average annual export growth rate of the agri-food sector (4.5%) was higher than the import growth rate (4.2%), and the foreign trade surplus of 2.02 billion USD in 2010 reached 3.36 billion USD in 2019. The share of Food Products Manufacturing sector in total exports also increased from 63.5% to 71.8% in the same period. Significant success has been achieved in the "Fisheries and aquaculture" sector, with an annual average increase of 14.2% (Table 10).
In imports, unlike exports, the share of unprocessed agriculture-livestock products is higher than processed food products, and this item creates a significant foreign trade deficit. In Turkey, import aimed at the food industry largely consists of agricultural commodities, whose demand is mostly not met through production, whose import is restricted with customs duties and non-tariff barriers, and as necessitated by the inward processing regime (TÜSİAD, 2020).

FOOD INDUSTRY ANALYSIS REPORT AND GUIDETR22 REGION (Balıkesir, Çanakkale)
19
Table 10: Turkey - Agri-Food Foreign Trade According to Economic Classes (Import-Export-For-eign Trade Balance)
NACE Code Name
Export (1000 $) Amount of Change
Share in Exports
2010 2019 (2010-2019) 2010 2019
Annual Average Growth
Rate
11.764.452 17.463.544 5.699.091 100% 100% 4,5%
1 Crop and Animal Production, Hunting and Related Service Activities
3.962.541 4.112.899 150.358 33,7% 23,6% 0,4%
3 Fishing and Aquaculture 156.025 517.251 361.227 1,3% 3,0% 14,2%
10 Manufacture of Food Products 7.465.023 12.541.209 5.076.185 63,5% 71,8% 5,9%
11 Manufacture of Drinks 180.863 292.185 111.321 1,5% 1,7% 5,5%
NACE Code Name
Import (1000 $) Amount of Change Share in Import
2010 2019 (2010-2019) 2010 2019
Annual Average Growth
Rate
9.734.909 14.095.005 4.360.097 100% 100% 4,2%
1 Crop and Animal Production, Hunting and Related Service Activities
5.918.958 8.805.962 2.887.005 60,8% 62,5% 4,5%
3 Fishing and Aquaculture 33.343 52.485 19.142 0,3% 0,4% 5,2%
10 Manufacture of Food Products 3.591.428 4.806.099 1.214.670 36,9% 34,1% 3,3%
11 Manufacture of Drinks 191.180 430.460 239.280 2,0% 3,1% 9,4%
NACE Code Name
Foreign Trade Balance (1000 $) Amount of Change
2010 2019 (2010-2019)
2.029.544 3.368.538 1.338.995
1 Crop and Animal Production, Hunting and Related Service Activities -1.956.417 -4.693.063 -2.736.647
3 Fishing and Aquaculture 122.682 464.767 342.085
10 Manufacture of Food Products 3.873.595 7.735.110 3.861.515
11 Manufacture of Drinks -10.317 -138.275 -127.958
Source: Calculated based on TURKSTAT data
When the agri-food foreign trade data are analyzed according to the HS CODE classification, it is seen that there is an increase in the foreign trade surplus in total (Table 11). The export performance of Turkey (average annual growth rate: 4.53%) remained above the world export growth rate (3.57%), through which its share in the world agri-food products increased from 1.04 % (2010) to 1.13% (2019)(Table 12).
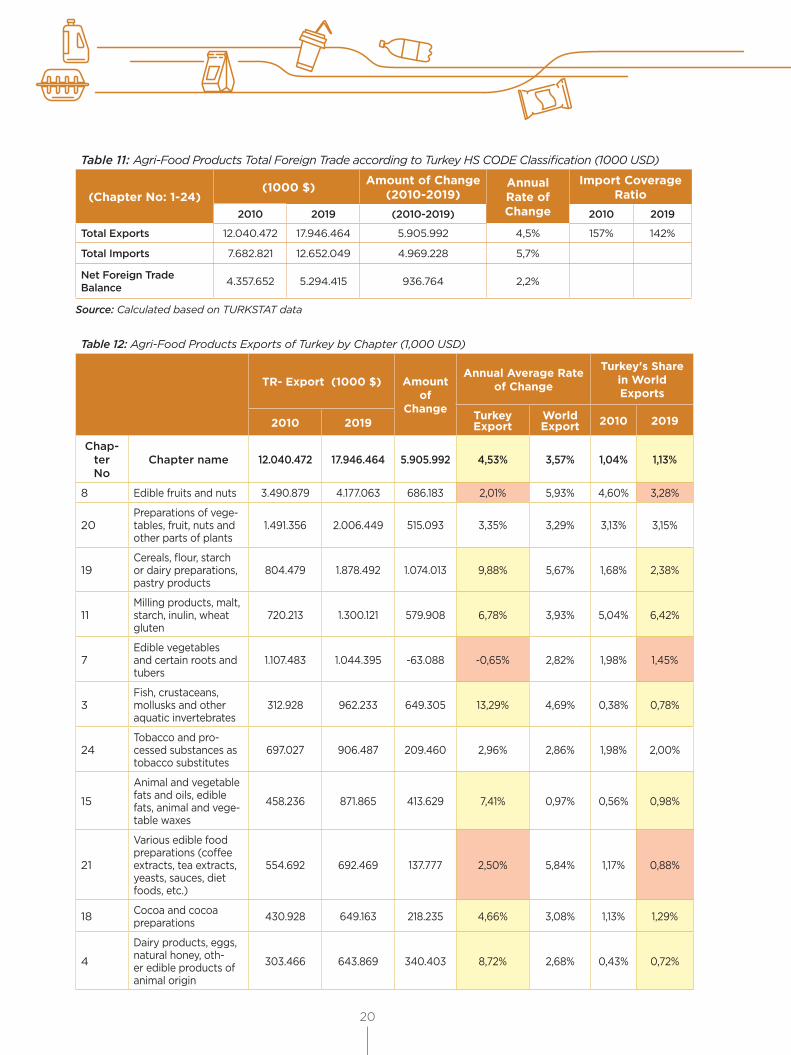
20
Table 11: Agri-Food Products Total Foreign Trade according to Turkey HS CODE Classification (1000 USD)
(Chapter No: 1-24) (1000 $) Amount of Change
(2010-2019)Annual Rate of Change
Import Coverage Ratio
2010 2019 (2010-2019) 2010 2019
Total Exports 12.040.472 17.946.464 5.905.992 4,5% 157% 142%
Total Imports 7.682.821 12.652.049 4.969.228 5,7%
Net Foreign Trade Balance 4.357.652 5.294.415 936.764 2,2%
Source: Calculated based on TURKSTAT data
Table 12: Agri-Food Products Exports of Turkey by Chapter (1,000 USD)
TR- Export (1000 $) Amount of
Change
Annual Average Rate of Change
Turkey's Share in World Exports
Turkey Export
World Export 2010 20192010 2019
Chap-ter No
Chapter name 12.040.472 17.946.464 5.905.992 4,53% 3,57% 1,04% 1,13%
8 Edible fruits and nuts 3.490.879 4.177.063 686.183 2,01% 5,93% 4,60% 3,28%
20Preparations of vege-tables, fruit, nuts and other parts of plants
1.491.356 2.006.449 515.093 3,35% 3,29% 3,13% 3,15%
19Cereals, flour, starch or dairy preparations, pastry products
804.479 1.878.492 1.074.013 9,88% 5,67% 1,68% 2,38%
11Milling products, malt, starch, inulin, wheat gluten
720.213 1.300.121 579.908 6,78% 3,93% 5,04% 6,42%
7Edible vegetables and certain roots and tubers
1.107.483 1.044.395 -63.088 -0,65% 2,82% 1,98% 1,45%
3Fish, crustaceans, mollusks and other aquatic invertebrates
312.928 962.233 649.305 13,29% 4,69% 0,38% 0,78%
24Tobacco and pro-cessed substances as tobacco substitutes
697.027 906.487 209.460 2,96% 2,86% 1,98% 2,00%
15
Animal and vegetable fats and oils, edible fats, animal and vege-table waxes
458.236 871.865 413.629 7,41% 0,97% 0,56% 0,98%
21
Various edible food preparations (coffee extracts, tea extracts, yeasts, sauces, diet foods, etc.)
554.692 692.469 137.777 2,50% 5,84% 1,17% 0,88%
18 Cocoa and cocoa preparations 430.928 649.163 218.235 4,66% 3,08% 1,13% 1,29%
4
Dairy products, eggs, natural honey, oth-er edible products of animal origin
303.466 643.869 340.403 8,72% 2,68% 0,43% 0,72%
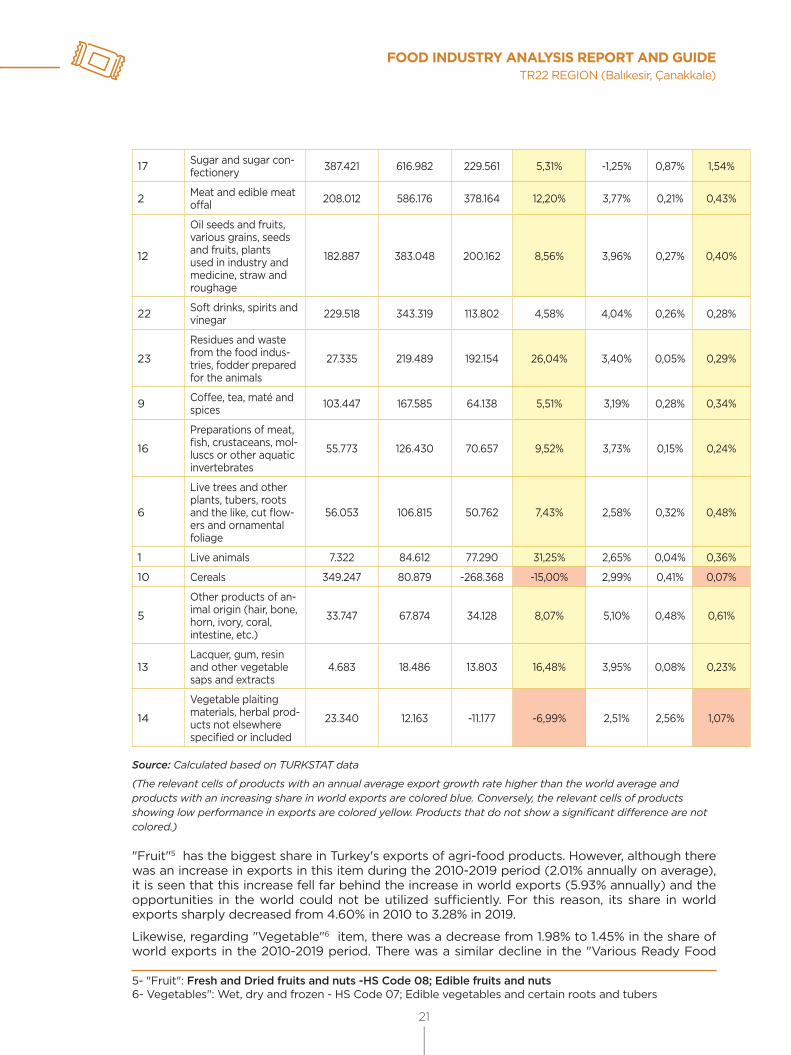
FOOD INDUSTRY ANALYSIS REPORT AND GUIDETR22 REGION (Balıkesir, Çanakkale)
21
17 Sugar and sugar con-fectionery 387.421 616.982 229.561 5,31% -1,25% 0,87% 1,54%
2 Meat and edible meat offal 208.012 586.176 378.164 12,20% 3,77% 0,21% 0,43%
12
Oil seeds and fruits, various grains, seeds and fruits, plants used in industry and medicine, straw and roughage
182.887 383.048 200.162 8,56% 3,96% 0,27% 0,40%
22 Soft drinks, spirits and vinegar 229.518 343.319 113.802 4,58% 4,04% 0,26% 0,28%
23
Residues and waste from the food indus-tries, fodder prepared for the animals
27.335 219.489 192.154 26,04% 3,40% 0,05% 0,29%
9 Coffee, tea, maté and spices 103.447 167.585 64.138 5,51% 3,19% 0,28% 0,34%
16
Preparations of meat, fish, crustaceans, mol-luscs or other aquatic invertebrates
55.773 126.430 70.657 9,52% 3,73% 0,15% 0,24%
6
Live trees and other plants, tubers, roots and the like, cut flow-ers and ornamental foliage
56.053 106.815 50.762 7,43% 2,58% 0,32% 0,48%
1 Live animals 7.322 84.612 77.290 31,25% 2,65% 0,04% 0,36%
10 Cereals 349.247 80.879 -268.368 -15,00% 2,99% 0,41% 0,07%
5
Other products of an-imal origin (hair, bone, horn, ivory, coral, intestine, etc.)
33.747 67.874 34.128 8,07% 5,10% 0,48% 0,61%
13Lacquer, gum, resin and other vegetable saps and extracts
4.683 18.486 13.803 16,48% 3,95% 0,08% 0,23%
14
Vegetable plaiting materials, herbal prod-ucts not elsewhere specified or included
23.340 12.163 -11.177 -6,99% 2,51% 2,56% 1,07%
Source: Calculated based on TURKSTAT data
(The relevant cells of products with an annual average export growth rate higher than the world average and products with an increasing share in world exports are colored blue. Conversely, the relevant cells of products showing low performance in exports are colored yellow. Products that do not show a significant difference are not colored.)
"Fruit"5 has the biggest share in Turkey's exports of agri-food products. However, although there was an increase in exports in this item during the 2010-2019 period (2.01% annually on average), it is seen that this increase fell far behind the increase in world exports (5.93% annually) and the opportunities in the world could not be utilized sufficiently. For this reason, its share in world exports sharply decreased from 4.60% in 2010 to 3.28% in 2019.
Likewise, regarding "Vegetable"6 item, there was a decrease from 1.98% to 1.45% in the share of world exports in the 2010-2019 period. There was a similar decline in the "Various Ready Food
5- "Fruit": Fresh and Dried fruits and nuts -HS Code 08; Edible fruits and nuts6- Vegetables": Wet, dry and frozen - HS Code 07; Edible vegetables and certain roots and tubers
22
Products"7 class. Although the export performance in "Processed Fruit and Vegetables"8 products was close to the increase in world exports, it is thought that the potential could not be utilized sufficiently when compared to other successful products.
The main driver of the increase in Turkey's agri-food exports is "cake/biscuits, pasta, bulghur9 and "Wheat flour"10 the raw material of which are mostly based on imports. In 2019, Turkey exported 3.3 million tons of" Wheat Flour" (HS CODE 1101) in return for 1.05 billion US Dollars and took first place in world exports with a share of 21%. Approximately 6.5 million tons of wheat were imported in 2019, and processed products (flour, pasta, bulghur, semolina, biscuits) equivalent to 7.9 million tons of wheat were exported. (Export data and world ranking regarding pasta, bulghur, biscuits, and selected products, which have a remarkable share in Turkey's exports are given in Table 13).
A significant increase was also achieved in the export of "Cocoa and cocoa preparations" products, the raw materials of which are based on imports. It is thought that the threat of being dependent on imports in the raw materials of these products is low and it is a market that is open to development, as it is not among the basic food products, its raw material can be produced efficiently by a small number of countries due to its suitability to climate and geography, and therefore there are equal competition conditions in raw material supply with all rival countries.
The growth was also above the world export increase rate in the export of "Animal and vegetable oils"11 products, where olive oil, sunflower seed oil, and soybean oil have a large share. Although export to Iraq in this class reached 833 million USD in 2012 from 146 million USD in 2010, it decreased to 119 million USD in 2019, being on a continuous decline. Being dependent on foreign sources in soybean and sunflower seeds, the war and economic uncertainties in the neighbors (Iraq, Syria), which constitute the main market, since a market diversity could not be formed, pose a threat to this sector.
The increase in exports of "Fish and Aquaculture"12, where the share of domestic inputs is higher compared to these products, "Meats and edible meat offal" (poultry meat with a 97% share), "Dairy products, eggs, natural honey, other edible products of animal origin" (mainly eggs and cheese), and "Sugar and sugar products" (mainly confectionaries) has had a significant share in the increase in total exports and has shown a successful performance by achieving growth above the global export growth rates. The exports of “coffee, tea, maté and spice” products, in which spices have the largest share, also displayed a successful performance with a high increase, although they did not have a large share in the increase in exports.
The raw material of the food industry (Grain), which has increased in high rates and amounts in recent years, takes the biggest share in imports and foreign trade deficit (Table 14). It is followed by "Oil seeds and fruits"13 "Residues and waste of the food industry, roughages prepared for animals" and "Live Animals." It can be seen that the increase in exports of "cereal products" (pasta, wheat flour) and "Vegetable Oils" (Sunflower Oil, Soybean Oil) is provided by the processing of imported products (Table 15, Table 16).
7- "Various Ready to Eat Food Products": HS Code 21; Various edible food preparations - coffee extracts, tea extracts, yeasts, sauces, diet foods, etc. -8- "Processed Fruits and Vegetables": HS Code 20; Preparations of vegetables, fruits, nuts, and other parts of plants9- “Cake/biscuit, pasta, bulgur: HS Code 19: Cereals, flour, starch or milk preparations, pastry products10- "Wheat flour": HS Code 11: Milling products, malt, starch, inulin, wheat gluten11- "Animal and vegetable oils": HS Code 15: Animal and vegetable fats and oils, edible fats, animal and vegetable waxes12- "Fish and aquaculture": HS Code 3: Fish, crustaceans, mollusks and other aquatic invertebrates13- "Oilseeds and fruits": HS Code 12: Oilseeds and fruits, various grains, seeds and fruits, plants used in industry and medicine, straw and roughage)

FOOD INDUSTRY ANALYSIS REPORT AND GUIDETR22 REGION (Balıkesir, Çanakkale)
23
Table 13: Turkey - Export Volume of Selected Products, Its Share and Ranking in Global Exports
Export - 2019Shares in the world export World RankingQuantity
(1.000 ton)Amount
(1.000 $)Name of the product HS Code
Hazelnut - Unshelled 080222 193 1.245.000 67% 1
Wheat flour 1101 3.262 1.051.000 21% 1
Pasta 1902 1.273 607.000 6% 4
Poultry Meat 0207 457 571.400 2,1% 12
Raisins 080620 243 521.600 29% 1
Biscuit - Dessert 190531 188 343.000 4,1% 7
Wafer 190532 132 332.000 7,4% 5
Egg 0407 273 295.000 7,2% 4
Dry fig 080420 85 284.000 50% 1
Dried apricots 081310 100 253.100 72% 1
Bulghur 190430 263 117.000 69% 1
Pistachio - Unshelled 080252 5 83.400 16% 3
Source: Calculated based on the data in www.trademap.org
Table 14: Agri-Food Products Exports of Turkey by Chapter (1,000 USD)
TR- Import (1.000 $) Amount of
Change
Annual Rate of Change
Import Coverage Ratio
2010 2019 TR-Import
World Imports
2010 2019
Chapter No Chapter name 7.682.821 12.652.049 4.969.228 5,70% 3,55% 157% 142%
10 Cereals 1.056.747 3.219.269 2.162.522 13,18% 2,92% 33% 3%
12
Oil seeds and fruits, various grains, seeds and fruits, plants used in industry and medicine, straw and roughage
1.558.753 1.967.228 408.475 2,62% 3,95% 12% 19%
23Residues and waste from the food industries, fodder prepared for the animals
739.080 1.538.952 799.873 8,49% 3,35% 4% 14%
15Animal and vegetable fats and oils, edible fats, animal and vegetable waxes
990.266 1.128.055 137.789 1,46% 1,60% 46% 77%
1 Live animals 333.080 700.574 367.494 8,61% 2,18% 2% 12%
21Various edible food preparations (coffee extracts, tea extracts, yeasts, sauces, diet foods, etc.)
375.926 606.417 230.490 5,46% 5,36% 148% 114%
18 Cocoa and cocoa preparations 406.759 576.715 169.955 3,96% 2,91% 106% 113%
24Tobacco and processed substances as tobacco substitutes
368.274 554.783 186.510 4,66% 3,19% 189% 163%
8 Edible fruits and nuts 315.153 468.719 153.565 4,51% 5,96% 1108% 891%
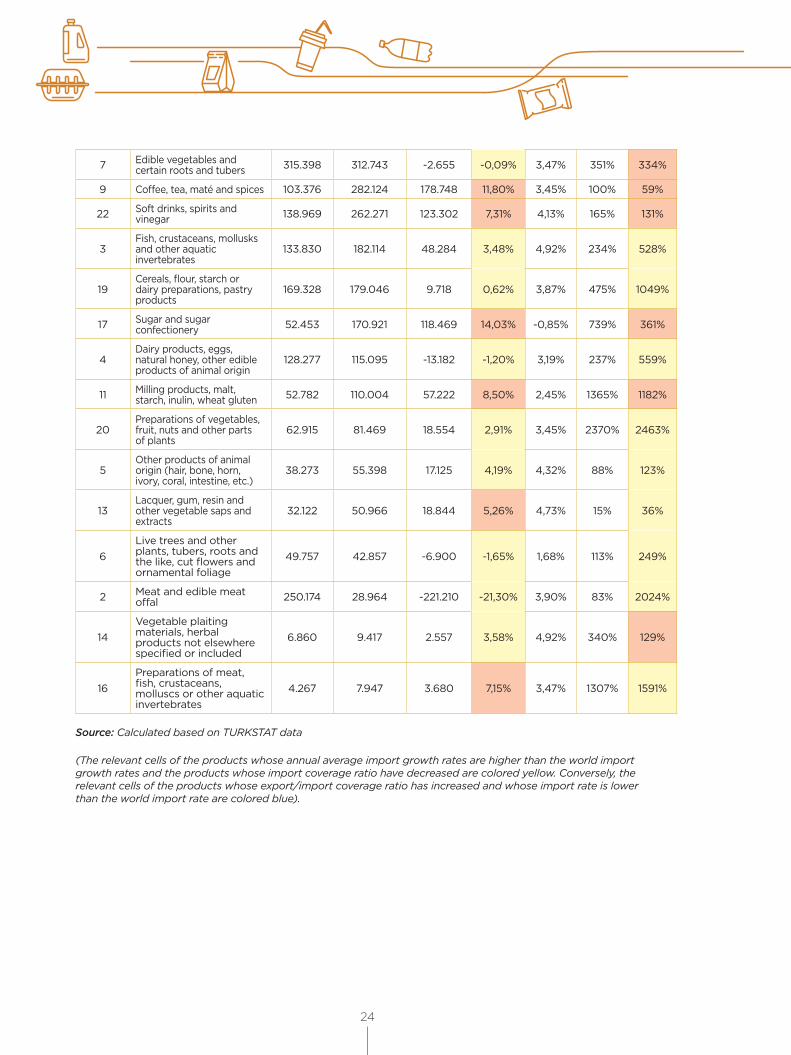
24
7 Edible vegetables and certain roots and tubers 315.398 312.743 -2.655 -0,09% 3,47% 351% 334%
9 Coffee, tea, maté and spices 103.376 282.124 178.748 11,80% 3,45% 100% 59%
22 Soft drinks, spirits and vinegar 138.969 262.271 123.302 7,31% 4,13% 165% 131%
3Fish, crustaceans, mollusks and other aquatic invertebrates
133.830 182.114 48.284 3,48% 4,92% 234% 528%
19Cereals, flour, starch or dairy preparations, pastry products
169.328 179.046 9.718 0,62% 3,87% 475% 1049%
17 Sugar and sugar confectionery 52.453 170.921 118.469 14,03% -0,85% 739% 361%
4Dairy products, eggs, natural honey, other edible products of animal origin
128.277 115.095 -13.182 -1,20% 3,19% 237% 559%
11 Milling products, malt, starch, inulin, wheat gluten 52.782 110.004 57.222 8,50% 2,45% 1365% 1182%
20Preparations of vegetables, fruit, nuts and other parts of plants
62.915 81.469 18.554 2,91% 3,45% 2370% 2463%
5Other products of animal origin (hair, bone, horn, ivory, coral, intestine, etc.)
38.273 55.398 17.125 4,19% 4,32% 88% 123%
13Lacquer, gum, resin and other vegetable saps and extracts
32.122 50.966 18.844 5,26% 4,73% 15% 36%
6Live trees and other plants, tubers, roots and the like, cut flowers and ornamental foliage
49.757 42.857 -6.900 -1,65% 1,68% 113% 249%
2 Meat and edible meat offal 250.174 28.964 -221.210 -21,30% 3,90% 83% 2024%
14Vegetable plaiting materials, herbal products not elsewhere specified or included
6.860 9.417 2.557 3,58% 4,92% 340% 129%
16Preparations of meat, fish, crustaceans, molluscs or other aquatic invertebrates
4.267 7.947 3.680 7,15% 3,47% 1307% 1591%
Source: Calculated based on TURKSTAT data
(The relevant cells of the products whose annual average import growth rates are higher than the world import growth rates and the products whose import coverage ratio have decreased are colored yellow. Conversely, the relevant cells of the products whose export/import coverage ratio has increased and whose import rate is lower than the world import rate are colored blue).

FOOD INDUSTRY ANALYSIS REPORT AND GUIDETR22 REGION (Balıkesir, Çanakkale)
25
Table 15: Turkey - Agri-Food Items That Have Foreign Trade Surplus by Chapters (1,000 US dollars)
TR- Foreign Trade Surplus (1000 $)
Amount of
Change2010 2019
Chapter No Chapter name 8.037.919 12.355.621 4.317.701
8 Edible fruits and nuts 3.175.726 3.708.344 532.618
20 Preparations of vegetables, fruit, nuts and other parts of plants 1.428.441 1.924.980 496.539
19 Cereals, flour, starch or dairy preparations, pastry products 635.151 1.699.446 1.064.295
11 Milling products, malt, starch, inulin, wheat gluten 667.431 1.190.117 522.686
3 Fish, crustaceans, mollusks and other aquatic invertebrates 179.098 780.119 601.021
7 Edible vegetables and certain roots and tubers 792.085 731.652 -60.433
2 Meat and edible meat offal -42.162 557.211 599.374
4 Dairy products, eggs, natural honey, other edible products of animal origin 175.189 528.774 353.585
17 Sugar and sugar confectionery 334.968 446.060 111.092
24 Tobacco and processed substances as tobacco substitutes 328.754 351.704 22.950
16 Preparations of meat, fish, crustaceans, molluscs or other aquatic invertebrates 51.506 118.483 66.977
21 Various edible food preparations (coffee extracts, tea extracts, yeasts, sauces, diet foods, etc.) 178.765 86.052 -92.713
22 Soft drinks, spirits and vinegar 90.549 81.049 -9.500
18 Cocoa and cocoa preparations 24.168 72.448 48.280
6 Live trees and other plants, tubers, roots and the like, cut flowers and ornamental foliage 6.296 63.959 57.662
5 Other products of animal origin (hair, bone, horn, ivory, coral, intestine, etc.) -4.527 12.476 17.003
14 Vegetable plaiting materials, herbal products not elsewhere specified or included 16.480 2.746 -13.734
Source: TURKSTAT
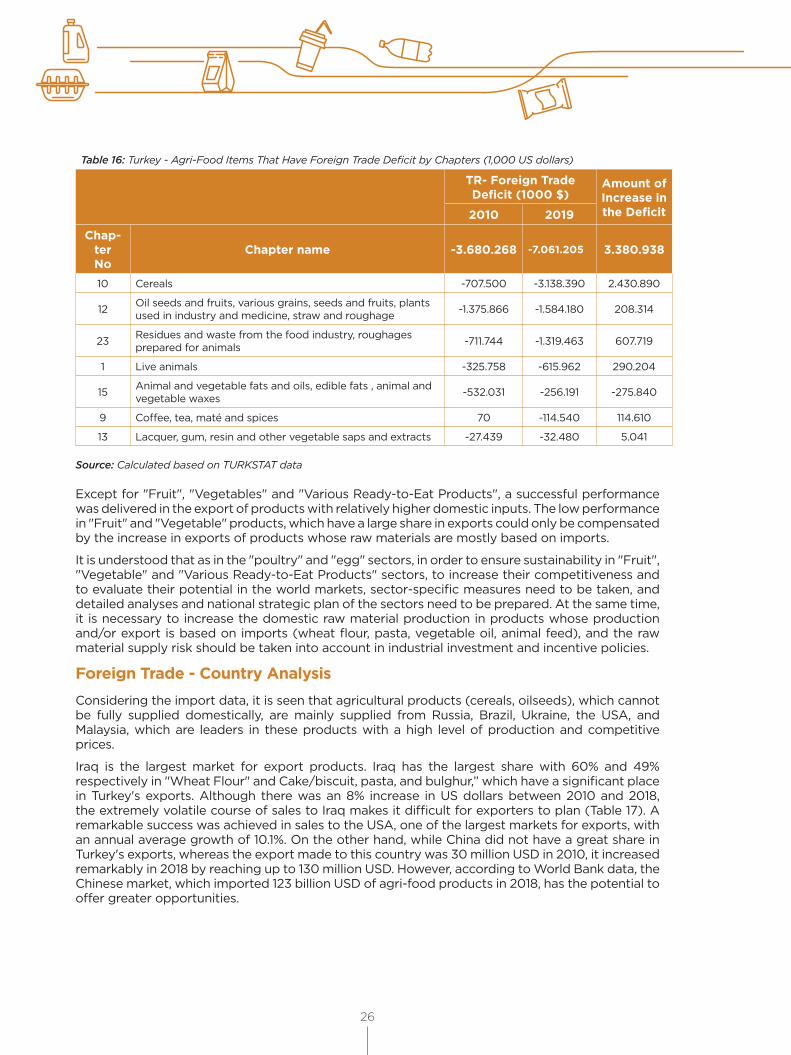
26
Table 16: Turkey - Agri-Food Items That Have Foreign Trade Deficit by Chapters (1,000 US dollars)
TR- Foreign Trade Deficit (1000 $)
Amount of Increase in the Deficit2010 2019
Chap-ter No
Chapter name -3.680.268 -7.061.205 3.380.938
10 Cereals -707.500 -3.138.390 2.430.890
12 Oil seeds and fruits, various grains, seeds and fruits, plants used in industry and medicine, straw and roughage -1.375.866 -1.584.180 208.314
23 Residues and waste from the food industry, roughages prepared for animals -711.744 -1.319.463 607.719
1 Live animals -325.758 -615.962 290.204
15 Animal and vegetable fats and oils, edible fats , animal and vegetable waxes -532.031 -256.191 -275.840
9 Coffee, tea, maté and spices 70 -114.540 114.610
13 Lacquer, gum, resin and other vegetable saps and extracts -27.439 -32.480 5.041
Source: Calculated based on TURKSTAT data
Except for "Fruit", "Vegetables" and "Various Ready-to-Eat Products", a successful performance was delivered in the export of products with relatively higher domestic inputs. The low performance in "Fruit" and "Vegetable" products, which have a large share in exports could only be compensated by the increase in exports of products whose raw materials are mostly based on imports.
It is understood that as in the "poultry" and "egg" sectors, in order to ensure sustainability in "Fruit", "Vegetable" and "Various Ready-to-Eat Products" sectors, to increase their competitiveness and to evaluate their potential in the world markets, sector-specific measures need to be taken, and detailed analyses and national strategic plan of the sectors need to be prepared. At the same time, it is necessary to increase the domestic raw material production in products whose production and/or export is based on imports (wheat flour, pasta, vegetable oil, animal feed), and the raw material supply risk should be taken into account in industrial investment and incentive policies.
Foreign Trade - Country AnalysisConsidering the import data, it is seen that agricultural products (cereals, oilseeds), which cannot be fully supplied domestically, are mainly supplied from Russia, Brazil, Ukraine, the USA, and Malaysia, which are leaders in these products with a high level of production and competitive prices.
Iraq is the largest market for export products. Iraq has the largest share with 60% and 49% respectively in "Wheat Flour" and Cake/biscuit, pasta, and bulghur,” which have a significant place in Turkey's exports. Although there was an 8% increase in US dollars between 2010 and 2018, the extremely volatile course of sales to Iraq makes it difficult for exporters to plan (Table 17). A remarkable success was achieved in sales to the USA, one of the largest markets for exports, with an annual average growth of 10.1%. On the other hand, while China did not have a great share in Turkey's exports, whereas the export made to this country was 30 million USD in 2010, it increased remarkably in 2018 by reaching up to 130 million USD. However, according to World Bank data, the Chinese market, which imported 123 billion USD of agri-food products in 2018, has the potential to offer greater opportunities.

FOOD INDUSTRY ANALYSIS REPORT AND GUIDETR22 REGION (Balıkesir, Çanakkale)
27
Table 17: Turkey's Agri-Food Products Import and Export by Country (1,000 US dollars)
Turkey _Agriculture-Food Products Import (1000 $)
2010 2018 Amount of Change (2010-2018)
Average Annual Rate of
Change
World 7.407.569 12.499.242 5.091.673 6,8%
1 Russia 580.073 2.069.989 1.489.917 17,2%
2 Brazil 245.636 1.449.774 1.204.138 24,8%
3 Ukraine 589.360 817.996 228.637 4,2%
4 USA 1.132.296 768.850 -363.446 -4,7%
5 Malaysia 319.985 617.639 297.654 8,6%
6 Uruguay 155.480 421.407 265.927 13,3%
7 Germany 340.827 404.812 63.985 2,2%
8 Netherlands 227.366 354.109 126.742 5,7%
9 Poland 202.297 278.010 75.713 4,1%
10 Argentina 194.394 275.327 80.933 4,4%
11 Romania 118.575 275.274 156.699 11,1%
12 Bulgaria 225.618 245.340 19.722 1,1%
13 China 98.086 214.547 116.461 10,3%
14 Italy 133.316 200.442 67.125 5,2%
15 France 128.372 184.862 56.489 4,7%
Turkey _Agriculture-Food Products Export (1000 $)
2010 2018 Amount of Change (2010-2018)
Average Annual Rate of
Change
World 11.825.855 17.318.735 5.492.879 4,9%
1 Iraq 1.545.121 2.849.920 1.304.799 8,0%
2 Germany 1.148.687 1.323.222 174.535 1,8%
3 USA 409.817 905.730 495.913 10,4%
4 Russia 985.744 884.804 -100.940 -1,3%
5 Italy 536.108 680.398 144.290 3,0%
6 Syria 236.557 644.777 408.221 13,4%
7 Saudi Arabia 380.378 549.151 168.774 4,7%
8 Netherlands 373.985 541.252 167.267 4,7%
9 England 347.200 516.635 169.435 5,1%
10 France 438.411 341.020 -97.392 -3,1%
11 Israel 186.792 318.512 131.720 6,9%
12 Libya 94.973 307.018 212.046 15,8%
13 Romania 206.371 274.795 68.424 3,6%
14 UAE 110.607 256.198 145.591 11,1%
15 Belgium 270.282 237.360 -32.922 -1,6%
Source: World Bank (https://wits.worldbank.org/)
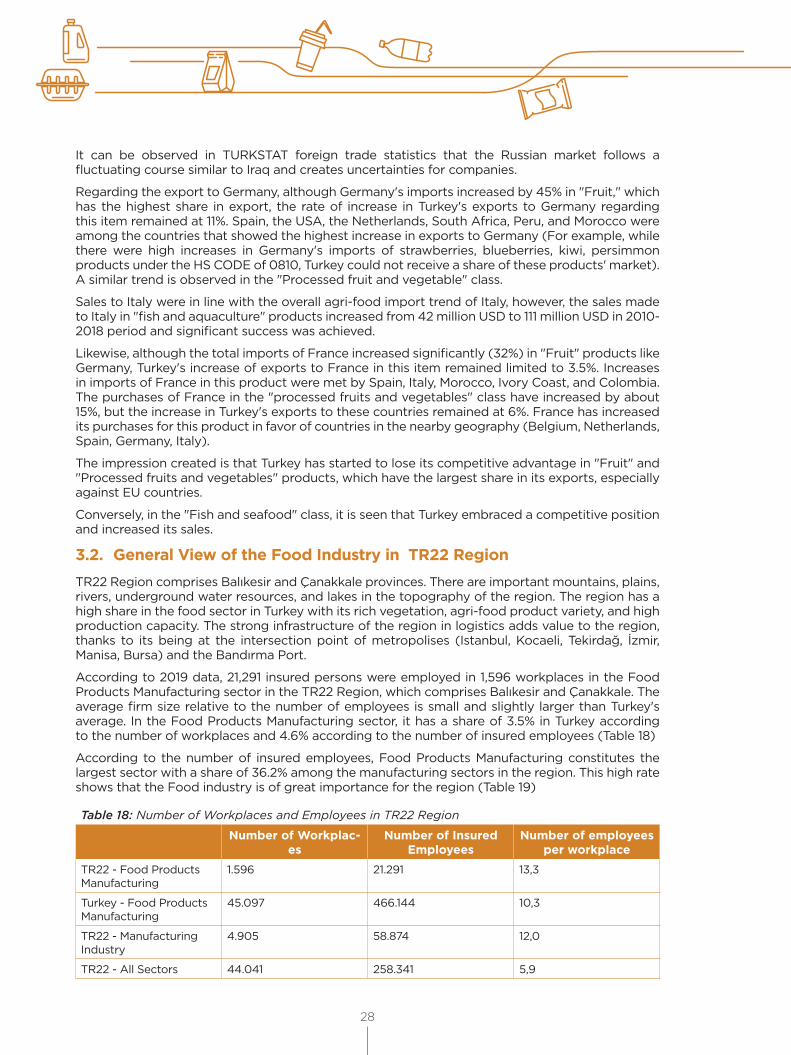
28
It can be observed in TURKSTAT foreign trade statistics that the Russian market follows a fluctuating course similar to Iraq and creates uncertainties for companies.
Regarding the export to Germany, although Germany's imports increased by 45% in "Fruit," which has the highest share in export, the rate of increase in Turkey's exports to Germany regarding this item remained at 11%. Spain, the USA, the Netherlands, South Africa, Peru, and Morocco were among the countries that showed the highest increase in exports to Germany (For example, while there were high increases in Germany's imports of strawberries, blueberries, kiwi, persimmon products under the HS CODE of 0810, Turkey could not receive a share of these products' market). A similar trend is observed in the "Processed fruit and vegetable" class.
Sales to Italy were in line with the overall agri-food import trend of Italy, however, the sales made to Italy in "fish and aquaculture" products increased from 42 million USD to 111 million USD in 2010-2018 period and significant success was achieved.
Likewise, although the total imports of France increased significantly (32%) in "Fruit" products like Germany, Turkey's increase of exports to France in this item remained limited to 3.5%. Increases in imports of France in this product were met by Spain, Italy, Morocco, Ivory Coast, and Colombia. The purchases of France in the "processed fruits and vegetables" class have increased by about 15%, but the increase in Turkey's exports to these countries remained at 6%. France has increased its purchases for this product in favor of countries in the nearby geography (Belgium, Netherlands, Spain, Germany, Italy).
The impression created is that Turkey has started to lose its competitive advantage in "Fruit" and "Processed fruits and vegetables" products, which have the largest share in its exports, especially against EU countries.
Conversely, in the "Fish and seafood" class, it is seen that Turkey embraced a competitive position and increased its sales.
3.2. General View of the Food Industry in TR22 RegionTR22 Region comprises Balıkesir and Çanakkale provinces. There are important mountains, plains, rivers, underground water resources, and lakes in the topography of the region. The region has a high share in the food sector in Turkey with its rich vegetation, agri-food product variety, and high production capacity. The strong infrastructure of the region in logistics adds value to the region, thanks to its being at the intersection point of metropolises (Istanbul, Kocaeli, Tekirdağ, İzmir, Manisa, Bursa) and the Bandırma Port.
According to 2019 data, 21,291 insured persons were employed in 1,596 workplaces in the Food Products Manufacturing sector in the TR22 Region, which comprises Balıkesir and Çanakkale. The average firm size relative to the number of employees is small and slightly larger than Turkey's average. In the Food Products Manufacturing sector, it has a share of 3.5% in Turkey according to the number of workplaces and 4.6% according to the number of insured employees (Table 18)
According to the number of insured employees, Food Products Manufacturing constitutes the largest sector with a share of 36.2% among the manufacturing sectors in the region. This high rate shows that the Food industry is of great importance for the region (Table 19)
Table 18: Number of Workplaces and Employees in TR22 Region
Number of Workplac-es
Number of Insured Employees
Number of employees per workplace
TR22 - Food Products Manufacturing
1.596 21.291 13,3
Turkey - Food Products Manufacturing
45.097 466.144 10,3
TR22 - Manufacturing Industry
4.905 58.874 12,0
TR22 - All Sectors 44.041 258.341 5,9
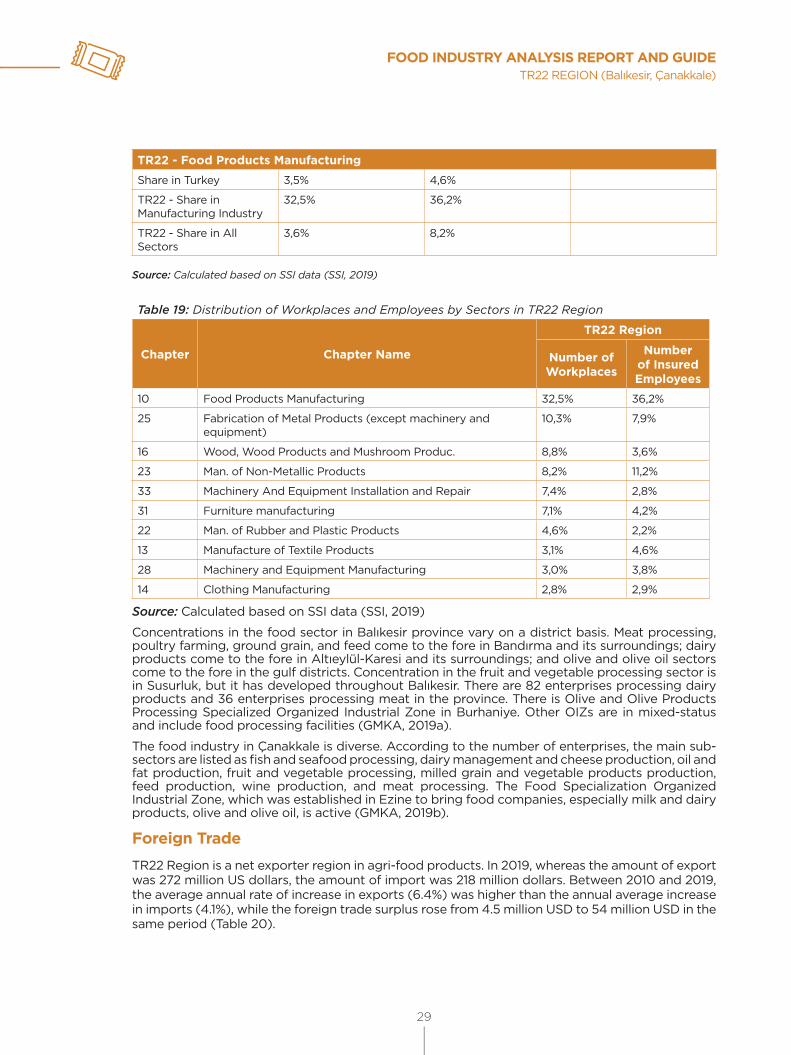
FOOD INDUSTRY ANALYSIS REPORT AND GUIDETR22 REGION (Balıkesir, Çanakkale)
29
TR22 - Food Products Manufacturing
Share in Turkey 3,5% 4,6%
TR22 - Share in Manufacturing Industry
32,5% 36,2%
TR22 - Share in All Sectors
3,6% 8,2%
Source: Calculated based on SSI data (SSI, 2019)
Table 19: Distribution of Workplaces and Employees by Sectors in TR22 Region
Chapter Chapter Name
TR22 Region
Number of Workplaces
Number of Insured Employees
10 Food Products Manufacturing 32,5% 36,2%
25 Fabrication of Metal Products (except machinery and equipment)
10,3% 7,9%
16 Wood, Wood Products and Mushroom Produc. 8,8% 3,6%
23 Man. of Non-Metallic Products 8,2% 11,2%
33 Machinery And Equipment Installation and Repair 7,4% 2,8%
31 Furniture manufacturing 7,1% 4,2%
22 Man. of Rubber and Plastic Products 4,6% 2,2%
13 Manufacture of Textile Products 3,1% 4,6%
28 Machinery and Equipment Manufacturing 3,0% 3,8%
14 Clothing Manufacturing 2,8% 2,9%
Source: Calculated based on SSI data (SSI, 2019)
Concentrations in the food sector in Balıkesir province vary on a district basis. Meat processing, poultry farming, ground grain, and feed come to the fore in Bandırma and its surroundings; dairy products come to the fore in Altıeylül-Karesi and its surroundings; and olive and olive oil sectors come to the fore in the gulf districts. Concentration in the fruit and vegetable processing sector is in Susurluk, but it has developed throughout Balıkesir. There are 82 enterprises processing dairy products and 36 enterprises processing meat in the province. There is Olive and Olive Products Processing Specialized Organized Industrial Zone in Burhaniye. Other OIZs are in mixed-status and include food processing facilities (GMKA, 2019a).
The food industry in Çanakkale is diverse. According to the number of enterprises, the main sub-sectors are listed as fish and seafood processing, dairy management and cheese production, oil and fat production, fruit and vegetable processing, milled grain and vegetable products production, feed production, wine production, and meat processing. The Food Specialization Organized Industrial Zone, which was established in Ezine to bring food companies, especially milk and dairy products, olive and olive oil, is active (GMKA, 2019b).
Foreign TradeTR22 Region is a net exporter region in agri-food products. In 2019, whereas the amount of export was 272 million US dollars, the amount of import was 218 million dollars. Between 2010 and 2019, the average annual rate of increase in exports (6.4%) was higher than the annual average increase in imports (4.1%), while the foreign trade surplus rose from 4.5 million USD to 54 million USD in the same period (Table 20).
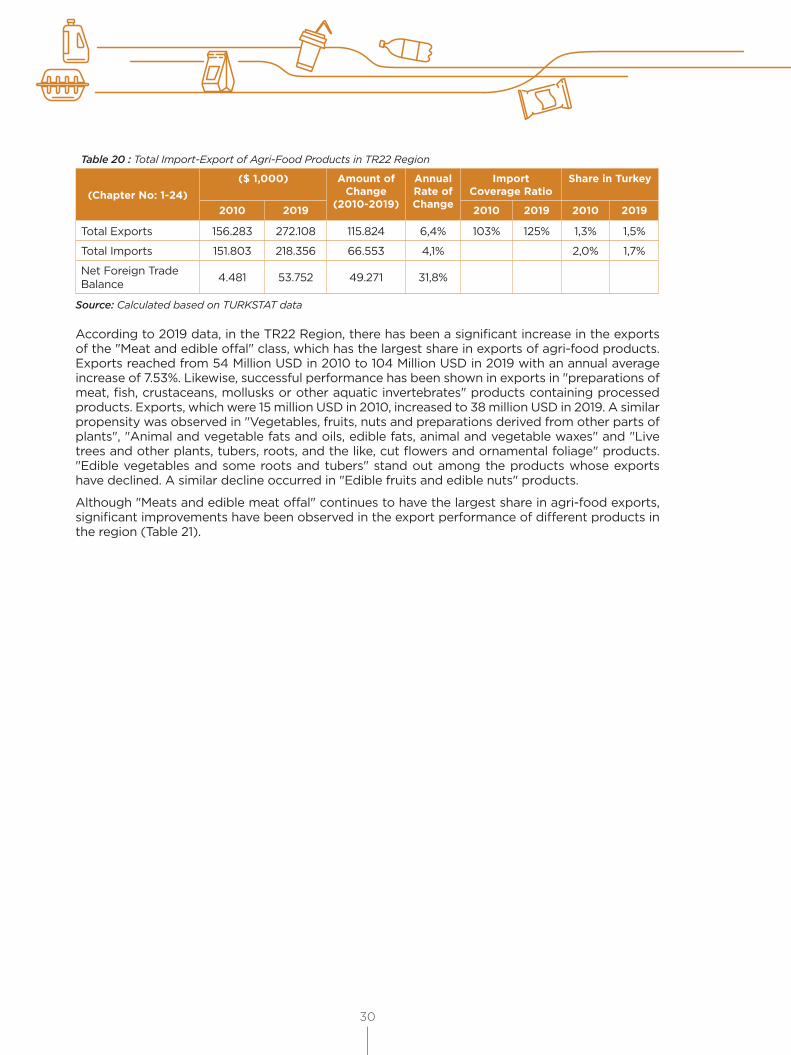
30
Table 20 : Total Import-Export of Agri-Food Products in TR22 Region
(Chapter No: 1-24)($ 1,000) Amount of
Change(2010-2019)
Annual Rate of Change
Import Coverage Ratio
Share in Turkey
2010 2019 2010 2019 2010 2019
Total Exports 156.283 272.108 115.824 6,4% 103% 125% 1,3% 1,5%
Total Imports 151.803 218.356 66.553 4,1% 2,0% 1,7%
Net Foreign Trade Balance 4.481 53.752 49.271 31,8%
Source: Calculated based on TURKSTAT data
According to 2019 data, in the TR22 Region, there has been a significant increase in the exports of the "Meat and edible offal" class, which has the largest share in exports of agri-food products. Exports reached from 54 Million USD in 2010 to 104 Million USD in 2019 with an annual average increase of 7.53%. Likewise, successful performance has been shown in exports in "preparations of meat, fish, crustaceans, mollusks or other aquatic invertebrates" products containing processed products. Exports, which were 15 million USD in 2010, increased to 38 million USD in 2019. A similar propensity was observed in "Vegetables, fruits, nuts and preparations derived from other parts of plants", "Animal and vegetable fats and oils, edible fats, animal and vegetable waxes" and "Live trees and other plants, tubers, roots, and the like, cut flowers and ornamental foliage" products. "Edible vegetables and some roots and tubers" stand out among the products whose exports have declined. A similar decline occurred in "Edible fruits and edible nuts" products.
Although "Meats and edible meat offal" continues to have the largest share in agri-food exports, significant improvements have been observed in the export performance of different products in the region (Table 21).
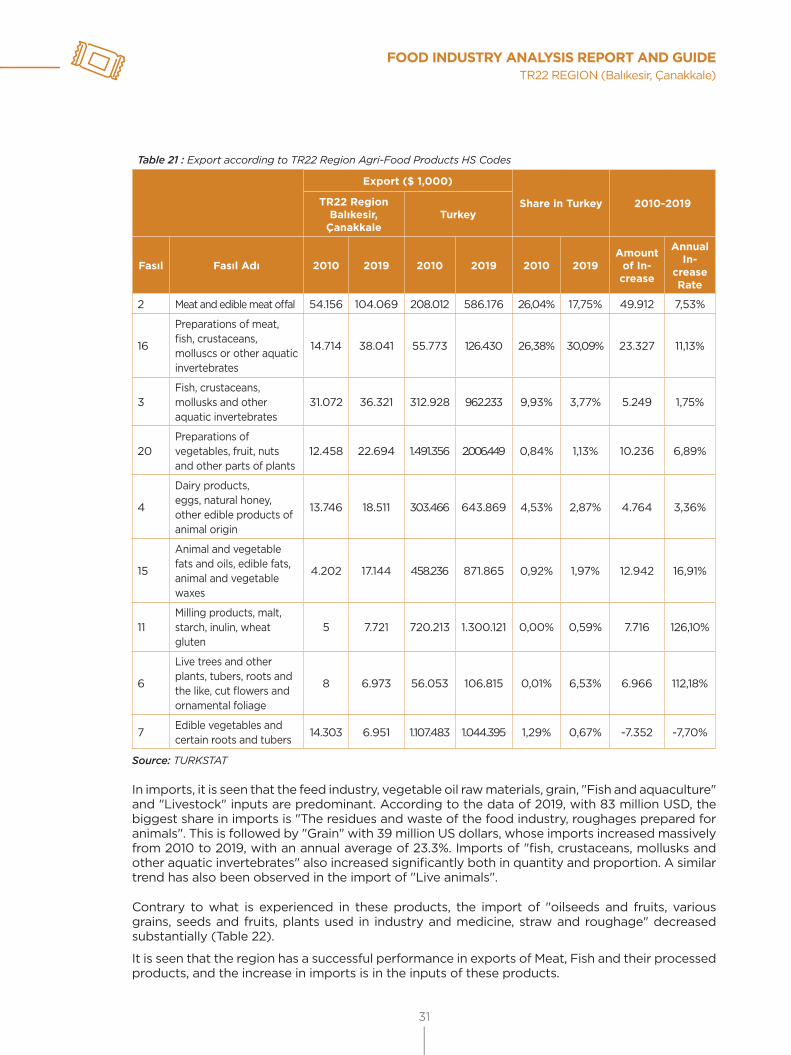
FOOD INDUSTRY ANALYSIS REPORT AND GUIDETR22 REGION (Balıkesir, Çanakkale)
31
Table 21 : Export according to TR22 Region Agri-Food Products HS Codes
Export ($ 1,000)
Share in Turkey 2010-2019TR22 Region Balıkesir,
ÇanakkaleTurkey
Fasıl Fasıl Adı 2010 2019 2010 2019 2010 2019Amount
of In-crease
Annual In-
crease Rate
2 Meat and edible meat offal 54.156 104.069 208.012 586.176 26,04% 17,75% 49.912 7,53%
16
Preparations of meat, fish, crustaceans, molluscs or other aquatic invertebrates
14.714 38.041 55.773 126.430 26,38% 30,09% 23.327 11,13%
3Fish, crustaceans, mollusks and other aquatic invertebrates
31.072 36.321 312.928 962.233 9,93% 3,77% 5.249 1,75%
20Preparations of vegetables, fruit, nuts and other parts of plants
12.458 22.694 1.491.356 2.006.449 0,84% 1,13% 10.236 6,89%
4
Dairy products, eggs, natural honey, other edible products of animal origin
13.746 18.511 303.466 643.869 4,53% 2,87% 4.764 3,36%
15
Animal and vegetable fats and oils, edible fats, animal and vegetable waxes
4.202 17.144 458.236 871.865 0,92% 1,97% 12.942 16,91%
11Milling products, malt, starch, inulin, wheat gluten
5 7.721 720.213 1.300.121 0,00% 0,59% 7.716 126,10%
6
Live trees and other plants, tubers, roots and the like, cut flowers and ornamental foliage
8 6.973 56.053 106.815 0,01% 6,53% 6.966 112,18%
7Edible vegetables and certain roots and tubers
14.303 6.951 1.107.483 1.044.395 1,29% 0,67% -7.352 -7,70%
Source: TURKSTAT
In imports, it is seen that the feed industry, vegetable oil raw materials, grain, "Fish and aquaculture" and "Livestock" inputs are predominant. According to the data of 2019, with 83 million USD, the biggest share in imports is "The residues and waste of the food industry, roughages prepared for animals". This is followed by "Grain" with 39 million US dollars, whose imports increased massively from 2010 to 2019, with an annual average of 23.3%. Imports of "fish, crustaceans, mollusks and other aquatic invertebrates" also increased significantly both in quantity and proportion. A similar trend has also been observed in the import of "Live animals".
Contrary to what is experienced in these products, the import of "oilseeds and fruits, various grains, seeds and fruits, plants used in industry and medicine, straw and roughage" decreased substantially (Table 22).
It is seen that the region has a successful performance in exports of Meat, Fish and their processed products, and the increase in imports is in the inputs of these products.
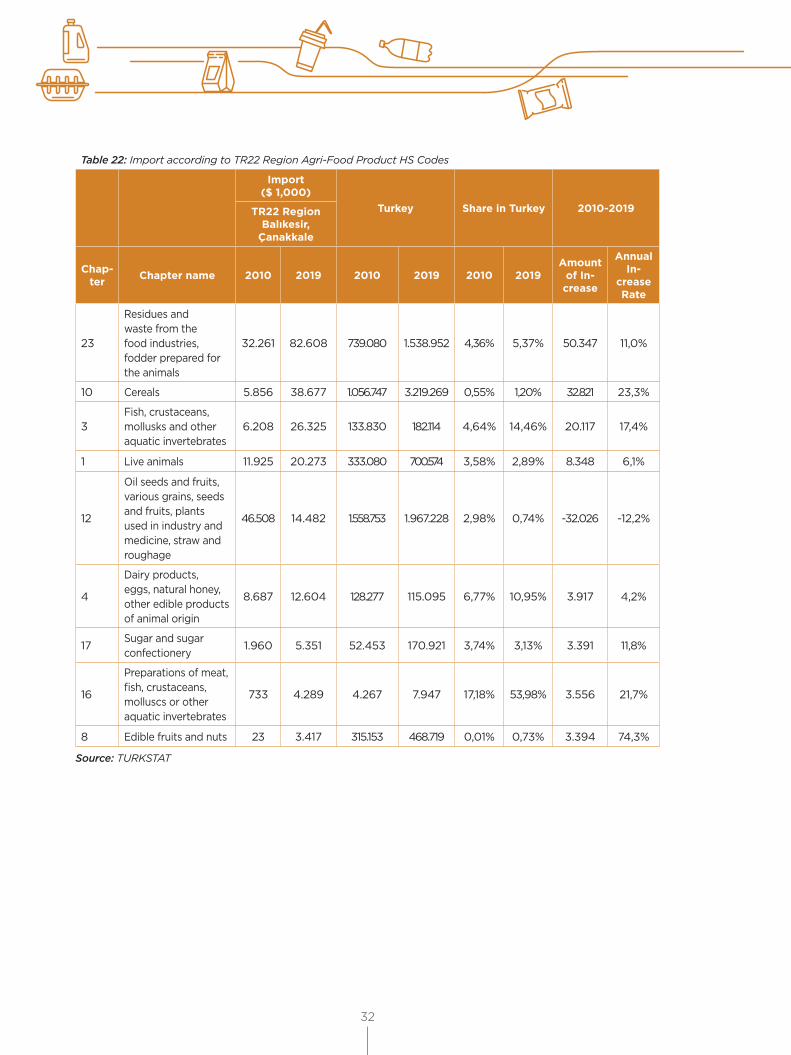
32
Table 22: Import according to TR22 Region Agri-Food Product HS Codes
Import($ 1,000)
Turkey Share in Turkey 2010-2019TR22 Region Balıkesir,
Çanakkale
Chap-ter Chapter name 2010 2019 2010 2019 2010 2019
Amount of In-crease
Annual In-
crease Rate
23
Residues and waste from the food industries, fodder prepared for the animals
32.261 82.608 739.080 1.538.952 4,36% 5,37% 50.347 11,0%
10 Cereals 5.856 38.677 1.056.747 3.219.269 0,55% 1,20% 32.821 23,3%
3Fish, crustaceans, mollusks and other aquatic invertebrates
6.208 26.325 133.830 182.114 4,64% 14,46% 20.117 17,4%
1 Live animals 11.925 20.273 333.080 700.574 3,58% 2,89% 8.348 6,1%
12
Oil seeds and fruits, various grains, seeds and fruits, plants used in industry and medicine, straw and roughage
46.508 14.482 1.558.753 1.967.228 2,98% 0,74% -32.026 -12,2%
4
Dairy products, eggs, natural honey, other edible products of animal origin
8.687 12.604 128.277 115.095 6,77% 10,95% 3.917 4,2%
17Sugar and sugar confectionery
1.960 5.351 52.453 170.921 3,74% 3,13% 3.391 11,8%
16
Preparations of meat, fish, crustaceans, molluscs or other aquatic invertebrates
733 4.289 4.267 7.947 17,18% 53,98% 3.556 21,7%
8 Edible fruits and nuts 23 3.417 315.153 468.719 0,01% 0,73% 3.394 74,3%
Source: TURKSTAT
FOOD INDUSTRY ANALYSIS REPORT AND GUIDETR22 REGION (Balıkesir, Çanakkale)
33
4. Effects of the COVID-19 Pandemic on the Food IndustryThe COVID-19 pandemic is putting unprecedented pressure on global agriculture and food supply chains. As a result, it has led to bottlenecks in input industries, agricultural production, food processing, shipping, and logistics, as well as major shifts in demand for food and food services (OECD - FAO, 2020).
Alınan tedbirler nedeniyle özellikle restoranlar, lokantalar, kafeler ve benzeri mekanlarda gıda tüketimi azalmıştır. Bu durum, ilk etapta gıdaya olan toplam talebi azaltmış durumdadır. Bu nedenle ihraç edilemeyen ürünlerin kısa vadede yurt içinde tüketilmesi de mümkün değildir. Depolanabilir ürünler için ekstra depolama masrafı, bozulabilir ürünler için ise gıda atığı ve israfı riski doğurmuştur (KKB, 2020).
Due to the measures taken, food consumption has decreased especially in restaurants, cafes, and similar places. Firstly, this situation has reduced the total demand for food. Therefore, it is not possible for products that cannot be exported to be consumed domestically in the short term. This created the risk of extra storage costs for storable products and food waste and squander for perishable products (KKB, 2020).
The pandemic has been found to have an impact on "food production" and "general food demand", but its devastating effect has been mainly observed more in the complex network of actors, from farm to table. Oversupply or shortage of different food products were also observed. For example, it has created both surpluses for producers and shortages for consumers in meat processing. Empty shelves were created in supermarkets, especially in the early days of COVID-19. However, the risk to food security for 2021 is largely due to disruptions in supply chains. COVID-19 is predicted to cause a serious increase in poverty and hunger, especially in developing countries where social safety nets are less developed. It is also foreseen that if rapid action is not taken by the World Food Program (WFP, 2020), the number of people suffering from acute food insecurity could double in 2020 to 265 million, and even in developed countries, more vulnerable groups such as the elderly, chronically ill and poor households may still be at risk. However, it should be borne in mind that COVID-19 reveals preexisting gaps in social protection systems (OECD, 2020a). Nevertheless, at the point reached in 2021, it seems that the product stocking insecurity has disappeared, the shelves are filled, and the long lines at the borders have shrunk. Delivering food to where it is needed reminds the importance of the international trade environment and emphasizes the importance of safety nets.
4.1. Comparison of Before and After the Pandemic
WorldThe COVID-19 pandemic has impacted all links of food supply chains, simultaneously affecting agricultural production, food processing, shipping and logistics, and final demand. Naturally, not all sectors and products are equally affected, but each product has been found to be disrupted at different stages of the supply chain:
a. Production in the field faced bottlenecks in terms of some inputs, and limitations on the mobility of the workforce have negatively affected the availability of seasonal workers for planting and harvesting in the fruit and vegetable sector in many countries. Cereals and oilseeds typically require less labor, while fruits and vegetables require more human labor and are more dependent on the seasonal workforce than others, causing bottlenecks in terms of some inputs, foremost being labor.
b. Food processing has been interrupted by labor shortages and shutdowns. COVID-19 has created disruptions in food processing industries due to rules regarding social distancing, labor shortages stemming from the disease, and measures taken to contain the spread of the virus. In closed areas such as fruit and vegetable packaging facilities or meat processing facilities, necessary social distancing measures have reduced the efficiency of operations; moreover, many firms report high
34
rates of worker absenteeism. For example, staff availability in meat processing facilities in the regions of France most affected by COVID-19 has decreased by up to 30% (OECD, 2020a).
c. In general, agricultural and food products are transported using three main transport methods (FAO, 2020c). Different products are transported by different transport methods such as ships and large boats (in bulk), containers and trucks, and air transport. For example, cereals and oilseeds are typically shipped in bulk, while meat and dairy products are usually transported in refrigerated containers and trucks, and high-value products and perishable products are transported by air in the 'bellies of passenger aircraft. Some modes of transport have been affected more than others by the pandemic; transport and logistics bottlenecks have disrupted the movement of products along supply chains. The impact of COVID-19 on these modes of transport has varied significantly. Although mass transportation prices in collective delivery were observed to be at the lowest levels of the last few years, air transport was severely disrupted. Global air cargo capacity was 26% lower in the week of May 10-16 compared to the same period last year. This decline of more than 80% was the largest on routes between Europe and Latin America, with the cut caused by the sudden drop in air travel, which accounts for most of the air cargo capacity. The disruptions in container and truck transportation have also created problems, although less often. Due to COVID-19 restrictions such as restrictions on crew replacement, health screenings, forced quarantines, and reduced demand, the number of container ships has dropped 8% below normal (Amis, 2021). Commercial road transport in April was approximately 20% lower than the normal figures for Canada and the USA (Geotab, 2021). Truck traffic in Europe was at least 50% lower in Spain, 46% lower in France, and 37% lower in Italy than in the pre-crisis period. In mid-April, the total distance traveled by trucks in Europe was 24% below the average of previous years (Sixfold, 2021). Therefore, transport and logistics problems were most prominent for perishable high-value products such as fruit and vegetables. The fruit and vegetable sector has been affected by quarantine measures and delays in border inspections, including a decrease in the number of import and export inspectors. In contrast, grain supply did not encounter major disruptions; public transport was less affected and grains could be loaded, shipped, and used with minimal labor input.
d. There have been rapid and unprecedented changes in consumer demand. COVID-19 has led to a dramatic shift in consumer demand, from restaurants, catering, and other "food-away-from-home" types to food consumed at home, causing significant changes in the food supply chains operations. As the COVID-19 pandemic accelerated, selling food away from home has come to a standstill in hotels, restaurants, dining halls, and cafes. Restaurant reservations decreased sharply in early March 2020, almost to zero as lockdowns were implemented (Opentable, 2021).
e. At the same time, retail food demand has increased. Frozen and packaged food sales in particular increased dramatically. While the weekly frozen food sales in France increased by 63% compared to the previous year, packaged food sales also increased by 56% compared to the previous year. Similar increases in demand have been observed in other countries as well. After this first spike in March, the increase in retail demand for fresh, frozen, or packaged food has stabilized at around 15-20% compared to a year ago (BCG, 2020).
This change in demand has a great impact on the food value chain. In the US, for example, "food away from home" sector normally constitutes 10% of fruit consumption, 32% of vegetables, 25% of dairy products, 31% of cereals, and 33% of protein food (the category, which includes meat, seafood, and eggs among other things) (USDA, 2021). In most countries, the industry accounts for at least 25% to 30% of total sales of fresh fruit and vegetables (OECD, 2020b). It is not easy to shift these volumes to the retail sector. In addition to logistical difficulties, household consumption habits at home differ from those outside the home. For example, out of-home foods include using more cheese than consumers use at home (e.g., as a sauce on pizza) and more expensive meat cuts (e.g. steak vs minced meat at home). Even where similar products are consumed, products that are normally sold to restaurants and food-service operations cannot always be sold without extra cost to the retail consumer. For example, while the food-service industry purchases large cheese blocks, much smaller packages are needed for retail sales. Retailers may have different quality expectations or other extra requirements. Finally, hotels and restaurants can make significant contributions to food banks, and their closure has reduced supply to these outlets at a time of rising demand for food banks' services (OECD, 2020c).
FOOD INDUSTRY ANALYSIS REPORT AND GUIDETR22 REGION (Balıkesir, Çanakkale)
35
As a result:
Given the major global impacts of COVID-19, "food and beverage companies" faced declining consumption and distortions in the supply chain. Home consumption has increased rapidly, and out-of-home consumption has come to a standstill. This situation negatively and rapidly affected the profitability of companies. Many companies tried to reduce the damage by directing their products to retail stores, agricultural products were suppressed by rapidly changing customer behaviors and demands, and the supply chain was disrupted.
Firms had to re-evaluate their sourcing strategies, product diversity, supply chain, and market access channels. The need to improve and modernize e-commerce and distribution networks has arisen. Depending on the effects of raw material prices and distribution costs, companies had to reschedule their price and promotion strategies, along with the methods of increasing demand (Deloitte, 2020). Many countries are taking different risk reduction and adaptation measures for the agriculture and food sectors in response to the pandemic. When the measures taken are grouped, it has been observed that the continuity of the agriculture and food distribution chain, financial sustainability of the agricultural value chain, agricultural work, encouraging local food, digitalization in agriculture, and data sharing stand out (KKB, 2020).
TurkeyImportant considerations in the evaluation process of the pandemic concerning Turkey are associated with the sector's position regarding internal and external supply as well as its resources. One of the strongest aspects of Turkish agriculture that can contribute to internal supply adequacy is the relatively low dependence on external labor for many products, and family farming, which is considered weakness for some other issues. In addition, throughout the process, the speed and level of adaptation of the urban population to the supply of products via the internet, as well as the retail chains, is one of the strong features that will protect the competence of the domestic market. However, the small producer structure, which has a less negative impact on the sustainability of production, cannot easily adapt to this system change, and producers have difficulties in accessing both the domestic market and the inputs obtained through imports (Ceylan & Özkan, 2020).
That the food sector in Turkey was affected by the pandemic was partially seen in the crystallizing of the existing problems. The risk of not being able to cultivate basic agricultural products due to foreign dependency in agricultural inputs such as fertilizers, vaccines, etc. is such a situation. A second example can be given as fish feed producers' cutting their production due to closing borders. On the other hand, that a cereal producer country such as Russia cut exports due to food security did not pose a problem since the wheat produced by Turkey was sufficient for domestic consumption. Moreover, thanks to sufficient stock, no problems were experienced in products such as the wheat that Turkey imported from Russia and products such as flour and pasta, produced in Turkey and exported, but the risk posed by this situation was recognized. In agriculture, it was difficult to obtain labor force during harvest due to travel obstacles and the fear of infection risk due to employee contact, wages have increased, but the need for unqualified labor has been met by immigrants (such as Syrian, Afghan). When the borders were closed, exports first stopped, and then started; in this period, exporters had difficulties, and the products were tried to be evaluated domestically. Changes in consumer behavior have also been observed, sales of storable products (flour, pasta, canned products) have increased due to panic, there was also an increase in demand for foods considered to be healthy and immune-enhancing (nutritional supplements, dairy products, fish and aquaculture in domestic consumption, etc.). In the past, packaged products were not preferred, but the sales of packaged products increased because they were safer. Although it did not compensate for their sales losses, many firms started to make sales via e-commerce and the home delivery sales model has also increased in the food sector. On the other hand, out-of-home food consumption has come to a standstill. This situation negatively affected employees in food sales outside the home, and they even lost their jobs. These negativities were followed by increases in food prices. Despite all these negativities observed, it was found that the main problem was not the production but the distribution of the product to the needy.
36
The aforementioned results are shared in more detail below;
a. Supply / Logistics
In the period when the pandemic started, problems such as prolongation or inability to supply imported inputs such as pesticides, oilseeds, feed raw materials, vaccines disrupted production. Imports were facilitated by reducing customs duties for products (cereals, sunflower seeds) that are predicted to pose problems in supply. That the countries restricted the export of agricultural products and increased taxes in order to ensure their own food security created supply risk and cost increase, especially in cereal products. At the same time, the fact that countries increased their commodity stocks in order to ensure food security caused an increase in prices. In the initial period of the pandemic, the curfew and the late announcement of holidays led to difficulties in production and shipment planning. This problem was solved with the early announcement of the curfews in the following periods. The decision of large food wholesalers and retailers to increase their safety stock limits due to the perception of supply risk caused by the pandemic led to 1-2 months of extra storage.
b. Production
The measures taken by the producers (personal protective equipment, etc.) due to the pandemic, the hygiene demands of the consumers, the disruptions in the sales process have increased costs, and this has also been reflected in the prices. Problems in supply (feed raw materials, vaccines, etc.) due to the closure of borders and quarantine in fish and aquaculture have hampered the production. It has been observed that the overall demand for fisheries has decreased due to restaurant closures, and some fish feed manufacturers have reduced production. In the flour, pasta, pulse, and vegetable oil sectors, retail sales have increased due to stocking behavior aimed at domestic consumption with the panic atmosphere. However, it was not possible for flour and yeast companies to take advantage of the opportunities in domestic consumption due to insufficient packaging capacities for retail consumption. Meat and dairy producers had to buy back their products due to the closure of hotels and restaurants. Although meat and milk producers turned to sales in the retail market for home consumption, the loss could not be compensated and significant losses were experienced in these sectors. Due to the increase in the demand for packaged products, there has been a recovery in the packaging sector and an increase in the sales of small businesses and especially women's cooperatives due to the increase in demand for local products. In the industry, especially in greenhouse cultivation, there has been an increase in the demand for products aimed at automation.
c. Human Resources
With the special permission granted to agricultural producers and enterprises, employees were prevented from staying away from production during curfews. In agriculture, it was difficult to obtain labor force during harvest due to travel obstacles and the fear of infection risk due to employee contact, wages have increased, but the need for unqualified labor has been met by immigrants (such as Syrian, Afghan). Social assistance support recipients may choose not to work. The young population tends not to work in agricultural production due to the low social status perception in the society regarding agricultural activities and young people's perception that the wages in the sector are low. This situation restricts the workforce resource. The pandemic has led to an increase in labor supply problems, which were previously experienced in agriculture. This problem is tried to be overcome by the employment of migrant workers. Firms, whose sales have dropped, have opted for a reduction in personnel, with female employees being the majority. The social crisis was tried to be prevented by providing public support with short-term work allowance to the personnel who had to take a temporary break from work or work part-time. Employment in this field has increased due to the increase in e-commerce.
d. Sales/Marketing
The pandemic has reduced global food demand in the first phase, as out-of-home food consumption is almost over and global food trade is disrupted. However, countries have felt and experienced a "food panic" in their domestic markets due to weakened product stocks, logistics
FOOD INDUSTRY ANALYSIS REPORT AND GUIDETR22 REGION (Balıkesir, Çanakkale)
37
and transportation problems, and restrictions in human movements (especially agricultural workers) before the summer season. In the first period of the pandemic, problems such as the consumption of stocks in the markets were experienced due to panic-induced domestic stocking. However, this problem was not repeated afterwards.
There has been no decline in brands that have invested in the loyal consumer size over the years. Instead of trying new products, the consumer turned to familiar products (TGDF, 2020). There have been changes in consumer preferences. Healthy, packaged products with a long shelf life have become more preferred. Therefore, the demand for domestic consumption of dairy products, products containing probiotics, canned food, organic products, and seafood has increased. Due to hygiene reasons, sales decreased in the first period of the pandemic in fresh fruits and vegetables, but after the panic passed, these products were evaluated as healthy, and there was an increase in sales. There has been a shift to the retail chain in sales channels, consumers preferred local food and local vendors (butchers, greengrocers, grocery stores, home delivery, and street vendors) during the pandemic. There has been a decrease in the sales of the wholesalers and the consumers have moved away from the neighborhood bazaars. E-commerce has increased during this period. Due to the quarantine, hotels, companies selling food products to hotels, catering companies, restaurants, and cafes have been the sectors most adversely affected in the food value chain in this process. It has been observed that the demand for fish and seafood has decreased due to the closure of the restaurants. At the same time, exports of fish and seafood have decreased, and campaigns have been organized to increase domestic demand. Those who were deprived of the opportunity to eat at the university were adversely affected. The severity of the difficulties in low-income families' access to food has increased over the course of the pandemic. Long-term waits at customs due to the closure of borders or quarantine caused export-oriented companies to have difficulty in selling. Export facilitation was provided 1-2 months after the start. The prices of many products increased in parallel with the increase in foreign currency. Russia's reduction of its tomato and pepper purchases led to a decrease in domestic prices. Since the markets in Russia have closed, sales have started to be made to the markets in Russia.
e. Finance
Payments were delayed due to the curfew. In the pandemic, hotels, catering establishments, and restaurants, whose sales decreased significantly, experienced a collection problem and consequently a cash problem. The same problem was observed in companies making sales to factories with decreased production. Public support was provided for the cash problems of the enterprises by deferring tax, insurance premium payments, and providing the companies with loans with credit guarantee fund-backed and non-payment periods. Due to the insufficient cash capital of the farmer, there are uncertainties regarding the production of the next year. Producers' debts and capital shortages remain the challenging conditions for production. Even if the demand increases, there are profitability and cash problems. The pandemic has increased the severity of these problems that have been experienced before. During the pandemic, banks provide all technological branchless banking services and alternative channels (call center, e-branch, mobile banking, ATM) to the service of their customers without interruption. In addition, some banks have started to share financial and agricultural consultancy services, field monitoring, fertilizer advice, current climate information, and product prices via mobile applications (KKB, 2020).
Survey ResultsIn the nationwide survey, the effects of COVID-19 were also asked. When the participating companies were asked to prioritize the problems they experienced during the COVID-19 outbreak in the range of 1-6 (1: high priority, 6: low priority), it was observed that the main problems of the participating companies were related to the decrease in sales and production volumes. Difficulties in obtaining labor took the last place in this ranking (Figure 12).

38
Decrease in Sales 4,71
4,67
3,98
2,58
2,19
2,88
Decrease in Production
Decrease in Profitability
Problems with Logistics
Increase in Stock Costs
Problems in Labor Supply
0,00 1,00 2,00 3,00 4,00 5,00 6,00
Figure 12: Problems Experienced in the COVID-19 Pandemic
One of the negative effects of COVID-19 has emerged as an increase in logistics costs. 69% of the companies participating in the survey stated that their logistics costs have increased, 20% stated that they have remained the same and 11% stated that they have decreased.
When asked about the negative consequences experienced in the raw material supply process, the main factors were the increase in raw material prices by 43%, the prolongation of raw material supply periods by 21%, and the decrease in the predictability of the lead times by 18%.
When companies are asked about the change in turnover, it is seen that the decrease in sales between 2019-2020 is not valid for every product or company. It is noteworthy that the sales of the majority of the respondents (56%) decreased, but sales did not change in 19% and increased in 25% of them. This situation is also valid for export. 56% of the companies participating in the survey stated that their exports decreased, 13% that it remained the same, and 31% stated that their sales increased (Figure 13).
Turnover Change (TL) Export Change (USD)
4%
8%
13%
17%
18%
21%
19%
0% 5% 10% 15% 20% 25%
Increased by 51% and More
Increased by 26-50%
Increased by 1-25%
Remained Same
Decreased by 1-25%
Decreased by 26-50%
Decreased by 51% and Over 15%
7%
8%
16%
32%
%9
13%
0% 5% 10% 15% 20% 25% 30% 35%
Increased by 51% and More
Increased by 26-50%
Increased by 1-25%
Remained Same
Decreased by 1-25%
Decreased by 26-50%
Decreased by 51% or More
Figure 13: Turnover (TL) and Export (USD) Change of Firms 2019-2020
When the turnover changes by sub-sectors are analyzed, all four companies in the vegetable oil sector that participated in the survey are found to have stated that there was no change in sales. The majority stated that the sales of meat, dairy and fish products decreased. The same is true for the bakery and bakery products industry. In the processing of vegetables and fruits, it is observed that sales increased in 43% of the respondents and there was no change in 14% (Figure 14).
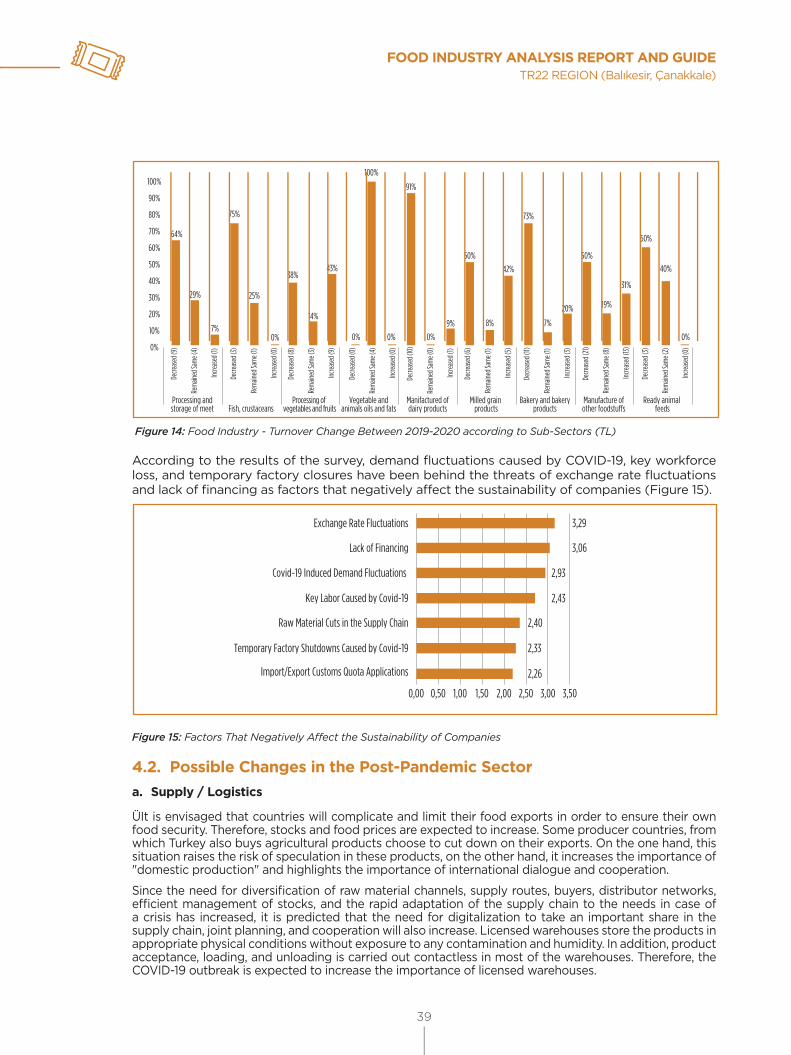
FOOD INDUSTRY ANALYSIS REPORT AND GUIDETR22 REGION (Balıkesir, Çanakkale)
39
0%
10%
20%
30%
40%
50%
60%
70%
80%
64%
75%
25%
0%
38%
14%
43%
100%
91%
9%
50%
42%
73%
7%
20%
50%
19%
31%
60%
40%
8%
0% 0% 0% 0%
29%
7%
90%
100%
Processing andstorage of meet
Decre
ased
(9)
Rem
ained
Sam
e (4)
Incre
ased
(1)
Decre
ased
(3)
Rem
ained
Sam
e (1)
Incre
ased
(0)
Decre
ased
(8)
Rem
ained
Sam
e (3)
Incre
ased
(9)
Decre
ased
(0)
Rem
ained
Sam
e (4)
Incre
ased
(0)
Decre
ased
(10)
Rem
ained
Sam
e (0)
Incre
ased
(1)
Decre
ased
(6)
Rem
ained
Sam
e (1)
Incre
ased
(5)
Decre
ased
(11)
Rem
ained
Sam
e (1)
Incre
ased
(3)
Decre
ased
(21)
Rem
ained
Sam
e (8)
Incre
ased
(13)
Decre
ased
(3)
Rem
ained
Sam
e (2)
Incre
ased
(0)
Fish, crustaceansProcessing of
vegetables and fruitsVegetable and
animals oils and fatsManifactured ofdairy products
Milled grain products
Bakery and bakeryproducts
Manufacture ofother foodstu�s
Ready animal feeds
Figure 14: Food Industry - Turnover Change Between 2019-2020 according to Sub-Sectors (TL)
According to the results of the survey, demand fluctuations caused by COVID-19, key workforce loss, and temporary factory closures have been behind the threats of exchange rate fluctuations and lack of financing as factors that negatively affect the sustainability of companies (Figure 15).
2,40
2,43
2,93
3,06
3,29
2,33
0,00 0,50 1,00 1,50 2,00 2,50 3,00
2,26
3,50
Exchange Rate Fluctuations
Lack of Financing
Covid-19 Induced Demand Fluctuations
Key Labor Caused by Covid-19
Raw Material Cuts in the Supply Chain
Temporary Factory Shutdowns Caused by Covid-19
Import/Export Customs Quota Applications
Figure 15: Factors That Negatively Affect the Sustainability of Companies
4.2. Possible Changes in the Post-Pandemic Sectora. Supply / Logistics
ÜIt is envisaged that countries will complicate and limit their food exports in order to ensure their own food security. Therefore, stocks and food prices are expected to increase. Some producer countries, from which Turkey also buys agricultural products choose to cut down on their exports. On the one hand, this situation raises the risk of speculation in these products, on the other hand, it increases the importance of "domestic production" and highlights the importance of international dialogue and cooperation.
Since the need for diversification of raw material channels, supply routes, buyers, distributor networks, efficient management of stocks, and the rapid adaptation of the supply chain to the needs in case of a crisis has increased, it is predicted that the need for digitalization to take an important share in the supply chain, joint planning, and cooperation will also increase. Licensed warehouses store the products in appropriate physical conditions without exposure to any contamination and humidity. In addition, product acceptance, loading, and unloading is carried out contactless in most of the warehouses. Therefore, the COVID-19 outbreak is expected to increase the importance of licensed warehouses.

40
The COVID-19 outbreak is expected to cause farmers and industrialists to listen to each other more, turn to planned and contracted production, and cooperate on a case-by-case basis in times of crisis such as pandemics. After COVID-19, the number of delivery points has increased from 500 thousand to 10 million households with the decrease in out-of-home consumption and the increase in domestic consumption. The logistics industry needs investment to make micro-scale deliveries to home consumers. At the same time, as the home delivery service increases, cargo companies' needs for cold vehicles to transport perishable products will increase (TGDF, 2020).
b. Production
Problems in the supply of raw materials and auxiliary products based on imports may adversely affect production. Due to changes in consumer preferences and distribution channels, product-based increases or decreases, changes in package sizes and properties (increased tendency towards small packaging, easy-to-use packaging) are expected, so companies will have to invest in means of production in this direction. It is also predicted that companies that think they may have problems in labor supply will invest more in automation. Due to the protective policies of the countries, it is expected that the greenhouse investments that allow production throughout the year will increase.
c. Human Resources
No significant improvement is expected in the scarce labor force in agricultural production. The labor force problem persists in this sector due to rural-urban migration, low earnings, and the fact that young people do not prefer to work in agricultural production due to sociological reasons. This problem is tried to be overcome with the employment of immigrants. Agricultural labor wages are likely to rise.
It is expected that farmers will be directed to digital information services and technologies in agriculture, climate, banking, and public services during and after the pandemic period. This will both reduce the contact risk further and increase the farmer's work efficiency (KKB, 2020). It is expected that digital technologies will improve and the need for human resources for these technologies will increase after the pandemic. With the increase in e-commerce, it is predicted that the need for human resources for this sector will increase. As the seed development studies will continue to increase, it is expected that the need for experts who will work in the field of seed development such as biotechnology will increase.
d. Sales and Marketing
Consumer preferences tend to increase towards healthy products. It is expected that the demand for functional products, fresh fruits and vegetables, high antioxidant products, organic products, medicinal and aromatic plants, fish and aquatic products, dairy products, nutritional supplements, probiotic and prebiotic products will increase. The importance of packaged products was understood in the pandemic period (TGDF, 2020). For this reason, it is anticipated that the demand for packaged products will increase and the demand for dried, frozen, canned, and packaged products with a long shelf life and ready meals that can be prepared without human touch will increase. The presentation and storage of products that will be excess supply in this way will also be beneficial in preventing food waste. It is expected that the importance of "product traceability" in terms of reliability will increase. Automation is predicted to come to the fore in terms of hygiene in packaging. It is anticipated that the demand for small packages and eco-friendly bio-intensive packages will increase, and eco-certified products will also become prominent.
In the packaging, storage, transportation stages of food after COVID-19 the presentation of products to consumers in accordance with the rules will be important. Unless farmers who directly sell their products as retail family food businesses and food tradesmen do not take this into account, they may lose their competitive advantage against large enterprises (KKB, 2020). It is expected that the momentum gained by digital marketing (e-commerce) channels, whose share in sales has increased significantly, will continue. Local supply chains will play an important role in sales operations.
e. Finance
The volatility in the exchange rate is seen as the biggest problem to be faced by the sector. If hotels, restaurants, and cafes remain closed and industrial production continues to remain low, bottlenecks may occur in the cash flows of these sectors and the companies serving these sectors. Businesses' and individuals' need for long-term loans with low interest and social assistance to overcome the cash crunch will continue. It is predicted that the use of digital technology in the financial system will increase due to the decrease in contact.
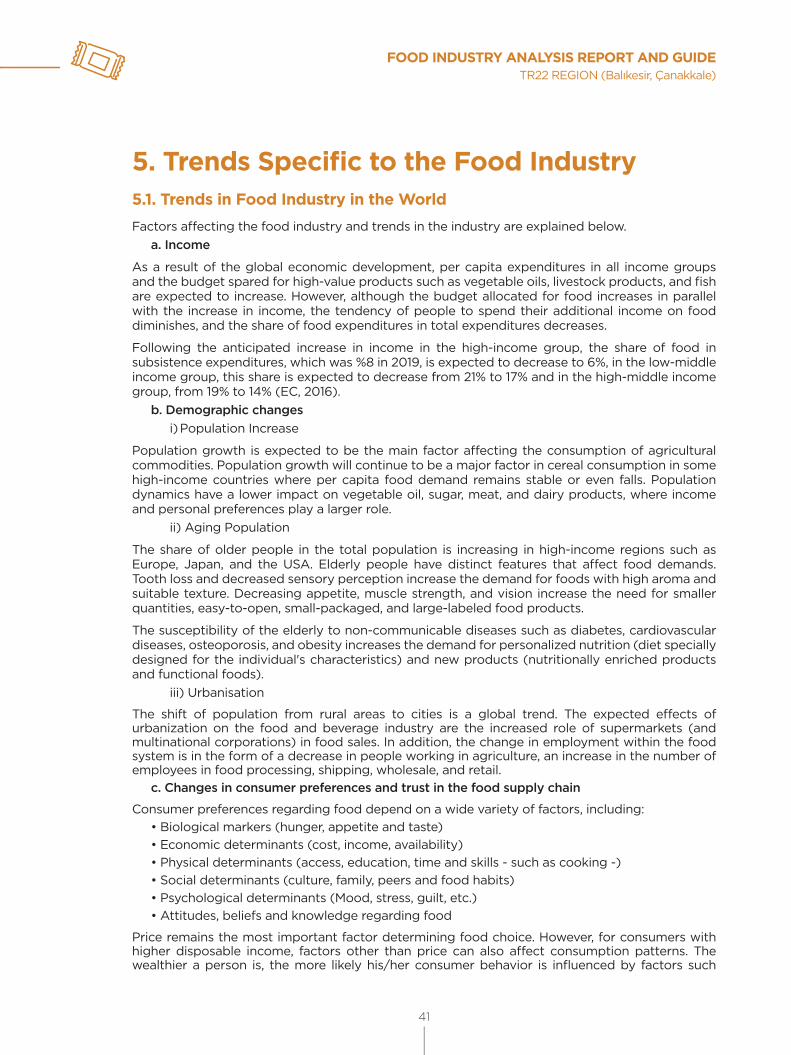
FOOD INDUSTRY ANALYSIS REPORT AND GUIDETR22 REGION (Balıkesir, Çanakkale)
41
5. Trends Specific to the Food Industry5.1. Trends in Food Industry in the WorldFactors affecting the food industry and trends in the industry are explained below.
a. Income
As a result of the global economic development, per capita expenditures in all income groups and the budget spared for high-value products such as vegetable oils, livestock products, and fish are expected to increase. However, although the budget allocated for food increases in parallel with the increase in income, the tendency of people to spend their additional income on food diminishes, and the share of food expenditures in total expenditures decreases.
Following the anticipated increase in income in the high-income group, the share of food in subsistence expenditures, which was %8 in 2019, is expected to decrease to 6%, in the low-middle income group, this share is expected to decrease from 21% to 17% and in the high-middle income group, from 19% to 14% (EC, 2016).
b. Demographic changesi) Population Increase
Population growth is expected to be the main factor affecting the consumption of agricultural commodities. Population growth will continue to be a major factor in cereal consumption in some high-income countries where per capita food demand remains stable or even falls. Population dynamics have a lower impact on vegetable oil, sugar, meat, and dairy products, where income and personal preferences play a larger role.
ii) Aging Population
The share of older people in the total population is increasing in high-income regions such as Europe, Japan, and the USA. Elderly people have distinct features that affect food demands. Tooth loss and decreased sensory perception increase the demand for foods with high aroma and suitable texture. Decreasing appetite, muscle strength, and vision increase the need for smaller quantities, easy-to-open, small-packaged, and large-labeled food products.
The susceptibility of the elderly to non-communicable diseases such as diabetes, cardiovascular diseases, osteoporosis, and obesity increases the demand for personalized nutrition (diet specially designed for the individual's characteristics) and new products (nutritionally enriched products and functional foods).
iii) Urbanisation
The shift of population from rural areas to cities is a global trend. The expected effects of urbanization on the food and beverage industry are the increased role of supermarkets (and multinational corporations) in food sales. In addition, the change in employment within the food system is in the form of a decrease in people working in agriculture, an increase in the number of employees in food processing, shipping, wholesale, and retail.
c. Changes in consumer preferences and trust in the food supply chain
Consumer preferences regarding food depend on a wide variety of factors, including:• Biological markers (hunger, appetite and taste)• Economic determinants (cost, income, availability)• Physical determinants (access, education, time and skills - such as cooking -)• Social determinants (culture, family, peers and food habits)• Psychological determinants (Mood, stress, guilt, etc.)• Attitudes, beliefs and knowledge regarding food
Price remains the most important factor determining food choice. However, for consumers with higher disposable income, factors other than price can also affect consumption patterns. The wealthier a person is, the more likely his/her consumer behavior is influenced by factors such

42
as food safety, quality, long shelf life, non-GMO (Genetically Modified Organism), and expected health benefits.
Besides price, consumer preferences are shaped by factors related to health (allergy and intolerance, healthy lifestyle, food safety), social responsibility (local products, animal welfare), and convenience.
i) Healthcare
As more information becomes available, consumer awareness of the ties between food and health increases. This can be considered as one of the most important social developments of recent years. In addition to maintaining a healthy lifestyle, the growing interest in actively preventing disease supports the adoption of healthy diets.
Serious and life-threatening food allergies and intolerances also cause an increase in consumers' interest in food ingredients. The so-called "free-from" foods (such as lactose-free, gluten-free, or wheat-free) are increasingly consumed by people with no food allergies or intolerances.
Food safety fears such as e-coli, cattle diseases, listeria, and bird flu have made consumers more concerned about food safety. In parallel, there has been a growing interest in agricultural practices (organic, pesticide use of antibiotics, and growth hormones in livestock or crops) and processing applications (use of certain special food additives such as aspartame).
ii) Social Responsibility
Consumers place an increasing emphasis on responsible consumption, that is, taking responsibility for the effects of consumption choices on climate change, public health, social and economic inequality, biodiversity, animal welfare, and scarce resources.
iii) Organic Food
The demand for organic food is concentrated mainly in the USA (about 44% of the world market), followed by the European Union (41%). Between 2004 and 2013, the EU organic market grew from 10 Billion Euro to 22 Billion Euro with an annual growth of over 13% (EC, 2016).
Knowledge level, health, availability, and education were observed to be among the factors that positively affect the attitudes of consumers towards organic food purchasing.
iv) Change in lifestyle
Convenience is a factor in increasing the demand for the food product. With consumers' lifestyles becoming increasingly mobile and fast, the availability of suitable products such as full meals "on the go" has become a fundamental requirement. Especially the demand for healthy ready-to-eat food is increasing.
Changing patterns in lifestyle also affect the preparation of meals at home. Less time is spent on the preparation and consumption of meals at home, especially in urban areas of developed and even developing countries. The preference for processed, more easily packaged and pre-prepared foods seems to have developed as a result of long working hours.
The increase in functional food consumption in industrialized countries is not only a result of the aging population but also a result of more intense lifestyles that make it difficult to meet nutritional needs.
v) Trust in the food industry
An important factor affecting food choices is the perception of consumers in the face of the food chain. Food fraud and food safety incidents uncover the complexity of the food supply chain while shaking consumers' trust in the food industry. Among other factors that could negatively affect the image of the food industry, concerns have been raised about the use of antibiotics in animal production and the possible development of antibiotic resistance.
d. Trends in the supply chaini) Modern Retail Market
A study of the impact of modern retail on consumer choice has shown that competition among retailers is intensified, especially with the development of discount retailers. The industry can

FOOD INDUSTRY ANALYSIS REPORT AND GUIDETR22 REGION (Balıkesir, Çanakkale)
43
increase quality and volumes while reducing the number of middlemen. The increasing importance of the retail sector results in an increase in bargaining power in negotiations regarding the food processing industry and SMEs in particular. Fierce competition between supermarket chains and other businesses leads to the lowering of prices of products and mergers.
ii) Private brand
There is an increasing tendency for private brands (products that retailers procure or produce under their own name or brand) to enter the market. Private brands support the internationalization of the sector by providing access to wider networks.
e. Innovation
Technological developments in the food industry have the potential to facilitate food safety management, provide healthier foods, increase efficiency and render operations more sustainable environmentally. For this reason, they attract the attention of the stakeholders involved in the food supply chain, as well as marketers, media, and public policymakers.
i) Innovation in the Food Sector
In the context of the food sector, innovation may comprise new products, new types of packaging (providing consumers with information about packaging as well as physical packaging), new formulation (new preservation types, new additives, new flavors), market expansion, re-entry to the market, new marketing methods and the implementation of a new or significantly improved logistics process.
Customer needs are a powerful driving force for invention and innovation. Consumers' expectations are also the main driving force of product innovation in the sector.
ii) Innovation in Packaging
The drivers of packaging innovations include business dynamics, distribution, and retail, consumption, legislation as well as cost-effectiveness. Rapidly changing social trends and changing consumer demands are the main drivers behind food packaging innovation.
Packaging plays an important role in providing suitable food. For example, it can contribute to saving time and effort during food preparation. Ease of access to a package, the ability to use, destroy and reseal the package, and microwave heating are among the features deemed suitable by consumers. These aspects have a huge impact on package innovation. For example, the "self-doing" function in food packaging has been a response to consumers' growing preference for suitable food. “Self-doing” means packaging with options such as self-opening, self-closing, self-dosing, or self-heating.
iii) Innovation in Distribution
Digitalization is a driver for growth in food and beverage distribution. As advances in digital communication technology allow more direct communication with customers, e-commerce creates new opportunities for single-focused businesses to enter the market. For example, personalized products have developed after the spread of social media (EC, 2016).
f. Technological Developments
Technology is increasingly contributing to the journey of food from farm to table. The food industry is a very important junction in this process. The competitiveness of food industry enterprises is closely linked to their ability to apply new technologies. The most promising food technology applications, robotics, data technology, and new processing techniques are mentioned below.
i) Agricultural Technologies
The main purpose of using technologies in agriculture is to increase harvest yield by reducing the environmental impact. Promising technologies include:
Precision Agriculture; drones, robots, and satellites will assist farmers.
Breeding Techniques; New techniques (genome technologies) and climate-resistant crop varieties
Aquaculture; Technological developments in fish farming

44
Circular agriculture Cycle; Technologies that support the efficient use of biomass and waste
Production of new protein sources; the use of insects, algae as a source of protein
Biotechnology; Technologies related to genetics, microbiology, and food safetyii) Food Technologies in Industry
The main purpose of using technologies in the industry is to produce higher quality by reducing the unit cost. Promising technologies include:
• Promising Technologies in the Short Term
Robotics; The use of robots in food processing
Data technology; Big data analysis and digitalization, artificial intelligence and RFID (Radio Frequency Identification) chips
Novel production techniques; Production at high pressure, steam boiling etc.• Promising Technologies in the Short Term
Nanotechnology; Nanoscale ingredients in food
3D printing; personalization of food production
Cell technology; Meat and fish production from stem cells (ING, 2019).
5.2. Trends in Food Industry in Turkeya. Income
Similar to the world, as the income level increases, the consumption of animal products (meat, milk) and fish, whose prices are relatively higher than agricultural products, increases, and the share of food in the household budget decreases. The per capita domestic product increased steadily from USD 10,629 in 2010 to USD 12,562 in 2013, then entered a downward trend and decreased to 9,2 thousand USD according to 2019 data
b. Demographic changesi) Population Increase
In Turkey, in 2019, the annual population growth rate was 1.39% (0.55% in 2020) and between the years 2009-2019 it was 1.36 % in average14 . In the same period, it is higher compared to the world annual average population growth rate (1.10%15 ). It is predicted that the demand for food will increase with the effect of migration to increase in population.
ii) Aging Population
While the population over the age of 65 constituted 7.2% of the total population in 2010, this rate reached 9.1% in16 2019. The share of the elderly population in the total population is increasing.
iii) Urbanisation
The proportion of the population living in the city is 56% in the world in 2019. After 1980, urbanization began to increase quickly in Turkey. While the proportion of people living in the city was 44% in 1980, this rate reached 76% in 2019, exceeding the world average (WORLDBANK, 2021).
c. Changes in consumer preferences and trust in the food supply chain
Urbanization, increase in education level, easy access to information thanks to digital technologies cause changes in consumers' preferences. The demand for healthy and organic products has gained momentum after the COVID-19 outbreak. Demand for ready meals and packaged products increases as a result of the reduction in the time allocated to food preparation due to industrialization and greater participation of women in working life. Imitation and fraud in the food sector can shake the trust in the food sector.
14- Calculated based on data of TURKSTAT (Provincial population by years, 2000-2020) 15- Calculated based on World Bank data (https://data.worldbank.org/indicator/SP.POP.TOTL) 16- Calculated based on TURKSTAT (Population according to province, single age, and sex, 2007-2020) data.
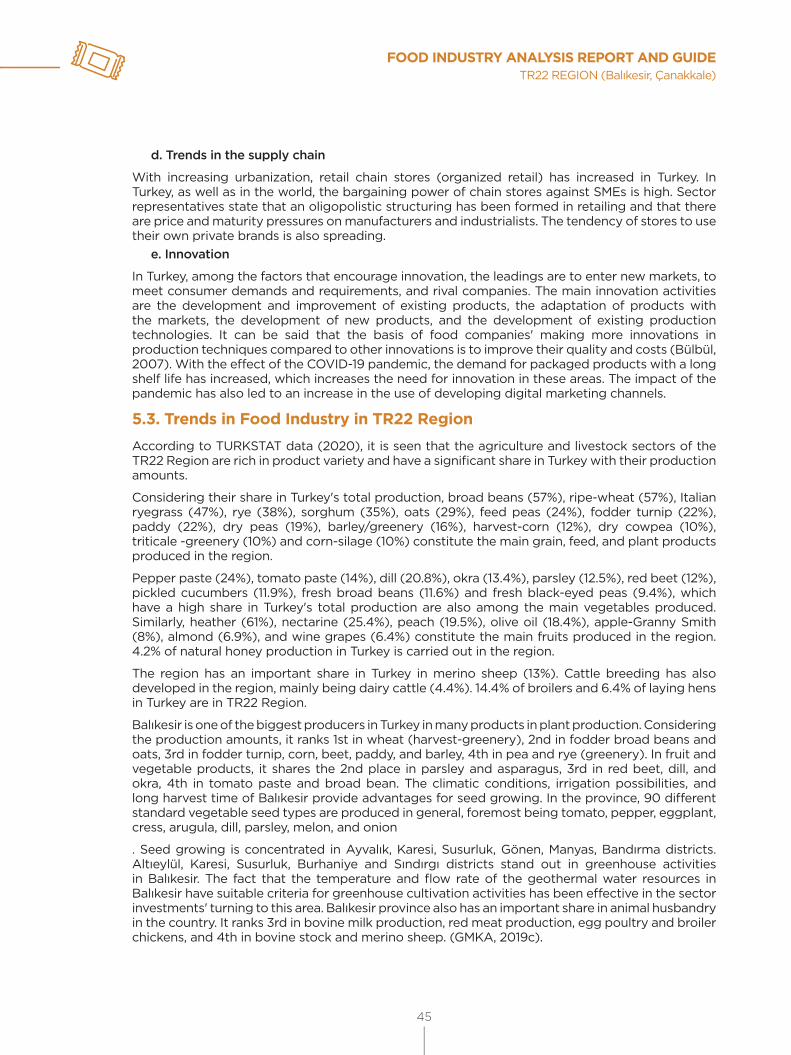
FOOD INDUSTRY ANALYSIS REPORT AND GUIDETR22 REGION (Balıkesir, Çanakkale)
45
d. Trends in the supply chain
With increasing urbanization, retail chain stores (organized retail) has increased in Turkey. In Turkey, as well as in the world, the bargaining power of chain stores against SMEs is high. Sector representatives state that an oligopolistic structuring has been formed in retailing and that there are price and maturity pressures on manufacturers and industrialists. The tendency of stores to use their own private brands is also spreading.
e. Innovation
In Turkey, among the factors that encourage innovation, the leadings are to enter new markets, to meet consumer demands and requirements, and rival companies. The main innovation activities are the development and improvement of existing products, the adaptation of products with the markets, the development of new products, and the development of existing production technologies. It can be said that the basis of food companies' making more innovations in production techniques compared to other innovations is to improve their quality and costs (Bülbül, 2007). With the effect of the COVID-19 pandemic, the demand for packaged products with a long shelf life has increased, which increases the need for innovation in these areas. The impact of the pandemic has also led to an increase in the use of developing digital marketing channels.
5.3. Trends in Food Industry in TR22 RegionAccording to TURKSTAT data (2020), it is seen that the agriculture and livestock sectors of the TR22 Region are rich in product variety and have a significant share in Turkey with their production amounts.
Considering their share in Turkey's total production, broad beans (57%), ripe-wheat (57%), Italian ryegrass (47%), rye (38%), sorghum (35%), oats (29%), feed peas (24%), fodder turnip (22%), paddy (22%), dry peas (19%), barley/greenery (16%), harvest-corn (12%), dry cowpea (10%), triticale -greenery (10%) and corn-silage (10%) constitute the main grain, feed, and plant products produced in the region.
Pepper paste (24%), tomato paste (14%), dill (20.8%), okra (13.4%), parsley (12.5%), red beet (12%), pickled cucumbers (11.9%), fresh broad beans (11.6%) and fresh black-eyed peas (9.4%), which have a high share in Turkey's total production are also among the main vegetables produced. Similarly, heather (61%), nectarine (25.4%), peach (19.5%), olive oil (18.4%), apple-Granny Smith (8%), almond (6.9%), and wine grapes (6.4%) constitute the main fruits produced in the region. 4.2% of natural honey production in Turkey is carried out in the region.
The region has an important share in Turkey in merino sheep (13%). Cattle breeding has also developed in the region, mainly being dairy cattle (4.4%). 14.4% of broilers and 6.4% of laying hens in Turkey are in TR22 Region.
Balıkesir is one of the biggest producers in Turkey in many products in plant production. Considering the production amounts, it ranks 1st in wheat (harvest-greenery), 2nd in fodder broad beans and oats, 3rd in fodder turnip, corn, beet, paddy, and barley, 4th in pea and rye (greenery). In fruit and vegetable products, it shares the 2nd place in parsley and asparagus, 3rd in red beet, dill, and okra, 4th in tomato paste and broad bean. The climatic conditions, irrigation possibilities, and long harvest time of Balıkesir provide advantages for seed growing. In the province, 90 different standard vegetable seed types are produced in general, foremost being tomato, pepper, eggplant, cress, arugula, dill, parsley, melon, and onion
. Seed growing is concentrated in Ayvalık, Karesi, Susurluk, Gönen, Manyas, Bandırma districts. Altıeylül, Karesi, Susurluk, Burhaniye and Sındırgı districts stand out in greenhouse activities in Balıkesir. The fact that the temperature and flow rate of the geothermal water resources in Balıkesir have suitable criteria for greenhouse cultivation activities has been effective in the sector investments' turning to this area. Balıkesir province also has an important share in animal husbandry in the country. It ranks 3rd in bovine milk production, red meat production, egg poultry and broiler chickens, and 4th in bovine stock and merino sheep. (GMKA, 2019c).

46
Çanakkale has an important share in many herbal products in Turkey, just like Balıkesir. In ranks 1st in nectarine, pepper paste, oat, broad bean, sorghum, and fodder pea cultivation, 2nd in peach, medlar, vetch, and Italian ryegrass, 3rd in broad bean (animal feed), rapeseed, fodder turnip, and triticale, and 4th in paddy, and 5th in pear, quince, and almond. Tomato cultivation for tomato paste is also high in the province. It is one of the leading provinces in the food industry in Turkey with organic agriculture, good agricultural practices, olive cultivation, organic livestock breeding, branded dairy products, quality meat products, poultry breeding, beekeeping activities in the rich flora of Kazdağları and Gökçeada, organic beekeeping and high standard aquaculture (including EU countries) (GMKA, 2019d). Organic and good agricultural practices are spreading in the region (GMKA, 2012a)
According to TURKSTAT data, demographic and income data affecting total food consumption are as follows:
In Balıkesir, the population increased by 0.17% in 2019 and 0.95% in 2020 and reached 1.24 million. Similarly, in Çanakkale, although the population increased by 0.28% in 2019, it decreased by 0.11% in 2020 and the population was 542 thousand.
The share of the elderly population in the total population in the region is increasing and it draws attention with its values above the average of Turkey (9.1%). The data of both provinces are close to each other17.
According to 2019 data, the domestic product per capita in Balıkesir was 7.8 thousand USD, which was below the average of Turkey (9.2 thousand $). In Çanakkale, per capita domestic product is 9.5 thousand USD, being slightly above Turkey's average.
17- Population rates of 65 and over in the provinces of the TR22 Region: Balıkesir; 2010: 11.9% - 2019: 15.2%, Çanakkale; 2010: 12.2% - 2019: 15.0%.

FOOD INDUSTRY ANALYSIS REPORT AND GUIDETR22 REGION (Balıkesir, Çanakkale)
47
6. Current State of the Food Industry 6.1. Primary Research Results
6.1.1. Survey Study
156 companies operating in the Food Products Manufacturing (Food Industry) participated in the survey. 1 (one) company participated in TR22 Region. Since the number of participants from the region is insufficient, it is thought that the region is not representative and may mislead in the determination of the problems, so the analyzes were made on the basis of a national scale survey. The weighting of the answers given to the survey questions;
It was designed as Very Low: 0, Low: 1, Medium: 2, High: 3, Very High: 4.
Participants in the survey according to TR22 Region, country, province, and sub-sectors were given in Tablo 23. 145 firms shared firm scale information. Accordingly, 61 of the participants are micro, 49 are small, 32 are medium and 5 are large scale.
Table 23: TR22 Distribution of the Firms Participating in the Survey in TR22 Region
Total Turkey TR22 Balıkesir Çanakkale
156 1 1 0
NACE Code
Sector Sector Total
(TR) (Region)
10.1 Processing and storage of meat and manufacture of meat products
18
10.2 Fish, crustaceans and mollusks processing and storage 4
10.3 Processing and storage of vegetables and fruits 24
10.4 Vegetable and animal oils and fats 6 1 1
10.5 Manufacture of dairy products 15
10.6 Manufacture of ground grain products, starch and starch products
12
10.7 Manufacture of bakery and bakery products 22
10.8 Manufacture of other foodstuffs 49
10.9 Manufacture of ready animal feeds 6
The sustainability of raw materials is one of the most important factors in Food Products Manufacturing. When the Contractual Planting application, which is one of the important tools used to reduce the raw material supply risk, was questioned in the survey, 71% of the 133 companies who answered the question stated that they did not carry out contractual planting. It meets 90% and more of the raw material need of only 5% of the companies with contractual planting. In the vegetable-fruit processing sector, where contractual cultivation is common, the contractual planting rate has been calculated as 58%. (Figure 16)
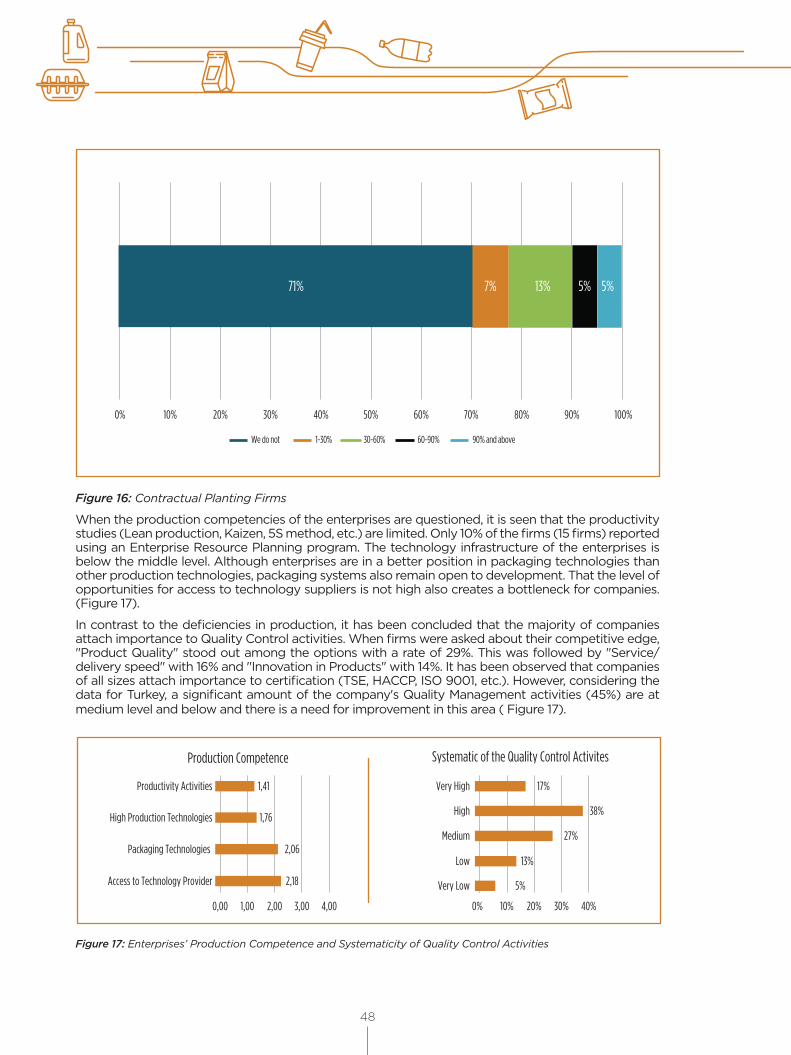
48
0% 10% 20% 30% 40% 50% 60% 70% 80% 90% 100%
We do not 1-30% 30-60% 60-90% 90% and above
71% 7% 13% 5% 5%
Figure 16: Contractual Planting Firms
When the production competencies of the enterprises are questioned, it is seen that the productivity studies (Lean production, Kaizen, 5S method, etc.) are limited. Only 10% of the firms (15 firms) reported using an Enterprise Resource Planning program. The technology infrastructure of the enterprises is below the middle level. Although enterprises are in a better position in packaging technologies than other production technologies, packaging systems also remain open to development. That the level of opportunities for access to technology suppliers is not high also creates a bottleneck for companies. (Figure 17).
In contrast to the deficiencies in production, it has been concluded that the majority of companies attach importance to Quality Control activities. When firms were asked about their competitive edge, "Product Quality" stood out among the options with a rate of 29%. This was followed by "Service/delivery speed" with 16% and "Innovation in Products" with 14%. It has been observed that companies of all sizes attach importance to certification (TSE, HACCP, ISO 9001, etc.). However, considering the data for Turkey, a significant amount of the company's Quality Management activities (45%) are at medium level and below and there is a need for improvement in this area ( Figure 17).
Production Competence
Productivity Activities 1,41
1,76
2,06
2,18
High Production Technologies
Packaging Technologies
Access to Technology Provider
0,00 1,00 2,00 3,00 4,00
Systematic of the Quality Control Activites
Very High 17%
38%
27%
13%
5%
High
Medium
Low
0% 10% 20% 30% 40%
Very Low
Figure 17: Enterprises’ Production Competence and Systematicity of Quality Control Activities

FOOD INDUSTRY ANALYSIS REPORT AND GUIDETR22 REGION (Balıkesir, Çanakkale)
49
The traceability system includes the stages of identifying all products and inputs, units or parties, collecting and storing information about where, when, and where they move, and establishing a system that will link these two data (Yaralı, 2019). It is seen that the awareness in product tracking systems is settled among companies. The majority of the businesses participating in the survey throughout Turkey (48%) are found to be at high and higher levels in Product Monitoring Systems applications. However, companies in the middle and below level (52%) need to improve their product tracking systems. As the awareness of food safety among consumers increases, the importance of traceability also increases. Since it is expected that there will be an increase in demands for traceability after the COVID-19 pandemic, it will be appropriate for companies to invest in this area (Figure 18).
It is seen that one of the areas that companies should develop is human resources management. According to the survey results, most of the firms (74%) are at the middle and below middle level regarding the ability to retain qualified personnel. This situation shows that companies need improvement in their human resources policies and practices (Figure 18).
Product Monitoring Ability to Hold Qualified Sta
Very High
35%
13%
32%
8%
11%
High
Medium
Low
Very Low
0% 5% 10% 15% 20% 25% 30% 35%
7%
20%
42%
12%
20%
0% 10% 20% 30% 40% 50%
Very High
High
Medium
Low
Very Low
Figure 18: Enterprises’ Product Tracking System and Ability to Retain Qualified Personnel
It has been determined that the weakest area in the competence of companies is R&D / P&D activities. It has been reported that the infrastructures of the companies are not sufficient for R&D activities and they do not have sufficient qualified personnel. Companies also have difficulties in accessing analysis and consultancy firms that will support these studies. The fact that R&D and innovation activities are not carried out systematically indicate that the companies do not show interest in this issue and that a significant part of the enterprises (39%) do not allocate a budget for R&D and innovation activities, which points to the weakness in this area (Şekil 19).
External stakeholders play an important role in increasing the company's competencies and accessing up-to-date knowledge. It is observed that knowledge sharing is mostly made with suppliers and customers, and cooperation with universities-research institutions is at a very low level. The level of knowledge sharing with engineering / consulting firms is also low. Similarly, customers, suppliers, and fairs came to the fore when companies were asked about the sources of knowledge they use. It is observed that the use of journals and publications, universities, and training as sources of knowledge is not common.
In order to increase the R&D / innovation activities, which have a high contribution to competitiveness, there is a need to expand the information resources of enterprises and to improve their cooperation with universities. Non-strategic information is shared free of charge by suppliers with the motive to sell products and by customers with the motive to reduce supplier risk and improve product quality. It is understood that there is a need to develop financial support mechanisms to improve cooperation with universities and engineering/consultancy firms, where information sharing is more costly (Şekil 19).

50
R&D/P&D R&D Competency Information Sharing
Systematic R&D, InnovationActivities 1,42
1,35
1,21
1,30
R&D/P&D InfrastructureCompetence
Number of R&D/P&D Personnel
Access to Analysis/ConsultingCompaines
0,00 0,50 1,00 1,50 2,00 2,50 3,00 3,50 4,001,67
1,52
1,03
0,000,501,001,502,002,503,00
2,33
2,53
Engineering/Consulting
Firm
Rival Firm Supplier
University-ResearchInstitutions
Customer
Figure 19: Enterprises’ R&D Management and Intensity of Information Sharing with Stakeholders
When marketing/sales competencies are questioned, it is seen that companies are at a moderate level in the systematicity of their marketing and sales strategy development activities, they mainly focus on productization, and they are in a better position than other factors in product diversity and branding. Lack of market diversity increases customer threat for companies. According to this picture, it can be said that companies should increase their brand awareness by intensifying their promotional activities. At the same time, companies should carry out their marketing strategy studies more systematically and reevaluate their distribution channel preferences in these studies (Şekil 20). When enterprises were asked about their digital marketing activities, most of them stated that they advertise via websites (103 companies) and social media (86 companies). However, the use of digital marketing tools in sales activities has not become widespread at the same rate; 31 companies reported that they made sales on their own e-commerce site, 29 companies on social media, and 33 companies on e-commerce platforms.
Most of the companies participating in the survey are in foreign markets with their own brands. This situation indicates that exporting companies have a good performance regarding the export initiative. However, 41% of the companies stated that they do not export. 60% of these are micro companies and 25% are small-scale companies. As the size of the firm grows, the number of exporting firms increases, indicating that micro and small-scale firms cannot export due to a lack of resources. It is seen that businesses in this field need finance, information, and human resources (Figure 20).
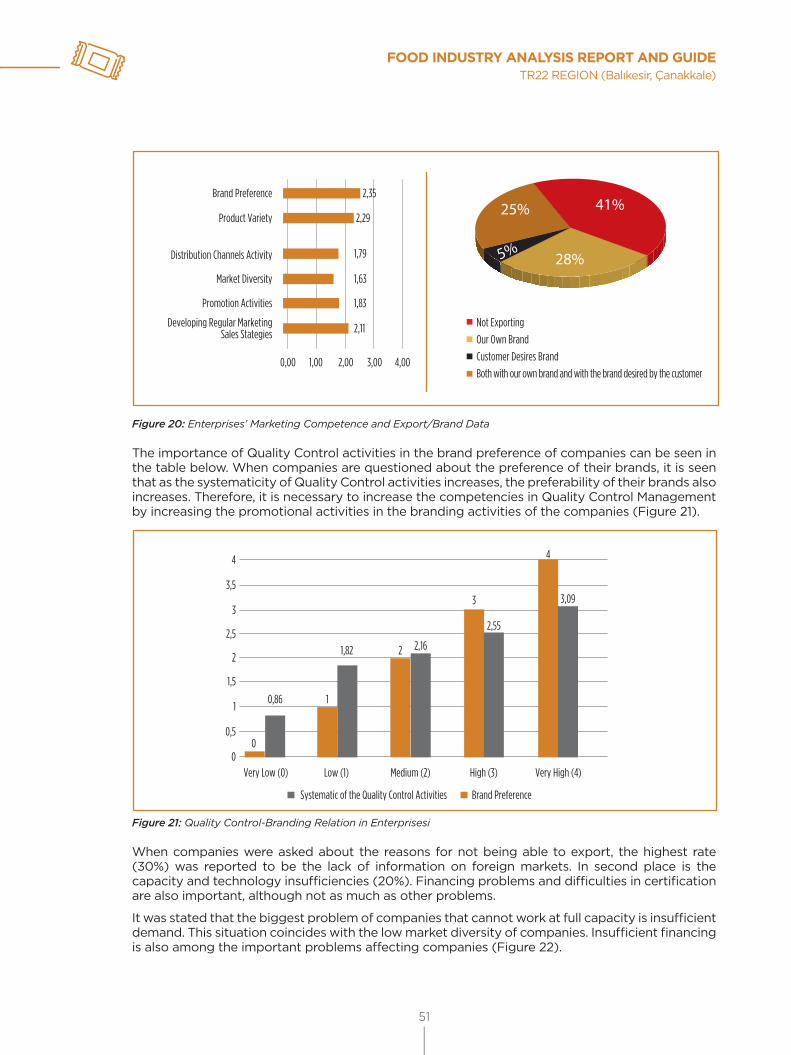
FOOD INDUSTRY ANALYSIS REPORT AND GUIDETR22 REGION (Balıkesir, Çanakkale)
51
2,29
2,35
1,79
1,63
0,00 1,00 2,00 3,00 4,00
1,83
2,11 Not Exporting
Our Own Brand
Customer Desires Brand
Both with our own brand and with the brand desired by the customer
41%
28%
25%
5%
Brand Preference
Product Variety
Distribution Channels Activity
Market Diversity
Promotion Activities
Developing Regular MarketingSales Stategies
Figure 20: Enterprises’ Marketing Competence and Export/Brand Data
The importance of Quality Control activities in the brand preference of companies can be seen in the table below. When companies are questioned about the preference of their brands, it is seen that as the systematicity of Quality Control activities increases, the preferability of their brands also increases. Therefore, it is necessary to increase the competencies in Quality Control Management by increasing the promotional activities in the branding activities of the companies (Figure 21).
Very Low (0) Low (1) Medium (2) High (3) Very High (4)0
0
0,86 1
1,82 2 2,16
3
4
3,09
2,55
0,5
1
1,5
2
2,5
3
3,5
4
Systematic of the Quality Control Activities Brand Preference
Figure 21: Quality Control-Branding Relation in Enterprisesi
When companies were asked about the reasons for not being able to export, the highest rate (30%) was reported to be the lack of information on foreign markets. In second place is the capacity and technology insufficiencies (20%). Financing problems and difficulties in certification are also important, although not as much as other problems.
It was stated that the biggest problem of companies that cannot work at full capacity is insufficient demand. This situation coincides with the low market diversity of companies. Insufficient financing is also among the important problems affecting companies (Figure 22).

52
30%
20%
15%
7%
5%
3%
3%
2%
15%
0% 5% 10% 15% 20% 25% 30%
31%
26%
21%
7%
5%
3%
7%
0% 5% 10% 15% 20% 25% 30% 35%
Lack of Information on Foreign Markets
Capacity and TechnologyInsu�ciency
Financing Issues
Certification Challenges
Height of our Prices
Foreign Language Problem
The Domestic Market BeingMore Profitable
Covid-19
Failing to Meet Quality Expectations
Insu�cient InternalDemand
Insu�cient Funding
Insu�cient Foreign Demand
We Work Full Capacity
Raw Material Shortage
Problems with Employees
Covid-19
Figure 22: The Reasons of Enterprises’ Not Being Able to Export and Work in Full Capacity
When companies were asked about the bottlenecks that affect their businesses the most, they primarily mentioned access to finance, sales, marketing, raw material supply, and access to the qualified workforce. Businesses also stated that the prevalence of informal and production contrary to legislation negatively affected competitiveness, in another question group in the survey.
In line with the main problems faced by businesses, it has been stated that the public can be more efficient in access to finance and supports in accessing foreign markets compared to other supports (Figure 23).
Financing/Grant 31%
22%
17%
11%
9%
8%
3%
0%1%
3%3%
5%5%6%6%
10%11%12%
16%22%
Access to New Markets
Businness Support Servicessuch as Training, Consultancy
University/Industry Collaboration
Access to Skilled Workforce
Improving Infrastructure
Regulations
New Product Development
Access to FinancingSales
MarketingRaw Material Supply
Access to Skilled WorkforceStatus and Cost of
ExportPackaging and Logistics
CertificationFrequent Legislative Changes
ProductionAccess to Test-Analiysis Services
0% 5% 10% 15% 20% 25% 0% 5% 10% 15% 20% 25% 30% 35%
Figure 23: Bottlenecks Affecting Enterprises and the Supports Expected from the Public
6.1.2. Focus Group Meetings
Focus group studies were organized in seven regions defined within the scope of the project in order to ensure the participation of sector stakeholders within the scope of the study and in order to integrate the highest possible sectoral view on the project outputs. The information obtained at the meetings was taken into account in the analysis and preparation of the report in relevant places. The meetings were carried out under 3 main headings. The main topics that stand out under these headings are as follows. The summary of the meeting with details and the participant list is presented in the Appendix.

FOOD INDUSTRY ANALYSIS REPORT AND GUIDETR22 REGION (Balıkesir, Çanakkale)
53
1- The Effects of COVID-19 on the Food Industry
While the pandemic affected some sectors positively, it affected others negatively. With the closure of hotels, schools, and restaurants, there was a shrinkage in the demand for dairy and meat products. The EU's non-purchasing of our White Meat and Dairy products for hygiene reasons has also caused the meat and dairy sector to shrink. With the closure of the borders, the fruit and vegetable sector experienced difficulties in exports. The weakness of international cooperation in foreign trade and long-term expectations at customs also put a strain on the sectors in this process.
Due to the high cost of soybean production, there is not enough soy in our country. Likewise, there is not enough production in maize. For this reason, there is a dependence on imports of soy and maize used in poultry feed. Bovine feed is also dependent on imports. Therefore, input prices of animal feed increased due to the increase in the exchange rate. For this reason, there have been changes in agricultural production from food raw material production to feed raw material production. Due to the insufficient number of bovines, the need for imported livestock continues.
With the contraction in demand for some products and the increase in imported input prices, businesses have had financial difficulties. This situation led to mass layoffs. In addition, the fact that countries increased their commodity stocks by 80% also caused an increase in prices.
The late declaration of the curfew resulted in the inability to plan production and shipment. The flour sector was positively affected due to the increase in domestic stocking during the pandemic period. As the demand for packaged products with a long shelf life has increased, the packaging industry has been positively affected.
During this period, interest in the products produced by housewives as unions or cooperatives has increased. For this reason, there has been a tendency towards gardening from the field. The region, has modern facilities in milk and livestock farming. Therefore, it is predicted that by supporting milk, the number of cows can be increased, and the need forimported livestock can be reduced.
It is thought that as an alternative to food products with insufficient production, it will be beneficial to intensify research on microalgae. International cooperation should be developed in order to alleviate the difficulties encountered in foreign trade. National planning should be made in food production, taking into account the population growth in the world.
2-Sustainability in Food Industry, Agriculture and Livestock
Wild irrigation methods are applied by using drinking water resources. Due to the heavy labor in drip irrigation, the farmer prefers traditional irrigation methods. Water channels are not maintained. Closed irrigation systems are not common. Irrigation resources are not used efficiently in the region. The drought experienced in the region is effective in the changes of product pattern, product amount, product quality, harvest, and sowing time. Inadequacy of water resources, change in the direction of prevailing winds and precipitation, decreasing soil and water meetings with decreasing rainfalls appear as important problems.
Animal wastes of large farms harm the environment. Biogas facilities established for the recycling of wastes are not sufficient. Studies on the utilization of vegetation water wastes have not yet been completed.
Especially the young population migrates to the cities due to the unsatisfactory agricultural income. With the decrease in the population living in the rural areas, difficulties are experienced in meeting the need for agricultural workers.
Food production is expected to be endangered due to reasons such as climate change, drought, environmental pollution, misuse of water resources, concreting of meadow and pasture areas. To avoid this danger;
• Drip irrigation system should be used instead of wild irrigation. Along with the above-ground drip, underground drip should also be widespread.• Closed irrigation channels should be made widespread by local governments. (Within 3-4 years)
54
• Investments should be made in geothermal greenhouses. • Seed studies suitable for dry agriculture should be increased.• It should be concentrated on R&D and investment activities on vertical agriculture.• The capacity of the electricity lines should be improved, and then biogas facilities should be established in partnership with local governments.• Commodity Exchanges, which know the culture of the people of the region well, should take an active role in product design and production planning by evaluating the soil analysis and rainfall.• The rural population should be increased by initiating projects for returning to villages.
3-Industry's General Problems and Solution Suggestions
In dairy production, production is carried out at EU standards. However, due to the high cost of milk, there are difficulties in terms of competition in international markets. There are businesses that breed indoors, feed hay to animals, and do not comply with hygiene rules. In order to prevent this mistake, OIZs in animal husbandry need to be expanded.
Adulteration is common in the region. Especially small producers cannot produce in accordance with the standards. With the cooperation of the existing Food OIZs and the General Directorate of Food and Control of the Ministry of Agriculture and Forestry, the inspection and control activities in this area should be tightened. The sensory analysis laboratory in the OIZ and the perfectionism center being established will make important contributions to the companies.
High logistics costs are forcing businesses. There is a lack of information regarding packaging. Producers need to be trained on this issue. Digitalization needs to be integrated into the agriculture and food sector. Farmers should be trained so that electronic commerce can develop. As the education level and quality are low in the region, a qualified workforce is needed. University-Industry cooperation should be developed. Cooperatives are not used effectively. Products should be made standard and salable abroad through clusters on a country basis.
The production of medicinal and aromatic herbs such as clove, chicory, garlic, indigo, walnut, and lavender should be supported. In addition, the promotion of the mushroom that meets the protein needs and the increase of its production should be ensured.
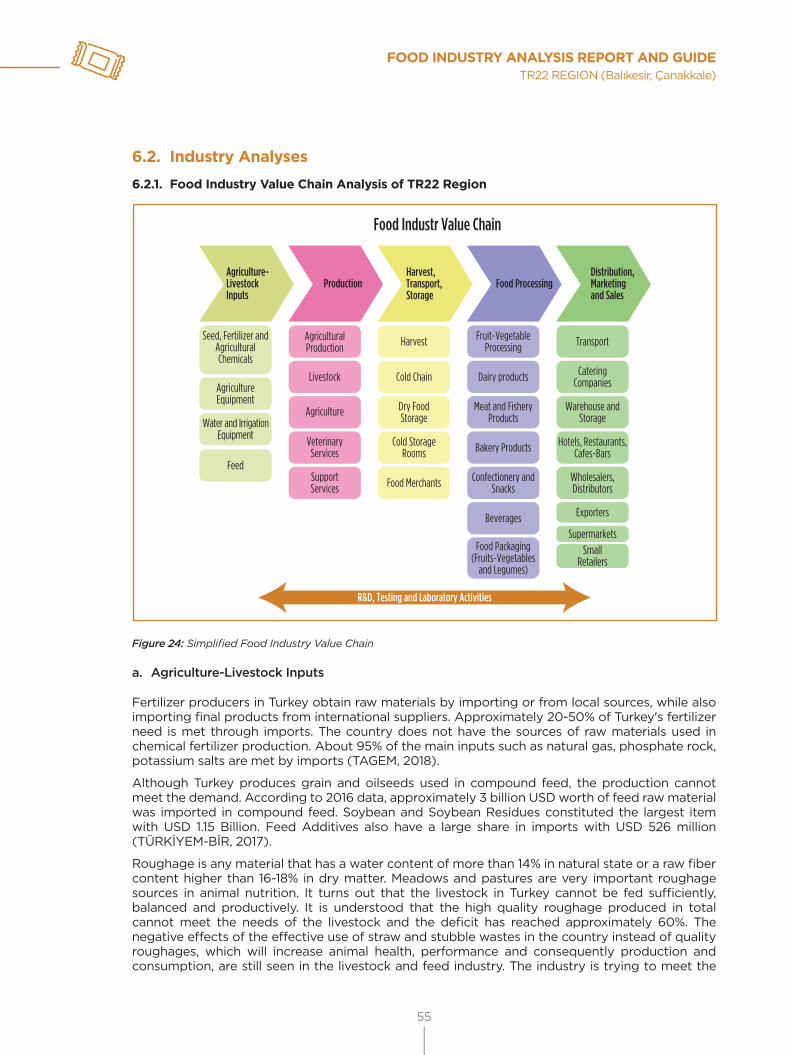
FOOD INDUSTRY ANALYSIS REPORT AND GUIDETR22 REGION (Balıkesir, Çanakkale)
55
6.2. Industry Analyses
6.2.1. Food Industry Value Chain Analysis of TR22 Region
R&D, Testing and Laboratory Activities
Food Industr Value Chain
Agriculture-LivestockInputs
Production
AgriculturalProduction
Harvest, Transport,Storage
Livestock
Agriculture
VeterinaryServices
SupportServices
Seed, Fertilizer andAgriculturalChemicals
AgricultureEquipment
Water and IrrigationEquipment
Feed
Harvest
Cold Chain
Dry FoodStorage
Cold StorageRooms
Food Merchants
Fruit-VegetableProcessing
Dairy products
Meat and FisheryProducts
Bakery Products
Confectionery andSnacks
Food ProcessingDistribution,Marketingand Sales
Beverages
Food Packaging(Fruits-Vegetables
and Legumes)
Transport
CateringCompanies
Warehouse andStorage
Hotels, Restaurants,Cafes-Bars
Wholesalers,Distributors
Exporters
SupermarketsSmall
Retailers
Figure 24: Simplified Food Industry Value Chain
a. Agriculture-Livestock Inputs
Fertilizer producers in Turkey obtain raw materials by importing or from local sources, while also importing final products from international suppliers. Approximately 20-50% of Turkey's fertilizer need is met through imports. The country does not have the sources of raw materials used in chemical fertilizer production. About 95% of the main inputs such as natural gas, phosphate rock, potassium salts are met by imports (TAGEM, 2018).
Although Turkey produces grain and oilseeds used in compound feed, the production cannot meet the demand. According to 2016 data, approximately 3 billion USD worth of feed raw material was imported in compound feed. Soybean and Soybean Residues constituted the largest item with USD 1.15 Billion. Feed Additives also have a large share in imports with USD 526 million (TÜRKİYEM-BİR, 2017).
Roughage is any material that has a water content of more than 14% in natural state or a raw fiber content higher than 16-18% in dry matter. Meadows and pastures are very important roughage sources in animal nutrition. It turns out that the livestock in Turkey cannot be fed sufficiently, balanced and productively. It is understood that the high quality roughage produced in total cannot meet the needs of the livestock and the deficit has reached approximately 60%. The negative effects of the effective use of straw and stubble wastes in the country instead of quality roughages, which will increase animal health, performance and consequently production and consumption, are still seen in the livestock and feed industry. The industry is trying to meet the
56
roughage deficit with straw and stubble. In order to provide the quality roughage required by the livestock industry, it is necessary to increase the production of forage crops and silage, as well as to increase the grazing capacity by improving the pastures, highlands and winter pastures, which are among the most important resources of Turkey (Özkan, 2016).
Turkey's annual consumable surface and groundwater potential is 112 billion m3 and annual water consumption is 54 billion m3 (DSI, 2018). 40.0 billion m3 (74%) of this amount of water is used for irrigation, 7 billion m3 (13%) for drinking and service, and 7 billion m3 (13%) for meeting the industrial water requirements. Irrigation efficiency in the agricultural sector is at the level of 51% (TOB, 2019a).
The amount of land that can be irrigated technically and economically in the country has been calculated as 8.5 million ha and 6.6 million ha of this area has been opened to irrigation as of 2019. As of 2018, 37% of the existing irrigation networks are used in classical, 41% canalette and 22% with pipe systems. The use of irrigation methods and techniques that ensure efficient use of water in the country is low. Traditional open canal and canalette systems are common in irrigation networks of the country. In areas dominated by these systems, the transmission and distribution efficiency is 60%, the water application efficiency is 50% and the total project efficiency is around 30%. Approximately 70% surface, 17% sprinkling and 13% drip irrigation are used in irrigated lands in Turkey (ZMO, 2020).
As of 2017, it has been determined that approximately 33% of the total tractors in the pool are used economically in agricultural activities (TARMAKBIR, 2020).
Box 1: Water Management
It was also mentioned in the focus group meetings that water management and its efficient use is one of the most important problems for the sustainability of food. It was stated that losses up to 65% occur during water transport through open channels, that some of the farmers tend to
give more water than the plant needs with the traditional wild irrigation method (traditional flood irrigation), this situation disrupts the structure of the fields, causes erosion, creates a drainage problem and thus reduces the production efficiency. It was stated that water transportation
should be carried out through closed canals, the spread of modern irrigation techniques (underground drip irrigation, overground drip irrigation, sprinkling), and that the farmer should be
directed to saving by abandoning the method of calculating the water fee per decare currently applied, and pricing is made according to the volume of water consumed. It was also stated that the need for a pump in pressurized irrigation methods can be eliminated with a suitable system by taking advantage of the pressure created by the water that is transported from high altitude
regions to lower levels.
b. Agricultural Production
Plant Production
There is 23.4 million hectares of agricultural land in Turkey. The number of agricultural lands per enterprise is 5.9, and the average size of land is 12.9 decares (2016). The amount of land per agricultural enterprise in the EU is 161 decares (2013) (Semerci, 2016).
The fact that agricultural lands in Turkey are generally composed of small parcels, and that these parcels are not together but scattered, significantly reduces the level of efficiency in the use of agricultural mechanization tools. In addition, the excess number of agricultural enterprises decreases the income per enterprise.
It is seen that low productivity is one of the main problems of the agri-food industry. In many products that have an important share in the food and livestock sector (wheat, barley, oats, sugar beet, triticale and tomatoes), the yield is low compared to France and Germany from EU countries (Table 24).
In order for Turkey to reach the level of EU countries in terms of productivity in agricultural production, it is necessary to solve the problems arising from the infrastructure of agricultural production and to increase the share of agricultural enterprises that make production based on economies of scale. In parallel with these, the dependence on natural conditions in agricultural production should be reduced, production materials with more qualified, high yield value, which

FOOD INDUSTRY ANALYSIS REPORT AND GUIDETR22 REGION (Balıkesir, Çanakkale)
57
are more resistant to dry conditions should be developed and their use should be encouraged, and emphasis should be placed on increasing the amount of irrigated land throughout the country in line with the planned targets every year (Semerci, 2016).
Table 24: Yield in Cereal and Some Herbal Products (kg/decare - 2019)
Yield in Cereal and Some Herbal Products (kg/decare) - 2019
Wheat Bar-ley Egypt Oat Soy Sunflow-
erSugar beet Triticale Tomato Olive
France 774 698 853 460 262 215 8.514 538 12.531 133
Germany 740 678 881 411 291 204 7.274 613 27.356 0
Spain 315 288 1.173 186 329 111 9.121 239 8.782 229
Europe 427 395 723 250 209 220 6.141 383 5.383 207
Turkey 278 266 940 242 425 279 5.832 336 7.076 173
Source: FAO; http://www.fao.org/faostat/en/?#data/QC
Between 2000 and 2018, Meadow and Pasture Lands increased by 517 thousand hectares, and the permanent crop land used in fruit cultivation increased by 909 thousand hectares. The total of temporary crop land and fallow land used in the cultivation of cereals and other field crops, defined as arable land, decreased significantly (4.10 million hectares) (Table 25).
There has been a very serious decrease of approximately 2.50 million hectares in wheat cultivation areas. There was also a high decrease in barley, cotton and sugar beet cultivation areas. It is seen that some of the producers have turned to sunflower and corn cultivation. With the increase in productivity, it has been ensured that the production amount in wheat did not decreaseand increased in sugar beet (Table 26). However, taking into account that the population increased by 22% during this period, it can be said that the per capita production amount for wheat and barley decreased at the same rate. According to the data of the Directorate General of Migration Management in 2019, considering the 3.6 million Syrians under temporary protection, it is seen that per capita production has decreased significantly.
Table 25: Distribution of Turkey's Land Area
Turkey Land Area (1.000 hectares)
(1)+(2)+(3)+(4) (1)+(2)+(3) (1)+(2) (1) (2) (3) (4)
Forest land
Other Land Farmland Field Arable
landTemporary crop land
Fallow land
Permanent crop land
Meadow, pasture
2000 20.148 16.336 40.479 26.379 23.826 2.553 14.100
2010 21.083 16.868 39.012 24.395 21.384 17.135 4.249 3.011 14.617
2018 21.908 17.253 37.802 23.185 19.723 16.210 3.513 3.462 14.617
Source: FAO, http://www.fao.org/faostat/en/#data/RL

58
Table 26: Land Planted, Production Amount and Yield Data on Selected Crops in Turkey
Planted area (Decares) Total Wheat Barley Egypt Sunflower Cotton
(Stubby) Sugar beet
2001 150934280 93500000 36400000 5500000 5100000 6846650 3587630
2010 131886169 81034000 30400000 5940000 6414000 4806500 3291 669
2019 118985163 68463271 28690715 6388287 7526318 4778681 3137891
Increase/Decrease (2001-2019) -31949117 -25036729 -7709285 888287 2426318 -2067969 -449739
Increase/Decrease (2001-2019) -21% -27% -21% 16% 48% -30% -13%
Production (tons) Total Wheat Barley Egypt Sunflower Cotton (Stubby) Sugar beet
2001 44340414 19000000 7500000 2200000 650000 2357892 12632522
2010 52646112 19674000 7250000 4310000 1320000 2150000 17942112
2019 54954320 19000000 7600000 6000000 2100000 2200000 18054320
Increase/Decrease (2001-2019) 10613906 0 100000 3 800000 1450000 -157892 5421798
Yield (Ton / de-care) Total Wheat Barley Egypt Sunflower Cotton
(Stubby) Sugar beet
2001 0,294 0,203 0,206 0,400 0,127 0,344 3,521
2010 0,399 0,243 0,238 0,726 0,206 0,447 5,451
2019 0,462 0,278 0,265 0,939 0,279 0,460 5,754
Increase/Decrease (2001-2019) 0,168 0,074 0,059 0,539 0,152 0,116 2,233
Increase/Decrease (2001-2019) 57% 37% 29% 135% 119% 34% 63%
Source: TURKSTAT
In the table below (Table 27), the possibility of producing all of the products imported in Cereals and other main Herbal Products in Turkey has been calculated. "Usable production" refers to the net production amount after the losses are deducted. With the assumption that production will be made with "current yield", the amount of additional land required to meet all imports is calculated as 5.61 million hectares. It is seen that 3.51 million hectares of fallow land cannot meet this need. In case of trying to meet the imports by increasing the yield on the production land (without using fallow lands), the required yield increase is given in the last column. When compared to the yields of developed countries, it is seen that the results for wheat and barley are achievable. For wheat and barley, it would be more appropriate to focus on increasing productivity rather than increasing the amount of cultivated land. When wheat and barley are excluded, it is seen that the land width needed to meet the imports of the listed crops (sunflower, corn, legumes, soy, cotton, etc.) is 2.9 million hectares and it is less than the amount of fallow land.
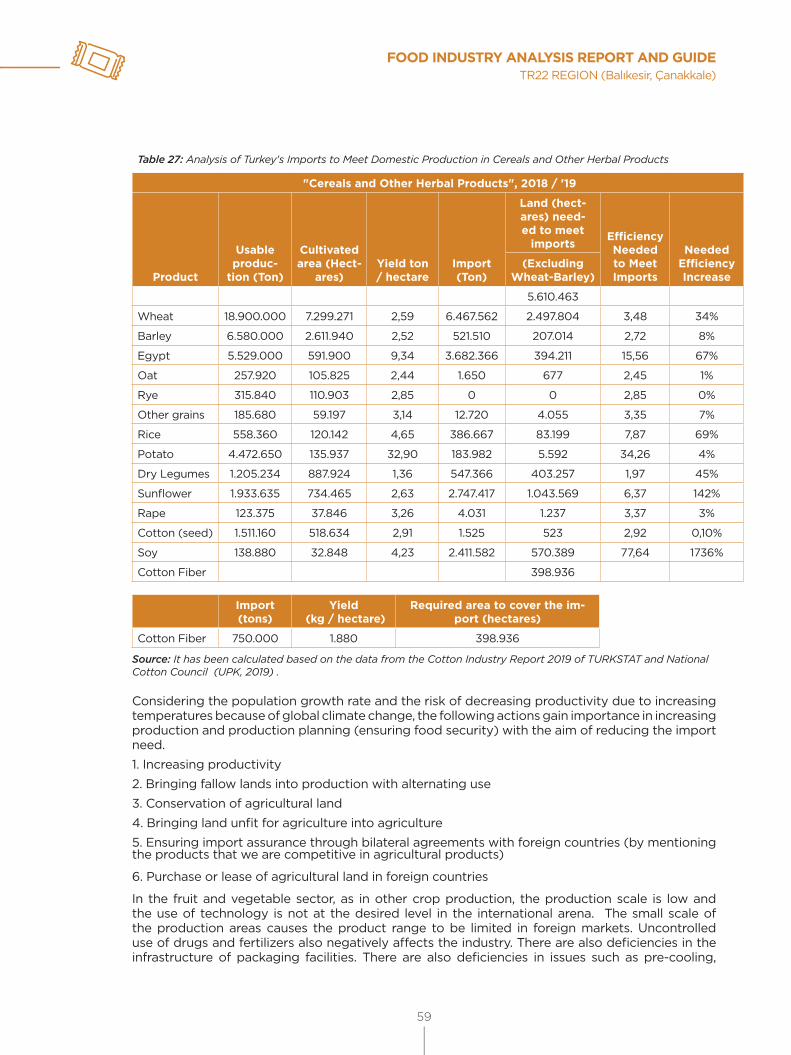
FOOD INDUSTRY ANALYSIS REPORT AND GUIDETR22 REGION (Balıkesir, Çanakkale)
59
Table 27: Analysis of Turkey's Imports to Meet Domestic Production in Cereals and Other Herbal Products
"Cereals and Other Herbal Products", 2018 / '19
Product
Usable produc-
tion (Ton)
Cultivated area (Hect-
ares)Yield ton / hectare
Import (Ton)
Land (hect-ares) need-ed to meet
importsEfficiency Needed to Meet Imports
Needed Efficiency Increase
(Excluding Wheat-Barley)
5.610.463
Wheat 18.900.000 7.299.271 2,59 6.467.562 2.497.804 3,48 34%
Barley 6.580.000 2.611.940 2,52 521.510 207.014 2,72 8%
Egypt 5.529.000 591.900 9,34 3.682.366 394.211 15,56 67%
Oat 257.920 105.825 2,44 1.650 677 2,45 1%
Rye 315.840 110.903 2,85 0 0 2,85 0%
Other grains 185.680 59.197 3,14 12.720 4.055 3,35 7%
Rice 558.360 120.142 4,65 386.667 83.199 7,87 69%
Potato 4.472.650 135.937 32,90 183.982 5.592 34,26 4%
Dry Legumes 1.205.234 887.924 1,36 547.366 403.257 1,97 45%
Sunflower 1.933.635 734.465 2,63 2.747.417 1.043.569 6,37 142%
Rape 123.375 37.846 3,26 4.031 1.237 3,37 3%
Cotton (seed) 1.511.160 518.634 2,91 1.525 523 2,92 0,10%
Soy 138.880 32.848 4,23 2.411.582 570.389 77,64 1736%
Cotton Fiber 398.936
Import (tons)
Yield (kg / hectare)
Required area to cover the im-port (hectares)
Cotton Fiber 750.000 1.880 398.936
Source: It has been calculated based on the data from the Cotton Industry Report 2019 of TURKSTAT and National Cotton Council (UPK, 2019) .
Considering the population growth rate and the risk of decreasing productivity due to increasing temperatures because of global climate change, the following actions gain importance in increasing production and production planning (ensuring food security) with the aim of reducing the import need. 1. Increasing productivity2. Bringing fallow lands into production with alternating use3. Conservation of agricultural land4. Bringing land unfit for agriculture into agriculture5. Ensuring import assurance through bilateral agreements with foreign countries (by mentioning the products that we are competitive in agricultural products)
6. Purchase or lease of agricultural land in foreign countries
In the fruit and vegetable sector, as in other crop production, the production scale is low and the use of technology is not at the desired level in the international arena. The small scale of the production areas causes the product range to be limited in foreign markets. Uncontrolled use of drugs and fertilizers also negatively affects the industry. There are also deficiencies in the infrastructure of packaging facilities. There are also deficiencies in issues such as pre-cooling,

60
sorting machines, cold air facilities and packaging technologies. It is necessary to focus on R&D activities in order to tend towards the production of high value added products. Seed breeding studies are also critical for the industry (TOB, 2016).
Organization
In the European Union, where cooperatives have an important place in the economic field, the market share of agricultural cooperatives reaches 40% (Bijman, 2016). In countries such as Scandinavian countries (Denmark, Finland, Sweden), Ireland, the Netherlands and France, this rate is over 50%. When the current situation of the cooperatives in Turkey is examined, it is possible to say that the number of cooperatives and their members is developing but not sufficient to the extent desired. Cooperative participation rates in some countries in the European Union, where cooperatives have an important place, are as follows: Ireland 70%, Finland 60%, Austria 58%. In Turkey, this rate is around 10% (TOB, 2019b).
Animal Production
The small size of stockbreeder enterprises is similar to agricultural enterprises in terms of scale. 59.6% of the stockbreeder enterprises have less than 50 cattles. 63.9% of the sheep and goat breeding enterprises have 150 and more, 36.3% have 300 and more sheep and goats (TURKSTAT, 2016). Low yields in agricultural products is also seen in milk yields. Even though EU average in carcass meat yield has been reached from 2000 to 2016, milk yield is less than half of EU average (Table 28).
Table 28: Meat and Milk Yield (Comparison of Turkey and EU)
Average Carcass Meat and Milk Amount per Animal (kg)
2000 2016
Turkey Meat 169 280
Milk 1.654 3.090
EU-28 Meat 257 290
Milk 5.321 6.702
Source: Semerci Arif, (2016).
Among the factors that adversely affect milk yield, breed improvement is incomplete and modern breeding techniques are not widespread, as well as the low fertility rate (offspring yield rate) is an important factor. The high rate of "calf mortality" also negatively affects the profitability and total milk production of cattle enterprises and causes the need for calf imports in the country.
According to the 2016 data, although the "rate of fertility" is around 90% in Europe, the rate of calves born per cow milked in the culture breed cattle of TR5-West Anatolia region is 78.60%, while Turkey is significantly behind the Europea, with an average of 64.8% (Tüzmen, 2018). While the calf loss rates are 2.47-7.42% in England (2013) and 6.4% in the USA (2007), it is high in Turkey with the range of 10-15% (KOP, 2017).
In addition, it is known that the main issue preventing the sale of dairy products to the EU (EU's justification) is the high number of somatic cells in raw milk produced in Turkey. The number of enterprises that can produce raw milk at EU standards is limited. Modernization of dairy farms is important for both lowering unit costs and access to alternative markets by providing high quality raw milk production, and creating market diversity in the dairy sector.
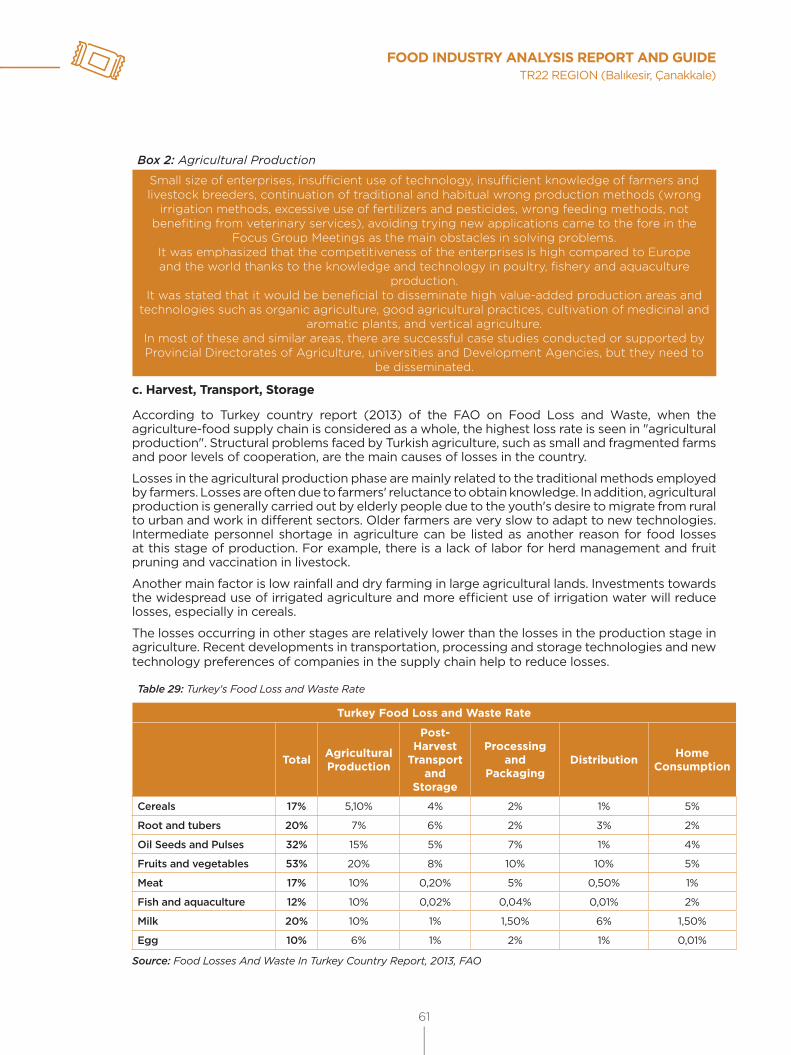
FOOD INDUSTRY ANALYSIS REPORT AND GUIDETR22 REGION (Balıkesir, Çanakkale)
61
Box 2: Agricultural Production
Small size of enterprises, insufficient use of technology, insufficient knowledge of farmers and livestock breeders, continuation of traditional and habitual wrong production methods (wrong
irrigation methods, excessive use of fertilizers and pesticides, wrong feeding methods, not benefiting from veterinary services), avoiding trying new applications came to the fore in the
Focus Group Meetings as the main obstacles in solving problems. It was emphasized that the competitiveness of the enterprises is high compared to Europe and the world thanks to the knowledge and technology in poultry, fishery and aquaculture
production.It was stated that it would be beneficial to disseminate high value-added production areas and
technologies such as organic agriculture, good agricultural practices, cultivation of medicinal and aromatic plants, and vertical agriculture.
In most of these and similar areas, there are successful case studies conducted or supported by Provincial Directorates of Agriculture, universities and Development Agencies, but they need to
be disseminated.
c. Harvest, Transport, Storage
According to Turkey country report (2013) of the FAO on Food Loss and Waste, when the agriculture-food supply chain is considered as a whole, the highest loss rate is seen in "agricultural production". Structural problems faced by Turkish agriculture, such as small and fragmented farms and poor levels of cooperation, are the main causes of losses in the country.
Losses in the agricultural production phase are mainly related to the traditional methods employed by farmers. Losses are often due to farmers' reluctance to obtain knowledge. In addition, agricultural production is generally carried out by elderly people due to the youth's desire to migrate from rural to urban and work in different sectors. Older farmers are very slow to adapt to new technologies. Intermediate personnel shortage in agriculture can be listed as another reason for food losses at this stage of production. For example, there is a lack of labor for herd management and fruit pruning and vaccination in livestock.
Another main factor is low rainfall and dry farming in large agricultural lands. Investments towards the widespread use of irrigated agriculture and more efficient use of irrigation water will reduce losses, especially in cereals.
The losses occurring in other stages are relatively lower than the losses in the production stage in agriculture. Recent developments in transportation, processing and storage technologies and new technology preferences of companies in the supply chain help to reduce losses.
Table 29: Turkey's Food Loss and Waste Rate
Turkey Food Loss and Waste Rate
Total Agricultural Production
Post-Harvest
Transport and
Storage
Processing and
PackagingDistribution Home
Consumption
Cereals 17% 5,10% 4% 2% 1% 5%
Root and tubers 20% 7% 6% 2% 3% 2%
Oil Seeds and Pulses 32% 15% 5% 7% 1% 4%
Fruits and vegetables 53% 20% 8% 10% 10% 5%
Meat 17% 10% 0,20% 5% 0,50% 1%
Fish and aquaculture 12% 10% 0,02% 0,04% 0,01% 2%
Milk 20% 10% 1% 1,50% 6% 1,50%
Egg 10% 6% 1% 2% 1% 0,01%
Source: Food Losses And Waste In Turkey Country Report, 2013, FAO
62
In regions where the cold chain is not established in the transportation of milk, its negative effect on the quality and price of the milk constitutes another problem at the transportation stage. This negatively affects the income of both the milk producers and the dairy producers.
d. Food Processing
The food industry in Turkey is constantly changing and developing. Recently, the fluctuations in the supply of food raw material resources due to natural, social and economic reasons and the price changes largely due to this have made it necessary to use the existing raw material resources more efficiently and effectively, and the change in domestic and foreign demand has forced the food industry to be more innovative and use advanced technologies. These reasons have led the food industry to also consider food safety, environmental awareness, food trade and competitiveness of food businesses. Behavioral changes that increase sensitivity and awareness to developments in various sub-sectors have been observed, and the sensitivity of the industry has been enhanced with social responsibility projects (TKB, 2018).
According to the analysis made with the survey study, it has been observed that the technologies of the companies operating in the food industry and their efficiency studies in production are not at an advanced level. It can be said that they are relatively better in packaging technologies, but there are gaps that can be improved. Enterprise Resource Planning software has also not become widespread. It is understood that most of the companies carry out their Quality Control activities systematically and this has a positive effect on branding. However, there are a significant number of companies that need improvement in this area. After the pandemic, the importance of access to safe food has increased, so product traceability systems, where companies are weak, appear as an area that needs improvement.
While the product variety of companies is close to a high level, it is observed that they have difficulties in accessing the market (sales and marketing), market diversity cannot be created, distribution channels are not effective and digital marketing activities are not widespread. Most of the companies that do not export are micro and small-scale companies, it is seen that these companies need support to increase their export competencies. As their R&D and innovation activities are low due to their inability to increase their competitiveness, they tend towards price-oriented competition.
The TR22 Region has important advantages in terms of its geographical location, product variety, industry, and research infrastructure in the field of agriculture and agriculture-based industry. The region is one of the leading regions of the country in the food industry, especially olive, olive oil, milk and dairy products, and the poultry sector. Agriculture and Agro-based Industry in the Region has been identified as one of the areas with the potential to provide sustainable competitive advantage through smart specialization. (GMKA, 2019e). In line with the focus group interviews and the information obtained from the experts, it is seen that the companies in the TR22 Region are competent in quality and management.
Inadequate development of the entrepreneurship culture in the provinces of the region and difficulty in accessing finance are important problems for SMEs. Clustering, which is a tool used to increase the competitiveness of regions, is very important for strengthening cooperation between companies and improving the innovation capacities of companies. In certain regions of the region, sectoral concentrations that will pave the way for clustering are observed. There is a cluster potential for olive cultivation, milk and dairy products, poultry, and red meat products in the TR22 Region. (GMKA, 2014)
There are also training and research infrastructure, research institutes, and laboratories required in the region for agriculture and agriculture-based industry. Food producers in the region are large-scale enterprises, and they can act as a leading company in the specialization process in this field. The development in the income levels of cities such as Istanbul, Izmir, and Bursa in the immediate vicinity of the region increases the demand for organic and high value-added food products. The region's highway access opportunity will increase further with new projects, and easy access to markets outside the region will be provided. Major weaknesses of the region may be counted as failure to develop a culture of communication and cooperation between the actors of the regional innovation system (firm, university, private sector, public, NGO, etc.); the migration
FOOD INDUSTRY ANALYSIS REPORT AND GUIDETR22 REGION (Balıkesir, Çanakkale)
63
of qualified human resources from the region; the weakness of the R&D and innovation skills and infrastructures of the companies in the region; the shortcomings of the companies in the region in branding, promotion, design, and marketing; lack of mechanisms to develop entrepreneurship in the region; lack of training centers for producers in strategic sectors (eg olive) (GMKA, 2019e).
According to the outputs of the Turkey's Food Innovation Platform workshop, which was held under the leadership of TUBITAK-MAM Food Institute with the participation of 66 institutions and 145 stakeholders across the country, among the main problems in the food sector, despite the significant potential of natural and functional foods and traditional and local products, the inadequacy of converting them into value-added products, packaging, branding, food safety and traceability have come to the fore. The inadequacy of accredited laboratories and internationally accepted analysis in the industry is one of the obstacles in overcoming these problems. There are inadequacies in the country in terms of compliance with directives and standards, which are predicted to be stricter in the scope of food safety, health and traceability. In addition, preparations for data analytics, digitization applications and advanced technology usage, which are seen to be increasingly important in the world, are not sufficient. In food components including seeds and raw materials, foreign dependency in production aids, absence of biodegradable and compost-featured materials in packaging are the areas that need to be improved in the industry. There are also weaknesses in food waste and waste recycling in the country. The need for education and especially qualified staff in some regions is seen as an important problem. Global warming, desertification and related problems threaten the industry. There are also weaknesses in cooperation with interdisciplinary studies, universities and research institutions within the framework of global new approaches that will contribute to the solution of the problems of the industry (TUGIP, 2021).
In addition to these, informal production and production out of regulation throughout Turkey continues for years as threats to fair competition and public health in the industry. Difficulties in accessing finance have been observed as one of the biggest problems threatening SMEs. This is mostly due to limited domestic financing resources, high financing costs and short maturities. However, financial support mechanisms for domestic investment, export and R&D activities can contribute to the financing needs of companies.
As stated in the 11th Development Plan, Report of the Special Expertise Commission on Competitive Production in Agriculture and Food, when the innovation performances of food and beverage enterprises in the world and in Turkey are examined, it is seen that Turkish enterprises make less innovation compared to the enterprises of EU countries. Especially in this respect, it is stated that the low R&D expenditures and insufficient use of technology, and the low competitiveness of the industry are among the main problems faced by the food industry. The results of the survey overlap with this inference.
It is important that academia and/or research centers contribute to R&D projects that will create added value and have a high commercialization potential. Involving various non-governmental organizations in this process is required. In order to facilitate the cooperation of these structures with the industry, the participation and willingness to meet the R&D requirement of the industry's leading organizations, industrial organizations and interface organizations are mandatory.
Although there has been progress in the food industry in terms of technological innovation, considering the existing potential, it may develop further. In the process of supplying raw materials, especially in parallel with the developments in the field of biotechnology, the development of agricultural raw materials with the characteristics required by the food industry through improvement studies is important for the development of the Turkish food industry. In terms of transportation/shipping, technological improvements in transportation and storage conditions will benefit the development of the food industry in the delivery of both raw materials and processed end products to the consumer. Sensor technologies that will provide instant tracking of logistics control, storage and transportation conditions based on global positioning systems (GPS) are the research areas needed in this field (TKB, 2018).
In addition, the financial support mechanisms and programs for R&D in the country contribute to the development of R&D awareness and activities in the industry. While R&D expenditures in Food Industry Manufacturing were realized as 115 million TL in 2015, it increased regularly to 320 million

64
TL in 2019. Its share (1.1%) among the total R&D expenditure in all industries remained unchanged. Full Time Equivalent R&D Manpower increased from 66 thousand in 2015 to 115 thousand in 2019. As of June 2019, the number of R&D centers operating in the food and beverage industry has increased to 53 ( TSB, 2019) .
The number of Food Technologies Patent/Utility Model applications increased from 17,530 in 2000 to 35,069 in 2010, after this year it accelerated further and reached 83,890 in 2015 and 99,163 in 2018 (Patentgrowth, 2020).
e. Distribution/Marketing/Sales
Distribution channels in Turkey has a two-sided structure, including classical and modern. At every stage of the channels, there are on the one hand, a large number of small and classic members, and on the other hand, few but constantly evolving modern members. However, the rate of small members is around 90%. The most complex and long distribution channels are found among foodstuffs. There are many organizations, especially at the wholesaler level. In the retail layer, there are thousands of small-scale sellers specialized in individual products and services, supermarkets, grocery stores, butchers, grocery stores, cooperative stores and semi-wholesaler semi-retail stores (Kıvrak, 2014). The use of digital marketing tools (website, e-commerce platforms, social media) has increased significantly in recent years and especially after the COVID-19 pandemic.
6.2.2. Food Industry PESTLE Analysis of TR22 Region
The analysis made to provide inputs in identifying opportunities and threats for short, medium and long term strategies to be established by evaluating the effects of macro developments on political, economic, sociocultural, technological, legal and environmental scales in the remote environment of the enterprises on the food sector in the TR22 Region is shared in the table below.
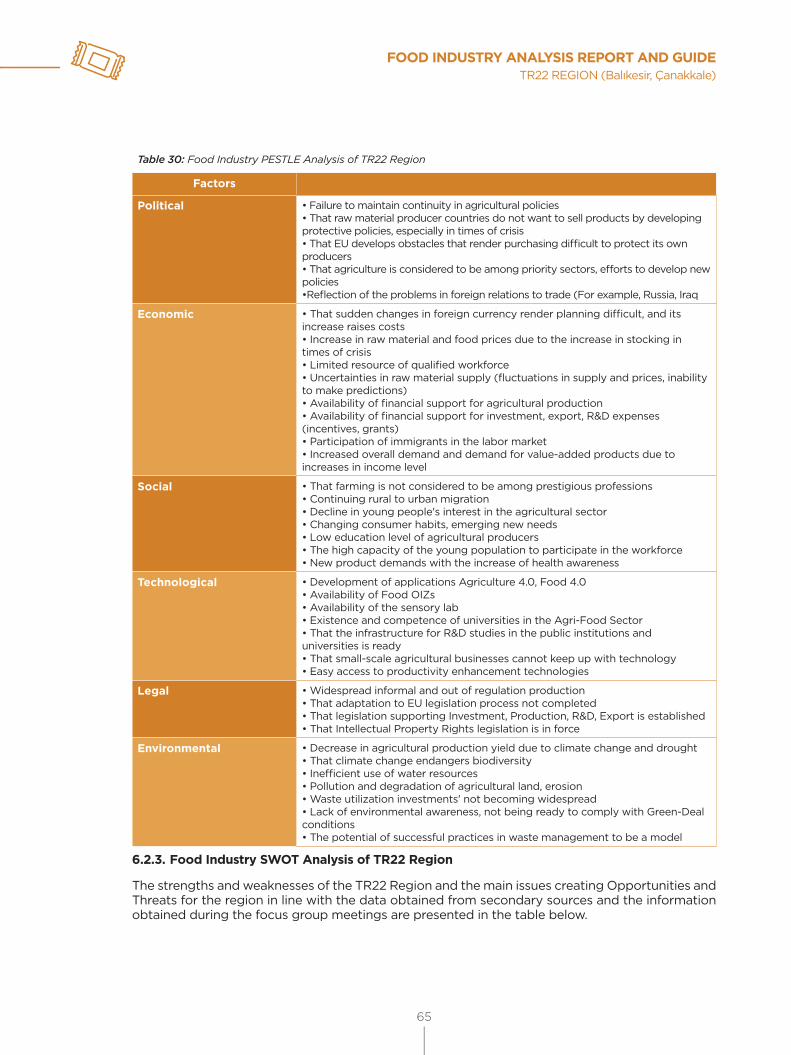
FOOD INDUSTRY ANALYSIS REPORT AND GUIDETR22 REGION (Balıkesir, Çanakkale)
65
Table 30: Food Industry PESTLE Analysis of TR22 Region
Factors
Political • Failure to maintain continuity in agricultural policies• That raw material producer countries do not want to sell products by developing protective policies, especially in times of crisis• That EU develops obstacles that render purchasing difficult to protect its own producers• That agriculture is considered to be among priority sectors, efforts to develop new policies•Reflection of the problems in foreign relations to trade (For example, Russia, Iraq
Economic • That sudden changes in foreign currency render planning difficult, and its increase raises costs• Increase in raw material and food prices due to the increase in stocking in times of crisis• Limited resource of qualified workforce• Uncertainties in raw material supply (fluctuations in supply and prices, inability to make predictions)• Availability of financial support for agricultural production• Availability of financial support for investment, export, R&D expenses (incentives, grants)• Participation of immigrants in the labor market• Increased overall demand and demand for value-added products due to increases in income level
Social • That farming is not considered to be among prestigious professions• Continuing rural to urban migration• Decline in young people's interest in the agricultural sector• Changing consumer habits, emerging new needs• Low education level of agricultural producers• The high capacity of the young population to participate in the workforce• New product demands with the increase of health awareness
Technological • Development of applications Agriculture 4.0, Food 4.0• Availability of Food OIZs• Availability of the sensory lab• Existence and competence of universities in the Agri-Food Sector• That the infrastructure for R&D studies in the public institutions and universities is ready• That small-scale agricultural businesses cannot keep up with technology • Easy access to productivity enhancement technologies
Legal • Widespread informal and out of regulation production• That adaptation to EU legislation process not completed• That legislation supporting Investment, Production, R&D, Export is established• That Intellectual Property Rights legislation is in force
Environmental • Decrease in agricultural production yield due to climate change and drought• That climate change endangers biodiversity• Inefficient use of water resources• Pollution and degradation of agricultural land, erosion• Waste utilization investments' not becoming widespread• Lack of environmental awareness, not being ready to comply with Green-Deal conditions• The potential of successful practices in waste management to be a model
6.2.3. Food Industry SWOT Analysis of TR22 Region
The strengths and weaknesses of the TR22 Region and the main issues creating Opportunities and Threats for the region in line with the data obtained from secondary sources and the information obtained during the focus group meetings are presented in the table below.
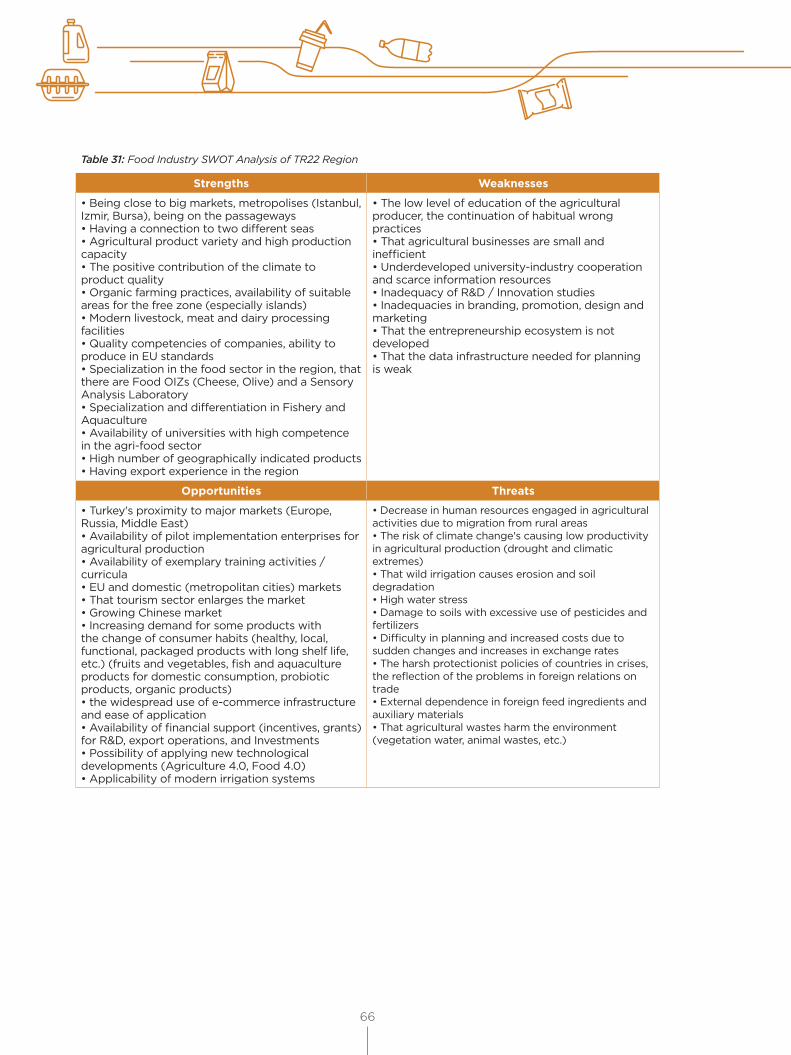
66
Table 31: Food Industry SWOT Analysis of TR22 Region
Strengths Weaknesses
• Being close to big markets, metropolises (Istanbul, Izmir, Bursa), being on the passageways• Having a connection to two different seas• Agricultural product variety and high production capacity• The positive contribution of the climate to product quality• Organic farming practices, availability of suitable areas for the free zone (especially islands)• Modern livestock, meat and dairy processing facilities• Quality competencies of companies, ability to produce in EU standards• Specialization in the food sector in the region, that there are Food OIZs (Cheese, Olive) and a Sensory Analysis Laboratory• Specialization and differentiation in Fishery and Aquaculture• Availability of universities with high competence in the agri-food sector• High number of geographically indicated products• Having export experience in the region
• The low level of education of the agricultural producer, the continuation of habitual wrong practices• That agricultural businesses are small and inefficient• Underdeveloped university-industry cooperation and scarce information resources• Inadequacy of R&D / Innovation studies• Inadequacies in branding, promotion, design and marketing• That the entrepreneurship ecosystem is not developed• That the data infrastructure needed for planning is weak
Opportunities Threats
• Turkey's proximity to major markets (Europe, Russia, Middle East)• Availability of pilot implementation enterprises for agricultural production• Availability of exemplary training activities / curricula• EU and domestic (metropolitan cities) markets• That tourism sector enlarges the market• Growing Chinese market• Increasing demand for some products with the change of consumer habits (healthy, local, functional, packaged products with long shelf life, etc.) (fruits and vegetables, fish and aquaculture products for domestic consumption, probiotic products, organic products)• the widespread use of e-commerce infrastructure and ease of application• Availability of financial support (incentives, grants) for R&D, export operations, and Investments• Possibility of applying new technological developments (Agriculture 4.0, Food 4.0)• Applicability of modern irrigation systems
• Decrease in human resources engaged in agricultural activities due to migration from rural areas• The risk of climate change's causing low productivity in agricultural production (drought and climatic extremes) • That wild irrigation causes erosion and soil degradation• High water stress• Damage to soils with excessive use of pesticides and fertilizers• Difficulty in planning and increased costs due to sudden changes and increases in exchange rates• The harsh protectionist policies of countries in crises, the reflection of the problems in foreign relations on trade• External dependence in foreign feed ingredients and auxiliary materials• That agricultural wastes harm the environment (vegetation water, animal wastes, etc.)

FOOD INDUSTRY ANALYSIS REPORT AND GUIDETR22 REGION (Balıkesir, Çanakkale)
67
6.2.4. Food Industry Five Forces Analysis of TR22 Region
As the number of participants from the TR22 Region is insufficient, only the analysis of the survey data across Turkey is presented below.
2,2
2,50,00,51,0
2,02,02,53,0
2,1
2,7
Bargaining Power ofBuyers
Substitute Threat Threat of NewCompanies to Enter the Sector
Bargaining Power ofSuppliers
Level of theCompetition in the
Sector
Turkey Average Medium Threat (2)
1,5
Figure 25: Turkey Food Industry Porter's 5 Forces Analysis
Threat of New Companies to Enter the Industry
Capital-intensive and knowledge-intensive industries are more difficult to enter. The threat of new companies in the country was perceived as moderate. Three out of four firms in fish and aquaculture perceived the threat as low. In the dairy manufacturing sector, the majority reported the severity of the threat as medium and high. In the meat processing sector, the lack of a certain concentration in the perception of the threat indicates the product-based change of the threat. The same is true for other sub-sectors.
Threat of Substitute Products
In the comparison made with the price and quality characteristics of the substitute products, the severity of the threat of the substitute products was perceived slightly above the middle. No significant difference was found on the basis of sub-sector.
Bargaining Power of Buyers
Although there are differences in the bargaining power threat of the buyers on the basis of the company, it is observed that the number of buyers generally does not pose a threat to the companies. However, the price-oriented preference of buyers is perceived as high and very high by many companies.
Bargaining Power of Suppliers
It is observed that the threat of the factors of the number of suppliers and the availability of raw materials at the desired quality and time is not significant, and is perceived as the threat with the lowest severity among the five factors.
Intensity of intra-industry competition
The intensity of intra-sector competition tends to increase with the increase in the number of producers (excess supply) and the decrease in the number of buyers (low demand). It is seen that competition in the sector is fierce. The threat is perceived to be higher in the manufacture of animal feed, milled grain products, processing of vegetables and fruits, and manufacture of dairy products.
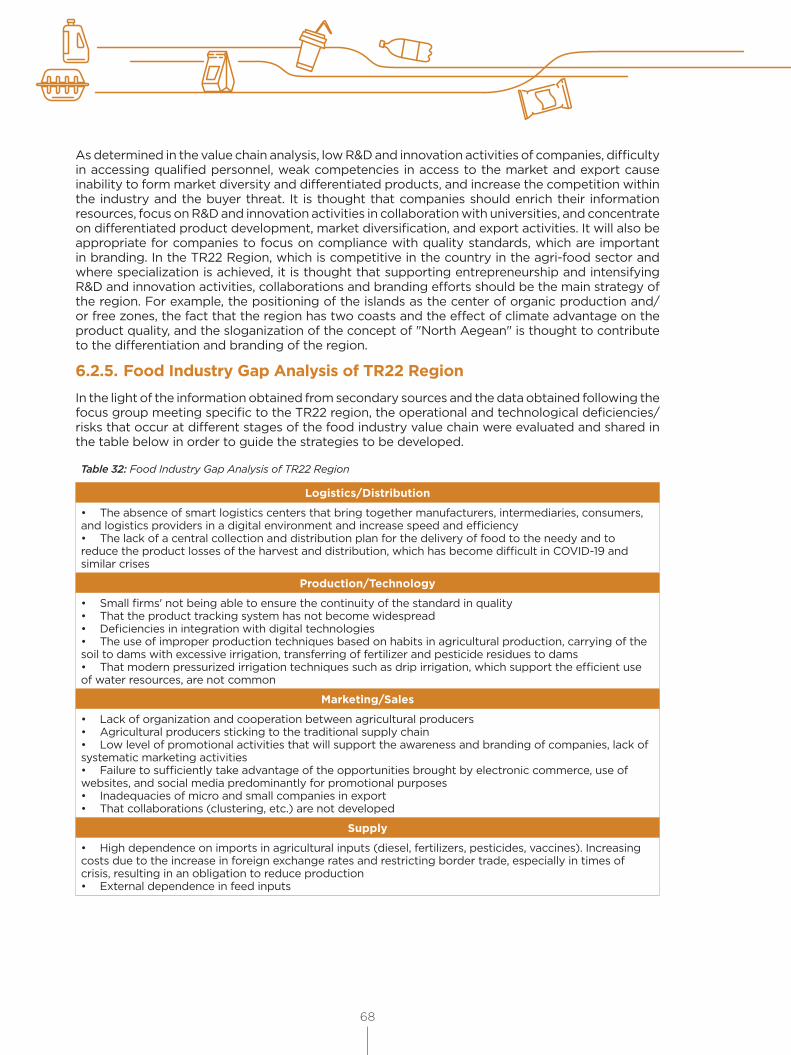
68
As determined in the value chain analysis, low R&D and innovation activities of companies, difficulty in accessing qualified personnel, weak competencies in access to the market and export cause inability to form market diversity and differentiated products, and increase the competition within the industry and the buyer threat. It is thought that companies should enrich their information resources, focus on R&D and innovation activities in collaboration with universities, and concentrate on differentiated product development, market diversification, and export activities. It will also be appropriate for companies to focus on compliance with quality standards, which are important in branding. In the TR22 Region, which is competitive in the country in the agri-food sector and where specialization is achieved, it is thought that supporting entrepreneurship and intensifying R&D and innovation activities, collaborations and branding efforts should be the main strategy of the region. For example, the positioning of the islands as the center of organic production and/or free zones, the fact that the region has two coasts and the effect of climate advantage on the product quality, and the sloganization of the concept of "North Aegean" is thought to contribute to the differentiation and branding of the region.
6.2.5. Food Industry Gap Analysis of TR22 RegionIn the light of the information obtained from secondary sources and the data obtained following the focus group meeting specific to the TR22 region, the operational and technological deficiencies/risks that occur at different stages of the food industry value chain were evaluated and shared in the table below in order to guide the strategies to be developed.
Table 32: Food Industry Gap Analysis of TR22 Region
Logistics/Distribution
• The absence of smart logistics centers that bring together manufacturers, intermediaries, consumers, and logistics providers in a digital environment and increase speed and efficiency• The lack of a central collection and distribution plan for the delivery of food to the needy and to reduce the product losses of the harvest and distribution, which has become difficult in COVID-19 and similar crises
Production/Technology
• Small firms' not being able to ensure the continuity of the standard in quality• That the product tracking system has not become widespread• Deficiencies in integration with digital technologies• The use of improper production techniques based on habits in agricultural production, carrying of the soil to dams with excessive irrigation, transferring of fertilizer and pesticide residues to dams• That modern pressurized irrigation techniques such as drip irrigation, which support the efficient use of water resources, are not common
Marketing/Sales
• Lack of organization and cooperation between agricultural producers• Agricultural producers sticking to the traditional supply chain• Low level of promotional activities that will support the awareness and branding of companies, lack of systematic marketing activities• Failure to sufficiently take advantage of the opportunities brought by electronic commerce, use of websites, and social media predominantly for promotional purposes• Inadequacies of micro and small companies in export• That collaborations (clustering, etc.) are not developed
Supply
• High dependence on imports in agricultural inputs (diesel, fertilizers, pesticides, vaccines). Increasing costs due to the increase in foreign exchange rates and restricting border trade, especially in times of crisis, resulting in an obligation to reduce production• External dependence in feed inputs
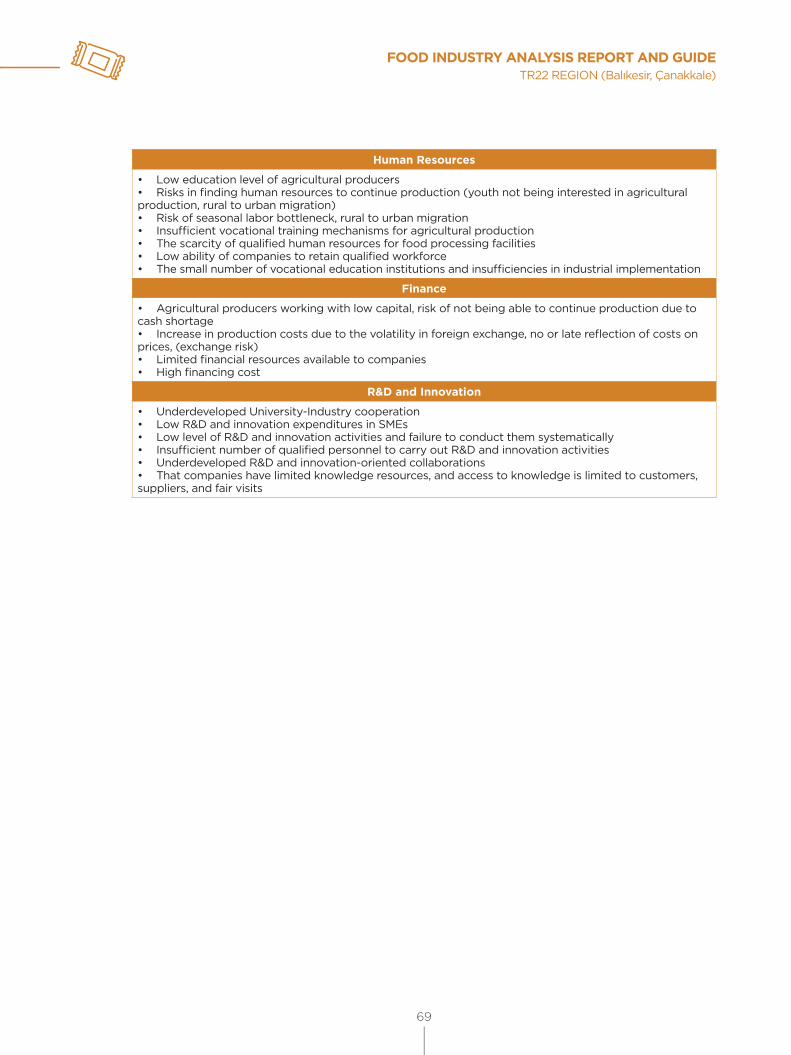
FOOD INDUSTRY ANALYSIS REPORT AND GUIDETR22 REGION (Balıkesir, Çanakkale)
69
Human Resources
• Low education level of agricultural producers• Risks in finding human resources to continue production (youth not being interested in agricultural production, rural to urban migration)• Risk of seasonal labor bottleneck, rural to urban migration • Insufficient vocational training mechanisms for agricultural production• The scarcity of qualified human resources for food processing facilities • Low ability of companies to retain qualified workforce • The small number of vocational education institutions and insufficiencies in industrial implementation
Finance
• Agricultural producers working with low capital, risk of not being able to continue production due to cash shortage• Increase in production costs due to the volatility in foreign exchange, no or late reflection of costs on prices, (exchange risk)• Limited financial resources available to companies• High financing cost
R&D and Innovation
• Underdeveloped University-Industry cooperation• Low R&D and innovation expenditures in SMEs• Low level of R&D and innovation activities and failure to conduct them systematically• Insufficient number of qualified personnel to carry out R&D and innovation activities• Underdeveloped R&D and innovation-oriented collaborations• That companies have limited knowledge resources, and access to knowledge is limited to customers, suppliers, and fair visits
70
7. Horizontal Subjects7.1. Crisis ManagementCross-border animal and plant pests and diseases, food security and radiation incidents have increased in recent years, affecting people's access to quality food and putting their livelihoods and health at risk. To meet this challenge, FAO (Food and Agriculture Organization) has established the Food Chain Crisis Management Framework (FCC).
The FCC is FAO's action tool that supports countries in the global management of threats to the human food chain at all stages from production to consumption. Two Committees at FAO, the Policy Advisory Committee and the Oversight Committee, have a governance role for these threats and crises. The FCC includes adequate threat supervision, early warning, preventive and risk reduction practices, better preparedness and response, and the adoption of appropriate policies.
The FCC consists of three areas of action that comprehensively address the entire cycle of a food chain crisis: "coordination and intelligence", "prevention and early warning", "intervention" (FAO, 2016).
It will be useful to construct a similar structure in Turkey. Panic, difficulties in the supply of labor, disruption of the supply chain, restriction of food exports due to the harsh protective policies of countries especially during the COVID-19 pandemic increased the risks in food security. It would be appropriate to establish a Crisis Management Committee within a public unit that will ensure coordination among the relevant stakeholders.
It is thought that if Agri-Food City Councils are established in provinces, they will be effective in ensuring coordination. With the establishment of Food Banks in the region where fruit and vegetable production is intense, products that are difficult to sell in times of crisis, when the harvest is abundant and/or exports are restricted, can be prevented from deteriorating and delivered to fragile and disadvantaged groups. The Smart/Digital Logistics Center proposed in the Focus Group Meeting will also contribute to ensuring effective planning and distribution.
7.2. Resource EfficiencyUnderground water is rapidly being used up in the world, and biodiversity is seriously damaged. As countries turn to alternative bioenergy sources and fossil fuels, competition for resources required for energy and food use increases. The demands of agriculture, industry and cities competing with each other cause water scarcity.
In order to adequately feed the growing population, resource-intensive food is needed, however, agricultural production must increase significantly due to the increase in demand for agricultural raw materials and bioenergy. At the same time, land and water resources are also under pressure, unsustainable agricultural practices and other human activities endanger biodiversity and ecosystems in general. With the effect of population growth, the amount of agricultural land per capita has decreased rapidly (Figure 29).
It is not possible for high-input, resource-intensive farming systems to provide sustainable agricultural production, which are held responsible for the reduction of forests, the depletion of soil and water resources, the loss of biodiversity and the high amount of greenhouse gas emissions. Therefore, innovative systems are needed to protect and improve natural resources while increasing productivity.
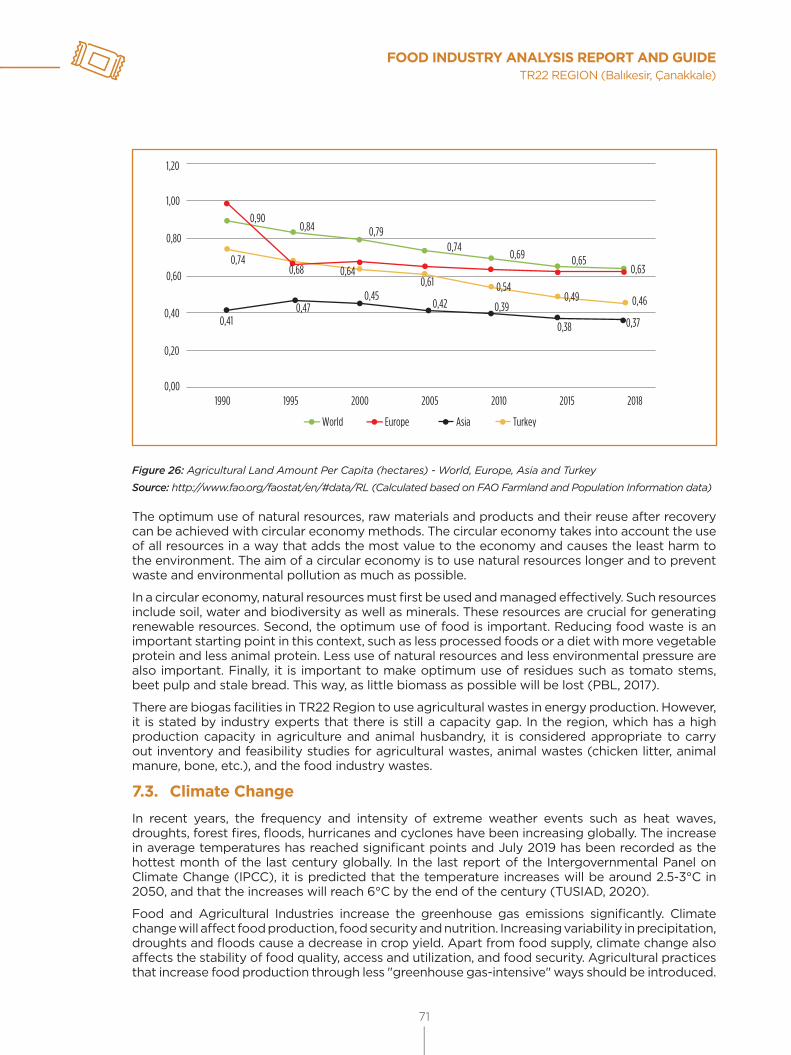
FOOD INDUSTRY ANALYSIS REPORT AND GUIDETR22 REGION (Balıkesir, Çanakkale)
71
0,00
0,410,47
0,450,42 0,39
0,38 0,37
0,46
1990 1995 2000 2005 2010 2015 2018
0,20
0,40
0,60
0,80
1,00
1,20
World AsiaEurope Turkey
0,490,540,61
0,640,680,74
0,630,650,69
0,740,790,84
0,90
Figure 26: Agricultural Land Amount Per Capita (hectares) - World, Europe, Asia and Turkey
Source: http://www.fao.org/faostat/en/#data/RL (Calculated based on FAO Farmland and Population Information data)
The optimum use of natural resources, raw materials and products and their reuse after recovery can be achieved with circular economy methods. The circular economy takes into account the use of all resources in a way that adds the most value to the economy and causes the least harm to the environment. The aim of a circular economy is to use natural resources longer and to prevent waste and environmental pollution as much as possible.
In a circular economy, natural resources must first be used and managed effectively. Such resources include soil, water and biodiversity as well as minerals. These resources are crucial for generating renewable resources. Second, the optimum use of food is important. Reducing food waste is an important starting point in this context, such as less processed foods or a diet with more vegetable protein and less animal protein. Less use of natural resources and less environmental pressure are also important. Finally, it is important to make optimum use of residues such as tomato stems, beet pulp and stale bread. This way, as little biomass as possible will be lost (PBL, 2017).
There are biogas facilities in TR22 Region to use agricultural wastes in energy production. However, it is stated by industry experts that there is still a capacity gap. In the region, which has a high production capacity in agriculture and animal husbandry, it is considered appropriate to carry out inventory and feasibility studies for agricultural wastes, animal wastes (chicken litter, animal manure, bone, etc.), and the food industry wastes.
7.3. Climate ChangeIn recent years, the frequency and intensity of extreme weather events such as heat waves, droughts, forest fires, floods, hurricanes and cyclones have been increasing globally. The increase in average temperatures has reached significant points and July 2019 has been recorded as the hottest month of the last century globally. In the last report of the Intergovernmental Panel on Climate Change (IPCC), it is predicted that the temperature increases will be around 2.5-3°C in 2050, and that the increases will reach 6°C by the end of the century (TUSIAD, 2020).
Food and Agricultural Industries increase the greenhouse gas emissions significantly. Climate change will affect food production, food security and nutrition. Increasing variability in precipitation, droughts and floods cause a decrease in crop yield. Apart from food supply, climate change also affects the stability of food quality, access and utilization, and food security. Agricultural practices that increase food production through less "greenhouse gas-intensive" ways should be introduced.

72
Small farms' adoption of sustainable agriculture, water, fisheries and forestry management is critical for adaptation to climate change, eradication of global poverty and ending hunger (FAO, 2017).
When examining how the climate in Turkey affected the crop pattern in cereals between 1991 and 2015, it is observed that the prolongation of sunshine in wheat production regions due to climate change has a restricting effect on wheat cultivation areas and has a shifting effect to other crops. It has been observed that the decrease in the amount of rainfall narrows the corn cultivation areas, while the increase in temperature has the effect of restriction the barley cultivation areas, while the increase in humidity has an effect on the expansion of the sunflower area. It is predicted that these effects will gradually increase at the regional level under the effect of climate change. As a result, price risks that yield variability will increase may cause pattern shifts.
Studies at the crop level have predicted that the production amount will decrease by 8% in wheat, 2% in barley, 9% in corn and 13% in sunflower due to the yield decreases caused by the climate effects.
Turkey is also exposed to significant risks through export restrictions that may be imposed by countries such as Russia, Ukraine and Kazakhistan, which are its important trade partners in wheat. It is estimated that these policy risks will increase even more with the effect of climate change, as seen between 2007 and 2011 (TUSIAD, 2020).
In the local effects of climate change report, the main impacts of climate change in the Marmara Region are; decreases in snowfall, as a result of this, decreases in ground and surface water levels, drinking water problems. Decrease in living and plant species, decrease in biological diversity of forest areas, extinction of endemic species. Low productivity in agriculture and animal husbandry. Decrease in yield, especially in chestnuts, peaches, figs, and cherries, which are among indigenous products. The impoverishment of the segment that makes a living from agriculture. Decrease in fisheries and damage to tourism, the proliferation of jellyfish, shifting of species. It has been summarized as observing seasonal shifts, trees shedding their leaves early, observing irregular rainfall (TEMA, 2015).
In the second period of the scenario modeled in the "Impact of Climate Change on Water Resources" project conducted by the Ministry of Agriculture and Forestry (TOB) covering the years 2015-2100, it is predicted that the precipitation of the plant growing season compared to the reference period (1971-2000), which is the second period of the scenario (1971-2000) will decrease almost everywhere or it will not change much compared to 1971-2000. Similarly, a small increase in precipitation is expected in the Marmara Region compared to the reference period in the 2070-2099 period. However, between the years 2070-2099, which is the last projection period, the amount of precipitation (due to intensifying air temperatures and increasing convective precipitation) may be close to the reference period; It is predicted that there may even be slight increases in the Southern and Northern Marmara Basins.
Although there are some differences in air temperatures in the country during all projection periods up to 2100 depending on the scenario, it generally increases significantly. According to a scenario, the increase in air temperature reaches approximately 4.5°C. It is predicted that the greatest temperature increases will occur in the inner and eastern parts, namely in Van, Fırat-Dicle, Seyhan, Ceyhan, and Konya Closed Basins, and the lowest temperature increases will occur in Ergene, Marmara, North Aegean, and the Black Sea Basins. This situation is expected to cause significant yield decreases with growth in the Aegean, Central Anatolia, Mediterranean, and Southeastern Anatolia Regions, together with more frequent heatwaves, droughts, and heat stress in plants (TGDF, 2017).
7.4. Gender EqualityTurkey is ranked among the lowest countries in terms of gender inequality worldwide. Turkey ranked 130th out of 153 countries in the World Economic Forum's 2020 Global Gender Inequality Index. In the index, Turkey ranked 136th in the category of women's participation in the economy and equal opportunity, 135th in participation in the labor force, 106th in equal pay for equal work, 13th in access to education opportunities, 64th in health and 109th in representation in political life (BBC, 2021).
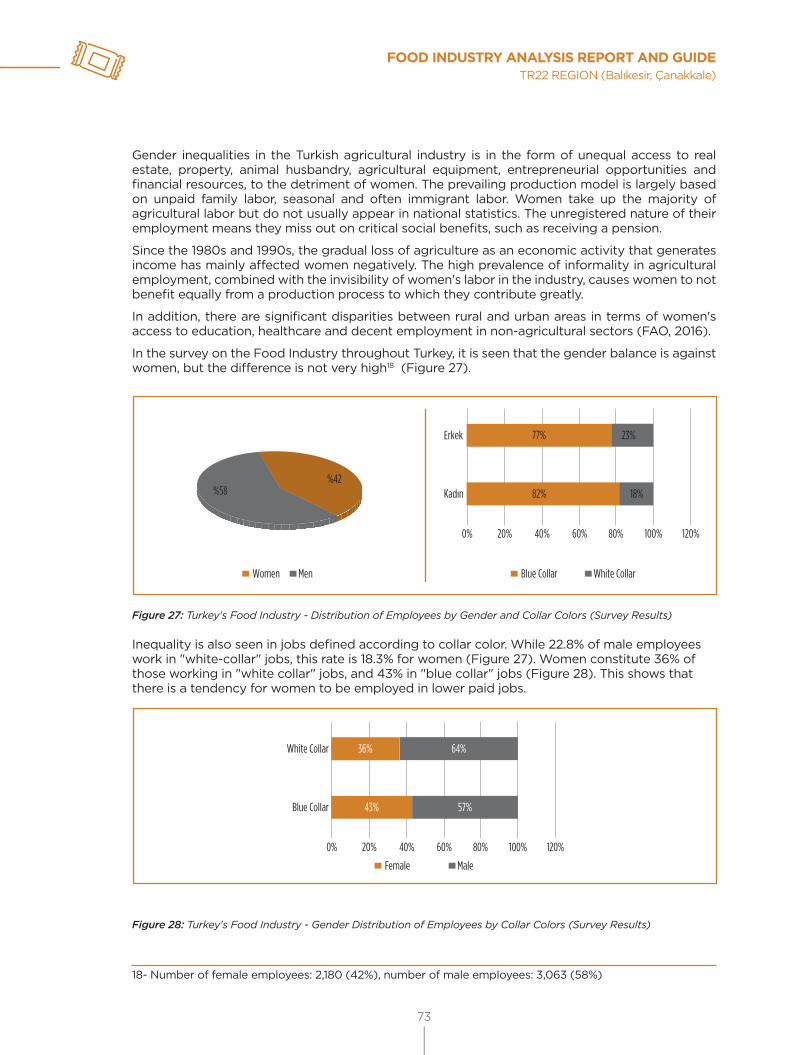
FOOD INDUSTRY ANALYSIS REPORT AND GUIDETR22 REGION (Balıkesir, Çanakkale)
73
Gender inequalities in the Turkish agricultural industry is in the form of unequal access to real estate, property, animal husbandry, agricultural equipment, entrepreneurial opportunities and financial resources, to the detriment of women. The prevailing production model is largely based on unpaid family labor, seasonal and often immigrant labor. Women take up the majority of agricultural labor but do not usually appear in national statistics. The unregistered nature of their employment means they miss out on critical social benefits, such as receiving a pension.
Since the 1980s and 1990s, the gradual loss of agriculture as an economic activity that generates income has mainly affected women negatively. The high prevalence of informality in agricultural employment, combined with the invisibility of women's labor in the industry, causes women to not benefit equally from a production process to which they contribute greatly.
In addition, there are significant disparities between rural and urban areas in terms of women's access to education, healthcare and decent employment in non-agricultural sectors (FAO, 2016).
In the survey on the Food Industry throughout Turkey, it is seen that the gender balance is against women, but the difference is not very high18 (Figure 27).
Erkek
Kadın
0% 20%
77%
82% 18%
23%
40% 60% 80% 100% 120%
%58%42
Blue Collar White CollarWomen Men
Figure 27: Turkey's Food Industry - Distribution of Employees by Gender and Collar Colors (Survey Results)
Inequality is also seen in jobs defined according to collar color. While 22.8% of male employees work in "white-collar" jobs, this rate is 18.3% for women (Figure 27). Women constitute 36% of those working in "white collar" jobs, and 43% in "blue collar" jobs (Figure 28). This shows that there is a tendency for women to be employed in lower paid jobs.
White Collar
Blue Collar
0% 20%
36%
43% 57%
64%
40% 60% 80% 100% 120%
Female Male
Figure 28: Turkey's Food Industry - Gender Distribution of Employees by Collar Colors (Survey Results)
18- Number of female employees: 2,180 (42%), number of male employees: 3,063 (58%)
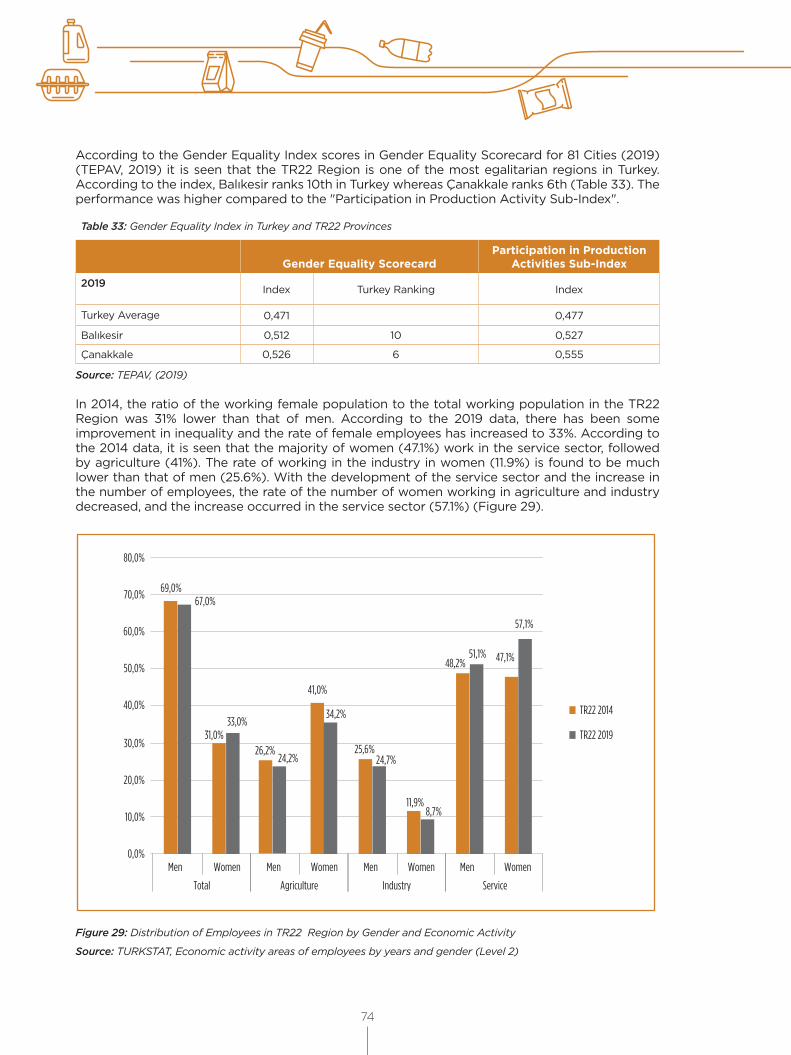
74
According to the Gender Equality Index scores in Gender Equality Scorecard for 81 Cities (2019) (TEPAV, 2019) it is seen that the TR22 Region is one of the most egalitarian regions in Turkey. According to the index, Balıkesir ranks 10th in Turkey whereas Çanakkale ranks 6th (Table 33). The performance was higher compared to the "Participation in Production Activity Sub-Index".
Table 33: Gender Equality Index in Turkey and TR22 Provinces
Gender Equality Scorecard Participation in Production
Activities Sub-Index
2019 Index Turkey Ranking Index
Turkey Average 0,471 0,477
Balıkesir 0,512 10 0,527
Çanakkale 0,526 6 0,555
Source: TEPAV, (2019)
In 2014, the ratio of the working female population to the total working population in the TR22 Region was 31% lower than that of men. According to the 2019 data, there has been some improvement in inequality and the rate of female employees has increased to 33%. According to the 2014 data, it is seen that the majority of women (47.1%) work in the service sector, followed by agriculture (41%). The rate of working in the industry in women (11.9%) is found to be much lower than that of men (25.6%). With the development of the service sector and the increase in the number of employees, the rate of the number of women working in agriculture and industry decreased, and the increase occurred in the service sector (57.1%) (Figure 29).
TR22 2014
TR22 2019
0,0%Men
Total
Women Men
Agriculture
Women Men
Industry
Women Men
Service
Women
10,0%
20,0%
30,0%31,0%
33,0%
41,0%
34,2%
11,9%8,7%
48,2%51,1% 47,1%
57,1%
40,0%
50,0%
60,0%
70,0% 69,0%67,0%
80,0%
25,6%24,7%
26,2%24,2%
Figure 29: Distribution of Employees in TR22 Region by Gender and Economic Activity
Source: TURKSTAT, Economic activity areas of employees by years and gender (Level 2)
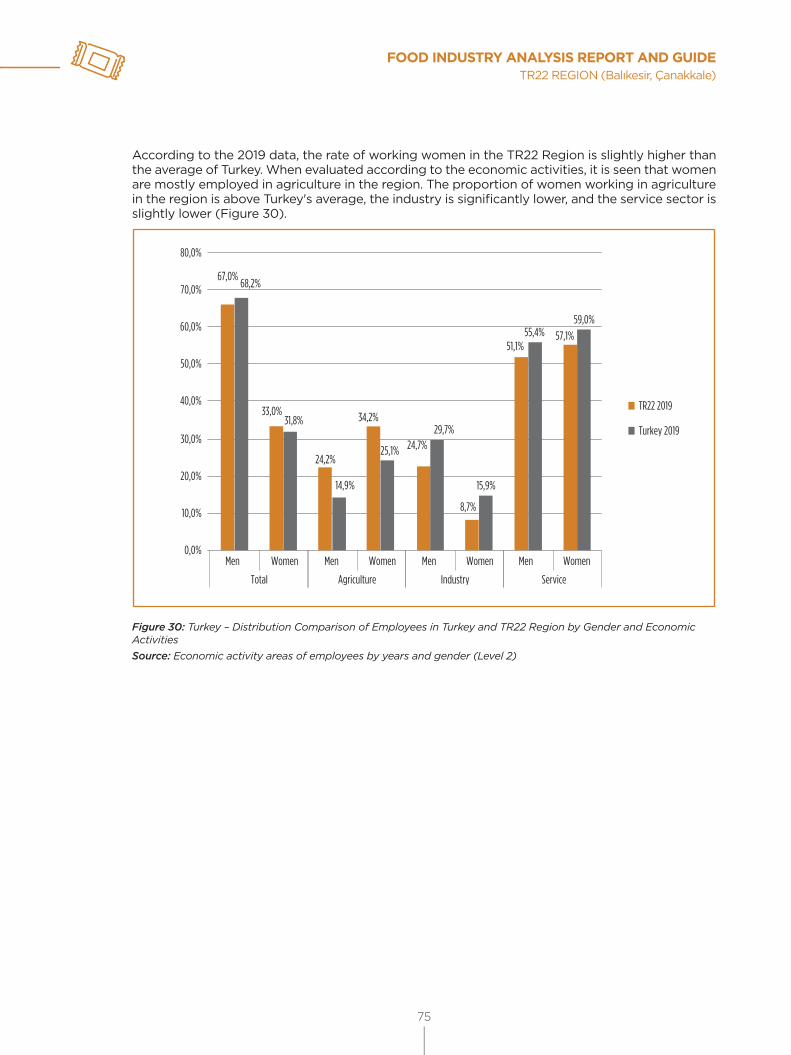
FOOD INDUSTRY ANALYSIS REPORT AND GUIDETR22 REGION (Balıkesir, Çanakkale)
75
According to the 2019 data, the rate of working women in the TR22 Region is slightly higher than the average of Turkey. When evaluated according to the economic activities, it is seen that women are mostly employed in agriculture in the region. The proportion of women working in agriculture in the region is above Turkey's average, the industry is significantly lower, and the service sector is slightly lower (Figure 30).
TR22 2019
Turkey 2019
0,0%
10,0%
20,0%
30,0%
33,0%31,8%
24,2%
14,9%
34,2%
24,7%29,7%
8,7%
15,9%
51,1%55,4% 57,1%
59,0%
25,1%
40,0%
50,0%
60,0%
70,0%67,0%
68,2%
80,0%
Men
Total
Women Men
Agriculture
Women Men
Industry
Women Men
Service
Women
Figure 30: Turkey – Distribution Comparison of Employees in Turkey and TR22 Region by Gender and Economic ActivitiesSource: Economic activity areas of employees by years and gender (Level 2)

76
8. Policy RecommendationsInfrastructure
Policy Recommendation Implementation Time
Designing agricultural production and planning in the food industry in line with the objectives of increasing the efficiency of investments and supply.
Medium Term(1-3 Years)
Designing programs that will increase added value through the adaptation of knowledge-based technologies and methods to food value chain processes
Medium Term(1-3 Years)
Designing physical infrastructure, managerial processes and organizations in order to create designs and plans based on accurate and up-to-date data
Medium Term(1-3 Years)
Planning strategic products in agricultural production, taking into account the self-sufficiency criteria, developing international collaborations.
Medium Term(1-3 Years)
Designing financial support mechanisms in line with the objectives of increasing efficiency, added value and cooperation, and ensuring social welfare and environmental protection
Medium Term(1-3 Years)
Establishing national and international collaborations to approach COVID-19 and similar crises with a holistic perspective, ensuring accessibility to information to prevent panic
Medium Term(1-3 Years)
Designing plans and programs to increase access to international markets and increase international competitiveness
Medium Term(1-3 Years)
The intensifying of branding activities in the TR22 Region Long Term(3-10 Years)
Increasing the R&D and innovation competencies of companies in the TR22 Region and developing collaborations within this scope
Long Term(3-10 Years)
Increasing the competence of companies in the TR22 Region to access foreign markets and cooperation in this context
Long Term(3-10 Years)
Designing collaborations to ensure the continuity of information flow in the value chain, to create synergy and to achieve economies of scale
Long Term(3-10 Years)
Integrating digital technology applications in value chain components (production, logistics, food processing, distribution, marketing/sales, test/analysis)
Long Term(3-10 Years)
Human Resources and Capacity Development
Policy Recommendation Implementation Time
Designing undergraduate and graduate formal education and vocational education programs in a practice-weighted manner and in line with industrial expectations, experiencing practices in real cases
Medium Term(1-3 Years)
Establishing programs to support women and people with disabilities who have limited access to economic activities due to the socio-economic structure
Medium Term(1-3 Years)
Establishing programs for migrants to participate in the agricultural labor market and to ensure their livelihoods and to eliminate the labor bottleneck
Medium Term(1-3 Years)
Establishing pilot implementation examples to increase the knowledge and skills of agricultural producers, developing models that will encourage producers to prefer new methods
Long Term(3-10 Years)
Ensuring that Blue-collar and White-collar employees stay up-to-date by creating infrastructures to access new developments in production methods, technology and management
Long Term(3-10 Years)
Developing cooperation between educational institutions and the private sector in order to determine and meet the human resource needs and qualifications of the sector, and modernizing educational institutions with up-to-date technologies
Long Term(3-10 Years)
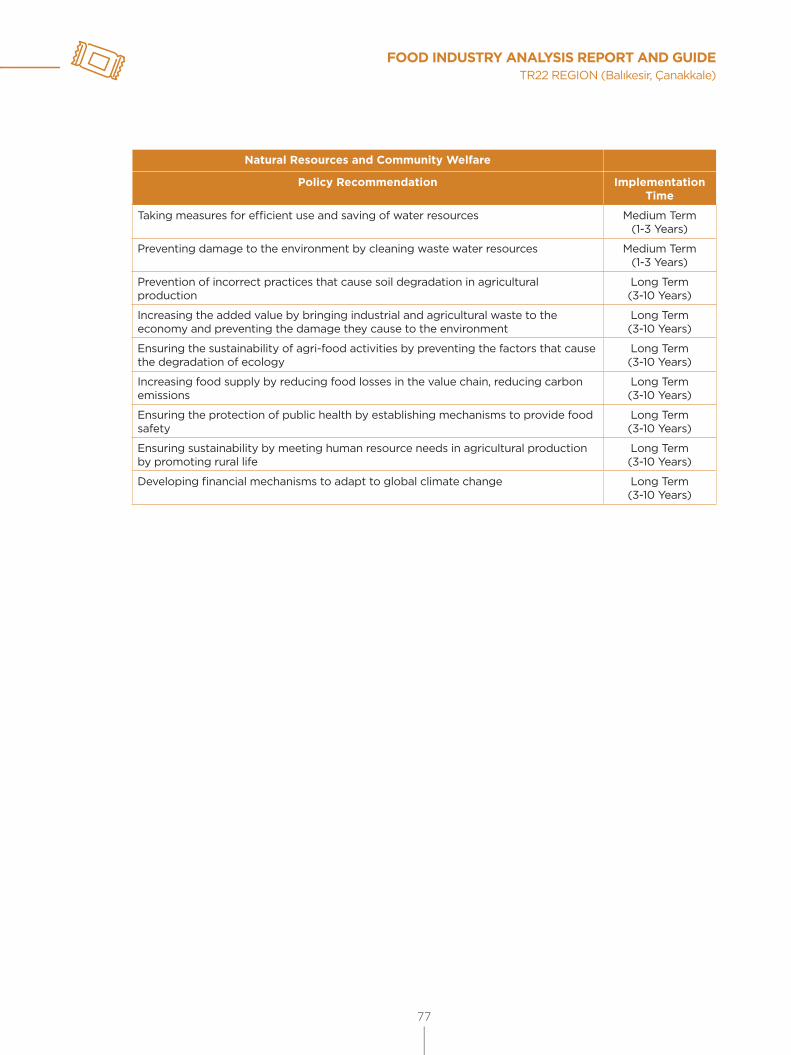
FOOD INDUSTRY ANALYSIS REPORT AND GUIDETR22 REGION (Balıkesir, Çanakkale)
77
Natural Resources and Community Welfare
Policy Recommendation Implementation Time
Taking measures for efficient use and saving of water resources Medium Term(1-3 Years)
Preventing damage to the environment by cleaning waste water resources Medium Term(1-3 Years)
Prevention of incorrect practices that cause soil degradation in agricultural production
Long Term(3-10 Years)
Increasing the added value by bringing industrial and agricultural waste to the economy and preventing the damage they cause to the environment
Long Term(3-10 Years)
Ensuring the sustainability of agri-food activities by preventing the factors that cause the degradation of ecology
Long Term(3-10 Years)
Increasing food supply by reducing food losses in the value chain, reducing carbon emissions
Long Term(3-10 Years)
Ensuring the protection of public health by establishing mechanisms to provide food safety
Long Term(3-10 Years)
Ensuring sustainability by meeting human resource needs in agricultural production by promoting rural life
Long Term(3-10 Years)
Developing financial mechanisms to adapt to global climate change Long Term(3-10 Years)

78
9. Short, Medium and Long Term StrategiesAlthough the crisis due to the COVID-19 pandemic has produced unique problems and changes in the agri-food industry, it has also caused many ongoing problems in the industry to come to light and become more severe. The importance of sustainability in agri-food products has become more evident for the most basic needs of the society, which are nutritional requirement and protection of health. Short, medium and long term strategies have been developed in National and Regional scope in order to find solutions to the problems identified in the analyses and tried to be expressed throughout the report. The concept of sustainability has been taken into account while developing strategies.
Sustainable Food Value Chain according to FAO:
It is defined as the consecutive coordinated value-added activities of all farms and companies that provide wide benefits to society, do not consume resources permanently, and the farms' production of agricultural products, transforming these products to food products by the companies to sell them to final consumers and then dispose them. Beyond commercial and financial viability, the sustainability element of the sustainable value chain includes the transition to institutional mechanisms that lead to a more equitable distribution of increased added value and less use and impact on non-renewable resources. The three sustainability aspects (economic, social, environmental) are closely interrelated: social and environmental sustainability become determinants of market access and competitiveness (FAO, 2014).
Strategies considered in the context of sustainability are designed under three aspects as “Strategies within the Economical Scope”, “Strategies within the Social Scope” and “Strategies within the Environmental Scope”. Within the economical scope, the focus is on the means of participation in the value chain (access to the market, access to training, coordination and cooperation building, access to finance) (Stark&Damper, 2012) and activities that create value in the agricultural value chain (Başer&Bozoğlu, 2018) (increasing quality, increasing system efficiency, differentiated product development). Strategies for pandemic crisis management are designed by considering the analysis results, expert opinions and FAO's response recommendations (FAO, 2020d).
9.1. Strategies within the Economical Scope
Description Explanation Implementation Time (Year)
Strategy E.1: Providing central planning and coordination
Sub-strategy E.1.1
Establishment of National and City Agri-Food Councils
It aims to systematize and accelerate communication between the multi-structured industrial stakeholders (public-university-private sector-local government-non-governmental organizations) and to develop policies and strategies for planning, management and crisis management by eliminating information asymmetry
Medium Term(1-3 Years)
Sub-strategy E.1.2
Establishment of the Planning Scientific Board
It requires an interdisciplinary study as it includes dynamic and multi-variables such as agricultural planning, agricultural land resources and characteristics, climate and water needs of products, water resources, population, population growth, number of tourists, productivity increase, consumer habits, region-based cost, usage areas (food, feed, biomass), international competition, bilateral agreements, policies, and disaster scenarios such as climate change, periodic drought, flood, etc. It should be aimed at developing strategies and planning by considering the scenario outputs prepared with mathematical models.
Medium Term(1-3 Years)
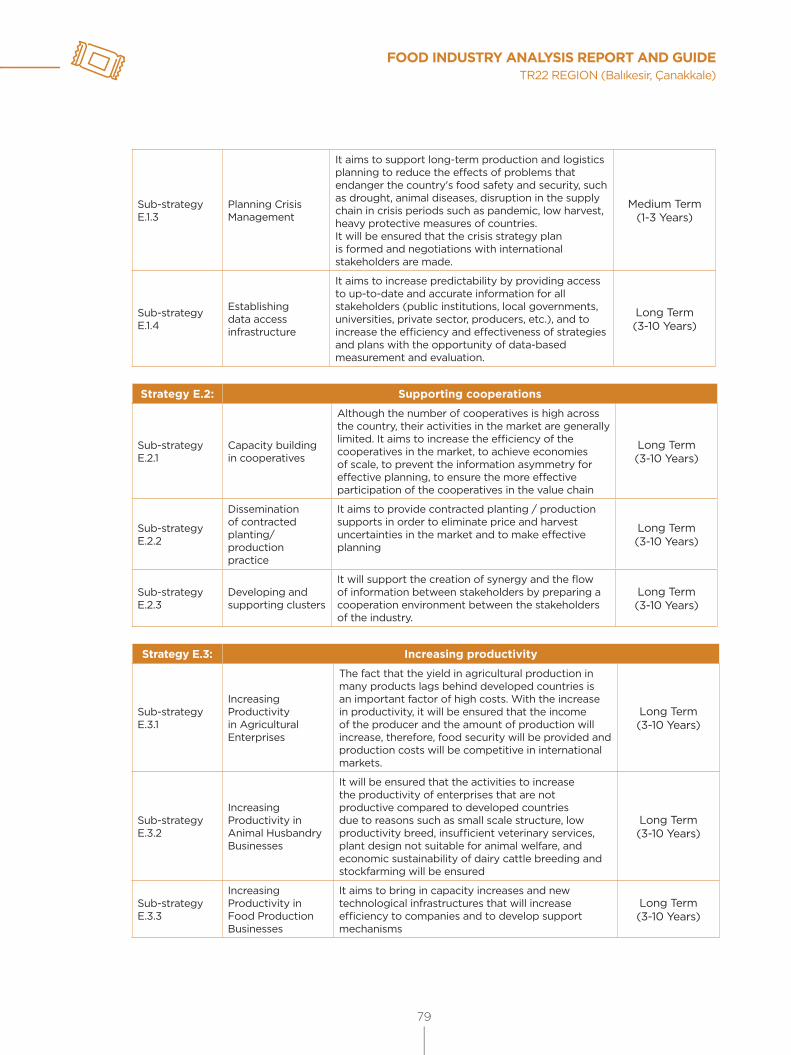
FOOD INDUSTRY ANALYSIS REPORT AND GUIDETR22 REGION (Balıkesir, Çanakkale)
79
Sub-strategy E.1.3
Planning Crisis Management
It aims to support long-term production and logistics planning to reduce the effects of problems that endanger the country's food safety and security, such as drought, animal diseases, disruption in the supply chain in crisis periods such as pandemic, low harvest, heavy protective measures of countries.It will be ensured that the crisis strategy plan is formed and negotiations with international stakeholders are made.
Medium Term(1-3 Years)
Sub-strategy E.1.4
Establishing data access infrastructure
It aims to increase predictability by providing access to up-to-date and accurate information for all stakeholders (public institutions, local governments, universities, private sector, producers, etc.), and to increase the efficiency and effectiveness of strategies and plans with the opportunity of data-based measurement and evaluation.
Long Term(3-10 Years)
Strategy E.2: Supporting cooperations
Sub-strategy E.2.1
Capacity building in cooperatives
Although the number of cooperatives is high across the country, their activities in the market are generally limited. It aims to increase the efficiency of the cooperatives in the market, to achieve economies of scale, to prevent the information asymmetry for effective planning, to ensure the more effective participation of the cooperatives in the value chain
Long Term(3-10 Years)
Sub-strategy E.2.2
Dissemination of contracted planting/production practice
It aims to provide contracted planting / production supports in order to eliminate price and harvest uncertainties in the market and to make effective planning
Long Term(3-10 Years)
Sub-strategy E.2.3
Developing and supporting clusters
It will support the creation of synergy and the flow of information between stakeholders by preparing a cooperation environment between the stakeholders of the industry.
Long Term(3-10 Years)
Strategy E.3: Increasing productivity
Sub-strategy E.3.1
Increasing Productivity in Agricultural Enterprises
The fact that the yield in agricultural production in many products lags behind developed countries is an important factor of high costs. With the increase in productivity, it will be ensured that the income of the producer and the amount of production will increase, therefore, food security will be provided and production costs will be competitive in international markets.
Long Term(3-10 Years)
Sub-strategy E.3.2
Increasing Productivity in Animal Husbandry Businesses
It will be ensured that the activities to increase the productivity of enterprises that are not productive compared to developed countries due to reasons such as small scale structure, low productivity breed, insufficient veterinary services, plant design not suitable for animal welfare, and economic sustainability of dairy cattle breeding and stockfarming will be ensured
Long Term(3-10 Years)
Sub-strategy E.3.3
Increasing Productivity in Food Production Businesses
It aims to bring in capacity increases and new technological infrastructures that will increase efficiency to companies and to develop support mechanisms
Long Term(3-10 Years)

80
Strategy E.4: Increasing the added value
Sub-strategy E.4.1
Developing Network Structures
Developing networks that contribute to the flow of information with National and international stakeholders in order to access up-to-date information and find partners in R&D activities
Medium Term(1-3 Years)
Sub-strategy E.4.2
Supporting (focused) R&D activities
Efficient use of financial resources will be ensured by transferring financial resources to the development of promising value-added products and technologies.
Long Term(3-10 Years)
Sub-strategy E.4.3
Supporting investments that will increase added value
It aims to support logistics, production and service infrastructure investments that will increase the added value of the product.
Long Term(3-10 Years)
Strategy E.5: Providing access to the market
Sub-strategy E.5.1
Supporting Infrastructures
By supporting mechanisms and infrastructure for access to domestic and international markets it will be ensured that more shares are taken from the new distribution channels of companies and markets where the potential cannot be used.
Long Term(3-10 Years)
Sub-strategy E.5.2
Training and Consultancy Activities
SMEs in the country generally focus on production activities and price-based competition. It aims to support training and consultancy activities to increase human competencies in business model, marketing and export issues, which are important in the business plan, and to support the necessary mechanisms and infrastructures to provide them.
Long Term(3-10 Years)
Strategy E.6: Skill and Capacity Building
Sub-strategy E.6.1
Development of Vocational Education Infrastructure
It aims to support the structural change and the development of new mechanisms to solve the problem of qualified intermediate staff that has been going on for years in the country.
Long Term(3-10 Years)
Sub-strategy E.6.2
Development of Professional Education System
Adapting applied education to the structure of formal education in line with the needs of the industry. It aims to support the infrastructure that will enable the personnel working in the enterprises to access up-to-date information after formal education
Medium Term(1-3 Years)
Strategy E.7: Ensuring access to financial resources
Sub-strategy E.7.1
Improving financial support systems
It aims to renew the subsidies in agricultural products in a way to support international competition and productivity.
Medium Term(1-3 Years)
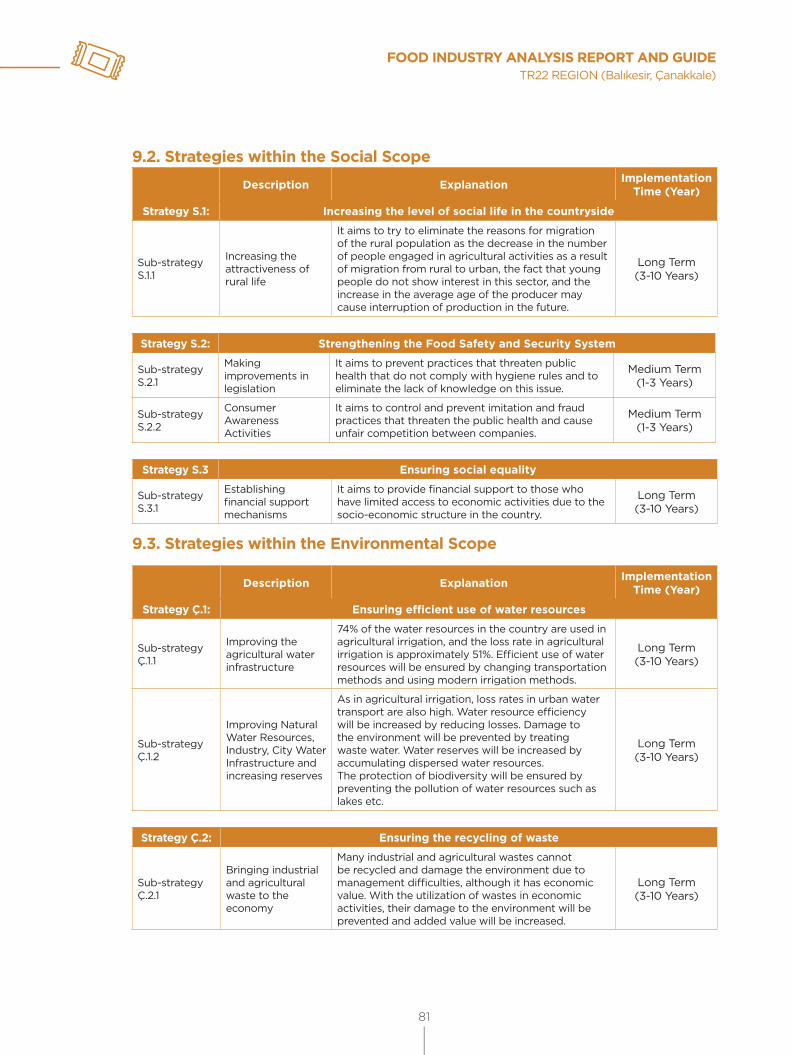
FOOD INDUSTRY ANALYSIS REPORT AND GUIDETR22 REGION (Balıkesir, Çanakkale)
81
9.2. Strategies within the Social Scope
Description Explanation Implementation Time (Year)
Strategy S.1: Increasing the level of social life in the countryside
Sub-strategy S.1.1
Increasing the attractiveness of rural life
It aims to try to eliminate the reasons for migration of the rural population as the decrease in the number of people engaged in agricultural activities as a result of migration from rural to urban, the fact that young people do not show interest in this sector, and the increase in the average age of the producer may cause interruption of production in the future.
Long Term(3-10 Years)
Strategy S.2: Strengthening the Food Safety and Security System
Sub-strategy S.2.1
Making improvements in legislation
It aims to prevent practices that threaten public health that do not comply with hygiene rules and to eliminate the lack of knowledge on this issue.
Medium Term(1-3 Years)
Sub-strategy S.2.2
Consumer Awareness Activities
It aims to control and prevent imitation and fraud practices that threaten the public health and cause unfair competition between companies.
Medium Term(1-3 Years)
Strategy S.3 Ensuring social equality
Sub-strategy S.3.1
Establishing financial support mechanisms
It aims to provide financial support to those who have limited access to economic activities due to the socio-economic structure in the country.
Long Term(3-10 Years)
9.3. Strategies within the Environmental Scope
Description Explanation Implementation Time (Year)
Strategy Ç.1: Ensuring efficient use of water resources
Sub-strategy Ç.1.1
Improving the agricultural water infrastructure
74% of the water resources in the country are used in agricultural irrigation, and the loss rate in agricultural irrigation is approximately 51%. Efficient use of water resources will be ensured by changing transportation methods and using modern irrigation methods.
Long Term(3-10 Years)
Sub-strategy Ç.1.2
Improving Natural Water Resources, Industry, City Water Infrastructure and increasing reserves
As in agricultural irrigation, loss rates in urban water transport are also high. Water resource efficiency will be increased by reducing losses. Damage to the environment will be prevented by treating waste water. Water reserves will be increased by accumulating dispersed water resources. The protection of biodiversity will be ensured by preventing the pollution of water resources such as lakes etc.
Long Term(3-10 Years)
Strategy Ç.2: Ensuring the recycling of waste
Sub-strategy Ç.2.1
Bringing industrial and agricultural waste to the economy
Many industrial and agricultural wastes cannot be recycled and damage the environment due to management difficulties, although it has economic value. With the utilization of wastes in economic activities, their damage to the environment will be prevented and added value will be increased.
Long Term(3-10 Years)

82
Strategy Ç.3: Adapting to climate change
Sub-strategy Ç.3.1
Supporting energy saving applications
Carbon emissions will decrease and costs will be reduced by reducing energy consumption.
Long Term(3-10 Years)
Sub-strategy Ç.3.2
Supporting climate change adaptation activities
It aims to provide financial support to be used in financing of technologies developed for adaptation to climate change and measures to be taken.
Long Term(3-10 Years)
Strategy Ç.4: Reducing food losses
Sub-strategy Ç.4.1
Improving storage/transport systems
A significant amount of losses occur during and after the harvest of agricultural products. By reducing losses, the supply will be increased, thus carbon emission will be reduced and product unit costs will be reduced.
Long Term(3-10 Years)
Sub-strategy Ç.4.2
Utilization of disused products
It aims to bring the products in a center and bring them to the economy.that cannot be utilized on time in sales or consumption places
Long Term(3-10 Years)
Sub-strategy Ç.4.3 Protecting ecology
The practices that harm the ecology and endanger biodiversity and sustainability will be prevented. Long Term
(3-10 Years)

FOOD INDUSTRY ANALYSIS REPORT AND GUIDETR22 REGION (Balıkesir, Çanakkale)
83
10. Industrial Action Plan and Draft BudgetThe recommended national and regional activities (actions) to be implemented under the headings of the strategies are given in the tables below. In the explanations, initially, the actions on the national scale were taken into consideration. Many national-scale programs have the opportunity to be implemented in cooperation with regional stakeholders or independent from the central structuring in the region. These are specified regionally in the explanations and are colored in blue. Priority programs for the region are specified in blue characters. Explanations regarding actions that can be carried out in parallel or independently with national programs at the regional level are colored in blue. Globally important actions are indicated with green characters.
The sustainability of Agri-Food products may be directly or indirectly related to the problems that occurred or became apparent in the COVID-19 crisis. The relationship between the actions that are thought to have a direct effect on these problems has been tried to be explained and colored with green. Explanations to avoid repetition are not included in every action, as different actions can serve similar purposes.
Actions are planned as short, medium and long term. In budgeting, the national scale was taken into consideration and classified as follows:
Nano Investment : 0 – 10 Million TL Micro Investment : 10 – 100 Million TLMeso Investment : 100 Million – 1 Billion TLMacro Investment : 1 – 10 Billion TLMega Investment : Over 10 Billion TL
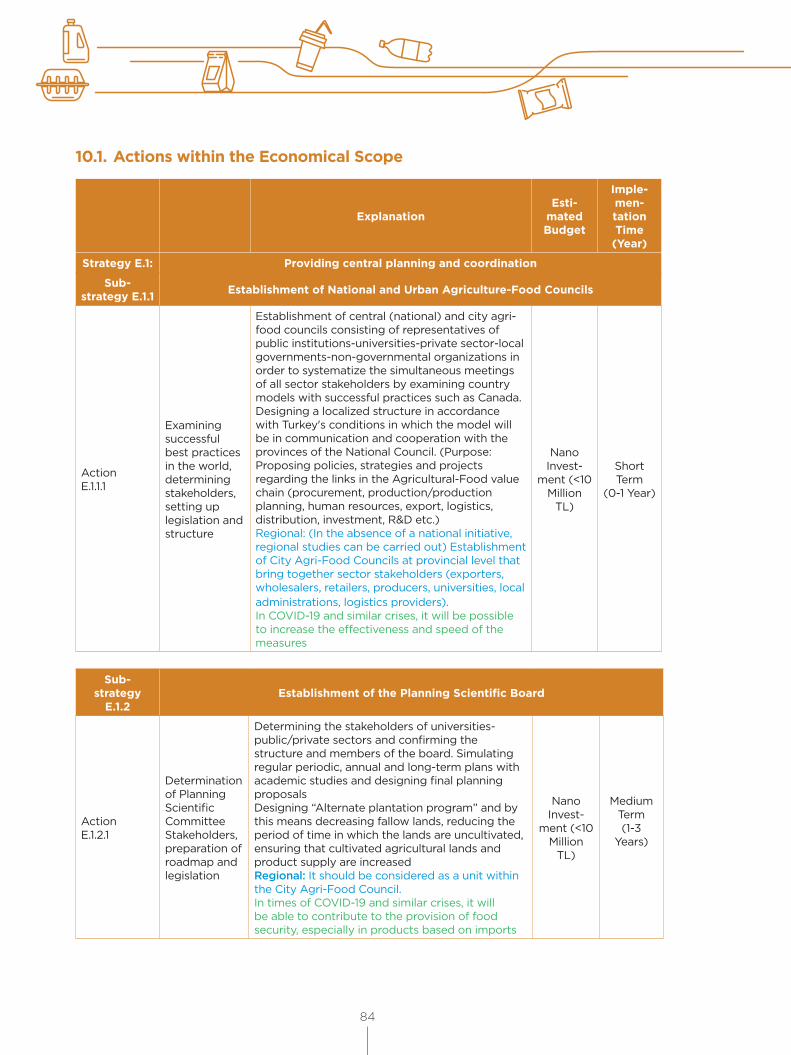
84
10.1. Actions within the Economical Scope
Explanation Esti-
mated Budget
Imple-men-tation Time
(Year)
Strategy E.1: Providing central planning and coordination
Sub-strategy E.1.1 Establishment of National and Urban Agriculture-Food Councils
Action E.1.1.1
Examining successful best practices in the world, determining stakeholders, setting up legislation and structure
Establishment of central (national) and city agri-food councils consisting of representatives of public institutions-universities-private sector-local governments-non-governmental organizations in order to systematize the simultaneous meetings of all sector stakeholders by examining country models with successful practices such as Canada. Designing a localized structure in accordance with Turkey's conditions in which the model will be in communication and cooperation with the provinces of the National Council. (Purpose: Proposing policies, strategies and projects regarding the links in the Agricultural-Food value chain (procurement, production/production planning, human resources, export, logistics, distribution, investment, R&D etc.)Regional: (In the absence of a national initiative, regional studies can be carried out) Establishment of City Agri-Food Councils at provincial level that bring together sector stakeholders (exporters, wholesalers, retailers, producers, universities, local administrations, logistics providers).In COVID-19 and similar crises, it will be possible to increase the effectiveness and speed of the measures
Nano Invest-
ment (<10 Million
TL)
Short Term
(0-1 Year)
Sub-strategy
E.1.2Establishment of the Planning Scientific Board
Action E.1.2.1
Determination of Planning Scientific Committee Stakeholders, preparation of roadmap and legislation
Determining the stakeholders of universities-public/private sectors and confirming the structure and members of the board. Simulating regular periodic, annual and long-term plans with academic studies and designing final planning proposalsDesigning “Alternate plantation program” and by this means decreasing fallow lands, reducing the period of time in which the lands are uncultivated, ensuring that cultivated agricultural lands and product supply are increasedRegional: It should be considered as a unit within the City Agri-Food Council.In times of COVID-19 and similar crises, it will be able to contribute to the provision of food security, especially in products based on imports
Nano Invest-
ment (<10 Million
TL)
Medium Term(1-3
Years)
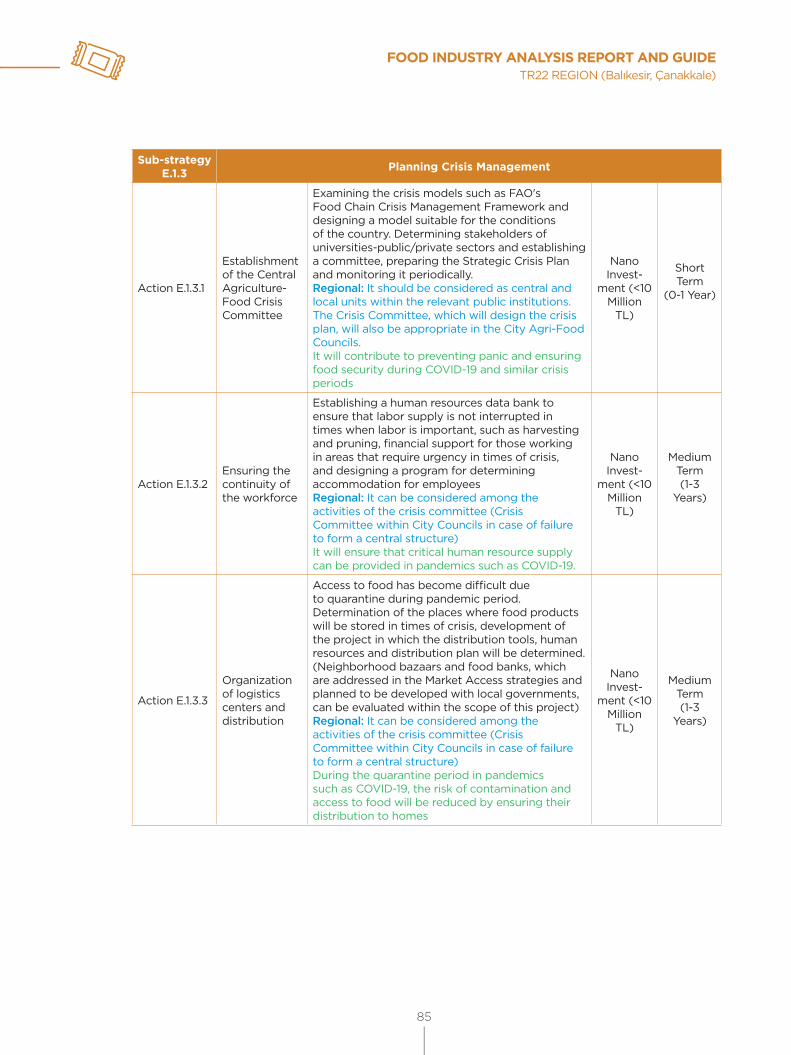
FOOD INDUSTRY ANALYSIS REPORT AND GUIDETR22 REGION (Balıkesir, Çanakkale)
85
Sub-strategy E.1.3 Planning Crisis Management
Action E.1.3.1
Establishment of the Central Agriculture-Food Crisis Committee
Examining the crisis models such as FAO's Food Chain Crisis Management Framework and designing a model suitable for the conditions of the country. Determining stakeholders of universities-public/private sectors and establishing a committee, preparing the Strategic Crisis Plan and monitoring it periodically.Regional: It should be considered as central and local units within the relevant public institutions. The Crisis Committee, which will design the crisis plan, will also be appropriate in the City Agri-Food Councils.It will contribute to preventing panic and ensuring food security during COVID-19 and similar crisis periods
Nano Invest-
ment (<10 Million
TL)
Short Term
(0-1 Year)
Action E.1.3.2Ensuring the continuity of the workforce
Establishing a human resources data bank to ensure that labor supply is not interrupted in times when labor is important, such as harvesting and pruning, financial support for those working in areas that require urgency in times of crisis, and designing a program for determining accommodation for employeesRegional: It can be considered among the activities of the crisis committee (Crisis Committee within City Councils in case of failure to form a central structure)It will ensure that critical human resource supply can be provided in pandemics such as COVID-19.
Nano Invest-
ment (<10 Million
TL)
Medium Term(1-3
Years)
Action E.1.3.3
Organization of logistics centers and distribution
Access to food has become difficult due to quarantine during pandemic period. Determination of the places where food products will be stored in times of crisis, development of the project in which the distribution tools, human resources and distribution plan will be determined. (Neighborhood bazaars and food banks, which are addressed in the Market Access strategies and planned to be developed with local governments, can be evaluated within the scope of this project)Regional: It can be considered among the activities of the crisis committee (Crisis Committee within City Councils in case of failure to form a central structure)During the quarantine period in pandemics such as COVID-19, the risk of contamination and access to food will be reduced by ensuring their distribution to homes
Nano Invest-
ment (<10 Million
TL)
Medium Term(1-3
Years)
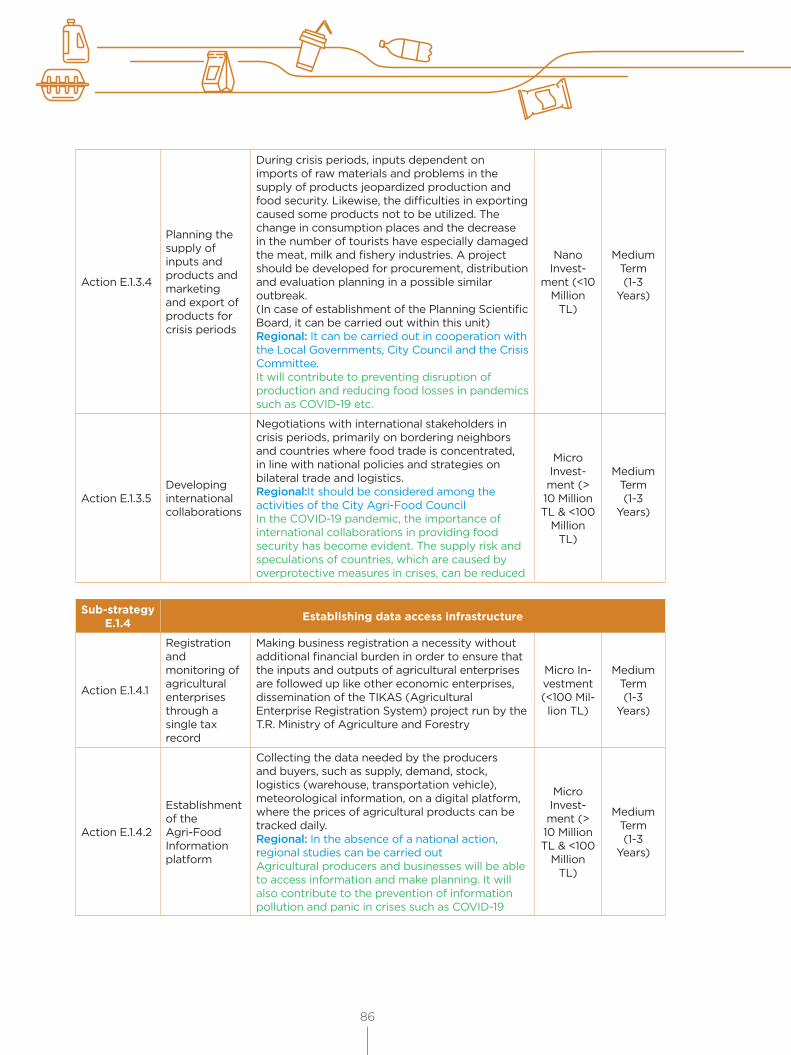
86
Action E.1.3.4
Planning the supply of inputs and products and marketing and export of products for crisis periods
During crisis periods, inputs dependent on imports of raw materials and problems in the supply of products jeopardized production and food security. Likewise, the difficulties in exporting caused some products not to be utilized. The change in consumption places and the decrease in the number of tourists have especially damaged the meat, milk and fishery industries. A project should be developed for procurement, distribution and evaluation planning in a possible similar outbreak. (In case of establishment of the Planning Scientific Board, it can be carried out within this unit)Regional: It can be carried out in cooperation with the Local Governments, City Council and the Crisis Committee.It will contribute to preventing disruption of production and reducing food losses in pandemics such as COVID-19 etc.
Nano Invest-
ment (<10 Million
TL)
Medium Term(1-3
Years)
Action E.1.3.5Developing international collaborations
Negotiations with international stakeholders in crisis periods, primarily on bordering neighbors and countries where food trade is concentrated, in line with national policies and strategies on bilateral trade and logistics.Regional:It should be considered among the activities of the City Agri-Food CouncilIn the COVID-19 pandemic, the importance of international collaborations in providing food security has become evident. The supply risk and speculations of countries, which are caused by overprotective measures in crises, can be reduced
Micro Invest-ment (> 10 Million TL & <100
Million TL)
Medium Term(1-3
Years)
Sub-strategy E.1.4 Establishing data access infrastructure
Action E.1.4.1
Registration and monitoring of agricultural enterprises through a single tax record
Making business registration a necessity without additional financial burden in order to ensure that the inputs and outputs of agricultural enterprises are followed up like other economic enterprises, dissemination of the TIKAS (Agricultural Enterprise Registration System) project run by the T.R. Ministry of Agriculture and Forestry
Micro In-vestment (<100 Mil-lion TL)
Medium Term(1-3
Years)
Action E.1.4.2
Establishment of the Agri-Food Information platform
Collecting the data needed by the producers and buyers, such as supply, demand, stock, logistics (warehouse, transportation vehicle), meteorological information, on a digital platform, where the prices of agricultural products can be tracked daily.Regional: In the absence of a national action, regional studies can be carried outAgricultural producers and businesses will be able to access information and make planning. It will also contribute to the prevention of information pollution and panic in crises such as COVID-19
Micro Invest-ment (> 10 Million TL & <100
Million TL)
Medium Term(1-3
Years)
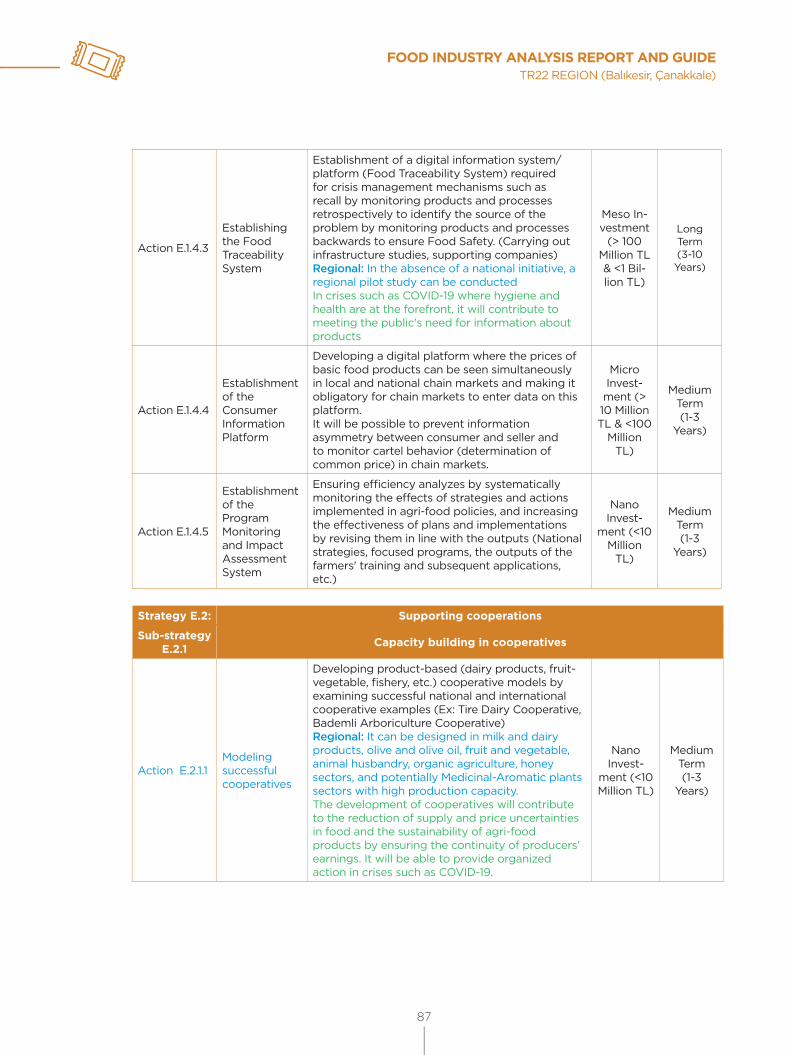
FOOD INDUSTRY ANALYSIS REPORT AND GUIDETR22 REGION (Balıkesir, Çanakkale)
87
Action E.1.4.3
Establishing the Food Traceability System
Establishment of a digital information system/platform (Food Traceability System) required for crisis management mechanisms such as recall by monitoring products and processes retrospectively to identify the source of the problem by monitoring products and processes backwards to ensure Food Safety. (Carrying out infrastructure studies, supporting companies)Regional: In the absence of a national initiative, a regional pilot study can be conductedIn crises such as COVID-19 where hygiene and health are at the forefront, it will contribute to meeting the public's need for information about products
Meso In-vestment
(> 100 Million TL & <1 Bil-lion TL)
Long Term (3-10 Years)
Action E.1.4.4
Establishment of the Consumer Information Platform
Developing a digital platform where the prices of basic food products can be seen simultaneously in local and national chain markets and making it obligatory for chain markets to enter data on this platform.It will be possible to prevent information asymmetry between consumer and seller and to monitor cartel behavior (determination of common price) in chain markets.
Micro Invest-ment (> 10 Million TL & <100
Million TL)
Medium Term(1-3
Years)
Action E.1.4.5
Establishment of the Program Monitoring and Impact Assessment System
Ensuring efficiency analyzes by systematically monitoring the effects of strategies and actions implemented in agri-food policies, and increasing the effectiveness of plans and implementations by revising them in line with the outputs (National strategies, focused programs, the outputs of the farmers' training and subsequent applications, etc.)
Nano Invest-
ment (<10 Million
TL)
Medium Term(1-3
Years)
Strategy E.2: Supporting cooperations
Sub-strategy E.2.1 Capacity building in cooperatives
Action E.2.1.1Modeling successful cooperatives
Developing product-based (dairy products, fruit-vegetable, fishery, etc.) cooperative models by examining successful national and international cooperative examples (Ex: Tire Dairy Cooperative, Bademli Arboriculture Cooperative)Regional: It can be designed in milk and dairy products, olive and olive oil, fruit and vegetable, animal husbandry, organic agriculture, honey sectors, and potentially Medicinal-Aromatic plants sectors with high production capacity.The development of cooperatives will contribute to the reduction of supply and price uncertainties in food and the sustainability of agri-food products by ensuring the continuity of producers' earnings. It will be able to provide organized action in crises such as COVID-19.
Nano Invest-
ment (<10 Million TL)
Medium Term(1-3
Years)

88
Action E.2.1.2
Implemen-tation of designed cooperative models with a provincial pilot implementa-tion program
Planning and supporting at least one pilot implementation for each province, considering the designed models that are suitable for the product pattern of the provinceRegional: Primarily milk and dairy products, olive and olive oil, fruit and vegetable, animal husbandry, organic agriculture, honey sectors, which have high production capacity, and Medicinal-Aromatic plants sectors, which have potential should be considered.
Meso In-vestment (> 100 Mil-lion TL & <1 Billion
TL)
Long Term (3-10 Years)
Action E.2.1.3
Providing support for the development of marketing infrastructure (physical, digital and human)
Using alternative distribution channels (e-commerce) for further participation in the value chain, standardization/quality management, marketing, branding infrastructure, training and providing financial support. Making use of EU financial support programs by designing projects in this regard.Supporting Producer Cooperatives that make contractual sales to retail stores.Regional: Studies can be carried out for the cooperatives in the region.
Meso In-vestment (> 100 Mil-lion TL & <1 Billion
TL)
Long Term (3-10 Years)
Action E.2.1.4Developing a culture of col-lectivization
Cooperatives that use agricultural mechanization tools and warehouses jointly will be supported financially and their capital efficiency will be increased.Regional: Studies can be carried out for the cooperatives in the region.
Meso In-vestment (> 100 Mil-lion TL & <1 Billion
TL)
Long Term (3-10 Years)
Sub-strategy E.2.2 Dissemination of contracted planting/production practice
Action E.2.2.1
Providing financial support to contracted planting producers, cooperatives and industrialists purchasing with contracted planting agreements
Providing additional financial support to cooperatives and producers who have contracted planting agreements with the producerProviding additional financial support to industrialists making contracted purchases from cooperatives (it is aimed at supporting contracted planting and cooperatives simultaneously)Regional: Studies can be carried out for the cooperatives and industrialists in the region.Supply-demand imbalances and price fluctuations will be prevented. It will contribute to sustainability in agri-food products by ensuring the continuity of the earnings of the producers.
Meso In-vestment
(> 100 Million TL & <1 Billion
TL)
Long Term (3-10 Years)
Action E.2.2.2
Distributing the products of the cooperatives to students and people in need through campaigns
Supporting the purchase of Milk through local governments and its distribution to students and/or families with low income. It aims to provide market assurance to the producers and healthy nutrition of the households.(It can be carried out in conjunction with Food Banks' activities)Regional: Milk and egg, which have high production capacity are applicable in the region.
Meso In-vestment
(> 100 Million TL & <1 Billion
TL)
Long Term (3-10 Years)

FOOD INDUSTRY ANALYSIS REPORT AND GUIDETR22 REGION (Balıkesir, Çanakkale)
89
Sub-strate-gy E.2.3 Developing and supporting clusters
Action E.2.3.1
Preparation of Strategic Industrial Plans in the sub-sectors of the Agriculture-Food Industry
Preparation of needs analysis and strategic plans to increase the share of industries (first of all, the "fruit ", "vegetable ", "various food products" industries with a falling share in the world market, and "poultry", "egg" industries that take place in the world market by creating low added value due to price-oriented competition, then "fishery and aquaculture", "cereals", "vegetable oil", "confectionery", "HS Code 20- processed fruit and vegetable") in the global value chain, primarily industries that are strategically important in employment, exports, added value, etc.Regional: First of all, studies can be carried out in the region, specific to Olive and Olive Oil, Milk and Dairy Products, Fish and Aquaculture, Poultry and Eggs, Organic Products, and Medicinal-Aromatic Plants, which have a high production capacity.
Micro Invest-ment (> 10 Million TL & <100 Million TL)
Medium Term(1-3
Years)
Action E.2.3.2
Supporting clusters in strategic products
That the public and/or national umbrella organizations lead the national clusters in line with National Strategic plans.Carrying out the branding studies of national/regional products (North Aegean Olive Oil, Turkish Tuna, Turkish Crayfish, etc.)(Eurofish Cluster in EU can be considered as an example model)Establishment of Regional Food Clusters.Promotion studies of Ur-Ge (International Program for Developing Competition) projects(Collaborations should be based on the market pull principle. Ensuring that public support is provided for exporters/sellers to determine customer demands/needs and for the producers can make investments in this regard and that R&D projects are carried out in cooperation with the universities)Regional: Milk and Dairy products, Olive and Olive Oil, Meat and Meat Products, Fish and Aquaculture, Honey, Organic Products sectors should be considered as a priority:
Meso In-vestment
(> 100 Million TL & <1 Billion
TL)
Long Term (3-10 Years)
Strategy E.3: Increasing productivity
Sub-strate-gy E.3.1 Increasing Productivity in Agricultural Enterprises
Action E.3.1.1
Bringing water to currently non-irrigated, but economically irrigatable lands
Developing projects to bring water to the economically irrigatable lands where dry farming is carried outThe importance of self-sufficiency in agricultural production has become more evident in the COVID-19 pandemic. With the increase in the amount of production, the rate of self-sufficiency will be increased.
Mega In-vestment
(>10 Billion TL)
Long Term (3-10 Years)
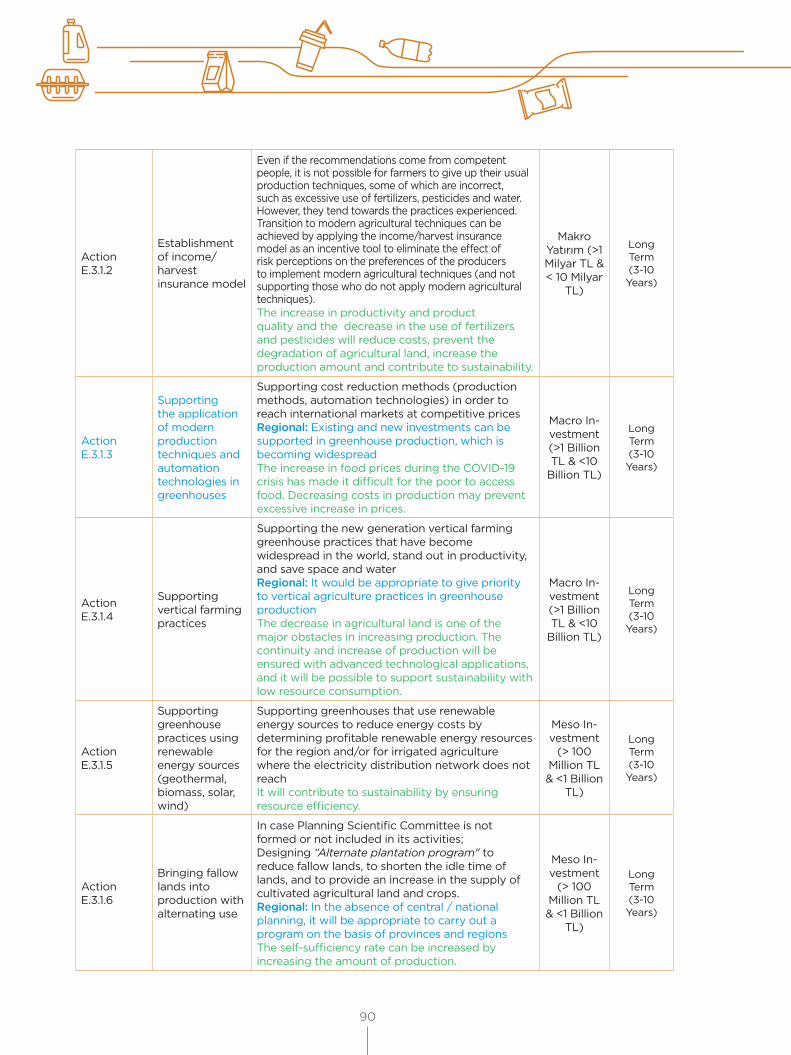
90
Action E.3.1.2
Establishment of income/harvest insurance model
Even if the recommendations come from competent people, it is not possible for farmers to give up their usual production techniques, some of which are incorrect, such as excessive use of fertilizers, pesticides and water. However, they tend towards the practices experienced. Transition to modern agricultural techniques can be achieved by applying the income/harvest insurance model as an incentive tool to eliminate the effect of risk perceptions on the preferences of the producers to implement modern agricultural techniques (and not supporting those who do not apply modern agricultural techniques).The increase in productivity and product quality and the decrease in the use of fertilizers and pesticides will reduce costs, prevent the degradation of agricultural land, increase the production amount and contribute to sustainability.
Makro Yatırım (>1 Milyar TL & < 10 Milyar
TL)
Long Term (3-10 Years)
Action E.3.1.3
Supporting the application of modern production techniques and automation technologies in greenhouses
Supporting cost reduction methods (production methods, automation technologies) in order to reach international markets at competitive prices Regional: Existing and new investments can be supported in greenhouse production, which is becoming widespreadThe increase in food prices during the COVID-19 crisis has made it difficult for the poor to access food. Decreasing costs in production may prevent excessive increase in prices.
Macro In-vestment (>1 Billion TL & <10
Billion TL)
Long Term (3-10 Years)
Action E.3.1.4
Supporting vertical farming practices
Supporting the new generation vertical farming greenhouse practices that have become widespread in the world, stand out in productivity, and save space and waterRegional: It would be appropriate to give priority to vertical agriculture practices in greenhouse productionThe decrease in agricultural land is one of the major obstacles in increasing production. The continuity and increase of production will be ensured with advanced technological applications, and it will be possible to support sustainability with low resource consumption.
Macro In-vestment (>1 Billion TL & <10
Billion TL)
Long Term (3-10 Years)
Action E.3.1.5
Supporting greenhouse practices using renewable energy sources (geothermal, biomass, solar, wind)
Supporting greenhouses that use renewable energy sources to reduce energy costs by determining profitable renewable energy resources for the region and/or for irrigated agriculture where the electricity distribution network does not reachIt will contribute to sustainability by ensuring resource efficiency.
Meso In-vestment
(> 100 Million TL & <1 Billion
TL)
Long Term (3-10 Years)
Action E.3.1.6
Bringing fallow lands into production with alternating use
In case Planning Scientific Committee is not formed or not included in its activities;Designing “Alternate plantation program" to reduce fallow lands, to shorten the idle time of lands, and to provide an increase in the supply of cultivated agricultural land and crops.Regional: In the absence of central / national planning, it will be appropriate to carry out a program on the basis of provinces and regionsThe self-sufficiency rate can be increased by increasing the amount of production.
Meso In-vestment
(> 100 Million TL & <1 Billion
TL)
Long Term (3-10 Years)

FOOD INDUSTRY ANALYSIS REPORT AND GUIDETR22 REGION (Balıkesir, Çanakkale)
91
Action E.3.1.7
Land consolidation activities
Creating lands that are large enough to use agricultural mechanization tools efficiently and have economies of scale by combining small pieces of land.By increasing efficiency in production, it will be possible to reduce production costs and prices. By establishing a business structure that will provide the producers with a livelihood, the number of migration from rural to urban will be reduced and it will contribute to continuity in production.
Meso In-vestment
(> 100 Million TL & <1 Billion
TL)
Long Term (3-10 Years)
Sub-strate-gy E.3.2 Increasing Productivity in Animal Husbandry Businesses
Action E.3.2.1
Development and implementation of the "Calf Program"
Low "fertility" and high "calf mortality rate” decrease the milk yield and cause the income of the farms to decrease. They also cause the need for calf import. Systematic implementation and support of veterinary services aimed at increasing the "fertility" (calving rate) and decreasing the "calf mortality rates" within the scope of a programRegional: In case a national program is not developed, a regional study program can be developed in cooperation with the relevant institutionsIncreasing the number of calves will support the decrease in imports. With the increase in milk yield and the increase in calf incomes, the income of the enterprises will increase and the costs will decrease. It will contribute to the supply security of milk and meat products.
Meso In-vestment
(> 100 Million TL & <1 Billion
TL)
Long Term (3-10 Years)
Action E.3.2.2
Breed improvement studies suitable for the region
Supporting the dissemination of transition from low-yielding breeds that affect milk and meat yield to breeds suitable for the regionRegional: Although modern livestock enterprises are common in the region, the problem of inefficiency in small enterprises continues. In case a national program is not developed, a regional study program can be developed in cooperation with the relevant institutionsIncreasing the number of calves will support the decrease in imports. With the increase in milk yield and the increase in calf incomes, the income of the enterprises will increase and the costs will decrease. It will contribute to the supply security of milk and meat products.
Meso In-vestment
(> 100 Million TL & <1 Billion
TL)
Long Term (3-10 Years)
Action E.3.2.3
Reducing the cost of feed by increasing pasture livestock breeding with the improvement of pastures and infrastructure supports
Due to the lack of sufficient amount of roughage (green grass, etc.) throughout the country, grain and oilseed-based compound feeds are used more than ideal rates. This situation leads to low productivity and cost increase in meat and milk. Cost reduction and productivity increase can be achieved by supporting the development of pasture livestock.Regional: In case a national program is not developed, a regional study program can be developed in cooperation with the relevant institutions
Meso In-vestment
(> 100 Million TL & <1 Billion
TL)
Long Term (3-10 Years)

92
Action E.3.2.4
Supporting modern, economical livestock enterprises in scale
Modernization of facilities that are not suitable for animal welfare and/or having high unit costs due to their small scale, and supporting capacity increases for the scale that the producer can live on with the income of the enterprise without the need for engaging in other activities (prioritizing in the existing Rural Development Supports and increasing the budget).Regional: In case a national program is not developed, a regional study program can be developed in cooperation with the relevant institutions
Meso In-vestment
(> 100 Million TL & <1 Billion
TL)
Long Term (3-10 Years)
Action E.3.2.5
Dissemination of livestock OIZs
Supporting the dissemination of Animal Husbandry Specialized Organized Industrial Zones that increase efficiency in production and take environmental risks under control (provided that designs that minimize disease transmission risks are taken into account)Regional: It is thought that the experience of modern livestock practices in the region will facilitate the establishment of Animal Husbandry OIZ.
Meso Investment
(> 100 Million TL & <1 Billion
TL)
Long Term (3-10 Years)
Sub-strate-gy E.3.3 Increasing Efficiency in Food Production Businesses
Action E.3.3.1
Supporting the capacity increase of small scale meat and milk processing plants
Supporting the capacity increases of the facilities with high costs due to their small scale (prioritizing the existing Rural Development Supports and increasing the budget)
Meso In-vestment
(> 100 Million TL & <1 Billion
TL)
Long Term (3-10 Years)
Action E.3.3.2
Supporting Digital Technology infrastructure
Supporting Enterprise Resource Planning (ERP) software, in-house communication infrastructure, automation, Food 4.0 (Digital Transformation applications in the Food Industry) technology investmentsRegional: Use of the Enterprise Resource Planning program is not common. This software should be considered with priority as it is necessary for the infrastructure. Support program can be designed for businesses in the regionThanks to the dissemination of digital technologies, the productivity of companies will be increased, and traceability of food and effective planning will be provided, and together with the decrease in the cost of companies and increase in their durability, supply assurance, and food security in processed food products will be supported.
Meso In-vestment
(> 100 Million TL & <1 Billion
TL)
Long Term (3-10 Years)
Action E.3.3.3
Dissemination of food OIZs
Expanding Food Organized Industrial Zones will contribute to the increase in added value and productivity by making use of industrial symbiosis opportunities.
Meso In-vestment
(> 100 Million TL & <1 Billion
TL)
Long Term (3-10 Years)
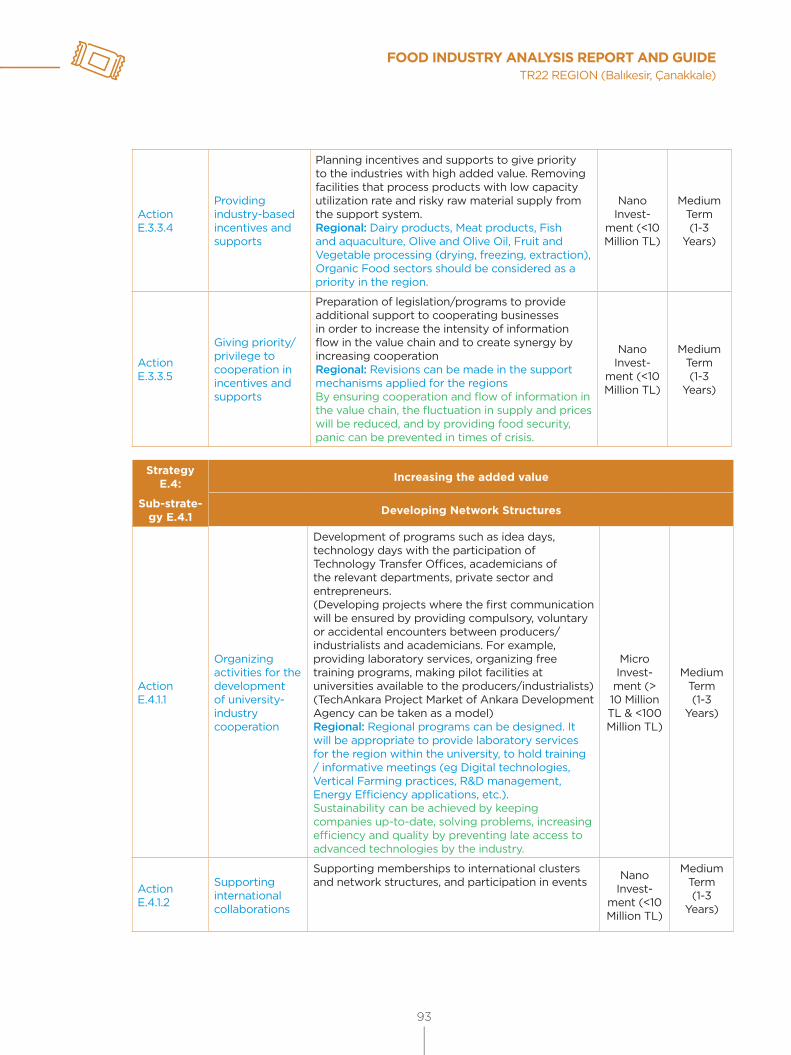
FOOD INDUSTRY ANALYSIS REPORT AND GUIDETR22 REGION (Balıkesir, Çanakkale)
93
Action E.3.3.4
Providing industry-based incentives and supports
Planning incentives and supports to give priority to the industries with high added value. Removing facilities that process products with low capacity utilization rate and risky raw material supply from the support system. Regional: Dairy products, Meat products, Fish and aquaculture, Olive and Olive Oil, Fruit and Vegetable processing (drying, freezing, extraction), Organic Food sectors should be considered as a priority in the region.
Nano Invest-
ment (<10 Million TL)
Medium Term(1-3
Years)
Action E.3.3.5
Giving priority/privilege to cooperation in incentives and supports
Preparation of legislation/programs to provide additional support to cooperating businesses in order to increase the intensity of information flow in the value chain and to create synergy by increasing cooperationRegional: Revisions can be made in the support mechanisms applied for the regionsBy ensuring cooperation and flow of information in the value chain, the fluctuation in supply and prices will be reduced, and by providing food security, panic can be prevented in times of crisis.
Nano Invest-
ment (<10 Million TL)
Medium Term(1-3
Years)
Strategy E.4: Increasing the added value
Sub-strate-gy E.4.1 Developing Network Structures
Action E.4.1.1
Organizing activities for the development of university-industry cooperation
Development of programs such as idea days, technology days with the participation of Technology Transfer Offices, academicians of the relevant departments, private sector and entrepreneurs.(Developing projects where the first communication will be ensured by providing compulsory, voluntary or accidental encounters between producers/industrialists and academicians. For example, providing laboratory services, organizing free training programs, making pilot facilities at universities available to the producers/industrialists)(TechAnkara Project Market of Ankara Development Agency can be taken as a model)Regional: Regional programs can be designed. It will be appropriate to provide laboratory services for the region within the university, to hold training / informative meetings (eg Digital technologies, Vertical Farming practices, R&D management, Energy Efficiency applications, etc.).Sustainability can be achieved by keeping companies up-to-date, solving problems, increasing efficiency and quality by preventing late access to advanced technologies by the industry.
Micro Invest-ment (> 10 Million TL & <100 Million TL)
Medium Term(1-3
Years)
Action E.4.1.2
Supporting international collaborations
Supporting memberships to international clusters and network structures, and participation in events Nano
Invest-ment (<10 Million TL)
Medium Term(1-3
Years)
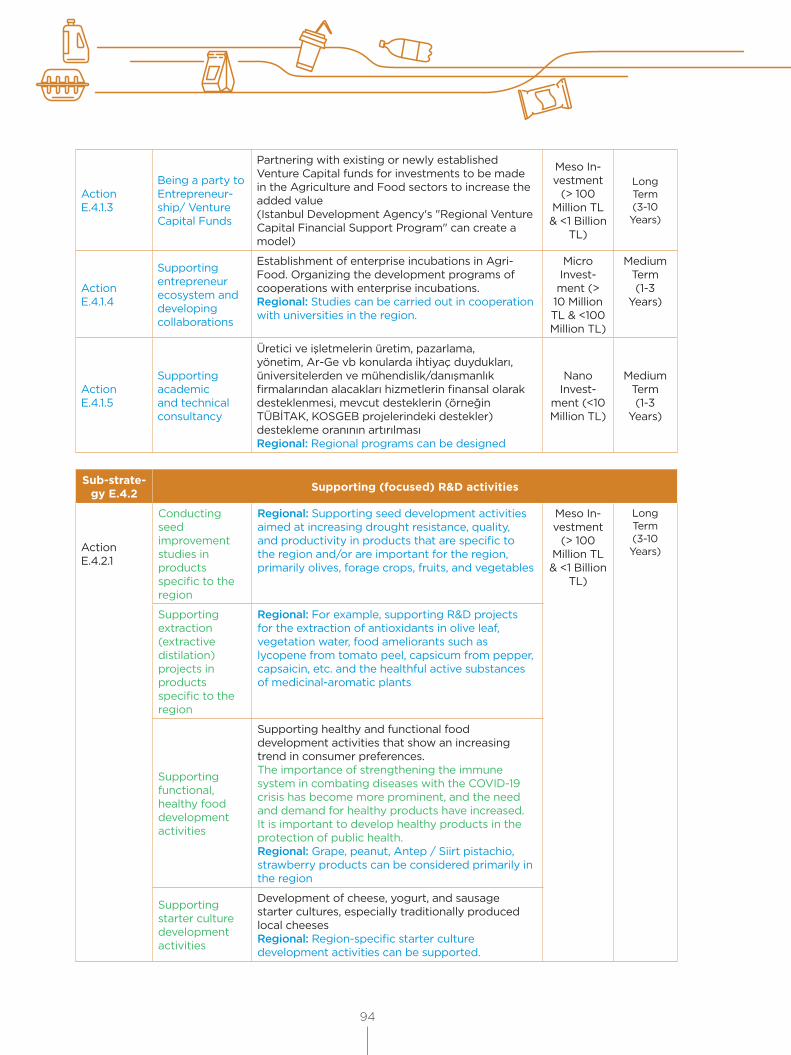
94
Action E.4.1.3
Being a party to Entrepreneur-ship/ Venture Capital Funds
Partnering with existing or newly established Venture Capital funds for investments to be made in the Agriculture and Food sectors to increase the added value(Istanbul Development Agency's "Regional Venture Capital Financial Support Program" can create a model)
Meso In-vestment
(> 100 Million TL & <1 Billion
TL)
Long Term (3-10 Years)
Action E.4.1.4
Supporting entrepreneur ecosystem and developing collaborations
Establishment of enterprise incubations in Agri-Food. Organizing the development programs of cooperations with enterprise incubations.Regional: Studies can be carried out in cooperation with universities in the region.
Micro Invest-ment (> 10 Million TL & <100 Million TL)
Medium Term(1-3
Years)
Action E.4.1.5
Supporting academic and technical consultancy
Üretici ve işletmelerin üretim, pazarlama, yönetim, Ar-Ge vb konularda ihtiyaç duydukları, üniversitelerden ve mühendislik/danışmanlık firmalarından alacakları hizmetlerin finansal olarak desteklenmesi, mevcut desteklerin (örneğin TÜBİTAK, KOSGEB projelerindeki destekler) destekleme oranının artırılmasıRegional: Regional programs can be designed
Nano Invest-
ment (<10 Million TL)
Medium Term(1-3
Years)
Sub-strate-gy E.4.2 Supporting (focused) R&D activities
Action E.4.2.1
Conducting seed improvement studies in products specific to the region
Regional: Supporting seed development activities aimed at increasing drought resistance, quality, and productivity in products that are specific to the region and/or are important for the region, primarily olives, forage crops, fruits, and vegetables
Meso In-vestment
(> 100 Million TL & <1 Billion
TL)
Long Term (3-10 Years)
Supporting extraction (extractive distilation) projects in products specific to the region
Regional: For example, supporting R&D projects for the extraction of antioxidants in olive leaf, vegetation water, food ameliorants such as lycopene from tomato peel, capsicum from pepper, capsaicin, etc. and the healthful active substances of medicinal-aromatic plants
Supporting functional, healthy food development activities
Supporting healthy and functional food development activities that show an increasing trend in consumer preferences.The importance of strengthening the immune system in combating diseases with the COVID-19 crisis has become more prominent, and the need and demand for healthy products have increased. It is important to develop healthy products in the protection of public health.Regional: Grape, peanut, Antep / Siirt pistachio, strawberry products can be considered primarily in the region
Supporting starter culture development activities
Development of cheese, yogurt, and sausage starter cultures, especially traditionally produced local cheesesRegional: Region-specific starter culture development activities can be supported.

FOOD INDUSTRY ANALYSIS REPORT AND GUIDETR22 REGION (Balıkesir, Çanakkale)
95
Supporting activities aimed at developing the techniques of packaging and extending shelf life
Supporting the development activities of long-shelf-life products and packaging types that have gained importance in consumer preferences (eg, easy-open lid, small packaging, biodegradable packaging). (Ex: Projects to market protein-containing products in small packages)In the COVID-19 crisis, it has been observed that domestic stocking for food security has increased. It seems that there is a need to develop techniques that extend the shelf life for long-term storage of the products.Regional: Grape, peanut, Antep / Siirt pistachio, strawberry products can be considered primarily in the region.
Supporting the researches aimed at the new usage areas of Medicinal-Aromatic plants
Supporting R&D projects by taking into consideration the cooperation with the pharmaceutical industry and the food industry for the usage areas of medicinal-aromatic plants with value-added, health-oriented (medicine, protective food) wide alternative use potential Regional: Lavender, thyme, lemon balm, sage, and peppermint, which are tried to be disseminated through pilot-scale production in the region, should be taken into consideration.
Supporting activities aimed at developing fertile, drought-tolerant seed
Development of drought-resistant seeds to prevent yield losses in agricultural production caused by global warming as a result of climate changeRegional: Supports can be provided according to the product pattern of the region. (Ex: Lentil, grape, Antep / Siirt pistachio)There is a risk that climate change will decrease harvest productivity, thus jeopardizing supply security. The importance of drought-resistant seed has increased in order to ensure supply assurance.
Supporting alterrnative Feed and Food projects (mushroom, microalgae, insect etc.)
Supporting R&D and investment activities aimed at reducing feed costs and meeting the protein needs of the increasing population that may be endangered
Supporting R&D studies aimed at feed additives
Supporting R&D activities for domestic production of feed additives, which have an important share in feed costsDomestic production of additives, which have a significant share in costs in terms of society's access to meat and dairy products with high nutritional value for their health, will support the reduction of costs. However, it will contribute to the elimination of supply risk during crisis periods when international trade is restricted.
Supporting the projects aimed at developing agricultural production technologies
Supporting projects for the development of soilless agriculture, vertical agriculture, hydroponic and aquaponic farming practices
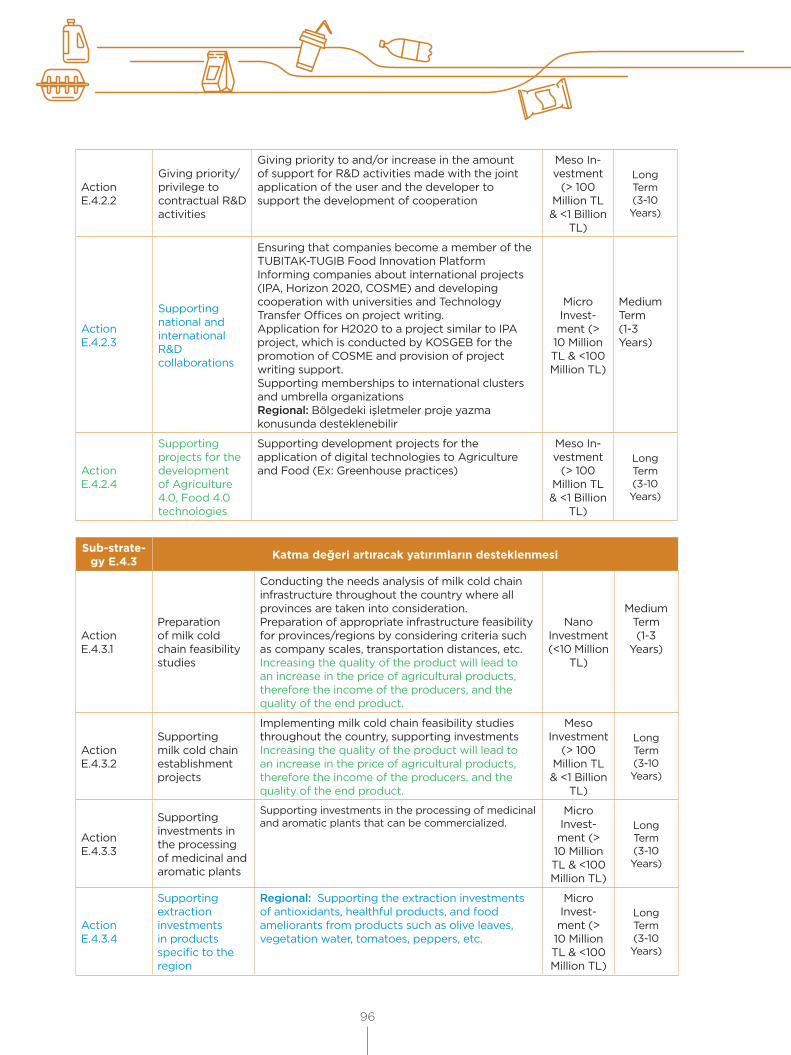
96
Action E.4.2.2
Giving priority/privilege to contractual R&D activities
Giving priority to and/or increase in the amount of support for R&D activities made with the joint application of the user and the developer to support the development of cooperation
Meso In-vestment
(> 100 Million TL & <1 Billion
TL)
Long Term (3-10 Years)
Action E.4.2.3
Supporting national and international R&D collaborations
Ensuring that companies become a member of the TUBITAK-TUGIB Food Innovation PlatformInforming companies about international projects (IPA, Horizon 2020, COSME) and developing cooperation with universities and Technology Transfer Offices on project writing.Application for H2020 to a project similar to IPA project, which is conducted by KOSGEB for the promotion of COSME and provision of project writing support.Supporting memberships to international clusters and umbrella organizations Regional: Bölgedeki işletmeler proje yazma konusunda desteklenebilir
Micro Invest-ment (> 10 Million TL & <100 Million TL)
Medium Term(1-3 Years)
Action E.4.2.4
Supporting projects for the development of Agriculture 4.0, Food 4.0 technologies
Supporting development projects for the application of digital technologies to Agriculture and Food (Ex: Greenhouse practices)
Meso In-vestment
(> 100 Million TL & <1 Billion
TL)
Long Term (3-10 Years)
Sub-strate-gy E.4.3 Katma değeri artıracak yatırımların desteklenmesi
Action E.4.3.1
Preparation of milk cold chain feasibility studies
Conducting the needs analysis of milk cold chain infrastructure throughout the country where all provinces are taken into consideration.Preparation of appropriate infrastructure feasibility for provinces/regions by considering criteria such as company scales, transportation distances, etc.Increasing the quality of the product will lead to an increase in the price of agricultural products, therefore the income of the producers, and the quality of the end product.
Nano Investment (<10 Million
TL)
Medium Term(1-3
Years)
Action E.4.3.2
Supporting milk cold chain establishment projects
Implementing milk cold chain feasibility studies throughout the country, supporting investmentsIncreasing the quality of the product will lead to an increase in the price of agricultural products, therefore the income of the producers, and the quality of the end product.
Meso Investment
(> 100 Million TL & <1 Billion
TL)
Long Term (3-10 Years)
Action E.4.3.3
Supporting investments in the processing of medicinal and aromatic plants
Supporting investments in the processing of medicinal and aromatic plants that can be commercialized.
Micro Invest-ment (> 10 Million TL & <100 Million TL)
Long Term (3-10 Years)
Action E.4.3.4
Supporting extraction investments in products specific to the region
Regional: Supporting the extraction investments of antioxidants, healthful products, and food ameliorants from products such as olive leaves, vegetation water, tomatoes, peppers, etc.
Micro Invest-ment (> 10 Million TL & <100 Million TL)
Long Term (3-10 Years)
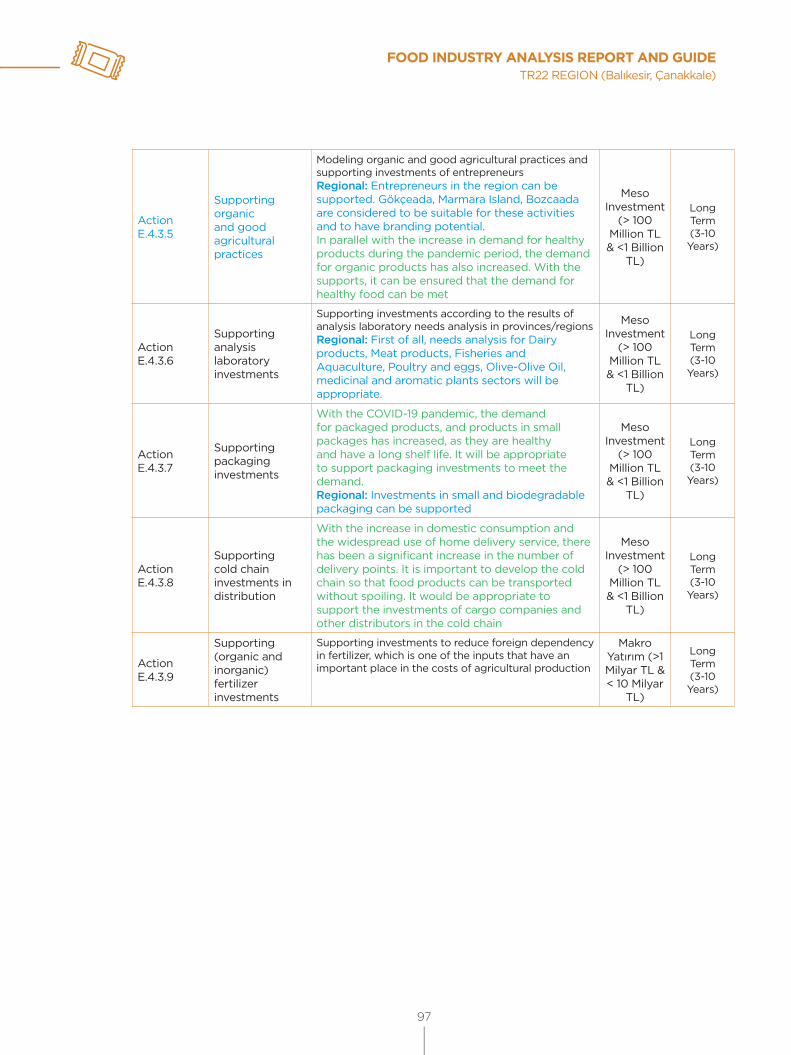
FOOD INDUSTRY ANALYSIS REPORT AND GUIDETR22 REGION (Balıkesir, Çanakkale)
97
Action E.4.3.5
Supporting organic and good agricultural practices
Modeling organic and good agricultural practices and supporting investments of entrepreneursRegional: Entrepreneurs in the region can be supported. Gökçeada, Marmara Island, Bozcaada are considered to be suitable for these activities and to have branding potential. In parallel with the increase in demand for healthy products during the pandemic period, the demand for organic products has also increased. With the supports, it can be ensured that the demand for healthy food can be met
Meso Investment
(> 100 Million TL & <1 Billion
TL)
Long Term (3-10 Years)
Action E.4.3.6
Supporting analysis laboratory investments
Supporting investments according to the results of analysis laboratory needs analysis in provinces/regionsRegional: First of all, needs analysis for Dairy products, Meat products, Fisheries and Aquaculture, Poultry and eggs, Olive-Olive Oil, medicinal and aromatic plants sectors will be appropriate.
Meso Investment
(> 100 Million TL & <1 Billion
TL)
Long Term (3-10 Years)
Action E.4.3.7
Supporting packaging investments
With the COVID-19 pandemic, the demand for packaged products, and products in small packages has increased, as they are healthy and have a long shelf life. It will be appropriate to support packaging investments to meet the demand.Regional: Investments in small and biodegradable packaging can be supported
Meso Investment
(> 100 Million TL & <1 Billion
TL)
Long Term (3-10 Years)
Action E.4.3.8
Supporting cold chain investments in distribution
With the increase in domestic consumption and the widespread use of home delivery service, there has been a significant increase in the number of delivery points. It is important to develop the cold chain so that food products can be transported without spoiling. It would be appropriate to support the investments of cargo companies and other distributors in the cold chain
Meso Investment
(> 100 Million TL & <1 Billion
TL)
Long Term (3-10 Years)
Action E.4.3.9
Supporting (organic and inorganic) fertilizer investments
Supporting investments to reduce foreign dependency in fertilizer, which is one of the inputs that have an important place in the costs of agricultural production
Makro Yatırım (>1 Milyar TL & < 10 Milyar
TL)
Long Term (3-10 Years)
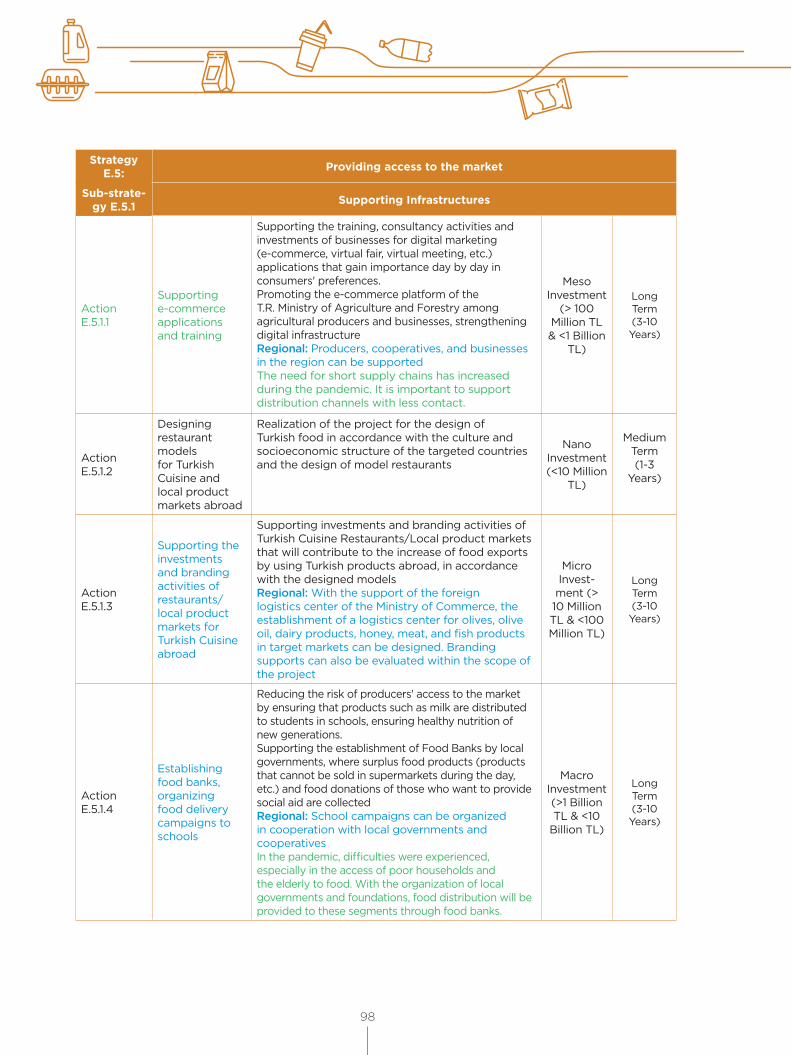
98
Strategy E.5: Providing access to the market
Sub-strate-gy E.5.1 Supporting Infrastructures
Action E.5.1.1
Supporting e-commerce applications and training
Supporting the training, consultancy activities and investments of businesses for digital marketing (e-commerce, virtual fair, virtual meeting, etc.) applications that gain importance day by day in consumers' preferences.Promoting the e-commerce platform of the T.R. Ministry of Agriculture and Forestry among agricultural producers and businesses, strengthening digital infrastructureRegional: Producers, cooperatives, and businesses in the region can be supportedThe need for short supply chains has increased during the pandemic. It is important to support distribution channels with less contact.
Meso Investment
(> 100 Million TL & <1 Billion
TL)
Long Term (3-10 Years)
Action E.5.1.2
Designing restaurant models for Turkish Cuisine and local product markets abroad
Realization of the project for the design of Turkish food in accordance with the culture and socioeconomic structure of the targeted countries and the design of model restaurants
Nano Investment (<10 Million
TL)
Medium Term(1-3
Years)
Action E.5.1.3
Supporting the investments and branding activities of restaurants/local product markets for Turkish Cuisine abroad
Supporting investments and branding activities of Turkish Cuisine Restaurants/Local product markets that will contribute to the increase of food exports by using Turkish products abroad, in accordance with the designed modelsRegional: With the support of the foreign logistics center of the Ministry of Commerce, the establishment of a logistics center for olives, olive oil, dairy products, honey, meat, and fish products in target markets can be designed. Branding supports can also be evaluated within the scope of the project
Micro Invest-ment (> 10 Million TL & <100 Million TL)
Long Term (3-10 Years)
Action E.5.1.4
Establishing food banks, organizing food delivery campaigns to schools
Reducing the risk of producers' access to the market by ensuring that products such as milk are distributed to students in schools, ensuring healthy nutrition of new generations.Supporting the establishment of Food Banks by local governments, where surplus food products (products that cannot be sold in supermarkets during the day, etc.) and food donations of those who want to provide social aid are collectedRegional: School campaigns can be organized in cooperation with local governments and cooperativesIn the pandemic, difficulties were experienced, especially in the access of poor households and the elderly to food. With the organization of local governments and foundations, food distribution will be provided to these segments through food banks.
Macro Investment (>1 Billion TL & <10
Billion TL)
Long Term (3-10 Years)

FOOD INDUSTRY ANALYSIS REPORT AND GUIDETR22 REGION (Balıkesir, Çanakkale)
99
Action E.5.1.5
Establishment of Smart/Digital Logistics Centers
Supporting the establishment of Digital Logistics Centers where farmers/cooperatives bring their products to buyers under the leadership of local governments, supply and demand, idle capacities and logistics demands of logistics providers are brought together in a digital environment, and sales can be made through e-platformsRegional: Digital logistics centers can be established on the basis of provinces/districts. It is thought that the region with a high capacity for agricultural products can be an exampleBy providing fast access to information, efficient production planning, efficient use of resources, more effective participation of producers in the value chain will be ensured and it will be possible to contribute to food safety and security by shortening the supply chain.
Macro Investment (>1 Billion TL & <10
Billion TL)
Long Term (3-10 Years)
Action E.5.1.6
Establishment of foreign trade intelligence centers
Supporting the establishment of Foreign Trade Intelligence Centers, especially in order to support the access of micro and small-scale companies to foreign markets
Meso Investment
(> 100 Million TL & <1 Billion
TL)
Long Term (3-10 Years)
Action E.5.1.7
Establishing national trade centers abroad
Supporting trade centers to ensure the determination of customer needs by increasing the intensity and speed of customer communication in foreign markets
Meso Investment
(> 100 Million TL & <1 Billion
TL)
Medium Term(1-3
Years)
Action E.5.1.8
Establishment of private sector trade center/contact office abroad
National/Regional: Supporting the establishment of trade centers/contact offices established in cooperation with private sector representatives to ensure the determination of customer needs by increasing the intensity and speed of customer communication in foreign markets.It can also be considered in cluster projects. The Foreign Logistics Support program of the Ministry of Commerce can be evaluated
Meso Investment
(> 100 Million TL & <1 Billion
TL)
Long Term (3-10 Years)
Action E.5.1.9
Establishment of Virtual Fair
National/Regional: Establishment of a virtual fair (with the support program of the Ministry of Trade) where the items produced in the country/region are promoted
Meso Investment
(> 100 Million TL & <1 Billion
TL)
Long Term (3-10 Years)
Action E.5.1.10
Setting up neighborhood bazaars for times of crisis
During the COVID-19 pandemic, there were difficulties in accessing food due to the risk of transmission. Developing the design of neighborhood/district bazaar in which protection measures are taken into account, determining the places where the markets will be set up.Regional: If a national program is not designed, regional studies can be carried out.
Meso Investment
(> 100 Million TL & <1 Billion
TL)
Medium Term(1-3
Years)
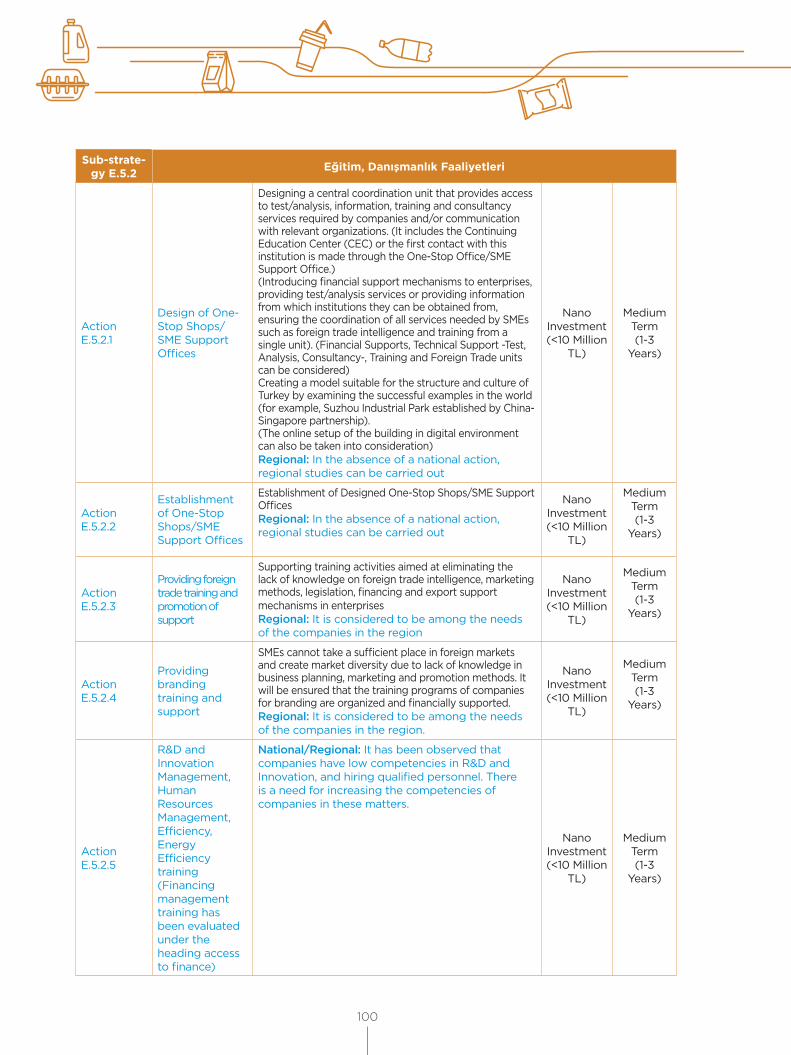
100
Sub-strate-gy E.5.2 Eğitim, Danışmanlık Faaliyetleri
Action E.5.2.1
Design of One-Stop Shops/SME Support Offices
Designing a central coordination unit that provides access to test/analysis, information, training and consultancy services required by companies and/or communication with relevant organizations. (It includes the Continuing Education Center (CEC) or the first contact with this institution is made through the One-Stop Office/SME Support Office.)(Introducing financial support mechanisms to enterprises, providing test/analysis services or providing information from which institutions they can be obtained from, ensuring the coordination of all services needed by SMEs such as foreign trade intelligence and training from a single unit). (Financial Supports, Technical Support -Test, Analysis, Consultancy-, Training and Foreign Trade units can be considered)Creating a model suitable for the structure and culture of Turkey by examining the successful examples in the world (for example, Suzhou Industrial Park established by China-Singapore partnership).(The online setup of the building in digital environment can also be taken into consideration)Regional: In the absence of a national action, regional studies can be carried out
Nano Investment (<10 Million
TL)
Medium Term(1-3
Years)
Action E.5.2.2
Establishment of One-Stop Shops/SME Support Offices
Establishment of Designed One-Stop Shops/SME Support OfficesRegional: In the absence of a national action, regional studies can be carried out
Nano Investment (<10 Million
TL)
Medium Term(1-3
Years)
Action E.5.2.3
Providing foreign trade training and promotion of support
Supporting training activities aimed at eliminating the lack of knowledge on foreign trade intelligence, marketing methods, legislation, financing and export support mechanisms in enterprisesRegional: It is considered to be among the needs of the companies in the region
Nano Investment (<10 Million
TL)
Medium Term(1-3
Years)
Action E.5.2.4
Providing branding training and support
SMEs cannot take a sufficient place in foreign markets and create market diversity due to lack of knowledge in business planning, marketing and promotion methods. It will be ensured that the training programs of companies for branding are organized and financially supported.Regional: It is considered to be among the needs of the companies in the region.
Nano Investment (<10 Million
TL)
Medium Term(1-3
Years)
Action E.5.2.5
R&D and Innovation Management, Human Resources Management, Efficiency, Energy Efficiency training (Financing management training has been evaluated under the heading access to finance)
National/Regional: It has been observed that companies have low competencies in R&D and Innovation, and hiring qualified personnel. There is a need for increasing the competencies of companies in these matters.
Nano Investment (<10 Million
TL)
Medium Term(1-3
Years)
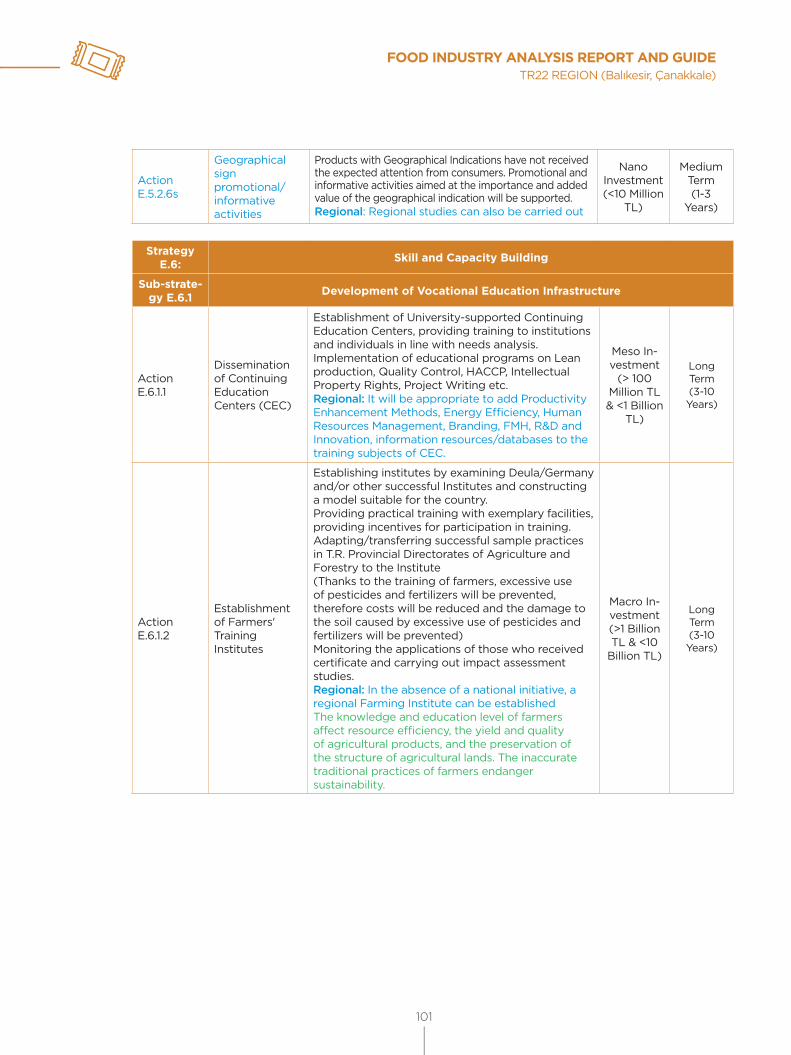
FOOD INDUSTRY ANALYSIS REPORT AND GUIDETR22 REGION (Balıkesir, Çanakkale)
101
Action E.5.2.6s
Geographical sign promotional/informative activities
Products with Geographical Indications have not received the expected attention from consumers. Promotional and informative activities aimed at the importance and added value of the geographical indication will be supported.Regional: Regional studies can also be carried out
Nano Investment (<10 Million
TL)
Medium Term(1-3
Years)
Strategy E.6: Skill and Capacity Building
Sub-strate-gy E.6.1 Development of Vocational Education Infrastructure
Action E.6.1.1
Dissemination of Continuing Education Centers (CEC)
Establishment of University-supported Continuing Education Centers, providing training to institutions and individuals in line with needs analysis.Implementation of educational programs on Lean production, Quality Control, HACCP, Intellectual Property Rights, Project Writing etc.Regional: It will be appropriate to add Productivity Enhancement Methods, Energy Efficiency, Human Resources Management, Branding, FMH, R&D and Innovation, information resources/databases to the training subjects of CEC.
Meso In-vestment
(> 100 Million TL & <1 Billion
TL)
Long Term (3-10 Years)
Action E.6.1.2
Establishment of Farmers' Training Institutes
Establishing institutes by examining Deula/Germany and/or other successful Institutes and constructing a model suitable for the country.Providing practical training with exemplary facilities, providing incentives for participation in training.Adapting/transferring successful sample practices in T.R. Provincial Directorates of Agriculture and Forestry to the Institute(Thanks to the training of farmers, excessive use of pesticides and fertilizers will be prevented, therefore costs will be reduced and the damage to the soil caused by excessive use of pesticides and fertilizers will be prevented)Monitoring the applications of those who received certificate and carrying out impact assessment studies. Regional: In the absence of a national initiative, a regional Farming Institute can be establishedThe knowledge and education level of farmers affect resource efficiency, the yield and quality of agricultural products, and the preservation of the structure of agricultural lands. The inaccurate traditional practices of farmers endanger sustainability.
Macro In-vestment (>1 Billion TL & <10
Billion TL)
Long Term (3-10 Years)

102
Sub-strate-gy E.6.2 Development of Professional Education System
Action E.6.2.1
Dissemination of Continuing Education Centers (CEC)
Establishment of University-supported Continuing Education Centers, providing training to institutions and individuals in line with needs analysis.Implementation of educational programs on Lean production, Quality Control, HACCP, Intellectual Property Rights, Project Writing etc.Regional: It will be appropriate to add Productivity Enhancement Methods, Energy Efficiency, Human Resources Management, Branding, FMH, R&D and Innovation, information resources/databases to the training subjects of CEC.
Meso Investment
(> 100 Million TL & <1 Billion
TL)
Long Term (3-10 Years)
Action E.6.2.2
Dissemination of applied education in universities
Providing senior university students (and graduate senior students) to work part-time in companies, ensuring that their final papers (master's thesis) are prepared practically on a real problem in the industry.Regional: Thesis studies in industry can be financially supported
Micro Invest-ment (> 10 Million TL & <100 Million TL)
Long Term (3-10 Years)
Action E.6.2.3
Establishment of Digital Transformation Centers (model facility, model factory) for Agriculture 4.0 (Digital Transformation in Agriculture/Smart Agriculture) and Food 4.0 (Digital Transformation in Food Industry) technologies
Designing and supporting projects for Agriculture 4.0 and Food 4.0 similar to Digital Transformation Centers that started to be developed in TurkeyIt will contribute to ensuring productivity and sustainability in agricultural production and food industry Regional: Considering the production capacity of the region, establishment of Food 4.0 Model Factory in cooperation with the region and/or Bursa
Micro Invest-ment (> 10 Million TL & <100 Million TL)
Long Term (3-10 Years)
Strategy E.7: Ensuring access to financial resources
Sub-strate-gy E.7.1 Improving financial support systems
Action E.7.1.1
Emphasizing efficiency and cooperation in the investment support model
Creating models that take into account the increase in productivity and cooperation in agricultural product support Increasing the amount of supply by increasing the efficiency of agricultural activities is important for keeping the income of agricultural producers at a certain level by decreasing the costs, for the producers to continue these activities and thus to ensure supply security.
Macro In-vestment (>1 Billion TL & <10
Billion TL)
Long Term (3-10 Years)

FOOD INDUSTRY ANALYSIS REPORT AND GUIDETR22 REGION (Balıkesir, Çanakkale)
103
Action E.7.1.2
Establishing a crisis fund, providing financing support to negatively affected sectors and the labor force whose employment is required
As seen in the COVID-19 pandemic, in the negatively affected industries, especially in the restaurant, cafe, hotel, food service (catering) industries, a chain of income loss, problem of collection and cash flow, and a decrease in employment have been experienced. By establishing a crisis fund, the negative effects of the industries adversely affected by the crises on the entire industries will be prevented and the continuity of employment will be ensured.At the same time, if the labor force cannot be provided during periods such as harvest and pruning, it will be possible to financially support the labor force that endangers agricultural production, the provision of which is especially hard during the pandemic and whose wages increase.
Mega In-vestment
(>10 Billion TL)
Long Term (3-10 Years)
Action E.7.1.3
Developing the financial information of producers and industrialists
Introducing alternative financing resources, national and international financing support mechanisms (investment, export, R&D etc.) to producers and industrialists, providing training in cost accounting, financial risk management and financing managementRegional: Providing training on regional/provincial basis
Nano Invest-
ment (<10 Million TL)
Medium Term(1-3
Years)
10.2. Actions within the Social Scope
Explanation Estimated Budget
Imple-menta-
tion Time (Year)
Strategy S.1: Increasing the level of social life in the countryside
Sub-strate-gy S.1.1 Increasing the attractiveness of rural life
Action S.1.1.1
Increasing the number and quality of rural schools
Solving the problem of access to educational services, which is one of the important reasons of rural-to-urban migration, by increasing the number and quality of rural schoolsBy making rural life attractive, the continuity of the labor force will be ensured in order to sustain agricultural production.
Mega In-vestment
(>10 Billion TL)
Long Term (3-10 Years)
Action S.1.1.2
Establishing sports facilities and social facilities
Establishment of sports facilities aimed at enriching social life in rural areas and social facilities where internet access is provided free of chargeRegional: Investments can be made in rural areas
Macro In-vestment (>1 Billion TL & <10
Billion TL)
Long Term (3-10 Years)
Action S.1.1.3
Providing social assistance to those engaged in agricultural activities in rural areas
Providing direct or indirect financial support (such as covering insurance premiums) to producers who have difficulty in making a living in rural areas. Grading the supports considering production and efficiencyRegional: Producers in the region can be supported (young, woman and disabled entrepreneurs can be given additional support)
Nano Invest-
ment (<10 Million TL)
Medium Term(1-3
Years)

104
Action S.1.1.4
Developing projects to improve social life in rural areas
Organizing contests for the improvement of social life in rural areas. Application to EU-funded financial support programs for projectsRegional: Project development studies of public institutions, local governments and non-governmental organizations in the region can be supported
Macro In-vestment (>1 Billion TL & <10
Billion TL)
Long Term (3-10 Years)
Strategy S.2: Strengthening the Food Safety and Security System
Sub-strate-gy S.2.1 Making improvements in legislation
Action S.2.1.1
Improving inspection method
Developing the infrastructure and increasing human resources systematically to increase the number of periodic inspections according to the product risk groupBy ensuring food security, society will be able to access healthy food.
Meso Investment
(> 100 Million TL & <1 Billion
TL)
Long Term (3-10 Years)
Action S.2.1.2
Making HACCP implementation mandatory in food processing companies
Making the HACCP (Hazard Analysis and Critical Control Points) system mandatory in food processing companies in order to ensure hygiene in food businesses, providing financial support and training in this regardRegional: Training support can be provided to companies in the region.
Micro Invest-ment (> 10 Million TL & <100 Million TL)
Long Term (3-10 Years)
Action S.2.1.3
Prevention of cartelization in retail chain markets
increasing the frequency of the inspections with the consumer information platform.Restricting the private brands of the markets.Ensuring equal competitive conditions with alternative sales points by increasing tax and insurance premium audits
Micro Invest-ment (> 10 Million TL & <100 Million TL)
Medium Term(1-3
Years)
Sub-strate-gy S.2.2 Consumer Awareness Activities
Action S.2.2.1.
Supporting organizations for awareness-raising promotional activities
Supporting the promotions of umbrella organizations to inform consumers about imitation and fraud, and eliminating the lack of information of the consumerRegional: Organizations in the region can be supported
Nano Invest-
ment (<10 Million TL)
Medium Term(1-3
Years)
Action S.2.2.2
Establishment of a platform that will provide continuous access to the information of those who adulterate
T.R. Ministry of Agriculture and Forestry periodically publishes those who adulterate in food. However, its awareness is not high and its access is not continuous. Continuous accessibility will be provided by designing a digital platform.Regional: In the absence of a national initiative, umbrella organizations can be supported for the establishment of the infrastructure
Nano Invest-
ment (<10 Million TL)
Medium Term(1-3
Years)
Action S.2.2.3
Ensuring that the nutritiveness is perceived by the consumer with markings on the products
Putting colored signs to distinguish between nutritious and unhealthy (sugary, salty) products by making changes in the legislation.Increasing the tax on unhealthy products.
Nano Invest-
ment (<10 Million TL)
Medium Term(1-3
Years)

FOOD INDUSTRY ANALYSIS REPORT AND GUIDETR22 REGION (Balıkesir, Çanakkale)
105
Strategy S.3 Ensuring social equality
Sub-strate-gy S.3.1 Establishing financial support mechanisms
Action S.2.3.1
Providing positive discrimination to women and disabled citizens
Increasing financial support, regulation of special grant and micro-credit programs for women entrepreneurs, disabled citizens
Meso Investment
(> 100 Million TL & <1 Billion
TL)
Long Term (3-10 Years)
Action S.2.3.2
Providing training to immigrants (Syrian, Afghan) to engage in agricultural activities and giving financial support
By creating a job area for immigrants (by giving temporary work permit and/or permanent work permit in accordance with the law), it will be possible to ensure their livelihood and to overcome the labor bottleneck in agriculture.Regional: Regional support can be appliedThe repetition of the labor bottleneck experienced during the harvest period in the COVID-19 pandemic can be prevented
Meso Investment
(> 100 Million TL & <1 Billion
TL)
Long Term (3-10 Years)
10.3. Actions within the Environmental Scope
Explanation Estimated Budget
Imple-menta-
tion Time (Year)
Strategy Ç.1: Ensuring efficient use of water resources
Sub-strate-gy Ç.1.1 Improving the agricultural water infrastructure
Action Ç.1.1.1
Conversion of open water transport systems to closed water transport systems
Transporting water to agricultural areas often causes great losses. By transforming open water transport channels into closed channels, a great contribution will be made to the efficient use of water.Continuity of agricultural production and supply security can be achieved by efficient use of resources.Regional: It is important for the region with high water stress.
Mega In-vestment
(>10 Billion TL)
Long Term (3-10 Years)
Action Ç.1.1.2
Dissemation of pressurized irrigation systems
By using drip irrigation, underground drip irrigation, sprinkling techniques, controlled irrigation, and water savings will be achieved, and the damage caused by excessive irrigation will be reduced (soil erosion, calcification, groundwater rise, etc.)Regional: It is important for the region with high water stress.
Mega In-vestment
(>10 Billion TL)
Long Term (3-10 Years)
Action Ç.1.1.3
Supporting pressure irrigation systems workmanship
Installation and dismantling of the equipment system in drip irrigation requires intensive labor and time. This may cause farmers not to prefer drip irrigation. It would be appropriate to financially support the labor force for drip irrigation systems.Regional: Producers in the region can be supported
Meso Investment
(> 100 Million TL & <1 Billion
TL)
Long Term (3-10 Years)
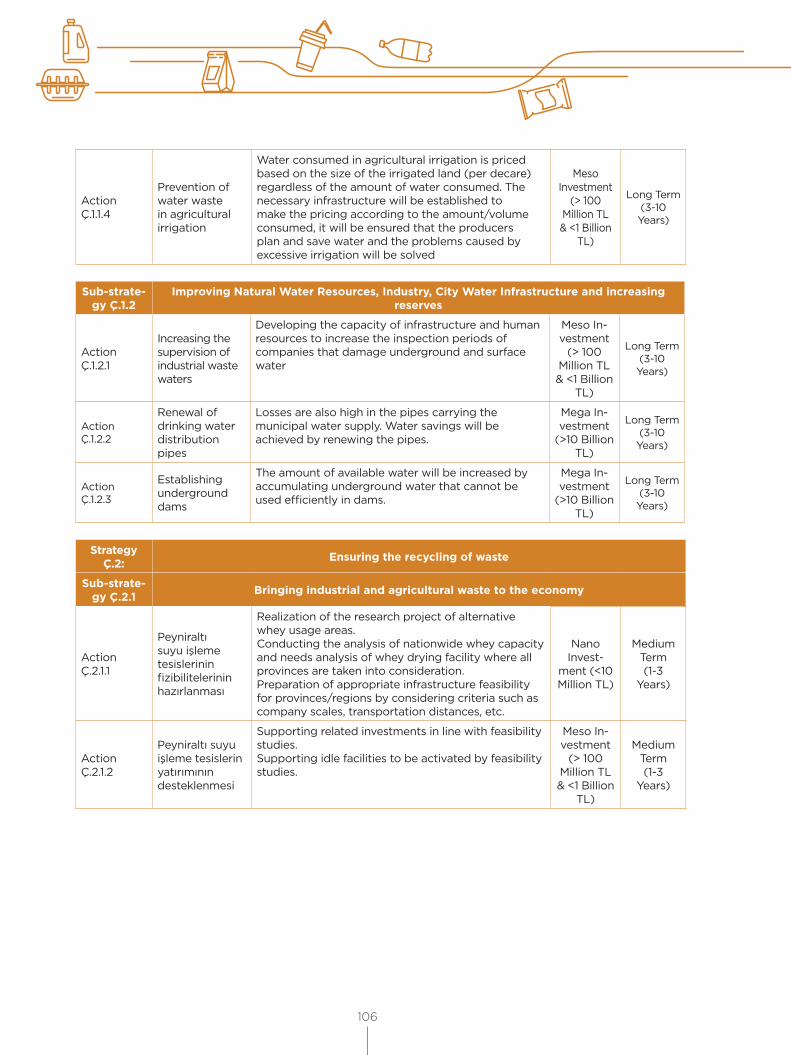
106
Action Ç.1.1.4
Prevention of water waste in agricultural irrigation
Water consumed in agricultural irrigation is priced based on the size of the irrigated land (per decare) regardless of the amount of water consumed. The necessary infrastructure will be established to make the pricing according to the amount/volume consumed, it will be ensured that the producers plan and save water and the problems caused by excessive irrigation will be solved
Meso Investment
(> 100 Million TL & <1 Billion
TL)
Long Term (3-10 Years)
Sub-strate-gy Ç.1.2
Improving Natural Water Resources, Industry, City Water Infrastructure and increasing reserves
Action Ç.1.2.1
Increasing the supervision of industrial waste waters
Developing the capacity of infrastructure and human resources to increase the inspection periods of companies that damage underground and surface water
Meso In-vestment
(> 100 Million TL & <1 Billion
TL)
Long Term (3-10 Years)
Action Ç.1.2.2
Renewal of drinking water distribution pipes
Losses are also high in the pipes carrying the municipal water supply. Water savings will be achieved by renewing the pipes.
Mega In-vestment
(>10 Billion TL)
Long Term (3-10 Years)
Action Ç.1.2.3
Establishing underground dams
The amount of available water will be increased by accumulating underground water that cannot be used efficiently in dams.
Mega In-vestment
(>10 Billion TL)
Long Term (3-10 Years)
Strategy Ç.2: Ensuring the recycling of waste
Sub-strate-gy Ç.2.1 Bringing industrial and agricultural waste to the economy
Action Ç.2.1.1
Peyniraltı suyu işleme tesislerinin fizibilitelerinin hazırlanması
Realization of the research project of alternative whey usage areas.Conducting the analysis of nationwide whey capacity and needs analysis of whey drying facility where all provinces are taken into consideration.Preparation of appropriate infrastructure feasibility for provinces/regions by considering criteria such as company scales, transportation distances, etc.
Nano Invest-
ment (<10 Million TL)
Medium Term(1-3
Years)
Action Ç.2.1.2
Peyniraltı suyu işleme tesislerin yatırımının desteklenmesi
Supporting related investments in line with feasibility studies.Supporting idle facilities to be activated by feasibility studies.
Meso In-vestment
(> 100 Million TL & <1 Billion
TL)
Medium Term(1-3
Years)
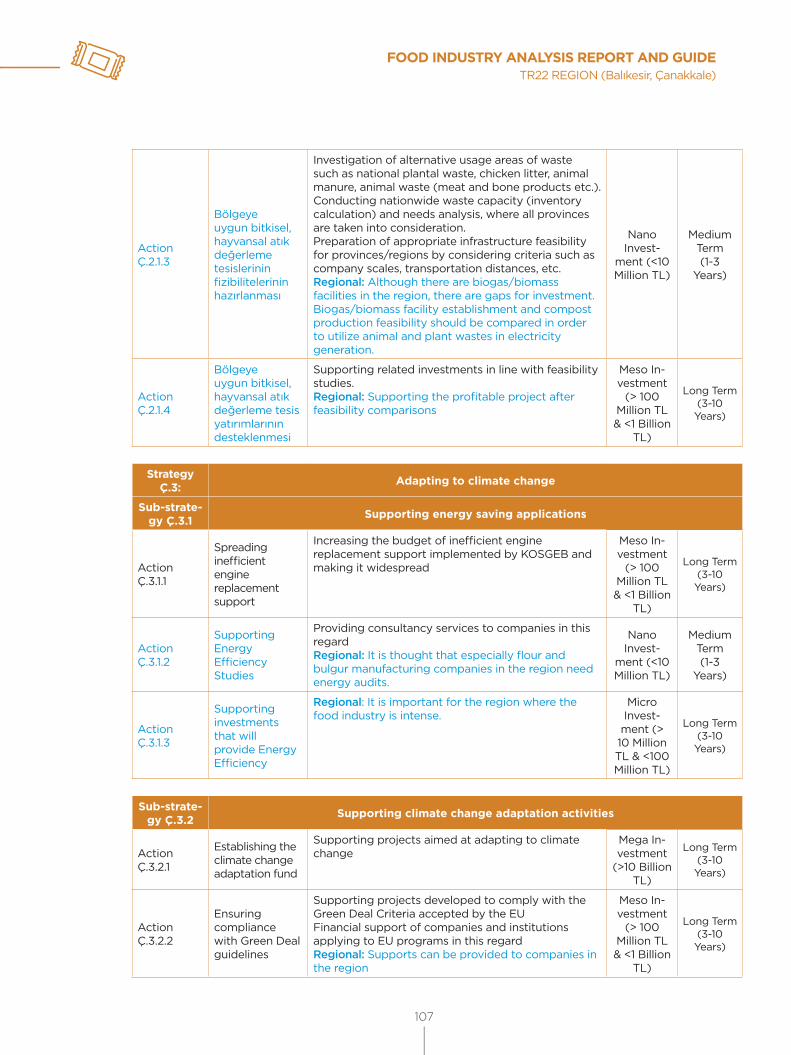
FOOD INDUSTRY ANALYSIS REPORT AND GUIDETR22 REGION (Balıkesir, Çanakkale)
107
Action Ç.2.1.3
Bölgeye uygun bitkisel, hayvansal atık değerleme tesislerinin fizibilitelerinin hazırlanması
Investigation of alternative usage areas of waste such as national plantal waste, chicken litter, animal manure, animal waste (meat and bone products etc.).Conducting nationwide waste capacity (inventory calculation) and needs analysis, where all provinces are taken into consideration.Preparation of appropriate infrastructure feasibility for provinces/regions by considering criteria such as company scales, transportation distances, etc.Regional: Although there are biogas/biomass facilities in the region, there are gaps for investment. Biogas/biomass facility establishment and compost production feasibility should be compared in order to utilize animal and plant wastes in electricity generation.
Nano Invest-
ment (<10 Million TL)
Medium Term(1-3
Years)
Action Ç.2.1.4
Bölgeye uygun bitkisel, hayvansal atık değerleme tesis yatırımlarının desteklenmesi
Supporting related investments in line with feasibility studies.Regional: Supporting the profitable project after feasibility comparisons
Meso In-vestment
(> 100 Million TL & <1 Billion
TL)
Long Term (3-10 Years)
Strategy Ç.3: Adapting to climate change
Sub-strate-gy Ç.3.1 Supporting energy saving applications
Action Ç.3.1.1
Spreading inefficient engine replacement support
Increasing the budget of inefficient engine replacement support implemented by KOSGEB and making it widespread
Meso In-vestment
(> 100 Million TL & <1 Billion
TL)
Long Term (3-10 Years)
Action Ç.3.1.2
Supporting Energy Efficiency Studies
Providing consultancy services to companies in this regardRegional: It is thought that especially flour and bulgur manufacturing companies in the region need energy audits.
Nano Invest-
ment (<10 Million TL)
Medium Term(1-3
Years)
Action Ç.3.1.3
Supporting investments that will provide Energy Efficiency
Regional: It is important for the region where the food industry is intense.
Micro Invest-ment (> 10 Million TL & <100 Million TL)
Long Term (3-10 Years)
Sub-strate-gy Ç.3.2 Supporting climate change adaptation activities
Action Ç.3.2.1
Establishing the climate change adaptation fund
Supporting projects aimed at adapting to climate change
Mega In-vestment
(>10 Billion TL)
Long Term (3-10 Years)
Action Ç.3.2.2
Ensuring compliance with Green Deal guidelines
Supporting projects developed to comply with the Green Deal Criteria accepted by the EUFinancial support of companies and institutions applying to EU programs in this regardRegional: Supports can be provided to companies in the region
Meso In-vestment
(> 100 Million TL & <1 Billion
TL)
Long Term (3-10 Years)
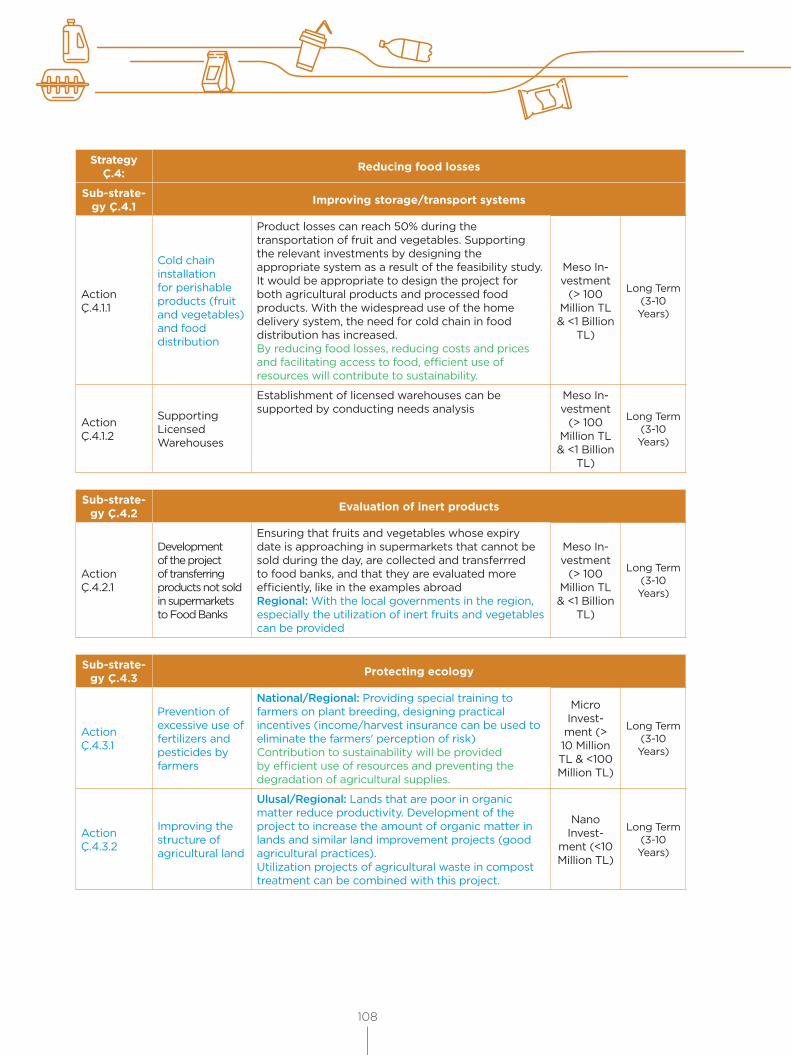
108
Strategy Ç.4: Reducing food losses
Sub-strate-gy Ç.4.1 Improving storage/transport systems
Action Ç.4.1.1
Cold chain installation for perishable products (fruit and vegetables) and food distribution
Product losses can reach 50% during the transportation of fruit and vegetables. Supporting the relevant investments by designing the appropriate system as a result of the feasibility study.It would be appropriate to design the project for both agricultural products and processed food products. With the widespread use of the home delivery system, the need for cold chain in food distribution has increased.By reducing food losses, reducing costs and prices and facilitating access to food, efficient use of resources will contribute to sustainability.
Meso In-vestment
(> 100 Million TL & <1 Billion
TL)
Long Term (3-10 Years)
Action Ç.4.1.2
Supporting Licensed Warehouses
Establishment of licensed warehouses can be supported by conducting needs analysis
Meso In-vestment
(> 100 Million TL & <1 Billion
TL)
Long Term (3-10 Years)
Sub-strate-gy Ç.4.2 Evaluation of inert products
Action Ç.4.2.1
Development of the project of transferring products not sold in supermarkets to Food Banks
Ensuring that fruits and vegetables whose expiry date is approaching in supermarkets that cannot be sold during the day, are collected and transferrred to food banks, and that they are evaluated more efficiently, like in the examples abroadRegional: With the local governments in the region, especially the utilization of inert fruits and vegetables can be provided
Meso In-vestment
(> 100 Million TL & <1 Billion
TL)
Long Term (3-10 Years)
Sub-strate-gy Ç.4.3 Protecting ecology
Action Ç.4.3.1
Prevention of excessive use of fertilizers and pesticides by farmers
National/Regional: Providing special training to farmers on plant breeding, designing practical incentives (income/harvest insurance can be used to eliminate the farmers' perception of risk)Contribution to sustainability will be provided by efficient use of resources and preventing the degradation of agricultural supplies.
Micro Invest-ment (> 10 Million TL & <100 Million TL)
Long Term (3-10 Years)
Action Ç.4.3.2
Improving the structure of agricultural land
Ulusal/Regional: Lands that are poor in organic matter reduce productivity. Development of the project to increase the amount of organic matter in lands and similar land improvement projects (good agricultural practices). Utilization projects of agricultural waste in compost treatment can be combined with this project.
Nano Invest-
ment (<10 Million TL)
Long Term (3-10 Years)
FOOD INDUSTRY ANALYSIS REPORT AND GUIDETR22 REGION (Balıkesir, Çanakkale)
109
11. Conclusion and EvaluationThe food industry, which develops based on a labor-intensive system, is directly related to the utilization of agricultural products, the supply of raw materials to the industry, its contribution to employment and a balanced diet of the people. Food industry is one of the industries that has the most important socio-economic effects, as food intake has a direct impact on the health and welfare of the society.
Global agri-food trade has more than doubled between 1995 and 2019, reaching 1.5 Trillion USD from 680 Billion USD. Since early 2000s, countries with upper-middle and lower middle incomes have been increasing their share in global agri-food exports. This ratio increased from approximately 25% in 2001 to 36% in 2018. A large part of the agri-food trade includes processed food products of the food sector. Whereas the share of food in total agri-food export was about 70% in 2000, it reached up to 76% in 2018. The largest shares in global trade are fruits and vegetables (23%), Cereal and cereal products (14%), Fisheries (11%), Meat and meat products (11%), Beverages (8%), Animal and vegetable oils (%) 6), Dairy products and eggs (6%), Sugar and honey (3%) and Other foods (16%). The top five countries with the highest imports in world trade are the USA, China, Germany, Japan and the Netherlands. The ranking in exports is the USA, the Netherlands, Germany, Brazil and China. The Global Market for Food Products is expected to reach 8 trillion USD in 2021, and the market is expected to grow at an annual rate of 3.1% between 2020-2025. It is foreseen that Confectionery and Snacks will constitute the largest part of the market with 1.4 trillion USD for 2021 and China will be the largest market in the world with a turnover of 1.3 trillion USD.
According to data of 2019, in Turkey, Food Products Manufacturing industry (Food Industry) is one of the industries with the highest share in manufacturing industry with the rate of 13.6%. According to the data of 2018, 515 thousand employees were employed in 49 thousand companies, and a turnover of 296 billion TL (61 billion USD) was realized. The highest shares in the "added value with factor cost" created are respectively "Manufacture of other foodstuffs", "Manufacture of bakery products", "Processing and storage of vegetables and fruits" and "Manufacture of dairy products". With the decline in the "Meat processing and storage and production of meat products" industry between 2010 and 2018, this industry fell from fourth place to sixth in value added creation. The decline in the "10.12: "Poultry meat processing and storage" sub-sector has a major impact on the occurrence of this situation. The Iraqi market, which has high economic uncertainties, has a large share in exports (about 60%) and price-oriented competition are seen as the main problems of this industry and the associated "Egg" production industry. Industries that show a successful performance in the increase in "value added per employee", which is accepted as an indicator of productivity, "Processing and storage of fish and aquaculture products", "Manufacture of ready-made animal feed", "Processing and storage of vegetables and fruits" and "Manufacture of solid and liquid vegetable and animal oils".
In crop production, between 2010 and 2019, there was an increase of approximately 20% in the amount of vegetables, 34% in fruit, beverage and spice plants, and 5% in cereals and other herbal products. Considering that the population growth rate was 12.8% in the same period, it is seen that the increase in grain production remained low.
Growth rates are higher in livestock and fisheries. In the same period, the number of bovine animals increased by 56%, the number of ovine animals by 52%, the number of eggs by 68%, the amount of poultry meat by 48% and the number of beehives by 45%. In aquaculture production, there was a 5% decrease in fishing, but a high (123%) increase in aquaculture.
In the 2010-2019 period, according to economic activities, agri-food exports (4.5% annually on average) of Turkey increased more than its imports (4.2% per year on average) and its foreign trade surplus reached 3.36 billion USD. The share of processed food products in exports increased from 63.5% to 71.8%. In imports, unlike exports, the share of unprocessed agricultureal products is higher than processed food products, and this item creates a significant foreign trade deficit. Wheat imports for export purposes of flour and pasta production have the biggest share. This is followed by oil seeds and other feed raw materials used in feed and vegetable oil production. The export performance of Turkey (average annual growth rate: 4.53%) remained above the world
110
export growth rate (3.57%), through which its share in the world agri-food products increased from 1.04 % to 1.13%.
However, since the average annual rate of increase in "Edible foods and nuts", which has the largest share in exports of agri-food products of Turkey (2.01%), is far behind the global export growth rate (5.92%), and its share in world exports decreased from 4.60% to 3.28%. Similar low performance has also been experienced in "Edible vegetables and some roots and tubers" and "Various edible food preparations (coffee extracts, tea extracts, yeasts, sauces, diet foods, etc.)".
Among the products that have a high rate and amount in the increase in Turkey's agri-food exports, it is seen that the industries of "Cereals, flour, starch or milk preparations, pastry products" whose raw material is mostly based on the import of "wheat" and "Milling products, malt, starch, inulin, wheat gluten" where "wheat flour" has the largest share.
"Fisheries and aquaculture" has achieved the most successful performance in export growth with an annual average increase of 13%. There was also a significant increase in exports in the sections of "Dairy products and eggs", in which "Egg" and "Cheese", which are among the products with a high share in exports, "Meats and edible meat offal" and "Animal and vegetable oils" where "poultry meat" has a 97% share.
When the export performances are evaluated, it is seen that the country has started to lose its competitive advantage in the industries of "Edible fruits and nuts", "Edible vegetables and some roots and tubers" and "Various edible food preparations", whose share in world exports decreased, and there is a need to take measures. The same is true for the "Poultry" and "Egg" industries, where the "added value with factor cost" declines and concentrates on price-oriented competition. Exports of cereal products have also decreased, and products based on wheat imports (pasta, wheat flour) have a high share in exports. The industry is faced with a high supply risk due to trade restrictions as a result of protectionist measures during crisis periods and the possibility of producing countries to enter these industries (producing pasta and wheat flour).
In the TR61 Region, Antalya is the country leader with a 7% share in plant production value and 48% share in greenhouse production when the country's total values are taken into account. The arrival of approximately 12 million local and foreign tourists to Antalya significantly expands the food market in the region. The fact that the industry for processing agricultural products is not developed in Antalya causes the products to be sold outside the region without processing.
Burdur ranks 16th in Turkey based on the amount of milking (369 thousand tons) per year. Most of the milk produced in Burdur Province (about 70%) goes to processing facilities outside the province. In Turkey, it has a share of 8% in the production of Oil Rose and 11% in the production of lavender.
Isparta takes the lead in Turkey with lavender production and rose production for rose oil. In Turkey, 85% of oil rose production and 47% of lavender production take place in Isparta. Sander lucioperca, salmon and crayfish in the Region of Lakes are processed in the facilities established in the city center and Eğirdir and all of them are exported. Apple, dried apple, apple juice and apple juice concentrate have an important place in the economy of the province. There are structural problems related to competition in the agriculture industry, which is one of the main sources of income in the province. The main problems of the agricultural sector are small and fragmented land, low productivity, limited export potential, low added value due to the inability to process agricultural products.
The region has an important share in the export of "fresh fruits and vegetables" in Turkey. However, the export growth rate of these products is realized lower than the export growth rate in Turkey and the world, there is a need to take measures for the industry.
The COVID-19 pandemic has created disruptions and changes in the food supply chain. Its main effect is seen in changing places of consumption of food. With the closure of hotels, restaurants, cafes and schools, out-of-home consumption has come to a halt, and domestic consumption has increased. With the increase in domestic consumption, the load in retail stores, electronic commerce and home delivery services increased. Local products and local vendors have become more preferred. The other major impact occurred in consumer preferences. Demand for storable
FOOD INDUSTRY ANALYSIS REPORT AND GUIDETR22 REGION (Balıkesir, Çanakkale)
111
pasta, flour, canned, dried and frozen foods with long shelf life has increased. Likewise, there has been an increase in demand for healthy products that support the immune system. Probiotic products, organic products, nutritional supplements are among these products. The demand for packaged products has also increased, as they are considered healthy. Although there was a decrease in the demand for fruit and vegetable products due to the risk of contamination in the early days of the pandemic, the demand increased because of the health after the panic atmosphere passed. Domestic consumption of milk and dairy products has increased due to the fact that they are healthy, but there has been a decrease in total sales in this industry as out-of-home consumption has decreased. Total sales reduced with the decrease in out-of-home consumption in meat products, fish and aquaculture products. Domestic consumption has increased since fish and aquaculture products are healthy, but could not compensate for the industry's loss. In general, there was an increase in food prices.
Those who were most adversely affected by the pandemic process were those who run hotels, restaurants and cafes, and companies that sell to these industries and catering companies.
One of the most important facts threatening the food chain is the restriction of exports by grain and oilseed exporting countries trying to ensure their own food security. The availability of sufficient stocks in the country and in the world and the opening of the way for imports by lowering import customs rates have prevented a food bottleneck. Since the plantings were completed when the pandemic started, there was no problem with the crop cultivation. During the harvest period, a labor shortage was experienced. The fact that the majority of the producers are family businesses and the authorization of the producers to work during the quarantine period by the central unit has prevented this problem from being felt deeply. Part of the labor requirement during the harvest and pruning periods was met by migrants. During this period, seasonal labor wages increased.
Another problem caused by the pandemic was the restriction of border trade due to contagion reasons. Imports of agricultural inputs were delayed and production (eg fish-feed production) was disrupted. Likewise, since fresh fruit and vegetable exports could not be carried out, the products were tried to be used domestically. Until exports resumed, there was a decrease in prices in 1-2 months.
In the region, which hosted 12 million tourists, the food market contracted with the cessation of tourism. Those who made sales to these points through hotels, restaurants and cafes in the region ended the period with losses.
There are various factors affecting the food industry in the world. The main ones are income, demographic changes (population growth, population aging, urbanization), changes in consumer preferences (health, social responsibility, organic food, lifestyle changes, trust in the food industry), trends in the supply chain (modern retail market, private brands) and innovation (innovation in the food industry, innovation in packaging, innovation in distribution). In agricultural technologies, precision agriculture, new breeding techniques, agricultural cycle, production of new protein sources, biotechnology come to the fore. In food technologies in industry, robots, data technologies and new production techniques are promising technologies in the short term. In the long run, nanotechnology, 3D printers and cell technology promise.
In value chain analysis, the fact that inputs are based on imports in agricultural production stands as one of the biggest threats. Transporting water by open transport channels and not using modern irrigation methods cause water to be wasted. Water stress is felt severely in the country and the region. It is seen that the transportation of water through closed channels and the implementation of pressurized irrigation (drip, underground drip, sprinkler) systems have become a necessity rather than a strategic choice for the sustainability of agriculture.
The decrease in arable agricultural lands in crop production poses a great threat to the country. Some of the producers have switched from wheat to corn and sunflower. Wheat cultivation areas have decreased significantly. There was no decrease in total wheat production, and this was achieved with an increase in productivity. However, considering the population growth, it is seen that there is approximately 22% decrease in per capita production. It is seen that the productivity in grain production is behind the European average. In order to reduce wheat, sunflower seed and corn imports, productivity enhancement activities especially in wheat come into prominence.

112
Providing water for dry farming areas and seed development studies should be considered as a priority. It seems possible to reduce imports of corn and sunflower seeds by bringing fallow lands to agriculture by alternating planting.
Small scales of agricultural and livestock enterprises are an obstacle to efficient production. The lack of knowledge of the producers, the continuation of wrong practices, their reluctance to implement innovations, the aging of the productive population, the continuing migration to the rural cities and the decrease in the labor force are important problems in agricultural production.
Although the European average in the amount of carcass meat per animal in livestock breeding is caught, it is seen that milk yield is lower than half of the European average. The low fertility rate is an important factor in this. The high mortality rate of calves also leads to an increase in livestock imports. For this reason, it is important to expand veterinary services.
In the survey conducted for Food Industry companies, the weakest issue is the low level of competencies in R&D and innovation, which support product differentiation and value-added production. In this respect, the ability to increase and retain qualified personnel, developing university-industry cooperation, and enriching information resources are the competencies that should be brought in companies. Market access competencies are also one of the main weaknesses. Access to finance has been found to be another area that needs improvement.
Climate change is seen as the biggest threat to the sustainability of the agri-food sector. With the increase in temperature in the world and in the country, it is expected that yield decreases in agricultural production. The depletion of water resources, agricultural lands, the degradation of agricultural lands, and the decrease in biodiversity threaten agricultural production. Innovative systems are needed to reduce the impact of these threats. It should be aimed at increasing resource efficiency by using less biomass by ensuring circular economic integration. In the TR22 Region, all of the whey is utilized and there are biogas/biomass facilities in the region. However, biogas/biomass facilities for electricity generation do not meet the need. It is expected that climate change will cause an increase in temperatures in the TR22 Region, albeit at a slower rate compared to other regions, and therefore, heatwaves, together with drought, and heat stress are anticipated to cause significant yield losses in agriculture. The high water stress in the region increases the importance of the measures to be taken against global climate change.
The TR22 Region, which is located at the intersection of metropolises (Istanbul, Kocaeli, Tekirdağ, İzmir, Manisa, Bursa) and hosts important mountains, plains, rivers, underground water resources, and lakes, has an important share in agricultural production in Turkey. It has a rich product range with the production of cereals (wheat, rice), forage crops, vegetables (especially tomato paste, pepper paste), and fruit (nectarine, peach, olive for oil, apple). Merino sheep, dairy cattle, broiler chickens, and laying hens cultivation has also developed in the region. The share of the food industry in the manufacturing industry in the region is high (36.2% according to the number of employees). It also takes an important place in Turkey (4.6%). Modern animal husbandry is common in the region. It has the capacity to compete with the world in the technology and the production of poultry. The food industry has developed in parallel with agricultural production in the region. There are two Food Industry Specialization Zones. Olive and olive oil, fruit and vegetable processing, dairy products, oil-fat production, feed production, meat processing, poultry farming, fish and aquaculture processing, cereal processing sectors constitute the main sectors of the food industry in the region.
Meat and meat products, fish and aquaculture, processed fruits and vegetables, dairy products, and animal and vegetable oils are the main export items of the region. It has been observed that the region with high production capacity has deficiencies in product differentiation and branding, and marketing competencies and R&D activities are at a low level among its sub-reasons. It is considered that branding activities should be the main strategy of the region and R&D and innovation activities should be increased to support this strategy. That the islands in the region are organic product production centers and/or animal husbandry is carried out in the islands declared "disease-free zone", that strategies of increasing added value and differentiation are implemented by foregrounding the superiorities and/or differences of the region, which affect quality such as the "North Aegean" slogan will probably make significant contributions to the region.
FOOD INDUSTRY ANALYSIS REPORT AND GUIDETR22 REGION (Balıkesir, Çanakkale)
113
As a result of all these evaluations, FAO's guidelines on how to respond COVID-19 were taken into consideration, and national and regional short, medium and long-term strategies were developed to provide solutions to problems within the framework of the concept of sustainability. These strategies are classified within economic, social and environmental scope, which are the basic pillars of sustainability. Within the economic measures, the focus is on the means of participation in the value chain (access to the market, access to training, coordination and cooperation building, access to finance) and factors that create value in the agricultural value chain (increasing quality, increasing system efficiency, differentiated product development).
During the interviews with industry representatives, academics and experts, the lack of communication between the public institutions, university and private sector was emphasized. In order to solve this problem, it has been proposed to establish National and City Councils where all industry stakeholders will be together to develop strategy and policy proposals for the problems of the agri-food industry. Stakeholders stated that agricultural planning could not be done systematically and that difficulties in accessing data were also a factor in this. For this reason, in order to improve the access to data infrastructure, it is recommended that agricultural enterprises be evaluated and registered as other enterprises operating economically, establishing an agri-food information platform and consumer information platforms, and establishing a planning scientific board. For the management of COVID-19 and similar crises, FAO's Food Crisis Management Framework model will be appropriate, and the measures will be carried out in cooperation with the Agri-Food Crisis Management Committee and National/City Councils to be formed within the relevant public unit.
During the crisis period, ensuring the continuity of the workforce, determining the logistics centers where the products will be collected and planning the distribution organization, in case of difficult border trade, creating plans for import-based strategic products and export products, and holding international negotiations to prevent heavy protective measures were recommended as the main measures.
The share of cooperatives in agricultural production is far behind the world average, which makes planning difficult, reduces productivity and makes it difficult for producers to participate effectively in the agricultural value chain. Modeling and popularizing successful cooperatives in the world and in the country, supporting producers and industrialists who cooperate with them financially will contribute to the solution of the structural problems of the cooperatives. It is recommended to support contractual cultivation practices and clusters within the scope of developing cooperation.
It seems that one of the main problems in agriculture and animal husbandry is inefficiency. It is thought that productivity and supply of agricultural products can be increased by bringing together dry farming areas with water, using modern, controlled irrigation methods such as drip irrigation, supporting advanced technologies (such as vertical agriculture), increasing land consolidation activities, decreasing the amount of fallow land by alternating planting.
Increasing business scales in livestock enterprises, breeding development studies, dissemination of Livestock OIZs, improvement of pastures can provide improvement in this industry. With the definition of "Calf Program", it is suggested to solve the problems of low "fertility/calving rate" and high "calf mortality", which are among the important problems of the industry, by raising awareness and expanding veterinary services.
Agricultural producers use the methods they are used to and avoid applying scientific methods suggested by experts because of the concern that they will lose income despite the recommendations of the experts. In order to support the solution of this problem, it would be appropriate to develop an income/harvest insurance model.
In order to increase productivity in the food industry, it is recommended to support the capacity increase of small-scale meat and dairy facilities, to spread Food OIZs, to give support to strategic areas and to prefer models that will encourage cooperation in support. It has been proposed to establish and support collaborations to contribute to increase added value, and to encourage focused R&D projects and investments in strategic products and technologies.
114
Establishing e-commerce applications, smart/digital logistics centers, establishing food banks and using these points as logistics centers in times of crisis to provide access to the market, providing food supply to those in need, and designing and establishing neighborhood bazaars that reduce the risk of contamination during crisis periods are recommended. Establishing foreign trade intelligence centers in the regions and supporting national and/or private sector trade centers abroad will contribute to access to foreign markets. It has also been proposed to support investors who will use Turkish products abroad by developing a Turkish Cuisine model to increase food exports. Virtual fairs to be established across the country or regionally will also make significant contributions to the development of exports.
It is important to establish One-Stop Shops (SME Support Offices) for SMEs to access the services (test/analysis, training, consultancy, financial support, etc.) or access information to these services from a single point. It would be appropriate to provide training in foreign trade and branding, which is one of the weaknesses of SMEs. It is recommended to support informative and promotional activities about Geographical Indication, whose importance in society is insufficiently understood.
It is recommended to develop models by taking successful examples into consideration in vocational education institutions, to increase the weight of applied education and to be implemented in the schools allocated by the Ministry of National Education to Chambers of Industry. It is important to consider applied program in undergraduate and graduate education. It has been proposed to establish Farmers' Training Institutes for the training of agricultural producers and to encourage the participants. Employees should be kept up to date with the training to be provided at Continuing Education Centers.
The acquisition of digital technologies to companies is one of the most important concepts of today. It is considered that TR61 Region is a suitable region for Smart Agriculture (Agriculture 4.0) and it would be beneficial to establish a Model Agricultural Facility in this region.
Among financial measures, the establishment of a crisis fund has been proposed. In order not to cause a social crisis, it is important to compensate those negatively affected during crisis periods and to finance the strategically important workforce. It is suggested that agricultural supports should be designed in a way that encourages efficiency and cooperation. Providing financial management training for producers and business owners will contribute to the elimination of knowledge deficiencies on this subject.
As a measure to decrease the population working in agricultural production due to migration from rural to urban areas, the level of social life in rural areas should be increased. It is recommended to increase the number of village schools, establish sports and social facilities, and provide financial support directly or indirectly (eg financial support for social security premiums) to those engaged in agricultural activities.
Regarding Food Safety, it is recommended to make HACCP implementation mandatory in food processing companies, to enrich the inspection infrastructure, and to support consumer awareness and information activities.
In order to ensure social equality, it has been proposed to increase financial support by making positive discrimination for women and disabled people and to design micro-credit programs.
In order to prevent water waste in agricultural irrigation, with the transition to closed transportation systems, pressurized irrigation systems and supporting labor in pressurized irrigation, it is important to determine the cost of water according to the amount of water used rather than the scale of the irrigated land. Increasing the inspections of industrial wastewater, industrial and domestic wastewater recovery projects, renovation of drinking water distribution channels with high loss rates, establishment of underground dams are presented as water management measures.
Developing projects specifically for the region to prevent the elements that pollute the Lake Eğirdir and preventing the decrease in the water levels of the lakes in the region are important areas. Prevention of illegal fishing in the lakes in the region with inspections and training, training to prevent excessive use of pesticides and fertilizers by farmers, and the use of income/harvest insurance mechanism will support the protection of ecology. Measures to improve the structure of agricultural lands such as combating harmful species and increasing organic matter gain importance in the protection of ecology and productivity increase.

FOOD INDUSTRY ANALYSIS REPORT AND GUIDETR22 REGION (Balıkesir, Çanakkale)
115
It is recommended to develop national scale project(s) for the utilization of industrial and agricultural wastes such as whey, vegetable and animal wastes. For the region, it will be appropriate to make investments to utilize the wastes in compost production.
It is recommended to extend the support of inefficient motors to adapt to climate change, and to provide management consultancy support for energy efficiency studies. In addition, it would be appropriate to establish a Climate Change Adaptation Fund to support Green Deal guidelines and projects developed to adapt to climate change.
Projects for the transportation of agricultural products and the establishment of cold chains for the transportation of food products should be supported to reduce food losses. Considering the fruit and vegetable production capacity, the region is considered to be suitable for pilot implementation. It would be appropriate to continue supporting licensed warehouses. It will be possible to reduce food losses in markets by transferring fruit and vegetable products in supermarkets, whose expiry date is approaching and cannot be sold during the day, to food banks.
116
ReferencesAday Serpil, Aday Mehmet Seçkin, (2020). Impact of COVID-19 on the food supply chain, 24 August 2020Amis, (2021). http://www.amis-outlook.org/; Date Accessed: 26.02.2021Başer Uğur, Bozoğlu Mehmet, (2018). Tarımsal Değer Zincirinde Değer Yaratan Faaliyetlerin Belirlenmesi, 20 July 2018BBC, (2021). https://www.bbc.com/turkce/haberler-dunya-50822713, Date Accessed: 27.02.2021BCG, (2020). COVID-19 Impact, Consumer Spending Tracker for Measured Channels https://www.iriworldwide.com/IRI/media/Library/2020-05-15-IRI-BCG-COVID-Global-Consumer-Spend-Tracker.pdfBülbül Hasan, (2007). Türkiye’deki Büyük Gıda Sanayi Firmalarının Rekabetçi Ve Yenilikçi Uygulamaları, H.Ü. İktisadi ve İdari Bilimler Fakültesi Dergisi, Cilt 25, Sayı 1, 2007, s. 91-120Ceylan Rahmiye Figen, Özkan Burhan, (2020). COVID-19’un Dünyada ve Türkiye’de Tarımsal Üretim ve Gıda Sistemlerine Etkisinin Değerlendirilmesi; 24 Ağustos 2020Deloitte, (2020). Understanding The Sector Impact of Covid19; Consumer Products: Food&Beverage; 25 Mart 2020.EC, (2016). The competitive position of the European food and drink industry, Final Report, Written by the ECSIP consortium February 2016, European CommisionFAO, (2014). David Neven, Developing sustainable food value chains Guiding principles, Food And Agrİculture Organİzatıon Of The Unİted Natİons, Rome, 2014FAO, (2016). FCC-EMPRES Information Sheets - 12; Food Chain Crisis Management Framework; FAO, 2016FAO, (2016). National Gender Profile Of Agrıcultural And Rural Livelihoods Turkey; 2016, FAOFAO, (2017). The Future of Food and Agriculture; Trends and Challenges, 2017, FAOFAO, (2020a). The State of Agricultural Commodity Markets, 2020, FAOFAO, (2020b). Statistical Yearbook World Food and Agriculture, 2020, FAOFAO, (2020c). Schmidhuberand Qiao, “Comparing Crises: Great Lockdown versus Great Recession”, FAO Publicaitons, Rome, https://doi.org/10.4060/ca8833en.FAO, (2020d). COVID-19 and the risk to food supply chains: How to respond?, 29 March 2020, FAOGeotab, (2021). https://www.geotab.com/blog/impact-of-covid-19/; Date Accessed: 26.02.2021https://read.oecd-ilibrary.org/view/?ref=134_134305-ybqvdf0kg9&title=Food-Supply-Chains-and-COVID-19-Impacts-and-policy-lessons GMKA, (2012a). Tarım Araştırma Raporu, 2012. Güney Marmara Kalkınma AjansıGMKA, (2014). Güney Marmara Bölgesi 2014-2023 Kalkınma Planı. Güney Marmara Kalkınma AjansıGMKA, (2019a). Balıkesir Sanayi ve Yatırım Rehberi, 2019. Güney Marmara Kalkınma AjansıGMKA, (2019b). Çanakkale Sanayi ve Yatırım Rehberi, 2019. Güney Marmara Kalkınma AjansıGMKA, (2019c). Balıkesir Tarım ve Hayvancılık Yatırım Rehberi, 2019. Güney Marmara Kalkınma AjansıGMKA, (2019d). Çanakkale Tarım ve Hayvancılık Yatırım Rehberi, 2018. Güney Marmara Kalkınma AjansıGMKA, (2019e). Güney Marmara Bölgesel Yenilik Stratejisi ve Eylem Planı, 24 Ocak 2019. Güney Marmara Kalkınma AjansıING, (2019). Food tech: technology in the food industry; ING Economics Department, April 2019
FOOD INDUSTRY ANALYSIS REPORT AND GUIDETR22 REGION (Balıkesir, Çanakkale)
117
Kıvrak Serpil, (2014). Gıda Sektöründe Dağıtım Kanalı Modelleri Ve Seçim Yaklaşımları, Yüksek Lisans tezi, 2014, Serpil KıvrakKKB, (2020). Koronavirüsün (COVID-19) Tarım ve Gıda Sektörüne Etkileri, April 2020, Kredi Kayıt BürosuKOP, (2017). Buzağı Kayıpları Sempozyumu, KIRIKKALE. 21-22 December 2017. Accessed from https://www.kalkinmakutuphanesi.gov.tr/assets/upload/dosyalar/11-kop_buzagi_kayiplari_sempozyum_kitabi.pdf adresinden erişildi.OECD, (2020a) https://read.oecd-ilibrary.org/view/?ref=134_134305-ybqvdf0kg9&title=Food-Supply-Chains-and-COVID-19-Impacts-and-policy-lessons, Date Accessed: 26.02.2021OECD, (2020b). https://www.oecd.org/agriculture/fruit-vegetables/oecd-covid-19-impact-on-fruit-and-vegetables-trade.pdf OECD, (2020c). Food Supply Chains and COVID-19: Impacts and Policy Lessons, June 2020, OECD-FAO, (2020). Agricultural Outlook 2020-2029Opentable, (2021). https://www.opentable.com/state-of-industry; Date Accessed: 26.02.2021Özkan Uğur, (2016). Türkiyede Kaliteli Kaba Yem Kaynaklarını Mevcut Durumu, Ağustos 2016, Ankara UniversityPatentgrowth, (2020). Gıda ve Tarım Teknoloji Vizyon Raporu, 2020. Accessed from https://www.patentgrowth.com/teknoloji-vizyon-raporlari-pg2020 PBL, (2017). Food for the circular economy, PBL Policy Brief, PBL Netherlands Environmental Assessment Agency, 2017Semerci Arif, (2016). Tarımsal Verimlilik Düzeyleri İle Avrupa Birliği-Türkiye Tarımı, 19.12.2016, Gaziosmanpaşa Üniversitesi Ziraat Fakültesi Dergisi.SGK, (2019). Sigortalı ve İşyeri İstatistikleri. Accessed from http://www.sgk.gov.tr/wps/portal/sgk/tr/kurumsal/istatistik/sgk_istatistik_yilliklari Sixfold, (2021). https://sixfold.com/news/covid-impact-on-logistics-share-of-idling-trucks-almost-triples; Date Accessed: 26.02.2021Stark Karina Fernandez & Bamber Penny, (2012) Basic Principles And Guıdelınes For Impactful And Sustainable Inclusıve Business Interventions In High-Value Agro-Food Value Chains, Karina Fernandez-Stark & Penny Bamber, Aralık 2012, DukeStatista, (2021). https://www.statista.com/outlook/cmo/food/worldwide; Date Accessed: 26.02.2021TAGEM, (2018). Gübre Sektör Politika Belgesi, 2018-2020, Ankara 2018TARMAKBİR, (2020). Türkiye Tarım Makinaları Sektörü Sektör Raporu 03 February 2020, TARMAKBİRTEMA, (2015). Iklim Değişikliğinin Yerel Etkileri Raporu, March 2015. TEMA, WWF, STGMTEPAV, (2019). 81 İl İçin Toplumsal Cinsiyet Eşitliği Karnesi – 2019, TEPAVTGDF, (2017). Türkiye’de İklim Değişikliği ve Tarımda Sürdürülebilirlik, 2017, TGDFTGDF, (2020). COVID-19 Sonrası Gıda ve İçecek Sektörü, Haziran 2020, TGDF AkademiTKB, (2018). 11. Kalkınma Planı, Tarım ve Gıdada Rekabetçi Üretim Özel İhtisas Komisyonu Raporu, Ankara 2018, T.C. Kalkınma BakanlığıTOB, (2016). (Yaş Ve Kuru Meyve Sebze İle Seracılık Dış Pazar Çalışması, T.C. Gıda Tarım Ve Hayvancılık Bakanlığı Avrupa Birliği Ve Dış İlişkiler Genel Müdürlüğü November / 2016TOB, (2019a). Ulusal Su Planı, (2019-2023), T.C. Tarım ve Orman BakanlığıTOB, (2019b). Tarımsal Kooperatiflerin Dünya ve Türkiye’de Mevcut Durumunun Karşılaştırılması, T.C. Tarım ve Orman Bakanlığı, Bekir PAKDEMİRLİ, 28.11.2019Trademap, (2021). www.trademap.org, Date Accessed: 15.01.2021TSB, (2019). Gıda ve İçecek Sektörü Raporu (2019); T.C. Sanayi ve Teknoloji BakanlığıTTGV, (2017). Girişimcilik ve Yenilikçilik İhtiyaç Analizi ve Kümelenme Çalışmaları, 2017. TTGV
118
TÜBİTAK, (2010). Gıda Alanı Ulusal Ar-Ge ve Yenilik Stratejisi Hazırlanmasına İlişkin Bilgi Notu, Ankara, Aralık 2010, TÜBİTAK Bilim, Teknoloji ve Yenilik Politikaları Daire BaşkanlığıTÜGİP, (2021). TÜGİP, IPA-INNOFOOD, Türkiye Gıda İnovasyon Platformu Kurumsal Paydaşlar Çalıştayı. TÜGİP, 25 January 2021TÜİK, (2016). “Büyükbaş hayvanı olan işletmelerin işletme büyüklüğüne göre işletme ve hayvan varlığı dağılımı, 2016” ve “Küçükbaş hayvanı olan işletmelerin işletme büyüklüğüne göre işletme ve hayvan varlığı dağılımı, 2016”TÜİK, (2019). İl Bazında Gayrisafi Yurt İçi Hasıla, 2019. Türkiye İstatistik KurumuTÜRKİYEM-BİR, (2017). Türkiye’de Yem Üretimi: Hedefler ve Potansiyel Problemler, 22 ŞUBAT 2017 Türkiye Yem Sanayicileri BirliğiTÜSİAD, (2020). Sürdürülebilir Büyüme Bağlamında Tarım Ve Gıda Sektörünün Analizi, March 2020Tüzmen Naci, (2018). Türkiye'de Besi ve Et Üretiminde İhracat Potansiyeli, Naci TÜZEMEN, Kastamonu Üniversitesi, Genetik ve Biyomühendislik Bölümü, Kastamonu, 11.2018UPK, (2019). Ulusal Pamuk Konseyi Pamuk Sektör Raporu 2019USDA, (2021). https://www.ers.usda.gov/data-products/food-consumption-and-nutrient-intakes/; Date Accessed: 26.02.2021WFP, (2020). https://www.wfp.org/news/covid-19-will-double-number-people-facing-food-crises-unless-swift-action-taken ; 21 April 2020. Date Accessed: 26.03.2021WORLDBANK, (2021). https://data.worldbank.org/indicator/SP.URB.TOTL.IN.ZS?name_desc=false ; Date Accessed: 26.03.2021Yaralı Engin, (2019). Gıda Zincirinde İzlenebilirlik, Harran Tarım ve Gıda Bilimleri Derg. 2019, 23(1): 108-119ZMO, (2020). Sulama Teknolojileri Türkiye Ziraat Mühendisliği IX. Teknik Kongresi, 13-17 Ocak 2020, Bildiriler Kitabı-1, ISBN-978-605-01-1321-1, Ankara, s. 345-367; Accessed from https://www.zmo.org.tr/yayinlar/kitap_goster.php?kodu=252

FOOD INDUSTRY ANALYSIS REPORT AND GUIDETR22 REGION (Balıkesir, Çanakkale)
119
Annexes:Annex 1: Data on Added Value and Analysis with Factor Cost for Food Production Industry
ADDED VALUE (USD) Value Added Per Employee ($)
CODE NACE Rev. 2
Section, group and class 2010 2018
Rate of change (2010-2018)
2010 2018
Rate of change (2010-2018)
Index 2010
Index 2018
10 Manufacture of Food Products 7.747.389.721 9.288.642.454 19,9% 21.911 18.037 -18% 100 100
10.1Processing and storage of meat and manufacture of meat products
941.107.533 684.935.377 -27,2% 29.637 14.120 -52% 135 78
10.11 Processing and storage of meat 126.752.907 22.198 0 101
10.12 Processing and storage of poultry meat 675.805.651 456.248.308 -32,5% 32.979 15.295 -54% 151 85
10.13 Manufacture of products made from meat and poultry meat 138.548.975 24.950 0 114
10.2 Fish, crustaceans and mollusks processing and storage 130.351.433 344.362.711 164,2% 27.061 38.102 41% 124 211
10.20 Fish, crustaceans and mollusks processing and storage 130.351.433 344.362.711 164,2% 27.061 38.102 41% 124 211
10.3 Processing and storage of vegetables and fruits 747.549.110 1.419.055.546 89,8% 17.091 21.249 24% 78 118
10.31 Potato processing and storage 28.528.021 71.811.570 151,7% 28.962 37.344 29% 132 207
10.32 Vegetable and fruit juice production 118.482.729 251.752.382 112,5% 28.359 42.895 51% 129 238
10.39Processing and storage of fruits and vegetables not classified elsewhere
600.538.361 1.095.491.595 82,4% 15.567 18.570 19% 71 103
10.4 Manufacture of vegetable and animal oils and fats 400.352.975 548.032.032 36,9% 30.872 36.284 18% 141 201
10.41 Oil and fat manufacturing 472.066.443 33.303 185
10.42 Manufacture of margarine and similar edible fats 75.965.588 81.771 453
10.5 Manufacture of dairy products 990.450.716 1.169.600.305 18,1% 30.350 23.892 -21% 139 132
10.51 Dairy management and cheese production 0 0
10.52 Ice cream manufacture 0 0
10.6Manufacture of ground grain products, starch and starch products
655.741.041 704.692.261 7,5% 26.820 26.017 -3% 122 144
10.61 Manufacture of ground grains and vegetable products 564.464.017 585.443.607 3,7% 24.196 23.252 -4% 110 129
10.62 Manufacture of starch and starch products 91.277.023 119.248.654 30,6% 81.425 62.499 -23% 372 347
10.7 Manufacture of bakery and bakery products 1.424.231.729 1.810.150.705 27,1% 11.109 8.874 -20% 51 49
10.71 Bread, fresh pastry products and fresh cake production 886.204.950 973.578.709 9,9% 8.324 5.945 -29% 38 33

10.72
Rusks and biscuits production; durable pastry products and durable cake production
456.726.630 662.409.852 45,0% 24.217 18.656 -23% 111 103
10.73Manufacture of pasta, noodles, couscous and similar bakery products
81.300.149 174.162.143 114,2% 28.171 37.040 31% 129 205
10.8 Manufacture of other foodstuffs 2.167.832.129 2.087.402.511 -3,7% 33.815 25.606 -24% 154 142
10.81 Sugar manufacture 902.975.254 544.083.042 -39,7% 47.126 36.311 -23% 215 201
10.82 Manufacture of cocoa, chocolate and confectionery 473.854.935 672.434.539 41,9% 24.297 24.390 0% 111 135
10.83 Processing of coffee and tea 440.752.235 359.251.121 -18,5% 29.173 20.544 -30% 133 114
10.84 Manufacture of spices, sauces, vinegar and other seasonings 102.995.461 168.619.766 63,7% 24.741 25.898 5% 113 144
10.85 Manufacture of ready meals 15.971.467 85.607.148 436,0% 10.843 12.567 16% 49 70
10.86 Homogenized food preparations and dietetic food manufacturing 5.579.103 5.379.154 -3,6% 23.640 18.173 -23% 108 101
10.89 Manufacture of other foodstuffs not elsewhere classified 225.703.675 252.027.742 11,7% 50.561 32.061 -37% 231 178
10.9 Manufacture of ready animal feeds 289.773.055 520.411.005 79,6% 26.553 37.191 40% 121 206
10.91 Manufacture of ready-made feed for farm animals 283.654.077 511.127.905 80,2% 26.421 37.867 43% 121 210
10.92 Manufacture of prepared food for pets 6.118.979 9.283.100 51,7% 34.571 18.754 -46% 158 104
Source: Calculated on the basis of TURKSTAT data
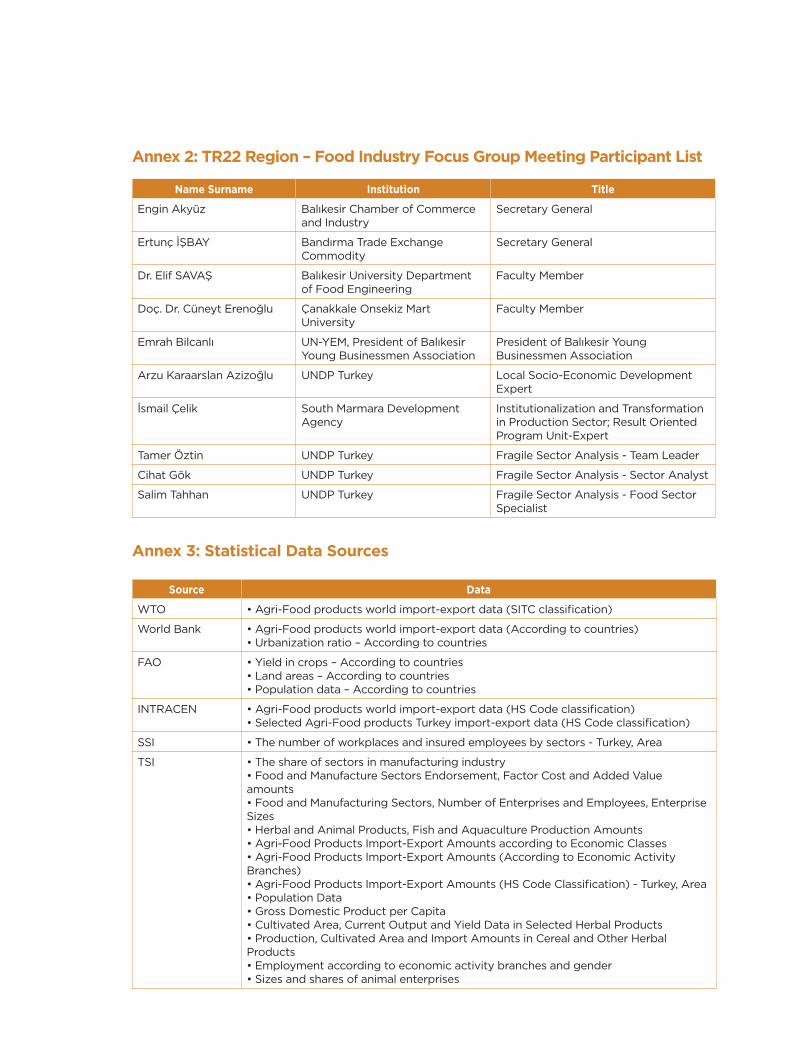
Annex 2: TR22 Region – Food Industry Focus Group Meeting Participant List
Name Surname Institution Title
Engin Akyüz Balıkesir Chamber of Commerce and Industry
Secretary General
Ertunç İŞBAY Bandırma Trade Exchange Commodity
Secretary General
Dr. Elif SAVAŞ Balıkesir University Department of Food Engineering
Faculty Member
Doç. Dr. Cüneyt Erenoğlu Çanakkale Onsekiz Mart University
Faculty Member
Emrah Bilcanlı UN-YEM, President of Balıkesir Young Businessmen Association
President of Balıkesir Young Businessmen Association
Arzu Karaarslan Azizoğlu UNDP Turkey Local Socio-Economic Development Expert
İsmail Çelik South Marmara Development Agency
Institutionalization and Transformation in Production Sector; Result Oriented Program Unit-Expert
Tamer Öztin UNDP Turkey Fragile Sector Analysis - Team Leader
Cihat Gök UNDP Turkey Fragile Sector Analysis - Sector Analyst
Salim Tahhan UNDP Turkey Fragile Sector Analysis - Food Sector Specialist
Annex 3: Statistical Data Sources
Source Data
WTO • Agri-Food products world import-export data (SITC classification)
World Bank • Agri-Food products world import-export data (According to countries)• Urbanization ratio – According to countries
FAO • Yield in crops – According to countries• Land areas – According to countries• Population data – According to countries
INTRACEN • Agri-Food products world import-export data (HS Code classification)• Selected Agri-Food products Turkey import-export data (HS Code classification)
SSI • The number of workplaces and insured employees by sectors - Turkey, Area
TSI • The share of sectors in manufacturing industry• Food and Manufacture Sectors Endorsement, Factor Cost and Added Value amounts• Food and Manufacturing Sectors, Number of Enterprises and Employees, Enterprise Sizes • Herbal and Animal Products, Fish and Aquaculture Production Amounts• Agri-Food Products Import-Export Amounts according to Economic Classes• Agri-Food Products Import-Export Amounts (According to Economic Activity Branches) • Agri-Food Products Import-Export Amounts (HS Code Classification) - Turkey, Area• Population Data• Gross Domestic Product per Capita• Cultivated Area, Current Output and Yield Data in Selected Herbal Products• Production, Cultivated Area and Import Amounts in Cereal and Other Herbal Products• Employment according to economic activity branches and gender• Sizes and shares of animal enterprises

122

TR22 REGION
FOOD INDUSTRYANALYSIS REPORT
AND GUIDE
COVID-19 Crisis Response and Resilience Project


