Embed Size (px)
Citation preview
www.harriswilliams.com
Member FINRA/SIPC
Food and Beverage Industry Update
October 2014
2 of 16
What We’re SeeingCONTENTS
INDUSTRY VITAL SIGNS
EQUITY MARKET OVERVIEW
M&A MARKET OVERVIEW
DEBT MARKET OVERVIEW
NOTABLE M&A ACTIVITY
PUBLIC COMPARABLES
EARNINGS CALENDAR
GROUP OVERVIEW
Harris Williams & Co. is a leading
advisor to the food and beverage
market. Our significant experience
covers a broad range of end
markets, industries, and business
models. This particular report
focuses on trends and metrics in the
following areas:
• Agribusiness
• Baked and Prepared Goods
• Beverages
• Branded and Private Label
• Dairy
• Distribution
• Ingredients
• Meat and Protein
• Natural and Organic
• Processing
• Produce
• Restaurant and Retail
• Snacks
CONTACTS
Glenn Gurtcheff | Managing Director
+1 (612) 359-2702
Tim Alexander | Managing Director
+1 (612) 359-2716
Ryan Budlong | Director
+1 (415) 217-3409
Brant Cash | Vice President
+1 (612) 359-2709
Ryan Freeman | Vice President
+1 (612) 359-2703
Matt Whebbe | Vice President
+1 (612) 359-2727
www.harriswilliams.com
On September 10th, Ajinomoto North America, Inc. announced the acquisition of Windsor Foods for
approximately $800 million. The acquisition will enable Ajinomoto to combine its global strength in food
manufacturing with Windsor’s strong market position and distribution network throughout the US.
Following the transaction, Ajinomoto will solidify its leading position in the Asian/Ethnic frozen foods
category in the US. Like other Japanese firms, Ajinomoto is looking abroad as the domestic market
shrinks due to an aging population and a slowing economy.
Access to the investor presentation here.
Ajinomoto Expands Frozen Foods Footprint With Purchase of Windsor Foods
What We’re Reading
On September 17th, The WhiteWave Foods Company announced its agreement to acquire So Delicious®
Dairy Free from Wasserstein & Co. for approximately $195 million. The acquisition provides WhiteWave
with further penetration of its core market of plant-based food and beverages, along with the #1 plant-
based frozen dessert brand in the US. Following the acquisition of Earthbound Farms, this transaction
marks WhiteWave’s second expansion in the non-GMO category.
Access to the full article here.
WhiteWave Foods Broadens Plant-Based Platform with Purchase of So Delicious
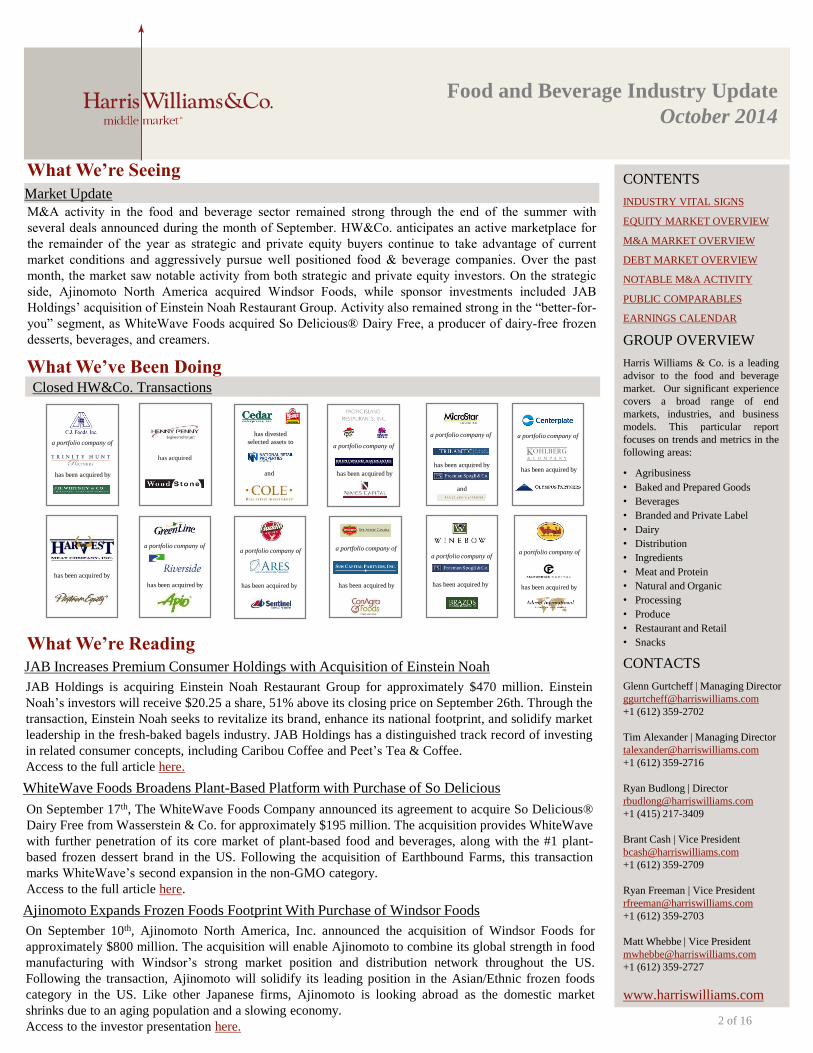
M&A activity in the food and beverage sector remained strong through the end of the summer with
several deals announced during the month of September. HW&Co. anticipates an active marketplace for
the remainder of the year as strategic and private equity buyers continue to take advantage of current
market conditions and aggressively pursue well positioned food & beverage companies. Over the past
month, the market saw notable activity from both strategic and private equity investors. On the strategic
side, Ajinomoto North America acquired Windsor Foods, while sponsor investments included JAB
Holdings’ acquisition of Einstein Noah Restaurant Group. Activity also remained strong in the “better-for-
you” segment, as WhiteWave Foods acquired So Delicious® Dairy Free, a producer of dairy-free frozen
desserts, beverages, and creamers.
Market Update
Food and Beverage Industry Update
October 2014
What We’ve Been DoingClosed HW&Co. Transactions
has been acquired by
has been acquired by
a portfolio company of
has been acquired by
a portfolio company ofhas divested
selected assets to
and
has been acquired by
has acquired
JAB Increases Premium Consumer Holdings with Acquisition of Einstein Noah
JAB Holdings is acquiring Einstein Noah Restaurant Group for approximately $470 million. Einstein
Noah’s investors will receive $20.25 a share, 51% above its closing price on September 26th. Through the
transaction, Einstein Noah seeks to revitalize its brand, enhance its national footprint, and solidify market
leadership in the fresh-baked bagels industry. JAB Holdings has a distinguished track record of investing
in related consumer concepts, including Caribou Coffee and Peet’s Tea & Coffee.
Access to the full article here.
a portfolio company of a portfolio company of
has been acquired by
a portfolio company of
has been acquired by
a portfolio company of
has been acquired by
a portfolio company of
has been acquired by
has been acquired by
and
a portfolio company of
has been acquired by
a portfolio company of
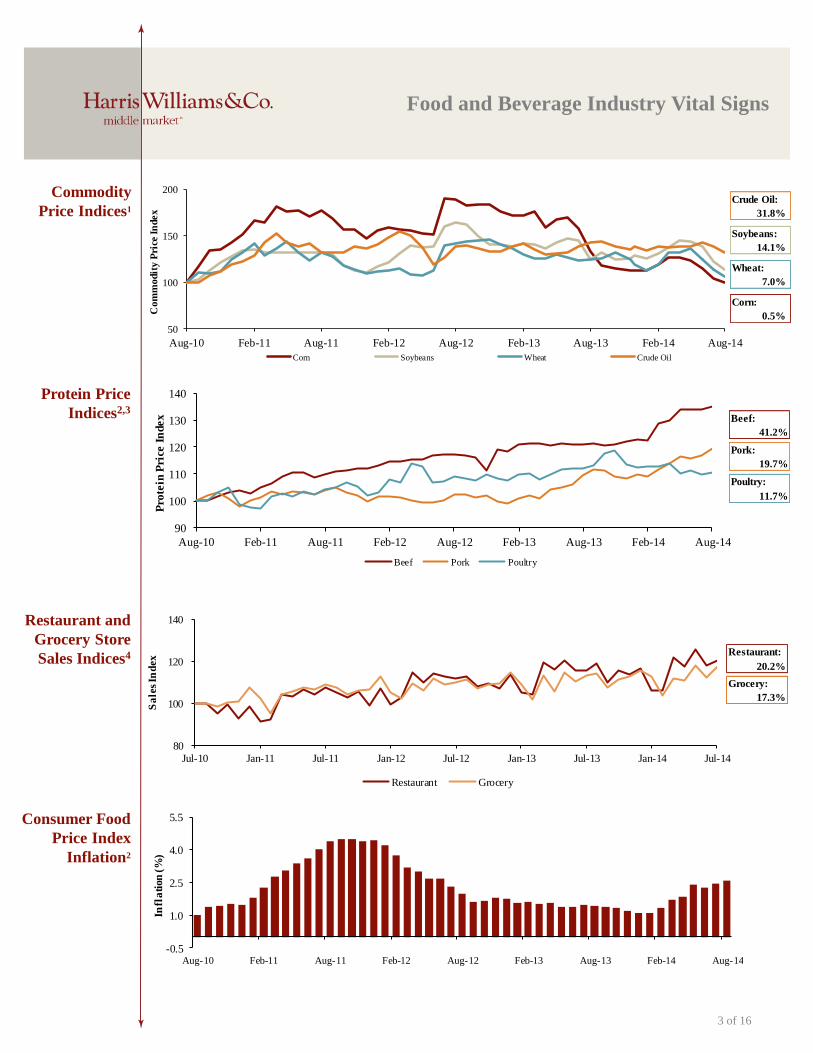
Crude Oil:
31.8%
Soybeans:
14.1%
Wheat:
7.0%
Corn:
0.5%
3 of 16
Food and Beverage Industry Vital Signs
Consumer Food
Price Index
Inflation2
Commodity
Price Indices1
50
100
150
200
Aug-10 Feb-11 Aug-11 Feb-12 Aug-12 Feb-13 Aug-13 Feb-14 Aug-14
Com
modit
y P
rice
In
dex
Corn Soybeans Wheat Crude Oil
Protein Price
Indices2,3
Restaurant and
Grocery Store
Sales Indices4
80
100
120
140
Jul-10 Jan-11 Jul-11 Jan-12 Jul-12 Jan-13 Jul-13 Jan-14 Jul-14
Sa
les
Ind
ex
Restaurant Grocery
90
100
110
120
130
140
Aug-10 Feb-11 Aug-11 Feb-12 Aug-12 Feb-13 Aug-13 Feb-14 Aug-14
Pro
tein
Pri
ce I
nd
ex
Beef Pork Poultry
-0.5
1.0
2.5
4.0
5.5
Aug-10 Feb-11 Aug-11 Feb-12 Aug-12 Feb-13 Aug-13 Feb-14 Aug-14
Infl
ati
on
(%
)
Restaurant:
20.2%
Grocery:
17.3%
Beef:
41.2%
Pork:
19.7%
Poultry:
11.7%
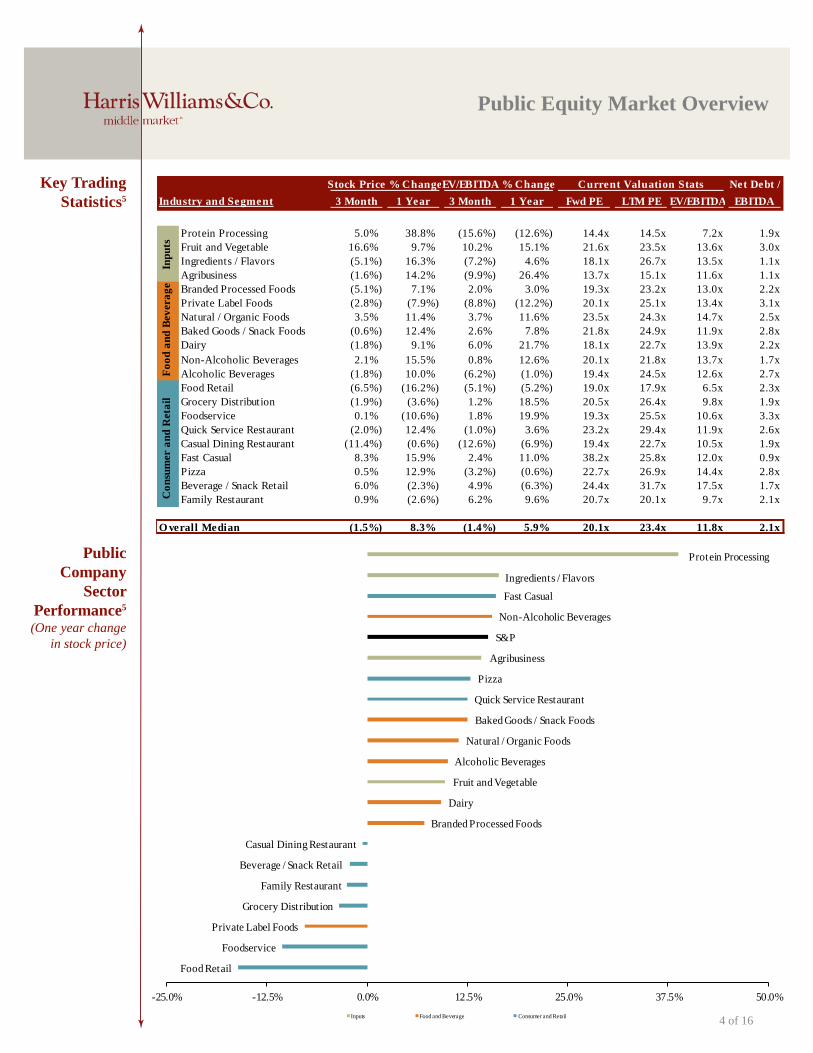
Net Debt /
Industry and Segment 3 Month 1 Year 3 Month 1 Year Fwd PE LTM PE EV/EBITDA EBITDA
Protein Processing 5.0% 38.8% (15.6%) (12.6%) 14.4x 14.5x 7.2x 1.9x
Fruit and Vegetable 16.6% 9.7% 10.2% 15.1% 21.6x 23.5x 13.6x 3.0x
Ingredients / Flavors (5.1%) 16.3% (7.2%) 4.6% 18.1x 26.7x 13.5x 1.1x
Agribusiness (1.6%) 14.2% (9.9%) 26.4% 13.7x 15.1x 11.6x 1.1x
Branded Processed Foods (5.1%) 7.1% 2.0% 3.0% 19.3x 23.2x 13.0x 2.2x
Private Label Foods (2.8%) (7.9%) (8.8%) (12.2%) 20.1x 25.1x 13.4x 3.1x
Natural / Organic Foods 3.5% 11.4% 3.7% 11.6% 23.5x 24.3x 14.7x 2.5x
Baked Goods / Snack Foods (0.6%) 12.4% 2.6% 7.8% 21.8x 24.9x 11.9x 2.8x
Dairy (1.8%) 9.1% 6.0% 21.7% 18.1x 22.7x 13.9x 2.2x
Non-Alcoholic Beverages 2.1% 15.5% 0.8% 12.6% 20.1x 21.8x 13.7x 1.7x
Alcoholic Beverages (1.8%) 10.0% (6.2%) (1.0%) 19.4x 24.5x 12.6x 2.7x
Food Retail (6.5%) (16.2%) (5.1%) (5.2%) 19.0x 17.9x 6.5x 2.3x
Grocery Distribution (1.9%) (3.6%) 1.2% 18.5% 20.5x 26.4x 9.8x 1.9x
Foodservice 0.1% (10.6%) 1.8% 19.9% 19.3x 25.5x 10.6x 3.3x
Quick Service Restaurant (2.0%) 12.4% (1.0%) 3.6% 23.2x 29.4x 11.9x 2.6x
Casual Dining Restaurant (11.4%) (0.6%) (12.6%) (6.9%) 19.4x 22.7x 10.5x 1.9x
Fast Casual 8.3% 15.9% 2.4% 11.0% 38.2x 25.8x 12.0x 0.9x
Pizza 0.5% 12.9% (3.2%) (0.6%) 22.7x 26.9x 14.4x 2.8x
Beverage / Snack Retail 6.0% (2.3%) 4.9% (6.3%) 24.4x 31.7x 17.5x 1.7x
Family Restaurant 0.9% (2.6%) 6.2% 9.6% 20.7x 20.1x 9.7x 2.1x
O verall Median (1.5%) 8.3% (1.4%) 5.9% 20.1x 23.4x 11.8x 2.1x
Stock Price % ChangeEV/EBITDA % Change Current Valuation Stats
Fo
od
an
d B
ev
era
ge
Inp
uts
Co
nsu
mer a
nd
Reta
il
Key Trading
Statistics5
4 of 16
Public Equity Market Overview
Public
Company
Sector
Performance5
(One year change
in stock price)
Food Retail
Foodservice
Private Label Foods
Grocery Distribution
Family Restaurant
Beverage / Snack Retail
Casual Dining Restaurant
Branded Processed Foods
Dairy
Fruit and Vegetable
Alcoholic Beverages
Natural / Organic Foods
Baked Goods / Snack Foods
Quick Service Restaurant
Pizza
Agribusiness
S&P
Non-Alcoholic Beverages
Fast Casual
Ingredients / Flavors
Protein Processing
-25.0% -12.5% 0.0% 12.5% 25.0% 37.5% 50.0%
Inputs Food and Beverage Consumer and Retail
80
90
100
110
120
130
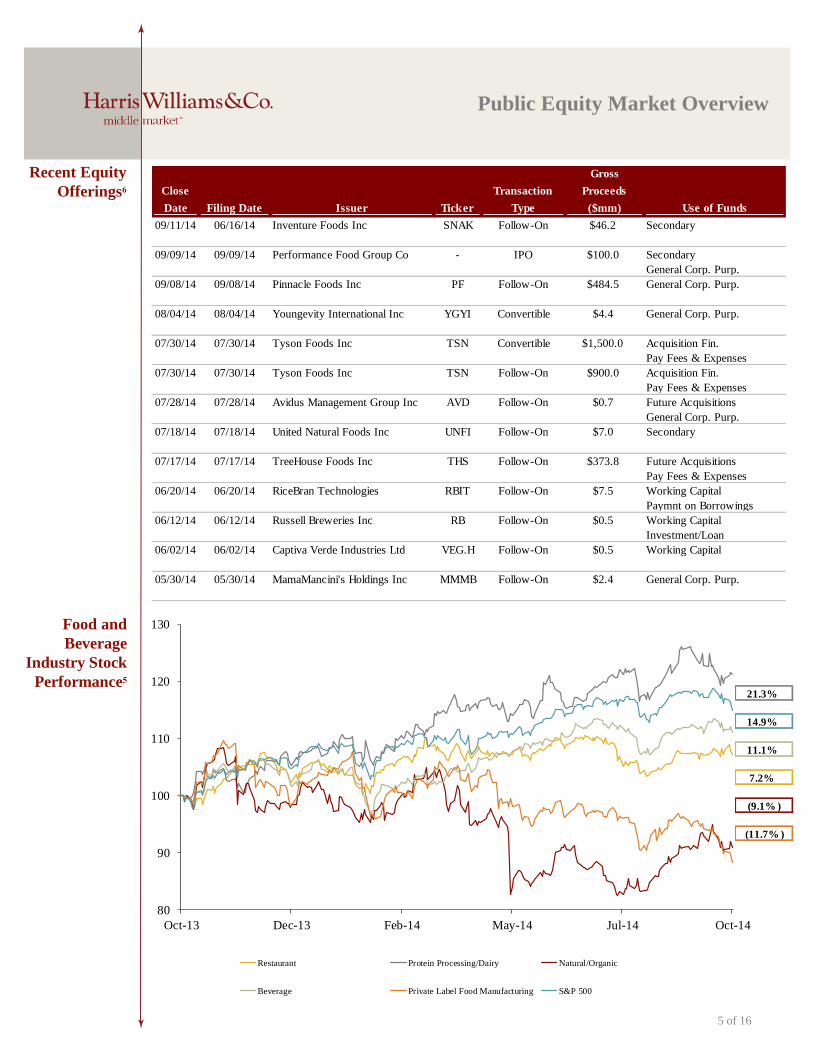
Oct-13 Dec-13 Feb-14 May-14 Jul-14 Oct-14
Restaurant Protein Processing/Dairy Natural/Organic
Beverage Private Label Food Manufacturing S&P 500
Close
Date Filing Date Issuer Ticker
Transaction
Type
Gross
Proceeds
($mm) Use of Funds
09/11/14 06/16/14 Inventure Foods Inc SNAK Follow-On $46.2 Secondary
09/09/14 09/09/14 Performance Food Group Co - IPO $100.0 Secondary
General Corp. Purp.
09/08/14 09/08/14 Pinnacle Foods Inc PF Follow-On $484.5 General Corp. Purp.
08/04/14 08/04/14 Youngevity International Inc YGYI Convertible $4.4 General Corp. Purp.
07/30/14 07/30/14 Tyson Foods Inc TSN Convertible $1,500.0 Acquisition Fin.
Pay Fees & Expenses
07/30/14 07/30/14 Tyson Foods Inc TSN Follow-On $900.0 Acquisition Fin.
Pay Fees & Expenses
07/28/14 07/28/14 Avidus Management Group Inc AVD Follow-On $0.7 Future Acquisitions
General Corp. Purp.
07/18/14 07/18/14 United Natural Foods Inc UNFI Follow-On $7.0 Secondary
07/17/14 07/17/14 TreeHouse Foods Inc THS Follow-On $373.8 Future Acquisitions
Pay Fees & Expenses
06/20/14 06/20/14 RiceBran Technologies RBIT Follow-On $7.5 Working Capital
Paymnt on Borrowings
06/12/14 06/12/14 Russell Breweries Inc RB Follow-On $0.5 Working Capital
Investment/Loan
06/02/14 06/02/14 Captiva Verde Industries Ltd VEG.H Follow-On $0.5 Working Capital
05/30/14 05/30/14 MamaMancini's Holdings Inc MMMB Follow-On $2.4 General Corp. Purp.
Recent Equity
Offerings6
5 of 16
Public Equity Market Overview
Food and
Beverage
Industry Stock
Performance521.3%
14.9%
11.1%
7.2%
(9.1% )
(11.7% )
Last 10 Deals Announced Private Equity Investments and Exits
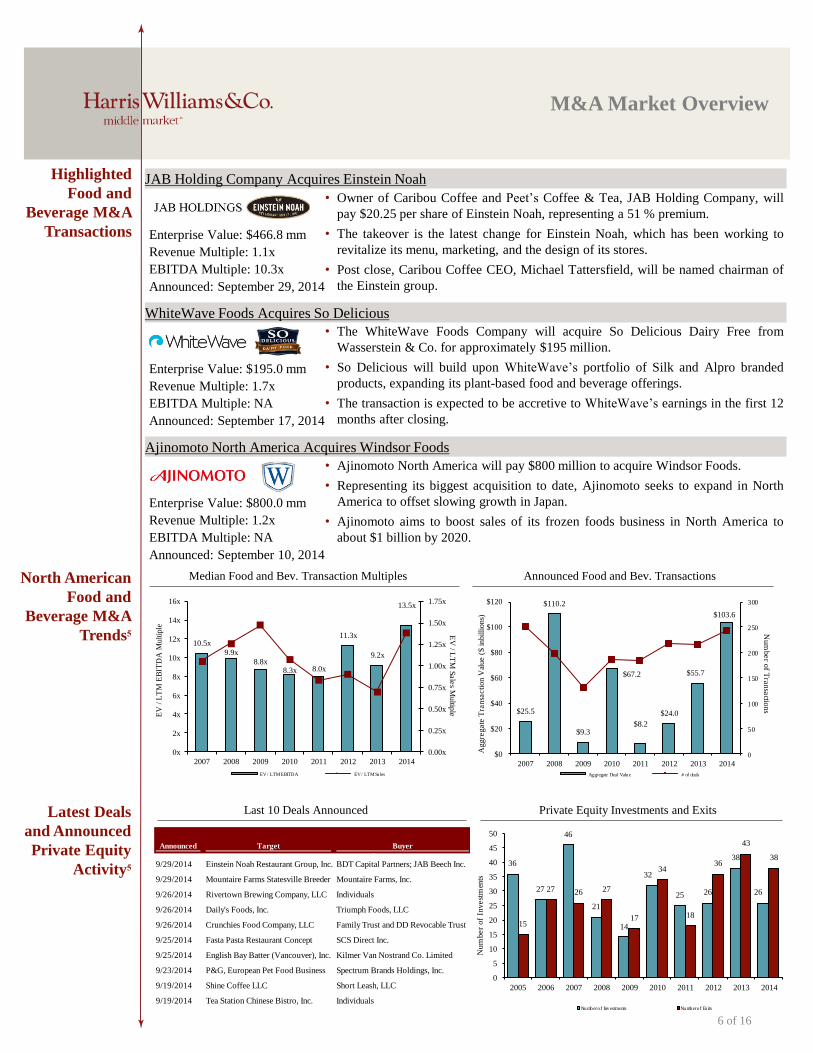
Median Food and Bev. Transaction Multiples Announced Food and Bev. TransactionsNorth American
Food and
Beverage M&A
Trends5
6 of 16
M&A Market Overview
Latest Deals
and Announced
Private Equity
Activity5
Highlighted
Food and
Beverage M&A
Transactions
36
27
46
21
14
32
25 26
38
26
15
27 26 27
17
34
18
36
43
38
0
5
10
15
20
25
30
35
40
45
50
2005 2006 2007 2008 2009 2010 2011 2012 2013 2014
Num
ber
of
Invest
men
ts
Number of Investments Number of Exits
$25.5
$110.2
$9.3
$67.2
$8.2
$24.0
$55.7
$103.6
0
50
100
150
200
250
300
$0
$20
$40
$60
$80
$100
$120
2007 2008 2009 2010 2011 2012 2013 2014
Nu
mb
er o
f Tra
nsa
ctions
Ag
gre
gate
Tra
nsa
ctio
n V
alu
e (
$ in
billio
ns)
Aggregate Deal Value # of deals
Announced Target Buyer1/0/1900 0 JAB Holdings B.V.
9/29/2014 Einstein Noah Restaurant Group, Inc. BDT Capital Partners; JAB Beech Inc.
9/29/2014 Mountaire Farms Statesville Breeder Mountaire Farms, Inc.
9/26/2014 Rivertown Brewing Company, LLC Individuals
9/26/2014 Daily's Foods, Inc. Triumph Foods, LLC
9/26/2014 Crunchies Food Company, LLC Family Trust and DD Revocable Trust
9/25/2014 Fasta Pasta Restaurant Concept SCS Direct Inc.
9/25/2014 English Bay Batter (Vancouver), Inc. Kilmer Van Nostrand Co. Limited
9/23/2014 P&G, European Pet Food Business Spectrum Brands Holdings, Inc.
9/19/2014 Shine Coffee LLC Short Leash, LLC
9/19/2014 Tea Station Chinese Bistro, Inc. Individuals
10.5x
9.9x
8.8x 8.3x 8.0x
11.3x
9.2x
13.5x
0.00x
0.25x
0.50x
0.75x
1.00x
1.25x
1.50x
1.75x
0x
2x
4x
6x
8x
10x
12x
14x
16x
2007 2008 2009 2010 2011 2012 2013 2014
EV
/ LT
M S
ale
s Mu
ltiple
EV
/ L
TM
EB
ITD
A M
ultip
le
EV / LTM EBITDA EV / LTM Sa les
Enterprise Value: $800.0 mm
Revenue Multiple: 1.2x
EBITDA Multiple: NA
Announced: September 10, 2014
Ajinomoto North America Acquires Windsor Foods
• Ajinomoto North America will pay $800 million to acquire Windsor Foods.
• Representing its biggest acquisition to date, Ajinomoto seeks to expand in North
America to offset slowing growth in Japan.
• Ajinomoto aims to boost sales of its frozen foods business in North America to
about $1 billion by 2020.
Enterprise Value: $195.0 mm
Revenue Multiple: 1.7x
EBITDA Multiple: NA
Announced: September 17, 2014
WhiteWave Foods Acquires So Delicious
• The WhiteWave Foods Company will acquire So Delicious Dairy Free from
Wasserstein & Co. for approximately $195 million.
• So Delicious will build upon WhiteWave’s portfolio of Silk and Alpro branded
products, expanding its plant-based food and beverage offerings.
• The transaction is expected to be accretive to WhiteWave’s earnings in the first 12
months after closing.
Enterprise Value: $466.8 mm
Revenue Multiple: 1.1x
EBITDA Multiple: 10.3x
Announced: September 29, 2014
JAB Holding Company Acquires Einstein Noah
• Owner of Caribou Coffee and Peet’s Coffee & Tea, JAB Holding Company, will
pay $20.25 per share of Einstein Noah, representing a 51 % premium.
• The takeover is the latest change for Einstein Noah, which has been working to
revitalize its menu, marketing, and the design of its stores.
• Post close, Caribou Coffee CEO, Michael Tattersfield, will be named chairman of
the Einstein group.
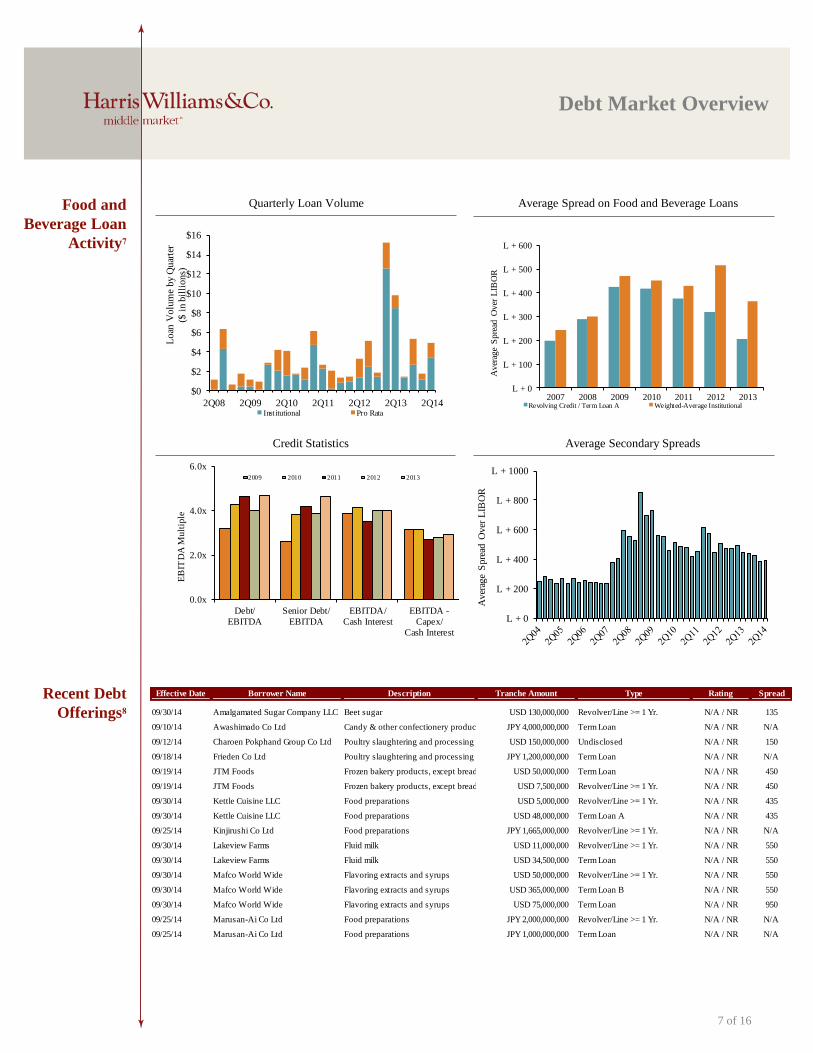
Credit Statistics Average Secondary Spreads
Quarterly Loan Volume Average Spread on Food and Beverage LoansFood and
Beverage Loan
Activity7
Recent Debt
Offerings8Effective Date Borrower Name Description Tranche Amount Type Rating Spread
09/30/14 Amalgamated Sugar Company LLC Beet sugar USD 130,000,000 Revolver/Line >= 1 Yr. N/A / NR 135
09/10/14 Awashimado Co Ltd Candy & other confectionery products JPY 4,000,000,000 Term Loan N/A / NR N/A
09/12/14 Charoen Pokphand Group Co Ltd Poultry slaughtering and processing USD 150,000,000 Undisclosed N/A / NR 150
09/18/14 Frieden Co Ltd Poultry slaughtering and processing JPY 1,200,000,000 Term Loan N/A / NR N/A
09/19/14 JTM Foods Frozen bakery products, except bread USD 50,000,000 Term Loan N/A / NR 450
09/19/14 JTM Foods Frozen bakery products, except bread USD 7,500,000 Revolver/Line >= 1 Yr. N/A / NR 450
09/30/14 Kettle Cuisine LLC Food preparations USD 5,000,000 Revolver/Line >= 1 Yr. N/A / NR 435
09/30/14 Kettle Cuisine LLC Food preparations USD 48,000,000 Term Loan A N/A / NR 435
09/25/14 Kinjirushi Co Ltd Food preparations JPY 1,665,000,000 Revolver/Line >= 1 Yr. N/A / NR N/A
09/30/14 Lakeview Farms Fluid milk USD 11,000,000 Revolver/Line >= 1 Yr. N/A / NR 550
09/30/14 Lakeview Farms Fluid milk USD 34,500,000 Term Loan N/A / NR 550
09/30/14 Mafco World Wide Flavoring extracts and syrups USD 50,000,000 Revolver/Line >= 1 Yr. N/A / NR 550
09/30/14 Mafco World Wide Flavoring extracts and syrups USD 365,000,000 Term Loan B N/A / NR 550
09/30/14 Mafco World Wide Flavoring extracts and syrups USD 75,000,000 Term Loan N/A / NR 950
09/25/14 Marusan-Ai Co Ltd Food preparations JPY 2,000,000,000 Revolver/Line >= 1 Yr. N/A / NR N/A
09/25/14 Marusan-Ai Co Ltd Food preparations JPY 1,000,000,000 Term Loan N/A / NR N/A
7 of 16
Debt Market Overview
0.0x
2.0x
4.0x
6.0x
Debt/
EBITDA
Senior Debt/
EBITDA
EBITDA/
Cash Interest
EBITDA -
Capex/
Cash Interest
EB
ITD
A M
ult
iple
2009 2010 2011 2012 2013
L + 0
L + 200
L + 400
L + 600
L + 800
L + 1000A
ver
age
Spre
ad O
ver
LIB
OR
L + 0
L + 100
L + 200
L + 300
L + 400
L + 500
L + 600
2007 2008 2009 2010 2011 2012 2013
Aver
age
Spre
ad O
ver
LIB
OR
Revolving Credit / Term Loan A Weighted-Average Institutional
$0
$2
$4
$6
$8
$10
$12
$14
$16
2Q08 2Q09 2Q10 2Q11 2Q12 2Q13 2Q14
Lo
an V
olu
me
by
Qu
arte
r
($ i
n b
illi
ons)
Inst itutional Pro Rata
8 of 16
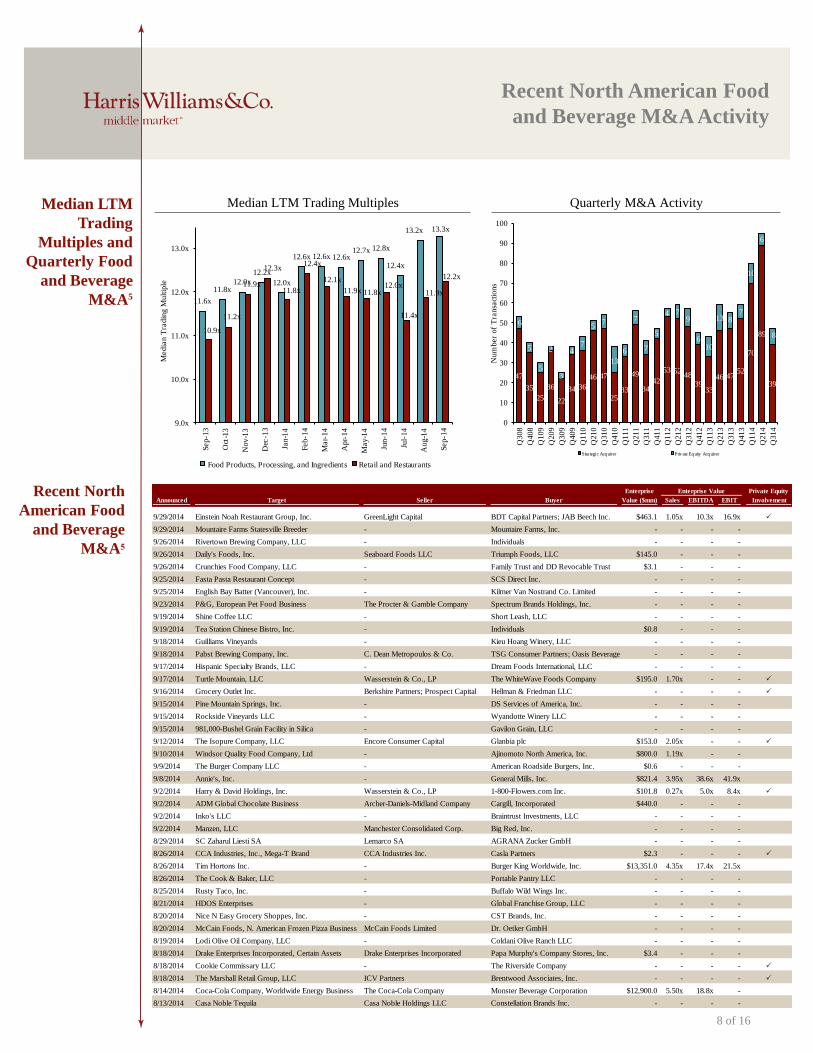
Recent North
American Food
and Beverage
M&A5
Recent North American Food
and Beverage M&A Activity
Quarterly M&A ActivityMedian LTM
Trading
Multiples and
Quarterly Food
and Beverage
M&A5
Median LTM Trading Multiples
47
35
25
36
22
34 36
46 47
2533
49
3442
53 5248
3933
46 4752
70
89
39
6
5
5
2
3
47
57
13
6
7
7
5
4 79
610
13 87
10
6
8
0
10
20
30
40
50
60
70
80
90
100
Q3
08
Q4
08
Q1
09
Q209
Q3
09
Q4
09
Q1
10
Q2
10
Q310
Q4
10
Q1
11
Q2
11
Q3
11
Q411
Q1
12
Q2
12
Q3
12
Q4
12
Q113
Q2
13
Q3
13
Q4
13
Q1
14
Q214
Q3
14
Nu
mb
er
of
Tra
nsa
ctio
ns
Stra tegic Acquirer Private Equity Acquirer
Enterprise Enterprise Value Private Equity
Announced Target Seller Buyer Value ($mm) Sales EBITDA EBIT Involvement
9/29/2014 Einstein Noah Restaurant Group, Inc. GreenLight Capital BDT Capital Partners; JAB Beech Inc. $463.1 1.05x 10.3x 16.9x P
9/29/2014 Mountaire Farms Statesville Breeder - Mountaire Farms, Inc. - - - -
9/26/2014 Rivertown Brewing Company, LLC - Individuals - - - -
9/26/2014 Daily's Foods, Inc. Seaboard Foods LLC Triumph Foods, LLC $145.0 - - -
9/26/2014 Crunchies Food Company, LLC - Family Trust and DD Revocable Trust $3.1 - - -
9/25/2014 Fasta Pasta Restaurant Concept - SCS Direct Inc. - - - -
9/25/2014 English Bay Batter (Vancouver), Inc. - Kilmer Van Nostrand Co. Limited - - - -
9/23/2014 P&G, European Pet Food Business The Procter & Gamble Company Spectrum Brands Holdings, Inc. - - - -
9/19/2014 Shine Coffee LLC - Short Leash, LLC - - - -
9/19/2014 Tea Station Chinese Bistro, Inc. - Individuals $0.8 - - -
9/18/2014 Guilliams Vineyards - Kieu Hoang Winery, LLC - - - -
9/18/2014 Pabst Brewing Company, Inc. C. Dean Metropoulos & Co. TSG Consumer Partners; Oasis Beverages - - - -
9/17/2014 Hispanic Specialty Brands, LLC - Dream Foods International, LLC - - - -
9/17/2014 Turtle Mountain, LLC Wasserstein & Co., LP The WhiteWave Foods Company $195.0 1.70x - - P
9/16/2014 Grocery Outlet Inc. Berkshire Partners; Prospect Capital Hellman & Friedman LLC - - - - P
9/15/2014 Pine Mountain Springs, Inc. - DS Services of America, Inc. - - - -
9/15/2014 Rockside Vineyards LLC - Wyandotte Winery LLC - - - -
9/15/2014 981,000-Bushel Grain Facility in Silica - Gavilon Grain, LLC - - - -
9/12/2014 The Isopure Company, LLC Encore Consumer Capital Glanbia plc $153.0 2.05x - - P
9/10/2014 Windsor Quality Food Company, Ltd - Ajinomoto North America, Inc. $800.0 1.19x - -
9/9/2014 The Burger Company LLC - American Roadside Burgers, Inc. $0.6 - - -
9/8/2014 Annie's, Inc. - General Mills, Inc. $821.4 3.95x 38.6x 41.9x
9/2/2014 Harry & David Holdings, Inc. Wasserstein & Co., LP 1-800-Flowers.com Inc. $101.8 0.27x 5.0x 8.4x P
9/2/2014 ADM Global Chocolate Business Archer-Daniels-Midland Company Cargill, Incorporated $440.0 - - -
9/2/2014 Inko's LLC - Braintrust Investments, LLC - - - -
9/2/2014 Manzen, LLC Manchester Consolidated Corp. Big Red, Inc. - - - -
8/29/2014 SC Zaharul Liesti SA Lemarco SA AGRANA Zucker GmbH - - - -
8/26/2014 CCA Industries, Inc., Mega-T Brand CCA Industries Inc. Casla Partners $2.3 - - - P
8/26/2014 Tim Hortons Inc. - Burger King Worldwide, Inc. $13,351.0 4.35x 17.4x 21.5x
8/26/2014 The Cook & Baker, LLC - Portable Pantry LLC - - - -
8/25/2014 Rusty Taco, Inc. - Buffalo Wild Wings Inc. - - - -
8/21/2014 HDOS Enterprises - Global Franchise Group, LLC - - - -
8/20/2014 Nice N Easy Grocery Shoppes, Inc. - CST Brands, Inc. - - - -
8/20/2014 McCain Foods, N. American Frozen Pizza Business McCain Foods Limited Dr. Oetker GmbH - - - -
8/19/2014 Lodi Olive Oil Company, LLC - Coldani Olive Ranch LLC - - - -
8/18/2014 Drake Enterprises Incorporated, Certain Assets Drake Enterprises Incorporated Papa Murphy's Company Stores, Inc. $3.4 - - -
8/18/2014 Cookie Commissary LLC - The Riverside Company - - - - P
8/18/2014 The Marshall Retail Group, LLC ICV Partners Brentwood Associates, Inc. - - - - P
8/14/2014 Coca-Cola Company, Worldwide Energy Business The Coca-Cola Company Monster Beverage Corporation $12,900.0 5.50x 18.8x -
8/13/2014 Casa Noble Tequila Casa Noble Holdings LLC Constellation Brands Inc. - - - -
11.6x
11.8x12.0x
12.2x
12.0x
12.6x 12.6x 12.6x12.7x 12.8x
12.4x
13.2x 13.3x
10.9x
11.2x
11.9x
12.3x
11.8x
12.4x
12.1x
11.9x 11.8x12.0x
11.4x
11.9x
12.2x
9.0x
10.0x
11.0x
12.0x
13.0x
Sep
-13
Oct
-13
Nov
-13
Dec
-13
Jan
-14
Feb-1
4
Mar-
14
Apr-
14
May
-14
Jun-1
4
Jul-
14
Aug
-14
Sep
-14
Me
dia
n T
radin
g M
ult
iple
Food Products, Processing, and Ingredients Retail and Restaurants
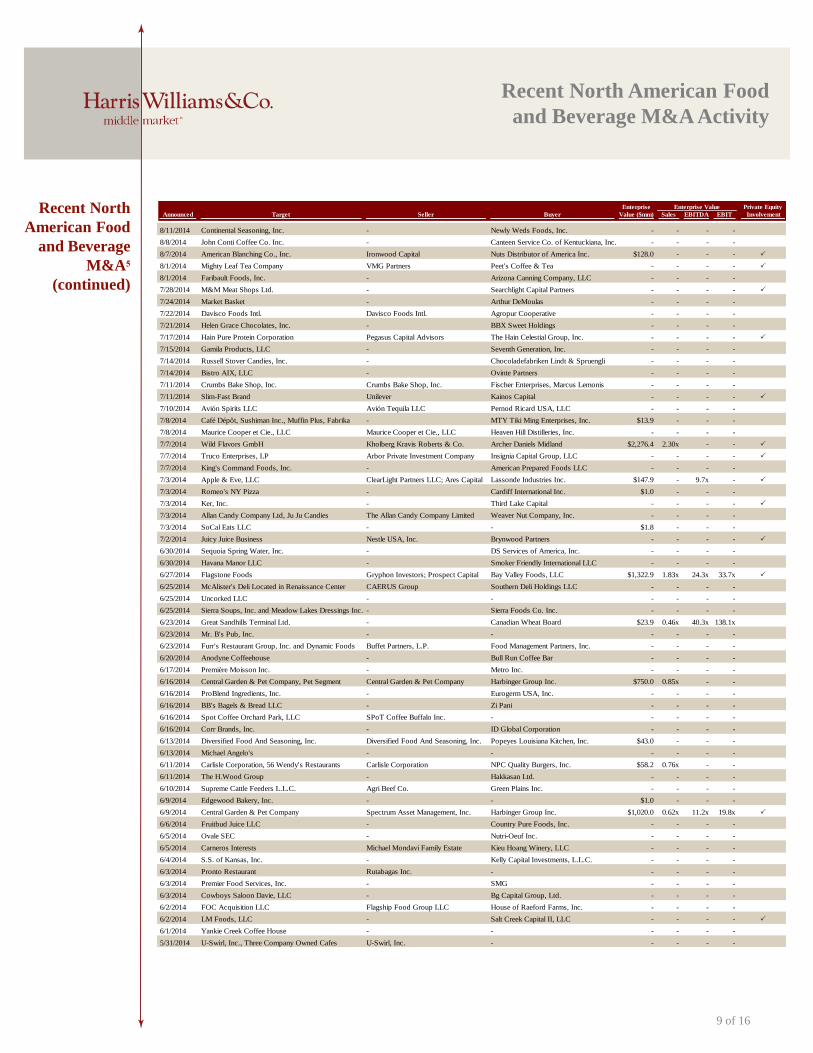
Recent North
American Food
and Beverage
M&A5
(continued)
9 of 16
Recent North American Food
and Beverage M&A Activity
Enterprise Enterprise Value Private Equity
Announced Target Seller Buyer Value ($mm) Sales EBITDA EBIT Involvement
8/11/2014 Continental Seasoning, Inc. - Newly Weds Foods, Inc. - - - -
8/8/2014 John Conti Coffee Co. Inc. - Canteen Service Co. of Kentuckiana, Inc. - - - -
8/7/2014 American Blanching Co., Inc. Ironwood Capital Nuts Distributor of America Inc. $128.0 - - - P
8/1/2014 Mighty Leaf Tea Company VMG Partners Peet's Coffee & Tea - - - - P
8/1/2014 Faribault Foods, Inc. - Arizona Canning Company, LLC - - - -
7/28/2014 M&M Meat Shops Ltd. - Searchlight Capital Partners - - - - P
7/24/2014 Market Basket - Arthur DeMoulas - - - -
7/22/2014 Davisco Foods Intl. Davisco Foods Intl. Agropur Cooperative - - - -
7/21/2014 Helen Grace Chocolates, Inc. - BBX Sweet Holdings - - - -
7/17/2014 Hain Pure Protein Corporation Pegasus Capital Advisors The Hain Celestial Group, Inc. - - - - P
7/15/2014 Gamila Products, LLC - Seventh Generation, Inc. - - - -
7/14/2014 Russell Stover Candies, Inc. - Chocoladefabriken Lindt & Spruengli - - - -
7/14/2014 Bistro AIX, LLC - Ovinte Partners - - - -
7/11/2014 Crumbs Bake Shop, Inc. Crumbs Bake Shop, Inc. Fischer Enterprises, Marcus Lemonis - - - -
7/11/2014 Slim-Fast Brand Unilever Kainos Capital - - - - P
7/10/2014 Avión Spirits LLC Avión Tequila LLC Pernod Ricard USA, LLC - - - -
7/8/2014 Café Dépôt, Sushiman Inc., Muffin Plus, Fabrika - MTY Tiki Ming Enterprises, Inc. $13.9 - - -
7/8/2014 Maurice Cooper et Cie., LLC Maurice Cooper et Cie., LLC Heaven Hill Distilleries, Inc. - - - -
7/7/2014 Wild Flavors GmbH Kholberg Kravis Roberts & Co. Archer Daniels Midland $2,276.4 2.30x - - P
7/7/2014 Truco Enterprises, LP Arbor Private Investment Company Insignia Capital Group, LLC - - - - P
7/7/2014 King's Command Foods, Inc. - American Prepared Foods LLC - - - -
7/3/2014 Apple & Eve, LLC ClearLight Partners LLC; Ares Capital Lassonde Industries Inc. $147.9 - 9.7x - P
7/3/2014 Romeo's NY Pizza - Cardiff International Inc. $1.0 - - -
7/3/2014 Ker, Inc. - Third Lake Capital - - - - P
7/3/2014 Allan Candy Company Ltd, Ju Ju Candies The Allan Candy Company Limited Weaver Nut Company, Inc. - - - -
7/3/2014 SoCal Eats LLC - - $1.8 - - -
7/2/2014 Juicy Juice Business Nestle USA, Inc. Brynwood Partners - - - - P
6/30/2014 Sequoia Spring Water, Inc. - DS Services of America, Inc. - - - -
6/30/2014 Havana Manor LLC - Smoker Friendly International LLC - - - -
6/27/2014 Flagstone Foods Gryphon Investors; Prospect Capital Bay Valley Foods, LLC $1,322.9 1.83x 24.3x 33.7x P
6/25/2014 McAlister's Deli Located in Renaissance Center CAERUS Group Southern Deli Holdings LLC - - - -
6/25/2014 Uncorked LLC - - - - - -
6/25/2014 Sierra Soups, Inc. and Meadow Lakes Dressings Inc. - Sierra Foods Co. Inc. - - - -
6/23/2014 Great Sandhills Terminal Ltd. - Canadian Wheat Board $23.9 0.46x 40.3x 138.1x
6/23/2014 Mr. B's Pub, Inc. - - - - - -
6/23/2014 Furr's Restaurant Group, Inc. and Dynamic Foods Buffet Partners, L.P. Food Management Partners, Inc. - - - -
6/20/2014 Anodyne Coffeehouse - Bull Run Coffee Bar - - - -
6/17/2014 Première Moisson Inc. - Metro Inc. - - - -
6/16/2014 Central Garden & Pet Company, Pet Segment Central Garden & Pet Company Harbinger Group Inc. $750.0 0.85x - -
6/16/2014 ProBlend Ingredients, Inc. - Eurogerm USA, Inc. - - - -
6/16/2014 BB's Bagels & Bread LLC - Zi Pani - - - -
6/16/2014 Spot Coffee Orchard Park, LLC SPoT Coffee Buffalo Inc. - - - - -
6/16/2014 Corr Brands, Inc. - ID Global Corporation - - - -
6/13/2014 Diversified Food And Seasoning, Inc. Diversified Food And Seasoning, Inc. Popeyes Louisiana Kitchen, Inc. $43.0 - - -
6/13/2014 Michael Angelo's - - - - - -
6/11/2014 Carlisle Corporation, 56 Wendy's Restaurants Carlisle Corporation NPC Quality Burgers, Inc. $58.2 0.76x - -
6/11/2014 The H.Wood Group - Hakkasan Ltd. - - - -
6/10/2014 Supreme Cattle Feeders L.L.C. Agri Beef Co. Green Plains Inc. - - - -
6/9/2014 Edgewood Bakery, Inc. - - $1.0 - - -
6/9/2014 Central Garden & Pet Company Spectrum Asset Management, Inc. Harbinger Group Inc. $1,020.0 0.62x 11.2x 19.8x P
6/6/2014 Fruitbud Juice LLC - Country Pure Foods, Inc. - - - -
6/5/2014 Ovale SEC - Nutri-Oeuf Inc. - - - -
6/5/2014 Carneros Interests Michael Mondavi Family Estate Kieu Hoang Winery, LLC - - - -
6/4/2014 S.S. of Kansas, Inc. - Kelly Capital Investments, L.L.C. - - - -
6/3/2014 Pronto Restaurant Rutabagas Inc. - - - - -
6/3/2014 Premier Food Services, Inc. - SMG - - - -
6/3/2014 Cowboys Saloon Davie, LLC - Bg Capital Group, Ltd. - - - -
6/2/2014 FOC Acquisition LLC Flagship Food Group LLC House of Raeford Farms, Inc. - - - -
6/2/2014 LM Foods, LLC - Salt Creek Capital II, LLC - - - - P
6/1/2014 Yankie Creek Coffee House - - - - - -
5/31/2014 U-Swirl, Inc., Three Company Owned Cafes U-Swirl, Inc. - - - - -
10 of 16
Member FINRA/SIPC
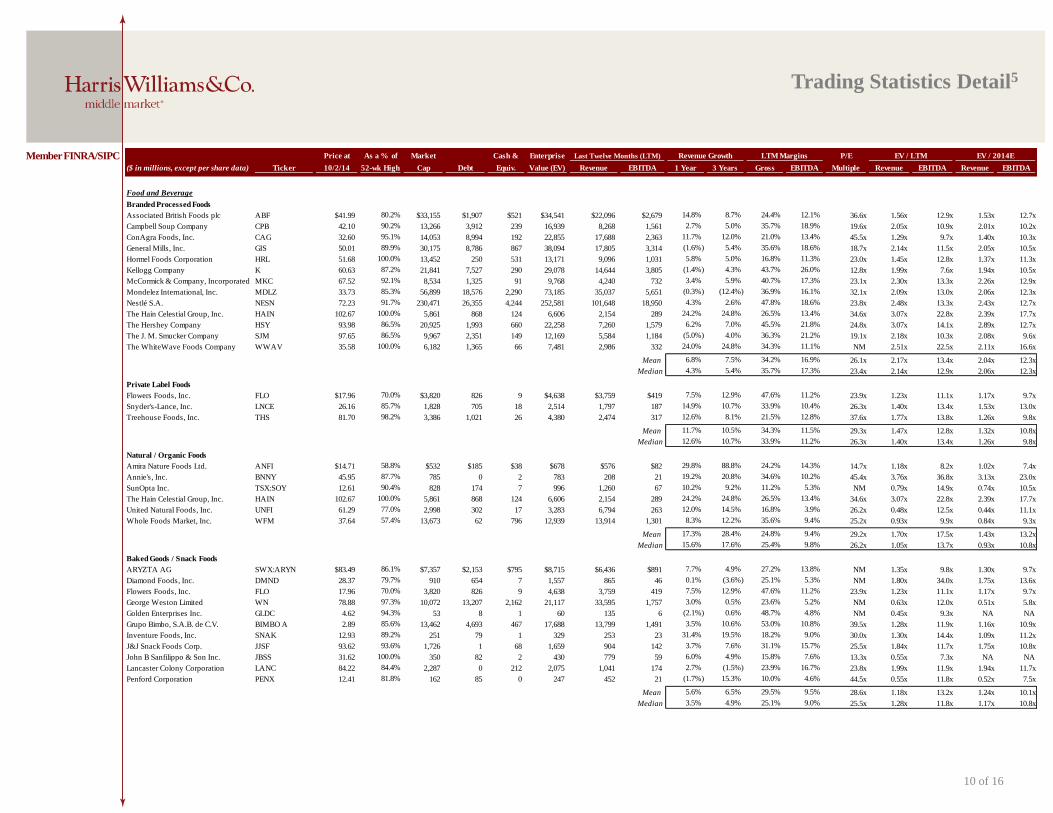
Trading Statistics Detail5
Price at As a % of Market Cash & Enterprise P/E
($ in millions, except per share data) Ticker 10/2/14 52-wk High Cap Debt Equiv. Value (EV) Revenue EBITDA 1 Year 3 Years Gross EBITDA Multiple Revenue EBITDA Revenue EBITDA
Food and Beverage
Branded Processed Foods
Associated British Foods plc ABF $41.99 80.2% $33,155 $1,907 $521 $34,541 $22,096 $2,679 14.8% 8.7% 24.4% 12.1% 36.6x 1.56x 12.9x 1.53x 12.7x
Campbell Soup Company CPB 42.10 90.2% 13,266 3,912 239 16,939 8,268 1,561 2.7% 5.0% 35.7% 18.9% 19.6x 2.05x 10.9x 2.01x 10.2x
ConAgra Foods, Inc. CAG 32.60 95.1% 14,053 8,994 192 22,855 17,688 2,363 11.7% 12.0% 21.0% 13.4% 45.5x 1.29x 9.7x 1.40x 10.3x
General Mills, Inc. GIS 50.01 89.9% 30,175 8,786 867 38,094 17,805 3,314 (1.6%) 5.4% 35.6% 18.6% 18.7x 2.14x 11.5x 2.05x 10.5x
Hormel Foods Corporation HRL 51.68 100.0% 13,452 250 531 13,171 9,096 1,031 5.8% 5.0% 16.8% 11.3% 23.0x 1.45x 12.8x 1.37x 11.3x
Kellogg Company K 60.63 87.2% 21,841 7,527 290 29,078 14,644 3,805 (1.4%) 4.3% 43.7% 26.0% 12.8x 1.99x 7.6x 1.94x 10.5x
McCormick & Company, Incorporated MKC 67.52 92.1% 8,534 1,325 91 9,768 4,240 732 3.4% 5.9% 40.7% 17.3% 23.1x 2.30x 13.3x 2.26x 12.9x
Mondelez International, Inc. MDLZ 33.73 85.3% 56,899 18,576 2,290 73,185 35,037 5,651 (0.3%) (12.4%) 36.9% 16.1% 32.1x 2.09x 13.0x 2.06x 12.3x
Nestlé S.A. NESN 72.23 91.7% 230,471 26,355 4,244 252,581 101,648 18,950 4.3% 2.6% 47.8% 18.6% 23.8x 2.48x 13.3x 2.43x 12.7x
The Hain Celestial Group, Inc. HAIN 102.67 100.0% 5,861 868 124 6,606 2,154 289 24.2% 24.8% 26.5% 13.4% 34.6x 3.07x 22.8x 2.39x 17.7x
The Hershey Company HSY 93.98 86.5% 20,925 1,993 660 22,258 7,260 1,579 6.2% 7.0% 45.5% 21.8% 24.8x 3.07x 14.1x 2.89x 12.7x
The J. M. Smucker Company SJM 97.65 86.5% 9,967 2,351 149 12,169 5,584 1,184 (5.0%) 4.0% 36.3% 21.2% 19.1x 2.18x 10.3x 2.08x 9.6x
The WhiteWave Foods Company WWAV 35.58 100.0% 6,182 1,365 66 7,481 2,986 332 24.0% 24.8% 34.3% 11.1% NM 2.51x 22.5x 2.11x 16.6x
Mean 6.8% 7.5% 34.2% 16.9% 26.1x 2.17x 13.4x 2.04x 12.3x
Median 4.3% 5.4% 35.7% 17.3% 23.4x 2.14x 12.9x 2.06x 12.3x
Private Label Foods
Flowers Foods, Inc. FLO $17.96 70.0% $3,820 826 9 $4,638 $3,759 $419 7.5% 12.9% 47.6% 11.2% 23.9x 1.23x 11.1x 1.17x 9.7x
Snyder's-Lance, Inc. LNCE 26.16 85.7% 1,828 705 18 2,514 1,797 187 14.9% 10.7% 33.9% 10.4% 26.3x 1.40x 13.4x 1.53x 13.0x
Treehouse Foods, Inc. THS 81.70 98.2% 3,386 1,021 26 4,380 2,474 317 12.6% 8.1% 21.5% 12.8% 37.6x 1.77x 13.8x 1.26x 9.8x
Mean 11.7% 10.5% 34.3% 11.5% 29.3x 1.47x 12.8x 1.32x 10.8x
Median 12.6% 10.7% 33.9% 11.2% 26.3x 1.40x 13.4x 1.26x 9.8x
Natural / Organic Foods
Amira Nature Foods Ltd. ANFI $14.71 58.8% $532 $185 $38 $678 $576 $82 29.8% 88.8% 24.2% 14.3% 14.7x 1.18x 8.2x 1.02x 7.4x
Annie's, Inc. BNNY 45.95 87.7% 785 0 2 783 208 21 19.2% 20.8% 34.6% 10.2% 45.4x 3.76x 36.8x 3.13x 23.0x
SunOpta Inc. TSX:SOY 12.61 90.4% 828 174 7 996 1,260 67 10.2% 9.2% 11.2% 5.3% NM 0.79x 14.9x 0.74x 10.5x
The Hain Celestial Group, Inc. HAIN 102.67 100.0% 5,861 868 124 6,606 2,154 289 24.2% 24.8% 26.5% 13.4% 34.6x 3.07x 22.8x 2.39x 17.7x
United Natural Foods, Inc. UNFI 61.29 77.0% 2,998 302 17 3,283 6,794 263 12.0% 14.5% 16.8% 3.9% 26.2x 0.48x 12.5x 0.44x 11.1x
Whole Foods Market, Inc. WFM 37.64 57.4% 13,673 62 796 12,939 13,914 1,301 8.3% 12.2% 35.6% 9.4% 25.2x 0.93x 9.9x 0.84x 9.3x
Mean 17.3% 28.4% 24.8% 9.4% 29.2x 1.70x 17.5x 1.43x 13.2x
Median 15.6% 17.6% 25.4% 9.8% 26.2x 1.05x 13.7x 0.93x 10.8x
Baked Goods / Snack Foods
ARYZTA AG SWX:ARYN $83.49 86.1% $7,357 $2,153 $795 $8,715 $6,436 $891 7.7% 4.9% 27.2% 13.8% NM 1.35x 9.8x 1.30x 9.7x
Diamond Foods, Inc. DMND 28.37 79.7% 910 654 7 1,557 865 46 0.1% (3.6%) 25.1% 5.3% NM 1.80x 34.0x 1.75x 13.6x
Flowers Foods, Inc. FLO 17.96 70.0% 3,820 826 9 4,638 3,759 419 7.5% 12.9% 47.6% 11.2% 23.9x 1.23x 11.1x 1.17x 9.7x
George Weston Limited WN 78.88 97.3% 10,072 13,207 2,162 21,117 33,595 1,757 3.0% 0.5% 23.6% 5.2% NM 0.63x 12.0x 0.51x 5.8x
Golden Enterprises Inc. GLDC 4.62 94.3% 53 8 1 60 135 6 (2.1%) 0.6% 48.7% 4.8% NM 0.45x 9.3x NA NA
Grupo Bimbo, S.A.B. de C.V. BIMBO A 2.89 85.6% 13,462 4,693 467 17,688 13,799 1,491 3.5% 10.6% 53.0% 10.8% 39.5x 1.28x 11.9x 1.16x 10.9x
Inventure Foods, Inc. SNAK 12.93 89.2% 251 79 1 329 253 23 31.4% 19.5% 18.2% 9.0% 30.0x 1.30x 14.4x 1.09x 11.2x
J&J Snack Foods Corp. JJSF 93.62 93.6% 1,726 1 68 1,659 904 142 3.7% 7.6% 31.1% 15.7% 25.5x 1.84x 11.7x 1.75x 10.8x
John B Sanfilippo & Son Inc. JBSS 31.62 100.0% 350 82 2 430 779 59 6.0% 4.9% 15.8% 7.6% 13.3x 0.55x 7.3x NA NA
Lancaster Colony Corporation LANC 84.22 84.4% 2,287 0 212 2,075 1,041 174 2.7% (1.5%) 23.9% 16.7% 23.8x 1.99x 11.9x 1.94x 11.7x
Penford Corporation PENX 12.41 81.8% 162 85 0 247 452 21 (1.7%) 15.3% 10.0% 4.6% 44.5x 0.55x 11.8x 0.52x 7.5x
Mean 5.6% 6.5% 29.5% 9.5% 28.6x 1.18x 13.2x 1.24x 10.1x
Median 3.5% 4.9% 25.1% 9.0% 25.5x 1.28x 11.8x 1.17x 10.8x
EV / LTM EV / 2014ERevenue Growth LTM MarginsLast Twelve Months (LTM)
Member FINRA/SIPC
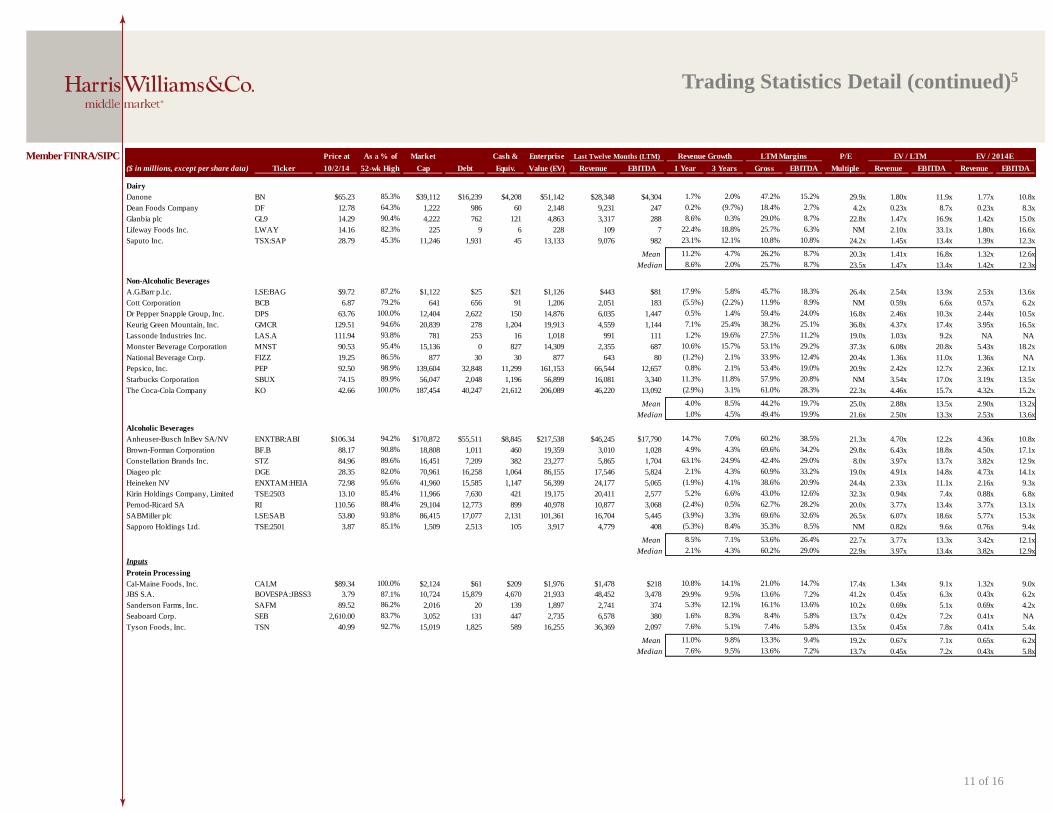
11 of 16
Trading Statistics Detail (continued)5
Price at As a % of Market Cash & Enterprise P/E
($ in millions, except per share data) Ticker 10/2/14 52-wk High Cap Debt Equiv. Value (EV) Revenue EBITDA 1 Year 3 Years Gross EBITDA Multiple Revenue EBITDA Revenue EBITDA
Dairy
Danone BN $65.23 85.3% $39,112 $16,239 $4,208 $51,142 $28,348 $4,304 1.7% 2.0% 47.2% 15.2% 29.9x 1.80x 11.9x 1.77x 10.8x
Dean Foods Company DF 12.78 64.3% 1,222 986 60 2,148 9,231 247 0.2% (9.7%) 18.4% 2.7% 4.2x 0.23x 8.7x 0.23x 8.3x
Glanbia plc GL9 14.29 90.4% 4,222 762 121 4,863 3,317 288 8.6% 0.3% 29.0% 8.7% 22.8x 1.47x 16.9x 1.42x 15.0x
Lifeway Foods Inc. LWAY 14.16 82.3% 225 9 6 228 109 7 22.4% 18.8% 25.7% 6.3% NM 2.10x 33.1x 1.80x 16.6x
Saputo Inc. TSX:SAP 28.79 45.3% 11,246 1,931 45 13,133 9,076 982 23.1% 12.1% 10.8% 10.8% 24.2x 1.45x 13.4x 1.39x 12.3x
Mean 11.2% 4.7% 26.2% 8.7% 20.3x 1.41x 16.8x 1.32x 12.6x
Median 8.6% 2.0% 25.7% 8.7% 23.5x 1.47x 13.4x 1.42x 12.3x
Non-Alcoholic Beverages
A.G.Barr p.l.c. LSE:BAG $9.72 87.2% $1,122 $25 $21 $1,126 $443 $81 17.9% 5.8% 45.7% 18.3% 26.4x 2.54x 13.9x 2.53x 13.6x
Cott Corporation BCB 6.87 79.2% 641 656 91 1,206 2,051 183 (5.5%) (2.2%) 11.9% 8.9% NM 0.59x 6.6x 0.57x 6.2x
Dr Pepper Snapple Group, Inc. DPS 63.76 100.0% 12,404 2,622 150 14,876 6,035 1,447 0.5% 1.4% 59.4% 24.0% 16.8x 2.46x 10.3x 2.44x 10.5x
Keurig Green Mountain, Inc. GMCR 129.51 94.6% 20,839 278 1,204 19,913 4,559 1,144 7.1% 25.4% 38.2% 25.1% 36.8x 4.37x 17.4x 3.95x 16.5x
Lassonde Industries Inc. LAS.A 111.94 93.8% 781 253 16 1,018 991 111 1.2% 19.6% 27.5% 11.2% 19.0x 1.03x 9.2x NA NA
Monster Beverage Corporation MNST 90.53 95.4% 15,136 0 827 14,309 2,355 687 10.6% 15.7% 53.1% 29.2% 37.3x 6.08x 20.8x 5.43x 18.2x
National Beverage Corp. FIZZ 19.25 86.5% 877 30 30 877 643 80 (1.2%) 2.1% 33.9% 12.4% 20.4x 1.36x 11.0x 1.36x NA
Pepsico, Inc. PEP 92.50 98.9% 139,604 32,848 11,299 161,153 66,544 12,657 0.8% 2.1% 53.4% 19.0% 20.9x 2.42x 12.7x 2.36x 12.1x
Starbucks Corporation SBUX 74.15 89.9% 56,047 2,048 1,196 56,899 16,081 3,340 11.3% 11.8% 57.9% 20.8% NM 3.54x 17.0x 3.19x 13.5x
The Coca-Cola Company KO 42.66 100.0% 187,454 40,247 21,612 206,089 46,220 13,092 (2.9%) 3.1% 61.0% 28.3% 22.3x 4.46x 15.7x 4.32x 15.2x
Mean 4.0% 8.5% 44.2% 19.7% 25.0x 2.88x 13.5x 2.90x 13.2x
Median 1.0% 4.5% 49.4% 19.9% 21.6x 2.50x 13.3x 2.53x 13.6x
Alcoholic Beverages
Anheuser-Busch InBev SA/NV ENXTBR:ABI $106.34 94.2% $170,872 $55,511 $8,845 $217,538 $46,245 $17,790 14.7% 7.0% 60.2% 38.5% 21.3x 4.70x 12.2x 4.36x 10.8x
Brown-Forman Corporation BF.B 88.17 90.8% 18,808 1,011 460 19,359 3,010 1,028 4.9% 4.3% 69.6% 34.2% 29.8x 6.43x 18.8x 4.50x 17.1x
Constellation Brands Inc. STZ 84.96 89.6% 16,451 7,209 382 23,277 5,865 1,704 63.1% 24.9% 42.4% 29.0% 8.0x 3.97x 13.7x 3.82x 12.9x
Diageo plc DGE 28.35 82.0% 70,961 16,258 1,064 86,155 17,546 5,824 2.1% 4.3% 60.9% 33.2% 19.0x 4.91x 14.8x 4.73x 14.1x
Heineken NV ENXTAM:HEIA 72.98 95.6% 41,960 15,585 1,147 56,399 24,177 5,065 (1.9%) 4.1% 38.6% 20.9% 24.4x 2.33x 11.1x 2.16x 9.3x
Kirin Holdings Company, Limited TSE:2503 13.10 85.4% 11,966 7,630 421 19,175 20,411 2,577 5.2% 6.6% 43.0% 12.6% 32.3x 0.94x 7.4x 0.88x 6.8x
Pernod-Ricard SA RI 110.56 88.4% 29,104 12,773 899 40,978 10,877 3,068 (2.4%) 0.5% 62.7% 28.2% 20.0x 3.77x 13.4x 3.77x 13.1x
SABMiller plc LSE:SAB 53.80 93.8% 86,415 17,077 2,131 101,361 16,704 5,445 (3.9%) 3.3% 69.6% 32.6% 26.5x 6.07x 18.6x 5.77x 15.3x
Sapporo Holdings Ltd. TSE:2501 3.87 85.1% 1,509 2,513 105 3,917 4,779 408 (5.3%) 8.4% 35.3% 8.5% NM 0.82x 9.6x 0.76x 9.4x
Mean 8.5% 7.1% 53.6% 26.4% 22.7x 3.77x 13.3x 3.42x 12.1x
Median 2.1% 4.3% 60.2% 29.0% 22.9x 3.97x 13.4x 3.82x 12.9x
Inputs
Protein Processing
Cal-Maine Foods, Inc. CALM $89.34 100.0% $2,124 $61 $209 $1,976 $1,478 $218 10.8% 14.1% 21.0% 14.7% 17.4x 1.34x 9.1x 1.32x 9.0x
JBS S.A. BOVESPA:JBSS3 3.79 87.1% 10,724 15,879 4,670 21,933 48,452 3,478 29.9% 9.5% 13.6% 7.2% 41.2x 0.45x 6.3x 0.43x 6.2x
Sanderson Farms, Inc. SAFM 89.52 86.2% 2,016 20 139 1,897 2,741 374 5.3% 12.1% 16.1% 13.6% 10.2x 0.69x 5.1x 0.69x 4.2x
Seaboard Corp. SEB 2,610.00 83.7% 3,052 131 447 2,735 6,578 380 1.6% 8.3% 8.4% 5.8% 13.7x 0.42x 7.2x 0.41x NA
Tyson Foods, Inc. TSN 40.99 92.7% 15,019 1,825 589 16,255 36,369 2,097 7.6% 5.1% 7.4% 5.8% 13.5x 0.45x 7.8x 0.41x 5.4x
Mean 11.0% 9.8% 13.3% 9.4% 19.2x 0.67x 7.1x 0.65x 6.2x
Median 7.6% 9.5% 13.6% 7.2% 13.7x 0.45x 7.2x 0.43x 5.8x
EV / 2014ELTM MarginsLast Twelve Months (LTM) EV / LTMRevenue Growth
Member FINRA/SIPC
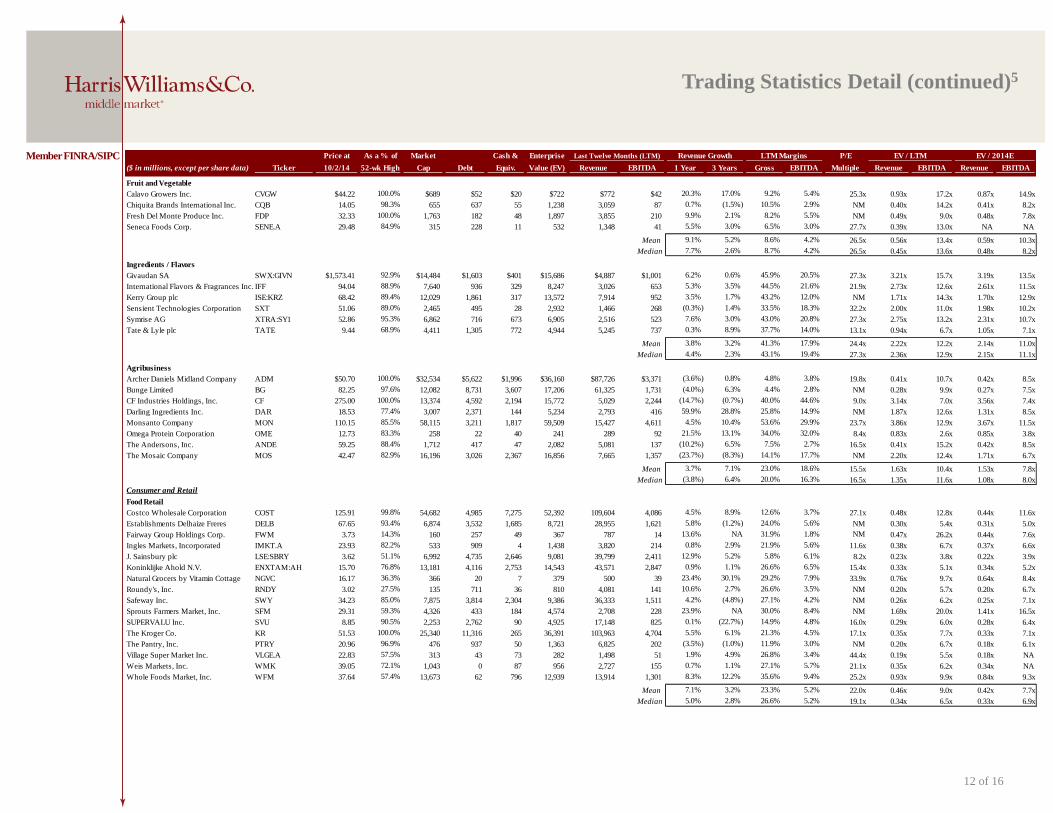
12 of 16
Trading Statistics Detail (continued)5
Price at As a % of Market Cash & Enterprise P/E
($ in millions, except per share data) Ticker 10/2/14 52-wk High Cap Debt Equiv. Value (EV) Revenue EBITDA 1 Year 3 Years Gross EBITDA Multiple Revenue EBITDA Revenue EBITDA
Fruit and Vegetable
Calavo Growers Inc. CVGW $44.22 100.0% $689 $52 $20 $722 $772 $42 20.3% 17.0% 9.2% 5.4% 25.3x 0.93x 17.2x 0.87x 14.9x
Chiquita Brands International Inc. CQB 14.05 98.3% 655 637 55 1,238 3,059 87 0.7% (1.5%) 10.5% 2.9% NM 0.40x 14.2x 0.41x 8.2x
Fresh Del Monte Produce Inc. FDP 32.33 100.0% 1,763 182 48 1,897 3,855 210 9.9% 2.1% 8.2% 5.5% NM 0.49x 9.0x 0.48x 7.8x
Seneca Foods Corp. SENE.A 29.48 84.9% 315 228 11 532 1,348 41 5.5% 3.0% 6.5% 3.0% 27.7x 0.39x 13.0x NA NA
Mean 9.1% 5.2% 8.6% 4.2% 26.5x 0.56x 13.4x 0.59x 10.3x
Median 7.7% 2.6% 8.7% 4.2% 26.5x 0.45x 13.6x 0.48x 8.2x
Ingredients / Flavors
Givaudan SA SWX:GIVN $1,573.41 92.9% $14,484 $1,603 $401 $15,686 $4,887 $1,001 6.2% 0.6% 45.9% 20.5% 27.3x 3.21x 15.7x 3.19x 13.5x
International Flavors & Fragrances Inc. IFF 94.04 88.9% 7,640 936 329 8,247 3,026 653 5.3% 3.5% 44.5% 21.6% 21.9x 2.73x 12.6x 2.61x 11.5x
Kerry Group plc ISE:KRZ 68.42 89.4% 12,029 1,861 317 13,572 7,914 952 3.5% 1.7% 43.2% 12.0% NM 1.71x 14.3x 1.70x 12.9x
Sensient Technologies Corporation SXT 51.06 89.0% 2,465 495 28 2,932 1,466 268 (0.3%) 1.4% 33.5% 18.3% 32.2x 2.00x 11.0x 1.98x 10.2x
Symrise AG XTRA:SY1 52.86 95.3% 6,862 716 673 6,905 2,516 523 7.6% 3.0% 43.0% 20.8% 27.3x 2.75x 13.2x 2.31x 10.7x
Tate & Lyle plc TATE 9.44 68.9% 4,411 1,305 772 4,944 5,245 737 0.3% 8.9% 37.7% 14.0% 13.1x 0.94x 6.7x 1.05x 7.1x
Mean 3.8% 3.2% 41.3% 17.9% 24.4x 2.22x 12.2x 2.14x 11.0x
Median 4.4% 2.3% 43.1% 19.4% 27.3x 2.36x 12.9x 2.15x 11.1x
Agribusiness
Archer Daniels Midland Company ADM $50.70 100.0% $32,534 $5,622 $1,996 $36,160 $87,726 $3,371 (3.6%) 0.8% 4.8% 3.8% 19.8x 0.41x 10.7x 0.42x 8.5x
Bunge Limited BG 82.25 97.6% 12,082 8,731 3,607 17,206 61,325 1,731 (4.0%) 6.3% 4.4% 2.8% NM 0.28x 9.9x 0.27x 7.5x
CF Industries Holdings, Inc. CF 275.00 100.0% 13,374 4,592 2,194 15,772 5,029 2,244 (14.7%) (0.7%) 40.0% 44.6% 9.0x 3.14x 7.0x 3.56x 7.4x
Darling Ingredients Inc. DAR 18.53 77.4% 3,007 2,371 144 5,234 2,793 416 59.9% 28.8% 25.8% 14.9% NM 1.87x 12.6x 1.31x 8.5x
Monsanto Company MON 110.15 85.5% 58,115 3,211 1,817 59,509 15,427 4,611 4.5% 10.4% 53.6% 29.9% 23.7x 3.86x 12.9x 3.67x 11.5x
Omega Protein Corporation OME 12.73 83.3% 258 22 40 241 289 92 21.5% 13.1% 34.0% 32.0% 8.4x 0.83x 2.6x 0.85x 3.8x
The Andersons, Inc. ANDE 59.25 88.4% 1,712 417 47 2,082 5,081 137 (10.2%) 6.5% 7.5% 2.7% 16.5x 0.41x 15.2x 0.42x 8.5x
The Mosaic Company MOS 42.47 82.9% 16,196 3,026 2,367 16,856 7,665 1,357 (23.7%) (8.3%) 14.1% 17.7% NM 2.20x 12.4x 1.71x 6.7x
Mean 3.7% 7.1% 23.0% 18.6% 15.5x 1.63x 10.4x 1.53x 7.8x
Median (3.8%) 6.4% 20.0% 16.3% 16.5x 1.35x 11.6x 1.08x 8.0x
Consumer and Retail
Food Retail
Costco Wholesale Corporation COST 125.91 99.8% 54,682 4,985 7,275 52,392 109,604 4,086 4.5% 8.9% 12.6% 3.7% 27.1x 0.48x 12.8x 0.44x 11.6x
Establishments Delhaize Freres DELB 67.65 93.4% 6,874 3,532 1,685 8,721 28,955 1,621 5.8% (1.2%) 24.0% 5.6% NM 0.30x 5.4x 0.31x 5.0x
Fairway Group Holdings Corp. FWM 3.73 14.3% 160 257 49 367 787 14 13.6% NA 31.9% 1.8% NM 0.47x 26.2x 0.44x 7.6x
Ingles Markets, Incorporated IMKT.A 23.93 82.2% 533 909 4 1,438 3,820 214 0.8% 2.9% 21.9% 5.6% 11.6x 0.38x 6.7x 0.37x 6.6x
J. Sainsbury plc LSE:SBRY 3.62 51.1% 6,992 4,735 2,646 9,081 39,799 2,411 12.9% 5.2% 5.8% 6.1% 8.2x 0.23x 3.8x 0.22x 3.9x
Koninklijke Ahold N.V. ENXTAM:AH 15.70 76.8% 13,181 4,116 2,753 14,543 43,571 2,847 0.9% 1.1% 26.6% 6.5% 15.4x 0.33x 5.1x 0.34x 5.2x
Natural Grocers by Vitamin Cottage NGVC 16.17 36.3% 366 20 7 379 500 39 23.4% 30.1% 29.2% 7.9% 33.9x 0.76x 9.7x 0.64x 8.4x
Roundy's, Inc. RNDY 3.02 27.5% 135 711 36 810 4,081 141 10.6% 2.7% 26.6% 3.5% NM 0.20x 5.7x 0.20x 6.7x
Safeway Inc. SWY 34.23 85.0% 7,875 3,814 2,304 9,386 36,333 1,511 4.2% (4.8%) 27.1% 4.2% NM 0.26x 6.2x 0.25x 7.1x
Sprouts Farmers Market, Inc. SFM 29.31 59.3% 4,326 433 184 4,574 2,708 228 23.9% NA 30.0% 8.4% NM 1.69x 20.0x 1.41x 16.5x
SUPERVALU Inc. SVU 8.85 90.5% 2,253 2,762 90 4,925 17,148 825 0.1% (22.7%) 14.9% 4.8% 16.0x 0.29x 6.0x 0.28x 6.4x
The Kroger Co. KR 51.53 100.0% 25,340 11,316 265 36,391 103,963 4,704 5.5% 6.1% 21.3% 4.5% 17.1x 0.35x 7.7x 0.33x 7.1x
The Pantry, Inc. PTRY 20.96 96.9% 476 937 50 1,363 6,825 202 (3.5%) (1.0%) 11.9% 3.0% NM 0.20x 6.7x 0.18x 6.1x
Village Super Market Inc. VLGE.A 22.83 57.5% 313 43 73 282 1,498 51 1.9% 4.9% 26.8% 3.4% 44.4x 0.19x 5.5x 0.18x NA
Weis Markets, Inc. WMK 39.05 72.1% 1,043 0 87 956 2,727 155 0.7% 1.1% 27.1% 5.7% 21.1x 0.35x 6.2x 0.34x NA
Whole Foods Market, Inc. WFM 37.64 57.4% 13,673 62 796 12,939 13,914 1,301 8.3% 12.2% 35.6% 9.4% 25.2x 0.93x 9.9x 0.84x 9.3x
Mean 7.1% 3.2% 23.3% 5.2% 22.0x 0.46x 9.0x 0.42x 7.7x
Median 5.0% 2.8% 26.6% 5.2% 19.1x 0.34x 6.5x 0.33x 6.9x
EV / 2014ELast Twelve Months (LTM) Revenue Growth EV / LTMLTM Margins
Member FINRA/SIPC
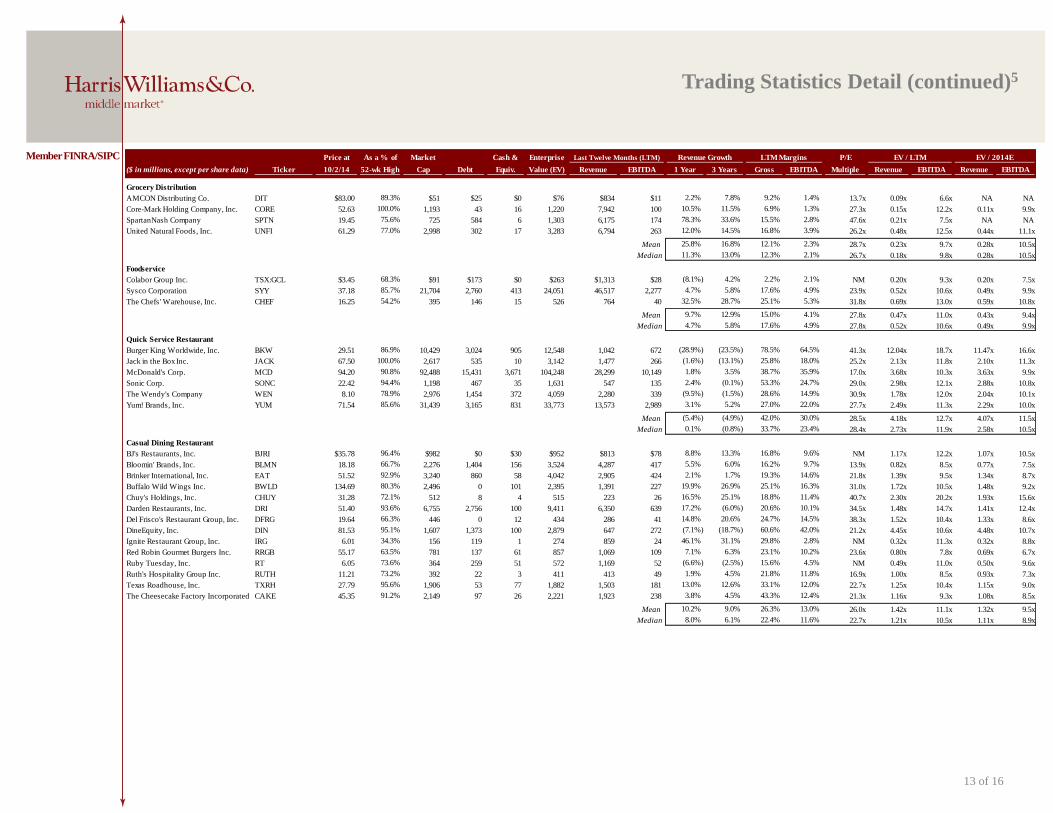
13 of 16
Trading Statistics Detail (continued)5
Price at As a % of Market Cash & Enterprise P/E
($ in millions, except per share data) Ticker 10/2/14 52-wk High Cap Debt Equiv. Value (EV) Revenue EBITDA 1 Year 3 Years Gross EBITDA Multiple Revenue EBITDA Revenue EBITDA
Grocery Distribution
AMCON Distributing Co. DIT $83.00 89.3% $51 $25 $0 $76 $834 $11 2.2% 7.8% 9.2% 1.4% 13.7x 0.09x 6.6x NA NA
Core-Mark Holding Company, Inc. CORE 52.63 100.0% 1,193 43 16 1,220 7,942 100 10.5% 11.5% 6.9% 1.3% 27.3x 0.15x 12.2x 0.11x 9.9x
SpartanNash Company SPTN 19.45 75.6% 725 584 6 1,303 6,175 174 78.3% 33.6% 15.5% 2.8% 47.6x 0.21x 7.5x NA NA
United Natural Foods, Inc. UNFI 61.29 77.0% 2,998 302 17 3,283 6,794 263 12.0% 14.5% 16.8% 3.9% 26.2x 0.48x 12.5x 0.44x 11.1x
Mean 25.8% 16.8% 12.1% 2.3% 28.7x 0.23x 9.7x 0.28x 10.5x
Median 11.3% 13.0% 12.3% 2.1% 26.7x 0.18x 9.8x 0.28x 10.5x
Foodservice
Colabor Group Inc. TSX:GCL $3.45 68.3% $91 $173 $0 $263 $1,313 $28 (8.1%) 4.2% 2.2% 2.1% NM 0.20x 9.3x 0.20x 7.5x
Sysco Corporation SYY 37.18 85.7% 21,704 2,760 413 24,051 46,517 2,277 4.7% 5.8% 17.6% 4.9% 23.9x 0.52x 10.6x 0.49x 9.9x
The Chefs' Warehouse, Inc. CHEF 16.25 54.2% 395 146 15 526 764 40 32.5% 28.7% 25.1% 5.3% 31.8x 0.69x 13.0x 0.59x 10.8x
Mean 9.7% 12.9% 15.0% 4.1% 27.8x 0.47x 11.0x 0.43x 9.4x
Median 4.7% 5.8% 17.6% 4.9% 27.8x 0.52x 10.6x 0.49x 9.9x
Quick Service Restaurant
Burger King Worldwide, Inc. BKW 29.51 86.9% 10,429 3,024 905 12,548 1,042 672 (28.9%) (23.5%) 78.5% 64.5% 41.3x 12.04x 18.7x 11.47x 16.6x
Jack in the Box Inc. JACK 67.50 100.0% 2,617 535 10 3,142 1,477 266 (1.6%) (13.1%) 25.8% 18.0% 25.2x 2.13x 11.8x 2.10x 11.3x
McDonald's Corp. MCD 94.20 90.8% 92,488 15,431 3,671 104,248 28,299 10,149 1.8% 3.5% 38.7% 35.9% 17.0x 3.68x 10.3x 3.63x 9.9x
Sonic Corp. SONC 22.42 94.4% 1,198 467 35 1,631 547 135 2.4% (0.1%) 53.3% 24.7% 29.0x 2.98x 12.1x 2.88x 10.8x
The Wendy's Company WEN 8.10 78.9% 2,976 1,454 372 4,059 2,280 339 (9.5%) (1.5%) 28.6% 14.9% 30.9x 1.78x 12.0x 2.04x 10.1x
Yum! Brands, Inc. YUM 71.54 85.6% 31,439 3,165 831 33,773 13,573 2,989 3.1% 5.2% 27.0% 22.0% 27.7x 2.49x 11.3x 2.29x 10.0x
Mean (5.4%) (4.9%) 42.0% 30.0% 28.5x 4.18x 12.7x 4.07x 11.5x
Median 0.1% (0.8%) 33.7% 23.4% 28.4x 2.73x 11.9x 2.58x 10.5x
Casual Dining Restaurant
BJ's Restaurants, Inc. BJRI $35.78 96.4% $982 $0 $30 $952 $813 $78 8.8% 13.3% 16.8% 9.6% NM 1.17x 12.2x 1.07x 10.5x
Bloomin' Brands, Inc. BLMN 18.18 66.7% 2,276 1,404 156 3,524 4,287 417 5.5% 6.0% 16.2% 9.7% 13.9x 0.82x 8.5x 0.77x 7.5x
Brinker International, Inc. EAT 51.52 92.9% 3,240 860 58 4,042 2,905 424 2.1% 1.7% 19.3% 14.6% 21.8x 1.39x 9.5x 1.34x 8.7x
Buffalo Wild Wings Inc. BWLD 134.69 80.3% 2,496 0 101 2,395 1,391 227 19.9% 26.9% 25.1% 16.3% 31.0x 1.72x 10.5x 1.48x 9.2x
Chuy's Holdings, Inc. CHUY 31.28 72.1% 512 8 4 515 223 26 16.5% 25.1% 18.8% 11.4% 40.7x 2.30x 20.2x 1.93x 15.6x
Darden Restaurants, Inc. DRI 51.40 93.6% 6,755 2,756 100 9,411 6,350 639 17.2% (6.0%) 20.6% 10.1% 34.5x 1.48x 14.7x 1.41x 12.4x
Del Frisco's Restaurant Group, Inc. DFRG 19.64 66.3% 446 0 12 434 286 41 14.8% 20.6% 24.7% 14.5% 38.3x 1.52x 10.4x 1.33x 8.6x
DineEquity, Inc. DIN 81.53 95.1% 1,607 1,373 100 2,879 647 272 (7.1%) (18.7%) 60.6% 42.0% 21.2x 4.45x 10.6x 4.48x 10.7x
Ignite Restaurant Group, Inc. IRG 6.01 34.3% 156 119 1 274 859 24 46.1% 31.1% 29.8% 2.8% NM 0.32x 11.3x 0.32x 8.8x
Red Robin Gourmet Burgers Inc. RRGB 55.17 63.5% 781 137 61 857 1,069 109 7.1% 6.3% 23.1% 10.2% 23.6x 0.80x 7.8x 0.69x 6.7x
Ruby Tuesday, Inc. RT 6.05 73.6% 364 259 51 572 1,169 52 (6.6%) (2.5%) 15.6% 4.5% NM 0.49x 11.0x 0.50x 9.6x
Ruth's Hospitality Group Inc. RUTH 11.21 73.2% 392 22 3 411 413 49 1.9% 4.5% 21.8% 11.8% 16.9x 1.00x 8.5x 0.93x 7.3x
Texas Roadhouse, Inc. TXRH 27.79 95.6% 1,906 53 77 1,882 1,503 181 13.0% 12.6% 33.1% 12.0% 22.7x 1.25x 10.4x 1.15x 9.0x
The Cheesecake Factory Incorporated CAKE 45.35 91.2% 2,149 97 26 2,221 1,923 238 3.8% 4.5% 43.3% 12.4% 21.3x 1.16x 9.3x 1.08x 8.5x
Mean 10.2% 9.0% 26.3% 13.0% 26.0x 1.42x 11.1x 1.32x 9.5x
Median 8.0% 6.1% 22.4% 11.6% 22.7x 1.21x 10.5x 1.11x 8.9x
Last Twelve Months (LTM) Revenue Growth LTM Margins EV / LTM EV / 2014E
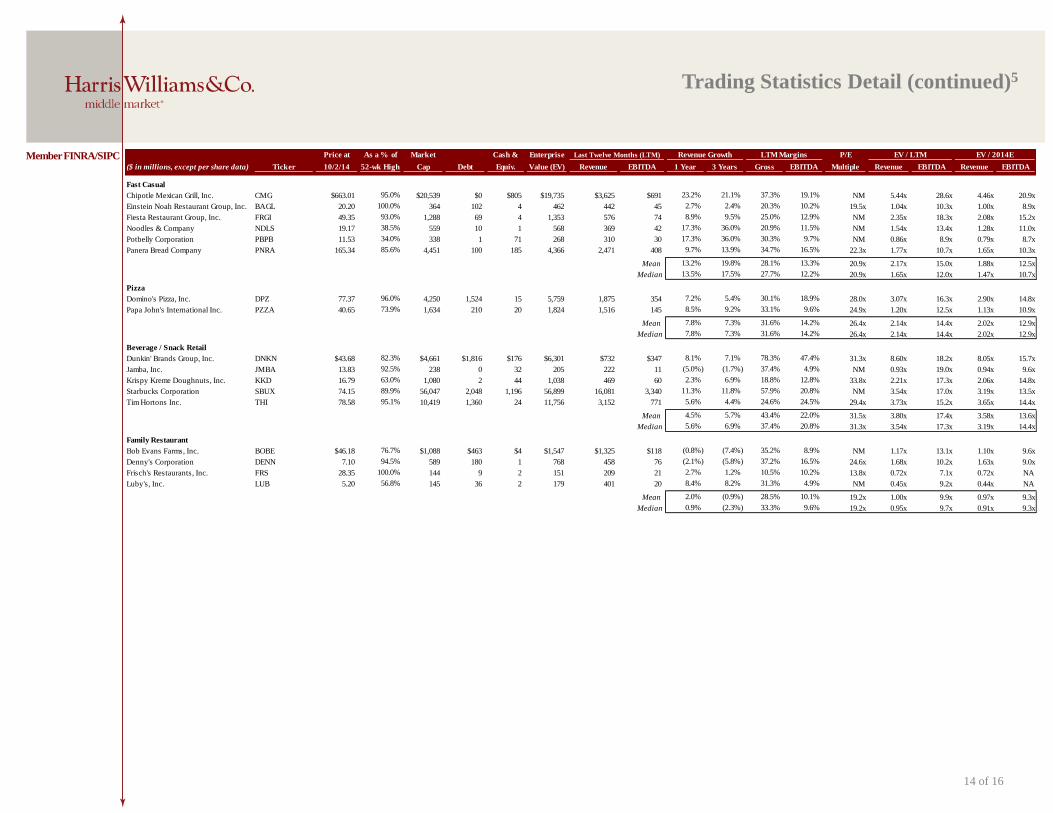
14 of 16
Trading Statistics Detail (continued)5
Member FINRA/SIPC Price at As a % of Market Cash & Enterprise P/E
($ in millions, except per share data) Ticker 10/2/14 52-wk High Cap Debt Equiv. Value (EV) Revenue EBITDA 1 Year 3 Years Gross EBITDA Multiple Revenue EBITDA Revenue EBITDA
Fast Casual
Chipotle Mexican Grill, Inc. CMG $663.01 95.0% $20,539 $0 $805 $19,735 $3,625 $691 23.2% 21.1% 37.3% 19.1% NM 5.44x 28.6x 4.46x 20.9x
Einstein Noah Restaurant Group, Inc. BAGL 20.20 100.0% 364 102 4 462 442 45 2.7% 2.4% 20.3% 10.2% 19.5x 1.04x 10.3x 1.00x 8.9x
Fiesta Restaurant Group, Inc. FRGI 49.35 93.0% 1,288 69 4 1,353 576 74 8.9% 9.5% 25.0% 12.9% NM 2.35x 18.3x 2.08x 15.2x
Noodles & Company NDLS 19.17 38.5% 559 10 1 568 369 42 17.3% 36.0% 20.9% 11.5% NM 1.54x 13.4x 1.28x 11.0x
Potbelly Corporation PBPB 11.53 34.0% 338 1 71 268 310 30 17.3% 36.0% 30.3% 9.7% NM 0.86x 8.9x 0.79x 8.7x
Panera Bread Company PNRA 165.34 85.6% 4,451 100 185 4,366 2,471 408 9.7% 13.9% 34.7% 16.5% 22.3x 1.77x 10.7x 1.65x 10.3x
Mean 13.2% 19.8% 28.1% 13.3% 20.9x 2.17x 15.0x 1.88x 12.5x
Median 13.5% 17.5% 27.7% 12.2% 20.9x 1.65x 12.0x 1.47x 10.7x
Pizza
Domino's Pizza, Inc. DPZ 77.37 96.0% 4,250 1,524 15 5,759 1,875 354 7.2% 5.4% 30.1% 18.9% 28.0x 3.07x 16.3x 2.90x 14.8x
Papa John's International Inc. PZZA 40.65 73.9% 1,634 210 20 1,824 1,516 145 8.5% 9.2% 33.1% 9.6% 24.9x 1.20x 12.5x 1.13x 10.9x
Mean 7.8% 7.3% 31.6% 14.2% 26.4x 2.14x 14.4x 2.02x 12.9x
Median 7.8% 7.3% 31.6% 14.2% 26.4x 2.14x 14.4x 2.02x 12.9x
Beverage / Snack Retail
Dunkin' Brands Group, Inc. DNKN $43.68 82.3% $4,661 $1,816 $176 $6,301 $732 $347 8.1% 7.1% 78.3% 47.4% 31.3x 8.60x 18.2x 8.05x 15.7x
Jamba, Inc. JMBA 13.83 92.5% 238 0 32 205 222 11 (5.0%) (1.7%) 37.4% 4.9% NM 0.93x 19.0x 0.94x 9.6x
Krispy Kreme Doughnuts, Inc. KKD 16.79 63.0% 1,080 2 44 1,038 469 60 2.3% 6.9% 18.8% 12.8% 33.8x 2.21x 17.3x 2.06x 14.8x
Starbucks Corporation SBUX 74.15 89.9% 56,047 2,048 1,196 56,899 16,081 3,340 11.3% 11.8% 57.9% 20.8% NM 3.54x 17.0x 3.19x 13.5x
Tim Hortons Inc. THI 78.58 95.1% 10,419 1,360 24 11,756 3,152 771 5.6% 4.4% 24.6% 24.5% 29.4x 3.73x 15.2x 3.65x 14.4x
Mean 4.5% 5.7% 43.4% 22.0% 31.5x 3.80x 17.4x 3.58x 13.6x
Median 5.6% 6.9% 37.4% 20.8% 31.3x 3.54x 17.3x 3.19x 14.4x
Family Restaurant
Bob Evans Farms, Inc. BOBE $46.18 76.7% $1,088 $463 $4 $1,547 $1,325 $118 (0.8%) (7.4%) 35.2% 8.9% NM 1.17x 13.1x 1.10x 9.6x
Denny's Corporation DENN 7.10 94.5% 589 180 1 768 458 76 (2.1%) (5.8%) 37.2% 16.5% 24.6x 1.68x 10.2x 1.63x 9.0x
Frisch's Restaurants, Inc. FRS 28.35 100.0% 144 9 2 151 209 21 2.7% 1.2% 10.5% 10.2% 13.8x 0.72x 7.1x 0.72x NA
Luby's, Inc. LUB 5.20 56.8% 145 36 2 179 401 20 8.4% 8.2% 31.3% 4.9% NM 0.45x 9.2x 0.44x NA
Mean 2.0% (0.9%) 28.5% 10.1% 19.2x 1.00x 9.9x 0.97x 9.3x
Median 0.9% (2.3%) 33.3% 9.6% 19.2x 0.95x 9.7x 0.91x 9.3x
Last Twelve Months (LTM) Revenue Growth LTM Margins EV / LTM EV / 2014E
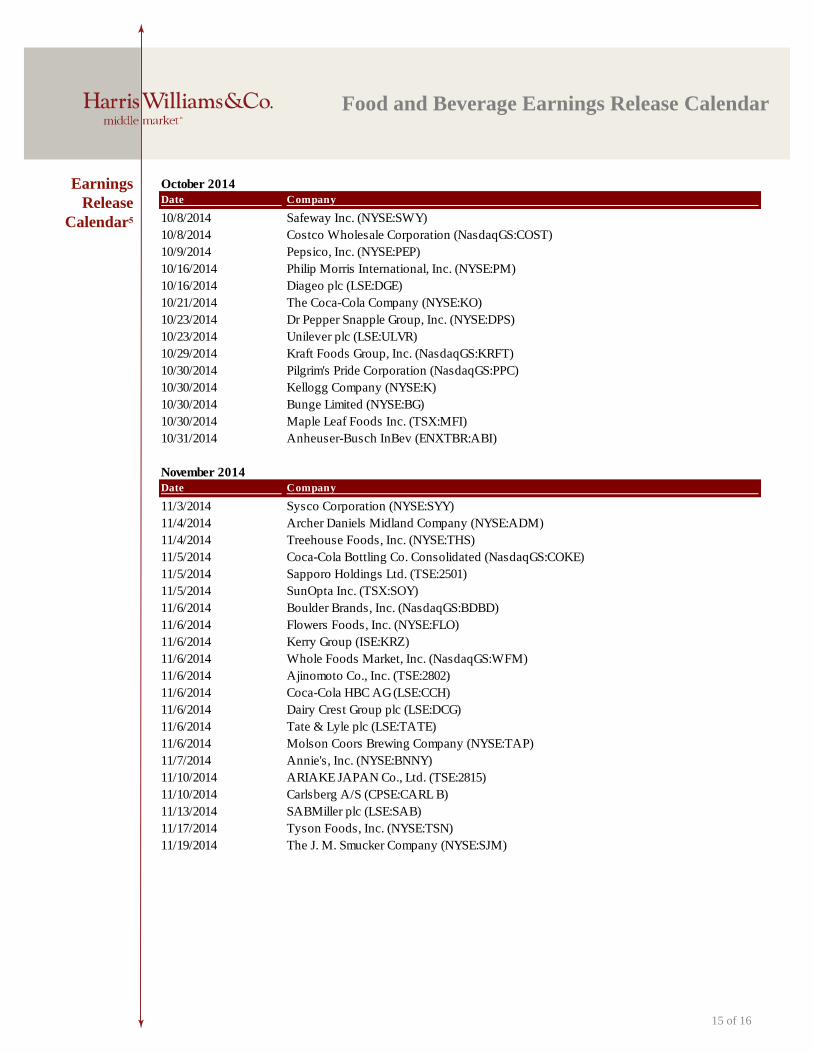
Earnings
Release
Calendar5
15 of 16
Food and Beverage Earnings Release Calendar
October 2014
Date Company
10/8/2014 Safeway Inc. (NYSE:SWY)
10/8/2014 Costco Wholesale Corporation (NasdaqGS:COST)
10/9/2014 Pepsico, Inc. (NYSE:PEP)
10/16/2014 Philip Morris International, Inc. (NYSE:PM)
10/16/2014 Diageo plc (LSE:DGE)
10/21/2014 The Coca-Cola Company (NYSE:KO)
10/23/2014 Dr Pepper Snapple Group, Inc. (NYSE:DPS)
10/23/2014 Unilever plc (LSE:ULVR)
10/29/2014 Kraft Foods Group, Inc. (NasdaqGS:KRFT)
10/30/2014 Pilgrim's Pride Corporation (NasdaqGS:PPC)
10/30/2014 Kellogg Company (NYSE:K)
10/30/2014 Bunge Limited (NYSE:BG)
10/30/2014 Maple Leaf Foods Inc. (TSX:MFI)
10/31/2014 Anheuser-Busch InBev (ENXTBR:ABI)
November 2014
Date Company
11/3/2014 Sysco Corporation (NYSE:SYY)
11/4/2014 Archer Daniels Midland Company (NYSE:ADM)
11/4/2014 Treehouse Foods, Inc. (NYSE:THS)
11/5/2014 Coca-Cola Bottling Co. Consolidated (NasdaqGS:COKE)
11/5/2014 Sapporo Holdings Ltd. (TSE:2501)
11/5/2014 SunOpta Inc. (TSX:SOY)
11/6/2014 Boulder Brands, Inc. (NasdaqGS:BDBD)
11/6/2014 Flowers Foods, Inc. (NYSE:FLO)
11/6/2014 Kerry Group (ISE:KRZ)
11/6/2014 Whole Foods Market, Inc. (NasdaqGS:WFM)
11/6/2014 Ajinomoto Co., Inc. (TSE:2802)
11/6/2014 Coca-Cola HBC AG (LSE:CCH)
11/6/2014 Dairy Crest Group plc (LSE:DCG)
11/6/2014 Tate & Lyle plc (LSE:TATE)
11/6/2014 Molson Coors Brewing Company (NYSE:TAP)
11/7/2014 Annie's, Inc. (NYSE:BNNY)
11/10/2014 ARIAKE JAPAN Co., Ltd. (TSE:2815)
11/10/2014 Carlsberg A/S (CPSE:CARL B)
11/13/2014 SABMiller plc (LSE:SAB)
11/17/2014 Tyson Foods, Inc. (NYSE:TSN)
11/19/2014 The J. M. Smucker Company (NYSE:SJM)
Sources:
1. IMF
2. U.S. Bureau of Labor Statistics
3. Unweighted Average
4. U.S. Census Bureau
5. Capital IQ
6. Thomson Financial
7. S&P
8. Reuters
Harris Williams & Co. (www.harriswilliams.com) is a preeminent middle market investment bank focused on the advisory
needs of clients worldwide. The firm has deep industry knowledge, global transaction expertise, and an unwavering
commitment to excellence. Harris Williams & Co. provides sell-side and acquisition advisory, restructuring advisory,
board advisory, private placements, and capital markets advisory services.
Investment banking services are provided by Harris Williams LLC, a registered broker-dealer and member of FINRA and
SIPC, and Harris Williams & Co. Ltd, which is authorized and regulated by the Financial Conduct Authority. Harris
Williams & Co. is a trade name under which Harris Williams LLC and Harris Williams & Co. Ltd conduct business.
THIS REPORT MAY CONTAIN REFERENCES TO REGISTERED TRADEMARKS, SERVICE MARKS AND
COPYRIGHTS OWNED BY THIRD-PARTY INFORMATION PROVIDERS. NONE OF THE THIRD-PARTY
INFORMATION PROVIDERS IS ENDORSING THE OFFERING OF, AND SHALL NOT IN ANY WAY BE
DEEMED AN ISSUER OR UNDERWRITER OF, THE SECURITIES, FINANCIAL INSTRUMENTS OR
OTHER INVESTMENTS DISCUSSED IN THIS REPORT, AND SHALL NOT HAVE ANY LIABILITY OR
RESPONSIBILITY FOR ANY STATEMENTS MADE IN THE REPORT OR FOR ANY FINANCIAL
STATEMENTS, FINANCIAL PROJECTIONS OR OTHER FINANCIAL INFORMATION CONTAINED OR
ATTACHED AS AN EXHIBIT TO THE REPORT. FOR MORE INFORMATION ABOUT THE MATERIALS
PROVIDED BY SUCH THIRD PARTIES, PLEASE CONTACT US AT +1 (804) 648-0072.
The information and views contained in this report were prepared by Harris Williams & Co. (“Harris Williams”). It is not
a research report, as such term is defined by applicable law and regulations, and is provided for informational purposes
only. It is not to be construed as an offer to buy or sell or a solicitation of an offer to buy or sell any financial instruments
or to participate in any particular trading strategy. The information contained herein is believed by Harris Williams to be
reliable, but Harris Williams makes no representation as to the accuracy or completeness of such information. Harris
Williams and/or its affiliates may be market makers or specialists in, act as advisers or lenders to, have positions in and
effect transactions in securities of companies mentioned herein and also may provide, may have provided, or may seek to
provide investment banking services for those companies. In addition, Harris Williams and/or its affiliates or their
respective officers, directors and employees may hold long or short positions in the securities, options thereon or other
related financial products of companies discussed herein. Opinions, estimates and projections in this report constitute
Harris Williams’ judgment and are subject to change without notice. The financial instruments discussed in this report
may not be suitable for all investors, and investors must make their own investment decisions using their own independent
advisors as they believe necessary and based upon their specific financial situations and investment objectives. Also, past
performance is not necessarily indicative of future results. No part of this material may be copied or duplicated in any
form or by any means, or redistributed, without Harris Williams’ prior written consent.
Copyright© 2014 Harris Williams & Co., all rights reserved.
16 of 16
Contacts BostonPhone: +1 (617) 482-7501
Cleveland
Phone: +1 (216) 689-2400
MinneapolisPhone: +1 (612) 359-2700
Philadelphia
Phone: +1 (267) 675-5900
Richmond
Phone: +1 (804) 648-0072
San Francisco
Phone: +1 (415) 288-4260
LondonPhone: +44 (0)20 7518 8900
FrankfurtPhone: +49 069 3650638 00


