Embed Size (px)
Citation preview
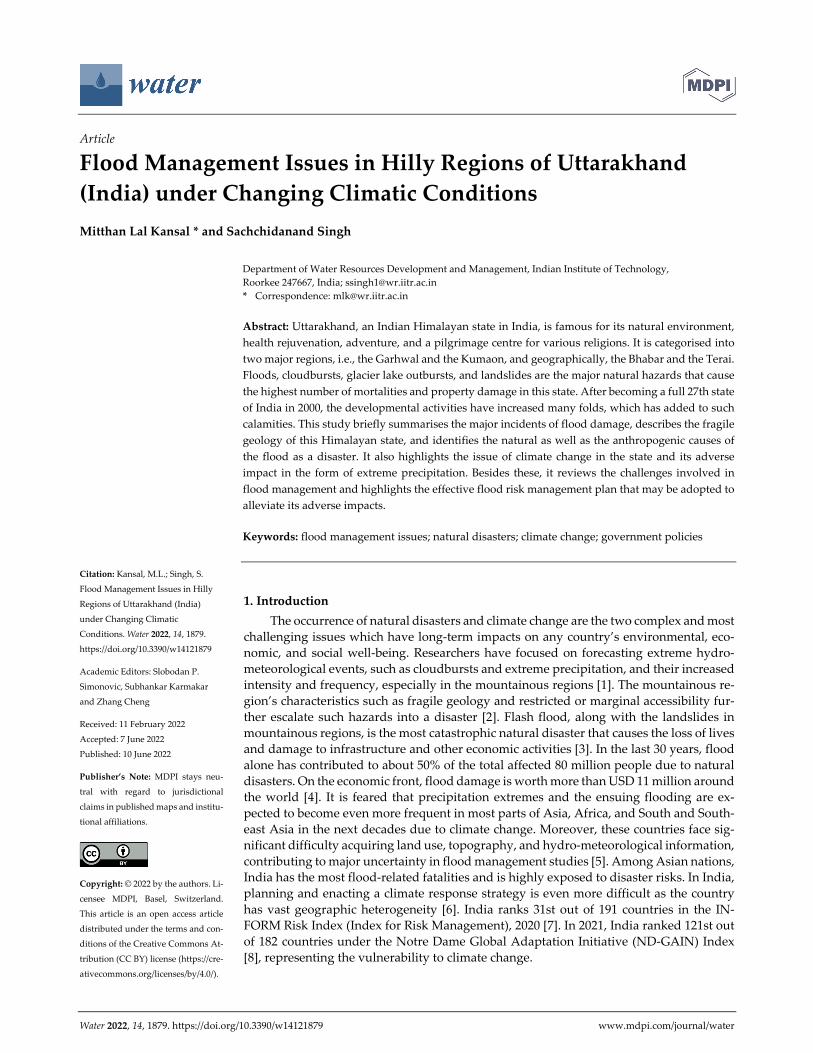
Water 2022, 14, 1879. https://doi.org/10.3390/w14121879 www.mdpi.com/journal/water
Article
Flood Management Issues in Hilly Regions of Uttarakhand
(India) under Changing Climatic Conditions
Mitthan Lal Kansal * and Sachchidanand Singh
Department of Water Resources Development and Management, Indian Institute of Technology,
Roorkee 247667, India; [email protected]
* Correspondence: [email protected]
Abstract: Uttarakhand, an Indian Himalayan state in India, is famous for its natural environment,
health rejuvenation, adventure, and a pilgrimage centre for various religions. It is categorised into
two major regions, i.e., the Garhwal and the Kumaon, and geographically, the Bhabar and the Terai.
Floods, cloudbursts, glacier lake outbursts, and landslides are the major natural hazards that cause
the highest number of mortalities and property damage in this state. After becoming a full 27th state
of India in 2000, the developmental activities have increased many folds, which has added to such
calamities. This study briefly summarises the major incidents of flood damage, describes the fragile
geology of this Himalayan state, and identifies the natural as well as the anthropogenic causes of
the flood as a disaster. It also highlights the issue of climate change in the state and its adverse
impact in the form of extreme precipitation. Besides these, it reviews the challenges involved in
flood management and highlights the effective flood risk management plan that may be adopted to
alleviate its adverse impacts.
Keywords: flood management issues; natural disasters; climate change; government policies
1. Introduction
The occurrence of natural disasters and climate change are the two complex and most
challenging issues which have long‐term impacts on any country’s environmental, eco‐
nomic, and social well‐being. Researchers have focused on forecasting extreme hydro‐
meteorological events, such as cloudbursts and extreme precipitation, and their increased
intensity and frequency, especially in the mountainous regions [1]. The mountainous re‐
gion’s characteristics such as fragile geology and restricted or marginal accessibility fur‐
ther escalate such hazards into a disaster [2]. Flash flood, along with the landslides in
mountainous regions, is the most catastrophic natural disaster that causes the loss of lives
and damage to infrastructure and other economic activities [3]. In the last 30 years, flood
alone has contributed to about 50% of the total affected 80 million people due to natural
disasters. On the economic front, flood damage is worth more than USD 11 million around
the world [4]. It is feared that precipitation extremes and the ensuing flooding are ex‐
pected to become even more frequent in most parts of Asia, Africa, and South and South‐
east Asia in the next decades due to climate change. Moreover, these countries face sig‐
nificant difficulty acquiring land use, topography, and hydro‐meteorological information,
contributing to major uncertainty in flood management studies [5]. Among Asian nations,
India has the most flood‐related fatalities and is highly exposed to disaster risks. In India,
planning and enacting a climate response strategy is even more difficult as the country
has vast geographic heterogeneity [6]. India ranks 31st out of 191 countries in the IN‐
FORM Risk Index (Index for Risk Management), 2020 [7]. In 2021, India ranked 121st out
of 182 countries under the Notre Dame Global Adaptation Initiative (ND‐GAIN) Index
[8], representing the vulnerability to climate change.
Citation: Kansal, M.L.; Singh, S.
Flood Management Issues in Hilly
Regions of Uttarakhand (India)
under Changing Climatic
Conditions. Water 2022, 14, 1879.
https://doi.org/10.3390/w14121879
Academic Editors: Slobodan P.
Simonovic, Subhankar Karmakar
and Zhang Cheng
Received: 11 February 2022
Accepted: 7 June 2022
Published: 10 June 2022
Publisher’s Note: MDPI stays neu‐
tral with regard to jurisdictional
claims in published maps and institu‐
tional affiliations.
Copyright: © 2022 by the authors. Li‐
censee MDPI, Basel, Switzerland.
This article is an open access article
distributed under the terms and con‐
ditions of the Creative Commons At‐
tribution (CC BY) license (https://cre‐
ativecommons.org/licenses/by/4.0/).
Water 2022, 14, 1879 2 of 24
The Indian Himalayan Region (IHR), with diverse demographic, economic, social,
environmental, and political systems, plays an important role in the country’s nexus of
water, energy, and food. It has an inimitable topographical and climatic setting, making
it prone to numerous hydro‐meteorological disasters such as floods, cloudbursts, glacier
lake outbursts, and landslides [9,10]. In the last 30–40 years, the frequency and severity of
natural hazards have risen due to various anthropogenic and changing climatic conditions
[11]. The anthropogenic activities such as the construction of dams, roads, deforestation,
etc., have further aggravated the disasters which have disrupted the Himalayan ecosys‐
tem in the various states such as Uttarakhand [12]. The climate change in the Himalayas
has resulted in irregular precipitation, temperature rise, drying up of perennial rivers, de‐
pletion of natural resources, and an increase in the frequency and intensity of flash floods
[13]. Uttarakhand, an important state in the IHR, has undergone a considerable expanse
of flood disasters. The major natural disasters in Uttarakhand include the disasters of 1970,
1986, 1991, 1998, 2001, 2002, 2004, 2005, 2008, 2009, 2010, 2012, 2013, 2016, 2017, 2019, 2020,
and 2021 [14,15]. It may be noticed that the severity and frequency of flood incidents have
increased in recent years.
Flood risk management is crucial as it provides optimal utilisation and exploitation
of land and water resources that bring prosperity and sustainable development to a nation
[16]. In India, flood risk management in plains has been emphasised, and policies have
been framed to mitigate its ill effects. However, flood risk management in hilly regions is
still in the infancy stage, particularly due to complex and tough terrain with limited ac‐
cessibility and a low level of monitoring [17,18]. Experience with the last few decadal
floods has shown that the structural measures alone could not ensure adequate security
against such disasters. Therefore, an effective flood management strategy to safeguard
these disasters is essential. This study briefly summarises the major flood damage inci‐
dents in the state and identifies its natural and anthropogenic causes. Further, the study
reviews the challenges involved in flood management and highlights the flood risk man‐
agement plan that may be adopted to alleviate its adverse impacts.
2. Material and Methods
2.1. Study Area Physiography
The IHR is one of the world’s youngest mountain ranges and is characterised by frag‐
ile and sensitive ecosystems concerning geological hazards, geodynamics, topography,
biodiversity, and water resources status [19]. It spreads over 11 states and 2 union territo‐
ries and covers 500,000 sq. km. It stretches approximately 2500 km from the Hindu Kush
in the north‐west to Myanmar in the south‐east [20].
The state of Uttarakhand, a part of IHR, is located between latitudes 28.44° and 31.28°
north and longitudes 77.35° and 81.01°east. Uttarakhand was created out of northern Uttar
Pradesh in the year 2000. Uttarakhand is well‐known for its thriving spiritual and reli‐
gious tourism industry, ecological diversity and richness, and a cultural ethos rooted in
traditions. The state hosts numerous pilgrimage sites, namely Panch Kedar for Hindus,
Piran Kaliyar for Muslims, Hemkund Sahib for Sikhs, Digambar Jain temple for Jains, and
Christ Church for Christians, the hotspot of tourism activities. The state is divided into
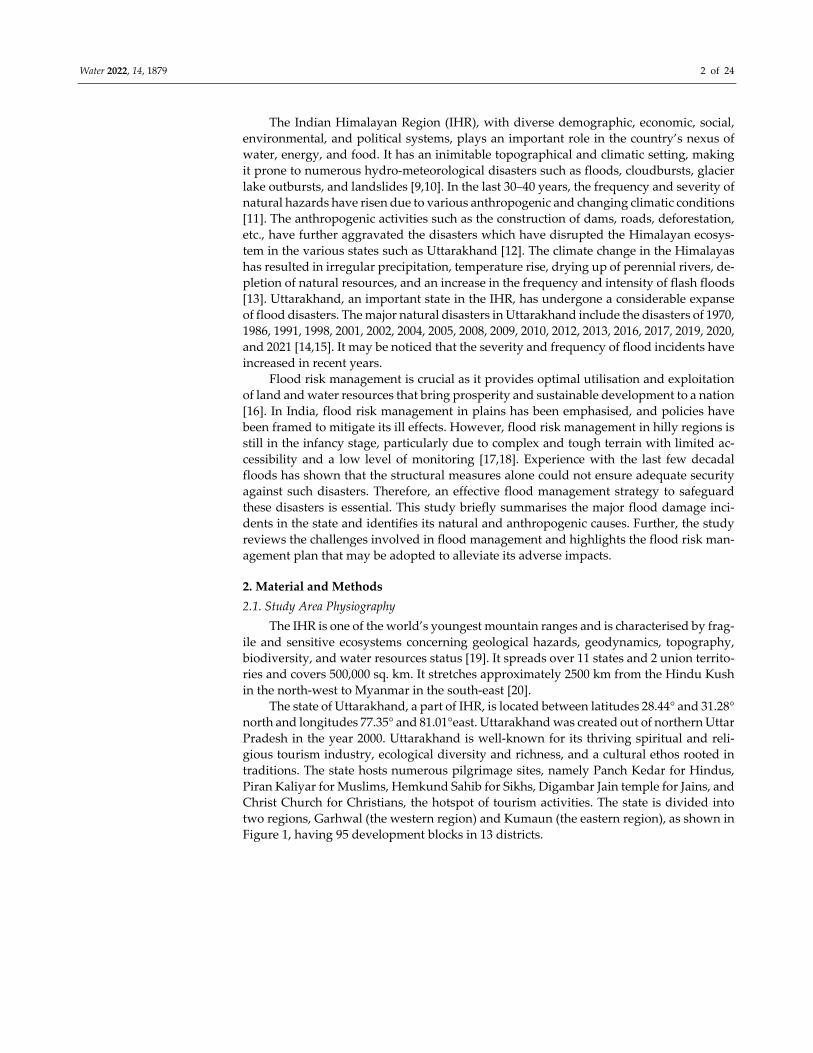
two regions, Garhwal (the western region) and Kumaun (the eastern region), as shown in
Figure 1, having 95 development blocks in 13 districts.
Water 2022, 14, 1879 3 of 24
Figure 1. Map of Uttarakhand showing district, regions, and locations of cloudbursts.
Many perennial Indian rivers originate in Uttarakhand. There are six major river ba‐
sins in the states, namely, Alaknanda, Bhagirathi, Ganga, Kali, Ramganga, and Yamuna,
as shown in Figure 2. The major basins of Garhwal region are Alaknanda, Bhagirathi, Ya‐
muna, and Ganga and major tributaries are Bhilangna, Dhauliganga‐Garhwal, Manda‐
kini, and Tons. The major basins of Kumaon region are Kali and Ramganga and major
tributaries are Saryu, Gori Ganga, and Pindar. Some basic characteristics of the major river
basin of Uttarakhand estimated from geographic information system (GIS) analysis are
given in Table 1.
Figure 2. The spatial distribution of IMD‐ARG and IMD‐AWG along with the major river basins in
the state of Uttarakhand.

Water 2022, 14, 1879 4 of 24
Table 1. The basic characteristics of major rivers of Uttarakhand estimated from GIS analysis.
S. No. Name Area
(sq. km.)
Mean
Annual
Rainfall
(mm)
Mean
Slope
(Degrees)
Mean
Elevation
(m)
Elevation
Range (m)
River
Length
(km)
1 Alaknanda 11,083 1035 28 3402 459–7785 195
2 Bhagirathi 7323 1011 27 3451 459–7054 190
3 Yamuna 5462 1175 24 2182 360–6278 170
4 Ganga 7282 1240 14 936 217–3076 125
5 Ramganga 11,319 1354 13 939 190–3089 185
6 Kali 11,014 1193 26 2552 185–7070 252
The state is divided into five transverse zones: (a) To the south of the Himalayan
Frontal Fault (HFF)—the Terai. (b) Between the Shivalik (Outer Himalayan) range and the
Main Boundary Fault (MBF)—the Doons. (c) Between the Main Central Thrust (MCT) and
the MBF, along with the ridges up to around 3000 m high—the Middle Himalaya. (d) The
area north of the MCT, which includes the perennially snow‐covered peaks at heights of
up to 8000 m—Inner Himalaya. (e) To the north of the snow‐covered hills—the Trans
Himalaya. Uttarakhand is a geological part of the Western Himalayas that can be classi‐
fied into five morphological regions of varying physiographical and geological features.
The regions from South to North comprise the Outer (sub‐Himalayas), then the Lower
Himalayas (Lesser Himalayas), followed by the Greater Himalayas, the Tethys (Tibet),
and the Trans Himalaya [21].
2.2. Climatic Characteristics
The climate in the state ranges widely from the Terai region’s sub‐tropical humid
atmosphere to the tundra‐like atmosphere in the Greater Himalayas. The climate and
landscape vary greatly with altitude (186–7619 m), from the largest glaciers in the higher
elevation to the subtropical forests in the lowest elevation. Substantial annual precipita‐
tion falls as snow and feeds the Himalayans at high altitudes (>3000 m) [22].
The lowlands along the border of Uttar Pradesh are covered by the drier Terai‐Sa‐
vanna grasslands, the moist deciduous forest of the Upper Gangetic Plains, and form the
Bhabhar belt. However, due to the extensive agricultural practices, most of these lowland
forests have been cleared [21]. Snow and bare ice occupy the highest altitudes.
This mountainous state occupies 53,483 sq. km., i.e., 1.63% of India’s total land area.
Out of the 13 districts, Uttarkashi occupies the maximum area of 8039 sq. km. (15%), while
Champawat covers the minimum area of 1634 sq. km. (3%). Uttarakhand experiences four
types of seasons, namely, Monsoon from June to September (JJAS), Post‐monsoon from
October to November (ON), Cold weather from December to February (DJF), and Pre‐
monsoon (Hot Weather) from March to May (MAM). The estimated normal annual pre‐
cipitation in the state is 1446 mm. Rain usually starts at the end of April and lasts until
September. The monsoon rainfall amounts to 78% of annual rainfall, making this state
prone to flood incidents during monsoon. Bageshwar receives the maximum normal an‐
nual rainfall (1872 mm), out of which 81% falls in the monsoon season. Haridwar receives
the minimum normal annual rainfall (1107 mm) of all.
Further, due to differences in elevation, position, slope, and other topographical fea‐
tures throughout the state, the state’s temperatures vary widely. During March and April,
temperatures rise until they peak in May and June, when the mean maximum temperature
in the southern and valley regions of the state is between 34 and 38 °C, and the mean
minimum temperature is between 20 and 24 °C. Temperatures can reach 42 °C in the val‐
leys and southern half of the state and 30 °C in two‐kilometre‐high elevations on some
days. Day and night temperatures begin to dip around the end of September and reach

Water 2022, 14, 1879 5 of 24
the lowest in January and early February. January is the coldest month, with an average
maximum temperature of around 20 °C and an average lowest temperature of approxi‐
mately 6 °C in the southern section and river valleys. The mean maximum and mean min‐
imum temperatures range from 10 to 12 °C at altitudes of 2 km [23]. Table 2 summarises
the district‐wise details of the area, rainfall, temperature, and elevation characteristics in
the various seasons. Figure 3 shows the state’s district‐wise climatic characteristics regard‐
ing normal rainfall and temperature.
Table 2. The district‐wise climatic characteristics and topography of the state.
District Area
(sq. km.) Temperature (°C) Normal Rainfall (mm) Elevation (m)
Min. Temp. Max. Temp. ON DJF MAM JJAS Annual Min. Max.
Min. Max. Mean Min. Max. Mean
Almora 3088 1.9 19.2 11.0 13.7 26.7 21.6 32 118 188 1238 1576 519 2619
Bageshwar 2267 −4.8 14.5 4.9 6.4 20.3 14.8 37 128 192 1515 1872 714 6513
Chamoli 7821 −13.3 8.5 −2.8 −3.0 15.1 7.1 40 150 229 1286 1705 714 7619
Champawat 1634 4.2 20.5 12.9 15.5 28.1 23.1 28 92 116 1114 1351 268 2199
Dehradun 3055 2.1 20.9 12.0 14.6 29.6 23.4 25 127 170 931 1253 283 2962
Garhwal 5444 4.4 22.0 14.0 16.3 31.3 24.9 29 107 156 1070 1361 254 3049
Hardwar 2372 6.6 25.6 17.0 19.0 36.8 28.8 19 93 91 904 1107 214 874
Nainital 4124 5.0 22.0 14.3 16.5 31.2 24.9 31 101 124 1099 1355 212 2522
Pithoragarh 7228 −4.2 8.6 3.0 −2.9 15.1 7.1 27 122 134 1184 1467 428 6985
Rudraprayag 1821 −7.8 12.8 2.2 3.9 18.8 12.6 44 144 262 1400 1851 584 6869
Tehri Garhwal 3854 −0.6 18.4 9.2 11.7 25.7 20.2 30 131 204 1031 1396 339 6392
Udham Singh
Nagar 2737 7.3 24.8 17.2 19.1 35.6 28.3 32 78 81 1209 1400 186 421
Uttarkashi 8039 −7.0 8.6 −4.0 −3.5 15.9 7.3 30 144 203 875 1252 711 6990
Overall 53,483 − − − − − − 31 123 172 1120 1446 186 7619
Figure 3. The climatic characteristics of various districts in Uttarakhand.
2.3. Flash‐Flood Incidents
Hydro‐meteorological disasters have increased rapidly over the last 20 years [24], as
displayed in Table 3. Chamoli, Pithoragarh, Rudraprayag, and Uttarkashi are the most
affected districts. Therefore, to alleviate the future occurrences of such disasters and sug‐
gest probable mitigation strategies, it is necessary to identify various issues and challenges
faced during flood management.

Water 2022, 14, 1879 6 of 24
Table 3. The list of major flash‐flood locations in the state of Uttarakhand.
S.
No. Date Region District Damage Reference
1 7 February
2021 Tapovan Chamoli
More than 200 peo‐
ple were killed or
missing, and sev‐
eral hydel plants
suffered
[25,26]
2 18 August
2019 Makudi Uttarkashi 17 people died
https://sandrp.in/
(accessed on 25 January
2022)
3 16 July 2018 Tharali Chamoli
55 houses, 10 vehi‐
cles, 2 ropeways, 1
road bridge
washed, 2 cattle
died, mini‐hydro
projects affected
https://sandrp.in/
(accessed on 25 January
2022)
4 14 August
2017 Dharchula Pithoragarh 16 people
https://www.skymetwea
ther.com
(accessed on 25 January
2022)
5 28 May 2016 Kemra Tehri 120 houses, 100 ani‐
mals
Millennium post, 28 May
2016
6 15 August
2014 Purala
Pauri
Gharwal
16 people reported
dead [13]
7 16 June 2013 Kedarnath Rudraprayag 10,000 people, 365
houses [27,28]
8 13 Septem‐
ber 2012 Ukhimath Chamoli 66 people [15]
9 3 August
2012
Pandrasu
ridge Uttarkashi
35 people, 436 live‐
stock lost, 591
houses
[29]
10 11 August
2001 Phata Rudraprayag
27 people, 64 ani‐
mals, 22 houses [30]
2.4. Hydroclimatic and Topographic Dataset
The daily gridded IMD precipitation datasets at 0.25° resolution and maximum tem‐
perature datasets at 1° resolution from 1990 to 2019 were used in this study. Both datasets
were obtained from https://www.imdpune.gov.in/ (accessed on 25 January 2022). Around
103 rainfall and 13 temperature grid points were utilised to cover the entire state, as shown
in Figure 2. The daily rainfall and temperature datasets of the fifth generation “European
Centre for Medium‐Range Weather Forecasts (ECMWF) Atmospheric Reanalysis (ERA5)
[31]” for the period 1990–2019 from Google Earth Engine [32] were also utilised.
The elevation map was prepared from Shuttle Radar Topography Mission (SRTM)
Digital Elevation Model (DEM) acquired from https://portal.opentopography.org (ac‐
cessed on 25 January 2022) at 30 m resolution. The locations of the India Meteorological
Department’s (IMD) Automatic Weather Station (AWS) and Automatic Rain Gauges
(ARG) were obtained from http://aws.imd.gov.in:8091 (accessed on 25 January 2022). The
satellite imageries of the flood events were acquired from Google Earth Pro. The climatic
characteristics of the state were also obtained from the IMD annual report, and State Dis‐
aster Management Action plan on climate change [6,33,34].
Water 2022, 14, 1879 7 of 24
2.5. The Proposed Methodology for Flood Risk Management
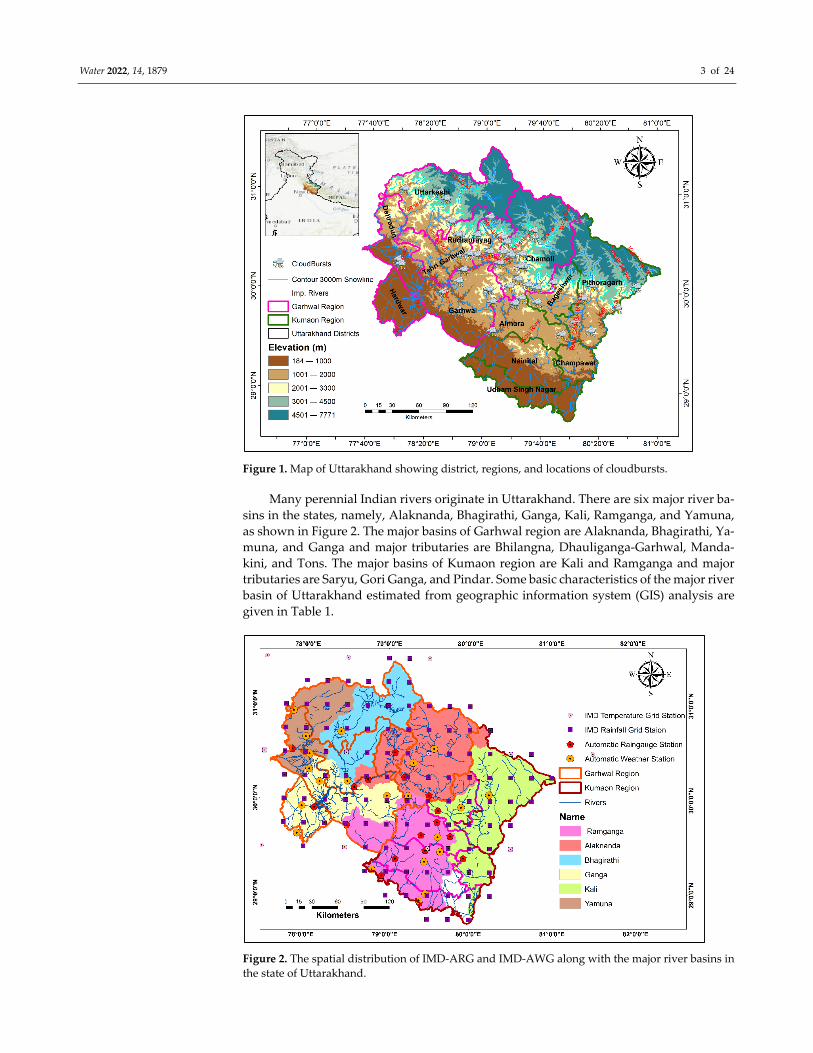
The methodology adopted in this study is divided into three parts, A, B and C, as
shown in Figure 4. Part A summarises the primary causes of the disasters in the state and
analyses the climatic variation by incorporating rainfall and temperature datasets. This
part also discusses the topographic influences causing the two major disasters in the state.
Part B reviews the issues and challenges involved in the flood management of the
region. Part C provides the basic approach for flood risk management in the Himalayan
state to reduce the likelihood of flood incidents for people living in flood‐prone areas.
Figure 4. The proposed methodology for flood risk management.
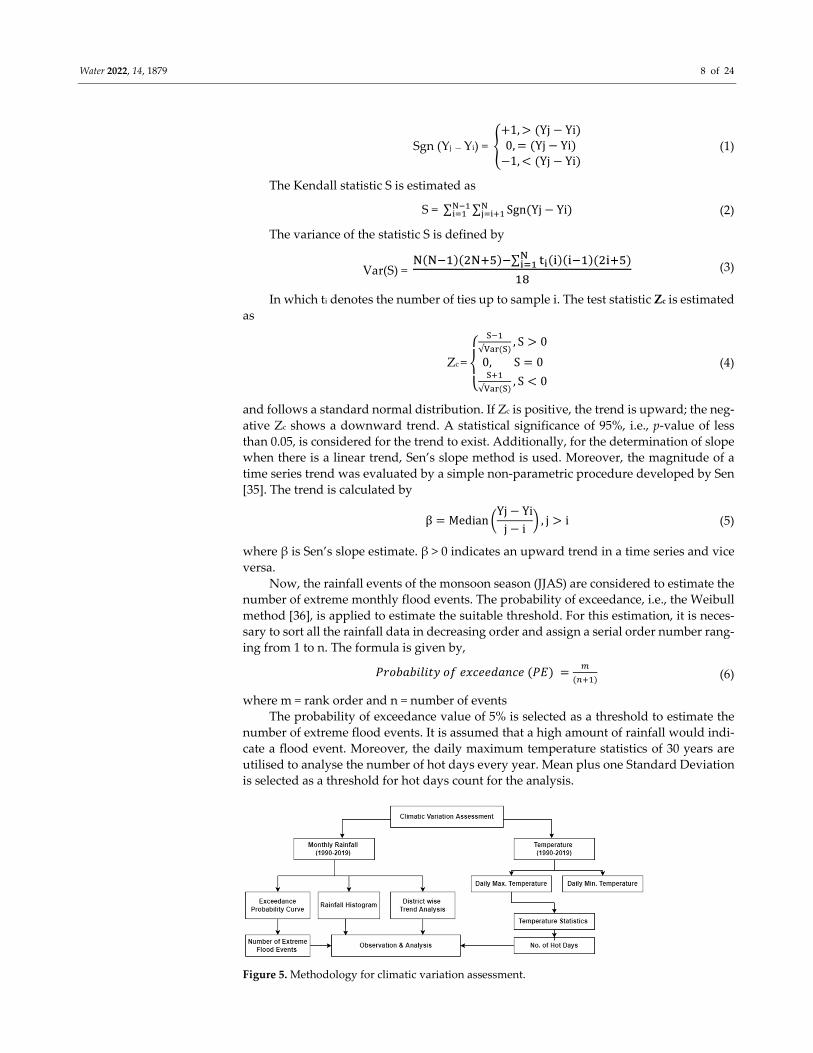
2.6. Methodology for Climatic Variation Assessment
The methodology for climatic (rainfall and temperature) assessment is shown in Fig‐
ure 5. The daily rainfall datasets are aggregated into seasonal datasets to assess the rainfall
trends and variations. Then, the histogram of the rainfall value is plotted to assess the
distribution. Furthermore, the Mann–Kendall and Theil–Sen slope method (Equations (1)–
(5)) is utilised to estimate each district’s trend. Non‐parametric tests, such as the Mann–
Kendall (MK) [34,35] test, are frequently used to identify patterns in time series of hydro‐
logical changes. For instance, Yi ranked from i = 1, 2...N − 1, and Yj ranked from j = i + 1,
2…N. Each data point Yi is used as a reference point and is compared with all other data
points Yj such that,
Water 2022, 14, 1879 8 of 24
Sgn (Yj — Yi) =
1, Yj Yi0, Yj Yi1, Yj Yi
(1)
The Kendall statistic S is estimated as
S = ∑ ∑ Sgn Yj Yi (2)
The variance of the statistic S is defined by
Var(S) = ∑
(3)
In which ti denotes the number of ties up to sample i. The test statistic Zc is estimated
as
Zc =
⎩⎨
⎧√ , S 0
0, S 0
√, S 0
(4)
and follows a standard normal distribution. If Zc is positive, the trend is upward; the neg‐
ative Zc shows a downward trend. A statistical significance of 95%, i.e., p‐value of less
than 0.05, is considered for the trend to exist. Additionally, for the determination of slope
when there is a linear trend, Sen’s slope method is used. Moreover, the magnitude of a
time series trend was evaluated by a simple non‐parametric procedure developed by Sen
[35]. The trend is calculated by
β MedianYj Yi
j i, j i (5)
where β is Sen’s slope estimate. β > 0 indicates an upward trend in a time series and vice
versa.
Now, the rainfall events of the monsoon season (JJAS) are considered to estimate the
number of extreme monthly flood events. The probability of exceedance, i.e., the Weibull
method [36], is applied to estimate the suitable threshold. For this estimation, it is neces‐
sary to sort all the rainfall data in decreasing order and assign a serial order number rang‐
ing from 1 to n. The formula is given by,
𝑃𝑟𝑜𝑏𝑎𝑏𝑖𝑙𝑖𝑡𝑦 𝑜𝑓 𝑒𝑥𝑐𝑒𝑒𝑑𝑎𝑛𝑐𝑒 𝑃𝐸 (6)
where m = rank order and n = number of events
The probability of exceedance value of 5% is selected as a threshold to estimate the
number of extreme flood events. It is assumed that a high amount of rainfall would indi‐
cate a flood event. Moreover, the daily maximum temperature statistics of 30 years are
utilised to analyse the number of hot days every year. Mean plus one Standard Deviation
is selected as a threshold for hot days count for the analysis.
Figure 5. Methodology for climatic variation assessment.

Water 2022, 14, 1879 9 of 24
2.7. Methodology for Topographic Influence Estimation
For the analysis of topographic influence, the visual image interpretation technique
was employed [37]. The information of area, shape, texture, tone, size, pattern, and asso‐
ciation of the incidents was taken as the image interpretation elements. Moreover, the
analysis used Google Earth imagery of pre and post incidents information gleaned from
literature and the DEM of the region to estimate the basic physiography of the affected
watersheds. Two case studies were investigated. The first case study examined the Ked‐
arnath flood incident of 2013 [38–41]. The second case study assessed the Chamoli flash
flood of 2021 [26,42].
3. Results and Discussion
3.1. Part A—Causes of the Flood Disasters in the State
The Himalayan’s young, fragile, steep gradients are vulnerable to climate change
[19]. In addition, these mountain areas’ ecological and social‐economic systems are be‐
coming increasingly susceptible due to swelling human density. Moreover, the disasters
disrupt society’s functioning and adversely damage infrastructure, properties, life, and
the environment. Furthermore, they aggravate other distress such as social conflict, finan‐
cial crisis, environmental degradation, and diseases. Both natural and anthropogenic
causes trigger these disasters in the mountain ecosystem.
3.1.1. Natural Causes
The two major natural causes of disaster in the state are the harsh climatic conditions
causing extreme rainfall and the complex undulating topography causing rapid flood
characteristics. During the southwest monsoon season, the Uttarakhand area experiences
significant to extremely heavy rainfall.
The following are the primary meteorological conditions that contribute to high rain‐
fall in the area:
(1) From the Bay of Bengal, the low‐pressure areas rise and migrate through the central
part of India and then recurve northwards and north‐eastwards and cause high rain‐
fall in the Uttarakhand’s foothill. Furthermore, depressions from the Arabian sea
cross north Maharashtra and south Gujarat coasts, reach the Kumaun‐Garhwal re‐
gion and cause severe cloudbursts, flash floods, and landslides.
(2) Flooding due to heavy rainfall occurs in the central and eastern Himalayas when the
monsoon’s axis shifts to the Himalayan foothills from the Northern Indian plains in
July and August (the setting in the ‘break situation’).
(3) Western/Extra‐tropical disturbances, originating from Caspian and the Mediterra‐
nean Sea in the far west and moving towards north India through Afghanistan, Iran,
and Pakistan, cause snow and rain during the winter season over the western Hima‐
layas. This rainfall from Western disturbances occurs four to five times per month
during monsoon and six to seven times during the winters.
Results for Climatic Variation Assessment
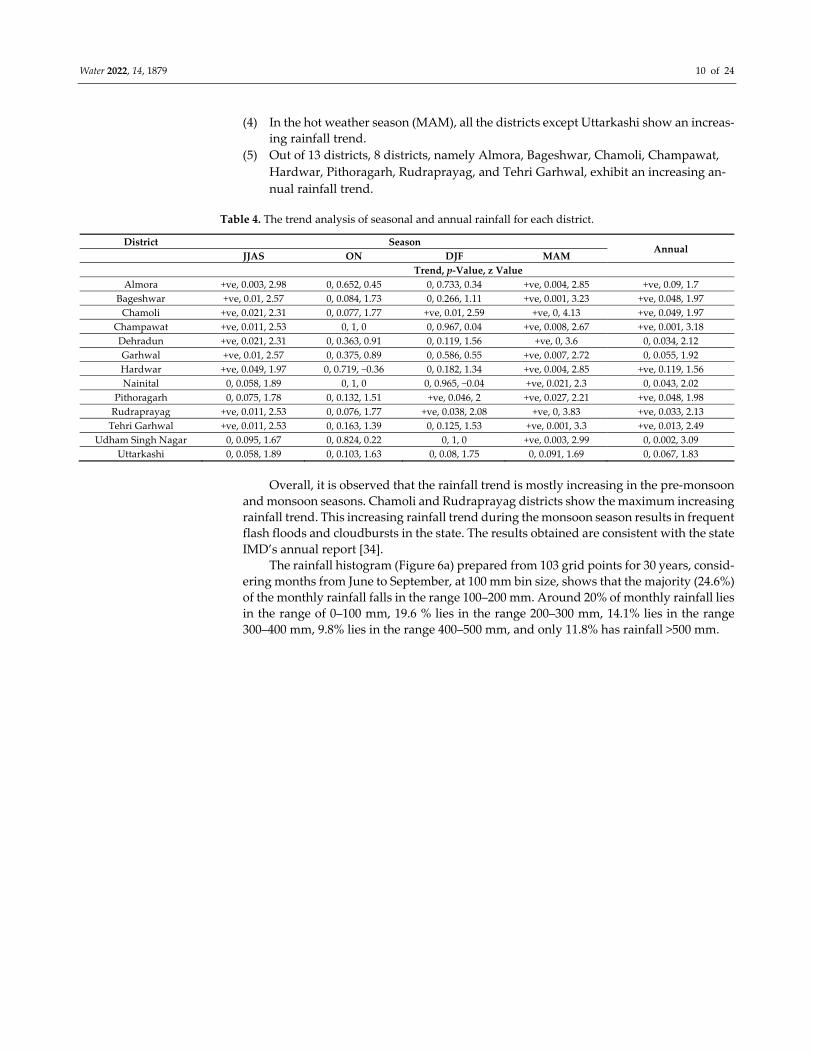
A detailed seasonal rainfall trend analysis (Equations (1)–(5)) for each district is car‐
ried out to study the temporal variation in rainfall, and the results are displayed in Table
4. The increasing trend is represented by ‘+ve’, decreasing trend by ‘‐ve’, and the no‐trend
by ‘0’. The observations made are as follows,
(1) In the monsoon season (JJAS), 9 out of 13 districts, namely, Almora, Bageshwar, Cha‐
moli, Champawat, Dehradun, Garhwal, Hardwar, Rudraprayag, and Tehri Garhwal,
show an increasing rainfall trend.
(2) In post‐monsoon (ON), no significant trend is observed.
(3) In the cold season (DJF), an increasing trend is observed for Chamoli, Pithoragarh,
and Rudraprayag districts, while in the other districts, no trend is observed.
Water 2022, 14, 1879 10 of 24
(4) In the hot weather season (MAM), all the districts except Uttarkashi show an increas‐
ing rainfall trend.
(5) Out of 13 districts, 8 districts, namely Almora, Bageshwar, Chamoli, Champawat,
Hardwar, Pithoragarh, Rudraprayag, and Tehri Garhwal, exhibit an increasing an‐
nual rainfall trend.
Table 4. The trend analysis of seasonal and annual rainfall for each district.
District Season Annual
JJAS ON DJF MAM
Trend, p‐Value, z Value
Almora +ve, 0.003, 2.98 0, 0.652, 0.45 0, 0.733, 0.34 +ve, 0.004, 2.85 +ve, 0.09, 1.7
Bageshwar +ve, 0.01, 2.57 0, 0.084, 1.73 0, 0.266, 1.11 +ve, 0.001, 3.23 +ve, 0.048, 1.97
Chamoli +ve, 0.021, 2.31 0, 0.077, 1.77 +ve, 0.01, 2.59 +ve, 0, 4.13 +ve, 0.049, 1.97
Champawat +ve, 0.011, 2.53 0, 1, 0 0, 0.967, 0.04 +ve, 0.008, 2.67 +ve, 0.001, 3.18
Dehradun +ve, 0.021, 2.31 0, 0.363, 0.91 0, 0.119, 1.56 +ve, 0, 3.6 0, 0.034, 2.12
Garhwal +ve, 0.01, 2.57 0, 0.375, 0.89 0, 0.586, 0.55 +ve, 0.007, 2.72 0, 0.055, 1.92
Hardwar +ve, 0.049, 1.97 0, 0.719, −0.36 0, 0.182, 1.34 +ve, 0.004, 2.85 +ve, 0.119, 1.56
Nainital 0, 0.058, 1.89 0, 1, 0 0, 0.965, −0.04 +ve, 0.021, 2.3 0, 0.043, 2.02
Pithoragarh 0, 0.075, 1.78 0, 0.132, 1.51 +ve, 0.046, 2 +ve, 0.027, 2.21 +ve, 0.048, 1.98
Rudraprayag +ve, 0.011, 2.53 0, 0.076, 1.77 +ve, 0.038, 2.08 +ve, 0, 3.83 +ve, 0.033, 2.13
Tehri Garhwal +ve, 0.011, 2.53 0, 0.163, 1.39 0, 0.125, 1.53 +ve, 0.001, 3.3 +ve, 0.013, 2.49
Udham Singh Nagar 0, 0.095, 1.67 0, 0.824, 0.22 0, 1, 0 +ve, 0.003, 2.99 0, 0.002, 3.09
Uttarkashi 0, 0.058, 1.89 0, 0.103, 1.63 0, 0.08, 1.75 0, 0.091, 1.69 0, 0.067, 1.83
Overall, it is observed that the rainfall trend is mostly increasing in the pre‐monsoon
and monsoon seasons. Chamoli and Rudraprayag districts show the maximum increasing
rainfall trend. This increasing rainfall trend during the monsoon season results in frequent
flash floods and cloudbursts in the state. The results obtained are consistent with the state
IMD’s annual report [34].
The rainfall histogram (Figure 6a) prepared from 103 grid points for 30 years, consid‐
ering months from June to September, at 100 mm bin size, shows that the majority (24.6%)
of the monthly rainfall falls in the range 100–200 mm. Around 20% of monthly rainfall lies
in the range of 0–100 mm, 19.6 % lies in the range 200–300 mm, 14.1% lies in the range
300–400 mm, 9.8% lies in the range 400–500 mm, and only 11.8% has rainfall >500 mm.

Water 2022, 14, 1879 11 of 24
Figure 6. (a) The histogram and (b) the probability of exceedance curve of the monthly rainfall (June
to September) obtained for the years 1990–2019.
The probability of exceedance curve (Figure 6b) was prepared using Equation (6),
and considering the value of 5%, the value of rainfall depth threshold was estimated to be
650 mm. Therefore, all the monthly rainfall of more than 650 mm is considered an extreme
flood. The result shows that the maximum number (288) of total extreme flood events is
in July, 242 in August, 51 in September, and 34 in June in the past 30 years. This also
demonstrates that the region is highly vulnerable in July and August. To understand the
trend of the flood incidents, the Mann–Kendall test was carried out. It is observed that
there is no statistically significant trend in the monsoon season (June to September) (Fig‐
ure 7). However, a very small increasing trend in July and August and a small decreasing
trend in June and September may be due to random fluctuating components in the time
series.
Figure 7. The time series of the number of flood incidents.

Water 2022, 14, 1879 12 of 24
The daily maximum temperature statistics revealed that the region has a normal
maximum temperature of 30.1 °C and a standard deviation of 6.2 °C. Therefore, consider‐
ing the threshold temperature as 36.3 °C (mean + one std. dev.), the values of no. of hot
days obtained are shown in Figure 8. It is observed that the years 1999, 2002, 2009, 2010,
2012, 2014, and 2019 experienced more than 70 hot days in a year. To understand the trend,
the Mann–Kendall test was performed. It is observed that statistically, there is no signifi‐
cant trend in the number of hot days during the last three decades. The very small increas‐
ing trend may be due to natural random fluctuating components in the time series. These
increasing hot day events contribute to the glaciers’ mass loss, permafrost degradation,
and increased snowmelt in the Himalayas.
Figure 8. The time series of the number of hot days.
Results for Topographic Influence Assessment
The floods developed in a mountainous region differ from those generated in flood
plains lying in low elevation zones. In hilly regions of Uttarakhand, floods are sudden and
often termed flash floods. These flash floods are usually generated by extreme events such
as heavy rainfall, cloudbursts, glacial lake outbursts, and dams created due to the block‐
age of rivers [43]. Such incidents are localised, occur with little to no warning, and pose
significant damage in downstream areas. A wide range of variables, including hydrolog‐
ical characteristics, such as high‐intensity rainfall and huge flow velocity, high frequency
of occurrence, high peak flood, and basic characteristics such as the steepness of slope,
elevation, and shape of the area, the degree to which the water carries sediments, and the
vulnerability of the populations to the flowing floods, can further stimulate their impact.
In 2013, an extreme event in the form of a cloudburst combined with flash floods and
landslides occurred in the Mandakini River basin. More than 10,000 people were pre‐
sumed dead as a result of this catastrophe. Over 135 highways, 150 bridges, and 2000
houses/buildings were affected [39,40]. The basin length of Mandakini is about 66 km and
covers 1982 sq. km. The relative relief ranges from 177 to 1416 m, in which 53% of the
relied ranges from 500 to 750 m (moderate‐high). Additionally, around 68% of the region
has a slope of 25–35° [44] . Such topographical conditions of the basin make it prone to
flash floods. The pre‐ and post‐flash‐flood scenario near the Kedarnath temple depicting
the debris deposition and damage to the roads is shown in Figure 9.

Water 2022, 14, 1879 13 of 24
Figure 9. The Google Earth images showing, (A) Pre‐flood (November 2011), (B) Post flood (Decem‐
ber 2013) impact of the extreme flash‐flood event in the Kedarnath region of the Mandakini river
basin.
Apart from extreme weather‐induced disasters, the region also suffers from land‐
slides and avalanches. In 2021, the Chamoli region experienced a flash‐flood event result‐
ing from an avalanche near the Ronti Glacier (Figure 10) at an elevation of 4064 m. At the
confluence of the Rishi and Dhauliganga rivers, the height is 1908 m, while Nanda Devi,
at 7817 m, is the highest point in the region. The floods, while travelling downstream,
demolished the bridge near Raini village, damaged the Rishiganga and the National Ther‐
mal Power Corporation (NTPC) Tapovan Hydel plant, and killed over 200 people [45].
The velocity and flood discharge at 89 m upstream of the Rishiganga Dam is estimated to
be 24 m/s and 12,448 cumecs. The length of the rockslide surface is about 1182 m, having
a maximum width of 755 m and a mean slope of 62° [46].
Figure 10. The Google Earth imagery shows, (A) An overall view of the incident, (B) The actual
location of the avalanche near Ronti Glacier, (C) The confluence of Dhauliganga and Rishiganga,
near Raini village, and (D) The inundated NTPC Tapovan sites.

Water 2022, 14, 1879 14 of 24
3.1.2. Anthropogenic Causes
The increasing population growth in these mountain regions hampers the ecological
and socio‐economic systems. Numerous anthropogenic activities, such as the construction
of roads, buildings, hydropower projects, abundant tourism, forest encroachment, etc.,
pose a serious threat to the climate and mountain ecosystem [40]. Blasting and massive
cutting of the rocks, which generates high‐intensity vibrations, is the primary method of
clearing mountains for development. New roads are continually being developed, and
old highways are being expanded and maintained in the Indian Himalayas. Such activities
cause steepening of the hill slopes and further lead to slope instability. The unplanned
development over the riverbed has essentially replaced the agricultural land, allowing the
river habitat to decline.
The elimination of natural vegetation, and the expansion of impervious areas, lead
to a reduced water storage capacity and, as a result, a higher flood peak and a shorter time
to peak [47]. Certain anthropogenic ritual activities such as cremation ceremonies cause
heavy pressure on the forest ecosystem as they result in deforestation and lead to air and
water pollution. Morbidity among agricultural workers is exacerbated by these develop‐
ments, which have a greater impact on the economy [48].
Greenhouse gas (GHG) emissions in the valley have increased significantly due to
uncontrolled human activities such as tourism and vehicle traffic. The AR6 IPCC reports
that solar radiation is absorbed by anthropogenic aerosols such as black carbon, which
increases moist static energy, warms the lower troposphere, and further increases convec‐
tion inhibition, suppressing light rainfall [49]. Aerosols intensify convection in the Hima‐
layan foothills during the pre‐monsoon season, resulting in regional convergence; this
phenomenon is known as the ‘Elevated‐Heat‐Pump’ mechanism [50]. Intense monsoon
rainfall in northern India and western Nepal in 2013, which caused landslides and one of
the worst floods in history, has been further linked to increased GHG and aerosols [38]. A
direct association between an increase in tourism and the landslide’s frequency has also
been observed [51]. The major anthropogenic activities in the state of Uttarakhand has
been discussed [52] and are shown in Figure 11.
Figure 11. The impact of anthropogenic activities on the degradation of river ecosystem in Utta‐
rakhand. (A) (Source : https://sandrp.in/2020/02/24/uttarakhand‐road‐widening‐work‐in‐almora‐
damages‐traditional‐water‐sources/ (accessed on 6 June 2022)), (B) (Source : https://san‐
drp.in/2021/09/17/uttarakhand‐cloud‐bursts‐around‐vyasi‐hep/ (accessed on 6 June 2022)), (C)
(Source : https://news.euttaranchal.com/uttarakhand‐bans‐quarrying‐ganga‐tributaries‐following‐
ngt‐order (accessed on 6 June 2022)), (D) (Source : https://news.euttaranchal.com/no‐mining‐
within‐10‐km‐national‐parks‐uttarakhand‐high‐court (accessed on 6 June 2022)), (E) (Source :
https://www.downtoearth.org.in/news/urbanisation/undone‐by‐rampant‐mining‐illegal‐build‐
ings‐41450 (accessed on 6 June 2022)), (F) (Source : https://www.hindustantimes.com/cities/deh‐
radun‐news/uttarakhand‐char‐dham‐yatra‐to‐kedarnath‐halted‐amid‐heavy‐rain‐imd‐warns‐of‐
thunderstorms‐101653301156476.html (accessed on 6 June 2022)).

Water 2022, 14, 1879 15 of 24
3.2. Part B—Issues and Challenges of Flood Management in the State of Uttarakhand
Flood hazards in Himalayan Rivers are diverse, necessitating a multi‐faceted and
multi‐scaled approach to preparedness. It is necessary to monitor, forecast, and dissemi‐
nate information about these processes and phenomena. These initiatives must cross tra‐
ditional disciplinary boundaries and involve scientists, policymakers, and members of
civil society working together at all levels of government and administration to be effec‐
tive. The four major challenges of flood management in Uttarakhand are: (1) complex and
steep topography that controls the flow path and velocity, (2) lack of comprehensive pol‐
icy and governance, which is essential for effective risk governance, (3) inadequate data
and infrastructure, that is necessary for estimation and evaluation of flood‐generating
mechanisms, and (4) climate change and flood management integration, which is required
for a long‐term solution to flooding risks and hazards.
3.2.1. Complex Topography of the Mountainous Terrain
The complex and steep topography of the hilly regions of Uttarakhand links to their
unusual sharp atmospheric changes (i.e., moisture, precipitation, radiation, temperature,
pressure), soil, vegetation, and hydrological conditions over short distances. These sharp
gradients throughout the terrain control the form of precipitation, intensity and fre‐
quency, groundwater interactions, biodiversity, and soil moisture, which sequentially
lead to high rates of flood variability over short distances [17,53,54]. The main impact in
hilly terrain is undercutting check dams, river damming by debris, riverbanks collapse
and erosion, debris flows and deposits, channel displacement, clogging bridges, scour,
and inundations of low‐lying areas. Floods associated with geophysical flows, such as
glacial dam burst floods, river avulsions, and glacial lake outburst floods (GLOF), are of‐
ten extremely disruptive and lack enough evidence and models for understanding and
controlling them in mountain regions [55,56]. When combined with limited hydro‐mete‐
orological statistics, such complexities lead to partial knowledge of the flood generation
process, particularly with localised extreme events such as cloudbursts and glacier lake
outbursts, landslides, and other convective storms. In the Himalayas, the cloudbursts are
the least understood weather patterns [15,28]. The terms thunderstorms and cloudbursts
have been used for decades interchangeably. However, the cloudbursts are hard to track
as they are scattered and mostly occur on remote mountain slopes with limited rain
gauges [24]; they are often only reported if lives are lost [57]. Given the degree to which
the infrastructure and human resources are harmed, it is crucial to underline the processes
that produce cloudbursts and establish a model for proper predictions.
3.2.2. Lack of Comprehensive Policy and Governance on Flood Mitigation
The key gaps in current policy are the lack of rigidity of the legislative framework,
the inability to follow a legal strategy, the question of authorisation of power, and the local
government’s role in policy processes. In the Disaster Mitigation, Management and Pre‐
vention Act (2005), the separation of responsibilities and the functions of local authorities
was remarkably integrated but not implemented as a legislative framework [10]. Land
management policies and preparation may better mitigate floods by reducing risk and
hazard exposure. Such laws include construction codes, land use laws, environmental
protection acts, emergency management legislation, and water policy, which govern hu‐
man actions and practices focused on environmental and ecological conservation, flood
prevention, and control measures. Building law, for example, specifies the safe distance
of houses from the rivers, construction size, and floor height to reduce waterlogging and
flood damage. In flood control, institutional aspects and effective governance play a criti‐
cal role. Policy planning alone is not adequate to handle the flood without enough prepa‐
ration.
Furthermore, for local‐level planning and proper land use management, the partici‐
pation of the community is also required. There is also a requirement for strong
Water 2022, 14, 1879 16 of 24
coordination among the institutes and flood management boards for effective risk gov‐
ernance. A strong rehabilitation and resettlement policy for re‐establishing the socio‐eco‐
nomic stability of the vulnerable communities is much needed in the state.
3.2.3. Inadequate Data and Infrastructure
The Himalayan regions’ basic climate and hydrological data are scarce, which greatly
disrupts the prediction, estimation, and evaluation of devastating flood‐generating cli‐
mate events, flood warnings, and other life‐saving management systems [17]. Due to the
remoteness, lack of connectivity, inadequate communication networks, and other infra‐
structure, it is challenging to develop response systems and instrumentation in hilly
mountain areas. Primary data collection issues include transportation logistics to the
gauging sites, loss of facilities during extreme flood events, and the expense of installation
and maintenance of gauges. In addition, in river basins with steep valley walls, wireless
coverage, and radio telemetry are frequently inaccessible with highly restricted choices
for transmitting long‐term hydrographic data and early warning systems. Remote sensing
systems can address the difficulties of in situ measurements. However, mountainous
places might have significant constraints (e.g., resource‐intensive processing of data
through remote sensing, limited data documentation, the cloud cover impacts, or other
data biases) and complex topography, including insufficient spatial and temporal resolu‐
tions [58–60]. Due to the difficulties in data gathering and the insufficiency of information,
the hydrology of hilly mountain areas is still not understood fully.
In Uttarakhand, the flood forecasting (FF) and early‐warning system (EWS) are ex‐
panding. The district offices do have sirens but have a small range of 2 km, which is a
significant shortcoming considering the geographic area that would be addressed. Data,
however, is transmitted with the help of different media, such as televisions, mobiles, ra‐
dio, and newspapers. With the speed of urbanisation and development witnessed in the
villages, various patterns were observed in the individuals. Many people used radio, and
those who had television did not wish to watch weather reports. Rather, many people,
despite having TV access, did not have the set‐up boxes that made them work. As per the
India Water Resources Information System portal, the state of Uttarakhand has 85 flood
forecasting sites of the Central Water Commission, as shown in Figure 12, along various
rivers of Uttarakhand. However, most rivers in this region come under the category of
“Classified river”; thus, the information about their flood discharge, velocities, and related
warning is unknown to the public. Furthermore, due to a limited number of communica‐
tion towers in remote locations and the unavailability of good quality real‐time data, the
whole set‐up of the warning system fails during heavy rainfall and cloudbursts, which
leads to a huge loss of lives and properties.

Water 2022, 14, 1879 17 of 24
Figure 12. The locations of various river monitoring stations of the Central Water Commission.
3.2.4. Climate Change and Flood Management Integration
The Himalayan glaciers are the source of several river systems in India, but they are
affected by human‐caused global warming and climate change. The AR6, IPCC 2021,
states that significant changes in temperature and precipitation have occurred in the Him‐
alayas since the 1960s, including glacier mass loss, permafrost degradation, snowmelt,
and increased glacier runoff [61]. Moreover, studies show that the glaciers in the Himala‐
yan regions have unpredictable retreat and volume change rates due to microclimate and
physiography variations [62]. Out of over 5000 glaciers, only 11 glaciers in the Indian Him‐
alayas are being examined for their mass balance. Nearly 100 glaciers are regularly tracked
for glacier snout shifts [48]. Decreasing glacier area and magnitude can briefly raise runoff
before the glacier has retreated to such a degree that it no longer leads to runoff, tempo‐
rarily raising flood levels and eventually causing landslides, GLOFs, and other geophysi‐
cal flows. Due to the rapid response of landscapes, ecosystems, vegetation, water, snow
and glaciers, and soil to environmental change, mountain areas are exclusively vulnerable
to climate change [63–65]. Thus, incorporating climate change into flood management
could be an effective long‐term solution to flooding risks and hazards.
Furthermore, the land erosion in the state is likely due to a combination of excessive
rainfall and prolonged drought periods. The vulnerability of mountain areas against cli‐
mate change indicates that mountain populations become highly susceptible because
snowpack, glacial cover, and weather cycles shift and increase the severity and intensity
of several mountain flood processes. Future flood management strategies must integrate
glacier shifts, monsoonal rains, and snowfall patterns.
3.3. Part C—Flood Risk Management Plan
Flood risk management aims to reduce the likelihood of flood incidents for people
living in flood‐prone areas. It involves “the development of policies and strategies and
plans for implementation and associated means of review”. The hilly regions of Uttarak‐
hand are mostly affected by the flash‐floods situation because of steep slopes and high
drainage density. Thus, implementing flood reduction measures requires a holistic ap‐
proach throughout the pre‐flood, post‐flood, and post‐flood stages [66,67]. During the
pre‐flood stage, the recommendations are as follows: implementation of disaster contin‐
gency planning and flood risk management for all causes of flood, preventing inapt
Water 2022, 14, 1879 18 of 24
development within the flood plains, constructing physical flood defence infrastructure,
implementation of proper warning and forecast systems, proper land use planning and
public communications. Then, at the ‘during‐flood’ stage, the following measures could
be followed: issuing a warning to the appropriate authorities, forecasting the future river
flow conditions, and identifying the probability of flood‐forming zones. At the ‘post‐
flood’ stage, measures adopted are as follows: reconstruction and restoration of damaged
infrastructure, providing relief to the affected, regeneration and retrieval of the economic
activities, and improving and reviewing the flood management activities for future occur‐
rences. Thus, for effective flood management, coordinated development and management
of flood plains for maximising the benefits in a balanced manner could be ensured via the
following approach:
3.3.1. Risk Mapping, Modelling, and Vulnerability Analysis
Mapping the specific hazards, locating important facilities, mobilising resources dur‐
ing and after an event, and mapping the physical constraints of an incident site to mitigate
the risks of possible hazardous occurrences would help in hazard zoning, vulnerability
assessment, and identifying the risk areas. Furthermore, involving local knowledge, per‐
ceptions, and socio‐cultural values would help develop know‐how, resources, and self‐
help capacities.
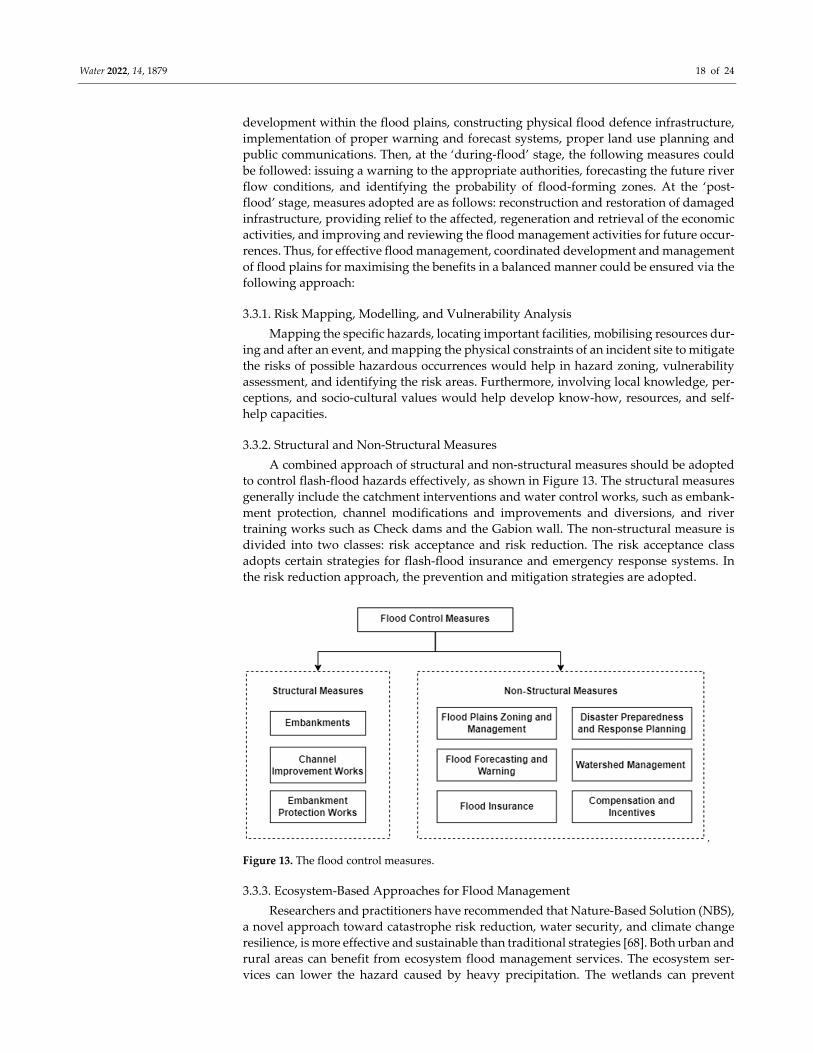
3.3.2. Structural and Non‐Structural Measures
A combined approach of structural and non‐structural measures should be adopted
to control flash‐flood hazards effectively, as shown in Figure 13. The structural measures
generally include the catchment interventions and water control works, such as embank‐
ment protection, channel modifications and improvements and diversions, and river
training works such as Check dams and the Gabion wall. The non‐structural measure is
divided into two classes: risk acceptance and risk reduction. The risk acceptance class
adopts certain strategies for flash‐flood insurance and emergency response systems. In
the risk reduction approach, the prevention and mitigation strategies are adopted.
.
Figure 13. The flood control measures.
3.3.3. Ecosystem‐Based Approaches for Flood Management
Researchers and practitioners have recommended that Nature‐Based Solution (NBS),
a novel approach toward catastrophe risk reduction, water security, and climate change
resilience, is more effective and sustainable than traditional strategies [68]. Both urban and
rural areas can benefit from ecosystem flood management services. The ecosystem ser‐
vices can lower the hazard caused by heavy precipitation. The wetlands can prevent

Water 2022, 14, 1879 19 of 24
floods by storing and temporarily slowing them down. Additionally, the roots of the wet‐
land vegetations stabilise the riverbanks and hill slopes by holding the soils. The runoff
fraction reduces the vegetated buffer zones, and other natural processes such as infiltra‐
tion, evapotranspiration, water storage in aquifers, etc., reduce the runoff fraction [69,70].
Thus, a large‐scale NBS is ideal in extreme events due to its ability to make more space for
water, hence reducing the risk through retention, slowdown, and infiltration [71].
3.3.4. Effective Hydrological Information System
The management of flood data and related information necessitates the implementa‐
tion of an effective Hydrological Information System. It could be done by maintaining the
hydrometric networks and utilising its datasets for hydrological and hydrodynamic mod‐
elling, which would help generate flood scenarios and forecast floods during extreme
events. Additionally, the interaction of land use land cover with climate change and hy‐
drology should be adopted in the research [72–74]. Furthermore, increasing inter‐sectoral
communication through enhancing human and institutional capacities must be promoted.
Moreover, the development of shared information portals and platforms for facilitating
knowledge exchange between stakeholders should be espoused.
3.3.5. Flood Forecasting and Early Warning Systems (EWS)
For effective flood control, accurate and timely flood forecasts and early warnings
are continually improved and upgraded [75]. An early warning system employs a flood
sensor coupled to a transmitter to detect increasing water levels in local water basins (riv‐
ers, lakes) or flood defence structures such as dams and embankments. When the water
reaches a crucial level, a signal is wirelessly relayed to the receiver. The flood warning is
subsequently communicated to concerned agencies and vulnerable people through mo‐
bile phones [76,77]. By incorporating local participation, the critical flood levels could be
determined. IMD and CWC are developing observation sites, weather stations, computa‐
tional simulation tools, computer infrastructure, and communication networks to im‐
prove the forecasting framework to deliver more reliable data that can produce greater
socio‐economic benefits. The spatial distribution of IMD–AWS and ARG in Uttarakhand
is already shown in Figure 2. The locations of the flood forecast station of the CWC are
shown in Figure 12. For example, approximately 11 CWC gauging sites in the Alaknanda
river basin can be viewed at https://ffs.tamcnhp.com/main/site (last accessed on 10 April
2022). In an extreme rainfall event, real‐time flood level information upstream and down‐
stream of the Alaknanda river could aid in formulating appropriate disaster response and
management strategies.
3.3.6. Mitigation, Preparedness, Response, and Recovery
The whole system is broken into four steps for effective flood management: Mitiga‐
tion, Preparedness, Response, and Recovery [33].
Mitigation aims to reduce or remove the risk of flooding substantially before its oc‐
currence by developing a strategy to minimise the effects of disaster on a community,
facility, or organisation through raising public knowledge of disaster risk management.
The main components of the mitigation strategy, therefore, are,
Land‐use planning and management.
Retrofitting of the existing structures.
Risk assessment and vulnerability analysis.
Performance and conceptual design of the structures.
Building bylaws and codes.
Preparedness activities are structured to create a sense of readiness for an emergency
disaster. The key initiative for disaster preparedness is community participation in con‐
tributing to the response process by being involved in the training and capacity building
process. The effective flood management response involves providing immediate

Water 2022, 14, 1879 20 of 24
emergency relief and search and rescue assistance. The actual work of this process de‐
pends on the characteristics of the community, but the primary goal is to meet citizens’
basic needs before the rehabilitation begins. In the hilly regions, the response phase forms
an important criterion for successfully preventing the adverse impact of natural hazards,
as the warning durations are less. In this regard, incident management systems and tools
for analysing the consequences of disasters built on geographic information systems (GIS)
may substantially aid rapid response and emergency management. A useful application
of geospatial technology during a disaster may be a map showing public access to emer‐
gency services (such as electricity and transportation). The final stage, known as the re‐
covery phase, includes assessing the damage, rebuilding, and helping the afflicted. Re‐
storing normalcy to disaster‐affected areas is the overall objective of this stage. Conduct‐
ing a quick damage assessment forms a top objective to expedite the rescue effort. Rapid
damage assessment and relief operations can be supplemented by measures such as coor‐
dinating the spatial inventory of damage, assuaging and educating the public, and avert‐
ing reoccurrence.
4. Conclusions
The Indian Himalayan Regions are the home of the major Indian population and cre‐
ate an important nexus among water, energy, and food for society, biodiversity, and life,
but they are often subject to catastrophic natural disasters, especially floods. The study
highlights the natural causes, such as harsh climatic conditions and topographical influ‐
ence and anthropogenic causes, such as construction activities, deforestation, and tourism
that have aggravated the extreme flood conditions. Further, the study identifies the chal‐
lenges of flood management, viz., complex topography, weak policy and governance, lack
of adequate data and infrastructure, and the need for climate change and flood manage‐
ment integration. The study suggests adopting an effective flood risk management plan
to assess the multi‐institutional, land use planning, mitigation policy execution, and mit‐
igation strategies in pre‐, during‐, and post‐flood scenarios with a special focus on the
districts, viz., Chamoli, Pithoragarh, Rudraprayag, and Uttarkashi.
Furthermore, adopting nature‐based solutions, such as wetlands, is proposed to
counter extreme flood events. Additionally, a combined structural and non‐structural
measures approach is recommended to manage flash floods effectively. Furthermore, the
study commends a need for collaborative governance between local, state, and central
policymakers and an integrated communication network for improved flood control in
hilly regions. Additionally, the work recommends installing and upgrading flood fore‐
casts and early warning systems for the region’s accurate and timely flood forecasts.
Adopting an effective flood management system in hilly regions requires an infrastruc‐
tural and technical contribution to long‐term monitoring and assessment. Moreover, com‐
prehensive model‐based studies of climate changes and environmental effects and pro‐
cess‐based hydrology studies in altitudinal and mountainous gradients should be es‐
poused.
Author Contributions: Conceptualisation—M.L.K. and S.S. formal analysis and writing—S.S.; su‐
pervision and guidance—M.L.K. All authors have read and agreed to the published version of the
manuscript.
Funding: The second author is thankful to the Ministry of Education, Govt. of India, for the fellow‐
ship grant for carrying out the research at the Department of Water Resources Development & Man‐
agement at IIT Roorkee. The APC is waived‐off.
Institutional Review Board Statement: Not applicable.
Informed Consent Statement: Not applicable.
Data Availability Statement: Not applicable.

Water 2022, 14, 1879 21 of 24
Acknowledgments: The authors are thankful to the Ministry of Education, Government of India for
the financial support provided through the Indian Institute of Technology, Roorkee, for carrying
out this research.
Conflicts of Interest: The authors declare no conflict of interest.
References
1. Munpa, P.; Kittipongvises, S.; Phetrak, A.; Sirichokchatchawan, W.; Taneepanichskul, N.; Lohwacharin, J.; Polprasert, C. Cli‐
matic and Hydrological Factors Affecting the Assessment of Flood Hazards and Resilience Using Modified UNDRR Indicators:
Ayutthaya, Thailand. Water 2022, 14, 1603. https://doi.org/10.3390/w14101603.
2. Wester, P.; Mishra, A.; Mukherji, A.; Shrestha, A.B.; Change, C. The Hindu Kush Himalaya Assessment; Wester, P., Mishra, A.,
Mukherji, A., Shrestha, A.B., Eds.; Springer International Publishing: Cham, Switzerland, 2019; ISBN 978‐3‐319‐92287‐4.
3. Murray, V.; Ebi, K.L. IPCC Special Report on Managing the Risks of Extreme Events and Disasters to Advance Climate Change
Adaptation (SREX). J. Epidemiol. Community Health 2012, 66, 759–760. https://doi.org/10.1136/jech‐2012‐201045.
4. Bhatt, G.D.; Sinha, K.; Deka, P.K.; Kumar, A. Flood Hazard and Risk Assessment in Chamoli District, Uttarakhand Using Sat‐
ellite Remote Sensing and GIS Techniques. Int. J. Innov. Res. Sci. Eng. Technol. 2014, 3, 15348–15356.
https://doi.org/10.15680/IJIRSET.2014.0308039.
5. Ashraf, S.; Luqman, M.; Iftikhar, M.; Ashraf, I.; Hassan, Z.Y. Understanding Flood Risk Management in Asia: Concepts and
Challenges. In Flood Risk Management; Hromadka, T., Rao, P., Eds.; IntechOpen: Rijeka, Croatia, 2017.
6. Raj, J. Uttarakhand Action Plan on Climate Change: Transforming Crisis into Opportunity; Government of Uttarakhand: Dehradun,
India, 2014.
7. European Commission. INFORM Index for Risk Management. India Country Profile. Available online: https://drmkc.jrc.ec.eu‐
ropa.eu/inform‐index (accessed on 6 June 2022).
8. Chen, C.; Noble, I.; Hellmann, J.; Coffee, J.; Murillo, M.; Chawla, N. Notre Dame Global Adaptation Initiative. Available online:
https://gain.nd.edu/our‐work/country‐index/rankings/ (accessed on 6 June 2022).
9. Lindell, M.K.; Arlikatti, S.; Huang, S.K. Immediate behavioral response to the June 17, 2013 flash floods in Uttarakhand, North
India. Int. J. Disaster Risk Reduct. 2019, 34, 129–146. https://doi.org/10.1016/j.ijdrr.2018.11.011.
10. Dash, P.; Punia, M. Governance and disaster: Analysis of land use policy with reference to Uttarakhand flood 2013, India. Int.
J. Disaster Risk Reduct. 2019, 36, 101090. https://doi.org/10.1016/j.ijdrr.2019.101090.
11. Dimri, A.P.; Kumar, D.; Choudhary, A.; Maharana, P. Future changes over the Himalayas: Maximum and minimum tempera‐
ture. Glob. Planet. Chang. 2018, 162, 212–234. https://doi.org/10.1016/j.gloplacha.2018.01.015.
12. Geneletti, D.; Dawa, D. Environmental impact assessment of mountain tourism in developing regions: A study in Ladakh,
Indian Himalaya. Environ. Impact Assess. Rev. 2009, 29, 229–242. https://doi.org/10.1016/j.eiar.2009.01.003.
13. Mishra, P.K.; Thayyen, R.J.; Singh, H.; Das, S.; Nema, M.K.; Kumar, P. Assessment of cloudbursts, extreme rainfall and vulner‐
able regions in the Upper Ganga basin, Uttarakhand, India. Int. J. Disaster Risk Reduct. 2021, 69, 102744.
https://doi.org/10.1016/j.ijdrr.2021.102744.
14. Das, S.; Ashrit, R.; Moncrieff, M.W. Simulation of a Himalayan cloudburst event. J. Earth Syst. Sci. 2006, 115, 299–313.
https://doi.org/10.1007/BF02702044.
15. Dimri, A.P.; Chevuturi, A.; Niyogi, D.; Thayyen, R.J.; Ray, K.; Tripathi, S.N.; Pandey, A.K.; Mohanty, U.C. Cloudbursts in Indian
Himalayas: A review. Earth Sci. Rev. 2017, 168, 1–23. https://doi.org/10.1016/j.earscirev.2017.03.006.
16. Wheater, H.; Evans, E. Land use, water management and future flood risk. Land Use policy 2009, 26, 251–264.
https://doi.org/10.1016/j.landusepol.2009.08.019.
17. Tullos, D.; Byron, E.; Galloway, G.; Obeysekera, J.; Prakash, O.; Sun, Y.H. Review of challenges of and practices for sustainable
management of mountain flood hazards. Nat. Hazards 2016, 83, 1763–1797. https://doi.org/10.1007/s11069‐016‐2400‐3.
18. Li, W.; Lin, K.; Zhao, T.; Lan, T.; Chen, X.; Du, H.; Chen, H. Risk assessment and sensitivity analysis of flash floods in ungauged
basins using coupled hydrologic and hydrodynamic models. J. Hydrol. 2019, 572, 108–120. https://doi.org/10.1016/j.jhy‐
drol.2019.03.002.
19. Saha, S.K.; Kumar, A.S. Northwest Himalayan Ecosystems: Issues, Challenges and Role of Geospatial Techniques. In Remote
Sensing of Northwest Himalayan Ecosystems; Navalgund, R.R., Kumar, A.S., Nandy, S., Eds.; Springer: Singapore, 2019; pp. 3–14,
ISBN 978‐981‐13‐2127‐6.
20. Satendra; Gupta, A.K. Uttarakhand Disaster 2013; Naik, V.K., Roy, T.K.S., Sharma, A.K., Dwivedi, M., Eds.; National Institute of
Disaster Management: New Delhi, India, 2014. ISBN 9789382571148.
21. Pandey, V.K.; Mishra, A. Trends of Hydro‐Meteorological Disaster in Uttarakhand, India. Int. J. Curr. Res. 2018, 4, 1–7.
22. Singh, P.; Kumar, N. Effect of orography on precipitation in the western Himalayan region. J. Hydrol. 1997, 199, 183–206.
https://doi.org/10.1016/S0022‐169403222‐2.
23. Climatological Publication Section. Climate of Uttarakhand; India Meteorological Department: Pune, India, 2014.
24. Singh, S.; Kansal, M.L. Cloudburst—A Major Disaster in The Indian Himalayan States. In Civil Engineering for Disaster Risk
Reduction; Kolathayar, S., Pal, I., Chian, S.C., Mondal, A., Eds.; Springer: Singapore, 2022; pp. 115–126, ISBN 978‐981‐16‐5312‐4.

Water 2022, 14, 1879 22 of 24
25. Pandey, P.; Chauhan, P.; Praveen, C.M.B.; Suresh, K.T. Cause and Process Mechanism of Rockslide Triggered Flood Event in
Rishiganga and Dhauliganga River Valleys, Chamoli, Uttarakhand, India Using Satellite Remote Sensing and in situ Observa‐
tions. J. Indian Soc. Remote Sens. 2021, 3, 1011–1024. https://doi.org/10.1007/s12524‐021‐01360‐3.
26. Singh, S.; Kansal, M.L. Chamoli flash‐flood mapping and evaluation with a supervised classifier and NDWI thresholding using
Sentinel‐2 optical data in Google earth engine. Earth Sci. Inform. 2022, 15, 1073–1086. https://doi.org/10.1007/s12145‐022‐00786‐
8.
27. Mishra, A.; Srinivasan, J. Did a cloud burst occur in Kedarnath during 16 and 17 June 2013? Curr. Sci. 2013, 105, 1351–1352.
28. Kumar, A.; Gupta, A.K.; Bhambri, R.; Verma, A.; Tiwari, S.K.; Asthana, A.K.L. Assessment and review of hydro‐meteorological
aspects for cloudburst and flash flood events in the third pole region (Indian Himalaya). Polar Sci. 2018, 18, 5–20.
29. Gupta, V.; Dobhal, D.P.; Vaideswaran, S.C. August 2012 cloudburst and subsequent flash flood in the Asi Ganga, a tributary of
the Bhagirathi river, Garhwal Himalaya, India. Curr. Sci. 2013, 105, 249–253.
30. Joshi, V.; Kumar, K. Extreme rainfall events and associated natural hazards in Alaknanda valley, Indian Himalayan region. J.
Mt. Sci. 2006, 3, 228–236. https://doi.org/10.1007/s11629‐006‐0228‐0.
31. Copernicus Climate Change Service. (C3S) ERA5: Fifth Generation of ECMWF Atmospheric Reanalyses of the Global Climate;
Copernicus Climate Change Service Climate Data Store (CDS). Available online: https://cds.climate.coperni‐
cus.eu/cdsapp#!/home (accessed on 6 June 2022),.
32. Gorelick, N.; Hancher, M.; Dixon, M.; Ilyushchenko, S.; Thau, D.; Moore, R. Google Earth Engine: Planetary‐scale geospatial
analysis for everyone. Remote Sens. Environ. 2017, 202, 18–27. https://doi.org/10.1016/j.rse.2017.06.031.
33. DMMC. State Disaster Management Action Plan for the State of Uttarakhand; Disaster Mitigation & Management Centre Uttarak‐
hand Secretariat: Uttarakhand, India, 2012.
34. Guhathakurta, P.; Bandgar, A.; Menon, P.; Prasad, A.K.; Sable, S.T.; Sangwan, N. Climate Research and Services Observed Rainfall
Variability and Changes over Uttarakhand State; India Meteorological Department: Pune, India, 2020; Volume 52.
35. Sen, P.K. Estimates of the Regression Coefficient Based on Kendall’s Tau. J. Am. Stat. Assoc. 1968, 63, 1379–1389.
https://doi.org/10.1080/01621459.1968.10480934.
36. Ciupak, M.; Ozga‐zieli, B.; Tokarczyk, T.; Adamowski, J. A Probabilistic Model for Maximum Rainfall Frequency. Water 2021,
13, 2688. https://doi.org/2073‐4441/13/19/2688.
37. Asokan, A.; Anitha, J.; Ciobanu, M.; Gabor, A.; Naaji, A.; Hemanth, D.J. Image processing techniques for analysis of satellite
images for historical maps classification—An overview. Appl. Sci. 2020, 10, 4207. https://doi.org/10.3390/app10124207.
38. Cho, C.; Li, R.; Wang, S.Y.; Yoon, J.H.; Gillies, R.R. Anthropogenic footprint of climate change in the June 2013 northern India
flood. Clim. Dyn. 2016, 46, 797–805. https://doi.org/10.1007/s00382‐015‐2613‐2.
39. Chevuturi, A.; Dimri, A.P. Investigation of Uttarakhand (India) disaster‐2013 using weather research and forecasting model.
Nat. Hazards 2016, 82, 1703–1726. https://doi.org/10.1007/s11069‐016‐2264‐6.
40. Kansal, M.L.; Shukla, S.; Tyagi, A. Probable Role of Anthropogenic Activities in 2013 Flood Disaster in Uttarakhand, India. In
Proceedings of the World Environmental Water Resources Congress Water Without Borders, Portland, Oregon, 1–5 June 2014,
924–937. https://doi.org/10.1061/9780784413548.095.
41. Das, P.K. ‘The Himalayan Tsunami’—Cloudburst, Flash Flood & Death Toll: A Geographical Postmortem. IOSR J. Environ. Sci.
Toxicol. Food Technol. 2013, 7, 33–45. https://doi.org/10.9790/2402–0723345.
42. Shrestha, A.B.; Steiner, J.; Nepal, S.; Maharjan, S.B.; Jackson, M.; Rasul, G.; Bajracharya, B. Understanding the Chamoli Cause,
process, impacts, context of rapid infrastructure development. Cryosphere 2021, 1–15. Available online: https://www.ici‐
mod.org/article/understanding‐the‐chamoli‐flood‐cause‐process‐impacts‐and‐context‐of‐rapid‐infrastructure‐development/
(accessed on 6 June 2022).
43. Sene, K. Hydrometeorology Forecasting and Applications; Springer: Dordrecht, The Netherlands, 2010; ISBN 978‐90‐481‐3402‐1.
44. Kumar, A.; Negi, M.S. Physiographic study of Mandakini valley (Rudraprayag District) Garhwal Himalaya by morphometric
analysis and Geospatial Techniques. Int. J. Geomat. Geosci. 2016, 7, 285–298.
45. Thayyen, R.J.; Mishra, P.K.; Jain, S.K.; Wani, J.M.; Singh, H. Hanging glacier avalanche (Raunthigad‐Rishiganga) and debris
flow disaster of 7th February 2021, Uttarakhand, India: A Preliminary assessment. Nat. Hazards 2021, 1–37.
https://doi.org/10.21203/rs.3.rs‐340429/v1.
46. Pandey, V.K.; Kumar, R.; Singh, R.; Kumar, R.; Rai, S.C.; Singh, R.P.; Tripathi, A.K.; Soni, V.K.; Ali, S.N.; Tamang, D.; et al.
Catastrophic ice‐debris flow in the Rishiganga River, Chamoli, Uttarakhand (India). Geomat. Nat. Hazards Risk 2022, 13, 289–309.
https://doi.org/10.1080/19475705.2021.2023661.
47. Singh, S.; Kansal, M.L. Flash Flood Hazard mapping using Satellite Images and GIS: A Case Study of Alaknanda River Basin.
In Flash Floods: Challenges and its Management; The Institution of Engineers Centenary Publication: Kolkata, India, 2020; pp. 77–
83.
48. Thadani, R.; Singh, V.; Chauhan, D.; Dwivedi, V.; Pandey, A. Climate Change in Uttarakhand: Current State of Knowledge and Way
Forward; Bishen Singh Mahendra Pal Singh: Dehradun, India, 2015; pp. 1–66.
49. Wang, H.; Easter, R.C.; Zhang, R.; Ma, P.L.; Singh, B.; Zhang, K.; Ganguly, D.; Rasch, P.J.; Burrows, S.M.; Ghan, S.J.; et al. Aero‐
sols in the E3SM Version 1: New Developments and Their Impacts on Radiative Forcing. J. Adv. Model. Earth Syst. 2020, 12, 1–
36. https://doi.org/10.1029/2019MS001851.

Water 2022, 14, 1879 23 of 24
50. D’Errico, M.; Cagnazzo, C.; Fogli, P.G.; Lau, W.K.M.; Hardenberg, J.; Fierli, F.; Cherchi, A. Indian monsoon and the elevated‐
heat‐pump mechanism in a coupled aerosol‐climate model. J. Geophys. Res. Atmos. 2015, 120, 8712–8723.
https://doi.org/10.1002/2015JD023346.
51. Prasad, A.S.; Pandey, B.W.; Leimgruber, W.; Kunwar, R.M. Mountain hazard susceptibility and livelihood security in the upper
catchment area of the river Beas, Kullu Valley, Himachal Pradesh, India. Geoenviron. Disasters 2016, 3, 1.
https://doi.org/10.1186/s40677‐016‐0037‐x.
52. Joshi, L.M.; Singh, A.K.; Kotlia, B.S. Rivers of Uttarakhand Himalaya: Impact of Floods in the Pindar and Saryu Valleys. In The
Indian Rivers; Scientific and Socio‐economic Aspects; Singh, D.S., Ed.; Springer: Singapore, 2018; pp. 413–427, ISBN 978‐981‐10‐
2984‐4.
53. Haeberli, W.; Beniston, M. Climate change and its impacts on glaciers and permafrost in the Alps. Ambio 1998, 27, 258–265.
https://doi.org/10.2307/4314732.
54. Beniston, M. Climatic Change in Mountain Regions: A Review of Possible Impacts. In Climate Variability and Change in High
Elevation Regions: Past, Present & Future; Advances in Global Change Research; Diaz, H.F., Eds.; Springer: Dordrecht, The Neth‐
erlands, 2003, Volume 15, pp. 5–31. https://doi.org/10.1007/978‐94‐015‐1252‐7_2.
55. Zhang, D. wei; Quan, J.; Zhang, H. bin; Wang, F.; Wang, H.; He, X. yan; Gabr, S.; El Bastawesy, M.M.; Khosravi, K.; Shahabi, H.;
et al. The role of Greater Copenhagen utility in implementing the city’s Cloudburst Management Plan. J. Hydrol. 2019, 12, 1–10.
https://doi.org/10.1007/978‐3‐030‐29684‐1.
56. Mergili, M.; Emmer, A.; Juřicová, A.; Cochachin, A.; Fischer, J.T.; Huggel, C.; Pudasaini, S.P. How well can we simulate complex
hydro‐geomorphic process chains? The 2012 multi‐lake outburst flood in the Santa Cruz Valley (Cordillera Blanca, Perú). Earth
Surf. Process. Landf. 2018, 43, 1373–1389. https://doi.org/10.1002/esp.4318.
57. Thayyen, R.J.; Dimri, A.P.; Kumar, P.; Agnihotri, G. Study of cloudburst and flash floods around Leh, India, during August 4–
6, 2010. Nat. Hazards 2013, 65, 2175–2204. https://doi.org/10.1007/s11069–012–0464–2.
58. Anders, A.M.; Roe, G.H.; Hallet, B.; Montgomery, D.R.; Finnegan, N.J.; Putkonen, J. Spatial patterns of precipitation and topog‐
raphy in the Himalaya. Spec. Pap. Geol. Soc. Am. 2006, 398, 39–53. https://doi.org/10.1130/2006.2398.
59. Bookhagen, B. Appearance of extreme monsoonal rainfall events and their impact on erosion in the Himalaya. Geomat. Nat.
Hazards Risk 2010, 1, 37–50. https://doi.org/10.1080/19475701003625737.
60. Shrestha, D.; Singh, P.; Nakamura, K. Spatiotemporal variation of rainfall over the central Himalayan region revealed by TRMM
Precipitation Radar. J. Geophys. Res. Atmos. 2012, 117, 1–14. https://doi.org/10.1029/2012JD018140.
61. Masson‐Delmotte, V.; Zhai, P.; Pirani, S.L.; Connors, C.; Péan, S.; Berger, N.; Caud, Y.; Chen, L.; Goldfarb, M.I.; Gomis, M.; et
al. Climate Change 2021: The Physical Science Basis. Contribution of Working Group I to the Sixth Assessment Report of the Intergovern‐
mental Panel on Climate Change; Cambridge University Press: Cambridge, UK, 2021.
62. Krishnan, R.; Shrestha, A.B.; Ren, G.; Rajbhandari, R.; Saeed, S.; Sanjay, J.; Syed, A.; Vellore, R.; Xu, Y.; You, Q.; et al. Unravelling
Climate Change in the Hindu Kush Himalaya: Rapid Warming in the Mountains and Increasing Extremes. In The Hindu Kush
Himalaya Assessment; Wester, P., Mishra, A., Mukherji, A., Shrestha, A.B., Eds.; Springer International Publishing: Cham, Swit‐
zerland, 2019; p. 41, ISBN 9783319922881.
63. Huggel, C. Assessment of Glacial Hazards based on Remote Sensing and GIS Modeling. Schriftenr. Phys. Geogr. Glaziologie Geo‐
morphodynamik 2004, 44, 87.
64. Terzi, S.; Torresan, S.; Schneiderbauer, S.; Critto, A.; Zebisch, M.; Marcomini, A. Multi‐risk assessment in mountain regions: A
review of modelling approaches for climate change adaptation. J. Environ. Manag. 2019, 232, 759–771.
https://doi.org/10.1016/j.jenvman.2018.11.100.
65. de Jong, C. Challenges for mountain hydrology in the third millennium. Front. Environ. Sci. 2015, 3, 1–13.
https://doi.org/10.3389/fenvs.2015.00038.
66. Wang, Z.; Lai, C.; Chen, X.; Yang, B.; Zhao, S.; Bai, X. Flood hazard risk assessment model based on random forest. J. Hydrol.
2015, 527, 1130–1141. https://doi.org/10.1016/j.jhydrol.2015.06.008.
67. Chan, F.K.S.; Chuah, C.J.; Ziegler, A.D.; Dąbrowski, M.; Varis, O. Towards resilient flood risk management for Asian coastal
cities: Lessons learned from Hong Kong and Singapore. J. Clean. Prod. 2018, 187, 576–589. https://doi.org/10.1016/j.jcle‐
pro.2018.03.217.
68. Vojinovic, Z.; Alves, A.; Gómez, J.P.; Weesakul, S.; Keerakamolchai, W.; Meesuk, V.; Sanchez, A. Effectiveness of small‐ and
large‐scale Nature‐Based Solutions for flood mitigation: The case of Ayutthaya, Thailand. Sci. Total Environ. 2021, 789, 147725.
https://doi.org/10.1016/j.scitotenv.2021.147725.
69. Gallay, I.; Olah, B.; Gallayová, Z.; Lepeška, T. Monetary valuation of flood protection ecosystem service based on hydrological
modelling and avoided damage costs. An example from the Čierny hron river basin, Slovakia. Water 2021, 13, 198.
https://doi.org/10.3390/w13020198.
70. Hillard, U.; Sridhar, V.; Lettenmaier, D.P.; McDonald, K.C. Assessing snowmelt dynamics with NASA scatterometer (NSCAT)
data and a hydrologic process model. Remote Sens. Environ. 2003, 86, 52–69. https://doi.org/10.1016/S0034–425700068–3.
71. Thorslund, J.; Jarsjö, J.; Jaramillo, F.; Jawitz, J.W.; Manzoni, S.; Basu, N.B.; Chalov, S.R.; Cohen, M.J.; Creed, I.F.; Goldenberg, R.;
et al. Wetlands as large‐scale nature‐based solutions: Status and challenges for research, engineering and management. Ecol.
Eng. 2017, 108, 489–497. https://doi.org/10.1016/j.ecoleng.2017.07.012.

Water 2022, 14, 1879 24 of 24
72. Sridhar, V.; Jin, X.; Jaksa, W.T.A. Explaining the hydroclimatic variability and change in the Salmon River basin. Clim. Dyn.
2013, 40, 1921–1937. https://doi.org/10.1007/s00382‐012‐1467‐0.
73. Sridhar, V.; Kang, H.; Ali, S.A. Human‐induced alterations to land use and climate and their responses for hydrology and water
management in the Mekong River Basin. Water 2019, 11, 1307. https://doi.org/10.3390/w11061307.
74. Seong, C.; Sridhar, V.; Billah, M.M. Implications of potential evapotranspiration methods for streamflow estimations under
changing climatic conditions. Int. J. Climatol. 2018, 914, 896–914. https://doi.org/10.1002/joc.5218.
75. Yang, S.N.; Chang, L.C. Regional inundation forecasting using machine learning techniques with the internet of things. Water
2020, 12, 1578. https://doi.org/10.3390/W12061578.
76. Chang, L.C.; Chang, F.J.; Yang, S.N.; Tsai, F.H.; Chang, T.H.; Herricks, E.E. Self‐organizing maps of typhoon tracks allow for
flood forecasts up to two days in advance. Nat. Commun. 2020, 11, 1983. https://doi.org/10.1038/s41467‐020‐15734‐7.
77. Chang, F.; Hsu, K.; Chang, L. Flood Forecasting Using Machine Learning Methods; MDPI: Basel, Switzerland, 2019; ISBN 978‐3‐
03897‐549‐6.


