Embed Size (px)
Citation preview
Erreichbarkeit bis EOBT-Tel.:
Available until EOBT -FAX:
Bitte BeratungRequest Briefing
3-
C
S P
D
D M J
REMARKS NOT FOR TRANSMISSIONBEMERKUNGEN NICHT ZU ÜBERMITTELN
N
C /
/
/
/
FILED BYNAME DES FLUGPLANAUFGEBERS
SIGNATURE AISUNTERSCHRIFT FB
)PILOT IN COMMANDVERANTWORTLICHER LFZ.-FÜHRER
AREMARKSBEMERKUNGEN
AIRCRAFT COLOUR AND MARKINGSFARBE UND MARKIERUNG D. LFZ
SURVIVAL EQUIPMENTRETTUNGSAUSRÜSTUNG
NUMBERANZAHL
COLOURFARBE
CAPACITYTRAGFÄHIGKEIT
DINGHIES/SCHLAUCHBOOTE
COVER
J
P /
/
/
L F U V
E
F
U VJACKETS
SCHWIMMWESTEN
)SUPPLEMENTARY INFORMATON - ERGÄNZENDE ANGABEN
PERS. ON BOARDPERS. AN BORD
ENDURANCEHÖCHSTFLUGDAUER
EMERGENCY RADIONOTFUNKFREQUENZ
LIGHT FLUORES UHF VHF
VHF ELBA
POLAR DESERT MARITIME JUNGLE
RE /
/
HR MIN19 UHF
2ND ALTERNATE AERODROME2. AUSWEICHFLUGPLATZ
ALTERNATE AERODROMEAUSWEICHFLUGPLATZ
TOTAL EETVORAUSS. GESAMTFLUGDAUER
HR MINDESTINATION AERODROMEZIELFLUGPLATZ
18 OTHER INFORMATIONANDERE ANGABEN
16
15
9
13
SPEEDGESCHWINDIGKEIT
NUMBERANZAHL
TYPE OF AIRCRAFTMUSTER D. LFZ
DEPARTURE AERODROMESTARTFLUGPLATZ
LEVELREISEFLUGHÖHE
TIMEZEIT
ROUTEROUTE
WAKE TURBULNCE CATEGORYWIRBELSCHLEPPENKATEGORIE
EQUIPMENTAUSRÜSTUNG
ORIGINATORAUFGEBER
ADRESSEE(S)ANSCHRIFTEN
SPECIFIC IDENT OF ADRESSEE(S) AND/OR ORIGINATORBESONDERE ANSCHRIFTEN UND/ODER AUFGEBER
AIRCRAFT IDENTIFICATIONLFZ.-KENNUNG
FILING TIMEAUFGABEZEIT
7
BUNDESREPUBLIKDEUTSCHLAND
FF
FLIGHT PLANFLUGPLAN
FPL(
//
FLIGHT RULESFLUGREGELN
TYPE OF FLIGHTART DES FLUGES
8
10
Zusätzliche Angaben sofern erforderlich / Additional remarks if applicalbe
Beispielberechnungen
Mittelstreckenstrahlflugzeug
© 2011 Civil Aviation Training · ATPL(A) · Mass and Balance · V5.0-ts Seite 124

CAP 696
CAA JAR-FCL Examinations
Mass and Balance Manual (Aeroplanes)
Third Edition July 2006
www.caa.co.uk
Safety Regulation Group

www.caa.co.uk
CAP 696
CAA JAR-FCL Examinations
Mass and Balance Manual (Aeroplanes)
Third Edition July 2006
Safety Regulation Group
CAP 696 CAA JAR-FCL Examinations - Mass and Balance Manual (Aeroplanes)
© Civil Aviation Authority 2006
All rights reserved. Copies of this publication may be reproduced as training material for students, foruse within a company or organisation, or for personal use, but may not otherwise be reproduced forpublication or for commercial gain.
To use or reference CAA publications for any other purpose, please contact the CAA at the addressbelow for formal agreement.
ISBN 0 11790 389 2
First published August 1999Second edition June 2001Third edition July 2006
Enquiries regarding the content of this publication should be addressed to:Personnel Licensing Department, Safety Regulation Group, Civil Aviation Authority, Aviation House,Gatwick Airport South, West Sussex, RH6 0YR.
The latest version of this document is available in electronic format at www.caa.co.uk, where you mayalso register for e-mail notification of amendments.
Published by TSO (The Stationery Office) on behalf of the UK Civil Aviation Authority.
Printed copy available from: TSO, PO Box 29, Norwich NR3 1GN www.tso.co.uk/bookshopTelephone orders/General enquiries: 0870 600 5522 E-mail: [email protected] orders: 0870 600 5533 Textphone: 0870 240 3701
CAP 696 CAA JAR-FCL Examinations - Mass and Balance Manual (Aeroplanes)
Section Page Date Section Page Date
Page iii
iii July 2006
iv July 2006
v July 2006
vi July 2006
Revision History 1 July 2006
Revision History 2 July 2006
Section 1 1 July 2006
Section 1 2 July 2006
Section 1 3 July 2006
Section 1 4 July 2006
Section 1 5 July 2006
Section 1 6 July 2006
Section 2 1 July 2006
Section 2 2 July 2006
Section 2 3 July 2006
Section 2 4 July 2006
Section 3 1 July 2006
Section 3 2 July 2006
Section 3 3 July 2006
Section 3 4 July 2006
Section 3 5 July 2006
Section 3 6 July 2006
Section 4 1 July 2006
Section 4 2 July 2006
Section 4 3 July 2006
Section 4 4 July 2006
Section 4 5 July 2006
Section 4 6 July 2006
Section 4 7 July 2006
Section 4 8 July 2006
Section 4 9 July 2006
Section 4 10 July 2006
Section 4 11 July 2006
Section 4 12 July 2006
July 2006
List of Effective Pages
INTENTIONALLY LEFT BLANK
Page iv
CAP 696 CAA JAR-FCL Examinations - Mass and Balance Manual (Aeroplanes)
July 2006
CAP 696 CAA JAR-FCL Examinations - Mass and Balance Manual (Aeroplanes)
Page v
List of Effective Pages iii
Revision History 1
Section 1 General Notes
Introduction 1
Aircraft Description 1
Layout of Data Sheets 2
Definitions 2
Conversions 4
Standard Mass Values 5
Section 2 Data for Single-Engine Piston Aeroplane (SEP1)
Aeroplane Description and Data 1
Procedure for Mass and Balance Calculation 3
Section 3 Data for Light Twin-Engine Piston Aeroplane (MEP1)
Aeroplane Description and Data 1
Configuration Options 1
Procedure for Mass and Balance Calculations 2
Section 4 Data for Medium-Range Twin Jet (MRJT1)
Aircraft Description 1
Aircraft Data Constants 1
Mass and Balance Limitations 2
Fuel Data 3
Passenger and Personnel Data 4
Cargo Data 5
Mass and Balance Calculations 6
July 2006
Table of Contents

INTENTIONALLY LEFT BLANK
Page vi
CAP 696 CAA JAR-FCL Examinations - Mass and Balance Manual (Aeroplanes)
July 2006
CAP 696 CAA JAR-FCL Examinations - Mass and Balance Manual (Aeroplanes)
Revision History Page 1
Revision History
1st Edition August 1999
CAP 696, CAA JAR-FCL Examinations Loading Manual, was produced to support training and examinations in JAR-FCL Subject 031 - Mass and Balance for Aeroplanes.
2nd Edition June 2001
The manual was reissued to incorporate CAA House Style.
3rd Edition July 2006
This edition has been retitled and upgraded with digitised graphics. Definitions and conver-sions have been rationalised and known errors have been corrected.
July 2006
INTENTIONALLY LEFT BLANK
Revision History Page 2
CAP 696 CAA JAR-FCL Examinations - Mass and Balance Manual (Aeroplanes)
July 2006
CAP 696 CAA JAR-FCL Examinations - Mass and Balance Manual (Aeroplanes)
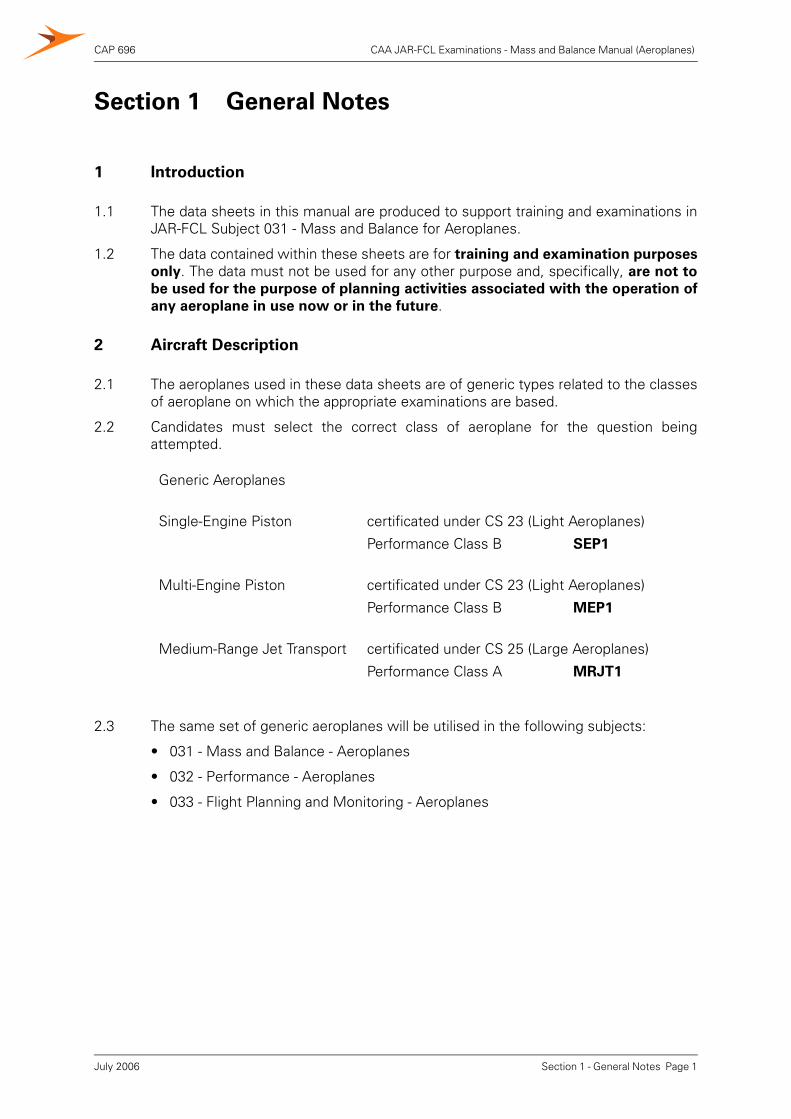
Section 1 General Notes1 Introduction
1.1 The data sheets in this manual are produced to support training and examinations inJAR-FCL Subject 031 - Mass and Balance for Aeroplanes.
1.2 The data contained within these sheets are for training and examination purposes
only. The data must not be used for any other purpose and, specifically, are not to
be used for the purpose of planning activities associated with the operation of
any aeroplane in use now or in the future.
2 Aircraft Description
2.1 The aeroplanes used in these data sheets are of generic types related to the classesof aeroplane on which the appropriate examinations are based.
2.2 Candidates must select the correct class of aeroplane for the question beingattempted.
2.3 The same set of generic aeroplanes will be utilised in the following subjects:
• 031 - Mass and Balance - Aeroplanes
• 032 - Performance - Aeroplanes
• 033 - Flight Planning and Monitoring - Aeroplanes
Generic Aeroplanes
Single-Engine Piston certificated under CS 23 (Light Aeroplanes)
Performance Class B SEP1
Multi-Engine Piston certificated under CS 23 (Light Aeroplanes)
Performance Class B MEP1
Medium-Range Jet Transport certificated under CS 25 (Large Aeroplanes)
Performance Class A MRJT1
Section 1 - General Notes Page 1July 2006
CAP 696 CAA JAR-FCL Examinations - Mass and Balance Manual (Aeroplanes)
3 Layout of Data Sheets
3.1 Each set of data sheets will consist of an introduction that will contain some pertinentinformation relating to the aircraft and the subject being examined. This data willinclude (but not be limited to) a list of abbreviations and some conversion factors.
3.2 This will be followed by a selection of graphs and/or tables that will provide coveragesuitable for the syllabus to be examined. A worked example will accompany eachgraph/table and will demonstrate typical usage.
4 Definitions
Definitions given in italics are not given in ICAO, or JAA or EASA documentation butare in common use.
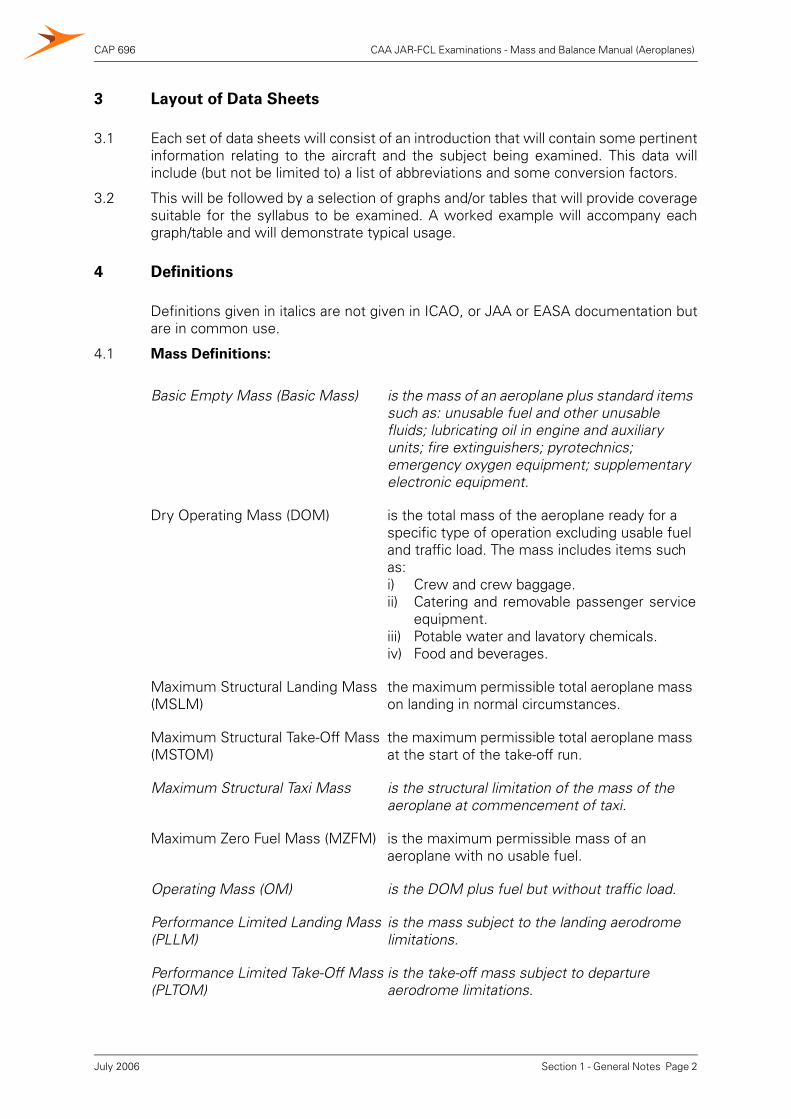
4.1 Mass Definitions:
Basic Empty Mass (Basic Mass) is the mass of an aeroplane plus standard items such as: unusable fuel and other unusable fluids; lubricating oil in engine and auxiliary units; fire extinguishers; pyrotechnics; emergency oxygen equipment; supplementary electronic equipment.
Dry Operating Mass (DOM) is the total mass of the aeroplane ready for a specific type of operation excluding usable fuel and traffic load. The mass includes items such as: i) Crew and crew baggage.ii) Catering and removable passenger service
equipment.iii) Potable water and lavatory chemicals.iv) Food and beverages.
Maximum Structural Landing Mass (MSLM)
the maximum permissible total aeroplane mass on landing in normal circumstances.
Maximum Structural Take-Off Mass (MSTOM)
the maximum permissible total aeroplane mass at the start of the take-off run.
Maximum Structural Taxi Mass is the structural limitation of the mass of the aeroplane at commencement of taxi.
Maximum Zero Fuel Mass (MZFM) is the maximum permissible mass of an aeroplane with no usable fuel.
Operating Mass (OM) is the DOM plus fuel but without traffic load.
Performance Limited Landing Mass (PLLM)
is the mass subject to the landing aerodrome limitations.
Performance Limited Take-Off Mass (PLTOM)
is the take-off mass subject to departure aerodrome limitations.
Section 1 - General Notes Page 2July 2006
CAP 696 CAA JAR-FCL Examinations - Mass and Balance Manual (Aeroplanes)
4.2 Other Definitions
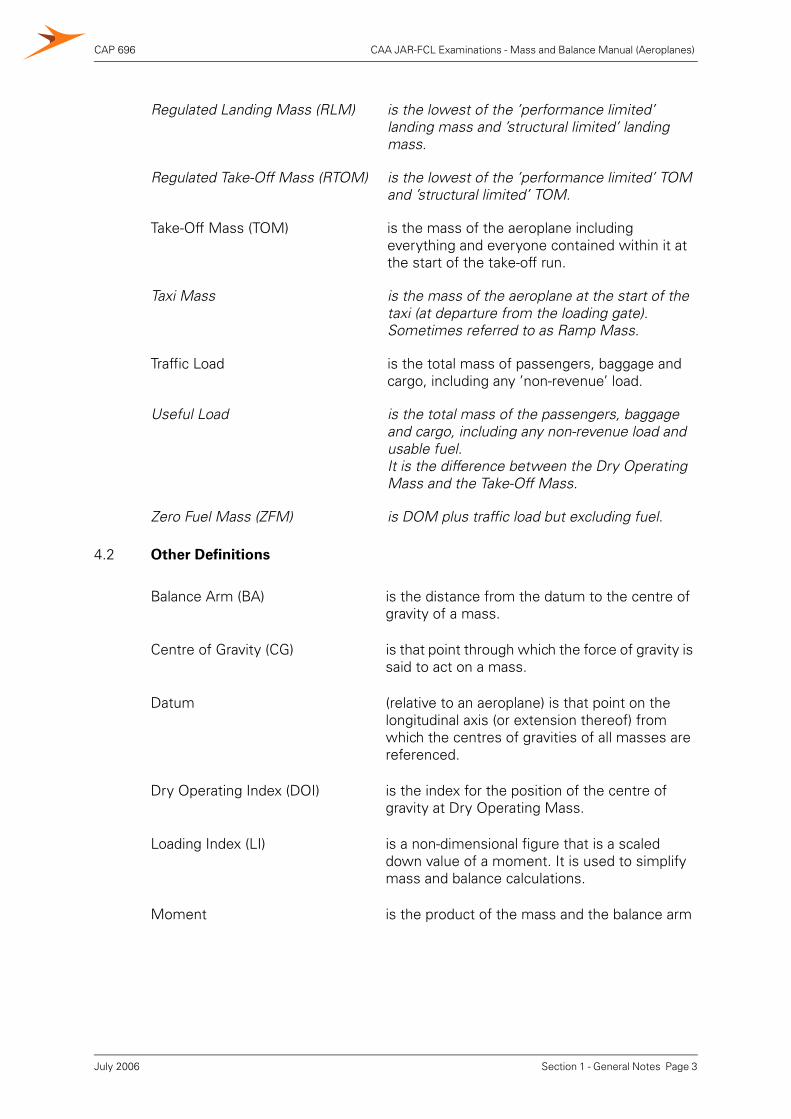
Regulated Landing Mass (RLM) is the lowest of the ’performance limited’ landing mass and ’structural limited’ landing mass.
Regulated Take-Off Mass (RTOM) is the lowest of the ’performance limited’ TOM and ’structural limited’ TOM.
Take-Off Mass (TOM) is the mass of the aeroplane including everything and everyone contained within it at the start of the take-off run.
Taxi Mass is the mass of the aeroplane at the start of the taxi (at departure from the loading gate). Sometimes referred to as Ramp Mass.
Traffic Load is the total mass of passengers, baggage and cargo, including any ’non-revenue’ load.
Useful Load is the total mass of the passengers, baggage and cargo, including any non-revenue load and usable fuel.It is the difference between the Dry Operating Mass and the Take-Off Mass.
Zero Fuel Mass (ZFM) is DOM plus traffic load but excluding fuel.
Balance Arm (BA) is the distance from the datum to the centre of gravity of a mass.
Centre of Gravity (CG) is that point through which the force of gravity is said to act on a mass.
Datum (relative to an aeroplane) is that point on the longitudinal axis (or extension thereof) from which the centres of gravities of all masses are referenced.
Dry Operating Index (DOI) is the index for the position of the centre of gravity at Dry Operating Mass.
Loading Index (LI) is a non-dimensional figure that is a scaled down value of a moment. It is used to simplify mass and balance calculations.
Moment is the product of the mass and the balance arm
Section 1 - General Notes Page 3July 2006
CAP 696 CAA JAR-FCL Examinations - Mass and Balance Manual (Aeroplanes)
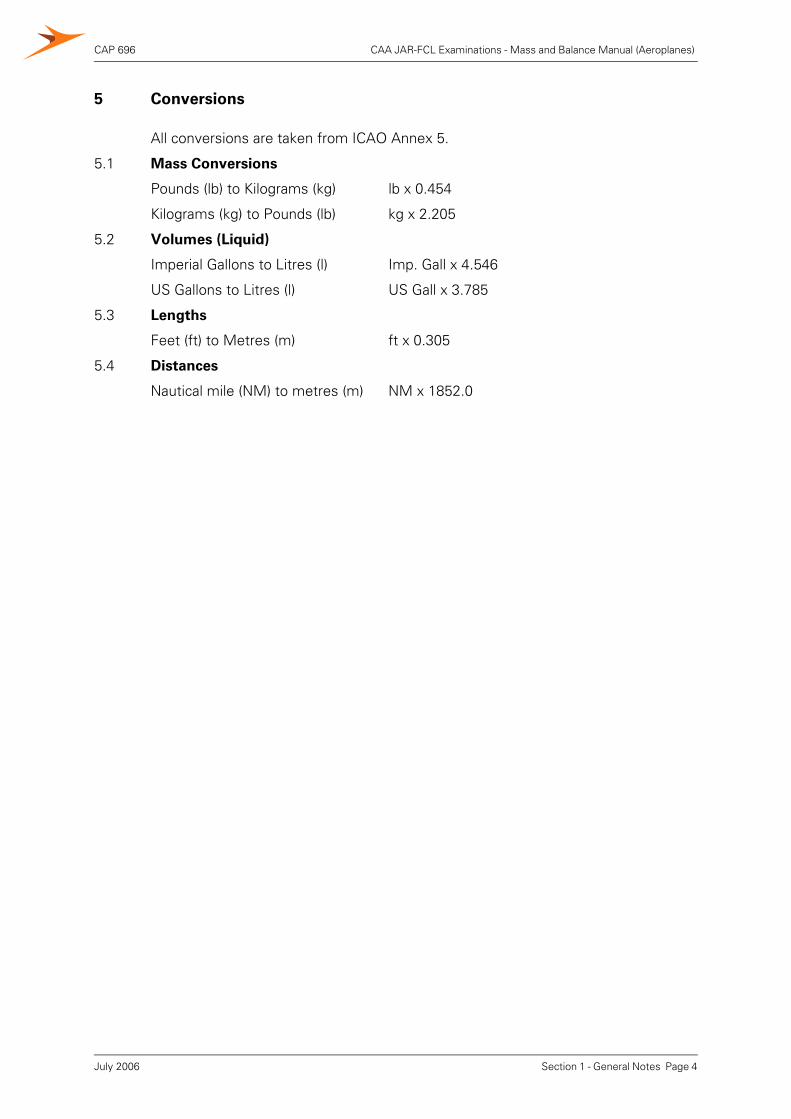
5 Conversions
All conversions are taken from ICAO Annex 5.
5.1 Mass Conversions
Pounds (lb) to Kilograms (kg) lb x 0.454
Kilograms (kg) to Pounds (lb) kg x 2.205
5.2 Volumes (Liquid)
Imperial Gallons to Litres (l) Imp. Gall x 4.546
US Gallons to Litres (l) US Gall x 3.785
5.3 Lengths
Feet (ft) to Metres (m) ft x 0.305
5.4 Distances
Nautical mile (NM) to metres (m) NM x 1852.0
Section 1 - General Notes Page 4July 2006
CAP 696 CAA JAR-FCL Examinations - Mass and Balance Manual (Aeroplanes)
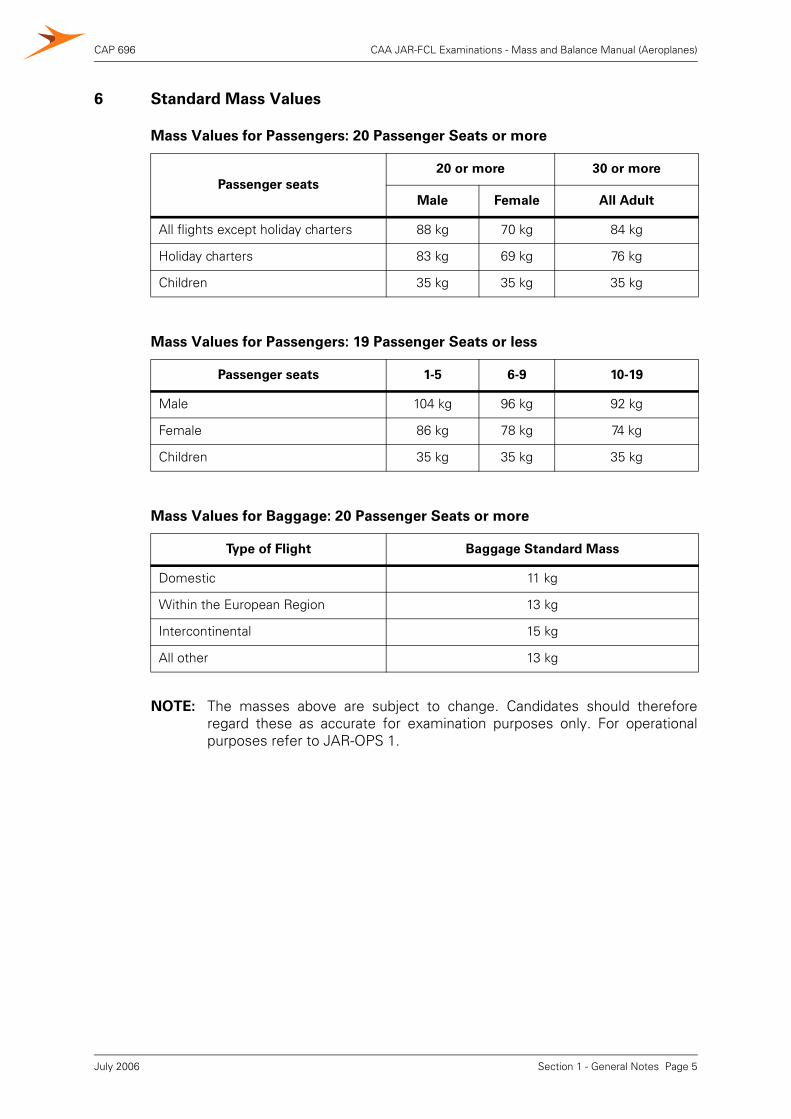
6 Standard Mass Values
NOTE: The masses above are subject to change. Candidates should thereforeregard these as accurate for examination purposes only. For operationalpurposes refer to JAR-OPS 1.
Mass Values for Passengers: 20 Passenger Seats or more
Passenger seats
20 or more 30 or more
Male Female All Adult
All flights except holiday charters 88 kg 70 kg 84 kg
Holiday charters 83 kg 69 kg 76 kg
Children 35 kg 35 kg 35 kg
Mass Values for Passengers: 19 Passenger Seats or less
Passenger seats 1-5 6-9 10-19
Male 104 kg 96 kg 92 kg
Female 86 kg 78 kg 74 kg
Children 35 kg 35 kg 35 kg
Mass Values for Baggage: 20 Passenger Seats or more
Type of Flight Baggage Standard Mass
Domestic 11 kg
Within the European Region 13 kg
Intercontinental 15 kg
All other 13 kg
Section 1 - General Notes Page 5July 2006

INTENTIONALLY LEFT BLANK
Section 2 - SEP1 Page 6
CAP 696 CAA JAR-FCL Examinations - Mass and Balance Manual (Aeroplanes)
July 2006
CAP 696 CAA JAR-FCL Examinations - Mass and Balance Manual (Aeroplanes)
Section 2 Data for Single-Engine Piston Aeroplane(SEP1)
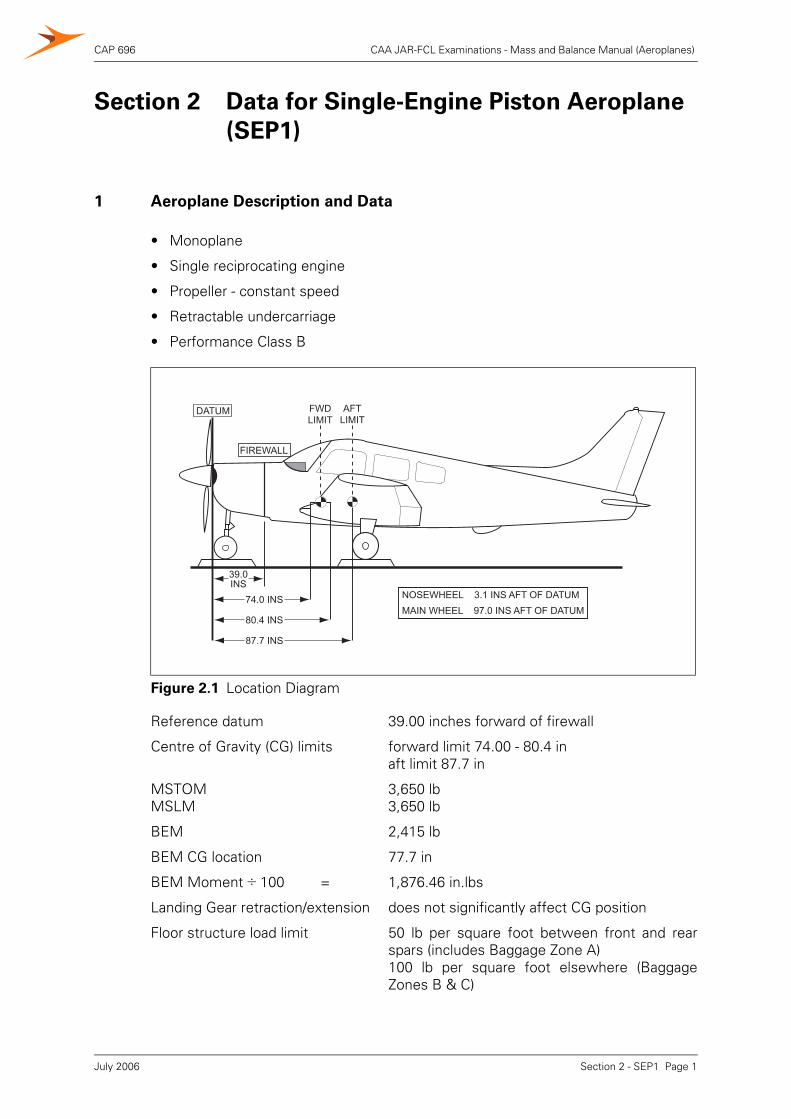
1 Aeroplane Description and Data
• Monoplane
• Single reciprocating engine
• Propeller - constant speed
• Retractable undercarriage
• Performance Class B
Reference datum 39.00 inches forward of firewall
Centre of Gravity (CG) limits forward limit 74.00 - 80.4 in aft limit 87.7 in
MSTOM 3,650 lbMSLM 3,650 lb
BEM 2,415 lb
BEM CG location 77.7 in
BEM Moment ÷ 100 = 1,876.46 in.lbs
Landing Gear retraction/extension does not significantly affect CG position
Floor structure load limit 50 lb per square foot between front and rearspars (includes Baggage Zone A)100 lb per square foot elsewhere (BaggageZones B & C)
Figure 2.1 Location Diagram
DATUM
FIREWALL
39.0INS
74.0 INS
80.4 INS
87.7 INS
NOSEWHEEL 3.1 INS AFT OF DATUMMAIN WHEEL 97.0 INS AFT OF DATUM
FWDLIMIT
AFTLIMIT
Section 2 - SEP1 Page 1July 2006
CAP 696 CAA JAR-FCL Examinations - Mass and Balance Manual (Aeroplanes)
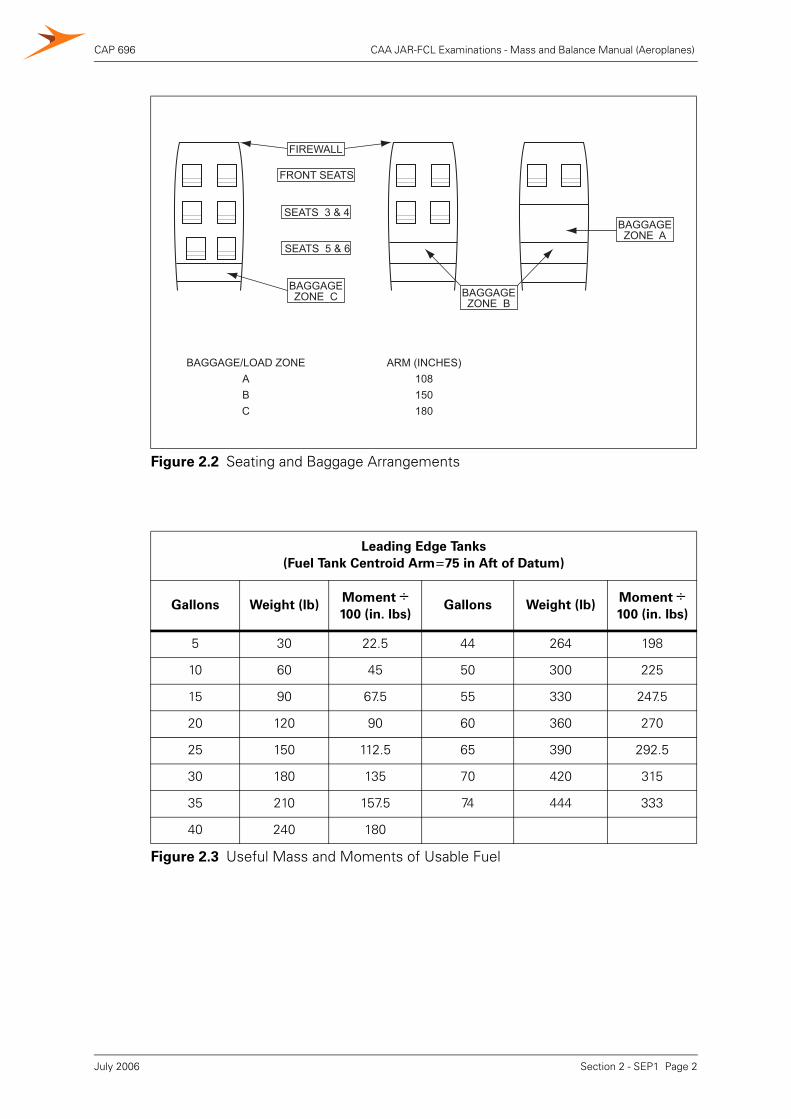
Figure 2.2 Seating and Baggage Arrangements
Leading Edge Tanks
(Fuel Tank Centroid Arm=75 in Aft of Datum)
Gallons Weight (lb)Moment ÷
100 (in. lbs)Gallons Weight (lb)
Moment ÷
100 (in. lbs)
5 30 22.5 44 264 198
10 60 45 50 300 225
15 90 67.5 55 330 247.5
20 120 90 60 360 270
25 150 112.5 65 390 292.5
30 180 135 70 420 315
35 210 157.5 74 444 333
40 240 180
Figure 2.3 Useful Mass and Moments of Usable Fuel
FRONT SEATS
FIREWALL
SEATS 3 & 4
SEATS 5 & 6
BAGGAGEZONE A
BAGGAGEZONE C BAGGAGE
ZONE B
BAGGAGE/LOAD ZONEABC
ARM (INCHES)108150180
Section 2 - SEP1 Page 2July 2006
CAP 696 CAA JAR-FCL Examinations - Mass and Balance Manual (Aeroplanes)
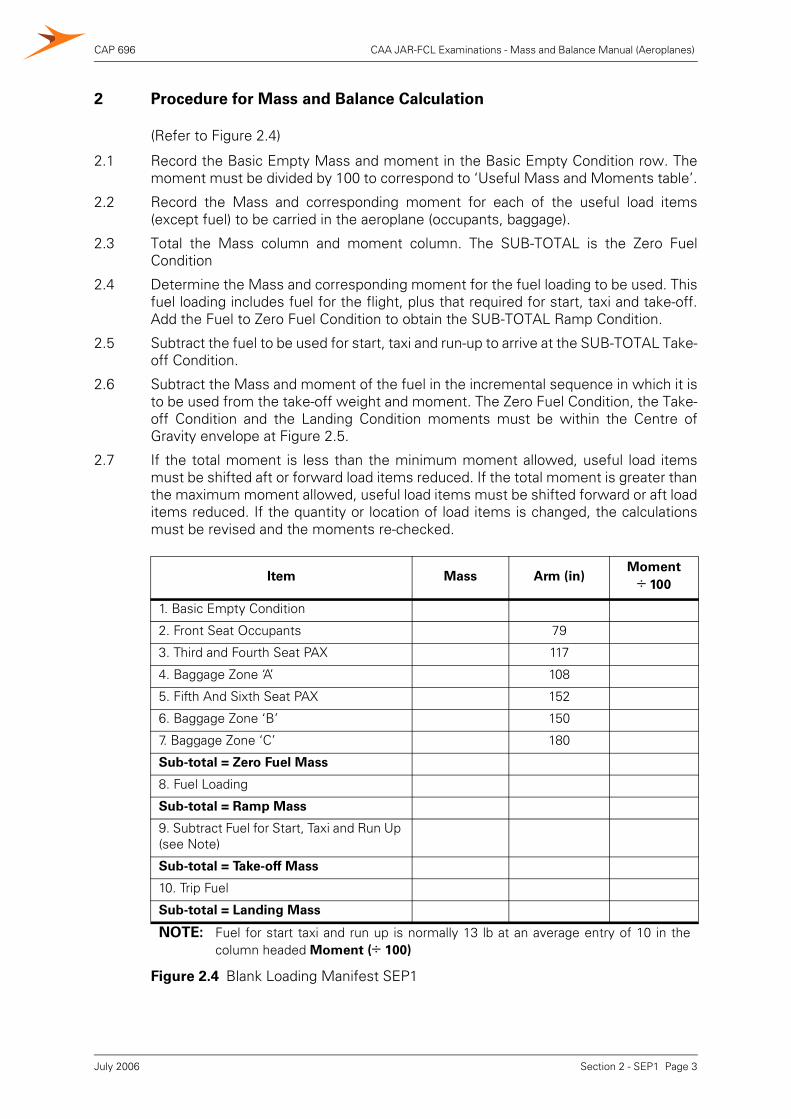
2 Procedure for Mass and Balance Calculation
(Refer to Figure 2.4)
2.1 Record the Basic Empty Mass and moment in the Basic Empty Condition row. Themoment must be divided by 100 to correspond to ‘Useful Mass and Moments table’.
2.2 Record the Mass and corresponding moment for each of the useful load items(except fuel) to be carried in the aeroplane (occupants, baggage).
2.3 Total the Mass column and moment column. The SUB-TOTAL is the Zero FuelCondition
2.4 Determine the Mass and corresponding moment for the fuel loading to be used. Thisfuel loading includes fuel for the flight, plus that required for start, taxi and take-off.Add the Fuel to Zero Fuel Condition to obtain the SUB-TOTAL Ramp Condition.
2.5 Subtract the fuel to be used for start, taxi and run-up to arrive at the SUB-TOTAL Take-off Condition.
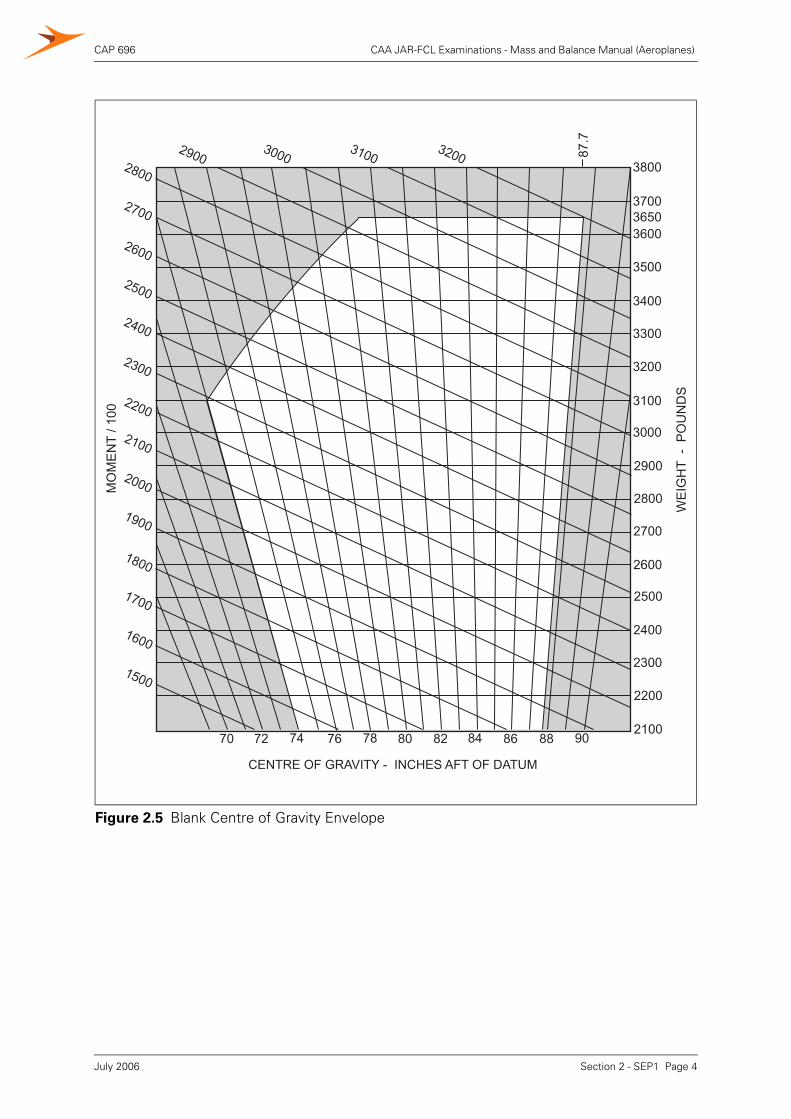
2.6 Subtract the Mass and moment of the fuel in the incremental sequence in which it isto be used from the take-off weight and moment. The Zero Fuel Condition, the Take-off Condition and the Landing Condition moments must be within the Centre ofGravity envelope at Figure 2.5.
2.7 If the total moment is less than the minimum moment allowed, useful load itemsmust be shifted aft or forward load items reduced. If the total moment is greater thanthe maximum moment allowed, useful load items must be shifted forward or aft loaditems reduced. If the quantity or location of load items is changed, the calculationsmust be revised and the moments re-checked.
Item Mass Arm (in)Moment
÷ 100
1. Basic Empty Condition
2. Front Seat Occupants 79
3. Third and Fourth Seat PAX 117
4. Baggage Zone ‘A’ 108
5. Fifth And Sixth Seat PAX 152
6. Baggage Zone ‘B’ 150
7. Baggage Zone ‘C’ 180
Sub-total = Zero Fuel Mass
8. Fuel Loading
Sub-total = Ramp Mass
9. Subtract Fuel for Start, Taxi and Run Up (see Note)
Sub-total = Take-off Mass
10. Trip Fuel
Sub-total = Landing Mass
NOTE: Fuel for start taxi and run up is normally 13 lb at an average entry of 10 in thecolumn headed Moment (÷ 100)
Figure 2.4 Blank Loading Manifest SEP1
Section 2 - SEP1 Page 3July 2006
CAP 696 CAA JAR-FCL Examinations - Mass and Balance Manual (Aeroplanes)
Figure 2.5 Blank Centre of Gravity Envelope
WE
IGH
T -
PO
UN
DS
MO
ME
NT
/ 100
2100
2200
2300
2400
2500
2600
2700
2800
2900
3000
3100
3200
3300
3400
3500
3600
3700
3800
3650
1500
1600
1700
1800
1900
2000
2100
2200
2300
2400
2500
2600
2700
2800
29003000
31003200 87
.7
70 72 74 76 78 80 82 84 86 88 90
CENTRE OF GRAVITY - INCHES AFT OF DATUM
Section 2 - SEP1 Page 4July 2006
CAP 696 CAA JAR-FCL Examinations - Mass and Balance Manual (Aeroplanes)
Section 3 Data for Light Twin-Engine PistonAeroplane (MEP1)
1 Aeroplane Description and Data
1.1 Description
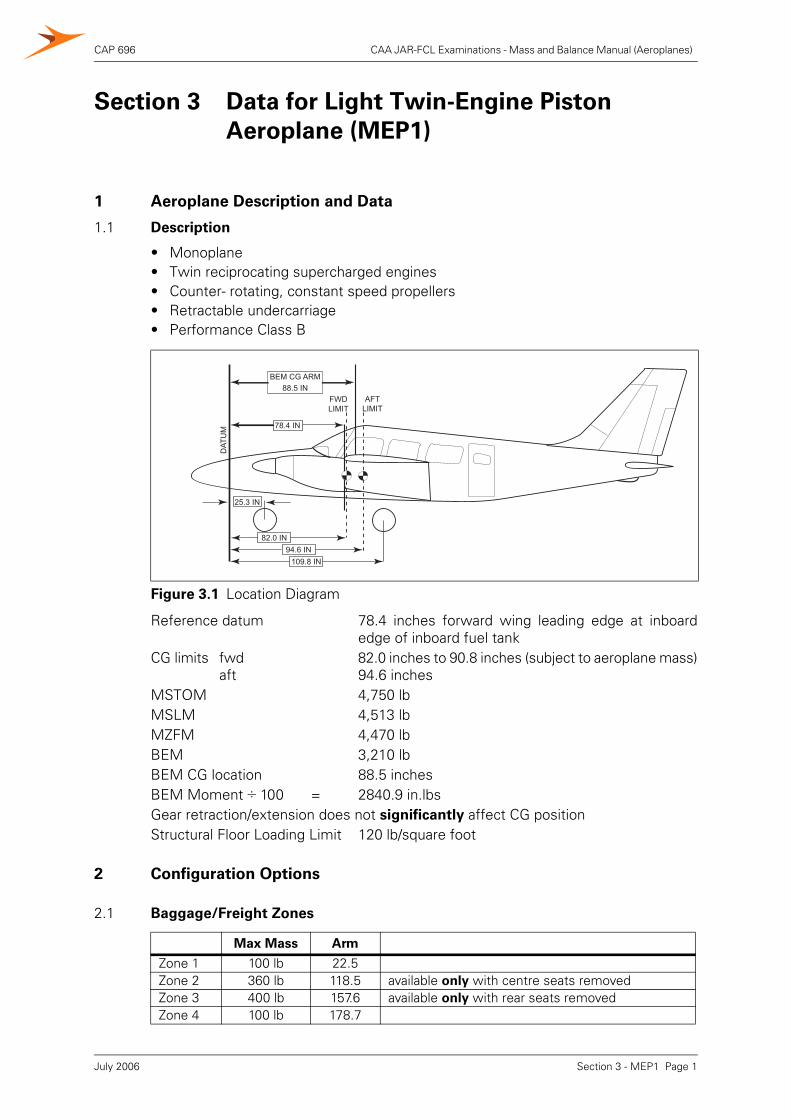
• Monoplane• Twin reciprocating supercharged engines• Counter- rotating, constant speed propellers• Retractable undercarriage• Performance Class B
Reference datum 78.4 inches forward wing leading edge at inboardedge of inboard fuel tank
CG limits fwd 82.0 inches to 90.8 inches (subject to aeroplane mass)aft 94.6 inches
MSTOM 4,750 lbMSLM 4,513 lbMZFM 4,470 lbBEM 3,210 lb BEM CG location 88.5 inchesBEM Moment ÷ 100 = 2840.9 in.lbsGear retraction/extension does not significantly affect CG positionStructural Floor Loading Limit 120 lb/square foot
2 Configuration Options
2.1 Baggage/Freight Zones
Figure 3.1 Location Diagram
Max Mass Arm
Zone 1 100 lb 22.5Zone 2 360 lb 118.5 available only with centre seats removedZone 3 400 lb 157.6 available only with rear seats removedZone 4 100 lb 178.7
78.4 IN
DAT
UM
25.3 IN
109.8 IN
FWDLIMIT
AFTLIMIT
94.6 IN82.0 IN
BEM CG ARM88.5 IN
Section 3 - MEP1 Page 1July 2006
CAP 696 CAA JAR-FCL Examinations - Mass and Balance Manual (Aeroplanes)
2.2 Standard Allowances
2.2.1 Fuel relative density - an average mass of 6 lb per US gallon should be used.Passenger and pilot mass - actual mass values should be used.
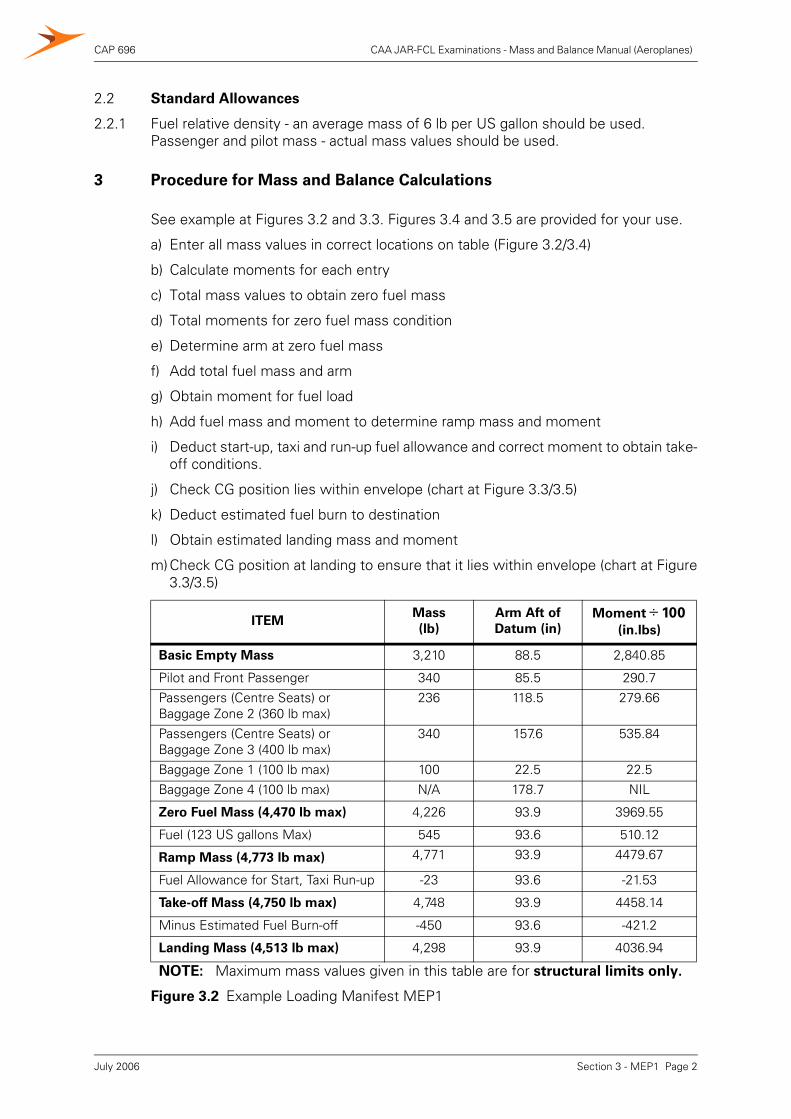
3 Procedure for Mass and Balance Calculations
See example at Figures 3.2 and 3.3. Figures 3.4 and 3.5 are provided for your use.
a) Enter all mass values in correct locations on table (Figure 3.2/3.4)
b) Calculate moments for each entry
c) Total mass values to obtain zero fuel mass
d) Total moments for zero fuel mass condition
e) Determine arm at zero fuel mass
f) Add total fuel mass and arm
g) Obtain moment for fuel load
h) Add fuel mass and moment to determine ramp mass and moment
i) Deduct start-up, taxi and run-up fuel allowance and correct moment to obtain take-off conditions.
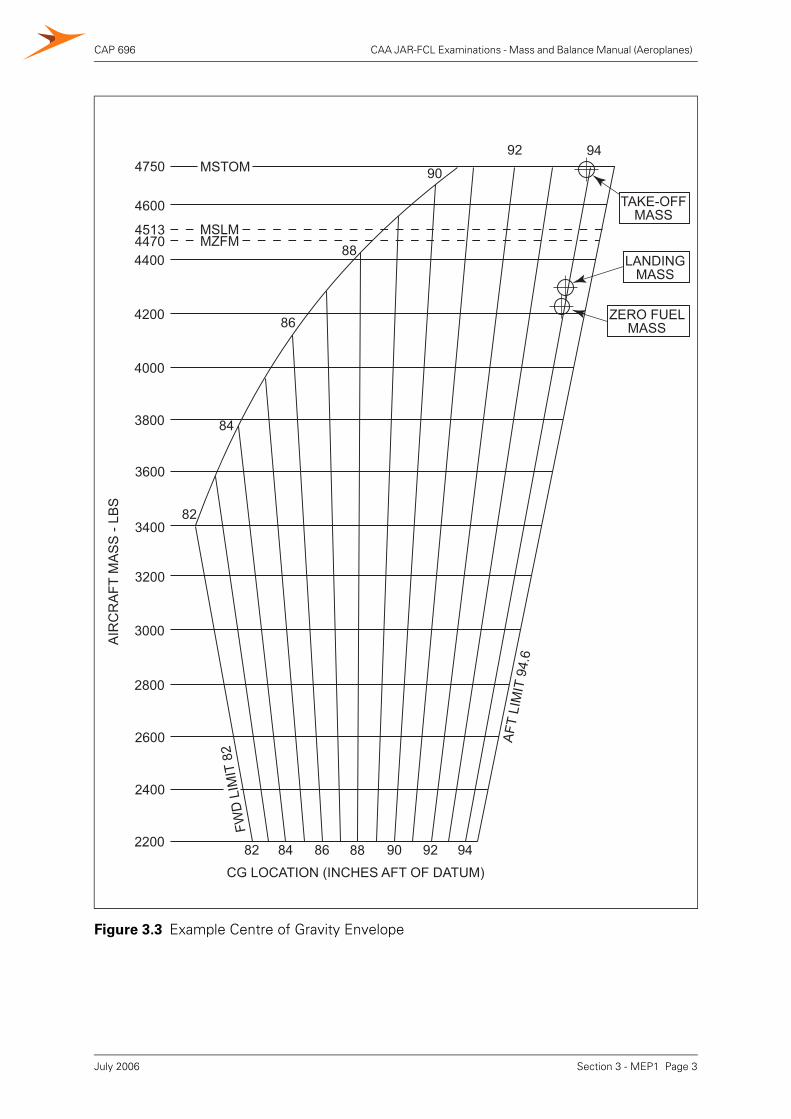
j) Check CG position lies within envelope (chart at Figure 3.3/3.5)
k) Deduct estimated fuel burn to destination
l) Obtain estimated landing mass and moment
m)Check CG position at landing to ensure that it lies within envelope (chart at Figure3.3/3.5)
ITEMMass
(lb)
Arm Aft of
Datum (in)
Moment ÷ 100
(in.lbs)
Basic Empty Mass 3,210 88.5 2,840.85
Pilot and Front Passenger 340 85.5 290.7Passengers (Centre Seats) orBaggage Zone 2 (360 lb max)
236 118.5 279.66
Passengers (Centre Seats) orBaggage Zone 3 (400 lb max)
340 157.6 535.84
Baggage Zone 1 (100 lb max) 100 22.5 22.5Baggage Zone 4 (100 lb max) N/A 178.7 NIL
Zero Fuel Mass (4,470 lb max) 4,226 93.9 3969.55
Fuel (123 US gallons Max) 545 93.6 510.12
Ramp Mass (4,773 lb max) 4,771 93.9 4479.67
Fuel Allowance for Start, Taxi Run-up -23 93.6 -21.53
Take-off Mass (4,750 lb max) 4,748 93.9 4458.14
Minus Estimated Fuel Burn-off -450 93.6 -421.2
Landing Mass (4,513 lb max) 4,298 93.9 4036.94
NOTE: Maximum mass values given in this table are for structural limits only.
Figure 3.2 Example Loading Manifest MEP1
Section 3 - MEP1 Page 2July 2006
CAP 696 CAA JAR-FCL Examinations - Mass and Balance Manual (Aeroplanes)
Figure 3.3 Example Centre of Gravity Envelope
2200
2400
2600
2800
3000
3200
3400
3600
3800
4000
4200
440044704513
4600
4750
MSLMMZFM
AFT
LIM
IT 9
4.6
90
92 94
88
86
84
82
MSTOM
82 84 86 88 90 92 94CG LOCATION (INCHES AFT OF DATUM)
FWD
LIM
IT 8
2
AIR
CR
AFT
MA
SS
- LB
S
TAKE-OFFMASS
LANDINGMASS
ZERO FUELMASS
Section 3 - MEP1 Page 3July 2006
CAP 696 CAA JAR-FCL Examinations - Mass and Balance Manual (Aeroplanes)
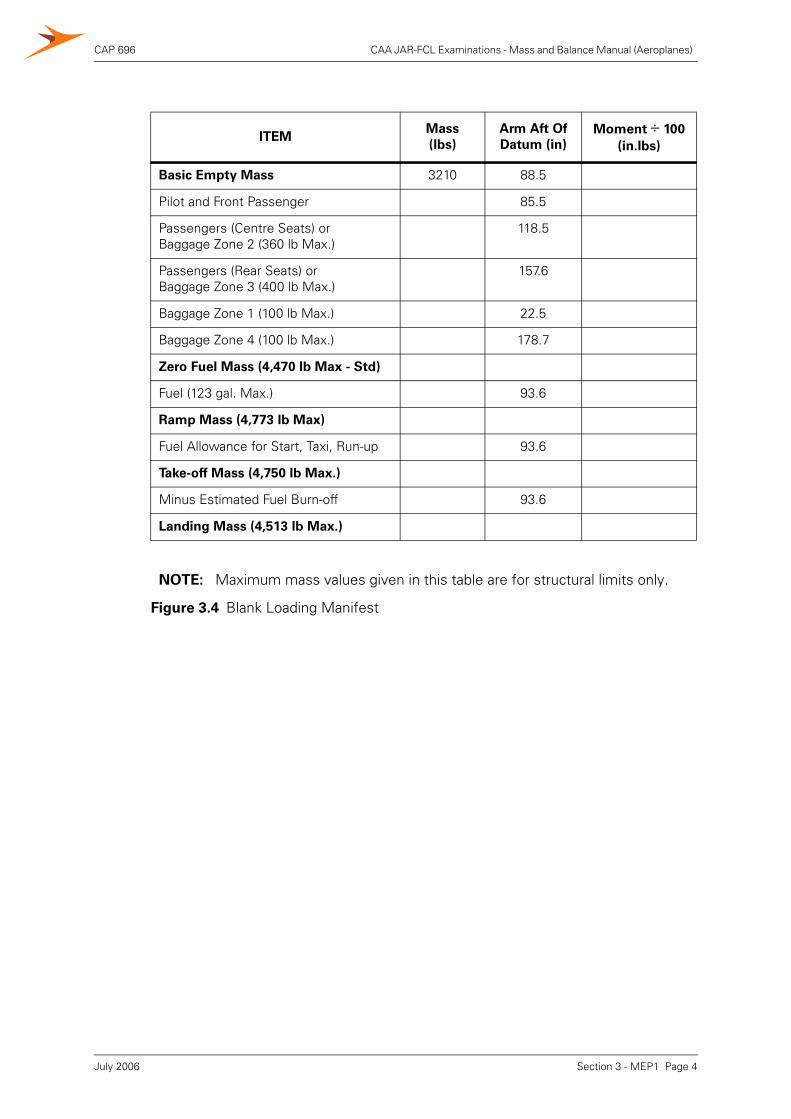
ITEMMass
(lbs)
Arm Aft Of
Datum (in)
Moment ÷ 100
(in.lbs)
Basic Empty Mass 3210 88.5
Pilot and Front Passenger 85.5
Passengers (Centre Seats) or Baggage Zone 2 (360 lb Max.)
118.5
Passengers (Rear Seats) orBaggage Zone 3 (400 lb Max.)
157.6
Baggage Zone 1 (100 lb Max.) 22.5
Baggage Zone 4 (100 lb Max.) 178.7
Zero Fuel Mass (4,470 lb Max - Std)
Fuel (123 gal. Max.) 93.6
Ramp Mass (4,773 lb Max)
Fuel Allowance for Start, Taxi, Run-up 93.6
Take-off Mass (4,750 lb Max.)
Minus Estimated Fuel Burn-off 93.6
Landing Mass (4,513 lb Max.)
NOTE: Maximum mass values given in this table are for structural limits only.
Figure 3.4 Blank Loading Manifest
Section 3 - MEP1 Page 4July 2006

CAP 696 CAA JAR-FCL Examinations - Mass and Balance Manual (Aeroplanes)
Figure 3.5 Blank Centre of Gravity Envelope
2200
2400
2600
2800
3000
3200
3400
3600
3800
4000
4200
440044704513
4600
4750
MSLMMZFM
AFT
LIM
IT 9
4.6
90
92 94
88
86
84
82
MSTOM
82 84 86 88 90 92 94CG LOCATION (INCHES AFT OF DATUM)
FWD
LIM
IT 8
2
AIR
CR
AFT
MA
SS
- LB
S
Section 3 - MEP1 Page 5July 2006
INTENTIONALLY LEFT BLANK
Section 3 - MEP1 Page 6
CAP 696 CAA JAR-FCL Examinations - Mass and Balance Manual (Aeroplanes)
July 2006
CAP 696 CAA JAR-FCL Examinations - Mass and Balance Manual (Aeroplanes)
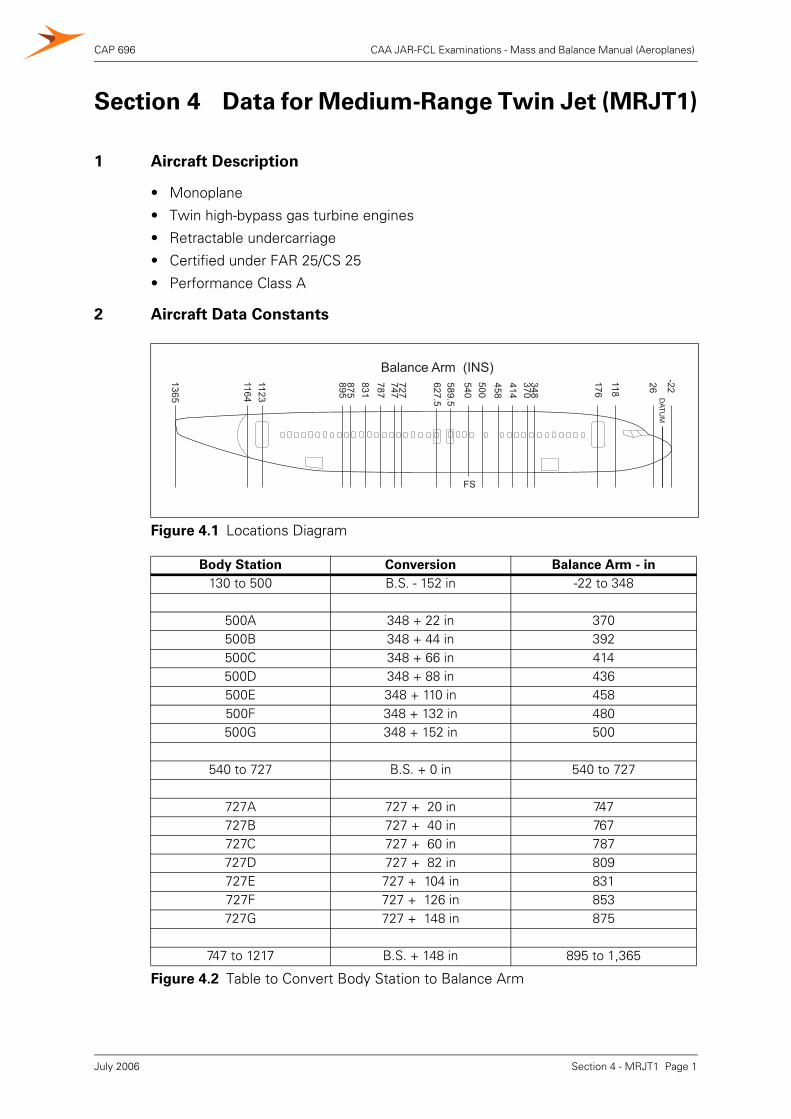
Section 4 Data for Medium-Range Twin Jet (MRJT1)1 Aircraft Description
• Monoplane
• Twin high-bypass gas turbine engines
• Retractable undercarriage
• Certified under FAR 25/CS 25
• Performance Class A
2 Aircraft Data Constants
Figure 4.1 Locations Diagram
Body Station Conversion Balance Arm - in
130 to 500 B.S. - 152 in -22 to 348
500A 348 + 22 in 370500B 348 + 44 in 392500C 348 + 66 in 414500D 348 + 88 in 436500E 348 + 110 in 458500F 348 + 132 in 480500G 348 + 152 in 500
540 to 727 B.S. + 0 in 540 to 727
727A 727 + 20 in 747727B 727 + 40 in 767727C 727 + 60 in 787727D 727 + 82 in 809727E 727 + 104 in 831727F 727 + 126 in 853727G 727 + 148 in 875
747 to 1217 B.S. + 148 in 895 to 1,365
Figure 4.2 Table to Convert Body Station to Balance Arm
DATU
M
118
26176
-22348370414458500540
1123
589.5627.5
727747787831875895
1164
1365
FS
Balance Arm (INS)
Section 4 - MRJT1 Page 1July 2006
CAP 696 CAA JAR-FCL Examinations - Mass and Balance Manual (Aeroplanes)
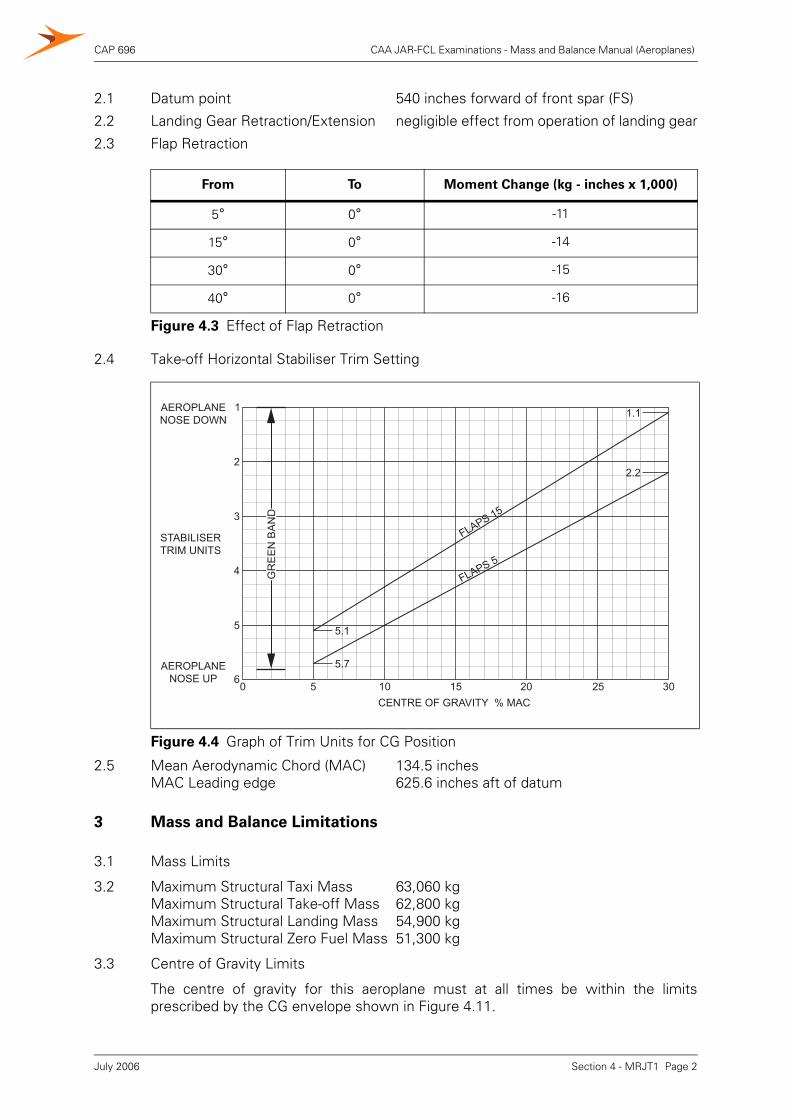
2.1 Datum point 540 inches forward of front spar (FS)
2.2 Landing Gear Retraction/Extension negligible effect from operation of landing gear
2.3 Flap Retraction
2.4 Take-off Horizontal Stabiliser Trim Setting
2.5 Mean Aerodynamic Chord (MAC) 134.5 inchesMAC Leading edge 625.6 inches aft of datum
3 Mass and Balance Limitations
3.1 Mass Limits
3.2 Maximum Structural Taxi Mass 63,060 kgMaximum Structural Take-off Mass 62,800 kgMaximum Structural Landing Mass 54,900 kgMaximum Structural Zero Fuel Mass 51,300 kg
3.3 Centre of Gravity Limits
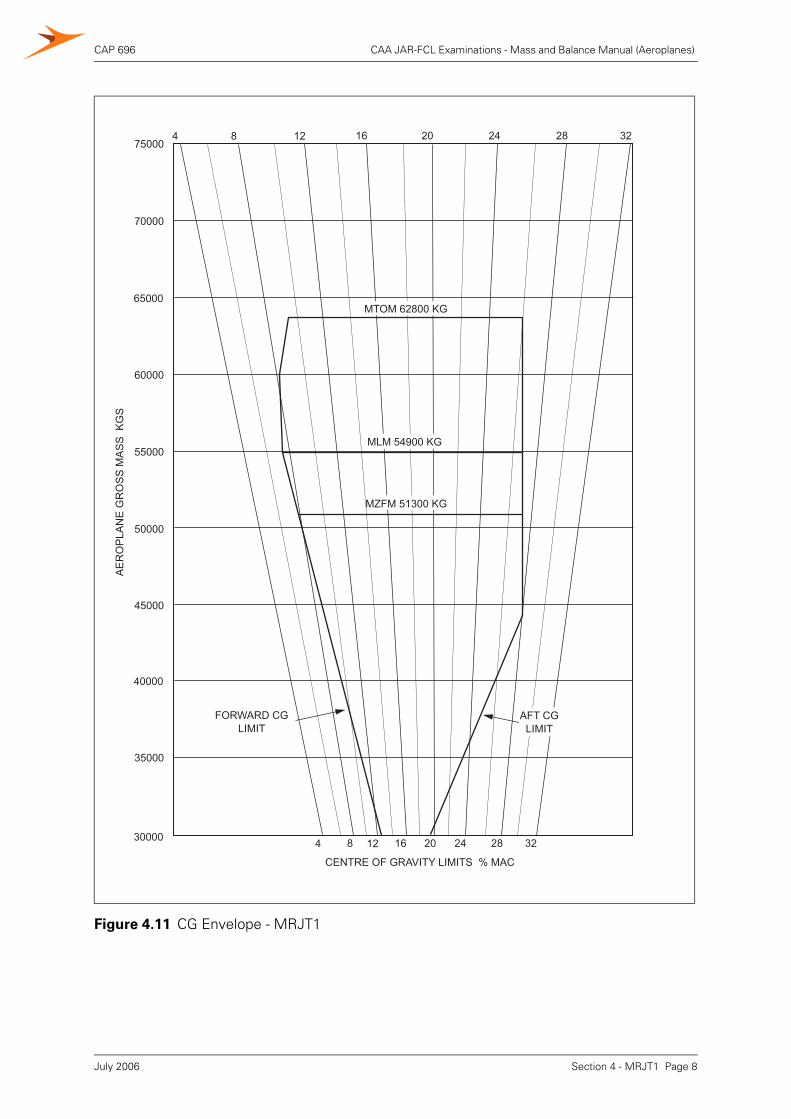
The centre of gravity for this aeroplane must at all times be within the limitsprescribed by the CG envelope shown in Figure 4.11.
From To Moment Change (kg - inches x 1,000)
5° 0° -11
15° 0° -14
30° 0° -15
40° 0° -16
Figure 4.3 Effect of Flap Retraction
Figure 4.4 Graph of Trim Units for CG Position
GR
EE
N B
AN
D
4
5
6
3
2
1
0 5 10 15 20 25 30
CENTRE OF GRAVITY % MAC
AEROPLANE
NOSE DOWN
AEROPLANE
NOSE UP
STABILISER
TRIM UNITS
5.1
5.7
1.1
2.2
FLAPS 15
FLAPS 5
Section 4 - MRJT1 Page 2July 2006
CAP 696 CAA JAR-FCL Examinations - Mass and Balance Manual (Aeroplanes)
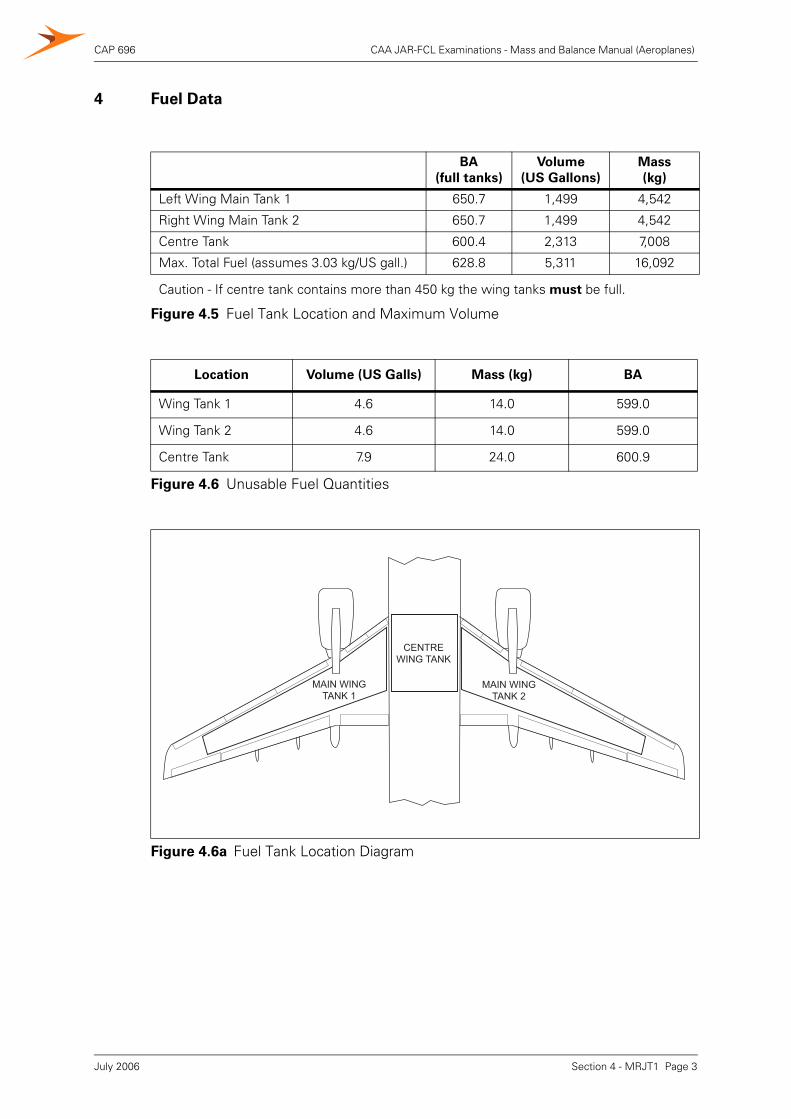
4 Fuel Data
BA
(full tanks)
Volume
(US Gallons)
Mass
(kg)
Left Wing Main Tank 1 650.7 1,499 4,542
Right Wing Main Tank 2 650.7 1,499 4,542
Centre Tank 600.4 2,313 7,008
Max. Total Fuel (assumes 3.03 kg/US gall.) 628.8 5,311 16,092
Caution - If centre tank contains more than 450 kg the wing tanks must be full.
Figure 4.5 Fuel Tank Location and Maximum Volume
Location Volume (US Galls) Mass (kg) BA
Wing Tank 1 4.6 14.0 599.0
Wing Tank 2 4.6 14.0 599.0
Centre Tank 7.9 24.0 600.9
Figure 4.6 Unusable Fuel Quantities
Figure 4.6a Fuel Tank Location Diagram
CENTREWING TANK
MAIN WINGTANK 1
MAIN WINGTANK 2
Section 4 - MRJT1 Page 3July 2006
CAP 696 CAA JAR-FCL Examinations - Mass and Balance Manual (Aeroplanes)
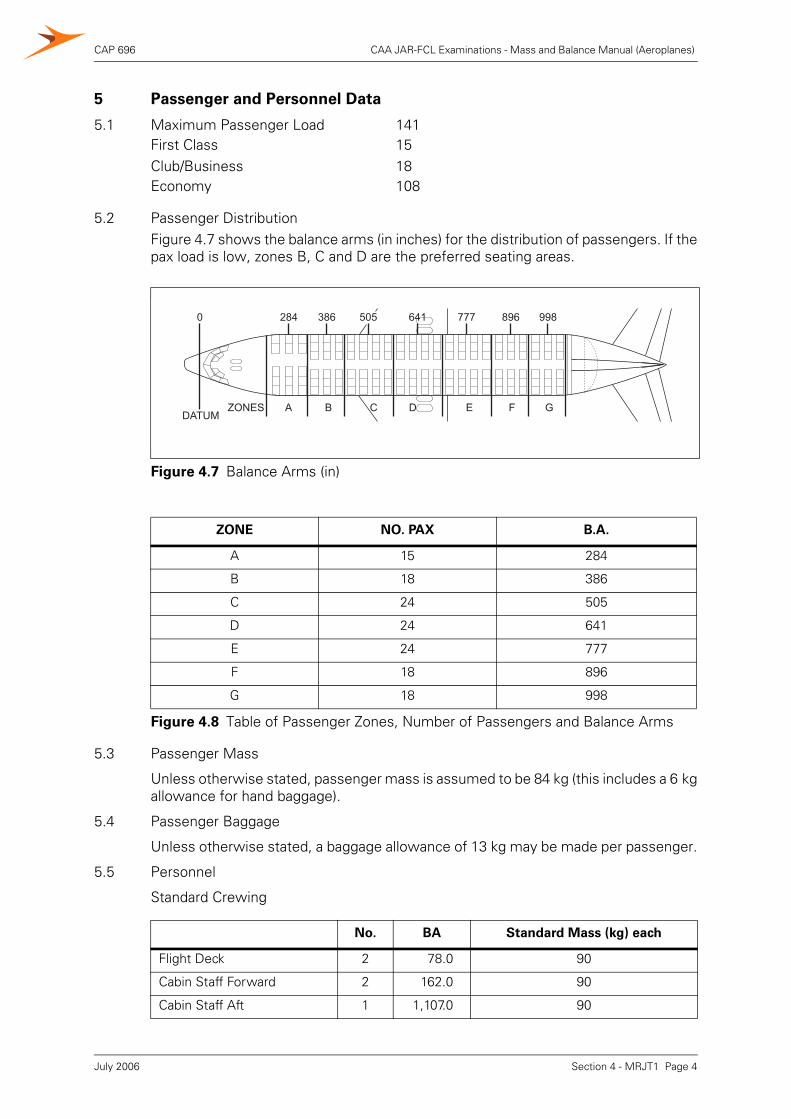
5 Passenger and Personnel Data
5.1 Maximum Passenger Load 141First Class 15Club/Business 18Economy 108
5.2 Passenger DistributionFigure 4.7 shows the balance arms (in inches) for the distribution of passengers. If thepax load is low, zones B, C and D are the preferred seating areas.
5.3 Passenger Mass
Unless otherwise stated, passenger mass is assumed to be 84 kg (this includes a 6 kgallowance for hand baggage).
5.4 Passenger Baggage
Unless otherwise stated, a baggage allowance of 13 kg may be made per passenger.
5.5 Personnel
Standard Crewing
Figure 4.7 Balance Arms (in)
ZONE NO. PAX B.A.
A 15 284
B 18 386
C 24 505
D 24 641
E 24 777
F 18 896
G 18 998
Figure 4.8 Table of Passenger Zones, Number of Passengers and Balance Arms
No. BA Standard Mass (kg) each
Flight Deck 2 78.0 90
Cabin Staff Forward 2 162.0 90
Cabin Staff Aft 1 1,107.0 90
A B C D E F GDATUM
ZONES
284 386 505 641 777 896 9980
Section 4 - MRJT1 Page 4July 2006
CAP 696 CAA JAR-FCL Examinations - Mass and Balance Manual (Aeroplanes)
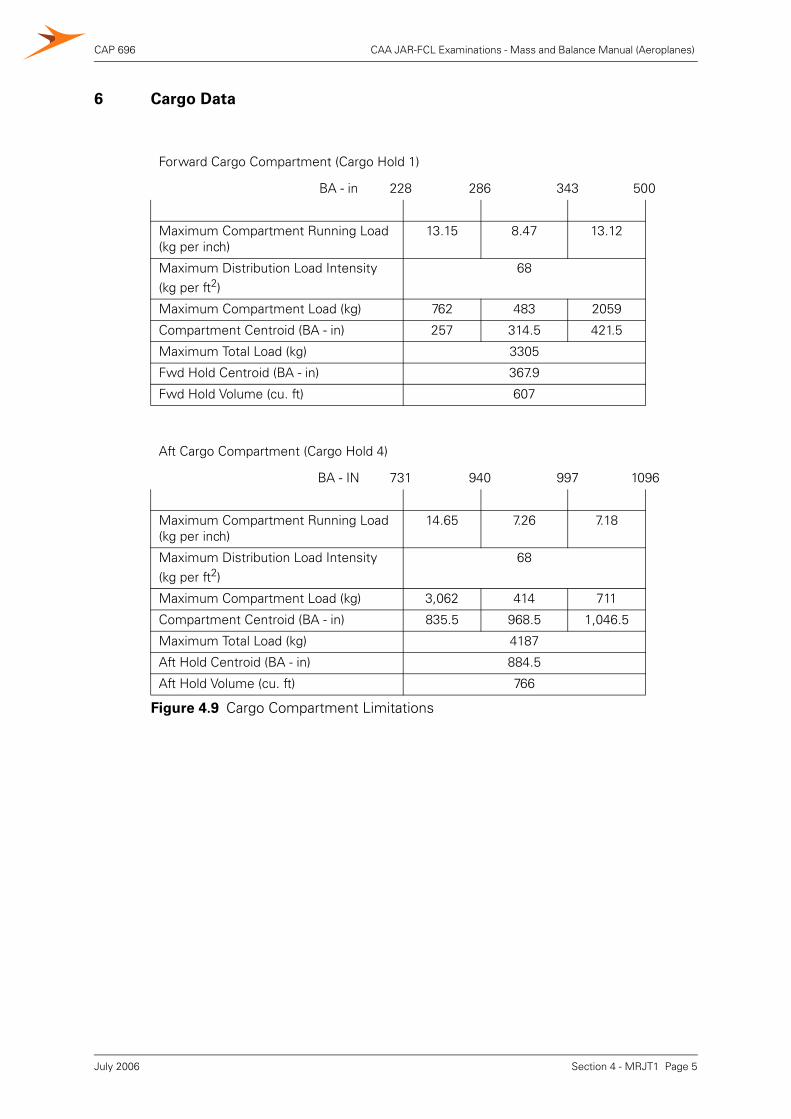
6 Cargo Data
Forward Cargo Compartment (Cargo Hold 1)
BA - in 228 286 343 500
Maximum Compartment Running Load (kg per inch)
13.15 8.47 13.12
Maximum Distribution Load Intensity (kg per ft2)
68
Maximum Compartment Load (kg) 762 483 2059
Compartment Centroid (BA - in) 257 314.5 421.5
Maximum Total Load (kg) 3305
Fwd Hold Centroid (BA - in) 367.9
Fwd Hold Volume (cu. ft) 607
Aft Cargo Compartment (Cargo Hold 4)
BA - IN 731 940 997 1096
Maximum Compartment Running Load (kg per inch)
14.65 7.26 7.18
Maximum Distribution Load Intensity (kg per ft2)
68
Maximum Compartment Load (kg) 3,062 414 711
Compartment Centroid (BA - in) 835.5 968.5 1,046.5
Maximum Total Load (kg) 4187
Aft Hold Centroid (BA - in) 884.5
Aft Hold Volume (cu. ft) 766
Figure 4.9 Cargo Compartment Limitations
Section 4 - MRJT1 Page 5July 2006
CAP 696 CAA JAR-FCL Examinations - Mass and Balance Manual (Aeroplanes)
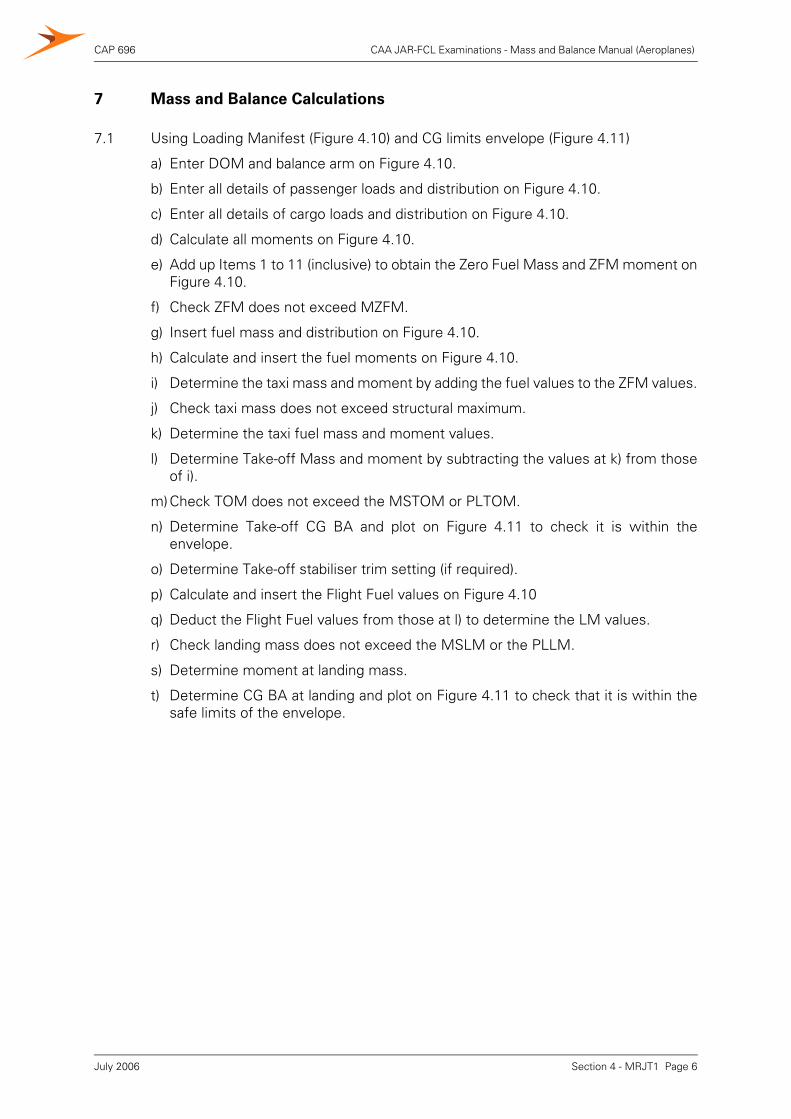
7 Mass and Balance Calculations
7.1 Using Loading Manifest (Figure 4.10) and CG limits envelope (Figure 4.11)
a) Enter DOM and balance arm on Figure 4.10.
b) Enter all details of passenger loads and distribution on Figure 4.10.
c) Enter all details of cargo loads and distribution on Figure 4.10.
d) Calculate all moments on Figure 4.10.
e) Add up Items 1 to 11 (inclusive) to obtain the Zero Fuel Mass and ZFM moment onFigure 4.10.
f) Check ZFM does not exceed MZFM.
g) Insert fuel mass and distribution on Figure 4.10.
h) Calculate and insert the fuel moments on Figure 4.10.
i) Determine the taxi mass and moment by adding the fuel values to the ZFM values.
j) Check taxi mass does not exceed structural maximum.
k) Determine the taxi fuel mass and moment values.
l) Determine Take-off Mass and moment by subtracting the values at k) from thoseof i).
m)Check TOM does not exceed the MSTOM or PLTOM.
n) Determine Take-off CG BA and plot on Figure 4.11 to check it is within theenvelope.
o) Determine Take-off stabiliser trim setting (if required).
p) Calculate and insert the Flight Fuel values on Figure 4.10
q) Deduct the Flight Fuel values from those at l) to determine the LM values.
r) Check landing mass does not exceed the MSLM or the PLLM.
s) Determine moment at landing mass.
t) Determine CG BA at landing and plot on Figure 4.11 to check that it is within thesafe limits of the envelope.
Section 4 - MRJT1 Page 6July 2006
CAP 696 CAA JAR-FCL Examinations - Mass and Balance Manual (Aeroplanes)
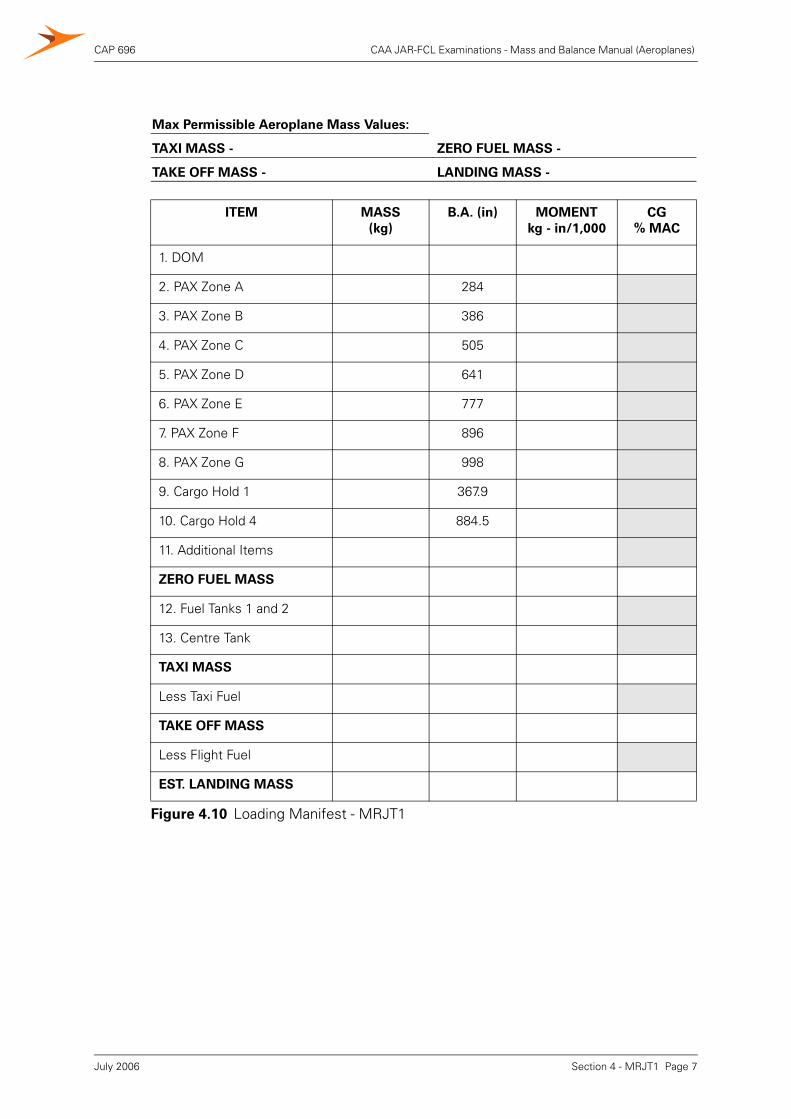
Max Permissible Aeroplane Mass Values:
TAXI MASS - ZERO FUEL MASS -
TAKE OFF MASS - LANDING MASS -
ITEM MASS
(kg)
B.A. (in) MOMENT
kg - in/1,000
CG
% MAC
1. DOM
2. PAX Zone A 284
3. PAX Zone B 386
4. PAX Zone C 505
5. PAX Zone D 641
6. PAX Zone E 777
7. PAX Zone F 896
8. PAX Zone G 998
9. Cargo Hold 1 367.9
10. Cargo Hold 4 884.5
11. Additional Items
ZERO FUEL MASS
12. Fuel Tanks 1 and 2
13. Centre Tank
TAXI MASS
Less Taxi Fuel
TAKE OFF MASS
Less Flight Fuel
EST. LANDING MASS
Figure 4.10 Loading Manifest - MRJT1
Section 4 - MRJT1 Page 7July 2006
CAP 696 CAA JAR-FCL Examinations - Mass and Balance Manual (Aeroplanes)
Figure 4.11 CG Envelope - MRJT1
30000
35000
40000
45000
50000
55000
65000
60000
70000
75000
4 12
CENTRE OF GRAVITY LIMITS % MAC
AE
RO
PLA
NE
GR
OS
S M
AS
S K
GS
16 20 24 28 32
4 12 16 20 24 28 328
8
MTOM 62800 KG
MLM 54900 KG
MZFM 51300 KG
FORWARD CGLIMIT
AFT CGLIMIT
Section 4 - MRJT1 Page 8July 2006
CAP 696 CAA JAR-FCL Examinations - Mass and Balance Manual (Aeroplanes)
Section 4 - MRJT1 Page 9
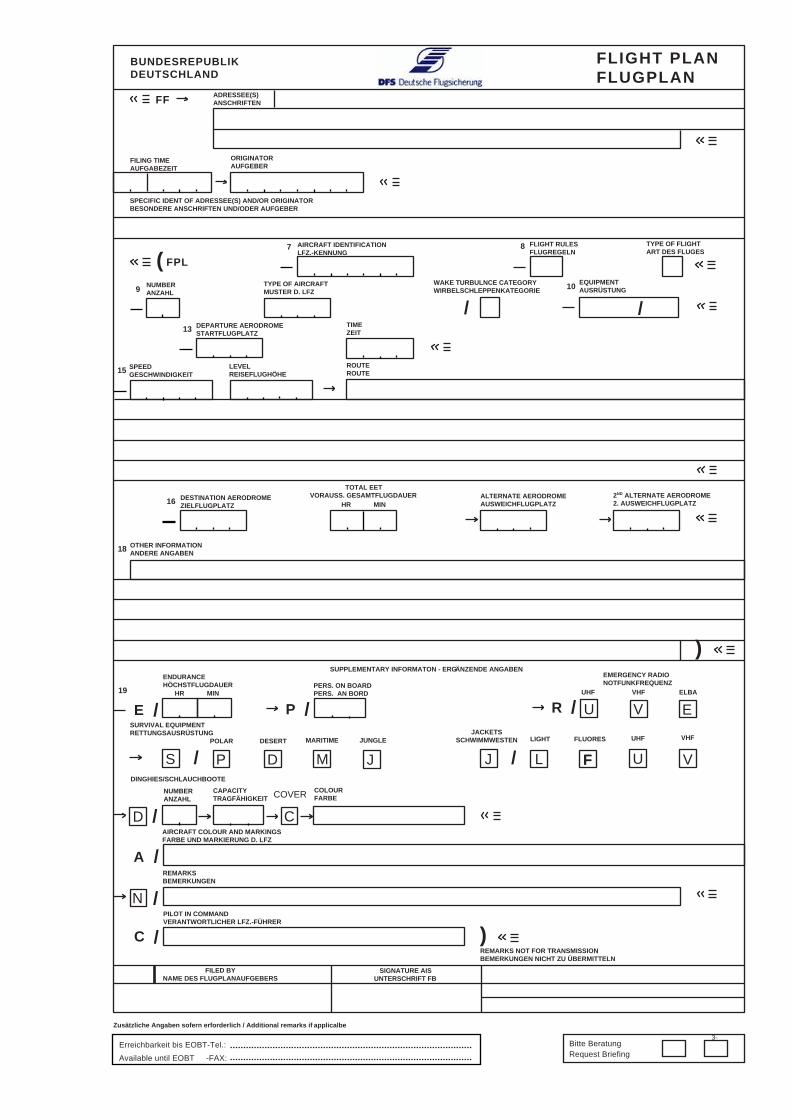
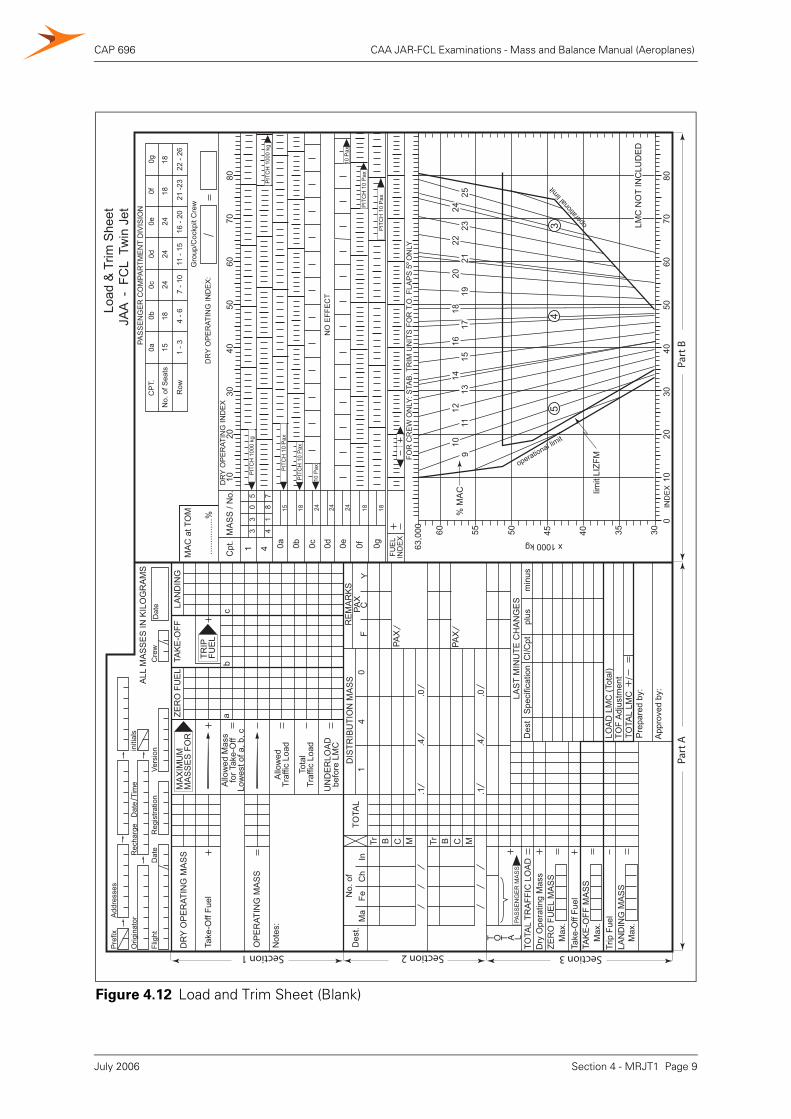
Figure 4.12 Load and Trim Sheet (Blank)
010
2030
4050
6070
80IN
DE
X
operational limit
opera
tiona
l limit
60
63,0
00 55 50 45 40 35 30
x 1000 kg
FOR
CR
EW
ON
LY: S
TAB
. TR
IM U
NIT
S F
OR
T.O
. FLA
PS
5 O
NLY
1012
1416
1820
2422
2523
2119
1715
1311
limit
LIZF
M
LMC
NO
T IN
CLU
DE
D
% M
AC
1020
3040
5060
7080
DR
Y O
PE
RAT
ING
IND
EX
DR
Y O
PE
RAT
ING
IND
EX
:
PAS
SE
NG
ER
CO
MPA
RTM
EN
T D
IVIS
ION
CP
T.
22 -
2621
-23
16 -
2011
- 15
7 - 1
04
- 61
- 3R
ow
No.
of S
eats
1518
2424
2418
18
0a0b
0c0d
0e0f
0g
Gro
up/C
ockp
it C
rew
MA
C a
t TO
M
......
......
...%
18P
ITC
H 1
0 P
ax
PIT
CH
10
Pax
PIT
CH
10
Pax
PIT
CH
100
0 kg
PIT
CH
100
0 kg
PIT
CH
10
Pax
10 P
ax
10 P
ax
NO
EFF
EC
T
15 24 24 24 18 18
0a 0b 0c 0d 0e 0f 0g
Cpt
.M
AS
S /
No.
1 43
30
5
84
17
FUE
LIN
DE
X
TOTA
LR
EM
AR
KS
PAX
FC
Y
DIS
TRIB
UTI
ON
MA
SS
14
0
LAS
T M
INU
TE C
HA
NG
ES
TOTA
L TR
AFF
IC L
OA
DPA
SS
EN
GE
R M
AS
S
T O T A L
Dry
Ope
ratin
g M
ass
ZER
O F
UE
L M
AS
S
Take
-Off
Fuel
TAK
E-O
FF M
AS
S
Max
.
Max
.
Max
.LA
ND
ING
MA
SS
Trip
Fue
l
TOTA
L LM
CP
repa
red
by:
App
rove
d by
:
Des
tS
peci
ficat
ion
Cl C
ptpl
usm
inus
.1.4
.0
.1.4
.0
LOA
D L
MC
(Tot
al)
TOF
Adj
ustm
ent
PAX
PAX
Tr B C M Tr B C M
No.
of
Ma
FeC
hIn
UN
DE
RLO
AD
befo
re L
MC
Tota
lTr
affic
Loa
d
Allo
wed
Traf
fic L
oad
Allo
wed
Mas
sfo
r Tak
e-O
ffLo
wes
t of a
, b, c
Not
es:
OP
ER
ATIN
G M
AS
S
Take
-Off
Fuel
DR
Y O
PE
RAT
ING
MA
SS
ZER
O F
UE
LTA
KE
-OFF
LAN
DIN
G
ab
c
MA
XIM
UM
MA
SS
ES
FO
R
TRIP
FUE
L
Add
ress
es
Orig
inat
or
Pre
fix
Flig
htC
rew
Dat
e
ALL
MA
SS
ES
IN K
ILO
GR
AM
SR
echa
rge
Dat
e T
ime
Dat
eR
egis
tratio
nVe
rsio
niniti
als
9
Des
t.
Load
& T
rim S
heet
JA
A -
FC
L T
win
Jet
Part
BPa
rt A
Section 3Section 2Section 1
34
5
July 2006
CAP 696 CAA JAR-FCL Examinations - Mass and Balance Manual (Aeroplanes)
7.2 Using Load and Trim Sheet
The load/trim sheet (as shown in the example at Figure 4.12) is in two parts.
Part A (to the left) is a loading summary which should be completed as follows:
Section 1 is used to establish the limiting take-off mass; maximum allowable trafficload; underload before last minute changes (LMC).
Section 2 shows the distribution of the traffic load. In this section the followingabbreviations are used:
TR TransitB BaggageC CargoM MailPax PassengersPax F First ClassPax C Club/BusinessPax Y Economy
Section 3 is used to summarise load and cross check that limits have not beenexceeded.
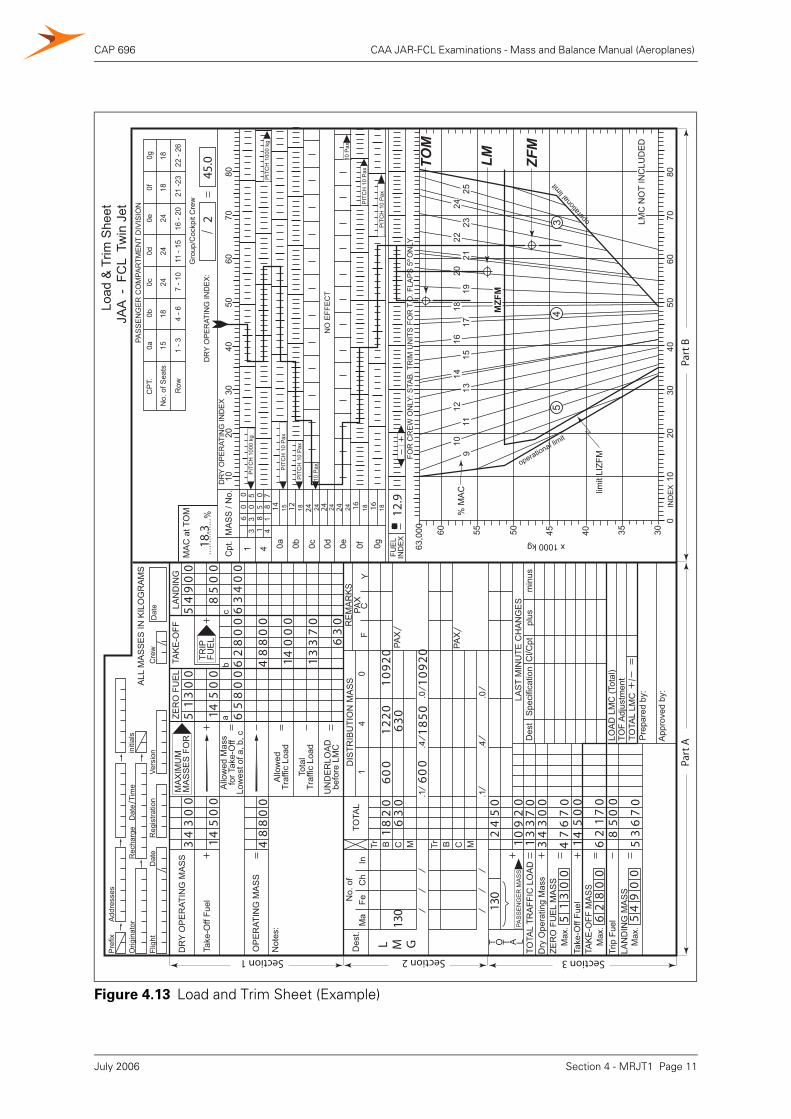
The example shown uses the following data:
Part B is the trim portion
• Using data from the loading summary, start by entering the index for the DOM.
• Move the index in turn (for the mass in each cargo hold) then in accordance withthe passenger distribution.
• Establish the CG % MAC at ZFM and ensure that it lies within the envelope.
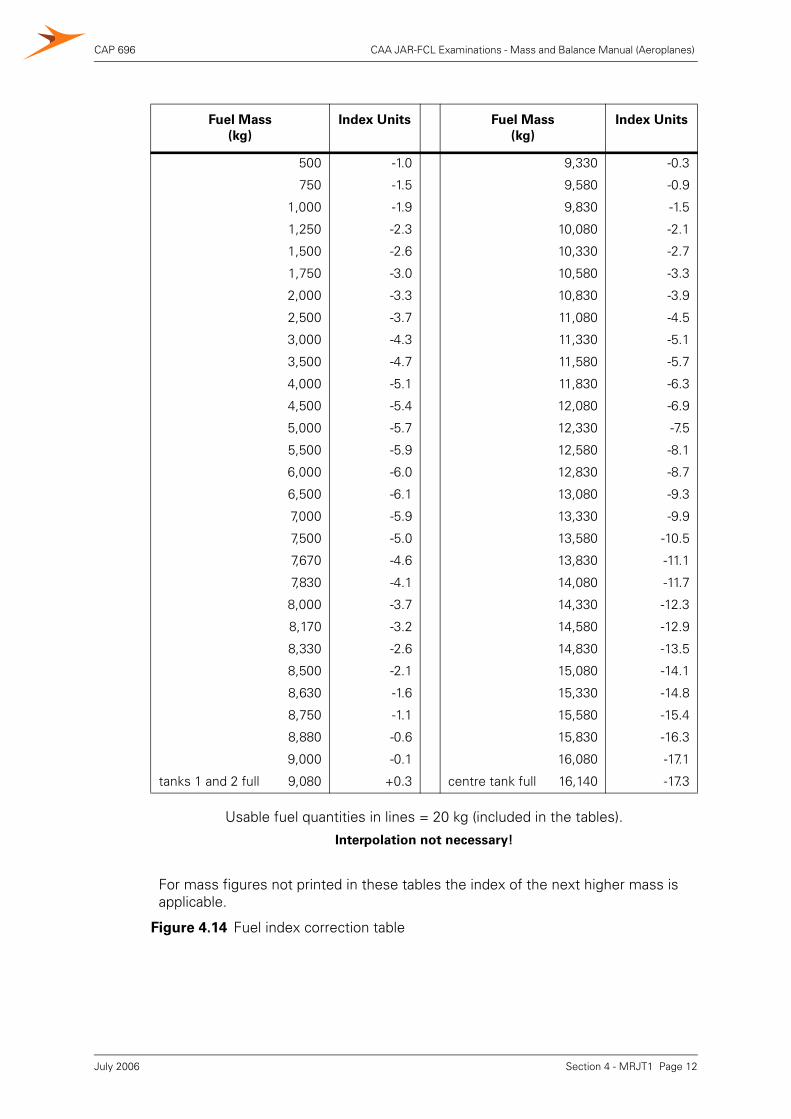
• Add fuel index correction (from Figure 4.14) to obtain the TOM index and ensurethat the CG lies within the envelope.
• Extract the % MAC value for the CG position at TOM.
DOM 34,300 kg DOI 45.0 MSTOM 62,800 kg
MZFM 51,300 kg MSLM 54,900 kg
Passengers 130
Average Passenger Mass 84 kg
Baggage 130 items at 14 kg per piece (this example only)
Cargo 630 kg
Take-off Fuel Total 14,500 kg
Trip Fuel 8,500 kg
Section 4 - MRJT1 Page 10July 2006
CAP 696 CAA JAR-FCL Examinations - Mass and Balance Manual (Aeroplanes)
Section 4 - MRJT1 Page 11
Figure 4.13 Load and Trim Sheet (Example)
010
2030
4050
6070
80IN
DE
X
operational limit
opera
tiona
l limit
60
63,0
00 55 50 45 40 35 30
x 1000 kg
FOR
CR
EW
ON
LY: S
TAB
. TR
IM U
NIT
S F
OR
T.O
. FLA
PS
5 O
NLY
1012
1416
1820
2422
2523
2119
1715
1311
limit
LIZF
M
LMC
NO
T IN
CLU
DE
D
% M
AC
1020
3040
5060
7080
DR
Y O
PE
RAT
ING
IND
EX
DR
Y O
PE
RAT
ING
IND
EX
:
PAS
SE
NG
ER
CO
MPA
RTM
EN
T D
IVIS
ION
CP
T.
22 -
2621
-23
16 -
2011
- 15
7 - 1
04
- 61
- 3R
ow
No.
of S
eats
1518
2424
2418
18
0a0b
0c0d
0e0f
0g
Gro
up/C
ockp
it C
rew
MA
C a
t TO
M
......
......
...%
18P
ITC
H 1
0 P
ax
PIT
CH
10
Pax
PIT
CH
10
Pax
PIT
CH
100
0 kg
PIT
CH
100
0 kg
PIT
CH
10
Pax
10 P
ax
10 P
ax
NO
EFF
EC
T
15 24 24 24 18 18
0a 0b 0c 0d 0e 0f 0g
Cpt
.M
AS
S /
No.
1 43
30
5
84
17
FUE
LIN
DE
X
TOTA
LR
EM
AR
KS
PAX
FC
Y
DIS
TRIB
UTI
ON
MA
SS
14
0
LAS
T M
INU
TE C
HA
NG
ES
TOTA
L TR
AFF
IC L
OA
DPA
SS
EN
GE
R M
AS
S
T O T A L
Dry
Ope
ratin
g M
ass
ZER
O F
UE
L M
AS
S
Take
-Off
Fuel
TAK
E-O
FF M
AS
S
Max
.
Max
.
Max
.LA
ND
ING
MA
SS
Trip
Fue
l
TOTA
L LM
CP
repa
red
by:
App
rove
d by
:
Des
tS
peci
ficat
ion
Cl C
ptpl
usm
inus
.1.4
.0
.1.4
.0
LOA
D L
MC
(Tot
al)
TOF
Adj
ustm
ent
PAX
PAX
Tr B C M Tr B C M
No.
of
Ma
FeC
hIn
UN
DE
RLO
AD
befo
re L
MC
Tota
lTr
affic
Loa
d
Allo
wed
Traf
fic L
oad
Allo
wed
Mas
sfo
r Tak
e-O
ffLo
wes
t of a
, b, c
Not
es:
OP
ER
ATIN
G M
AS
S
Take
-Off
Fuel
DR
Y O
PE
RAT
ING
MA
SS
ZER
O F
UE
LTA
KE
-OFF
LAN
DIN
G
ab
c
MA
XIM
UM
MA
SS
ES
FO
R
TRIP
FUE
L
Add
ress
es
Orig
inat
or
Pre
fix
Flig
htC
rew
Dat
e
ALL
MA
SS
ES
IN K
ILO
GR
AM
SR
echa
rge
Dat
e T
ime
Dat
eR
egis
tratio
nVe
rsio
niniti
als
9
Des
t.
Load
& T
rim S
heet
JA
A -
FC
L T
win
Jet
Part
BPa
rt A
Section 3Section 2Section 1
34
5
ZFM
TOM
34300
14500
00
88
4
00
513
00
145
00
658
00
628
00
549
00
85
00
634
245
.0
00
88
4
00
40
1
70
33
1
630
L M G
1820
630
1092
018
50
600
630
1220
1092
0
20
09
1
130
50
24
70
33
1 343
00
476
07
513
00
628
00
621
07
145
00
549
00
85
00
536
07
60
0
18
50
14 12 24 24 24 16 16
LM
130
600
MZFM
18.3
12.9
July 2006
CAP 696 CAA JAR-FCL Examinations - Mass and Balance Manual (Aeroplanes)
Fuel Mass(kg)
Index Units Fuel Mass
(kg)
Index Units
500 -1.0 9,330 -0.3
750 -1.5 9,580 -0.9
1,000 -1.9 9,830 -1.5
1,250 -2.3 10,080 -2.1
1,500 -2.6 10,330 -2.7
1,750 -3.0 10,580 -3.3
2,000 -3.3 10,830 -3.9
2,500 -3.7 11,080 -4.5
3,000 -4.3 11,330 -5.1
3,500 -4.7 11,580 -5.7
4,000 -5.1 11,830 -6.3
4,500 -5.4 12,080 -6.9
5,000 -5.7 12,330 -7.5
5,500 -5.9 12,580 -8.1
6,000 -6.0 12,830 -8.7
6,500 -6.1 13,080 -9.3
7,000 -5.9 13,330 -9.9
7,500 -5.0 13,580 -10.5
7,670 -4.6 13,830 -11.1
7,830 -4.1 14,080 -11.7
8,000 -3.7 14,330 -12.3
8,170 -3.2 14,580 -12.9
8,330 -2.6 14,830 -13.5
8,500 -2.1 15,080 -14.1
8,630 -1.6 15,330 -14.8
8,750 -1.1 15,580 -15.4
8,880 -0.6 15,830 -16.3
9,000 -0.1 16,080 -17.1
tanks 1 and 2 full 9,080 +0.3 centre tank full 16,140 -17.3
Usable fuel quantities in lines = 20 kg (included in the tables).
Interpolation not necessary!
For mass figures not printed in these tables the index of the next higher mass is applicable.
Figure 4.14 Fuel index correction table
Section 4 - MRJT1 Page 12July 2006
CAP 698
CAA JAR-FCL Examinations
Aeroplane Performance Manual
Third Edition July 2006
www.caa.co.uk
Safety Regulation Group


www.caa.co.uk
CAP 698
CAA JAR-FCL Examinations
Aeroplane Performance Manual
Third Edition July 2006
Safety Regulation Group
CAP 698 CAA JAR-FCL Examinations - Aeroplane Performance Manual
© Civil Aviation Authority 2006
All rights reserved. Copies of this publication may be reproduced as training material for students, foruse within a company or organisation, or for personal use, but may not otherwise be reproduced forpublication or for commercial gain.
To use or reference CAA publications for any other purpose, please contact the CAA at the addressbelow for formal agreement.
ISBN 0 11790 653 0
First published August 1999Second edition June 2001Third edition July 2006Third edition (corrected) September 2006
Enquiries regarding the content of this publication should be addressed to:Personnel Licensing Department, Safety Regulation Group, Civil Aviation Authority, Aviation House,Gatwick Airport South, West Sussex, RH6 0YR.
The latest version of this document is available in electronic format at www.caa.co.uk/publications,where you may also register for e-mail notification of amendments.
Published by TSO (The Stationery Office) on behalf of the UK Civil Aviation Authority.
Printed copy available from: TSO, PO Box 29, Norwich NR3 1GN www.tso.co.uk/bookshopTelephone orders/General enquiries: 0870 600 5522 E-mail: [email protected] orders: 0870 600 5533 Textphone: 0870 240 3701
CAP 698 CAA JAR-FCL Examinations - Aeroplane Performance Manual
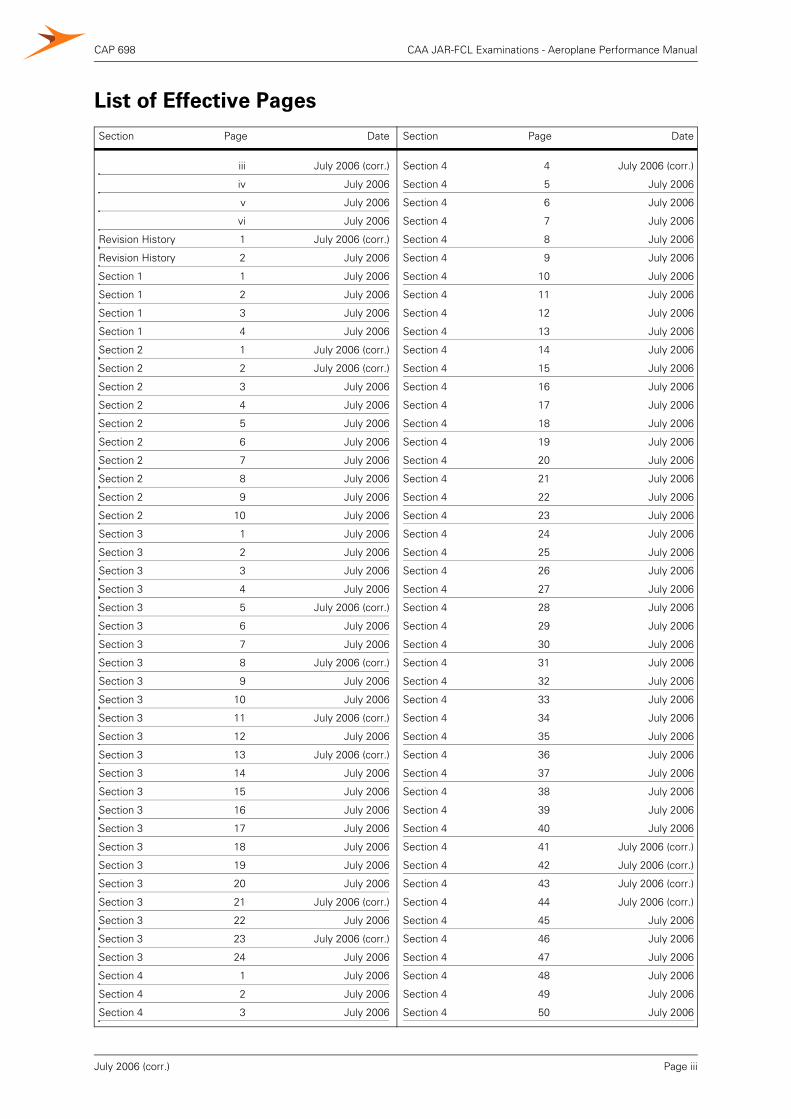
Section Page Date Section Page Date
List of Effective Pages
iii July 2006 (corr.)
iv July 2006
v July 2006
vi July 2006
Revision History 1 July 2006 (corr.)
Revision History 2 July 2006
Section 1 1 July 2006
Section 1 2 July 2006
Section 1 3 July 2006
Section 1 4 July 2006
Section 2 1 July 2006 (corr.)
Section 2 2 July 2006 (corr.)
Section 2 3 July 2006
Section 2 4 July 2006
Section 2 5 July 2006
Section 2 6 July 2006
Section 2 7 July 2006
Section 2 8 July 2006
Section 2 9 July 2006
Section 2 10 July 2006
Section 3 1 July 2006
Section 3 2 July 2006
Section 3 3 July 2006
Section 3 4 July 2006
Section 3 5 July 2006 (corr.)
Section 3 6 July 2006
Section 3 7 July 2006
Section 3 8 July 2006 (corr.)
Section 3 9 July 2006
Section 3 10 July 2006
Section 3 11 July 2006 (corr.)
Section 3 12 July 2006
Section 3 13 July 2006 (corr.)
Section 3 14 July 2006
Section 3 15 July 2006
Section 3 16 July 2006
Section 3 17 July 2006
Section 3 18 July 2006
Section 3 19 July 2006
Section 3 20 July 2006
Section 3 21 July 2006 (corr.)
Section 3 22 July 2006
Section 3 23 July 2006 (corr.)
Section 3 24 July 2006
Section 4 1 July 2006
Section 4 2 July 2006
Section 4 3 July 2006
Section 4 4 July 2006 (corr.)
Section 4 5 July 2006
Section 4 6 July 2006
Section 4 7 July 2006
Section 4 8 July 2006
Section 4 9 July 2006
Section 4 10 July 2006
Section 4 11 July 2006
Section 4 12 July 2006
Section 4 13 July 2006
Section 4 14 July 2006
Section 4 15 July 2006
Section 4 16 July 2006
Section 4 17 July 2006
Section 4 18 July 2006
Section 4 19 July 2006
Section 4 20 July 2006
Section 4 21 July 2006
Section 4 22 July 2006
Section 4 23 July 2006
Section 4 24 July 2006
Section 4 25 July 2006
Section 4 26 July 2006
Section 4 27 July 2006
Section 4 28 July 2006
Section 4 29 July 2006
Section 4 30 July 2006
Section 4 31 July 2006
Section 4 32 July 2006
Section 4 33 July 2006
Section 4 34 July 2006
Section 4 35 July 2006
Section 4 36 July 2006
Section 4 37 July 2006
Section 4 38 July 2006
Section 4 39 July 2006
Section 4 40 July 2006
Section 4 41 July 2006 (corr.)
Section 4 42 July 2006 (corr.)
Section 4 43 July 2006 (corr.)
Section 4 44 July 2006 (corr.)
Section 4 45 July 2006
Section 4 46 July 2006
Section 4 47 July 2006
Section 4 48 July 2006
Section 4 49 July 2006
Section 4 50 July 2006
Page iiiJuly 2006 (corr.)
CAP 698 CAA JAR-FCL Examinations - Aeroplane Performance Manual
INTENTIONALLY LEFT BLANK
Page ivJuly 2006
CAP 698 CAA JAR-FCL Examinations - Aeroplane Performance Manual
Contents
List of Effective Pages iii
Revision History 1
Section 1 General Notes
Aircraft Description 1
Layout of Data Sheets 1
Definitions 2
Conversions 4
Section 2 Data for Single-Engine Piston Aeroplane (SEP1)
General Considerations 1
Take-Off 1
Take-Off Climb 6
En-Route 8
Landing 9
Section 3 Data for Multi-Engine Piston Aeroplane (MEP1)
General Considerations 1
Take-Off 1
Take-Off Climb 9
En-route 17
Landing 17
Section 4 Data for Medium-Range Jet Transport (MRJT1)
General Considerations 1
Take-Off 7
Obstacle Clearance 35
En-route 39
Landing 45
Page vJuly 2006
CAP 698 CAA JAR-FCL Examinations - Aeroplane Performance Manual
INTENTIONALLY LEFT BLANK
Page viJuly 2006
CAP 698 CAA JAR-FCL Examinations - Aeroplane Performance Manual
Revision History1st Edition August 1999
CAP 698, CAA JAR-FCL Examinations Performance Manual, was produced to support trainingand examinations in JAR-FCL Subject 032 - Performance for Aeroplanes.
2nd Edition June 2001
The manual was reissued to incorporate CAA House Style.
3rd Edition July 2006
This edition has been upgraded with digitised graphics. Definitions and conversions have beenrationalised and known errors have been corrected.
3rd Edition (corrected) September 2006
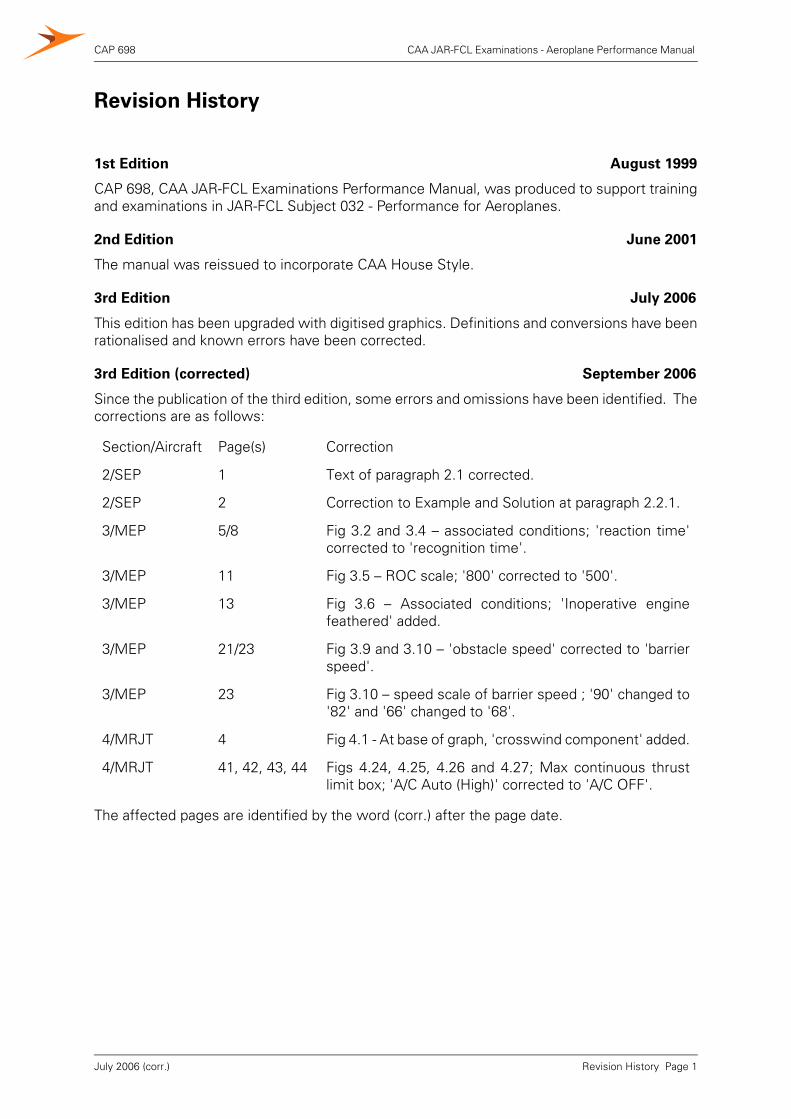
Since the publication of the third edition, some errors and omissions have been identified. Thecorrections are as follows:
The affected pages are identified by the word (corr.) after the page date.
Section/Aircraft Page(s) Correction
2/SEP 1 Text of paragraph 2.1 corrected.
2/SEP 2 Correction to Example and Solution at paragraph 2.2.1.
3/MEP 5/8 Fig 3.2 and 3.4 – associated conditions; 'reaction time'corrected to 'recognition time'.
3/MEP 11 Fig 3.5 – ROC scale; '800' corrected to '500'.
3/MEP 13 Fig 3.6 – Associated conditions; 'Inoperative enginefeathered' added.
3/MEP 21/23 Fig 3.9 and 3.10 – 'obstacle speed' corrected to 'barrierspeed'.
3/MEP 23 Fig 3.10 – speed scale of barrier speed ; '90' changed to'82' and '66' changed to '68'.
4/MRJT 4 Fig 4.1 - At base of graph, 'crosswind component' added.
4/MRJT 41, 42, 43, 44 Figs 4.24, 4.25, 4.26 and 4.27; Max continuous thrustlimit box; 'A/C Auto (High)' corrected to 'A/C OFF'.
Revision History Page 1July 2006 (corr.)

CAP 698 CAA JAR-FCL Examinations - Aeroplane Performance Manual
INTENTIONALLY LEFT BLANK
Revision History Page 2July 2006
CAP 698 CAA JAR-FCL Examinations - Aeroplane Performance Manual
Section 1 General Notes1 Introduction
Important Notice
1.1 The data sheets in this manual are produced to support training and examinations inJAR-FCL Subject 032 - Performance for Aeroplanes.
1.2 The data contained within these sheets are for training and examination purposes
only. The data must not be used for any other purpose and, specifically, are not to
be used for the purpose of planning activities associated with the operation of
any aeroplane in use now or in the future.
2 Aircraft Description
2.1 The aeroplanes used in these data sheets are of generic types related to the classesof aeroplane on which the appropriate examinations are based.
2.2 Candidates must select the correct class of aeroplane for the question beingattempted.
2.3 The same set of generic aeroplanes will be utilised in the following subjects:
• 031 - Mass and Balance - Aeroplanes
• 032 - Performance - Aeroplanes
• 033 - Flight Planning and Monitoring - Aeroplanes
3 Layout of Data Sheets
3.1 Each set of data sheets will consist of an introduction that will contain some pertinentinformation relating to the aircraft and the subject being examined. This data willinclude (but is not limited to) a list of abbreviations and some conversion factors.
3.2 This will be followed by a selection of graphs and/or tables that will provide coveragesuitable for the syllabus to be examined. A worked example will accompany eachgraph/table and will demonstrate typical usage.
Generic Aeroplanes
Single-Engine Piston certificated under CS 23 (Light Aeroplanes)
Performance Class B SEP1
Multi-Engine Piston certificated under CS 23 (Light Aeroplanes)
Performance Class B MEP1
Medium-Range Jet Transport certificated under CS 25 (Large Aeroplanes)
Performance Class A MRJT1
Section 1 - General Notes Page 1July 2006
CAP 698 CAA JAR-FCL Examinations - Aeroplane Performance Manual
4 Definitions
Definitions given in italics are not given in ICAO, or JAA or EASA documentation butare in common use.
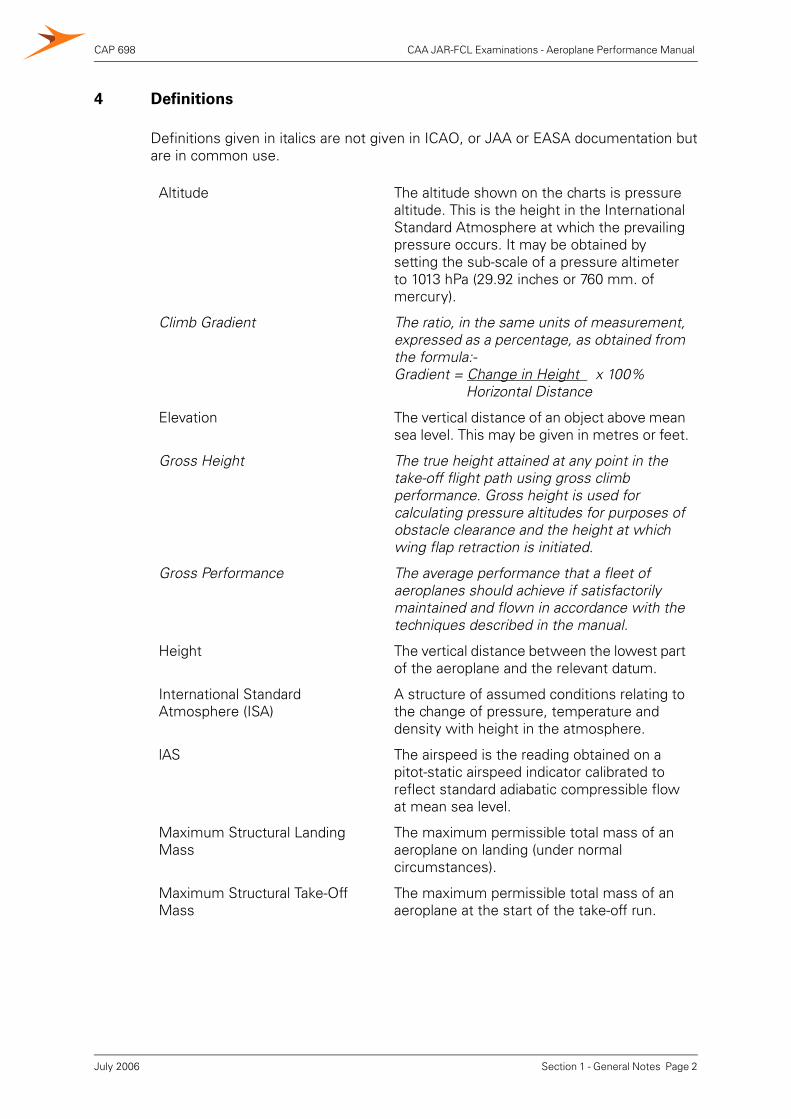
Altitude The altitude shown on the charts is pressure altitude. This is the height in the International Standard Atmosphere at which the prevailing pressure occurs. It may be obtained by setting the sub-scale of a pressure altimeter to 1013 hPa (29.92 inches or 760 mm. of mercury).
Climb Gradient The ratio, in the same units of measurement, expressed as a percentage, as obtained from the formula:-Gradient = Change in Height x 100%
Horizontal Distance
Elevation The vertical distance of an object above mean sea level. This may be given in metres or feet.
Gross Height The true height attained at any point in the take-off flight path using gross climb performance. Gross height is used for calculating pressure altitudes for purposes of obstacle clearance and the height at which wing flap retraction is initiated.
Gross Performance The average performance that a fleet of aeroplanes should achieve if satisfactorily maintained and flown in accordance with the techniques described in the manual.
Height The vertical distance between the lowest part of the aeroplane and the relevant datum.
International Standard Atmosphere (ISA)
A structure of assumed conditions relating to the change of pressure, temperature and density with height in the atmosphere.
lAS The airspeed is the reading obtained on a pitot-static airspeed indicator calibrated to reflect standard adiabatic compressible flow at mean sea level.
Maximum Structural Landing Mass
The maximum permissible total mass of an aeroplane on landing (under normal circumstances).
Maximum Structural Take-Off Mass
The maximum permissible total mass of an aeroplane at the start of the take-off run.
Section 1 - General Notes Page 2July 2006
CAP 698 CAA JAR-FCL Examinations - Aeroplane Performance Manual
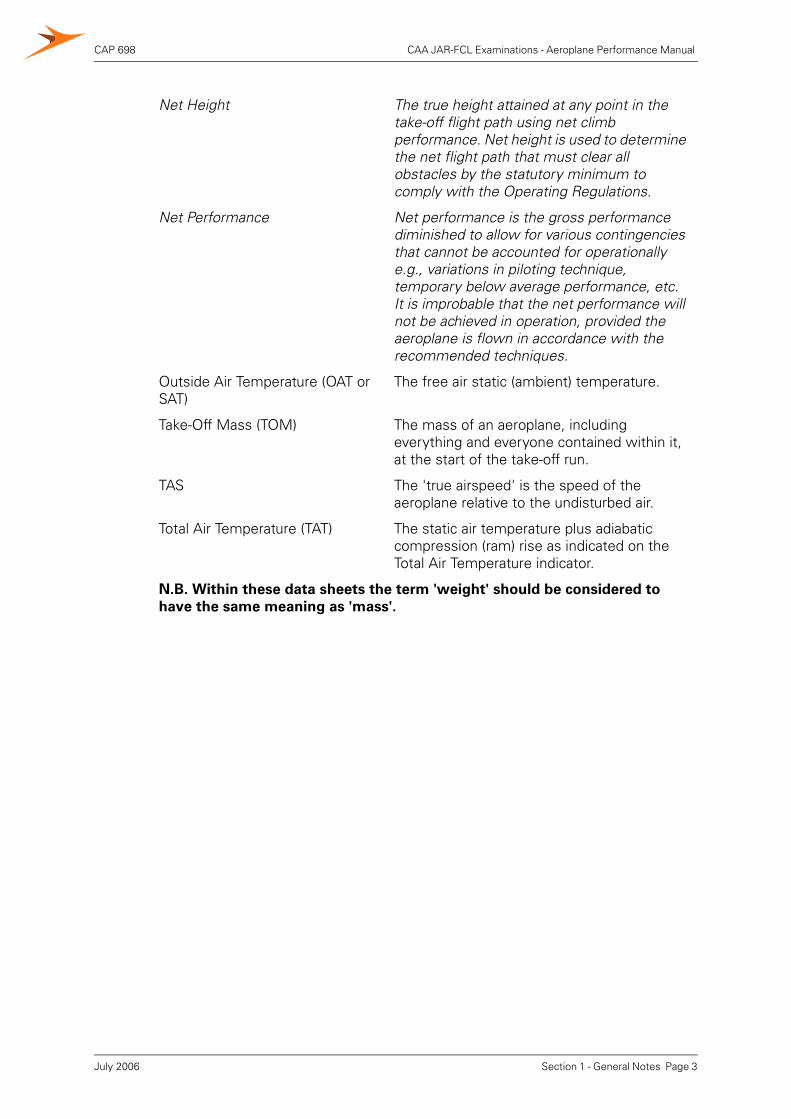
Net Height The true height attained at any point in thetake-off flight path using net climb performance. Net height is used to determine the net flight path that must clear all obstacles by the statutory minimum to comply with the Operating Regulations.
Net Performance Net performance is the gross performance diminished to allow for various contingencies that cannot be accounted for operationally e.g., variations in piloting technique, temporary below average performance, etc. It is improbable that the net performance will not be achieved in operation, provided the aeroplane is flown in accordance with the recommended techniques.
Outside Air Temperature (OAT or SAT)
The free air static (ambient) temperature.
Take-Off Mass (TOM) The mass of an aeroplane, including everything and everyone contained within it, at the start of the take-off run.
TAS The 'true airspeed' is the speed of the aeroplane relative to the undisturbed air.
Total Air Temperature (TAT) The static air temperature plus adiabatic compression (ram) rise as indicated on the Total Air Temperature indicator.
N.B. Within these data sheets the term 'weight' should be considered to
have the same meaning as 'mass'.
Section 1 - General Notes Page 3July 2006
CAP 698 CAA JAR-FCL Examinations - Aeroplane Performance Manual
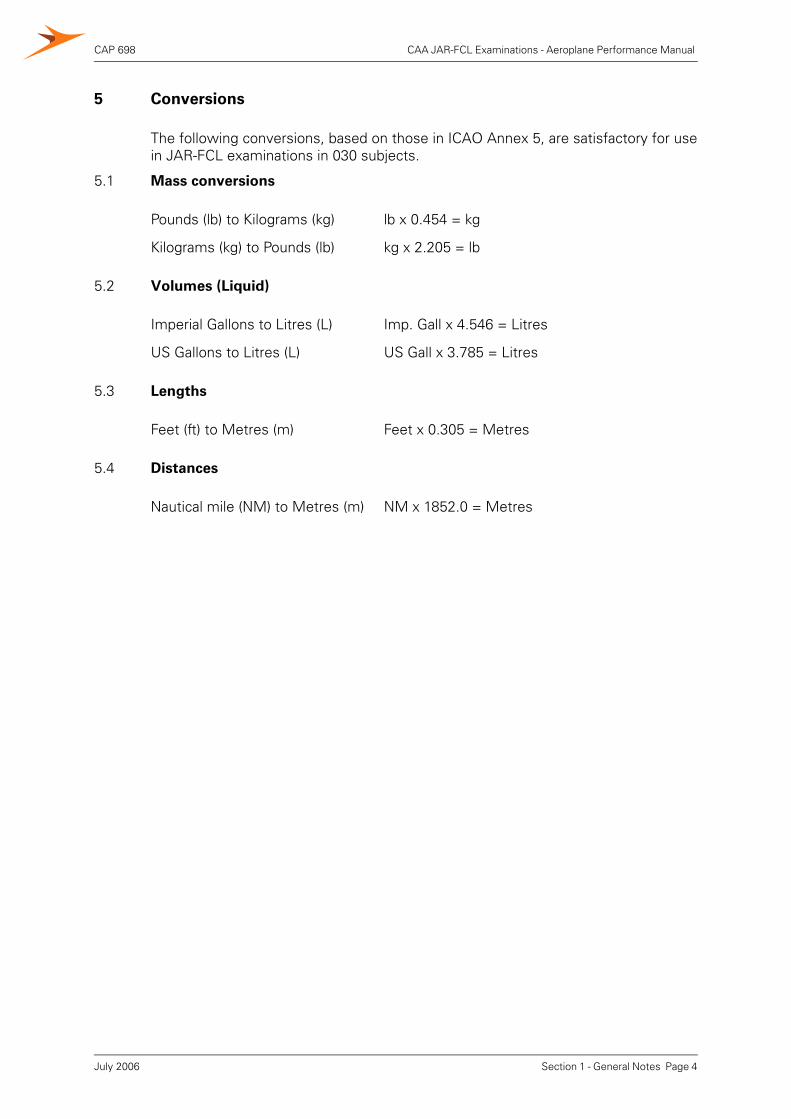
5 Conversions
The following conversions, based on those in ICAO Annex 5, are satisfactory for usein JAR-FCL examinations in 030 subjects.
5.1 Mass conversions
5.2 Volumes (Liquid)
5.3 Lengths
5.4 Distances
Pounds (lb) to Kilograms (kg) lb x 0.454 = kg
Kilograms (kg) to Pounds (lb) kg x 2.205 = lb
Imperial Gallons to Litres (L) Imp. Gall x 4.546 = Litres
US Gallons to Litres (L) US Gall x 3.785 = Litres
Feet (ft) to Metres (m) Feet x 0.305 = Metres
Nautical mile (NM) to Metres (m) NM x 1852.0 = Metres
Section 1 - General Notes Page 4July 2006
CAP 698 CAA JAR-FCL Examinations - Aeroplane Performance Manual
Section 2 Data for Single-Engine Piston Aeroplane(SEP1)
1 General Considerations
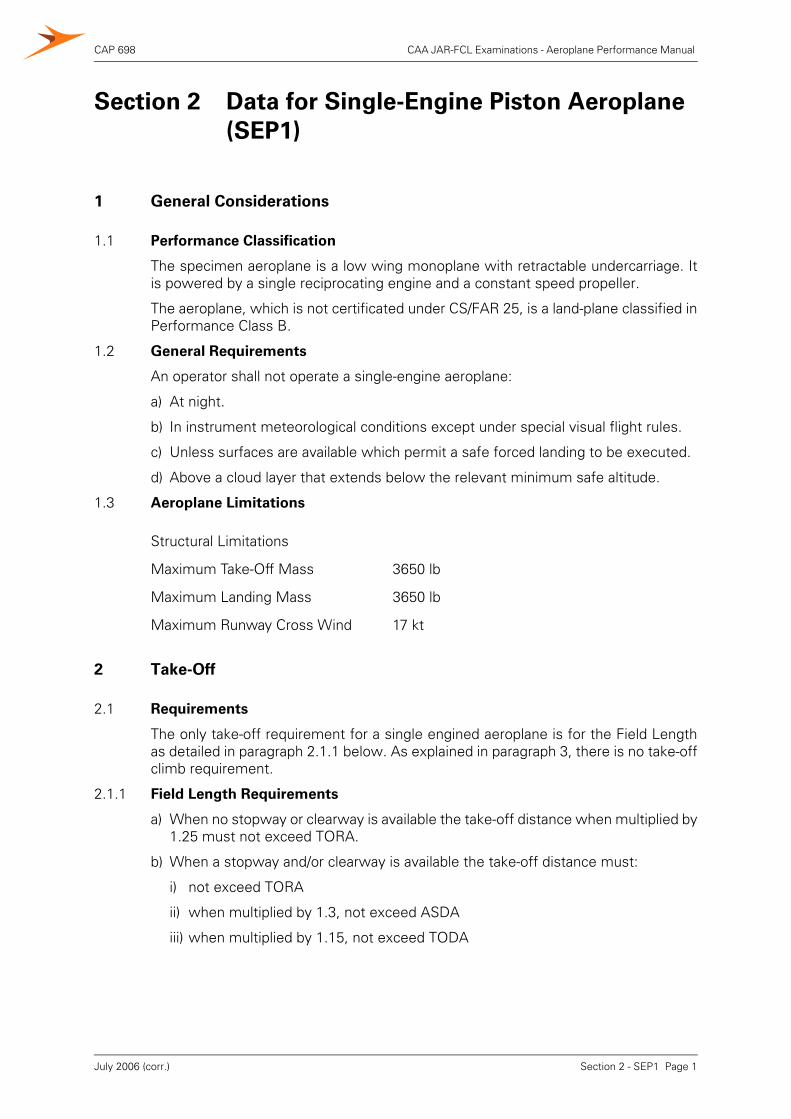
1.1 Performance Classification
The specimen aeroplane is a low wing monoplane with retractable undercarriage. Itis powered by a single reciprocating engine and a constant speed propeller.
The aeroplane, which is not certificated under CS/FAR 25, is a land-plane classified inPerformance Class B.
1.2 General Requirements
An operator shall not operate a single-engine aeroplane:
a) At night.
b) In instrument meteorological conditions except under special visual flight rules.
c) Unless surfaces are available which permit a safe forced landing to be executed.
d) Above a cloud layer that extends below the relevant minimum safe altitude.
1.3 Aeroplane Limitations
2 Take-Off
2.1 Requirements
The only take-off requirement for a single engined aeroplane is for the Field Lengthas detailed in paragraph 2.1.1 below. As explained in paragraph 3, there is no take-offclimb requirement.
2.1.1 Field Length Requirements
a) When no stopway or clearway is available the take-off distance when multiplied by1.25 must not exceed TORA.
b) When a stopway and/or clearway is available the take-off distance must:
i) not exceed TORA
ii) when multiplied by 1.3, not exceed ASDA
iii) when multiplied by 1.15, not exceed TODA
Structural Limitations
Maximum Take-Off Mass 3650 lb
Maximum Landing Mass 3650 lb
Maximum Runway Cross Wind 17 kt
Section 2 - SEP1 Page 1July 2006 (corr.)
CAP 698 CAA JAR-FCL Examinations - Aeroplane Performance Manual
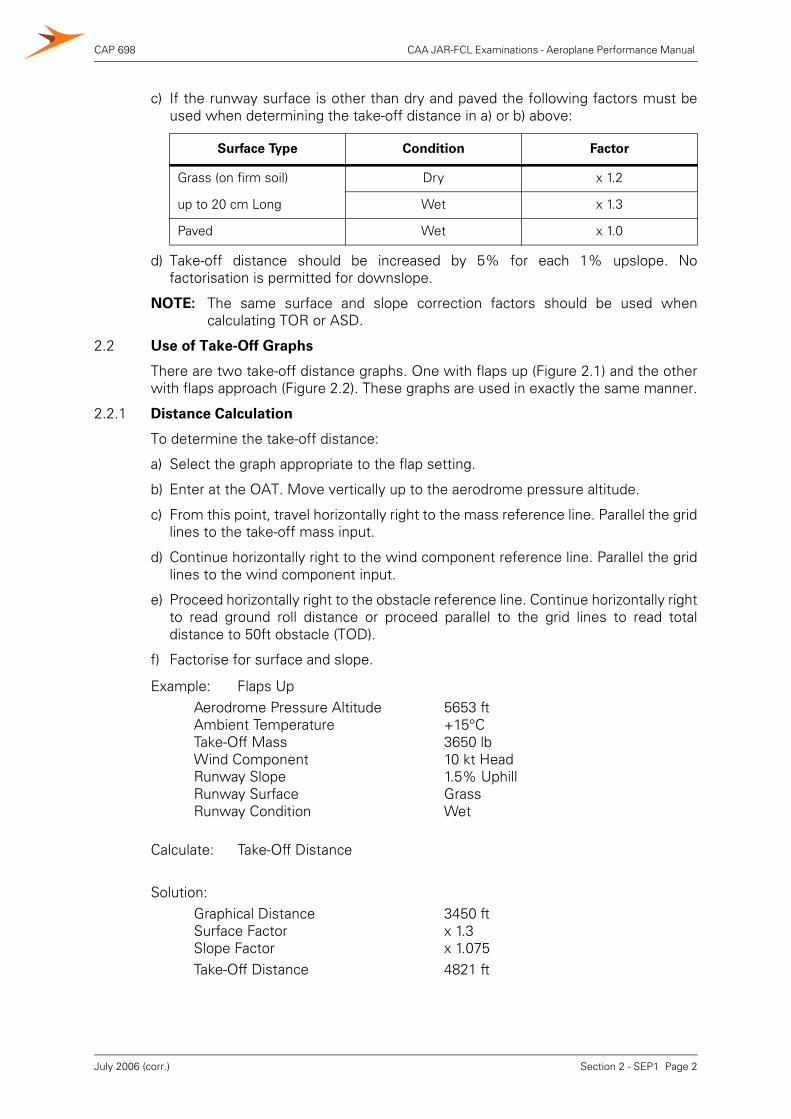
c) If the runway surface is other than dry and paved the following factors must beused when determining the take-off distance in a) or b) above:
d) Take-off distance should be increased by 5% for each 1% upslope. Nofactorisation is permitted for downslope.
NOTE: The same surface and slope correction factors should be used whencalculating TOR or ASD.
2.2 Use of Take-Off Graphs
There are two take-off distance graphs. One with flaps up (Figure 2.1) and the otherwith flaps approach (Figure 2.2). These graphs are used in exactly the same manner.
2.2.1 Distance Calculation
To determine the take-off distance:
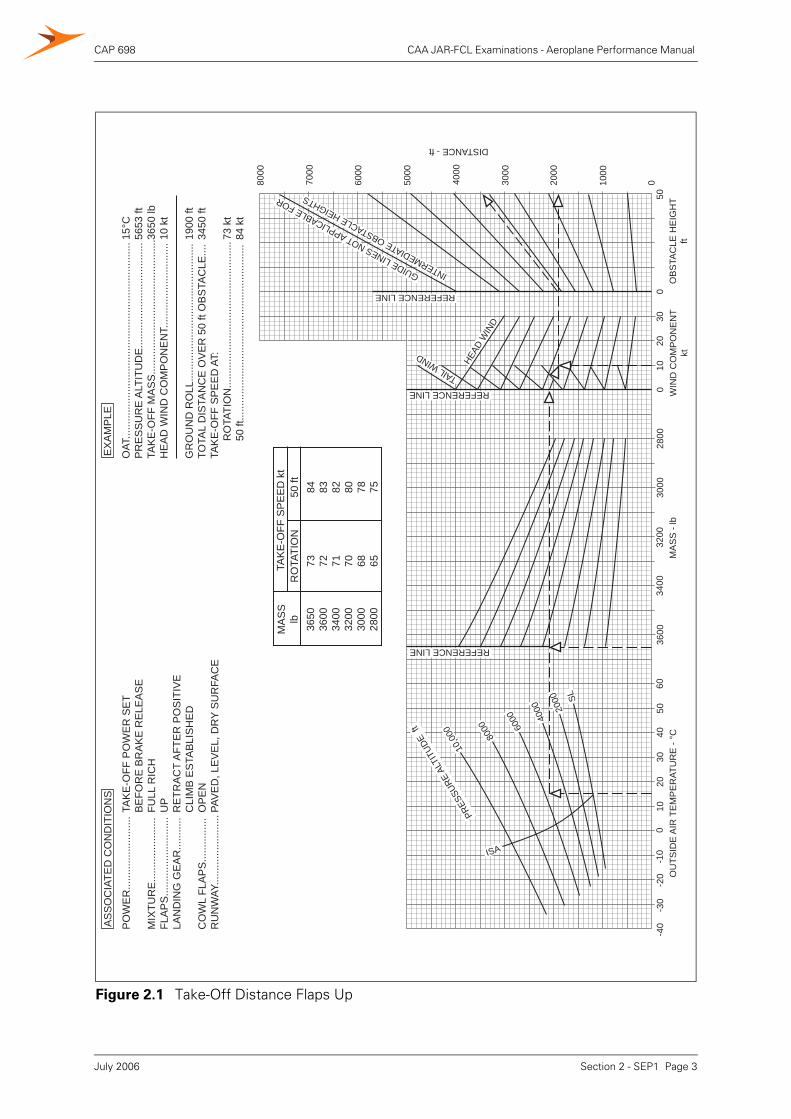
a) Select the graph appropriate to the flap setting.
b) Enter at the OAT. Move vertically up to the aerodrome pressure altitude.
c) From this point, travel horizontally right to the mass reference line. Parallel the gridlines to the take-off mass input.
d) Continue horizontally right to the wind component reference line. Parallel the gridlines to the wind component input.
e) Proceed horizontally right to the obstacle reference line. Continue horizontally rightto read ground roll distance or proceed parallel to the grid lines to read totaldistance to 50ft obstacle (TOD).
f) Factorise for surface and slope.
Surface Type Condition Factor
Grass (on firm soil) Dry x 1.2
up to 20 cm Long Wet x 1.3
Paved Wet x 1.0
Example: Flaps UpAerodrome Pressure AltitudeAmbient TemperatureTake-Off Mass Wind ComponentRunway SlopeRunway SurfaceRunway Condition
5653 ft+15°C3650 lb10 kt Head1.5% UphillGrassWet
Calculate: Take-Off Distance
Solution:Graphical DistanceSurface FactorSlope Factor
3450 ftx 1.3x 1.075
Take-Off Distance 4821 ft
Section 2 - SEP1 Page 2July 2006 (corr.)
CAP 698 CAA JAR-FCL Examinations - Aeroplane Performance Manual
Figure 2.1 Take-Off Distance Flaps Up
0-1
0-2
0-3
0-4
010
2030
4050
60O
UTS
IDE
AIR
TE
MP
ER
ATU
RE
- °C
MA
SS
- lb
3600
3400
3200
3000
2800
010
2030
WIN
D C
OM
PO
NE
NT
ktO
BS
TAC
LE H
EIG
HT
ft
050
01000
2000
3000
4000
5000
6000
7000
8000
DISTANCE - ft
10,0
00 8000 60
00 4000 20
00 SL
PRES
SURE
ALT
ITUD
E ft
ISA
REFERENCE LINE
REFERENCE LINE
REFERENCE LINE
GUIDE LINES NOT APPLICABLE FOR
INTERMEDIATE OBSTACLE HEIGHTS
TAIL WIND
HEAD
WIN
D
PO
WE
R...
......
......
......
....
MIX
TUR
E...
......
......
......
.FL
AP
S...
......
......
......
......
LAN
DIN
G G
EA
R...
......
..
CO
WL
FLA
PS
......
......
...R
UN
WAY
......
......
......
......
TAK
E-O
FF P
OW
ER
SE
TB
EFO
RE
BR
AK
E R
ELE
AS
EFU
LL R
ICH
UP
RE
TRA
CT
AFT
ER
PO
SIT
IVE
CLI
MB
ES
TAB
LIS
HE
DO
PE
NPA
VE
D, L
EV
EL,
DR
Y S
UR
FAC
E
AS
SO
CIA
TED
CO
ND
ITIO
NS
OAT
......
......
......
......
......
......
......
......
......
......
......
.P
RE
SS
UR
E A
LTIT
UD
E...
......
......
......
......
......
...TA
KE
-OFF
MA
SS
......
......
......
......
......
......
......
....
HE
AD
WIN
D C
OM
PO
NE
NT.
......
......
......
......
....
GR
OU
ND
RO
LL...
......
......
......
......
......
......
......
..TO
TAL
DIS
TAN
CE
OV
ER
50
ft O
BS
TAC
LE...
.TA
KE
-OFF
SP
EE
D A
T:
R
OTA
TIO
N...
......
......
......
......
......
......
......
.....
50 ft
......
......
......
......
......
......
......
......
......
......
15°C
5653
ft36
50 lb
10 k
t
1900
ft34
50 ft
73 k
t84
kt
EX
AM
PLE
MA
SS
lbTA
KE
-OFF
SP
EE
D k
t R
OTA
TIO
N
50
ft36
5036
0034
0032
0030
0028
00
73
84
72
83
71
82
70
80
68
78
65
75
Section 2 - SEP1 Page 3July 2006
CAP 698 CAA JAR-FCL Examinations - Aeroplane Performance Manual
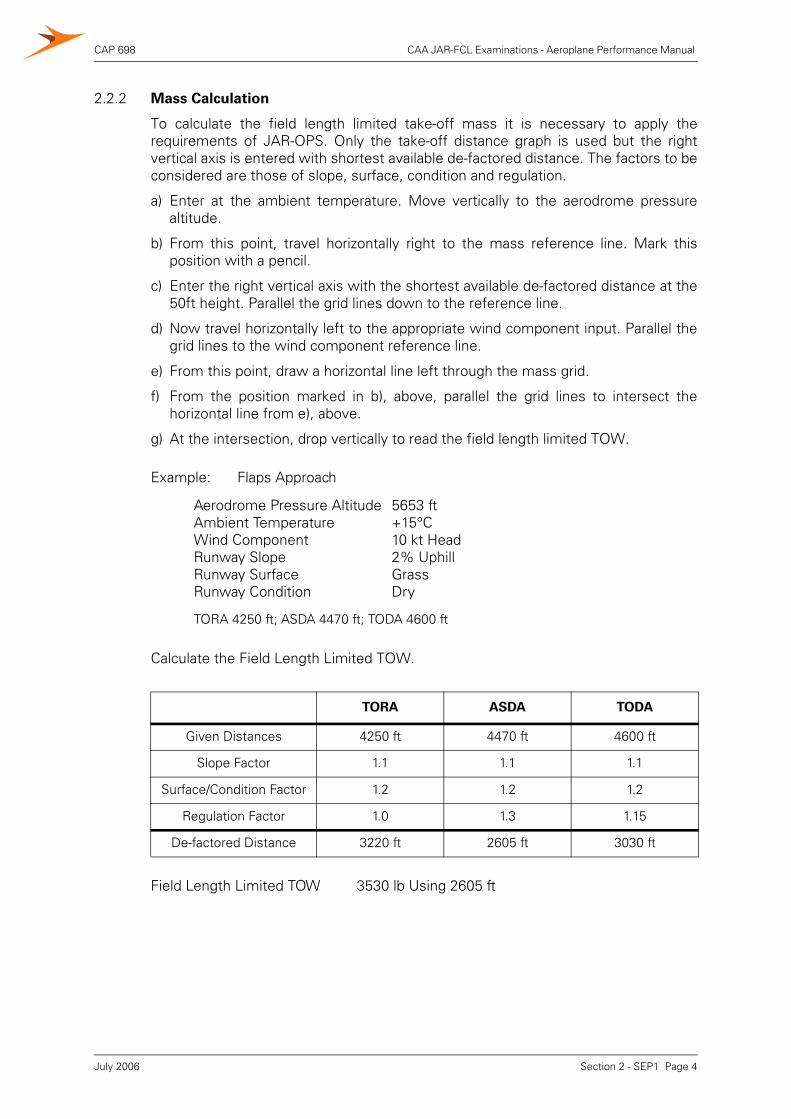
2.2.2 Mass Calculation
To calculate the field length limited take-off mass it is necessary to apply therequirements of JAR-OPS. Only the take-off distance graph is used but the rightvertical axis is entered with shortest available de-factored distance. The factors to beconsidered are those of slope, surface, condition and regulation.
a) Enter at the ambient temperature. Move vertically to the aerodrome pressurealtitude.
b) From this point, travel horizontally right to the mass reference line. Mark thisposition with a pencil.
c) Enter the right vertical axis with the shortest available de-factored distance at the50ft height. Parallel the grid lines down to the reference line.
d) Now travel horizontally left to the appropriate wind component input. Parallel thegrid lines to the wind component reference line.
e) From this point, draw a horizontal line left through the mass grid.
f) From the position marked in b), above, parallel the grid lines to intersect thehorizontal line from e), above.
g) At the intersection, drop vertically to read the field length limited TOW.
Calculate the Field Length Limited TOW.
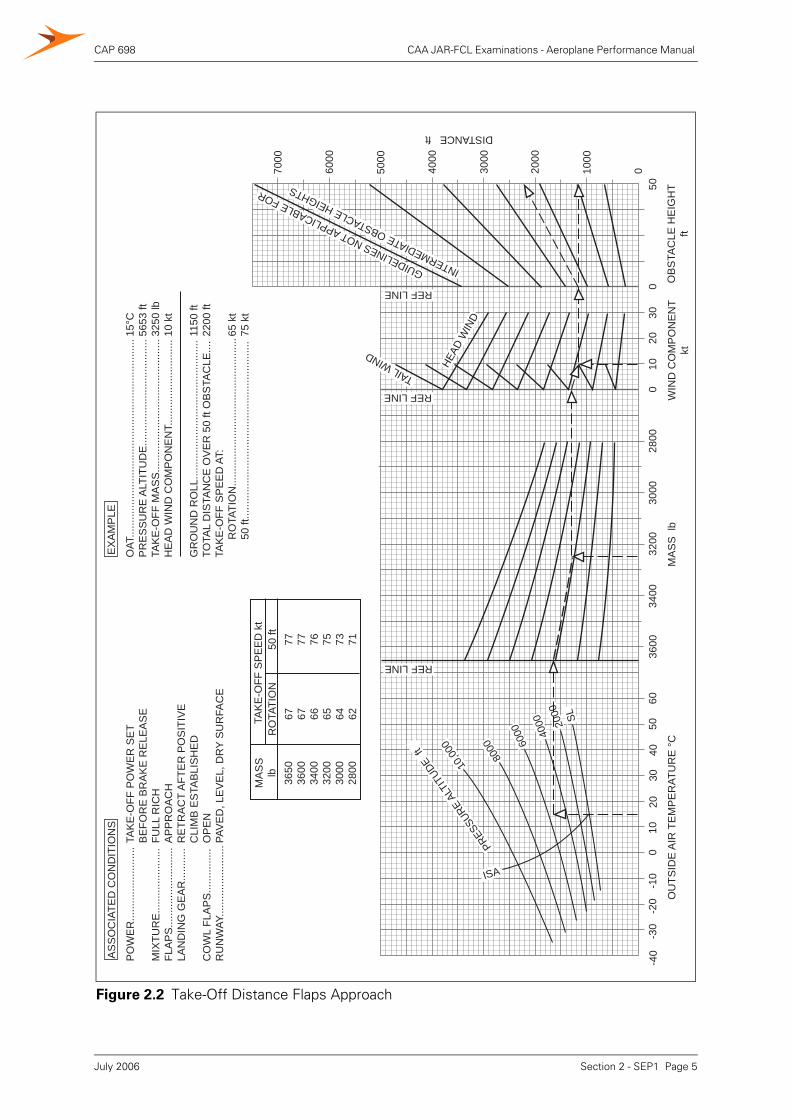
Example: Flaps Approach
Aerodrome Pressure AltitudeAmbient TemperatureWind ComponentRunway SlopeRunway SurfaceRunway Condition
5653 ft+15°C10 kt Head2% UphillGrassDry
TORA 4250 ft; ASDA 4470 ft; TODA 4600 ft
TORA ASDA TODA
Given Distances 4250 ft 4470 ft 4600 ft
Slope Factor 1.1 1.1 1.1
Surface/Condition Factor 1.2 1.2 1.2
Regulation Factor 1.0 1.3 1.15
De-factored Distance 3220 ft 2605 ft 3030 ft
Field Length Limited TOW 3530 lb Using 2605 ft
Section 2 - SEP1 Page 4July 2006
CAP 698 CAA JAR-FCL Examinations - Aeroplane Performance Manual
Figure 2.2 Take-Off Distance Flaps Approach
PRES
SURE
ALTI
TUDE
ft
10,0
00
8000 60
00 4000 20
00 SL
ISA
REF LINE
REF LINE
HEAD
WIN
D
TAIL WIND
REF LINE
GUIDELINES NOT APPLICABLE FOR
INTERMEDIATE OBSTACLE HEIGHTS
7000
6000
5000
4000
3000
2000
1000
0
DISTANCE ft
OU
TSID
E A
IR T
EM
PE
RAT
UR
E °
CM
AS
S l
bW
IND
CO
MP
ON
EN
Tkt
OB
STA
CLE
HE
IGH
Tft
-40
-30
-20
-10
010
2030
4050
6036
0034
0032
0030
0028
000
1020
300
50
PO
WE
R...
......
......
......
....
MIX
TUR
E...
......
......
......
.FL
AP
S...
......
......
......
......
LAN
DIN
G G
EA
R...
......
..
CO
WL
FLA
PS
......
......
...R
UN
WAY
......
......
......
......
TAK
E-O
FF P
OW
ER
SE
TB
EFO
RE
BR
AK
E R
ELE
AS
EFU
LL R
ICH
AP
PR
OA
CH
RE
TRA
CT
AFT
ER
PO
SIT
IVE
CLI
MB
ES
TAB
LIS
HE
DO
PE
NPA
VE
D, L
EV
EL,
DR
Y S
UR
FAC
E
AS
SO
CIA
TED
CO
ND
ITIO
NS
MA
SS
lbTA
KE
-OFF
SP
EE
D k
t R
OTA
TIO
N
50
ft36
5036
0034
0032
0030
0028
00
67
77
67
77
66
76
65
75
64
73
62
71
OAT
......
......
......
......
......
......
......
......
......
......
......
.P
RE
SS
UR
E A
LTIT
UD
E...
......
......
......
......
......
...TA
KE
-OFF
MA
SS
......
......
......
......
......
......
......
...H
EA
D W
IND
CO
MP
ON
EN
T....
......
......
......
......
.
GR
OU
ND
RO
LL...
......
......
......
......
......
......
......
..TO
TAL
DIS
TAN
CE
OV
ER
50
ft O
BS
TAC
LE...
.TA
KE
-OFF
SP
EE
D A
T:
R
OTA
TIO
N...
......
......
......
......
......
......
......
.....
50 ft
......
......
......
......
......
......
......
......
......
......
15°C
5653
ft32
50 lb
10 k
t
1150
ft22
00 ft
65 k
t75
kt
EX
AM
PLE
Section 2 - SEP1 Page 5July 2006
CAP 698 CAA JAR-FCL Examinations - Aeroplane Performance Manual
3 Take-Off Climb
3.1 Requirements
There are no obstacle clearance limits or minimum acceptable climb gradient requiredby JAR-OPS 1.
3.2 Use of Climb Graph
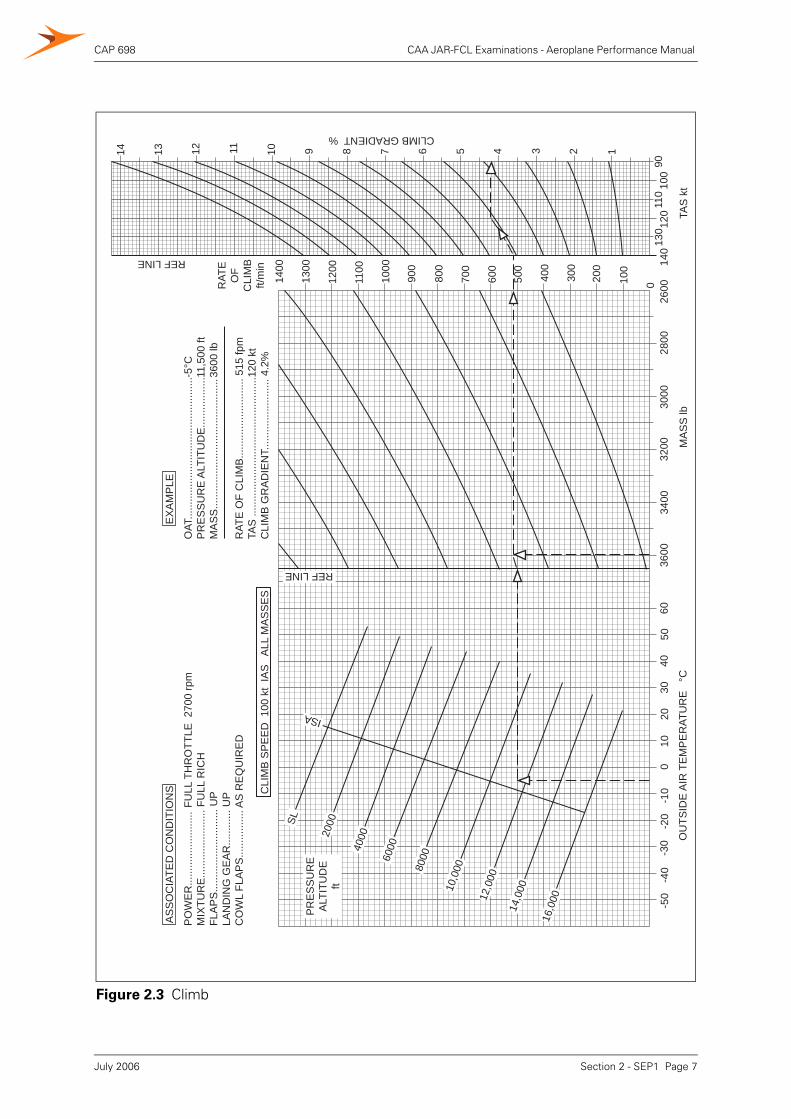
3.2.1 Climb Gradient and Rate of Climb.
To determine the climb gradient and rate of climb:
a) Use the navigation computer to calculate the TAS.b) Enter the graph at the ambient temperature. Move vertically up to the pressure
altitude.c) From this point, travel horizontally right to the mass reference line. Parallel the grid
lines to the appropriate mass input.d) Now continue horizontally right to the first vertical axis to read the rate of climb.
Continue horizontally to the TAS reference line.e) Parallel the grid lines to intersect the TAS input then travel horizontally right to the
right vertical axis to read the climb gradient.
3.2.2 Maximum Weight
To determine the maximum weight for a given gradient:
a) Enter the graph at the ambient temperature. Move vertically up to the PressureAltitude.
b) From this point, travel horizontally right to the weight reference line and mark witha pencil.
c) Calculate the TAS using the Navigation Computer.d) Enter the right vertical axis at the appropriate gradient and travel horizontally left to
intercept the TAS calculated in c). From this point follow the grid lines to reach thereference line and draw a horizontal line through the weight grid.
e) From the pencil mark in b), above, parallel the grid lines to intersect the horizontalline drawn in d) above. Drop vertically to read the Climb-Limited Take-off weight.
Example:Pressure AltitudeAmbient TemperatureWeight
11500 ft-5°C3600 lb
Solution:Graphical ROCTASClimb Gradient
515 fpm120 kt4.2%
Example:Aerodrome Pressure AltitudeAmbient TemperatureGradient
11000 ft+25°C4.2%
Solution:TASMaximum Weight
125 kt3360 lb
Section 2 - SEP1 Page 6July 2006
CAP 698 CAA JAR-FCL Examinations - Aeroplane Performance Manual
Figure 2.3 Climb
0100
200
300
400
500
600
700
800
900
1000
1100
1200
1300
1400
RAT
EO
FC
LIM
Bft/
min
-50
-40
-30
-20
-10
010
2030
4050
6036
0034
0032
0030
0028
0026
00
OU
TSID
E A
IR T
EM
PE
RAT
UR
E
°CM
AS
S lb
PO
WE
R...
......
......
......
....
MIX
TUR
E...
......
......
......
.. FU
LL R
ICH
FLA
PS
......
......
......
......
.... U
PLA
ND
ING
GE
AR
......
......
UP
CO
WL
FLA
PS
......
......
.... A
S R
EQ
UIR
ED
FULL
TH
RO
TTLE
270
0 rp
m
AS
SO
CIA
TED
CO
ND
ITIO
NS
-5°C
11,5
00 ft
3600
lb
OAT
......
......
......
......
......
......
......
......
PR
ES
SU
RE
ALT
ITU
DE
......
......
.....
MA
SS
......
......
......
......
......
......
......
..
RAT
E O
F C
LIM
B...
......
......
......
......
515
fpm
TAS
.....
......
......
......
......
......
......
......
120
ktC
LIM
B G
RA
DIE
NT.
......
......
......
.....
4.2%
EX
AM
PLE
CLI
MB
SP
EE
D 1
00 k
t IA
S
ALL
MA
SS
ES
16,0
00
14,0
00
12,0
00
10,0
00800060
00400020
00SL
ISA
PR
ES
SU
RE
ALT
ITU
DE
ft
REF LINE
CLIMB GRADIENT %
1234567891011121314
TAS
kt
140
120
100
130
110
90
REF LINE
Section 2 - SEP1 Page 7July 2006
CAP 698 CAA JAR-FCL Examinations - Aeroplane Performance Manual
3.2.3 Distance to Reach given height.
To calculate the ground distance travelled in order to attain a given height abovereference zero:
a) Convert the IAS 100 kt to a TAS, assume no position error.
b) Apply the wind component to the TAS to obtain the ground speed.
c) Determine the climb gradient from the graph.
d) Calculate the still air distance using the formula:
Still Air Distance (ft) = Height Difference (ft) x 100 Gradient
e) Calculate ground distance using the formula:
Ground Distance = Still Air Distance x GroundspeedTAS
Calculate the ground distance to reach 950 ft above reference zero from the end ofTODR.
4 En-Route
4.1 Requirements
The aeroplane may not be assumed to be flying above the altitude at which a rate ofclimb of 300 ft/min is attained.
The net gradient of descent, in the event of engine failure, shall be the gross gradientof descent increased by a gradient of 0.5%
Example:
Aerodrome Pressure AltitudeAmbient TemperatureWind ComponentTake-Off Weight
4000 ft+30°C30 kt tail3200 lb
Solution:
100 kt lAS = 110 kt TAS
Groundspeed = 140 kt
Graph Gradient = 10.0%
Still Air Distance = 900 10.0
x 100 = 9000 ft
Ground Distance = 9000 x 140 110
= 11455 ft = 1.88 NM.
Section 2 - SEP1 Page 8July 2006
CAP 698 CAA JAR-FCL Examinations - Aeroplane Performance Manual
5 Landing
5.1 Requirements
Field Length Requirements
a) The landing distance, from a screen height of 50 ft, must not exceed 70 % of thelanding distance available, i.e. a factor of 1.43.
b) If the landing surface is grass up to 20 cm long on firm soil, the landing distanceshould be multiplied by a factor of 1.15.
c) If the METAR or TAF or combination of both indicate that the runway may be wetat the estimated time of arrival, the landing distance should be multiplied by afactor of 1.15.
d) The landing distance should be increased by 5% for each 1% downslope. Noallowance is permitted for upslope.
e) The despatch rules for scheduled (planned) landing calculations are in JAR - OPS1.550 (c).
5.2 Use of the Landing Field Length Graph
Distance Calculations
a) Enter at the ambient temperature. Move vertically to the aerodrome pressurealtitude.
b) From this point, move horizontally right to the landing mass reference line. Parallelthe grid lines to the appropriate landing mass input.
c) Continue from this intersection to the wind component reference line. Parallel thegrid line to the appropriate wind component input.
d) Travel horizontally right to the ground roll reference line. Either continuehorizontally to the right vertical axis to read the ground roll distance or parallel thegrid lines to the right vertical axis to read the graphical distance.
e) Apply the surface and slope factors to the graphical distance to obtain the landingdistance. Apply the regulatory factor to the landing distance to obtain the landingdistance required.
Calculate Landing Distance Required
Example: Normal LandingAerodrome Pressure AltitudeAmbient TemperatureLanding MassWind ComponentRunway SlopeRunway SurfaceRunway Condition
3965 ft+25°C3479 lb10 kt Head1% downGrassWet
Solution:Graphical DistanceSlope Correction FactorSurface Correction FactorCondition Correction FactorRegulatory Factor
1500 ftx 1.05x 1.15x 1.15x 1.43
Landing Distance Required = 2979 ft
Section 2 - SEP1 Page 9July 2006
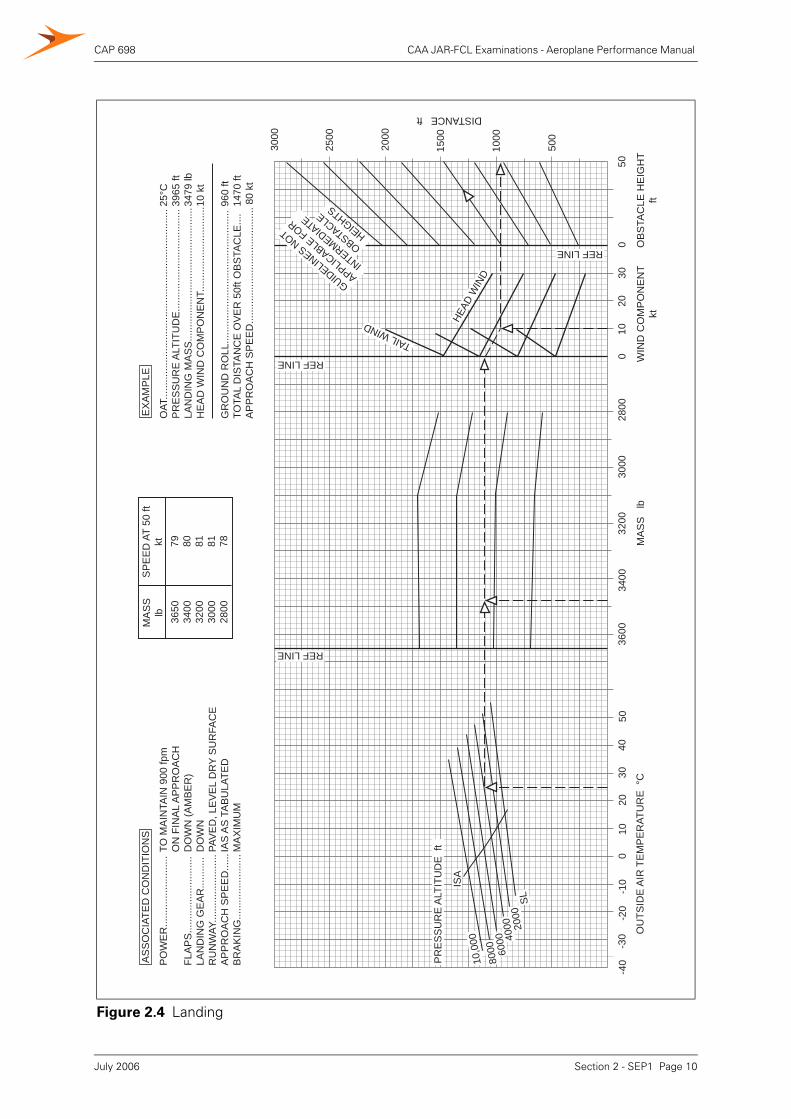
CAP 698 CAA JAR-FCL Examinations - Aeroplane Performance Manual
Figure 2.4 Landing
500
1000
1500
2000
2500
3000
DISTANCE ft
-40
-30
-20
-10
010
2030
4050
3600
3400
3200
3000
2800
OU
TSID
E A
IR T
EM
PE
RAT
UR
E °
CM
AS
S
lb
010
2030
050
WIN
D C
OM
PO
NE
NT
ktO
BS
TAC
LE H
EIG
HT
ft
PO
WE
R...
......
......
......
....
FLA
PS
......
......
......
......
...LA
ND
ING
GE
AR
......
.....
RU
NW
AY...
......
......
......
...A
PP
RO
AC
H S
PE
ED
......
BR
AK
ING
......
......
......
.....
TO M
AIN
TAIN
900
fpm
ON
FIN
AL
AP
PR
OA
CH
DO
WN
(AM
BE
R)
DO
WN
PAV
ED
, LE
VE
L D
RY
SU
RFA
CE
IAS
AS
TA
BU
LATE
DM
AX
IMU
M
AS
SO
CIA
TED
CO
ND
ITIO
NS
OAT
......
......
......
......
......
......
......
......
......
......
......
.P
RE
SS
UR
E A
LTIT
UD
E...
......
......
......
......
......
...LA
ND
ING
MA
SS
......
......
......
......
......
......
......
.....
HE
AD
WIN
D C
OM
PO
NE
NT.
......
......
......
......
.....
GR
OU
ND
RO
LL...
......
......
......
......
......
......
......
..TO
TAL
DIS
TAN
CE
OV
ER
50f
t OB
STA
CLE
....
AP
PR
OA
CH
SP
EE
D...
......
......
......
......
......
......
.. 80
kt
25°C
3965
ft34
79 lb
10 k
t
960
ft14
70 ft
EX
AM
PLE
MA
SS
lb 3650
3400
3200
3000
2800
SP
EE
D A
T 50
ftkt 79 80 81 81 78
10,0
00
8000 60
00 4000 20
00SL
PR
ES
SU
RE
ALT
ITU
DE
ft
REF LINE
HEAD
WIN
D
TAIL WIND
GUIDELINES NOT
APPLICABLE FOR
INTERMEDIATE
OBSTACLE
HEIGHTS
REF LINE
REF LINEIS
A
Section 2 - SEP1 Page 10July 2006
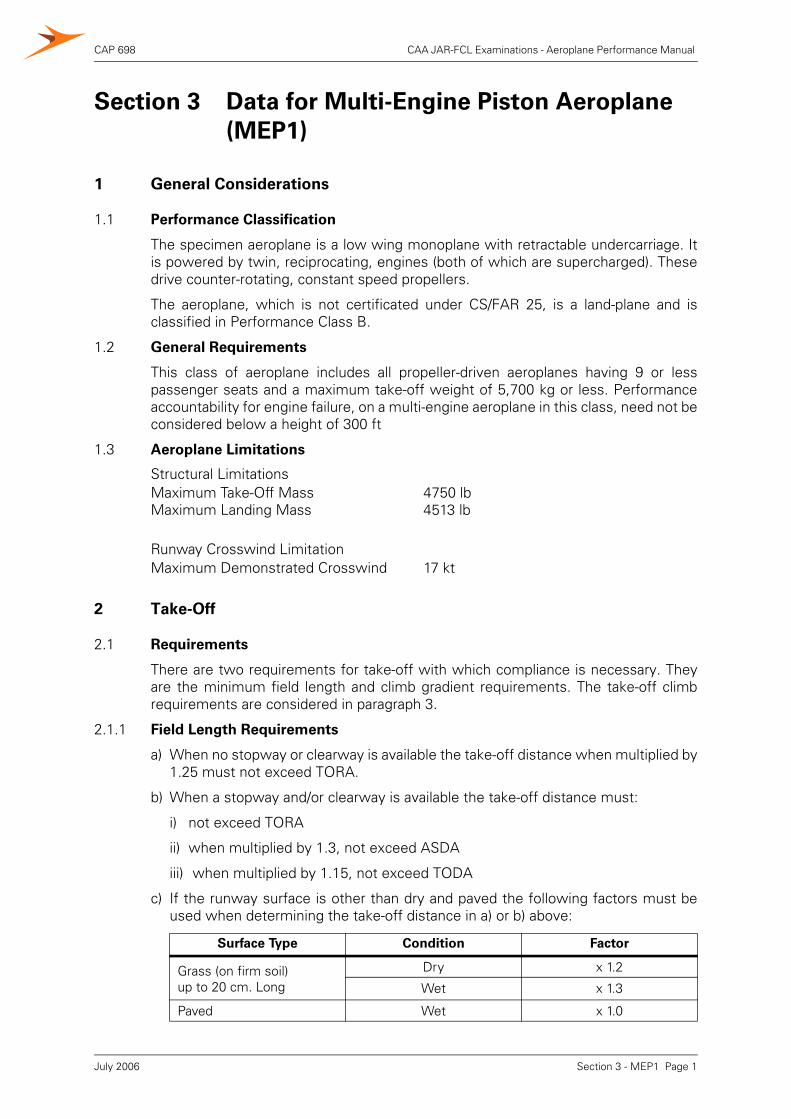
CAP 698 CAA JAR-FCL Examinations - Aeroplane Performance Manual
Section 3 Data for Multi-Engine Piston Aeroplane(MEP1)
1 General Considerations
1.1 Performance Classification
The specimen aeroplane is a low wing monoplane with retractable undercarriage. Itis powered by twin, reciprocating, engines (both of which are supercharged). Thesedrive counter-rotating, constant speed propellers.
The aeroplane, which is not certificated under CS/FAR 25, is a land-plane and isclassified in Performance Class B.
1.2 General Requirements
This class of aeroplane includes all propeller-driven aeroplanes having 9 or lesspassenger seats and a maximum take-off weight of 5,700 kg or less. Performanceaccountability for engine failure, on a multi-engine aeroplane in this class, need not beconsidered below a height of 300 ft
1.3 Aeroplane Limitations
2 Take-Off
2.1 Requirements
There are two requirements for take-off with which compliance is necessary. Theyare the minimum field length and climb gradient requirements. The take-off climbrequirements are considered in paragraph 3.
2.1.1 Field Length Requirements
a) When no stopway or clearway is available the take-off distance when multiplied by1.25 must not exceed TORA.
b) When a stopway and/or clearway is available the take-off distance must:
i) not exceed TORA
ii) when multiplied by 1.3, not exceed ASDA
iii) when multiplied by 1.15, not exceed TODA
c) If the runway surface is other than dry and paved the following factors must beused when determining the take-off distance in a) or b) above:
Structural LimitationsMaximum Take-Off MassMaximum Landing Mass
4750 lb4513 lb
Runway Crosswind LimitationMaximum Demonstrated Crosswind 17 kt
Surface Type Condition Factor
Grass (on firm soil)up to 20 cm. Long
Dry x 1.2
Wet x 1.3
Paved Wet x 1.0
Section 3 - MEP1 Page 1July 2006
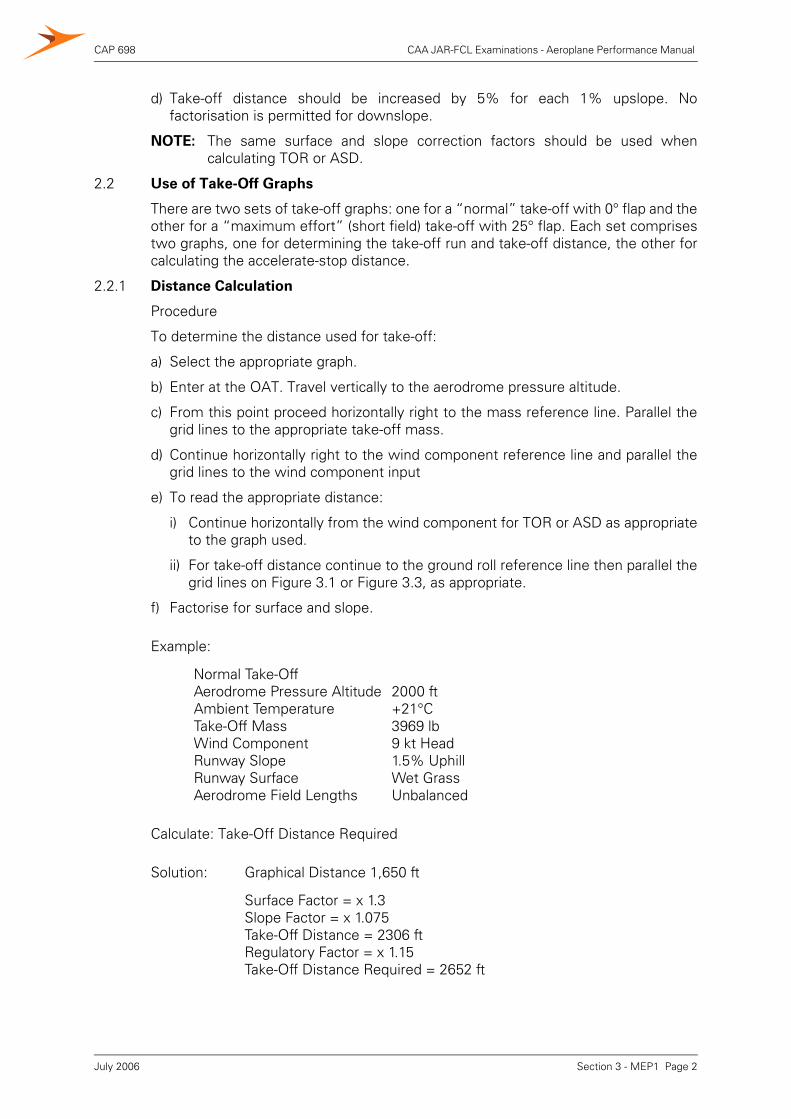
CAP 698 CAA JAR-FCL Examinations - Aeroplane Performance Manual
d) Take-off distance should be increased by 5% for each 1% upslope. Nofactorisation is permitted for downslope.
NOTE: The same surface and slope correction factors should be used whencalculating TOR or ASD.
2.2 Use of Take-Off Graphs
There are two sets of take-off graphs: one for a “normal” take-off with 0° flap and theother for a “maximum effort” (short field) take-off with 25° flap. Each set comprisestwo graphs, one for determining the take-off run and take-off distance, the other forcalculating the accelerate-stop distance.
2.2.1 Distance Calculation
Procedure
To determine the distance used for take-off:
a) Select the appropriate graph.
b) Enter at the OAT. Travel vertically to the aerodrome pressure altitude.
c) From this point proceed horizontally right to the mass reference line. Parallel thegrid lines to the appropriate take-off mass.
d) Continue horizontally right to the wind component reference line and parallel thegrid lines to the wind component input
e) To read the appropriate distance:
i) Continue horizontally from the wind component for TOR or ASD as appropriateto the graph used.
ii) For take-off distance continue to the ground roll reference line then parallel thegrid lines on Figure 3.1 or Figure 3.3, as appropriate.
f) Factorise for surface and slope.
Calculate: Take-Off Distance Required
Example:
Normal Take-OffAerodrome Pressure AltitudeAmbient TemperatureTake-Off Mass Wind ComponentRunway SlopeRunway SurfaceAerodrome Field Lengths
2000 ft+21°C3969 lb9 kt Head1.5% UphillWet GrassUnbalanced
Solution: Graphical Distance 1,650 ft
Surface Factor = x 1.3 Slope Factor = x 1.075Take-Off Distance = 2306 ftRegulatory Factor = x 1.15Take-Off Distance Required = 2652 ft
Section 3 - MEP1 Page 2July 2006
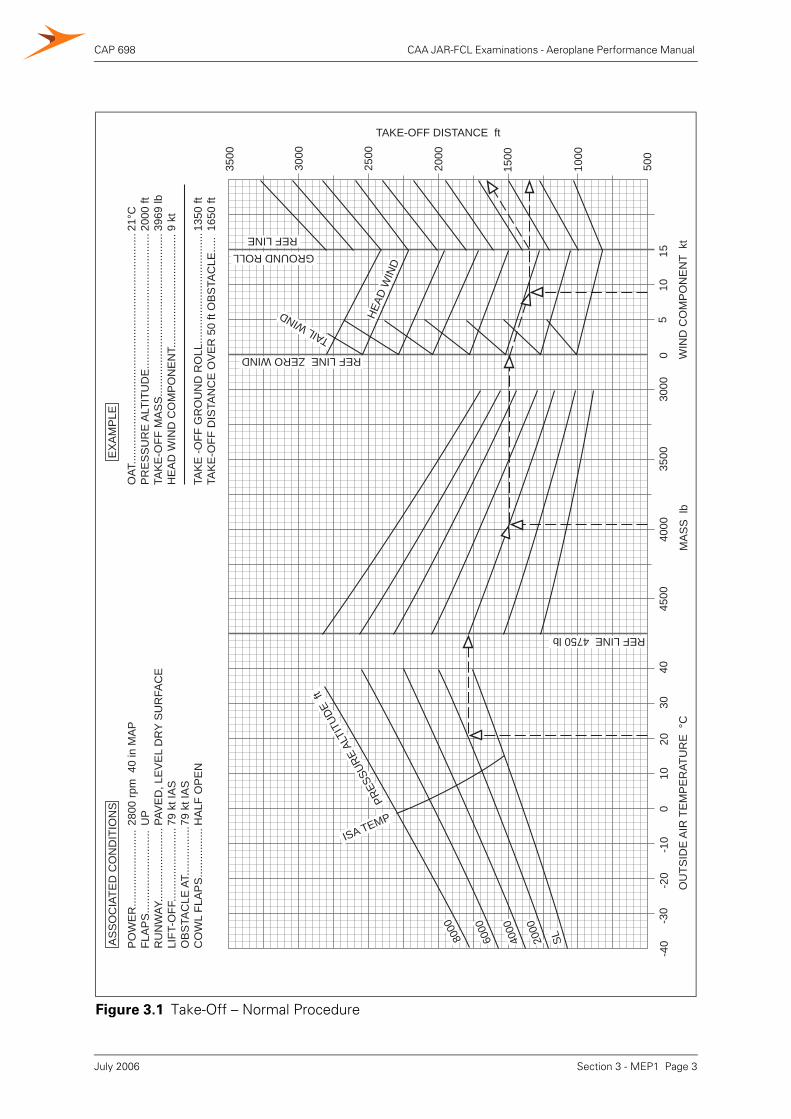
CAP 698 CAA JAR-FCL Examinations - Aeroplane Performance Manual
Figure 3.1 Take-Off – Normal Procedure
1000
1500
2000
2500
3000
3500
TAKE-OFF DISTANCE ft
500
HEAD
WIN
D
TAIL WIND
REF LINE 4750 lb
GROUND ROLLREF LINE
REF LINE ZERO WIND
8000
6000
4000
2000
SL
PRES
SURE
ALT
ITUD
E ft
ISA TEMP
PO
WE
R...
......
......
......
....
FLA
PS
......
......
......
......
...R
UN
WAY
......
......
......
......
LIFT
-OFF
......
......
......
......
OB
STA
CLE
AT.
......
......
...C
OW
L FL
AP
S...
......
......
.2800
rpm
40
in M
AP
UP
PAV
ED
, LE
VE
L D
RY
SU
RFA
CE
79 k
t IA
S79
kt I
AS
HA
LF O
PE
N
AS
SO
CIA
TED
CO
ND
ITIO
NS
OAT
......
......
......
......
......
......
......
......
......
......
......
......
...P
RE
SS
UR
E A
LTIT
UD
E...
......
......
......
......
......
......
.....
TAK
E-O
FF M
AS
S...
......
......
......
......
......
......
......
......
..H
EA
D W
IND
CO
MP
ON
EN
T....
......
......
......
......
......
...
TAK
E -O
FF G
RO
UN
D R
OLL
......
......
......
......
......
......
TAK
E-O
FF D
ISTA
NC
E O
VE
R 5
0 ft
OB
STA
CLE
.....
21°C
2000
ft39
69 lb
9 kt
1350
ft16
50 ft
EX
AM
PLE
-40
-30
-20
-10
010
2030
4045
0040
0035
00
OU
TSID
E A
IR T
EM
PE
RAT
UR
E °
CM
AS
S l
b
010
15
WIN
D C
OM
PO
NE
NT
kt
530
00
Section 3 - MEP1 Page 3July 2006
CAP 698 CAA JAR-FCL Examinations - Aeroplane Performance Manual
2.2.2 Mass Calculation
To calculate the field length limited take-off mass it is necessary to apply therequirements of JAR-OPS. Only the take-off distance graph is used but the rightvertical axis is entered with shortest available de-factored distance. The factors to beconsidered are those of slope, surface condition and regulation. Examples are shownat page 6.
Procedure
a) Enter at the ambient temperature. Move vertically to the aerodrome pressurealtitude.
b) From this point, travel horizontally right to the mass reference line. Mark thisposition with a pencil.
c) Enter the right vertical axis at the shortest available de-factored distance at the 50ftheight. Parallel the grid lines to the ground roll reference line.
d) Now travel horizontally left to the appropriate wind component input. Parallel thegrid lines to the wind component reference line.
e) From this point draw a horizontal line left through the mass grid.
f) From the position marked in b) above, parallel the grid lines to intersect thehorizontal line from e) above.
g) At the intersection, drop vertically to read the field length limited TOM.
Section 3 - MEP1 Page 4July 2006
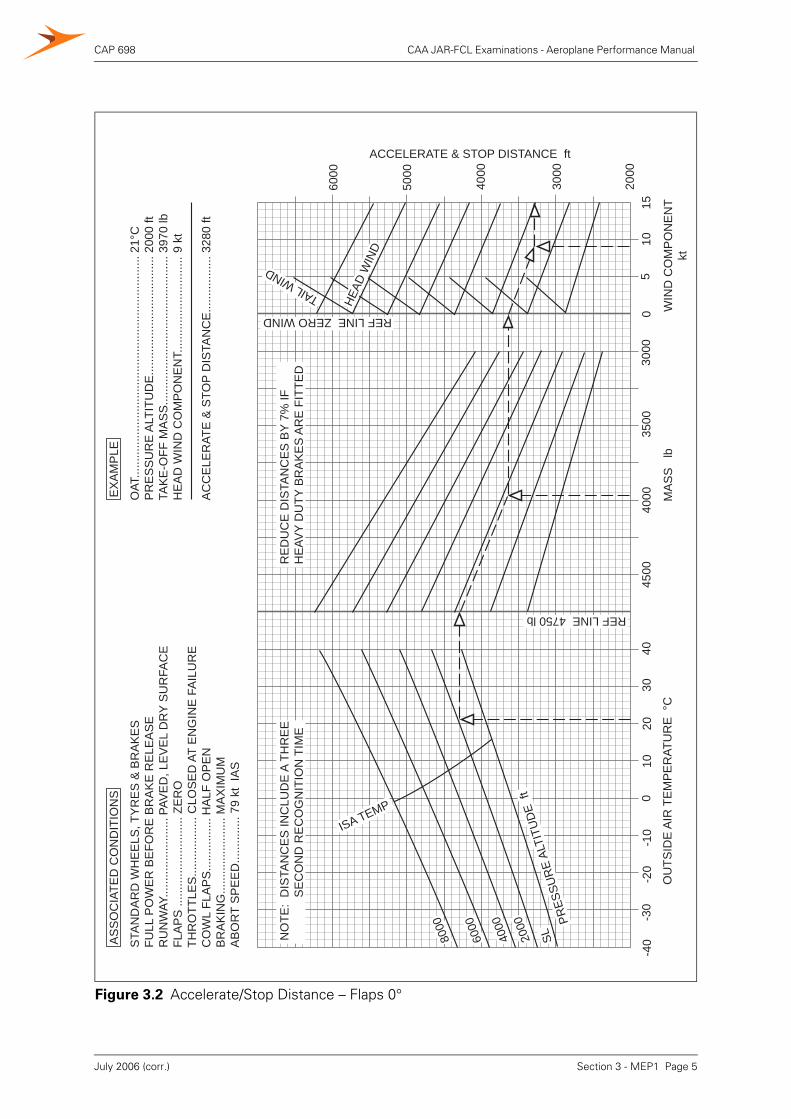
CAP 698 CAA JAR-FCL Examinations - Aeroplane Performance Manual
Figure 3.2 Accelerate/Stop Distance – Flaps 0°
-40
-30
-20
-10
010
2030
4045
0040
0035
00
OU
TSID
E A
IR T
EM
PE
RAT
UR
E °
CM
AS
S
lb
010
15
WIN
D C
OM
PO
NE
NT
kt
530
00
OAT
......
......
......
......
......
......
......
......
......
......
......
.P
RE
SS
UR
E A
LTIT
UD
E...
......
......
......
......
......
...TA
KE
-OFF
MA
SS
......
......
......
......
......
......
......
...H
EA
D W
IND
CO
MP
ON
EN
T....
......
......
......
......
.
AC
CE
LER
ATE
& S
TOP
DIS
TAN
CE
......
......
.....
21°C
2000
ft39
70 lb
9 kt
3280
ft
EX
AM
PLE
2000
3000
4000
5000
6000
ACCELERATE & STOP DISTANCE ft
STA
ND
AR
D W
HE
ELS
, TY
RE
S &
BR
AK
ES
FULL
PO
WE
R B
EFO
RE
BR
AK
E R
ELE
AS
ER
UN
WAY
......
......
......
......
FLA
PS
.....
......
......
......
.... Z
ER
OTH
RO
TTLE
S...
......
......
... C
LOS
ED
AT
EN
GIN
E F
AIL
UR
EC
OW
L FL
AP
S...
......
......
.B
RA
KIN
G...
......
......
......
.. M
AX
IMU
MA
BO
RT
SP
EE
D...
......
.....
79 k
t IA
S
PAV
ED
, LE
VE
L D
RY
SU
RFA
CE
HA
LF O
PE
N
AS
SO
CIA
TED
CO
ND
ITIO
NS
HEAD
WIN
D
TAIL WIND
REF LINE 4750 lb
REF LINE ZERO WIND
8000
6000
4000
2000
SLPR
ESSU
RE
ALTI
TUD
E ft
ISA TEMP
NO
TE:
DIS
TAN
CE
S IN
CLU
DE
A T
HR
EE
SE
CO
ND
RE
CO
GN
ITIO
N T
IME
RE
DU
CE
DIS
TAN
CE
S B
Y 7%
IFH
EAV
Y D
UTY
BR
AK
ES
AR
E F
ITTE
D
Section 3 - MEP1 Page 5July 2006 (corr.)
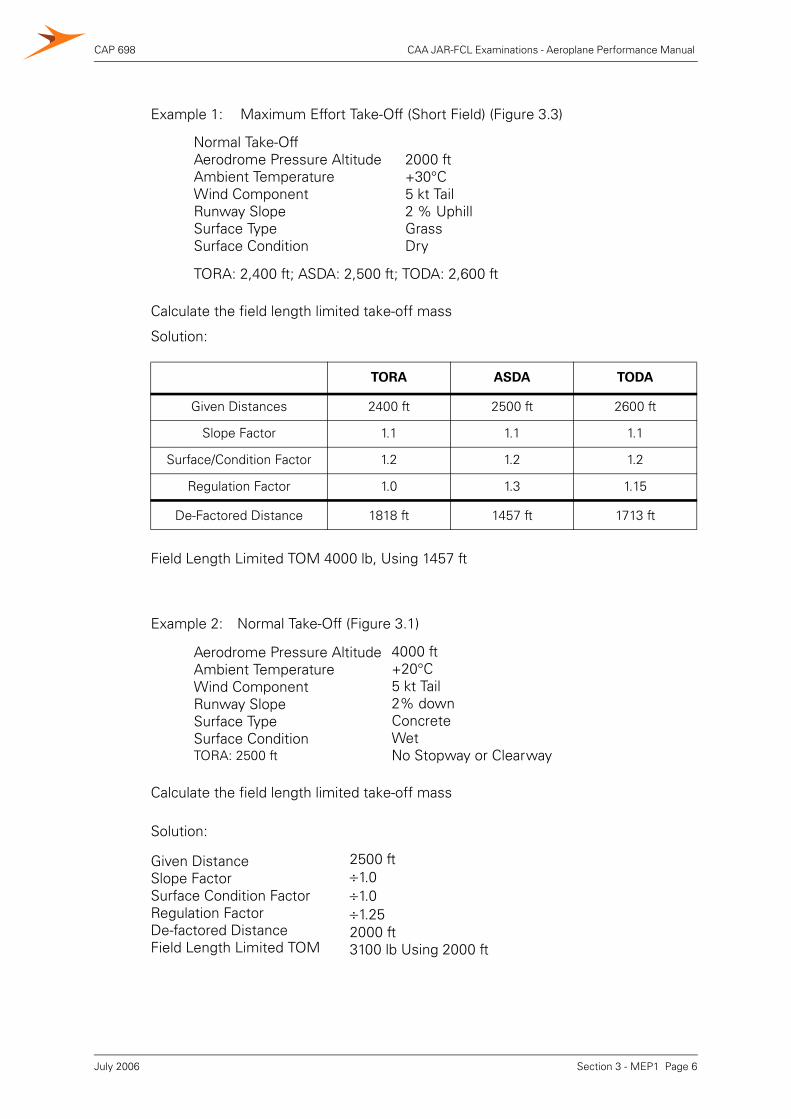
CAP 698 CAA JAR-FCL Examinations - Aeroplane Performance Manual
Calculate the field length limited take-off mass
Solution:
Calculate the field length limited take-off mass
Example 1: Maximum Effort Take-Off (Short Field) (Figure 3.3)
Normal Take-OffAerodrome Pressure AltitudeAmbient TemperatureWind ComponentRunway SlopeSurface TypeSurface Condition
2000 ft+30°C5 kt Tail2 % UphillGrassDry
TORA: 2,400 ft; ASDA: 2,500 ft; TODA: 2,600 ft
TORA ASDA TODA
Given Distances 2400 ft 2500 ft 2600 ft
Slope Factor 1.1 1.1 1.1
Surface/Condition Factor 1.2 1.2 1.2
Regulation Factor 1.0 1.3 1.15
De-Factored Distance 1818 ft 1457 ft 1713 ft
Field Length Limited TOM 4000 lb, Using 1457 ft
Example 2: Normal Take-Off (Figure 3.1)
Aerodrome Pressure AltitudeAmbient TemperatureWind ComponentRunway SlopeSurface TypeSurface ConditionTORA: 2500 ft
4000 ft+20°C5 kt Tail2% downConcreteWetNo Stopway or Clearway
Solution:
Given DistanceSlope Factor Surface Condition FactorRegulation FactorDe-factored DistanceField Length Limited TOM
2500 ft÷1.0÷1.0÷1.252000 ft3100 lb Using 2000 ft
Section 3 - MEP1 Page 6July 2006
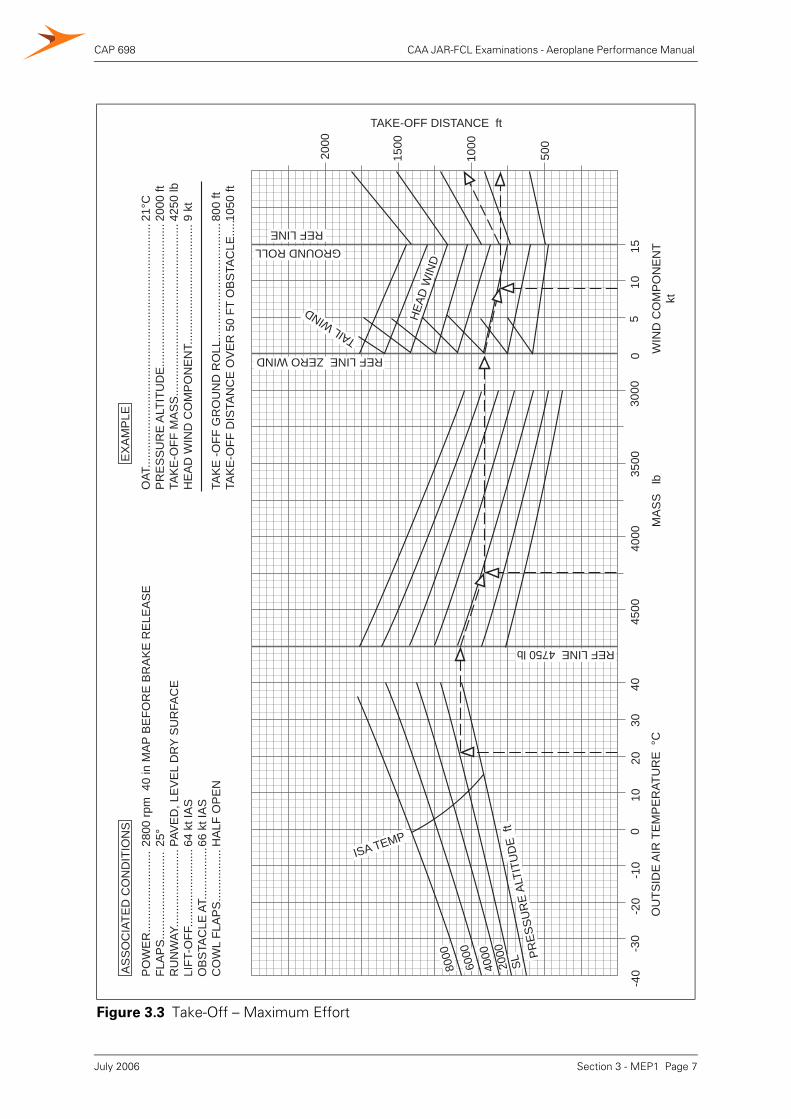
CAP 698 CAA JAR-FCL Examinations - Aeroplane Performance Manual
Figure 3.3 Take-Off – Maximum Effort
SL2000
-40
-30
-20
-10
010
2030
4045
0040
0035
00
OU
TSID
E A
IR T
EM
PE
RAT
UR
E °
CM
AS
S
lb
010
15
WIN
D C
OM
PO
NE
NT
kt
530
00
500
1000
1500
2000
TAKE-OFF DISTANCE ft
OAT
......
......
......
......
......
......
......
......
......
......
......
......
...P
RE
SS
UR
E A
LTIT
UD
E...
......
......
......
......
......
......
.....
TAK
E-O
FF M
AS
S...
......
......
......
......
......
......
......
......
..H
EA
D W
IND
CO
MP
ON
EN
T....
......
......
......
......
......
...
TAK
E -O
FF G
RO
UN
D R
OLL
......
......
......
......
......
......
TAK
E-O
FF D
ISTA
NC
E O
VE
R 5
0 FT
OB
STA
CLE
.....21
°C20
00 ft
4250
lb9
kt
800
ft10
50 ft
EX
AM
PLE
PO
WE
R...
......
......
......
....
FLA
PS
......
......
......
......
...R
UN
WAY
......
......
......
......
LIFT
-OFF
......
......
......
......
OB
STA
CLE
AT.
......
......
...C
OW
L FL
AP
S...
......
......
.2800
rpm
40
in M
AP
BE
FOR
E B
RA
KE
RE
LEA
SE
25°
PAV
ED
, LE
VE
L D
RY
SU
RFA
CE
64 k
t IA
S66
kt I
AS
HA
LF O
PE
N
AS
SO
CIA
TED
CO
ND
ITIO
NS
HEA
D W
IND
TAIL WIND
REF LINE 4750 lb
GROUND ROLLREF LINE
REF LINE ZERO WIND
8000
6000
4000 PR
ESSU
RE
ALTI
TUD
E ft
ISA TEMP
Section 3 - MEP1 Page 7July 2006
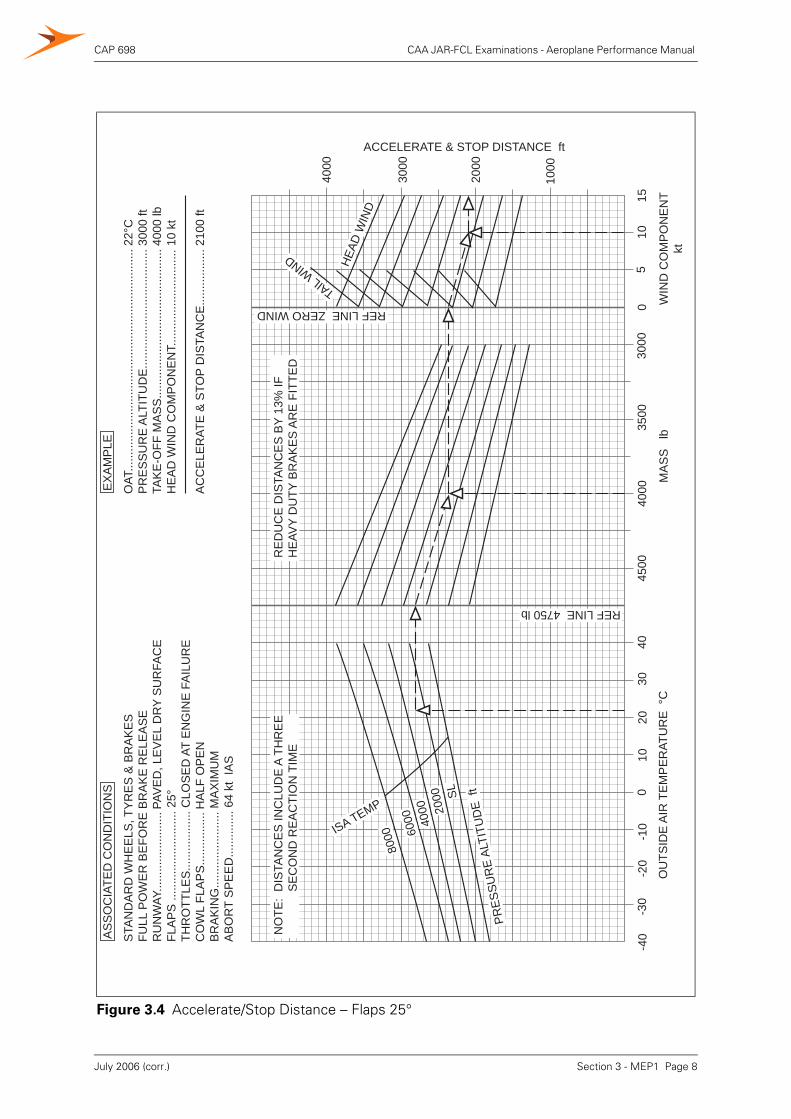
CAP 698 CAA JAR-FCL Examinations - Aeroplane Performance Manual
Figure 3.4 Accelerate/Stop Distance – Flaps 25°
SL
-40
-30
-20
-10
010
2030
4045
0040
0035
00
OU
TSID
E A
IR T
EM
PE
RAT
UR
E °
CM
AS
S
lb
010
15
WIN
D C
OM
PO
NE
NT
kt
530
00
OAT
......
......
......
......
......
......
......
......
......
......
......
.P
RE
SS
UR
E A
LTIT
UD
E...
......
......
......
......
......
...TA
KE
-OFF
MA
SS
......
......
......
......
......
......
......
...H
EA
D W
IND
CO
MP
ON
EN
T....
......
......
......
......
.
AC
CE
LER
ATE
& S
TOP
DIS
TAN
CE
......
......
.....
22°C
3000
ft40
00 lb
10 k
t
2100
ft
EX
AM
PLE
HEA
D W
IND
TAIL WIND
REF LINE 4750 lb
REF LINE ZERO WIND
8000 60
00 4000 20
00
PRES
SUR
E AL
TITU
DE
ft
ISA TEMP
NO
TE:
DIS
TAN
CE
S IN
CLU
DE
A T
HR
EE
SE
CO
ND
RE
AC
TIO
N T
IME
RE
DU
CE
DIS
TAN
CE
S B
Y 13
% IF
HE
AVY
DU
TY B
RA
KE
S A
RE
FIT
TED
STA
ND
AR
D W
HE
ELS
, TY
RE
S &
BR
AK
ES
FULL
PO
WE
R B
EFO
RE
BR
AK
E R
ELE
AS
ER
UN
WAY
......
......
......
......
FLA
PS
.....
......
......
......
.... 2
5°TH
RO
TTLE
S...
......
......
... C
LOS
ED
AT
EN
GIN
E F
AIL
UR
EC
OW
L FL
AP
S...
......
......
.B
RA
KIN
G...
......
......
......
.. M
AX
IMU
MA
BO
RT
SP
EE
D...
......
.....
64 k
t IA
S
PAV
ED
, LE
VE
L D
RY
SU
RFA
CE
HA
LF O
PE
N
AS
SO
CIA
TED
CO
ND
ITIO
NS
2000
3000
4000
ACCELERATE & STOP DISTANCE ft
1000
Section 3 - MEP1 Page 8July 2006 (corr.)
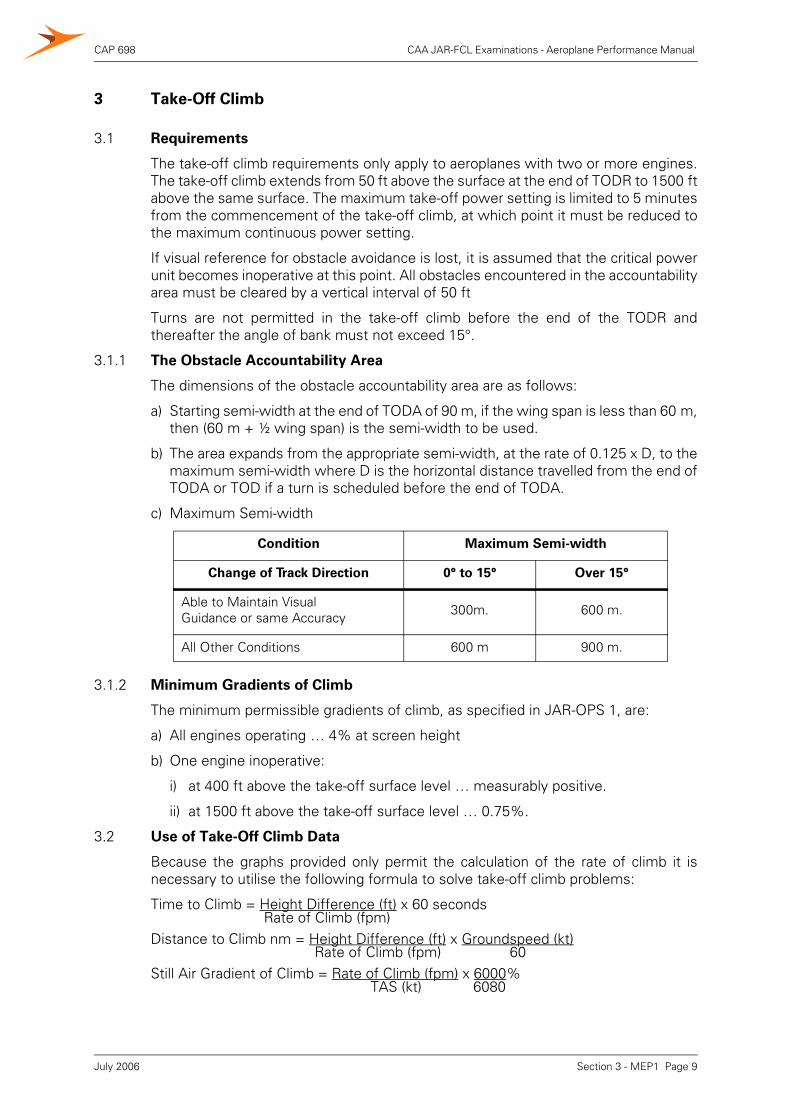
CAP 698 CAA JAR-FCL Examinations - Aeroplane Performance Manual
3 Take-Off Climb
3.1 Requirements
The take-off climb requirements only apply to aeroplanes with two or more engines.The take-off climb extends from 50 ft above the surface at the end of TODR to 1500 ftabove the same surface. The maximum take-off power setting is limited to 5 minutesfrom the commencement of the take-off climb, at which point it must be reduced tothe maximum continuous power setting.
If visual reference for obstacle avoidance is lost, it is assumed that the critical powerunit becomes inoperative at this point. All obstacles encountered in the accountabilityarea must be cleared by a vertical interval of 50 ft
Turns are not permitted in the take-off climb before the end of the TODR andthereafter the angle of bank must not exceed 15°.
3.1.1 The Obstacle Accountability Area
The dimensions of the obstacle accountability area are as follows:
a) Starting semi-width at the end of TODA of 90 m, if the wing span is less than 60 m,then (60 m + ½ wing span) is the semi-width to be used.
b) The area expands from the appropriate semi-width, at the rate of 0.125 x D, to themaximum semi-width where D is the horizontal distance travelled from the end ofTODA or TOD if a turn is scheduled before the end of TODA.
c) Maximum Semi-width
3.1.2 Minimum Gradients of Climb
The minimum permissible gradients of climb, as specified in JAR-OPS 1, are:
a) All engines operating … 4% at screen height
b) One engine inoperative:
i) at 400 ft above the take-off surface level … measurably positive.
ii) at 1500 ft above the take-off surface level … 0.75%.
3.2 Use of Take-Off Climb Data
Because the graphs provided only permit the calculation of the rate of climb it isnecessary to utilise the following formula to solve take-off climb problems:
Time to Climb = Height Difference (ft) x 60 secondsRate of Climb (fpm)
Distance to Climb nm = Height Difference (ft) x Groundspeed (kt) Rate of Climb (fpm) 60
Still Air Gradient of Climb = Rate of Climb (fpm) x 6000% TAS (kt) 6080
Condition Maximum Semi-width
Change of Track Direction 0° to 15° Over 15°
Able to Maintain VisualGuidance or same Accuracy 300m. 600 m.
All Other Conditions 600 m 900 m.
Section 3 - MEP1 Page 9July 2006
CAP 698 CAA JAR-FCL Examinations - Aeroplane Performance Manual
3.2.1 Climb graphs
There are three graphs provided for climb calculations:
a) Gear extended, maximum take-off power (Figure 3.5)
b) Gear retracted, maximum take-off power (Figure. 3.6)
c) Gear retracted, maximum continuous power (Figure 3.7)
NOTE: If a graph is used to show compliance with the obstacle clearancerequirement, the gradient from 50 ft to the assumed engine failure height isto be the average all-engine gradient x 0.77. This is equivalent to the distancetravelled with all engines operating x 1.3.
3.2.2 Use of Graph (Figure 3.5)
a) Enter with the temperature and travel vertically to the pressure altitude.
b) Travel horizontally to the curved graph line.
c) From this intersection drop a vertical line to the bottom scale. Read off rate ofclimb.
An example is shown on the graph.
Section 3 - MEP1 Page 10July 2006
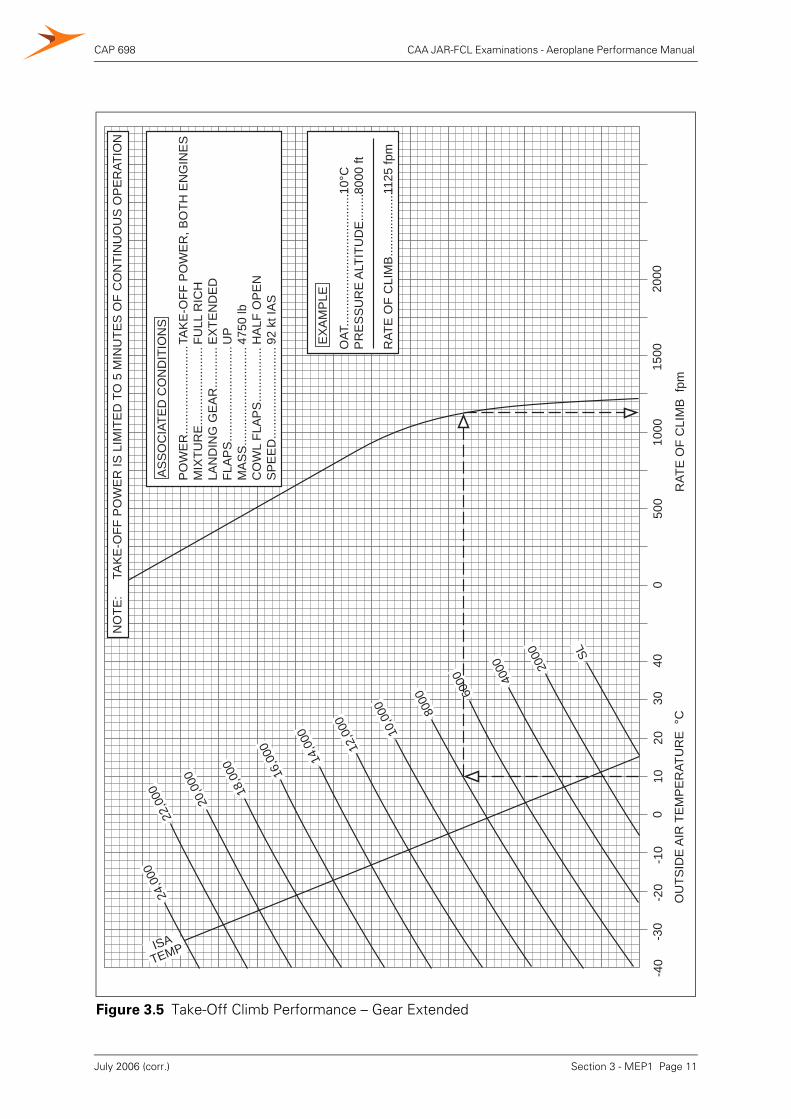
CAP 698 CAA JAR-FCL Examinations - Aeroplane Performance Manual
Figure 3.5 Take-Off Climb Performance – Gear Extended
-40
-30
-20
-10
010
2030
400
500
1000
OU
TSID
E A
IR T
EM
PE
RAT
UR
E °
CR
ATE
OF
CLI
MB
fpm
1500
2000
OAT
......
......
......
......
......
......
....
PR
ES
SU
RE
ALT
ITU
DE
......
...
RAT
E O
F C
LIM
B...
......
......
.....
EX
AM
PLE
10°C
8000
ft
1125
fpm
PO
WE
R...
......
......
......
.....
MIX
TUR
E...
......
......
......
..LA
ND
ING
GE
AR
......
......
FLA
PS
......
......
......
......
....
MA
SS
......
......
......
......
.....
CO
WL
FLA
PS
......
......
....
SP
EE
D...
......
......
......
......
TAK
E-O
FF P
OW
ER
, BO
TH E
NG
INE
SFU
LL R
ICH
EX
TEN
DE
DU
P47
50 lb
HA
LF O
PE
N92
kt I
AS
AS
SO
CIA
TED
CO
ND
ITIO
NS
24,0
0022
,000 20,0
00
18,0
00 16,0
00 14,0
00
12,0
00 10,0
00 8000 60
00 4000 20
00 SL
ISATEMP
NO
TE:
TA
KE
-OFF
PO
WE
R IS
LIM
ITE
D T
O 5
MIN
UTE
S O
F C
ON
TIN
UO
US
OP
ER
ATIO
N
Section 3 - MEP1 Page 11July 2006 (corr.)
CAP 698 CAA JAR-FCL Examinations - Aeroplane Performance Manual
3.2.3 Use of Graphs (Figure 3.6 and Figure 3.7)
a) Enter with OAT. Travel vertically to the pressure altitude.
b) From this point, travel horizontally right to intercept the interpolated value of take-off mass.
c) Drop vertically to read the all-engine-operating rate of climb.
d) From the TOM intersection, continue horizontally right to intercept the secondinterpolated weight (if applicable).
e) Drop vertically to read the one-engine-inoperative rate of climb.
Calculate the distance from the end of TODR to 1500 ft above Reference Zero for thepurpose of obstacle clearance.
Solution:
All engines rate of climb at take-off power 1650 fpmOne engine inoperative rate of climb at take-off power 300 fpm One engine inoperative rate of climb at MCP 220 fpm Time to cloud base at take-off power = 350 x 60 = 12.73 seconds
1650
Time to 1500 ft from cloud base at take-off power = 1100 x 60 = 220 seconds = 3 minutes 40 seconds. 300
Total time = 12.73 Seconds + 3 minutes 40 seconds = 3 minutes 52.73 seconds.i.e. less than 5 minutes. Therefore Maximum Take-off Power can be maintainedthroughout the climb.
Distance to cloud base = 350 x 90 x 1.3 = 0.414 NM 1650 60
Distance cloud base to 1500 = 1100 x 90 = 5.5 NM300 60
Total Distance = 0.414 + 5.5 = 5.914 NM
Example 1:
Aerodrome Pressure AltitudeAmbient TemperatureTake-Off Mass Gear up (Undercarriage Retracted) Flaps 0°;Climb speedCloud BaseWind Component
10000 ft+10°C4000 lb
92 kt lAS400 ft above Reference Zero40 kt Head
92 kt IAS = 110 kt TAS.
G/S = 110 = 20 = 90 kt (Using 50% of head wind component)
Section 3 - MEP1 Page 12July 2006
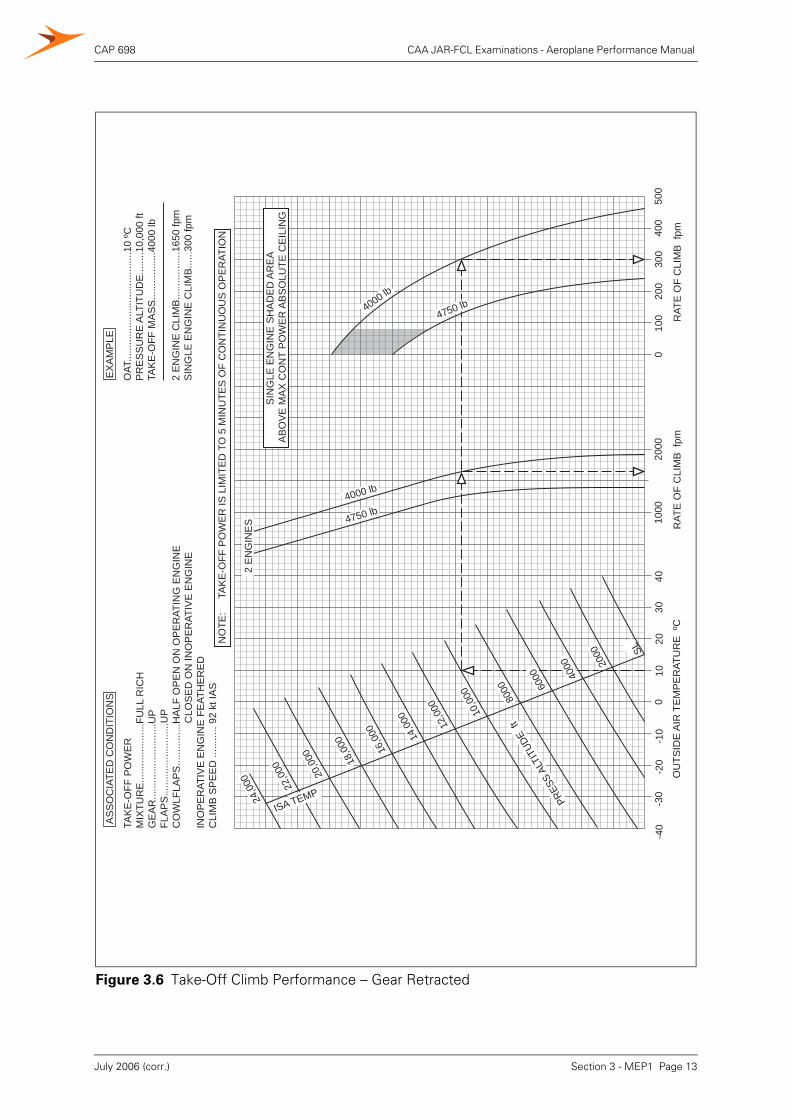
CAP 698 CAA JAR-FCL Examinations - Aeroplane Performance Manual
Figure 3.6 Take-Off Climb Performance – Gear Retracted
1000
2000
300
400
500
-40
-30
-20
-10
010
2030
40
OU
TSID
E A
IR T
EM
PE
RAT
UR
E º
CR
ATE
OF
CLI
MB
fpm
200
100
0
RAT
E O
F C
LIM
B f
pm
TAK
E-O
FF P
OW
ER
MIX
TUR
E...
......
......
......
FULL
RIC
HG
EA
R...
......
......
......
......
UP
FLA
PS
......
......
......
......
..UP
CO
WLF
LAP
S...
......
......
HA
LF O
PE
N O
N O
PE
RAT
ING
EN
GIN
E
CLO
SE
D O
N IN
OP
ER
ATIV
E E
NG
INE
INO
PE
RAT
IVE
EN
GIN
E F
EAT
HE
RE
DC
LIM
B S
PE
ED
.....
......
92
kt IA
S
AS
SO
CIA
TED
CO
ND
ITIO
NS
OAT
......
......
......
......
......
......
...10
ºCP
RE
SS
UR
E A
LTIT
UD
E...
.....1
0,00
0 ft
TAK
E-O
FF M
AS
S...
......
......
..400
0 lb
2 E
NG
INE
CLI
MB
......
......
.....1
650
fpm
SIN
GLE
EN
GIN
E C
LIM
B...
...30
0 fp
m
EX
AM
PLE
NO
TE:
TA
KE
-OFF
PO
WE
R IS
LIM
ITE
D T
O 5
MIN
UTE
S O
F C
ON
TIN
UO
US
OP
ER
ATIO
N
2 E
NG
INE
S
SIN
GLE
EN
GIN
E S
HA
DE
D A
RE
A A
BO
VE
MA
X C
ON
T P
OW
ER
AB
SO
LUTE
CE
ILIN
G
24,0
00 22,0
00 20,0
00 18,0
00 16,0
00 14,0
00 12,0
00 10,0
00 8000 60
00 4000 20
00 SL
ISA TEMP PRES
S AL
TITU
DE f
t4000 lb
4750 lb
4000 lb
4750 lb
Section 3 - MEP1 Page 13July 2006 (corr.)
CAP 698 CAA JAR-FCL Examinations - Aeroplane Performance Manual
Calculate the vertical clearance of the obstacle by the aeroplane.
Time to cloud base =350 x 60 = 13.9 seconds1510
Time to 1500 ft from cloud base =1100 x 60 = 258.8 seconds = 4 minutes 18.8 seconds 255
Total time = 13.9 seconds + 4 minutes 18.8 seconds = 4 minutes 32.7 seconds.Therefore Maximum Take-Off power can be maintained throughout the take-offclimb.
Distance to cloud base = 350 x 124 x 6080 x 1.3 = 3786 ft1510 60
Distance cloud base to obstacle = 14000 - 3786 = 10214 ft
Height gain = 10214 x 255 x 60 = 207.3 ft124 x 6080
Height at obstacle = 400 + 207.3 = 607.3 ft
Clearance = 607.3 - 600 = 7.3 ft
Example 2:
Aerodrome Pressure AltitudeAmbient TemperatureTake-Off Mass Gear up (Undercarriage Retracted) Flaps 0°Climb SpeedCloud BaseWind Component
6000 ft+20°C4500 lb
92 kt lAS400 ft above Reference Zero13 kt Tail
Obstacle in the domain at 14000 ft from the end TODR and 600 ft above Reference Zero
Solution:
Figure 3.6 Figure 3.6 Figure 3.7
All engines rate of climb at take-off power 1510 fpmOne engine inoperative rate of climb at take-off power 255 fpm One engine inoperative rate of climb at maximum continuous power 220 fpm
92 kt IAS = 104 kt TAS.
G/S = 104 + 20 = 124 kt (Using 150% of tailwind component rounded up)
Section 3 - MEP1 Page 14July 2006
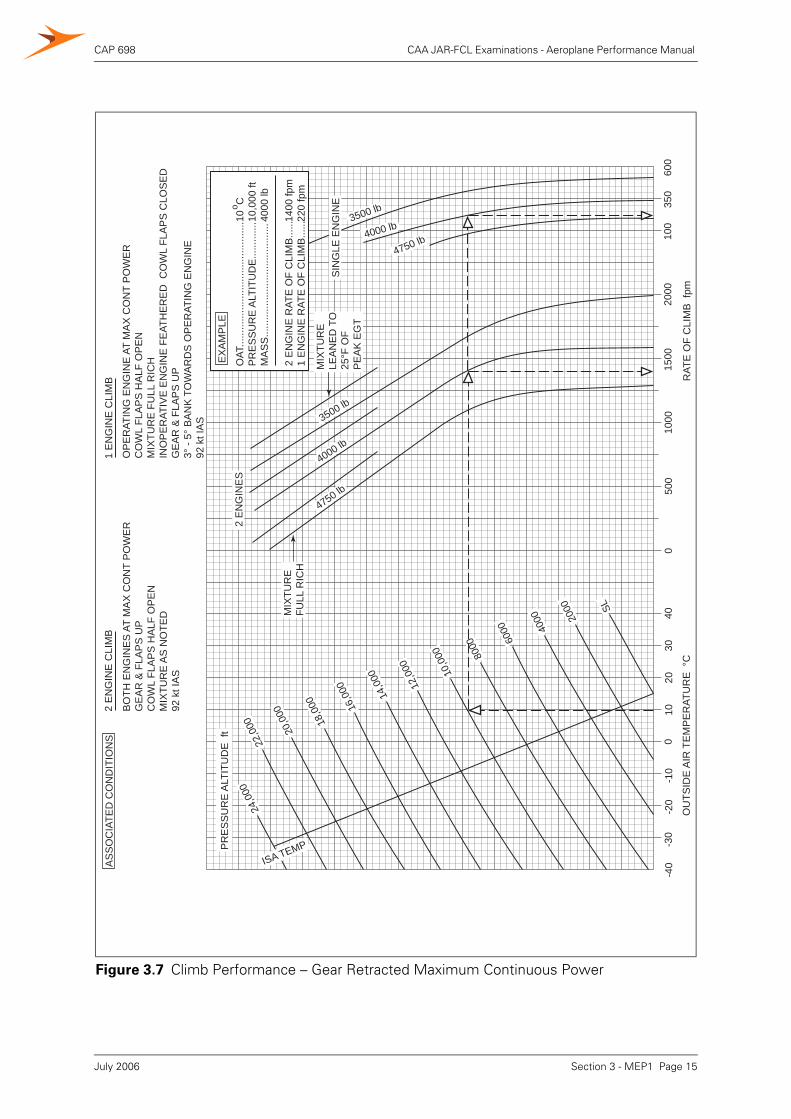
CAP 698 CAA JAR-FCL Examinations - Aeroplane Performance Manual
Figure 3.7 Climb Performance – Gear Retracted Maximum Continuous Power
OAT
......
......
......
......
......
......
......
..P
RE
SS
UR
E A
LTIT
UD
E...
......
....
MA
SS
......
......
......
......
......
......
....
2 E
NG
INE
RAT
E O
F C
LIM
B...
...1
EN
GIN
E R
ATE
OF
CLI
MB
......
EX
AM
PLE
10 C
10,0
00 ft
4000
lb
1400
fpm
220
fpm
o
AS
SO
CIA
TED
CO
ND
ITIO
NS
24,0
0022
,000 20,0
00
18,0
00 16,0
00 14,0
00
12,0
00 10,0
00 8000 60
00 4000 20
00 SL
ISA TEMP
2 E
NG
INE
S
4750 lb
SIN
GLE
EN
GIN
E
4000 lb
3500 lb
4000 lb3500 lb
4750 lb
BO
TH E
NG
INE
S A
T M
AX
CO
NT
PO
WE
RG
EA
R &
FLA
PS
UP
CO
WL
FLA
PS
HA
LF O
PE
NM
IXTU
RE
AS
NO
TED
92 k
t IA
S
2 E
NG
INE
CLI
MB
1 E
NG
INE
CLI
MB
OP
ER
ATIN
G E
NG
INE
AT
MA
X C
ON
T P
OW
ER
CO
WL
FLA
PS
HA
LF O
PE
NM
IXTU
RE
FU
LL R
ICH
INO
PE
RAT
IVE
EN
GIN
E F
EAT
HE
RE
D C
OW
L FL
AP
S C
LOS
ED
GE
AR
& F
LAP
S U
P3°
- 5°
BA
NK
TO
WA
RD
S O
PE
RAT
ING
EN
GIN
E92
kt I
AS
MIX
TUR
EFU
LL R
ICH
MIX
TUR
ELE
AN
ED
TO
25°F
OF
PE
AK
EG
T
PR
ES
SU
RE
ALT
ITU
DE
ft
-40
-30
-20
-10
010
2030
400
500
1000
OU
TSID
E A
IR T
EM
PE
RAT
UR
E °
CR
ATE
OF
CLI
MB
fpm
1500
2000
100
600
350
Section 3 - MEP1 Page 15July 2006

CAP 698 CAA JAR-FCL Examinations - Aeroplane Performance Manual
INTENTIONALLY LEFT BLANK
Section 3 - MEP1 Page 16July 2006
CAP 698 CAA JAR-FCL Examinations - Aeroplane Performance Manual
4 En-route
The en-route phase extends from 1500 ft above the take-off surface level to 1000 ftabove the landing aerodrome surface level.
4.1 Requirements
In the event of engine failure, with the remaining engine(s) set at the maximumcontinuous setting, the aeroplane must be able to continue flight at or above therelevant minimum safe altitude to an aerodrome at which the landing requirementscan be attained.
To show compliance:
a) The aeroplane may not be assumed to be flying above that altitude at which therate of climb is 300 fpm with all engines operating.
b) The one-engine-inoperative net gradient of climb is the gross gradient of climbdecreased by 0.5%, or the net gradient of descent is the gross gradient of descentincreased by 0.5%.
5 Landing
5.1 Requirements
There are three requirements for landing with which compliance is necessary. Theyare the climb gradient requirements in the event of a balked landing and a missedapproach, and the landing field length requirement.
5.1.1 Field Length Requirements
a) The landing distance, from a screen height of 50 ft, must not exceed 70% of thelanding distance available, i.e. a factor of 1.43.
b) If the landing surface is grass up to 20 cm long on firm soil, the landing distanceshould be multiplied by a factor of 1.15.
c) If the METAR or TAF or combination of both indicate that the runway may be wetat the estimated time of arrival, the landing distance should be multiplied by afactor of 1.15.
d) The landing distance should be increased by 5% for each 1% downslope. Noallowance is permitted for upslope.
e) The despatch rules for scheduled (planned) landing calculations are in JAR-OPS1.550 (c).
5.1.2 Balked Landing Requirements
The minimum acceptable gross gradient of climb after a balked landing is 2.5%. Thismust be achieved with:
a) The power developed 8 seconds after moving the power controls to the take-offposition.
b) The landing gear (undercarriage) extended.
c) Flaps at the landing setting.
d) Climb speed equal to VREF.
Section 3 - MEP1 Page 17July 2006
CAP 698 CAA JAR-FCL Examinations - Aeroplane Performance Manual
5.1.3 Missed Approach Requirements
The minimum acceptable gross gradient of climb, after a missed approach, is 0.75%at 1500 ft above the landing surface. This must be achieved with:
a) The critical engine inoperative and the propeller feathered.
b) The live engine set at maximum continuous power.
c) The landing gear (undercarriage) retracted.
d) The flaps retracted.
e) Climb speed not less than 1.2 VS1.
5.2 Balked Landing Climb Graph
The graph provided for this purpose is constructed for the maximum landing mass of4513 lb (Figure 3.8).
Use of Graph:
a) Enter at the ambient temperature. Travel vertically to the aerodrome pressurealtitude.
b) From this point travel horizontally right to intercept the rate of climb graph line.Now drop a vertical to read the rate of climb.
c) Convert the rate of climb to a still-air gradient of climb using the formula:
Still Air Gradient of Climb = ROC (fpm) x 6000 % TAS (kt) 6080
Example: Flaps UpAerodrome Pressure AltitudeAmbient TemperatureAeroplane Mass
===
6000 ft+10°C4000 lb
Calculate the missed approach gradient of climb:
Solution: Use Figure 3.7: One-engine-inoperative gridTrue Airspeed = 102 ktRate of Climb = 300fpmGradient of Climb = 300 x 6000 = 2.9%
102 6080
Example:
Aerodrome Pressure AltitudeAmbient Temperature
3000 ft+22°C
Solution:Graphical ROC = 810 fpm.IAS 85 kt = 91 kt TASClimb Gradient = 810 x 6000 = 8.78%
91 6080
Section 3 - MEP1 Page 18July 2006
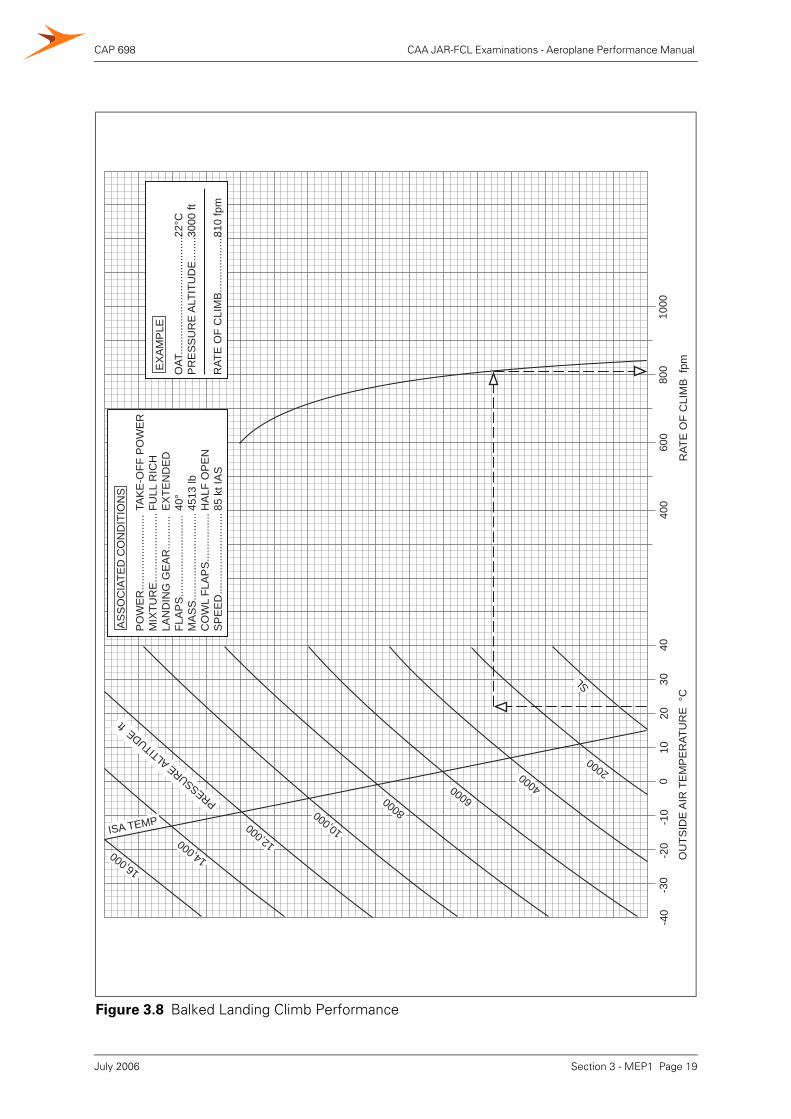
CAP 698 CAA JAR-FCL Examinations - Aeroplane Performance Manual
Figure 3.8 Balked Landing Climb Performance
-40
-30
-20
-10
010
2030
4040
060
0
OU
TSID
E A
IR T
EM
PE
RAT
UR
E °
CR
ATE
OF
CLI
MB
fpm
800
1000
16,000 14,000 12,000 10,000 8000 6000 4000 2000
SL
ISA TEMP
PRESSURE ALTITUDE ft
OAT
......
......
......
......
......
......
....
PR
ES
SU
RE
ALT
ITU
DE
......
...
RAT
E O
F C
LIM
B...
......
......
.....
EX
AM
PLE
22°C
3000
ft
810
fpm
PO
WE
R...
......
......
......
....
MIX
TUR
E...
......
......
......
..LA
ND
ING
GE
AR
......
.....
FLA
PS
......
......
......
......
...M
AS
S...
......
......
......
......
..C
OW
L FL
AP
S...
......
......
.S
PE
ED
......
......
......
......
...
TAK
E-O
FF P
OW
ER
FULL
RIC
HE
XTE
ND
ED
40°
4513
lbH
ALF
OP
EN
85 k
t IA
S
AS
SO
CIA
TED
CO
ND
ITIO
NS
Section 3 - MEP1 Page 19July 2006
CAP 698 CAA JAR-FCL Examinations - Aeroplane Performance Manual
5.3 Use of Landing Field Length Graphs
There are two landing field length graphs: one for normal landings with 40° landingflap (Figure 3.9), and the other for short field landings with 40° landing flap. (Figure3.10).
5.3.1 Distance Calculations
a) Enter at the ambient temperature. Move vertically to the aerodrome pressurealtitude.
b) From this point, move horizontally right to the landing weight reference line.Parallel the grid lines to the appropriate landing mass input.
c) Continue from this intersection to the wind component reference line. Parallel thegrid lines to the appropriate wind component input.
d) Travel horizontally right to the ground roll reference line. Either continuehorizontally to the right vertical axis to read the ground roll distance or parallel thegrid lines to the right vertical axis to read the landing distance from 50 ft.
e) Apply the appropriate factors to the landing distance to obtain the landing distancerequired.
Calculate Landing Distance Required
Example: Normal Landing
Aerodrome Pressure AltitudeAmbient TemperatureLanding MassWind ComponentRunway SlopeRunway SurfaceRunway Condition
3000 ft+22°C3650 lb10 kt Head1% DownGrassWet
Solution:
Graphical DistanceSlope Correction FactorSurface Correction FactorCondition Correction FactorRegulatory FactorLanding Distance Required
2220 ftx 1.05x 1.15x 1.15x 1.43= 4408ft
Section 3 - MEP1 Page 20July 2006
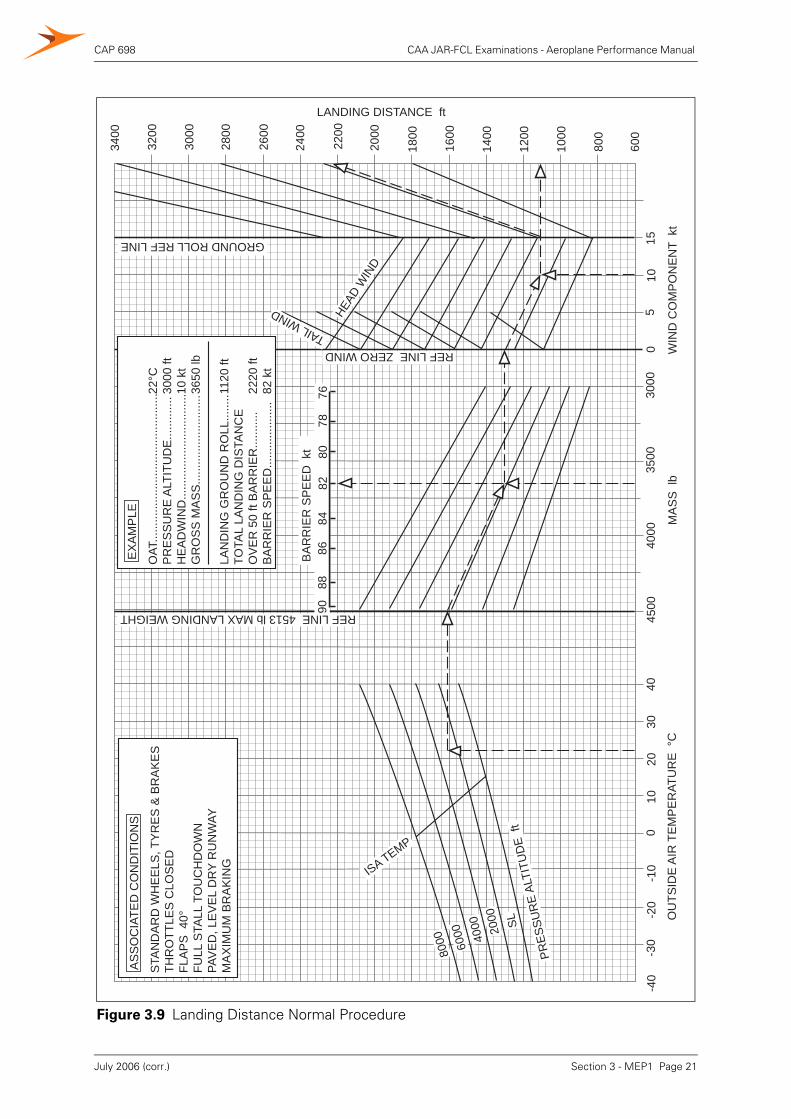
CAP 698 CAA JAR-FCL Examinations - Aeroplane Performance Manual
Figure 3.9 Landing Distance Normal Procedure
-40
-30
-20
-10
010
2030
4045
0040
00
OU
TSID
E A
IR T
EM
PE
RAT
UR
E °
C
MA
SS
lb
WIN
D C
OM
PO
NE
NT
kt
3500
3000
05
1015
9088
8684
8280
7876
BA
RR
IER
SP
EE
D k
t
600
800
1000
1200
1400
1600
1800
2000
2200
2400
2600
2800
3000
3200
3400
LANDING DISTANCE ft
STA
ND
AR
D W
HE
ELS
, TY
RE
S &
BR
AK
ES
THR
OTT
LES
CLO
SE
DFL
AP
S 4
0°FU
LL S
TALL
TO
UC
HD
OW
NPA
VE
D, L
EV
EL
DR
Y R
UN
WAY
MA
XIM
UM
BR
AK
ING
AS
SO
CIA
TED
CO
ND
ITIO
NS
OAT
......
......
......
......
......
......
......
...P
RE
SS
UR
E A
LTIT
UD
E...
......
....
HE
AD
WIN
D...
......
......
......
......
.....
GR
OS
S M
AS
S...
......
......
......
......
LAN
DIN
G G
RO
UN
D R
OLL
......
..TO
TAL
LAN
DIN
G D
ISTA
NC
E
OV
ER
50
ft B
AR
RIE
R...
......
..B
AR
RIE
R S
PE
ED
......
......
......
..
EX
AM
PLE
22°C
3000
ft10
kt
3650
lb
1120
ft
2220
ft82
kt
SL
HEAD
WIN
D
TAIL WIND
REF LINE 4513 lb MAX LANDING WEIGHT
REF LINE ZERO WIND
8000 60
00 4000 20
00
PRES
SUR
E AL
TITU
DE
ft
ISA TEMP
GROUND ROLL REF LINE
Section 3 - MEP1 Page 21July 2006 (corr.)
CAP 698 CAA JAR-FCL Examinations - Aeroplane Performance Manual
5.3.2 Landing Mass Calculations
The procedure for calculating the field length limited landing mass is:
a) De-factorise the landing distance available by dividing by the slope correctionfactor, the surface type correction factor, the surface condition correction factorand the regulatory factor.
b) Enter at the ambient temperature. Move vertically to the aerodrome pressurealtitude.
c) From this point, travel horizontally right to the mass reference line. Mark with apencil.
d) Enter right vertical axis with the distance from a) above. Parallel the grid lines tothe ground roll reference line.
e) From this point, travel horizontally left to the appropriate wind component input.Parallel the grid lines to the wind component reference line.
f) Now draw a line horizontally from this point through the mass grid.
g) From the pencil mark in c) above, parallel the grid lines to intersect the horizontalline. Drop vertically to read field length limited landing mass.
Calculate the field length limited landing mass
Example: Short Field Landing
Aerodrome Pressure AltitudeAmbient TemperatureLanding Distance AvailableWind ComponentRunway SlopeRunway SurfaceRunway Condition
3000 ft+22°C3733 ft10 kt Head1% downGrassWet
Solution:
Landing Distance AvailableSlope Correction FactorSurface Type Correction FactorSurface Condition Correction FactorRegulatory FactorDe-factorised LDAField Length Limited Landing Mass
3733 ft÷1.05÷1.15÷1.15÷1.43= 1880 ft= 3800 lb
Section 3 - MEP1 Page 22July 2006
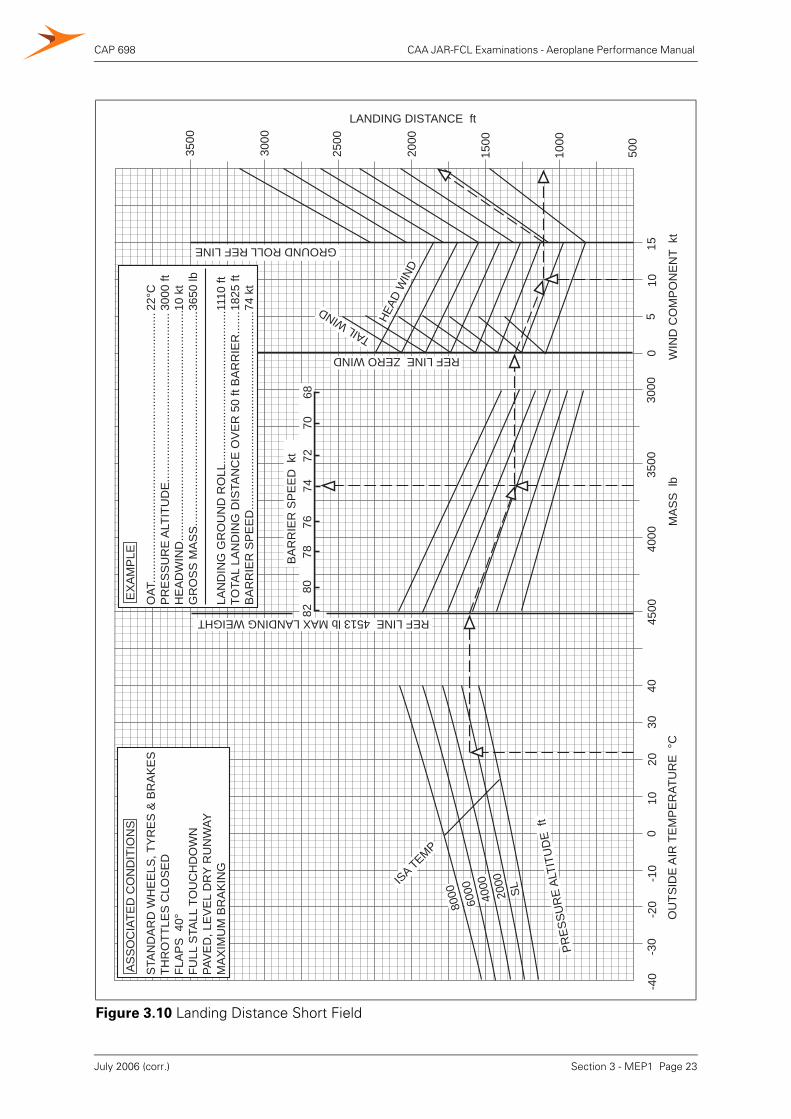
CAP 698 CAA JAR-FCL Examinations - Aeroplane Performance Manual
Figure 3.10 Landing Distance Short Field
500
1000
1500
2000
2500
3000
3500
LANDING DISTANCE ft
-40
-30
-20
-10
010
2030
40
OU
TSID
E A
IR T
EM
PE
RAT
UR
E °
CM
AS
S l
b
WIN
D C
OM
PO
NE
NT
kt
4500
4000
3500
3000
05
1015
8280
7876
7472
7068
BA
RR
IER
SP
EE
D k
t
REF LINE 4513 lb MAX LANDING WEIGHT
GROUND ROLL REF LINE
HEAD
WIN
D
TAIL WIND
REF LINE ZERO WIND
SL
8000
6000
4000
2000
PRES
SUR
E AL
TITU
DE
ft
ISA TEMP
STA
ND
AR
D W
HE
ELS
, TY
RE
S &
BR
AK
ES
THR
OTT
LES
CLO
SE
DFL
AP
S 4
0°FU
LL S
TALL
TO
UC
HD
OW
NPA
VE
D, L
EV
EL
DR
Y R
UN
WAY
MA
XIM
UM
BR
AK
ING
AS
SO
CIA
TED
CO
ND
ITIO
NS
OAT
......
......
......
......
......
......
......
......
......
......
......
......
......
.....
PR
ES
SU
RE
ALT
ITU
DE
......
......
......
......
......
......
......
......
....
HE
AD
WIN
D...
......
......
......
......
......
......
......
......
......
......
......
..G
RO
SS
MA
SS
......
......
......
......
......
......
......
......
......
......
......
LAN
DIN
G G
RO
UN
D R
OLL
......
......
......
......
......
......
......
.....
TOTA
L LA
ND
ING
DIS
TAN
CE
OV
ER
50
ft B
AR
RIE
R...
....
BA
RR
IER
SP
EE
D...
......
......
......
......
......
......
......
......
......
....
EX
AM
PLE
22°C
3000
ft10
kt
3650
lb
1110
ft18
25 ft
74 k
t
Section 3 - MEP1 Page 23July 2006 (corr.)
CAP 698 CAA JAR-FCL Examinations - Aeroplane Performance Manual
INTENTIONALLY LEFT BLANK
Section 3 - MEP1 Page 24July 2006
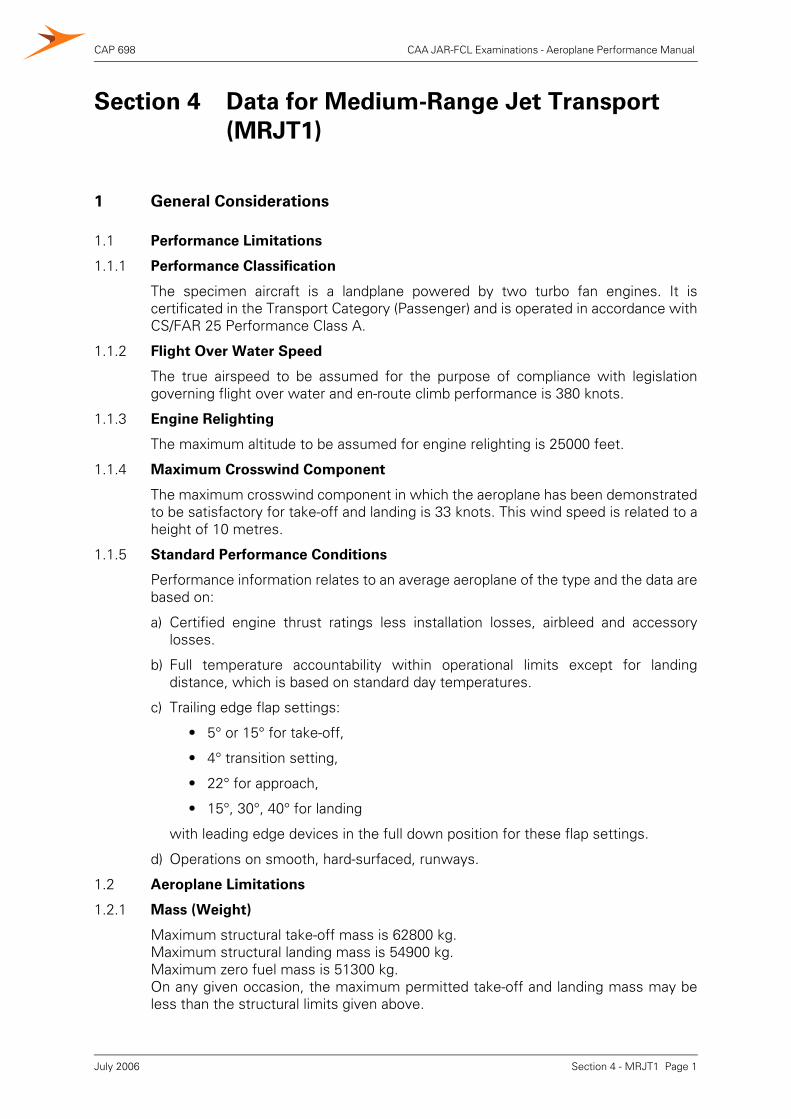
CAP 698 CAA JAR-FCL Examinations - Aeroplane Performance Manual
Section 4 Data for Medium-Range Jet Transport(MRJT1)
1 General Considerations
1.1 Performance Limitations
1.1.1 Performance Classification
The specimen aircraft is a landplane powered by two turbo fan engines. It iscertificated in the Transport Category (Passenger) and is operated in accordance withCS/FAR 25 Performance Class A.
1.1.2 Flight Over Water Speed
The true airspeed to be assumed for the purpose of compliance with legislationgoverning flight over water and en-route climb performance is 380 knots.
1.1.3 Engine Relighting
The maximum altitude to be assumed for engine relighting is 25000 feet.
1.1.4 Maximum Crosswind Component
The maximum crosswind component in which the aeroplane has been demonstratedto be satisfactory for take-off and landing is 33 knots. This wind speed is related to aheight of 10 metres.
1.1.5 Standard Performance Conditions
Performance information relates to an average aeroplane of the type and the data arebased on:
a) Certified engine thrust ratings less installation losses, airbleed and accessorylosses.
b) Full temperature accountability within operational limits except for landingdistance, which is based on standard day temperatures.
c) Trailing edge flap settings:
• 5° or 15° for take-off,
• 4° transition setting,
• 22° for approach,
• 15°, 30°, 40° for landing
with leading edge devices in the full down position for these flap settings.
d) Operations on smooth, hard-surfaced, runways.
1.2 Aeroplane Limitations
1.2.1 Mass (Weight)
Maximum structural take-off mass is 62800 kg.Maximum structural landing mass is 54900 kg.Maximum zero fuel mass is 51300 kg.On any given occasion, the maximum permitted take-off and landing mass may beless than the structural limits given above.
Section 4 - MRJT1 Page 1July 2006
CAP 698 CAA JAR-FCL Examinations - Aeroplane Performance Manual
1.2.2 Wing Span
The wingspan of the aeroplane is 28.88 metres.
1.2.3 Power Plant
The engines shall not be operated continuously at maximum take-off thrust forperiods exceeding 5 minutes.
1.2.4 Operating Limitations
Operational mass (weight) limits are determined from the following performanceconsiderations:
a) Take-off field lengths.
b) Take-off climb limits.
c) Tyre speed limits.
d) Brake energy limits.
e) Net take-off flight path.
f) En route climb performance.
g) Landing climb limits.
h) Landing field lengths.
1.3 Additional Definitions for Class ‘A’ Aeroplanes
Air Minimum Control Speed - VMC The minimum flight speed at which theaeroplane is controllable, with a maximumof 5° bank, when the critical enginesuddenly becomes inoperative with theremaining engines at take-off thrust.
Approach and Landing Minimum Control Speed - VMCL
The minimum speed with a wing engineinoperative where it is possible todecrease thrust to idle or increase thrust tomaximum take-off without encounteringdangerous flight characteristics.
Decision Speed - V1 The maximum speed during take-off atwhich the pilot must take the first action(e.g. apply brakes, reduce thrust, deployspeed brakes) to stop the aeroplane withinthe accelerate-stop distance available. It isalso the minimum speed during take-off,following the failure of the critical engine atVEF, at which the pilot can continue thetake-off and achieve screen height withinthe take-off distance available. V1 must notbe less than VMCG, not greater than VR andnot greater than VMBE.
Ground Minimum Control Speed - VMCG The minimum speed on the ground atwhich the take-off can be safely continued,when the critical engine suddenlybecomes inoperative with the remainingengines at take-off thrust.
Section 4 - MRJT1 Page 2July 2006
CAP 698 CAA JAR-FCL Examinations - Aeroplane Performance Manual
Maximum Brake Energy Speed - VMBE The maximum speed on the ground fromwhich an aeroplane can safely stop withinthe energy capabilities of the brakes.
Maximum Threshold Speed - VTMAX The speed at the threshold above whichthe risk of exceeding the scheduledlanding field length is unacceptably high.Go-around action should normally be takenif it appears that maximum thresholdspeed will be exceeded. This speed is 15knots greater than the all-enginesoperating target threshold speed.
PMC Power Management Computer.
QRH Quick Reference Handbook.
Reference Landing Speed - VREF The speed of the aeroplane, in thespecified landing configuration, at screenheight, which is used to determine thelanding distance for manual landings.
Rotation Speed - VR The speed at which, during the take-off,rotation is initiated with the intention ofbecoming airborne.
Screen Height The height of an imaginary screen placedat the end of the Take-Off DistanceRequired and at the beginning of theLanding Distance Required.
Steady Initial Climb Speed - V4 The all engines operating take-off climbspeed used to the point whereacceleration to flap retraction speed isinitiated. V4 should be attained by a grossheight of 400 feet.
Take-Off Safety Speed - V2 The target speed to be attained at thescreen height with one engine inoperative,and used to the point where accelerationto flap retraction speed is initiated.
Threshold Speed - VT The speed at which the pilot should aim tocross the runway threshold to ensure thatthe scheduled landing field lengths areconsistently achieved. The speeds at thethreshold are: VTO - all engines operatingVT1 - a critical engine inoperative
Section 4 - MRJT1 Page 3July 2006
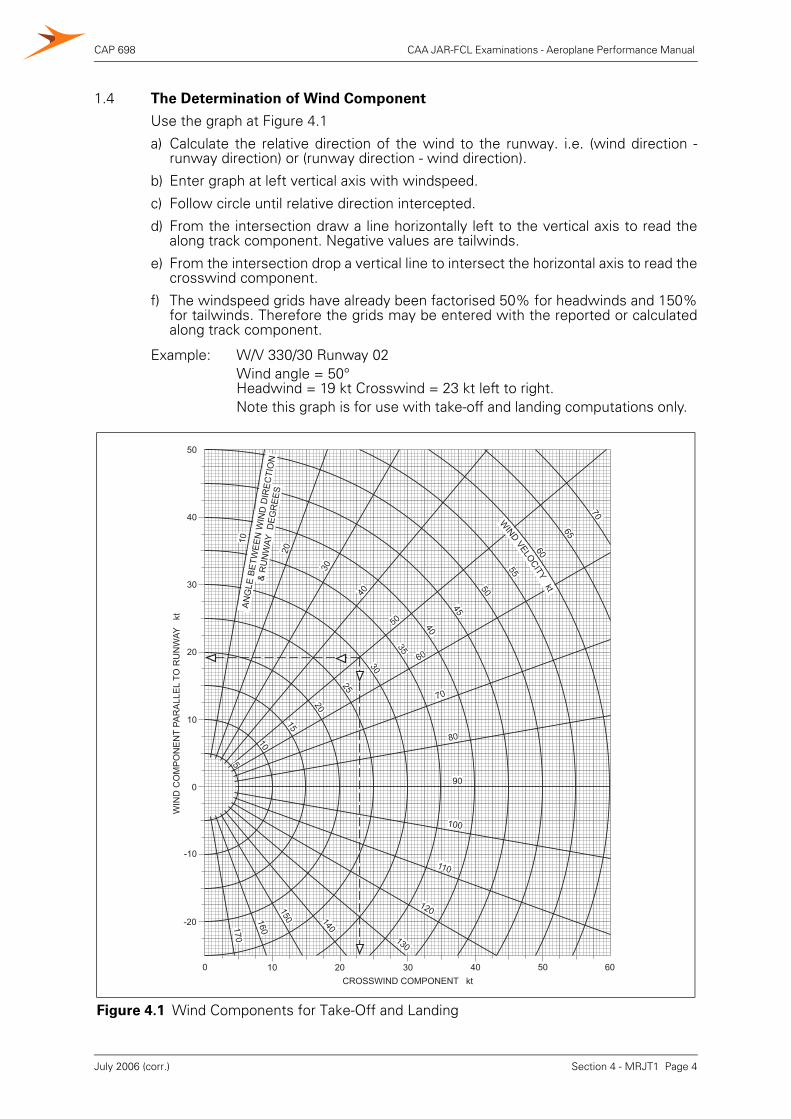
CAP 698 CAA JAR-FCL Examinations - Aeroplane Performance Manual
1.4 The Determination of Wind Component
Use the graph at Figure 4.1
a) Calculate the relative direction of the wind to the runway. i.e. (wind direction -runway direction) or (runway direction - wind direction).
b) Enter graph at left vertical axis with windspeed.
c) Follow circle until relative direction intercepted.
d) From the intersection draw a line horizontally left to the vertical axis to read thealong track component. Negative values are tailwinds.
e) From the intersection drop a vertical line to intersect the horizontal axis to read thecrosswind component.
f) The windspeed grids have already been factorised 50% for headwinds and 150%for tailwinds. Therefore the grids may be entered with the reported or calculatedalong track component.
Example: W/V 330/30 Runway 02Wind angle = 50°Headwind = 19 kt Crosswind = 23 kt left to right.Note this graph is for use with take-off and landing computations only.
Figure 4.1 Wind Components for Take-Off and Landing
CROSSWIND COMPONENT kt
0 10 20 30 40 50 60
WIN
D C
OM
PO
NE
NT
PA
RA
LL
EL T
O R
UN
WA
Y k
t
-20
-10
0
10
20
30
40
50
WIN
DVELO
CIT
Ykt
70
60
50
40
30
20
10
65
55
45
35
25
15
5
10
20
30
40
50
60
70
80
90
100
120
130
140
1501
60170
110
AN
GLE
BE
TW
EE
N W
IND
DIR
EC
TIO
N
& R
UN
WA
Y D
EG
RE
ES
Section 4 - MRJT1 Page 4July 2006 (corr.)
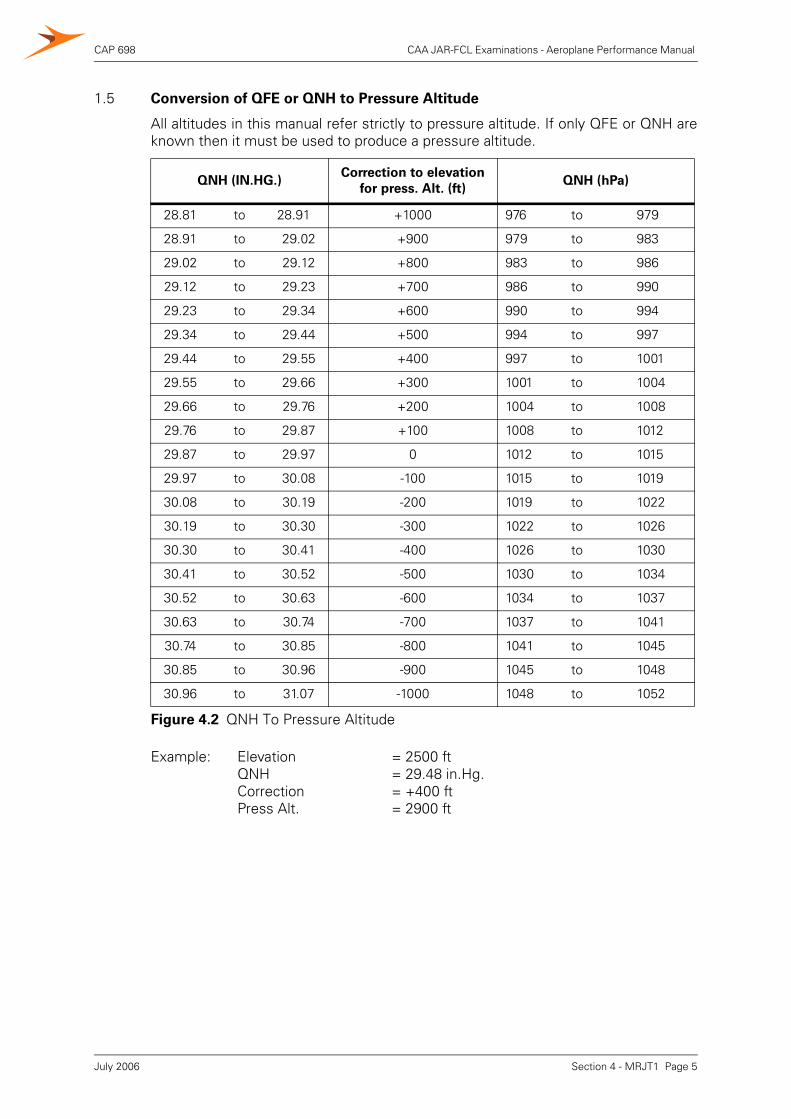
CAP 698 CAA JAR-FCL Examinations - Aeroplane Performance Manual
1.5 Conversion of QFE or QNH to Pressure Altitude
All altitudes in this manual refer strictly to pressure altitude. If only QFE or QNH areknown then it must be used to produce a pressure altitude.
QNH (IN.HG.)Correction to elevation
for press. Alt. (ft)QNH (hPa)
28.81 to 28.91 +1000 976 to 979
28.91 to 29.02 +900 979 to 983
29.02 to 29.12 +800 983 to 986
29.12 to 29.23 +700 986 to 990
29.23 to 29.34 +600 990 to 994
29.34 to 29.44 +500 994 to 997
29.44 to 29.55 +400 997 to 1001
29.55 to 29.66 +300 1001 to 1004
29.66 to 29.76 +200 1004 to 1008
29.76 to 29.87 +100 1008 to 1012
29.87 to 29.97 0 1012 to 1015
29.97 to 30.08 -100 1015 to 1019
30.08 to 30.19 -200 1019 to 1022
30.19 to 30.30 -300 1022 to 1026
30.30 to 30.41 -400 1026 to 1030
30.41 to 30.52 -500 1030 to 1034
30.52 to 30.63 -600 1034 to 1037
30.63 to 30.74 -700 1037 to 1041
30.74 to 30.85 -800 1041 to 1045
30.85 to 30.96 -900 1045 to 1048
30.96 to 31.07 -1000 1048 to 1052
Figure 4.2 QNH To Pressure Altitude
Example: ElevationQNHCorrectionPress Alt.
= 2500 ft= 29.48 in.Hg.= +400 ft= 2900 ft
Section 4 - MRJT1 Page 5July 2006
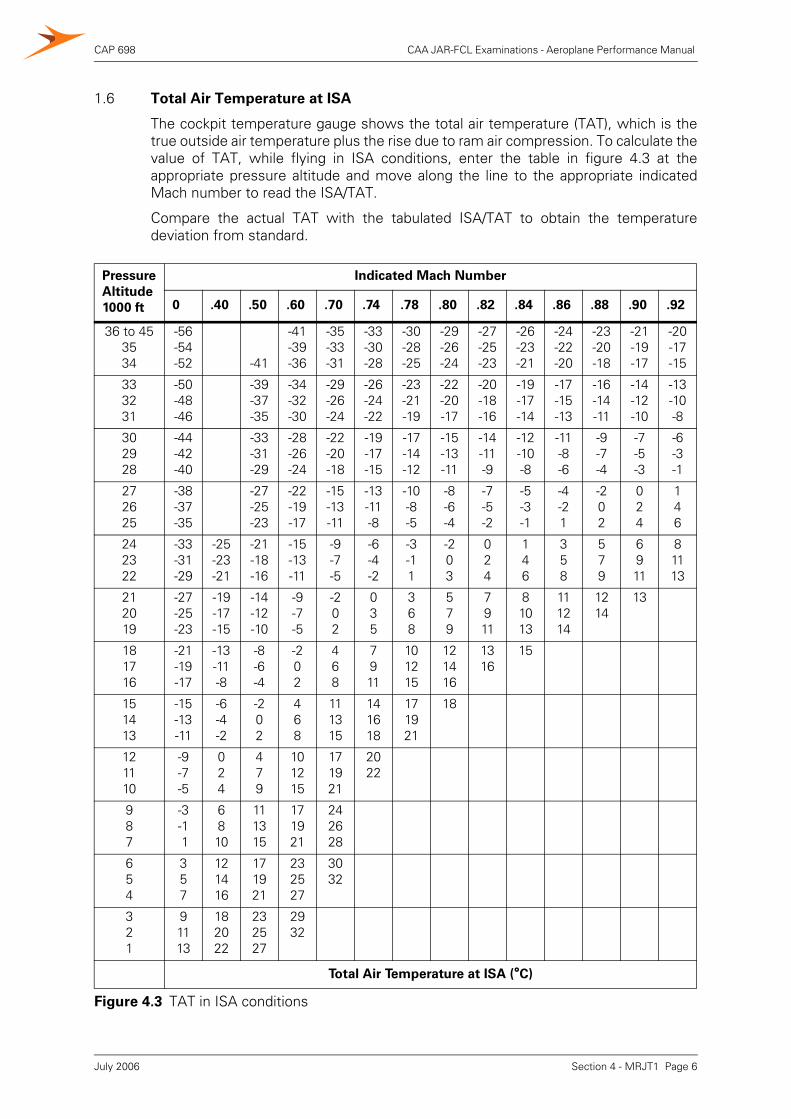
CAP 698 CAA JAR-FCL Examinations - Aeroplane Performance Manual
1.6 Total Air Temperature at ISA
The cockpit temperature gauge shows the total air temperature (TAT), which is thetrue outside air temperature plus the rise due to ram air compression. To calculate thevalue of TAT, while flying in ISA conditions, enter the table in figure 4.3 at theappropriate pressure altitude and move along the line to the appropriate indicatedMach number to read the ISA/TAT.
Compare the actual TAT with the tabulated ISA/TAT to obtain the temperaturedeviation from standard.
Pressure
Altitude
1000 ft
Indicated Mach Number
0 .40 .50 .60 .70 .74 .78 .80 .82 .84 .86 .88 .90 .92
36 to 453534
-56-54-52 -41
-41-39-36
-35-33-31
-33-30-28
-30-28-25
-29-26-24
-27-25-23
-26-23-21
-24-22-20
-23-20-18
-21-19-17
-20-17-15
333231
-50-48-46
-39-37-35
-34-32-30
-29-26-24
-26-24-22
-23-21-19
-22-20-17
-20-18-16
-19-17-14
-17-15-13
-16-14-11
-14-12-10
-13-10-8
302928
-44-42-40
-33-31-29
-28-26-24
-22-20-18
-19-17-15
-17-14-12
-15-13-11
-14-11-9
-12-10-8
-11-8-6
-9-7-4
-7-5-3
-6-3-1
272625
-38-37-35
-27-25-23
-22-19-17
-15-13-11
-13-11-8
-10-8-5
-8-6-4
-7-5-2
-5-3-1
-4-21
-202
024
146
242322
-33-31-29
-25-23-21
-21-18-16
-15-13-11
-9-7-5
-6-4-2
-3-11
-203
024
146
358
579
6911
81113
212019
-27-25-23
-19-17-15
-14-12-10
-9-7-5
-202
035
368
579
7911
81013
111214
1214
13
181716
-21-19-17
-13-11-8
-8-6-4
-202
468
7911
101215
121416
1316
15
151413
-15-13-11
-6-4-2
-202
468
111315
141618
171921
18
121110
-9-7-5
024
479
101215
171921
2022
987
-3-1 1
6810
111315
171921
242628
654
357
121416
171921
232527
3032
321
91113
182022
232527
2932
Total Air Temperature at ISA (°C)
Figure 4.3 TAT in ISA conditions
Section 4 - MRJT1 Page 6July 2006
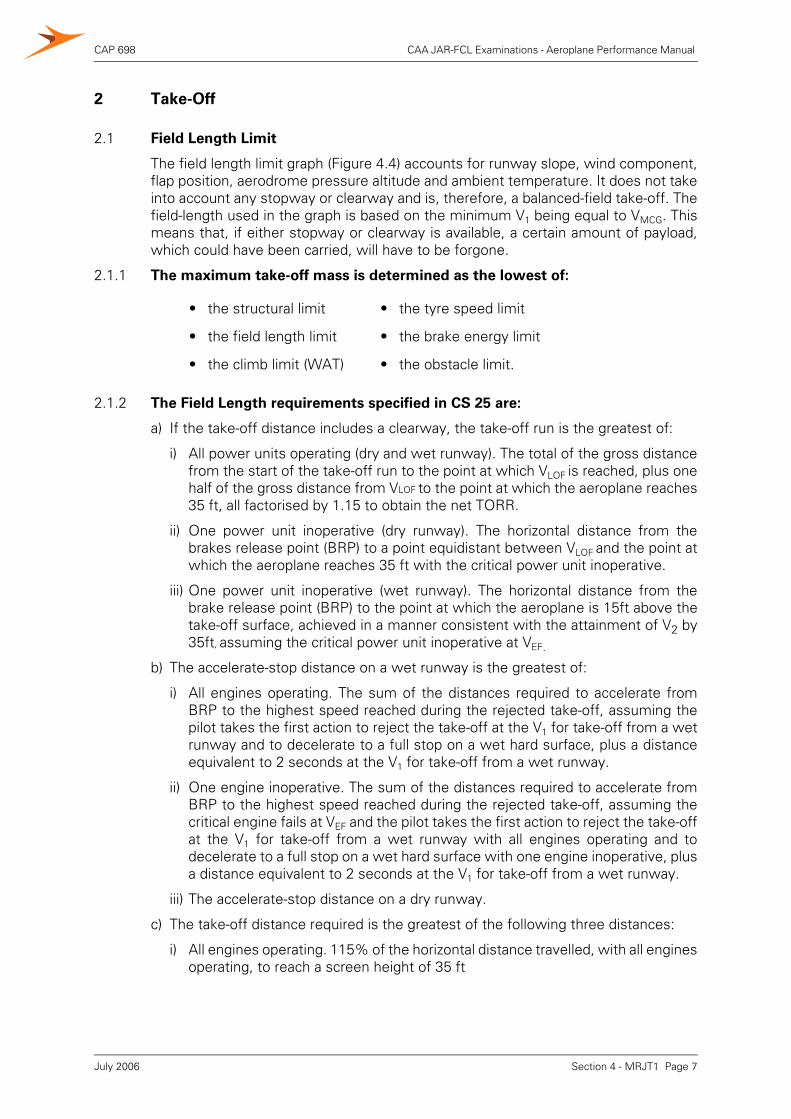
CAP 698 CAA JAR-FCL Examinations - Aeroplane Performance Manual
2 Take-Off
2.1 Field Length Limit
The field length limit graph (Figure 4.4) accounts for runway slope, wind component,flap position, aerodrome pressure altitude and ambient temperature. It does not takeinto account any stopway or clearway and is, therefore, a balanced-field take-off. Thefield-length used in the graph is based on the minimum V1 being equal to VMCG. Thismeans that, if either stopway or clearway is available, a certain amount of payload,which could have been carried, will have to be forgone.
2.1.1 The maximum take-off mass is determined as the lowest of:
2.1.2 The Field Length requirements specified in CS 25 are:
a) If the take-off distance includes a clearway, the take-off run is the greatest of:
i) All power units operating (dry and wet runway). The total of the gross distancefrom the start of the take-off run to the point at which VLOF is reached, plus onehalf of the gross distance from VLOF to the point at which the aeroplane reaches35 ft, all factorised by 1.15 to obtain the net TORR.
ii) One power unit inoperative (dry runway). The horizontal distance from thebrakes release point (BRP) to a point equidistant between VLOF and the point atwhich the aeroplane reaches 35 ft with the critical power unit inoperative.
iii) One power unit inoperative (wet runway). The horizontal distance from thebrake release point (BRP) to the point at which the aeroplane is 15ft above thetake-off surface, achieved in a manner consistent with the attainment of V2 by35ft, assuming the critical power unit inoperative at VEF.
b) The accelerate-stop distance on a wet runway is the greatest of:
i) All engines operating. The sum of the distances required to accelerate fromBRP to the highest speed reached during the rejected take-off, assuming thepilot takes the first action to reject the take-off at the V1 for take-off from a wetrunway and to decelerate to a full stop on a wet hard surface, plus a distanceequivalent to 2 seconds at the V1 for take-off from a wet runway.
ii) One engine inoperative. The sum of the distances required to accelerate fromBRP to the highest speed reached during the rejected take-off, assuming thecritical engine fails at VEF and the pilot takes the first action to reject the take-offat the V1 for take-off from a wet runway with all engines operating and todecelerate to a full stop on a wet hard surface with one engine inoperative, plusa distance equivalent to 2 seconds at the V1 for take-off from a wet runway.
iii) The accelerate-stop distance on a dry runway.
c) The take-off distance required is the greatest of the following three distances:
i) All engines operating. 115% of the horizontal distance travelled, with all enginesoperating, to reach a screen height of 35 ft
• the structural limit • the tyre speed limit
• the field length limit • the brake energy limit
• the climb limit (WAT) • the obstacle limit.
Section 4 - MRJT1 Page 7July 2006
CAP 698 CAA JAR-FCL Examinations - Aeroplane Performance Manual
ii) One engine inoperative (dry runway). The horizontal distance from BRP to thepoint at which the aeroplane attains 35 ft, assuming the critical power unit failsat VEF on a dry, hard surface.
iii) One engine inoperative (wet runway). The horizontal distance from BRP to thepoint at which the aeroplane attains 15 ft, assuming the critical power unit failsat VEF on a wet or contaminated hard surface, achieved in a manner consistentwith the achievement of V2 by 35ft.
2.1.3 Method of Use of the “Take-Off Performance Field Limit” Graph (Figure 4.4)
a) Enter with Field Length Available (TORA). Move vertically to the runway slopereference line.
b) Parallel the grid lines to the appropriate runway slope then continue vertically to thewind component reference line.
c) Parallel the grid lines to the appropriate wind component then continue verticallyto the flap reference line.
d) If flap is 15°, parallel grid lines then, with a pencil, draw a vertical line through theweight grid. If flap is 5°, with a pencil, draw a vertical line from the reference linethrough the mass grid.
e) Enter at the aerodrome ambient temperature and proceed vertically to theaerodrome pressure altitude.
f) Proceed horizontally right to the mass grid reference line.
g) From this point interpolate and follow the grid lines to intersect the vertical linedrawn in d) above.
h) From this intersection draw a horizontal line to read the Field Length Limited TOM
i) Apply any corrections necessary.
Example:
Field Length Available (TORA)Runway slopeWind ComponentFlapsPMCAmbient TemperatureAerodrome Pressure Altitude
9600 ft1% Uphill20 kt Head15°ON+ 33 °C2,000 ft
Solution:
Field Length Limited TOM 63000 kg
Section 4 - MRJT1 Page 8July 2006
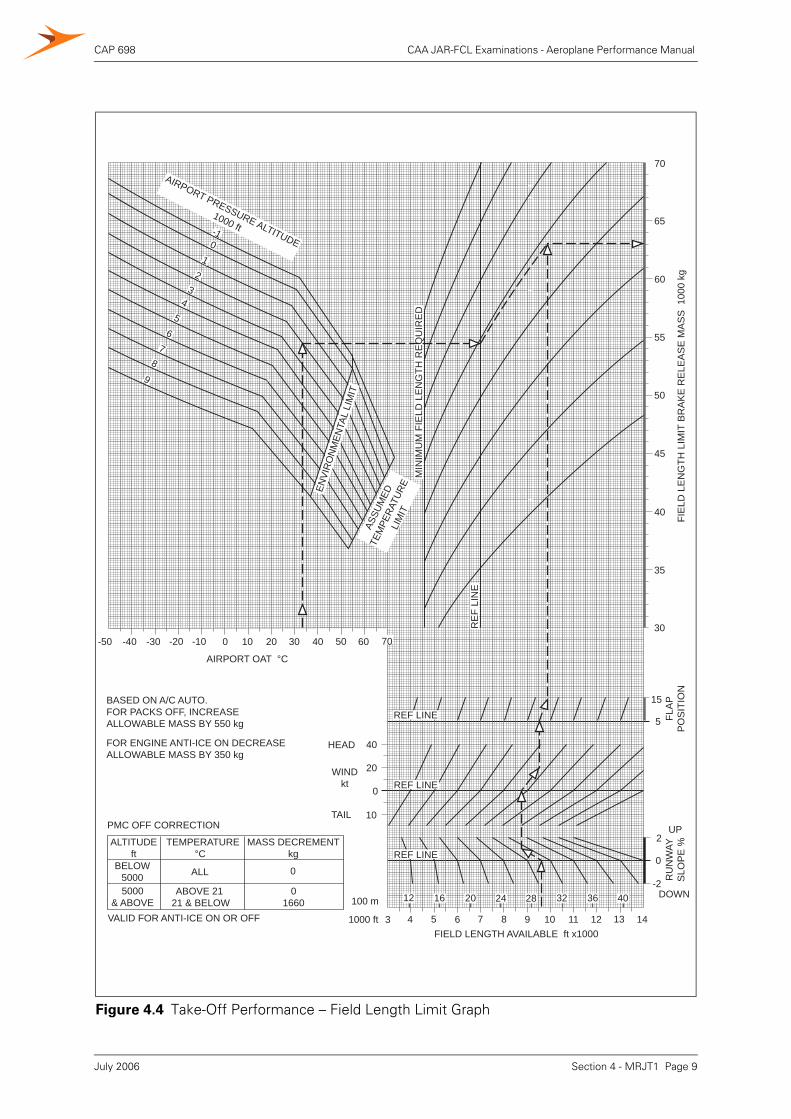
CAP 698 CAA JAR-FCL Examinations - Aeroplane Performance Manual
Figure 4.4 Take-Off Performance – Field Length Limit Graph
40
20
0
10
HEAD
TAIL
WINDkt
REF LINE
REF LINE
REF LINE
30
35
40
45
50
55
60
65
70
15
5
2
-2
0
RU
NW
AYS
LOP
E %
UP
DOWN
FLA
PP
OS
ITIO
NFI
ELD
LE
NG
TH L
IMIT
BR
AK
E R
ELE
AS
E M
AS
S 1
000
kg
3 4 5 6 7 8 9 10 11 12 13 14FIELD LENGTH AVAILABLE ft x1000
-50 -40 -30 -20 -10 0 2010 30 40 50 60 70
AIRPORT OAT °C
AIRPORT PRESSURE ALTITUDE
1000 ft
98
76
54
32
10-1
ENVI
RO
NM
ENTA
L LI
MIT
ASSU
MED
TEM
PERA
TURE
LIM
IT
MIN
IMU
M F
IELD
LE
NG
TH R
EQ
UIR
ED
RE
F LI
NE
BASED ON A/C AUTO.FOR PACKS OFF, INCREASEALLOWABLE MASS BY 550 kg
FOR ENGINE ANTI-ICE ON DECREASEALLOWABLE MASS BY 350 kg
ALTITUDEft
TEMPERATURE°C
MASS DECREMENTkg
BELOW50005000
& ABOVE
ALL
ABOVE 21 21 & BELOW
0
01660
VALID FOR ANTI-ICE ON OR OFF
PMC OFF CORRECTION
1000 ft
100 m 12 16 20 24 28 32 36 40
Section 4 - MRJT1 Page 9July 2006
CAP 698 CAA JAR-FCL Examinations - Aeroplane Performance Manual
2.2 Take-Off Climb
2.2.1 Requirements
During the take-off climb the aeroplane must:
a) Attain the most severe gradient requirement of the take-off Net Flight Path
b) Avoid all obstacles in the obstacle accountability area by the statutory minimumvertical interval.
2.2.2 Use of the Climb Limit Graph (Figure 4.5)
The graph at Figure 4.5 guarantees attainment of the most severe gradientrequirement of the net flight path. It does not guarantee obstacle clearance.
Method of Use
a) Enter the graph at aerodrome ambient temperature.
b) Move vertically to the aerodrome pressure altitude.
c) Travel horizontally left to the flap reference line and apply the appropriate settingto read climb limit mass.
d) Apply any corrections necessary.
Example:
Field Length Available (TORA)OATFlaps
2000 ft+ 33°C15°
Solution:
Climb Limited TOM 53400 kg
Section 4 - MRJT1 Page 10July 2006
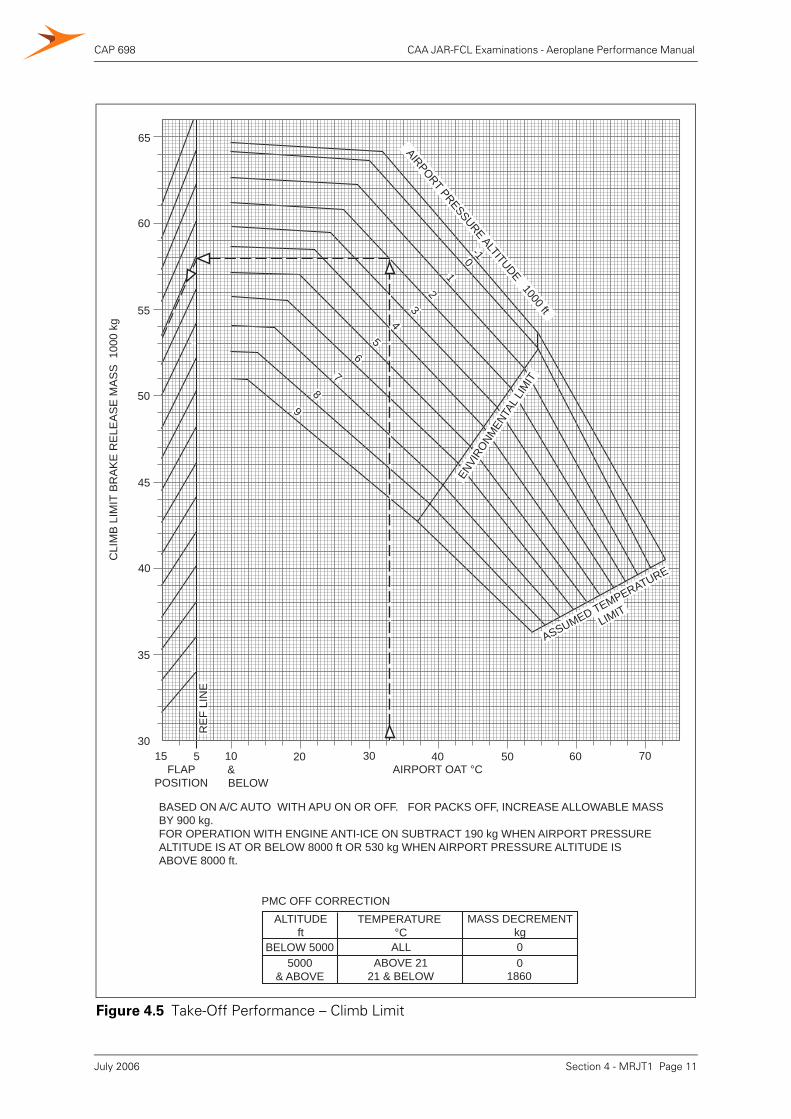
CAP 698 CAA JAR-FCL Examinations - Aeroplane Performance Manual
Figure 4.5 Take-Off Performance – Climb Limit
20 30 40 50 60 7010&
BELOWAIRPORT OAT °CFLAP
POSITION
15 5
AIRPORT PRESSURE ALTITUDE 1000 ft
-101
23
4
5
6
78
9
ENVI
RONM
ENTA
L LIM
IT
ASSUMED TEMPERATURE
LIMIT
CLI
MB
LIM
IT B
RA
KE
RE
LEA
SE
MA
SS
100
0 kg
30
35
40
45
50
55
60
65
BASED ON A/C AUTO WITH APU ON OR OFF. FOR PACKS OFF, INCREASE ALLOWABLE MASS BY 900 kg.FOR OPERATION WITH ENGINE ANTI-ICE ON SUBTRACT 190 kg WHEN AIRPORT PRESSUREALTITUDE IS AT OR BELOW 8000 ft OR 530 kg WHEN AIRPORT PRESSURE ALTITUDE ISABOVE 8000 ft.
PMC OFF CORRECTIONALTITUDE
ftMASS DECREMENT
kg
5000& ABOVE
BELOW 5000 ALL 0ABOVE 21
21 & BELOW0
1860
TEMPERATURE °C
RE
F LI
NE
Section 4 - MRJT1 Page 11July 2006
CAP 698 CAA JAR-FCL Examinations - Aeroplane Performance Manual
2.3 Take-Off Tyre Speed Limit
The graph at Figure 4.6 presents the limitation on take-off weight for 225 mph tyresand 5° flap.
Method of Use
Enter the graph with aerodrome OAT. Proceed vertically to the aerodromepressure altitude, then horizontally left to read the tyre speed limit.Correct as necessary.
For 210 mph tyres and/or 15° flap, apply the correction below the graph.
Example:
OATAirfield Pressure AltitudeFlapsPMCTyresUncorrected limitCorrection
+ 33°C2000 ft15°ON210 mph80400 kg-1500 kg
Solution:
Tyre Limit Mass 78900 kg
Section 4 - MRJT1 Page 12July 2006
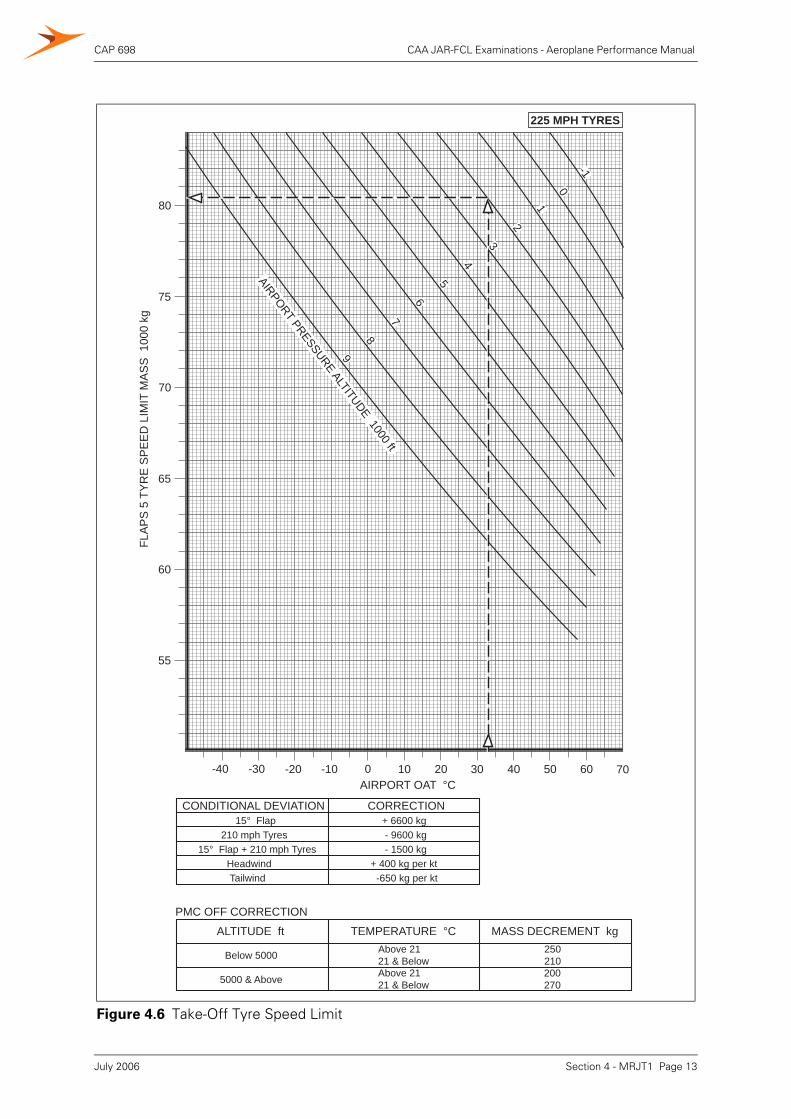
CAP 698 CAA JAR-FCL Examinations - Aeroplane Performance Manual
Figure 4.6 Take-Off Tyre Speed Limit
0 70605040302010-10-20-30-40
AIRPORT PRESSURE ALTITUDE 1000 ft
-1
0
1
2
3
4
5
6
7
8
9
80
55
60
70
65
75
FLA
PS
5 T
YR
E S
PE
ED
LIM
IT M
AS
S 1
000
kg
ALTITUDE ft MASS DECREMENT kgTEMPERATURE °C
Below 5000
PMC OFF CORRECTION
5000 & Above
Above 2121 & BelowAbove 2121 & Below
250210200270
225 MPH TYRES
AIRPORT OAT °C
CONDITIONAL DEVIATION CORRECTION15° Flap
210 mph Tyres15° Flap + 210 mph Tyres
HeadwindTailwind
+ 6600 kg- 9600 kg- 1500 kg
+ 400 kg per kt-650 kg per kt
Section 4 - MRJT1 Page 13July 2006
CAP 698 CAA JAR-FCL Examinations - Aeroplane Performance Manual
2.4 Take-Off Brake Energy Limit
Figure 4.7 enables the determination of VMBE.
Generally VMBE will not be limiting except at hot, high aerodromes or operating with atail wind.
Always check VMBE when outside the shaded area of the top left grid or when thereis a tail wind or when employing the improved climb technique. If V1 exceeds VMBE,apply the correction below the graph. Make V1 = VMBE and recalculate the other Vspeeds for the reduced mass.
Method of Use
Enter the graph with aerodrome pressure altitude. Travel horizontally to OAT.Drop vertically to take-off mass, then horizontally right to VMBE.
Example:
Take-Off MassAirfield Pressure AltitudeAmbient TemperatureRunway SlopeWind ComponentPMC
64000 kg5600 ft-10° C1.5% Uphill10 kt HeadON
Solution:
VMBE = 165 + 3 + 3 =171 kt
Section 4 - MRJT1 Page 14July 2006
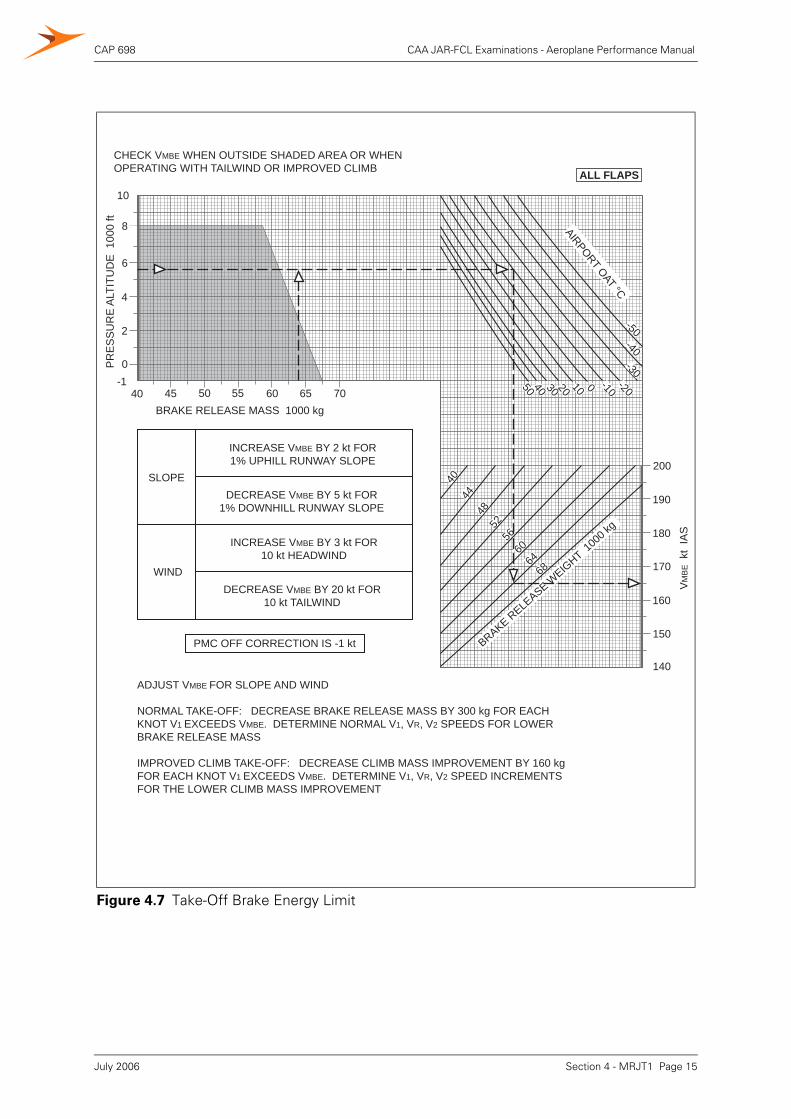
CAP 698 CAA JAR-FCL Examinations - Aeroplane Performance Manual
Figure 4.7 Take-Off Brake Energy Limit
40 45 50 60 65 7055BRAKE RELEASE MASS 1000 kg
-10
2
4
6
8
10
PR
ES
SU
RE
ALT
ITU
DE
100
0 ft
BRAKE RELE
ASE WEIG
HT 100
0 kg
4044
4852
56
6064
68
AIRPORT OAT °C-50
-40-30
-20-1001020304050
SLOPE
INCREASE VMBE BY 2 kt FOR1% UPHILL RUNWAY SLOPE
DECREASE VMBE BY 5 kt FOR1% DOWNHILL RUNWAY SLOPE
INCREASE VMBE BY 3 kt FOR10 kt HEADWIND
DECREASE VMBE BY 20 kt FOR10 kt TAILWIND
WIND
PMC OFF CORRECTION IS -1 kt
ADJUST VMBE FOR SLOPE AND WIND
NORMAL TAKE-OFF: DECREASE BRAKE RELEASE MASS BY 300 kg FOR EACHKNOT V1 EXCEEDS VMBE. DETERMINE NORMAL V1, VR, V2 SPEEDS FOR LOWERBRAKE RELEASE MASS
IMPROVED CLIMB TAKE-OFF: DECREASE CLIMB MASS IMPROVEMENT BY 160 kgFOR EACH KNOT V1 EXCEEDS VMBE. DETERMINE V1, VR, V2 SPEED INCREMENTSFOR THE LOWER CLIMB MASS IMPROVEMENT
ALL FLAPS
CHECK VMBE WHEN OUTSIDE SHADED AREA OR WHENOPERATING WITH TAILWIND OR IMPROVED CLIMB
140
150
160
170
180
190
200
VM
BE k
t IA
S
Section 4 - MRJT1 Page 15July 2006
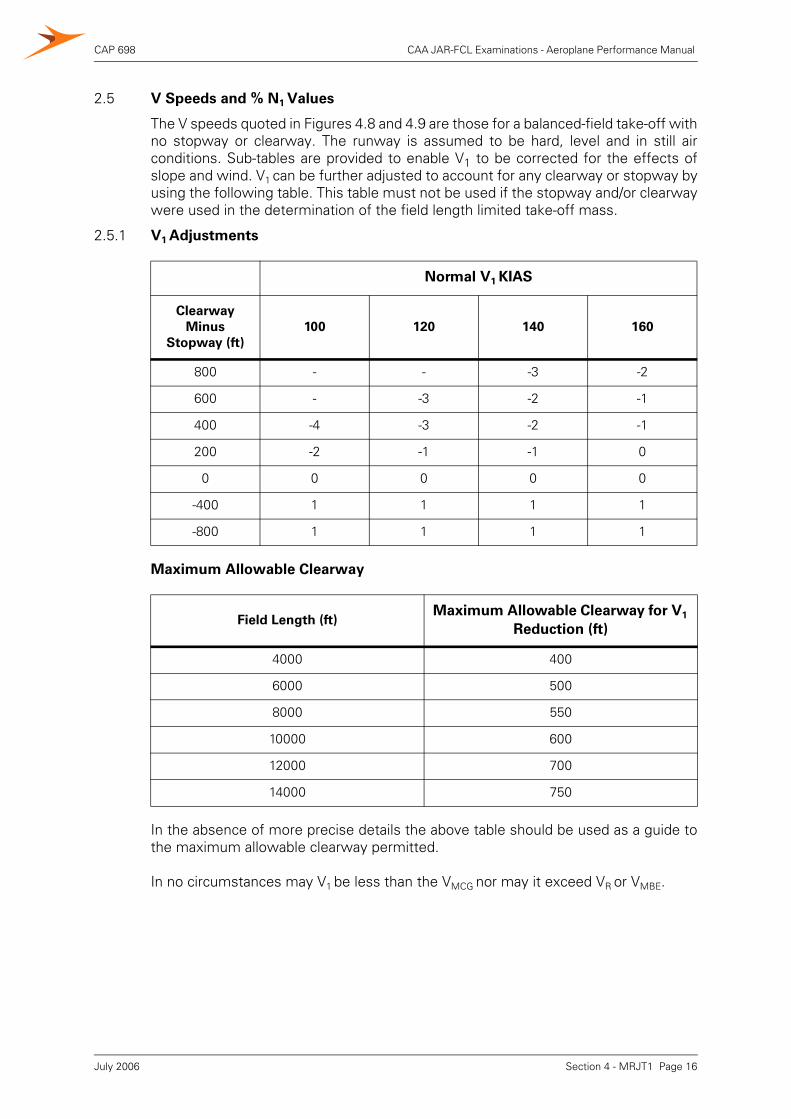
CAP 698 CAA JAR-FCL Examinations - Aeroplane Performance Manual
2.5 V Speeds and % N1 Values
The V speeds quoted in Figures 4.8 and 4.9 are those for a balanced-field take-off withno stopway or clearway. The runway is assumed to be hard, level and in still airconditions. Sub-tables are provided to enable V1 to be corrected for the effects ofslope and wind. V1 can be further adjusted to account for any clearway or stopway byusing the following table. This table must not be used if the stopway and/or clearwaywere used in the determination of the field length limited take-off mass.
2.5.1 V1 Adjustments
Maximum Allowable Clearway
In the absence of more precise details the above table should be used as a guide tothe maximum allowable clearway permitted.
In no circumstances may V1 be less than the VMCG nor may it exceed VR or VMBE.
Normal V1 KIAS
Clearway
Minus
Stopway (ft)
100 120 140 160
800 - - -3 -2
600 - -3 -2 -1
400 -4 -3 -2 -1
200 -2 -1 -1 0
0 0 0 0 0
-400 1 1 1 1
-800 1 1 1 1
Field Length (ft)Maximum Allowable Clearway for V1
Reduction (ft)
4000 400
6000 500
8000 550
10000 600
12000 700
14000 750
Section 4 - MRJT1 Page 16July 2006
CAP 698 CAA JAR-FCL Examinations - Aeroplane Performance Manual
2.5.2 The Calculation of V Speeds
To calculate the V speeds use the tables (at Figure 4.8 or 4.9 as appropriate) in thefollowing manner:
a) Enter the density sub-graph (below) with pressure altitude and ambienttemperature to determine which of the columns of the tables should be used.
b) Select the tables appropriate to the flap setting from Figure 4.8 or 4.9.
c) Enter the V speed tables at the actual take-off mass. Extract V1, VR and V2.
d) If it is necessary to correct V1 for slope and/or wind component, enter the table atthe top of Figure 4.8 or 4.9, as appropriate, at the actual take-off mass andinterpolate the correction necessary.
e) Apply the corrections to V1.
f) Use the sub-table below Figure 4.8 or 4.9, as appropriate, to determine the VMCG.Enter the left column at the ambient temperature and then proceed right along therow to the appropriate aerodrome pressure altitude (interpolating if necessary).Extract VMCG.
g) Compare V1 with VMCG. If V1 is less than VMCG, take-off is not permitted.
h) Check TORA exceeds TORR. If it does not, the take-off mass must be reduced.
Density Sub Graph
2.5.3 Stabiliser Trim Setting
To determine the take-off stabiliser trim setting select the appropriate table and usethe actual take-off mass and % MAC centre of gravity to read or calculate theappropriate setting.
TEMPERATURE °C10 20 30 40 50 60 70
PRESSUREALTITUDE
1000 ft
0
3
6
9
4 &below
A
BC
D
E
F
TEMPERATURE °F40 & below 60 80 100 120 140 160
Section 4 - MRJT1 Page 17July 2006
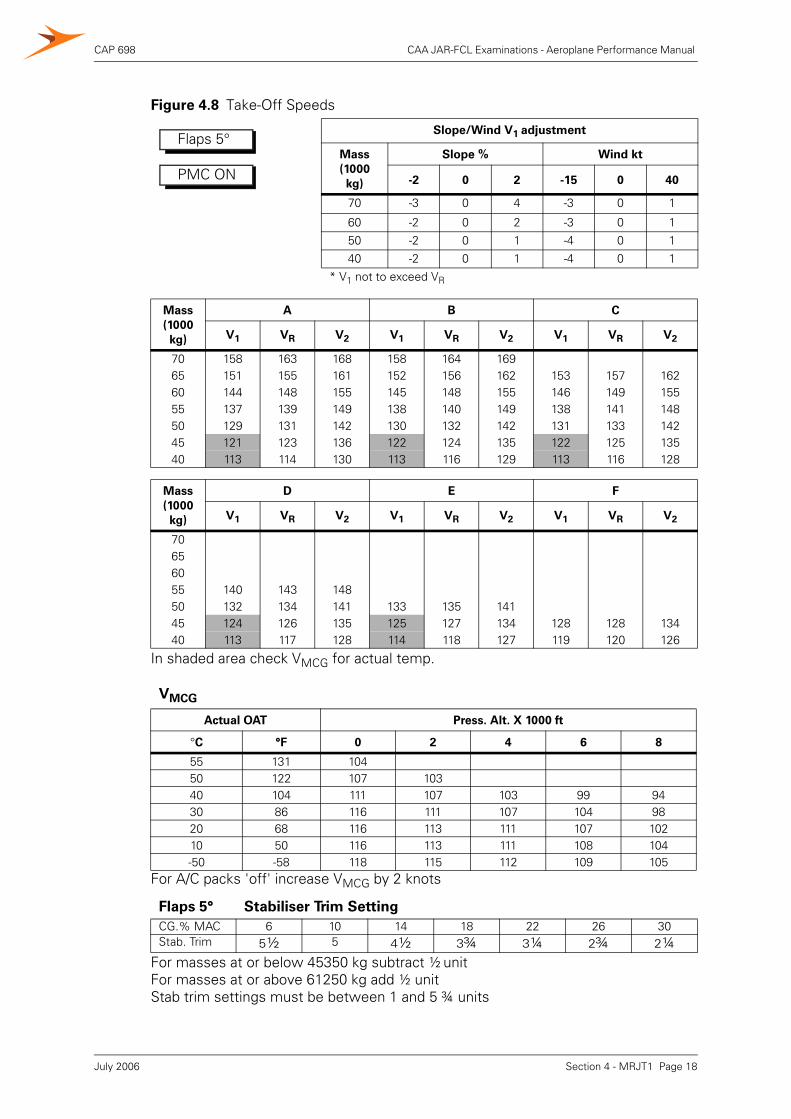
CAP 698 CAA JAR-FCL Examinations - Aeroplane Performance Manual
In shaded area check VMCG for actual temp.
For A/C packs 'off' increase VMCG by 2 knots
For masses at or below 45350 kg subtract ½ unitFor masses at or above 61250 kg add ½ unitStab trim settings must be between 1 and 5 ¾ units
Figure 4.8 Take-Off Speeds
Slope/Wind V1 adjustment
Mass
(1000
kg)
Slope % Wind kt
-2 0 2 -15 0 40
70 -3 0 4 -3 0 1
60 -2 0 2 -3 0 150 -2 0 1 -4 0 1
40 -2 0 1 -4 0 1
* V1 not to exceed VR
Mass
(1000
kg)
A B C
V1 VR V2 V1 VR V2 V1 VR V2
70 158 163 168 158 164 16965 151 155 161 152 156 162 153 157 16260 144 148 155 145 148 155 146 149 15555 137 139 149 138 140 149 138 141 14850 129 131 142 130 132 142 131 133 14245 121 123 136 122 124 135 122 125 13540 113 114 130 113 116 129 113 116 128
Mass
(1000
kg)
D E F
V1 VR V2 V1 VR V2 V1 VR V2
70656055 140 143 14850 132 134 141 133 135 14145 124 126 135 125 127 134 128 128 13440 113 117 128 114 118 127 119 120 126
VMCG
Actual OAT Press. Alt. X 1000 ft
°C °F 0 2 4 6 8
55 131 10450 122 107 10340 104 111 107 103 99 9430 86 116 111 107 104 9820 68 116 113 111 107 10210 50 116 113 111 108 104-50 -58 118 115 112 109 105
Flaps 5° Stabiliser Trim Setting
CG.% MAC 6 10 14 18 22 26 30Stab. Trim 5½ 5 4½ 3¾ 3¼ 2¾ 2¼
Flaps 5°
PMC ON
Section 4 - MRJT1 Page 18July 2006
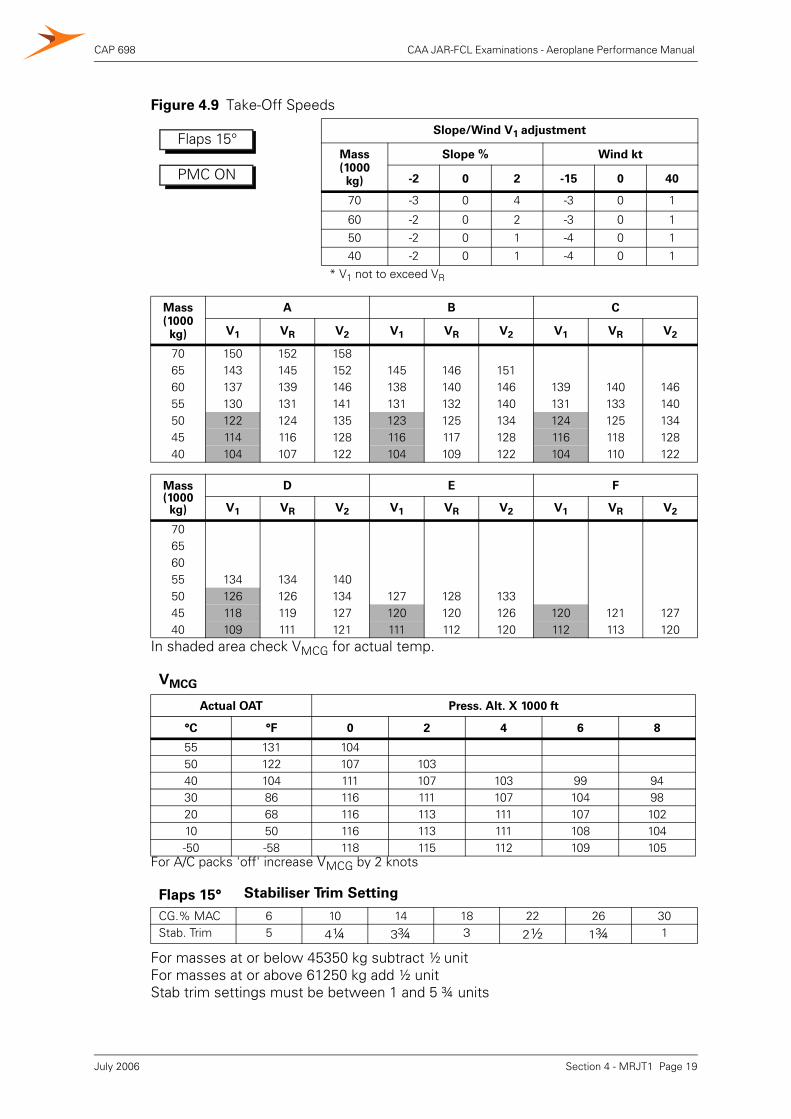
CAP 698 CAA JAR-FCL Examinations - Aeroplane Performance Manual
In shaded area check VMCG for actual temp.
For A/C packs 'off' increase VMCG by 2 knots
For masses at or below 45350 kg subtract ½ unitFor masses at or above 61250 kg add ½ unitStab trim settings must be between 1 and 5 ¾ units
Figure 4.9 Take-Off Speeds
Slope/Wind V1 adjustment
Mass(1000kg)
Slope % Wind kt
-2 0 2 -15 0 40
70 -3 0 4 -3 0 1
60 -2 0 2 -3 0 1
50 -2 0 1 -4 0 1
40 -2 0 1 -4 0 1* V1 not to exceed VR
Mass (1000 kg)
A B C
V1 VR V2 V1 VR V2 V1 VR V2
70 150 152 15865 143 145 152 145 146 15160 137 139 146 138 140 146 139 140 14655 130 131 141 131 132 140 131 133 14050 122 124 135 123 125 134 124 125 13445 114 116 128 116 117 128 116 118 12840 104 107 122 104 109 122 104 110 122
Mass (1000 kg)
D E F
V1 VR V2 V1 VR V2 V1 VR V2
70656055 134 134 14050 126 126 134 127 128 13345 118 119 127 120 120 126 120 121 12740 109 111 121 111 112 120 112 113 120
VMCG
Actual OAT Press. Alt. X 1000 ft
°C °F 0 2 4 6 8
55 131 10450 122 107 10340 104 111 107 103 99 9430 86 116 111 107 104 9820 68 116 113 111 107 10210 50 116 113 111 108 104-50 -58 118 115 112 109 105
Flaps 15° Stabiliser Trim Setting
CG.% MAC 6 10 14 18 22 26 30Stab. Trim 5 4¼ 3¾ 3 2½ 1¾ 1
Flaps 15°
PMC ON
Section 4 - MRJT1 Page 19July 2006
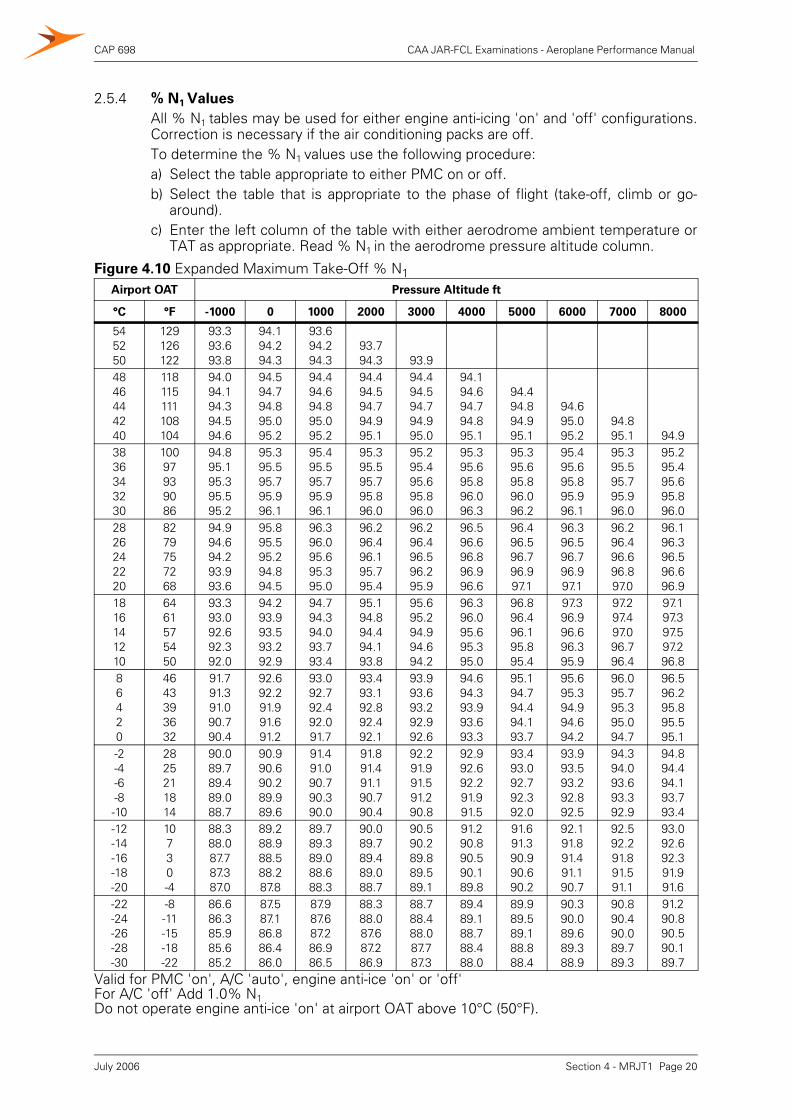
CAP 698 CAA JAR-FCL Examinations - Aeroplane Performance Manual
2.5.4 % N1 Values
All % N1 tables may be used for either engine anti-icing 'on' and 'off' configurations.Correction is necessary if the air conditioning packs are off.To determine the % N1 values use the following procedure:a) Select the table appropriate to either PMC on or off.b) Select the table that is appropriate to the phase of flight (take-off, climb or go-
around).c) Enter the left column of the table with either aerodrome ambient temperature or
TAT as appropriate. Read % N1 in the aerodrome pressure altitude column.
Valid for PMC 'on', A/C 'auto', engine anti-ice 'on' or 'off'For A/C 'off' Add 1.0% N1Do not operate engine anti-ice 'on' at airport OAT above 10°C (50°F).
Figure 4.10 Expanded Maximum Take-Off % N1Airport OAT Pressure Altitude ft
°C °F -1000 0 1000 2000 3000 4000 5000 6000 7000 8000
545250
129126122
93.393.693.8
94.194.294.3
93.694.294.3
93.794.3 93.9
4846444240
118115111108104
94.094.194.394.594.6
94.594.794.895.095.2
94.494.694.895.095.2
94.494.594.794.995.1
94.494.594.794.995.0
94.194.694.794.895.1
94.494.894.995.1
94.695.095.2
94.895.1 94.9
3836343230
10097939086
94.895.195.395.595.2
95.395.595.795.996.1
95.495.595.795.996.1
95.395.595.795.896.0
95.295.495.695.896.0
95.395.695.896.096.3
95.395.695.896.096.2
95.495.695.895.996.1
95.395.595.795.996.0
95.295.495.695.896.0
2826242220
8279757268
94.994.694.293.993.6
95.895.595.294.894.5
96.396.095.695.395.0
96.296.496.195.795.4
96.296.496.596.295.9
96.596.696.896.996.6
96.496.596.796.997.1
96.396.596.796.997.1
96.296.496.696.897.0
96.196.396.596.696.9
1816141210
6461575450
93.393.092.692.392.0
94.293.993.593.292.9
94.794.394.093.793.4
95.194.894.494.193.8
95.695.294.994.694.2
96.396.095.695.395.0
96.896.496.195.895.4
97.396.996.696.395.9
97.297.497.096.796.4
97.197.397.597.296.8
86420
4643393632
91.791.391.090.790.4
92.692.291.991.691.2
93.092.792.492.091.7
93.493.192.892.492.1
93.993.693.292.992.6
94.694.393.993.693.3
95.194.794.494.193.7
95.695.394.994.694.2
96.095.795.395.094.7
96.596.295.895.595.1
-2-4-6-8-10
2825211814
90.089.789.489.088.7
90.990.690.289.989.6
91.491.090.790.390.0
91.891.491.190.790.4
92.291.991.591.290.8
92.992.692.291.991.5
93.493.092.792.392.0
93.993.593.292.892.5
94.394.093.693.392.9
94.894.494.193.793.4
-12-14-16-18-20
10730-4
88.388.087.787.387.0
89.288.988.588.287.8
89.789.389.088.688.3
90.089.789.489.088.7
90.590.289.889.589.1
91.290.890.590.189.8
91.691.390.990.690.2
92.191.891.491.190.7
92.592.291.891.591.1
93.092.692.391.991.6
-22-24-26-28-30
-8-11-15-18-22
86.686.385.985.685.2
87.587.186.886.486.0
87.987.687.286.986.5
88.388.087.687.286.9
88.788.488.087.787.3
89.489.188.788.488.0
89.989.589.188.888.4
90.390.089.689.388.9
90.890.490.089.789.3
91.290.890.590.189.7
Section 4 - MRJT1 Page 20July 2006
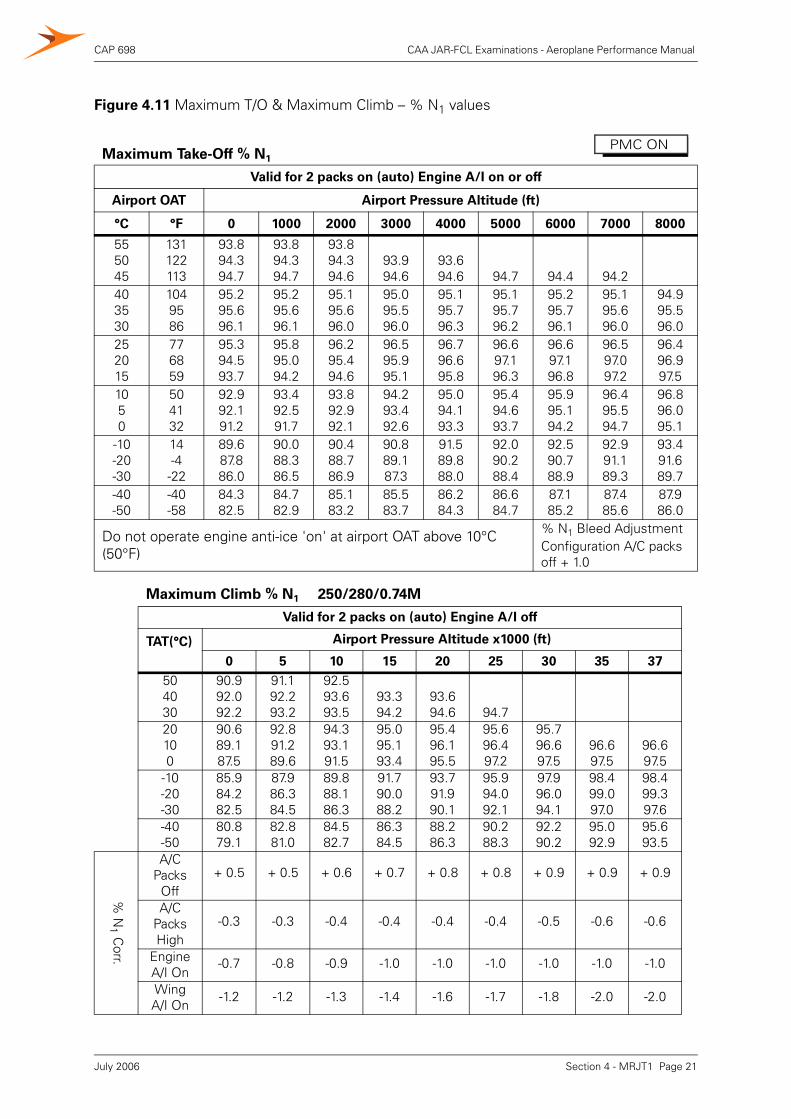
CAP 698 CAA JAR-FCL Examinations - Aeroplane Performance Manual
Figure 4.11 Maximum T/O & Maximum Climb – % N1 valuesMaximum Take-Off % N1
Valid for 2 packs on (auto) Engine A/I on or off
Airport OAT Airport Pressure Altitude (ft)
°C °F 0 1000 2000 3000 4000 5000 6000 7000 8000
555045
131122113
93.894.394.7
93.894.394.7
93.894.394.6
93.994.6
93.694.6 94.7 94.4 94.2
403530
1049586
95.295.696.1
95.295.696.1
95.195.696.0
95.095.596.0
95.195.796.3
95.195.796.2
95.295.796.1
95.195.696.0
94.995.596.0
252015
776859
95.394.593.7
95.895.094.2
96.295.494.6
96.595.995.1
96.796.695.8
96.697.196.3
96.697.196.8
96.597.097.2
96.496.997.5
1050
504132
92.992.191.2
93.492.591.7
93.892.992.1
94.293.492.6
95.094.193.3
95.494.693.7
95.995.194.2
96.495.594.7
96.896.095.1
-10-20-30
14-4-22
89.687.886.0
90.088.386.5
90.488.786.9
90.889.187.3
91.589.888.0
92.090.288.4
92.590.788.9
92.991.189.3
93.491.689.7
-40-50
-40-58
84.382.5
84.782.9
85.183.2
85.583.7
86.284.3
86.684.7
87.185.2
87.485.6
87.986.0
Do not operate engine anti-ice 'on' at airport OAT above 10°C (50°F)
% N1 Bleed Adjustment Configuration A/C packs off + 1.0
Maximum Climb % N1 250/280/0.74M
Valid for 2 packs on (auto) Engine A/I off
TAT(°C) Airport Pressure Altitude x1000 (ft)
0 5 10 15 20 25 30 35 37
504030
90.992.092.2
91.192.293.2
92.593.693.5
93.394.2
93.694.6 94.7
20100
90.689.187.5
92.891.289.6
94.393.191.5
95.095.193.4
95.496.195.5
95.696.497.2
95.796.697.5
96.697.5
96.697.5
-10-20-30
85.984.282.5
87.986.384.5
89.888.186.3
91.790.088.2
93.791.990.1
95.994.092.1
97.996.094.1
98.499.097.0
98.499.397.6
-40-50
80.879.1
82.881.0
84.582.7
86.384.5
88.286.3
90.288.3
92.290.2
95.092.9
95.693.5
% N
1 Corr.
A/C Packs
Off+ 0.5 + 0.5 + 0.6 + 0.7 + 0.8 + 0.8 + 0.9 + 0.9 + 0.9
A/C Packs High
-0.3 -0.3 -0.4 -0.4 -0.4 -0.4 -0.5 -0.6 -0.6
Engine A/I On
-0.7 -0.8 -0.9 -1.0 -1.0 -1.0 -1.0 -1.0 -1.0
WingA/I On
-1.2 -1.2 -1.3 -1.4 -1.6 -1.7 -1.8 -2.0 -2.0
PMC ON
Section 4 - MRJT1 Page 21July 2006
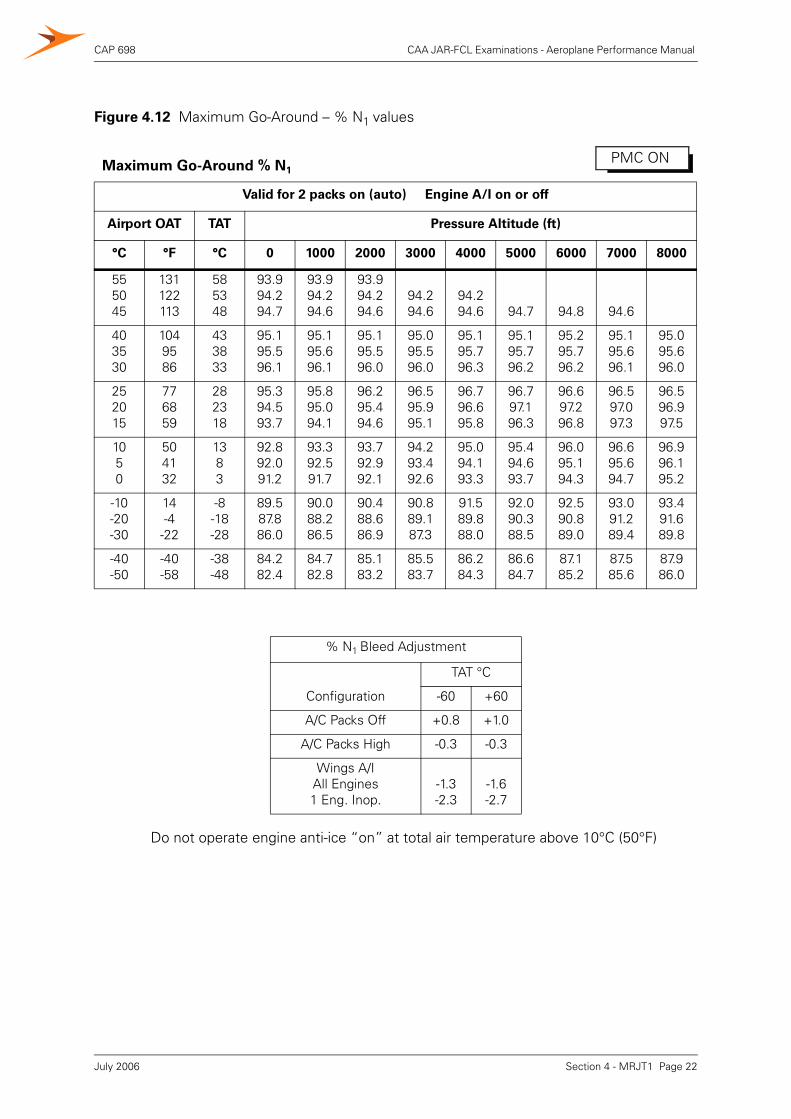
CAP 698 CAA JAR-FCL Examinations - Aeroplane Performance Manual
Do not operate engine anti-ice “on” at total air temperature above 10°C (50°F)
Figure 4.12 Maximum Go-Around – % N1 values
Maximum Go-Around % N1
Valid for 2 packs on (auto) Engine A/I on or off
Airport OAT TAT Pressure Altitude (ft)
°C °F °C 0 1000 2000 3000 4000 5000 6000 7000 8000
555045
131122113
585348
93.994.294.7
93.994.294.6
93.994.294.6
94.294.6
94.294.6 94.7 94.8 94.6
403530
1049586
433833
95.195.596.1
95.195.696.1
95.195.596.0
95.095.596.0
95.195.796.3
95.195.796.2
95.295.796.2
95.195.696.1
95.095.696.0
252015
776859
282318
95.394.593.7
95.895.094.1
96.295.494.6
96.595.995.1
96.796.695.8
96.797.196.3
96.697.296.8
96.597.097.3
96.596.997.5
1050
504132
1383
92.892.091.2
93.392.591.7
93.792.992.1
94.293.492.6
95.094.193.3
95.494.693.7
96.095.194.3
96.695.694.7
96.996.195.2
-10-20-30
14-4
-22
-8-18-28
89.587.886.0
90.088.286.5
90.488.686.9
90.889.187.3
91.589.888.0
92.090.388.5
92.590.889.0
93.091.289.4
93.491.689.8
-40-50
-40-58
-38-48
84.282.4
84.782.8
85.183.2
85.583.7
86.284.3
86.684.7
87.185.2
87.585.6
87.986.0
% N1 Bleed Adjustment
Configuration
TAT °C
-60 +60
A/C Packs Off +0.8 +1.0
A/C Packs High -0.3 -0.3
Wings A/IAll Engines1 Eng. Inop.
-1.3-2.3
-1.6-2.7
PMC ON
Section 4 - MRJT1 Page 22July 2006
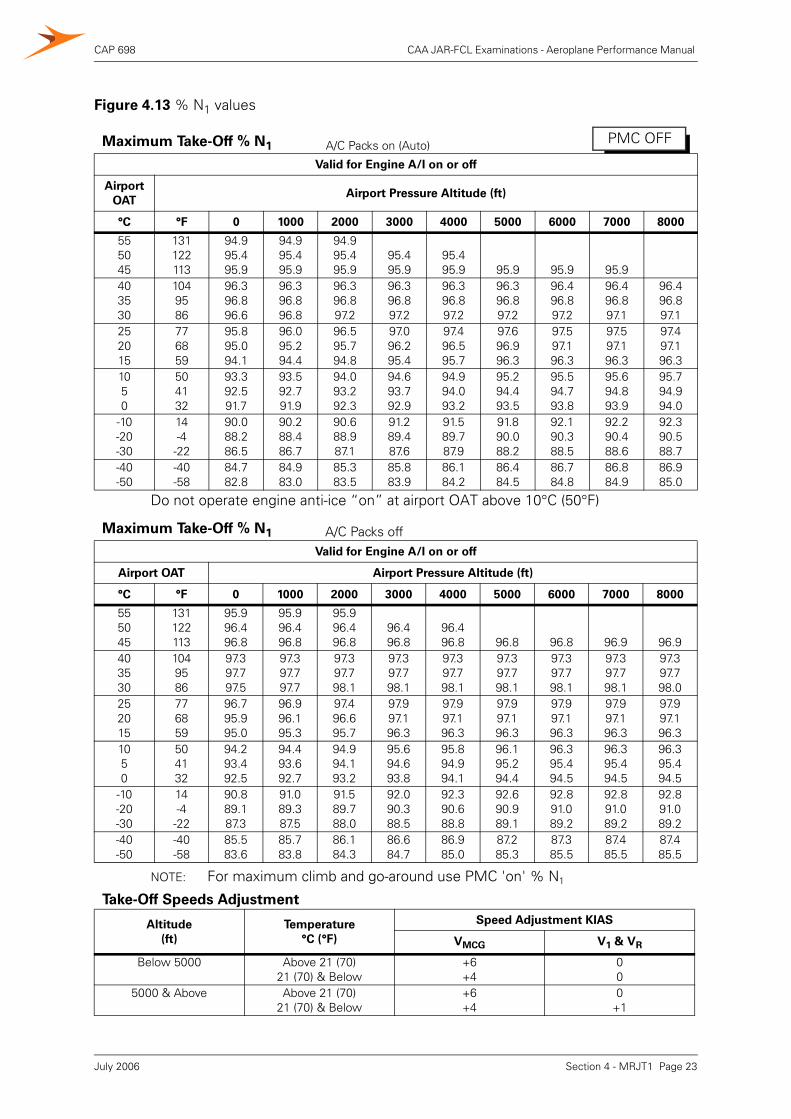
CAP 698 CAA JAR-FCL Examinations - Aeroplane Performance Manual
Do not operate engine anti-ice “on” at airport OAT above 10°C (50°F)
NOTE: For maximum climb and go-around use PMC 'on' % N1
Figure 4.13 % N1 values
Maximum Take-Off % N1 A/C Packs on (Auto)
Valid for Engine A/I on or off
Airport
OATAirport Pressure Altitude (ft)
°C °F 0 1000 2000 3000 4000 5000 6000 7000 8000
555045
131122113
94.995.495.9
94.995.495.9
94.995.495.9
95.495.9
95.495.9 95.9 95.9 95.9
403530
1049586
96.396.896.6
96.396.896.8
96.396.897.2
96.396.897.2
96.396.897.2
96.396.897.2
96.496.897.2
96.496.897.1
96.496.897.1
252015
776859
95.895.094.1
96.095.294.4
96.595.794.8
97.096.295.4
97.496.595.7
97.696.996.3
97.597.196.3
97.597.196.3
97.497.196.3
1050
504132
93.392.591.7
93.592.791.9
94.093.292.3
94.693.792.9
94.994.093.2
95.294.493.5
95.594.793.8
95.694.893.9
95.794.994.0
-10-20-30
14-4
-22
90.088.286.5
90.288.486.7
90.688.987.1
91.289.487.6
91.589.787.9
91.890.088.2
92.190.388.5
92.290.488.6
92.390.588.7
-40-50
-40-58
84.782.8
84.983.0
85.383.5
85.883.9
86.184.2
86.484.5
86.784.8
86.884.9
86.985.0
Maximum Take-Off % N1 A/C Packs offValid for Engine A/I on or off
Airport OAT Airport Pressure Altitude (ft)
°C °F 0 1000 2000 3000 4000 5000 6000 7000 8000
555045
131122113
95.996.496.8
95.996.496.8
95.996.496.8
96.496.8
96.496.8 96.8 96.8 96.9 96.9
403530
1049586
97.397.797.5
97.397.797.7
97.397.798.1
97.397.798.1
97.397.798.1
97.397.798.1
97.397.798.1
97.397.798.1
97.397.798.0
252015
776859
96.795.995.0
96.996.195.3
97.496.695.7
97.997.196.3
97.997.196.3
97.997.196.3
97.997.196.3
97.997.196.3
97.997.196.3
1050
504132
94.293.492.5
94.493.692.7
94.994.193.2
95.694.693.8
95.894.994.1
96.195.294.4
96.395.494.5
96.395.494.5
96.395.494.5
-10-20-30
14-4-22
90.889.187.3
91.089.387.5
91.589.788.0
92.090.388.5
92.390.688.8
92.690.989.1
92.891.089.2
92.891.089.2
92.891.089.2
-40-50
-40-58
85.583.6
85.783.8
86.184.3
86.684.7
86.985.0
87.285.3
87.385.5
87.485.5
87.485.5
Take-Off Speeds Adjustment
Altitude
(ft)
Temperature
°C (°F)
Speed Adjustment KIAS
VMCG V1 & VR
Below 5000 Above 21 (70) 21 (70) & Below
+6+4
00
5000 & Above Above 21 (70) 21 (70) & Below
+6+4
0+1
PMC OFF
Section 4 - MRJT1 Page 23July 2006
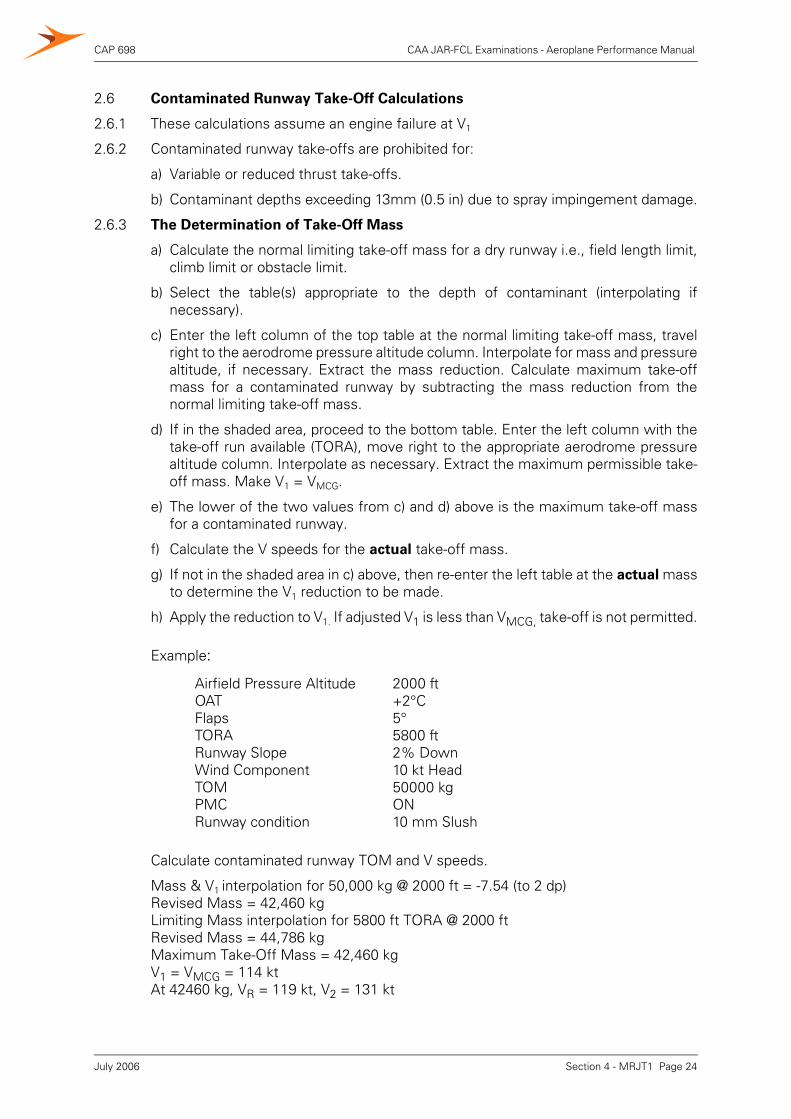
CAP 698 CAA JAR-FCL Examinations - Aeroplane Performance Manual
2.6 Contaminated Runway Take-Off Calculations
2.6.1 These calculations assume an engine failure at V1
2.6.2 Contaminated runway take-offs are prohibited for:
a) Variable or reduced thrust take-offs.
b) Contaminant depths exceeding 13mm (0.5 in) due to spray impingement damage.
2.6.3 The Determination of Take-Off Mass
a) Calculate the normal limiting take-off mass for a dry runway i.e., field length limit,climb limit or obstacle limit.
b) Select the table(s) appropriate to the depth of contaminant (interpolating ifnecessary).
c) Enter the left column of the top table at the normal limiting take-off mass, travelright to the aerodrome pressure altitude column. Interpolate for mass and pressurealtitude, if necessary. Extract the mass reduction. Calculate maximum take-offmass for a contaminated runway by subtracting the mass reduction from thenormal limiting take-off mass.
d) If in the shaded area, proceed to the bottom table. Enter the left column with thetake-off run available (TORA), move right to the appropriate aerodrome pressurealtitude column. Interpolate as necessary. Extract the maximum permissible take-off mass. Make V1 = VMCG.
e) The lower of the two values from c) and d) above is the maximum take-off massfor a contaminated runway.
f) Calculate the V speeds for the actual take-off mass.
g) If not in the shaded area in c) above, then re-enter the left table at the actual massto determine the V1 reduction to be made.
h) Apply the reduction to V1. If adjusted V1 is less than VMCG, take-off is not permitted.
Calculate contaminated runway TOM and V speeds.
Mass & V1 interpolation for 50,000 kg @ 2000 ft = -7.54 (to 2 dp)Revised Mass = 42,460 kgLimiting Mass interpolation for 5800 ft TORA @ 2000 ft Revised Mass = 44,786 kgMaximum Take-Off Mass = 42,460 kgV1 = VMCG = 114 ktAt 42460 kg, VR = 119 kt, V2 = 131 kt
Example:
Airfield Pressure AltitudeOATFlapsTORARunway SlopeWind ComponentTOMPMCRunway condition
2000 ft+2°C5°5800 ft2% Down10 kt Head50000 kgON10 mm Slush
Section 4 - MRJT1 Page 24July 2006
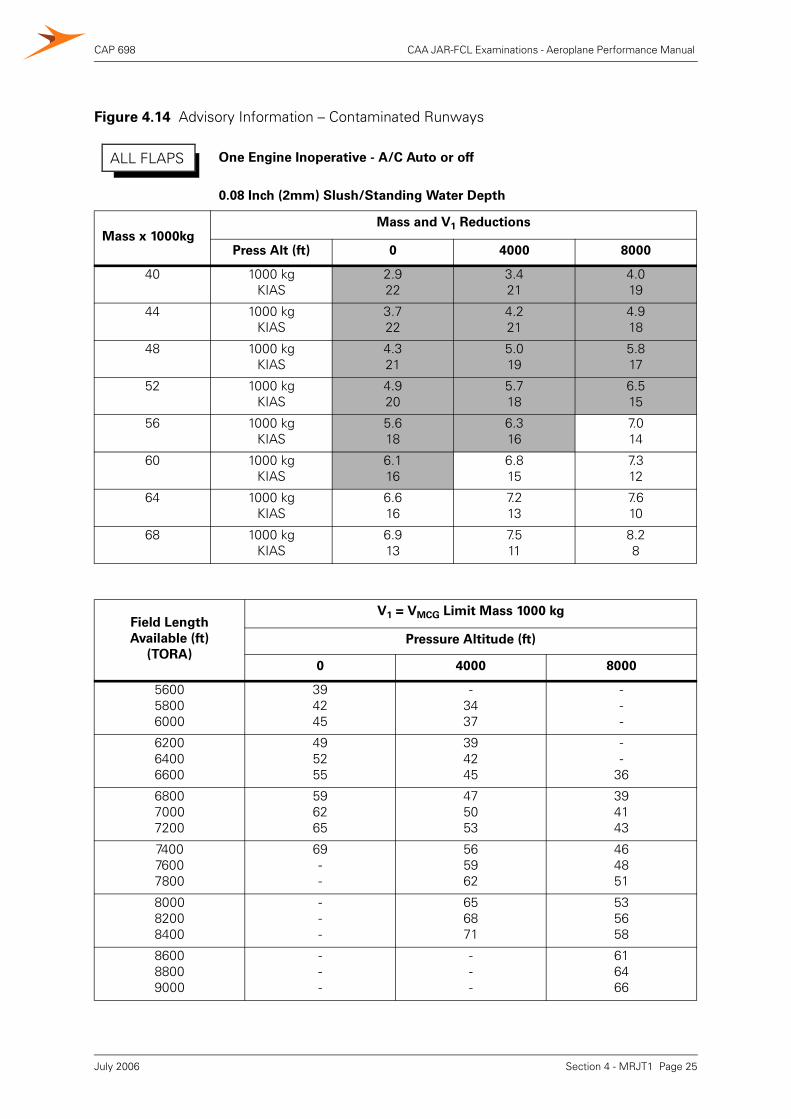
CAP 698 CAA JAR-FCL Examinations - Aeroplane Performance Manual
Figure 4.14 Advisory Information – Contaminated RunwaysOne Engine Inoperative - A/C Auto or off
0.08 Inch (2mm) Slush/Standing Water Depth
Mass x 1000kgMass and V1 Reductions
Press Alt (ft) 0 4000 8000
40 1000 kg KIAS
2.922
3.421
4.019
44 1000 kg KIAS
3.722
4.221
4.918
48 1000 kg KIAS
4.321
5.019
5.817
52 1000 kg KIAS
4.920
5.718
6.515
56 1000 kg KIAS
5.618
6.316
7.014
60 1000 kg KIAS
6.116
6.815
7.312
64 1000 kg KIAS
6.616
7.213
7.610
68 1000 kg KIAS
6.913
7.511
8.28
Field Length
Available (ft)
(TORA)
V1 = VMCG Limit Mass 1000 kg
Pressure Altitude (ft)
0 4000 8000
560058006000
394245
-3437
---
620064006600
495255
394245
--
36
680070007200
596265
475053
394143
740076007800
69--
565962
464851
800082008400
---
656871
535658
860088009000
---
---
616466
ALL FLAPS
Section 4 - MRJT1 Page 25July 2006
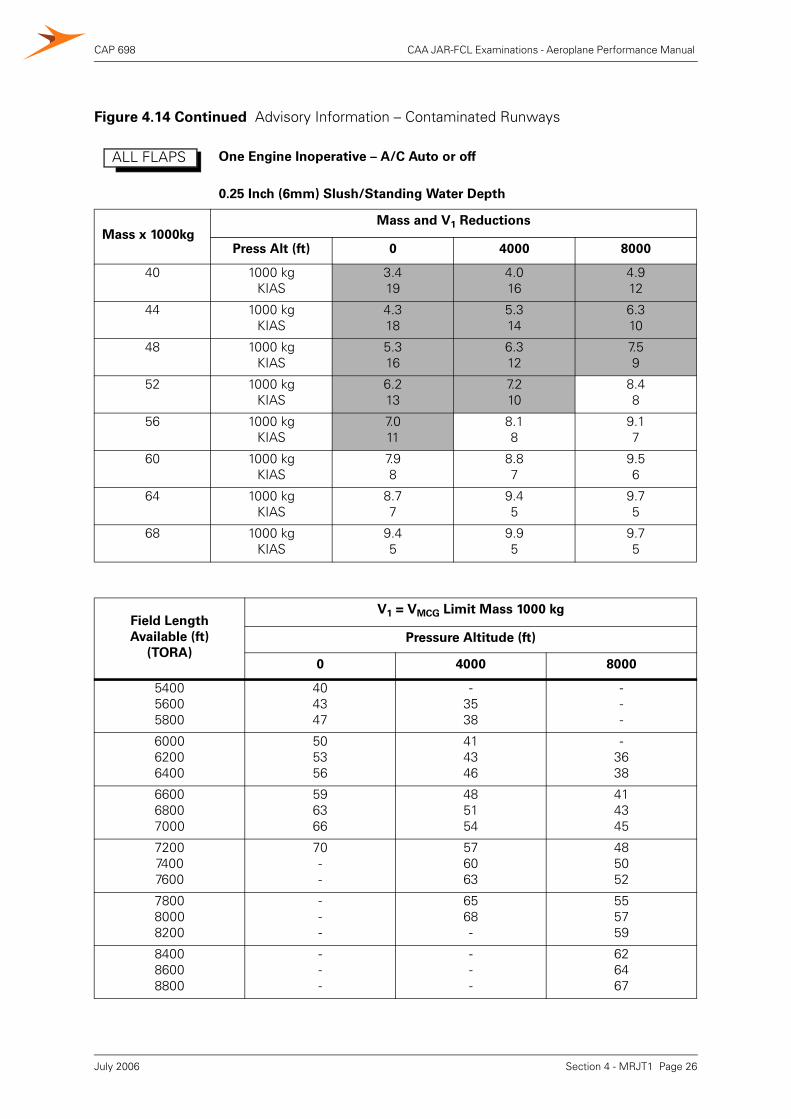
CAP 698 CAA JAR-FCL Examinations - Aeroplane Performance Manual
Figure 4.14 Continued Advisory Information – Contaminated RunwaysOne Engine Inoperative – A/C Auto or off
0.25 Inch (6mm) Slush/Standing Water Depth
Mass x 1000kgMass and V1 Reductions
Press Alt (ft) 0 4000 8000
40 1000 kg KIAS
3.419
4.016
4.912
44 1000 kg KIAS
4.318
5.314
6.310
48 1000 kg KIAS
5.316
6.312
7.59
52 1000 kg KIAS
6.213
7.210
8.48
56 1000 kg KIAS
7.011
8.18
9.17
60 1000 kg KIAS
7.98
8.87
9.56
64 1000 kg KIAS
8.77
9.45
9.75
68 1000 kg KIAS
9.45
9.95
9.75
Field Length
Available (ft)
(TORA)
V1 = VMCG Limit Mass 1000 kg
Pressure Altitude (ft)
0 4000 8000
540056005800
404347
-3538
---
600062006400
505356
414346
-3638
660068007000
596366
485154
414345
720074007600
70--
576063
485052
780080008200
---
6568-
555759
840086008800
---
---
626467
ALL FLAPS
Section 4 - MRJT1 Page 26July 2006
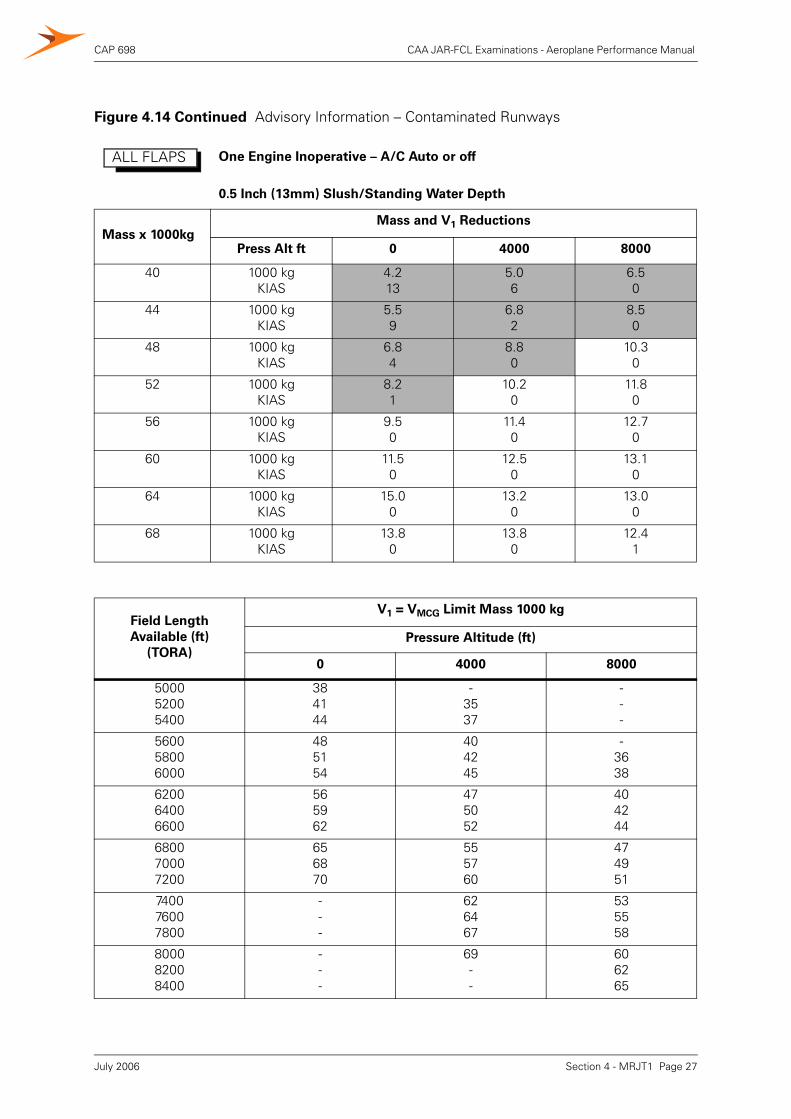
CAP 698 CAA JAR-FCL Examinations - Aeroplane Performance Manual
Figure 4.14 Continued Advisory Information – Contaminated RunwaysOne Engine Inoperative – A/C Auto or off
0.5 Inch (13mm) Slush/Standing Water Depth
Mass x 1000kgMass and V1 Reductions
Press Alt ft 0 4000 8000
40 1000 kg KIAS
4.213
5.06
6.50
44 1000 kg KIAS
5.59
6.82
8.50
48 1000 kg KIAS
6.84
8.80
10.30
52 1000 kg KIAS
8.21
10.20
11.80
56 1000 kgKIAS
9.50
11.40
12.70
60 1000 kg KIAS
11.50
12.50
13.10
64 1000 kg KIAS
15.00
13.20
13.00
68 1000 kg KIAS
13.80
13.80
12.41
Field Length
Available (ft)
(TORA)
V1 = VMCG Limit Mass 1000 kg
Pressure Altitude (ft)
0 4000 8000
500052005400
384144
-3537
---
560058006000
485154
404245
-3638
620064006600
565962
475052
404244
680070007200
656870
555760
474951
740076007800
---
626467
535558
800082008400
---
69--
606265
ALL FLAPS
Section 4 - MRJT1 Page 27July 2006
CAP 698 CAA JAR-FCL Examinations - Aeroplane Performance Manual
2.7 Increased V2 Take-Off
If the maximum take-off mass is limited by the minimum acceptable climb gradientsof the net flight path, and there is a large excess of available field length over thatwhich is required, then it is possible to improve the take-off weight and still attain theminimum climb gradient requirement (subject to the limitations of the tyre speed andfield length limitations). This is done by holding the aeroplane on the ground until itreaches an increased VR and climbing at an increased V2, which equates to Vx (thespeed that will attain the maximum climb gradient).
2.7.1 Method of Use of Figure 4.15
a) Select the set of graphs appropriate to the flap setting on the “improved climbperformance field length limit” graph (Figure 4.15).
b) Enter the relevant left-hand graph with the value of the field length limit massminus the climb limit mass. Travel vertically up to the normal 'climb limit' massline.
c) From this intersection move horizontally left to the vertical axis to read the climbmass improvement and horizontally right to the vertical axis to read the increase toapply to V1.
d) Continue horizontally right to the reference line of the right-hand graph. From thispoint interpolate and follow the grid lines to reach a vertical input in the right-handgraph of the normal climb limit mass.
e) From this intersection, travel horizontally right to the vertical axis to read theincrease to apply to VR and V2.
f) Repeat this process in the improved climb performance tyre speed limit graph(Figure 4.16) except that the initial entry point is the tyre limit mass minus the climblimit mass.
g) The lower of the two mass increases is that which must be used together with itsassociated speed increases.
h) Add the mass increase to the normal climb mass limit.
i) Determine the V speeds for this increased mass.
j) Apply the speed increases to the appropriate speeds. Check VMBE.
Section 4 - MRJT1 Page 28July 2006
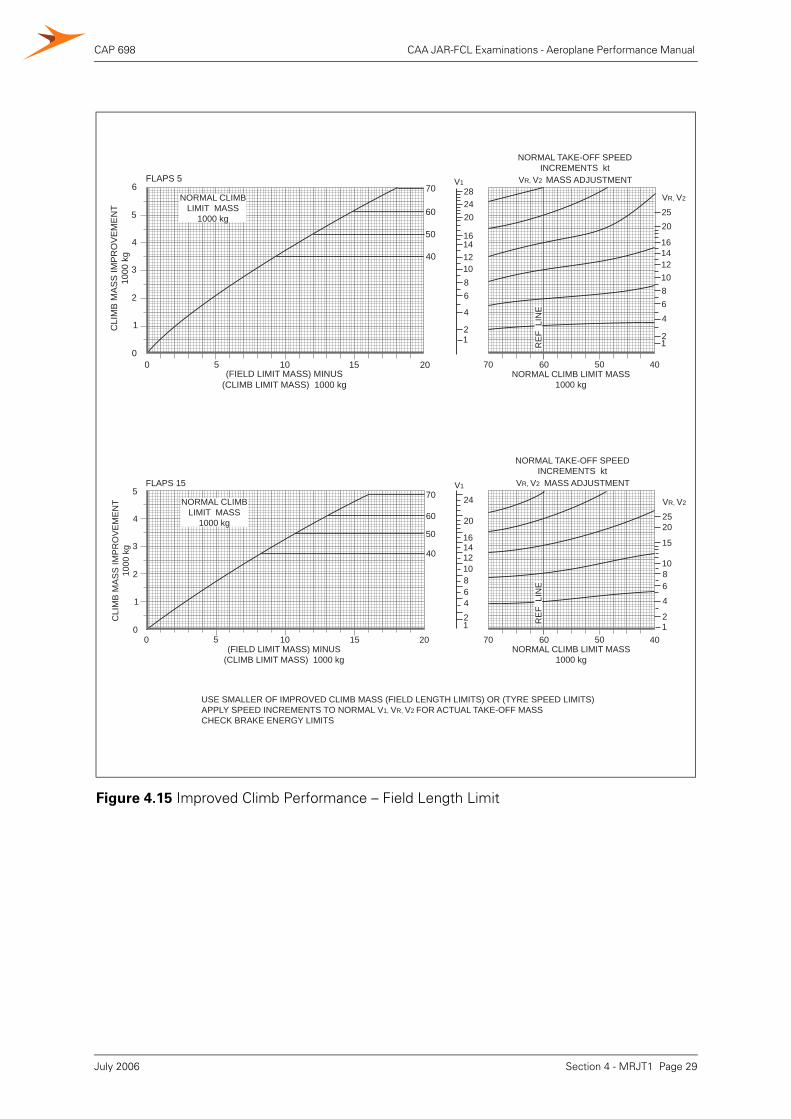
CAP 698 CAA JAR-FCL Examinations - Aeroplane Performance Manual
Figure 4.15 Improved Climb Performance – Field Length Limit
10121416
86421
20
24
2520
15
1086
4
21
70
60
50
40
FLAPS 15
FLAPS 5
1
2
3
4
5
0
CLI
MB
MA
SS
IMP
RO
VE
ME
NT
1000
kg
1
2
3
4
5
0
6
CLI
MB
MA
SS
IMP
RO
VE
ME
NT
1000
kg
20151050(FIELD LIMIT MASS) MINUS
(CLIMB LIMIT MASS) 1000 kg
20151050(FIELD LIMIT MASS) MINUS
(CLIMB LIMIT MASS) 1000 kg
70 60 50 40NORMAL CLIMB LIMIT MASS
1000 kg
NORMAL CLIMB LIMIT MASS1000 kg
70 60 50 40
VR, V2
2520
1086
4
21
VR, V2
6810121416
202428
4
21
70
60
50
40 1416
12
USE SMALLER OF IMPROVED CLIMB MASS (FIELD LENGTH LIMITS) OR (TYRE SPEED LIMITS)APPLY SPEED INCREMENTS TO NORMAL V1, VR, V2 FOR ACTUAL TAKE-OFF MASSCHECK BRAKE ENERGY LIMITS
RE
F L
INE
RE
F L
INE
NORMAL CLIMBLIMIT MASS
1000 kg
V1
V1 VR, V2 MASS ADJUSTMENT
NORMAL TAKE-OFF SPEEDINCREMENTS kt
VR, V2 MASS ADJUSTMENT
NORMAL TAKE-OFF SPEEDINCREMENTS kt
NORMAL CLIMBLIMIT MASS
1000 kg
Section 4 - MRJT1 Page 29July 2006
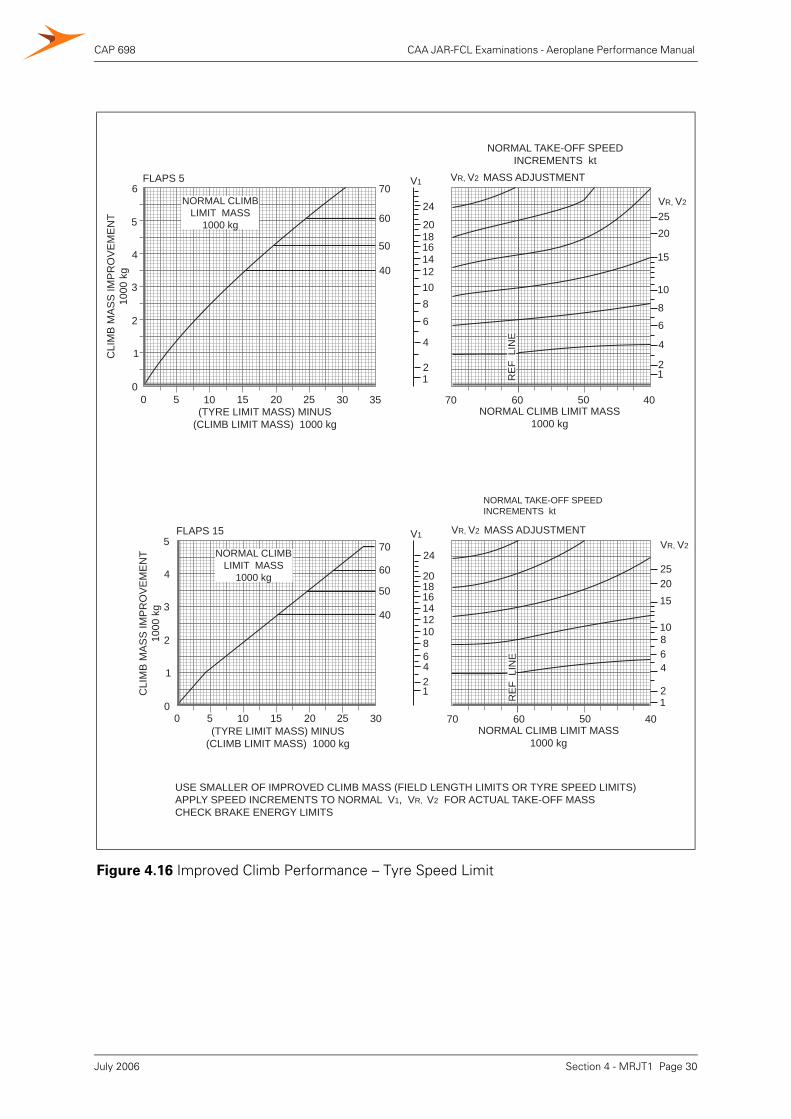
CAP 698 CAA JAR-FCL Examinations - Aeroplane Performance Manual
Figure 4.16 Improved Climb Performance – Tyre Speed Limit
10121416
86421
20
24
V1
18
252015
10864
21
VR, V2
10121416
8
6
4
21
20
24
V1
18
2520
15
10
8
6
4
21
VR, V2
70
60
50
40
70
60
50
40
NORMAL TAKE-OFF SPEEDINCREMENTS kt
VR, V2 MASS ADJUSTMENT
70 60 50 40NORMAL CLIMB LIMIT MASS
1000 kg
VR, V2 MASS ADJUSTMENT
NORMAL CLIMB LIMIT MASS1000 kg
70 60 50 40
FLAPS 5
1
2
3
4
5
0
6
CLI
MB
MA
SS
IMP
RO
VE
ME
NT
1000
kg
FLAPS 15
1
2
3
4
5
0
CLI
MB
MA
SS
IMP
RO
VE
ME
NT
1000
kg
(TYRE LIMIT MASS) MINUS(CLIMB LIMIT MASS) 1000 kg
0 5 10 15 20 25 30 35
0 5 10 15 20 25 30(TYRE LIMIT MASS) MINUS
(CLIMB LIMIT MASS) 1000 kg
NORMAL TAKE-OFF SPEEDINCREMENTS kt
USE SMALLER OF IMPROVED CLIMB MASS (FIELD LENGTH LIMITS OR TYRE SPEED LIMITS)APPLY SPEED INCREMENTS TO NORMAL V1, VR, V2 FOR ACTUAL TAKE-OFF MASSCHECK BRAKE ENERGY LIMITS
RE
F L
INE
RE
F L
INE
NORMAL CLIMBLIMIT MASS
1000 kg
NORMAL CLIMBLIMIT MASS
1000 kg
Section 4 - MRJT1 Page 30July 2006
CAP 698 CAA JAR-FCL Examinations - Aeroplane Performance Manual
2.8 Reduced Thrust Take-Off
The reduced thrust take-off procedure is referred to by a number of different namessuch as the 'Variable Thrust Take-Off' or the 'Assumed Temperature Take-Off'. It is atechnique employed to preserve engine life or reduce the noise generated at take-off.
This technique can only be used when the available distance greatly exceeds thatwhich is required. The maximum reduction in thrust permitted is 25% of that requiredfor a normal take-off.
2.8.1 Restrictions
A reduced thrust take-off is not permitted with:
• icy or very slippery runways
• contaminated runways
• anti-skid unserviceable
• reverse thrust unserviceable
• increased V2 procedure
• the PMC off.
2.8.2 Calculation Procedure
It is first necessary to determine the most limiting performance condition. The onlycommon parameter to enable comparison is that of temperature. Thus the maximumpermissible temperature must be calculated for the actual take-off mass from each ofthe following:
• field limit graph
• climb limit graph
• tyre-speed limit graph
• obstacle limit graph
From these temperatures, select the lowest and ensure that it does not exceed theenvironmental limit. If it does, then the environmental limit becomes the assumedtemperature.
2.8.3 Chart Procedure
a) Calculate the maximum assumed temperature from Figure 4.17a or b, asappropriate. Enter the left column with the actual ambient temperature and readthe maximum temperature in the column appropriate to the aerodrome pressurealtitude.
b) From Figure 4.17c on bottom line, determine the minimum assumed temperaturefor the aerodrome pressure altitude.
c) From the same table, for the assumed temperature to be used, determine themaximum take-off % N1. Add 1.0% N1 if air conditioning packs are off. Theassumed temperature used must neither exceed the maximum from paragraph a)above or be below the minimum from paragraph b) above.
d) Enter the left column of Figure 4.17d with assumed temperature minus ambienttemperature. Travel right along the line to the column appropriate to the ambienttemperature, interpolating if necessary. Read the % N1 adjustment.
e) Subtract the value determined at paragraph d) from that at paragraph c) todetermine the % N1 to be set at take-off.
Section 4 - MRJT1 Page 31July 2006
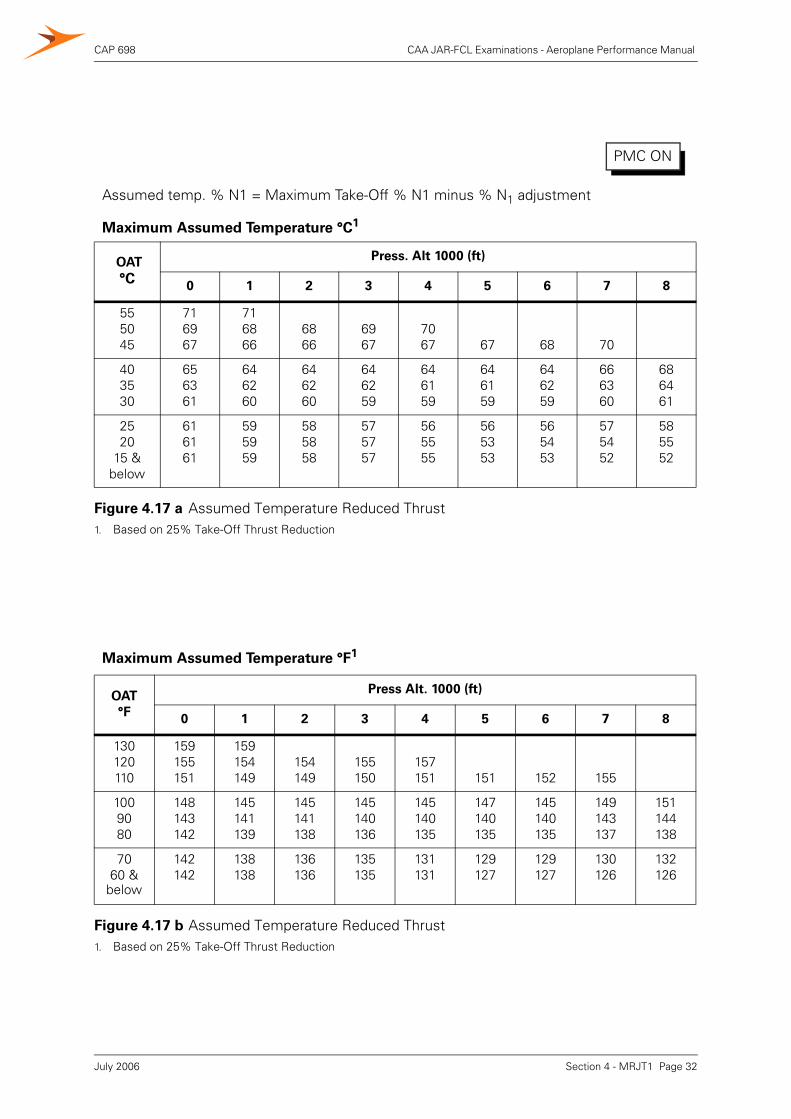
CAP 698 CAA JAR-FCL Examinations - Aeroplane Performance Manual
Assumed temp. % N1 = Maximum Take-Off % N1 minus % N1 adjustment
Maximum Assumed Temperature °C1
1. Based on 25% Take-Off Thrust Reduction
OAT
°C
Press. Alt 1000 (ft)
0 1 2 3 4 5 6 7 8
555045
716967
716866
6866
6967
7067 67 68 70
403530
656361
646260
646260
646259
646159
646159
646259
666360
686461
2520
15 &below
616161
595959
585858
575757
565555
565353
565453
575452
585552
Figure 4.17 a Assumed Temperature Reduced Thrust
Maximum Assumed Temperature °F1
1. Based on 25% Take-Off Thrust Reduction
OAT
°F
Press Alt. 1000 (ft)
0 1 2 3 4 5 6 7 8
130120110
159155151
159154149
154149
155150
157151 151 152 155
1009080
148143142
145141139
145141138
145140136
145140135
147140135
145140135
149143137
151144138
7060 &
below
142142
138138
136136
135135
131131
129127
129127
130126
132126
Figure 4.17 b Assumed Temperature Reduced Thrust
PMC ON
Section 4 - MRJT1 Page 32July 2006
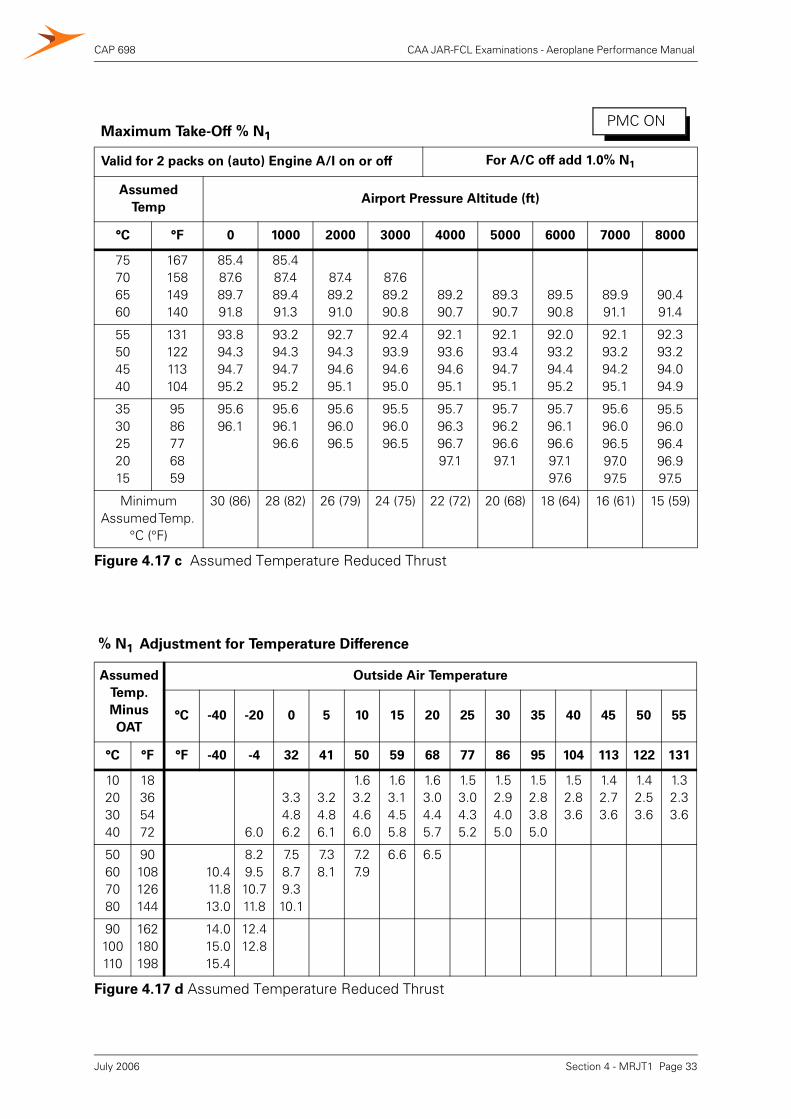
CAP 698 CAA JAR-FCL Examinations - Aeroplane Performance Manual
Maximum Take-Off % N1Valid for 2 packs on (auto) Engine A/I on or off For A/C off add 1.0% N1
Assumed
TempAirport Pressure Altitude (ft)
°C °F 0 1000 2000 3000 4000 5000 6000 7000 8000
75706560
167158149140
85.487.689.791.8
85.487.489.491.3
87.489.291.0
87.689.290.8
89.290.7
89.390.7
89.590.8
89.991.1
90.491.4
55504540
131122113104
93.894.394.795.2
93.294.394.795.2
92.794.394.695.1
92.493.994.695.0
92.193.694.695.1
92.193.494.795.1
92.093.294.495.2
92.193.294.295.1
92.393.294.094.9
3530252015
9586776859
95.696.1
95.696.196.6
95.696.096.5
95.596.096.5
95.796.396.797.1
95.796.296.697.1
95.796.196.697.197.6
95.696.096.597.097.5
95.596.096.496.997.5
Minimum Assumed Temp.
°C (°F)
30 (86) 28 (82) 26 (79) 24 (75) 22 (72) 20 (68) 18 (64) 16 (61) 15 (59)
Figure 4.17 c Assumed Temperature Reduced Thrust
% N1 Adjustment for Temperature Difference
Assumed
Temp.
Minus
OAT
Outside Air Temperature
°C -40 -20 0 5 10 15 20 25 30 35 40 45 50 55
°C °F °F -40 -4 32 41 50 59 68 77 86 95 104 113 122 131
10203040
18365472 6.0
3.34.86.2
3.24.86.1
1.63.24.66.0
1.63.14.55.8
1.63.04.45.7
1.53.04.35.2
1.52.94.05.0
1.52.83.85.0
1.52.83.6
1.42.73.6
1.42.53.6
1.32.33.6
50607080
90108126144
10.411.813.0
8.29.510.711.8
7.58.79.310.1
7.38.1
7.27.9
6.6 6.5
90100110
162180198
14.015.015.4
12.412.8
Figure 4.17 d Assumed Temperature Reduced Thrust
PMC ON
Section 4 - MRJT1 Page 33July 2006
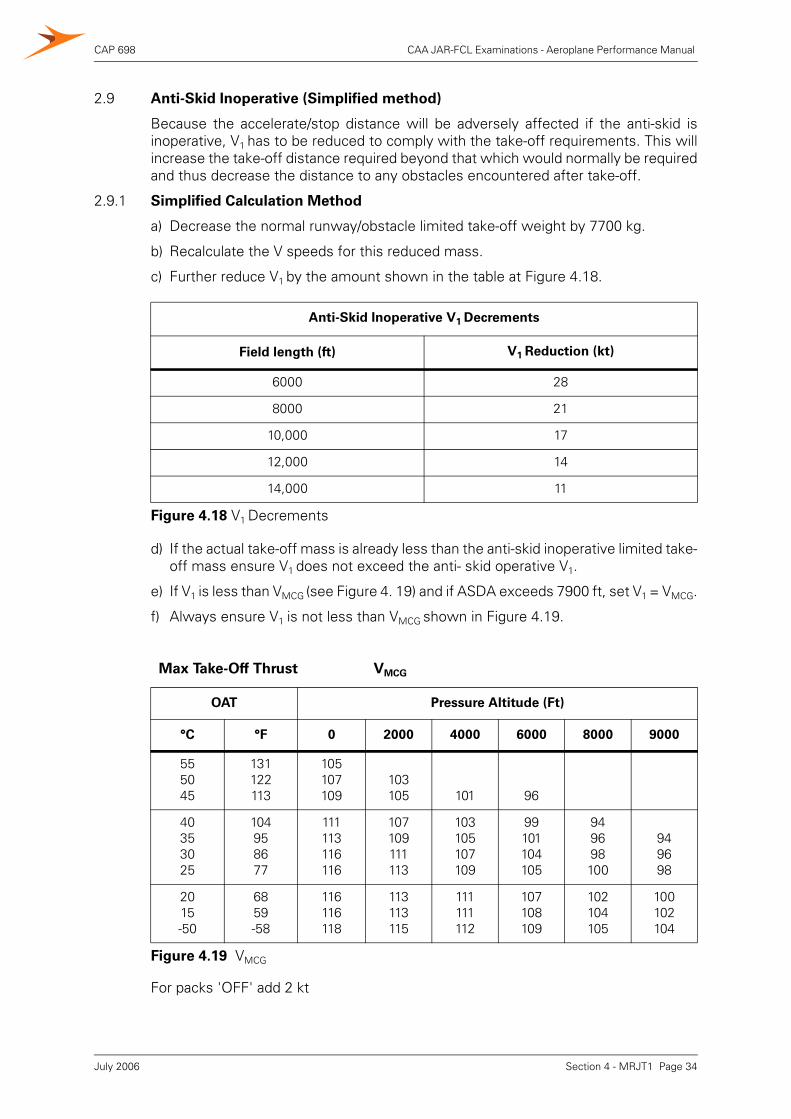
CAP 698 CAA JAR-FCL Examinations - Aeroplane Performance Manual
2.9 Anti-Skid Inoperative (Simplified method)
Because the accelerate/stop distance will be adversely affected if the anti-skid isinoperative, V1 has to be reduced to comply with the take-off requirements. This willincrease the take-off distance required beyond that which would normally be requiredand thus decrease the distance to any obstacles encountered after take-off.
2.9.1 Simplified Calculation Method
a) Decrease the normal runway/obstacle limited take-off weight by 7700 kg.
b) Recalculate the V speeds for this reduced mass.
c) Further reduce V1 by the amount shown in the table at Figure 4.18.
d) If the actual take-off mass is already less than the anti-skid inoperative limited take-off mass ensure V1 does not exceed the anti- skid operative V1.
e) If V1 is less than VMCG (see Figure 4. 19) and if ASDA exceeds 7900 ft, set V1 = VMCG.
f) Always ensure V1 is not less than VMCG shown in Figure 4.19.
For packs 'OFF' add 2 kt
Anti-Skid Inoperative V1 Decrements
Field length (ft) V1 Reduction (kt)
6000 28
8000 21
10,000 17
12,000 14
14,000 11
Figure 4.18 V1 Decrements
Max Take-Off Thrust VMCG
OAT Pressure Altitude (Ft)
°C °F 0 2000 4000 6000 8000 9000
555045
131122113
105107109
103105 101 96
40353025
104958677
111113116116
107109111113
103105107109
99101104105
949698100
949698
2015-50
6859-58
116116118
113113115
111111112
107108109
102104105
100102104
Figure 4.19 VMCG
Section 4 - MRJT1 Page 34July 2006
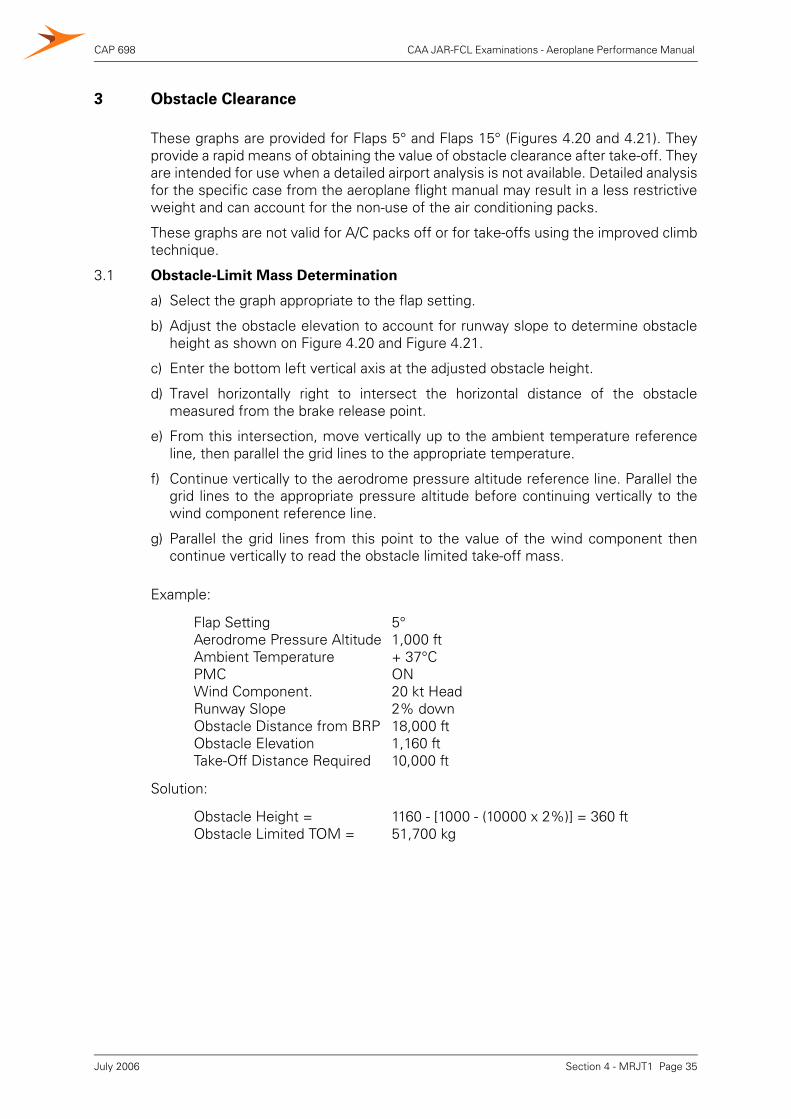
CAP 698 CAA JAR-FCL Examinations - Aeroplane Performance Manual
3 Obstacle Clearance
These graphs are provided for Flaps 5° and Flaps 15° (Figures 4.20 and 4.21). Theyprovide a rapid means of obtaining the value of obstacle clearance after take-off. Theyare intended for use when a detailed airport analysis is not available. Detailed analysisfor the specific case from the aeroplane flight manual may result in a less restrictiveweight and can account for the non-use of the air conditioning packs.
These graphs are not valid for A/C packs off or for take-offs using the improved climbtechnique.
3.1 Obstacle-Limit Mass Determination
a) Select the graph appropriate to the flap setting.
b) Adjust the obstacle elevation to account for runway slope to determine obstacleheight as shown on Figure 4.20 and Figure 4.21.
c) Enter the bottom left vertical axis at the adjusted obstacle height.
d) Travel horizontally right to intersect the horizontal distance of the obstaclemeasured from the brake release point.
e) From this intersection, move vertically up to the ambient temperature referenceline, then parallel the grid lines to the appropriate temperature.
f) Continue vertically to the aerodrome pressure altitude reference line. Parallel thegrid lines to the appropriate pressure altitude before continuing vertically to thewind component reference line.
g) Parallel the grid lines from this point to the value of the wind component thencontinue vertically to read the obstacle limited take-off mass.
Example:
Flap SettingAerodrome Pressure Altitude Ambient TemperaturePMCWind Component.Runway SlopeObstacle Distance from BRPObstacle Elevation Take-Off Distance Required
5°1,000 ft+ 37°CON20 kt Head2% down18,000 ft1,160 ft10,000 ft
Solution:
Obstacle Height = Obstacle Limited TOM =
1160 - [1000 - (10000 x 2%)] = 360 ft51,700 kg
Section 4 - MRJT1 Page 35July 2006
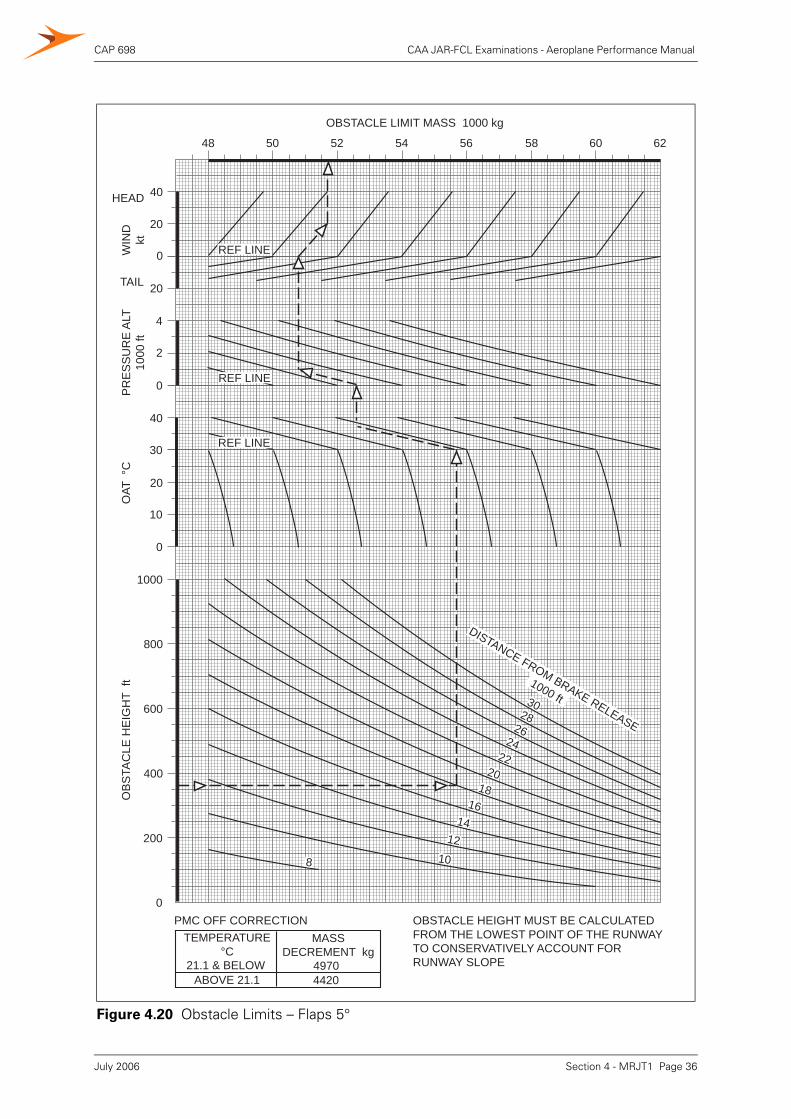
CAP 698 CAA JAR-FCL Examinations - Aeroplane Performance Manual
Figure 4.20 Obstacle Limits – Flaps 5°
REF LINE
REF LINE
REF LINE
40
20
0
20
4
2
0
40
30
20
10
0
1000
800
600
400
200
0
HEAD
TAIL
WIN
Dkt
PR
ES
SU
RE
ALT
1000
ftO
BS
TAC
LE H
EIG
HT
ftO
AT °
C
30
OBSTACLE HEIGHT MUST BE CALCULATED FROM THE LOWEST POINT OF THE RUNWAYTO CONSERVATIVELY ACCOUNT FOR RUNWAY SLOPE
MASSDECREMENT kg
49704420ABOVE 21.1
TEMPERATURE°C
21.1 & BELOW
PMC OFF CORRECTION
DISTANCE FROM BRAKE RELEASE
1000 ft28
2624
2220
1816
1412
108
48 50
OBSTACLE LIMIT MASS 1000 kg
52 54 56 58 60 62
Section 4 - MRJT1 Page 36July 2006
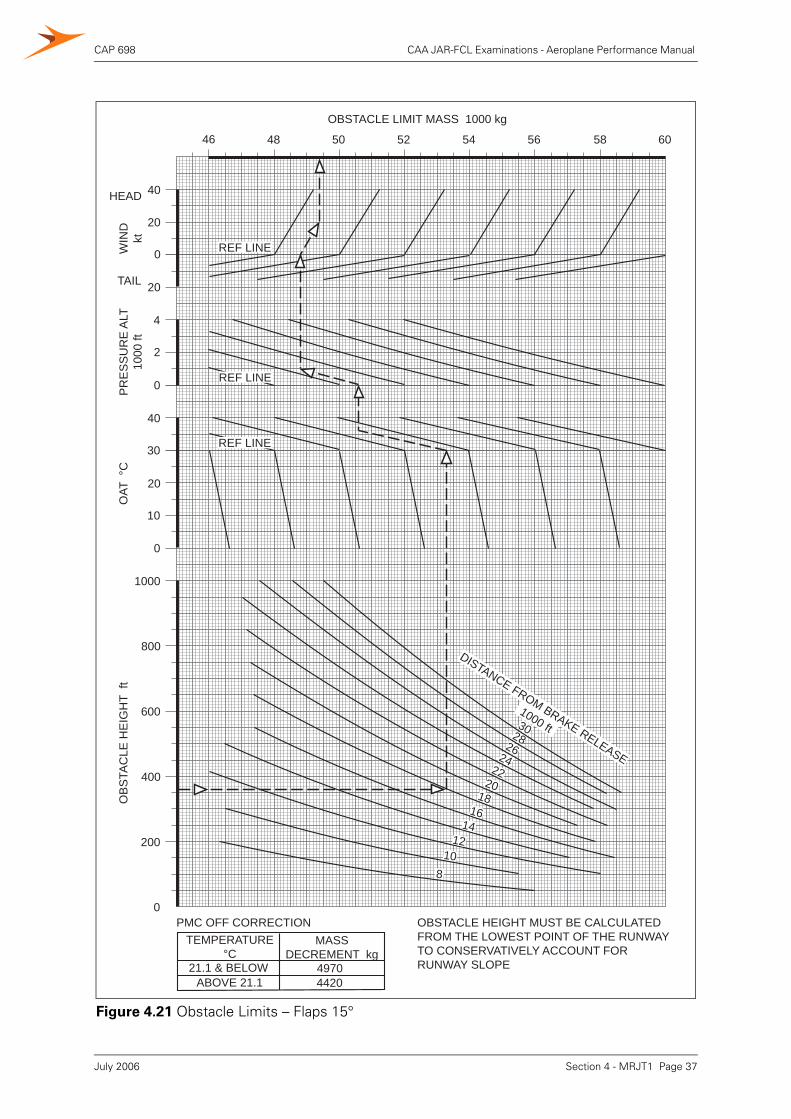
CAP 698 CAA JAR-FCL Examinations - Aeroplane Performance Manual
Figure 4.21 Obstacle Limits – Flaps 15°
40
20
0
20
4
2
0
40
30
20
10
0
1000
800
600
400
200
0
HEAD
TAIL
WIN
Dkt
PR
ES
SU
RE
ALT
1000
ftO
BS
TAC
LE H
EIG
HT
ftO
AT °
COBSTACLE LIMIT MASS 1000 kg
48 50 52 54 56 58 6046
30282624
2220
1816
1412
10
DISTANCE FROM BRAKE RELEASE
1000 ft
REF LINE
REF LINE
REF LINE
8
OBSTACLE HEIGHT MUST BE CALCULATED FROM THE LOWEST POINT OF THE RUNWAYTO CONSERVATIVELY ACCOUNT FOR RUNWAY SLOPE
MASSDECREMENT kg
49704420ABOVE 21.1
TEMPERATURE°C
21.1 & BELOW
PMC OFF CORRECTION
Section 4 - MRJT1 Page 37July 2006
CAP 698 CAA JAR-FCL Examinations - Aeroplane Performance Manual
INTENTIONALLY LEFT BLANK
Section 4 - MRJT1 Page 38July 2006
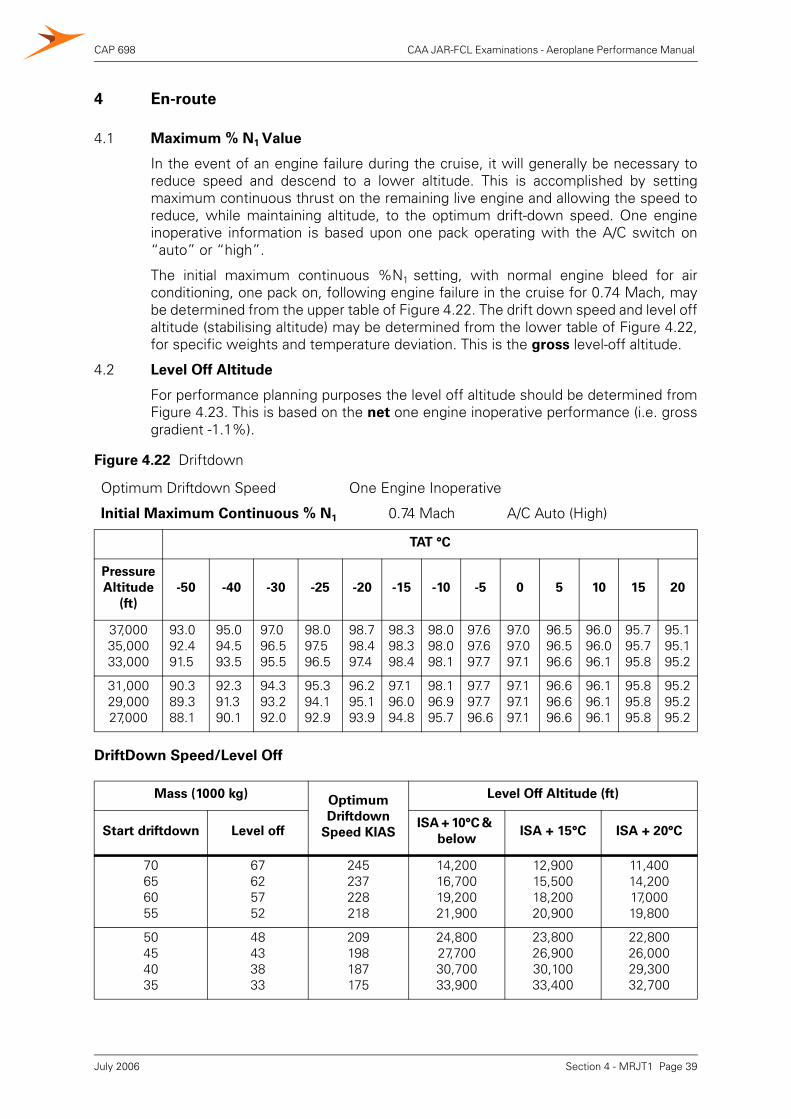
CAP 698 CAA JAR-FCL Examinations - Aeroplane Performance Manual
4 En-route
4.1 Maximum % N1 Value
In the event of an engine failure during the cruise, it will generally be necessary toreduce speed and descend to a lower altitude. This is accomplished by settingmaximum continuous thrust on the remaining live engine and allowing the speed toreduce, while maintaining altitude, to the optimum drift-down speed. One engineinoperative information is based upon one pack operating with the A/C switch on“auto” or “high”.
The initial maximum continuous %N1 setting, with normal engine bleed for airconditioning, one pack on, following engine failure in the cruise for 0.74 Mach, maybe determined from the upper table of Figure 4.22. The drift down speed and level offaltitude (stabilising altitude) may be determined from the lower table of Figure 4.22,for specific weights and temperature deviation. This is the gross level-off altitude.
4.2 Level Off Altitude
For performance planning purposes the level off altitude should be determined fromFigure 4.23. This is based on the net one engine inoperative performance (i.e. grossgradient -1.1%).
DriftDown Speed/Level Off
Figure 4.22 Driftdown
Optimum Driftdown Speed One Engine Inoperative
Initial Maximum Continuous % N1 0.74 Mach A/C Auto (High)
TAT °C
Pressure
Altitude
(ft)
-50 -40 -30 -25 -20 -15 -10 -5 0 5 10 15 20
37,00035,00033,000
93.092.491.5
95.094.593.5
97.096.595.5
98.097.596.5
98.798.497.4
98.398.398.4
98.098.098.1
97.697.697.7
97.097.097.1
96.596.596.6
96.096.096.1
95.795.795.8
95.195.195.2
31,00029,00027,000
90.389.388.1
92.391.390.1
94.393.292.0
95.394.192.9
96.295.193.9
97.196.094.8
98.196.995.7
97.797.796.6
97.197.197.1
96.696.696.6
96.196.196.1
95.895.895.8
95.2 95.2 95.2
Mass (1000 kg)Optimum
Driftdown
Speed KIAS
Level Off Altitude (ft)
Start driftdown Level offISA + 10°C &
belowISA + 15°C ISA + 20°C
70656055
67625752
245237228218
14,20016,70019,20021,900
12,90015,50018,20020,900
11,40014,20017,00019,800
50454035
48433833
209198187175
24,80027,70030,70033,900
23,80026,90030,10033,400
22,80026,00029,30032,700
Section 4 - MRJT1 Page 39July 2006
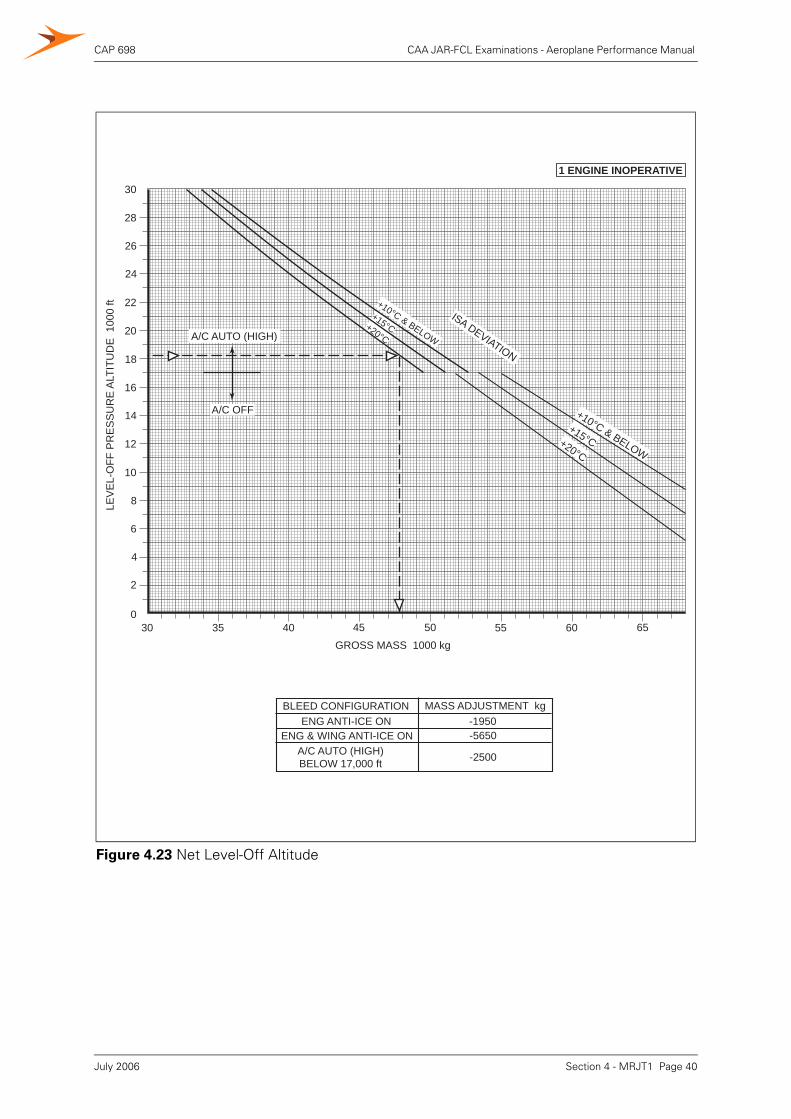
CAP 698 CAA JAR-FCL Examinations - Aeroplane Performance Manual
Figure 4.23 Net Level-Off Altitude
30
28
26
24
22
20
18
16
14
12
10
8
6
4
2
0
LEV
EL-
OFF
PR
ES
SU
RE
ALT
ITU
DE
100
0 ft
A/C AUTO (HIGH)
A/C OFF
ISA DEVIATION
+10°C & BELOW
+15°C+20°C
+10°C & BELOW
+15°C+20°C
30 35 40 45 5550 60 65
GROSS MASS 1000 kg
BLEED CONFIGURATION MASS ADJUSTMENT kgENG ANTI-ICE ON
ENG & WING ANTI-ICE ONA/C AUTO (HIGH)BELOW 17,000 ft
-1950-5650
-2500
1 ENGINE INOPERATIVE
Section 4 - MRJT1 Page 40July 2006
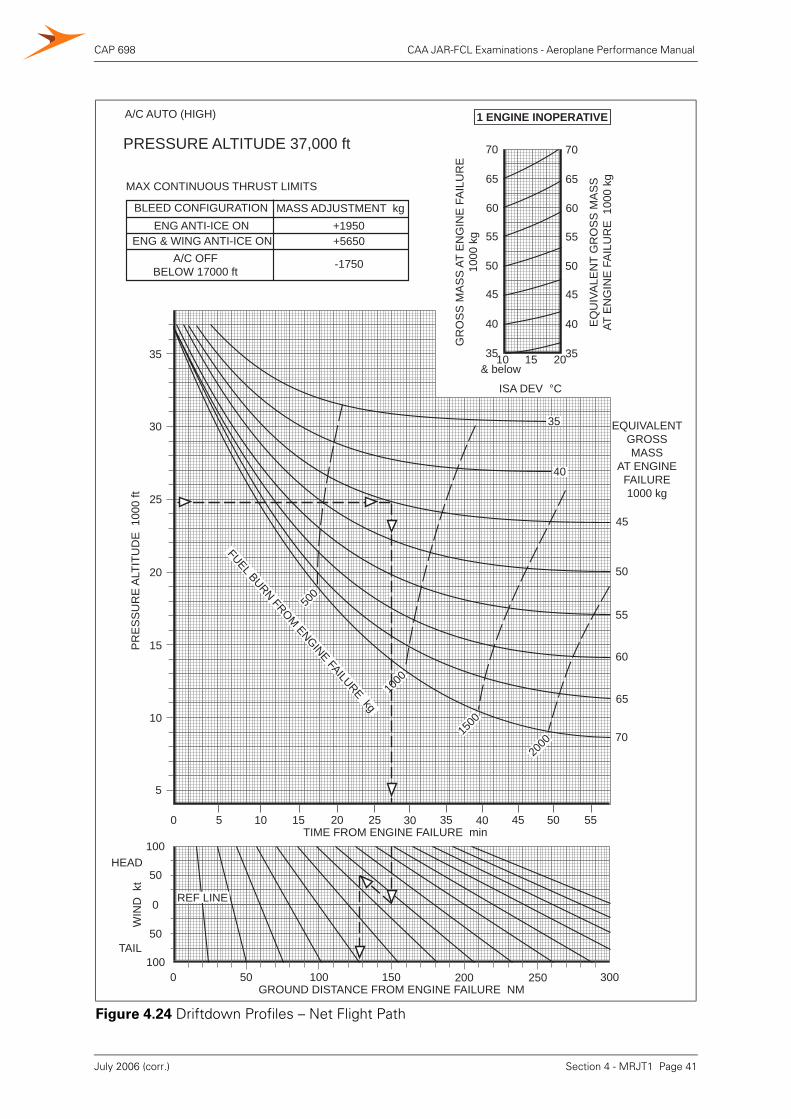
CAP 698 CAA JAR-FCL Examinations - Aeroplane Performance Manual
Figure 4.24 Driftdown Profiles – Net Flight Path
70
65
60
55
50
45
40
35
45
50
55
60
65
70
EQUIVALENTGROSSMASS
AT ENGINEFAILURE1000 kg
35
30
25
20
15
10
5
PR
ES
SU
RE
ALT
ITU
DE
100
0 ft
10 15 20
ISA DEV °C
EQ
UIV
ALE
NT
GR
OS
S M
AS
SAT
EN
GIN
E F
AIL
UR
E 1
000
kg
& below
70
65
60
55
50
45
40
35
A/C AUTO (HIGH)
GROUND DISTANCE FROM ENGINE FAILURE NM0 50 100 150 200 250 300
GR
OS
S M
AS
S A
T E
NG
INE
FA
ILU
RE
1000
kg
WIN
D k
t
50
0
50
100
REF LINE
0 5 10 15 20 25 30 35 40 45 50 55TIME FROM ENGINE FAILURE min
FUEL BURN FROM ENGINE FAILURE kg
1000
1500
2000
500
40
35
BLEED CONFIGURATION MASS ADJUSTMENT kgENG ANTI-ICE ON
ENG & WING ANTI-ICE ONA/C OFF
BELOW 17000 ft
+1950+5650
-1750
MAX CONTINUOUS THRUST LIMITS
1 ENGINE INOPERATIVE
PRESSURE ALTITUDE 37,000 ft
100
HEAD
TAIL
Section 4 - MRJT1 Page 41July 2006 (corr.)
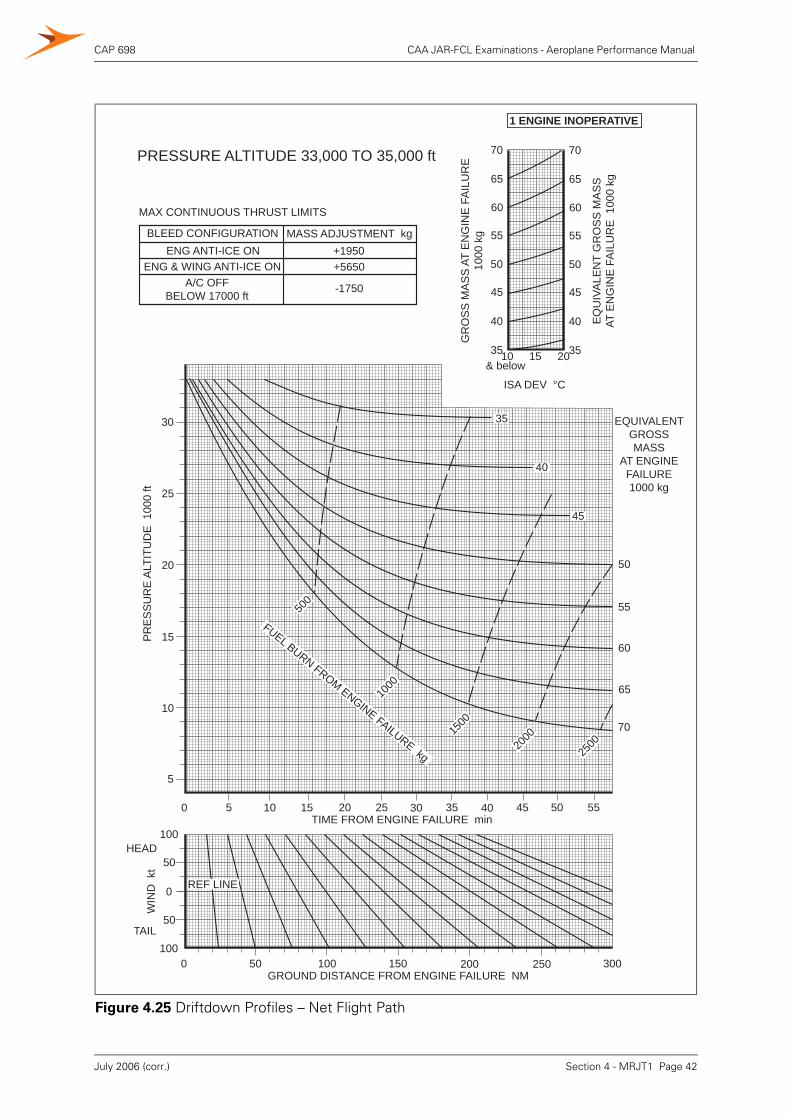
CAP 698 CAA JAR-FCL Examinations - Aeroplane Performance Manual
Figure 4.25 Driftdown Profiles – Net Flight Path
30
25
20
15
10
5
70
65
60
55
50
45
40
35
50
55
60
65
70
EQUIVALENTGROSSMASS
AT ENGINEFAILURE1000 kg
PR
ES
SU
RE
ALT
ITU
DE
100
0 ft
10 15 20
ISA DEV °C
EQ
UIV
ALE
NT
GR
OS
S M
AS
SAT
EN
GIN
E F
AIL
UR
E 1
000
kg
& below
70
65
60
55
50
45
40
35
GROUND DISTANCE FROM ENGINE FAILURE NM0 50 100 150 200 250 300
GR
OS
S M
AS
S A
T E
NG
INE
FA
ILU
RE
1000
kg
0 REF LINE
0 5 10 15 20 25 30 35 40 45 50 55TIME FROM ENGINE FAILURE min
1 ENGINE INOPERATIVE
FUEL BURN FROM ENGINE FAILURE kg
1000
1500
2000
500
40
35
2500
45
BLEED CONFIGURATION MASS ADJUSTMENT kgENG ANTI-ICE ON
ENG & WING ANTI-ICE ONA/C OFF
BELOW 17000 ft
+1950+5650
-1750
MAX CONTINUOUS THRUST LIMITS
PRESSURE ALTITUDE 33,000 TO 35,000 ftW
IND
kt
50
50
100
100
HEAD
TAIL
Section 4 - MRJT1 Page 42July 2006 (corr.)
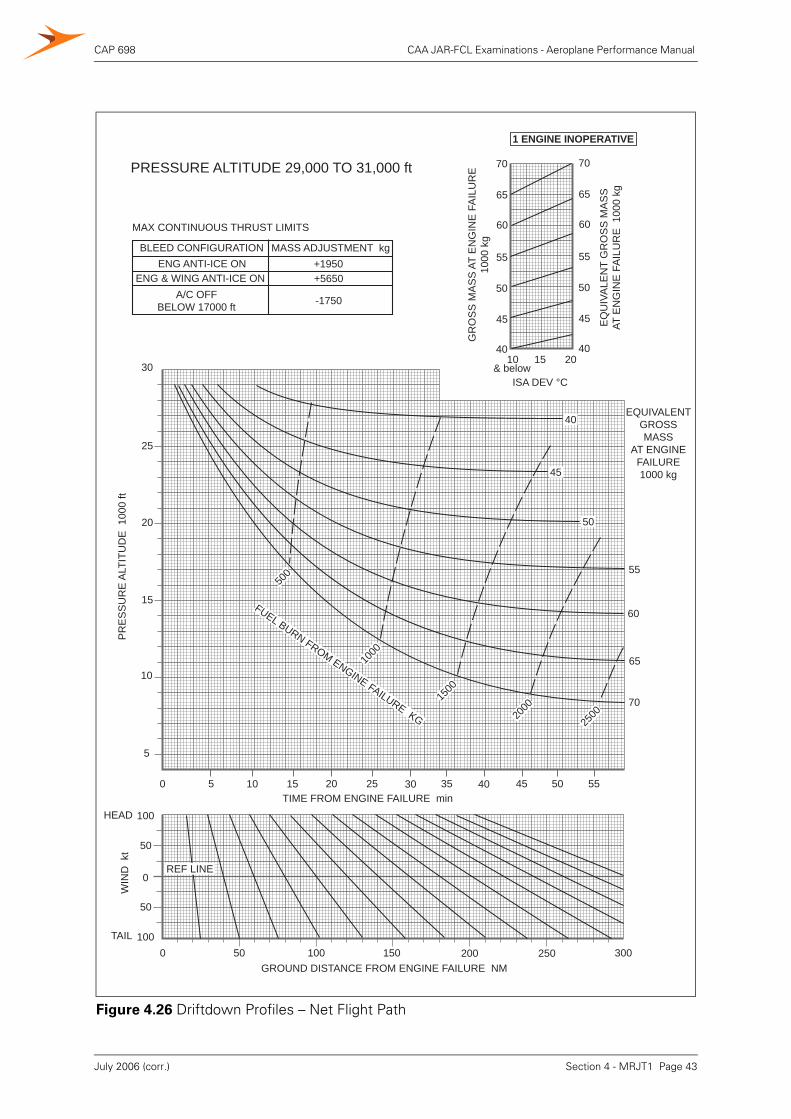
CAP 698 CAA JAR-FCL Examinations - Aeroplane Performance Manual
Figure 4.26 Driftdown Profiles – Net Flight Path
45
50
55
60
65
70
EQUIVALENTGROSSMASS
AT ENGINEFAILURE1000 kg
30
25
20
15
10
5
PR
ES
SU
RE
ALT
ITU
DE
100
0 ft
EQ
UIV
ALE
NT
GR
OS
S M
AS
SAT
EN
GIN
E F
AIL
UR
E 1
000
kg
10 15 20
ISA DEV °C& below
70
65
60
55
50
45
40
GROUND DISTANCE FROM ENGINE FAILURE NM0 50 100 150 200 250 300
GR
OS
S M
AS
S A
T E
NG
INE
FA
ILU
RE
1000
kg
REF LINE
WIN
D k
t
50
0
50
100HEAD
TAIL 100
40
70
65
60
55
50
45
40
1 ENGINE INOPERATIVE
BLEED CONFIGURATION MASS ADJUSTMENT kgENG ANTI-ICE ON
ENG & WING ANTI-ICE ONA/C OFF
BELOW 17000 ft
+1950+5650
-1750
MAX CONTINUOUS THRUST LIMITS
PRESSURE ALTITUDE 29,000 TO 31,000 ft
0 5 10 15 20 25 30 35 40 45 50 55TIME FROM ENGINE FAILURE min
FUEL BURN FROM ENGINE FAILURE KG
1000
1500
2000
500
2500
Section 4 - MRJT1 Page 43July 2006 (corr.)
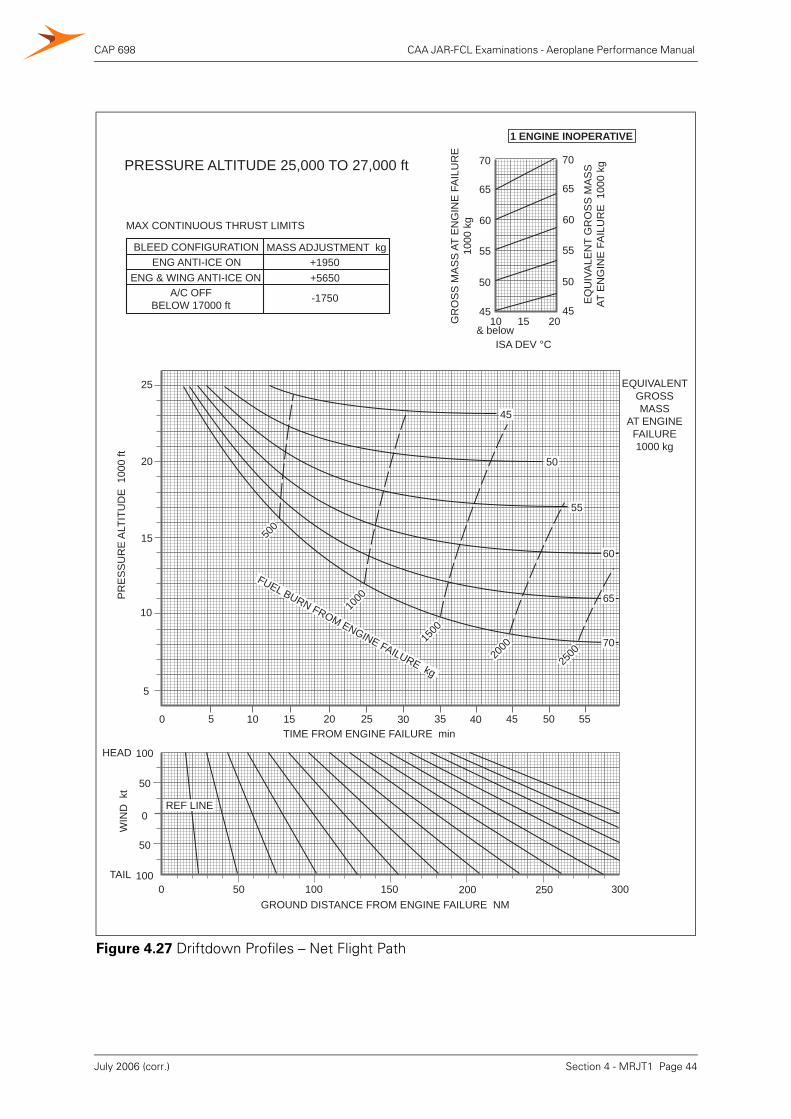
CAP 698 CAA JAR-FCL Examinations - Aeroplane Performance Manual
Figure 4.27 Driftdown Profiles – Net Flight Path
0 5 10 15 20 25 30 35 40 45 50 55TIME FROM ENGINE FAILURE min
GROUND DISTANCE FROM ENGINE FAILURE NM0 50 100 150 200 250 300
WIN
D k
t
50
0
50
100HEAD
TAIL 100
REF LINE
EQ
UIV
ALE
NT
GR
OS
S M
AS
SAT
EN
GIN
E F
AIL
UR
E 1
000
kg
10 15 20
ISA DEV °C& below
70
65
60
55
50
45
GR
OS
S M
AS
S A
T E
NG
INE
FA
ILU
RE
1000
kg
70
65
60
55
50
45
1 ENGINE INOPERATIVE
BLEED CONFIGURATION MASS ADJUSTMENT kgENG ANTI-ICE ON
ENG & WING ANTI-ICE ONA/C OFF
BELOW 17000 ft
+1950+5650
-1750
MAX CONTINUOUS THRUST LIMITS
PRESSURE ALTITUDE 25,000 TO 27,000 ft
25
20
15
10
5
PR
ES
SU
RE
ALT
ITU
DE
100
0 ft
45
50
55
FUEL BURN FROM ENGINE FAILURE kg
1000
1500
2000
500
2500
EQUIVALENTGROSSMASS
AT ENGINEFAILURE1000 kg
60
65
70
Section 4 - MRJT1 Page 44July 2006 (corr.)
CAP 698 CAA JAR-FCL Examinations - Aeroplane Performance Manual
5 Landing
5.1 Landing Performance
The landing performance calculations are divided into two elements.
a) The field length limited landing mass can be determined from Figure 4.28.
b) The landing 'climb limit' (Figure 4.29). This mass ensures the minimum permissiblegradient is obtained and should be corrected in accordance with the statementsbeneath the graph.
c) The maximum landing mass is the lower of a), and b) and the structural limit.
5.2 Quick Turnaround Limit
The maximum permissible landing mass for a quick turnaround can be determinedfrom Figure 4.30. The masses are tabulated for aerodrome pressure altitude andambient temperature and should be adjusted in accordance with the statement belowthe tables for runway slope and wind component. If the landing mass exceeds thisvalue then, after 53 minutes, check the wheel thermal plugs have not melted beforecommencing a take-off.
Example 1
Given: Aerodrome Pressure AltitudeAerodrome OATWind ComponentRunway ConditionFlap SettingAnti-skid SystemSpoilersAir ConditioningIcing
2000 ft+33 °C20 kt HeadWet30°InoperativeAutomaticAutoNone forecast
Solution:Figure 4.28:Figure 4.29:
Field length limited landing massClimb limited landing massStructural limited landing mass
46,800 kg60,400 kg54,900 kg
Therefore Maximum Landing Mass 46,800 kg
Section 4 - MRJT1 Page 45July 2006
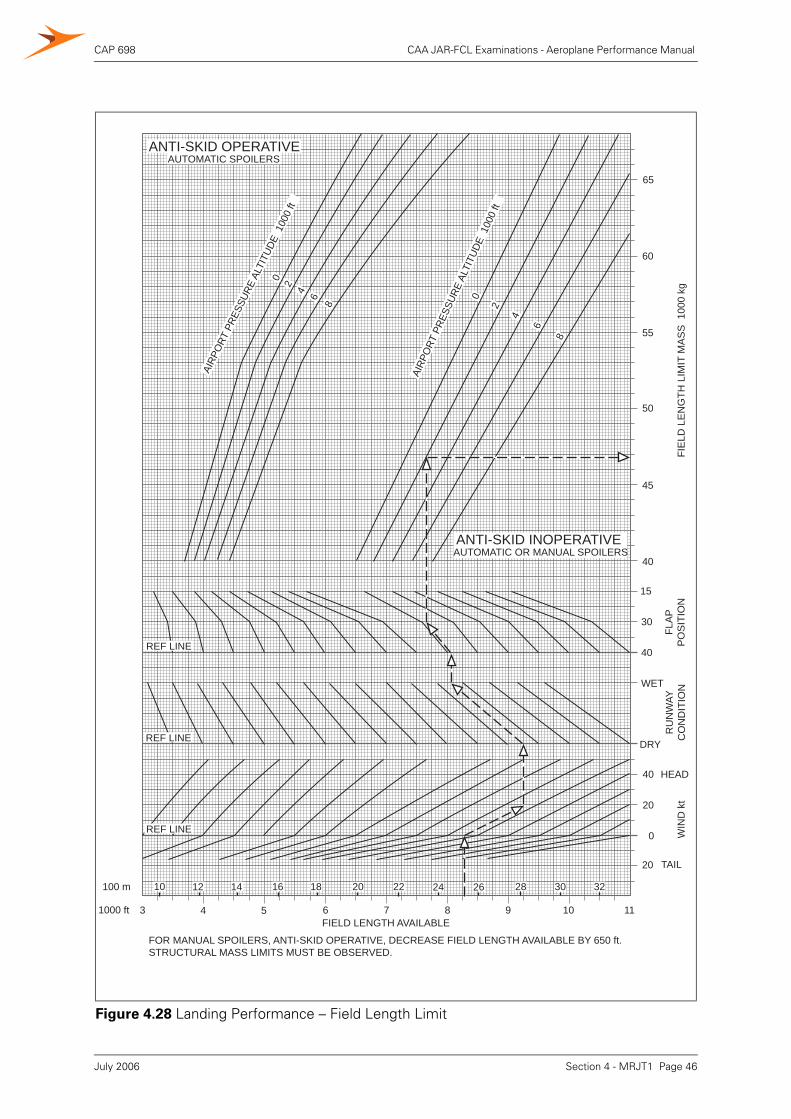
CAP 698 CAA JAR-FCL Examinations - Aeroplane Performance Manual
Figure 4.28 Landing Performance – Field Length Limit
ANTI-SKID OPERATIVEAUTOMATIC SPOILERS
ANTI-SKID INOPERATIVEAUTOMATIC OR MANUAL SPOILERS
REF LINE
REF LINE
REF LINE
AIRP
ORT
PRE
SSUR
E AL
TITU
DE 1
000
ft
AIRP
ORT
PRE
SSUR
E AL
TITU
DE 1
000
ft
0
2
4
6
8
0 2 4 68
10 12 14 16 18 20 22 24 26 28 30 32100 m
FIELD LENGTH AVAILABLE3 4 5 6 7 8 9 10 111000 ft
20
0
20
40 HEAD
TAIL
WIN
D k
tR
UN
WAY
CO
ND
ITIO
NWET
DRY
FLA
PP
OS
ITIO
N
15
30
40
40
45
50
55
60
65
FIE
LD L
EN
GTH
LIM
IT M
AS
S 1
000
kg
FOR MANUAL SPOILERS, ANTI-SKID OPERATIVE, DECREASE FIELD LENGTH AVAILABLE BY 650 ft.STRUCTURAL MASS LIMITS MUST BE OBSERVED.
Section 4 - MRJT1 Page 46July 2006
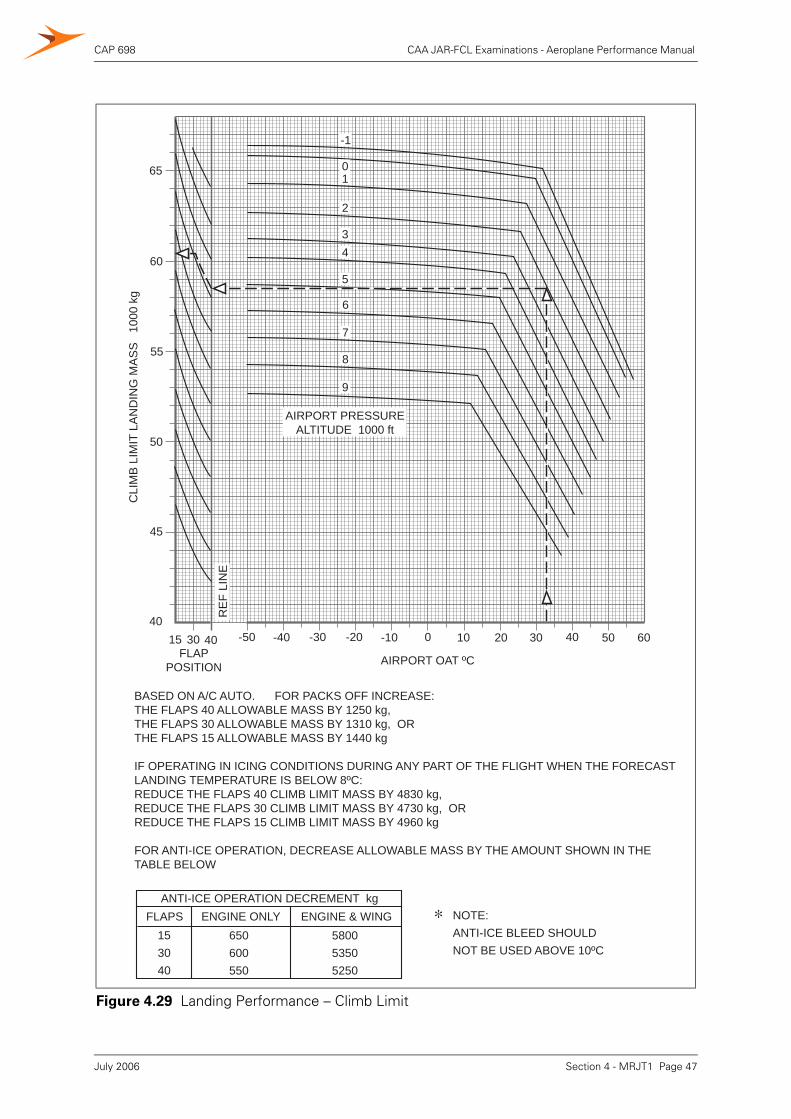
CAP 698 CAA JAR-FCL Examinations - Aeroplane Performance Manual
Figure 4.29 Landing Performance – Climb Limit
15 30 40FLAP
POSITION
-50 -40 -30 -20 -10 0 10 20 30 40 50 60
AIRPORT OAT ºC
40
45
50
55
60
65
CLI
MB
LIM
IT L
AN
DIN
G M
AS
S
1000
kg
RE
F LI
NE
AIRPORT PRESSUREALTITUDE 1000 ft
9
8
7
6
5
43
2
10
-1
BASED ON A/C AUTO. FOR PACKS OFF INCREASE:THE FLAPS 40 ALLOWABLE MASS BY 1250 kg,THE FLAPS 30 ALLOWABLE MASS BY 1310 kg, ORTHE FLAPS 15 ALLOWABLE MASS BY 1440 kg
IF OPERATING IN ICING CONDITIONS DURING ANY PART OF THE FLIGHT WHEN THE FORECASTLANDING TEMPERATURE IS BELOW 8ºC:REDUCE THE FLAPS 40 CLIMB LIMIT MASS BY 4830 kg,REDUCE THE FLAPS 30 CLIMB LIMIT MASS BY 4730 kg, ORREDUCE THE FLAPS 15 CLIMB LIMIT MASS BY 4960 kg
FOR ANTI-ICE OPERATION, DECREASE ALLOWABLE MASS BY THE AMOUNT SHOWN IN THETABLE BELOW
FLAPS ENGINE ONLY ENGINE & WINGANTI-ICE OPERATION DECREMENT kg
153040
650600550
580053505250
NOTE:ANTI-ICE BLEED SHOULDNOT BE USED ABOVE 10ºC
∗
Section 4 - MRJT1 Page 47July 2006
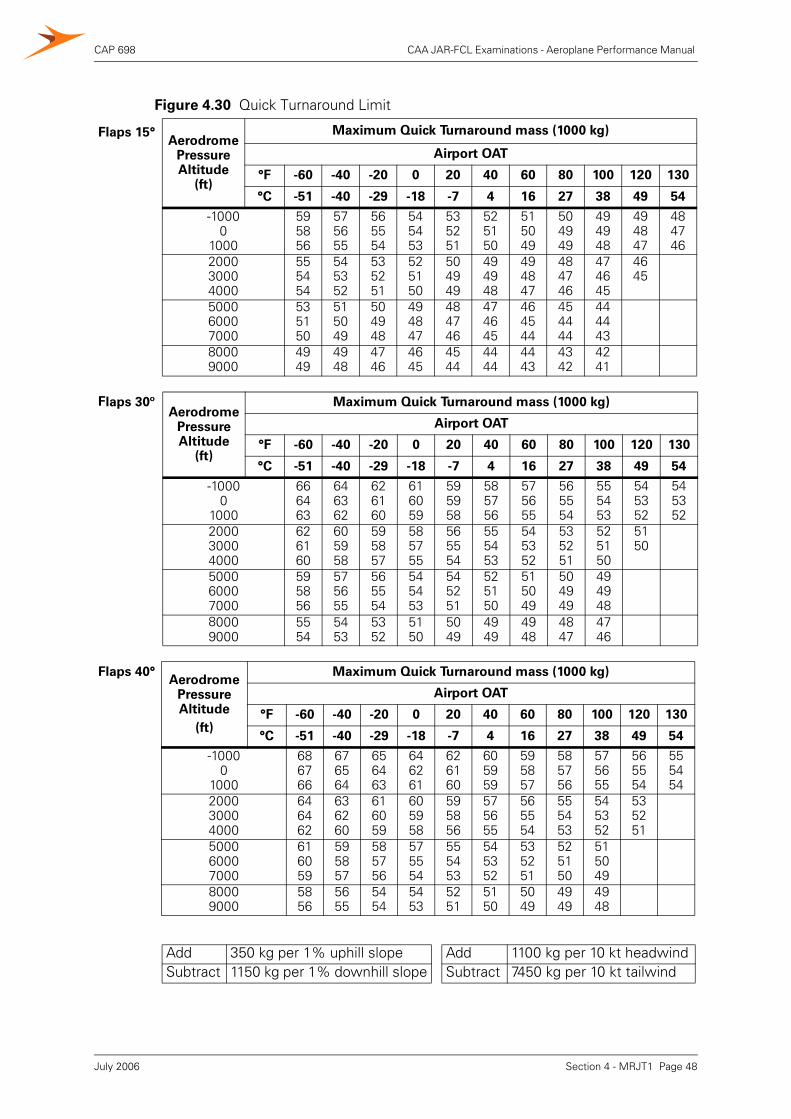
CAP 698 CAA JAR-FCL Examinations - Aeroplane Performance Manual
Figure 4.30 Quick Turnaround Limit
Flaps 15°Aerodrome
Pressure Altitude
(ft)
Maximum Quick Turnaround mass (1000 kg)
Airport OAT
°F -60 -40 -20 0 20 40 60 80 100 120 130
°C -51 -40 -29 -18 -7 4 16 27 38 49 54
-10000
1000
595856
575655
565554
545453
535251
525150
515049
504949
494948
494847
484746
200030004000
555454
545352
535251
525150
504949
494948
494847
484746
474645
4645
500060007000
535150
515049
504948
494847
484746
474645
464544
454444
444443
80009000
4949
4948
4746
4645
4544
4444
4443
4342
4241
Flaps 30ºAerodrome
Pressure Altitude
(ft)
Maximum Quick Turnaround mass (1000 kg)
Airport OAT
°F -60 -40 -20 0 20 40 60 80 100 120 130
°C -51 -40 -29 -18 -7 4 16 27 38 49 54
-10000
1000
666463
646362
626160
616059
595958
585756
575655
565554
555453
545352
545352
200030004000
626160
605958
595857
585755
565554
555453
545352
535251
525150
5150
500060007000
595856
575655
565554
545453
545251
525150
515049
504949
494948
80009000
5554
5453
5352
5150
5049
4949
4948
4847
4746
Flaps 40°Aerodrome
Pressure Altitude
(ft)
Maximum Quick Turnaround mass (1000 kg)
Airport OAT
°F -60 -40 -20 0 20 40 60 80 100 120 130
°C -51 -40 -29 -18 -7 4 16 27 38 49 54
-10000
1000
686766
676564
656463
646261
626160
605959
595857
585756
575655
565554
555454
200030004000
646462
636260
616059
605958
595856
575655
565554
555453
545352
535251
500060007000
616059
595857
585756
575554
555453
545352
535251
525150
515049
80009000
5856
5655
5454
5453
5251
5150
5049
4949
4948
Add 350 kg per 1% uphill slope Add 1100 kg per 10 kt headwindSubtract 1150 kg per 1% downhill slope Subtract 7450 kg per 10 kt tailwind
Section 4 - MRJT1 Page 48July 2006
CAP 698 CAA JAR-FCL Examinations - Aeroplane Performance Manual
5.3 Brake Cooling Schedule
The graph at Figure 4.31 provides advisory information to enable the operator to avoidbrake overheat problems. The chart enables due allowance to be made for a singlestop and, by using the graph as indicated, provides advice on the procedure to beadopted and the minimum cooling time. Separate sub-graphs are provided fordetermining the stop distance with manual braking.
5.3.1 Method of Use of the “Brake Cooling Schedule” Graph (Figure 4.31)
5.3.1.1 Abandoned Take-Off
a) Enter the top left vertical axis at the Regulated Take-Off Mass and travelhorizontally right to V1 minus 50% of headwind or plus 150% of tailwind.
b) From this intersection, drop vertically to the first reference line then follow thegridlines to correct for Pressure Altitude and OAT.
c) From this intersection continue vertically downward to read the Brake Energy perBrake in millions of foot pounds.
d) To this value add one million foot pounds for each taxi mile to obtain the totalenergy.
e) From the value of the total energy continue vertically downward to determine theadvised cooling schedule and recommended cooling time.
5.3.1.2 Landing
a) Enter the left vertical axis at the estimated landing mass and travel horizontallyright to a speed of (VREF - 3) kt corrected for wind component minus 50% of aheadwind or plus 150% for a tailwind.
b) From this intersection, drop vertically to the first reference line then follow thegridlines to correct for Pressure Altitude and OAT.
c) From this intersection continue vertically downward to the Braking Configurationreference line.
d) Follow the grid-lines to the appropriate braking configuration.
e) From the intersection continue vertically downward to read the Brake Energy perBrake in millions of foot pounds.
f) To this value, add one million foot pounds for each taxi mile to obtain the totalenergy.
g) From the value of the total energy on continue vertically downward to determinethe advised cooling schedule and recommend cooling time.
5.3.1.3 Braking Distance
For a manual braked landing with no reverse thrust or for a manual braked landingwith normal thrust #2 detent, select the appropriate sub-graph in Figure 4.31, thenenter the sub-graph at the Brakes ON IRS Ground Speed KIAS and travel vertically upto intersect the equivalent autobrake setting. From this intersection travel horizontallyleft to the vertical axis to read the stopping distance in thousands of feet.
Section 4 - MRJT1 Page 49July 2006
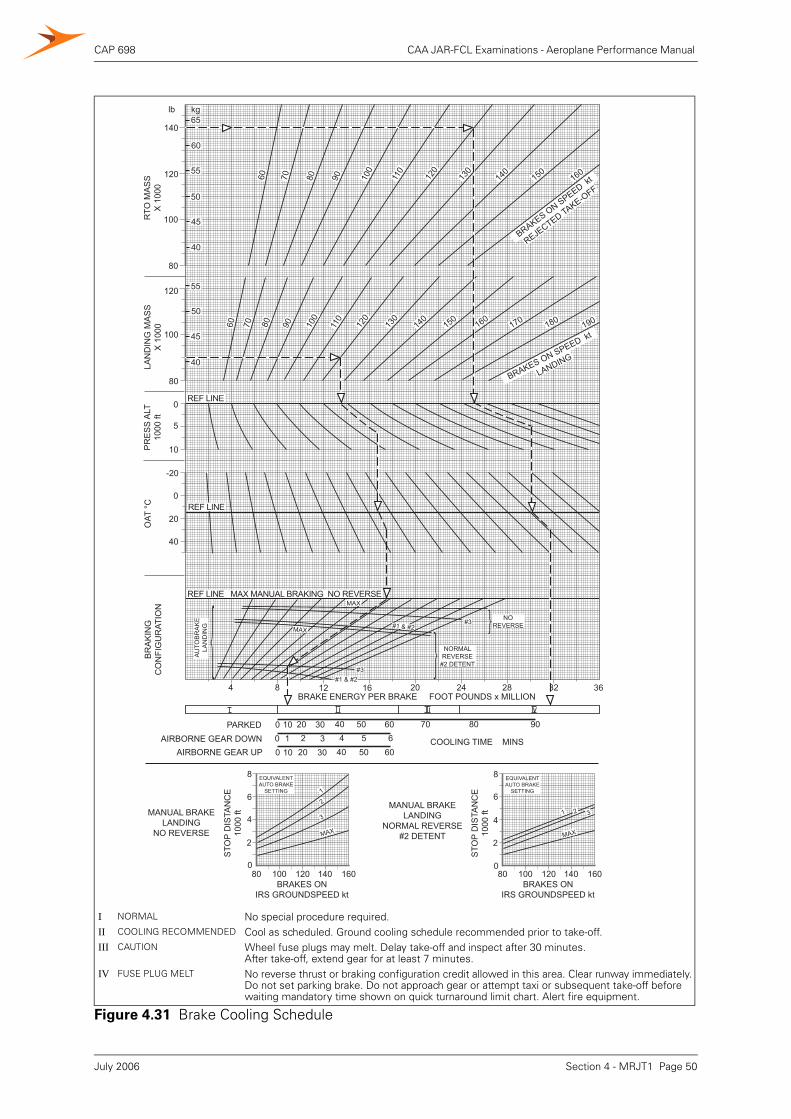
CAP 698 CAA JAR-FCL Examinations - Aeroplane Performance Manual
Section 4 - MRJT1 Page 50
I NORMAL No special procedure required.II COOLING RECOMMENDED Cool as scheduled. Ground cooling schedule recommended prior to take-off.III CAUTION Wheel fuse plugs may melt. Delay take-off and inspect after 30 minutes.
After take-off, extend gear for at least 7 minutes.IV FUSE PLUG MELT No reverse thrust or braking configuration credit allowed in this area. Clear runway immediately.
Do not set parking brake. Do not approach gear or attempt taxi or subsequent take-off before waiting mandatory time shown on quick turnaround limit chart. Alert fire equipment.
Figure 4.31 Brake Cooling Schedule
0 10 20 30 40 50 60 70 80 90PARKED0 1 2 3 4 5 6AIRBORNE GEAR DOWN COOLING TIME MINS0 10 20 30 40 50 60AIRBORNE GEAR UP
65
60
55
50
45
40
55
50
45
40
kg
REF LINE
REF LINE
REF LINE MAX MANUAL BRAKING NO REVERSE
4 8 12 16 20 24 28 32 36BRAKE ENERGY PER BRAKE FOOT POUNDS x MILLION
MANUAL BRAKELANDING
NO REVERSE
MANUAL BRAKELANDING
NORMAL REVERSE#2 DETENT
STO
P D
ISTA
NC
E10
00 ft
0
2
4
6
8
STO
P D
ISTA
NC
E10
00 ft
0
2
4
6
8
80 100 120 140 160BRAKES ON
IRS GROUNDSPEED kt
BRAKES ON SPEED kt
REJECTED TAKE-O
FF
BRAKES ON SPEED kt
LANDING
60 70 80 90 100
110
120
130
140
150160
190180170160150
140
130
120
110
100
90807060
AU
TOB
RA
KE
LAN
DIN
G
NORMALREVERSE
#2 DETENT
NOREVERSE
MAX
MAX
#3#1 & #2
#3#1 & #2
lb
140
120
100
80
120
100
80
0
5
10
-20
0
20
40
RTO
MA
SS
X 1
000
LAN
DIN
G M
AS
SX
100
0B
RA
KIN
GC
ON
FIG
UR
ATIO
NP
RE
SS
ALT
1000
ftO
AT °
C
EQUIVALENTAUTO BRAKE
SETTING 1
MAX
3
2
EQUIVALENTAUTO BRAKE
SETTING
1
MAX
32
80 100 120 140 160BRAKES ON
IRS GROUNDSPEED kt
July 2006
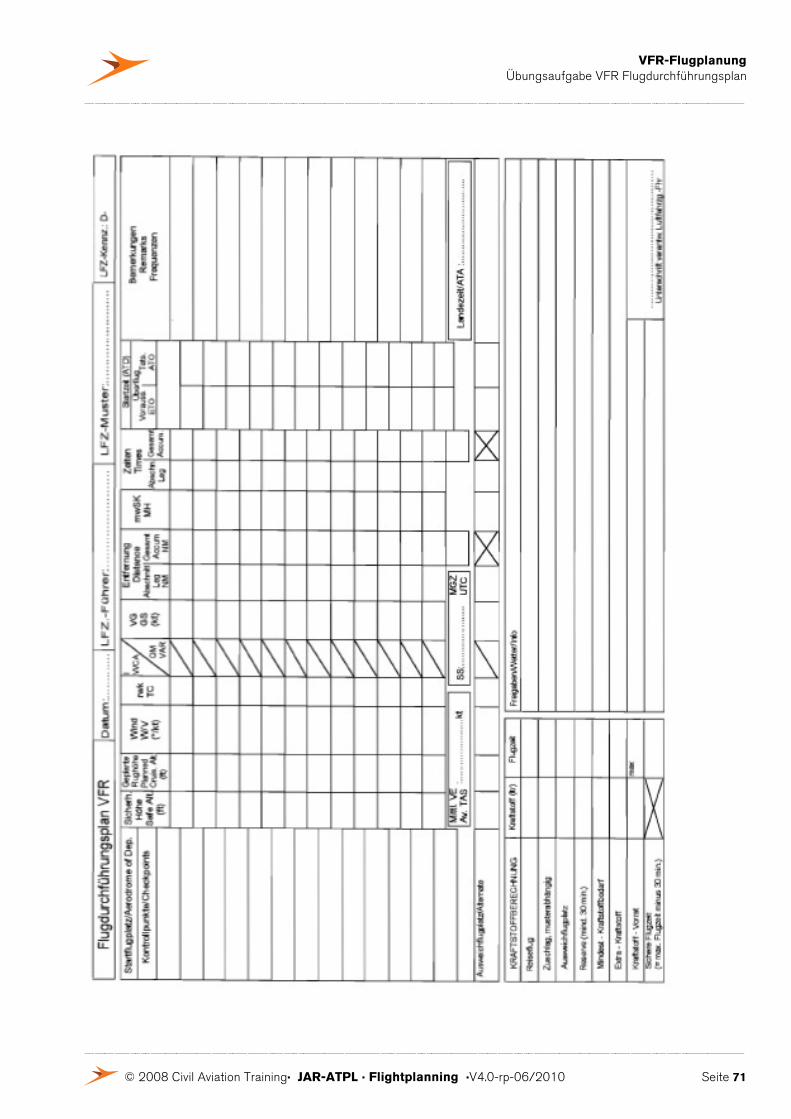
VFR-Flugplanung Übungsaufgabe VFR Flugdurchführungsplan
© 2008 Civil Aviation Training. JAR-ATPL . Flightplanning .V4.0-rp-06/2010 Seite 71
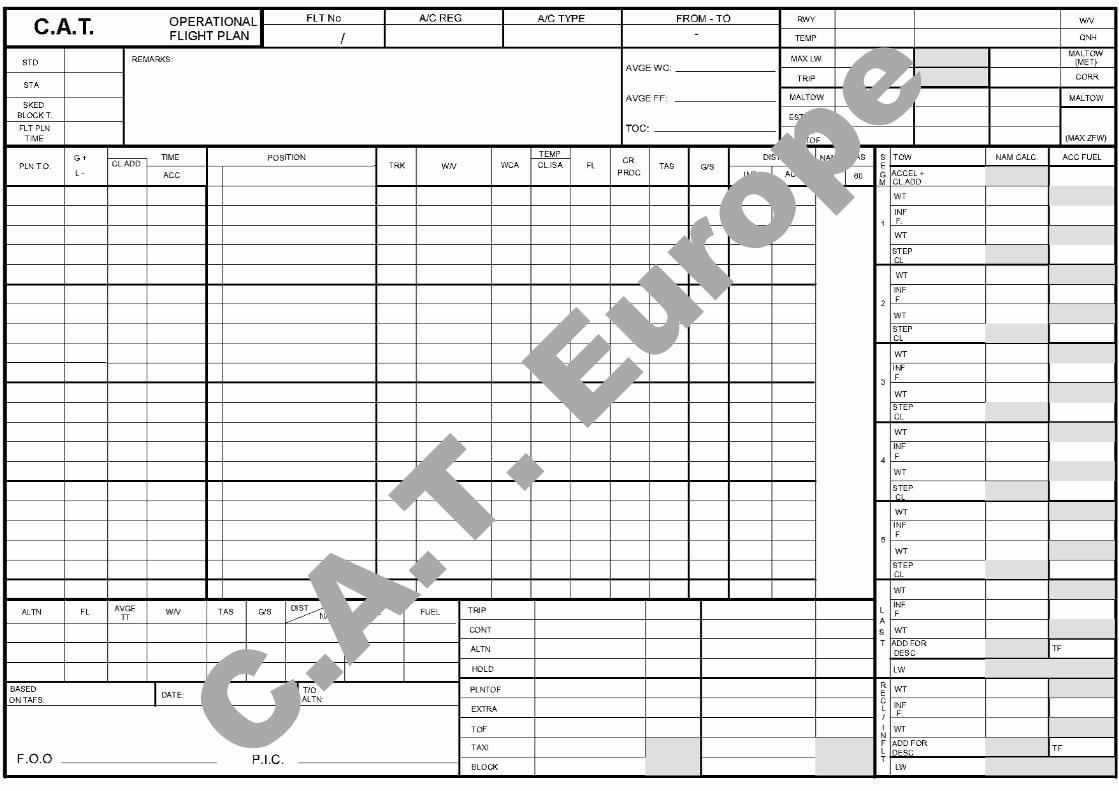
C.A.T
. Eur
ope
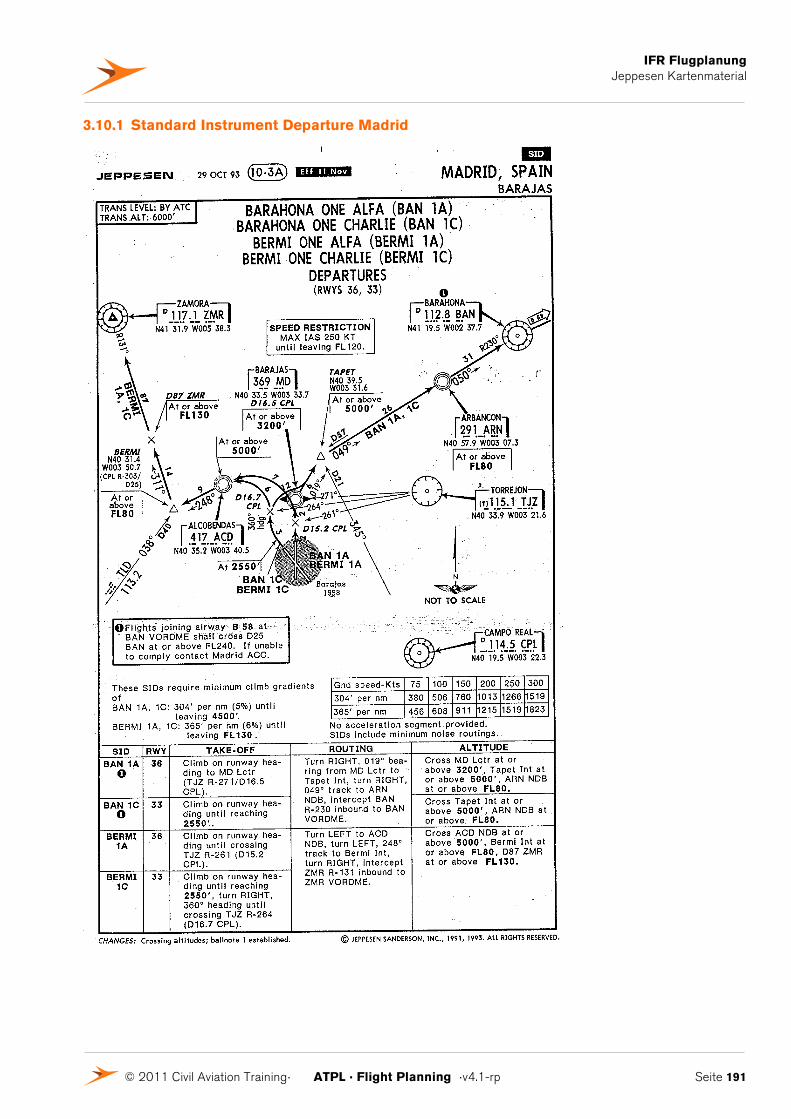
IFR Flugplanung Jeppesen Kartenmaterial
© 2011 Civil Aviation Training. ATPL . Flight Planning .v4.1-rp Seite 191
3.10.1 Standard Instrument Departure Madrid
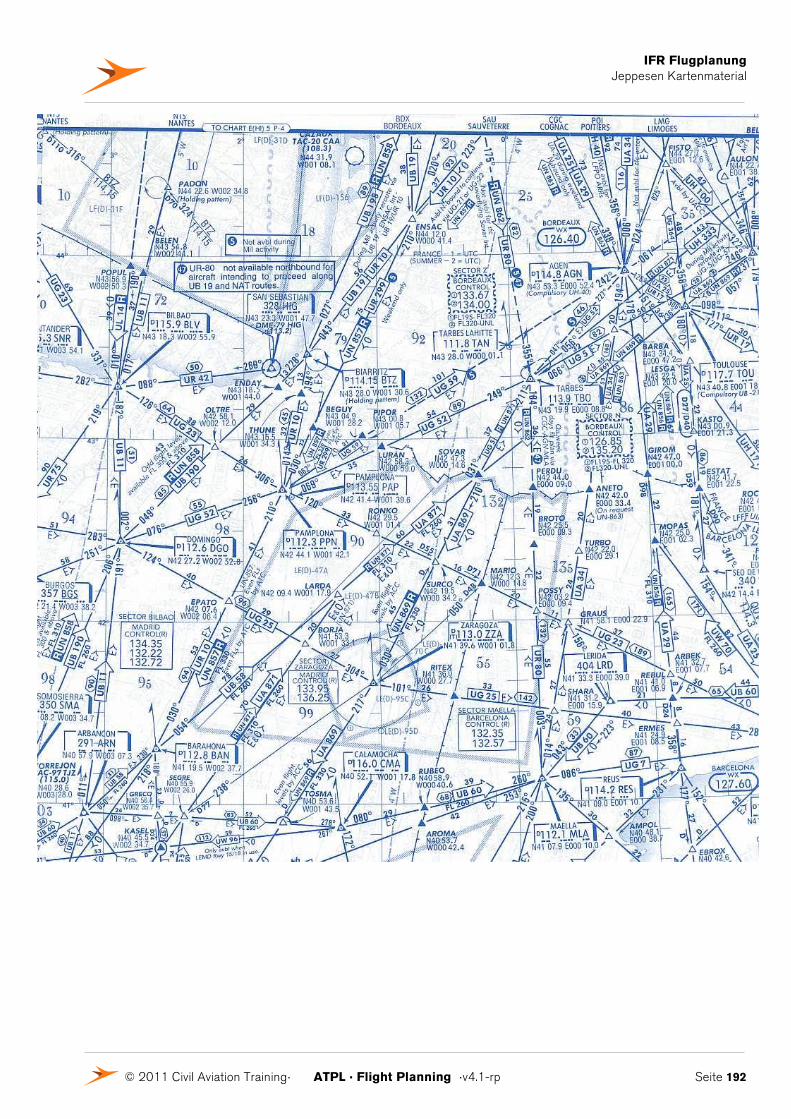
IFR Flugplanung Jeppesen Kartenmaterial
© 2011 Civil Aviation Training. ATPL . Flight Planning .v4.1-rp Seite 192
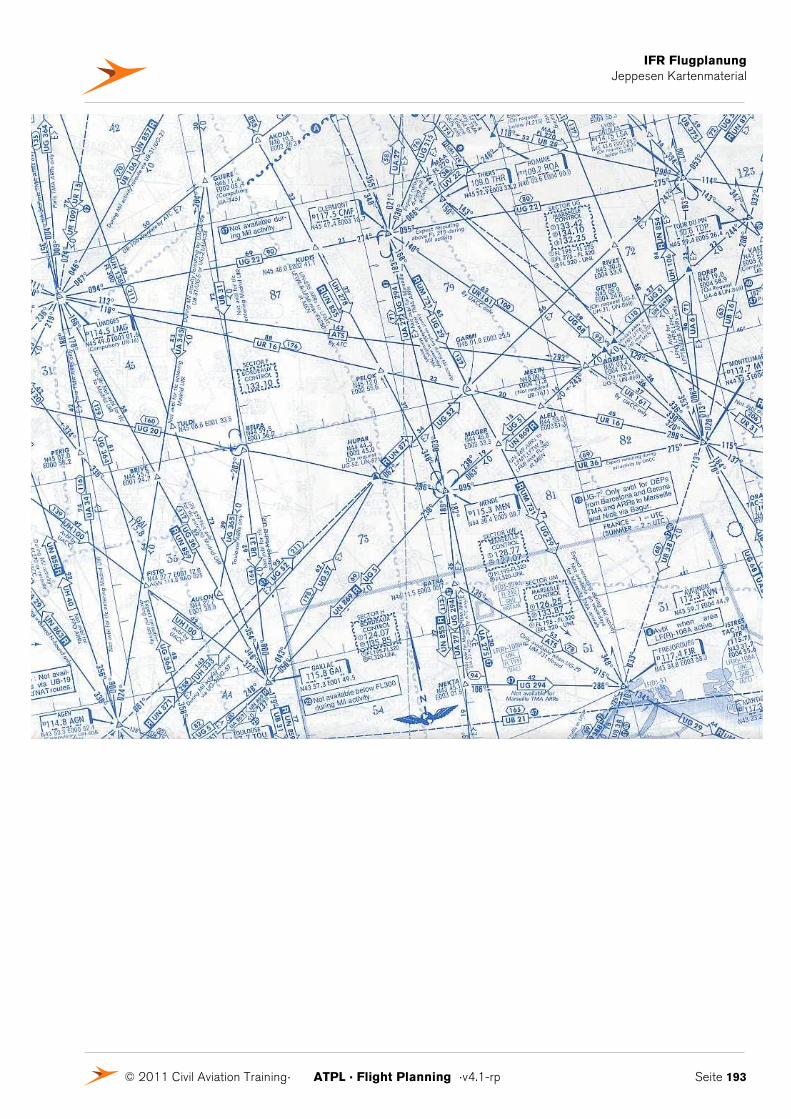
IFR Flugplanung Jeppesen Kartenmaterial
© 2011 Civil Aviation Training. ATPL . Flight Planning .v4.1-rp Seite 193
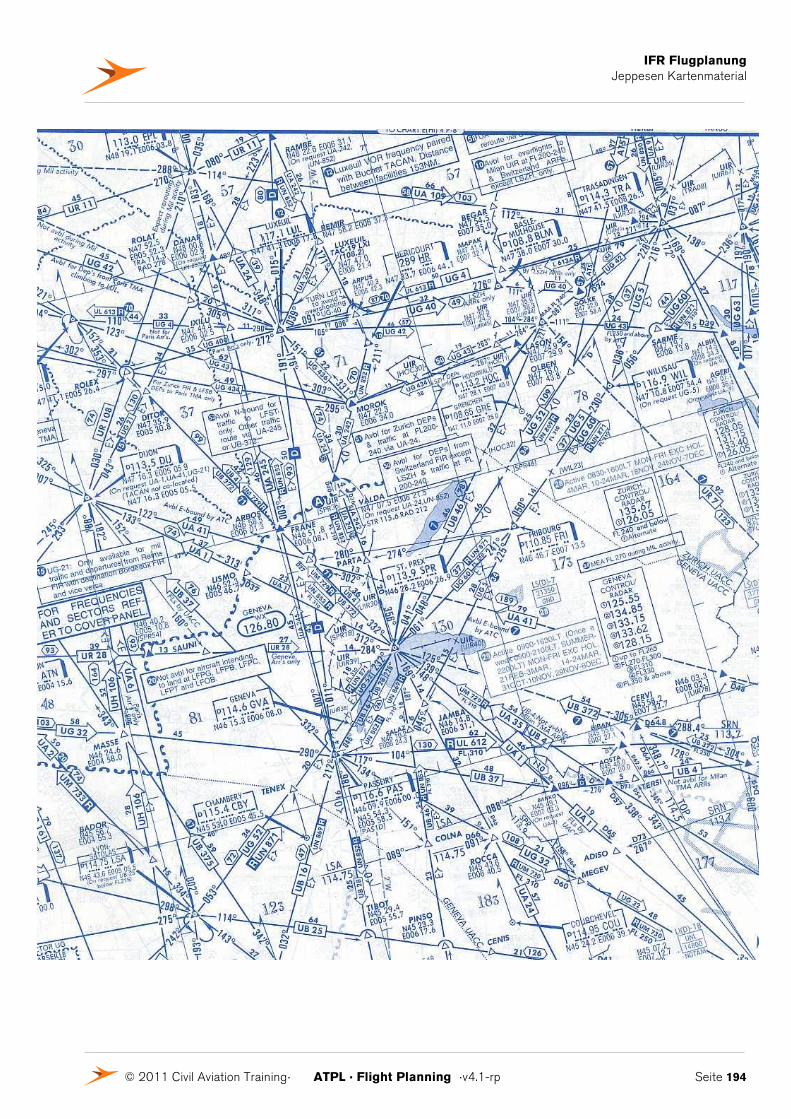
IFR Flugplanung Jeppesen Kartenmaterial
© 2011 Civil Aviation Training. ATPL . Flight Planning .v4.1-rp Seite 194
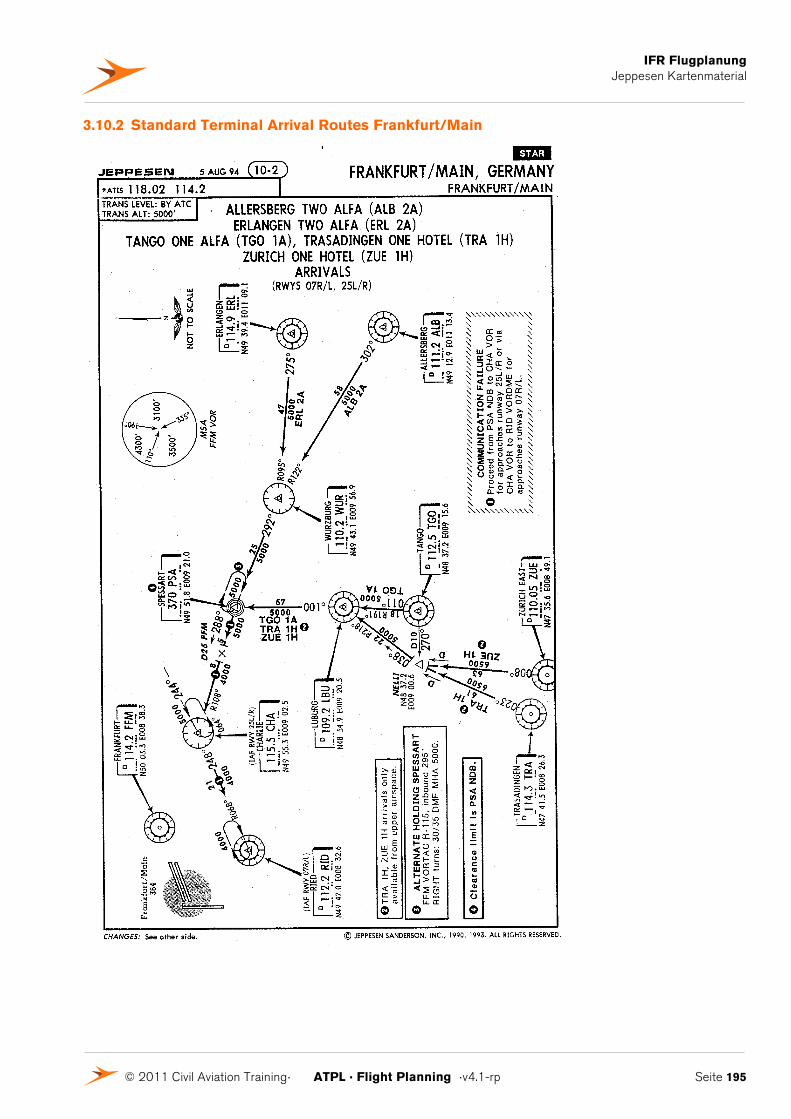
IFR Flugplanung Jeppesen Kartenmaterial
© 2011 Civil Aviation Training. ATPL . Flight Planning .v4.1-rp Seite 195
3.10.2 Standard Terminal Arrival Routes Frankfurt/Main
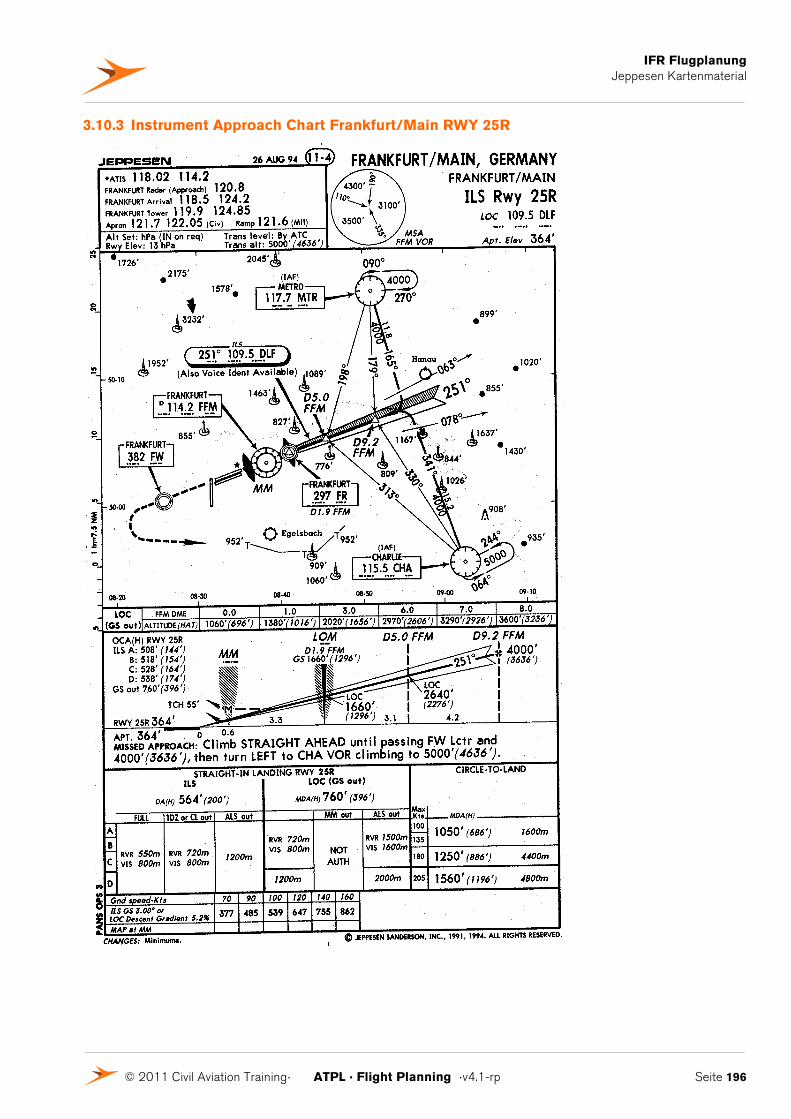
IFR Flugplanung Jeppesen Kartenmaterial
© 2011 Civil Aviation Training. ATPL . Flight Planning .v4.1-rp Seite 196
3.10.3 Instrument Approach Chart Frankfurt/Main RWY 25R
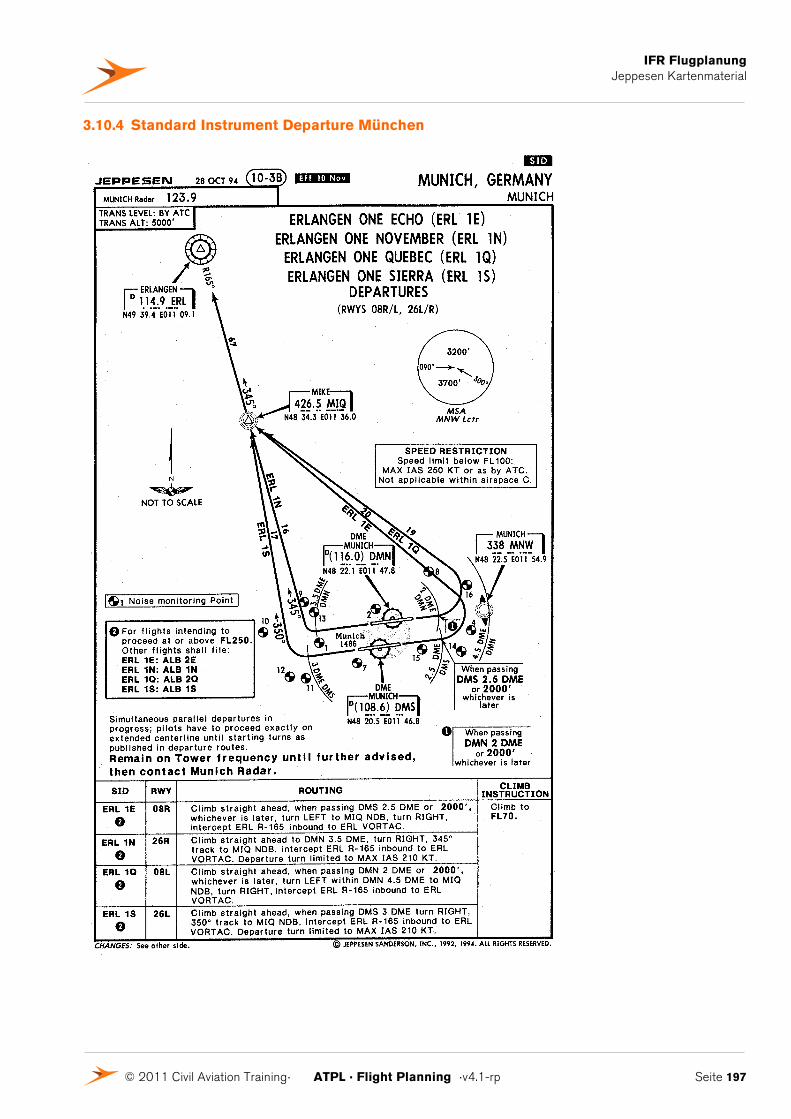
IFR Flugplanung Jeppesen Kartenmaterial
© 2011 Civil Aviation Training. ATPL . Flight Planning .v4.1-rp Seite 197
3.10.4 Standard Instrument Departure München
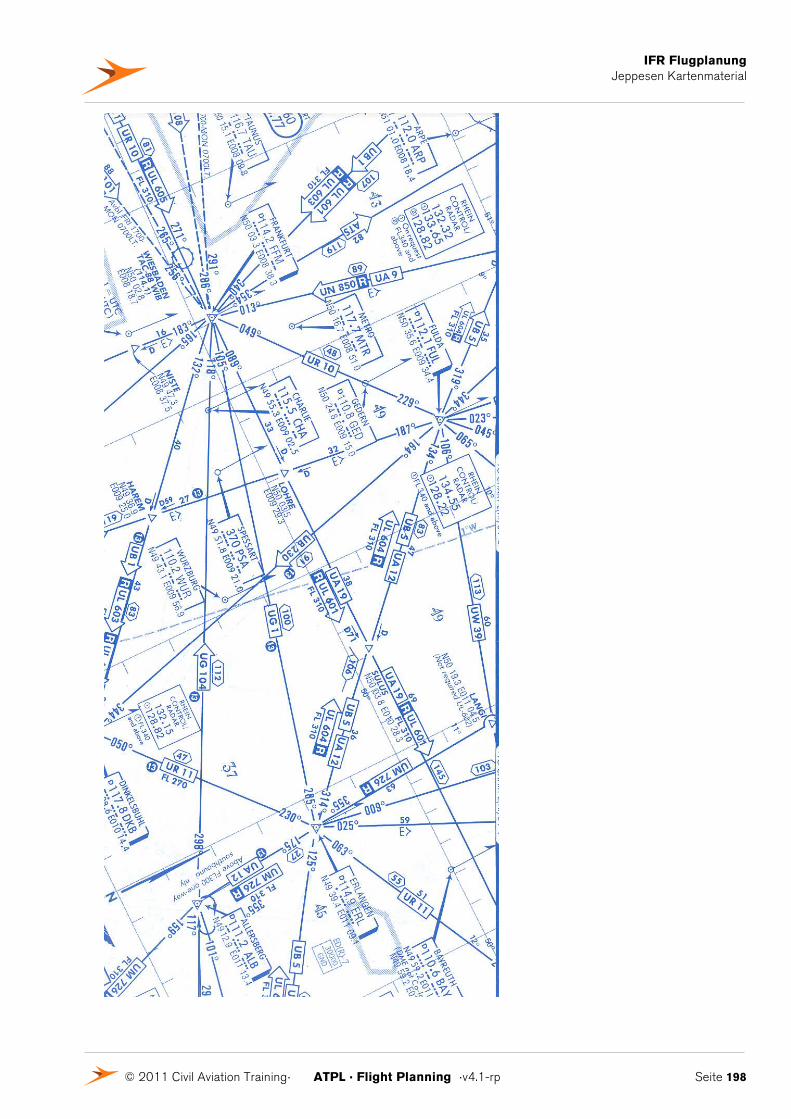
IFR Flugplanung Jeppesen Kartenmaterial
© 2011 Civil Aviation Training. ATPL . Flight Planning .v4.1-rp Seite 198
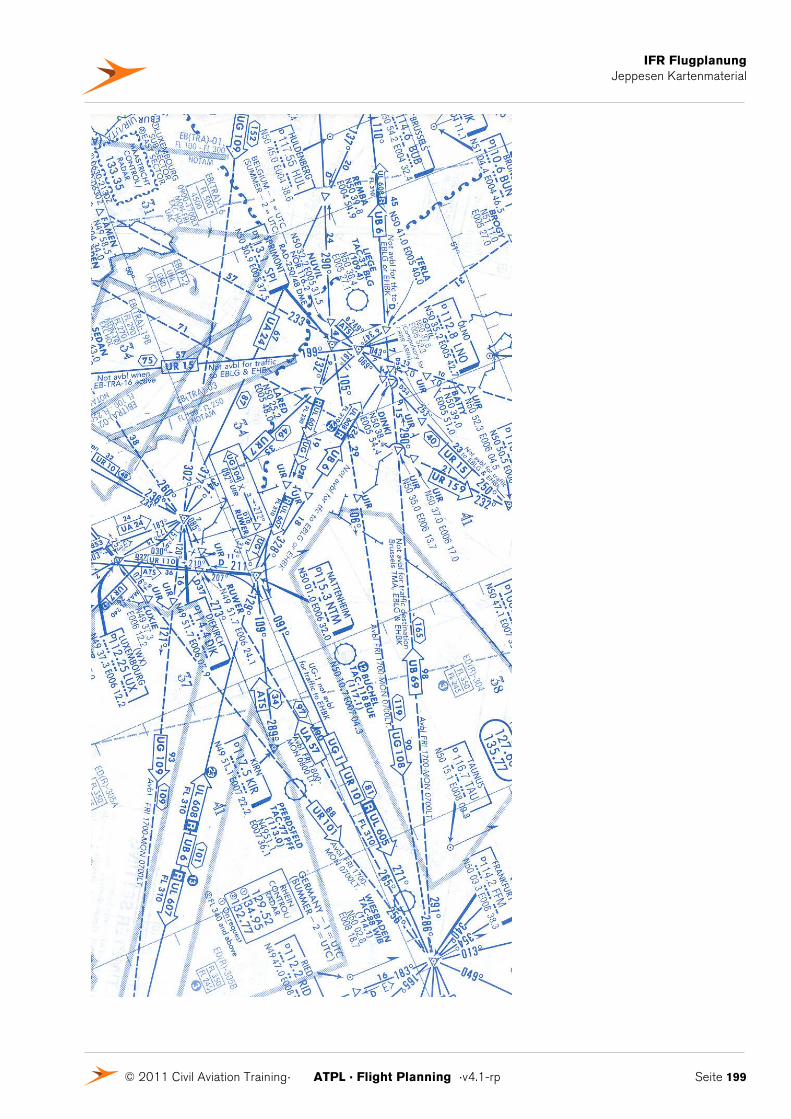
IFR Flugplanung Jeppesen Kartenmaterial
© 2011 Civil Aviation Training. ATPL . Flight Planning .v4.1-rp Seite 199
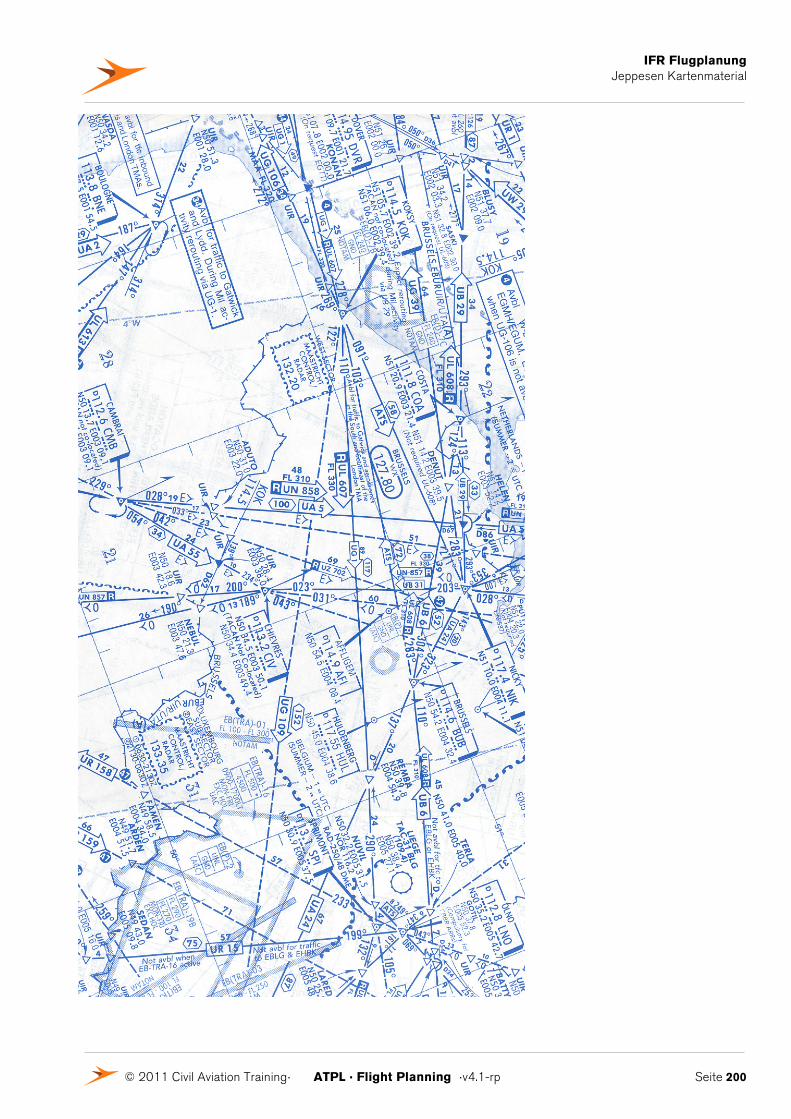
IFR Flugplanung Jeppesen Kartenmaterial
© 2011 Civil Aviation Training. ATPL . Flight Planning .v4.1-rp Seite 200
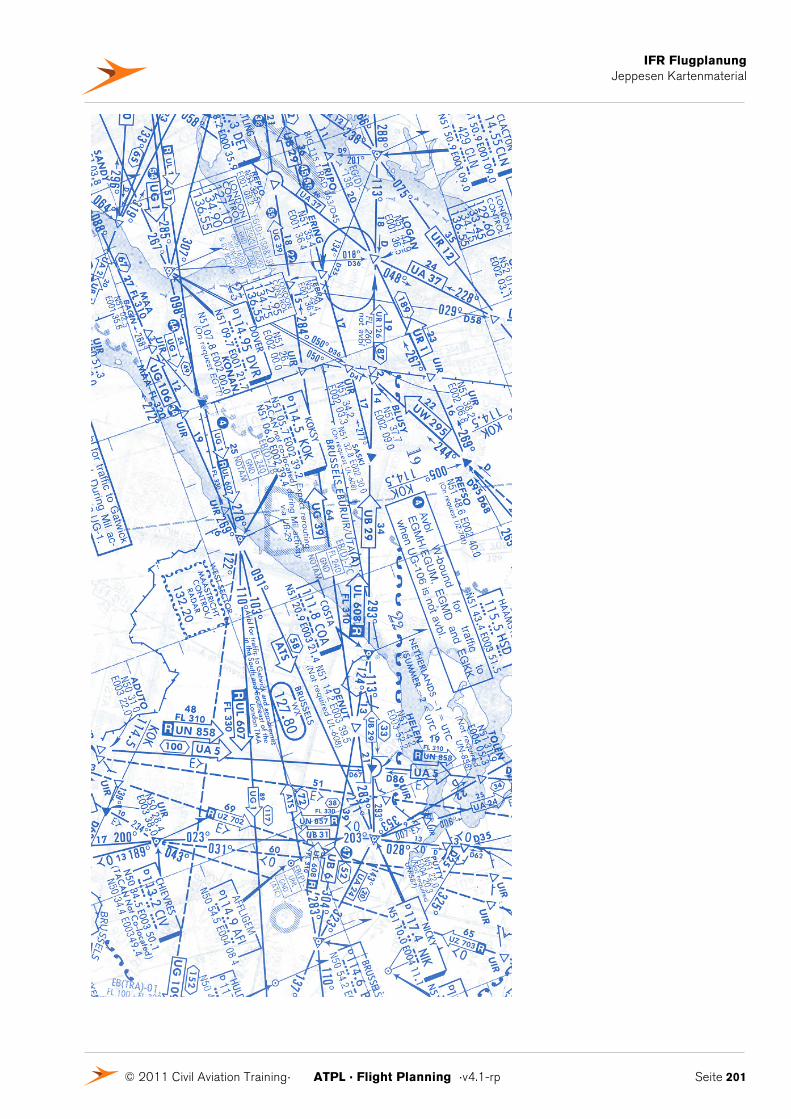
IFR Flugplanung Jeppesen Kartenmaterial
© 2011 Civil Aviation Training. ATPL . Flight Planning .v4.1-rp Seite 201
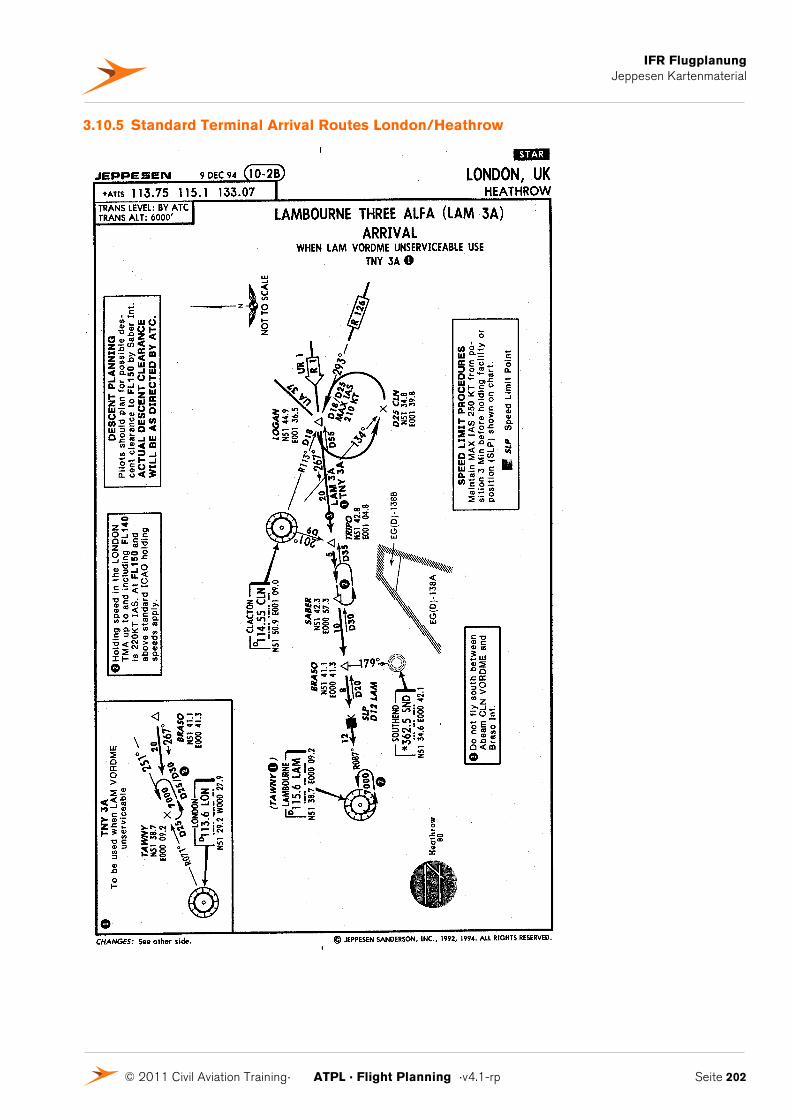
IFR Flugplanung Jeppesen Kartenmaterial
© 2011 Civil Aviation Training. ATPL . Flight Planning .v4.1-rp Seite 202
3.10.5 Standard Terminal Arrival Routes London/Heathrow
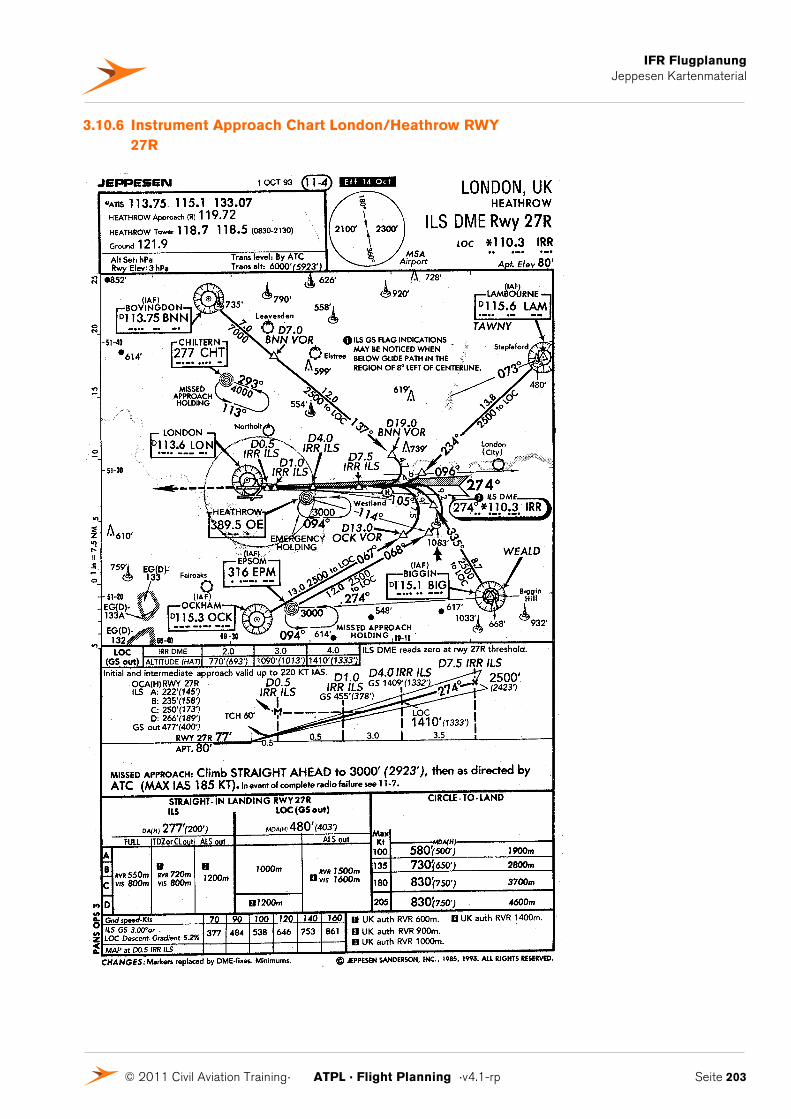
IFR Flugplanung Jeppesen Kartenmaterial
© 2011 Civil Aviation Training. ATPL . Flight Planning .v4.1-rp Seite 203
3.10.6 Instrument Approach Chart London/Heathrow RWY 27R
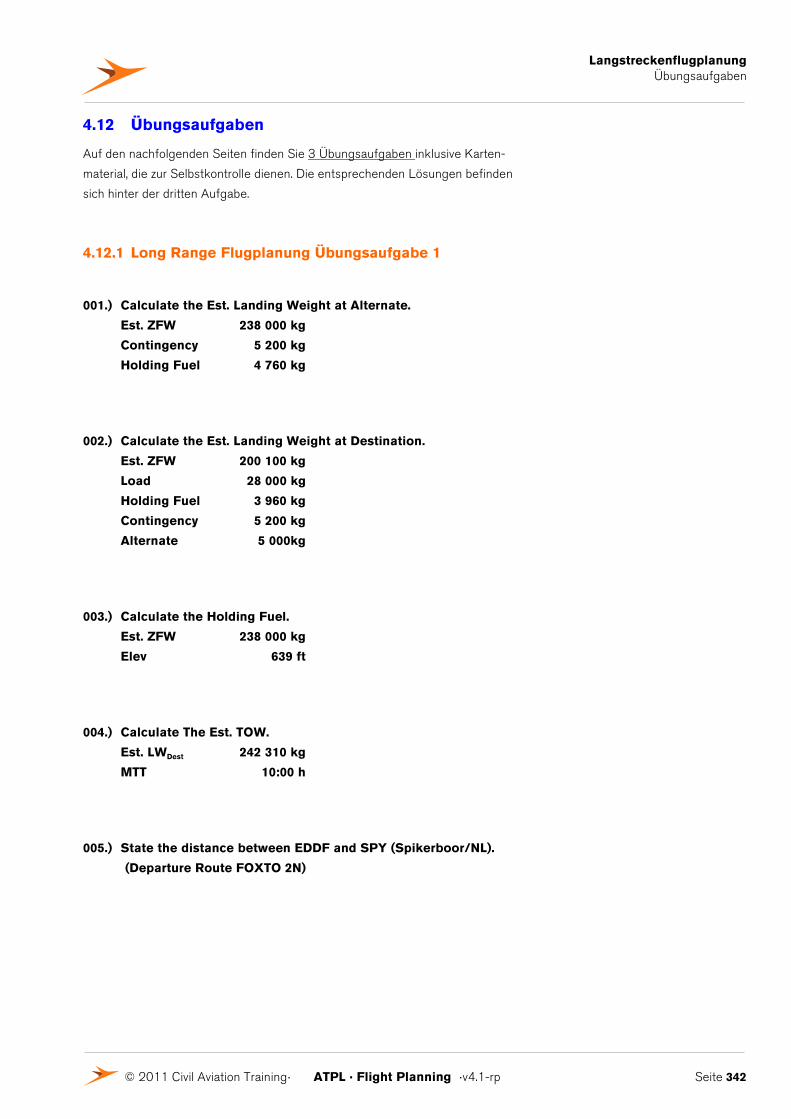
Langstreckenflugplanung Übungsaufgaben
© 2011 Civil Aviation Training. ATPL . Flight Planning .v4.1-rp Seite 342
4.12 Übungsaufgaben
Auf den nachfolgenden Seiten finden Sie 3 Übungsaufgaben inklusive Karten-
material, die zur Selbstkontrolle dienen. Die entsprechenden Lösungen befinden
sich hinter der dritten Aufgabe.
4.12.1 Long Range Flugplanung Übungsaufgabe 1
001.) Calculate the Est. Landing Weight at Alternate.
Est. ZFW 238 000 kg
Contingency 5 200 kg
Holding Fuel 4 760 kg
002.) Calculate the Est. Landing Weight at Destination.
Est. ZFW 200 100 kg
Load 28 000 kg
Holding Fuel 3 960 kg
Contingency 5 200 kg
Alternate 5 000kg
003.) Calculate the Holding Fuel.
Est. ZFW 238 000 kg
Elev 639 ft
004.) Calculate The Est. TOW.
Est. LWDest 242 310 kg
MTT 10:00 h
005.) State the distance between EDDF and SPY (Spikerboor/NL).
(Departure Route FOXTO 2N)
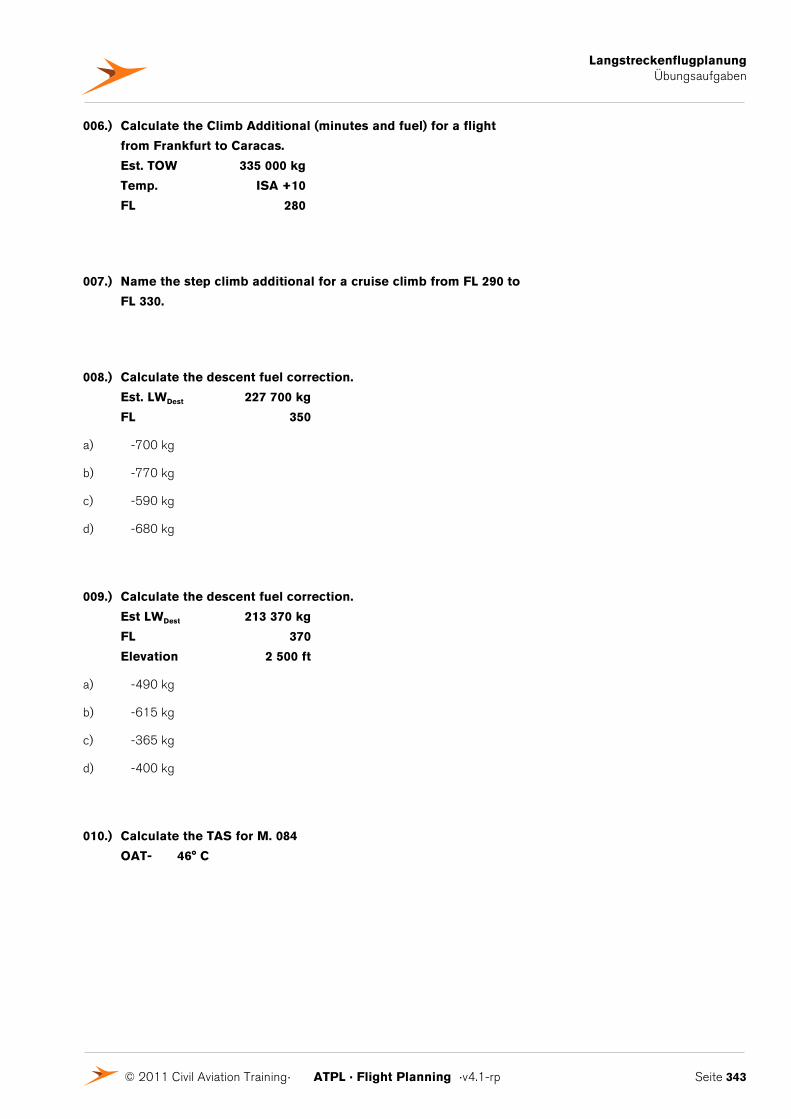
Langstreckenflugplanung Übungsaufgaben
© 2011 Civil Aviation Training. ATPL . Flight Planning .v4.1-rp Seite 343
006.) Calculate the Climb Additional (minutes and fuel) for a flight
from Frankfurt to Caracas.
Est. TOW 335 000 kg
Temp. ISA +10
FL 280
007.) Name the step climb additional for a cruise climb from FL 290 to
FL 330.
008.) Calculate the descent fuel correction.
Est. LWDest 227 700 kg
FL 350
a) -700 kg
b) -770 kg
c) -590 kg
d) -680 kg
009.) Calculate the descent fuel correction.
Est LWDest 213 370 kg
FL 370
Elevation 2 500 ft
a) -490 kg
b) -615 kg
c) -365 kg
d) -400 kg
010.) Calculate the TAS for M. 084
OAT- 46° C
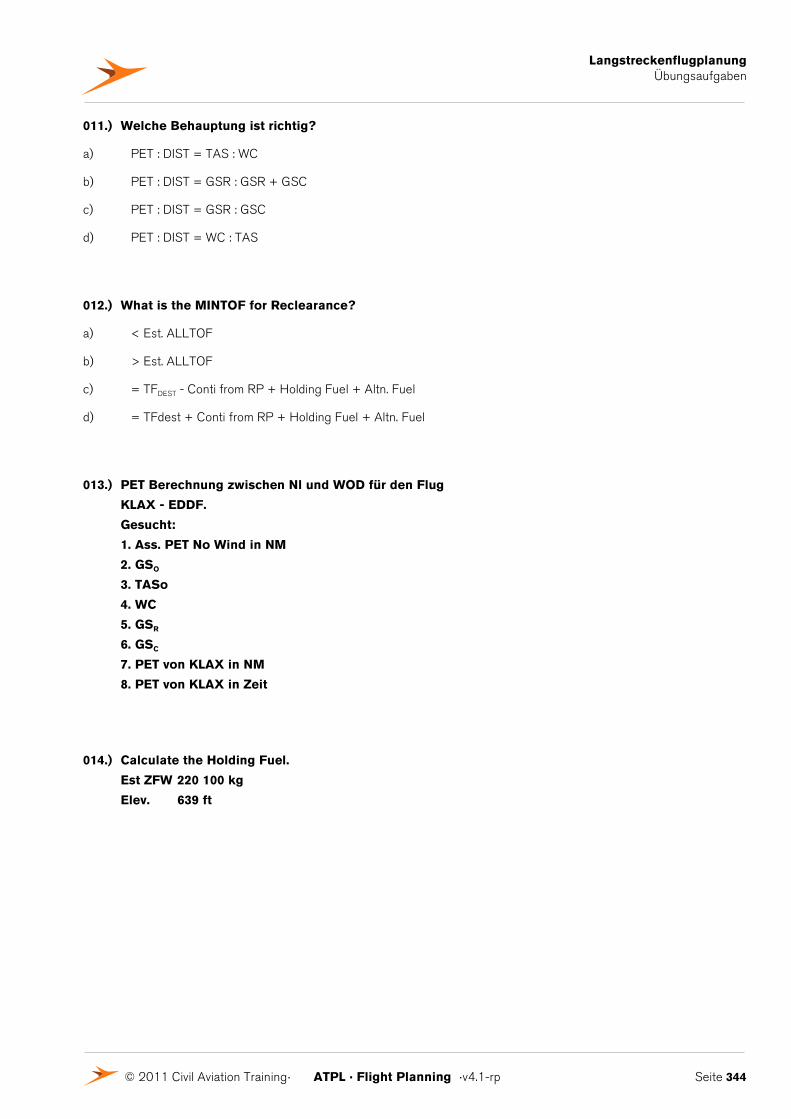
Langstreckenflugplanung Übungsaufgaben
© 2011 Civil Aviation Training. ATPL . Flight Planning .v4.1-rp Seite 344
011.) Welche Behauptung ist richtig?
a) PET : DIST = TAS : WC
b) PET : DIST = GSR : GSR + GSC
c) PET : DIST = GSR : GSC
d) PET : DIST = WC : TAS
012.) What is the MINTOF for Reclearance?
a) < Est. ALLTOF
b) > Est. ALLTOF
c) = TFDEST - Conti from RP + Holding Fuel + Altn. Fuel
d) = TFdest + Conti from RP + Holding Fuel + Altn. Fuel
013.) PET Berechnung zwischen Nl und WOD für den Flug
KLAX - EDDF.
Gesucht:
1. Ass. PET No Wind in NM
2. GSO
3. TASo
4. WC
5. GSR
6. GSC
7. PET von KLAX in NM
8. PET von KLAX in Zeit
014.) Calculate the Holding Fuel.
Est ZFW 220 100 kg
Elev. 639 ft
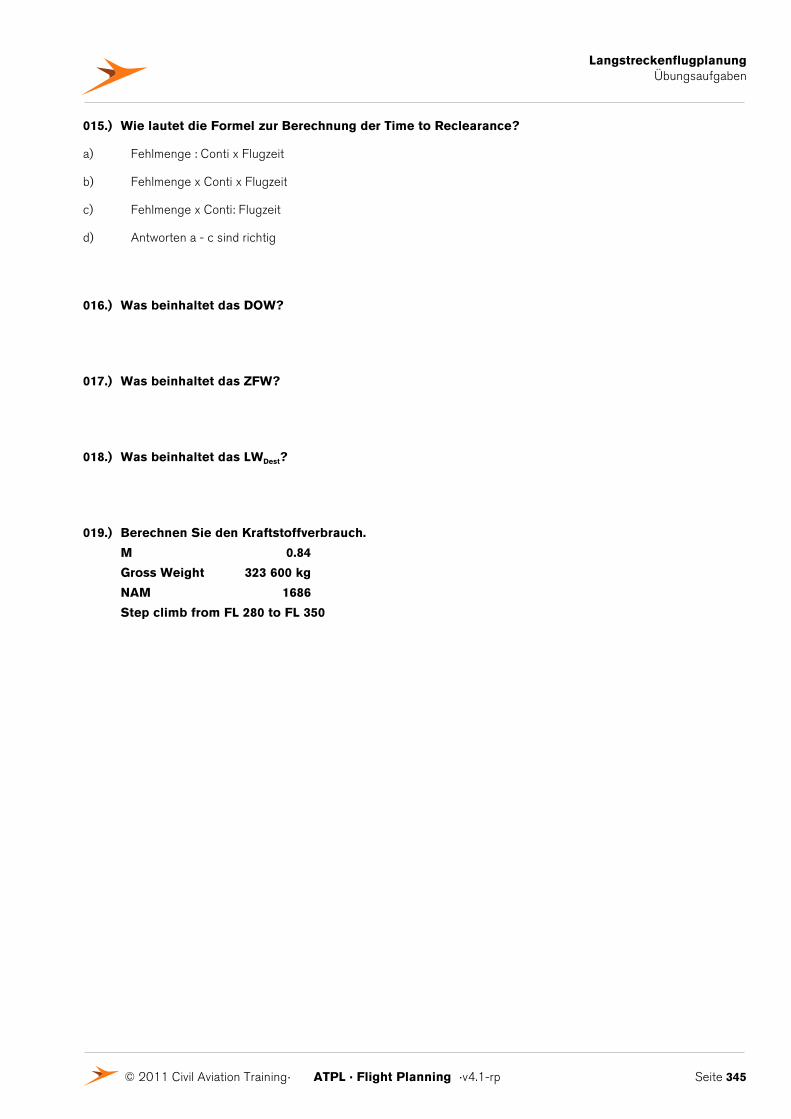
Langstreckenflugplanung Übungsaufgaben
© 2011 Civil Aviation Training. ATPL . Flight Planning .v4.1-rp Seite 345
015.) Wie lautet die Formel zur Berechnung der Time to Reclearance?
a) Fehlmenge : Conti x Flugzeit
b) Fehlmenge x Conti x Flugzeit
c) Fehlmenge x Conti: Flugzeit
d) Antworten a - c sind richtig
016.) Was beinhaltet das DOW?
017.) Was beinhaltet das ZFW?
018.) Was beinhaltet das LWDest?
019.) Berechnen Sie den Kraftstoffverbrauch.
M 0.84
Gross Weight 323 600 kg
NAM 1686
Step climb from FL 280 to FL 350
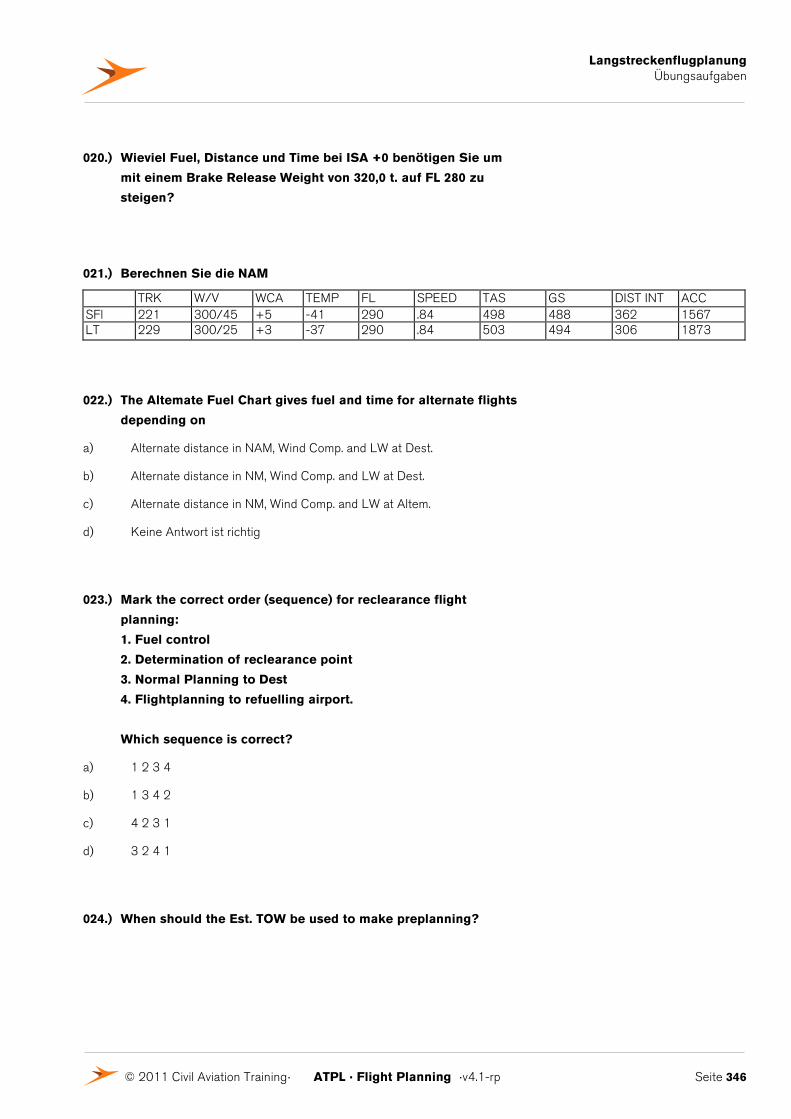
Langstreckenflugplanung Übungsaufgaben
© 2011 Civil Aviation Training. ATPL . Flight Planning .v4.1-rp Seite 346
020.) Wieviel Fuel, Distance und Time bei ISA +0 benötigen Sie um
mit einem Brake Release Weight von 320,0 t. auf FL 280 zu
steigen?
021.) Berechnen Sie die NAM
TRK W/V WCA TEMP FL SPEED TAS GS DIST INT ACC SFl 221 300/45 +5 -41 290 .84 498 488 362 1567 LT 229 300/25 +3 -37 290 .84 503 494 306 1873
022.) The Altemate Fuel Chart gives fuel and time for alternate flights
depending on
a) Alternate distance in NAM, Wind Comp. and LW at Dest.
b) Alternate distance in NM, Wind Comp. and LW at Dest.
c) Alternate distance in NM, Wind Comp. and LW at Altem.
d) Keine Antwort ist richtig
023.) Mark the correct order (sequence) for reclearance flight
planning:
1. Fuel control
2. Determination of reclearance point
3. Normal Planning to Dest
4. Flightplanning to refuelling airport.
Which sequence is correct?
a) 1 2 3 4
b) 1 3 4 2
c) 4 2 3 1
d) 3 2 4 1
024.) When should the Est. TOW be used to make preplanning?
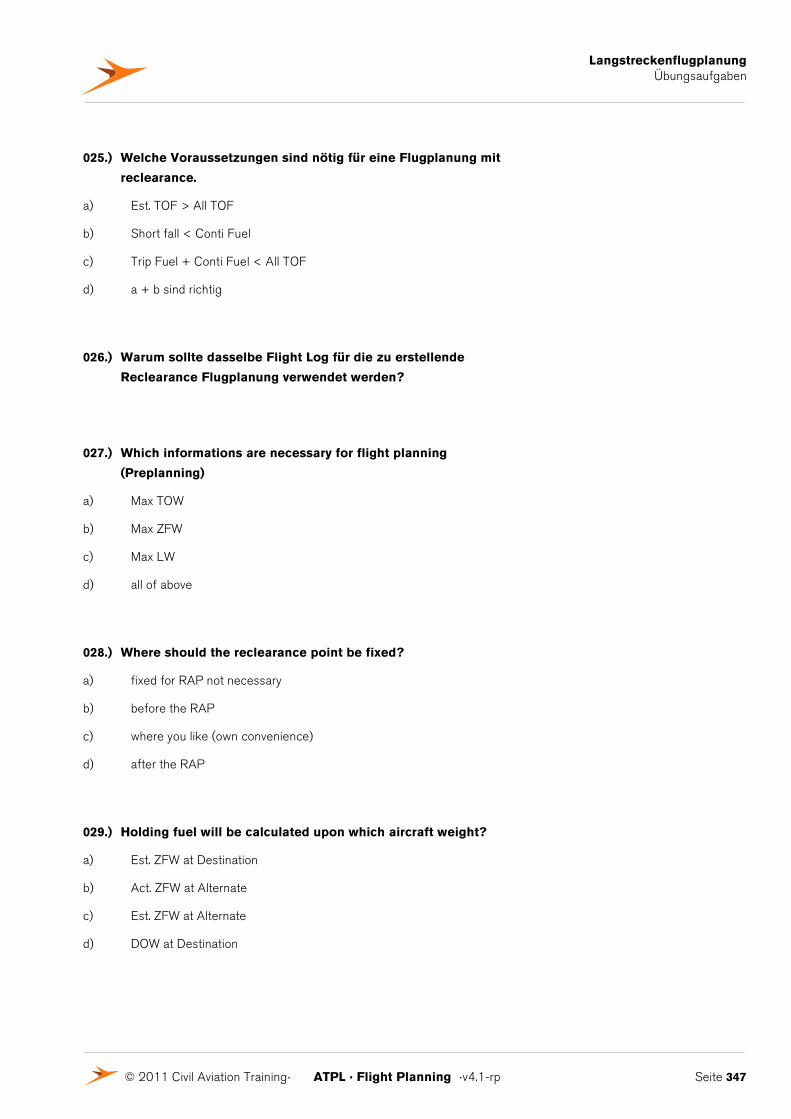
Langstreckenflugplanung Übungsaufgaben
© 2011 Civil Aviation Training. ATPL . Flight Planning .v4.1-rp Seite 347
025.) Welche Voraussetzungen sind nötig für eine Flugplanung mit
reclearance.
a) Est. TOF > All TOF
b) Short fall < Conti Fuel
c) Trip Fuel + Conti Fuel < All TOF
d) a + b sind richtig
026.) Warum sollte dasselbe Flight Log für die zu erstellende
Reclearance Flugplanung verwendet werden?
027.) Which informations are necessary for flight planning
(Preplanning)
a) Max TOW
b) Max ZFW
c) Max LW
d) all of above
028.) Where should the reclearance point be fixed?
a) fixed for RAP not necessary
b) before the RAP
c) where you like (own convenience)
d) after the RAP
029.) Holding fuel will be calculated upon which aircraft weight?
a) Est. ZFW at Destination
b) Act. ZFW at Alternate
c) Est. ZFW at Alternate
d) DOW at Destination
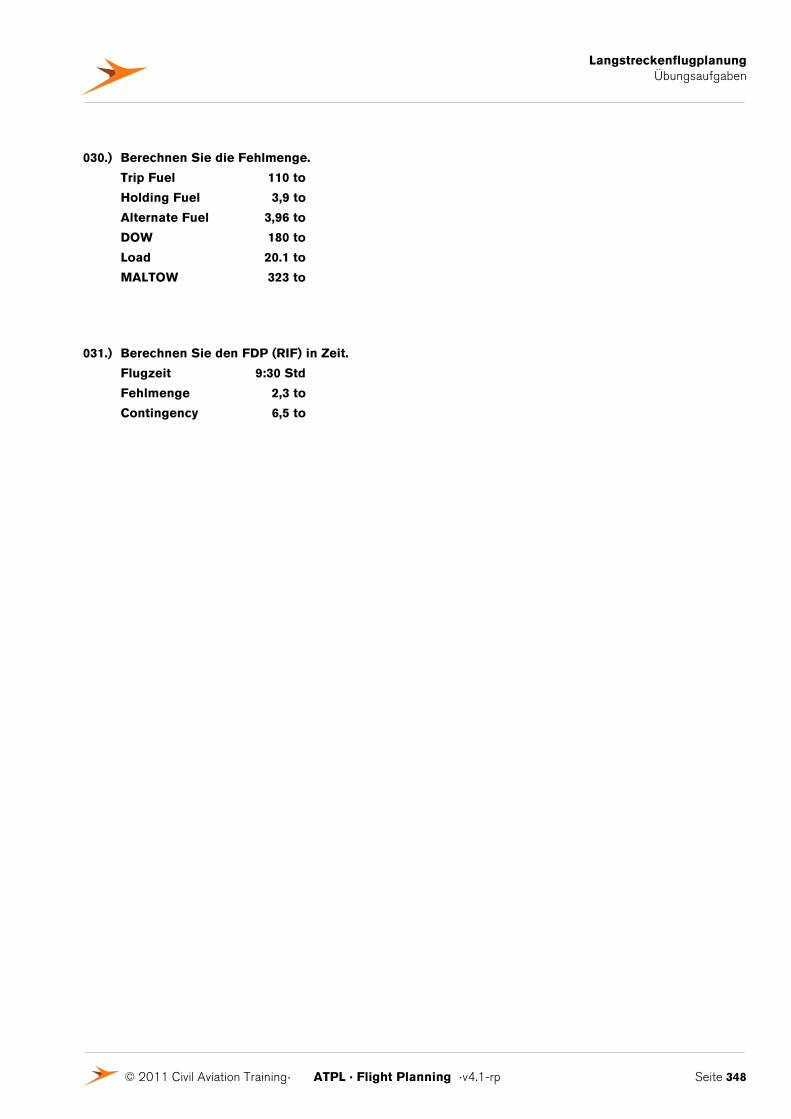
Langstreckenflugplanung Übungsaufgaben
© 2011 Civil Aviation Training. ATPL . Flight Planning .v4.1-rp Seite 348
030.) Berechnen Sie die Fehlmenge.
Trip Fuel 110 to
Holding Fuel 3,9 to
Alternate Fuel 3,96 to
DOW 180 to
Load 20.1 to
MALTOW 323 to
031.) Berechnen Sie den FDP (RIF) in Zeit.
Flugzeit 9:30 Std
Fehlmenge 2,3 to
Contingency 6,5 to

Langstreckenflugplanung Übungsaufgaben
© 2011 Civil Aviation Training. ATPL . Flight Planning .v4.1-rp Seite 349
Anlage zur Übungsaufgabe

Langstreckenflugplanung Übungsaufgaben
© 2011 Civil Aviation Training. ATPL . Flight Planning .v4.1-rp Seite 350
Langstreckenflugplanung Übungsaufgaben
© 2011 Civil Aviation Training. ATPL . Flight Planning .v4.1-rp Seite 354
4.12.2 Long Range Flugplanung Übungsaufgabe 2
001.) Calculate the estimated holding fuel for a flight from Frankfurt/
EDDF to Chicago/KORD with alternate Detroit/ KDTW (PA 410
ft)
DOW: 178 000 kg
Load: 60 000 kg
Holding Fuel: ___________ kg
002.) Holding fuel will be calculated upon which aircraft weight:
a) Est. ZFW at Destination
b) Act. ZFW at Alternate
c) Est. ZFW at Alternate
d) DOW at Destination
003.) Calculate the estimated alternate fuel for a flight from
Frankfurt/EDDF to Chicago/KORD with alternate Detroit/
KDTW. Distance from Chicago to Detroit: 208 NM., WC: -70 kts,
Est. LAW Alternate: 242 860 kg.
Alternate Fuel: ___________ kg
Flight Time: ___________ Min
004.) The alternate fuel chart gives fuel and time for alternate flights
depending on
a) Alternate distance in NAM, Wind component and LW at destination.
b) Alternate distance in NM, Wind component and LW at destination.
c) Alternate distance in NM, Wind component and LW at alternate.
d) No answer is correct.
Langstreckenflugplanung Übungsaufgaben
© 2011 Civil Aviation Training. ATPL . Flight Planning .v4.1-rp Seite 355
005.) Calculate the estimated trip fuel for a flight from Frankfurt/
EDDF to Chicago/KORD.
Est. LW at Alternate: 242 860 kg
Holding Fuel: 4 860 kg
Alternate Fuel: 8 100 kg
MTT: 8:55 hr
Cont.: ___________ kg
LWDest.: ___________ kg
Trip Fuel: ___________ kg
Est. TOW: ___________ kg
006.) Was beinhaltet das DOW.
007.) Was beinhaltet das ZFW
008.) Was beinhaltet das LWDest
009.) Calculate the trip fuel for a flight from Frankfurt (EDDF) to
Chicago (KORD) and execute a Reclearance Flight Planning
taking the necessary data from Appendix 1
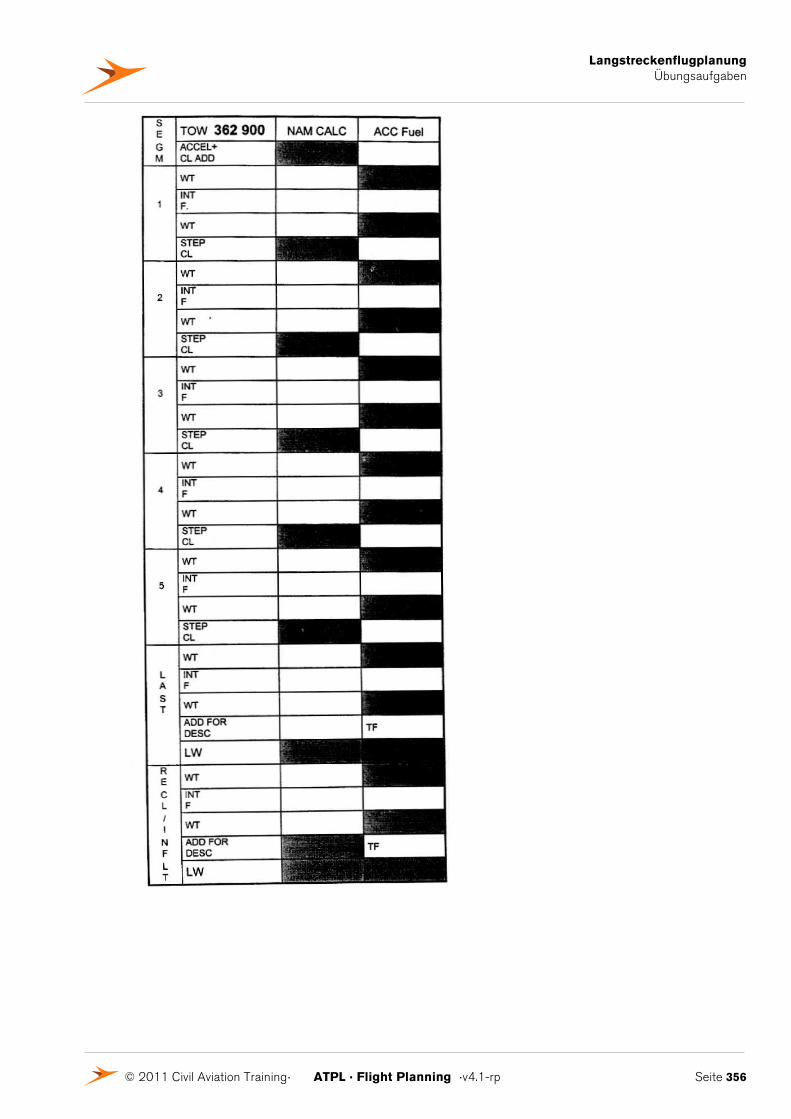
Langstreckenflugplanung Übungsaufgaben
© 2011 Civil Aviation Training. ATPL . Flight Planning .v4.1-rp Seite 356
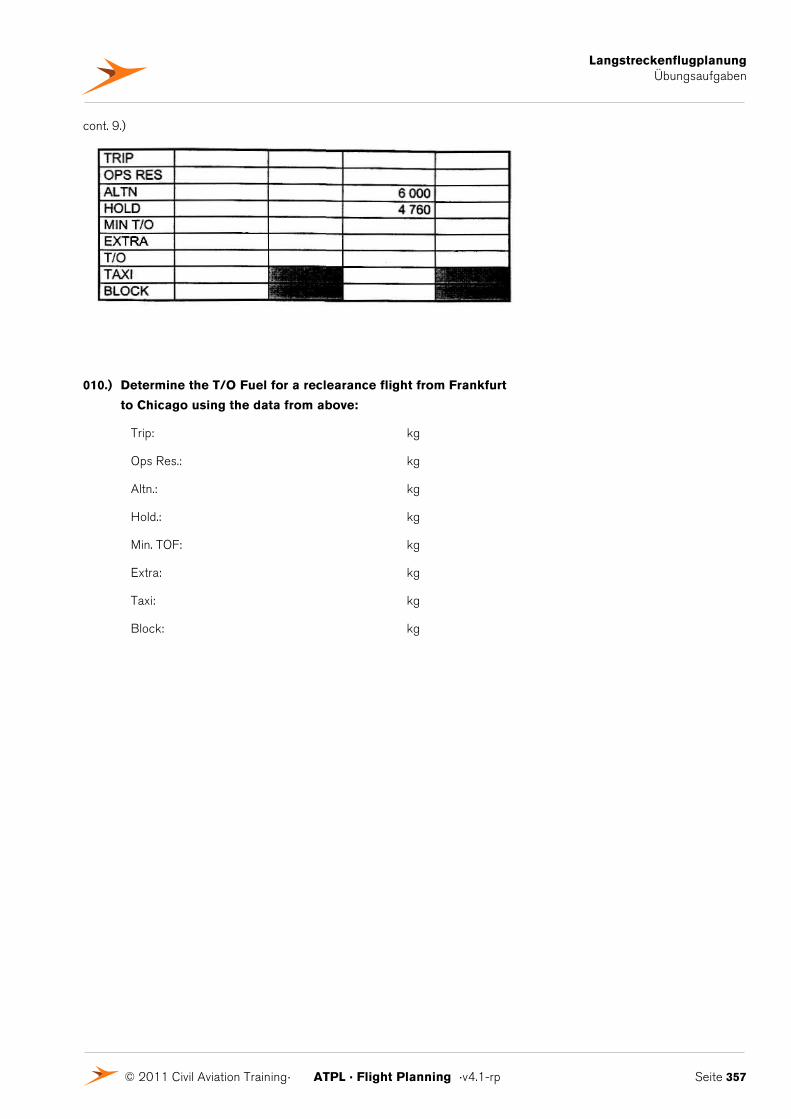
Langstreckenflugplanung Übungsaufgaben
© 2011 Civil Aviation Training. ATPL . Flight Planning .v4.1-rp Seite 357
cont. 9.)
010.) Determine the T/O Fuel for a reclearance flight from Frankfurt
to Chicago using the data from above:
Trip: kg
Ops Res.: kg
Altn.: kg
Hold.: kg
Min. TOF: kg
Extra: kg
Taxi: kg
Block: kg
Langstreckenflugplanung Übungsaufgaben
© 2011 Civil Aviation Training. ATPL . Flight Planning .v4.1-rp Seite 358
011.) Determine the PSR for a flight from Frankfurt/EDDF to
Chicago/KORD using the data given from above and appendix
1. Note: The minimum diversion fuel for a return flight to
Frankfurt is 11 000 kg.
1. Safe End.: hrs
2. PSR No Wind: hrs
3. Ass PSR:
4. GSO: kts
5. TASO: kts
6. WC: kts
7. GSR: kts
8. PSR from EDDF: NM
9. PSR from EDDF: hrs
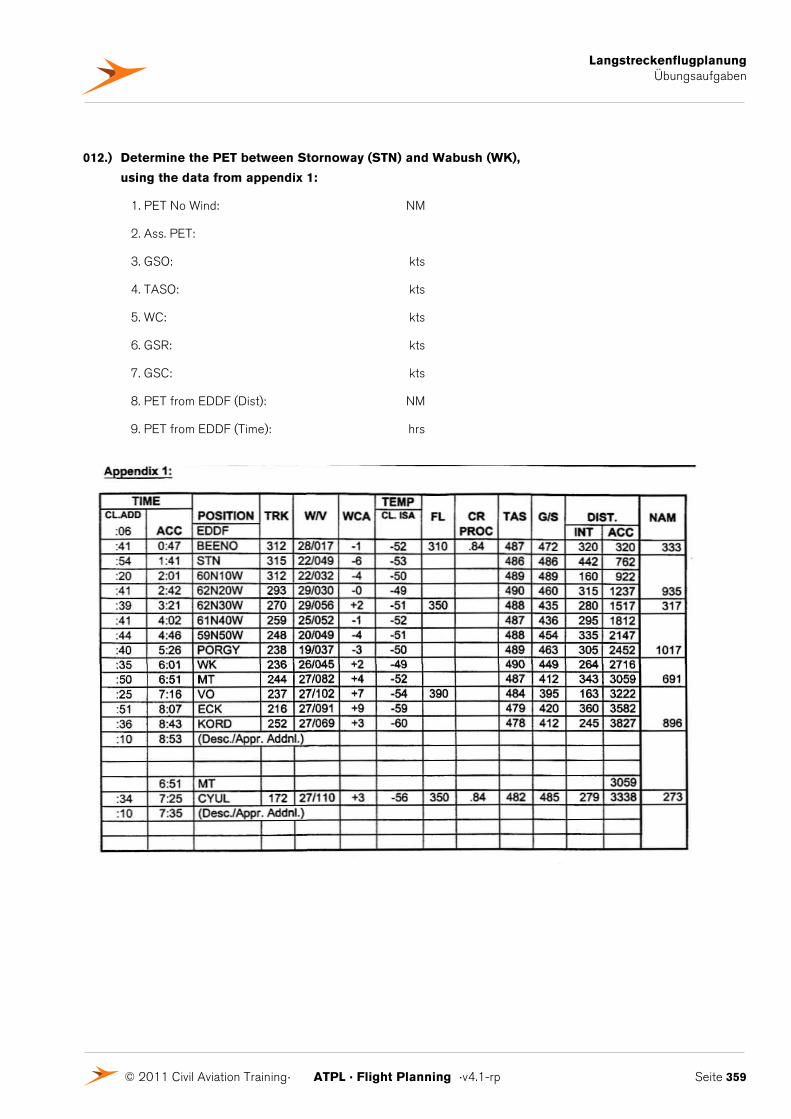
Langstreckenflugplanung Übungsaufgaben
© 2011 Civil Aviation Training. ATPL . Flight Planning .v4.1-rp Seite 359
012.) Determine the PET between Stornoway (STN) and Wabush (WK),
using the data from appendix 1:
1. PET No Wind: NM
2. Ass. PET:
3. GSO: kts
4. TASO: kts
5. WC: kts
6. GSR: kts
7. GSC: kts
8. PET from EDDF (Dist): NM
9. PET from EDDF (Time): hrs
Langstreckenflugplanung Übungsaufgaben
© 2011 Civil Aviation Training. ATPL . Flight Planning .v4.1-rp Seite 363
4.12.3 Long Range Flugplanung Übungsaufgabe 3
Prepare an Operational Flightplan based on following data and using all
necessary parts from the aircraft manual
from Frankfurt (EDDF)
to Toronto (CYYZ)
Altn Detroit (KDTW)
Routing to Destination:
EDDF0300
N0491F310 FOXTO2N DEVON UB5 SPY UB5 GOW UN590 BEN
UN59059N010W/M084F330 61N020W 61N030W 60N040W
58N050W DCT LOACH DCT YYR/N0492F350 NA230 ML J553 YOW
SUNDE5
ALTERNATE: Elevation 639 ft
A reclearance procedure will be necessary for this flight:
Reclearance Airport: Montreal (CYMX)
Altn: Ottawa (CYOW) (Elevation 374 ft)
Data for the Flightplan:
Flight Number: LH4712/dte
A/C Registration: D - ABYO
A/C Type: B 747
STD: 03:00 UTC
Est. Flight Time: 08:49 hrs LOAD: 87200 kg Mach Nr.: M 0.84
For DOW, MALTOW and MALLW see list next page.
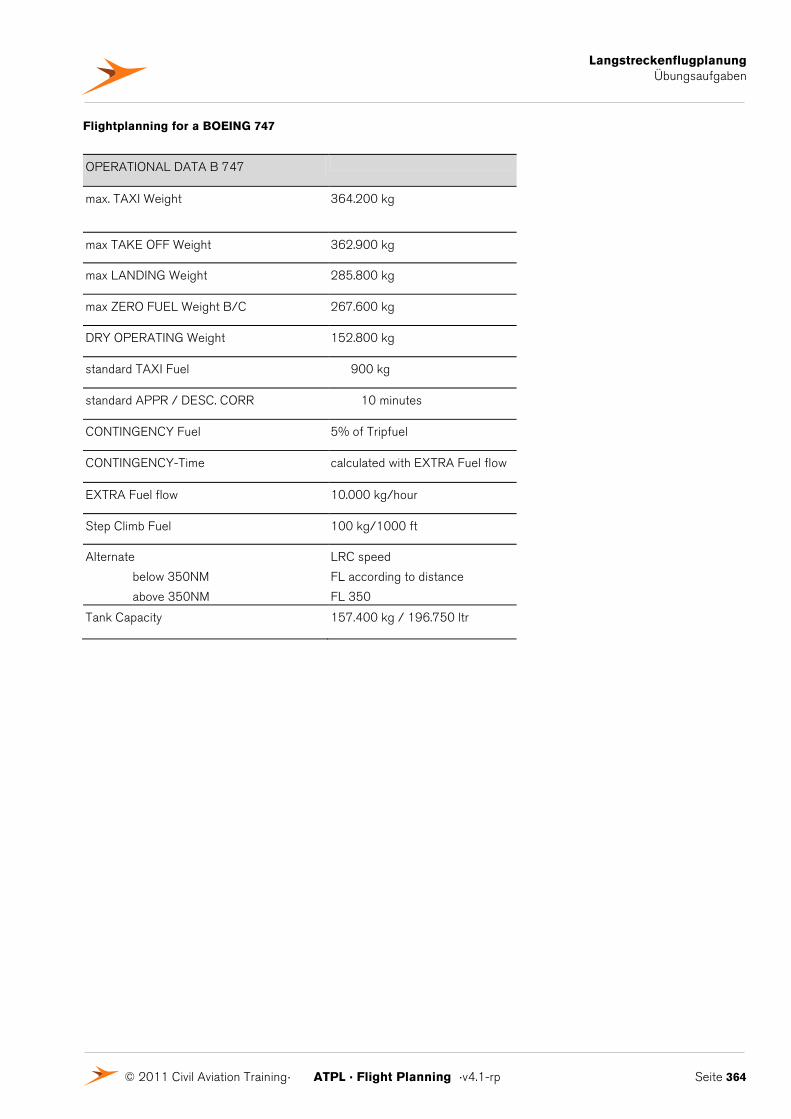
Langstreckenflugplanung Übungsaufgaben
© 2011 Civil Aviation Training. ATPL . Flight Planning .v4.1-rp Seite 364
Flightplanning for a BOEING 747
OPERATIONAL DATA B 747
max. TAXI Weight 364.200 kg
max TAKE OFF Weight 362.900 kg
max LANDING Weight 285.800 kg
max ZERO FUEL Weight B/C 267.600 kg
DRY OPERATING Weight 152.800 kg
standard TAXI Fuel 900 kg
standard APPR / DESC. CORR 10 minutes
CONTINGENCY Fuel 5% of Tripfuel
CONTINGENCY-Time calculated with EXTRA Fuel flow
EXTRA Fuel flow 10.000 kg/hour
Step Climb Fuel 100 kg/1000 ft
Alternate
below 350NM
above 350NM
LRC speed
FL according to distance
FL 350
Tank Capacity 157.400 kg / 196.750 ltr
Langstreckenflugplanung Übungsaufgaben
© 2011 Civil Aviation Training. ATPL . Flight Planning .v4.1-rp Seite 365
001.) Carry out a Preplanning and give following data:
a) Est ZFW ………….
b) Holding Fuel ………….
c) Est Landing Weight at Alternate Aerodrome
………….
d) Alternate Fuel ………….
e) Contingency Fuel ………….
f) Est Landing Weight at Destination ………….
g) Est Trip Fuel ………….
h) Estimated Take Off Weight………….
i) Est MINTOF ………….
002.) Prepare an Operational Flightplan (OFP B) including the
Reclearance procedure:
Give following data:
TOC: time MIN
fuel KG
distance NM
DESC Correction: fuel KG
time MIN
Langstreckenflugplanung Übungsaufgaben
© 2011 Civil Aviation Training. ATPL . Flight Planning .v4.1-rp Seite 366
003.) Carry out the FUEL CALCULATION for the Final Destination and
the FUEL CALCULATION and ENDURANCE for the Reclearance
Destination on the OFP B and calculate the Minimum TOF for
Reclearance according the data of the prepared OFP.
Minimum TOF for Reclearance:
Fuel time
Trip Fuel: :
CONT. Fuel: :
Altn Fuel: :
Hold Fuel: :
Mintof/Reel: :
Langstreckenflugplanung Übungsaufgaben
© 2011 Civil Aviation Training. ATPL . Flight Planning .v4.1-rp Seite 367
004.) Calculate the SAFE ENDURANCE
(Diversion fuel = 11000 kg):
a) SAFE ENDURANCE …………. hrs
005.) Find out the PSR (Point of Safe Return) for a return flight to
Frankfurt (EDDF, distances from the OFP B)
a) PSR (no wind): …………. hrs
b) ASS PSR: …………. hrs …………. NM
c) GSO: …………. kts
d) TASO: …………. kts
e) WC: …………. kts
f) GSR: …………. kts
PSR: …………. hrs
006.) Find out the PET (Point of Equal Time) between Glasgow (GOW)
and Goosebay (YYR, distances from the OFP B)
a) PET (no wind): …………. NM
b) ASS PET: …………. NM
(Position) ………….
c) GSO: …………. kts
d) TASO: …………. kts
e) WC: …………. kts
f) GSR: …………. kts
g) GSC: …………. kts
PET: …………. NM …………. hrs
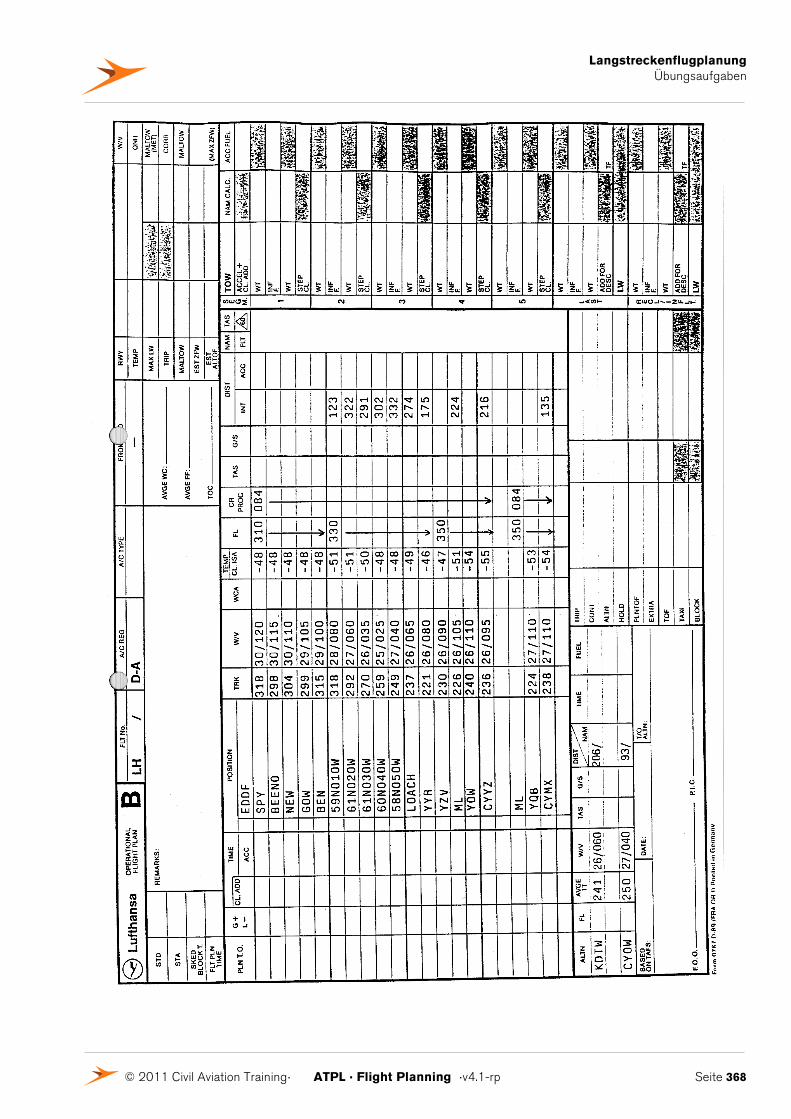
Langstreckenflugplanung Übungsaufgaben
© 2011 Civil Aviation Training. ATPL . Flight Planning .v4.1-rp Seite 368
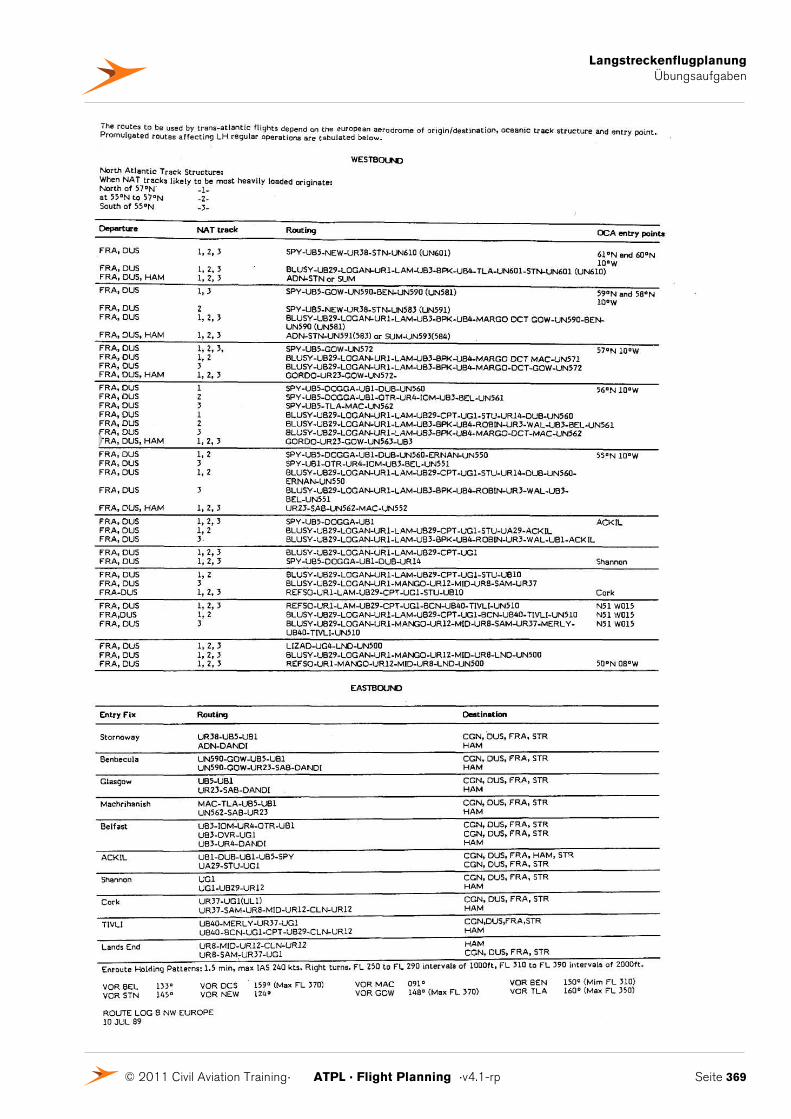
Langstreckenflugplanung Übungsaufgaben
© 2011 Civil Aviation Training. ATPL . Flight Planning .v4.1-rp Seite 369
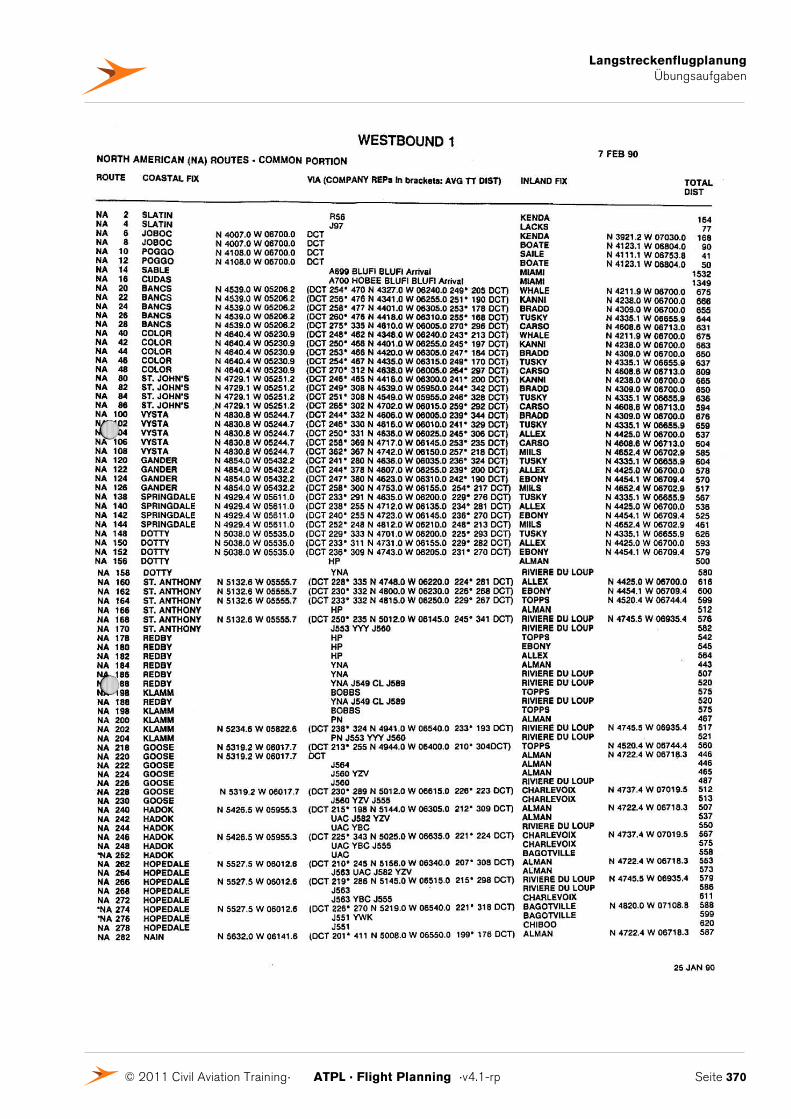
Langstreckenflugplanung Übungsaufgaben
© 2011 Civil Aviation Training. ATPL . Flight Planning .v4.1-rp Seite 370
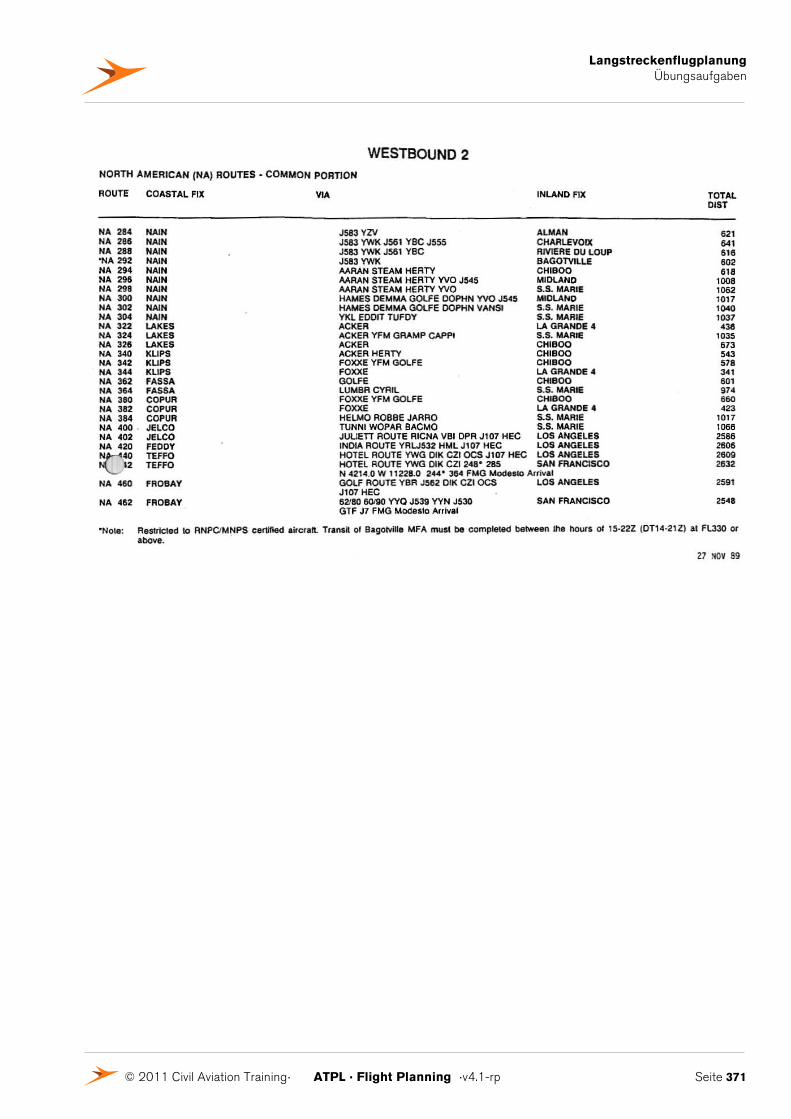
Langstreckenflugplanung Übungsaufgaben
© 2011 Civil Aviation Training. ATPL . Flight Planning .v4.1-rp Seite 371
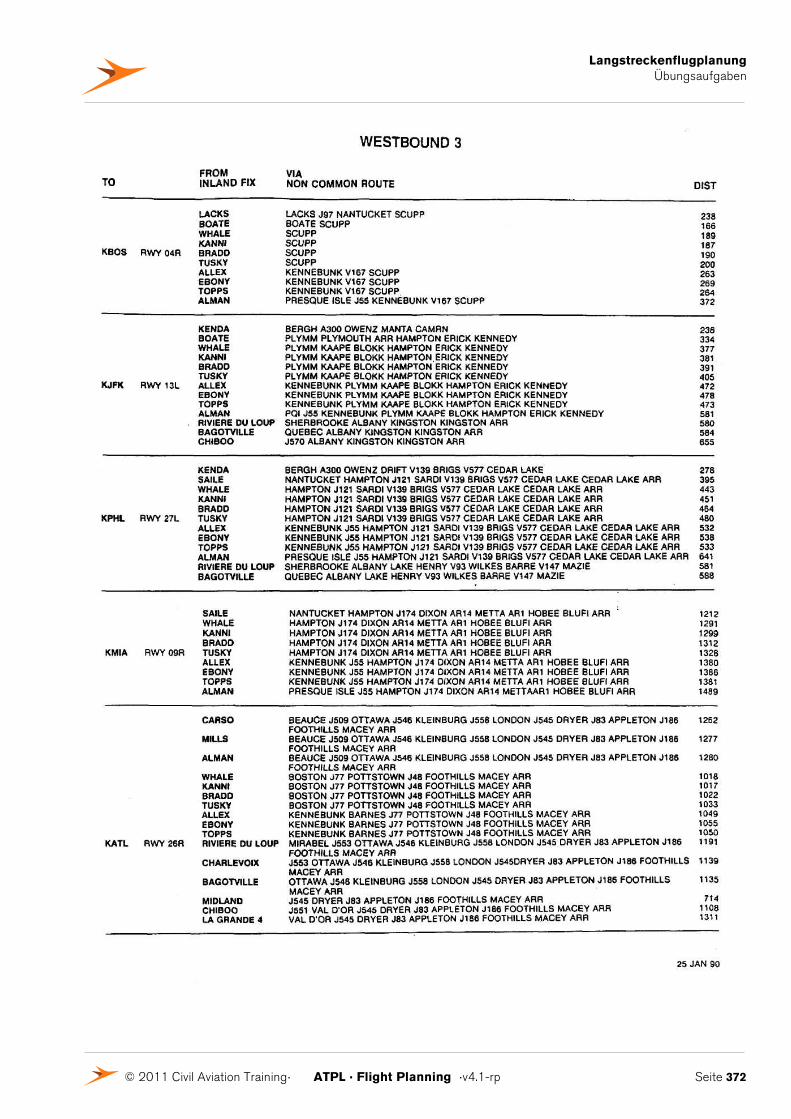
Langstreckenflugplanung Übungsaufgaben
© 2011 Civil Aviation Training. ATPL . Flight Planning .v4.1-rp Seite 372
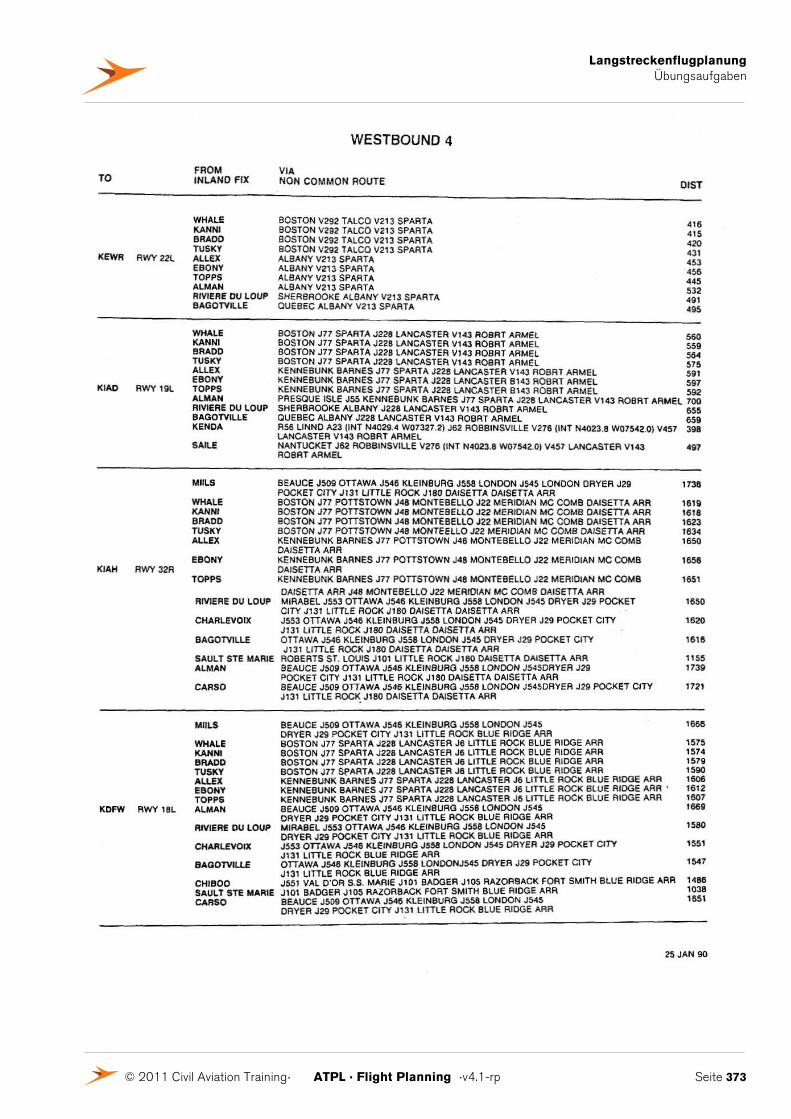
Langstreckenflugplanung Übungsaufgaben
© 2011 Civil Aviation Training. ATPL . Flight Planning .v4.1-rp Seite 373
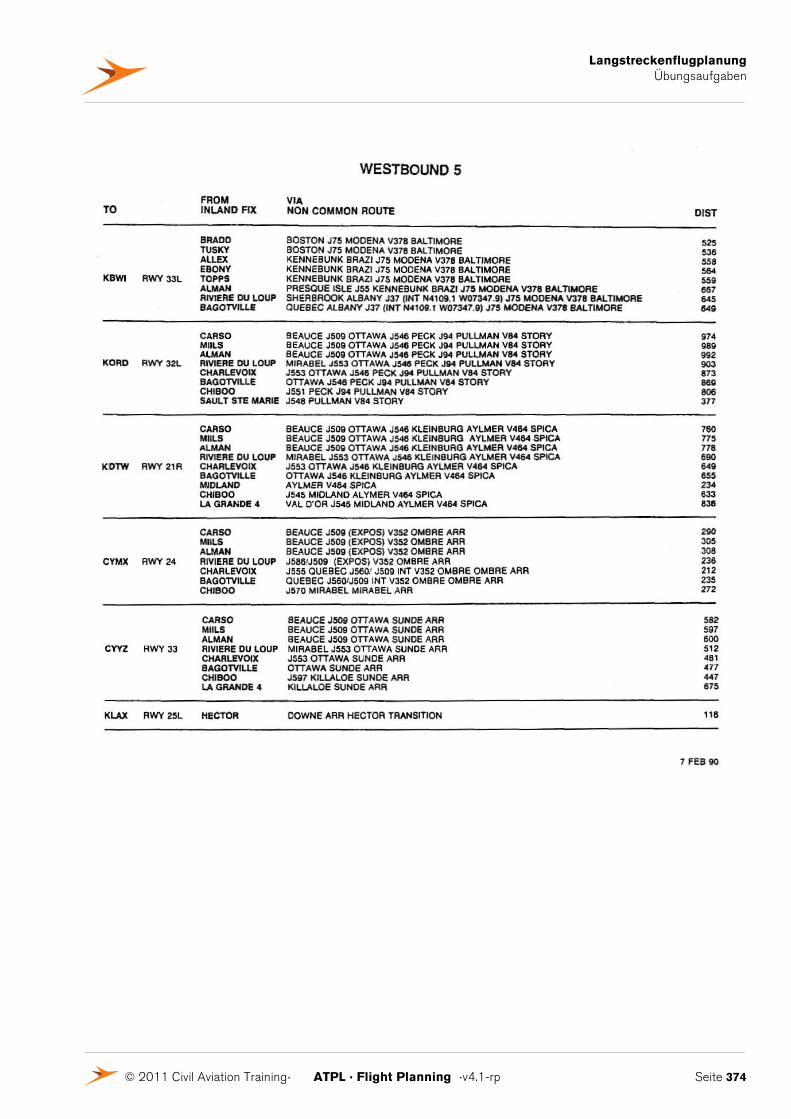
Langstreckenflugplanung Übungsaufgaben
© 2011 Civil Aviation Training. ATPL . Flight Planning .v4.1-rp Seite 374
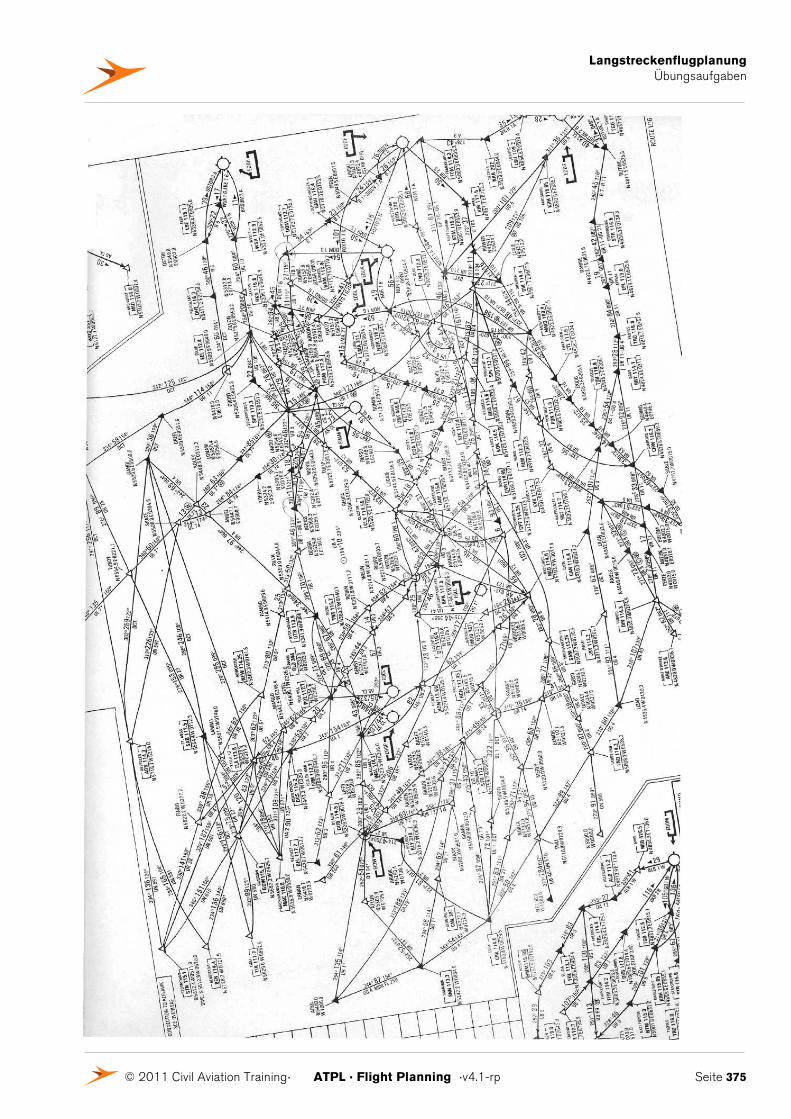
Langstreckenflugplanung Übungsaufgaben
© 2011 Civil Aviation Training. ATPL . Flight Planning .v4.1-rp Seite 375
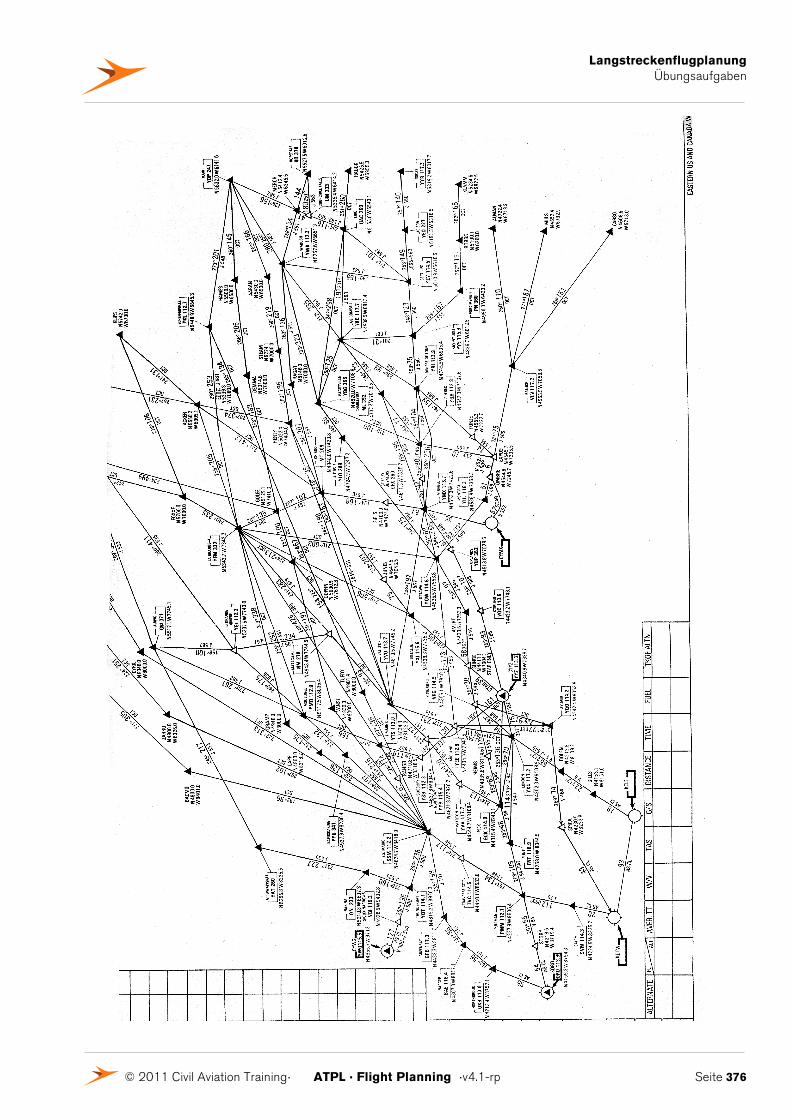
Langstreckenflugplanung Übungsaufgaben
© 2011 Civil Aviation Training. ATPL . Flight Planning .v4.1-rp Seite 376
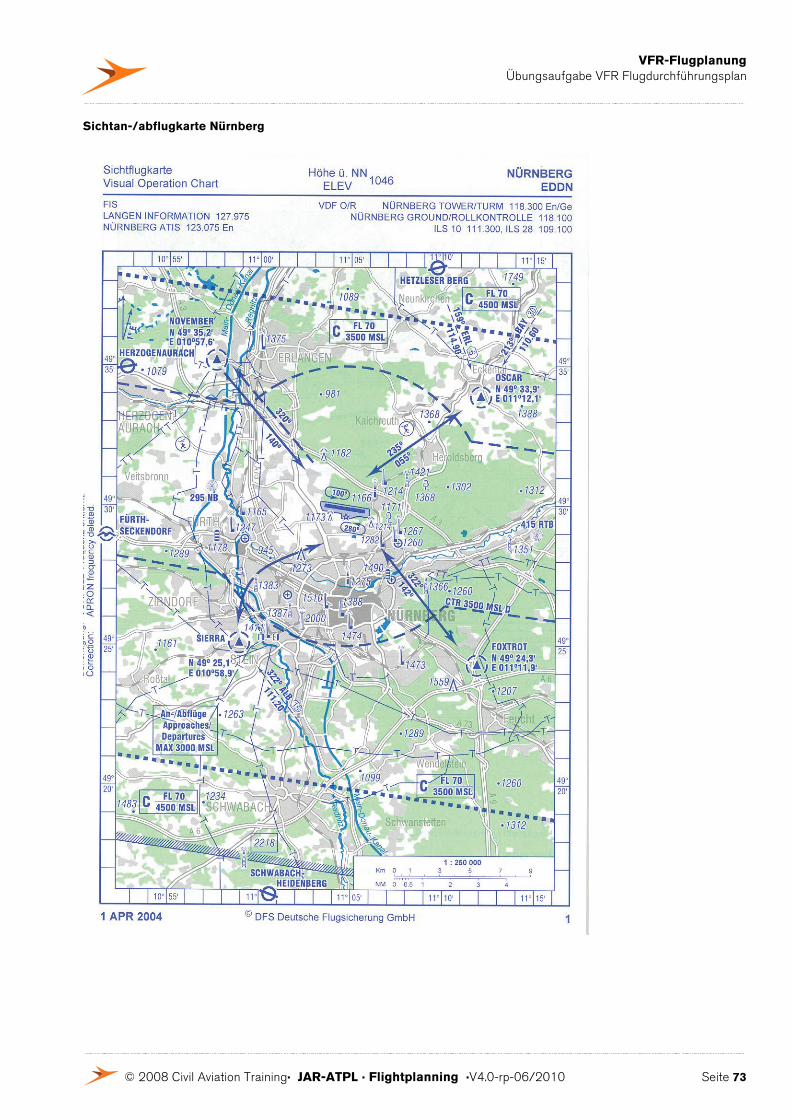
VFR-Flugplanung Übungsaufgabe VFR Flugdurchführungsplan
© 2008 Civil Aviation Training. JAR-ATPL . Flightplanning .V4.0-rp-06/2010 Seite 73
Sichtan-/abflugkarte Nürnberg

VFR-Flugplanung Übungsaufgabe VFR Flugdurchführungsplan
© 2008 Civil Aviation Training. JAR-ATPL . Flightplanning .V4.0-rp-06/2010 Seite 74
Ausschnitt (1) Luftfahrtkarte ICAO 1:500 000 Blatt Nürnberg
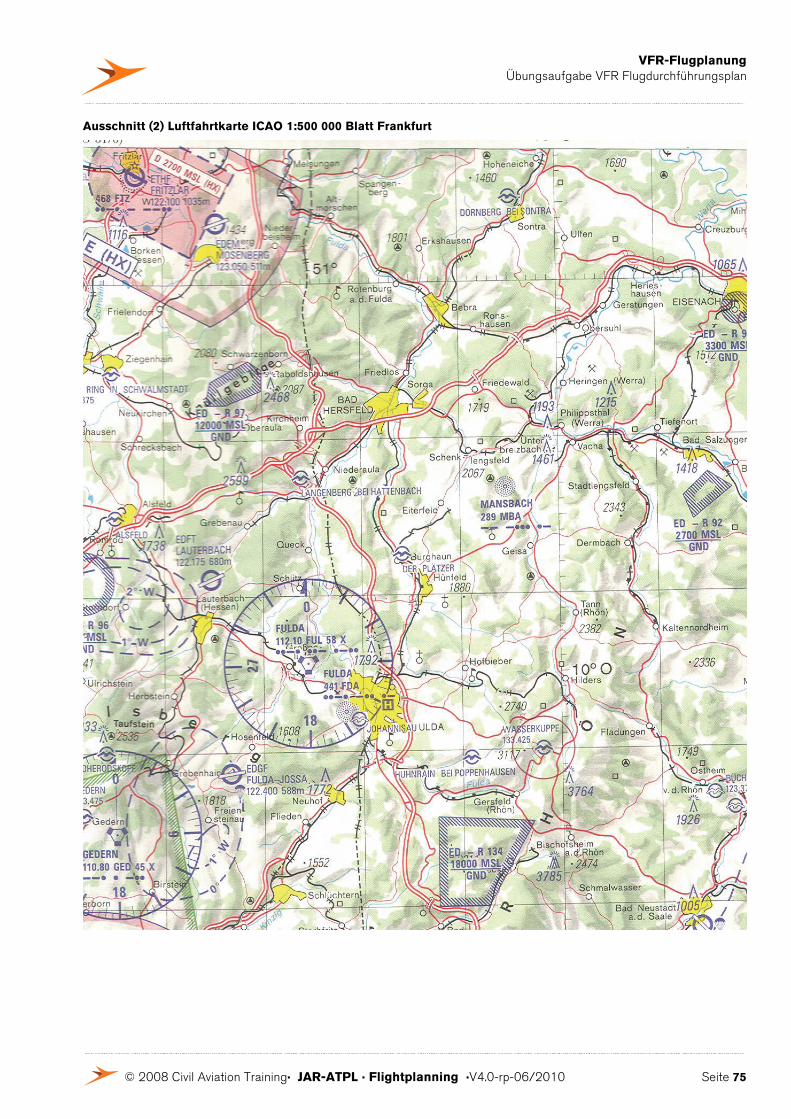
VFR-Flugplanung Übungsaufgabe VFR Flugdurchführungsplan
© 2008 Civil Aviation Training. JAR-ATPL . Flightplanning .V4.0-rp-06/2010 Seite 75
Ausschnitt (2) Luftfahrtkarte ICAO 1:500 000 Blatt Frankfurt
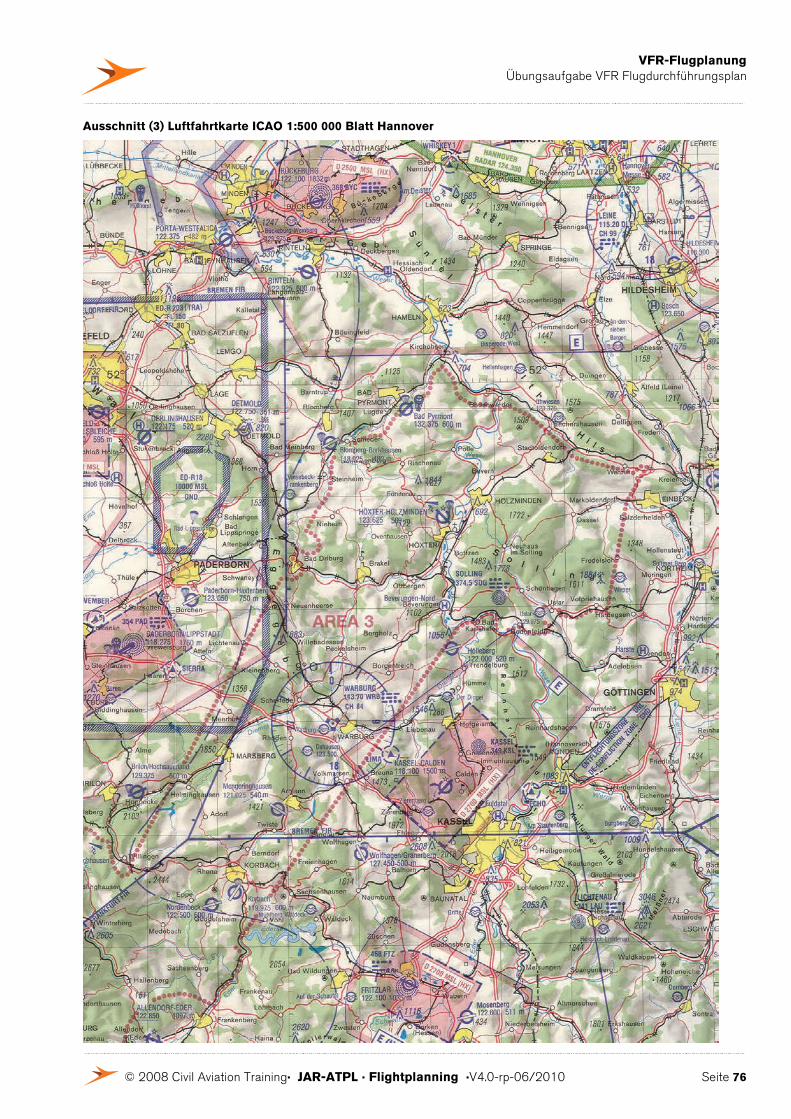
VFR-Flugplanung Übungsaufgabe VFR Flugdurchführungsplan
© 2008 Civil Aviation Training. JAR-ATPL . Flightplanning .V4.0-rp-06/2010 Seite 76
Ausschnitt (3) Luftfahrtkarte ICAO 1:500 000 Blatt Hannover
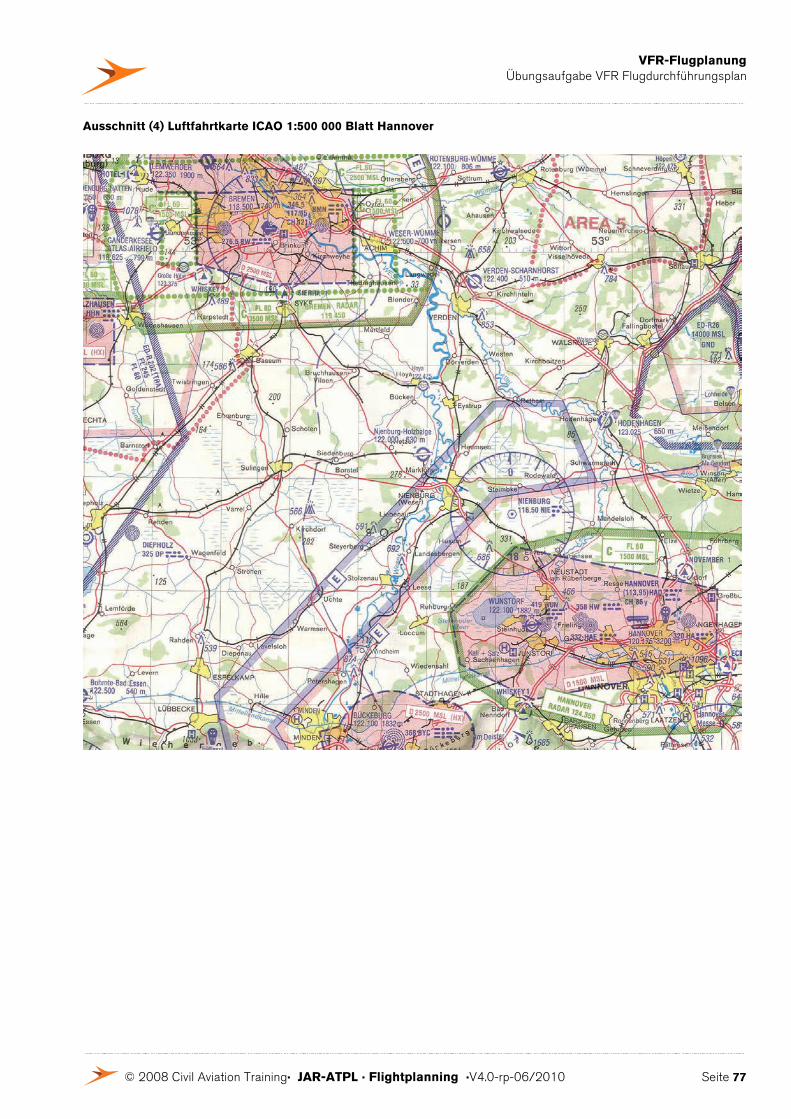
VFR-Flugplanung Übungsaufgabe VFR Flugdurchführungsplan
© 2008 Civil Aviation Training. JAR-ATPL . Flightplanning .V4.0-rp-06/2010 Seite 77
Ausschnitt (4) Luftfahrtkarte ICAO 1:500 000 Blatt Hannover
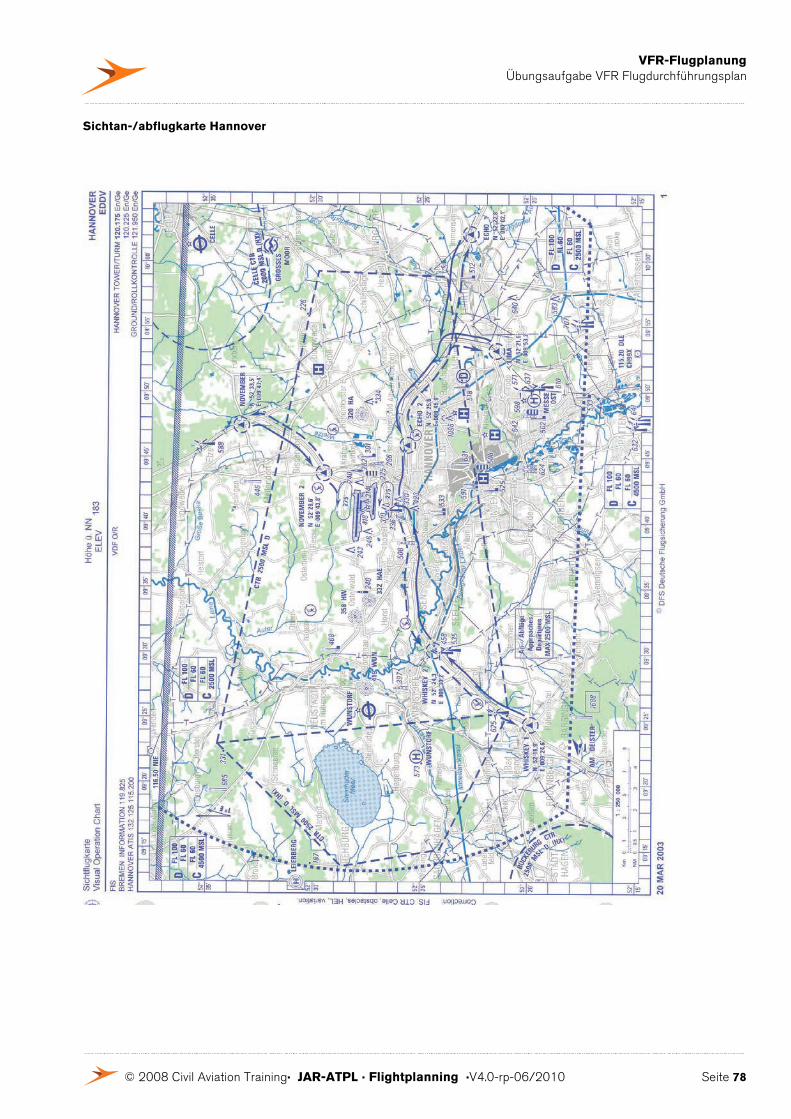
VFR-Flugplanung Übungsaufgabe VFR Flugdurchführungsplan
© 2008 Civil Aviation Training. JAR-ATPL . Flightplanning .V4.0-rp-06/2010 Seite 78
Sichtan-/abflugkarte Hannover
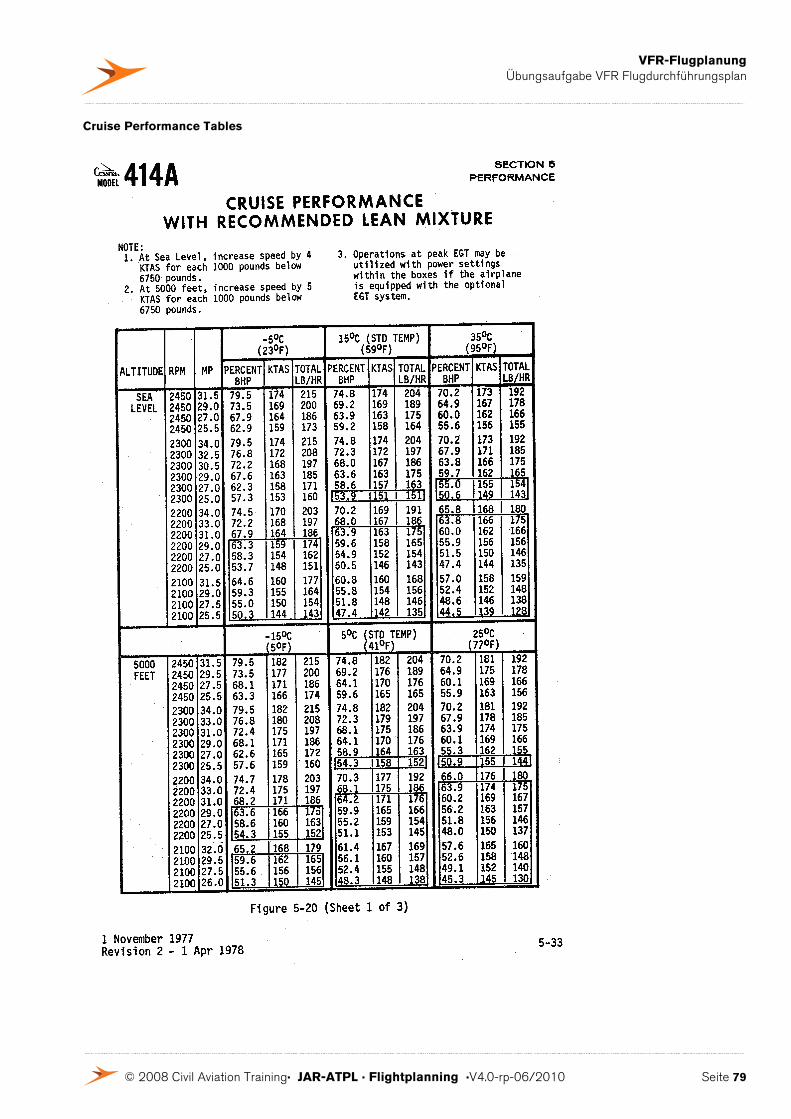
VFR-Flugplanung Übungsaufgabe VFR Flugdurchführungsplan
© 2008 Civil Aviation Training. JAR-ATPL . Flightplanning .V4.0-rp-06/2010 Seite 79
Cruise Performance Tables
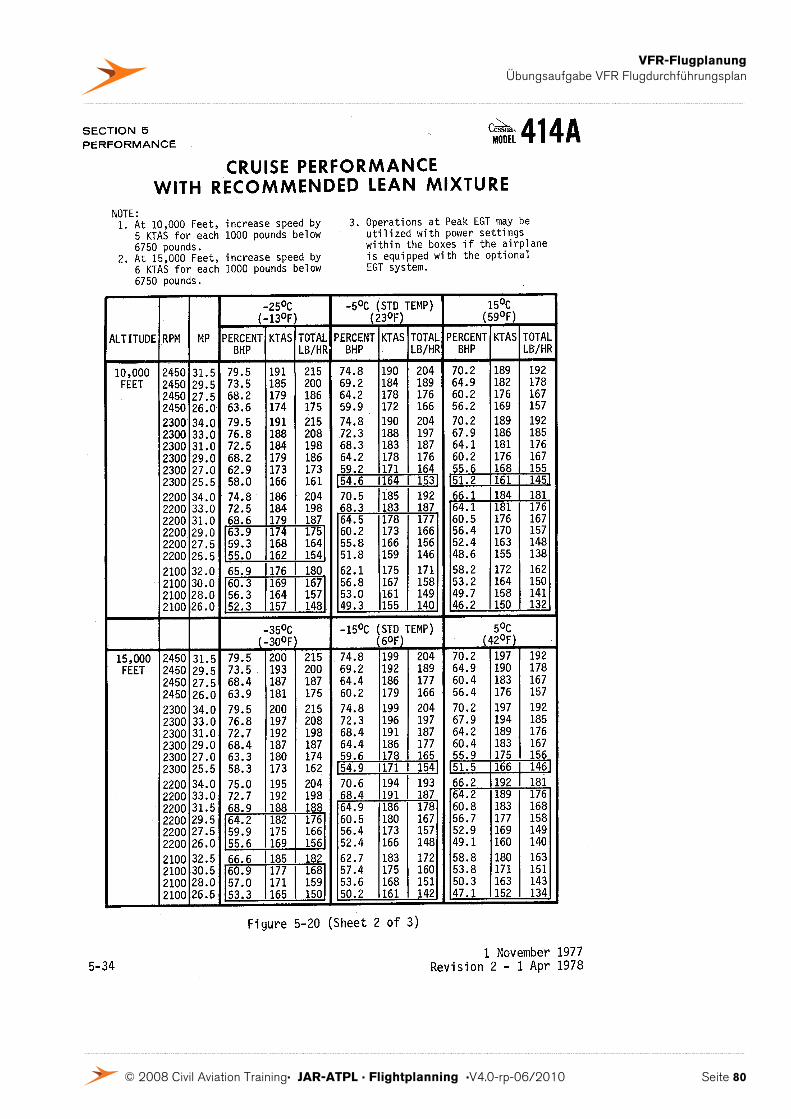
VFR-Flugplanung Übungsaufgabe VFR Flugdurchführungsplan
© 2008 Civil Aviation Training. JAR-ATPL . Flightplanning .V4.0-rp-06/2010 Seite 80
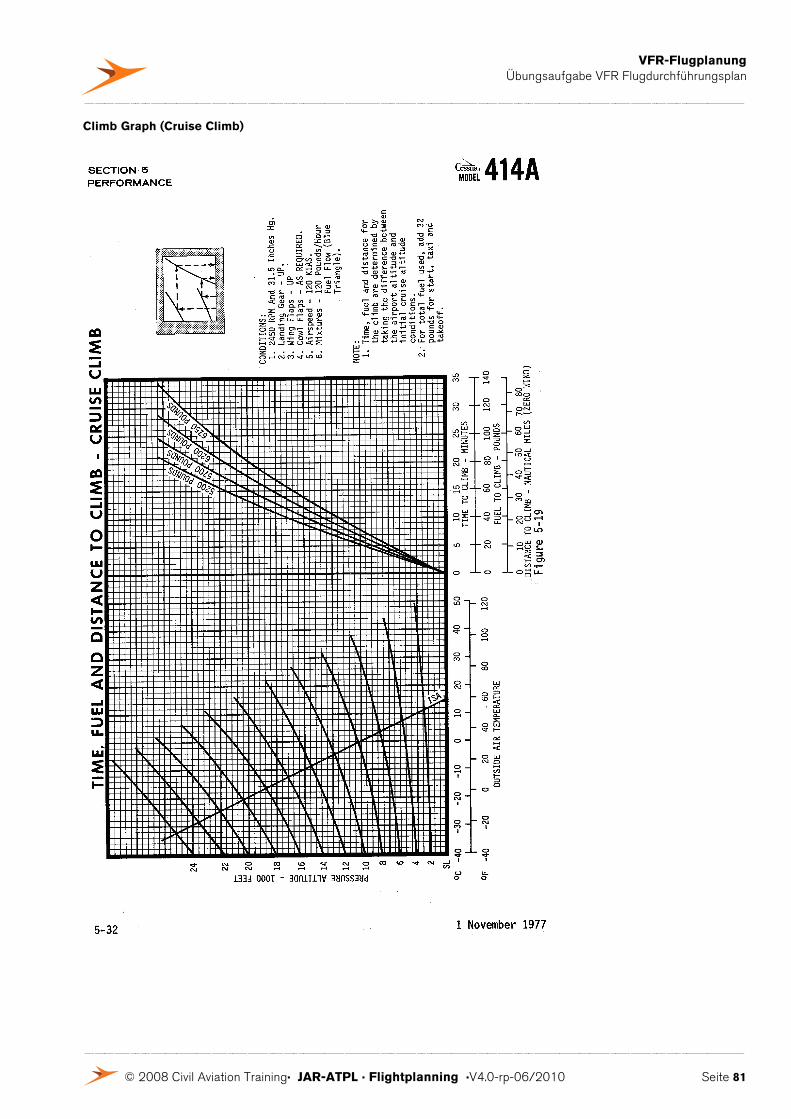
VFR-Flugplanung Übungsaufgabe VFR Flugdurchführungsplan
© 2008 Civil Aviation Training. JAR-ATPL . Flightplanning .V4.0-rp-06/2010 Seite 81
Climb Graph (Cruise Climb)
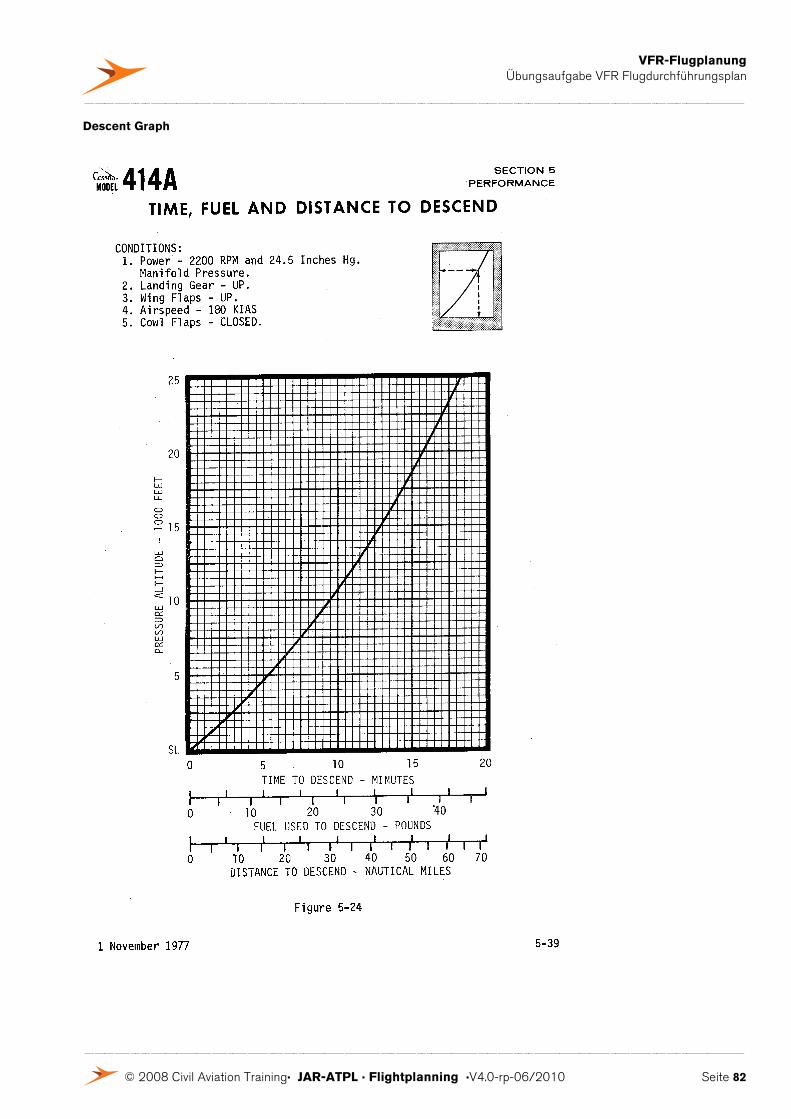
VFR-Flugplanung Übungsaufgabe VFR Flugdurchführungsplan
© 2008 Civil Aviation Training. JAR-ATPL . Flightplanning .V4.0-rp-06/2010 Seite 82
Descent Graph

CAP 697
CAA JAR-FCL Examinations
Flight Planning Manual
Second Edition July 2006
www.caa.co.uk
Safety Regulation Group

CAP 697
CAA JAR-FCL Examinations
Flight Planning Manual
Second Edition July 2006
www.caa.co.uk
Safety Regulation Group
CAP 697 CAA JAR-FCL Examinations - Flight Planning Manual
© Civil Aviation Authority 2006
All rights reserved. Copies of this publication may be reproduced as training material for students, foruse within a company or organisation, or for personal use, but may not otherwise be reproduced forpublication or for commercial gain.
To use or reference CAA publications for any other purpose, please contact the CAA at the addressbelow for formal agreement.
ISBN 0 11790 652 2
First published August 1999Second edition July 2006Second edition (corrected) September 2006
Enquiries regarding the content of this publication should be addressed to:Personnel Licensing Department, Safety Regulation Group, Civil Aviation Authority, Aviation House,Gatwick Airport South, West Sussex, RH6 0YR.
The latest version of this document is available in electronic format at www.caa.co.uk/publications,where you may also register for e-mail notification of amendments.
Published by TSO (The Stationery Office) on behalf of the UK Civil Aviation Authority.
Printed copy available from: TSO, PO Box 29, Norwich NR3 1GN www.tso.co.uk/bookshopTelephone orders/General enquiries: 0870 600 5522 E-mail: [email protected] orders: 0870 600 5533 Textphone: 0870 240 3701
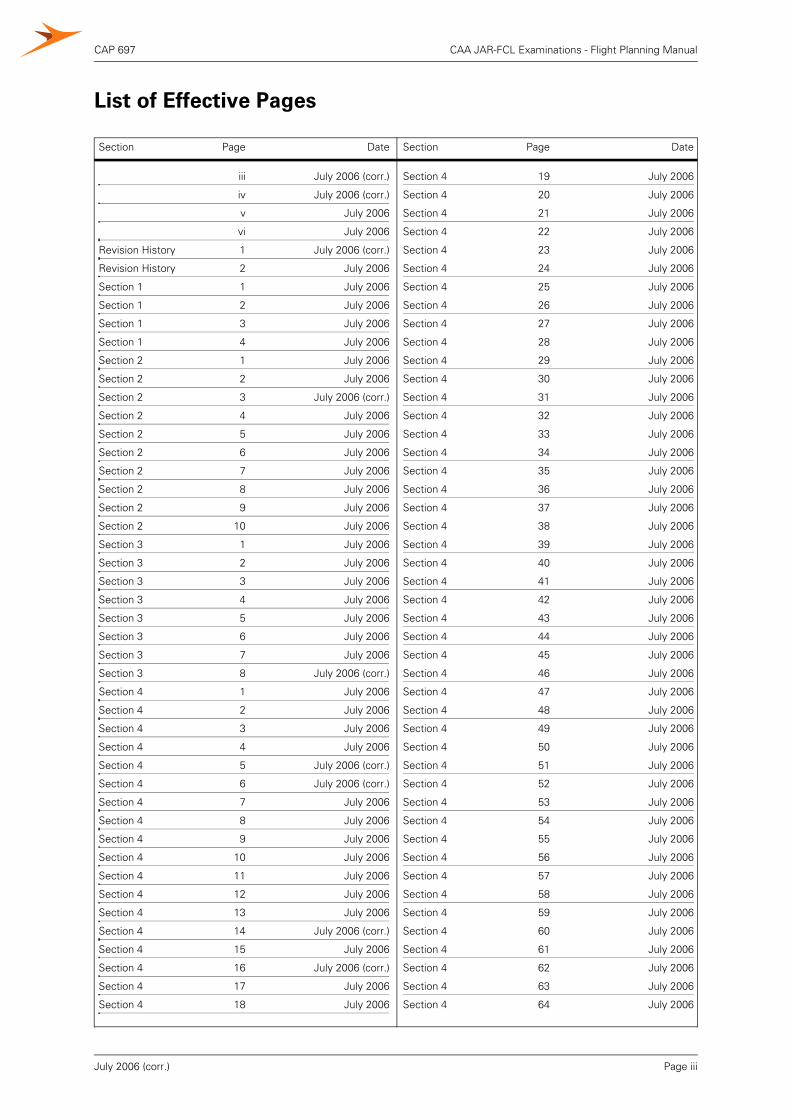
CAP 697 CAA JAR-FCL Examinations - Flight Planning Manual
Section Page Date Section Page Date
List of Effective Pages
iii July 2006 (corr.)
iv July 2006 (corr.)
v July 2006
vi July 2006
Revision History 1 July 2006 (corr.)
Revision History 2 July 2006
Section 1 1 July 2006
Section 1 2 July 2006
Section 1 3 July 2006
Section 1 4 July 2006
Section 2 1 July 2006
Section 2 2 July 2006
Section 2 3 July 2006 (corr.)
Section 2 4 July 2006
Section 2 5 July 2006
Section 2 6 July 2006
Section 2 7 July 2006
Section 2 8 July 2006
Section 2 9 July 2006
Section 2 10 July 2006
Section 3 1 July 2006
Section 3 2 July 2006
Section 3 3 July 2006
Section 3 4 July 2006
Section 3 5 July 2006
Section 3 6 July 2006
Section 3 7 July 2006
Section 3 8 July 2006 (corr.)
Section 4 1 July 2006
Section 4 2 July 2006
Section 4 3 July 2006
Section 4 4 July 2006
Section 4 5 July 2006 (corr.)
Section 4 6 July 2006 (corr.)
Section 4 7 July 2006
Section 4 8 July 2006
Section 4 9 July 2006
Section 4 10 July 2006
Section 4 11 July 2006
Section 4 12 July 2006
Section 4 13 July 2006
Section 4 14 July 2006 (corr.)
Section 4 15 July 2006
Section 4 16 July 2006 (corr.)
Section 4 17 July 2006
Section 4 18 July 2006
Section 4 19 July 2006
Section 4 20 July 2006
Section 4 21 July 2006
Section 4 22 July 2006
Section 4 23 July 2006
Section 4 24 July 2006
Section 4 25 July 2006
Section 4 26 July 2006
Section 4 27 July 2006
Section 4 28 July 2006
Section 4 29 July 2006
Section 4 30 July 2006
Section 4 31 July 2006
Section 4 32 July 2006
Section 4 33 July 2006
Section 4 34 July 2006
Section 4 35 July 2006
Section 4 36 July 2006
Section 4 37 July 2006
Section 4 38 July 2006
Section 4 39 July 2006
Section 4 40 July 2006
Section 4 41 July 2006
Section 4 42 July 2006
Section 4 43 July 2006
Section 4 44 July 2006
Section 4 45 July 2006
Section 4 46 July 2006
Section 4 47 July 2006
Section 4 48 July 2006
Section 4 49 July 2006
Section 4 50 July 2006
Section 4 51 July 2006
Section 4 52 July 2006
Section 4 53 July 2006
Section 4 54 July 2006
Section 4 55 July 2006
Section 4 56 July 2006
Section 4 57 July 2006
Section 4 58 July 2006
Section 4 59 July 2006
Section 4 60 July 2006
Section 4 61 July 2006
Section 4 62 July 2006
Section 4 63 July 2006
Section 4 64 July 2006
Page iiiJuly 2006 (corr.)
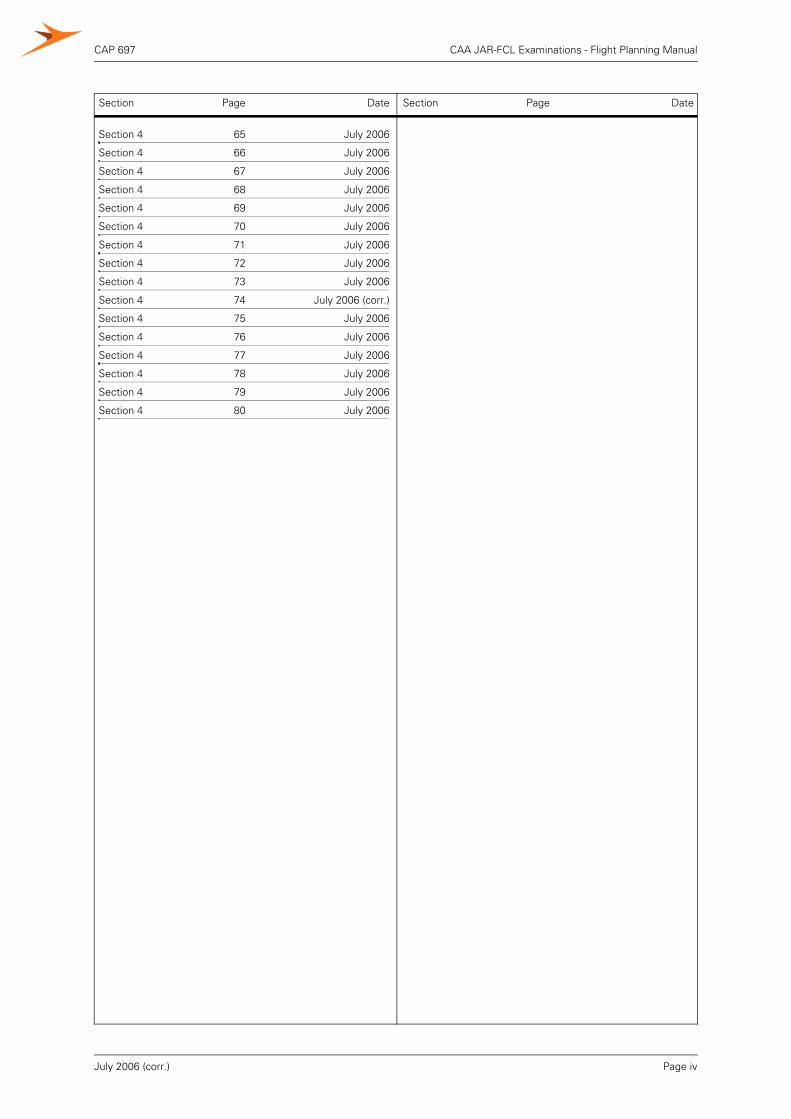
CAP 697 CAA JAR-FCL Examinations - Flight Planning Manual
Section Page Date Section Page Date
Section 4 65 July 2006
Section 4 66 July 2006
Section 4 67 July 2006
Section 4 68 July 2006
Section 4 69 July 2006
Section 4 70 July 2006
Section 4 71 July 2006
Section 4 72 July 2006
Section 4 73 July 2006
Section 4 74 July 2006 (corr.)
Section 4 75 July 2006
Section 4 76 July 2006
Section 4 77 July 2006
Section 4 78 July 2006
Section 4 79 July 2006
Section 4 80 July 2006
Page ivJuly 2006 (corr.)
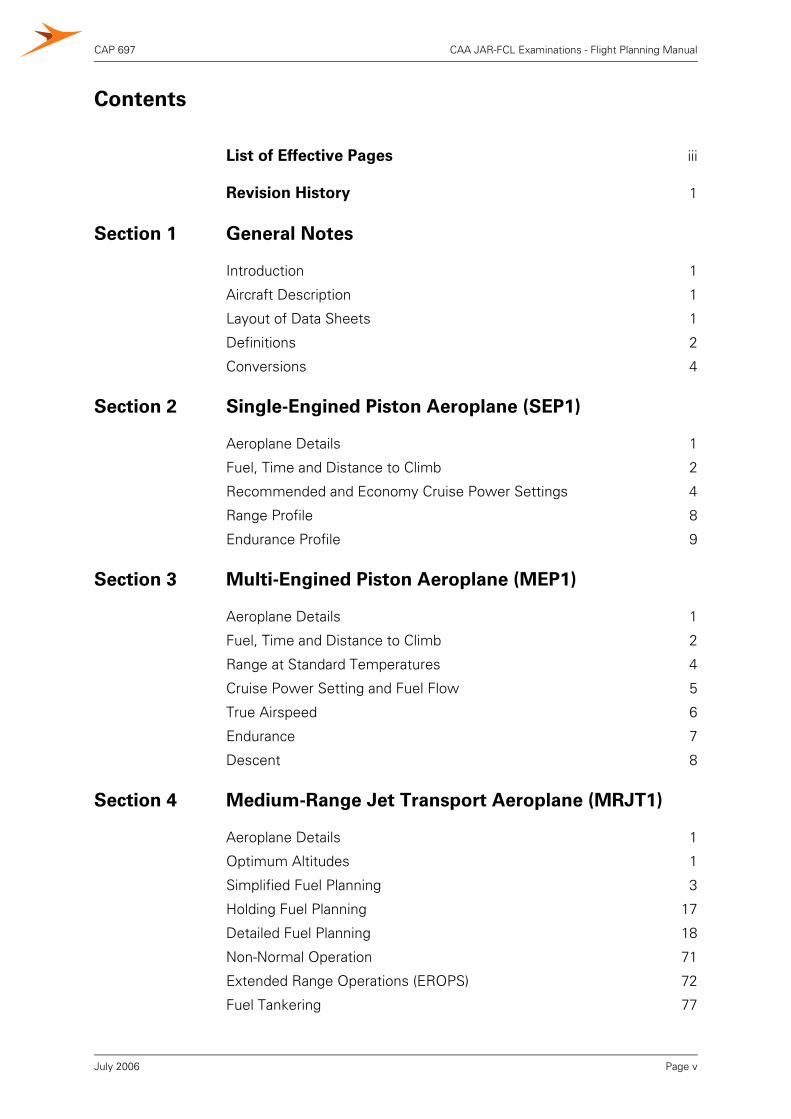
CAP 697 CAA JAR-FCL Examinations - Flight Planning Manual
Page v
List of Effective Pages iii
Revision History 1
Section 1 General Notes
Introduction 1
Aircraft Description 1
Layout of Data Sheets 1
Definitions 2
Conversions 4
Section 2 Single-Engined Piston Aeroplane (SEP1)
Aeroplane Details 1
Fuel, Time and Distance to Climb 2
Recommended and Economy Cruise Power Settings 4
Range Profile 8
Endurance Profile 9
Section 3 Multi-Engined Piston Aeroplane (MEP1)
Aeroplane Details 1
Fuel, Time and Distance to Climb 2
Range at Standard Temperatures 4
Cruise Power Setting and Fuel Flow 5
True Airspeed 6
Endurance 7
Descent 8
Section 4 Medium-Range Jet Transport Aeroplane (MRJT1)
Aeroplane Details 1
Optimum Altitudes 1
Simplified Fuel Planning 3
Holding Fuel Planning 17
Detailed Fuel Planning 18
Non-Normal Operation 71
Extended Range Operations (EROPS) 72
Fuel Tankering 77
July 2006
Contents
CAP 697 CAA JAR-FCL Examinations - Flight Planning Manual
INTENTIONALLY LEFT BLANK
Page viJuly 2006
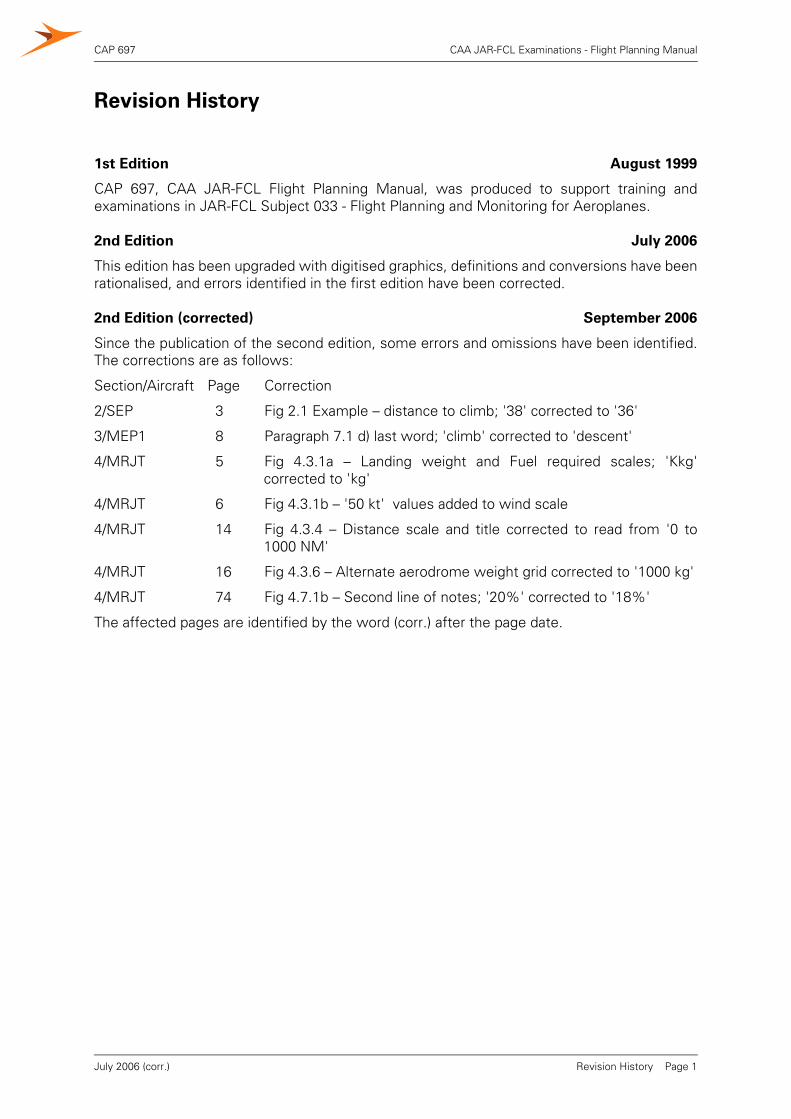
CAP 697 CAA JAR-FCL Examinations - Flight Planning Manual
Revision History Page 1
Revision History
1st Edition August 1999
CAP 697, CAA JAR-FCL Flight Planning Manual, was produced to support training andexaminations in JAR-FCL Subject 033 - Flight Planning and Monitoring for Aeroplanes.
2nd Edition July 2006
This edition has been upgraded with digitised graphics, definitions and conversions have beenrationalised, and errors identified in the first edition have been corrected.
2nd Edition (corrected) September 2006
Since the publication of the second edition, some errors and omissions have been identified.The corrections are as follows:
Section/Aircraft Page Correction
2/SEP 3 Fig 2.1 Example – distance to climb; '38' corrected to '36'
3/MEP1 8 Paragraph 7.1 d) last word; 'climb' corrected to 'descent'
4/MRJT 5 Fig 4.3.1a – Landing weight and Fuel required scales; 'Kkg'corrected to 'kg'
4/MRJT 6 Fig 4.3.1b – '50 kt' values added to wind scale
4/MRJT 14 Fig 4.3.4 – Distance scale and title corrected to read from '0 to1000 NM'
4/MRJT 16 Fig 4.3.6 – Alternate aerodrome weight grid corrected to '1000 kg'
4/MRJT 74 Fig 4.7.1b – Second line of notes; '20%' corrected to '18%'
The affected pages are identified by the word (corr.) after the page date.
July 2006 (corr.)

CAP 697 CAA JAR-FCL Examinations - Flight Planning Manual
INTENTIONALLY LEFT BLANK
Revision History Page 2July 2006
CAP 697 CAA JAR-FCL Examinations - Flight Planning Manual
Section 1 General Notes
1 Introduction
Important Notice
1.1 The data sheets in this manual are produced to support training and examinations inJAR-FCL Subject 033 - Flight Planning and Monitoring for Aeroplanes.
1.2 The data contained within these sheets are for training and examination purposes
only. The data must not be used for any other purpose and specifically, are not to be
used for the purpose of planning activities associated with the operation of any
aeroplane in use now or in the future.
2 Aircraft Description
2.1 The aeroplanes used in these data sheets are of generic types related to the classesof aeroplane on which the appropriate examinations are based.
2.2 Candidates must select the correct class of aeroplane for the question beingattempted.
Generic Aeroplanes
2.3 The same set of generic aeroplanes will be utilised in the following subjects:
• 031 – Mass and Balance - Aeroplanes
• 032 – Performance – Aeroplanes
• 033 – Flight Planning and Monitoring – Aeroplanes
3 Layout of Data Sheets
3.1 Each set of data sheets will consist of an introduction that will contain some pertinentinformation relating to the aeroplane and the subject being examined. This data willinclude (but is not limited to) a list of abbreviations and some conversion factors.
3.2 This will be followed by a selection of graphs and/or tables that will provide coveragesuitable for the syllabus being examined. A worked example will accompany eachgraph/table and will demonstrate its use.
Single-Engined Piston certificated under CS 23 (Light Aeroplanes)
Performance Class B SEP1
Multi-Engined Piston certificated under CS 23 (Light Aeroplanes)
Performance Class B MEP1
Medium-Range Jet Transport certificated under CS 25 (Large Aeroplanes)
Performance Class A MRJT1
Section 1 - General Notes Page 1July 2006
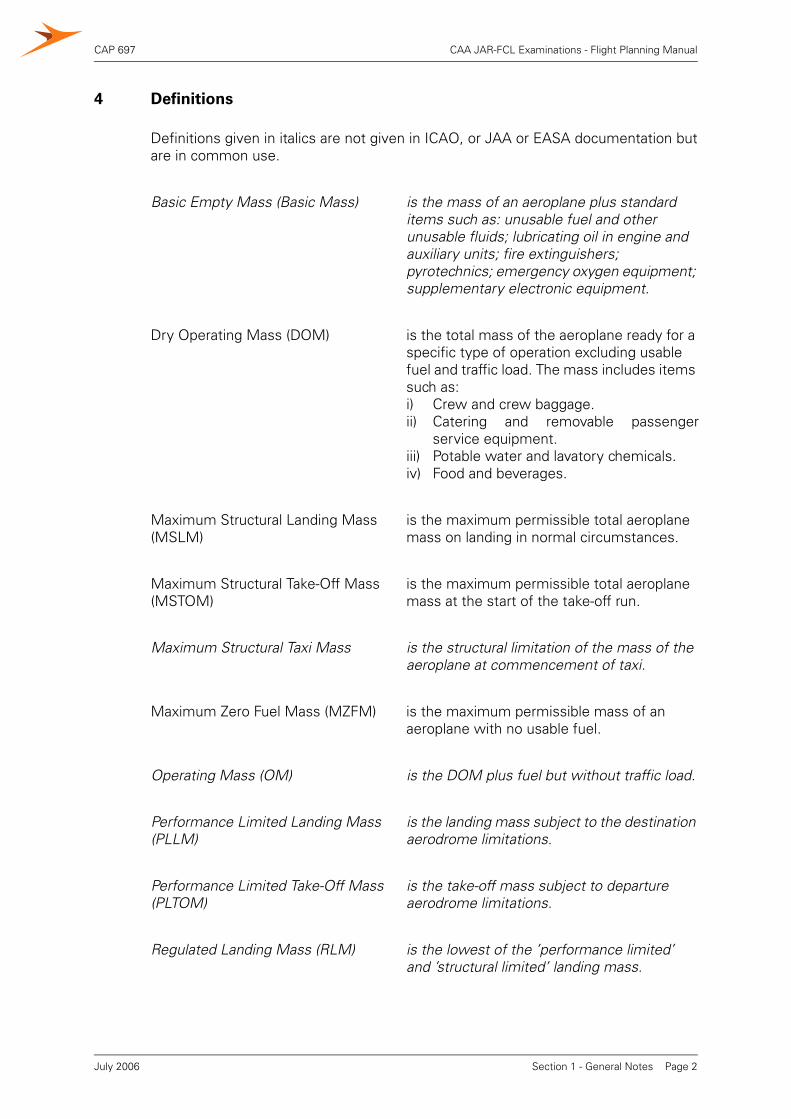
CAP 697 CAA JAR-FCL Examinations - Flight Planning Manual
4 Definitions
Definitions given in italics are not given in ICAO, or JAA or EASA documentation butare in common use.
Basic Empty Mass (Basic Mass) is the mass of an aeroplane plus standard items such as: unusable fuel and other unusable fluids; lubricating oil in engine and auxiliary units; fire extinguishers; pyrotechnics; emergency oxygen equipment; supplementary electronic equipment.
Dry Operating Mass (DOM) is the total mass of the aeroplane ready for a specific type of operation excluding usable fuel and traffic load. The mass includes items such as: i) Crew and crew baggage.ii) Catering and removable passenger
service equipment.iii) Potable water and lavatory chemicals.iv) Food and beverages.
Maximum Structural Landing Mass (MSLM)
is the maximum permissible total aeroplane mass on landing in normal circumstances.
Maximum Structural Take-Off Mass (MSTOM)
is the maximum permissible total aeroplane mass at the start of the take-off run.
Maximum Structural Taxi Mass is the structural limitation of the mass of the aeroplane at commencement of taxi.
Maximum Zero Fuel Mass (MZFM) is the maximum permissible mass of an aeroplane with no usable fuel.
Operating Mass (OM) is the DOM plus fuel but without traffic load.
Performance Limited Landing Mass (PLLM)
is the landing mass subject to the destination aerodrome limitations.
Performance Limited Take-Off Mass (PLTOM)
is the take-off mass subject to departure aerodrome limitations.
Regulated Landing Mass (RLM) is the lowest of the ’performance limited’ and ’structural limited’ landing mass.
Section 1 - General Notes Page 2July 2006
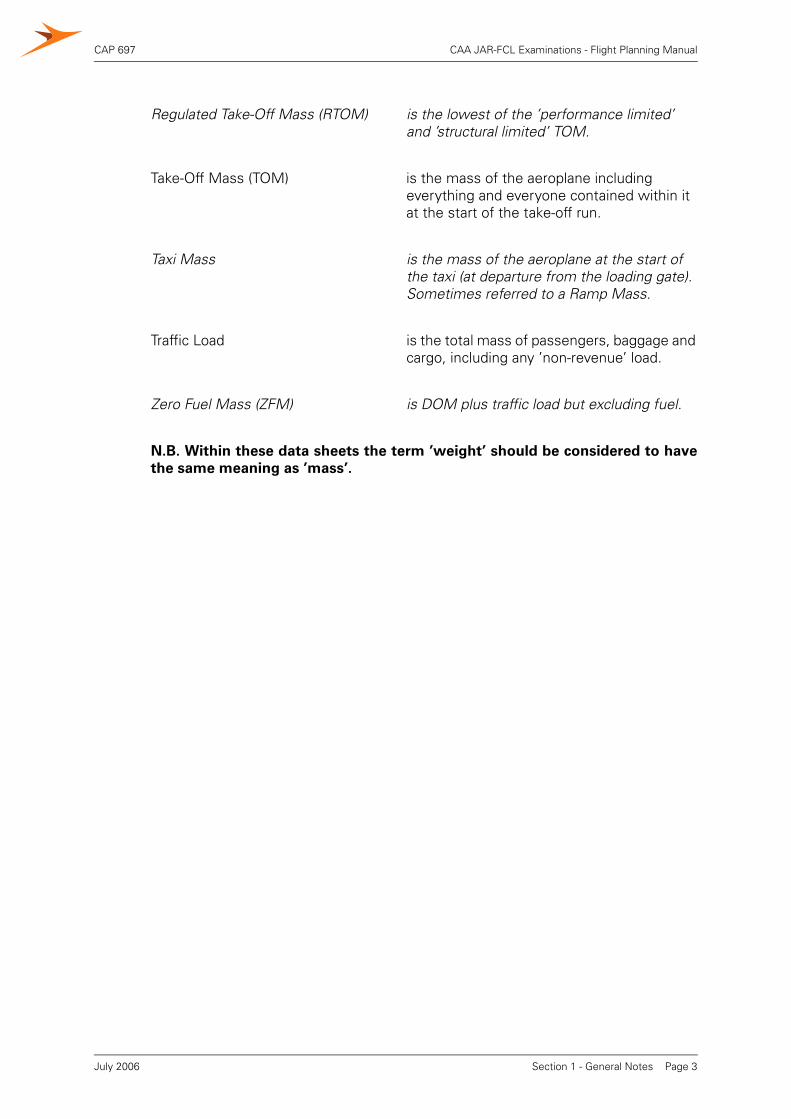
CAP 697 CAA JAR-FCL Examinations - Flight Planning Manual
N.B. Within these data sheets the term ’weight’ should be considered to have
the same meaning as ’mass’.
Regulated Take-Off Mass (RTOM) is the lowest of the ’performance limited’ and ’structural limited’ TOM.
Take-Off Mass (TOM) is the mass of the aeroplane including everything and everyone contained within it at the start of the take-off run.
Taxi Mass is the mass of the aeroplane at the start of the taxi (at departure from the loading gate). Sometimes referred to a Ramp Mass.
Traffic Load is the total mass of passengers, baggage and cargo, including any ’non-revenue’ load.
Zero Fuel Mass (ZFM) is DOM plus traffic load but excluding fuel.
Section 1 - General Notes Page 3July 2006
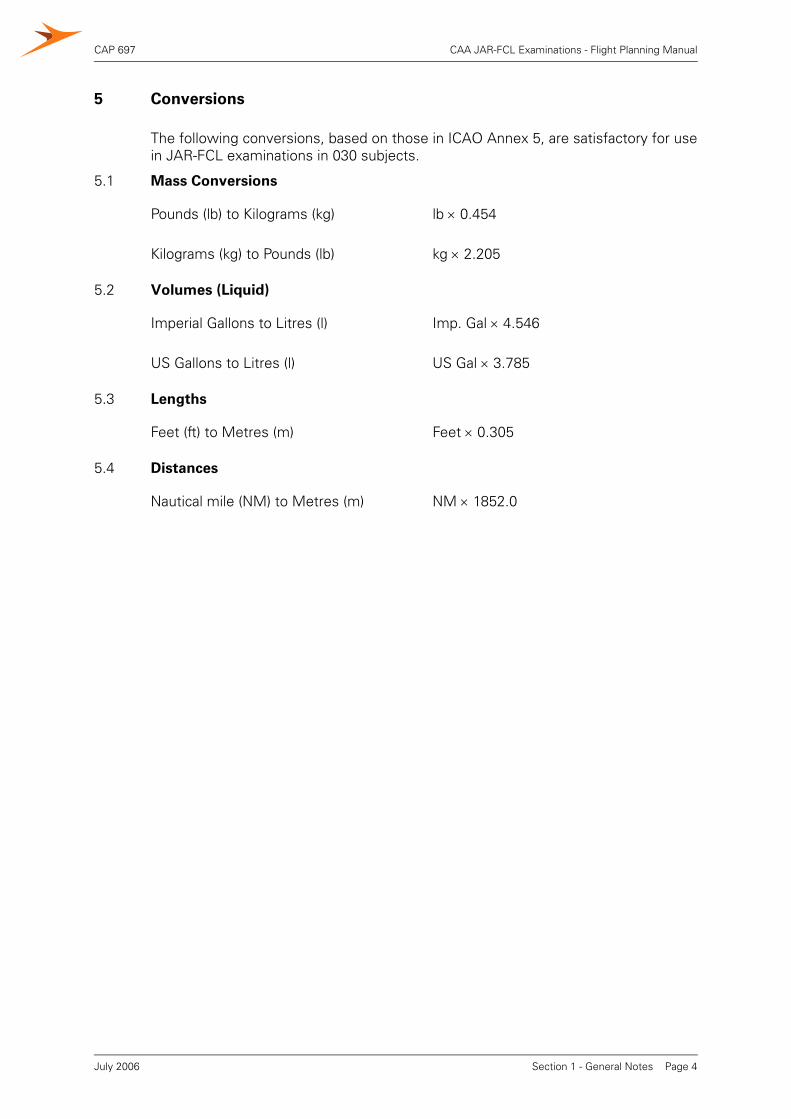
CAP 697 CAA JAR-FCL Examinations - Flight Planning Manual
5 Conversions
The following conversions, based on those in ICAO Annex 5, are satisfactory for usein JAR-FCL examinations in 030 subjects.
5.1 Mass Conversions
5.2 Volumes (Liquid)
5.3 Lengths
5.4 Distances
Pounds (lb) to Kilograms (kg) lb × 0.454
Kilograms (kg) to Pounds (lb) kg × 2.205
Imperial Gallons to Litres (l) Imp. Gal × 4.546
US Gallons to Litres (l) US Gal × 3.785
Feet (ft) to Metres (m) Feet × 0.305
Nautical mile (NM) to Metres (m) NM × 1852.0
Section 1 - General Notes Page 4July 2006
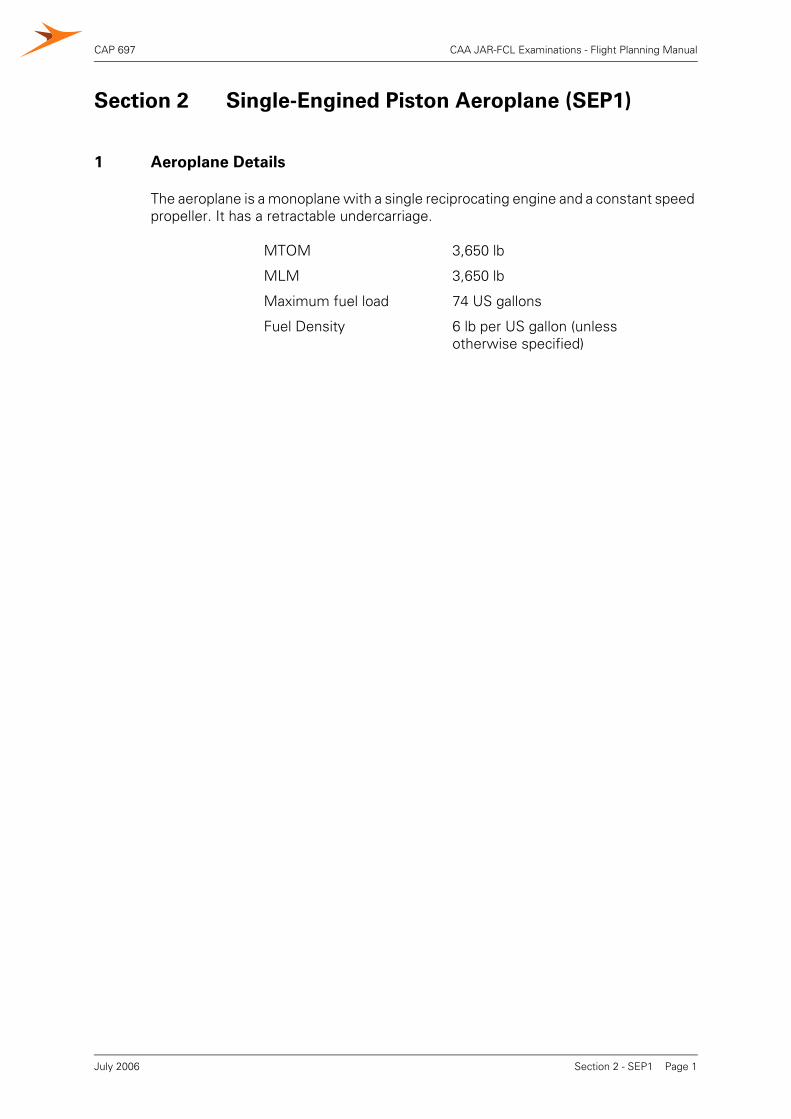
CAP 697 CAA JAR-FCL Examinations - Flight Planning Manual
Section 2 Single-Engined Piston Aeroplane (SEP1)
1 Aeroplane Details
The aeroplane is a monoplane with a single reciprocating engine and a constant speed propeller. It has a retractable undercarriage.
MTOM 3,650 lb
MLM 3,650 lb
Maximum fuel load 74 US gallons
Fuel Density 6 lb per US gallon (unlessotherwise specified)
Section 2 - SEP1 Page 1July 2006
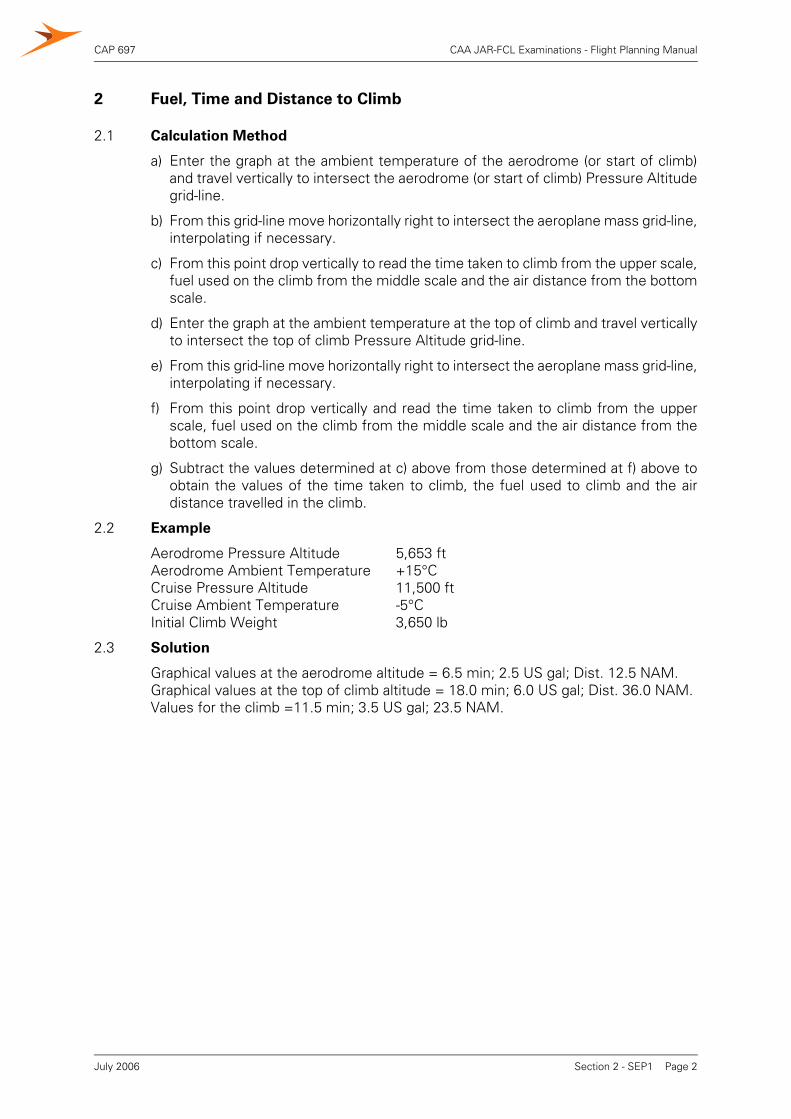
CAP 697 CAA JAR-FCL Examinations - Flight Planning Manual
2 Fuel, Time and Distance to Climb
2.1 Calculation Method
a) Enter the graph at the ambient temperature of the aerodrome (or start of climb)and travel vertically to intersect the aerodrome (or start of climb) Pressure Altitudegrid-line.
b) From this grid-line move horizontally right to intersect the aeroplane mass grid-line,interpolating if necessary.
c) From this point drop vertically to read the time taken to climb from the upper scale,fuel used on the climb from the middle scale and the air distance from the bottomscale.
d) Enter the graph at the ambient temperature at the top of climb and travel verticallyto intersect the top of climb Pressure Altitude grid-line.
e) From this grid-line move horizontally right to intersect the aeroplane mass grid-line,interpolating if necessary.
f) From this point drop vertically and read the time taken to climb from the upperscale, fuel used on the climb from the middle scale and the air distance from thebottom scale.
g) Subtract the values determined at c) above from those determined at f) above toobtain the values of the time taken to climb, the fuel used to climb and the airdistance travelled in the climb.
2.2 Example
Aerodrome Pressure Altitude 5,653 ftAerodrome Ambient Temperature +15°CCruise Pressure Altitude 11,500 ftCruise Ambient Temperature -5°CInitial Climb Weight 3,650 lb
2.3 Solution
Graphical values at the aerodrome altitude = 6.5 min; 2.5 US gal; Dist. 12.5 NAM.Graphical values at the top of climb altitude = 18.0 min; 6.0 US gal; Dist. 36.0 NAM.Values for the climb =11.5 min; 3.5 US gal; 23.5 NAM.
Section 2 - SEP1 Page 2July 2006
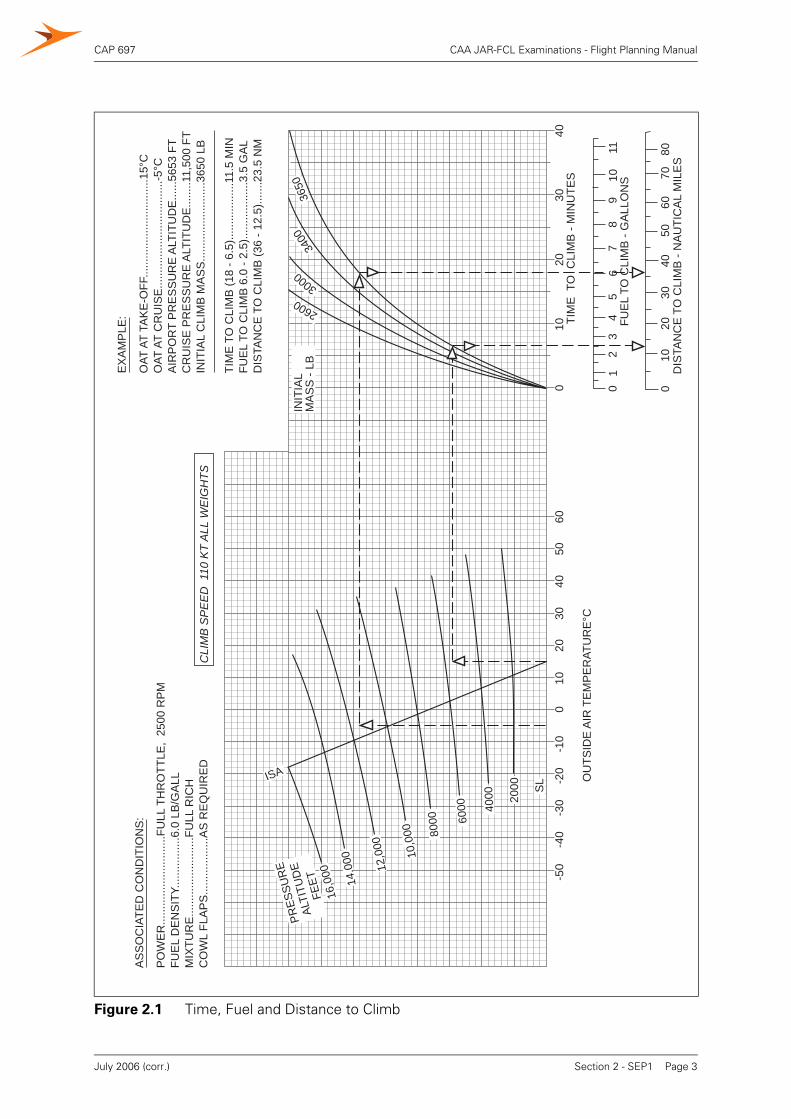
CAP 697 CAA JAR-FCL Examinations - Flight Planning Manual
Figure 2.1 Time, Fuel and Distance to Climb
010
2030
40TI
ME
TO
CLI
MB
- M
INU
TES
-50
-40
-30
-20
-10
010
2030
4050
60
OU
TSID
E A
IR T
EM
PE
RAT
UR
E°C
FUE
L TO
CLI
MB
- G
ALL
ON
S0
12
34
56
78
910
11
DIS
TAN
CE
TO
CLI
MB
- N
AU
TIC
AL
MIL
ES
010
2030
4050
6070
80
ISA
16,0
00
14,0
00 12,0
00
10,0
00 8000 60
00 4000 20
00
PRES
SUR
E
ALTI
TUD
E
FEET
SL
3650
3400
3000
2600
INIT
IAL
MA
SS
- LB
PO
WE
R...
......
......
......
......
.FU
LL T
HR
OTT
LE,
2500
RP
MFU
EL
DE
NS
ITY.
......
......
...6.
0 LB
/GA
LLM
IXTU
RE
......
......
......
......
.FU
LL R
ICH
CO
WL
FLA
PS
......
......
......
AS
RE
QU
IRE
D
AS
SO
CIA
TED
CO
ND
ITIO
NS
:E
XA
MP
LE:
OAT
AT
TAK
E-O
FF...
......
......
......
......
....1
5°C
OAT
AT
CR
UIS
E...
......
......
......
......
......
.-5°C
AIR
PO
RT
PR
ES
SU
RE
ALT
ITU
DE
......
5653
FT
CR
UIS
E P
RE
SS
UR
E A
LTIT
UD
E...
.....1
1,50
0 FT
INIT
IAL
CLI
MB
MA
SS
......
......
......
......
.365
0 LB
TIM
E T
O C
LIM
B (1
8 - 6
.5)..
......
......
....1
1.5
MIN
FUE
L TO
CLI
MB
6.0
- 2.
5)...
......
......
...3.
5 G
AL
DIS
TAN
CE
TO
CLI
MB
(36
- 12.
5)...
....2
3.5
NM
CLI
MB
SPEE
D 1
10 K
T AL
L W
EIG
HTS
Section 2 - SEP1 Page 3July 2006 (corr.)
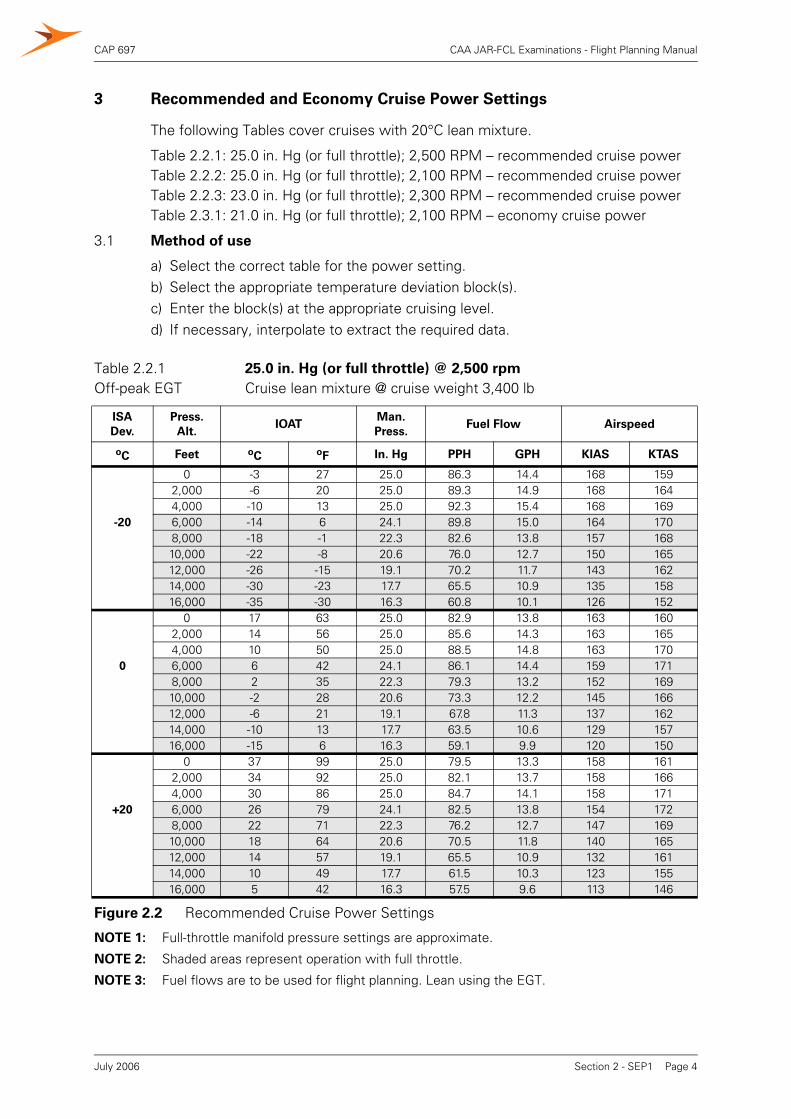
CAP 697 CAA JAR-FCL Examinations - Flight Planning Manual
3 Recommended and Economy Cruise Power Settings
The following Tables cover cruises with 20°C lean mixture.
Table 2.2.1: 25.0 in. Hg (or full throttle); 2,500 RPM – recommended cruise powerTable 2.2.2: 25.0 in. Hg (or full throttle); 2,100 RPM – recommended cruise powerTable 2.2.3: 23.0 in. Hg (or full throttle); 2,300 RPM – recommended cruise powerTable 2.3.1: 21.0 in. Hg (or full throttle); 2,100 RPM – economy cruise power
3.1 Method of use
a) Select the correct table for the power setting.b) Select the appropriate temperature deviation block(s).c) Enter the block(s) at the appropriate cruising level.d) If necessary, interpolate to extract the required data.
Table 2.2.1 25.0 in. Hg (or full throttle) @ 2,500 rpm
Off-peak EGT Cruise lean mixture @ cruise weight 3,400 lb
Figure 2.2 Recommended Cruise Power Settings
NOTE 1: Full-throttle manifold pressure settings are approximate.
NOTE 2: Shaded areas represent operation with full throttle.
NOTE 3: Fuel flows are to be used for flight planning. Lean using the EGT.
ISA
Dev.
Press.
Alt.IOAT
Man.
Press.Fuel Flow Airspeed
oC Feet oC oF In. Hg PPH GPH KIAS KTAS
0 -3 27 25.0 86.3 14.4 168 1592,000 -6 20 25.0 89.3 14.9 168 1644,000 -10 13 25.0 92.3 15.4 168 169
-20 6,000 -14 6 24.1 89.8 15.0 164 1708,000 -18 -1 22.3 82.6 13.8 157 16810,000 -22 -8 20.6 76.0 12.7 150 16512,000 -26 -15 19.1 70.2 11.7 143 16214,000 -30 -23 17.7 65.5 10.9 135 15816,000 -35 -30 16.3 60.8 10.1 126 152
0 17 63 25.0 82.9 13.8 163 1602,000 14 56 25.0 85.6 14.3 163 1654,000 10 50 25.0 88.5 14.8 163 170
0 6,000 6 42 24.1 86.1 14.4 159 1718,000 2 35 22.3 79.3 13.2 152 16910,000 -2 28 20.6 73.3 12.2 145 16612,000 -6 21 19.1 67.8 11.3 137 16214,000 -10 13 17.7 63.5 10.6 129 15716,000 -15 6 16.3 59.1 9.9 120 150
0 37 99 25.0 79.5 13.3 158 1612,000 34 92 25.0 82.1 13.7 158 1664,000 30 86 25.0 84.7 14.1 158 171
+20 6,000 26 79 24.1 82.5 13.8 154 1728,000 22 71 22.3 76.2 12.7 147 16910,000 18 64 20.6 70.5 11.8 140 16512,000 14 57 19.1 65.5 10.9 132 16114,000 10 49 17.7 61.5 10.3 123 15516,000 5 42 16.3 57.5 9.6 113 146
Section 2 - SEP1 Page 4July 2006
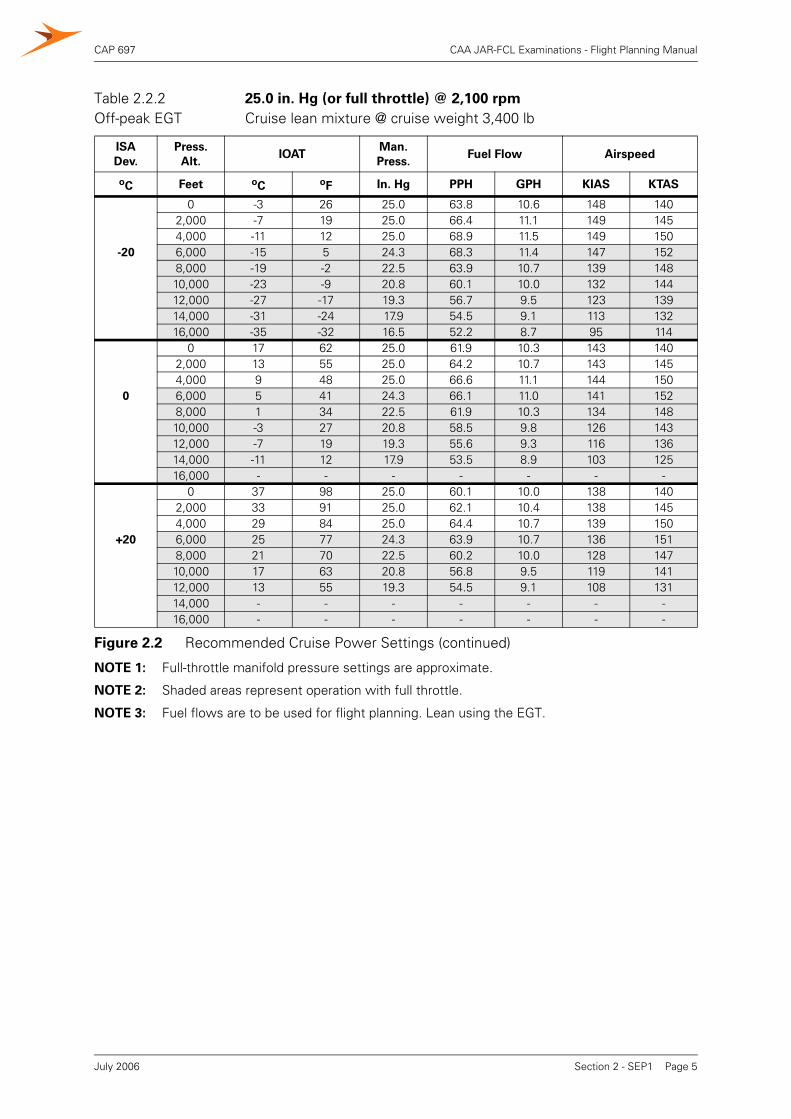
CAP 697 CAA JAR-FCL Examinations - Flight Planning Manual
Table 2.2.2 25.0 in. Hg (or full throttle) @ 2,100 rpm
Off-peak EGT Cruise lean mixture @ cruise weight 3,400 lb
Figure 2.2 Recommended Cruise Power Settings (continued)
NOTE 1: Full-throttle manifold pressure settings are approximate.
NOTE 2: Shaded areas represent operation with full throttle.
NOTE 3: Fuel flows are to be used for flight planning. Lean using the EGT.
ISA
Dev.
Press.
Alt.IOAT
Man.
Press.Fuel Flow Airspeed
oC Feet oC oF In. Hg PPH GPH KIAS KTAS
0 -3 26 25.0 63.8 10.6 148 1402,000 -7 19 25.0 66.4 11.1 149 1454,000 -11 12 25.0 68.9 11.5 149 150
-20 6,000 -15 5 24.3 68.3 11.4 147 1528,000 -19 -2 22.5 63.9 10.7 139 14810,000 -23 -9 20.8 60.1 10.0 132 14412,000 -27 -17 19.3 56.7 9.5 123 13914,000 -31 -24 17.9 54.5 9.1 113 13216,000 -35 -32 16.5 52.2 8.7 95 114
0 17 62 25.0 61.9 10.3 143 1402,000 13 55 25.0 64.2 10.7 143 1454,000 9 48 25.0 66.6 11.1 144 150
0 6,000 5 41 24.3 66.1 11.0 141 1528,000 1 34 22.5 61.9 10.3 134 14810,000 -3 27 20.8 58.5 9.8 126 14312,000 -7 19 19.3 55.6 9.3 116 13614,000 -11 12 17.9 53.5 8.9 103 12516,000 - - - - - - -
0 37 98 25.0 60.1 10.0 138 1402,000 33 91 25.0 62.1 10.4 138 1454,000 29 84 25.0 64.4 10.7 139 150
+20 6,000 25 77 24.3 63.9 10.7 136 1518,000 21 70 22.5 60.2 10.0 128 14710,000 17 63 20.8 56.8 9.5 119 14112,000 13 55 19.3 54.5 9.1 108 13114,000 - - - - - - -16,000 - - - - - - -
Section 2 - SEP1 Page 5July 2006
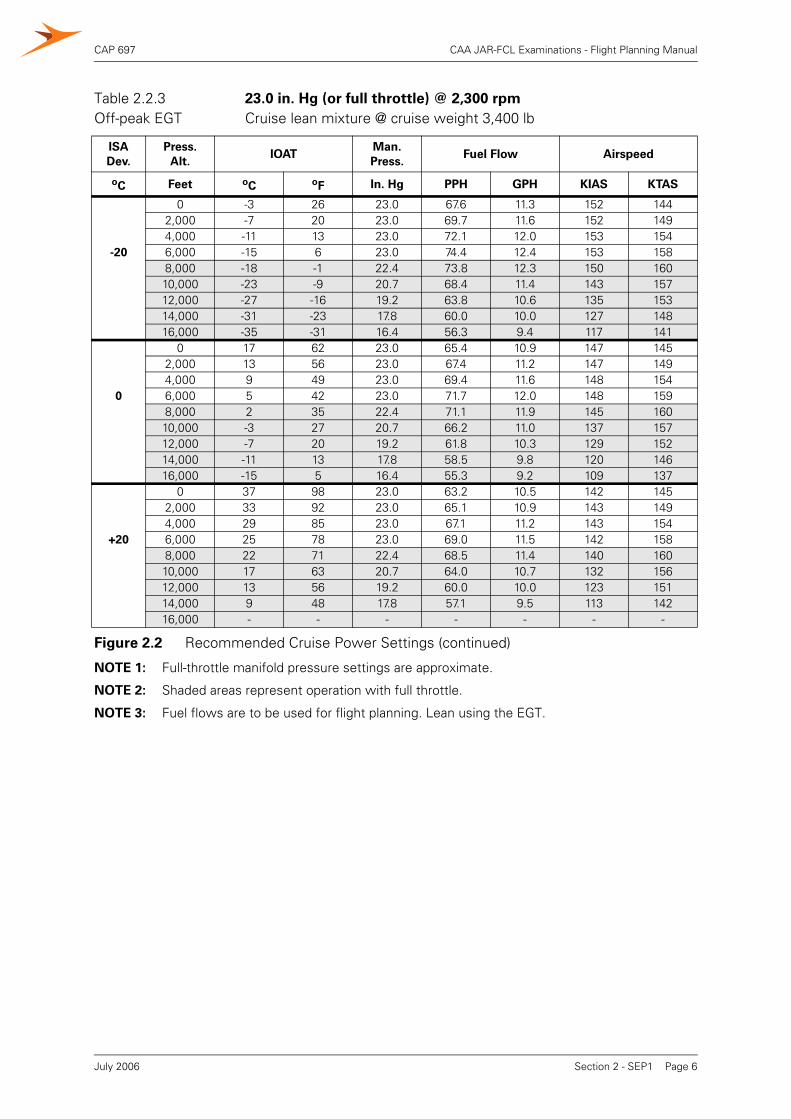
CAP 697 CAA JAR-FCL Examinations - Flight Planning Manual
Table 2.2.3 23.0 in. Hg (or full throttle) @ 2,300 rpm
Off-peak EGT Cruise lean mixture @ cruise weight 3,400 lb
Figure 2.2 Recommended Cruise Power Settings (continued)
NOTE 1: Full-throttle manifold pressure settings are approximate.
NOTE 2: Shaded areas represent operation with full throttle.
NOTE 3: Fuel flows are to be used for flight planning. Lean using the EGT.
ISA
Dev.
Press.
Alt.IOAT
Man.
Press.Fuel Flow Airspeed
oC Feet oC oF In. Hg PPH GPH KIAS KTAS
0 -3 26 23.0 67.6 11.3 152 1442,000 -7 20 23.0 69.7 11.6 152 1494,000 -11 13 23.0 72.1 12.0 153 154
-20 6,000 -15 6 23.0 74.4 12.4 153 1588,000 -18 -1 22.4 73.8 12.3 150 16010,000 -23 -9 20.7 68.4 11.4 143 15712,000 -27 -16 19.2 63.8 10.6 135 15314,000 -31 -23 17.8 60.0 10.0 127 14816,000 -35 -31 16.4 56.3 9.4 117 141
0 17 62 23.0 65.4 10.9 147 1452,000 13 56 23.0 67.4 11.2 147 1494,000 9 49 23.0 69.4 11.6 148 154
0 6,000 5 42 23.0 71.7 12.0 148 1598,000 2 35 22.4 71.1 11.9 145 16010,000 -3 27 20.7 66.2 11.0 137 15712,000 -7 20 19.2 61.8 10.3 129 15214,000 -11 13 17.8 58.5 9.8 120 14616,000 -15 5 16.4 55.3 9.2 109 137
0 37 98 23.0 63.2 10.5 142 1452,000 33 92 23.0 65.1 10.9 143 1494,000 29 85 23.0 67.1 11.2 143 154
+20 6,000 25 78 23.0 69.0 11.5 142 1588,000 22 71 22.4 68.5 11.4 140 16010,000 17 63 20.7 64.0 10.7 132 15612,000 13 56 19.2 60.0 10.0 123 15114,000 9 48 17.8 57.1 9.5 113 14216,000 - - - - - - -
Section 2 - SEP1 Page 6July 2006
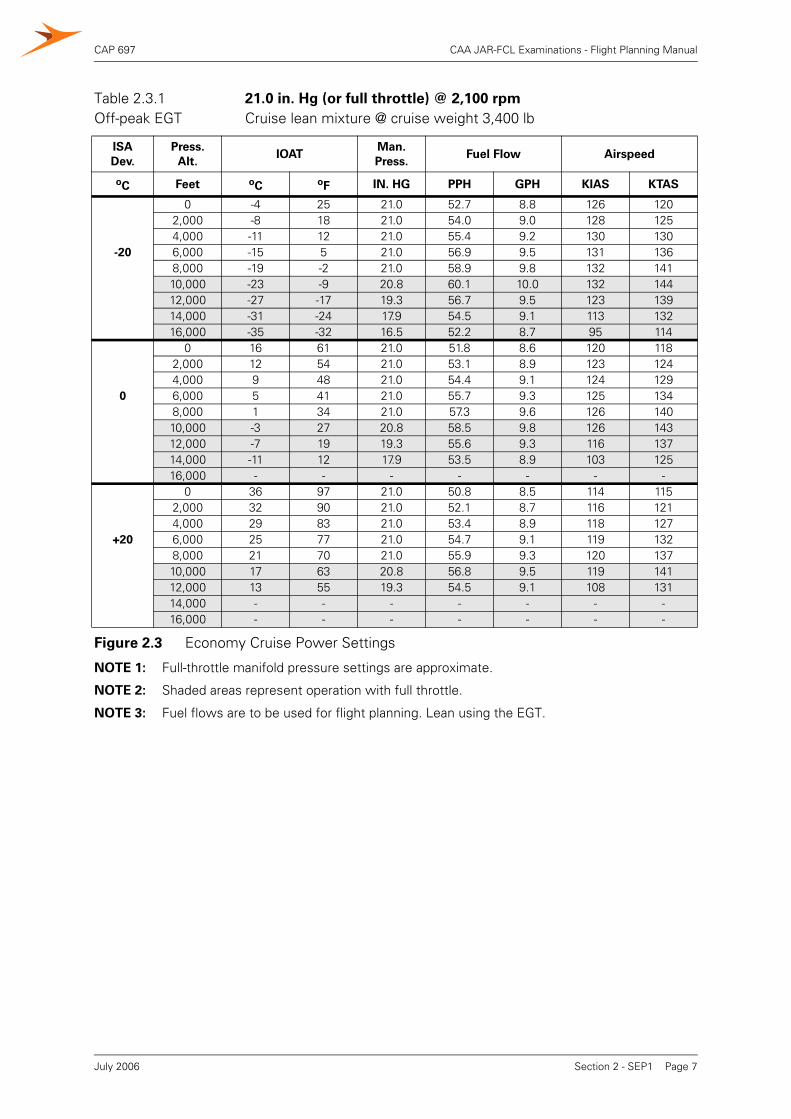
CAP 697 CAA JAR-FCL Examinations - Flight Planning Manual
Table 2.3.1 21.0 in. Hg (or full throttle) @ 2,100 rpm
Off-peak EGT Cruise lean mixture @ cruise weight 3,400 lb
Figure 2.3 Economy Cruise Power Settings
NOTE 1: Full-throttle manifold pressure settings are approximate.
NOTE 2: Shaded areas represent operation with full throttle.
NOTE 3: Fuel flows are to be used for flight planning. Lean using the EGT.
ISA
Dev.
Press.
Alt.IOAT
Man.
Press.Fuel Flow Airspeed
oC Feet oC oF IN. HG PPH GPH KIAS KTAS
0 -4 25 21.0 52.7 8.8 126 1202,000 -8 18 21.0 54.0 9.0 128 1254,000 -11 12 21.0 55.4 9.2 130 130
-20 6,000 -15 5 21.0 56.9 9.5 131 1368,000 -19 -2 21.0 58.9 9.8 132 14110,000 -23 -9 20.8 60.1 10.0 132 14412,000 -27 -17 19.3 56.7 9.5 123 13914,000 -31 -24 17.9 54.5 9.1 113 13216,000 -35 -32 16.5 52.2 8.7 95 114
0 16 61 21.0 51.8 8.6 120 1182,000 12 54 21.0 53.1 8.9 123 1244,000 9 48 21.0 54.4 9.1 124 129
0 6,000 5 41 21.0 55.7 9.3 125 1348,000 1 34 21.0 57.3 9.6 126 14010,000 -3 27 20.8 58.5 9.8 126 14312,000 -7 19 19.3 55.6 9.3 116 13714,000 -11 12 17.9 53.5 8.9 103 12516,000 - - - - - - -
0 36 97 21.0 50.8 8.5 114 1152,000 32 90 21.0 52.1 8.7 116 1214,000 29 83 21.0 53.4 8.9 118 127
+20 6,000 25 77 21.0 54.7 9.1 119 1328,000 21 70 21.0 55.9 9.3 120 13710,000 17 63 20.8 56.8 9.5 119 14112,000 13 55 19.3 54.5 9.1 108 13114,000 - - - - - - -16,000 - - - - - - -
Section 2 - SEP1 Page 7July 2006
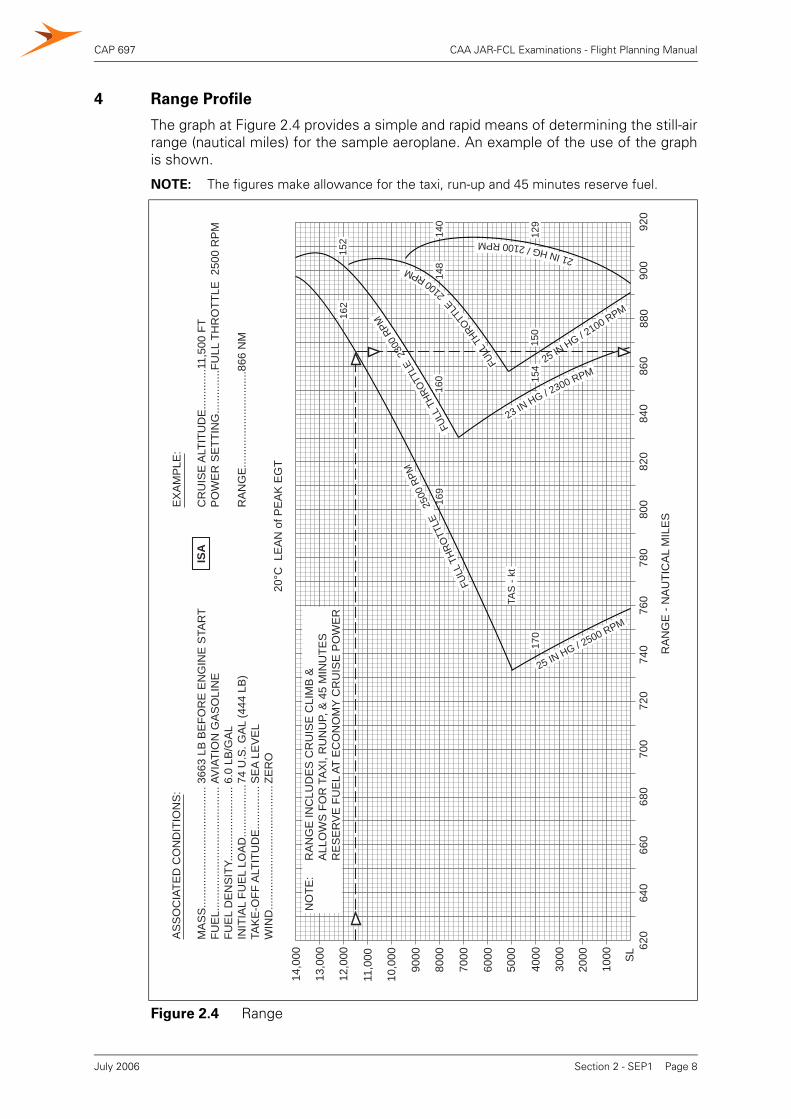
CAP 697 CAA JAR-FCL Examinations - Flight Planning Manual
4 Range Profile
The graph at Figure 2.4 provides a simple and rapid means of determining the still-airrange (nautical miles) for the sample aeroplane. An example of the use of the graphis shown.
NOTE: The figures make allowance for the taxi, run-up and 45 minutes reserve fuel.
Figure 2.4 Range
SL
1000
2000
3000
4000
5000
6000
7000
8000
9000
10,0
00
11,0
00
12,0
00
13,0
00
14,0
00
620
640
660
680
700
720
740
760
780
800
820
840
860
880
900
920
RA
NG
E -
NA
UTI
CA
L M
ILE
S
NO
TE:
RA
NG
E IN
CLU
DE
S C
RU
ISE
CLI
MB
&
A
LLO
WS
FO
R T
AX
I, R
UN
UP,
& 4
5 M
INU
TES
R
ES
ER
VE
FU
EL
AT E
CO
NO
MY
CR
UIS
E P
OW
ER
FULL
THR
OTT
LE
2500
RPM
FULL
THROTT
LE
2100RPM
21INHG/2100RPM
FULL
THRO
TTLE
2300
RPM
23 IN HG / 2300 RPM25 IN
HG / 2100 RPM
AS
SO
CIA
TED
CO
ND
ITIO
NS
:
MA
SS
......
......
......
......
......
......
...FU
EL.
......
......
......
......
......
......
...FU
EL
DE
NS
ITY.
......
......
......
.....
INIT
IAL
FUE
L LO
AD
......
......
.....
TAK
E-O
FF A
LTIT
UD
E...
......
.....
WIN
D...
......
......
......
......
......
......
.3663
LB
BE
FOR
E E
NG
INE
STA
RT
AVIA
TIO
N G
AS
OLI
NE
6.0
LB/G
AL
74 U
.S. G
AL
(444
LB
)S
EA
LEV
EL
ZER
O
EX
AM
PLE
:
CR
UIS
E A
LTIT
UD
E...
......
....1
1,50
0 FT
PO
WE
R S
ETT
ING
......
......
..FU
LL T
HR
OTT
LE 2
500
RP
M
RA
NG
E...
......
......
......
......
....8
66 N
M
20°C
LE
AN
of P
EA
K E
GT
162
152
160
148
140
129
150
154
169
170
25 IN HG / 2500 RPM
TAS
- kt
ISA
Section 2 - SEP1 Page 8July 2006
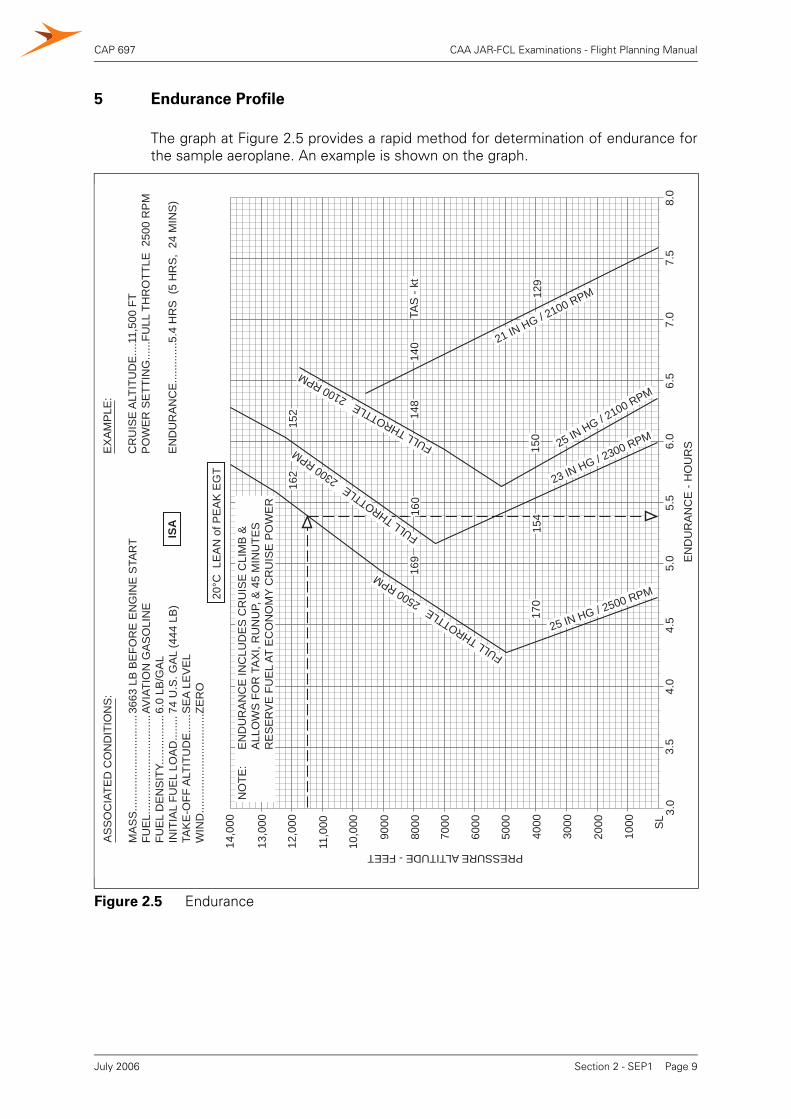
CAP 697 CAA JAR-FCL Examinations - Flight Planning Manual
5 Endurance Profile
The graph at Figure 2.5 provides a rapid method for determination of endurance forthe sample aeroplane. An example is shown on the graph.
Figure 2.5 Endurance
FULL THROTTLE 2500 RPM
FULL THROTTLE 2300 RPM
FULL THROTTLE 2100 RPM
25 IN HG / 2100 RPM
21 IN HG / 2100 RPM
23 IN HG / 2300 RPM
25 IN HG / 2500 RPM
SL
1000
2000
3000
4000
5000
6000
7000
8000
9000
10,0
00
11,0
00
12,0
00
13,0
00
14,0
00
PRESSURE ALTITUDE - FEET
3.0
3.5
4.0
4.5
5.0
5.5
6.0
6.5
7.0
7.5
8.0
EN
DU
RA
NC
E -
HO
UR
S
NO
TE:
EN
DU
RA
NC
E IN
CLU
DE
S C
RU
ISE
CLI
MB
&
A
LLO
WS
FO
R T
AX
I, R
UN
UP,
& 4
5 M
INU
TES
R
ES
ER
VE
FU
EL
AT E
CO
NO
MY
CR
UIS
E P
OW
ER
AS
SO
CIA
TED
CO
ND
ITIO
NS
:
MA
SS
......
......
......
......
......
.FU
EL.
......
......
......
......
......
.FU
EL
DE
NS
ITY.
......
......
...IN
ITIA
L FU
EL
LOA
D...
.....
TAK
E-O
FF A
LTIT
UD
E...
...W
IND
......
......
......
......
......
..3663
LB
BE
FOR
E E
NG
INE
STA
RT
AVIA
TIO
N G
AS
OLI
NE
6.0
LB/G
AL
74 U
.S. G
AL
(444
LB
)S
EA
LEV
EL
ZER
O
EX
AM
PLE
:
CR
UIS
E A
LTIT
UD
E...
.11,
500
FTP
OW
ER
SE
TTIN
G...
...FU
LL T
HR
OTT
LE 2
500
RP
M
EN
DU
RA
NC
E...
......
....5
.4 H
RS
(5
HR
S,
24 M
INS
)
20°C
LE
AN
of P
EA
K E
GT
150
129
140
148
154
170
169
160
162
152
TAS
- kt
ISA
Section 2 - SEP1 Page 9July 2006
CAP 697 CAA JAR-FCL Examinations - Flight Planning Manual
INTENTIONALLY LEFT BLANK
Section 2 - SEP1 Page 10July 2006
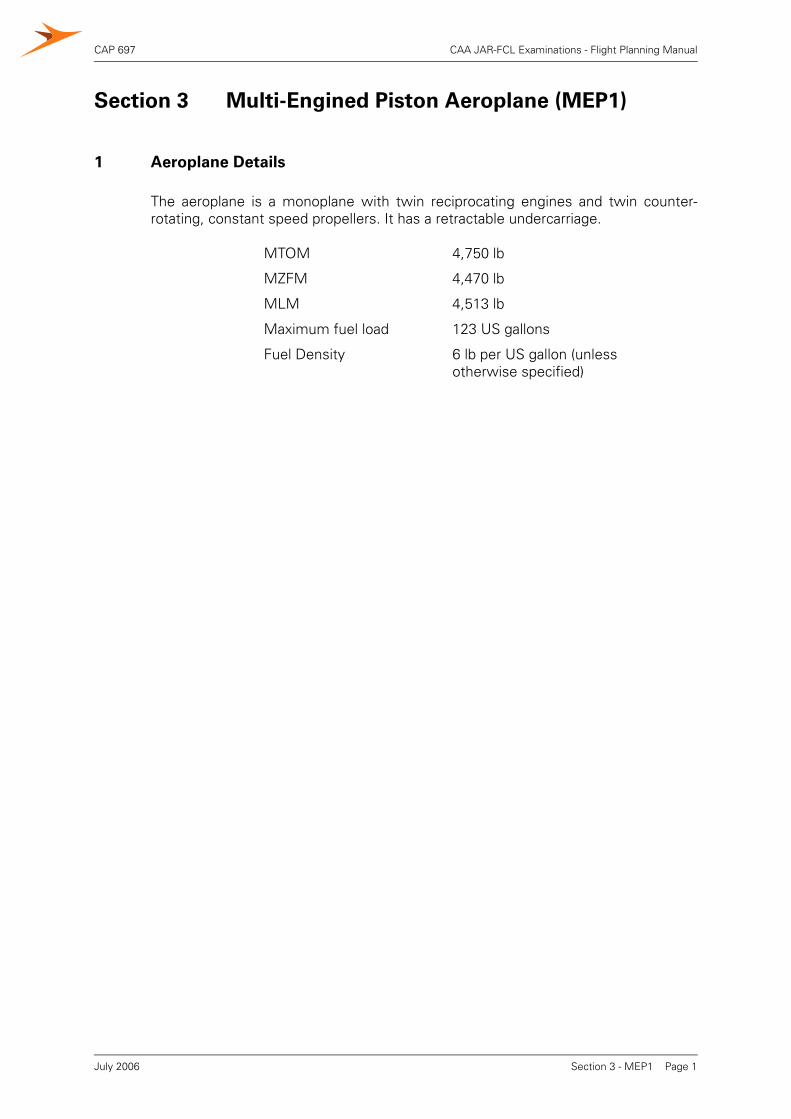
CAP 697 CAA JAR-FCL Examinations - Flight Planning Manual
Section 3 Multi-Engined Piston Aeroplane (MEP1)
1 Aeroplane Details
The aeroplane is a monoplane with twin reciprocating engines and twin counter-rotating, constant speed propellers. It has a retractable undercarriage.
MTOM 4,750 lb
MZFM 4,470 lb
MLM 4,513 lb
Maximum fuel load 123 US gallons
Fuel Density 6 lb per US gallon (unlessotherwise specified)
Section 3 - MEP1 Page 1July 2006
CAP 697 CAA JAR-FCL Examinations - Flight Planning Manual
2 Fuel, Time and Distance to Climb
2.1 Calculation Method
a) Enter the graph (Figure 3.1) at the ambient temperature of the aerodrome (or startof climb) and travel vertically to intersect the aerodrome (or start of climb) PressureAltitude grid-line.
b) From this grid-line move horizontally right to intersect the fuel, time and distancegrid-lines in turn.
c) From each intersection drop vertically to read the appropriate value from the graph.
d) Enter the graph at the ambient temperature at the top of climb and travel verticallyto intersect the top of climb Pressure Altitude grid-line.
e) From this grid-line move horizontally right to intersect the fuel, time and distancegrid-lines in turn.
f) From each intersection drop vertically to read the appropriate value from the graph.
g) Subtract the values determined at c) above from those determined at f) above toobtain the values of the fuel used to climb, the time taken to climb, and the airdistance travelled in the climb.
2.2 Example
Aerodrome Pressure Altitude 2,000 ftAerodrome Ambient Temperature +21°CCruise Pressure Altitude 16,500 ftCruise Ambient Temperature -13°C
2.3 Solution
Graphical values at the aerodrome altitude = 3.0 min; 2.0 US gal; Dist. 5.0 NAM.Graphical values at the top of climb altitude = 27.0 min; 15.0 US gal; Dist. 50.0 NAM.Values for the climb = 24.0 min; 13.0 US gal; 45.0 NAM.
Section 3 - MEP1 Page 2July 2006
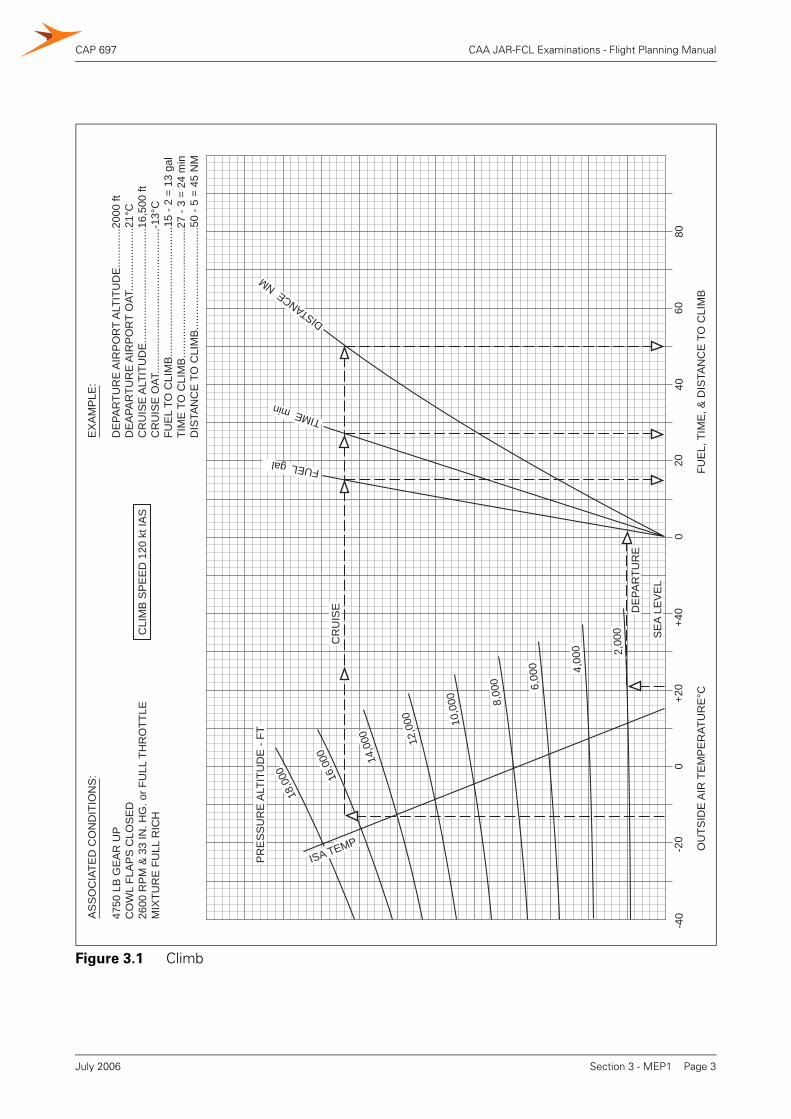
CAP 697 CAA JAR-FCL Examinations - Flight Planning Manual
Figure 3.1 Climb
-40
-20
0+2
0+4
00
2040
6080
OU
TSID
E A
IR T
EM
PE
RAT
UR
E°C
FUE
L, T
IME
, & D
ISTA
NC
E T
O C
LIM
B
AS
SO
CIA
TED
CO
ND
ITIO
NS
:
4750
LB
GE
AR
UP
CO
WL
FLA
PS
CLO
SE
D26
00 R
PM
& 3
3 IN
. HG
. or F
ULL
TH
RO
TTLE
MIX
TUR
E F
ULL
RIC
H
EX
AM
PLE
:
DE
PAR
TUR
E A
IRP
OR
T A
LTIT
UD
E...
......
....2
000
ftD
EA
PAR
TUR
E A
IRP
OR
T O
AT...
......
......
......
21°C
CR
UIS
E A
LTIT
UD
E...
......
......
......
......
......
.....1
6,50
0 ft
CR
UIS
E O
AT...
......
......
......
......
......
......
......
...-1
3°C
FUE
L TO
CLI
MB
......
......
......
......
......
......
......
.15
- 2 =
13
gal
TIM
E T
O C
LIM
B...
......
......
......
......
......
......
....2
7 - 3
= 2
4 m
inD
ISTA
NC
E T
O C
LIM
B...
......
......
......
......
......
.50
- 5 =
45
NM
18,0
00
8,00
0
16,0
00 14,0
00 12,0
00 10,0
00
6,00
0 4,00
0 2,00
0 SE
A LE
VE
L
PR
ES
SU
RE
ALT
ITU
DE
- FT
ISA TEMP
DE
PAR
TUR
EFUEL gal
TIME min
DISTANCE NM
CR
UIS
E
CLI
MB
SP
EE
D 1
20 k
t IA
S
Section 3 - MEP1 Page 3July 2006
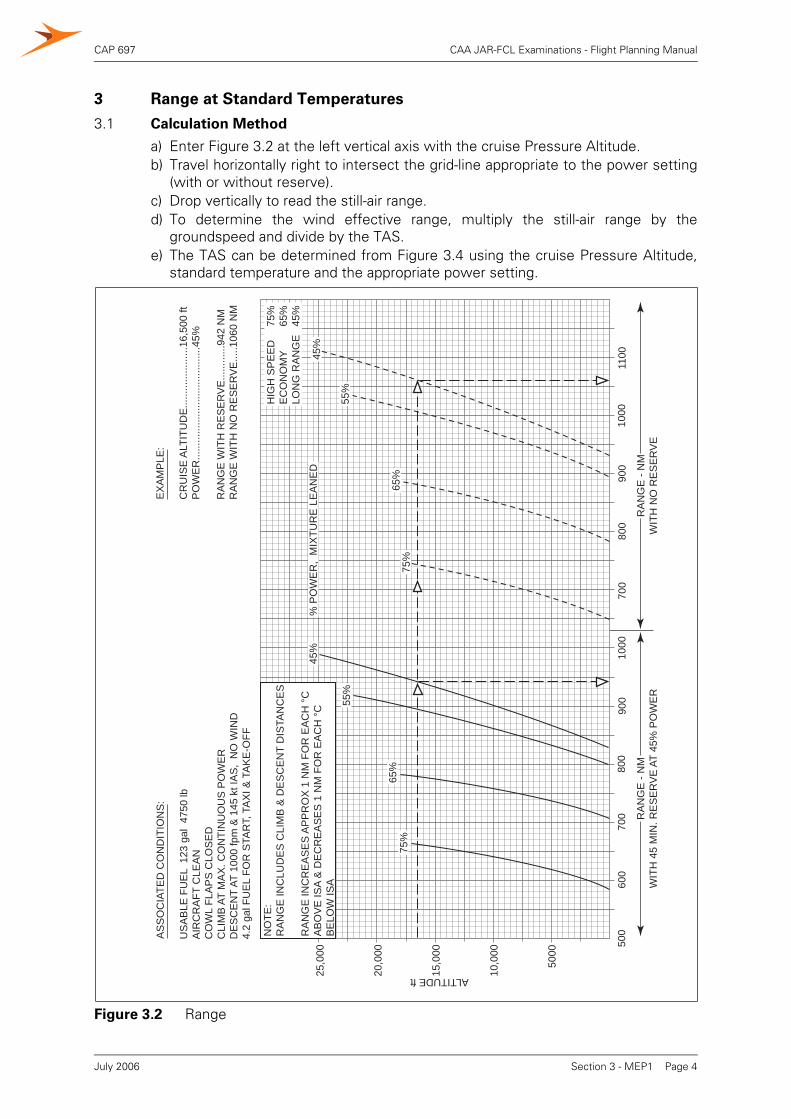
CAP 697 CAA JAR-FCL Examinations - Flight Planning Manual
3 Range at Standard Temperatures
3.1 Calculation Method
a) Enter Figure 3.2 at the left vertical axis with the cruise Pressure Altitude.b) Travel horizontally right to intersect the grid-line appropriate to the power setting
(with or without reserve).c) Drop vertically to read the still-air range.d) To determine the wind effective range, multiply the still-air range by the
groundspeed and divide by the TAS.e) The TAS can be determined from Figure 3.4 using the cruise Pressure Altitude,
standard temperature and the appropriate power setting.
Figure 3.2 Range
AS
SO
CIA
TED
CO
ND
ITIO
NS
:
US
AB
LE F
UE
L 1
23 g
al 4
750
lbA
IRC
RA
FT C
LEA
NC
OW
L FL
AP
S C
LOS
ED
CLI
MB
AT
MA
X. C
ON
TIN
UO
US
PO
WE
RD
ES
CE
NT
AT 1
000
fpm
& 1
45 k
t IA
S,
NO
WIN
D4.
2 ga
l FU
EL
FOR
STA
RT,
TA
XI &
TA
KE
-OFF
EX
AM
PLE
:
CR
UIS
E A
LTIT
UD
E...
......
......
......
16,5
00 ft
PO
WE
R...
......
......
......
......
......
......
45%
RA
NG
E W
ITH
RE
SE
RV
E...
......
...94
2 N
MR
AN
GE
WIT
H N
O R
ES
ER
VE
.....1
060
NM
NO
TE:
RA
NG
E IN
CLU
DE
S C
LIM
B &
DE
SC
EN
T D
ISTA
NC
ES
RA
NG
E IN
CR
EA
SE
S A
PP
RO
X 1
NM
FO
R E
AC
H °
CA
BO
VE
ISA
& D
EC
RE
AS
ES
1 N
M F
OR
EA
CH
°C
BE
LOW
ISA
75%
% P
OW
ER
, M
IXTU
RE
LE
AN
ED
75%
65%
45%
HIG
H S
PE
ED
EC
ON
OM
YLO
NG
RA
NG
E
65%
55%
45%
75%
65%
55%
45%
500
600
700
800
900
1000
700
800
900
1000
1100
RA
NG
E -
NM
WIT
H 4
5 M
IN. R
ES
ER
VE
AT
45%
PO
WE
RR
AN
GE
- N
MW
ITH
NO
RE
SE
RV
E
5000
10,0
00
15,0
00
20,0
00
25,0
00
ALTITUDE ft
Section 3 - MEP1 Page 4July 2006
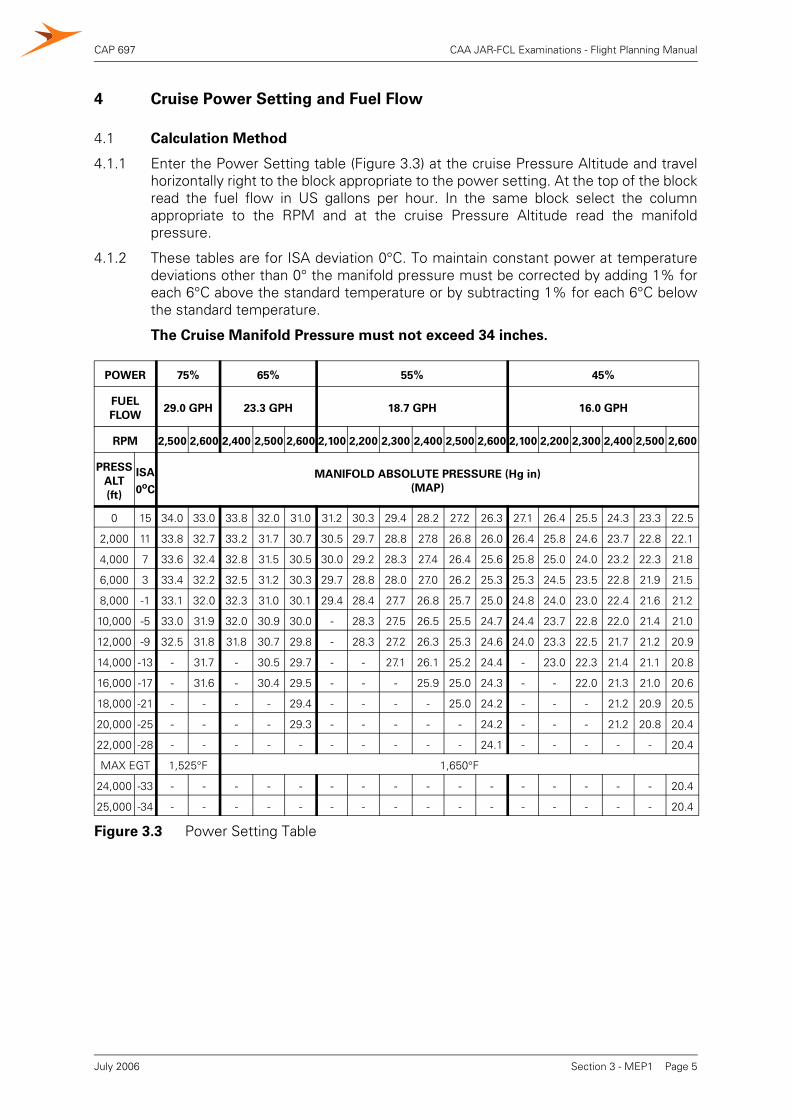
CAP 697 CAA JAR-FCL Examinations - Flight Planning Manual
4 Cruise Power Setting and Fuel Flow
4.1 Calculation Method
4.1.1 Enter the Power Setting table (Figure 3.3) at the cruise Pressure Altitude and travelhorizontally right to the block appropriate to the power setting. At the top of the blockread the fuel flow in US gallons per hour. In the same block select the columnappropriate to the RPM and at the cruise Pressure Altitude read the manifoldpressure.
4.1.2 These tables are for ISA deviation 0°C. To maintain constant power at temperaturedeviations other than 0° the manifold pressure must be corrected by adding 1% foreach 6°C above the standard temperature or by subtracting 1% for each 6°C belowthe standard temperature.
The Cruise Manifold Pressure must not exceed 34 inches.
Figure 3.3 Power Setting Table
POWER 75% 65% 55% 45%
FUEL
FLOW29.0 GPH 23.3 GPH 18.7 GPH 16.0 GPH
RPM 2,500 2,600 2,400 2,500 2,600 2,100 2,200 2,300 2,400 2,500 2,600 2,100 2,200 2,300 2,400 2,500 2,600
PRESS
ALT
(ft)
ISA
0oC
MANIFOLD ABSOLUTE PRESSURE (Hg in)
(MAP)
0 15 34.0 33.0 33.8 32.0 31.0 31.2 30.3 29.4 28.2 27.2 26.3 27.1 26.4 25.5 24.3 23.3 22.5
2,000 11 33.8 32.7 33.2 31.7 30.7 30.5 29.7 28.8 27.8 26.8 26.0 26.4 25.8 24.6 23.7 22.8 22.1
4,000 7 33.6 32.4 32.8 31.5 30.5 30.0 29.2 28.3 27.4 26.4 25.6 25.8 25.0 24.0 23.2 22.3 21.8
6,000 3 33.4 32.2 32.5 31.2 30.3 29.7 28.8 28.0 27.0 26.2 25.3 25.3 24.5 23.5 22.8 21.9 21.5
8,000 -1 33.1 32.0 32.3 31.0 30.1 29.4 28.4 27.7 26.8 25.7 25.0 24.8 24.0 23.0 22.4 21.6 21.2
10,000 -5 33.0 31.9 32.0 30.9 30.0 - 28.3 27.5 26.5 25.5 24.7 24.4 23.7 22.8 22.0 21.4 21.0
12,000 -9 32.5 31.8 31.8 30.7 29.8 - 28.3 27.2 26.3 25.3 24.6 24.0 23.3 22.5 21.7 21.2 20.9
14,000 -13 - 31.7 - 30.5 29.7 - - 27.1 26.1 25.2 24.4 - 23.0 22.3 21.4 21.1 20.8
16,000 -17 - 31.6 - 30.4 29.5 - - - 25.9 25.0 24.3 - - 22.0 21.3 21.0 20.6
18,000 -21 - - - - 29.4 - - - - 25.0 24.2 - - - 21.2 20.9 20.5
20,000 -25 - - - - 29.3 - - - - - 24.2 - - - 21.2 20.8 20.4
22,000 -28 - - - - - - - - - - 24.1 - - - - - 20.4
MAX EGT 1,525°F 1,650°F
24,000 -33 - - - - - - - - - - - - - - - - 20.4
25,000 -34 - - - - - - - - - - - - - - - - 20.4
Section 3 - MEP1 Page 5July 2006
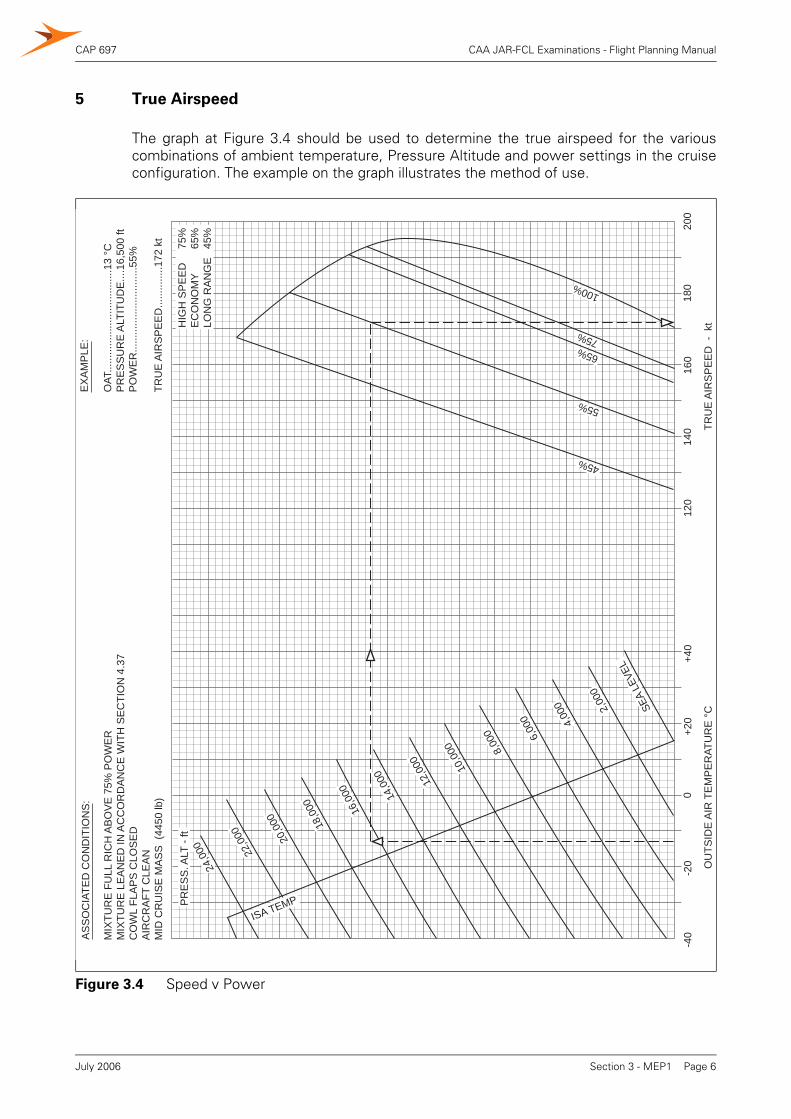
CAP 697 CAA JAR-FCL Examinations - Flight Planning Manual
5 True Airspeed
The graph at Figure 3.4 should be used to determine the true airspeed for the variouscombinations of ambient temperature, Pressure Altitude and power settings in the cruiseconfiguration. The example on the graph illustrates the method of use.
Figure 3.4 Speed v Power
8,00
0
OU
TSID
E A
IR T
EM
PE
RAT
UR
E °
CTR
UE
AIR
SP
EE
D -
kt
-20
-40
0+2
0+4
012
014
016
018
020
0
14,0
00
16,0
00
12,0
00 10,0
00
6,00
0 4,00
0 2,00
0
SEA
LEVE
L
18,0
00
20,0
00
22,0
00
24,0
00P
RE
SS
. ALT
- ft
75%
65%
45%
HIG
H S
PE
ED
EC
ON
OM
YLO
NG
RA
NG
E
EX
AM
PLE
:
OAT
......
......
......
......
......
.....1
3 °C
PR
ES
SU
RE
ALT
ITU
DE
....1
6,50
0 ft
PO
WE
R...
......
......
......
......
..55%
TRU
E A
IRS
PE
ED
......
......
..172
kt
AS
SO
CIA
TED
CO
ND
ITIO
NS
:
MIX
TUR
E F
ULL
RIC
H A
BO
VE
75%
PO
WE
RM
IXTU
RE
LE
AN
ED
IN A
CC
OR
DA
NC
E W
ITH
SE
CTI
ON
4.3
7C
OW
L FL
AP
S C
LOS
ED
AIR
CR
AFT
CLE
AN
MID
CR
UIS
E M
AS
S (
4450
lb)
75%
65%
55%
45%
100%
ISA TEMP
Section 3 - MEP1 Page 6July 2006
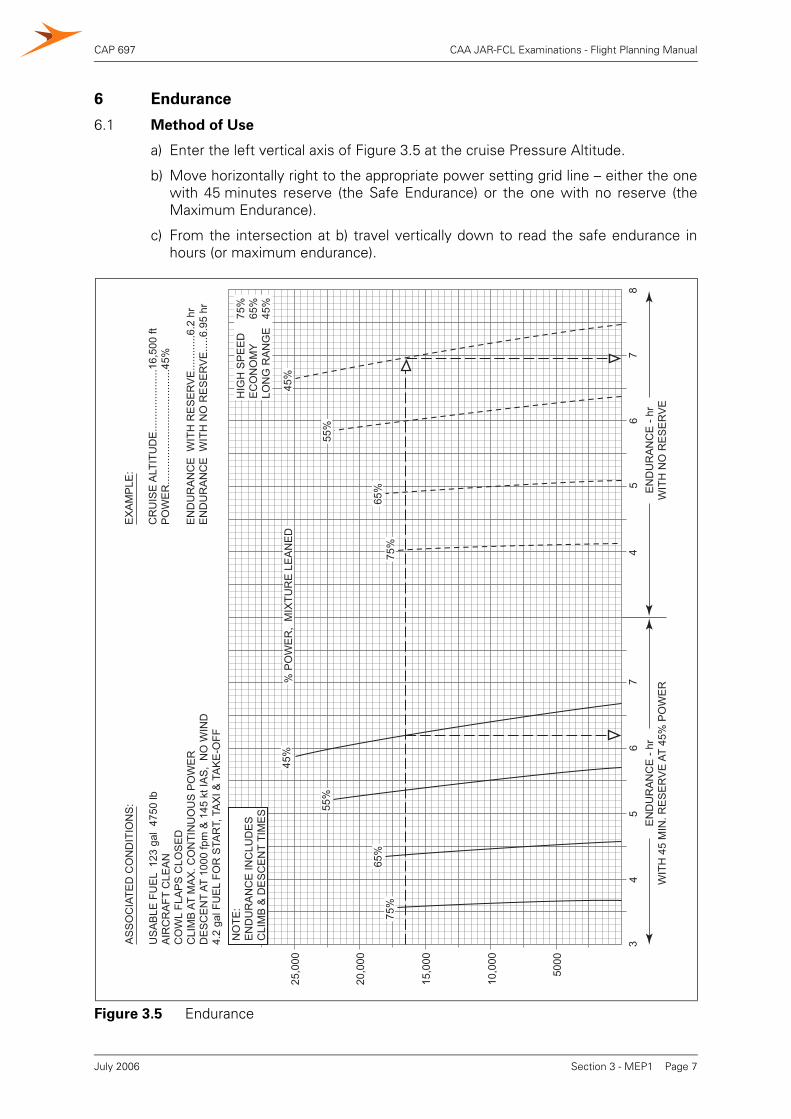
CAP 697 CAA JAR-FCL Examinations - Flight Planning Manual
6 Endurance
6.1 Method of Use
a) Enter the left vertical axis of Figure 3.5 at the cruise Pressure Altitude.
b) Move horizontally right to the appropriate power setting grid line – either the onewith 45 minutes reserve (the Safe Endurance) or the one with no reserve (theMaximum Endurance).
c) From the intersection at b) travel vertically down to read the safe endurance inhours (or maximum endurance).
Figure 3.5 Endurance
Section 3 - MEP1 Page 7July 2006
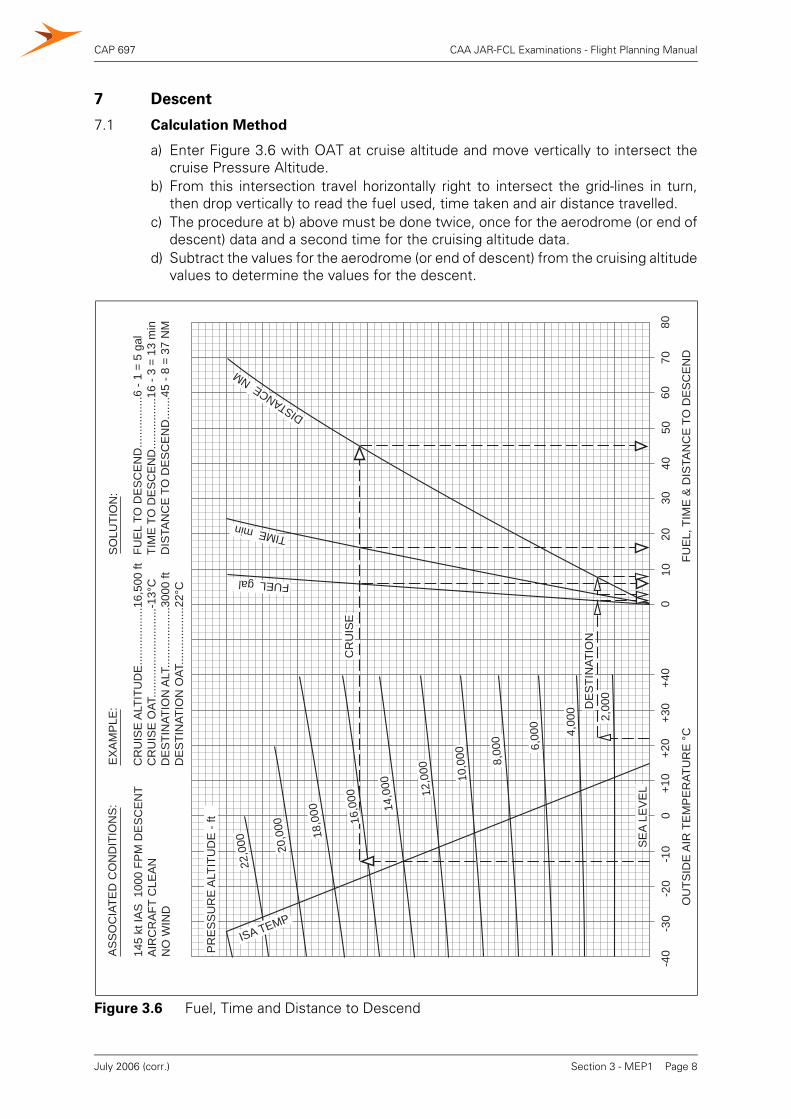
CAP 697 CAA JAR-FCL Examinations - Flight Planning Manual
7 Descent
7.1 Calculation Method
a) Enter Figure 3.6 with OAT at cruise altitude and move vertically to intersect thecruise Pressure Altitude.
b) From this intersection travel horizontally right to intersect the grid-lines in turn,then drop vertically to read the fuel used, time taken and air distance travelled.
c) The procedure at b) above must be done twice, once for the aerodrome (or end ofdescent) data and a second time for the cruising altitude data.
d) Subtract the values for the aerodrome (or end of descent) from the cruising altitudevalues to determine the values for the descent.
Figure 3.6 Fuel, Time and Distance to Descend
-40
-30
-20
-10
0+1
0+2
0+3
0+4
00
1020
3040
5060
7080
OU
TSID
E A
IR T
EM
PE
RAT
UR
E °
CFU
EL,
TIM
E &
DIS
TAN
CE
TO
DE
SC
EN
D
DE
STI
NAT
ION
CR
UIS
E
SE
A LE
VE
L
ISA TEMP
FUEL gal
TIME min
DISTANCE NM
18,0
00
8,00
0
16,0
00
14,0
00 12,0
00 10,0
00
6,00
0
4,00
0 2,00
0
PR
ES
SU
RE
ALT
ITU
DE
- ft
22,0
00 20,0
00
AS
SO
CIA
TED
CO
ND
ITIO
NS
:
145
kt IA
S 1
000
FPM
DE
SC
EN
TA
IRC
RA
FT C
LEA
NN
O W
IND
EX
AM
PLE
:
CR
UIS
E A
LTIT
UD
E...
......
......
...16
,500
ftC
RU
ISE
OAT
......
......
......
......
....-1
3°C
DE
STI
NAT
ION
ALT
......
......
......
.300
0 ft
DE
STI
NAT
ION
OAT
......
......
......
22°C
FUE
L TO
DE
SC
EN
D...
......
......
.6 -
1 =
5 ga
lTI
ME
TO
DE
SC
EN
D...
......
......
.16
- 3 =
13
min
DIS
TAN
CE
TO
DE
SC
EN
D...
....4
5 - 8
= 3
7 N
M
SO
LUTI
ON
:
Section 3 - MEP1 Page 8July 2006 (corr.)
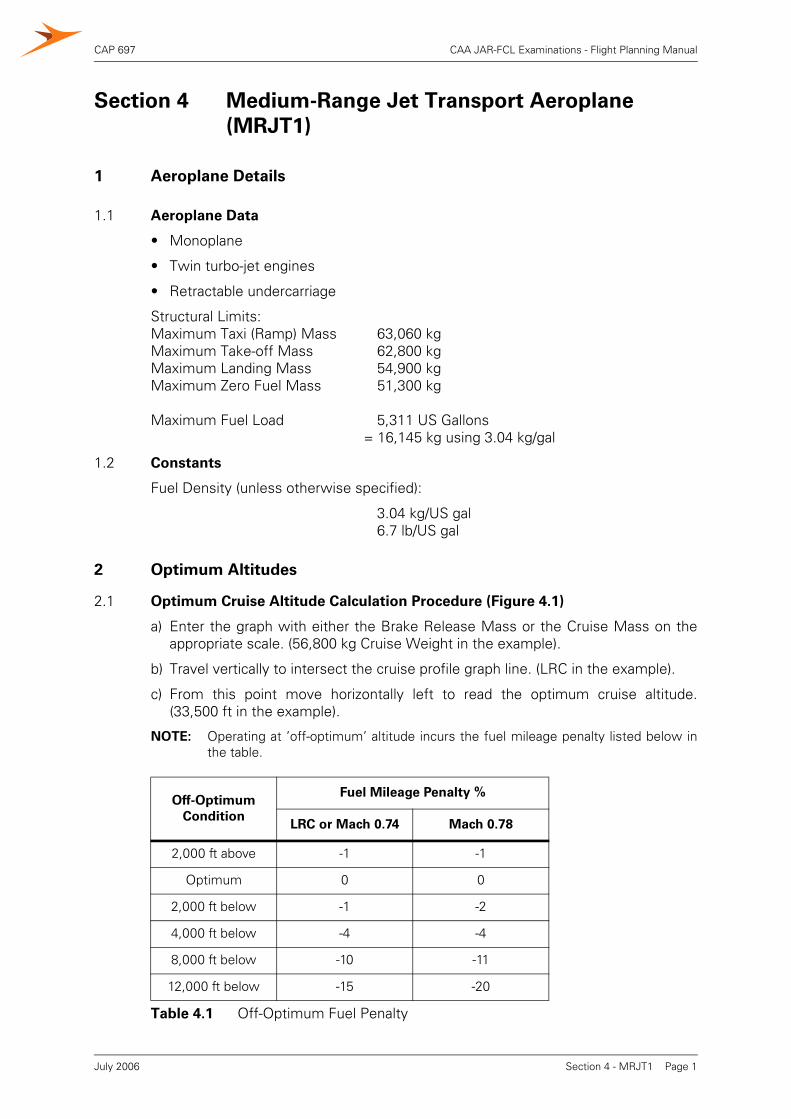
CAP 697 CAA JAR-FCL Examinations - Flight Planning Manual
Section 4 Medium-Range Jet Transport Aeroplane
(MRJT1)
1 Aeroplane Details
1.1 Aeroplane Data
• Monoplane
• Twin turbo-jet engines
• Retractable undercarriage
Structural Limits:Maximum Taxi (Ramp) Mass 63,060 kgMaximum Take-off Mass 62,800 kgMaximum Landing Mass 54,900 kgMaximum Zero Fuel Mass 51,300 kg
Maximum Fuel Load 5,311 US Gallons= 16,145 kg using 3.04 kg/gal
1.2 Constants
Fuel Density (unless otherwise specified):
3.04 kg/US gal6.7 lb/US gal
2 Optimum Altitudes
2.1 Optimum Cruise Altitude Calculation Procedure (Figure 4.1)
a) Enter the graph with either the Brake Release Mass or the Cruise Mass on theappropriate scale. (56,800 kg Cruise Weight in the example).
b) Travel vertically to intersect the cruise profile graph line. (LRC in the example).
c) From this point move horizontally left to read the optimum cruise altitude.(33,500 ft in the example).
NOTE: Operating at ’off-optimum’ altitude incurs the fuel mileage penalty listed below inthe table.
Off-Optimum
Condition
Fuel Mileage Penalty %
LRC or Mach 0.74 Mach 0.78
2,000 ft above -1 -1
Optimum 0 0
2,000 ft below -1 -2
4,000 ft below -4 -4
8,000 ft below -10 -11
12,000 ft below -15 -20
Table 4.1 Off-Optimum Fuel Penalty
Section 4 - MRJT1 Page 1July 2006
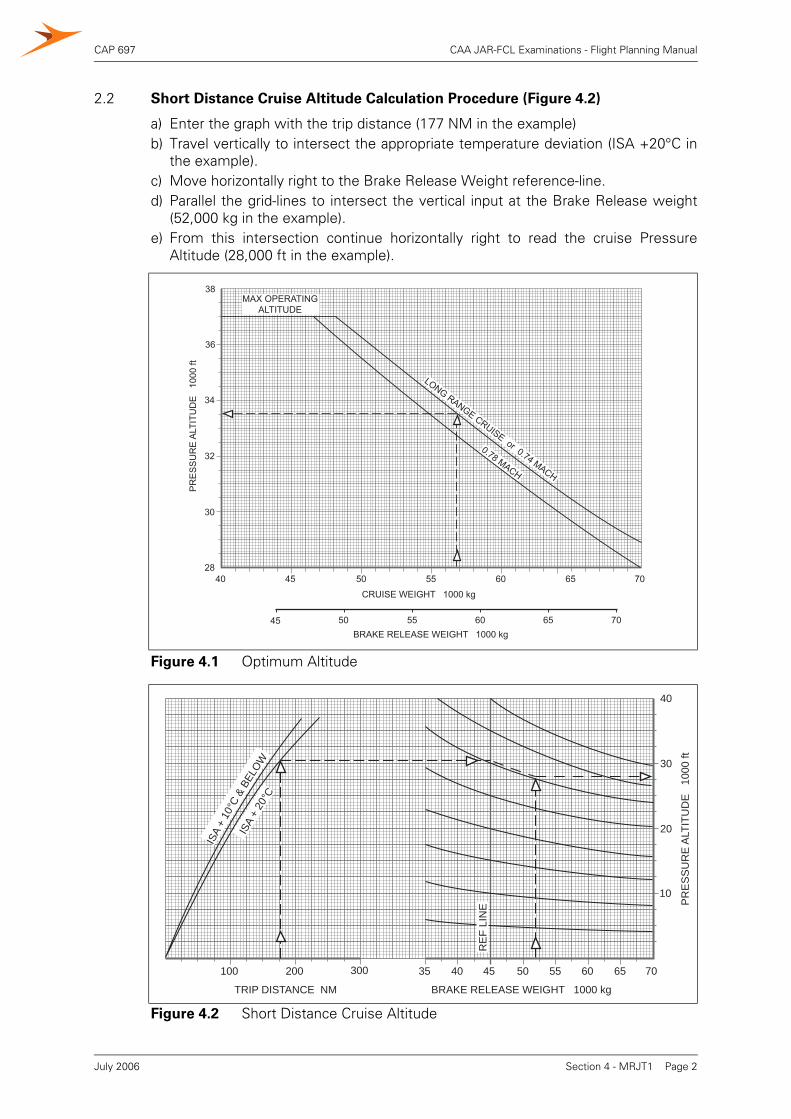
CAP 697 CAA JAR-FCL Examinations - Flight Planning Manual
2.2 Short Distance Cruise Altitude Calculation Procedure (Figure 4.2)
a) Enter the graph with the trip distance (177 NM in the example)b) Travel vertically to intersect the appropriate temperature deviation (ISA +20°C in
the example).c) Move horizontally right to the Brake Release Weight reference-line.d) Parallel the grid-lines to intersect the vertical input at the Brake Release weight
(52,000 kg in the example).e) From this intersection continue horizontally right to read the cruise Pressure
Altitude (28,000 ft in the example).
Figure 4.1 Optimum Altitude
Figure 4.2 Short Distance Cruise Altitude
PR
ES
SU
RE
ALT
ITU
DE
10
00 ft
10
20
30
40
45 50 55 60 65 7040
BRAKE RELEASE WEIGHT 1000 kg
35
TRIP DISTANCE NM
100 200 300
RE
F LI
NE
ISA
+20
°C
ISA
+10
°C&
BELO
W
Section 4 - MRJT1 Page 2July 2006
CAP 697 CAA JAR-FCL Examinations - Flight Planning Manual
3 Simplified Fuel Planning
The Simplified Planning Charts permit the rapid determination the estimated trip timeand the fuel required from the brakes release point. Charts are provided for thevarious cruise modes, as follows:
Figure 4.3.1 Long Range Cruise (LRC)
Figure 4.3.2 0.74 Mach Cruise
Figure 4.3.3 0.78 Mach Cruise
Figure 4.3.4 Low-Level 300 KIAS Cruise
Figure 4.3.5 Stepped Climb
Figure 4.3.6 Alternate Planning – LRC
These graphs are similar to each other in layout and use.
3.1 Simplified Planning Chart Corrections
a) Cost Index Adjustment
If the flight is planned to operate with the FMS in the ’ECON’ mode, adjustmentsto the LRC trip fuel and time are necessary in order to account for the differentspeed profiles flown. The adjustments are given in the following table:
b) Ground Operations
APU fuel flow 115 kg per hourTaxi fuel 11 kg per minute
c) Altitude Selection
Operation ’off-optimum’ altitude will result in fuel penalties (see table in paragraph2.1, page 1).
d) Cruise
i) Increase trip fuel by 1% for operation with A.C. packs at high flow.
ii) Increase trip fuel for operation with anti-ice ’on’ as follows:
Engine anti-ice only 70 kg/hourEngine and wing anti-ice 180 kg/hour
COST INDEX FUEL ADJUSTMENT TIME ADJUSTMENT %
0 -1 +4
20 +1 +1
40 +2 -1
60 +4 -2
80 +5 -3
100 +7 -4
150 +10 -5
200 +14 -7
Section 4 - MRJT1 Page 3July 2006
CAP 697 CAA JAR-FCL Examinations - Flight Planning Manual
e) Descent
Simplified Charts assume a descent at 0.74 M/250 KIAS and a straight-in approach.
i) For every additional minute of flaps down manoeuvre add 75 kg fuel.
ii) For engine anti-ice during descent add 50 kg.
f) Holding Fuel
Determine from the table at Figure 4.4.
3.2 Calculation Method
This example is shown in Figure 4.3.1a.
Given:
Trip Distance 350 NM
Cruise Altitude 29,000 ft
Estimated Landing Weight 30,000 kg
Average Wind Component 50 kt headwind
Temperature Deviation ISA +20°C
a) Enter the graph at the trip distance (350 NM).
b) Travel vertically to the wind component reference-line.
c) Follow the grid-lines to reach the appropriate wind component (50 kt).
d) From this point continue vertically to intercept the appropriate Cruise PressureAltitude grid line (29,000 ft).
e) From this intersection travel horizontally right to the Landing Weight gridreference-line.
f) Interpolate between the trade-lines for the appropriate Cruise Pressure Altitudeand travel along this line from the reference-line to intersect the Landing Weightinput (30,000 kg).
g) Continue horizontally right to the right vertical axis to read the fuel required(2,300 kg).
h) Return to the intersection at e) above and travel vertically to intersect the secondPressure Altitude grid at the Cruise Pressure Altitude.
i) Travel left from this intersection to the ISA Deviation reference-line.
j) Parallel the grid-lines to intersect the appropriate temperature deviation (ISA+20°C).
k) Continue horizontally left to read the trip time in hours from the left vertical axis(approximately 1.05 hr).
l) Apply the corrections in accordance with paragraph 3.1 as necessary.
NOTE: Additional allowances must be made if the climb, cruise or descent
schedules are different from those listed.
Section 4 - MRJT1 Page 4July 2006
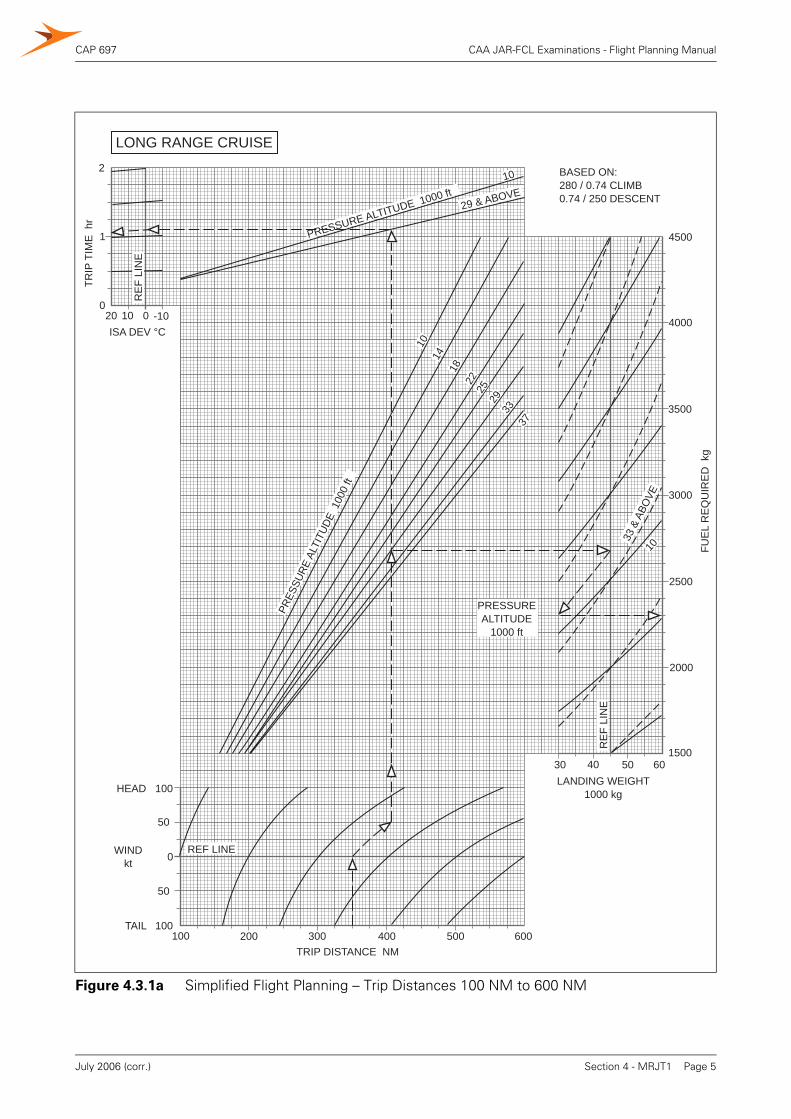
CAP 697 CAA JAR-FCL Examinations - Flight Planning Manual
Figure 4.3.1a Simplified Flight Planning – Trip Distances 100 NM to 600 NM
0
30 40 50 60LANDING WEIGHT
1000 kg100
100
HEAD
TAIL
WINDkt
50
50
100TRIP DISTANCE NM
200 300 400 500 600
BASED ON:280 / 0.74 CLIMB0.74 / 250 DESCENT
20 10 0 -10ISA DEV °C
TRIP
TIM
E h
r
1
2
0
PRESSUREALTITUDE
1000 ft
PRESSURE ALTITUDE 1000 ft
PRES
SURE
ALT
ITUD
E 1
000
ft
37
3329
2522
18
14
10
REF LINE
RE
F LI
NE
29 & ABOVE10
33 &
ABO
VE10
1500
2000
2500
3000
3500
4000
4500
FUE
L R
EQ
UIR
ED
kg
RE
F LI
NE
LONG RANGE CRUISE
Section 4 - MRJT1 Page 5July 2006 (corr.)
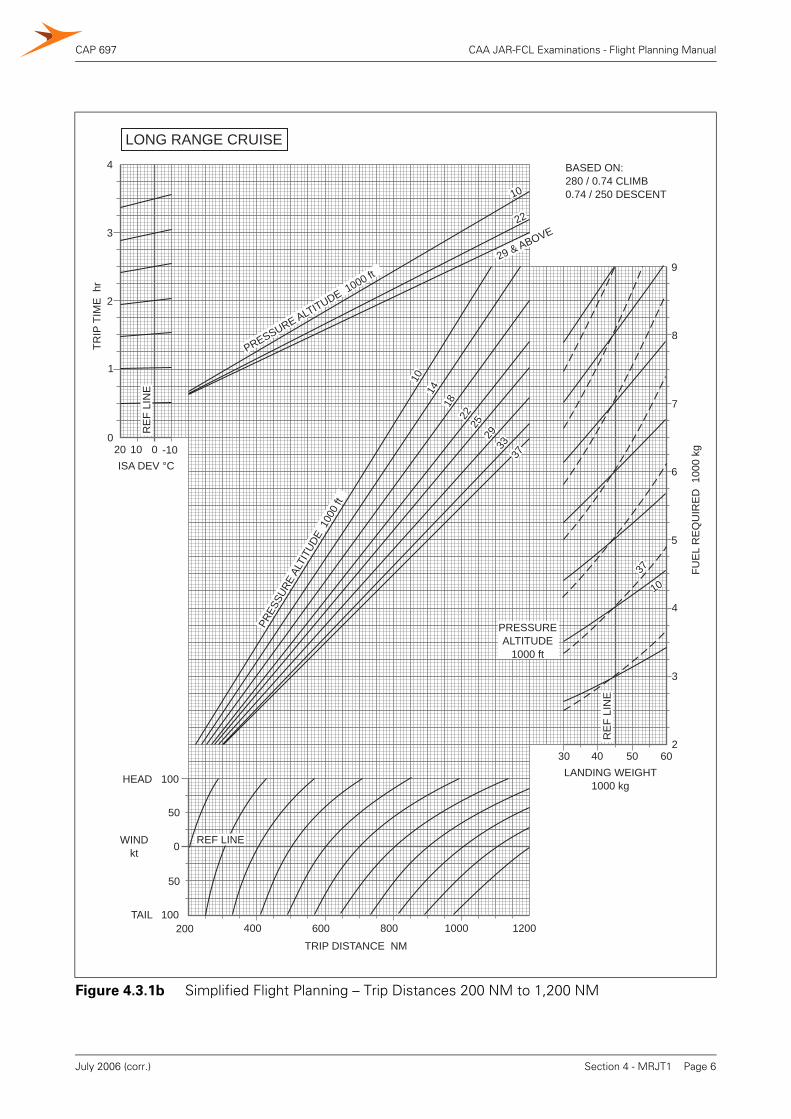
CAP 697 CAA JAR-FCL Examinations - Flight Planning Manual
Figure 4.3.1b Simplified Flight Planning – Trip Distances 200 NM to 1,200 NM
37
BASED ON:280 / 0.74 CLIMB0.74 / 250 DESCENT
30 40 50 60
10
2
3
4
5
6
7
8
9
FUE
L R
EQ
UIR
ED
100
0 kg
0
TRIP
TIM
E h
r
1
2
3
4
20 10 0 -10ISA DEV °C
100
0
100
HEAD
TAIL
WINDkt
200 400 600 800 1000 1200
TRIP DISTANCE NM
LANDING WEIGHT1000 kg
PRESSUREALTITUDE
1000 ft
PRESSURE ALTITUDE 1000 ftPR
ESSU
RE A
LTIT
UDE
100
0 ft
37
3329
2522
18
14
10
29 & ABOVE
10
RE
F LI
NE
22
RE
F LI
NE
REF LINE
LONG RANGE CRUISE
50
50
Section 4 - MRJT1 Page 6July 2006 (corr.)
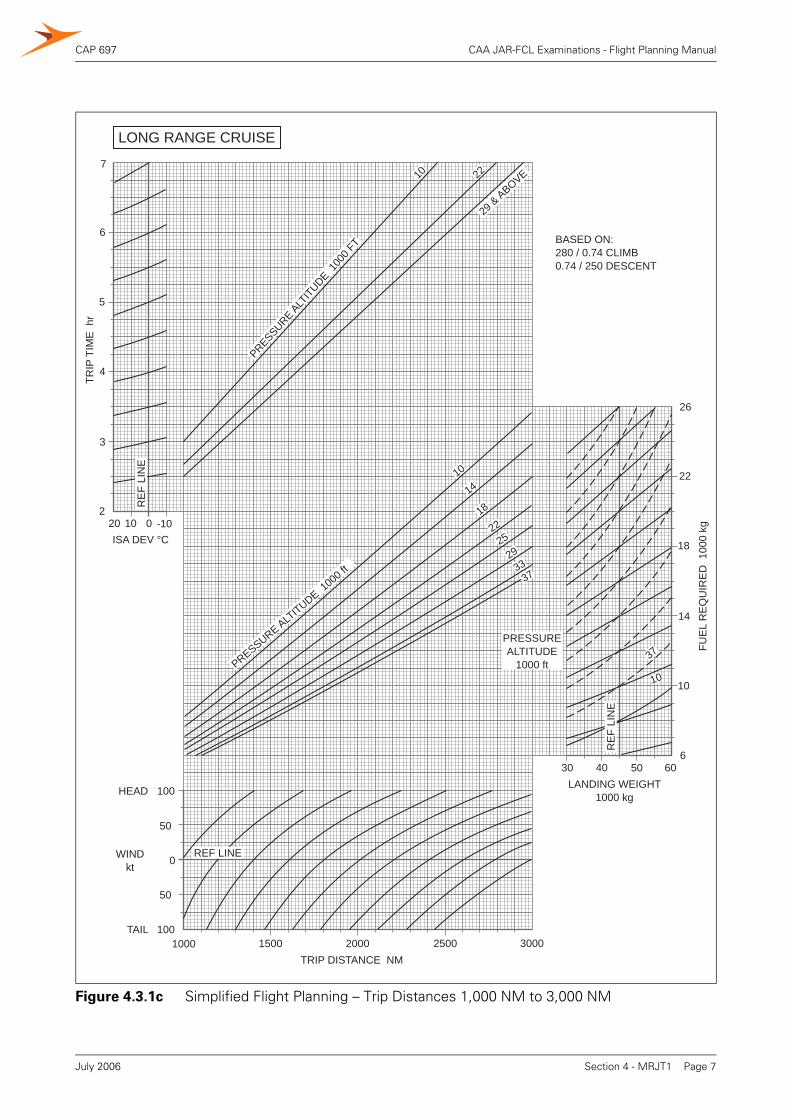
CAP 697 CAA JAR-FCL Examinations - Flight Planning Manual
Figure 4.3.1c Simplified Flight Planning – Trip Distances 1,000 NM to 3,000 NM
TRIP DISTANCE NM
30 40 50 60LANDING WEIGHT
1000 kg100
100
HEAD
TAIL
WINDkt
50
50
0
1000 1500 2000 2500 3000
TRIP
TIM
E h
r
20 10 0 -10ISA DEV °C
2
3
4
5
6
7
BASED ON:280 / 0.74 CLIMB0.74 / 250 DESCENT
FUE
L R
EQ
UIR
ED
100
0 kg
6
10
14
18
22
26
PRESSUREALTITUDE
1000 ft
RE
F LI
NE
RE
F LI
NE
REF LINE
PRESSURE ALTITU
DE 100
0 FT
29 & ABOVE10 22
3733
2925
2218
1410
PRESSURE ALTITUDE 1
000 ft
37
10
LONG RANGE CRUISE
Section 4 - MRJT1 Page 7July 2006

CAP 697 CAA JAR-FCL Examinations - Flight Planning Manual
Figure 4.3.2a Simplified Flight Planning – Trip Distances 100 NM to 600 NM
100
0
TRIP DISTANCE NAUTICAL NM
30 40 50 60LANDING WEIGHT
1000 kg100
100
HEAD
TAIL
WINDkt
50
50
200 300 400 500 600
BASED ON:280 / 0.74 CLIMB0.74 / 250 DESCENT
TRIP
TIM
E h
r
20 10 0 -10ISA DEV °C
1
2
0
PRESSUREALTITUDE
1000 ft
PRESSURE ALTITUDE 1000 ft
PRES
SURE
ALT
ITUD
E 1
000
ft 35 &
ABO
VE33
312927
2523
21
REF LINE
RE
F LI
NE
37
35 &
ABO
VE21
1500
2000
2500
3000
3500
4000
4500
FUE
L R
EQ
UIR
ED
kg
RE
F LI
NE
21
0.74 MACH CRUISE
Section 4 - MRJT1 Page 8July 2006
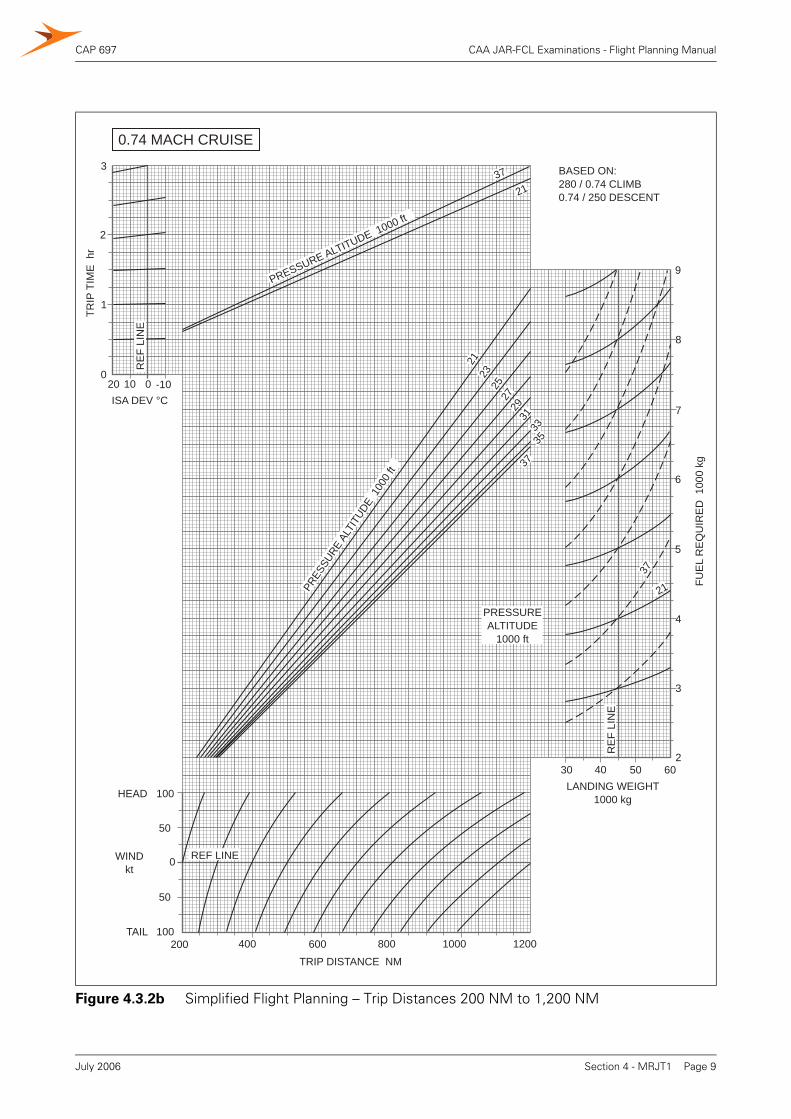
CAP 697 CAA JAR-FCL Examinations - Flight Planning Manual
Figure 4.3.2b Simplified Flight Planning – Trip Distances 200 NM to 1,200 NM
PRESSURE ALTITUDE 1000 ft
PRES
SURE
ALTI
TUDE
100
0 ft
3331
2927
2523
21
37
21
3537
PRESSUREALTITUDE
1000 ft
RE
F LI
NE
21
37
100
100
HEAD
TAIL
WINDkt
50
50
REF LINE
200 400 600 800 1000 1200
TRIP DISTANCE NM
2
3
4
5
6
7
8
9
FUE
L R
EQ
UIR
ED
100
0 kg
0
30 40 50 60LANDING WEIGHT
1000 kg
0.74 MACH CRUISE
BASED ON:280 / 0.74 CLIMB0.74 / 250 DESCENT
TRIP
TIM
E h
r
20 10 0 -10ISA DEV °C
1
2
0
RE
F LI
NE
3
Section 4 - MRJT1 Page 9July 2006
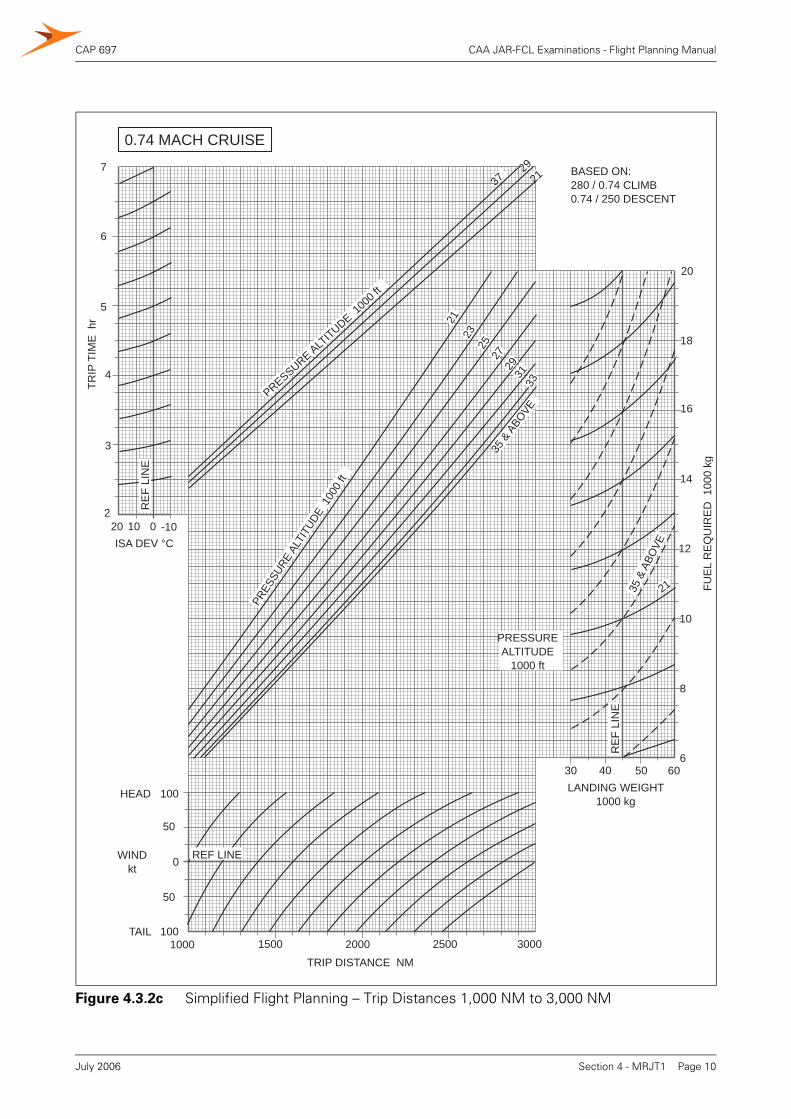
CAP 697 CAA JAR-FCL Examinations - Flight Planning Manual
Figure 4.3.2c Simplified Flight Planning – Trip Distances 1,000 NM to 3,000 NM
6
8
10
12
14
16
18
20
BASED ON:280 / 0.74 CLIMB0.74 / 250 DESCENT
30 40 50 60
FUE
L R
EQ
UIR
ED
100
0 kg
TRIP
TIM
E h
r
2
3
4
20 10 0 -10ISA DEV °C
100
0
100
HEAD
TAIL
WINDkt
1000 1500 2000 2500 3000
TRIP DISTANCE NM
LANDING WEIGHT1000 kg
50
50
5
6
737
35 &
ABO
VE
PRESSUREALTITUDE
1000 ft
PRESSURE ALTITUDE 1
000 f
t
PRES
SURE
ALT
ITUD
E 1
000
ft
3129
2725
23
21
33
REF LINE
RE
F LI
NE
35 &
ABO
VE
21
RE
F LI
NE
2921
0.74 MACH CRUISE
Section 4 - MRJT1 Page 10July 2006
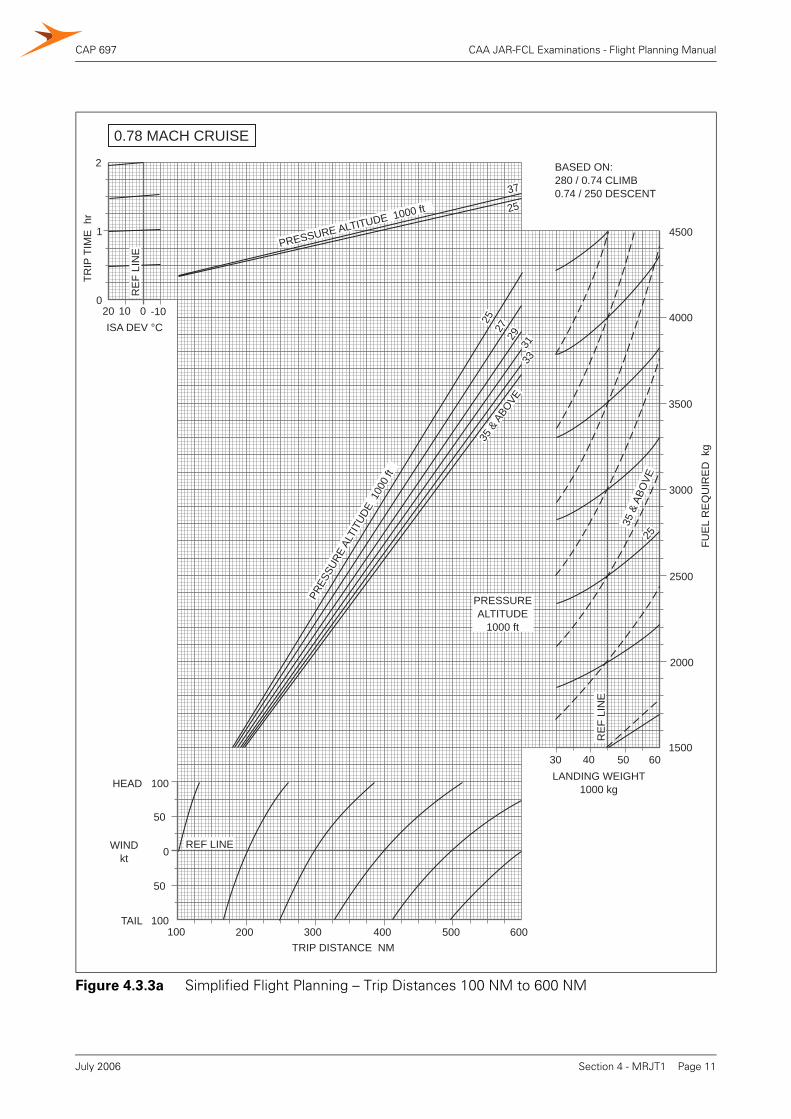
CAP 697 CAA JAR-FCL Examinations - Flight Planning Manual
Figure 4.3.3a Simplified Flight Planning – Trip Distances 100 NM to 600 NM
100
0
TRIP DISTANCE NM
30 40 50 60LANDING WEIGHT
1000 kg100
100
HEAD
TAIL
WINDkt
50
50
200 300 400 500 600
BASED ON:280 / 0.74 CLIMB0.74 / 250 DESCENT
TRIP
TIM
E h
r
20 10 0 -10ISA DEV °C
1
2
0
PRESSUREALTITUDE
1000 ft
PRESSURE ALTITUDE 1000 ft
PRES
SURE
ALT
ITUD
E 1
000
ft
35 &
ABO
VE33
3129
2725
REF LINE
RE
F LI
NE
37
35 &
ABO
VE25
1500
2000
2500
3000
3500
4000
4500
FUE
L R
EQ
UIR
ED
kg
RE
F LI
NE
25
0.78 MACH CRUISE
Section 4 - MRJT1 Page 11July 2006
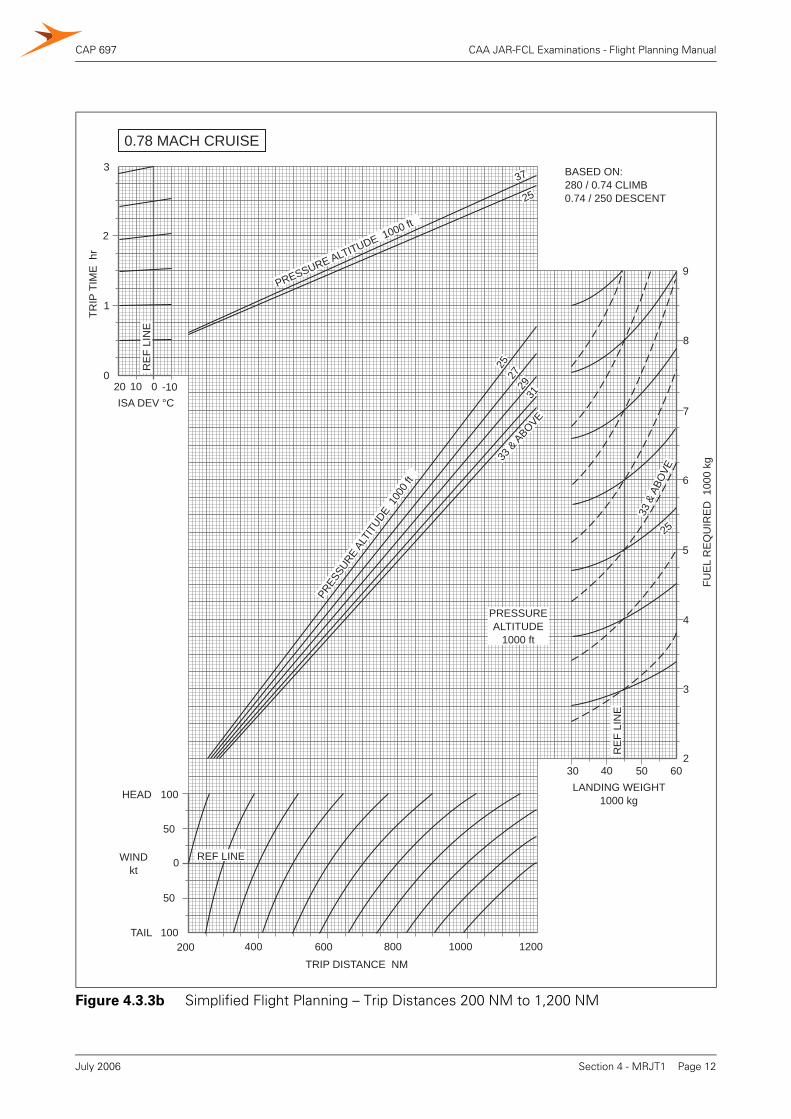
CAP 697 CAA JAR-FCL Examinations - Flight Planning Manual
Figure 4.3.3b Simplified Flight Planning – Trip Distances 200 NM to 1,200 NM
PRESSURE ALTITUDE 1000 ft
PRES
SURE
ALTI
TUDE
1000
ft
33 &
ABOVE31
2927
25
37
25
PRESSUREALTITUDE
1000 ft
RE
F LI
NE
25
REF LINE
200 400 600 800 1000 1200
TRIP DISTANCE NM
2
3
4
5
6
7
8
9
FUE
L R
EQ
UIR
ED
100
0 kg
100
100
HEAD
TAIL
WINDkt
50
50
0
30 40 50 60LANDING WEIGHT
1000 kg
TRIP
TIM
E h
r
1
2
0
3
20 10 0 -10ISA DEV °C
RE
F LI
NE
BASED ON:280 / 0.74 CLIMB0.74 / 250 DESCENT
33 &
ABO
VE
0.78 MACH CRUISE
Section 4 - MRJT1 Page 12July 2006
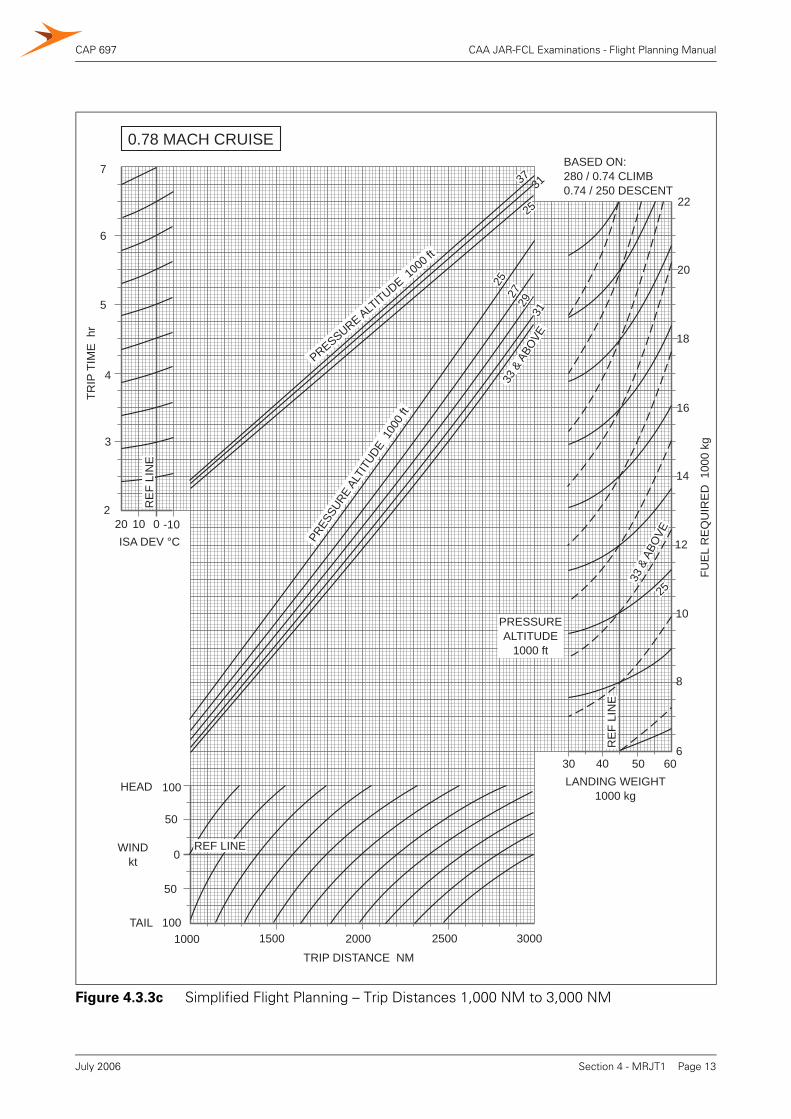
CAP 697 CAA JAR-FCL Examinations - Flight Planning Manual
Figure 4.3.3c Simplified Flight Planning – Trip Distances 1,000 NM to 3,000 NM
RE
F LI
NE
PRESSUREALTITUDE
1000 ft33
& A
BOVE
BASED ON:280 / 0.74 CLIMB0.74 / 250 DESCENT
30 40 50 60
TRIP
TIM
E h
r
2
3
4
20 10 0 -10ISA DEV °C
100
0
100
HEAD
TAIL
WINDkt
1000 1500 2000 2500 3000
TRIP DISTANCE NM
LANDING WEIGHT1000 kg
50
50
5
6
731
33 &
ABO
VE
25
6
8
10
12
14
16
18
20
FUE
L R
EQ
UIR
ED
100
0 kg
22
0.78 MACH CRUISE
RE
F LI
NE
REF LINE
PRESSURE ALTITUDE 1
000 f
t
PRES
SURE
ALTI
TUDE
100
0 ft
2527
2931
25
37
Section 4 - MRJT1 Page 13July 2006
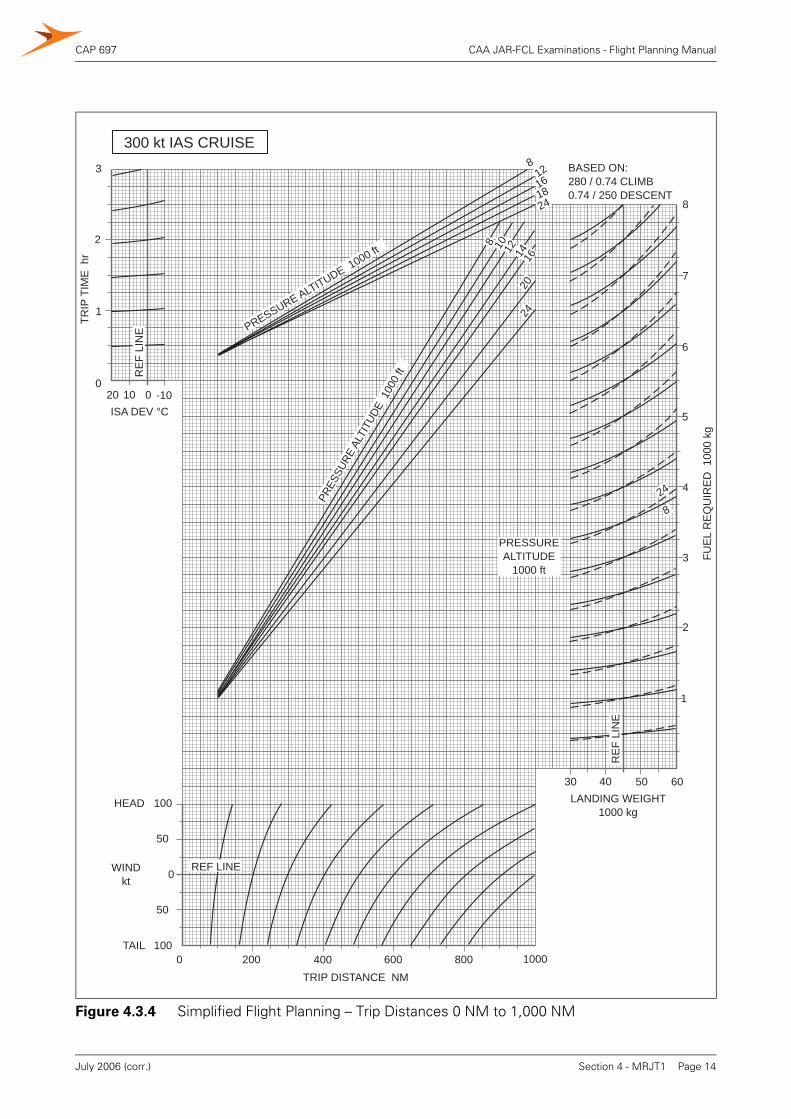
CAP 697 CAA JAR-FCL Examinations - Flight Planning Manual
Figure 4.3.4 Simplified Flight Planning – Trip Distances 0 NM to 1,000 NM
TRIP
TIM
E h
r
1
2
0
3
20 10 0 -10ISA DEV °C
RE
F LI
NE
REF LINE
0 200 400 600 800 1000
TRIP DISTANCE NM
100
100
HEAD
TAIL
WINDkt
50
50
0
2
3
4
5
6
7
8
FUE
L R
EQ
UIR
ED
100
0 kg
30 40 50 60LANDING WEIGHT
1000 kg
1
BASED ON:280 / 0.74 CLIMB0.74 / 250 DESCENT
PRESSURE ALTITUDE 1000 ft
PRES
SURE
ALT
ITUD
E 1
000
ft
PRESSUREALTITUDE
1000 ft
12
24
20
8
1618
8 10 12 14 1624
824
RE
F LI
NE
300 kt IAS CRUISE
Section 4 - MRJT1 Page 14July 2006 (corr.)
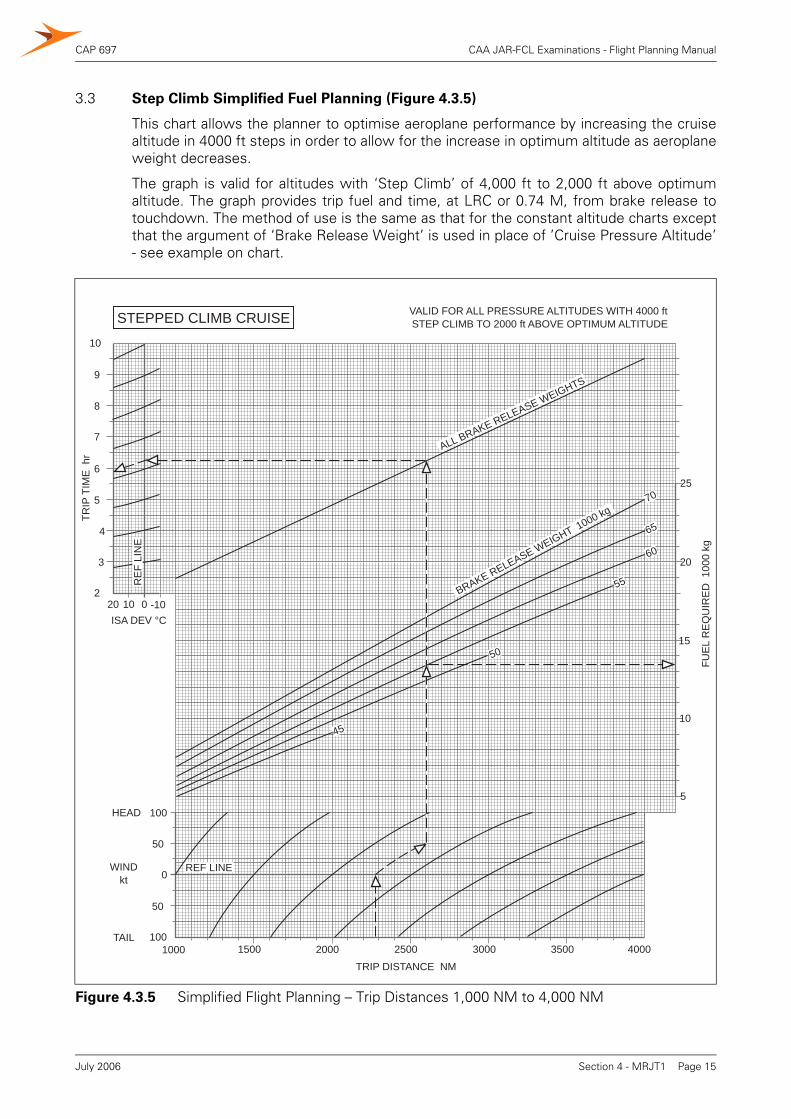
CAP 697 CAA JAR-FCL Examinations - Flight Planning Manual
3.3 Step Climb Simplified Fuel Planning (Figure 4.3.5)
This chart allows the planner to optimise aeroplane performance by increasing the cruisealtitude in 4000 ft steps in order to allow for the increase in optimum altitude as aeroplaneweight decreases.
The graph is valid for altitudes with ‘Step Climb’ of 4,000 ft to 2,000 ft above optimumaltitude. The graph provides trip fuel and time, at LRC or 0.74 M, from brake release totouchdown. The method of use is the same as that for the constant altitude charts exceptthat the argument of ‘Brake Release Weight’ is used in place of ’Cruise Pressure Altitude’- see example on chart.
Figure 4.3.5 Simplified Flight Planning – Trip Distances 1,000 NM to 4,000 NM
RE
F LI
NE
TRIP
TIM
E h
r
3
4
20 10 0 -10ISA DEV °C
100
0
HEAD
WINDkt
1000 1500 2000 2500 3000
TRIP DISTANCE NM
50
50
5
6
7
10
15
20
25
FUE
L R
EQ
UIR
ED
100
0 kg
2
8
9
10
100TAIL3500 4000
5
VALID FOR ALL PRESSURE ALTITUDES WITH 4000 ft STEP CLIMB TO 2000 ft ABOVE OPTIMUM ALTITUDESTEPPED CLIMB CRUISE
70
65
60
55
45
50
BRAKE RELEASE WEIGHT 1000 kg
ALL BRAKE RELEASE WEIGHTS
REF LINE
Section 4 - MRJT1 Page 15July 2006
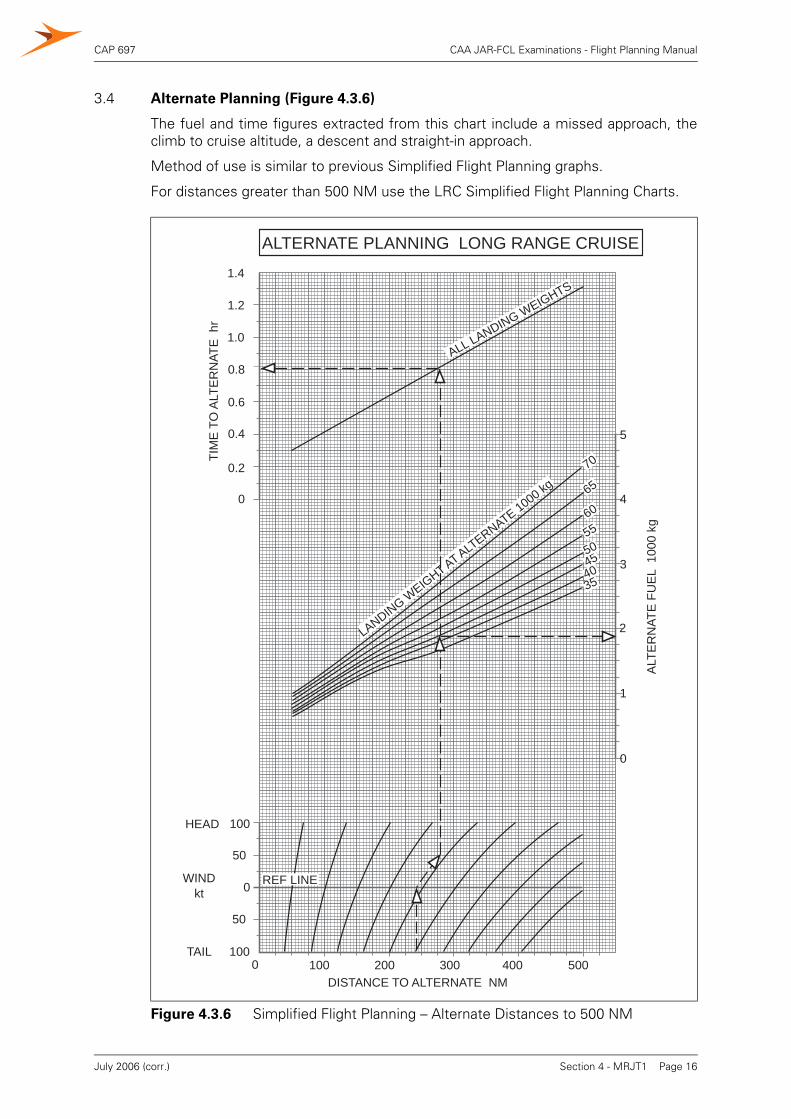
CAP 697 CAA JAR-FCL Examinations - Flight Planning Manual
3.4 Alternate Planning (Figure 4.3.6)
The fuel and time figures extracted from this chart include a missed approach, theclimb to cruise altitude, a descent and straight-in approach.
Method of use is similar to previous Simplified Flight Planning graphs.
For distances greater than 500 NM use the LRC Simplified Flight Planning Charts.
Figure 4.3.6 Simplified Flight Planning – Alternate Distances to 500 NM
0
1
2
3
4
5
ALT
ER
NAT
E F
UE
L 1
000
kg
TIM
E T
O A
LTE
RN
ATE
hr
1.4
1.2
1.0
0.8
0.6
0.4
0.2
0
100
0
HEAD
WINDkt
50
50
100TAIL0 100 200 300 400 500
DISTANCE TO ALTERNATE NM
REF LINE
ALTERNATE PLANNING LONG RANGE CRUISE
LANDING WEIGHT AT ALT
ERNATE 1000 kg
ALL LANDING WEIGHTS
70
65
60
55
4550
4035
Section 4 - MRJT1 Page 16July 2006 (corr.)
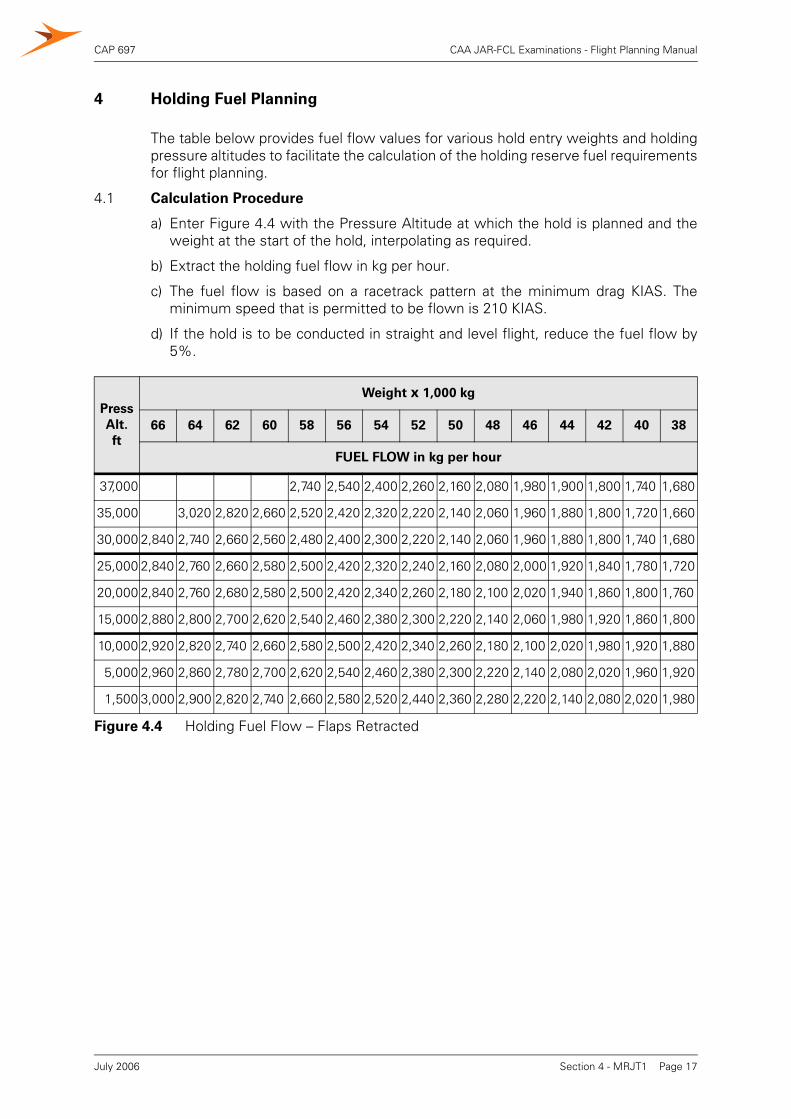
CAP 697 CAA JAR-FCL Examinations - Flight Planning Manual
4 Holding Fuel Planning
The table below provides fuel flow values for various hold entry weights and holdingpressure altitudes to facilitate the calculation of the holding reserve fuel requirementsfor flight planning.
4.1 Calculation Procedure
a) Enter Figure 4.4 with the Pressure Altitude at which the hold is planned and theweight at the start of the hold, interpolating as required.
b) Extract the holding fuel flow in kg per hour.
c) The fuel flow is based on a racetrack pattern at the minimum drag KIAS. Theminimum speed that is permitted to be flown is 210 KIAS.
d) If the hold is to be conducted in straight and level flight, reduce the fuel flow by5%.
Press
Alt.
ft
Weight x 1,000 kg
66 64 62 60 58 56 54 52 50 48 46 44 42 40 38
FUEL FLOW in kg per hour
37,000 2,740 2,540 2,400 2,260 2,160 2,080 1,980 1,900 1,800 1,740 1,680
35,000 3,020 2,820 2,660 2,520 2,420 2,320 2,220 2,140 2,060 1,960 1,880 1,800 1,720 1,660
30,000 2,840 2,740 2,660 2,560 2,480 2,400 2,300 2,220 2,140 2,060 1,960 1,880 1,800 1,740 1,680
25,000 2,840 2,760 2,660 2,580 2,500 2,420 2,320 2,240 2,160 2,080 2,000 1,920 1,840 1,780 1,720
20,000 2,840 2,760 2,680 2,580 2,500 2,420 2,340 2,260 2,180 2,100 2,020 1,940 1,860 1,800 1,760
15,000 2,880 2,800 2,700 2,620 2,540 2,460 2,380 2,300 2,220 2,140 2,060 1,980 1,920 1,860 1,800
10,000 2,920 2,820 2,740 2,660 2,580 2,500 2,420 2,340 2,260 2,180 2,100 2,020 1,980 1,920 1,880
5,000 2,960 2,860 2,780 2,700 2,620 2,540 2,460 2,380 2,300 2,220 2,140 2,080 2,020 1,960 1,920
1,500 3,000 2,900 2,820 2,740 2,660 2,580 2,520 2,440 2,360 2,280 2,220 2,140 2,080 2,020 1,980
Figure 4.4 Holding Fuel Flow – Flaps Retracted
Section 4 - MRJT1 Page 17July 2006
CAP 697 CAA JAR-FCL Examinations - Flight Planning Manual
5 Detailed Fuel Planning
5.1 En-route Climb (Figures 4.5.1)
a) Tables are provided for a range of temperature deviations from ISA -15°C to ISA+25°C.
b) The values for fuel used and time taken shown in the tables are measured fromthe brake release point.
c) The values for air distance quoted in the tables are measured from the point atwhich a height of 1,500 ft is attained above reference zero.
d) The TAS stated in the tables is the average value for the climb.
e) All of the values given in the tables are based on a climb regime of 280 KIAS/M 0.74with all engines operating.
5.2 Calculation Procedure
a) Select the table appropriate to the ISA deviation.
b) Enter the left column at the top of climb Pressure Altitude and travel through thecolumns to the right to the appropriate brake release weight, extract the values fortime taken, fuel used, distance travelled and TAS from the appropriate column(s),interpolating if necessary.
c) If the aerodrome has a high elevation, correct the fuel used from the sub-table atthe bottom of the main table.
d) To determine the ground distance travelled in the climb, multiply the air distanceby the groundspeed and divide by the TAS.
Section 4 - MRJT1 Page 18July 2006
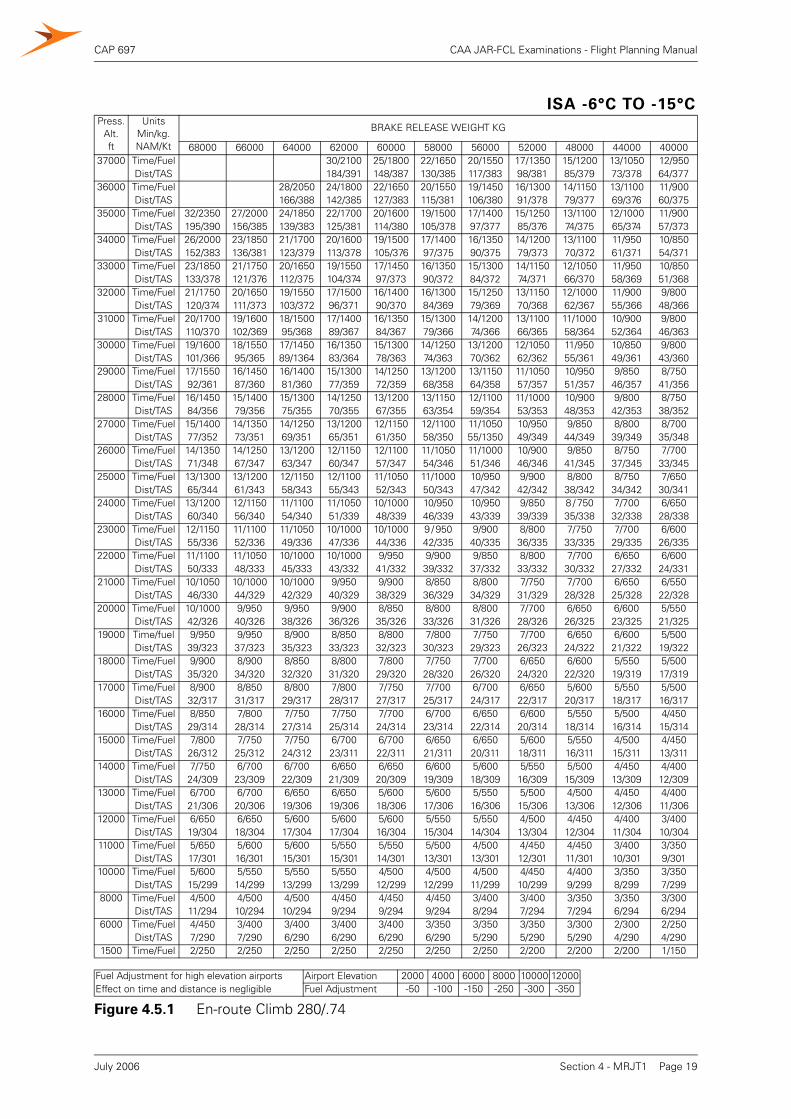
CAP 697 CAA JAR-FCL Examinations - Flight Planning Manual
ISA -6°C TO -15°CPress.
Alt.ft
UnitsMin/kg.NAM/Kt
BRAKE RELEASE WEIGHT KG
68000 66000 64000 62000 60000 58000 56000 52000 48000 44000 4000037000 Time/Fuel 30/2100 25/1800 22/1650 20/1550 17/1350 15/1200 13/1050 12/950
Dist/TAS 184/391 148/387 130/385 117/383 98/381 85/379 73/378 64/37736000 Time/Fuel 28/2050 24/1800 22/1650 20/1550 19/1450 16/1300 14/1150 13/1100 11/900
Dist/TAS 166/388 142/385 127/383 115/381 106/380 91/378 79/377 69/376 60/37535000 Time/Fuel 32/2350 27/2000 24/1850 22/1700 20/1600 19/1500 17/1400 15/1250 13/1100 12/1000 11/900
Dist/TAS 195/390 156/385 139/383 125/381 114/380 105/378 97/377 85/376 74/375 65/374 57/37334000 Time/Fuel 26/2000 23/1850 21/1700 20/1600 19/1500 17/1400 16/1350 14/1200 13/1100 11/950 10/850
Dist/TAS 152/383 136/381 123/379 113/378 105/376 97/375 90/375 79/373 70/372 61/371 54/37133000 Time/Fuel 23/1850 21/1750 20/1650 19/1550 17/1450 16/1350 15/1300 14/1150 12/1050 11/950 10/850
Dist/TAS 133/378 121/376 112/375 104/374 97/373 90/372 84/372 74/371 66/370 58/369 51/36832000 Time/Fuel 21/1750 20/1650 19/1550 17/1500 16/1400 16/1300 15/1250 13/1150 12/1000 11/900 9/800
Dist/TAS 120/374 111/373 103/372 96/371 90/370 84/369 79/369 70/368 62/367 55/366 48/36631000 Time/Fuel 20/1700 19/1600 18/1500 17/1400 16/1350 15/1300 14/1200 13/1100 11/1000 10/900 9/800
Dist/TAS 110/370 102/369 95/368 89/367 84/367 79/366 74/366 66/365 58/364 52/364 46/36330000 Time/Fuel 19/1600 18/1550 17/1450 16/1350 15/1300 14/1250 13/1200 12/1050 11/950 10/850 9/800
Dist/TAS 101/366 95/365 89/1364 83/364 78/363 74/363 70/362 62/362 55/361 49/361 43/36029000 Time/Fuel 17/1550 16/1450 16/1400 15/1300 14/1250 13/1200 13/1150 11/1050 10/950 9/850 8/750
Dist/TAS 92/361 87/360 81/360 77/359 72/359 68/358 64/358 57/357 51/357 46/357 41/35628000 Time/Fuel 16/1450 15/1400 15/1300 14/1250 13/1200 13/1150 12/1100 11/1000 10/900 9/800 8/750
Dist/TAS 84/356 79/356 75/355 70/355 67/355 63/354 59/354 53/353 48/353 42/353 38/35227000 Time/Fuel 15/1400 14/1350 14/1250 13/1200 12/1150 12/1100 11/1050 10/950 9/850 8/800 8/700
Dist/TAS 77/352 73/351 69/351 65/351 61/350 58/350 55/1350 49/349 44/349 39/349 35/34826000 Time/Fuel 14/1350 14/1250 13/1200 12/1150 12/1100 11/1050 11/1000 10/900 9/850 8/750 7/700
Dist/TAS 71/348 67/347 63/347 60/347 57/347 54/346 51/346 46/346 41/345 37/345 33/34525000 Time/Fuel 13/1300 13/1200 12/1150 12/1100 11/1050 11/1000 10/950 9/900 8/800 8/750 7/650
Dist/TAS 65/344 61/343 58/343 55/343 52/343 50/343 47/342 42/342 38/342 34/342 30/34124000 Time/Fuel 13/1200 12/1150 11/1100 11/1050 10/1000 10/950 10/950 9/850 8 / 750 7/700 6/650
Dist/TAS 60/340 56/340 54/340 51/339 48/339 46/339 43/339 39/339 35/338 32/338 28/33823000 Time/Fuel 12/1150 11/1100 11/1050 10/1000 10/1000 9 / 950 9/900 8/800 7/750 7/700 6/600
Dist/TAS 55/336 52/336 49/336 47/336 44/336 42/335 40/335 36/335 33/335 29/335 26/33522000 Time/Fuel 11/1100 11/1050 10/1000 10/1000 9/950 9/900 9/850 8/800 7/700 6/650 6/600
Dist/TAS 50/333 48/333 45/333 43/332 41/332 39/332 37/332 33/332 30/332 27/332 24/33121000 Time/Fuel 10/1050 10/1000 10/1000 9/950 9/900 8/850 8/800 7/750 7/700 6/650 6/550
Dist/TAS 46/330 44/329 42/329 40/329 38/329 36/329 34/329 31/329 28/328 25/328 22/32820000 Time/Fuel 10/1000 9/950 9/950 9/900 8/850 8/800 8/800 7/700 6/650 6/600 5/550
Dist/TAS 42/326 40/326 38/326 36/326 35/326 33/326 31/326 28/326 26/325 23/325 21/32519000 Time/fuel 9/950 9/950 8/900 8/850 8/800 7/800 7/750 7/700 6/650 6/600 5/500
Dist/TAS 39/323 37/323 35/323 33/323 32/323 30/323 29/323 26/323 24/322 21/322 19/32218000 Time/Fuel 9/900 8/900 8/850 8/800 7/800 7/750 7/700 6/650 6/600 5/550 5/500
Dist/TAS 35/320 34/320 32/320 31/320 29/320 28/320 26/320 24/320 22/320 19/319 17/31917000 Time/Fuel 8/900 8/850 8/800 7/800 7/750 7/700 6/700 6/650 5/600 5/550 5/500
Dist/TAS 32/317 31/317 29/317 28/317 27/317 25/317 24/317 22/317 20/317 18/317 16/31716000 Time/Fuel 8/850 7/800 7/750 7/750 7/700 6/700 6/650 6/600 5/550 5/500 4/450
Dist/TAS 29/314 28/314 27/314 25/314 24/314 23/314 22/314 20/314 18/314 16/314 15/31415000 Time/Fuel 7/800 7/750 7/750 6/700 6/700 6/650 6/650 5/600 5/550 4/500 4/450
Dist/TAS 26/312 25/312 24/312 23/311 22/311 21/311 20/311 18/311 16/311 15/311 13/31114000 Time/Fuel 7/750 6/700 6/700 6/650 6/650 6/600 5/600 5/550 5/500 4/450 4/400
Dist/TAS 24/309 23/309 22/309 21/309 20/309 19/309 18/309 16/309 15/309 13/309 12/30913000 Time/Fuel 6/700 6/700 6/650 6/650 5/600 5/600 5/550 5/500 4/500 4/450 4/400
Dist/TAS 21/306 20/306 19/306 19/306 18/306 17/306 16/306 15/306 13/306 12/306 11/30612000 Time/Fuel 6/650 6/650 5/600 5/600 5/600 5/550 5/550 4/500 4/450 4/400 3/400
Dist/TAS 19/304 18/304 17/304 17/304 16/304 15/304 14/304 13/304 12/304 11/304 10/30411000 Time/Fuel 5/650 5/600 5/600 5/550 5/550 5/500 4/500 4/450 4/450 3/400 3/350
Dist/TAS 17/301 16/301 15/301 15/301 14/301 13/301 13/301 12/301 11/301 10/301 9/30110000 Time/Fuel 5/600 5/550 5/550 5/550 4/500 4/500 4/500 4/450 4/400 3/350 3/350
Dist/TAS 15/299 14/299 13/299 13/299 12/299 12/299 11/299 10/299 9/299 8/299 7/2998000 Time/Fuel 4/500 4/500 4/500 4/450 4/450 4/450 3/400 3/400 3/350 3/350 3/300
Dist/TAS 11/294 10/294 10/294 9/294 9/294 9/294 8/294 7/294 7/294 6/294 6/2946000 Time/Fuel 4/450 3/400 3/400 3/400 3/400 3/350 3/350 3/350 3/300 2/300 2/250
Dist/TAS 7/290 7/290 6/290 6/290 6/290 6/290 5/290 5/290 5/290 4/290 4/2901500 Time/Fuel 2/250 2/250 2/250 2/250 2/250 2/250 2/250 2/200 2/200 2/200 1/150
Fuel Adjustment for high elevation airports Airport Elevation 2000 4000 6000 8000 10000 12000Effect on time and distance is negligible Fuel Adjustment -50 -100 -150 -250 -300 -350
Figure 4.5.1 En-route Climb 280/.74
Section 4 - MRJT1 Page 19July 2006

CAP 697 CAA JAR-FCL Examinations - Flight Planning Manual
ISA -5°C TO +5°CPress.
Alt.ft
UnitsMin/kg.NAM/Kt
BRAKE RELEASE WEIGHT KG
68000 66000 64000 62000 60000 58000 56000 52000 48000 44000 4000037000 Time/Fuel 32/2250 26/1900 23/1750 21/1600 18/1400 16/1250 14/1100 12/1000
Dist/TAS 197/400 158/396 138/393 124/392 105/389 90/388 78/386 68/38536000 Time/Fuel 29/2150 25/1900 23/1750 21/1650 19/1550 17/1350 15/1200 13/1050 11/950
Dist/TAS 177/397 151/393 135/391 122/390 112/388 96/386 84/385 73/384 64/38335000 Time/Fuel 33/2450 28/2150 25/1950 22/1800 21/1650 19/1550 18/1450 16/1300 14/1150 12/1050 11/950
Dist/TAS 209/399 169/394 148/391 133/389 121/388 112/387 104/386 90/384 78/383 69/382 60138134000 Time/Fuel 27/2150 24/1950 22/1800 21/1700 19/1600 18/1500 17/1400 15/1250 13/1150 12/1000 11/900
Dist/TAS 162/391 144/389 131/387 120/386 111/385 103/384 96/383 84/381 74/380 65/379 57/37933000 Time/Fuel 24/1950 22/1850 21/1700 19/1600 18/1550 17/1450 16/1350 14/1200 13/1100 11/1000 10/900
Dist/TAS 142/386 129/385 119/383 110/382 103/381 96/380 90/380 79/379 70/378 62/377 54/37632000 Time/Fuel 22/1850 21/1750 19/1650 18/1550 17/1450 16/1400 15/1300 14/1200 12/1050 11/950 10/850
Dist/TAS 128/382 118/381 110/380 102/379 96/378 90/377 84/377 74/376 66/375 58/374 51/37431000 Time/Fuel 21/1800 19/1650 18/1600 17/1500 16/1400 15/1350 14/1300 13/1150 12/1050 10/950 9/850
Dist/TAS 117/378 109/377 102/376 95/375 89/375 84/374 79/374 70/373 62/372 55/371 49/37130000 Time/Fuel 19/1700 18/1600 17/1500 16/1450 15/1350 15/1300 14/1250 12/1100 11/1000 10/900 9/800
Dist/TAS 108/374 101/373 95/372 89/372 84/371 79/371 74/370 66/369 59/369 52/368 46/36829000 Time/Fuel 18/1600 17/1550 16/1450 15/1400 14/1300 14/1250 13/1200 12/1100 11/950 10/900 9/800
Dist/TAS 98/369 92/368 87/367 82/367 77/367 73/366 69/366 61/365 55/365 49/364 43/36428000 Time/Fuel 17/1550 16/1450 15/1400 14/1300 14/1250 13/1200 12/1150 11/1050 10/950 9/850 8/750
Dist/TAS 90/364 84/363 79/363 75/362 71/362 67/362 63/351 57/361 51/360 45/360 40/36027000 Time/Fuel 16/1450 15/1400 14/1350 13/1250 13/1200 12/1150 12/1100 11/1000 10/900 9/800 8/750
Dist/TAS 82/359 77/359 73/358 69/358 65/358 62/357 58/357 52/357 47/356 42/356 37/35626000 Time/Fuel 15/1400 14/1350 13/1250 13/1200 12/1150 12/1100 11/1050 10/950 9/850 8/800 7/700
Dist/TAS 75/355 71/355 67/354 63/354 60/354 57/353 54/353 48/353 43/352 39/352 35/35225000 Time/Fuel 14/1350 13/1250 13/1200 12/1150 11/1100 11/1050 10/1000 9/900 9/850 8/750 7/700
Dist/TAS 69/351 65/351 62/350 58/350 55/350 53/350 50/349 45/349 40/349 36/348 32/34824000 Time/Fuel 13/1300 12/1200 12/1150 11/1100 11/1050 10/1000 10/950 9/900 8/800 7/750 7/650
Dist/TAS 63/347 60/347 57/346 54/346 51/346 48/346 46/346 41/345 37/345 33/345 30/34523000 Time/Fuel 12/1200 12/1150 11/1100 11/1050 10/1000 10/950 9/950 8/850 8/750 7/700 6/650
Dist/TAS 58/343 55/343 52/343 50/343 47/342 45/342 42/342 38/342 34/342 31/341 28/34122000 Time/Fuel 11/1150 11/1100 10/1050 10/1000 10/1000 9/950 9/900 8/800 7/750 7/700 6/600
Dist/TAS 53/340 51/339 48/339 46/339 43/339 41/339 39/339 35/338 32/338 29/338 26/33821000 Time/Fuel 11/1100 10/1050 10/1000 9/1000 9/950 9/900 8/850 8/800 7/700 6/650 6/600
Dist/TAS 49/336 46/336 44/336 42/336 40/336 38/335 36/335 33/335 29/335 26/335 24/33520000 Time/Fuel 10/1050 10/1000 9/950 9/950 9/900 8/850 8/800 7/750 7/700 6/600 5/550
Dist/TAS 45/333 42/333 40/332 39/332 37/332 35/332 33/332 30/332 27/332 24/332 22/33219000 Time/Fuel 10/1000 9/950 9/950 8/900 8/850 8 / 800 7/800 7/700 6/650 6/600 5/550
Dist/TAS 41/329 39/329 37/329 35/329 34/329 32/329 30/329 28/329 25/329 22/329 20/32918000 Time/Fuel 9/950 9/900 8/900 8/850 8/800 7/800 7/750 6/700 6/650 5/550 5/500
Dist/TAS 37/326 36/326 34/326 32/326 31/326 29/326 28/326 25/326 23/326 21/326 18/32617000 Time/Fuel 8/900 8/900 8/850 7/800 7/800 7/750 7/700 6/650 6/600 5/550 5/500
Dist/TAS 34/323 32/323 31/323 29/323 26/323 27/323 26/323 23/323 21/323 19/323 17/32316000 Time/Fuel 81/850 8/850 7/800 7/750 7/750 6/700 6/700 6/650 5/600 5/550 4/500
Dist/TAS 31/320 29/320 28/320 27/320 26/320 24/320 23/320 21/320 19/320 17/320 15/32015000 Time/Fuel 7/800 7/800 7/750 7/750 6/700 6/700 6/650 5/600 5/550 5/500 4/450
Dist/TAS 28/318 27/318 25/317 24/317 23/317 22/317 21/317 19/317 17/317 16/317 14/31714000 Time/Fuel 7/800 7/750 6/700 6/700 6/650 6/650 5/600 5/550 5/500 4/500 4/450
Dist/TAS 25/315 24/315 23/315 22/315 21/315 20/315 19/315 17/315 16/315 14/315 13/31413000 Time/Fuel 6/750 6/700 6/700 6/650 6/650 5/600 5/600 5/550 4/500 4/450 4/400
Dist/TAS 22/312 21/312 21/312 20/312 19/312 18/312 17/312 16/312 14/312 13/312 11/31212000 Time/Fuel 6/700 6/650 6/650 5/600 5/600 5/550 5/550 4/500 4/450 4/450 3/400
Dist/TAS 20/310 19/310 18/310 17/309 17/309 16/309 15/309 14/309 13/309 11/309 10/30911000 Time/Fuel 6/650 5/650 5/600 5/600 5/550 5/550 4/500 4/500 4/450 4/400 3/350
Dist/TAS 18/307 17/307 16/307 15/307 15/307 14/307 13/307 12/307 11/307 10/307 9/30710000 Time/Fuel 5/600 5/600 5/550 5/550 4/550 4/500 4/500 4/450 4/400 3/400 3/350
Dist/TAS 15/305 15/305 14/305 13/305 13/305 12/305 12/305 11/304 10/304 9/304 8/3048000 Time/Fuel 4/500 4/500 4/500 4/450 4/450 4/450 4/450 3/400 3/350 3/350 3/300
Dist/TAS 11/300 11/300 10/300 10/300 9/300 9/300 9/300 8/300 7/300 6/300 6/3006000 Time/Fuel 4/450 3/450 3/400 3/400 3/400 3/400 3/350 3/350 3/300 2/300 2/250
Dist/TAS 7/295 7/295 7/295 7/295 6/295 6/295 6/295 5/295 5/295 4/295 4/2951500 Time/Fuel 2/250 2/250 2/250 2/250 2/250 2/250 2/250 2/200 2/200 2/200 1/150
Fuel Adjustment for high elevation airports Airport Elevation 2000 4000 6000 8000 10000 12000Effect on time and distance is negligible Fuel Adjustment -50 -100 -200 -250 -300 -350
Figure 4.5.1 En-route Climb 280/.74 (continued)
Section 4 - MRJT1 Page 20July 2006
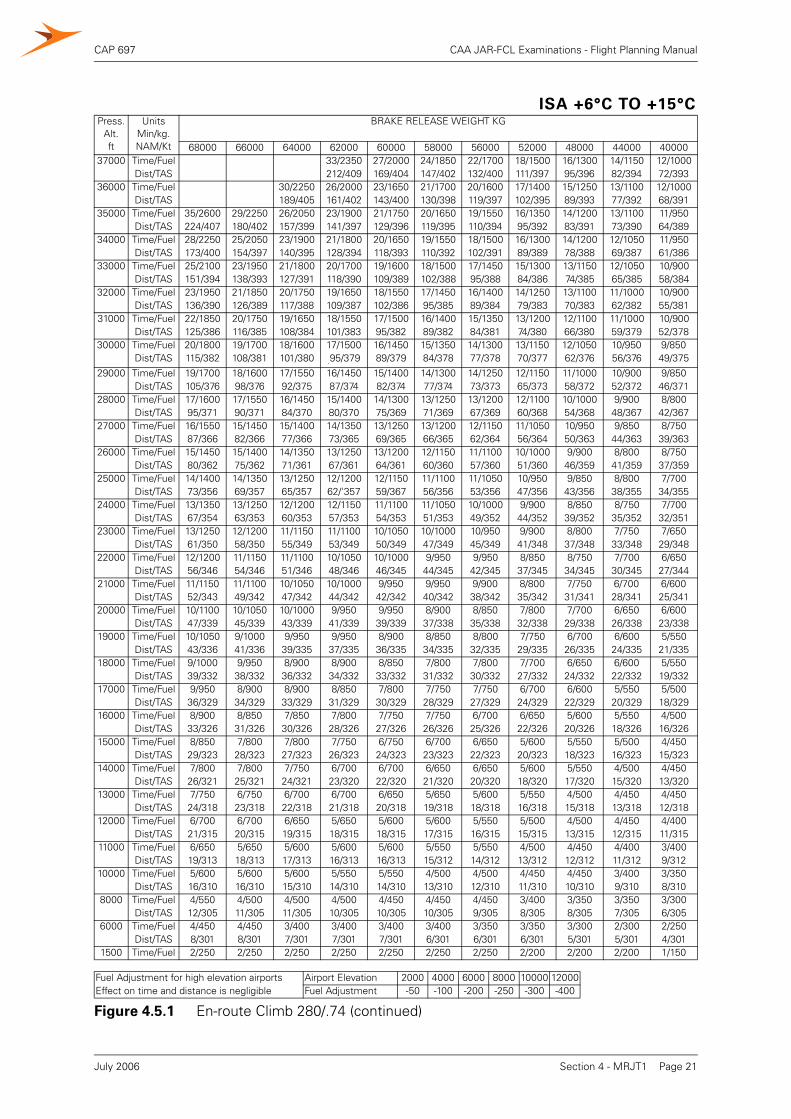
CAP 697 CAA JAR-FCL Examinations - Flight Planning Manual
ISA +6°C TO +15°CPress.
Alt.ft
UnitsMin/kg.NAM/Kt
BRAKE RELEASE WEIGHT KG
68000 66000 64000 62000 60000 58000 56000 52000 48000 44000 4000037000 Time/Fuel 33/2350 27/2000 24/1850 22/1700 18/1500 16/1300 14/1150 12/1000
Dist/TAS 212/409 169/404 147/402 132/400 111/397 95/396 82/394 72/39336000 Time/Fuel 30/2250 26/2000 23/1650 21/1700 20/1600 17/1400 15/1250 13/1100 12/1000
Dist/TAS 189/405 161/402 143/400 130/398 119/397 102/395 89/393 77/392 68/39135000 Time/Fuel 35/2600 29/2250 26/2050 23/1900 21/1750 20/1650 19/1550 16/1350 14/1200 13/1100 11/950
Dist/TAS 224/407 180/402 157/399 141/397 129/396 119/395 110/394 95/392 83/391 73/390 64/38934000 Time/Fuel 28/2250 25/2050 23/1900 21/1800 20/1650 19/1550 18/1500 16/1300 14/1200 12/1050 11/950
Dist/TAS 173/400 154/397 140/395 128/394 118/393 110/392 102/391 89/389 78/388 69/387 61/38633000 Time/Fuel 25/2100 23/1950 21/1800 20/1700 19/1600 18/1500 17/1450 15/1300 13/1150 12/1050 10/900
Dist/TAS 151/394 138/393 127/391 118/390 109/389 102/388 95/388 84/386 74/385 65/385 58/38432000 Time/Fuel 23/1950 21/1850 20/1750 19/1650 18/1550 17/1450 16/1400 14/1250 13/1100 11/1000 10/900
Dist/TAS 136/390 126/389 117/388 109/387 102/386 95/385 89/384 79/383 70/383 62/382 55/38131000 Time/Fuel 22/1850 20/1750 19/1650 18/1550 17/1500 16/1400 15/1350 13/1200 12/1100 11/1000 10/900
Dist/TAS 125/386 116/385 108/384 101/383 95/382 89/382 84/381 74/380 66/380 59/379 52/37830000 Time/Fuel 20/1800 19/1700 18/1600 17/1500 16/1450 15/1350 14/1300 13/1150 12/1050 10/950 9/850
Dist/TAS 115/382 108/381 101/380 .95/379 89/379 84/378 77/378 70/377 62/376 56/376 49/37529000 Time/Fuel 19/1700 18/1600 17/1550 16/1450 15/1400 14/1300 14/1250 12/1150 11/1000 10/900 9/850
Dist/TAS 105/376 98/376 92/375 87/374 82/374 77/374 73/373 65/373 58/372 52/372 46/37128000 Time/Fuel 17/1600 17/1550 16/1450 15/1400 14/1300 13/1250 13/1200 12/1100 10/1000 9/900 8/800
Dist/TAS 95/371 90/371 84/370 80/370 75/369 71/369 67/369 60/368 54/368 48/367 42/36727000 Time/Fuel 16/1550 15/1450 15/1400 14/1350 13/1250 13/1200 12/1150 11/1050 10/950 9/850 8/750
Dist/TAS 87/366 82/366 77/366 73/365 69/365 66/365 62/364 56/364 50/363 44/363 39/36326000 Time/Fuel 15/1450 15/1400 14/1350 13/1250 13/1200 12/1150 11/1100 10/1000 9/900 8/800 8/750
Dist/TAS 80/362 75/362 71/361 67/361 64/361 60/360 57/360 51/360 46/359 41/359 37/35925000 Time/Fuel 14/1400 14/1350 13/1250 12/1200 12/1150 11/1100 11/1050 10/950 9/850 8/800 7/700
Dist/TAS 73/356 69/357 65/357 62/'357 59/367 56/356 53/356 47/356 43/356 38/355 34/35524000 Time/Fuel 13/1350 13/1250 12/1200 12/1150 11/1100 11/1050 10/1000 9/900 8/850 8/750 7/700
Dist/TAS 67/354 63/353 60/353 57/353 54/353 51/353 49/352 44/352 39/352 35/352 32/35123000 Time/Fuel 13/1250 12/1200 11/1150 11/1100 10/1050 10/1000 10/950 9/900 8/800 7/750 7/650
Dist/TAS 61/350 58/350 55/349 53/349 50/349 47/349 45/349 41/348 37/348 33/348 29/34822000 Time/Fuel 12/1200 11/1150 11/1100 10/1050 10/1000 9/950 9/950 8/850 8/750 7/700 6/650
Dist/TAS 56/346 54/346 51/346 48/346 46/345 44/345 42/345 37/345 34/345 30/345 27/34421000 Time/Fuel 11/1150 11/1100 10/1050 10/1000 9/950 9/950 9/900 8/800 7/750 6/700 6/600
Dist/TAS 52/343 49/342 47/342 44/342 42/342 40/342 38/342 35/342 31/341 28/341 25/34120000 Time/Fuel 10/1100 10/1050 10/1000 9/950 9/950 8/900 8/850 7/800 7/700 6/650 6/600
Dist/TAS 47/339 45/339 43/339 41/339 39/339 37/338 35/338 32/338 29/338 26/338 23/33819000 Time/Fuel 10/1050 9/1000 9/950 9/950 8/900 8/850 8/800 7/750 6/700 6/600 5/550
Dist/TAS 43/336 41/336 39/335 37/335 36/335 34/335 32/335 29/335 26/335 24/335 21/33518000 Time/Fuel 9/1000 9/950 8/900 8/900 8/850 7/800 7/800 7/700 6/650 6/600 5/550
Dist/TAS 39/332 38/332 36/332 34/332 33/332 31/332 30/332 27/332 24/332 22/332 19/33217000 Time/Fuel 9/950 8/900 8/900 8/850 7/800 7/750 7/750 6/700 6/600 5/550 5/500
Dist/TAS 36/329 34/329 33/329 31/329 30/329 28/329 27/329 24/329 22/329 20/329 18/32916000 Time/Fuel 8/900 8/850 7/850 7/800 7/750 7/750 6/700 6/650 5/600 5/550 4/500
Dist/TAS 33/326 31/326 30/326 28/326 27/326 26/326 25/326 22/326 20/326 18/326 16/32615000 Time/Fuel 8/850 7/800 7/800 7/750 6/750 6/700 6/650 5/600 5/550 5/500 4/450
Dist/TAS 29/323 28/323 27/323 26/323 24/323 23/323 22/323 20/323 18/323 16/323 15/32314000 Time/Fuel 7/800 7/800 7/750 6/700 6/700 6/650 6/650 5/600 5/550 4/500 4/450
Dist/TAS 26/321 25/321 24/321 23/320 22/320 21/320 20/320 18/320 17/320 15/320 13/32013000 Time/Fuel 7/750 6/750 6/700 6/700 6/650 5/650 5/600 5/550 4/500 4/450 4/450
Dist/TAS 24/318 23/318 22/318 21/318 20/318 19/318 18/318 16/318 15/318 13/318 12/31812000 Time/Fuel 6/700 6/700 6/650 5/650 5/600 5/600 5/550 5/500 4/500 4/450 4/400
Dist/TAS 21/315 20/315 19/315 18/315 18/315 17/315 16/315 15/315 13/315 12/315 11/31511000 Time/Fuel 6/650 5/650 5/600 5/600 5/600 5/550 5/550 4/500 4/450 4/400 3/400
Dist/TAS 19/313 18/313 17/313 16/313 16/313 15/312 14/312 13/312 12/312 11/312 9/31210000 Time/Fuel 5/600 5/600 5/600 5/550 5/550 4/500 4/500 4/450 4/450 3/400 3/350
Dist/TAS 16/310 16/310 15/310 14/310 14/310 13/310 12/310 11/310 10/310 9/310 8/3108000 Time/Fuel 4/550 4/500 4/500 4/500 4/450 4/450 4/450 3/400 3/350 3/350 3/300
Dist/TAS 12/305 11/305 11/305 10/305 10/305 10/305 9/305 8/305 8/305 7/305 6/3056000 Time/Fuel 4/450 4/450 3/400 3/400 3/400 3/400 3/350 3/350 3/300 2/300 2/250
Dist/TAS 8/301 8/301 7/301 7/301 7/301 6/301 6/301 6/301 5/301 5/301 4/3011500 Time/Fuel 2/250 2/250 2/250 2/250 2/250 2/250 2/250 2/200 2/200 2/200 1/150
Fuel Adjustment for high elevation airports Airport Elevation 2000 4000 6000 8000 10000 12000Effect on time and distance is negligible Fuel Adjustment -50 -100 -200 -250 -300 -400
Figure 4.5.1 En-route Climb 280/.74 (continued)
Section 4 - MRJT1 Page 21July 2006
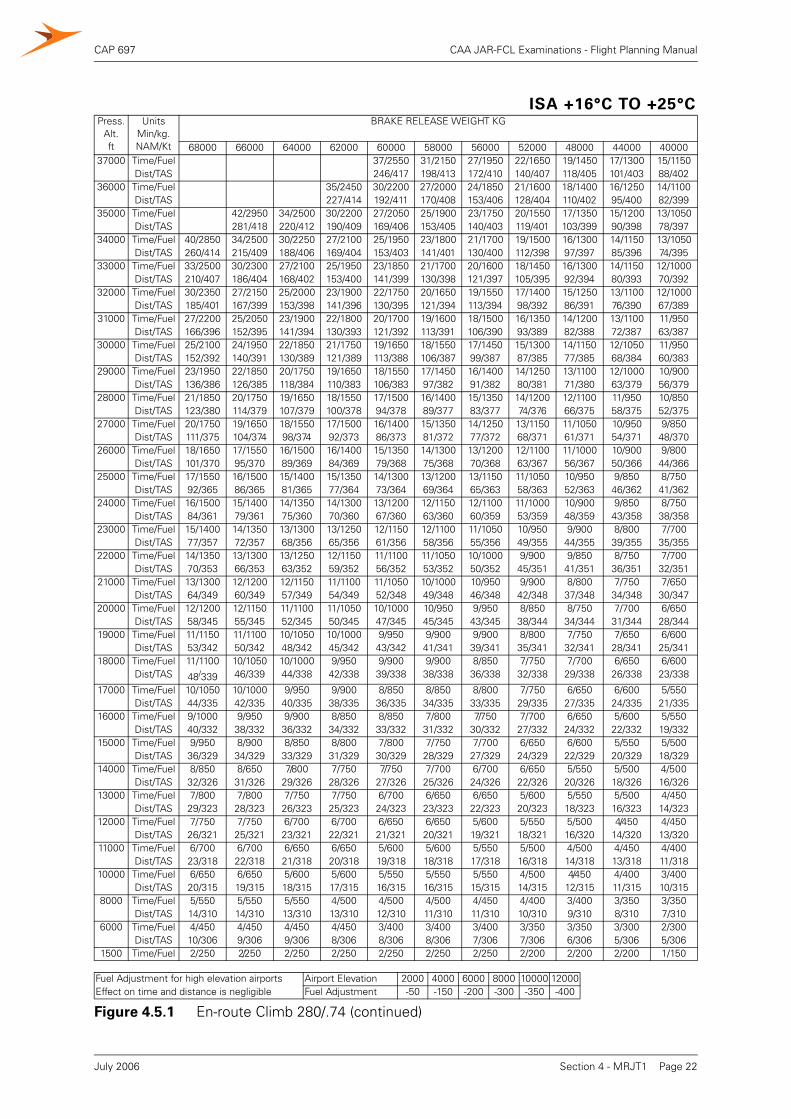
CAP 697 CAA JAR-FCL Examinations - Flight Planning Manual
ISA +16°C TO +25°CPress.
Alt.ft
UnitsMin/kg.NAM/Kt
BRAKE RELEASE WEIGHT KG
68000 66000 64000 62000 60000 58000 56000 52000 48000 44000 4000037000 Time/Fuel 37/2550 31/2150 27/1950 22/1650 19/1450 17/1300 15/1150
Dist/TAS 246/417 198/413 172/410 140/407 118/405 101/403 88/40236000 Time/Fuel 35/2450 30/2200 27/2000 24/1850 21/1600 18/1400 16/1250 14/1100
Dist/TAS 227/414 192/411 170/408 153/406 128/404 110/402 95/400 82/39935000 Time/Fuel 42/2950 34/2500 30/2200 27/2050 25/1900 23/1750 20/1550 17/1350 15/1200 13/1050
Dist/TAS 281/418 220/412 190/409 169/406 153/405 140/403 119/401 103/399 90/398 78/39734000 Time/Fuel 40/2850 34/2500 30/2250 27/2100 25/1950 23/1800 21/1700 19/1500 16/1300 14/1150 13/1050
Dist/TAS 260/414 215/409 188/406 169/404 153/403 141/401 130/400 112/398 97/397 85/396 74/39533000 Time/Fuel 33/2500 30/2300 27/2100 25/1950 23/1850 21/1700 20/1600 18/1450 16/1300 14/1150 12/1000
Dist/TAS 210/407 186/404 168/402 153/400 141/399 130/398 121/397 105/395 92/394 80/393 70/39232000 Time/Fuel 30/2350 27/2150 25/2000 23/1900 22/1750 20/1650 19/1550 17/1400 15/1250 13/1100 12/1000
Dist/TAS 185/401 167/399 153/398 141/396 130/395 121/394 113/394 98/392 86/391 76/390 67/38931000 Time/Fuel 27/2200 25/2050 23/1900 22/1800 20/1700 19/1600 18/1500 16/1350 14/1200 13/1100 11/950
Dist/TAS 166/396 152/395 141/394 130/393 121/392 113/391 106/390 93/389 82/388 72/387 63/38730000 Time/Fuel 25/2100 24/1950 22/1850 21/1750 19/1650 18/1550 17/1450 15/1300 14/1150 12/1050 11/950
Dist/TAS 152/392 140/391 130/389 121/389 113/388 106/387 99/387 87/385 77/385 68/384 60/38329000 Time/Fuel 23/1950 22/1850 20/1750 19/1650 18/1550 17/1450 16/1400 14/1250 13/1100 12/1000 10/900
Dist/TAS 136/386 126/385 118/384 110/383 106/383 97/382 91/382 80/381 71/380 63/379 56/37928000 Time/Fuel 21/1850 20/1750 19/1650 18/1550 17/1500 16/1400 15/1350 14/1200 12/1100 11/950 10/850
Dist/TAS 123/380 114/379 107/379 100/378 94/378 89/377 83/377 74/376 66/375 58/375 52/37527000 Time/Fuel 20/1750 19/1650 18/1550 17/1500 16/1400 15/1350 14/1250 13/1150 11/1050 10/950 9/850
Dist/TAS 111/375 104/374 98/374 92/373 86/373 81/372 77/372 68/371 61/371 54/371 48/37026000 Time/Fuel 18/1650 17/1550 16/1500 16/1400 15/1350 14/1300 13/1200 12/1100 11/1000 10/900 9/800
Dist/TAS 101/370 95/370 89/369 84/369 79/368 75/368 70/368 63/367 56/367 50/366 44/36625000 Time/Fuel 17/1550 16/1500 15/1400 15/1350 14/1300 13/1200 13/1150 11/1050 10/950 9/850 8/750
Dist/TAS 92/365 86/365 81/365 77/364 73/364 69/364 65/363 58/363 52/363 46/362 41/36224000 Time/Fuel 16/1500 15/1400 14/1350 14/1300 13/1200 12/1150 12/1100 11/1000 10/900 9/850 8/750
Dist/TAS 84/361 79/361 75/360 70/360 67/360 63/360 60/359 53/359 48/359 43/358 38/35823000 Time/Fuel 15/1400 14/1350 13/1300 13/1250 12/1150 12/1100 11/1050 10/950 9/900 8/800 7/700
Dist/TAS 77/357 72/357 68/356 65/356 61/356 58/356 55/356 49/355 44/355 39/355 35/35522000 Time/Fuel 14/1350 13/1300 13/1250 12/1150 11/1100 11/1050 10/1000 9/900 9/850 8/750 7/700
Dist/TAS 70/353 66/353 63/352 59/352 56/352 53/352 50/352 45/351 41/351 36/351 32/35121000 Time/Fuel 13/1300 12/1200 12/1150 11/1100 11/1050 10/1000 10/950 9/900 8/800 7/750 7/650
Dist/TAS 64/349 60/349 57/349 54/349 52/348 49/348 46/348 42/348 37/348 34/348 30/34720000 Time/Fuel 12/1200 12/1150 11/1100 11/1050 10/1000 10/950 9/950 8/850 8/750 7/700 6/650
Dist/TAS 58/345 55/345 52/345 50/345 47/345 45/345 43/345 38/344 34/344 31/344 28/34419000 Time/Fuel 11/1150 11/1100 10/1050 10/1000 9/950 9/900 9/900 8/800 7/750 7/650 6/600
Dist/TAS 53/342 50/342 48/342 45/342 43/342 41/341 39/341 35/341 32/341 28/341 25/34118000 Time/Fuel 11/1100 10/1050 10/1000 9/950 9/900 9/900 8/850 7/750 7/700 6/650 6/600
Dist/TAS 48/339 46/339 44/338 42/338 39/338 38/338 36/338 32/338 29/338 26/338 23/338
17000 Time/Fuel 10/1050 10/1000 9/950 9/900 8/850 8/850 8/800 7/750 6/650 6/600 5/550Dist/TAS 44/335 42/335 40/335 38/335 36/335 34/335 33/335 29/335 27/335 24/335 21/335
16000 Time/Fuel 9/1000 9/950 9/900 8/850 8/850 7/800 7/750 7/700 6/650 5/600 5/550Dist/TAS 40/332 38/332 36/332 34/332 33/332 31/332 30/332 27/332 24/332 22/332 19/332
15000 Time/Fuel 9/950 8/900 8/850 8/800 7/800 7/750 7/700 6/650 6/600 5/550 5/500Dist/TAS 36/329 34/329 33/329 31/329 30/329 28/329 27/329 24/329 22/329 20/329 18/329
14000 Time/Fuel 8/850 8/650 7/800 7/750 7/750 7/700 6/700 6/650 5/550 5/500 4/500Dist/TAS 32/326 31/326 29/326 28/326 27/326 25/326 24/326 22/326 20/326 18/326 16/326
13000 Time/Fuel 7/800 7/800 7/750 7/750 6/700 6/650 6/650 5/600 5/550 5/500 4/450Dist/TAS 29/323 28/323 26/323 25/323 24/323 23/323 22/323 20/323 18/323 16/323 14/323
12000 Time/Fuel 7/750 7/750 6/700 6/700 6/650 6/650 5/600 5/550 5/500 4/450 4/450Dist/TAS 26/321 25/321 23/321 22/321 21/321 20/321 19/321 18/321 16/320 14/320 13/320
11000 Time/Fuel 6/700 6/700 6/650 6/650 5/600 5/600 5/550 5/500 4/500 4/450 4/400Dist/TAS 23/318 22/318 21/318 20/318 19/318 18/318 17/318 16/318 14/318 13/318 11/318
10000 Time/Fuel 6/650 6/650 5/600 5/600 5/550 5/550 5/550 4/500 4/450 4/400 3/400Dist/TAS 20/315 19/315 18/315 17/315 16/315 16/315 15/315 14/315 12/315 11/315 10/315
8000 Time/Fuel 5/550 5/550 5/550 4/500 4/500 4/500 4/450 4/400 3/400 3/350 3/350Dist/TAS 14/310 14/310 13/310 13/310 12/310 11/310 11/310 10/310 9/310 8/310 7/310
6000 Time/Fuel 4/450 4/450 4/450 4/450 3/400 3/400 3/400 3/350 3/350 3/300 2/300Dist/TAS 10/306 9/306 9/306 8/306 8/306 8/306 7/306 7/306 6/306 5/306 5/306
1500 Time/Fuel 2/250 2/250 2/250 2/250 2/250 2/250 2/250 2/200 2/200 2/200 1/150
Fuel Adjustment for high elevation airports Airport Elevation 2000 4000 6000 8000 10000 12000Effect on time and distance is negligible Fuel Adjustment -50 -150 -200 -300 -350 -400
Figure 4.5.1 En-route Climb 280/.74 (continued)
Section 4 - MRJT1 Page 22July 2006
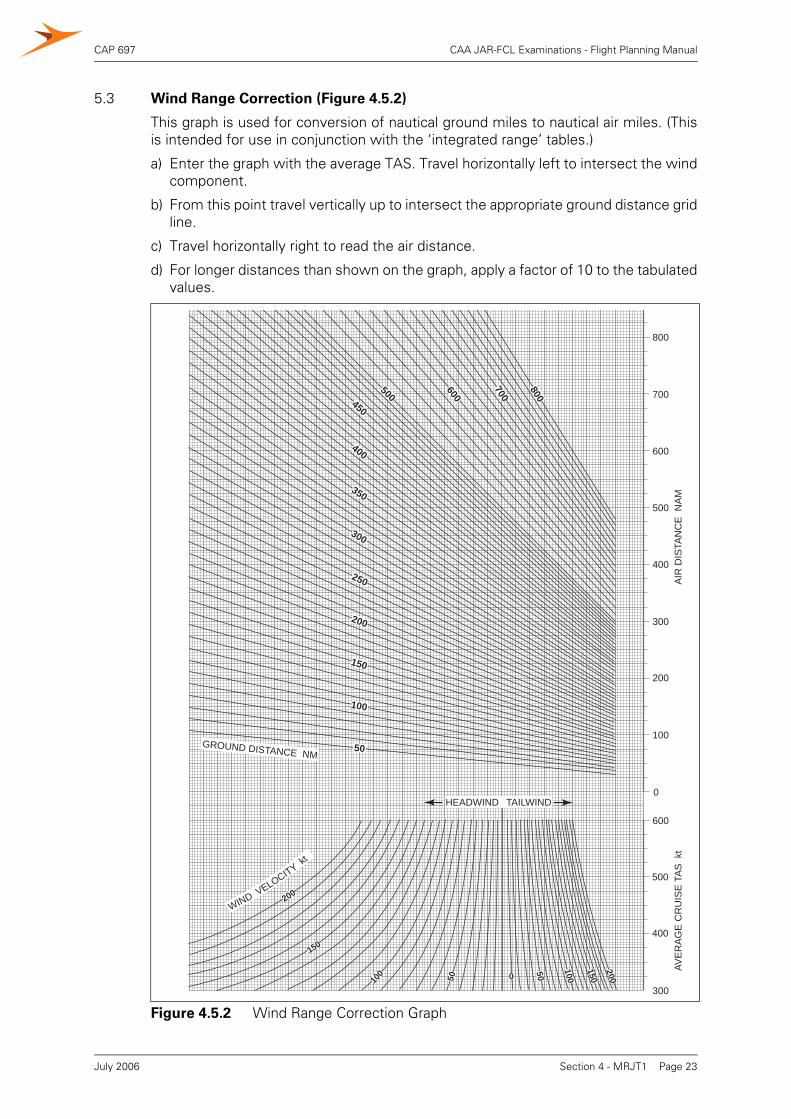
CAP 697 CAA JAR-FCL Examinations - Flight Planning Manual
5.3 Wind Range Correction (Figure 4.5.2)
This graph is used for conversion of nautical ground miles to nautical air miles. (Thisis intended for use in conjunction with the ‘integrated range’ tables.)
a) Enter the graph with the average TAS. Travel horizontally left to intersect the windcomponent.
b) From this point travel vertically up to intersect the appropriate ground distance gridline.
c) Travel horizontally right to read the air distance.
d) For longer distances than shown on the graph, apply a factor of 10 to the tabulatedvalues.
Figure 4.5.2 Wind Range Correction Graph
300
400
500
600
0
100
200
300
400
500
600
700
800
HEADWIND TAILWIND
GROUND DISTANCE NM
700
800
600
500450
400
350
300
250
200
150
100
50
150
200
100
50050100
150
200WIND VELOCITY
kt
AVE
RA
GE
CR
UIS
E T
AS
kt
AIR
DIS
TAN
CE
NA
M
Section 4 - MRJT1 Page 23July 2006
CAP 697 CAA JAR-FCL Examinations - Flight Planning Manual
5.4 Integrated Range
This section allows for detailed flight planning for the cruise.
Tables are given as follows:
The tables in this section are identical in use.The tables are based on a ’differences’ principle, the difference between two grossweights representing a weight of fuel used. The corresponding difference intabulated distance represents the still air (zero wind) distance available for that weightof fuel used.
5.4.1 Example
An aircraft commences a cruise at 0.74 Mach at FL 330 where the temperature is ISA.The following gives the relevant data for the first two sectors:
Weight at beginning of first sector is 53,500 kg.
5.4.2 Method
Using the TAS given for cruise (430 kt):
N.B. These tables are based on ISA conditions
If conditions are non-standard use the corrections given below the appropriate table.
Figures 4.5.3.1 Long Range CruiseFL 270 to FL 370 (pages 25- 35)
Figures 4.5.3.2 0.74 Mach CruiseFL 210 to FL 370 (pages 36- 52)
Figures 4.5.3.3 0.78 Mach CruiseFL 290, 300, 310, 330, 350, 370.
(pages 53- 58)
Figures 4.5.3.4 Low level (300 KIAS) CruiseFL 140 to FL 210. (pages 59 -66)
NGM W.C (kt)
A - B B - C
240 370
-20-30
Obtain NAM for each leg. A - B B - C
252398
Select table for 0.74 Mach Enter with gross weight Extract value for cruise equivalent air distance Subtract first leg NAMObtain new cruise equivalent air distance value Enter table to find corresponding weightSubtract from start weight to obtain leg fuel used
P. Alt. 33,000 ft.= 53,500 kg= 3,796= 252= 3,544= 52,100 kg= 1,400 kg
Repeat processSubtract second leg NAMObtain new cruise equivalent air distance value Enter table to find weight Subtract from start weight to obtain leg fuel used
3983,14650,000 kg2,100 kg
Section 4 - MRJT1 Page 24July 2006
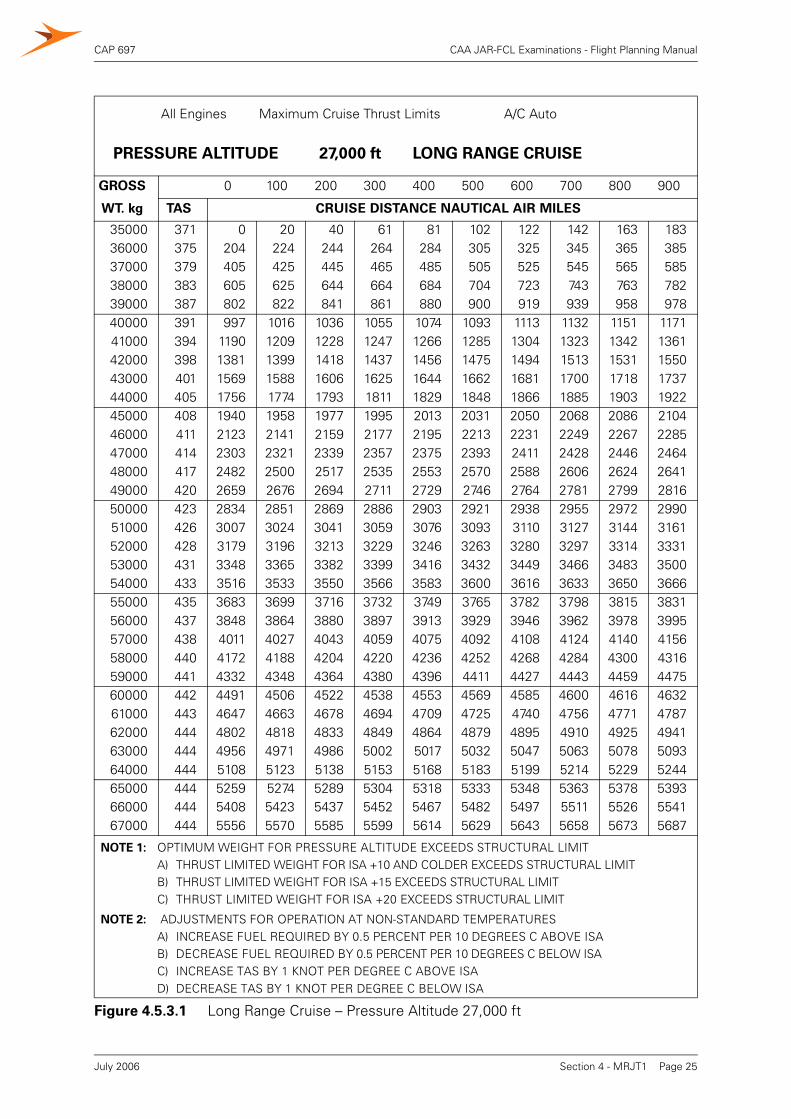
CAP 697 CAA JAR-FCL Examinations - Flight Planning Manual
All Engines Maximum Cruise Thrust Limits A/C Auto
PRESSURE ALTITUDE 27,000 ft LONG RANGE CRUISE
GROSS 0 100 200 300 400 500 600 700 800 900
WT. kg TAS CRUISE DISTANCE NAUTICAL AIR MILES
35000 371 0 20 40 61 81 102 122 142 163 18336000 375 204 224 244 264 284 305 325 345 365 38537000 379 405 425 445 465 485 505 525 545 565 58538000 383 605 625 644 664 684 704 723 743 763 78239000 387 802 822 841 861 880 900 919 939 958 97840000 391 997 1016 1036 1055 1074 1093 1113 1132 1151 117141000 394 1190 1209 1228 1247 1266 1285 1304 1323 1342 136142000 398 1381 1399 1418 1437 1456 1475 1494 1513 1531 155043000 401 1569 1588 1606 1625 1644 1662 1681 1700 1718 173744000 405 1756 1774 1793 1811 1829 1848 1866 1885 1903 192245000 408 1940 1958 1977 1995 2013 2031 2050 2068 2086 210446000 411 2123 2141 2159 2177 2195 2213 2231 2249 2267 228547000 414 2303 2321 2339 2357 2375 2393 2411 2428 2446 246448000 417 2482 2500 2517 2535 2553 2570 2588 2606 2624 264149000 420 2659 2676 2694 2711 2729 2746 2764 2781 2799 281650000 423 2834 2851 2869 2886 2903 2921 2938 2955 2972 299051000 426 3007 3024 3041 3059 3076 3093 3110 3127 3144 316152000 428 3179 3196 3213 3229 3246 3263 3280 3297 3314 333153000 431 3348 3365 3382 3399 3416 3432 3449 3466 3483 350054000 433 3516 3533 3550 3566 3583 3600 3616 3633 3650 366655000 435 3683 3699 3716 3732 3749 3765 3782 3798 3815 383156000 437 3848 3864 3880 3897 3913 3929 3946 3962 3978 399557000 438 4011 4027 4043 4059 4075 4092 4108 4124 4140 415658000 440 4172 4188 4204 4220 4236 4252 4268 4284 4300 431659000 441 4332 4348 4364 4380 4396 4411 4427 4443 4459 447560000 442 4491 4506 4522 4538 4553 4569 4585 4600 4616 463261000 443 4647 4663 4678 4694 4709 4725 4740 4756 4771 478762000 444 4802 4818 4833 4849 4864 4879 4895 4910 4925 494163000 444 4956 4971 4986 5002 5017 5032 5047 5063 5078 509364000 444 5108 5123 5138 5153 5168 5183 5199 5214 5229 524465000 444 5259 5274 5289 5304 5318 5333 5348 5363 5378 539366000 444 5408 5423 5437 5452 5467 5482 5497 5511 5526 554167000 444 5556 5570 5585 5599 5614 5629 5643 5658 5673 5687
NOTE 1: OPTIMUM WEIGHT FOR PRESSURE ALTITUDE EXCEEDS STRUCTURAL LIMITA) THRUST LIMITED WEIGHT FOR ISA +10 AND COLDER EXCEEDS STRUCTURAL LIMITB) THRUST LIMITED WEIGHT FOR ISA +15 EXCEEDS STRUCTURAL LIMITC) THRUST LIMITED WEIGHT FOR ISA +20 EXCEEDS STRUCTURAL LIMIT
NOTE 2: ADJUSTMENTS FOR OPERATION AT NON-STANDARD TEMPERATURES A) INCREASE FUEL REQUIRED BY 0.5 PERCENT PER 10 DEGREES C ABOVE ISAB) DECREASE FUEL REQUIRED BY 0.5 PERCENT PER 10 DEGREES C BELOW ISAC) INCREASE TAS BY 1 KNOT PER DEGREE C ABOVE ISAD) DECREASE TAS BY 1 KNOT PER DEGREE C BELOW ISA
Figure 4.5.3.1 Long Range Cruise – Pressure Altitude 27,000 ft
Section 4 - MRJT1 Page 25July 2006
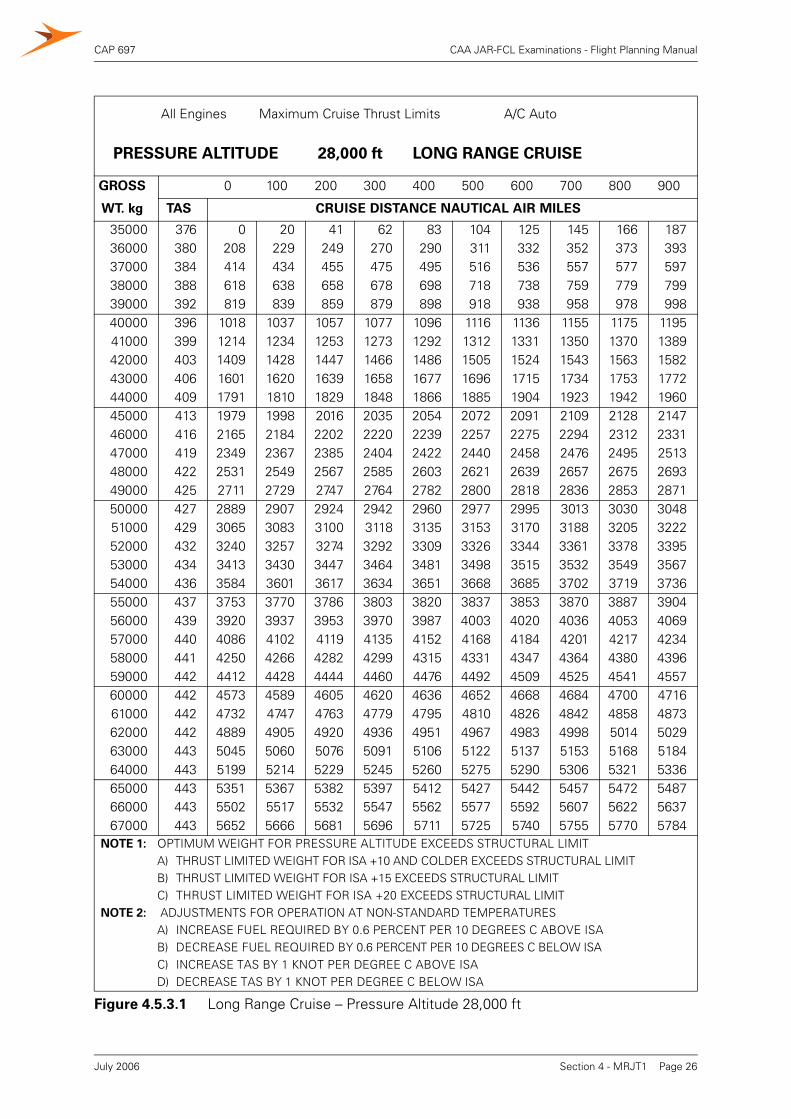
CAP 697 CAA JAR-FCL Examinations - Flight Planning Manual
All Engines Maximum Cruise Thrust Limits A/C Auto
PRESSURE ALTITUDE 28,000 ft LONG RANGE CRUISE
GROSS 0 100 200 300 400 500 600 700 800 900
WT. kg TAS CRUISE DISTANCE NAUTICAL AIR MILES
35000 376 0 20 41 62 83 104 125 145 166 18736000 380 208 229 249 270 290 311 332 352 373 39337000 384 414 434 455 475 495 516 536 557 577 59738000 388 618 638 658 678 698 718 738 759 779 79939000 392 819 839 859 879 898 918 938 958 978 99840000 396 1018 1037 1057 1077 1096 1116 1136 1155 1175 119541000 399 1214 1234 1253 1273 1292 1312 1331 1350 1370 138942000 403 1409 1428 1447 1466 1486 1505 1524 1543 1563 158243000 406 1601 1620 1639 1658 1677 1696 1715 1734 1753 177244000 409 1791 1810 1829 1848 1866 1885 1904 1923 1942 196045000 413 1979 1998 2016 2035 2054 2072 2091 2109 2128 214746000 416 2165 2184 2202 2220 2239 2257 2275 2294 2312 233147000 419 2349 2367 2385 2404 2422 2440 2458 2476 2495 251348000 422 2531 2549 2567 2585 2603 2621 2639 2657 2675 269349000 425 2711 2729 2747 2764 2782 2800 2818 2836 2853 287150000 427 2889 2907 2924 2942 2960 2977 2995 3013 3030 304851000 429 3065 3083 3100 3118 3135 3153 3170 3188 3205 322252000 432 3240 3257 3274 3292 3309 3326 3344 3361 3378 339553000 434 3413 3430 3447 3464 3481 3498 3515 3532 3549 356754000 436 3584 3601 3617 3634 3651 3668 3685 3702 3719 373655000 437 3753 3770 3786 3803 3820 3837 3853 3870 3887 390456000 439 3920 3937 3953 3970 3987 4003 4020 4036 4053 406957000 440 4086 4102 4119 4135 4152 4168 4184 4201 4217 423458000 441 4250 4266 4282 4299 4315 4331 4347 4364 4380 439659000 442 4412 4428 4444 4460 4476 4492 4509 4525 4541 455760000 442 4573 4589 4605 4620 4636 4652 4668 4684 4700 471661000 442 4732 4747 4763 4779 4795 4810 4826 4842 4858 487362000 442 4889 4905 4920 4936 4951 4967 4983 4998 5014 502963000 443 5045 5060 5076 5091 5106 5122 5137 5153 5168 518464000 443 5199 5214 5229 5245 5260 5275 5290 5306 5321 533665000 443 5351 5367 5382 5397 5412 5427 5442 5457 5472 548766000 443 5502 5517 5532 5547 5562 5577 5592 5607 5622 563767000 443 5652 5666 5681 5696 5711 5725 5740 5755 5770 5784
NOTE 1: OPTIMUM WEIGHT FOR PRESSURE ALTITUDE EXCEEDS STRUCTURAL LIMITA) THRUST LIMITED WEIGHT FOR ISA +10 AND COLDER EXCEEDS STRUCTURAL LIMITB) THRUST LIMITED WEIGHT FOR ISA +15 EXCEEDS STRUCTURAL LIMITC) THRUST LIMITED WEIGHT FOR ISA +20 EXCEEDS STRUCTURAL LIMIT
NOTE 2: ADJUSTMENTS FOR OPERATION AT NON-STANDARD TEMPERATURESA) INCREASE FUEL REQUIRED BY 0.6 PERCENT PER 10 DEGREES C ABOVE ISAB) DECREASE FUEL REQUIRED BY 0.6 PERCENT PER 10 DEGREES C BELOW ISAC) INCREASE TAS BY 1 KNOT PER DEGREE C ABOVE ISAD) DECREASE TAS BY 1 KNOT PER DEGREE C BELOW ISA
Figure 4.5.3.1 Long Range Cruise – Pressure Altitude 28,000 ft
Section 4 - MRJT1 Page 26July 2006
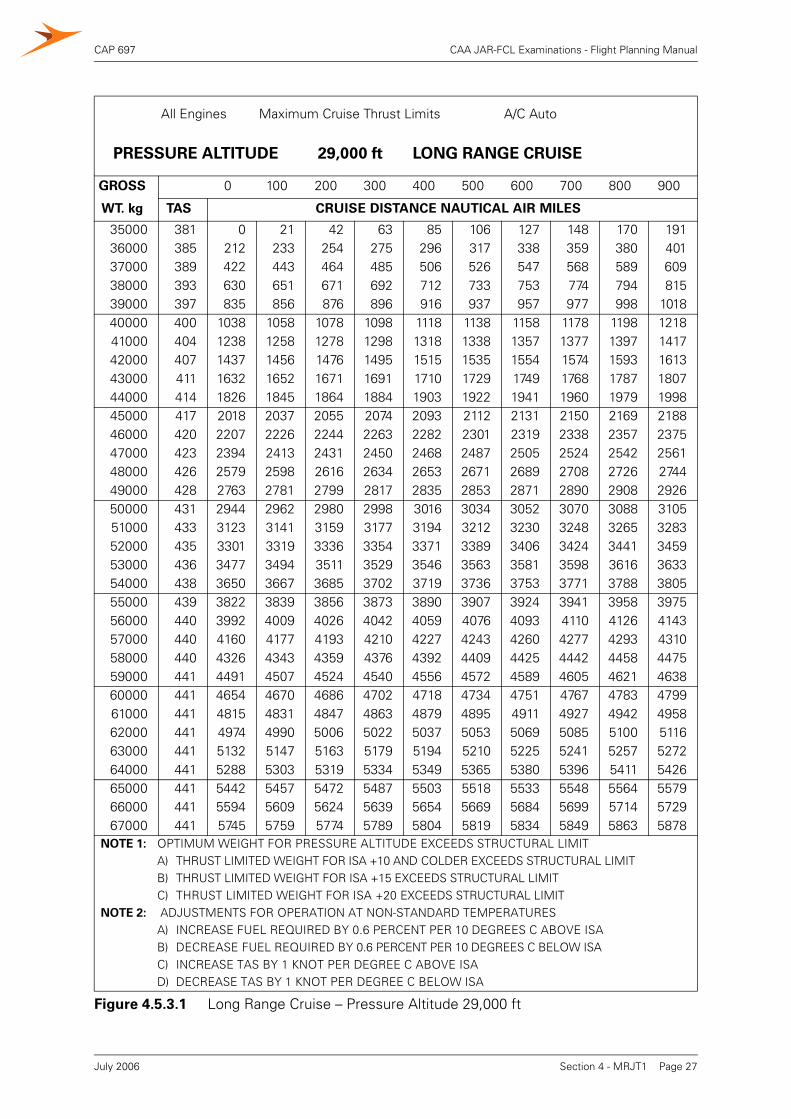
CAP 697 CAA JAR-FCL Examinations - Flight Planning Manual
All Engines Maximum Cruise Thrust Limits A/C Auto
PRESSURE ALTITUDE 29,000 ft LONG RANGE CRUISE
GROSS 0 100 200 300 400 500 600 700 800 900
WT. kg TAS CRUISE DISTANCE NAUTICAL AIR MILES
35000 381 0 21 42 63 85 106 127 148 170 19136000 385 212 233 254 275 296 317 338 359 380 40137000 389 422 443 464 485 506 526 547 568 589 60938000 393 630 651 671 692 712 733 753 774 794 81539000 397 835 856 876 896 916 937 957 977 998 101840000 400 1038 1058 1078 1098 1118 1138 1158 1178 1198 121841000 404 1238 1258 1278 1298 1318 1338 1357 1377 1397 141742000 407 1437 1456 1476 1495 1515 1535 1554 1574 1593 161343000 411 1632 1652 1671 1691 1710 1729 1749 1768 1787 180744000 414 1826 1845 1864 1884 1903 1922 1941 1960 1979 199845000 417 2018 2037 2055 2074 2093 2112 2131 2150 2169 218846000 420 2207 2226 2244 2263 2282 2301 2319 2338 2357 237547000 423 2394 2413 2431 2450 2468 2487 2505 2524 2542 256148000 426 2579 2598 2616 2634 2653 2671 2689 2708 2726 274449000 428 2763 2781 2799 2817 2835 2853 2871 2890 2908 292650000 431 2944 2962 2980 2998 3016 3034 3052 3070 3088 310551000 433 3123 3141 3159 3177 3194 3212 3230 3248 3265 328352000 435 3301 3319 3336 3354 3371 3389 3406 3424 3441 345953000 436 3477 3494 3511 3529 3546 3563 3581 3598 3616 363354000 438 3650 3667 3685 3702 3719 3736 3753 3771 3788 380555000 439 3822 3839 3856 3873 3890 3907 3924 3941 3958 397556000 440 3992 4009 4026 4042 4059 4076 4093 4110 4126 414357000 440 4160 4177 4193 4210 4227 4243 4260 4277 4293 431058000 440 4326 4343 4359 4376 4392 4409 4425 4442 4458 447559000 441 4491 4507 4524 4540 4556 4572 4589 4605 4621 463860000 441 4654 4670 4686 4702 4718 4734 4751 4767 4783 479961000 441 4815 4831 4847 4863 4879 4895 4911 4927 4942 495862000 441 4974 4990 5006 5022 5037 5053 5069 5085 5100 511663000 441 5132 5147 5163 5179 5194 5210 5225 5241 5257 527264000 441 5288 5303 5319 5334 5349 5365 5380 5396 5411 542665000 441 5442 5457 5472 5487 5503 5518 5533 5548 5564 557966000 441 5594 5609 5624 5639 5654 5669 5684 5699 5714 572967000 441 5745 5759 5774 5789 5804 5819 5834 5849 5863 5878
NOTE 1: OPTIMUM WEIGHT FOR PRESSURE ALTITUDE EXCEEDS STRUCTURAL LIMITA) THRUST LIMITED WEIGHT FOR ISA +10 AND COLDER EXCEEDS STRUCTURAL LIMITB) THRUST LIMITED WEIGHT FOR ISA +15 EXCEEDS STRUCTURAL LIMITC) THRUST LIMITED WEIGHT FOR ISA +20 EXCEEDS STRUCTURAL LIMIT
NOTE 2: ADJUSTMENTS FOR OPERATION AT NON-STANDARD TEMPERATURESA) INCREASE FUEL REQUIRED BY 0.6 PERCENT PER 10 DEGREES C ABOVE ISAB) DECREASE FUEL REQUIRED BY 0.6 PERCENT PER 10 DEGREES C BELOW ISAC) INCREASE TAS BY 1 KNOT PER DEGREE C ABOVE ISAD) DECREASE TAS BY 1 KNOT PER DEGREE C BELOW ISA
Figure 4.5.3.1 Long Range Cruise – Pressure Altitude 29,000 ft
Section 4 - MRJT1 Page 27July 2006
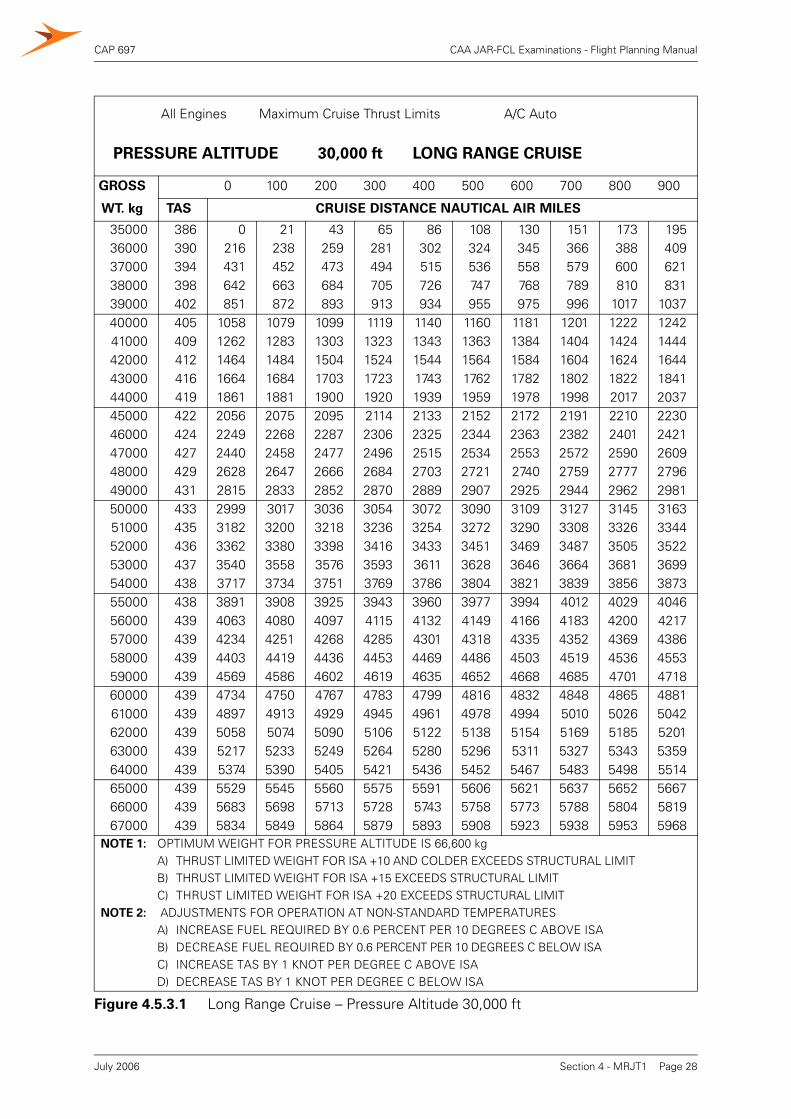
CAP 697 CAA JAR-FCL Examinations - Flight Planning Manual
All Engines Maximum Cruise Thrust Limits A/C Auto
PRESSURE ALTITUDE 30,000 ft LONG RANGE CRUISE
GROSS 0 100 200 300 400 500 600 700 800 900
WT. kg TAS CRUISE DISTANCE NAUTICAL AIR MILES
35000 386 0 21 43 65 86 108 130 151 173 19536000 390 216 238 259 281 302 324 345 366 388 40937000 394 431 452 473 494 515 536 558 579 600 62138000 398 642 663 684 705 726 747 768 789 810 83139000 402 851 872 893 913 934 955 975 996 1017 103740000 405 1058 1079 1099 1119 1140 1160 1181 1201 1222 124241000 409 1262 1283 1303 1323 1343 1363 1384 1404 1424 144442000 412 1464 1484 1504 1524 1544 1564 1584 1604 1624 164443000 416 1664 1684 1703 1723 1743 1762 1782 1802 1822 184144000 419 1861 1881 1900 1920 1939 1959 1978 1998 2017 203745000 422 2056 2075 2095 2114 2133 2152 2172 2191 2210 223046000 424 2249 2268 2287 2306 2325 2344 2363 2382 2401 242147000 427 2440 2458 2477 2496 2515 2534 2553 2572 2590 260948000 429 2628 2647 2666 2684 2703 2721 2740 2759 2777 279649000 431 2815 2833 2852 2870 2889 2907 2925 2944 2962 298150000 433 2999 3017 3036 3054 3072 3090 3109 3127 3145 316351000 435 3182 3200 3218 3236 3254 3272 3290 3308 3326 334452000 436 3362 3380 3398 3416 3433 3451 3469 3487 3505 352253000 437 3540 3558 3576 3593 3611 3628 3646 3664 3681 369954000 438 3717 3734 3751 3769 3786 3804 3821 3839 3856 387355000 438 3891 3908 3925 3943 3960 3977 3994 4012 4029 404656000 439 4063 4080 4097 4115 4132 4149 4166 4183 4200 421757000 439 4234 4251 4268 4285 4301 4318 4335 4352 4369 438658000 439 4403 4419 4436 4453 4469 4486 4503 4519 4536 455359000 439 4569 4586 4602 4619 4635 4652 4668 4685 4701 471860000 439 4734 4750 4767 4783 4799 4816 4832 4848 4865 488161000 439 4897 4913 4929 4945 4961 4978 4994 5010 5026 504262000 439 5058 5074 5090 5106 5122 5138 5154 5169 5185 520163000 439 5217 5233 5249 5264 5280 5296 5311 5327 5343 535964000 439 5374 5390 5405 5421 5436 5452 5467 5483 5498 551465000 439 5529 5545 5560 5575 5591 5606 5621 5637 5652 566766000 439 5683 5698 5713 5728 5743 5758 5773 5788 5804 581967000 439 5834 5849 5864 5879 5893 5908 5923 5938 5953 5968
NOTE 1: OPTIMUM WEIGHT FOR PRESSURE ALTITUDE IS 66,600 kgA) THRUST LIMITED WEIGHT FOR ISA +10 AND COLDER EXCEEDS STRUCTURAL LIMITB) THRUST LIMITED WEIGHT FOR ISA +15 EXCEEDS STRUCTURAL LIMITC) THRUST LIMITED WEIGHT FOR ISA +20 EXCEEDS STRUCTURAL LIMIT
NOTE 2: ADJUSTMENTS FOR OPERATION AT NON-STANDARD TEMPERATURESA) INCREASE FUEL REQUIRED BY 0.6 PERCENT PER 10 DEGREES C ABOVE ISAB) DECREASE FUEL REQUIRED BY 0.6 PERCENT PER 10 DEGREES C BELOW ISAC) INCREASE TAS BY 1 KNOT PER DEGREE C ABOVE ISAD) DECREASE TAS BY 1 KNOT PER DEGREE C BELOW ISA
Figure 4.5.3.1 Long Range Cruise – Pressure Altitude 30,000 ft
Section 4 - MRJT1 Page 28July 2006
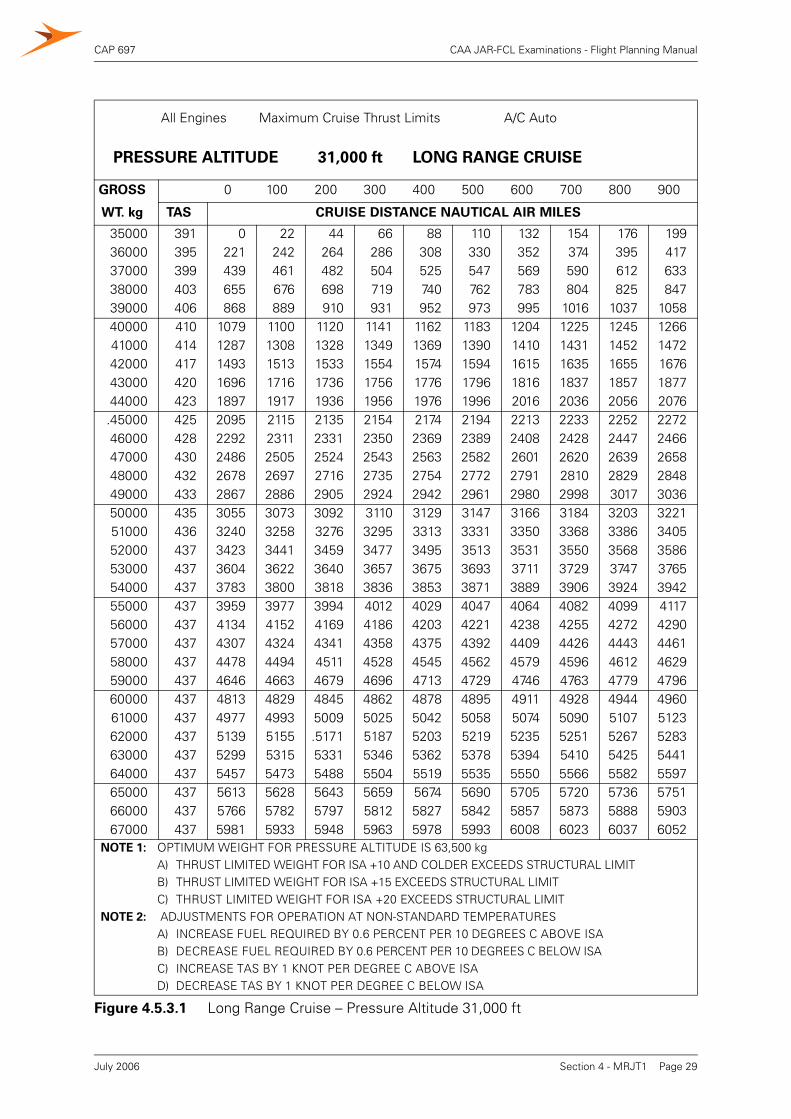
CAP 697 CAA JAR-FCL Examinations - Flight Planning Manual
All Engines Maximum Cruise Thrust Limits A/C Auto
PRESSURE ALTITUDE 31,000 ft LONG RANGE CRUISE
GROSS 0 100 200 300 400 500 600 700 800 900
WT. kg TAS CRUISE DISTANCE NAUTICAL AIR MILES
35000 391 0 22 44 66 88 110 132 154 176 19936000 395 221 242 264 286 308 330 352 374 395 41737000 399 439 461 482 504 525 547 569 590 612 63338000 403 655 676 698 719 740 762 783 804 825 84739000 406 868 889 910 931 952 973 995 1016 1037 105840000 410 1079 1100 1120 1141 1162 1183 1204 1225 1245 126641000 414 1287 1308 1328 1349 1369 1390 1410 1431 1452 147242000 417 1493 1513 1533 1554 1574 1594 1615 1635 1655 167643000 420 1696 1716 1736 1756 1776 1796 1816 1837 1857 187744000 423 1897 1917 1936 1956 1976 1996 2016 2036 2056 2076.45000 425 2095 2115 2135 2154 2174 2194 2213 2233 2252 227246000 428 2292 2311 2331 2350 2369 2389 2408 2428 2447 246647000 430 2486 2505 2524 2543 2563 2582 2601 2620 2639 265848000 432 2678 2697 2716 2735 2754 2772 2791 2810 2829 284849000 433 2867 2886 2905 2924 2942 2961 2980 2998 3017 303650000 435 3055 3073 3092 3110 3129 3147 3166 3184 3203 322151000 436 3240 3258 3276 3295 3313 3331 3350 3368 3386 340552000 437 3423 3441 3459 3477 3495 3513 3531 3550 3568 358653000 437 3604 3622 3640 3657 3675 3693 3711 3729 3747 376554000 437 3783 3800 3818 3836 3853 3871 3889 3906 3924 394255000 437 3959 3977 3994 4012 4029 4047 4064 4082 4099 411756000 437 4134 4152 4169 4186 4203 4221 4238 4255 4272 429057000 437 4307 4324 4341 4358 4375 4392 4409 4426 4443 446158000 437 4478 4494 4511 4528 4545 4562 4579 4596 4612 462959000 437 4646 4663 4679 4696 4713 4729 4746 4763 4779 479660000 437 4813 4829 4845 4862 4878 4895 4911 4928 4944 496061000 437 4977 4993 5009 5025 5042 5058 5074 5090 5107 512362000 437 5139 5155 .5171 5187 5203 5219 5235 5251 5267 528363000 437 5299 5315 5331 5346 5362 5378 5394 5410 5425 544164000 437 5457 5473 5488 5504 5519 5535 5550 5566 5582 559765000 437 5613 5628 5643 5659 5674 5690 5705 5720 5736 575166000 437 5766 5782 5797 5812 5827 5842 5857 5873 5888 590367000 437 5981 5933 5948 5963 5978 5993 6008 6023 6037 6052
NOTE 1: OPTIMUM WEIGHT FOR PRESSURE ALTITUDE IS 63,500 kgA) THRUST LIMITED WEIGHT FOR ISA +10 AND COLDER EXCEEDS STRUCTURAL LIMITB) THRUST LIMITED WEIGHT FOR ISA +15 EXCEEDS STRUCTURAL LIMITC) THRUST LIMITED WEIGHT FOR ISA +20 EXCEEDS STRUCTURAL LIMIT
NOTE 2: ADJUSTMENTS FOR OPERATION AT NON-STANDARD TEMPERATURESA) INCREASE FUEL REQUIRED BY 0.6 PERCENT PER 10 DEGREES C ABOVE ISAB) DECREASE FUEL REQUIRED BY 0.6 PERCENT PER 10 DEGREES C BELOW ISAC) INCREASE TAS BY 1 KNOT PER DEGREE C ABOVE ISAD) DECREASE TAS BY 1 KNOT PER DEGREE C BELOW ISA
Figure 4.5.3.1 Long Range Cruise – Pressure Altitude 31,000 ft
Section 4 - MRJT1 Page 29July 2006
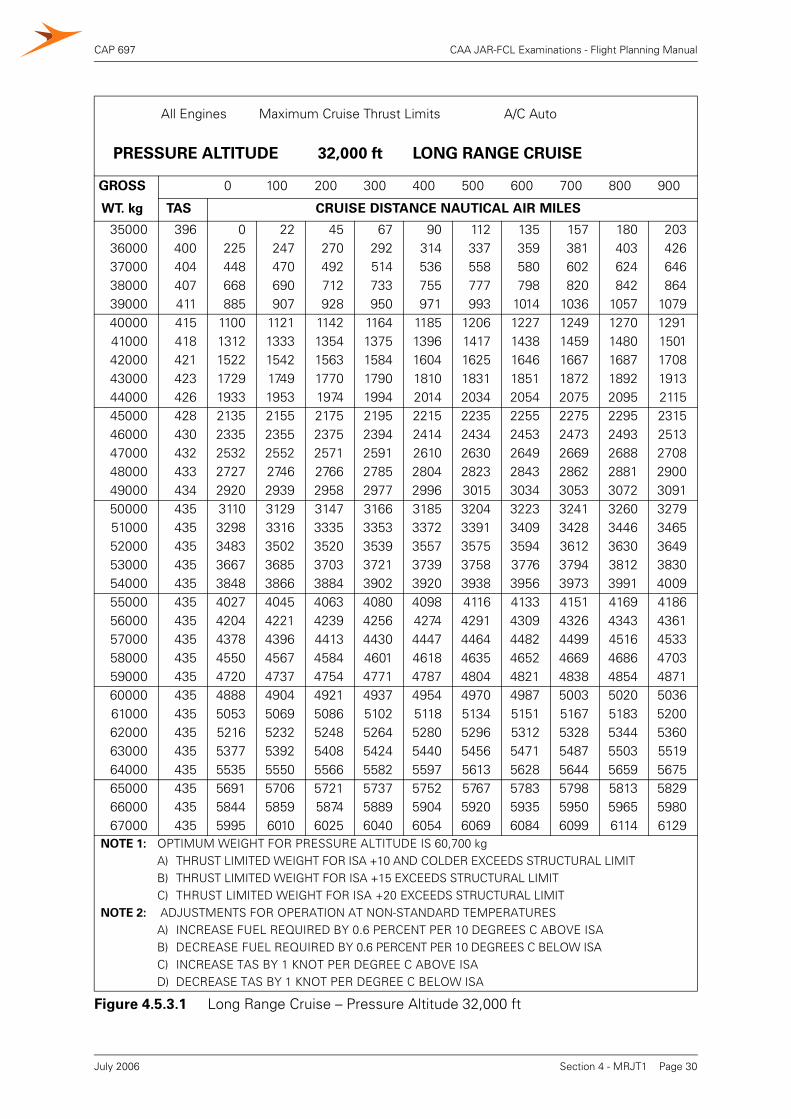
CAP 697 CAA JAR-FCL Examinations - Flight Planning Manual
All Engines Maximum Cruise Thrust Limits A/C Auto
PRESSURE ALTITUDE 32,000 ft LONG RANGE CRUISE
GROSS 0 100 200 300 400 500 600 700 800 900
WT. kg TAS CRUISE DISTANCE NAUTICAL AIR MILES
35000 396 0 22 45 67 90 112 135 157 180 20336000 400 225 247 270 292 314 337 359 381 403 42637000 404 448 470 492 514 536 558 580 602 624 64638000 407 668 690 712 733 755 777 798 820 842 86439000 411 885 907 928 950 971 993 1014 1036 1057 107940000 415 1100 1121 1142 1164 1185 1206 1227 1249 1270 129141000 418 1312 1333 1354 1375 1396 1417 1438 1459 1480 150142000 421 1522 1542 1563 1584 1604 1625 1646 1667 1687 170843000 423 1729 1749 1770 1790 1810 1831 1851 1872 1892 191344000 426 1933 1953 1974 1994 2014 2034 2054 2075 2095 211545000 428 2135 2155 2175 2195 2215 2235 2255 2275 2295 231546000 430 2335 2355 2375 2394 2414 2434 2453 2473 2493 251347000 432 2532 2552 2571 2591 2610 2630 2649 2669 2688 270848000 433 2727 2746 2766 2785 2804 2823 2843 2862 2881 290049000 434 2920 2939 2958 2977 2996 3015 3034 3053 3072 309150000 435 3110 3129 3147 3166 3185 3204 3223 3241 3260 327951000 435 3298 3316 3335 3353 3372 3391 3409 3428 3446 346552000 435 3483 3502 3520 3539 3557 3575 3594 3612 3630 364953000 435 3667 3685 3703 3721 3739 3758 3776 3794 3812 383054000 435 3848 3866 3884 3902 3920 3938 3956 3973 3991 400955000 435 4027 4045 4063 4080 4098 4116 4133 4151 4169 418656000 435 4204 4221 4239 4256 4274 4291 4309 4326 4343 436157000 435 4378 4396 4413 4430 4447 4464 4482 4499 4516 453358000 435 4550 4567 4584 4601 4618 4635 4652 4669 4686 470359000 435 4720 4737 4754 4771 4787 4804 4821 4838 4854 487160000 435 4888 4904 4921 4937 4954 4970 4987 5003 5020 503661000 435 5053 5069 5086 5102 5118 5134 5151 5167 5183 520062000 435 5216 5232 5248 5264 5280 5296 5312 5328 5344 536063000 435 5377 5392 5408 5424 5440 5456 5471 5487 5503 551964000 435 5535 5550 5566 5582 5597 5613 5628 5644 5659 567565000 435 5691 5706 5721 5737 5752 5767 5783 5798 5813 582966000 435 5844 5859 5874 5889 5904 5920 5935 5950 5965 598067000 435 5995 6010 6025 6040 6054 6069 6084 6099 6114 6129
NOTE 1: OPTIMUM WEIGHT FOR PRESSURE ALTITUDE IS 60,700 kgA) THRUST LIMITED WEIGHT FOR ISA +10 AND COLDER EXCEEDS STRUCTURAL LIMITB) THRUST LIMITED WEIGHT FOR ISA +15 EXCEEDS STRUCTURAL LIMITC) THRUST LIMITED WEIGHT FOR ISA +20 EXCEEDS STRUCTURAL LIMIT
NOTE 2: ADJUSTMENTS FOR OPERATION AT NON-STANDARD TEMPERATURESA) INCREASE FUEL REQUIRED BY 0.6 PERCENT PER 10 DEGREES C ABOVE ISAB) DECREASE FUEL REQUIRED BY 0.6 PERCENT PER 10 DEGREES C BELOW ISAC) INCREASE TAS BY 1 KNOT PER DEGREE C ABOVE ISAD) DECREASE TAS BY 1 KNOT PER DEGREE C BELOW ISA
Figure 4.5.3.1 Long Range Cruise – Pressure Altitude 32,000 ft
Section 4 - MRJT1 Page 30July 2006
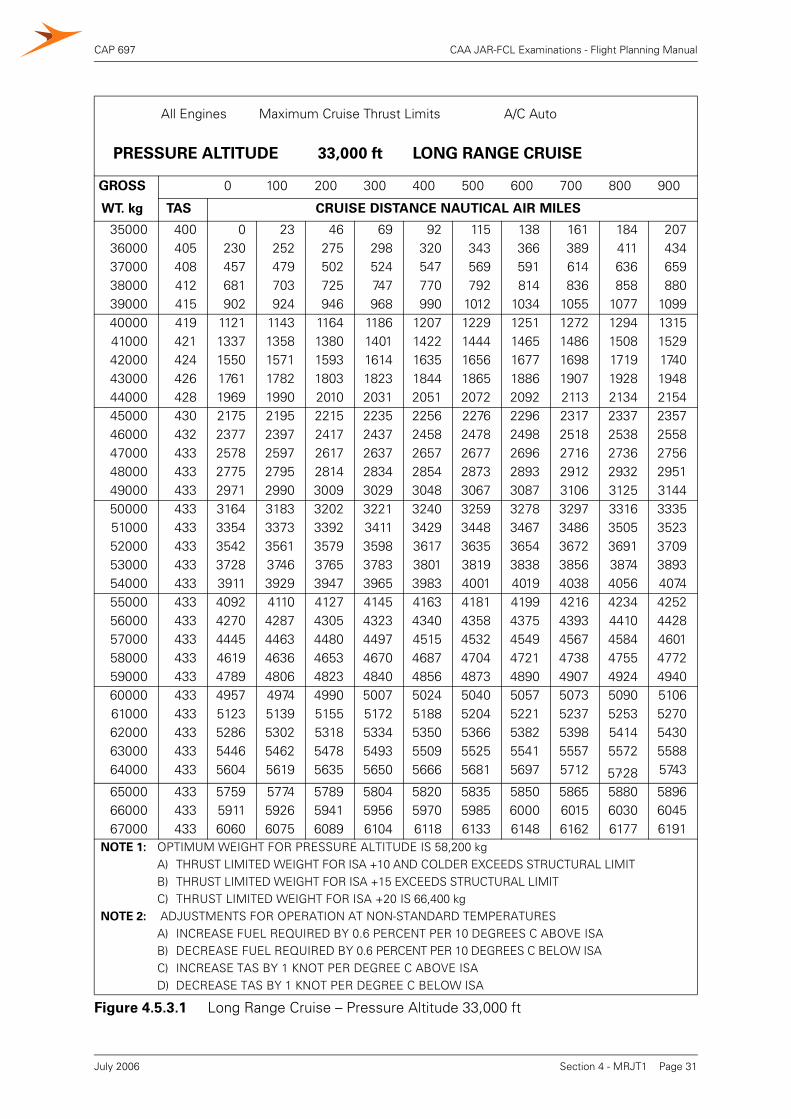
CAP 697 CAA JAR-FCL Examinations - Flight Planning Manual
All Engines Maximum Cruise Thrust Limits A/C Auto
PRESSURE ALTITUDE 33,000 ft LONG RANGE CRUISE
GROSS 0 100 200 300 400 500 600 700 800 900
WT. kg TAS CRUISE DISTANCE NAUTICAL AIR MILES
35000 400 0 23 46 69 92 115 138 161 184 20736000 405 230 252 275 298 320 343 366 389 411 43437000 408 457 479 502 524 547 569 591 614 636 65938000 412 681 703 725 747 770 792 814 836 858 88039000 415 902 924 946 968 990 1012 1034 1055 1077 109940000 419 1121 1143 1164 1186 1207 1229 1251 1272 1294 131541000 421 1337 1358 1380 1401 1422 1444 1465 1486 1508 152942000 424 1550 1571 1593 1614 1635 1656 1677 1698 1719 174043000 426 1761 1782 1803 1823 1844 1865 1886 1907 1928 194844000 428 1969 1990 2010 2031 2051 2072 2092 2113 2134 215445000 430 2175 2195 2215 2235 2256 2276 2296 2317 2337 235746000 432 2377 2397 2417 2437 2458 2478 2498 2518 2538 255847000 433 2578 2597 2617 2637 2657 2677 2696 2716 2736 275648000 433 2775 2795 2814 2834 2854 2873 2893 2912 2932 295149000 433 2971 2990 3009 3029 3048 3067 3087 3106 3125 314450000 433 3164 3183 3202 3221 3240 3259 3278 3297 3316 333551000 433 3354 3373 3392 3411 3429 3448 3467 3486 3505 352352000 433 3542 3561 3579 3598 3617 3635 3654 3672 3691 370953000 433 3728 3746 3765 3783 3801 3819 3838 3856 3874 389354000 433 3911 3929 3947 3965 3983 4001 4019 4038 4056 407455000 433 4092 4110 4127 4145 4163 4181 4199 4216 4234 425256000 433 4270 4287 4305 4323 4340 4358 4375 4393 4410 442857000 433 4445 4463 4480 4497 4515 4532 4549 4567 4584 460158000 433 4619 4636 4653 4670 4687 4704 4721 4738 4755 477259000 433 4789 4806 4823 4840 4856 4873 4890 4907 4924 494060000 433 4957 4974 4990 5007 5024 5040 5057 5073 5090 510661000 433 5123 5139 5155 5172 5188 5204 5221 5237 5253 527062000 433 5286 5302 5318 5334 5350 5366 5382 5398 5414 543063000 433 5446 5462 5478 5493 5509 5525 5541 5557 5572 558864000 433 5604 5619 5635 5650 5666 5681 5697 5712 57,28 5743
65000 433 5759 5774 5789 5804 5820 5835 5850 5865 5880 589666000 433 5911 5926 5941 5956 5970 5985 6000 6015 6030 604567000 433 6060 6075 6089 6104 6118 6133 6148 6162 6177 6191
NOTE 1: OPTIMUM WEIGHT FOR PRESSURE ALTITUDE IS 58,200 kgA) THRUST LIMITED WEIGHT FOR ISA +10 AND COLDER EXCEEDS STRUCTURAL LIMITB) THRUST LIMITED WEIGHT FOR ISA +15 EXCEEDS STRUCTURAL LIMITC) THRUST LIMITED WEIGHT FOR ISA +20 IS 66,400 kg
NOTE 2: ADJUSTMENTS FOR OPERATION AT NON-STANDARD TEMPERATURESA) INCREASE FUEL REQUIRED BY 0.6 PERCENT PER 10 DEGREES C ABOVE ISAB) DECREASE FUEL REQUIRED BY 0.6 PERCENT PER 10 DEGREES C BELOW ISAC) INCREASE TAS BY 1 KNOT PER DEGREE C ABOVE ISAD) DECREASE TAS BY 1 KNOT PER DEGREE C BELOW ISA
Figure 4.5.3.1 Long Range Cruise – Pressure Altitude 33,000 ft
Section 4 - MRJT1 Page 31July 2006
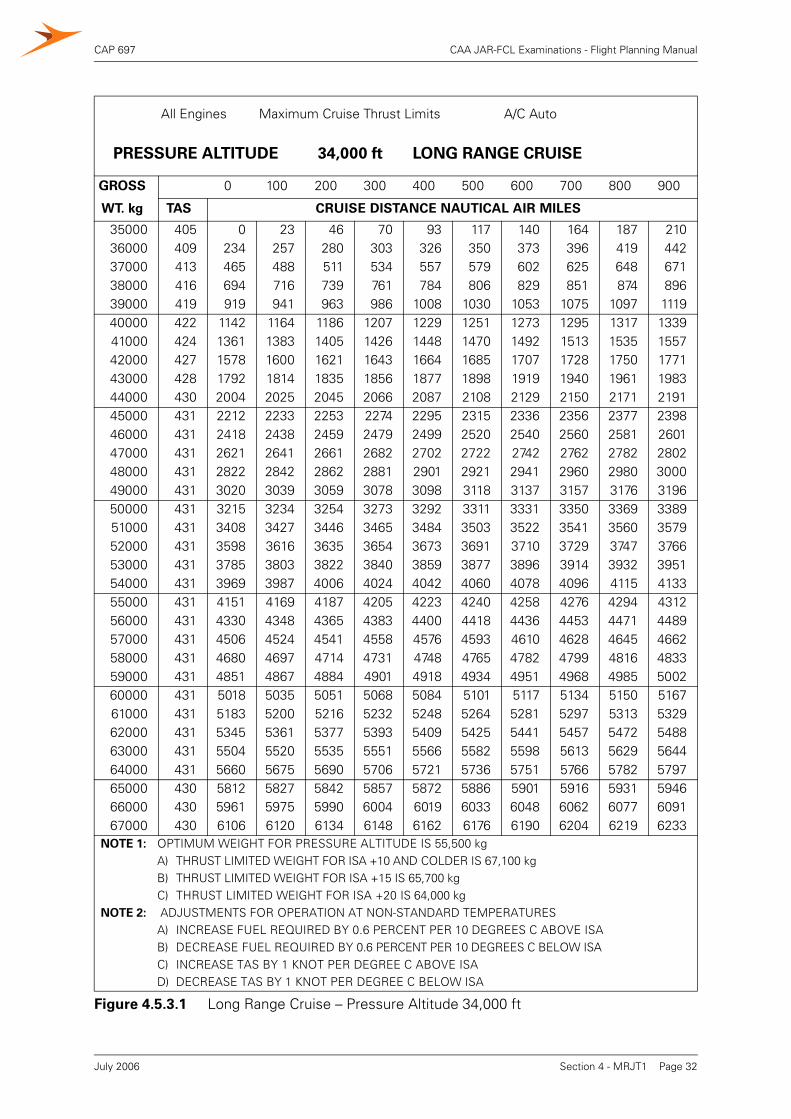
CAP 697 CAA JAR-FCL Examinations - Flight Planning Manual
All Engines Maximum Cruise Thrust Limits A/C Auto
PRESSURE ALTITUDE 34,000 ft LONG RANGE CRUISE
GROSS 0 100 200 300 400 500 600 700 800 900
WT. kg TAS CRUISE DISTANCE NAUTICAL AIR MILES
35000 405 0 23 46 70 93 117 140 164 187 21036000 409 234 257 280 303 326 350 373 396 419 44237000 413 465 488 511 534 557 579 602 625 648 67138000 416 694 716 739 761 784 806 829 851 874 89639000 419 919 941 963 986 1008 1030 1053 1075 1097 111940000 422 1142 1164 1186 1207 1229 1251 1273 1295 1317 133941000 424 1361 1383 1405 1426 1448 1470 1492 1513 1535 155742000 427 1578 1600 1621 1643 1664 1685 1707 1728 1750 177143000 428 1792 1814 1835 1856 1877 1898 1919 1940 1961 198344000 430 2004 2025 2045 2066 2087 2108 2129 2150 2171 219145000 431 2212 2233 2253 2274 2295 2315 2336 2356 2377 239846000 431 2418 2438 2459 2479 2499 2520 2540 2560 2581 260147000 431 2621 2641 2661 2682 2702 2722 2742 2762 2782 280248000 431 2822 2842 2862 2881 2901 2921 2941 2960 2980 300049000 431 3020 3039 3059 3078 3098 3118 3137 3157 3176 319650000 431 3215 3234 3254 3273 3292 3311 3331 3350 3369 338951000 431 3408 3427 3446 3465 3484 3503 3522 3541 3560 357952000 431 3598 3616 3635 3654 3673 3691 3710 3729 3747 376653000 431 3785 3803 3822 3840 3859 3877 3896 3914 3932 395154000 431 3969 3987 4006 4024 4042 4060 4078 4096 4115 413355000 431 4151 4169 4187 4205 4223 4240 4258 4276 4294 431256000 431 4330 4348 4365 4383 4400 4418 4436 4453 4471 448957000 431 4506 4524 4541 4558 4576 4593 4610 4628 4645 466258000 431 4680 4697 4714 4731 4748 4765 4782 4799 4816 483359000 431 4851 4867 4884 4901 4918 4934 4951 4968 4985 500260000 431 5018 5035 5051 5068 5084 5101 5117 5134 5150 516761000 431 5183 5200 5216 5232 5248 5264 5281 5297 5313 532962000 431 5345 5361 5377 5393 5409 5425 5441 5457 5472 548863000 431 5504 5520 5535 5551 5566 5582 5598 5613 5629 564464000 431 5660 5675 5690 5706 5721 5736 5751 5766 5782 579765000 430 5812 5827 5842 5857 5872 5886 5901 5916 5931 594666000 430 5961 5975 5990 6004 6019 6033 6048 6062 6077 609167000 430 6106 6120 6134 6148 6162 6176 6190 6204 6219 6233
NOTE 1: OPTIMUM WEIGHT FOR PRESSURE ALTITUDE IS 55,500 kgA) THRUST LIMITED WEIGHT FOR ISA +10 AND COLDER IS 67,100 kgB) THRUST LIMITED WEIGHT FOR ISA +15 IS 65,700 kgC) THRUST LIMITED WEIGHT FOR ISA +20 IS 64,000 kg
NOTE 2: ADJUSTMENTS FOR OPERATION AT NON-STANDARD TEMPERATURESA) INCREASE FUEL REQUIRED BY 0.6 PERCENT PER 10 DEGREES C ABOVE ISAB) DECREASE FUEL REQUIRED BY 0.6 PERCENT PER 10 DEGREES C BELOW ISAC) INCREASE TAS BY 1 KNOT PER DEGREE C ABOVE ISAD) DECREASE TAS BY 1 KNOT PER DEGREE C BELOW ISA
Figure 4.5.3.1 Long Range Cruise – Pressure Altitude 34,000 ft
Section 4 - MRJT1 Page 32July 2006
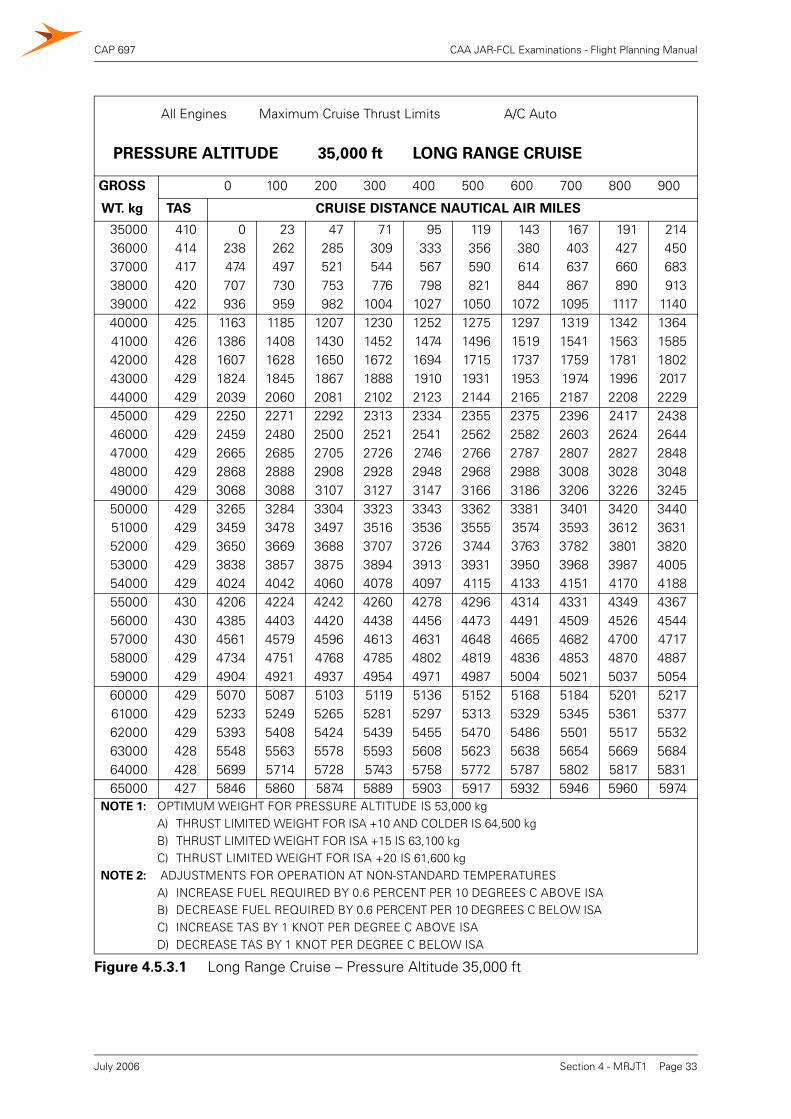
CAP 697 CAA JAR-FCL Examinations - Flight Planning Manual
All Engines Maximum Cruise Thrust Limits A/C Auto
PRESSURE ALTITUDE 35,000 ft LONG RANGE CRUISE
GROSS 0 100 200 300 400 500 600 700 800 900
WT. kg TAS CRUISE DISTANCE NAUTICAL AIR MILES
35000 410 0 23 47 71 95 119 143 167 191 21436000 414 238 262 285 309 333 356 380 403 427 45037000 417 474 497 521 544 567 590 614 637 660 68338000 420 707 730 753 776 798 821 844 867 890 91339000 422 936 959 982 1004 1027 1050 1072 1095 1117 114040000 425 1163 1185 1207 1230 1252 1275 1297 1319 1342 136441000 426 1386 1408 1430 1452 1474 1496 1519 1541 1563 158542000 428 1607 1628 1650 1672 1694 1715 1737 1759 1781 180243000 429 1824 1845 1867 1888 1910 1931 1953 1974 1996 201744000 429 2039 2060 2081 2102 2123 2144 2165 2187 2208 222945000 429 2250 2271 2292 2313 2334 2355 2375 2396 2417 243846000 429 2459 2480 2500 2521 2541 2562 2582 2603 2624 264447000 429 2665 2685 2705 2726 2746 2766 2787 2807 2827 284848000 429 2868 2888 2908 2928 2948 2968 2988 3008 3028 304849000 429 3068 3088 3107 3127 3147 3166 3186 3206 3226 324550000 429 3265 3284 3304 3323 3343 3362 3381 3401 3420 344051000 429 3459 3478 3497 3516 3536 3555 3574 3593 3612 363152000 429 3650 3669 3688 3707 3726 3744 3763 3782 3801 382053000 429 3838 3857 3875 3894 3913 3931 3950 3968 3987 400554000 429 4024 4042 4060 4078 4097 4115 4133 4151 4170 418855000 430 4206 4224 4242 4260 4278 4296 4314 4331 4349 436756000 430 4385 4403 4420 4438 4456 4473 4491 4509 4526 454457000 430 4561 4579 4596 4613 4631 4648 4665 4682 4700 471758000 429 4734 4751 4768 4785 4802 4819 4836 4853 4870 488759000 429 4904 4921 4937 4954 4971 4987 5004 5021 5037 505460000 429 5070 5087 5103 5119 5136 5152 5168 5184 5201 521761000 429 5233 5249 5265 5281 5297 5313 5329 5345 5361 537762000 429 5393 5408 5424 5439 5455 5470 5486 5501 5517 553263000 428 5548 5563 5578 5593 5608 5623 5638 5654 5669 568464000 428 5699 5714 5728 5743 5758 5772 5787 5802 5817 583165000 427 5846 5860 5874 5889 5903 5917 5932 5946 5960 5974
NOTE 1: OPTIMUM WEIGHT FOR PRESSURE ALTITUDE IS 53,000 kgA) THRUST LIMITED WEIGHT FOR ISA +10 AND COLDER IS 64,500 kgB) THRUST LIMITED WEIGHT FOR ISA +15 IS 63,100 kgC) THRUST LIMITED WEIGHT FOR ISA +20 IS 61,600 kg
NOTE 2: ADJUSTMENTS FOR OPERATION AT NON-STANDARD TEMPERATURESA) INCREASE FUEL REQUIRED BY 0.6 PERCENT PER 10 DEGREES C ABOVE ISAB) DECREASE FUEL REQUIRED BY 0.6 PERCENT PER 10 DEGREES C BELOW ISAC) INCREASE TAS BY 1 KNOT PER DEGREE C ABOVE ISAD) DECREASE TAS BY 1 KNOT PER DEGREE C BELOW ISA
Figure 4.5.3.1 Long Range Cruise – Pressure Altitude 35,000 ft
Section 4 - MRJT1 Page 33July 2006
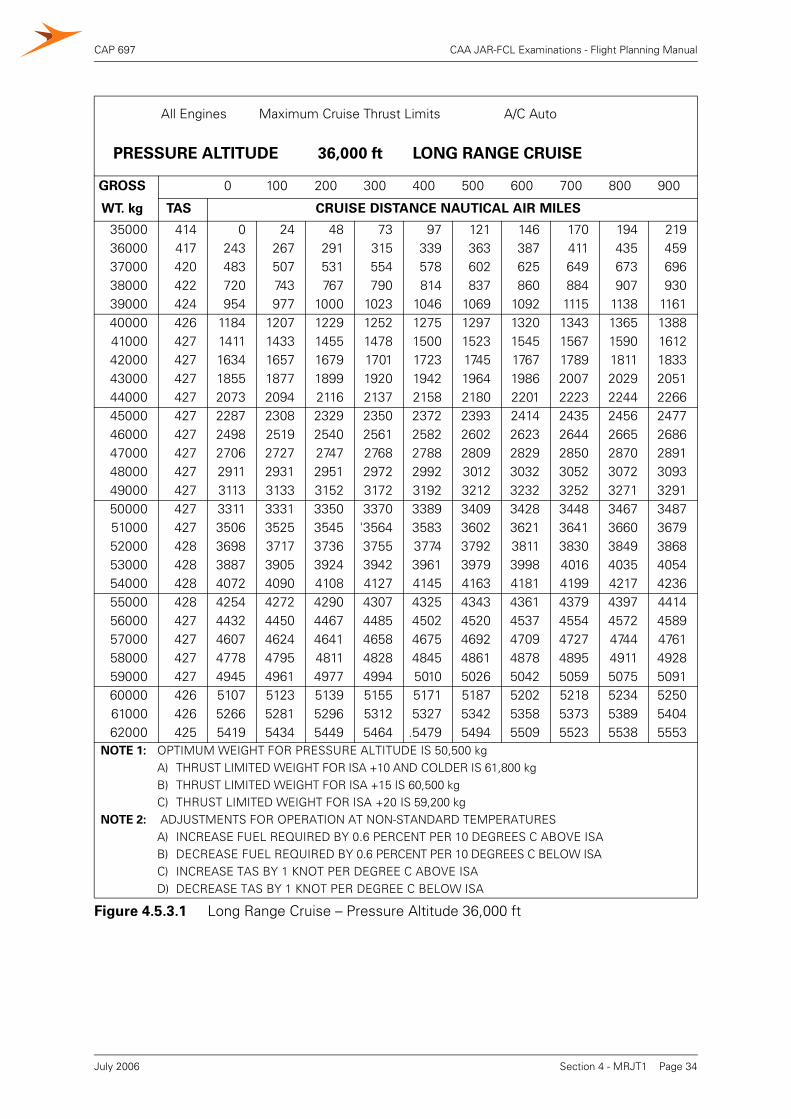
CAP 697 CAA JAR-FCL Examinations - Flight Planning Manual
All Engines Maximum Cruise Thrust Limits A/C Auto
PRESSURE ALTITUDE 36,000 ft LONG RANGE CRUISE
GROSS 0 100 200 300 400 500 600 700 800 900
WT. kg TAS CRUISE DISTANCE NAUTICAL AIR MILES
35000 414 0 24 48 73 97 121 146 170 194 21936000 417 243 267 291 315 339 363 387 411 435 45937000 420 483 507 531 554 578 602 625 649 673 69638000 422 720 743 767 790 814 837 860 884 907 93039000 424 954 977 1000 1023 1046 1069 1092 1115 1138 116140000 426 1184 1207 1229 1252 1275 1297 1320 1343 1365 138841000 427 1411 1433 1455 1478 1500 1523 1545 1567 1590 161242000 427 1634 1657 1679 1701 1723 1745 1767 1789 1811 183343000 427 1855 1877 1899 1920 1942 1964 1986 2007 2029 205144000 427 2073 2094 2116 2137 2158 2180 2201 2223 2244 226645000 427 2287 2308 2329 2350 2372 2393 2414 2435 2456 247746000 427 2498 2519 2540 2561 2582 2602 2623 2644 2665 268647000 427 2706 2727 2747 2768 2788 2809 2829 2850 2870 289148000 427 2911 2931 2951 2972 2992 3012 3032 3052 3072 309349000 427 3113 3133 3152 3172 3192 3212 3232 3252 3271 329150000 427 3311 3331 3350 3370 3389 3409 3428 3448 3467 348751000 427 3506 3525 3545 '3564 3583 3602 3621 3641 3660 367952000 428 3698 3717 3736 3755 3774 3792 3811 3830 3849 386853000 428 3887 3905 3924 3942 3961 3979 3998 4016 4035 405454000 428 4072 4090 4108 4127 4145 4163 4181 4199 4217 423655000 428 4254 4272 4290 4307 4325 4343 4361 4379 4397 441456000 427 4432 4450 4467 4485 4502 4520 4537 4554 4572 458957000 427 4607 4624 4641 4658 4675 4692 4709 4727 4744 476158000 427 4778 4795 4811 4828 4845 4861 4878 4895 4911 492859000 427 4945 4961 4977 4994 5010 5026 5042 5059 5075 509160000 426 5107 5123 5139 5155 5171 5187 5202 5218 5234 525061000 426 5266 5281 5296 5312 5327 5342 5358 5373 5389 540462000 425 5419 5434 5449 5464 .5479 5494 5509 5523 5538 5553
NOTE 1: OPTIMUM WEIGHT FOR PRESSURE ALTITUDE IS 50,500 kgA) THRUST LIMITED WEIGHT FOR ISA +10 AND COLDER IS 61,800 kgB) THRUST LIMITED WEIGHT FOR ISA +15 IS 60,500 kgC) THRUST LIMITED WEIGHT FOR ISA +20 IS 59,200 kg
NOTE 2: ADJUSTMENTS FOR OPERATION AT NON-STANDARD TEMPERATURESA) INCREASE FUEL REQUIRED BY 0.6 PERCENT PER 10 DEGREES C ABOVE ISAB) DECREASE FUEL REQUIRED BY 0.6 PERCENT PER 10 DEGREES C BELOW ISAC) INCREASE TAS BY 1 KNOT PER DEGREE C ABOVE ISAD) DECREASE TAS BY 1 KNOT PER DEGREE C BELOW ISA
Figure 4.5.3.1 Long Range Cruise – Pressure Altitude 36,000 ft
Section 4 - MRJT1 Page 34July 2006
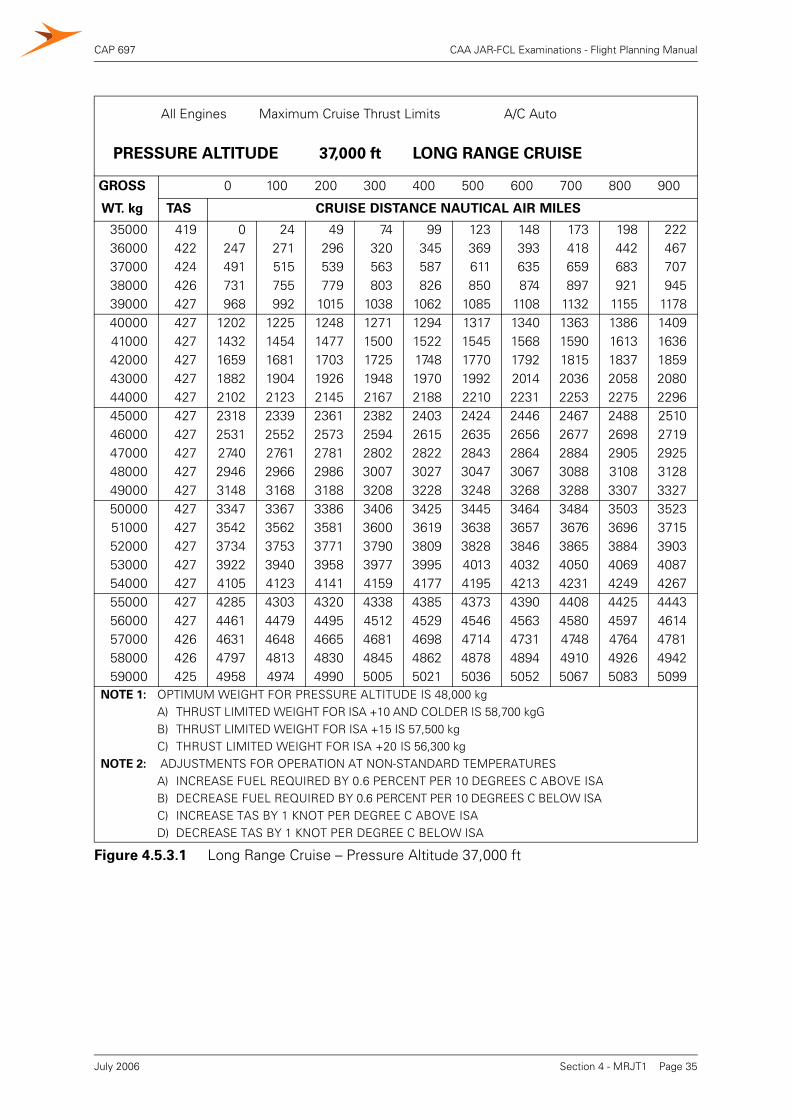
CAP 697 CAA JAR-FCL Examinations - Flight Planning Manual
All Engines Maximum Cruise Thrust Limits A/C Auto
PRESSURE ALTITUDE 37,000 ft LONG RANGE CRUISE
GROSS 0 100 200 300 400 500 600 700 800 900
WT. kg TAS CRUISE DISTANCE NAUTICAL AIR MILES
35000 419 0 24 49 74 99 123 148 173 198 22236000 422 247 271 296 320 345 369 393 418 442 46737000 424 491 515 539 563 587 611 635 659 683 70738000 426 731 755 779 803 826 850 874 897 921 94539000 427 968 992 1015 1038 1062 1085 1108 1132 1155 117840000 427 1202 1225 1248 1271 1294 1317 1340 1363 1386 140941000 427 1432 1454 1477 1500 1522 1545 1568 1590 1613 163642000 427 1659 1681 1703 1725 1748 1770 1792 1815 1837 185943000 427 1882 1904 1926 1948 1970 1992 2014 2036 2058 208044000 427 2102 2123 2145 2167 2188 2210 2231 2253 2275 229645000 427 2318 2339 2361 2382 2403 2424 2446 2467 2488 251046000 427 2531 2552 2573 2594 2615 2635 2656 2677 2698 271947000 427 2740 2761 2781 2802 2822 2843 2864 2884 2905 292548000 427 2946 2966 2986 3007 3027 3047 3067 3088 3108 312849000 427 3148 3168 3188 3208 3228 3248 3268 3288 3307 332750000 427 3347 3367 3386 3406 3425 3445 3464 3484 3503 352351000 427 3542 3562 3581 3600 3619 3638 3657 3676 3696 371552000 427 3734 3753 3771 3790 3809 3828 3846 3865 3884 390353000 427 3922 3940 3958 3977 3995 4013 4032 4050 4069 408754000 427 4105 4123 4141 4159 4177 4195 4213 4231 4249 426755000 427 4285 4303 4320 4338 4385 4373 4390 4408 4425 444356000 427 4461 4479 4495 4512 4529 4546 4563 4580 4597 461457000 426 4631 4648 4665 4681 4698 4714 4731 4748 4764 478158000 426 4797 4813 4830 4845 4862 4878 4894 4910 4926 494259000 425 4958 4974 4990 5005 5021 5036 5052 5067 5083 5099
NOTE 1: OPTIMUM WEIGHT FOR PRESSURE ALTITUDE IS 48,000 kgA) THRUST LIMITED WEIGHT FOR ISA +10 AND COLDER IS 58,700 kgGB) THRUST LIMITED WEIGHT FOR ISA +15 IS 57,500 kgC) THRUST LIMITED WEIGHT FOR ISA +20 IS 56,300 kg
NOTE 2: ADJUSTMENTS FOR OPERATION AT NON-STANDARD TEMPERATURESA) INCREASE FUEL REQUIRED BY 0.6 PERCENT PER 10 DEGREES C ABOVE ISAB) DECREASE FUEL REQUIRED BY 0.6 PERCENT PER 10 DEGREES C BELOW ISAC) INCREASE TAS BY 1 KNOT PER DEGREE C ABOVE ISAD) DECREASE TAS BY 1 KNOT PER DEGREE C BELOW ISA
Figure 4.5.3.1 Long Range Cruise – Pressure Altitude 37,000 ft
Section 4 - MRJT1 Page 35July 2006

CAP 697 CAA JAR-FCL Examinations - Flight Planning Manual
INTENTIONALLY LEFT BLANK
Section 4 - MRJT1 Page 36July 2006

CAP 697 CAA JAR-FCL Examinations - Flight Planning Manual
All Engines Maximum Cruise Thrust Limits A/C Auto
PRESSURE ALTITUDE 21,000 ft MACH 0.74 CRUISE TAS 453 kt
GROSS 0 100 200 300 400 500 600 700 800 900
WT. kg CRUISE DISTANCE NAUTICAL AIR MILES
35000 0 14 29 44 59 74 89 104 119 13436000 149 164 179 193 208 223 238 253 268 28337000 298 313 328 342 357 372 387 402 417 43238000 447 461 476 491 506 521 536 550 565 58039000 595 610 625 639 654 669 684 699 714 72840000 743 758 773 788 802 817 832 847 861 87641000 891 906 921 935 950 965 980 994 1009 102442000 1039 1053 1068 1083 1097 1112 1127 1142 1156 117143000 1186 1200 1215 1230 1244 1259 1274 1288 1303 131844000 1332 1347 1362 1376 1391 1406 1420 1435 1450 146445000 1479 1493 1508 1523 1537 1552 1566 1581 1596 161046000 1625 1639 1654 1669 1683 1698 1712 1727 1741 175647000 1770 1785 1799 1814 1828 1843 1857 1872 1887 190148000 1916 1930 1944 1959 1973 1988 2002 2017 2031 204649000 2060 2075 2089 2103 2118 2132 2147 2161 2175 219050000 2204 2219 2233 2247 2262 2276 2290 2305 2319 233351000 2348 2362 2376 2391 2405 2419 2434 2448 2462 247652000 2491 2505 2519 2534 2548 2562 2576 2590 2605 261953000 2633 2647 2662 2676 2690 2704 2718 2733 2747 276154000 2775 2789 2803 2817 2832 2846 2860 2874 2888 290255000 2916 2930 2944 2958 2973 2987 3001 3015 3029 304356000 3057 3071 3085 3099 3113 3127 3141 3155 3169 318357000 3197 3211 3225 3239 3253 3267 3280 3294 3308 332258000 3336 3350 3364 3378 3392 3405 3419 3433 3447 346159000 3475 3489 3502 3516 3530 3544 3558 3571 3585 359960000 3613 3626 3640 3654 3668 3681 3695 3709 3722 373661000 3750 3764 3777 3791 3804 3818 3832 3845 3859 387362000 3886 3900 3913 3927 3941 3954 3968 3981 3995 400863000 4022 4036 4049 4063 4076 4090 4103 4117 4130 414464000 4157 4170 4184 4197 4211 4224 4238 4251 4264 427865000 4291 4305 4318 4331 4345 4358 4371 4385 4398 441166000 4425 4438 4451 4465 4478 4491 4504 4518 4531 454467000 4558 4571 4584 4597 4610 4623 4637 4650 4663 4676
NOTE 1: OPTIMUM WEIGHT FOR PRESSURE ALTITUDE EXCEEDS STRUCTURAL LIMITA) THRUST LIMITED WEIGHT FOR ISA +10 AND COLDER EXCEEDS STRUCTURAL LIMITB) THRUST LIMITED WEIGHT FOR ISA +15 EXCEEDS STRUCTURAL LIMITC) THRUST LIMITED WEIGHT FOR ISA +20 EXCEEDS STRUCTURAL LIMIT
NOTE 2: ADJUSTMENTS FOR OPERATION AT NON-STANDARD TEMPERATURESA) INCREASE FUEL REQUIRED BY 0.6 PERCENT PER 10 DEGREES C ABOVE ISAB) DECREASE FUEL REQUIRED BY 0.6 PERCENT PER 10 DEGREES C BELOW ISAC) INCREASE TAS BY 1 KNOT PER DEGREE C ABOVE ISAD) DECREASE TAS BY 1 KNOT PER DEGREE C BELOW ISA
Figure 4.5.3.2 Mach 0.74 Cruise – Pressure Altitude 21,000 ft
Section 4 - MRJT1 Page 37July 2006
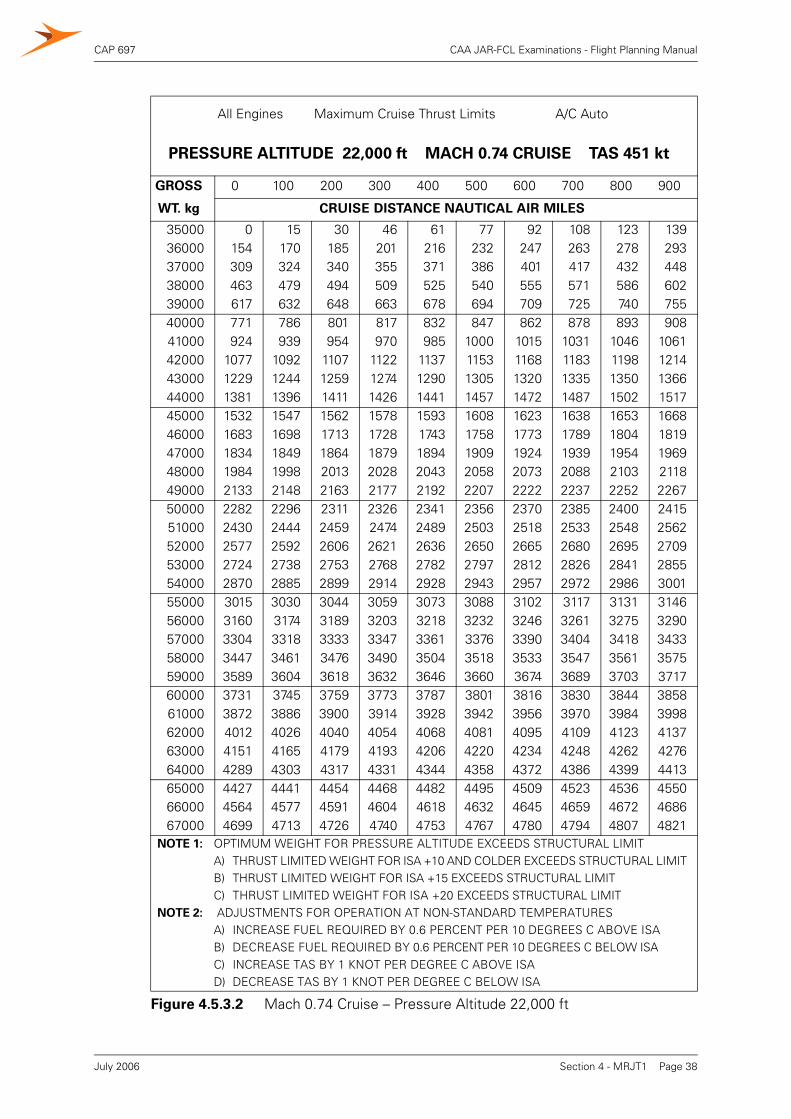
CAP 697 CAA JAR-FCL Examinations - Flight Planning Manual
All Engines Maximum Cruise Thrust Limits A/C Auto
PRESSURE ALTITUDE 22,000 ft MACH 0.74 CRUISE TAS 451 kt
GROSS 0 100 200 300 400 500 600 700 800 900
WT. kg CRUISE DISTANCE NAUTICAL AIR MILES
35000 0 15 30 46 61 77 92 108 123 13936000 154 170 185 201 216 232 247 263 278 29337000 309 324 340 355 371 386 401 417 432 44838000 463 479 494 509 525 540 555 571 586 60239000 617 632 648 663 678 694 709 725 740 75540000 771 786 801 817 832 847 862 878 893 90841000 924 939 954 970 985 1000 1015 1031 1046 106142000 1077 1092 1107 1122 1137 1153 1168 1183 1198 121443000 1229 1244 1259 1274 1290 1305 1320 1335 1350 136644000 1381 1396 1411 1426 1441 1457 1472 1487 1502 151745000 1532 1547 1562 1578 1593 1608 1623 1638 1653 166846000 1683 1698 1713 1728 1743 1758 1773 1789 1804 181947000 1834 1849 1864 1879 1894 1909 1924 1939 1954 196948000 1984 1998 2013 2028 2043 2058 2073 2088 2103 211849000 2133 2148 2163 2177 2192 2207 2222 2237 2252 226750000 2282 2296 2311 2326 2341 2356 2370 2385 2400 241551000 2430 2444 2459 2474 2489 2503 2518 2533 2548 256252000 2577 2592 2606 2621 2636 2650 2665 2680 2695 270953000 2724 2738 2753 2768 2782 2797 2812 2826 2841 285554000 2870 2885 2899 2914 2928 2943 2957 2972 2986 300155000 3015 3030 3044 3059 3073 3088 3102 3117 3131 314656000 3160 3174 3189 3203 3218 3232 3246 3261 3275 329057000 3304 3318 3333 3347 3361 3376 3390 3404 3418 343358000 3447 3461 3476 3490 3504 3518 3533 3547 3561 357559000 3589 3604 3618 3632 3646 3660 3674 3689 3703 371760000 3731 3745 3759 3773 3787 3801 3816 3830 3844 385861000 3872 3886 3900 3914 3928 3942 3956 3970 3984 399862000 4012 4026 4040 4054 4068 4081 4095 4109 4123 413763000 4151 4165 4179 4193 4206 4220 4234 4248 4262 427664000 4289 4303 4317 4331 4344 4358 4372 4386 4399 441365000 4427 4441 4454 4468 4482 4495 4509 4523 4536 455066000 4564 4577 4591 4604 4618 4632 4645 4659 4672 468667000 4699 4713 4726 4740 4753 4767 4780 4794 4807 4821
NOTE 1: OPTIMUM WEIGHT FOR PRESSURE ALTITUDE EXCEEDS STRUCTURAL LIMITA) THRUST LIMITED WEIGHT FOR ISA +10 AND COLDER EXCEEDS STRUCTURAL LIMITB) THRUST LIMITED WEIGHT FOR ISA +15 EXCEEDS STRUCTURAL LIMITC) THRUST LIMITED WEIGHT FOR ISA +20 EXCEEDS STRUCTURAL LIMIT
NOTE 2: ADJUSTMENTS FOR OPERATION AT NON-STANDARD TEMPERATURESA) INCREASE FUEL REQUIRED BY 0.6 PERCENT PER 10 DEGREES C ABOVE ISAB) DECREASE FUEL REQUIRED BY 0.6 PERCENT PER 10 DEGREES C BELOW ISAC) INCREASE TAS BY 1 KNOT PER DEGREE C ABOVE ISAD) DECREASE TAS BY 1 KNOT PER DEGREE C BELOW ISA
Figure 4.5.3.2 Mach 0.74 Cruise – Pressure Altitude 22,000 ft
Section 4 - MRJT1 Page 38July 2006
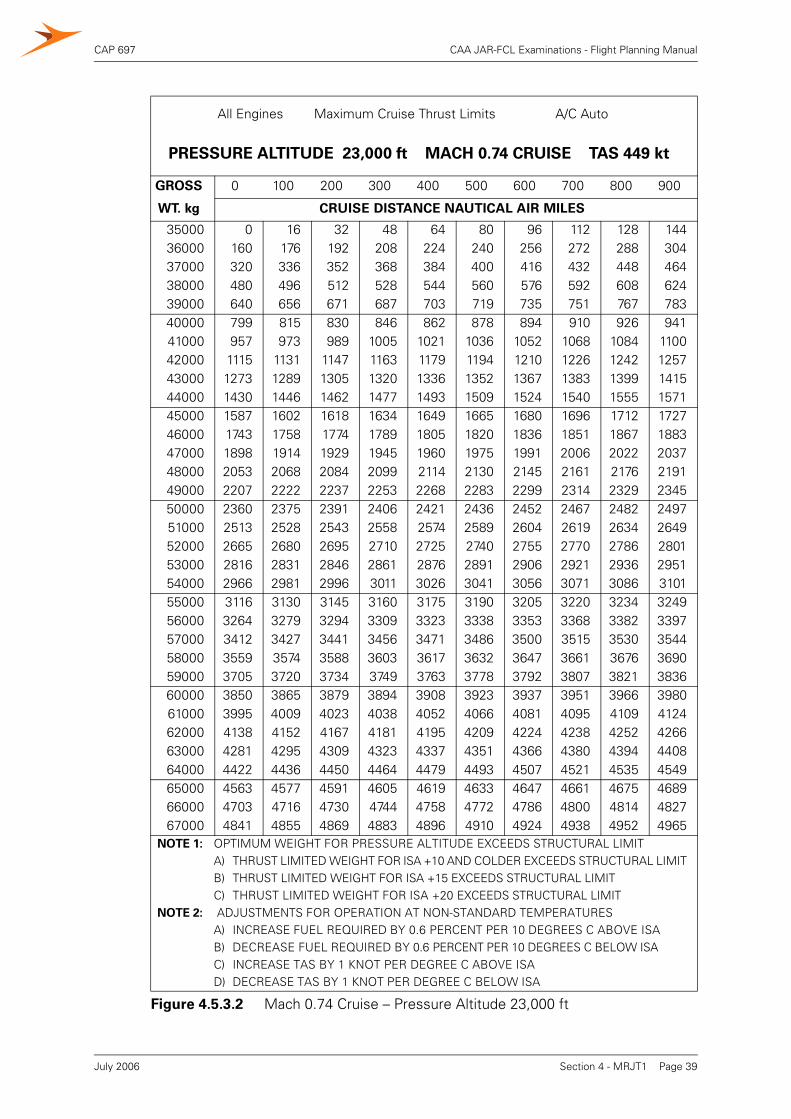
CAP 697 CAA JAR-FCL Examinations - Flight Planning Manual
All Engines Maximum Cruise Thrust Limits A/C Auto
PRESSURE ALTITUDE 23,000 ft MACH 0.74 CRUISE TAS 449 kt
GROSS 0 100 200 300 400 500 600 700 800 900
WT. kg CRUISE DISTANCE NAUTICAL AIR MILES
35000 0 16 32 48 64 80 96 112 128 14436000 160 176 192 208 224 240 256 272 288 30437000 320 336 352 368 384 400 416 432 448 46438000 480 496 512 528 544 560 576 592 608 62439000 640 656 671 687 703 719 735 751 767 78340000 799 815 830 846 862 878 894 910 926 94141000 957 973 989 1005 1021 1036 1052 1068 1084 110042000 1115 1131 1147 1163 1179 1194 1210 1226 1242 125743000 1273 1289 1305 1320 1336 1352 1367 1383 1399 141544000 1430 1446 1462 1477 1493 1509 1524 1540 1555 157145000 1587 1602 1618 1634 1649 1665 1680 1696 1712 172746000 1743 1758 1774 1789 1805 1820 1836 1851 1867 188347000 1898 1914 1929 1945 1960 1975 1991 2006 2022 203748000 2053 2068 2084 2099 2114 2130 2145 2161 2176 219149000 2207 2222 2237 2253 2268 2283 2299 2314 2329 234550000 2360 2375 2391 2406 2421 2436 2452 2467 2482 249751000 2513 2528 2543 2558 2574 2589 2604 2619 2634 264952000 2665 2680 2695 2710 2725 2740 2755 2770 2786 280153000 2816 2831 2846 2861 2876 2891 2906 2921 2936 295154000 2966 2981 2996 3011 3026 3041 3056 3071 3086 310155000 3116 3130 3145 3160 3175 3190 3205 3220 3234 324956000 3264 3279 3294 3309 3323 3338 3353 3368 3382 339757000 3412 3427 3441 3456 3471 3486 3500 3515 3530 354458000 3559 3574 3588 3603 3617 3632 3647 3661 3676 369059000 3705 3720 3734 3749 3763 3778 3792 3807 3821 383660000 3850 3865 3879 3894 3908 3923 3937 3951 3966 398061000 3995 4009 4023 4038 4052 4066 4081 4095 4109 412462000 4138 4152 4167 4181 4195 4209 4224 4238 4252 426663000 4281 4295 4309 4323 4337 4351 4366 4380 4394 440864000 4422 4436 4450 4464 4479 4493 4507 4521 4535 454965000 4563 4577 4591 4605 4619 4633 4647 4661 4675 468966000 4703 4716 4730 4744 4758 4772 4786 4800 4814 482767000 4841 4855 4869 4883 4896 4910 4924 4938 4952 4965
NOTE 1: OPTIMUM WEIGHT FOR PRESSURE ALTITUDE EXCEEDS STRUCTURAL LIMITA) THRUST LIMITED WEIGHT FOR ISA +10 AND COLDER EXCEEDS STRUCTURAL LIMITB) THRUST LIMITED WEIGHT FOR ISA +15 EXCEEDS STRUCTURAL LIMITC) THRUST LIMITED WEIGHT FOR ISA +20 EXCEEDS STRUCTURAL LIMIT
NOTE 2: ADJUSTMENTS FOR OPERATION AT NON-STANDARD TEMPERATURESA) INCREASE FUEL REQUIRED BY 0.6 PERCENT PER 10 DEGREES C ABOVE ISAB) DECREASE FUEL REQUIRED BY 0.6 PERCENT PER 10 DEGREES C BELOW ISAC) INCREASE TAS BY 1 KNOT PER DEGREE C ABOVE ISAD) DECREASE TAS BY 1 KNOT PER DEGREE C BELOW ISA
Figure 4.5.3.2 Mach 0.74 Cruise – Pressure Altitude 23,000 ft
Section 4 - MRJT1 Page 39July 2006
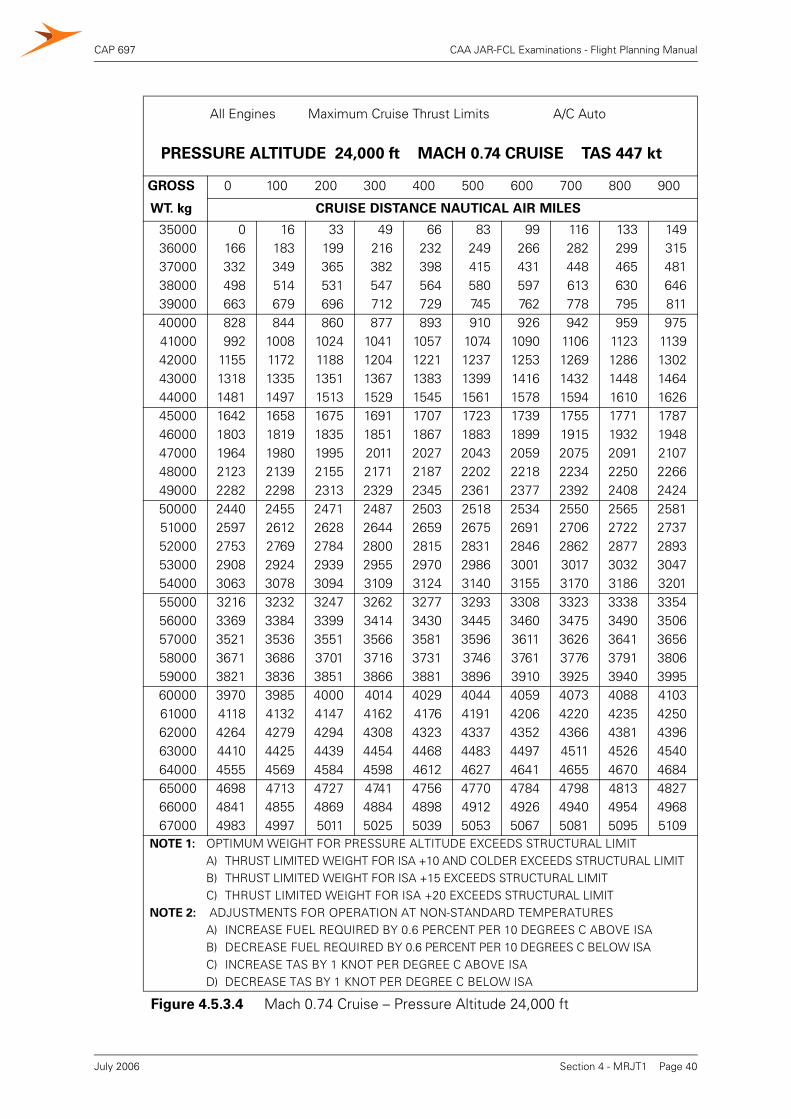
CAP 697 CAA JAR-FCL Examinations - Flight Planning Manual
All Engines Maximum Cruise Thrust Limits A/C Auto
PRESSURE ALTITUDE 24,000 ft MACH 0.74 CRUISE TAS 447 kt
GROSS 0 100 200 300 400 500 600 700 800 900
WT. kg CRUISE DISTANCE NAUTICAL AIR MILES
35000 0 16 33 49 66 83 99 116 133 14936000 166 183 199 216 232 249 266 282 299 31537000 332 349 365 382 398 415 431 448 465 48138000 498 514 531 547 564 580 597 613 630 64639000 663 679 696 712 729 745 762 778 795 81140000 828 844 860 877 893 910 926 942 959 97541000 992 1008 1024 1041 1057 1074 1090 1106 1123 113942000 1155 1172 1188 1204 1221 1237 1253 1269 1286 130243000 1318 1335 1351 1367 1383 1399 1416 1432 1448 146444000 1481 1497 1513 1529 1545 1561 1578 1594 1610 162645000 1642 1658 1675 1691 1707 1723 1739 1755 1771 178746000 1803 1819 1835 1851 1867 1883 1899 1915 1932 194847000 1964 1980 1995 2011 2027 2043 2059 2075 2091 210748000 2123 2139 2155 2171 2187 2202 2218 2234 2250 226649000 2282 2298 2313 2329 2345 2361 2377 2392 2408 242450000 2440 2455 2471 2487 2503 2518 2534 2550 2565 258151000 2597 2612 2628 2644 2659 2675 2691 2706 2722 273752000 2753 2769 2784 2800 2815 2831 2846 2862 2877 289353000 2908 2924 2939 2955 2970 2986 3001 3017 3032 304754000 3063 3078 3094 3109 3124 3140 3155 3170 3186 320155000 3216 3232 3247 3262 3277 3293 3308 3323 3338 335456000 3369 3384 3399 3414 3430 3445 3460 3475 3490 350657000 3521 3536 3551 3566 3581 3596 3611 3626 3641 365658000 3671 3686 3701 3716 3731 3746 3761 3776 3791 380659000 3821 3836 3851 3866 3881 3896 3910 3925 3940 399560000 3970 3985 4000 4014 4029 4044 4059 4073 4088 410361000 4118 4132 4147 4162 4176 4191 4206 4220 4235 425062000 4264 4279 4294 4308 4323 4337 4352 4366 4381 439663000 4410 4425 4439 4454 4468 4483 4497 4511 4526 454064000 4555 4569 4584 4598 4612 4627 4641 4655 4670 468465000 4698 4713 4727 4741 4756 4770 4784 4798 4813 482766000 4841 4855 4869 4884 4898 4912 4926 4940 4954 496867000 4983 4997 5011 5025 5039 5053 5067 5081 5095 5109
NOTE 1: OPTIMUM WEIGHT FOR PRESSURE ALTITUDE EXCEEDS STRUCTURAL LIMITA) THRUST LIMITED WEIGHT FOR ISA +10 AND COLDER EXCEEDS STRUCTURAL LIMITB) THRUST LIMITED WEIGHT FOR ISA +15 EXCEEDS STRUCTURAL LIMITC) THRUST LIMITED WEIGHT FOR ISA +20 EXCEEDS STRUCTURAL LIMIT
NOTE 2: ADJUSTMENTS FOR OPERATION AT NON-STANDARD TEMPERATURESA) INCREASE FUEL REQUIRED BY 0.6 PERCENT PER 10 DEGREES C ABOVE ISAB) DECREASE FUEL REQUIRED BY 0.6 PERCENT PER 10 DEGREES C BELOW ISAC) INCREASE TAS BY 1 KNOT PER DEGREE C ABOVE ISAD) DECREASE TAS BY 1 KNOT PER DEGREE C BELOW ISA
Figure 4.5.3.4 Mach 0.74 Cruise – Pressure Altitude 24,000 ft
Section 4 - MRJT1 Page 40July 2006

CAP 697 CAA JAR-FCL Examinations - Flight Planning Manual
All Engines Maximum Cruise Thrust Limits A/C Auto
PRESSURE ALTITUDE 25,000 ft MACH 0.74 CRUISE TAS 445 kt
GROSS 0 100 200 300 400 500 600 700 800 900
WT. kg CRUISE DISTANCE NAUTICAL AIR MILES
35000 0 17 34 51 69 86 103 120 138 15536000 172 189 206 224 241 258 275 293 310 32737000 344 361 378 396 413 430 447 464 481 49938000 516 533 550 567 584 601 618 635 652 67039000 687 704 721 738 755 772 789 806 823 84040000 857 874 891 908 925 942 959 976 993 101041000 1027 1044 1061 1076 1094 1111 1128 1145 1162 117942000 1196 1213 1230 1246 1263 1280 1297 1314 1331 134743000 1364 1381 1398 1414 1431 1448 1465 1482 1498 151544000 1532 1548 1565 1582 1599 1615 1632 1649 1665 168245000 1699 1715 1732 1748 1765 1782 1798 1815 1831 184846000 1865 1881 1898 1914 1931 1947 1964 1980 1997 201347000 2030 2046 2063 2079 2096 2112 2128 2145 2161 217848000 2194 2210 2227 2243 2259 2276 2292 2308 2325 234149000 2358 2374 2390 2406 2422 2439 2455 2471 2487 250450000 2520 2536 2552 2568 2585 2601 2617 2633 2649 266551000 2681 2698 2714 2730 2746 2762 2778 2794 2810 282652000 2842 2858 2874 2890 2906 2922 2938 2954 2970 298653000 3002 3017 3033 3049 3065 3081 3097 3113 3128 314454000 3160 3176 3192 3207 3223 3239 3255 3270 3286 330255000 3318 3333 3349 3365 3380 3396 3411 3427 3443 345856000 3474 3490 3505 3521 3536 3552 3567 3583 3598 361457000 3630 3645 3660 3676 3691 3707 3722 3738 3753 376858000 3784 3799 3815 3830 3845 3861 3876 3891 3906 392259000 3937 3952 3968 3983 3998 4013 4028 4044 4059 407460000 4089 4104 4119 4135 4150 4165 4180 4195 4210 422561000 4240 4255 4270 4285 4300 4315 4330 4345 4360 437562000 4390 4405 4420 4435 4450 4465 4479 4494 4509 452463000 4539 4554 4568 4583 4598 4613 4628 4642 4657 467264000 4687 4701 4716 4731 4745 4760 4774 4789 4804 481865000 4833 4848 4862 4877 4891 4906 4920 4935 4949 496466000 4978 4993 5007 5022 5036 5050 5065 5079 5094 510867000 5122 5137 5151 5165 5180 5194 5208 5222 5237 5251
NOTE 1: OPTIMUM WEIGHT FOR PRESSURE ALTITUDE EXCEEDS STRUCTURAL LIMITA) THRUST LIMITED WEIGHT FOR ISA +10 AND COLDER EXCEEDS STRUCTURAL LIMITB) THRUST LIMITED WEIGHT FOR ISA +15 EXCEEDS STRUCTURAL LIMITC) THRUST LIMITED WEIGHT FOR ISA +20 EXCEEDS STRUCTURAL LIMIT
NOTE 2: ADJUSTMENTS FOR OPERATION AT NON-STANDARD TEMPERATURESA) INCREASE FUEL REQUIRED BY 0.6 PERCENT PER 10 DEGREES C ABOVE ISAB) DECREASE FUEL REQUIRED BY 0.6 PERCENT PER 10 DEGREES C BELOW ISAC) INCREASE TAS BY 1 KNOT PER DEGREE C ABOVE ISAD) DECREASE TAS BY 1 KNOT PER DEGREE C BELOW ISA
Figure 4.5.3.2 Mach 0.74 Cruise – Pressure Altitude 25,000 ft
Section 4 - MRJT1 Page 41July 2006

CAP 697 CAA JAR-FCL Examinations - Flight Planning Manual
All Engines Maximum Cruise Thrust Limits A/C Auto
PRESSURE ALTITUDE 26,000 ft MACH 0.74 CRUISE TAS 443 kt
GROSS 0 100 200 300 400 500 600 700 800 900
WT. kg CRUISE DISTANCE NAUTICAL AIR MILES
35000 0 17 35 53 71 89 107 125 143 16036000 178 196 214 232 250 267 285 303 321 33937000 356 374 392 410 427 445 463 481 498 51638000 534 552 569 587 605 622 640 658 675 69339000 711 728 746 764 781 799 817 834 852 86940000 887 905 922 940 957 975 992 1010 1027 104541000 1062 1080 1097 1115 1132 1150 1167 1185 1202 121942000 1237 1254 1272 1289 1306 1324 1341 1359 1376 139343000 1411 1428 1445 1463 1480 1497 1514 1532 1549 156644000 1584 1601 1618 1635 1652 1669 1687 1704 1721 173845000 1755 1773 1790 1807 1824 1841 1858 1875 1892 190946000 1926 1943 1960 1977 1994 2011 2028 2045 2062 208047000 2097 2113 2130 2147 2164 2181 2198 2215 2232 224948000 2266 2282 2299 2316 2333 2350 2366 2383 2400 241749000 2433 2450 2467 2484 2500 2517 2534 2550 2567 258450000 2600 2617 2634 2650 2667 2683 2700 2716 2733 275051000 2766 2783 2799 2816 2832 2849 2865 2882 2898 291552000 2931 2947 2964 2980 2996 3013 3029 3046 3062 307853000 3095 3111 3127 3143 3160 3176 3192 3208 3225 324154000 3257 3273 3289 3306 3322 3338 3354 3370 3386 340255000 3419 3435 3451 3467 3483 3499 3515 3531 3547 356356000 3579 3595 3611 3626 3642 3658 3674 3690 3706 372257000 3738 3754 3769 3785 3801 3817 3832 3848 3864 388058000 3896 3911 3927 3943 3958 3974 3990 4005 4021 403659000 4052 4068 4083 4099 4114 4130 4145 4161 4176 419260000 4207 4223 4238 4254 4269 4285 4300 4315 4331 434661000 4362 4377 4392 4407 4423 4438 4453 4469 4484 449962000 4514 4530 4545 4560 4575 4590 4605 4621 4636 465163000 4666 4681 4696 4711 4726 4741 4756 4771 4786 480164000 4816 4831 4846 4861 4876 4891 4906 4921 4936 495065000 4965 4980 4995 5010 5024 5039 5054 5069 5083 509866000 5113 5128 5142 5157 5172 5186 5201 5215 5230 524567000 5259 5274 5288 5303 5317 5332 5346 5361 5375 5390
NOTE 1: OPTIMUM WEIGHT FOR PRESSURE ALTITUDE EXCEEDS STRUCTURAL LIMITA) THRUST LIMITED WEIGHT FOR ISA +10 AND COLDER EXCEEDS STRUCTURAL LIMITB) THRUST LIMITED WEIGHT FOR ISA +15 EXCEEDS STRUCTURAL LIMITC) THRUST LIMITED WEIGHT FOR ISA +20 EXCEEDS STRUCTURAL LIMIT
NOTE 2: ADJUSTMENTS FOR OPERATION AT NON-STANDARD TEMPERATURESA) INCREASE FUEL REQUIRED BY 0.6 PERCENT PER 10 DEGREES C ABOVE ISAB) DECREASE FUEL REQUIRED BY 0.6 PERCENT PER 10 DEGREES C BELOW ISAC) INCREASE TAS BY 1 KNOT PER DEGREE C ABOVE ISAD) DECREASE TAS BY 1 KNOT PER DEGREE C BELOW ISA
Figure 4.5.3.2 Mach 0.74 Cruise – Pressure Altitude 26,000 ft
Section 4 - MRJT1 Page 42July 2006

CAP 697 CAA JAR-FCL Examinations - Flight Planning Manual
All Engines Maximum Cruise Thrust Limits A/C Auto
PRESSURE ALTITUDE 27,000 ft MACH 0.74 CRUISE TAS 442 kt
GROSS 0 100 200 300 400 500 600 700 800 900
WT. kg CRUISE DISTANCE NAUTICAL AIR MILES
35000 0 18 37 55 74 92 111 129 148 16636000 185 203 221 240 258 277 295 314 332 35137000 369 387 406 424 442 461 479 497 516 53438000 553 571 589 607 626 644 662 680 699 71739000 735 754 772 790 808 826 844 863 881 89940000 917 935 953 972 990 1008 1026 1044 1062 108041000 1098 1116 1134 1152 1170 1188 1206 1224 1242 126042000 1278 1296 1314 1332 1350 1368 1386 1404 1422 144043000 1457 1475 1493 1511 1529 1546 1564 1582 1600 161844000 1636 1653 1671 1689 1706 1724 1742 1759 1777 179545000 1813 1830 1848 1865 1883 1900 1918 1936 1953 197146000 1988 2006 2023 2041 2058 2076 2093 2111 2128 214647000 2163 2181 2198 2215 2233 2250 2267 2285 2302 232048000 2337 2354 2371 2389 2406 2423 2440 2458 2475 249249000 2509 2527 2544 2561 2578 2595 2612 2629 2646 266450000 2681 2698 2715 2732 2749 2766 2783 2800 2817 283451000 2851 2868 2885 2902 2918 2935 2952 2969 2986 300352000 3020 3036 3053 3070 3087 3104 3120 3137 3154 317153000 3187 3204 3221 3237 3254 3271 3287 3304 3320 333754000 3354 3370 3387 3403 3420 3436 3453 3469 3486 350255000 3519 3535 3552 3568 3584 3601 3617 3633 3650 366656000 3683 3699 3715 3731 3747 3764 3780 3796 3812 382957000 3845 3861 3877 3893 3909 3925 3942 3958 3974 399058000 4006 4022 4038 4054 4070 4086 4102 4118 4134 415059000 4166 4182 4197 4213 4229 4245 4261 4277 4292 430860000 4324 4340 4356 4371 4387 4403 4418 4434 4450 446561000 4481 4497 4512 4528 4543 4559 4574 4590 4606 462162000 4637 4652 4668 4683 4698 4714 4729 4745 4760 477563000 4791 4806 4821 4837 4852 4867 4882 4898 4913 492864000 4943 4959 4974 4989 5004 5019 5034 5049 5064 508065000 5095 5110 5125 5140 5155 5170 5185 5200 5214 522966000 5244 5259 5274 5289 5304 5319 5333 5348 5363 537867000 5393 5407 5422 5437 5451 5466 5481 5495 5510 5525
NOTE 1: OPTIMUM WEIGHT FOR PRESSURE ALTITUDE EXCEEDS STRUCTURAL LIMITA) THRUST LIMITED WEIGHT FOR ISA +10 AND COLDER EXCEEDS STRUCTURAL LIMITB) THRUST LIMITED WEIGHT FOR ISA +15 EXCEEDS STRUCTURAL LIMITC) THRUST LIMITED WEIGHT FOR ISA +20 EXCEEDS STRUCTURAL LIMIT
NOTE 2: ADJUSTMENTS FOR OPERATION AT NON-STANDARD TEMPERATURESA) INCREASE FUEL REQUIRED BY 0.6 PERCENT PER 10 DEGREES C ABOVE ISAB) DECREASE FUEL REQUIRED BY 0.6 PERCENT PER 10 DEGREES C BELOW ISAC) INCREASE TAS BY 1 KNOT PER DEGREE C ABOVE ISAD) DECREASE TAS BY 1 KNOT PER DEGREE C BELOW ISA
Figure 4.5.3.2 Mach 0.74 Cruise – Pressure Altitude 27,000 ft
Section 4 - MRJT1 Page 43July 2006
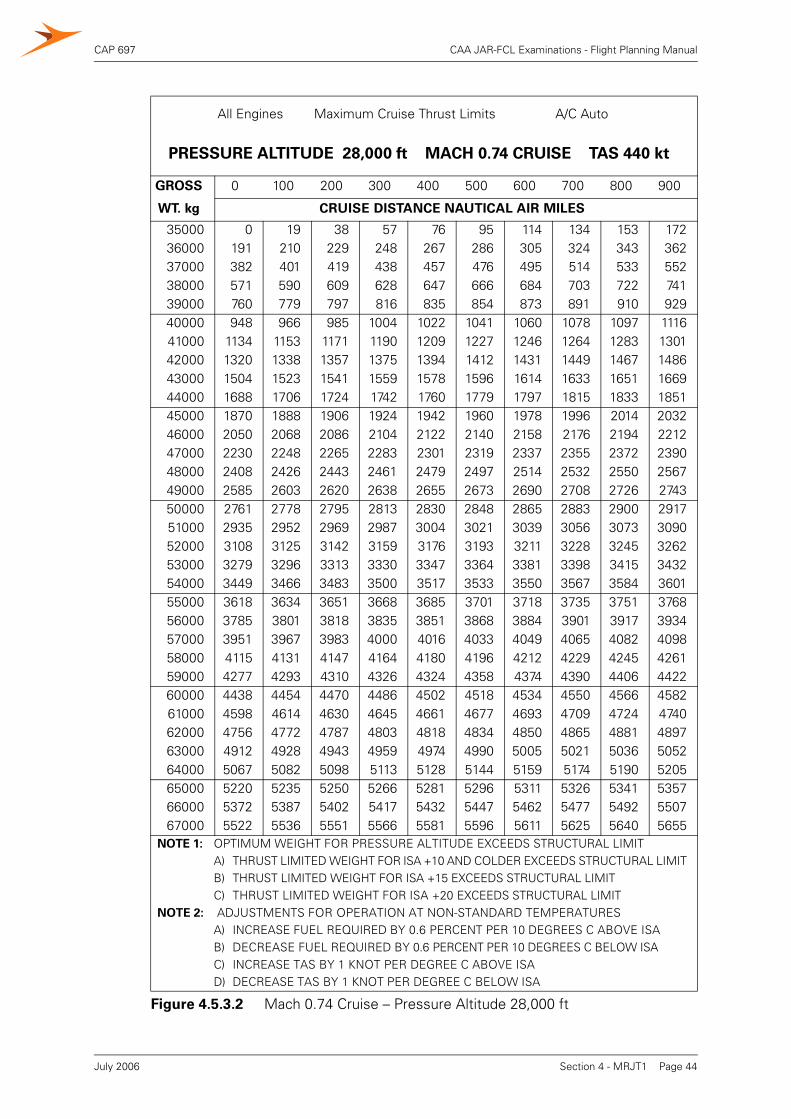
CAP 697 CAA JAR-FCL Examinations - Flight Planning Manual
All Engines Maximum Cruise Thrust Limits A/C Auto
PRESSURE ALTITUDE 28,000 ft MACH 0.74 CRUISE TAS 440 kt
GROSS 0 100 200 300 400 500 600 700 800 900
WT. kg CRUISE DISTANCE NAUTICAL AIR MILES
35000 0 19 38 57 76 95 114 134 153 17236000 191 210 229 248 267 286 305 324 343 36237000 382 401 419 438 457 476 495 514 533 55238000 571 590 609 628 647 666 684 703 722 74139000 760 779 797 816 835 854 873 891 910 92940000 948 966 985 1004 1022 1041 1060 1078 1097 111641000 1134 1153 1171 1190 1209 1227 1246 1264 1283 130142000 1320 1338 1357 1375 1394 1412 1431 1449 1467 148643000 1504 1523 1541 1559 1578 1596 1614 1633 1651 166944000 1688 1706 1724 1742 1760 1779 1797 1815 1833 185145000 1870 1888 1906 1924 1942 1960 1978 1996 2014 203246000 2050 2068 2086 2104 2122 2140 2158 2176 2194 221247000 2230 2248 2265 2283 2301 2319 2337 2355 2372 239048000 2408 2426 2443 2461 2479 2497 2514 2532 2550 256749000 2585 2603 2620 2638 2655 2673 2690 2708 2726 274350000 2761 2778 2795 2813 2830 2848 2865 2883 2900 291751000 2935 2952 2969 2987 3004 3021 3039 3056 3073 309052000 3108 3125 3142 3159 3176 3193 3211 3228 3245 326253000 3279 3296 3313 3330 3347 3364 3381 3398 3415 343254000 3449 3466 3483 3500 3517 3533 3550 3567 3584 360155000 3618 3634 3651 3668 3685 3701 3718 3735 3751 376856000 3785 3801 3818 3835 3851 3868 3884 3901 3917 393457000 3951 3967 3983 4000 4016 4033 4049 4065 4082 409858000 4115 4131 4147 4164 4180 4196 4212 4229 4245 426159000 4277 4293 4310 4326 4324 4358 4374 4390 4406 442260000 4438 4454 4470 4486 4502 4518 4534 4550 4566 458261000 4598 4614 4630 4645 4661 4677 4693 4709 4724 474062000 4756 4772 4787 4803 4818 4834 4850 4865 4881 489763000 4912 4928 4943 4959 4974 4990 5005 5021 5036 505264000 5067 5082 5098 5113 5128 5144 5159 5174 5190 520565000 5220 5235 5250 5266 5281 5296 5311 5326 5341 535766000 5372 5387 5402 5417 5432 5447 5462 5477 5492 550767000 5522 5536 5551 5566 5581 5596 5611 5625 5640 5655
NOTE 1: OPTIMUM WEIGHT FOR PRESSURE ALTITUDE EXCEEDS STRUCTURAL LIMITA) THRUST LIMITED WEIGHT FOR ISA +10 AND COLDER EXCEEDS STRUCTURAL LIMITB) THRUST LIMITED WEIGHT FOR ISA +15 EXCEEDS STRUCTURAL LIMITC) THRUST LIMITED WEIGHT FOR ISA +20 EXCEEDS STRUCTURAL LIMIT
NOTE 2: ADJUSTMENTS FOR OPERATION AT NON-STANDARD TEMPERATURESA) INCREASE FUEL REQUIRED BY 0.6 PERCENT PER 10 DEGREES C ABOVE ISAB) DECREASE FUEL REQUIRED BY 0.6 PERCENT PER 10 DEGREES C BELOW ISAC) INCREASE TAS BY 1 KNOT PER DEGREE C ABOVE ISAD) DECREASE TAS BY 1 KNOT PER DEGREE C BELOW ISA
Figure 4.5.3.2 Mach 0.74 Cruise – Pressure Altitude 28,000 ft
Section 4 - MRJT1 Page 44July 2006

CAP 697 CAA JAR-FCL Examinations - Flight Planning Manual
All Engines Maximum Cruise Thrust Limits A/C Auto
PRESSURE ALTITUDE 29,000 ft MACH 0.74 CRUISE TAS 438 kt
GROSS 0 100 200 300 400 500 600 700 800 900
WT. kg CRUISE DISTANCE NAUTICAL AIR MILES
35000 0 19 39 59 79 98 118 138 158 17836000 197 217 237 256 276 296 315 335 355 37537000 394 414 433 453 473 492 512 531 551 57038000 590 609 629 648 668 687 707 726 746 76539000 785 804 823 843 862 881 901 920 939 95940000 978 997 1017 1036 1055 1074 1093 1113 1132 115141000 1170 1189 1209 1228 1247 1266 1285 1304 1323 134242000 1361 1380 1399 1418 1437 1456 1475 1494 1513 153243000 1551 1570 1589 1608 1626 1645 1664 1683 1702 172144000 1739 1758 1777 1795 1814 1833 1852 1870 1889 190845000 1926 1945 1963 1982 2001 2019 2038 2056 2075 209346000 2112 2130 2149 2167 2186 2204 2222 2241 2259 227847000 2296 2314 2333 2351 2369 2387 2406 2424 2442 246148000 2479 2497 2515 2533 2551 2569 2588 2606 2624 264249000 2660 2678 2696 2714 2732 2750 2768 2786 2804 282250000 2840 2858 2875 2893 2911 2929 2947 2964 2982 300051000 3018 3036 3053 3071 3089 3106 3124 3142 3159 317752000 3195 3212 3230 3247 3265 3282 3300 3317 3335 335253000 3370 3387 3404 3422 3439 3456 3474 3491 3508 352654000 3543 3560 3578 3595 3612 3629 3646 3664 3681 369855000 3715 3732 3749 3766 3783 3800 3817 3834 3851 386856000 3885 3902 3919 3936 3953 3970 3987 4003 4020 403757000 4054 4071 4087 4104 4121 4137 4154 4171 4187 420458000 4221 4237 4254 4270 4287 4303 4320 4337 4353 437059000 4386 4402 4419 4435 4451 4468 4484 4501 4517 453360000 4550 4566 4582 4598 4614 4630 4647 4663 4679 469561000 4711 4727 4743 4759 4775 4791 4807 4823 4839 485562000 4871 4887 4903 4919 4935 4950 4966 4982 4998 501463000 5030 5045 5061 5077 5092 5108 5123 5139 5155 517064000 5186 5202 5217 5233 5248 5263 5279 5294 5310 532565000 5341 5356 5371 5387 5402 5417 5433 5448 5463 547966000 5494 5509 5524 5539 5554 5569 5585 5600 5615 563067000 5645 5660 5675 5690 5705 5720 5735 5750 5765 5780
NOTE 1: OPTIMUM WEIGHT FOR PRESSURE ALTITUDE EXCEEDS STRUCTURAL LIMITA) THRUST LIMITED WEIGHT FOR ISA +10 AND COLDER EXCEEDS STRUCTURAL LIMITB) THRUST LIMITED WEIGHT FOR ISA +15 EXCEEDS STRUCTURAL LIMITC) THRUST LIMITED WEIGHT FOR ISA +20 EXCEEDS STRUCTURAL LIMIT
NOTE 2: ADJUSTMENTS FOR OPERATION AT NON-STANDARD TEMPERATURESA) INCREASE FUEL REQUIRED BY 0.6 PERCENT PER 10 DEGREES C ABOVE ISAB) DECREASE FUEL REQUIRED BY 0.6 PERCENT PER 10 DEGREES C BELOW ISAC) INCREASE TAS BY 1 KNOT PER DEGREE C ABOVE ISAD) DECREASE TAS BY 1 KNOT PER DEGREE C BELOW ISA
Figure 4.5.3.2 Mach 0.74 Cruise – Pressure Altitude 29,000 ft
Section 4 - MRJT1 Page 45July 2006
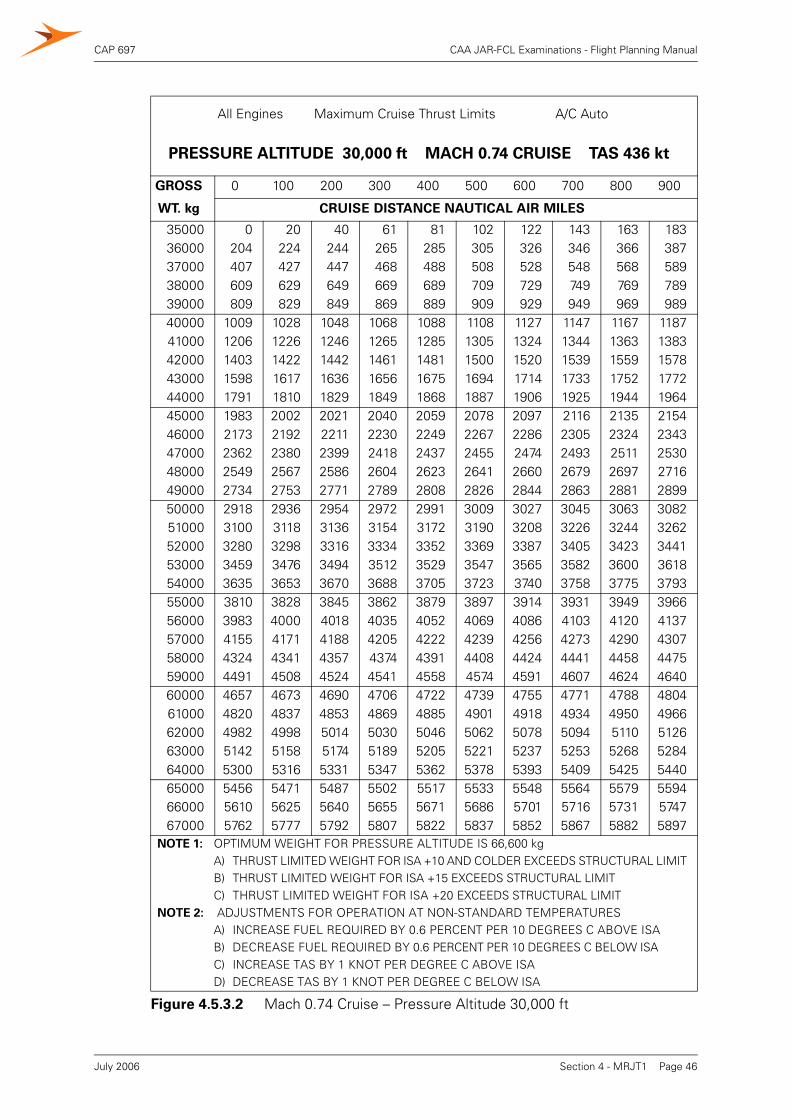
CAP 697 CAA JAR-FCL Examinations - Flight Planning Manual
All Engines Maximum Cruise Thrust Limits A/C Auto
PRESSURE ALTITUDE 30,000 ft MACH 0.74 CRUISE TAS 436 kt
GROSS 0 100 200 300 400 500 600 700 800 900
WT. kg CRUISE DISTANCE NAUTICAL AIR MILES
35000 0 20 40 61 81 102 122 143 163 18336000 204 224 244 265 285 305 326 346 366 38737000 407 427 447 468 488 508 528 548 568 58938000 609 629 649 669 689 709 729 749 769 78939000 809 829 849 869 889 909 929 949 969 98940000 1009 1028 1048 1068 1088 1108 1127 1147 1167 118741000 1206 1226 1246 1265 1285 1305 1324 1344 1363 138342000 1403 1422 1442 1461 1481 1500 1520 1539 1559 157843000 1598 1617 1636 1656 1675 1694 1714 1733 1752 177244000 1791 1810 1829 1849 1868 1887 1906 1925 1944 196445000 1983 2002 2021 2040 2059 2078 2097 2116 2135 215446000 2173 2192 2211 2230 2249 2267 2286 2305 2324 234347000 2362 2380 2399 2418 2437 2455 2474 2493 2511 253048000 2549 2567 2586 2604 2623 2641 2660 2679 2697 271649000 2734 2753 2771 2789 2808 2826 2844 2863 2881 289950000 2918 2936 2954 2972 2991 3009 3027 3045 3063 308251000 3100 3118 3136 3154 3172 3190 3208 3226 3244 326252000 3280 3298 3316 3334 3352 3369 3387 3405 3423 344153000 3459 3476 3494 3512 3529 3547 3565 3582 3600 361854000 3635 3653 3670 3688 3705 3723 3740 3758 3775 379355000 3810 3828 3845 3862 3879 3897 3914 3931 3949 396656000 3983 4000 4018 4035 4052 4069 4086 4103 4120 413757000 4155 4171 4188 4205 4222 4239 4256 4273 4290 430758000 4324 4341 4357 4374 4391 4408 4424 4441 4458 447559000 4491 4508 4524 4541 4558 4574 4591 4607 4624 464060000 4657 4673 4690 4706 4722 4739 4755 4771 4788 480461000 4820 4837 4853 4869 4885 4901 4918 4934 4950 496662000 4982 4998 5014 5030 5046 5062 5078 5094 5110 512663000 5142 5158 5174 5189 5205 5221 5237 5253 5268 528464000 5300 5316 5331 5347 5362 5378 5393 5409 5425 544065000 5456 5471 5487 5502 5517 5533 5548 5564 5579 559466000 5610 5625 5640 5655 5671 5686 5701 5716 5731 574767000 5762 5777 5792 5807 5822 5837 5852 5867 5882 5897
NOTE 1: OPTIMUM WEIGHT FOR PRESSURE ALTITUDE IS 66,600 kgA) THRUST LIMITED WEIGHT FOR ISA +10 AND COLDER EXCEEDS STRUCTURAL LIMITB) THRUST LIMITED WEIGHT FOR ISA +15 EXCEEDS STRUCTURAL LIMITC) THRUST LIMITED WEIGHT FOR ISA +20 EXCEEDS STRUCTURAL LIMIT
NOTE 2: ADJUSTMENTS FOR OPERATION AT NON-STANDARD TEMPERATURESA) INCREASE FUEL REQUIRED BY 0.6 PERCENT PER 10 DEGREES C ABOVE ISAB) DECREASE FUEL REQUIRED BY 0.6 PERCENT PER 10 DEGREES C BELOW ISAC) INCREASE TAS BY 1 KNOT PER DEGREE C ABOVE ISAD) DECREASE TAS BY 1 KNOT PER DEGREE C BELOW ISA
Figure 4.5.3.2 Mach 0.74 Cruise – Pressure Altitude 30,000 ft
Section 4 - MRJT1 Page 46July 2006

CAP 697 CAA JAR-FCL Examinations - Flight Planning Manual
All Engines Maximum Cruise Thrust Limits A/C Auto
PRESSURE ALTITUDE 31,000 ft MACH 0.74 CRUISE TAS 434 kt
GROSS 0 100 200 300 400 500 600 700 800 900
WT. kg CRUISE DISTANCE NAUTICAL AIR MILES
35000 0 21 42 63 84 105 126 147 168 18936000 210 231 252 273 294 315 336 357 378 39937000 420 440 461 482 503 524 544 565 586 60738000 628 648 669 689 710 731 751 772 793 81339000 834 854 875 895 916 936 957 977 998 101840000 1039 1059 1079 1100 1120 1140 1161 1181 1201 122241000 1242 1262 1282 1303 1323 1343 1363 1383 1403 142342000 1444 1464 1484 1504 1524 1544 1564 1584 1604 162443000 1644 1663 1683 1703 1723 1743 1763 1782 1802 182244000 1842 1862 1881 1901 1921 1940 1960 1979 1999 201945000 2038 2058 2077 2097 2116 2136 2155 2175 2194 221446000 2233 2252 2272 2291 2310 2330 2349 2368 2388 240747000 2426 2445 2464 2483 2503 2522 2541 2560 2579 259848000 2617 2636 2655 2674 2693 2712 2731 2750 2769 278849000 2807 2825 2844 2863 2882 2900 2919 2938 2956 297550000 2994 3013 3031 3050 3068 3087 3105 3124 3142 316151000 3179 3198 3216 3235 3253 3271 3290 3308 3326 334552000 3363 3381 3399 3417 3436 3454 3472 3490 3508 352653000 3545 3563 3580 3598 3616 3634 3652 3670 3688 370654000 3724 3742 3760 3777 3795 3813 3831 3848 3866 388455000 3902 3919 3937 3954 3972 3989 4007 4024 4042 406056000 4077 4094 4112 4129 4146 4164 4181 4198 4216 423357000 4251 4268 4285 4302 4319 4336 4353 4370 4388 440558000 4422 4439 4456 4473 4490 4507 4523 4540 4557 457459000 4591 4608 4625 4641 4658 4675 4691 4708 4725 474260000 4758 4775 4791 4808 4824 4841 4857 4874 4890 490761000 4923 4940 4956 4972 4989 5005 5021 5038 5054 507062000 5086 5103 5119 5135 5151 5167 5183 5199 5215 523163000 5247 5263 5279 5295 5311 5327 5343 5358 5374 539064000 5406 5422 5437 5453 5469 5484 5500 5516 5531 554765000 5563 5578 5594 5609 5624 5640 5655 5671 5686 570266000 5717 5732 5748 5763 5778 5793 5809 5824 5839 585467000 5870 5885 5900 5915 5930 5945 5960 5975 5990 6005
NOTE 1: OPTIMUM WEIGHT FOR PRESSURE ALTITUDE IS 63,500 kgA) THRUST LIMITED WEIGHT FOR ISA +10 AND COLDER EXCEEDS STRUCTURAL LIMITB) THRUST LIMITED WEIGHT FOR ISA +15 EXCEEDS STRUCTURAL LIMITC) THRUST LIMITED WEIGHT FOR ISA +20 EXCEEDS STRUCTURAL LIMIT
NOTE 2: ADJUSTMENTS FOR OPERATION AT NON-STANDARD TEMPERATURESA) INCREASE FUEL REQUIRED BY 0.6 PERCENT PER 10 DEGREES C ABOVE ISAB) DECREASE FUEL REQUIRED BY 0.6 PERCENT PER 10 DEGREES C BELOW ISAC) INCREASE TAS BY 1 KNOT PER DEGREE C ABOVE ISAD) DECREASE TAS BY 1 KNOT PER DEGREE C BELOW ISA
Figure 4.5.3.2 Mach 0.74 Cruise – Pressure Altitude 31,000 ft
Section 4 - MRJT1 Page 47July 2006
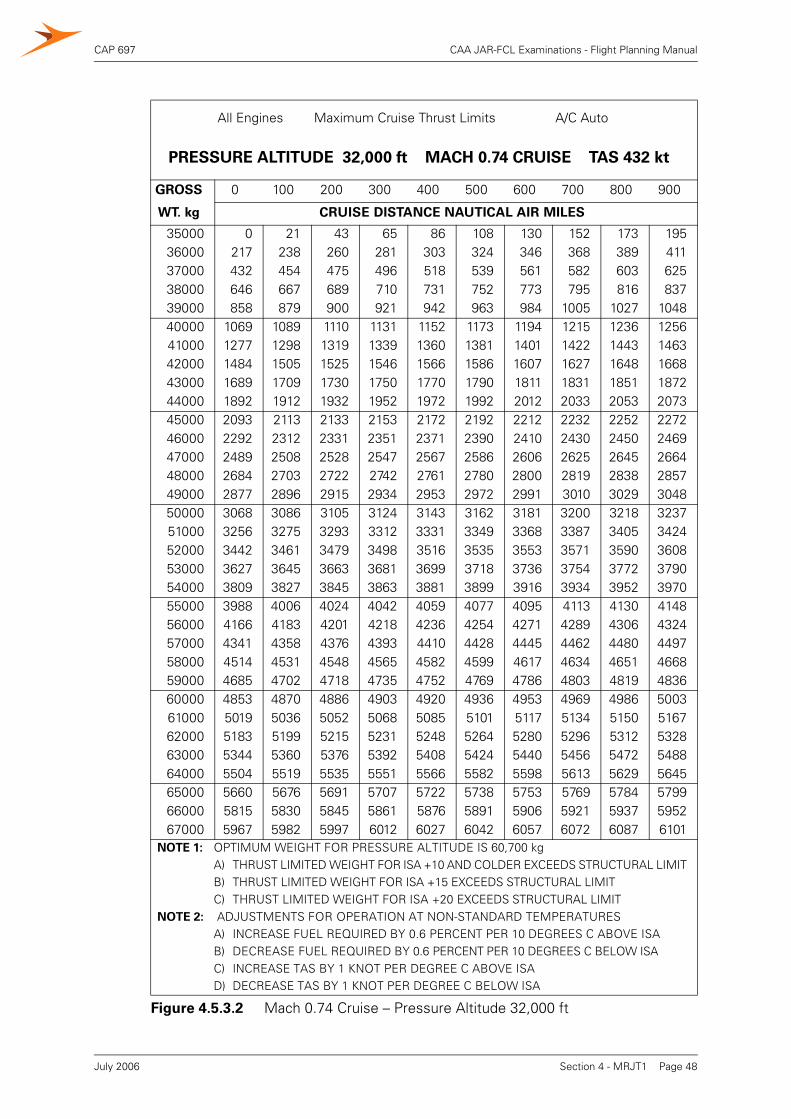
CAP 697 CAA JAR-FCL Examinations - Flight Planning Manual
All Engines Maximum Cruise Thrust Limits A/C Auto
PRESSURE ALTITUDE 32,000 ft MACH 0.74 CRUISE TAS 432 kt
GROSS 0 100 200 300 400 500 600 700 800 900
WT. kg CRUISE DISTANCE NAUTICAL AIR MILES
35000 0 21 43 65 86 108 130 152 173 19536000 217 238 260 281 303 324 346 368 389 41137000 432 454 475 496 518 539 561 582 603 62538000 646 667 689 710 731 752 773 795 816 83739000 858 879 900 921 942 963 984 1005 1027 104840000 1069 1089 1110 1131 1152 1173 1194 1215 1236 125641000 1277 1298 1319 1339 1360 1381 1401 1422 1443 146342000 1484 1505 1525 1546 1566 1586 1607 1627 1648 166843000 1689 1709 1730 1750 1770 1790 1811 1831 1851 187244000 1892 1912 1932 1952 1972 1992 2012 2033 2053 207345000 2093 2113 2133 2153 2172 2192 2212 2232 2252 227246000 2292 2312 2331 2351 2371 2390 2410 2430 2450 246947000 2489 2508 2528 2547 2567 2586 2606 2625 2645 266448000 2684 2703 2722 2742 2761 2780 2800 2819 2838 285749000 2877 2896 2915 2934 2953 2972 2991 3010 3029 304850000 3068 3086 3105 3124 3143 3162 3181 3200 3218 323751000 3256 3275 3293 3312 3331 3349 3368 3387 3405 342452000 3442 3461 3479 3498 3516 3535 3553 3571 3590 360853000 3627 3645 3663 3681 3699 3718 3736 3754 3772 379054000 3809 3827 3845 3863 3881 3899 3916 3934 3952 397055000 3988 4006 4024 4042 4059 4077 4095 4113 4130 414856000 4166 4183 4201 4218 4236 4254 4271 4289 4306 432457000 4341 4358 4376 4393 4410 4428 4445 4462 4480 449758000 4514 4531 4548 4565 4582 4599 4617 4634 4651 466859000 4685 4702 4718 4735 4752 4769 4786 4803 4819 483660000 4853 4870 4886 4903 4920 4936 4953 4969 4986 500361000 5019 5036 5052 5068 5085 5101 5117 5134 5150 516762000 5183 5199 5215 5231 5248 5264 5280 5296 5312 532863000 5344 5360 5376 5392 5408 5424 5440 5456 5472 548864000 5504 5519 5535 5551 5566 5582 5598 5613 5629 564565000 5660 5676 5691 5707 5722 5738 5753 5769 5784 579966000 5815 5830 5845 5861 5876 5891 5906 5921 5937 595267000 5967 5982 5997 6012 6027 6042 6057 6072 6087 6101
NOTE 1: OPTIMUM WEIGHT FOR PRESSURE ALTITUDE IS 60,700 kgA) THRUST LIMITED WEIGHT FOR ISA +10 AND COLDER EXCEEDS STRUCTURAL LIMITB) THRUST LIMITED WEIGHT FOR ISA +15 EXCEEDS STRUCTURAL LIMITC) THRUST LIMITED WEIGHT FOR ISA +20 EXCEEDS STRUCTURAL LIMIT
NOTE 2: ADJUSTMENTS FOR OPERATION AT NON-STANDARD TEMPERATURESA) INCREASE FUEL REQUIRED BY 0.6 PERCENT PER 10 DEGREES C ABOVE ISAB) DECREASE FUEL REQUIRED BY 0.6 PERCENT PER 10 DEGREES C BELOW ISAC) INCREASE TAS BY 1 KNOT PER DEGREE C ABOVE ISAD) DECREASE TAS BY 1 KNOT PER DEGREE C BELOW ISA
Figure 4.5.3.2 Mach 0.74 Cruise – Pressure Altitude 32,000 ft
Section 4 - MRJT1 Page 48July 2006
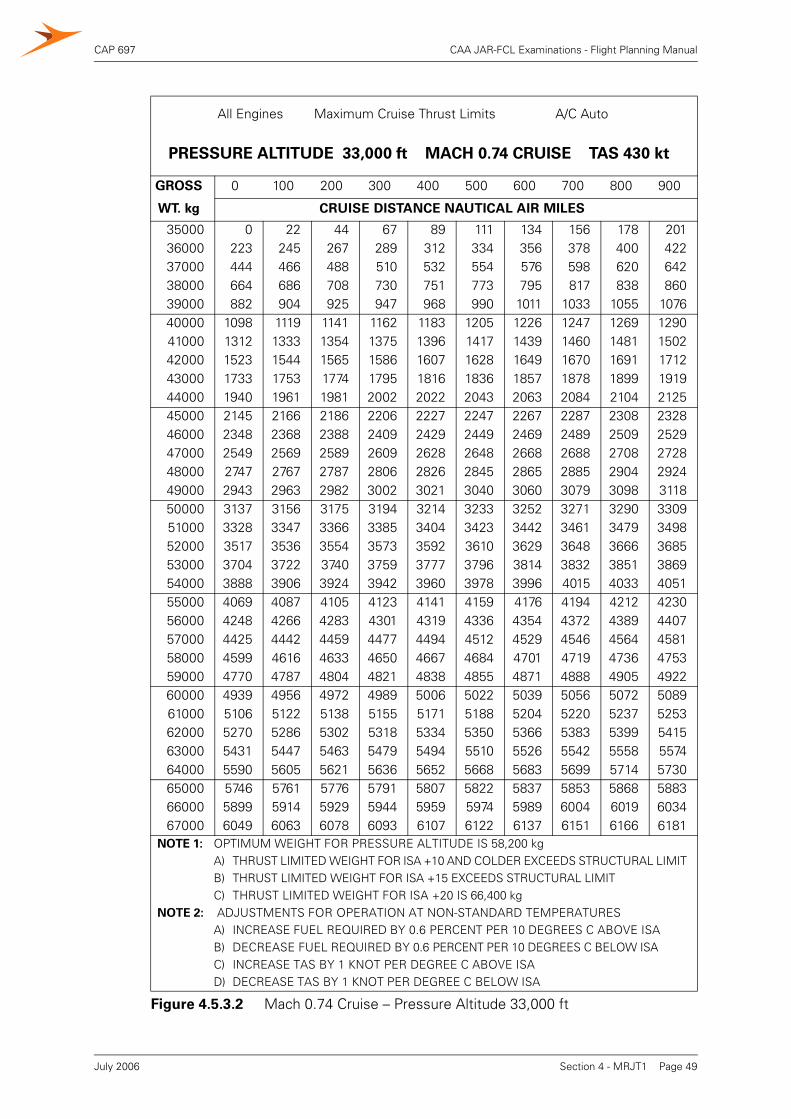
CAP 697 CAA JAR-FCL Examinations - Flight Planning Manual
All Engines Maximum Cruise Thrust Limits A/C Auto
PRESSURE ALTITUDE 33,000 ft MACH 0.74 CRUISE TAS 430 kt
GROSS 0 100 200 300 400 500 600 700 800 900
WT. kg CRUISE DISTANCE NAUTICAL AIR MILES
35000 0 22 44 67 89 111 134 156 178 20136000 223 245 267 289 312 334 356 378 400 42237000 444 466 488 510 532 554 576 598 620 64238000 664 686 708 730 751 773 795 817 838 86039000 882 904 925 947 968 990 1011 1033 1055 107640000 1098 1119 1141 1162 1183 1205 1226 1247 1269 129041000 1312 1333 1354 1375 1396 1417 1439 1460 1481 150242000 1523 1544 1565 1586 1607 1628 1649 1670 1691 171243000 1733 1753 1774 1795 1816 1836 1857 1878 1899 191944000 1940 1961 1981 2002 2022 2043 2063 2084 2104 212545000 2145 2166 2186 2206 2227 2247 2267 2287 2308 232846000 2348 2368 2388 2409 2429 2449 2469 2489 2509 252947000 2549 2569 2589 2609 2628 2648 2668 2688 2708 272848000 2747 2767 2787 2806 2826 2845 2865 2885 2904 292449000 2943 2963 2982 3002 3021 3040 3060 3079 3098 311850000 3137 3156 3175 3194 3214 3233 3252 3271 3290 330951000 3328 3347 3366 3385 3404 3423 3442 3461 3479 349852000 3517 3536 3554 3573 3592 3610 3629 3648 3666 368553000 3704 3722 3740 3759 3777 3796 3814 3832 3851 386954000 3888 3906 3924 3942 3960 3978 3996 4015 4033 405155000 4069 4087 4105 4123 4141 4159 4176 4194 4212 423056000 4248 4266 4283 4301 4319 4336 4354 4372 4389 440757000 4425 4442 4459 4477 4494 4512 4529 4546 4564 458158000 4599 4616 4633 4650 4667 4684 4701 4719 4736 475359000 4770 4787 4804 4821 4838 4855 4871 4888 4905 492260000 4939 4956 4972 4989 5006 5022 5039 5056 5072 508961000 5106 5122 5138 5155 5171 5188 5204 5220 5237 525362000 5270 5286 5302 5318 5334 5350 5366 5383 5399 541563000 5431 5447 5463 5479 5494 5510 5526 5542 5558 557464000 5590 5605 5621 5636 5652 5668 5683 5699 5714 573065000 5746 5761 5776 5791 5807 5822 5837 5853 5868 588366000 5899 5914 5929 5944 5959 5974 5989 6004 6019 603467000 6049 6063 6078 6093 6107 6122 6137 6151 6166 6181
NOTE 1: OPTIMUM WEIGHT FOR PRESSURE ALTITUDE IS 58,200 kgA) THRUST LIMITED WEIGHT FOR ISA +10 AND COLDER EXCEEDS STRUCTURAL LIMITB) THRUST LIMITED WEIGHT FOR ISA +15 EXCEEDS STRUCTURAL LIMITC) THRUST LIMITED WEIGHT FOR ISA +20 IS 66,400 kg
NOTE 2: ADJUSTMENTS FOR OPERATION AT NON-STANDARD TEMPERATURESA) INCREASE FUEL REQUIRED BY 0.6 PERCENT PER 10 DEGREES C ABOVE ISAB) DECREASE FUEL REQUIRED BY 0.6 PERCENT PER 10 DEGREES C BELOW ISAC) INCREASE TAS BY 1 KNOT PER DEGREE C ABOVE ISAD) DECREASE TAS BY 1 KNOT PER DEGREE C BELOW ISA
Figure 4.5.3.2 Mach 0.74 Cruise – Pressure Altitude 33,000 ft
Section 4 - MRJT1 Page 49July 2006
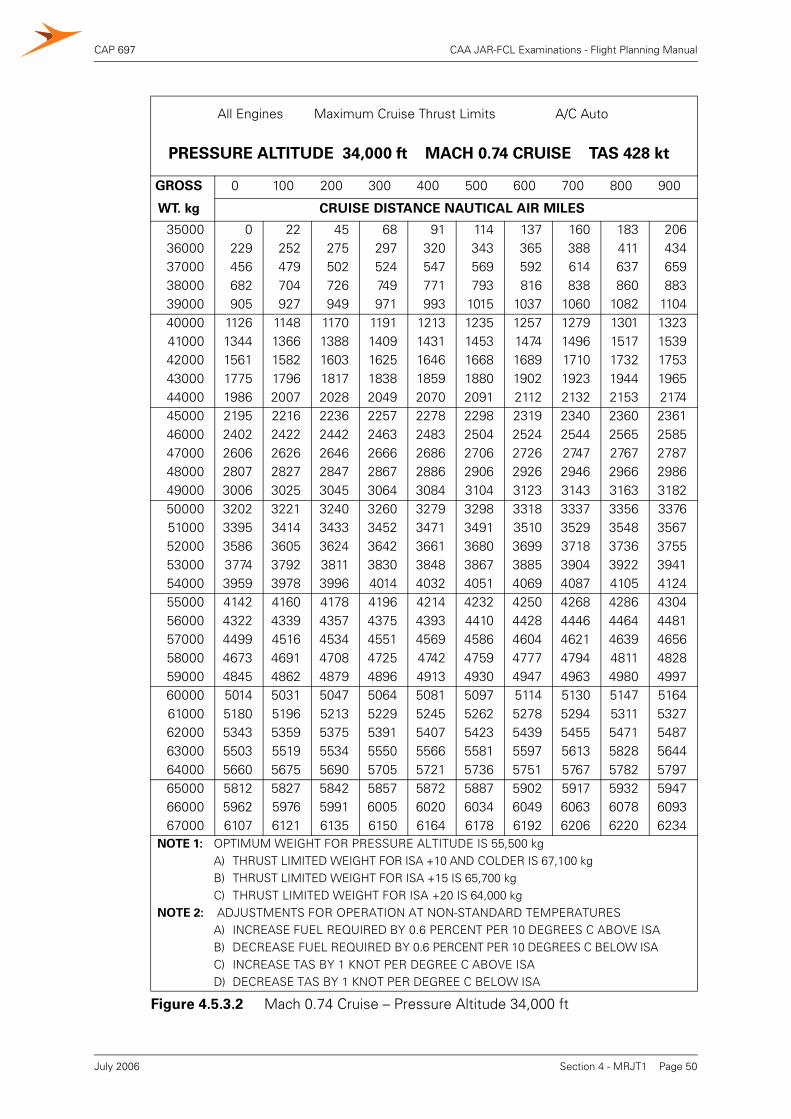
CAP 697 CAA JAR-FCL Examinations - Flight Planning Manual
All Engines Maximum Cruise Thrust Limits A/C Auto
PRESSURE ALTITUDE 34,000 ft MACH 0.74 CRUISE TAS 428 kt
GROSS 0 100 200 300 400 500 600 700 800 900
WT. kg CRUISE DISTANCE NAUTICAL AIR MILES
35000 0 22 45 68 91 114 137 160 183 20636000 229 252 275 297 320 343 365 388 411 43437000 456 479 502 524 547 569 592 614 637 65938000 682 704 726 749 771 793 816 838 860 88339000 905 927 949 971 993 1015 1037 1060 1082 110440000 1126 1148 1170 1191 1213 1235 1257 1279 1301 132341000 1344 1366 1388 1409 1431 1453 1474 1496 1517 153942000 1561 1582 1603 1625 1646 1668 1689 1710 1732 175343000 1775 1796 1817 1838 1859 1880 1902 1923 1944 196544000 1986 2007 2028 2049 2070 2091 2112 2132 2153 217445000 2195 2216 2236 2257 2278 2298 2319 2340 2360 236146000 2402 2422 2442 2463 2483 2504 2524 2544 2565 258547000 2606 2626 2646 2666 2686 2706 2726 2747 2767 278748000 2807 2827 2847 2867 2886 2906 2926 2946 2966 298649000 3006 3025 3045 3064 3084 3104 3123 3143 3163 318250000 3202 3221 3240 3260 3279 3298 3318 3337 3356 337651000 3395 3414 3433 3452 3471 3491 3510 3529 3548 356752000 3586 3605 3624 3642 3661 3680 3699 3718 3736 375553000 3774 3792 3811 3830 3848 3867 3885 3904 3922 394154000 3959 3978 3996 4014 4032 4051 4069 4087 4105 412455000 4142 4160 4178 4196 4214 4232 4250 4268 4286 430456000 4322 4339 4357 4375 4393 4410 4428 4446 4464 448157000 4499 4516 4534 4551 4569 4586 4604 4621 4639 465658000 4673 4691 4708 4725 4742 4759 4777 4794 4811 482859000 4845 4862 4879 4896 4913 4930 4947 4963 4980 499760000 5014 5031 5047 5064 5081 5097 5114 5130 5147 516461000 5180 5196 5213 5229 5245 5262 5278 5294 5311 532762000 5343 5359 5375 5391 5407 5423 5439 5455 5471 548763000 5503 5519 5534 5550 5566 5581 5597 5613 5828 564464000 5660 5675 5690 5705 5721 5736 5751 5767 5782 579765000 5812 5827 5842 5857 5872 5887 5902 5917 5932 594766000 5962 5976 5991 6005 6020 6034 6049 6063 6078 609367000 6107 6121 6135 6150 6164 6178 6192 6206 6220 6234
NOTE 1: OPTIMUM WEIGHT FOR PRESSURE ALTITUDE IS 55,500 kgA) THRUST LIMITED WEIGHT FOR ISA +10 AND COLDER IS 67,100 kgB) THRUST LIMITED WEIGHT FOR ISA +15 IS 65,700 kgC) THRUST LIMITED WEIGHT FOR ISA +20 IS 64,000 kg
NOTE 2: ADJUSTMENTS FOR OPERATION AT NON-STANDARD TEMPERATURESA) INCREASE FUEL REQUIRED BY 0.6 PERCENT PER 10 DEGREES C ABOVE ISAB) DECREASE FUEL REQUIRED BY 0.6 PERCENT PER 10 DEGREES C BELOW ISAC) INCREASE TAS BY 1 KNOT PER DEGREE C ABOVE ISAD) DECREASE TAS BY 1 KNOT PER DEGREE C BELOW ISA
Figure 4.5.3.2 Mach 0.74 Cruise – Pressure Altitude 34,000 ft
Section 4 - MRJT1 Page 50July 2006
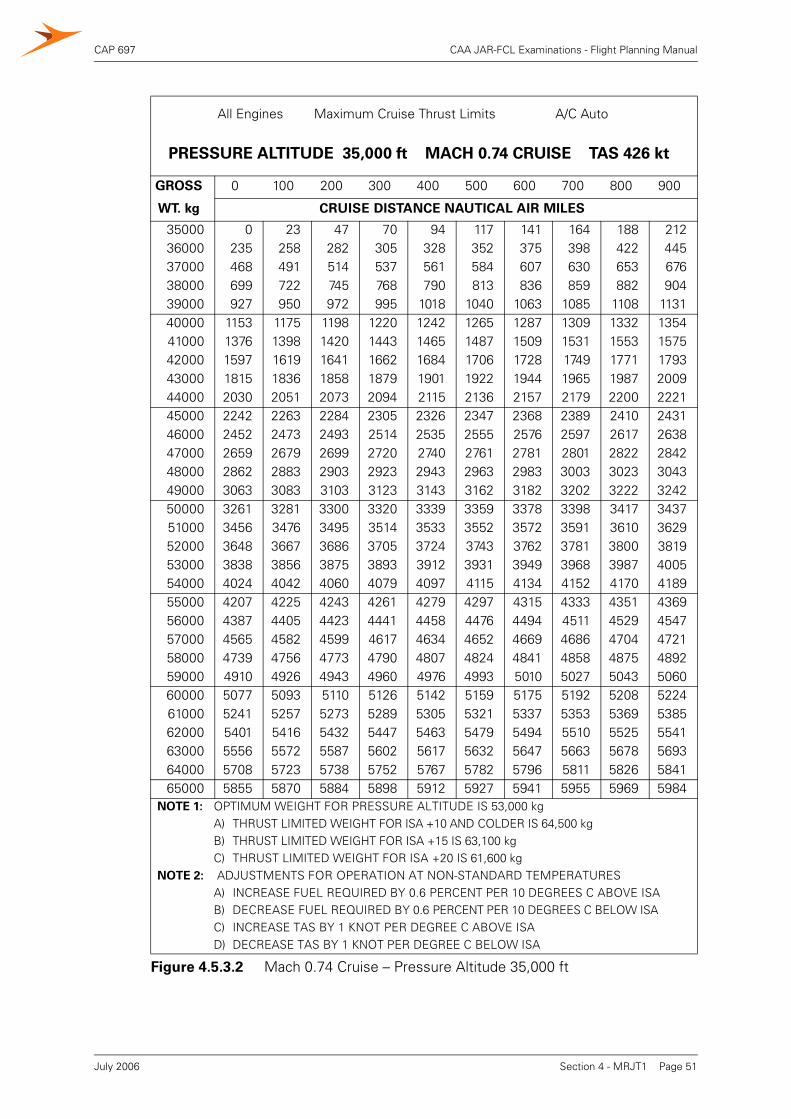
CAP 697 CAA JAR-FCL Examinations - Flight Planning Manual
All Engines Maximum Cruise Thrust Limits A/C Auto
PRESSURE ALTITUDE 35,000 ft MACH 0.74 CRUISE TAS 426 kt
GROSS 0 100 200 300 400 500 600 700 800 900
WT. kg CRUISE DISTANCE NAUTICAL AIR MILES
35000 0 23 47 70 94 117 141 164 188 21236000 235 258 282 305 328 352 375 398 422 44537000 468 491 514 537 561 584 607 630 653 67638000 699 722 745 768 790 813 836 859 882 90439000 927 950 972 995 1018 1040 1063 1085 1108 113140000 1153 1175 1198 1220 1242 1265 1287 1309 1332 135441000 1376 1398 1420 1443 1465 1487 1509 1531 1553 157542000 1597 1619 1641 1662 1684 1706 1728 1749 1771 179343000 1815 1836 1858 1879 1901 1922 1944 1965 1987 200944000 2030 2051 2073 2094 2115 2136 2157 2179 2200 222145000 2242 2263 2284 2305 2326 2347 2368 2389 2410 243146000 2452 2473 2493 2514 2535 2555 2576 2597 2617 263847000 2659 2679 2699 2720 2740 2761 2781 2801 2822 284248000 2862 2883 2903 2923 2943 2963 2983 3003 3023 304349000 3063 3083 3103 3123 3143 3162 3182 3202 3222 324250000 3261 3281 3300 3320 3339 3359 3378 3398 3417 343751000 3456 3476 3495 3514 3533 3552 3572 3591 3610 362952000 3648 3667 3686 3705 3724 3743 3762 3781 3800 381953000 3838 3856 3875 3893 3912 3931 3949 3968 3987 400554000 4024 4042 4060 4079 4097 4115 4134 4152 4170 418955000 4207 4225 4243 4261 4279 4297 4315 4333 4351 436956000 4387 4405 4423 4441 4458 4476 4494 4511 4529 454757000 4565 4582 4599 4617 4634 4652 4669 4686 4704 472158000 4739 4756 4773 4790 4807 4824 4841 4858 4875 489259000 4910 4926 4943 4960 4976 4993 5010 5027 5043 506060000 5077 5093 5110 5126 5142 5159 5175 5192 5208 522461000 5241 5257 5273 5289 5305 5321 5337 5353 5369 538562000 5401 5416 5432 5447 5463 5479 5494 5510 5525 554163000 5556 5572 5587 5602 5617 5632 5647 5663 5678 569364000 5708 5723 5738 5752 5767 5782 5796 5811 5826 584165000 5855 5870 5884 5898 5912 5927 5941 5955 5969 5984
NOTE 1: OPTIMUM WEIGHT FOR PRESSURE ALTITUDE IS 53,000 kgA) THRUST LIMITED WEIGHT FOR ISA +10 AND COLDER IS 64,500 kgB) THRUST LIMITED WEIGHT FOR ISA +15 IS 63,100 kgC) THRUST LIMITED WEIGHT FOR ISA +20 IS 61,600 kg
NOTE 2: ADJUSTMENTS FOR OPERATION AT NON-STANDARD TEMPERATURESA) INCREASE FUEL REQUIRED BY 0.6 PERCENT PER 10 DEGREES C ABOVE ISAB) DECREASE FUEL REQUIRED BY 0.6 PERCENT PER 10 DEGREES C BELOW ISAC) INCREASE TAS BY 1 KNOT PER DEGREE C ABOVE ISAD) DECREASE TAS BY 1 KNOT PER DEGREE C BELOW ISA
Figure 4.5.3.2 Mach 0.74 Cruise – Pressure Altitude 35,000 ft
Section 4 - MRJT1 Page 51July 2006
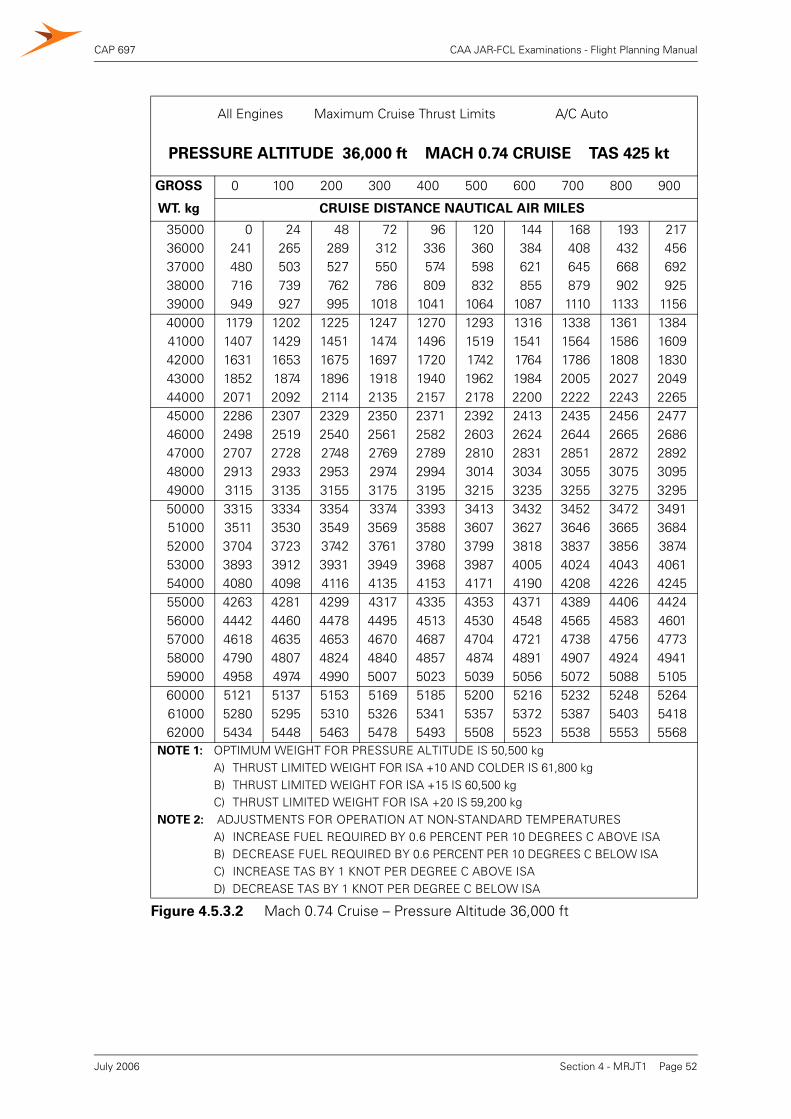
CAP 697 CAA JAR-FCL Examinations - Flight Planning Manual
All Engines Maximum Cruise Thrust Limits A/C Auto
PRESSURE ALTITUDE 36,000 ft MACH 0.74 CRUISE TAS 425 kt
GROSS 0 100 200 300 400 500 600 700 800 900
WT. kg CRUISE DISTANCE NAUTICAL AIR MILES
35000 0 24 48 72 96 120 144 168 193 21736000 241 265 289 312 336 360 384 408 432 45637000 480 503 527 550 574 598 621 645 668 69238000 716 739 762 786 809 832 855 879 902 92539000 949 927 995 1018 1041 1064 1087 1110 1133 115640000 1179 1202 1225 1247 1270 1293 1316 1338 1361 138441000 1407 1429 1451 1474 1496 1519 1541 1564 1586 160942000 1631 1653 1675 1697 1720 1742 1764 1786 1808 183043000 1852 1874 1896 1918 1940 1962 1984 2005 2027 204944000 2071 2092 2114 2135 2157 2178 2200 2222 2243 226545000 2286 2307 2329 2350 2371 2392 2413 2435 2456 247746000 2498 2519 2540 2561 2582 2603 2624 2644 2665 268647000 2707 2728 2748 2769 2789 2810 2831 2851 2872 289248000 2913 2933 2953 2974 2994 3014 3034 3055 3075 309549000 3115 3135 3155 3175 3195 3215 3235 3255 3275 329550000 3315 3334 3354 3374 3393 3413 3432 3452 3472 349151000 3511 3530 3549 3569 3588 3607 3627 3646 3665 368452000 3704 3723 3742 3761 3780 3799 3818 3837 3856 387453000 3893 3912 3931 3949 3968 3987 4005 4024 4043 406154000 4080 4098 4116 4135 4153 4171 4190 4208 4226 424555000 4263 4281 4299 4317 4335 4353 4371 4389 4406 442456000 4442 4460 4478 4495 4513 4530 4548 4565 4583 460157000 4618 4635 4653 4670 4687 4704 4721 4738 4756 477358000 4790 4807 4824 4840 4857 4874 4891 4907 4924 494159000 4958 4974 4990 5007 5023 5039 5056 5072 5088 510560000 5121 5137 5153 5169 5185 5200 5216 5232 5248 526461000 5280 5295 5310 5326 5341 5357 5372 5387 5403 541862000 5434 5448 5463 5478 5493 5508 5523 5538 5553 5568
NOTE 1: OPTIMUM WEIGHT FOR PRESSURE ALTITUDE IS 50,500 kgA) THRUST LIMITED WEIGHT FOR ISA +10 AND COLDER IS 61,800 kgB) THRUST LIMITED WEIGHT FOR ISA +15 IS 60,500 kgC) THRUST LIMITED WEIGHT FOR ISA +20 IS 59,200 kg
NOTE 2: ADJUSTMENTS FOR OPERATION AT NON-STANDARD TEMPERATURESA) INCREASE FUEL REQUIRED BY 0.6 PERCENT PER 10 DEGREES C ABOVE ISAB) DECREASE FUEL REQUIRED BY 0.6 PERCENT PER 10 DEGREES C BELOW ISAC) INCREASE TAS BY 1 KNOT PER DEGREE C ABOVE ISAD) DECREASE TAS BY 1 KNOT PER DEGREE C BELOW ISA
Figure 4.5.3.2 Mach 0.74 Cruise – Pressure Altitude 36,000 ft
Section 4 - MRJT1 Page 52July 2006
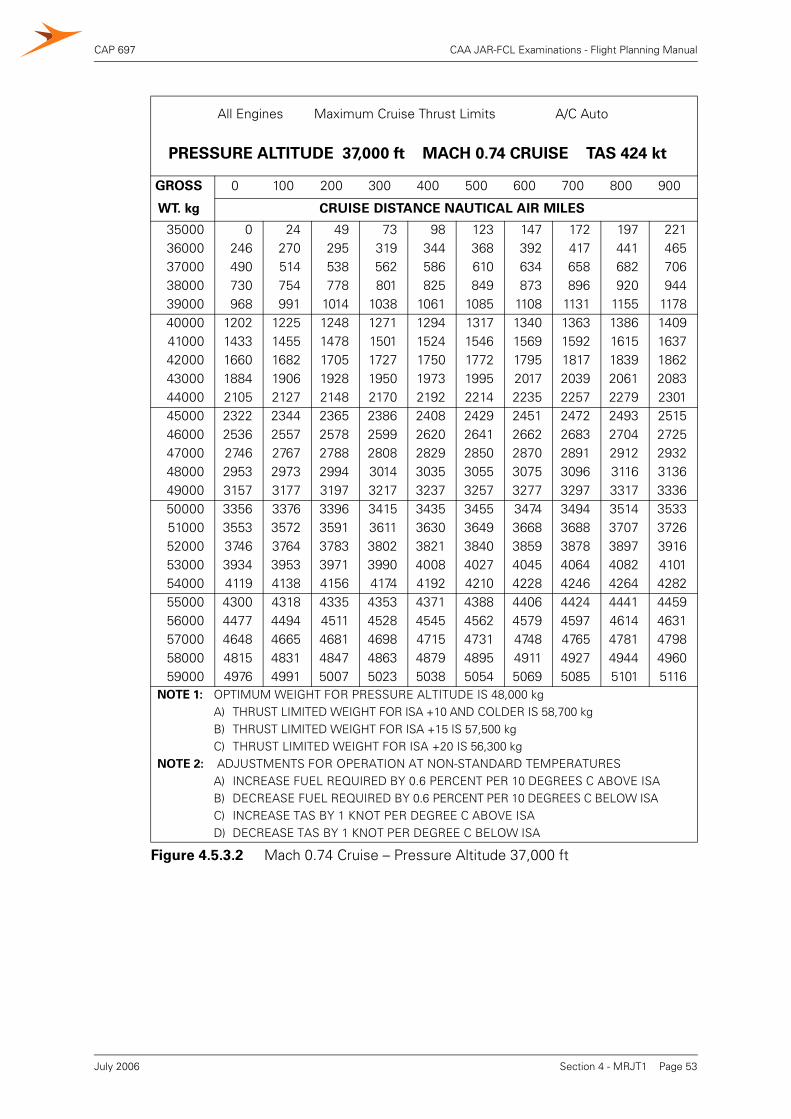
CAP 697 CAA JAR-FCL Examinations - Flight Planning Manual
All Engines Maximum Cruise Thrust Limits A/C Auto
PRESSURE ALTITUDE 37,000 ft MACH 0.74 CRUISE TAS 424 kt
GROSS 0 100 200 300 400 500 600 700 800 900
WT. kg CRUISE DISTANCE NAUTICAL AIR MILES
35000 0 24 49 73 98 123 147 172 197 22136000 246 270 295 319 344 368 392 417 441 46537000 490 514 538 562 586 610 634 658 682 70638000 730 754 778 801 825 849 873 896 920 94439000 968 991 1014 1038 1061 1085 1108 1131 1155 117840000 1202 1225 1248 1271 1294 1317 1340 1363 1386 140941000 1433 1455 1478 1501 1524 1546 1569 1592 1615 163742000 1660 1682 1705 1727 1750 1772 1795 1817 1839 186243000 1884 1906 1928 1950 1973 1995 2017 2039 2061 208344000 2105 2127 2148 2170 2192 2214 2235 2257 2279 230145000 2322 2344 2365 2386 2408 2429 2451 2472 2493 251546000 2536 2557 2578 2599 2620 2641 2662 2683 2704 272547000 2746 2767 2788 2808 2829 2850 2870 2891 2912 293248000 2953 2973 2994 3014 3035 3055 3075 3096 3116 313649000 3157 3177 3197 3217 3237 3257 3277 3297 3317 333650000 3356 3376 3396 3415 3435 3455 3474 3494 3514 353351000 3553 3572 3591 3611 3630 3649 3668 3688 3707 372652000 3746 3764 3783 3802 3821 3840 3859 3878 3897 391653000 3934 3953 3971 3990 4008 4027 4045 4064 4082 410154000 4119 4138 4156 4174 4192 4210 4228 4246 4264 428255000 4300 4318 4335 4353 4371 4388 4406 4424 4441 445956000 4477 4494 4511 4528 4545 4562 4579 4597 4614 463157000 4648 4665 4681 4698 4715 4731 4748 4765 4781 479858000 4815 4831 4847 4863 4879 4895 4911 4927 4944 496059000 4976 4991 5007 5023 5038 5054 5069 5085 5101 5116
NOTE 1: OPTIMUM WEIGHT FOR PRESSURE ALTITUDE IS 48,000 kgA) THRUST LIMITED WEIGHT FOR ISA +10 AND COLDER IS 58,700 kgB) THRUST LIMITED WEIGHT FOR ISA +15 IS 57,500 kgC) THRUST LIMITED WEIGHT FOR ISA +20 IS 56,300 kg
NOTE 2: ADJUSTMENTS FOR OPERATION AT NON-STANDARD TEMPERATURESA) INCREASE FUEL REQUIRED BY 0.6 PERCENT PER 10 DEGREES C ABOVE ISAB) DECREASE FUEL REQUIRED BY 0.6 PERCENT PER 10 DEGREES C BELOW ISAC) INCREASE TAS BY 1 KNOT PER DEGREE C ABOVE ISAD) DECREASE TAS BY 1 KNOT PER DEGREE C BELOW ISA
Figure 4.5.3.2 Mach 0.74 Cruise – Pressure Altitude 37,000 ft
Section 4 - MRJT1 Page 53July 2006

CAP 697 CAA JAR-FCL Examinations - Flight Planning Manual
INTENTIONALLY LEFT BLANK
Section 4 - MRJT1 Page 54July 2006
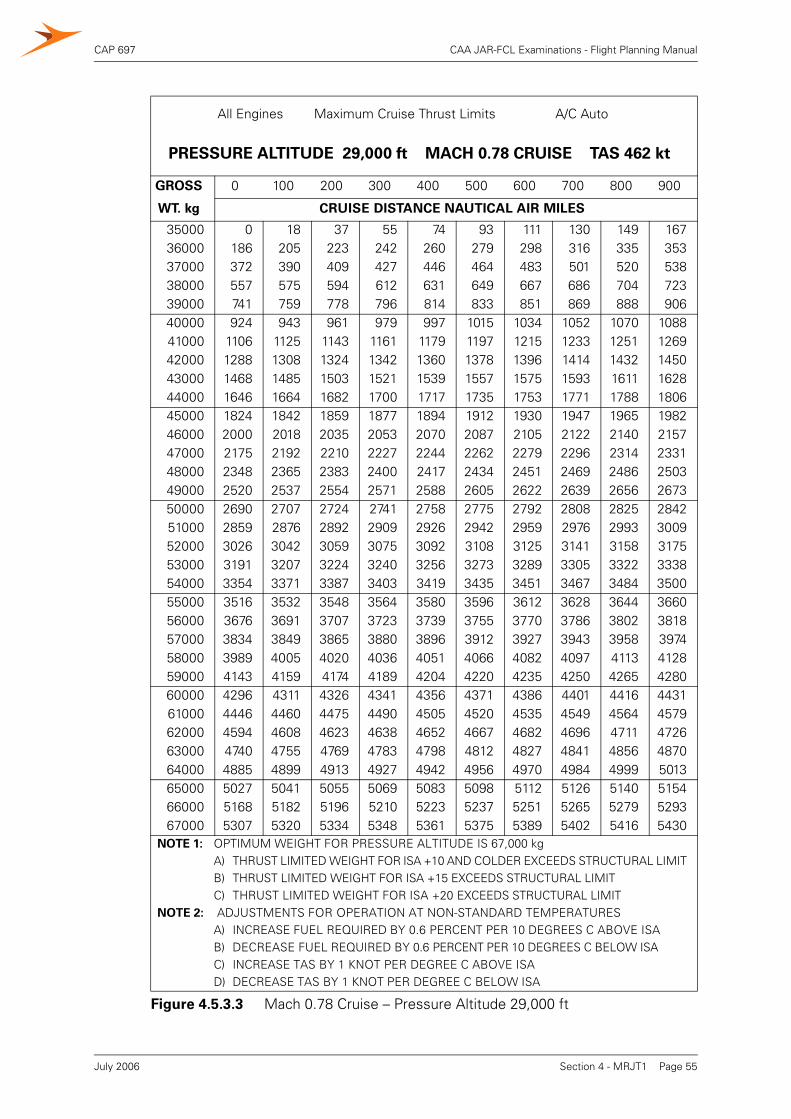
CAP 697 CAA JAR-FCL Examinations - Flight Planning Manual
All Engines Maximum Cruise Thrust Limits A/C Auto
PRESSURE ALTITUDE 29,000 ft MACH 0.78 CRUISE TAS 462 kt
GROSS 0 100 200 300 400 500 600 700 800 900
WT. kg CRUISE DISTANCE NAUTICAL AIR MILES
35000 0 18 37 55 74 93 111 130 149 16736000 186 205 223 242 260 279 298 316 335 35337000 372 390 409 427 446 464 483 501 520 53838000 557 575 594 612 631 649 667 686 704 72339000 741 759 778 796 814 833 851 869 888 90640000 924 943 961 979 997 1015 1034 1052 1070 108841000 1106 1125 1143 1161 1179 1197 1215 1233 1251 126942000 1288 1308 1324 1342 1360 1378 1396 1414 1432 145043000 1468 1485 1503 1521 1539 1557 1575 1593 1611 162844000 1646 1664 1682 1700 1717 1735 1753 1771 1788 180645000 1824 1842 1859 1877 1894 1912 1930 1947 1965 198246000 2000 2018 2035 2053 2070 2087 2105 2122 2140 215747000 2175 2192 2210 2227 2244 2262 2279 2296 2314 233148000 2348 2365 2383 2400 2417 2434 2451 2469 2486 250349000 2520 2537 2554 2571 2588 2605 2622 2639 2656 267350000 2690 2707 2724 2741 2758 2775 2792 2808 2825 284251000 2859 2876 2892 2909 2926 2942 2959 2976 2993 300952000 3026 3042 3059 3075 3092 3108 3125 3141 3158 317553000 3191 3207 3224 3240 3256 3273 3289 3305 3322 333854000 3354 3371 3387 3403 3419 3435 3451 3467 3484 350055000 3516 3532 3548 3564 3580 3596 3612 3628 3644 366056000 3676 3691 3707 3723 3739 3755 3770 3786 3802 381857000 3834 3849 3865 3880 3896 3912 3927 3943 3958 397458000 3989 4005 4020 4036 4051 4066 4082 4097 4113 412859000 4143 4159 4174 4189 4204 4220 4235 4250 4265 428060000 4296 4311 4326 4341 4356 4371 4386 4401 4416 443161000 4446 4460 4475 4490 4505 4520 4535 4549 4564 457962000 4594 4608 4623 4638 4652 4667 4682 4696 4711 472663000 4740 4755 4769 4783 4798 4812 4827 4841 4856 487064000 4885 4899 4913 4927 4942 4956 4970 4984 4999 501365000 5027 5041 5055 5069 5083 5098 5112 5126 5140 515466000 5168 5182 5196 5210 5223 5237 5251 5265 5279 529367000 5307 5320 5334 5348 5361 5375 5389 5402 5416 5430
NOTE 1: OPTIMUM WEIGHT FOR PRESSURE ALTITUDE IS 67,000 kgA) THRUST LIMITED WEIGHT FOR ISA +10 AND COLDER EXCEEDS STRUCTURAL LIMITB) THRUST LIMITED WEIGHT FOR ISA +15 EXCEEDS STRUCTURAL LIMITC) THRUST LIMITED WEIGHT FOR ISA +20 EXCEEDS STRUCTURAL LIMIT
NOTE 2: ADJUSTMENTS FOR OPERATION AT NON-STANDARD TEMPERATURESA) INCREASE FUEL REQUIRED BY 0.6 PERCENT PER 10 DEGREES C ABOVE ISAB) DECREASE FUEL REQUIRED BY 0.6 PERCENT PER 10 DEGREES C BELOW ISAC) INCREASE TAS BY 1 KNOT PER DEGREE C ABOVE ISAD) DECREASE TAS BY 1 KNOT PER DEGREE C BELOW ISA
Figure 4.5.3.3 Mach 0.78 Cruise – Pressure Altitude 29,000 ft
Section 4 - MRJT1 Page 55July 2006
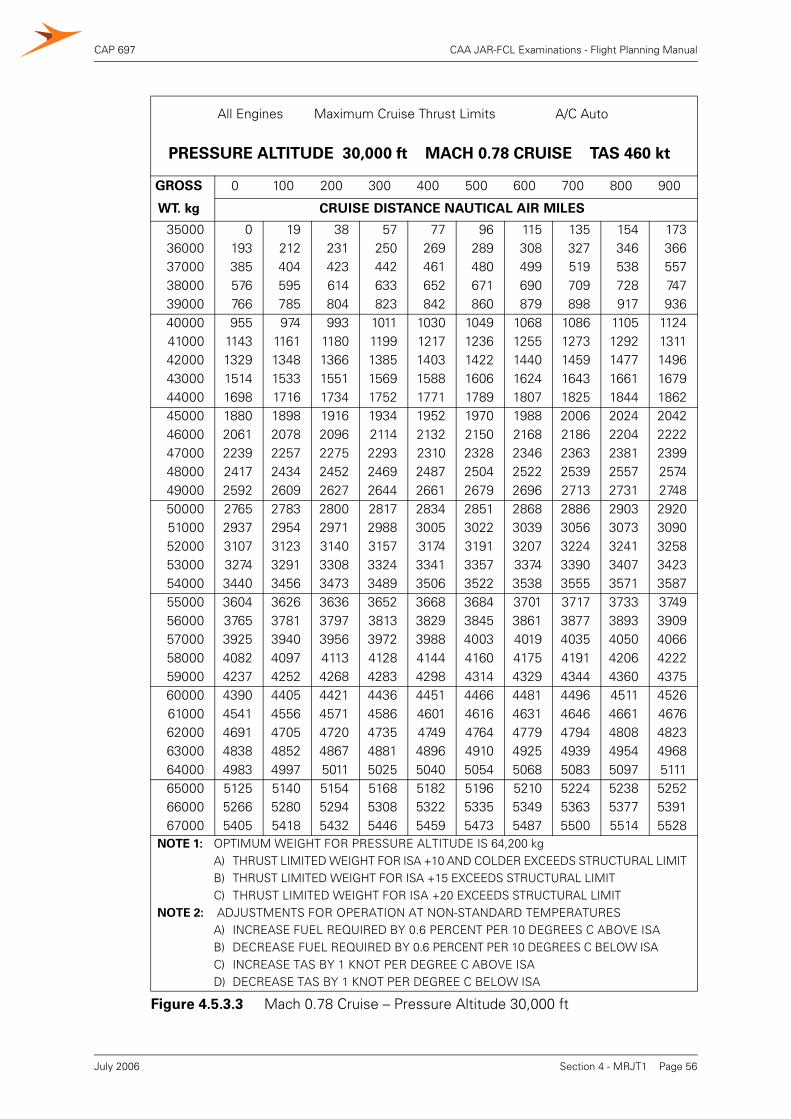
CAP 697 CAA JAR-FCL Examinations - Flight Planning Manual
All Engines Maximum Cruise Thrust Limits A/C Auto
PRESSURE ALTITUDE 30,000 ft MACH 0.78 CRUISE TAS 460 kt
GROSS 0 100 200 300 400 500 600 700 800 900
WT. kg CRUISE DISTANCE NAUTICAL AIR MILES
35000 0 19 38 57 77 96 115 135 154 17336000 193 212 231 250 269 289 308 327 346 36637000 385 404 423 442 461 480 499 519 538 55738000 576 595 614 633 652 671 690 709 728 74739000 766 785 804 823 842 860 879 898 917 93640000 955 974 993 1011 1030 1049 1068 1086 1105 112441000 1143 1161 1180 1199 1217 1236 1255 1273 1292 131142000 1329 1348 1366 1385 1403 1422 1440 1459 1477 149643000 1514 1533 1551 1569 1588 1606 1624 1643 1661 167944000 1698 1716 1734 1752 1771 1789 1807 1825 1844 186245000 1880 1898 1916 1934 1952 1970 1988 2006 2024 204246000 2061 2078 2096 2114 2132 2150 2168 2186 2204 222247000 2239 2257 2275 2293 2310 2328 2346 2363 2381 239948000 2417 2434 2452 2469 2487 2504 2522 2539 2557 257449000 2592 2609 2627 2644 2661 2679 2696 2713 2731 274850000 2765 2783 2800 2817 2834 2851 2868 2886 2903 292051000 2937 2954 2971 2988 3005 3022 3039 3056 3073 309052000 3107 3123 3140 3157 3174 3191 3207 3224 3241 325853000 3274 3291 3308 3324 3341 3357 3374 3390 3407 342354000 3440 3456 3473 3489 3506 3522 3538 3555 3571 358755000 3604 3626 3636 3652 3668 3684 3701 3717 3733 374956000 3765 3781 3797 3813 3829 3845 3861 3877 3893 390957000 3925 3940 3956 3972 3988 4003 4019 4035 4050 406658000 4082 4097 4113 4128 4144 4160 4175 4191 4206 422259000 4237 4252 4268 4283 4298 4314 4329 4344 4360 437560000 4390 4405 4421 4436 4451 4466 4481 4496 4511 452661000 4541 4556 4571 4586 4601 4616 4631 4646 4661 467662000 4691 4705 4720 4735 4749 4764 4779 4794 4808 482363000 4838 4852 4867 4881 4896 4910 4925 4939 4954 496864000 4983 4997 5011 5025 5040 5054 5068 5083 5097 511165000 5125 5140 5154 5168 5182 5196 5210 5224 5238 525266000 5266 5280 5294 5308 5322 5335 5349 5363 5377 539167000 5405 5418 5432 5446 5459 5473 5487 5500 5514 5528
NOTE 1: OPTIMUM WEIGHT FOR PRESSURE ALTITUDE IS 64,200 kgA) THRUST LIMITED WEIGHT FOR ISA +10 AND COLDER EXCEEDS STRUCTURAL LIMITB) THRUST LIMITED WEIGHT FOR ISA +15 EXCEEDS STRUCTURAL LIMITC) THRUST LIMITED WEIGHT FOR ISA +20 EXCEEDS STRUCTURAL LIMIT
NOTE 2: ADJUSTMENTS FOR OPERATION AT NON-STANDARD TEMPERATURESA) INCREASE FUEL REQUIRED BY 0.6 PERCENT PER 10 DEGREES C ABOVE ISAB) DECREASE FUEL REQUIRED BY 0.6 PERCENT PER 10 DEGREES C BELOW ISAC) INCREASE TAS BY 1 KNOT PER DEGREE C ABOVE ISAD) DECREASE TAS BY 1 KNOT PER DEGREE C BELOW ISA
Figure 4.5.3.3 Mach 0.78 Cruise – Pressure Altitude 30,000 ft
Section 4 - MRJT1 Page 56July 2006
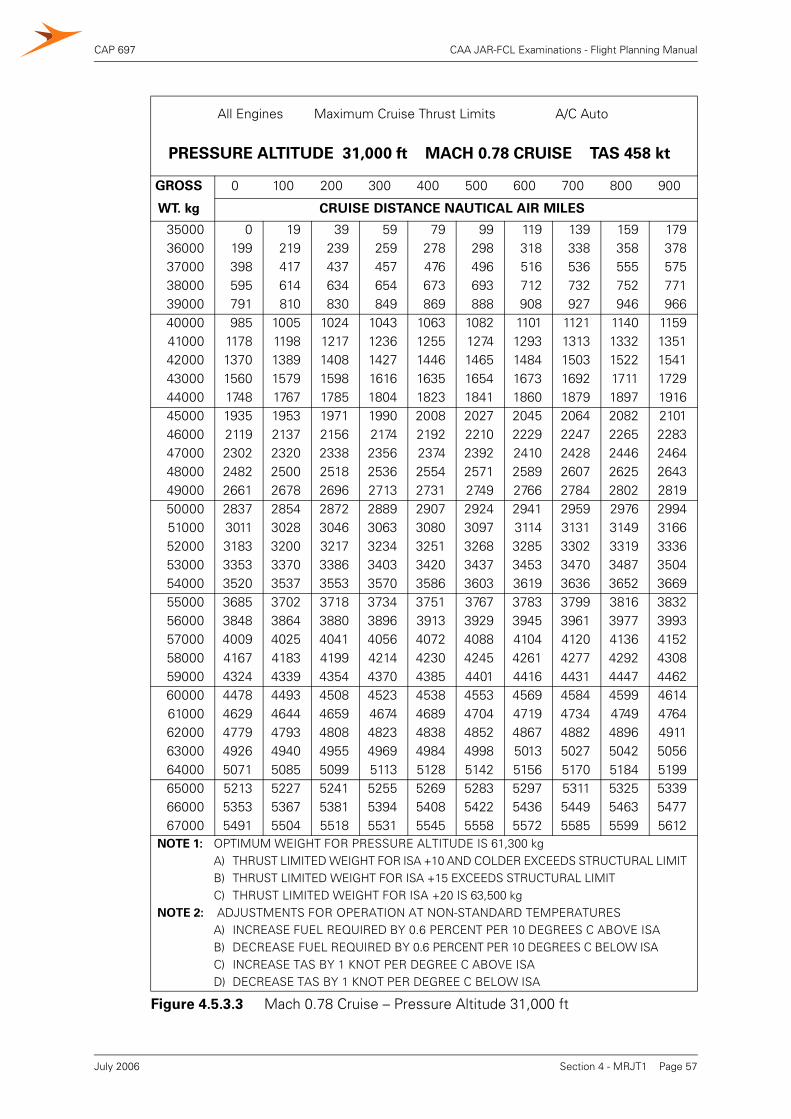
CAP 697 CAA JAR-FCL Examinations - Flight Planning Manual
All Engines Maximum Cruise Thrust Limits A/C Auto
PRESSURE ALTITUDE 31,000 ft MACH 0.78 CRUISE TAS 458 kt
GROSS 0 100 200 300 400 500 600 700 800 900
WT. kg CRUISE DISTANCE NAUTICAL AIR MILES
35000 0 19 39 59 79 99 119 139 159 17936000 199 219 239 259 278 298 318 338 358 37837000 398 417 437 457 476 496 516 536 555 57538000 595 614 634 654 673 693 712 732 752 77139000 791 810 830 849 869 888 908 927 946 96640000 985 1005 1024 1043 1063 1082 1101 1121 1140 115941000 1178 1198 1217 1236 1255 1274 1293 1313 1332 135142000 1370 1389 1408 1427 1446 1465 1484 1503 1522 154143000 1560 1579 1598 1616 1635 1654 1673 1692 1711 172944000 1748 1767 1785 1804 1823 1841 1860 1879 1897 191645000 1935 1953 1971 1990 2008 2027 2045 2064 2082 210146000 2119 2137 2156 2174 2192 2210 2229 2247 2265 228347000 2302 2320 2338 2356 2374 2392 2410 2428 2446 246448000 2482 2500 2518 2536 2554 2571 2589 2607 2625 264349000 2661 2678 2696 2713 2731 2749 2766 2784 2802 281950000 2837 2854 2872 2889 2907 2924 2941 2959 2976 299451000 3011 3028 3046 3063 3080 3097 3114 3131 3149 316652000 3183 3200 3217 3234 3251 3268 3285 3302 3319 333653000 3353 3370 3386 3403 3420 3437 3453 3470 3487 350454000 3520 3537 3553 3570 3586 3603 3619 3636 3652 366955000 3685 3702 3718 3734 3751 3767 3783 3799 3816 383256000 3848 3864 3880 3896 3913 3929 3945 3961 3977 399357000 4009 4025 4041 4056 4072 4088 4104 4120 4136 415258000 4167 4183 4199 4214 4230 4245 4261 4277 4292 430859000 4324 4339 4354 4370 4385 4401 4416 4431 4447 446260000 4478 4493 4508 4523 4538 4553 4569 4584 4599 461461000 4629 4644 4659 4674 4689 4704 4719 4734 4749 476462000 4779 4793 4808 4823 4838 4852 4867 4882 4896 491163000 4926 4940 4955 4969 4984 4998 5013 5027 5042 505664000 5071 5085 5099 5113 5128 5142 5156 5170 5184 519965000 5213 5227 5241 5255 5269 5283 5297 5311 5325 533966000 5353 5367 5381 5394 5408 5422 5436 5449 5463 547767000 5491 5504 5518 5531 5545 5558 5572 5585 5599 5612
NOTE 1: OPTIMUM WEIGHT FOR PRESSURE ALTITUDE IS 61,300 kgA) THRUST LIMITED WEIGHT FOR ISA +10 AND COLDER EXCEEDS STRUCTURAL LIMITB) THRUST LIMITED WEIGHT FOR ISA +15 EXCEEDS STRUCTURAL LIMITC) THRUST LIMITED WEIGHT FOR ISA +20 IS 63,500 kg
NOTE 2: ADJUSTMENTS FOR OPERATION AT NON-STANDARD TEMPERATURESA) INCREASE FUEL REQUIRED BY 0.6 PERCENT PER 10 DEGREES C ABOVE ISAB) DECREASE FUEL REQUIRED BY 0.6 PERCENT PER 10 DEGREES C BELOW ISAC) INCREASE TAS BY 1 KNOT PER DEGREE C ABOVE ISAD) DECREASE TAS BY 1 KNOT PER DEGREE C BELOW ISA
Figure 4.5.3.3 Mach 0.78 Cruise – Pressure Altitude 31,000 ft
Section 4 - MRJT1 Page 57July 2006
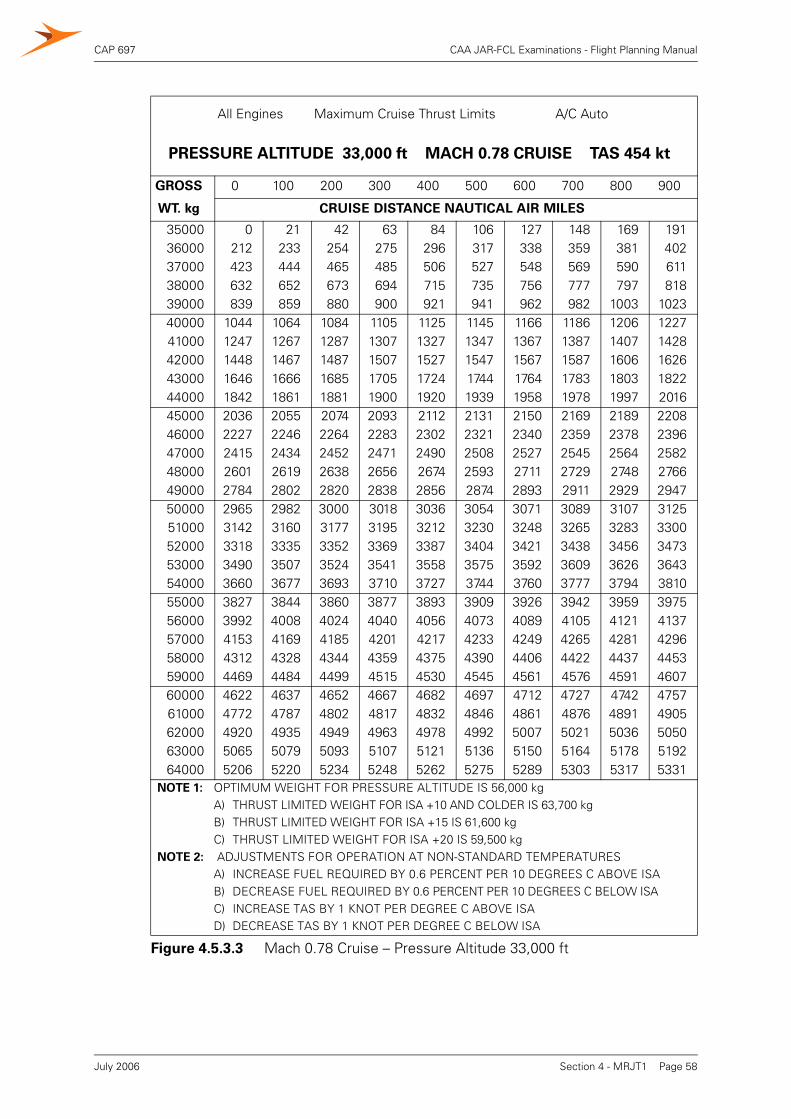
CAP 697 CAA JAR-FCL Examinations - Flight Planning Manual
All Engines Maximum Cruise Thrust Limits A/C Auto
PRESSURE ALTITUDE 33,000 ft MACH 0.78 CRUISE TAS 454 kt
GROSS 0 100 200 300 400 500 600 700 800 900
WT. kg CRUISE DISTANCE NAUTICAL AIR MILES
35000 0 21 42 63 84 106 127 148 169 19136000 212 233 254 275 296 317 338 359 381 40237000 423 444 465 485 506 527 548 569 590 61138000 632 652 673 694 715 735 756 777 797 81839000 839 859 880 900 921 941 962 982 1003 102340000 1044 1064 1084 1105 1125 1145 1166 1186 1206 122741000 1247 1267 1287 1307 1327 1347 1367 1387 1407 142842000 1448 1467 1487 1507 1527 1547 1567 1587 1606 162643000 1646 1666 1685 1705 1724 1744 1764 1783 1803 182244000 1842 1861 1881 1900 1920 1939 1958 1978 1997 201645000 2036 2055 2074 2093 2112 2131 2150 2169 2189 220846000 2227 2246 2264 2283 2302 2321 2340 2359 2378 239647000 2415 2434 2452 2471 2490 2508 2527 2545 2564 258248000 2601 2619 2638 2656 2674 2593 2711 2729 2748 276649000 2784 2802 2820 2838 2856 2874 2893 2911 2929 294750000 2965 2982 3000 3018 3036 3054 3071 3089 3107 312551000 3142 3160 3177 3195 3212 3230 3248 3265 3283 330052000 3318 3335 3352 3369 3387 3404 3421 3438 3456 347353000 3490 3507 3524 3541 3558 3575 3592 3609 3626 364354000 3660 3677 3693 3710 3727 3744 3760 3777 3794 381055000 3827 3844 3860 3877 3893 3909 3926 3942 3959 397556000 3992 4008 4024 4040 4056 4073 4089 4105 4121 413757000 4153 4169 4185 4201 4217 4233 4249 4265 4281 429658000 4312 4328 4344 4359 4375 4390 4406 4422 4437 445359000 4469 4484 4499 4515 4530 4545 4561 4576 4591 460760000 4622 4637 4652 4667 4682 4697 4712 4727 4742 475761000 4772 4787 4802 4817 4832 4846 4861 4876 4891 490562000 4920 4935 4949 4963 4978 4992 5007 5021 5036 505063000 5065 5079 5093 5107 5121 5136 5150 5164 5178 519264000 5206 5220 5234 5248 5262 5275 5289 5303 5317 5331
NOTE 1: OPTIMUM WEIGHT FOR PRESSURE ALTITUDE IS 56,000 kgA) THRUST LIMITED WEIGHT FOR ISA +10 AND COLDER IS 63,700 kgB) THRUST LIMITED WEIGHT FOR ISA +15 IS 61,600 kgC) THRUST LIMITED WEIGHT FOR ISA +20 IS 59,500 kg
NOTE 2: ADJUSTMENTS FOR OPERATION AT NON-STANDARD TEMPERATURESA) INCREASE FUEL REQUIRED BY 0.6 PERCENT PER 10 DEGREES C ABOVE ISAB) DECREASE FUEL REQUIRED BY 0.6 PERCENT PER 10 DEGREES C BELOW ISAC) INCREASE TAS BY 1 KNOT PER DEGREE C ABOVE ISAD) DECREASE TAS BY 1 KNOT PER DEGREE C BELOW ISA
Figure 4.5.3.3 Mach 0.78 Cruise – Pressure Altitude 33,000 ft
Section 4 - MRJT1 Page 58July 2006

CAP 697 CAA JAR-FCL Examinations - Flight Planning Manual
All Engines Maximum Cruise Thrust Limits A/C Auto
PRESSURE ALTITUDE 35,000 ft MACH 0.78 CRUISE TAS 449 kt
GROSS 0 100 200 300 400 500 600 700 800 900
WT. kg CRUISE DISTANCE NAUTICAL AIR MILES
35000 0 22 44 67 89 112 134 156 179 20136000 224 246 268 290 313 335 357 379 401 42337000 446 468 490 511 533 555 577 599 621 64338000 665 687 708 730 752 773 795 817 838 86039000 882 903 924 946 967 988 1010 1031 1053 107440000 1095 1116 1137 1159 1180 1201 1222 1243 1264 128541000 1306 1327 1348 1368 1389 1410 1431 1452 1472 149342000 1514 1534 1555 1575 1596 1616 1637 1657 1678 169843000 1719 1739 1759 1779 1799 1820 1840 1860 1880 190044000 1920 1940 1960 1980 2000 2020 2040 2059 2079 209945000 2119 2138 2158 2178 2197 2217 2236 2256 2275 229546000 2314 2333 2353 2372 2391 2410 2430 2449 2468 248747000 2506 2525 2544 2563 2582 2601 2620 2639 2658 267748000 2695 2714 2733 2751 2770 2788 2807 2826 2844 286349000 2881 2900 2918 2936 2954 2973 2991 3009 3028 304650000 3064 3082 3100 3118 3136 3154 3172 3190 3208 322651000 3244 3261 3279 3297 3314 3332 3349 3367 3385 340252000 3420 3437 3454 3472 3489 3506 3524 3541 3558 357653000 3593 3610 3627 3644 3661 3678 3695 3712 3729 374554000 3762 3779 3796 3812 3829 3846 3862 3879 3895 391255000 3929 3945 3961 3978 3994 4010 4026 4043 4059 407556000 4092 4107 4123 4139 4155 4171 4187 4203 4219 423557000 4251 4266 4282 4297 4313 4329 4344 4360 4375 439158000 4406 4422 4437 4452 4467 4482 4498 4513 4528 454359000 4558 4573 4588 4603 4618 4632 4647 4662 4677 4692
NOTE 1: OPTIMUM WEIGHT FOR PRESSURE ALTITUDE IS 51,100 kgA) THRUST LIMITED WEIGHT FOR ISA +10 AND COLDER IS 58,800 kgB) THRUST LIMITED WEIGHT FOR ISA +15 IS 57,200 kgC) THRUST LIMITED WEIGHT FOR ISA +20 IS 55,500 kg
NOTE 2: ADJUSTMENTS FOR OPERATION AT NON-STANDARD TEMPERATURESA) INCREASE FUEL REQUIRED BY 0.6 PERCENT PER 10 DEGREES C ABOVE ISAB) DECREASE FUEL REQUIRED BY 0.6 PERCENT PER 10 DEGREES C BELOW ISAC) INCREASE TAS BY 1 KNOT PER DEGREE C ABOVE ISAD) DECREASE TAS BY 1 KNOT PER DEGREE C BELOW ISA
Figure 4.5.3.3 Mach 0.78 Cruise – Pressure Altitude 35,000 ft
Section 4 - MRJT1 Page 59July 2006
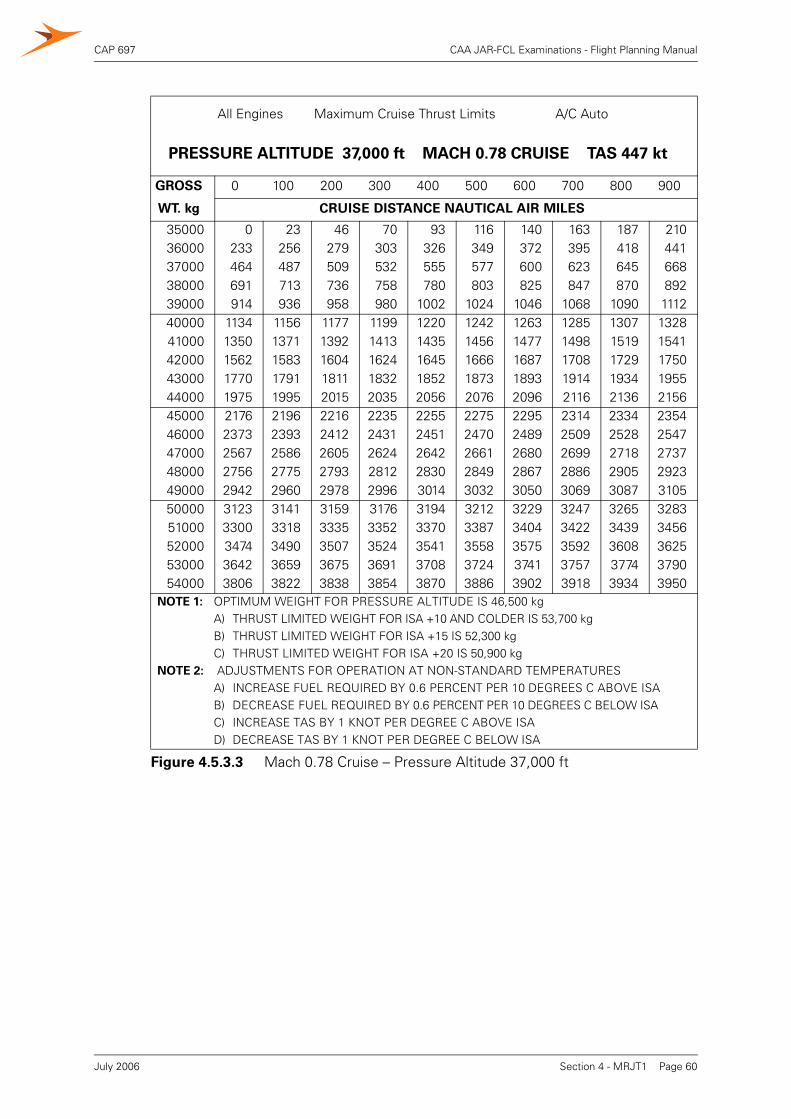
CAP 697 CAA JAR-FCL Examinations - Flight Planning Manual
All Engines Maximum Cruise Thrust Limits A/C Auto
PRESSURE ALTITUDE 37,000 ft MACH 0.78 CRUISE TAS 447 kt
GROSS 0 100 200 300 400 500 600 700 800 900
WT. kg CRUISE DISTANCE NAUTICAL AIR MILES
35000 0 23 46 70 93 116 140 163 187 21036000 233 256 279 303 326 349 372 395 418 44137000 464 487 509 532 555 577 600 623 645 66838000 691 713 736 758 780 803 825 847 870 89239000 914 936 958 980 1002 1024 1046 1068 1090 111240000 1134 1156 1177 1199 1220 1242 1263 1285 1307 132841000 1350 1371 1392 1413 1435 1456 1477 1498 1519 154142000 1562 1583 1604 1624 1645 1666 1687 1708 1729 175043000 1770 1791 1811 1832 1852 1873 1893 1914 1934 195544000 1975 1995 2015 2035 2056 2076 2096 2116 2136 215645000 2176 2196 2216 2235 2255 2275 2295 2314 2334 235446000 2373 2393 2412 2431 2451 2470 2489 2509 2528 254747000 2567 2586 2605 2624 2642 2661 2680 2699 2718 273748000 2756 2775 2793 2812 2830 2849 2867 2886 2905 292349000 2942 2960 2978 2996 3014 3032 3050 3069 3087 310550000 3123 3141 3159 3176 3194 3212 3229 3247 3265 328351000 3300 3318 3335 3352 3370 3387 3404 3422 3439 345652000 3474 3490 3507 3524 3541 3558 3575 3592 3608 362553000 3642 3659 3675 3691 3708 3724 3741 3757 3774 379054000 3806 3822 3838 3854 3870 3886 3902 3918 3934 3950
NOTE 1: OPTIMUM WEIGHT FOR PRESSURE ALTITUDE IS 46,500 kgA) THRUST LIMITED WEIGHT FOR ISA +10 AND COLDER IS 53,700 kgB) THRUST LIMITED WEIGHT FOR ISA +15 IS 52,300 kgC) THRUST LIMITED WEIGHT FOR ISA +20 IS 50,900 kg
NOTE 2: ADJUSTMENTS FOR OPERATION AT NON-STANDARD TEMPERATURESA) INCREASE FUEL REQUIRED BY 0.6 PERCENT PER 10 DEGREES C ABOVE ISAB) DECREASE FUEL REQUIRED BY 0.6 PERCENT PER 10 DEGREES C BELOW ISAC) INCREASE TAS BY 1 KNOT PER DEGREE C ABOVE ISAD) DECREASE TAS BY 1 KNOT PER DEGREE C BELOW ISA
Figure 4.5.3.3 Mach 0.78 Cruise – Pressure Altitude 37,000 ft
Section 4 - MRJT1 Page 60July 2006
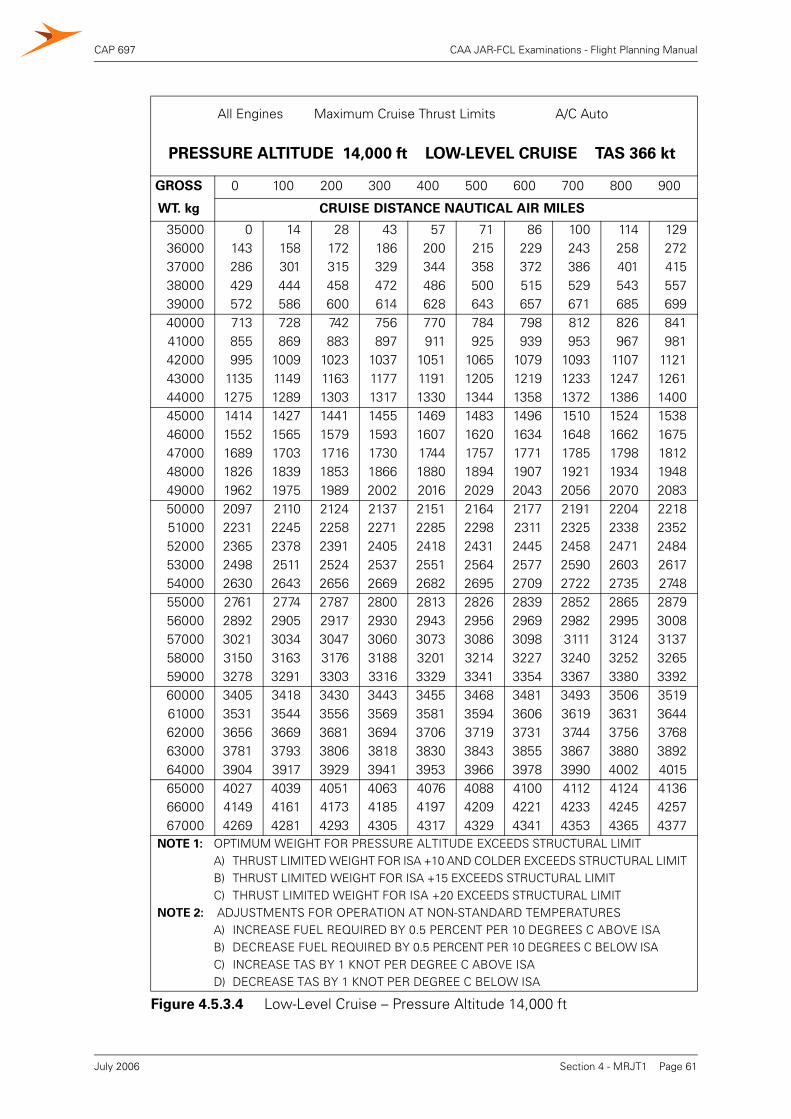
CAP 697 CAA JAR-FCL Examinations - Flight Planning Manual
All Engines Maximum Cruise Thrust Limits A/C Auto
PRESSURE ALTITUDE 14,000 ft LOW-LEVEL CRUISE TAS 366 kt
GROSS 0 100 200 300 400 500 600 700 800 900
WT. kg CRUISE DISTANCE NAUTICAL AIR MILES
35000 0 14 28 43 57 71 86 100 114 12936000 143 158 172 186 200 215 229 243 258 27237000 286 301 315 329 344 358 372 386 401 41538000 429 444 458 472 486 500 515 529 543 55739000 572 586 600 614 628 643 657 671 685 69940000 713 728 742 756 770 784 798 812 826 84141000 855 869 883 897 911 925 939 953 967 98142000 995 1009 1023 1037 1051 1065 1079 1093 1107 112143000 1135 1149 1163 1177 1191 1205 1219 1233 1247 126144000 1275 1289 1303 1317 1330 1344 1358 1372 1386 140045000 1414 1427 1441 1455 1469 1483 1496 1510 1524 153846000 1552 1565 1579 1593 1607 1620 1634 1648 1662 167547000 1689 1703 1716 1730 1744 1757 1771 1785 1798 181248000 1826 1839 1853 1866 1880 1894 1907 1921 1934 194849000 1962 1975 1989 2002 2016 2029 2043 2056 2070 208350000 2097 2110 2124 2137 2151 2164 2177 2191 2204 221851000 2231 2245 2258 2271 2285 2298 2311 2325 2338 235252000 2365 2378 2391 2405 2418 2431 2445 2458 2471 248453000 2498 2511 2524 2537 2551 2564 2577 2590 2603 261754000 2630 2643 2656 2669 2682 2695 2709 2722 2735 274855000 2761 2774 2787 2800 2813 2826 2839 2852 2865 287956000 2892 2905 2917 2930 2943 2956 2969 2982 2995 300857000 3021 3034 3047 3060 3073 3086 3098 3111 3124 313758000 3150 3163 3176 3188 3201 3214 3227 3240 3252 326559000 3278 3291 3303 3316 3329 3341 3354 3367 3380 339260000 3405 3418 3430 3443 3455 3468 3481 3493 3506 351961000 3531 3544 3556 3569 3581 3594 3606 3619 3631 364462000 3656 3669 3681 3694 3706 3719 3731 3744 3756 376863000 3781 3793 3806 3818 3830 3843 3855 3867 3880 389264000 3904 3917 3929 3941 3953 3966 3978 3990 4002 401565000 4027 4039 4051 4063 4076 4088 4100 4112 4124 413666000 4149 4161 4173 4185 4197 4209 4221 4233 4245 425767000 4269 4281 4293 4305 4317 4329 4341 4353 4365 4377
NOTE 1: OPTIMUM WEIGHT FOR PRESSURE ALTITUDE EXCEEDS STRUCTURAL LIMITA) THRUST LIMITED WEIGHT FOR ISA +10 AND COLDER EXCEEDS STRUCTURAL LIMITB) THRUST LIMITED WEIGHT FOR ISA +15 EXCEEDS STRUCTURAL LIMITC) THRUST LIMITED WEIGHT FOR ISA +20 EXCEEDS STRUCTURAL LIMIT
NOTE 2: ADJUSTMENTS FOR OPERATION AT NON-STANDARD TEMPERATURESA) INCREASE FUEL REQUIRED BY 0.5 PERCENT PER 10 DEGREES C ABOVE ISAB) DECREASE FUEL REQUIRED BY 0.5 PERCENT PER 10 DEGREES C BELOW ISAC) INCREASE TAS BY 1 KNOT PER DEGREE C ABOVE ISAD) DECREASE TAS BY 1 KNOT PER DEGREE C BELOW ISA
Figure 4.5.3.4 Low-Level Cruise – Pressure Altitude 14,000 ft
Section 4 - MRJT1 Page 61July 2006

CAP 697 CAA JAR-FCL Examinations - Flight Planning Manual
All Engines Maximum Cruise Thrust Limits A/C Auto
PRESSURE ALTITUDE 15,000 ft LOW-LEVEL CRUISE TAS 371 kt
GROSS 0 100 200 300 400 500 600 700 800 900
WT. kg CRUISE DISTANCE NAUTICAL AIR MILES
35000 0 14 29 43 58 73 87 102 117 13136000 146 161 175 190 205 219 234 248 263 27837000 292 307 321 336 350 365 380 394 409 42338000 438 452 467 481 496 510 525 540 554 56939000 583 598 612 626 641 655 670 684 699 71340000 728 742 757 771 785 800 814 829 843 85741000 872 886 900 915 929 943 958 972 987 100142000 1015 1029 1044 1058 1072 1087 1101 1115 1129 114443000 1158 1172 1186 1201 1215 1229 1243 1257 1272 128644000 1300 1314 1328 1343 1357 1371 1385 1399 1413 142745000 1442 1456 1470 1484 1498 1512 1526 1540 1554 156846000 1582 1596 1610 1624 1638 1652 1666 1680 1694 170847000 1722 1736 1750 1764 1778 1792 1806 1820 1834 184848000 1862 1875 1889 1903 1917 1931 1945 1959 1972 198649000 2000 2014 2028 2041 2055 2069 2083 2097 2110 212450000 2138 2152 2165 2179 2193 2206 2220 2234 2247 226151000 2275 2288 2302 2316 2329 2343 2357 2370 2384 239752000 2411 2425 2438 2452 2465 2479 2492 2506 2519 253353000 2546 2560 2573 2587 2600 2614 2627 2641 2654 266854000 2681 2694 2708 2721 2734 2748 2761 2775 2788 280155000 2815 2828 2841 2855 2868 2881 2894 2908 2921 293456000 2948 2961 2974 2987 3000 3014 3027 3040 3053 306657000 3080 3093 3106 3119 3132 3145 3158 3171 3185 319858000 3211 3224 3237 3250 3263 3276 3289 3302 3315 332859000 3341 3354 3367 3380 3393 3406 3419 3432 3445 345860000 3470 3483 3496 3509 3522 3535 3548 3560 3573 358661000 3599 3612 3624 3637 3650 3663 3675 3688 3701 371462000 3727 3739 3752 3765 3777 3790 3803 3815 3828 384163000 3853 3866 3878 3891 3903 3916 3929 3941 3954 396664000 3979 3991 4004 4016 4029 4041 4054 4066 4079 409165000 4104 4116 4129 4141 4153 4166 4178 4190 4203 421566000 4228 4240 4252 4264 4277 4289 4301 4314 4326 433867000 4351 4363 4375 4387 4399 4411 4424 4436 4448 4460
NOTE 1: OPTIMUM WEIGHT FOR PRESSURE ALTITUDE EXCEEDS STRUCTURAL LIMITA) THRUST LIMITED WEIGHT FOR ISA +10 AND COLDER EXCEEDS STRUCTURAL LIMITB) THRUST LIMITED WEIGHT FOR ISA +15 EXCEEDS STRUCTURAL LIMITC) THRUST LIMITED WEIGHT FOR ISA +20 EXCEEDS STRUCTURAL LIMIT
NOTE 2: ADJUSTMENTS FOR OPERATION AT NON-STANDARD TEMPERATURESA) INCREASE FUEL REQUIRED BY 0.5 PERCENT PER 10 DEGREES C ABOVE ISAB) DECREASE FUEL REQUIRED BY 0.5 PERCENT PER 10 DEGREES C BELOW ISAC) INCREASE TAS BY 1 KNOT PER DEGREE C ABOVE ISAD) DECREASE TAS BY 1 KNOT PER DEGREE C BELOW ISA
Figure 4.5.3.4 Low-Level Cruise – Pressure Altitude 15,000 ft
Section 4 - MRJT1 Page 62July 2006

CAP 697 CAA JAR-FCL Examinations - Flight Planning Manual
All Engines Maximum Cruise Thrust Limits A/C Auto
PRESSURE ALTITUDE 16,000 ft LOW-LEVEL CRUISE TAS 377 kt
GROSS 0 100 200 300 400 500 600 700 800 900
WT. kg CRUISE DISTANCE NAUTICAL AIR MILES
35000 0 14 29 44 59 74 89 104 119 13436000 149 164 179 194 209 224 239 254 269 28437000 299 313 328 343 358 373 388 403 418 43338000 447 462 477 492 507 522 536 551 566 58139000 596 611 625 640 655 670 684 699 714 72940000 744 758 773 788 802 817 832 847 861 87641000 891 905 920 935 949 964 979 993 1008 102342000 1037 1052 1066 1081 1096 1110 1125 1139 1154 116843000 1183 1198 1212 1227 1241 1256 1270 1285 1299 131444000 1328 1343 1357 1371 1386 1400 1415 1429 1444 145845000 1473 1487 1501 1516 1530 1544 1559 1573 1588 160246000 1616 1631 1645 1659 1673 1688 1702 1716 1731 174547000 1759 1773 1788 1802 1816 1830 1845 1859 1873 188748000 1901 1916 1930 1944 1958 1972 1986 2000 2015 202949000 2043 2057 2071 2085 2099 2113 2127 2141 2155 216950000 2183 2197 2211 2225 2239 2253 2267 2281 2295 230951000 2323 2337 2351 2365 2379 2393 2407 2421 2435 244852000 2462 2476 2490 2504 2518 2531 2545 2559 2573 258753000 2600 2614 2628 2642 2655 2669 2683 2697 2710 272454000 2738 2751 2765 2779 2792 2806 2820 2833 2847 286155000 2874 2888 2901 2915 2928 2942 2956 2969 2983 299656000 3010 3023 3037 3050 3064 3077 3091 3104 3118 313157000 3145 3158 3171 3185 3198 3211 3225 3238 3252 326558000 3278 3292 3305 3318 3331 3345 3358 3371 3385 339859000 3411 3424 3438 3451 3464 3477 3490 3504 3517 353060000 3543 3556 3569 3582 3596 3609 3622 3635 3648 366161000 3674 3687 3700 3713 3726 3739 3752 3765 3778 379162000 3804 3817 3830 3843 3856 3869 3882 3895 3908 392063000 3933 3946 3959 3972 3985 3997 4010 4023 4036 404964000 4062 4074 4087 4100 4112 4125 4138 4151 4163 417665000 4189 4201 4214 4227 4239 4252 4265 4277 4290 430266000 4315 4328 4340 4353 4365 4378 4390 4403 4415 442867000 4440 4453 4465 4478 4490 4503 4515 4527 4540 4552
NOTE 1: OPTIMUM WEIGHT FOR PRESSURE ALTITUDE EXCEEDS STRUCTURAL LIMITA) THRUST LIMITED WEIGHT FOR ISA +10 AND COLDER EXCEEDS STRUCTURAL LIMITB) THRUST LIMITED WEIGHT FOR ISA +15 EXCEEDS STRUCTURAL LIMITC) THRUST LIMITED WEIGHT FOR ISA +20 EXCEEDS STRUCTURAL LIMIT
NOTE 2: ADJUSTMENTS FOR OPERATION AT NON-STANDARD TEMPERATURESA) INCREASE FUEL REQUIRED BY 0.5 PERCENT PER 10 DEGREES C ABOVE ISAB) DECREASE FUEL REQUIRED BY 0.5 PERCENT PER 10 DEGREES C BELOW ISAC) INCREASE TAS BY 1 KNOT PER DEGREE C ABOVE ISAD) DECREASE TAS BY 1 KNOT PER DEGREE C BELOW ISA
Figure 4.5.3.4 Low-Level Cruise – Pressure Altitude 16,000 ft
Section 4 - MRJT1 Page 63July 2006
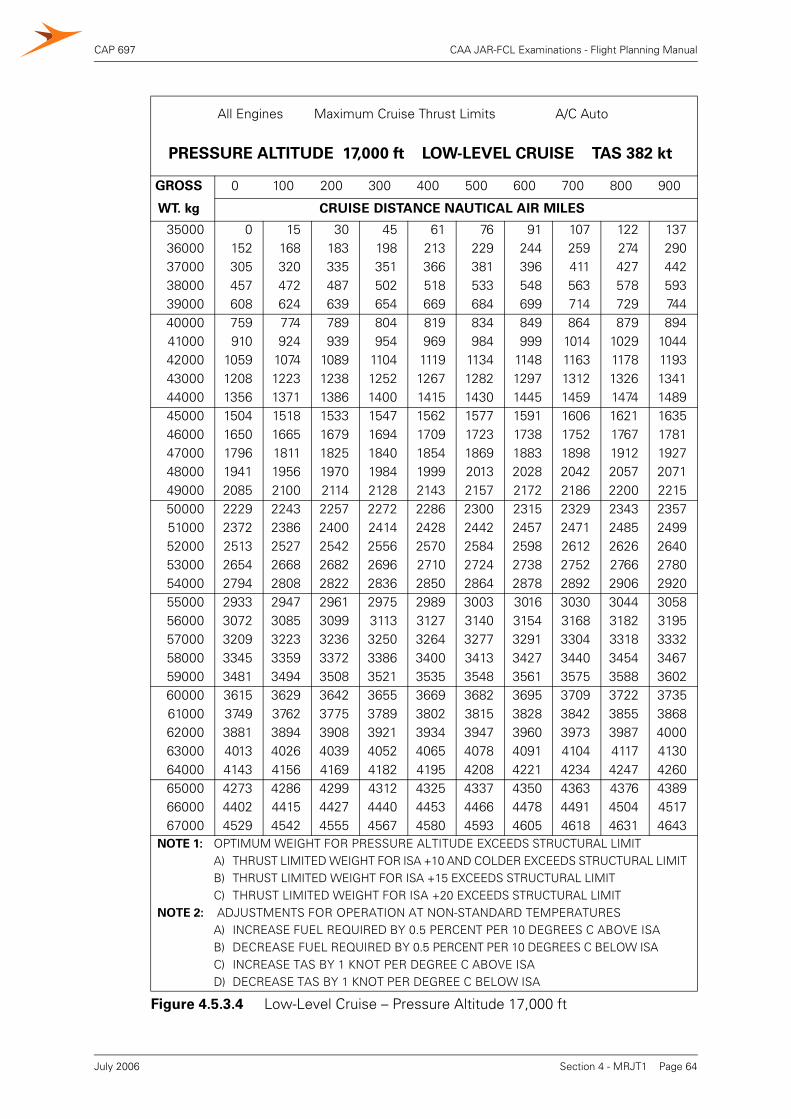
CAP 697 CAA JAR-FCL Examinations - Flight Planning Manual
All Engines Maximum Cruise Thrust Limits A/C Auto
PRESSURE ALTITUDE 17,000 ft LOW-LEVEL CRUISE TAS 382 kt
GROSS 0 100 200 300 400 500 600 700 800 900
WT. kg CRUISE DISTANCE NAUTICAL AIR MILES
35000 0 15 30 45 61 76 91 107 122 13736000 152 168 183 198 213 229 244 259 274 29037000 305 320 335 351 366 381 396 411 427 44238000 457 472 487 502 518 533 548 563 578 59339000 608 624 639 654 669 684 699 714 729 74440000 759 774 789 804 819 834 849 864 879 89441000 910 924 939 954 969 984 999 1014 1029 104442000 1059 1074 1089 1104 1119 1134 1148 1163 1178 119343000 1208 1223 1238 1252 1267 1282 1297 1312 1326 134144000 1356 1371 1386 1400 1415 1430 1445 1459 1474 148945000 1504 1518 1533 1547 1562 1577 1591 1606 1621 163546000 1650 1665 1679 1694 1709 1723 1738 1752 1767 178147000 1796 1811 1825 1840 1854 1869 1883 1898 1912 192748000 1941 1956 1970 1984 1999 2013 2028 2042 2057 207149000 2085 2100 2114 2128 2143 2157 2172 2186 2200 221550000 2229 2243 2257 2272 2286 2300 2315 2329 2343 235751000 2372 2386 2400 2414 2428 2442 2457 2471 2485 249952000 2513 2527 2542 2556 2570 2584 2598 2612 2626 264053000 2654 2668 2682 2696 2710 2724 2738 2752 2766 278054000 2794 2808 2822 2836 2850 2864 2878 2892 2906 292055000 2933 2947 2961 2975 2989 3003 3016 3030 3044 305856000 3072 3085 3099 3113 3127 3140 3154 3168 3182 319557000 3209 3223 3236 3250 3264 3277 3291 3304 3318 333258000 3345 3359 3372 3386 3400 3413 3427 3440 3454 346759000 3481 3494 3508 3521 3535 3548 3561 3575 3588 360260000 3615 3629 3642 3655 3669 3682 3695 3709 3722 373561000 3749 3762 3775 3789 3802 3815 3828 3842 3855 386862000 3881 3894 3908 3921 3934 3947 3960 3973 3987 400063000 4013 4026 4039 4052 4065 4078 4091 4104 4117 413064000 4143 4156 4169 4182 4195 4208 4221 4234 4247 426065000 4273 4286 4299 4312 4325 4337 4350 4363 4376 438966000 4402 4415 4427 4440 4453 4466 4478 4491 4504 451767000 4529 4542 4555 4567 4580 4593 4605 4618 4631 4643
NOTE 1: OPTIMUM WEIGHT FOR PRESSURE ALTITUDE EXCEEDS STRUCTURAL LIMITA) THRUST LIMITED WEIGHT FOR ISA +10 AND COLDER EXCEEDS STRUCTURAL LIMITB) THRUST LIMITED WEIGHT FOR ISA +15 EXCEEDS STRUCTURAL LIMITC) THRUST LIMITED WEIGHT FOR ISA +20 EXCEEDS STRUCTURAL LIMIT
NOTE 2: ADJUSTMENTS FOR OPERATION AT NON-STANDARD TEMPERATURESA) INCREASE FUEL REQUIRED BY 0.5 PERCENT PER 10 DEGREES C ABOVE ISAB) DECREASE FUEL REQUIRED BY 0.5 PERCENT PER 10 DEGREES C BELOW ISAC) INCREASE TAS BY 1 KNOT PER DEGREE C ABOVE ISAD) DECREASE TAS BY 1 KNOT PER DEGREE C BELOW ISA
Figure 4.5.3.4 Low-Level Cruise – Pressure Altitude 17,000 ft
Section 4 - MRJT1 Page 64July 2006
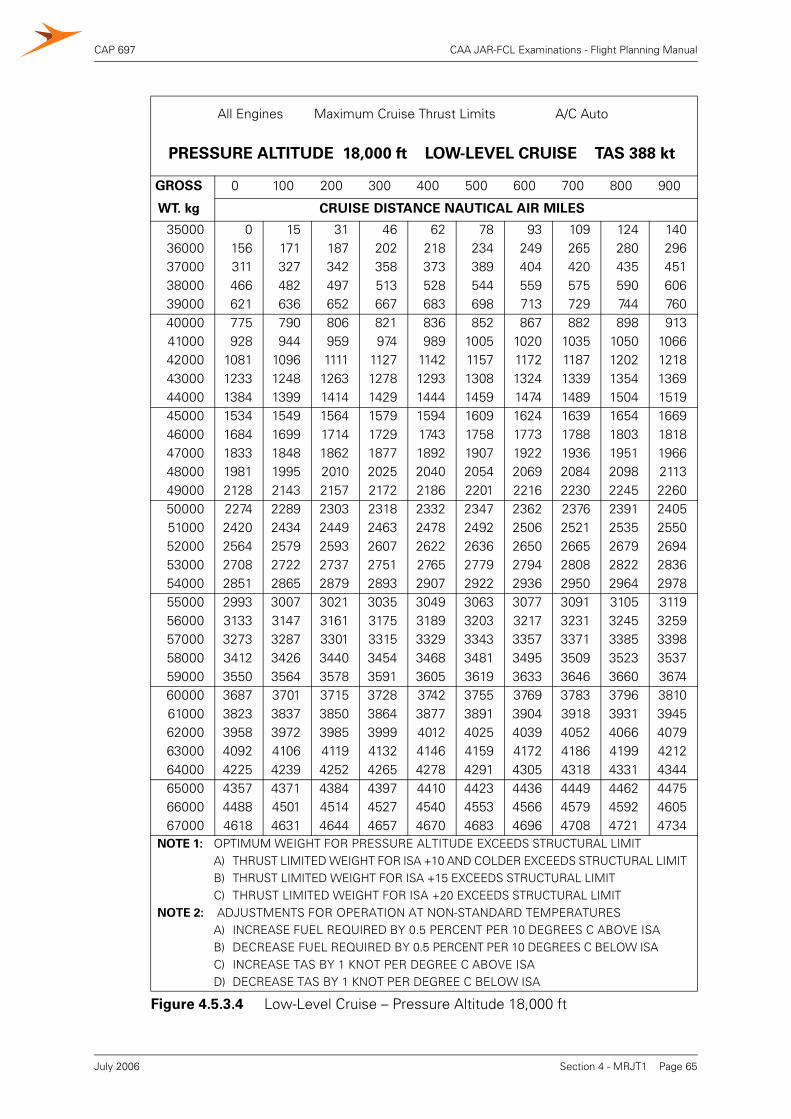
CAP 697 CAA JAR-FCL Examinations - Flight Planning Manual
All Engines Maximum Cruise Thrust Limits A/C Auto
PRESSURE ALTITUDE 18,000 ft LOW-LEVEL CRUISE TAS 388 kt
GROSS 0 100 200 300 400 500 600 700 800 900
WT. kg CRUISE DISTANCE NAUTICAL AIR MILES
35000 0 15 31 46 62 78 93 109 124 14036000 156 171 187 202 218 234 249 265 280 29637000 311 327 342 358 373 389 404 420 435 45138000 466 482 497 513 528 544 559 575 590 60639000 621 636 652 667 683 698 713 729 744 76040000 775 790 806 821 836 852 867 882 898 91341000 928 944 959 974 989 1005 1020 1035 1050 106642000 1081 1096 1111 1127 1142 1157 1172 1187 1202 121843000 1233 1248 1263 1278 1293 1308 1324 1339 1354 136944000 1384 1399 1414 1429 1444 1459 1474 1489 1504 151945000 1534 1549 1564 1579 1594 1609 1624 1639 1654 166946000 1684 1699 1714 1729 1743 1758 1773 1788 1803 181847000 1833 1848 1862 1877 1892 1907 1922 1936 1951 196648000 1981 1995 2010 2025 2040 2054 2069 2084 2098 211349000 2128 2143 2157 2172 2186 2201 2216 2230 2245 226050000 2274 2289 2303 2318 2332 2347 2362 2376 2391 240551000 2420 2434 2449 2463 2478 2492 2506 2521 2535 255052000 2564 2579 2593 2607 2622 2636 2650 2665 2679 269453000 2708 2722 2737 2751 2765 2779 2794 2808 2822 283654000 2851 2865 2879 2893 2907 2922 2936 2950 2964 297855000 2993 3007 3021 3035 3049 3063 3077 3091 3105 311956000 3133 3147 3161 3175 3189 3203 3217 3231 3245 325957000 3273 3287 3301 3315 3329 3343 3357 3371 3385 339858000 3412 3426 3440 3454 3468 3481 3495 3509 3523 353759000 3550 3564 3578 3591 3605 3619 3633 3646 3660 367460000 3687 3701 3715 3728 3742 3755 3769 3783 3796 381061000 3823 3837 3850 3864 3877 3891 3904 3918 3931 394562000 3958 3972 3985 3999 4012 4025 4039 4052 4066 407963000 4092 4106 4119 4132 4146 4159 4172 4186 4199 421264000 4225 4239 4252 4265 4278 4291 4305 4318 4331 434465000 4357 4371 4384 4397 4410 4423 4436 4449 4462 447566000 4488 4501 4514 4527 4540 4553 4566 4579 4592 460567000 4618 4631 4644 4657 4670 4683 4696 4708 4721 4734
NOTE 1: OPTIMUM WEIGHT FOR PRESSURE ALTITUDE EXCEEDS STRUCTURAL LIMITA) THRUST LIMITED WEIGHT FOR ISA +10 AND COLDER EXCEEDS STRUCTURAL LIMITB) THRUST LIMITED WEIGHT FOR ISA +15 EXCEEDS STRUCTURAL LIMITC) THRUST LIMITED WEIGHT FOR ISA +20 EXCEEDS STRUCTURAL LIMIT
NOTE 2: ADJUSTMENTS FOR OPERATION AT NON-STANDARD TEMPERATURESA) INCREASE FUEL REQUIRED BY 0.5 PERCENT PER 10 DEGREES C ABOVE ISAB) DECREASE FUEL REQUIRED BY 0.5 PERCENT PER 10 DEGREES C BELOW ISAC) INCREASE TAS BY 1 KNOT PER DEGREE C ABOVE ISAD) DECREASE TAS BY 1 KNOT PER DEGREE C BELOW ISA
Figure 4.5.3.4 Low-Level Cruise – Pressure Altitude 18,000 ft
Section 4 - MRJT1 Page 65July 2006
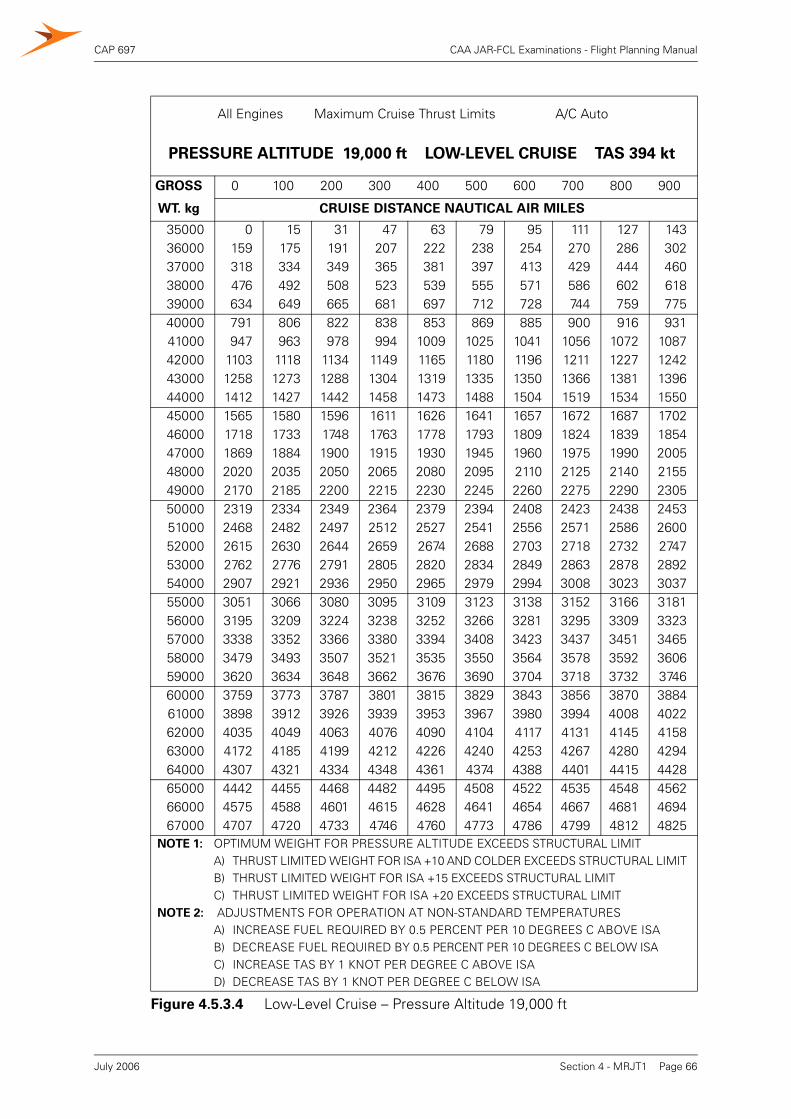
CAP 697 CAA JAR-FCL Examinations - Flight Planning Manual
All Engines Maximum Cruise Thrust Limits A/C Auto
PRESSURE ALTITUDE 19,000 ft LOW-LEVEL CRUISE TAS 394 kt
GROSS 0 100 200 300 400 500 600 700 800 900
WT. kg CRUISE DISTANCE NAUTICAL AIR MILES
35000 0 15 31 47 63 79 95 111 127 14336000 159 175 191 207 222 238 254 270 286 30237000 318 334 349 365 381 397 413 429 444 46038000 476 492 508 523 539 555 571 586 602 61839000 634 649 665 681 697 712 728 744 759 77540000 791 806 822 838 853 869 885 900 916 93141000 947 963 978 994 1009 1025 1041 1056 1072 108742000 1103 1118 1134 1149 1165 1180 1196 1211 1227 124243000 1258 1273 1288 1304 1319 1335 1350 1366 1381 139644000 1412 1427 1442 1458 1473 1488 1504 1519 1534 155045000 1565 1580 1596 1611 1626 1641 1657 1672 1687 170246000 1718 1733 1748 1763 1778 1793 1809 1824 1839 185447000 1869 1884 1900 1915 1930 1945 1960 1975 1990 200548000 2020 2035 2050 2065 2080 2095 2110 2125 2140 215549000 2170 2185 2200 2215 2230 2245 2260 2275 2290 230550000 2319 2334 2349 2364 2379 2394 2408 2423 2438 245351000 2468 2482 2497 2512 2527 2541 2556 2571 2586 260052000 2615 2630 2644 2659 2674 2688 2703 2718 2732 274753000 2762 2776 2791 2805 2820 2834 2849 2863 2878 289254000 2907 2921 2936 2950 2965 2979 2994 3008 3023 303755000 3051 3066 3080 3095 3109 3123 3138 3152 3166 318156000 3195 3209 3224 3238 3252 3266 3281 3295 3309 332357000 3338 3352 3366 3380 3394 3408 3423 3437 3451 346558000 3479 3493 3507 3521 3535 3550 3564 3578 3592 360659000 3620 3634 3648 3662 3676 3690 3704 3718 3732 374660000 3759 3773 3787 3801 3815 3829 3843 3856 3870 388461000 3898 3912 3926 3939 3953 3967 3980 3994 4008 402262000 4035 4049 4063 4076 4090 4104 4117 4131 4145 415863000 4172 4185 4199 4212 4226 4240 4253 4267 4280 429464000 4307 4321 4334 4348 4361 4374 4388 4401 4415 442865000 4442 4455 4468 4482 4495 4508 4522 4535 4548 456266000 4575 4588 4601 4615 4628 4641 4654 4667 4681 469467000 4707 4720 4733 4746 4760 4773 4786 4799 4812 4825
NOTE 1: OPTIMUM WEIGHT FOR PRESSURE ALTITUDE EXCEEDS STRUCTURAL LIMITA) THRUST LIMITED WEIGHT FOR ISA +10 AND COLDER EXCEEDS STRUCTURAL LIMITB) THRUST LIMITED WEIGHT FOR ISA +15 EXCEEDS STRUCTURAL LIMITC) THRUST LIMITED WEIGHT FOR ISA +20 EXCEEDS STRUCTURAL LIMIT
NOTE 2: ADJUSTMENTS FOR OPERATION AT NON-STANDARD TEMPERATURESA) INCREASE FUEL REQUIRED BY 0.5 PERCENT PER 10 DEGREES C ABOVE ISAB) DECREASE FUEL REQUIRED BY 0.5 PERCENT PER 10 DEGREES C BELOW ISAC) INCREASE TAS BY 1 KNOT PER DEGREE C ABOVE ISAD) DECREASE TAS BY 1 KNOT PER DEGREE C BELOW ISA
Figure 4.5.3.4 Low-Level Cruise – Pressure Altitude 19,000 ft
Section 4 - MRJT1 Page 66July 2006

CAP 697 CAA JAR-FCL Examinations - Flight Planning Manual
All Engines Maximum Cruise Thrust Limits A/C Auto
PRESSURE ALTITUDE 20,000 ft LOW-LEVEL CRUISE TAS 400 kt
GROSS 0 100 200 300 400 500 600 700 800 900
WT. kg CRUISE DISTANCE NAUTICAL AIR MILES
35000 0 16 32 48 65 81 97 113 130 14636000 162 178 194 211 227 243 259 275 292 30837000 324 340 356 372 389 405 421 437 453 46938000 485 502 518 534 550 566 582 598 614 63039000 646 662 678 694 710 726 742 758 774 79040000 806 822 838 854 870 886 902 918 934 95041000 966 982 998 1013 1029 1045 1061 1077 1093 110942000 1124 1140 1156 1172 1188 1203 1219 1235 1251 126743000 1282 1298 1314 1329 1345 1361 1377 1392 1408 142444000 1439 1455 1471 1486 .1502 1518 1533 1549 1564 158045000 1596 1611 1627 1642 1658 1673 1689 1705 1720 173646000 1751 1767 1782 1798 1813 1829 1844 1859 1875 189047000 1906 1921 1937 1952 1967 1983 1998 2013 2029 204448000 2060 2075 2090 2105 2121 2136 2151 2167 2182 219749000 2213 2228 2243 2258 2273 2289 2304 2319 2334 234950000 2365 2380 2395 2410 2425 2440 2455 2470 2485 250051000 2516 2531 2546 2561 2576 2591 2606 2621 2636 265152000 2666 2681 2696 2710 2725 2740 2755 2770 2785 280053000 2815 2830 2844 2859 2874 2889 2904 2918 2933 294854000 2963 2978 2992 3007 3022 3036 3051 3066 3081 309555000 3110 3125 3139 3154 3169 3183 3198 3212 3227 324256000 3256 3271 3285 3300 3314 3329 3343 3358 3372 338757000 3401 3416 3430 3445 3459 3474 3488 3502 3517 353158000 3546 3560 3574 3589 3603 3617 3632 3646 3660 367459000 3689 3703 3717 3731 3746 3760 3774 3788 3803 381760000 3831 3845 3859 3873 3887 3901 3916 3930 3944 395861000 3972 3986 4000 4014 4028 4042 4056 4070 4084 409862000 4112 4126 4140 4153 4167 4181 4195 4209 4223 423763000 4251 4264 4278 4292 4306 4320 4333 4347 4361 437564000 4389 4402 4416 4430 4443 4457 4471 4484 4498 451265000 4525 4539 4552 4566 4580 4593 4607 4620 4634 464766000 4661 4674 4688 4701 4715 4728 4742 4755 4769 478267000 4795 4809 4822 4835 4849 4862 4875 4889 4902 4915
NOTE 1: OPTIMUM WEIGHT FOR PRESSURE ALTITUDE EXCEEDS STRUCTURAL LIMITA) THRUST LIMITED WEIGHT FOR ISA +10 AND COLDER EXCEEDS STRUCTURAL LIMITB) THRUST LIMITED WEIGHT FOR ISA +15 EXCEEDS STRUCTURAL LIMITC) THRUST LIMITED WEIGHT FOR ISA +20 EXCEEDS STRUCTURAL LIMIT
NOTE 2: ADJUSTMENTS FOR OPERATION AT NON-STANDARD TEMPERATURESA) INCREASE FUEL REQUIRED BY 0.5 PERCENT PER 10 DEGREES C ABOVE ISAB) DECREASE FUEL REQUIRED BY 0.5 PERCENT PER 10 DEGREES C BELOW ISAC) INCREASE TAS BY 1 KNOT PER DEGREE C ABOVE ISAD) DECREASE TAS BY 1 KNOT PER DEGREE C BELOW ISA
Figure 4.5.3.4 Low-Level Cruise – Pressure Altitude 20,000 ft
Section 4 - MRJT1 Page 67July 2006
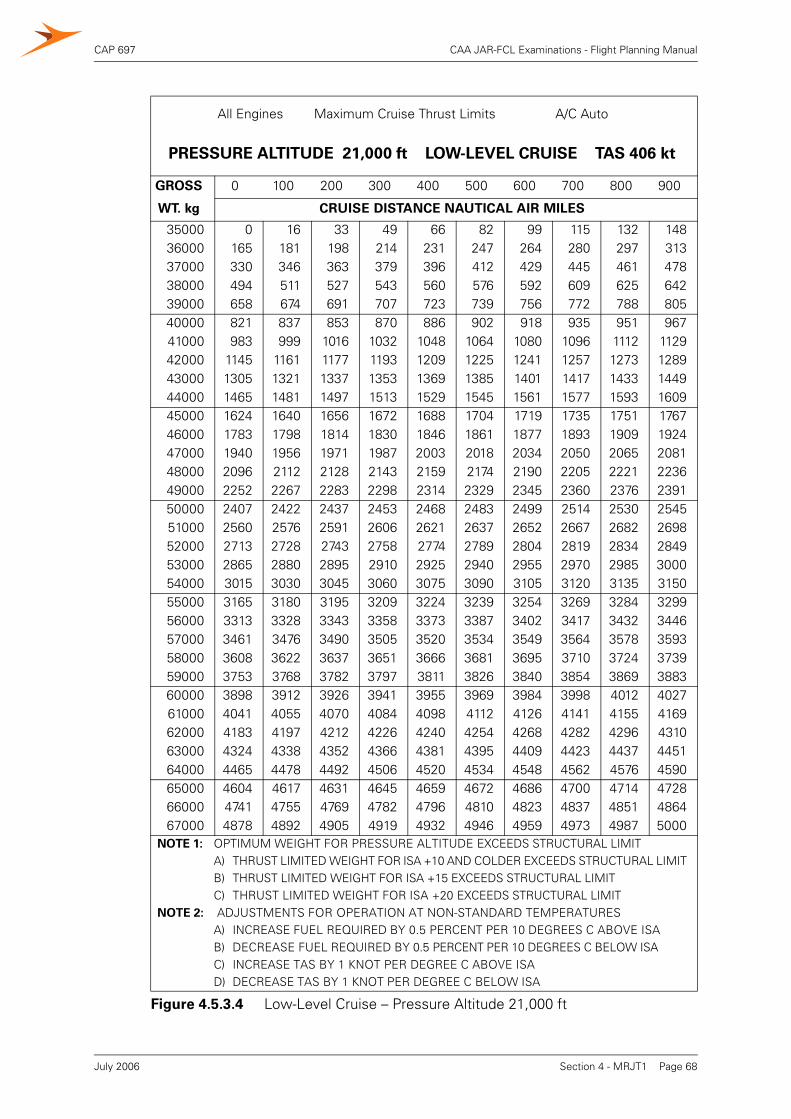
CAP 697 CAA JAR-FCL Examinations - Flight Planning Manual
All Engines Maximum Cruise Thrust Limits A/C Auto
PRESSURE ALTITUDE 21,000 ft LOW-LEVEL CRUISE TAS 406 kt
GROSS 0 100 200 300 400 500 600 700 800 900
WT. kg CRUISE DISTANCE NAUTICAL AIR MILES
35000 0 16 33 49 66 82 99 115 132 14836000 165 181 198 214 231 247 264 280 297 31337000 330 346 363 379 396 412 429 445 461 47838000 494 511 527 543 560 576 592 609 625 64239000 658 674 691 707 723 739 756 772 788 80540000 821 837 853 870 886 902 918 935 951 96741000 983 999 1016 1032 1048 1064 1080 1096 1112 112942000 1145 1161 1177 1193 1209 1225 1241 1257 1273 128943000 1305 1321 1337 1353 1369 1385 1401 1417 1433 144944000 1465 1481 1497 1513 1529 1545 1561 1577 1593 160945000 1624 1640 1656 1672 1688 1704 1719 1735 1751 176746000 1783 1798 1814 1830 1846 1861 1877 1893 1909 192447000 1940 1956 1971 1987 2003 2018 2034 2050 2065 208148000 2096 2112 2128 2143 2159 2174 2190 2205 2221 223649000 2252 2267 2283 2298 2314 2329 2345 2360 2376 239150000 2407 2422 2437 2453 2468 2483 2499 2514 2530 254551000 2560 2576 2591 2606 2621 2637 2652 2667 2682 269852000 2713 2728 2743 2758 2774 2789 2804 2819 2834 284953000 2865 2880 2895 2910 2925 2940 2955 2970 2985 300054000 3015 3030 3045 3060 3075 3090 3105 3120 3135 315055000 3165 3180 3195 3209 3224 3239 3254 3269 3284 329956000 3313 3328 3343 3358 3373 3387 3402 3417 3432 344657000 3461 3476 3490 3505 3520 3534 3549 3564 3578 359358000 3608 3622 3637 3651 3666 3681 3695 3710 3724 373959000 3753 3768 3782 3797 3811 3826 3840 3854 3869 388360000 3898 3912 3926 3941 3955 3969 3984 3998 4012 402761000 4041 4055 4070 4084 4098 4112 4126 4141 4155 416962000 4183 4197 4212 4226 4240 4254 4268 4282 4296 431063000 4324 4338 4352 4366 4381 4395 4409 4423 4437 445164000 4465 4478 4492 4506 4520 4534 4548 4562 4576 459065000 4604 4617 4631 4645 4659 4672 4686 4700 4714 472866000 4741 4755 4769 4782 4796 4810 4823 4837 4851 486467000 4878 4892 4905 4919 4932 4946 4959 4973 4987 5000
NOTE 1: OPTIMUM WEIGHT FOR PRESSURE ALTITUDE EXCEEDS STRUCTURAL LIMITA) THRUST LIMITED WEIGHT FOR ISA +10 AND COLDER EXCEEDS STRUCTURAL LIMITB) THRUST LIMITED WEIGHT FOR ISA +15 EXCEEDS STRUCTURAL LIMITC) THRUST LIMITED WEIGHT FOR ISA +20 EXCEEDS STRUCTURAL LIMIT
NOTE 2: ADJUSTMENTS FOR OPERATION AT NON-STANDARD TEMPERATURESA) INCREASE FUEL REQUIRED BY 0.5 PERCENT PER 10 DEGREES C ABOVE ISAB) DECREASE FUEL REQUIRED BY 0.5 PERCENT PER 10 DEGREES C BELOW ISAC) INCREASE TAS BY 1 KNOT PER DEGREE C ABOVE ISAD) DECREASE TAS BY 1 KNOT PER DEGREE C BELOW ISA
Figure 4.5.3.4 Low-Level Cruise – Pressure Altitude 21,000 ft
Section 4 - MRJT1 Page 68July 2006
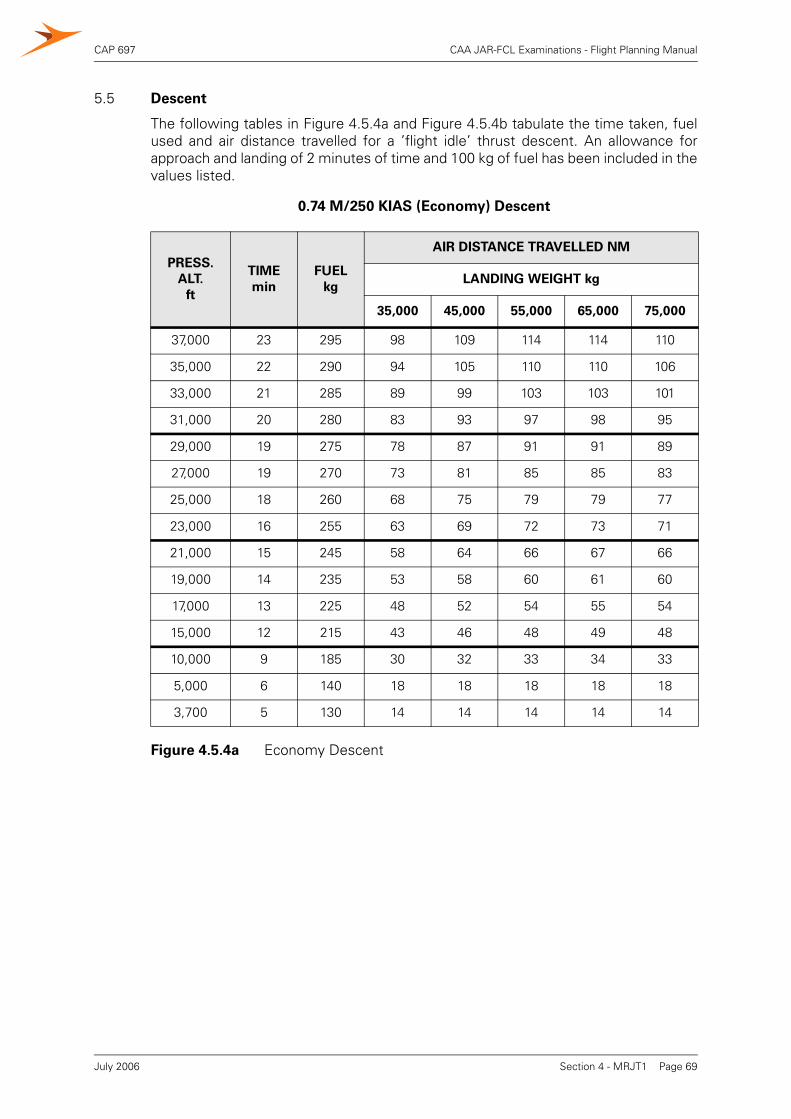
CAP 697 CAA JAR-FCL Examinations - Flight Planning Manual
5.5 Descent
The following tables in Figure 4.5.4a and Figure 4.5.4b tabulate the time taken, fuelused and air distance travelled for a ’flight idle’ thrust descent. An allowance forapproach and landing of 2 minutes of time and 100 kg of fuel has been included in thevalues listed.
0.74 M/250 KIAS (Economy) Descent
Figure 4.5.4a Economy Descent
PRESS.
ALT.
ft
TIME
min
FUEL
kg
AIR DISTANCE TRAVELLED NM
LANDING WEIGHT kg
35,000 45,000 55,000 65,000 75,000
37,000 23 295 98 109 114 114 110
35,000 22 290 94 105 110 110 106
33,000 21 285 89 99 103 103 101
31,000 20 280 83 93 97 98 95
29,000 19 275 78 87 91 91 89
27,000 19 270 73 81 85 85 83
25,000 18 260 68 75 79 79 77
23,000 16 255 63 69 72 73 71
21,000 15 245 58 64 66 67 66
19,000 14 235 53 58 60 61 60
17,000 13 225 48 52 54 55 54
15,000 12 215 43 46 48 49 48
10,000 9 185 30 32 33 34 33
5,000 6 140 18 18 18 18 18
3,700 5 130 14 14 14 14 14
Section 4 - MRJT1 Page 69July 2006
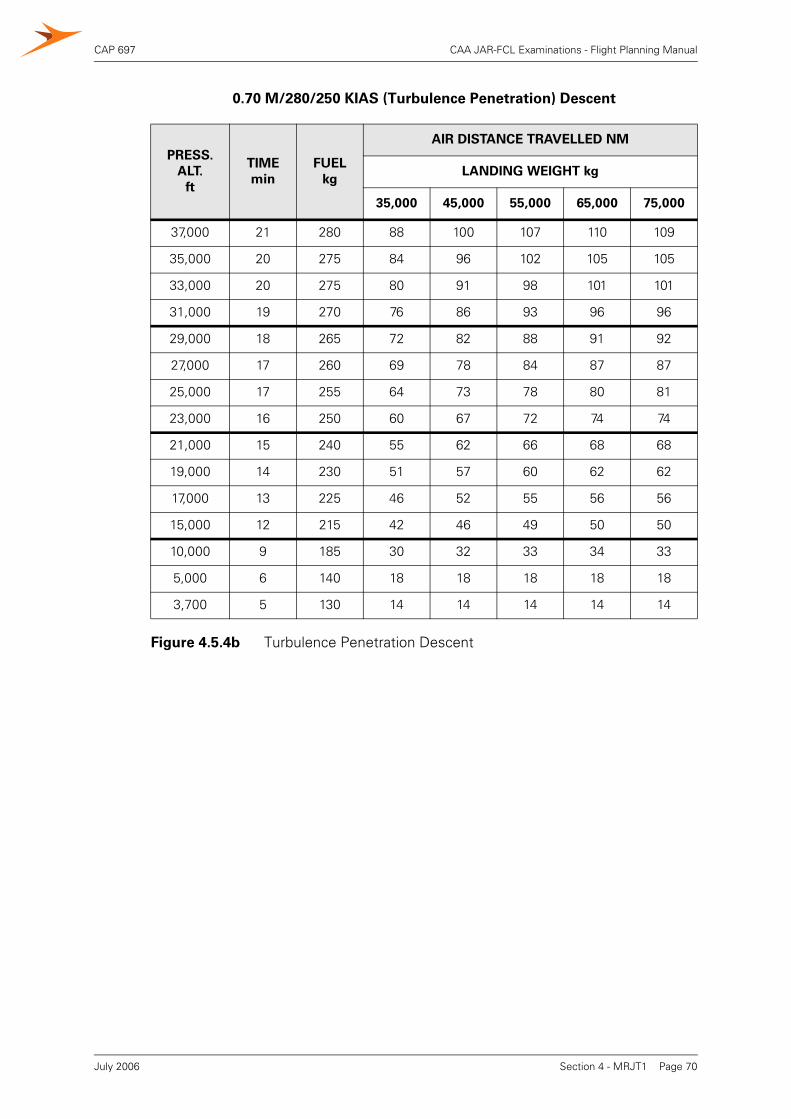
CAP 697 CAA JAR-FCL Examinations - Flight Planning Manual
0.70 M/280/250 KIAS (Turbulence Penetration) Descent
Figure 4.5.4b Turbulence Penetration Descent
PRESS.
ALT.
ft
TIME
min
FUEL
kg
AIR DISTANCE TRAVELLED NM
LANDING WEIGHT kg
35,000 45,000 55,000 65,000 75,000
37,000 21 280 88 100 107 110 109
35,000 20 275 84 96 102 105 105
33,000 20 275 80 91 98 101 101
31,000 19 270 76 86 93 96 96
29,000 18 265 72 82 88 91 92
27,000 17 260 69 78 84 87 87
25,000 17 255 64 73 78 80 81
23,000 16 250 60 67 72 74 74
21,000 15 240 55 62 66 68 68
19,000 14 230 51 57 60 62 62
17,000 13 225 46 52 55 56 56
15,000 12 215 42 46 49 50 50
10,000 9 185 30 32 33 34 33
5,000 6 140 18 18 18 18 18
3,700 5 130 14 14 14 14 14
Section 4 - MRJT1 Page 70July 2006
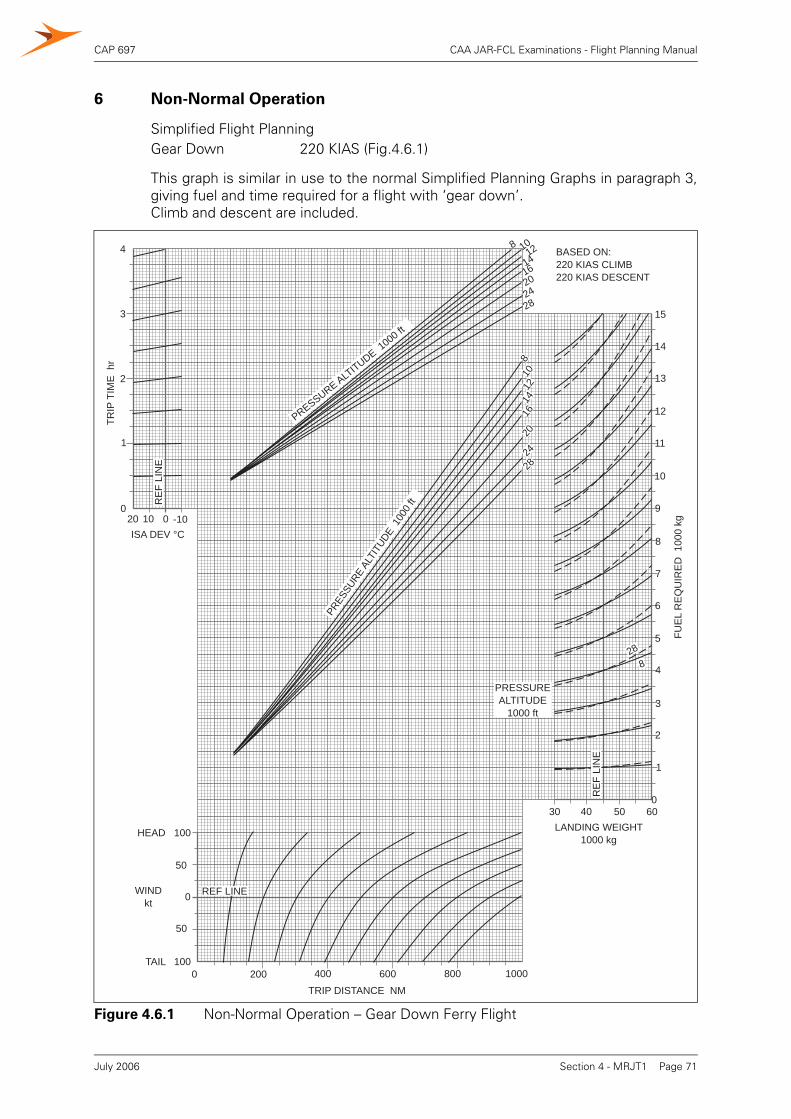
CAP 697 CAA JAR-FCL Examinations - Flight Planning Manual
6 Non-Normal Operation
This graph is similar in use to the normal Simplified Planning Graphs in paragraph 3,giving fuel and time required for a flight with ‘gear down’.Climb and descent are included.
Simplified Flight PlanningGear Down 220 KIAS (Fig.4.6.1)
Figure 4.6.1 Non-Normal Operation – Gear Down Ferry Flight
RE
F LI
NE
REF LINE
PRESSUREALTITUDE
1000 ft
BASED ON:220 KIAS CLIMB220 KIAS DESCENT
30 40 50 60
TRIP
TIM
E h
r
0
1
2
3
4
20 10 0 -10ISA DEV °C
TRIP DISTANCE NM
LANDING WEIGHT1000 kg
0
3
4
5
6
7
8
9
FUE
L R
EQ
UIR
ED
100
0 kg
1
2
10
11
12
15
14
13
100
0
100
HEAD
TAIL
WINDkt
50
50
200 400 600 800 10000
2824
2016
1412
108
282420161412108
288
PRES
SURE
ALTI
TUDE
100
0 ft
PRESSURE ALTITUDE 1
000 ft
RE
F LI
NE
Section 4 - MRJT1 Page 71July 2006
CAP 697 CAA JAR-FCL Examinations - Flight Planning Manual
7 Extended Range Operations (EROPS)
This paragraph provides planning information necessary for the conduct of EROPS.
7.1 Critical Fuel Reserve (Figs. 4.7.1a and 4.7.1b)
These graphs are for the determination of the minimum fuel reserve at the criticalpoint. If this fuel reserve exceeds the predicted (planned) fuel remaining at that point,the fuel load must be adjusted accordingly. Determine the fuel required from eachgraph in the following manner:
a) Enter the graph at the distance from the critical point to the diversion aerodromeand travel vertically to the wind component reference line.
b) Parallel the grid-lines to apply the appropriate wind component. Then continuevertically to intercept the grid-line appropriate to the weight at the critical point.
c) From this point travel horizontally right to read the fuel required.
d) Compare the result obtained from Fig. 4.7.1a with that obtained from Fig. 4.7.1b;the higher of the two is the fuel required.
7.2 Area of Operation – Diversion Distance (Fig. 4.7.2)
The area of operation is defined as the region within which the operator is authorisedto conduct extended range operations. The distance to the diversion airport from anypoint along the route must be covered within the approved time using the singleengine cruise speed and assuming still air and ISA conditions. The maximumdiversion distance used to establish the area of operation may be obtained from thischart.
a) Enter the chart for the appropriate speed with the weight at the point of diversion.
b) Select the appropriate time and read off the maximum diversion distance.
7.3 In-Flight Diversion (LRC) (Fig. 4.7.3)
Figure 4.7.3 is a simplified flight planning method of determining the fuel required andtime for a flight from the point of diversion to a selected alternate.The graph is similar in layout and use to the normal Simplified Flight Planning graphsin paragraph 3.
Section 4 - MRJT1 Page 72July 2006
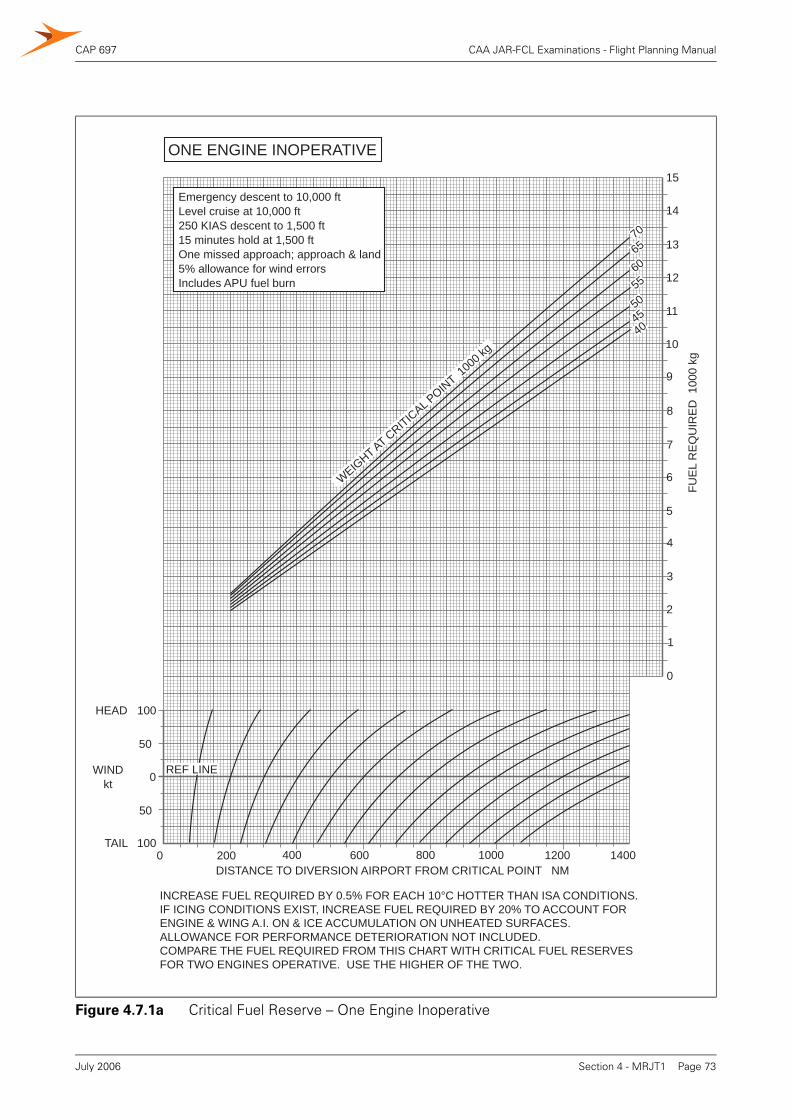
CAP 697 CAA JAR-FCL Examinations - Flight Planning Manual
Figure 4.7.1a Critical Fuel Reserve – One Engine Inoperative
0
3
4
5
6
7
8
9
FUE
L R
EQ
UIR
ED
100
0 kg
1
2
10
11
12
15
14
13
100
0
100
HEAD
TAIL
WINDkt
50
50
200 400 600 800 10000 1200 1400DISTANCE TO DIVERSION AIRPORT FROM CRITICAL POINT NM
REF LINE
Emergency descent to 10,000 ftLevel cruise at 10,000 ft250 KIAS descent to 1,500 ft15 minutes hold at 1,500 ftOne missed approach; approach & land5% allowance for wind errorsIncludes APU fuel burn
70
65
60
55
504540
ONE ENGINE INOPERATIVE
WEIGHT AT CRITICAL P
OINT 100
0 kg
INCREASE FUEL REQUIRED BY 0.5% FOR EACH 10°C HOTTER THAN ISA CONDITIONS.IF ICING CONDITIONS EXIST, INCREASE FUEL REQUIRED BY 20% TO ACCOUNT FORENGINE & WING A.I. ON & ICE ACCUMULATION ON UNHEATED SURFACES.ALLOWANCE FOR PERFORMANCE DETERIORATION NOT INCLUDED.COMPARE THE FUEL REQUIRED FROM THIS CHART WITH CRITICAL FUEL RESERVESFOR TWO ENGINES OPERATIVE. USE THE HIGHER OF THE TWO.
Section 4 - MRJT1 Page 73July 2006
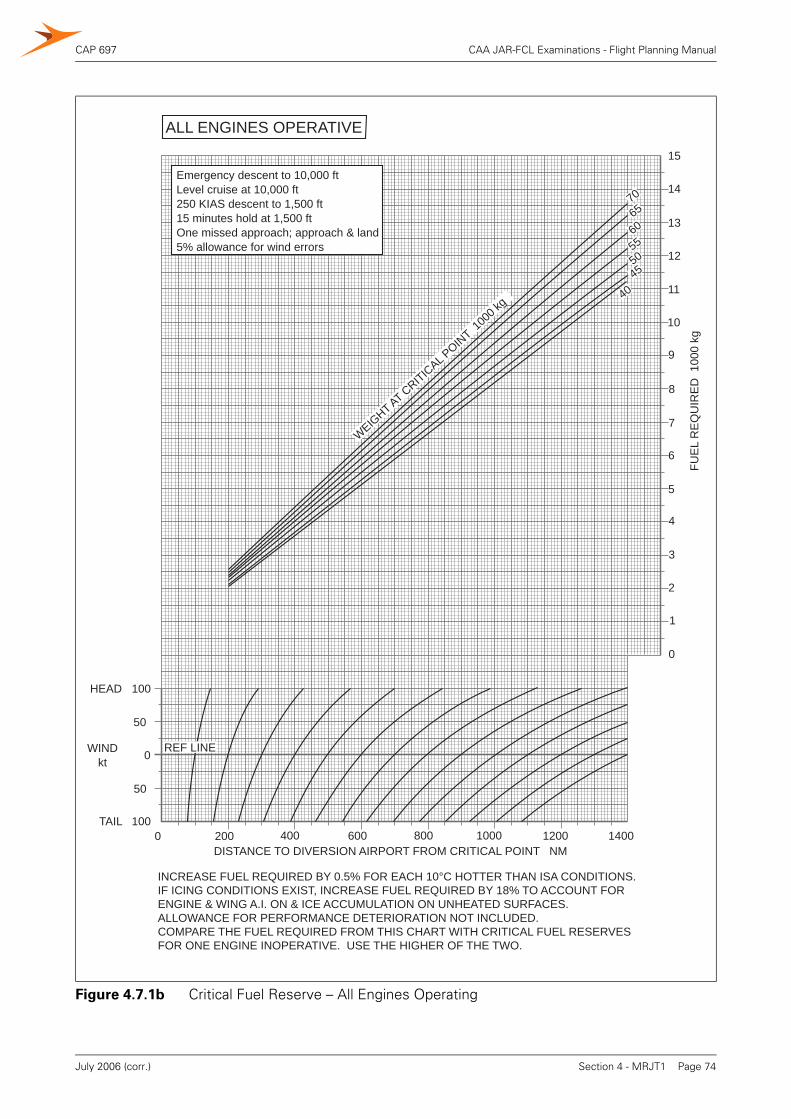
CAP 697 CAA JAR-FCL Examinations - Flight Planning Manual
Figure 4.7.1b Critical Fuel Reserve – All Engines Operating
0
3
4
5
6
7
8
9
FUE
L R
EQ
UIR
ED
100
0 kg
1
2
10
11
12
15
14
13
100
0
100
HEAD
TAIL
WINDkt
50
50
200 400 600 800 10000 1200 1400DISTANCE TO DIVERSION AIRPORT FROM CRITICAL POINT NM
REF LINE
Emergency descent to 10,000 ftLevel cruise at 10,000 ft250 KIAS descent to 1,500 ft15 minutes hold at 1,500 ftOne missed approach; approach & land5% allowance for wind errors
7065
60
555045
40
ALL ENGINES OPERATIVE
WEIGHT AT C
RITICAL P
OINT 1
000 k
g
INCREASE FUEL REQUIRED BY 0.5% FOR EACH 10°C HOTTER THAN ISA CONDITIONS.IF ICING CONDITIONS EXIST, INCREASE FUEL REQUIRED BY 18% TO ACCOUNT FORENGINE & WING A.I. ON & ICE ACCUMULATION ON UNHEATED SURFACES.ALLOWANCE FOR PERFORMANCE DETERIORATION NOT INCLUDED.COMPARE THE FUEL REQUIRED FROM THIS CHART WITH CRITICAL FUEL RESERVESFOR ONE ENGINE INOPERATIVE. USE THE HIGHER OF THE TWO.
Section 4 - MRJT1 Page 74July 2006 (corr.)
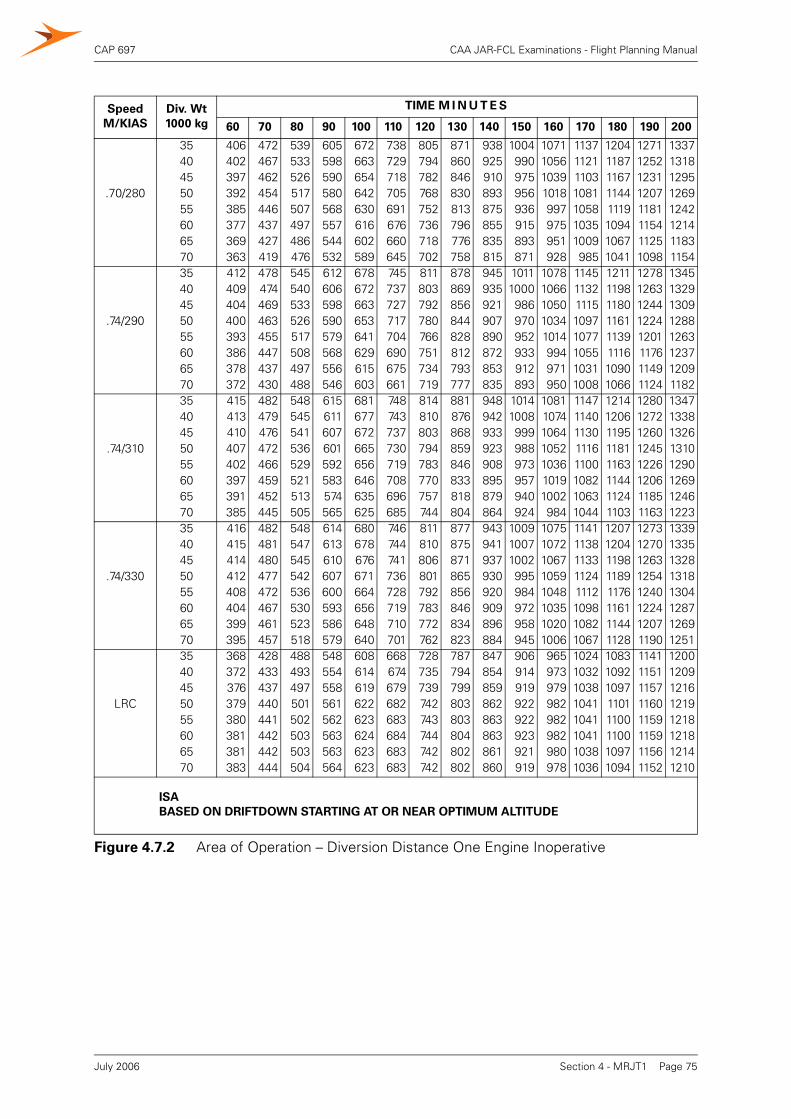
CAP 697 CAA JAR-FCL Examinations - Flight Planning Manual
Speed
M/KIAS
Div. Wt
1000 kg
TIME M I N U T E S
60 70 80 90 100 110 120 130 140 150 160 170 180 190 200
35 406 472 539 605 672 738 805 871 938 1004 1071 1137 1204 1271 133740 402 467 533 598 663 729 794 860 925 990 1056 1121 1187 1252 131845 397 462 526 590 654 718 782 846 910 975 1039 1103 1167 1231 1295
.70/280 50 392 454 517 580 642 705 768 830 893 956 1018 1081 1144 1207 126955 385 446 507 568 630 691 752 813 875 936 997 1058 1119 1181 124260 377 437 497 557 616 676 736 796 855 915 975 1035 1094 1154 121465 369 427 486 544 602 660 718 776 835 893 951 1009 1067 1125 118370 363 419 476 532 589 645 702 758 815 871 928 985 1041 1098 115435 412 478 545 612 678 745 811 878 945 1011 1078 1145 1211 1278 134540 409 474 540 606 672 737 803 869 935 1000 1066 1132 1198 1263 132945 404 469 533 598 663 727 792 856 921 986 1050 1115 1180 1244 1309
.74/290 50 400 463 526 590 653 717 780 844 907 970 1034 1097 1161 1224 128855 393 455 517 579 641 704 766 828 890 952 1014 1077 1139 1201 126360 386 447 508 568 629 690 751 812 872 933 994 1055 1116 1176 123765 378 437 497 556 615 675 734 793 853 912 971 1031 1090 1149 120970 372 430 488 546 603 661 719 777 835 893 950 1008 1066 1124 118235 415 482 548 615 681 748 814 881 948 1014 1081 1147 1214 1280 134740 413 479 545 611 677 743 810 876 942 1008 1074 1140 1206 1272 133845 410 476 541 607 672 737 803 868 933 999 1064 1130 1195 1260 1326
.74/310 50 407 472 536 601 665 730 794 859 923 988 1052 1116 1181 1245 131055 402 466 529 592 656 719 783 846 908 973 1036 1100 1163 1226 129060 397 459 521 583 646 708 770 833 895 957 1019 1082 1144 1206 126965 391 452 513 574 635 696 757 818 879 940 1002 1063 1124 1185 124670 385 445 505 565 625 685 744 804 864 924 984 1044 1103 1163 122335 416 482 548 614 680 746 811 877 943 1009 1075 1141 1207 1273 133940 415 481 547 613 678 744 810 875 941 1007 1072 1138 1204 1270 133545 414 480 545 610 676 741 806 871 937 1002 1067 1133 1198 1263 1328
.74/330 50 412 477 542 607 671 736 801 865 930 995 1059 1124 1189 1254 131855 408 472 536 600 664 728 792 856 920 984 1048 1112 1176 1240 130460 404 467 530 593 656 719 783 846 909 972 1035 1098 1161 1224 128765 399 461 523 586 648 710 772 834 896 958 1020 1082 1144 1207 126970 395 457 518 579 640 701 762 823 884 945 1006 1067 1128 1190 125135 368 428 488 548 608 668 728 787 847 906 965 1024 1083 1141 120040 372 433 493 554 614 674 735 794 854 914 973 1032 1092 1151 120945 376 437 497 558 619 679 739 799 859 919 979 1038 1097 1157 1216
LRC 50 379 440 501 561 622 682 742 803 862 922 982 1041 1101 1160 121955 380 441 502 562 623 683 743 803 863 922 982 1041 1100 1159 121860 381 442 503 563 624 684 744 804 863 923 982 1041 1100 1159 121865 381 442 503 563 623 683 742 802 861 921 980 1038 1097 1156 121470 383 444 504 564 623 683 742 802 860 919 978 1036 1094 1152 1210
ISA
BASED ON DRIFTDOWN STARTING AT OR NEAR OPTIMUM ALTITUDE
Figure 4.7.2 Area of Operation – Diversion Distance One Engine Inoperative
Section 4 - MRJT1 Page 75July 2006
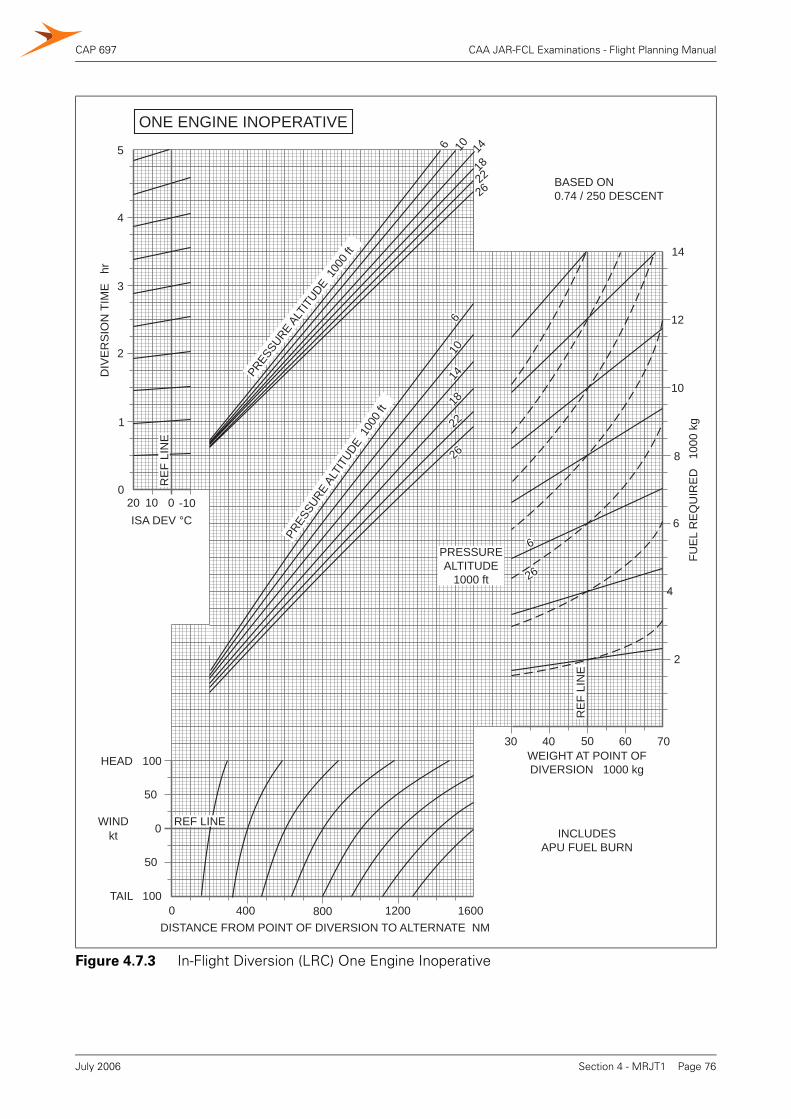
CAP 697 CAA JAR-FCL Examinations - Flight Planning Manual
Figure 4.7.3 In-Flight Diversion (LRC) One Engine Inoperative
20 10 0 -10ISA DEV °C
100
0
100
HEAD
TAIL
WINDkt
50
50
DISTANCE FROM POINT OF DIVERSION TO ALTERNATE NM0 400 800 1200 1600
30 40 50 60 70WEIGHT AT POINT OFDIVERSION 1000 kg
INCLUDESAPU FUEL BURN
BASED ON0.74 / 250 DESCENT
2
4
6
8
10
12
14
FUE
L R
EQ
UIR
ED
10
00 k
g
RE
F LI
NE
RE
F LI
NE
0
1
2
3
4
5
DIV
ER
SIO
N T
IME
hr
2622
1814106
26
22
1814
106
26
6PRESSUREALTITUDE
1000 ft
ONE ENGINE INOPERATIVE
REF LINE
PRES
SURE
ALTI
TUDE
100
0 ft
PRES
SURE
ALTI
TUDE
1000
ft
Section 4 - MRJT1 Page 76July 2006
CAP 697 CAA JAR-FCL Examinations - Flight Planning Manual
8 Fuel Tankering
Because of fuel cost differentials between those at departure airport and those atdestination airport, economic benefit can sometimes be gained from carrying excessfuel (i.e. a fuel load greater than that required for the flight). The following graphsprovide a ready means of determining whether such an action is beneficial.
• Fig. 4.8.1 – Fuel Tankering (LRC and M 0.74)
These graphs show the surplus fuel burn required for carriage of extra fuel. In theexample shown on the Long Range Cruise graph of Fig. 4.8.1, a trip has a distanceof 1600 NAM and is to be conducted at FL 330.If excess fuel is carried, 13.2% of that excess will be consumed as a ’fuel penalty’.
• Fig. 4.8.2 – Fuel Price Differential
Using the percentage value for the surplus fuel burn (as obtained from Fig. 4.8.1)and fuel price at the departure airport, the break-even price at the destinationairport can be determined.
Section 4 - MRJT1 Page 77July 2006
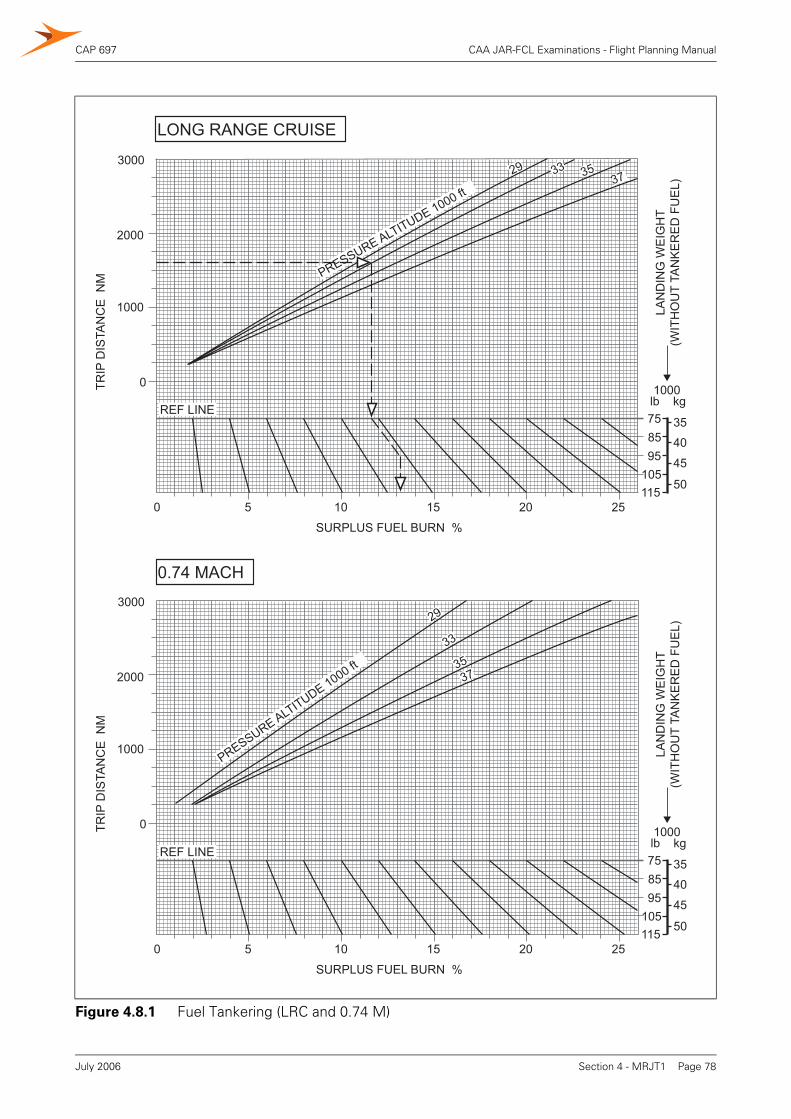
CAP 697 CAA JAR-FCL Examinations - Flight Planning Manual
Figure 4.8.1 Fuel Tankering (LRC and 0.74 M)
29 33 3537
SURPLUS FUEL BURN %
5 10 15 20 250
0
1000
2000
TRIP
DIS
TAN
CE
NM
3000
LAN
DIN
G W
EIG
HT
(WIT
HO
UT
TAN
KE
RE
D F
UE
L)
758595
105115
35
40
45
50
lb kg1000
LONG RANGE CRUISE
REF LINE
PRESSURE ALTITUDE 1000 ft
5 10 15 20 250
0
1000
2000
TRIP
DIS
TAN
CE
NM
3000
LAN
DIN
G W
EIG
HT
(WIT
HO
UT
TAN
KE
RE
D F
UE
L)
758595
105115
35
40
45
50
lb kg1000
REF LINE
29
33
3537
PRESSURE ALTITUDE 1000 ft
0.74 MACH
SURPLUS FUEL BURN %
Section 4 - MRJT1 Page 78July 2006
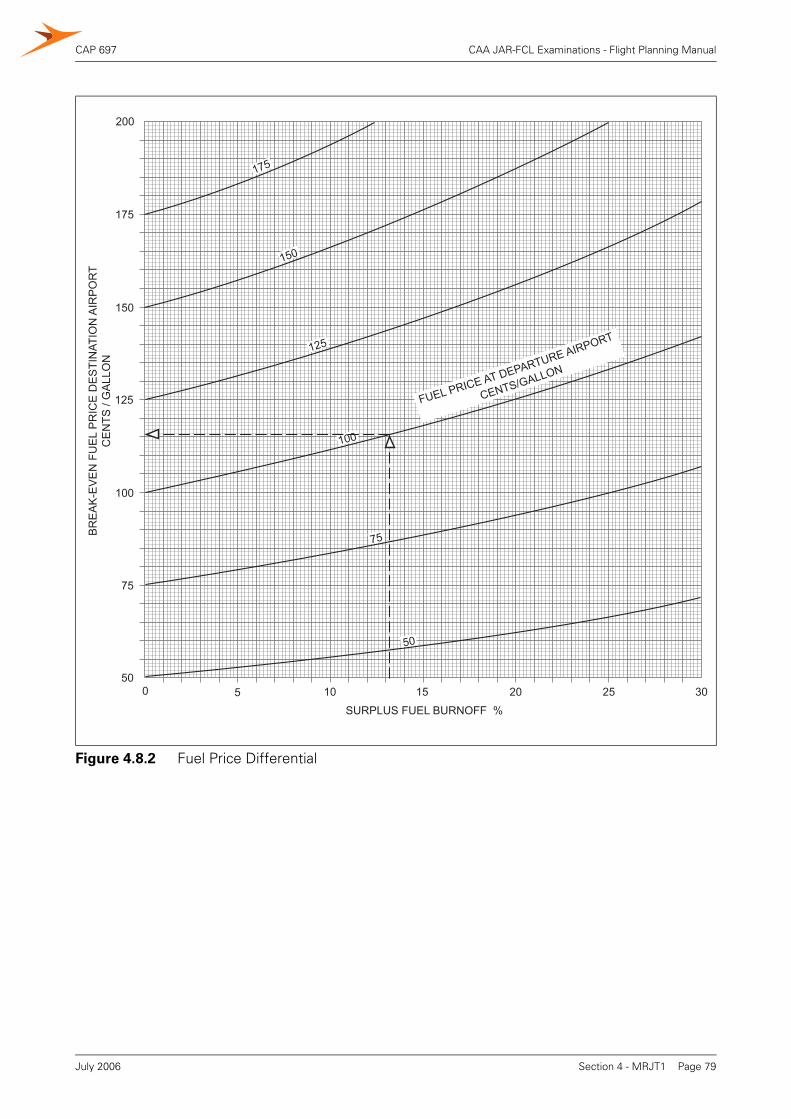
CAP 697 CAA JAR-FCL Examinations - Flight Planning Manual
Figure 4.8.2 Fuel Price Differential
0 5 10 15 20 25 30
SURPLUS FUEL BURNOFF %
50
75
100
125
150
175
200
BR
EA
K-E
VE
N F
UE
L P
RIC
E D
ES
TIN
ATIO
N A
IRP
OR
TC
EN
TS /
GA
LLO
N
175
150
125
100
75
50
FUEL PRICE AT DEPARTURE AIRPORT
CENTS/GALLON
Section 4 - MRJT1 Page 79July 2006

CAP 697 CAA JAR-FCL Examinations - Flight Planning Manual
INTENTIONALLY LEFT BLANK
Section 4 - MRJT1 Page 80July 2006