Embed Size (px)
Citation preview
14FAO SmartFish Publication
FLAVOURING FISH INTO FOOD SECURITY
John Kurien
Javier López Ríos

Cover photograph courtesy of FAO, Davide Signa
REPORT/RAPPORT: SF-FAO/2013/14
Flavouring fish into Food security
A Preliminary Assessment of the Integration
of Fisheries and Aquaculture into
Food and Nutrition Policy Frameworks
of East and South Africa and Indian Ocean Countries
August 2013
GCP/RAF/466/EC SmartFish Project

The designations employed and the presentation of material in this
information product do not imply the expression of any opinion
whatsoever on the part of the Food and Agriculture Organization of the
United Nations (FAO) concerning the legal or development status of any
country, territory, city or area or of its authorities, or concerning the
delimitation of its frontiers or boundaries. The mention of specific
companies or products of manufacturers, whether or not these have
been patented, does not imply that these have been endorsed or
recommended by FAO in preference to others of a similar nature that
are not mentioned.
The views expressed in this information product are those of the
author(s) and do not necessarily reflect the views or policies of FAO.
The contents of this publication are the sole responsibility of the
author(s) and can in no way be taken to reflect the views of the
European Union
© FAO 2013
FAO encourages the use, reproduction and dissemination of material in
this information product. Except where otherwise indicated, material
may be copied, downloaded and printed for private study, research and
teaching purposes, or for use in non-commercial products or services,
provided that appropriate acknowledgement of FAO as the source and
copyright holder is given and that FAO’s endorsement of users’ views,
products or services is not implied in any way.
All requests for translation and adaptation rights, and for resale and
other commercial use rights should be made via www.fao.org/contact-
us/licence-request or addressed to [email protected].
FAO information products are available on the FAO website
(www.fao.org/publications) and can be purchased through publications-
For more information, please contact [email protected].
Kurien, John & López Ríos, Javier 2013. Flavouring fish into food security.
Report/Rapport: SF-FAO/2013/14. August/Aout 2013. FAO-SmartFish Programme of the
Indian Ocean Commission, Ebene, Mauritius.
3
Acknowledgements
We are grateful to the following officers from the East and South Africa and Indian Ocean
(ESA-IO) region for taking time out to fill in the questionnaires sent to them. They have
made this study more participatory:
Evariste Rumbete; Joseph Ndikumana; Said Boina; Koffi Mulumba; Mahamoud Youssoul;
Ahmed Darar Djibril; Tsion Dveje; Brook Lema; Hussein Abegaz; Lucy Obungu;
Samueline Vololoherimandimby Ranaivoson; Tantely Harimanana Razafindrajery; Moffat
Mzama Manase; Orton M. Kachinjika; Daroomalingum Mauree; Jean Claude Ndorimana;
Finley Racombo; Abdiwali Nur Farah Fagalah; Suzana Gabriel; Aloma Francis Sarafino;
Nadia Eldindring Omar Karoum; Julius P. Mairi; Kabuye Geoffrey; Bukirwa Faridah; Harris
Phiri; Bothwell Mkodza; Tecle Alemseghed Desta.
Additionally, the authors would like to thank Ms Josefine Gesien for her help in collecting
the policy papers for the countries and the Regional Economic Communities (RECs)
involved, and the FAO staff Ms Helga Josupeit, Mr John Ryder and Mr Davide Signa, for
their feedback and assistance.
4
Executive Summary
This study makes a preliminary assessment of fisheries and aquaculture incorporation
into the food and nutrition policy frameworks of twenty countries in the East and South
Africa and Indian Ocean (ESA-IO) region.
In a world where we are confronted with the paradox of hunger, food resources such as
fish, which are readily available in the ESA-IO countries, can become an important part
of the solution to food and nutritional insecurity that plagues the sub-Saharan countries
as a whole and the ESA-IO region in particular. The vast aquatic resources – in the sea,
rivers, lakes and man-made water bodies - of the region provide the basis for supporting
vibrant small-scale fishery activities. Development inputs dedicated to these activities
can, in turn, increase the purchasing power of fishers and fish workers and also make
fish available at reasonable prices to needy rural consumers.
Policy making for food security presupposes that the formulators have a good
understanding of all the food sectors of the economy and the inter-relations that exist
between them. In this study, we first assessed the extent to which fish and fisheries have
been integrated into food security related, as well as economic and social development,
policy documents. This assessment was followed-up by using fishery related indicators to
consider the extent to which fish and fisheries are integrated into the diets and
economies of the 20 ESA-IO countries. The extent of congruence or mismatch between
integration by word (incorporation into policy) and integration by deed (the reality of
food and the economy) was examined.
Fishery officers, who are the key link between high level policy makers and people in the
fisheries sector, play a crucial role in translating policy into action. Consequently, their
understanding of the various factors that have a bearing on the role of fish and fisheries
in food and nutritional security is paramount. An assessment of the knowledge of these
officers and their creative suggestions on what is to be done to improve integration was
carried out and highlighted their potential as policy makers.
There is not an iota of doubt that enhancing the integration of fish into the diets and
fisheries into the economic activities of countries will raise the well-being of all. Using a
menu of indicators, we arrived at a gradated list of countries with different levels of
potential for enhancing integration. It should be noted that by using this approach, we
run the risk of betting on the strong and neglecting the weak. This prompted us to
embark on an exercise to identify countries where there is a real need and, within this
category, where it would be possible to raise a real awareness among the population
about this need. The resulting list of countries includes: Kenya, Malawi, Rwanda,
Tanzania, Zambia and Zimbabwe. These countries straddle the spectrum of nations with
high, medium and low potentials for enhancing the integration of fish and fisheries into
their food intake and economic activities.
5
The analysis of the Regional Economic Communities indicates that much needs to be
done to make their policy orientation process recognise more cogently the role that fish
and fisheries play in the economic activities and dietary habits of the citizens. In
particular, the East Africa Community, the Common Market for Eastern and Southern
Africa ESA-IO and the Indian Ocean Commission perform badly when comparing the
importance of fisheries in their region with the presence of fisheries issues in their policy
papers.
The final chapter of this study provides an assessment of the degree of integration in
word and deed, of seven countries namely: Comoros, Djibouti, Malawi, Rwanda, Burundi,
the Democratic Republic of Congo and Zambia. Fish was identified as important in these
countries but this fact is presently overlooked in policy discussions. Integrating these
countries with those identified above as having potential for increased fish consumption,
we are left with a final list of five countries where SmartFish could start advocacy work:
Comoros, Djibouti, Malawi, Rwanda, and Zambia. Furthermore, Mauritius should also be
included as another country where actions should be implemented by SmartFish, given
the high potential and low inclusion of this subject in current policies in this country.
This is the challenge of flavouring fish into food security.
6
Résumé exécutif
Cette étude est une évaluation préliminaire des composantes pêche et aquaculture dans
les politiques alimentaire et nutritionnelle des vingt pays de la région Afrique orientale et
australe et océan Indien (AfOA-OI).
Dans le monde actuel confronté au paradoxe de la faim, les ressources alimentaires telles
que le poisson, facilement accessibles dans les pays de la région, peuvent contribuer de
manière significative à solutionner l’insécurité alimentaire des pays d’Afrique sub-
saharienne dans leur ensemble et ceux de la région AfOA-OI en particulier. Les
ressources aquatiques de la région – issues des rivières, mers, lacs et plans d’eau – sont
un support de base à la pêche à petite échelle. Le développement d’intrants dédiés à ces
activités peut améliorer le pouvoir d’achat des pêcheurs et des travailleurs de la pêche,
et également rendre le poisson plus accessible pour les consommateurs ruraux.
L’élaboration des politiques de sécurité alimentaire suppose que les législateurs aient une
bonne compréhension des secteurs de l’économie et de leurs interrelations. Cette étude a
premièrement évalué l’étendue de l’intégration de la pêche dans les politiques de sécurité
alimentaire et les politiques de développement économique et social. Cette évaluation a
été réalisée en examinant l’intégration d’indicateurs « pêche » dans le régime et dans
l’économie des 20 pays de la région AfOA-OI. L’importance des convergences ou
disparités entre l’intégration par les mots (dans les textes de lois) et dans les faits
(l’alimentation et l’économie) a été examinée.
Les officiers des pêches, qui sont le lien entre les décideurs politiques et les travailleurs
du secteur de la pêche, jouent un rôle crucial en mettant en œuvre les politiques.
L’analyse qu’ils font des éléments susceptibles d’influencer le rôle de la pêche dans la
sécurité alimentaire et nutritionnelle est donc extrêmement importante. Une évaluation
des connaissances de ces officiers et de leurs suggestions afin d’améliorer l’intégration de
la pêche a été réalisée. Leur potentiel en tant que législateurs a été mis en avant.
Il ne fait aucun doute que favoriser l’intégration de la pêche dans les régimes
alimentaires et les activités économique élèvera le niveau de vie de tous. Grâce à
l’utilisation d’indicateurs, nous sommes parvenus à classer les pays selon leur degré
potentiel d’intégration de la pêche. Il faut noter qu’en utilisant cette approche, il existe
un risque de négliger les faiblesses tout en favorisant les forces. Cela nous a mené à
faire un exercice d’identification des pays où il existe un besoin réel et, dans cette
catégorie, d’identifier où il serait possible de sensibiliser réellement la population à ce
besoin. Le résultat est : le Kenya, le Malawi, le Rwanda, la Tanzanie, la Zambie et le
Zimbabwe. Ces pays font partie des Nations avec un haut, moyen et bas potentiel pour
améliorer l’intégration de la pêche au sein de leurs apports alimentaires et activités
économiques.
L’analyse des Communautés économiques régionales indique qu’il reste beaucoup à faire
pour que le processus politique s’oriente vers plus de reconnaissance du rôle de la pêche
dans l’activité économique et les habitudes alimentaires des citoyens.
7
En particulier, la Communauté de l’Afrique de l’Est, le Marché commun de l'Afrique
orientale et australe et la Commission de l’océan Indien réalisent de mauvaises
performances quant à l’intégration de la pêche dans les textes de loi dans leur région
respective.
Le dernier chapitre de cette étude contient une évaluation du degré d’intégration, dans la
loi et dans les faits, des sept pays suivants : Union des Comores, Djibouti, Malawi,
Rwanda, Burundi, République Démocratique du Congo et Zambie. La pêche a été
identifiée comme étant importante dans ces pays mais on ce fait a tendance à être oublié
dans les discussions politiques. Ces pays ont donc été ajoutés à la liste de ceux avec un
potentiel d’augmentation de la consommation du poisson. Il en reste donc cinq dans
lesquels SmartFish pourrait commencer un travail de sensibilisation : Union des
Comores, Djibouti, Malawi, Rwanda et Zambie. De plus, Maurice devrait également être
inclus comme pays où SmartFish pourrait mettre en œuvre ses actions car il y existe un
potentiel important et une faible intégration du sujet dans les politiques du pays.
C’est le challenge de mettre la pêche au goût du jour de la sécurité alimentaire.
8
Contents
Acknowledgements __________________________________________________ 3
Executive Summary _________________________________________________ 4
Résumé exécutif ____________________________________________________ 6
Contents __________________________________________________________ 8
List of Tables _______________________________________________________ 9
Acronyms and abbreviations __________________________________________ 10
1 Introduction ________________________________________________ 11
1.1 Why hunger amidst plenty? __________________________________________ 11
1.2 Food insecurity in Africa_____________________________________________ 12
1.3 Fish and fisheries for food security _____________________________________ 13
1.4 Role of policy ____________________________________________________ 14
1.5 Focus of this study _________________________________________________ 14
1.6 Limitations of the study _____________________________________________ 16
2 Understanding integration: views of the fishery officers ________________ 17
2.1 Factors and impacts _______________________________________________ 17
2.2 Protein preferences ________________________________________________ 18
2.3 What has to be done? _____________________________________________ 20
2.4 Merits of participation ______________________________________________ 22
3 Enhancing integration: potential, need and awareness ________________ 22
3.1 Where is the potential for enhancement? _______________________________ 23
3.2 ‘Need’ as a deciding factor for enhancement ___________________________ 27
3.3 Creating awareness about real needs __________________________________ 29
4 Assessing integration: words and deeds ___________________________ 31
4.1 Integration by word: analysis of policy documents _________________________ 31
4.2 Integration by deed: assessing integration through indicators per country ____ 33
4.3 Aggregated analysis for the Regional Economic Communities ________________ 40
4.4 Merging words with deeds: Improving policy and practice___________________ 46
5 Conclusions ________________________________________________ 48
References ________________________________________________________ 50
Annex 1 Member countries of the Regional Economic Commissions _____________ 51
Annex 2 Consolidating integration: what can be meaningfully achieved _________ 52
Annex 3 Qualitative and quantitative dimensions of integrating
fisheries and aquaculture in the ESA-IO region. ______________________ 61
Annex 4 Questionnaire to be filled by policy makers and fishery managers _______ 171

9
List of Tables
Table 1 Fishery officers’ awareness and understanding of the role of fisheries and
aquaculture in food security ___________________________________________________ 18
Table 2 Protein preferences by country as indicated by the fishery officers _______________ 19
Table 3 Summary of opinions expressed by fishery officers on important factors that will
help increase the role of fish in food and nutritional security ______________________ 20
Table 4 Assessing the potential for fisheries to play a role in food and nutritional security ___ 25
Table 5 Country ranking with regard to the potential for fisheries and aquaculture
to play a role in food and nutritional security ____________________________________ 26
Table 6 Countries where there is need to enhance the role of fisheries in food security ____ 28
Table 7 Countries where the scope to raise awareness about the role of fisheries
in food security is high _________________________________________________________ 30
Table 8 Review of ESA-IO countries policy documents with mention of
fish and fisheries content _______________________________________________________ 33
Table 9 Assessing the level of integration of fish and fisheries into food security ____________ 36
Table 10 Ranking of countries with regard to current level of integration of
fish into food and nutritional security ____________________________________________ 37
Table 11 Assessing the integration of fisheries in food security (real terms) __________________ 38
Table 12 Ranking of countries with regard to mismatch between importance of
fisheries and presence of fisheries in policy papers _______________________________ 39
Table 13 Identification of countries with regard to mismatch between the importance of
fisheries and the presence of fisheries in policies papers and their food insecurity __ 40
Table 14 Assessing the level of integration of fish and fisheries into food security in RECs ____ 42
Table 15 Ranking of RECs with regard to the importance of fish and fisheries
for the member countries and food security ____________________________________ 43
Table 16 Assessing the potential for fisheries to play a role in the food and
nutritional security of RECs _____________________________________________________ 44
Table 17 Ranking of RECs with regard to the potential for fish and fisheries
to play a role in food and nutritional security ____________________________________ 44
Table 18 RECs needs in terms of enhancing the role of fisheries in food security ____________ 45
Flavouring fish into food security 10
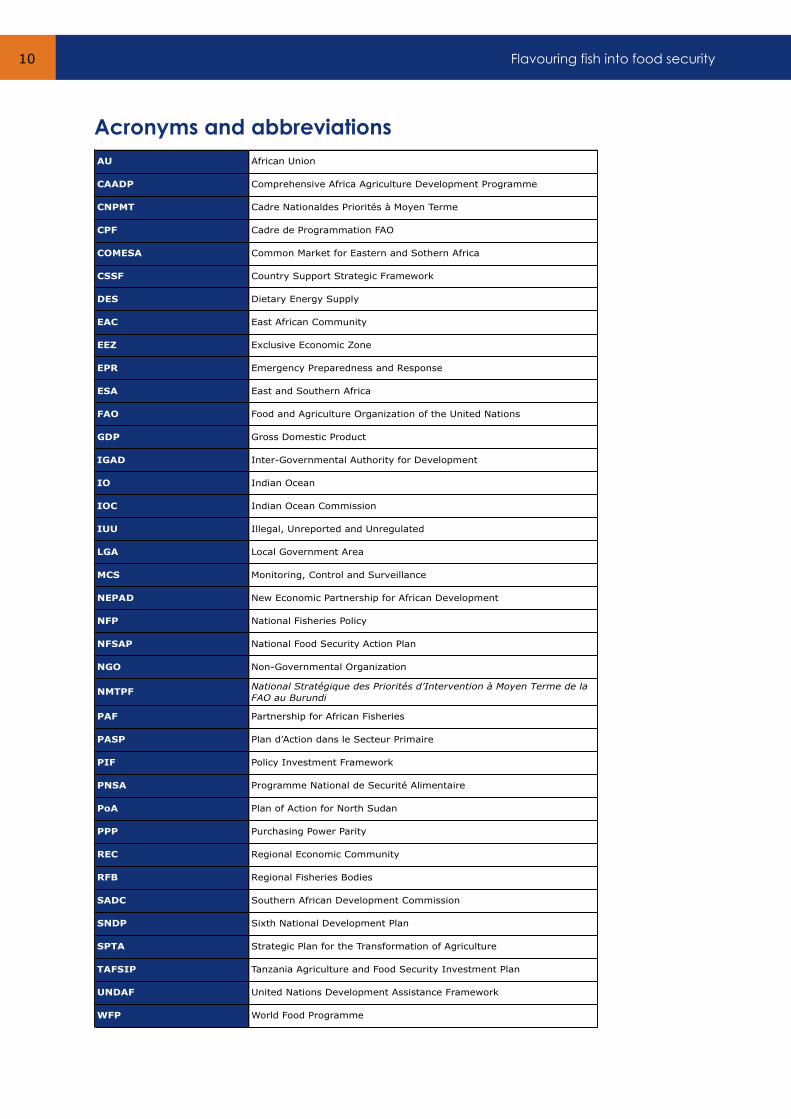
AU African Union
CAADP Comprehensive Africa Agriculture Development Programme
CNPMT Cadre Nationaldes Priorités à Moyen Terme
CPF Cadre de Programmation FAO
COMESA Common Market for Eastern and Sothern Africa
CSSF Country Support Strategic Framework
DES Dietary Energy Supply
EAC East African Community
EEZ Exclusive Economic Zone
EPR Emergency Preparedness and Response
ESA East and Southern Africa
FAO Food and Agriculture Organization of the United Nations
GDP Gross Domestic Product
IGAD Inter-Governmental Authority for Development
IO Indian Ocean
IOC Indian Ocean Commission
IUU Illegal, Unreported and Unregulated
LGA Local Government Area
MCS Monitoring, Control and Surveillance
NEPAD New Economic Partnership for African Development
NFP National Fisheries Policy
NFSAP National Food Security Action Plan
NGO Non-Governmental Organization
NMTPFNational Stratégique des Priorités d’Intervention à Moyen Terme de la
FAO au Burundi
PAF Partnership for African Fisheries
PASP Plan d’Action dans le Secteur Primaire
PIF Policy Investment Framework
PNSA Programme National de Securité Alimentaire
PoA Plan of Action for North Sudan
PPP Purchasing Power Parity
REC Regional Economic Community
RFB Regional Fisheries Bodies
SADC Southern African Development Commission
SNDP Sixth National Development Plan
SPTA Strategic Plan for the Transformation of Agriculture
TAFSIP Tanzania Agriculture and Food Security Investment Plan
UNDAF United Nations Development Assistance Framework
WFP World Food Programme
Acronyms and abbreviations
Introduction 11
1. Introduction
“….…fish should be regarded as one of the most important sources of food in any
program for raising the nutritional levels of peoples throughout the world”
FAO. 1945. Five technical reports on food and agriculture:
Fisheries. Report of the Technical Committee on Fisheries,
submitted to the United Nations Interim Commission on Food
and Agriculture. Washington. pp. 175–216.
The most pressing economic, social, cultural and ethical problem, which the world faces
today is one of the oldest and most tenacious: hunger. Hunger still persists at a time when
there is more food available in the world than ever before.
Almost a billion people do not have enough to eat. They live in uncertainty as to where
their next meal will come from. They are both under-nourished and malnourished from not
having enough food and from not having food with the right nutrients. The majority of
these people live on the South-Asian sub-continent and in sub-Saharan Africa.
Hunger is not just a problem for developing countries. The USA and several European
countries are currently spending money on food stamps and operating food banks to help
feed increasing numbers of poor and marginalised people.
The cruel paradox is that another billion people have to come to terms with the opposite
problem – obesity; they eat too much. However, they too are malnourished from
excessive consumption of poor quality foods. Most of these people live in developed
countries, but an increasing share can now also be found in urban areas of developing
countries.
An argument put forward by many was that hunger would disappear once economic
growth in developing countries increased. If this were true, then indeed most countries of
South Asia and sub-Saharan Africa would be free from hunger. These countries have been
able to achieve respectable growth rates in terms of their gross domestic products (GDP)
over the last decade, even during the ongoing uncertainties of the global economy.
However hunger and food insecurity persists – and is even on the increase. While food is
rotting in warehouses, people around the world, who are often food producers themselves,
are going hungry.
1.1 Why hunger amidst plenty?
Several reasons have been put forward for this phenomenon of hunger and food insecurity
amidst plenty. The most important of these are the persistent poverty of millions of people
in rural and urban areas and the rising prices of food commodities at the retail level. The
issue is not the availability of food alone. The problem is the inability to muster the
economic resources to access this food. Simply put, people may be poor because they
have no source of income and therefore do not have the money to buy food.
Flavouring fish into food security 12
Even when people can just about manage to buy food, their bodies may be unable to
retain and convert it into useful energy due to poor health and/or illness. Much of this ill
health is caused by the habitat and environment in which they live; often they are
deprived of basic amenities such as clean water and sanitation. When people are ill their
bodies are not able to absorb the necessary nutrients from the food they eat.
An additional reason for both under-nourishment and malnutrition can be attributed to the
fact that people are not aware of the right food choices to make. Good nutritious and
inexpensive foods may be available in their own neighbourhood/locality/country. However,
people may be unaware of this, or they may be influenced to make the wrong choices and
access foods that are not nutritious.
1.2 Food insecurity in Africa
There is no life without food and there is no human development without food security.
The prevalence of hunger is highest in sub-Saharan Africa. One in every four Africans is
under-nourished. In 2008, the count was 218 million. Hunger and malnourishment attack
the very foundation of human development. Food security and human development are
therefore mutually reinforcing.
FAO defines food security as “a condition when all people, at all times, have physical and
economic access to sufficient, safe and nutritious food to meet their dietary needs and
food preferences for an active and healthy life”. There are two ways to achieve food
security. The first is to make food directly available to those in need. The second is to
provide employment opportunities to people so that they can earn an income and use it to
buy food of their choice.
In Africa, and particularly in sub-Saharan Africa, both direct and indirect approaches to
achieving food security are at risk in most of the countries. Despite moderate economic
growth – measured conventionally as the percentage rate of increase in real GDP – the
level of food production has not increased substantially and poverty in the population has
not declined significantly. The nutrition outcomes have been inadequate and malnutrition
continues to plague the region’s population – particularly its children and thus its future.
Along with malnutrition, there is also pervasive ‘hidden hunger’ in the form of micro-
nutrient deficiencies which are rampant in the East and Southern African (ESA) countries
and sub-Saharan Africa as a whole.
Food insecurity thus continues to be a stark reality in sub-Saharan Africa. Food insecure
people are less healthy and become economically unproductive. This leads to lower
income-earning possibilities. Food insecure people also tend to have lower educational
achievements. Taken together, these factors account for the low human development of
the people in the region. Enhancing food security is thus the only sustainable route to
achieving wholesome human development. Higher human development in turn ensures
greater food security thus creating a virtuous cycle.
Introduction 13
Incorporating and integrating food security – its direct and indirect methods of
achievement – into plans and policy making processes and making them a reality on the
ground in countries of the region, is of great importance. Such exercises must be country
specific particularly with respect to the kind of food commodities that are included in the
food security basket. Food choices are greatly influenced by particular elements of the
ecosystem e.g. the kind of land and water sources that are available; but they are also
socially and culturally conditioned.
Discussions, debates and policy-making processes, with regard to food security in Africa
(and in other parts of the world), are centred on cereals, pulses and meats. Food policy is
largely terrestrial oriented. Little is said about fish, even in countries where fish is central
to the population’s diet, irrespective of income levels and social status. This is unfortunate
to say the least. The pivotal role that fish can play in direct food security is not adequately
recognised, it only appears to find its place on the periphery of policy makers’ concerns. In
fact it could even be considered as a ‘policy blind spot’.
1.3 Fish and fisheries for food security
In the context of hunger and obesity, the role of fish as a wholesome and inexpensive food
source for achieving food security merits serious consideration.
Many of the discussions and reports on food security focus on terrestrial foods. This is
primarily due to the fact that they account for a larger proportion of the calories needed
for daily human consumption.
Humans cannot live on fish alone, however small quantities of fish in human diets can
make crucial differences in brain development; are beneficial for the development of bone
and muscle tissue; can prevent blindness, heart attacks and cancer; as well as mitigate
the effects of HIV/AIDS.
Where there are aquatic resources, fish can be found naturally. In rivers, lakes, ponds,
reservoirs, floodplains, coastal waters and the open sea, fish as well as other edible
aquatic organisms and plants, are in plentiful supply. Fish can also be easily cultured in
different aquatic milieu.
Sub-Saharan countries are blessed with a large share of such aquatic resources, making
the potential for fisheries development a natural choice. With small, dedicated and
‘quality-investments’ of time and money, returns, in the form of fish can be substantial.
Thus, contrary to popular belief, the potential for growing and harvesting fish in sub-
Saharan Africa, for a direct contribution to increased food supply and food security, is
considerable.
In this context, it is important to highlight that fish is not a homogenous product. Species
diversity, and consequently physical form, is vast and manifold.
Flavouring fish into food security 14
Substituting meat with fish is therefore not always easy. Tastes are culturally acquired and
require time to adjust. Palates are more easily adaptable if one starts young, therefore the
introduction of fish into school feeding programmes could prove to be the means to
promote fish consumption for future generations.
1.4 Role of policy
Policies are principles or guidelines, which provide direction for decision-making. Good
policies can provide a sound basis for enlightened actions and a ‘vision’ which will help
formulate food and nutritional strategies to assess needs, identify potentials and assist in
linking and integrating potential needs. Good policy making, however, is a process not a
one-time event of drafting of good intentions. It presupposes adequate knowledge of the
realities on the ground. It requires hard facts and data, and their appropriate
juxtaposition, to give rise to sound information based on which guidelines can be
formulated and decisions taken. Policy making for food security presupposes that the
initiators have a good understanding of all the food sectors of the economy and the inter-
relations that exist between them.
Involving personnel, such as government executives who are responsible for implementing
the policy, is important to ensure that policy formulation is participatory. Consultations, or
prior public hearings, with various stakeholders from the sector, allow for the creation of a
realistic and inclusive policy. Balanced gender representation provides the much-needed
‘household-level view’ of food security that women alone provide with greater empathy
and authority.
1.5 Focus of this study
This study is part of the European Union funded SmartFish Program financed under the
10th European Development Fund. The Program aims to contribute to an increased level of
social, economic and environmental development and deeper regional integration in the
Eastern-Southern Africa and Indian Ocean Region (ESA-IO) through improved capacities
for the sustainable exploitation of fisheries resources. The Program focuses on five
components: (1) Fisheries Management; (2) Governance; (3) Effective Monitoring Control
and Surveillance; (4) Trade; and (5) Food Security.
This study is part of component 5, which focuses on food security. The emphasis of
component 5 is on making a preliminary assessment of the level and nature of fisheries
and aquaculture integration both regionally and nationally in food security, nutrition
policies, plans and strategies. Twenty countries were included in the assessment, see Map
1. below.
Introduction 15
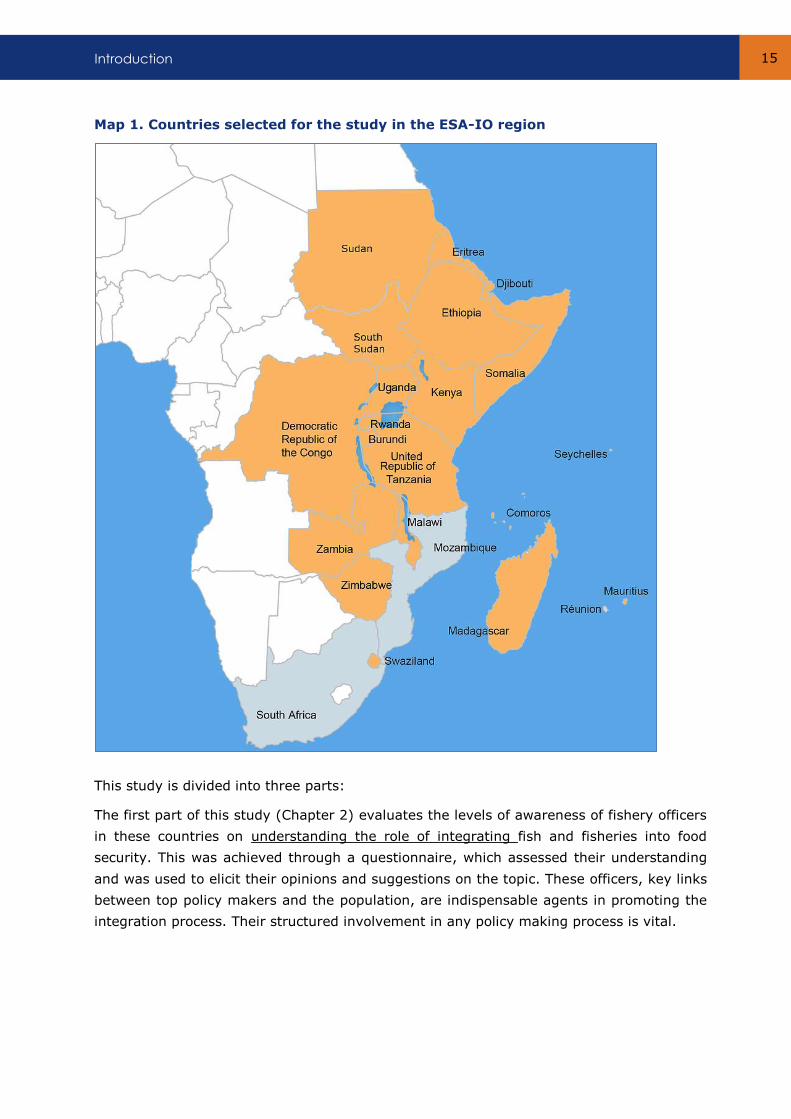
Map 1. Countries selected for the study in the ESA-IO region
This study is divided into three parts:
The first part of this study (Chapter 2) evaluates the levels of awareness of fishery officers
in these countries on understanding the role of integrating fish and fisheries into food
security. This was achieved through a questionnaire, which assessed their understanding
and was used to elicit their opinions and suggestions on the topic. These officers, key links
between top policy makers and the population, are indispensable agents in promoting the
integration process. Their structured involvement in any policy making process is vital.
Flavouring fish into food security 16
The second part of this study (Chapter 3) uses the quantitative data, which is available in
the public domain, to make an informed analysis of enhancing integration by assessing
potentials, needs and the scope for raising awareness in these countries with respect to
factoring fish and fisheries into their food and nutritional security scenarios.
The principal part of this study (Chapter 4) deals with assessing the integration of fish and
fisheries into policies and plans of 20 countries of the ESA-IO and in the regional
organizations of the same region. This meant analysing the contents of about 100
documents, which pertain to policies on, inter alia, food security, food production,
development assistance frameworks, water strategies, oceans and fisheries. Given the
diverse nature of the countries involved – islands, coastal states, landlocked nations – and
the different levels of economic activities in the fisheries sector, it is natural to expect
variations in the levels of inclusion and integration of fisheries such policy documents. This
final part of the study identifies those countries where fisheries play an important role in
the national and regional economy, but are neglected in the policy discussion, especially
when dealing with food security issues.
Annex 1 gives an indication of the participation of ESA-IO countries in the various RECs.
Annex 2 gives some ideas on concrete actions for integrating fisheries and aquaculture
into national and regional development work. Finally, Annex 3 discusses statistical data
and policy papers for individual countries, and also includes an analysis of sets of countries
in five different RECs.
Chapter 2 to Chapter 4 of this study are important for an understanding of the goal
articulated in the FAO statement of 1945, quoted at the outset of this introduction:
“….… fish should be regarded as one of the most important sources of food in
any program for raising the nutritional levels of peoples throughout the world.”
1.6 Limitations of the study
This study should to be viewed as a very preliminary attempt to understand the domain of
policy and real world praxis. Analysing documents for content is always subjective and
time determinate. If another set of documents from a different period in time relating to
the same set of countries is studied, the inferences could differ. The same could be said
about the use of data sets. These caveats need to be kept in mind when reading the
contents of this study. However, this study is a signpost at the start of a journey that
points in the general direction to which further analysis may be undertaken.
Understanding integration: views of the fishery officers 17
2. Understanding integration: views of the fishery officers
One important element of this study was to involve the fishery officers from the 20
different countries. The aim was to assess their views, positions and suggestions with
regard to enhancing the role of fisheries and aquaculture in the food and nutritional
security of their respective countries and the ESA-IO region as a whole.
2.1 Factors and impacts
Preliminary efforts focused on having the officers assess those factors that have a bearing
on the role of fish in food and nutritional security. They had to decide if the impact of a
certain factor was favourable, adverse or of had no effect. We listed 18 factors that
covered different aspects of the four pillars of food security as defined at the World
Summit of Food Security in 2009 namely: availability, access (economic and physical),
utilisation and stability.
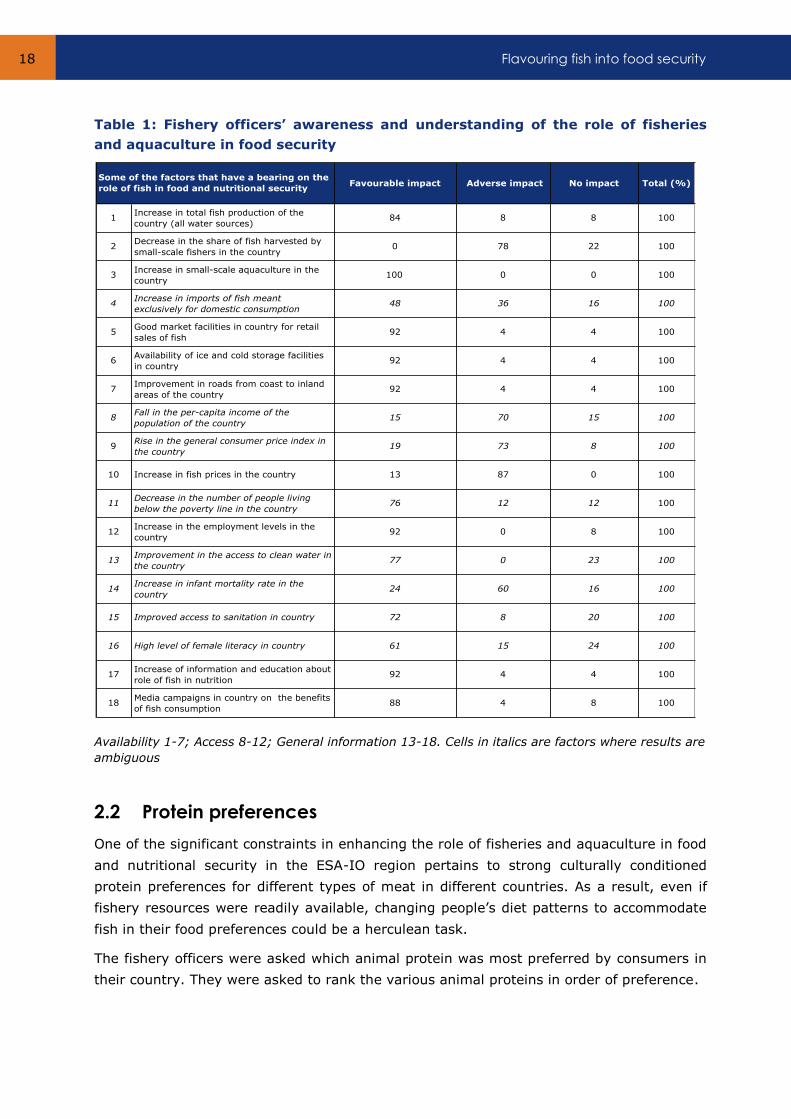
The analysis shown in Table 1 below reveals that, taken collectively, the 27 participating
officers have a good understanding of the impact of these factors on food security. There
is still however, a lack of clarity and ambiguity. General issues: (Factors 13 - 16 in Table
1). It should be emphasized that improvements in access to clean water and sanitation will
have a very positive bearing on food security, as will higher levels of female literacy. On
the other hand, increased infant mortality - which is actually a good proxy indicator for
improvement in water and sanitation conditions and also female literacy - will have the
opposite effect. The high level of ambiguity which is displayed in the results thus points to
a lacuna in the understanding and awareness of the officers concerning these very crucial
dimensions of achieving food security.
Access: (Factors 8 - 12 in Table 1). Acess is a well-established factor that reflects per
capita income. Price increases (rises in the consumer price index) will have an adverse
impact on food security because people will have less money to buy (access) food. On the
other hand, if there is a decrease in the number of people living below the poverty line,
this implies, inter alia, an increase in income, a decrease in commodity prices, or both.
The ambiguity which is displayed in the results indicates a lack of awareness on the part of
the officers about this important aspect of achieving food security.
Availability (Factors 1 - 7 in Table 1). There is ambiguity with regard to the factor:
“Increase in imports into the country of fish meant exclusively for domestic consumption”.
There may have been confusion between imports meant for processing and re-export,
which is usually the case, and imports meant specifically to supply the domestic market.
Flavouring fish into food security 18
Favourable impact Adverse impact No impact Total (%)
1Increase in total fish production of the
country (all water sources)84 8 8 100
2Decrease in the share of fish harvested by
small-scale fishers in the country0 78 22 100
3Increase in small-scale aquaculture in the
country100 0 0 100
4Increase in imports of fish meant
exclusively for domestic consumption48 36 16 100
5Good market facilities in country for retail
sales of fish 92 4 4 100
6Availability of ice and cold storage facilities
in country92 4 4 100
7Improvement in roads from coast to inland
areas of the country92 4 4 100
8Fall in the per-capita income of the
population of the country15 70 15 100
9Rise in the general consumer price index in
the country19 73 8 100
10 Increase in fish prices in the country 13 87 0 100
11Decrease in the number of people living
below the poverty line in the country76 12 12 100
12Increase in the employment levels in the
country92 0 8 100
13Improvement in the access to clean water in
the country77 0 23 100
14Increase in infant mortality rate in the
country24 60 16 100
15 Improved access to sanitation in country 72 8 20 100
16 High level of female literacy in country 61 15 24 100
17Increase of information and education about
role of fish in nutrition92 4 4 100
18Media campaigns in country on the benefits
of fish consumption88 4 8 100
Some of the factors that have a bearing on the
role of fish in food and nutritional security
Table 1: Fishery officers’ awareness and understanding of the role of fisheries
and aquaculture in food security
Availability 1-7; Access 8-12; General information 13-18. Cells in italics are factors where results are
ambiguous
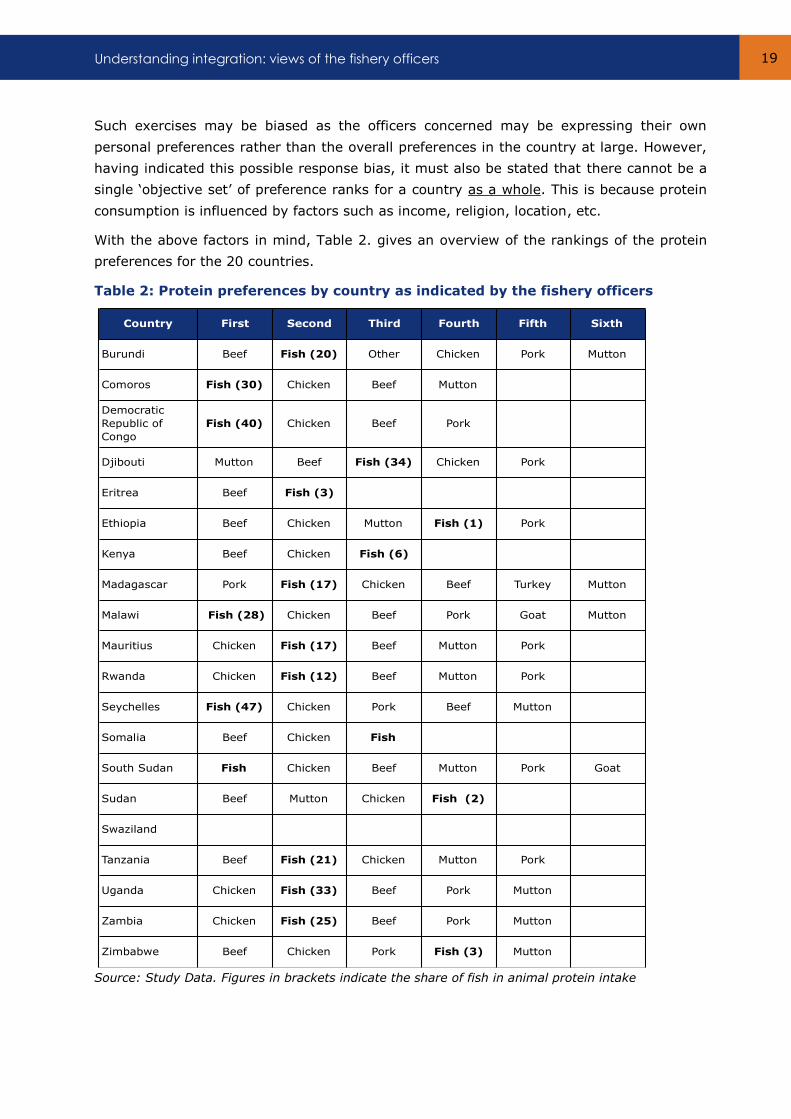
2.2 Protein preferences
One of the significant constraints in enhancing the role of fisheries and aquaculture in food
and nutritional security in the ESA-IO region pertains to strong culturally conditioned
protein preferences for different types of meat in different countries. As a result, even if
fishery resources were readily available, changing people’s diet patterns to accommodate
fish in their food preferences could be a herculean task.
The fishery officers were asked which animal protein was most preferred by consumers in
their country. They were asked to rank the various animal proteins in order of preference.
Understanding integration: views of the fishery officers 19
Country First Second Third Fourth Fifth Sixth
Burundi Beef Fish (20) Other Chicken Pork Mutton
Comoros Fish (30) Chicken Beef Mutton
Democratic
Republic of
Congo
Fish (40) Chicken Beef Pork
Djibouti Mutton Beef Fish (34) Chicken Pork
Eritrea Beef Fish (3)
Ethiopia Beef Chicken Mutton Fish (1) Pork
Kenya Beef Chicken Fish (6)
Madagascar Pork Fish (17) Chicken Beef Turkey Mutton
Malawi Fish (28) Chicken Beef Pork Goat Mutton
Mauritius Chicken Fish (17) Beef Mutton Pork
Rwanda Chicken Fish (12) Beef Mutton Pork
Seychelles Fish (47) Chicken Pork Beef Mutton
Somalia Beef Chicken Fish
South Sudan Fish Chicken Beef Mutton Pork Goat
Sudan Beef Mutton Chicken Fish (2)
Swaziland
Tanzania Beef Fish (21) Chicken Mutton Pork
Uganda Chicken Fish (33) Beef Pork Mutton
Zambia Chicken Fish (25) Beef Pork Mutton
Zimbabwe Beef Chicken Pork Fish (3) Mutton
Such exercises may be biased as the officers concerned may be expressing their own
personal preferences rather than the overall preferences in the country at large. However,
having indicated this possible response bias, it must also be stated that there cannot be a
single ‘objective set’ of preference ranks for a country as a whole. This is because protein
consumption is influenced by factors such as income, religion, location, etc.
With the above factors in mind, Table 2. gives an overview of the rankings of the protein
preferences for the 20 countries.
Table 2: Protein preferences by country as indicated by the fishery officers
Source: Study Data. Figures in brackets indicate the share of fish in animal protein intake
Flavouring fish into food security 20
Food Security DimensionTotal number of
opinions
Percentage of each
dimension
Factors that will increase
the role of fish in food and
nutritional security
11 26Increase aquaculture
production
10 23Increase capture from marine
and inland sources
10 23Credit availability, equipment,
training to enhance production
6 14 Reduce post-harvest losses
6 14Improve resource
management
20 59
Improve cold chain facilities,
transportation facilities,
communications, markets and
roads
7 20
Training and capacity building
of all participants along the
value chain
4 12Support small sellers to reach
low income consumers
3 9 Lower prices
9 64
Educate about the general
nutritional value of fish and its
health impacts
5 36
Specifically targeted
awareness initiatives for
mothers, youth and school
children
3 50Hygiene for handling of the
product
3 50Sanitary and hygienic
conditions of the markets
Availability (43)
Access (34)
Utilisation (14)
Stability (6)
2.3 What has to be done?
Having assessed their understanding of the different factors that have a bearing on the
role of fish in food security and obtained information on protein preferences in their
respective countries, we requested the officers to provide at least three suggestions on
what needs to be done to increase the role of fisheries in the food and nutritional security
in their respective countries.
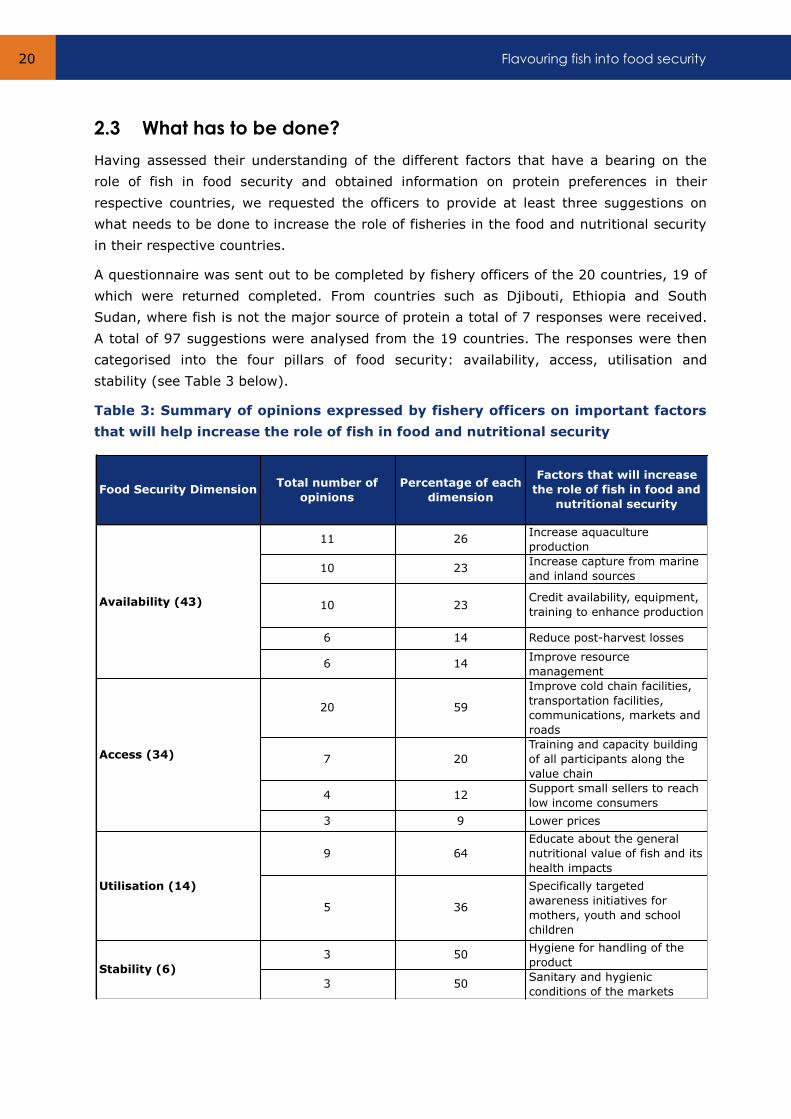
A questionnaire was sent out to be completed by fishery officers of the 20 countries, 19 of
which were returned completed. From countries such as Djibouti, Ethiopia and South
Sudan, where fish is not the major source of protein a total of 7 responses were received.
A total of 97 suggestions were analysed from the 19 countries. The responses were then
categorised into the four pillars of food security: availability, access, utilisation and
stability (see Table 3 below).
Table 3: Summary of opinions expressed by fishery officers on important factors
that will help increase the role of fish in food and nutritional security
Understanding integration: views of the fishery officers 21
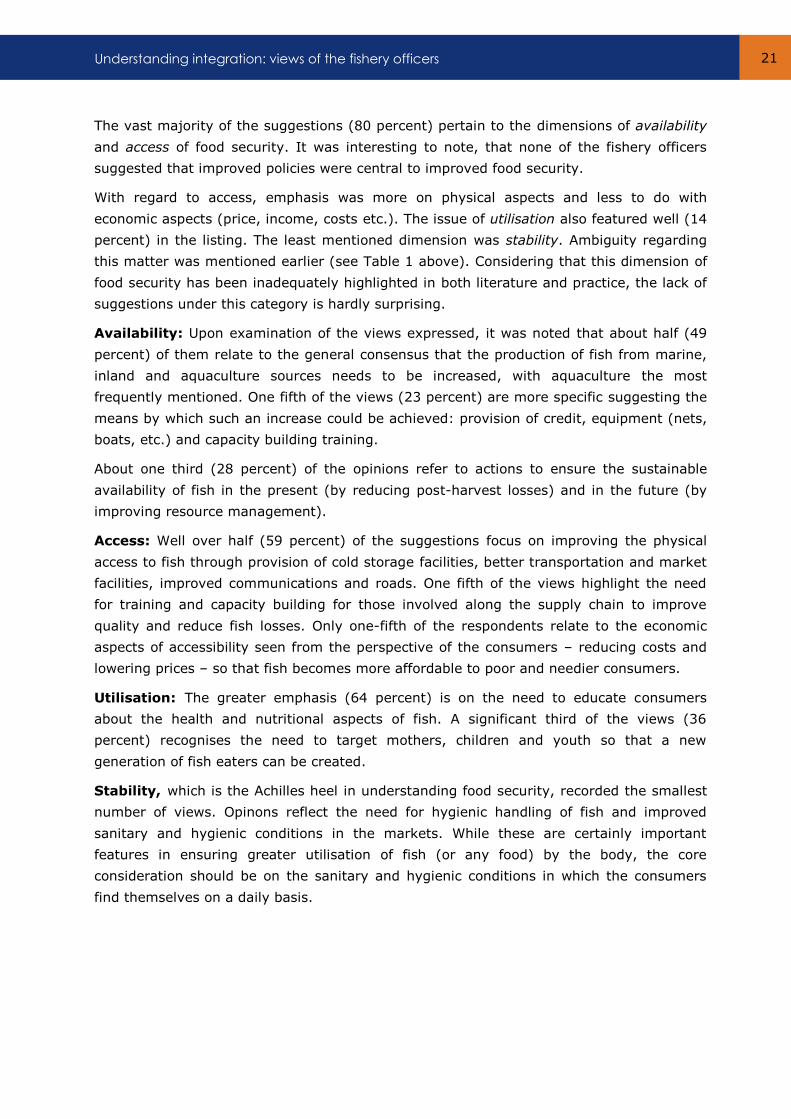
The vast majority of the suggestions (80 percent) pertain to the dimensions of availability
and access of food security. It was interesting to note, that none of the fishery officers
suggested that improved policies were central to improved food security.
With regard to access, emphasis was more on physical aspects and less to do with
economic aspects (price, income, costs etc.). The issue of utilisation also featured well (14
percent) in the listing. The least mentioned dimension was stability. Ambiguity regarding
this matter was mentioned earlier (see Table 1 above). Considering that this dimension of
food security has been inadequately highlighted in both literature and practice, the lack of
suggestions under this category is hardly surprising.
Availability: Upon examination of the views expressed, it was noted that about half (49
percent) of them relate to the general consensus that the production of fish from marine,
inland and aquaculture sources needs to be increased, with aquaculture the most
frequently mentioned. One fifth of the views (23 percent) are more specific suggesting the
means by which such an increase could be achieved: provision of credit, equipment (nets,
boats, etc.) and capacity building training.
About one third (28 percent) of the opinions refer to actions to ensure the sustainable
availability of fish in the present (by reducing post-harvest losses) and in the future (by
improving resource management).
Access: Well over half (59 percent) of the suggestions focus on improving the physical
access to fish through provision of cold storage facilities, better transportation and market
facilities, improved communications and roads. One fifth of the views highlight the need
for training and capacity building for those involved along the supply chain to improve
quality and reduce fish losses. Only one-fifth of the respondents relate to the economic
aspects of accessibility seen from the perspective of the consumers – reducing costs and
lowering prices – so that fish becomes more affordable to poor and needier consumers.
Utilisation: The greater emphasis (64 percent) is on the need to educate consumers
about the health and nutritional aspects of fish. A significant third of the views (36
percent) recognises the need to target mothers, children and youth so that a new
generation of fish eaters can be created.
Stability, which is the Achilles heel in understanding food security, recorded the smallest
number of views. Opinons reflect the need for hygienic handling of fish and improved
sanitary and hygienic conditions in the markets. While these are certainly important
features in ensuring greater utilisation of fish (or any food) by the body, the core
consideration should be on the sanitary and hygienic conditions in which the consumers
find themselves on a daily basis.
Flavouring fish into food security 22
2.4 Merits of participation
On the whole, this participatory exercise with the fishery officers, who may also be
important in influencing food security policies in their respective countries, point to both
their reasonably good levels of awareness, as well as some “blind spots” in their
understanding of the multi-dimensional factors which influence the role of fish in food and
nutritional security.
It is in the interest of governments of the ESA-IO Region to enhance the capacity and
capabilities of government officers in the Fisheries Departments to further the goal of
increasing their country’s food security. A well-informed cadre of officers needs to stress
the importance of fish in food consumption. Equally, and perhaps more importantly, they
need to highlight the crucial associated, enabling conditions which are needed to achieve
this goal.
Many of these latter conditions are outside the realm of the Fisheries Departments.
However, it is only when there is a collective and consorted effort by all, the food,
nutrition, health, education, water supply and sanitation departments, that governments,
and their top policy makers, will begin to perceive the logic for a more coordinated and
multi-faceted approach to achieving food and nutritional security.
It seems likely that officers in the Fisheries Departments are not consulted during the
formulation of policy regarding economic development and/or food and nutrition security.
For if they were, then certainly the role of fisheries and aquaculture would have been more
centrally integrated into the food and nutrition policies of many of the countries of the
region. This lack of consultation has proven to be a great loss for policy making.
The participation of the officers in this manner enabled us to partly tap into the ‘internal’
views and knowledge of their respective governments on this subject. Additionally, it also
provided us with information which would be hard to obtain from secondary sources. It
also gave us the possibility to identify ‘gaps’ in their understanding and possibly
recommend the kind of actions which could be taken to fill them. Many of the policy
suggestions indicated by the fisheries officers have been integrated into the individual
country policy briefs.
Equally important, is the fact that the results obtained reinforce the conviction that
participation of the officers is a valuable process for integration.
3. Enhancing integration: potential, need and awareness
Assessing the levels of integration and understanding the processes of integration provides
the background for probing into the possibilities for enhancing integration of fisheries and
aquaculture into food and nutritional security policies and strategies
Assessing integration: words and deeds 23
Integration cannot be uniformly enhanced across the countries. There can be no standard
package or project design to achieve this. Standard indicators may be used to narrow
down our choice of countries where enhancement of integration of fisheries and
aquaculture into food security is feasible.
It is likely that the countries at the top of a ‘potential list’ are also the ones where
integration levels are already high. However, if fish and fisheries are to make a difference
in raising the level and quality of food and nutritional security in sub-Saharan Africa, then
greater integration is warranted in the countries where the need is most. Such countries
must be prioritized. However, catering to needs requires a modicum of supportive
capabilities and measures, which should also be identified. Fundamental to this is
information and assistance with awareness raising.
3.1 Where is the potential for enhancement?
The first task in the methodology for assessing the potential for fish and fisheries to play a
role in food and nutritional security is to choose the indicators which need to be included.
Indicators
Five indicators were chosen and weighted according to the importance perceived for this
study:
(1) Fish availability per capita per year (kg/person/year). Weighting: 2
(2) The per capita GDP at purchasing power parity (USD/person/year). Weighting: 3
(3) Water supply coverage (percent of population). Weighting: 2
(4) Sanitation coverage (percent of population). Weighting: 1
(5) Female literacy above 15 years (percent of women). Weighting: 2
Fish availability refers to the amount of fish retained in a country for consumption by the
population. It is calculated by adding imports to the domestic production and deducting
non-food uses and exports, all expressed in life weight equivalents. This quantity, divided
by the population, gives us the indicator of “fish availability per capita per year”. This is a
good proxy for the amount of fish actually consumed by the population. As an average, it
hides the variations in consumption between different income groups of the population and
between those who prefer fish and those who do not. The higher the fish availability in a
country the more fish will be available for consumption. Availability of a food item is the
starting point for ensuring food security.
Per Capita GDP is the value of goods and services generated in the country divided by
the population. This figure is expressed here at purchasing power parity (PPP). The PPP is
a method used to ‘level’ the different countries with a technique which asks how much
money would be needed to purchase the same goods and services in two countries, and
uses that figure to calculate an implicit foreign exchange rate.
Flavouring fish into food security 24
Using the PPP rate, an amount of money thus has the same purchasing power in different
countries. PPP rates facilitate international comparisons of income, since market exchange
rates are often volatile. The per capita GDP is an average measure of the potential level of
accessibility of a food item.
Water supply and sanitation coverage provide a fair indication of the level of hygiene
in a country. Hygiene is an important factor to ensure the health of a population. This in
turn, ensures greater food consumption. When a person is unhealthy and sick due to
his/her unsanitary living conditions and lack of potable water, consuming food does not
contribute to his/her health and well-being because the body is less able to absorb
nutrients in the food.
Female literacy1 has been highlighted as one of the most crucial elements in contributing
to food security. When women are literate they are more vigilant about the nutritional
needs of their children and family. They can be offered greater awareness about food and
nutritional security, if they have purchasing power; and if the water and sanitation
situation is adequate. A heightened level of awareness will allow them to make more
informed and responsible choices in ensuring greater food security for their family and
themselves.
Level of potential
Four levels of potential were chosen: Low (1); Medium (2); High (3) and Very High (4).
The level of importance of any particular indicator was assessed by listing the countries in
ascending according to the numerical value assigned for each one. Then a sub-grouping
was made combining those countries having unit values within a particular range.
Consequently, for each of the five indicators, the countries studied were grouped into four
levels of potential.
The numerical units denoted after each country relate to the actual value of the relevant
indicator. For example, under the Indicator: “Per Capita GDP”, the unit (175) after
Zimbabwe indicates that the per capita GDP was US $175.00 per person per year in 2009.
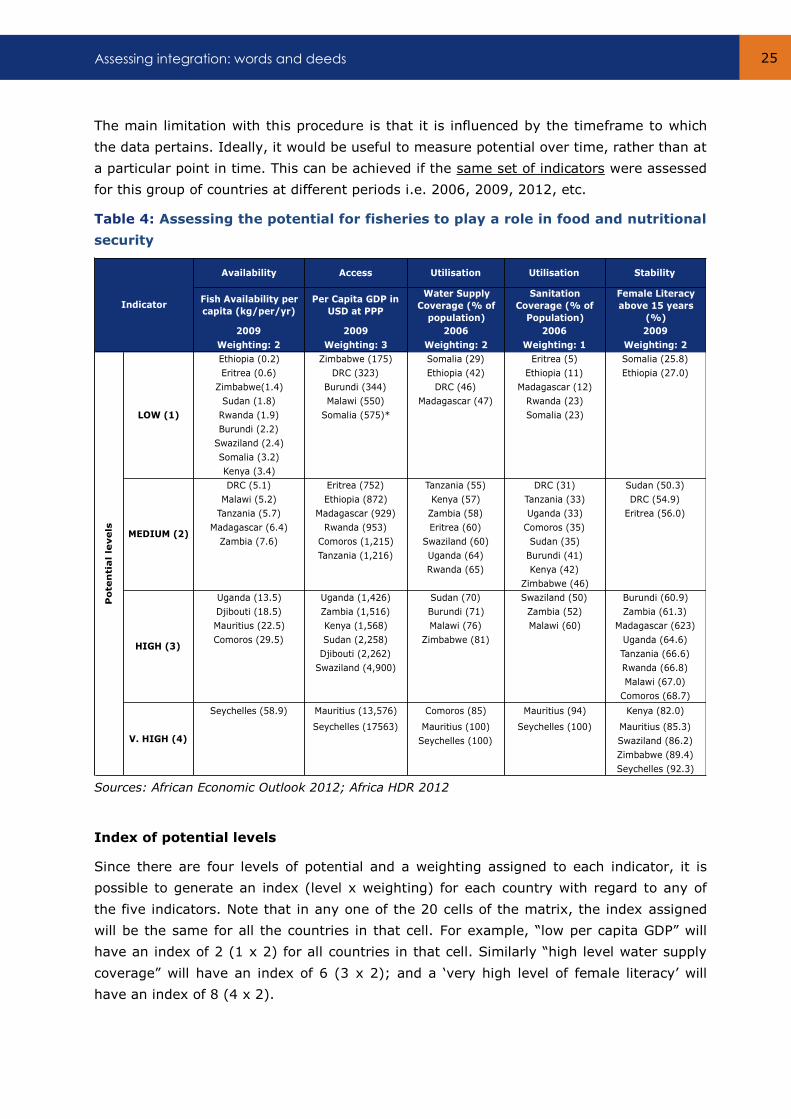
The resulting matrix of twenty cells, indicators (5) and potential levels (4), as shown in
Table 4 below reflects the position of a country in relation to its potential with regard to an
indicator. For example, there are countries with ‘low’ levels of water supply coverage
(Madagascar and the Democratic Republic of Congo); or countries where a ‘very high’
percentage of females are literate (Kenya and Seychelles).
1 Ref. United Nations University, UNU-Wider, World Institute for development Economics Research, Research
Paper No. 2006/131 by Nira Ramachandran, 2006 Women, food security and nutrition in South Asia, http://www.eldis.org/id21ext/s2nr1g1.html
Assessing integration: words and deeds 25
Availability Access Utilisation Utilisation Stability
Fish Availability per
capita (kg/per/yr)
Per Capita GDP in
USD at PPP
Water Supply
Coverage (% of
population)
Sanitation
Coverage (% of
Population)
Female Literacy
above 15 years
(%)
2009 2009 2006 2006 2009
Weighting: 2 Weighting: 3 Weighting: 2 Weighting: 1 Weighting: 2
Ethiopia (0.2) Zimbabwe (175) Somalia (29) Eritrea (5) Somalia (25.8)
Eritrea (0.6) DRC (323) Ethiopia (42) Ethiopia (11) Ethiopia (27.0)
Zimbabwe(1.4) Burundi (344) DRC (46) Madagascar (12)
Sudan (1.8) Malawi (550) Madagascar (47) Rwanda (23)
Rwanda (1.9) Somalia (575)* Somalia (23)
Burundi (2.2)
Swaziland (2.4)
Somalia (3.2)
Kenya (3.4)
DRC (5.1) Eritrea (752) Tanzania (55) DRC (31) Sudan (50.3)
Malawi (5.2) Ethiopia (872) Kenya (57) Tanzania (33) DRC (54.9)
Tanzania (5.7) Madagascar (929) Zambia (58) Uganda (33) Eritrea (56.0)
Madagascar (6.4) Rwanda (953) Eritrea (60) Comoros (35)
Zambia (7.6) Comoros (1,215) Swaziland (60) Sudan (35)
Tanzania (1,216) Uganda (64) Burundi (41)
Rwanda (65) Kenya (42)
Zimbabwe (46)
Uganda (13.5) Uganda (1,426) Sudan (70) Swaziland (50) Burundi (60.9)
Djibouti (18.5) Zambia (1,516) Burundi (71) Zambia (52) Zambia (61.3)
Mauritius (22.5) Kenya (1,568) Malawi (76) Malawi (60) Madagascar (623)
Comoros (29.5) Sudan (2,258) Zimbabwe (81) Uganda (64.6)
Djibouti (2,262) Tanzania (66.6)
Swaziland (4,900) Rwanda (66.8)
Malawi (67.0)
Comoros (68.7)
Seychelles (58.9) Mauritius (13,576) Comoros (85) Mauritius (94) Kenya (82.0)
Seychelles (17563) Mauritius (100) Seychelles (100) Mauritius (85.3)
Seychelles (100) Swaziland (86.2)
Zimbabwe (89.4)
Seychelles (92.3)
Indicator
Po
ten
tia
l le
vels
LOW (1)
MEDIUM (2)
HIGH (3)
V. HIGH (4)
The main limitation with this procedure is that it is influenced by the timeframe to which
the data pertains. Ideally, it would be useful to measure potential over time, rather than at
a particular point in time. This can be achieved if the same set of indicators were assessed
for this group of countries at different periods i.e. 2006, 2009, 2012, etc.
Table 4: Assessing the potential for fisheries to play a role in food and nutritional
security
Sources: African Economic Outlook 2012; Africa HDR 2012
Index of potential levels
Since there are four levels of potential and a weighting assigned to each indicator, it is
possible to generate an index (level x weighting) for each country with regard to any of
the five indicators. Note that in any one of the 20 cells of the matrix, the index assigned
will be the same for all the countries in that cell. For example, “low per capita GDP” will
have an index of 2 (1 x 2) for all countries in that cell. Similarly “high level water supply
coverage” will have an index of 6 (3 x 2); and a ‘very high level of female literacy’ will
have an index of 8 (4 x 2).
Flavouring fish into food security 26
Availability Access Utilisation Utilisation Stability
Fish
availability
per capita
(kg/per/yr)
2009
Per Capita
GDP in USD
at PPP 2009
Water
supply (%
of
population)
2006
Access to
sanitation (%
of
population)
2006
Female
literacy above
15 years (%,
2009
1 Seychelles 8 12 8 4 8 40
2 Mauritius 6 12 8 4 8 38
3 Comoros 6 6 8 2 6 28
4 Uganda 6 9 4 2 6 27
5 Zambia 4 9 4 3 6 26
6 Swaziland 2 9 4 3 8 26
7 Kenya 2 9 4 2 8 25
8 Sudan 2 9 6 2 4 23
9 Tanzania 4 6 4 2 6 22
10 Malawi 4 3 6 3 6 22
11 Zimbabwe 2 3 6 2 8 21
12 Madagascar 4 6 2 1 6 19
13 Rwanda 2 6 4 1 6 19
14 Burundi 2 3 6 2 6 19
15 Eritrea 2 6 4 1 4 17
16 Djibouti 6 9 No Data No Data No Data 15+
17 DRC 4 3 2 2 4 15
18 Ethiopia 2 6 2 1 2 13
19 Somalia 2 (2007) 3 (2007) 2 1 2 10
20 S.Sudan No data available
No. Country Total Score
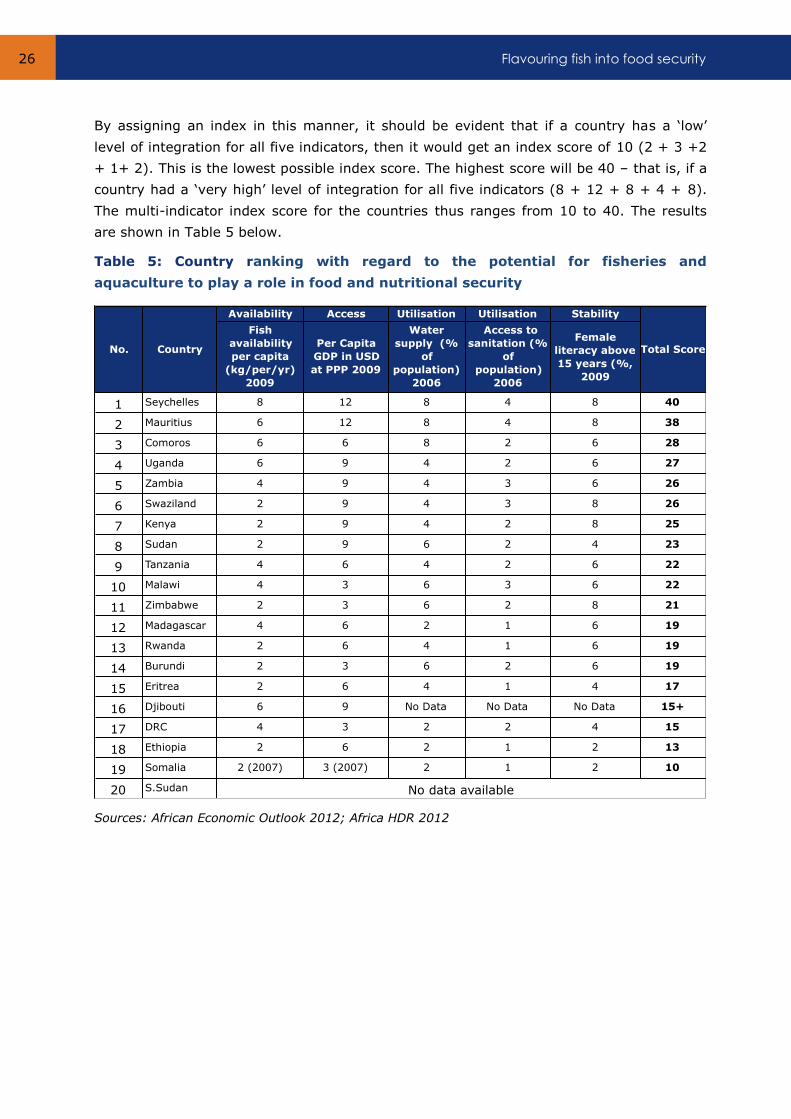
By assigning an index in this manner, it should be evident that if a country has a ‘low’
level of integration for all five indicators, then it would get an index score of 10 (2 + 3 +2
+ 1+ 2). This is the lowest possible index score. The highest score will be 40 – that is, if a
country had a ‘very high’ level of integration for all five indicators (8 + 12 + 8 + 4 + 8).
The multi-indicator index score for the countries thus ranges from 10 to 40. The results
are shown in Table 5 below.
Table 5: Country ranking with regard to the potential for fisheries and
aquaculture to play a role in food and nutritional security
Sources: African Economic Outlook 2012; Africa HDR 2012

Assessing integration: words and deeds 27
Based on the total scores we can categorise the countries into four groups according to the
level of potential for fisheries and aquaculture to play a role in food and nutritional
security:
Countries with very high potential: Seychelles and Mauritius;
Countries with high potential: Comoros, Uganda, Zambia, Swaziland, Kenya and Sudan;
Countries with medium potential: Tanzania, Malawi, Zimbabwe, Madagascar, Rwanda
and Burundi;
Countries with low potential: Eritrea, Djibouti, Congo DR, Ethiopia, and Somalia.
3.2 ‘Need’ as a deciding factor for enhancement
In the context of food and nutritional security, if we calibrate countries according to their
potential (as defined using the indicators in Table 4 and 5) we run the risk of betting on
the strong and neglecting the weak. The countries which have potential are the countries
which already have a reasonable supply of fish, a high per capita income, access to water
and sanitation and at least medium levels of female education. To avoid this ‘trap’ we
must uncover the countries which have a real ‘need’ to integrate more fish into the diets of
their populations and consequently encourage more activities in fisheries and aquaculture.
To uncover those with the greatest need from among our sample of 20 countries, we have
chosen five indicators to assess the extent of the ‘need’ for fish and fisheries to have a role
in food security. The size of a country’s population was also considered.
These indicators are: (1) fish availability per person; (2) food availability per person; (3)
the prevalence of Vitamin A deficiency in the population; (4) the percentage of the
population which is undernourished; and (5) the percentage of the population who live
below the poverty line.
The cut off points with respect to the indicators are the following: the quantities below the
African average (shown in the Table 6 below) in the case of fish and food availability; and
the percentage above the African average or a percentage above 50 percent - whichever is
least - in the case of Vitamin A deficiency; the population of undernourished and the
population below the poverty line.
Our choice countries are shown in Table 6 below. If data for Somalia and South Sudan
were available they would also, most likely, be included in the list.
Flavouring fish into food security 28
CountryPopulation
(000’s) 2009
(AOE 2012)
Fish Availability
Per/Capita
(Kg/year) 2009
(FAO)
Food Availability
(kCal/per/day)
2003-2005 (AOE
2012)
Vitamin A
deficiency
prevalence (%
population) 1995-
2005 (HDR
2012)
Percentage
undernourishe
d 2006-2008
(AOE 2012)
International
poverty line %
(below US
$1.00) 2001/06
(AOE 2012)
Burundi 8,303 2.2 1,630 28 63 81.3
Comoros 676 29.5 1,800 22 51 46.1
DRC 66,020 5.1 1,500 61 75 59.2
Djibouti 864 18.5 2,170 31 18.8
Eritrea 5,073 0.6 1,530 21 66 53
Ethiopia 82,825 0.2 1,810 46 44 39
Kenya * 39,802 3.4 2,040 84 30 19.7
Madagascar 19,625 6.4 2,010 42 35 67.8
Malawi * 15,263 5.2 2,130 59 29 73.9
Mauritius 1,288 22.5 2,880 9 6 ...
Rwanda * 9,998 1.9 1,940 6 40 57
Seychelles 84 58.9 2,380 8 8 …
Somalia 9,133 3.2 ... ….. … …
South Sudan 10,625** 1,890*** 47*** 50.6**
Sudan 34,206** 1.8 2,290 ….. 20 46.0**
Swaziland 1,185 2.4 2,320 45 18 62.9
Tanzania * 43,739 5.7 2,010 24 35 88.5
Uganda 32,710 13.5 2,380 28 15 51.5
Zambia * 12,935 7.6 1,890 54 45 64.3
Zimbabwe * 12,523 1.4 2,040 36 39 61.9
Africa 1,008,354 9.4 2,307 67 29 62.9
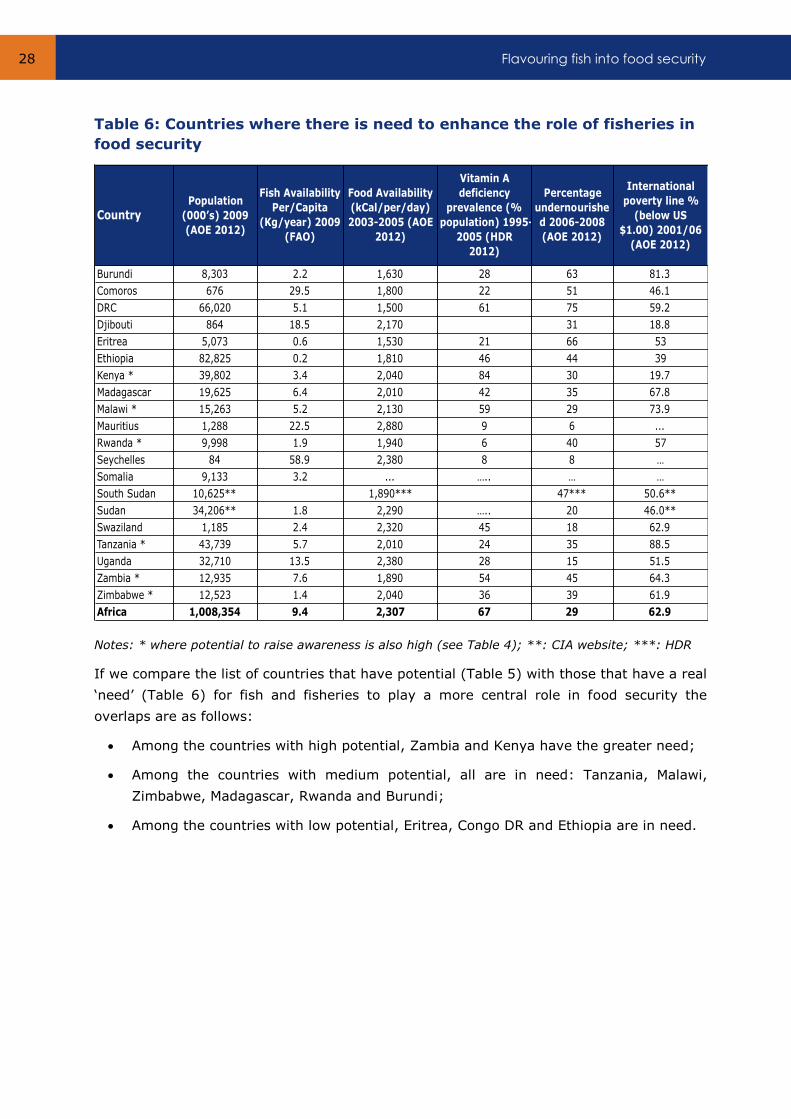
Table 6: Countries where there is need to enhance the role of fisheries in
food security
Notes: * where potential to raise awareness is also high (see Table 4); **: CIA website; ***: HDR
If we compare the list of countries that have potential (Table 5) with those that have a real
‘need’ (Table 6) for fish and fisheries to play a more central role in food security the
overlaps are as follows:
Among the countries with high potential, Zambia and Kenya have the greater need;
Among the countries with medium potential, all are in need: Tanzania, Malawi,
Zimbabwe, Madagascar, Rwanda and Burundi;
Among the countries with low potential, Eritrea, Congo DR and Ethiopia are in need.
Assessing integration: words and deeds 29
3.3 Creating awareness about real needs
There has been significant debate in economic development circles about the distinction
between the demands people make and their real needs. For example, people who are
malnourished may not realise this fact and continue to follow unhealthy diet patterns. The
role of good information and the availability of the human, physical and social capabilities
to transmit this information to people, who need it most, is one of the major challenges in
development practices. This is abundantly true with regard to food security issues.
Creating awareness about real needs is essential to achieve one’s maximum development
potentials. This is the ‘slow option’ for development but also the most sustainable path to
this goal.
Fish may easily be made available. People may have the purchasing power to buy it. They
may live in a clean environment. Yet, due to a variety of other factors, primarily
inadequate knowledge and information, they may not consume fish. Therefore, creating
awareness about fish, particularly its nutritional qualities, its relatively low cost and ease
of preparation as a food, warrant far greater investment in effort, time and money than
has hitherto been the case in countries in the ESA-IO region.
In order to select the countries from our list where awareness about fish and fisheries can
be generated, the following criteria were developed (see Table 7 below):
those countries with low or medium fish availability at the current (2009) levels;
those countries where efforts have already been made to create awareness about
fish through the mass media;
those countries where nutrition awareness programs are in place;
those countries where roads are reasonably good;
those countries where there is significant use of mobile phones;
and those countries where female literacy is high.
We have also included in Table 7 the population density of the country. This is one good
proxy for the scope for ‘diffusion’ of awareness. If people live in close proximity, there are
far better chances of ‘word of mouth’ communication which is most effective in rural areas.
There is also a greater possibility for people to experience the ‘show-how’ and ‘see-how’
effects of fish in diets and fisheries, e.g. aquaculture in small ponds, for improved
livelihoods.
Among the criteria selected we wish to highlight the importance of female literacy. This
refers to literate mothers and home makers whose awareness and consequent actions or
choices are most crucial in ensuring that fish will be factored into children’s and family
diets.
Based on the above criteria, the countries selected are: Kenya, Malawi, Rwanda, Tanzania,
Zambia and Zimbabwe.
Flavouring fish into food security 30
Burundi 298 60.9 49.7 10.4 NO NO Low 2.2
Comoros 302 68.7 118 76.5 NO YES High 29.5
Congo Dem. Rep. 28 54.9 49.4 1.8 NO NO Medium 5.1
Djibouti 37 .. … …. NO NO High 18.5
Eritrea 43 56 107.1 21.8 NO YES Low 0.6
Ethiopia 75 27 59.3 13.7 NO NO Low 0.2
Kenya 67 82 76.3 14.1 YES YES Low 3.4
Madagascar 33 62.3 67.5 11.6 NO NO Medium 6.4
Malawi 129 67 17.4 45 YES YES Medium 5.2
Mauritius 631 85.3 58.9 98 NO NO High 22.5
Rwanda 380 66.8 13.7 19 YES YES Low 1.9
Seychelles 185 92.3 49.7 96.5 YES YES V. High 58.9
Somalia 14 25.8 25.7 …. … … Low 3.2*
South Sudan 16 16 No Data No data YES YES Low (??)
Sudan 18 50.3 86.8 NO YES Low 1.8*
Swaziland 68 86.2 44.3 30 … … Low 2.4
Tanzania 46 66 46.3 7.4 YES YES Medium 5.7
Uganda 136 64.6 61.6 23 YES YES High 13.5
Zambia 17 61.3 71.1 22 YES YES Medium 7.6
Zimbabwe 32 89.4 35.4 19 YES YES Low 1.4
Africa 33 60.04 9.4
Population
density
(pop/km2) (AEO
2012)
Paved roads (%
to total) (AHDR
2012)
Country
Female literacy
(above 15 yrs)
(AEO 2012)
Mobile line per
100 inhabitants
(AEO 2012)
Nutrition
awareness
programs exist
(Study
questionnaire)
Publicity about
fish in mass
media (Study
questionnaire)
Current Fish
Consumption
(2009) (FAO
stats.)
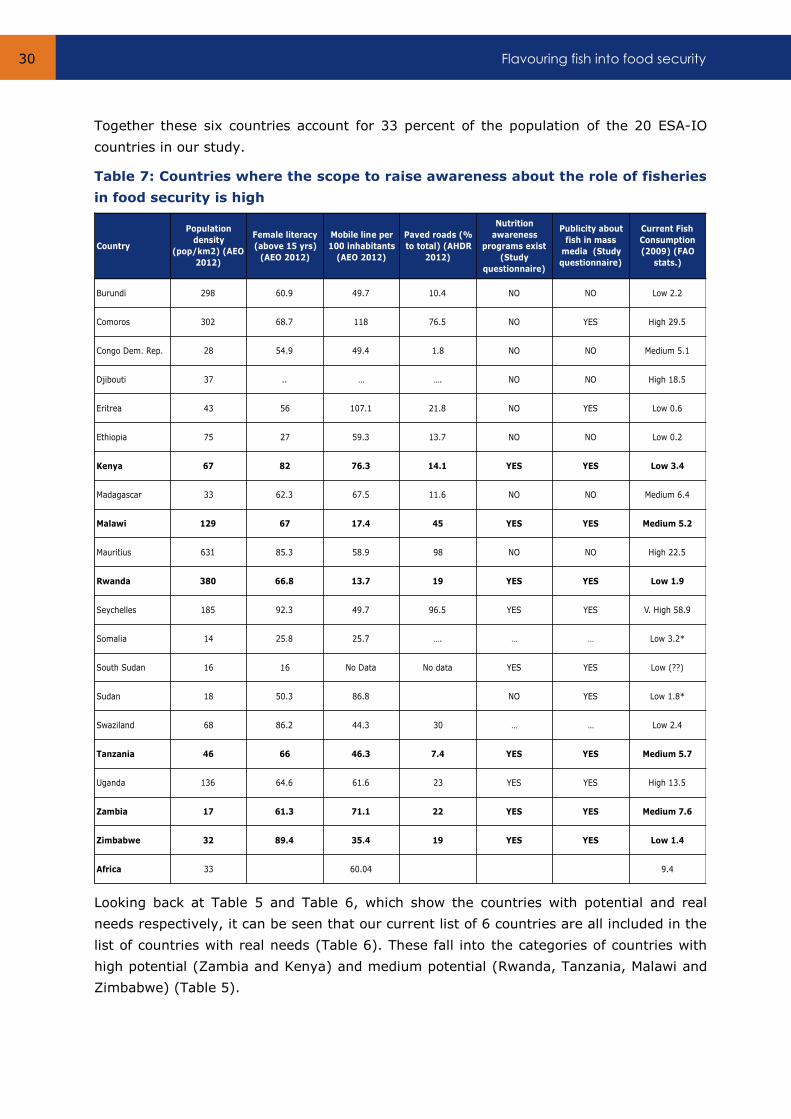
Together these six countries account for 33 percent of the population of the 20 ESA-IO
countries in our study.
Table 7: Countries where the scope to raise awareness about the role of fisheries
in food security is high
Looking back at Table 5 and Table 6, which show the countries with potential and real
needs respectively, it can be seen that our current list of 6 countries are all included in the
list of countries with real needs (Table 6). These fall into the categories of countries with
high potential (Zambia and Kenya) and medium potential (Rwanda, Tanzania, Malawi and
Zimbabwe) (Table 5).
Assessing integration: words and deeds 31
Enhancing the integration of fish and fisheries into food and nutritional security is a task
which all countries have the innate potential to effectively undertake. However, there are
some countries where this potential is also in harmony with the population’s need for
better diets and improvement in their food security. Often such needs are not identified by
policy makers. In some countries, although this need is perceived, the ability to raise
awareness about it, and mechanisms to achieve this, may not exist.
Using a series of macro-indicators, a list of countries has been drawn up where the efforts
at enhancing integration of fish and fisheries into food and nutritional security may be
meaningfully commenced and pursued with reasonable success.
4. Assessing integration: words and deeds
The key objectives of this study are to examine the level and extent of fisheries and
aquaculture integration into food and nutrition strategies and policy plans assessed at
national and regional levels.
Two approaches will be adopted to achieve this objective.
Firstly an overall analysis of official documents will be made, which can be classified as
‘policy documents’. For this exercise, the content of these documents will be given a
broad-brush treatment. Our objective is to examine the degree of inclusion of issues
pertaining to fisheries and aquaculture, with particular focus on food and nutritional
security. This may be considered as ‘integration by word’. This will be the key focus of this
chapter.
Secondly, by building upon and combining with this content analysis, an attempt will be
made to make a preliminary, but more ‘quantitative, indicator-based’ analysis to assess
the degree of physical integration of fish and fisheries into the diets and economy of the
respective countries. This will be known as ‘integration by deed’. Finally we will identify
those countries, that are food insecure and where fisheries play an important role, but
where this important element is forgotten or overlooked in the policy discussion.
4.1 Integration by word: analysis of policy documents
It should be noted that the inherent limitations of any exercise that attempt a content
analysis in search of particular aspects or emphasis within policy documents, are indeed
subjective by nature. The outcome is conditioned by the choice of documents and their
date of publication. Conclusions reached based on an analysis of a particular set of
documents for a given country can be ‘proven wrong’, for example if a completely different
set of documents pertaining to an earlier phase in time were analysed.
Flavouring fish into food security 32
Bearing in mind the above, the following analysis was made both at the individual country
level and the regional level. This analysis is based on documents brought to our attention
as being some of the most relevant for the respective countries during the last five years.
Many of the documents examined also pertain to the plans for the immediate future.
National Documents
As many as 89 national documents were closely examined from the 20 countries included
in this analysis. In many cases, these include the UN Development Assistance Framework
(UNDAF) for the country; the national food security action plans; food and agriculture
sector policies; fishery policies and plans; nutritional strategy documents; country
development plans; FAO medium term policy frameworks and so forth. (see Table 8 below
for the quantitative analysis. For specific details on the documents examined for each
country see Annex 3).
The aggregate analysis reveals that although every one of the countries included in the
study had either a marine, riverine or lacustrine fishery (or a combination of these), as
many as one fifth (21 percent) of the country documents made no reference to the
fisheries sector. This lacuna is not just in countries such as Ethiopia or Zimbabwe where
fish is not the preferred source of protein and fisheries is not a significant primary
economic activity. Surprisingly, this oversight was observed in 50 percent of the
documents analysed from Mauritius and Uganda where fish consumption is high and
fisheries has significant economy activity.
Out of the 89 country documents, 57 of them (64 percent) specifically dealt with issues
directly relating to food and nutritional security of the concerned country. From amongst
these, as many as 20 documents (more than one third) made no reference to the role of
fish.
National documents often exhibit a degree of schizophrenia with regard to references to
the fisheries sector and fish in the context of food security.
In one country, the food policy document had some key references about the significance
of fish in the food security of the poor. In the fishery policy of the same country however,
the focus was entirely about commercializing the production and marketing without
alluding to the role of fish in food security.
In two island nations, the action plans for food security and nutrition highlight the fact that
fishing households are the most food insecure. Yet the UN Development Assistance
Framework (UNDAF) documents of these nations, recognizing fisheries as a ‘growth
driving’ sector make no mention of the role which fish can or should play in enhancing food
security.

Assessing integration: words and deeds 33
Total
Documents
in which
fish is
mentioned
Documents in
which fish not
mentioned
92 19 73 60 40 20
(100%) (21%) (79%)(65%) /
(100%)(67%) (33%)
10 4 6 7 6 1
(100%) (40%) (60%)(70%) /
(100%)(85%) (15%)
1 Burundi 4 2 2 2 1 1
2 Comoros 2 0 2 2 1 1
3 DRC 2 0 2 2 0 2
4 Djibouti 4 0 4 2 2 0
5 Eritrea 3 1 2 1 1 0
6 Ethiopia 6 2 4 1 0 1
7 Kenya 5 0 5 4 4 0
8 Madagascar 4 0 4 3 1 2
9 Malawi 5 1 4 5 4 1
10 Mauritius 2 1 1 2 1 1
11 Rwanda 4 1 3 1 1 0
12 Seychelles 4 0 4 4 3 1
13 Somalia 6 0 6 4 1 3
14 South Sudan 4 2 2 2 2 0
15 Sudan 5 1 4 3 2 1
16 Swaziland 6 2 4 3 3 0
17 Tanzania 8 1 7 6 5 1
18 Uganda 9 1 8 8 4 4
19 Zambia 5 1 4 4 4 0
20 Zimbabwe 4 3 1 1 0 1
Documents specifically mentioning issues
on food and nutritional security
National Documents
Regional Documents
Country
Documents
on food and
nutritional
plans and
strategy
analysed
Documents
without any
references
to the
fisheries
sector
Documents
containing
issues
relating to
the fisheries
sector
In one major fishing nation, where fish consumption is also very high, the UNDAF and FAO
Country Support Strategic Framework put great emphasis on fisheries, aquaculture and
fish as a source of food security, livelihoods and export earnings. However, the country’s
food and nutrition policy documents make no meaningful reference to the role of fisheries
in food security.
Table 8: Review of ESA-IO countries policy documents with mention of fish and
fisheries content
Source: Content analysis of the documents reviewed during the study
4.2 Integration by deed: assessing integration through indicators per
country
Plans and policies of a country greatly influence actions on the ground. Realities on ground
realities, however, must also be adequately reflected in policies.
We have chosen five indicators with regard to the integration through ‘actions and deeds’
i.e. on the ground realities.
Flavouring fish into food security 34
Indicators
The five indicators and weightings assigned to them according to the importance perceived
for this study are given below:
(1) Fish availability per capita per year (kg/person/year). Weighting: 1
(2) The share of fish in animal protein intake (percentage). Weighting: 2
(3) The persons employed in fisheries (persons/1000 population). Weighting: 2
(4) The mention of fisheries issues in policy documents (percentage). Weighting:2
(5) The mention of fish in food security policy documents (percentage). Weighting: 3
Fish availability refers to the amount of fish retained in a country for consumption by the
local population. It is calculated by adding imports to the domestic production and
deducting non-food use and exports – all expressed in life weight equivalents. This
quantity, divided by the population, gives the indicator of ‘fish availability per capita per
year’. This is a good proxy for what is actually consumed by the population as food.
However, as an average, it hides variations in consumption between different income
groups of the population and between those who prefer fish and those who do not. The
higher the fish availability, the higher we can assume will be the integration of fish into
food of the people thus contributing to their food security.
The share of fish in the animal protein intake of a population reflects, to an important
degree, its protein preference. Generally, fish availability and the share of fish in animal
protein are positively correlated. However, when the fish availability and the share of fish
in animal protein together are examined, some of the ‘outliers’ in the relationship
mentioned provide a different insight into the integration. Consider the case of Burundi
and the Democratic Republic of Congo (DRC) (see Table 9 below). Burundi has low fish
availability, only 2.2 kg/person/year and for for DRC the figure is 5.1 kg. However, the
share of fish in the animal protein intake is almost 20 percent and 40 percent for Burundi
and DRC respectively. This intake compares well to those countries with significantly
higher fish availability levels, island nations such as Mauritius and Seychelles, and thus
point to the greater ‘criticality’ of fish in the food and nutritional security of Burundi and
DRC than might be assumed from the per capita data alone.
The persons employed in fisheries provide a perspective of the ‘indirect’ role of fish in
food security. While those employed in fishery-related activities – harvesting, processing,
and marketing – are likely to consume fish, it is the income generation dimension of fish
which merits attention here. With their earnings, employees have access to greater food
security. It is also their activity which plays an important role in ensuring availability of
fish to consumers. If data was available on the scale of the enterprise these individuals are
employed in, whether they are small-scale or large-scale operators, an insight into the
structural nature of integration could be obtained.
Assessing integration: words and deeds 35
The mention of fisheries and aquaculture issues in the policy and planning
documents, as well as the role of fish in food security in the documents pertaining to food
and nutritional security, are included here as indicators because this is the key focus of the
study. What is considered is the mere fact of mentioning fisheries and fish in these
documents, we have not entered into any assessment of the number of citations or the
quality of the analysis made. This is another of the limitations of this study.
Integration levels
Four levels of integration were chosen:
Low (1); Medium (2); High (3); and Very High (4).
The level of importance of any particular indicator was assessed by listing the countries in
ascending order according to the numerical value assigned for each of the indicators. Then
a sub-grouping was made with countries having unit values within a particular range.
Consequently, for each of the five indicators, the countries studied are grouped into four
levels of integration.
The numerical value given after each country name relates to the actual value of the
relevant indicator. For example, under the indicator, ‘Fish availability per capita’, the unit
(0.2) after Ethiopia indicates that the per capita availability of fish (which is a proxy for
‘consumption’) was low at just 0.2 kg (200 grams) per person per year in 2009.
The resulting matrix, indicators (5) and integration levels (4), of 20 cells, given below in
Table 9 reflects the position of a country in relation to its integration with respect to an
indicator. To illustrate, there are countries with ‘low’ levels of fish availability (Ethiopia,
Eritrea); and countries where a ‘very high’ percentage of policy documents mention the
role of fish (Seychelles, Zambia).
One of the procedure’s limitations is that the time period to which the data pertains is
subject to change. For example, fish availability in a country may increase substantially in
a particular year as a result of imports. This will then shift the country’s position in the
matrix.
Ideally, integration over time should be measured rather than at a particular time. This
can be achieved if the same set of indicators were assessed for this grouping of countries
at different time periods, for example, 2006, 2009, 2012. Such a procedure would give a
better picture of the integration process.
Index of integration levels
Since there are four levels of integration and a weighting assigned to each indicator, it is
possible to generate an index (level x weighting) for each country with regard to each of
the five indicators.

Flavouring fish into food security 36
Fish availability
per capita
(kg/per/yr)
2009 Weighting:
1
Fish share in
animal protein
(%) 2009
Weighting: 2
Persons
employed in
fisheries (per
1000 of
population)
Weighting: 2
Fisheries in policy
(% of
documents)
Weighting: 2
Fish in food
security policy (%
of documents)
Weighting: 3
Ethiopia (0.2) Ethiopia (1.0) Ethiopia (0.1) Congo DR (0)
Eritrea (0.6) Sudan (1.9) Zimbabwe (0.1) Ethiopia (0)
Zimbabwe (1.4) Eritrea (2.5) Sudan (2) Zimbabwe (0)
Sudan (1.8) Zimbabwe (3.4) Djibouti (2)
Rwanda (1.9) Swaziland (4.4) Eritrea (3)
Burundi (2.2) Kenya (5.4) Rwanda (4)
Swaziland (2.4) Zambia (4)
Somalia (3.2)
Kenya (3.4)
Congo DR (5.1) Somalia (10.0) Mauritius (9) Sudan (40) Somalia (16)
Malawi (5.2) Rwanda (11.9) Madagascar (10) Burundi (50) Burundi (25)
Tanzania (5.7) Mauritius (16.9) Congo DR (10) Mauritius (50) Madagascar (25)
Madagascar (6.4) Madagascar (17.4) Burundi (14) S. Sudan (50) Rwanda (25)
Zambia (7.6) Burundi (19.7) Eritrea (66) Eritrea (33)
Tanzania (20.7) Ethiopia (66)
Zambia (25.3) Swaziland (66)
Malawi (28.4)
Uganda (13.5) Uganda (33.3) Somalia (20) Rwanda (75) Sudan (40)
Djibouti (18.5) Djibouti (33.8) Uganda (21) Malawi (80) Uganda (45)
Mauritius (22.5) Congo DR (39.6) Kenya (22) Tanzania (90) Comoros (50)
Comoros (29.5) Seychelles (46.8) Malawi (27) Zambia (80) Djibouti (50)
Uganda (90) Mauritius (50)
S.Sudan (50)
Swaziland (50)
Comoros (48) Comoros (100) Kenya (80)
Tanzania (50) Congo DR (100) Malawi (80)
Seychelles (66) Djibouti (100) Seychelles (80)
Kenya (100) Tanzania (80)
Madagascar (100) Zambia (80)
Seychelles (100)
Somalia (100)
Indicator
In
teg
rati
on
levels
Zimbabwe (25)
Seychelles (58.9) Comoros (70.2)
LOW (1)
MEDIUM
(2)
HIGH (3)
V. HIGH
(4)
Note that in any one of the 20 cells of the matrix, the index assigned will be the same for
all the countries in that cell. For example, ‘low level of fish availability’ will have an index
of 1 (1 x 1) for all countries in that cell. Similarly ‘high number of persons employed in
fisheries’ will have an index of 6 (3 x 2); and a ‘very high level of fish included in food
security policy documents’ will have an index of 12 (4 x 3).
By assigning an index in this manner, it should be evident that if a country had a ‘low’
level of integration for all five indicators, then it would get an index score of 10 (1 + 2 +2
+2 +3). This is the lowest possible index score. The highest will be 40, that is, if a country
had a ‘very high’ level of integration for all five indicators (4 + 8 + 8 + 8 + 12). The multi-
indicator index score for the countries thus ranges from 10 to 40. The higher the score,
the greater the level of integration.
The results are given in Table 10 below. As data for South Sudan and Swaziland are
unavailable, the scoring for these countries remains incomplete. Their rankings, however,
are unlikely to change dramatically.
Table 9: Assessing the level of integration of fish and fisheries into food security
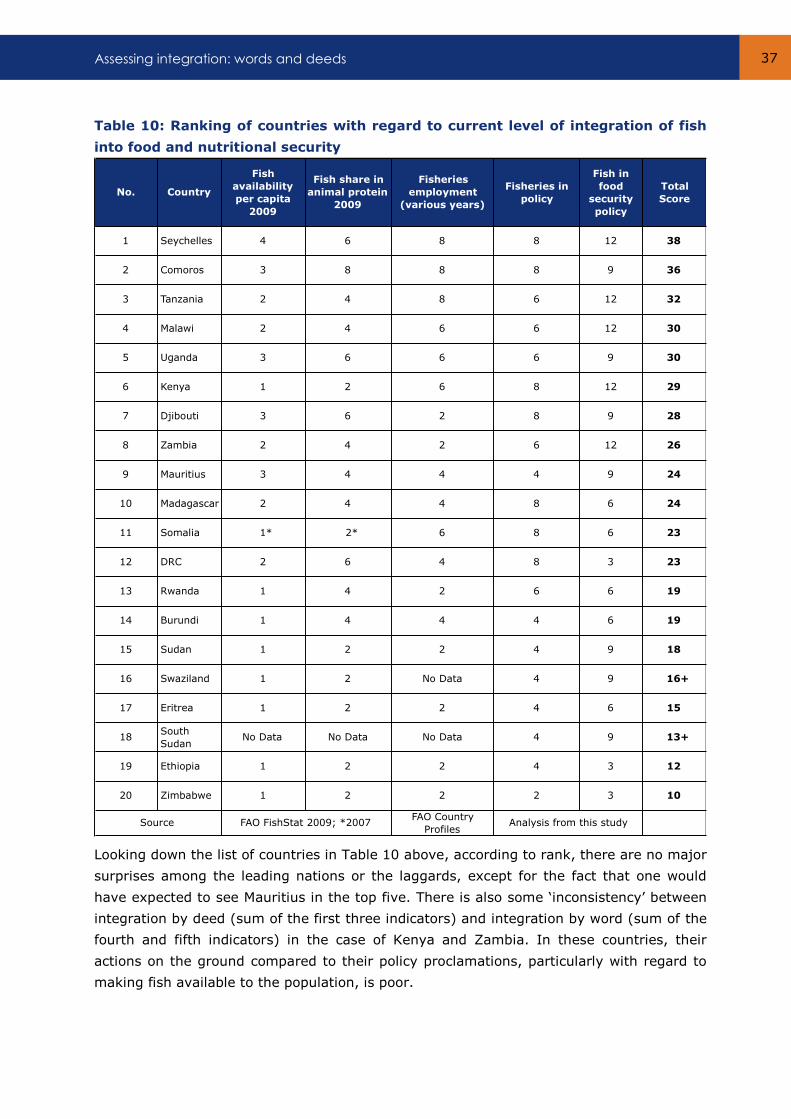
Assessing integration: words and deeds 37
No. Country
Fish
availability
per capita
2009
Fish share in
animal protein
2009
Fisheries
employment
(various years)
Fisheries in
policy
Fish in
food
security
policy
Total
Score
1 Seychelles 4 6 8 8 12 38
2 Comoros 3 8 8 8 9 36
3 Tanzania 2 4 8 6 12 32
4 Malawi 2 4 6 6 12 30
5 Uganda 3 6 6 6 9 30
6 Kenya 1 2 6 8 12 29
7 Djibouti 3 6 2 8 9 28
8 Zambia 2 4 2 6 12 26
9 Mauritius 3 4 4 4 9 24
10 Madagascar 2 4 4 8 6 24
11 Somalia 1* 2* 6 8 6 23
12 DRC 2 6 4 8 3 23
13 Rwanda 1 4 2 6 6 19
14 Burundi 1 4 4 4 6 19
15 Sudan 1 2 2 4 9 18
16 Swaziland 1 2 No Data 4 9 16+
17 Eritrea 1 2 2 4 6 15
18South
SudanNo Data No Data No Data 4 9 13+
19 Ethiopia 1 2 2 4 3 12
20 Zimbabwe 1 2 2 2 3 10
FAO Country
ProfilesSource FAO FishStat 2009; *2007 Analysis from this study
Table 10: Ranking of countries with regard to current level of integration of fish
into food and nutritional security
Looking down the list of countries in Table 10 above, according to rank, there are no major
surprises among the leading nations or the laggards, except for the fact that one would
have expected to see Mauritius in the top five. There is also some ‘inconsistency’ between
integration by deed (sum of the first three indicators) and integration by word (sum of the
fourth and fifth indicators) in the case of Kenya and Zambia. In these countries, their
actions on the ground compared to their policy proclamations, particularly with regard to
making fish available to the population, is poor.
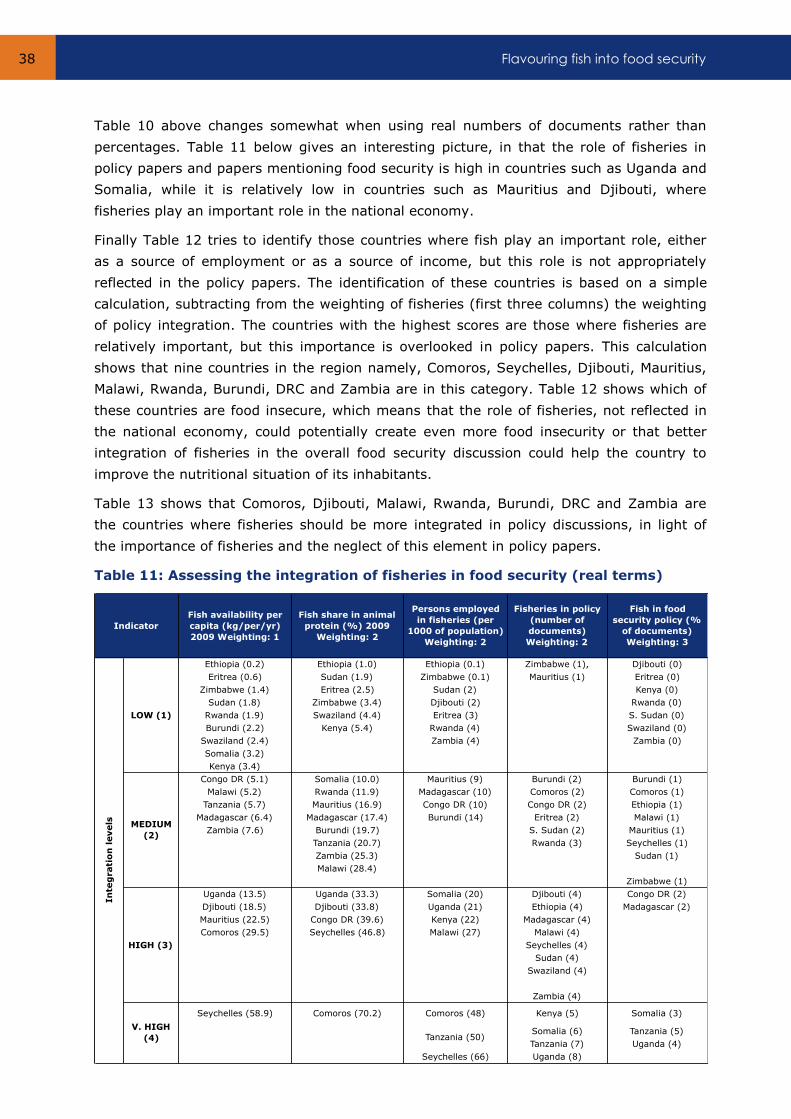
Flavouring fish into food security 38
Fish availability per
capita (kg/per/yr)
2009 Weighting: 1
Fish share in animal
protein (%) 2009
Weighting: 2
Persons employed
in fisheries (per
1000 of population)
Weighting: 2
Fisheries in policy
(number of
documents)
Weighting: 2
Fish in food
security policy (%
of documents)
Weighting: 3
Ethiopia (0.2) Ethiopia (1.0) Ethiopia (0.1) Zimbabwe (1), Djibouti (0)
Eritrea (0.6) Sudan (1.9) Zimbabwe (0.1) Mauritius (1) Eritrea (0)
Zimbabwe (1.4) Eritrea (2.5) Sudan (2) Kenya (0)
Sudan (1.8) Zimbabwe (3.4) Djibouti (2) Rwanda (0)
Rwanda (1.9) Swaziland (4.4) Eritrea (3) S. Sudan (0)
Burundi (2.2) Kenya (5.4) Rwanda (4) Swaziland (0)
Swaziland (2.4) Zambia (4) Zambia (0)
Somalia (3.2)
Kenya (3.4)
Congo DR (5.1) Somalia (10.0) Mauritius (9) Burundi (2) Burundi (1)
Malawi (5.2) Rwanda (11.9) Madagascar (10) Comoros (2) Comoros (1)
Tanzania (5.7) Mauritius (16.9) Congo DR (10) Congo DR (2) Ethiopia (1)
Madagascar (6.4) Madagascar (17.4) Burundi (14) Eritrea (2) Malawi (1)
Zambia (7.6) Burundi (19.7) S. Sudan (2) Mauritius (1)
Tanzania (20.7) Rwanda (3) Seychelles (1)
Zambia (25.3) Sudan (1)
Malawi (28.4)
Zimbabwe (1)
Uganda (13.5) Uganda (33.3) Somalia (20) Djibouti (4) Congo DR (2)
Djibouti (18.5) Djibouti (33.8) Uganda (21) Ethiopia (4) Madagascar (2)
Mauritius (22.5) Congo DR (39.6) Kenya (22) Madagascar (4)
Comoros (29.5) Seychelles (46.8) Malawi (27) Malawi (4)
Seychelles (4)
Sudan (4)
Swaziland (4)
Zambia (4)
Seychelles (58.9) Comoros (70.2) Comoros (48) Kenya (5) Somalia (3)
Somalia (6) Tanzania (5)
Tanzania (7) Uganda (4)
Seychelles (66) Uganda (8)
Indicator
In
teg
rati
on
levels
Tanzania (50)
LOW (1)
MEDIUM
(2)
HIGH (3)
V. HIGH
(4)
Table 10 above changes somewhat when using real numbers of documents rather than
percentages. Table 11 below gives an interesting picture, in that the role of fisheries in
policy papers and papers mentioning food security is high in countries such as Uganda and
Somalia, while it is relatively low in countries such as Mauritius and Djibouti, where
fisheries play an important role in the national economy.
Finally Table 12 tries to identify those countries where fish play an important role, either
as a source of employment or as a source of income, but this role is not appropriately
reflected in the policy papers. The identification of these countries is based on a simple
calculation, subtracting from the weighting of fisheries (first three columns) the weighting
of policy integration. The countries with the highest scores are those where fisheries are
relatively important, but this importance is overlooked in policy papers. This calculation
shows that nine countries in the region namely, Comoros, Seychelles, Djibouti, Mauritius,
Malawi, Rwanda, Burundi, DRC and Zambia are in this category. Table 12 shows which of
these countries are food insecure, which means that the role of fisheries, not reflected in
the national economy, could potentially create even more food insecurity or that better
integration of fisheries in the overall food security discussion could help the country to
improve the nutritional situation of its inhabitants.
Table 13 shows that Comoros, Djibouti, Malawi, Rwanda, Burundi, DRC and Zambia are
the countries where fisheries should be more integrated in policy discussions, in light of
the importance of fisheries and the neglect of this element in policy papers.
Table 11: Assessing the integration of fisheries in food security (real terms)
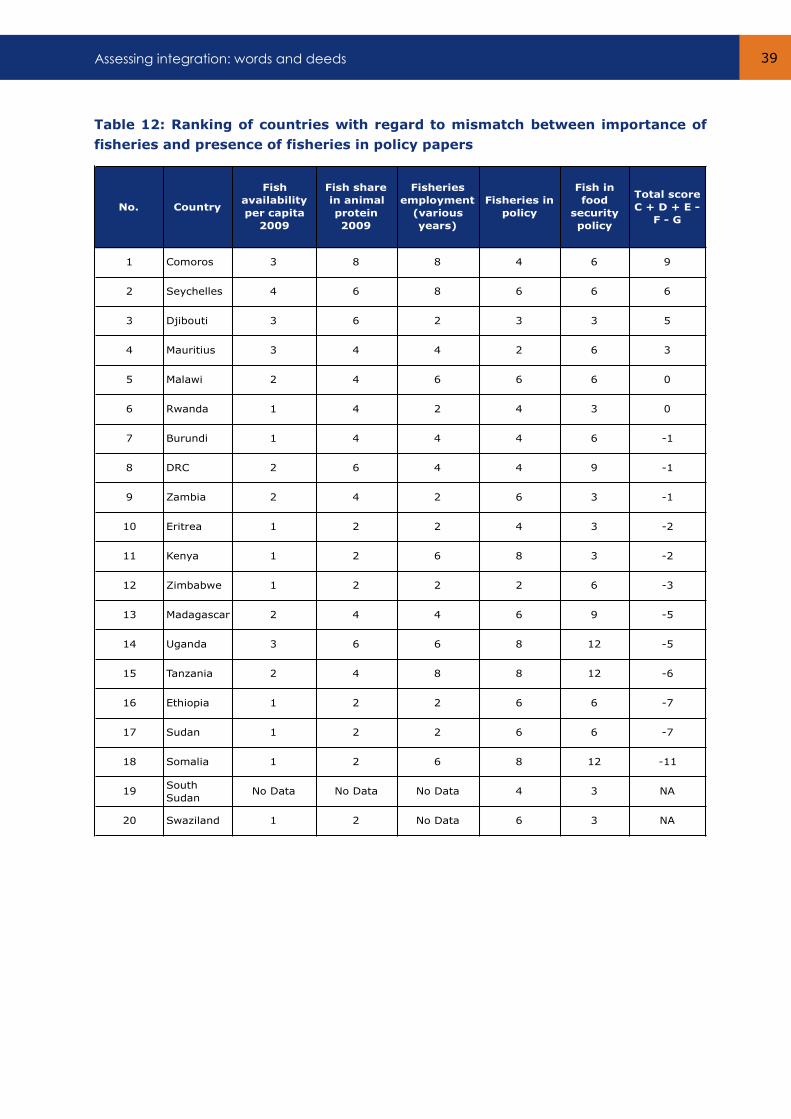
Assessing integration: words and deeds 39
No. Country
Fish
availability
per capita
2009
Fish share
in animal
protein
2009
Fisheries
employment
(various
years)
Fisheries in
policy
Fish in
food
security
policy
Total score
C + D + E -
F - G
1 Comoros 3 8 8 4 6 9
2 Seychelles 4 6 8 6 6 6
3 Djibouti 3 6 2 3 3 5
4 Mauritius 3 4 4 2 6 3
5 Malawi 2 4 6 6 6 0
6 Rwanda 1 4 2 4 3 0
7 Burundi 1 4 4 4 6 -1
8 DRC 2 6 4 4 9 -1
9 Zambia 2 4 2 6 3 -1
10 Eritrea 1 2 2 4 3 -2
11 Kenya 1 2 6 8 3 -2
12 Zimbabwe 1 2 2 2 6 -3
13 Madagascar 2 4 4 6 9 -5
14 Uganda 3 6 6 8 12 -5
15 Tanzania 2 4 8 8 12 -6
16 Ethiopia 1 2 2 6 6 -7
17 Sudan 1 2 2 6 6 -7
18 Somalia 1 2 6 8 12 -11
19South
SudanNo Data No Data No Data 4 3 NA
20 Swaziland 1 2 No Data 6 3 NA
Table 12: Ranking of countries with regard to mismatch between importance of
fisheries and presence of fisheries in policy papers
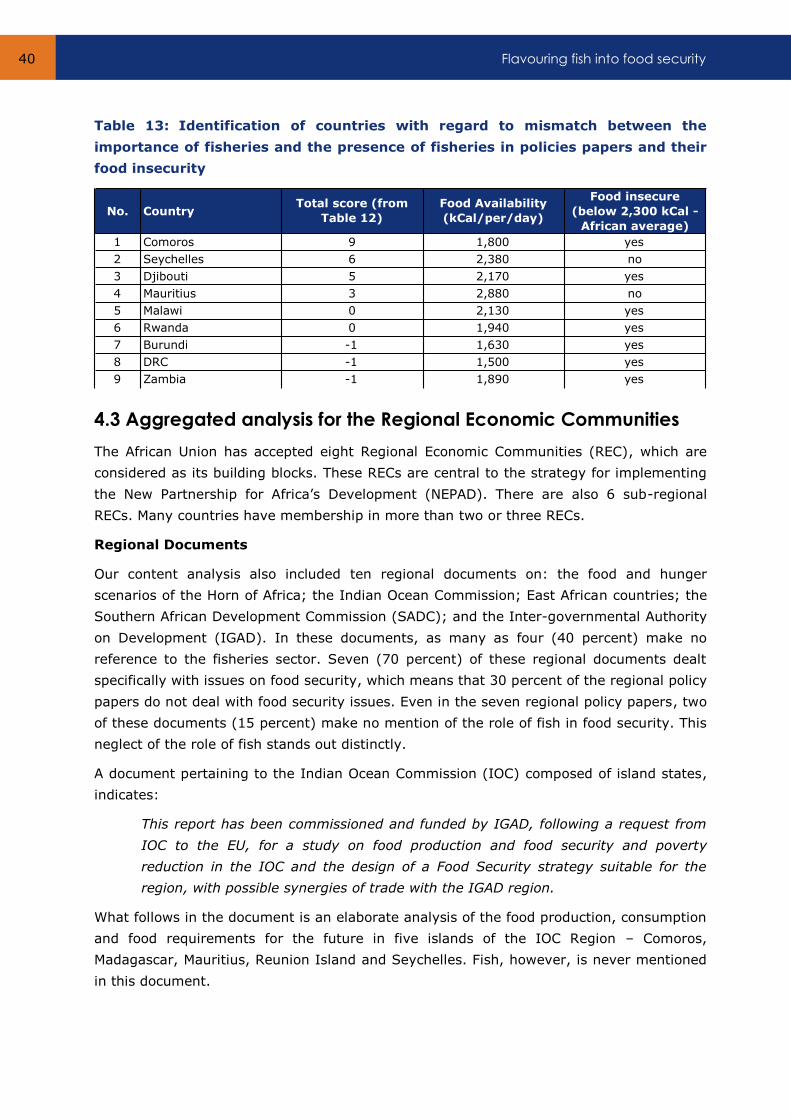
Flavouring fish into food security 40
No. CountryTotal score (from
Table 12)
Food Availability
(kCal/per/day)
Food insecure
(below 2,300 kCal -
African average)
1 Comoros 9 1,800 yes
2 Seychelles 6 2,380 no
3 Djibouti 5 2,170 yes
4 Mauritius 3 2,880 no
5 Malawi 0 2,130 yes
6 Rwanda 0 1,940 yes
7 Burundi -1 1,630 yes
8 DRC -1 1,500 yes
9 Zambia -1 1,890 yes
Table 13: Identification of countries with regard to mismatch between the
importance of fisheries and the presence of fisheries in policies papers and their
food insecurity
4.3 Aggregated analysis for the Regional Economic Communities
The African Union has accepted eight Regional Economic Communities (REC), which are
considered as its building blocks. These RECs are central to the strategy for implementing
the New Partnership for Africa’s Development (NEPAD). There are also 6 sub-regional
RECs. Many countries have membership in more than two or three RECs.
Regional Documents
Our content analysis also included ten regional documents on: the food and hunger
scenarios of the Horn of Africa; the Indian Ocean Commission; East African countries; the
Southern African Development Commission (SADC); and the Inter-governmental Authority
on Development (IGAD). In these documents, as many as four (40 percent) make no
reference to the fisheries sector. Seven (70 percent) of these regional documents dealt
specifically with issues on food security, which means that 30 percent of the regional policy
papers do not deal with food security issues. Even in the seven regional policy papers, two
of these documents (15 percent) make no mention of the role of fish in food security. This
neglect of the role of fish stands out distinctly.
A document pertaining to the Indian Ocean Commission (IOC) composed of island states,
indicates:
This report has been commissioned and funded by IGAD, following a request from
IOC to the EU, for a study on food production and food security and poverty
reduction in the IOC and the design of a Food Security strategy suitable for the
region, with possible synergies of trade with the IGAD region.
What follows in the document is an elaborate analysis of the food production, consumption
and food requirements for the future in five islands of the IOC Region – Comoros,
Madagascar, Mauritius, Reunion Island and Seychelles. Fish, however, is never mentioned
in this document.
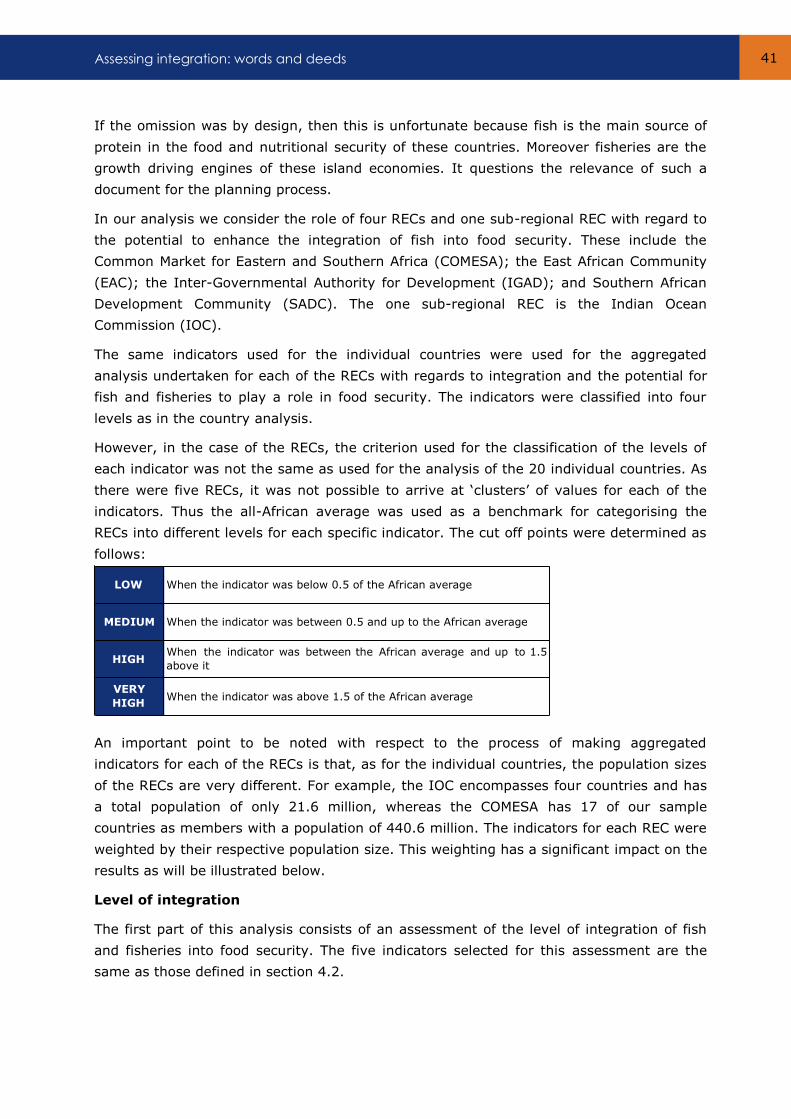
Assessing integration: words and deeds 41
LOW When the indicator was below 0.5 of the African average
MEDIUM When the indicator was between 0.5 and up to the African average
HIGHWhen the indicator was between the African average and up to 1.5
above it
VERY
HIGHWhen the indicator was above 1.5 of the African average
If the omission was by design, then this is unfortunate because fish is the main source of
protein in the food and nutritional security of these countries. Moreover fisheries are the
growth driving engines of these island economies. It questions the relevance of such a
document for the planning process.
In our analysis we consider the role of four RECs and one sub-regional REC with regard to
the potential to enhance the integration of fish into food security. These include the
Common Market for Eastern and Southern Africa (COMESA); the East African Community
(EAC); the Inter-Governmental Authority for Development (IGAD); and Southern African
Development Community (SADC). The one sub-regional REC is the Indian Ocean
Commission (IOC).
The same indicators used for the individual countries were used for the aggregated
analysis undertaken for each of the RECs with regards to integration and the potential for
fish and fisheries to play a role in food security. The indicators were classified into four
levels as in the country analysis.
However, in the case of the RECs, the criterion used for the classification of the levels of
each indicator was not the same as used for the analysis of the 20 individual countries. As
there were five RECs, it was not possible to arrive at ‘clusters’ of values for each of the
indicators. Thus the all-African average was used as a benchmark for categorising the
RECs into different levels for each specific indicator. The cut off points were determined as
follows:
An important point to be noted with respect to the process of making aggregated
indicators for each of the RECs is that, as for the individual countries, the population sizes
of the RECs are very different. For example, the IOC encompasses four countries and has
a total population of only 21.6 million, whereas the COMESA has 17 of our sample
countries as members with a population of 440.6 million. The indicators for each REC were
weighted by their respective population size. This weighting has a significant impact on the
results as will be illustrated below.
Level of integration
The first part of this analysis consists of an assessment of the level of integration of fish
and fisheries into food security. The five indicators selected for this assessment are the
same as those defined in section 4.2.

Flavouring fish into food security 42
1 2 3 4 5
Fish
availability
per capita
(kg/per/yr)
2009
Weighting: 1
Fish share in
animal
protein (%)
2009
Weighting: 2
Persons
employed in
fisheries
(per 1000 of
population)
Weighting: 2
Fisheries in
policy (% of
documents)
Weighting: 2
Fish in food
security
policy (% of
documents)
Weighting: 3
LOW (1) IGAD
IOC
MEDIUM
(2)EAC (6.38)
COMESA
(14.6)COMESA (8.9) EAC
COMESA
(6.62)SADC (15.1) IOC (11.4) SADC
SADC (6.69) EAC (16.9) SADC (13.6)
IOC (8.15) IOC (18.6)
HIGH (3)
V. HIGH
(4)
9.4 19.1 16.57 - -African average
-
- - EAC (28.9) - -
-
-
- - - -
IGAD (8.2)
Indicator
In
teg
rati
on
levels
IGAD (3.38) IGAD (7.1)
Table 14: Assessing the level of integration of fish and fisheries into food security
in RECs
It should be noted that in the analysis of RECs, when the integration of fisheries is
considered ‘by word’, only policy documents which dealt specifically with food security
were considered and reviewed (column 5 of Table 14).
From Table 14 it is apparent that IGAD is clearly the REC with the lowest level of
integration. This is mainly due to the fact that the bigger countries in this REC are land-
locked and culturally have a very low preference for fish as a source of protein. All the
remaining four RECs are positioned in the medium level of integration.
To illustrate the impact of the weighting by population size a good example is the IOC,
which is composed of, four island nations of which Madagascar alone has a population of
approximately 19 million and the other three combined have a total of only 2 million. If
Madagascar were excluded from the aggregation, then in Table 14 above, the ‘fish
availability per capita’ would move to a ‘very high’ ranking (20.2 kg/per capita/year),
whilst the ‘fish share in animal protein’ (22.7 percent) and employment in fisheries (24
persons/1000 population) would score a ‘high’. This would therefore make the IOC the REC
with the greatest level of integration of fish and fisheries in food security.
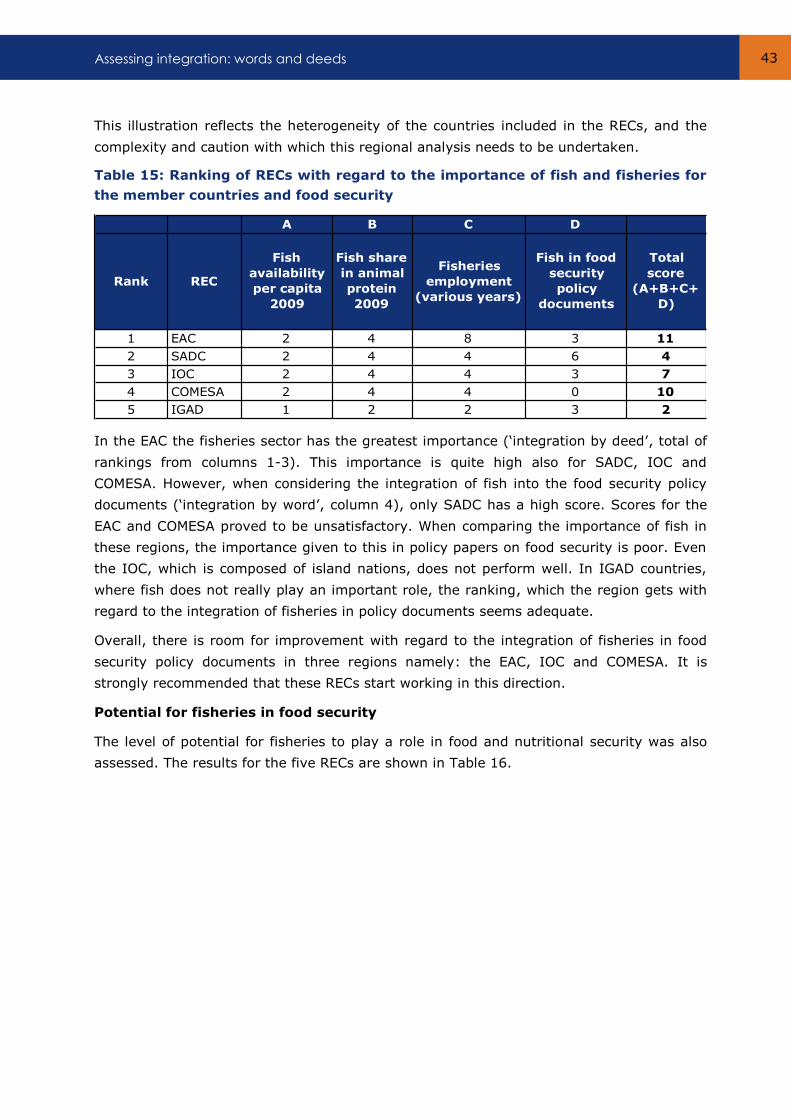
Assessing integration: words and deeds 43
A B C D
Rank REC
Fish
availability
per capita
2009
Fish share
in animal
protein
2009
Fisheries
employment
(various years)
Fish in food
security
policy
documents
Total
score
(A+B+C+
D)
1 EAC 2 4 8 3 11
2 SADC 2 4 4 6 4
3 IOC 2 4 4 3 7
4 COMESA 2 4 4 0 10
5 IGAD 1 2 2 3 2
This illustration reflects the heterogeneity of the countries included in the RECs, and the
complexity and caution with which this regional analysis needs to be undertaken.
Table 15: Ranking of RECs with regard to the importance of fish and fisheries for
the member countries and food security
In the EAC the fisheries sector has the greatest importance (‘integration by deed’, total of
rankings from columns 1-3). This importance is quite high also for SADC, IOC and
COMESA. However, when considering the integration of fish into the food security policy
documents (‘integration by word’, column 4), only SADC has a high score. Scores for the
EAC and COMESA proved to be unsatisfactory. When comparing the importance of fish in
these regions, the importance given to this in policy papers on food security is poor. Even
the IOC, which is composed of island nations, does not perform well. In IGAD countries,
where fish does not really play an important role, the ranking, which the region gets with
regard to the integration of fisheries in policy documents seems adequate.
Overall, there is room for improvement with regard to the integration of fisheries in food
security policy documents in three regions namely: the EAC, IOC and COMESA. It is
strongly recommended that these RECs start working in this direction.
Potential for fisheries in food security
The level of potential for fisheries to play a role in food and nutritional security was also
assessed. The results for the five RECs are shown in Table 16.
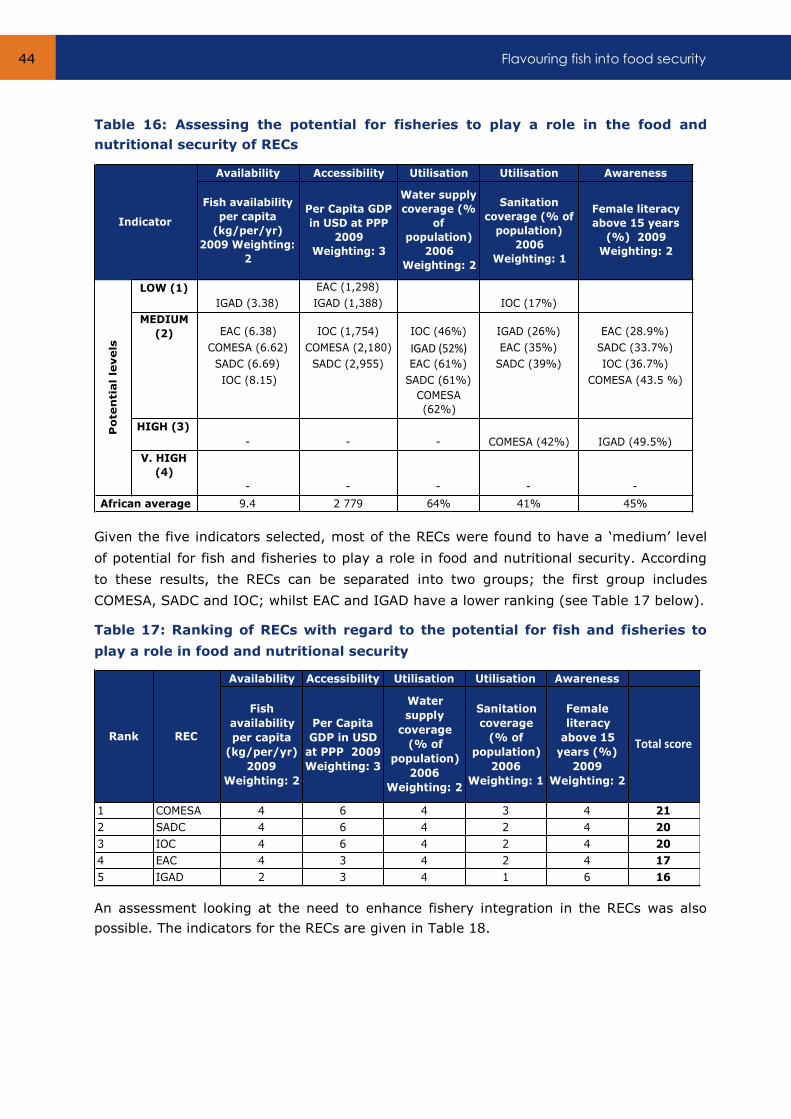
Flavouring fish into food security 44
Availability Accessibility Utilisation Utilisation Awareness
Fish availability
per capita
(kg/per/yr)
2009 Weighting:
2
Per Capita GDP
in USD at PPP
2009
Weighting: 3
Water supply
coverage (%
of
population)
2006
Weighting: 2
Sanitation
coverage (% of
population)
2006
Weighting: 1
Female literacy
above 15 years
(%) 2009
Weighting: 2
LOW (1) EAC (1,298)
IGAD (1,388)
MEDIUM
(2) EAC (6.38) IOC (1,754) IOC (46%) IGAD (26%) EAC (28.9%)
COMESA (6.62) COMESA (2,180) IGAD(52%) EAC (35%) SADC (33.7%)
SADC (6.69) SADC (2,955) EAC (61%) SADC (39%) IOC (36.7%)
IOC (8.15) SADC (61%) COMESA (43.5 %)
COMESA
(62%)
HIGH (3)
V. HIGH
(4)
9.4 2 779 64% 41% 45%African average
IGAD (49.5%)
- - - - -
Indicator
Po
ten
tia
l le
vels
IGAD (3.38) IOC (17%)
- - - COMESA (42%)
Availability Accessibility Utilisation Utilisation Awareness
Fish
availability
per capita
(kg/per/yr)
2009
Weighting: 2
Per Capita
GDP in USD
at PPP 2009
Weighting: 3
Water
supply
coverage
(% of
population)
2006
Weighting: 2
Sanitation
coverage
(% of
population)
2006
Weighting: 1
Female
literacy
above 15
years (%)
2009
Weighting: 2
Totalscore
1 COMESA 4 6 4 3 4 21
2 SADC 4 6 4 2 4 20
3 IOC 4 6 4 2 4 20
4 EAC 4 3 4 2 4 17
5 IGAD 2 3 4 1 6 16
RECRank
Table 16: Assessing the potential for fisheries to play a role in the food and
nutritional security of RECs
Given the five indicators selected, most of the RECs were found to have a ‘medium’ level
of potential for fish and fisheries to play a role in food and nutritional security. According
to these results, the RECs can be separated into two groups; the first group includes
COMESA, SADC and IOC; whilst EAC and IGAD have a lower ranking (see Table 17 below).
Table 17: Ranking of RECs with regard to the potential for fish and fisheries to
play a role in food and nutritional security
An assessment looking at the need to enhance fishery integration in the RECs was also
possible. The indicators for the RECs are given in Table 18.
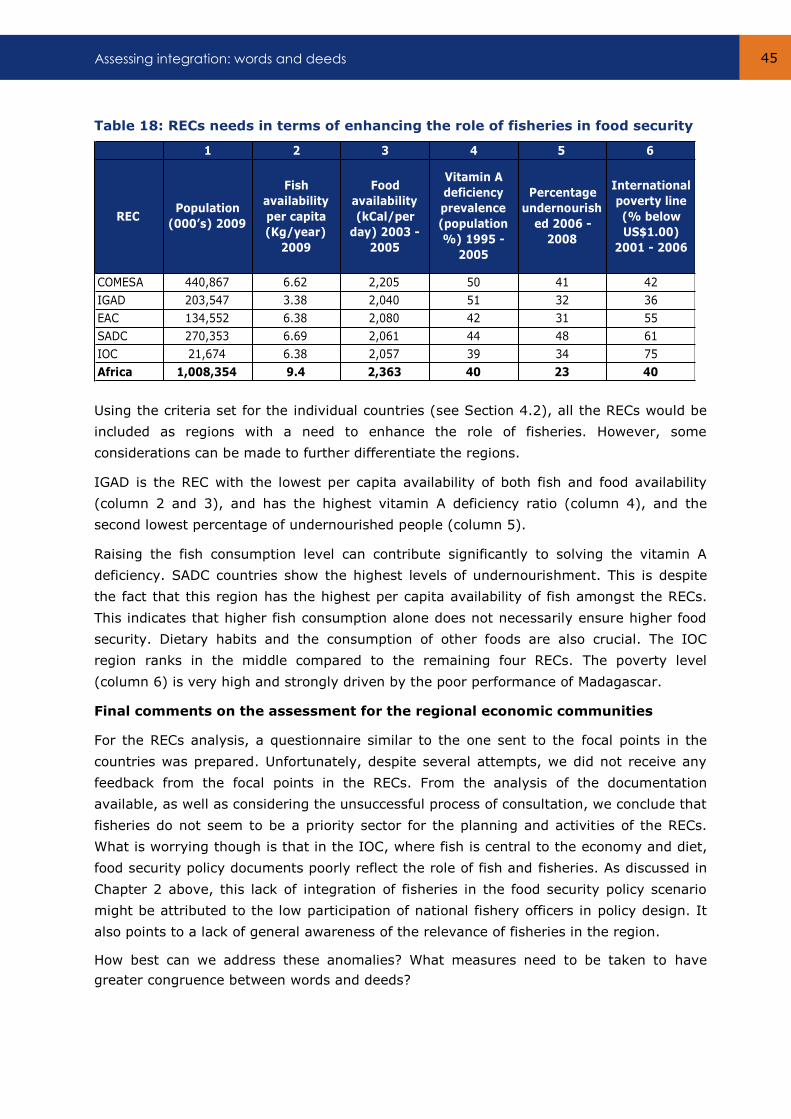
Assessing integration: words and deeds 45
1 2 3 4 5 6
RECPopulation
(000’s) 2009
Fish
availability
per capita
(Kg/year)
2009
Food
availability
(kCal/per
day) 2003 -
2005
Vitamin A
deficiency
prevalence
(population
%) 1995 -
2005
Percentage
undernourish
ed 2006 -
2008
International
poverty line
(% below
US$1.00)
2001 - 2006
COMESA 440,867 6.62 2,205 50 41 42
IGAD 203,547 3.38 2,040 51 32 36
EAC 134,552 6.38 2,080 42 31 55
SADC 270,353 6.69 2,061 44 48 61
IOC 21,674 6.38 2,057 39 34 75
Africa 1,008,354 9.4 2,363 40 23 40
Table 18: RECs needs in terms of enhancing the role of fisheries in food security
Using the criteria set for the individual countries (see Section 4.2), all the RECs would be
included as regions with a need to enhance the role of fisheries. However, some
considerations can be made to further differentiate the regions.
IGAD is the REC with the lowest per capita availability of both fish and food availability
(column 2 and 3), and has the highest vitamin A deficiency ratio (column 4), and the
second lowest percentage of undernourished people (column 5).
Raising the fish consumption level can contribute significantly to solving the vitamin A
deficiency. SADC countries show the highest levels of undernourishment. This is despite
the fact that this region has the highest per capita availability of fish amongst the RECs.
This indicates that higher fish consumption alone does not necessarily ensure higher food
security. Dietary habits and the consumption of other foods are also crucial. The IOC
region ranks in the middle compared to the remaining four RECs. The poverty level
(column 6) is very high and strongly driven by the poor performance of Madagascar.
Final comments on the assessment for the regional economic communities
For the RECs analysis, a questionnaire similar to the one sent to the focal points in the
countries was prepared. Unfortunately, despite several attempts, we did not receive any
feedback from the focal points in the RECs. From the analysis of the documentation
available, as well as considering the unsuccessful process of consultation, we conclude that
fisheries do not seem to be a priority sector for the planning and activities of the RECs.
What is worrying though is that in the IOC, where fish is central to the economy and diet,
food security policy documents poorly reflect the role of fish and fisheries. As discussed in
Chapter 2 above, this lack of integration of fisheries in the food security policy scenario
might be attributed to the low participation of national fishery officers in policy design. It
also points to a lack of general awareness of the relevance of fisheries in the region.
How best can we address these anomalies? What measures need to be taken to have
greater congruence between words and deeds?
Flavouring fish into food security 46
4.4 Merging words with deeds: Improving policy and practice
Policies may be considered as guides for action. Policy can also be defined as making
decisions that reflect values and allocating resources based on such values. Policies may
contain guidelines, principles or directions on what is to be done, who is to do it, how it is
to be done and who stands to benefit. Thus, policy represents a particular political, ethical,
or programmatic viewpoint. A country’s policy reflects theoretical or experiential
assumptions about what is required to resolve a particular issue or problem.
In developing countries and in the sub-Saharan countries in particular, the issues of
poverty, hunger, food and nutritional security are all central to the present and future
prospects of human and economic development. Policy formulation on these issues
requires a clear understanding of the realities on the ground.
Unfortunately, government policy formulation procedures have become exercises which
are increasingly ‘top-down’ with the involvement of ‘expert consultants’ and undertaken
(perhaps) with tight time schedules. These policies are then, passed down to the
departments, organizations or groups responsible for implementing the policy. Finally, the
impacts reach the people who are affected by the policy. Often, policies cannot be
integrated with reality and so they remain solely on paper.
Ensuring greater integration in policies
From our analysis of policy documents, the inadequacy of integration of fisheries and
aquaculture in policies that pertain to food and nutritional security is clearly evident.
Unquestionably, there are deficiencies in the process of policy formulation.
There are at least three important measures that could be taken to rectify these
deficiencies.
Firstly, integration presupposes greater participation of at least two interest groups, those
responsible for implementing the policy and those affected by the policy. To start with,
policy formulation must incorporate some structured or mandatory requirement for greater
participation of national-level officers who represent the fisheries sectors. Our analysis of
the awareness and knowledge of the fishery officers (see Chapter 2 above) points to a
reasonably high level of understanding of the role of fish in food and nutritional security.
This would not have been possible if they did not have adequate academic attainments,
and field level involvement. An important strategy to achieve such participation would be
for national governments to have mandated requirements for well informed and motivated
officers involved in the policy making process with external consultants.
A second measure for greater integration would be to strengthen institutional memory.
There is an important corpus of studies that have been completed at the national and
regional levels on various aspects of fish and fisheries. These form an important body of
knowledge and evidence relating to the various patterns of fish production and
consumption in the ESA-IO countries.
Assessing integration: words and deeds 47
Every time a new policy formulation is commissioned, it should be made mandatory to
review the existing fund of knowledge. There is no rationale or justification for re-inventing
the wheel.
A third measure for greater integration lies in more focused capacity development of
officers dealing with fish and fishery issues at the national level. Specific training programs
are needed for middle- and top-level officers on data requirements for policy formulation
and how this data should be converted to information elements for policy. For example,
capable officers should be encouraged to formulate policy briefs by themselves,
substantiated with data and credible information; highlighting the significance of fish and
fisheries; and direct and indirect paths for achieving food security in the country.
If in the short and medium term, the above-mentioned measures can be implemented,
there is likely to be more integration of the importance of fish and fisheries into the food
security policies of countries of the ESA-IO region.
If there is structured involvement of the various interest groups in the fisheries and
aquaculture sector in the policy development process, a far greater level of integration can
be achieved (bottom-up approach). These may include: arranging for public hearings;
consultation with local level organisations of fishers and fish harvesters the processing
industry, the fish distributors and traders; inputs from NGOs working in the sector;
sourcing ideas from food and nutrition extension workers and mothers who gather at
health and nutrition clinics and so forth.
Greater integration can also come from a top-down approach involving senior political
leaders. This can be achieved by well-planned and short (one-day) awareness and policy
workshops organized with support from international organisations such as the FAO/UN,
World Food Program (WFP), UNICEF and others. Such events2 need to be high profile at
national or regional levels. They should be followed through systematically with publicity,
awareness programs, demonstration vents and so forth. These events must link with the
political and electoral interests of top policy makers.
2 A good example is the “Fish For All” summit held in Abuja, Nigeria in 2005.
Flavouring fish into food security 48
5. Conclusions
A preliminary assessment of the integration of fisheries and aquaculture into the food and
nutrition policy frameworks of the East and South Africa and Indian Ocean countries was
attempted as part of this study. This initiated the understanding of factors that aid and
hinder integration as viewed by fishery officers of the 20 countries involved. There is
always a desire to raise the levels of integration of fisheries into policy and fish into diets.
This practice may not be possible or viable in every country.
Countries with the potential for integration and countries with a real need were then
examined. The latter was the focus of our attention because greater integration of fisheries
and fish is the challenge of the SmartFish program. It is necessary to raise awareness of
this point: this is only possible in countries where the right conditions exist to create
awareness. Our foregoing analysis led to the creation of a list of six countries: Kenya,
Malawi, Rwanda, Tanzania, Zambia and Zimbabwe. Together they account for a third of
the population in our study of 20 countries. Currently fish consumption is not high in these
countries but they have the resources and ecosystem potential for expansion of their
fisheries. This can raise food security both directly (increasing the consumption of fish)
and indirectly (creating jobs, raising income, etc. leading to a greater purchase and
consumption of fish).
From the REC analysis it is apparent that there are also consolidation measures that can
be undertaken regionally and these should also be attempted simultaneously. There is
synergy in linking national and regional initiatives. Most measures call for greater levels of
cooperation between the various departments of countries. Integration is possible only
with genuine and committed cooperation. Emphasis must be placed on capacity building
and greater participation, directly and indirectly, in the policy making process.
Whilst the debates on ‘right to food’ rage on in policy arenas of international development
discourse, millions of people go hungry. Equal numbers eat but do not necessarily the
same or adequate nourishment from their meals to prepare their bodies for a hard day’s
work. It is in such contexts where sourcing foods, which are readily available and
affordable, attains significance.
Chapter 4 assesses the degree of integration in ‘word and deed’, in seven countries in this
study namely: Comoros, Djibouti, Malawi, Rwanda, Burundi, Democratic Republic of Congo
and Zambia. These countries were identified fish as being important but presently
overlooked in policy discussions. By integrating these countries with those identified above
as having potential for increased fish consumption, a final list of five countries where
SmartFish could start advocacy work can be drawn up: Comoros, Djibouti, Malawi,
Rwanda, and Zambia.
Some countries are of particular interest, such as Mauritius: Mauritius ranks as one of the
countries with a very high potential for fisheries and aquaculture to play a role in food and
nutritional security.
Conclusions 49
However, in terms of the integration of fisheries and aquaculture, Mauritius ranks in the
medium range, whilst in the analysis of the mismatch between the importance of fisheries
and its inclusion in policies, it is listed in the upper ranks. This puts Mauritius in a strange
position, since fisheries already seem to play a very relevant role in terms of food security
however, not enough importance is given to the sector in national policies. Therefore, it
seems relevant to include Mauritius among those countries where SmartFish should
implement activities, given the focus of interventions could be on policies and means of
enhancing fisheries integration in the food security scheme, and the redesign of policies to
improve the consideration of fisheries when it comes to food security. This could be
considered as a higher intervention in terms of enhancing the inclusion of fisheries in food
security policies, since consumption is already high in a non-food insecure country. It
could also provide lessons for application in the first five countries selected, where
consolidation of the fisheries and aquaculture sector in national food security is at an
earlier stage. It would also help to assess the particular requirements in terms of policy
interventions for island nations, in order to widen the spectrum of actions to adopt towards
strengthening the contribution of fisheries to national food and nutritional security.
Consequently, it is recommended interventions by the SmartFish program in Comoros,
Djibouti, Malawi, Rwanda, Zambia and Mauritius, be designed to include advocacy work
towards the promotion of consumption, capacity building, and deepening awareness of the
need to include fisheries in national food security policies, and at the same time, take into
consideration the particular needs and characteristics of these nations.
This is the challenge of flavouring fish into food security.
Flavouring fish into food security 50
References
ADB, OECD, UNDP, UNECA 2012: African Economic Outlook, 2012
FAO, 1993: Marketing and consumption of fish in eastern and southern Africa: Selected
country studies. FTP 332, Rome
FAO, 2010: Post-harvest losses in small-scale fisheries: case studies in five sub-Saharan
African countries. FTP 550, Rome
FAO, 2012: The State of Food Insecurity in the World 2012, Rome
FAO, 2012: The State of Fisheries and Aquaculture, 2012, Rome
Haug, A. et al, 2010: Use of dried Kapenta (Limnothrissa miodon and Stolothrissa
tanganicae) and other products based on whole fish for complementing maize-based diets,
AJFAND Online Vol. 10 No. 5
ICLARM/GTZ, 1991: The Context of Small-Scale Integrated Agriculture-Aquaculture
Systems in Africa: A Case Study of Malawi, Manila
MRAG, 2005: Review of Impacts of Illegal, Unreported and Unregulated Fishing on
Developing Countries: Synthesis Report, London
NEPAD, 2005: HIDDEN HARVESTS: Unlocking the Potential of Aquaculture in Africa,
Technical Review Paper, Aquaculture, NEPAD, Fish for All Summit, Abuja
UNDP, 2012: Africa Human Development Report 2012: Towards a Food Secure Future,
New York
WorldFish, 1995: Fish Supply and Food Security for Africa, Penang
WorldFish, 2009: Aquaculture, Fisheries, Poverty and Food Security, Working paper 2011-
65, Penang
World Bank, 2011: African Development Indicators 2011, Washington
World Bank, 2011: The Little Data Book on Africa, Washington
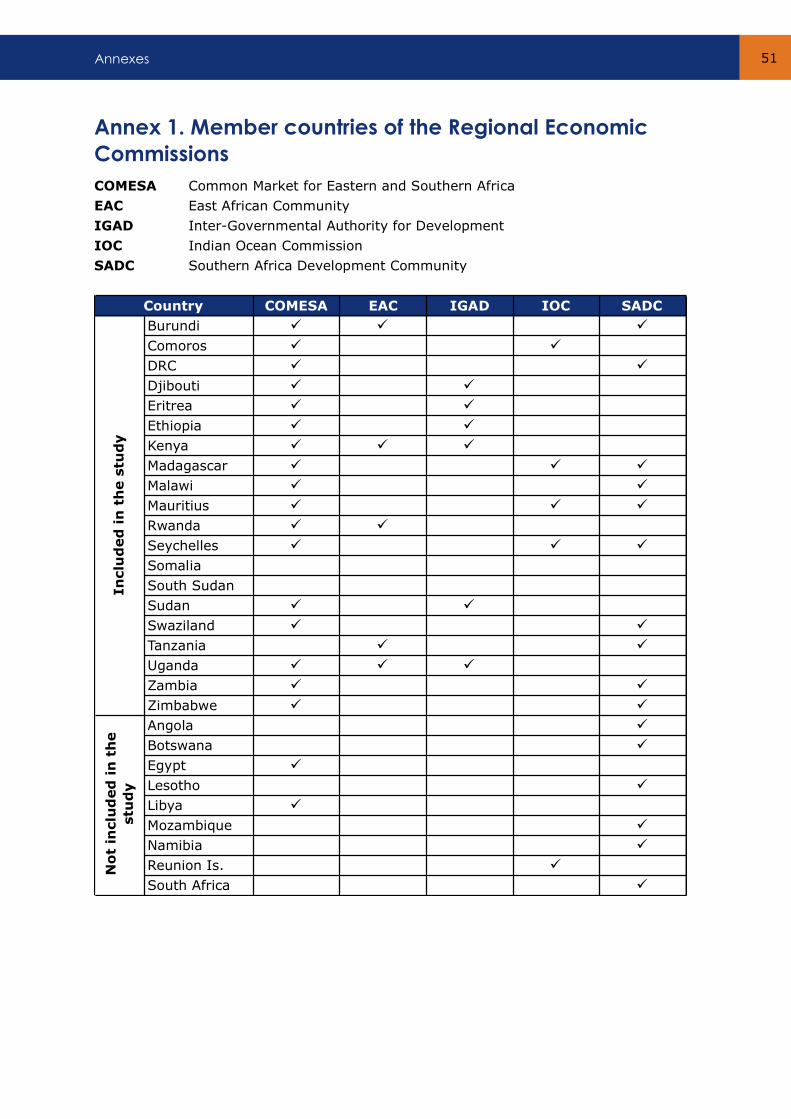
Annexes 51
COMESA EAC IGAD IOC SADC
Burundi ü ü ü
Comoros ü ü
DRC ü ü
Djibouti ü ü
Eritrea ü ü
Ethiopia ü ü
Kenya ü ü ü
Madagascar ü ü ü
Malawi ü ü
Mauritius ü ü ü
Rwanda ü ü
Seychelles ü ü ü
Somalia
South Sudan
Sudan ü ü
Swaziland ü ü
Tanzania ü ü
Uganda ü ü ü
Zambia ü ü
Zimbabwe ü ü
Angola ü
Botswana ü
Egypt ü
Lesotho ü
Libya ü
Mozambique ü
Namibia ü
Reunion Is. ü
South Africa ü
Country
In
clu
ded
in
th
e s
tud
yN
ot
inclu
ded
in
th
e
stu
dy
Annex 1. Member countries of the Regional Economic
Commissions
COMESA Common Market for Eastern and Southern Africa
EAC East African Community
IGAD Inter-Governmental Authority for Development
IOC Indian Ocean Commission
SADC Southern Africa Development Community
Flavouring fish into food security 52
Annex 2. Consolidating integration: what can be
meaningfully achieved
Consolidating the integration process would be a logical conclusion to the steps taken in
the main body of the report. Consolidation can be undertaken at all levels: regional,
national and local. It would therefore be best to consider a series of contemporary actions,
which will provide linkages to all levels. What follows is a list of actions that can be
meaningfully started and reasonably achieved within the time frame of the project.
This list is by no means exhaustive, however, it is based on one premise: that greater
participation and a more people-friendly approach to policy-oriented and policy-related
actions is a desirable process. This will lead to more sustainable outcomes of which
different stakeholders will take ownership. The list also takes into consideration many of
the suggestions made by the fishery officers and integrates the needs and potentials of the
countries identified where consolidation approaches are a priority. Many actions can be
applied at the regional level.
The important responsibility and moral obligations that nations must exercise to fulfil the
right to food for their populations is the most fitting backdrop for this proposed set of
actions.
The UN Special Rapporteur on the Right to Food submitted an Interim Report on the role
of fishers, fish workers and fisheries with regard to the debate on the right to food to the
UN General Assembly on 30 October 20123. The report covers a wide range of topics that
are of central value to the issue of greater integration of fish and fisheries into the food
and nutritional security of UN member states. The first recommendation of the report
reads:
States should discharge their duties to respect, protect and fulfil the right to food in the
fisheries sector by moving towards sustainable resource use while ensuring that the rights
and livelihoods of small-scale fishers and coastal communities are respected and that the
food security of all groups depending on fish is improved. This is a difficult balance to
strike, but, without swift and bold action by States, the contribution made by fisheries to
securing the right to food will diminish, with considerable consequences, in particular for
poorer rural communities that depend on fisheries for both their nutritional needs and their
income. Both coastal and flag States should accept their duties in this regard and should
actively involve the fishing communities themselves, both in fisheries management and in
the design and implementation of policies in adjacent sectors that could affect fishing.
3 http://www.un.org/ga/search/view_doc.asp?symbol=A%2F67%2F268&Submit=Search&Lang=E
Annexes 53
If nation states accept this call for action, then mainstreaming fish into food and nutritional
security can be seen as a moral obligation from the perspective of the right to food.
Let’s not reinvent the policy wheel: follow-up of major studies
(National/Regional)
Many important aspects pertaining to fish in relation to food security issues have been
covered by some major studies in the countries of the ESA-IO region. Three of these that
are relevant to the questions of integration, potential, needs and awareness of are the
following:
The Context of Small-Scale Integrated Agriculture-Aquaculture Systems in Africa: A
Case Study of Malawi, ICLARM/GTZ, Manila 1991;
Marketing and consumption of fish in eastern and southern Africa: Selected country
studies, FAO Fisheries Technical Paper 332, FAO Rome 1993;
Post-harvest Losses in Small-scale Fisheries: Case Study in five sub-Saharan
Countries, FAO Technical Paper 550, FAO Rome 2010.
These are examples of studies that are well documented, based on extensive field
investigations, written by, or based on the work of nationals, often officers of fisheries
departments and fishery research institutions, from the respective countries, or people
who have a lot of experience in the region. These studies are filled with an enormous
amount of valuable data and information, and have provided many practical suggestions
that make good inputs for policy making. Some of the suggestions may be dated; but
others are still valid.
It would therefore be appropriate to review and build on this corpus of knowledge. Many of
the authors may still be around. It would be useful to get them involved along with other
appropriate people from the respective countries to re-visit the action and policy
suggestions made in these studies and come up with a fresh, refurbished list based on the
current realities. A regional workshop based on this idea of building on accumulated
knowledge could become a good model for what is needed in other food security related
sectors as well.
This would be a good start to stop the huge amount of effort, time and money, which is
being spent on re-inventing the policy wheel.
Policy brief competition and regional high-level workshop
(National/Regional)
At the national level, as can be seen in the study, good talent exists among the officers in
the respective fishery departments. It would therefore be appropriate and necessary to
raise the capacity of these officers of the ESA-IO region in order to involve them in policy
making at both the national and regional level. It would be fitting to propose a collective
policy brief writing competition followed by a regional high-level workshop.
Flavouring fish into food security 54
The purpose of introducing a competition is to encourage the appropriate-level officers to
make an extra effort, on a collective basis, which could be rewarded by a formal certificate
of recognition and a study visit to another country in the region. Short-listed policy briefs
could form the background documents for a one-day high–level workshop for top policy
makers and political leaders of the region on the subject of integrating fish into food
security. Collaboration with New Economic Partnership for African Development (NEPAD)
and its Partnership for African Fisheries initiative could also be beneficial.
Capacity building training in data needs for food security initiatives
(Regional)
There is paucity of good data; lack of awareness about where to source existing data; as
well as the need to better equip people with simple techniques on how to use data and
information. Middle-level officers who have the responsibility to further the cause of
integrating fish and fisheries into food and nutritional security policies, plans, campaigns,
projects etc. could benefit greatly from such a training program spread over a week or ten
days. Such a program should also involve field visits, data collection and processing to
provide participants with first-hand knowledge of the difficulties, pitfalls and complications
of translating ‘concrete reality’ into ‘general statements’ and policy inputs.
Inter-departmental initiative for fish in food security (National)
One of the inherent structural weaknesses of governance mechanisms is the manner in
which the initiative of integrating fish into food security policy in the fisheries department
of a country is restricted. This is true with regard to other policy processes as well. A small
initiative in one country (where inter-departmental cooperation can be fostered without
too many bureaucratic or political hurdles and where fisheries is a ‘growth sector’) to
organise a two or three day workshop to examine the roles which different government
departments – fisheries, water, agriculture, food and nutrition, rural development,
commerce, health, women’s affairs, transport and roads, finance etc. – have in fostering
greater harmonisation of policy formulation should be attempted. Issues such as ‘fish
exports, domestic food security and the health of coastal communities’ could provide for
meaningful inter-departmental interactions. This process could help raise participants’
awareness of the cross-sector linkages that underpin any policy building process.
Monitoring, control and surveillance against IUU (National/Regional)
Illegal, Unreported and Unregulated (IUU) fishing is one of the significant reasons for the
low availability of fish for domestic use in the coastal states of the ESA-IO countries.
According to the ‘Stop Illegal Fishing’ initiative of the Partnership for African Fisheries of
NEPAD, one out of every four fish in Africa is caught illegally. Greater efforts need to be
taken to set up Monitoring, Control and Surveillance (MCS) initiatives.
Annexes 55
Some of these MCS ventures need to be more decentralised, community-partnered and
less dependent on hugely capital-intensive and centralised paraphernalia commonly
associated with MCS projects.
Savings and credit for fishers and fish workers (National)
Access to adequate credit at moderate costs will be a boon to fishers and fish workers in
most countries. Most often, the major barrier for men and women to making a self-reliant
living is just a matter of not having US $200 or $300 worth of equipment for fishing; a
bicycle for transporting fish; a rack for drying fish; or capital to buy fish directly at the
landing sites. This need prompts the concepts of entrepreneurial self-help groups;
neighbourhood associations; self-employed women’s initiatives etc. which start by
individual savings (piggy-bank approach), later pooled and lent out to individuals on a
lottery basis. When compared to traditional micro-finance programs, where funds tend to
flow largely into consumptive purposes making repayments difficult, linking a micro-loan
scheme to such collective saving initiatives provides greater scope for success. Assisting
extension workers of fisheries and agriculture departments to initiate such ventures, after
providing them with the proper training, will give a boost to self-reliant livelihood
ventures. These initiatives can greatly enhance the food security of the participants, since
it is well known that poorer communities spend more on food, as incomes increase.
People oriented technology cooperation programs (National)
There are likely to be numerous small but innovative discoveries (products, processes)
being made in the ESA-IO countries by working people in the course of making a
livelihood. Such initiatives are rarely recognised in the public sphere. They remain the
‘Eureka’s of the weak”. These are never giant leaps in product development or knowledge
production. However, these initiatives are based on local resources, require only
resourcefulness and industrious effort, are easy to replicate and risk averse. Examples
include: small developments in fishing gear design which reduce by-catch; changes in fish
drying processes which reduce wastage; new materials for fabricating packaging
containers which improve the shelf-life of a fish product and such like. Identifying such
initiatives, documenting them and arranging for exchange programs between these rural-
based persons/groups will foster a very good uptake of ideas and a much higher diffusion
rate of innovations.
Training and equipment to become fishers (National)
In the aquatic-agriculture systems which prevail in many of the countries, foraging for fish
is a seasonal livelihood option. However, if such individuals are provided with basic fishing
knowledge and simple equipment they can greatly enhance their food security context and
also earn some extra income in times of the agriculture slack season. For such training,
the people-oriented TCP option will be more cost-effective and sustainable.

Flavouring fish into food security 56
Public hearing on potentials and constraints for developing
aquaculture systems (National)
The scope for increasing fish production by introducing aquaculture has been voiced in
many of the policy documents of the ESO-IO region countries. However, aquaculture, in
whatever form, is no remedy for solving food security issues. It is at best a supplementary
technology for producing food and comes with a very wide range of possibilities which are
applicable in different aquatic and aquatic-agriculture systems in the region. Prima facie,
given the variety of water bodies in the region, the potential for aquaculture seems bright.
Yet there are also many constraints – ecological, economic and even socio-cultural. There
are numerous stakeholders with different interests – some who are pushing and others
who are being cautious -- about the process of aquaculture development. Organising a
series of public hearings in different countries, structuring the possibility for different
interest groups to express their views on the same platform, will provide a good occasion
to listen and understand the challenges of useful aquaculture for making more fish
available for contributing to food security.
Maximising water productivity (National)
There is a Kampuchean proverb that states, “Where there is water, there is fish. Take care
of the water and the fish will take care of you”. The large number of small water bodies,
particularly those that are man-made in countries like Zimbabwe, are sites where this
proverb can be given its African rendition. Stocking water bodies with small indigenous
species, in the form of polyculture, with other larger (naturally existing or introduced)
species like perch, carp and prawns etc. could significantly contribute to the supply of
micronutrient rich fish. Such preliminary efforts at raising stock densities could be a
precursor to more organised and semi-intensive aquaculture initiatives.
Aquaculture adapted to sub-Saharan society (Regional)
Aquaculture is not a cure for hunger. Any attempt to portray it so in the sub-Saharan
context is suspect. It needs to be viewed as a complementary technology for producing
food. Aquaculture must be seen in the context of: (1) national development goals; (2) its
relationship to other sources of both animal and vegetable protein currently available in
the country; (3) the physical, biological and socio-economic environments into which its
introduction is proposed; (4) its capacity for integration with existing or potential resource
use practices, especially farming.
The local availability of species suitable for culture is key to successful aquaculture.
Indigenous species are preferable, but higher-yielding exotic breeds are commonly
introduced. Exotic breeds however have drawbacks. When such fish escape from their
milieu, feral populations may threaten indigenous genetic resources, disrupt natural
habitats or inadvertently introduce pathogens, predators and pests.
Annexes 57
A position paper on the wide-ranging issues with regard to aquaculture should be
prepared, including inputs from major institutions such as WorldFish and other major
funding agencies that see a bright future for aquaculture as a source of fish for food
security in sub-Saharan Africa.
Emphasis on small-scale fisheries to solve food insecurity of fish
producers (Regional)
It is a cruel paradox that food producers are often the most food insecure. This seems to
be true of fishers in the ESA-IO region and is highlighted by many policy documents
reviewed for this assessment. Poverty in fishing communities is well known. Since fishers
cannot live off fish alone, they must enter into market or barter transactions in order to
get the food supplies necessary for their diets. Low productivity and unfavourable
exchange entitlements are the root cause of poverty for fishers and fish workers and the
consequent inability for many of them to achieve minimum standards of food intake and
food security.
A fair part of the solution to this paradox lies in exhibiting a bias in policy-making
favouring the small-scale sector in harvesting, processing and marketing of fish. In most
of the large ESA-IO countries, support for sectors of the economy which are more labour-
absorbing and rural-oriented, makes perfect economic, social, ecological and cultural
sense. There is certainly a place in many of the smaller IO countries for technology-
intensive, urban-oriented, private sector led initiatives in fishery related activities. This
would be appropriate for export-oriented activities and relevant to those catering to
domestic urban consumers. Replicating this model in the ESA-IO region would not be
advisable since the bulk of those who are food insecure are the small fish producers and
needy fish consumers in the rural hinterland.
Data and information on small-scale fisheries (National/Regional)
The small-scale fishery sector, whether harvesting, processing or distribution, plays an
important role in all the 20 countries of the study. There is a dearth of data and
information about the most basic parameters such as the number of people involved in the
different activities; their gender; their share in the overall activities; whether their
involvement is full- or part-time; their other activities; their spatial location etc. Despite
this one confirmed fact is that small-scale fisheries’ contribution to food security is
paramount in all countries.
It may be appropriate to undertake a study to assess the nature of data and information
which currently exists and knowledge gaps from the Fisheries Departments, Fishery
Research Organisations, fisheries studies in Universities, etc. This could then be followed
up by a data and information assessment, in any one of the countries, where there is a
concentration of small-scale sector activity.
Flavouring fish into food security 58
Close collaboration with local authorities and academics, as well as contact with fisher
organisations, trade associations and NGOs should be a pre-requisite for success in
undertaking investigations which comply with local cultural norms and values. The
example of the Nigerian Local Government Area (LGA) Geodemographic Classification
System and Profiler (http://nigerianlgaclassification.com) shows the potential and the
power of garnering such information. In the context of the Voluntary Guidelines for
Securing Sustainable Small-Scale Fisheries, currently being negotiated by FAO/UN, to start
bridging this data gap in the ESA-IO region could attract support.
Fish powder for school meals (National/Regional)
The WFP school meals scheme, which is implemented in many of the countries, could be a
good entry point for introducing fish powder (fish protein concentrates) as an additive in
standard school meals. This would help wean children onto fish diets in a socialised context
outside their homes. Studies on the feasibility of converting some of the small pelagic fish
of the ESO-IO region into consumable products with a longer shelf life are encouraging.
Collaboration with WFP could provide a large market for such products and could be seen
as an incentive for private sector entrepreneurs, who have a social commitment, to
venture into the mass production of such socially-desirable commodities. Some form of
public-private partnerships between quasi-state agencies (e.g. the health and nutrition
departments) and private investors (e.g. small-scale food processing units) may be in
order to kick start such a program which would have high social returns if successful. An
investigation into the possibility of such a program in those countries bordering Lake
Victoria could be a rewarding initiative.
Extension services and media (National)
Governmental extension services, particularly in the realm of health and family welfare,
are an important channel for creating awareness about the role of fish in food and
nutritional security. The focus of attention for these services should be women, particularly
mothers. Since the level of literacy among women is reasonably high, the written word as
a means for awareness creation may be used effectively. Special radio programs, SMS
alerts through the mobile phone networks or TV spots using well known stars to anchor a
social advertisement might be more effective in spreading the message about the benefits
of eating more fish. Where fish consumption is not high, emphasis on its food and
nutritional value for children could also be an important focus.
Regulations for diversion of fish for non-food use (National)
There is an increasing trend of fish being diverted for non-food uses in the ESO-IO region.
This tendency needs to be observed and monitored. In a context where the purchasing
power of poor people is declining, a context where pets of the more wealthy citizens and
stall-fed livestock exercise greater market power over fish could evolve. In the current
context of under-nutrition and mal-nutrition among vast sections of the population in ESA-
IO countries, such a situation is both economically and ethically untenable since it would
undermine the food security of needy humans.

Annexes 59
Regulatory measures that prescribe the species and quantity of fish that could be used for
such purposes need to be put in place as part of a national food policy. Public debate and
support for such policy measures that would help divert more fish for human consumption
is vital.
Post- harvest losses reduction (National/Regional)
Post-harvest losses of fish and aquatic products in the ESA-IO region have been estimated
at 20-25 percent of the current production. Every small savings made is a potential
contribution to enhancing food security. There are a variety of factors, which account for
such loss. They are importantly related to the overall low level of infrastructure
development for perishables such as fish: ice, cold storage facilities, and good roads, as
well as the lack of awareness for simple preventive measures to reduce product quality
deterioration. Given the erratic supply and high demand for fish, there is also very little
consumer resistance to purchasing poor quality fish products; hence there is little
incentive for sellers to improve quality. Reducing post-harvest losses must therefore be
fostered by both consumer education, e.g. provision of hygiene awareness, and quality
improvement facilities, e.g. fish storage, to fish processors/sellers.
Better urban fish markets (National/Regional)
Setting up cleaner and more accessible urban fish markets would help expand the
consumption of all varieties of fish among more well-to-do consumers. The downstream
impact of this would be better returns for both fish producers and fish sellers. This would
have a broad impact on food security: direct for urban consumers and indirect for fishers
and sellers.
Labour intensive, low fuel using transport alternatives
(National/Regional)
Much of the food commodities in the ESA-IO region are carried from the production site to
a first point of transport by person. The energy and time spent for this by men, and more
importantly by women, has been and still is one of the main constraints to increasing
agriculture and fishery productivity. The mere introduction of sturdy bicycles with a load
carrier attachment and other types of animal drawn or human/fuel driven carts could
transform market access. It could improve product quality delivered to consumers and
greatly expand the market for perishable products such as fish. The direct and indirect
food security implications of this expansion of physical accessibility of fish in countries
where the road infrastructure is not well developed are bound to be significant. Some
international development agencies have been supporting such initiatives, however more
still needs to be done.
Flavouring fish into food security 60
Promoting fisher and fish worker organizations (National/Regional)
When people are united in action they are able to achieve far more than if they act
individually. Associations, cooperatives, trade unions, welfare organisations, and a whole
host of other kinds of groups, which foster collective action, provide good platforms, which
can demand greater actions for food and nutritional security.
They are also able to channel, more effectively, any programs and projects that cater to
fulfilling this need. Encouraging the promotion of fisher and fish worker organisations as a
policy perspective for the countries of the ESA-IO region would be a positive step to
ensure that the benefits of development initiatives reach the beneficiaries.
Earmarking revenues from fish export for the welfare of fishing
communities (National)
Fish is a major foreign exchange earner in many of the ESA-IO countries. These revenues
go into the general financial pool of the concerned country. They get utilised in numerous
ways and means for development activities based on food imports, fuel, capital goods and
services or for directly funding domestic economic and social activities.
In most of the developing countries, where fish and fishery products constitute an
important part of the export basket, it is also observed that fishers and fish workers
continue to be poor, marginalised and often live in unhygienic locations. The trade-related
infrastructure (landing sites, freezing plants, etc.) are generally upgraded to meet
international HACCP standards, but livelihood-related infrastructure of the fishers in the
vicinity nearby leave a lot to be desired. This dichotomy, if meaningfully addressed would
contribute to the food security of the fishers in the country and greater food safety for the
consumer in international markets.
Financial protocols that earmark a small share of earnings from fish exports to address
welfare issues should become part of policy considerations in the ESA-IO region. Expert
discussions with international banks and development agencies; national finance;
commerce and fisheries department policy makers; to explore the feasibility of such
measures need to be considered.
Annexes 61
Annex 3. Qualitative and quantitative dimensions of
integrating fisheries and aquaculture in the ESA-IO region
Burundi
Country Indicators 67
Qualitative Dimensions 68
Quantitative Dimensions 69
Comoros
Country Indicators 71
Qualitative Dimensions 72
Quantitative Dimensions 73
Democratic Republic of the Congo
Country Indicators 75
Qualitative Dimensions 76
Quantitative Dimensions 77
Djibouti
Country Indicators 79
Qualitative Dimensions 80
Quantitative Dimensions 82
Eritrea
Country Indicators 84
Qualitative Dimensions 85
Quantitative Dimensions 87
Ethiopia
Country Indicators 89
Qualitative Dimensions 90
Quantitative Dimensions 93
Flavouring fish into food security 62
Kenya
Country Indicators 95
Qualitative Dimensions 96
Quantitative Dimensions 99
Madagascar
Country Indicators 101
Qualitative Dimensions 102
Quantitative Dimensions 103
Malawi
Country Indicators 105
Qualitative Dimensions 106
Quantitative Dimensions 108
Mauritius
Country Indicators 110
Qualitative Dimensions 111
Quantitative Dimensions 112
Rwanda
Country Indicators 114
Qualitative Dimensions 115
Quantitative Dimensions 116
Seychelles
Country Indicators 118
Qualitative Dimensions 119
Quantitative Dimensions 121
Somalia
Country Indicators 123
Qualitative Dimensions 124
Quantitative Dimensions 128

Annexes 63
South Sudan
Country Indicators 130
Qualitative Dimensions 131
Quantitative Dimensions 132
Sudan
Country Indicators 134
Qualitative Dimensions 135
Quantitative Dimensions 137
Swaziland
Country Indicators 139
Qualitative Dimensions 140
Quantitative Dimensions 142
Tanzania
Country Indicators 144
Qualitative Dimensions 145
Quantitative Dimensions 150
Uganda
Country Indicators 152
Qualitative Dimensions 153
Quantitative Dimensions 158
Zambia
Country Indicators 160
Qualitative Dimensions 161
Quantitative Dimensions 163
Zimbabwe
Country Indicators 165
Qualitative Dimensions 166
Quantitative Dimensions 167
Regional Documents 168
Final Comments 172
Flavouring fish into food security 64
BURUNDI
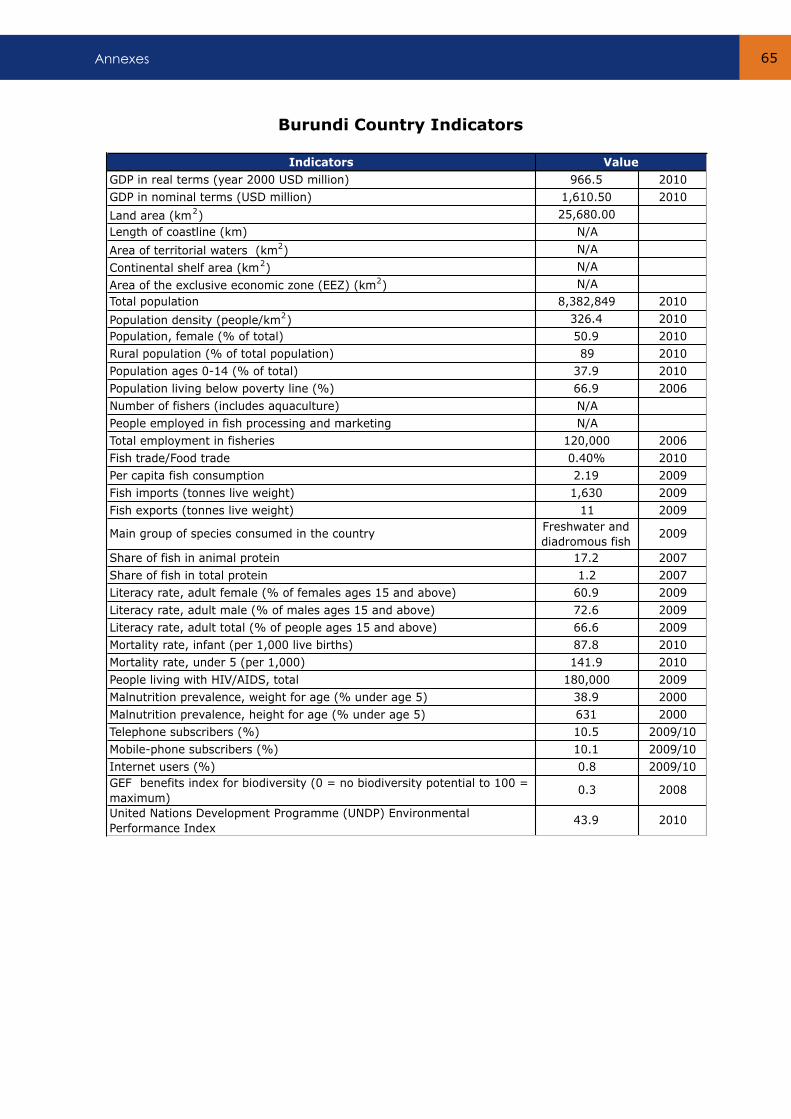
Annexes 65
Indicators
GDP in real terms (year 2000 USD million) 966.5 2010
GDP in nominal terms (USD million) 1,610.50 2010
Land area (km2) 25,680.00
Length of coastline (km) N/A
Area of territorial waters (km2) N/A
Continental shelf area (km2) N/A
Area of the exclusive economic zone (EEZ) (km2) N/A
Total population 8,382,849 2010
Population density (people/km2) 326.4 2010
Population, female (% of total) 50.9 2010
Rural population (% of total population) 89 2010
Population ages 0-14 (% of total) 37.9 2010
Population living below poverty line (%) 66.9 2006
Number of fishers (includes aquaculture) N/A
People employed in fish processing and marketing N/A
Total employment in fisheries 120,000 2006
Fish trade/Food trade 0.40% 2010
Per capita fish consumption 2.19 2009
Fish imports (tonnes live weight) 1,630 2009
Fish exports (tonnes live weight) 11 2009
Main group of species consumed in the country Freshwater and
diadromous fish2009
Share of fish in animal protein 17.2 2007
Share of fish in total protein 1.2 2007
Literacy rate, adult female (% of females ages 15 and above) 60.9 2009
Literacy rate, adult male (% of males ages 15 and above) 72.6 2009
Literacy rate, adult total (% of people ages 15 and above) 66.6 2009
Mortality rate, infant (per 1,000 live births) 87.8 2010
Mortality rate, under 5 (per 1,000) 141.9 2010
People living with HIV/AIDS, total 180,000 2009
Malnutrition prevalence, weight for age (% under age 5) 38.9 2000
Malnutrition prevalence, height for age (% under age 5) 631 2000
Telephone subscribers (%) 10.5 2009/10
Mobile-phone subscribers (%) 10.1 2009/10
Internet users (%) 0.8 2009/10
GEF benefits index for biodiversity (0 = no biodiversity potential to 100 =
maximum) 0.3 2008
United Nations Development Programme (UNDP) Environmental
Performance Index 43.9 2010
Value
Burundi Country Indicators
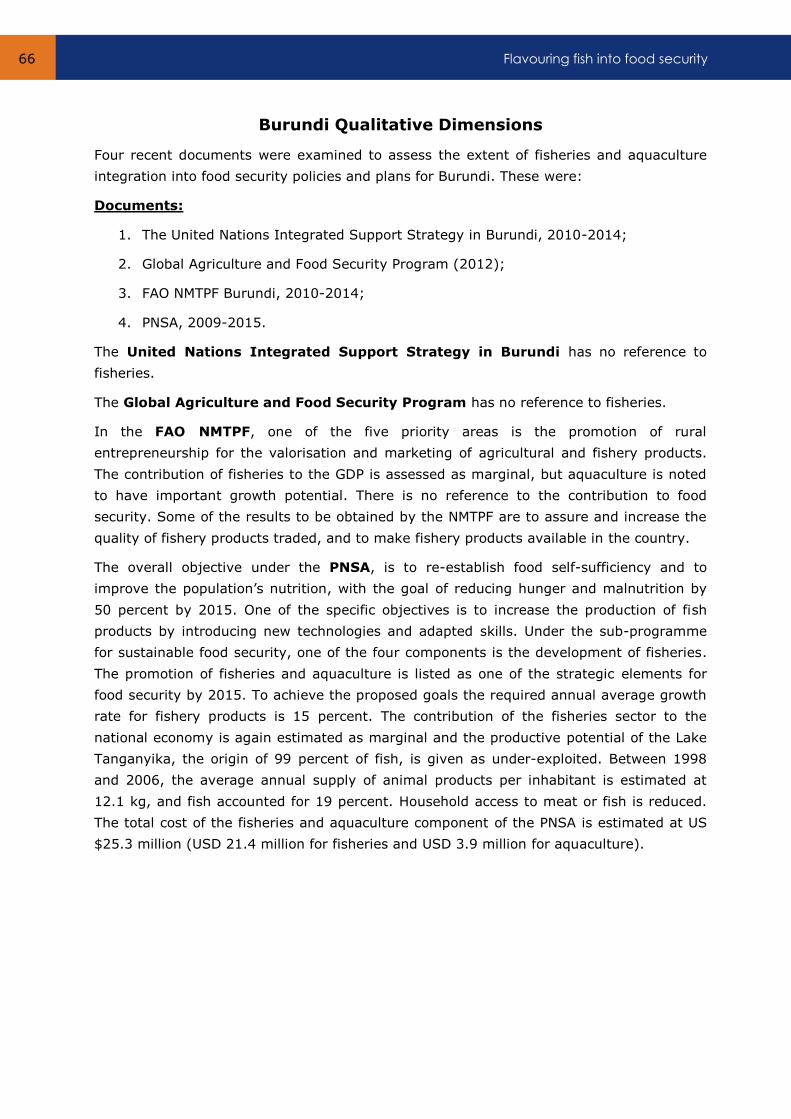
Flavouring fish into food security 66
Burundi Qualitative Dimensions
Four recent documents were examined to assess the extent of fisheries and aquaculture
integration into food security policies and plans for Burundi. These were:
Documents:
1. The United Nations Integrated Support Strategy in Burundi, 2010-2014;
2. Global Agriculture and Food Security Program (2012);
3. FAO NMTPF Burundi, 2010-2014;
4. PNSA, 2009-2015.
The United Nations Integrated Support Strategy in Burundi has no reference to
fisheries.
The Global Agriculture and Food Security Program has no reference to fisheries.
In the FAO NMTPF, one of the five priority areas is the promotion of rural
entrepreneurship for the valorisation and marketing of agricultural and fishery products.
The contribution of fisheries to the GDP is assessed as marginal, but aquaculture is noted
to have important growth potential. There is no reference to the contribution to food
security. Some of the results to be obtained by the NMTPF are to assure and increase the
quality of fishery products traded, and to make fishery products available in the country.
The overall objective under the PNSA, is to re-establish food self-sufficiency and to
improve the population’s nutrition, with the goal of reducing hunger and malnutrition by
50 percent by 2015. One of the specific objectives is to increase the production of fish
products by introducing new technologies and adapted skills. Under the sub-programme
for sustainable food security, one of the four components is the development of fisheries.
The promotion of fisheries and aquaculture is listed as one of the strategic elements for
food security by 2015. To achieve the proposed goals the required annual average growth
rate for fishery products is 15 percent. The contribution of the fisheries sector to the
national economy is again estimated as marginal and the productive potential of the Lake
Tanganyika, the origin of 99 percent of fish, is given as under-exploited. Between 1998
and 2006, the average annual supply of animal products per inhabitant is estimated at
12.1 kg, and fish accounted for 19 percent. Household access to meat or fish is reduced.
The total cost of the fisheries and aquaculture component of the PNSA is estimated at US
$25.3 million (USD 21.4 million for fisheries and USD 3.9 million for aquaculture).
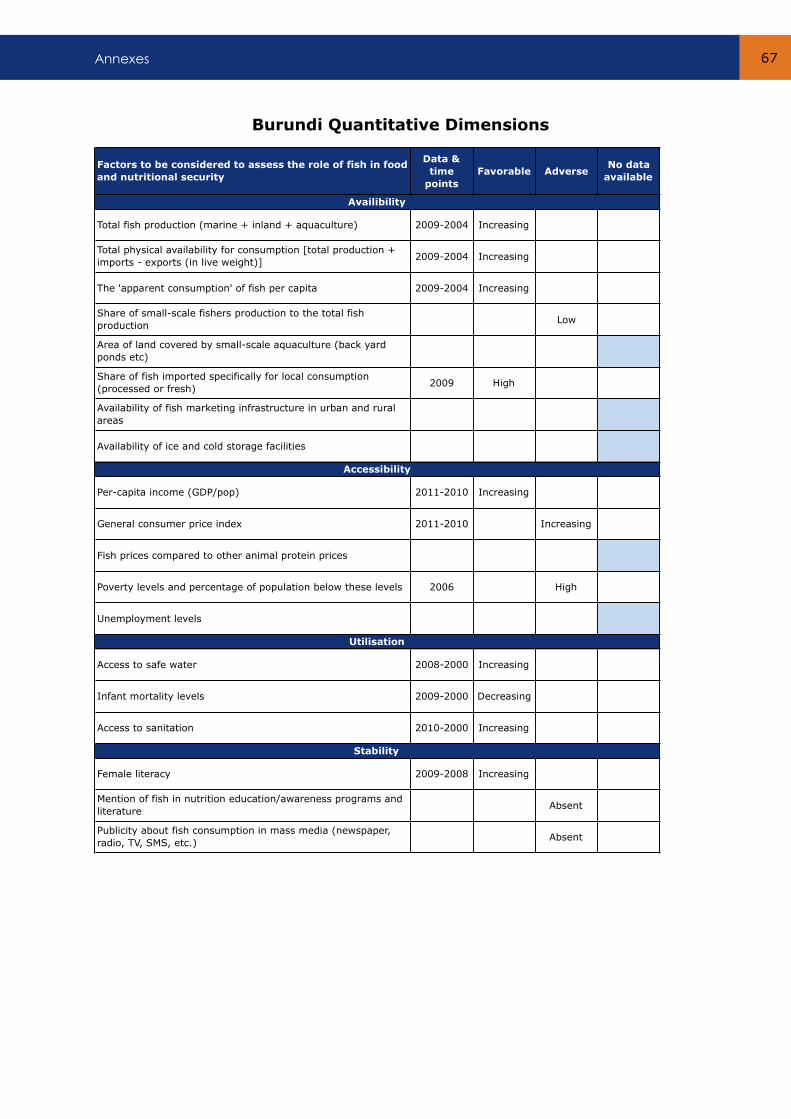
Annexes 67
Factors to be considered to assess the role of fish in food
and nutritional security
Data &
time
points
Favorable AdverseNo data
available
Total fish production (marine + inland + aquaculture) 2009-2004 Increasing
Total physical availability for consumption [total production +
imports - exports (in live weight)]2009-2004 Increasing
The 'apparent consumption' of fish per capita 2009-2004 Increasing
Share of small-scale fishers production to the total fish
productionLow
Area of land covered by small-scale aquaculture (back yard
ponds etc)
Share of fish imported specifically for local consumption
(processed or fresh)2009 High
Availability of fish marketing infrastructure in urban and rural
areas
Availability of ice and cold storage facilities
Per-capita income (GDP/pop) 2011-2010 Increasing
General consumer price index 2011-2010 Increasing
Fish prices compared to other animal protein prices
Poverty levels and percentage of population below these levels 2006 High
Unemployment levels
Access to safe water 2008-2000 Increasing
Infant mortality levels 2009-2000 Decreasing
Access to sanitation 2010-2000 Increasing
Female literacy 2009-2008 Increasing
Mention of fish in nutrition education/awareness programs and
literatureAbsent
Publicity about fish consumption in mass media (newspaper,
radio, TV, SMS, etc.)Absent
Availibility
Accessibility
Utilisation
Stability
Burundi Quantitative Dimensions
Flavouring fish into food security 68
COMOROS
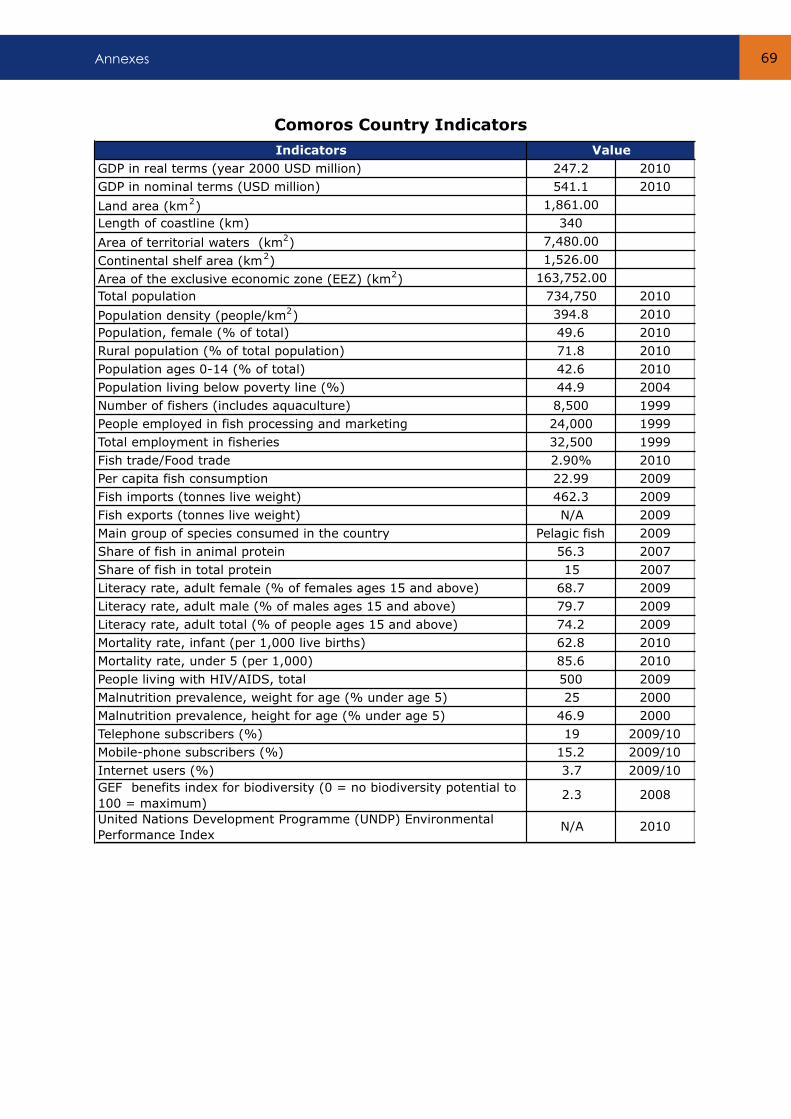
Annexes 69
Indicators
GDP in real terms (year 2000 USD million) 247.2 2010
GDP in nominal terms (USD million) 541.1 2010
Land area (km2) 1,861.00
Length of coastline (km) 340
Area of territorial waters (km2) 7,480.00
Continental shelf area (km2) 1,526.00
Area of the exclusive economic zone (EEZ) (km2) 163,752.00
Total population 734,750 2010
Population density (people/km2) 394.8 2010
Population, female (% of total) 49.6 2010
Rural population (% of total population) 71.8 2010
Population ages 0-14 (% of total) 42.6 2010
Population living below poverty line (%) 44.9 2004
Number of fishers (includes aquaculture) 8,500 1999
People employed in fish processing and marketing 24,000 1999
Total employment in fisheries 32,500 1999
Fish trade/Food trade 2.90% 2010
Per capita fish consumption 22.99 2009
Fish imports (tonnes live weight) 462.3 2009
Fish exports (tonnes live weight) N/A 2009
Main group of species consumed in the country Pelagic fish 2009
Share of fish in animal protein 56.3 2007
Share of fish in total protein 15 2007
Literacy rate, adult female (% of females ages 15 and above) 68.7 2009
Literacy rate, adult male (% of males ages 15 and above) 79.7 2009
Literacy rate, adult total (% of people ages 15 and above) 74.2 2009
Mortality rate, infant (per 1,000 live births) 62.8 2010
Mortality rate, under 5 (per 1,000) 85.6 2010
People living with HIV/AIDS, total 500 2009
Malnutrition prevalence, weight for age (% under age 5) 25 2000
Malnutrition prevalence, height for age (% under age 5) 46.9 2000
Telephone subscribers (%) 19 2009/10
Mobile-phone subscribers (%) 15.2 2009/10
Internet users (%) 3.7 2009/10
GEF benefits index for biodiversity (0 = no biodiversity potential to
100 = maximum) 2.3 2008
United Nations Development Programme (UNDP) Environmental
Performance Index N/A 2010
Value
Comoros Country Indicators
Flavouring fish into food security 70
Comoros Qualitative Dimensions
Two recent documents were examined to assess the extent of integration of fisheries and
aquaculture into the food security policies and plans of Comoros. These were:
Documents:
1. The United Nations Development Assistance Framework (UNDAF), 2008-2012;
2. Comprehensive Food Security and Vulnerability Analysis (2006).
To achieve the goal of improving the incomes, employment and food security of poor
households, one of the specific programmes in the United Nations Development
Assistance Framework (UNDAF), is to exploit Comoros’ potential in the fisheries sector
to benefit food security. Fisheries are considered a growth sector, although fisher men and
women are included as one of the vulnerable population groups. Activities for sustainable
resource exploitation and labelling of products are mentioned. There is no analysis of the
contribution of fish to food security in the country.
The Comprehensive Food Security and Vulnerability Analysis notes that fishing is
one of the four main activities in which households participate. It estimates that
agriculture and fishing account for more than 40 percent of the country’s GDP. Fisheries
employ an estimated 6 percent of the working population. Estimates are that there are
about 8,500 professional fishermen and 24,000 people employed in the fish processing
industry. Fishing is one of the livelihoods most vulnerable to transitory food insecurity
given the seasonality of catches. Food security is assessed in the country as an issue of
access to food. Fishing is a relevant activity for all islands of the country, and while some
households use fisheries as their only means of subsistence it is carried out in conjunction
with agriculture, being a small-scale activity without large commercial fishing fleets. One
of the issues that limits production is the lack of storage and processing facilities. Meat,
fish and rice are the food items most frequently lacking in daily diets, according to the
report. Protein consumption is below acceptable levels, and 50 percent of animal proteins
come from imported food. There is a deficit in the production of animal proteins on the
three islands, although fish production in Mohéli and Grand Comore largely make up for
these deficits. Households depending exclusively or primarily on fishing are among the
most vulnerable to chronic food insecurity, and fishing families were identified by UNDP as
one of the main groups with poor food security outcomes. Migration from the other two
islands to Mohéli (the least food insecure) is likely to increase its vulnerability to food
insecurity due to higher demand for arable land and an increased access to fishing areas.
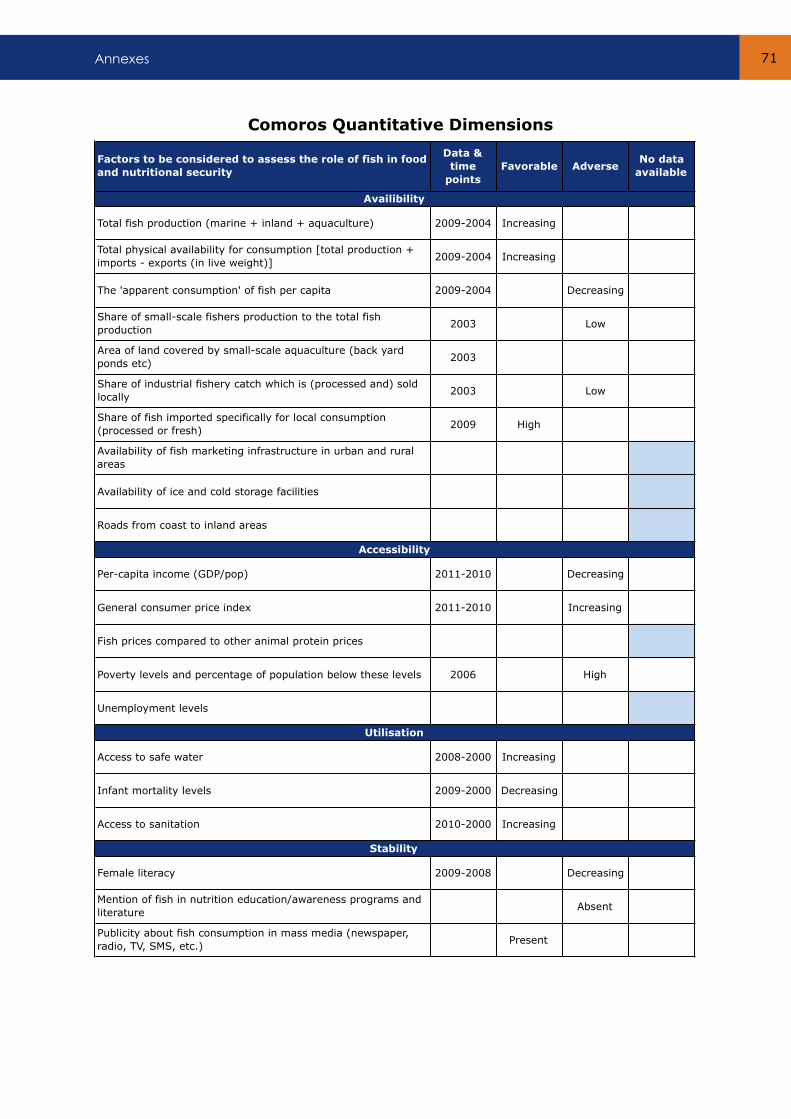
Annexes 71
Factors to be considered to assess the role of fish in food
and nutritional security
Data &
time
points
Favorable AdverseNo data
available
Total fish production (marine + inland + aquaculture) 2009-2004 Increasing
Total physical availability for consumption [total production +
imports - exports (in live weight)]2009-2004 Increasing
The 'apparent consumption' of fish per capita 2009-2004 Decreasing
Share of small-scale fishers production to the total fish
production2003 Low
Area of land covered by small-scale aquaculture (back yard
ponds etc)2003
Share of industrial fishery catch which is (processed and) sold
locally2003 Low
Share of fish imported specifically for local consumption
(processed or fresh)2009 High
Availability of fish marketing infrastructure in urban and rural
areas
Availability of ice and cold storage facilities
Roads from coast to inland areas
Per-capita income (GDP/pop) 2011-2010 Decreasing
General consumer price index 2011-2010 Increasing
Fish prices compared to other animal protein prices
Poverty levels and percentage of population below these levels 2006 High
Unemployment levels
Access to safe water 2008-2000 Increasing
Infant mortality levels 2009-2000 Decreasing
Access to sanitation 2010-2000 Increasing
Female literacy 2009-2008 Decreasing
Mention of fish in nutrition education/awareness programs and
literatureAbsent
Publicity about fish consumption in mass media (newspaper,
radio, TV, SMS, etc.)Present
Availibility
Accessibility
Utilisation
Stability
Comoros Quantitative Dimensions
Flavouring fish into food security 72
DEMOCRATIC
REPUBLIC OF THE
CONGO
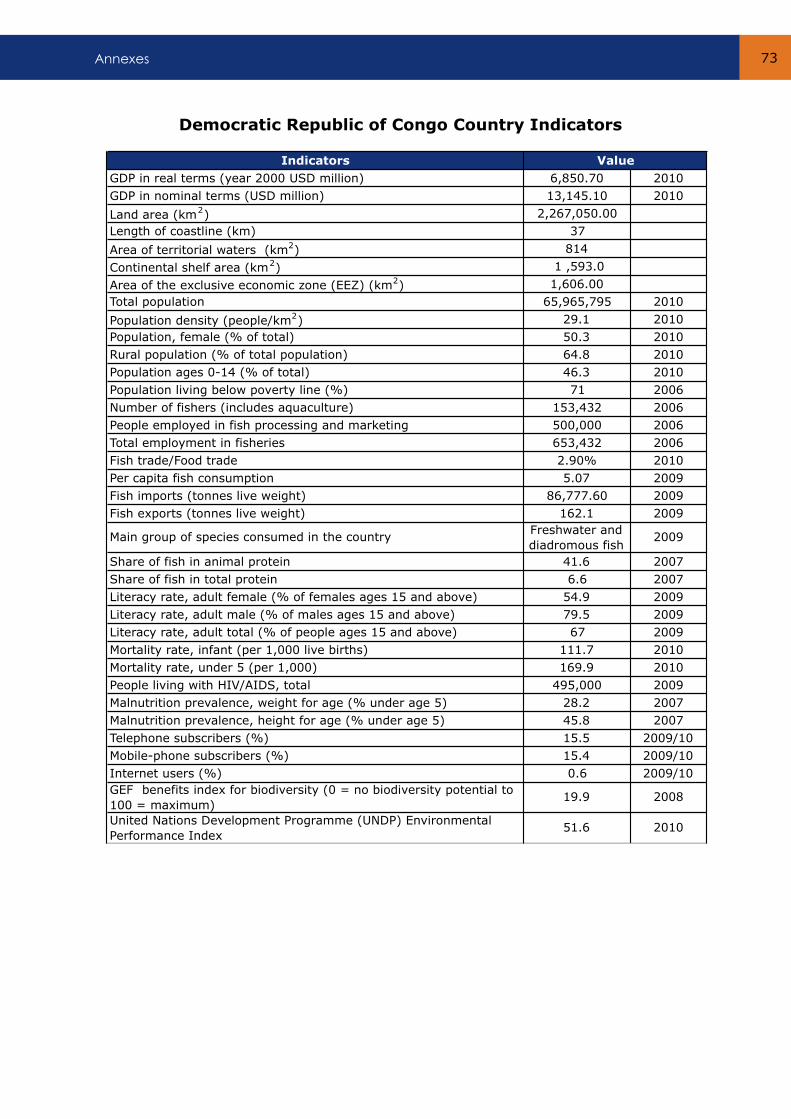
Annexes 73
Indicators
GDP in real terms (year 2000 USD million) 6,850.70 2010
GDP in nominal terms (USD million) 13,145.10 2010
Land area (km2) 2,267,050.00
Length of coastline (km) 37
Area of territorial waters (km2) 814
Continental shelf area (km2) 1 ,593.0
Area of the exclusive economic zone (EEZ) (km2) 1,606.00
Total population 65,965,795 2010
Population density (people/km2) 29.1 2010
Population, female (% of total) 50.3 2010
Rural population (% of total population) 64.8 2010
Population ages 0-14 (% of total) 46.3 2010
Population living below poverty line (%) 71 2006
Number of fishers (includes aquaculture) 153,432 2006
People employed in fish processing and marketing 500,000 2006
Total employment in fisheries 653,432 2006
Fish trade/Food trade 2.90% 2010
Per capita fish consumption 5.07 2009
Fish imports (tonnes live weight) 86,777.60 2009
Fish exports (tonnes live weight) 162.1 2009
Main group of species consumed in the country Freshwater and
diadromous fish2009
Share of fish in animal protein 41.6 2007
Share of fish in total protein 6.6 2007
Literacy rate, adult female (% of females ages 15 and above) 54.9 2009
Literacy rate, adult male (% of males ages 15 and above) 79.5 2009
Literacy rate, adult total (% of people ages 15 and above) 67 2009
Mortality rate, infant (per 1,000 live births) 111.7 2010
Mortality rate, under 5 (per 1,000) 169.9 2010
People living with HIV/AIDS, total 495,000 2009
Malnutrition prevalence, weight for age (% under age 5) 28.2 2007
Malnutrition prevalence, height for age (% under age 5) 45.8 2007
Telephone subscribers (%) 15.5 2009/10
Mobile-phone subscribers (%) 15.4 2009/10
Internet users (%) 0.6 2009/10
GEF benefits index for biodiversity (0 = no biodiversity potential to
100 = maximum) 19.9 2008
United Nations Development Programme (UNDP) Environmental
Performance Index 51.6 2010
Value
Democratic Republic of Congo Country Indicators
Flavouring fish into food security 74
Democratic Republic of Congo Qualitative Dimensions
Two recent documents were examined to assess the extent of integration of fisheries and
aquaculture into the food security policies and plans of the Democratic Republic of Congo.
These are:
Documents:
1. Country Assistance Framework and the United Nations Development Assistance
Framework (UNDAF), 2008-2012;
2. FAO NMTPF, 2011-2015.
The Country Assistance Framework and the United Nations Development
Assistance Framework document make no reference to the impact of fisheries on food
security. It notes that the country’s agricultural potential has never been met and that
inland fisheries could yield an annual production of 700,000 tonnes.
In the FAO NMTPF, fisheries is analysed as a separate sub-sector of the agriculture and
rural sector. Total fishing potential is estimated at 707,000 tonnes per year, while present
production is 220,000 tonnes, resulting in an annual supply of 5.2 kg. Mainly artisanal
fisheries accounted for the majority of the catches. The agriculture sector employs nearly
80 percent of the population and accounts for 40 percent of national GDP. Fisheries and
aquaculture represent 12 percent of the agricultural GDP (nearly 5 percent of national
GDP). It is estimated that nearly 75 percent of the population suffer from malnutrition.
The document divides the country into five regions considering the productive potential,
the population density and the access to markets. It identifies sectors to develop. Fisheries
and aquaculture are included in three of the five regions. The document refers to the
Country Assessment Framework, which despite being a coherent analysis of the country
situation it omits fisheries, a relevant sector given its contribution to national economy
(above livestock) and important source of animal proteins. The NPMTF estimates a budget
of US $37.5 million for the period 2011-2015 for the FAO priority area of management and
sustainable exploitation of fisheries and aquaculture resources.

Annexes 75
Factors to be considered to assess the role of fish in food
and nutritional security
Data &
time
points
Favorable AdverseNo data
available
Total fish production (marine + inland + aquaculture) 2009-2004 Decreasing
Total physical availability for consumption [total production +
imports - exports (in live weight)]2009-2004 Decreasing
The 'apparent consumption' of fish per capita 2009-2004 Decreasing
Share of small-scale fishers production to the total fish
production2006 High
Area of land covered by small-scale aquaculture (back yard
ponds etc)
Share of industrial fishery catch which is (processed and) sold
locally
Share of fish imported specifically for local consumption
(processed or fresh)2009 High
Availability of fish marketing infrastructure in urban and rural
areas
Availability of ice and cold storage facilities
Roads from coast to inland areas
Per-capita income (GDP/pop) 2011-2010 Increasing
General consumer price index 2011-2010 Increasing
Fish prices compared to other animal protein prices
Poverty levels and percentage of population below these levels 2006 High
Unemployment levels
Access to safe water 2008-2000 Increasing
Infant mortality levels 2009 High
Access to sanitation 2010-2000 Increasing
Female literacy 2009-2008 Increasing
Mention of fish in nutrition education/awareness programs and
literatureAbsent
Publicity about fish consumption in mass media (newspaper,
radio, TV, SMS, etc.)Absent
Availibility
Accessibility
Utilisation
Stability
Democratic Republic of Congo Quantitative Dimensions
Flavouring fish into food security 76
DJIBOUTI
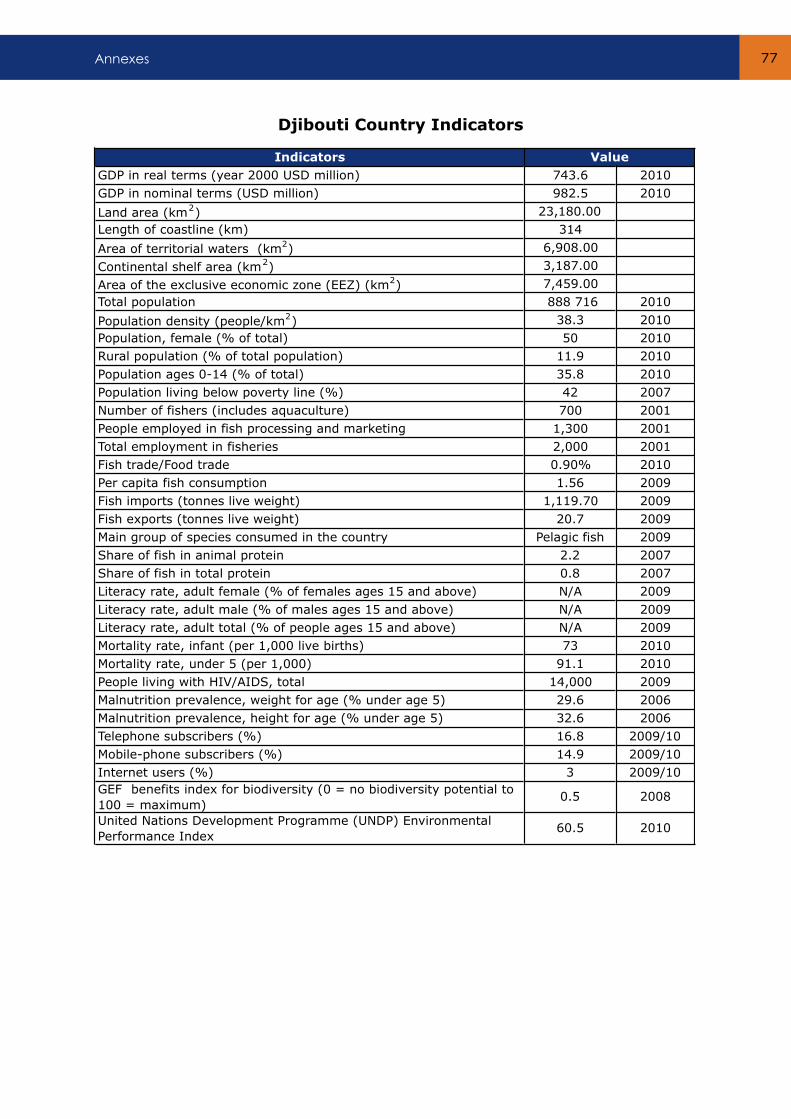
Annexes 77
Indicators
GDP in real terms (year 2000 USD million) 743.6 2010
GDP in nominal terms (USD million) 982.5 2010
Land area (km2) 23,180.00
Length of coastline (km) 314
Area of territorial waters (km2) 6,908.00
Continental shelf area (km2) 3,187.00
Area of the exclusive economic zone (EEZ) (km2) 7,459.00
Total population 888 716 2010
Population density (people/km2) 38.3 2010
Population, female (% of total) 50 2010
Rural population (% of total population) 11.9 2010
Population ages 0-14 (% of total) 35.8 2010
Population living below poverty line (%) 42 2007
Number of fishers (includes aquaculture) 700 2001
People employed in fish processing and marketing 1,300 2001
Total employment in fisheries 2,000 2001
Fish trade/Food trade 0.90% 2010
Per capita fish consumption 1.56 2009
Fish imports (tonnes live weight) 1,119.70 2009
Fish exports (tonnes live weight) 20.7 2009
Main group of species consumed in the country Pelagic fish 2009
Share of fish in animal protein 2.2 2007
Share of fish in total protein 0.8 2007
Literacy rate, adult female (% of females ages 15 and above) N/A 2009
Literacy rate, adult male (% of males ages 15 and above) N/A 2009
Literacy rate, adult total (% of people ages 15 and above) N/A 2009
Mortality rate, infant (per 1,000 live births) 73 2010
Mortality rate, under 5 (per 1,000) 91.1 2010
People living with HIV/AIDS, total 14,000 2009
Malnutrition prevalence, weight for age (% under age 5) 29.6 2006
Malnutrition prevalence, height for age (% under age 5) 32.6 2006
Telephone subscribers (%) 16.8 2009/10
Mobile-phone subscribers (%) 14.9 2009/10
Internet users (%) 3 2009/10
GEF benefits index for biodiversity (0 = no biodiversity potential to
100 = maximum) 0.5 2008
United Nations Development Programme (UNDP) Environmental
Performance Index 60.5 2010
Value
Djibouti Country Indicators
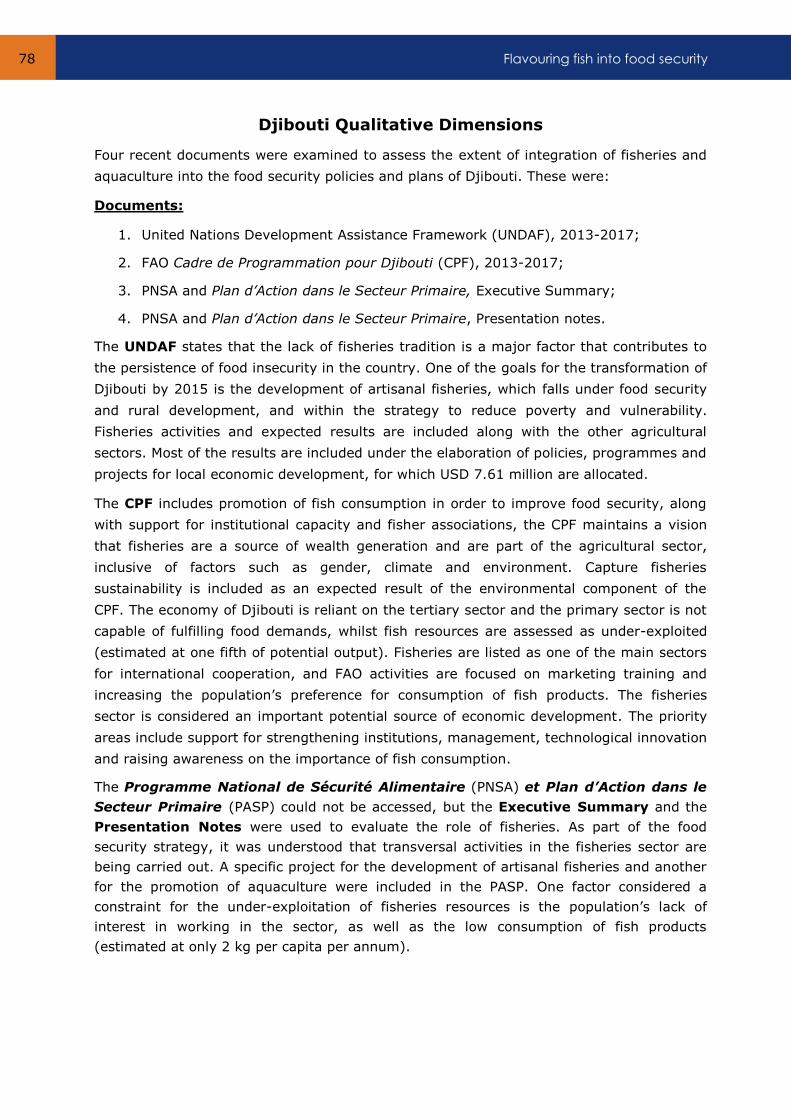
Flavouring fish into food security 78
Djibouti Qualitative Dimensions
Four recent documents were examined to assess the extent of integration of fisheries and
aquaculture into the food security policies and plans of Djibouti. These were:
Documents:
1. United Nations Development Assistance Framework (UNDAF), 2013-2017;
2. FAO Cadre de Programmation pour Djibouti (CPF), 2013-2017;
3. PNSA and Plan d’Action dans le Secteur Primaire, Executive Summary;
4. PNSA and Plan d’Action dans le Secteur Primaire, Presentation notes.
The UNDAF states that the lack of fisheries tradition is a major factor that contributes to
the persistence of food insecurity in the country. One of the goals for the transformation of
Djibouti by 2015 is the development of artisanal fisheries, which falls under food security
and rural development, and within the strategy to reduce poverty and vulnerability.
Fisheries activities and expected results are included along with the other agricultural
sectors. Most of the results are included under the elaboration of policies, programmes and
projects for local economic development, for which USD 7.61 million are allocated.
The CPF includes promotion of fish consumption in order to improve food security, along
with support for institutional capacity and fisher associations, the CPF maintains a vision
that fisheries are a source of wealth generation and are part of the agricultural sector,
inclusive of factors such as gender, climate and environment. Capture fisheries
sustainability is included as an expected result of the environmental component of the
CPF. The economy of Djibouti is reliant on the tertiary sector and the primary sector is not
capable of fulfilling food demands, whilst fish resources are assessed as under-exploited
(estimated at one fifth of potential output). Fisheries are listed as one of the main sectors
for international cooperation, and FAO activities are focused on marketing training and
increasing the population’s preference for consumption of fish products. The fisheries
sector is considered an important potential source of economic development. The priority
areas include support for strengthening institutions, management, technological innovation
and raising awareness on the importance of fish consumption.
The Programme National de Sécurité Alimentaire (PNSA) et Plan d’Action dans le
Secteur Primaire (PASP) could not be accessed, but the Executive Summary and the
Presentation Notes were used to evaluate the role of fisheries. As part of the food
security strategy, it was understood that transversal activities in the fisheries sector are
being carried out. A specific project for the development of artisanal fisheries and another
for the promotion of aquaculture were included in the PASP. One factor considered a
constraint for the under-exploitation of fisheries resources is the population’s lack of
interest in working in the sector, as well as the low consumption of fish products
(estimated at only 2 kg per capita per annum).

Annexes 79
Projects will strengthen institutional capabilities, increase domestic production, promote
consumption and assess the potential for aquaculture production. The budget allocated for
each project is US $5.94 million and US $431,000 respectively.
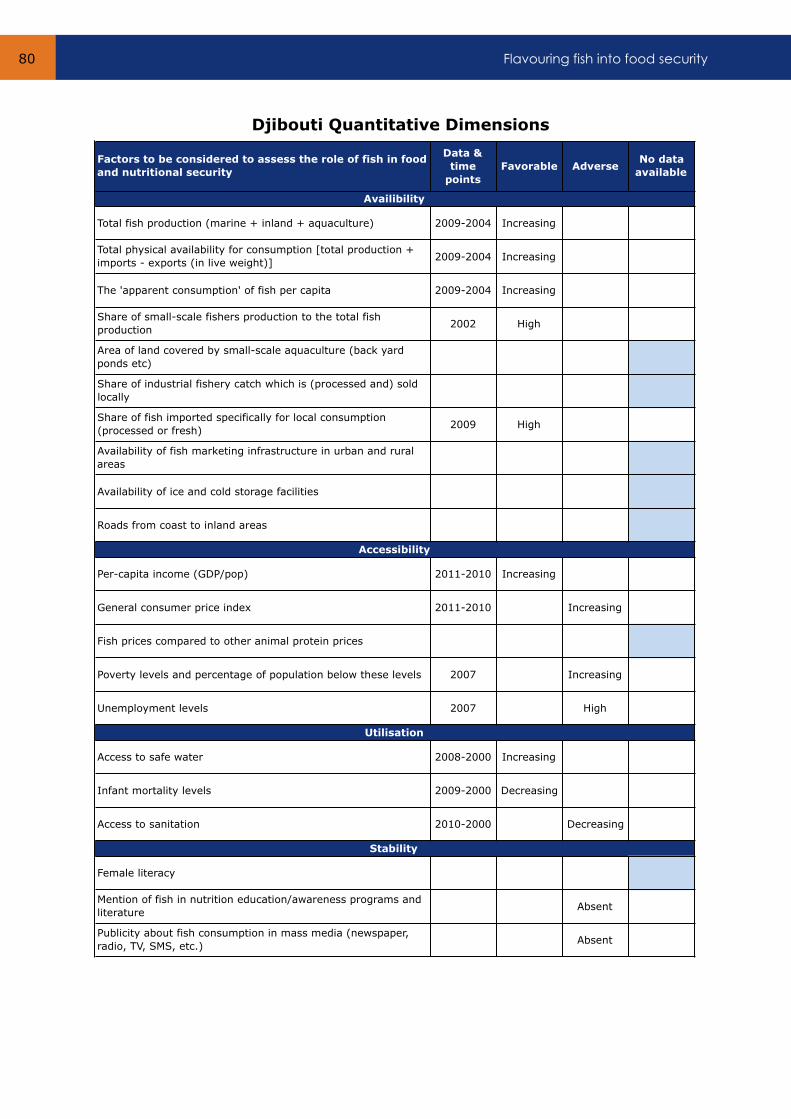
Flavouring fish into food security 80
Factors to be considered to assess the role of fish in food
and nutritional security
Data &
time
points
Favorable AdverseNo data
available
Total fish production (marine + inland + aquaculture) 2009-2004 Increasing
Total physical availability for consumption [total production +
imports - exports (in live weight)]2009-2004 Increasing
The 'apparent consumption' of fish per capita 2009-2004 Increasing
Share of small-scale fishers production to the total fish
production2002 High
Area of land covered by small-scale aquaculture (back yard
ponds etc)
Share of industrial fishery catch which is (processed and) sold
locally
Share of fish imported specifically for local consumption
(processed or fresh)2009 High
Availability of fish marketing infrastructure in urban and rural
areas
Availability of ice and cold storage facilities
Roads from coast to inland areas
Per-capita income (GDP/pop) 2011-2010 Increasing
General consumer price index 2011-2010 Increasing
Fish prices compared to other animal protein prices
Poverty levels and percentage of population below these levels 2007 Increasing
Unemployment levels 2007 High
Access to safe water 2008-2000 Increasing
Infant mortality levels 2009-2000 Decreasing
Access to sanitation 2010-2000 Decreasing
Female literacy
Mention of fish in nutrition education/awareness programs and
literatureAbsent
Publicity about fish consumption in mass media (newspaper,
radio, TV, SMS, etc.)Absent
Availibility
Accessibility
Utilisation
Stability
Djibouti Quantitative Dimensions

Annexes 81
ERITREA
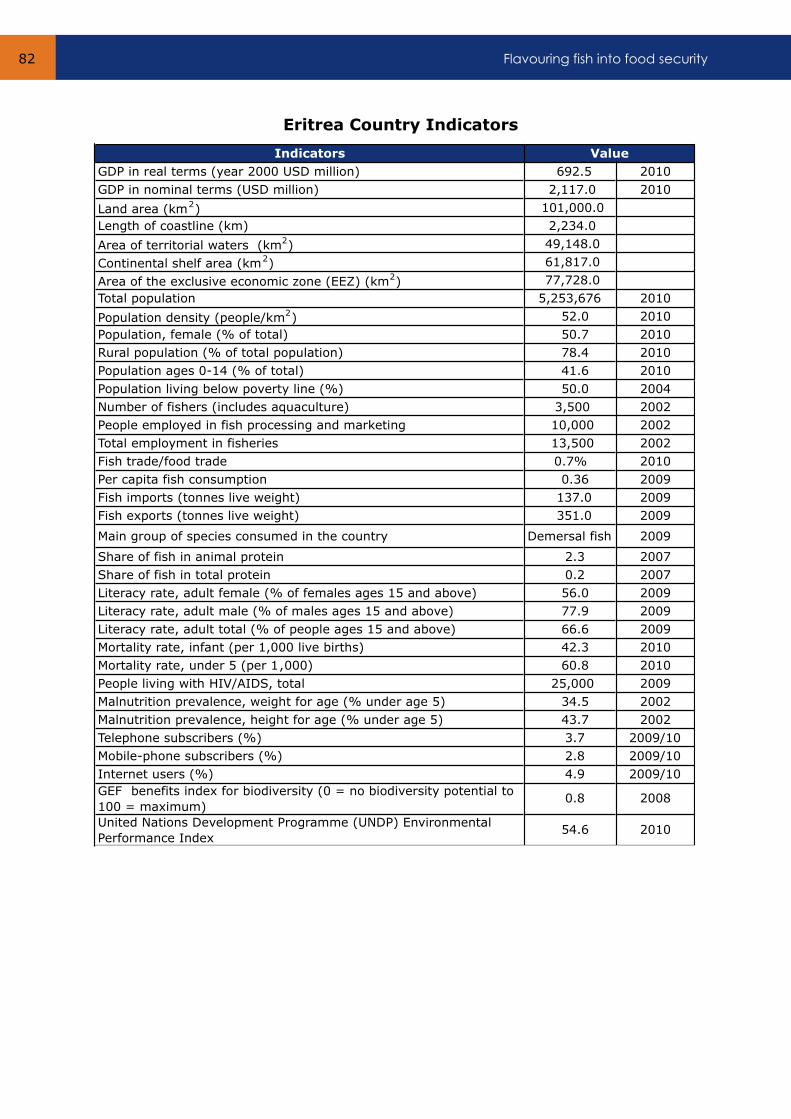
Flavouring fish into food security 82
Indicators
GDP in real terms (year 2000 USD million) 692.5 2010
GDP in nominal terms (USD million) 2,117.0 2010
Land area (km2) 101,000.0
Length of coastline (km) 2,234.0
Area of territorial waters (km2) 49,148.0
Continental shelf area (km2) 61,817.0
Area of the exclusive economic zone (EEZ) (km2) 77,728.0
Total population 5,253,676 2010
Population density (people/km2) 52.0 2010
Population, female (% of total) 50.7 2010
Rural population (% of total population) 78.4 2010
Population ages 0-14 (% of total) 41.6 2010
Population living below poverty line (%) 50.0 2004
Number of fishers (includes aquaculture) 3,500 2002
People employed in fish processing and marketing 10,000 2002
Total employment in fisheries 13,500 2002
Fish trade/food trade 0.7% 2010
Per capita fish consumption 0.36 2009
Fish imports (tonnes live weight) 137.0 2009
Fish exports (tonnes live weight) 351.0 2009
Main group of species consumed in the country Demersal fish 2009
Share of fish in animal protein 2.3 2007
Share of fish in total protein 0.2 2007
Literacy rate, adult female (% of females ages 15 and above) 56.0 2009
Literacy rate, adult male (% of males ages 15 and above) 77.9 2009
Literacy rate, adult total (% of people ages 15 and above) 66.6 2009
Mortality rate, infant (per 1,000 live births) 42.3 2010
Mortality rate, under 5 (per 1,000) 60.8 2010
People living with HIV/AIDS, total 25,000 2009
Malnutrition prevalence, weight for age (% under age 5) 34.5 2002
Malnutrition prevalence, height for age (% under age 5) 43.7 2002
Telephone subscribers (%) 3.7 2009/10
Mobile-phone subscribers (%) 2.8 2009/10
Internet users (%) 4.9 2009/10
GEF benefits index for biodiversity (0 = no biodiversity potential to
100 = maximum) 0.8 2008
United Nations Development Programme (UNDP) Environmental
Performance Index 54.6 2010
Value
Eritrea Country Indicators

Annexes 83
Eritrea Qualitative Dimensions
Three recent documents were examined to assess the extent of integration of fisheries and
aquaculture into the food security policies and plans of Eritrea. These were:
Documents:
1. United Nations Development Assistance Framework (UNDAF), 2007-2011;
2. Food Security Strategy, (2004);
3. Fisheries Development Project, Project Design Report (2010).
The UN Development Assistance Framework does not refer to the relation between
the food insecurity situation in the country and the fisheries sector. References to fisheries
in the food security section are, as in many documents, general to many sectors. The
proposed response of the UN system is to enhance the food security situation in the
country. This includes increasing access of rural poor to finance in order to diversify their
sources of income; and strengthening the Government’s capacity to improve food security
planning and the development of policies related to agriculture, fisheries and water
resources. Management of natural resources is included as an integral part of the approach
to address food insecurity, and the UN intends to support conservation of marine resources
among other areas. Although not specific, some outcomes can be related to fisheries since
one of the partners is the Ministry of Fisheries. Such is the case of the outcome ‘Enhanced
decision making on food security,’ and outputs of the development and updating of
strategies, policies, plans and projects, or development of regulatory procedures. The
outcome “Improved access and availability of food,’ with outputs of income generation
activities and livelihoods, intended to support 10 percent of the poor through micro credit
financing.
In the Food Security Strategy it is estimated that about 10 percent of all households’
income are due to fisheries. The diversity on the dietary intake is evaluated as low, and
the share for animal and fish products is reduced (6-7 percent). In order to ensure
national and household food security the proposed strategy has three pillars: to increase
agricultural and fisheries production; to enhance foreign exchange earnings through
exports; and to use food assistance effectively. Under the first pillar, the fishing sector is
has a high potential, given that it is not (it should be noted that the document dates back
to 2004) overcapitalized and most of the stocks are not overfished, and some are
considered underexploited. The strategic objectives, in order to achieve higher production
in fisheries, are increased productivity of artisanal fisheries by strengthening cooperatives
through technical assistance, and enhanced resource management and planning. The key
element of the strategy is improved income for coastal villagers through higher
productivity and stronger cooperatives, to enhance their food security. Specific measures
to promote domestic fish processing and marketing by small-scale fishermen are expected.
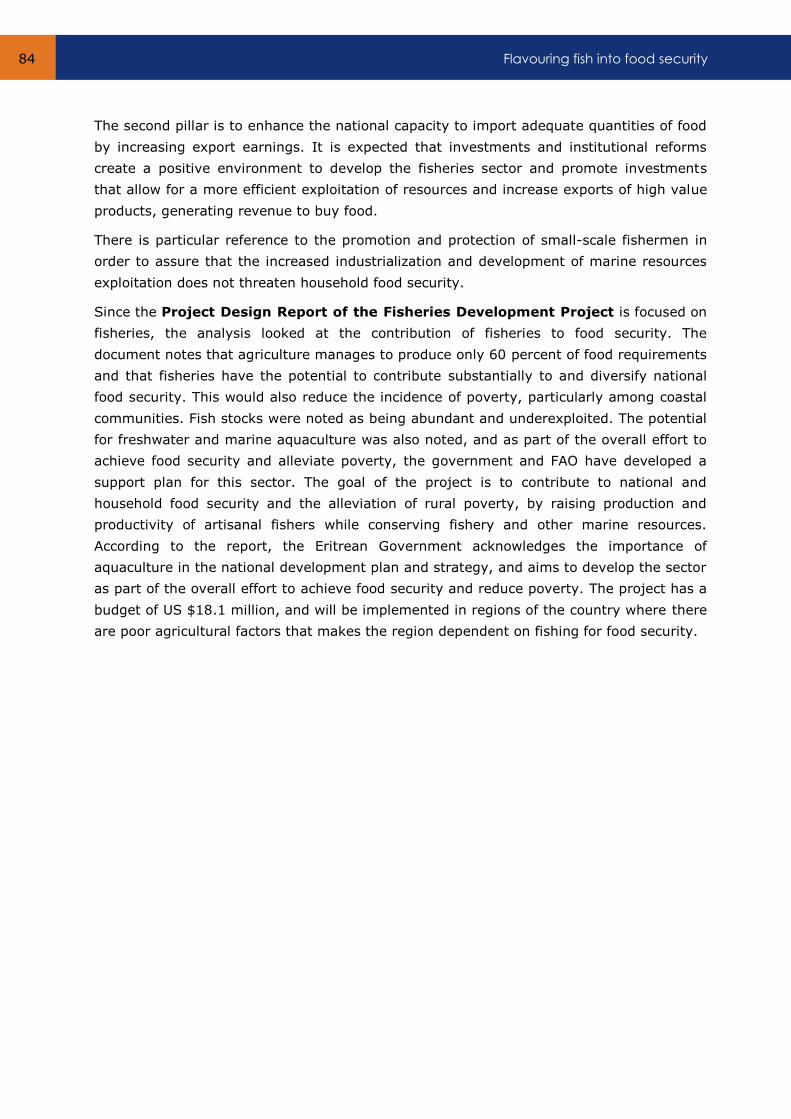
Flavouring fish into food security 84
The second pillar is to enhance the national capacity to import adequate quantities of food
by increasing export earnings. It is expected that investments and institutional reforms
create a positive environment to develop the fisheries sector and promote investments
that allow for a more efficient exploitation of resources and increase exports of high value
products, generating revenue to buy food.
There is particular reference to the promotion and protection of small-scale fishermen in
order to assure that the increased industrialization and development of marine resources
exploitation does not threaten household food security.
Since the Project Design Report of the Fisheries Development Project is focused on
fisheries, the analysis looked at the contribution of fisheries to food security. The
document notes that agriculture manages to produce only 60 percent of food requirements
and that fisheries have the potential to contribute substantially to and diversify national
food security. This would also reduce the incidence of poverty, particularly among coastal
communities. Fish stocks were noted as being abundant and underexploited. The potential
for freshwater and marine aquaculture was also noted, and as part of the overall effort to
achieve food security and alleviate poverty, the government and FAO have developed a
support plan for this sector. The goal of the project is to contribute to national and
household food security and the alleviation of rural poverty, by raising production and
productivity of artisanal fishers while conserving fishery and other marine resources.
According to the report, the Eritrean Government acknowledges the importance of
aquaculture in the national development plan and strategy, and aims to develop the sector
as part of the overall effort to achieve food security and reduce poverty. The project has a
budget of US $18.1 million, and will be implemented in regions of the country where there
are poor agricultural factors that makes the region dependent on fishing for food security.

Annexes 85
Factors to be considered to assess the role of fish in food
and nutritional security
Data &
time
points
Favorable AdverseNo data
available
Total fish production (marine + inland + aquaculture) 2009-2004 Decreasing
Total physical availability for consumption [total production +
imports - exports (in live weight)]2009-2004 Decreasing
The 'apparent consumption' of fish per capita 2009-2004 Decreasing
Share of small-scale fishers production to the total fish
production2002 High
Area of land covered by small-scale aquaculture (back yard
ponds etc)
Share of industrial fishery catch which is (processed and) sold
locally
Share of fish imported specifically for local consumption
(processed or fresh)2009 High
Availability of fish marketing infrastructure in urban and rural
areas
Availability of ice and cold storage facilities
Roads from coast to inland areas
Per-capita income (GDP/pop) 2010-2009 Increasing
General consumer price index 2011-2010 Increasing
Fish prices compared to other animal protein prices
Poverty levels and percentage of population below these levels 2004 High
Unemployment levels
Access to safe water 2008-2000 Increasing
Infant mortality levels 2009-2000 Decreasing
Access to sanitation 2010-2000 High
Female literacy 2009-2006 Increasing
Mention of fish in nutrition education/awareness programs and
literatureAbsent
Publicity about fish consumption in mass media (newspaper,
radio, TV, SMS, etc.)Present
Availibility
Accessibility
Utilisation
Stability
Eritrea Quantitative Dimensions
Flavouring fish into food security 86
ETHIOPIA
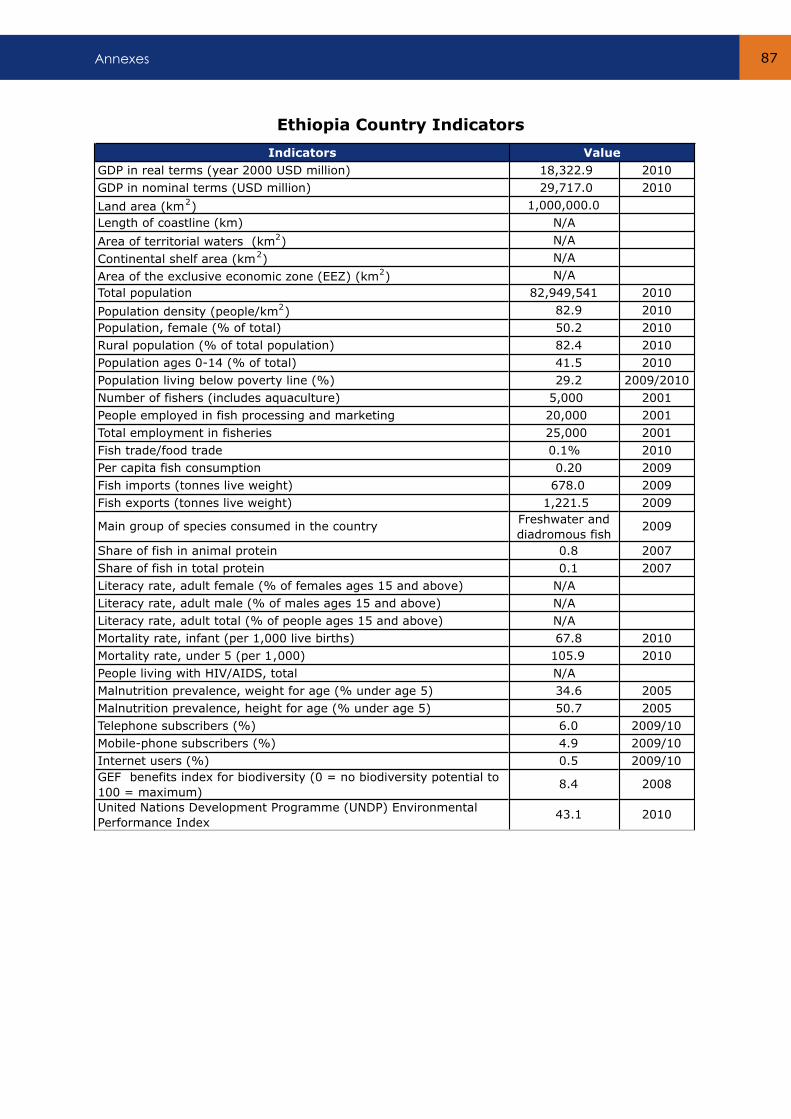
Annexes 87
Indicators
GDP in real terms (year 2000 USD million) 18,322.9 2010
GDP in nominal terms (USD million) 29,717.0 2010
Land area (km2) 1,000,000.0
Length of coastline (km) N/A
Area of territorial waters (km2) N/A
Continental shelf area (km2) N/A
Area of the exclusive economic zone (EEZ) (km2) N/A
Total population 82,949,541 2010
Population density (people/km2) 82.9 2010
Population, female (% of total) 50.2 2010
Rural population (% of total population) 82.4 2010
Population ages 0-14 (% of total) 41.5 2010
Population living below poverty line (%) 29.2 2009/2010
Number of fishers (includes aquaculture) 5,000 2001
People employed in fish processing and marketing 20,000 2001
Total employment in fisheries 25,000 2001
Fish trade/food trade 0.1% 2010
Per capita fish consumption 0.20 2009
Fish imports (tonnes live weight) 678.0 2009
Fish exports (tonnes live weight) 1,221.5 2009
Main group of species consumed in the country Freshwater and
diadromous fish2009
Share of fish in animal protein 0.8 2007
Share of fish in total protein 0.1 2007
Literacy rate, adult female (% of females ages 15 and above) N/A
Literacy rate, adult male (% of males ages 15 and above) N/A
Literacy rate, adult total (% of people ages 15 and above) N/A
Mortality rate, infant (per 1,000 live births) 67.8 2010
Mortality rate, under 5 (per 1,000) 105.9 2010
People living with HIV/AIDS, total N/A
Malnutrition prevalence, weight for age (% under age 5) 34.6 2005
Malnutrition prevalence, height for age (% under age 5) 50.7 2005
Telephone subscribers (%) 6.0 2009/10
Mobile-phone subscribers (%) 4.9 2009/10
Internet users (%) 0.5 2009/10
GEF benefits index for biodiversity (0 = no biodiversity potential to
100 = maximum) 8.4 2008
United Nations Development Programme (UNDP) Environmental
Performance Index 43.1 2010
Value
Ethiopia Country Indicators
Flavouring fish into food security 88
Ethiopia Qualitative Dimensions
Six recent documents were examined to assess the extent of integration of fisheries and
aquaculture into the food security policies and plans of Ethiopia. These were:
Documents:
1. Ethiopia’s Agricultural Sector Policy and Investment Framework (PIF), 2010-2020;
2. Ethiopia’s Agricultural Sector PIF 2010-2020 – Ten Year Road Map;
3. Water Sector Strategy (2001);
4. Growth and Transformation Plan, 2010/11-2014/15;
5. FAO Ethiopia Country Programming Framework, 2012-2015;
6. United Nations Development Assistance Framework (UNDAF), 2012-2015.
The Agricultural Sector Policy and Investment Framework aims to provide a
strategic framework for the planning and prioritisation of investments for growth and
development in Ethiopia’s agricultural sector. It states that a broad definition of agriculture
is used in the document, including ‘all forms of agriculture, livestock, fisheries, forestry,
irrigation and natural resource management.’ Four strategic objectives are linked to one
thematic area:
1. Productivity and production: to achieve a sustainable increase in agricultural
productivity and production;
2. Rural commercialisation: to accelerate agricultural commercialization and agro-
industrial development;
3. Natural resource degradation and improve productivity of natural resources;
4. Disaster risk management and food security: to achieve universal food security and
protect vulnerable households from natural disasters.
When the document gives further details of the activities foreseen the focus is clearly on
agriculture and livestock.
The sections dedicated to water resources management concentrate on agriculture and
livestock uses of water, and does not refer to fish production (either capture or eventual
aquaculture development). Conversely there are strategies presented for agriculture and
livestock that could benefit fisheries and aquaculture. These are: the development of value
chain efficiency; the reduction of post-harvest losses; improved infrastructure and market
access; access to financial services; the development of commercial supply chain market
information services; product standards; quality assurance systems; post-harvest storage
and transport facilities.
Annexes 89
Although the Ten Year Road Map, does not include specific analysis for fisheries, it
acknowledges the importance of fisheries as a natural resource sub-sector and highlights
the need to review its treatment in programme and in organisational settings. In the
outline of proposed programs, the document includes natural resources and agriculture
research activities and it highlights a fishery and aquaculture component.
One of the supporting documents of the PIF is the Water Sector Strategy (2001). This
includes a component concerning the assessment, preservation and enrichment of aquatic
resources in rivers and lakes, and incorporates aquatic resources development. In order to
achieve these goals the document proposes:
to conduct surveys to assess the existing state of aquatic resources development;
take actions to develop and maintain the potential of aquaculture;
enhance the development of capture fisheries in existing and future reservoirs;
install fish breeding stations in the reservoirs to enhance fish production;
investigate and develop rain water harvesting options in areas where there is
scarcity of water resources for enrichment of aquatic resources.
When analyzing the use for irrigation, the strategy also proposes an integrated view for
irrigation usage of water, ensuring complementary use and multi-purpose development
between irrigation, power, livestock, fishery, tourism, recreation, etc.
The Growth Transformation Plan does not refer to fisheries and the food security
components are included under the section dedicated to agriculture and rural
development, without mentioning the contribution of fisheries to food security. However,
some expected outcomes of the plan, such as the Ethiopian Commodity Exchange, could
indirectly have a positive impact on the development of the fish trade in the country.
The FAO Country Programming Framework for Ethiopia sets out FAO’s contributions to
achieve the goals set by the Growth and Transformation Plan and the Agricultural Sector
Policy and Investment Plan. The document identifies two core functions and three priority
focus areas. The core functions are to boost the country’s technical and institutional
capacity in agricultural policy and regulatory framework, and agricultural information and
knowledge management. The focus areas are: agricultural productivity and
competitiveness; sustainable natural resources development and management; and
improved food and nutrition security.
References to fisheries and aquaculture are included under the priority area ‘Agriculture
productivity and competitiveness,’ with outcome “Livestock production and productivity
improved”, and output ‘Fisheries and aquaculture development increased.’
Flavouring fish into food security 90
According to this output, it is expected that through FAO’s support the capacity for the
transfer and adoption of proper technology in fishery and aquaculture will be
strengthened, especially in parts of the country with rich water resources. It is also
expected that fish production will increase in a sustainable and gender-sensitive manner,
introducing appropriate technology that provides proper care for the existing lakes, and
allows production of fish without threatening the balance of the fish population.
Under the same priority area as part of the outcome ‘Crop production and productivity
improved,’ the expected output ‘National phytosanitary system to meet the international
requirements improved,’ could be indirectly related to fisheries. The output expects to
revise and upgrade the technical capacity for the regulation and enforcement of safety and
phytosanitary systems. The output also includes the preparation of guidelines and
manuals, as well as strengthening capacities to meet international of specific standards.
However, the priority area ‘Improved food and nutrition security’ does not consider the
potential contribution of fisheries. In the set of indicators of the results matrix, there is no
indicator for fisheries related outputs.
The UN Development Assistance Framework does not include any reference to
fisheries or aquaculture.
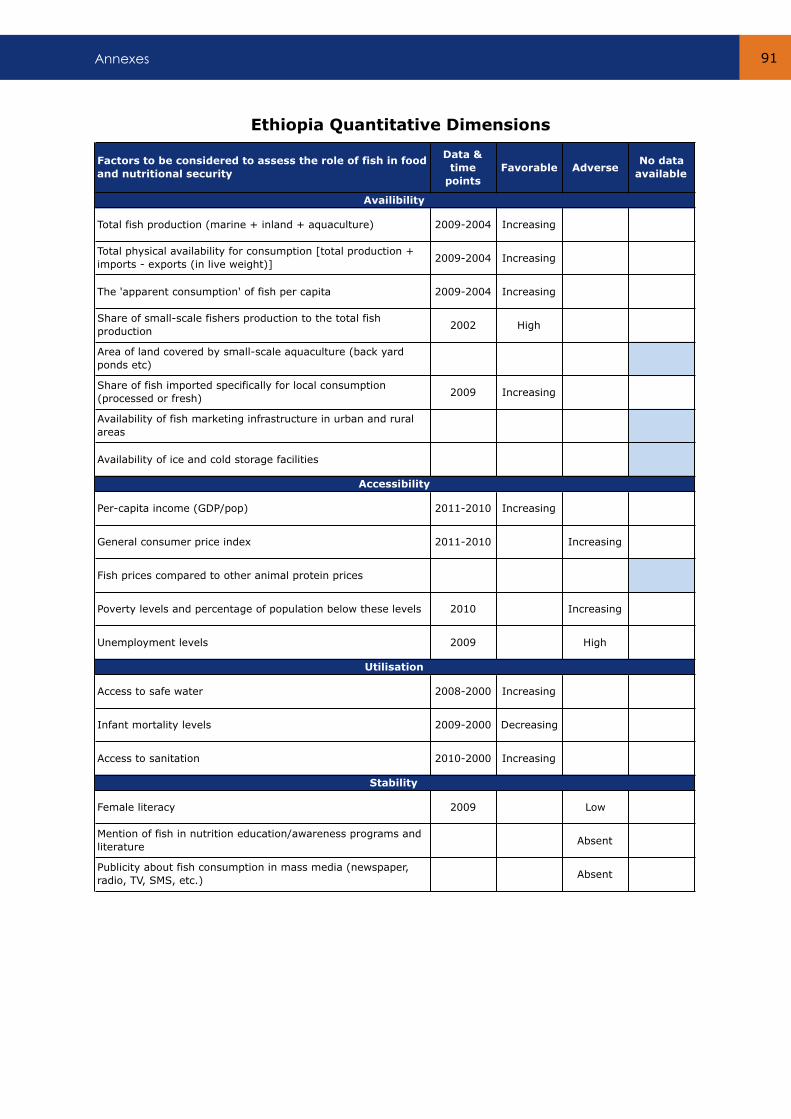
Annexes 91
Factors to be considered to assess the role of fish in food
and nutritional security
Data &
time
points
Favorable AdverseNo data
available
Total fish production (marine + inland + aquaculture) 2009-2004 Increasing
Total physical availability for consumption [total production +
imports - exports (in live weight)]2009-2004 Increasing
The 'apparent consumption' of fish per capita 2009-2004 Increasing
Share of small-scale fishers production to the total fish
production2002 High
Area of land covered by small-scale aquaculture (back yard
ponds etc)
Share of fish imported specifically for local consumption
(processed or fresh)2009 Increasing
Availability of fish marketing infrastructure in urban and rural
areas
Availability of ice and cold storage facilities
Per-capita income (GDP/pop) 2011-2010 Increasing
General consumer price index 2011-2010 Increasing
Fish prices compared to other animal protein prices
Poverty levels and percentage of population below these levels 2010 Increasing
Unemployment levels 2009 High
Access to safe water 2008-2000 Increasing
Infant mortality levels 2009-2000 Decreasing
Access to sanitation 2010-2000 Increasing
Female literacy 2009 Low
Mention of fish in nutrition education/awareness programs and
literatureAbsent
Publicity about fish consumption in mass media (newspaper,
radio, TV, SMS, etc.)Absent
Availibility
Accessibility
Utilisation
Stability
Ethiopia Quantitative Dimensions
Flavouring fish into food security 92
KENYA
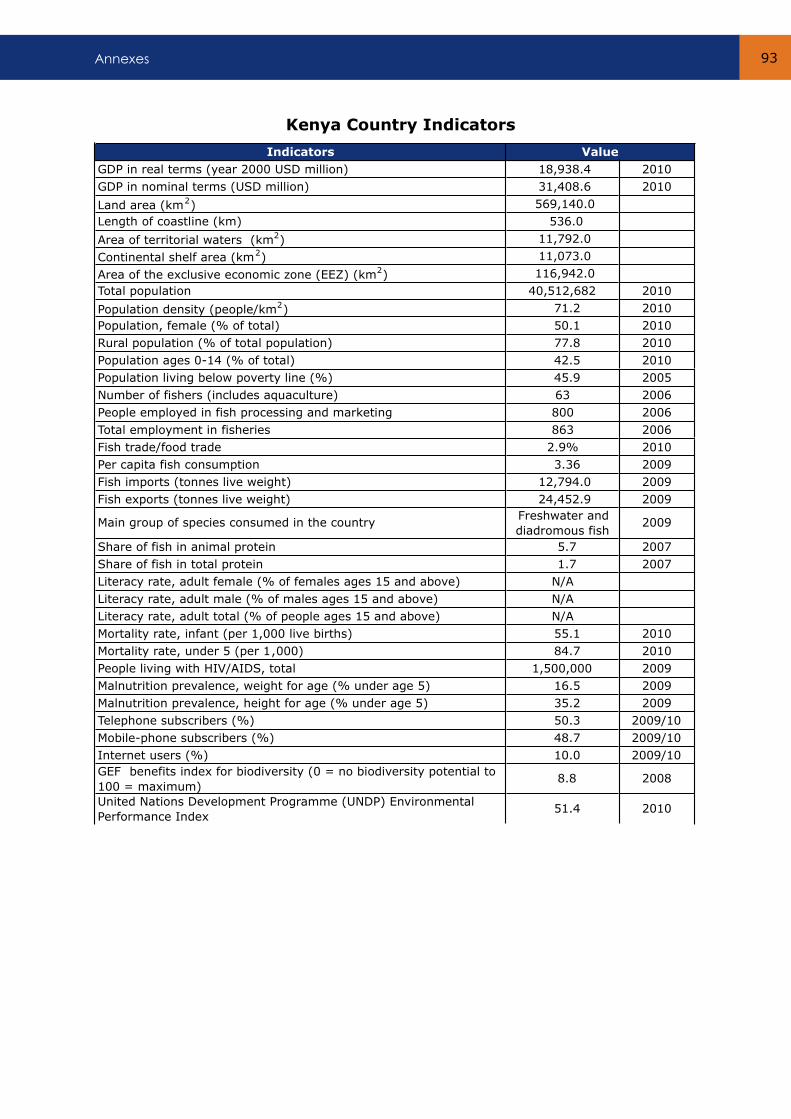
Annexes 93
Indicators
GDP in real terms (year 2000 USD million) 18,938.4 2010
GDP in nominal terms (USD million) 31,408.6 2010
Land area (km2) 569,140.0
Length of coastline (km) 536.0
Area of territorial waters (km2) 11,792.0
Continental shelf area (km2) 11,073.0
Area of the exclusive economic zone (EEZ) (km2) 116,942.0
Total population 40,512,682 2010
Population density (people/km2) 71.2 2010
Population, female (% of total) 50.1 2010
Rural population (% of total population) 77.8 2010
Population ages 0-14 (% of total) 42.5 2010
Population living below poverty line (%) 45.9 2005
Number of fishers (includes aquaculture) 63 2006
People employed in fish processing and marketing 800 2006
Total employment in fisheries 863 2006
Fish trade/food trade 2.9% 2010
Per capita fish consumption 3.36 2009
Fish imports (tonnes live weight) 12,794.0 2009
Fish exports (tonnes live weight) 24,452.9 2009
Main group of species consumed in the country Freshwater and
diadromous fish2009
Share of fish in animal protein 5.7 2007
Share of fish in total protein 1.7 2007
Literacy rate, adult female (% of females ages 15 and above) N/A
Literacy rate, adult male (% of males ages 15 and above) N/A
Literacy rate, adult total (% of people ages 15 and above) N/A
Mortality rate, infant (per 1,000 live births) 55.1 2010
Mortality rate, under 5 (per 1,000) 84.7 2010
People living with HIV/AIDS, total 1,500,000 2009
Malnutrition prevalence, weight for age (% under age 5) 16.5 2009
Malnutrition prevalence, height for age (% under age 5) 35.2 2009
Telephone subscribers (%) 50.3 2009/10
Mobile-phone subscribers (%) 48.7 2009/10
Internet users (%) 10.0 2009/10
GEF benefits index for biodiversity (0 = no biodiversity potential to
100 = maximum) 8.8 2008
United Nations Development Programme (UNDP) Environmental
Performance Index 51.4 2010
Value
Kenya Country Indicators
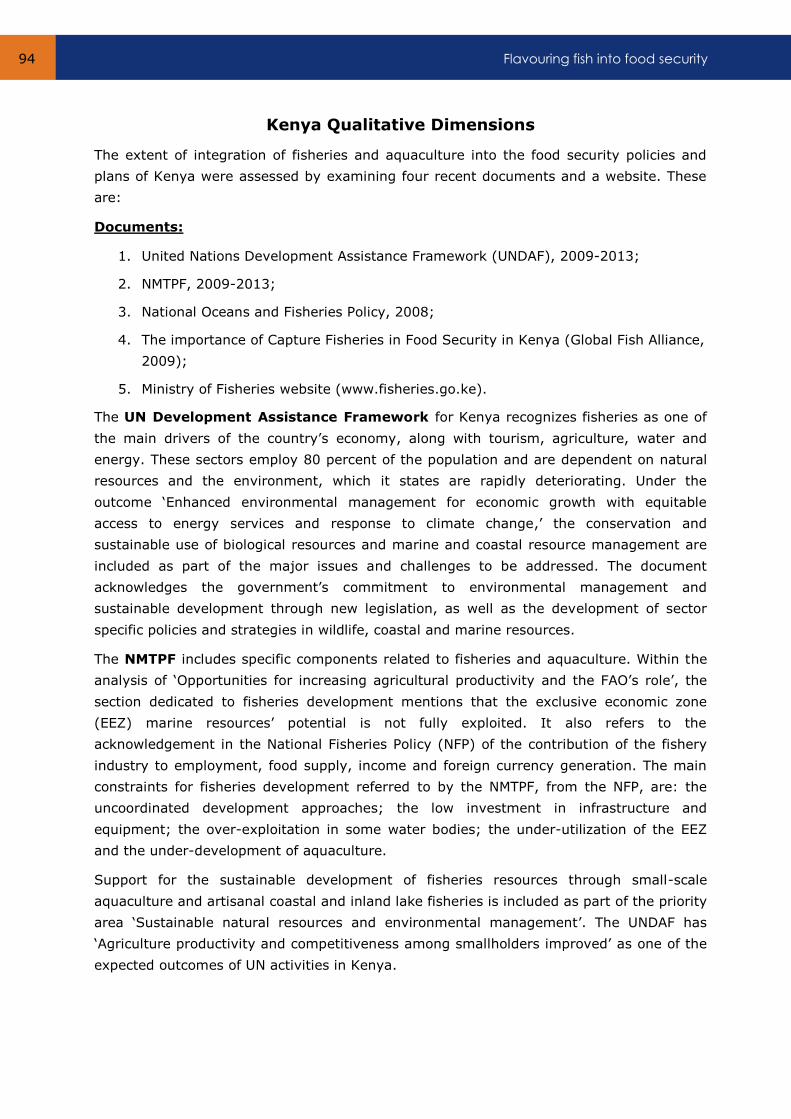
Flavouring fish into food security 94
Kenya Qualitative Dimensions
The extent of integration of fisheries and aquaculture into the food security policies and
plans of Kenya were assessed by examining four recent documents and a website. These
are:
Documents:
1. United Nations Development Assistance Framework (UNDAF), 2009-2013;
2. NMTPF, 2009-2013;
3. National Oceans and Fisheries Policy, 2008;
4. The importance of Capture Fisheries in Food Security in Kenya (Global Fish Alliance,
2009);
5. Ministry of Fisheries website (www.fisheries.go.ke).
The UN Development Assistance Framework for Kenya recognizes fisheries as one of
the main drivers of the country’s economy, along with tourism, agriculture, water and
energy. These sectors employ 80 percent of the population and are dependent on natural
resources and the environment, which it states are rapidly deteriorating. Under the
outcome ‘Enhanced environmental management for economic growth with equitable
access to energy services and response to climate change,’ the conservation and
sustainable use of biological resources and marine and coastal resource management are
included as part of the major issues and challenges to be addressed. The document
acknowledges the government’s commitment to environmental management and
sustainable development through new legislation, as well as the development of sector
specific policies and strategies in wildlife, coastal and marine resources.
The NMTPF includes specific components related to fisheries and aquaculture. Within the
analysis of ‘Opportunities for increasing agricultural productivity and the FAO’s role’, the
section dedicated to fisheries development mentions that the exclusive economic zone
(EEZ) marine resources’ potential is not fully exploited. It also refers to the
acknowledgement in the National Fisheries Policy (NFP) of the contribution of the fishery
industry to employment, food supply, income and foreign currency generation. The main
constraints for fisheries development referred to by the NMTPF, from the NFP, are: the
uncoordinated development approaches; the low investment in infrastructure and
equipment; the over-exploitation in some water bodies; the under-utilization of the EEZ
and the under-development of aquaculture.
Support for the sustainable development of fisheries resources through small-scale
aquaculture and artisanal coastal and inland lake fisheries is included as part of the priority
area ‘Sustainable natural resources and environmental management’. The UNDAF has
‘Agriculture productivity and competitiveness among smallholders improved’ as one of the
expected outcomes of UN activities in Kenya.

Annexes 95
The NMTPF includes an output of increased productivity and value addition of crops,
livestock, commercial insects and fisheries. Fishery-specific expected outputs are an
improvement in the capacity for value addition, the capability to meet food safety
regulations and the diversification of nutrition and livelihood sources for fishing
communities; as well as enhanced aquaculture development through technical training,
extension and marketing activities. In line with the UNDAF outcome ‘Sustainable
management of natural resources and environmental management enhanced’, the NMTPF
output can be considered as enhancing support for regulatory reforms and institutions to
foster wider exploitation of EEZ’s marine and freshwater resources, as well relating to
several outputs concerned with the improvement and enhancement of institutional
strength and capabilities under environmental management.
The National Oceans and Fisheries Policy highlights that the government recognizes
the critical role of fisheries in food security, employment and general economic benefit.
This has resulted in the creation of a Ministry of Fisheries Ministry. The potential of
aquaculture to contribute to food security, poverty reduction, employment generation and
reduced pressure on capture fisheries resources have also been acknowledged. The overall
objective of the policy is to enhance the fisheries sectors’ contribution to wealth creation,
employment generation (especially for youth and women), food security and income
generation. The policy also focuses on the promotion of fish consumption to increase food
security, employment, income and foreign currency gains. One of the specific objectives is
to enhance food supply and food security. Another goal is to achieve self-sufficiency in fish
and an adequate supply for the domestic market at all times, with an emphasis in the
nutritional importance of fish consumption.
The Global Fish Alliance prepared a report on The Importance of Capture Fisheries in
Food Security in Kenya, which presents the contribution of fishery products to food
security by supplying 11 percent of the average daily protein consumption, despite its low
consumption levels. It also mentions that most of the fish production is destined for export
markets. The contribution of fisheries to the national economy in 2005 was estimated at
27 percent of agricultural GDP, mainly through Lake Victoria fisheries. Employment
generated by the fisheries sector, both directly and indirectly, was estimated at nearly one
million jobs. The document also refers to the importance given to fisheries in national
documents as a way of improving communities’ livelihoods.
Flavouring fish into food security 96
The Ministry of Fisheries website presents the following policy priorities and a strategy
for poverty reduction:
Policy priorities
Strengthening institutional, policy and legal framework;
Sustainable utilization of fisheries resources;
Sustainable aquaculture development;
Promotion of fish safety and quality assurance, investment, value addition and
marketing;
Promotion of regional and international cooperation;
Infrastructure and institutional capacity development;
Promotion and coordination of fisheries research.
Poverty reduction strategy
Within the context of poverty alleviation and wealth creation, the policy priorities for
fisheries are:
Management, control and utilization of fisheries resources to support economic
growth and to provide food security;
Promotion of aquaculture development to increase fisheries resources base;
Management and control of fish marketing systems to reduce post-harvest losses,
assure quality and safety for the consumer, and ensure sustainability of local and
export markets;
Promotion of innovative saving schemes for the fishing community and community
participation in resource management and infrastructure improvement.
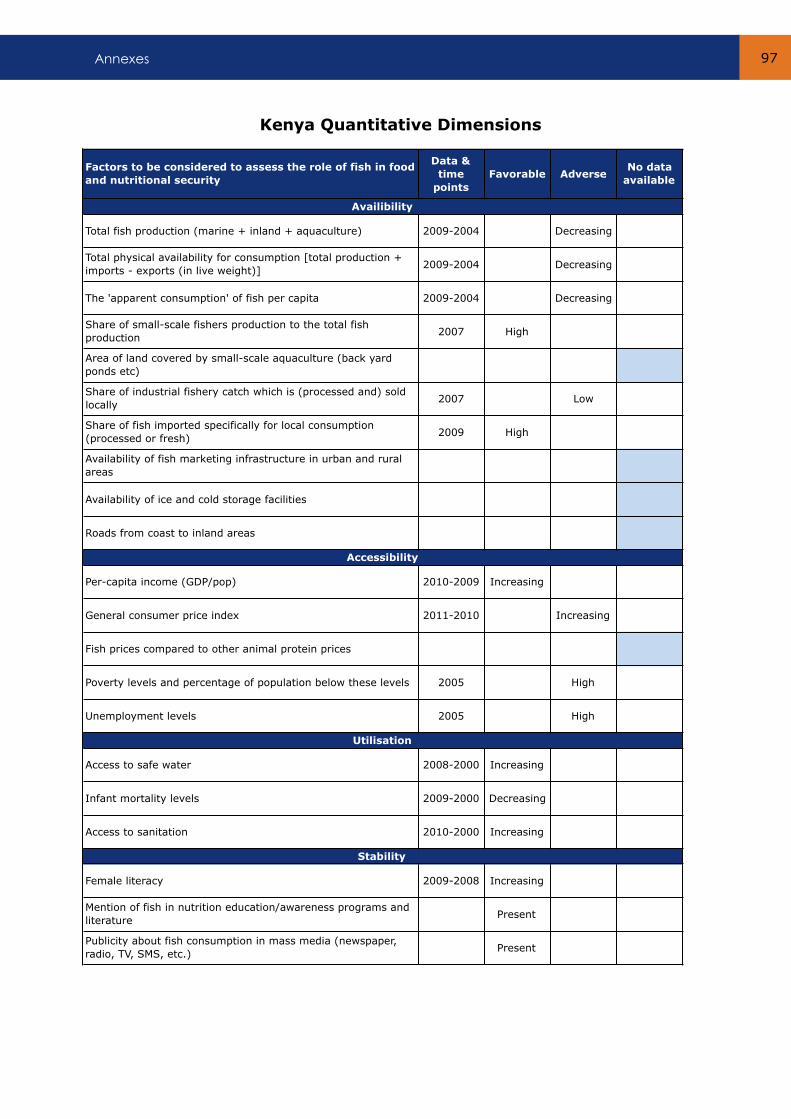
Annexes 97
Factors to be considered to assess the role of fish in food
and nutritional security
Data &
time
points
Favorable AdverseNo data
available
Total fish production (marine + inland + aquaculture) 2009-2004 Decreasing
Total physical availability for consumption [total production +
imports - exports (in live weight)]2009-2004 Decreasing
The 'apparent consumption' of fish per capita 2009-2004 Decreasing
Share of small-scale fishers production to the total fish
production2007 High
Area of land covered by small-scale aquaculture (back yard
ponds etc)
Share of industrial fishery catch which is (processed and) sold
locally2007 Low
Share of fish imported specifically for local consumption
(processed or fresh)2009 High
Availability of fish marketing infrastructure in urban and rural
areas
Availability of ice and cold storage facilities
Roads from coast to inland areas
Per-capita income (GDP/pop) 2010-2009 Increasing
General consumer price index 2011-2010 Increasing
Fish prices compared to other animal protein prices
Poverty levels and percentage of population below these levels 2005 High
Unemployment levels 2005 High
Access to safe water 2008-2000 Increasing
Infant mortality levels 2009-2000 Decreasing
Access to sanitation 2010-2000 Increasing
Female literacy 2009-2008 Increasing
Mention of fish in nutrition education/awareness programs and
literaturePresent
Publicity about fish consumption in mass media (newspaper,
radio, TV, SMS, etc.)Present
Availibility
Accessibility
Utilisation
Stability
Kenya Quantitative Dimensions
Flavouring fish into food security 98
MADAGASCAR
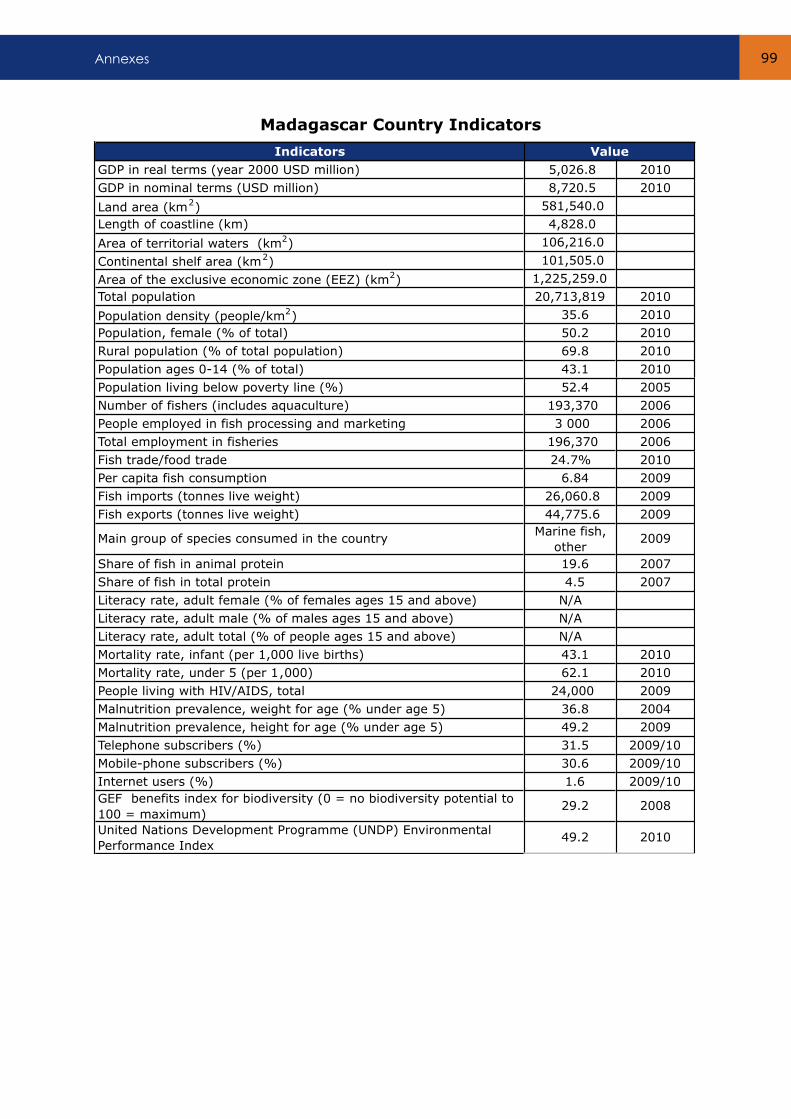
Annexes 99
Indicators
GDP in real terms (year 2000 USD million) 5,026.8 2010
GDP in nominal terms (USD million) 8,720.5 2010
Land area (km2) 581,540.0
Length of coastline (km) 4,828.0
Area of territorial waters (km2) 106,216.0
Continental shelf area (km2) 101,505.0
Area of the exclusive economic zone (EEZ) (km2) 1,225,259.0
Total population 20,713,819 2010
Population density (people/km2) 35.6 2010
Population, female (% of total) 50.2 2010
Rural population (% of total population) 69.8 2010
Population ages 0-14 (% of total) 43.1 2010
Population living below poverty line (%) 52.4 2005
Number of fishers (includes aquaculture) 193,370 2006
People employed in fish processing and marketing 3 000 2006
Total employment in fisheries 196,370 2006
Fish trade/food trade 24.7% 2010
Per capita fish consumption 6.84 2009
Fish imports (tonnes live weight) 26,060.8 2009
Fish exports (tonnes live weight) 44,775.6 2009
Main group of species consumed in the country Marine fish,
other2009
Share of fish in animal protein 19.6 2007
Share of fish in total protein 4.5 2007
Literacy rate, adult female (% of females ages 15 and above) N/A
Literacy rate, adult male (% of males ages 15 and above) N/A
Literacy rate, adult total (% of people ages 15 and above) N/A
Mortality rate, infant (per 1,000 live births) 43.1 2010
Mortality rate, under 5 (per 1,000) 62.1 2010
People living with HIV/AIDS, total 24,000 2009
Malnutrition prevalence, weight for age (% under age 5) 36.8 2004
Malnutrition prevalence, height for age (% under age 5) 49.2 2009
Telephone subscribers (%) 31.5 2009/10
Mobile-phone subscribers (%) 30.6 2009/10
Internet users (%) 1.6 2009/10
GEF benefits index for biodiversity (0 = no biodiversity potential to
100 = maximum) 29.2 2008
United Nations Development Programme (UNDP) Environmental
Performance Index 49.2 2010
Value
Madagascar Country Indicators
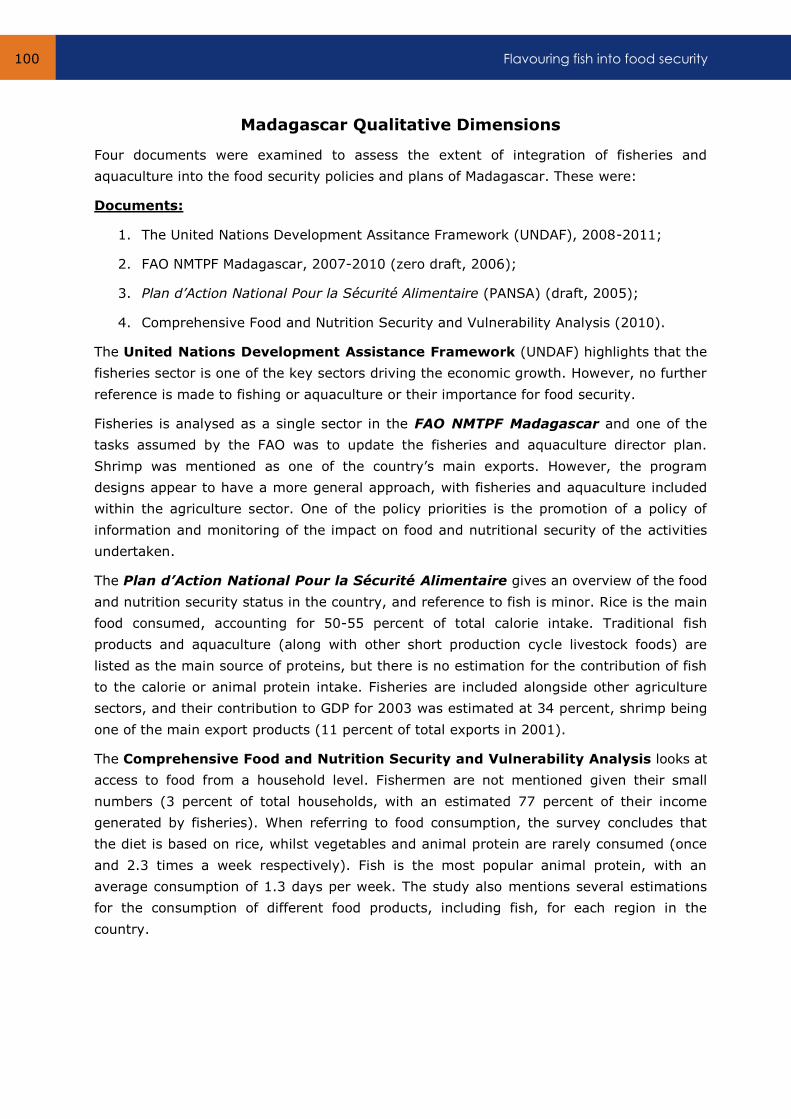
Flavouring fish into food security 100
Madagascar Qualitative Dimensions
Four documents were examined to assess the extent of integration of fisheries and
aquaculture into the food security policies and plans of Madagascar. These were:
Documents:
1. The United Nations Development Assitance Framework (UNDAF), 2008-2011;
2. FAO NMTPF Madagascar, 2007-2010 (zero draft, 2006);
3. Plan d’Action National Pour la Sécurité Alimentaire (PANSA) (draft, 2005);
4. Comprehensive Food and Nutrition Security and Vulnerability Analysis (2010).
The United Nations Development Assistance Framework (UNDAF) highlights that the
fisheries sector is one of the key sectors driving the economic growth. However, no further
reference is made to fishing or aquaculture or their importance for food security.
Fisheries is analysed as a single sector in the FAO NMTPF Madagascar and one of the
tasks assumed by the FAO was to update the fisheries and aquaculture director plan.
Shrimp was mentioned as one of the country’s main exports. However, the program
designs appear to have a more general approach, with fisheries and aquaculture included
within the agriculture sector. One of the policy priorities is the promotion of a policy of
information and monitoring of the impact on food and nutritional security of the activities
undertaken.
The Plan d’Action National Pour la Sécurité Alimentaire gives an overview of the food
and nutrition security status in the country, and reference to fish is minor. Rice is the main
food consumed, accounting for 50-55 percent of total calorie intake. Traditional fish
products and aquaculture (along with other short production cycle livestock foods) are
listed as the main source of proteins, but there is no estimation for the contribution of fish
to the calorie or animal protein intake. Fisheries are included alongside other agriculture
sectors, and their contribution to GDP for 2003 was estimated at 34 percent, shrimp being
one of the main export products (11 percent of total exports in 2001).
The Comprehensive Food and Nutrition Security and Vulnerability Analysis looks at
access to food from a household level. Fishermen are not mentioned given their small
numbers (3 percent of total households, with an estimated 77 percent of their income
generated by fisheries). When referring to food consumption, the survey concludes that
the diet is based on rice, whilst vegetables and animal protein are rarely consumed (once
and 2.3 times a week respectively). Fish is the most popular animal protein, with an
average consumption of 1.3 days per week. The study also mentions several estimations
for the consumption of different food products, including fish, for each region in the
country.
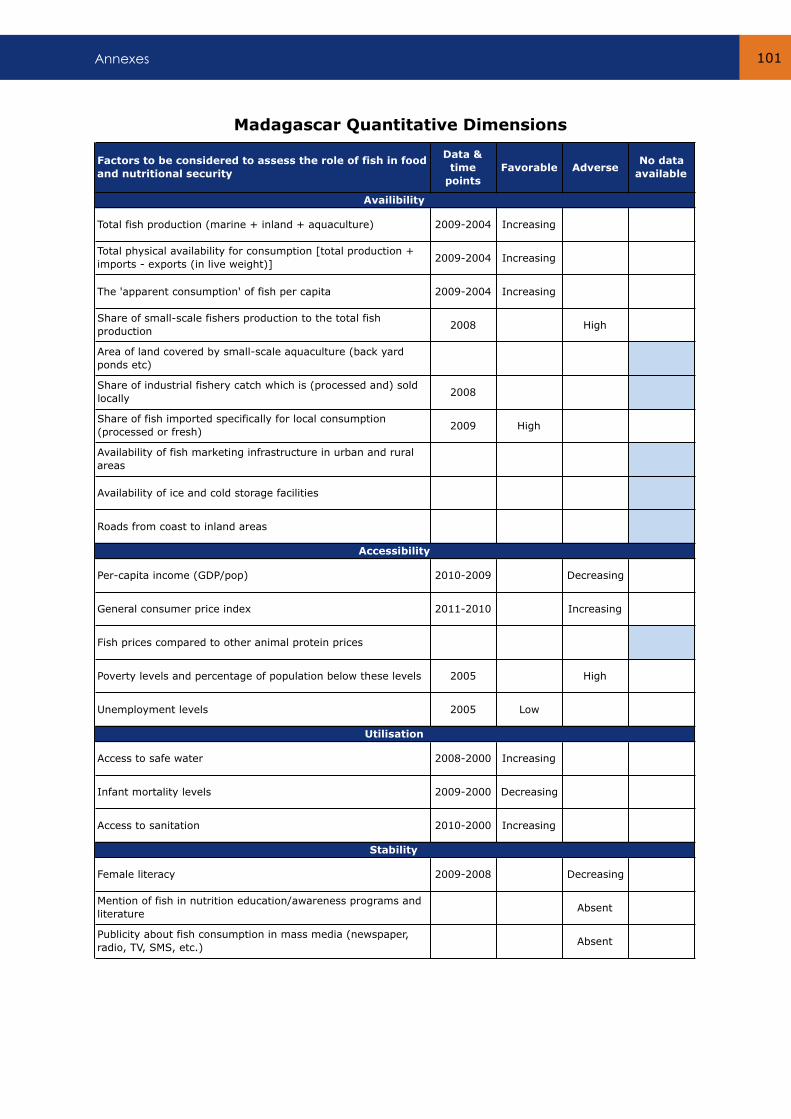
Annexes 101
Factors to be considered to assess the role of fish in food
and nutritional security
Data &
time
points
Favorable AdverseNo data
available
Total fish production (marine + inland + aquaculture) 2009-2004 Increasing
Total physical availability for consumption [total production +
imports - exports (in live weight)]2009-2004 Increasing
The 'apparent consumption' of fish per capita 2009-2004 Increasing
Share of small-scale fishers production to the total fish
production2008 High
Area of land covered by small-scale aquaculture (back yard
ponds etc)
Share of industrial fishery catch which is (processed and) sold
locally2008
Share of fish imported specifically for local consumption
(processed or fresh)2009 High
Availability of fish marketing infrastructure in urban and rural
areas
Availability of ice and cold storage facilities
Roads from coast to inland areas
Per-capita income (GDP/pop) 2010-2009 Decreasing
General consumer price index 2011-2010 Increasing
Fish prices compared to other animal protein prices
Poverty levels and percentage of population below these levels 2005 High
Unemployment levels 2005 Low
Access to safe water 2008-2000 Increasing
Infant mortality levels 2009-2000 Decreasing
Access to sanitation 2010-2000 Increasing
Female literacy 2009-2008 Decreasing
Mention of fish in nutrition education/awareness programs and
literatureAbsent
Publicity about fish consumption in mass media (newspaper,
radio, TV, SMS, etc.)Absent
Availibility
Accessibility
Utilisation
Stability
Madagascar Quantitative Dimensions
Flavouring fish into food security 102
MALAWI
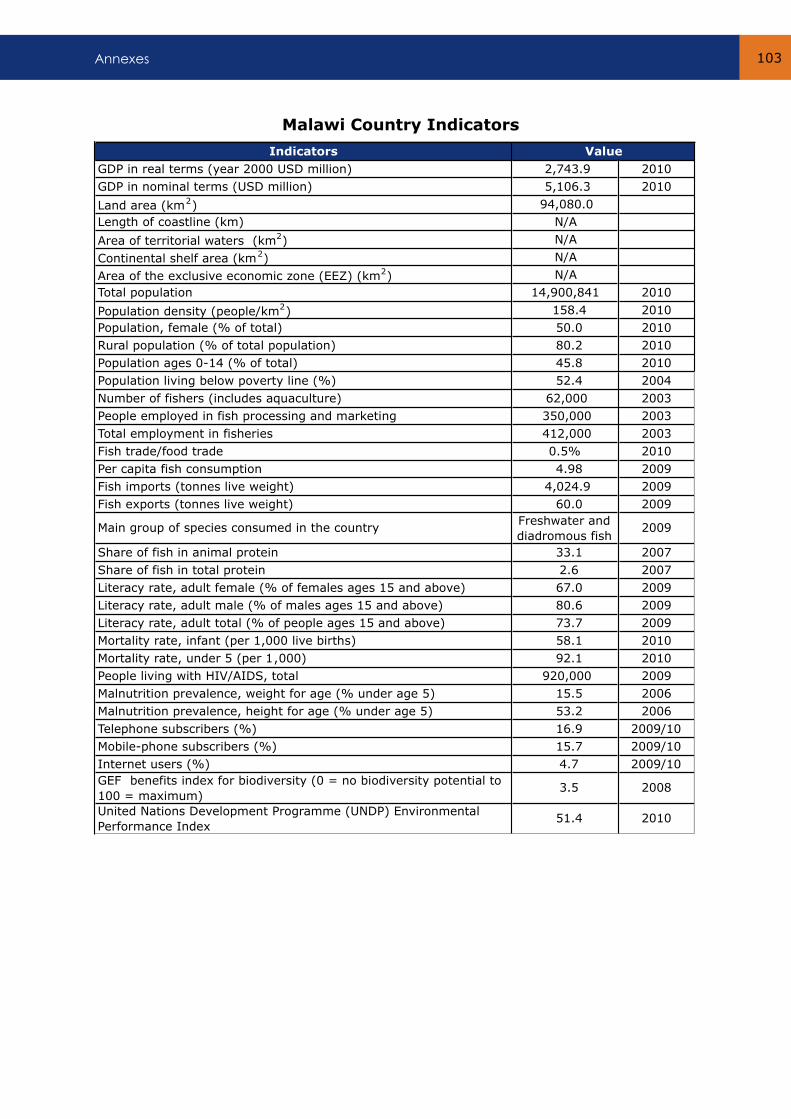
Annexes 103
Indicators
GDP in real terms (year 2000 USD million) 2,743.9 2010
GDP in nominal terms (USD million) 5,106.3 2010
Land area (km2) 94,080.0
Length of coastline (km) N/A
Area of territorial waters (km2) N/A
Continental shelf area (km2) N/A
Area of the exclusive economic zone (EEZ) (km2) N/A
Total population 14,900,841 2010
Population density (people/km2) 158.4 2010
Population, female (% of total) 50.0 2010
Rural population (% of total population) 80.2 2010
Population ages 0-14 (% of total) 45.8 2010
Population living below poverty line (%) 52.4 2004
Number of fishers (includes aquaculture) 62,000 2003
People employed in fish processing and marketing 350,000 2003
Total employment in fisheries 412,000 2003
Fish trade/food trade 0.5% 2010
Per capita fish consumption 4.98 2009
Fish imports (tonnes live weight) 4,024.9 2009
Fish exports (tonnes live weight) 60.0 2009
Main group of species consumed in the country Freshwater and
diadromous fish2009
Share of fish in animal protein 33.1 2007
Share of fish in total protein 2.6 2007
Literacy rate, adult female (% of females ages 15 and above) 67.0 2009
Literacy rate, adult male (% of males ages 15 and above) 80.6 2009
Literacy rate, adult total (% of people ages 15 and above) 73.7 2009
Mortality rate, infant (per 1,000 live births) 58.1 2010
Mortality rate, under 5 (per 1,000) 92.1 2010
People living with HIV/AIDS, total 920,000 2009
Malnutrition prevalence, weight for age (% under age 5) 15.5 2006
Malnutrition prevalence, height for age (% under age 5) 53.2 2006
Telephone subscribers (%) 16.9 2009/10
Mobile-phone subscribers (%) 15.7 2009/10
Internet users (%) 4.7 2009/10
GEF benefits index for biodiversity (0 = no biodiversity potential to
100 = maximum) 3.5 2008
United Nations Development Programme (UNDP) Environmental
Performance Index 51.4 2010
Value
Malawi Country Indicators
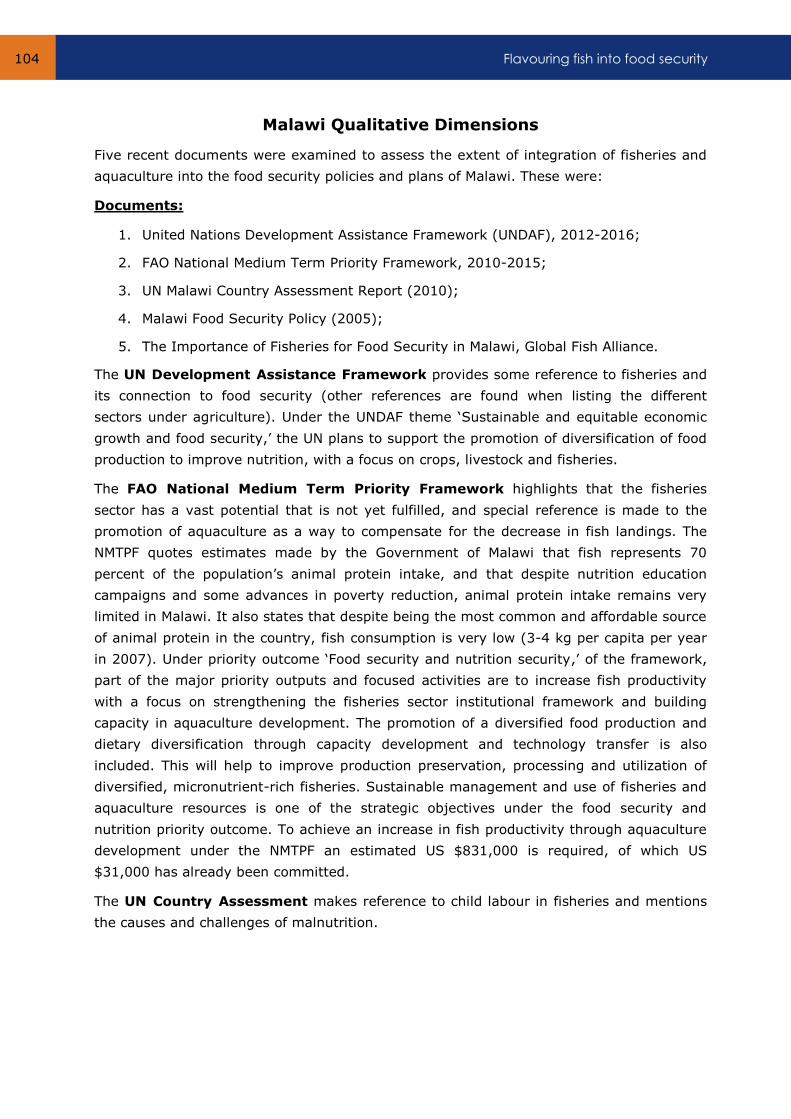
Flavouring fish into food security 104
Malawi Qualitative Dimensions
Five recent documents were examined to assess the extent of integration of fisheries and
aquaculture into the food security policies and plans of Malawi. These were:
Documents:
1. United Nations Development Assistance Framework (UNDAF), 2012-2016;
2. FAO National Medium Term Priority Framework, 2010-2015;
3. UN Malawi Country Assessment Report (2010);
4. Malawi Food Security Policy (2005);
5. The Importance of Fisheries for Food Security in Malawi, Global Fish Alliance.
The UN Development Assistance Framework provides some reference to fisheries and
its connection to food security (other references are found when listing the different
sectors under agriculture). Under the UNDAF theme ‘Sustainable and equitable economic
growth and food security,’ the UN plans to support the promotion of diversification of food
production to improve nutrition, with a focus on crops, livestock and fisheries.
The FAO National Medium Term Priority Framework highlights that the fisheries
sector has a vast potential that is not yet fulfilled, and special reference is made to the
promotion of aquaculture as a way to compensate for the decrease in fish landings. The
NMTPF quotes estimates made by the Government of Malawi that fish represents 70
percent of the population’s animal protein intake, and that despite nutrition education
campaigns and some advances in poverty reduction, animal protein intake remains very
limited in Malawi. It also states that despite being the most common and affordable source
of animal protein in the country, fish consumption is very low (3-4 kg per capita per year
in 2007). Under priority outcome ‘Food security and nutrition security,’ of the framework,
part of the major priority outputs and focused activities are to increase fish productivity
with a focus on strengthening the fisheries sector institutional framework and building
capacity in aquaculture development. The promotion of a diversified food production and
dietary diversification through capacity development and technology transfer is also
included. This will help to improve production preservation, processing and utilization of
diversified, micronutrient-rich fisheries. Sustainable management and use of fisheries and
aquaculture resources is one of the strategic objectives under the food security and
nutrition priority outcome. To achieve an increase in fish productivity through aquaculture
development under the NMTPF an estimated US $831,000 is required, of which US
$31,000 has already been committed.
The UN Country Assessment makes reference to child labour in fisheries and mentions
the causes and challenges of malnutrition.

Annexes 105
Despite the high incidence of fish noted in other documents, there is no mention of fish in
the analysis of causes of malnutrition. Some linkages may be found through the inclusion
of inadequate food storage, processing and utilization knowledge that results in food
wastage. The document also mentions that population growth along with reliance on low
productivity agriculture for income generation and unsustainable exploitation of the
environment may lead to the degradation and depletion of natural resources like fisheries.
In the chapter on food availability of the Food Security Policy document, it states that in
order to ensure the availability of food in sufficient quantities, adequate quality and variety
to meet demand at all times, one of the outputs foreseen is the promotion of fisheries and
aquaculture development. In order to achieve this, the strategies include integrating
aquaculture into irrigation development programs; creating a favourable investment
environment for fisheries and aquaculture; and empowering local communities to manage
fisheries resources.
The Importance of Fisheries for Food Security in Malawi paper collates information
from several documents. It states that the fisheries sector in 2003 directly employed
62,000 people and generated an additional 350,000 jobs. The fisheries sector contributed
to nearly 4 percent of the GDP in 2002. Fish is estimated to be the single most important
source of protein, contributing between 60 and 70 percent of national animal protein.
Regarding aquaculture, in 2002 there were about 4,000 farmers that owned and operated
around 7,000 fish ponds.
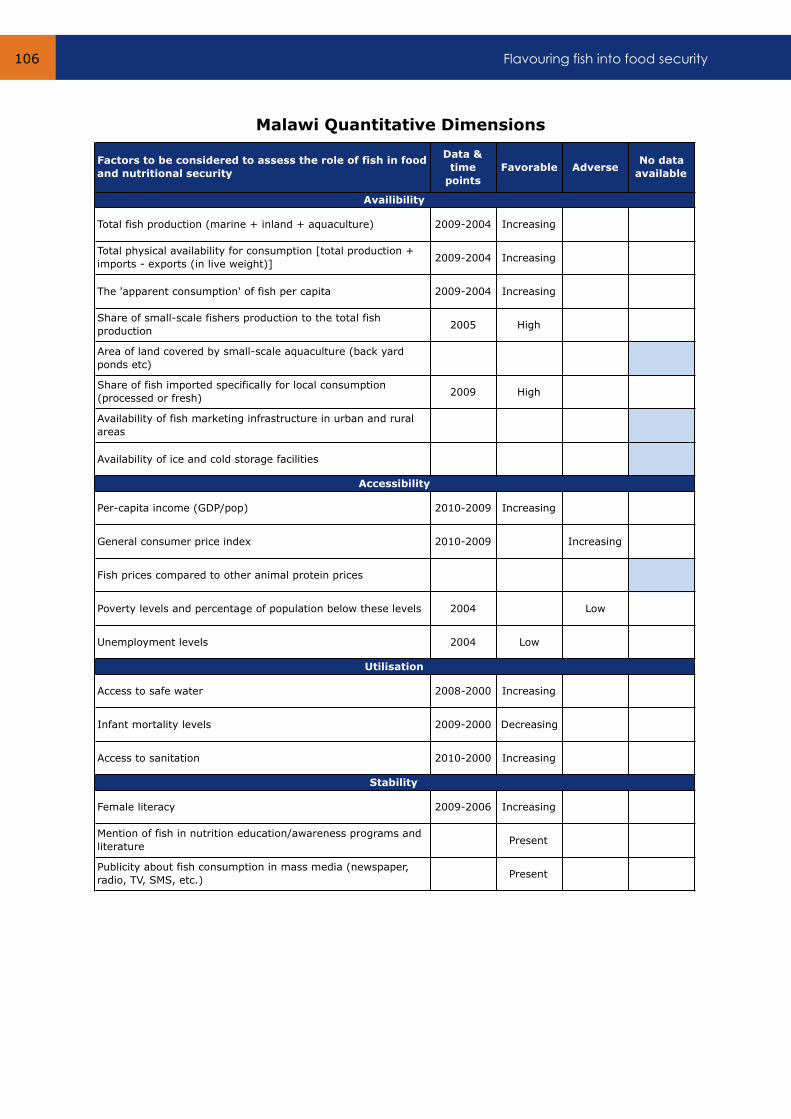
Flavouring fish into food security 106
Factors to be considered to assess the role of fish in food
and nutritional security
Data &
time
points
Favorable AdverseNo data
available
Total fish production (marine + inland + aquaculture) 2009-2004 Increasing
Total physical availability for consumption [total production +
imports - exports (in live weight)]2009-2004 Increasing
The 'apparent consumption' of fish per capita 2009-2004 Increasing
Share of small-scale fishers production to the total fish
production2005 High
Area of land covered by small-scale aquaculture (back yard
ponds etc)
Share of fish imported specifically for local consumption
(processed or fresh)2009 High
Availability of fish marketing infrastructure in urban and rural
areas
Availability of ice and cold storage facilities
Per-capita income (GDP/pop) 2010-2009 Increasing
General consumer price index 2010-2009 Increasing
Fish prices compared to other animal protein prices
Poverty levels and percentage of population below these levels 2004 Low
Unemployment levels 2004 Low
Access to safe water 2008-2000 Increasing
Infant mortality levels 2009-2000 Decreasing
Access to sanitation 2010-2000 Increasing
Female literacy 2009-2006 Increasing
Mention of fish in nutrition education/awareness programs and
literaturePresent
Publicity about fish consumption in mass media (newspaper,
radio, TV, SMS, etc.)Present
Availibility
Accessibility
Utilisation
Stability
Malawi Quantitative Dimensions
Annexes 107
MAURITIUS
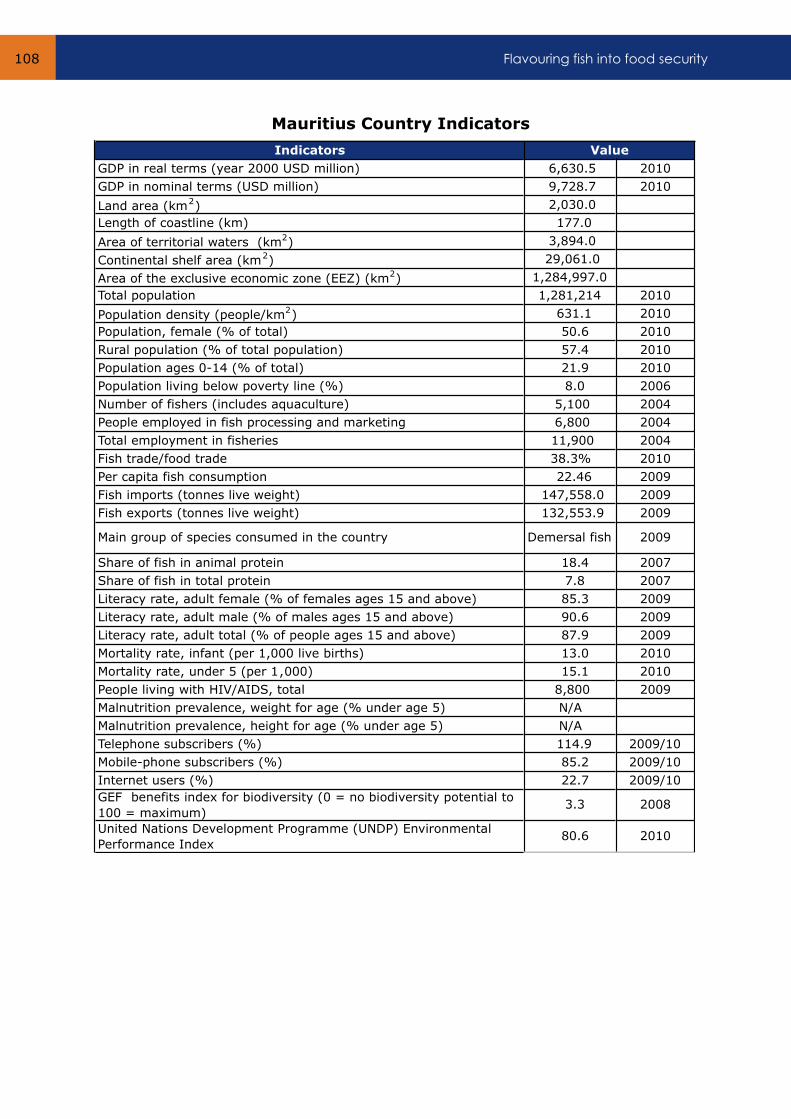
Flavouring fish into food security 108
Indicators
GDP in real terms (year 2000 USD million) 6,630.5 2010
GDP in nominal terms (USD million) 9,728.7 2010
Land area (km2) 2,030.0
Length of coastline (km) 177.0
Area of territorial waters (km2) 3,894.0
Continental shelf area (km2) 29,061.0
Area of the exclusive economic zone (EEZ) (km2) 1,284,997.0
Total population 1,281,214 2010
Population density (people/km2) 631.1 2010
Population, female (% of total) 50.6 2010
Rural population (% of total population) 57.4 2010
Population ages 0-14 (% of total) 21.9 2010
Population living below poverty line (%) 8.0 2006
Number of fishers (includes aquaculture) 5,100 2004
People employed in fish processing and marketing 6,800 2004
Total employment in fisheries 11,900 2004
Fish trade/food trade 38.3% 2010
Per capita fish consumption 22.46 2009
Fish imports (tonnes live weight) 147,558.0 2009
Fish exports (tonnes live weight) 132,553.9 2009
Main group of species consumed in the country Demersal fish 2009
Share of fish in animal protein 18.4 2007
Share of fish in total protein 7.8 2007
Literacy rate, adult female (% of females ages 15 and above) 85.3 2009
Literacy rate, adult male (% of males ages 15 and above) 90.6 2009
Literacy rate, adult total (% of people ages 15 and above) 87.9 2009
Mortality rate, infant (per 1,000 live births) 13.0 2010
Mortality rate, under 5 (per 1,000) 15.1 2010
People living with HIV/AIDS, total 8,800 2009
Malnutrition prevalence, weight for age (% under age 5) N/A
Malnutrition prevalence, height for age (% under age 5) N/A
Telephone subscribers (%) 114.9 2009/10
Mobile-phone subscribers (%) 85.2 2009/10
Internet users (%) 22.7 2009/10
GEF benefits index for biodiversity (0 = no biodiversity potential to
100 = maximum) 3.3 2008
United Nations Development Programme (UNDP) Environmental
Performance Index 80.6 2010
Value
Mauritius Country Indicators
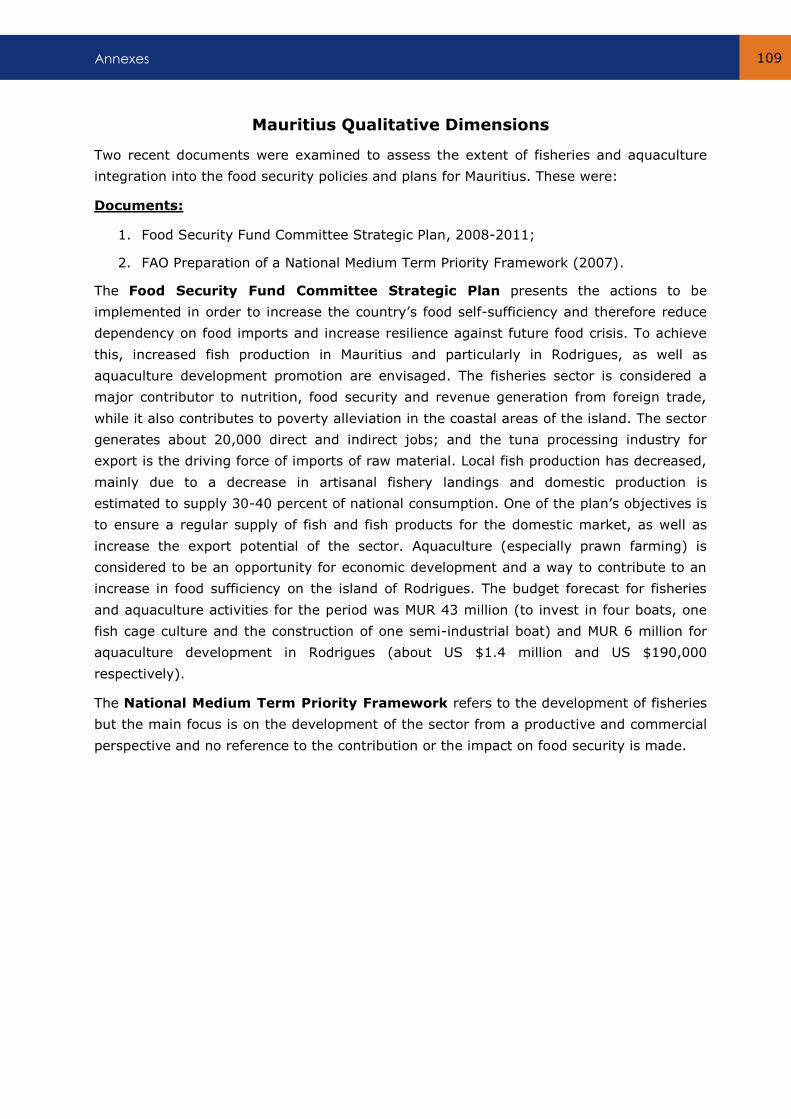
Annexes 109
Mauritius Qualitative Dimensions
Two recent documents were examined to assess the extent of fisheries and aquaculture
integration into the food security policies and plans for Mauritius. These were:
Documents:
1. Food Security Fund Committee Strategic Plan, 2008-2011;
2. FAO Preparation of a National Medium Term Priority Framework (2007).
The Food Security Fund Committee Strategic Plan presents the actions to be
implemented in order to increase the country’s food self-sufficiency and therefore reduce
dependency on food imports and increase resilience against future food crisis. To achieve
this, increased fish production in Mauritius and particularly in Rodrigues, as well as
aquaculture development promotion are envisaged. The fisheries sector is considered a
major contributor to nutrition, food security and revenue generation from foreign trade,
while it also contributes to poverty alleviation in the coastal areas of the island. The sector
generates about 20,000 direct and indirect jobs; and the tuna processing industry for
export is the driving force of imports of raw material. Local fish production has decreased,
mainly due to a decrease in artisanal fishery landings and domestic production is
estimated to supply 30-40 percent of national consumption. One of the plan’s objectives is
to ensure a regular supply of fish and fish products for the domestic market, as well as
increase the export potential of the sector. Aquaculture (especially prawn farming) is
considered to be an opportunity for economic development and a way to contribute to an
increase in food sufficiency on the island of Rodrigues. The budget forecast for fisheries
and aquaculture activities for the period was MUR 43 million (to invest in four boats, one
fish cage culture and the construction of one semi-industrial boat) and MUR 6 million for
aquaculture development in Rodrigues (about US $1.4 million and US $190,000
respectively).
The National Medium Term Priority Framework refers to the development of fisheries
but the main focus is on the development of the sector from a productive and commercial
perspective and no reference to the contribution or the impact on food security is made.
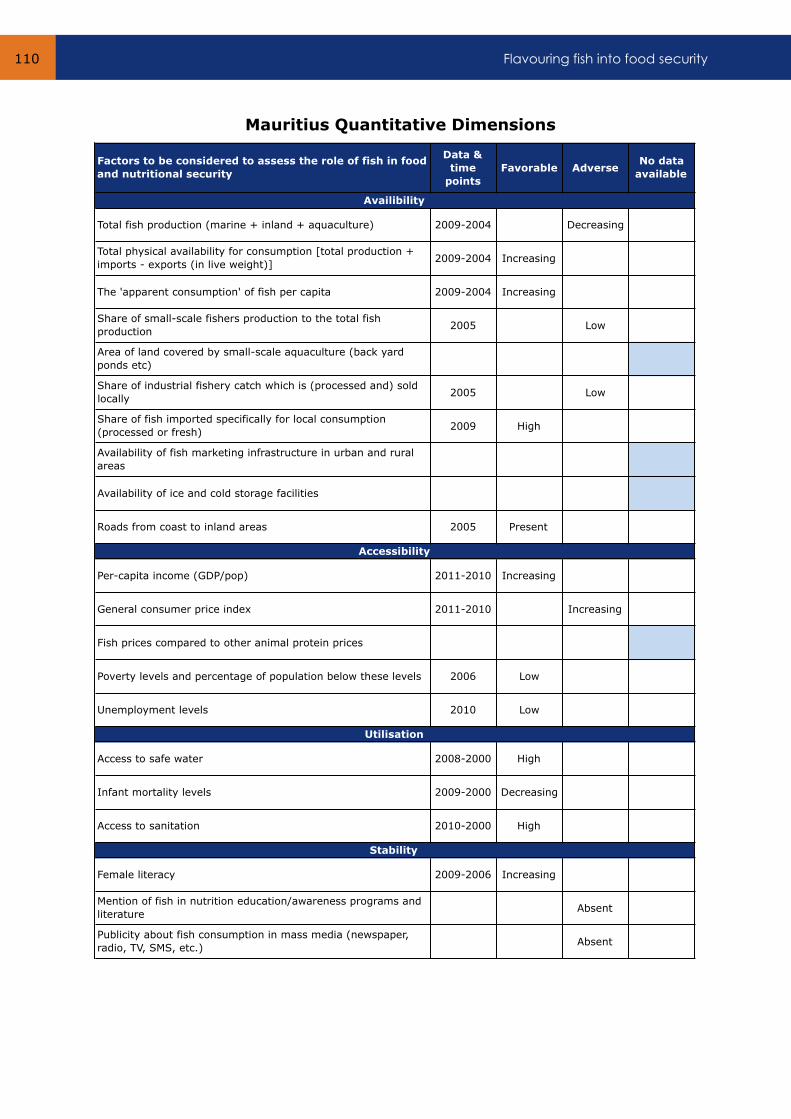
Flavouring fish into food security 110
Factors to be considered to assess the role of fish in food
and nutritional security
Data &
time
points
Favorable AdverseNo data
available
Total fish production (marine + inland + aquaculture) 2009-2004 Decreasing
Total physical availability for consumption [total production +
imports - exports (in live weight)]2009-2004 Increasing
The 'apparent consumption' of fish per capita 2009-2004 Increasing
Share of small-scale fishers production to the total fish
production2005 Low
Area of land covered by small-scale aquaculture (back yard
ponds etc)
Share of industrial fishery catch which is (processed and) sold
locally2005 Low
Share of fish imported specifically for local consumption
(processed or fresh)2009 High
Availability of fish marketing infrastructure in urban and rural
areas
Availability of ice and cold storage facilities
Roads from coast to inland areas 2005 Present
Per-capita income (GDP/pop) 2011-2010 Increasing
General consumer price index 2011-2010 Increasing
Fish prices compared to other animal protein prices
Poverty levels and percentage of population below these levels 2006 Low
Unemployment levels 2010 Low
Access to safe water 2008-2000 High
Infant mortality levels 2009-2000 Decreasing
Access to sanitation 2010-2000 High
Female literacy 2009-2006 Increasing
Mention of fish in nutrition education/awareness programs and
literatureAbsent
Publicity about fish consumption in mass media (newspaper,
radio, TV, SMS, etc.)Absent
Availibility
Accessibility
Utilisation
Stability
Mauritius Quantitative Dimensions
Annexes 111
RWANDA

Flavouring fish into food security 112
Indicators
GDP in real terms (year 2000 USD million) 3,593.7 2010
GDP in nominal terms (USD million) 5,627.7 2010
Land area (km2) 24,670.0
Length of coastline (km) N/A
Area of territorial waters (km2) N/A
Continental shelf area (km2) N/A
Area of the exclusive economic zone (EEZ) (km2) N/A
Total population 10,624,005 2010
Population density (people/km2) 430.6 2010
Population, female (% of total) 50.9 2010
Rural population (% of total population) 81.1 2010
Population ages 0-14 (% of total) 42.6 2010
Population living below poverty line (%) 58.5 2006
Number of fishers (includes aquaculture) 32,700 2005
People employed in fish processing and marketing 3,000 2005
Total employment in fisheries 35,700 2005
Fish trade/food trade 2.0% 2010
Per capita fish consumption 1.93 2009
Fish imports (tonnes live weight) 11,786.6 2009
Fish exports (tonnes live weight) 1,387.5 2009
Main group of species consumed in the country Freshwater and
diadromous fish2009
Share of fish in animal protein 12.8 2007
Share of fish in total protein 1.3 2007
Literacy rate, adult female (% of females ages 15 and above) 66.8 2009
Literacy rate, adult male (% of males ages 15 and above) 75.0 2009
Literacy rate, adult total (% of people ages 15 and above) 70.7 2009
Mortality rate, infant (per 1,000 live births) 59.1 2010
Mortality rate, under 5 (per 1,000) 91.1 2010
People living with HIV/AIDS, total 170,000 2009
Malnutrition prevalence, weight for age (% under age 5) 18.0 2005
Malnutrition prevalence, height for age (% under age 5) 51.7 2005
Telephone subscribers (%) 24.6 2009/10
Mobile-phone subscribers (%) 24.3 2009/10
Internet users (%) 45 2009/10
GEF benefits index for biodiversity (0 = no biodiversity potential to
100 = maximum) 0.9 2008
United Nations Development Programme (UNDP) Environmental
Performance Index 44.6 2010
Value
Rwanda Country Indicators
Annexes 113
Rwanda Qualitative Dimensions
The extent of fisheries and aquaculture integration into the food security policies and plans
of Rwanda were assessed by examining four recent documents. These are:
Documents:
1. United Nations Development Assistance Framework, 2008-2012;
2. FAO NMTPF Rwanda;
3. Strategic Plan for the Transformation of Agriculture in Rwanda – Phase II (Final
report – 2009);
4. Agriculture Sector Investment Plan 2009-2012.
In the UN Development Assistance Framework there is no reference to fisheries.
In the FAO NMTPF Rwanda (NMTPF) the reference to fisheries is as one of the productive
sectors to be supported by the African Bank of Development, for the development of lake
fisheries, and as one of the areas in which FAO is executing projects.
The Strategic Plan for the Transformation of Agriculture (SPTA) has, as an overall
objective, to increase agricultural output and incomes under sustainable production
systems for all groups of farmers, and to ensure food security for the entire population.
Under the programme of intensification and development of sustainable production
systems and the sub-programme integrated development and intensification of crops and
livestock, one of the objectives is to increase the output and value of the fisheries sub-
sector. One line of action in this framework is to intensify and extend the programme for
management of internal lakes and develop aquaculture with an emphasis on activities like
tilapia farming, which can increase food security and nutrition and provide alternative
sources of income for rural households. It is also foreseen to promote the development of
product chains for domestic and export markets, through the investment in infrastructure
and equipment for fishermen in Lake Kivu.
The Agriculture Sector Investment Plan takes the SPTA as a basis, and allocates funds
for the different programmes, but there is no specific identification of budget for fisheries
components.

Flavouring fish into food security 114
Factors to be considered to assess the role of fish in food
and nutritional security
Data &
time
points
Favorable AdverseNo data
available
Total fish production (marine + inland + aquaculture) 2009-2004 Increasing
Total physical availability for consumption [total production +
imports - exports (in live weight)]2009-2004 Increasing
The 'apparent consumption' of fish per capita 2009-2004 Increasing
Share of small-scale fishers production to the total fish
productionHigh
Area of land covered by small-scale aquaculture (back yard
ponds etc)
Share of fish imported specifically for local consumption
(processed or fresh)2009 High
Availability of fish marketing infrastructure in urban and rural
areas
Availability of ice and cold storage facilities
Per-capita income (GDP/pop) 2011-2010 Increasing
General consumer price index 2011-2010 Increasing
Fish prices compared to other animal protein prices
Poverty levels and percentage of population below these levels 2006 High
Unemployment levels
Access to safe water 2008-2000 Decreasing
Infant mortality levels 2009-2000 Decreasing
Access to sanitation 2010-2000 Increasing
Female literacy 2009-2008 Increasing
Mention of fish in nutrition education/awareness programs and
literaturePresent
Publicity about fish consumption in mass media (newspaper,
radio, TV, SMS, etc.)Present
Availibility
Accessibility
Utilisation
Stability
Rwanda Quantitative Dimensions

Annexes 115
SEYCHELLES
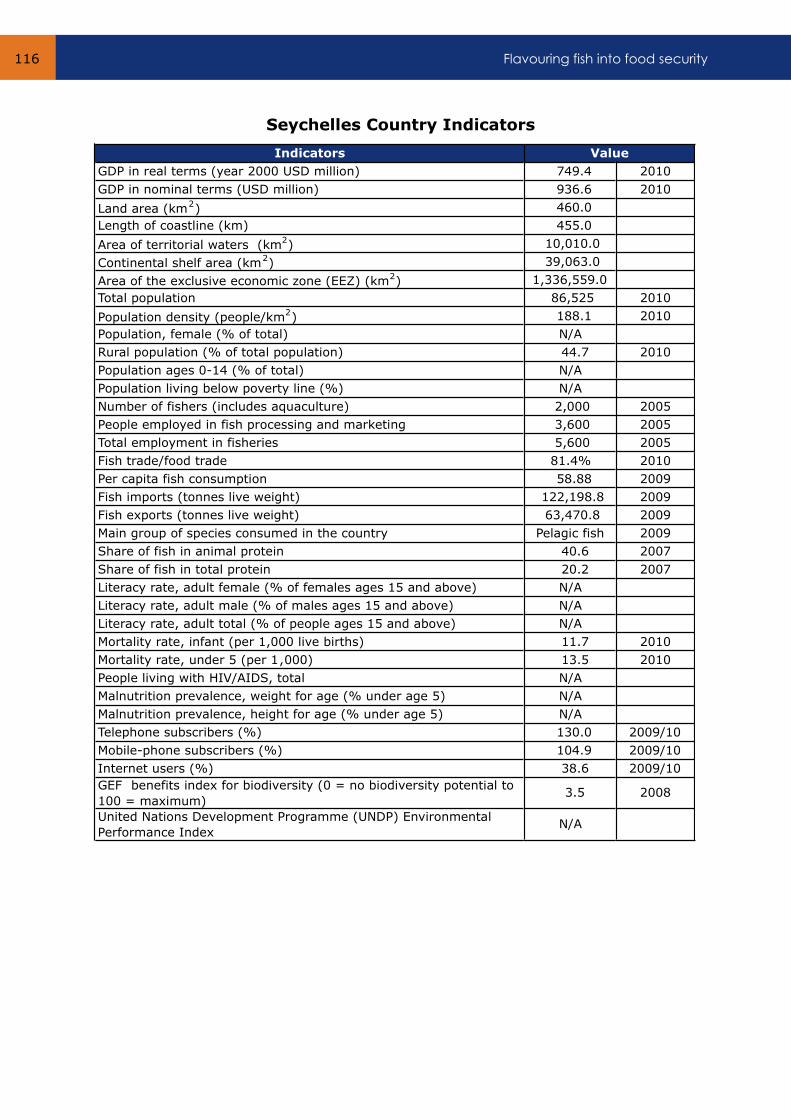
Flavouring fish into food security 116
Indicators
GDP in real terms (year 2000 USD million) 749.4 2010
GDP in nominal terms (USD million) 936.6 2010
Land area (km2) 460.0
Length of coastline (km) 455.0
Area of territorial waters (km2) 10,010.0
Continental shelf area (km2) 39,063.0
Area of the exclusive economic zone (EEZ) (km2) 1,336,559.0
Total population 86,525 2010
Population density (people/km2) 188.1 2010
Population, female (% of total) N/A
Rural population (% of total population) 44.7 2010
Population ages 0-14 (% of total) N/A
Population living below poverty line (%) N/A
Number of fishers (includes aquaculture) 2,000 2005
People employed in fish processing and marketing 3,600 2005
Total employment in fisheries 5,600 2005
Fish trade/food trade 81.4% 2010
Per capita fish consumption 58.88 2009
Fish imports (tonnes live weight) 122,198.8 2009
Fish exports (tonnes live weight) 63,470.8 2009
Main group of species consumed in the country Pelagic fish 2009
Share of fish in animal protein 40.6 2007
Share of fish in total protein 20.2 2007
Literacy rate, adult female (% of females ages 15 and above) N/A
Literacy rate, adult male (% of males ages 15 and above) N/A
Literacy rate, adult total (% of people ages 15 and above) N/A
Mortality rate, infant (per 1,000 live births) 11.7 2010
Mortality rate, under 5 (per 1,000) 13.5 2010
People living with HIV/AIDS, total N/A
Malnutrition prevalence, weight for age (% under age 5) N/A
Malnutrition prevalence, height for age (% under age 5) N/A
Telephone subscribers (%) 130.0 2009/10
Mobile-phone subscribers (%) 104.9 2009/10
Internet users (%) 38.6 2009/10
GEF benefits index for biodiversity (0 = no biodiversity potential to
100 = maximum) 3.5 2008
United Nations Development Programme (UNDP) Environmental
Performance Index N/A
Value
Seychelles Country Indicators
Annexes 117
Seychelles Qualitative Dimensions
Four recent documents were examined to assess the extent of fisheries and aquaculture
integration into the food security policies and plans of Seychelles. These were:
Documents:
1. FAO National Medium Term Priority Framework, 2007-2010 (draft);
2. Seychelles CAADP (2011);
3. Seychelles Fisheries Policy, 2005;
4. Seychelles Strategy, 2017.
The FAO National Medium Term Priority Framework contains an evaluation of the
contribution of the fisheries sector to the national economy, but no estimation of the
contribution to food security is given. It estimates that 10 percent of total households, or
the equivalent of 8,800 people depend, to some extent, on fisheries related activities;
while around 4,500 people are directly or indirectly employed by the fisheries sector.
Fisheries are considered the most promising activity in the agricultural sector and have
become the second largest employer in the country and the second main source of foreign
currency. The government has prepared a National Agricultural and Fisheries Policy 2003-
2013 (no copy could be obtained for this analysis), which includes the enhancement of
food security as one of the guiding principles.
The Comprehensive Africa Agriculture Development Programme (CAADP)
document was drawn up to support the implementation of the food security, trade and
diversification components of the Seychelles Medium Term National Development
Strategy. The development of sustainable fisheries is one of the five focus areas for
interventions and investment. The document sets out some production targets for food
items that are consumed locally but there is no target for fish production. The contribution
of fish to food security is highlighted. Despite the fact that the country relies on imports
for a substantial amount of the food consumed, it is acknowledged that fish provides a
significant amount of the protein component for the diet and accounts for 35-40 percent of
total protein consumed.
In the Fisheries Policy document, the only reference to food security is as one of the
overall policy objectives. The policy aims to enhance food supply and food security, with
steps to ensure that the country is self-sufficient in terms of fish and that the supply for
the domestic market is adequate at all times, with further emphasis on the importance of
fish consumption for nutrition.
Strategy 2017 has an overall goal to double the national GDP by 2017, boosting the
development of tourism and fisheries, the main economic activities of the country, in order
to develop other related activities. Regarding fisheries, the strategic overview is to
increase the yield and value, and the financial benefits by maximising domestic
production, promoting exports and increasing national stake holding in the industry.

Flavouring fish into food security 118
In 2005, the fishing industry accounted for 30 percent of national GDP. In relation to food
security and with reference to fisheries the document notes that the country should turn to
imported food products when it is more cost effective rather than trying to achieve self-
sufficiency. Care should also be taken to ensure that agricultural development policies do
not affect the development of key sectors like fisheries.
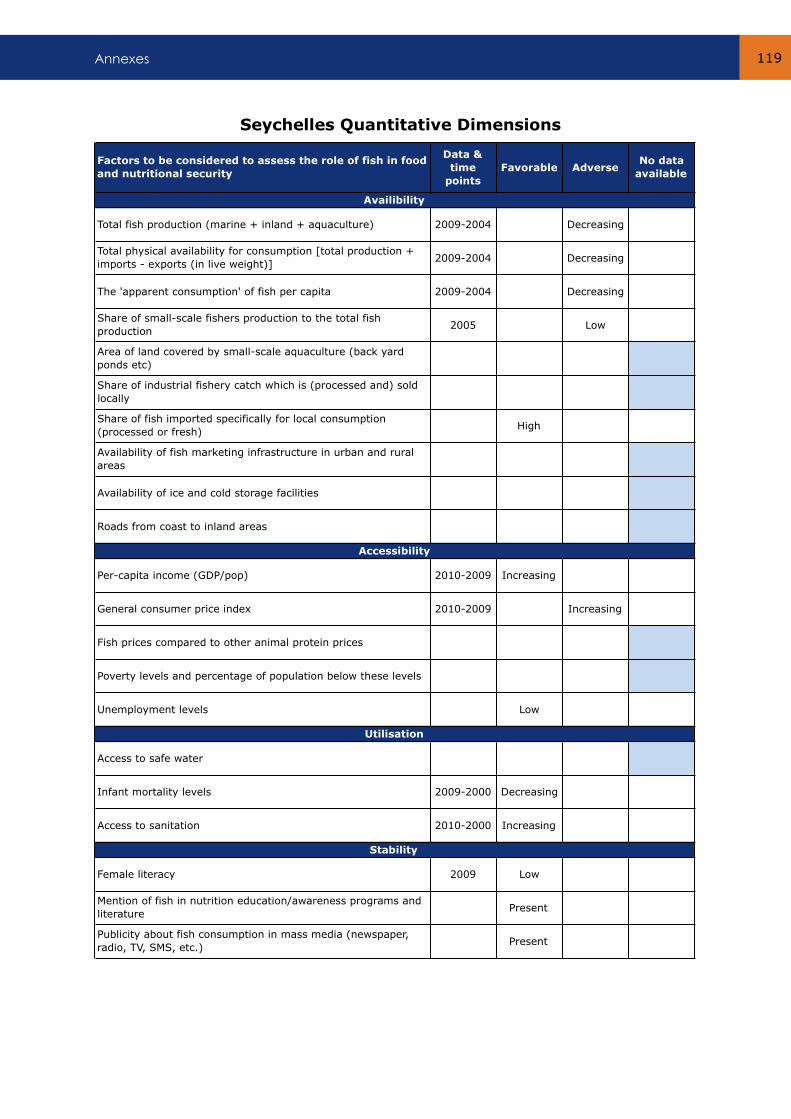
Annexes 119
Factors to be considered to assess the role of fish in food
and nutritional security
Data &
time
points
Favorable AdverseNo data
available
Total fish production (marine + inland + aquaculture) 2009-2004 Decreasing
Total physical availability for consumption [total production +
imports - exports (in live weight)]2009-2004 Decreasing
The 'apparent consumption' of fish per capita 2009-2004 Decreasing
Share of small-scale fishers production to the total fish
production2005 Low
Area of land covered by small-scale aquaculture (back yard
ponds etc)
Share of industrial fishery catch which is (processed and) sold
locally
Share of fish imported specifically for local consumption
(processed or fresh)High
Availability of fish marketing infrastructure in urban and rural
areas
Availability of ice and cold storage facilities
Roads from coast to inland areas
Per-capita income (GDP/pop) 2010-2009 Increasing
General consumer price index 2010-2009 Increasing
Fish prices compared to other animal protein prices
Poverty levels and percentage of population below these levels
Unemployment levels Low
Access to safe water
Infant mortality levels 2009-2000 Decreasing
Access to sanitation 2010-2000 Increasing
Female literacy 2009 Low
Mention of fish in nutrition education/awareness programs and
literaturePresent
Publicity about fish consumption in mass media (newspaper,
radio, TV, SMS, etc.)Present
Availibility
Accessibility
Utilisation
Stability
Seychelles Quantitative Dimensions
Flavouring fish into food security 120
SOMALIA
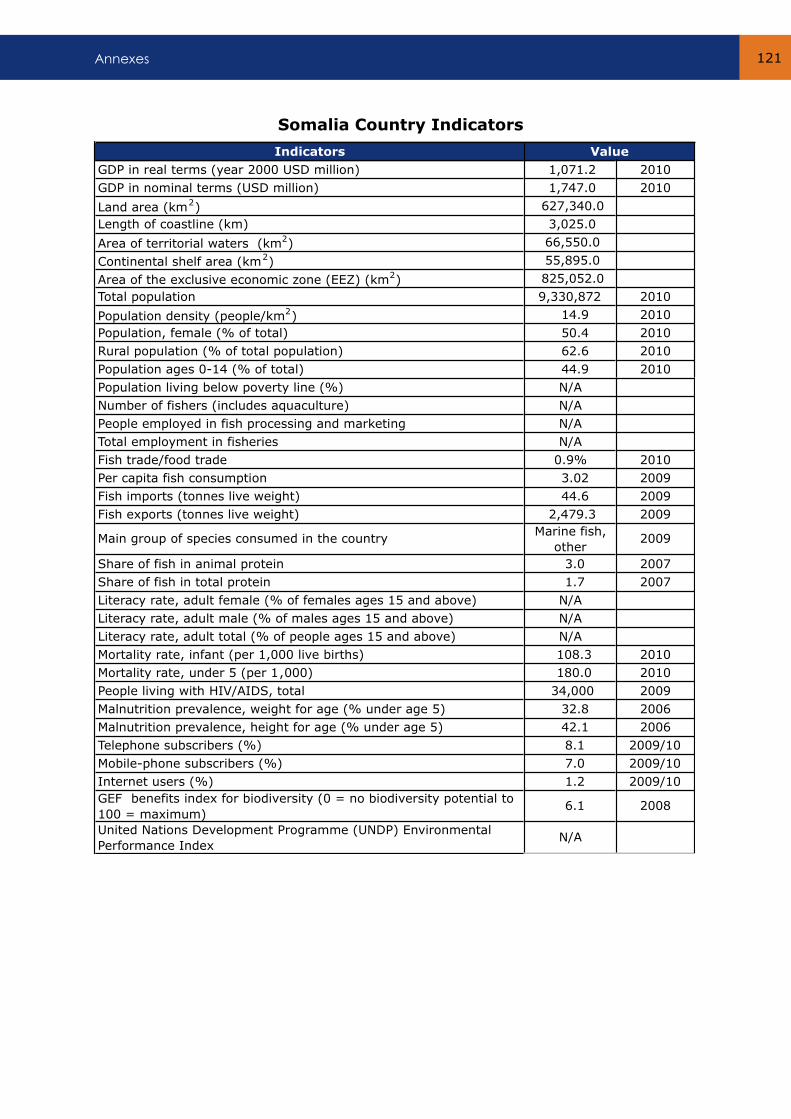
Annexes 121
Indicators
GDP in real terms (year 2000 USD million) 1,071.2 2010
GDP in nominal terms (USD million) 1,747.0 2010
Land area (km2) 627,340.0
Length of coastline (km) 3,025.0
Area of territorial waters (km2) 66,550.0
Continental shelf area (km2) 55,895.0
Area of the exclusive economic zone (EEZ) (km2) 825,052.0
Total population 9,330,872 2010
Population density (people/km2) 14.9 2010
Population, female (% of total) 50.4 2010
Rural population (% of total population) 62.6 2010
Population ages 0-14 (% of total) 44.9 2010
Population living below poverty line (%) N/A
Number of fishers (includes aquaculture) N/A
People employed in fish processing and marketing N/A
Total employment in fisheries N/A
Fish trade/food trade 0.9% 2010
Per capita fish consumption 3.02 2009
Fish imports (tonnes live weight) 44.6 2009
Fish exports (tonnes live weight) 2,479.3 2009
Main group of species consumed in the country Marine fish,
other2009
Share of fish in animal protein 3.0 2007
Share of fish in total protein 1.7 2007
Literacy rate, adult female (% of females ages 15 and above) N/A
Literacy rate, adult male (% of males ages 15 and above) N/A
Literacy rate, adult total (% of people ages 15 and above) N/A
Mortality rate, infant (per 1,000 live births) 108.3 2010
Mortality rate, under 5 (per 1,000) 180.0 2010
People living with HIV/AIDS, total 34,000 2009
Malnutrition prevalence, weight for age (% under age 5) 32.8 2006
Malnutrition prevalence, height for age (% under age 5) 42.1 2006
Telephone subscribers (%) 8.1 2009/10
Mobile-phone subscribers (%) 7.0 2009/10
Internet users (%) 1.2 2009/10
GEF benefits index for biodiversity (0 = no biodiversity potential to
100 = maximum) 6.1 2008
United Nations Development Programme (UNDP) Environmental
Performance Index N/A
Value
Somalia Country Indicators
Flavouring fish into food security 122
Somalia Qualitative Dimensions
Six recent documents were examined to assess the extent of fisheries and aquaculture
integration into the food security policies and plans of Somalia. These were:
Documents:
1. United Nations Somali Assistance Strategy, 2011-2015;
2. FAO 5 Year Strategy and Plan of Action, 2011-2015;
3. FAO/Somalia Plan of Action, 2011-2012;
4. UN-WB Somali Reconstruction and Development Programme – Deepening Peace
and Reducing Poverty – Volume I (draft), 2008;
5. Food Security and Nutrition Analysis Unit – Somalia – Food Security and Nutrition
Quarterly Brief (June 2012)
6. Food Security and Nutrition Analysis Unit – Somalia – Nutrition Update (May-June,
2012)
The UN Somali Assistance Strategy does not make any specific reference to the
fisheries or aquaculture sector. However, part of the UN response to reduce poverty and
improve livelihoods is to stimulate an increase in production levels for economic sectors
through a broad based economic development plan. One of the goals is to successfully
expand productive capabilities of the agriculture, livestock and fisheries sector, and this
will depend on the empowerment of youth. These sectors rely on the environment and the
UN will support the development and utilization of effective and sustainable systems of
natural resource management. One of the indicators for the achievement of the outcome
‘Key economic sectors increase sustainable production and productivity in partnership with
public and private sector’ is the level of income from fish sales and consumption of the
coastal population, with targets to be set as the percentage increase in income.
The FAO 5 Year Strategy and Plan of Action’s main goal is to improve livelihoods and
food security in the country. The strategy is centred on six strategic components, of which
the third is ‘sustainable fishing for increased incomes of fishing communities and
fishermen’ and the following component is ‘managing natural resources for recovery and
sustainable use’. Under each component, fisheries are also related to the first component
of the strategy, ‘increasing and stabilizing agricultural production and productivity and
rural families’ income’, since livelihoods and food security depend on production systems
based on natural resources: pastoralism, farming and fishing. The ‘sustainable fishing for
increased incomes of fishing communities and fishermen’ component is divided into two
outcomes, fishing sustainability, and increased family and community income.
Annexes 123
The results under the first outcome are: fisheries sustainably managed and regulated;
capacity for surveillance and monitoring fishing activities and to enforce fishing laws and
regulations in place; and fishermen awareness, knowledge and adoption of sustainable
fishing methods, gear and participatory management increased. The latter outcome falls
under one result, to increase in value and quality fish and fish products available for local
and export markets. The component ‘managing natural resources for recovery and
sustainable use’, has as one of its results, an improvement in access to natural resource
management information, which includes the provision of technical support for land, water,
forest and fisheries assessments and management. Although it is not fishery-specific, the
first component of the strategy, ‘increasing and stabilizing agricultural production and
productivity and rural families’ incomes, includes as a result the improvement in access to
markets and market information, and in terms of activities includes the rehabilitation of
infrastructure and local and urban markets, which would also benefit the trade of fishery
products.
The document lists marine fisheries as a productive sector. The country does not have
information on total annual fish captures, fish stocks or their status. There are no policies,
management plans or means to manage marine resources. There is also no infrastructure
to support the artisanal fishing industry with equipment, and the marketing chain is
rudimentary in most places. Marine resources are mainly exploited by foreign fishing
vessels, and therefore, the local economy obtains only a small benefit from this activity.
Demand for fishery products is increasing, particularly in urban areas, and there has been
a change in the perception of fishing activities, in favour of the development of trade in
addition to free and open markets. The sector has received minimal support, and post-
harvest losses are thought to be significant. Value addition in the small-scale fisheries
sector is virtually inexistent, while the existence of two tuna canning factories indicates
that there is room for interventions aimed at developing a processing industry. The
development of fisheries is also given as a means to reduce incentives to piracy, through
the generation of alternative sources of income. Demand in urban areas exceeds supply,
while there is scope for the increase of consumption in inland areas, as long as there is an
increase in supply. The document also acknowledges that ‘if sustainably is ensured and
managed, the Somali fisheries sector has the potential to significantly contribute to the
national economy through food security, foreign exchange earnings and the creation of
employment opportunities, on the condition that resources are managed in a sustainable
manner. Effective and sustainable fisheries resource management will require improved
fishing, storage, processing and market access infrastructure as well as adequate research
and stock assessments’.
Flavouring fish into food security 124
The overall impact of coastal fisheries in the country is small, engaging only 2 percent of
the population, but the contribution to household economies is uneven and seasonal. In
southern coastal fishing areas, fishing complements livestock income during the dry
seasons, while in the north fishing contributes to nearly 90 percent of annual household
income.
The lack of regulations implies that both industrial and artisanal fisheries disregard the
impact of their activity on marine systems and fish stocks. There are no policy or
regulatory frameworks, and there is no institutional strength or resources to implement
policy and enforce regulations. Improvement of income for artisanal fishermen is also
restrained by the lack of sufficient infrastructure, weak market chains, poor equipment and
the absence of quality control and safety certifications. The development of the fisheries
sector would bring direct net benefits to people living in coastal areas, through the
generation of alternative income options and improved nutrition through the consumption
of fish.
The FAO/Somalia Plan of Action is derived from the FAO Strategy. It has the same
goals and is structured around the same strategic components. The document describes
how the strategy will be implemented over the first two years. The Plan of Action aims to
reduce poverty, improve food security and gain control of resources in order to assure
sustainability. It outlines actions in crucial sectors, among which fisheries and natural
resources are included. The areas of action related to fisheries are: to manage and
regulate fisheries for sustainability; develop fisheries extension services; build capacity to
monitor fishing activities and to enforce fishing laws and regulations; increase awareness
and build support among fishermen for sustainable fishing; increase the quality and value
of fish products for local and export markets; and development of aquaculture. There is no
direct reference to the contribution of fisheries to food security, or the potential of the
sector to improve food security in the country. The Plan of Action estimates that nearly
400,000 Somalis obtain their income from fisheries, and it recognizes the potential to
generate new employment and foreign currency, while the present situation of the sector
limits its contribution to the economy. On the other hand, it states that the potential for
aquaculture is not being exploited, and if developed, it could become an important source
of employment in rural areas, generate income and improve nutrition. Expected returns of
supporting actions in the fisheries sector are the opening of new employment
opportunities, increased income and public revenue, but there is no mention of possible
enhanced food security, despite the fact that the strategy reports that in the north of the
country fisheries account for 90 percent of household’s annual income.
The UN and WB Somali Reconstruction and Development Programme (Volume I)
quotes FAO estimates that fish and crustaceans potential output is up to 1,500 percent
higher than current levels.
Annexes 125
Throughout the document, references to fisheries focus on three driving concepts: the
creation of an environment fit for private investment that allows sector growth, expands
employment and reduces poverty; sustainable use of resources, through the establishment
of a legal framework and enforcement capabilities; and the reconstruction of infrastructure
for business operations and trade. Fisheries are listed as one of the key areas of private
sector activity. Among the activities programmed for the Economic Recovery, Institution
Building and Resources Mobilization Committee it is the introduction of a sound regulatory
framework that improves processing, human resources development, technological and
scientific innovation to achieve sustainable and productive fisheries, along with other
productive sectors as well as the rehabilitation of the fisheries sector. Support for the
private sector is evaluated as key to rapid economic growth and the expansion of
productive capacity. One of the short and medium-term priorities listed is the rehabilitation
of the ports to ease trade, as well as the extension of a network for secondary ports and
jetties to facilitate the development of local fisheries. Fishing is included as one of the key
productive sectors to be rebuilt. In order to achieve this, it proposes better regulation of
the sector and actions to recover marine resources and to control boats and activities
through investment in public infrastructure and equipment to allow enforcement. The
document mentions that the search for livelihoods are one of the threats to natural
resources, the success to achieve sustainable natural resource management will depend
on the generation of alternative livelihoods and employment.
In the section dedicated to ‘Improving livelihood and food security’, there is a special
reference to the impact of illegal fisheries on artisanal fishermen’s livelihoods. The
priorities to improve and diversify livelihoods and reduce livelihood insecurity, among
others are: the rehabilitation of key productive sectors (including fisheries); the expansion
of alternative livelihood opportunities through private sector development of other
activities; and the rehabilitation of infrastructure to link markets and reduce the cost of
doing business. In the results matrix, the monitoring and management of fisheries
resources is included as a target outcome as part of the rebuilding of the productive sector
and regulations of production falls under the actions and intermediate outcomes to achieve
the target of ensuring environmental sustainability. However, there is no reference in the
document to the contribution of fisheries to food security, and there is no reference to the
development of aquaculture.
The Food Security and Nutrition Quarterly Brief refers to the decline in fisheries
activities in the northern regions due to the high monsoon period as well as the start-up of
trade between Somalia and Yemen. The next seasonal peak for fishing activities is
between October 2012 and February 2013. The Nutrition Update has only one reference
to fisheries, stating that the reduction in fisheries activities due to weather conditions
contributed to the poor nutrition situation in the area of Bossasso Town in the north of the
country, where the nutrition situation is considered critical.
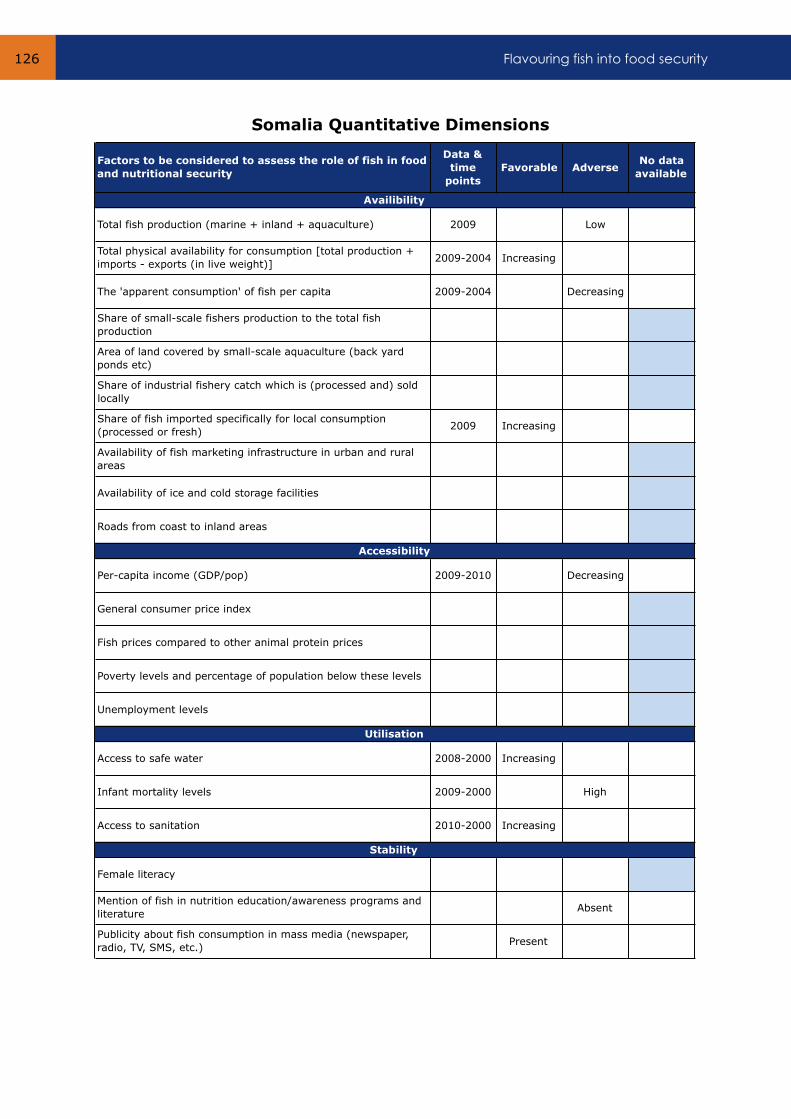
Flavouring fish into food security 126
Factors to be considered to assess the role of fish in food
and nutritional security
Data &
time
points
Favorable AdverseNo data
available
Total fish production (marine + inland + aquaculture) 2009 Low
Total physical availability for consumption [total production +
imports - exports (in live weight)]2009-2004 Increasing
The 'apparent consumption' of fish per capita 2009-2004 Decreasing
Share of small-scale fishers production to the total fish
production
Area of land covered by small-scale aquaculture (back yard
ponds etc)
Share of industrial fishery catch which is (processed and) sold
locally
Share of fish imported specifically for local consumption
(processed or fresh)2009 Increasing
Availability of fish marketing infrastructure in urban and rural
areas
Availability of ice and cold storage facilities
Roads from coast to inland areas
Per-capita income (GDP/pop) 2009-2010 Decreasing
General consumer price index
Fish prices compared to other animal protein prices
Poverty levels and percentage of population below these levels
Unemployment levels
Access to safe water 2008-2000 Increasing
Infant mortality levels 2009-2000 High
Access to sanitation 2010-2000 Increasing
Female literacy
Mention of fish in nutrition education/awareness programs and
literatureAbsent
Publicity about fish consumption in mass media (newspaper,
radio, TV, SMS, etc.)Present
Availibility
Accessibility
Utilisation
Stability
Somalia Quantitative Dimensions
Annexes 127
SOUTH SUDAN
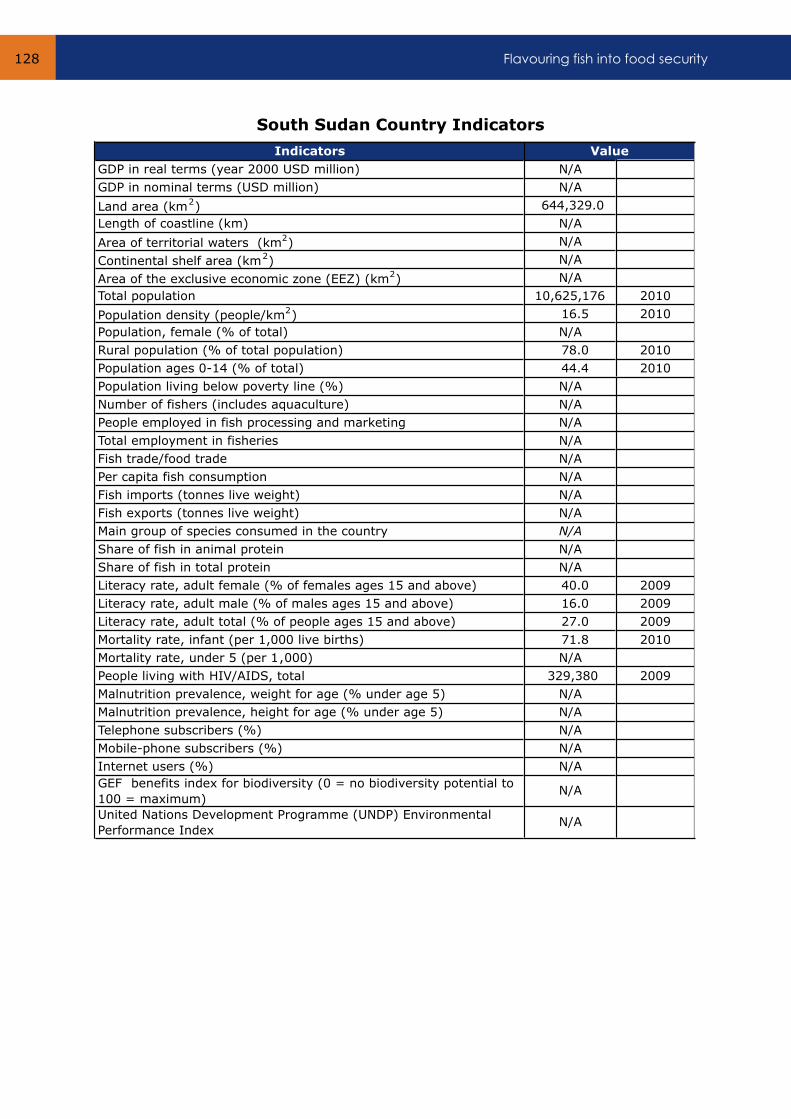
Flavouring fish into food security 128
Indicators
GDP in real terms (year 2000 USD million) N/A
GDP in nominal terms (USD million) N/A
Land area (km2) 644,329.0
Length of coastline (km) N/A
Area of territorial waters (km2) N/A
Continental shelf area (km2) N/A
Area of the exclusive economic zone (EEZ) (km2) N/A
Total population 10,625,176 2010
Population density (people/km2) 16.5 2010
Population, female (% of total) N/A
Rural population (% of total population) 78.0 2010
Population ages 0-14 (% of total) 44.4 2010
Population living below poverty line (%) N/A
Number of fishers (includes aquaculture) N/A
People employed in fish processing and marketing N/A
Total employment in fisheries N/A
Fish trade/food trade N/A
Per capita fish consumption N/A
Fish imports (tonnes live weight) N/A
Fish exports (tonnes live weight) N/A
Main group of species consumed in the country N/A
Share of fish in animal protein N/A
Share of fish in total protein N/A
Literacy rate, adult female (% of females ages 15 and above) 40.0 2009
Literacy rate, adult male (% of males ages 15 and above) 16.0 2009
Literacy rate, adult total (% of people ages 15 and above) 27.0 2009
Mortality rate, infant (per 1,000 live births) 71.8 2010
Mortality rate, under 5 (per 1,000) N/A
People living with HIV/AIDS, total 329,380 2009
Malnutrition prevalence, weight for age (% under age 5) N/A
Malnutrition prevalence, height for age (% under age 5) N/A
Telephone subscribers (%) N/A
Mobile-phone subscribers (%) N/A
Internet users (%) N/A
GEF benefits index for biodiversity (0 = no biodiversity potential to
100 = maximum) N/A
United Nations Development Programme (UNDP) Environmental
Performance Index N/A
Value
South Sudan Country Indicators
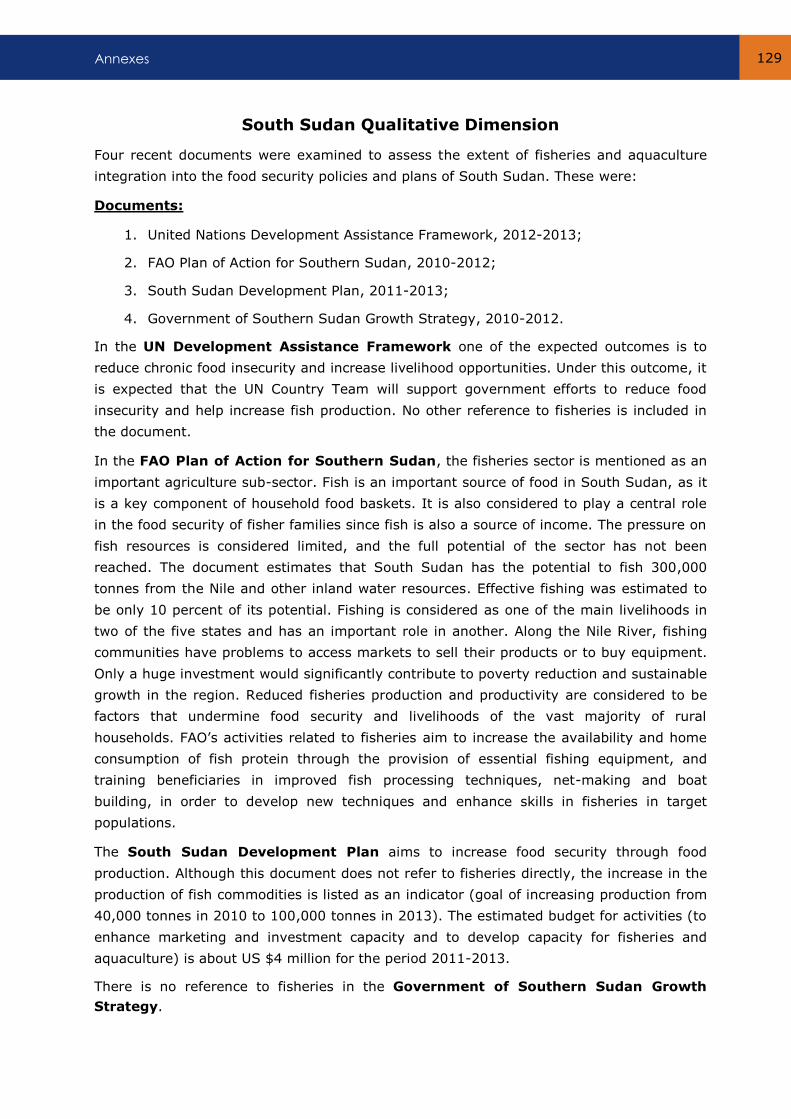
Annexes 129
South Sudan Qualitative Dimension
Four recent documents were examined to assess the extent of fisheries and aquaculture
integration into the food security policies and plans of South Sudan. These were:
Documents:
1. United Nations Development Assistance Framework, 2012-2013;
2. FAO Plan of Action for Southern Sudan, 2010-2012;
3. South Sudan Development Plan, 2011-2013;
4. Government of Southern Sudan Growth Strategy, 2010-2012.
In the UN Development Assistance Framework one of the expected outcomes is to
reduce chronic food insecurity and increase livelihood opportunities. Under this outcome, it
is expected that the UN Country Team will support government efforts to reduce food
insecurity and help increase fish production. No other reference to fisheries is included in
the document.
In the FAO Plan of Action for Southern Sudan, the fisheries sector is mentioned as an
important agriculture sub-sector. Fish is an important source of food in South Sudan, as it
is a key component of household food baskets. It is also considered to play a central role
in the food security of fisher families since fish is also a source of income. The pressure on
fish resources is considered limited, and the full potential of the sector has not been
reached. The document estimates that South Sudan has the potential to fish 300,000
tonnes from the Nile and other inland water resources. Effective fishing was estimated to
be only 10 percent of its potential. Fishing is considered as one of the main livelihoods in
two of the five states and has an important role in another. Along the Nile River, fishing
communities have problems to access markets to sell their products or to buy equipment.
Only a huge investment would significantly contribute to poverty reduction and sustainable
growth in the region. Reduced fisheries production and productivity are considered to be
factors that undermine food security and livelihoods of the vast majority of rural
households. FAO’s activities related to fisheries aim to increase the availability and home
consumption of fish protein through the provision of essential fishing equipment, and
training beneficiaries in improved fish processing techniques, net-making and boat
building, in order to develop new techniques and enhance skills in fisheries in target
populations.
The South Sudan Development Plan aims to increase food security through food
production. Although this document does not refer to fisheries directly, the increase in the
production of fish commodities is listed as an indicator (goal of increasing production from
40,000 tonnes in 2010 to 100,000 tonnes in 2013). The estimated budget for activities (to
enhance marketing and investment capacity and to develop capacity for fisheries and
aquaculture) is about US $4 million for the period 2011-2013.
There is no reference to fisheries in the Government of Southern Sudan Growth
Strategy.
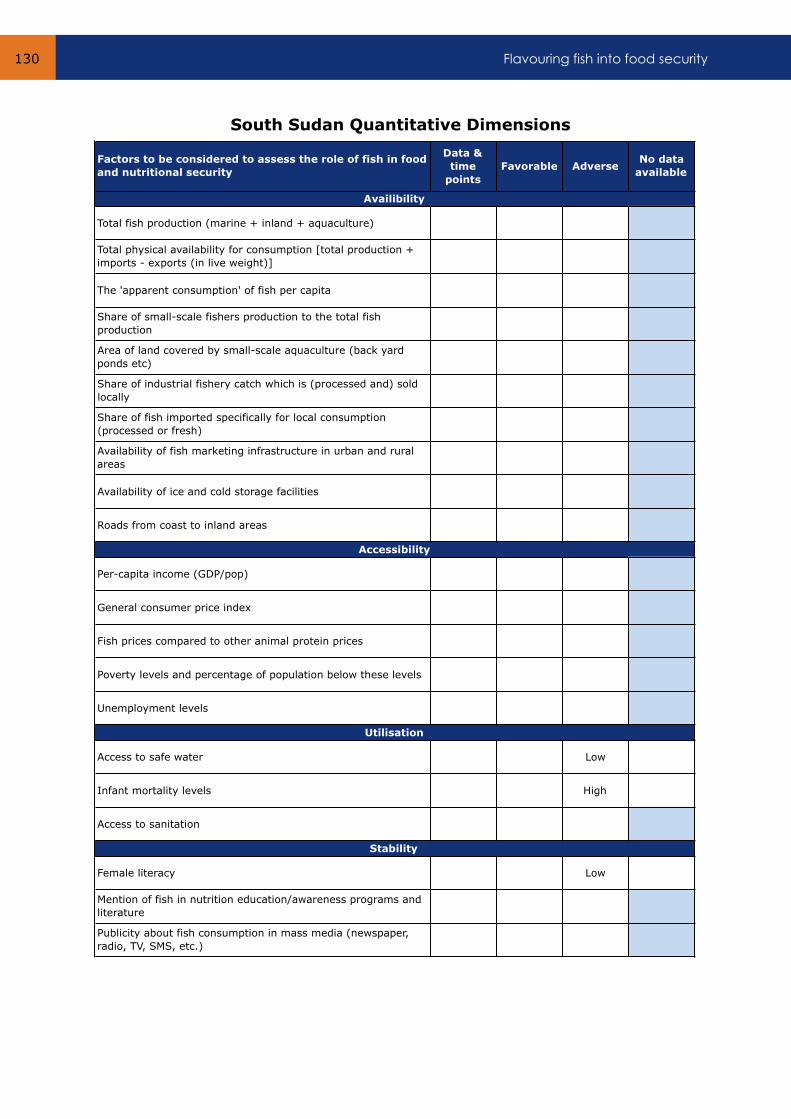
Flavouring fish into food security 130
Factors to be considered to assess the role of fish in food
and nutritional security
Data &
time
points
Favorable AdverseNo data
available
Total fish production (marine + inland + aquaculture)
Total physical availability for consumption [total production +
imports - exports (in live weight)]
The 'apparent consumption' of fish per capita
Share of small-scale fishers production to the total fish
production
Area of land covered by small-scale aquaculture (back yard
ponds etc)
Share of industrial fishery catch which is (processed and) sold
locally
Share of fish imported specifically for local consumption
(processed or fresh)
Availability of fish marketing infrastructure in urban and rural
areas
Availability of ice and cold storage facilities
Roads from coast to inland areas
Per-capita income (GDP/pop)
General consumer price index
Fish prices compared to other animal protein prices
Poverty levels and percentage of population below these levels
Unemployment levels
Access to safe water Low
Infant mortality levels High
Access to sanitation
Female literacy Low
Mention of fish in nutrition education/awareness programs and
literature
Publicity about fish consumption in mass media (newspaper,
radio, TV, SMS, etc.)
Availibility
Accessibility
Utilisation
Stability
South Sudan Quantitative Dimensions
Annexes 131
SUDAN

Flavouring fish into food security 132
Indicators
GDP in real terms (year 2000 USD million) 22,819.1 2010
GDP in nominal terms (USD million) 62,045.8 2010
Land area (km2) 2,376,000.0
Length of coastline (km) 853.0
Area of territorial waters (km2) 18,766.0
Continental shelf area (km2) 19,827.0
Area of the exclusive economic zone (EEZ) (km2) 68,148.0
Total population 43,551,941 2010
Population density (people/km2) 18.3 2010
Population, female (% of total) 49.6 2010
Rural population (% of total population) 54.8 2010
Population ages 0-14 (% of total) 40.1 2010
Population living below poverty line (%) 40.0 2004
Number of fishers (includes aquaculture) 12,900 2006
People employed in fish processing and marketing 51,600 2006
Total employment in fisheries 64,500 2006
Fish trade/food trade 0.5% 2010
Per capita fish consumption 3.02 2009
Fish imports (tonnes live weight) 4,247.1 2009
Fish exports (tonnes live weight) 606.9 2009
Main group of species consumed in the country Freshwater and
diadromous fish2009
Share of fish in animal protein 1.8 2007
Share of fish in total protein 0.7 2007
Literacy rate, adult female (% of females ages 15 and above) N/A
Literacy rate, adult male (% of males ages 15 and above) N/A
Literacy rate, adult total (% of people ages 15 and above) N/A
Mortality rate, infant (per 1,000 live births) 66.4 2010
Mortality rate, under 5 (per 1,000) 103.3 2010
People living with HIV/AIDS, total 260,000 2009
Malnutrition prevalence, weight for age (% under age 5) 31.7 2006
Malnutrition prevalence, height for age (% under age 5) 37.9 2006
Telephone subscribers (%) 37.2 2009/10
Mobile-phone subscribers (%) 36.3 2009/10
Internet users (%) 9.9 2009/10
GEF benefits index for biodiversity (0 = no biodiversity potential to
100 = maximum) 5.1 2008
United Nations Development Programme (UNDP) Environmental
Performance Index 47.1 2010
Value
Sudan Country Indicators
Annexes 133
Sudan Qualitative Dimension
Five recent documents were examined to assess the extent of fisheries and aquaculture
integration into the food security policies and plans of Sudan. These were:
Documents:
1. United Nations Development Assistance Framework (UNDAF), 2009-2012;
2. FAO National Medium Term Priority Framework 2008-2012;
3. FAO Plan of Action for North Sudan 2010-2012;
4. FAO Country Programming Framework 2012-2016 (Final draft);
5. National Food Security Action Plan (2008).
One of the outcomes of the UN Development Assistance Framework (UNDAF) relates
to livelihoods and productive sectors, and under this outcome, the framework mentions
that there is a need to increase food security, improve agricultural productivity and
strengthen sustainable fisheries practices. There are no further references to fisheries in
the UNDAF.
In the FAO National Medium Term Priority Framework (NMTPF), all references to
fisheries fall under the general context along with the remaining productive sectors, and
no reference to the impact on food security is presented.
The FAO Plan of Action for North Sudan (PoA) includes limited opportunities and
constraints to fisheries production among the factors linked to vulnerability and under-
nutrition among food-insecure populations. It estimates that high food prices mean that 76
percent of the resource-limited population are affected by serious food insecurity and this
has become a threat for their survival. One of the priorities to cope with the problem of
reduced livestock production and productivity is fisheries promotion through training on
gear making and fish processing. The goal of FAO’s response through the PoA is to
improve food security and livelihoods for rural populations and one of the programs to
support and improve production is support to fishing households. There is no further
relevant reference to fisheries, or any specific fund allocations.
The section dedicated to agriculture, food security and rural development in the FAO
Country Programming Framework, includes fisheries as part of the agriculture sector.
Sudan’s potential in terms of fisheries is highlighted given the availability of both
freshwater and marine fish resources. It estimates that current captures are no more than
30 percent of potential levels. The availability of these resources is also considered part of
the opportunities the country has related to the issue of food security, agriculture and
rural development. Under the priority area to enhance production, productivity and
competitiveness of the agricultural sector, it is expected that some of the actions to be
undertaken by FAO include mobilization of resources and technical assistance for the
development of aquaculture and artisanal fisheries.

Flavouring fish into food security 134
The National Food Security Action Plan (NFSAP), was drawn up prior to the separation
of South Sudan but mentions North and South Sudan separately. The document notes that
the fisheries sector has significant potential, but gives no reliable quantitative information.
One NFSAP’s programs is the promotion of smallholder based food production, and part of
one of the sub-programs is support for smallholder fisheries production. Fisher folk are
considered among the most vulnerable groups in Sudan. Fisheries constitute an important
livelihood for displaced populations. The program has a specific component to support
small-scale fisher folks. The objective of the first component of the project, related to
inland fisheries, is to improve the food security level of fisher folks and other vulnerable
groups with livelihoods depending essentially on the traditional fisheries sector. The
second component, focused on fresh water rural aquaculture development, aims to
improve the health status of vulnerable groups subject to protein deficiency and water
borne diseases. This component seeks to address the imbalance in animal protein intake
by promoting aquaculture in irrigation channels, in order to control insects and aquatic
weeds. The budget allocated for these two components was US $8.25 million and US $2.75
million.
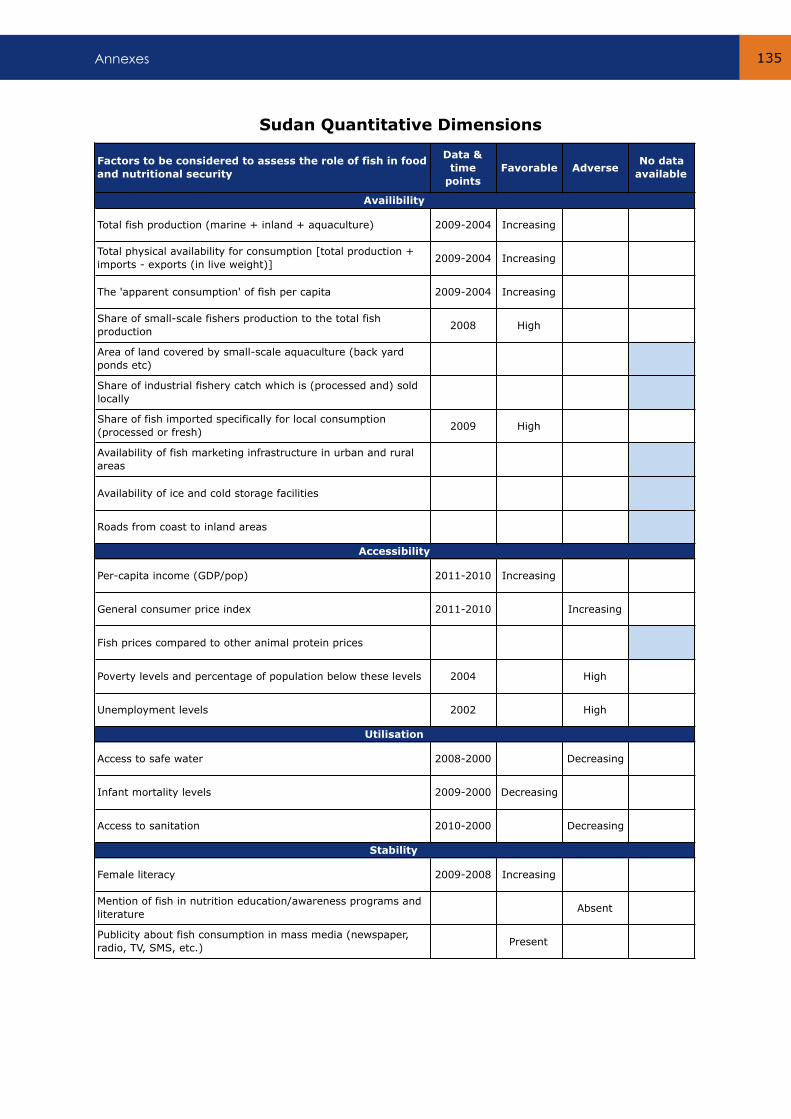
Annexes 135
Factors to be considered to assess the role of fish in food
and nutritional security
Data &
time
points
Favorable AdverseNo data
available
Total fish production (marine + inland + aquaculture) 2009-2004 Increasing
Total physical availability for consumption [total production +
imports - exports (in live weight)]2009-2004 Increasing
The 'apparent consumption' of fish per capita 2009-2004 Increasing
Share of small-scale fishers production to the total fish
production2008 High
Area of land covered by small-scale aquaculture (back yard
ponds etc)
Share of industrial fishery catch which is (processed and) sold
locally
Share of fish imported specifically for local consumption
(processed or fresh)2009 High
Availability of fish marketing infrastructure in urban and rural
areas
Availability of ice and cold storage facilities
Roads from coast to inland areas
Per-capita income (GDP/pop) 2011-2010 Increasing
General consumer price index 2011-2010 Increasing
Fish prices compared to other animal protein prices
Poverty levels and percentage of population below these levels 2004 High
Unemployment levels 2002 High
Access to safe water 2008-2000 Decreasing
Infant mortality levels 2009-2000 Decreasing
Access to sanitation 2010-2000 Decreasing
Female literacy 2009-2008 Increasing
Mention of fish in nutrition education/awareness programs and
literatureAbsent
Publicity about fish consumption in mass media (newspaper,
radio, TV, SMS, etc.)Present
Availibility
Accessibility
Utilisation
Stability
Sudan Quantitative Dimensions
Flavouring fish into food security 136
SWAZILAND
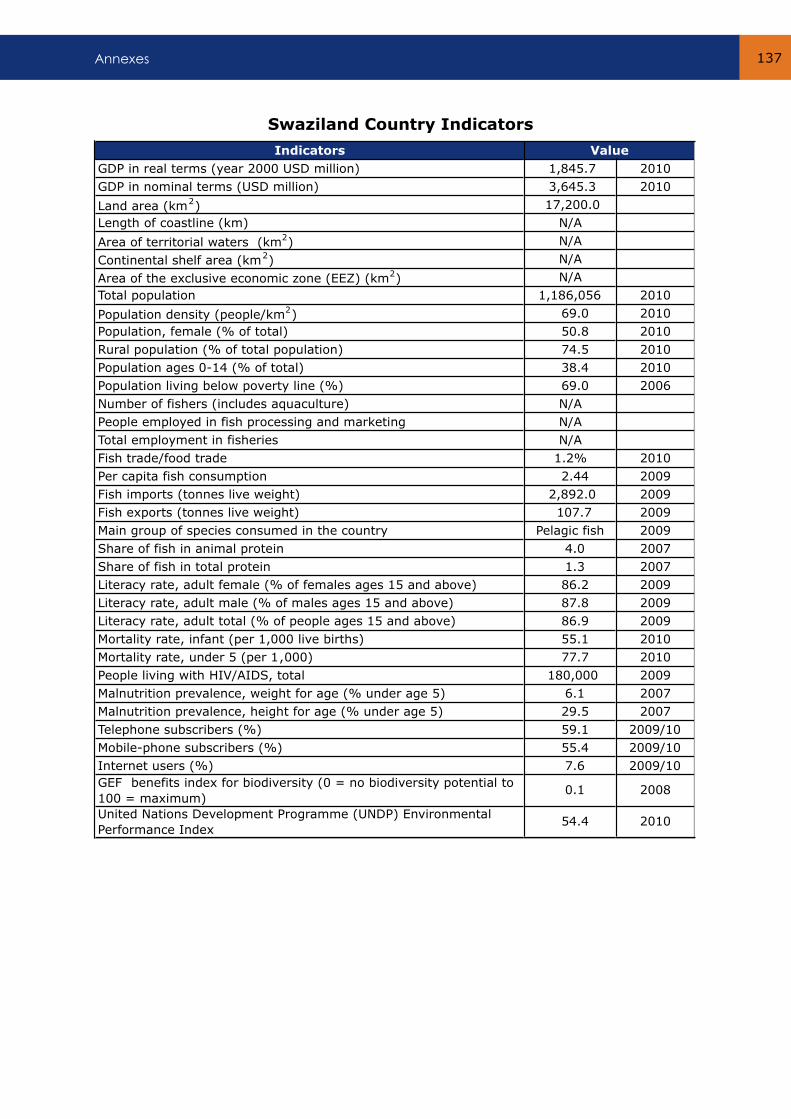
Annexes 137
Indicators
GDP in real terms (year 2000 USD million) 1,845.7 2010
GDP in nominal terms (USD million) 3,645.3 2010
Land area (km2) 17,200.0
Length of coastline (km) N/A
Area of territorial waters (km2) N/A
Continental shelf area (km2) N/A
Area of the exclusive economic zone (EEZ) (km2) N/A
Total population 1,186,056 2010
Population density (people/km2) 69.0 2010
Population, female (% of total) 50.8 2010
Rural population (% of total population) 74.5 2010
Population ages 0-14 (% of total) 38.4 2010
Population living below poverty line (%) 69.0 2006
Number of fishers (includes aquaculture) N/A
People employed in fish processing and marketing N/A
Total employment in fisheries N/A
Fish trade/food trade 1.2% 2010
Per capita fish consumption 2.44 2009
Fish imports (tonnes live weight) 2,892.0 2009
Fish exports (tonnes live weight) 107.7 2009
Main group of species consumed in the country Pelagic fish 2009
Share of fish in animal protein 4.0 2007
Share of fish in total protein 1.3 2007
Literacy rate, adult female (% of females ages 15 and above) 86.2 2009
Literacy rate, adult male (% of males ages 15 and above) 87.8 2009
Literacy rate, adult total (% of people ages 15 and above) 86.9 2009
Mortality rate, infant (per 1,000 live births) 55.1 2010
Mortality rate, under 5 (per 1,000) 77.7 2010
People living with HIV/AIDS, total 180,000 2009
Malnutrition prevalence, weight for age (% under age 5) 6.1 2007
Malnutrition prevalence, height for age (% under age 5) 29.5 2007
Telephone subscribers (%) 59.1 2009/10
Mobile-phone subscribers (%) 55.4 2009/10
Internet users (%) 7.6 2009/10
GEF benefits index for biodiversity (0 = no biodiversity potential to
100 = maximum) 0.1 2008
United Nations Development Programme (UNDP) Environmental
Performance Index 54.4 2010
Value
Swaziland Country Indicators
Flavouring fish into food security 138
Swaziland Qualitative Dimension
The extent of fisheries and aquaculture integration into the food security policies and plans
of Swaziland were assessed by examining six recent documents. These include
Documents:
1. United Nations Development Assistance Framework (UNDAF), 2011-2015;
2. UNDAF 2011-2015 Complementary Country Analysis;
3. Strategy Brief for National Food Security and Agriculture Development, horizon
2015;
4. National Food Security Policy for Swaziland (2005);
5. National Programme for Food Security (draft, 2006);
6. Freshwater Fisheries and Aquaculture Policy in Swaziland (final draft, 2011).
There is no reference to fisheries or aquaculture in the United Nations Development
Assistance Framework or in the UNDAF Complementary Country Analysis.
The Strategy Brief for National Food Security and Agriculture Development
includes fish as a component of the ideal dietary composition of the Dietary Energy Supply
(DES). Fish should, along with other animal products, represent 25 percent of the DES.
Animal products represented 14.6 percent of total DES in 2001. The strategy includes,
with the objective of improving access to nutritious quality food and its utilization, under
the priority area of promotion of alternative non-agriculture rural livelihoods and income
earning opportunities, actions aimed at the development and strengthening of sustainable
alternative livelihoods and vocational skills in non-agricultural activities, such as
aquaculture. With the objective of stimulating marketing of livestock and fisheries
products, under the priority area of improvement of fisheries and aquaculture production,
actions for the promotion and development of aquaculture to boost income and provide
nutritious food are also included.
The National Food Security Policy acknowledges that sound policies and strategies on
agriculture (including fisheries) are essential to a food security policy. One of the policy
principles is to respect and protect the rights of individuals over resources such as fish.
Fisheries and aquaculture are included under three of the four pillars of the policy, namely:
(i) food availability; (ii) food access, and (iii) food utilisation and nutritional requirements.
Under the food availability pillar, in order to improve the impact of gender on food
availability through special programmes, the policy aims to gather information and
integrate it in programmes aimed at improving food availability, women’s traditional
knowledge and skills in fisheries. The policy has a specific component for the promotion of
fisheries and aquaculture. The potential of fisheries and aquaculture to play an important
role in food security by providing food of high nutritional value is also recognised.

Annexes 139
The contribution of these sectors to national food security is seen to be minor. The
document includes a list of strategies to stimulate the development of fisheries and
aquaculture to improve food security, that include the assessment of resources, the
integration of projects in national development programmes and the promotion of
investment. The promotion of aquaculture as an alternative livelihood to increase income
in rural communities is included under the food access pillar of the policy. Finally, under
the pillar of food utilization and nutritional requirements, the policy aims to promote food
and dietary diversification, as one of the issues is that fish is currently an insignificant
component of the national diet.
The National Programme for Food Security takes the National Food Security Policy as
an input, and proposes interventions. In order to stimulate the development of fisheries
and aquaculture to improve food security, the proposed intervention is establishing a
fingerling hatchery, with an allocated budget of US $500,000. Among the food security
priorities, one of the components is the intensification and diversification of production and
one of the subcomponents is aquaculture. This component will focus on the promotion and
development of small-scale aquaculture through the establishment of a hatchery and fish
farming demonstrations. The outcomes and indicators are the establishment of the
hatchery and demonstrations, to identify markets for fish products and to increase fish
production and consumption. The budget is US $850,000 (of which US $500,000 is
earmarked for the establishment of the hatchery) scaling up to US $1.7 million.
The Freshwater Fisheries and Aquaculture Policy also takes the National Food
Security Policy as a starting point. As part of its objectives the policy mentions the
development of subsistence, small-scale and intensive commercial fish farming; and the
integration of fish and agrarian farming into current subsistence and small-scale
commercial farming programs. The latter aims, not only to allow farmers to increase their
level of food security and income, but also to reduce their dependence on government and
donors. Regular access to fish protein is also highlighted as very important for Swaziland,
since it represents an important source of nutrition to curb the effects of HIV and AIDS.
Subsistence aquaculture (the only type of aquaculture in the country according to the
policy document) is not considered to be sustainable in the long term, but its promotion is
still seen to be a way to diversify food sources for rural farmers, and therefore, reduce
their risk of food insecurity and shortages.

Flavouring fish into food security 140
Factors to be considered to assess the role of fish in food
and nutritional security
Data &
time
points
Favorable AdverseNo data
available
Total fish production (marine + inland + aquaculture) 2009 Low
Total physical availability for consumption [total production +
imports - exports (in live weight)]2009-2004 Decreasing
The 'apparent consumption' of fish per capita 2009-2004 Decreasing
Share of small-scale fishers production to the total fish
production2008 High
Area of land covered by small-scale aquaculture (back yard
ponds etc)
Share of fish imported specifically for local consumption
(processed or fresh)2009 High
Availability of fish marketing infrastructure in urban and rural
areas
Availability of ice and cold storage facilities
Per-capita income (GDP/pop) 2011-2010 Increasing
General consumer price index 2011-2010 Increasing
Fish prices compared to other animal protein prices
Poverty levels and percentage of population below these levels 2006 High
Unemployment levels 2006 High
Access to safe water 2008-2000 Increasing
Infant mortality levels 2009-2000 Decreasing
Access to sanitation 2010-2000 Increasing
Female literacy 2009-2008 Increasing
Mention of fish in nutrition education/awareness programs and
literature
Publicity about fish consumption in mass media (newspaper,
radio, TV, SMS, etc.)
Availibility
Accessibility
Utilisation
Stability
Swaziland Quantitative Dimensions
Annexes 141
TANZANIA
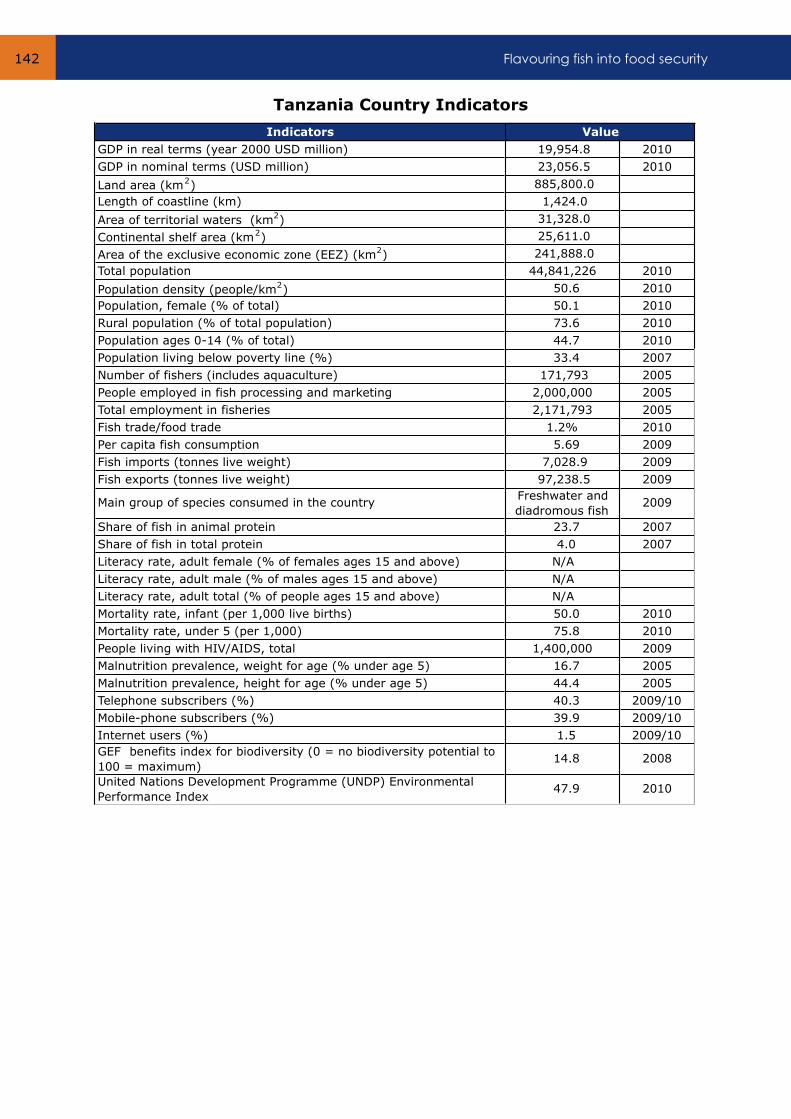
Flavouring fish into food security 142
Indicators
GDP in real terms (year 2000 USD million) 19,954.8 2010
GDP in nominal terms (USD million) 23,056.5 2010
Land area (km2) 885,800.0
Length of coastline (km) 1,424.0
Area of territorial waters (km2) 31,328.0
Continental shelf area (km2) 25,611.0
Area of the exclusive economic zone (EEZ) (km2) 241,888.0
Total population 44,841,226 2010
Population density (people/km2) 50.6 2010
Population, female (% of total) 50.1 2010
Rural population (% of total population) 73.6 2010
Population ages 0-14 (% of total) 44.7 2010
Population living below poverty line (%) 33.4 2007
Number of fishers (includes aquaculture) 171,793 2005
People employed in fish processing and marketing 2,000,000 2005
Total employment in fisheries 2,171,793 2005
Fish trade/food trade 1.2% 2010
Per capita fish consumption 5.69 2009
Fish imports (tonnes live weight) 7,028.9 2009
Fish exports (tonnes live weight) 97,238.5 2009
Main group of species consumed in the country Freshwater and
diadromous fish2009
Share of fish in animal protein 23.7 2007
Share of fish in total protein 4.0 2007
Literacy rate, adult female (% of females ages 15 and above) N/A
Literacy rate, adult male (% of males ages 15 and above) N/A
Literacy rate, adult total (% of people ages 15 and above) N/A
Mortality rate, infant (per 1,000 live births) 50.0 2010
Mortality rate, under 5 (per 1,000) 75.8 2010
People living with HIV/AIDS, total 1,400,000 2009
Malnutrition prevalence, weight for age (% under age 5) 16.7 2005
Malnutrition prevalence, height for age (% under age 5) 44.4 2005
Telephone subscribers (%) 40.3 2009/10
Mobile-phone subscribers (%) 39.9 2009/10
Internet users (%) 1.5 2009/10
GEF benefits index for biodiversity (0 = no biodiversity potential to
100 = maximum) 14.8 2008
United Nations Development Programme (UNDP) Environmental
Performance Index 47.9 2010
Value
Tanzania Country Indicators
Annexes 143
Tanzania Qualitative Dimensions
Eight recent documents were examined to assess the extent of fisheries and aquaculture
integration into the food security policies and plans of Tanzania. These include:
Documents:
1. National Food Security Policy (NFSP), 2005;
2. Tanzania Agriculture and Food Security Investment Plan (TAFSIP), 2011-12/2020-
21;
3. National Nutrition Strategy, July 2009-June 2015;
4. Food Security in Tanzania: Enabling Environment, Opportunities & Constraints;
5. United Nations Development Assistance Plan (UNDAP), 2011-2015;
6. The Zanzibar Food Security And Nutrition Act;
7. Zanzibar Food Security & Nutrition Situational Analysis1, RGoZ, 2006;
8. Zanzibar Food Security and Nutrition Programme, RGoZ April 2008.
The National Food Security Policy (NFSP) mentions that about 95 percent of total food
requirements in Tanzania are produced domestically. The indicator for food self-sufficiency
presented in the document is the self-sufficiency ratio. The document mentions that this
ratio may not capture the total extent of food availability, since it does not take into
account some food commodities that are produced or obtained at the household level,
such as fish and other marine or aquatic products. Fishery products, among other products
listed, are important in the Tanzanian food basket and contribute significantly to food
availability. It is also worth highlighting that when identifying groups vulnerable to food
insecurity, which would require specific interventions, the document does not list
fishermen among them. Among other sectorial and sub-sectorial policies with direct impact
on food security, reference is made to a National Fisheries Policy (1997), which aims to
promote efficient utilization of available fisheries resources in order to contribute to the
growth of national and household food supply and dietary diversification. The NFSP has the
mission ‘to promote sustainable aggregate food production and productivity, trade
accessibility and utilisation of safe and nutritionally balanced food’. One of the objectives is
to promote sustainable food availability through increased production, productivity and
trade. One of the issues related to this objective is the low productivity of labour and other
inputs due to inadequate use of inputs or capital that enhance productivity, limited
availability of support services and appropriate technologies. In order to cope with this
issue, the policy proposes government actions to promote the participation of the private
sector in the supply of inputs and activities for the productive sectors, including fishing
equipment. To deal with the issue of high post-harvest losses, the government should
promote better handling and improved storage of food and food products at all levels, as
well as promote value addition to fish.
Flavouring fish into food security 144
The Tanzania Agriculture and Food Security Investment Plan (TAFSIP) is a ten-year
investment plan and not an agricultural development strategy or programme, with a goal
of 6 percent annual growth for agricultural GDP. The document uses a broad definition of
the agricultural sector, to include all forms of agriculture, livestock, fisheries, forestry,
irrigation and natural resource management. The primary beneficiaries will be, among
others, smallholder fishing households adopting improved practices that increase food
production and cash income generation. The document also acknowledges that
smallholders are not a homogeneous group, and include farmers, pastoralists, fishers and
combinations of these. According the TAFSIP, Tanzania’s production is dominated by
small-scale subsistence producers, and this includes fisheries. The fishing sector has been
growing at around 5 percent per annum, but is affected by over-exploitation of inshore
resources and underutilisation of deep sea resources.
One of the key issues regarding sustainable water resources use and management on
mainland Tanzania is the over-exploitation of common property resources, such as
fisheries. Key issues regarding productivity on the mainland concern the limited
aquaculture practices, while in Zanzibar there is inadequate knowledge of aquaculture and
seaweed farming resulting in low exploitation of aquaculture potential. With regard to
commercialisation, the key issues that affects growth rates (on the mainland) according to
the document are: limited knowledge about value adding opportunities and innovative
marketing approaches; poor market linkages forward and backward in the marketing
chain; inadequate skills for business; value chain development and value addition etc. In
Zanzibar, the main topics related to commercialisation are: the lack of investment in deep
sea fisheries development and inshore aquaculture industries (including seaweed
production and processing); low fish quality and standards due to poor fishing technology;
handling; post-harvest losses and under developed fish value chain; and inadequate
quality control infrastructure for fisheries (such as laboratories, fish landing sites, etc.).
The overall objective of the investment plan is to transform the agricultural sector in
general, from a subsistence to a market-based economy, for which it requires investment
in infrastructure, market access and trade for the production of the sectors included in the
analysis. Poor infrastructure and inadequate knowledge for producers to identify potential
markets (at both the domestic and international level) are seen as constraints for
development. The key issues in Zanzibar are: weak management of fish and animal
health; poor enforcement of food safety controls in the mainland; low fish quality and
standards due to poor fishing technology; handling; post-harvest losses; underdeveloped
value chains; and inadequate quality control of infrastructures for fisheries.
Annexes 145
With regard to food security, several factors contribute to food and nutrition insecurity.
The main factors affecting food security are, among others related to other sectors, low
productivity of fisheries, high post-harvest losses depleting food stocks, variable food
prices, and inadequate and poor food storage facilities at the household level. Additionally,
nutritional security is affected by the low availability of nutritious foods, including fish.
In relation to climate change mitigation and adaptation, in order to broaden the capacity
to analyse and predict food security crisis, the plan states the necessity to expand the
national cereal balance and include fisheries and other sources of food in the population’s
diet. Issues of food availability and prices, purchasing power and nutritional needs should
also be addressed. One of the relevant issues in Zanzibar is the destruction of coastal and
marine eco-systems, as well as the lack of adequate database for fisheries management
(the latter point is related to policy reforms and support presented in the plan).
In the chapter dedicated to priority investment areas, the first priority area relates to the
use and management of water resources. Improvements in this area are thought to be
critical for the sustainability of production and productivity, since the water is used for
both irrigation and fisheries. The second main area is productivity and commercialisation.
The TAFSIP focuses on increasing the productivity of the main food production sectors as
well as fisheries and aquaculture through increased use of improved inputs, extension and
research services. Fisheries and aquaculture are considered to play a vital role in the
nutritional value of food and are considered to be main income generators in some
communities. Specific measures will be taken to improve fisheries and aquaculture
production and management, including infrastructure and sanitary measures. Also, in
order to increase commercialisation, processing and value addition are considered
important, and post-harvest losses are estimated at about 20 percent for the fisheries
sector, due to inadequate processing facilities.
The TAFSIP includes a global investment plan, but there is no mention of funds specifically
for fisheries and/or aquaculture activities.
In the National Nutrition Strategy the only reference to fisheries that can be found is
that the Ministry of Fisheries is one of the many agencies that have nutrition concerns.
In the Food Security in Tanzania: Enabling Environment, Opportunities &
Constraints paper the first reference to the relation between fish and food security is the
lack of an analytical framework for the implementation of policies. This refers to a ban on
fish exports in order to encourage value addition. This has resulted in lower prices due to
reduced demand and threatens food security by reducing the income of fishermen. The
paper also states that export taxes and the lack of fish markets have caused an increase in
the smuggling fish to Kenya.
Flavouring fish into food security 146
The document mentions the impact of rising food prices on food security, allowing for both
an increase in income and a hike in the cost of purchasing food. Short term, Tanzania is
considered a net food importer and higher food prices deteriorate in terms of trade.
Fishing communities are considered one of the populations’ groups that are net food
buyers and therefore would be negatively affected by this trend. The impact of fisheries on
food security is presented in a specific section. Fisheries contribution to GDP is estimated
between 1.6 percent and 3.1 percent. Artisanal fisheries account for 90 percent of the
sector’s activity, and industrial fisheries account for the remaining 10 percent.
Aquaculture, according to FAO estimates employs 17,000 people (13,000 in fish farming
and 4,000 in seaweed farming). Fisheries is considered a fundamental activity for food
security, since nearly 30 percent of protein intake by Tanzanians comes from the 10
percent of fish production that it is marketed locally. The development of fisheries faces
seven major obstacles: inadequate knowledge of fishery data bases and resources;
inadequate quality of fish seeds used in aquaculture; inadequate extension services; lack
of funding for research; poor access to capital for fishermen; lack of market information;
and poor infrastructure for fish production and processing. The document proposes a
series of indicators to assess the signs of food insecurity related to natural resources. The
indicators for fisheries are: terms of trade for fish products in local currency (price of
exports/price of imports); percentage of fish stocks that are overexploited; and the change
in the annual number of fishing vessels committing a severe violation. Finally, in the
recommendations section, the paper acknowledges great potential for the development of
Tanzania’s fisheries, and the fish processing industry in particular, suggesting development
of the canning of some species from Lake Tanganyika and Lake Victoria, as well as others
from the marine EEZ.
The UN Development Assistance Plan makes many references to fisheries. The first
one is that fisheries have not benefited from structural changes in the country’s economy
due to the fact that they are labour intensive. When discussing the environmental and
climate change context, the plan mentions that demand for fresh water, natural products
and environmental degradation stretch resource utilization and management. There is a
special reference to the threat that illegal fishing poses for the sustainability of marine
stocks. In the programme of cooperation, no mention is made about fisheries, apart from
FAO being listed as the agency responsible for improving fisheries and the Emergency
Preparedness and Response (EPR) for fisheries. The document highlights the need for
sustainable natural resource management for the country’s fresh water and marine areas.
Annexes 147
Finally, in the programme results matrix, related to the Millennium Development Goal
‘Eradicate extreme poverty and hunger,’ and under the national goals of ‘Allocating and
utilizing national resources equitably and efficiently for growth and poverty reduction’ and
‘Promoting sustainable and equitable pro-poor and broad based growth,’ with the expected
outcome of improving enforcement of environmental laws and regulations for the
protection of ecosystems, biodiversity and the sustainable management of natural
resources, it mentions technical assistance for the implementation of an ecosystem
approach to fisheries and a reduction of IUU fishing, in cooperation with FAO. The
resources allocated to do this are US $5,750,000.
The three documents on food security in Zanzibar all highlight the importance of fish for
food security on the island. They also mention that the fisheries sector is predominantly
artisanal, characterized by the use of traditional fishing equipment; fish is the most
important source of animal protein and about 99 percent of the average annual fish catch
is consumed locally. Artisanal fishermen are identified as those who normally experience
food shortages. Fish and legumes are the main source of protein. Fisheries are identified
as one of the key areas for interventions, with the promotion of fisheries production and
productivity to meet domestic demands and increase the sector's contribution to reducing
malnutrition and poverty. The regional policy briefs for Zanzibar are thus very much
focused on fisheries, while the national briefs, on the whole, rather neglect fisheries.

Flavouring fish into food security 148
Factors to be considered to assess the role of fish in food
and nutritional security
Data &
time
points
Favorable AdverseNo data
available
Total fish production (marine + inland + aquaculture) 2009-2004 Decreasing
Total physical availability for consumption [total production +
imports - exports (in live weight)]2009-2004 Decreasing
The 'apparent consumption' of fish per capita 2009-2004 Decreasing
Share of small-scale fishers production to the total fish
production2004 High
Area of land covered by small-scale aquaculture (back yard
ponds etc)
Share of industrial fishery catch which is (processed and) sold
locally2004 Low
Share of fish imported specifically for local consumption
(processed or fresh)2009 High
Availability of fish marketing infrastructure in urban and rural
areas
Availability of ice and cold storage facilities
Roads from coast to inland areas
Per-capita income (GDP/pop) 2010-2009 Increasing
General consumer price index 2010-2009 Increasing
Fish prices compared to other animal protein prices
Poverty levels and percentage of population below these levels 2007 High
Unemployment levels 2006 Low
Access to safe water 2008-2000 Low
Infant mortality levels 2009-2000 Decreasing
Access to sanitation 2010-2000 Increasing
Female literacy 2009-2006 Increasing
Mention of fish in nutrition education/awareness programs and
literaturePresent
Publicity about fish consumption in mass media (newspaper,
radio, TV, SMS, etc.)Present
Availibility
Accessibility
Utilisation
Stability
Tanzania Quantitative Dimensions
Annexes 149
UGANDA
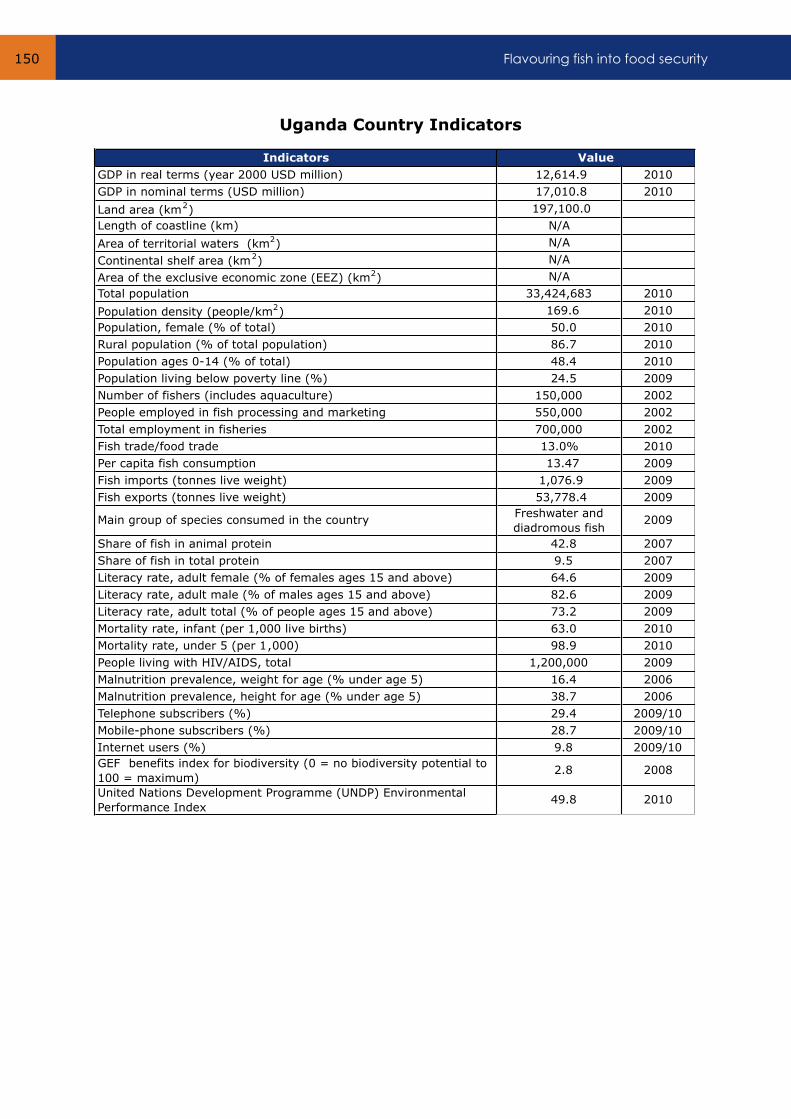
Flavouring fish into food security 150
Indicators
GDP in real terms (year 2000 USD million) 12,614.9 2010
GDP in nominal terms (USD million) 17,010.8 2010
Land area (km2) 197,100.0
Length of coastline (km) N/A
Area of territorial waters (km2) N/A
Continental shelf area (km2) N/A
Area of the exclusive economic zone (EEZ) (km2) N/A
Total population 33,424,683 2010
Population density (people/km2) 169.6 2010
Population, female (% of total) 50.0 2010
Rural population (% of total population) 86.7 2010
Population ages 0-14 (% of total) 48.4 2010
Population living below poverty line (%) 24.5 2009
Number of fishers (includes aquaculture) 150,000 2002
People employed in fish processing and marketing 550,000 2002
Total employment in fisheries 700,000 2002
Fish trade/food trade 13.0% 2010
Per capita fish consumption 13.47 2009
Fish imports (tonnes live weight) 1,076.9 2009
Fish exports (tonnes live weight) 53,778.4 2009
Main group of species consumed in the country Freshwater and
diadromous fish2009
Share of fish in animal protein 42.8 2007
Share of fish in total protein 9.5 2007
Literacy rate, adult female (% of females ages 15 and above) 64.6 2009
Literacy rate, adult male (% of males ages 15 and above) 82.6 2009
Literacy rate, adult total (% of people ages 15 and above) 73.2 2009
Mortality rate, infant (per 1,000 live births) 63.0 2010
Mortality rate, under 5 (per 1,000) 98.9 2010
People living with HIV/AIDS, total 1,200,000 2009
Malnutrition prevalence, weight for age (% under age 5) 16.4 2006
Malnutrition prevalence, height for age (% under age 5) 38.7 2006
Telephone subscribers (%) 29.4 2009/10
Mobile-phone subscribers (%) 28.7 2009/10
Internet users (%) 9.8 2009/10
GEF benefits index for biodiversity (0 = no biodiversity potential to
100 = maximum) 2.8 2008
United Nations Development Programme (UNDP) Environmental
Performance Index 49.8 2010
Value
Uganda Country Indicators
Annexes 151
Uganda Qualitative Dimensions
Nine recent documents were examined to assess the extent of integration of fisheries and
aquaculture into the food security policies and plans of Uganda. These include:
Documents:
1. United Nations Development Assistance Framework (UNDAF) for Uganda, 2010-
2014;
2. FAO Country Support Strategic Framework, 2010-2014;
3. Support to capacity building to promote formal marketing and trade of fish and fish
products from the Horn of Africa (TCP/RAF/3308) – Country Report Uganda;
4. The Uganda Food and Nutrition Policy (2003);
5. The National Food and Nutrition Strategy (2005);
6. The National Fisheries Policy (2004);
7. Uganda National Aquaculture Development Strategy (2008);
8. Agriculture Sector Development Strategy and Investment Plan, 2010/11-2014/15;
9. Department of Fisheries Resources Annual Report 2010/2011.
The UN Development Assistance Framework for Uganda makes very few references
to fishery products. References are general to the agricultural sector and mention the
impact of increasing production to address high food prices to contribute to food security
and nutrition. The document reports that 77 percent of the working population is employed
in agriculture and fisheries (it does not differentiate the individual contribution of these
sectors). Among the outcomes of the UNDAF are: strengthening capacity building to
implement policies and laws for household economies, food and nutrition security; support
for research and development; the use of appropriate technologies in fisheries (among
other sectors); and protection of the environment and natural resources.
The FAO Country Support Strategic Framework (CSSF) is Uganda’s National Medium
Term Priority Framework for FAO’s assistance aimed at supporting achievements of goals
set by the national development policy for fisheries and the other productive sectors of the
country. The expected outcome of the CSSF is: ‘Public institutions, civil society and private
sector are providing improved access to socio-economic infrastructure, systems and
technologies, for farming communities (especially the vulnerable), for sustainable increase
in agricultural production and productivity, household income and food and nutrition
security.’
Flavouring fish into food security 152
The strategic objectives of the CSSF, which will allow the achievement of this outcome,
are: ‘to support sustainable increase in household incomes and improved food and
nutrition security and reduce vulnerability of the farming communities; to generate and
increase access to reliable appropriate information and knowledge on food, crops,
livestock, fisheries and forestry and share the good practices and lessons learned within
the context of attaining sustainable development; to support enabling policy and
regulatory framework development, dissemination and implementation; to support
sustainable management utilization of natural resources’.
The document notes the abundance of water and favourable temperatures in Uganda that
are suitable for the growth of aquaculture, in addition to the fact that the waters have the
potential for this activity and that there is idle capacity for aquaculture. This activity could
replace or even surpass the fisheries sector (stated as depleted) if promotion was strong.
Uganda is said to be a lead country in this activity in the IGAD region. Overfishing and the
use of wrong equipment and methods have resulted in the depletion of stocks in lakes and
a decline in the growth of the fisheries sector, while development of aquaculture has been
affected by the low capacity to supply the necessary inputs for pond construction, fish fry
and feeds. The CSSF also highlights that the fisheries subsector lacks a reference plan,
besides the references included in the Agriculture Sector Development Strategy and
Investment Plan and the 2009 draft of a fisheries strategy (however, as listed above, some
similar documents were found during research for relevant documents). The CSSF also
refers to the fact that in the national development frameworks, there is less emphasis on
fisheries, although it has high industrial potential, and the fact that fish and fish products
are one of the main lead exports. Despite the importance of foreign trade, the document
does not mention the contribution of fisheries to food security.
FAO’s interventions are structured under five focus areas, and fisheries and aquaculture
are mentioned in three of them. Under focus area 1, ‘Strategy, Policy and Planning,’ and
outcome 1.1 “Capacity of national and local government institutions to review, identify
policy gaps, develop and harmonise, prioritise, disseminate and implement policies, plans
and strategies that increase production, processing, employment, food security and
income strengthened,’ one intervention is to provide technical assistance in line with
policies related to quality assurance and safety for fisheries (and other products), as well
as several interventions of a more general profile. Under focus area 2, ‘Production and
Productivity,’ and outcome 2.1 ‘Capacity of public institutions to deliver increased and
sustainable production and productivity strengthened,’ related interventions are to provide
technical assistance for aquaculture and artisanal fisheries development; and to develop
and disseminate tools for surveillance, monitoring, forecasting and control of pests and
diseases of fisheries (and other productive sectors).
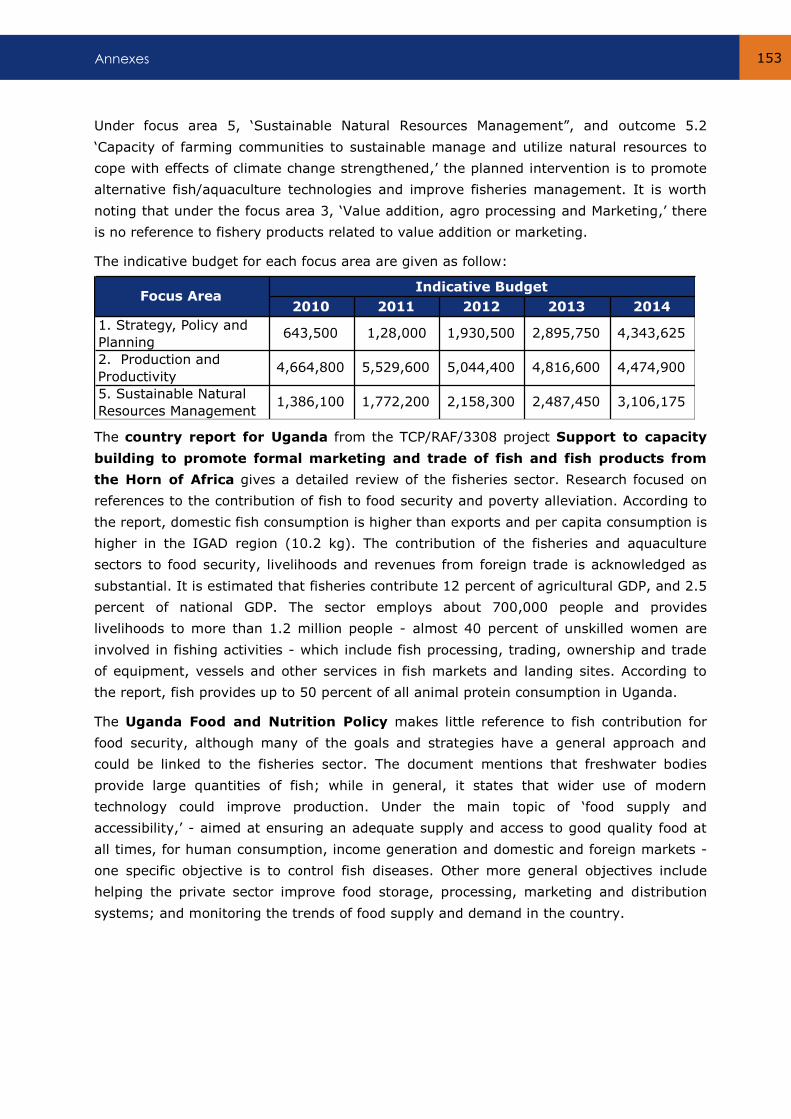
Annexes 153
2010 2011 2012 2013 2014
1. Strategy, Policy and
Planning643,500 1,28,000 1,930,500 2,895,750 4,343,625
2. Production and
Productivity4,664,800 5,529,600 5,044,400 4,816,600 4,474,900
5. Sustainable Natural
Resources Management1,386,100 1,772,200 2,158,300 2,487,450 3,106,175
Focus AreaIndicative Budget
Under focus area 5, ‘Sustainable Natural Resources Management”, and outcome 5.2
‘Capacity of farming communities to sustainable manage and utilize natural resources to
cope with effects of climate change strengthened,’ the planned intervention is to promote
alternative fish/aquaculture technologies and improve fisheries management. It is worth
noting that under the focus area 3, ‘Value addition, agro processing and Marketing,’ there
is no reference to fishery products related to value addition or marketing.
The indicative budget for each focus area are given as follow:
The country report for Uganda from the TCP/RAF/3308 project Support to capacity
building to promote formal marketing and trade of fish and fish products from
the Horn of Africa gives a detailed review of the fisheries sector. Research focused on
references to the contribution of fish to food security and poverty alleviation. According to
the report, domestic fish consumption is higher than exports and per capita consumption is
higher in the IGAD region (10.2 kg). The contribution of the fisheries and aquaculture
sectors to food security, livelihoods and revenues from foreign trade is acknowledged as
substantial. It is estimated that fisheries contribute 12 percent of agricultural GDP, and 2.5
percent of national GDP. The sector employs about 700,000 people and provides
livelihoods to more than 1.2 million people - almost 40 percent of unskilled women are
involved in fishing activities - which include fish processing, trading, ownership and trade
of equipment, vessels and other services in fish markets and landing sites. According to
the report, fish provides up to 50 percent of all animal protein consumption in Uganda.
The Uganda Food and Nutrition Policy makes little reference to fish contribution for
food security, although many of the goals and strategies have a general approach and
could be linked to the fisheries sector. The document mentions that freshwater bodies
provide large quantities of fish; while in general, it states that wider use of modern
technology could improve production. Under the main topic of ‘food supply and
accessibility,’ - aimed at ensuring an adequate supply and access to good quality food at
all times, for human consumption, income generation and domestic and foreign markets -
one specific objective is to control fish diseases. Other more general objectives include
helping the private sector improve food storage, processing, marketing and distribution
systems; and monitoring the trends of food supply and demand in the country.
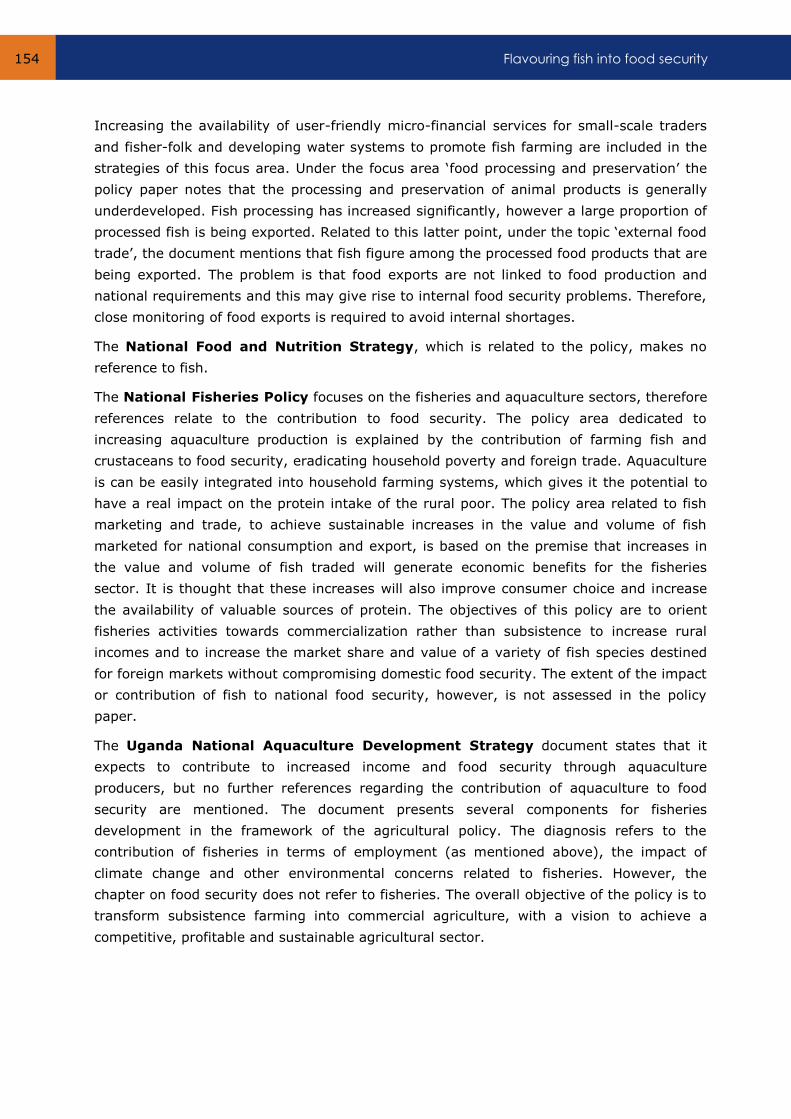
Flavouring fish into food security 154
Increasing the availability of user-friendly micro-financial services for small-scale traders
and fisher-folk and developing water systems to promote fish farming are included in the
strategies of this focus area. Under the focus area ‘food processing and preservation’ the
policy paper notes that the processing and preservation of animal products is generally
underdeveloped. Fish processing has increased significantly, however a large proportion of
processed fish is being exported. Related to this latter point, under the topic ‘external food
trade’, the document mentions that fish figure among the processed food products that are
being exported. The problem is that food exports are not linked to food production and
national requirements and this may give rise to internal food security problems. Therefore,
close monitoring of food exports is required to avoid internal shortages.
The National Food and Nutrition Strategy, which is related to the policy, makes no
reference to fish.
The National Fisheries Policy focuses on the fisheries and aquaculture sectors, therefore
references relate to the contribution to food security. The policy area dedicated to
increasing aquaculture production is explained by the contribution of farming fish and
crustaceans to food security, eradicating household poverty and foreign trade. Aquaculture
is can be easily integrated into household farming systems, which gives it the potential to
have a real impact on the protein intake of the rural poor. The policy area related to fish
marketing and trade, to achieve sustainable increases in the value and volume of fish
marketed for national consumption and export, is based on the premise that increases in
the value and volume of fish traded will generate economic benefits for the fisheries
sector. It is thought that these increases will also improve consumer choice and increase
the availability of valuable sources of protein. The objectives of this policy are to orient
fisheries activities towards commercialization rather than subsistence to increase rural
incomes and to increase the market share and value of a variety of fish species destined
for foreign markets without compromising domestic food security. The extent of the impact
or contribution of fish to national food security, however, is not assessed in the policy
paper.
The Uganda National Aquaculture Development Strategy document states that it
expects to contribute to increased income and food security through aquaculture
producers, but no further references regarding the contribution of aquaculture to food
security are mentioned. The document presents several components for fisheries
development in the framework of the agricultural policy. The diagnosis refers to the
contribution of fisheries in terms of employment (as mentioned above), the impact of
climate change and other environmental concerns related to fisheries. However, the
chapter on food security does not refer to fisheries. The overall objective of the policy is to
transform subsistence farming into commercial agriculture, with a vision to achieve a
competitive, profitable and sustainable agricultural sector.
Annexes 155
The main objectives are to increase rural incomes, livelihoods, improve household food,
nutrition and security. In order to achieve this, the immediate objectives are to enhance
productivity in fisheries and the remaining sectors, carry out activities related to value
addition and markets, protect the environment and strengthen institutions. For each
component there are activities related to fisheries, but no impact on food security is
mentioned for any of them. For the period between 2010 and 2015, funds were specifically
allocated for aquaculture production programs (2010/11: UGX 32,000 million; 2011/12:
UGX 41,600 million; 2012/13: UGX 50,210 million; 2013/14: UGX 52,331 million;
2014/2015: UGX 54,464 million).
The Department of Fisheries Resources Annual Report 2010/ 2011 highlights the
importance of fish in diets, and states it is a major source of animal protein for about 34.5
million Ugandans. Some species are considered as the only way to address the prevalent
lack of micronutrients (hidden hunger) in the population. The document estimates that
between 1 and 1.5 million people are directly or indirectly employed in the fisheries sector
and contributing to the livelihoods of nearly 5.3 million people.
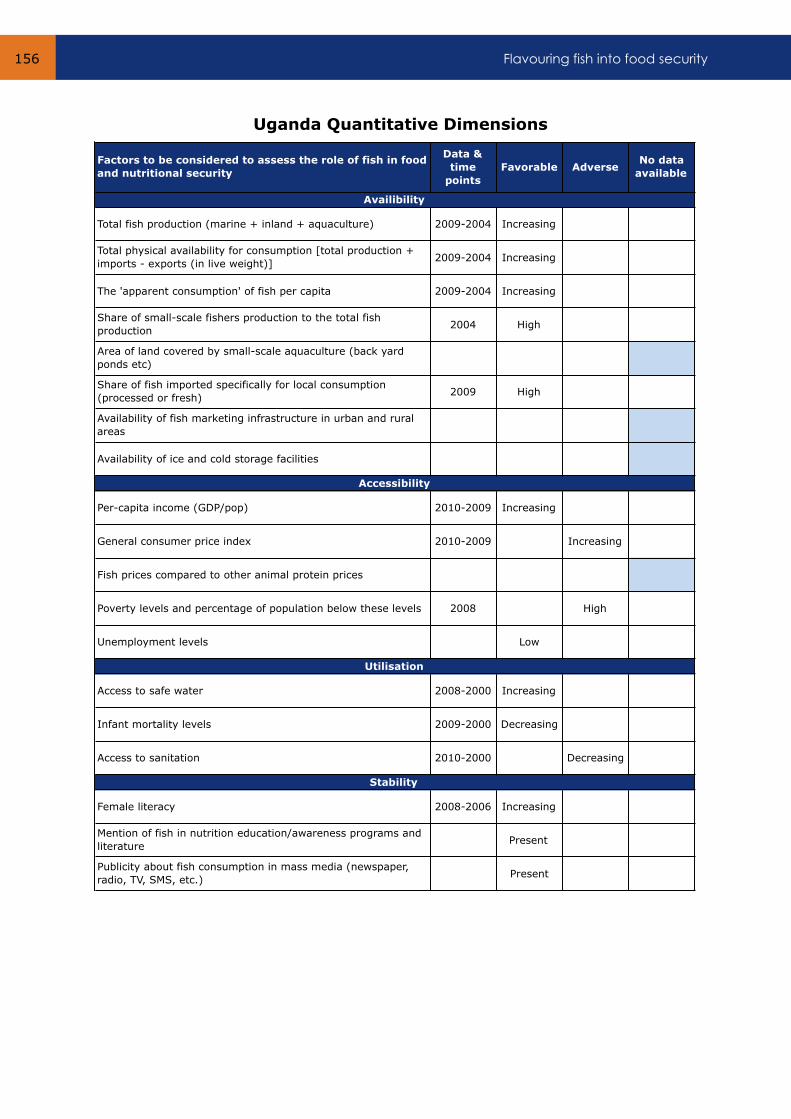
Flavouring fish into food security 156
Factors to be considered to assess the role of fish in food
and nutritional security
Data &
time
points
Favorable AdverseNo data
available
Total fish production (marine + inland + aquaculture) 2009-2004 Increasing
Total physical availability for consumption [total production +
imports - exports (in live weight)]2009-2004 Increasing
The 'apparent consumption' of fish per capita 2009-2004 Increasing
Share of small-scale fishers production to the total fish
production2004 High
Area of land covered by small-scale aquaculture (back yard
ponds etc)
Share of fish imported specifically for local consumption
(processed or fresh)2009 High
Availability of fish marketing infrastructure in urban and rural
areas
Availability of ice and cold storage facilities
Per-capita income (GDP/pop) 2010-2009 Increasing
General consumer price index 2010-2009 Increasing
Fish prices compared to other animal protein prices
Poverty levels and percentage of population below these levels 2008 High
Unemployment levels Low
Access to safe water 2008-2000 Increasing
Infant mortality levels 2009-2000 Decreasing
Access to sanitation 2010-2000 Decreasing
Female literacy 2008-2006 Increasing
Mention of fish in nutrition education/awareness programs and
literaturePresent
Publicity about fish consumption in mass media (newspaper,
radio, TV, SMS, etc.)Present
Availibility
Accessibility
Utilisation
Stability
Uganda Quantitative Dimensions
Annexes 157
ZAMBIA
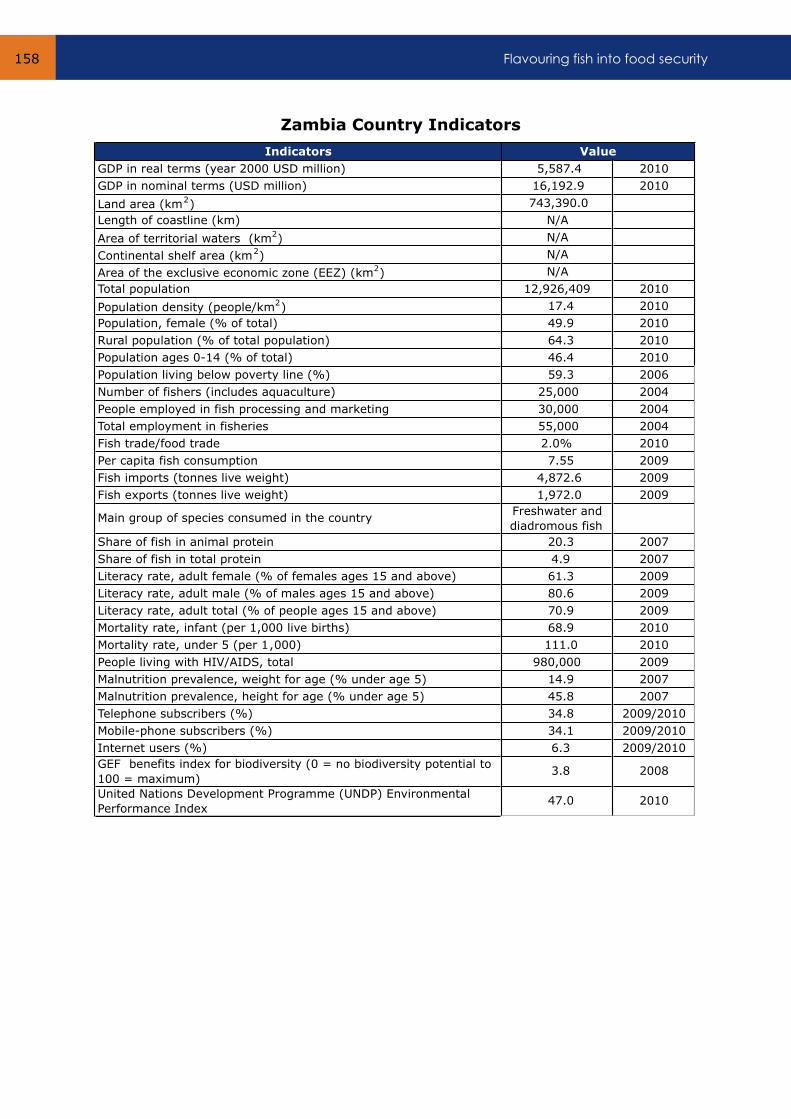
Flavouring fish into food security 158
Indicators
GDP in real terms (year 2000 USD million) 5,587.4 2010
GDP in nominal terms (USD million) 16,192.9 2010
Land area (km2) 743,390.0
Length of coastline (km) N/A
Area of territorial waters (km2) N/A
Continental shelf area (km2) N/A
Area of the exclusive economic zone (EEZ) (km2) N/A
Total population 12,926,409 2010
Population density (people/km2) 17.4 2010
Population, female (% of total) 49.9 2010
Rural population (% of total population) 64.3 2010
Population ages 0-14 (% of total) 46.4 2010
Population living below poverty line (%) 59.3 2006
Number of fishers (includes aquaculture) 25,000 2004
People employed in fish processing and marketing 30,000 2004
Total employment in fisheries 55,000 2004
Fish trade/food trade 2.0% 2010
Per capita fish consumption 7.55 2009
Fish imports (tonnes live weight) 4,872.6 2009
Fish exports (tonnes live weight) 1,972.0 2009
Main group of species consumed in the country Freshwater and
diadromous fish
Share of fish in animal protein 20.3 2007
Share of fish in total protein 4.9 2007
Literacy rate, adult female (% of females ages 15 and above) 61.3 2009
Literacy rate, adult male (% of males ages 15 and above) 80.6 2009
Literacy rate, adult total (% of people ages 15 and above) 70.9 2009
Mortality rate, infant (per 1,000 live births) 68.9 2010
Mortality rate, under 5 (per 1,000) 111.0 2010
People living with HIV/AIDS, total 980,000 2009
Malnutrition prevalence, weight for age (% under age 5) 14.9 2007
Malnutrition prevalence, height for age (% under age 5) 45.8 2007
Telephone subscribers (%) 34.8 2009/2010
Mobile-phone subscribers (%) 34.1 2009/2010
Internet users (%) 6.3 2009/2010
GEF benefits index for biodiversity (0 = no biodiversity potential to
100 = maximum) 3.8 2008
United Nations Development Programme (UNDP) Environmental
Performance Index 47.0 2010
Value
Zambia Country Indicators

Annexes 159
Zambia Qualitative Dimensions
Five recent documents were examined to assess the extent of fisheries and aquaculture
integration into the food security policies and plans of Zambia. These include:
Documents:
1. United Nations Development Assistance Framework (UNDAF), 2011-2015;
2. FAO National Medium Term Priority Framework, 2013;
3. Sixth National Development Plan, 2011-2015;
4. Fisheries in Zambia: An undervalued contributor to poverty reduction (2009);
5. The Governance of Small-Scale Fisheries in Zambia (2007).
There is no reference to the fisheries sector in the UN Development Assistance
Framework.
The FAO National Medium Term Priority Framework (NMTPF) mentions that the
fisheries sector showed a negative growth rate between 2000 and 2005 and its potential to
contribute to food security and employment was affected due to under-capitalization, lack
of environmental awareness among fisher folk, weak extension services and lack of private
investment. The document estimates that over 300,000 people are involved in activities
related to fisheries. The average per capita consumption is estimated at 7 kg and this
accounts for more than 40 percent of animal protein intake in the average diet. Fish is
therefore considered an important source of high quality animal protein. Demand
surpasses supply but the sector is constrained by poor infrastructure. One of the
challenges in the fisheries sector is the declining yield due to population growth in fishing
areas and unsustainable fishing practices. The promotion of aquaculture development is
seen as an opportunity to increase fish yields and contribute to food security and GDP.
Under the Fifth National Development Plan 2008-2010, there were ZMK 195,000 million
(about US $40 million) allocated for fisheries development. Under the national priority
‘Improved food availability,’ and output ‘Improved national capacity to analyse and
manage disaster, climate change adaptation and risk, including environmental risks,’
fisheries is included as a specific priority sector to carry out activities, such as support for
the preparation of an aquaculture programme at the national level and the design and
implementation of programmes for the improvement of artisanal fisheries.
In the Sixth National Development Plan (SNDP) fisheries is one of the key sectors of
interest for nutrition. In this section, there is no further analysis of the contribution of the
different sectors to nutritional security in the country. The SNDP is focused on enhancing
the investment of sustainable production and higher productivity of fisheries, in line with
the Fifth National Development Plan (FNDP). An increase in fisheries and aquaculture
production will be considered as a result of the FNDP. The contribution of the fisheries
sector to the 2009 GDP is estimated at about 3.2 percent.
Flavouring fish into food security 160
The strategic focus for the fisheries sector is on aquaculture development and
infrastructure for fisheries research and marketing, as well as investment promotion. The
SNDP presents a list of strategies focused on the promotion of trade, management and
information towards achieving sustainable exploitation of resources. The budget allocated
for the Fisheries Development for the 2011-2015 period is ZMK 171,000 million (about US
$35 million), with an incremental yearly distribution.
The Fisheries in Zambia: An undervalued contributor to poverty reduction paper
prepared by the WorldFish Center, collates information from several reports and
documents. The contribution of fisheries to the GDP in 2007 was estimated at around 1.2
percent, but despite this low contribution at the aggregated level, the contribution of fish
production is important to the rural economy through employment, income generation and
food supply. The estimate for fish with regard to total animal protein intake is low at
around 20 percent. Nevertheless, it highlights the important role of fish and fish products
for food and nutrition security, especially for the urban poor and people living with
HIV/AIDS (fisher folk and female fish traders are considered to be a population group with
at risk of HIV). Demand for fish is growing in the country due to population growth and
increasing urbanization. According to consumer surveys in 2008, the most common fish
species were among the leading items driving the inflation of food prices. Fish processing
and marketing is dominated by artisanal operations and in order to safeguard and increase
the economic and food security value of the sector, the major constraints are post-harvest
losses (estimated at nearly 30 percent), low access to improved technologies, services and
financing. The recommendations are: to implement a strategic approach to secure the
needs for the sector’s human resources; support the integration of aquaculture in the
context of small-scale water resources development at the community and household
level; with a focus on multi-purpose use in order to increase food security and reduce
livelihood vulnerability.
The Governance of Small-Scale Fisheries in Zambia document focuses on the
management of the fisheries sector. It quotes similar estimations for the contribution of
fisheries to GDP, total animal protein intake and the level of annual per capita
consumption as mentioned above. The document mentions that fish is one of the cheapest
animal proteins in the country and is therefore a key product in securing household food
security.
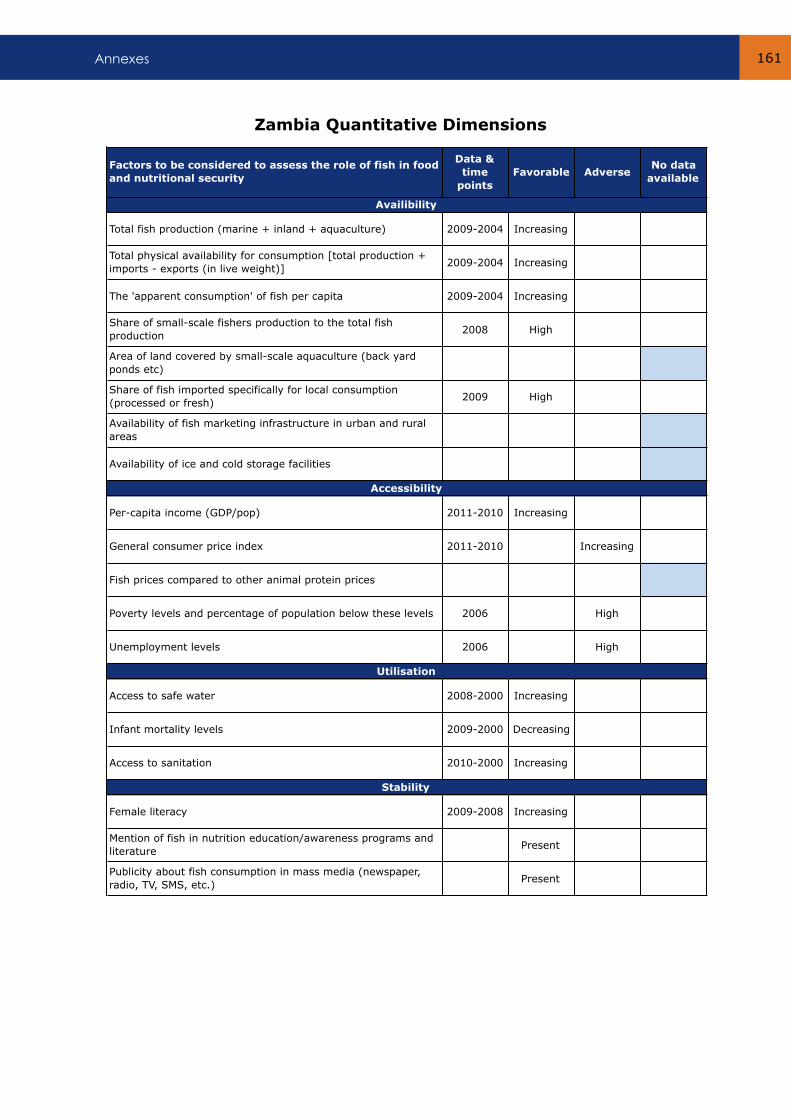
Annexes 161
Factors to be considered to assess the role of fish in food
and nutritional security
Data &
time
points
Favorable AdverseNo data
available
Total fish production (marine + inland + aquaculture) 2009-2004 Increasing
Total physical availability for consumption [total production +
imports - exports (in live weight)]2009-2004 Increasing
The 'apparent consumption' of fish per capita 2009-2004 Increasing
Share of small-scale fishers production to the total fish
production2008 High
Area of land covered by small-scale aquaculture (back yard
ponds etc)
Share of fish imported specifically for local consumption
(processed or fresh)2009 High
Availability of fish marketing infrastructure in urban and rural
areas
Availability of ice and cold storage facilities
Per-capita income (GDP/pop) 2011-2010 Increasing
General consumer price index 2011-2010 Increasing
Fish prices compared to other animal protein prices
Poverty levels and percentage of population below these levels 2006 High
Unemployment levels 2006 High
Access to safe water 2008-2000 Increasing
Infant mortality levels 2009-2000 Decreasing
Access to sanitation 2010-2000 Increasing
Female literacy 2009-2008 Increasing
Mention of fish in nutrition education/awareness programs and
literaturePresent
Publicity about fish consumption in mass media (newspaper,
radio, TV, SMS, etc.)Present
Availibility
Accessibility
Utilisation
Stability
Zambia Quantitative Dimensions
Flavouring fish into food security 162
ZIMBABWE
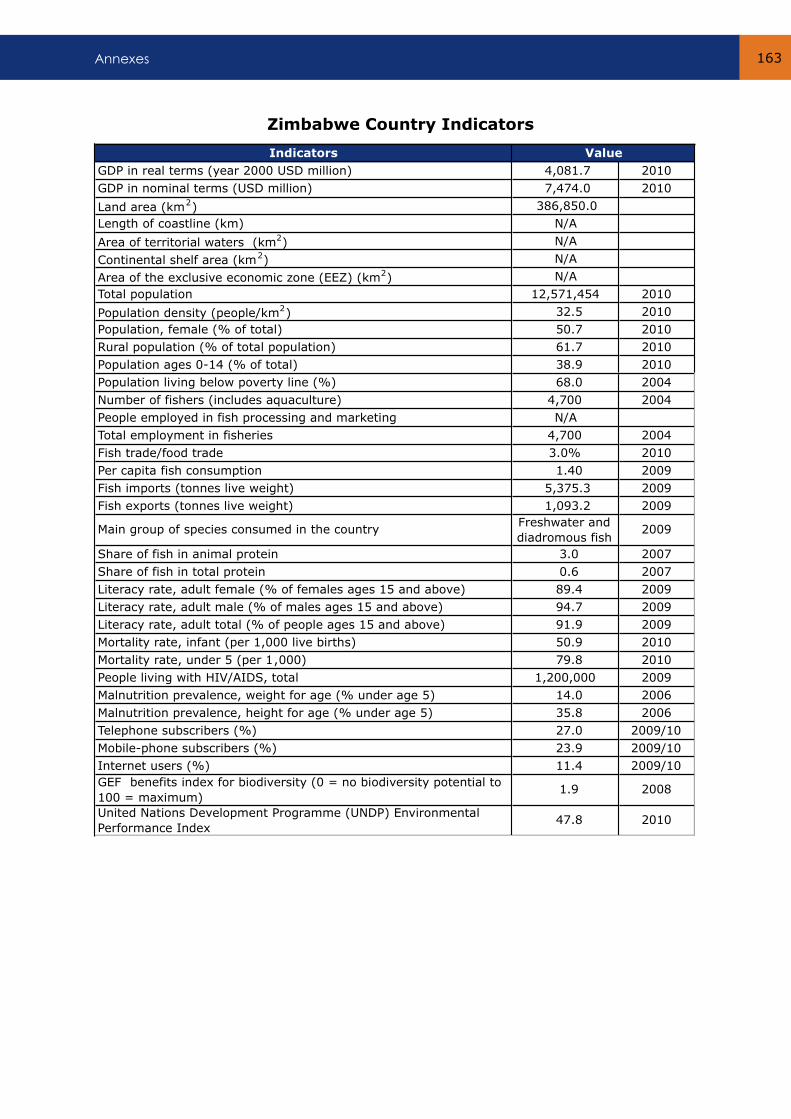
Annexes 163
Indicators
GDP in real terms (year 2000 USD million) 4,081.7 2010
GDP in nominal terms (USD million) 7,474.0 2010
Land area (km2) 386,850.0
Length of coastline (km) N/A
Area of territorial waters (km2) N/A
Continental shelf area (km2) N/A
Area of the exclusive economic zone (EEZ) (km2) N/A
Total population 12,571,454 2010
Population density (people/km2) 32.5 2010
Population, female (% of total) 50.7 2010
Rural population (% of total population) 61.7 2010
Population ages 0-14 (% of total) 38.9 2010
Population living below poverty line (%) 68.0 2004
Number of fishers (includes aquaculture) 4,700 2004
People employed in fish processing and marketing N/A
Total employment in fisheries 4,700 2004
Fish trade/food trade 3.0% 2010
Per capita fish consumption 1.40 2009
Fish imports (tonnes live weight) 5,375.3 2009
Fish exports (tonnes live weight) 1,093.2 2009
Main group of species consumed in the country Freshwater and
diadromous fish2009
Share of fish in animal protein 3.0 2007
Share of fish in total protein 0.6 2007
Literacy rate, adult female (% of females ages 15 and above) 89.4 2009
Literacy rate, adult male (% of males ages 15 and above) 94.7 2009
Literacy rate, adult total (% of people ages 15 and above) 91.9 2009
Mortality rate, infant (per 1,000 live births) 50.9 2010
Mortality rate, under 5 (per 1,000) 79.8 2010
People living with HIV/AIDS, total 1,200,000 2009
Malnutrition prevalence, weight for age (% under age 5) 14.0 2006
Malnutrition prevalence, height for age (% under age 5) 35.8 2006
Telephone subscribers (%) 27.0 2009/10
Mobile-phone subscribers (%) 23.9 2009/10
Internet users (%) 11.4 2009/10
GEF benefits index for biodiversity (0 = no biodiversity potential to
100 = maximum) 1.9 2008
United Nations Development Programme (UNDP) Environmental
Performance Index 47.8 2010
Value
Zimbabwe Country Indicators
Flavouring fish into food security 164
Zimbabwe Qualitative Dimensions
Four recent documents were examined to assess the extent of fisheries and aquaculture
integration into the food security policies and plans of Zimbabwe:
Documents:
1. United Nations Development Assistance Framework (UNDAF), 2012-2015;
2. FAO Country Programme Framework, 2012-2015;
3. FAO Country Analysis Report (2010);
4. Zimbabwe Food Security Issues Paper.
The UN Development Assistance Framework does not include any reference to
fisheries. Under the national development priority ‘Food security at household and national
levels,’ the focus is on agriculture or the sustainable use of natural resources, under the
framework of assistance for agriculture development. Under the national development
priority ‘Sound management and use of the environment, natural resources and land to
promote sustainable development,’ references are for water as a resource or biodiversity
as a whole with no focus on fisheries.
The FAO Country Programme Framework makes general references to fisheries along
with agriculture and forestry. Whilst there is no mention of the contribution of fisheries to
food security in the section dedicated to food security, agriculture or resource
management, it estimates that livestock and fisheries account for about 40 percent of the
agricultural GDP. It also states that this contribution remains underestimated in
comparison with the crop sector. The CPF also mentions that the fisheries sector has
remained marginalized despite available water resources in dams. The fragmentation of
functions among many agencies is a challenge for the implementation of development
plans in fisheries and remaining productive sectors. Fisheries are included with the
remaining sectors under priority areas in terms of strengthening competent institutions
and increasing productivity, diversification and competitiveness in the smallholder sector,
with a special focus on the implementation of gender-sensitive models. Although it is not
specifically mentioned in the document, the priority matrix included in the annex mentions
the sustainable management of fisheries and aquaculture resources under the CPF priority
of disaster risk reduction and management as an FAO priority.
In the FAO Country Analysis Report there is no reference to fisheries (except for the
negative impact of water weed species on fish stocks). The main section focuses on land
priorities for agriculture and environment refers to water and natural resources. When the
report mentions agriculture more specifically for identifying priority development areas for
improved food security, no mention is made of fisheries or aquaculture.
In the Zimbabwe Food Security Issues Paper there is no reference to fisheries or
aquaculture.
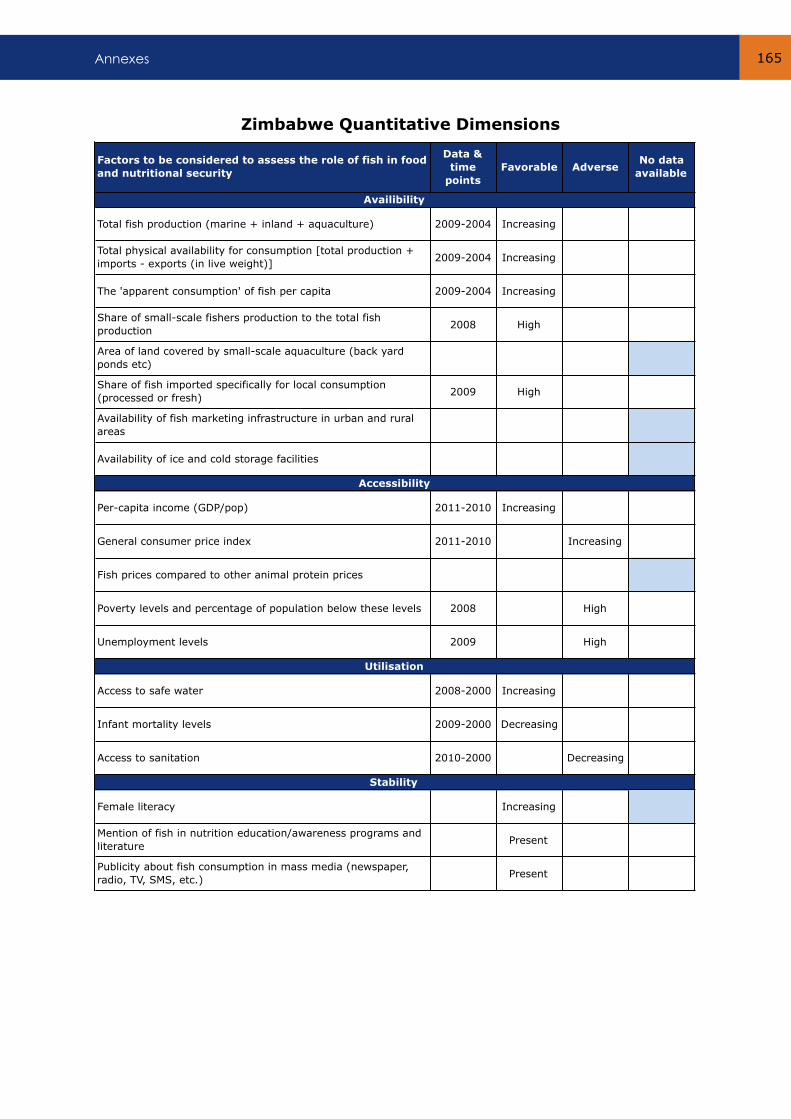
Annexes 165
Factors to be considered to assess the role of fish in food
and nutritional security
Data &
time
points
Favorable AdverseNo data
available
Total fish production (marine + inland + aquaculture) 2009-2004 Increasing
Total physical availability for consumption [total production +
imports - exports (in live weight)]2009-2004 Increasing
The 'apparent consumption' of fish per capita 2009-2004 Increasing
Share of small-scale fishers production to the total fish
production2008 High
Area of land covered by small-scale aquaculture (back yard
ponds etc)
Share of fish imported specifically for local consumption
(processed or fresh)2009 High
Availability of fish marketing infrastructure in urban and rural
areas
Availability of ice and cold storage facilities
Per-capita income (GDP/pop) 2011-2010 Increasing
General consumer price index 2011-2010 Increasing
Fish prices compared to other animal protein prices
Poverty levels and percentage of population below these levels 2008 High
Unemployment levels 2009 High
Access to safe water 2008-2000 Increasing
Infant mortality levels 2009-2000 Decreasing
Access to sanitation 2010-2000 Decreasing
Female literacy Increasing
Mention of fish in nutrition education/awareness programs and
literaturePresent
Publicity about fish consumption in mass media (newspaper,
radio, TV, SMS, etc.)Present
Availibility
Accessibility
Utilisation
Stability
Zimbabwe Quantitative Dimensions

Flavouring fish into food security 166
REGIONAL
DOCUMENTS
Annexes 167
Qualitative Dimensions
Ten recent documents were examined to assess the extent of fisheries and aquaculture
integration into the food security policies and plans in the region. These include:
Documents:
1. FAO’s Renewed Commitment to a Hunger Free Horn of Africa – Programme of Work
and Results Framework;
2. FAO Horn of Africa Response – Medium and Long Term Agriculture and Food
Security Investments;
3. FAO Regional Strategic Framework for Africa;
4. IOC Food Security Strategy;
5. Economic Commission for Africa, Sub-regional Office for Eastern Africa – An
Overview of the Food Security Situation in Eastern Africa;
6. East African Community Food Security Action Plan 2011-2015;
7. Regional Food Security and Risk Management Programme – Inventory on Policy
Measures for Food Security and Prioritisation in the IGAD Region, IGAD;
8. Comprehensive Africa Agriculture Development Programme (CAADP) – Framework
for African Food Security;
9. Measures to Address Food Security in the SADC Region;
10. INFOSA: Fisheries in the SADC Region, Selected Country Profiles (2007).
The FAO Renewed Commitment to a Hunger Free Horn of Africa presents a brief
description of the activities and projects to be carried out by FAO in countries of the
region. It does not include any specific reference to the effect of contribution from fisheries
sector activities to national or regional food security.
In the FAO Horn of Africa Response – Medium and Long Term Agriculture and
Food Security Investments, references are made to fisheries relationships to food
security under the presentation of the strategy for Somalia, which mentions sustainable
fishing for increased incomes of fishing communities as one of six strategic areas for
action.
The FAO Regional Strategic Framework for Africa considers that sustainable
management of fisheries (and other natural resources) is key to attaining food security
and environmental stability in Africa. The document also includes an estimate that fish
provides 19 percent of total animal protein intake in Africa, although fish per capita
consumption has stagnated and is showing a decreasing trend. The main agreements
related to food security are given and investment in fisheries and aquaculture is one of the
NEPAD/CAADP priorities.
Flavouring fish into food security 168
One of the four priorities of the Regional Office for Africa is: to promote sustainable natural
resource management (support for fisheries policies and institutionalization of framework
development falls under this agenda); to encourage fisheries equipment and infrastructure
improvement; and to promote commercial aquaculture.
In the IOC Food Security Strategy there is no reference to fish.
The Overview of the Food Security Situation in Eastern Africa provides a brief
overview on the food security situation in the different countries and fish is mentioned
under the Democratic Republic of Congo and points to a declining trend of landing sites
and the use of imports to supply demand in the larger cities. Further on in the document,
the food security programmes undertaken in the RECs are listed. Under the agreement of
the International Conference on the Great Lakes Region, food security is part of the
economic development and regional integration programme, which focuses on agriculture,
livestock and fisheries development.
The EAC Food Security Action Plan mentions that inadequate institutional support for
the fishing industry (both capture and aquaculture fisheries) as one of the constraints in
achieving food security in the EAC. It estimates that between 24 and 48 percent of the
GDP accounted for by the agriculture sector might be under-estimated because fisheries,
livestock and other food supply systems are not always taken into account. One of the
priority areas for the plan is to increase quality food availability. Subcomponents of this
area are to increase agricultural (which includes fisheries) productivity and make the
region a net food exporter, as well as to improve the exploitation of alternative food
sources, such as fisheries. The expected output of the latter would be to diversify food
products. More specific actions are required in order to promote fish farming and
sustainable exploitation of marine resources. The estimated cost of this output (which
includes other activities also) is US $101 million.
The Inventory on Policy Measures for Food Security and Prioritisation in the IGAD
Region does not make any reference to measures that involve the fisheries sector or that
include fish consumption as a component of the policy.
One of the strategic responses to food insecurity mentioned in the Framework for
African Food Security is to increase the supply of affordable commodities through
increased production and improved market linkages. Under this strategy there is a plan to
facilitate the attainment of continental self-reliance for aquaculture by 2015. No further
references to fisheries or aquaculture are given in the document.
One of the objectives of the Measures to Address Food Security in the SADC Region
document is to enhance and stabilize fishery production. It is suggested that diversification
towards fisheries activities in rural communities in riverine areas would offer increased
livelihood opportunities for these communities. Small-scale fisheries are mentioned as
being able to generate significant profits, improve resilience to shocks, and make
meaningful contributions to poverty alleviation and food security.

Annexes 169
In order to stabilize production, it is recommended that member states improve fish stock
management and fish product quality. The improvement of policies for the sustainable
management of marine resources and inland fisheries, up scaling of aquaculture and
quality improvements in fish handling, processing and distribution are considered the key
challenges for the fishery industry.
In the Fisheries in the SADC Region document there is no mention of the contribution
of fisheries to food security in the region or countries analysed.
Flavouring fish into food security 170
Final Comments
The approach of the fisheries sector and its contribution to national food security in the
region is very uneven. Some countries give fisheries a key role in food security and
strongly emphasize the importance of the fisheries sector for diversified livelihoods and
food security, fish being one of the main sources of animal protein. In other countries the
role of fisheries is marginal. In many cases, fisheries are included along with livestock,
forestry and agriculture under a general definition of the agricultural sector. However,
planning and actions programmed for the agricultural sector, in many cases, do not have
any direct relation to the fisheries sector when analysed further.
In the majority of countries, the marine fisheries sector is still considered to be under-
exploited. However, fisheries management is a key issue that is addressed in all
documents that refer to fisheries. Inland fisheries are more affected by unsustainable
exploitation of the resources. This is because they are more accessible to rural households
and communities and become an alternative source for food and livelihood. In many cases,
fishing is a secondary activity that households undertake in order to complement their diet
or as an alternative source of food in times of scarcity. The development of aquaculture is
given as a goal in some of the food security, poverty alleviation and/or development plans,
but in many cases, emphasis is put on improved performance of the inland and marine
capture sector.
It is worth noting that the focus of some reports is on fisheries as an export sector, as a
way to generate revenue and foreign exchange to finance food purchases required to
alleviate food insecurity. This approach to fisheries is based on the availability of high
valued species, with good acceptance in high-end markets.
Another issue that appears throughout the documents reviewed is the lack of storage
capacity and market infrastructure. This results in high post-harvest losses and reduced
production prices, which also restricts the contribution of fisheries to poverty alleviation
and increases food security, by reducing the income of fishing households.
The fishing sector in the countries reviewed is mainly small-scale and artisanal. The
processing industry is more focused on export markets. Seychelles, for example, operates
as a major hub for tuna. The predominance of small-scale fisher folks and subsistence
fisheries, along with the poor institutional capacity to follow-up on the performance of the
sector implies that, in many cases, the relevance of the fisheries sector might be under-
estimated.

Annexes 171
Annex 4. Questionnaire to be filled by policy makers and
fishery managers
Thank you for agreeing to participate in this short survey, which is being conducted in all
the 20 countries participating in the ESA-IO SmartFish program.
Please indicate your name and official designation. Please be assured that your identity will
not be revealed. The information gathered will be disseminated in a consolidated form.
Full Name: __________________________________
Official Designation: __________________________________
Country: __________________________________
Place and Date: __________________________________
Signature: __________________________________
1. Are fisheries (marine and/or inland) an important economic activity in your country?
YES / / NO/ /
2. Is fish processing for export an important activity in your country?
YES / / NO / /
3. Do you have fishing agreements with other countries for undertaking fishing in your
country’s EEZ?
YES / / NO / /
4. Which animal protein is most preferred by the consumers in your country? Kindly
rank in order of preference (1, 2, 3, etc.).
Chicken Beef Fish
Mutton Pork Other (specify) ____________________
5. Does fish play an important role in the food and nutritional security of your country
today?
YES / / NO / /
6. In your opinion then, what are the three most important factors that will help to
increase the role of fish in the food and nutritional security of your country?
1. ___________________________________________________________
2. ___________________________________________________________
3. ___________________________________________________________
7. The table below lists some of the factors that have a bearing on the role of fish in food
and nutritional security.

Flavouring fish into food security 172
Kindly indicate if they have a favorable impact, an adverse impact or no impact on the role
of fish in food and nutritional security in your country.
(Put a tick (√) in the appropriate column)
No. Some of the factors which have a bearing
on the role of fish in food and nutritional
security
Favorable
impact
Adverse
impact
No
impact
1 Increase in total fish production of the country
from all water sources
2 Overall increase in fish imports
3 Increase in fish exports
4 Decrease in the share of fish harvested by
small-scale fishers in the country
5 Increase in small-scale aquaculture in the
country
6 Increase in fish harvested by industrial fishing
vessels in the EEZ
7 Increase in fish imports meant exclusively for
domestic consumption
8 Good market facilities for retail sales of fish
9 Availability of ice and cold storage facilities
10 Improvement in roads from coast to inland
areas
11 Decrease in per-capita income
12 Rise in the general consumer price index
13 Increase in fish prices
14 Decrease in the number of persons living below
the poverty line
15 Increase in the employment levels
16 Improvement in the access to clean water
17 Increase in the infant mortality levels
18 Improvement in the access to sanitation
19 High Vitamin A deficiency
20 High level of female literacy
21 Increase of information and education in the
country about role of fish in nutrition
22 Media publicity campaigns undertaken on the
benefits of fish consumption
Annexes 173
1. Do you have any nutrition education or awareness programs in your country that
specifically mention the benefits of fish consumption for human health and
nutrition?
No / /
Yes / /
Please provide details:
_____________________________________________________________________
_____________________________________________________________________
_______________________________________________________________
2. Can you provide examples of any publicity campaigns – in the newspapers, TV, Radio,
SMS alerts – which encourage people to consume more fish?
We have no such campaigns / /
Yes, we do have examples / /
Please provide details of the most important one:
_____________________________________________________________________
_____________________________________________________________________
_______________________________________________________________
3. Are there any specific legislations, regulations, policies or development plans in your
country, that directly contribute to enhancing the role of fish in food and nutritional
security in your country?
YES / / (Please provide specific references below)
NO / / (Please provide information on what you think needs to be done to
make this happen)
_____________________________________________________________________
_____________________________________________________________________
_______________________________________________________________
Thank you for your cooperation
SmartFish is a regional fisheries programme managed by the Indian Ocean Commission, funded by the European Union and co-implemented by the Food and Agriculture Organization of the United Nations. SmartFish, which operates in 20 countries throughout the East and Southern Africa - Indian Ocean region, focuses on fisheries governance, management, monitoring, control and surveillance, trade, and food security.
Incorporating and integrating food security into country plans and policies and turning them into a reality on the ground is of great importance. The role of fish as a wholesome and inexpensive food source for achieving food security merits serious consideration. This report presents the results of a preliminary assessment of the integration of fisheries and aquaculture into food and nutrition policy frameworks of 20 countries in the East and Southern Africa and Indian Ocean region.
Following an initial assessment examining the awareness levels of national fishery officers, quantitative country data was used to determine needs and scope for raising awareness with respect to factoring fish into food and nutritional security scenarios. Finally, a desk review looked at country policies and plans to identify those countries where fisheries play an important role in the national and regional economy, but are neglected in policy discussions, especially when dealing with food security issues.
“[…] fish should be regarded as one of the most important sources of food in any program for raising the nutritional levels of peoples throughout the world.”


