Embed Size (px)
Citation preview

Fishery Discards Impact on
Current Biology 20, 215–222, February 9, 2010 ª2010 Elsevier Ltd All rights reserved DOI 10.1016/j.cub.2009.11.073
ReportSeabird
Movement Patterns at Regional Scales
Frederic Bartumeus,1,2,* Luca Giuggioli,1,3 Maite Louzao,4,5
Vincent Bretagnolle,6 Daniel Oro,4 and Simon A. Levin1
1Department of Ecology and Evolutionary Biologyand Princeton Environmental Institute, 106 Guyot Hall,Princeton University, Princeton, NJ 08544-1003, USA2Institut Catala de Ciencies del Clima (IC3),Carrer del Doctor Trueta 203, 08005 Barcelona, Spain3Bristol Centre for Complexity Sciences, Department ofEngineering Mathematics, and School of Biological Sciences,University of Bristol, Bristol BS8 1TR, UK4Institut Mediterrani d’Estudis Avancats (IMEDEA),Consejo Superior de Investigaciones Cientıficas (CSIC),Miquel Marques 21, 07190 Esporles, Mallorca, Spain5Helmholtz Centre for Environmental Research–UFZ,Permoserstraße 15, 04318 Leipzig, Germany6Centre d’Etudes Biologiques de Chize, CNRS,79360 Villiers en Bois, France
Summary
Human fishing activities are negatively altering marineecosystems in many ways [1, 2], but scavenging animals
such as seabirds are taking advantage of such activities byexploiting fishery discards [3–5]. Despite the well-known
impact of fisheries on seabird population dynamics [6–10],little is known about how discard availability affects seabird
movement patterns. Using scenarios with and without trawl-
ing activity, we present evidence that fisheries modify thenatural way in which two Mediterranean seabirds explore
the seascape to look for resources during the breedingseason. Based on satellite tracking data and a mathematical
framework to quantify anomalous diffusion phenomena, weshow how the interplay between traveling distances and
pause periods contributes to the spatial spreading of theseabirds at regional scales (i.e., 10–250 km). When trawlers
operate, seabirds show exponentially distributed travelingdistances and a strong site fidelity to certain foraging areas,
the whole foraging process being subdiffusive. In theabsence of trawling activity, the site fidelity increases, but
the whole movement pattern appears dominated by rarebut very large traveling distances, making foraging a super-
diffusive process. Our results demonstrate human involve-ment on landscape-level behavioral ecology and provide
a new ecosystemic approach in the study of fishery-seabirdinteractions.
Results and Discussion
Fishery Discards: A Human-Induced Experiment
on How Resource Predictability Impacts SeabirdForaging Strategies
Fishery activities have long-term negative effects on seabirdpopulations via their impact on marine food webs (e.g., habitatdestruction and resource overexploitation) [1, 2]. Nevertheless,
*Correspondence: [email protected]
it has been demonstrated that the availability of supplementaryforaging resources in the form of fishery discards stronglymodifies seabird population biology [5, 7, 9, 10], enhancingshort-term breeding and survival performances [9]. The latteris especially true in some marine areas, such as the westernMediterranean, where trawling fisheries provide scavengingseabirds with a naturally unavailable trophic resource (i.e.,demersal fish) that can be acquired with more predictabilitythan their natural prey (e.g., small pelagic fish) [9–12]. Thisfinding raises a key question about how fishery discards impacton seabird foraging strategies by modifying resource avail-ability and predictability at regional scales.
To characterize how the presence of fishery activitiesmodifies the foraging strategies of seabirds during thebreeding season, we analyzed and modeled satellite trackingdata (Argos system) covering 10 foraging trips of breedingBalearic shearwaters (Puffinus mauretanicus) and 26 trips ofbreeding Cory’s shearwaters (Calonectris diomedea) in thenorthwestern Mediterranean during the period 1999–2005.The foraging trips usually lasted less than two days, thetotal distances traveled per foraging trip ranging from 10 to1000 km, and the maximum distances between two succes-sive locations being about 300 km. The foraging range of thesespecies is delimited by the isobath of 1000 m, including thecontinental shelf as well as the area within the shelf break[13–15] (Figure 1). Within these areas, shearwaters feed onsmall shoaling pelagic fish and squids, particularly mobileprey whose availability is unpredictable in space and time[16, 17], but they can also feed on trawling discards thatshow predictable temporal and spatial dynamics (e.g., [11]).Across the entire western coast of Spain, trawlers operateapproximately 12 hours per day from Monday to Friday, de-parting from harbors early in the morning and returning in thelate afternoon. Fisheries target demersal species with haulingand discarding procedures occurring at approximately thesame hours each day ([18] and references therein). Fromeach harbor, captains choose specific fishing grounds basedon weather conditions, distance to other fishing grounds,and their expectation of other trawlers’ activities. Such poten-tial variability is however strongly suppressed because thefishing grounds of one harbor are limited in space by thefishing grounds of the neighboring harbors. There are nofishery activities during the weekend, calendar holidays, andtrawling moratorium days, except for a few coastal artisanalboats, which generate negligible discards. Poaching is nonex-istent because both fishing guilds and conservation agenciescontrol the fleets and prevent boats from operating duringfishery closure periods.
In the present work, we characterize movement patternswithin the 1000 m isobath and consider the presence orabsence of trawling activities according to whether or notthese displacements occur during weekends, calendar holi-days, and trawling moratorium days [18] (see SupplementalResults and Table S1 available online).
A Generalized Random Walk Model for Seabird Movements
Based on a sequence of recorded locations in the xy plane,a moving animal can be quantitatively characterized by means

Figure 1. Shearwater Foraging Trajectories in the Western Mediterranean Region
Examples of single trajectories for the Cory’s shearwater (upper panels) and the Balearic shearwater (lower panels). For illustrative purposes, we have
assigned each of the trajectories to one of the two possible scenarios under study: absence (left panels) or presence (right panels) of fishery activity.
For a given trajectory, if less than 50% of the total number of locations occurred in the presence of fishery activities, we considered that trajectory as
a ‘‘no fisheries’’ trajectory; otherwise, the trajectory was considered as a ‘‘fisheries’’ trajectory. For the four trajectories shown, the percentage of locations
occurring in the presence of fishery activities are 16% (upper left), 68% (upper right), 37% (lower left), and 65% (lower right). The percentage differences
among trajectories are not great, but they are large enough to recover the average behavior of the spatial kernels measured in the presence and in the
absence of fisheries when pooling the flying segments at the population level. Pelagic and nonpelagic flights are characterized by dashed lines and bold
solid lines, respectively. The limit of the foraging grounds is at the isobath of 1000 m, represented here by a continuous line. Breeding colonies are indicated
by stars. It can be observed that large, nonpelagic displacements are more prone to occur in the two trajectories associated with periods with no fishery
activity (left panels) than in the two periods with more fishery activity (right panels). For more details on the data set, see Figure S1 and Table S1.
Current Biology Vol 20 No 3216
of a random walk model [19, 20]. The fractional diffusion equa-tion (FDE) [21–25] is a powerful mathematical framework todescribe the stochastic movement of objects in space andtime. The FDE assumes that motion results from a randomseries of displacement and pausing periods, and it requiresthe computation of a spatial and a temporal kernel. Thespreading behavior of seabirds while searching for food isbuilt up from the displacement and the pause distributions.Sub- or superdiffusion regimes can be identified dependingon whether the spreading rates are smaller or larger than innormal diffusive processes (e.g., [22, 23]).
We show that in a two-dimensional FDE, the temporal kernelis proportional to t 2 1 2 að0<a%1Þ, whereas the spatial kernel isproportional to jzj2 m, where z represents either of the twoCartesian coordinates and m is the Levy index (1<m%3) [21,22]. A temporal kernel or a pause-time distribution froma data set that does not show explicit pauses (Argos satellitetracking) is obtained by estimating a site fidelity kernel SAðtÞ.SAðtÞ is defined as the probability of observing a seabird within
a square area A = L2 as function of time t, and its theoreticalshape can be derived from the FDE itself. The relevance ofSAðtÞ is doubly important: (1) it can be estimated from Argostracking data, directly connecting empirical records to thetemporal kernel of the FDE, and (2) it has a straightforward bio-logical interpretation as a measure of the local intensity use ofparticular sites by an animal (Supplemental ExperimentalProcedures).
Looking at the long-time limit behavior of SAðtÞ, i.e.,SAðtÞwt 2 b, it is possible to determine the exponent a charac-terizing the scaling of the temporal kernel in the FDE. Once thespatial kernel FðrÞ and the site fidelity kernel SAðtÞ are recon-structed from the empirical data, one is able to estimate theirrespective exponents m and b and finally recover the value a,i.e., the scaling exponent of the temporal kernel. Assumingfinite displacement speed, it is possible to compute the expo-nent g in the expression <r2>ðtÞftg, which characterizesthe spreading behavior of the seabirds [26, 27]. The exponentg determines different qualitative regimes of spreading
10337211262km
0
0.2
0.4
0.6
0.8
wA
ICc
5100200300400500# data points
1852817104km
0
0.2
0.4
0.6
0.8
1
wA
ICc
550100150200230# data points
351174.53hr
0
0.2
0.4
0.6
0.8
1
wA
ICc
550100150200223# data points
311174.53hr
0
0.2
0.4
0.6
0.8
1
wA
ICc
5255075100117# data points
NO FISHERIES FISHERIESA B
C D
F(r)
SA
(t)
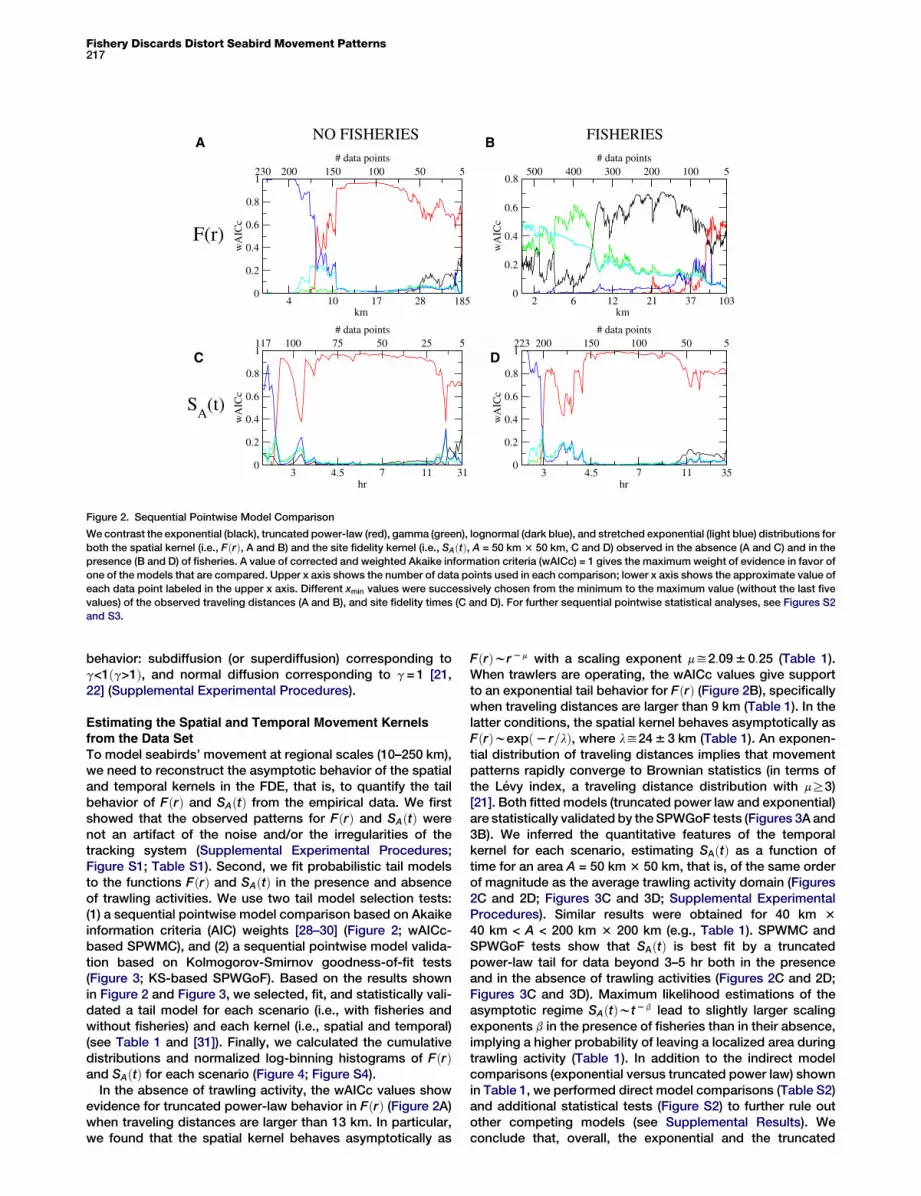
Figure 2. Sequential Pointwise Model Comparison
We contrast the exponential (black), truncated power-law (red), gamma (green), lognormal (dark blue), and stretched exponential (light blue) distributions for
both the spatial kernel (i.e., FðrÞ, A and B) and the site fidelity kernel (i.e., SAðtÞ, A = 50 km 3 50 km, C and D) observed in the absence (A and C) and in the
presence (B and D) of fisheries. A value of corrected and weighted Akaike information criteria (wAICc) = 1 gives the maximum weight of evidence in favor of
one of the models that are compared. Upper x axis shows the number of data points used in each comparison; lower x axis shows the approximate value of
each data point labeled in the upper x axis. Different xmin values were successively chosen from the minimum to the maximum value (without the last five
values) of the observed traveling distances (A and B), and site fidelity times (C and D). For further sequential pointwise statistical analyses, see Figures S2
and S3.
Fishery Discards Distort Seabird Movement Patterns217
behavior: subdiffusion (or superdiffusion) corresponding tog<1ðg>1Þ, and normal diffusion corresponding to g = 1 [21,22] (Supplemental Experimental Procedures).
Estimating the Spatial and Temporal Movement Kernelsfrom the Data Set
To model seabirds’ movement at regional scales (10–250 km),we need to reconstruct the asymptotic behavior of the spatialand temporal kernels in the FDE, that is, to quantify the tailbehavior of FðrÞ and SAðtÞ from the empirical data. We firstshowed that the observed patterns for FðrÞ and SAðtÞ werenot an artifact of the noise and/or the irregularities of thetracking system (Supplemental Experimental Procedures;Figure S1; Table S1). Second, we fit probabilistic tail modelsto the functions FðrÞ and SAðtÞ in the presence and absenceof trawling activities. We use two tail model selection tests:(1) a sequential pointwise model comparison based on Akaikeinformation criteria (AIC) weights [28–30] (Figure 2; wAICc-based SPWMC), and (2) a sequential pointwise model valida-tion based on Kolmogorov-Smirnov goodness-of-fit tests(Figure 3; KS-based SPWGoF). Based on the results shownin Figure 2 and Figure 3, we selected, fit, and statistically vali-dated a tail model for each scenario (i.e., with fisheries andwithout fisheries) and each kernel (i.e., spatial and temporal)(see Table 1 and [31]). Finally, we calculated the cumulativedistributions and normalized log-binning histograms of FðrÞand SAðtÞ for each scenario (Figure 4; Figure S4).
In the absence of trawling activity, the wAICc values showevidence for truncated power-law behavior in FðrÞ (Figure 2A)when traveling distances are larger than 13 km. In particular,we found that the spatial kernel behaves asymptotically as
FðrÞwr 2 m with a scaling exponent my2:09 6 0:25 (Table 1).When trawlers are operating, the wAICc values give supportto an exponential tail behavior for FðrÞ (Figure 2B), specificallywhen traveling distances are larger than 9 km (Table 1). In thelatter conditions, the spatial kernel behaves asymptotically asFðrÞwexpð2 r=lÞ, where ly24 6 3 km (Table 1). An exponen-tial distribution of traveling distances implies that movementpatterns rapidly converge to Brownian statistics (in terms ofthe Levy index, a traveling distance distribution with mR3)[21]. Both fitted models (truncated power law and exponential)are statistically validated by the SPWGoF tests (Figures 3A and3B). We inferred the quantitative features of the temporalkernel for each scenario, estimating SAðtÞ as a function oftime for an area A = 50 km 3 50 km, that is, of the same orderof magnitude as the average trawling activity domain (Figures2C and 2D; Figures 3C and 3D; Supplemental ExperimentalProcedures). Similar results were obtained for 40 km 340 km < A < 200 km 3 200 km (e.g., Table 1). SPWMC andSPWGoF tests show that SAðtÞ is best fit by a truncatedpower-law tail for data beyond 3–5 hr both in the presenceand in the absence of trawling activities (Figures 2C and 2D;Figures 3C and 3D). Maximum likelihood estimations of theasymptotic regime SAðtÞwt 2 b lead to slightly larger scalingexponents b in the presence of fisheries than in their absence,implying a higher probability of leaving a localized area duringtrawling activity (Table 1). In addition to the indirect modelcomparisons (exponential versus truncated power law) shownin Table 1, we performed direct model comparisons (Table S2)and additional statistical tests (Figure S2) to further rule outother competing models (see Supplemental Results). Weconclude that, overall, the exponential and the truncated

10337211262km
0
0.2
0.4
0.6
0.8
1
p va
lue
5100200300400535# data points
1852817104km
0
0.2
0.4
0.6
0.8
1
p va
lue
550100150200230# data points
351174.53hr
0
0.2
0.4
0.6
0.8
1
p va
lue
550100150200225# data points
311174.531.7hr
0
0.2
0.4
0.6
0.8
1
p va
lue
5255075100125140# data points
NO FISHERIES FISHERIES
SA
(t)
F(r)
A B
C D
Figure 3. Sequential Pointwise Goodness of Fits
Goodness of fits are based on Monte Carlo replicates and the computation of Kolmogorov-Smirnov tests as in Clauset et al. [30]. Statistical validation was
performed for exponential (black), truncated power-law (red), gamma (green), lognormal (dark blue), and stretched exponential (light blue) distributions for
both the spatial kernel (i.e., FðrÞ, A and B) and the site fidelity kernel (i.e., SAðtÞ, A = 50 km 3 50 km, C and D) observed in the absence (A and C) and in the
presence (B and D) of fisheries. For each data point, if the p value is much less than 1 (i.e., p < 0.1), it is unlikely that the subset of data including all of the
values above that point is drawn from the corresponding model; therefore, the tail model can be ruled out. For further sequential pointwise statistical
analyses, see Figures S2 and S3.
Current Biology Vol 20 No 3218
power-law models are good enough probabilistic models todescribe our data beyond some threshold values (Figure 4;Figure S4). These results allow us to use the FDE modelingframework to statistically characterize seabird movementswithin the fitted range of spatiotemporal scales, that is, from10 to 250 km and from 3 to 40 hr.
Similar quantitative behavior for FðrÞ and qualitativebehavior for SAðtÞ were observed when considering the twoseabird species separately, indicating that, in statistical terms,trawling activities similarly affect the movement patterns ofboth species (Figure S3 and Table S3). Our results suggestthat closely related species might respond similarly to trawlingactivities on marine ecosystems.
From the fitted b values SAðtÞwt 2 b, one can determine theexponent a characterizing the scaling of the temporal kernelin the FDE through the relations b = 2a=m 2 1 when FðrÞ decaysas a power law, and b = 2a when FðrÞ is an exponential (seeSupplemental Experimental Procedures and SupplementalResults). We computed different estimates for the temporalscaling exponent a based on the central values of m andb and their 95% confidence intervals. We then averaged theseover the two areas A used for the calculation of SAðtÞ (seeTable 1) to finally obtain the values a = 0:9 6 0:25 when trawlersoperate and a = 0:3 6 0:25 when trawlers are absent (note thenonoverlapping confidence intervals). The exponents m anda, obtained from FðrÞ and SAðtÞ, respectively, can thus be em-ployed to estimate the spreading behavior of seabirds duringtheir foraging or, equivalently, how the mean square displace-ment <r2>ðtÞftg grows over time with g < 1 (g > 1) correspond-ing to subdiffusion (or superdiffusion) [21, 22, 32, 33]. Aver-aging the maximum likelihood estimations for m and a and
their confidence intervals, and averaging also the resultsobtained for the two areas (A1 and A2) used to computethe site fidelity kernel (Table 1), we obtain the valuesg = 1:26ð1:23 2 1:44Þ and g = 0:91ð0:65 2 1:19Þ in the absenceand in the presence of trawling activity, respectively. In bothcases, g values are close to 1, indicating that seabird foragingpatterns generate statistical properties at the edges of normaldiffusion. Our results suggest that the behavioral changebetween an opportunistic search in the presence of fisheriesand an active search in its absence can be accompanied bya statistical transition from diffusive or even subdiffusivemotion (gmean = 0.91) to superdiffusive motion (gmean = 1.26).
From the series expansion in powers of t of SAðtÞ (Supple-mental Results), it is also possible to determine the general-ized diffusion constants Da;m for the case m = 3. Such constantscan be used to compute the daily (12 hr) area explored bya seabird in the foraging grounds, giving an average value of200 km2 per day, consistent with the observed seabird move-ment scales over a breeding month [34].
Fishery Activities Modify Seabird Movement Patterns
at Regional ScalesIt is conceivable that the observed change in seabird move-ment patterns at regional scales may be reflecting a corre-sponding change in the spatiotemporal pattern of theexploited resources, in this case, natural prey (small pelagicfish) versus discards (demersal, benthic fish) [35–39]. Theforaging movements of seabirds exploiting discards are Brow-nian-like and mainly depend on the activities of trawlers, whichin turn should resonate with the distributions of the preytargeted, i.e., demersal fish. Demersal fish live in particular

Table 1. Maximum Likelihood Parameter Estimation of the Selected Tail Models
Fitted Model xmin Parameter (CI) n (Tail) Range GOF1 GOF2
No fisheries F(r) w r2m 13.21 km 2.09 (1.84–2.35) 130 13.21–254 km 0.567* 0*
SA1(t)/t w t2b 3.3 hr 1.63 (1.31–1.96) 78 3.3–41.50 hr 0.406* 0.101*
SA2(t)/t w t2b 3.3 hr 1.67 (1.38–1.97) 95 3.3–41.50 hr 0.725 0.158
Fisheries F(r) w e2r/l 9.16 km 24.39 (21.73–27.02) 333 9.16–165 km 0.639* 0*
SA1(t)/t w t2b 3.73 hr 1.85 (1.6–2.12) 122 3.73–55.44 hr 0.843* 0.002*
SA2(t)/t w t2b 5.27 hr 1.98 (1.70–2.27) 135 5.27–55.44 hr 0.484* 0.019*
Maximum likelihood fits of the probabilistic tail models selected through sequential pointwise model comparison and goodness of fits in the absence and in
the presence of fishery activities for FðrÞ and SAðtÞ (i.e., A1 = 50 km 3 50 km and A2 = 100 km 3 100 km). xmin, lower bound (in km or hr); parameter, maximum
likelihood estimator of l (exponential model) and b (truncated power-law model); CI, 95% confidence interval; n, number of data points at the tail used for the
fit; range, range of values fitted; GOF1, goodness of fit for the fitted model; GOF2, goodness of fit for the competing model. In all cases, the lower bounds
(xmin) of the tails were chosen to be those generating the best (lowest) Kolmogorov-Smirnov statistic in the data fits [30]. A truncated power law was assumed
as the competing model for the exponential fit (i.e., fisheries; FðrÞ). Exponential tail models are assumed as the competing models of the truncated power-
law fits. In all cases, p values were obtained from 2500 Monte Carlo replicates. Asterisks (*) indicate statistically significant p values that do not rule out
the fitted model but rule out the competing model. The competing models were tested covering the same range of values as the fitted models. For further
statistical results, see Tables S2 and S3.
Fishery Discards Distort Seabird Movement Patterns219
productive marine areas such as canyons or continentalslopes, whereas the main natural prey of Mediterranean shear-waters, i.e., small pelagic fish and squid, are relatively elusivegiven that they are very mobile and are not heavily targeted bytrawlers or any other fishery [6, 11, 40, 41]. Similarly to theforaging movements of Mediterranean shearwaters on dayswithout trawling activity, purse seiners that target smallpelagic fish along the Peruvian coast produce Levy trajectories[42, 43]. In complex and dynamic marine environments,however, it is difficult to know whether such movement
0 1 2log r (km)
-4
-3
-2
-1
log
F(r
)
0 1 2log r (km)
-2
-1
0
log
P(R
>r)
A NO FISHERIES
μ = 2.09
F(r)
0 1 2log t (hr)
-3
-2
-1
log
[SA
(t)/
t]
0 0.5 1 1.5log t (hr)
-2
-1
0
log
P(T
>t)
C
δ = 0.63S
A(t)
Figure 4. Cumulative and Probability Density Distribution Plots
Cumulative probability distribution plots for the spatial kernel (i.e., FðrÞ, A and
absence (A and C) and in the presence (B and D) of fishery activities. Insets s
functions. Red and dashed lines illustrate the behavior of the best fits (see Tab
density forms. The exponent of the site fidelity kernel density function is d = 1
patterns represent a tight (unambiguous) mapping of thespatial resource distribution or whether they represent partof an efficient behavioral strategy to explore highly unpredict-able environments [44, 45]. Also noteworthy is the fact thata Levy (fat-tailed) spatial kernel can emerge either as a resultof a change in the average behavior of the population or asa result of the emergence of a few superspreaders responsiblefor the largest traveling distances [46]. Although we can-not determine the underlying mechanism, it is notable thata highly heterogeneous spatial redistribution kernel favors
0 1 2log r (km)
-4
-3
-2
-1
log
F(r
)
0 1 2log r (km)
-3
-2
-1
0
log
P(R
>r)
FISHERIES
λ = 24 km
0 1 2log t (hr)
-3
-2
-1
log
[SA
(t)/
t]
0 0.5 1 1.5log t (hr)
-2
-1
0
log
P(T
>t)
B
D
δ = 0.85
B) and the site fidelity kernel (i.e., SAðtÞ, A = 50 km 3 50 km, C and D) in the
how log-binned, normalized plots of the behavior of the probability density
le 1) for the tail of the distribution in both the cumulative and the probability
2 b because SAðtÞwt 2 b. See also Figure S4.

Current Biology Vol 20 No 3220
efficient searching in complex and unpredictable environ-ments [45, 47–50].
Within their foraging grounds, most seabirds restrict theirsearches to particular environments where prey are moreabundant [13, 44, 51]. Such strong site fidelities suggestthat seabirds ‘‘know’’ where to find food, probably fromprevious experience. The local area intensity of use and theamount of time spent within each of these high-resource-density areas (‘‘hot spots’’) must be correlated to both localresource availability and predictability patterns [44, 51]. Inthe western Mediterranean, the hot spots overlap with thetrawling fishing areas of relative high marine productivity,where small pelagic fishes are also abundant [10, 13, 16].We show that the probability of observing an animal in a local-ized area (supposedly a hot spot) at different time intervalsdecays faster (i.e., has a larger scaling exponent) in the pres-ence of trawlers than in their absence. Hence, when trawlersare operating, the foraging fidelity to hot-spot areas probablydecreases because seabirds become much more efficient, viafishery discards, in fulfilling their energetic requirements. Onthe contrary, in the absence of trawling activity, seabirdsmay spend much more time looking for prey or prey cues,most probably in the same highly productive marine areas[10]. Larger site fidelities in the absence of trawlers produce,in terms of the FDE model, larger pause probabilities, i.e.,smaller scaling exponents in the temporal kernel. Becausediscard availability improves the breeding performance ofMediterranean shearwaters ([4–6], but see also [52]) butdecreases their fidelity to hot spots, we hypothesize that inthe presence of trawling activities, shearwater breeding pop-ulations may take advantage of the extra time available toincrease the frequency of return trips to the colony (thesedisplacements are not taken into account in this study)[10, 53–55]. In seabird populations that breed on islands, tripsto and from the richer areas of the mainland coast might bestrongly competing with lengthy exploration trips within theforaging grounds. To the extent that human activities producemore predictable resource patterns, the investment effort inlarge displacements should be biased more toward tripsto and from the colony than toward lengthy explorationdisplacements within the foraging grounds. If trawlers areoperating, seabirds may trust previous experiences aboutthe time and energetic costs of finding and exploitingresources in successive feeding trips. In the absence of trawl-ing activities, food availability and predictability become moreuncertain. Seabirds may need more time to successfullyexploit the hot spots within the foraging grounds [40], and,provided a high uncertainty about future foraging success,‘‘good enough’’ spots might be less prone to being underex-ploited. However, seabirds seem to be able to overcompen-sate for the slow dispersal due to strong site fidelity effectsvia very large albeit rare flights, which can lead to a free-rangetype of exploration. Such a strategy generates a fast andhighly heterogeneous spreading over the seascape, mini-mizing potential unsuccessful site fidelities on commonlyexploited areas and maximizing encounters with new (knownor unknown) high-resource patches. The nontrivial algebraiclaws and the statistical changes observed in both the trav-eling distances and the site fidelity kernels clearly illustratethe complexity of patch-use dynamics by the seabirds.Such results should be taken as a call to incorporate newlandscape-level behavioral ideas into optimal foragingmodels [56, 57]. Further investigations and higher-resolutiondata would be needed to gain a complete mechanistic
understanding of the regionally scaled seabird movementpatterns identified in the present work.
ConclusionsUnderstanding how animal behavior generates varying spatio-temporal movement patterns at different scales is a classicproblem in ecology [19, 20]. Our approach to understandingthe impact of human fishing activities on seabird movementpatterns has been based on three steps: (1) assuming that,at regional scales, the search for food follows a FDE model;(2) estimating the FDE model’s free parameters directly (i.e., m)and indirectly (i.e., a is obtained via the computation of b inSAðtÞ) from the empirical data; and (3) interpreting the FDEmodel and its diffusive properties (i.e., g) in biological terms.Our work bridges the existing gap between animal ecologyand anomalous diffusion phenomena and illustrates howhuman activity impacts on landscape-level behavioral ecologyby modifying the availability and predictability patterns ofresources.
Experimental Procedures
Breeding individuals were equipped with satellite transmitters (Microwave
Telemetry, Inc.) [34]. Tracking data for Balearic shearwaters were recorded
from breeders from two colonies in the islands of Mallorca and Menorca
(1999–2000) and for Cory’s shearwaters from three colonies in Mallorca,
Menorca, and Corsica (2003–2005). Trajectory series ranged from 7 to 147
locations (mean value of 35), and our final data set consisted of 1402 loca-
tions. The time interval between successive positions spanned from 15 min
to 48 hr, although 80% of the time intervals were less than 24 hr. The median
sampling interval was 3.65 hr, giving an average rate of 6.5 positions per
day. Traveling distances were computed as geodetic distances (km) based
on the implementation of Vicenty’s algorithm made available as a MATLAB
script by M. Kleder (http://www.mathworks.com/matlabcentral/). Statistical
computations were performed with R version 2.2.0 (http://www.r-project.
org) and the ‘‘bbmle’’ R package, made available by B. Bolker (http://
www.zoology.ufl.edu/bolker/; see also [58]). The Supplementary Informa-
tion provides a detailed explanation of the statistical procedures, a formal
description of the fractional diffusion equation and the site fidelity kernel,
and an extended set of statistical results supporting the main conclusions
of our work.
Supplemental Information
Supplemental Information includes four figures, three tables, Supplemental
Experimental Procedures, and Supplemental Results and can be found with
this article online at doi:10.1016/j.cub.2009.11.073.
Acknowledgments
We thank the Balearic regional government (J. Mayol) for allowing us the use
of field data, as well SEO/BirdLife for performing the corresponding field
work, all funded by LIFE grants from the European Union. The Spanish Insti-
tute of Oceanography also provided helpful information on trawling fishery
dynamics. F.B. thanks the members of the Population Ecology Group (IME-
DEA, CSIC-UIB) for fruitful discussions. F.B. also is indebted to S. Pueyo
and B. Bolker for generously answering questions regarding power-law
model selection and parameter estimations and the use of the ‘‘bbmle’’
package, respectively. This study was funded by Spanish Ministry of
Science grants BOS2003-01960 and CGL2006-04325/BOS. F.B. was funded
by postdoctoral research grant MEC-EX1011 from the Spanish government.
F.B., L.G., and S.A.L. were also funded by National Science Foundation
grant DEB-0434319 and Defense Advanced Research Projects Agency
grant HR0011-05-1-0057. M.L. was supported by a predoctoral research
grant from the Balearic regional government.
Received: August 10, 2009
Revised: October 8, 2009
Accepted: November 23, 2009
Published online: January 28, 2010

Fishery Discards Distort Seabird Movement Patterns221
References
1. van Gils, J.A., Piersma, T., Dekinga, A., Spaans, B., and Kraan, C. (2006).
Shellfish dredging pushes a flexible avian top predator out of a marine
protected area. PLoS Biol. 4, e376.
2. Pauly, D., Christensen, V., V, Dalsgaard, J., Froese, R., and Torres, F., Jr.
(1998). Fishing down marine food webs. Science 279, 860–863.
3. Votier, S.C., Furness, R.W., Bearhop, S., Crane, J.E., Caldow, R.W.G.,
Catry, P., Ensor, K., Hamer, K.C., Hudson, A.V., Kalmbach, E., et al.
(2004). Changes in fisheries discard rates and seabird communities.
Nature 427, 727–730.
4. Furness, R.W. (2003). Impacts of fisheries on seabird communities. Sci.
Mar. 67, 33–45.
5. Oro, D., Cam, E., Pradel, R., and Martınez-Abraın, A. (2004). Influence of
food availability on demography and local population dynamics in
a long-lived seabird. Proc. Biol. Sci. 271, 387–396.
6. Louzao, M., Igual, J.M., McMinn, M., Aguilar, J.S., Triay, R., and Oro, D.
(2006). Small pelagic fish, trawling discards and breeding performance
of the critically endangered Balearic shearwater: Improving the conser-
vation diagnosis. Mar. Ecol. Prog. Ser. 318, 247–254.
7. Oro, D., Jover, L., and Ruiz, X. (1996). Influence of trawling activity on the
breeding ecology of a threatened seabird, Audouin’s gull Larus audoui-
nii. Mar. Ecol. Prog. Ser. 139, 19–29.
8. Arcos, J.M., and Oro, D. (2002). Significance of fisheries discards for
a threatened Mediterranean seabird, the Balearic shearwater Puffinus
mauretanicus. Mar. Ecol. Prog. Ser. 239, 209–220.
9. Tavecchia, G., Pradel, R., Genovart, M., and Oro, D. (2007). Density-
dependent parameters and demographic equilibrium in open popula-
tions. Oikos 116, 1481–1492.
10. Manosa, S., Oro, D., and Ruiz, X. (2004). Activity patterns and foraging
behavior of Audouin’s gulls at the Ebro Delta, NW Mediterranean. Sci.
Mar. 68, 605–614.
11. Oro, D. (1999). Trawler discards: A threat or a resource for opportunistic
seabirds? In Proceedings of the 22nd International Ornithological
Congress, N.J. Adams and R.H. Slotow, eds. (Durban, South Africa:
BirdLife South Africa), pp. 717–730.
12. Furness, R.W., Edwards, A.E., and Oro, D. (2007). Influence of manage-
ment practices and of scavenging seabirds on availability of fisheries
discards to benthic scavengers. Mar. Ecol. Prog. Ser. 350, 235–244.
13. Louzao, M., Hyrenbach, K.D., Arcos, J.M., Abello, P., Gil de Sola, L., and
Oro, D. (2006). Oceanographic habitat of an endangered Mediterranean
procellariiform: implications for marine protected areas. Ecol. Appl. 16,
1683–1695.
14. Abello, P., Arcos, J.M., and Gil de Sola, L. (2003). Geographical patterns
of seabird attendance to a research trawler along the Iberian Mediterra-
nean coast. Sci. Mar. 67, 69–75.
15. Louzao, M., Becares, J., Rodrıguez, B., Hyrenbach, K.D., Ruiz, A., and
Arcos, J.M. (2009). Combining vessel-based surveys and tracking
data to identify key marine areas for seabirds. Mar. Ecol. Prog. Ser.
391, 183–197.
16. Oro, D. (1995). The influence of commercial fisheries in daily activity of
Audouin’s gull in the Ebro Delta, NE Spain. Ornis Fennica 72, 154–158.
17. Helbig, J.A., and Pepin, P. (2002). The effects of short space and time
scale current variability on the predictability of passive ichthyoplankton
distributions: An analysis based on HF radar observations. Fish. Ocean-
ogr. 11, 175–188.
18. Arcos, J.M., Louzao, M., and Oro, D. (2008). Fisheries ecosystem
impacts and management in the Mediterranean: Seabirds point of
view. In Proceedings of the Fourth World Fisheries Congress: Recon-
ciling Fisheries with Conservation, J. Nielsen, J. Dodson, K. Friedland,
T. Hamon, N. Hughes, J. Musick, and E. Verspoor, eds. (Bethesda,
MD: American Fisheries Society), pp. 587–596.
19. Okubo, A., and Levin, S.A. (2002). Diffusion and Ecological Problems:
Modern Perspectives (Berlin: Springer-Verlag).
20. Turchin, P. (1998). Quantitative Analysis of Movement: Measuring and
Modelling Population Redistribution in Animals and Plants (Sunderland,
MA: Sinauer Associates).
21. Shlesinger M.F., Zaslavsky G., and Frisch U., eds. (1995). Levy Flights
and Related Topics in Physics (Berlin: Springer-Verlag).
22. Klafter, J., Shlesinger, M.F., and Zumofen, G. (1996). Beyond Brownian
motion. Phys. Today 49, 33–39.
23. Metzler, R., and Klafter, J. (2000). The random walks guide to anomalous
diffusion: A fractional dynamics approach. Phys. Rep. 339, 1–77.
24. Mainardi, F., Luchko, Y., and Pagnini, G. (2001). The fundamental solu-
tion of the space-time fractional diffusion equation. Fractional Calculus
Appl. Anal. 4, 153–192.
25. Shlesinger, M.F. (2006). Mathematical physics: search research. Nature
443, 281–282.
26. Zumofen, G., and Klafter, J. (1995). Laminar-localized-phase coexis-
tence in dynamical systems. Phys. Rev. E Stat. Phys. Plasmas Fluids
Relat. Interdiscip. Topics 51, 1818–1821.
27. Vazquez, A., Sotolongo-Costa, O., and Brouers, F. (1999). Diffusion
regimes in Levy flights with trapping. Physica A 264, 424–431.
28. Hilborn, R., and Mangel, M. (1997). The Ecological Detective: Confront-
ing Models with Data (Princeton, NJ: Princeton University Press).
29. Burnham, K.P., and Anderson, D.R. (2002). Model Selection and Infer-
ence. A Practical Information-Theoretical Approach, Second Edition
(Berlin: Springer-Verlag).
30. Edwards, A.M., Phillips, R.A., Watkins, N.W., Freeman, M.P., Murphy,
E.J., Afanasyev, V., Buldyrev, S.V., da Luz, M.G., Raposo, E.P., Stanley,
H.E., and Viswanathan, G.M. (2007). Revisiting Levy flight search
patterns of wandering albatrosses, bumblebees and deer. Nature 449,
1044–1048.
31. Clauset, A., Shalizi, C.R., and Newman, M.E.J. (2009). Power-law distri-
butions in empirical data. arXiv:0706.1062v2 [physics.data-an]. (http://
arxiv.org/abs/0706.1062).
32. Brockmann, D., Hufnagel, L., and Geisel, T. (2007). The scaling laws of
human travel. Nature 409, 463–465.
33. Klafter, J., Blumen, A., and Shlesinger, M.F. (1987). Stochastic pathway
to anomalous diffusion. Phys. Rev. A 35, 3081–3085.
34. Ruiz A. and Martı R., eds. (2004). La Pardela Balear (Madrid: SEO/Bird-
Life-Conselleria de Medi Ambient del Govern de les Illes Balears).
35. Arcos, J.M. (2001). Foraging ecology of seabirds at sea: Significance
of commercial fisheries in the NW Mediterranean. PhD thesis, University
of Barcelona, Barcelona, Spain (http://www.tdx.cesca.es/TESIS_UB/
AVAILABLE/TDX-0219102-114337/TOL38.pdf).
36. Sims, D.W., Southall, E.J., Humphries, N.E., Hays, G.C., Bradshaw,
C.J.A., Pitchford, J.W., James, A., Ahmed, M.Z., Brierley, A.S., Hindell,
M.A., et al. (2008). Scaling laws of marine predator search behaviour.
Nature 451, 1098–1102.
37. Benhamou, S. (2007). How many animals really do the Levy walk?
Ecology 88, 1962–1969.
38. Reynolds, A. (2008). How many animals really do the Levy walk?
Comment. Ecology 89, 2347–2351, discussion 2351–2352.
39. Boyer, D., Ramos-Fernandez, G., Miramontes, O., Mateos, J.L., Cocho,
G., Larralde, H., Ramos, H., and Rojas, F. (2006). Scale-free foraging by
primates emerges from their interaction with a complex environment.
Proc. Biol. Sci. 273, 1743–1750.
40. Oro, D., Ruiz, X., Jover, L., Pedrocchi, V., and Gonzalez-Solis, J. (1997).
Audouin’s gull diet and adult time budget responses on changes in food
availability induced by commercial fisheries. Ibis 139, 631–637.
41. Coll, M., Palomera, I., Tudela, S., and Dowd, M. (2008). Food-web
dynamics in the South Catalan Sea ecosystem (NW Mediterranean)
for 1978-2003. Ecol. Modell. 217, 95–116.
42. Bertrand, S., Burgos, J.M., Gerlotto, F., and Atiquipa, J. (2005). Levy
trajectories of Peruvian purse-seiners as an indicator of the spatial
distribution of anchovy (Engraulis ringens). ICES J. Mar. Sci. 62,
477–482.
43. Bertrand, S., Bertrand, A., Guevara-Carrasco, R., and Gerlotto, F. (2007).
Scale-invariant movements of fishermen: the same foraging strategy as
natural predators. Ecol. Appl. 17, 331–337.
44. Weimerskirch, H. (2007). Are seabirds foraging for unpredictable
resources? Deep Sea Res. II 54, 211–223.
45. Bartumeus, F. (2007). Levy processes in animal movement: An evolu-
tionary hypothesis. Fractals 15, 151–162.
46. Lloyd-Smith, J.O., Schreiber, S.J., Kopp, P.E., and Getz, W.M. (2005).
Superspreading and the effect of individual variation on disease emer-
gence. Nature 438, 355–359.
47. Viswanathan, G.M., Raposo, E.P., and da Luz, M.G.E. (2008). Levy flights
and superdiffusion in the context of biological encounters and random
searches. Phys. Life Rev. 5, 133–150.
48. Bartumeus, F., and Levin, S.A. (2008). Fractal reorientation clocks: Link-
ing animal behavior to statistical patterns of search. Proc. Natl. Acad.
Sci. USA 105, 19072–19077.
49. Viswanathan, G.M., Buldyrev, S.V., Havlin, S., da Luz, M.G.E., Raposo,
E.P., and Stanley, H.E. (1999). Optimizing the success of random
searches. Nature 401, 911–914.

Current Biology Vol 20 No 3222
50. Bartumeus, F., da Luz, M.G.E., Viswanathan, G.M., and Catalan, J.
(2005). Animal search strategies: A quantitative random-walk analysis.
Ecology 86, 3078–3087.
51. Weimerskirch, H., Pinaud, D., Pawlowski, F., and Bost, C.-A. (2007).
Does prey capture induce area-restricted search? A fine-scale study
using GPS in a marine predator, the wandering albatross. Am. Nat.
170, 734–743.
52. Gremillet, D., Pichegru, L., Kuntz, G., Woakes, A.G., Wilkinson, S., Craw-
ford, R.J.M., and Ryan, P.G. (2008). A junk-food hypothesis for gannets
feeding on fishery waste. Proc. Biol. Sci. 275, 1149–1156.
53. Weimerskirch, H. (1998). How can a pelagic seabird provision its chick
when relying on a distant food resource? Cyclic attendance at the
colony, foraging decision and body condition in sooty shearwaters.
J. Anim. Ecol. 67, 99–109.
54. Weimerskirch, H., Fradet, G., and Cherel, Y. (1999). Natural and experi-
mental changes in chick provisioning in a long-lived seabird, the
Antarctic prion. J. Avian Biol. 30, 165–174.
55. Waugh, S.M., Filippi, D., Fukuda, A., Suzuki, M., Higuchi, H., Setiawan,
A.N., and Davis, L.S. (2005). Foraging of royal albatrosses, Diomedea
epomophora, from the Otago Peninsula and its relationships to fish-
eries. Can. J. Fish. Aquat. Sci. 62, 1410–1421.
56. Bartumeus, F., and Catalan, J. (2009). Optimal search behaviour and
classic foraging theory. J. Phys. A Math. Theor. 42, 434002.
57. Lima, S.L., and Zollner, P.A. (1996). Towards a behavioral ecology of
ecological landscapes. Trends Ecol. Evol. 11, 131–135.
58. Bolker, B.M. (2008). Ecological Models and Data in R (Princeton, NJ:
Princeton University Press).


