Embed Size (px)
Citation preview
Firm ownership and the labour share
Sophie Piton� & Antoine Vatany
This version: November 2, 2018.
Abstract:
Since the early 1980s, there has been a broad, worldwide decrease in the share of income accruing
to labour. We argue that this trend could be driven by recent trends in �rm ownership. Using
national accounts data, we �rst document the decline in the labour share since the 1980s in both
Europe and the United States. This trend is common to most sectors of the economy, and is robust
when accounting for the income of the self-employed. We show that this decline was mirrored by
an increase in the share of payouts (dividends and buybacks) to shareholders. We provide evidence
that countries with a larger share of non-�nancial corporations owned by institutional investors are
countries with the largest share of payouts in gross value added. We use institutional ownership as
an instrumental variable for payouts. We show that more institutional ownership leads to higher
payouts and to a lower labour share. Overall, recent trends in �rm ownership could explain half of
the decline in the labour share in Europe and the United States.
JEL: D3, E22, G3.
Key words: labour share, cost of capital, ownership, corporate �nance, institutional investors.
�Paris School of Economics � University Paris 1 Panthéon Sorbonne & CEPII. Email: [email protected].
Website: https://sites.google.com/site/sophiepiton.yEconomist at CEPII. Email: [email protected].
We are extremely grateful to Michel Aglietta, Agnès Bénassy-Quéré, Gunther Capelle-Blancard, Jézabel Couppey-
Soubeyran, as well as seminar participants at CEPII and Université Paris I Panthéon-Sorbonne for their useful discus-
sions and comments.
1. Introduction
The question of how the bene�ts of economic growth are distributed has recently been the subject
of a renewed interest among economists and policy-makers. This interest is sparked by the ob-
servation of a worldwide decrease in the share of income accruing to labour since the early 1980s
(Karabarbounis and Neiman, 2014). Parallel to this trend, there is also a growing concern about
the allocation of corporate value added that could be more and more in favor of shareholders.
In the United States, Lazonick (2014) points to the fact that companies in the S&P 500 index
used 54% of their earnings to buy back their own stock, and 37% to distribute dividends from
2003 through 2012. With only 9% left for investments in productive capabilities or higher incomes
for employees, he denounces this distribution of earnings as unequal, and calls it "pro�ts without
prosperity".1
Could the decline in the labour share of income since the 1980s result from a rising share of value
added distributed to shareholders? To answer, this paper provides evidence of recent changes
in �rm ownership since the early 1980s, embodied in the increasing ownership of non-�nancial
corporations by institutional investors. These changes have resulted in an increased share of value
added distributed as payouts to shareholders (in the form of dividends and stock buybacks), and in
a decline in the labour share. Our results show that recent trends in �rm ownership could explain
half of the decline in the labour share in Europe and the United States on average. The contribution
of this paper is thus to provide a novel explanation for the decline in the labour share, relating the
labour share to �rm ownership.
We start by documenting three stylized facts common to Europe and the United States since the
1980s. The �rst one is the decline in the labour share of income (share of total labour compensation
in gross value added), common to most sectors, and robust when accounting for the income of
the self-employed. Mirroring this decline, we observe an increase in its counterpart: the capital
share. In the second stylized fact we identify, in this capital share, the share of current pro�ts
before distribution (what is left of the gross operating surplus after deducting capital depreciation,
receiving property income, paying interests, rents and charges payables, and paying current taxes).
We show that the increasing capital share re�ects an increase in the pro�t share. And this increase
in the pro�t share re�ects mostly an increase in payouts to shareholders (dividends and buybacks).
Finally, in the third stylized fact, we provide evidence that the share of payouts evolves closely with
institutional ownership and that countries with more institutional ownership have a larger share of
payouts on average.2
1In the Spring 2018, Oxfam made a similar case against the distribution of corporate income of �rms in the CAC
40 in France. From 2009 up to 2016, �rms have distributed 67% of their earnings in dividends, leaving only 27%
for investment, and 5% for employee bene�ts. Oxfam (2018), "CAC 40, des pro�ts sans partage", 14 mai. Last
accessed at this address: http://www.oxfamfrance.org/rapports/justice-�scale/cac-40-des-pro�ts-sans-partage.2We follow OECD classi�cation and consider that institutional investors include investment funds (money market
and non-money market funds), insurance corporations and pension funds. Institutional investors have in common
2
We discuss three mechanisms through which �rm ownership a�ects resource-allocation decisions:
by tightening governance, by inducing a short-termist governance or by increasing concentration.
We argue that, whatever the mechanism, more institutional ownership may lead to a lower labour
share by increasing �rms' pro�tability while reducing both employment and wages. In the empirical
part, we are unable to di�erentiate between the three hypotheses. We simply test whether an
increase in institutional ownership leads to a higher pro�t share and a lower labour share. We
quantify the causal e�ect of increased pro�t shares on labour shares using lagged institutional
ownership as an instrumental variable. Results show that more institutional ownership leads to
higher payouts and to a lower labour share. Firm ownership could explain about half of the fall in
the labour share since the early 1980s. Despite the common declining trend in the long-run, some
European countries display stable or even increasing labour share since the mid-1990s. We show
that our explanation can partly account for this heterogeneity.
This paper relates to recent studies of the determinants of the decline in the labour share. Three
main views emerge to explain the decline in the labour share. The �rst one focuses on the coun-
terpart of the labour share: the capital share. They argue that this share has increased because
of capital accumulation, which is not o�set by a fall in the returns per unit of capital. Piketty
and Zucman (2014) document wealth accumulation for 8 developed economies since the 1970s.
Karabarbounis and Neiman (2014) relate this trend to the recent decline in the price of capital
goods. Koh et al. (2015) argue that this increasing capital re�ects the accumulation of a new form
of capital: intangible assets. Acemoglu and Restrepo (2016) relate it to a "race between machine
and man". Another view is supported by Elsby et al. (2013), who show evidence that o�shoring
is a leading potential explanation of the decline in the labour share in the United States.3 Finally,
recent papers have emphasized the role of increasing pro�ts in explaining the counterpart of the
declining labour share: the rising capital share. These increasing pro�ts could be explained by an
increased scarcity of safe assets (Rognlie, 2015; Caballero et al., 2017). It could also re�ect the
increased concentration of �rms (Dorn et al., 2017). But Gutiérrez (2017) recently show evidence
that the e�ect of competition cannot explain dynamics of the labour share in Europe.
All of these explanations are certainly at play to explain the long-term declining trend in the labour
share. However, they cannot account for heterogeneous patterns of the dynamics of the labour
share in Europe. Our contribution is to provide a novel hypothesis that can explain the declining
trend in the labour share as well as its heterogeneous dynamics across European countries. Gutiérrez
and Philippon (2018) establish a causal relationship between increased institutional ownership and
decreased investment. Focusing on the United States since the 1980s, they show that investment
is weak relative to the measure of pro�tability in the business sector. They suggest that one of
that they are agents of their clients' money as opposed to individual investors.3Elsby et al. (2013) also show that there is little evidence supporting previous explanations based on the hypothesis
of a reduced bargaining power of workers. On the e�ect of the bargaining power of workers on the labour share, see
for instance Blanchard and Giavazzi (2003); Kristal (2010).
3
the reasons for this "investment-less growth" is to be found in recent trends in �rm governance.
Crane et al. (2016) have already provided evidence that higher institutional ownership causes �rms
to pay more dividends. And the role of institutional investors have increased substantially in the
United States since the 1980s. This change in �rm ownership has led �rms to repurchase more
shares at the expense of investment. We suggest that these trends could also contribute to the
decline in the labour share since the 1980s.
Our contribution is threefold. First, building on national accounting data, we provide evidence
that increased pro�t shares in Europe and the United States re�ect mostly the increase in payouts
to shareholders. We document these trends for up to 28 countries and over at most 1950-2015.
Second, we show that there is a causal relationship from the pro�t share to the labour share. We
subsequently provide a novel explanation for the decline in the labour share, relating the labour share
to �rm ownership. Finally, we show that our narrative accounts for a large part of the declining
trend in the labour share, but also for heterogeneous patterns of the labour share over time and
across countries.
The remainder of the paper is organized as follows. Section 2 describes the data gathered to
show three main stylized facts in Europe and the United States since the 1980s: (i) the decline
in the labour share of income; (ii) mirrored by an increase in the share of payouts (dividends
and buybacks) to shareholders; (iii) the positive relationship between the share of payouts and
institutional ownership. Section 3 provides theoretical intuitions to understand better the e�ect
of �rm ownership on the allocation of resources. Section 4 describes the empirical strategy used
to establish a causal relationship between institutional ownership and the labour share, and shows
macroeconomic implications of this relationship. Section 5 concludes.
2. Stylized Facts
In this section, we describe the data used and indicators built to document three trends concerning
the non-�nancial corporate sector: the decline in the labour share, the increase in the share of
payouts (dividends and buybacks) to shareholders, the positive relationship between the share of
payouts and institutional ownership.
2.1. Data
We use di�erent data sources: Eurostat and OECD �nancial accounts as well as the US Flow of
Funds for data by institutional sectors; EU KLEMS for industry-level data.
Aggregate accounts of the non-�nancial corporate sector Eurostat and OECD �nancial ac-
counts and the US Flow of Funds provide data by institutional sectors, including data for the
non-�nancial corporate sector. They provide a detailed decomposition of the sector accounts
4
(generation and allocation of income, as well as �nancial transactions and balance-sheets). Data
are available for up to 29 countries from 1950 to 2015.
Industry accounts of the non-�nancial market economy We use the 2017 update of EU
KLEMS which provides data on gross value added and its decomposition into labour and capital
compensations, as well as data on produced capital (tangible and intangible capital) by industry for
European countries and the United States.4 For some countries, the time coverage is shorter than
in previous updates of EU KLEMS. When possible, missing data was �lled with the 2011 update
to increase the time coverage for these countries. EU KLEMS classi�es industries according to
the International Standard Industrial Classi�cation (ISIC rev. 4). We focus on the non-�nancial
market economy, which is the closest aggregate to the non-�nancial corporate sector. We discuss
the comparison between both sectors in the following section. The non-�nancial market economy
is composed of 19 industries, excluding non-market services sectors (data are very poor), public
administration (by construction, its labour share is 100%) and the �nancial sector (for which the
measure of output is not clear).5 Data are available for up to 29 countries from 1970 to 2015.
The role of institutional investors in equity markets In the data by institutional sectors provided
by Eurostat, the OECD and the US Flow of Funds, it is possible to identify institutional investors.
We follow OECD classi�cation and consider that institutional investors include investment funds
(money market and non-money market funds), insurance corporations and pension funds.6 We
focus on their activity on equity markets, and build a measure that is comparable across countries:
the ratio of total equity owned by institutional investors (excluding investment fund shares) to total
market capitalization of non-�nancial corporations. We use this indicator as a proxy for institutional
ownership. Data are available for up to 29 countries from 1950 to 2015.
Country coverage We focus on the comparison between Europe and the United States over
1980-2015. For Europe, data coverage is very heterogeneous across countries. We build an
EU (moving sample) aggregate representing a weighted average for all European countries.7 To
account for entry and exit during the sample, as in Karabarbounis and Neiman (2014), evolutions
4Data are freely available at: http://www.euklems.net/.5Since the previous updates were in a di�erent classi�cation, some industries had to be aggregated to make the
correspondence. We end up with the non-�nancial market economy being composed of 19 industries. Non-market
services sectors include the Nace revision 2 codes T and U: activities of households as employers and non-pro�ts serving
households, but also sector L: real estate, which re�ects mostly the imputed rental income. Public administration
includes the sector codes O, P and Q. The �nancial and insurance sector (K) is also excluded.6European Commission (2013) de�nes as investment funds all �nancial corporations and quasi-corporations whose
business is to issue investment fund shares or units as close substitutes for deposits from institutional units, and, for
their own account, make investments.7We weight countries using their share in total GDP at PPP.
5
for the EU (moving sample) plot the year �xed e�ects from a regression that also includes country
�xed e�ects, and which is weighted by the country's share in the European total gross value added.
The e�ects are then normalized to equal the European average in 1997.
2.2. Accounting framework and methodological issues
National accounts data describe the generation and distribution of income and the accumulation
of non-�nancial and �nancial assets.8 Each dataset here complies with the standards of the 2008
System of National Accounts (SNA 2008). The main accounting identities are summarized in
table 1.
Gross value added at factor costs can be decomposed into labour compensations and gross oper-
ating surplus. Consumption of �xed capital is deduced from the gross to get the net operating
surplus. Current pro�ts before distribution are what is left of the net operating surplus after re-
ceiving property income, paying interests, rents and charges payables, and paying current taxes
(including the corporate income tax). Part of these current pro�ts are then distributed to share-
holders in the form of dividends or stock buybacks.9 In the following we will discuss how we build,
in EU KLEMS and in �nancial accounts data, the di�erent measures of the labour share (the ratio
of labour compensation to gross value added), the pro�t share (ratio of current pro�ts before dis-
tribution to gross value added), and the share of payouts to shareholders (dividends + buybacks)
in gross value added.
Delineation of the corporate versus market economy Financial accounts data are available
for the non-�nancial corporate sector. By construction, this sector excludes the activity of self-
employed.10
We build in EU KLEMS the accounts for the non-�nancial market economy. Contrary to the non-
�nancial corporate sector, the non-�nancial market economy includes both the activity of employees
and self-employed. The gross value added is then the sum of the compensation to employees, the
gross operating surplus and the mixed income of self-employed. Mixed income includes both the
compensation and the gross operating surplus of self-employed.
8For more details, see chapter 8 of European Commission (2013).9Current pro�t before distribution is a concept used in business accounting. Its equivalent is the net entrepreneurial
income in national accounting. See European Commission (2013), paragraph 8.26 on p.209 for a discussion on this
equivalence.10In some countries (Italy and Germany especially), corporate income includes the activity of certain types of self-
employment (quasi-corporations). See the next section for a discussion on the implications for the measure of the
labour share.
6
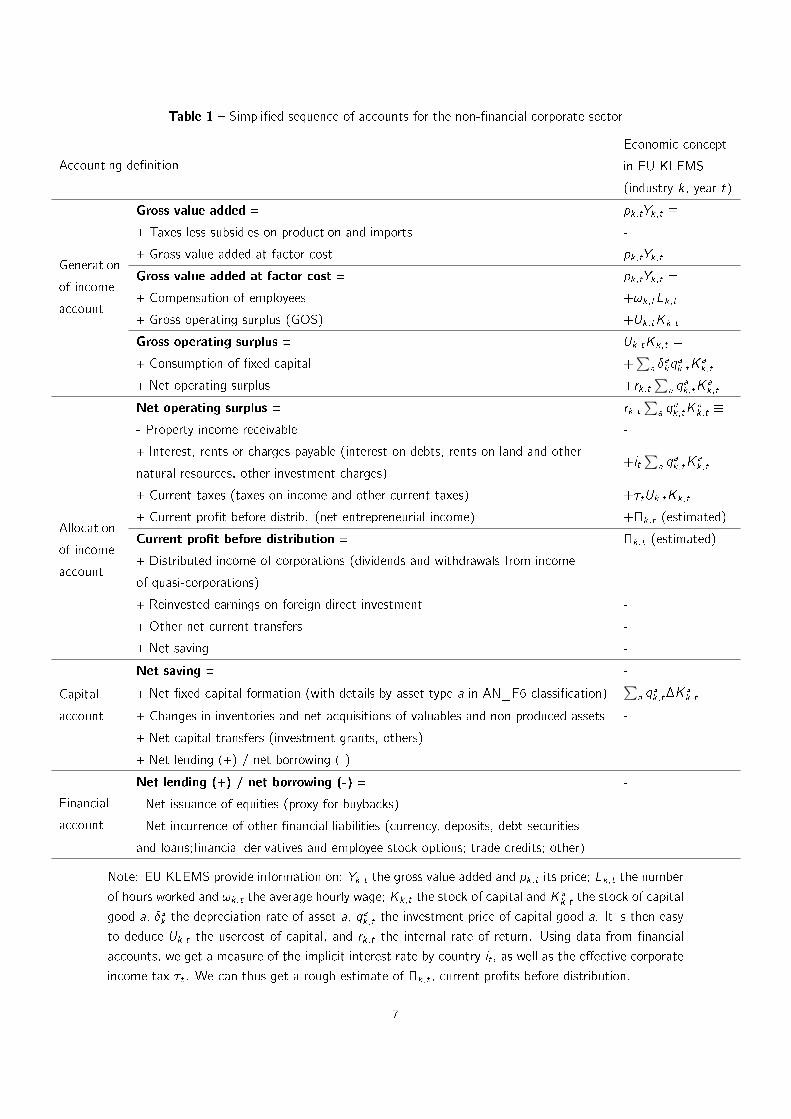
Table 1 � Simpli�ed sequence of accounts for the non-�nancial corporate sector
Accounting de�nition
Economic concept
in EU KLEMS
(industry k , year t)
Gross value added = pk;tYk;t �
+ Taxes less subsidies on production and imports -
+ Gross value added at factor cost pk;tYk;t
Gross value added at factor cost = pk;tYk;t =
+ Compensation of employees +!k;tLk;t
+ Gross operating surplus (GOS) +Uk;tKk;t
Gross operating surplus = Uk;tKk;t =
+ Consumption of �xed capital +∑
a�akqak;tKa
k;t
Generation
of income
account
+ Net operating surplus +rk;t∑
aqak;tKa
k;t
Net operating surplus = rk;t∑
aqak;tKa
k;t�
- Property income receivable -
+ Interest, rents or charges payable (interest on debts, rents on land and other
natural resources, other investment charges)+it
∑aqak;tKa
k;t
+ Current taxes (taxes on income and other current taxes) +�tUk;tKk;t
+ Current pro�t before distrib. (net entrepreneurial income) +�k;t (estimated)
Current pro�t before distribution = �k;t (estimated)
+ Distributed income of corporations (dividends and withdrawals from income
of quasi-corporations)-
+ Reinvested earnings on foreign direct investment -
+ Other net current transfers -
Allocation
of income
account
+ Net saving -
Net saving = -
+ Net �xed capital formation (with details by asset type a in AN_F6 classi�cation)∑
aqak;t�Ka
k;t
+ Changes in inventories and net acquisitions of valuables and non-produced assets -
+ Net capital transfers (investment grants, others) -
Capital
account
+ Net lending (+) / net borrowing (-) -
Net lending (+) / net borrowing (-) = -
- Net issuance of equities (proxy for buybacks) -Financial
account - Net incurrence of other �nancial liabilities (currency, deposits, debt securities
and loans;�nancial derivatives and employee stock options; trade credits; other)-
Note: EU KLEMS provide information on: Yk;t the gross value added and pk;t its price; Lk;t the number
of hours worked and !k;t the average hourly wage; Kk;t the stock of capital and Kak;t
the stock of capital
good a, �akthe depreciation rate of asset a, qa
k;tthe investment price of capital good a. It is then easy
to deduce Uk;t the usercost of capital, and rk;t the internal rate of return. Using data from �nancial
accounts, we get a measure of the implicit interest rate by country it , as well as the e�ective corporate
income tax �t . We can thus get a rough estimate of �k;t , current pro�ts before distribution.
7
Measuring the labour share Using both EU KLEMS and �nancial accounts data, we can compare
three di�erent measures of the labour share:
� the wage share (total compensation of employees to total gross value added) for the
non-�nancial corporate sector using �nancial accounts data;
� the wage share for the non-�nancial market economy in EU KLEMS, this measure is
also available at the industry-level;
� the labour share (total compensation of employees and self-employed to total gross
value added) for the non-�nancial market economy in EU KLEMS, this measure is also
available at the industry-level.
As explained earlier, the non-�nancial market economy in EU KLEMS includes both the activity of
employees and self-employed. The measurement of the labour share can be biased if it does not
account for the compensation of self-employed (i.e. when focusing on the wage share only). This
is especially true in cross country comparisons (Gollin, 2002). The third measure, the labour share
in EU KLEMS, is adjusted for the income of self-employed.
To obtain an indicator of total labour compensation of employees and self-employed, a measure
of the compensation of self-employed is needed. In EU KLEMS, labour income of self-employed
are estimated assuming the average earning per hour worked for self-employed is the same as for
employees:11
LSk;t = WSk;t +!k;tL
Sk;t
pk;tYk;t=
!k;t(LEk;t
+ LSk;t)
pk;tYk;t(1)
with WSk;t the wage share, LEk;t
the number of hours worked by employees, LSk;t
the number of
hours worked by self-employed, and !k;t the average hourly wage in industry k and year t.
Measuring current pro�ts before distribution We can easily observe data on the entrepreneurial
account for the aggregate non-�nancial corporate sector in �nancial accounts �the equivalent in
national accountings to current pro�ts before distribution. However, we do not directly observe
current pro�ts before distribution in EU KLEMS. EU KLEMS provides only the generation of
income account and the capital account for produced �xed assets. It does not provide information
on the allocation of income nor on the �nancial account.
It is possible to construct a proxy of current pro�ts before distribution in EU KLEMS �k;t , for year
t and industry k (Table 1).
11Self-employed represent, on average, 14% of total employment, with the highest share in Italy (31%) and the
lowest share in the United States (8%). On average, the labour share is thus 1.16 (1/(1-14%)) times the wage
share. By estimating the earnings of self-employed, some labour shares are larger than 1 in some countries. When
this is the case, we set the labour share to 1.
8
EU KLEMS provides information on gross value added at current prices and its decomposition into
labour and capital compensation (capital compensation being the gross operating surplus):
pk;tYk;t = !k;tLk;t + Uk;tKk;t (2)
with Yk;t the gross value added and pk;t its price, Lk;t the total number of hours worked, Kk;t the
stock of capital and Uk;t the usercost of capital.
EU KLEMS provides also information on depreciation rates by industry and asset type (�ak). Using
these depreciation rates, we can get an estimate of the consumption of �xed capital. By deducting
the consumption of �xed capital from the gross operating surplus, we get the net operating surplus:
rk;t∑a
qak;tKak;t = Uk;tKk;t �
∑a
�akqak;tK
ak;t (3)
with Kak;t
the stock of capital good a and qak;t
its price, and rk;t the 'internal' rate of return. See
table A.1 in Appendix for a classi�cation of assets a.
As shown in Table 1, current pro�ts before distribution correspond roughly to the net operating
surplus minus interests and charges payable and minus current taxes (assuming that property income
receivable is negligible).12 We get that pro�ts are:
�k;t = (1� �t)Uk;tKk;t �
∑a
(it + �ak)qak;tK
ak;t (4)
with it the interest rate, and �t the e�ective tax rate.
When accounting for holding gains and losses on assets, we get:
�k;t = (1� �t)Uk;tKk;t �
∑a
(it + �ak � q̂ak;t)qak;tK
ak;t (5)
with qak;t
the in�ation rate in the price of asset a. We get the usual Jorgenson and Hall (1967)
formula for the user cost of capital: Uak;t
= (it + �ak� q̂a
k;t)�tq
ak;t.
EU KLEMS does not provide information on neither the interest rate nor the e�ective tax rate.
We use Eurostat and US Flow of funds data to get implicit measures of these rates at the country-
level (we implicitely assume that these rates are the same in each industry). Implicit interest rates
are calculated as the ratio of interests paid to the current stock of debt at market prices. For
robustness checks, we alternatively use the nominal long term interest rate on government bonds
given by Ameco.
Finally, pro�t shares (ratio of total pro�ts to gross value added) can be estimated as follows:
PSk;t =�k;t
pk;tYk;t= 1� LSk;t �
∑a(it + �a
k� q̂a
k;t)�tq
ak;tKa
k;t
pk;tYk;t(6)
12By assuming that property income is null, the net operating surplus is slightly overestimated. In aggregate data,
the sum of interests and pro�ts are 25% larger than the net operating surplus.
9
The pro�t share is a negative function of the labour share. It also depends negatively on capital
depreciation, on the rental rate (in real terms, de�ated by the in�ation in the investment price),
on the e�ective tax rate, on the real investment price (de�ated by the price of gross value added),
and on the capital-to-output ratio.
Payouts to shareholders in aggregate data In the aggregate data for the non-�nancial corporate
sector, the allocation of income account provides data on distributed income of corporations,
and more speci�cally of distributed dividends. The �nancial account also provides data on the
net issuance of equities by corporations. Net equity issues are new corporate stock issues minus
outstanding stock withdrawn through repurchases and merger and acquisition activities. We use
the negative of these net equity issues as a proxy for buybacks.
2.3. Three facts about non-�nancial corporations
Fact #1: A decline in the labour share...
Figure 1 shows the labour share13 in Europe and in the United States, over 1980 to 2015. Three
measures of the labour share are confronted. The grey line shows the wage share for the non-
�nancial corporate sector using �nancial accounts data. The dotted black line shows the wage
share for the non-�nancial market economy in EU KLEMS. The black full line shows the labour
share adjusted for self-employed in EU KLEMS. As already explained, the aggregate for Europe
(moving sample) shows the estimated year �xed e�ects from a least-squared regression of the
labour share on country and year �xed e�ects, to eliminate the in�uence of entry and exit in the
dataset. The e�ects have been normalized to equal to the average labour share in 1997.
Accounting for the self-employed in EU KLEMS leads to an upward correction of the labour share,
by more than 16p.p. in Europe and 7p.p. in the United States on average over the period. In the
United States, the estimated labour share in the non-�nancial market economy (EU KLEMS) is
very close to the labour share in the non-�nancial corporate sector (Flow of funds). In Europe, the
labour share in non-�nancial corporate sector (Eurostat) is signi�cantly lower than the labour share
in the non-�nancial market economy (EU KLEMS). This gap might be explained by two reasons.
The �rst one is that there are cross-country di�erences in the delineation of the corporate sector
(Pionnier and Guidetti, 2015). In some countries (Italy and Germany especially), corporate income
includes the activity of certain types of self-employment (quasi-corporations). In other countries
(like France or the United States), it does not. In countries where corporate income is over-
stated compared to the number of hours worked by employees, the wage share of the non-�nancial
13We here focus on the gross labour share, i.e. labour compensations to gross value added, and not the net labour
share. See Rognlie (2015) for a discussion on gross versus net labour shares.
10
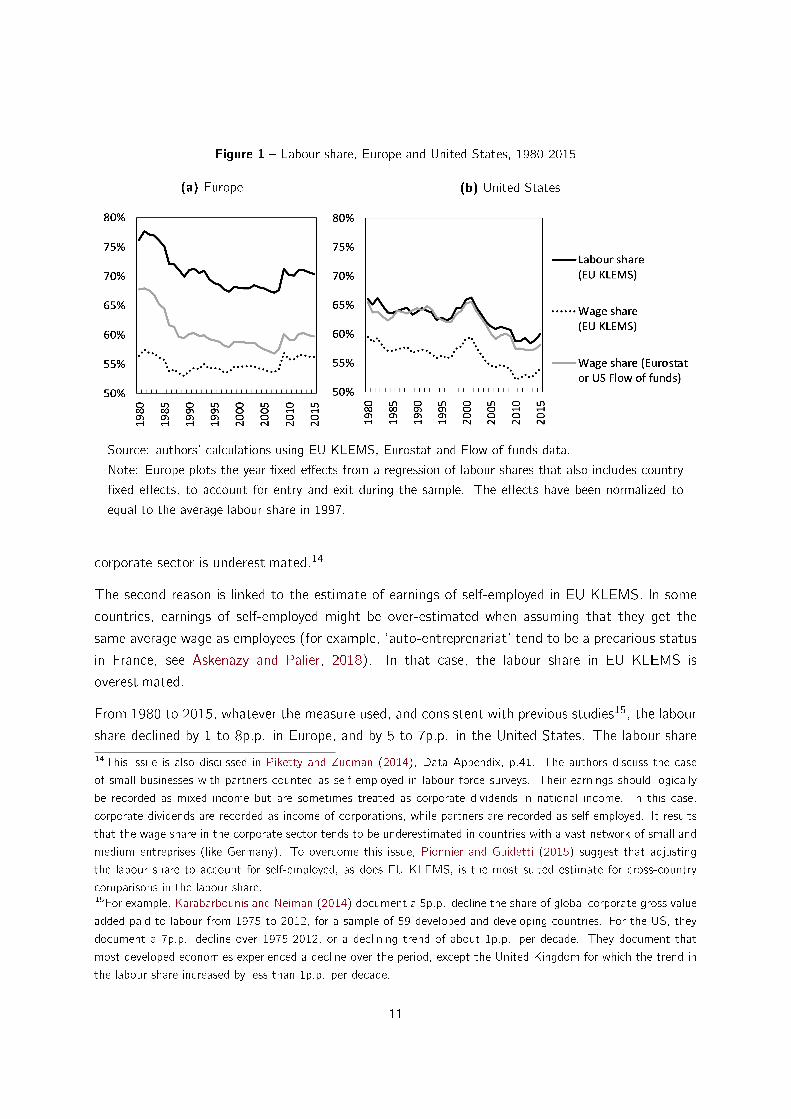
Figure 1 � Labour share, Europe and United States, 1980-2015
(a) Europe (b) United States
Source: authors' calculations using EU KLEMS, Eurostat and Flow of funds data.
Note: Europe plots the year �xed e�ects from a regression of labour shares that also includes country
�xed e�ects, to account for entry and exit during the sample. The e�ects have been normalized to
equal to the average labour share in 1997.
corporate sector is underestimated.14
The second reason is linked to the estimate of earnings of self-employed in EU KLEMS. In some
countries, earnings of self-employed might be over-estimated when assuming that they get the
same average wage as employees (for example, 'auto-entreprenariat' tend to be a precarious status
in France, see Askenazy and Palier, 2018). In that case, the labour share in EU KLEMS is
overestimated.
From 1980 to 2015, whatever the measure used, and consistent with previous studies15, the labour
share declined by 1 to 8p.p. in Europe, and by 5 to 7p.p. in the United States. The labour share
14This issue is also discussed in Piketty and Zucman (2014), Data Appendix, p.41. The authors discuss the case
of small businesses with partners counted as self-employed in labour force surveys. Their earnings should logically
be recorded as mixed income but are sometimes treated as corporate dividends in national income. In this case,
corporate dividends are recorded as income of corporations, while partners are recorded as self-employed. It results
that the wage share in the corporate sector tends to be underestimated in countries with a vast network of small and
medium entreprises (like Germany). To overcome this issue, Pionnier and Guidetti (2015) suggest that adjusting
the labour share to account for self-employed, as does EU KLEMS, is the most suited estimate for cross-country
comparisons in the labour share.15For example, Karabarbounis and Neiman (2014) document a 5p.p. decline the share of global corporate gross value
added paid to labour from 1975 to 2012, for a sample of 59 developed and developing countries. For the US, they
document a 7p.p. decline over 1975-2012, or a declining trend of about 1p.p. per decade. They document that
most developed economies experienced a decline over the period, except the United Kingdom for which the trend in
the labour share increased by less than 1p.p. per decade.
11
has di�erent dynamics in Europe and the United States. In Europe, it starts declining in 1980,
stabilizes in the mid-1990s and slightly increases since 2008. In the United States, the labour share
declines steadily from 2000 to 2015. This decline happened despite the increase in employers'
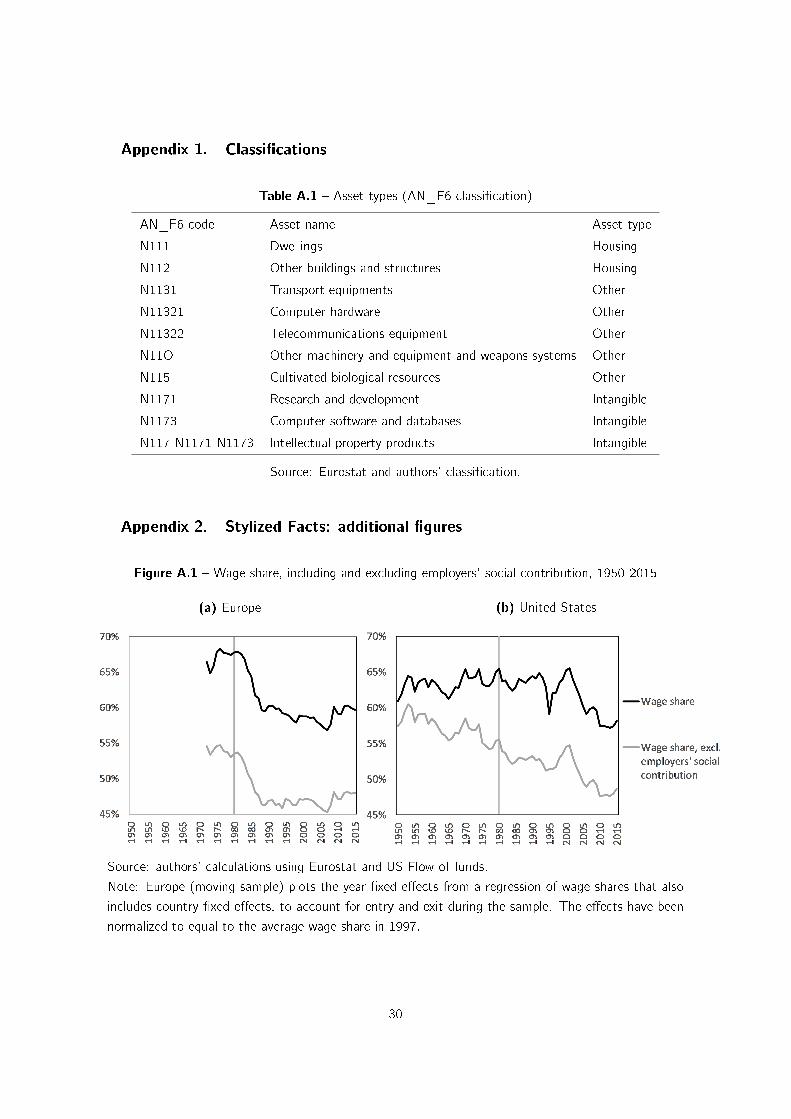
social contribution (see Figure A.1 in Appendix).
Figures A.2a and A.2b in Appendix show estimated linear trends for countries and each 19 industries
using EU KLEMS data. The labour share shows a declining trend in 21 of the 29 countries present
in the dataset. Of the 21 countries where the trend is signi�cant at the 5% level, the labour share
declines in 17 of them. Increasing trends are found in new member States (Estonia, Latvia, Czech
Republic, Cyprus, Bulgaria), but also in the United Kingdom and in Greece. For new member
States, data is available only since the mid-1990s. And if looking at the dynamics of the labour
share for European countries since the mid-1990s, there is no evidence of a decline. The labour
share is stable on average, with strong heterogeneous patterns across countries. Concerning the
UK, the decline happened in the 1970s (Piketty and Zucman, 2014).
Finally, as in Karabarbounis and Neiman (2014), we investigate to what extent the change in the
labour share is the result of a composition e�ect (increasing size of sectors with a low labour share).
To do so, we decompose the trend in the labour share into a within and between components:
�LSi =∑k
!i ;k�LSi ;k︸ ︷︷ ︸Within-industry
+∑k
LSi ;k�!i ;k︸ ︷︷ ︸Between-industry
(7)
where LSi ;k is the labour share in country i and sector k , !i ;k is the sector k 's share in country i 's
gross value added, �x is the estimated linear trend in x over the entire period, and x is its arithmetic
mean over the entire period. Figure A.3 in Appendix plots the country trends in the labour share
(x-axis) against the within-industry component (y-axis). As in Karabarbounis and Neiman (2014),
with a few exceptions countries are aligned along the 45-degree line, implying that the fall of the
labour share is mostly driven by the within-industry component. 70% of the trend in the labour
share re�ects the within-industry component in the US and EU9. This result casts doubts on the
fact that increased import competition drives the decline in the labour share, as argued by Elsby
et al. (2013), as this import competition should a�ect mostly tradable sectors and not all sectors
equally.16
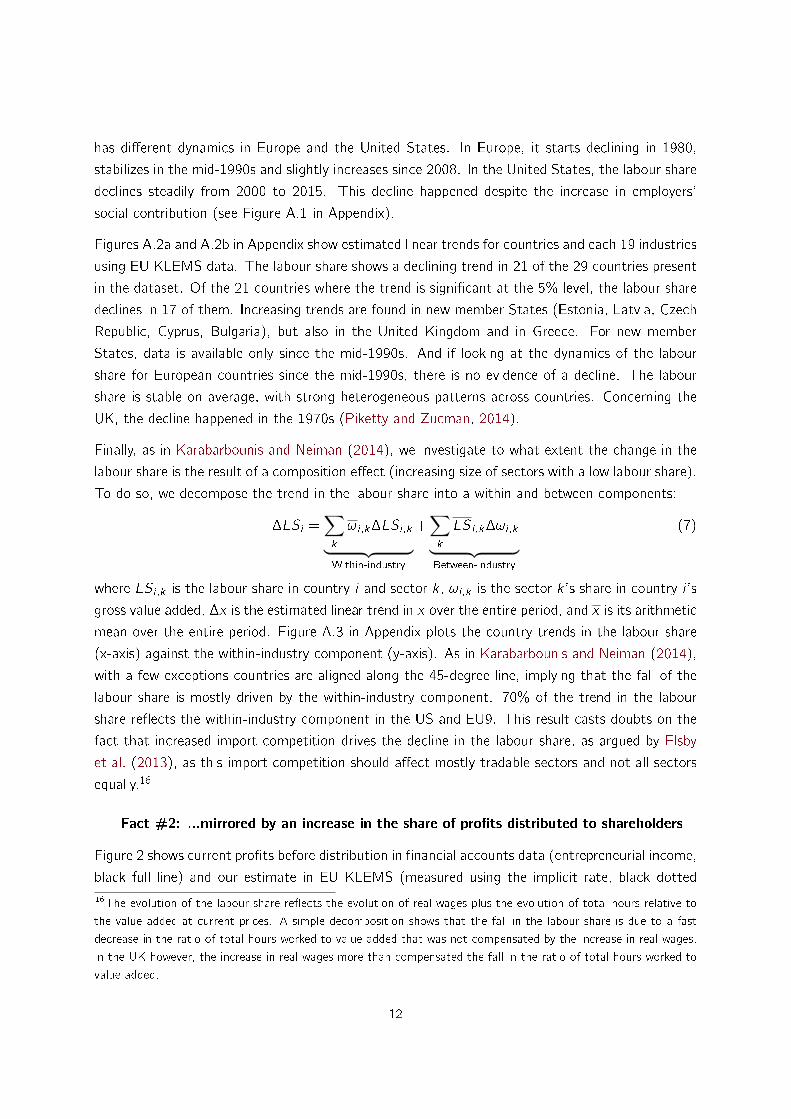
Fact #2: ...mirrored by an increase in the share of pro�ts distributed to shareholders
Figure 2 shows current pro�ts before distribution in �nancial accounts data (entrepreneurial income,
black full line) and our estimate in EU KLEMS (measured using the implicit rate, black dotted
16The evolution of the labour share re�ects the evolution of real wages plus the evolution of total hours relative to
the value added at current prices. A simple decomposition shows that the fall in the labour share is due to a fast
decrease in the ratio of total hours worked to value added that was not compensated by the increase in real wages.
In the UK however, the increase in real wages more than compensated the fall in the ratio of total hours worked to
value added.
12
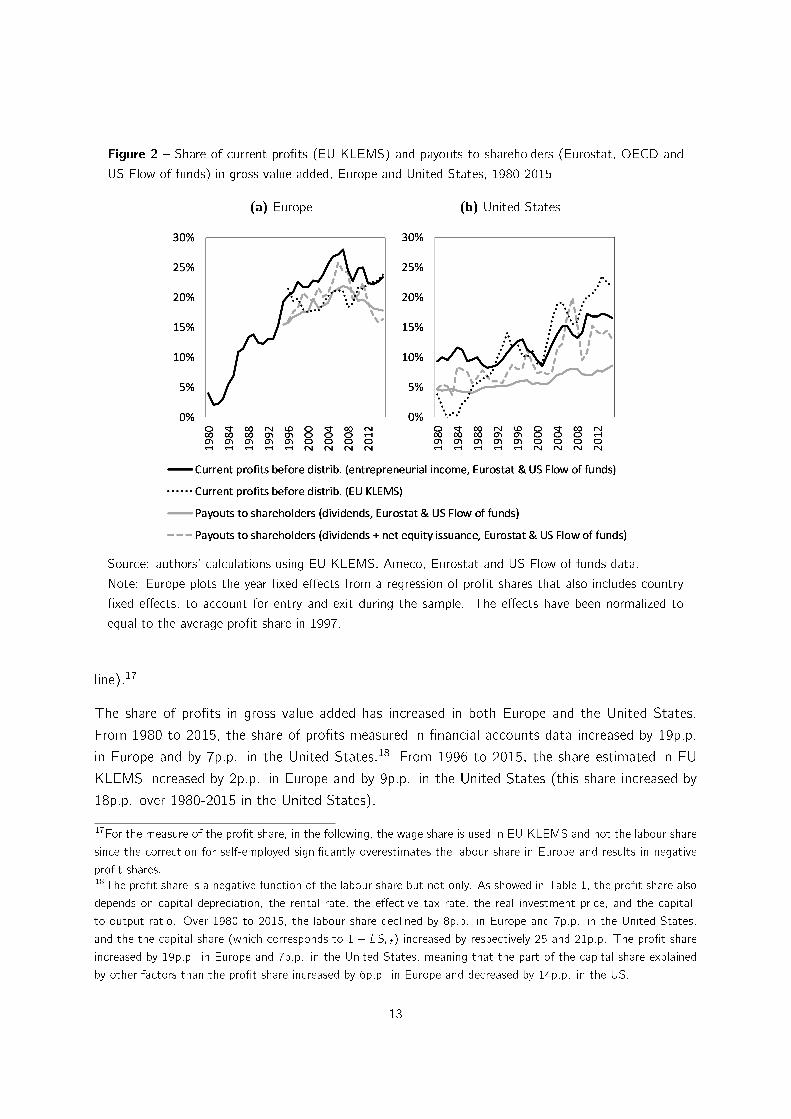
Figure 2 � Share of current pro�ts (EU KLEMS) and payouts to shareholders (Eurostat, OECD and
US Flow of funds) in gross value added, Europe and United States, 1980-2015
(a) Europe (b) United States
Source: authors' calculations using EU KLEMS, Ameco, Eurostat and US Flow of funds data.
Note: Europe plots the year �xed e�ects from a regression of pro�t shares that also includes country
�xed e�ects, to account for entry and exit during the sample. The e�ects have been normalized to
equal to the average pro�t share in 1997.
line).17
The share of pro�ts in gross value added has increased in both Europe and the United States.
From 1980 to 2015, the share of pro�ts measured in �nancial accounts data increased by 19p.p.
in Europe and by 7p.p. in the United States.18 From 1996 to 2015, the share estimated in EU
KLEMS increased by 2p.p. in Europe and by 9p.p. in the United States (this share increased by
18p.p. over 1980-2015 in the United States).
17For the measure of the pro�t share, in the following, the wage share is used in EU KLEMS and not the labour share
since the correction for self-employed signi�cantly overestimates the labour share in Europe and results in negative
pro�t shares.18The pro�t share is a negative function of the labour share but not only. As showed in Table 1, the pro�t share also
depends on capital depreciation, the rental rate, the e�ective tax rate, the real investment price, and the capital-
to-output ratio. Over 1980 to 2015, the labour share declined by 8p.p. in Europe and 7p.p. in the United States,
and the the capital share (which corresponds to 1� LSi ;t) increased by respectively 25 and 21p.p. The pro�t share
increased by 19p.p. in Europe and 7p.p. in the United States, meaning that the part of the capital share explained
by other factors than the pro�t share increased by 6p.p. in Europe and decreased by 14p.p. in the US.
13
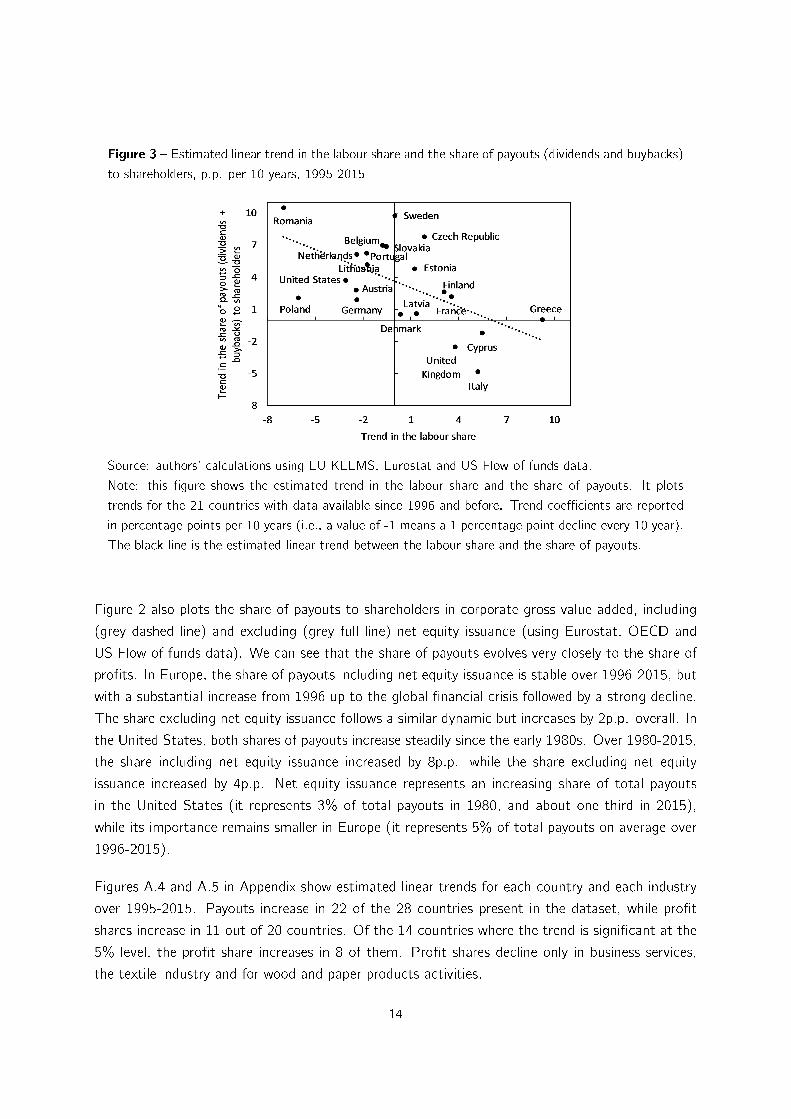
Figure 3 � Estimated linear trend in the labour share and the share of payouts (dividends and buybacks)
to shareholders, p.p. per 10 years, 1995-2015
Source: authors' calculations using EU KLEMS, Eurostat and US Flow of funds data.
Note: this �gure shows the estimated trend in the labour share and the share of payouts. It plots
trends for the 21 countries with data available since 1996 and before. Trend coe�cients are reported
in percentage points per 10 years (i.e., a value of -1 means a 1 percentage point decline every 10 year).
The black line is the estimated linear trend between the labour share and the share of payouts.
Figure 2 also plots the share of payouts to shareholders in corporate gross value added, including
(grey dashed line) and excluding (grey full line) net equity issuance (using Eurostat, OECD and
US Flow of funds data). We can see that the share of payouts evolves very closely to the share of
pro�ts. In Europe, the share of payouts including net equity issuance is stable over 1996-2015, but
with a substantial increase from 1996 up to the global �nancial crisis followed by a strong decline.
The share excluding net equity issuance follows a similar dynamic but increases by 2p.p. overall. In
the United States, both shares of payouts increase steadily since the early 1980s. Over 1980-2015,
the share including net equity issuance increased by 8p.p. while the share excluding net equity
issuance increased by 4p.p. Net equity issuance represents an increasing share of total payouts
in the United States (it represents 3% of total payouts in 1980, and about one third in 2015),
while its importance remains smaller in Europe (it represents 5% of total payouts on average over
1996-2015).
Figures A.4 and A.5 in Appendix show estimated linear trends for each country and each industry
over 1995-2015. Payouts increase in 22 of the 28 countries present in the dataset, while pro�t
shares increase in 11 out of 20 countries. Of the 14 countries where the trend is signi�cant at the
5% level, the pro�t share increases in 8 of them. Pro�t shares decline only in business services,
the textile industry and for wood and paper products activities.
14
We investigate to what extent the change in the pro�t share is the result of a composition e�ect
(increasing size of sector with a high pro�t share). To do so, we decompose the trend in the
pro�t share (measured using the implicit rate) into a within and between component, using the
same formula as for the labour share. Figure A.6 in Appendix plots the country trends in the pro�t
share (x-axis) against the within-industry component (y-axis). With a few exceptions countries
are aligned along the 45-degree line, implying that the increase in the pro�t is mostly driven by
the within-industry component. 95% of the trend in the pro�t share re�ects the within-industry
component.
All in all, the decline in the labour share is mirrored by an increase in the pro�t share, and more
speci�cally the share of payouts to shareholders. Figure 3 shows this negative relationship over
1995-2015, period for which we have data on payouts (dividends + buybacks) to shareholders in
Europe. As explained already, there is a lot of heterogeneity in the dynamics of labour shares in
Europe over this period. On this �gure we can see that whatever the trend in the labour share,
it mirrors the trend in the share of payouts: countries experiencing a decline in the labour share
over the period are countries where the share of payouts increased (the US for example); countries
experiencing an increase in the labour share over the period are countries where the share of payouts
decreased (the UK for example).
Fact #3: A strong positive relationship between the share of payouts to shareholders
and institutional ownership
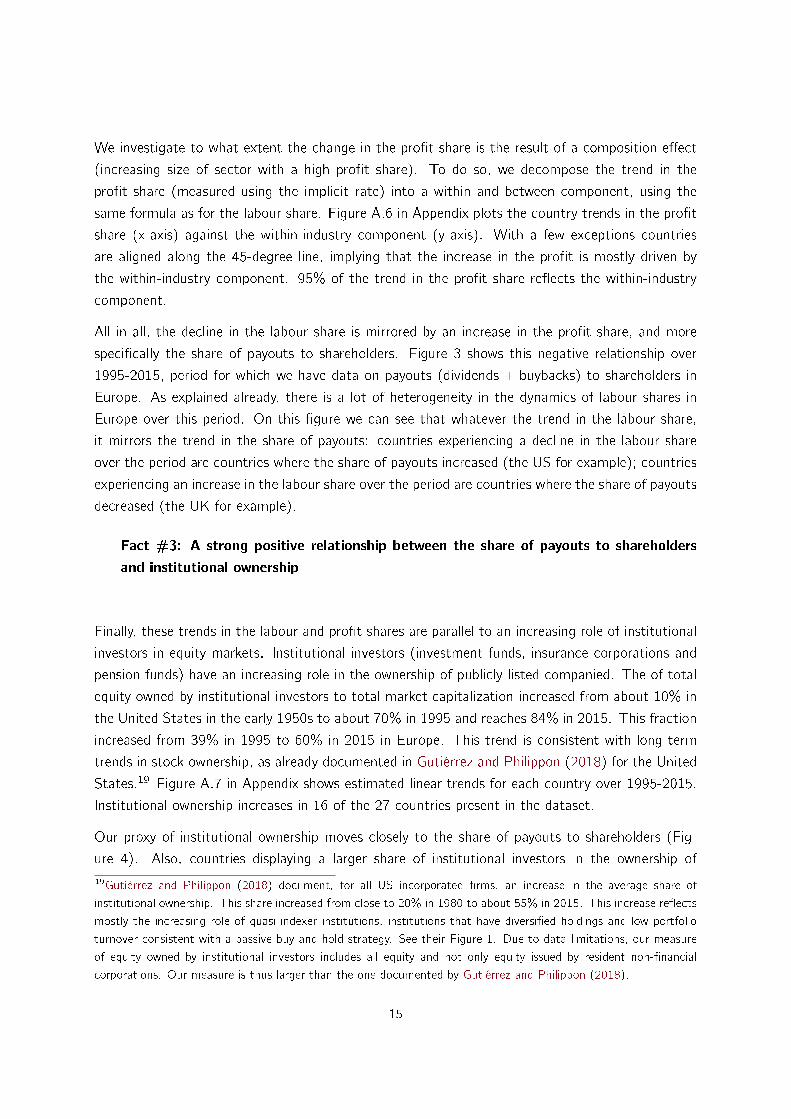
Finally, these trends in the labour and pro�t shares are parallel to an increasing role of institutional
investors in equity markets. Institutional investors (investment funds, insurance corporations and
pension funds) have an increasing role in the ownership of publicly listed companied. The of total
equity owned by institutional investors to total market capitalization increased from about 10% in
the United States in the early 1950s to about 70% in 1995 and reaches 84% in 2015. This fraction
increased from 39% in 1995 to 60% in 2015 in Europe. This trend is consistent with long term
trends in stock ownership, as already documented in Gutiérrez and Philippon (2018) for the United
States.19 Figure A.7 in Appendix shows estimated linear trends for each country over 1995-2015.
Institutional ownership increases in 16 of the 27 countries present in the dataset.
Our proxy of institutional ownership moves closely to the share of payouts to shareholders (Fig-
ure 4). Also, countries displaying a larger share of institutional investors in the ownership of
19Gutiérrez and Philippon (2018) document, for all US incorporated �rms, an increase in the average share of
institutional ownership. This share increased from close to 20% in 1980 to about 55% in 2015. This increase re�ects
mostly the increasing role of quasi-indexer institutions, institutions that have diversi�ed holdings and low portfolio
turnover consistent with a passive buy-and-hold strategy. See their Figure 1. Due to data limitations, our measure
of equity owned by institutional investors includes all equity and not only equity issued by resident non-�nancial
corporations. Our measure is thus larger than the one documented by Gutiérrez and Philippon (2018).
15
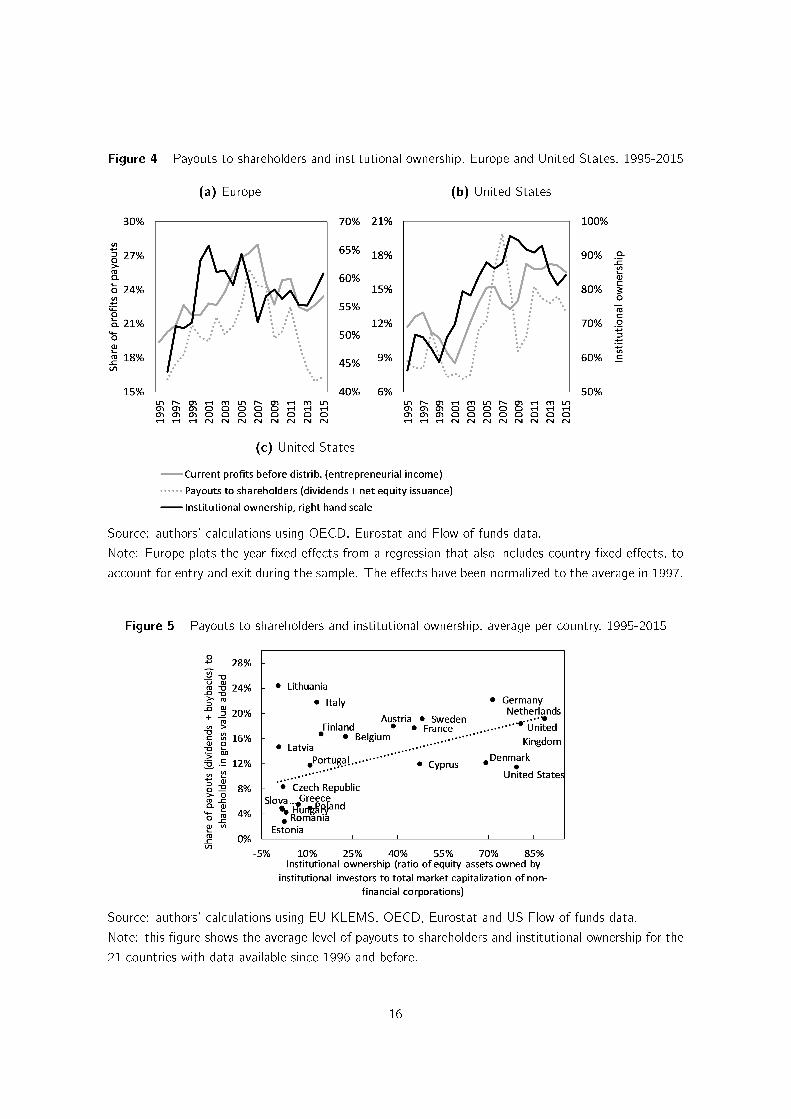
Figure 4 � Payouts to shareholders and institutional ownership, Europe and United States, 1995-2015
(a) Europe (b) United States
(c) United States
Source: authors' calculations using OECD, Eurostat and Flow of funds data.
Note: Europe plots the year �xed e�ects from a regression that also includes country �xed e�ects, to
account for entry and exit during the sample. The e�ects have been normalized to the average in 1997.
Figure 5 � Payouts to shareholders and institutional ownership, average per country, 1995-2015
Source: authors' calculations using EU KLEMS, OECD, Eurostat and US Flow of funds data.
Note: this �gure shows the average level of payouts to shareholders and institutional ownership for the
21 countries with data available since 1996 and before.
16
non-�nancial corporations on average over 1995-2015 are also countries with a larger share of
payouts to shareholders (Figure 5).
All in all, in the United States for example, the labour share declined by 1p.p. per decade on
average, while payouts increased by 4p.p., and the pro�t share by 4p.p. Parallel to this, institutional
ownership also increased by 16p.p. The United-Kingdom has trends that are opposite to the United
States: the labour share increased by 1p.p. per decade on average, while payouts declined by 3p.p.,
and the pro�t share by 1p.p. Institutional ownership also declined by 4p.p. This evidence suggests
that there is a relationship between �rm ownership and the labour share.
3. Theoretical intuitions
Before turning to the empirical analysis, we discuss in this section the three main mechanisms
through which ownership a�ects resource-allocation. Ownership can a�ect management incentives
in three ways: by tightening governance, by inducing a short-termist horizon, by inducing anti-
competitive behaviors through common ownership. These changes can in turn a�ect the allocation
of resources within the �rm. In this section, we discuss .
Governance A large literature following Jensen (1986) argues that con�icts of interest between
managers and shareholders can lead �rms to grow beyond their optimal size. It could be, as
Jensen (1986) argues, that managers are reluctant to return cash to shareholders as it reduces the
resources they have under control; in that case, managers actively over-invest. But it could also
be that managers enjoy a 'quiet life', and prefer to avoid the di�cult decisions and costly e�orts
associated with shutting down old plants or starting new plants, or increase wages to buy peace
with their workers (Bertrand and Mullainathan, 2003). The large stockholdings and sophistication
of institutional investors allow them to monitor and discipline managers (Bushee, 1998), thereby
increasing the �rms' value while reducing both employment and wages.
Short-termism Short-term investors might pressure managers to maximize short-run pro�ts at
the expense of long-run �rm value (Bushee, 1998). Similarly, equity markets can put excessive
emphasis on quarterly earnings, and higher stock-based compensation incentivizes managers to
focus on short-term share prices at the expense of long term pro�ts (Lazonick, 2014). Almeida
et al. (2016) show that the probability of share repurchases is higher for �rms that would have
just missed the earnings per share (EPS) forecast in the absence of a repurchase. An increase in
share repurchases made by �rms that would have a small negative EPS surprise is associated with a
decrease in employment relative to companies that just meet analyst EPS forecasts. These results
suggest that companies are willing to trade o� employment for stock repurchases. The rise of
17
institutional ownership, re�ecting mostly an increase in short-term oriented investors20, may lead
�rms to increasingly trade o� employment for payouts to shareholders.
Concentration Institutional investors have concentrated investment strategies. They are con-
centrated in only a few foreign markets and aim at speci�c industries (Choi et al., 2017). Fichtner
et al. (2017) document, for example, that BlackRock, Vanguard and State Street constitute the
largest shareholder in 88% of the S&P500 �rms. BlackRock and Vanguard are also among the
largest shareholders of CAC 40 �rms in France (Manon Aubry, 2018). Onwership concentration
has long been studied in the industrial organization literature, which argues that common owner-
ship of natural competitors may reduce incentives to compete. AZAR et al. (2018) document this
ownership concentration for the US airline industry. They show that ownership concentration is 10
times larger than market concentration. They also show that ticket prices are approximately up to
7% higher than would be the case under separate ownership. As ownership concentration may lead
a few �rms to dominate the market, these few �rms also dominate hiring in the market. Using
data from a leading US employment website, Azar et al. (2017) show that more concentration
on the labour market is associated with a decline in posted wages, suggesting that concentration
increases labour market power and decreases the labour share.
All in all, there is empirical evidence showing that more institutional ownership leads to increased
payouts to shareholders (Crane et al., 2016). Whether it results from increased short-termism,
improved governance or increased (ownership, product and labour market) concentration does not
change the result: more institutional ownership may lead to a lower labour share by increasing
�rms' pro�tability while reducing both employment and wages. In the empirical part, we are unable
to di�erentiate between the two hypotheses empirically (short-termism or monitoring). We simply
test whether an increase in institutional ownership leads to a higher pro�t share and a lower labour
share.
4. Empirical Investigation
In this section we investigate empirically to what extent do higher payouts to shareholders leads to
a lower labour share. In a �rst step, we use OLS regressions of the labour share on the lagged pro�t
share. We show that a higher pro�t share is correlated to a lower labour share in the following year.
However, these regressions only show a correlation between pro�t shares and labour shares and do
not allow us to establish a causal relationship from the pro�t share to the labour share. Building
on Gutiérrez and Philippon (2018), we then use institutional ownership as an instrumental variable
for the pro�t share. Gutiérrez and Philippon (2018) focus on the United States and and show that
20Gutiérrez and Philippon (2018) show that the increase in institutional ownership in the US is mostly driven by
the growth in transient and quasi-indexers institutions, investors that have diversi�ed holdings and a high portfolio
turnover.
18
�rms with higher institutional ownership spend a disproportionate amount of free cash �ow buying
back their shares, and invest less. Using di�erent speci�cations, we �nd that industries that are
in countries with more institutional ownership have a higher pro�t share and a lower labour share.
Finally, we drive macroeconomic implications and assess how much changes in �rm ownership can
account for the decline in labour shares in Europe and the United States.
4.1. Data
We focus on our hypothesis relating recent trends in �rm ownership to the dynamics of the labour
share. We use the data presented in the stylized facts. Our baseline regressions use the labour
share (adjusted for self-employed) as well as the pro�t share (measured using the long-term nominal
rate) built using EU KLEMS. Both measures focus on the non-�nancial market economy. For the
activity of institutional investors, data are only available at the country-level. We will thus use
variations in our proxy of institutional ownership built using �nancial accounts data.
Alternative measures are used for robustness checks. We will use only alternative measures from
EU KLEMS: the wage share (not ajusted for self-employed), as well as the pro�t share measured
using the implicit rate. We also run some regressions on aggregate country-level data using the
payouts to shareholders, being the sum of dividends and net equity issuance, measured in �nancial
accounts data.
We add a series of country and industry-level controls. Appendix 3 includes a detailed discussion
of these controls.
We keep countries for which which industry-level data is available since 1997 and before. We end
up with a panel of 12 countries with data for up to 38 years (1980-2015) and for 19 industries.21
4.2. Empirical strategy
We run di�erent speci�cations of an equation of the labour share in country i , industry k and
year t:
LSk;i ;t = �PSk;i ;t�1 + �Ck;i ;t�1 + FEi ;k + FEi ;t + �k;i ;t (8)
where LSk;i ;t is the labour share, PSk;i ;t�1 is the one-year lagged pro�t share measured using the
implicit rate and built in EU KLEMS, Ck;i ;t�1 is a vector of industry-level controls described in
Appendix 3, FEi ;k and FEi ;t are respectively country-industry and country-year �xed e�ects, and
�k;i ;t is the idiosyncratic error.
Concerning the controls, each measure is �rst included individually and then simultaneously if
signi�cant.
21When including the control for the concentration hypothesis, we end up with a panel of 11 countries with data for
up to 10 years and for 13 industries.
19
Given the structure of �xed e�ects we do not focus on country trends in our panel data, nor on
cross-country and cross-industry di�erences in the level of the labour share. We exploit rather
variations in the dynamics of industry labour shares.
Endogeneity issues The main problem with our speci�cation is that a lower share of labour in
value added leads to a higher pro�t share, almost by de�nition.22 And OLS regressions do not
allow us to establish a causal relationship from the pro�t share to the labour share. We thus
need to isolate the dynamics of the pro�t share that is driven by changes in governance, but is
exogenous to the industry performance, and study its implications for the labour share. Building
on Gutiérrez and Philippon (2018), we use institutional ownership as an instrumental variable for
the pro�t share. Gutiérrez and Philippon (2018) focus on the United States and show that higher
institutional ownership leads �rms to spend a disproportionate amount of free cash �ow buying
back their shares, and to invest less.23
To instrument pro�t shares, we use the interaction between the lagged institutional ownership in
year t and country i and the world level of industry-pro�ts in 1980, controlling for both country-level
and industry-level controls decribed in Appendix 3, and with country and year �xed e�ects:
PSk;i ;t = PSt=0i � IIi ;t�1 + �Ck;i ;t�1 + FEi + FEt + uk;i ;t (9)
The problem with institutional ownership is that it might also depend on the current and expected
industry performance: investors might invest in sectors that initially have a lower labour share
and a higher pro�t share. Therefore, we build a second instrument for pro�t shares. We use the
interaction between the institutional ownership proxy in country i in the initial year (IIi ;t=0) and
the lag of world pro�ts in industry k , controlling for both country-level and industry-level controls,
and country-industry and year �xed e�ects:
PSk;i ;t = IIt=0i � PSk;t�1 + �Ck;i ;t�1 + FEi ;k + FEi ;t + uk;i ;t (10)
The intuition here is that countries with initially more institutional ownership are more sensitive to
aggregate (world) trends in the share of pro�ts.24
This strategy is consistent if institutional ownership (the initial or lagged) is not related with the
labour share. There are two reasons to think this is true. The �rst one is that institutional22As explained in the stylized facts, the pro�t share is a negative function of the labour share. It also depends
negatively on capital depreciation, on the rental rate, the e�ective tax rate, the real investment price and on the
capital-to-output ratio.23Our focus is on understanding the di�erent dynamics of the labour share across countries and industries. Our
dataset thus has a wide coverage, allowing us to derive implications for macroeconomic outcomes that �rm-level
data could not provide us. The drawback is that we do not have �rm-level information on �rm ownership, and have
to build a proxy for institutional ownership. As described in the stylized facts, we use variations in the ratio of equity
owned by institutional investors to total market capitalization of the non-�nancial corporate sector.24Since our dataset is unbalanced, the initial dates di�er for each countries.
20
ownership is highly persistent: the regression of ownership on time t on the one on time t � 5
displays a coe�cient of 0.95, even after controlling for country characteristics. This suggests that
ownership in the initial year is likely to persist and in�uence pro�ts in the following years, but is
not in�uenced by the expected changes in the labour share. At the country level, institutional
ownership re�ects rather other characteristics, like the country's pension system. The second one
is that both governance and short-termism, the main two mechanisms through which ownership
a�ects the labour share, increased only after the 2000s.25 Previous investment decisions could not
have foreseen these trends.
These facts suggest that institutional ownership is indeed uncorrelated with the labour share in the
following years. It can therefore be used as an instrument for the pro�t share, which in turn a�ects
the labour share.
4.3. Main results
We report summary results in the body of the paper, and detailed regression output in the Appendix.
In following regressions, only controls for the real investment price and the bargaining power of
workers will be included (See Appendix 3 for a discussion of these controls).26
Table 2 reports estimates of di�erent speci�cations of equation 8 using the labour share and the
pro�t share measured using EU KLEMS. Column 1 starts with the simplest OLS estimation of
equation 8. Column 1 adds sector-year �xed e�ects to this OLS regression. On average, a 1p.p.
increase in the pro�t share is correlated with a 0.2p.p. decrease in the labour share, and coe�cients
are signi�cant at the 1% level.
In columns 3 to 8, we implement the two alternative IV strategies. Columns 3 and 4 display
results when the pro�t share is instrumented using the interaction between the lagged institutional
ownership in year t and country i and the world level of industry-pro�ts in 1980. Columns 5 and 8
display results when the pro�t share is instrumented by the interaction between the initial role of
institutional investors and the lagged world industry pro�t share. Columns 3, 5 and 7 present the
�rst-stage regressions; columns 4, 6, and 8 present the second-stage regressions.
Let us �rst discuss the �rst-stage regressions. As expected, lagged institutional ownership is
25Gutiérrez and Philippon (2018); Barton et al. (2017) document these trends for the United States.26 Before turning to our main regressions, we �rst run similar regressions to Gutiérrez and Philippon (2018) to validate
their conclusions on our data. In a �rst step, we check how much our proxy of institutional ownership and our proxy
of payouts are correlated. A simple OLS regression of the log-pro�ts on our ratio of the role of institutional investors
on equity markets gives an estimate of 1.6. This coe�cient is smaller than what the authors �nd, a coe�cient
of 2.59 when regressing log-buybacks on institutional ownership. However, our proxy of institutional ownership is
50% bigger than their indicator on average, so coe�cients are of equivalent order of magnitude. We then estimate
equation 8 replacing the labour share by the investment share (ratio of total investment to value added). Results
are presented in Table A.5 in Appendix. Both OLS and IV regressions con�rm the negative e�ect of institutional
ownership on investment.
21
positively correlated with the pro�t share. Similarly, industries in countries with more institutional
ownership are more a�ected by the world industry pro�t share. All F -tests for nullity of the
instrument are above 10, which leads us to conclude that these instruments are not weak.
All results con�rm that an increase in the pro�t share is correlated with a decrease in the labour
share, and coe�cients are all signi�cant at the 1% level. The IV coe�cients are larger than in
OLS: the e�ect of a 1p.p. increase in the pro�t share due to institutional ownership on the labour
share ranges from -0.1 to -0.6p.p.
4.4. Robustness checks
Table 3 provides various robustness checks of the baseline estimation of equation 8 (with the
speci�cation presented in columns 5 and 6 of Table 2).
Columns 1 and 2 present estimates using a di�erent measure of the pro�t share: the pro�t share
built using the implicit rate (from �nancial accounts) and not the long-term nominal rate. Columns
(3) and (4) present estimates using another measure of the labour share: the wage share, not
adjusted for self-employed. Neither the signi�cance nor the magnitude of the coe�cient of interest
change in both cases.
Columns 5 and 6 present estimates for a sample excluding tradable sectors.27 This speci�cation is
used to make sure that the e�ect that we capture is not linked to globalization. Again, neither the
signi�cance nor the magnitude of the coe�cient of interest change when considering non-tradable
sectors only.
Columns 7 and 8 present estimates for a sample excluding the United States. This speci�cation
addresses the fact that we do not have a proxy to control for the concentration and market power
hypothesis for the entire sample. The growing concentration of �rms a�ects the labour share,
but only in the United States (Gutiérrez, 2017). To make sure that our results are not driven by
this e�ects, we exclude the United States from our sample, and estimate the e�ect on European
countries only. Neither the signi�cance nor the magnitude of the coe�cient of interest change
when considering European countries only.
Columns 9 and 10 present estimates for a sample focusing on the post global �nancial crisis period.
Previous narratives on the labour share focus on explaining the decline in the labour share. But the
labour share is increasing in Europe since the global �nancial crisis, a trend that could be explained
by a declining payouts to shareholders. To con�rm that our hypothesis can explain both upward and
downward trends in the labour share, we focus on its dynamics since 2007. Neither the signi�cance
nor the magnitude of the coe�cient of interest change, con�rming that our e�ect is not coming
from some particular years in our sample.
27Tradable sectors are sectors for which more than 10% of their production is internationally traded (using data on
trade in goods and services).
22
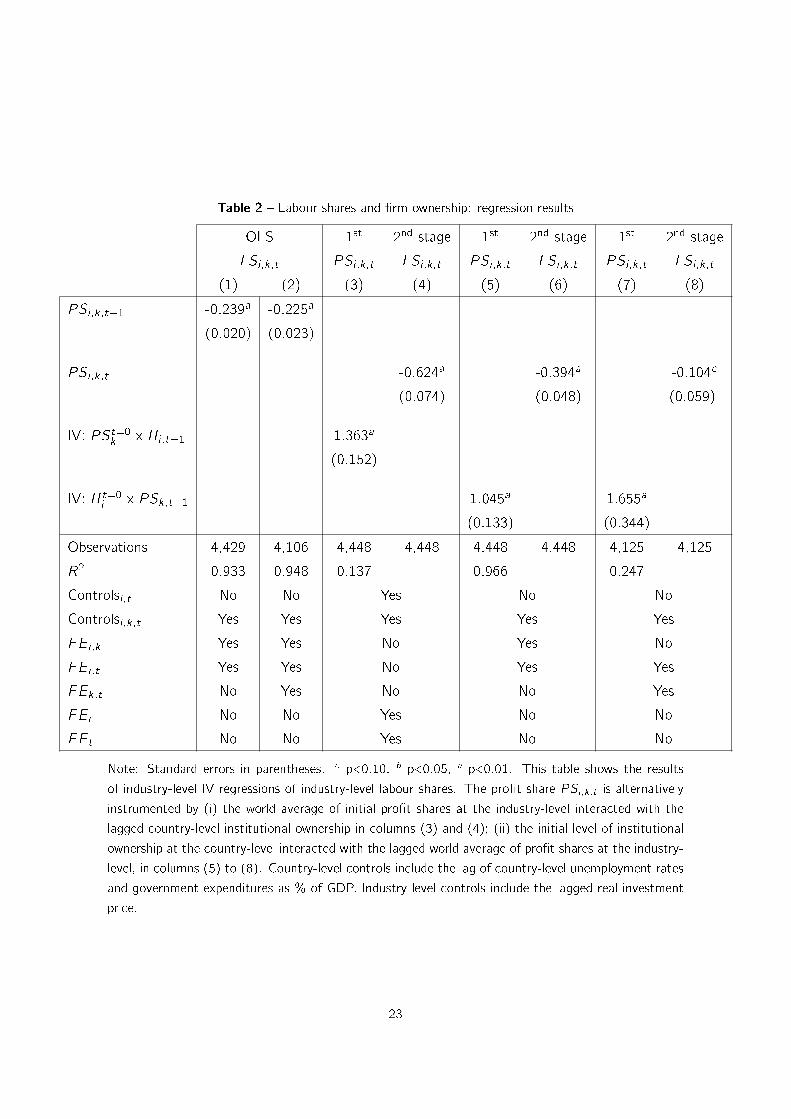
Table 2 � Labour shares and �rm ownership: regression results
OLS 1st 2nd stage 1st 2nd stage 1st 2nd stage
LSi ;k;t PSi ;k;t LSi ;k;t PSi ;k;t LSi ;k;t PSi ;k;t LSi ;k;t
(1) (2) (3) (4) (5) (6) (7) (8)
PSi ;k;t�1 -0.239a -0.225a
(0.020) (0.023)
PSi ;k;t -0.624a -0.394a -0.104c
(0.074) (0.048) (0.059)
IV: PSt=0k
x IIi ;t�1 1.363a
(0.152)
IV: IIt=0i
x PSk;t�1 1.045a 1.655a
(0.133) (0.344)
Observations 4,429 4,106 4,448 4,448 4,448 4,448 4,125 4,125
R2 0.933 0.948 0.137 0.966 0.247
Controlsi ;t No No Yes No No
Controlsi ;k;t Yes Yes Yes Yes Yes
FEi ;k Yes Yes No Yes No
FEi ;t Yes Yes No Yes Yes
FEk;t No Yes No No Yes
FEi No No Yes No No
FEt No No Yes No No
Note: Standard errors in parentheses. c p<0.10, b p<0.05, a p<0.01. This table shows the results
of industry-level IV regressions of industry-level labour shares. The pro�t share PSi ;k;t is alternatively
instrumented by (i) the world average of initial pro�t shares at the industry-level interacted with the
lagged country-level institutional ownership in columns (3) and (4); (ii) the initial level of institutional
ownership at the country-level interacted with the lagged world average of pro�t shares at the industry-
level, in columns (5) to (8). Country-level controls include the lag of country-level unemployment rates
and government expenditures as % of GDP. Industry-level controls include the lagged real investment
price.
23
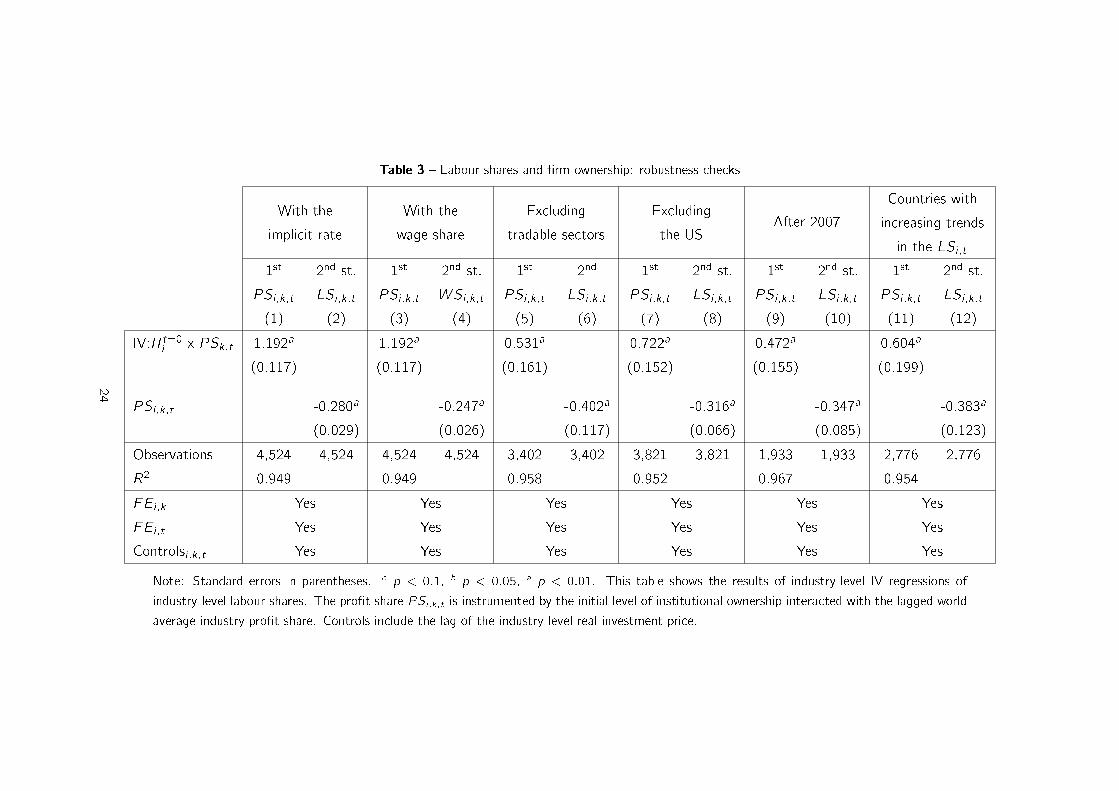
Table 3 � Labour shares and �rm ownership: robustness checks
With the
implicit rate
With the
wage share
Excluding
tradable sectors
Excluding
the USAfter 2007
Countries with
increasing trends
in the LSi ;t
1st 2nd st. 1st 2nd st. 1st 2nd 1st 2nd st. 1st 2nd st. 1st 2nd st.
PSi ;k;t LSi ;k;t PSi ;k;t WSi ;k;t PSi ;k;t LSi ;k;t PSi ;k;t LSi ;k;t PSi ;k;t LSi ;k;t PSi ;k;t LSi ;k;t
(1) (2) (3) (4) (5) (6) (7) (8) (9) (10) (11) (12)
IV:IIt=0i
x PSk;t 1.192a 1.192a 0.531a 0.722a 0.472a 0.604a
(0.117) (0.117) (0.161) (0.152) (0.155) (0.199)
PSi ;k;t -0.280a -0.247a -0.402a -0.316a -0.347a -0.383a
(0.029) (0.026) (0.117) (0.066) (0.085) (0.123)
Observations 4,524 4,524 4,524 4,524 3,402 3,402 3,821 3,821 1,933 1,933 2,776 2,776
R2 0.949 0.949 0.958 0.952 0.967 0.954
FEi ;k Yes Yes Yes Yes Yes Yes
FEi ;t Yes Yes Yes Yes Yes Yes
Controlsi ;k;t Yes Yes Yes Yes Yes Yes
Note: Standard errors in parentheses. c p < 0:1, b p < 0:05, a p < 0:01. This table shows the results of industry-level IV regressions of
industry-level labour shares. The pro�t share PSi ;k;t is instrumented by the initial level of institutional ownership interacted with the lagged world
average industry pro�t share. Controls include the lag of the industry-level real investment price.
24
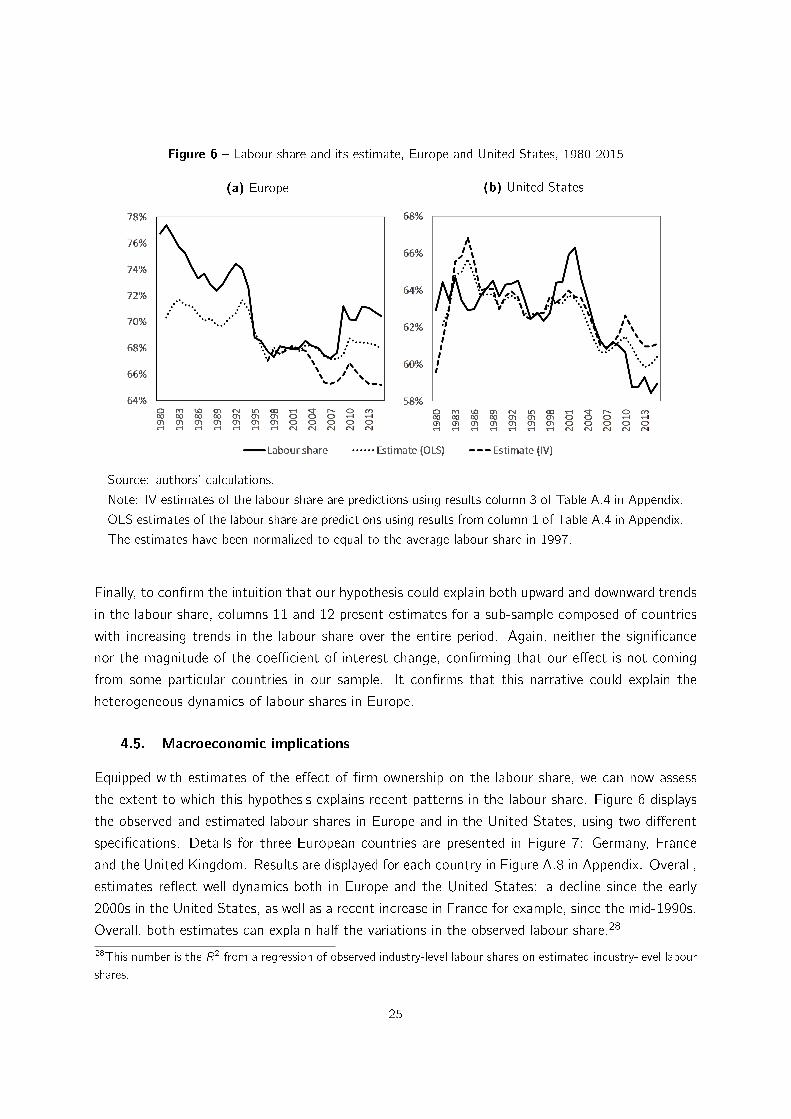
Figure 6 � Labour share and its estimate, Europe and United States, 1980-2015
(a) Europe (b) United States
Source: authors' calculations.
Note: IV estimates of the labour share are predictions using results column 3 of Table A.4 in Appendix.
OLS estimates of the labour share are predictions using results from column 1 of Table A.4 in Appendix.
The estimates have been normalized to equal to the average labour share in 1997.
Finally, to con�rm the intuition that our hypothesis could explain both upward and downward trends
in the labour share, columns 11 and 12 present estimates for a sub-sample composed of countries
with increasing trends in the labour share over the entire period. Again, neither the signi�cance
nor the magnitude of the coe�cient of interest change, con�rming that our e�ect is not coming
from some particular countries in our sample. It con�rms that this narrative could explain the
heterogeneous dynamics of labour shares in Europe.
4.5. Macroeconomic implications
Equipped with estimates of the e�ect of �rm ownership on the labour share, we can now assess
the extent to which this hypothesis explains recent patterns in the labour share. Figure 6 displays
the observed and estimated labour shares in Europe and in the United States, using two di�erent
speci�cations. Details for three European countries are presented in Figure 7: Germany, France
and the United Kingdom. Results are displayed for each country in Figure A.8 in Appendix. Overall,
estimates re�ect well dynamics both in Europe and the United States: a decline since the early
2000s in the United States, as well as a recent increase in France for example, since the mid-1990s.
Overall, both estimates can explain half the variations in the observed labour share.28
28This number is the R2 from a regression of observed industry-level labour shares on estimated industry-level labour
shares.
25
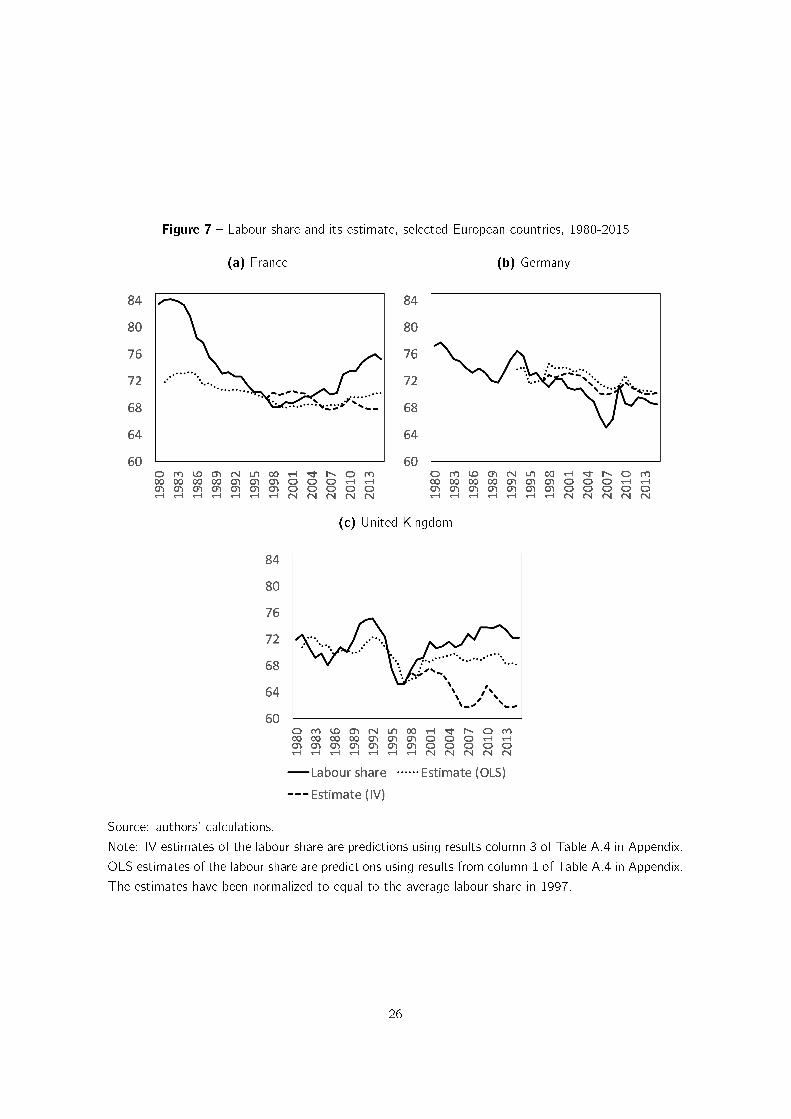
Figure 7 � Labour share and its estimate, selected European countries, 1980-2015
(a) France (b) Germany
(c) United Kingdom
Source: authors' calculations.
Note: IV estimates of the labour share are predictions using results column 3 of Table A.4 in Appendix.
OLS estimates of the labour share are predictions using results from column 1 of Table A.4 in Appendix.
The estimates have been normalized to equal to the average labour share in 1997.
26
5. Concluding remarks
How do recent trends in �rm governance a�ect their resource-allocation decisions? And what are
the macroeconomic outcomes for the distribution of national incomes? To answer these questions,
this paper starts by documenting three stylized facts common to Europe and the United States
since the 1980s: (i) the decline in the labour share of income, common to most sectors, and
robust when accounting for the income of the self-employed; (ii) a this decline mirrors an increase
in the share of payouts to shareholders (dividends and buybacks); (iii) a larger share of payouts to
shareholders is associated with more institutional ownership. The causal e�ect of increased pro�t
shares on labour shares is then quanti�ed using lagged institutional ownership as an instrumental
variable. Results show that more institutional ownership leads to higher payouts and to a lower
labour share. This novel narrative could explain about half of the fall in the labour share since the
early 1980s and can account for heterogeneous patterns of the labour share over time and across
countries.
This paper suggests that �rm ownership is an important determinant of the distribution of income
between labour and capital. The increasing share of payouts to shareholders is also a key driver
of income inequalities: Garbinti et al. (2018) document that capital income, and more speci�cally
the rise in corporate retained earnings, has been the key driver of the rise of the top 1% income
share in the twenty-�rst century. This empirical �nding thus bears important implications for future
economic and social policy making.
27
References
Acemoglu, D. and Restrepo, P. (2016). The race between machine and man: Implications of technology for
growth, factor shares and employment. Working Paper 22252, National Bureau of Economic Research.
Almeida, H., Fos, V., and Kronlund, M. (2016). The real e�ects of share repurchases. Journal of Financial
Economics, 119(1):168�185.
Askenazy, P. and Palier, B. (2018). France: rising precariousness supported by the welfare State. Working
Paper 1801, CEPREMAP.
Azar, J., Marinescu, I., and Steinbaum, M. I. (2017). Labor market concentration. Working Paper 24147,
National Bureau of Economic Research.
AZAR, J., SCHMALZ, M. C., and TECU, I. (2018). Anticompetitive e�ects of common ownership. The
Journal of Finance, 73(4).
Barton, D., Manyika, J., Koller, T., Palter, R., Godsall, J., and Zo�er, J. (2017). Measuring the economic
impact of short-termism. Discussion paper, McKinsey Global Institute.
Bertrand, M. and Mullainathan, S. (2003). Enjoying the quiet life? corporate governance and managerial
preferences. Journal of Political Economy, 111(5):1043�1075.
Blanchard, O. and Giavazzi, F. (2003). Macroeconomic E�ects Of Regulation And Deregulation In Goods
And Labor Markets. The Quarterly Journal of Economics, 118(3):879�907.
Bushee, B. J. (1998). The In�uence of Institutional Investors on Myopic R&D Investment Behavior. The
Accounting Review, 73(3):305�333.
Caballero, R. J., Farhi, E., and Gourinchas, P.-O. (2017). Rents, technical change, and risk premia account-
ing for secular trends in interest rates, returns on capital, earning yields, and factor shares. American
Economic Review, 107(5):614�20.
Choi, N., Fedenia, M., Skiba, H., and Sokolyk, T. (2017). Portfolio concentration and performance of
institutional investors worldwide. Journal of Financial Economics, 123(1):189 � 208.
Crane, A. D., Michenaud, S., and Weston, J. P. (2016). The e�ect of institutional ownership on payout
policy: Evidence from index thresholds. The Review of Financial Studies, 29(6):1377�1408.
Dorn, D., Katz, L. F., Patterson, C., Van Reenen, J., et al. (2017). Concentrating on the fall of the labor
share. American Economic Review, 107(5):180�85.
Elsby, M., Hobijn, B., and Sahin, A. (2013). The Decline of the U.S. Labor Share. Brookings Papers on
Economic Activity, 44(2):1�63.
European Commission (2013). European system of accounts - ESA 2010.
28
Fichtner, J., Heemskerk, E. M., and Garcia-Bernardo, J. (2017). Hidden power of the big three? passive
index funds, re-concentration of corporate ownership, and new �nancial risk. Business and Politics,
19(02):298�326.
Garbinti, B., Goupille-Lebret, J., and Piketty, T. (2018). Income inequality in france, 1900�2014: Evidence
from distributional national accounts (dina). Journal of Public Economics, 162:63 � 77. In Honor of
Sir Tony Atkinson (1944-2017).
Gollin, D. (2002). Getting Income Shares Right. Journal of Political Economy, 110(2):458�474.
Gutiérrez, G. (2017). Declining competition and labor shares in the U.S. Working paper, NYU.
Gutiérrez, G. and Philippon, T. (2018). Ownership, concentration, and investment. AEA Papers and
Proceedings, 108:432�37.
Jensen, M. C. (1986). Agency Costs of Free Cash Flow, Corporate Finance, and Takeovers. American
Economic Review, 76(2):323�329.
Jorgenson, D. and Hall, R. (1967). Tax policy and investment behavior. American Economic Review,
57(3):391�414. Reprinted in Bobbs-Merrill Reprint Series in Economics , Econ-130. Investment 2, ch.
1, pp 1-26.
Karabarbounis, L. and Neiman, B. (2014). The global decline of the labor share. The Quarterly Journal of
Economics, 129(1):61.
Koh, D., Santaeulàlia-Llopis, R., and Zheng, Y. (2015). Labor share decline and intellectual property
products capital. Technical Report ECO2015/05, European University Institute.
Kristal, T. (2010). Good times, bad times: postwar labor's share of national income in capitalist democracies.
American Sociological Review, 75(5):729�763.
Lazonick, W. (2014). Pro�ts without prosperity. Harvard Business Review.
Manon Aubry, Christophe Alliot, S. L. (2018). CAC 40 : des pro�ts sans partage. Discussion paper, Oxfam
France.
Piketty, T. and Zucman, G. (2014). Capital is back: Wealth-income ratios in rich countries 1700-2010.
The Quarterly Journal of Economics, 129(3):1255.
Pionnier, P.-A. and Guidetti, E. (2015). Comparing pro�t shares in value-added in four OECD countries.
OECD Statistics Working Papers 2015/03, OECD.
Rognlie, M. (2015). Deciphering the Fall and Rise in the Net Capital Share. Brookings Papers on Economic
Activity, 46(1):1�69.
29
Appendix 1. Classi�cations
Table A.1 � Asset types (AN_F6 classi�cation)
AN_F6 code Asset name Asset type
N111 Dwellings Housing
N112 Other buildings and structures Housing
N1131 Transport equipments Other
N11321 Computer hardware Other
N11322 Telecommunications equipment Other
N11O Other machinery and equipment and weapons systems Other
N115 Cultivated biological resources Other
N1171 Research and development Intangible
N1173 Computer software and databases Intangible
N117-N1171-N1173 Intellectual property products Intangible
Source: Eurostat and authors' classi�cation.
Appendix 2. Stylized Facts: additional �gures
Figure A.1 � Wage share, including and excluding employers' social contribution, 1950-2015
(a) Europe (b) United States
Source: authors' calculations using Eurostat and US Flow of funds.
Note: Europe (moving sample) plots the year �xed e�ects from a regression of wage shares that also
includes country �xed e�ects, to account for entry and exit during the sample. The e�ects have been
normalized to equal to the average wage share in 1997.
30
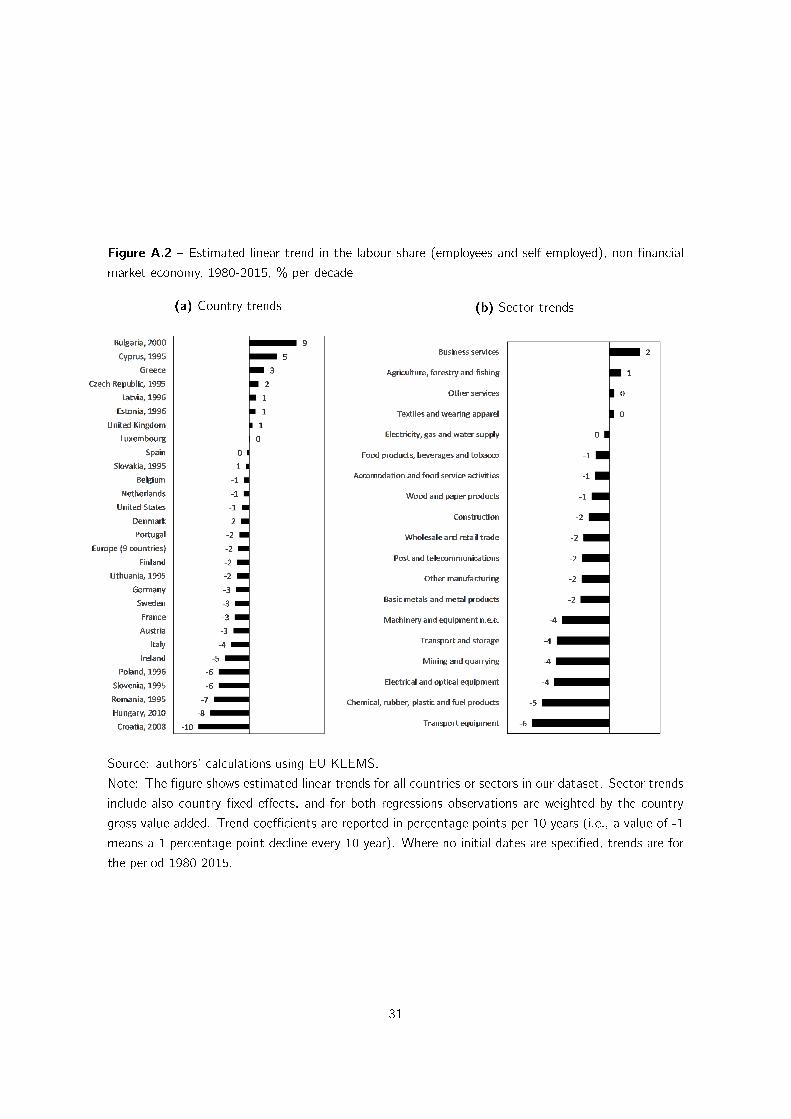
Figure A.2 � Estimated linear trend in the labour share (employees and self-employed), non-�nancial
market economy, 1980-2015, % per decade
(a) Country trends (b) Sector trends
Source: authors' calculations using EU KLEMS.
Note: The �gure shows estimated linear trends for all countries or sectors in our dataset. Sector trends
include also country �xed e�ects, and for both regressions observations are weighted by the country
gross value added. Trend coe�cients are reported in percentage points per 10 years (i.e., a value of -1
means a 1 percentage point decline every 10 year). Where no initial dates are speci�ed, trends are for
the period 1980-2015.
31
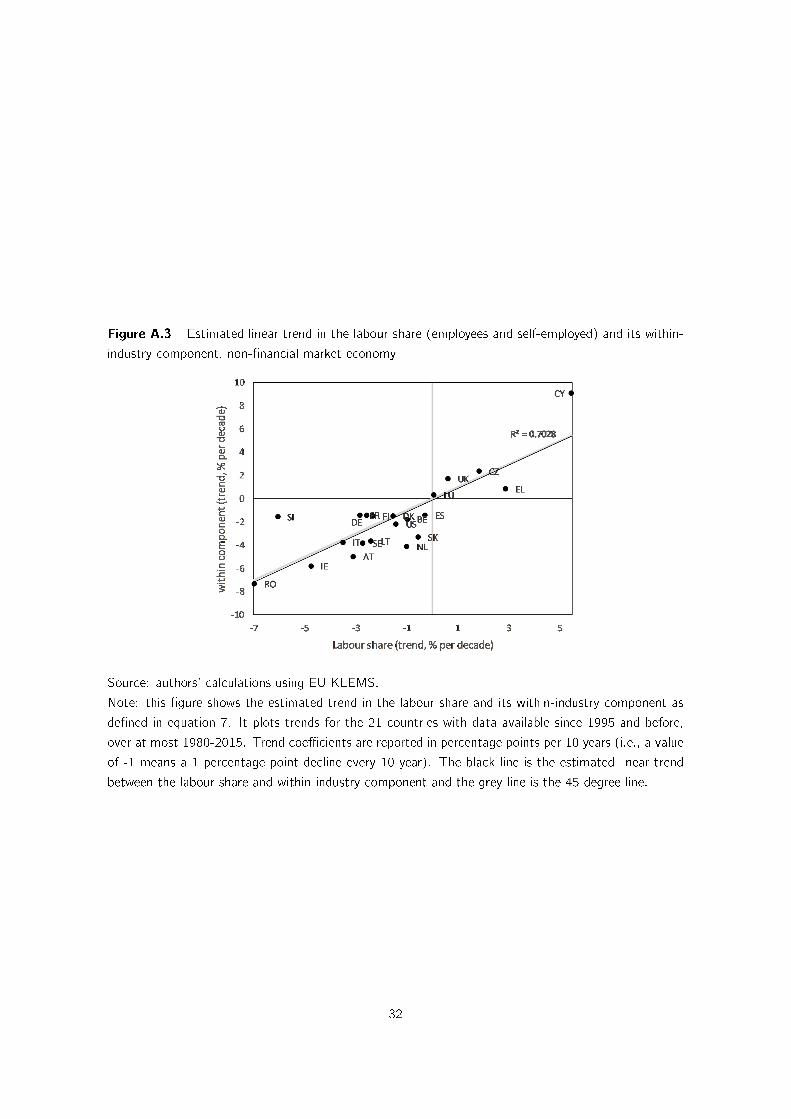
Figure A.3 � Estimated linear trend in the labour share (employees and self-employed) and its within-
industry component, non-�nancial market economy
Source: authors' calculations using EU KLEMS.
Note: this �gure shows the estimated trend in the labour share and its within-industry component as
de�ned in equation 7. It plots trends for the 21 countries with data available since 1995 and before,
over at most 1980-2015. Trend coe�cients are reported in percentage points per 10 years (i.e., a value
of -1 means a 1 percentage point decline every 10 year). The black line is the estimated linear trend
between the labour share and within-industry component and the grey line is the 45-degree line.
32
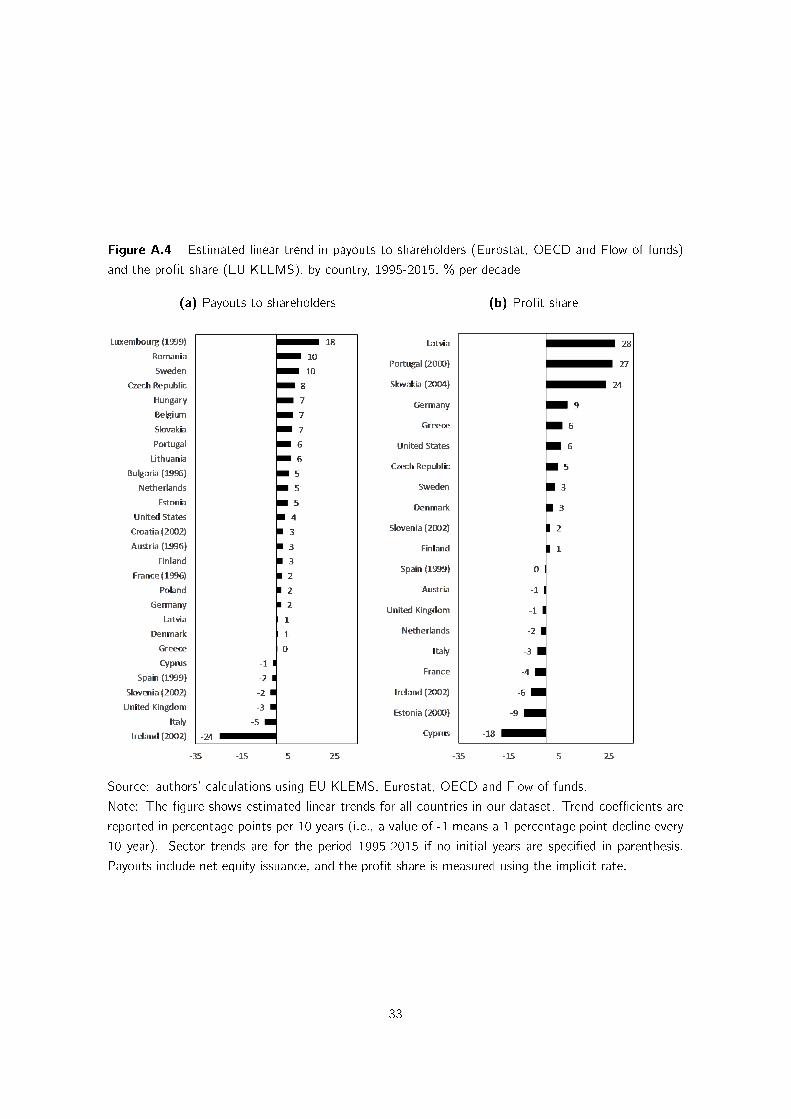
Figure A.4 � Estimated linear trend in payouts to shareholders (Eurostat, OECD and Flow of funds)
and the pro�t share (EU KLEMS), by country, 1995-2015, % per decade
(a) Payouts to shareholders (b) Pro�t share
Source: authors' calculations using EU KLEMS, Eurostat, OECD and Flow of funds.
Note: The �gure shows estimated linear trends for all countries in our dataset. Trend coe�cients are
reported in percentage points per 10 years (i.e., a value of -1 means a 1 percentage point decline every
10 year). Sector trends are for the period 1995-2015 if no initial years are speci�ed in parenthesis.
Payouts include net equity issuance, and the pro�t share is measured using the implicit rate.
33
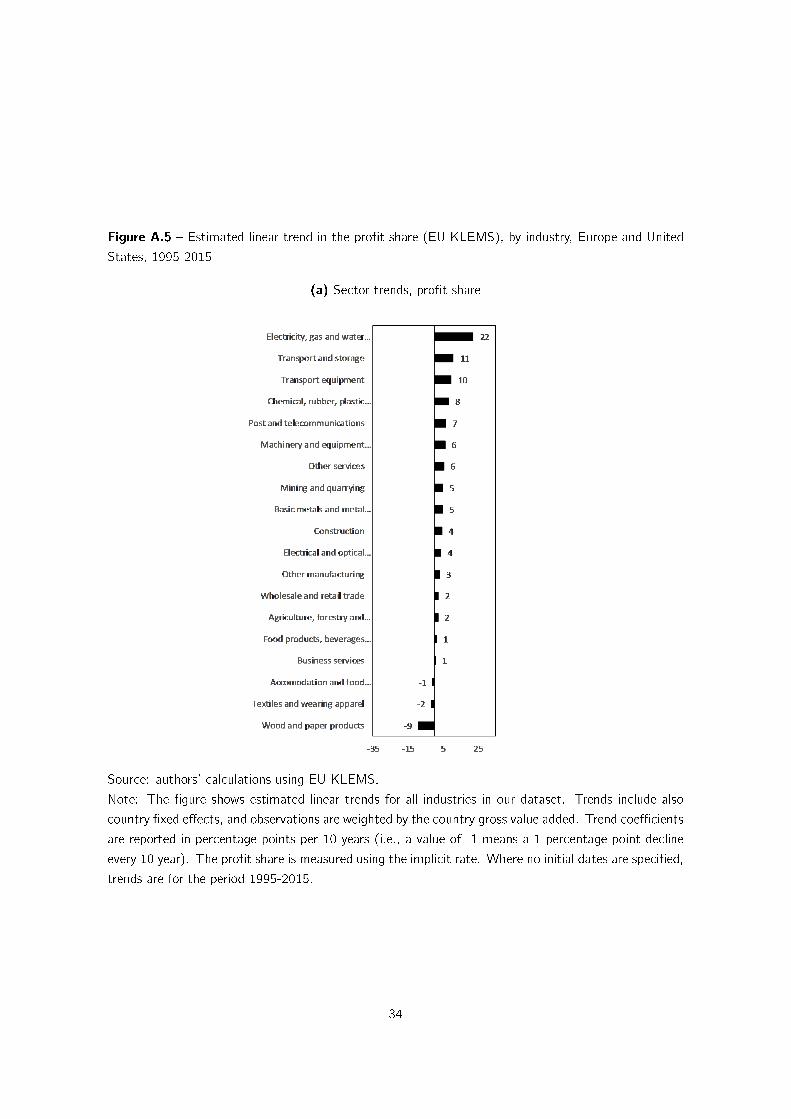
Figure A.5 � Estimated linear trend in the pro�t share (EU KLEMS), by industry, Europe and United
States, 1995-2015
(a) Sector trends, pro�t share
Source: authors' calculations using EU KLEMS.
Note: The �gure shows estimated linear trends for all industries in our dataset. Trends include also
country �xed e�ects, and observations are weighted by the country gross value added. Trend coe�cients
are reported in percentage points per 10 years (i.e., a value of -1 means a 1 percentage point decline
every 10 year). The pro�t share is measured using the implicit rate. Where no initial dates are speci�ed,
trends are for the period 1995-2015.
34
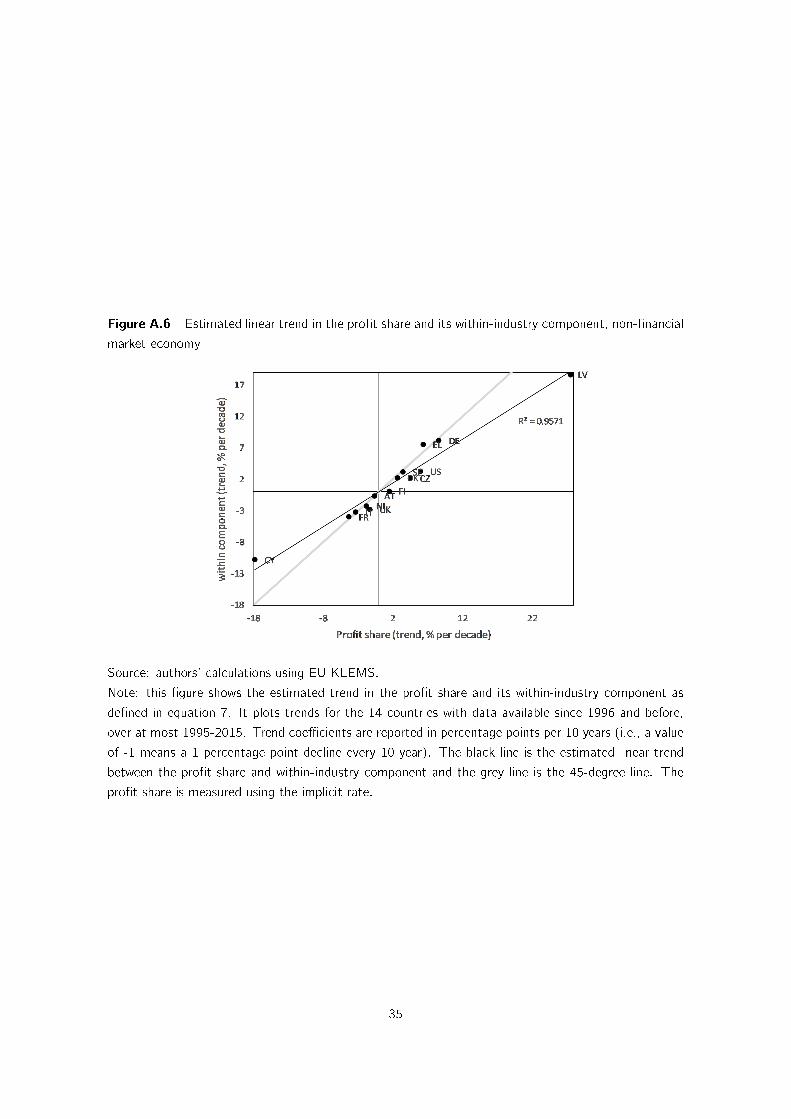
Figure A.6 � Estimated linear trend in the pro�t share and its within-industry component, non-�nancial
market economy
Source: authors' calculations using EU KLEMS.
Note: this �gure shows the estimated trend in the pro�t share and its within-industry component as
de�ned in equation 7. It plots trends for the 14 countries with data available since 1996 and before,
over at most 1995-2015. Trend coe�cients are reported in percentage points per 10 years (i.e., a value
of -1 means a 1 percentage point decline every 10 year). The black line is the estimated linear trend
between the pro�t share and within-industry component and the grey line is the 45-degree line. The
pro�t share is measured using the implicit rate.
35
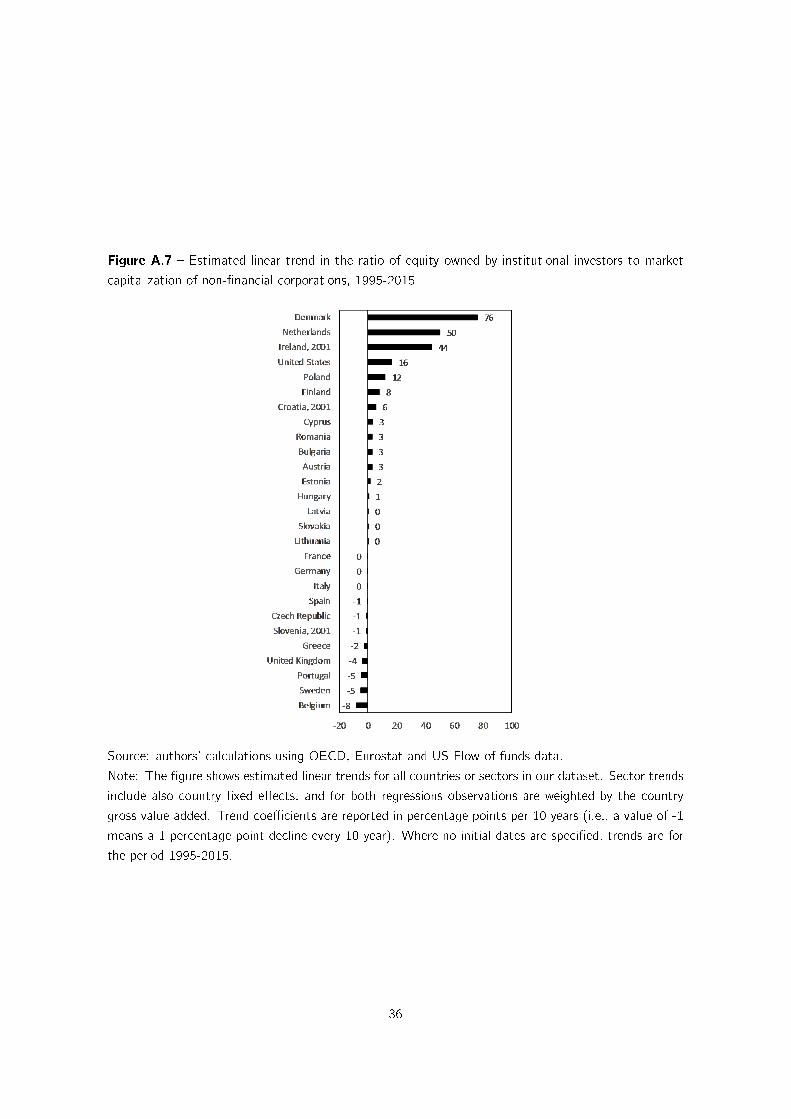
Figure A.7 � Estimated linear trend in the ratio of equity owned by institutional investors to market
capitalization of non-�nancial corporations, 1995-2015
Source: authors' calculations using OECD, Eurostat and US Flow of funds data.
Note: The �gure shows estimated linear trends for all countries or sectors in our dataset. Sector trends
include also country �xed e�ects, and for both regressions observations are weighted by the country
gross value added. Trend coe�cients are reported in percentage points per 10 years (i.e., a value of -1
means a 1 percentage point decline every 10 year). Where no initial dates are speci�ed, trends are for
the period 1995-2015.
36
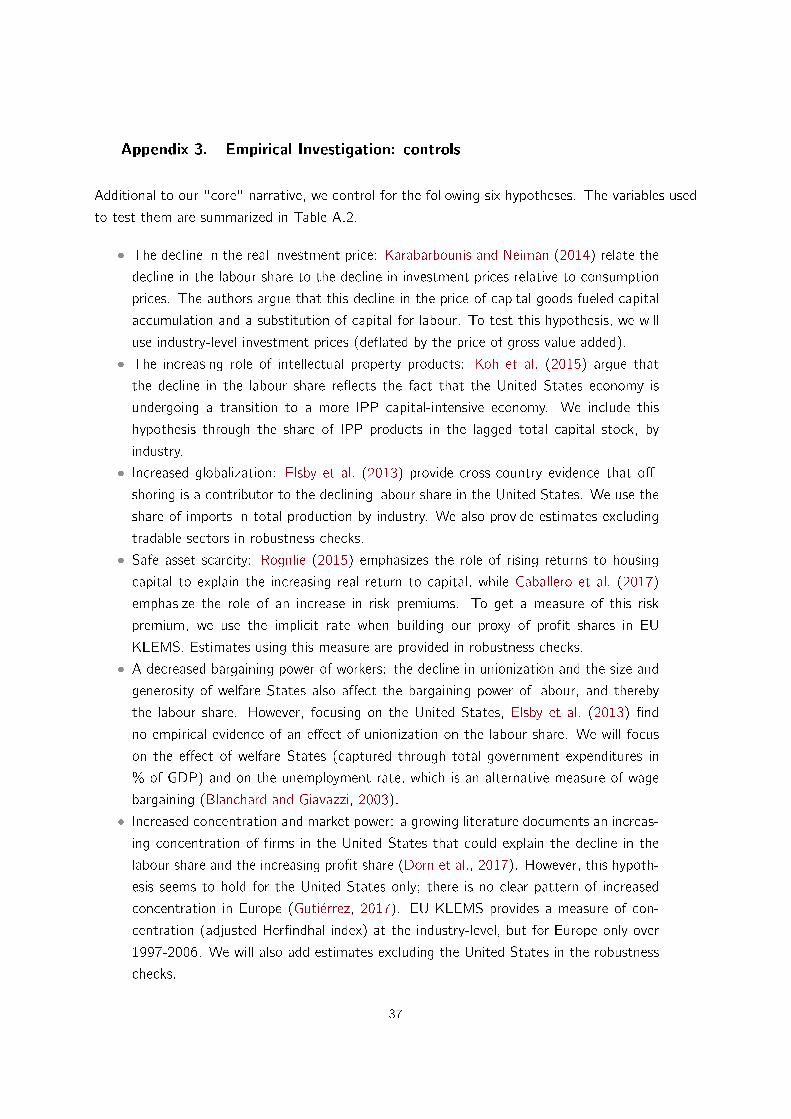
Appendix 3. Empirical Investigation: controls
Additional to our "core" narrative, we control for the following six hypotheses. The variables used
to test them are summarized in Table A.2.
� The decline in the real investment price: Karabarbounis and Neiman (2014) relate the
decline in the labour share to the decline in investment prices relative to consumption
prices. The authors argue that this decline in the price of capital goods fueled capital
accumulation and a substitution of capital for labour. To test this hypothesis, we will
use industry-level investment prices (de�ated by the price of gross value added).
� The increasing role of intellectual property products: Koh et al. (2015) argue that
the decline in the labour share re�ects the fact that the United States economy is
undergoing a transition to a more IPP capital-intensive economy. We include this
hypothesis through the share of IPP products in the lagged total capital stock, by
industry.
� Increased globalization: Elsby et al. (2013) provide cross-country evidence that o�-
shoring is a contributor to the declining labour share in the United States. We use the
share of imports in total production by industry. We also provide estimates excluding
tradable sectors in robustness checks.
� Safe asset scarcity: Rognlie (2015) emphasizes the role of rising returns to housing
capital to explain the increasing real return to capital, while Caballero et al. (2017)
emphasize the role of an increase in risk premiums. To get a measure of this risk
premium, we use the implicit rate when building our proxy of pro�t shares in EU
KLEMS. Estimates using this measure are provided in robustness checks.
� A decreased bargaining power of workers: the decline in unionization and the size and
generosity of welfare States also a�ect the bargaining power of labour, and thereby
the labour share. However, focusing on the United States, Elsby et al. (2013) �nd
no empirical evidence of an e�ect of unionization on the labour share. We will focus
on the e�ect of welfare States (captured through total government expenditures in
% of GDP) and on the unemployment rate, which is an alternative measure of wage
bargaining (Blanchard and Giavazzi, 2003).
� Increased concentration and market power: a growing literature documents an increas-
ing concentration of �rms in the United States that could explain the decline in the
labour share and the increasing pro�t share (Dorn et al., 2017). However, this hypoth-
esis seems to hold for the United States only; there is no clear pattern of increased
concentration in Europe (Gutiérrez, 2017). EU KLEMS provides a measure of con-
centration (adjusted Her�ndhal index) at the industry-level, but for Europe only over
1997-2006. We will also add estimates excluding the United States in the robustness
checks.
37
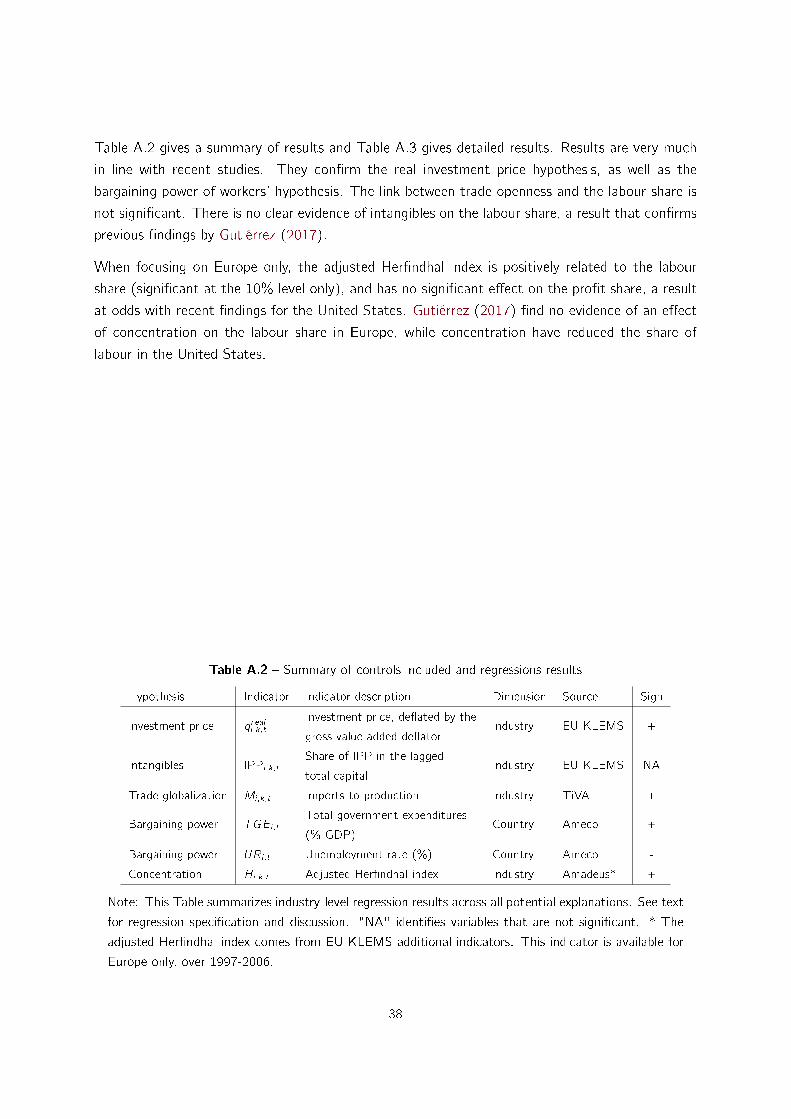
Table A.2 gives a summary of results and Table A.3 gives detailed results. Results are very much
in line with recent studies. They con�rm the real investment price hypothesis, as well as the
bargaining power of workers' hypothesis. The link between trade openness and the labour share is
not signi�cant. There is no clear evidence of intangibles on the labour share, a result that con�rms
previous �ndings by Gutiérrez (2017).
When focusing on Europe only, the adjusted Her�ndhal index is positively related to the labour
share (signi�cant at the 10% level only), and has no signi�cant e�ect on the pro�t share, a result
at odds with recent �ndings for the United States. Gutiérrez (2017) �nd no evidence of an e�ect
of concentration on the labour share in Europe, while concentration have reduced the share of
labour in the United States.
Table A.2 � Summary of controls included and regressions results
Hypothesis Indicator Indicator description Dimension Source Sign
Investment price qreali ;k;t
Investment price, de�ated by the
gross value added de�atorIndustry EU KLEMS +
Intangibles IPPi ;k;t
Share of IPP in the lagged
total capitalIndustry EU KLEMS NA
Trade globalization Mi ;k;t Imports to production Industry TiVA +
Bargaining power TGEi ;t
Total government expenditures
(% GDP)Country Ameco +
Bargaining power URi ;t Unemployment rate (%) Country Ameco -
Concentration Hi ;k;t Adjusted Her�ndhal index Industry Amadeus* +
Note: This Table summarizes industry-level regression results across all potential explanations. See text
for regression speci�cation and discussion. "NA" identi�es variables that are not signi�cant. * The
adjusted Her�ndhal index comes from EU KLEMS additional indicators. This indicator is available for
Europe only, over 1997-2006.
38
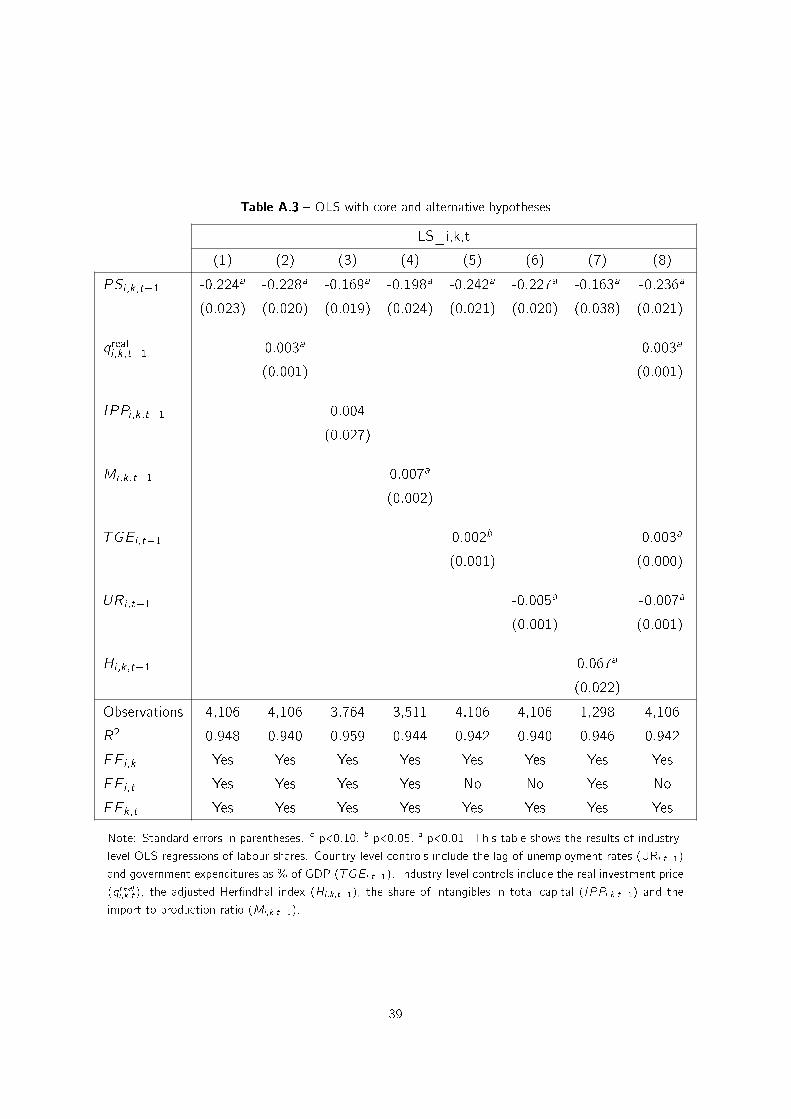
Table A.3 � OLS with core and alternative hypotheses
LS_i,k,t
(1) (2) (3) (4) (5) (6) (7) (8)
PSi ;k;t�1 -0.224a -0.228a -0.169a -0.198a -0.242a -0.227a -0.163a -0.236a
(0.023) (0.020) (0.019) (0.024) (0.021) (0.020) (0.038) (0.021)
qreali ;k;t�1 0.003a 0.003a
(0.001) (0.001)
IPPi ;k;t�1 0.004
(0.027)
Mi ;k;t�1 0.007a
(0.002)
TGEi ;t�1 0.002b 0.003a
(0.001) (0.000)
URi ;t�1 -0.005a -0.007a
(0.001) (0.001)
Hi ;k;t�1 0.067a
(0.022)
Observations 4,106 4,106 3,764 3,511 4,106 4,106 1,298 4,106
R2 0.948 0.940 0.959 0.944 0.942 0.940 0.946 0.942
FEi ;k Yes Yes Yes Yes Yes Yes Yes Yes
FEi ;t Yes Yes Yes Yes No No Yes No
FEk;t Yes Yes Yes Yes Yes Yes Yes Yes
Note: Standard errors in parentheses. c p<0.10, b p<0.05, a p<0.01. This table shows the results of industry-
level OLS regressions of labour shares. Country-level controls include the lag of unemployment rates (URi ;t�1)
and government expenditures as % of GDP (TGEi ;t�1). Industry-level controls include the real investment price
(qreali ;k;t), the adjusted Her�ndhal index (Hi ;k;t�1), the share of intangibles in total capital (IPPi ;k;t�1) and the
import to production ratio (Mi ;k;t�1).
39
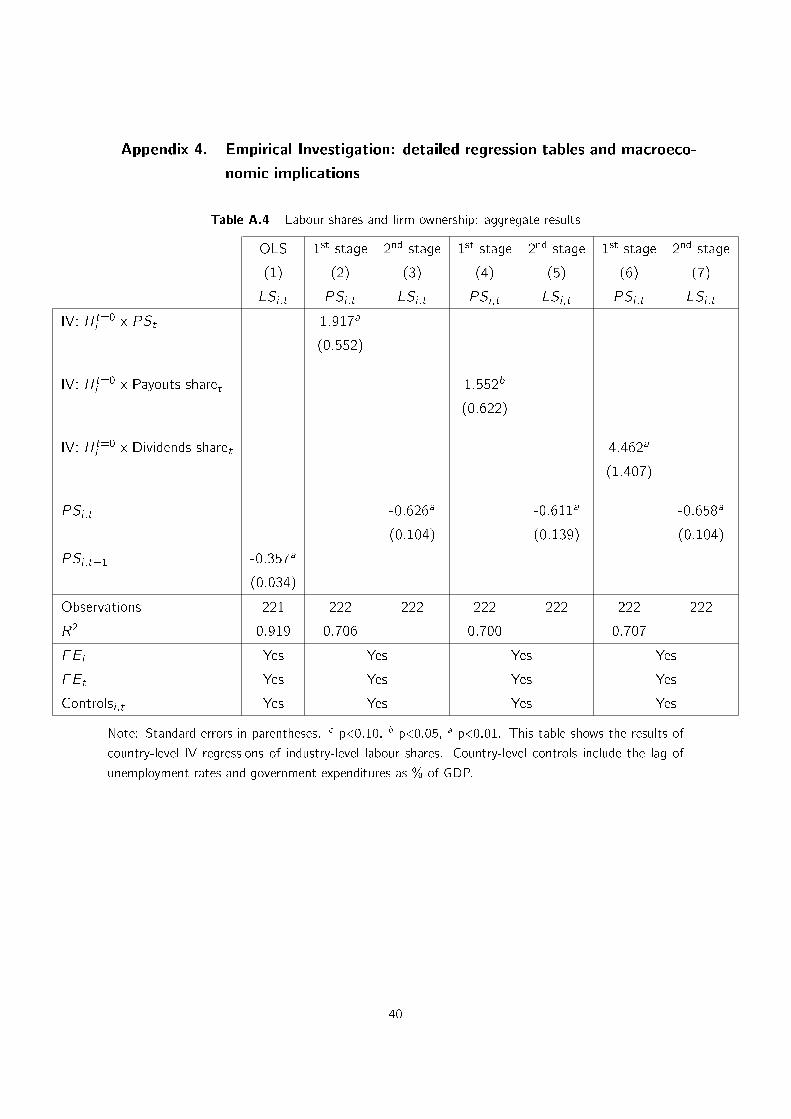
Appendix 4. Empirical Investigation: detailed regression tables and macroeco-
nomic implications
Table A.4 � Labour shares and �rm ownership: aggregate results
OLS 1st stage 2nd stage 1st stage 2nd stage 1st stage 2nd stage
(1) (2) (3) (4) (5) (6) (7)
LSi ;t PSi ;t LSi ;t PSi ;t LSi ;t PSi ;t LSi ;t
IV: IIt=0i
x PSt 1.917a
(0.552)
IV: IIt=0i
x Payouts sharet 1.552b
(0.622)
IV: IIt=0i
x Dividends sharet 4.462a
(1.407)
PSi ;t -0.626a -0.611a -0.658a
(0.104) (0.139) (0.104)
PSi ;t�1 -0.357a
(0.034)
Observations 221 222 222 222 222 222 222
R2 0.919 0.706 0.700 0.707
FEi Yes Yes Yes Yes
FEt Yes Yes Yes Yes
Controlsi ;t Yes Yes Yes Yes
Note: Standard errors in parentheses. c p<0.10, b p<0.05, a p<0.01. This table shows the results of
country-level IV regressions of industry-level labour shares. Country-level controls include the lag of
unemployment rates and government expenditures as % of GDP.
40
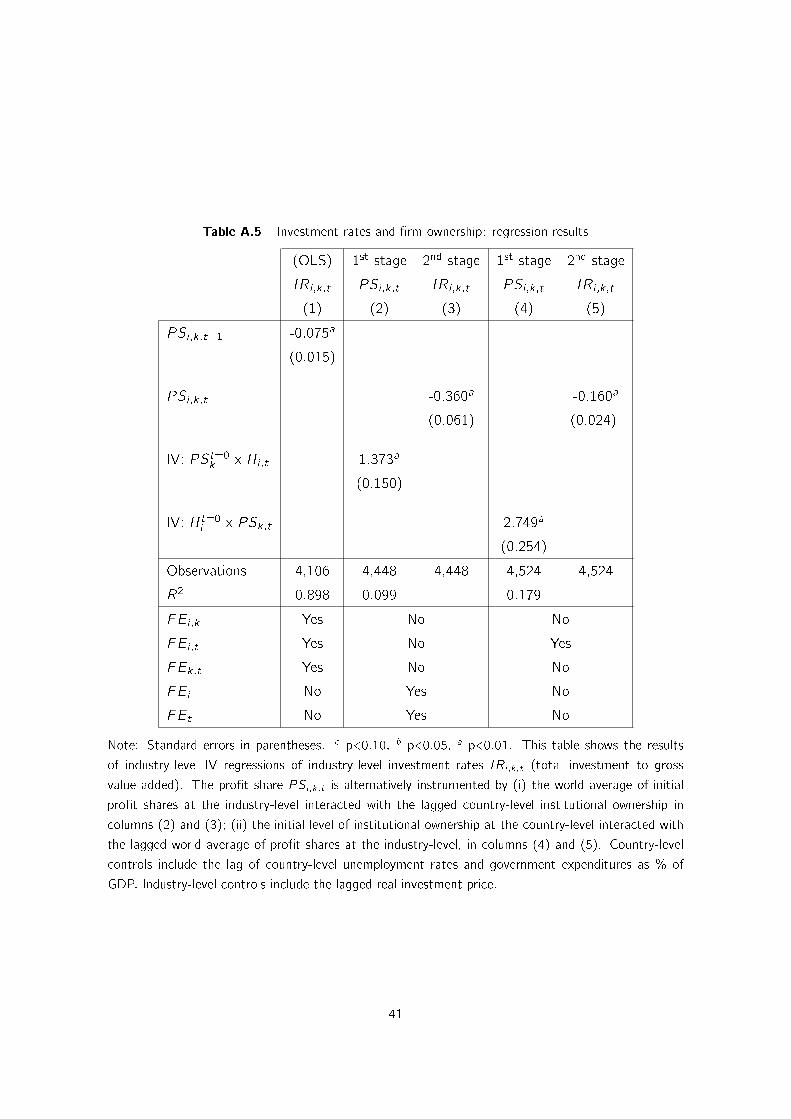
Table A.5 � Investment rates and �rm ownership: regression results
(OLS) 1st stage 2nd stage 1st stage 2nd stage
IRi ;k;t PSi ;k;t IRi ;k;t PSi ;k;t IRi ;k;t
(1) (2) (3) (4) (5)
PSi ;k;t�1 -0.075a
(0.015)
PSi ;k;t -0.360a -0.160a
(0.061) (0.024)
IV: PSt=0k
x IIi ;t 1.373a
(0.150)
IV: IIt=0i
x PSk;t 2.749a
(0.254)
Observations 4,106 4,448 4,448 4,524 4,524
R2 0.898 0.099 0.179
FEi ;k Yes No No
FEi ;t Yes No Yes
FEk;t Yes No No
FEi No Yes No
FEt No Yes No
Note: Standard errors in parentheses. c p<0.10, b p<0.05, a p<0.01. This table shows the results
of industry-level IV regressions of industry-level investment rates IRi ;k;t (total investment to gross
value added). The pro�t share PSi ;k;t is alternatively instrumented by (i) the world average of initial
pro�t shares at the industry-level interacted with the lagged country-level institutional ownership in
columns (2) and (3); (ii) the initial level of institutional ownership at the country-level interacted with
the lagged world average of pro�t shares at the industry-level, in columns (4) and (5). Country-level
controls include the lag of country-level unemployment rates and government expenditures as % of
GDP. Industry-level controls include the lagged real investment price.
41
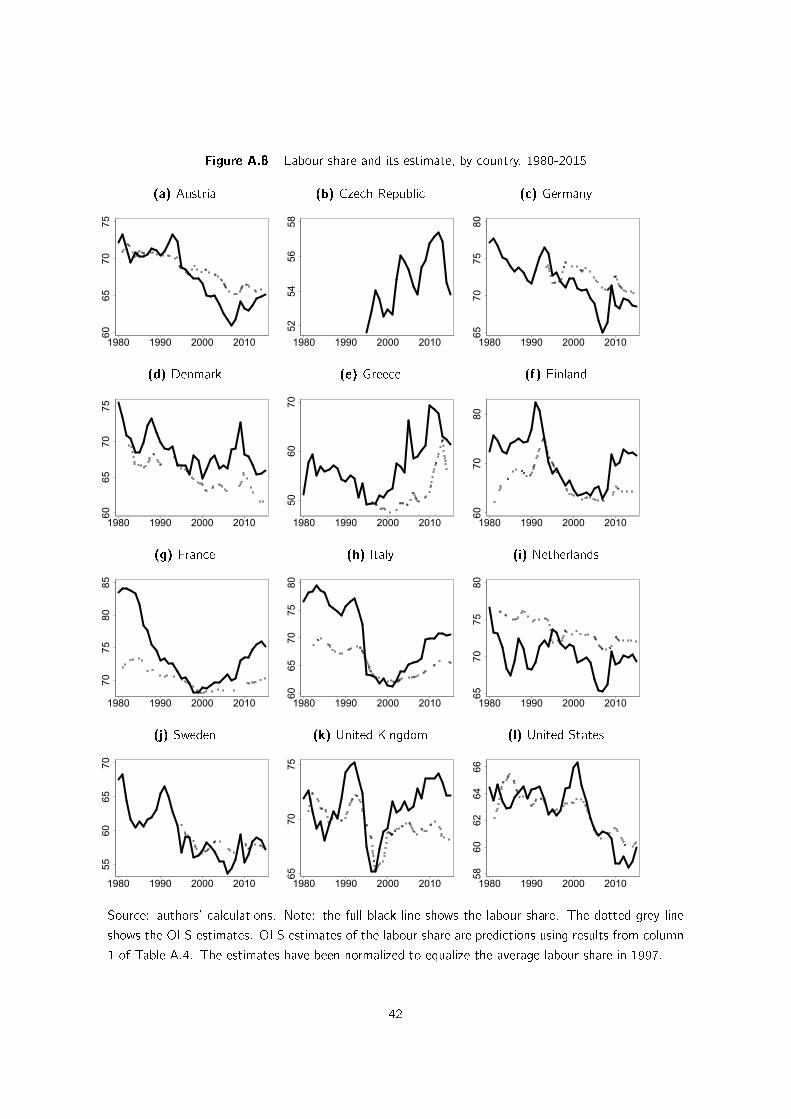
Figure A.8 � Labour share and its estimate, by country, 1980-2015
(a) Austria
6065
7075
1980 1990 2000 2010
(b) Czech Republic
5254
5658
1980 1990 2000 2010
(c) Germany
6570
7580
1980 1990 2000 2010
(d) Denmark
6065
7075
1980 1990 2000 2010
(e) Greece
5060
70
1980 1990 2000 2010
(f) Finland
6070
80
1980 1990 2000 2010
(g) France
7075
8085
1980 1990 2000 2010
(h) Italy
6065
7075
80
1980 1990 2000 2010
(i) Netherlands
6570
7580
1980 1990 2000 2010
(j) Sweden
5560
6570
1980 1990 2000 2010
(k) United Kingdom
6570
75
1980 1990 2000 2010
(l) United States
5860
6264
66
1980 1990 2000 2010
Source: authors' calculations. Note: the full black line shows the labour share. The dotted grey line
shows the OLS estimates. OLS estimates of the labour share are predictions using results from column
1 of Table A.4. The estimates have been normalized to equalize the average labour share in 1997.
42


