Embed Size (px)
Citation preview
Finan ial Stru ture Changeand Banking In ome:a Canada-U.S. ComparisonChristian P. A. Calm�esD�epartement des S ien es AdministrativesUniversit�e du Qu�ebe en OutaouaisLaboratory for Resear h in Statisti s and Probability
Ying LiuDepartment of Monetary and Finan ial AnalysisBank of CanadaRePAd Working Paper No. 0302005�
�Postal: Christian Calm�es, D�epartement des S ien es Administratives, Universit�e du Qu�ebe en Outaouais, PavillonLu ien Brault, 101 rue Saint Jean Bos o, Gatineau, Qu�ebe , Canada, J8Y 3G5.Corresponden e: hristian. almes�uqo. a. Telephone: (819) 595 3900 -1893. Fax: (819) 773-1747.HOME PAGE: http://e onpapers.repe .org/RAS/p a19.htmChristian Calm�es would like to thank seminar parti ipants at the 2004 annual onferen e of the So i�et�e Canadienne deS ien e �E onomique and the 2003 annual onferen es of the Canadian E onomi s Asso iation and So i�et�e Canadiennede S ien e �E onomique. We thank Alejandro Gar ��a, C�eline Gauthier, Patri k Gonz�alez, Lloyd Paquin, Eri Santorand Kevin Stiroh for their suggestions.This paper an be downloaded from RePAd.org: http://ideas.repe .org/p/pqs/wpaper/0302005.html.LATEX 2005
Finan ial Stru ture Change and Banking In ome:a Canada-U.S. ComparisonAbstra tData suggest that the Canadian �nan ial stru ture, and parti ularly indire t �nan e(e.g., banking), have be ome more market-oriented. We asso iate this �nan ial trend inpart with the regulatory hanges that have o ured in Canada sin e the 1980s. Finan ialintermediaries are in reasingly involved with �nan ial market a tivities |e.g. o�-balan esheet (OBS) a tivities su h as underwriting se urities. For this reason, we analyze thenoninterest in ome attributable to �nan ial market a tivities. We �nd that the varian eof Canadian banks' aggregate operating-in ome growth is rising be ause of the in reased ontribution of noninterest in ome. This omponent is by nature quite volatile omparedto interest in ome. Consequently, our analysis orroborates the U.S. �ndings of Stiroh2004, and Stiroh and Rumble 2005: By ontributing to banking in ome volatility, market-oriented a tivities do not ne essarily yield straightforward diversi� ation bene�ts to Cana-dian banks.Keywords: Regulatory hanges, indire t �nan e, noninterest in ome, diversi� ationJEL: G20, G21
1 Introdu tionOver the 1990s, Canadian businesses relied in reasingly on �nan ial markets as their primary sour eof external funding (Calm�es and Dolar 2002, Calm�es 2004). Data display a trend towards a moremarket-oriented �nan ial stru ture. In parallel, Canadian banks have be ome in reasingly involvedwith non-traditional a tivities, e.g. OBS a tivities. This trend is partly related to the regulatory hanges that o ured in Canadian banking. It started after the 1980 banking legislation amendmentsand was a entuated after the 1992 amendments. A omplex ombination of legislative modi� ations(e.g. the Basle a ords) and various market onditions explains the urrent situation.In the U.S, Boyd and Gertler (1994) observe a similar shift in banking. Going a step further, Stiroh(2004) and Stiroh and Rumble (2005) investigate the onsequen e of the market-oriented trend onU.S. banking riskiness {as measured by net operating revenue volatility. Surprisingly, these authors�nd \little obvious diversi� ation bene�t" from this ongoing phenomenon.To our knowledge, the approa h proposed by Stiroh (2004) has not yet been used to assess the aseof Canadian banking riskiness. Dionne and Har haoui (2003) �nd that there is a positive relationshipbetween regulatory apital standards and a bank's de ision to engage in risky a tivities, notably se- uritization with partial re ourse. With a simultaneous equations model, the authors on lude thatse uritization has a negative impa t on the bank's apital ratios and that there is a positive linkbetween se uritization and bank risk. While their results relate to our argument, the authors fo uson redit risk. They do not frame banking riskiness in terms of in ome volatility. D'Souza and Lai(2003) fo us on Canadian bank portfolio eÆ ien y and the impa t of regional and industrial portfolio on entration. They �nd that geographi al diversi� ation ould have a positive impa t on Canadianbanks, but that more diversi�ed business lines and industries would be somewhat detrimental tobanks' eÆ ien y. However, on entrating on on-balan e sheet a tivities, the authors annot fullya ount for �nan ial market a tivities.This paper ontributes to the perspe tive held by Stiroh (2004), Dionne and Har haoui (2003)and Stiroh and Rumble (2005) regarding the urrent banking stan e. Be ause non-traditional a -tivities tend to a ount for an important part of the banking business volatility, we investigate therelationship between �nan ial stru ture hange and banking riskiness, with a parti ular emphasis onthe in rease in noninterest in ome1 a tivities. More pre isely, our primary fo us is the study of the1Noninterest in ome is the in ome generated by banks outside of their traditional a tivities { i.e., OBS a tivities1
nature of the diversi� ation asso iated with market-oriented a tivities.This resear h o�ers a ontribution in addressing a deli ate question: would the urrent trendbe bene� ial to Canadian banks? The question deserves parti ular attention in the urrent ontextof Canadian banking. Investigating this ase might help shed some light on the merger debate.A ording to Van den Heuvel (2002), banks' apital distribution has an impa t on the degree ofeÆ a y of monetary poli y. Therefore, eteris paribus, regulators ould favor mergers that indu ebetter apital distribution within the banking system. A ording to D'Souza and Lai (2003), thereare also eÆ ien y gains asso iated with geographi al diversi� ation. Therefore, eteris paribus, theregulators ould favor mergers that in rease geographi al dispersion, fostering banking eÆ ien y.Our preliminary results suggest that regulators wanting to redu e the volatility of banks noninterestin ome ould onsider mergers that minimize the non-traditional a tivities of the merged entity.In this empiri al study, we argue that �nan ial market a tivities do not ne essarily provide diver-si� ation bene�ts to Canadian banks, in the sense that they ontribute to banks in ome volatility.We �nd that the ontribution of noninterest in ome to the volatility of the aggregate net operating-revenue growth has in reased sin e the early 1980s {and espe ially in re ent years. This has nothingto do with a bad draw; instead, this persistent in rease partly oin ides with a regulatory hange inthe �nan ial stru ture {parti ularly in the banking business. The next se tion des ribes this hangeand explains it in relation with the onse utive hanges in regulation and market onditions. Weestablish that Canadian banks in reasingly rely on non-traditional a tivities. Se tion 3 studies theimpa t of this trend on banking.Our empiri al analysis suggests that Canadian aggregate bank revenue is volatile both be ause of thein reased relian e on noninterest in ome and be ause of the important volatility of this omponent.In this se tion, we also report estimates suggesting that banking is pro y li al with respe t to bothGDP and the TSE, owing in part to the in uen e of noninterest in ome. The last se tion on ludeswith a dis ussion on some poli y impli ations and possible extensions of this study.in luding market-related a tivities.2
2 The Change in the Canadian Finan ial Stru tureWhen fo ussing on Canadian banking, our study reveals that its stru ture is be oming more market-based, with a greater proportion of �nan ing being done through orporate bonds and equity. Weanalyze this banking trend in the ontext of the Canadian legislative developments, be ause regu-latory hanges help explain why and when �nan ial intermediaries, espe ially banks, be ame moremarket-oriented. The regular revisions in Canadian �nan ial legislation, the results of whi h are oftenin uen ed by market onditions, are usually followed by a series of �nan ial innovations. In turn,these �nan ial innovations an potentially ontribute to a stru tural break in the nature of external�nan ing. Obviously, the regulatory hanges are endogenous, as they often a ommodate the needsof the �nan ial system. However, it is reasonable to think that there is a dire t relationship be-tween the regulatory hanges and the stru ture of the Canadian �nan ial system (Calm�es and Dolar2002, Calm�es 2004). In parti ular, these hanges, along with the evolution in the market onditions,have an impa t on banking. In the following se tion, we asso iate these regulatory hanges to thestru tural breaks and hara terize the urrent Canadian banking trend.2.1 The Regulatory ChangesThe \sunset" lause of the Canadian Bank A t requires a periodi reassessment of the legislationruling the national hartered banks. This lause led to signi� ant revisions whi h might have helpfoster bank pro�ts while also responding to the hanges in market onditions. A priori, we an alsothink that the amendments would reate some diversi� ation bene�ts along the way. In any ase,these legislative revisions and various market onditions were intimately intertwined, and there islittle doubt that both ontributed to the hange in the �nan ial industry.The 1980 amendments was the �rst of a series that had a persistent e�e t on banks and other�nan ial institutions. It allowed banks to have subsidiaries in di�erent areas su h as venture apitaland mortgage loans. In 1987 and 1992, banks entered into a range of new businesses su h as newOBS a tivities (see Table 1). Canadian banks were permitted to invest in orporate se urities, andto distribute government bonds. They made substantial investments in the se urities business andgained ontrol of most investment dealers. Finan ial intermediaries were also allowed to ondu tbrokerage a tivities.Consequently, the �nan ial stru ture is more market-oriented, with a pronoun ed hange asso i-3
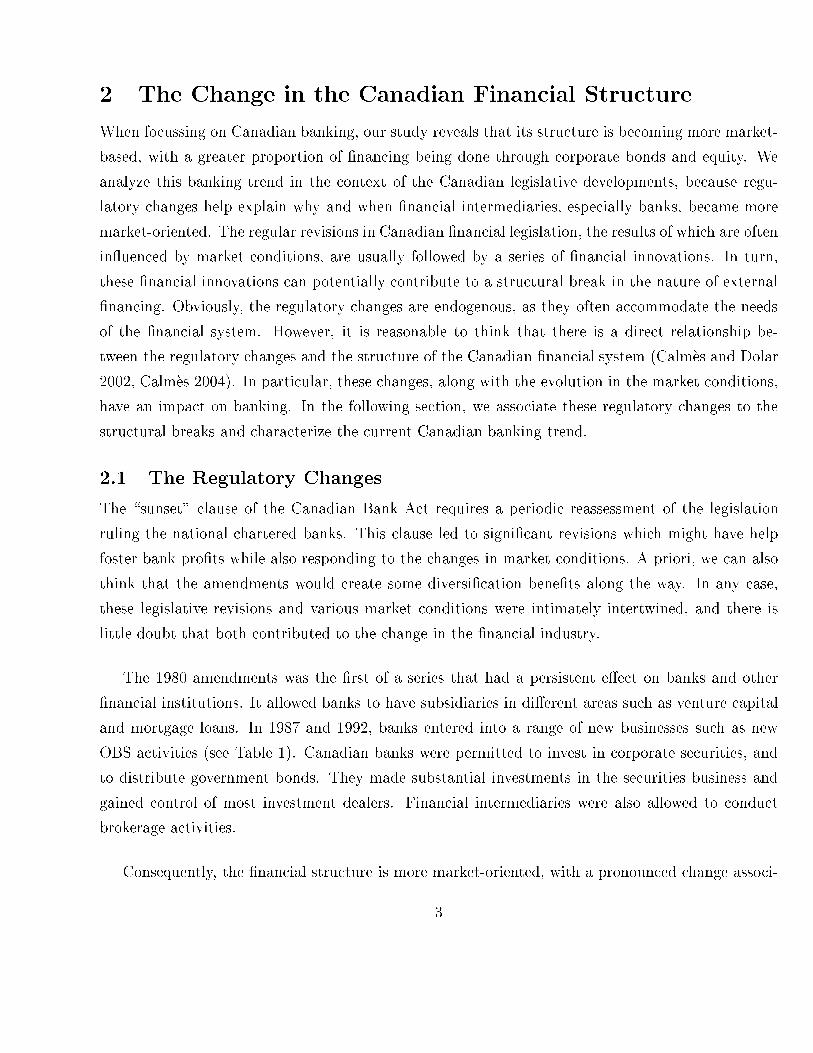
Table 1: The Amendments in a Nutshell1980 Subsidiaries are allowed, e.g. venture apital, mortgage loans1987 Distribution of government bonds is allowedInvestment in orporate se urities is allowedBanks pur hase ontrol of the investment dealersBanks make investments in the se urities business1992 Banks buy the trust ompaniesBanks are permitted to o�er in-house a tivities:Portfolio management, investment advi e et .1997 Update and re�nement of the 1992 amendmentated with the 1987 amendments. The transition o urred between 1987 and 1989, as bank ustomersbegan to be able to invest in �nan ial markets dire tly through their banks. The situation evolvedfurther in 1992. Among other things, the 1992 amendment allowed banks to o�er a number ofin-house a tivities su h as portfolio management and investment advi e.2.2 The Relative De line of the Canadian Loan BusinessIn re ent years, the share of Canadian banks has been stable relative to other lending institutions.However, in relation to the amendments, the �nan ial institutions together have been losing marketshare to the �nan ial markets. In the 1990s, indire t �nan ing sharply de reased2. Canadian �nan ialinstitutions have been experien ing a relative drop in loan business, from approximately 60 per entof external �nan ing in the 1980s to just under 40 per ent in re ent years3. Figure 1 shows thispattern quite learly. We onstru t a dire t/indire t ratio by dividing bonds, shares and other byloans extended by �nan ial institutions. The �gure displays a U-shaped dire t/indire t �nan ingratio: the �nan ial stru ture is urrently hara terized by a trend toward a more market-orientedsystem, more pronoun ed sin e the implementation phase of the 1987 amendments. More pre isely,2The overall pi ture does not hange mu h when the same four series (loans, bonds, sto ks, other) are expressedrelative to nominal GDP.3As illustrated in Figure 4 (in appendix), the trend in the Canadian �nan ial stru ture is towards a more market-based system. 4
Figure 1: Dire t/Indire t Private Finan e
1968 1970 1972 1974 1976 1978 1980 1982 1984 1986 1988 1990 1992 1994 1996 1998 20000.4
0.6
0.8
1.0
1.2
1.4
1.6
1.8
2.0
2.2Direct/Indirect Ratio
Dir
ect/I
ndir
ect L
endi
ng
Note: The verti al lines represent the years in whi h signi� ant revisions of the Bank A t were made.Sour e: Calm�es (2004).the transition o urred between 1987 and 1989, as banks' ustomers begun to be able to invest in�nan ial markets dire tly through their banks.2.3 Stylized Fa tsIt is quite understandable that regulatory hanges, by allowing banks to enter the brokerage business,have de fa to initiated the growth of banks' non-traditional a tivities. As dis ussed below, thesea tivities likely ontribute to Canadian banks prosperity.5

Figure 2: Total Assets, Credit Equivalent, and Commer ial Loans Extended by Finan ial Interme-diaries as a Per entage of Nominal Gross Domesti Produ t
1984 1985 1986 1987 1988 1989 1990 1991 1992 1993 1994 1995 1996 1997 1998 1999 2000 2001 20020
100
200
300
400
500
600
700
Total Assets of Financial IntermediariesTotal Loans Extended by Financial IntermediariesCredit EquivalentTotal Assets + Credit Equivalent
Perc
enta
ge
Note: The verti al lines represent the years in whi h signi� ant revisions of the Bank A t were made.Sour e: Calm�es (2004).2.3.1 The In rease in Non-Traditional A tivitiesThe growth in Canadian banks' total assets shares the same pattern as its U.S. ounterpart (Boydand Gertler 1994). Of parti ular interest is the growth in non-traditional a tivities (su h as OBSa tivities for example). These a tivities generate noninterest in ome without relying on traditionallending. In the last de ades, noninterest in ome has grown mu h faster than net-interest in ome.This has been parti ularly true sin e the 1992 (and 1997) Bank A t amendments.Surprisingly however, non-traditional a tivities are sometimes overlooked. One of the reasons mightbe the fa t that noninterest in ome a tivities, by de�nition, are not reported as traditional lending,so it is more diÆ ult to get a somewhat ompatible �nan ial indi ator of bank a tivities in these areas.6
Consequently, as Boyd and Gertler (1994), we use the noninterest in ome series to assess theimportan e of noninterest in ome a tivities in term of assets4. We transform the noninterest in omeseries into a redit equivalent series, as if this noninterest in ome had been generated from regularassets. Figure 2 shows that, after the 1992 and 1997 amendments, this �nan ial indi ator grewrapidly. In re ent years, mu h of the growth in total (adjusted) banks assets, on- and o�-balan esheet, has a tually ome from noninterest in ome. It is a global phenomenon taking pla e in Canada,in the U.S. (Boyd and Gertler 1994) and Europe (Rajan and Zingales 2003).3 AnalysisWhile do umenting fa ts regarding the �nan ial stru ture, we have established that regulatory hanges have allowed the system to be ome more market-oriented. In parti ular, banks have in- reased their non-traditional businesses. However, little attention has been paid to the onsequen eof this situation in terms of diversi� ation of Canadian banking. The aim of this se tion is to providea preliminary analysis of this question, with a parti ular fo us on banking in ome.3.1 Summary Statisti sTwo types of data are used in our analysis: the banks' onsolidated monthly balan e sheet data andthe quaterly onsolidated statement of in ome olle ted by the OÆ e of the Superintendent of Fi-nan ial Institutions Canada. Aggregate levels for balan e sheet data are taken from the Banking andFinan ial Statisti s (Bank of Canada, Tables C1 and C2). For statement of in ome, we rely on thesame sour e (Table K2). Both types of data are on a quaterly frequen y from 1983:Q1 to 2002:Q4,the longest period available on a onsistent basis, de ated with the GDP de ator (1997=100) andseasonally adjusted. Noninterest in ome is a heterogenous aggregate that in ludes di�erent a tivities:trading in ome, gains (losses) on instruments held for other than trading purposes, �du iary in ome,servi e fees, investment banking related fees, insuran e, and other fees and ommisions. In pra tise,we substra t net interest in ome from net operating in ome to retreive the aggregate series.4Boyd and Gertler (1994) impli itly assume a perfe t maping between OBS a tivities and noninterest in ome. Sin enoninterest in ome a tually involves some on-balan e sheet items, the method only provides an approximate indi atorof OBS a tivities. 7
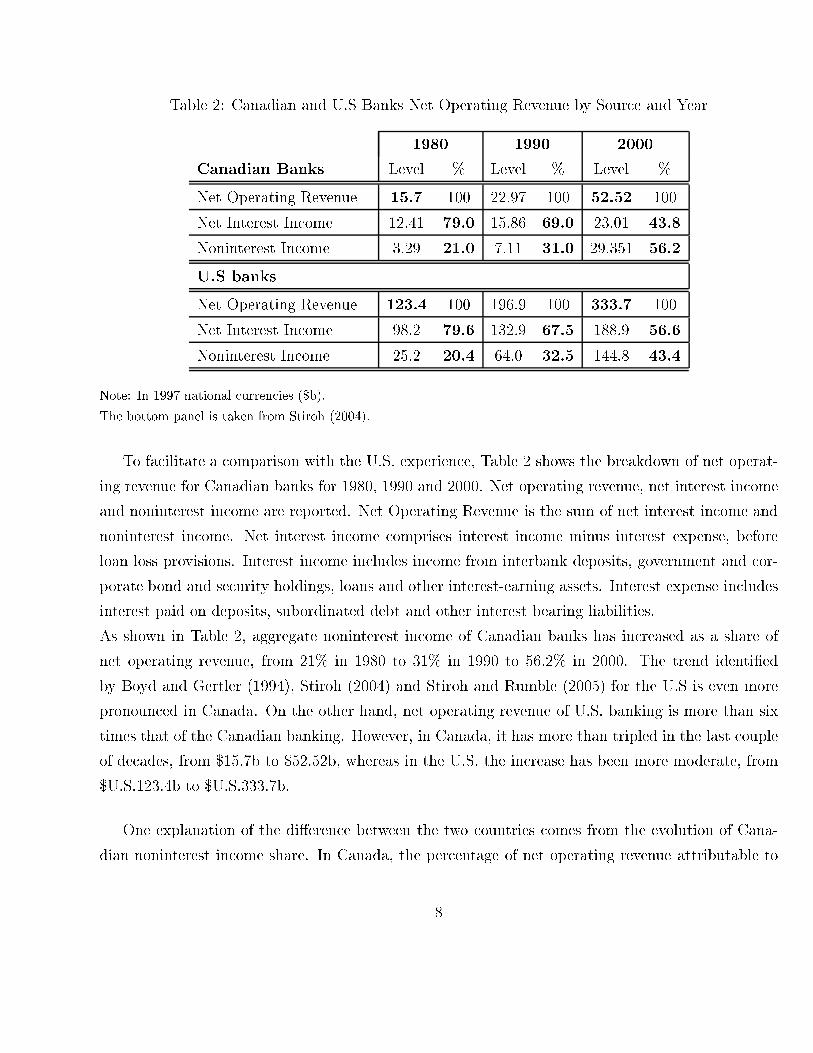
Table 2: Canadian and U.S Banks Net Operating Revenue by Sour e and Year1980 1990 2000Canadian Banks Level % Level % Level %Net Operating Revenue 15.7 100 22.97 100 52.52 100Net Interest In ome 12.41 79.0 15.86 69.0 23.01 43.8Noninterest In ome 3.29 21.0 7.11 31.0 29.351 56.2U.S banksNet Operating Revenue 123.4 100 196.9 100 333.7 100Net Interest In ome 98.2 79.6 132.9 67.5 188.9 56.6Noninterest In ome 25.2 20.4 64.0 32.5 144.8 43.4Note: In 1997 national urren ies ($b).The bottom panel is taken from Stiroh (2004).To fa ilitate a omparison with the U.S. experien e, Table 2 shows the breakdown of net operat-ing revenue for Canadian banks for 1980, 1990 and 2000. Net operating revenue, net interest in omeand noninterest in ome are reported. Net Operating Revenue is the sum of net interest in ome andnoninterest in ome. Net interest in ome omprises interest in ome minus interest expense, beforeloan loss provisions. Interest in ome in ludes in ome from interbank deposits, government and or-porate bond and se urity holdings, loans and other interest-earning assets. Interest expense in ludesinterest paid on deposits, subordinated debt and other interest bearing liabilities.As shown in Table 2, aggregate noninterest in ome of Canadian banks has in reased as a share ofnet operating revenue, from 21% in 1980 to 31% in 1990 to 56.2% in 2000. The trend identi�edby Boyd and Gertler (1994), Stiroh (2004) and Stiroh and Rumble (2005) for the U.S is even morepronoun ed in Canada. On the other hand, net operating revenue of U.S. banking is more than sixtimes that of the Canadian banking. However, in Canada, it has more than tripled in the last oupleof de ades, from $15.7b to $52.52b, whereas in the U.S. the in rease has been more moderate, from$U.S.123.4b to $U.S.333.7b.One explanation of the di�eren e between the two ountries omes from the evolution of Cana-dian noninterest in ome share. In Canada, the per entage of net operating revenue attributable to8
noninterest in ome has in reased signi� antly, while the in rease in the U.S. was more moderate.This result suggests that, in re ent episodes, the in rease in net operating revenue have been mainlydriven by the in rease in the noninterest omponent. This is onsistent with the observation thatnet operating revenue in rease has been greater in Canada than in the U.S.In this ontext, it is parti ularly interesting to investigate whether the in reased ontribution of non-interest in ome to net operating revenue is a \neutral" substitution (in terms of risk) or not. Whatfollows is then an assessment of net operating revenue volatility.3.2 Banks In ome Volatility: a Canada-U.S. ComparisonWe expe t that an in reased volatility oin ides with a growing share of �nan ial market a tivities.This should be the ase sin e noninterest in ome tends to be more volatile than the net interestin ome omponent of net operating revenue ( f Figure 5 in appendix). So, if noninterest in omein reasingly ontributes to banks revenue, then it an be suspe ted that it in reases u tuations innet operating revenue as well. The analysis arried below investigates this idea.In this analysis, it helps think of net operating revenue as a portfolio omposed of two types ofassets. First, a bank's regular assets generate net interest in ome. Se ond, a bank's asset equivalentyields noninterest in ome. A standard examination of the volatility of aggregate return of this kindof portfolio would require some asset equivalent indi ator of non-interest in ome. Instead, followingStiroh (2004) and Stiroh and Rumble (2005), we onsider a dire t approa h based on a modi� ationof the standard portfolio analysis. Rather than omputing a regular de omposition of return volatil-ity and rely on some asset equivalent series, we dire tly ompute a de omposition of portfolio growthvolatility.In standard portfolio theory, the volatility of a portfolio aggregate return is a fun tion of the volatil-ities of ea h of its omponents, and also a fun tion of their ovarian e. Hen e, adapting this ideato banks' revenue boils down to spe ifying the volatility of the growth rate of net operating revenue(NOR) as the weighted average of the varian e of the growth rate of noninterest in ome (NONIN)and of the varian e of the growth rate of net interest in ome (NI), plus the ovarian e between thesetwo omponents. More pre isely, sin e NOR = NONIN +NI we have:�2d ln(NOR) = �2�2d ln(NONIN) + (1� �)2�2d ln(NI) (1)+2�(1� �) ov(d ln(NONIN); d ln(NI))9
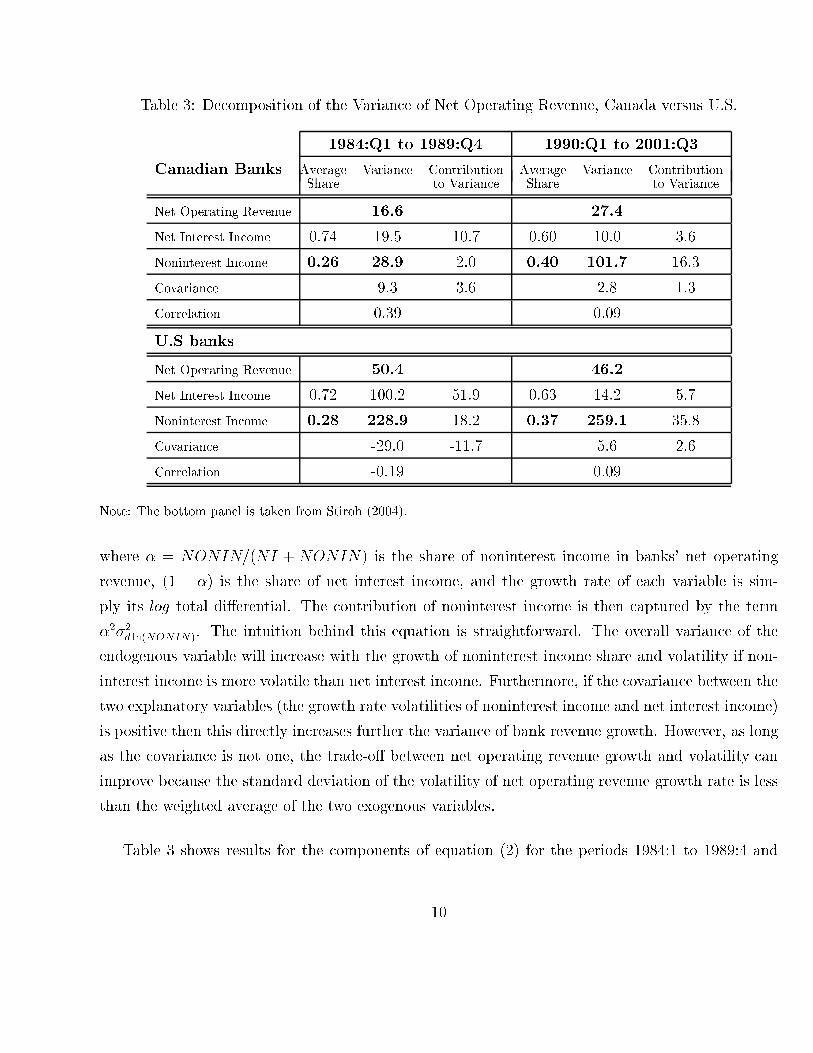
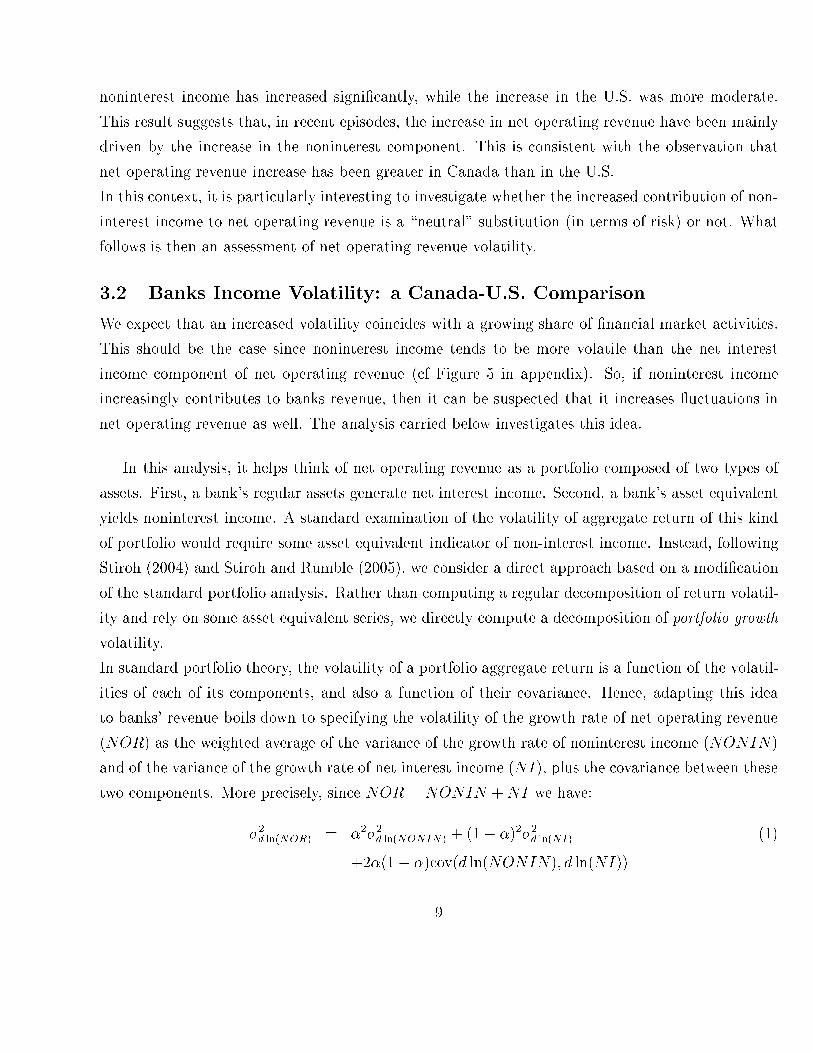
Table 3: De omposition of the Varian e of Net Operating Revenue, Canada versus U.S.1984:Q1 to 1989:Q4 1990:Q1 to 2001:Q3Canadian Banks Average Varian e Contribution Average Varian e ContributionShare to Varian e Share to Varian eNet Operating Revenue 16.6 27.4Net Interest In ome 0.74 19.5 10.7 0.60 10.0 3.6Noninterest In ome 0.26 28.9 2.0 0.40 101.7 16.3Covarian e 9.3 3.6 2.8 1.3Correlation 0.39 0.09U.S banksNet Operating Revenue 50.4 46.2Net Interest In ome 0.72 100.2 51.9 0.63 14.2 5.7Noninterest In ome 0.28 228.9 18.2 0.37 259.1 35.8Covarian e -29.0 -11.7 5.6 2.6Correlation -0.19 0.09Note: The bottom panel is taken from Stiroh (2004).where � = NONIN=(NI + NONIN) is the share of noninterest in ome in banks' net operatingrevenue, (1 � �) is the share of net interest in ome, and the growth rate of ea h variable is sim-ply its log total di�erential. The ontribution of noninterest in ome is then aptured by the term�2�2d ln(NONIN). The intuition behind this equation is straightforward. The overall varian e of theendogenous variable will in rease with the growth of noninterest in ome share and volatility if non-interest in ome is more volatile than net interest in ome. Furthermore, if the ovarian e between thetwo explanatory variables (the growth rate volatilities of noninterest in ome and net interest in ome)is positive then this dire tly in reases further the varian e of bank revenue growth. However, as longas the ovarian e is not one, the trade-o� between net operating revenue growth and volatility animprove be ause the standard deviation of the volatility of net operating revenue growth rate is lessthan the weighted average of the two exogenous variables.Table 3 shows results for the omponents of equation (2) for the periods 1984:1 to 1989:4 and10
1990:1 to 2001:3. We take the same periods as Stiroh and Rumble (2005) to enable a dire t om-parison with the U.S. experien e. For ea h period, the �rst sub olumns display �, the average ofthe shares of noninterest in ome over the periods, and 1 � � (for net interest in ome). The se ondsub olumns provide the varian es, ovarian e and orrelation, while the third sub olumns give theshare-weighted varian es {i.e. the ontribution to the overall varian e of net operating revenue.Table 3 provides a omparison between the estimates of the two ountries. In the U.S., bank revenuehas be ome less volatile as the varian e of net operating revenue growth fell from 50.4 to 46.2, but thedi�eren e is not signi� ant. Contrary to the �nding in the U.S., the varian e of net operating revenuea tually in reased in Canada, from 16.6 for 1984:1-1989:4 to 27.4 for 1990:1-2001:3. This in rease omes essentially from an in rease in the varian e of noninterest in ome, an in rease substantiallylarger than the one observed in the U.S. Indeed, for Canada, the volatility of noninterest in omegrowth rate went from 28.9 in the �rst period to 101.7 in the se ond period, whereas in the U.S. itin reased from 228.9 to 259.1 only5.Another dimension along whi h the Canadian experien e is di�erent omes from the growth in �.In Canada, the noninterest in ome omponent is more volatile than its U.S. ounterpart and growingmore in relative size. The di�eren e however is not very large on average. In Canada, the sharein reased from 26% to 40%, whereas it in reased from 28% to 37% in the U.S. Hen e, the fa t thatnet operating revenue is more volatile in Canada omes mainly from the fa t that the noninterestin ome omponent is more volatile than in the U.S., and, to a minor extent, it also omes from thefa t that the rise in noninterest in ome share has been slightly more pronoun ed than in the U.S.Regardless of the ountry onsidered, the in reased volatility in noninterest in ome leads to agreater ontribution of this omponent to the overall varian e of net operating in ome growth (from18.2 to 35.8, and 2.0 to 16.3 in the U.S. and Canada, respe tively). Should the volatility in netinterest in ome have been in reasing instead of de reasing, the net operating in ome would havebeen even more volatile. In the U.S., this volatility ame down from 100.2 to 14.2. By ontrast, inCanada, it de reased from 19.5 to 10.0 only. In other words, if Canada has experien ed a relativein rease in bank revenue volatility, it is both be ause noninterest in ome has ontributed more to thisvolatility, but also be ause the de rease in net interest in ome volatility has been far less pronoun edthan in the U.S.5Stiroh (2004) �nds this di�eren e to be not statisti ally signi� ant.11
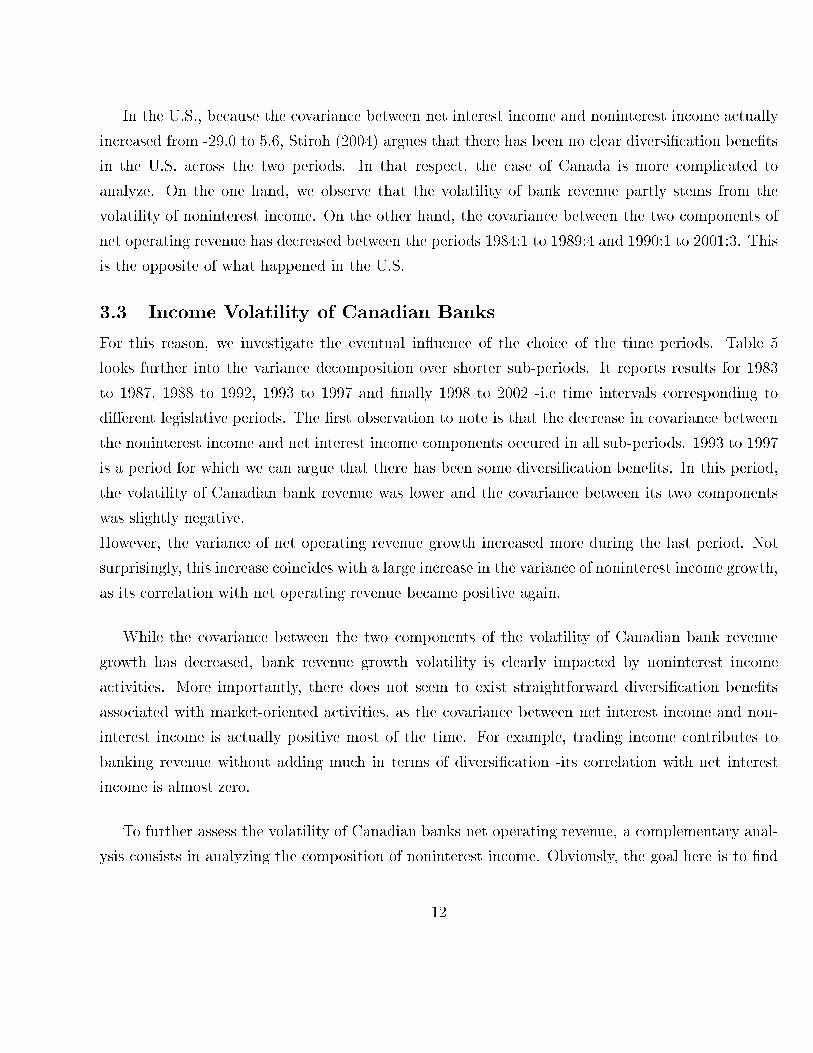
In the U.S., be ause the ovarian e between net interest in ome and noninterest in ome a tuallyin reased from -29.0 to 5.6, Stiroh (2004) argues that there has been no lear diversi� ation bene�tsin the U.S. a ross the two periods. In that respe t, the ase of Canada is more ompli ated toanalyze. On the one hand, we observe that the volatility of bank revenue partly stems from thevolatility of noninterest in ome. On the other hand, the ovarian e between the two omponents ofnet operating revenue has de reased between the periods 1984:1 to 1989:4 and 1990:1 to 2001:3. Thisis the opposite of what happened in the U.S.3.3 In ome Volatility of Canadian BanksFor this reason, we investigate the eventual in uen e of the hoi e of the time periods. Table 5looks further into the varian e de omposition over shorter sub-periods. It reports results for 1983to 1987, 1988 to 1992, 1993 to 1997 and �nally 1998 to 2002 -i.e time intervals orresponding todi�erent legislative periods. The �rst observation to note is that the de rease in ovarian e betweenthe noninterest in ome and net interest in ome omponents o ured in all sub-periods. 1993 to 1997is a period for whi h we an argue that there has been some diversi� ation bene�ts. In this period,the volatility of Canadian bank revenue was lower and the ovarian e between its two omponentswas slightly negative.However, the varian e of net operating revenue growth in reased more during the last period. Notsurprisingly, this in rease oin ides with a large in rease in the varian e of noninterest in ome growth,as its orrelation with net operating revenue be ame positive again.While the ovarian e between the two omponents of the volatility of Canadian bank revenuegrowth has de reased, bank revenue growth volatility is learly impa ted by noninterest in omea tivities. More importantly, there does not seem to exist straightforward diversi� ation bene�tsasso iated with market-oriented a tivities, as the ovarian e between net interest in ome and non-interest in ome is a tually positive most of the time. For example, trading in ome ontributes tobanking revenue without adding mu h in terms of diversi� ation -its orrelation with net interestin ome is almost zero.To further assess the volatility of Canadian banks net operating revenue, a omplementary anal-ysis onsists in analyzing the omposition of noninterest in ome. Obviously, the goal here is to �nd12
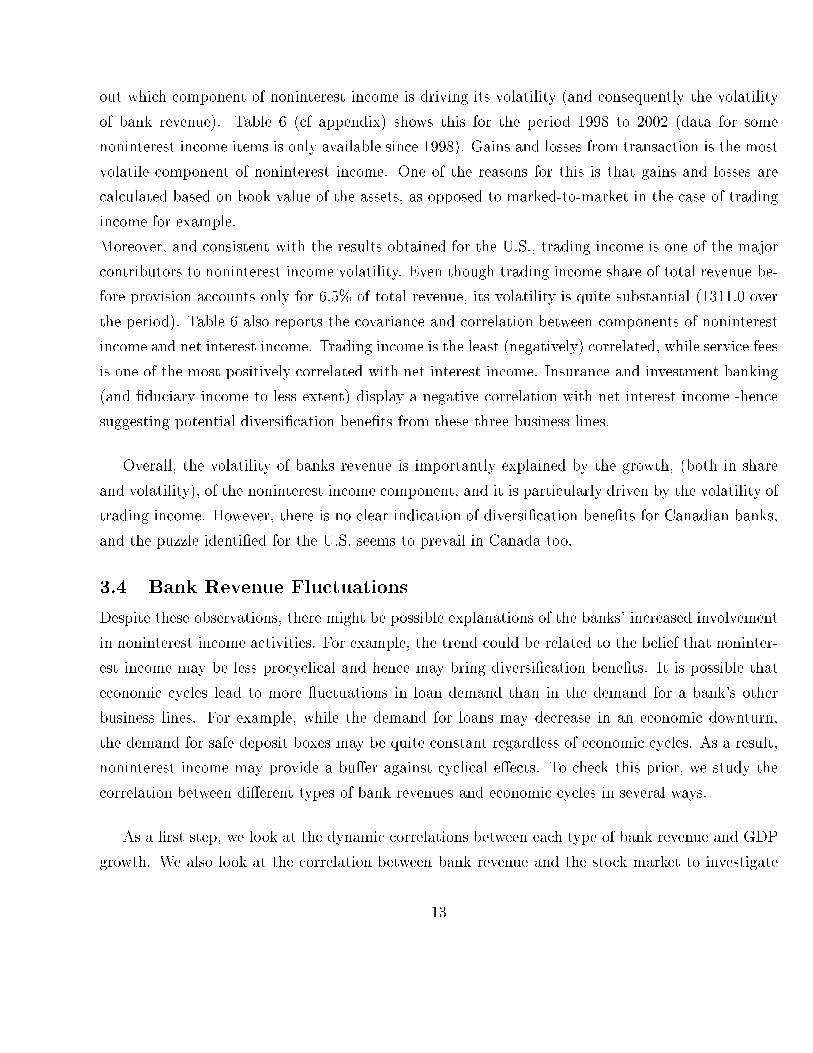
out whi h omponent of noninterest in ome is driving its volatility (and onsequently the volatilityof bank revenue). Table 6 ( f appendix) shows this for the period 1998 to 2002 (data for somenoninterest in ome items is only available sin e 1998). Gains and losses from transa tion is the mostvolatile omponent of noninterest in ome. One of the reasons for this is that gains and losses are al ulated based on book value of the assets, as opposed to marked-to-market in the ase of tradingin ome for example.Moreover, and onsistent with the results obtained for the U.S., trading in ome is one of the major ontributors to noninterest in ome volatility. Even though trading in ome share of total revenue be-fore provision a ounts only for 6.5% of total revenue, its volatility is quite substantial (1311.0 overthe period). Table 6 also reports the ovarian e and orrelation between omponents of noninterestin ome and net interest in ome. Trading in ome is the least (negatively) orrelated, while servi e feesis one of the most positively orrelated with net interest in ome. Insuran e and investment banking(and �du iary in ome to less extent) display a negative orrelation with net interest in ome -hen esuggesting potential diversi� ation bene�ts from these three business lines.Overall, the volatility of banks revenue is importantly explained by the growth, (both in shareand volatility), of the noninterest in ome omponent, and it is parti ularly driven by the volatility oftrading in ome. However, there is no lear indi ation of diversi� ation bene�ts for Canadian banks,and the puzzle identi�ed for the U.S. seems to prevail in Canada too.3.4 Bank Revenue Flu tuationsDespite these observations, there might be possible explanations of the banks' in reased involvementin noninterest in ome a tivities. For example, the trend ould be related to the belief that noninter-est in ome may be less pro y li al and hen e may bring diversi� ation bene�ts. It is possible thate onomi y les lead to more u tuations in loan demand than in the demand for a bank's otherbusiness lines. For example, while the demand for loans may de rease in an e onomi downturn,the demand for safe deposit boxes may be quite onstant regardless of e onomi y les. As a result,noninterest in ome may provide a bu�er against y li al e�e ts. To he k this prior, we study the orrelation between di�erent types of bank revenues and e onomi y les in several ways.As a �rst step, we look at the dynami orrelations between ea h type of bank revenue and GDPgrowth. We also look at the orrelation between bank revenue and the sto k market to investigate13
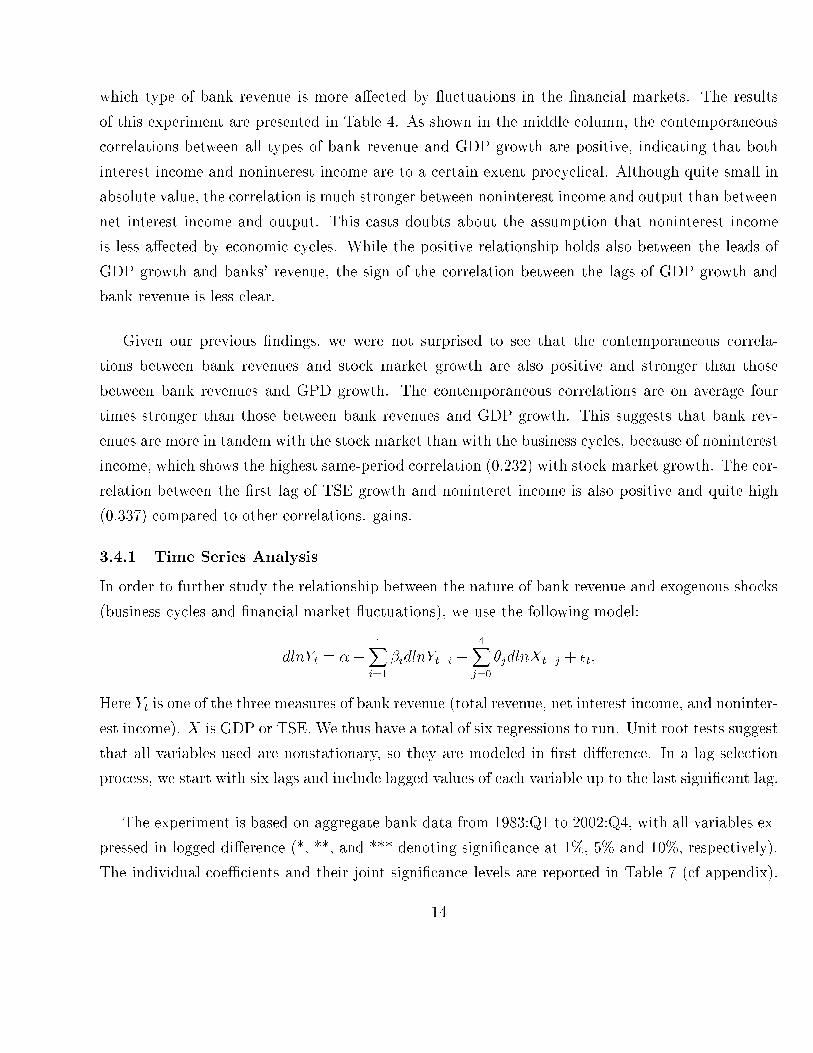
whi h type of bank revenue is more a�e ted by u tuations in the �nan ial markets. The resultsof this experiment are presented in Table 4. As shown in the middle olumn, the ontemporaneous orrelations between all types of bank revenue and GDP growth are positive, indi ating that bothinterest in ome and noninterest in ome are to a ertain extent pro y li al. Although quite small inabsolute value, the orrelation is mu h stronger between noninterest in ome and output than betweennet interest in ome and output. This asts doubts about the assumption that noninterest in omeis less a�e ted by e onomi y les. While the positive relationship holds also between the leads ofGDP growth and banks' revenue, the sign of the orrelation between the lags of GDP growth andbank revenue is less lear.Given our previous �ndings, we were not surprised to see that the ontemporaneous orrela-tions between bank revenues and sto k market growth are also positive and stronger than thosebetween bank revenues and GPD growth. The ontemporaneous orrelations are on average fourtimes stronger than those between bank revenues and GDP growth. This suggests that bank rev-enues are more in tandem with the sto k market than with the business y les, be ause of noninterestin ome, whi h shows the highest same-period orrelation (0.232) with sto k market growth. The or-relation between the �rst lag of TSE growth and noninteret in ome is also positive and quite high(0.337) ompared to other orrelations. gains.3.4.1 Time Series AnalysisIn order to further study the relationship between the nature of bank revenue and exogenous sho ks(business y les and �nan ial market u tuations), we use the following model:dlnYt = �+ 4Xi=1 �idlnYt�i + 4Xj=0 �jdlnXt�j + �t;Here Yt is one of the three measures of bank revenue (total revenue, net interest in ome, and noninter-est in ome). X is GDP or TSE. We thus have a total of six regressions to run. Unit root tests suggestthat all variables used are nonstationary, so they are modeled in �rst di�eren e. In a lag sele tionpro ess, we start with six lags and in lude lagged values of ea h variable up to the last signi� ant lag.The experiment is based on aggregate bank data from 1983:Q1 to 2002:Q4, with all variables ex-pressed in logged di�eren e (*, **, and *** denoting signi� an e at 1%, 5% and 10%, respe tively).The individual oeÆ ients and their joint signi� an e levels are reported in Table 7 ( f appendix).14
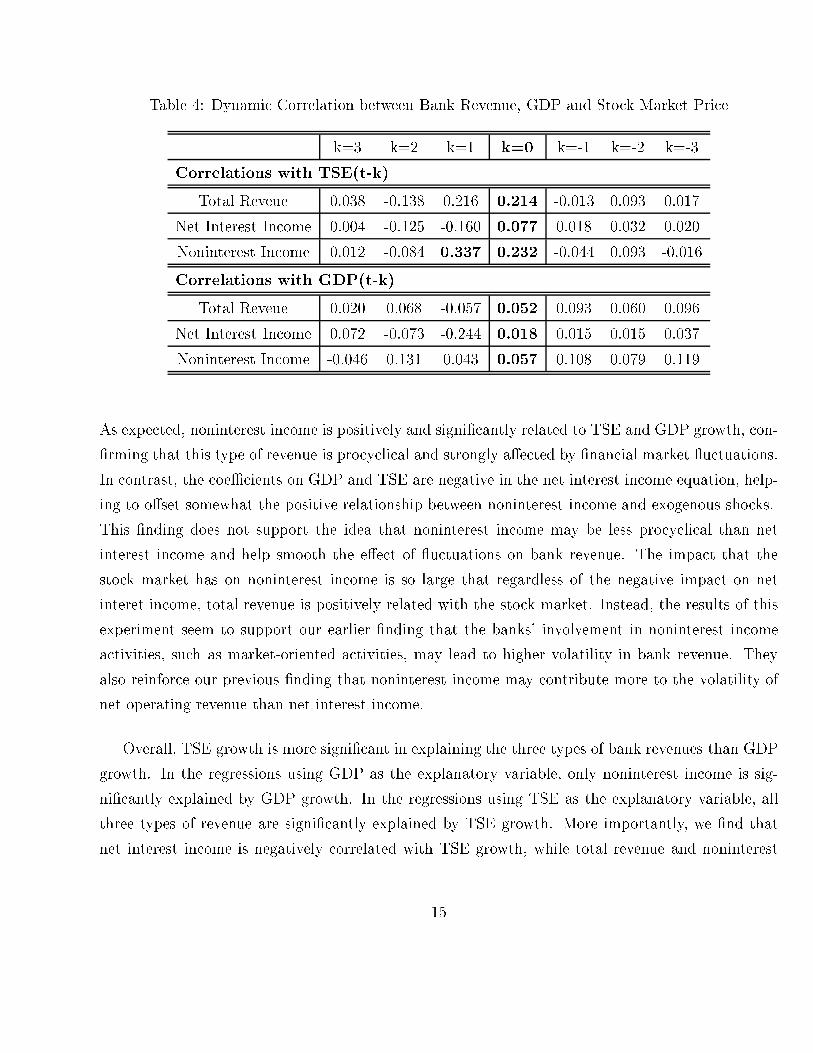
Table 4: Dynami Correlation between Bank Revenue, GDP and Sto k Market Pri ek=3 k=2 k=1 k=0 k=-1 k=-2 k=-3Correlations with TSE(t-k)Total Reveue 0.038 -0.138 0.216 0.214 -0.013 0.093 0.017Net Interest In ome 0.004 -0.125 -0.160 0.077 0.018 0.032 0.020Noninterest In ome 0.012 -0.084 0.337 0.232 -0.044 0.093 -0.016Correlations with GDP(t-k)Total Reveue 0.020 0.068 -0.057 0.052 0.093 0.060 0.096Net Interest In ome 0.072 -0.073 -0.244 0.018 0.015 0.015 0.037Noninterest In ome -0.046 0.131 0.043 0.057 0.108 0.079 0.119As expe ted, noninterest in ome is positively and signi� antly related to TSE and GDP growth, on-�rming that this type of revenue is pro y li al and strongly a�e ted by �nan ial market u tuations.In ontrast, the oeÆ ients on GDP and TSE are negative in the net interest in ome equation, help-ing to o�set somewhat the positive relationship between noninterest in ome and exogenous sho ks.This �nding does not support the idea that noninterest in ome may be less pro y li al than netinterest in ome and help smooth the e�e t of u tuations on bank revenue. The impa t that thesto k market has on noninterest in ome is so large that regardless of the negative impa t on netinteret in ome, total revenue is positively related with the sto k market. Instead, the results of thisexperiment seem to support our earlier �nding that the banks' involvement in noninterest in omea tivities, su h as market-oriented a tivities, may lead to higher volatility in bank revenue. Theyalso reinfor e our previous �nding that noninterest in ome may ontribute more to the volatility ofnet operating revenue than net interest in ome.Overall, TSE growth is more signi� ant in explaining the three types of bank revenues than GDPgrowth. In the regressions using GDP as the explanatory variable, only noninterest in ome is sig-ni� antly explained by GDP growth. In the regressions using TSE as the explanatory variable, allthree types of revenue are signi� antly explained by TSE growth. More importantly, we �nd thatnet interest in ome is negatively orrelated with TSE growth, while total revenue and noninterest15
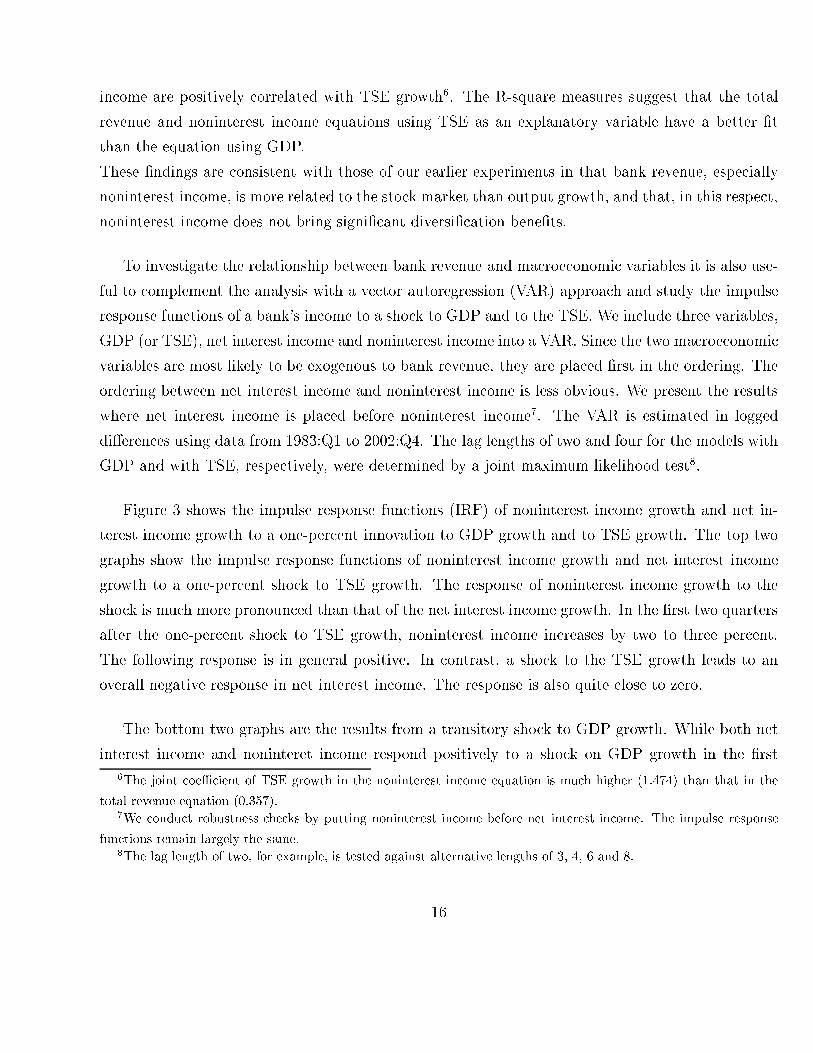
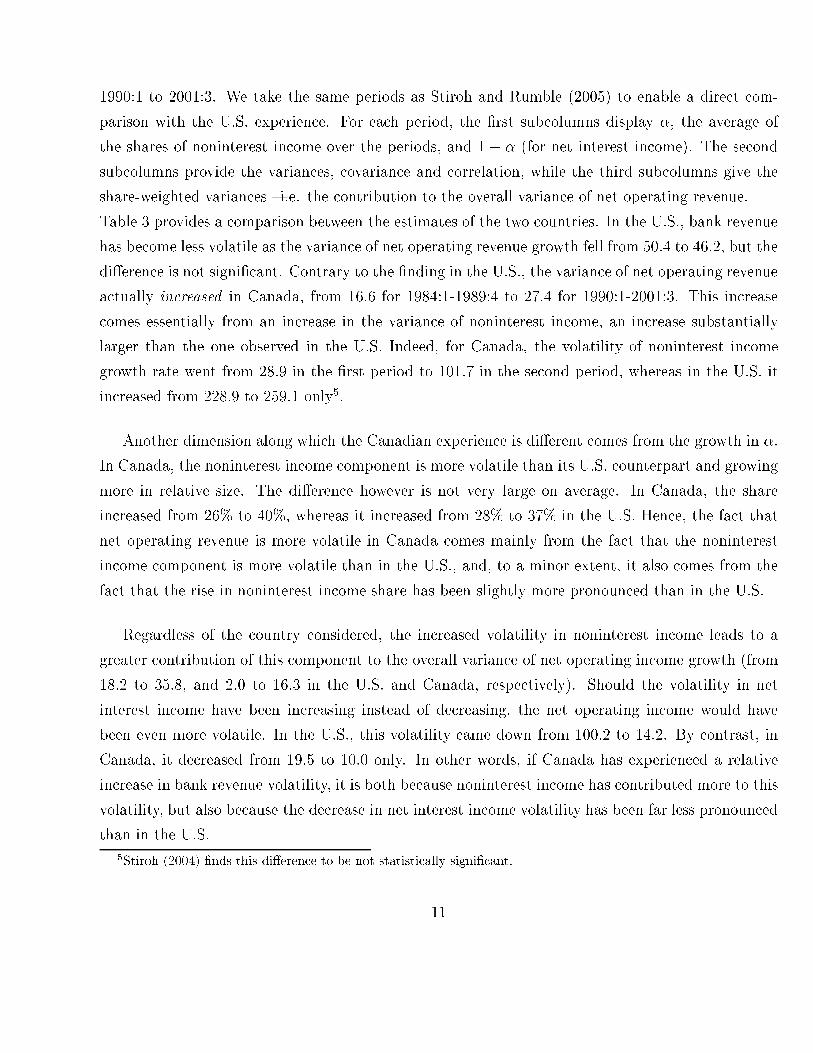
in ome are positively orrelated with TSE growth6. The R-square measures suggest that the totalrevenue and noninterest in ome equations using TSE as an explanatory variable have a better �tthan the equation using GDP.These �ndings are onsistent with those of our earlier experiments in that bank revenue, espe iallynoninterest in ome, is more related to the sto k market than output growth, and that, in this respe t,noninterest in ome does not bring signi� ant diversi� ation bene�ts.To investigate the relationship between bank revenue and ma roe onomi variables it is also use-ful to omplement the analysis with a ve tor autoregression (VAR) approa h and study the impulseresponse fun tions of a bank's in ome to a sho k to GDP and to the TSE. We in lude three variables,GDP (or TSE), net interest in ome and noninterest in ome into a VAR. Sin e the two ma roe onomi variables are most likely to be exogenous to bank revenue, they are pla ed �rst in the ordering. Theordering between net interest in ome and noninterest in ome is less obvious. We present the resultswhere net interest in ome is pla ed before noninterest in ome7. The VAR is estimated in loggeddi�eren es using data from 1983:Q1 to 2002:Q4. The lag lengths of two and four for the models withGDP and with TSE, respe tively, were determined by a joint maximum likelihood test8.Figure 3 shows the impulse response fun tions (IRF) of noninterest in ome growth and net in-terest in ome growth to a one-per ent innovation to GDP growth and to TSE growth. The top twographs show the impulse response fun tions of noninterest in ome growth and net interest in omegrowth to a one-per ent sho k to TSE growth. The response of noninterest in ome growth to thesho k is mu h more pronoun ed than that of the net interest in ome growth. In the �rst two quartersafter the one-per ent sho k to TSE growth, noninterest in ome in reases by two to three per ent.The following response is in general positive. In ontrast, a sho k to the TSE growth leads to anoverall negative response in net interest in ome. The response is also quite lose to zero.The bottom two graphs are the results from a transitory sho k to GDP growth. While both netinterest in ome and noninteret in ome respond positively to a sho k on GDP growth in the �rst6The joint oeÆ ient of TSE growth in the noninterest in ome equation is mu h higher (1.474) than that in thetotal revenue equation (0.357).7We ondu t robustness he ks by putting noninterest in ome before net interest in ome. The impulse responsefun tions remain largely the same.8The lag length of two, for example, is tested against alternative lengths of 3, 4, 6 and 8.16
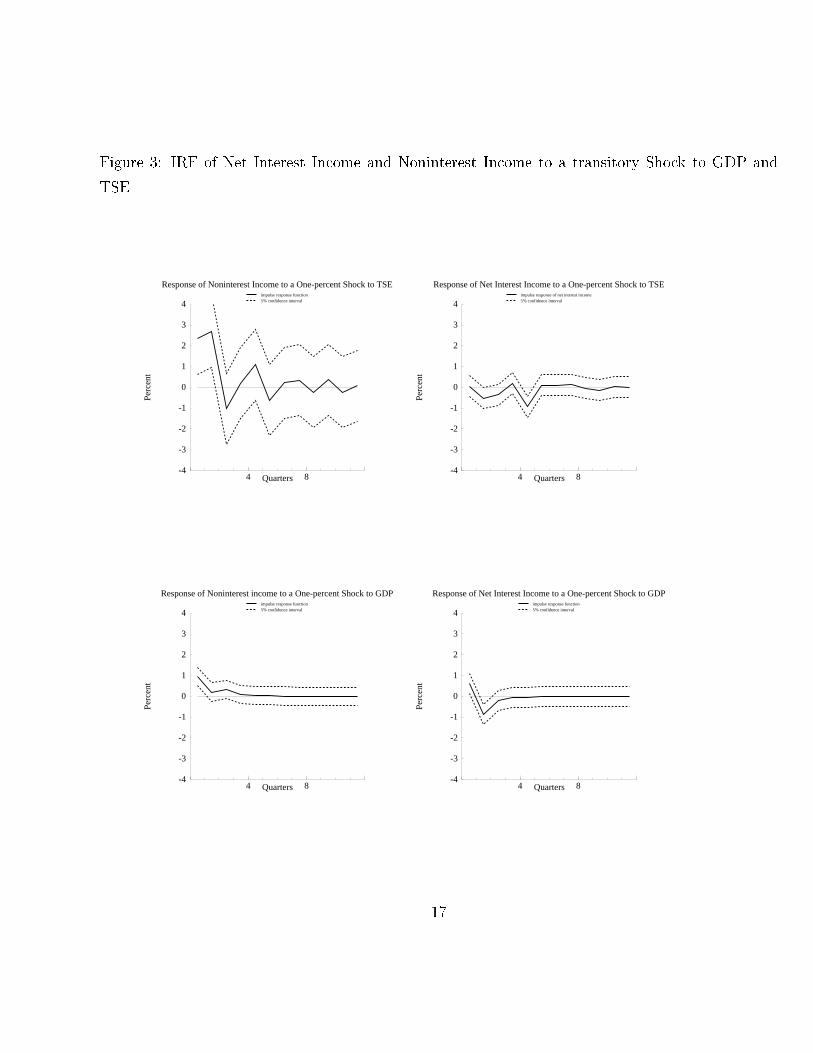
Figure 3: IRF of Net Interest In ome and Noninterest In ome to a transitory Sho k to GDP andTSE
-4
-3
-2
-1
0
1
2
3
4
4 8
impulse response function5% confidence interval
Response of Noninterest Income to a One-percent Shock to TSE
Perc
ent
Quarters-4
-3
-2
-1
0
1
2
3
4
4 8
impulse response of net interest income5% confidence interval
Response of Net Interest Income to a One-percent Shock to TSE
Perc
ent
Quarters
-4
-3
-2
-1
0
1
2
3
4
4 8
impulse response function5% confidence interval
Response of Noninterest income to a One-percent Shock to GDP
Perc
ent
Quarters-4
-3
-2
-1
0
1
2
3
4
4 8
impulse response function5% confidence interval
Response of Net Interest Income to a One-percent Shock to GDP
Perc
ent
Quarters
17
quarter, the response of noninterest in ome is more pronoun ed. The positive response of noninteretin ome is also more persistent than that of net interet in ome. In fa t, the latter be omes negativein the se ond quarter, while the former remains positive throughout. This supports our view thatnoninterest in ome is more pro y li al than net interest in ome.Even if the IRF are only signi� ant in the two �rst quarters9, these �ndings are quite onsistentwith our results using the single-equation analysis: noninterest in ome is strongly and positively orrelated with sto k market a tivities, while net interest in ome is slightly negatively orrelatedwith the growth in TSE. Consistent with the results from the dynami orrelation exer ise and thesingle-equation regressions, the responses to a sho k to the TSE growth are more pronoun ed thanthose to a sho k to GDP growth. This is true even in the ase of net interest in ome. This seems tosupport the view that market a tivities play a more important role in determining both sour es ofbank revenue than real e onomi a tivities.To di uss time series results omparable to Stiroh (2004), we present the on�den e intervalsbased on the varian e of the impulse response fun tions. A ording to these on�den e intervals, atimpa t, both sour es of in ome respond more signi� antly to a sho k on GDP than those in Stiroh(2004), whi h did not �nd either of the responses to be statisti ally signi� ant10.We also ondu t a robust test applying Stiroh's spe i� ation. When ondu ting Monte Carlo exper-iments to generate the on�den e intervals, none of the responses were found statisti ally signi� ant;yet, we an state that overall, the time series eviden e tends to go in the same dire tion as Stiroh(2004) �ndings.3.5 Noninterest In ome Share and Bank Pro�tabilityEven if noninterest in ome a tivities do not bring lear diversi� ation bene�ts, they an still bring ahigher average return to the bank's apital or asset. Therefore, a natural question to ask is whetherengaging in su h non-traditional a tivities an at least yield a higher risk-adjusted pro�t. This se tioninvestigates this eÆ ien y issue. We onsider four measures of bank pro�tability: return on equity(ROE), risk-adjusted ROE, return on asset (ROA), and risk-adjusted ROA, where,9Note also that th responses often return to zero before the fourth quarter.10The author did not look at a sho k to the sto k market. He uses a VAR with the logged levels of the data and atime trend and in ludes four lags in the model. 18
risk � adjustedROE = ROE�ROEand risk � adjustedROA = ROA�ROA�ROE (�ROA respe tively) is the four quarter moving standard deviation of ROE (ROA) and isused as a measure of risk. We regress one of these four measures on its own lags, ontemporaneousand lagged values of the share of noninterest in ome in total revenue, and a set of ontrol variablesas follows: Yt = � + mXi=1 �iYt�i + nXj=1 �jsnonint�j + pXk=1 kZkt + �t;where Y is one of the four measures of bank pro�tability; snonin is the share of noninterestin ome in a bank's net operating revenue, and Z is a ve tor of ontrol variables in luding the equtiyover asset ratio, log of asset, growth of asset and the ratio of loan loss provisions to total asset. A onstant is also in luded to apture s aling e�e t in the dependent variable. The lag length of ea hvariable is hosen using a sele tion riterion in whi h lags up to the last signi� ant one are kept.The model is run using data from 1983:Q1 to 2002:Q4 for the aggregate of the eight publi ly tradedCanadian banks. All data are stationary, so they are modeled in levels.The results of the regressions are presented in Table 8 ( f appendix). Control variables areeliminated whenever they are insigni� ant. Not surprisingly, the only one left is the ratio of loan lossprovisions to total asset. Consistent with expe tations that loan loss provisions lower pro�ts, theratio of loan loss provisions to total asset is negative in all equations. As reported in the table, thesum of oeÆ ients of noninterest in ome share in all four spe i� ations is negative and statisti allysigni� ant. This suggests that an in rease in noninterest in ome share signi� antly de reases thepro�tability of a bank. This holds when pro�tablility is measured as the level of ROE and ROA, andrisk-adjusted ROE and ROA. Even though the ontrol variable is not perfe tly orthogonal to snonin,these additional �ndings, again, tend to ast doubt on the notion that noninterest in ome a tivities an bring better bank performan e through diversi� ation bene�t (redu tion in risk) and/or higherreturns.19
4 Con lusionIn this paper, we report some stylized fa ts regarding the Canadian �nan ial stru ture. In parti u-lar, we establish that the regulatory hanges that allowed banks to operate non-traditional a tivities{e.g. OBS a tivities{ have onsequently hanged bank in ome volatility. The volatility of Cana-dian aggregate bank revenue growth seems to be in reasingly impa ted by noninterest in ome, bothbe ause of the in reased relian e on noninterest in ome and be ause of the in reased volatility ofthis omponent. Overall, the empiri al eviden e we gather tends to suggest that market-orienteda tivities, su h as trading servi es, do not bring any lear diversi� ation bene�ts to Canadian banks.As a matter of fa t, noninterest in ome seems to omove with both the business y le and �nan ialmarkets. Hen e, this Canadian study orroborates the U.S. �ndings of Stiroh (2004) and Stiroh andRumble (2005).Considering the fa ts we do ument, several resear h questions ome into mind. First, while weinvestigate the diversi� ation that �nan ial market a tivities onstitute, the question of optimalityis still somewhat opened to debate. To further address the question of eÆ ien y, it is possible, inprin iple, to exploit the asset equivalent series we built11, and then follow a methodology similar toClark and Siems (2002) for example.Another question would onsist in investigating whether the �nan ial trend we do ument an orrespond to a weakening of the redit hannel. Empiri al eviden e would tend to suggest that this hannel is rather weak in Canada, but it might have weakened further in re ent years |be ause ofthe relative de line in the borrowing business (Calm�es 2004). Indeed, if Canadian �rms are relativelymore in lined to rely on �nan ial markets than before, then the traditional e�e t of monetary poli y(operating through the ost of borrowing) might have lost some steam. It would be interesting to on�rm this intuition empiri ally.The third possible resear h avenue that omes into mind is related to the former, and morespe i� ally related to the debate regarding the role of entral banks in dampening in ation volatility.11This an be a hieved by relying on the Boyd and Gertler (1994) transformation. This transformation an be usednot only as a �nan ial indi ator, like in Boyd and Gertler (1994) or in the urrent study, but it an also be used forother purposes, like assessing x-eÆ ien y. Note however that our preliminary results point to a suboptimal behaviourof Canadian banks. 20
Clarida Gal�� and Gertler (1999), Ce hetti et al. (2004) and others suggest that better monetarypoli y has helped in dampening in ation volatility. However, in the U.S., around 50 per ent of thede rease in in ation volatility seem only attributable to \lu k" (Sto k and Watson 2002). Sin eCanadian �rms tend to rely in reasingly on �nan ial markets rather than loans, a question then iswhether the new trend in dampened in ation's volatility an be partly explained by the �nan ial hange we do ument.Relatedly, a ording to Lettau et al. (2004), the dampening of ma roe onomi risk has lowered theequity premium in the U.S. It is also likely that banks' level of trading in ome has de reased be auseof the onse utive hange in the onsumption-wealth ratio (i.e. onsumption risk). In an extension,we ould investigate whether the market-oriented a tivities an ontribute to the observed de reasein ma roe onomi un ertainty. We know for a fa t that banks do adjust their asset portfolios in a oordinate order when there is an in rease in systemi riskiness (Gar ��a and Calm�es 2005). One anwonder about a omplementary role noninterest in ome a tivities may play. These questions are leftfor future work.
21
Referen esBoyd, J. and M. Gertler. 1994. \Are Banks Dead? Or Are the Reports Greatly Exaggerated",Federal Reserve Bank of Minneapolis Quarterly Review, Summer 18 (3).Calm�es, C. and V. Dolar. 2002. \Trends in the Canadian Finan ial System", Bank of Canada FN-02-110.Calm�es, C. 2004. \Regulatory Changes and Finan ial Stru ture: the Case of Canada", Swiss Journalof E onomi s and Statisti s, 140(1), p. 1-35.Ce hetti, S.G., A. Flores-Lagunes and S. Krause. 2004. "Has Monetary Poli y Be ome More EÆ- ient? A Cross-Country Analysis", Ohio State University Working Paper.Clarida, R., J. Gal�� and M. Gertler. 1999. \The S ien e of Monetary Poli y: a New KeynesianPerspe tive", Journal of E onomi Literature, 37(4).Clark, J. and T. Siems. 2002. \X-EÆ ien y in Banking: Looking beyond the balan e sheet", Journalof Money, Credit, and Banking, 34(4).Dionne, G. and T. Har haoui. 2003. \Banks' Capital Se uritization and Credit Risk: an Empiri alEviden e for Canada", CIRP�EE Working Paper 03-11.D'Souza, C. and A. Lai. 2003. \Is Diversi� ation Good for Bank EÆ ien y", Bank of Canada.Gar ��a, A. and C. Calm�es. 2005. \Banks Lending and Ma roe onomi Un ertainty: the Case ofCanada", Pro eedings of the 2005 ASAC Conferen e, Ryerson University.Heuvel, S. 2002. \The Bank Capital Channel of Monetary Poli y", Wharton S hool Working Paper(University of Pennsylvania).Lettau, M. S. Ludvigson and J. Wa hter. 2004. \The De lining Equity Premium: What role DoesMa roe onomi Risk Play?", New-York University Working Paper.22
Rajan, R. and L. Zingales. 2003. \Banks and Markets: The Changing Chara ter of European Fi-nan e", NBER working paper 9595.Sto k, J. and M. Watson. 2002. \Has the Business Cy le Changed and why?" NBER working paper9127.Stiroh, K. 2004. \Diversi� ation in Banking: Is Noninterest In ome the Answer?", Jounal of Money,Credit, and Banking, 36(5).Stiroh, K. and A. Rumble. 2005. \The Darkside of Diversi� ation: the Case of U.S. Finan ial Hold-ing Companies", Journal of Banking and Finan e, forth oming.
23
AppendixFigure 4: Sour es of External Funds for Canadian Non-Finan ial BusinessesFigure 5: 4-Quarter Moving Varian e of the Growth Rate of Net Operating Revenue, NoninterestIn ome and Net Interest In omeTable 5: De omposition of the Varian e of Net Operating Revenue, Before Provision (CanadianBanks)Table 6: Relationship Between the Components of Noninterest In ome and Net Interest In omeTable 7: Bank In ome Growth versus Growth in GDP and Sto k Market Pri eTable 8: Bank Pro�tability versus Noninterest In ome Share
24
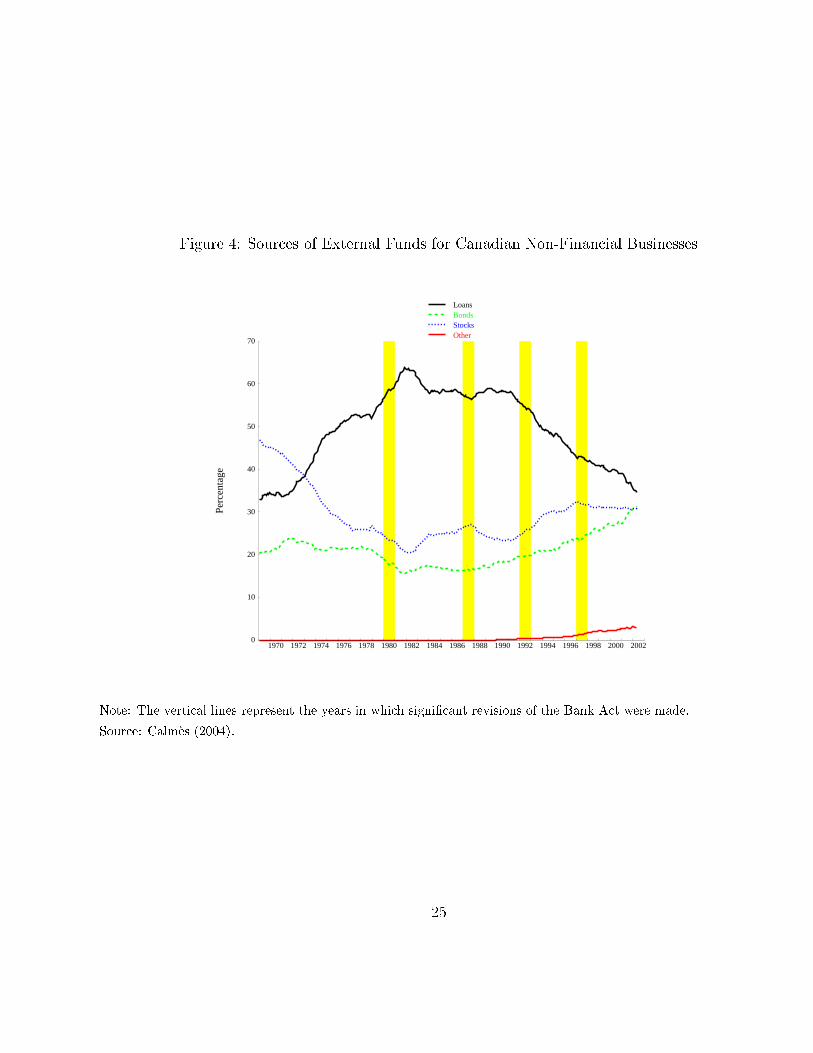
Figure 4: Sour es of External Funds for Canadian Non-Finan ial Businesses
1970 1972 1974 1976 1978 1980 1982 1984 1986 1988 1990 1992 1994 1996 1998 2000 20020
10
20
30
40
50
60
70
LoansBondsStocksOther
Perc
enta
ge
Note: The verti al lines represent the years in whi h signi� ant revisions of the Bank A t were made.Sour e: Calm�es (2004).25
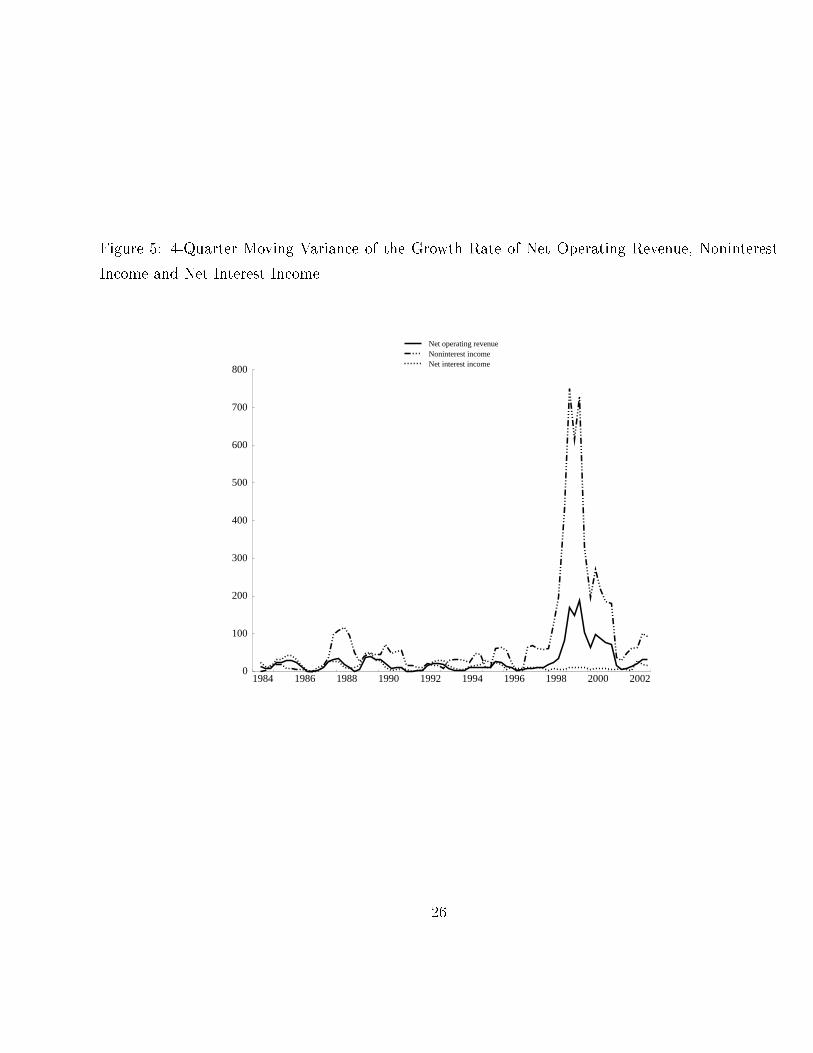
Figure 5: 4-Quarter Moving Varian e of the Growth Rate of Net Operating Revenue, NoninterestIn ome and Net Interest In ome
1984 1986 1988 1990 1992 1994 1996 1998 2000 20020
100
200
300
400
500
600
700
800
Net operating revenueNoninterest incomeNet interest income
26
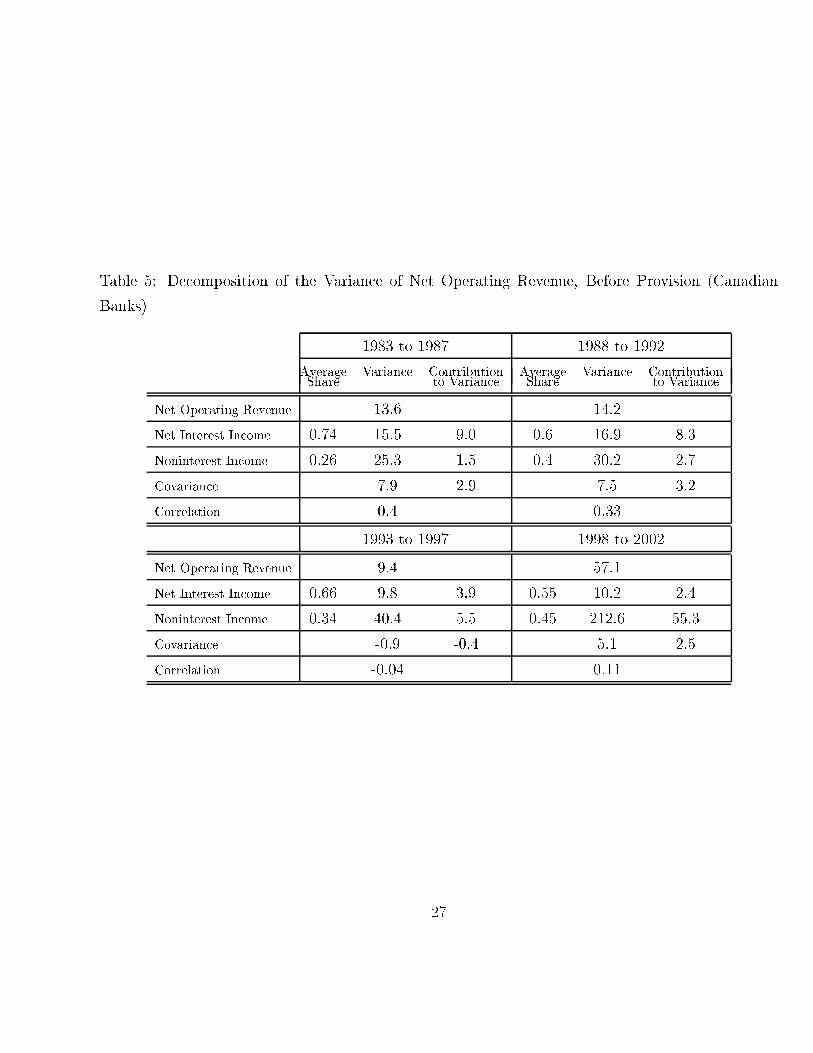
Table 5: De omposition of the Varian e of Net Operating Revenue, Before Provision (CanadianBanks) 1983 to 1987 1988 to 1992Average Varian e Contribution Average Varian e ContributionShare to Varian e Share to Varian eNet Operating Revenue 13.6 14.2Net Interest In ome 0.74 15.5 9.0 0.6 16.9 8.3Noninterest In ome 0.26 25.3 1.5 0.4 30.2 2.7Covarian e 7.9 2.9 7.5 3.2Correlation 0.4 0.331993 to 1997 1998 to 2002Net Operating Revenue 9.4 57.1Net Interest In ome 0.66 9.8 3.9 0.55 10.2 2.4Noninterest In ome 0.34 40.4 5.5 0.45 212.6 55.3Covarian e -0.9 -0.4 5.1 2.5Correlation -0.04 0.11
27
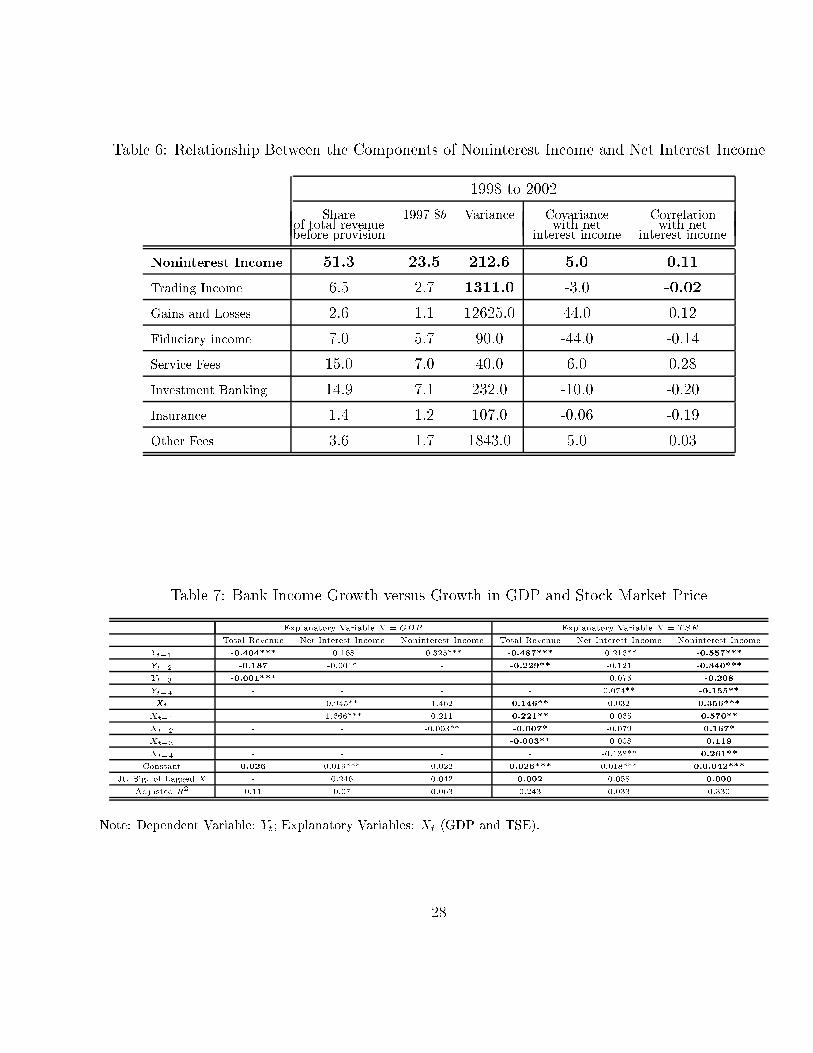
Table 6: Relationship Between the Components of Noninterest In ome and Net Interest In ome1998 to 2002Share 1997 $b Varian e Covarian e Correlationof total revenue with net with netbefore provision interest in ome interest in omeNoninterest In ome 51.3 23.5 212.6 5.0 0.11Trading In ome 6.5 2.7 1311.0 -3.0 -0.02Gains and Losses 2.6 1.1 12625.0 44.0 0.12Fidu iary in ome 7.0 5.7 90.0 -44.0 -0.14Servi e Fees 15.0 7.0 40.0 6.0 0.28Investment Banking 14.9 7.1 232.0 -10.0 -0.20Insuran e 1.4 1.2 107.0 -0.06 -0.19Other Fees 3.6 1.7 1843.0 5.0 0.03Table 7: Bank In ome Growth versus Growth in GDP and Sto k Market Pri eExplanatory Variable X = GDP Explanatory Variable X = TSETotal Revenue Net Interest In ome Noninterest In ome Total Revenue Net Interest In ome Noninterest In omeYt�1 -0.404*** -0.168 -0.325*** -0.487*** -0.216** -0.557***Yt�2 -0.187 -0.001* - -0.229** -0.121 -0.340***Yt�3 -0.001*** - - - -0.075 -0.208Yt�4 - - - - 0.074** -0.155**Xt - 0.945** 1.462 0.146** 0.032 0.356***Xt�1 - -1.666*** 0.211 0.221** -0.065 0.570**Xt�2 - - -0.003** -0.007* -0.079 0.167*Xt�3 - - - -0.003** -0.008 0.119Xt�4 - - - - -0.138** 0.261**Constant 0.026 0.019*** 0.022 0.026*** 0.018*** 0.0.042***Jt. Sig. of Lagged X - 0.246 0.042 0.002 0.058 0.000Adjusted R2 0.11 0.07 0.063 0.243 0.033 0.330Note: Dependent Variable: Yt; Explanatory Variables: Xt (GDP and TSE).
28
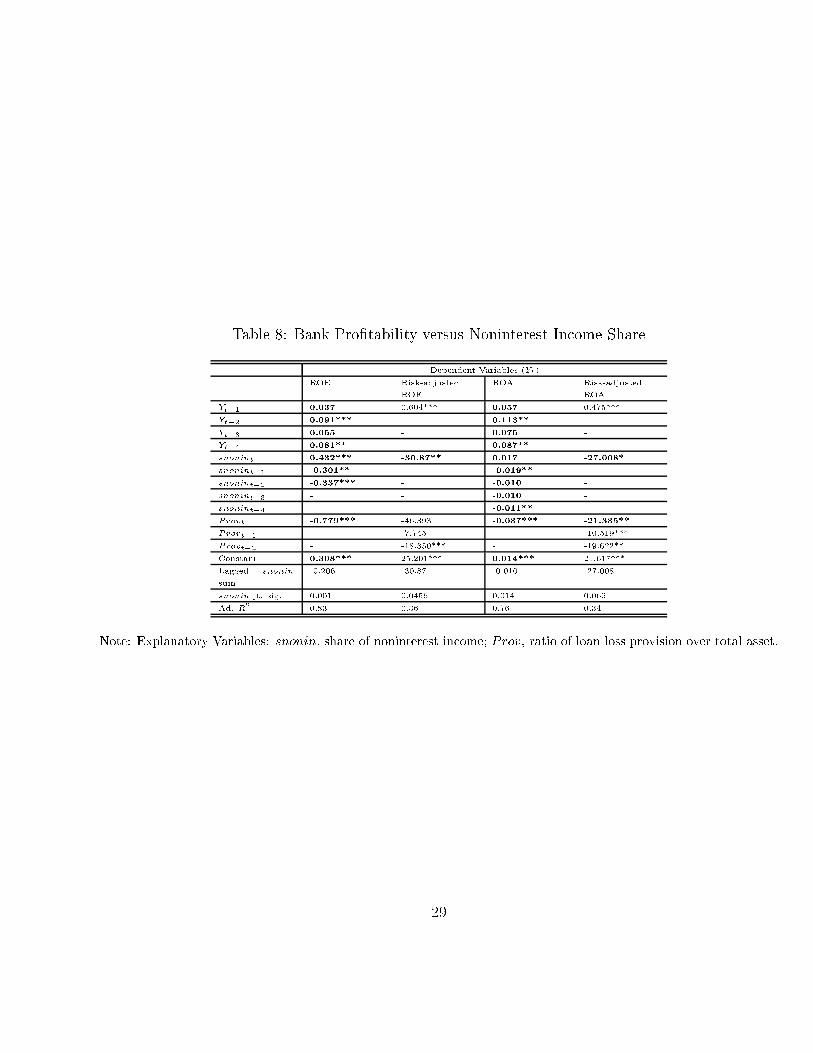
Table 8: Bank Pro�tability versus Noninterest In ome ShareDependent Variables (Yt)ROE Risk-adjustedROE ROA Risk-adjustedROAYt�1 0.037 0.604*** 0.057 0.475***Yt�2 0.091*** - 0.113** -Yt�3 0.055 - 0.075 -Yt�4 0.081** - 0.087** -snonint 0.432*** -30.87** 0.017 -27.008*snonint�1 -0.301** - -0.019** -snonint�2 -0.337*** - -0.010 -snonint�3 - - -0.010 -snonint�4 - - -0.011** -Provt -0.779*** -46.393 -0.037*** -21.335**Provt�1 - -7.745 - -10.519***Provt�2 - -18.350*** - -19.622**Constant 0.308*** 25.201*** 0.014*** 21.617***Lagged snoninsum -0.206 -30.87 -0.010 -27.008snonin jt. sig. 0.001 0.0456 0.014 0.069Ad. R2 0.83 0.36 0.76 0.34Note: Explanatory Variables: snonin, share of noninterest in ome; Prov, ratio of loan loss provision over total asset.
29


