Embed Size (px)
Citation preview
Financial StatementsYear ended November 30, 2010
The Annual Report of Carnival plc comprises the Carnival plc consolidated and company IFRS financialstatements contained herein, together with the Carnival Corporation & plc 2010 Annual Report (“DLCAnnual Report”) and certain parts of the Proxy Statement, dated February 17, 2011.
The Carnival plc consolidated IFRS financial statements, which are required to satisfy reportingrequirements of the Companies Act 2006, incorporate the results of Carnival plc and its subsidiaries and,accordingly, do not include the IFRS results of Carnival Corporation and its subsidiaries. However, theDirectors consider that within the Carnival Corporation and Carnival plc Dual Listed Company (“DLC”)arrangement the most appropriate presentation of Carnival plc’s results and financial position is byreference to the U.S. GAAP consolidated financial statements of Carnival Corporation & plc. Accordingly,the Carnival Corporation & plc U.S. GAAP consolidated financial statements that are included within theDLC Annual Report form part of the Carnival plc IFRS financial statements as additional disclosures.
In order to obtain a better understanding of the Carnival Corporation & plc business, financial condition andresults of operations, the Carnival plc stakeholders should read the items referenced below, in addition to theCarnival plc Financial Statements contained herein.
The locations where the Carnival plc Annual Report Documents and Other Information can be found are asfollows:
CARNIVAL PLC ANNUAL REPORT DOCUMENTS LOCATIONS PAGE NO.
2010 Carnival Corporation & plc U.S. GAAP Consolidated FinancialStatements . . . . . . . . . . . . . . . . . . . . . . . . . . . . . . . . . . . . . . . . . . . . . DLC Annual Report 5-33
Management Discussion & Analysis of Financial Condition andResults of Operations (“MD&A”), including Critical AccountingEstimates and Key Performance Indicators . . . . . . . . . . . . . . . . . . . DLC Annual Report 36-54
Chairman’s Letter to Shareholders . . . . . . . . . . . . . . . . . . . . . . . . . . . . DLC Annual Report 2-3Carnival plc Directors’ Report . . . . . . . . . . . . . . . . . . . . . . . . . . . . . . . Proxy Statement Annex ACarnival plc Directors’ Remuneration Report – Part I . . . . . . . . . . . . . Proxy Statement 55-72Carnival plc Directors’ Remuneration Report – Part II . . . . . . . . . . . . Proxy Statement Annex BCarnival plc Corporate Governance Report . . . . . . . . . . . . . . . . . . . . . Proxy Statement Annex C
OTHER INFORMATION
Selected Financial Data . . . . . . . . . . . . . . . . . . . . . . . . . . . . . . . . . . . . DLC Annual Report 55-56Market Price for Common Stock and Ordinary Shares . . . . . . . . . . . . DLC Annual Report 57Stock Performance Graphs . . . . . . . . . . . . . . . . . . . . . . . . . . . . . . . . . . DLC Annual Report 58-59Selected Quarterly Financial Data (Unaudited) . . . . . . . . . . . . . . . . . . DLC Annual Report 60Corporate and Other Information . . . . . . . . . . . . . . . . . . . . . . . . . . . . . DLC Annual Report Back Inside CoverCertain Relationships and Related Party Transactions . . . . . . . . . . . . . Proxy Statement 90-92Business-General . . . . . . . . . . . . . . . . . . . . . . . . . . . . . . . . . . . . . . . . . Form 10-K 3-4Mission, Primary Financial Goal and Related Strategies . . . . . . . . . . . Form 10-K 4Health, Environment, Safety and Security Policy . . . . . . . . . . . . . . . . Form 10-K 4Cruise Operations-Industry Background-Overview . . . . . . . . . . . . . . . Form 10-K 5-6Characteristics of the Cruise Industry . . . . . . . . . . . . . . . . . . . . . . . . . . Form 10-K 6-7Passengers, Capacity and Occupancy . . . . . . . . . . . . . . . . . . . . . . . . . . Form 10-K 7North America Cruise Brands . . . . . . . . . . . . . . . . . . . . . . . . . . . . . . . . Form 10-K 7-9Europe, Australia & Asia Cruise Brands . . . . . . . . . . . . . . . . . . . . . . . Form 10-K 9-13Ships Under Contract for Construction . . . . . . . . . . . . . . . . . . . . . . . . Form 10-K 14Cruise Port and Repair Facility Development and Operations . . . . . . . Form 10-K 14Cruise Pricing and Payment Terms, Onboard and Other Revenues,
Sales Relationships, Marketing Activities, Seasonality andCompetition . . . . . . . . . . . . . . . . . . . . . . . . . . . . . . . . . . . . . . . . . . . Form 10-K 15-17
Government Regulations . . . . . . . . . . . . . . . . . . . . . . . . . . . . . . . . . . . Form 10-K 17-22Employees, Suppliers, Insurance and Taxation . . . . . . . . . . . . . . . . . . Form 10-K 22-25Risk Factors . . . . . . . . . . . . . . . . . . . . . . . . . . . . . . . . . . . . . . . . . . . . . Form 10-K 25-32Properties, Executive Officers and Dividends . . . . . . . . . . . . . . . . . . . Form 10-K 33-35Repurchase Authorizations and Stock Swap Programs . . . . . . . . . . . . Form 10-K 35-36
The Notice of Annual Meetings and Proxy Statement, dated February 17, 2011 (“Proxy Statement”), CarnivalCorporation & plc joint Annual Report on Form 10-K (“Form 10-K”) and DLC Annual Report are not set forthwithin the Carnival plc IFRS Financial Statements, but are available for viewing at www.carnivalcorp.com orwww.carnivalplc.com. The Carnival plc IFRS Financial Statements will be available at the National StorageMechanism and will be included in the Annual Meeting materials available to the Carnival plc shareholders.
CARNIVAL PLCGROUP STATEMENTS OF INCOME
(in millions, except per share data)
Years Ended November 30,2010 2009
RevenuesCruise
Passenger tickets . . . . . . . . . . . . . . . . . . . . . . . . . . . . . . . . . . . . . . . . . . . . . . . . . . . . $ 5,087 $ 4,718Onboard and other . . . . . . . . . . . . . . . . . . . . . . . . . . . . . . . . . . . . . . . . . . . . . . . . . . . 1,078 953
Tour and other . . . . . . . . . . . . . . . . . . . . . . . . . . . . . . . . . . . . . . . . . . . . . . . . . . . . . . . . 308 313
6,473 5,984
Costs and ExpensesOperating
CruiseCommissions, transportation and other . . . . . . . . . . . . . . . . . . . . . . . . . . . . . . . . . 1,217 1,181Onboard and other . . . . . . . . . . . . . . . . . . . . . . . . . . . . . . . . . . . . . . . . . . . . . . . . . 197 188Payroll and related . . . . . . . . . . . . . . . . . . . . . . . . . . . . . . . . . . . . . . . . . . . . . . . . . 601 536Fuel . . . . . . . . . . . . . . . . . . . . . . . . . . . . . . . . . . . . . . . . . . . . . . . . . . . . . . . . . . . . 653 445Food . . . . . . . . . . . . . . . . . . . . . . . . . . . . . . . . . . . . . . . . . . . . . . . . . . . . . . . . . . . . 318 297Other ship operating . . . . . . . . . . . . . . . . . . . . . . . . . . . . . . . . . . . . . . . . . . . . . . . 955 871
Tour and other . . . . . . . . . . . . . . . . . . . . . . . . . . . . . . . . . . . . . . . . . . . . . . . . . . . . . . 255 277
Total . . . . . . . . . . . . . . . . . . . . . . . . . . . . . . . . . . . . . . . . . . . . . . . . . . . . . . . . . . . . . . 4,196 3,795Selling and administrative . . . . . . . . . . . . . . . . . . . . . . . . . . . . . . . . . . . . . . . . . . . . . . . 618 612Depreciation and amortisation . . . . . . . . . . . . . . . . . . . . . . . . . . . . . . . . . . . . . . . . . . . . 572 516Impairment loss . . . . . . . . . . . . . . . . . . . . . . . . . . . . . . . . . . . . . . . . . . . . . . . . . . . . . . . - 29
5,386 4,952
Operating Income . . . . . . . . . . . . . . . . . . . . . . . . . . . . . . . . . . . . . . . . . . . . . . . . . . . . . . 1,087 1,032
Nonoperating (Expense) IncomeInterest income . . . . . . . . . . . . . . . . . . . . . . . . . . . . . . . . . . . . . . . . . . . . . . . . . . . . . . . 6 8Interest expense, net of capitalised interest . . . . . . . . . . . . . . . . . . . . . . . . . . . . . . . . . . (167) (155)Other (expense) income, net . . . . . . . . . . . . . . . . . . . . . . . . . . . . . . . . . . . . . . . . . . . . . (6) 6
(167) (141)
Income Before Income Taxes . . . . . . . . . . . . . . . . . . . . . . . . . . . . . . . . . . . . . . . . . . . . . 920 891Income Tax Benefit (Expense), Net . . . . . . . . . . . . . . . . . . . . . . . . . . . . . . . . . . . . . . . . 18 (16)
Net Income . . . . . . . . . . . . . . . . . . . . . . . . . . . . . . . . . . . . . . . . . . . . . . . . . . . . . $ 938 $ 875
Earnings Per ShareBasic . . . . . . . . . . . . . . . . . . . . . . . . . . . . . . . . . . . . . . . . . . . . . . . . . . . . . . . . . . . . . . . $ 4.39 $ 4.10
Diluted . . . . . . . . . . . . . . . . . . . . . . . . . . . . . . . . . . . . . . . . . . . . . . . . . . . . . . . . . . . . . . $ 4.38 $ 4.10
The accompanying notes are an integral part of these financial statements. These financial statements onlypresent the Carnival plc consolidated IFRS financial statements and, accordingly, do not include the consolidatedIFRS results of Carnival Corporation. In accordance with Section 408 of the Companies Act 2006, the Companyhas not presented its own Statements of Income or Statements of Comprehensive Income.
Within the DLC arrangement the most appropriate presentation of Carnival plc’s results and financial positionis considered to be by reference to the U.S. GAAP consolidated financial statements of Carnival Corporation &plc, which are included within the DLC Annual Report (see note 1). For information, set out below is the U.S.GAAP consolidated earnings per share included within the Carnival Corporation & plc consolidated financialstatements for the years ended November 30:
2010 2009
DLC Basic earnings per share . . . . . . . . . . . . . . . . . . . . . . . . . . . . . . . . . . . . . . . . . . . . . . . . . . . . . . . . . $ 2.51 $ 2.27
DLC Diluted earnings per share . . . . . . . . . . . . . . . . . . . . . . . . . . . . . . . . . . . . . . . . . . . . . . . . . . . . . . . . $ 2.47 $ 2.24
1
CARNIVAL PLCGROUP STATEMENTS OF COMPREHENSIVE INCOME
(in millions)
Years Ended November 30,2010 2009
Net Income . . . . . . . . . . . . . . . . . . . . . . . . . . . . . . . . . . . . . . . . . . . . . . . . . . . . . . . $ 938 $ 875Items Included in Other Comprehensive (Loss) Income
Foreign currency translation adjustment . . . . . . . . . . . . . . . . . . . . . . . . . . . . . (917) 1,132Net gains (losses) on hedges of net investments in foreign operations . . . . . . 173 (136)Net (losses) gains on cash flow derivative hedges . . . . . . . . . . . . . . . . . . . . . . (15) 13Actuarial gains (losses) on post-employment benefit obligations . . . . . . . . . . 16 (59)
Net Other Comprehensive (Loss) Income . . . . . . . . . . . . . . . . . . . . . . . . . . . . . . (743) 950
Total Comprehensive Income . . . . . . . . . . . . . . . . . . . . . . . . . . . . . . . . . . . . . . . . $ 195 $ 1,825
The accompanying notes are an integral part of these financial statements. These financial statements onlypresent the Carnival plc consolidated IFRS financial statements and, accordingly, do not include the consolidatedIFRS results of Carnival Corporation.
Within the DLC arrangement the most appropriate presentation of Carnival plc’s results and financial positionis considered to be by reference to the U.S. GAAP consolidated financial statements of Carnival Corporation &plc, which are included within the DLC Annual Report (see note 1).
2
CARNIVAL PLCBALANCE SHEETS
(in millions)
Group CompanyNovember 30,
2010 2009 2010 2009
ASSETSCurrent Assets
Cash and cash equivalents . . . . . . . . . . . . . . . . . . . . . . . . . . . . . . . . . . . . $ 328 $ 431 $ 181 $ 275Trade and other receivables, net . . . . . . . . . . . . . . . . . . . . . . . . . . . . . . . 177 345 86 142Amounts owed by subsidiaries . . . . . . . . . . . . . . . . . . . . . . . . . . . . . . . . - - 56 57Inventories, net . . . . . . . . . . . . . . . . . . . . . . . . . . . . . . . . . . . . . . . . . . . . . 136 134 50 39Prepaid expenses and other . . . . . . . . . . . . . . . . . . . . . . . . . . . . . . . . . . . 82 198 21 45
Total current assets . . . . . . . . . . . . . . . . . . . . . . . . . . . . . . . . . . . . . . . 723 1,108 394 558
Property and Equipment, Net . . . . . . . . . . . . . . . . . . . . . . . . . . . . . . . . . . 13,278 12,405 4,468 3,440Intangibles . . . . . . . . . . . . . . . . . . . . . . . . . . . . . . . . . . . . . . . . . . . . . . . . . 874 990 171 181Other Assets . . . . . . . . . . . . . . . . . . . . . . . . . . . . . . . . . . . . . . . . . . . . . . . . 226 174 41 33Investments in Subsidiaries . . . . . . . . . . . . . . . . . . . . . . . . . . . . . . . . . . . . - - 5,366 5,681
$ 15,101 $ 14,677 $ 10,440 $ 9,893
LIABILITIES AND SHAREHOLDERS’ EQUITYCurrent Liabilities
Short-term borrowings . . . . . . . . . . . . . . . . . . . . . . . . . . . . . . . . . . . . . . . $ 400 $ 39 $ 355 $ -Current portion of long-term debt . . . . . . . . . . . . . . . . . . . . . . . . . . . . . . 174 288 127 187Amounts owed to the Carnival Corporation group . . . . . . . . . . . . . . . . . 1,442 1,459 374 317Amounts owed to subsidiaries . . . . . . . . . . . . . . . . . . . . . . . . . . . . . . . . . - - 2,289 2,374Accounts payable . . . . . . . . . . . . . . . . . . . . . . . . . . . . . . . . . . . . . . . . . . . 312 310 77 33Accrued liabilities and other . . . . . . . . . . . . . . . . . . . . . . . . . . . . . . . . . . 444 368 152 160Customer deposits . . . . . . . . . . . . . . . . . . . . . . . . . . . . . . . . . . . . . . . . . . 1,125 1,001 690 593
Total current liabilities . . . . . . . . . . . . . . . . . . . . . . . . . . . . . . . . . . . . . 3,897 3,465 4,064 3,664
Long-Term Debt . . . . . . . . . . . . . . . . . . . . . . . . . . . . . . . . . . . . . . . . . . . . 3,096 3,186 2,231 2,489Other Long-Term Liabilities . . . . . . . . . . . . . . . . . . . . . . . . . . . . . . . . . . 188 244 38 97
Shareholders’ Equity . . . . . . . . . . . . . . . . . . . . . . . . . . . . . . . . . . . . . . . . .Share capital . . . . . . . . . . . . . . . . . . . . . . . . . . . . . . . . . . . . . . . . . . . . . . . 355 354 355 354Share premium . . . . . . . . . . . . . . . . . . . . . . . . . . . . . . . . . . . . . . . . . . . . . 107 104 102 99Retained earnings . . . . . . . . . . . . . . . . . . . . . . . . . . . . . . . . . . . . . . . . . . . 6,637 5,744 3,699 3,106Other reserves . . . . . . . . . . . . . . . . . . . . . . . . . . . . . . . . . . . . . . . . . . . . . 821 1,580 (49) 84
Total shareholders’ equity . . . . . . . . . . . . . . . . . . . . . . . . . . . . . . . . . . 7,920 7,782 4,107 3,643
$ 15,101 $ 14,677 $ 10,440 $ 9,893
The accompanying notes are an integral part of these financial statements. These financial statements onlypresent the Carnival plc consolidated IFRS financial statements and, accordingly, do not include the consolidatedIFRS results of Carnival Corporation.
Approved by the Board of Directors on February 17, 2011 and signed on its behalf by
Micky ArisonChairman of the Board of Directors and Chief Executive Officer
Howard S. FrankVice Chairman of the Board of Directors and Chief Operating Officer
Within the DLC arrangement the most appropriate presentation of Carnival plc’s results and financial positionis considered to be by reference to the U.S. GAAP consolidated financial statements of Carnival Corporation &plc, which are included within the DLC Annual Report (see note 1).
3
CARNIVAL PLCSTATEMENTS OF CASH FLOWS
(in millions)
Group CompanyYears ended November 30,
2010 2009 2010 2009
OPERATING ACTIVITIESIncome before income taxes . . . . . . . . . . . . . . . . . . . . . . . . . . . . . . . . . . . . . . . . . . . . . $ 920 $ 891 $ 643 $ 216Adjustments to reconcile income before taxes to net cash provided by operating
activitiesDepreciation and amortisation . . . . . . . . . . . . . . . . . . . . . . . . . . . . . . . . . . . . . . . 572 516 173 156Impairment loss . . . . . . . . . . . . . . . . . . . . . . . . . . . . . . . . . . . . . . . . . . . . . . . . . . . - 29 - -Gains on disposal of property and equipment, net . . . . . . . . . . . . . . . . . . . . . . . . - (22) - (34)Share-based compensation . . . . . . . . . . . . . . . . . . . . . . . . . . . . . . . . . . . . . . . . . . 10 10 3 6Other . . . . . . . . . . . . . . . . . . . . . . . . . . . . . . . . . . . . . . . . . . . . . . . . . . . . . . . . . . . 5 2 4 8
1,507 1,426 823 352Changes in operating assets and liabilities
Receivables . . . . . . . . . . . . . . . . . . . . . . . . . . . . . . . . . . . . . . . . . . . . . . . . . . . . . . . . 129 17 2 63Inventories . . . . . . . . . . . . . . . . . . . . . . . . . . . . . . . . . . . . . . . . . . . . . . . . . . . . . . . . (15) (6) (13) 8Prepaid expenses and other . . . . . . . . . . . . . . . . . . . . . . . . . . . . . . . . . . . . . . . . . . . . (35) 27 10 (8)Accounts payable . . . . . . . . . . . . . . . . . . . . . . . . . . . . . . . . . . . . . . . . . . . . . . . . . . . 30 35 44 24Accrued and other liabilities . . . . . . . . . . . . . . . . . . . . . . . . . . . . . . . . . . . . . . . . . . . 159 173 62 22Customer deposits . . . . . . . . . . . . . . . . . . . . . . . . . . . . . . . . . . . . . . . . . . . . . . . . . . . 164 110 109 67
Cash provided by operations before interest and taxes . . . . . . . . . . . . . . . . . . . . . . . . . 1,939 1,782 1,037 528Interest received . . . . . . . . . . . . . . . . . . . . . . . . . . . . . . . . . . . . . . . . . . . . . . . . . . . . . . 5 8 2 6Interest paid . . . . . . . . . . . . . . . . . . . . . . . . . . . . . . . . . . . . . . . . . . . . . . . . . . . . . . . . . . (187) (159) (107) (117)Income taxes refunded (paid), net . . . . . . . . . . . . . . . . . . . . . . . . . . . . . . . . . . . . . . . . . 1 (16) 2 (4)
Net cash provided by operating activities . . . . . . . . . . . . . . . . . . . . . . . . . . . . . . . 1,758 1,615 934 413
INVESTING ACTIVITIESAdditions to property and equipment . . . . . . . . . . . . . . . . . . . . . . . . . . . . . . . . . . . . . . (2,463) (1,835) (1,313) (145)Other, net . . . . . . . . . . . . . . . . . . . . . . . . . . . . . . . . . . . . . . . . . . . . . . . . . . . . . . . . . . . 148 (64) 73 15
Net cash used in investing activities . . . . . . . . . . . . . . . . . . . . . . . . . . . . . . . . . . . (2,315) (1,899) (1,240) (130)
FINANCING ACTIVITIESChanges in loans with the Carnival Corporation group and Group companies . . . . . . 59 863 (129) (134)Proceeds from (repayments of) short-term borrowings, net . . . . . . . . . . . . . . . . . . . . . 382 (384) 355 -Principal repayments of revolvers . . . . . . . . . . . . . . . . . . . . . . . . . . . . . . . . . . . . . . . . (354) (939) (50) -Proceeds from revolvers . . . . . . . . . . . . . . . . . . . . . . . . . . . . . . . . . . . . . . . . . . . . . . . . 91 731 - 52Principal repayments of other long-term debt . . . . . . . . . . . . . . . . . . . . . . . . . . . . . . . (240) (640) (213) (640)Proceeds from issuance of other long-term debt . . . . . . . . . . . . . . . . . . . . . . . . . . . . . 557 521 305 244Dividends paid . . . . . . . . . . . . . . . . . . . . . . . . . . . . . . . . . . . . . . . . . . . . . . . . . . . . . . . (53) (64) (53) (64)Proceeds from settlement of foreign currency swaps . . . . . . . . . . . . . . . . . . . . . . . . . . - 113 - 113Other, net . . . . . . . . . . . . . . . . . . . . . . . . . . . . . . . . . . . . . . . . . . . . . . . . . . . . . . . . . . . 4 2 4 2
Net cash provided by (used in) financing activities . . . . . . . . . . . . . . . . . . . . . . . 446 203 219 (427)Effect of exchange rate changes on cash and cash equivalents . . . . . . . . . . . . . . . . . . 8 21 (7) 5
Net decrease in cash and cash equivalents . . . . . . . . . . . . . . . . . . . . . . . . . . . . . . (103) (60) (94) (139)Cash and cash equivalents at beginning of year . . . . . . . . . . . . . . . . . . . . . . . . . . . . . . 431 491 275 414
Cash and cash equivalents at end of year . . . . . . . . . . . . . . . . . . . . . . . . . . . . . . . . . . . $ 328 $ 431 $ 181 $ 275
The accompanying notes are an integral part of these financial statements. These financial statements onlypresent the Carnival plc consolidated IFRS financial statements and, accordingly, do not include the consolidatedIFRS results of Carnival Corporation.
Within the DLC arrangement the most appropriate presentation of Carnival plc’s results and financial positionis considered to be by reference to the U.S. GAAP consolidated financial statements of Carnival Corporation &plc, which are included within the DLC Annual Report (see note 1).
4
CARNIVAL PLCGROUP STATEMENTS OF CHANGES IN SHAREHOLDERS’ EQUITY
(in millions)
Sharecapital
Sharepremium
Retainedearnings
Other reserves Totalshareholders’
equityTranslation
reserveCash flow
hedgesMergerreserve Total
Balances atNovember 30, 2008 . . . . $ 354 $ 134 $ 4,919 $ (937) $ 5 $ 1,503 $ 571 $ 5,978
Net income . . . . . . . . . . . . . - - 875 - - - - 875Foreign currency
translation adjustment . . - - - 1,132 - - 1,132 1,132Net losses on hedges of net
investments in foreignoperations . . . . . . . . . . . . - - - (136) - - (136) (136)
Net gains on cash flowderivative hedges . . . . . . - - - - 13 - 13 13
Actuarial losses onpost-employment benefitobligations . . . . . . . . . . . - - (59) - - - - (59)
Other . . . . . . . . . . . . . . . . . . - (30) 9 - - - - (21)
Balances atNovember 30, 2009 . . . . 354 104 5,744 59 18 1,503 1,580 7,782
Net income . . . . . . . . . . . . . - - 938 - - - - 938Foreign currency
translation adjustment . . - - - (917) - - (917) (917)Net gains on hedges of net
investments in foreignoperations . . . . . . . . . . . . - - - 173 - - 173 173
Net losses on cash flowderivative hedges . . . . . . - - - - (15) - (15) (15)
Actuarial gains onpost-employment benefitobligations . . . . . . . . . . . - - 16 - - - - 16
Cash dividends declared . . . - - (71) - - - - (71)Other . . . . . . . . . . . . . . . . . . 1 3 10 - - - - 14
Balances atNovember 30, 2010 . . . . $ 355 $ 107 $ 6,637 $ (685) $ 3 $ 1,503 $ 821 $ 7,920
The accompanying notes are an integral part of these financial statements. These financial statements onlypresent the Carnival plc consolidated IFRS financial statements and, accordingly, do not include the consolidatedIFRS results of Carnival Corporation.
Within the DLC arrangement the most appropriate presentation of Carnival plc’s results and financial positionis considered to be by reference to the U.S. GAAP consolidated financial statements of Carnival Corporation &plc, which are included within the DLC Annual Report (see note 1).
5
CARNIVAL PLCCOMPANY STATEMENTS OF CHANGES IN SHAREHOLDERS’ EQUITY
(in millions)
Sharecapital
Sharepremium
Retainedearnings
Other reserves Totalshareholders’
equityTranslation
reserveCash flow
hedgesMergerreserve Total
Balances atNovember 30, 2008 . . . . $ 354 $ 96 $ 2,935 $ (189) $ 5 $ 36 $ (148) $ 3,237
Net income . . . . . . . . . . . . . - - 226 - - - - 226Foreign currency
translation adjustment . . - - - 355 - - 355 355Net losses on hedges of net
investments in foreignoperations . . . . . . . . . . . . - - - (136) - - (136) (136)
Net gains on cash flowderivative hedges . . . . . . - - - - 13 - 13 13
Actuarial losses onpost-employment benefitobligations . . . . . . . . . . . - - (59) - - - - (59)
Other . . . . . . . . . . . . . . . . . - 3 4 - - - - 7
Balances atNovember 30, 2009 . . . . 354 99 3,106 30 18 36 84 3,643
Net income . . . . . . . . . . . . . - - 644 - - - - 644Foreign currency
translation adjustment . . - - - (291) - - (291) (291)Net gains on hedges of net
investments in foreignoperations . . . . . . . . . . . . - - - 173 - - 173 173
Net losses on cash flowderivative hedges . . . . . . - - - - (15) - (15) (15)
Actuarial gains onpost-employment benefitobligations . . . . . . . . . . . - - 16 - - - - 16
Cash dividends declared . . - - (71) - - - - (71)Other . . . . . . . . . . . . . . . . . 1 3 4 - - - - 8
Balances atNovember 30, 2010 . . . . $ 355 $ 102 $ 3,699 $ (88) $ 3 $ 36 $ (49) $ 4,107
The accompanying notes are an integral part of these financial statements. These financial statements onlypresent the Carnival plc consolidated IFRS financial statements and, accordingly, do not include the consolidatedIFRS results of Carnival Corporation.
Within the DLC arrangement the most appropriate presentation of Carnival plc’s results and financial positionis considered to be by reference to the U.S. GAAP consolidated financial statements of Carnival Corporation &plc, which are included within the DLC Annual Report (see note 1).
6
CARNIVAL PLCNOTES TO GROUP AND COMPANY FINANCIAL STATEMENTS
1. Summary of Significant Accounting Policies
The following accounting policies have been applied consistently in dealing with items which are consideredmaterial in relation to Carnival plc (the “Company”), its subsidiaries and associates (collectively the “Group,”“our,” “us,” and “we”). Carnival plc was incorporated in England and Wales in 2000 and its headquarters islocated at 5 Gainsford Street, London, SE1 2NE, UK (registration number 4039524).
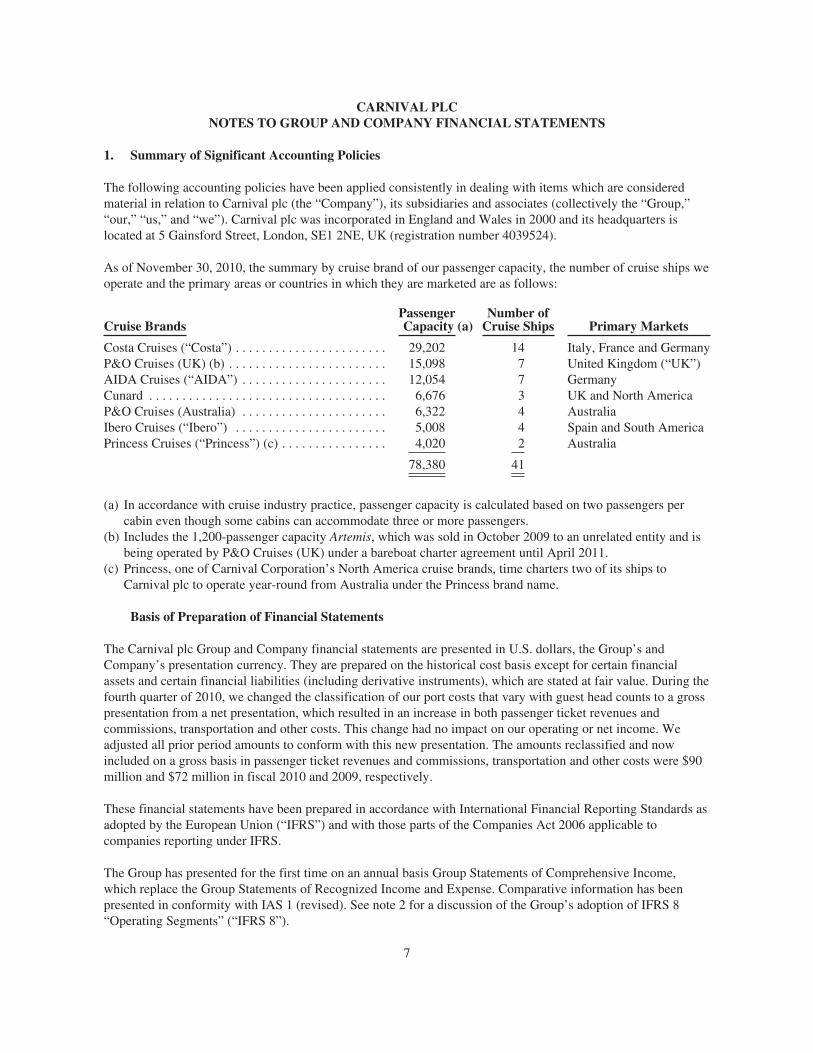
As of November 30, 2010, the summary by cruise brand of our passenger capacity, the number of cruise ships weoperate and the primary areas or countries in which they are marketed are as follows:
Cruise BrandsPassengerCapacity (a)
Number ofCruise Ships Primary Markets
Costa Cruises (“Costa”) . . . . . . . . . . . . . . . . . . . . . . . 29,202 14 Italy, France and GermanyP&O Cruises (UK) (b) . . . . . . . . . . . . . . . . . . . . . . . . 15,098 7 United Kingdom (“UK”)AIDA Cruises (“AIDA”) . . . . . . . . . . . . . . . . . . . . . . 12,054 7 GermanyCunard . . . . . . . . . . . . . . . . . . . . . . . . . . . . . . . . . . . . 6,676 3 UK and North AmericaP&O Cruises (Australia) . . . . . . . . . . . . . . . . . . . . . . 6,322 4 AustraliaIbero Cruises (“Ibero”) . . . . . . . . . . . . . . . . . . . . . . . 5,008 4 Spain and South AmericaPrincess Cruises (“Princess”) (c) . . . . . . . . . . . . . . . . 4,020 2 Australia
78,380 41
(a) In accordance with cruise industry practice, passenger capacity is calculated based on two passengers percabin even though some cabins can accommodate three or more passengers.
(b) Includes the 1,200-passenger capacity Artemis, which was sold in October 2009 to an unrelated entity and isbeing operated by P&O Cruises (UK) under a bareboat charter agreement until April 2011.
(c) Princess, one of Carnival Corporation’s North America cruise brands, time charters two of its ships toCarnival plc to operate year-round from Australia under the Princess brand name.
Basis of Preparation of Financial Statements
The Carnival plc Group and Company financial statements are presented in U.S. dollars, the Group’s andCompany’s presentation currency. They are prepared on the historical cost basis except for certain financialassets and certain financial liabilities (including derivative instruments), which are stated at fair value. During thefourth quarter of 2010, we changed the classification of our port costs that vary with guest head counts to a grosspresentation from a net presentation, which resulted in an increase in both passenger ticket revenues andcommissions, transportation and other costs. This change had no impact on our operating or net income. Weadjusted all prior period amounts to conform with this new presentation. The amounts reclassified and nowincluded on a gross basis in passenger ticket revenues and commissions, transportation and other costs were $90million and $72 million in fiscal 2010 and 2009, respectively.
These financial statements have been prepared in accordance with International Financial Reporting Standards asadopted by the European Union (“IFRS”) and with those parts of the Companies Act 2006 applicable tocompanies reporting under IFRS.
The Group has presented for the first time on an annual basis Group Statements of Comprehensive Income,which replace the Group Statements of Recognized Income and Expense. Comparative information has beenpresented in conformity with IAS 1 (revised). See note 2 for a discussion of the Group’s adoption of IFRS 8“Operating Segments” (“IFRS 8”).
7
The preparation of our Group and Company financial statements in conformity with IFRS requires managementto make estimates and assumptions that affect the application of policies and reported and disclosed amounts inthese financial statements. The estimates and underlying assumptions are based on historical experience andvarious other factors that we believe to be reasonable under the circumstances, and form the basis of makingjudgements about carrying values of assets and liabilities that are not readily apparent from other sources. Actualresults could differ from these estimates.
The estimates and underlying assumptions are reviewed on an ongoing basis. Revisions to accounting estimatesare recognised in the period in which the estimate is revised if the revision affects only that period or in theperiod of the revision and future periods if the revision affects both current and future periods.
A review of the critical accounting estimates made by management is included within the MD&A section of theCarnival Corporation & plc 2010 Annual Report (“DLC Annual Report”) on pages 38 to 40.
Basis of Consolidation
The Carnival plc Group IFRS financial statements include the results of the Company and all its controlledsubsidiaries, as typically evidenced by a direct ownership interest of greater than 50%, and incorporate theGroup’s interest in its associates under the equity method of accounting, as typically evidenced by a directownership interest from 20% to 50%. All intra-Group balances and transactions are eliminated in consolidation.
Carnival Corporation and Carnival plc operate as a Dual Listed Company (“DLC”), known as CarnivalCorporation & plc, whereby the businesses of Carnival Corporation and Carnival plc are combined through anumber of contracts and through provisions in Carnival Corporation’s Articles of Incorporation and By-Laws andCarnival plc’s Articles of Association. The two companies operate the largest cruise business in the world as if itwas a single economic enterprise, but each has retained its separate legal identity. Each company’s shares arepublicly traded; on the New York Stock Exchange (“NYSE”) for Carnival Corporation and the London StockExchange for Carnival plc. In addition, Carnival plc American Depository Shares are traded on the NYSE. Thecontracts governing the DLC arrangement provide that Carnival Corporation and Carnival plc each continue tohave separate boards of directors, but the boards and senior executive management of both companies areidentical. Under the contracts governing the DLC, the Carnival Corporation & plc consolidated earnings accrueequally to each unit of Carnival Corporation common stock and each Carnival plc ordinary share. Further detailsrelating to the DLC are included in note 3 of the Carnival Corporation & plc consolidated financial statements.
In order to provide the Carnival Corporation and Carnival plc shareholders with the most meaningful picture of theireconomic interest in the DLC formed by Carnival Corporation and Carnival plc, consolidated financial statementsand management commentary of Carnival Corporation & plc are included in the DLC Annual Report. The CarnivalCorporation & plc consolidated financial statements have been prepared under purchase accounting principleswhereby the DLC transaction was accounted for as an acquisition of Carnival plc by Carnival Corporation.
The Group and Company IFRS financial statements are required to satisfy reporting requirements of theCompanies Act 2006. However, the Directors consider that within the DLC arrangement the most appropriatepresentation of Carnival plc’s results and financial position is by reference to the U.S. generally acceptedaccounting principles (“U.S. GAAP”) consolidated financial statements of Carnival Corporation & plc, on thebasis that all significant financial and operating decisions affecting the DLC companies are made on the basis ofU.S. GAAP information and consequences. Accordingly, the Carnival Corporation & plc U.S. GAAPconsolidated financial statements on pages 5 to 33 in the DLC Annual Report, which form part of these financialstatements, are incorporated into the Carnival plc IFRS financial statements as additional disclosures. In addition,Management’s Discussion and Analysis of Financial Condition and Results of Operations (“MD&A”) and theChairman’s Letter to Shareholders on pages 36 to 54 and pages 2 and 3, respectively, in the DLC Annual Reportare included as part of the 2010 Carnival plc Annual Report and contain a review of the business and sets out theprincipal activities, operations, performance, liquidity, financial condition and capital resources, debt covenants,key performance indicators and likely future developments of Carnival Corporation & plc. That discussion also
8
identifies the principal risks and uncertainties with related mitigating factors that might affect CarnivalCorporation & plc’s future performance. Finally, our Directors’ Report, Part II of our Directors’ RemunerationReport and our Corporate Governance Report, included as Annexes A, B and C to the Notice of Annual Meetingsand Proxy Statement, dated February 17, 2011 (“Proxy Statement”), and Part I of our Directors’ RemunerationReport contained within the Proxy Statement are all included as part of the 2010 Carnival plc Annual Report. Allof these documents, as well as the Carnival Corporation & plc joint Annual Report on Form 10-K (“Form 10-K”)can be found at the Carnival Corporation & plc website at www.carnivalcorp.com or www.carnivalplc.com.
Additional information related to our business and the cruise industry, including, but not limited to, a discussionof our cruise brands’ competitors, employees, products, properties, risk factors, seasonality, services, keysuppliers and the cruise industry and its regulations can be found in the Form 10-K. Finally, information relatedto environmental, social and governance issues can be found in our Directors’ Report, Corporate GovernanceReport, Chairman’s Letter to Shareholders and Form 10-K.
Intangibles
Goodwill represents the excess of the cost of acquisition of a business over the acquiror’s share of the fair valueof identifiable net assets acquired. Goodwill is allocated to our business units, also referred to as cruise brands,on the basis of expected benefit resulting from the acquisition and is stated at cost less accumulated goodwillimpairment losses, if any. Goodwill is subject to annual impairment reviews and, more frequently, whenindicators of impairment are detected. The recoverability of goodwill is determined by comparing the carryingamount of the net assets allocated to each cash-generating unit (“CGU” or “cruise brand”) with its recoverableamount. The estimated recoverable amount is the higher of the cruise brand fair value less cost to sell and itsvalue in use, and if the recoverable amount is greater than the cruise brand net asset carrying value, then thegoodwill amount is deemed recoverable.
The costs of developing and maintaining our trademarks are expensed as incurred. Trademarks acquired as partof acquisitions of certain of our businesses are capitalised separately from goodwill if their value can bemeasured reliably, and are initially recorded at fair value. Trademarks are considered to have an indefinite usefullife and, therefore, are not amortisable but are reviewed for impairment annually and, more frequently, whenindicators of impairment are detected. Our trademarks would be considered impaired if their carrying valueexceeds their estimated recoverable amount.
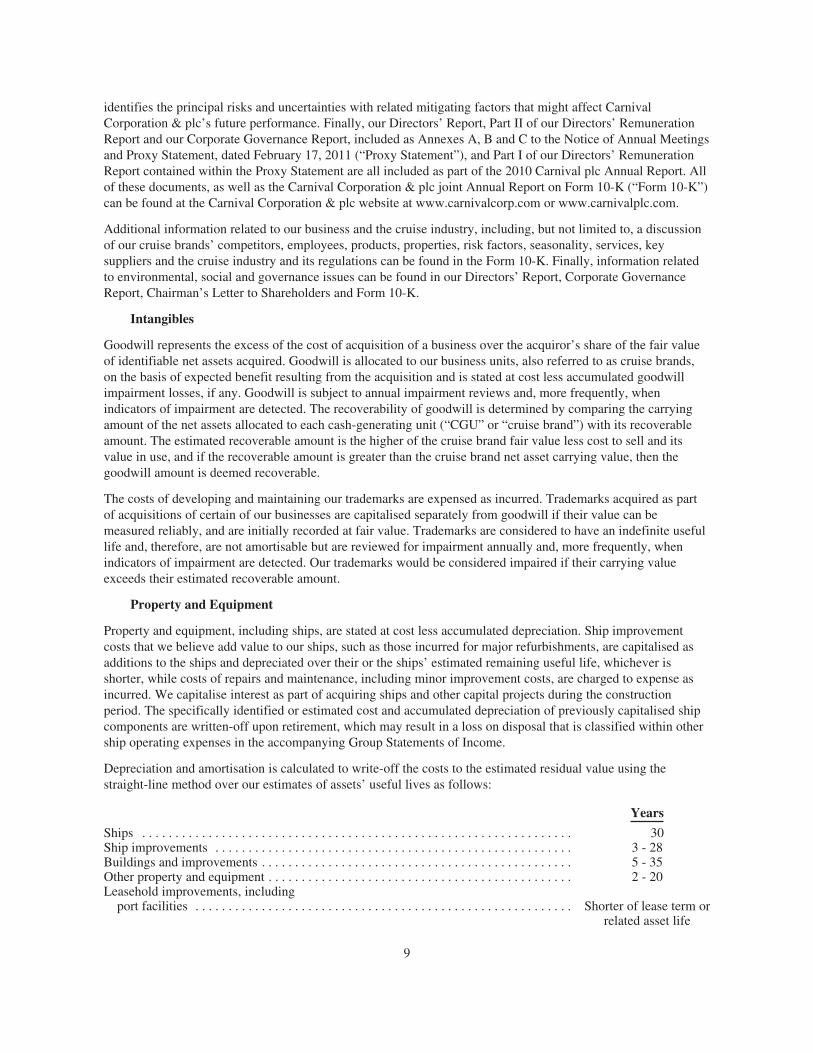
Property and Equipment
Property and equipment, including ships, are stated at cost less accumulated depreciation. Ship improvementcosts that we believe add value to our ships, such as those incurred for major refurbishments, are capitalised asadditions to the ships and depreciated over their or the ships’ estimated remaining useful life, whichever isshorter, while costs of repairs and maintenance, including minor improvement costs, are charged to expense asincurred. We capitalise interest as part of acquiring ships and other capital projects during the constructionperiod. The specifically identified or estimated cost and accumulated depreciation of previously capitalised shipcomponents are written-off upon retirement, which may result in a loss on disposal that is classified within othership operating expenses in the accompanying Group Statements of Income.
Depreciation and amortisation is calculated to write-off the costs to the estimated residual value using thestraight-line method over our estimates of assets’ useful lives as follows:
Years
Ships . . . . . . . . . . . . . . . . . . . . . . . . . . . . . . . . . . . . . . . . . . . . . . . . . . . . . . . . . . . . . . . . . 30Ship improvements . . . . . . . . . . . . . . . . . . . . . . . . . . . . . . . . . . . . . . . . . . . . . . . . . . . . . . 3 - 28Buildings and improvements . . . . . . . . . . . . . . . . . . . . . . . . . . . . . . . . . . . . . . . . . . . . . . . 5 - 35Other property and equipment . . . . . . . . . . . . . . . . . . . . . . . . . . . . . . . . . . . . . . . . . . . . . . 2 - 20Leasehold improvements, including
port facilities . . . . . . . . . . . . . . . . . . . . . . . . . . . . . . . . . . . . . . . . . . . . . . . . . . . . . . . . . Shorter of lease term orrelated asset life
9
Property and equipment are reviewed for impairment whenever events or changes in circumstances indicate thatthe carrying amounts of these assets may not be fully recoverable. The assessment of possible impairment isbased on our ability to recover the carrying value of our asset based on our estimate of the recoverable amount,which is the higher of the fair value less cost to sell and its value in use.
Dry-dock Costs
Dry-dock costs primarily represent planned major maintenance activities that are incurred when a ship is takenout of service for scheduled maintenance. These costs are expensed as incurred and included within other shipoperating expenses in the accompanying Group Statements of Income.
Grants
Government grants received related to property and equipment are deducted from the carrying amount of suchassets.
Inventories
Inventories consist primarily of food and beverage provisions, hotel and restaurant products and supplies, giftshop merchandise held for resale and fuel, which are all carried at the lower of cost or net realisable value. Costis determined using the weighted-average or first-in, first-out methods.
Trade Receivables
Trade receivables are recognised initially at fair value and subsequently are stated net of allowances for baddebts.
Cash and Cash Equivalents
Cash and cash equivalents include investments with maturities of three months or less at acquisition, which arestated at cost.
Revenue and Expense Recognition
Revenue comprises sales to third parties and excludes VAT and other similar sales taxes. Guest cruise depositsrepresent unearned revenues and are initially recorded as customer deposit liabilities generally when received(see the MD&A section on page 50 within the DLC Annual Report for additional discussion of customerdeposits). Customer deposits are subsequently recognised as cruise revenues, together with revenues fromonboard and other activities, and all associated direct costs and expenses of a voyage are recognised as cruisecosts and expenses, upon completion of voyages with durations of ten nights or less and on a pro rata basis forvoyages in excess of ten nights. The impact of recognizing these shorter duration cruise revenues and expenseson a completed voyage basis versus on a pro rata basis is not material. Future travel discount vouchers issued toguests are typically recorded as a reduction of cruise passenger ticket revenues when such vouchers areutilised. Cancellation fees are recognised in cruise passenger ticket revenue at the time of the cancellation.
Our sale to guests of air and other transportation to and from our ships and the related cost of purchasing thisservice are recorded as cruise passenger ticket revenues and cruise transportation costs, respectively. Theproceeds that we collect from the sale of third party shore excursions and on behalf of onboard concessionaires,net of the amounts remitted to them, are recorded as concession revenues, on a net basis, in onboard and othercruise revenues. These amounts are recognized on a completed voyage or pro rata basis as discussed above.
Cruise passenger ticket revenues include port charges collected from our guests that vary with guest head counts.As previously discussed, these same amounts are also expensed within commissions, transportation and othercosts in the accompanying Group Statements of Income when the corresponding revenues are recognized.
10
Revenues and expenses from our tour and travel services are recognized at the time the services are performed orexpenses are incurred. Revenues from the leasing of our owned ship to an unaffiliated party is recognized ratablyover the term of the charter agreement using the straight-line method.
Insurance and Self-Insurance
We use a combination of third party insurance, Carnival Corporation & plc group risk sharing programs and self-insurance to address a number of risks including, among others, injuries related to crew and guests, damage tohull and machinery, war risk, workers’ compensation, property damage and general liability. Liabilitiesassociated with certain of these risks are estimated based on historical claims experience and otherassumptions. While we believe the estimated loss amounts accrued are adequate, the ultimate loss may differfrom the amounts provided.
Operating Leases
Rent expenses under operating leases are charged to expense using the straight-line method over the term of thelease. Estimated amounts that are contractually due to the lessor to restore the leased property to its originalcondition are expensed over the term of lease using the straight-line method.
Selling and Administrative Expenses
Selling expenses include a broad range of advertising, such as marketing and promotional costs. Advertising ischarged to expense as incurred. Advertising expenses were $244 million and $239 million in fiscal 2010 and2009, respectively. Administrative expenses represent the costs of shoreside ship support, reservations and otheradministrative functions, and include salaries and related benefits, professional fees and occupancy costs, whichare typically expensed as incurred.
Pensions
The Group operates both defined benefit and defined contribution plans. The net deficit or surplus for eachdefined benefit pension plan is calculated in accordance with IAS 19, based on the present value of the definedbenefit obligation at the balance sheet date less the fair value of the plan assets. The calculation is performed by aqualified actuary using the projected unit credit method. The discount rate is the yield at the balance sheet date onAA credit rated bonds or local equivalents that have maturity dates approximating the terms of the pension plans’obligations.
Actuarial gains and losses that arise in calculating the pension plans’ obligations are recognised in the period inwhich they arise directly in the accompanying Group Statements of Comprehensive Income.
The operating and financing costs of defined benefit pension plans are recognised in the accompanying GroupStatements of Income; current service costs are spread systematically over the expected average remainingservice lives of employees and financing costs are recognised in the periods within which they arise. To theextent that the benefits vest immediately, the expense is recognised immediately in the accompanying GroupStatements of Income.
Defined contribution plan expenses are recognised in the period to which they relate. We contribute to theseplans based on employee contributions, salary levels and length of service.
Share-Based Compensation
The fair value of share options granted to employees was estimated at the grant date using the Black-Scholesvaluation model. The resulting cost is charged to expense over the period during which the employees becomeunconditionally entitled to the options. The amount recognised as an expense is adjusted to reflect changes inexpected and actual levels of options vesting.
11
The fair values of restricted share awards, restricted stock units (“RSUs”) and matching share awards under theplans are measured by reference to the Carnival plc ordinary share price. The fair value is measured at grant dateand, in accordance with IFRS 2, the resulting cost is charged to expense over the period during which theemployees become unconditionally entitled to the shares. The amount recognised as an expense is adjusted toreflect changes in expected and actual levels of shares vesting.
Earnings Per Share
Basic earnings per share is computed by dividing net income by the weighted-average number of ordinary sharesoutstanding during each period. Diluted earnings per share is computed by dividing adjusted net income by theweighted-average number of ordinary shares, common stock equivalents and other potentially dilutive securitiesoutstanding during each period.
Dividends
Dividend distributions are recognised in the period in which the dividends are declared, since under the DLCarrangement the declaration of a dividend by the Boards of Directors of Carnival Corporation and Carnival plcestablishes a liability for Carnival plc.
Foreign Currencies
The underlying Group businesses generate earnings in a number of different currencies, principally euros,sterling and Australian and U.S. dollars. Each business determines its functional currency by reference to itsrelevant economic environment. Transactions in currencies other than a business’s functional currency arerecorded at the rate of exchange at the date of the transaction and any exchange gains and losses arisingthereafter are included in nonoperating income. Monetary assets and liabilities denominated in non-functionalcurrencies are remeasured at the period end exchange rates and any exchange gains or losses arising therefromare also included in nonoperating income, unless such assets and liabilities have been designated to act as hedgesof ship commitments or net investments in our foreign operations, respectively. Net foreign currency transactionexchange gains or losses included in nonoperating income were insignificant in fiscal 2010 and 2009. In addition,the unrealized exchange gains or losses on our long-term intercompany or inter-division receivables or payablesdenominated in a non-functional currency, which are not expected to be repaid in the foreseeable future and aretherefore considered to form part of our net investments, are recorded as foreign currency translationadjustments, which are included in translation reserves.
Revenues and expenses of subsidiaries and divisions and their assets and liabilities that have functionalcurrencies other than the U.S. dollar are translated into the U.S. dollar presentation currency at weighted-averageand period end rates of exchange, respectively. Equity is translated at historical rates and the resulting cumulativeforeign currency translation adjustments are included in translation reserves. Therefore, the U.S. dollar value ofthese non-equity translated items in our Group and Company financial statements will fluctuate from period toperiod, depending on the changing value of the dollar versus these currencies.
Derivatives and Other Financial Instruments
The Group uses derivative and nonderivative financial instruments, such as foreign currency forwards, options,swaps, foreign currency debt obligations and foreign currency cash balances to manage its exposure tofluctuations in certain foreign currency exchange rates, and interest rate swaps to manage its interest rateexposure in order to achieve a desired proportion of fixed and floating rate debt. Our policy is to not use anyfinancial instruments for trading or other speculative purposes.
All derivative financial instruments are recorded at fair value, and the changes in fair value are immediatelyincluded in earnings if the derivatives do not qualify as effective hedges. Subject to specific criteria, derivative
12
financial instruments, financial assets and financial liabilities may be designated as forming hedge relationships,as a result of which changes in fair value are offset in the accompanying Group Statements of Income orrecognised directly in the accompanying Group Statements of Comprehensive Income, depending on the natureof the hedge relationship. Hedging derivatives fall into three classifications: fair value hedges, cash flow hedgesand hedges of a net investment. Changes in the fair value of fair value hedge derivatives are offset against thechanges in the fair value of the underlying hedged items in the accompanying Group Statements of Income. Theeffective portion of changes in fair value of cash flow hedge derivatives are recognized in the accompanyingGroup Statements of Comprehensive Income until the underlying hedged item is recognised in earnings or theforecasted transaction is no longer probable. Changes in the fair value of hedges of a net investment arerecognised in the accompanying Group Statements of Comprehensive Income to offset a portion of the change inthe translated value of the net investment being hedged. In the event that a previously hedged investment isdisposed of, the accumulated amount previously recognised from hedging is required to be removed from thehedging reserve within shareholders’ equity and reflected in net income. We formally document hedgingrelationships for all derivative and nonderivative hedges and the underlying hedged items, as well as our riskmanagement objectives and strategies for undertaking the hedge transactions.
We classify the fair values of all our derivative contracts and the fair value of our hedged firm commitments aseither current or long-term, which are included in prepaid expenses and other assets and accrued and otherliabilities, depending on whether the maturity date of the derivative contract is within or beyond one year fromthe balance sheet date. The cash flows from derivatives treated as hedges are classified in the accompanyingStatements of Cash Flows in the same category as the item being hedged.
Interest-bearing debt and bank overdrafts are recorded at their initial fair value which normally reflects theproceeds received by us, net of debt issuance costs, and subsequently stated at amortised cost, including accruedinterest. Any difference between the proceeds after debt issuance costs and the premium and redemption valuesare amortised to interest expense over the term of the debt, typically on a straight-line basis which approximatesthe effective interest method.
Income Taxes
Deferred income taxes are provided using the liability method. Deferred income tax assets are recognised to theextent that it is probable that future taxable income will be available against which the temporary differences canbe utilised. Deferred income taxes are measured at the average tax rates that are expected to apply in the periodsin which the timing differences are expected to reverse based on tax rates and laws that have been enacted orsubstantially enacted by the balance sheet date. Current income taxes are the taxes payable on the taxable incomefor the year, applying current rates and any adjustments in respect of previous years.
Standards, Amendments and Interpretations to Published Standards That Are Not Yet Effective
At November 30, 2010, certain new standards, amendments and interpretations to published standards had beenpublished that will be mandatory for future accounting periods, but which have not been early adopted in thesefinancial statements. These are set out below as follows:
• IAS 24 (revised), “Related party disclosures,” effective January 1, 2011;• Amendments to IAS 32 “Financial instruments: Presentation on classification of rights issues,”
effective for annual periods beginning on or after February 1, 2010;• Amendments to IFRS 1 for additional exemptions, effective for annual periods beginning on or after
January 1, 2010;• Amendment to IFRS 2, “Share-based payments – Group cash-settled share-based payment
transactions,” effective for annual periods beginning on or after 1 January 1, 2010;• IFRIC 13, “Customer loyalty programmes relating to IAS 18, Revenue,” effective for annual periods
beginning on or after January 1, 2010;
13
• Amendment to IFRIC 14, “Pre-payments of a Minimum Funding Requirement,” effective January 1,2011;
• IFRIC 17, “Distributions of non-cash assets to owners,” effective for annual periods beginning on orafter July 1, 2009;
• IFRIC 18, “Transfers of assets from customers,” effective for transfer of assets received on or afterJuly 1, 2009; and
• IFRIC 19, “Extinguishing financial liabilities with equity instruments,” effective for annual periodsbeginning on or after July 1, 2010.
Management does not believe the adoption of these new standards, amendments and interpretations will have amaterial impact on the Group or Company results and financial position.
2. Segment Information
The Group has adopted IFRS 8 on December 1, 2009. IFRS 8 requires that an entity’s operating segments arereported on the same basis as the internally reported information that is provided to the chief operating decisionmaker (“CODM”). The CODM has been identified as the Chairman of the Board of Directors and ChiefExecutive Officer of the Group, who is also the CODM of Carnival Corporation & plc. Following the adoption ofIFRS 8, the Group has revised its previously reported operating segment information to be in conformity withIFRS 8.
Within the DLC arrangement the most appropriate presentation of Carnival plc’s results and financial position isby reference to the U.S. GAAP consolidated financial statements of Carnival Corporation & plc. Accordingly,decisions to allocate resources and assess performance for Carnival plc are taken by the CODM upon review ofthe U.S. GAAP segment results across all of Carnival Corporation & plc’s cruise brands and othersegments. These Carnival Corporation & plc segments consist of (1) North America cruise brands, (2) Europe,Australia & Asia cruise brands (“EAA”), (3) Cruise Support and (4) Tour and Other. Substantially all of theGroup’s results are included within the EAA cruise brand segment.
The Carnival Corporation & plc North America cruise segment includes Carnival Cruise Lines, Holland AmericaLine, Princess and Seabourn. The Carnival Corporation & plc EAA cruise segment includes AIDA, Costa,Cunard, Ibero, P&O Cruises (UK) and P&O Cruises (Australia). These individual cruise brand operatingsegments have been aggregated as two reportable segments based on the similarity of their economic and othercharacteristics, including the products and services they provide. The Carnival Corporation & plc Cruise Supportsegment represents certain of its port and related facilities and other corporate-wide services that are provided forthe benefit of its cruise brands. The Carnival Corporation & plc Tour and Other segment represents the hotel,tour and transportation operations of Holland America Princess Alaska Tours and two of the group’s owned shipsthat it charters to an unaffiliated entity. The significant accounting policies of these segments are the same asthose described in Note 2 of the Carnival Corporation & plc financial statements.
14
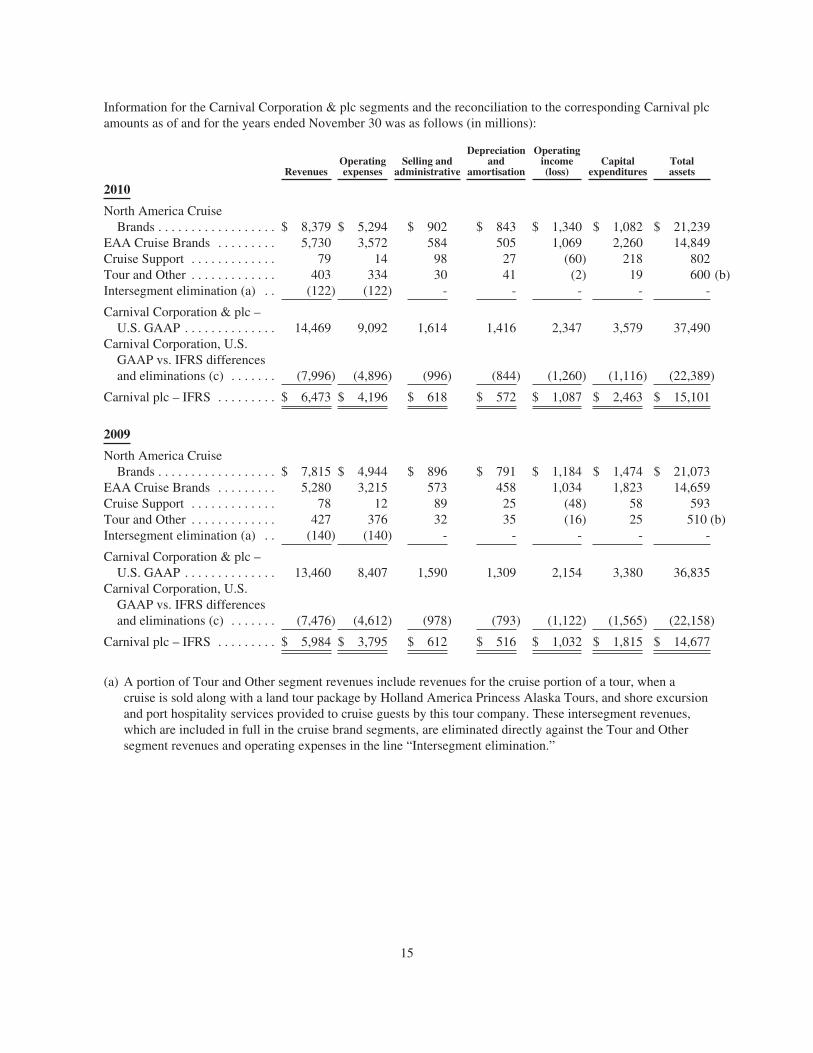
Information for the Carnival Corporation & plc segments and the reconciliation to the corresponding Carnival plcamounts as of and for the years ended November 30 was as follows (in millions):
RevenuesOperatingexpenses
Selling andadministrative
Depreciationand
amortisation
Operatingincome(loss)
Capitalexpenditures
Totalassets
2010
North America CruiseBrands . . . . . . . . . . . . . . . . . . $ 8,379 $ 5,294 $ 902 $ 843 $ 1,340 $ 1,082 $ 21,239
EAA Cruise Brands . . . . . . . . . 5,730 3,572 584 505 1,069 2,260 14,849Cruise Support . . . . . . . . . . . . . 79 14 98 27 (60) 218 802Tour and Other . . . . . . . . . . . . . 403 334 30 41 (2) 19 600 (b)Intersegment elimination (a) . . (122) (122) - - - - -
Carnival Corporation & plc –U.S. GAAP . . . . . . . . . . . . . . 14,469 9,092 1,614 1,416 2,347 3,579 37,490
Carnival Corporation, U.S.GAAP vs. IFRS differencesand eliminations (c) . . . . . . . (7,996) (4,896) (996) (844) (1,260) (1,116) (22,389)
Carnival plc – IFRS . . . . . . . . . $ 6,473 $ 4,196 $ 618 $ 572 $ 1,087 $ 2,463 $ 15,101
2009
North America CruiseBrands . . . . . . . . . . . . . . . . . . $ 7,815 $ 4,944 $ 896 $ 791 $ 1,184 $ 1,474 $ 21,073
EAA Cruise Brands . . . . . . . . . 5,280 3,215 573 458 1,034 1,823 14,659Cruise Support . . . . . . . . . . . . . 78 12 89 25 (48) 58 593Tour and Other . . . . . . . . . . . . . 427 376 32 35 (16) 25 510 (b)Intersegment elimination (a) . . (140) (140) - - - - -
Carnival Corporation & plc –U.S. GAAP . . . . . . . . . . . . . . 13,460 8,407 1,590 1,309 2,154 3,380 36,835
Carnival Corporation, U.S.GAAP vs. IFRS differencesand eliminations (c) . . . . . . . (7,476) (4,612) (978) (793) (1,122) (1,565) (22,158)
Carnival plc – IFRS . . . . . . . . . $ 5,984 $ 3,795 $ 612 $ 516 $ 1,032 $ 1,815 $ 14,677
(a) A portion of Tour and Other segment revenues include revenues for the cruise portion of a tour, when acruise is sold along with a land tour package by Holland America Princess Alaska Tours, and shore excursionand port hospitality services provided to cruise guests by this tour company. These intersegment revenues,which are included in full in the cruise brand segments, are eliminated directly against the Tour and Othersegment revenues and operating expenses in the line “Intersegment elimination.”
15
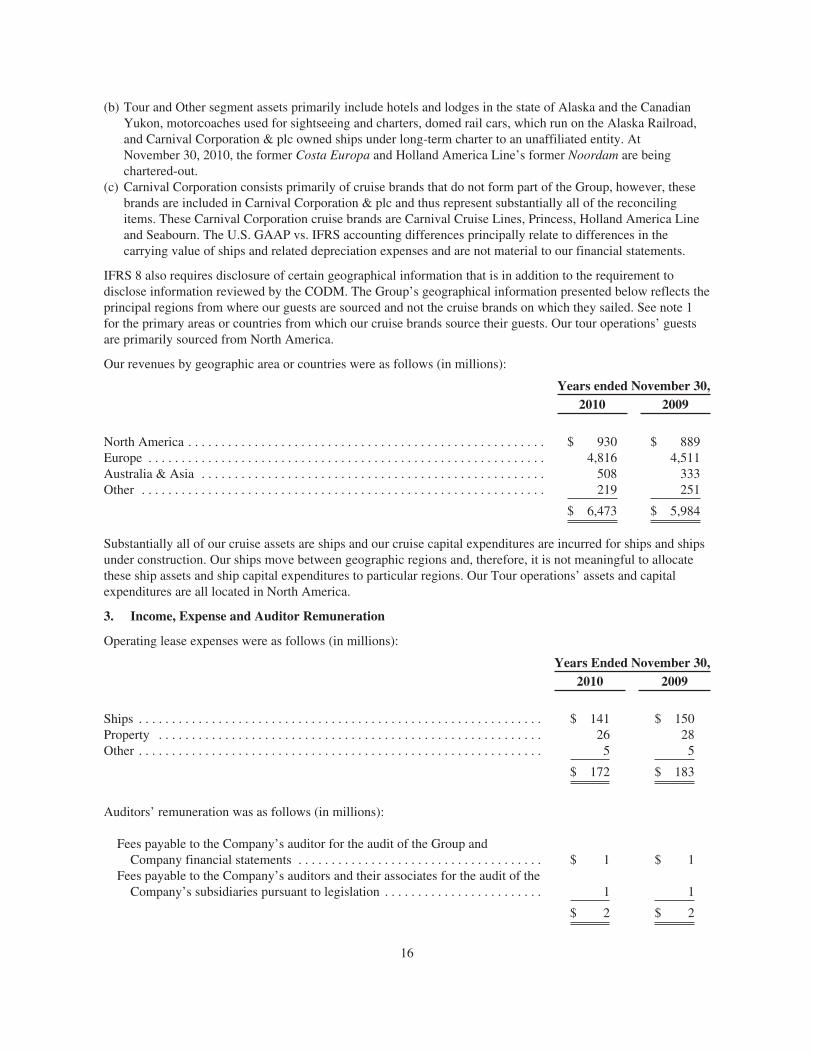
(b) Tour and Other segment assets primarily include hotels and lodges in the state of Alaska and the CanadianYukon, motorcoaches used for sightseeing and charters, domed rail cars, which run on the Alaska Railroad,and Carnival Corporation & plc owned ships under long-term charter to an unaffiliated entity. AtNovember 30, 2010, the former Costa Europa and Holland America Line’s former Noordam are beingchartered-out.
(c) Carnival Corporation consists primarily of cruise brands that do not form part of the Group, however, thesebrands are included in Carnival Corporation & plc and thus represent substantially all of the reconcilingitems. These Carnival Corporation cruise brands are Carnival Cruise Lines, Princess, Holland America Lineand Seabourn. The U.S. GAAP vs. IFRS accounting differences principally relate to differences in thecarrying value of ships and related depreciation expenses and are not material to our financial statements.
IFRS 8 also requires disclosure of certain geographical information that is in addition to the requirement todisclose information reviewed by the CODM. The Group’s geographical information presented below reflects theprincipal regions from where our guests are sourced and not the cruise brands on which they sailed. See note 1for the primary areas or countries from which our cruise brands source their guests. Our tour operations’ guestsare primarily sourced from North America.
Our revenues by geographic area or countries were as follows (in millions):
Years ended November 30,2010 2009
North America . . . . . . . . . . . . . . . . . . . . . . . . . . . . . . . . . . . . . . . . . . . . . . . . . . . . . . $ 930 $ 889Europe . . . . . . . . . . . . . . . . . . . . . . . . . . . . . . . . . . . . . . . . . . . . . . . . . . . . . . . . . . . . 4,816 4,511Australia & Asia . . . . . . . . . . . . . . . . . . . . . . . . . . . . . . . . . . . . . . . . . . . . . . . . . . . . 508 333Other . . . . . . . . . . . . . . . . . . . . . . . . . . . . . . . . . . . . . . . . . . . . . . . . . . . . . . . . . . . . . 219 251
$ 6,473 $ 5,984
Substantially all of our cruise assets are ships and our cruise capital expenditures are incurred for ships and shipsunder construction. Our ships move between geographic regions and, therefore, it is not meaningful to allocatethese ship assets and ship capital expenditures to particular regions. Our Tour operations’ assets and capitalexpenditures are all located in North America.
3. Income, Expense and Auditor Remuneration
Operating lease expenses were as follows (in millions):
Years Ended November 30,2010 2009
Ships . . . . . . . . . . . . . . . . . . . . . . . . . . . . . . . . . . . . . . . . . . . . . . . . . . . . . . . . . . . . . $ 141 $ 150Property . . . . . . . . . . . . . . . . . . . . . . . . . . . . . . . . . . . . . . . . . . . . . . . . . . . . . . . . . . 26 28Other . . . . . . . . . . . . . . . . . . . . . . . . . . . . . . . . . . . . . . . . . . . . . . . . . . . . . . . . . . . . . 5 5
$ 172 $ 183
Auditors’ remuneration was as follows (in millions):
Fees payable to the Company’s auditor for the audit of the Group andCompany financial statements . . . . . . . . . . . . . . . . . . . . . . . . . . . . . . . . . . . . . $ 1 $ 1
Fees payable to the Company’s auditors and their associates for the audit of theCompany’s subsidiaries pursuant to legislation . . . . . . . . . . . . . . . . . . . . . . . . 1 1
$ 2 $ 2
16
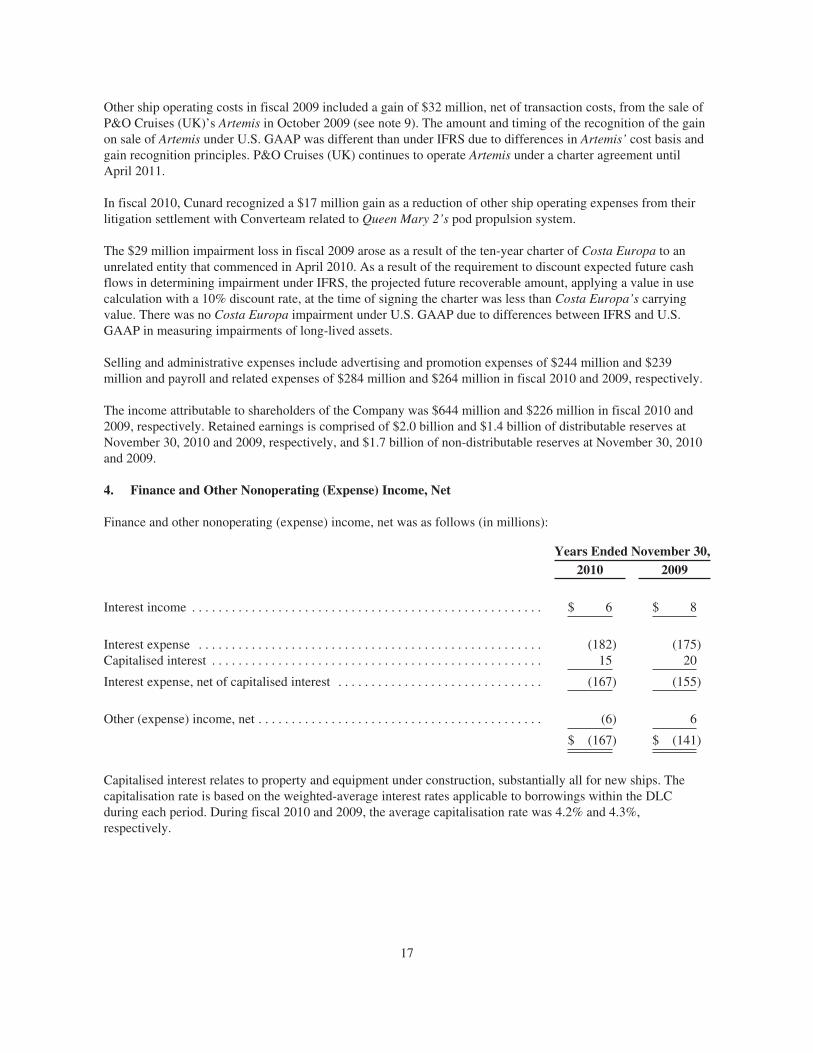
Other ship operating costs in fiscal 2009 included a gain of $32 million, net of transaction costs, from the sale ofP&O Cruises (UK)’s Artemis in October 2009 (see note 9). The amount and timing of the recognition of the gainon sale of Artemis under U.S. GAAP was different than under IFRS due to differences in Artemis’ cost basis andgain recognition principles. P&O Cruises (UK) continues to operate Artemis under a charter agreement untilApril 2011.
In fiscal 2010, Cunard recognized a $17 million gain as a reduction of other ship operating expenses from theirlitigation settlement with Converteam related to Queen Mary 2’s pod propulsion system.
The $29 million impairment loss in fiscal 2009 arose as a result of the ten-year charter of Costa Europa to anunrelated entity that commenced in April 2010. As a result of the requirement to discount expected future cashflows in determining impairment under IFRS, the projected future recoverable amount, applying a value in usecalculation with a 10% discount rate, at the time of signing the charter was less than Costa Europa’s carryingvalue. There was no Costa Europa impairment under U.S. GAAP due to differences between IFRS and U.S.GAAP in measuring impairments of long-lived assets.
Selling and administrative expenses include advertising and promotion expenses of $244 million and $239million and payroll and related expenses of $284 million and $264 million in fiscal 2010 and 2009, respectively.
The income attributable to shareholders of the Company was $644 million and $226 million in fiscal 2010 and2009, respectively. Retained earnings is comprised of $2.0 billion and $1.4 billion of distributable reserves atNovember 30, 2010 and 2009, respectively, and $1.7 billion of non-distributable reserves at November 30, 2010and 2009.
4. Finance and Other Nonoperating (Expense) Income, Net
Finance and other nonoperating (expense) income, net was as follows (in millions):
Years Ended November 30,2010 2009
Interest income . . . . . . . . . . . . . . . . . . . . . . . . . . . . . . . . . . . . . . . . . . . . . . . . . . . . . $ 6 $ 8
Interest expense . . . . . . . . . . . . . . . . . . . . . . . . . . . . . . . . . . . . . . . . . . . . . . . . . . . . (182) (175)Capitalised interest . . . . . . . . . . . . . . . . . . . . . . . . . . . . . . . . . . . . . . . . . . . . . . . . . . 15 20
Interest expense, net of capitalised interest . . . . . . . . . . . . . . . . . . . . . . . . . . . . . . . (167) (155)
Other (expense) income, net . . . . . . . . . . . . . . . . . . . . . . . . . . . . . . . . . . . . . . . . . . . (6) 6
$ (167) $ (141)
Capitalised interest relates to property and equipment under construction, substantially all for new ships. Thecapitalisation rate is based on the weighted-average interest rates applicable to borrowings within the DLCduring each period. During fiscal 2010 and 2009, the average capitalisation rate was 4.2% and 4.3%,respectively.
17
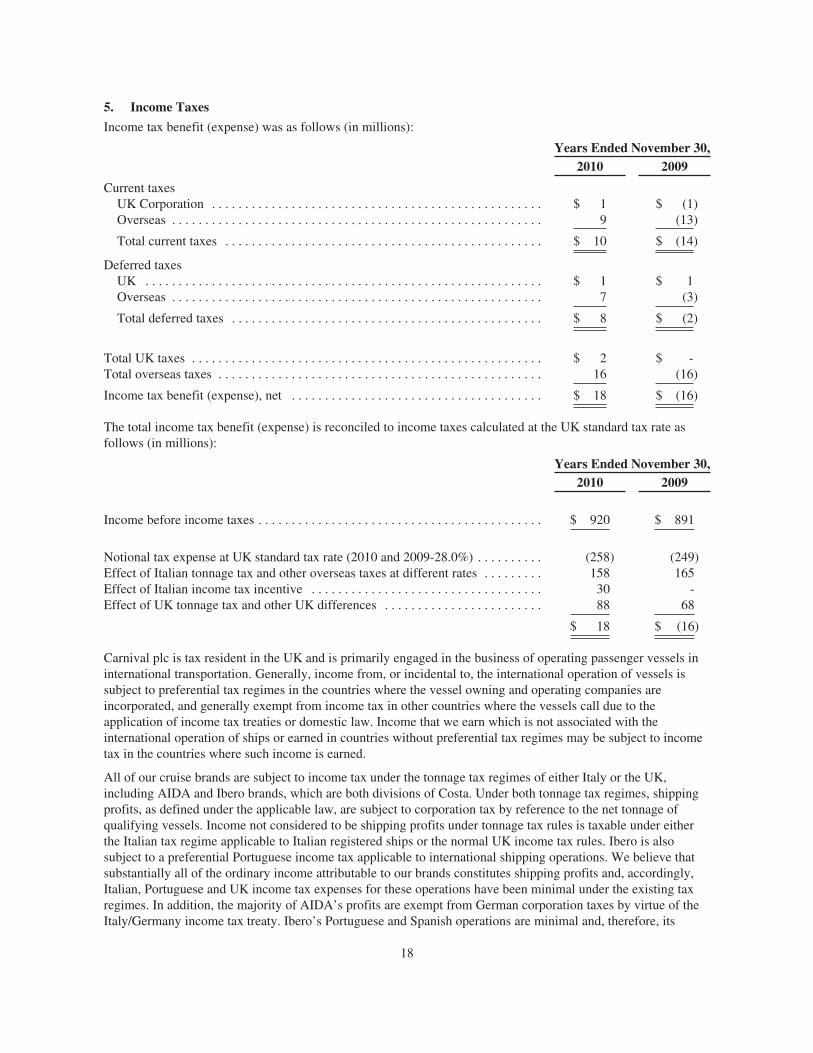
5. Income Taxes
Income tax benefit (expense) was as follows (in millions):
Years Ended November 30,2010 2009
Current taxesUK Corporation . . . . . . . . . . . . . . . . . . . . . . . . . . . . . . . . . . . . . . . . . . . . . . . . . . $ 1 $ (1)Overseas . . . . . . . . . . . . . . . . . . . . . . . . . . . . . . . . . . . . . . . . . . . . . . . . . . . . . . . . 9 (13)
Total current taxes . . . . . . . . . . . . . . . . . . . . . . . . . . . . . . . . . . . . . . . . . . . . . . . . $ 10 $ (14)
Deferred taxesUK . . . . . . . . . . . . . . . . . . . . . . . . . . . . . . . . . . . . . . . . . . . . . . . . . . . . . . . . . . . . $ 1 $ 1Overseas . . . . . . . . . . . . . . . . . . . . . . . . . . . . . . . . . . . . . . . . . . . . . . . . . . . . . . . . 7 (3)
Total deferred taxes . . . . . . . . . . . . . . . . . . . . . . . . . . . . . . . . . . . . . . . . . . . . . . . $ 8 $ (2)
Total UK taxes . . . . . . . . . . . . . . . . . . . . . . . . . . . . . . . . . . . . . . . . . . . . . . . . . . . . . $ 2 $ -Total overseas taxes . . . . . . . . . . . . . . . . . . . . . . . . . . . . . . . . . . . . . . . . . . . . . . . . . 16 (16)
Income tax benefit (expense), net . . . . . . . . . . . . . . . . . . . . . . . . . . . . . . . . . . . . . . $ 18 $ (16)
The total income tax benefit (expense) is reconciled to income taxes calculated at the UK standard tax rate asfollows (in millions):
Years Ended November 30,2010 2009
Income before income taxes . . . . . . . . . . . . . . . . . . . . . . . . . . . . . . . . . . . . . . . . . . . $ 920 $ 891
Notional tax expense at UK standard tax rate (2010 and 2009-28.0%) . . . . . . . . . . (258) (249)Effect of Italian tonnage tax and other overseas taxes at different rates . . . . . . . . . 158 165Effect of Italian income tax incentive . . . . . . . . . . . . . . . . . . . . . . . . . . . . . . . . . . . 30 -Effect of UK tonnage tax and other UK differences . . . . . . . . . . . . . . . . . . . . . . . . 88 68
$ 18 $ (16)
Carnival plc is tax resident in the UK and is primarily engaged in the business of operating passenger vessels ininternational transportation. Generally, income from, or incidental to, the international operation of vessels issubject to preferential tax regimes in the countries where the vessel owning and operating companies areincorporated, and generally exempt from income tax in other countries where the vessels call due to theapplication of income tax treaties or domestic law. Income that we earn which is not associated with theinternational operation of ships or earned in countries without preferential tax regimes may be subject to incometax in the countries where such income is earned.
All of our cruise brands are subject to income tax under the tonnage tax regimes of either Italy or the UK,including AIDA and Ibero brands, which are both divisions of Costa. Under both tonnage tax regimes, shippingprofits, as defined under the applicable law, are subject to corporation tax by reference to the net tonnage ofqualifying vessels. Income not considered to be shipping profits under tonnage tax rules is taxable under eitherthe Italian tax regime applicable to Italian registered ships or the normal UK income tax rules. Ibero is alsosubject to a preferential Portuguese income tax applicable to international shipping operations. We believe thatsubstantially all of the ordinary income attributable to our brands constitutes shipping profits and, accordingly,Italian, Portuguese and UK income tax expenses for these operations have been minimal under the existing taxregimes. In addition, the majority of AIDA’s profits are exempt from German corporation taxes by virtue of theItaly/Germany income tax treaty. Ibero’s Portuguese and Spanish operations are minimal and, therefore, its
18
Portuguese and Spanish income taxes are minimal. In fiscal 2010, AIDA and Costa recognized a $30 millionincome tax benefit from an Italian investment incentive related to certain of their newbuild expenditures.
We do not expect to incur income taxes on future distributions of undistributed earnings of foreign subsidiariesand, accordingly, no deferred income taxes have been provided for the distribution of these earnings. All interestexpense related to income tax liabilities is classified as income tax expenses. In addition to, or in place of incometaxes, virtually all jurisdictions where our ships call impose taxes and/or fees based on guest counts, shiptonnage, ship capacity or some other measure.
Australian Income Tax
P&O Cruises (Australia) is a division of Carnival plc, and the shipping profit income from this operation issubject to UK tonnage tax as discussed above. Substantially all of this operation’s income is exempt fromAustralian corporation taxes by virtue of the UK/Australian income tax treaty. P&O Cruises (Australia)’s nonshipping profits are minimal.
U.S. Federal and State Income Taxes
The hotel, transportation and tour business of Holland America Princess Alaska Tours is taxed at the applicableU.S. federal and state corporate income tax rates, which approximates 39%.
6. Dividends
In October 2008 at the height of the financial crisis, the Carnival Corporation and Carnival plc Boards ofDirectors voted to suspend their quarterly dividends beginning March 2009, and maintained such dividendsuspension throughout fiscal 2009. At the January, April, July and October 2010 Boards of Directors meetings itwas decided to declare March, June, September and December 2010 quarterly dividends at $0.10 per share. Ourquarterly dividend declarations amounted to $17 million, $17 million, $18 million and $19 million for each of thequarters in fiscal 2010, respectively, or an aggregate of $71 million. At the January 2011 Boards of Directorsmeetings it was decided to increase the March 2011 quarterly dividend to $0.25 per share.
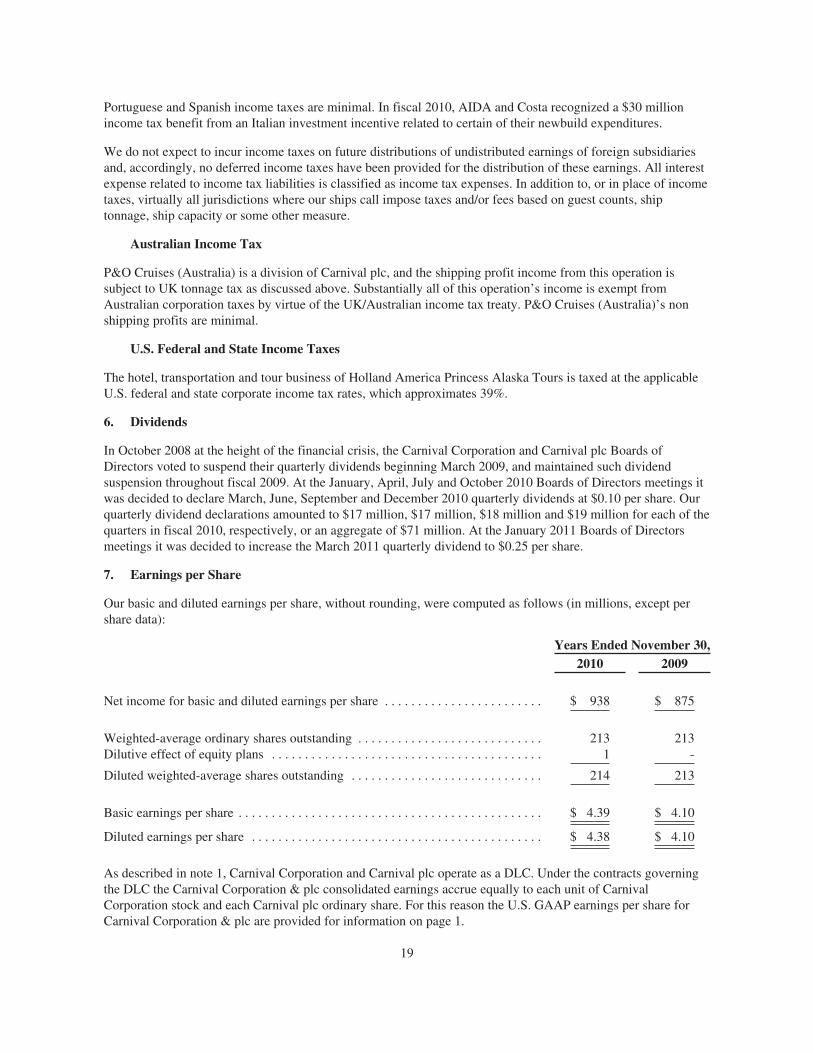
7. Earnings per Share
Our basic and diluted earnings per share, without rounding, were computed as follows (in millions, except pershare data):
Years Ended November 30,2010 2009
Net income for basic and diluted earnings per share . . . . . . . . . . . . . . . . . . . . . . . . $ 938 $ 875
Weighted-average ordinary shares outstanding . . . . . . . . . . . . . . . . . . . . . . . . . . . . 213 213Dilutive effect of equity plans . . . . . . . . . . . . . . . . . . . . . . . . . . . . . . . . . . . . . . . . . 1 -
Diluted weighted-average shares outstanding . . . . . . . . . . . . . . . . . . . . . . . . . . . . . 214 213
Basic earnings per share . . . . . . . . . . . . . . . . . . . . . . . . . . . . . . . . . . . . . . . . . . . . . . $ 4.39 $ 4.10
Diluted earnings per share . . . . . . . . . . . . . . . . . . . . . . . . . . . . . . . . . . . . . . . . . . . . $ 4.38 $ 4.10
As described in note 1, Carnival Corporation and Carnival plc operate as a DLC. Under the contracts governingthe DLC the Carnival Corporation & plc consolidated earnings accrue equally to each unit of CarnivalCorporation stock and each Carnival plc ordinary share. For this reason the U.S. GAAP earnings per share forCarnival Corporation & plc are provided for information on page 1.
19
The weighted-average number of ordinary shares has been reduced for shares in the Company held by theCompany’s Employee Benefit Trust for the satisfaction of equity awards that have not vestedunconditionally. These Employee Benefit Trust held shares do not receive any dividends.
The dilutive shares relate to ordinary shares to be issued on the exercise of employee share options and vesting ofRSUs (see note 21).
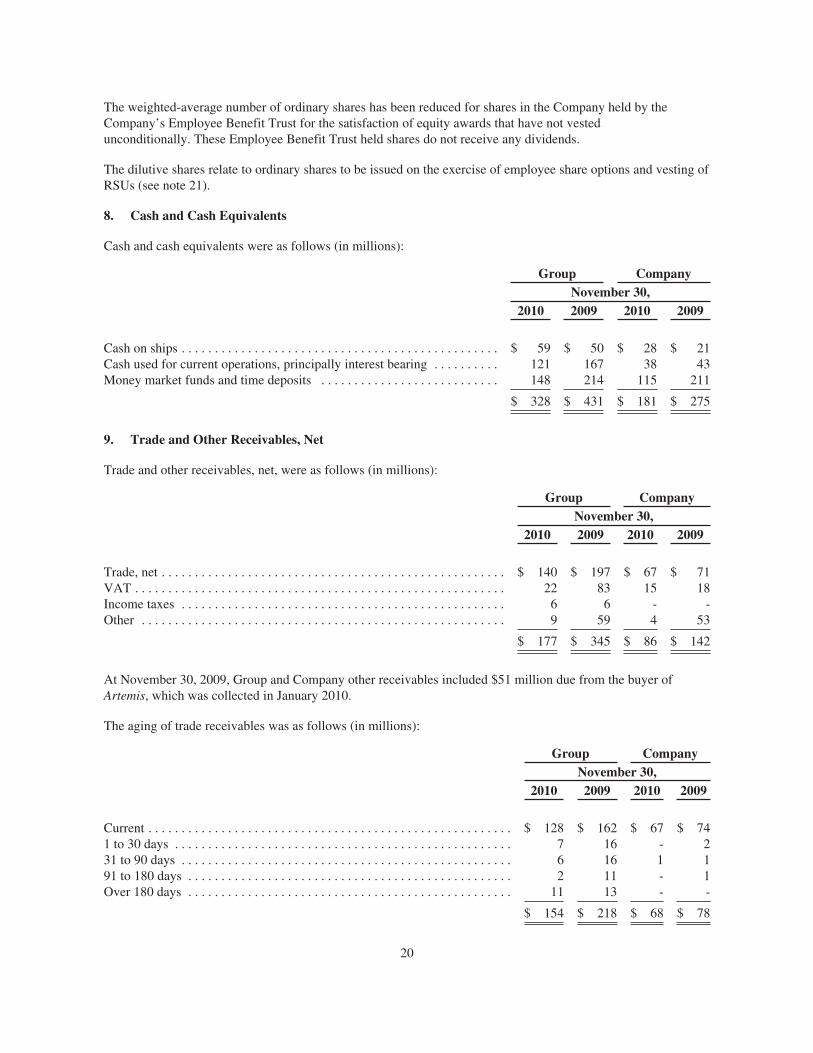
8. Cash and Cash Equivalents
Cash and cash equivalents were as follows (in millions):
Group CompanyNovember 30,
2010 2009 2010 2009
Cash on ships . . . . . . . . . . . . . . . . . . . . . . . . . . . . . . . . . . . . . . . . . . . . . . . . $ 59 $ 50 $ 28 $ 21Cash used for current operations, principally interest bearing . . . . . . . . . . 121 167 38 43Money market funds and time deposits . . . . . . . . . . . . . . . . . . . . . . . . . . . 148 214 115 211
$ 328 $ 431 $ 181 $ 275
9. Trade and Other Receivables, Net
Trade and other receivables, net, were as follows (in millions):
Group CompanyNovember 30,
2010 2009 2010 2009
Trade, net . . . . . . . . . . . . . . . . . . . . . . . . . . . . . . . . . . . . . . . . . . . . . . . . . . . . $ 140 $ 197 $ 67 $ 71VAT . . . . . . . . . . . . . . . . . . . . . . . . . . . . . . . . . . . . . . . . . . . . . . . . . . . . . . . . 22 83 15 18Income taxes . . . . . . . . . . . . . . . . . . . . . . . . . . . . . . . . . . . . . . . . . . . . . . . . . 6 6 - -Other . . . . . . . . . . . . . . . . . . . . . . . . . . . . . . . . . . . . . . . . . . . . . . . . . . . . . . . 9 59 4 53
$ 177 $ 345 $ 86 $ 142
At November 30, 2009, Group and Company other receivables included $51 million due from the buyer ofArtemis, which was collected in January 2010.
The aging of trade receivables was as follows (in millions):
Group CompanyNovember 30,
2010 2009 2010 2009
Current . . . . . . . . . . . . . . . . . . . . . . . . . . . . . . . . . . . . . . . . . . . . . . . . . . . . . . . $ 128 $ 162 $ 67 $ 741 to 30 days . . . . . . . . . . . . . . . . . . . . . . . . . . . . . . . . . . . . . . . . . . . . . . . . . . . 7 16 - 231 to 90 days . . . . . . . . . . . . . . . . . . . . . . . . . . . . . . . . . . . . . . . . . . . . . . . . . . 6 16 1 191 to 180 days . . . . . . . . . . . . . . . . . . . . . . . . . . . . . . . . . . . . . . . . . . . . . . . . . 2 11 - 1Over 180 days . . . . . . . . . . . . . . . . . . . . . . . . . . . . . . . . . . . . . . . . . . . . . . . . . 11 13 - -
$ 154 $ 218 $ 68 $ 78
20
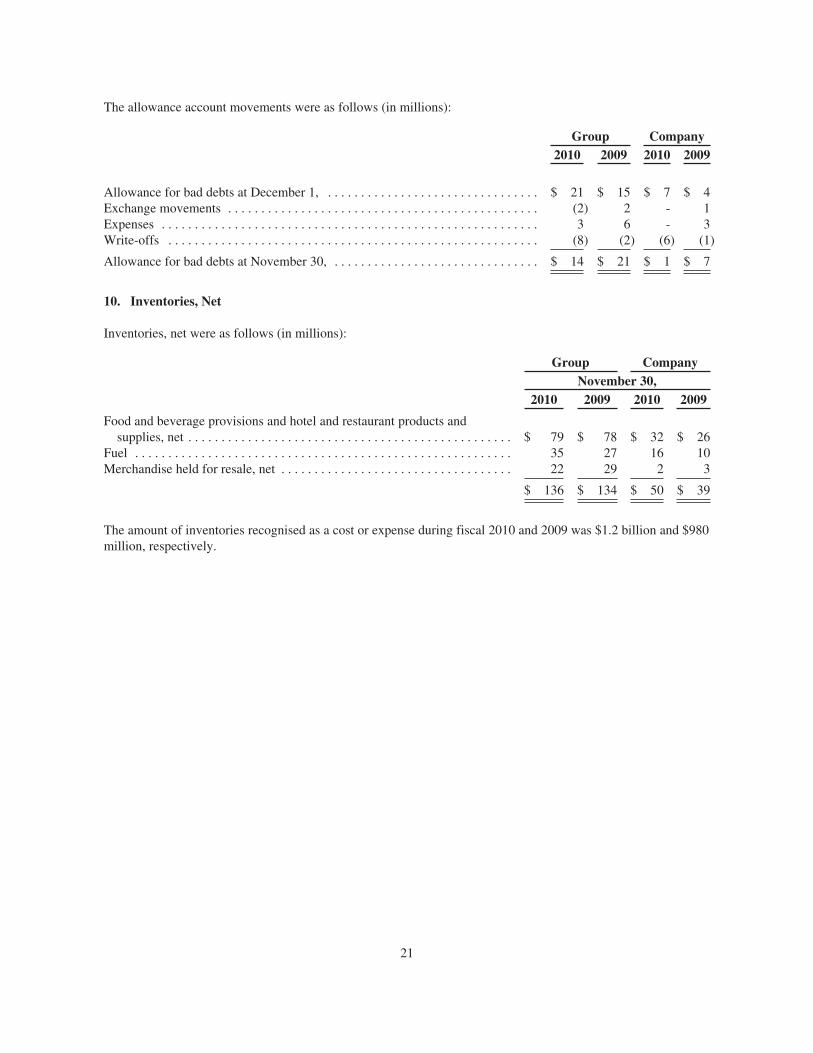
The allowance account movements were as follows (in millions):
Group Company2010 2009 2010 2009
Allowance for bad debts at December 1, . . . . . . . . . . . . . . . . . . . . . . . . . . . . . . . . $ 21 $ 15 $ 7 $ 4Exchange movements . . . . . . . . . . . . . . . . . . . . . . . . . . . . . . . . . . . . . . . . . . . . . . . (2) 2 - 1Expenses . . . . . . . . . . . . . . . . . . . . . . . . . . . . . . . . . . . . . . . . . . . . . . . . . . . . . . . . . 3 6 - 3Write-offs . . . . . . . . . . . . . . . . . . . . . . . . . . . . . . . . . . . . . . . . . . . . . . . . . . . . . . . . (8) (2) (6) (1)
Allowance for bad debts at November 30, . . . . . . . . . . . . . . . . . . . . . . . . . . . . . . . $ 14 $ 21 $ 1 $ 7
10. Inventories, Net
Inventories, net were as follows (in millions):
Group CompanyNovember 30,
2010 2009 2010 2009
Food and beverage provisions and hotel and restaurant products andsupplies, net . . . . . . . . . . . . . . . . . . . . . . . . . . . . . . . . . . . . . . . . . . . . . . . . . $ 79 $ 78 $ 32 $ 26
Fuel . . . . . . . . . . . . . . . . . . . . . . . . . . . . . . . . . . . . . . . . . . . . . . . . . . . . . . . . . 35 27 16 10Merchandise held for resale, net . . . . . . . . . . . . . . . . . . . . . . . . . . . . . . . . . . . 22 29 2 3
$ 136 $ 134 $ 50 $ 39
The amount of inventories recognised as a cost or expense during fiscal 2010 and 2009 was $1.2 billion and $980million, respectively.
21
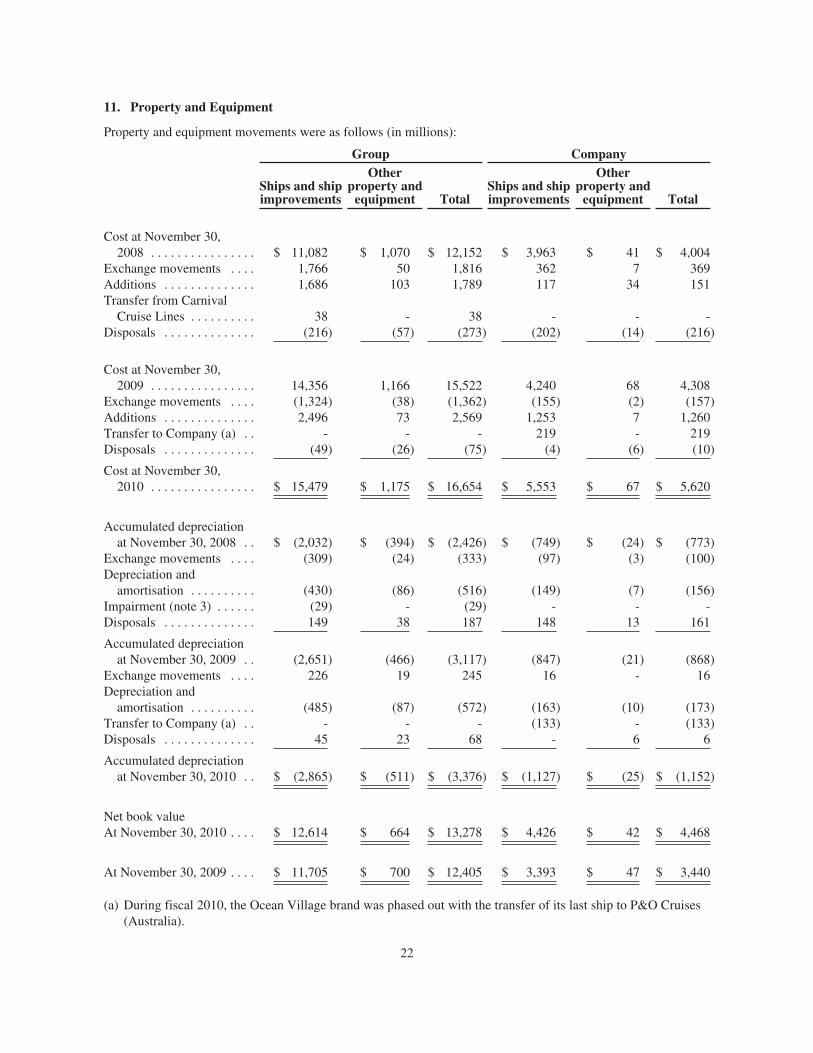
11. Property and Equipment
Property and equipment movements were as follows (in millions):
Group Company
Ships and shipimprovements
Otherproperty and
equipment TotalShips and shipimprovements
Otherproperty and
equipment Total
Cost at November 30,2008 . . . . . . . . . . . . . . . . $ 11,082 $ 1,070 $ 12,152 $ 3,963 $ 41 $ 4,004
Exchange movements . . . . 1,766 50 1,816 362 7 369Additions . . . . . . . . . . . . . . 1,686 103 1,789 117 34 151Transfer from Carnival
Cruise Lines . . . . . . . . . . 38 - 38 - - -Disposals . . . . . . . . . . . . . . (216) (57) (273) (202) (14) (216)
Cost at November 30,2009 . . . . . . . . . . . . . . . . 14,356 1,166 15,522 4,240 68 4,308
Exchange movements . . . . (1,324) (38) (1,362) (155) (2) (157)Additions . . . . . . . . . . . . . . 2,496 73 2,569 1,253 7 1,260Transfer to Company (a) . . - - - 219 - 219Disposals . . . . . . . . . . . . . . (49) (26) (75) (4) (6) (10)
Cost at November 30,2010 . . . . . . . . . . . . . . . . $ 15,479 $ 1,175 $ 16,654 $ 5,553 $ 67 $ 5,620
Accumulated depreciationat November 30, 2008 . . $ (2,032) $ (394) $ (2,426) $ (749) $ (24) $ (773)
Exchange movements . . . . (309) (24) (333) (97) (3) (100)Depreciation and
amortisation . . . . . . . . . . (430) (86) (516) (149) (7) (156)Impairment (note 3) . . . . . . (29) - (29) - - -Disposals . . . . . . . . . . . . . . 149 38 187 148 13 161
Accumulated depreciationat November 30, 2009 . . (2,651) (466) (3,117) (847) (21) (868)
Exchange movements . . . . 226 19 245 16 - 16Depreciation and
amortisation . . . . . . . . . . (485) (87) (572) (163) (10) (173)Transfer to Company (a) . . - - - (133) - (133)Disposals . . . . . . . . . . . . . . 45 23 68 - 6 6
Accumulated depreciationat November 30, 2010 . . $ (2,865) $ (511) $ (3,376) $ (1,127) $ (25) $ (1,152)
Net book valueAt November 30, 2010 . . . . $ 12,614 $ 664 $ 13,278 $ 4,426 $ 42 $ 4,468
At November 30, 2009 . . . . $ 11,705 $ 700 $ 12,405 $ 3,393 $ 47 $ 3,440
(a) During fiscal 2010, the Ocean Village brand was phased out with the transfer of its last ship to P&O Cruises(Australia).
22
During fiscal 2010, the Group took delivery of four new ships, AIDAblu, P&O Cruises (UK)’s Azura, CostaDeliziosa, and Cunard’s Queen Elizabeth, and made stage payments for ships under construction.
At November 30, 2010 and 2009, ships under construction included above totalled $403 million and $516million, respectively. At November 30, 2010 and 2009, the net book value of ship assets is after deductinggovernment construction grants of $172 million and $206 million, respectively. At November 30, 2010 and 2009,the book value of our land was $24 million and $25 million, respectively.
12. Intangibles
Intangible movements were as follows (in millions):
Group CompanyGoodwill Trademarks Total Goodwill
At November 30, 2008 . . . . . . . . . . . . . . . . . . . . . . . . . . . . . . . $ 805 $ 32 $ 837 $ 169Exchange movements . . . . . . . . . . . . . . . . . . . . . . . . . . . . . . . . 148 5 153 12
At November 30, 2009 . . . . . . . . . . . . . . . . . . . . . . . . . . . . . . . 953 37 990 181Exchange movements . . . . . . . . . . . . . . . . . . . . . . . . . . . . . . . . (113) (3) (116) (10)
At November 30, 2010 . . . . . . . . . . . . . . . . . . . . . . . . . . . . . . . $ 840 $ 34 $ 874 $ 171
Our trademark balances relate to Ibero and have an indefinite useful life. We performed an annual impairmentreview as of July 31, 2010 by comparing the estimated recoverable amount of Ibero’s trademarks to theircarrying values. Ibero’s trademark recoverable amounts exceeded their carrying values and, therefore, were notimpaired. We estimated the recoverable amounts based upon a discounted future cash flow analysis, whichestimated the amount of royalties that we are relieved from having to pay for the use of Ibero’s trademarks, basedupon forecasted cruise revenues and royalty rates that a market participant would forecast. The royalty rate wasestimated primarily using comparable royalty agreements for similar industries.
At November 30, 2010 and 2009, each of our CGUs’ or cruise brands’ goodwill balance was as follows: AIDA,$153 million (2009 $172 million), Costa, $363 million (2009 $426 million), Cunard, $171 million (2009 $181million) and Ibero, $153 million (2009 $174 million). As of July 31, 2010, we performed our annual impairmentreviews to assess the recoverable amount of each cruise brand’s goodwill. For the July 31, 2010 impairmentreviews, the estimated recoverable amounts were based on the higher of the cruise brand’s fair value less costs tosell and its value in use. Fair values were determined using 10-year discounted future cash flow analysis, at theestimated weighted-average cost of capital for comparable publicly-traded companies, adjusted for the riskattributable to the cruise brand including the geographic region in which it operates. These annual impairmentreviews resulted in no impairments.
The principal assumptions used in our cash flow analysis related to forecasting future operating results includingthe following:
- net revenue yields and net cruise costs including fuel prices;- capacity changes, including the expected deployment of vessels into, or out of, the cruise brand;- weighted-average cost of capital, which ranged from 10% to 12%; and- terminal values.
The cash flows were estimated based on those a market participant would expect to derive from thebusinesses. For all the cruise brands, we used past experience, among other things, in determining an estimate offuture cash flows. However, our forecasted net revenue yield increase for Ibero was higher than Ibero’s pastexperience primarily as a result of expected improvements in the vacation markets from which Ibero primarilysources its guests, and operational and other efficiencies derived from the continuing restructuring of Ibero.
23
We believe the impairment reviews demonstrated significant headroom over each of our cruise brand’srecoverable amounts, except for Ibero. At July 31, 2010 and September 30, 2009, Ibero’s IFRS recoverableamount exceeded its carrying value by 10.6%, or $68 million and 3.5%, or $24 million, respectively. It should benoted that the IFRS carrying value is higher than the U.S. GAAP carrying value, as a result of a higher IFRS shipcost basis arising from the sale of Carnival Cruise Lines’ Celebration to Ibero in May 2008. Therefore, the U.S.GAAP headroom was $73 million and $84 million higher than the IFRS headroom at July 31, 2010 andSeptember 30, 2009, respectively.
We performed a sensitivity analysis to identify the magnitude of the changes to Ibero’s principal discounted cashflow assumptions that would eliminate this excess. Based on this analysis, relatively minor changes to theseassumptions would lead to an Ibero impairment.
Given the weakness of the Spanish economy and its impact on the vacation industry, it is possible that Ibero’sgoodwill could become impaired in the future if the Spanish vacation industry does not recover enough to enableIbero to increase its cruise pricing. The recoverability of Ibero’s goodwill is not without doubt because it isdifficult to predict the timing of the resurgence of the Spanish economy and its vacation industry. The status ofthe Ibero operation will continue to be periodically monitored.
There have not been any events or circumstances subsequent to July 31, 2010, which we believe would require usto perform interim goodwill or trademark impairment reviews.
13. Other Assets
Other assets were as follows (in millions):
Group CompanyNovember 30,
2010 2009 2010 2009
Other receivables, including VAT, and insurance recoverables . . . . . . . . . . . $ 101 $ 72 $ 2 $ -Deferred taxes . . . . . . . . . . . . . . . . . . . . . . . . . . . . . . . . . . . . . . . . . . . . . . . . . 47 22 7 5Prepaid expenses and other . . . . . . . . . . . . . . . . . . . . . . . . . . . . . . . . . . . . . . . 36 41 21 26Income taxes receivable . . . . . . . . . . . . . . . . . . . . . . . . . . . . . . . . . . . . . . . . . 31 39 - 2Derivative contract receivables . . . . . . . . . . . . . . . . . . . . . . . . . . . . . . . . . . . . 11 - 11 -
$ 226 $ 174 $ 41 $ 33
Substantially all deferred tax assets relate to net operating losses expected to be recovered against future taxableincome. At November 30, 2010 and 2009, the Group had gross deferred tax assets of $132 million and $82million, respectively, which were not recognized.
14. Investments in Subsidiaries
Investments in subsidiaries movements were as follows (in millions):
At November 30, 2008 . . . . . . . . . . . . . . . . . . . . . . . . . . . . . . . . . . . . . . . . . . . . . . . . . . . . . . . . . . . . . . . $ 5,091Exchange movements . . . . . . . . . . . . . . . . . . . . . . . . . . . . . . . . . . . . . . . . . . . . . . . . . . . . . . . . . . . . . . . . 382Additions . . . . . . . . . . . . . . . . . . . . . . . . . . . . . . . . . . . . . . . . . . . . . . . . . . . . . . . . . . . . . . . . . . . . . . . . . 208
At November 30, 2009 . . . . . . . . . . . . . . . . . . . . . . . . . . . . . . . . . . . . . . . . . . . . . . . . . . . . . . . . . . . . . . . 5,681Exchange movements . . . . . . . . . . . . . . . . . . . . . . . . . . . . . . . . . . . . . . . . . . . . . . . . . . . . . . . . . . . . . . . . (315)
At November 30, 2010 . . . . . . . . . . . . . . . . . . . . . . . . . . . . . . . . . . . . . . . . . . . . . . . . . . . . . . . . . . . . . . . $ 5,366
24

During fiscal 2009, the ownership of Grand Celebration Sociedade Unipessoal Lda was transferred from ourwholly owned subsidiary, Società di Crociere Jupiter S.r.l., to the Company. The purchase price for thisinvestment was $204 million, and further details are included in note 23.
At November 30, 2010, the Company’s principal operating subsidiary was Costa Crociere S.p.A., which isincorporated in Italy and is 99.98% directly owned by the Company. This subsidiary owns and operates the Costaand AIDA cruise brands.
The full information for all of the Carnival plc subsidiaries will be annexed to the Company’s next annual return.
25
15. Debt
Long-term debt and short-term borrowings consisted of the following (in millions):
Group CompanyNovember 30,
2010 2009 2010 2009
Long-Term DebtSecured Debt . . . . . . . . . . . . . . . . . . . . . . . . . . . . . . . . . . . . . . . . . $ 1 $ 1 $ - $ -Unsecured Debt
Export Credit FacilitiesFixed rate . . . . . . . . . . . . . . . . . . . . . . . . . . . . . . . . . . . . . . . . . 450 513 450 513Euro fixed rate . . . . . . . . . . . . . . . . . . . . . . . . . . . . . . . . . . . . . 467 278 - -Euro floating rate . . . . . . . . . . . . . . . . . . . . . . . . . . . . . . . . . . . 190 244 190 244
Bank LoansFixed rate . . . . . . . . . . . . . . . . . . . . . . . . . . . . . . . . . . . . . . . . . 149 149 149 149Euro fixed rate . . . . . . . . . . . . . . . . . . . . . . . . . . . . . . . . . . . . . 11 38 11 38Floating rate . . . . . . . . . . . . . . . . . . . . . . . . . . . . . . . . . . . . . . . 149 99 - 99Euro floating rate . . . . . . . . . . . . . . . . . . . . . . . . . . . . . . . . . . . 126 - 126 -
RevolverFloating rate . . . . . . . . . . . . . . . . . . . . . . . . . . . . . . . . . . . . . . . - 138 - -
Private Placement NotesEuro fixed rate . . . . . . . . . . . . . . . . . . . . . . . . . . . . . . . . . . . . . 246 278 - -
Publicly-Traded NotesEuro fixed rate . . . . . . . . . . . . . . . . . . . . . . . . . . . . . . . . . . . . . 989 1,117 989 1,117Sterling fixed rate . . . . . . . . . . . . . . . . . . . . . . . . . . . . . . . . . . 316 329 316 329
Other . . . . . . . . . . . . . . . . . . . . . . . . . . . . . . . . . . . . . . . . . . . . . . 2 2 - -
Long-Term Debt . . . . . . . . . . . . . . . . . . . . . . . . . . . . . . . . . . . . . . 3,096 3,186 2,231 2,489
Current Portion of Long-Term DebtUnsecured Debt
Export Credit FacilitiesFixed rate . . . . . . . . . . . . . . . . . . . . . . . . . . . . . . . . . . . . . . . . . 67 67 67 67Euro fixed rate . . . . . . . . . . . . . . . . . . . . . . . . . . . . . . . . . . . . . 39 25 - -Euro floating rate . . . . . . . . . . . . . . . . . . . . . . . . . . . . . . . . . . . 26 30 26 30
Bank LoansFixed rate . . . . . . . . . . . . . . . . . . . . . . . . . . . . . . . . . . . . . . . . . 1 1 - 1Euro fixed rate . . . . . . . . . . . . . . . . . . . . . . . . . . . . . . . . . . . . . 23 26 23 26
RevolverFloating rate . . . . . . . . . . . . . . . . . . . . . . . . . . . . . . . . . . . . . . . 5 74 - -Euro floating rate . . . . . . . . . . . . . . . . . . . . . . . . . . . . . . . . . . . - 52 - 52
Private Placement NotesEuro fixed rate . . . . . . . . . . . . . . . . . . . . . . . . . . . . . . . . . . . . . 2 2 - -
Publicly-Traded Notes . . . . . . . . . . . . . . . . . . . . . . . . . . . . . . .Euro fixed rate . . . . . . . . . . . . . . . . . . . . . . . . . . . . . . . . . . . . . 1 1 1 1Sterling fixed rate . . . . . . . . . . . . . . . . . . . . . . . . . . . . . . . . . . 10 10 10 10
Current Portion of Long-Term Debt . . . . . . . . . . . . . . . . . . . . . . 174 288 127 187
Short-Term BorrowingsCommercial paper . . . . . . . . . . . . . . . . . . . . . . . . . . . . . . . . . . . . 355 - 355 -Euro bank loans . . . . . . . . . . . . . . . . . . . . . . . . . . . . . . . . . . . . . . 45 39 - -
Short-Term Borrowings . . . . . . . . . . . . . . . . . . . . . . . . . . . . . . . . 400 39 355 -
Total Debt . . . . . . . . . . . . . . . . . . . . . . . . . . . . . . . . . . . . . . . . . . . . $ 3,670 $ 3,513 $ 2,713 $ 2,676
26
At November 30, 2010, the Group and Company’s debt decreased $267 million and $192 million as a result ofthe change in currency exchange rates of the U.S. dollar to the euro and sterling at November 30, 2010 comparedto November 30, 2009.
The previous debt table does not include the impact of our foreign currency and interest rate swaps. Amountsfalling due within one year include accrued interest. At November 30, 2010 and 2009, total debt in the Groupincludes $896 million and $676 million, respectively, of floating rate debt and in the Company includes $697million and $425 million, respectively, of floating rate debt. The floating rate is based on LIBOR orEURIBOR. Further detail relating to the Group’s policies on managing currency and interest rate risks andadditional information on debt and committed financings are provided in notes 5 and 10 of the CarnivalCorporation & plc financial statements and within the MD&A section of the DLC Annual Report and notes 1 and26.
Scheduled annual maturities of our debt were as follows (in millions):
Group CompanyNovember 30,
Fiscal 2010 2009 2010 2009
2010 . . . . . . . . . . . . . . . . . . . . . . . . . . . . . . . . . . . . . . . . . . . . . . . . . $ 327 $ 1872011 . . . . . . . . . . . . . . . . . . . . . . . . . . . . . . . . . . . . . . . . . . . . . . . . . $ 574 136 $ 482 1162012 . . . . . . . . . . . . . . . . . . . . . . . . . . . . . . . . . . . . . . . . . . . . . . . . . 505 755 414 5312013 . . . . . . . . . . . . . . . . . . . . . . . . . . . . . . . . . . . . . . . . . . . . . . . . . 1,264 1,229 1,079 1,2122014 . . . . . . . . . . . . . . . . . . . . . . . . . . . . . . . . . . . . . . . . . . . . . . . . . 427 292 366 2412015 . . . . . . . . . . . . . . . . . . . . . . . . . . . . . . . . . . . . . . . . . . . . . . . . . 124 112 88 92Thereafter . . . . . . . . . . . . . . . . . . . . . . . . . . . . . . . . . . . . . . . . . . . . 776 662 284 297
$ 3,670 $ 3,513 $ 2,713 $ 2,676
Debt is denominated in three currencies, including the effect of foreign currency swaps, as follows (in millions):
Group CompanyNovember 30,
2010 2009 2010 2009
Euro . . . . . . . . . . . . . . . . . . . . . . . . . . . . . . . . . . . . . . . . . . . . . . . . . $ 2,165 $ 2,130 $ 1,366 $ 1,508U.S. dollar . . . . . . . . . . . . . . . . . . . . . . . . . . . . . . . . . . . . . . . . . . . . 1,179 1,044 1,021 829Sterling . . . . . . . . . . . . . . . . . . . . . . . . . . . . . . . . . . . . . . . . . . . . . . 326 339 326 339
$ 3,670 $ 3,513 $ 2,713 $ 2,676
16. Other Long-Term Liabilities
Other long-term liabilities were as follows (in millions):
Group CompanyNovember 30,
2010 2009 2010 2009
Income taxes . . . . . . . . . . . . . . . . . . . . . . . . . . . . . . . . . . . . . . . . . . . . . . . . . . $ 52 $ 41 $ 6 $ 6Deferred income taxes . . . . . . . . . . . . . . . . . . . . . . . . . . . . . . . . . . . . . . . . . . . 42 53 - -Post-employment benefits (note 22) . . . . . . . . . . . . . . . . . . . . . . . . . . . . . . . . 42 77 - 40Derivative contracts . . . . . . . . . . . . . . . . . . . . . . . . . . . . . . . . . . . . . . . . . . . . . - 20 - 20Other . . . . . . . . . . . . . . . . . . . . . . . . . . . . . . . . . . . . . . . . . . . . . . . . . . . . . . . . 52 53 32 31
$ 188 $ 244 $ 38 $ 97
27
Deferred income tax liabilities are principally related to differences between the (1) book and tax methods ofcalculating depreciation expense in our Holland America Princes Alaska Tours business and other NorthAmerica operations and (2) the timing of recognizing our Cozumel, Mexico port hurricane insurance settlement.
Other liabilities of the Group and Company primarily include liabilities for contractual disputes and propertylease obligations. These lease obligations are expected to be settled over their term. The Group’s other liabilitiesalso include guest and crew provisions.
17. Share Capital
The issued and fully paid Carnival plc ordinary share capital was as follows (dollars in millions):
No. of SharesShare
Capital
At November 30, 2008 . . . . . . . . . . . . . . . . . . . . . . . . . . . . . . . . . . . . . . . . . . . . . . . . . . . 213,241,941 $ 354Shares issued . . . . . . . . . . . . . . . . . . . . . . . . . . . . . . . . . . . . . . . . . . . . . . . . . . . . . . . . . . 91,835 -
At November 30, 2009 . . . . . . . . . . . . . . . . . . . . . . . . . . . . . . . . . . . . . . . . . . . . . . . . . . . 213,333,776 354Shares issued . . . . . . . . . . . . . . . . . . . . . . . . . . . . . . . . . . . . . . . . . . . . . . . . . . . . . . . . . . 206,953 1
At November 30, 2010 . . . . . . . . . . . . . . . . . . . . . . . . . . . . . . . . . . . . . . . . . . . . . . . . . . . 213,540,729 $ 355
During fiscal 2010 and 2009, the Company issued 174,274 and 54,646 ordinary shares following the exercise ofshare options, for total consideration of $4 million and $2 million, and for the issuance of restricted share awardsand RSUs, issued 20,002 and 18,269 ordinary shares to a former executive in connection with his deferred bonusplan and issued 12,677 and 18,920 ordinary shares in connection with the Carnival plc Employee Stock PurchasePlan, respectively. In addition, 100,000 shares were issued in fiscal 2009 to the Carnival plc Employee BenefitTrust, which is not included above as they were recorded as treasury stock.
The Company has 50,000 allotted but unissued redeemable preference shares of £1 each. These redeemablepreference shares are entitled to a cumulative fixed dividend of 8% per annum. The preference shares, whichcarry no voting rights, rank behind other classes of shares in relation to the payment of capital on certain types ofdistributions from the Company. The Company also has two allotted and issued subscriber shares of £1 each, thatcarry no voting rights and no right to receive any dividend or any amount paid on a return of capital. Finally, theCompany has one special voting share of £1 issued to Carnival Corporation in connection with the DLCtransaction to enable Carnival Corporation’s shareholders to vote as a group on Company shareholder matters.
Details of options over ordinary shares and RSUs granted to employees and other restricted share awards tosenior managers are discussed in note 21.
18. Other Reserves
The Group merger reserve relates to the difference between the book value and the fair value of certainbusinesses sold to Carnival Corporation during fiscal 2004 as part of a DLC corporate restructuring, which wasaccounted for as a group reconstruction.
At November 30, 2010 and 2009, the Carnival plc Employee Benefit Trust held 55,697 and 98,106 ordinaryshares of Carnival plc, respectively, with an aggregate par value of $0.1 million and $0.2 million, respectively.At November 30, 2010 and 2009, the market value of these shares was $2 million and $3 million, respectively. Ifthey had been sold at this market value there would have been no tax liability in either fiscal 2010 or 2009 on thecapital gain arising from the sale. The costs of administering the Carnival plc Employee Benefit Trust arecharged to expense as incurred.
Refer to the Statements of Changes in Shareholders’ Equity for movements in capital and other reserves.
28
19. Acquisition
In July 2009, Costa Crociere S.p.A completed the purchase of the remaining 25% interest in Ibero that it did notown for $33 million, which approximated this minority interest’s carrying value, and recorded this payment as areduction to minority interests that is included within share premium.
The amounts of our minority interests were only $3 million at November 30, 2010 and 2009 and, therefore, we haveincluded them within share premium rather than presenting them as a separate component of shareholders’ equity.
20. Key Management
The aggregate compensation of the Group’s key management was as follows (in millions):
Years Ended November 30,2010 2009
Fees . . . . . . . . . . . . . . . . . . . . . . . . . . . . . . . . . . . . . . . . . . . . . . . . . . . . . . . . . . . . . . $ 1 $ 1Salaries and benefits . . . . . . . . . . . . . . . . . . . . . . . . . . . . . . . . . . . . . . . . . . . . . . . . . 4 4Performance related bonuses . . . . . . . . . . . . . . . . . . . . . . . . . . . . . . . . . . . . . . . . . . 7 6
Total short-term employment benefits . . . . . . . . . . . . . . . . . . . . . . . . . . . . . . . . . . . 12 11Share-based compensation . . . . . . . . . . . . . . . . . . . . . . . . . . . . . . . . . . . . . . . . . . . . 8 12
$ 20 $ 23
The key management, which consists of the Boards of Directors, has responsibility and authority for controlling,directing and planning Carnival plc’s activities. Their aggregate compensation includes amounts paid by bothCarnival Corporation and Carnival plc.
Further details on directors’ remuneration, including share options, restricted share awards, RSUs, long-termincentive plans and pension entitlements, are set out in Parts I and II of the Directors’ Remuneration Report. Duringfiscal 2010 and 2009, no directors made gains on the exercise of options over Carnival plc ordinary shares.
21. Employees
The average number of our employees was as follows:
Years Ended November 30,2010 2009
Shore staff . . . . . . . . . . . . . . . . . . . . . . . . . . . . . . . . . . . . . . . . . . . . . . . . . . . . . . . . . 8,016 8,407Sea staff . . . . . . . . . . . . . . . . . . . . . . . . . . . . . . . . . . . . . . . . . . . . . . . . . . . . . . . . . . 27,421 24,050
35,437 32,457
The aggregate payroll and related expenses included in both cruise operating expenses and selling andadministrative expenses were as follows (in millions):
Years Ended November 30,2010 2009
Salaries, wages and benefits . . . . . . . . . . . . . . . . . . . . . . . . . . . . . . . . . . . . . . . . . . . $ 714 $ 709Social security and payroll taxes . . . . . . . . . . . . . . . . . . . . . . . . . . . . . . . . . . . . . . . 24 24Pensions . . . . . . . . . . . . . . . . . . . . . . . . . . . . . . . . . . . . . . . . . . . . . . . . . . . . . . . . . . 24 11Share-based compensation . . . . . . . . . . . . . . . . . . . . . . . . . . . . . . . . . . . . . . . . . . . . 10 10
$ 772 $ 754
29
Share-based compensation included $0.6 million in fiscal 2010 and $0.7 million in fiscal 2009 that wererecharged by Carnival Corporation in respect of options and RSUs granted over Carnival Corporation commonstock to certain U.S.-based Carnival plc Group employees.
Equity Plans
Share options over Carnival plc ordinary shares, granted under the Carnival plc 2005 Employee Share Plan andthe Carnival plc Executive Share Option Plan, typically vest three years after the date of the grant, provided theemployee remains employed within Carnival Corporation & plc or upon the grantee becoming retirementeligible, and have maximum terms of up to 7 years for options granted after October 2006. Options granted priorto October 2006 have maximum terms of up to 10 years. The number and weighted-average exercise price ofCarnival plc options were as follows:
2010 2009
Number ofoptions
Weighted-averageexercise
priceNumber of
options
Weighted-averageexercise
price
Outstanding at December 1, . . . . . . . . . . . . . . . . . . . . . . . . 2,785,375 $ 48.18 2,984,404 $ 47.80Exercised . . . . . . . . . . . . . . . . . . . . . . . . . . . . . . . . . . . . . . (174,274) $ 21.64 (54,646) $ 25.87Forfeited or expired . . . . . . . . . . . . . . . . . . . . . . . . . . . . . . (99,168) $ 30.70 (144,383) $ 48.88
Outstanding at November 30, . . . . . . . . . . . . . . . . . . . . . . . 2,511,933 $ 41.46 2,785,375 $ 48.18
Exercisable at November 30, . . . . . . . . . . . . . . . . . . . . . . . 2,376,054 $ 41.09 2,635,850 $ 47.94
The exercise price range and weighted-average remaining life of outstanding options at November 30, 2010 wereas follows:
Number ofoptions
Weighted-average
remaininglife (years)
$10.00 to $19.99 . . . . . . . . . . . . . . . . . . . . . . . . . . . . . . . . . . . . . . . . . . . . . . . . . . . . . . . 10,080 1.0$20.00 to $29.99 . . . . . . . . . . . . . . . . . . . . . . . . . . . . . . . . . . . . . . . . . . . . . . . . . . . . . . . 275,976 2.0$30.00 to $39.99 . . . . . . . . . . . . . . . . . . . . . . . . . . . . . . . . . . . . . . . . . . . . . . . . . . . . . . . 891,002 1.8$40.00 to $49.99 . . . . . . . . . . . . . . . . . . . . . . . . . . . . . . . . . . . . . . . . . . . . . . . . . . . . . . . 1,334,875 3.3
Total . . . . . . . . . . . . . . . . . . . . . . . . . . . . . . . . . . . . . . . . . . . . . . . . . . . . . . . . . . . . . . . . 2,511,933 2.6
Since 2008, the Compensation Committees of the Boards of Directors have granted only restricted share awardsand RSUs.
The Group awarded 254,870 and 388,247 RSUs in fiscal 2010 and 2009, respectively, to certain officers andemployees. RSUs vest after three years. The Group also operates the Carnival plc Deferred Bonus andCo-Investment Matching Plan, under which certain senior managers were able to invest a percentage of theirannual bonus into Carnival plc ordinary shares, with a view to receiving a matching award if certainpredetermined performance targets are achieved. The compensation expense related to these RSUs and shareawards is calculated by reference to the Carnival plc share price on the date of grant and expensed over thevesting period. The Group ceased allowing any of its employees to participate in the Carnival plc Deferred Bonusand Co-Investment Matching Plan, and the last awards included within this plan were issued in February2008. The eligibility for the plan matching of these last awards was not met.
30
Awards of RSUs do not receive dividends or have voting rights. Each RSU awarded is credited with dividendequivalents equal to the value of cash and stock dividends, if any, paid on Carnival plc ordinary shares, and forawards granted prior to December 1, 2008, interest is credited on the amount of cash dividend equivalents at arate of 2% per annum. The cash and stock dividend equivalents will be, if any, distributed upon the settlement ofthe RSUs upon vesting.
The obligations underlying our stock options and restricted stock are settled through the issuance of Carnival plcordinary shares.
22. Post-Employment Benefits
Employee Benefit Plans
Carnival plc is a contributing employer to two pension plans, the P&O Cruises (UK) pension plan (“UK Plan”)and the multiemployer Merchant Navy Officers Pension Fund (“MNOPF” or “Fund”). These defined benefitplans are formally valued triennially by independent qualified actuaries.
The Company’s UK Plan’s assets are managed on behalf of the trustee by independent fund managers. This planis closed to new membership. The UK Plan is funded pursuant to UK regulations.
The MNOPF is a funded defined benefit multiemployer plan in which British officers employed by companieswithin the Group have participated and continue to participate. This plan is closed to new membership. TheMNOPF is divided into two sections, the “New Section” and the “Old Section,” each of which covers a differentgroup of participants. The New Section was the subject of a court ruling in 2005 which established, at that time,the allocation of the fund to participating employers and, accordingly, this New Section of the plan is accountedfor as a defined benefit plan.
The Old Section has been closed to benefit accrual since 1978 and covers predecessor employers’ officersemployed prior to 1978. The Group’s share, if any, of the Old Section is currently not known. At November 30,2010 and 2009, we believe the plan has a surplus. If the Old Section has a funding deficit in the future, then itcould result in the fund’s trustee invoicing us for amounts, if they believe the Fund requires furthercontributions. As long as there continues to be significant uncertainty over the participating employers’ share ofany funding requirements, the Group will account for this Old Section on a contribution basis, until theunderlying assets and liabilities of the Old Section, and the Group’s share of this deficit, are able to be identifiedon a consistent and reasonable basis.
The recorded assets and liabilities on the Group’s balance sheets for the UK Plan, the Group’s share of theMNOPF New Section and other post-employment benefit liabilities were as follows (in millions):
November 30,2010 2009
Long-term assetsEmployee benefit plan surplus . . . . . . . . . . . . . . . . . . . . . . . . . . . . . . . . . . . . . . . . . . . . . . . . . . . . $ 1 $ -
Long-term liabilitiesEmployee benefit plan deficits . . . . . . . . . . . . . . . . . . . . . . . . . . . . . . . . . . . . . . . . . . . . . . . . . . . . $ - $ 40Other post-employment benefits . . . . . . . . . . . . . . . . . . . . . . . . . . . . . . . . . . . . . . . . . . . . . . . . . . . 42 37
$ 42 $ 77
The employee benefit plan information provided below relates to the UK Plan and the Group’s share of theMNOPF New Section.
31
The pension liabilities for accounting purposes were calculated at November 30, 2010 and 2009 by the Group’squalified actuary. The principal assumptions used were as follows:
UK Plan (%)MNOPF
New Section (%)2010 2009 2010 2009
Discount rates . . . . . . . . . . . . . . . . . . . . . . . . . . . . . . . . . . . . . . . . . . . . . . . . . . 5.5 5.4 5.5 5.4Expected rates of salary increases . . . . . . . . . . . . . . . . . . . . . . . . . . . . . . . . . . 5.0 5.0 5.0 5.0Pension increases
Deferment . . . . . . . . . . . . . . . . . . . . . . . . . . . . . . . . . . . . . . . . . . . . . . . . . . . 2.8 3.5 2.8 3.5Payment . . . . . . . . . . . . . . . . . . . . . . . . . . . . . . . . . . . . . . . . . . . . . . . . . . . . 3.4 3.5 3.4 3.5
Inflation . . . . . . . . . . . . . . . . . . . . . . . . . . . . . . . . . . . . . . . . . . . . . . . . . . . . . . 3.5 3.5 3.5 3.5Expected rates of return on plan assets . . . . . . . . . . . . . . . . . . . . . . . . . . . . . . 5.8 5.6 6.7 6.7
Assumptions regarding future mortality experience are set based on the Self Administered Pension Schemestables for the “base” mortality tables. The weighted-average life expectancy in years of a 65-year old pensioneron the balance sheet dates was as follows:
November 30,2010 2009
Male . . . . . . . . . . . . . . . . . . . . . . . . . . . . . . . . . . . . . . . . . . . . . . . . . . . . . . . . . . . . . . . . . . . . . . . . . 21.9 19.4Female . . . . . . . . . . . . . . . . . . . . . . . . . . . . . . . . . . . . . . . . . . . . . . . . . . . . . . . . . . . . . . . . . . . . . . . 24.3 23.0
The weighted-average life expectancy in years of a 45-year old future pensioner retiring at age 65 was as follows:
November 30,2010 2009
Male . . . . . . . . . . . . . . . . . . . . . . . . . . . . . . . . . . . . . . . . . . . . . . . . . . . . . . . . . . . . . . . . . . . . . . . . . 24.0 20.8Female . . . . . . . . . . . . . . . . . . . . . . . . . . . . . . . . . . . . . . . . . . . . . . . . . . . . . . . . . . . . . . . . . . . . . . . 26.3 24.6
With regard to the UK plan, management considers the types of investment classes in which pension plan assetsare invested and the expected compound return that the portfolio can reasonably be expected to earn over time,based on long-term real rates of return experienced in the respective markets.
The amounts recognised in the balance sheets for these plans were determined as follows (in millions):
November 30,2010 2009 2008 2007 2006
Present value of obligations . . . . . . . . . . . . . . . . . . . . . . . . . $ (306) $ (307) $ (183) $ (274) $ (257)Fair value of plans’ assets . . . . . . . . . . . . . . . . . . . . . . . . . . . 307 267 190 296 220
Net assets (liabilities) recognised in the balance sheets . . . . $ 1 $ (40) $ 7 $ 22 $ (37)
Actuarial gains and losses for these plans were as follows (in millions):
Fiscal2010 2009 2008 2007 2006
Gains (losses) on plans’ liabilities . . . . . . . . . . . . . . . . . . . . . . . . . . $ 19 $ (86) $ 28 $ (16) $ (10)(Losses) gains on plans’ assets, including restriction on assets . . . . (3) 27 (41) 12 5
$ 16 $ (59) $ (13) $ (4) $ (5)
32
The cumulative actuarial losses recognised in the accompanying Statements of Shareholder’s Equity atNovember 30, 2010 and 2009 for these plans were $24 million and $40 million, respectively.
The amounts recognised in the accompanying Group Statements of Income for these plans were as follows (inmillions):
Years endedNovember 30,
2010 2009
Current service cost . . . . . . . . . . . . . . . . . . . . . . . . . . . . . . . . . . . . . . . . . . . . . . . . . . . . . . . $ 7 $ 4Interest cost . . . . . . . . . . . . . . . . . . . . . . . . . . . . . . . . . . . . . . . . . . . . . . . . . . . . . . . . . . . . . 15 13Expected return on plan assets . . . . . . . . . . . . . . . . . . . . . . . . . . . . . . . . . . . . . . . . . . . . . . (15) (14)Past service cost . . . . . . . . . . . . . . . . . . . . . . . . . . . . . . . . . . . . . . . . . . . . . . . . . . . . . . . . . - 1
Total included within payroll and related expenses . . . . . . . . . . . . . . . . . . . . . . . . . . . . . . $ 7 $ 4
The estimated contributions expected to be paid into these plans during fiscal 2011 are $6 million, excludingMNOPF New Section special assessments, if any.
Analysis of the movements in the balance sheet assets (liabilities) for these plans was as follows (in millions):
2010 2009
Net (liabilities) assets at December 1, . . . . . . . . . . . . . . . . . . . . . . . . . . . . . . . . . . . . . . . . . . . . . $ (40) $ 7Exchange movements . . . . . . . . . . . . . . . . . . . . . . . . . . . . . . . . . . . . . . . . . . . . . . . . . . . . . . . . . . 2 9Expenses (see above) . . . . . . . . . . . . . . . . . . . . . . . . . . . . . . . . . . . . . . . . . . . . . . . . . . . . . . . . . . (7) (4)Amounts recognised in the accompanying Group Statements of Comprehensive Income . . . . . 16 (59)Employer contributions . . . . . . . . . . . . . . . . . . . . . . . . . . . . . . . . . . . . . . . . . . . . . . . . . . . . . . . . 30 7
Net assets (liabilities) at November 30, . . . . . . . . . . . . . . . . . . . . . . . . . . . . . . . . . . . . . . . . . . . . $ 1 $ (40)
Changes in the present value of defined benefit obligations for these plans were as follows (in millions):
2010 2009
Present value of obligations at December 1, . . . . . . . . . . . . . . . . . . . . . . . . . . . . . . . . . . . . . . . . $ 307 $ 183Exchange movements . . . . . . . . . . . . . . . . . . . . . . . . . . . . . . . . . . . . . . . . . . . . . . . . . . . . . . . . . (16) 4Current service cost . . . . . . . . . . . . . . . . . . . . . . . . . . . . . . . . . . . . . . . . . . . . . . . . . . . . . . . . . . . 7 4Interest cost . . . . . . . . . . . . . . . . . . . . . . . . . . . . . . . . . . . . . . . . . . . . . . . . . . . . . . . . . . . . . . . . . 15 13Contributions from employees . . . . . . . . . . . . . . . . . . . . . . . . . . . . . . . . . . . . . . . . . . . . . . . . . . 1 1Past service cost . . . . . . . . . . . . . . . . . . . . . . . . . . . . . . . . . . . . . . . . . . . . . . . . . . . . . . . . . . . . . - 1Benefits paid . . . . . . . . . . . . . . . . . . . . . . . . . . . . . . . . . . . . . . . . . . . . . . . . . . . . . . . . . . . . . . . . (10) (8)Actuarial (gains) losses on plan liabilities . . . . . . . . . . . . . . . . . . . . . . . . . . . . . . . . . . . . . . . . . (19) 86Adjustment in Group share of MNOPF . . . . . . . . . . . . . . . . . . . . . . . . . . . . . . . . . . . . . . . . . . . 21 23
Present value of obligations at November 30, . . . . . . . . . . . . . . . . . . . . . . . . . . . . . . . . . . . . . . $ 306 $ 307
33
Changes in the fair value of these plans’ assets were as follows (in millions):
2010 2009
Fair value of plans’ assets at December 1, . . . . . . . . . . . . . . . . . . . . . . . . . . . . . . . . . . . . . . . . . $ 267 $ 190Exchange movements . . . . . . . . . . . . . . . . . . . . . . . . . . . . . . . . . . . . . . . . . . . . . . . . . . . . . . . . . (14) 13Expected return on plan assets . . . . . . . . . . . . . . . . . . . . . . . . . . . . . . . . . . . . . . . . . . . . . . . . . . 15 14Employer contributions . . . . . . . . . . . . . . . . . . . . . . . . . . . . . . . . . . . . . . . . . . . . . . . . . . . . . . . . 30 7Contributions from employees . . . . . . . . . . . . . . . . . . . . . . . . . . . . . . . . . . . . . . . . . . . . . . . . . . 1 1Benefits paid . . . . . . . . . . . . . . . . . . . . . . . . . . . . . . . . . . . . . . . . . . . . . . . . . . . . . . . . . . . . . . . . (10) (8)Actuarial gains on plan assets (a) . . . . . . . . . . . . . . . . . . . . . . . . . . . . . . . . . . . . . . . . . . . . . . . . 7 27Restriction on assets . . . . . . . . . . . . . . . . . . . . . . . . . . . . . . . . . . . . . . . . . . . . . . . . . . . . . . . . . . (10) -Adjustment in Group’s share of MNOPF . . . . . . . . . . . . . . . . . . . . . . . . . . . . . . . . . . . . . . . . . . 21 23
Fair value of plans’ assets at November 30, . . . . . . . . . . . . . . . . . . . . . . . . . . . . . . . . . . . . . . . . $ 307 $ 267
(a) In fiscal 2010, the UK government announced that in the future it will use the Consumer Price Index ratherthan the Retail Prices Index for the purposes of determining statutory minimum pension increases for privatesector occupational pension plans. The Group’s UK Plan rules specify that pensions in deferment willincrease in line with the annual statutory order published by the UK government. The Group has thereforeamended its assumption for increases to pensions in deferment to reflect this change. The resulting reductionin the present value of plan liabilities of $9 million is included as a change in assumptions within othercomprehensive income in the accompanying Group Statements of Comprehensive Income.
The actual gains (losses) on these plans’ assets in fiscal 2010 and 2009 were $22 million and $41 million,respectively.
These plans’ assets were comprised as follows (in millions, except percentages):
November 30,2010 2009
% %Equities . . . . . . . . . . . . . . . . . . . . . . . . . . . . . . . . . . . . . . . . . . . . . . . . . . . . . . . . . $ 107 33.8 $ 88 33.1Property . . . . . . . . . . . . . . . . . . . . . . . . . . . . . . . . . . . . . . . . . . . . . . . . . . . . . . . . . 8 2.5 6 2.2Corporate bonds . . . . . . . . . . . . . . . . . . . . . . . . . . . . . . . . . . . . . . . . . . . . . . . . . . 73 23.0 104 39.0Fixed interest gilts . . . . . . . . . . . . . . . . . . . . . . . . . . . . . . . . . . . . . . . . . . . . . . . . . 129 40.7 69 25.7
317 267Restriction on assets . . . . . . . . . . . . . . . . . . . . . . . . . . . . . . . . . . . . . . . . . . . . . . . (10) -
$ 307 $ 267
The Company’s net pension balance represents substantially all of the Group’s funded employee benefit plans.
Other Post-Employment Benefits
At November 30, 2010 and 2009, other post-employment benefit liabilities included $13 million and $14 millionfor a deferred bonus agreement to make annual payments to a former executive director through 2019. Furtherdetails of this arrangement are included in Part II of the Directors’ Remuneration Report. In addition, underItalian employment legislation Costa is required to maintain a staff leaving indemnity. Under the indemnityemployees are entitled to receive a payment, calculated by reference to their length of service and salary up toDecember 31, 2006, if they cease employment with Costa. These payments are not conditional on employees
34
reaching normal retirement age and following amendments to the legislation generate no further benefit accrualafter December 31, 2006. At November 30, 2010 and 2009, $13 million and $18 million had been accrued as aliability by Costa, respectively.
Defined Contribution Plans
The Group has several defined contribution plans available to most of its employees. During fiscal 2010 and2009, the Group expensed $5 million and $4 million, respectively, for these plans.
23. Related Party Transactions
Group
Within the DLC, there are instances where Carnival Corporation group companies provide services to the Group,and also where the Group provides services to the Carnival Corporation group. During 2010 and 2009, the Grouppurchased $47 million and $55 million, respectively, in cruises from the Carnival Corporation group andpackaged these cruises with land tours, which were then sold by Holland America Princess Alaska Tours. Alsoduring 2010 and 2009, the Carnival Corporation group purchased $58 million and $68 million, respectively, inland tours from the Group and packaged them with cruises, which were then sold by Princess. In addition during2010 and 2009, the Group sold $22 million and $25 million, respectively, of pre and post cruise vacations, shoreexcursions and transportation services to the Carnival Corporation group. Finally, the Group participates inCarnival Corporation & plc’s group risk sharing programs related to hull and machinery and crew and guestclaim risks. These transactions represented the most significant trading relationships between the two groups.
In November 2009, the Group purchased its vessel Grand Holiday from Carnival Cruise Lines for $38 million. InMay 2008, the Group purchased its vessel Grand Celebration from Carnival Cruise Lines for $158 million. Theconsideration for both these purchases was settled in cash.
During fiscal 2010 and 2009, the Group and Company had multi-year ship charter agreements with Princess. Thetotal annual charter payments to Princess in fiscal 2010 and 2009 were $131 million and $149 million,respectively. In addition, in November 2009 Carnival FC B.V., a wholly owned subsidiary of the Company,acquired an investment in the charter rights for two vessels operated by Holland America Line for $73 million,which amount is included in “Prepaid expenses and other” in the November 30, 2009 balance sheet. These rightsentitle Carnival FC B.V. to receive a return on its investment through the collection of charter payments in anaggregate amount of $74 million over the approximate one-year term of the charter. At November 30, 2010, theamount remaining in the Carnival FC B.V. balance sheet was insignificant.
At November 30, 2010 and 2009, the Group owed $1.4 billion and $1.5 billion, respectively, to the CarnivalCorporation group, which was unsecured. Of the total Group liability to the Carnival Corporation group atNovember 30, 2010 $1.0 billion is euro-denominated, repayable on demand and bears interest, and the remainingbalance of $421 million is non-interest bearing and is also repayable on demand. During fiscal 2010, CarnivalInvestments Limited, a wholly-owned subsidiary of Carnival Corporation, sold 14.8 million shares in Carnivalplc for $545 million under the Stock Swap Program. Finally at November 30, 2010 and 2009, CarnivalCorporation owned 1,115,450, or 0.5% of the Company’s ordinary shares, which are non-voting. AtNovember 30, 2010 and 2009, Carnival Investments Limited, owned 30,375,744, or 14.2%, and 45,130,740, or21.2%, respectively, of the Company’s ordinary shares, which are also non-voting. In fiscal 2010 and 2009,Carnival Corporation and Carnival Investments Limited both waived their rights to dividends on these Carnivalplc ordinary shares.
Within the operational and organisational structure of the Group, the key management personnel, as definedunder IAS 24 “Related Party Disclosures,” is considered to consist of the directors of the Company. Details ofthe directors’ remuneration are provided in the Directors’ Remuneration Report and any relevant transactions aregiven in the “Certain Relationships and Related Party Transactions” section, both of which are included withinthe Proxy Statement. The aggregate emoluments of the Group’s key management is shown in note 20.
35
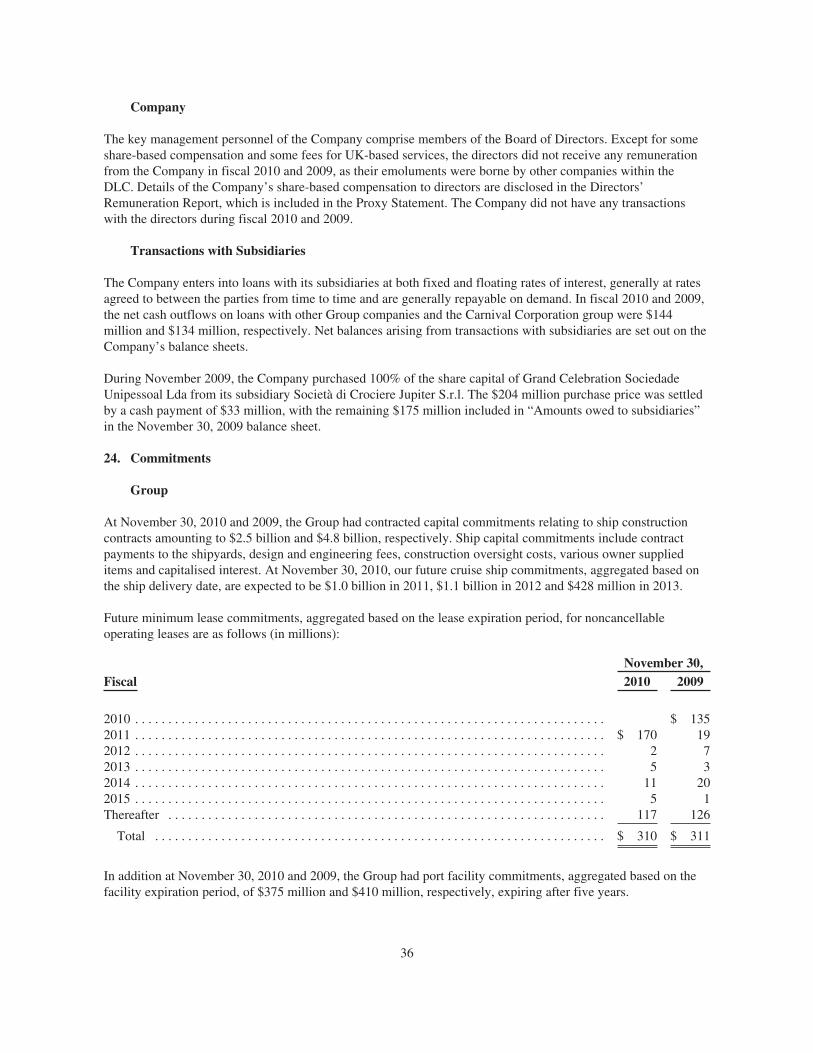
Company
The key management personnel of the Company comprise members of the Board of Directors. Except for someshare-based compensation and some fees for UK-based services, the directors did not receive any remunerationfrom the Company in fiscal 2010 and 2009, as their emoluments were borne by other companies within theDLC. Details of the Company’s share-based compensation to directors are disclosed in the Directors’Remuneration Report, which is included in the Proxy Statement. The Company did not have any transactionswith the directors during fiscal 2010 and 2009.
Transactions with Subsidiaries
The Company enters into loans with its subsidiaries at both fixed and floating rates of interest, generally at ratesagreed to between the parties from time to time and are generally repayable on demand. In fiscal 2010 and 2009,the net cash outflows on loans with other Group companies and the Carnival Corporation group were $144million and $134 million, respectively. Net balances arising from transactions with subsidiaries are set out on theCompany’s balance sheets.
During November 2009, the Company purchased 100% of the share capital of Grand Celebration SociedadeUnipessoal Lda from its subsidiary Società di Crociere Jupiter S.r.l. The $204 million purchase price was settledby a cash payment of $33 million, with the remaining $175 million included in “Amounts owed to subsidiaries”in the November 30, 2009 balance sheet.
24. Commitments
Group
At November 30, 2010 and 2009, the Group had contracted capital commitments relating to ship constructioncontracts amounting to $2.5 billion and $4.8 billion, respectively. Ship capital commitments include contractpayments to the shipyards, design and engineering fees, construction oversight costs, various owner supplieditems and capitalised interest. At November 30, 2010, our future cruise ship commitments, aggregated based onthe ship delivery date, are expected to be $1.0 billion in 2011, $1.1 billion in 2012 and $428 million in 2013.
Future minimum lease commitments, aggregated based on the lease expiration period, for noncancellableoperating leases are as follows (in millions):
November 30,Fiscal 2010 2009
2010 . . . . . . . . . . . . . . . . . . . . . . . . . . . . . . . . . . . . . . . . . . . . . . . . . . . . . . . . . . . . . . . . . . . . . . . $ 1352011 . . . . . . . . . . . . . . . . . . . . . . . . . . . . . . . . . . . . . . . . . . . . . . . . . . . . . . . . . . . . . . . . . . . . . . . $ 170 192012 . . . . . . . . . . . . . . . . . . . . . . . . . . . . . . . . . . . . . . . . . . . . . . . . . . . . . . . . . . . . . . . . . . . . . . . 2 72013 . . . . . . . . . . . . . . . . . . . . . . . . . . . . . . . . . . . . . . . . . . . . . . . . . . . . . . . . . . . . . . . . . . . . . . . 5 32014 . . . . . . . . . . . . . . . . . . . . . . . . . . . . . . . . . . . . . . . . . . . . . . . . . . . . . . . . . . . . . . . . . . . . . . . 11 202015 . . . . . . . . . . . . . . . . . . . . . . . . . . . . . . . . . . . . . . . . . . . . . . . . . . . . . . . . . . . . . . . . . . . . . . . 5 1Thereafter . . . . . . . . . . . . . . . . . . . . . . . . . . . . . . . . . . . . . . . . . . . . . . . . . . . . . . . . . . . . . . . . . . 117 126
Total . . . . . . . . . . . . . . . . . . . . . . . . . . . . . . . . . . . . . . . . . . . . . . . . . . . . . . . . . . . . . . . . . . . . $ 310 $ 311
In addition at November 30, 2010 and 2009, the Group had port facility commitments, aggregated based on thefacility expiration period, of $375 million and $410 million, respectively, expiring after five years.
36
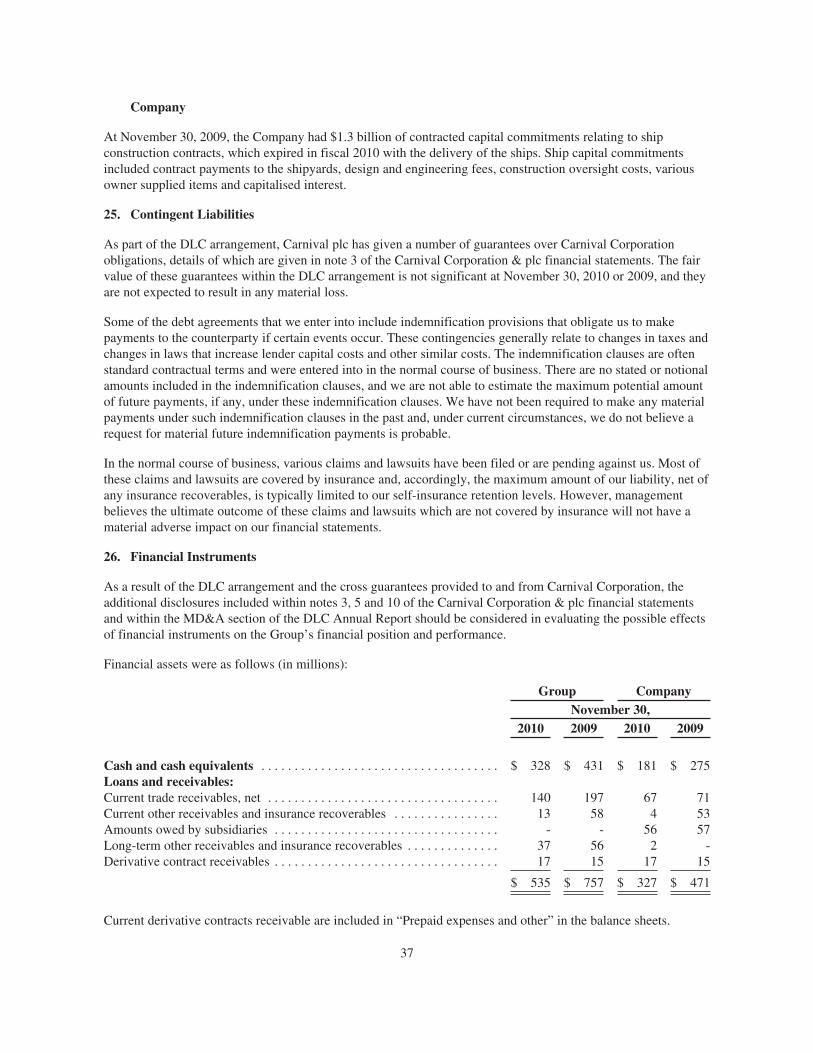
Company
At November 30, 2009, the Company had $1.3 billion of contracted capital commitments relating to shipconstruction contracts, which expired in fiscal 2010 with the delivery of the ships. Ship capital commitmentsincluded contract payments to the shipyards, design and engineering fees, construction oversight costs, variousowner supplied items and capitalised interest.
25. Contingent Liabilities
As part of the DLC arrangement, Carnival plc has given a number of guarantees over Carnival Corporationobligations, details of which are given in note 3 of the Carnival Corporation & plc financial statements. The fairvalue of these guarantees within the DLC arrangement is not significant at November 30, 2010 or 2009, and theyare not expected to result in any material loss.
Some of the debt agreements that we enter into include indemnification provisions that obligate us to makepayments to the counterparty if certain events occur. These contingencies generally relate to changes in taxes andchanges in laws that increase lender capital costs and other similar costs. The indemnification clauses are oftenstandard contractual terms and were entered into in the normal course of business. There are no stated or notionalamounts included in the indemnification clauses, and we are not able to estimate the maximum potential amountof future payments, if any, under these indemnification clauses. We have not been required to make any materialpayments under such indemnification clauses in the past and, under current circumstances, we do not believe arequest for material future indemnification payments is probable.
In the normal course of business, various claims and lawsuits have been filed or are pending against us. Most ofthese claims and lawsuits are covered by insurance and, accordingly, the maximum amount of our liability, net ofany insurance recoverables, is typically limited to our self-insurance retention levels. However, managementbelieves the ultimate outcome of these claims and lawsuits which are not covered by insurance will not have amaterial adverse impact on our financial statements.
26. Financial Instruments
As a result of the DLC arrangement and the cross guarantees provided to and from Carnival Corporation, theadditional disclosures included within notes 3, 5 and 10 of the Carnival Corporation & plc financial statementsand within the MD&A section of the DLC Annual Report should be considered in evaluating the possible effectsof financial instruments on the Group’s financial position and performance.
Financial assets were as follows (in millions):
Group CompanyNovember 30,
2010 2009 2010 2009
Cash and cash equivalents . . . . . . . . . . . . . . . . . . . . . . . . . . . . . . . . . . . . $ 328 $ 431 $ 181 $ 275Loans and receivables:Current trade receivables, net . . . . . . . . . . . . . . . . . . . . . . . . . . . . . . . . . . . 140 197 67 71Current other receivables and insurance recoverables . . . . . . . . . . . . . . . . 13 58 4 53Amounts owed by subsidiaries . . . . . . . . . . . . . . . . . . . . . . . . . . . . . . . . . . - - 56 57Long-term other receivables and insurance recoverables . . . . . . . . . . . . . . 37 56 2 -Derivative contract receivables . . . . . . . . . . . . . . . . . . . . . . . . . . . . . . . . . . 17 15 17 15
$ 535 $ 757 $ 327 $ 471
Current derivative contracts receivable are included in “Prepaid expenses and other” in the balance sheets.
37
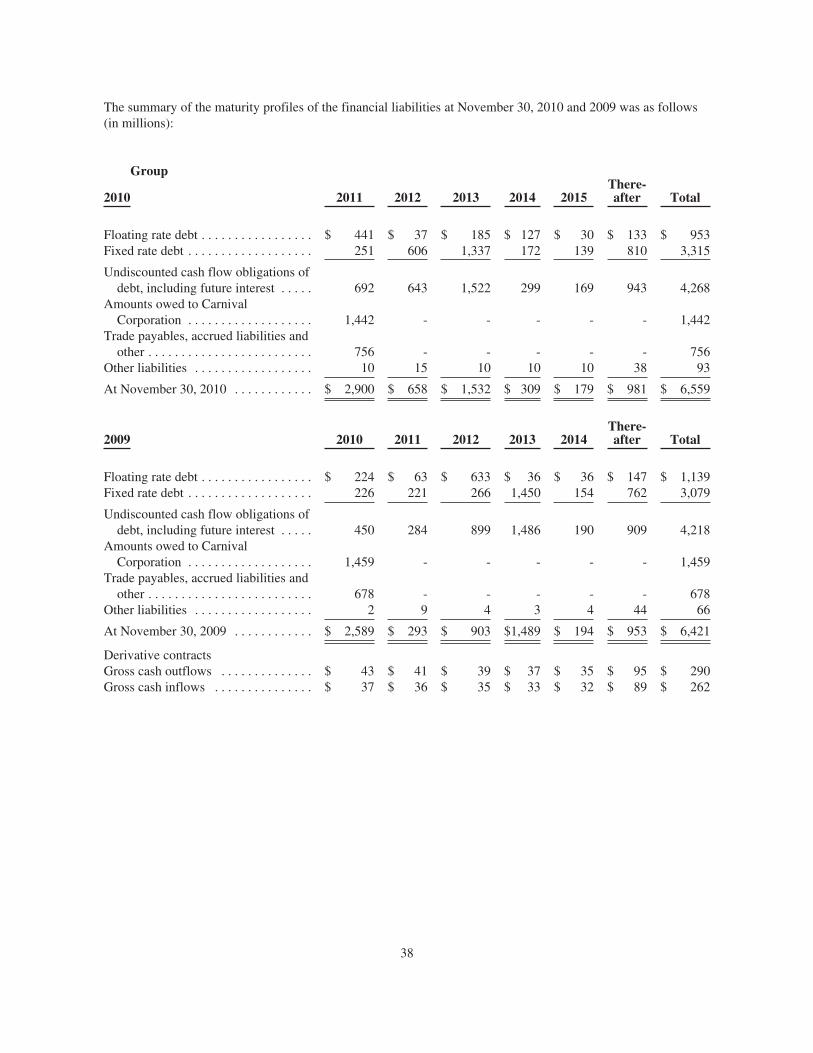
The summary of the maturity profiles of the financial liabilities at November 30, 2010 and 2009 was as follows(in millions):
Group
2010 2011 2012 2013 2014 2015There-after Total
Floating rate debt . . . . . . . . . . . . . . . . . $ 441 $ 37 $ 185 $ 127 $ 30 $ 133 $ 953Fixed rate debt . . . . . . . . . . . . . . . . . . . 251 606 1,337 172 139 810 3,315
Undiscounted cash flow obligations ofdebt, including future interest . . . . . 692 643 1,522 299 169 943 4,268
Amounts owed to CarnivalCorporation . . . . . . . . . . . . . . . . . . . 1,442 - - - - - 1,442
Trade payables, accrued liabilities andother . . . . . . . . . . . . . . . . . . . . . . . . . 756 - - - - - 756
Other liabilities . . . . . . . . . . . . . . . . . . 10 15 10 10 10 38 93
At November 30, 2010 . . . . . . . . . . . . $ 2,900 $ 658 $ 1,532 $ 309 $ 179 $ 981 $ 6,559
2009 2010 2011 2012 2013 2014There-after Total
Floating rate debt . . . . . . . . . . . . . . . . . $ 224 $ 63 $ 633 $ 36 $ 36 $ 147 $ 1,139Fixed rate debt . . . . . . . . . . . . . . . . . . . 226 221 266 1,450 154 762 3,079
Undiscounted cash flow obligations ofdebt, including future interest . . . . . 450 284 899 1,486 190 909 4,218
Amounts owed to CarnivalCorporation . . . . . . . . . . . . . . . . . . . 1,459 - - - - - 1,459
Trade payables, accrued liabilities andother . . . . . . . . . . . . . . . . . . . . . . . . . 678 - - - - - 678
Other liabilities . . . . . . . . . . . . . . . . . . 2 9 4 3 4 44 66
At November 30, 2009 . . . . . . . . . . . . $ 2,589 $ 293 $ 903 $1,489 $ 194 $ 953 $ 6,421
Derivative contractsGross cash outflows . . . . . . . . . . . . . . $ 43 $ 41 $ 39 $ 37 $ 35 $ 95 $ 290Gross cash inflows . . . . . . . . . . . . . . . $ 37 $ 36 $ 35 $ 33 $ 32 $ 89 $ 262
38
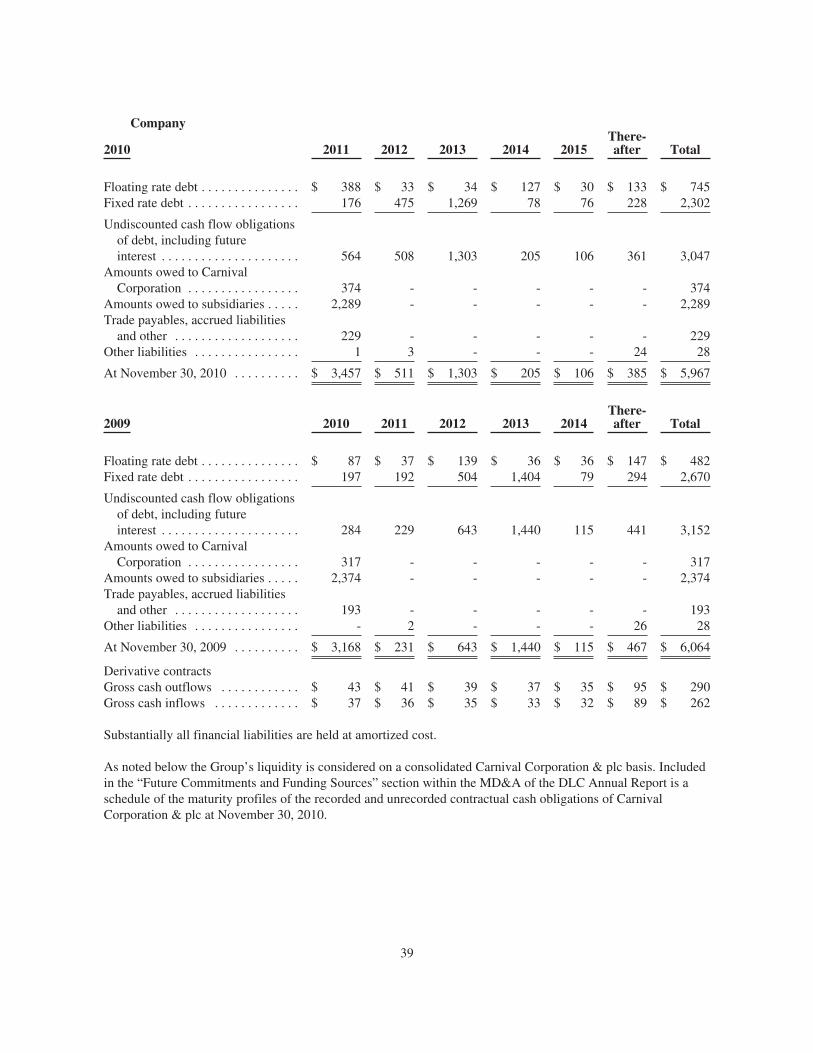
Company
2010 2011 2012 2013 2014 2015There-after Total
Floating rate debt . . . . . . . . . . . . . . . $ 388 $ 33 $ 34 $ 127 $ 30 $ 133 $ 745Fixed rate debt . . . . . . . . . . . . . . . . . 176 475 1,269 78 76 228 2,302
Undiscounted cash flow obligationsof debt, including futureinterest . . . . . . . . . . . . . . . . . . . . . 564 508 1,303 205 106 361 3,047
Amounts owed to CarnivalCorporation . . . . . . . . . . . . . . . . . 374 - - - - - 374
Amounts owed to subsidiaries . . . . . 2,289 - - - - - 2,289Trade payables, accrued liabilities
and other . . . . . . . . . . . . . . . . . . . 229 - - - - - 229Other liabilities . . . . . . . . . . . . . . . . 1 3 - - - 24 28
At November 30, 2010 . . . . . . . . . . $ 3,457 $ 511 $ 1,303 $ 205 $ 106 $ 385 $ 5,967
2009 2010 2011 2012 2013 2014There-after Total
Floating rate debt . . . . . . . . . . . . . . . $ 87 $ 37 $ 139 $ 36 $ 36 $ 147 $ 482Fixed rate debt . . . . . . . . . . . . . . . . . 197 192 504 1,404 79 294 2,670
Undiscounted cash flow obligationsof debt, including futureinterest . . . . . . . . . . . . . . . . . . . . . 284 229 643 1,440 115 441 3,152
Amounts owed to CarnivalCorporation . . . . . . . . . . . . . . . . . 317 - - - - - 317
Amounts owed to subsidiaries . . . . . 2,374 - - - - - 2,374Trade payables, accrued liabilities
and other . . . . . . . . . . . . . . . . . . . 193 - - - - - 193Other liabilities . . . . . . . . . . . . . . . . - 2 - - - 26 28
At November 30, 2009 . . . . . . . . . . $ 3,168 $ 231 $ 643 $ 1,440 $ 115 $ 467 $ 6,064
Derivative contractsGross cash outflows . . . . . . . . . . . . $ 43 $ 41 $ 39 $ 37 $ 35 $ 95 $ 290Gross cash inflows . . . . . . . . . . . . . $ 37 $ 36 $ 35 $ 33 $ 32 $ 89 $ 262
Substantially all financial liabilities are held at amortized cost.
As noted below the Group’s liquidity is considered on a consolidated Carnival Corporation & plc basis. Includedin the “Future Commitments and Funding Sources” section within the MD&A of the DLC Annual Report is aschedule of the maturity profiles of the recorded and unrecorded contractual cash obligations of CarnivalCorporation & plc at November 30, 2010.
39
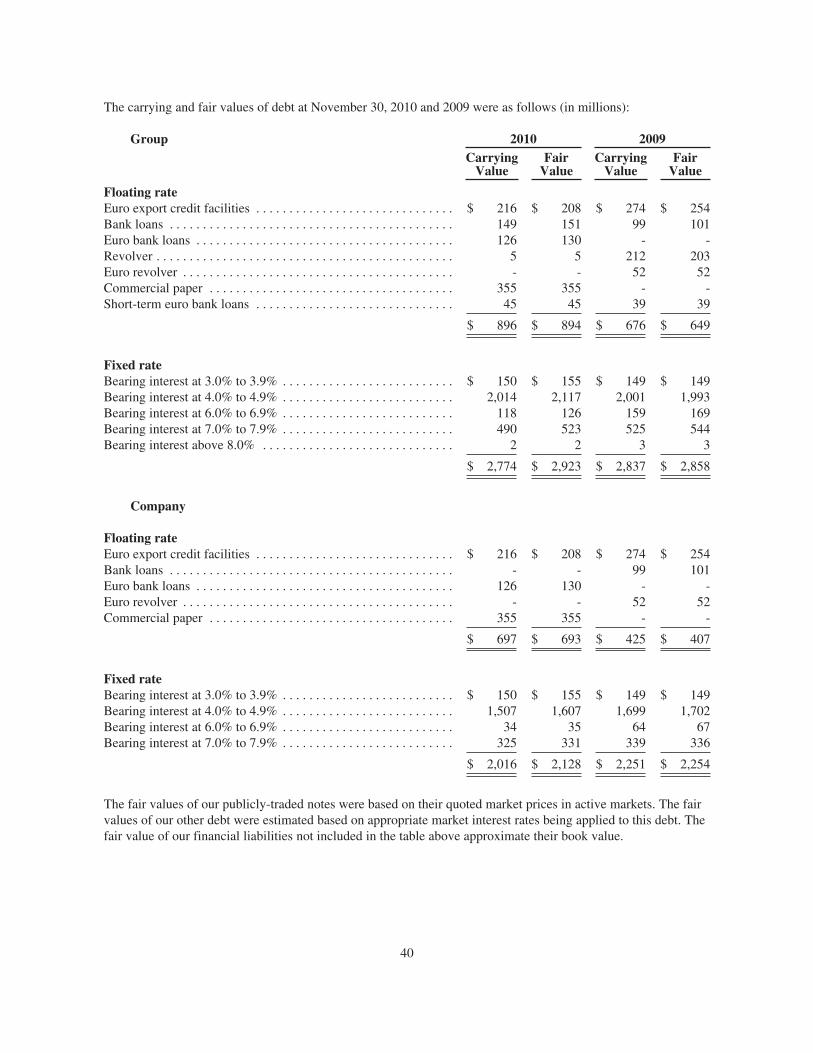
The carrying and fair values of debt at November 30, 2010 and 2009 were as follows (in millions):
Group 2010 2009Carrying
ValueFair
ValueCarrying
ValueFair
Value
Floating rateEuro export credit facilities . . . . . . . . . . . . . . . . . . . . . . . . . . . . . . $ 216 $ 208 $ 274 $ 254Bank loans . . . . . . . . . . . . . . . . . . . . . . . . . . . . . . . . . . . . . . . . . . . 149 151 99 101Euro bank loans . . . . . . . . . . . . . . . . . . . . . . . . . . . . . . . . . . . . . . . 126 130 - -Revolver . . . . . . . . . . . . . . . . . . . . . . . . . . . . . . . . . . . . . . . . . . . . . 5 5 212 203Euro revolver . . . . . . . . . . . . . . . . . . . . . . . . . . . . . . . . . . . . . . . . . - - 52 52Commercial paper . . . . . . . . . . . . . . . . . . . . . . . . . . . . . . . . . . . . . 355 355 - -Short-term euro bank loans . . . . . . . . . . . . . . . . . . . . . . . . . . . . . . 45 45 39 39
$ 896 $ 894 $ 676 $ 649
Fixed rateBearing interest at 3.0% to 3.9% . . . . . . . . . . . . . . . . . . . . . . . . . . $ 150 $ 155 $ 149 $ 149Bearing interest at 4.0% to 4.9% . . . . . . . . . . . . . . . . . . . . . . . . . . 2,014 2,117 2,001 1,993Bearing interest at 6.0% to 6.9% . . . . . . . . . . . . . . . . . . . . . . . . . . 118 126 159 169Bearing interest at 7.0% to 7.9% . . . . . . . . . . . . . . . . . . . . . . . . . . 490 523 525 544Bearing interest above 8.0% . . . . . . . . . . . . . . . . . . . . . . . . . . . . . 2 2 3 3
$ 2,774 $ 2,923 $ 2,837 $ 2,858
Company
Floating rateEuro export credit facilities . . . . . . . . . . . . . . . . . . . . . . . . . . . . . . $ 216 $ 208 $ 274 $ 254Bank loans . . . . . . . . . . . . . . . . . . . . . . . . . . . . . . . . . . . . . . . . . . . - - 99 101Euro bank loans . . . . . . . . . . . . . . . . . . . . . . . . . . . . . . . . . . . . . . . 126 130 - -Euro revolver . . . . . . . . . . . . . . . . . . . . . . . . . . . . . . . . . . . . . . . . . - - 52 52Commercial paper . . . . . . . . . . . . . . . . . . . . . . . . . . . . . . . . . . . . . 355 355 - -
$ 697 $ 693 $ 425 $ 407
Fixed rateBearing interest at 3.0% to 3.9% . . . . . . . . . . . . . . . . . . . . . . . . . . $ 150 $ 155 $ 149 $ 149Bearing interest at 4.0% to 4.9% . . . . . . . . . . . . . . . . . . . . . . . . . . 1,507 1,607 1,699 1,702Bearing interest at 6.0% to 6.9% . . . . . . . . . . . . . . . . . . . . . . . . . . 34 35 64 67Bearing interest at 7.0% to 7.9% . . . . . . . . . . . . . . . . . . . . . . . . . . 325 331 339 336
$ 2,016 $ 2,128 $ 2,251 $ 2,254
The fair values of our publicly-traded notes were based on their quoted market prices in active markets. The fairvalues of our other debt were estimated based on appropriate market interest rates being applied to this debt. Thefair value of our financial liabilities not included in the table above approximate their book value.
40
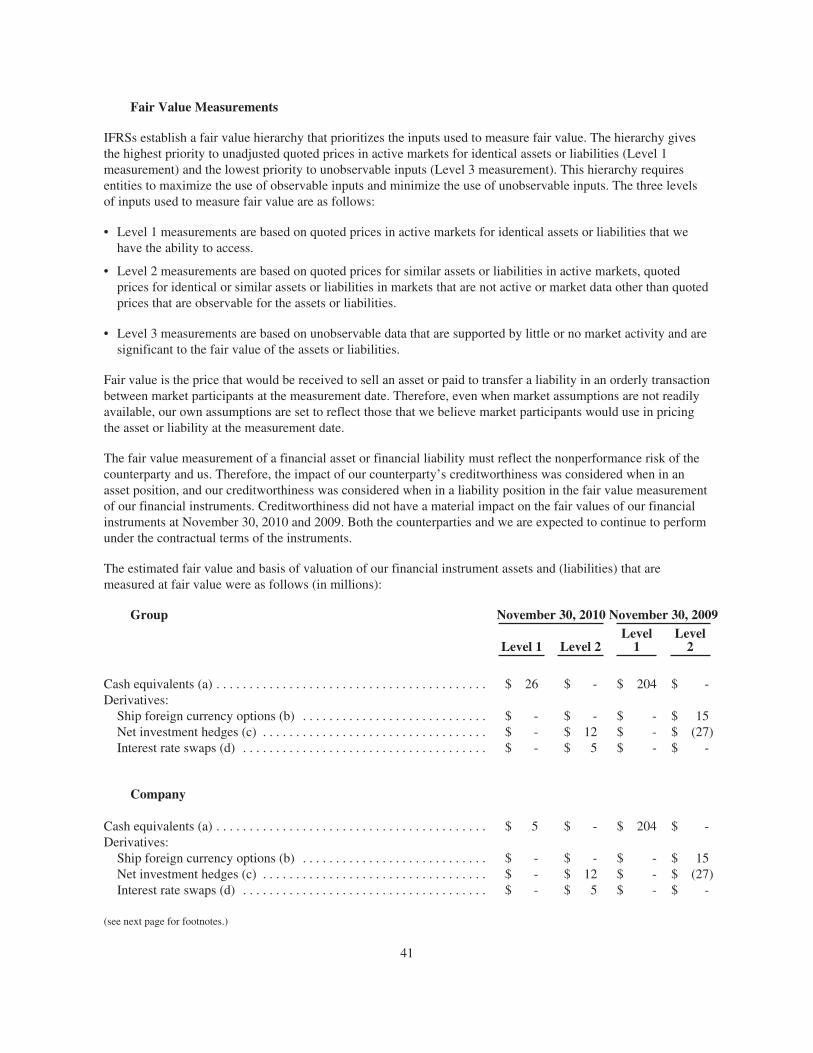
Fair Value Measurements
IFRSs establish a fair value hierarchy that prioritizes the inputs used to measure fair value. The hierarchy givesthe highest priority to unadjusted quoted prices in active markets for identical assets or liabilities (Level 1measurement) and the lowest priority to unobservable inputs (Level 3 measurement). This hierarchy requiresentities to maximize the use of observable inputs and minimize the use of unobservable inputs. The three levelsof inputs used to measure fair value are as follows:
• Level 1 measurements are based on quoted prices in active markets for identical assets or liabilities that wehave the ability to access.
• Level 2 measurements are based on quoted prices for similar assets or liabilities in active markets, quotedprices for identical or similar assets or liabilities in markets that are not active or market data other than quotedprices that are observable for the assets or liabilities.
• Level 3 measurements are based on unobservable data that are supported by little or no market activity and aresignificant to the fair value of the assets or liabilities.
Fair value is the price that would be received to sell an asset or paid to transfer a liability in an orderly transactionbetween market participants at the measurement date. Therefore, even when market assumptions are not readilyavailable, our own assumptions are set to reflect those that we believe market participants would use in pricingthe asset or liability at the measurement date.
The fair value measurement of a financial asset or financial liability must reflect the nonperformance risk of thecounterparty and us. Therefore, the impact of our counterparty’s creditworthiness was considered when in anasset position, and our creditworthiness was considered when in a liability position in the fair value measurementof our financial instruments. Creditworthiness did not have a material impact on the fair values of our financialinstruments at November 30, 2010 and 2009. Both the counterparties and we are expected to continue to performunder the contractual terms of the instruments.
The estimated fair value and basis of valuation of our financial instrument assets and (liabilities) that aremeasured at fair value were as follows (in millions):
Group November 30, 2010 November 30, 2009
Level 1 Level 2Level
1Level
2
Cash equivalents (a) . . . . . . . . . . . . . . . . . . . . . . . . . . . . . . . . . . . . . . . . . $ 26 $ - $ 204 $ -Derivatives:
Ship foreign currency options (b) . . . . . . . . . . . . . . . . . . . . . . . . . . . . $ - $ - $ - $ 15Net investment hedges (c) . . . . . . . . . . . . . . . . . . . . . . . . . . . . . . . . . . $ - $ 12 $ - $ (27)Interest rate swaps (d) . . . . . . . . . . . . . . . . . . . . . . . . . . . . . . . . . . . . . $ - $ 5 $ - $ -
Company
Cash equivalents (a) . . . . . . . . . . . . . . . . . . . . . . . . . . . . . . . . . . . . . . . . . $ 5 $ - $ 204 $ -Derivatives:
Ship foreign currency options (b) . . . . . . . . . . . . . . . . . . . . . . . . . . . . $ - $ - $ - $ 15Net investment hedges (c) . . . . . . . . . . . . . . . . . . . . . . . . . . . . . . . . . . $ - $ 12 $ - $ (27)Interest rate swaps (d) . . . . . . . . . . . . . . . . . . . . . . . . . . . . . . . . . . . . . $ - $ 5 $ - $ -
(see next page for footnotes.)
41
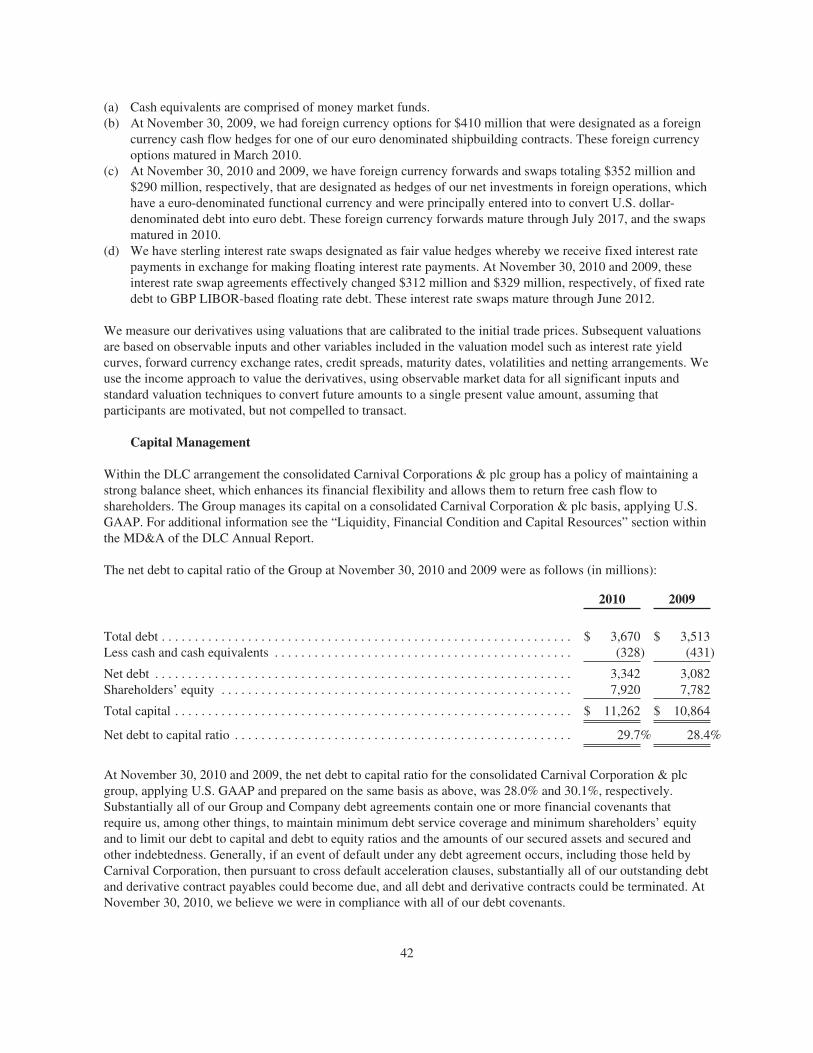
(a) Cash equivalents are comprised of money market funds.(b) At November 30, 2009, we had foreign currency options for $410 million that were designated as a foreign
currency cash flow hedges for one of our euro denominated shipbuilding contracts. These foreign currencyoptions matured in March 2010.
(c) At November 30, 2010 and 2009, we have foreign currency forwards and swaps totaling $352 million and$290 million, respectively, that are designated as hedges of our net investments in foreign operations, whichhave a euro-denominated functional currency and were principally entered into to convert U.S. dollar-denominated debt into euro debt. These foreign currency forwards mature through July 2017, and the swapsmatured in 2010.
(d) We have sterling interest rate swaps designated as fair value hedges whereby we receive fixed interest ratepayments in exchange for making floating interest rate payments. At November 30, 2010 and 2009, theseinterest rate swap agreements effectively changed $312 million and $329 million, respectively, of fixed ratedebt to GBP LIBOR-based floating rate debt. These interest rate swaps mature through June 2012.
We measure our derivatives using valuations that are calibrated to the initial trade prices. Subsequent valuationsare based on observable inputs and other variables included in the valuation model such as interest rate yieldcurves, forward currency exchange rates, credit spreads, maturity dates, volatilities and netting arrangements. Weuse the income approach to value the derivatives, using observable market data for all significant inputs andstandard valuation techniques to convert future amounts to a single present value amount, assuming thatparticipants are motivated, but not compelled to transact.
Capital Management
Within the DLC arrangement the consolidated Carnival Corporations & plc group has a policy of maintaining astrong balance sheet, which enhances its financial flexibility and allows them to return free cash flow toshareholders. The Group manages its capital on a consolidated Carnival Corporation & plc basis, applying U.S.GAAP. For additional information see the “Liquidity, Financial Condition and Capital Resources” section withinthe MD&A of the DLC Annual Report.
The net debt to capital ratio of the Group at November 30, 2010 and 2009 were as follows (in millions):
2010 2009
Total debt . . . . . . . . . . . . . . . . . . . . . . . . . . . . . . . . . . . . . . . . . . . . . . . . . . . . . . . . . . . . . . $ 3,670 $ 3,513Less cash and cash equivalents . . . . . . . . . . . . . . . . . . . . . . . . . . . . . . . . . . . . . . . . . . . . . (328) (431)
Net debt . . . . . . . . . . . . . . . . . . . . . . . . . . . . . . . . . . . . . . . . . . . . . . . . . . . . . . . . . . . . . . . 3,342 3,082Shareholders’ equity . . . . . . . . . . . . . . . . . . . . . . . . . . . . . . . . . . . . . . . . . . . . . . . . . . . . . 7,920 7,782
Total capital . . . . . . . . . . . . . . . . . . . . . . . . . . . . . . . . . . . . . . . . . . . . . . . . . . . . . . . . . . . . $ 11,262 $ 10,864
Net debt to capital ratio . . . . . . . . . . . . . . . . . . . . . . . . . . . . . . . . . . . . . . . . . . . . . . . . . . . 29.7% 28.4%
At November 30, 2010 and 2009, the net debt to capital ratio for the consolidated Carnival Corporation & plcgroup, applying U.S. GAAP and prepared on the same basis as above, was 28.0% and 30.1%, respectively.Substantially all of our Group and Company debt agreements contain one or more financial covenants thatrequire us, among other things, to maintain minimum debt service coverage and minimum shareholders’ equityand to limit our debt to capital and debt to equity ratios and the amounts of our secured assets and secured andother indebtedness. Generally, if an event of default under any debt agreement occurs, including those held byCarnival Corporation, then pursuant to cross default acceleration clauses, substantially all of our outstanding debtand derivative contract payables could become due, and all debt and derivative contracts could be terminated. AtNovember 30, 2010, we believe we were in compliance with all of our debt covenants.
42
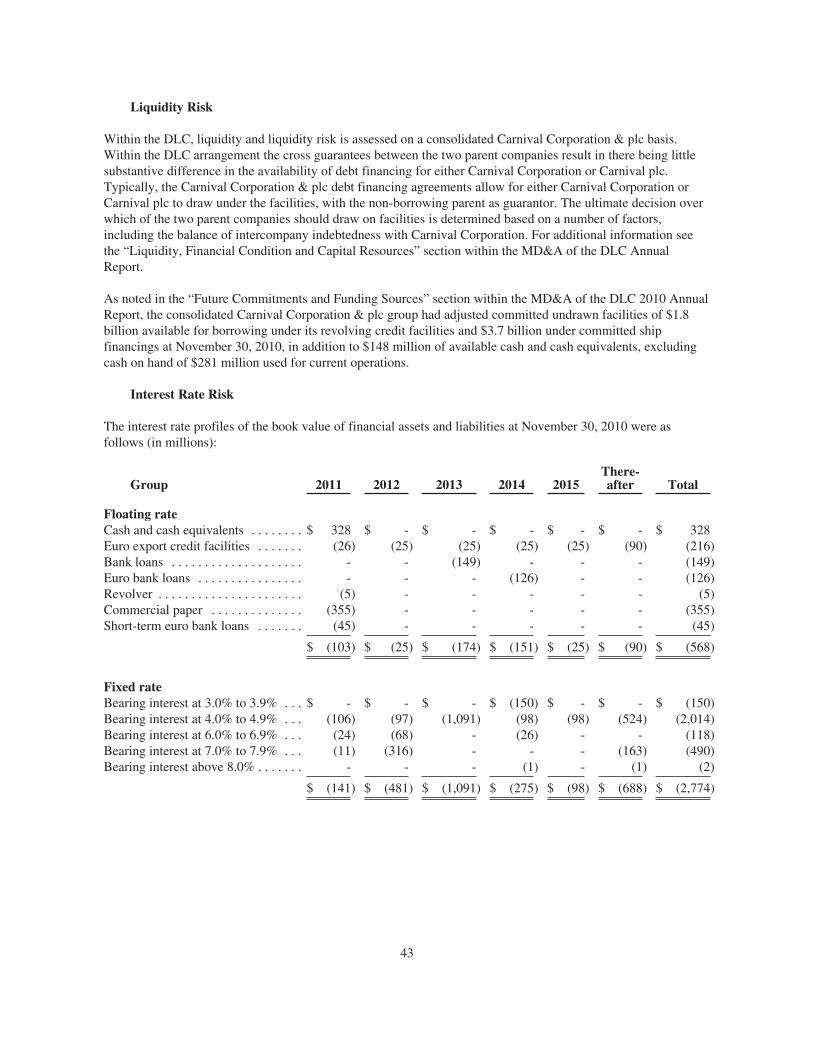
Liquidity Risk
Within the DLC, liquidity and liquidity risk is assessed on a consolidated Carnival Corporation & plc basis.Within the DLC arrangement the cross guarantees between the two parent companies result in there being littlesubstantive difference in the availability of debt financing for either Carnival Corporation or Carnival plc.Typically, the Carnival Corporation & plc debt financing agreements allow for either Carnival Corporation orCarnival plc to draw under the facilities, with the non-borrowing parent as guarantor. The ultimate decision overwhich of the two parent companies should draw on facilities is determined based on a number of factors,including the balance of intercompany indebtedness with Carnival Corporation. For additional information seethe “Liquidity, Financial Condition and Capital Resources” section within the MD&A of the DLC AnnualReport.
As noted in the “Future Commitments and Funding Sources” section within the MD&A of the DLC 2010 AnnualReport, the consolidated Carnival Corporation & plc group had adjusted committed undrawn facilities of $1.8billion available for borrowing under its revolving credit facilities and $3.7 billion under committed shipfinancings at November 30, 2010, in addition to $148 million of available cash and cash equivalents, excludingcash on hand of $281 million used for current operations.
Interest Rate Risk
The interest rate profiles of the book value of financial assets and liabilities at November 30, 2010 were asfollows (in millions):
Group 2011 2012 2013 2014 2015There-after Total
Floating rateCash and cash equivalents . . . . . . . . $ 328 $ - $ - $ - $ - $ - $ 328Euro export credit facilities . . . . . . . (26) (25) (25) (25) (25) (90) (216)Bank loans . . . . . . . . . . . . . . . . . . . . - - (149) - - - (149)Euro bank loans . . . . . . . . . . . . . . . . - - - (126) - - (126)Revolver . . . . . . . . . . . . . . . . . . . . . . (5) - - - - - (5)Commercial paper . . . . . . . . . . . . . . (355) - - - - - (355)Short-term euro bank loans . . . . . . . (45) - - - - - (45)
$ (103) $ (25) $ (174) $ (151) $ (25) $ (90) $ (568)
Fixed rateBearing interest at 3.0% to 3.9% . . . $ - $ - $ - $ (150) $ - $ - $ (150)Bearing interest at 4.0% to 4.9% . . . (106) (97) (1,091) (98) (98) (524) (2,014)Bearing interest at 6.0% to 6.9% . . . (24) (68) - (26) - - (118)Bearing interest at 7.0% to 7.9% . . . (11) (316) - - - (163) (490)Bearing interest above 8.0% . . . . . . . - - - (1) - (1) (2)
$ (141) $ (481) $ (1,091) $ (275) $ (98) $ (688) $ (2,774)
43
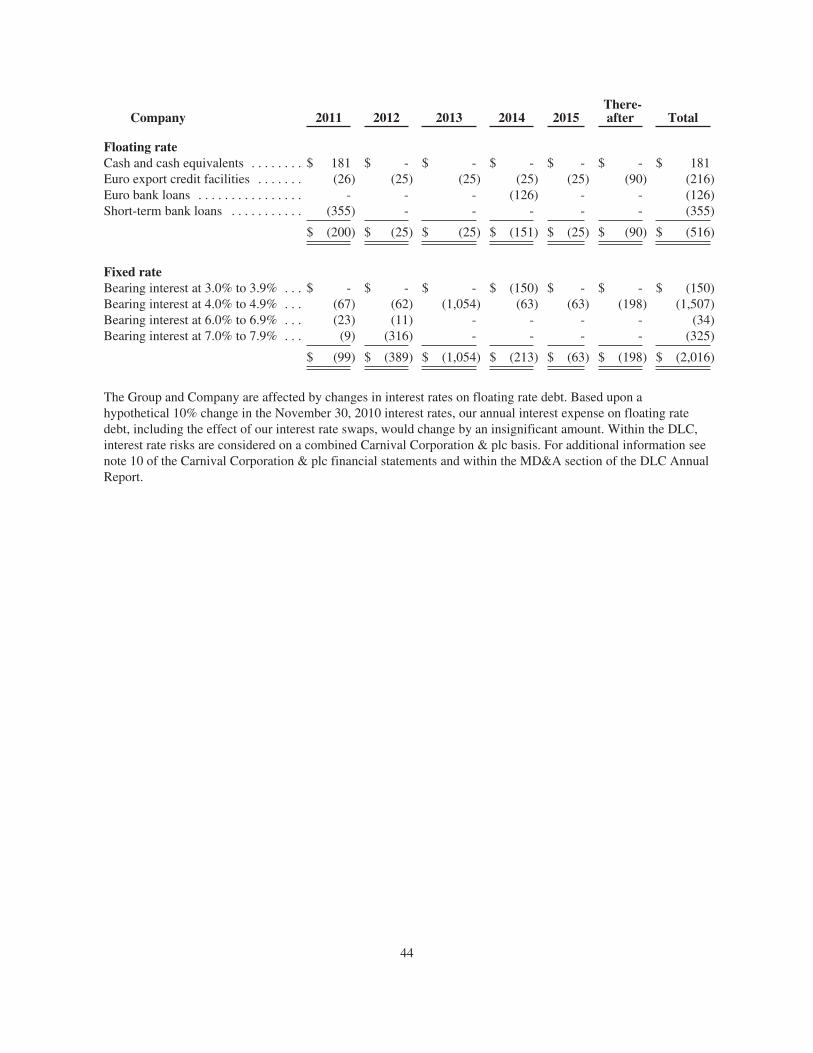
Company 2011 2012 2013 2014 2015There-after Total
Floating rateCash and cash equivalents . . . . . . . . $ 181 $ - $ - $ - $ - $ - $ 181Euro export credit facilities . . . . . . . (26) (25) (25) (25) (25) (90) (216)Euro bank loans . . . . . . . . . . . . . . . . - - - (126) - - (126)Short-term bank loans . . . . . . . . . . . (355) - - - - - (355)
$ (200) $ (25) $ (25) $ (151) $ (25) $ (90) $ (516)
Fixed rateBearing interest at 3.0% to 3.9% . . . $ - $ - $ - $ (150) $ - $ - $ (150)Bearing interest at 4.0% to 4.9% . . . (67) (62) (1,054) (63) (63) (198) (1,507)Bearing interest at 6.0% to 6.9% . . . (23) (11) - - - - (34)Bearing interest at 7.0% to 7.9% . . . (9) (316) - - - - (325)
$ (99) $ (389) $ (1,054) $ (213) $ (63) $ (198) $ (2,016)
The Group and Company are affected by changes in interest rates on floating rate debt. Based upon ahypothetical 10% change in the November 30, 2010 interest rates, our annual interest expense on floating ratedebt, including the effect of our interest rate swaps, would change by an insignificant amount. Within the DLC,interest rate risks are considered on a combined Carnival Corporation & plc basis. For additional information seenote 10 of the Carnival Corporation & plc financial statements and within the MD&A section of the DLC AnnualReport.
44
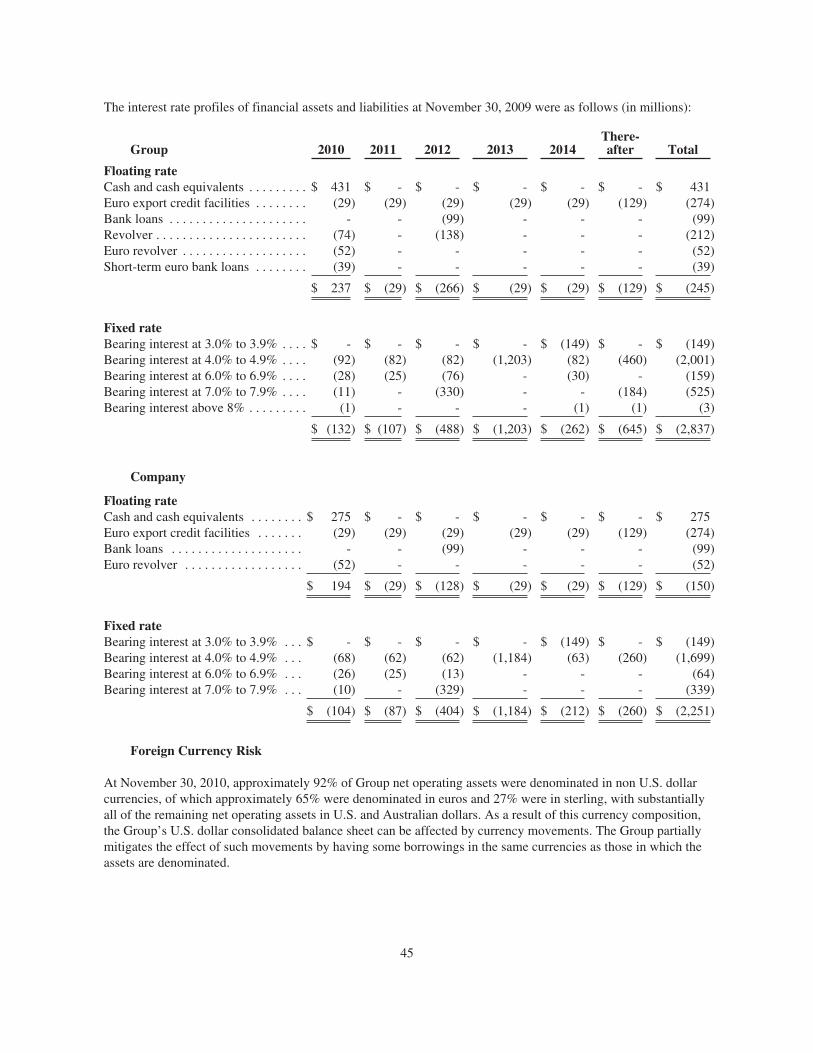
The interest rate profiles of financial assets and liabilities at November 30, 2009 were as follows (in millions):
Group 2010 2011 2012 2013 2014There-after Total
Floating rateCash and cash equivalents . . . . . . . . . $ 431 $ - $ - $ - $ - $ - $ 431Euro export credit facilities . . . . . . . . (29) (29) (29) (29) (29) (129) (274)Bank loans . . . . . . . . . . . . . . . . . . . . . - - (99) - - - (99)Revolver . . . . . . . . . . . . . . . . . . . . . . . (74) - (138) - - - (212)Euro revolver . . . . . . . . . . . . . . . . . . . (52) - - - - - (52)Short-term euro bank loans . . . . . . . . (39) - - - - - (39)
$ 237 $ (29) $ (266) $ (29) $ (29) $ (129) $ (245)
Fixed rateBearing interest at 3.0% to 3.9% . . . . $ - $ - $ - $ - $ (149) $ - $ (149)Bearing interest at 4.0% to 4.9% . . . . (92) (82) (82) (1,203) (82) (460) (2,001)Bearing interest at 6.0% to 6.9% . . . . (28) (25) (76) - (30) - (159)Bearing interest at 7.0% to 7.9% . . . . (11) - (330) - - (184) (525)Bearing interest above 8% . . . . . . . . . (1) - - - (1) (1) (3)
$ (132) $ (107) $ (488) $ (1,203) $ (262) $ (645) $ (2,837)
Company
Floating rateCash and cash equivalents . . . . . . . . $ 275 $ - $ - $ - $ - $ - $ 275Euro export credit facilities . . . . . . . (29) (29) (29) (29) (29) (129) (274)Bank loans . . . . . . . . . . . . . . . . . . . . - - (99) - - - (99)Euro revolver . . . . . . . . . . . . . . . . . . (52) - - - - - (52)
$ 194 $ (29) $ (128) $ (29) $ (29) $ (129) $ (150)
Fixed rateBearing interest at 3.0% to 3.9% . . . $ - $ - $ - $ - $ (149) $ - $ (149)Bearing interest at 4.0% to 4.9% . . . (68) (62) (62) (1,184) (63) (260) (1,699)Bearing interest at 6.0% to 6.9% . . . (26) (25) (13) - - - (64)Bearing interest at 7.0% to 7.9% . . . (10) - (329) - - - (339)
$ (104) $ (87) $ (404) $ (1,184) $ (212) $ (260) $ (2,251)
Foreign Currency Risk
At November 30, 2010, approximately 92% of Group net operating assets were denominated in non U.S. dollarcurrencies, of which approximately 65% were denominated in euros and 27% were in sterling, with substantiallyall of the remaining net operating assets in U.S. and Australian dollars. As a result of this currency composition,the Group’s U.S. dollar consolidated balance sheet can be affected by currency movements. The Group partiallymitigates the effect of such movements by having some borrowings in the same currencies as those in which theassets are denominated.
45
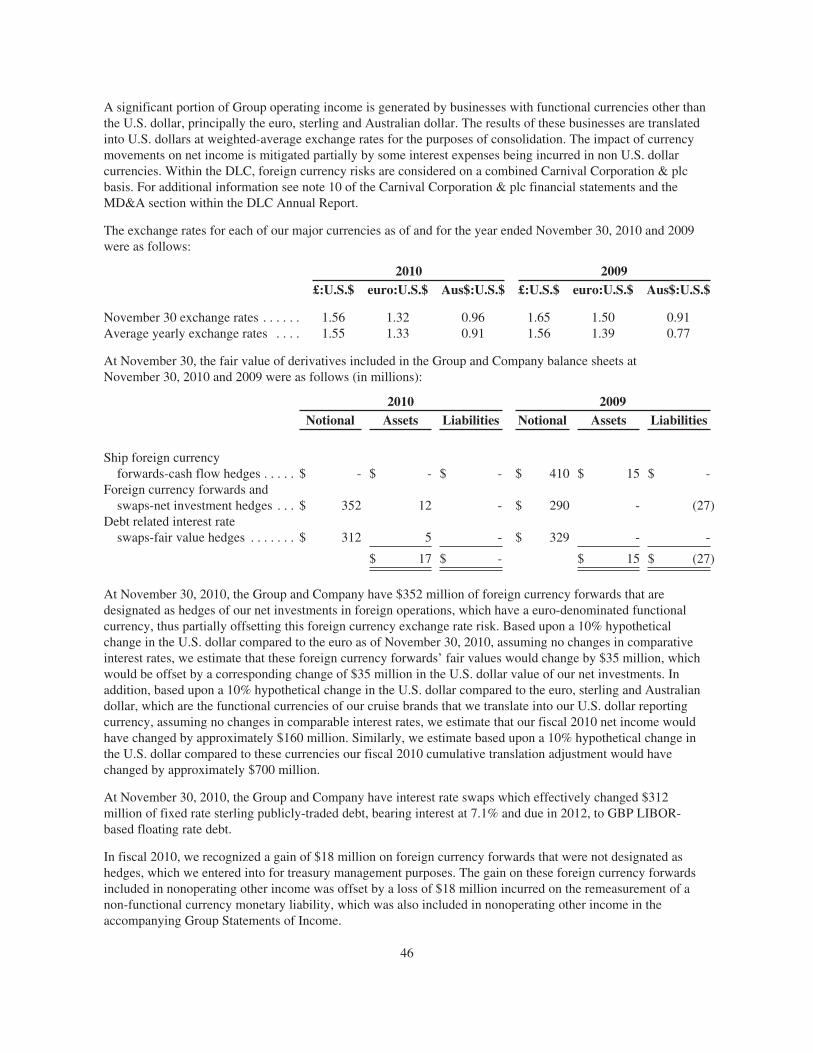
A significant portion of Group operating income is generated by businesses with functional currencies other thanthe U.S. dollar, principally the euro, sterling and Australian dollar. The results of these businesses are translatedinto U.S. dollars at weighted-average exchange rates for the purposes of consolidation. The impact of currencymovements on net income is mitigated partially by some interest expenses being incurred in non U.S. dollarcurrencies. Within the DLC, foreign currency risks are considered on a combined Carnival Corporation & plcbasis. For additional information see note 10 of the Carnival Corporation & plc financial statements and theMD&A section within the DLC Annual Report.
The exchange rates for each of our major currencies as of and for the year ended November 30, 2010 and 2009were as follows:
2010 2009£:U.S.$ euro:U.S.$ Aus$:U.S.$ £:U.S.$ euro:U.S.$ Aus$:U.S.$
November 30 exchange rates . . . . . . 1.56 1.32 0.96 1.65 1.50 0.91Average yearly exchange rates . . . . 1.55 1.33 0.91 1.56 1.39 0.77
At November 30, the fair value of derivatives included in the Group and Company balance sheets atNovember 30, 2010 and 2009 were as follows (in millions):
2010 2009Notional Assets Liabilities Notional Assets Liabilities
Ship foreign currencyforwards-cash flow hedges . . . . . $ - $ - $ - $ 410 $ 15 $ -
Foreign currency forwards andswaps-net investment hedges . . . $ 352 12 - $ 290 - (27)
Debt related interest rateswaps-fair value hedges . . . . . . . $ 312 5 - $ 329 - -
$ 17 $ - $ 15 $ (27)
At November 30, 2010, the Group and Company have $352 million of foreign currency forwards that aredesignated as hedges of our net investments in foreign operations, which have a euro-denominated functionalcurrency, thus partially offsetting this foreign currency exchange rate risk. Based upon a 10% hypotheticalchange in the U.S. dollar compared to the euro as of November 30, 2010, assuming no changes in comparativeinterest rates, we estimate that these foreign currency forwards’ fair values would change by $35 million, whichwould be offset by a corresponding change of $35 million in the U.S. dollar value of our net investments. Inaddition, based upon a 10% hypothetical change in the U.S. dollar compared to the euro, sterling and Australiandollar, which are the functional currencies of our cruise brands that we translate into our U.S. dollar reportingcurrency, assuming no changes in comparable interest rates, we estimate that our fiscal 2010 net income wouldhave changed by approximately $160 million. Similarly, we estimate based upon a 10% hypothetical change inthe U.S. dollar compared to these currencies our fiscal 2010 cumulative translation adjustment would havechanged by approximately $700 million.
At November 30, 2010, the Group and Company have interest rate swaps which effectively changed $312million of fixed rate sterling publicly-traded debt, bearing interest at 7.1% and due in 2012, to GBP LIBOR-based floating rate debt.
In fiscal 2010, we recognized a gain of $18 million on foreign currency forwards that were not designated ashedges, which we entered into for treasury management purposes. The gain on these foreign currency forwardsincluded in nonoperating other income was offset by a loss of $18 million incurred on the remeasurement of anon-functional currency monetary liability, which was also included in nonoperating other income in theaccompanying Group Statements of Income.
46
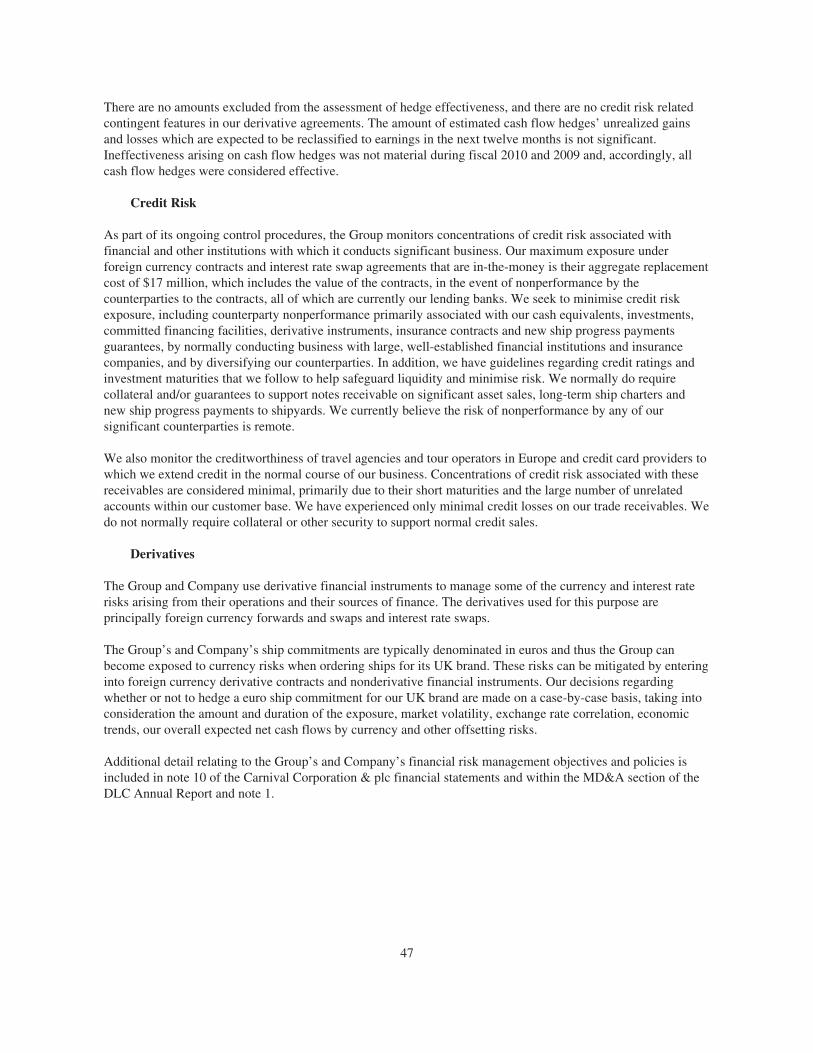
There are no amounts excluded from the assessment of hedge effectiveness, and there are no credit risk relatedcontingent features in our derivative agreements. The amount of estimated cash flow hedges’ unrealized gainsand losses which are expected to be reclassified to earnings in the next twelve months is not significant.Ineffectiveness arising on cash flow hedges was not material during fiscal 2010 and 2009 and, accordingly, allcash flow hedges were considered effective.
Credit Risk
As part of its ongoing control procedures, the Group monitors concentrations of credit risk associated withfinancial and other institutions with which it conducts significant business. Our maximum exposure underforeign currency contracts and interest rate swap agreements that are in-the-money is their aggregate replacementcost of $17 million, which includes the value of the contracts, in the event of nonperformance by thecounterparties to the contracts, all of which are currently our lending banks. We seek to minimise credit riskexposure, including counterparty nonperformance primarily associated with our cash equivalents, investments,committed financing facilities, derivative instruments, insurance contracts and new ship progress paymentsguarantees, by normally conducting business with large, well-established financial institutions and insurancecompanies, and by diversifying our counterparties. In addition, we have guidelines regarding credit ratings andinvestment maturities that we follow to help safeguard liquidity and minimise risk. We normally do requirecollateral and/or guarantees to support notes receivable on significant asset sales, long-term ship charters andnew ship progress payments to shipyards. We currently believe the risk of nonperformance by any of oursignificant counterparties is remote.
We also monitor the creditworthiness of travel agencies and tour operators in Europe and credit card providers towhich we extend credit in the normal course of our business. Concentrations of credit risk associated with thesereceivables are considered minimal, primarily due to their short maturities and the large number of unrelatedaccounts within our customer base. We have experienced only minimal credit losses on our trade receivables. Wedo not normally require collateral or other security to support normal credit sales.
Derivatives
The Group and Company use derivative financial instruments to manage some of the currency and interest raterisks arising from their operations and their sources of finance. The derivatives used for this purpose areprincipally foreign currency forwards and swaps and interest rate swaps.
The Group’s and Company’s ship commitments are typically denominated in euros and thus the Group canbecome exposed to currency risks when ordering ships for its UK brand. These risks can be mitigated by enteringinto foreign currency derivative contracts and nonderivative financial instruments. Our decisions regardingwhether or not to hedge a euro ship commitment for our UK brand are made on a case-by-case basis, taking intoconsideration the amount and duration of the exposure, market volatility, exchange rate correlation, economictrends, our overall expected net cash flows by currency and other offsetting risks.
Additional detail relating to the Group’s and Company’s financial risk management objectives and policies isincluded in note 10 of the Carnival Corporation & plc financial statements and within the MD&A section of theDLC Annual Report and note 1.
47
Independent Auditors’ Report To The Members of Carnival plc
We have audited the financial statements of Carnival plc for the year ended November 30, 2010 which comprisethe Group statements of income, the Group statements of comprehensive income, the Group and Parent Companybalance sheets, the Group and Parent Company statements of cash flows, the Group and Parent Companystatements of changes in shareholders’ equity and the related notes including the Carnival Corporation & plcconsolidated financial statements on pages 5 to 33 of the Carnival Corporation & plc 2010 Annual Report. Thefinancial reporting framework that has been applied in their preparation is applicable law and InternationalFinancial Reporting Standards (IFRSs) as adopted by the European Union and, as regards the Parent Companyfinancial statements, as applied in accordance with the provisions of the Companies Act 2006.
Respective responsibilities of directors and auditors
As explained more fully in the Directors’ Responsibilities Statement, the directors are responsible for thepreparation of the financial statements and for being satisfied that they give a true and fair view. Ourresponsibility is to audit the financial statements in accordance with applicable law and International Standardson Auditing (UK and Ireland). Those standards require us to comply with the Auditing Practices Board’s EthicalStandards for Auditors.
This report, including the opinions, has been prepared for and only for the Company’s members as a body inaccordance with Chapter 3 of Part 16 of the Companies Act 2006 and for no other purpose. We do not, in givingthese opinions, accept or assume responsibility for any other purpose or to any other person to whom this reportis shown or into whose hands it may come save where expressly agreed by our prior consent in writing.
Scope of the audit of the financial statements
An audit involves obtaining evidence about the amounts and disclosures in the financial statements sufficient togive reasonable assurance that the financial statements are free from material misstatement, whether caused byfraud or error. This includes an assessment of: whether the accounting policies are appropriate to the Group’s andthe Parent Company’s circumstances and have been consistently applied and adequately disclosed; thereasonableness of significant accounting estimates made by the directors; and the overall presentation of thefinancial statements.
Opinion on financial statements
In our opinion:• the financial statements give a true and fair view of the state of the Group’s and of the Parent
Company’s affairs as at November 30, 2010 and of the Group’s net income and Group’s and ParentCompany’s cash flows for the year then ended;
• the Group financial statements have been properly prepared in accordance with IFRSs as adopted bythe European Union;
• the Parent Company financial statements have been properly prepared in accordance with IFRSs asadopted by the European Union and as applied in accordance with the provisions of the Companies Act2006; and
• the financial statements have been prepared in accordance with the requirements of the Companies Act2006 and, as regards the Group financial statements, Article 4 of the IAS Regulation.
48
Opinion on other matters prescribed by the Companies Act 2006
In our opinion:• the part of the Directors’ Remuneration Report in Annex B to the Proxy Statement, dated February 17,
2011, to be audited has been properly prepared in accordance with the Companies Act 2006; and• the information given in the Directors’ Report set out in Annex A to the Proxy Statement, dated
February 17, 2011, for the financial year for which the financial statements are prepared is consistentwith the financial statements.
Matters on which we are required to report by exception
We have nothing to report in respect of the following:
Under the Companies Act 2006 we are required to report to you if, in our opinion:• adequate accounting records have not been kept by the Parent Company, or returns adequate for our
audit have not been received from branches not visited by us; or• the Parent Company financial statements and the part of the Directors’ Remuneration Report to be
audited are not in agreement with the accounting records and returns; or• certain disclosures of directors’ remuneration specified by law are not made; or• we have not received all the information and explanations we require for our audit.
Under the Listing Rules we are required to review:• the directors’ statement, set out on page C-9 in Annex C to the Proxy Statement, dated February 17,
2011, in relation to going concern; and• the parts of the Corporate Governance Report in Annex C to the Proxy Statement, dated February 17,
2011, relating to the Company’s compliance with the nine provisions of the June 2008 Combined Codespecified for our review.
John Waters (Senior Statutory Auditor)for and on behalf of PricewaterhouseCoopers LLP
Chartered Accountants and Statutory AuditorsLondonFebruary 18, 2011
The maintenance and integrity of the Carnival plc website is the responsibility of the directors; the work carriedout by the auditors does not involve consideration of these matters and, accordingly, the auditors accept noresponsibility for any changes that may have occurred to the financial statements since they were initiallypresented on the website.
Legislation in the United Kingdom governing the preparation and dissemination of financial statements maydiffer from legislation in other jurisdiction.
49

Carnival House 5 Gainsford Street London SE1 2NE UK www.carnivalplc.com


