Embed Size (px)
Citation preview

GLASTON CORPORATION Financial Statement Bulletin 9 February 2012 15.30 Glaston Corporation Financial Statement Release 1 January – 31 December 2011 - Orders received in January-December totalled EUR 141.3 (147.7) million. Orders received in the fourth quarter totalled EUR 39.7 (40.1) million. - The order book on 31 December 2011 was EUR 37.6 (41.5) million. - Consolidated net sales totalled EUR 142.7 (149.4) million. Final quarter net sales were EUR 39.3 (37.7) million. - EBITDA was EUR 7.0 (-10.4) million, i.e. 4.9 (-6.9)% of net sales. - The operating result was a loss of EUR 1.1 (24.9 loss) million, i.e. -0.8 (-16.7)% of net sales. The final quarter operating result was EUR 1.1 (17.6 loss) million. -The operating result, excluding non-recurring items, was a loss of EUR 1.4 (11.3 loss) million, i.e. -1.0 (-7.5)% of net sales. The final quarter operating result, excluding non-recurring items, was EUR 0.9 (3.9 loss). - Return on capital employed (ROCE) was 0.3 (-19.0)% - Earnings per share in January-December were EUR -0.14 (-0.39) and fourth-quarter earnings per share were EUR -0.01 (-0.23). - The Board of Directors proposes to the Annual General Meeting that no dividend be distributed. - Glaston expects that 2012 net sales will be at least at the 2011 level and that the operating result will be positive. President & CEO Arto Metsänen: “In 2011 Glaston’s operating environment and market situation remained challenging. At the beginning of the year there were signs of growth, but in the second half the problems of the world economy were reflected in our customers’ willingness to invest and led to the postponement of larger investment decisions. In 2011 Glaston’s market did not grow and our net sales fell slightly short of the previous year’s figure. Despite this, we still managed to improve our profitability significantly. All segments improved their result compared with the previous year. The biggest improvement came in the Machines segment. I would like to thank everyone in the organisation for their valuable contribution. Continuous product development is extremely important to Glaston. Despite the recession, we have continued to invest strongly in research and development in order to maintain competitiveness. Last year, research and development spending totalled EUR 8.1 million, i.e. 5,7% of net sales. During the year we launched a number of new products covering the whole life cycle of glass processing. I look towards 2012 with confidence. We are bringing our operational efficiency measures to completion. We have purposefully developed our operations and through active product development we are able to offer a comprehensive range of up-to-date products and services. These measures create a foundation for growing our business.” Markets The cautiously positive development of the glass processing market in the early part of 2011 slowed in the second half of the year. The poorer economic outlook and market uncertainty in the latter part of the year were reflected in customers’ willingness to invest, increasing their caution with respect to new machine investments in particular. Glaston’s market situation was challenging in 2011, despite the positive development of some market areas. The South American market developed positively throughout the year. In Western Europe, demand remained weak, while in Eastern Europe the glass processing machine market picked up at the end of the year. In Asia, the levelling off of the market that began in the second quarter continued in the second half of the year. In North America, demand for machines remained weak. Machines Besides a few country-specific exceptions, 2011 was challenging for the Machines segment. In the EMEA area, demand was low throughout the year, which particularly affected the number of new orders for heat treatment machines. An exception was Eastern Europe, where demand showed signs of recovery in the second half of the year. Demand for pre-processing machines picked up in the latter
part of the year, particularly in Russia. Uncertain economic development impacted the development of the North American market, and demand was modest throughout the year. The South American market developed positively. In the Asian market, demand grew at the start of 2011, but owing to uncertainty in the world economy, demand levelled off in the second half of the year. In 2011 the Machines segment’s investments in product development continued, and during the year a number of new products were launched. The new Solar Line concept, the market’s first integrated production line for tempering, edging and washing of solar panel glass, was presented at the China Glass Fair, held in Shanghai in May. In autumn 2011, at the Vitrum Fair in Italy, Glaston launched Glaston Bavelloni straight line edging machine Hiyon™ and double edging machine Xtraedge™ and introduced the GlastonToolEx™ service for material management for diamond and polishing tools. During 2011 the profitability of the segment was improved by enhancing the operations of the global procurement organisation. The restructuring of the segment was completed in July when the previously separate pre-processing and heat treatment factories in Brazil were combined into a single manufacturing facility. Measures to adjust production capacity to correspond with demand continued in Finland and Italy. At the end of 2011, the segment had 541 (577) employees. Orders received in the Machines segment totalled EUR 89.2 (96.2) million in 2011. In January-December, net sales totalled EUR 90.0 (95.0) million. The January-December operating result was a loss of EUR 1.7 (20.4 loss) million, and the operating result excluding non-recurring items was a loss of EUR 1.9 (8.5 loss) million. Orders received in the Machines segment totalled EUR 26.9 (26.8) million in October-December. October-December net sales were EUR 26.2 (23.6) million and the operating result was EUR 1.7 (14.7 loss) million. The operating result, excluding non-recurring items, was EUR 1.5 (2.7 loss) million. Services In 2011 the Services segment market developed positively. Demand was good, despite a challenging market situation. Demand was directed particularly at upgrade products and spare parts. Compared with the previous year, the Services segment grew in Asia, South America and North America. Customers showed particular interest in products that raise capacity and improve quality. The Vortex Pro convection control system, which improves production line capacity and glass quality, was very well received in the North American market during the year. At the Vitrum Fair, Glaston introduced the GlastOnline™ spare parts web shop as well as the Warranty5 reliability programme for new flat tempering machines. Orders received in the Services segment totalled EUR 31.3 (29.8) million in 2011. In January-December, net sales totalled EUR 31.1 (32.0) million. Operational profitability improved further due to a higher invoicing rate for maintenance work, growing sales of upgrade products and spare parts, as well as faster spare parts deliveries. During the year, no significant changes took place in the segment’s worldwide maintenance service network and number of service locations. At the end of 2011, the segment had 117 (149) employees. The January-December operating result was EUR 5.7 (1.1) million, and the operating result excluding non-recurring items was EUR 5.6 (3.3) million. Orders received in the Services segment totalled EUR 8.0 (8.0) million in the final quarter of 2011. October-December net sales were EUR 7.9 (8.8) million and the operating result was EUR 0.9 (1.0 loss) million. The operating result, excluding non-recurring items, was EUR 0.9 (1.2) million. Software Solutions In 2011 the Software Solutions segment’s most significant market areas were Central, Western and Northern Europe, North America and Japan. Sales of maintenance contracts developed positively during the year. Demand for production control and monitoring systems was also good. At the beginning of the year, the Software Solutions segment launched the new window and glass industry applications CantorCockpit and Cockpit 2000, which have been developed for the iPhone and are available to registered Albat+Wirsam (A+W) customers in the Apple Store. With the aid of the

applications, users can receive key business information directly to their phones. The segment presented a new barcode reader solution at the Vitrum Fair in the autumn. The Dragonfly enterprise resource planning system, which enables better usability of glass processing machines as well as more efficient production scheduling, was presented to medium-sized glass processors. During 2011, the Software Solutions segment restructured product development and the sales organization, and continued intensive measures to improve profitability. Orders received in the Software Solutions segment totalled EUR 20.9 (21.7) million in 2011. In January-December, net sales totalled EUR 23.1 (23.9) million. At the end of 2011, the segment had 200 (214) employees. The January-December operating result was EUR 1.8 (1.5) million, and the operating result excluding non-recurring items was EUR 1.7 (1.1) million. In the final quarter of 2011 orders received in the Software Solutions segment totalled EUR 4.8 (5.3). October-December net sales were EUR 5.6 (5.8) million and the operating result was EUR 0.8 (0.1) million. The operating result, excluding non-recurring items, was EUR 0.8 (0.3 loss) million. Orders received and order book Glaston’s orders received during the financial year totalled EUR 141.3 (147.7) million. Of orders received, the Machines segment accounted for 63%, the Services segment 22% and the Software Solutions segment 15%. Orders received during the final quarter of the year totalled EUR 39.7 (40.1) million. Glaston’s order book on 31 December 2011 was EUR 37.6 (41.5) million. Of the order book, the Machines segment accounted for EUR 34.6 (37.4) million, the Services segment EUR 1.2 (1.2) million and Software Solutions segment EUR 1.8 (2.9) million. Order book, EUR million
31.12.2011 31.12.2010 Change, %
Machines 34.6 37.4 -7.5 Services 1.2 1.2 0.0 Software Solutions 1.8 2.9 -37.9 Total 37.6 41.5 -9.4
Net sales and operating result Glaston’s net sales in January-December totalled EUR 142.7 (149.4) million. Net sales development was impacted by the instability of the glass processing market. As the economic outlook deteriorated, customers’ became significantly more cautious about new investments, which was reflected most strongly in sales of heat treatment machines. Final quarter net sales were EUR 39.3 (37.7) million and were distributed across the business segments as follows: Machines EUR 26.2 (23.6) million, Services EUR 7.9 (8.8) million and Software Solutions EUR 5.6 (5.8) million. The Machines segment’s net sales in the review period were EUR 90.0 (95.0) million, the Services segment’s net sales EUR 31.1 (32.0) million and the Software Solutions segment's net sales EUR 23.1 (23.9) million. Net sales, EUR million 2011 2010
Machines 90.0 95.0 Services 31.1 32.0 Software Solutions 23.1 23.9 Other and internal sales -1.6 -1.5 Total 142.7 149.4
The operating result was a loss of EUR 1.1 (24.9 loss) million, i.e. -0.8 (-16.7)% of net sales. The operating result, excluding non-recurring items, was a loss of EUR 1.4 (11.3 loss) million, i.e. -1.0 (-
7.5)% of net sales. The final quarter operating result was EUR 1.1 (17.6 loss) and excluding non-recurring items was EUR 0.9 (3.9 loss) million. Although the operating result was a loss, there was a significant improvement from the previous year. All segments improved their result compared with the previous year. The biggest improvement came in the Machines segment. The Machines segment’s operating result, excluding non-recurring items, was a loss of EUR 1.9 (8.5 loss) million in January-December and a profit of EUR 1.5 (2.7 loss) million in the final quarter. The Services segment’s operating result, excluding non-recurring items, was EUR 5.6 (3.3) million and in the final quarter EUR 0.9 (1.2) million. The Software Solutions segment’s operating result, excluding non-recurring items, was EUR 1.7 (1.1) million in January-December and EUR 0.8 (0.3 loss) million in the final quarter. Operating result, EUR million 1-12/2011 1-12/2010 Machines -1.9 -8.5 Services 5.6 3.3 Software Solutions 1.7 1.1 Other and eliminations -6.8 -7.1 Total -1.4 -11.3 Non-recurring items 0.3 -13.7 Operating result, including non -recurring items
-1.1 -24.9
The result for the review period was a loss of EUR 14.4 (32.0 loss) million and in the final quarter a loss of EUR 1.2 (18.8 loss) million. In January-December, the return on capital employed (ROCE) was 0.3 (-19.0)%. Earnings per share were EUR -0.14 (-0.39) and fourth-quarter earnings per share were EUR -0.01 (-0.23). Financial position, cash flow and financing At the end of the review period, the consolidated asset total was EUR 187.2 (194.9) million. The equity attributable to the owners of the parent was EUR 52.8 (39.1) million, i.e. EUR 0.50 (0.48) per share. The equity ratio on 31 December 2011 was 31.1 (22.1)%. Return on equity in January-December was -31.2 (-58.7)%. Cash flow from operating activities, before the change in working capital, was EUR -7.7 (-13.7) million in the review period. Cash flow from operating activities was positively influenced by the improved result, while paid interests and other financial expenses as well as income taxes grew from the previous year and had a weakening impact. The change in working capital was EUR 12.2 (2.7) million. Cash flow from investments was EUR -5.5 (-3.5) million. Cash flow from financing activities in January-December was EUR 3.8 (11.9) million. In February 2011, Glaston arranged a financing package of around EUR 84 million whereby the company’s short-term funding was converted to long-term, financial flexibility was improved and equity strengthened. Around EUR 74 million of the funding is a syndicated loan, which has a maturity of three years. The funding agreement includes typical funding covenants. According to the funding agreement, the payment of a dividend is conditional on a net financial debt to EBITDA ratio of less than 2.75. These restrictions do not apply to statutory dividends. In addition, Glaston issued new shares valued at approximately EUR 6 million and also a EUR 4.0 million debenture loan with a maturity of three years. In 2011 convertible bonds to the value of EUR 21,250,000 were converted into shares, at which time 16,346,135 new shares were issued. In addition, as additional compensation to those who converted their convertible bonds into shares, a total of 3,092,501 shares were issued in a directed share issued without payment. Of the convertible bond issued in June 2009, approximately EUR 8,750,000 remains after the 2011 conversions. In accordance with the IAS 32
standard, a financial expense item of around EUR 3.4 million was recognised in the profit or loss statement for the additional consideration given in connection with the conversion of the convertible bond. The expense, however, had no effect on Glaston’s equity or cash flow. The converted amount of the convertible bond, as with the share issue, was recognized fully in the reserve for invested unrestricted equity. The Group’s liquid funds at the end of the review period totalled EUR 18.6 (15.7) million. Interest-bearing net debt totalled EUR 49.7 (74.6) million and net gearing was 93.5 (189.0)%. Adjustment measures In 2011, the operational development priorities were a clear improvement in business profitability and the completion of adjustment measures. Measures to adjust production capacity to correspond with demand continued throughout the year in Italy and Finland. In Italy, negotiations to cut around 40 jobs were completed during the first quarter of 2011. In the summer, the restructuring of the Pre-processing product line was completed when the Heat Treatment and Pre-processing production functions in Brazil were transferred to the same factory. In Finland, a programme to enhance the operational efficiency and improve the profitability of the Heat Treatment product line was launched in the autumn. During the year, lay-offs continued in Italy and Finland. During the second half of the year, extensive measures were launched in the Software Solutions segment to boost operational efficiency and improve profitability. The measures were directed mainly at product development and sales organization. Substantial lay-offs were under way in the segment during the final quarter. Research and product development Glaston’s research and product development expenditure in 2011 totalled EUR 8.1 (9.6) million, i.e. 5.7 (6.4)% of net sales. In product development, the main focus of attention was on bringing new products to the market, expanding the product portfolio and further development of the company’s main products. During the year, a number of new products were launched: a new series of Glaston Bavelloni Hiyon™ straight edging machines and XtraEdge™ double-edging machines as well as the GlastonOnline™ web shop, which in the first stage offers more than 1,000 spare parts for Tamglass™ and Uniglass™ machines. In addition, Glaston introduced for new heat treatment machines the five-year Warranty5 reliability programme and the new GlastonToolEx™ tool service concept for diamond and grinding wheels. In software solutions, Glaston launched the Albat+Wirsam barcode reader solution as well as an enterprise resource planning system, directed at medium-sized glass processors, which facilitates better usability of machines. Capital expenditure, depreciation and amortisation Glaston’s gross capital expenditure totalled EUR 5.7 (4.6) million. The most significant investments in 2011 were in product development. During 2011 depreciation and amortisation on property, plant and equipment, and intangible assets totalled EUR 7.9 (7.5) million. Impairment losses on tangible and intangible assets totalled EUR 0.2 (7.0) million. Changes in the company's management Topi Saarenhovi, Senior Vice President, Machines and member of the Executive Management Group, left Glaston on 1 February 2011. No new Senior Vice President, Machines was appointed; the segment now reports directly to the President & CEO. Uwe Schmid was appointed Senior Vice President, Software Solutions and member of the Executive Management Group on 8 April 2011. He assumed full business responsibility for the Software Solutions segment as of 1 September 2011. In connection with the appointment, the former Senior Vice President, Günter Befort, became a Senior Advisor. Befort also continues as a member of the Executive Management Group.
Personnel During the year, measures to adjust personnel numbers to the market situation continued. These were directed mainly at Europe (-109) and particularly at Finland and Italy. In Asia, human resources were strengthened (+20). In the Americas, there was no change in personnel numbers. On 31 December 2011, Glaston had a total of 870 (957) employees. Of the Group’s employees, 17% worked in Finland and 40% elsewhere in the EMEA area, 28% in Asia and 15% in the Americas. The average number of employees was 899 (1,028). Group structural changes in 2011 In 2011 the following Group companies were liquidated: Glaston Estonia Oü in Estonia, Glasto Holding B.V. and Glaston Netherlands B.V. in the Netherlands, Glaston Spain S.L. in Spain and Glaston Belgium GmbH in Belgium. At the beginning of 2011, Albat+Wirsam Software GmbH founded a branch in Belgium. In July 2011, the shares of Glaston Germany GmbH were sold to Albat+Wirsam Software GmbH. Tamglass Glass Processing Ltd. merged with Glaston Finland Ltd. in December 2011. Environment Glaston aims to be as environmentally friendly as possible in its operations. As a rule, Glaston's own production operations do not adversely affect the environment. In product development, attention to energy efficiency is of key importance in terms of both glass processing machines and end products. The machines manufactured by Glaston have long lifetimes, and the entire life cycle of each machine is taken into account in its design. Glass processing machines are developed and manufactured to withstand constant use at high production capacities. The new Tamglass FC500 tempering line consumes up to 40% less energy than traditional technology products, because it utilises, among other things, air recirculation in glass heating. Moreover, through the insulation material used in machines, every effort is made to minimise heat loss. The new Bavelloni Hiyon edging machine's GRIND&STOP function automatically sets the machine to standby once the glass moves to the next phase of processing and the edger is no longer required, resulting in considerable energy savings. In pre-processing machines that use water for cooling, Glaston has developed in cooperation with customers the machines’ recirculation and re-use of water. The modernisation of machines with new technical features extends the life of machines and reduces energy consumption in glass processing. Launched in 2011, the Vortex Pro convection control system upgrade for Tamglass tempering machines enables the production of modern energy glass while bringing energy savings of 30% to the processing of glass. Shares and share prices On 25 February 2011, Glaston published a stock exchange release outlining the company’s new financial package. As part of the arrangement, Glaston's convertible bond holders were offered the opportunity to convert their bond holdings into the company’s shares, and 6.8 million shares were issued in a directed share issue. A total of 18,530,768 new shares were subscribed for in the directed share issue and in the conversion of the convertible bonds into shares. These new shares were entered in the Trade Register on 4 March 2011 and became available for trading on the NASDAQ OMX Helsinki Stock Exchange on 7 March 2011. In addition, on 28 March 2011, the Board of Directors of Glaston approved bond conversion undertakings totalling EUR 6.0 million, for which bond holders received in the conversion a total of 4,615,367 Glaston shares. These shares were entered in the Trade Register on 4 April 2011 and became available for trading on the NASDAQ OMX Helsinki Stock Exchange on 5 April 2011. The Board of Directors of Glaston Corporation decided on 28 April 2011 to implement a directed share issue without payment on the basis of the authorisation granted to it by the Annual General Meeting on 5 April 2011. In the share issue, a total of 3,092,501 new company shares were issued without payment to those investors who had converted into company shares the convertible bonds issued by the company on 16 June 2009 and 18 February 2010. The new shares were entered into the Trade Register on 6 May 2011 and became available for public
trading on the NASDAQ OMX Helsinki Stock Exchange on 9 May 2011. Glaston Corporation’s paid and registered share capital on 31 December 2011 was EUR 12.7 million and the number of issued and registered shares totalled 105,588,636. The company has one series of share. At the end of the year, the company held 788,582 of the company’s own shares (treasury shares), corresponding to 0.75% of the total number of issued and registered shares and votes. The counter book value of treasury shares is EUR 94,819. Every share that the company does not hold itself entitles its owner to one vote at the Annual General Meeting. The share has no nominal value. The counter book value of each share is EUR 0.12. During 2011, a total of 8,446,549 of the company’s shares were traded, representing 8.5% of the average number of shares. The lowest price paid for a share was EUR 0.40 (in 2010: EUR 0.80) and the highest price EUR 1.27 (1.65). The volume-weighted average price of shares traded in January-December was EUR 0.84 (1.17). The closing price on 31 December 2011 was EUR 0.45 (1.13). On 31 December 2011, the market capitalisation of the company's shares, treasury shares excluded, was EUR 47.2 (88.8) million. The equity per share attributable to owners of the parent was EUR 0.50 (0.48). Disclosures under Chapter 2, Section 9 of the Secur ities Markets Act During 2011, Glaston was informed of the following changes in ownership: on 25 February 2011, Glaston was informed that Finnish Industry Investment Ltd. and Varma Mutual Pension Insurance Company had subscribed for shares in Glaston’s directed share offering and had converted their Glaston convertible bond holdings into the company’s shares. Finnish Industry Investment Ltd.’s ownership rose to 8.32% of Glaston's total shares and votes and Varma Mutual Pension Insurance Company’s ownership to 8.31%. On 29 March 2011, Glaston was informed that the holdings of both Oy G.W.Sohlberg Ab and GWS Trade Oy in Glaston Corporation had fallen below 15% as part of the convertible bond conversion relating to Glaston’s financing arrangements. Oy G.W.Sohlberg Ab’s ownership fell to 12.51% of Glaston’s total shares and votes and GWS Trade Oy’s ownership to 13.12%. On 29 April 2011, Glaston was informed that the holding in Glaston Corporation of Oy G.W. Sohlberg Ab and its controlled undertaking (GWS Trade Oy) had fallen below 25% as part of the directed share issue without payment relating the financing arrangements described in Glaston’s stock exchange release of 28 April 2011. Oy G.W. Sohlberg Ab’s ownership fell to 12.14% and GWS Trade Oy’s ownership fell to 12.73%. Shareholders Glaston Corporation’s largest shareholders on 31 December 2011, the distribution of ownership by shareholder group on 31 December 2011, and the distribution of share ownership by number of shares are presented in Note 4 of the consolidated financial statements. Information on the Glaston Corporation shares owned by Members of the Board of Directors and the President & CEO is presented in Note 30 of the consolidated financial statements. Glaston Corporation is unaware of any shareholder agreements or arrangements relating to share ownership or the exercise of votes. Glaston’s largest shareholders Oy G.W.Sohlberg Ab and GWS Trade Oy have separately undertaken not to claim minority dividends as prescribed in Chapter 13 Section 7 of the Finnish Companies Act. Share-based incentive plans On 9 June 2010, Glaston’s Board of Directors decided on a share-based incentive scheme for the Group’s key personnel. The scheme had one performance period covering 2010 and 2011, with the vesting condition being the development of the Group’s operating result. The scheme did not vest, as the vesting condition was not fulfilled. On 12 December 2011, Glaston’s Board of Directors decided on a new share-based incentive
scheme for the Group’s key personnel. The share bonus scheme has three performance periods, namely the calendar years 2012, 2013 and 2014. The company’s Board of Directors will decide on the scheme’s vesting conditions and the targets set for them at the beginning of each performance period. The possible bonus of the scheme for performance period 2012 will be based on the Glaston Group’s operating result (EBIT) and net profit. The share bonus scheme’s target group includes around 25 people. The bonuses payable on the basis of the scheme will correspond during three years to a maximum of 4.8 million Glaston Corporation shares. In addition to the above-mentioned incentive scheme, the President & CEO of Glaston Corporation has a separate share bonus arrangement, on the basis of which he was awarded a total of 50,000 Glaston Corporation shares on 3 September 2010. Decisions of the Annual General Meeting The Annual General Meeting of Glaston Corporation was held in Helsinki on 5 April 2011. The Annual General Meeting approved the financial statements and consolidated financial statements for 2010 and released the President & CEO and the Members of Board of Directors and from liability for the financial year 1 January–31 December 2010. The Annual General Meeting approved the proposal of the Board of Directors that no dividend be distributed for the financial year ending 31 December 2010. The Annual General Meeting confirmed the re-election of the following Members of the Board of Directors for a year-long term of office: Claus von Bonsdorff, Carl-Johan Rosenbröijer, Teuvo Salminen, Christer Sumelius and Andreas Tallberg. A new member, Pekka Vauramo, was also elected. Klaus Cawén and Jan Lång stood down from the Board of Directors. The Annual General Meeting decided to maintain the Chairman of the Board’s annual remuneration at EUR 40,000 and the Deputy Chairman’s annual remuneration at EUR 30,000. It was also decided to maintain the remuneration of the other Members of the Board at EUR 20,000 euros per year. The Annual General Meeting elected as auditor Public Accountants Ernst & Young Oy, with Harri Pärssinen, APA, as the responsible auditor. The Annual General Meeting approved an amendment to Article 1 of the Articles of Association so that the domicile of the company shall be Helsinki. At its organising meeting on 5 April 2011, Glaston’s Board of Directors elected Andreas Tallberg to continue as the Chairman of the Board and Christer Sumelius to continue as the Deputy Chairman of the Board. Authorisations given by the Annual General Meeting The Annual General Meeting authorised the Board of Directors to decide on the issuance of new shares and/or the conveyance of the own shares held by the company. By virtue of the authorisation, the Board of Directors is entitled to decide on the issuance of a maximum of 20,000,000 new shares and on the conveyance of a maximum of 20,000,000 own shares held by the company. However, the total number of shares to be issued and/or conveyed may not exceed 20,000,000 shares. The new shares may be issued and own shares held by the company may be conveyed either against payment or without payment. The new shares may be issued and/or own shares held by the company conveyed to the company’s shareholders in proportion to their existing shareholdings in the company, or by means of a directed share issue, in derogation of the pre-emptive subscription right of the shareholders, if there is a weighty reason for the company to do so, such as the shares are to be used to improve the capital structure of the company or as consideration in future acquisitions or other arrangements that are part of the company’s business or as part of the company’s or its subsidiaries’ incentive schemes.
Shares may be issued or conveyed without payment in derogation of the pre-emptive subscription right of shareholders only if there is an especially weighty financial reason for the company to do so, taking the interests of all shareholders into account. The Board of Directors may decide on a share issue without payment also to the company itself. A decision regarding a share issue to the company itself cannot be made such that the total number of shares held jointly by the company or its subsidiaries would exceed one tenth of all shares of the company. The subscription price of new shares issued and the consideration paid for the conveyance of the company’s own shares shall be credited to the reserve for invested unrestricted equity. By virtue of the share issue authorisation, the Board of Directors shall decide on other matters relating to the issuance and conveyance of shares. The share issue authorisation is valid until the end of the 2013 Annual General Meeting. The Board of Directors decided on 28 April 2011 to implement a directed share issue without payment. In the share issue, a total of 3,092,501 new company shares were issued without payment. At the end of 2011, the Board of Directors still had an authorisation to issue 16,907,499 shares. The Board of Directors has no other authorisations. Events after the review period On 5 January 2012, Glaston announced that it had signed an undertaking on the sale and leaseback of its factory property complex located at Vehmainen in Tampere, Finland. Glaston believes that the transaction will be completed during the first half of 2012. The property complex will be presented in Glaston’s balance sheet as held for sale asset when all conditions under IFRS 5 are fulfilled. Risk and risk management Glaston operates globally and changes in the development of the world economy directly affect the Group's operations and risks. A strategic risk for Glaston is above all the possible arrival of a competing machine technology on the market, which would require Glaston to make considerable product development investments. Moreover, loss of the Group's market shares, particularly in the most strongly emerging markets (Asia, South America) is a strategic risk. Glaston's most significant operational risks include management of large customer projects, the availability and price development of components, management of the subcontractor network, and the availability and permanence of personnel. Glaston is developing its information systems and despite careful planning, temporary disruptions to operations might be associated with the introduction stages. Connected with operations are financial risks, such as foreign exchange, interest rate, financing, counterparty, credit loss and liquidity risks. The nature of international business means that Glaston has risks arising from fluctuations in foreign exchange rates. Changes in interest rates represent an interest rate risk. Credit and counterparty risk arises from risk associated with the payment period granted to customers. The liquidity risk is the risk that the company's negotiated credit facilities are insufficient to cover the financial needs of the business. The Group’s loan agreements include terms and other commitments which are linked to consolidated key figures. If the covenant terms are not fulfilled, negotiations with the lenders will be initiated. These negotiations may lead to notice of termination of financial agreements. The covenants in use are interest cover, net debt /EBITDA, cash and gross capital expenditure. The covenants are monitored partly quarterly and partly monthly. In the end of the fourth quarter Glaston renegotiated some of the loan covenants with lenders. Uncertainties and risks in the near future Economic uncertainty increased in the second half of 2011. Slower economic growth may lead to the postponement of orders and changes in machine delivery schedules. The uncertain market outlook will also affect customers’ investment opportunities. The underlying nature of the sector is expected to remain unchanged, so development in the coming years is expected to be positive. If the recovery of the sector is delayed or slows, this will have a
negative effect on Glaston’s result. The shift of the geographical focus of activity to areas of higher economic growth will, however, dampen the economic effects of a possibly slower recovery in Western Europe and North America, despite a levelling off of the Asian market. Due to market uncertainty, it is possible that Glaston’s recoverable amounts will be insufficient to cover the carrying amounts of assets, particularly goodwill. If this happens, it will be necessary to recognise an impairment loss, which, when implemented, will weaken the result and equity. General business risks and risk management are outlined in more detail in Glaston's 2011 Annual Report and on the company’s website www.glaston.net. Outlook Glaston's market will remain challenging in 2012. Economic uncertainty will continue to impact customers’ investment decisions, with orders for heat treatment machines being particularly affected. Growth in the Asia market is expected to level off. In North America and the EMEA area, the market will also continue to be challenging. We believe that the positive development of the South American market will continue. The cornerstones of Glaston’s operations remain the architectural glass segment and the solar energy market. In the longer term, prospects for the solar energy segment are good. We will purposefully continue our investments in those areas which do not require significant investments from our customers, namely maintenance services and tools. We expect the good development of the service market to be sustained in 2012. Glaston expects that 2012 net sales will be at least at the 2011 level and that the operating result will be positive. Board of Directors' proposal on the distribution of profits The distributable funds of Glaston Corporation, the parent of Glaston Group, total EUR 37,007,425, of which the loss for the review period is EUR -33,093,461. Of the distributable funds, funds available for dividend distribution total EUR 10,202,178. The Board of Directors proposes to the Annual General Meeting that no dividend be distributed from the result for the year nor from retained earnings. EUR 37,007,425 will be left in distributable funds.
Helsinki, 9 February 2012 Glaston Corporation Board of Directors
For further information, please contact: CEO & President Arto Metsänen, tel. +358 10 500 500 Chief Financial Officer Tapio Engström, tel. +358 10 500 6419 GLASTON CORPORATION Agneta Selroos Director, Communications and Marketing Glaston Corporation Glaston Corporation is an international glass technology company and a pioneer in glass processing technology. Its product range and service network are the widest in the industry. Glaston's notable brands are Bavelloni in pre-processing machines and tools, Tamglass and Uniglass in safety glass machines, and Albat+Wirsam in glass industry software. Glaston's share (GLA1V) is listed on the NASDAQ OMX Helsinki Small Cap List. Distribution: NASDAQ OMX, key media, www.glaston.net
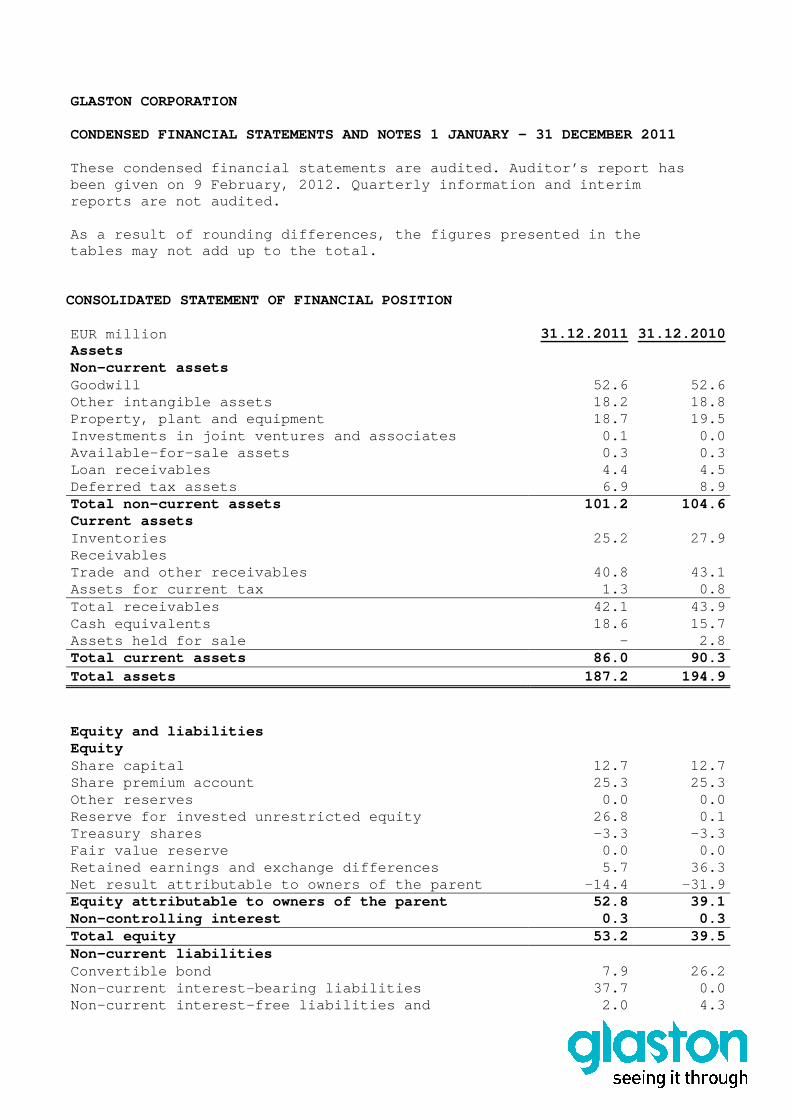
GLASTON CORPORATION CONDENSED FINANCIAL STATEMENTS AND NOTES 1 JANUARY - 31 DECEMBER 2011 These condensed financial statements are audited. A uditor’s report has been given on 9 February, 2012. Quarterly informati on and interim reports are not audited. As a result of rounding differences, the figures pr esented in the tables may not add up to the total.
CONSOLIDATED STATEMENT OF FINANCIAL POSITION EUR million 31.12.2011 31.12.2010 Assets Non-current assets Goodwill 52.6 52.6 Other intangible assets 18.2 18.8 Property, plant and equipment 18.7 19.5 Investments in joint ventures and associates 0.1 0.0 Available-for-sale assets 0.3 0.3 Loan receivables 4.4 4.5 Deferred tax assets 6.9 8.9 Total non-current assets 101.2 104.6 Current assets Inventories 25.2 27.9 Receivables Trade and other receivables 40.8 43.1 Assets for current tax 1.3 0.8 Total receivables 42.1 43.9 Cash equivalents 18.6 15.7 Assets held for sale - 2.8 Total current assets 86.0 90.3 Total assets 187.2 194.9
Equity and liabilities Equity
Share capital 12.7 12.7 Share premium account 25.3 25.3 Other reserves 0.0 0.0 Reserve for invested unrestricted equity 26.8 0.1 Treasury shares -3.3 -3.3 Fair value reserve 0.0 0.0 Retained earnings and exchange differences 5.7 36.3 Net result attributable to owners of the parent -14 .4 -31.9 Equity attributable to owners of the parent 52.8 39.1 Non-controlling interest 0.3 0.3 Total equity 53.2 39.5 Non-current liabilities Convertible bond 7.9 26.2 Non-current interest-bearing liabilities 37.7 0.0 Non-current interest-free liabilities and 2.0 4.3
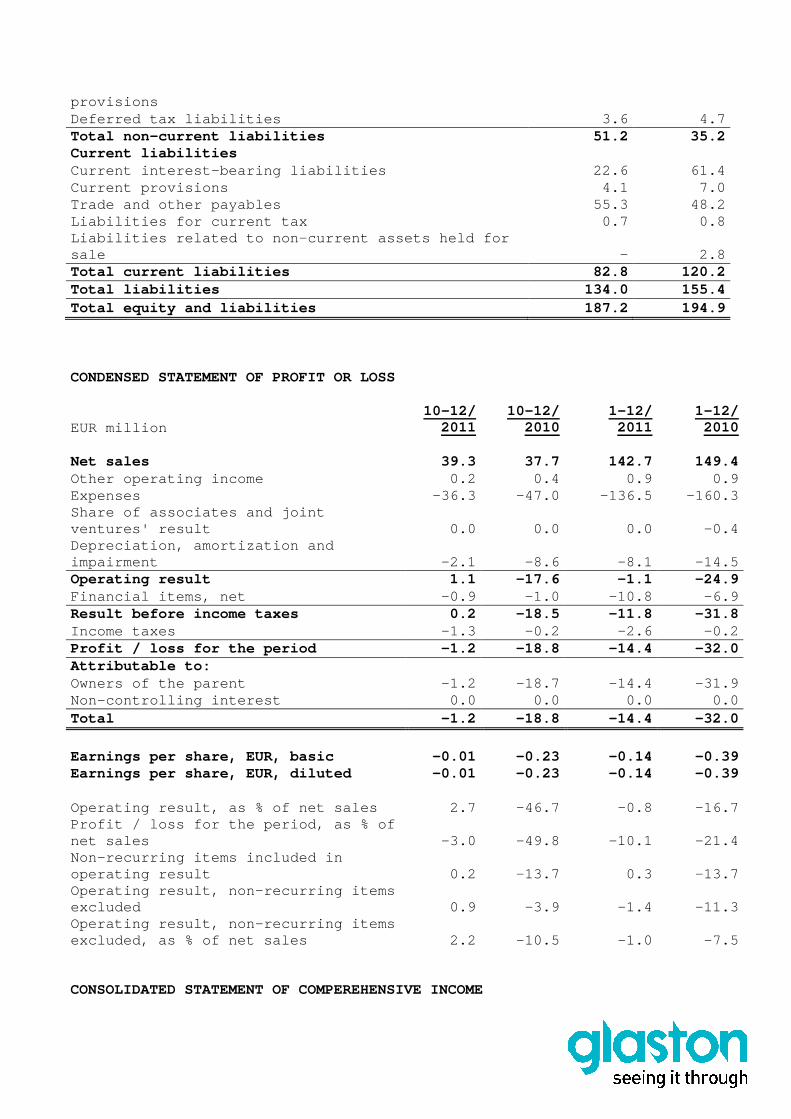
provisions Deferred tax liabilities 3.6 4.7 Total non-current liabilities 51.2 35.2 Current liabilities Current interest-bearing liabilities 22.6 61.4 Current provisions 4.1 7.0 Trade and other payables 55.3 48.2 Liabilities for current tax 0.7 0.8 Liabilities related to non-current assets held for sale - 2.8 Total current liabilities 82.8 120.2 Total liabilities 134.0 155.4 Total equity and liabilities 187.2 194.9
CONDENSED STATEMENT OF PROFIT OR LOSS
EUR million
10- 12/ 2011
10- 12/ 2010
1- 12/ 2011
1- 12/ 2010
Net sales 39.3 37.7 142.7 149.4 Other operating income 0.2 0.4 0.9 0.9 Expenses -36.3 -47.0 -136.5 -160.3 Share of associates and joint ventures' result 0.0 0.0 0.0 -0.4 Depreciation, amortization and impairment -2.1 -8.6 -8.1 -14.5 Operating result 1.1 -17.6 -1.1 -24.9 Financial items, net -0.9 -1.0 -10.8 -6.9 Result before income taxes 0.2 -18.5 -11.8 -31.8 Income taxes -1.3 -0.2 -2.6 -0.2 Profit / loss for the period -1.2 -18.8 -14.4 -32.0 Attributable to:
Owners of the parent -1.2 -18.7 -14.4 -31.9 Non-controlling interest 0.0 0.0 0.0 0.0 Total -1.2 -18.8 -14.4 -32.0
Earnings per share, EUR, basic -0.01 -0.23 -0.14 -0.39 Earnings per share, EUR, diluted -0.01 -0.23 -0.14 -0.39
Operating result, as % of net sales 2.7 -46.7 -0.8 -16.7 Profit / loss for the period, as % of net sales -3.0 -49.8 -10.1 -21.4 Non-recurring items included in operating result 0.2 -13.7 0.3 -13.7 Operating result, non-recurring items excluded 0.9 -3.9 -1.4 -11.3 Operating result, non-recurring items excluded, as % of net sales 2.2 -10.5 -1.0 -7.5
CONSOLIDATED STATEMENT OF COMPEREHENSIVE INCOME

10- 12/ 2011
10- 12/ 2010
1- 12/ 2011
1- 12/ 2010
Profit / loss for the period -1.2 -18.8 -14.4 -32.0 Other comprehensive income
Total exchange differences on translating foreign operations 0.4 0.3 0.5 1.0 Fair value changes of available-for-sale assets 0.0 0.0 0.0 0.0 Income tax on other comprehensive income 0.0 0.0 0.0 0.0 Other comprehensive income for the reporting period, net of tax 0.4 0.3 0.5 1.0
Total comprehensive income for the reporting period -0.8 -18.4 -14.0 -30.9
Attributable to Owners of the parent -0.8 -18.4 -14.0 -30.9
Non-controlling interest 0.0 0.0 0.0 0.0 Total comprehensive income for the reporting period -0.8 -18.4 -14.0 -30.9 CONDENSED CONSOLIDATED STATEMENT OF CASH FLOWS
EUR million 1-12/2011 1-12/2010 Cash flows from operat ing activities Cash flow before change in net working capital -7.7 -13.7 Change in net working capital 12.2 2.7 Net cash flow from operating activities 4.4 -11.0 Cash flow from investing activities Business combinations 0.0 0.0 Other purchases of non-current assets -5.7 -4.4 Investment in joint ventures - -0.2 Proceeds from sale of joint ventures - 0.4 Proceeds from sale of other non-current assets 0.2 0.7 Net cash flow from investing activities -5.5 -3.5 Cash flow before financing -1.1 -14.5 Cash flow from financing activities Share issue and conversion of convertible bond, net 5.8 - Increase in non-current liabilities 47.9 6.2 Decrease in non-current liabilities -3.4 -1.2 Changes in loan receivables (increase - / decrease +) 0.1 -0.1
Increase in short-term liabilities 34.9 50.1 Decrease in short-term liabilities -81.5 -44.5 Other financing 0.0 1.4 Net cash flow from financing activities 3.8 11.9
Effect of exchange rate changes 0.2 2.7 Net change in cash and cash equivalents 2.9 0.1
Cash and cash equivalents at the beginning of 15.7 15.6
period
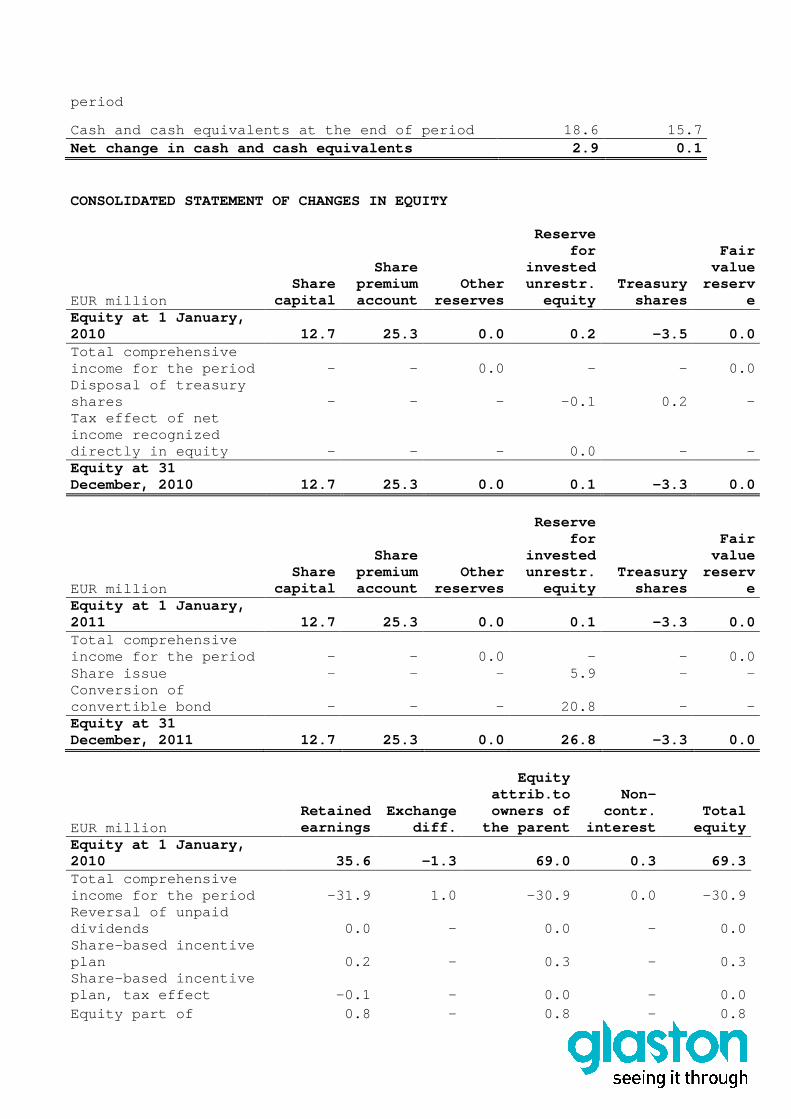
Cash and cash equivalents at the end of period 18.6 15.7 Net change in cash and cash equivalents 2.9 0.1
CONSOLIDATED STATEMENT OF CHANGES IN EQUITY
EUR million Share
capital
Share premium account
Other reserves
Reserve for
invested unrestr.
equity Treasury
shares
Fair value
reserve
Equity at 1 January, 2010 12.7 25.3 0.0 0.2 -3.5 0.0 Total comprehensive income for the period - - 0.0 - - 0.0 Disposal of treasury shares - - - -0.1 0.2 - Tax effect of net income recognized directly in equity - - - 0.0 - - Equity at 31 December, 2010 12.7 25.3 0.0 0.1 -3.3 0.0
EUR million Share
capital
Share premium account
Other reserves
Reserve for
invested unrestr.
equity Treasury
shares
Fair value
reserve
Equity at 1 January, 2011 12.7 25.3 0.0 0.1 -3.3 0.0 Total comprehensive income for the period - - 0.0 - - 0.0 Share issue - - - 5.9 - - Conversion of convertible bond - - - 20.8 - - Equity at 31 December, 2011 12.7 25.3 0.0 26.8 -3.3 0.0
EUR million Retained earnings
Exchange diff.
Equity attrib.to owners of
the parent
Non-contr.
interest Total
equity Equity at 1 January, 2010 35.6 -1.3 69.0 0.3 69.3 Total comprehensive income for the period -31.9 1.0 -30.9 0.0 -30.9 Reversal of unpaid dividends 0.0 - 0.0 - 0.0 Share-based incentive plan 0.2 - 0.3 - 0.3 Share-based incentive plan, tax effect -0.1 - 0.0 - 0.0 Equity part of 0.8 - 0.8 - 0.8
convertible bond Equity at 31 December, 2010 4.6 -0.3 39.1 0.3 39.5
EUR million Retained earnings
Exchange diff.
Equity attrib. to
owners of the parent
Non-contr.
interest Total
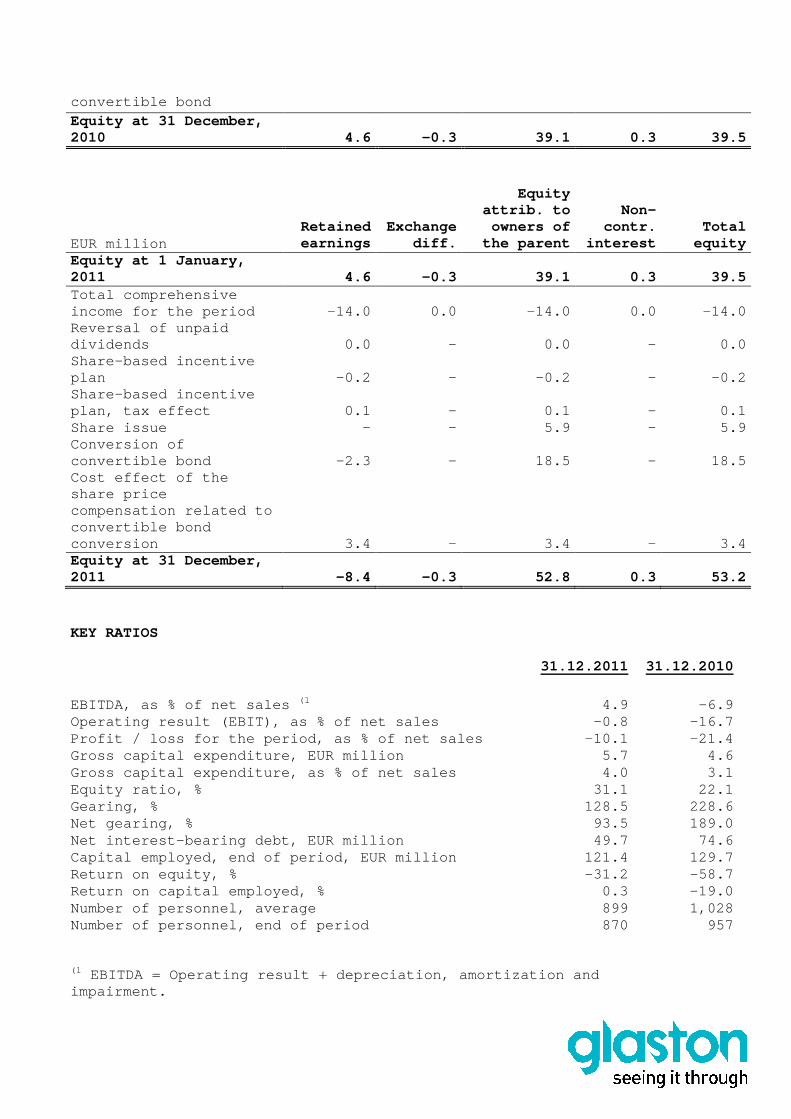
equity Equity at 1 January, 2011 4.6 -0.3 39.1 0.3 39.5 Total comprehensive income for the period -14.0 0.0
-14.0 0.0 -14.0
Reversal of unpaid dividends 0.0 - 0.0 - 0.0 Share-based incentive plan -0.2 - -0.2 - -0.2 Share-based incentive plan, tax effect 0.1 - 0.1 - 0.1 Share issue - - 5.9 - 5.9 Conversion of convertible bond -2.3 - 18.5 - 18.5 Cost effect of the share price compensation related to convertible bond conversion 3.4 - 3.4 - 3.4 Equity at 31 December, 2011 -8.4 -0.3 52.8 0.3 53.2
KEY RATIOS
31.12.2011 31.12.2010
EBITDA, as % of net sales (1 4.9 -6.9 Operating result (EBIT), as % of net sales -0.8 -16.7 Profit / loss for the period, as % of net sales -10 .1 -21.4 Gross capital expenditure, EUR million 5.7 4.6 Gross capital expenditure, as % of net sales 4.0 3.1 Equity ratio, % 31.1 22.1 Gearing, % 128.5 228.6 Net gearing, % 93.5 189.0 Net interest-bearing debt, EUR million 49.7 74.6 Capital employed, end of period, EUR million 121.4 129.7 Return on equity, % -31.2 -58.7 Return on capital employed, % 0.3 -19.0 Number of personnel, average 899 1,028 Number of personnel, end of period 870 957
(1 EBITDA = Operating result + depreciation, amortiza tion and impairment.
PER SHARE DATA 31.12.2011 31.12.2010
Number of registered shares, end of period, treasury shares excluded (1,000) 104,800 78,561 Number of shares issued, end of period, adjusted with share issue, treasury shares excluded (1,000) 104,800 82,179 Number of shares, average, adjusted with share issue, treasury shares excluded (1,000) 100,826 82,145 Number of shares, dilution effect of the convertible bond taken into account, average, adjusted with share issue, treasury shares excluded (1,000) (' 110,538 104,646 EPS, basic, adjusted with share issue, EUR -0.14 -0.39 EPS, diluted, adjusted with share issue, EUR -0.14 -0.39 Adjusted equity attributable to owners of the parent per share, EUR 0.50 0.48 Price per adjusted earnings per share (P/E) ratio -3.1 -2.9 Price per adjusted equity attributable to owners of the parent per share 0.89 2.37 Market capitalization of registered shares, EUR million 47.2 88.8 Share turnover, % (number of shares traded, % of the average registered number of shares) 8.5 19.6 Number of shares traded, (1,000) 8,447 15,419 Closing price of the share, EUR 0.45 1.13 Highest quoted price, EUR 1.27 1.65 Lowest quoted price, EUR 0.40 0.80 Volume-weighted average quoted price, EUR 0.84 1.17 DEFINITIONS OF KEY RATIOS Financial ratios EBITDA = Profit / loss before depreciation, amortiz ation and impairment, share of joint ventures' and associates ' results included Operating result (EBIT) = Profit / loss after depre ciation, amortization and impairment, share of joint venture s' and associates' results included Operating result (EBIT) excluding non-recurring ite ms = Profit / loss after depreciation, amortization and impairment, sh are of joint ventures' and associates' results included, non-rec urring items excluded Cash and cash equivalents = Cash + other financial assets Net interest-bearing debt = Interest-bearing liabil ities – cash and cash equivalents
Financial expenses = Interest expenses of financial liabilities + fees of financing arrangements + foreign currency differ ences of financial liabilities Equity ratio, % = Equity (Equity attributable to ow ners of the parent + non-controlling interest) x 100 / Total assets - ad vance payments received Gearing, % = Interest-bearing liabilities x 100 / E quity (Equity attributable to owners of the parent + non-controll ing interest) Net gearing, % = Net interest-bearing debt x 100 / Equity (Equity attributable to owners of the parent + non-controll ing interest) Return on investments, % (ROCE) = Profit / loss bef ore taxes + financial expenses x 100 / Equity + interest-bearin g liabilities (average of 1 January and end of the reporting peri od) Return on equity, % (ROE)= Profit / loss for the r eporting period x 100 / Equity (Equity attributable to owners of the parent + non-controlling interest) (average of 1 January and end of the reporting peri od) Non-recurring items = mainly items arising from res tructuring and structural changes. They can include expenses arisi ng from personnel reduction, product portfolio rationalization, chang es in production structure and from reduction of offices. Impairment loss of goodwill is also included in non-recurring items. Non-recurring items are recognized in profit or loss in the income or expen se category where they belong by their nature and they are included i n operating result. In its key ratios Glaston presents also operating r esult excluding non-recurring items. If a non-recurring expense is reve rsed for example due to changes in circumstances, the reversal is also i ncluded in non-recurring items. In addition, exceptionally large g ains or losses from disposals of property, plant and equipment and inta ngible assets as well as capital gains or losses arising from group restructuring are included in non-recurring items. Per share data Earnings per share (EPS) = Net result attributable to owners of the parent / Adjusted average number of shares Diluted earnings per share = Net result attributabl e to owners of the parent adjusted with the result effect of the conve rtible bond / Adjusted average number of shares, dilution effect of the convertible bond taken into account Dividend per share = Dividends paid / Adjusted numb er of issued shares at end of the period Dividend payout ratio = Dividend per share x 100 /E arnings per share Dividend yield = Dividend per share x 100 / Share p rice at end of the period
Equity attributable to owners of the parent per sha re = Equity attributable to owners of the parent at end of the period / Adjusted number of shares at end of the period Average trading price = Shares traded (EUR)/ Shares traded (volume) Price per earnings per share (P/E) = Share price at end of the period / Earnings per share (EPS) Price per equity attributable to owners of the pare nt per share = Share price at end of the period / Equity attributable to owners of the parent per share Share turnover = The proportion of number of shares traded during the period to weighted average number of shares Market capitalization = Number of shares at end of the period x share price at end of the period Number of shares at period end = Number of issued s hares - treasury shares ACCOUNTING POLICIES
The consolidated financial statements of Glaston Gr oup are prepared in accordance with International Financial Reporting S tandards (IFRS), including International Accounting Standards (IAS) and Interpretations issued by the International Financial Reporting Int erpretations Committee (SIC and IFRIC). International Financial Reporting Standards are standards and their interpretations adopted in accordance with the procedure laid down in regulation (EC) No 1606/2002 of the European Parliament and of the Council. The Notes to the Fin ancial Statements are also in accordance with the Finnish Accounting Act and Ordinance and the Finnish Companies' Act. These condensed consolidated financial statements h ave been prepared in accordance with International Financial Reporting S tandard IAS 34 Interim Reporting as approved by the European Union . They do not include all the information required for full annua l financial statements. The accounting principles applied in these condense d consolidated financial statements are the same as those applied by Glaston in its consolidated financial statements as at and for the year ended 31 December, 2010, with the exception of the following new or revised or amended standards and interpretations which have be en applied from 1 January, 2011: - IAS 24 (revised) Related Party Disclosures - Amendment to IAS 32 Financial Instruments: Presen tation – Classification of Rights Issues - Amendment to IFRIC 14 IAS 19 Prepayments of a Min imum Funding Requirement - IFRIC 19 Extinguishing Financial Liabilities with Equity Instruments

In addition, Glaston has applied the annual Improve ments to IFRSs issued in May 2010. These have affected mainly the disclosure information in Glaston’s consolidated financial sta tements. Other new or amended standards or interpretations a pplicable from 1 January, 2011 are not material for Glaston Group. Glaston will apply the following new or revised or amended standards and interpretations from 1 January, 2012: - Amendment to IFRS 7 Financial Instruments: Disclo sures – Transfers of Financial Assets The amendment shall be applied for annual periods b eginning on or after 1 July, 2011. The amendment increases the disclosur e requirements of transfers and derecognition of financial assets. Th e amendment does not have material effect on Glaston’s consolidated fina ncial statements but it increases the disclosure information in the cons olidated financial statements. Other new or amended standards or interpretations a pplicable from 1 January, 2012 are not material for Glaston Group. Glaston will apply the following new or revised or amended standards and interpretations from 1 January, 2013, if EU has approved them: - IFRS 10 Consolidated Financial Statements - IFRS 11 Joint Arrangements - IFRS 12 Disclosure of Interests in Other Entities - IFRS 13 Fair Value Measurements - Amendment to IAS 1 Presentation of Financial Stat ements: Presentation of Items of Other Comprehensive Income - IAS 19 (revised) Employee Benefits - IAS 27 (revised) Separate Financial Statements - IAS 28 (revised) Investments in Associates and Jo int Ventures The revised and amended standard shall be applied f or annual periods beginning on or after 1 January, 2013, except that revised IAS 1 shall be applied for annual periods beginning on or after 1 July, 2012. IFRS 10 Consolidated Financial Statements standard changes the definition of control in other entities. Control is the basis for including an entity in the consolidated financial s tatements. The application of IFRS 10 does not affect the consolid ated financial statements of Glaston. IFRS 12 Disclosure of Interests in Other Entities s tandard increases the disclosure information of group companies in th e consolidated financial statements. IFRS 13 Fair Value Measurements standard increases the disclosure information in the consolidated financial statement s but has otherwise no material effect on Glaston’s consolidated financ ial statements. Amended to IAS 1 Presentation of Items of Other Com prehensive Income standard changes the presentation of other comprehe nsive income in the
consolidated financial statements but has otherwise no effect on Glaston’s consolidated financial statements. Revised IAS 19 Employee Benefits standard changes t he recognition of actuarial gains and losses. The corridor method is no longer allowed in recognizing actuarial gains and losses but they are recognized in other comprehensive income. Only current and past service costs as well as net interest on net defined benefit liability can b e recorded in profit or loss. Other changes in net defined benefit liabi lity are recognized in other comprehensive income with not subsequent r ecycling to profit or loss. The revised IAS 19 standard is applied ret rospectively. As Glaston has no major defined benefit plans, the rev ised standard does not have material impact on Glaston’s profit or los s or statement of financial position. Other new or amended standards or interpretations a pplicable from 1 January, 2013 are not material for Glaston Group.
SEGMENT INFORMATION The reportable segments of Glaston are Machines, Se rvices and Software Solutions. The reportable segments apply Glaston Gr oup's accounting and measurement principles. Glaston follows the same co mmercial terms in transactions between segments as with third parties . The reportable segments consist of operating segmen ts, which have been aggregated in accordance with the criteria of IFRS 8.12. Operating segments have been aggregated, when the nature of t he products and services is similar, the nature of the production p rocess is similar, as well as the type or class of customers. Also the methods to distribute products or to provide services are simi lar. The reportable Machines segment consists of Glaston 's operating segments manufacturing glass processing machines an d related tools. The Machines segment includes manufacturing and sale of glass tempering, bending and laminating machines sold under Tamglass and Uniglass brands, glass pre-processing machines sold under th e Bavelloni brand as well as manufacturing and sale of tools. The sale o f tools was transferred to Machines segment from Services segme nt during the first quarter. Comparison information has been restated a ccordingly. Services segment includes maintenance and service o f glass processing machines, machine upgrades and sale of spare parts. Software Solutions segment’s product offering, sold under the Albat+Wirsam brand, covers enterprise resource plan ning systems for the glass industry, software for window and door glass manufacturers, and software for glass processor’s integrated line solu tions. The unallocated operating result consists of head o ffice operations of the Group and unallocated share of joint venture's result. Machines

EUR million 10- 12/
2011 10- 12/
2010 1- 12/
2011 1- 12/
2010 External sales 26.1 23.5 89.8 94.9 Intersegment sales 0.1 0.1 0.2 0.1 Net sales 26.2 23.6 90.0 95.0 EBIT excluding non-recurring items 1.5 -2.7 -1.9 -8.5 EBIT-%, excl. non-recurring items 5.6 -11.5 -2.1 -8.9 Non-recurring items 0.2 -12.0 0.2 -12.0 EBIT 1.7 -14.7 -1.7 -20.4 EBIT-% 6.3 -62.1 -1.9 -21.5 Net working capital 47.9 55.1 Number of personnel, average 557 616 Number of personnel, end of period 541 577 Services
EUR million 10- 12/
2011 10- 12/
2010 1- 12/
2011 1- 12/
2010 External sales 7.6 8.3 29.9 30.7 Intersegment sales 0.4 0.5 1.2 1.4 Net sales 7.9 8.8 31.1 32.0 EBIT excluding non-recurring items 0.9 1.2 5.6 3.3 EBIT-%, excl. non-recurring items 11.0 13.3 17.9 10.1 Non-recurring items 0.0 -2.2 0.1 -2.2 EBIT 0.9 -1.0 5.7 1.1 EBIT-% 11.4 -11.3 18.4 3.4 Net working capital 21.9 22.1 Number of personnel, average 127 171 Number of personnel, end of period 117 149 Software Solutions
EUR million 10- 12/
2011 10- 12/
2010 1- 12/
2011 1- 12/
2010 External sales 5.6 5.8 23.0 23.9 Intersegment sales 0.0 -0.1 0.1 0.0 Net sales 5.6 5.8 23.1 23.9 Share of associates' and joint ventures' results - - 0.0 0.0 EBIT excluding non-recurring items 0.8 -0.3 1.7 1.1 EBIT-%, excl. non-recurring items 13.4 -5.9 7.5 4.5 Non-recurring items - 0.5 0.0 0.5 EBIT 0.8 0.1 1.8 1.5 EBIT-% 13.4 2.2 7.7 6.4 Net working capital 20.4 21.3 Number of personnel, average 202 219 Number of personnel, end of period 200 214
Glaston Group EUR million
Net sales 10- 12/
2011 10- 12/
2010 1- 12/
2011 1- 12/
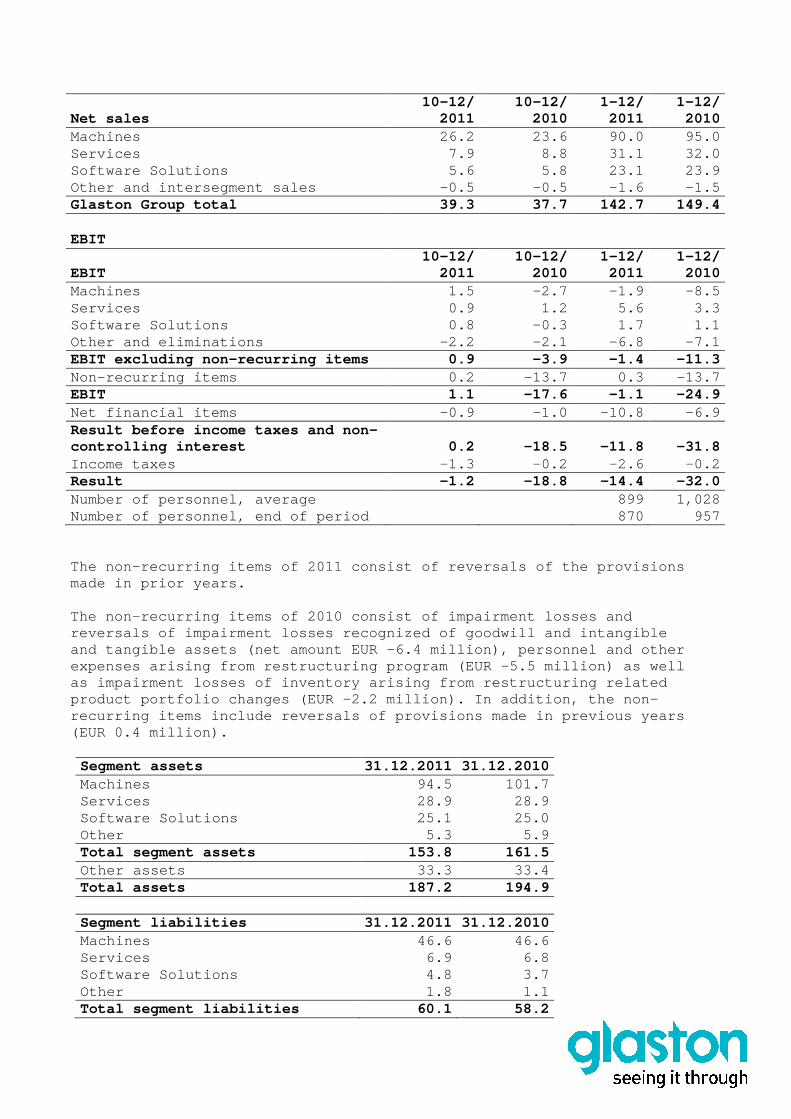
2010 Machines 26.2 23.6 90.0 95.0 Services 7.9 8.8 31.1 32.0 Software Solutions 5.6 5.8 23.1 23.9 Other and intersegment sales -0.5 -0.5 -1.6 -1.5 Glaston Group total 39.3 37.7 142.7 149.4
EBIT
EBIT 10- 12/
2011 10- 12/
2010 1- 12/
2011 1- 12/
2010 Machines 1.5 -2.7 -1.9 -8.5 Services 0.9 1.2 5.6 3.3 Software Solutions 0.8 -0.3 1.7 1.1 Other and eliminations -2.2 -2.1 -6.8 -7.1 EBIT excluding non-recurring items 0.9 -3.9 -1.4 -11.3 Non-recurring items 0.2 -13.7 0.3 -13.7 EBIT 1.1 -17.6 -1.1 -24.9 Net financial items -0.9 -1.0 -10.8 -6.9 Result before income taxes and non-controlling interest 0.2 -18.5 -11.8 -31.8 Income taxes -1.3 -0.2 -2.6 -0.2 Result -1.2 -18.8 -14.4 -32.0 Number of personnel, average 899 1,028 Number of personnel, end of period 870 957 The non-recurring items of 2011 consist of reversal s of the provisions made in prior years. The non-recurring items of 2010 consist of impairme nt losses and reversals of impairment losses recognized of goodwi ll and intangible and tangible assets (net amount EUR -6.4 million), personnel and other expenses arising from restructuring program (EUR -5 .5 million) as well as impairment losses of inventory arising from rest ructuring related product portfolio changes (EUR -2.2 million). In ad dition, the non-recurring items include reversals of provisions mad e in previous years (EUR 0.4 million).
Segment assets 31.12.2011 31.12.2010 Machines 94.5 101.7 Services 28.9 28.9 Software Solutions 25.1 25.0 Other 5.3 5.9 Total segment assets 153.8 161.5 Other assets 33.3 33.4 Total assets 187.2 194.9
Segment liabilities 31.12.2011 31.12.2010 Machines 46.6 46.6 Services 6.9 6.8 Software Solutions 4.8 3.7 Other 1.8 1.1 Total segment liabilities 60.1 58.2
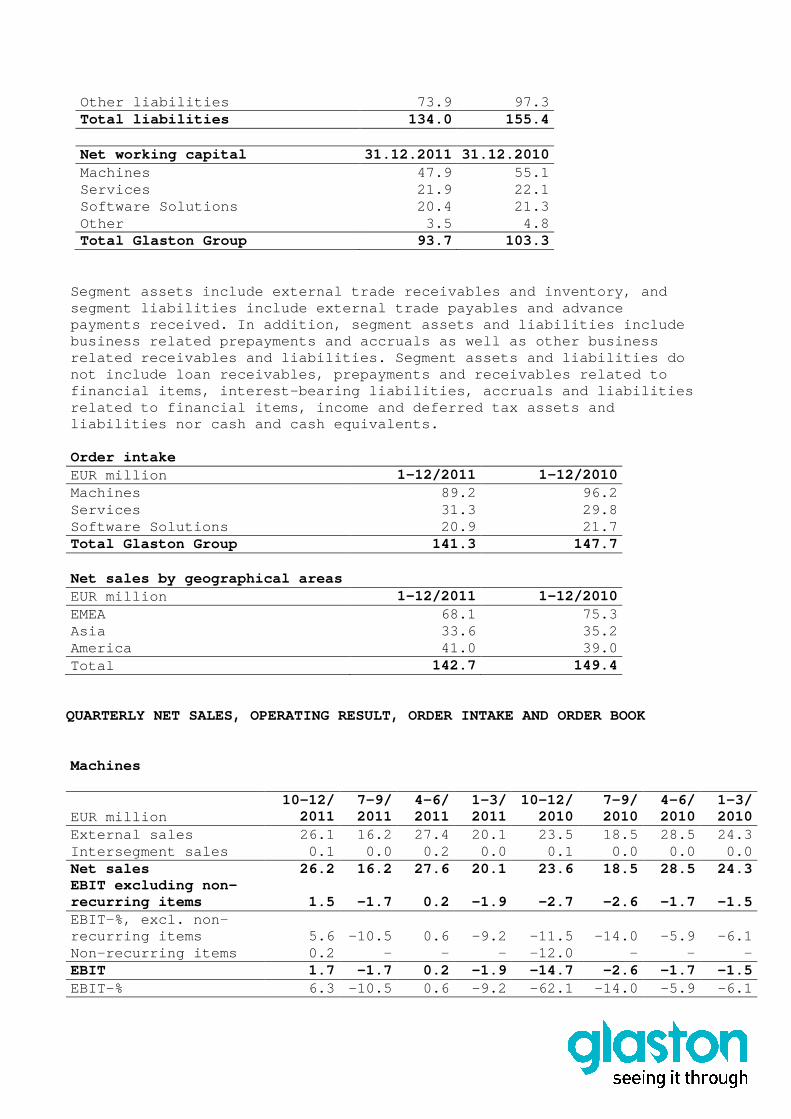
Other liabilities 73.9 97.3 Total liabilities 134.0 155.4
Net working capital 31.12.2011 31.12.2010 Machines 47.9 55.1 Services 21.9 22.1 Software Solutions 20.4 21.3 Other 3.5 4.8 Total Glaston Group 93.7 103.3
Segment assets include external trade receivables a nd inventory, and segment liabilities include external trade payables and advance payments received. In addition, segment assets and liabilities include business related prepayments and accruals as well a s other business related receivables and liabilities. Segment assets and liabilities do not include loan receivables, prepayments and recei vables related to financial items, interest-bearing liabilities, accr uals and liabilities related to financial items, income and deferred tax assets and liabilities nor cash and cash equivalents. Order intake EUR million 1-12/2011 1-12/2010 Machines 89.2 96.2 Services 31.3 29.8 Software Solutions 20.9 21.7 Total Glaston Group 141.3 147.7
Net sales by geographical areas EUR million 1-12/2011 1-12/2010 EMEA 68.1 75.3 Asia 33.6 35.2 America 41.0 39.0 Total 142.7 149.4
QUARTERLY NET SALES, OPERATING RESULT, ORDER INTAKE AND ORDER BOOK Machines
EUR million
10- 12/ 2011
7- 9/ 2011
4- 6/ 2011
1- 3/ 2011
10- 12/ 2010
7- 9/ 2010
4- 6/ 2010
1- 3/ 2010
External sales 26.1 16.2 27.4 20.1 23.5 18.5 28.5 24.3 Intersegment sales 0.1 0.0 0.2 0.0 0.1 0.0 0.0 0.0 Net sales 26.2 16.2 27.6 20.1 23.6 18.5 28.5 24.3 EBIT excluding non -recurring items 1.5 -1.7 0.2 -1.9 -2.7 -2.6 -1.7 -1.5 EBIT-%, excl. non-recurring items 5.6 -10.5 0.6 -9.2 -11.5 -14.0 -5.9 -6.1 Non-recurring items 0.2 - - - -12.0 - - - EBIT 1.7 -1.7 0.2 -1.9 -14.7 -2.6 -1.7 -1.5 EBIT-% 6.3 -10.5 0.6 -9.2 -62.1 -14.0 -5.9 -6.1
Services
EUR million 10- 12/
2011 7- 9/ 2011
4- 6/ 2011
1- 3/ 2011
10- 12/ 2010
7- 9/ 2010
4- 6/ 2010
1- 3/ 2010
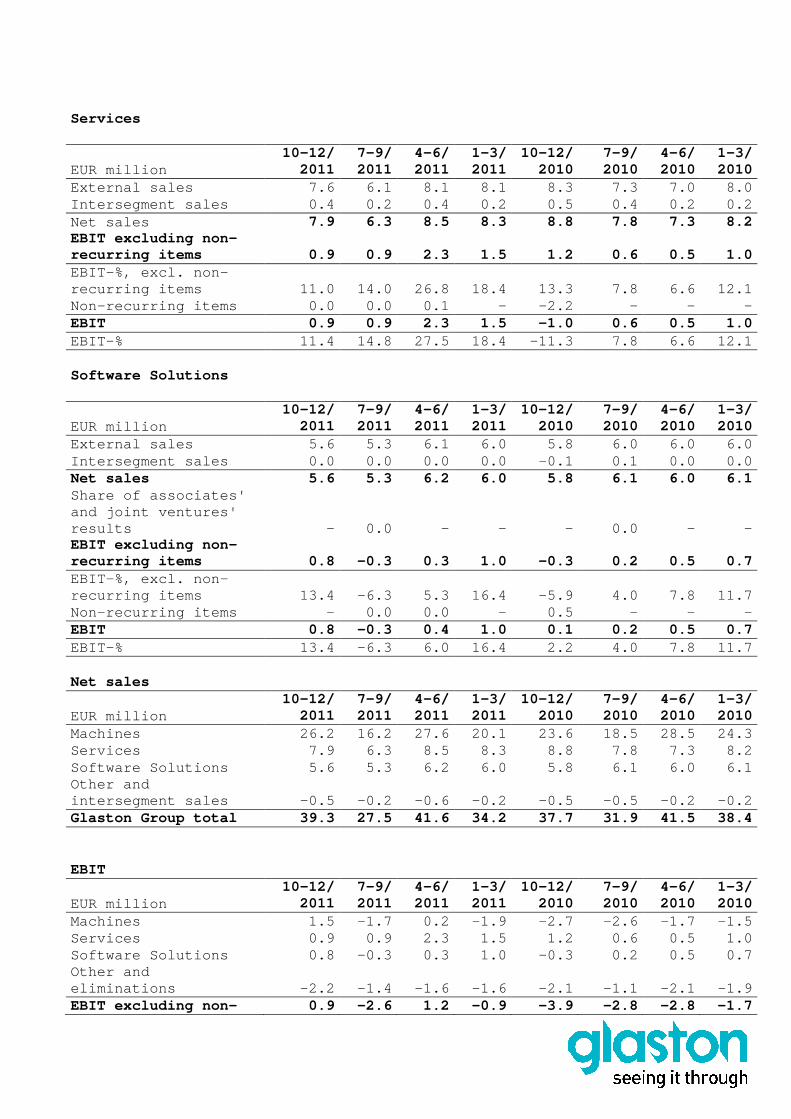
External sales 7.6 6.1 8.1 8.1 8.3 7.3 7.0 8.0 Intersegment sales 0.4 0.2 0.4 0.2 0.5 0.4 0.2 0.2 Net sales 7.9 6.3 8.5 8.3 8.8 7.8 7.3 8.2 EBIT excluding non -recurring items 0.9 0.9 2.3 1.5 1.2 0.6 0.5 1.0 EBIT-%, excl. non-recurring items 11.0 14.0 26.8 18.4 13.3 7.8 6.6 12.1 Non-recurring items 0.0 0.0 0.1 - -2.2 - - - EBIT 0.9 0.9 2.3 1.5 -1.0 0.6 0.5 1.0 EBIT-% 11.4 14.8 27.5 18.4 -11.3 7.8 6.6 12.1
Software Solutions
EUR million 10- 12/
2011 7- 9/ 2011
4- 6/ 2011
1- 3/ 2011
10- 12/ 2010
7- 9/ 2010
4- 6/ 2010
1- 3/ 2010
External sales 5.6 5.3 6.1 6.0 5.8 6.0 6.0 6.0 Intersegment sales 0.0 0.0 0.0 0.0 -0.1 0.1 0.0 0.0 Net sales 5.6 5.3 6.2 6.0 5.8 6.1 6.0 6.1 Share of associates' and joint ventures' results - 0.0 - - - 0.0 - - EBIT excluding non -recurring items 0.8 -0.3 0.3 1.0 -0.3 0.2 0.5 0.7 EBIT-%, excl. non-recurring items 13.4 -6.3 5.3 16.4 -5.9 4.0 7.8 11.7 Non-recurring items - 0.0 0.0 - 0.5 - - - EBIT 0.8 -0.3 0.4 1.0 0.1 0.2 0.5 0.7 EBIT-% 13.4 -6.3 6.0 16.4 2.2 4.0 7.8 11.7
Net sales
EUR million 10- 12/
2011 7- 9/ 2011
4- 6/ 2011
1- 3/ 2011
10- 12/ 2010
7- 9/ 2010
4- 6/ 2010
1- 3/ 2010
Machines 26.2 16.2 27.6 20.1 23.6 18.5 28.5 24.3 Services 7.9 6.3 8.5 8.3 8.8 7.8 7.3 8.2 Software Solutions 5.6 5.3 6.2 6.0 5.8 6.1 6.0 6.1 Other and intersegment sales -0.5 -0.2 -0.6 -0.2 -0.5 -0.5 -0.2 -0.2 Glaston Group total 39.3 27.5 41.6 34.2 37.7 31.9 41.5 38.4
EBIT
EUR million 10- 12/
2011 7- 9/ 2011
4- 6/ 2011
1- 3/ 2011
10- 12/ 2010
7- 9/ 2010
4- 6/ 2010
1- 3/ 2010
Machines 1.5 -1.7 0.2 -1.9 -2.7 -2.6 -1.7 -1.5 Services 0.9 0.9 2.3 1.5 1.2 0.6 0.5 1.0 Software Solutions 0.8 -0.3 0.3 1.0 -0.3 0.2 0.5 0.7 Other and eliminations -2.2 -1.4 -1.6 -1.6 -2.1 -1.1 -2.1 -1.9 EBIT excluding non- 0.9 -2.6 1.2 -0.9 -3.9 -2.8 -2.8 -1.7

recurring items Non-recurring items 0.2 0.0 0.1 - -13.7 - - - EBIT 1.1 -2.5 1.3 -0.9 -17.6 -2.8 -2.8 -1.7
Order book 31.12.
2011 30.9.
2011 30.6.
2011 31.3.
2011 31.12.
2010 30.9.
2010 30.6.
2010 31.3.
2010 Machines 34.6 33.1 35.4 40.2 37.4 34.7 25.6 32.4 Services 1.2 1.4 1.1 1.7 1.2 1.9 0.9 0.7 Software Solutions 1.8 2.2 2.2 2.5 2.9 3.0 3.2 3.1 Total Glaston Group 37.6 36.7 38.7 44.3 41.5 39.7 29.8 36.2 Order intake
EUR million 10- 12/
2011 7- 9/ 2011
4- 6/ 2011
1- 3/ 2011
10- 12/ 2010
7- 9/ 2010
4- 6/ 2010
1- 3/ 2010
Machines 26.9 15.2 23.1 24.0 26.8 25.3 23.8 20.3 Services 8.0 6.7 8.0 8.7 8.0 7.7 7.4 6.7 Software Solutions 4.8 5.0 5.7 5.4 5.3 5.5 5.7 5.2 Total Glaston Group 39.7 26.8 36.7 38.1 40.1 38.5 36.9 32.2 CONTINGENT LIABILITIES
EUR million 31.12.2011 31.12.2010 Mortgages and pledges On own behalf 490,1 274,6 On behalf of others 0,1 0,1 Guarantees On own behalf 0,5 0,7 On behalf of others 0,0 0,2 Lease obligations 9,6 10,7 Repurchase obligations - 0,2 Other obligation on own behalf 0,8 0,0
Mortgages and pledges include EUR 111.7 million sha res in group comapneis and EUR 41.4 million receivables from gro up companies.
Glaston Group has international operations and can be a defendant or plaintiff in a number of legal proceedings incident al to those operations. The Group does not expect the outcome o f any unmentioned legal proceedings currently pending, either individ ually or in the aggregate, to have material adverse effect upon the Group's consolidated financial position or results of opera tions.
DERIVATIVE INSTRUMENTS
EUR million 31.12.2011
31.12.2010 Nominal
value Fair
value Nominal
value Fair
value Currency derivatives Currency forwards - - 0.4 0.1 Commodity derivatives Electricity forwards 0.1 0.0 0.3 0.2
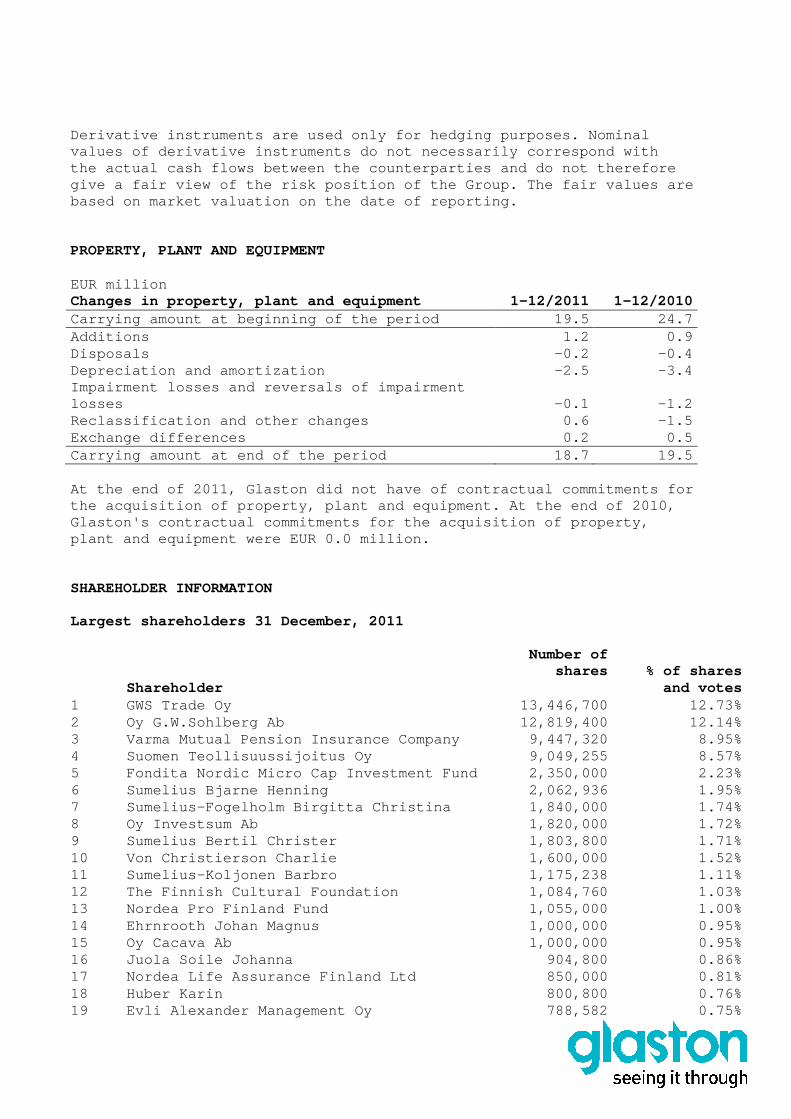
Derivative instruments are used only for hedging pu rposes. Nominal values of derivative instruments do not necessarily correspond with the actual cash flows between the counterparties an d do not therefore give a fair view of the risk position of the Group. The fair values are based on market valuation on the date of reporting. PROPERTY, PLANT AND EQUIPMENT EUR million Changes in property, plant and equipment 1-12/2011 1-12/2010 Carrying amount at beginning of the period 19.5 24.7 Additions 1.2 0.9 Disposals -0.2 -0.4 Depreciation and amortization -2.5 -3.4 Impairment losses and reversals of impairment losses -0.1 -1.2 Reclassification and other changes 0.6 -1.5 Exchange differences 0.2 0.5 Carrying amount at end of the period 18.7 19.5 At the end of 2011, Glaston did not have of contrac tual commitments for the acquisition of property, plant and equipment. A t the end of 2010, Glaston's contractual commitments for the acquisiti on of property, plant and equipment were EUR 0.0 million. SHAREHOLDER INFORMATION Largest shareholders 31 December, 2011
Number of shares % of shares
Shareholder
and votes 1 GWS Trade Oy 13,446,700 12.73% 2 Oy G.W.Sohlberg Ab 12,819,400 12.14% 3 Varma Mutual Pension Insurance Company 9,447,320 8.95% 4 Suomen Teollisuussijoitus Oy 9,049,255 8.57% 5 Fondita Nordic Micro Cap Investment Fund 2,350,00 0 2.23% 6 Sumelius Bjarne Henning 2,062,936 1.95% 7 Sumelius-Fogelholm Birgitta Christina 1,840,000 1.74% 8 Oy Investsum Ab 1,820,000 1.72% 9 Sumelius Bertil Christer 1,803,800 1.71% 10 Von Christierson Charlie 1,600,000 1.52% 11 Sumelius-Koljonen Barbro 1,175,238 1.11% 12 The Finnish Cultural Foundation 1,084,760 1.03% 13 Nordea Pro Finland Fund 1,055,000 1.00% 14 Ehrnrooth Johan Magnus 1,000,000 0.95% 15 Oy Cacava Ab 1,000,000 0.95% 16 Juola Soile Johanna 904,800 0.86% 17 Nordea Life Assurance Finland Ltd 850,000 0.81% 18 Huber Karin 800,800 0.76% 19 Evli Alexander Management Oy 788,582 0.75%
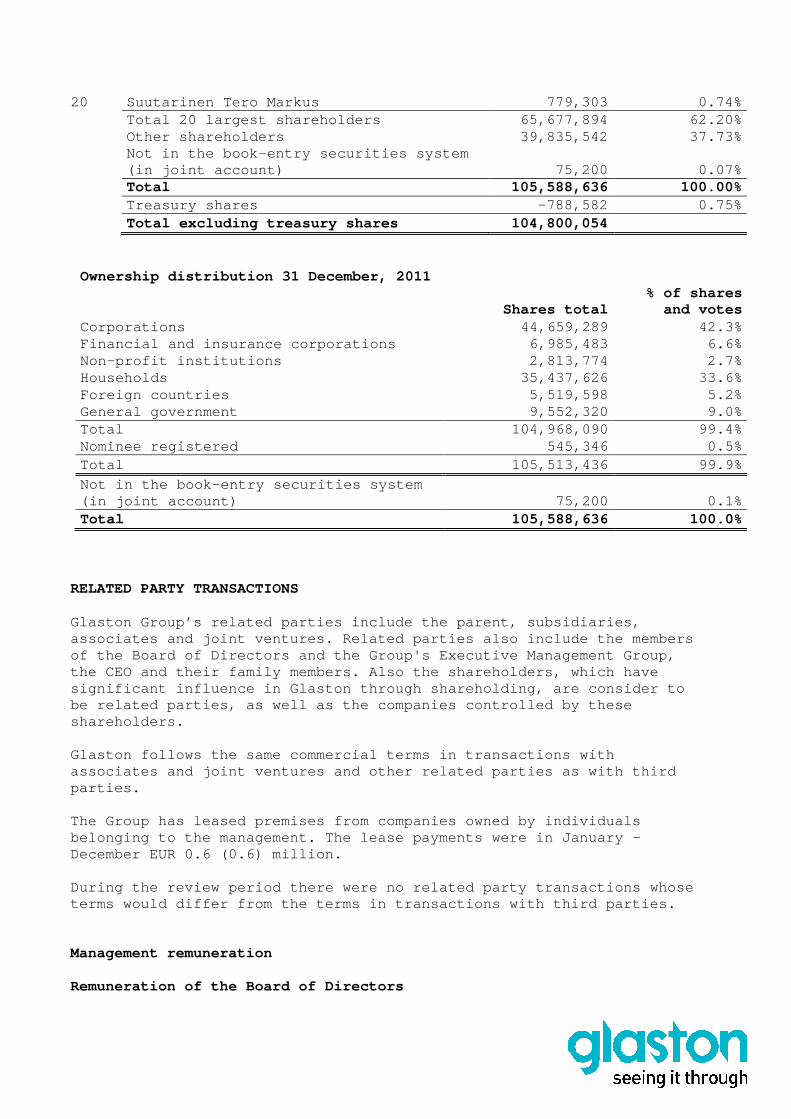
20 Suutarinen Tero Markus 779,303 0.74% Total 20 largest shareholders 65,677,894 62.20% Other shareholders 39,835,542 37.73% Not in the book-entry securities system (in joint account) 75,200 0.07% Total 105,588,636 100.00% Treasury shares -788,582 0.75% Total excluding treasury shares 104,800,054
Ownership distribution 31 December, 2011
Shares total % of shares
and votes Corporations 44,659,289 42.3% Financial and insurance corporations 6,985,483 6.6% Non-profit institutions 2,813,774 2.7% Households 35,437,626 33.6% Foreign countries 5,519,598 5.2% General government 9,552,320 9.0% Total 104,968,090 99.4% Nominee registered 545,346 0.5% Total 105,513,436 99.9%
Not in the book-entry securities system (in joint account) 75,200 0.1% Total 105,588,636 100.0%
RELATED PARTY TRANSACTIONS Glaston Group’s related parties include the parent, subsidiaries, associates and joint ventures. Related parties also include the members of the Board of Directors and the Group's Executive Management Group, the CEO and their family members. Also the sharehol ders, which have significant influence in Glaston through shareholdi ng, are consider to be related parties, as well as the companies contro lled by these shareholders. Glaston follows the same commercial terms in transa ctions with associates and joint ventures and other related par ties as with third parties. The Group has leased premises from companies owned by individuals belonging to the management. The lease payments wer e in January – December EUR 0.6 (0.6) million. During the review period there were no related part y transactions whose terms would differ from the terms in transactions w ith third parties. Management remuneration Remuneration of the Board of Directors
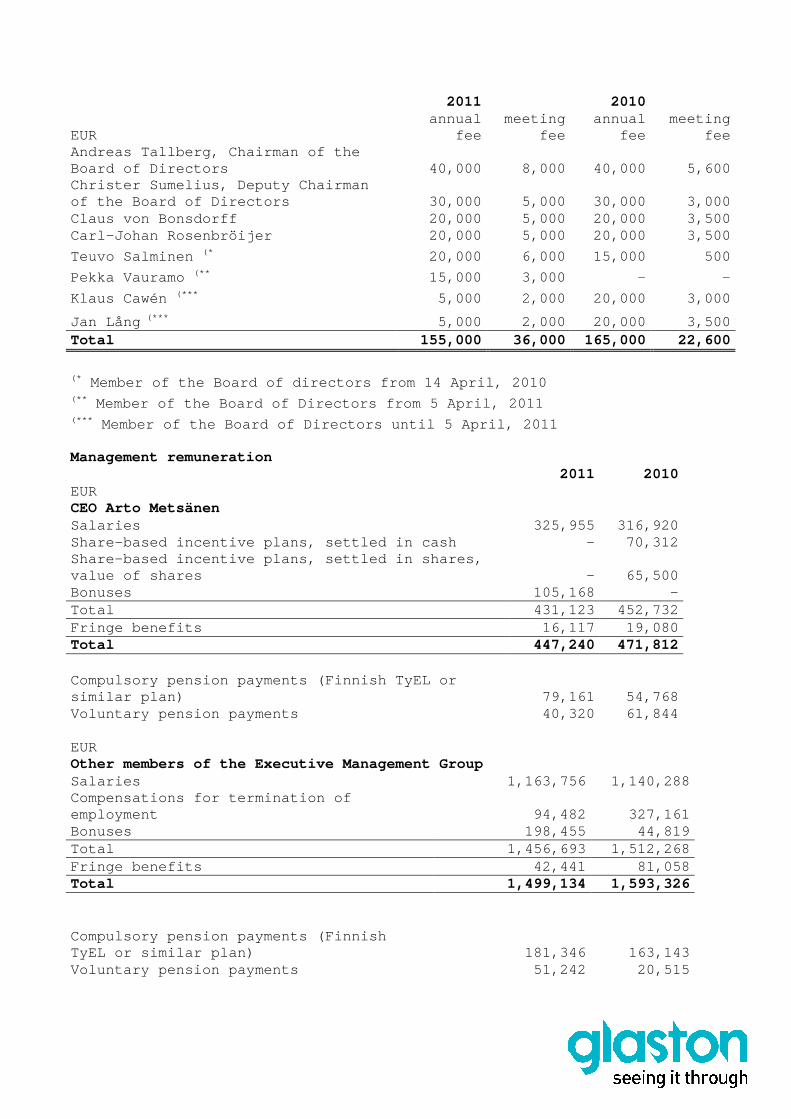
2011 2010
EUR annual
fee meeting
fee annual
fee meeting
fee Andreas Tallberg, Chairman of the Board of Directors 40,000 8,000 40,000 5,600 Christer Sumelius, Deputy Chairman of the Board of Directors 30,000 5,000 30,000 3,000 Claus von Bonsdorff 20,000 5,000 20,000 3,500 Carl-Johan Rosenbröijer 20,000 5,000 20,000 3,500
Teuvo Salminen (* 20,000 6,000 15,000 500
Pekka Vauramo (** 15,000 3,000 - -
Klaus Cawén (*** 5,000 2,000 20,000 3,000
Jan Lång (*** 5,000 2,000 20,000 3,500 Total 155,000 36,000 165,000 22,600
(* Member of the Board of directors from 14 April, 20 10 (** Member of the Board of Directors from 5 April, 201 1 (*** Member of the Board of Directors until 5 April, 20 11 Management remuneration
2011 2010
EUR CEO Arto Metsänen Salaries 325,955 316,920 Share-based incentive plans, settled in cash - 70,312 Share-based incentive plans, settled in shares, value of shares - 65,500 Bonuses 105,168 - Total 431,123 452,732 Fringe benefits 16,117 19,080 Total 447,240 471,812
Compulsory pension payments (Finnish TyEL or similar plan) 79,161 54,768 Voluntary pension payments 40,320 61,844 EUR Other members of the Executive Management Group Salaries 1,163,756 1,140,288 Compensations for termination of employment 94,482 327,161 Bonuses 198,455 44,819 Total 1,456,693 1,512,268 Fringe benefits 42,441 81,058 Total 1,499,134 1,593,326
Compulsory pension payments (Finnish TyEL or similar plan) 181,346 163,143 Voluntary pension payments 51,242 20,515
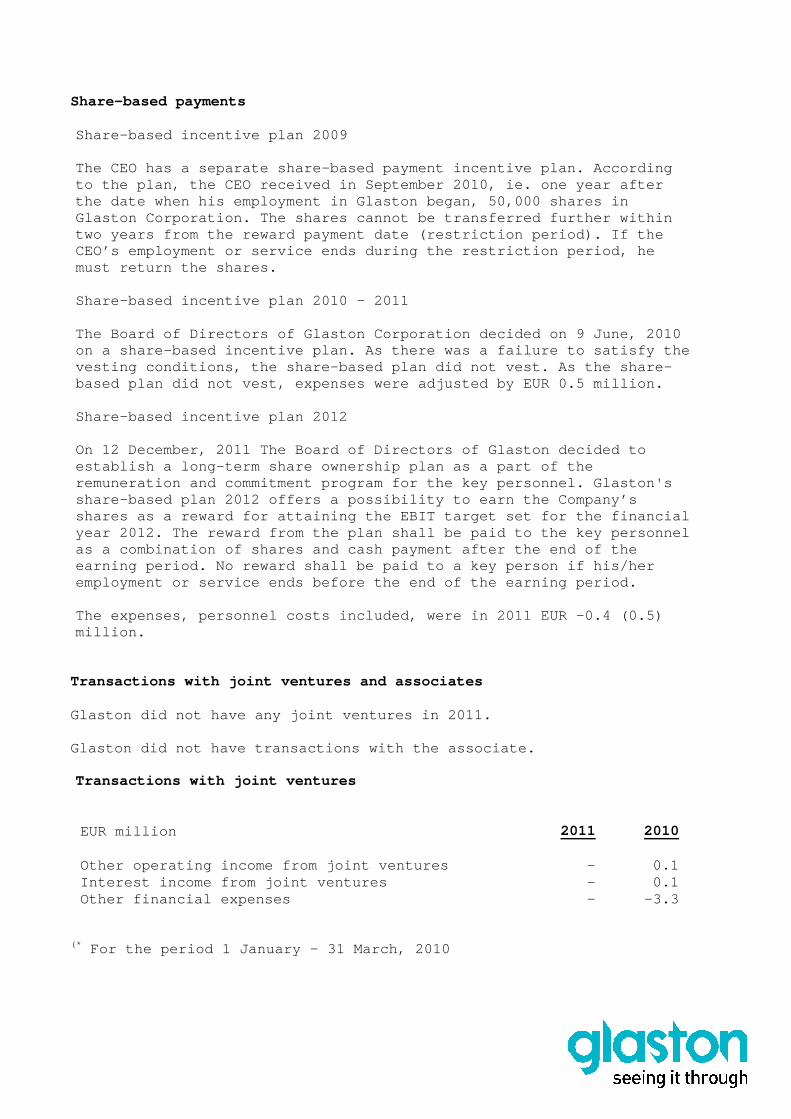
Share-based payments Share-based incentive plan 2009 The CEO has a separate share-based payment incentiv e plan. According to the plan, the CEO received in September 2010, ie . one year after the date when his employment in Glaston began, 50,0 00 shares in Glaston Corporation. The shares cannot be transferr ed further within two years from the reward payment date (restriction period). If the CEO’s employment or service ends during the restric tion period, he must return the shares. Share-based incentive plan 2010 – 2011 The Board of Directors of Glaston Corporation decid ed on 9 June, 2010 on a share-based incentive plan. As there was a fai lure to satisfy the vesting conditions, the share-based plan did not ve st. As the share-based plan did not vest, expenses were adjusted by EUR 0.5 million. Share-based incentive plan 2012 On 12 December, 2011 The Board of Directors of Glas ton decided to establish a long-term share ownership plan as a par t of the remuneration and commitment program for the key per sonnel. Glaston's share-based plan 2012 offers a possibility to earn the Company’s shares as a reward for attaining the EBIT target se t for the financial year 2012. The reward from the plan shall be paid t o the key personnel as a combination of shares and cash payment after t he end of the earning period. No reward shall be paid to a key pe rson if his/her employment or service ends before the end of the ea rning period. The expenses, personnel costs included, were in 201 1 EUR -0.4 (0.5) million.
Transactions with joint ventures and associates Glaston did not have any joint ventures in 2011. Glaston did not have transactions with the associat e.
Transactions with joint ventures
EUR million 2011 2010
Other operating income from joint ventures - 0.1 Interest income from joint ventures - 0.1 Other financial expenses - -3.3
(* For the period 1 January - 31 March, 2010


