Embed Size (px)
Citation preview
1
Financial Literacy of Korean High School Students
Jinsoo Hahn Department of Social Studies Education, Gyeongin National University of Education
Kyungho Jang Department of Social Studies Education, Inha University
Hyung Joon Park Department of Social Studies Education, Sungshin Women’s University
Abstract
Understanding the factors that determine financial literacy and their effects can help policymakers
and researchers design and implement effective interventions for youth. To this end, this study
examines what factors influence the level of financial literacy possessed by Korean high school
students. This study further investigates the effects of socioeconomic status, economic attitude and
financial attitude on financial literacy and financial behavior using structural equation models, in
which endogeneity among latent variables are incorporated. The results of structural models share
common and different findings with those of descriptive statistics and simple regression models. First,
student’s intention to select economics is the most influential factor of both economic attitude and
financial attitude, with GPA the second influential one. Second, economic attitude is more influential
than financial attitude in determining financial literacy. Third, the effect of financial attitude on
financial literacy changes dramatically depending on the assumptions. The descriptive statistics show
that financial attitude has positive effects on financial literacy, while its effects become insignificant in
the simple regression model and the benchmark model. However, if we incorporate the enodogeneity
of financial attitude explicitly among latent variables, the effects become negative and significant.
Finally, financial literacy has positive effects on financial behavior in all models. These findings
imply that economic or financial education plays an important role in changing students’ financial
behavior such as saving money for the future.
Keywords Financial Literacy, Economic Attitude, Financial Attitude, Financial Behavior
JEL Codes A21, A22, I21
2
I. Introduction
The ability to manage personal finances of youth, in particular, has received increasing attention in
Korea since the East Asian economic crisis of 1997 and subsequent credit card crisis of 2003 resulting
in credit delinquents of 10.3% of the total population aged 15 and over. In addition, the global
financial crisis of 2007-2008 played important roles in forming a social consensus for allocating more
effort to teach the value of money, credit management, and investment for young people. The
economic downturn caused by the global financial crisis put many Korean savings banks into
insolvency, in 2011, which had attracted financially illiterate depositors by offering unreasonably high
interest rates. Investors of the failed savings banks, who pursued high yields only while failing to
taking underlying risks into consideration, suffered great losses. The savings bank scandal was
enough to support more intensified financial education for youth.
A succession of economic shocks has imposed huge costs on the Korean economy as a whole, but
provided an opportunity to reflect what we teach for our youth.1 The school curriculum was revised
in 2007 such that credit and asset management should be included in the subject of social studies for
the ninth grade. Personal finance was introduced as an independent chapter into a new high school
economics textbooks consisting of six chapters. These changes can be regarded as a considerable
improvement in a very crowded school curriculum.
As Korean young people begin to be exposed to the financial markets at an earlier age, the ability to
manage money has become increasingly important. Actually they are conducting many financial
transactions as a consumer. A recent survey by the Financial Supervisory Service (2011) reported that
approximately 84% of Korean high school students had at least one bank account in their own names
and 44% had installment savings or time deposit accounts. As finance capitalism and on-line
transactions become dominant in the Korean economy, it is no longer strange for youth to use a check
card or even a credit card. More than half of high school students were surveyed to have experience
using a credit or a debit card to purchase online commodities. Many high schools in Korea now allow
students to use a prepaid card to make a transaction in a campus.
Examining how well-equipped young people are to make financial decisions has been the most
popular field of study. Cho and Park (2008), Kim and Moon (2010), Financial Supervisory Service
(2011), Kim and Lee (2011), Hahn (2013), and Jang, Hahn, and Park (2013), among others, measured
1 Friedman (2010) argued that we should draw lessons, including what we teach our students, from the recent
financial crisis. A study by Bernheim and Garrett (2003) showed that individuals who received financial
education had a significantly higher savings rate. A report by U.S. Department of the Treasury (2002)
recognized that financial education played an important role in preparing Americans to make informed financial
decisions every day, and that the best and most obvious starting place for providing financial education to young
people was in schools.
3
the level of financial literacy of Korean students. Although the findings of these studies vary, putting
them together leads up a conclusion that the level of Korean students’ financial literacy is gradually
increasing but their performance is yet unsatisfactory.
Unlike the aforementioned studies which measured and compared the financial literacy, this study
focuses on the factors determining the level of financial literacy. Identifying what affects a person’s
financial literacy has naturally been a worldwide research topic. For example, Chen and Volpe (1998)
reported that major, gender, age, and work experience affected U.S. college students’ financial literacy.
Lusardi, Mitchell, and Curto (2010), using the National Longitudinal Survey of Youth, showed that
financial literacy was strongly related to socio-demographic characteristics and family financial
sophistication. Samy et al. (2008) investigated into Australian data to find that a student’s year of
study, credit card status, and daily routine significantly affected financial knowledge. Olga (2011)
showed that gender, level of education, occupation, region, and wealth were significant in explaining
financial literacy of Ukrainian people aged 20-60. Sabri (2011) demonstrated that financial literacy of
Malaysian students were related to ethnicity, college type, and discussing finances with parents.
Ansong and Gyensare (2012), from the data of university students in Ghana, showed that age and
work experience positively contributed to financial literacy. Recently, Bhushan and Medury (2013)
identified gender, education, income, nature of employment, and place of work to be factors affecting
financial literacy of people in India.
The future of national development and economic welfare of people depends on the financial
literacy of young people in an increasingly more complex economy. It is, therefore, important to
assess the level of financial literacy and to identify factors determining financial literacy of the
young people. This can help policymakers and researchers design and implement effective
interventions for youth. To this end, this study, first of all, examines what factors influence the level
of financial literacy possessed by Korean high school students.2 And then, this study uses structural
equation models to further identify the effects of socioeconomic status, economic attitude, and
financial attitude on financial literacy and financial behavior.
II. Characteristics of the Sample
We measure the financial literacy using the scores on ‘Financial Fitness for Life: High School Test
(FFFL-HS test hereafter)’ (Walstad and Rebeck, 2005), which was developed by the Council on
2 Studies focusing on the financial literacy among high school students are scarce relative to ones among
college students or adults. Exceptionally, Mandell (2008) analyzed high school seniors’ financial literacy by
using five biennial national survey data.
4
Economic Education (then the National Council on Economic Education). This test includes fifty
questions that consist of ten items across each of the five themes, but we selected forty questions in
this study because some financial institutions and terms used in the FFFL-HS test items are quite
different from those in the Korean market, and therefore, some items cannot be translated on a word-
for-word basis. See Jang, Hahn, and Park (2013) for more specific reasons. The FFFL-HS test was
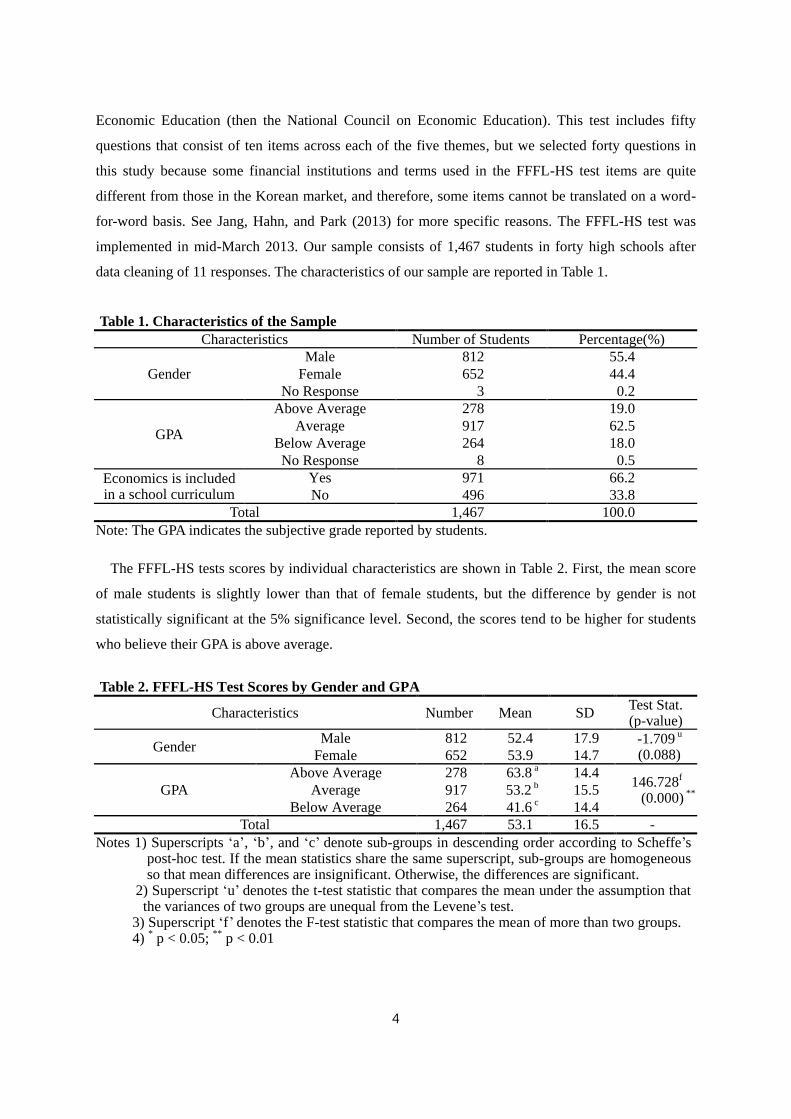
implemented in mid-March 2013. Our sample consists of 1,467 students in forty high schools after
data cleaning of 11 responses. The characteristics of our sample are reported in Table 1.
Table 1. Characteristics of the Sample
Characteristics Number of Students Percentage(%)
Gender
Male 812 55.4
Female 652 44.4
No Response 3 0.2
GPA
Above Average 278 19.0
Average 917 62.5
Below Average 264 18.0
No Response 8 0.5
Economics is included in a school curriculum
Yes 971 66.2
No 496 33.8
Total 1,467 100.0
Note: The GPA indicates the subjective grade reported by students.
The FFFL-HS tests scores by individual characteristics are shown in Table 2. First, the mean score
of male students is slightly lower than that of female students, but the difference by gender is not
statistically significant at the 5% significance level. Second, the scores tend to be higher for students
who believe their GPA is above average.
Table 2. FFFL-HS Test Scores by Gender and GPA
Characteristics Number Mean SD Test Stat. (p-value)
Gender Male 812 52.4 17.9 -1.709 u
(0.088) Female 652 53.9 14.7
GPA
Above Average 278 63.8 a 14.4 146.728f
(0.000) ** Average 917 53.2 b 15.5
Below Average 264 41.6 c 14.4
Total 1,467 53.1 16.5 -
Notes 1) Superscripts ‘a’, ‘b’, and ‘c’ denote sub-groups in descending order according to Scheffe’s post-hoc test. If the mean statistics share the same superscript, sub-groups are homogeneous so that mean differences are insignificant. Otherwise, the differences are significant.
2) Superscript ‘u’ denotes the t-test statistic that compares the mean under the assumption that the variances of two groups are unequal from the Levene’s test.
3) Superscript ‘f’ denotes the F-test statistic that compares the mean of more than two groups. 4) * p < 0.05; ** p < 0.01
5
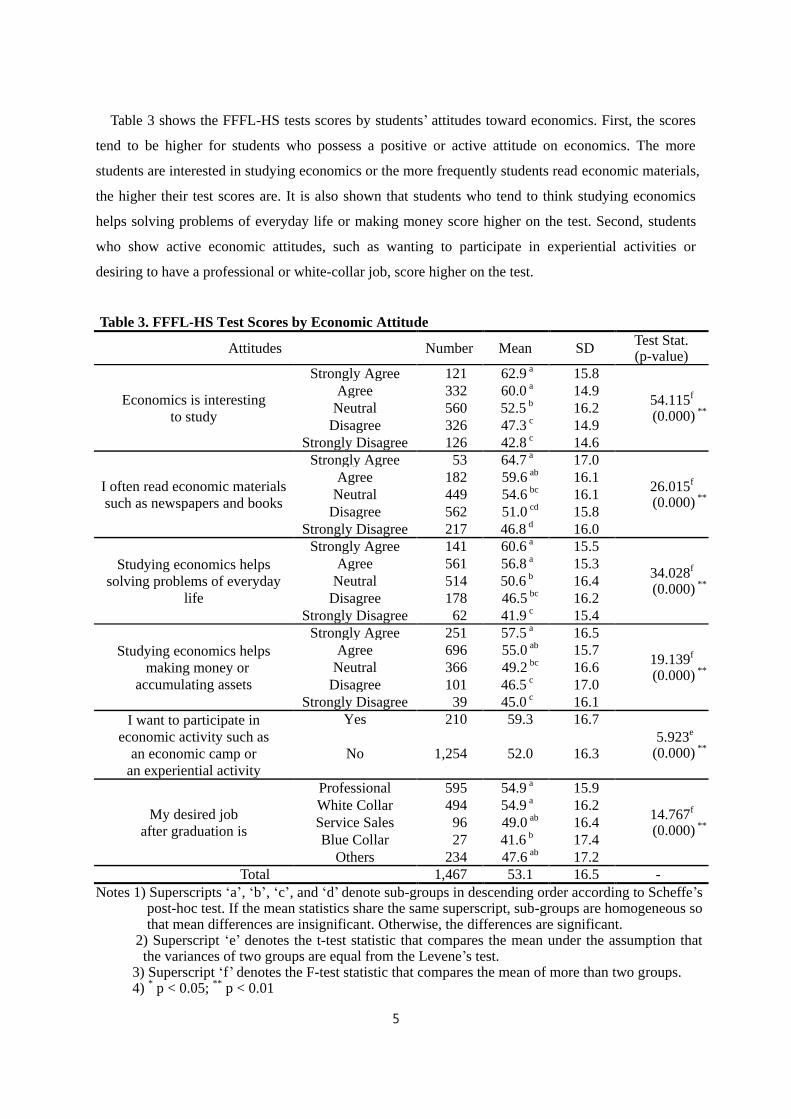
Table 3 shows the FFFL-HS tests scores by students’ attitudes toward economics. First, the scores
tend to be higher for students who possess a positive or active attitude on economics. The more
students are interested in studying economics or the more frequently students read economic materials,
the higher their test scores are. It is also shown that students who tend to think studying economics
helps solving problems of everyday life or making money score higher on the test. Second, students
who show active economic attitudes, such as wanting to participate in experiential activities or
desiring to have a professional or white-collar job, score higher on the test.
Table 3. FFFL-HS Test Scores by Economic Attitude
Attitudes Number Mean SD Test Stat. (p-value)
Economics is interesting
to study
Strongly Agree 121 62.9 a 15.8
54.115f (0.000) **
Agree 332 60.0 a 14.9
Neutral 560 52.5 b 16.2
Disagree 326 47.3 c 14.9
Strongly Disagree 126 42.8 c 14.6
I often read economic materials
such as newspapers and books
Strongly Agree 53 64.7 a 17.0
26.015f (0.000) **
Agree 182 59.6 ab 16.1
Neutral 449 54.6 bc 16.1
Disagree 562 51.0 cd 15.8
Strongly Disagree 217 46.8 d 16.0
Studying economics helps
solving problems of everyday
life
Strongly Agree 141 60.6 a 15.5
34.028f (0.000) **
Agree 561 56.8 a 15.3
Neutral 514 50.6 b 16.4
Disagree 178 46.5 bc 16.2
Strongly Disagree 62 41.9 c 15.4
Studying economics helps
making money or
accumulating assets
Strongly Agree 251 57.5 a 16.5
19.139f (0.000) **
Agree 696 55.0 ab 15.7
Neutral 366 49.2 bc 16.6
Disagree 101 46.5 c 17.0
Strongly Disagree 39 45.0 c 16.1
I want to participate in
economic activity such as
an economic camp or
an experiential activity
Yes 210 59.3 16.7
5.923e (0.000) ** No 1,254 52.0 16.3
My desired job
after graduation is
Professional 595 54.9 a 15.9
14.767f (0.000) **
White Collar 494 54.9 a 16.2
Service Sales 96 49.0 ab 16.4
Blue Collar 27 41.6 b 17.4
Others 234 47.6 ab 17.2
Total 1,467 53.1 16.5 -
Notes 1) Superscripts ‘a’, ‘b’, ‘c’, and ‘d’ denote sub-groups in descending order according to Scheffe’s post-hoc test. If the mean statistics share the same superscript, sub-groups are homogeneous so that mean differences are insignificant. Otherwise, the differences are significant.
2) Superscript ‘e’ denotes the t-test statistic that compares the mean under the assumption that the variances of two groups are equal from the Levene’s test.
3) Superscript ‘f’ denotes the F-test statistic that compares the mean of more than two groups. 4) * p < 0.05; ** p < 0.01
6
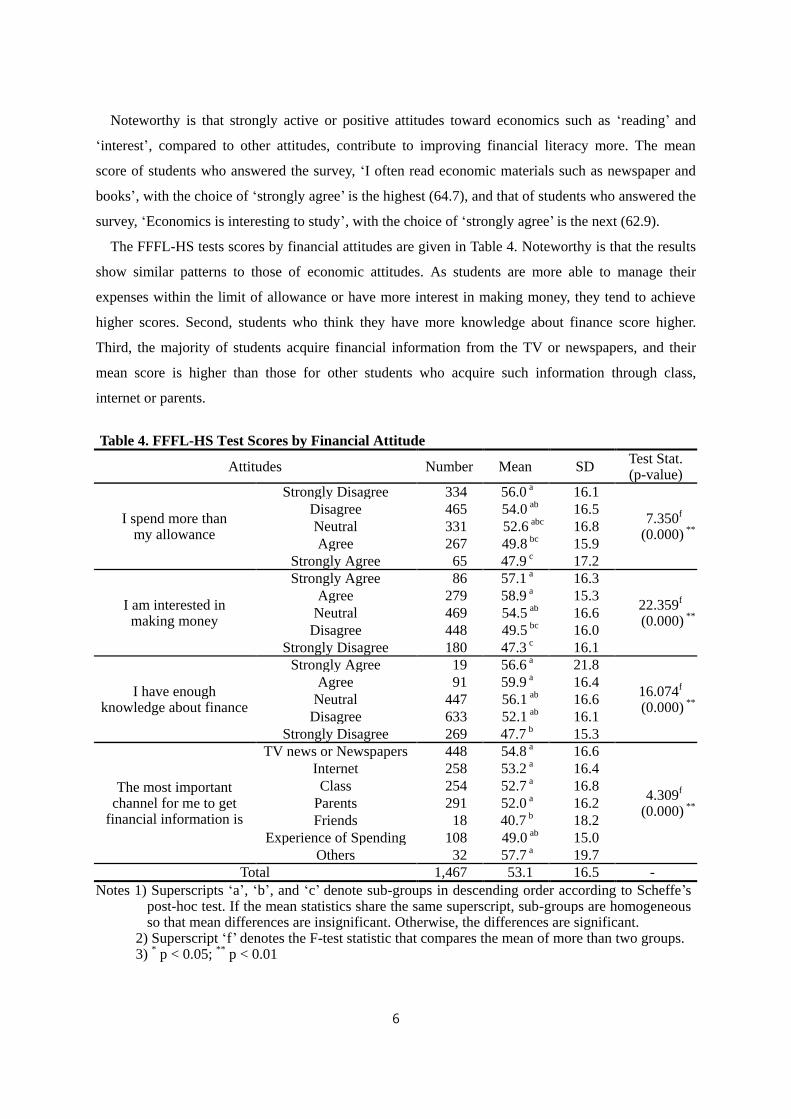
Noteworthy is that strongly active or positive attitudes toward economics such as ‘reading’ and
‘interest’, compared to other attitudes, contribute to improving financial literacy more. The mean
score of students who answered the survey, ‘I often read economic materials such as newspaper and
books’, with the choice of ‘strongly agree’ is the highest (64.7), and that of students who answered the
survey, ‘Economics is interesting to study’, with the choice of ‘strongly agree’ is the next (62.9).
The FFFL-HS tests scores by financial attitudes are given in Table 4. Noteworthy is that the results
show similar patterns to those of economic attitudes. As students are more able to manage their
expenses within the limit of allowance or have more interest in making money, they tend to achieve
higher scores. Second, students who think they have more knowledge about finance score higher.
Third, the majority of students acquire financial information from the TV or newspapers, and their
mean score is higher than those for other students who acquire such information through class,
internet or parents.
Table 4. FFFL-HS Test Scores by Financial Attitude
Attitudes Number Mean SD Test Stat. (p-value)
I spend more than my allowance
Strongly Disagree 334 56.0 a 16.1
7.350f (0.000) **
Disagree 465 54.0 ab 16.5
Neutral 331 52.6 abc 16.8
Agree 267 49.8 bc 15.9
Strongly Agree 65 47.9 c 17.2
I am interested in making money
Strongly Agree 86 57.1 a 16.3
22.359f (0.000) **
Agree 279 58.9 a 15.3
Neutral 469 54.5 ab 16.6
Disagree 448 49.5 bc 16.0
Strongly Disagree 180 47.3 c 16.1
I have enough knowledge about finance
Strongly Agree 19 56.6 a 21.8
16.074f (0.000) **
Agree 91 59.9 a 16.4
Neutral 447 56.1 ab 16.6
Disagree 633 52.1 ab 16.1
Strongly Disagree 269 47.7 b 15.3
The most important channel for me to get
financial information is
TV news or Newspapers 448 54.8 a 16.6
4.309f (0.000) **
Internet 258 53.2 a 16.4
Class 254 52.7 a 16.8
Parents 291 52.0 a 16.2
Friends 18 40.7 b 18.2
Experience of Spending 108 49.0 ab 15.0
Others 32 57.7 a 19.7
Total 1,467 53.1 16.5 -
Notes 1) Superscripts ‘a’, ‘b’, and ‘c’ denote sub-groups in descending order according to Scheffe’s post-hoc test. If the mean statistics share the same superscript, sub-groups are homogeneous so that mean differences are insignificant. Otherwise, the differences are significant.
2) Superscript ‘f’ denotes the F-test statistic that compares the mean of more than two groups. 3) * p < 0.05; ** p < 0.01
7
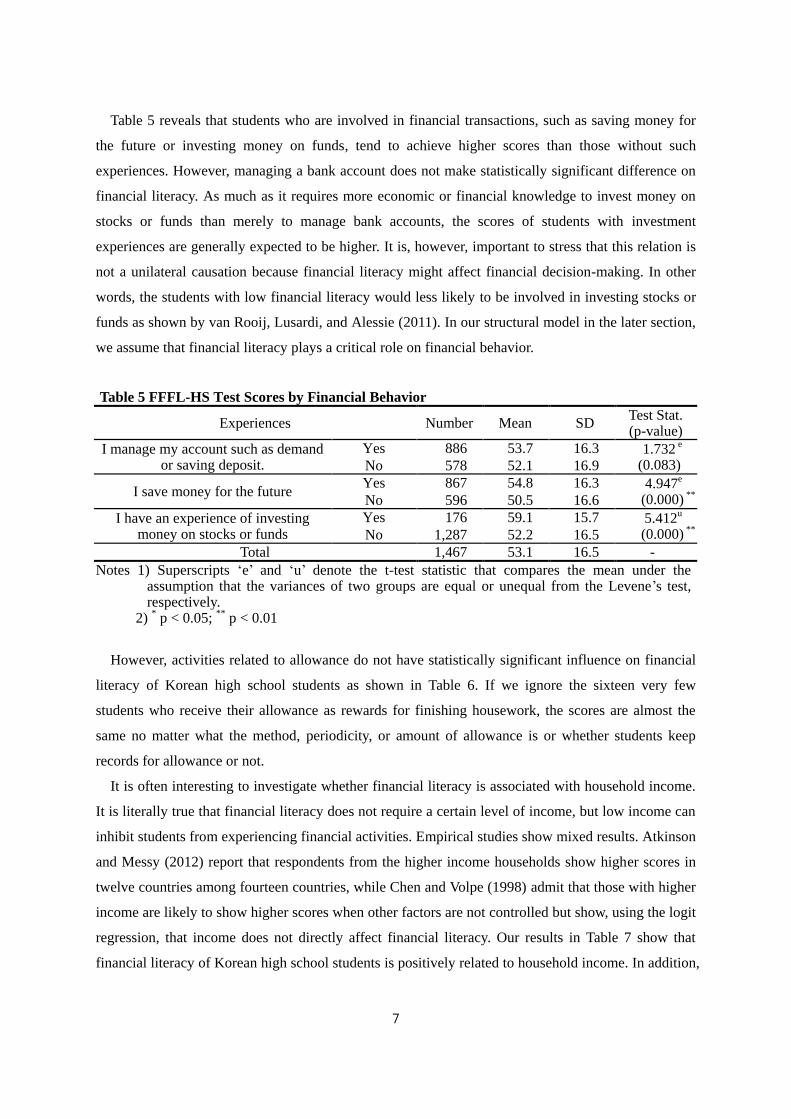
Table 5 reveals that students who are involved in financial transactions, such as saving money for
the future or investing money on funds, tend to achieve higher scores than those without such
experiences. However, managing a bank account does not make statistically significant difference on
financial literacy. As much as it requires more economic or financial knowledge to invest money on
stocks or funds than merely to manage bank accounts, the scores of students with investment
experiences are generally expected to be higher. It is, however, important to stress that this relation is
not a unilateral causation because financial literacy might affect financial decision-making. In other
words, the students with low financial literacy would less likely to be involved in investing stocks or
funds as shown by van Rooij, Lusardi, and Alessie (2011). In our structural model in the later section,
we assume that financial literacy plays a critical role on financial behavior.
Table 5 FFFL-HS Test Scores by Financial Behavior
Experiences Number Mean SD Test Stat. (p-value)
I manage my account such as demand or saving deposit.
Yes 886 53.7 16.3 1.732 e (0.083) No 578 52.1 16.9
I save money for the future Yes 867 54.8 16.3 4.947e
(0.000) ** No 596 50.5 16.6
I have an experience of investing money on stocks or funds
Yes 176 59.1 15.7 5.412u (0.000) ** No 1,287 52.2 16.5
Total 1,467 53.1 16.5 -
Notes 1) Superscripts ‘e’ and ‘u’ denote the t-test statistic that compares the mean under the assumption that the variances of two groups are equal or unequal from the Levene’s test, respectively.
2) * p < 0.05; ** p < 0.01
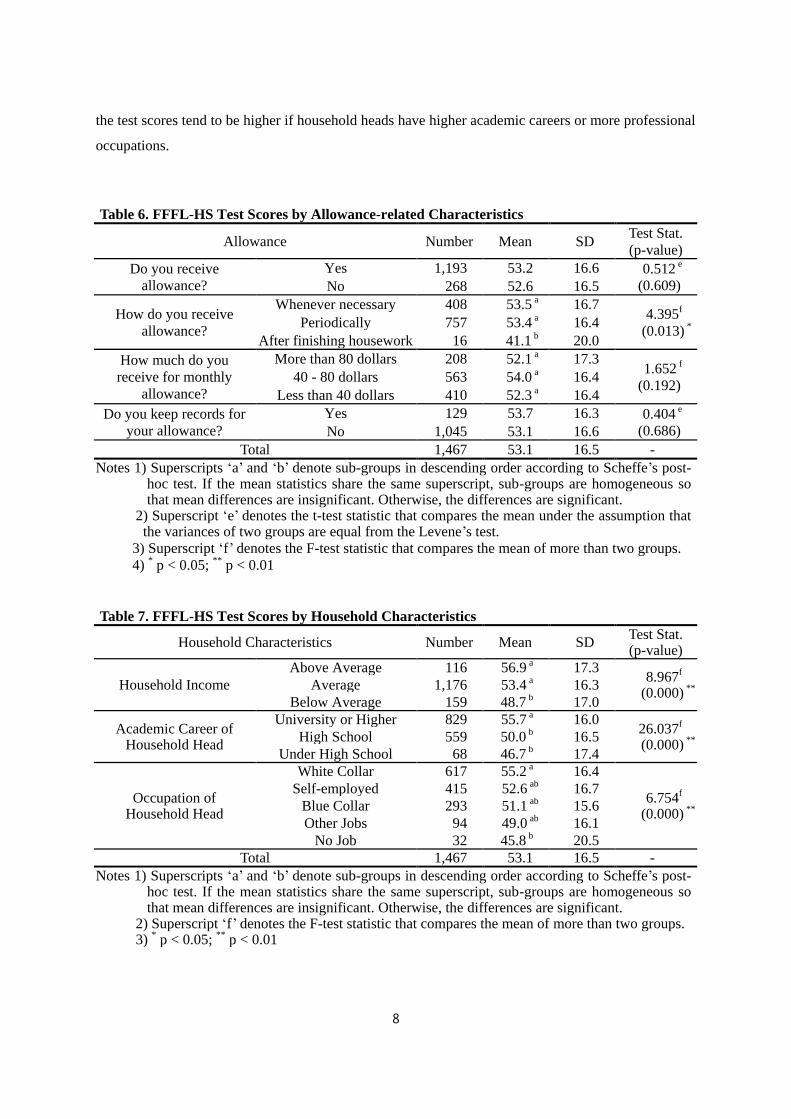
However, activities related to allowance do not have statistically significant influence on financial
literacy of Korean high school students as shown in Table 6. If we ignore the sixteen very few
students who receive their allowance as rewards for finishing housework, the scores are almost the
same no matter what the method, periodicity, or amount of allowance is or whether students keep
records for allowance or not.
It is often interesting to investigate whether financial literacy is associated with household income.
It is literally true that financial literacy does not require a certain level of income, but low income can
inhibit students from experiencing financial activities. Empirical studies show mixed results. Atkinson
and Messy (2012) report that respondents from the higher income households show higher scores in
twelve countries among fourteen countries, while Chen and Volpe (1998) admit that those with higher
income are likely to show higher scores when other factors are not controlled but show, using the logit
regression, that income does not directly affect financial literacy. Our results in Table 7 show that
financial literacy of Korean high school students is positively related to household income. In addition,
8
the test scores tend to be higher if household heads have higher academic careers or more professional
occupations.
Table 6. FFFL-HS Test Scores by Allowance-related Characteristics
Allowance Number Mean SD Test Stat.
(p-value)
Do you receive
allowance?
Yes 1,193 53.2 16.6 0.512 e
(0.609) No 268 52.6 16.5
How do you receive
allowance?
Whenever necessary 408 53.5 a 16.7 4.395f
(0.013) * Periodically 757 53.4 a 16.4
After finishing housework 16 41.1 b 20.0
How much do you
receive for monthly
allowance?
More than 80 dollars 208 52.1 a 17.3 1.652 f
(0.192) 40 - 80 dollars 563 54.0 a 16.4
Less than 40 dollars 410 52.3 a 16.4
Do you keep records for
your allowance?
Yes 129 53.7 16.3 0.404 e
(0.686) No 1,045 53.1 16.6
Total 1,467 53.1 16.5 -
Notes 1) Superscripts ‘a’ and ‘b’ denote sub-groups in descending order according to Scheffe’s post-hoc test. If the mean statistics share the same superscript, sub-groups are homogeneous so that mean differences are insignificant. Otherwise, the differences are significant.
2) Superscript ‘e’ denotes the t-test statistic that compares the mean under the assumption that the variances of two groups are equal from the Levene’s test.
3) Superscript ‘f’ denotes the F-test statistic that compares the mean of more than two groups.
4) * p < 0.05; ** p < 0.01
Table 7. FFFL-HS Test Scores by Household Characteristics
Household Characteristics Number Mean SD Test Stat. (p-value)
Household Income
Above Average 116 56.9 a 17.3 8.967f
(0.000) ** Average 1,176 53.4 a 16.3
Below Average 159 48.7 b 17.0
Academic Career of Household Head
University or Higher 829 55.7 a 16.0 26.037f (0.000) **
High School 559 50.0 b 16.5
Under High School 68 46.7 b 17.4
Occupation of Household Head
White Collar 617 55.2 a 16.4
6.754f (0.000) **
Self-employed 415 52.6 ab 16.7
Blue Collar 293 51.1 ab 15.6
Other Jobs 94 49.0 ab 16.1
No Job 32 45.8 b 20.5
Total 1,467 53.1 16.5 -
Notes 1) Superscripts ‘a’ and ‘b’ denote sub-groups in descending order according to Scheffe’s post-hoc test. If the mean statistics share the same superscript, sub-groups are homogeneous so that mean differences are insignificant. Otherwise, the differences are significant.
2) Superscript ‘f’ denotes the F-test statistic that compares the mean of more than two groups. 3) * p < 0.05; ** p < 0.01
9
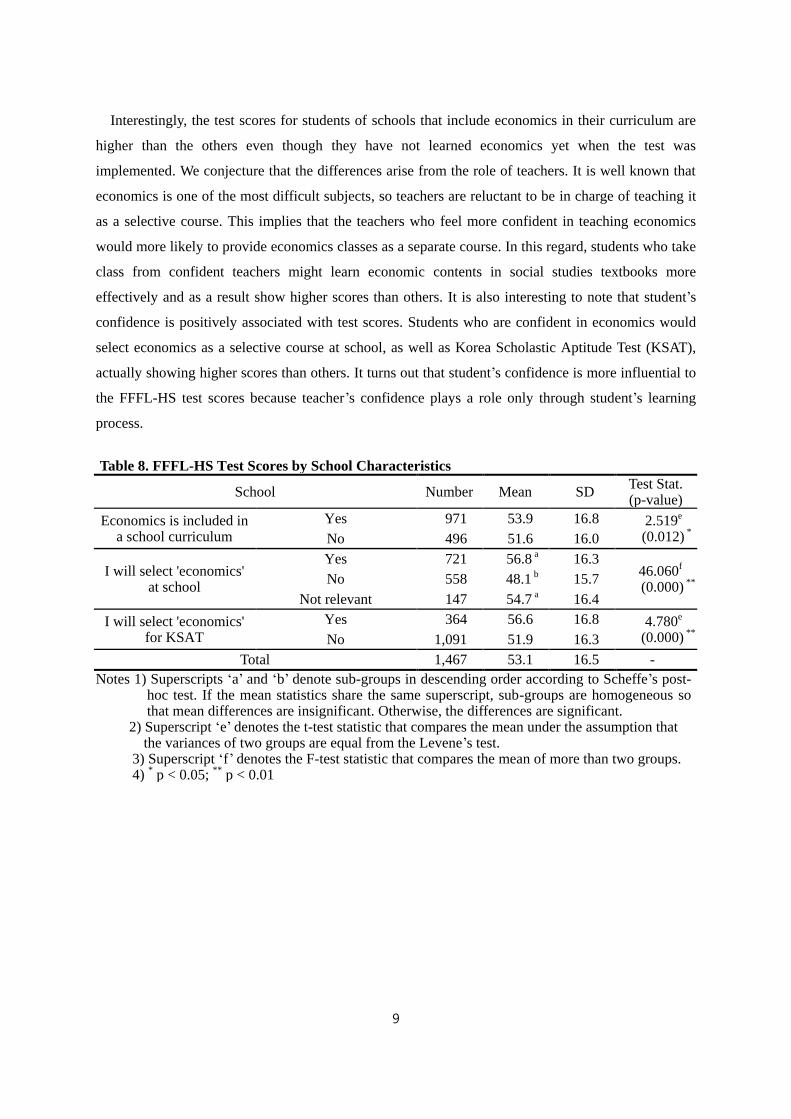
Interestingly, the test scores for students of schools that include economics in their curriculum are
higher than the others even though they have not learned economics yet when the test was
implemented. We conjecture that the differences arise from the role of teachers. It is well known that
economics is one of the most difficult subjects, so teachers are reluctant to be in charge of teaching it
as a selective course. This implies that the teachers who feel more confident in teaching economics
would more likely to provide economics classes as a separate course. In this regard, students who take
class from confident teachers might learn economic contents in social studies textbooks more
effectively and as a result show higher scores than others. It is also interesting to note that student’s
confidence is positively associated with test scores. Students who are confident in economics would
select economics as a selective course at school, as well as Korea Scholastic Aptitude Test (KSAT),
actually showing higher scores than others. It turns out that student’s confidence is more influential to
the FFFL-HS test scores because teacher’s confidence plays a role only through student’s learning
process.
Table 8. FFFL-HS Test Scores by School Characteristics
School Number Mean SD Test Stat. (p-value)
Economics is included in a school curriculum
Yes 971 53.9 16.8 2.519e (0.012) * No 496 51.6 16.0
I will select 'economics' at school
Yes 721 56.8 a 16.3
46.060f (0.000) **
No 558 48.1 b 15.7
Not relevant 147 54.7 a 16.4
I will select 'economics' for KSAT
Yes 364 56.6 16.8 4.780e (0.000) ** No 1,091 51.9 16.3
Total 1,467 53.1 16.5 -
Notes 1) Superscripts ‘a’ and ‘b’ denote sub-groups in descending order according to Scheffe’s post-hoc test. If the mean statistics share the same superscript, sub-groups are homogeneous so that mean differences are insignificant. Otherwise, the differences are significant.
2) Superscript ‘e’ denotes the t-test statistic that compares the mean under the assumption that the variances of two groups are equal from the Levene’s test.
3) Superscript ‘f’ denotes the F-test statistic that compares the mean of more than two groups. 4) * p < 0.05; ** p < 0.01
10
III. Factors Influencing Financial Literacy
1. Simple Regression Model
As a preliminary analysis, we examine a simple regression model where financial literacy is
regressed on several explanatory variables such as socioeconomic status (SES), economic attitude and
financial attitude. We measure the financial literacy by the scores on the FFFL-HS test. As the number
of items in each theme is different in our study, we use the principal component analysis to measure
the financial literacy instead of simple arithmetic sum of scores.3 Similarly we measure the economic
attitude and financial attitude by the principal components of survey responses, where ordered
variables are measured on a Likert scale (1 = strongly disagree, 2 = disagree, 3 = neutral, 4 = agree, 5
= strongly agree) and binomial variables are treated as dummy variables (1 = yes, 0 = no). Other
nominal variables are converted to dummy variables as follows. As for the responses of ‘desired job
after graduation’, we make a dummy variable by setting 1 if the job is ‘professional ‘or ‘white collar’
and 0 otherwise. We also make a dummy variable for the responses of ‘the most important channel to
get financial information’ by setting 1 if students get the information actively through ‘TV news or
newspapers’ or ‘internet’ and 0 otherwise. Even though financial behavior is not included in our
simple regression we also conduct a principal component analysis in order to check the adequacy of
structural model in the next section. The SES is measure by five dummy variables (Gender: 1 = male,
0 = female; Econ: 1 = economics is included in a school curriculum, 0 = otherwise; Selection: 1 = I
will select ‘economics’ at school, 0 = otherwise; KSAT: 1 = I will select ‘economics’ for Korea SAT, 0
= otherwise) and four ordinal variables measured on a Likert scale (GPA: 1 = below average, 2 =
average, 3 = above average; Household Income: 1 = household income is below average, 2 = average,
3 = above average; Academic Career: 1 = academic career of household head is under high school, 2
= high school, 3 = university or higher; Occupation: 1 = occupation of household head is no job, 2 =
other jobs, 3 = blue collar, 4 = self-employed, 5 = white collar). We do not include allowance-related
characteristics in the explanatory variables because they do not yield significant difference on the
FFFL-HS test scores as shown in Table 6.
In order to verify the adequacy of extracting factors for each set of variables, we examine the
Kaiser-Meyer-Olkin measure of sampling adequacy and Bartlett’s test of sphericity as shown in Table
9. The KMO statistic of financial literacy is great, and that of economic attitude is good while those of
3 We use the principal component analysis as a preliminary step, and will use the confirmatory factor analysis
for our structural equation model in the next section. In other words, the financial literacy, economic attitude,
financial attitude and financial behavior are measured by factors rather than principal components in our
alternative structural models.

11
financial attitude and financial behavior are mediocre. These results indicate that we may use a
principal component analysis for our sample in that the values are all above a bare minimum 0.50.4
The Bartlett’s test statistics are all significant at the 5% significance level, which implies that the
variables are correlated each other so that they can be explained by the same factor. 5
Table 9. Kaiser-Meyer-Olkin Measure of Sampling Adequacy and Bartlett’s Test of Sphericity
Variables Economic
Attitude
Financial
Attitude
Financial
Behavior
Financial
Literacy
KMO Measure of Sampling Adequacy 0.710 0.513 0.527 0.815
Bartlett’s Test of Sphericity χ2(degree of freedom) 1851.0**
(15) 520.3**(3) 131.3**
(6) 1891.0**(10)
Note: * p < 0.05; ** p < 0.01
Table 10 shows the eigenvalues and total variance explained by principal components. We can
select 1 as the number of principal components for economic attitude, financial attitude and financial
literacy, which can explain 42–54% of the variances. It seems that the first principal component of
financial behavior cannot explain most variation of the variables because the second largest
eigenvalue is just above the criterion value of 1. However, we decided to consider only one principal
component in related to the confirmatory factor analysis in our structural equation model.
Table 10. Eigenvalues and Total Variance Explained by Principal Components
Components
Economic Attitude Financial Attitude Financial Behavior Financial Literacy
Eigen-
value
% of
Variance
Eigen-
value
% of
Variance
Eigen-
value
% of
Variance
Eigen-
value
% of
Variance
1 2.516 41.9 1.585 52.8 1.331 33.3 2.701 54.0
2 0.998 16.6 0.971 32.4 1.001 25.0 0.724 14.5
3 0.930 15.5 0.444 14.8 0.931 23.3 0.634 12.7
4 0.776 12.9 0.736 18.4 0.478 9.6
5 0.435 7.2 0.463 9.3
6 0.345 5.8
Table 11 shows the results of ordinary least squares. The fraction of sample variance of the
financial literacy of Korean high school students explained by the explanatory variables, adjusted R2,
is 0.255 but the overall regression F-statistic is significant at the 5% significance level, which implies
that at least one of the explanatory variables has a non-zero slope. It is shown that GPA is the most
4 KMO statistic compares the magnitudes of the observed correlation and the partial correlation. Large statistics
indicate that a factor analysis is adequate for the sample. Kaiser (1974) recommends a bare minimum of 0.5.
Hutcheson and Sofroniou (1999) interpret other ranges of value as mediocre (0.5-0.7), good (0.7-0.8), great
(0.8-0.9) and superb (above 0.9). 5 The null hypothesis of Bartlett’s test is that the variables are uncorrelated. Large statistics indicate that the
variables are correlated each other so that they can be explained by the same factor.
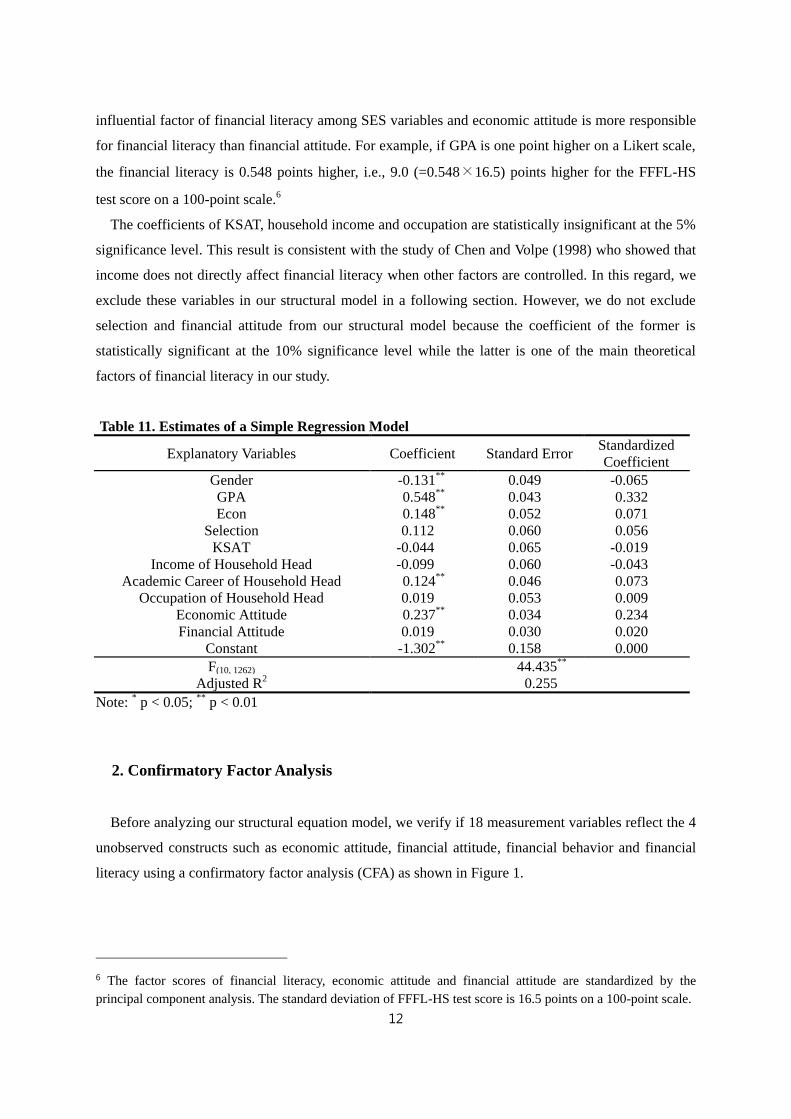
12
influential factor of financial literacy among SES variables and economic attitude is more responsible
for financial literacy than financial attitude. For example, if GPA is one point higher on a Likert scale,
the financial literacy is 0.548 points higher, i.e., 9.0 (=0.548×16.5) points higher for the FFFL-HS
test score on a 100-point scale.6
The coefficients of KSAT, household income and occupation are statistically insignificant at the 5%
significance level. This result is consistent with the study of Chen and Volpe (1998) who showed that
income does not directly affect financial literacy when other factors are controlled. In this regard, we
exclude these variables in our structural model in a following section. However, we do not exclude
selection and financial attitude from our structural model because the coefficient of the former is
statistically significant at the 10% significance level while the latter is one of the main theoretical
factors of financial literacy in our study.
Table 11. Estimates of a Simple Regression Model
Explanatory Variables Coefficient Standard Error Standardized
Coefficient
Gender -0.131** 0.049 -0.065
GPA 0.548** 0.043 0.332
Econ 0.148** 0.052 0.071
Selection 0.112 0.060 0.056
KSAT -0.044 0.065 -0.019
Income of Household Head -0.099 0.060 -0.043
Academic Career of Household Head 0.124** 0.046 0.073
Occupation of Household Head 0.019 0.053 0.009
Economic Attitude 0.237** 0.034 0.234
Financial Attitude 0.019 0.030 0.020
Constant -1.302** 0.158 0.000
F(10, 1262) 44.435**
Adjusted R2 0.255
Note: * p < 0.05; ** p < 0.01
2. Confirmatory Factor Analysis
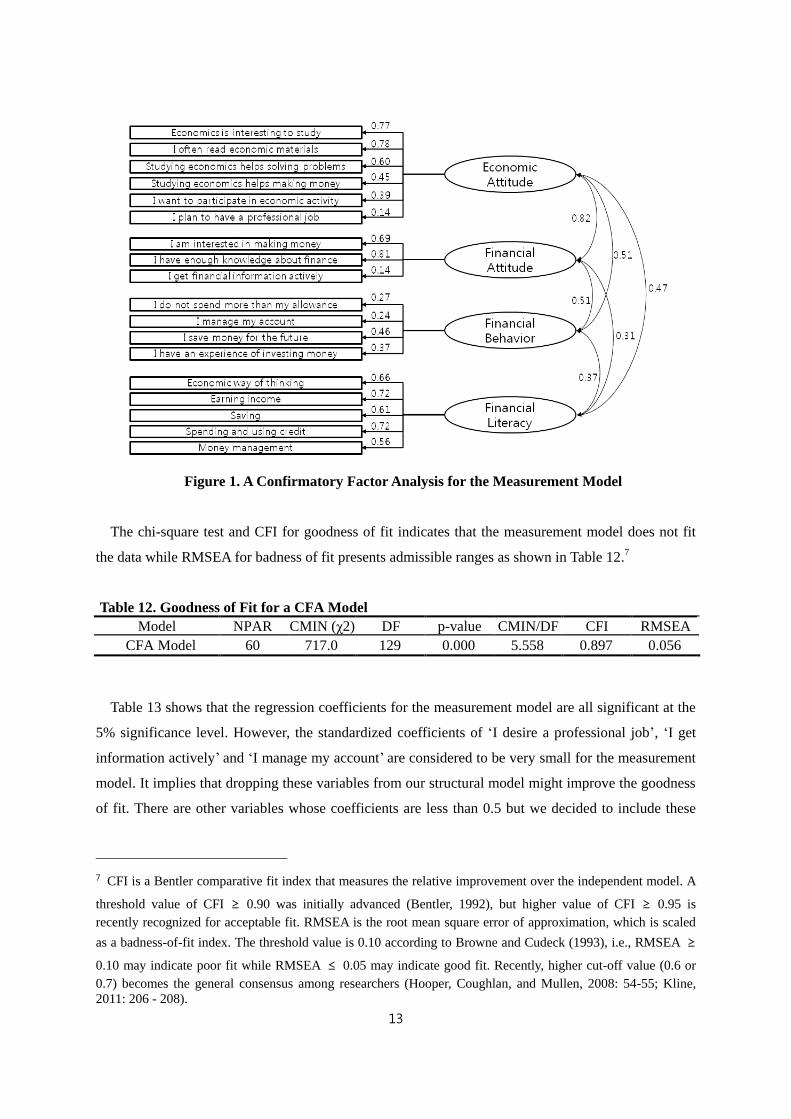
Before analyzing our structural equation model, we verify if 18 measurement variables reflect the 4
unobserved constructs such as economic attitude, financial attitude, financial behavior and financial
literacy using a confirmatory factor analysis (CFA) as shown in Figure 1.
6 The factor scores of financial literacy, economic attitude and financial attitude are standardized by the
principal component analysis. The standard deviation of FFFL-HS test score is 16.5 points on a 100-point scale.
13
Figure 1. A Confirmatory Factor Analysis for the Measurement Model
The chi-square test and CFI for goodness of fit indicates that the measurement model does not fit
the data while RMSEA for badness of fit presents admissible ranges as shown in Table 12.7
Table 12. Goodness of Fit for a CFA Model
Model NPAR CMIN (χ2) DF p-value CMIN/DF CFI RMSEA
CFA Model 60 717.0 129 0.000 5.558 0.897 0.056
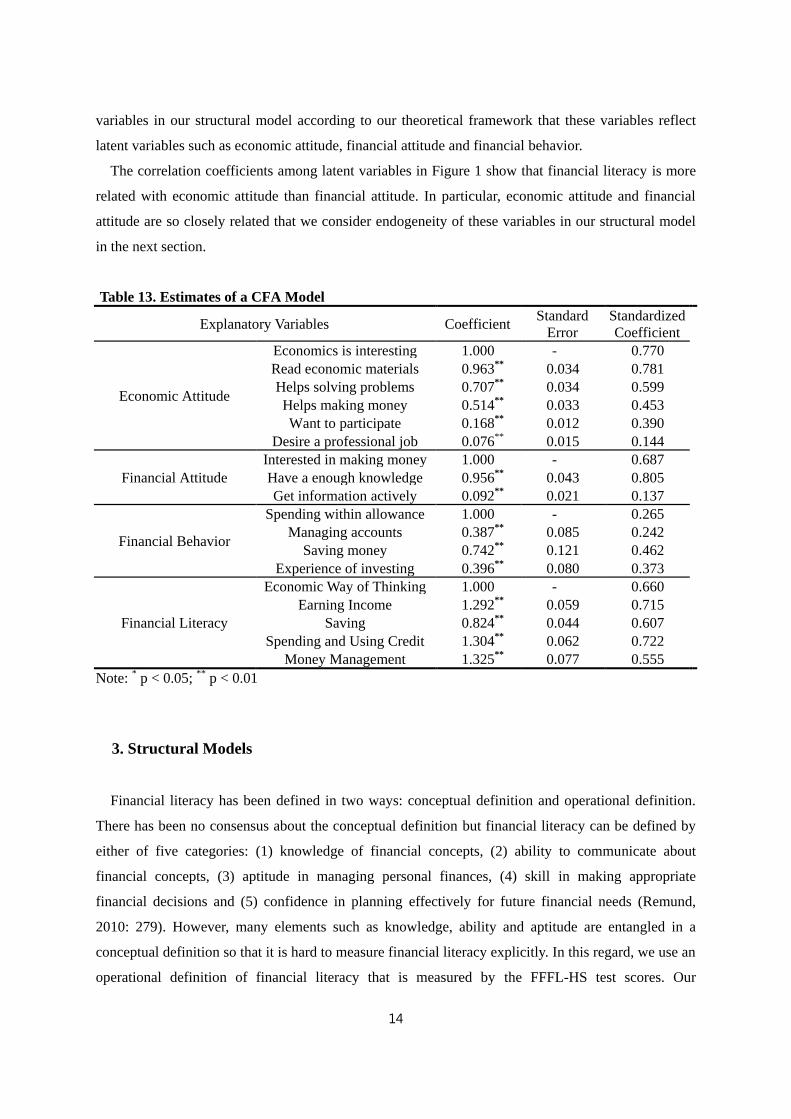
Table 13 shows that the regression coefficients for the measurement model are all significant at the
5% significance level. However, the standardized coefficients of ‘I desire a professional job’, ‘I get
information actively’ and ‘I manage my account’ are considered to be very small for the measurement
model. It implies that dropping these variables from our structural model might improve the goodness
of fit. There are other variables whose coefficients are less than 0.5 but we decided to include these
7 CFI is a Bentler comparative fit index that measures the relative improvement over the independent model. A
threshold value of CFI ≥ 0.90 was initially advanced (Bentler, 1992), but higher value of CFI ≥ 0.95 is
recently recognized for acceptable fit. RMSEA is the root mean square error of approximation, which is scaled
as a badness-of-fit index. The threshold value is 0.10 according to Browne and Cudeck (1993), i.e., RMSEA ≥
0.10 may indicate poor fit while RMSEA ≤ 0.05 may indicate good fit. Recently, higher cut-off value (0.6 or
0.7) becomes the general consensus among researchers (Hooper, Coughlan, and Mullen, 2008: 54-55; Kline,
2011: 206 - 208).
14
variables in our structural model according to our theoretical framework that these variables reflect
latent variables such as economic attitude, financial attitude and financial behavior.
The correlation coefficients among latent variables in Figure 1 show that financial literacy is more
related with economic attitude than financial attitude. In particular, economic attitude and financial
attitude are so closely related that we consider endogeneity of these variables in our structural model
in the next section.
Table 13. Estimates of a CFA Model
Explanatory Variables Coefficient Standard
Error
Standardized
Coefficient
Economic Attitude
Economics is interesting 1.000 - 0.770
Read economic materials 0.963** 0.034 0.781
Helps solving problems 0.707** 0.034 0.599
Helps making money 0.514** 0.033 0.453
Want to participate 0.168** 0.012 0.390
Desire a professional job 0.076** 0.015 0.144
Financial Attitude
Interested in making money 1.000 - 0.687
Have a enough knowledge 0.956** 0.043 0.805
Get information actively 0.092** 0.021 0.137
Financial Behavior
Spending within allowance 1.000 - 0.265
Managing accounts 0.387** 0.085 0.242
Saving money 0.742** 0.121 0.462
Experience of investing 0.396** 0.080 0.373
Financial Literacy
Economic Way of Thinking 1.000 - 0.660
Earning Income 1.292** 0.059 0.715
Saving 0.824** 0.044 0.607
Spending and Using Credit 1.304** 0.062 0.722
Money Management 1.325** 0.077 0.555
Note: * p < 0.05; ** p < 0.01
3. Structural Models
Financial literacy has been defined in two ways: conceptual definition and operational definition.
There has been no consensus about the conceptual definition but financial literacy can be defined by
either of five categories: (1) knowledge of financial concepts, (2) ability to communicate about
financial concepts, (3) aptitude in managing personal finances, (4) skill in making appropriate
financial decisions and (5) confidence in planning effectively for future financial needs (Remund,
2010: 279). However, many elements such as knowledge, ability and aptitude are entangled in a
conceptual definition so that it is hard to measure financial literacy explicitly. In this regard, we use an
operational definition of financial literacy that is measured by the FFFL-HS test scores. Our
15
operational definition is similar to the first category of conceptual definition as it measures the
financial literacy by knowledge in a tangible way. However, this definition enables us to analyze the
causal effects among financial knowledge, attitude and behavior.
Atkinson and Messy (2012) addressed that behavior was the most essential element of financial
literacy because certain behavior could enhance or reduce financial wellbeing. For example, they
argued, over-using credit could reduce financial wellbeing. Chinen and Endo (2012) investigated the
effects of age, gender, parents’ educational background and attitude toward financial education on
financial literacy. These studies showed that economic or financial attitudes as well as the
socioeconomic status affected financial literacy, which in turn influenced financial behavior. However,
a potential endogeneity among these variables are not deeply studied yet.
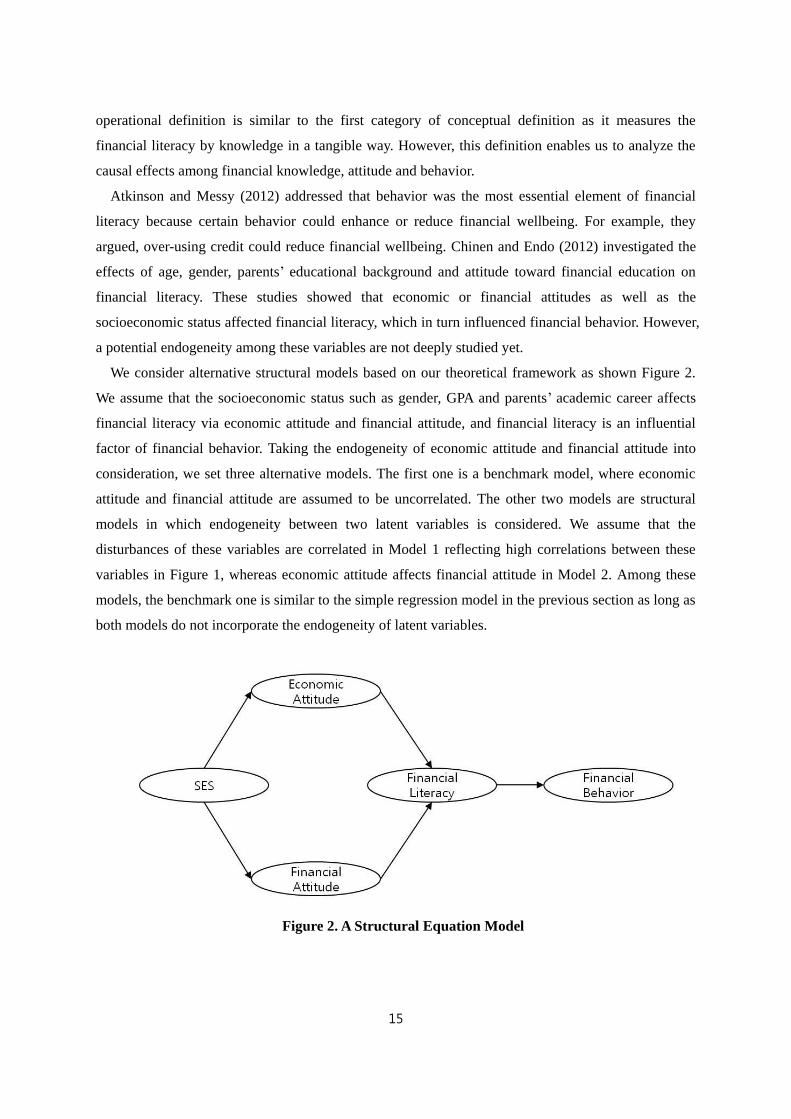
We consider alternative structural models based on our theoretical framework as shown Figure 2.
We assume that the socioeconomic status such as gender, GPA and parents’ academic career affects
financial literacy via economic attitude and financial attitude, and financial literacy is an influential
factor of financial behavior. Taking the endogeneity of economic attitude and financial attitude into
consideration, we set three alternative models. The first one is a benchmark model, where economic
attitude and financial attitude are assumed to be uncorrelated. The other two models are structural
models in which endogeneity between two latent variables is considered. We assume that the
disturbances of these variables are correlated in Model 1 reflecting high correlations between these
variables in Figure 1, whereas economic attitude affects financial attitude in Model 2. Among these
models, the benchmark one is similar to the simple regression model in the previous section as long as
both models do not incorporate the endogeneity of latent variables.
Figure 2. A Structural Equation Model
16
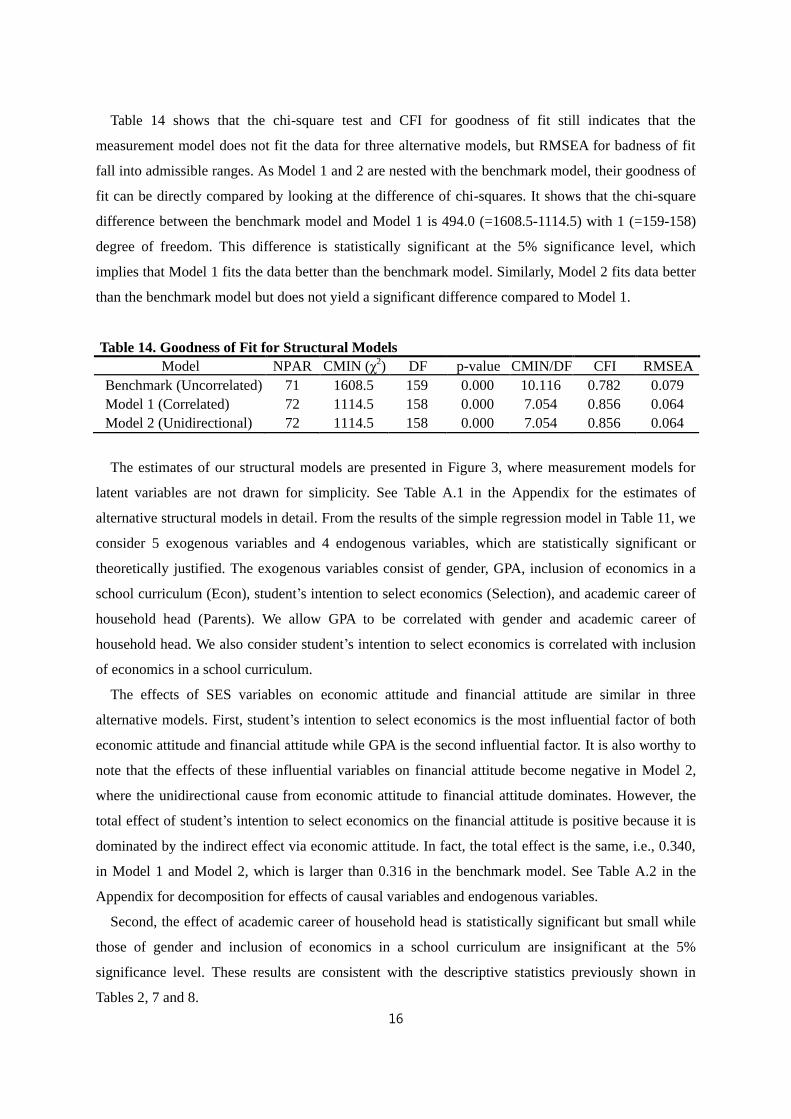
Table 14 shows that the chi-square test and CFI for goodness of fit still indicates that the
measurement model does not fit the data for three alternative models, but RMSEA for badness of fit
fall into admissible ranges. As Model 1 and 2 are nested with the benchmark model, their goodness of
fit can be directly compared by looking at the difference of chi-squares. It shows that the chi-square
difference between the benchmark model and Model 1 is 494.0 (=1608.5-1114.5) with 1 (=159-158)
degree of freedom. This difference is statistically significant at the 5% significance level, which
implies that Model 1 fits the data better than the benchmark model. Similarly, Model 2 fits data better
than the benchmark model but does not yield a significant difference compared to Model 1.
Table 14. Goodness of Fit for Structural Models
Model NPAR CMIN (χ2) DF p-value CMIN/DF CFI RMSEA
Benchmark (Uncorrelated) 71 1608.5 159 0.000 10.116 0.782 0.079
Model 1 (Correlated) 72 1114.5 158 0.000 7.054 0.856 0.064
Model 2 (Unidirectional) 72 1114.5 158 0.000 7.054 0.856 0.064
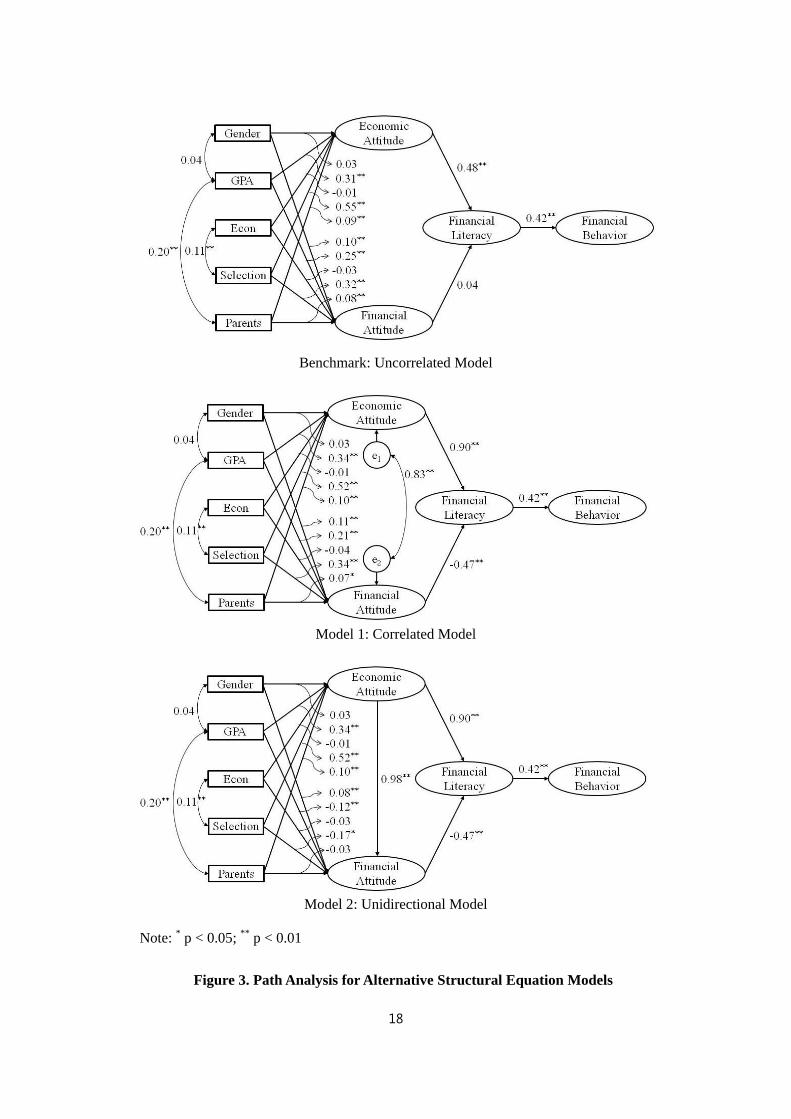
The estimates of our structural models are presented in Figure 3, where measurement models for
latent variables are not drawn for simplicity. See Table A.1 in the Appendix for the estimates of
alternative structural models in detail. From the results of the simple regression model in Table 11, we
consider 5 exogenous variables and 4 endogenous variables, which are statistically significant or
theoretically justified. The exogenous variables consist of gender, GPA, inclusion of economics in a
school curriculum (Econ), student’s intention to select economics (Selection), and academic career of
household head (Parents). We allow GPA to be correlated with gender and academic career of
household head. We also consider student’s intention to select economics is correlated with inclusion
of economics in a school curriculum.
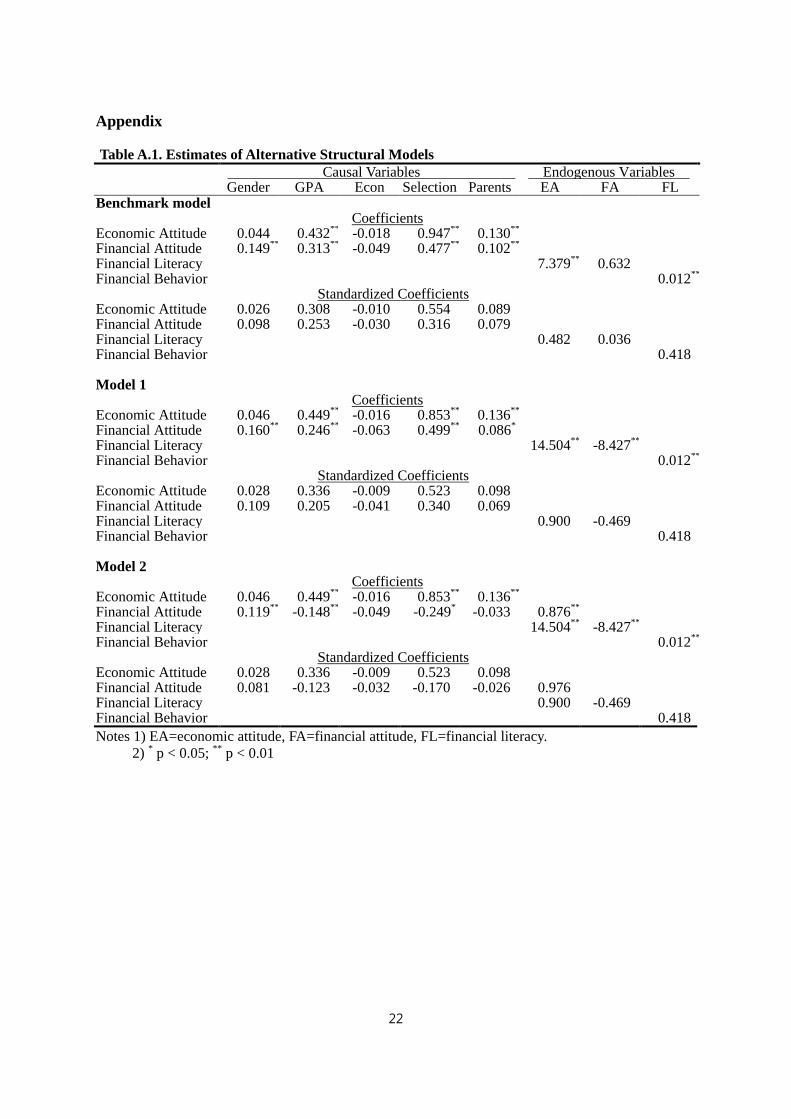
The effects of SES variables on economic attitude and financial attitude are similar in three
alternative models. First, student’s intention to select economics is the most influential factor of both
economic attitude and financial attitude while GPA is the second influential factor. It is also worthy to
note that the effects of these influential variables on financial attitude become negative in Model 2,
where the unidirectional cause from economic attitude to financial attitude dominates. However, the
total effect of student’s intention to select economics on the financial attitude is positive because it is
dominated by the indirect effect via economic attitude. In fact, the total effect is the same, i.e., 0.340,
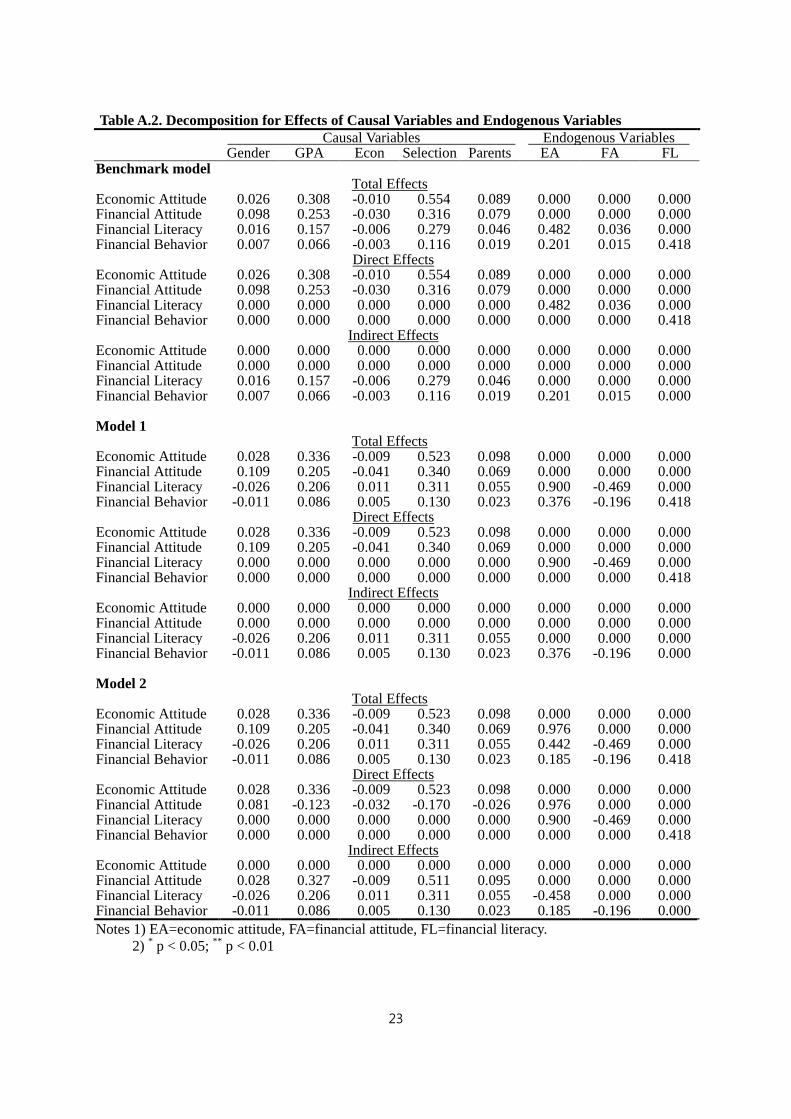
in Model 1 and Model 2, which is larger than 0.316 in the benchmark model. See Table A.2 in the
Appendix for decomposition for effects of causal variables and endogenous variables.
Second, the effect of academic career of household head is statistically significant but small while
those of gender and inclusion of economics in a school curriculum are insignificant at the 5%
significance level. These results are consistent with the descriptive statistics previously shown in
Tables 2, 7 and 8.
17
Economic attitude is more influential factor of financial literacy than financial attitude. The path
coefficient from economic attitude to financial literacy is 0.48 in the benchmark model and 0.90 in
Model 1 and Model 2, while that from financial attitude to financial literacy is 0.04 in the benchmark
model and -0.47 in Model 1 and Model 2. It is interesting to see that the path coefficient from
financial attitude to financial literacy changes dramatically when we consider endogeneity among
latent variables. The effect of financial attitude on financial literacy is insignificant in the benchmark
model, which is similar to results of the simple regression model in the previous section. When we
incorporate the enodogeneity of financial attitude explicitly among latent variables in Model 1 and
Model 2, the effect becomes significant but negative. We conjecture that the negative effect indicates
overconfidence that refers to an individual’s propensity to overestimate his/her financial literacy. This
conclusion is confirmed by the fact that financial attitude is a latent variable that consists of two
survey questions: ‘I am interested in making money’ and ‘I have enough knowledge about finance’, in
which the latter has larger factor weight (0.69 vs. 0.81) as shown in Figure 1.
Financial literacy has positive effects on financial behavior in all models, which is consistent with
the findings of Atkinson and Messy (2012). The path coefficient from financial literacy to financial
behavior is 0.42, which does not vary in three alternative models. The magnitude of effect can be
measured by multiplying the standard deviation of the FFFL-HS test scores and survey responses to
financial attitude questionnaires. For example, raising 33 points (= 16.5 x 2) of the FFFL-HS test
scores via economic or financial education may change students’ financial behavior such as saving
money for the future.8
8 As the factor scores of financial literacy, economic attitude and financial attitude are standardized, we need to
multiply the standard deviation of responses to survey questionnaires. However, this computation yields only an
approximation of the effects because the financial literacy and financial behavior are measured by the
confirmatory factors rather than simple arithmetic sum. The standard deviation of the FFFL-HS test score is
16.5 points on a 100-point scale while the standard deviations of responses to financial behavior questionnaires
are 1.16, 0.49 and 0.33 for three elements. The computation in the text use 0.5 as the approximate standard
deviation of financial behavior.
18
Benchmark: Uncorrelated Model
Model 1: Correlated Model
Model 2: Unidirectional Model
Note: * p < 0.05; ** p < 0.01
Figure 3. Path Analysis for Alternative Structural Equation Models
19
IV. Conclusion
This study investigates the effects of socioeconomic status, economic attitude and financial attitude
on financial literacy and the financial behavior using structural equation models, in which
endogeneity among latent variables are incorporated. The results of structural models share common
and different findings with those of descriptive statistics and simple regression models.
First, student’s intention to select economics is the most influential factor of both economic attitude
and financial attitude, with GPA the second influential one. Second, economic attitude is more
influential factor of financial literacy than financial attitude. Third, the effect of financial attitude on
financial literacy changes dramatically depending on the assumptions. The descriptive statistics show
that financial attitude has positive effects on financial literacy, while its effects become insignificant in
the simple regression model and the benchmark model. However, if we incorporate the enodogeneity
of financial attitude explicitly among latent variables, the effects become negative and significant,
which may reflect students’ overconfidence about financial literacy. Finally, financial literacy has
positive effects on financial behavior in all models, which implies an important role of economic or
financial education to change students’ financial behavior such as saving money for the future.
20
References
Ansong, Abraham and Michael Asiedu Gyensare (2012). “Determinants of University Working-
Students’ Financial Literacy at the University of Cape Coast, Ghana,” International Journal of
Business and Management, Vol. 7, No. 9, pp. 126-133.
Atkinson, Adele and Flore-Anne Messy (2012). “Measuring Financial Literacy: Results of the OECD
/ International Network on Financial Education (INFE) Pilot Study,” OECD Working Papers
on Finance, Insurance and Private Pensions, No. 15, OECD Publishing.
Bentler, Peter M. (1992). “On the Fit of Models to Covariances and Methodology to the Bulletin,”
Psychological Bulletin, Vol. 112, pp. 400–404.
Bernheim, B. Douglas and Daniel M. Garrett (2003). “The Effects of Financial Education in the
Workplace: Evidence from a Survey of Households,” Journal of Public Economics, Vol. 87,
Issues 7-8, pp. 1487-1519.
Bhushan, Puneet and Yajulu Medury (2013). “Financial Literacy and Its Determinants,” International
Journal of Engineering, Business and Enterprise Applications, Vol. 4, No. 2, pp. 155-160.
Browne, Michael W. and Robert Cudeck (1993). “Alternative Ways of Assessing Model Fit.” In K. A.
Bollen & J. S. Long (Ed.), Testing Structural Equation Models (pp. 136–162), Newbury Park,
CA: Sage.
Chen, Haiyang and Ronald P. Volpe (1998). “An Analysis of Personal Financial Literacy among
College Students,” Financial Services Review, Vol. 7, No. 2, pp. 107-128.
Chinen, Kenichiro and Hideki Endo (2012). “Effects of Attitude and Background on Personal
Financial Ability: A Student Survey in the United States,” International Journal of
Management, Vol. 29, No. 2, pp. 778-791.
Cho, Yeong-Suk and Song-Choon Park (2008). “A Study on the Regional Gap in High School
Students’ Financial and Economic Knowledge,” Korean Journal of Economic Education, Vol.
15, No. 2, pp. 121-143.
Financial Supervisory Service (2011). 2011 Report on Financial Quotient of High School Students,
Seoul, Korea.
Friedman, Benjamin M. (2010). “Reconstructing Economics in Light of the 2007-? Financial Crisis,”
Journal of Economic Education, Vol. 41, No. 4, pp. 391-397.
Hahn, Jinsoo (2013). “Financial Literacy of Korean Elementary School Students: Levels and
Determinants,” Korean Journal of Economic Education, Vol. 20, No. 2, pp. 39-63.
Hooper, Daire, Joseph Coughlan, and Michael Mullen (2008). “Structural Equation Modelling:
Guidelines for Determining Model Fit,” The Electronic Journal of Business Research Methods,
Vol. 6, No. 1, pp. 53 – 60.
Hutcheson, Graeme D. and Nick Sofroniou (1999). The Multivariate Social Scientist: Introductory
Statistics Using Generalized Linear Models, London: Sage.
Jang, Kyungho, Jinsoo Hahn, and Hyung-Joon Park (2013). “Comparison of Financial Literacy
21
between Korean and U.S. High School Students,” submitted to International Review of
Economics Education.
Kaiser, Henry F. (1974). “An Index of Factorial Simplicity,” Psychometrika, Vol. 39, pp. 31-36.
Kim, Min-Jeung and Hee-Sook Lee (2011). “The Financial Quotient according to Financial
Experience and Financial Management Behavior of Chungbuk National University Students in
Korea,” Journal of Human Ecology, Vol. 15, No. 1, pp. 149-167.
Kim, Eun-jung and Chung-Sook Moon (2010). “A Study on the Developing Financial Literacy in
Middle School,” Consumer Policy and Education Review, Vol. 6, No. 1, pp. 67-77.
Kline, Rex B. (2011). Principles and Practice of Structural Equation Modeling, 3rd edition, New York:
The Guilford Press.
Lusardi, Annamaria, Olivia S. Mitchell, and Vilsa Curto (2010). “Financial Literacy among the
Young,” Journal of Consumer Affairs, Vol. 44, No. 2, pp. 358-380.
Mandell, Lewis (2008). “Financial Literacy of High School Students.” In Jing Jian Xiao (Ed.),
Handbook of Consumer Finance Research (pp. 163-183), New York: Springer.
Olga, Kharchenko (2011). Financial Literacy in Ukraine: Determinants and Implications for Saving
Behavior. Unpublished Master’s Thesis, Kyiv School of Economics.
Remund, David L. (2010). “Financial Literacy Explicated: The Case for a Clear Definition in an
Increasingly Complex Economy,” Journal of Consumer Affairs, Vol. 44. No. 2, pp. 276-295.
Sabri, Mohamad F. F. (2011). Pathways to Financial Success: Determinants of Financial Literacy and
Financial Well-being among Young Adults. Doctoral Dissertation, Iowa State University.
Samy, Martin, H. Tawfik, R. Huang, and A. K. Nagar (2008). “Financial Literacy of Youth: A
Sensitivity Analysis of the Determinants,” International Journal of Economic Sciences and
Applied Research, Vol. 1, No. 1, pp. 55-70.
U.S. Department of the Treasury (2002). Integrating Financial Education into School Curricula,
Washington, D.C.
van Rooij, Maarten., Annamaria Lusardi, and Rob Alessie (2011). “Financial Literacy and Stock
Market Participation,” Journal of Financial Economics, Vol. 101, No. 2, pp. 449-472.
Walstad, William B. and Ken Rebeck (2005). Financial Fitness for Life: High School Test Examiner’s
Manual, Grades 9-12, New York: National Council on Economic Education.
22
Appendix
Table A.1. Estimates of Alternative Structural Models
Causal Variables Endogenous Variables Gender GPA Econ Selection Parents EA FA FL Benchmark model
Coefficients Economic Attitude 0.044 0.432** -0.018 0.947** 0.130** Financial Attitude 0.149** 0.313** -0.049 0.477** 0.102** Financial Literacy 7.379** 0.632 Financial Behavior 0.012**
Standardized Coefficients Economic Attitude 0.026 0.308 -0.010 0.554 0.089 Financial Attitude 0.098 0.253 -0.030 0.316 0.079 Financial Literacy 0.482 0.036 Financial Behavior 0.418 Model 1
Coefficients Economic Attitude 0.046 0.449** -0.016 0.853** 0.136** Financial Attitude 0.160** 0.246** -0.063 0.499** 0.086* Financial Literacy 14.504** -8.427** Financial Behavior 0.012**
Standardized Coefficients Economic Attitude 0.028 0.336 -0.009 0.523 0.098 Financial Attitude 0.109 0.205 -0.041 0.340 0.069 Financial Literacy 0.900 -0.469 Financial Behavior 0.418 Model 2
Coefficients Economic Attitude 0.046 0.449** -0.016 0.853** 0.136** Financial Attitude 0.119** -0.148** -0.049 -0.249* -0.033 0.876** Financial Literacy 14.504** -8.427** Financial Behavior 0.012**
Standardized Coefficients Economic Attitude 0.028 0.336 -0.009 0.523 0.098 Financial Attitude 0.081 -0.123 -0.032 -0.170 -0.026 0.976 Financial Literacy 0.900 -0.469 Financial Behavior 0.418
Notes 1) EA=economic attitude, FA=financial attitude, FL=financial literacy.
2) * p < 0.05; ** p < 0.01
23
Table A.2. Decomposition for Effects of Causal Variables and Endogenous Variables
Causal Variables Endogenous Variables Gender GPA Econ Selection Parents EA FA FL Benchmark model
Total Effects Economic Attitude 0.026 0.308 -0.010 0.554 0.089 0.000 0.000 0.000 Financial Attitude 0.098 0.253 -0.030 0.316 0.079 0.000 0.000 0.000 Financial Literacy 0.016 0.157 -0.006 0.279 0.046 0.482 0.036 0.000 Financial Behavior 0.007 0.066 -0.003 0.116 0.019 0.201 0.015 0.418
Direct Effects Economic Attitude 0.026 0.308 -0.010 0.554 0.089 0.000 0.000 0.000 Financial Attitude 0.098 0.253 -0.030 0.316 0.079 0.000 0.000 0.000 Financial Literacy 0.000 0.000 0.000 0.000 0.000 0.482 0.036 0.000 Financial Behavior 0.000 0.000 0.000 0.000 0.000 0.000 0.000 0.418
Indirect Effects Economic Attitude 0.000 0.000 0.000 0.000 0.000 0.000 0.000 0.000 Financial Attitude 0.000 0.000 0.000 0.000 0.000 0.000 0.000 0.000 Financial Literacy 0.016 0.157 -0.006 0.279 0.046 0.000 0.000 0.000 Financial Behavior 0.007 0.066 -0.003 0.116 0.019 0.201 0.015 0.000 Model 1
Total Effects Economic Attitude 0.028 0.336 -0.009 0.523 0.098 0.000 0.000 0.000 Financial Attitude 0.109 0.205 -0.041 0.340 0.069 0.000 0.000 0.000 Financial Literacy -0.026 0.206 0.011 0.311 0.055 0.900 -0.469 0.000 Financial Behavior -0.011 0.086 0.005 0.130 0.023 0.376 -0.196 0.418
Direct Effects Economic Attitude 0.028 0.336 -0.009 0.523 0.098 0.000 0.000 0.000 Financial Attitude 0.109 0.205 -0.041 0.340 0.069 0.000 0.000 0.000 Financial Literacy 0.000 0.000 0.000 0.000 0.000 0.900 -0.469 0.000 Financial Behavior 0.000 0.000 0.000 0.000 0.000 0.000 0.000 0.418
Indirect Effects Economic Attitude 0.000 0.000 0.000 0.000 0.000 0.000 0.000 0.000 Financial Attitude 0.000 0.000 0.000 0.000 0.000 0.000 0.000 0.000 Financial Literacy -0.026 0.206 0.011 0.311 0.055 0.000 0.000 0.000 Financial Behavior -0.011 0.086 0.005 0.130 0.023 0.376 -0.196 0.000 Model 2
Total Effects Economic Attitude 0.028 0.336 -0.009 0.523 0.098 0.000 0.000 0.000 Financial Attitude 0.109 0.205 -0.041 0.340 0.069 0.976 0.000 0.000 Financial Literacy -0.026 0.206 0.011 0.311 0.055 0.442 -0.469 0.000 Financial Behavior -0.011 0.086 0.005 0.130 0.023 0.185 -0.196 0.418
Direct Effects Economic Attitude 0.028 0.336 -0.009 0.523 0.098 0.000 0.000 0.000 Financial Attitude 0.081 -0.123 -0.032 -0.170 -0.026 0.976 0.000 0.000 Financial Literacy 0.000 0.000 0.000 0.000 0.000 0.900 -0.469 0.000 Financial Behavior 0.000 0.000 0.000 0.000 0.000 0.000 0.000 0.418
Indirect Effects Economic Attitude 0.000 0.000 0.000 0.000 0.000 0.000 0.000 0.000 Financial Attitude 0.028 0.327 -0.009 0.511 0.095 0.000 0.000 0.000 Financial Literacy -0.026 0.206 0.011 0.311 0.055 -0.458 0.000 0.000 Financial Behavior -0.011 0.086 0.005 0.130 0.023 0.185 -0.196 0.000
Notes 1) EA=economic attitude, FA=financial attitude, FL=financial literacy.
2) * p < 0.05; ** p < 0.01


