Embed Size (px)
Citation preview
FILLED PAUSE CLASSIFICATION USING
ENERGY-BOOSTED MEL- FREQUENCY
CEPSTRUM COEFFICIENTS (MFCC)
Raseeda Hamzah, Nursuriati Jamil,Noraini Seman
Faculty of Computer and Mathematical Sciences,
MARA University of Technology, Shah Alam, 40450 Selangor,
Malaysia.
[email protected], [email protected], [email protected]
Abstract.Filled pause is one type of disfluency, identified as the often occurred
disfluency in spontaneous speech and known to affect Automatic Speech
Recognition accuracy. The purpose of this study is to analyze the impact of
boosting Mel-Frequency Cepstral Coefficients with energy feature in
classifying filled pause. A total of 828 filled pauses comprising a mixture of 62
male and female speakers are classified into /mhm/, /aaa/ and /eer/. A back-
propagation neural network using fusion of gradient descent with momentum
and adaptive learning rate is used as the classifier. The results revealed that
energy-boosted Mel-Frequency Cepstral Coefficients produced a higher
accuracy rate of 77% in classifying filled pauses.
Keywords: Malay Filled Pause, Energy, Mel-Frequency Cepstral Coefficients,
Energy-Boosted MFCC, Artificial Neural Network, Gradient Descent
Momentum
1 Introduction
An Automatic Speech Recognition (ASR) system mainly processes read speech or
spontaneous speech and converts them into text. ASR for read speech is considerably
less complicated than spontaneous speech. One of the many hurdles of processing
spontaneous speech is the occurrence of disfluencies such as filled pause, repetition
and sentence restart; filled pause being the highest occurred disfluency. In this paper,
spontaneous speech is defined as unprepared speech, in opposition to read speech
where utterances contain formal, well-formed sentences close to those that can be
found in written documents. Many studies have focused on the detection and the
correction of these disfluencies. Our research focuses on classification of filled pauses
as it is the most common type of disfluencies occurring in spontaneous speeches.
Mel-Frequency Cepstral Coefficients (MFCC) feature is one of the best known and
most commonly used features for speech recognition (Mahesha and Vinod, 2012).It is
a type of speech feature involving coefficients that represent audio which are derived
from a type of cepstral representation of the audio clip (Rosdi, 2008).MFCC has been
successfully used in recent speech processing related work such as in non-speech
detection of dysarthric speech (Hu, 2009); isolated spoken speech recognition
(Seman, 2012) and continuous speech recognition (Horia, 2011). Prosodic features are
also widely used in acoustical-based filled pause detection. Energy, pitch and formant
frequency are three prosodic features used in filled pause detection by Gard and Ward
(2006), Kaushik et al., 2010 and Veiga, 2011.
In this research, energy is chosen as the acoustical feature to be integrated with
Mel Frequency Cepstral Coefficient (MFCC). Energy is chosen rather than pitch and
formant frequency because pitch shows no greater result of performance (Stouten et
al., 2006). Formant frequency is said to be better than pitch (Audkhasi, 2010).
However, formant frequency is highly computational as it involves complicated
calculations. Energy is a very good acoustical representation of noisy data as the
energy of the speech is higher compared to energy of speech with background noise
(Sakhnov et al., 2009).
Several well-known modeling methods such as Hidden Markov Model (HMM),
Gaussian Mixture Model (GMM), Support Vector Machine (SVM) and Artificial
Neural Network (ANN) have been used as classifiers in ASR. Among these
classifiers, ANN is the most efficient in speech recognition as stated in previous work
by (Majeed, 2012) and (Dede and Sazli, 2010).ANN also has the ability to generalize
after learning from the sample given to its network. The generalization ability makes
ANN to properly understand the hidden part of the population even if the sample data
contain noisy information (Zhang et al., 1998). The raw data used in this research is
gathered from Malaysia Parliamentary Hansard Document (MPHD) debate session of
the year 2008. Since the spontaneous speech data is recorded live, it is surrounded
with background noise, interruption, and various speaking style (low, medium and
high intonation). Therefore, ANN is preferred as the classifier model in this research.
1.1 Data Preparation and Methodology
The Malaysia Parliamentary Hansard Document (MPHD) spoken data used in this
research consists of 51 video files (.avi) and 42 text files (.pdf). Each session of the
debate contains six to eight hours of spoken speeches (Seman et al., 2010). It
comprises 253 topics with 222 selected male and female speakers. However, for the
purpose of this research the selection of 10 topics with 35 speakers are used. Thus,
the data collection contains 828 filled pauses. The Malay filled pauses that are
analyzed in this research are defined as /MHM/, /AAA/ and /EER/. Based on the
filled pause collection, there are 82 /MHM/, 484 /EER/ and 272 /AAA/.
For the initial stage of data collection, 562 sentences have been extracted from
the audio MPHD. Filled pause from each sentence is manually segmented and is
grouped based on its type (/EER/, /AAA/, and/MHM/) and labeled as Manual Datasets
(MDs).
1.2 Pre-processing
Pre-processing is a crucial step in signal processing especially in automatic speech
recognition. Without a proper pre-processing on the recorded speech input, the
classification performance or recognition rate will be decreased. In general, the pre-
processing operations involved in this research are filtering, pre-emphasis, frame
blocking, and windowing and feature extraction. The input of the speech waveform is
initially sampled at a sampling rate of 16 kHz. Then, it is filtered using high pass filter
to suppress the noises and accentuate only the high frequency speech waveform.
A pre-emphasis process is then applied to the input speech waveform. The pre-
emphasis is defined by:
]1[*][][ nsPnsny (1)
where, s[n] is the nth
speech sample, y[n] is the corresponding pre-emphasized sample
and P is the pre-emphasis factor typically having a value between 0:9 and 1. The input
speech waveform then will pass through frame blocking and windowing processes.
The common Hamming Window is applied by applying the formula:-
0
0)),1(|2cos(46.054.0 NnNn (2)
1.3 Features Extraction
The front- end signal processing used in ASR is feature extraction. Feature extraction
involved a process of converting the speech waveform to some type of parametric
representation.
1.3.1 Energy
Let )(ix be the thi sample of a speech signal. If the length of the frame is N samples,
then thethj frame can be represented as Eq. 3.
(3)
The most common way of calculating energy of a speech signal is by calculating its
frame by frame energy (Sakhnov et al., 2009) as shown Eq.4.
Nj
Nji
ixN
Ej
.
1).1(
2 )(.1
(4)
Where Ej Energy of the thj frame and fj thj frame is the considered frame
where the energy is calculated.
Otherwise
Nj
Njiixfj.
)1).(1()(
The energy for 82 /MHM/, 484 /EER/ and 272 /AAA/ are calculated and the average
energy of each filled pause is shown in Table 1. As can be seen, the energy value of
/AAA/ is much lower than /EER/ and /MHM/. However, /MHM/ and /EER/ energy
values are similar.
Table 1. The average energy of each type of filled pause
Type of filled pause Energy
/AAA/ 0.69
/EER/ 10.15
/MHM 11.66
1.3.2 Mel-Frequency Cepstral Coefficient Extraction
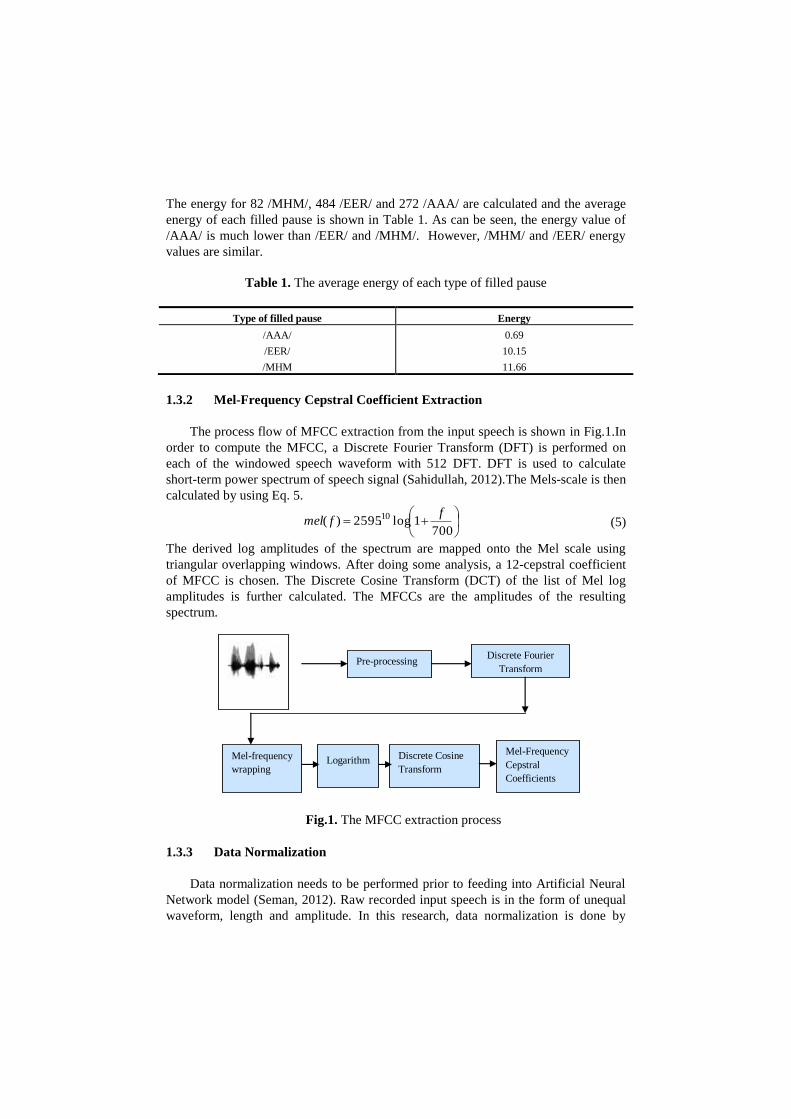
The process flow of MFCC extraction from the input speech is shown in Fig.1.In
order to compute the MFCC, a Discrete Fourier Transform (DFT) is performed on
each of the windowed speech waveform with 512 DFT. DFT is used to calculate
short-term power spectrum of speech signal (Sahidullah, 2012).The Mels-scale is then
calculated by using Eq. 5.
7001log.2595)( 10 f
fmel (5)
The derived log amplitudes of the spectrum are mapped onto the Mel scale using
triangular overlapping windows. After doing some analysis, a 12-cepstral coefficient
of MFCC is chosen. The Discrete Cosine Transform (DCT) of the list of Mel log
amplitudes is further calculated. The MFCCs are the amplitudes of the resulting
spectrum.
Fig.1. The MFCC extraction process
1.3.3 Data Normalization
Data normalization needs to be performed prior to feeding into Artificial Neural
Network model (Seman, 2012). Raw recorded input speech is in the form of unequal
waveform, length and amplitude. In this research, data normalization is done by
Pre-processing Discrete Fourier
Transform
Mel-frequency
wrapping
Discrete Cosine
Transform
Mel-Frequency
Cepstral
Coefficients
Logarithm
taking the mean of each MFCC and energy features extracted from the Manual
Datasets filled pause.
1.4 Classification and Evaluation
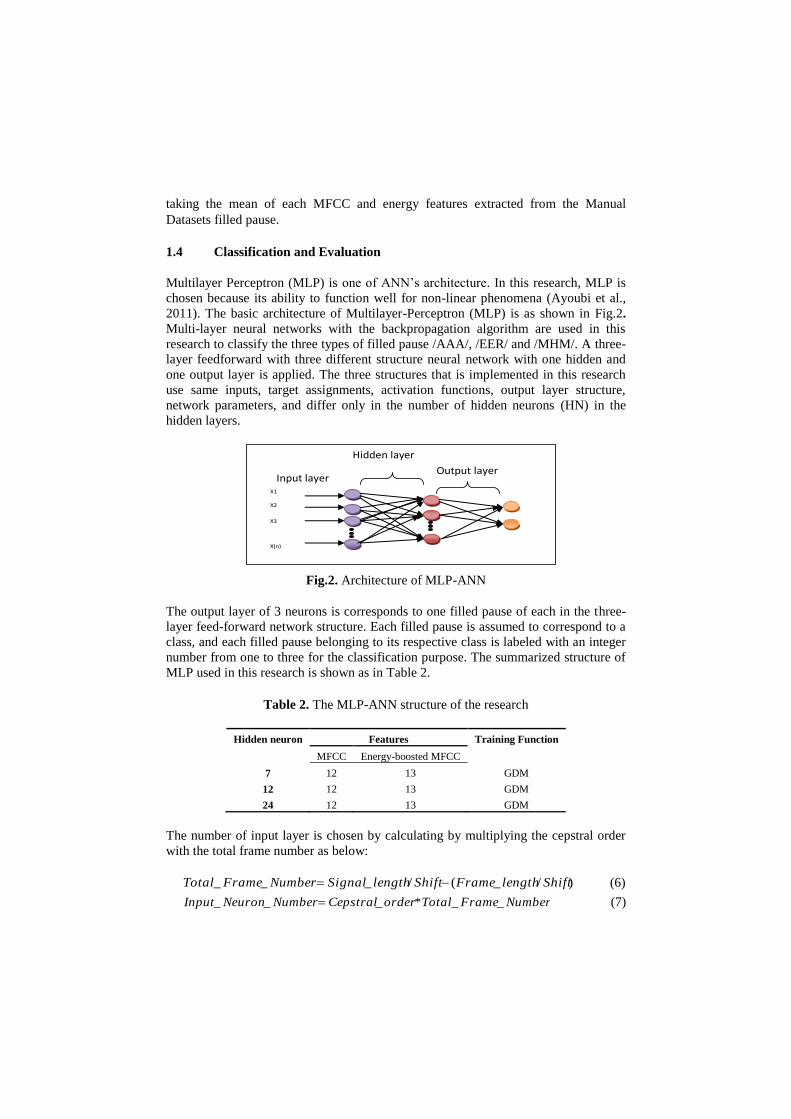
Multilayer Perceptron (MLP) is one of ANN’s architecture. In this research, MLP is
chosen because its ability to function well for non-linear phenomena (Ayoubi et al.,
2011). The basic architecture of Multilayer-Perceptron (MLP) is as shown in Fig.2.
Multi-layer neural networks with the backpropagation algorithm are used in this
research to classify the three types of filled pause /AAA/, /EER/ and /MHM/. A three-
layer feedforward with three different structure neural network with one hidden and
one output layer is applied. The three structures that is implemented in this research
use same inputs, target assignments, activation functions, output layer structure,
network parameters, and differ only in the number of hidden neurons (HN) in the
hidden layers.
Fig.2. Architecture of MLP-ANN
The output layer of 3 neurons is corresponds to one filled pause of each in the three-
layer feed-forward network structure. Each filled pause is assumed to correspond to a
class, and each filled pause belonging to its respective class is labeled with an integer
number from one to three for the classification purpose. The summarized structure of
MLP used in this research is shown as in Table 2.
Table 2. The MLP-ANN structure of the research
Hidden neuron Features Training Function
MFCC Energy-boosted MFCC
7 12 13 GDM
12 12 13 GDM
24 12 13 GDM
The number of input layer is chosen by calculating by multiplying the cepstral order
with the total frame number as below:
)/_(/___ ShiftlengthFrameShiftlengthSignalNumberFrameTotal (6)
NumberFrameTotalorderCepstralNumberNeuronInput __*___ (7)
Output layer
Hidden layer
Input layer X1
X2
X3
X(n)
In order to evaluate the performance each MLP structure used in this research,
different numbers of hidden neurons in the hidden layers were going through a trial an
error process. The number of hidden neuron cannot be too many, otherwise, it cannot
obtain good convergence rate (Seman, 2012). A too small number of hidden neuron
will causes large classification error .One of the guideline for choosing the number of
hidden neuron is by implementing Geometric Pyramid Rule (GPR) that is calculated
by the following equation
2/1)_*_( numberOutputnumberInputHNN (8)
The training algorithm that has been chosen is Gradient Descent with Momentum
(GDM) which is discussed further in the following subsection.
1.4.1 Training the Artificial Neural Network
Training of MLP-ANN is done using the standard Gradient Descent (GD) algorithm.
The training goal is set to 0.001 and to achieve this goal, 1,800 iterations of gain 300
are done. One of the disadvantage of GD is it uses a fix step-size (Gong et al., 2012).
This procedure makes the convergence time longer causing insufficient training on
MLP-ANN. To overcome this limitation, GDM is chosen as the training algorithm in
this research due to its ability to provide variable step size thus increases the
convergence time (Gong et al., 2012).
1.4.2 Testing and Evaluation
In this research, a ratio of 70% for training data and 30% of testing data is used in the
experiment. Accuracy rate is calculated as in Eq. 9 to measure the closeness of the
tested data to the actual data.
dataActual
datatesteddataActualAccuracy
_
__ (9)
Another evaluation is done to assess the maximum acceptance of the filled pauses in
ANN model. This is done by calculating the overall performance scores of true
positive and false positive rates of the filled pauses. True positive is defined as the
rate of correctly accepted filled pause while false positive is defined as incorrectly
rejected filled pause in ANN. Eq. 10 shows the equation of score measurements.
3.0*)__1(7.0*__ ratepositiveFalseratepositiveTrueScore (10)
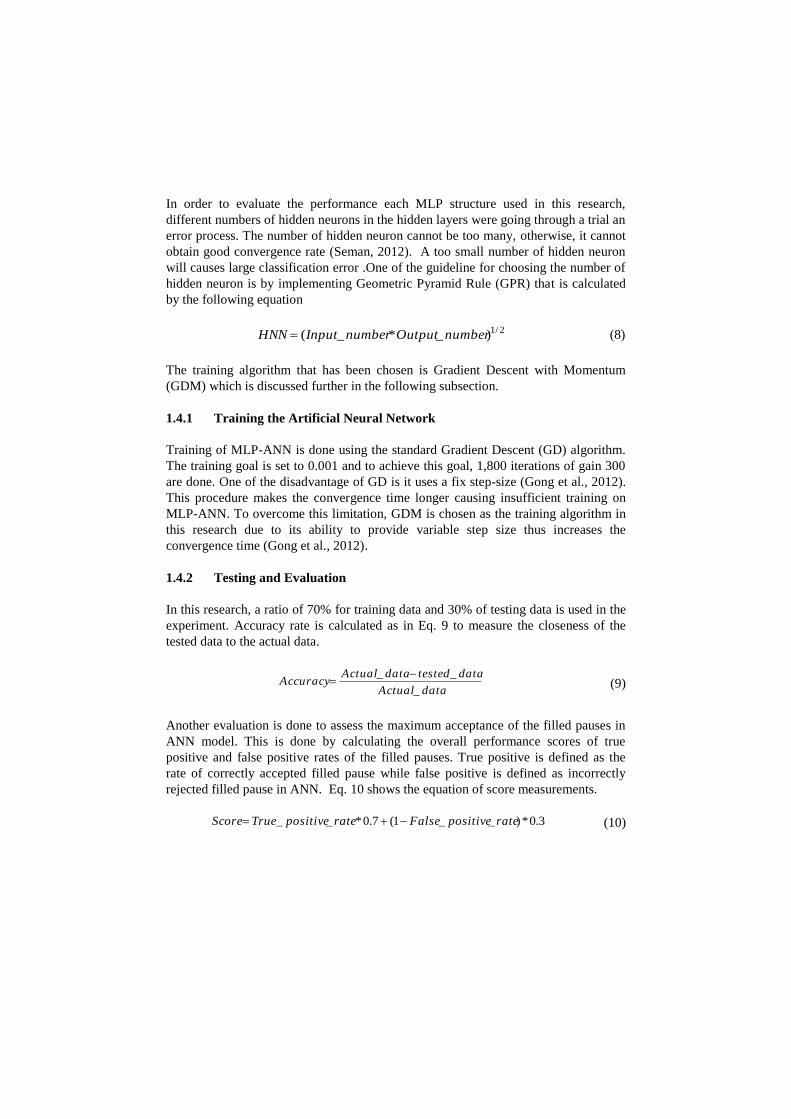
2 Results
Table 3 shows the results of filled pause classification using MFCC and Table 4
presented the results of classification using energy-boosted MFCC. As can be seen,
the results showed that energy-boosted MFCC outperformed classification done by
MFCC only. Among the three types of filled pauses, the highest accuracy rate is
achieved by energy-boosted MFCC for /AAA/ filled pause with average of 77%
accuracy rate and 63% score. The average energy of /AAA/ filled pause is much
lower than /EER/ and /MHM/ as tabulated earlier in Table1. The integration of MFCC
and energy on each filled pause boosted the pattern of the feature vector, thus
increasing the discriminations of patterns among the filled pauses.
Table 3. Performance result of MFCC-based feature
HN Epoch Time Performances
MSE Accuracy (%) Score (%)
AAA EER MHM TP FP Score
7
300 0:00:02 0.029500 60 60 20 53 47 53
600 0:06:36 0.009920 60 40 20 40 60 40
900 0:12:21 0.008910 60 40 40 47 53 47 1200 0:10:03 0.000996 20 40 20 47 53 47
1500 0:13:11 0.000997 80 40 40 53 47 53
12 300 0:03:03 0.041100 40 60 20 40 60 40
600 0:07:27 0.001750 80 40 60 60 40 60
900 0:10:20 0.006560 60 40 40 47 53 47
1200 0:16:48 0.000999 80 40 20 47 53 47
24 300 0:03:11 0.029700 40 60 20 40 60 40
600 0:08:02 0.018100 60 60 20 47 53 47
900 0:12:14 0.003690 40 60 60 53 47 53
1200 0:15:13 0.001770 80 40 20 47 53 47
1500 0:17:06 0.000999 40 60 40 47 53 47
Table 4. Performance result of Energy-boosted MFCC
HN Epoch Time Performances
MSE Accuracy (%) Score (%)
AAA EER MHM TP FP Score
7 300 0:03:36 0.022000 80 60 40 60 40 60
600 0:09:39 0.004800 40 60 40 53 47 53
900 0:12:54 0.002190 60 80 40 60 40 60 1200 0:11:32 0.000998 80 80 40 67 33 67
12 300 0:03:18 0.030300 60 80 40 60 40 60
600 0:06:25 0.001470 100 60 40 67 33 67
900 0:09:42 0.003320 100 80 40 73 27 73
1200 0:12:37 0.001880 100 60 40 67 33 67 1500 0:15:49 0.001100 100 80 40 73 27 73
1800 0:12:28 0.001000 80 60 40 60 40 60
24 300 0:03:21 0.015900 80 60 40 67 33 67
600 0:06:48 0.001300 60 60 40 53 47 53
900 0:10:29 0.000997 60 20 80 53 47 53

The ratio of average accuracy for each type of filled pause is calculated by
finding its accuracy average differences among filled pause types. The purpose of
calculating the ratio is to show the impact of energy-boosted MFCC towards the
classification of filled pause. The ratio of average accuracy between all types of filled
pauses is summarized in Table 5. From the table, it shows that the ratio becomes
larger as MFCC features of the filled pauses are integrated with energy. Therefore,
improving the classification accuracy of each filled pause types.
Table 5. The ratio of average accuracy for MFCC and energy-boosted MFCC feature
Filled pause MFCC MFCC+ENERGY
/AAA/ : /EER/ 8 12
/AAA/: /MHM/ 26 34
/EER/ : /MHM/ 18 22
The summarized comparison performance rate is described as in Fig.3, Fig.4 and
Fig.5 graphically shows the average performance comparisons of MFCC and energy-
boosted MFCC in terms of accuracy, score and Mean Square Error (MSE). MSE is
the standard criterion for the assessment of signal quality (Wang and Bovik, 2009).
The Mean Square Error (MSE) of energy-boosted MFCC is lower than MFCC-based
features as shown in Fig.3. Therefore, the ANN classifier produced higher accuracy
rate since the error is smaller as illustrated in Fig 4. The score of the ANN
performance that is used in this research is also calculated to show the acceptance of
filled pause throughout the ANN. It is proven that the energy-boosted MFCC
achieved higher score rate as exemplified in Fig.5.
Fig.3. The average MSE
Fig.4. The average accuracy

Fig. 5. The average Score
Acknowledgement: The authors thankfully acknowledge Ministry of Higher
Education Malaysia for Fundamental Research Grant Scheme (FRGS, Grant No: 600-
RMI/FRGS 5/3(48/2013) and MARA University of Technology for providing
research facilities throughout this research.
References
1. A.Veiga, S.Candeias,L. Carla,P. Fernando :Characterization of Hesitations Using
Acoustic Models. In: ICPhS XVII, Hong kong (2011)
2. F.Rosdi, R.N Ainon :Isolated Malay speech recognition using Hidden Markov
Models. Proceedings of the International Conference on Computer and
Communications Engineering (ICCCE08), Malaysia, pp.721-725,(2008)
3. F.Stouten: Coping with disfluencies in spontaneous speech recognition: Acoustic
detection and linguistic context manipulation. Speech Communication, 48(11): 1590-
1606.(2006)
4. G.Dede and M.H.Sazli: Speech Recognition with Artificial Neural Network. Digital
signal Processing 20(3),763-768 (2010)
5. G.Garg,N. Ward,:Detecting Filled Pauses in Tutorial Dialogs. In Report of University
of Texas at El Paso, El Paso (2006)
6. G.P.Zhang: Neural networks for classification: a survey. IEEE Transactions on
Systems, Man, and Cybernetics - Part C: Applications and Reviews; (2000). pp. 451–
462.
7. I.C.Horia: Towards a speaker-independent, large-vocabulary continuous speech
recognition system for Romanian. PhD. Thesis. University of PolitehnicaDin
Bucureşti (2011)
8. K.Audhkhasi, :Formant-Based Technique For Automatic Filled-Pause Detection In
Spontaneous Spoken English. In: Acoustics, Speech and Signal Processing, IEEE
International Conference ICASSP (2009)
9. L.Gong, C. Liu ,Y.Li , F.Yuan:Training Feed-forward Neural Networks Using the
Gradient Descent Method with the Optimal Stepsize. Journal of Computational
Information Systems 8: 4 (2012) 1359-1371
10. M.Kaushik :Automatic detection and removal of disfluencies from spontaneous
speech. In: Proc. 13th Australasian Int. Conf. on Speech Science and Technology
Melbourne, 98-101, 2010.
11. S. A., Majeed, H. Husain,S. A. Samad, and A. Hussain,Hierarchical K-Means
Algorithm Applied on Isolated Malay Digit Speech Recognition. International
Conference on System Engineering and Modeling (ICSEM 2012) IPCSIT vol. 34
IACSIT Press, Singapore(2012)
12. S.Karsoliya: Approximating Number of Hidden layer neurons in Multiple Hidden
Layer BPNN Architecture. International Journal of Engineering Trends and
Technology- Vol. 3(2012)
13. Seman: Coalition of artificial intelligent (AI) algorithms for isolated spoken Malay
speech recognition. PhD. Thesis. UniversitiTeknologi Mara, Shah Alam (2012)
14. Y.Hu: Detecting Non-Speech in Dysarthric Speech. Master. Thesis. University of
Sheffield (2009)
15. Z. Wang and A.C. Bovik: Mean Square Error: Love It or Leave It? Ieee Signal
Processing Magazine (2009)
16. P. Mahesha and D. S. Vinod: Feature based classification of dysfluent and normal
speech. In Proceedings of the Second International Conference on Computational
Science, Engineering and Information Technology (CCSEIT '12). ACM, New York,
NY, USA, 594-597(2012)


