Embed Size (px)
Citation preview
ASIAN DEVELOPMENT BANKASIAN DEVELOPMENT BANK
FIJIBuILDINg INcLuSIVE INSTITuTIONSFOr SuSTAINED grOwThCOUNTRY DIAGNOSTIC STUDY

Economic Research and Regional Cooperation DepartmentNovember 2015
AsiAn Development BAnk
FIJIBuILDINg INcLuSIVE INSTITuTIONSFOr SuSTAINED grOwThCOUNTRY DIAGNOSTIC STUDY
© 2015 Asian Development Bank6 ADB Avenue, Mandaluyong City, 1550 Metro Manila, PhilippinesTel +63 2 632 4444; Fax +63 2 636 2444www.adb.org; openaccess.adb.org
Some rights reserved. Published in 2015.Printed in the Philippines.
ISBN 978-92-9257-099-6 (Print), 978-92-9257-100-9 (e-ISBN)Publication Stock No. RPT157617-2
Cataloging-In-Publication Data
Asian Development Bank Fiji: Building inclusive institutions for sustained growth.Mandaluyong City, Philippines: Asian Development Bank, 2015.
1. Economic development. 2. Fiji. I. Asian Development Bank.
The views expressed in this publication are those of the authors and do not necessarily reflect the views and policies of the Asian Development Bank (ADB) or its Board of Governors or the governments they represent.
ADB does not guarantee the accuracy of the data included in this publication and accepts no responsibility for any consequence of their use. The mention of specific companies or products of manufacturers does not imply that theyare endorsed or recommended by ADB in preference to others of a similar nature that are not mentioned.
By making any designation of or reference to a particular territory or geographic area, or by using the term “country” in this document, ADB does not intend to make any judgments as to the legal or other status of any territory or area.
This work is available under the Creative Commons Attribution 3.0 IGO license (CC BY 3.0 IGO)https://creativecommons.org/licenses/by/3.0/igo/. By using the content of this publication, you agree to be bound by the terms of said license as well as the Terms of Use of the ADB Open Access Repository at openaccess.adb.org/termsofuse
This CC license does not apply to non-ADB copyright materials in this publication. If the material is attributed to another source, please contact the copyright owner or publisher of that source for permission to reproduce it. ADB cannot be held liable for any claims that arise as a result of your use of the material.
Attribution—In acknowledging ADB as the source, please be sure to include all of the following information: Author. Year of publication. Title of the material. © Asian Development Bank [and/or Publisher].https://openaccess.adb.org. Available under a CC BY 3.0 IGO license.
Translations—Any translations you create should carry the following disclaimer: Originally published by the Asian Development Bank in English under the title [title] © [Year of publication]Asian Development Bank. All rights reserved. The quality of this translation and its coherence with the original textis the sole responsibility of the [translator]. The English original of this work is the only official version.
Adaptations—Any adaptations you create should carry the following disclaimer: This is an adaptation of an original Work © Asian Development Bank [Year]. The views expressed here arethose of the authors and do not necessarily reflect the views and policies of ADB or its Board of Governors or thegovernments they represent. ADB does not endorse this work or guarantee the accuracy of the data included in thispublication and accepts no responsibility for any consequence of their use.
Please contact [email protected] or [email protected] if you have questions or comments with respectto content, or if you wish to obtain copyright permission for your intended use that does not fall within these terms,or for permission to use the ADB logo.
ADB recognizes “Kyrgyzstan” as the Kyrgyz Republic.
Note: In this publication, “$” refers to US dollars, unless otherwise stated.
Creative Commons Attribution 3.0 IGO license (CC BY 3.0 IGO)
iii
Foreword
With its vision of “A Better Fiji for All,” the Fijian Government adopted the Roadmap for Democracy and Sustainable Socio-Economic Development 2010–2014. This Roadmap outlined the key policy objectives for achieving the country’s goal of national unity, good and just governance, and socioeconomic prosperity for all Fijians.
Since implementing that Roadmap in 2010, Fiji has seen one of the longest spells of sustained growth in its history. This growth was made possible by prudent macroeconomic management and wide-ranging structural reforms, including several reforms in public financial management and in state-owned enterprises. With the successful conduct of general elections in 2014, business confidence in the economy has continued to improve, setting off a resurgence as well as growth in private investments.
Considerable progress has already been made by Fiji towards achieving the MDGs, in particular the goals relating to universal primary education, reducing child mortality, improving maternal health, and ensuring environment sustainability. Though poverty has declined in Fiji, nearly 30% of the population remains poor. The number of jobs created in the formal sector is insufficient to meet the demand of job seekers annually, with the majority working in the informal sector and with many underemployed or not earning enough from their primary job. To address these challenges to inclusive growth, the Government has found it necessary to significantly expand its social programs.
Crucial to generating more and better employment opportunities—which is also the key to making that growth inclusive—is high and sustained growth. It is the government’s goal to enable every Fijian to enjoy the fruits of that growth, and to provide adequate social safety nets to those who live below the poverty line to help them get on their way to likewise achieve that goal.
This report on Fiji’s critical development constraints will serve as a useful reference to the Government of Fiji in preparing its next medium-term development plan. It has clearly identified the major barriers to achieving inclusive growth, and the insights that it provides can greatly enhance the cooperation and understanding between Fiji and its development partners. The Government of Fiji gratefully acknowledges the support of the Asian Development Bank in providing this timely and effective assessment of the Fijian economy.
Filimone Waqabaca Permanent Secretary for FinanceGovernment of Fiji
iv
Preface
Fiji’s economy grew at an average annual rate of 3.3% during 2010–2014, nearly four times its growth rate during 2000–2009. This improved performance was brought about by accommodative macroeconomic policies, both fiscal and monetary, as well as by structural reforms. Extreme poverty—less than $1.25 a day—in Fiji is a low 6%, having gone down by 23 percentage points from the 2002/03 levels.
A large number of Fijians continue to have difficulty meeting their basic needs. One in three live below the national poverty line, with poverty incidence higher in the rural areas. Income inequality has also increased nationally. Even if the headline unemployment rate is low at 4.7%, many of those employed are in the informal sector, living below the poverty line or need to supplement money income with subsistence work. To alleviate this poverty incidence, Fiji needs not only to maintain or surpass its recent growth momentum but also to make its growth inclusive. In particular, it has to create more productive employment opportunities to achieve that inclusive growth.
Using an inclusive growth framework, this country development study on Fiji has identified these four critical constraints to inclusive growth: (i) weaknesses in the regulatory ecosystem for registering, starting, and operating new businesses; (ii) deficiencies in its existing infrastructure and related services, particularly the inadequate upgrading and maintenance of roads and the capacity shortage at its main ports; (iii) uneven access to productive assets, particularly to land and finance, owing in part to the customary ownership of land in Fiji; and (iv) lack of productive and adequately paying job opportunities, limited alternative career pathways, and poor labor market outcomes due to a mismatch between training and market demand.
Political stability and policy certainty are essential to effectively address all these constraints to Fiji’s growth. The country needs to build on the first crucial steps that it has taken in this direction when it adopted a new Constitution and successfully conducted national elections in September 2014. Its growth trajectory is likely to be defined by productive sectors that can surmount the constraints of the country’s smallness and remoteness. One possible route for overcoming such challenges is the development of niche products and services for which a higher price can be charged without becoming uncompetitive in the world market. Private investment in addition to public investment is crucial to the success of this effort, so the private sector’s entry and participation in this high-potential growth area need to be strongly encouraged and fully supported.
The Asian Development Bank looks forward to a continuing productive dialogue with the government of Fiji and other stakeholders on ways to achieve the government’s vision of “One Fiji and A Better Fiji for All.”
shang-Jin WeiChief Economist and Director GeneralEconomic Research and Regional Cooperation DepartmentAsian Development Bank
v
Acknowledgments
The Fiji country diagnostic study was conducted under the regional technical assistance project (RETA 7686), Diagnosing Critical Constraints to Growth and Structural Transformation in Selected Developing Member Countries, which was approved by the Asian Development Bank (ADB) on 7 December 2010. The study is intended to help strengthen the planning capacities of ADB developing member countries through the use of diagnostic approaches.
The Fiji study was undertaken by a team from the Economic Analysis and Operational Support Division (EREA), of ADB’s Economic Research and Regional Cooperation Department (ERCD) under the overall supervision and guidance of Cyn-Young Park, director, EREA. The study was carried out in collaboration with ADB’s Pacific Subregional Office (SPSO), Pacific Regional Department (PARD). The team was led by Utsav Kumar with assistance of Maria Rowena M. Cham. The report was prepared by Utsav Kumar and Maria Rowena M. Cham (Chapters 1, 2, 3, and 5), Sakiko Tanaka (Chapter 3), and Cyn-Young Park (Chapter 4). Valerie Mercer-Blackman, Caroline Currie, Robert Jauncey, Kee-Yung Nam, Laisiasa Tora, and Emma Veve provided useful inputs and valuable comments in its finalization. The study benefited from background papers prepared by a team of experts consisting of Satish Chand, Ronald Duncan, Hyeon-seung Huh, Dibyendu Maiti, and Cyn-Young Park. Research assistance was provided by Regina Salve Baroma, Amador Foronda, Arlene Evangelio, Ronaldo Ico, Ma. Concepcion Latoja, Lyndree Malang, Marymell Martillan, Mark Rex Romaraog, Lotis Quiao, and Marianne Joy Vital. The report was edited by Carlos Llorin Jr. and proofreading was done by Tuesday Soriano. Michael Cortes did the layout, cover design, and typesetting. Maria Melissa Gregorio-Dela Paz provided administrative and secretarial support.
The study benefited from a series of extensive consultations with the Government of Fiji and with the country’s key stakeholders. Inception and in-country consultation workshops were conducted to exchange views and to solicit inputs from the Government of Fiji, development partners, academe, and the private sector. Internal briefings about the study were also held to solicit views from colleagues from PARD. The study team is truly grateful for the support of the Government of Fiji; we are particularly indebted to Filimone Waqabaca, permanent secretary, Ministry of Finance, for his keen interest and guidance from inception to completion of the study.
We also would like to thank Governor Barry Whiteside and Deputy Governor Ariff Ali of the Reserve Bank of Fiji for their active participation during the consultation workshops and for their valuable insights; Epeli Waqavonovono, government statistician, for his full support in making data available for the study; the representatives from the various government ministries and agencies, state-owned enterprises, civil society, private sector, academia, and development partners, for taking the time to participate in the consultation workshops and to meet with the study team; and Lindsay Jolly of the International Sugar Organization for helpful discussions on the European Union’s sugar regime. We extend our appreciation to Xianbin Yao, director general, and Noriko Ogawa, deputy director general, PARD for their support for the study. Our special thanks also go to Adrian Ruthenberg, Norio Usui, Christopher Edmonds, and Rommel Rabanal for useful comments on the report, and to Leba Sovea for facilitating the conduct of the study.
vi
Foreword iiiPreface ivAcknowledgments vAbbreviations xiFiji Fast Facts xiiiExecutive Summary xivChapter 1: Growth and Development Performance 1 1.1. Introduction 1 1.2. Economic Performance 4 1.3. Macroeconomic Performance 15 1.4. Poverty and Inequality 24 1.5. Conclusion and Way Forward in this Study 26 Annex 1.1 Fiji’s Sugar Industry and the European Union’s Liberalized Sugar Regime 282. Critical Constraints to Growth 34 2.1. Introduction 34 2.2. Low Appropriability 35 2.3. Low Social Returns 54 2.4. Cost of Finance 69 2.5. Conclusion 743. Critical Constraints to Inclusiveness 75 3.1. Introduction 75 3.2. Poverty and Inequality in Fiji 75 3.3. Productive Employment Opportunities 81 3.4. Unequal Access to Opportunities 87 3.5. Leveling the Playing Field 100 3.6. Social Safety Nets 106 3.7. Conclusion 107 Annex 3.1 Social Protection System in Fiji 1084. Moving Beyond the Limitations of Customary Landholding 117 4.1. Introduction 117 4.2. History, Land Tenure, and the Political Economy 118 4.3. Reforms to Increase Efficiency of Land Use 120 4.4. Conclusion 1235. Summary and Policy Recommendations 125 5.1. Summary 125 5.2. Business Climate 126 5.3. Infrastructure Services 128 5.4. Access to Finance 130 5.5. Labor Market Outcomes 130 5.6. Conclusion 132 Annex 5.1 Key Policy Measures Introduced Since 2006 133
References 135
Contents
vii
Boxes Box 1.1: Fiji’s Trilemma Constraint—An Empirical Examination 17Box 2.1: Growth Diagnostic Framework 35Box 2.2: Fiji’s Business Start-Up Procedures and Licensing 43Box 2.3: Fiji National Provident Fund 70Box 3.1: Poverty and Inequality Diagnostic Framework 76Box 3.2: Mainstreaming TVET in Fiji 92Box 3.3: Secured Transactions Framework in Fiji 104
Figures Figure 1.1: Size of Pacific Island Countries 1Figure 1.2: GDP Growth, 1971–2014 4 Figure 1.3: Investment Rate, 1970–2014 5Figure 1.4: Structure of GDP by Production Sector, 1980–2014 7 Figure 1.5: Contribution of Production Sectors to GDP Growth, 1980–2014 7 Figure 1.6: Growth in Service Subsectors,1980–2014 8 Figure 1.7: Number of Tourist Arrivals by Country, 1981–2014 8Figure 1.8: Agriculture Sector and Sugar Industry Production Index, 1980–2014 9Figure 1.9: Composition of Agriculture Sector Production, 1980–2013 9 Figure 1.10: Industry Subsectors’ Contribution to Industry Growth, 1980–2014 10Figure 1.11: Growth of Industry Subsectors,1980–2014 10 Figure 1.12: Mining Sector Output and Gold Production, 1980–2014 11Figure 1.13: Major Expenditure Components, 1980–2012 12 Figure 1.14: Composition of Imports, 1980–2013 12 Figure 1.15: Composition of Exports, 1980–2013 13Figure 1.16: Exports of Garments, 1986–2013 14 Figure 1.17: Exports of Beverages, 1995–2013 14 Figure 1.18: Diversification of Export Basket and Stage of Development 15 Figure 1.19: Diversification of the Export Basket of Fiji and Select Small Island Countries, 1980–2013 15Figure 1.20: Current Account Balance, 2000–2013 16Figure B1.1.1: The Trilemma and International Reserves, Fiji and Small Island Countries 17Figure B1.1.2: Evolution of Trilemma Index for Fiji 18Figure 1.21: Nominal and Real Effective Exchange Rates, 2000–2014 19Figure 1.22: Inflation, 1996–2014 19Figure 1.23: Money and Credit, Annual Growth, 2002–2014 19Figure 1.24: Private Credit and Interest Rates, 2001–2014 19Figure 1.25: Loans and Advances by Commercial Banks, 2000–2014 20Figure 1.26: Liquid Assets Ratio of Commercial Banks, 2010–2014 20Figure 1.27: Liquidity Position of Commercial Banks, 2003–2014 20Figure 1.28: Capital Adequacy Ratio of Commercial Banks, 2010–2014 21Figure 1.29: Nonperforming Loans of Commercial Banks, 2010–2014 21Figure 1.30: Fiscal Position, 2000–2013 22Figure 1.31: Sources of Government Revenue, 2000–2013 22Figure 1.32: Government Expenditures, 2000–2013 23Figure 1.33: Total Government Expenditure on Key Services, 2005-2014 23Figure 1.34: Government Gross Financing, 2000–2014 24 Figure 1.35: Public Debt and Contingent Liabilities, 2000–2014 24Figure 1.36: Poverty Incidence, 2002/03 and 2008/09 25Figure 1.37: Inequality Outcomes, 2002/03 and 2008/09 26Figure 1.38: Decomposition of Income Inequality by Spatial Units, 2002/03 and 2008/09 26
Boxes, Figures, and tables
viii
Figure A1.1.1: Sugarcane Output and Yield, 1980–2013 28Figure A1.1.2: Sugar Production and Tons of Cane Required per Ton of Sugar, 1980–2014 28Figure A1.1.3: Sugar Prices in the European Union, Fiji, and the World, 1980–2013 30Figure A1.1.4: Productivity Indicators in World Sugar, Fiji and Select Large Sugar Exporters, Average 2009–2011 32Figure 2.1: GDP Growth, Fiji and Comparator Countries 34Figure 2.2: Investment Rate, Fiji and Comparator Countries 35Figure B2.1.1: Growth Diagnostic Framework 36Figure 2.3: Governance Indicators for Fiji and Selected Countries (percentile rank) 38Figure 2.4: Biggest Obstacles to Investments, 2009 40Figure 2.5: Political Instability as the Biggest Obstacle to Growth, Fiji and Comparator Countries 40Figure 2.6: Overall Ease of Doing Business, Fiji and Comparator Countries, 2014 41Figure 2.7: Overall Ease of Doing Business, 2006–2014 41Figure 2.8: Distance to the Frontier in Ease of Doing Business, Fiji and Comparator Countries 42Figure 2.9: Rank in Different Aspects of Business Environment, 2014 42Figure 2.10: Distance to the Frontier in Ease of Starting a Business, Fiji and Comparator Countries 42Figure 2.11: Courts as a Major Constraint, Fiji and Comparator Countries 47Figure 2.12: Perception of Corruption in Previous 2 Years, 2013 48 Figure 2.13: Effectiveness of Government Actions in Fighting Corruption, 2013 48Figure 2.14: Fiscal Balance, Fiji and Comparator Countries 51Figure 2.15: Public Debt, Fiji and Comparator Countries, 2014 51Figure 2.16: Export Sophistication and GDP per Capita 52 Figure 2.17: Diversification and GDP per Capita 53Figure 2.18: Smallness and Remoteness 55Figure 2.19: Educational Attainment of People 15 Years Old and Above, Fiji and Comparator Countries, 2010 57Figure 2.20: Government Expenditure on Education, 1998–2011 57Figure 2.21: Share of Spending by Education Levels in Total Public Spending on Education, 2011 57Figure 2.22: Spending on Education, Fiji and Comparator Countries 58Figure 2.23: Firms Reporting an Inadequately Educated Workforce as the Biggest Obstacle to Business, Fiji and Comparator Countries 58Figure 2.24: Vehicles Registered, 2000–2013 61Figure 2.25: Spending on Roads, 1990–2013 61Figure 2.26: UNCTAD Liner Shipping Connectivity Index, 2004 and 2014 62Figure 2.27: Distance to the Frontier in Ease of Trading Across Borders, Fiji and Comparator Countries, 2005 and 2014 63Figure 2.28: Electricity Generation 65Figure 2.29: Electricity Tariff Rates in the Pacific, Fiji and Other Pacific Island Countries, 2010 66Figure 2.30: Money Supply to GDP Ratio and GDP per Capita, Cross-Country Comparison 70Figure 2.31a: Interest Rate Spreads, Fiji and Pacific Comparator Countries 71Figure 2.31b: Interest Rate Spreads, Fiji and Non-Pacific Comparator Countries 71Figure 2.32: Savings Rate in Selected Small Island Countries, 1980–2012 71 Figure 2.33a: Real Lending Interest Rates, Fiji and Pacific Comparator Economies 72Figure 2.33b: Real Lending Interest Rates, Fiji and Non-Pacific Comparator Economies 72Figure 2.34: Proportion of Firms that Identified Finance as an Impediment, Fiji and Comparator Countries 73Figure B3.1.1: Diagnostic Framework for Constraints to Reducing Poverty and Inequality 76Figure 3.1: Poverty Incidence Across Divisions by Urbanity, 2002/03 and 2008/09 76Figure 3.2: Poverty Incidence Across Divisions by Ethnicity, 2002/03 and 2008/09 77Figure 3.3: Poverty Incidence Curve by Urbanity, 2002/03 and 2008/09 78Figure 3.4: Growth Incidence Curve by Urbanity 79 Figure 3.5: Growth Incidence Curve 79Figure 3.6: Employed by Industry, Area, and Division, 2010/11 81Figure 3.7: Share by Type of Activity, 2010/11 85Figure 3.8: Employed by Employment Status, Area, and Division, 2010/11 86
Boxes, Figures, and tables
ix
Figure 3.9: Earnings in the Past 12 Months from Primary Job by Area and Division, 2010/11 86Figure 3.10: Educational Attainment of Working-Age Population, 2008/09 89Figure 3.11: Educational Attainment of Fijians Who Have Left School, 2008/09 91Figure B3.2.1: Career Pathway through Fiji’s Educatio n System 92Figure 3.12: Prenatal and Delivery Care, Fiji and Comparator Countries 94Figure 3.13: Infant and Under-5 Mortality Rate by Division, 2009 95Figure 3.14: Health Expenditure, 1995–2012 96Figure 3.15: Average Household Expenditure on Health, 2009 96Figure 3.16: Access to Improved Water Source and Sanitation Facilities, 1990 and 2012 98Figure 3.17: Access to Telecommunication Services, 2008/09 101Figure 3.18: Collateral Value, Fiji and Comparator Countries 105Figure 4.1: Ethnic Composition of Population, 1881–2007 117Figure 4.2: Economic Growth, 1970–2013 118
tables Table 1.1: Poverty Measures for Fiji and Selected Comparator Countries (% of population) 25Table A1.1.1: Cost versus Market Access, Select ACP Countries and LDCs 31Table A1.1.2: Productivity Indicators in World Sugar, Fiji and Select ACP Countries and LDCs, Average 2012–2013 33Table 2.1: Starting a Business in 2014, Fiji and Comparator Countries 43Table 2.2: Obtaining Construction Permits in 2014, Fiji and Comparator Countries 45Table 2.3: Tax Rates and Administrative Burden in 2014, Fiji and Comparator Countries 46Table 2.4: Key Performance Indicators of SOEs 50Table 2.5: Enrollment Rates, Fiji and Comparator Countries 56Table 2.6: Progression to Secondary Level, Fiji and Comparator Countries 57Table 2.7: Road Statistics of Selected Countries 59Table 2.8: Inventory of Roads, Bridges, and Public Jetties, 2014 60Table 2.9: Land Transport Density, Fiji and Comparator Countries 60Table 2.10: Ease of Trading Across Borders, Fiji and Comparator Countries, 2014 63Table 2.11: Cost of Customs Clearance and Port and Terminal Handling, and Time Expended to Prepare Export and Import Documents, Fiji and Comparator Countries, 2014 64Table 2.12: Air Transport Statistics, Fiji and Comparator Countries, 2000 and 2013 64Table 2.13: Generation Levels and Tariffs in Asia and the Pacific Countries that Use Hydropower Extensively 67Table 2.14: Indicators of Reliability of Electricity, Fiji and Comparator Countries 68Table 2.15: Getting Electricity in 2014, Fiji and Comparator Countries 68Table 2.16: Access to Information and Communication Technology Services, Fiji and Comparator Countries, per 100 people 69Table 2.17: New FDI Projects 72Table 2.18: Getting Credit in 2014, Fiji and Comparator Countries 73Table 2.19: Summary of Diagnosis of Constraints to Growth in Fiji 74Table 3.1: Poverty Gap, 2002/03 and 2008/09 77Table 3.2: Poverty Incidence and Poverty Gap in Squatter Settlements and Urban Villages, 2008/09 77Table 3.3: Distribution of the Poor at Various Regional Levels, 2008/09 (%) 80Table 3.4: Labor Force Composition, 2004/05 and 2010/11 81Table 3.5: Labor Force Participation Rate and Unemployment Rate by Geography, 2010/11 (%) 82Table 3.6: Labor Force Participation Rate by Gender, Ethnicity, and Area, 2010/11 (%) 83Table 3.7: Unemployment Rate by Gender, Ethnicity, and Area, 2010/11 (%) 83Table 3.8: Youth Unemployment and Labor Force Participation Rate, 2010/11 (%) 83 Table 3.9: Distribution of Employed Persons in Formal and Informal Jobs by Demographic Group 84Table 3.10: Distribution of Employed Persons by Industry and Formal and/or Informal Jobs, 2010/11 84Table 3.11: Poverty by Employment Status of the Head of the Household 85 Table 3.12: Working for Money and Subsistence 85
Boxes, Figures, and tables
x
Table 3.13: Workers Overseas and in the Domestic Labor Market 87Table 3.14: Highest Level of and Change in Educational Attainment, 2004/05 and 2010/11 87 Table 3.15: MDG Targets for Achieving Universal Primary Education, Fiji and Comparator Countries 88Table 3.16: School Attendance, 2008/09 (%) 90Table 3.17: Unemployment Rate by Education Level, 2010/11 (%) 91Table 3.18: Top Ten Causes of Mortality, 2013 93Table 3.19: Health Outcomes, Fiji and Comparator Countries 94Table 3.20: Malnutrition, Fiji and Comparator Countries (% of children under 5 years old) 95Table 3.21: Access to Improved Water Source and Sanitation Facilities, Fiji and Comparator Countries 98Table 3.22: Access to Financial Services and Account Penetration, Fiji and Comparator Countries 102Table 3.23: Social Protection Index, Asia and the Pacific 106Table 3.24: Summary of Diagnosis of Constraints to Reducing Poverty and Inequality 107Annex Table 3.1: Poverty Incidence by Household Characteristic, 2008/09 (%) 112Annex Table 3.2: Poverty Regression 113Annex Table 3.3: Health Expenditure, Fiji and Comparator Countries, 2002–2012 115Annex Table 3.4: Health Facilities and Workers, Fiji and Comparator Countries 116
Boxes, Figures, and tables
xi
Abbreviations
ACP African, Caribbean, and PacificADB Asian Development BankAFL Airports Fiji LimitedALTA Agricultural Landlord and Tenants ActCAAF Civil Aviation Authority of Fiji CPA Care and Protection AllowanceDOE Department of EnergyDSW Department of Social WelfareDTCP Department of Town and Country PlanningEPA Economic Partnership AgreementEU European UnionEUS employment and unemployment surveyFAP Family Assistance ProgramFBOS Fiji Bureau of Statistics FCC Fiji Commerce CommissionFDI foreign direct investmentFEA Fiji Electricity AuthorityFIRC foreign investment registration certificateFNPF Fiji National Provident FundFNU Fiji National UniversityFPCL Fiji Ports Corporation LimitedFRA Fiji Roads AuthorityFRCA Fiji Revenue and Customs Authority FSC Fiji Sugar CorporationFSM Federated States of MicronesiaFVP Food Voucher ProgramFY financial yearGCC Great Council of ChiefsGDP gross domestic productGDS gross domestic savingsGFCF gross fixed capital formationGIC growth incidence curveGSS Government Shipping ServiceHART Housing Assistance Relief TrustHHI Hirschman–Herfindahl Index
HIES house income and expenditure surveyILO International Labour OrganizationILTA iTaukei Land Trust ActIMF International Monetary FundLDC least developed countryLFPR labor force participation rateMDG Millennium Development GoalMFI microfinance institutionMOF Ministry of FinanceMOH Ministry of Health MOSPNDS Ministry of Strategic, National Development and StatisticsNCD noncommunicable diseaseNCSMED National Center for Small and Micro Enterprise Development NEC National Employment CentreNEP National Energy PolicyNRW nonrevenue waterOECD Organisation for Economic Co-operation and DevelopmentORC Office of the Registrar of CompaniesPBS Poverty Benefit SchemePFIP Pacific Financial Inclusion ProgramPNG Papua New GuineaPPP purchasing power parityPRB Public Rental BoardPRC People’s Republic of ChinaRBF Reserve Bank of FijiRFMF Republic of Fiji Military ForcesSMEs small- and medium-sized enterprisesSOE state-owned enterpriseSPI Social Protection IndexSPS Social Pension SchemeSPSE South Pacific Stock ExchangeTFF Tax Free FactoryTIN tax identification numberTLTB iTaukei Land Trust Board
xii
TVET technical and vocational education and trainingUK United KingdomUNDP United Nations Development ProgrammeUNICEF United Nations Children’s FundUNSD United Nations Statistics DivisionUS United StatesVAT value-added taxWAF Water Authority of FijiWGI Worldwide Governance Indicators
Weights and measures
GWh gigawatt-hourha hectarekm kilometerkm2 square kilometerkWh kilowatt-hourMW megawattTCTS tons of cane required per tons of sugarTEU twenty-foot equivalent unit ton/ha ton per hectare
Abbreviations
xiii
xiv
Executive Summary
Fiji’s economy has seen 5 years of positive growth since 2010—one of its few episodes of sustained growth since 1970. Growth averaged 3.3% a year during 2010–2014, which is nearly four times the growth during 2000–2009. The economic revival since 2010 has been supported by accommodative macroeconomic policies, both fiscal and monetary, as well as by structural reforms. The key structural reforms included the reform of the native land-lease market, major changes in the mode of civil service hiring and compensation, deregulation and incorporation of selected public companies, electoral and parliamentary reforms, and reforms in the education and health sector. The fiscal measures were in the form of lower corporate and personal tax rates and of higher public investment spending. An accommodative monetary policy stance brought interest rates at an all-time low; this, along with an uptick in remittances and tourism, led to an increase in consumption spending.
Fiji’s decadal average total investment rate has been one of the lowest among selected small island countries since 1970. Fiji’s fiscal space for undertaking more public investment is likely to get narrower in the medium term, the government having committed to higher social spending and as its one-off revenues from divestments in state-owned enterprises (SOEs) decline. There is therefore a need to rebalance Fiji’s investment mix toward private investment to sustain the momentum of its economic growth and to achieve desired poverty reduction.
More than 30% of the population lives in poverty, although only 6% are considered extremely poor living under $1.25 a day (2005 purchasing power parity). Although the headline unemployment rate is low at 4.7%, many of those employed are in the informal sector and do not earn enough; and many live below the poverty line or need to supplement money income with subsistence work.
Fiji thus faces two major challenges: (i) creating an environment conducive to greater private sector activity so it can sustain its recently acquired growth momentum, and (ii) making that growth inclusive so it can benefit all sections of Fiji society as widely as possible. This country report on Fiji uses an inclusive growth framework to identify the critical constraints to that inclusive growth. They are as follows:
• Weaknesses in the regulatory ecosystem for registering, starting, and operating a business. Chief of these are cumbersome procedures of starting a new business, weak tax administration, lengthy judicial processes and onerous contract enforcement procedures, price controls, difficulties in accessing land and in obtaining site development approvals, and deficiencies in the legal and policy framework for facilitating private participation in activities currently dominated by SOEs.
• Deficiencies in infrastructure provision, particularly the inadequate funding for upgrading and maintenance of roads, the shortage of capacity at its main ports, the time-consuming and extensive export and import documentation requirements, the unrehabilitated infrastructure in remote areas and outer islands, and inadequate urban services to keep up with growing urbanization.
• Uneven access to productive assets, particularly to land and finance.
xv
Executive Summary
• Lack of productive and adequately paying job opportunities; limited opportunities for pursuing alternative career pathways for those dropping at secondary level of education; and a mismatch between training and market demand that leads to poor labor market outcomes.
Three other factors are at play here. To achieve inclusive growth, Fiji needs the all-important factor of political stability and policy certainty. It took the first crucial steps in this direction when it adopted a new Constitution in 2013 and successfully conducted national elections in September 2014. These developments helped boost investor and consumer confidence and stimulated economic activity. The next factor is Fiji’s economic geography—the country faces the double whammy of having a small population and a remote location. Its development trajectory is therefore unlikely to resemble that of East and Southeast Asian economies. Its growth is likely to come from sectors that can surmount the constraints of high costs imposed by its smallness and remoteness. The third factor is a cultural practice that stymies the entrepreneurial spirit among the iTaukeis in particular—the kerekere, or the custom of borrowing from kinsmen with no obligation to repay, thus becoming a disincentive to the benefactor from taking up productive economic activity only to give away the fruits of her/his labor.
What follows is a summary of Fiji’s major policy options for addressing its critical constraints to achieving inclusive growth. Many of these options now form part of the Fiji government’s policy proposals. By successfully implementing several key reforms, the Fiji government has already demonstrated its commitment to reforms. As the government embarks on further reforms, it needs to consider establishing formal mechanisms for regular consultations with the private sector and with all the other stakeholders in the country to obtain buy-in and to bring transparency and certainty to its development agenda.
Create a business-friendly ecosystem
simplify procedures for starting a new business. Fiji lags behind most small island countries in ease of starting a new business. It has actually moved away from best practices in this respect, in contrast to the experience of most other small island counties in the region. To simplify its business start-up procedures, Fiji needs to
• expedite the launch of the web-based portal for online investment approval based on current procedures, and adopt international best practices for the approval process (a single window clearance that allows for online investment approval from “tier one” agencies was launched in July 2015);
• introduce an integrated online system for company registration and consolidate the application process to cover all registration requirements;
• introduce a common business identifier across agencies; and• overhaul the business license regime by reviewing the purpose and the necessity of a particular license so as to
eliminate duplications, and by bringing its licensing process in line with international best practices.
Reduce the administrative burden of filing taxes. To cut down on the time spent and on the costs incurred in tax compliance, Fiji’s tax systems need to be made simpler, easier to navigate, and more transparent. The tax administration laws have to be harmonized by minimizing the current exemptions, and time-consuming steps and procedures have to be identified and benchmarked against best practices. As an incentive, the Gold Card priority tax service, which is currently limited to large taxpayers, can be expanded to cover taxpayers with a strong compliance record irrespective of the size or their contribution to national revenue.
xvi
Executive Summary
expedite dispute resolution and strengthen contract enforcement. The following measures will help ensure swift resolution of cases:
• Increasing the capacity of the judicial system to resolve commercial cases by appointing adequately skilled and experienced judges;
• Strengthening the small-claims tribunals through better referee training; • Strengthening and promoting alternative dispute-resolution mechanisms and ensuring that their outcomes
are legally binding;• In the event of borrower default, making seizure of collateral expeditious and low-cost; and • Codifying the contract law to improve its effectiveness.
Remove price controls. Price controls can have perverse effects on producer incentives because they hamper the efficient allocation of scarce resources while putting an unnecessary administrative burden on both government and businesses. For this reason, it is better to replace price controls with targeted social transfers that can mitigate the impact of their removal on the poor and the low-income sectors. Another option is to limit price controls to only a few basic commodities regularly consumed by the poor. To prevent collusive behavior in a small market with limited producers or suppliers, stronger antitrust policies may be considered.
Reform state-owned enterprises. SOE reforms have to be vigorously pursued through such modalities as service or management contracts, partial divestments, and public–private partnerships. The following action steps need to be undertaken:
• Review the various policy and legal frameworks governing SOEs and public–private partnerships, particularly the Public Enterprise Act and the Public Private Partnerships Act, and revise them as necessary to bring them in line with global best practices; and
• Develop a policy framework to guide privatization efforts and to identify SOEs that need reforms.
provide quality and adequate infrastructure services
Fiji’s physical infrastructure compares favorably with those of other countries in the Pacific region, but quality and service delivery have fallen over the years. There is little private sector participation in providing infrastructure and infrastructure services because this function continues to be dominated by state-run agencies. Some major measures were implemented in recent years to attract private sector participation, among them (i) the corporatization of the water utility (the process remains incomplete though), (ii) the port and terminal handling at Fiji’s two main ports by a private firm, (iii) the delineation of commercial and regulatory roles of the Fiji Electricity Authority, (iv) the liberalization of the telecommunications sector, and (v) setting up the Fiji Roads Authority and contracting an international firm under a multiyear arrangement to provide professional advisory services. However, Fiji needs more such private sector participation and a stronger focus to improve the quality and adequacy of its public infrastructure and infrastructure services. The key measures that Fiji needs to undertake are as follows:
• Continue to upgrade and rehabilitate Fiji’s road network by encouraging greater private sector participation in road projects through various modalities; building capacity of domestic road contractors to reduce reliance on foreign private contractors, a measure that can also help reduce costs in the long run; setting up a dedicated road fund to reduce the dependence of road projects on budgetary allocations for operation and maintenance; and ensuring sustainability of investments through better monitoring and enforcement of vehicle loads.
• Improve the quality and service delivery of maritime infrastructure for both international and domestic connectivity. Fiji’s international trade can be greatly facilitated by undertaking a master planning exercise to
xvii
Executive Summary
identify priority port investments as well as a time-cost analysis of the procedures to obtain export–import clearances; identifying areas for improving port services efficiency by benchmarking with those of major transshipment hubs; and exploring avenues for private sector participation to raise finances for port expansion. Domestic shipping services also need to be upgraded to connect Fiji’s remote islands with its two main islands.
• Provide adequate infrastructure services to key urban corridors that are likely to come under pressure owing to the growth of rural–urban migration and informal settlements. In particular, the timely completion of the ongoing reform process in Fiji’s water supply and sanitation sector, including the corporatization of the Water Authority of Fiji, is a priority.
enhance access to productive assets
improve access to itaukei land and make site development approvals more expeditious. • Land in Fiji is customary held and access to iTaukei land for commercial purposes is therefore possible only
through leases. To make the leasing framework more equitable, there is a need to address these longstanding issues: lease terms; rent-setting; frequency and quantum of rent review; and handling of improvements to land. It is important for the process to be consultative, with the needs and interests of both lessors and lessees duly considered.
• The site development approval process has to be made more transparent by preparing clear written information explaining the process and by providing manuals that spell out the standard operating procedures for getting approval.
make access to finance more inclusive. Fiji has one of the most developed financial systems among the Pacific island countries. However, weaknesses in its legal framework restrict access to funding particularly for small businesses. Fiji’s customary land-owning structure continues to be a major hurdle to using land or land lease as collateral. In addition, slow contract enforcement, along with the long process of repossession of the collateral in the event of borrower default, keeps the value of collateral high, thus limiting access to funding especially for new and small businesses.
The Fiji government has made greater financial inclusion a key priority and over the past few years, it has taken several steps to extend the reach of financial services. To make it easier for Fiji’s small- and medium-sized enterprises (SMEs) to access credit, however, the following measures still need to be undertaken:
• Review, update, and modernize its secured transactions framework to allow effective use of movable assets as collateral;
• Introduce credit bureau legislation to strengthen credit reporting and to address any concerns over the legality of credit disclosures made by the sole private credit bureau in Fiji; and
• Implement measures to enhance the sustainability of Fiji’s microfinance institutions, such as helping them improve their lending capacity and strengthening the regulatory supervision of the microfinance sector.
improve labor market outcomes
Create more productive employment opportunities and address the mismatch between training and the labor market demand. Employment is the key channel to making growth inclusive, but Fiji’s labor market is at present characterized by job creation largely in the informal and less productive sectors of the economy. The situation is compounded by a high level of youth inactivity, spatial disparities in the type of jobs, and gender gaps.
xviii
Executive Summary
Fiji has to undertake the following measures to improve its labor market outcomes:
• Facilitate SME development through various measures that will make it easier to start a business, improve access of SMEs to finance, and provide entrepreneurial skills training and business mentoring;
• Strengthen and improve the quality of the technical and vocational education and training system by promoting alternative career pathways leading to higher education, and by developing a curriculum aligned with the needs of labor markets both locally and globally;
• Facilitate school-to-work transitions for Fiji’s youth by fostering stronger links between education/training institutions and work places;
• Introduce volunteer and apprenticeship schemes in work places to address youth unemployment.• Develop a comprehensive and centralized human resources information database that captures the wide
range of labor market information from various agencies, tertiary institutions, and employers, thus making it possible to identify and project the immediate and future manpower needs of employers; and
• Strengthen placement agencies like the National Employment Centre (NEC), explore training partnerships with institutions like the Fiji National University and other tertiary institutions that can help reduce the cost of providing services, and allow the NEC to eventually collect a recruitment service fee from employers that do their hiring through the NEC to reduce its dependence on budgetary allocation.
1
Growth and Development Performance
Chapter 1growth and Development
Performance
the services sector has been a key driver of Fiji’s growth. As in other small island countries, the services sector is the dominant sector in the economy. The services sector’s share in GDP has increased steadily from 62% in the 1980s to 68% during 2010–2014. This increase in share of services in GDP during 1980–2014 has come on the back of expansion in trade and hotels as well as transport, storage, and communication subsectors. Tourism, having overtaken the sugar
1.1 introduction
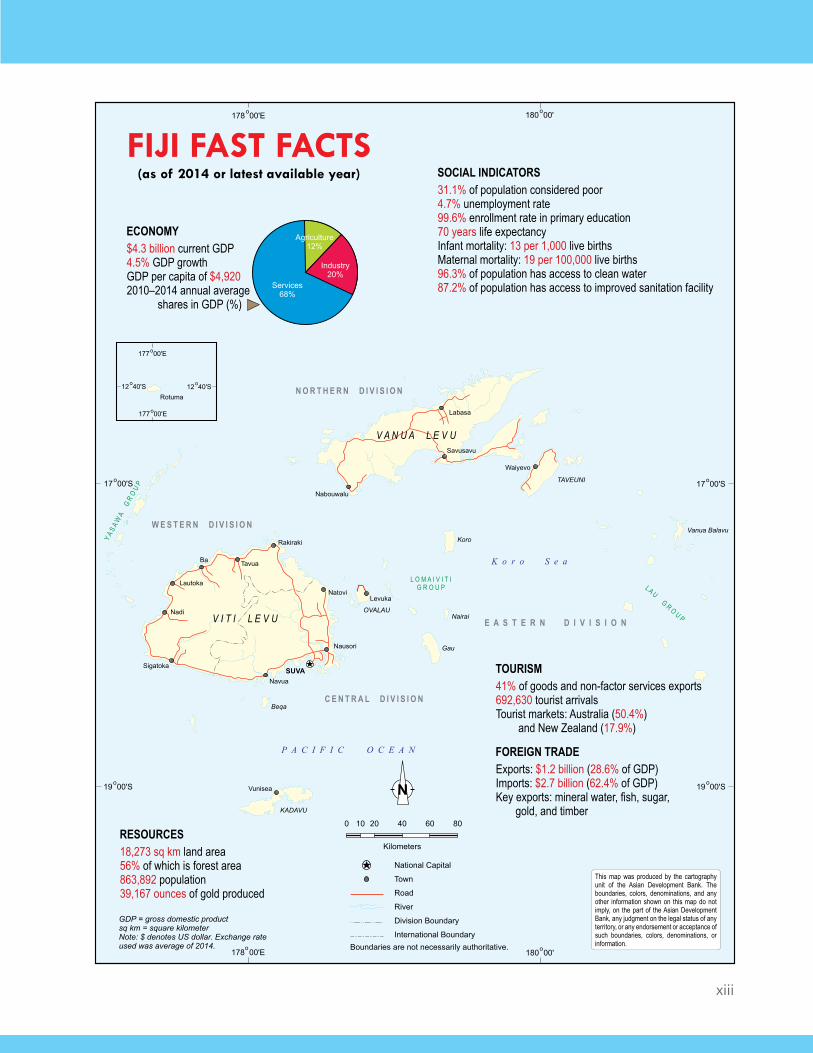
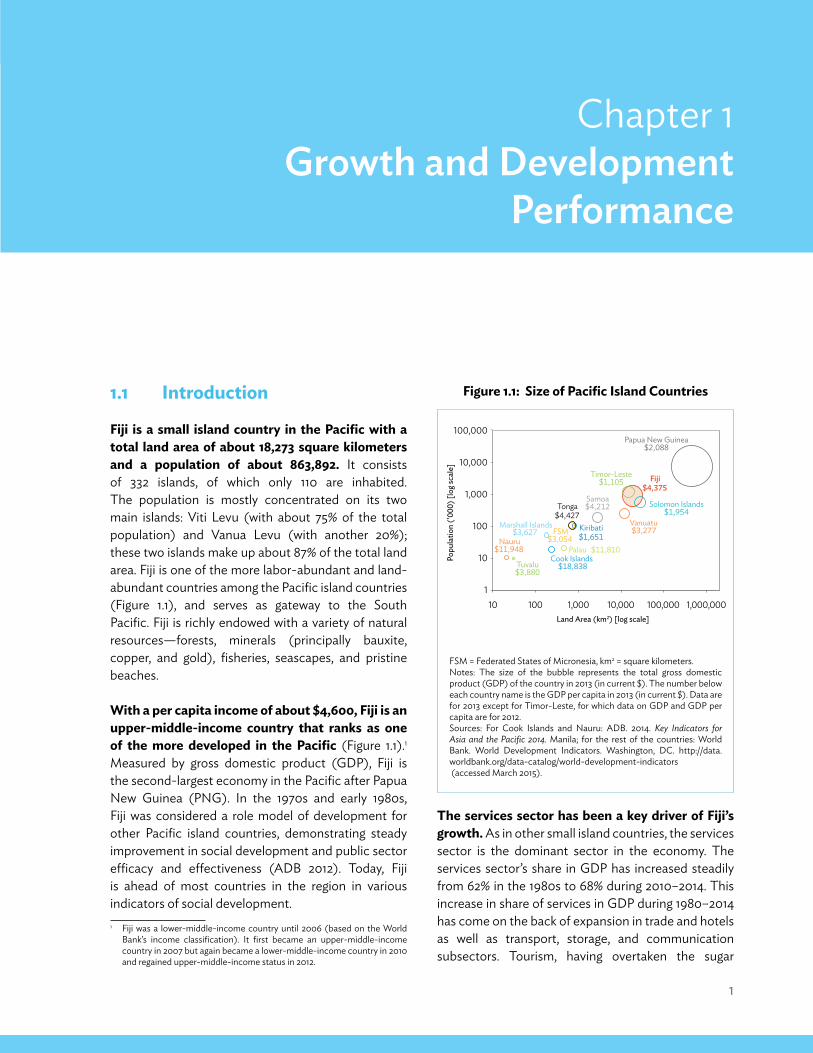
Fiji is a small island country in the pacific with a total land area of about 18,273 square kilometers and a population of about 863,892. It consists of 332 islands, of which only 110 are inhabited. The population is mostly concentrated on its two main islands: Viti Levu (with about 75% of the total population) and Vanua Levu (with another 20%); these two islands make up about 87% of the total land area. Fiji is one of the more labor-abundant and land-abundant countries among the Pacific island countries (Figure 1.1), and serves as gateway to the South Pacific. Fiji is richly endowed with a variety of natural resources—forests, minerals (principally bauxite, copper, and gold), fisheries, seascapes, and pristine beaches.
With a per capita income of about $4,600, Fiji is an upper-middle-income country that ranks as one of the more developed in the pacific (Figure 1.1).1 Measured by gross domestic product (GDP), Fiji is the second-largest economy in the Pacific after Papua New Guinea (PNG). In the 1970s and early 1980s, Fiji was considered a role model of development for other Pacific island countries, demonstrating steady improvement in social development and public sector efficacy and effectiveness (ADB 2012). Today, Fiji is ahead of most countries in the region in various indicators of social development. 1 Fiji was a lower-middle-income country until 2006 (based on the World
Bank’s income classification). It first became an upper-middle-income country in 2007 but again became a lower-middle-income country in 2010 and regained upper-middle-income status in 2012.
Fiji $4,375
Cook Islands $18,838
Kiribati $1,651
Marshall Islands$3,627 FSM
$3,054 Nauru $11,948 Palau $11,810
Samoa $4,212 Solomon Islands
$1,954
Timor-Leste $1,105
Tonga $4,427
Tuvalu $3,880
Vanuatu $3,277
Papua New Guinea $2,088
1
10
100
1,000
10,000
100,000
10 100 1,000 10,000 100,000 1,000,000
Popu
latio
n ('
000)
[log
scal
e]
Land Area (km2) [log scale]
Figure 1.1: size of pacific island Countries
FSM = Federated States of Micronesia, km2 = square kilometers.Notes: The size of the bubble represents the total gross domestic product (GDP) of the country in 2013 (in current $). The number below each country name is the GDP per capita in 2013 (in current $). Data are for 2013 except for Timor-Leste, for which data on GDP and GDP per capita are for 2012.Sources: For Cook Islands and Nauru: ADB. 2014. Key Indicators for Asia and the Pacific 2014. Manila; for the rest of the countries: World Bank. World Development Indicators. Washington, DC. http://data.worldbank.org/data-catalog/world-development-indicators (accessed March 2015).
2
Fiji: Building Inclusive Institutions for Sustained Growth
industry, is the country’s single most important source of foreign exchange earnings. Despite its declining contribution to GDp, agriculture remains one of the key sectors of the economy; it accounts for 44.2% of total employment.2 Sugarcane was, and is, the single most important crop, although its share in agriculture output has declined. Until the mid-1990s, the sugar industry was the single most important sector. Since then, however, the contribution of the sugar industry to the GDP and to total export earnings has declined. The sugar industry continues to be an important sector in Fiji’s economy, accounting for about 1.7% of real GDP and 5% of goods and nonfactor services exports (IMF 2014) and for the livelihood of nearly 20%–25% of the population (IMF 2013b and MOF 2012).
The sugar industry had long benefited from preferential access to markets in advanced countries in the form of quotas and preferential prices above the world price. These preferences not only ensured Fiji a market for its sugar but also helped the country meet high costs of production and transportation. However, with the implementation of reforms to the sugar regime in the European Union (EU), which is Fiji’s key export market, these preferences have been gradually phased out. Changes in the trading regime are likely to increase competition in Fiji’s key export market. Fiji’s strong dependence on sugar thus poses vulnerabilities to the economy and to all those dependent on the industry. The government has taken several steps that enabled the state-owned Fiji Sugar Corporation (FSC) to make a turnaround, thus increasing sugar production. Nevertheless, the country’s sugar output and exports remain well below the peak seen in the mid-1990s.
Fiji’s manufacturing base is larger and more diversified than is typical in small island countries. In addition to the sugar industry, manufacturing in Fiji consists of apparels, beverages (brewing and mineral water), cosmetics (in particular, skin care products), fabricated metals (excluding transport and machinery), food processing, and paint manufacturing.
2 Agriculture refers to agriculture, forestry, and fisheries. Estimates based on a 7-day recall period using Fiji Bureau of Statistics’ Employment and Unemployment Survey 2010/11.
Garment exports, supported by investment incentives and various trade preferences, burgeoned in the 1990s but declined as tax incentives and trade preferences expired. A section of the garment industry that remains in operation had to reorient itself and now caters primarily to the high-value, low-volume segment. In the mid-1990s, mineral water emerged as a sunrise sector under the leadership of a single company and has since become one of Fiji’s key exports.
macroeconomic policies and structural reforms have supported the economic revival since 2010. The economy grew at an average annual rate of 3.3% during 2010–2014, nearly four times the average growth of 0.8% in the 2000s. This growth has been driven by an expansionary fiscal policy in the form of lower corporate and personal tax rates as well as higher public investment spending, an accommodative monetary policy, and an uptick in remittances and tourism that, along with low interest rates, led to an increase in consumption spending. Various structural reforms and civil service reforms have bolstered the government’s reform credentials; the steps the government took to restore democracy likewise contributed to greater investor confidence in Fiji’s economy.
investments picked up during 2010–2014, averaging 20.9% of GDp. After declining in late 2000s, investment recovered buoyed by both private and public investments. The government has sought to achieve an investment-to-GDP rate of 25%—a rate that has been achieved only four times since independence—in 1980, 1981, 1998, and 2013. The overall pattern of total investment rate tracks more closely the pattern of private investment than that of public and quasi-public investments. After declining during the second half of the 2000s to an all-time low of 3.6% of GDP, private investment recovered to an all-time high of 19.7% of the GDP in 2014.
A key challenge for Fiji is to be able to sustain the growth momentum and create an environment conducive to greater private sector activity. In the road map, the government identified raising investment levels as one of its strategic priorities. To sustain growth, Fiji has to rebalance its sources of growth away from public investment toward private
3
Growth and Development Performance
sector activities. This has become even more advisable because the government has committed to increases in social expenditures, thus limiting the fiscal space to undertake further public investments. The first objective of this report is to identify constraints to private investment using the diagnostic approach proposed by Hausmann, Rodrik, and Velasco (2005).
making growth inclusive is another major challenge. Simply creating growth should not be made the end in itself. New empirical evidence shows that countries with a more equitable income distribution achieve longer spells of growth (Ostry, Berg, and Tsangarides 2014). Job creation is considered to be the single most important channel through which the fruits of growth can be shared. Fiji’s formal unemployment rate is low at less than 5%, but underemployment, informal sector employment, and engagement in subsistence activities are pervasive. Although poverty has declined, it remains high—nearly one-third of the population lives below the poverty line. The second purpose of this report is to identify constraints to inclusiveness. To do so, a diagnostic approach proposed by ADB (2007b) is used.
the country’s history has critically shaped the evolution of its political and economic institutions as well as its development outcomes. The institutions that took root during Fiji’s colonization continue to cast a long shadow over the nation’s political economy. These institutions gave rise to an elite, which then consolidated its power by, in turn, creating economic institutions that allowed them to do so. Challenges to the status quo resulted in political instability. For example, democratically elected governments that were perceived as dominated by Indo-Fijians were removed in coups in 1987 and 2000. Affirmative action policies after the 1987 coup strengthened the iTaukeis’ control of the political system and of jobs in the public sector. Massive emigration of Indo-Fijians followed each of the coups.
Fiji’s political economy is greatly influenced by three closely intertwined key factors: (i) inter-ethnicity divide between the two major ethnic groups—iTaukeis and Indo-Fijians. In addition to the inter-ethnicity divide, there are also intra-ethnic divisions within the
two major groups. Among the iTaukeis, there is tension between the chiefs and the commoners. Among the Indo-Fijians, on the other hand, tensions arise from differences in income, caste, region, and religion, which go way back to their ancestors’ roots in India; (ii) land-tenure arrangements that have created a longstanding landowner–laborer divide along ethnic lines; and (iii) benefits from cultivation of sugarcane, considering that sugar enjoyed preferential pricing.
political reforms were a major agenda in the medium-term development strategy. These reforms were spelled out in the government’s Roadmap for Democracy and Sustainable Socio-Economic Development 2010–2014, “the Roadmap” (MOSPNDS 2010). In September 2013, Fiji adopted a new Constitution, followed by a return to democracy in September 2014 with the holding of elections, which the international community deemed to be fair and free.
instrumental in shaping Fiji’s development trajectory is its economic geography. It has a small population and its location is remote from the world’s markets, a double handicap that it shares with other Pacific island countries. Winters and Martins (2004) show that the inherent cost disadvantages imposed by size undermine price competitiveness, making it difficult for the country to compete in international markets.
Fiji’s growth drivers and development trajectory are unlikely to resemble those of economies in East Asia and Southeast Asia. Growth in Fiji is likely to come from sectors that can surmount the constraints of high costs imposed by smallness and remoteness. These can take the form of differentiated or niche products that can be sold in imperfectly competitive markets, or natural resources such as fisheries, or products sold in markets that are protected. Indeed, Fiji’s growth drivers remain a combination of such goods and services—niche products like mineral water, skin care products, and high-value, low-bulk garments; and natural resources like seascapes and pristine beaches, gold, and fish. In the 1990s and early 2000s, its exports of sugar and low value-added garments benefited from protected markets.
4
Fiji: Building Inclusive Institutions for Sustained Growth
This chapter provides an overview of Fiji’s economic performance as backdrop to the analysis on constraints in the subsequent chapters. Section 1.2 characterizes Fiji’s growth and its economic structure from the production and the expenditure sides. Section 1.3 discusses the country’s macroeconomic performance. Section 1.4 examines trends in poverty and inequality. Section 1.5 concludes the chapter.
1.2 economic performance
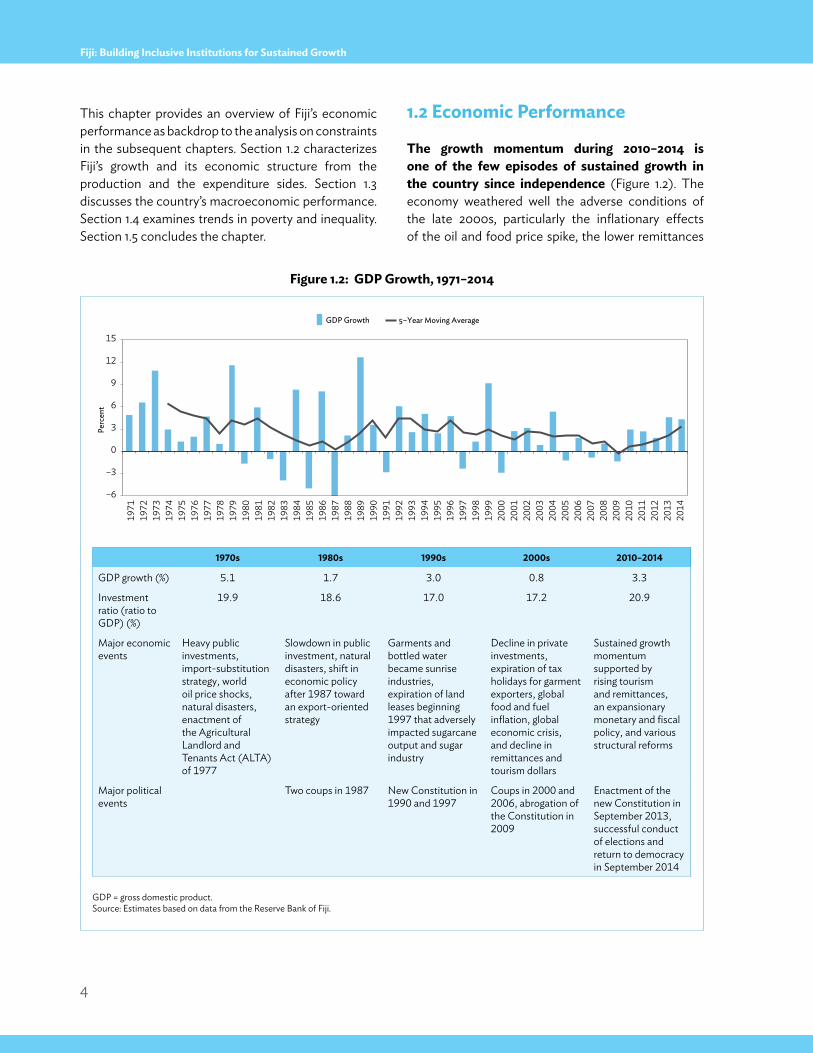
the growth momentum during 2010–2014 is one of the few episodes of sustained growth in the country since independence (Figure 1.2). The economy weathered well the adverse conditions of the late 2000s, particularly the inflationary effects of the oil and food price spike, the lower remittances
GDP Growth 5–Year Moving Average
Perc
ent
1980
1981
1982
1983
1984
1985
1986
1987
1988
1989
1971
1972
1973
1974
1975
1976
1977
1978
1979
1990
1991
1992
1993
1994
1995
1996
1997
1998
1999
2000
2001
2002
2003
2004
2005
2006
2007
2008
2009
2010
2011
2012
2014
2013
–6
–3
0
3
6
9
12
15
Figure 1.2: GDp Growth, 1971–2014
GDP = gross domestic product.Source: Estimates based on data from the Reserve Bank of Fiji.
1970s 1980s 1990s 2000s 2010–2014
GDP growth (%) 5.1 1.7 3.0 0.8 3.3
Investment ratio (ratio to GDP) (%)
19.9 18.6 17.0 17.2 20.9
Major economic events
Heavy public investments, import-substitution strategy, world oil price shocks, natural disasters, enactment of the Agricultural Landlord and Tenants Act (ALTA) of 1977
Slowdown in public investment, natural disasters, shift in economic policy after 1987 toward an export-oriented strategy
Garments and bottled water became sunrise industries, expiration of land leases beginning 1997 that adversely impacted sugarcane output and sugar industry
Decline in private investments, expiration of tax holidays for garment exporters, global food and fuel inflation, global economic crisis, and decline in remittances and tourism dollars
Sustained growth momentum supported by rising tourism and remittances, an expansionary monetary and fiscal policy, and various structural reforms
Major political events
Two coups in 1987 New Constitution in 1990 and 1997
Coups in 2000 and 2006, abrogation of the Constitution in 2009
Enactment of the new Constitution in September 2013, successful conduct of elections and return to democracy in September 2014
5
Growth and Development Performance
and lower tourist arrivals brought about by the global recession, and the uncertainty created by a less-than-favorable political climate at home. After a slowdown in the second-half of 2000s, the economy turned around during 2010–2014 to grow at an average rate of 3.3% per annum. As will be shown later, all sectors of the economy contributed to this growth and the sources of growth were more diversified than at any time in the past.
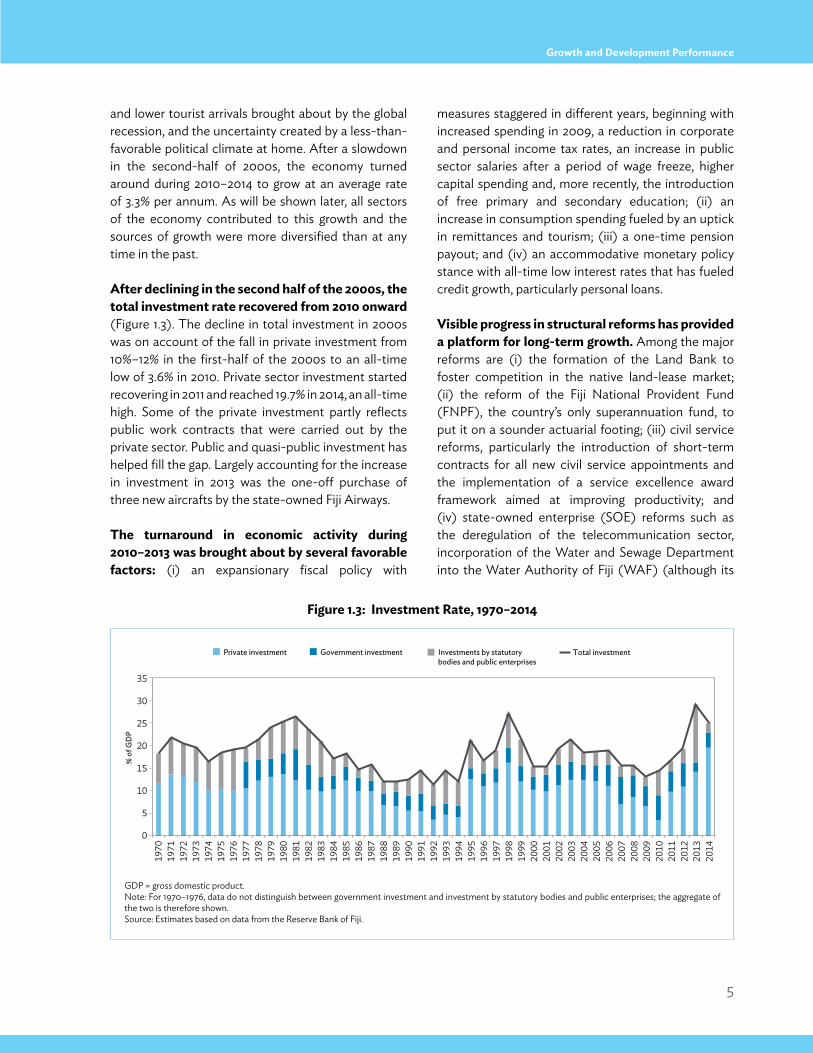
After declining in the second half of the 2000s, the total investment rate recovered from 2010 onward (Figure 1.3). The decline in total investment in 2000s was on account of the fall in private investment from 10%–12% in the first-half of the 2000s to an all-time low of 3.6% in 2010. Private sector investment started recovering in 2011 and reached 19.7% in 2014, an all-time high. Some of the private investment partly reflects public work contracts that were carried out by the private sector. Public and quasi-public investment has helped fill the gap. Largely accounting for the increase in investment in 2013 was the one-off purchase of three new aircrafts by the state-owned Fiji Airways.
the turnaround in economic activity during 2010–2013 was brought about by several favorable factors: (i) an expansionary fiscal policy with
measures staggered in different years, beginning with increased spending in 2009, a reduction in corporate and personal income tax rates, an increase in public sector salaries after a period of wage freeze, higher capital spending and, more recently, the introduction of free primary and secondary education; (ii) an increase in consumption spending fueled by an uptick in remittances and tourism; (iii) a one-time pension payout; and (iv) an accommodative monetary policy stance with all-time low interest rates that has fueled credit growth, particularly personal loans.
visible progress in structural reforms has provided a platform for long-term growth. Among the major reforms are (i) the formation of the Land Bank to foster competition in the native land-lease market; (ii) the reform of the Fiji National Provident Fund (FNPF), the country’s only superannuation fund, to put it on a sounder actuarial footing; (iii) civil service reforms, particularly the introduction of short-term contracts for all new civil service appointments and the implementation of a service excellence award framework aimed at improving productivity; and (iv) state-owned enterprise (SOE) reforms such as the deregulation of the telecommunication sector, incorporation of the Water and Sewage Department into the Water Authority of Fiji (WAF) (although its
Figure 1.3: investment Rate, 1970–2014
GDP = gross domestic product.Note: For 1970–1976, data do not distinguish between government investment and investment by statutory bodies and public enterprises; the aggregate of the two is therefore shown. Source: Estimates based on data from the Reserve Bank of Fiji.
0
5
10
15
20
25
30
35
% o
f GD
P
Private investment Government investment Investments by statutorybodies and public enterprises
Total investment
1980
1981
1982
1983
1984
1985
1986
1987
1988
1989
1970
1971
1972
1973
1974
1975
1976
1977
1978
1979
1990
1991
1992
1993
1994
1995
1996
1997
1998
1999
2000
2001
2002
2003
2004
2005
2006
2007
2008
2009
2010
2011
2012
2014
2013
6
Fiji: Building Inclusive Institutions for Sustained Growth
reform is yet to be completed), the restructuring of the FSC, the creation of the Fiji Roads Authority (FRA), and the establishment of an outsourcing committee.
With the adoption of a new Constitution in September 2013 and the successful conduct of national elections in September 2014, expectations for improved investor and consumer confidence are high. Alongside reengagement with the international community, these developments could provide the much-needed impetus for attracting private investments and for enhancing Fiji’s growth prospects as a whole.
Fiji’s economic growth since independence in 1970 averaged 2.7% per annum and has been marked by volatility (Figure 1.2). Growth outcomes have been influenced by external and/or exogenous factors such as natural disasters, commodity price shocks, downturns in advanced economies that affected tourism and remittances, and phasing out of preferential trade arrangements for Fiji’s sugar and garments; and internal factors such as adverse political climate and spurts of public investment spending. Limited diversification further exacerbated the impact of these shocks. For example, in the 1980s, natural disasters reduced the sugarcane output, which impacted the sugarcane-dominated agriculture sector, thus creating a domino effect on the sugar industry as a whole.
Weak long-term growth performance is partly explained by low investment (Figure 1.3). The overall pattern of total investment rate is more strongly correlated with private investment than it is with public and quasi-public investments. This correlation with private investment is more pronounced during periods of downturns in private investment (for example, during 1986–1994 and 2003–2010). Investment by statutory bodies and public enterprises and public investment have helped buffer the fall in private investment; the two are negatively correlated during periods of downturn in private investment. There is a need to sustain and increase further the rate of private investment in order to reduce dependence on public investment.
1.2.1 economic Growth by production sector
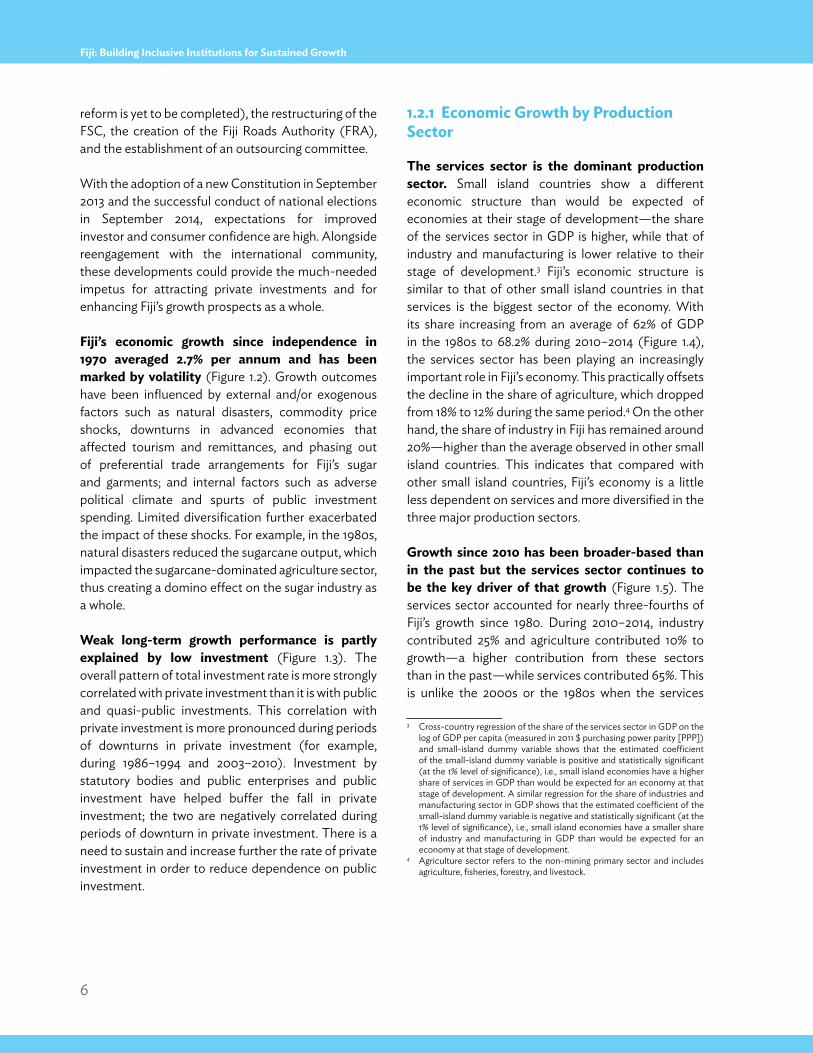
the services sector is the dominant production sector. Small island countries show a different economic structure than would be expected of economies at their stage of development—the share of the services sector in GDP is higher, while that of industry and manufacturing is lower relative to their stage of development.3 Fiji’s economic structure is similar to that of other small island countries in that services is the biggest sector of the economy. With its share increasing from an average of 62% of GDP in the 1980s to 68.2% during 2010–2014 (Figure 1.4), the services sector has been playing an increasingly important role in Fiji’s economy. This practically offsets the decline in the share of agriculture, which dropped from 18% to 12% during the same period.4 On the other hand, the share of industry in Fiji has remained around 20%—higher than the average observed in other small island countries. This indicates that compared with other small island countries, Fiji’s economy is a little less dependent on services and more diversified in the three major production sectors.
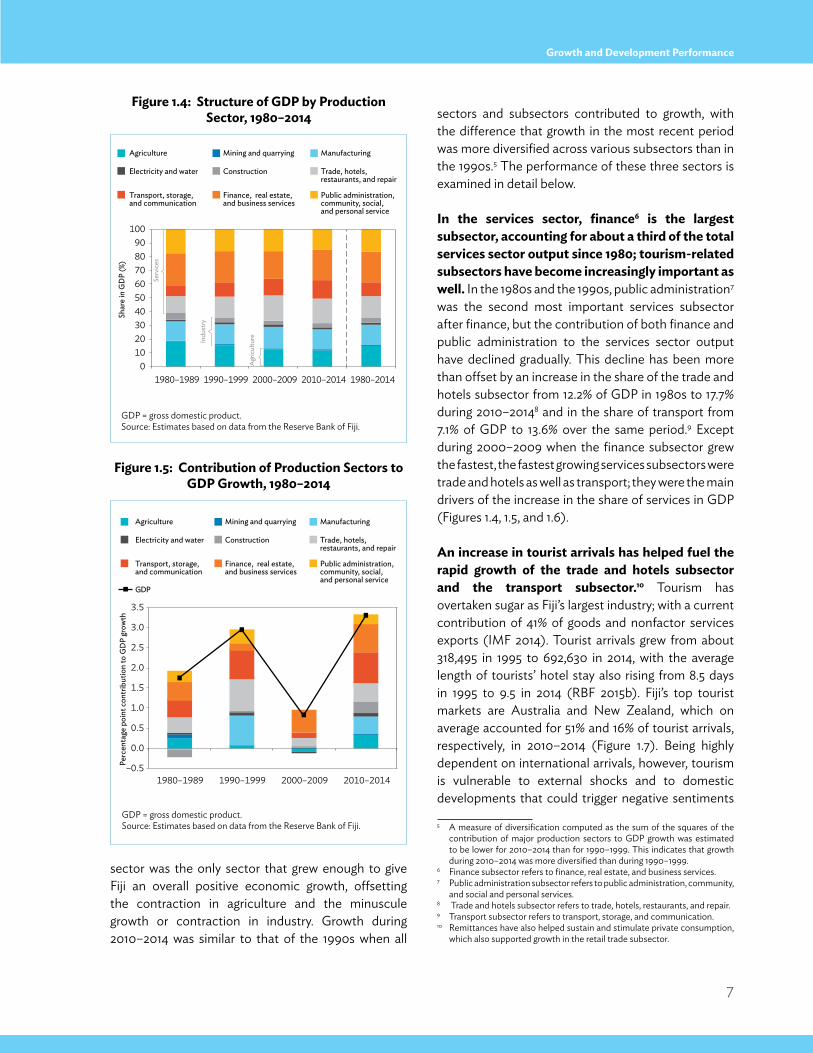
Growth since 2010 has been broader-based than in the past but the services sector continues to be the key driver of that growth (Figure 1.5). The services sector accounted for nearly three-fourths of Fiji’s growth since 1980. During 2010–2014, industry contributed 25% and agriculture contributed 10% to growth—a higher contribution from these sectors than in the past—while services contributed 65%. This is unlike the 2000s or the 1980s when the services
3 Cross-country regression of the share of the services sector in GDP on the log of GDP per capita (measured in 2011 $ purchasing power parity [PPP]) and small-island dummy variable shows that the estimated coefficient of the small-island dummy variable is positive and statistically significant (at the 1% level of significance), i.e., small island economies have a higher share of services in GDP than would be expected for an economy at that stage of development. A similar regression for the share of industries and manufacturing sector in GDP shows that the estimated coefficient of the small-island dummy variable is negative and statistically significant (at the 1% level of significance), i.e., small island economies have a smaller share of industry and manufacturing in GDP than would be expected for an economy at that stage of development.
4 Agriculture sector refers to the non-mining primary sector and includes agriculture, fisheries, forestry, and livestock.
7
Growth and Development Performance
sector was the only sector that grew enough to give Fiji an overall positive economic growth, offsetting the contraction in agriculture and the minuscule growth or contraction in industry. Growth during 2010–2014 was similar to that of the 1990s when all
sectors and subsectors contributed to growth, with the difference that growth in the most recent period was more diversified across various subsectors than in the 1990s.5 The performance of these three sectors is examined in detail below.
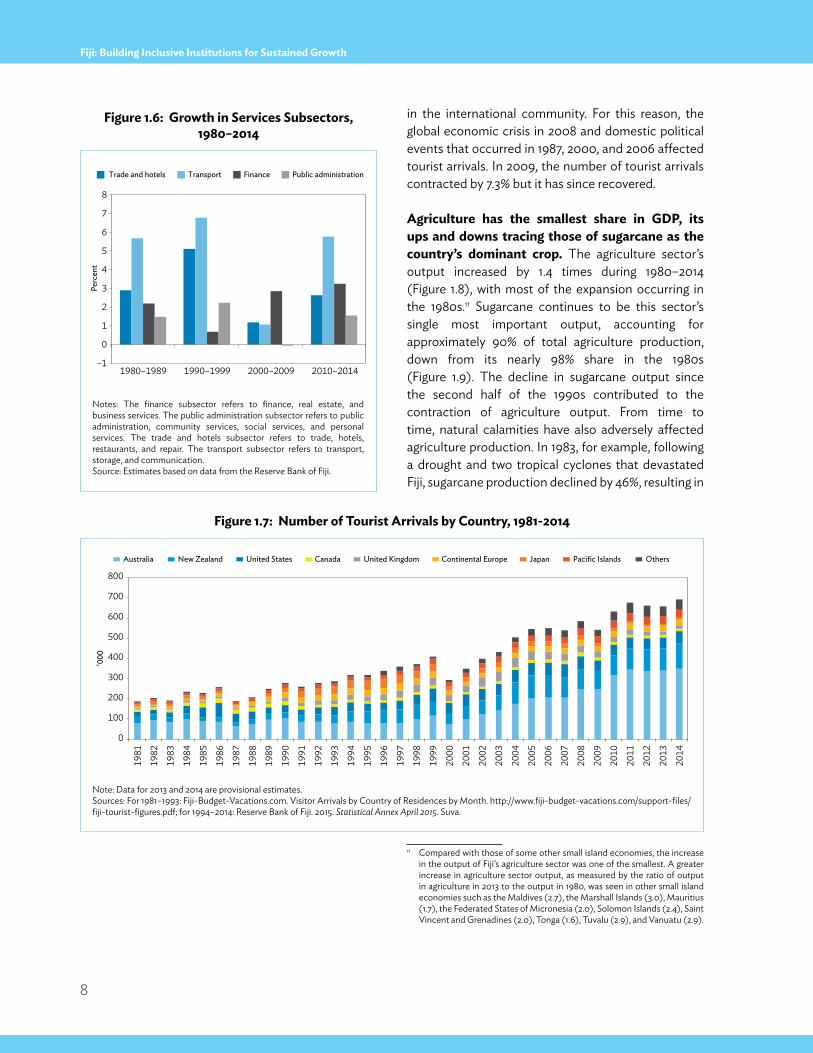
in the services sector, finance6 is the largest subsector, accounting for about a third of the total services sector output since 1980; tourism-related subsectors have become increasingly important as well. In the 1980s and the 1990s, public administration7 was the second most important services subsector after finance, but the contribution of both finance and public administration to the services sector output have declined gradually. This decline has been more than offset by an increase in the share of the trade and hotels subsector from 12.2% of GDP in 1980s to 17.7% during 2010–20148 and in the share of transport from 7.1% of GDP to 13.6% over the same period.9 Except during 2000–2009 when the finance subsector grew the fastest, the fastest growing services subsectors were trade and hotels as well as transport; they were the main drivers of the increase in the share of services in GDP (Figures 1.4, 1.5, and 1.6).
An increase in tourist arrivals has helped fuel the rapid growth of the trade and hotels subsector and the transport subsector.10 Tourism has overtaken sugar as Fiji’s largest industry; with a current contribution of 41% of goods and nonfactor services exports (IMF 2014). Tourist arrivals grew from about 318,495 in 1995 to 692,630 in 2014, with the average length of tourists’ hotel stay also rising from 8.5 days in 1995 to 9.5 in 2014 (RBF 2015b). Fiji’s top tourist markets are Australia and New Zealand, which on average accounted for 51% and 16% of tourist arrivals, respectively, in 2010–2014 (Figure 1.7). Being highly dependent on international arrivals, however, tourism is vulnerable to external shocks and to domestic developments that could trigger negative sentiments
5 A measure of diversification computed as the sum of the squares of the contribution of major production sectors to GDP growth was estimated to be lower for 2010–2014 than for 1990–1999. This indicates that growth during 2010–2014 was more diversified than during 1990–1999.
6 Finance subsector refers to finance, real estate, and business services.7 Public administration subsector refers to public administration, community,
and social and personal services.8 Trade and hotels subsector refers to trade, hotels, restaurants, and repair.9 Transport subsector refers to transport, storage, and communication.10 Remittances have also helped sustain and stimulate private consumption,
which also supported growth in the retail trade subsector.
Figure 1.4: structure of GDp by production sector, 1980–2014
Figure 1.5: Contribution of production sectors to GDp Growth, 1980–2014
GDP = gross domestic product.Source: Estimates based on data from the Reserve Bank of Fiji.
GDP = gross domestic product.Source: Estimates based on data from the Reserve Bank of Fiji.
0102030405060708090
100
1980–1989 1990–1999 2000–2009 2010–2014 1980–2014
Shar
e in
GD
P (%
)
Serv
ices
Indu
stry
Agr
icul
ture
Agriculture Mining and quarrying Manufacturing
Electricity and water Construction Trade, hotels, restaurants, and repair
Transport, storage, and communication
Finance, real estate,and business services
Public administration, community, social,and personal service
–0.5
0.0
0.5
1.0
1.5
2.0
2.5
3.0
3.5
1980–1989 1990–1999 2000–2009 2010–2014
Perc
enta
ge p
oint
con
trib
utio
n to
GD
P gr
owth
Agriculture Mining and quarrying Manufacturing
Electricity and water Construction Trade, hotels, restaurants, and repair
Transport, storage, and communication
GDP
Finance, real estate,and business services
Public administration, community, social,and personal service
8
Fiji: Building Inclusive Institutions for Sustained Growth
in the international community. For this reason, the global economic crisis in 2008 and domestic political events that occurred in 1987, 2000, and 2006 affected tourist arrivals. In 2009, the number of tourist arrivals contracted by 7.3% but it has since recovered.
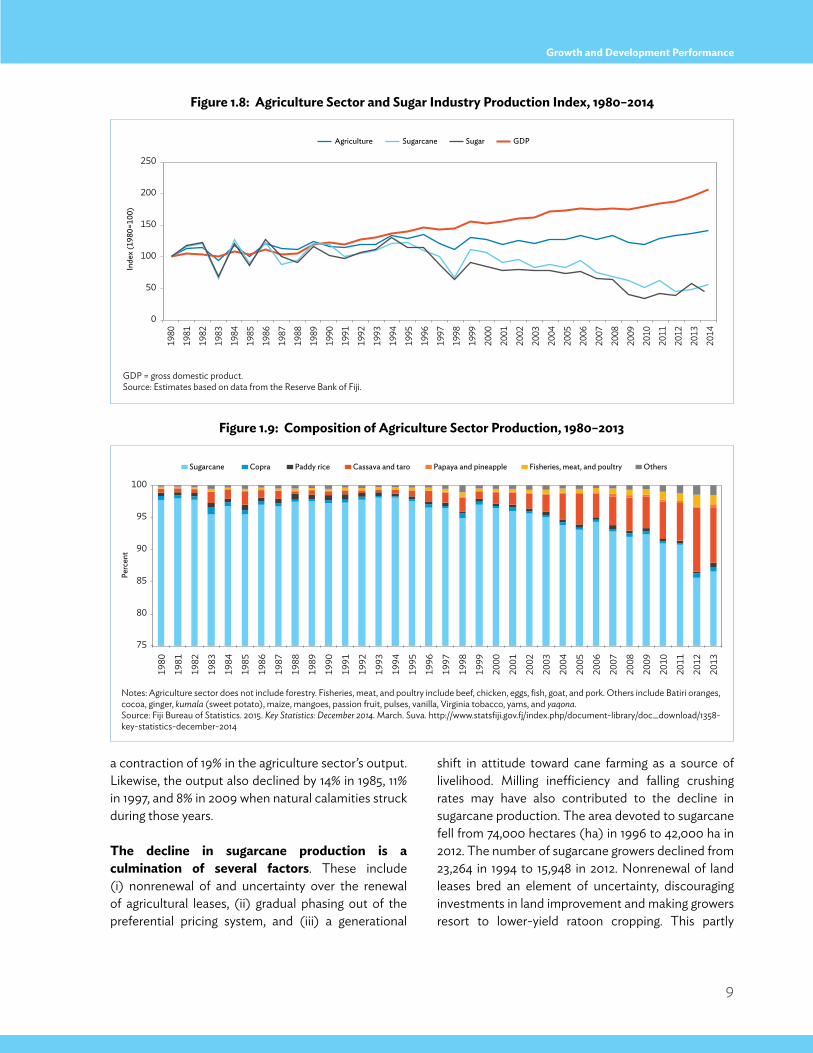
Agriculture has the smallest share in GDp, its ups and downs tracing those of sugarcane as the country’s dominant crop. The agriculture sector’s output increased by 1.4 times during 1980–2014 (Figure 1.8), with most of the expansion occurring in the 1980s.11 Sugarcane continues to be this sector’s single most important output, accounting for approximately 90% of total agriculture production, down from its nearly 98% share in the 1980s (Figure 1.9). The decline in sugarcane output since the second half of the 1990s contributed to the contraction of agriculture output. From time to time, natural calamities have also adversely affected agriculture production. In 1983, for example, following a drought and two tropical cyclones that devastated Fiji, sugarcane production declined by 46%, resulting in
11 Compared with those of some other small island economies, the increase in the output of Fiji’s agriculture sector was one of the smallest. A greater increase in agriculture sector output, as measured by the ratio of output in agriculture in 2013 to the output in 1980, was seen in other small island economies such as the Maldives (2.7), the Marshall Islands (3.0), Mauritius (1.7), the Federated States of Micronesia (2.0), Solomon Islands (2.4), Saint Vincent and Grenadines (2.0), Tonga (1.6), Tuvalu (2.9), and Vanuatu (2.9).
Figure 1.7: number of tourist Arrivals by Country, 1981-2014
Note: Data for 2013 and 2014 are provisional estimates.Sources: For 1981–1993: Fiji-Budget-Vacations.com. Visitor Arrivals by Country of Residences by Month. http://www.fiji-budget-vacations.com/support-files/fiji-tourist-figures.pdf; for 1994–2014: Reserve Bank of Fiji. 2015. Statistical Annex April 2015. Suva.
Figure 1.6: Growth in services subsectors, 1980–2014
Notes: The finance subsector refers to finance, real estate, and business services. The public administration subsector refers to public administration, community services, social services, and personal services. The trade and hotels subsector refers to trade, hotels, restaurants, and repair. The transport subsector refers to transport, storage, and communication. Source: Estimates based on data from the Reserve Bank of Fiji.
–1
0
1
2
3
4
5
6
7
8
1980–1989 1990–1999 2000–2009 2010–2014
Perc
ent
Trade and hotels Transport Finance Public administration
0
100
200
300
400
500
600
700
800
'000
Australia New Zealand United States Canada United Kingdom Continental Europe Japan Pacific Islands Others
1981
1982
1983
1984
1985
1986
1987
1988
1989
1990
1991
1992
1993
1994
1995
1996
1997
1998
1999
2000
2001
2002
2003
2004
2005
2006
2007
2008
2009
2010
2011
2012
2014
2013
9
Growth and Development Performance
shift in attitude toward cane farming as a source of livelihood. Milling inefficiency and falling crushing rates may have also contributed to the decline in sugarcane production. The area devoted to sugarcane fell from 74,000 hectares (ha) in 1996 to 42,000 ha in 2012. The number of sugarcane growers declined from 23,264 in 1994 to 15,948 in 2012. Nonrenewal of land leases bred an element of uncertainty, discouraging investments in land improvement and making growers resort to lower-yield ratoon cropping. This partly
a contraction of 19% in the agriculture sector’s output. Likewise, the output also declined by 14% in 1985, 11% in 1997, and 8% in 2009 when natural calamities struck during those years.
the decline in sugarcane production is a culmination of several factors. These include (i) nonrenewal of and uncertainty over the renewal of agricultural leases, (ii) gradual phasing out of the preferential pricing system, and (iii) a generational
Figure 1.9: Composition of Agriculture sector production, 1980–2013
GDP = gross domestic product.Source: Estimates based on data from the Reserve Bank of Fiji.
Figure 1.8: Agriculture sector and sugar industry production index, 1980–2014
Notes: Agriculture sector does not include forestry. Fisheries, meat, and poultry include beef, chicken, eggs, fish, goat, and pork. Others include Batiri oranges, cocoa, ginger, kumala (sweet potato), maize, mangoes, passion fruit, pulses, vanilla, Virginia tobacco, yams, and yaqona.Source: Fiji Bureau of Statistics. 2015. Key Statistics: December 2014. March. Suva. http://www.statsfiji.gov.fj/index.php/document-library/doc_download/1358-key-statistics-december-2014
Agriculture GDPSugarcane Sugar
0
50
100
150
200
25019
80
1981
1982
1983
1984
1985
1986
1987
1988
1989
1990
1991
1992
1993
1994
1995
1996
1997
1998
1999
2000
2001
2002
2003
2004
2005
2006
2007
2008
2009
2010
2011
2012
2014
2013
Inde
x (19
80=1
00)
75
80
85
90
95
100
1980
1981
1982
1983
1984
1985
1986
1987
1988
1989
1990
1991
1992
1993
1994
1995
1996
1997
1998
1999
2000
2001
2002
2003
2004
2005
2006
2007
2008
2009
2010
2011
2012
2013
Sugarcane Copra Paddy rice Cassava and taro Papaya and pineapple Fisheries, meat, and poultry Others
Perc
ent
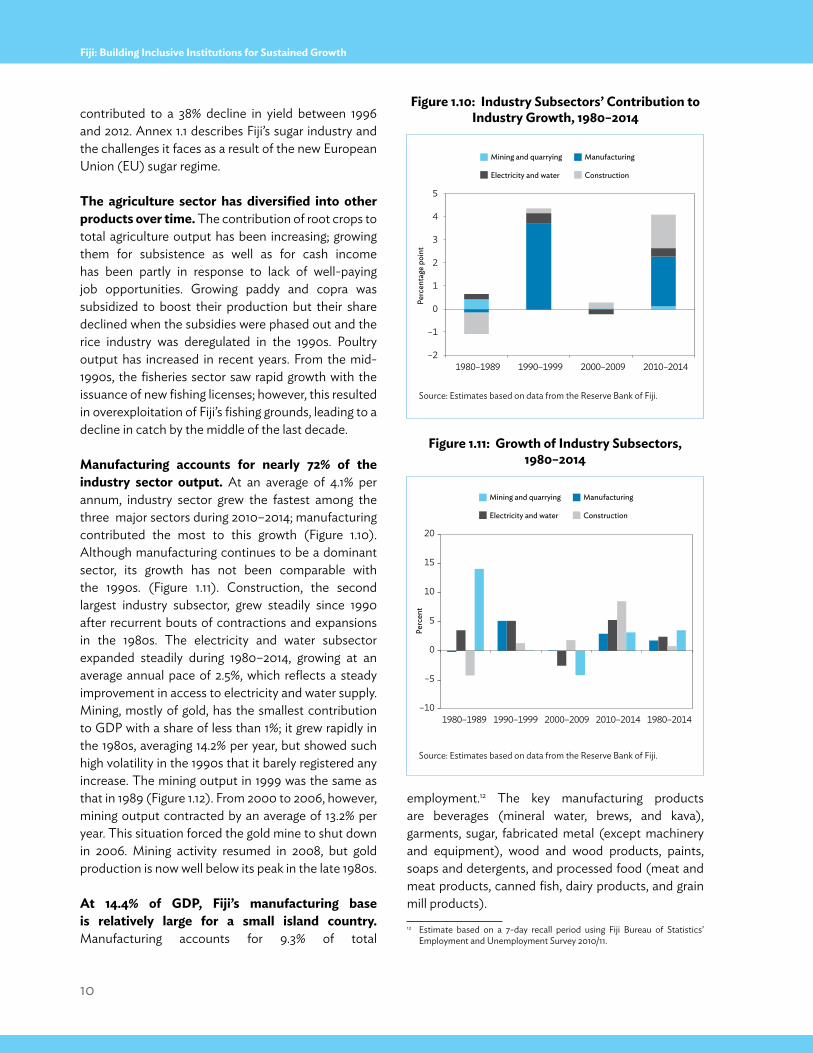
10
Fiji: Building Inclusive Institutions for Sustained Growth
contributed to a 38% decline in yield between 1996 and 2012. Annex 1.1 describes Fiji’s sugar industry and the challenges it faces as a result of the new European Union (EU) sugar regime.
the agriculture sector has diversified into other products over time. The contribution of root crops to total agriculture output has been increasing; growing them for subsistence as well as for cash income has been partly in response to lack of well-paying job opportunities. Growing paddy and copra was subsidized to boost their production but their share declined when the subsidies were phased out and the rice industry was deregulated in the 1990s. Poultry output has increased in recent years. From the mid-1990s, the fisheries sector saw rapid growth with the issuance of new fishing licenses; however, this resulted in overexploitation of Fiji’s fishing grounds, leading to a decline in catch by the middle of the last decade.
manufacturing accounts for nearly 72% of the industry sector output. At an average of 4.1% per annum, industry sector grew the fastest among the three major sectors during 2010–2014; manufacturing contributed the most to this growth (Figure 1.10). Although manufacturing continues to be a dominant sector, its growth has not been comparable with the 1990s. (Figure 1.11). Construction, the second largest industry subsector, grew steadily since 1990 after recurrent bouts of contractions and expansions in the 1980s. The electricity and water subsector expanded steadily during 1980–2014, growing at an average annual pace of 2.5%, which reflects a steady improvement in access to electricity and water supply. Mining, mostly of gold, has the smallest contribution to GDP with a share of less than 1%; it grew rapidly in the 1980s, averaging 14.2% per year, but showed such high volatility in the 1990s that it barely registered any increase. The mining output in 1999 was the same as that in 1989 (Figure 1.12). From 2000 to 2006, however, mining output contracted by an average of 13.2% per year. This situation forced the gold mine to shut down in 2006. Mining activity resumed in 2008, but gold production is now well below its peak in the late 1980s.
At 14.4% of GDp, Fiji’s manufacturing base is relatively large for a small island country. Manufacturing accounts for 9.3% of total
employment.12 The key manufacturing products are beverages (mineral water, brews, and kava), garments, sugar, fabricated metal (except machinery and equipment), wood and wood products, paints, soaps and detergents, and processed food (meat and meat products, canned fish, dairy products, and grain mill products). 12 Estimate based on a 7-day recall period using Fiji Bureau of Statistics’
Employment and Unemployment Survey 2010/11.
Figure 1.10: industry subsectors’ Contribution to industry Growth, 1980–2014
Source: Estimates based on data from the Reserve Bank of Fiji.
Figure 1.11: Growth of industry subsectors, 1980–2014
Source: Estimates based on data from the Reserve Bank of Fiji.
1980–1989 1990–1999 2000–2009 2010–2014
Mining and quarrying Manufacturing
Electricity and water Construction
–2
–1
0
1
2
3
4
5
Perc
enta
ge p
oint
1980–1989 1990–1999 2000–2009 2010–2014 1980–2014
Perc
ent
Mining and quarrying Manufacturing
Electricity and water Construction
–10
–5
0
5
10
15
20
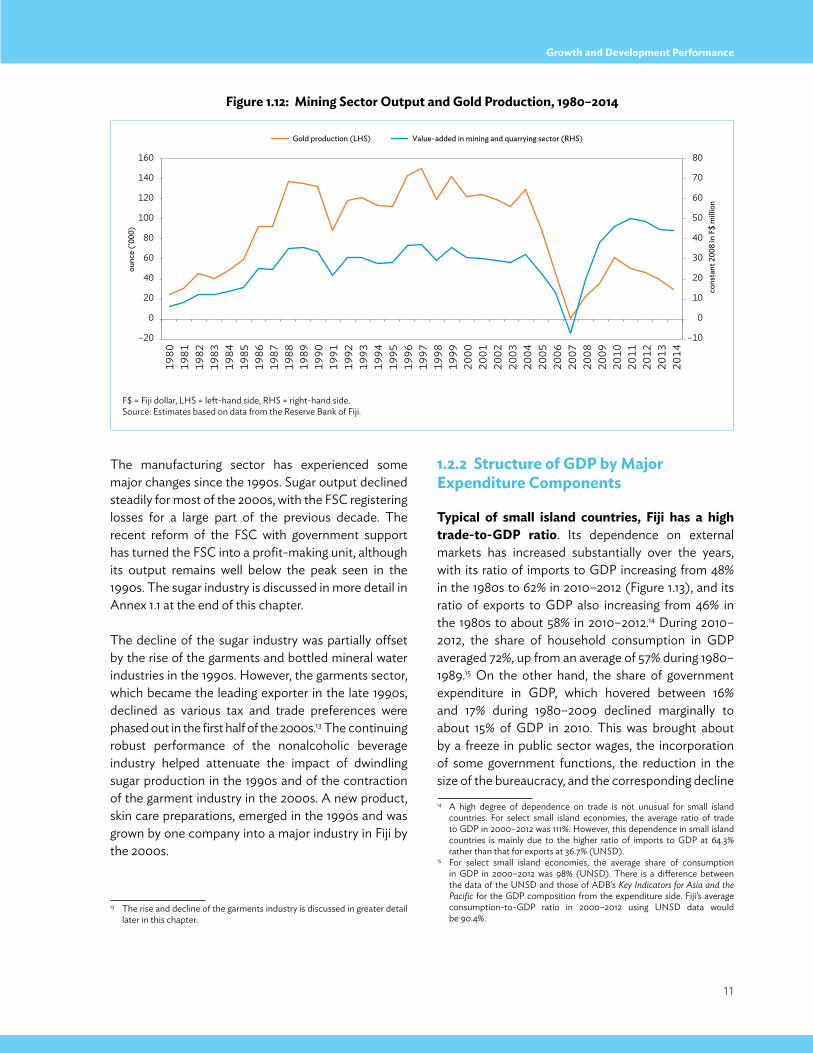
11
Growth and Development Performance
The manufacturing sector has experienced some major changes since the 1990s. Sugar output declined steadily for most of the 2000s, with the FSC registering losses for a large part of the previous decade. The recent reform of the FSC with government support has turned the FSC into a profit-making unit, although its output remains well below the peak seen in the 1990s. The sugar industry is discussed in more detail in Annex 1.1 at the end of this chapter.
The decline of the sugar industry was partially offset by the rise of the garments and bottled mineral water industries in the 1990s. However, the garments sector, which became the leading exporter in the late 1990s, declined as various tax and trade preferences were phased out in the first half of the 2000s.13 The continuing robust performance of the nonalcoholic beverage industry helped attenuate the impact of dwindling sugar production in the 1990s and of the contraction of the garment industry in the 2000s. A new product, skin care preparations, emerged in the 1990s and was grown by one company into a major industry in Fiji by the 2000s.
13 The rise and decline of the garments industry is discussed in greater detail later in this chapter.
1.2.2 structure of GDp by major expenditure Components
typical of small island countries, Fiji has a high trade-to-GDp ratio. Its dependence on external markets has increased substantially over the years, with its ratio of imports to GDP increasing from 48% in the 1980s to 62% in 2010–2012 (Figure 1.13), and its ratio of exports to GDP also increasing from 46% in the 1980s to about 58% in 2010–2012.14 During 2010–2012, the share of household consumption in GDP averaged 72%, up from an average of 57% during 1980–1989.15 On the other hand, the share of government expenditure in GDP, which hovered between 16% and 17% during 1980–2009 declined marginally to about 15% of GDP in 2010. This was brought about by a freeze in public sector wages, the incorporation of some government functions, the reduction in the size of the bureaucracy, and the corresponding decline 14 A high degree of dependence on trade is not unusual for small island
countries. For select small island economies, the average ratio of trade to GDP in 2000–2012 was 111%. However, this dependence in small island countries is mainly due to the higher ratio of imports to GDP at 64.3% rather than that for exports at 36.7% (UNSD).
15 For select small island economies, the average share of consumption in GDP in 2000–2012 was 98% (UNSD). There is a difference between the data of the UNSD and those of ADB’s Key Indicators for Asia and the Pacific for the GDP composition from the expenditure side. Fiji’s average consumption-to-GDP ratio in 2000–2012 using UNSD data would be 90.4%.
Figure 1.12: mining sector output and Gold production, 1980–2014
F$ = Fiji dollar, LHS = left-hand side, RHS = right-hand side.Source: Estimates based on data from the Reserve Bank of Fiji.
–10
0
10
20
30
40
50
60
70
80
–20
0
20
40
60
80
100
120
140
160
cons
tant
200
8 in
F$
mill
ion
ounc
e ('
000)
Gold production (LHS) Value-added in mining and quarrying sector (RHS)
1990
2000
1991
1992
1993
1994
1995
1996
1997
1998
1999
1980
1981
1982
1983
1984
1985
1986
1987
1988
1989
2010
2011
2012
2014
2013
2001
2002
2003
2004
2005
2006
2007
2008
2009
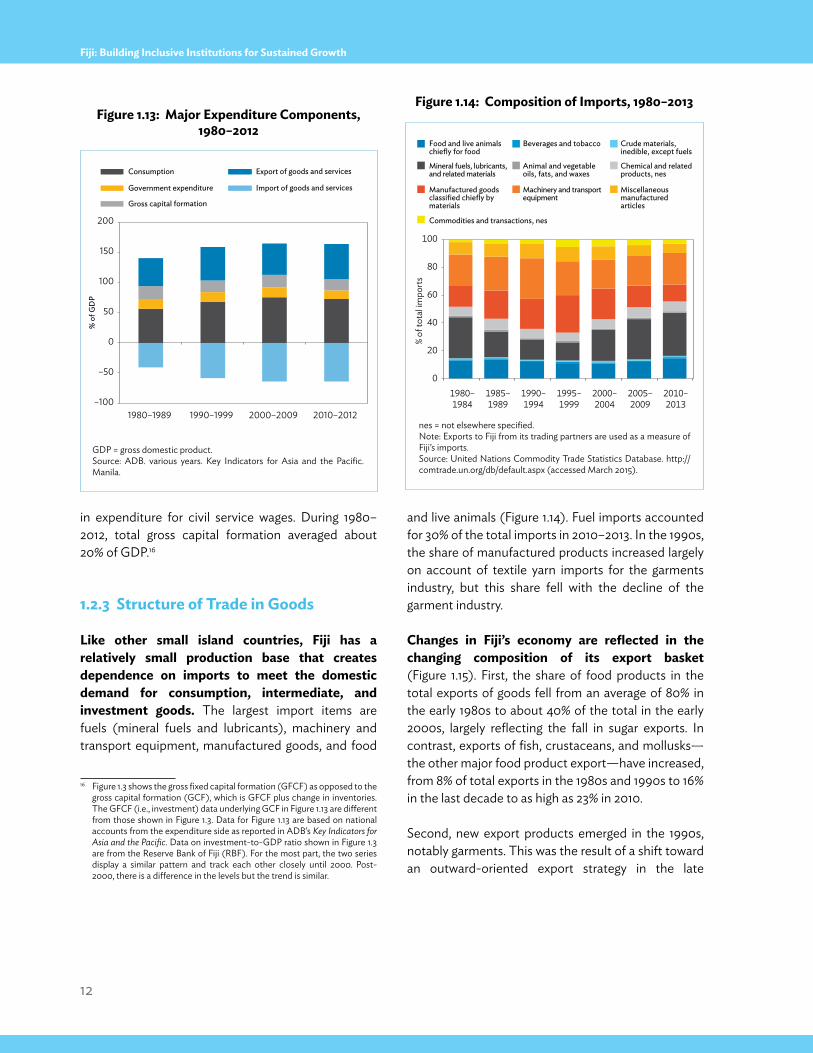
12
Fiji: Building Inclusive Institutions for Sustained Growth
in expenditure for civil service wages. During 1980–2012, total gross capital formation averaged about 20% of GDP.16
1.2.3 structure of trade in Goods
like other small island countries, Fiji has a relatively small production base that creates dependence on imports to meet the domestic demand for consumption, intermediate, and investment goods. The largest import items are fuels (mineral fuels and lubricants), machinery and transport equipment, manufactured goods, and food
16 Figure 1.3 shows the gross fixed capital formation (GFCF) as opposed to the gross capital formation (GCF), which is GFCF plus change in inventories. The GFCF (i.e., investment) data underlying GCF in Figure 1.13 are different from those shown in Figure 1.3. Data for Figure 1.13 are based on national accounts from the expenditure side as reported in ADB’s Key Indicators for Asia and the Pacific. Data on investment-to-GDP ratio shown in Figure 1.3 are from the Reserve Bank of Fiji (RBF). For the most part, the two series display a similar pattern and track each other closely until 2000. Post-2000, there is a difference in the levels but the trend is similar.
and live animals (Figure 1.14). Fuel imports accounted for 30% of the total imports in 2010–2013. In the 1990s, the share of manufactured products increased largely on account of textile yarn imports for the garments industry, but this share fell with the decline of the garment industry.
Changes in Fiji’s economy are reflected in the changing composition of its export basket (Figure 1.15). First, the share of food products in the total exports of goods fell from an average of 80% in the early 1980s to about 40% of the total in the early 2000s, largely reflecting the fall in sugar exports. In contrast, exports of fish, crustaceans, and mollusks—the other major food product export—have increased, from 8% of total exports in the 1980s and 1990s to 16% in the last decade to as high as 23% in 2010.
Second, new export products emerged in the 1990s, notably garments. This was the result of a shift toward an outward-oriented export strategy in the late
Figure 1.14: Composition of imports, 1980–2013
nes = not elsewhere specified.Note: Exports to Fiji from its trading partners are used as a measure of Fiji’s imports. Source: United Nations Commodity Trade Statistics Database. http://comtrade.un.org/db/default.aspx (accessed March 2015).
Figure 1.13: major expenditure Components, 1980–2012
GDP = gross domestic product.Source: ADB. various years. Key Indicators for Asia and the Pacific. Manila.
–100
–50
0
50
100
150
200
1980–1989 1990–1999 2000–2009 2010–2012
% o
f GD
P
Consumption
Government expenditure
Gross capital formation
Export of goods and services
Import of goods and services
Food and live animalschiefly for food
Beverages and tobacco Crude materials,inedible, except fuels
Mineral fuels, lubricants,and related materials
Animal and vegetableoils, fats, and waxes
Chemical and relatedproducts, nes
Manufactured goodsclassified chiefly bymaterials
Commodities and transactions, nes
Machinery and transportequipment
Miscellaneousmanufacturedarticles
0
20
40
60
80
100
1980–1984
1985–1989
1990–1994
1995–1999
2000–2004
2005–2009
2010–2013
% of
tota
l impo
rts
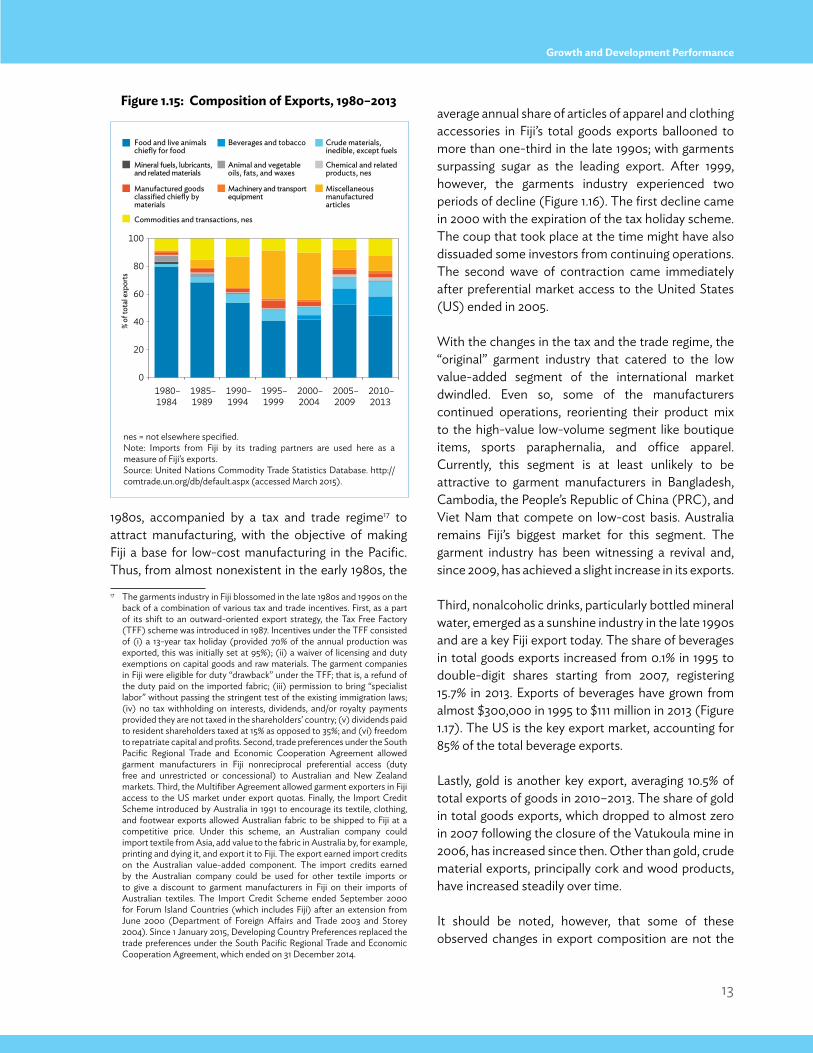
13
Growth and Development Performance
1980s, accompanied by a tax and trade regime17 to attract manufacturing, with the objective of making Fiji a base for low-cost manufacturing in the Pacific. Thus, from almost nonexistent in the early 1980s, the 17 The garments industry in Fiji blossomed in the late 1980s and 1990s on the
back of a combination of various tax and trade incentives. First, as a part of its shift to an outward-oriented export strategy, the Tax Free Factory (TFF) scheme was introduced in 1987. Incentives under the TFF consisted of (i) a 13-year tax holiday (provided 70% of the annual production was exported, this was initially set at 95%); (ii) a waiver of licensing and duty exemptions on capital goods and raw materials. The garment companies in Fiji were eligible for duty “drawback” under the TFF; that is, a refund of the duty paid on the imported fabric; (iii) permission to bring “specialist labor” without passing the stringent test of the existing immigration laws; (iv) no tax withholding on interests, dividends, and/or royalty payments provided they are not taxed in the shareholders’ country; (v) dividends paid to resident shareholders taxed at 15% as opposed to 35%; and (vi) freedom to repatriate capital and profits. Second, trade preferences under the South Pacific Regional Trade and Economic Cooperation Agreement allowed garment manufacturers in Fiji nonreciprocal preferential access (duty free and unrestricted or concessional) to Australian and New Zealand markets. Third, the Multifiber Agreement allowed garment exporters in Fiji access to the US market under export quotas. Finally, the Import Credit Scheme introduced by Australia in 1991 to encourage its textile, clothing, and footwear exports allowed Australian fabric to be shipped to Fiji at a competitive price. Under this scheme, an Australian company could import textile from Asia, add value to the fabric in Australia by, for example, printing and dying it, and export it to Fiji. The export earned import credits on the Australian value-added component. The import credits earned by the Australian company could be used for other textile imports or to give a discount to garment manufacturers in Fiji on their imports of Australian textiles. The Import Credit Scheme ended September 2000 for Forum Island Countries (which includes Fiji) after an extension from June 2000 (Department of Foreign Affairs and Trade 2003 and Storey 2004). Since 1 January 2015, Developing Country Preferences replaced the trade preferences under the South Pacific Regional Trade and Economic Cooperation Agreement, which ended on 31 December 2014.
average annual share of articles of apparel and clothing accessories in Fiji’s total goods exports ballooned to more than one-third in the late 1990s; with garments surpassing sugar as the leading export. After 1999, however, the garments industry experienced two periods of decline (Figure 1.16). The first decline came in 2000 with the expiration of the tax holiday scheme. The coup that took place at the time might have also dissuaded some investors from continuing operations. The second wave of contraction came immediately after preferential market access to the United States (US) ended in 2005.
With the changes in the tax and the trade regime, the “original” garment industry that catered to the low value-added segment of the international market dwindled. Even so, some of the manufacturers continued operations, reorienting their product mix to the high-value low-volume segment like boutique items, sports paraphernalia, and office apparel. Currently, this segment is at least unlikely to be attractive to garment manufacturers in Bangladesh, Cambodia, the People’s Republic of China (PRC), and Viet Nam that compete on low-cost basis. Australia remains Fiji’s biggest market for this segment. The garment industry has been witnessing a revival and, since 2009, has achieved a slight increase in its exports.
Third, nonalcoholic drinks, particularly bottled mineral water, emerged as a sunshine industry in the late 1990s and are a key Fiji export today. The share of beverages in total goods exports increased from 0.1% in 1995 to double-digit shares starting from 2007, registering 15.7% in 2013. Exports of beverages have grown from almost $300,000 in 1995 to $111 million in 2013 (Figure 1.17). The US is the key export market, accounting for 85% of the total beverage exports.
Lastly, gold is another key export, averaging 10.5% of total exports of goods in 2010–2013. The share of gold in total goods exports, which dropped to almost zero in 2007 following the closure of the Vatukoula mine in 2006, has increased since then. Other than gold, crude material exports, principally cork and wood products, have increased steadily over time.
It should be noted, however, that some of these observed changes in export composition are not the
Figure 1.15: Composition of exports, 1980–2013
nes = not elsewhere specified.Note: Imports from Fiji by its trading partners are used here as a measure of Fiji’s exports. Source: United Nations Commodity Trade Statistics Database. http://comtrade.un.org/db/default.aspx (accessed March 2015).
Food and live animalschiefly for food
Beverages and tobacco Crude materials,inedible, except fuels
Mineral fuels, lubricants,and related materials
Animal and vegetableoils, fats, and waxes
Chemical and relatedproducts, nes
Manufactured goodsclassified chiefly bymaterials
Commodities and transactions, nes
Machinery and transportequipment
Miscellaneousmanufacturedarticles
0
20
40
60
80
100
1980–1984
1985–1989
1990–1994
1995–1999
2000–2004
2005–2009
2010–2013
% of
tota
l exp
orts
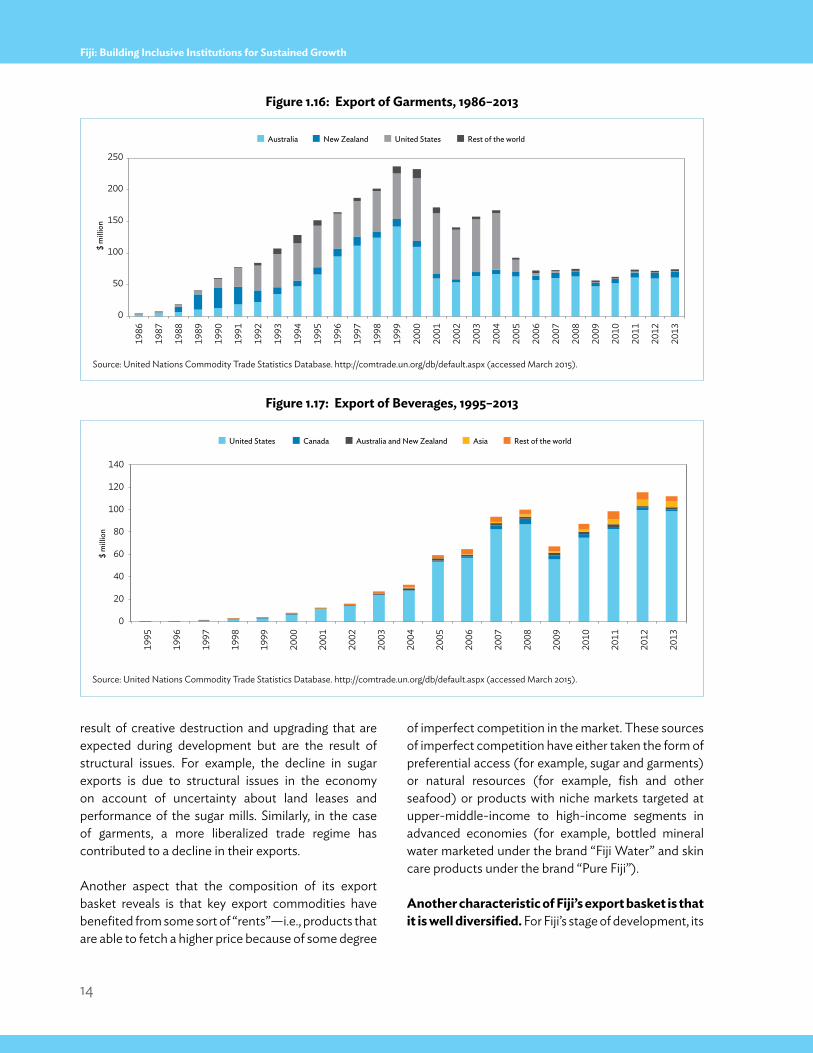
14
Fiji: Building Inclusive Institutions for Sustained Growth
result of creative destruction and upgrading that are expected during development but are the result of structural issues. For example, the decline in sugar exports is due to structural issues in the economy on account of uncertainty about land leases and performance of the sugar mills. Similarly, in the case of garments, a more liberalized trade regime has contributed to a decline in their exports.
Another aspect that the composition of its export basket reveals is that key export commodities have benefited from some sort of “rents”—i.e., products that are able to fetch a higher price because of some degree
of imperfect competition in the market. These sources of imperfect competition have either taken the form of preferential access (for example, sugar and garments) or natural resources (for example, fish and other seafood) or products with niche markets targeted at upper-middle-income to high-income segments in advanced economies (for example, bottled mineral water marketed under the brand “Fiji Water” and skin care products under the brand “Pure Fiji”).
Another characteristic of Fiji’s export basket is that it is well diversified. For Fiji’s stage of development, its
0
50
100
150
200
250
1986
1987
1988
1989
1990
1991
1992
1993
1994
1995
1996
1997
1998
1999
2000
2001
2002
2003
2004
2005
2006
2007
2008
2009
2010
2011
2012
2013
$ m
illio
n
Australia New Zealand United States Rest of the world
Figure 1.16: export of Garments, 1986–2013
Figure 1.17: export of Beverages, 1995–2013
Source: United Nations Commodity Trade Statistics Database. http://comtrade.un.org/db/default.aspx (accessed March 2015).
Source: United Nations Commodity Trade Statistics Database. http://comtrade.un.org/db/default.aspx (accessed March 2015).
$ m
illio
n
United States Canada Australia and New Zealand Asia Rest of the world
0
20
40
60
80
100
120
140
1995
1996
1997
1998
1999
2000
2001
2002
2003
2004
2005
2006
2007
2008
2009
2010
2011
2012
2013
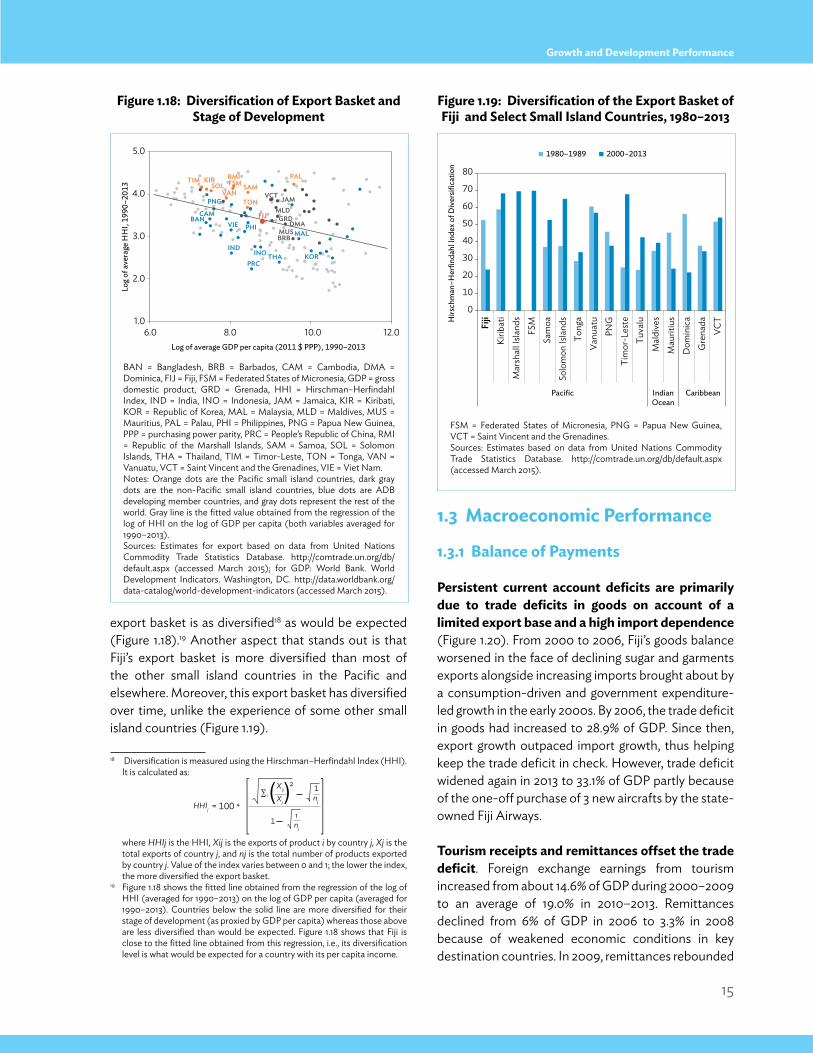
15
Growth and Development Performance
export basket is as diversified18 as would be expected (Figure 1.18).19 Another aspect that stands out is that Fiji’s export basket is more diversified than most of the other small island countries in the Pacific and elsewhere. Moreover, this export basket has diversified over time, unlike the experience of some other small island countries (Figure 1.19).
18 Diversification is measured using the Hirschman–Herfindahl Index (HHI). It is calculated as:
where HHIj is the HHI, Xij is the exports of product i by country j, Xj is the total exports of country j, and nj is the total number of products exported by country j. Value of the index varies between 0 and 1; the lower the index, the more diversified the export basket.
19 Figure 1.18 shows the fitted line obtained from the regression of the log of HHI (averaged for 1990–2013) on the log of GDP per capita (averaged for 1990–2013). Countries below the solid line are more diversified for their stage of development (as proxied by GDP per capita) whereas those above are less diversified than would be expected. Figure 1.18 shows that Fiji is close to the fitted line obtained from this regression, i.e., its diversification level is what would be expected for a country with its per capita income.
1.3 macroeconomic performance
1.3.1 Balance of payments
persistent current account deficits are primarily due to trade deficits in goods on account of a limited export base and a high import dependence (Figure 1.20). From 2000 to 2006, Fiji’s goods balance worsened in the face of declining sugar and garments exports alongside increasing imports brought about by a consumption-driven and government expenditure-led growth in the early 2000s. By 2006, the trade deficit in goods had increased to 28.9% of GDP. Since then, export growth outpaced import growth, thus helping keep the trade deficit in check. However, trade deficit widened again in 2013 to 33.1% of GDP partly because of the one-off purchase of 3 new aircrafts by the state-owned Fiji Airways.
tourism receipts and remittances offset the trade deficit. Foreign exchange earnings from tourism increased from about 14.6% of GDP during 2000–2009 to an average of 19.0% in 2010–2013. Remittances declined from 6% of GDP in 2006 to 3.3% in 2008 because of weakened economic conditions in key destination countries. In 2009, remittances rebounded
5.0
4.0
3.0
2.0
1.06.0 8.0 10.0 12.0
FIJ
FSMKIR RMI PALSAMSOL
TIM
TONVAN
BRB
DMAGRD
JAMMLD
MUS
VCT
BANCAM
PRC
INDINO
MAL
PNG
PHI
KORTHA
VIE
Log
of a
vera
ge H
HI,
1990
–201
3
Log of average GDP per capita (2011 $ PPP), 1990–2013
0
10
20
30
40
50
60
70
80
Fiji
Kirib
ati
Mar
shal
l Isla
nds
FSM
Sa
moa
So
lom
on Is
land
s To
nga
Vanu
atu
PNG
Ti
mor
-Les
te
Tuva
lu
Mal
dive
s M
aurit
ius
Dom
inic
a G
rena
da
VCT
Pacific IndianOcean
Caribbean
Hirs
chm
an–H
erfin
dahl
Inde
x of D
iver
sifica
tion
1980–1989 2000–2013
Figure 1.18: Diversification of export Basket and stage of Development
Figure 1.19: Diversification of the export Basket of Fiji and select small island Countries, 1980–2013
BAN = Bangladesh, BRB = Barbados, CAM = Cambodia, DMA = Dominica, FIJ = Fiji, FSM = Federated States of Micronesia, GDP = gross domestic product, GRD = Grenada, HHI = Hirschman–Herfindahl Index, IND = India, INO = Indonesia, JAM = Jamaica, KIR = Kiribati, KOR = Republic of Korea, MAL = Malaysia, MLD = Maldives, MUS = Mauritius, PAL = Palau, PHI = Philippines, PNG = Papua New Guinea, PPP = purchasing power parity, PRC = People’s Republic of China, RMI = Republic of the Marshall Islands, SAM = Samoa, SOL = Solomon Islands, THA = Thailand, TIM = Timor-Leste, TON = Tonga, VAN = Vanuatu, VCT = Saint Vincent and the Grenadines, VIE = Viet Nam.Notes: Orange dots are the Pacific small island countries, dark gray dots are the non-Pacific small island countries, blue dots are ADB developing member countries, and gray dots represent the rest of the world. Gray line is the fitted value obtained from the regression of the log of HHI on the log of GDP per capita (both variables averaged for 1990–2013).Sources: Estimates for export based on data from United Nations Commodity Trade Statistics Database. http://comtrade.un.org/db/default.aspx (accessed March 2015); for GDP: World Bank. World Development Indicators. Washington, DC. http://data.worldbank.org/data-catalog/world-development-indicators (accessed March 2015).
FSM = Federated States of Micronesia, PNG = Papua New Guinea, VCT = Saint Vincent and the Grenadines.Sources: Estimates based on data from United Nations Commodity Trade Statistics Database. http://comtrade.un.org/db/default.aspx (accessed March 2015).
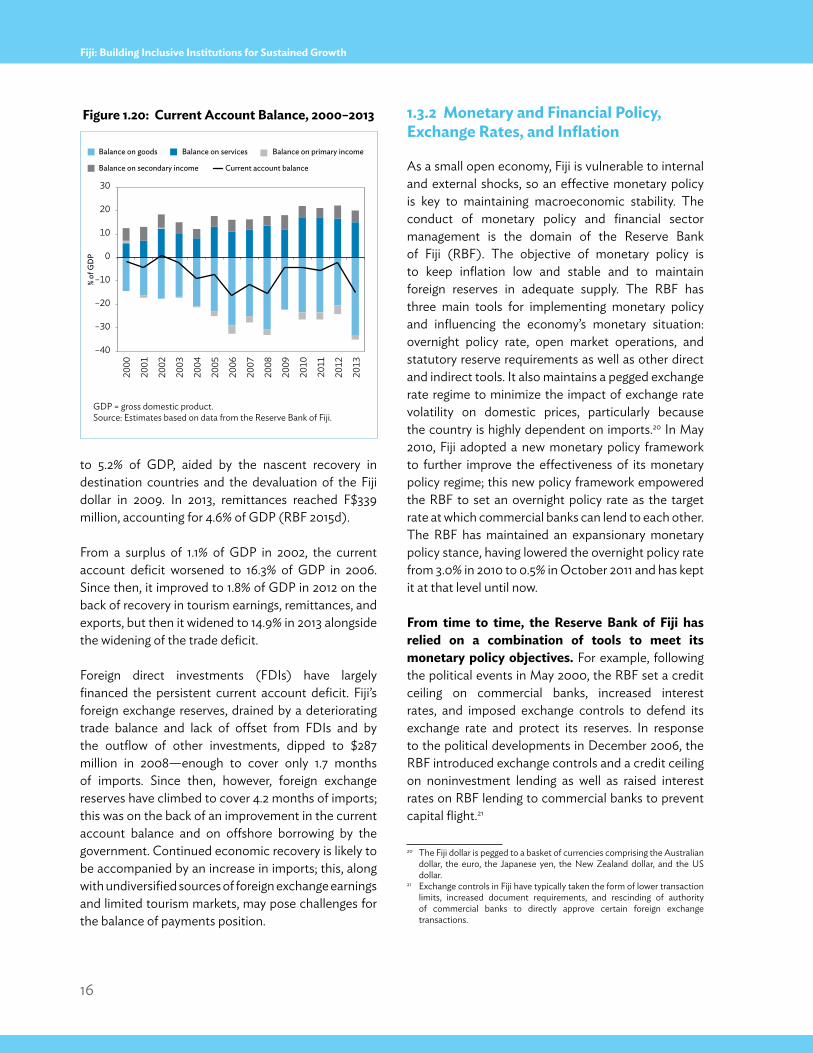
16
Fiji: Building Inclusive Institutions for Sustained Growth
to 5.2% of GDP, aided by the nascent recovery in destination countries and the devaluation of the Fiji dollar in 2009. In 2013, remittances reached F$339 million, accounting for 4.6% of GDP (RBF 2015d).
From a surplus of 1.1% of GDP in 2002, the current account deficit worsened to 16.3% of GDP in 2006. Since then, it improved to 1.8% of GDP in 2012 on the back of recovery in tourism earnings, remittances, and exports, but then it widened to 14.9% in 2013 alongside the widening of the trade deficit.
Foreign direct investments (FDIs) have largely financed the persistent current account deficit. Fiji’s foreign exchange reserves, drained by a deteriorating trade balance and lack of offset from FDIs and by the outflow of other investments, dipped to $287 million in 2008—enough to cover only 1.7 months of imports. Since then, however, foreign exchange reserves have climbed to cover 4.2 months of imports; this was on the back of an improvement in the current account balance and on offshore borrowing by the government. Continued economic recovery is likely to be accompanied by an increase in imports; this, along with undiversified sources of foreign exchange earnings and limited tourism markets, may pose challenges for the balance of payments position.
1.3.2 monetary and Financial policy, exchange Rates, and inflation
As a small open economy, Fiji is vulnerable to internal and external shocks, so an effective monetary policy is key to maintaining macroeconomic stability. The conduct of monetary policy and financial sector management is the domain of the Reserve Bank of Fiji (RBF). The objective of monetary policy is to keep inflation low and stable and to maintain foreign reserves in adequate supply. The RBF has three main tools for implementing monetary policy and influencing the economy’s monetary situation: overnight policy rate, open market operations, and statutory reserve requirements as well as other direct and indirect tools. It also maintains a pegged exchange rate regime to minimize the impact of exchange rate volatility on domestic prices, particularly because the country is highly dependent on imports.20 In May 2010, Fiji adopted a new monetary policy framework to further improve the effectiveness of its monetary policy regime; this new policy framework empowered the RBF to set an overnight policy rate as the target rate at which commercial banks can lend to each other. The RBF has maintained an expansionary monetary policy stance, having lowered the overnight policy rate from 3.0% in 2010 to 0.5% in October 2011 and has kept it at that level until now.
From time to time, the Reserve Bank of Fiji has relied on a combination of tools to meet its monetary policy objectives. For example, following the political events in May 2000, the RBF set a credit ceiling on commercial banks, increased interest rates, and imposed exchange controls to defend its exchange rate and protect its reserves. In response to the political developments in December 2006, the RBF introduced exchange controls and a credit ceiling on noninvestment lending as well as raised interest rates on RBF lending to commercial banks to prevent capital flight.21
20 The Fiji dollar is pegged to a basket of currencies comprising the Australian dollar, the euro, the Japanese yen, the New Zealand dollar, and the US dollar.
21 Exchange controls in Fiji have typically taken the form of lower transaction limits, increased document requirements, and rescinding of authority of commercial banks to directly approve certain foreign exchange transactions.
–40
–30
–20
–10
0
10
20
30
2000
2001
2002
2003
2004
2005
2006
2007
2008
2009
2010
2011
2012
2013
% of
GD
P
Balance on goods Balance on services
Balance on secondary income Current account balance
Balance on primary income
Figure 1.20: Current Account Balance, 2000–2013
GDP = gross domestic product.Source: Estimates based on data from the Reserve Bank of Fiji.
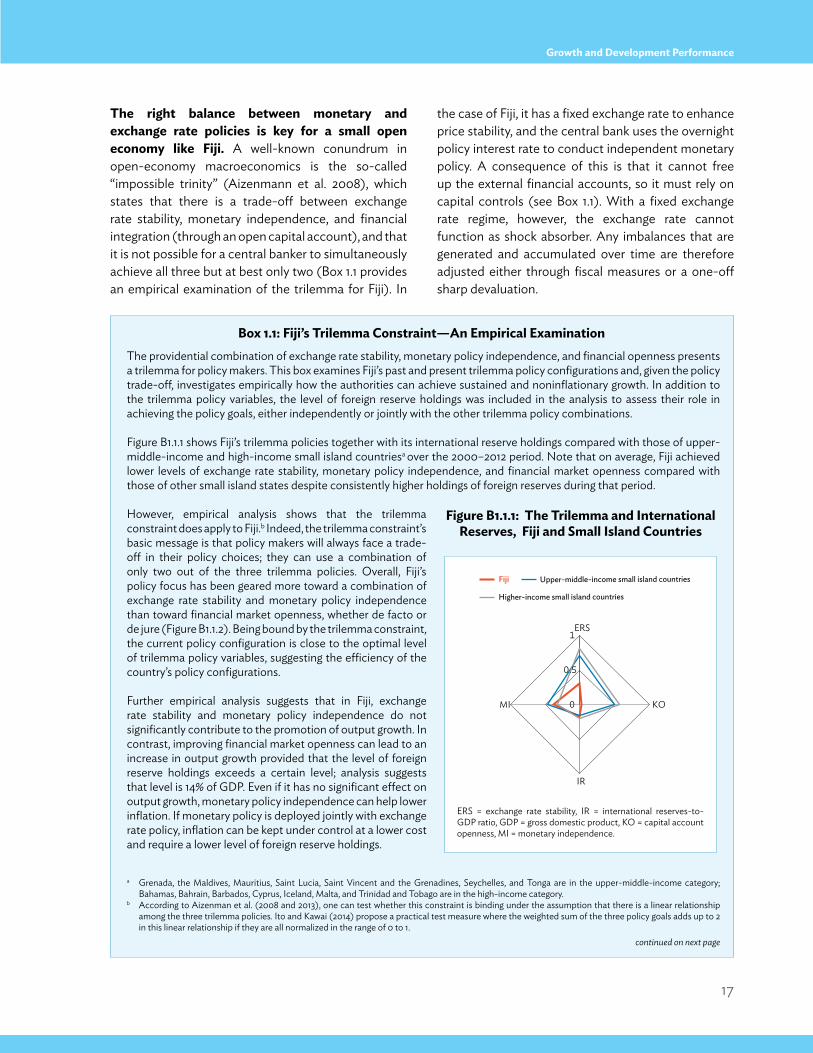
17
Growth and Development Performance
the right balance between monetary and exchange rate policies is key for a small open economy like Fiji. A well-known conundrum in open-economy macroeconomics is the so-called “impossible trinity” (Aizenmann et al. 2008), which states that there is a trade-off between exchange rate stability, monetary independence, and financial integration (through an open capital account), and that it is not possible for a central banker to simultaneously achieve all three but at best only two (Box 1.1 provides an empirical examination of the trilemma for Fiji). In
the case of Fiji, it has a fixed exchange rate to enhance price stability, and the central bank uses the overnight policy interest rate to conduct independent monetary policy. A consequence of this is that it cannot free up the external financial accounts, so it must rely on capital controls (see Box 1.1). With a fixed exchange rate regime, however, the exchange rate cannot function as shock absorber. Any imbalances that are generated and accumulated over time are therefore adjusted either through fiscal measures or a one-off sharp devaluation.
Box 1.1: Fiji’s trilemma Constraint—An empirical examination
Fiji Higher-income small island countriesUpper-middle-income small island countries
0
0.5
1ERS
KO
IR
MI
Fiji Higher-income small island countriesUpper-middle-income small island countries
0
0.5
1ERS
KO
IR
MI
Fiji Higher-income small island countriesUpper-middle-income small island countries
0
0.5
1ERS
KO
IR
MI
The providential combination of exchange rate stability, monetary policy independence, and financial openness presents a trilemma for policy makers. This box examines Fiji’s past and present trilemma policy configurations and, given the policy trade-off, investigates empirically how the authorities can achieve sustained and noninflationary growth. In addition to the trilemma policy variables, the level of foreign reserve holdings was included in the analysis to assess their role in achieving the policy goals, either independently or jointly with the other trilemma policy combinations.
Figure B1.1.1 shows Fiji’s trilemma policies together with its international reserve holdings compared with those of upper-middle-income and high-income small island countriesa over the 2000–2012 period. Note that on average, Fiji achieved lower levels of exchange rate stability, monetary policy independence, and financial market openness compared with those of other small island states despite consistently higher holdings of foreign reserves during that period.
However, empirical analysis shows that the trilemma constraint does apply to Fiji.b Indeed, the trilemma constraint’s basic message is that policy makers will always face a trade-off in their policy choices; they can use a combination of only two out of the three trilemma policies. Overall, Fiji’s policy focus has been geared more toward a combination of exchange rate stability and monetary policy independence than toward financial market openness, whether de facto or de jure (Figure B1.1.2). Being bound by the trilemma constraint, the current policy configuration is close to the optimal level of trilemma policy variables, suggesting the efficiency of the country’s policy configurations. Further empirical analysis suggests that in Fiji, exchange rate stability and monetary policy independence do not significantly contribute to the promotion of output growth. In contrast, improving financial market openness can lead to an increase in output growth provided that the level of foreign reserve holdings exceeds a certain level; analysis suggests that level is 14% of GDP. Even if it has no significant effect on output growth, monetary policy independence can help lower inflation. If monetary policy is deployed jointly with exchange rate policy, inflation can be kept under control at a lower cost and require a lower level of foreign reserve holdings.
a Grenada, the Maldives, Mauritius, Saint Lucia, Saint Vincent and the Grenadines, Seychelles, and Tonga are in the upper-middle-income category; Bahamas, Bahrain, Barbados, Cyprus, Iceland, Malta, and Trinidad and Tobago are in the high-income category.
b According to Aizenman et al. (2008 and 2013), one can test whether this constraint is binding under the assumption that there is a linear relationship among the three trilemma policies. Ito and Kawai (2014) propose a practical test measure where the weighted sum of the three policy goals adds up to 2 in this linear relationship if they are all normalized in the range of 0 to 1.
Figure B1.1.1: the trilemma and international Reserves, Fiji and small island Countries
ERS = exchange rate stability, IR = international reserves-to- GDP ratio, GDP = gross domestic product, KO = capital account openness, MI = monetary independence.
continued on next page
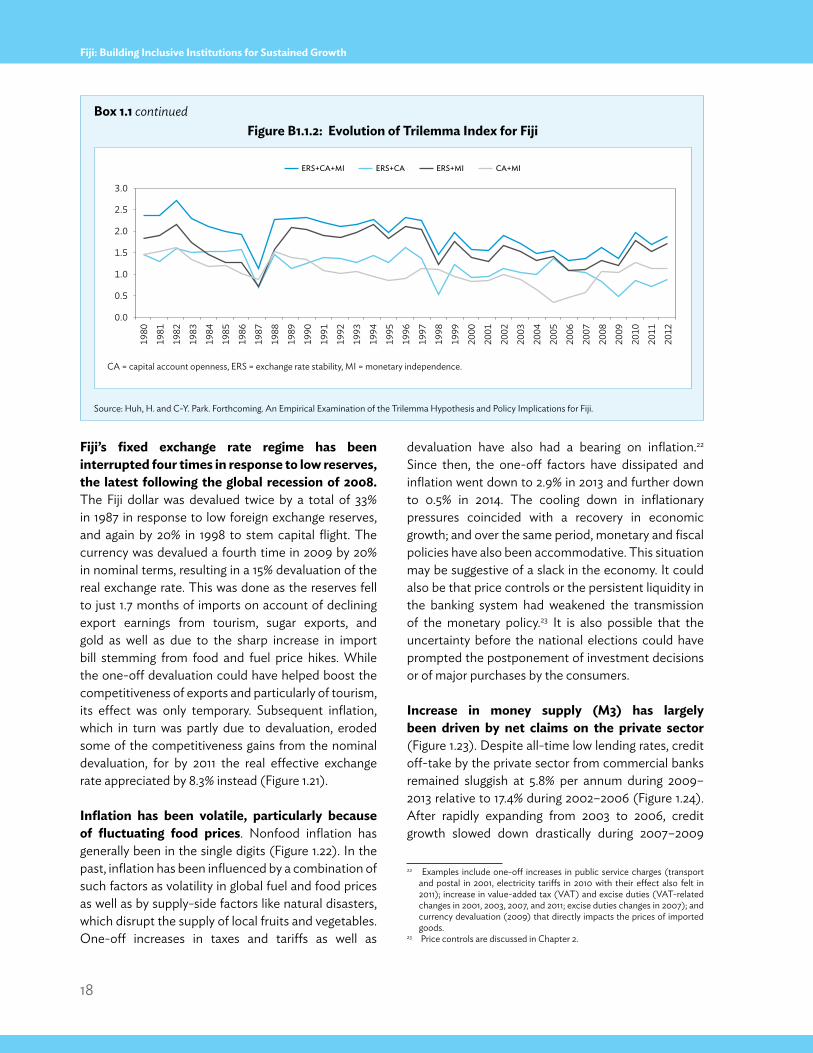
18
Fiji: Building Inclusive Institutions for Sustained Growth
Fiji’s fixed exchange rate regime has been interrupted four times in response to low reserves, the latest following the global recession of 2008. The Fiji dollar was devalued twice by a total of 33% in 1987 in response to low foreign exchange reserves, and again by 20% in 1998 to stem capital flight. The currency was devalued a fourth time in 2009 by 20% in nominal terms, resulting in a 15% devaluation of the real exchange rate. This was done as the reserves fell to just 1.7 months of imports on account of declining export earnings from tourism, sugar exports, and gold as well as due to the sharp increase in import bill stemming from food and fuel price hikes. While the one-off devaluation could have helped boost the competitiveness of exports and particularly of tourism, its effect was only temporary. Subsequent inflation, which in turn was partly due to devaluation, eroded some of the competitiveness gains from the nominal devaluation, for by 2011 the real effective exchange rate appreciated by 8.3% instead (Figure 1.21).
inflation has been volatile, particularly because of fluctuating food prices. Nonfood inflation has generally been in the single digits (Figure 1.22). In the past, inflation has been influenced by a combination of such factors as volatility in global fuel and food prices as well as by supply-side factors like natural disasters, which disrupt the supply of local fruits and vegetables. One-off increases in taxes and tariffs as well as
devaluation have also had a bearing on inflation.22 Since then, the one-off factors have dissipated and inflation went down to 2.9% in 2013 and further down to 0.5% in 2014. The cooling down in inflationary pressures coincided with a recovery in economic growth; and over the same period, monetary and fiscal policies have also been accommodative. This situation may be suggestive of a slack in the economy. It could also be that price controls or the persistent liquidity in the banking system had weakened the transmission of the monetary policy.23 It is also possible that the uncertainty before the national elections could have prompted the postponement of investment decisions or of major purchases by the consumers.
increase in money supply (m3) has largely been driven by net claims on the private sector (Figure 1.23). Despite all-time low lending rates, credit off-take by the private sector from commercial banks remained sluggish at 5.8% per annum during 2009–2013 relative to 17.4% during 2002–2006 (Figure 1.24). After rapidly expanding from 2003 to 2006, credit growth slowed down drastically during 2007–2009
22 Examples include one-off increases in public service charges (transport and postal in 2001, electricity tariffs in 2010 with their effect also felt in 2011); increase in value-added tax (VAT) and excise duties (VAT-related changes in 2001, 2003, 2007, and 2011; excise duties changes in 2007); and currency devaluation (2009) that directly impacts the prices of imported goods.
23 Price controls are discussed in Chapter 2.
Box 1.1 continued
ERS+CA+MI CA+MIERS+CA ERS+MI
0.0
0.5
1.0
1.5
2.0
2.5
3.0
1980
1981
1982
1983
1984
1985
1986
1987
1988
1989
1990
1991
1992
1993
1994
1995
1996
1997
1998
1999
2000
2001
2002
2003
2004
2005
2006
2007
2008
2009
2010
2011
2012
Figure B1.1.2: evolution of trilemma index for Fiji
CA = capital account openness, ERS = exchange rate stability, MI = monetary independence.
Source: Huh, H. and C-Y. Park. Forthcoming. An Empirical Examination of the Trilemma Hypothesis and Policy Implications for Fiji.
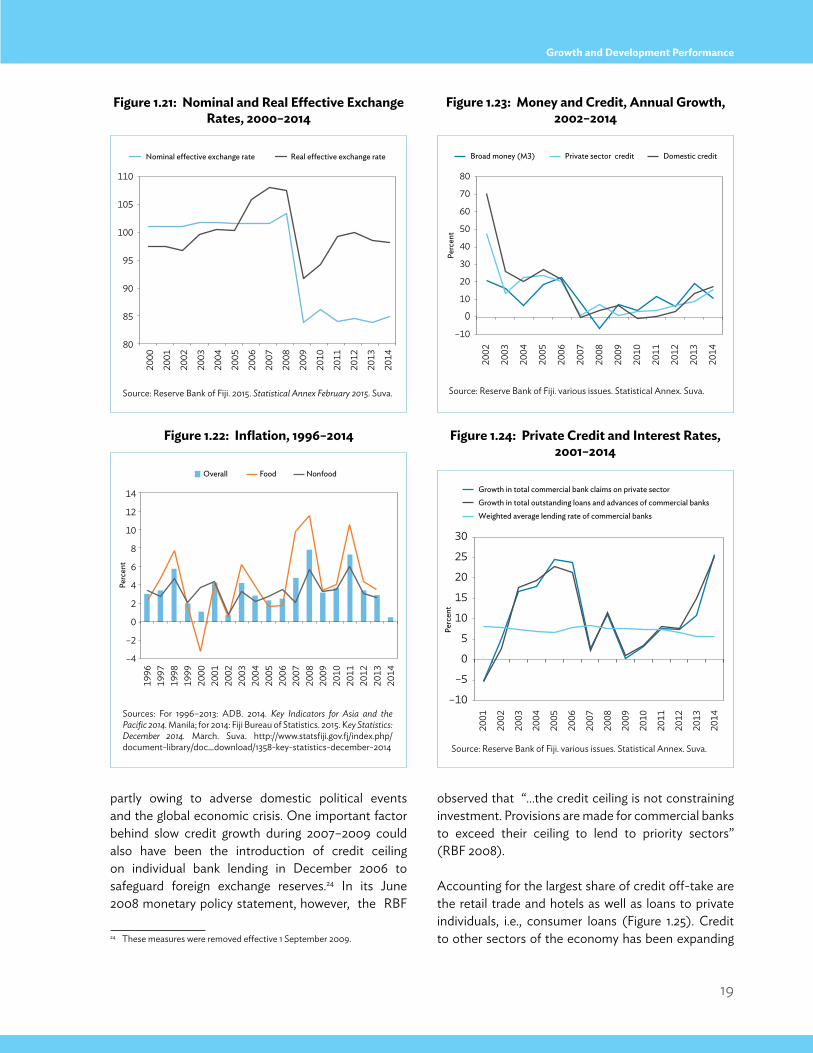
19
Growth and Development Performance
partly owing to adverse domestic political events and the global economic crisis. One important factor behind slow credit growth during 2007–2009 could also have been the introduction of credit ceiling on individual bank lending in December 2006 to safeguard foreign exchange reserves.24 In its June 2008 monetary policy statement, however, the RBF
24 These measures were removed effective 1 September 2009.
observed that “…the credit ceiling is not constraining investment. Provisions are made for commercial banks to exceed their ceiling to lend to priority sectors” (RBF 2008).
Accounting for the largest share of credit off-take are the retail trade and hotels as well as loans to private individuals, i.e., consumer loans (Figure 1.25). Credit to other sectors of the economy has been expanding
80
85
90
95
100
105
110
2000
2001
2002
2003
2004
2005
2006
2007
2008
2009
2010
2011
2012
2013
2014
Nominal e�ective exchange rate Real e�ective exchange rate
–4
–2
0
2
4
6
8
10
12
14
1996
1997
1998
1999
2000
2001
2002
2003
2004
2005
2006
2007
2008
2009
2010
2011
2012
2013
2014
Perc
ent
Overall Food Nonfood
Figure 1.21: nominal and Real effective exchange Rates, 2000–2014
Source: Reserve Bank of Fiji. 2015. Statistical Annex February 2015. Suva.
Figure 1.22: inflation, 1996–2014
Sources: For 1996–2013: ADB. 2014. Key Indicators for Asia and the Pacific 2014. Manila; for 2014: Fiji Bureau of Statistics. 2015. Key Statistics: December 2014. March. Suva. http://www.statsfiji.gov.fj/index.php/document-library/doc_download/1358-key-statistics-december-2014
Broad money (M3) Private sector credit Domestic credit
–10
010
20
30
40
50
60
70
80
2002
2003
2004
2005
2006
2007
2008
2009
2010
2011
2012
2013
2014
Perc
ent
–10
–5
0
5
10
15
20
25
30
2001
2002
2003
2004
2005
2006
2007
2008
2009
2010
2011
2012
2013
2014
Perc
ent
Weighted average lending rate of commercial banksGrowth in total outstanding loans and advances of commercial banksGrowth in total commercial bank claims on private sector
Figure 1.23: money and Credit, Annual Growth, 2002–2014
Source: Reserve Bank of Fiji. various issues. Statistical Annex. Suva.
Figure 1.24: private Credit and interest Rates, 2001–2014
Source: Reserve Bank of Fiji. various issues. Statistical Annex. Suva.
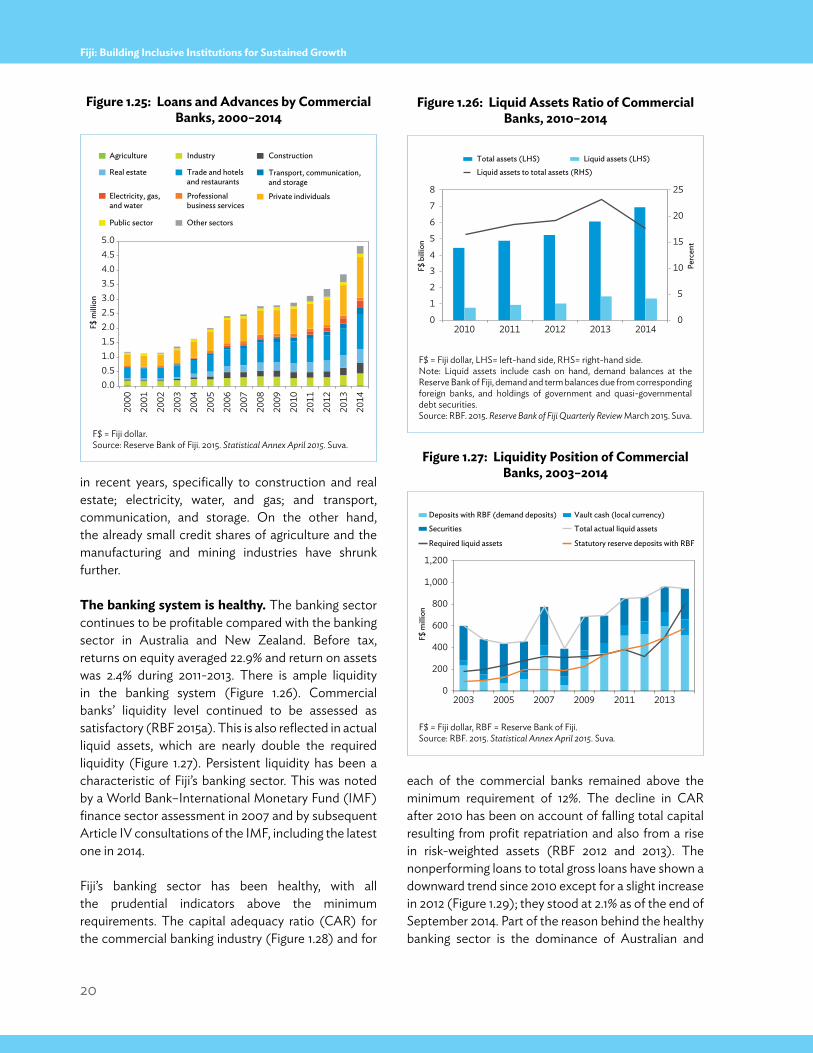
20
Fiji: Building Inclusive Institutions for Sustained Growth
in recent years, specifically to construction and real estate; electricity, water, and gas; and transport, communication, and storage. On the other hand, the already small credit shares of agriculture and the manufacturing and mining industries have shrunk further.
the banking system is healthy. The banking sector continues to be profitable compared with the banking sector in Australia and New Zealand. Before tax, returns on equity averaged 22.9% and return on assets was 2.4% during 2011-2013. There is ample liquidity in the banking system (Figure 1.26). Commercial banks’ liquidity level continued to be assessed as satisfactory (RBF 2015a). This is also reflected in actual liquid assets, which are nearly double the required liquidity (Figure 1.27). Persistent liquidity has been a characteristic of Fiji’s banking sector. This was noted by a World Bank–International Monetary Fund (IMF) finance sector assessment in 2007 and by subsequent Article IV consultations of the IMF, including the latest one in 2014.
Fiji’s banking sector has been healthy, with all the prudential indicators above the minimum requirements. The capital adequacy ratio (CAR) for the commercial banking industry (Figure 1.28) and for
each of the commercial banks remained above the minimum requirement of 12%. The decline in CAR after 2010 has been on account of falling total capital resulting from profit repatriation and also from a rise in risk-weighted assets (RBF 2012 and 2013). The nonperforming loans to total gross loans have shown a downward trend since 2010 except for a slight increase in 2012 (Figure 1.29); they stood at 2.1% as of the end of September 2014. Part of the reason behind the healthy banking sector is the dominance of Australian and
0.00.51.01.52.02.53.03.54.04.55.0
2000
2001
2002
2003
2004
2005
2006
2007
2008
2009
2010
2011
2012
2013
2014
F$ m
illio
n
Agriculture Industry Construction
Real estate Trade and hotelsand restaurants
Transport, communication,and storage
Electricity, gas,and water
Professionalbusiness services
Private individuals
Public sector Other sectors
Total assets (LHS) Liquid assets (LHS)Liquid assets to total assets (RHS)
0
5
10
15
20
25
0
1
2
3
4
5
6
7
8
2010 2011 2012 2013 2014
F$ b
illio
n
Perc
ent
Deposits with RBF (demand deposits) Vault cash (local currency)
Securities Total actual liquid assets
Required liquid assets Statutory reserve deposits with RBF
0
400
1,000
1,200
2003 2005 2007 2009 2011 2013
F$ m
illio
n 800
600
200
Figure 1.25: loans and Advances by Commercial Banks, 2000–2014
F$ = Fiji dollar.Source: Reserve Bank of Fiji. 2015. Statistical Annex April 2015. Suva.
Figure 1.26: liquid Assets Ratio of Commercial Banks, 2010–2014
F$ = Fiji dollar, LHS= left-hand side, RHS= right-hand side. Note: Liquid assets include cash on hand, demand balances at the Reserve Bank of Fiji, demand and term balances due from corresponding foreign banks, and holdings of government and quasi-governmental debt securities.Source: RBF. 2015. Reserve Bank of Fiji Quarterly Review March 2015. Suva.
Figure 1.27: liquidity position of Commercial Banks, 2003–2014
F$ = Fiji dollar, RBF = Reserve Bank of Fiji. Source: RBF. 2015. Statistical Annex April 2015. Suva.
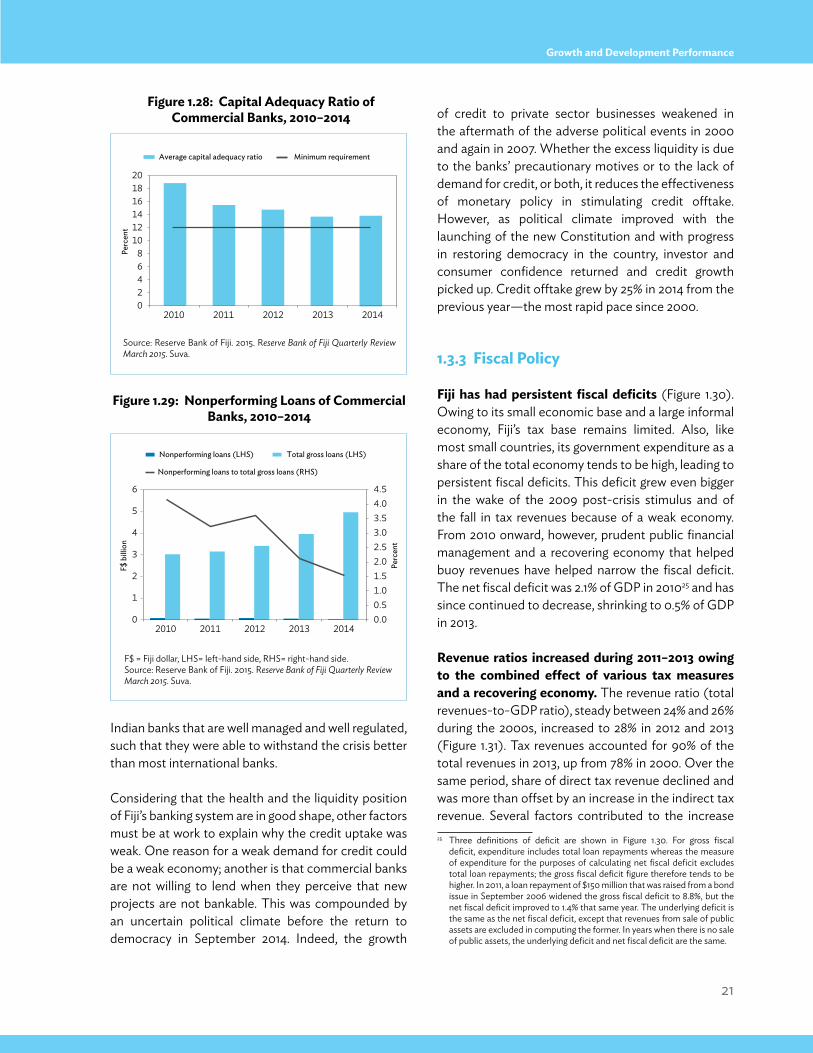
21
Growth and Development Performance
Indian banks that are well managed and well regulated, such that they were able to withstand the crisis better than most international banks.
Considering that the health and the liquidity position of Fiji’s banking system are in good shape, other factors must be at work to explain why the credit uptake was weak. One reason for a weak demand for credit could be a weak economy; another is that commercial banks are not willing to lend when they perceive that new projects are not bankable. This was compounded by an uncertain political climate before the return to democracy in September 2014. Indeed, the growth
of credit to private sector businesses weakened in the aftermath of the adverse political events in 2000 and again in 2007. Whether the excess liquidity is due to the banks’ precautionary motives or to the lack of demand for credit, or both, it reduces the effectiveness of monetary policy in stimulating credit offtake. However, as political climate improved with the launching of the new Constitution and with progress in restoring democracy in the country, investor and consumer confidence returned and credit growth picked up. Credit offtake grew by 25% in 2014 from the previous year—the most rapid pace since 2000.
1.3.3 Fiscal policy
Fiji has had persistent fiscal deficits (Figure 1.30). Owing to its small economic base and a large informal economy, Fiji’s tax base remains limited. Also, like most small countries, its government expenditure as a share of the total economy tends to be high, leading to persistent fiscal deficits. This deficit grew even bigger in the wake of the 2009 post-crisis stimulus and of the fall in tax revenues because of a weak economy. From 2010 onward, however, prudent public financial management and a recovering economy that helped buoy revenues have helped narrow the fiscal deficit. The net fiscal deficit was 2.1% of GDP in 201025 and has since continued to decrease, shrinking to 0.5% of GDP in 2013.
Revenue ratios increased during 2011–2013 owing to the combined effect of various tax measures and a recovering economy. The revenue ratio (total revenues-to-GDP ratio), steady between 24% and 26% during the 2000s, increased to 28% in 2012 and 2013 (Figure 1.31). Tax revenues accounted for 90% of the total revenues in 2013, up from 78% in 2000. Over the same period, share of direct tax revenue declined and was more than offset by an increase in the indirect tax revenue. Several factors contributed to the increase 25 Three definitions of deficit are shown in Figure 1.30. For gross fiscal
deficit, expenditure includes total loan repayments whereas the measure of expenditure for the purposes of calculating net fiscal deficit excludes total loan repayments; the gross fiscal deficit figure therefore tends to be higher. In 2011, a loan repayment of $150 million that was raised from a bond issue in September 2006 widened the gross fiscal deficit to 8.8%, but the net fiscal deficit improved to 1.4% that same year. The underlying deficit is the same as the net fiscal deficit, except that revenues from sale of public assets are excluded in computing the former. In years when there is no sale of public assets, the underlying deficit and net fiscal deficit are the same.
Average capital adequacy ratio Minimum requirement
0
68
101214161820
2010 2011 2012 2013 2014
Perc
ent
42
Nonperforming loans (LHS) Total gross loans (LHS)
Nonperforming loans to total gross loans (RHS)
0.0
2.53.03.54.04.5
0
4
5
6
2010 2011 2012 2013 2014
F$ b
illio
n
Perc
ent
3
2
1
2.01.51.00.5
Figure 1.28: Capital Adequacy Ratio of Commercial Banks, 2010–2014
Source: Reserve Bank of Fiji. 2015. Reserve Bank of Fiji Quarterly Review March 2015. Suva.
Figure 1.29: nonperforming loans of Commercial Banks, 2010–2014
F$ = Fiji dollar, LHS= left-hand side, RHS= right-hand side. Source: Reserve Bank of Fiji. 2015. Reserve Bank of Fiji Quarterly Review March 2015. Suva.
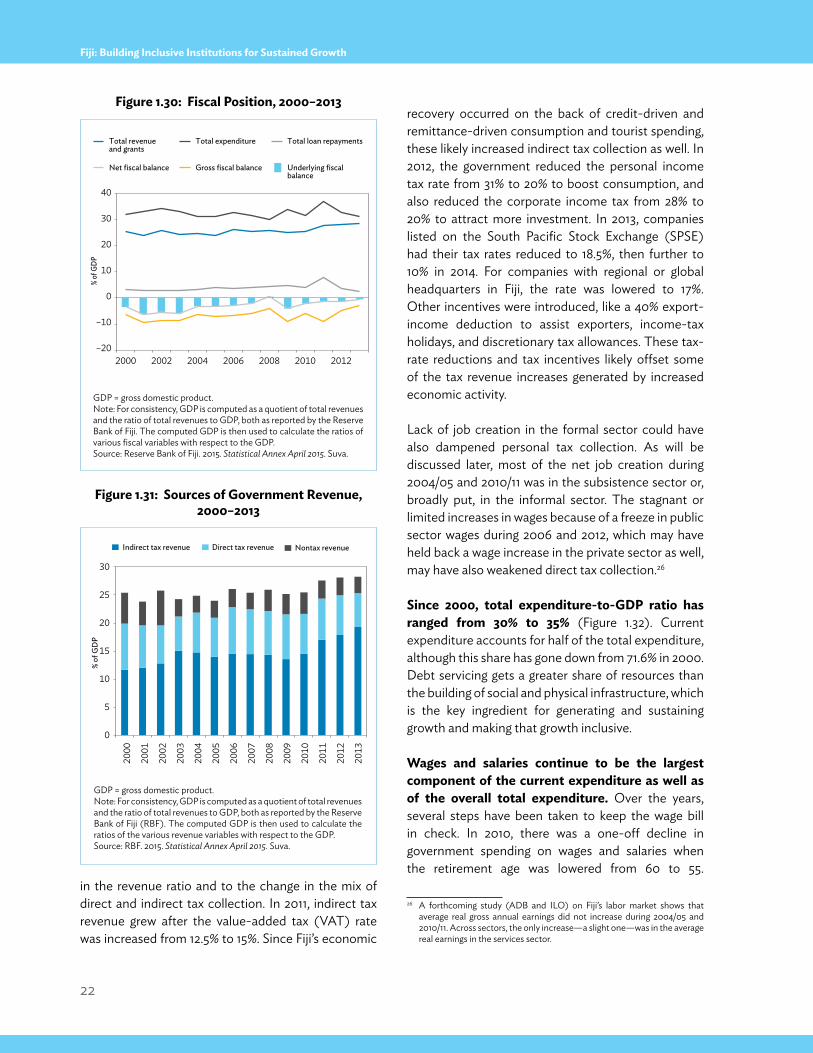
22
Fiji: Building Inclusive Institutions for Sustained Growth
in the revenue ratio and to the change in the mix of direct and indirect tax collection. In 2011, indirect tax revenue grew after the value-added tax (VAT) rate was increased from 12.5% to 15%. Since Fiji’s economic
recovery occurred on the back of credit-driven and remittance-driven consumption and tourist spending, these likely increased indirect tax collection as well. In 2012, the government reduced the personal income tax rate from 31% to 20% to boost consumption, and also reduced the corporate income tax from 28% to 20% to attract more investment. In 2013, companies listed on the South Pacific Stock Exchange (SPSE) had their tax rates reduced to 18.5%, then further to 10% in 2014. For companies with regional or global headquarters in Fiji, the rate was lowered to 17%. Other incentives were introduced, like a 40% export-income deduction to assist exporters, income-tax holidays, and discretionary tax allowances. These tax-rate reductions and tax incentives likely offset some of the tax revenue increases generated by increased economic activity.
Lack of job creation in the formal sector could have also dampened personal tax collection. As will be discussed later, most of the net job creation during 2004/05 and 2010/11 was in the subsistence sector or, broadly put, in the informal sector. The stagnant or limited increases in wages because of a freeze in public sector wages during 2006 and 2012, which may have held back a wage increase in the private sector as well, may have also weakened direct tax collection.26
since 2000, total expenditure-to-GDp ratio has ranged from 30% to 35% (Figure 1.32). Current expenditure accounts for half of the total expenditure, although this share has gone down from 71.6% in 2000. Debt servicing gets a greater share of resources than the building of social and physical infrastructure, which is the key ingredient for generating and sustaining growth and making that growth inclusive.
Wages and salaries continue to be the largest component of the current expenditure as well as of the overall total expenditure. Over the years, several steps have been taken to keep the wage bill in check. In 2010, there was a one-off decline in government spending on wages and salaries when the retirement age was lowered from 60 to 55.
26 A forthcoming study (ADB and ILO) on Fiji’s labor market shows that average real gross annual earnings did not increase during 2004/05 and 2010/11. Across sectors, the only increase—a slight one—was in the average real earnings in the services sector.
Net fiscal balance Gross fiscal balance Underlying fiscal balance
Total revenueand grants
Total loan repaymentsTotal expenditure
–20
–10
0
10
20
30
40
2000 2002 2004 2006 2008
% of
GDP
2010 2012
Figure 1.30: Fiscal position, 2000–2013
GDP = gross domestic product.Note: For consistency, GDP is computed as a quotient of total revenues and the ratio of total revenues to GDP, both as reported by the Reserve Bank of Fiji. The computed GDP is then used to calculate the ratios of various fiscal variables with respect to the GDP.Source: Reserve Bank of Fiji. 2015. Statistical Annex April 2015. Suva.
Indirect tax revenue Direct tax revenue Nontax revenue
0
5
10
15
20
25
30
% of
GD
P
2000
2001
2002
2003
2004
2005
2006
2007
2008
2009
2010
2011
2012
2013
Figure 1.31: sources of Government Revenue, 2000–2013
GDP = gross domestic product.Note: For consistency, GDP is computed as a quotient of total revenues and the ratio of total revenues to GDP, both as reported by the Reserve Bank of Fiji (RBF). The computed GDP is then used to calculate the ratios of the various revenue variables with respect to the GDP.Source: RBF. 2015. Statistical Annex April 2015. Suva.
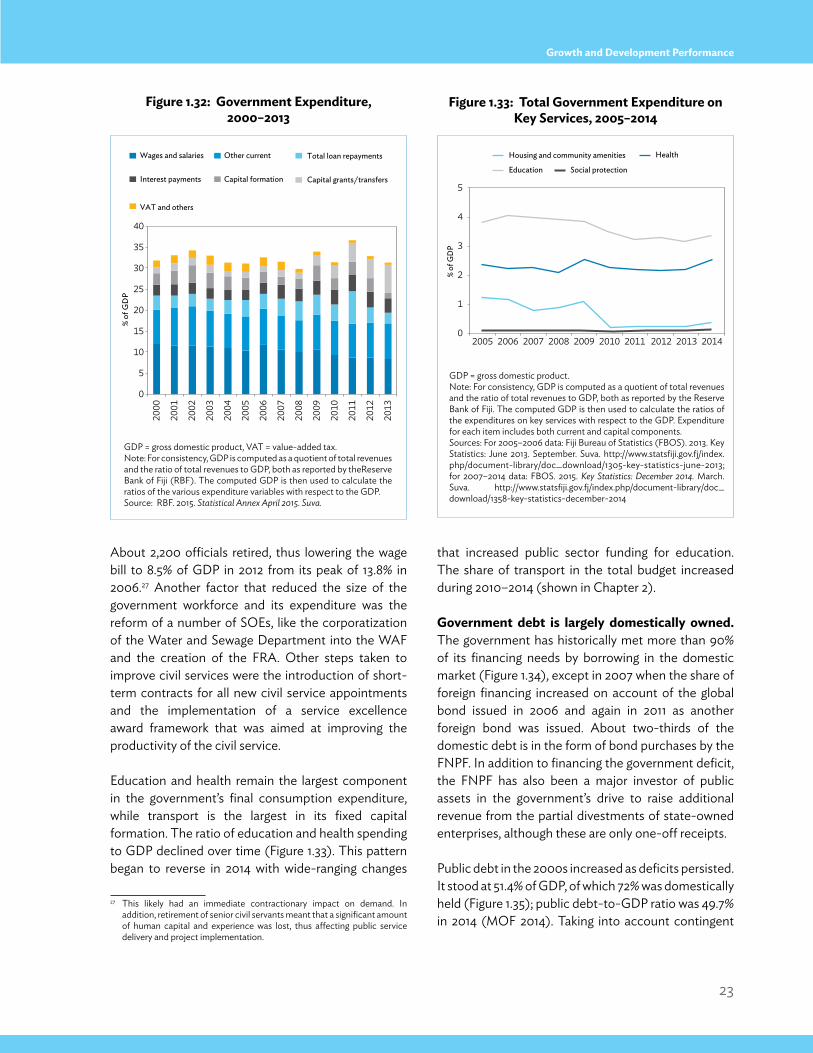
23
Growth and Development Performance
About 2,200 officials retired, thus lowering the wage bill to 8.5% of GDP in 2012 from its peak of 13.8% in 2006.27 Another factor that reduced the size of the government workforce and its expenditure was the reform of a number of SOEs, like the corporatization of the Water and Sewage Department into the WAF and the creation of the FRA. Other steps taken to improve civil services were the introduction of short-term contracts for all new civil service appointments and the implementation of a service excellence award framework that was aimed at improving the productivity of the civil service.
Education and health remain the largest component in the government’s final consumption expenditure, while transport is the largest in its fixed capital formation. The ratio of education and health spending to GDP declined over time (Figure 1.33). This pattern began to reverse in 2014 with wide-ranging changes
27 This likely had an immediate contractionary impact on demand. In addition, retirement of senior civil servants meant that a significant amount of human capital and experience was lost, thus affecting public service delivery and project implementation.
that increased public sector funding for education. The share of transport in the total budget increased during 2010–2014 (shown in Chapter 2).
Government debt is largely domestically owned. The government has historically met more than 90% of its financing needs by borrowing in the domestic market (Figure 1.34), except in 2007 when the share of foreign financing increased on account of the global bond issued in 2006 and again in 2011 as another foreign bond was issued. About two-thirds of the domestic debt is in the form of bond purchases by the FNPF. In addition to financing the government deficit, the FNPF has also been a major investor of public assets in the government’s drive to raise additional revenue from the partial divestments of state-owned enterprises, although these are only one-off receipts.
Public debt in the 2000s increased as deficits persisted. It stood at 51.4% of GDP, of which 72% was domestically held (Figure 1.35); public debt-to-GDP ratio was 49.7% in 2014 (MOF 2014). Taking into account contingent
Wages and salaries Other current Total loan repayments
Interest payments Capital formation Capital grants/transfers
VAT and others
0
5
10
15
20
25
30
35
40
2000
2001
2002
2003
2004
2005
2006
2007
2008
2009
2010
2011
2012
2013
% of
GD
P
Figure 1.32: Government expenditure, 2000–2013
GDP = gross domestic product, VAT = value-added tax.Note: For consistency, GDP is computed as a quotient of total revenues and the ratio of total revenues to GDP, both as reported by theReserve Bank of Fiji (RBF). The computed GDP is then used to calculate the ratios of the various expenditure variables with respect to the GDP.Source: RBF. 2015. Statistical Annex April 2015. Suva.
Health
Education
Housing and community amenities
Social protection
0
1
2
3
4
5
2005 2006 2007 2008 2009 2010 2011 2012 2013 2014
% of
GD
P
Figure 1.33: total Government expenditure on key services, 2005–2014
GDP = gross domestic product.Note: For consistency, GDP is computed as a quotient of total revenues and the ratio of total revenues to GDP, both as reported by the Reserve Bank of Fiji. The computed GDP is then used to calculate the ratios of the expenditures on key services with respect to the GDP. Expenditure for each item includes both current and capital components.Sources: For 2005–2006 data: Fiji Bureau of Statistics (FBOS). 2013. Key Statistics: June 2013. September. Suva. http://www.statsfiji.gov.fj/index.php/document-library/doc_download/1305-key-statistics-june-2013; for 2007–2014 data: FBOS. 2015. Key Statistics: December 2014. March. Suva. http://www.statsfiji.gov.fj/index.php/document-library/doc_ download/1358-key-statistics-december-2014
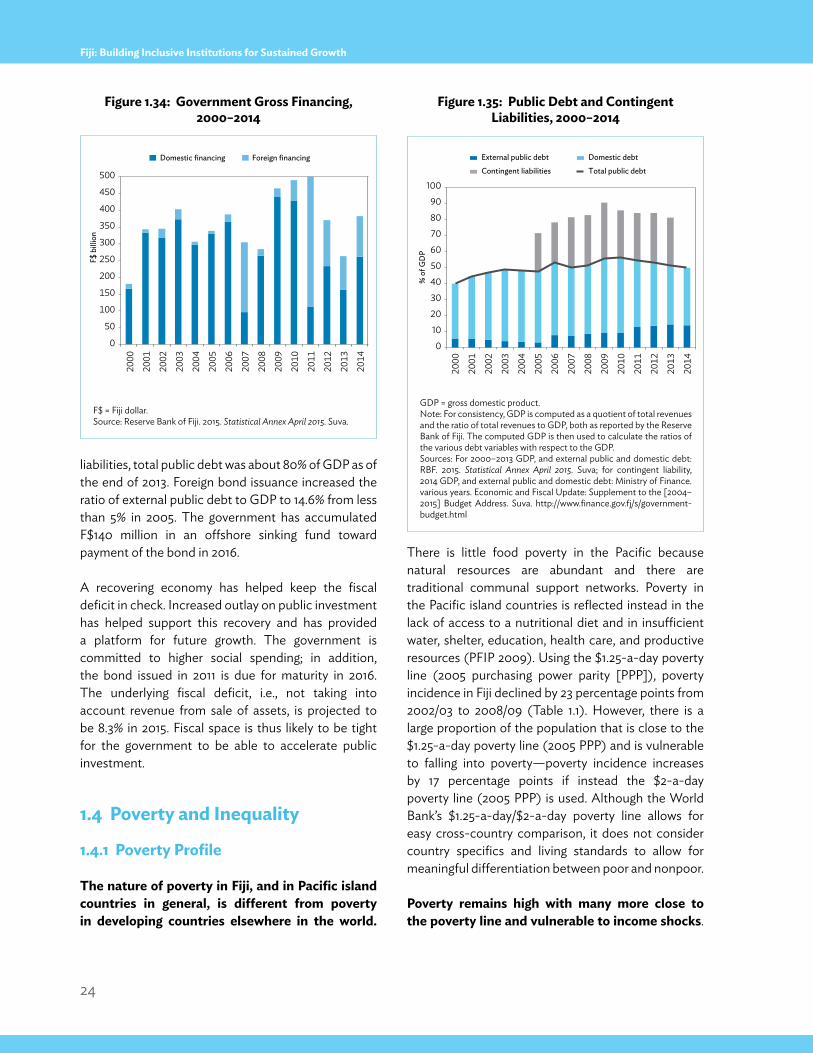
24
Fiji: Building Inclusive Institutions for Sustained Growth
liabilities, total public debt was about 80% of GDP as of the end of 2013. Foreign bond issuance increased the ratio of external public debt to GDP to 14.6% from less than 5% in 2005. The government has accumulated F$140 million in an offshore sinking fund toward payment of the bond in 2016.
A recovering economy has helped keep the fiscal deficit in check. Increased outlay on public investment has helped support this recovery and has provided a platform for future growth. The government is committed to higher social spending; in addition, the bond issued in 2011 is due for maturity in 2016. The underlying fiscal deficit, i.e., not taking into account revenue from sale of assets, is projected to be 8.3% in 2015. Fiscal space is thus likely to be tight for the government to be able to accelerate public investment.
1.4 poverty and inequality
1.4.1 poverty profile the nature of poverty in Fiji, and in pacific island countries in general, is different from poverty in developing countries elsewhere in the world.
There is little food poverty in the Pacific because natural resources are abundant and there are traditional communal support networks. Poverty in the Pacific island countries is reflected instead in the lack of access to a nutritional diet and in insufficient water, shelter, education, health care, and productive resources (PFIP 2009). Using the $1.25-a-day poverty line (2005 purchasing power parity [PPP]), poverty incidence in Fiji declined by 23 percentage points from 2002/03 to 2008/09 (Table 1.1). However, there is a large proportion of the population that is close to the $1.25-a-day poverty line (2005 PPP) and is vulnerable to falling into poverty—poverty incidence increases by 17 percentage points if instead the $2-a-day poverty line (2005 PPP) is used. Although the World Bank’s $1.25-a-day/$2-a-day poverty line allows for easy cross-country comparison, it does not consider country specifics and living standards to allow for meaningful differentiation between poor and nonpoor. poverty remains high with many more close to the poverty line and vulnerable to income shocks.
F$ b
illio
n
Domestic financing Foreign financing
0
50
100
150
200
250
300
350
400
450
500
2000
2001
2002
2003
2004
2005
2006
2007
2008
2009
2010
2011
2012
2013
2014
0
10
20
30
40
50
60
70
80
90
100
2000
2001
2002
2003
2004
2005
2006
2007
2008
2009
2010
2011
2012
2014
2013
% o
f GD
P
External public debt Domestic debt
Contingent liabilities Total public debt
Figure 1.34: Government Gross Financing, 2000–2014
F$ = Fiji dollar.Source: Reserve Bank of Fiji. 2015. Statistical Annex April 2015. Suva.
Figure 1.35: public Debt and Contingent liabilities, 2000–2014
GDP = gross domestic product.Note: For consistency, GDP is computed as a quotient of total revenues and the ratio of total revenues to GDP, both as reported by the Reserve Bank of Fiji. The computed GDP is then used to calculate the ratios of the various debt variables with respect to the GDP.Sources: For 2000–2013 GDP, and external public and domestic debt: RBF. 2015. Statistical Annex April 2015. Suva; for contingent liability, 2014 GDP, and external public and domestic debt: Ministry of Finance. various years. Economic and Fiscal Update: Supplement to the [2004–2015] Budget Address. Suva. http://www.finance.gov.fj/s/government-budget.html
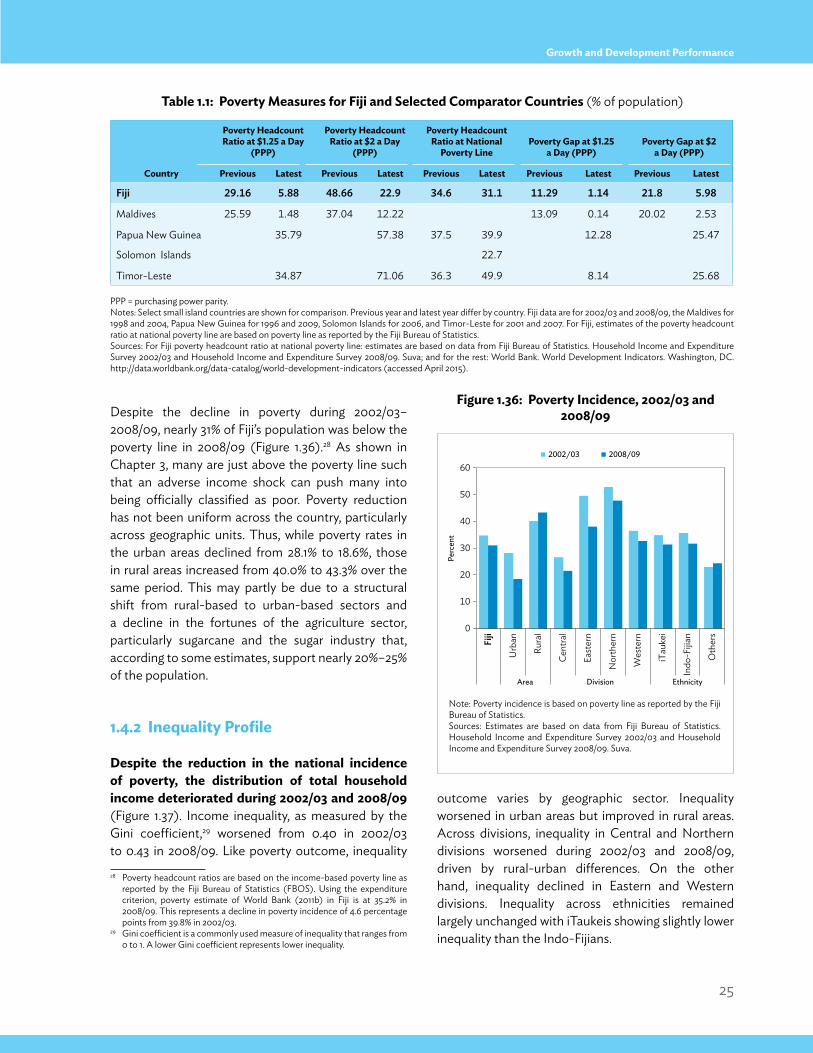
25
Growth and Development Performance
Despite the decline in poverty during 2002/03–2008/09, nearly 31% of Fiji’s population was below the poverty line in 2008/09 (Figure 1.36).28 As shown in Chapter 3, many are just above the poverty line such that an adverse income shock can push many into being officially classified as poor. Poverty reduction has not been uniform across the country, particularly across geographic units. Thus, while poverty rates in the urban areas declined from 28.1% to 18.6%, those in rural areas increased from 40.0% to 43.3% over the same period. This may partly be due to a structural shift from rural-based to urban-based sectors and a decline in the fortunes of the agriculture sector, particularly sugarcane and the sugar industry that, according to some estimates, support nearly 20%–25% of the population.
1.4.2 inequality profile
Despite the reduction in the national incidence of poverty, the distribution of total household income deteriorated during 2002/03 and 2008/09 (Figure 1.37). Income inequality, as measured by the Gini coefficient,29 worsened from 0.40 in 2002/03 to 0.43 in 2008/09. Like poverty outcome, inequality 28 Poverty headcount ratios are based on the income-based poverty line as
reported by the Fiji Bureau of Statistics (FBOS). Using the expenditure criterion, poverty estimate of World Bank (2011b) in Fiji is at 35.2% in 2008/09. This represents a decline in poverty incidence of 4.6 percentage points from 39.8% in 2002/03.
29 Gini coefficient is a commonly used measure of inequality that ranges from 0 to 1. A lower Gini coefficient represents lower inequality.
outcome varies by geographic sector. Inequality worsened in urban areas but improved in rural areas. Across divisions, inequality in Central and Northern divisions worsened during 2002/03 and 2008/09, driven by rural-urban differences. On the other hand, inequality declined in Eastern and Western divisions. Inequality across ethnicities remained largely unchanged with iTaukeis showing slightly lower inequality than the Indo-Fijians.
2002/03 2008/09
0
10
20
30
40
50
60
Perc
ent
Fiji
Urb
an
Rura
l
Cent
ral
East
ern
Nor
ther
n
Wes
tern
iTau
kei
Indo
-Fijia
n
Oth
ers
Area Division Ethnicity
table 1.1: poverty measures for Fiji and selected Comparator Countries (% of population)
PPP = purchasing power parity.Notes: Select small island countries are shown for comparison. Previous year and latest year differ by country. Fiji data are for 2002/03 and 2008/09, the Maldives for 1998 and 2004, Papua New Guinea for 1996 and 2009, Solomon Islands for 2006, and Timor-Leste for 2001 and 2007. For Fiji, estimates of the poverty headcount ratio at national poverty line are based on poverty line as reported by the Fiji Bureau of Statistics.Sources: For Fiji poverty headcount ratio at national poverty line: estimates are based on data from Fiji Bureau of Statistics. Household Income and Expenditure Survey 2002/03 and Household Income and Expenditure Survey 2008/09. Suva; and for the rest: World Bank. World Development Indicators. Washington, DC. http://data.worldbank.org/data-catalog/world-development-indicators (accessed April 2015).
Country
poverty Headcount Ratio at $1.25 a Day
(ppp)
poverty Headcount Ratio at $2 a Day
(ppp)
poverty Headcount Ratio at national
poverty line poverty Gap at $1.25
a Day (ppp) poverty Gap at $2
a Day (ppp)
previous latest previous latest previous latest previous latest previous latest
Fiji 29.16 5.88 48.66 22.9 34.6 31.1 11.29 1.14 21.8 5.98
Maldives 25.59 1.48 37.04 12.22 13.09 0.14 20.02 2.53
Papua New Guinea 35.79 57.38 37.5 39.9 12.28 25.47
Solomon Islands 22.7
Timor-Leste 34.87 71.06 36.3 49.9 8.14 25.68
Figure 1.36: poverty incidence, 2002/03 and 2008/09
Note: Poverty incidence is based on poverty line as reported by the Fiji Bureau of Statistics.Sources: Estimates are based on data from Fiji Bureau of Statistics. Household Income and Expenditure Survey 2002/03 and Household Income and Expenditure Survey 2008/09. Suva.
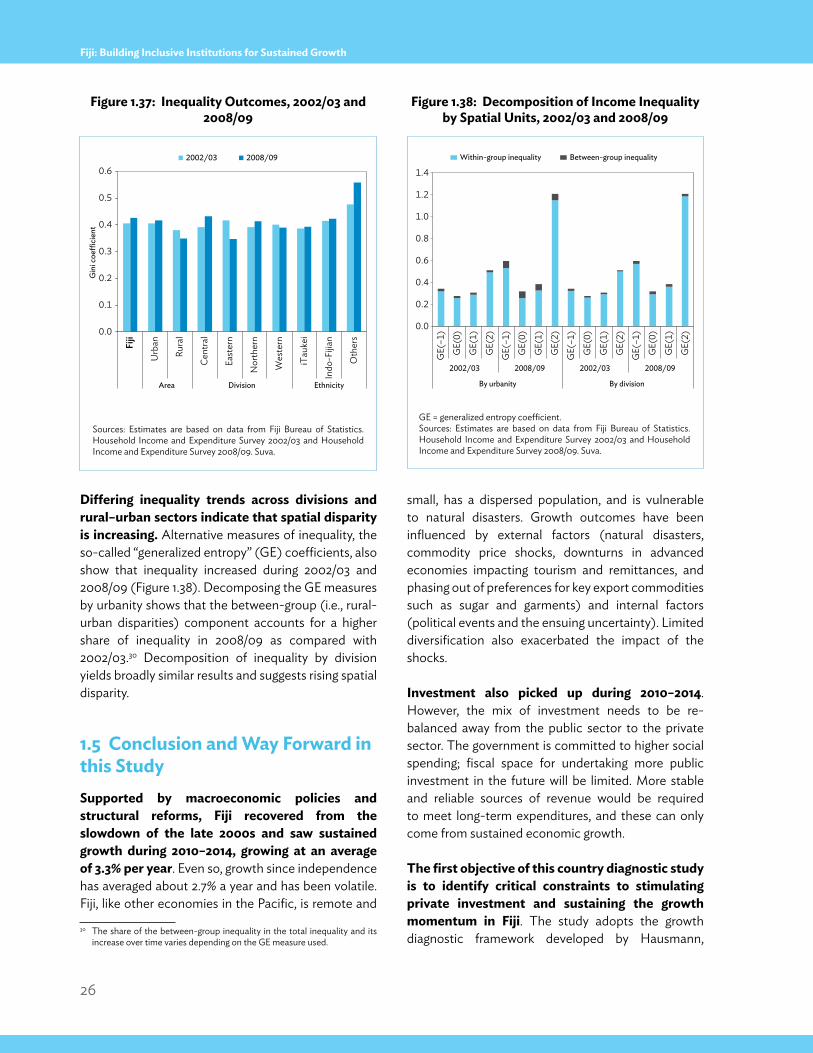
26
Fiji: Building Inclusive Institutions for Sustained Growth
Differing inequality trends across divisions and rural–urban sectors indicate that spatial disparity is increasing. Alternative measures of inequality, the so-called “generalized entropy” (GE) coefficients, also show that inequality increased during 2002/03 and 2008/09 (Figure 1.38). Decomposing the GE measures by urbanity shows that the between-group (i.e., rural-urban disparities) component accounts for a higher share of inequality in 2008/09 as compared with 2002/03.30 Decomposition of inequality by division yields broadly similar results and suggests rising spatial disparity.
1.5 Conclusion and Way Forward in this studysupported by macroeconomic policies and structural reforms, Fiji recovered from the slowdown of the late 2000s and saw sustained growth during 2010–2014, growing at an average of 3.3% per year. Even so, growth since independence has averaged about 2.7% a year and has been volatile. Fiji, like other economies in the Pacific, is remote and
30 The share of the between-group inequality in the total inequality and its increase over time varies depending on the GE measure used.
small, has a dispersed population, and is vulnerable to natural disasters. Growth outcomes have been influenced by external factors (natural disasters, commodity price shocks, downturns in advanced economies impacting tourism and remittances, and phasing out of preferences for key export commodities such as sugar and garments) and internal factors (political events and the ensuing uncertainty). Limited diversification also exacerbated the impact of the shocks.
investment also picked up during 2010–2014. However, the mix of investment needs to be re-balanced away from the public sector to the private sector. The government is committed to higher social spending; fiscal space for undertaking more public investment in the future will be limited. More stable and reliable sources of revenue would be required to meet long-term expenditures, and these can only come from sustained economic growth.
the first objective of this country diagnostic study is to identify critical constraints to stimulating private investment and sustaining the growth momentum in Fiji. The study adopts the growth diagnostic framework developed by Hausmann,
2002/03 2008/09
0.0
0.1
0.2
0.3
0.4
0.5
0.6
Gin
i coe
�ci
ent
Fiji
Urb
an
Rura
l
Cent
ral
East
ern
Nor
ther
n
Wes
tern
iTau
kei
Indo
-Fijia
n
Oth
ers
Area Division Ethnicity
Figure 1.37: inequality outcomes, 2002/03 and 2008/09
Sources: Estimates are based on data from Fiji Bureau of Statistics. Household Income and Expenditure Survey 2002/03 and Household Income and Expenditure Survey 2008/09. Suva.
Within-group inequality Between-group inequality
0.0
0.2
0.4
0.6
0.8
1.0
1.2
1.4
GE(
–1)
GE(
0)
GE(
1)
GE(
2)
GE(
–1)
GE(
0)
GE(
1)
GE(
2)
GE(
–1)
GE(
0)
GE(
1)
GE(
2)
GE(
–1)
GE(
0)
GE(
1)
GE(
2)
2002/03 2008/09 2002/03 2008/09
By urbanity By division
Figure 1.38: Decomposition of income inequalityby spatial Units, 2002/03 and 2008/09
GE = generalized entropy coefficient.Sources: Estimates are based on data from Fiji Bureau of Statistics. Household Income and Expenditure Survey 2002/03 and Household Income and Expenditure Survey 2008/09. Suva.
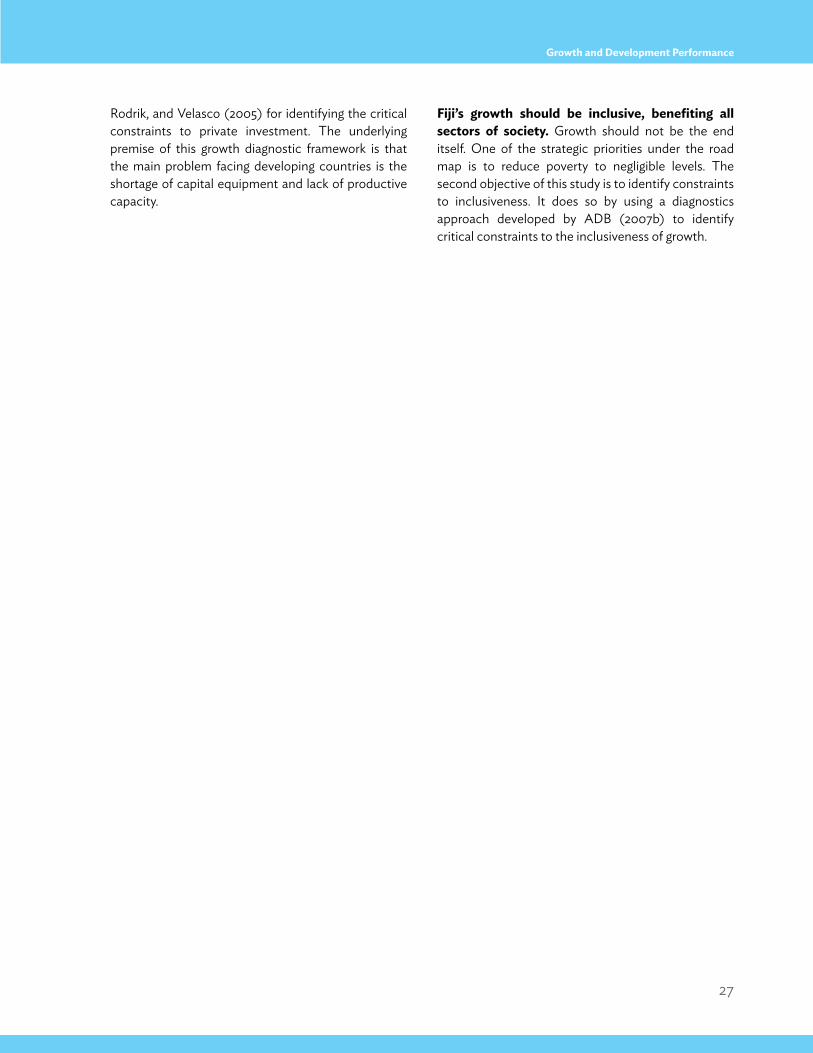
27
Growth and Development Performance
Rodrik, and Velasco (2005) for identifying the critical constraints to private investment. The underlying premise of this growth diagnostic framework is that the main problem facing developing countries is the shortage of capital equipment and lack of productive capacity.
Fiji’s growth should be inclusive, benefiting all sectors of society. Growth should not be the end itself. One of the strategic priorities under the road map is to reduce poverty to negligible levels. The second objective of this study is to identify constraints to inclusiveness. It does so by using a diagnostics approach developed by ADB (2007b) to identify critical constraints to the inclusiveness of growth.
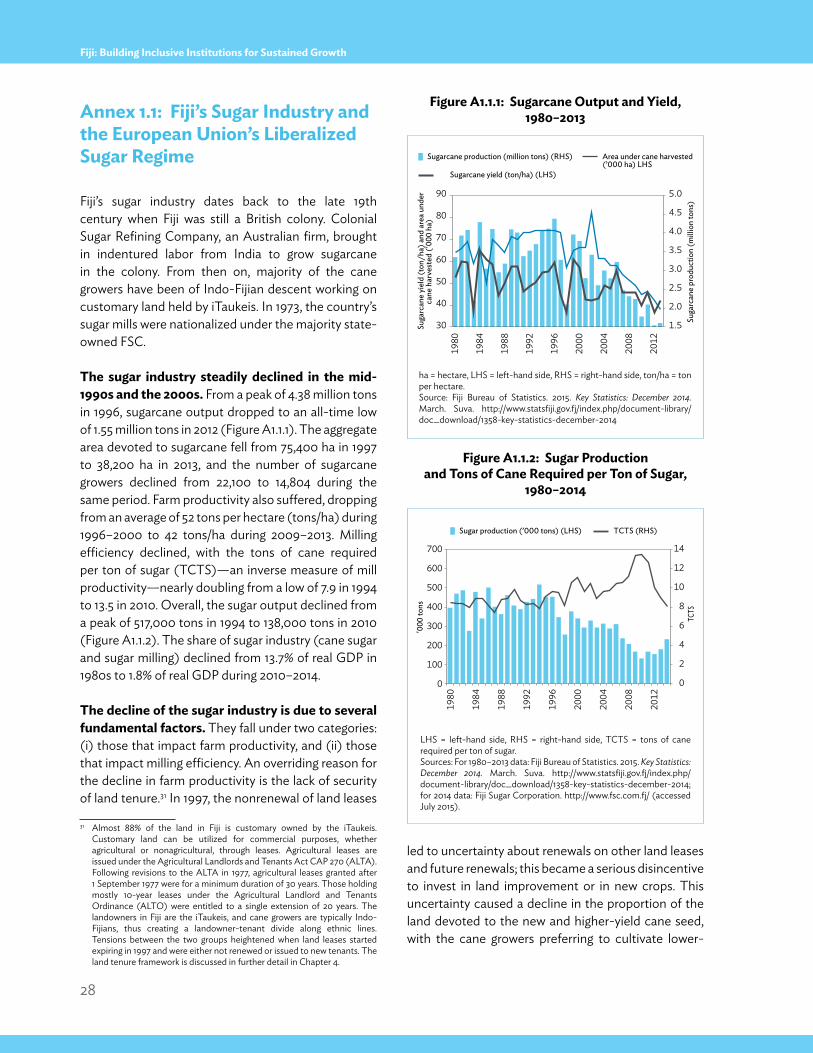
28
Fiji: Building Inclusive Institutions for Sustained Growth
Annex 1.1: Fiji’s sugar industry and the european Union’s liberalized sugar Regime
Fiji’s sugar industry dates back to the late 19th century when Fiji was still a British colony. Colonial Sugar Refining Company, an Australian firm, brought in indentured labor from India to grow sugarcane in the colony. From then on, majority of the cane growers have been of Indo-Fijian descent working on customary land held by iTaukeis. In 1973, the country’s sugar mills were nationalized under the majority state-owned FSC.
the sugar industry steadily declined in the mid-1990s and the 2000s. From a peak of 4.38 million tons in 1996, sugarcane output dropped to an all-time low of 1.55 million tons in 2012 (Figure A1.1.1). The aggregate area devoted to sugarcane fell from 75,400 ha in 1997 to 38,200 ha in 2013, and the number of sugarcane growers declined from 22,100 to 14,804 during the same period. Farm productivity also suffered, dropping from an average of 52 tons per hectare (tons/ha) during 1996–2000 to 42 tons/ha during 2009–2013. Milling efficiency declined, with the tons of cane required per ton of sugar (TCTS)—an inverse measure of mill productivity—nearly doubling from a low of 7.9 in 1994 to 13.5 in 2010. Overall, the sugar output declined from a peak of 517,000 tons in 1994 to 138,000 tons in 2010 (Figure A1.1.2). The share of sugar industry (cane sugar and sugar milling) declined from 13.7% of real GDP in 1980s to 1.8% of real GDP during 2010–2014.
the decline of the sugar industry is due to several fundamental factors. They fall under two categories: (i) those that impact farm productivity, and (ii) those that impact milling efficiency. An overriding reason for the decline in farm productivity is the lack of security of land tenure.31 In 1997, the nonrenewal of land leases
31 Almost 88% of the land in Fiji is customary owned by the iTaukeis. Customary land can be utilized for commercial purposes, whether agricultural or nonagricultural, through leases. Agricultural leases are issued under the Agricultural Landlords and Tenants Act CAP 270 (ALTA). Following revisions to the ALTA in 1977, agricultural leases granted after 1 September 1977 were for a minimum duration of 30 years. Those holding mostly 10-year leases under the Agricultural Landlord and Tenants Ordinance (ALTO) were entitled to a single extension of 20 years. The landowners in Fiji are the iTaukeis, and cane growers are typically Indo-Fijians, thus creating a landowner-tenant divide along ethnic lines. Tensions between the two groups heightened when land leases started expiring in 1997 and were either not renewed or issued to new tenants. The land tenure framework is discussed in further detail in Chapter 4.
led to uncertainty about renewals on other land leases and future renewals; this became a serious disincentive to invest in land improvement or in new crops. This uncertainty caused a decline in the proportion of the land devoted to the new and higher-yield cane seed, with the cane growers preferring to cultivate lower-
1.5
2.0
2.5
3.0
3.5
4.0
4.5
5.0
30
40
50
60
70
80
90
1980
1984
1988
1992
1996
2000
2004
2008
2012
Suga
rcan
e pr
oduc
tion
(mill
ion
tons
)
Suga
rcan
e yi
eld
(ton
/ha)
and
are
a un
der
cane
har
vest
ed ('
000
ha)
Sugarcane production (million tons) (RHS) Area under cane harvested(’000 ha) LHS
Sugarcane yield (ton/ha) (LHS)
Sugar production (’000 tons) (LHS) TCTS (RHS)
0
2
4
6
8
10
12
14
0
100
200
300
400
500
600
700
1980
1984
1988
1992
1996
2000
2004
2008
2012
TCTS
'000
tons
Figure A1.1.1: sugarcane output and Yield, 1980–2013
ha = hectare, LHS = left-hand side, RHS = right-hand side, ton/ha = ton per hectare.Source: Fiji Bureau of Statistics. 2015. Key Statistics: December 2014. March. Suva. http://www.statsfiji.gov.fj/index.php/document-library/doc_download/1358-key-statistics-december-2014
Figure A1.1.2: sugar production and tons of Cane Required per ton of sugar,
1980–2014
LHS = left-hand side, RHS = right-hand side, TCTS = tons of cane required per ton of sugar.Sources: For 1980–2013 data: Fiji Bureau of Statistics. 2015. Key Statistics: December 2014. March. Suva. http://www.statsfiji.gov.fj/index.php/document-library/doc_download/1358-key-statistics-december-2014; for 2014 data: Fiji Sugar Corporation. http://www.fsc.com.fj/ (accessed July 2015).
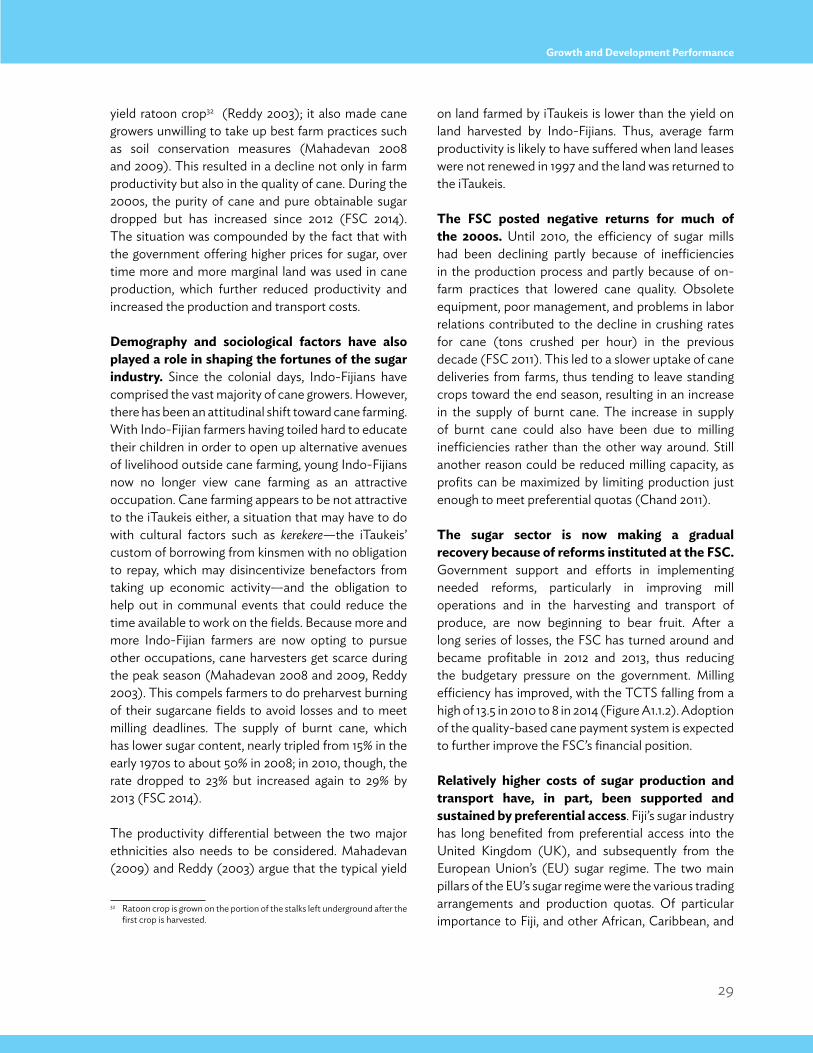
29
Growth and Development Performance
yield ratoon crop32 (Reddy 2003); it also made cane growers unwilling to take up best farm practices such as soil conservation measures (Mahadevan 2008 and 2009). This resulted in a decline not only in farm productivity but also in the quality of cane. During the 2000s, the purity of cane and pure obtainable sugar dropped but has increased since 2012 (FSC 2014). The situation was compounded by the fact that with the government offering higher prices for sugar, over time more and more marginal land was used in cane production, which further reduced productivity and increased the production and transport costs.
Demography and sociological factors have also played a role in shaping the fortunes of the sugar industry. Since the colonial days, Indo-Fijians have comprised the vast majority of cane growers. However, there has been an attitudinal shift toward cane farming. With Indo-Fijian farmers having toiled hard to educate their children in order to open up alternative avenues of livelihood outside cane farming, young Indo-Fijians now no longer view cane farming as an attractive occupation. Cane farming appears to be not attractive to the iTaukeis either, a situation that may have to do with cultural factors such as kerekere—the iTaukeis’ custom of borrowing from kinsmen with no obligation to repay, which may disincentivize benefactors from taking up economic activity—and the obligation to help out in communal events that could reduce the time available to work on the fields. Because more and more Indo-Fijian farmers are now opting to pursue other occupations, cane harvesters get scarce during the peak season (Mahadevan 2008 and 2009, Reddy 2003). This compels farmers to do preharvest burning of their sugarcane fields to avoid losses and to meet milling deadlines. The supply of burnt cane, which has lower sugar content, nearly tripled from 15% in the early 1970s to about 50% in 2008; in 2010, though, the rate dropped to 23% but increased again to 29% by 2013 (FSC 2014).
The productivity differential between the two major ethnicities also needs to be considered. Mahadevan (2009) and Reddy (2003) argue that the typical yield
32 Ratoon crop is grown on the portion of the stalks left underground after the first crop is harvested.
on land farmed by iTaukeis is lower than the yield on land harvested by Indo-Fijians. Thus, average farm productivity is likely to have suffered when land leases were not renewed in 1997 and the land was returned to the iTaukeis.
the FsC posted negative returns for much of the 2000s. Until 2010, the efficiency of sugar mills had been declining partly because of inefficiencies in the production process and partly because of on-farm practices that lowered cane quality. Obsolete equipment, poor management, and problems in labor relations contributed to the decline in crushing rates for cane (tons crushed per hour) in the previous decade (FSC 2011). This led to a slower uptake of cane deliveries from farms, thus tending to leave standing crops toward the end season, resulting in an increase in the supply of burnt cane. The increase in supply of burnt cane could also have been due to milling inefficiencies rather than the other way around. Still another reason could be reduced milling capacity, as profits can be maximized by limiting production just enough to meet preferential quotas (Chand 2011).
the sugar sector is now making a gradual recovery because of reforms instituted at the FsC. Government support and efforts in implementing needed reforms, particularly in improving mill operations and in the harvesting and transport of produce, are now beginning to bear fruit. After a long series of losses, the FSC has turned around and became profitable in 2012 and 2013, thus reducing the budgetary pressure on the government. Milling efficiency has improved, with the TCTS falling from a high of 13.5 in 2010 to 8 in 2014 (Figure A1.1.2). Adoption of the quality-based cane payment system is expected to further improve the FSC’s financial position.
Relatively higher costs of sugar production and transport have, in part, been supported and sustained by preferential access. Fiji’s sugar industry has long benefited from preferential access into the United Kingdom (UK), and subsequently from the European Union’s (EU) sugar regime. The two main pillars of the EU’s sugar regime were the various trading arrangements and production quotas. Of particular importance to Fiji, and other African, Caribbean, and
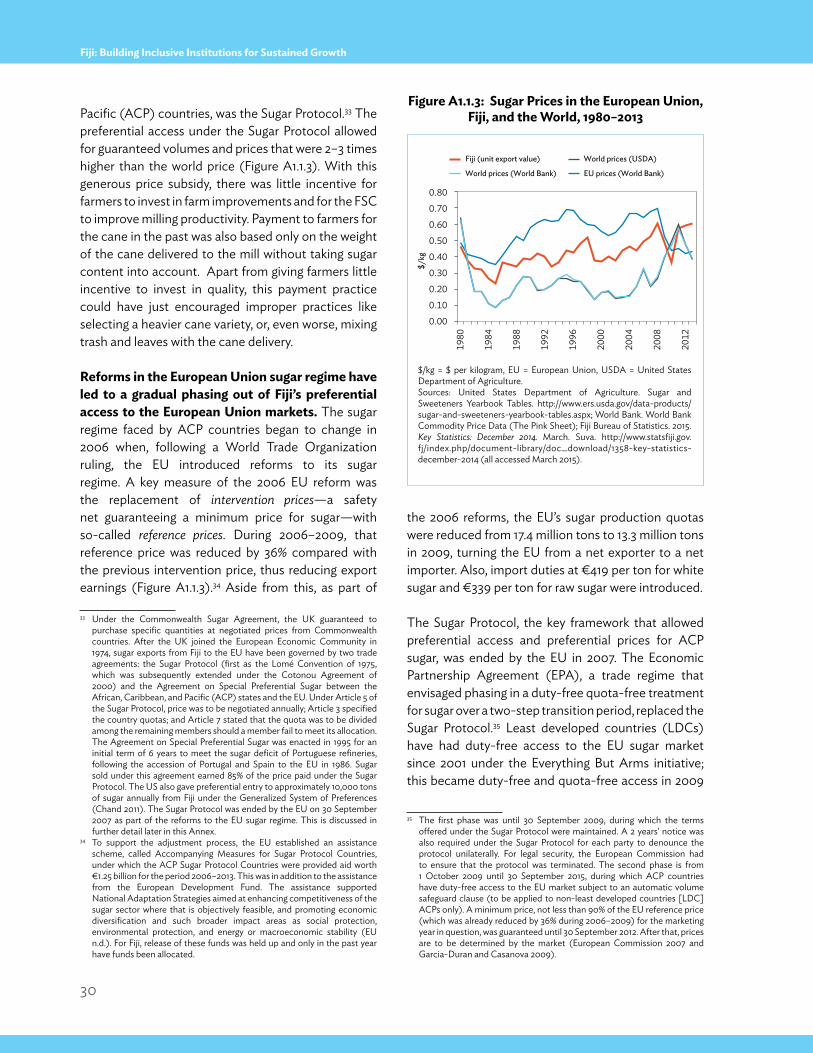
30
Fiji: Building Inclusive Institutions for Sustained Growth
Pacific (ACP) countries, was the Sugar Protocol.33 The preferential access under the Sugar Protocol allowed for guaranteed volumes and prices that were 2–3 times higher than the world price (Figure A1.1.3). With this generous price subsidy, there was little incentive for farmers to invest in farm improvements and for the FSC to improve milling productivity. Payment to farmers for the cane in the past was also based only on the weight of the cane delivered to the mill without taking sugar content into account. Apart from giving farmers little incentive to invest in quality, this payment practice could have just encouraged improper practices like selecting a heavier cane variety, or, even worse, mixing trash and leaves with the cane delivery.
Reforms in the european Union sugar regime have led to a gradual phasing out of Fiji’s preferential access to the european Union markets. The sugar regime faced by ACP countries began to change in 2006 when, following a World Trade Organization ruling, the EU introduced reforms to its sugar regime. A key measure of the 2006 EU reform was the replacement of intervention prices—a safety net guaranteeing a minimum price for sugar—with so-called reference prices. During 2006–2009, that reference price was reduced by 36% compared with the previous intervention price, thus reducing export earnings (Figure A1.1.3).34 Aside from this, as part of
33 Under the Commonwealth Sugar Agreement, the UK guaranteed to purchase specific quantities at negotiated prices from Commonwealth countries. After the UK joined the European Economic Community in 1974, sugar exports from Fiji to the EU have been governed by two trade agreements: the Sugar Protocol (first as the Lomé Convention of 1975, which was subsequently extended under the Cotonou Agreement of 2000) and the Agreement on Special Preferential Sugar between the African, Caribbean, and Pacific (ACP) states and the EU. Under Article 5 of the Sugar Protocol, price was to be negotiated annually; Article 3 specified the country quotas; and Article 7 stated that the quota was to be divided among the remaining members should a member fail to meet its allocation. The Agreement on Special Preferential Sugar was enacted in 1995 for an initial term of 6 years to meet the sugar deficit of Portuguese refineries, following the accession of Portugal and Spain to the EU in 1986. Sugar sold under this agreement earned 85% of the price paid under the Sugar Protocol. The US also gave preferential entry to approximately 10,000 tons of sugar annually from Fiji under the Generalized System of Preferences (Chand 2011). The Sugar Protocol was ended by the EU on 30 September 2007 as part of the reforms to the EU sugar regime. This is discussed in further detail later in this Annex.
34 To support the adjustment process, the EU established an assistance scheme, called Accompanying Measures for Sugar Protocol Countries, under which the ACP Sugar Protocol Countries were provided aid worth €1.25 billion for the period 2006–2013. This was in addition to the assistance from the European Development Fund. The assistance supported National Adaptation Strategies aimed at enhancing competitiveness of the sugar sector where that is objectively feasible, and promoting economic diversification and such broader impact areas as social protection, environmental protection, and energy or macroeconomic stability (EU n.d.). For Fiji, release of these funds was held up and only in the past year have funds been allocated.
the 2006 reforms, the EU’s sugar production quotas were reduced from 17.4 million tons to 13.3 million tons in 2009, turning the EU from a net exporter to a net importer. Also, import duties at €419 per ton for white sugar and €339 per ton for raw sugar were introduced.
The Sugar Protocol, the key framework that allowed preferential access and preferential prices for ACP sugar, was ended by the EU in 2007. The Economic Partnership Agreement (EPA), a trade regime that envisaged phasing in a duty-free quota-free treatment for sugar over a two-step transition period, replaced the Sugar Protocol.35 Least developed countries (LDCs) have had duty-free access to the EU sugar market since 2001 under the Everything But Arms initiative; this became duty-free and quota-free access in 2009
35 The first phase was until 30 September 2009, during which the terms offered under the Sugar Protocol were maintained. A 2 years' notice was also required under the Sugar Protocol for each party to denounce the protocol unilaterally. For legal security, the European Commission had to ensure that the protocol was terminated. The second phase is from 1 October 2009 until 30 September 2015, during which ACP countries have duty-free access to the EU market subject to an automatic volume safeguard clause (to be applied to non-least developed countries [LDC] ACPs only). A minimum price, not less than 90% of the EU reference price (which was already reduced by 36% during 2006–2009) for the marketing year in question, was guaranteed until 30 September 2012. After that, prices are to be determined by the market (European Commission 2007 and Garcia-Duran and Casanova 2009).
World prices (World Bank) EU prices (World Bank)
Fiji (unit export value) World prices (USDA)
0.00
0.10
0.20
0.30
0.40
0.50
0.60
0.70
0.80
1980
1984
1988
1992
1996
2000
2004
2008
2012
$/kg
Figure A1.1.3: sugar prices in the european Union, Fiji, and the World, 1980–2013
$/kg = $ per kilogram, EU = European Union, USDA = United States Department of Agriculture.Sources: United States Department of Agriculture. Sugar and Sweeteners Yearbook Tables. http://www.ers.usda.gov/data-products/sugar-and-sweeteners-yearbook-tables.aspx; World Bank. World Bank Commodity Price Data (The Pink Sheet); Fiji Bureau of Statistics. 2015. Key Statistics: December 2014. March. Suva. http://www.statsfiji.gov.fj/index.php/document-library/doc_download/1358-key-statistics-december-2014 (all accessed March 2015).
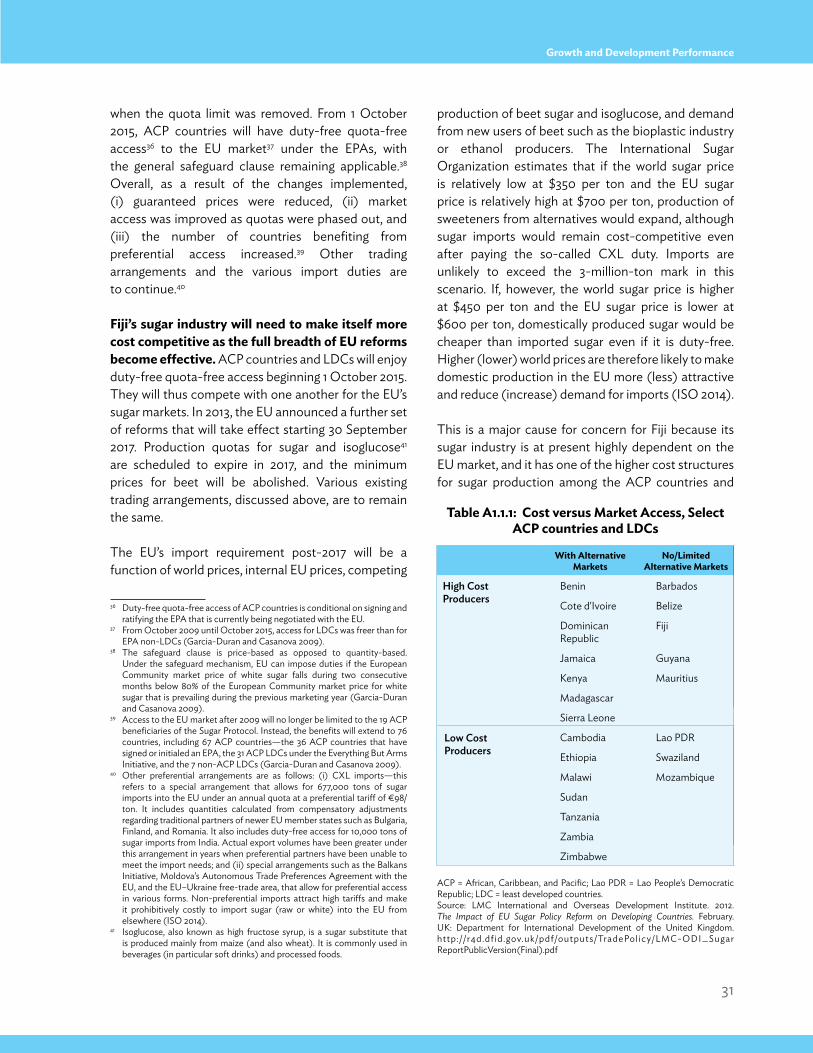
31
Growth and Development Performance
when the quota limit was removed. From 1 October 2015, ACP countries will have duty-free quota-free access36 to the EU market37 under the EPAs, with the general safeguard clause remaining applicable.38 Overall, as a result of the changes implemented, (i) guaranteed prices were reduced, (ii) market access was improved as quotas were phased out, and (iii) the number of countries benefiting from preferential access increased.39 Other trading arrangements and the various import duties are to continue.40
Fiji’s sugar industry will need to make itself more cost competitive as the full breadth of eU reforms become effective. ACP countries and LDCs will enjoy duty-free quota-free access beginning 1 October 2015. They will thus compete with one another for the EU’s sugar markets. In 2013, the EU announced a further set of reforms that will take effect starting 30 September 2017. Production quotas for sugar and isoglucose41 are scheduled to expire in 2017, and the minimum prices for beet will be abolished. Various existing trading arrangements, discussed above, are to remain the same.
The EU’s import requirement post-2017 will be a function of world prices, internal EU prices, competing
36 Duty-free quota-free access of ACP countries is conditional on signing and ratifying the EPA that is currently being negotiated with the EU.
37 From October 2009 until October 2015, access for LDCs was freer than for EPA non-LDCs (Garcia-Duran and Casanova 2009).
38 The safeguard clause is price-based as opposed to quantity-based. Under the safeguard mechanism, EU can impose duties if the European Community market price of white sugar falls during two consecutive months below 80% of the European Community market price for white sugar that is prevailing during the previous marketing year (Garcia-Duran and Casanova 2009).
39 Access to the EU market after 2009 will no longer be limited to the 19 ACP beneficiaries of the Sugar Protocol. Instead, the benefits will extend to 76 countries, including 67 ACP countries—the 36 ACP countries that have signed or initialed an EPA, the 31 ACP LDCs under the Everything But Arms Initiative, and the 7 non-ACP LDCs (Garcia-Duran and Casanova 2009).
40 Other preferential arrangements are as follows: (i) CXL imports—this refers to a special arrangement that allows for 677,000 tons of sugar imports into the EU under an annual quota at a preferential tariff of €98/ton. It includes quantities calculated from compensatory adjustments regarding traditional partners of newer EU member states such as Bulgaria, Finland, and Romania. It also includes duty-free access for 10,000 tons of sugar imports from India. Actual export volumes have been greater under this arrangement in years when preferential partners have been unable to meet the import needs; and (ii) special arrangements such as the Balkans Initiative, Moldova’s Autonomous Trade Preferences Agreement with the EU, and the EU–Ukraine free-trade area, that allow for preferential access in various forms. Non-preferential imports attract high tariffs and make it prohibitively costly to import sugar (raw or white) into the EU from elsewhere (ISO 2014).
41 Isoglucose, also known as high fructose syrup, is a sugar substitute that is produced mainly from maize (and also wheat). It is commonly used in beverages (in particular soft drinks) and processed foods.
production of beet sugar and isoglucose, and demand from new users of beet such as the bioplastic industry or ethanol producers. The International Sugar Organization estimates that if the world sugar price is relatively low at $350 per ton and the EU sugar price is relatively high at $700 per ton, production of sweeteners from alternatives would expand, although sugar imports would remain cost-competitive even after paying the so-called CXL duty. Imports are unlikely to exceed the 3-million-ton mark in this scenario. If, however, the world sugar price is higher at $450 per ton and the EU sugar price is lower at $600 per ton, domestically produced sugar would be cheaper than imported sugar even if it is duty-free. Higher (lower) world prices are therefore likely to make domestic production in the EU more (less) attractive and reduce (increase) demand for imports (ISO 2014).
This is a major cause for concern for Fiji because its sugar industry is at present highly dependent on the EU market, and it has one of the higher cost structures for sugar production among the ACP countries and
table A1.1.1: Cost versus market Access, select ACp countries and lDCs
With Alternative markets
no/limitedAlternative markets
high cost Producers
Benin Barbados
Cote d'Ivoire Belize
Dominican Republic
Fiji
Jamaica Guyana
Kenya Mauritius
Madagascar
Sierra Leone
Low cost Producers
Cambodia Lao PDR
Ethiopia Swaziland
Malawi Mozambique
Sudan
Tanzania
Zambia
Zimbabwe
ACP = African, Caribbean, and Pacific; Lao PDR = Lao People’s Democratic Republic; LDC = least developed countries.Source: LMC International and Overseas Development Institute. 2012. The Impact of EU Sugar Policy Reform on Developing Countries. February. UK: Department for International Development of the United Kingdom. http://r4d.dfid.gov.uk/pdf/outputs/TradePolicy/LMC- ODI_Sugar ReportPublicVersion(Final).pdf
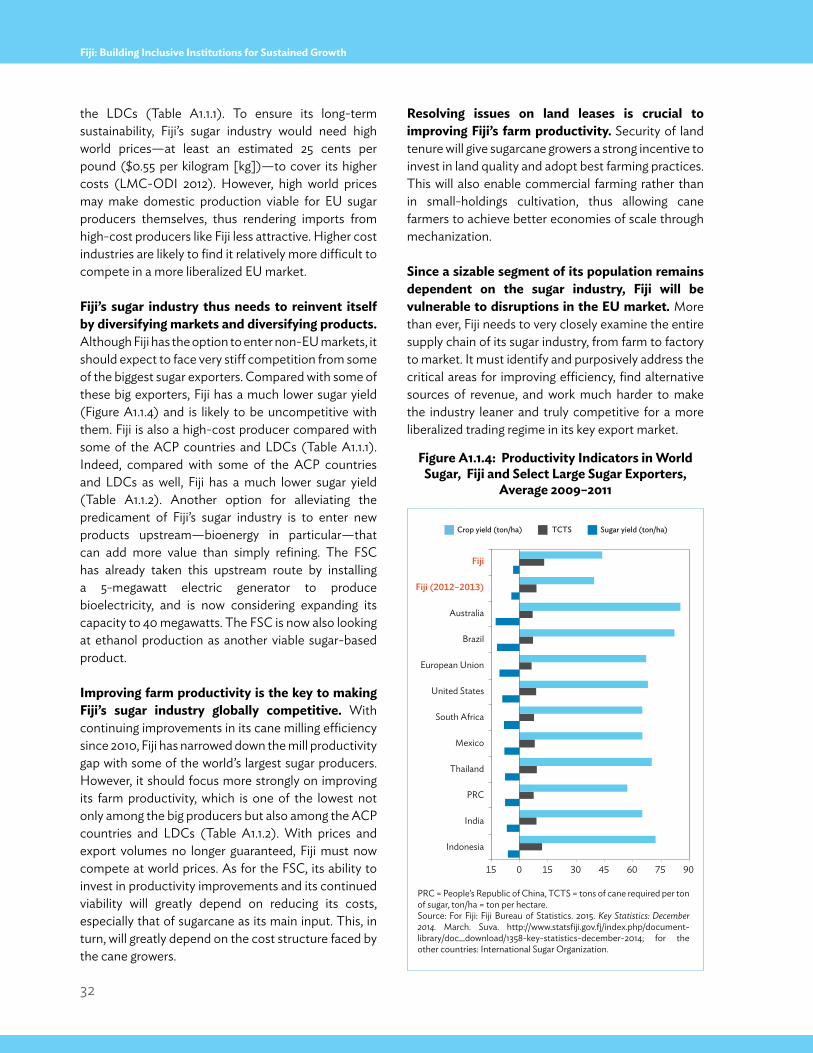
32
Fiji: Building Inclusive Institutions for Sustained Growth
the LDCs (Table A1.1.1). To ensure its long-term sustainability, Fiji’s sugar industry would need high world prices—at least an estimated 25 cents per pound ($0.55 per kilogram [kg])—to cover its higher costs (LMC-ODI 2012). However, high world prices may make domestic production viable for EU sugar producers themselves, thus rendering imports from high-cost producers like Fiji less attractive. Higher cost industries are likely to find it relatively more difficult to compete in a more liberalized EU market.
Fiji’s sugar industry thus needs to reinvent itself by diversifying markets and diversifying products. Although Fiji has the option to enter non-EU markets, it should expect to face very stiff competition from some of the biggest sugar exporters. Compared with some of these big exporters, Fiji has a much lower sugar yield (Figure A1.1.4) and is likely to be uncompetitive with them. Fiji is also a high-cost producer compared with some of the ACP countries and LDCs (Table A1.1.1). Indeed, compared with some of the ACP countries and LDCs as well, Fiji has a much lower sugar yield (Table A1.1.2). Another option for alleviating the predicament of Fiji’s sugar industry is to enter new products upstream—bioenergy in particular—that can add more value than simply refining. The FSC has already taken this upstream route by installing a 5-megawatt electric generator to produce bioelectricity, and is now considering expanding its capacity to 40 megawatts. The FSC is now also looking at ethanol production as another viable sugar-based product.
improving farm productivity is the key to making Fiji’s sugar industry globally competitive. With continuing improvements in its cane milling efficiency since 2010, Fiji has narrowed down the mill productivity gap with some of the world’s largest sugar producers. However, it should focus more strongly on improving its farm productivity, which is one of the lowest not only among the big producers but also among the ACP countries and LDCs (Table A1.1.2). With prices and export volumes no longer guaranteed, Fiji must now compete at world prices. As for the FSC, its ability to invest in productivity improvements and its continued viability will greatly depend on reducing its costs, especially that of sugarcane as its main input. This, in turn, will greatly depend on the cost structure faced by the cane growers.
Resolving issues on land leases is crucial to improving Fiji’s farm productivity. Security of land tenure will give sugarcane growers a strong incentive to invest in land quality and adopt best farming practices. This will also enable commercial farming rather than in small-holdings cultivation, thus allowing cane farmers to achieve better economies of scale through mechanization.
since a sizable segment of its population remains dependent on the sugar industry, Fiji will be vulnerable to disruptions in the eU market. More than ever, Fiji needs to very closely examine the entire supply chain of its sugar industry, from farm to factory to market. It must identify and purposively address the critical areas for improving efficiency, find alternative sources of revenue, and work much harder to make the industry leaner and truly competitive for a more liberalized trading regime in its key export market.
Crop yield (ton/ha) TCTS Sugar yield (ton/ha)
15 0 15 30 45 60 75 90
Indonesia
India
PRC
Thailand
Mexico
South Africa
United States
European Union
Brazil
Australia
Fiji (2012–2013)
Fiji
Figure A1.1.4: productivity indicators in World sugar, Fiji and select large sugar exporters,
Average 2009–2011
PRC = People’s Republic of China, TCTS = tons of cane required per ton of sugar, ton/ha = ton per hectare.Source: For Fiji: Fiji Bureau of Statistics. 2015. Key Statistics: December 2014. March. Suva. http://www.statsfiji.gov.fj/index.php/document-library/doc_download/1358-key-statistics-december-2014; for the other countries: International Sugar Organization.
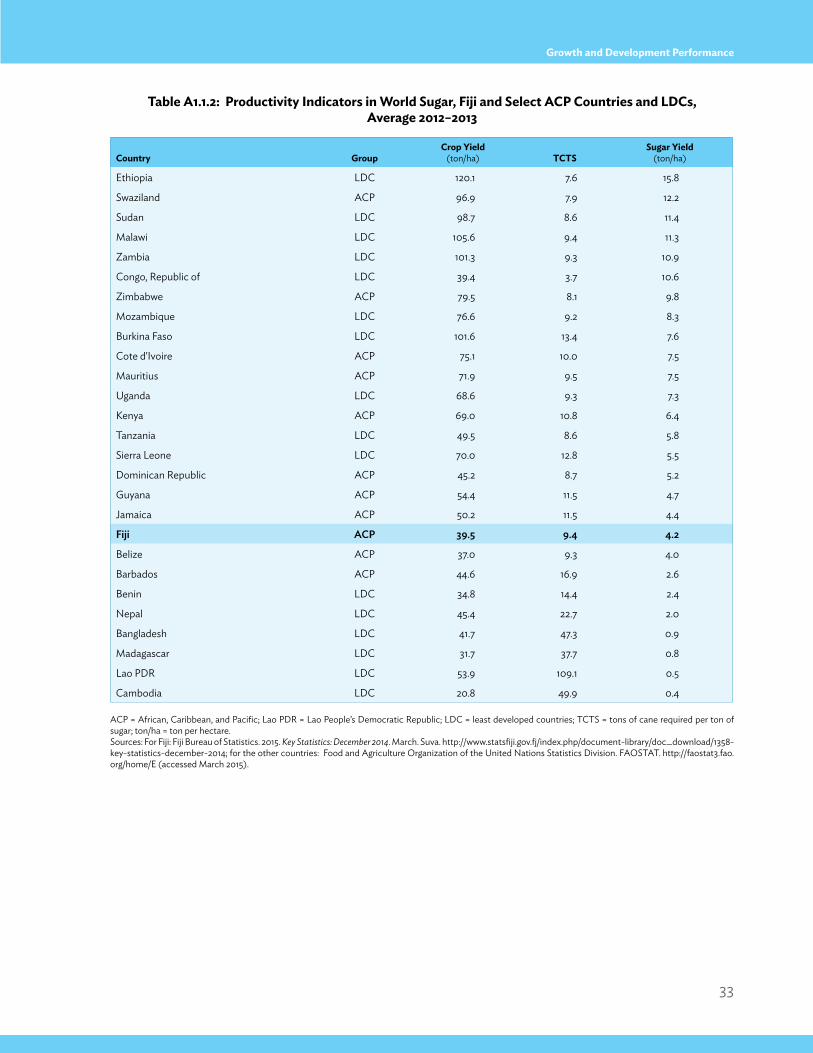
33
Growth and Development Performance
table A1.1.2: productivity indicators in World sugar, Fiji and select ACp Countries and lDCs, Average 2012–2013
ACP = African, Caribbean, and Pacific; Lao PDR = Lao People’s Democratic Republic; LDC = least developed countries; TCTS = tons of cane required per ton of sugar; ton/ha = ton per hectare. Sources: For Fiji: Fiji Bureau of Statistics. 2015. Key Statistics: December 2014. March. Suva. http://www.statsfiji.gov.fj/index.php/document-library/doc_download/1358-key-statistics-december-2014; for the other countries: Food and Agriculture Organization of the United Nations Statistics Division. FAOSTAT. http://faostat3.fao.org/home/E (accessed March 2015).
Country GroupCrop Yield
(ton/ha) tCtssugar Yield
(ton/ha)
Ethiopia LDC 120.1 7.6 15.8
Swaziland ACP 96.9 7.9 12.2
Sudan LDC 98.7 8.6 11.4
Malawi LDC 105.6 9.4 11.3
Zambia LDC 101.3 9.3 10.9
Congo, Republic of LDC 39.4 3.7 10.6
Zimbabwe ACP 79.5 8.1 9.8
Mozambique LDC 76.6 9.2 8.3
Burkina Faso LDC 101.6 13.4 7.6
Cote d'Ivoire ACP 75.1 10.0 7.5
Mauritius ACP 71.9 9.5 7.5
Uganda LDC 68.6 9.3 7.3
Kenya ACP 69.0 10.8 6.4
Tanzania LDC 49.5 8.6 5.8
Sierra Leone LDC 70.0 12.8 5.5
Dominican Republic ACP 45.2 8.7 5.2
Guyana ACP 54.4 11.5 4.7
Jamaica ACP 50.2 11.5 4.4
Fiji AcP 39.5 9.4 4.2
Belize ACP 37.0 9.3 4.0
Barbados ACP 44.6 16.9 2.6
Benin LDC 34.8 14.4 2.4
Nepal LDC 45.4 22.7 2.0
Bangladesh LDC 41.7 47.3 0.9
Madagascar LDC 31.7 37.7 0.8
Lao PDR LDC 53.9 109.1 0.5
Cambodia LDC 20.8 49.9 0.4
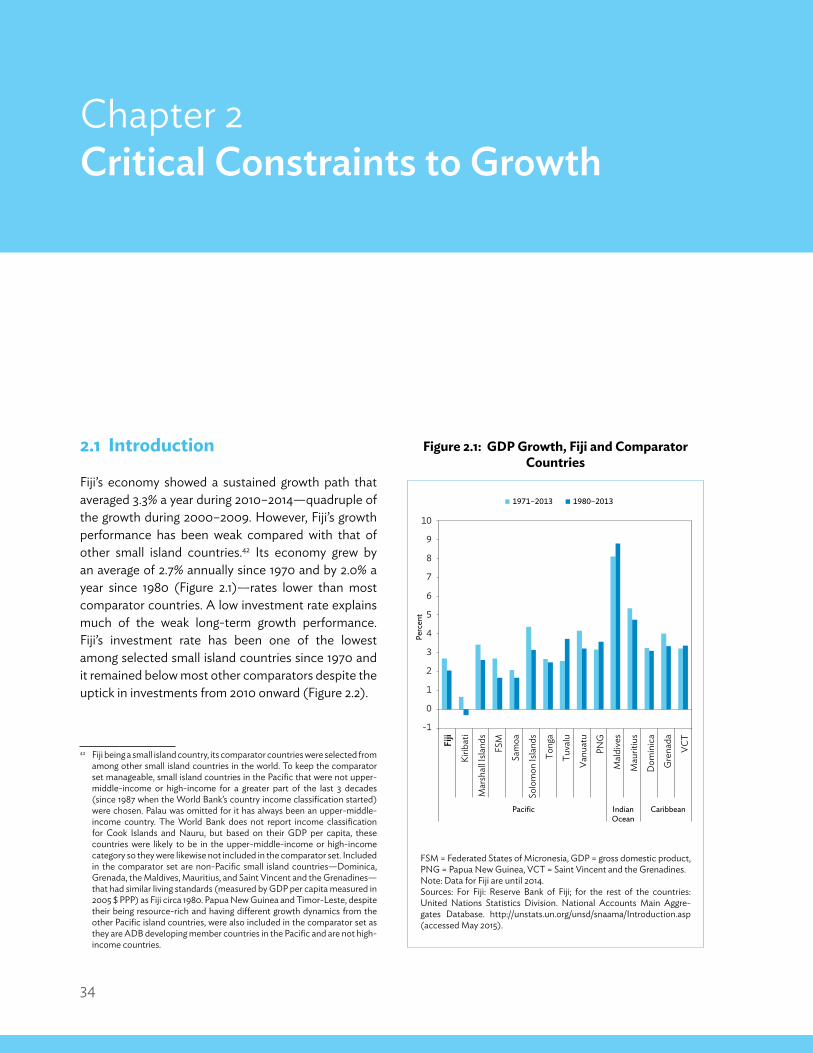
34
Fiji: Building Inclusive Institutions for Sustained Growth
Chapter 2Critical Constraints to Growth
2.1 Introduction
Fiji’s economy showed a sustained growth path that averaged 3.3% a year during 2010–2014—quadruple of the growth during 2000–2009. However, Fiji’s growth performance has been weak compared with that of other small island countries.42 Its economy grew by an average of 2.7% annually since 1970 and by 2.0% a year since 1980 (Figure 2.1)—rates lower than most comparator countries. A low investment rate explains much of the weak long-term growth performance. Fiji’s investment rate has been one of the lowest among selected small island countries since 1970 and it remained below most other comparators despite the uptick in investments from 2010 onward (Figure 2.2).
42 Fiji being a small island country, its comparator countries were selected from among other small island countries in the world. To keep the comparator set manageable, small island countries in the Pacific that were not upper-middle-income or high-income for a greater part of the last 3 decades (since 1987 when the World Bank’s country income classification started) were chosen. Palau was omitted for it has always been an upper-middle-income country. The World Bank does not report income classification for Cook Islands and Nauru, but based on their GDP per capita, these countries were likely to be in the upper-middle-income or high-income category so they were likewise not included in the comparator set. Included in the comparator set are non-Pacific small island countries—Dominica, Grenada, the Maldives, Mauritius, and Saint Vincent and the Grenadines—that had similar living standards (measured by GDP per capita measured in 2005 $ PPP) as Fiji circa 1980. Papua New Guinea and Timor-Leste, despite their being resource-rich and having different growth dynamics from the other Pacific island countries, were also included in the comparator set as they are ADB developing member countries in the Pacific and are not high-income countries.
Figure 2.1: GDP Growth, Fiji and Comparator Countries
FSM = Federated States of Micronesia, GDP = gross domestic product, PNG = Papua New Guinea, VCT = Saint Vincent and the Grenadines.Note: Data for Fiji are until 2014.Sources: For Fiji: Reserve Bank of Fiji; for the rest of the countries: United Nations Statistics Division. National Accounts Main Aggre-gates Database. http://unstats.un.org/unsd/snaama/Introduction.asp (accessed May 2015).
10
9
8
7
6
5
4
3
2
1
0
-1
Fiji
Kirib
ati
Mar
shal
l Isla
nds
FSM
Sam
oa
Solo
mon
Isla
nds
Tong
a
Tuva
lu
Vanu
atu
PNG
Mal
dive
s
Mau
ritiu
s
Dom
inic
a
Gre
nada
VCT
Pacific IndianOcean
Caribbean
Perc
ent
1971–2013 1980–2013
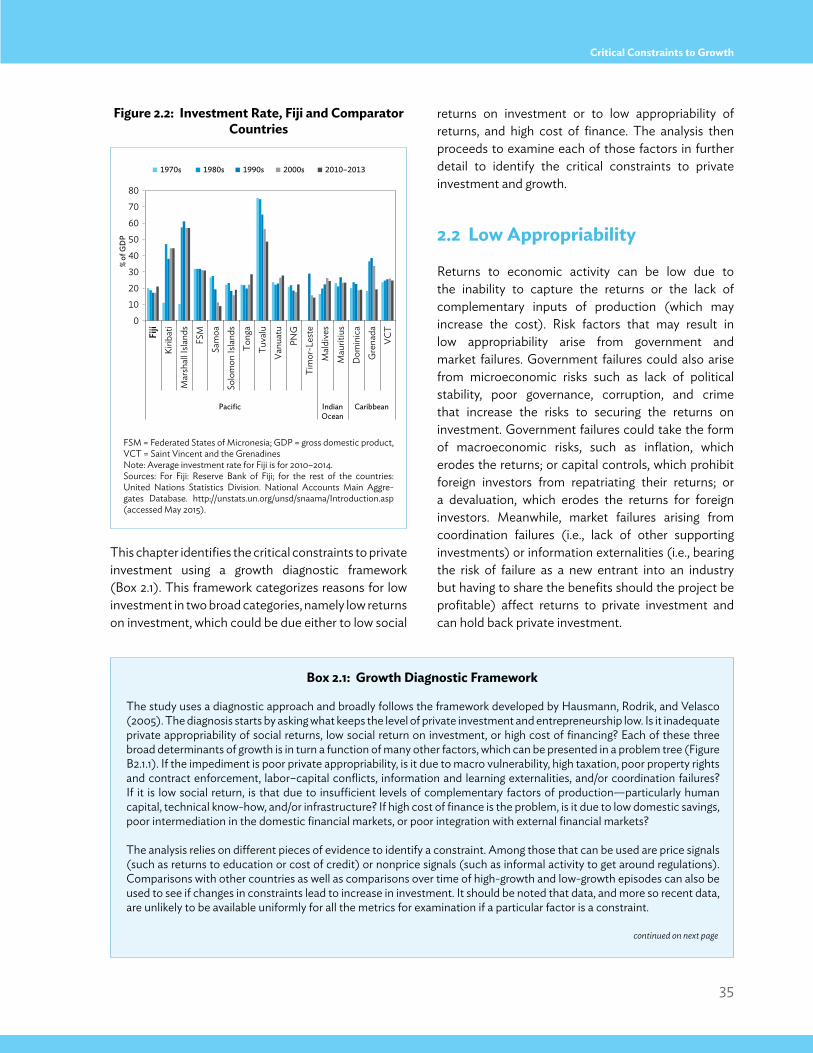
35
Critical Constraints to Growth
Figure 2.2: Investment Rate, Fiji and Comparator Countries
FSM = Federated States of Micronesia; GDP = gross domestic product, VCT = Saint Vincent and the GrenadinesNote: Average investment rate for Fiji is for 2010–2014. Sources: For Fiji: Reserve Bank of Fiji; for the rest of the countries: United Nations Statistics Division. National Accounts Main Aggre-gates Database. http://unstats.un.org/unsd/snaama/Introduction.asp (accessed May 2015).
This chapter identifies the critical constraints to private investment using a growth diagnostic framework (Box 2.1). This framework categorizes reasons for low investment in two broad categories, namely low returns on investment, which could be due either to low social
returns on investment or to low appropriability of returns, and high cost of finance. The analysis then proceeds to examine each of those factors in further detail to identify the critical constraints to private investment and growth.
2.2 Low Appropriability
Returns to economic activity can be low due to the inability to capture the returns or the lack of complementary inputs of production (which may increase the cost). Risk factors that may result in low appropriability arise from government and market failures. Government failures could also arise from microeconomic risks such as lack of political stability, poor governance, corruption, and crime that increase the risks to securing the returns on investment. Government failures could take the form of macroeconomic risks, such as inflation, which erodes the returns; or capital controls, which prohibit foreign investors from repatriating their returns; or a devaluation, which erodes the returns for foreign investors. Meanwhile, market failures arising from coordination failures (i.e., lack of other supporting investments) or information externalities (i.e., bearing the risk of failure as a new entrant into an industry but having to share the benefits should the project be profitable) affect returns to private investment and can hold back private investment.
80
70
60
50
40
30
20
10
0
% of
GD
P
Fiji
Kirib
ati
Mar
shal
l Isla
nds
FSM
Sa
moa
So
lom
on Is
land
s To
nga
Tuva
lu
Vanu
atu
PNG
Ti
mor
-Les
te
Mal
dive
s M
aurit
ius
Dom
inic
a G
rena
da
VCT
Pacific IndianOcean
Caribbean
2000s1990s1980s1970s 2010–2013
Box 2.1: Growth Diagnostic Framework
The study uses a diagnostic approach and broadly follows the framework developed by Hausmann, Rodrik, and Velasco (2005). The diagnosis starts by asking what keeps the level of private investment and entrepreneurship low. Is it inadequate private appropriability of social returns, low social return on investment, or high cost of financing? Each of these three broad determinants of growth is in turn a function of many other factors, which can be presented in a problem tree (Figure B2.1.1). If the impediment is poor private appropriability, is it due to macro vulnerability, high taxation, poor property rights and contract enforcement, labor–capital conflicts, information and learning externalities, and/or coordination failures? If it is low social return, is that due to insufficient levels of complementary factors of production—particularly human capital, technical know-how, and/or infrastructure? If high cost of finance is the problem, is it due to low domestic savings, poor intermediation in the domestic financial markets, or poor integration with external financial markets?
The analysis relies on different pieces of evidence to identify a constraint. Among those that can be used are price signals (such as returns to education or cost of credit) or nonprice signals (such as informal activity to get around regulations). Comparisons with other countries as well as comparisons over time of high-growth and low-growth episodes can also be used to see if changes in constraints lead to increase in investment. It should be noted that data, and more so recent data, are unlikely to be available uniformly for all the metrics for examination if a particular factor is a constraint.
continued on next page
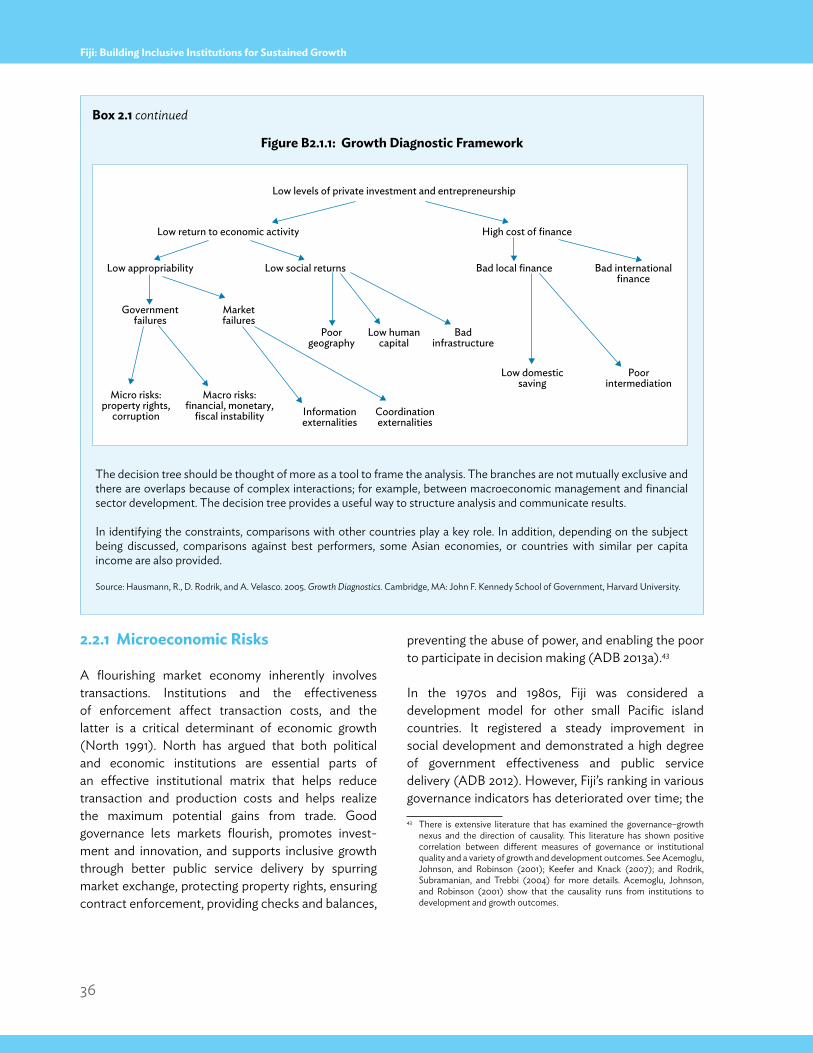
36
Fiji: Building Inclusive Institutions for Sustained Growth
2.2.1 Microeconomic Risks
A flourishing market economy inherently involves transactions. Institutions and the effectiveness of enforcement affect transaction costs, and the latter is a critical determinant of economic growth (North 1991). North has argued that both political and economic institutions are essential parts of an effective institutional matrix that helps reduce transaction and production costs and helps realize the maximum potential gains from trade. Good governance lets markets flourish, promotes invest-ment and innovation, and supports inclusive growth through better public service delivery by spurring market exchange, protecting property rights, ensuring contract enforcement, providing checks and balances,
preventing the abuse of power, and enabling the poor to participate in decision making (ADB 2013a).43
In the 1970s and 1980s, Fiji was considered a development model for other small Pacific island countries. It registered a steady improvement in social development and demonstrated a high degree of government effectiveness and public service delivery (ADB 2012). However, Fiji’s ranking in various governance indicators has deteriorated over time; the 43 There is extensive literature that has examined the governance–growth
nexus and the direction of causality. This literature has shown positive correlation between different measures of governance or institutional quality and a variety of growth and development outcomes. See Acemoglu, Johnson, and Robinson (2001); Keefer and Knack (2007); and Rodrik, Subramanian, and Trebbi (2004) for more details. Acemoglu, Johnson, and Robinson (2001) show that the causality runs from institutions to development and growth outcomes.
Figure B2.1.1: Growth Diagnostic Framework
The decision tree should be thought of more as a tool to frame the analysis. The branches are not mutually exclusive and there are overlaps because of complex interactions; for example, between macroeconomic management and financial sector development. The decision tree provides a useful way to structure analysis and communicate results.
In identifying the constraints, comparisons with other countries play a key role. In addition, depending on the subject being discussed, comparisons against best performers, some Asian economies, or countries with similar per capita income are also provided.
Source: Hausmann, R., D. Rodrik, and A. Velasco. 2005. Growth Diagnostics. Cambridge, MA: John F. Kennedy School of Government, Harvard University.
Box 2.1 continued
Low levels of private investment and entrepreneurship
Low return to economic activity High cost of finance
Bad internationalfinance
Bad local financeLow appropriability
Governmentfailures
Micro risks:property rights,
corruption
Macro risks:financial, monetary,
fiscal instability Informationexternalities
Coordinationexternalities
Marketfailures
Poorgeography
Low humancapital
Badinfrastructure
Low domesticsaving
Poorintermediation
Low social returns
37
Critical Constraints to Growth
timing of these declines coincided with political events (Figure 2.3).44 While the overall pattern shows that its ranking on various indicators of governance remains below that in 1996, some indicators have shown an improvement since 2010.
Political stability and policy certainty are critical to attracting private investment. Fiji’s political history since 1987 has been marked by four major political upheavals: two military coups in 1987, another one in 2000, and still another in 2006. For this reason, perceptions about Fiji’s political stability have become less positive, and these perceptions further worsened in the aftermath of the two later coups (Figure 2.3 Panel A).45 Behind these political developments are several intertwined layers that stem from between-ethnicity and within-ethnicity divisions, ownership of land, division of rents from land leasing, and sharing of benefits earned from the export of sugar (Fiji’s political economy is discussed in detail in Chapter 4). Since the first coup in 1987, political instability and the policy uncertainty that came with it have affected Fiji’s overall business climate and dampened investor confidence. The resulting uncertain business environment added to investor risk and became an additional cost of doing business. Uncertainty can hurt economic activity through various channels: firms may postpone or reduce investment, households may delay expenditures on durable items, and firms may delay hiring (Bloom, Kose, and Terrones 2013).46 Risks associated with viability of new projects owing to an uncertain political climate can make financial institutions reluctant to
44 There are different aspects of governance that are not only difficult to define but for which it is also hard to find one comprehensive measure (ADB 2013a, p. 43). Indicators of governance can be (i) perceptions-based, such as those reported in the Worldwide Governance Indicators (WGI), (ii) reality-based (de facto) from enterprise surveys such as the World Bank’s enterprise survey, or (iii) fact-based (de jure) such as the World Bank’s Doing Business indicators. Hallward–Driemeier and Pritchett (2011) show that findings on governance quality from the World Bank’s reality-based enterprise survey differ strikingly from the World Bank’s fact-based Doing Business indicators.
45 The WGI measure of political stability reflects the perception of the likelihood that a government will be destabilized or overthrown by unconstitutional means. A lower ranking implies a higher likelihood of political instability.
46 Several studies have examined the impact of policy uncertainty on investment and it has been argued that “even moderate amounts of policy uncertainty can act as a hefty tax on investment” (Rodrik 1991). Uncertainty can offset any positive effects that the reforms can bring to private investment.
lend to new projects, or make them willing to lend only at higher rates that reflect a significant risk premium, thus raising the cost of borrowing.
Political stability weighs on the minds of business owners. An example is that in the World Bank’s enterprise survey for Fiji in 2009, which was close to the 2006 coup and the 2009 abrogation of the Constitution, 44% of the firms identified political instability as the biggest obstacle to investments in Fiji (Figure 2.4).47 When compared with selected comparator countries, Fiji had a larger share of firms that identified political instability as the biggest obstacle to investments (Figure 2.5).
Policy certainty is important alongside political stability. Although several reforms were introduced in the last few years to stimulate private investment, private sector stakeholders found the way reforms were implemented to be a source of uncertainty. Private investors and businesspeople have not been able to keep up with the surge of new legislations and amendments from 2009 onward. For example, between January 2009 and September 2012, an estimated 241 decrees were enacted for an average of five decrees every month (ADB 2013b). Concerns have been expressed by private sector participants about the lack of transparency in the reform process, particularly over the lack of consultation in identifying priority problem areas and possible solutions. There is also a concern among the private sector that technical capacity, understanding, and experience are lacking among the staff of government agencies particularly on how to deal with private investors. This may be due to the loss of skilled manpower in various government agencies owing to emigration and lowering of the retirement age.
In its key strategic document, the road map, the interim government made strengthening of good governance one of Fiji’s strategic priorities (MOSPNDS 2010).
47 The World Bank’s enterprise survey questionnaire makes a distinction between “biggest obstacle” and “major constraint.” For the former, respondent firms were asked to identify from a list of constraints the single biggest obstacle. From the same list of constraints, respondent firms were asked to indicate with a “yes” or “no” whether that factor is a “major constraint.”
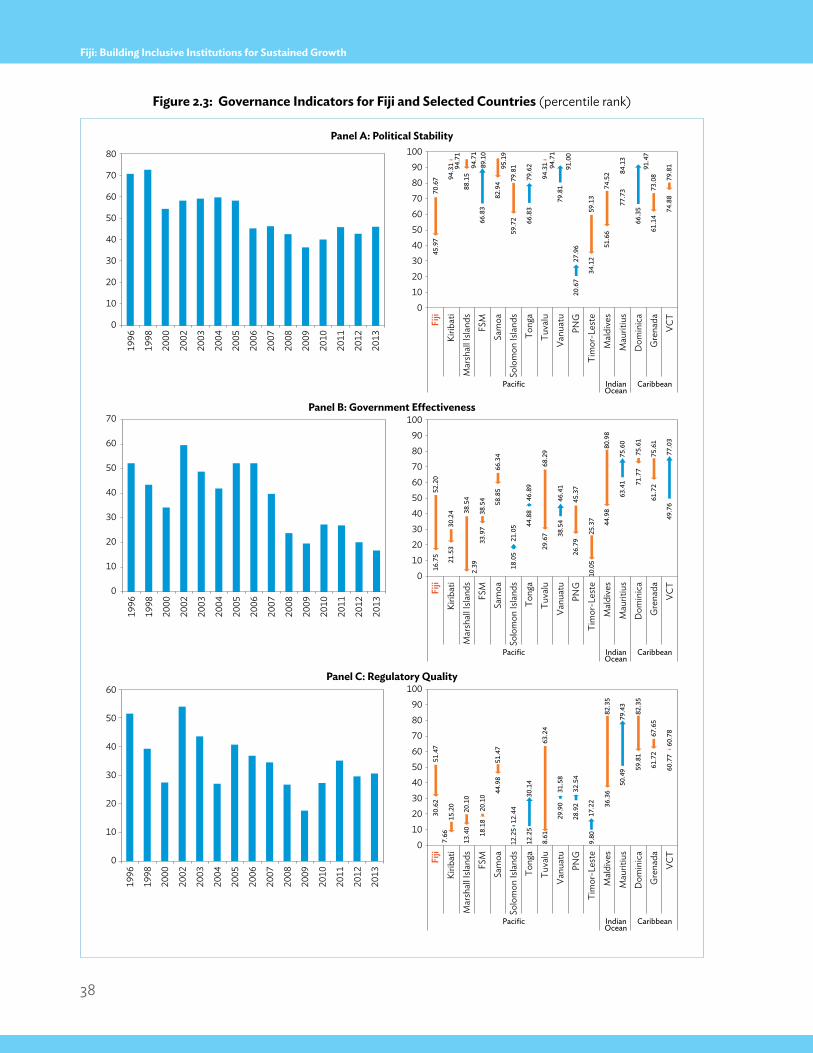
38
Fiji: Building Inclusive Institutions for Sustained Growth
Figure 2.3: Governance Indicators for Fiji and Selected Countries (percentile rank)
Panel A: Political Stability
0
10
20
30
40
50
60
70
80
1996
1998
2000
2002
2003
2004
2005
2006
2007
2008
2009
2010
2011
2012
2013
0 10 20 30 40 50 60 70 80 90
100
Fiji
Kirib
ati
Mar
shal
l Isla
nds
FSM
Sam
oaSo
lom
on Is
land
sTo
nga
Tuva
luVa
nuat
uPN
GTi
mor
-Les
teM
aldi
ves
Mau
ritiu
sD
omin
ica
Gre
nada
VCT
Pacific IndianOcean
Caribbean
70.6
7
94.7
1
94.7
1 66
.83
95.1
9 79
.81
66.8
3
94.7
1 79
.81
20.6
7
59.1
3
74.5
2 84.1
3
66.3
5
73.0
8 79.8
1
45.9
7
94.3
1
88.1
5
89.1
0
82.9
4
59.7
2
79.6
2
94.3
1 91.0
0 27
.96
34.1
2
51.6
6
77.7
3
91.4
7 61
.14
74.8
8
0
10
20
30
40
50
60
70
1996
1998
2000
2002
2003
2004
2005
2006
2007
2008
2009
2010
2011
2012
2013
0 10 20 30 40 50 60 70 80 90
100 Fi
jiKi
ribat
iM
arsh
all I
sland
sFS
MSa
moa
Solo
mon
Isla
nds
Tong
aTu
valu
Vanu
atu
PNG
Tim
or-L
este
Mal
dive
sM
aurit
ius
Dom
inic
aG
rena
daVC
T
Pacific IndianOcean
Caribbean
52.2
0
30.2
4 38.5
4 2.
39
38.5
4
66.3
4
18.0
5
44.8
8
68.2
9
38.5
4
45.3
7
25.3
7
80.9
8
63.4
1
75.6
1
75.6
1
49.7
6
16.7
5
21.5
3
33.9
7
58.8
5
21.0
5
46.8
9
29.6
7
46.4
1
26.7
9
10.0
5
44.9
8
75.6
0
71.7
7
61.7
2
77.0
3
0
10
20
30
40
50
60
1996
1998
2000
2002
2003
2004
2005
2006
2007
2008
2009
2010
2011
2012
2013
0 10 20 30 40 50 60 70 80 90
100
Fiji
Kirib
ati
Mar
shal
l Isla
nds
FSM
Sam
oaSo
lom
on Is
land
sTo
nga
Tuva
luVa
nuat
uPN
GTi
mor
-Les
teM
aldi
ves
Mau
ritiu
sD
omin
ica
Gre
nada
VCT
Pacific IndianOcean
Caribbean
51.4
7
15.2
0
20.1
0
20.1
0
51.4
7
12.2
5
12.2
5
63.2
4
29.9
0
28.9
2
9.80
82.3
5
50.4
9
82.3
5
67.6
5
60.7
8
30.6
2 7.
66
13.4
0
18.1
8
44.9
8
12.4
4
30.1
4
8.61
31.5
8
32.5
4
17.2
2 36.3
6
79.4
3
59.8
1
61.7
2
60.7
7
Panel B: Government Effectiveness
Panel C: Regulatory Quality
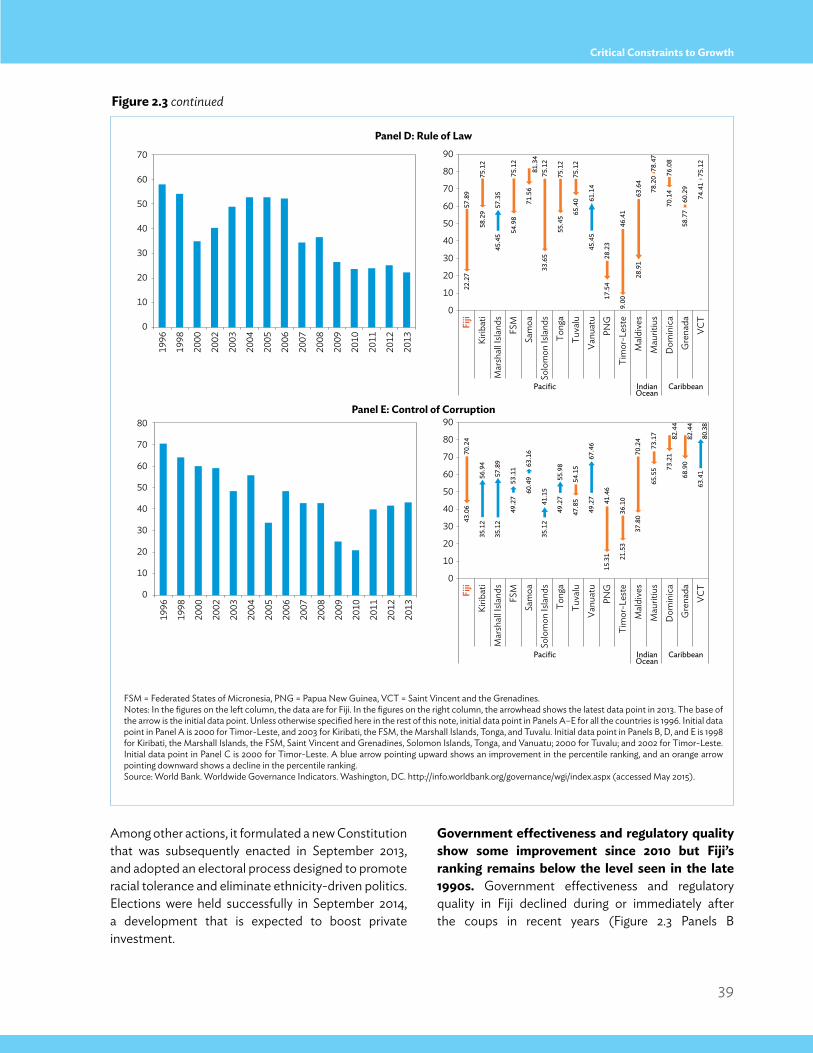
39
Critical Constraints to Growth
Among other actions, it formulated a new Constitution that was subsequently enacted in September 2013, and adopted an electoral process designed to promote racial tolerance and eliminate ethnicity-driven politics. Elections were held successfully in September 2014, a development that is expected to boost private investment.
Government effectiveness and regulatory quality show some improvement since 2010 but Fiji’s ranking remains below the level seen in the late 1990s. Government effectiveness and regulatory quality in Fiji declined during or immediately after the coups in recent years (Figure 2.3 Panels B
Figure 2.3 continued
Panel D: Rule of Law
FSM = Federated States of Micronesia, PNG = Papua New Guinea, VCT = Saint Vincent and the Grenadines.Notes: In the figures on the left column, the data are for Fiji. In the figures on the right column, the arrowhead shows the latest data point in 2013. The base of the arrow is the initial data point. Unless otherwise specified here in the rest of this note, initial data point in Panels A–E for all the countries is 1996. Initial data point in Panel A is 2000 for Timor-Leste, and 2003 for Kiribati, the FSM, the Marshall Islands, Tonga, and Tuvalu. Initial data point in Panels B, D, and E is 1998 for Kiribati, the Marshall Islands, the FSM, Saint Vincent and Grenadines, Solomon Islands, Tonga, and Vanuatu; 2000 for Tuvalu; and 2002 for Timor-Leste. Initial data point in Panel C is 2000 for Timor-Leste. A blue arrow pointing upward shows an improvement in the percentile ranking, and an orange arrow pointing downward shows a decline in the percentile ranking. Source: World Bank. Worldwide Governance Indicators. Washington, DC. http://info.worldbank.org/governance/wgi/index.aspx (accessed May 2015).
0
10
20
30
40
50
60
70 19
96
1998
2000
2002
2003
2004
2005
2006
2007
2008
2009
2010
2011
2012
2013
0
10
20
30
40
50
60
70
80
90
Fiji
Kirib
ati
Mar
shal
l Isla
nds
FSM
Sam
oaSo
lom
on Is
land
sTo
nga
Tuva
luVa
nuat
uPN
GTi
mor
-Les
teM
aldi
ves
Mau
ritiu
sD
omin
ica
Gre
nada
VCT
Pacific IndianOcean
Caribbean
57.8
9
75.1
2
45.4
5
75.1
2
81.3
4 75
.12
75.1
2
75.1
2
45.4
5
28.2
3
46.4
1
63.6
4
78.4
7
76.0
8
60.2
9
75.1
2
22.2
7
58.2
9
57.3
5
54.9
8
71.5
6
33.6
5
55.4
5 65.4
0 61.1
4
17.5
4
9.00
28.9
1
78.2
0
70.1
4
58.7
7
74.4
1
0
10
20
30
40
50
60
70
80
1996
1998
2000
2002
2003
2004
2005
2006
2007
2008
2009
2010
2011
2012
2013
70.2
4
35.1
2
35.1
2
49.2
7
60.4
9
35.1
2
49.2
7
54.1
5
49.2
7 41.4
6
36.1
0
70.2
4
73.1
7 82.4
4
82.4
4 63
.41
43.0
6
56.9
4
57.8
9
53.1
1 63.1
6
41.1
5
55.9
8
47.8
5
67.4
6
15.3
1 21.5
3
37.8
0
65.5
5 73.2
1
68.9
0
80.3
8
0
10
20
30
40
50
60
70
80
90
Fiji
Kirib
ati
Mar
shal
l Isla
nds
FSM
Sam
oaSo
lom
on Is
land
sTo
nga
Tuva
luVa
nuat
uPN
GTi
mor
-Les
teM
aldi
ves
Mau
ritiu
sD
omin
ica
Gre
nada
VCT
Pacific IndianOcean
Caribbean
Panel E: Control of Corruption
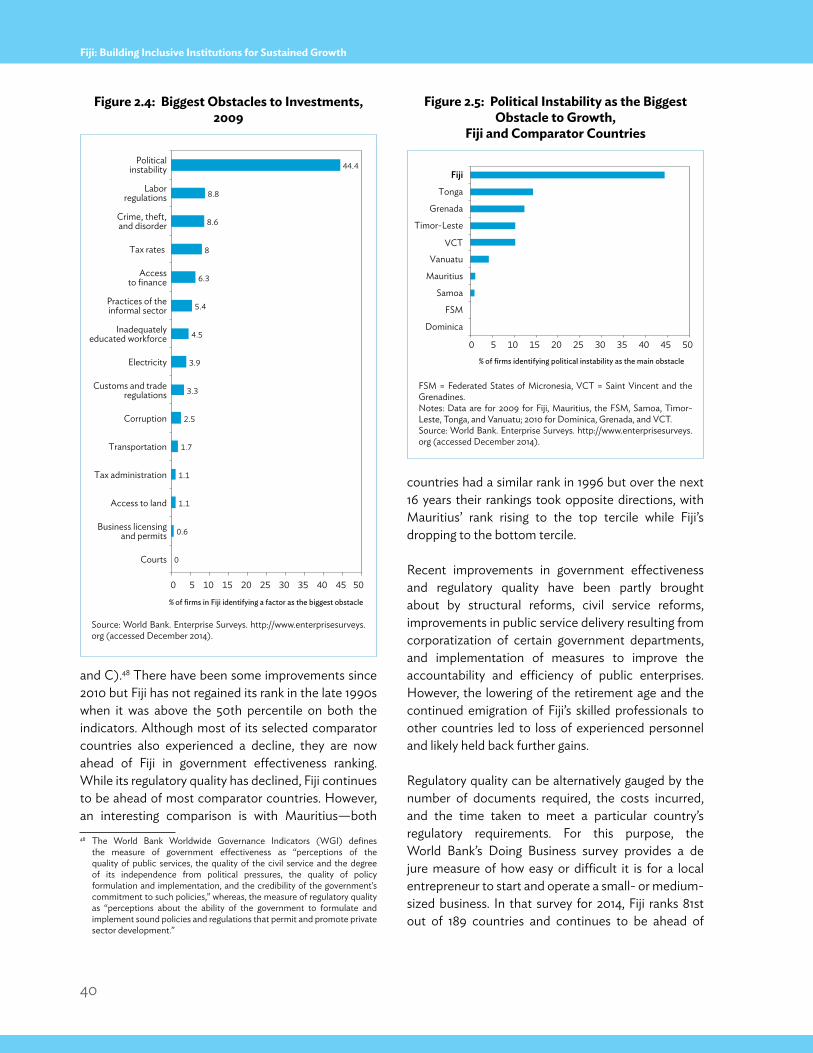
40
Fiji: Building Inclusive Institutions for Sustained Growth
and C).48 There have been some improvements since 2010 but Fiji has not regained its rank in the late 1990s when it was above the 50th percentile on both the indicators. Although most of its selected comparator countries also experienced a decline, they are now ahead of Fiji in government effectiveness ranking. While its regulatory quality has declined, Fiji continues to be ahead of most comparator countries. However, an interesting comparison is with Mauritius—both 48 The World Bank Worldwide Governance Indicators (WGI) defines
the measure of government effectiveness as “perceptions of the quality of public services, the quality of the civil service and the degree of its independence from political pressures, the quality of policy formulation and implementation, and the credibility of the government's commitment to such policies,” whereas, the measure of regulatory quality as “perceptions about the ability of the government to formulate and implement sound policies and regulations that permit and promote private sector development.”
countries had a similar rank in 1996 but over the next 16 years their rankings took opposite directions, with Mauritius’ rank rising to the top tercile while Fiji’s dropping to the bottom tercile.
Recent improvements in government effectiveness and regulatory quality have been partly brought about by structural reforms, civil service reforms, improvements in public service delivery resulting from corporatization of certain government departments, and implementation of measures to improve the accountability and efficiency of public enterprises. However, the lowering of the retirement age and the continued emigration of Fiji’s skilled professionals to other countries led to loss of experienced personnel and likely held back further gains.
Regulatory quality can be alternatively gauged by the number of documents required, the costs incurred, and the time taken to meet a particular country’s regulatory requirements. For this purpose, the World Bank’s Doing Business survey provides a de jure measure of how easy or difficult it is for a local entrepreneur to start and operate a small- or medium-sized business. In that survey for 2014, Fiji ranks 81st out of 189 countries and continues to be ahead of
Figure 2.4: Biggest Obstacles to Investments, 2009
Source: World Bank. Enterprise Surveys. http://www.enterprisesurveys.org (accessed December 2014).
0
0.6
1.1
1.1
1.7
2.5
3.3
3.9
4.5
5.4
6.3
8
8.6
8.8
44.4
0 5 10 15 20 25 30 35 40 45 50
Courts
Business licensingand permits
Access to land
Tax administration
Transportation
Corruption
Customs and traderegulations
Electricity
Inadequatelyeducated workforce
Practices of theinformal sector
Accessto finance
Tax rates
Crime, theft,and disorder
Laborregulations
Politicalinstability
% of firms in Fiji identifying a factor as the biggest obstacle
Figure 2.5: Political Instability as the Biggest Obstacle to Growth,
Fiji and Comparator Countries
FSM = Federated States of Micronesia, VCT = Saint Vincent and the Grenadines.Notes: Data are for 2009 for Fiji, Mauritius, the FSM, Samoa, Timor-Leste, Tonga, and Vanuatu; 2010 for Dominica, Grenada, and VCT. Source: World Bank. Enterprise Surveys. http://www.enterprisesurveys.org (accessed December 2014).
Dominica
FSM
Samoa
Mauritius
Vanuatu
VCT
Timor-Leste
Grenada
Tonga
Fiji
% of firms identifying political instability as the main obstacle
0 5 10 15 20 25 30 35 40 45 50
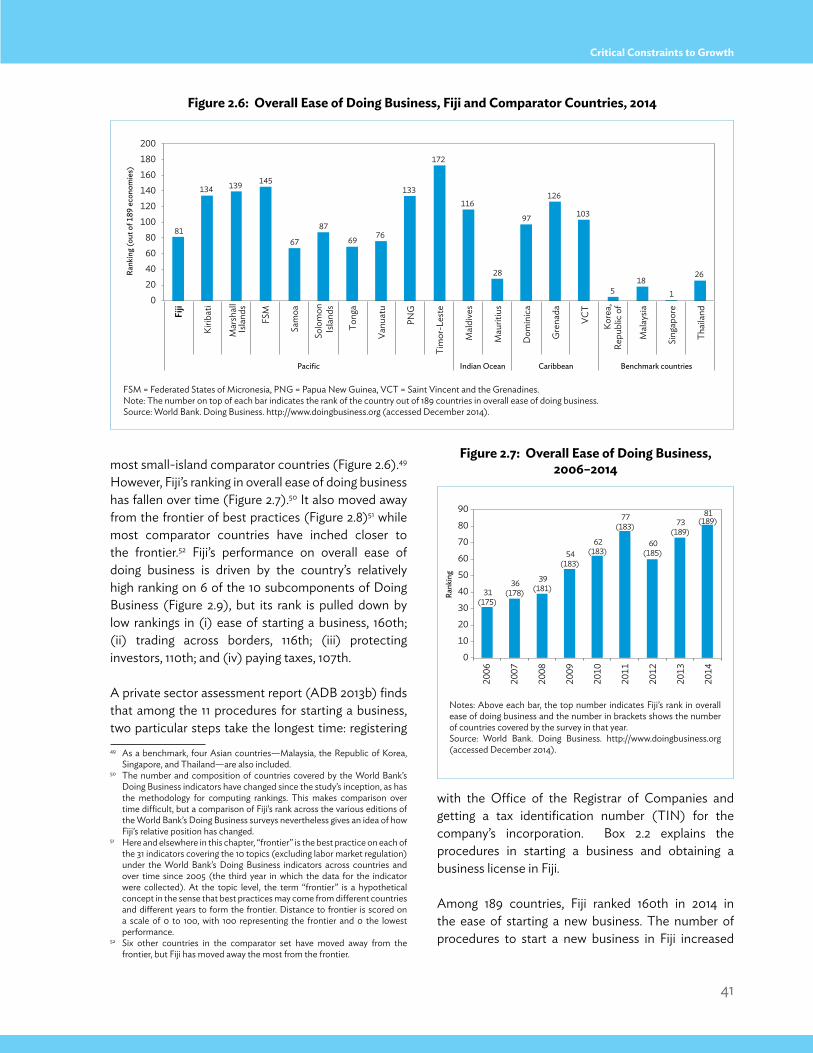
41
Critical Constraints to Growth
most small-island comparator countries (Figure 2.6).49 However, Fiji’s ranking in overall ease of doing business has fallen over time (Figure 2.7).50 It also moved away from the frontier of best practices (Figure 2.8)51 while most comparator countries have inched closer to the frontier.52 Fiji’s performance on overall ease of doing business is driven by the country’s relatively high ranking on 6 of the 10 subcomponents of Doing Business (Figure 2.9), but its rank is pulled down by low rankings in (i) ease of starting a business, 160th; (ii) trading across borders, 116th; (iii) protecting investors, 110th; and (iv) paying taxes, 107th.
A private sector assessment report (ADB 2013b) finds that among the 11 procedures for starting a business, two particular steps take the longest time: registering 49 As a benchmark, four Asian countries—Malaysia, the Republic of Korea,
Singapore, and Thailand—are also included.50 The number and composition of countries covered by the World Bank’s
Doing Business indicators have changed since the study’s inception, as has the methodology for computing rankings. This makes comparison over time difficult, but a comparison of Fiji’s rank across the various editions of the World Bank’s Doing Business surveys nevertheless gives an idea of how Fiji’s relative position has changed.
51 Here and elsewhere in this chapter, “frontier” is the best practice on each of the 31 indicators covering the 10 topics (excluding labor market regulation) under the World Bank’s Doing Business indicators across countries and over time since 2005 (the third year in which the data for the indicator were collected). At the topic level, the term “frontier” is a hypothetical concept in the sense that best practices may come from different countries and different years to form the frontier. Distance to frontier is scored on a scale of 0 to 100, with 100 representing the frontier and 0 the lowest performance.
52 Six other countries in the comparator set have moved away from the frontier, but Fiji has moved away the most from the frontier.
with the Office of the Registrar of Companies and getting a tax identification number (TIN) for the company’s incorporation. Box 2.2 explains the procedures in starting a business and obtaining a business license in Fiji.
Among 189 countries, Fiji ranked 160th in 2014 in the ease of starting a new business. The number of procedures to start a new business in Fiji increased
Figure 2.7: Overall Ease of Doing Business, 2006–2014
Notes: Above each bar, the top number indicates Fiji’s rank in overall ease of doing business and the number in brackets shows the number of countries covered by the survey in that year.Source: World Bank. Doing Business. http://www.doingbusiness.org (accessed December 2014).
0 20 40 60 80
100 120 140 160 180 200
81
134 139 145
67
87
69 76
133
172
116
28
97
126
103
5 18
1
26
Fiji
Kirib
ati
Mar
shal
lIs
land
s
FSM
Sam
oa
Solo
mon
Isla
nds
Tong
a
Vanu
atu
PNG
Tim
or-L
este
Mal
dive
s
Mau
ritiu
s
Dom
inic
a
Gre
nada
VCT
Kore
a,Re
publ
ic o
f
Mal
aysia
Sing
apor
e
Thai
land
Pacific Indian Ocean Caribbean Benchmark countries
Rank
ing
(out
of 1
89 e
cono
mie
s)
Figure 2.6: Overall Ease of Doing Business, Fiji and Comparator Countries, 2014
FSM = Federated States of Micronesia, PNG = Papua New Guinea, VCT = Saint Vincent and the Grenadines.Note: The number on top of each bar indicates the rank of the country out of 189 countries in overall ease of doing business. Source: World Bank. Doing Business. http://www.doingbusiness.org (accessed December 2014).
31(175)
36(178)
39(181)
54(183)
62(183)
77(183)
60(185)
73(189)
81(189)
0
10
20
30
40
50
60
70
80
90
2006
2007
2008
2009
2010
2011
2012
2013
2014
Rank
ing
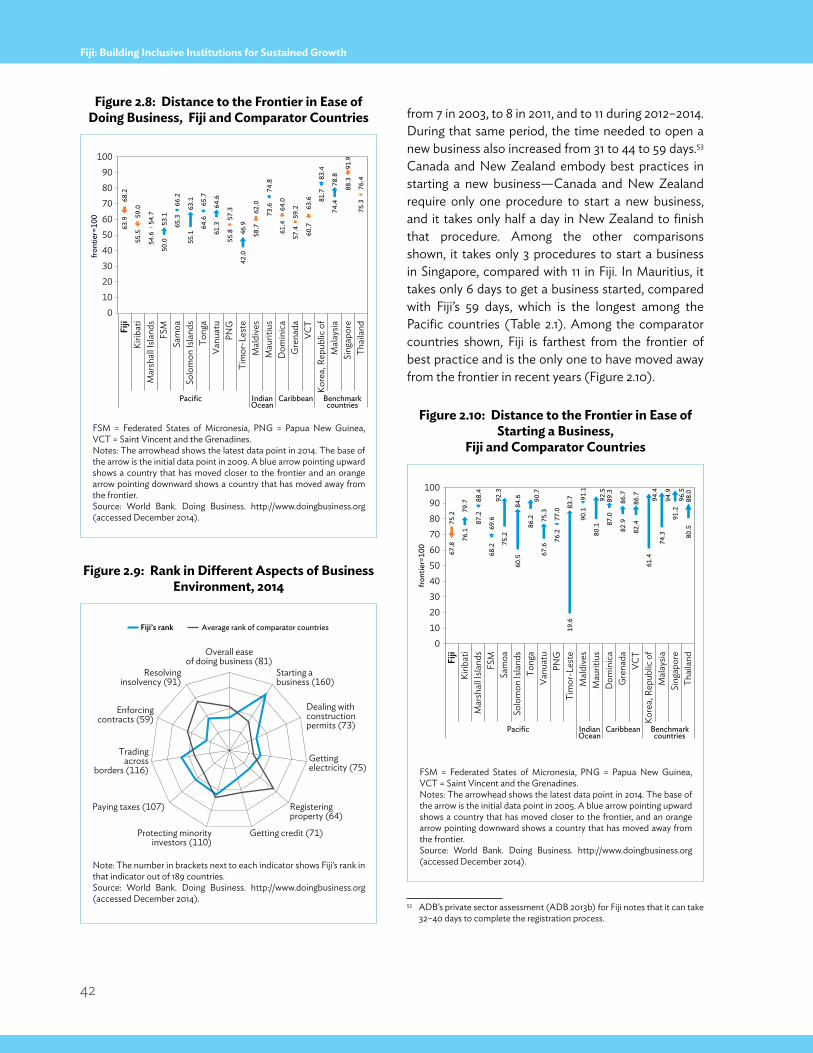
42
Fiji: Building Inclusive Institutions for Sustained Growth
from 7 in 2003, to 8 in 2011, and to 11 during 2012–2014. During that same period, the time needed to open a new business also increased from 31 to 44 to 59 days.53 Canada and New Zealand embody best practices in starting a new business—Canada and New Zealand require only one procedure to start a new business, and it takes only half a day in New Zealand to finish that procedure. Among the other comparisons shown, it takes only 3 procedures to start a business in Singapore, compared with 11 in Fiji. In Mauritius, it takes only 6 days to get a business started, compared with Fiji’s 59 days, which is the longest among the Pacific countries (Table 2.1). Among the comparator countries shown, Fiji is farthest from the frontier of best practice and is the only one to have moved away from the frontier in recent years (Figure 2.10).
53 ADB’s private sector assessment (ADB 2013b) for Fiji notes that it can take 32–40 days to complete the registration process.
Figure 2.8: Distance to the Frontier in Ease of Doing Business, Fiji and Comparator Countries
Figure 2.9: Rank in Different Aspects of Business Environment, 2014
Figure 2.10: Distance to the Frontier in Ease of Starting a Business,
Fiji and Comparator Countries FSM = Federated States of Micronesia, PNG = Papua New Guinea, VCT = Saint Vincent and the Grenadines.Notes: The arrowhead shows the latest data point in 2014. The base of the arrow is the initial data point in 2009. A blue arrow pointing upward shows a country that has moved closer to the frontier and an orange arrow pointing downward shows a country that has moved away from the frontier. Source: World Bank. Doing Business. http://www.doingbusiness.org (accessed December 2014).
Note: The number in brackets next to each indicator shows Fiji’s rank in that indicator out of 189 countries. Source: World Bank. Doing Business. http://www.doingbusiness.org (accessed December 2014).
FSM = Federated States of Micronesia, PNG = Papua New Guinea, VCT = Saint Vincent and the Grenadines.Notes: The arrowhead shows the latest data point in 2014. The base of the arrow is the initial data point in 2005. A blue arrow pointing upward shows a country that has moved closer to the frontier, and an orange arrow pointing downward shows a country that has moved away from the frontier. Source: World Bank. Doing Business. http://www.doingbusiness.org (accessed December 2014).
68.2
59.0
54.6
50.0
65.3
55.1
64.6
61.3
57.3
42.0
62.0
73.6
64.0
59.2
63.6
81.7
74.4
91.9
76.4
63.9
55.5
54.7
53.1
66.2
63.1
65.7
64.6
55.8
46.9
58.7
74.8
61.4
57.4
60.7
83.4
78.8
88.3
75.3
0 10 20 30 40 50 60 70 80 90
100
Fiji
Kirib
ati
Mar
shal
l Isla
nds
FSM
Sa
moa
So
lom
on Is
land
s To
nga
Vanu
atu
PNG
Ti
mor
-Les
te
Mal
dive
s M
aurit
ius
Dom
inic
a G
rena
da
VCT
Kore
a, R
epub
lic o
f M
alay
sia
Sing
apor
e Th
aila
nd
Pacific IndianOcean
Caribbean Benchmarkcountries
front
ier=
100
Overall easeof doing business (81)
Starting abusiness (160)
Dealing withconstructionpermits (73)
Gettingelectricity (75)
Registeringproperty (64)
Getting credit (71) Protecting minorityinvestors (110)
Paying taxes (107)
Tradingacross
borders (116)
Enforcingcontracts (59)
Resolvinginsolvency (91)
Fiji’s rank Average rank of comparator countries
0 10 20 30 40 50 60 70 80 90
100
Fiji
Kirib
ati
Mar
shal
l Isla
nds
FSM
Sa
moa
So
lom
on Is
land
s To
nga
Vanu
atu
PNG
Ti
mor
-Les
te
Mal
dive
s M
aurit
ius
Dom
inic
a G
rena
da
VCT
Kore
a, R
epub
lic o
f M
alay
sia
Sing
apor
e Th
aila
nd
Pacific IndianOcean
Caribbean Benchmarkcountries
front
ier=
100
76.1
87.2
68.2
75.2
60.5
86.2
67.6
76.2
19.6
90.1
80.1
87.0
82.9
82.4
61.4
91.2
80.5
79.7
75.2
67.8
88.4
69.6
92
.3
84.6
90.7
75
.3
77.0
83.7
91.1
92.5
89
.3
86.7
86.7
94.4
74
.3
94.9
96.5
88
.0
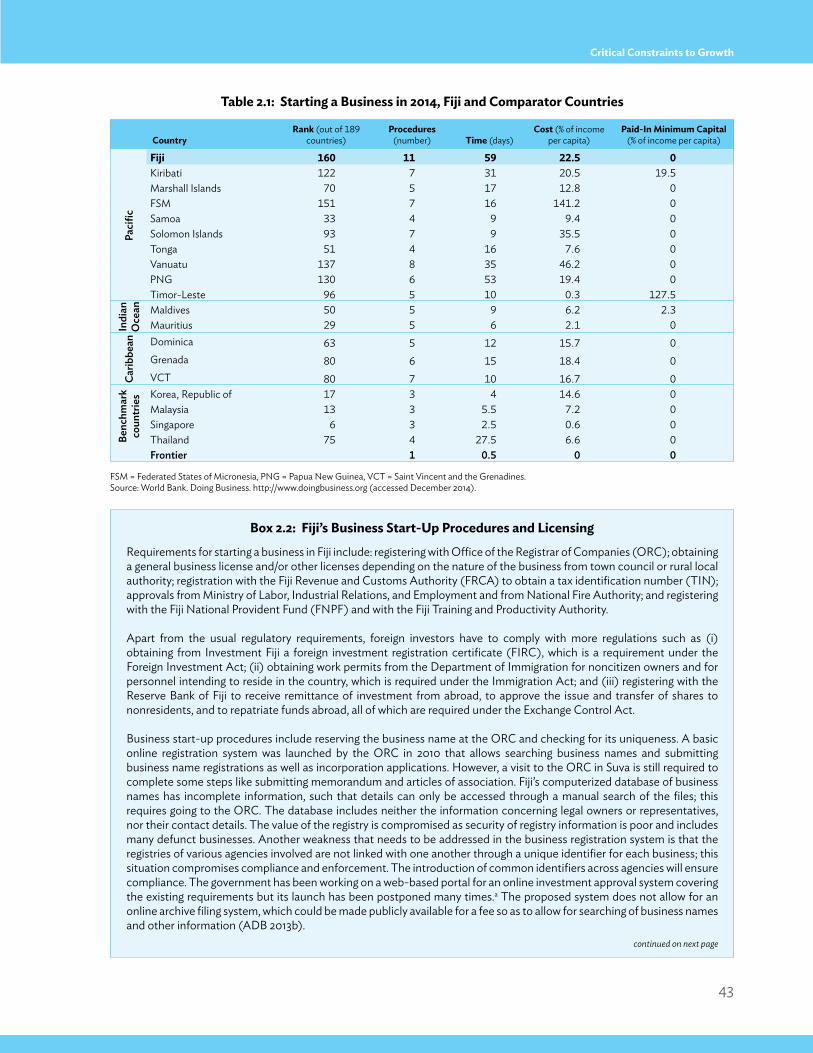
43
Critical Constraints to Growth
Box 2.2: Fiji’s Business Start-Up Procedures and Licensing
Table 2.1: Starting a Business in 2014, Fiji and Comparator Countries
FSM = Federated States of Micronesia, PNG = Papua New Guinea, VCT = Saint Vincent and the Grenadines.Source: World Bank. Doing Business. http://www.doingbusiness.org (accessed December 2014).
CountryRank (out of 189
countries)Procedures
(number) Time (days)Cost (% of income
per capita)Paid-In Minimum Capital
(% of income per capita)Pa
cific
Fiji 160 11 59 22.5 0Kiribati 122 7 31 20.5 19.5Marshall Islands 70 5 17 12.8 0FSM 151 7 16 141.2 0Samoa 33 4 9 9.4 0Solomon Islands 93 7 9 35.5 0Tonga 51 4 16 7.6 0Vanuatu 137 8 35 46.2 0PNG 130 6 53 19.4 0Timor-Leste 96 5 10 0.3 127.5
Indi
an
Oce
an Maldives 50 5 9 6.2 2.3Mauritius 29 5 6 2.1 0
Carib
bean Dominica 63 5 12 15.7 0
Grenada 80 6 15 18.4 0VCT 80 7 10 16.7 0
Benc
hmar
k co
untr
ies Korea, Republic of 17 3 4 14.6 0
Malaysia 13 3 5.5 7.2 0Singapore 6 3 2.5 0.6 0Thailand 75 4 27.5 6.6 0Frontier 1 0.5 0 0
Requirements for starting a business in Fiji include: registering with Office of the Registrar of Companies (ORC); obtaining a general business license and/or other licenses depending on the nature of the business from town council or rural local authority; registration with the Fiji Revenue and Customs Authority (FRCA) to obtain a tax identification number (TIN); approvals from Ministry of Labor, Industrial Relations, and Employment and from National Fire Authority; and registering with the Fiji National Provident Fund (FNPF) and with the Fiji Training and Productivity Authority.
Apart from the usual regulatory requirements, foreign investors have to comply with more regulations such as (i) obtaining from Investment Fiji a foreign investment registration certificate (FIRC), which is a requirement under the Foreign Investment Act; (ii) obtaining work permits from the Department of Immigration for noncitizen owners and for personnel intending to reside in the country, which is required under the Immigration Act; and (iii) registering with the Reserve Bank of Fiji to receive remittance of investment from abroad, to approve the issue and transfer of shares to nonresidents, and to repatriate funds abroad, all of which are required under the Exchange Control Act.
Business start-up procedures include reserving the business name at the ORC and checking for its uniqueness. A basic online registration system was launched by the ORC in 2010 that allows searching business names and submitting business name registrations as well as incorporation applications. However, a visit to the ORC in Suva is still required to complete some steps like submitting memorandum and articles of association. Fiji’s computerized database of business names has incomplete information, such that details can only be accessed through a manual search of the files; this requires going to the ORC. The database includes neither the information concerning legal owners or representatives, nor their contact details. The value of the registry is compromised as security of registry information is poor and includes many defunct businesses. Another weakness that needs to be addressed in the business registration system is that the registries of various agencies involved are not linked with one another through a unique identifier for each business; this situation compromises compliance and enforcement. The introduction of common identifiers across agencies will ensure compliance. The government has been working on a web-based portal for an online investment approval system covering the existing requirements but its launch has been postponed many times.a The proposed system does not allow for an online archive filing system, which could be made publicly available for a fee so as to allow for searching of business names and other information (ADB 2013b).
continued on next page
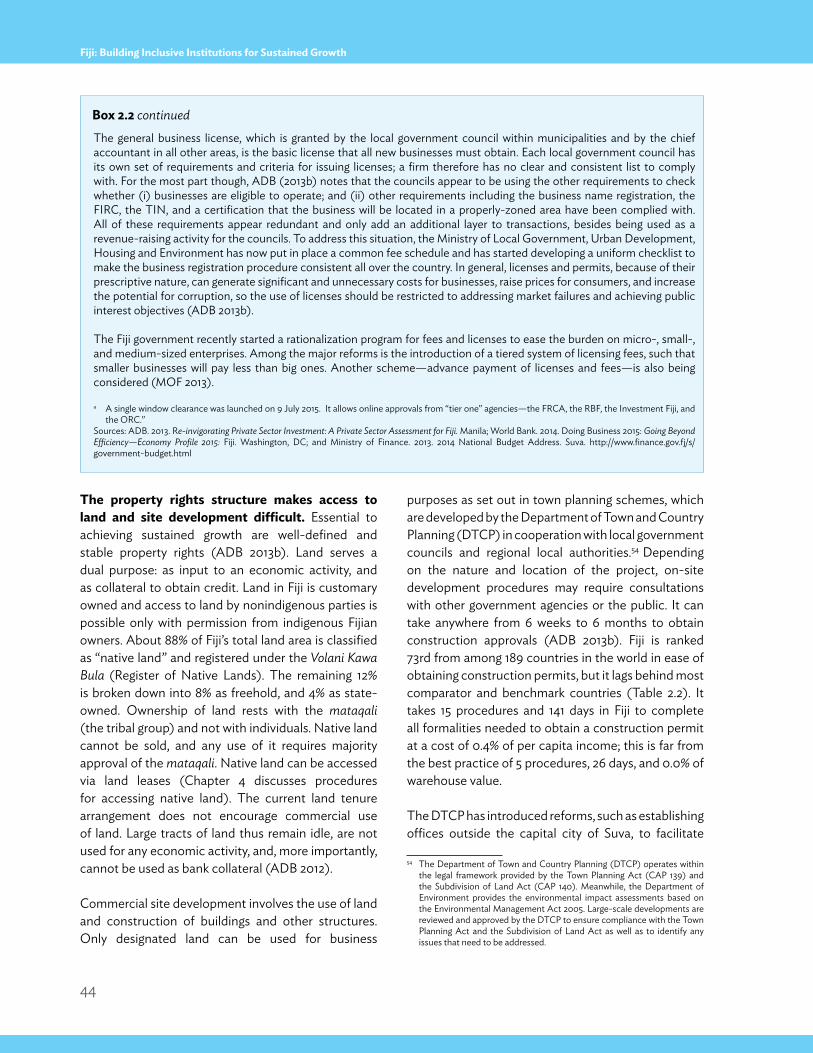
44
Fiji: Building Inclusive Institutions for Sustained Growth
The property rights structure makes access to land and site development difficult. Essential to achieving sustained growth are well-defined and stable property rights (ADB 2013b). Land serves a dual purpose: as input to an economic activity, and as collateral to obtain credit. Land in Fiji is customary owned and access to land by nonindigenous parties is possible only with permission from indigenous Fijian owners. About 88% of Fiji’s total land area is classified as “native land” and registered under the Volani Kawa Bula (Register of Native Lands). The remaining 12% is broken down into 8% as freehold, and 4% as state-owned. Ownership of land rests with the mataqali (the tribal group) and not with individuals. Native land cannot be sold, and any use of it requires majority approval of the mataqali. Native land can be accessed via land leases (Chapter 4 discusses procedures for accessing native land). The current land tenure arrangement does not encourage commercial use of land. Large tracts of land thus remain idle, are not used for any economic activity, and, more importantly, cannot be used as bank collateral (ADB 2012).
Commercial site development involves the use of land and construction of buildings and other structures. Only designated land can be used for business
purposes as set out in town planning schemes, which are developed by the Department of Town and Country Planning (DTCP) in cooperation with local government councils and regional local authorities.54 Depending on the nature and location of the project, on-site development procedures may require consultations with other government agencies or the public. It can take anywhere from 6 weeks to 6 months to obtain construction approvals (ADB 2013b). Fiji is ranked 73rd from among 189 countries in the world in ease of obtaining construction permits, but it lags behind most comparator and benchmark countries (Table 2.2). It takes 15 procedures and 141 days in Fiji to complete all formalities needed to obtain a construction permit at a cost of 0.4% of per capita income; this is far from the best practice of 5 procedures, 26 days, and 0.0% of warehouse value.
The DTCP has introduced reforms, such as establishing offices outside the capital city of Suva, to facilitate
54 The Department of Town and Country Planning (DTCP) operates within the legal framework provided by the Town Planning Act (CAP 139) and the Subdivision of Land Act (CAP 140). Meanwhile, the Department of Environment provides the environmental impact assessments based on the Environmental Management Act 2005. Large-scale developments are reviewed and approved by the DTCP to ensure compliance with the Town Planning Act and the Subdivision of Land Act as well as to identify any issues that need to be addressed.
The general business license, which is granted by the local government council within municipalities and by the chief accountant in all other areas, is the basic license that all new businesses must obtain. Each local government council has its own set of requirements and criteria for issuing licenses; a firm therefore has no clear and consistent list to comply with. For the most part though, ADB (2013b) notes that the councils appear to be using the other requirements to check whether (i) businesses are eligible to operate; and (ii) other requirements including the business name registration, the FIRC, the TIN, and a certification that the business will be located in a properly-zoned area have been complied with. All of these requirements appear redundant and only add an additional layer to transactions, besides being used as a revenue-raising activity for the councils. To address this situation, the Ministry of Local Government, Urban Development, Housing and Environment has now put in place a common fee schedule and has started developing a uniform checklist to make the business registration procedure consistent all over the country. In general, licenses and permits, because of their prescriptive nature, can generate significant and unnecessary costs for businesses, raise prices for consumers, and increase the potential for corruption, so the use of licenses should be restricted to addressing market failures and achieving public interest objectives (ADB 2013b).
The Fiji government recently started a rationalization program for fees and licenses to ease the burden on micro-, small-, and medium-sized enterprises. Among the major reforms is the introduction of a tiered system of licensing fees, such that smaller businesses will pay less than big ones. Another scheme—advance payment of licenses and fees—is also being considered (MOF 2013).
a A single window clearance was launched on 9 July 2015. It allows online approvals from “tier one” agencies—the FRCA, the RBF, the Investment Fiji, and the ORC.”
Sources: ADB. 2013. Re-invigorating Private Sector Investment: A Private Sector Assessment for Fiji. Manila; World Bank. 2014. Doing Business 2015: Going Beyond Efficiency—Economy Profile 2015: Fiji. Washington, DC; and Ministry of Finance. 2013. 2014 National Budget Address. Suva. http://www.finance.gov.fj/s/government-budget.html
Box 2.2 continued
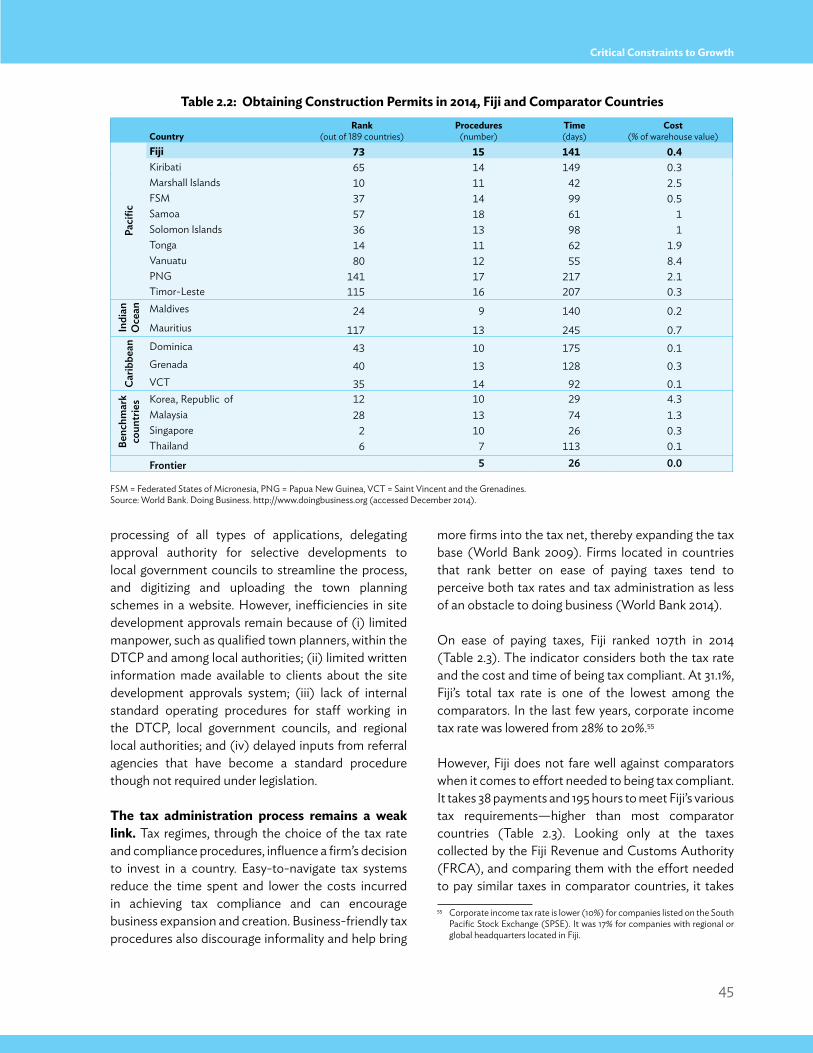
45
Critical Constraints to Growth
processing of all types of applications, delegating approval authority for selective developments to local government councils to streamline the process, and digitizing and uploading the town planning schemes in a website. However, inefficiencies in site development approvals remain because of (i) limited manpower, such as qualified town planners, within the DTCP and among local authorities; (ii) limited written information made available to clients about the site development approvals system; (iii) lack of internal standard operating procedures for staff working in the DTCP, local government councils, and regional local authorities; and (iv) delayed inputs from referral agencies that have become a standard procedure though not required under legislation. The tax administration process remains a weak link. Tax regimes, through the choice of the tax rate and compliance procedures, influence a firm’s decision to invest in a country. Easy-to-navigate tax systems reduce the time spent and lower the costs incurred in achieving tax compliance and can encourage business expansion and creation. Business-friendly tax procedures also discourage informality and help bring
more firms into the tax net, thereby expanding the tax base (World Bank 2009). Firms located in countries that rank better on ease of paying taxes tend to perceive both tax rates and tax administration as less of an obstacle to doing business (World Bank 2014).
On ease of paying taxes, Fiji ranked 107th in 2014 (Table 2.3). The indicator considers both the tax rate and the cost and time of being tax compliant. At 31.1%, Fiji’s total tax rate is one of the lowest among the comparators. In the last few years, corporate income tax rate was lowered from 28% to 20%.55
However, Fiji does not fare well against comparators when it comes to effort needed to being tax compliant. It takes 38 payments and 195 hours to meet Fiji’s various tax requirements—higher than most comparator countries (Table 2.3). Looking only at the taxes collected by the Fiji Revenue and Customs Authority (FRCA), and comparing them with the effort needed to pay similar taxes in comparator countries, it takes 55 Corporate income tax rate is lower (10%) for companies listed on the South
Pacific Stock Exchange (SPSE). It was 17% for companies with regional or global headquarters located in Fiji.
Table 2.2: Obtaining Construction Permits in 2014, Fiji and Comparator Countries
FSM = Federated States of Micronesia, PNG = Papua New Guinea, VCT = Saint Vincent and the Grenadines.Source: World Bank. Doing Business. http://www.doingbusiness.org (accessed December 2014).
CountryRank
(out of 189 countries)Procedures
(number)Time (days)
Cost (% of warehouse value)
Paci
fic
Fiji 73 15 141 0.4Kiribati 65 14 149 0.3Marshall Islands 10 11 42 2.5FSM 37 14 99 0.5Samoa 57 18 61 1Solomon Islands 36 13 98 1Tonga 14 11 62 1.9Vanuatu 80 12 55 8.4PNG 141 17 217 2.1Timor-Leste 115 16 207 0.3
Indi
an
Oce
an Maldives 24 9 140 0.2Mauritius 117 13 245 0.7
Carib
bean Dominica 43 10 175 0.1
Grenada 40 13 128 0.3VCT 35 14 92 0.1
Benc
hmar
k co
untr
ies Korea, Republic of 12 10 29 4.3
Malaysia 28 13 74 1.3Singapore 2 10 26 0.3Thailand 6 7 113 0.1
Frontier 5 26 0.0
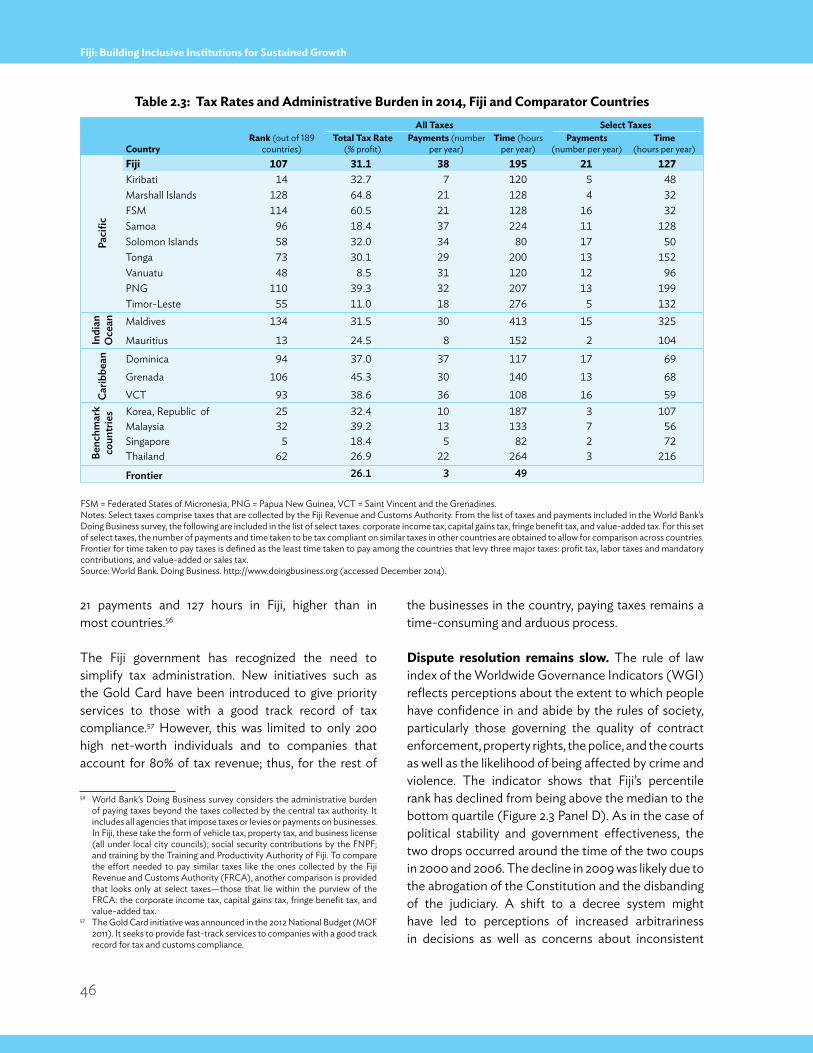
46
Fiji: Building Inclusive Institutions for Sustained Growth
21 payments and 127 hours in Fiji, higher than in most countries.56
The Fiji government has recognized the need to simplify tax administration. New initiatives such as the Gold Card have been introduced to give priority services to those with a good track record of tax compliance.57 However, this was limited to only 200 high net-worth individuals and to companies that account for 80% of tax revenue; thus, for the rest of
56 World Bank’s Doing Business survey considers the administrative burden of paying taxes beyond the taxes collected by the central tax authority. It includes all agencies that impose taxes or levies or payments on businesses. In Fiji, these take the form of vehicle tax, property tax, and business license (all under local city councils); social security contributions by the FNPF; and training by the Training and Productivity Authority of Fiji. To compare the effort needed to pay similar taxes like the ones collected by the Fiji Revenue and Customs Authority (FRCA), another comparison is provided that looks only at select taxes—those that lie within the purview of the FRCA: the corporate income tax, capital gains tax, fringe benefit tax, and value-added tax.
57 The Gold Card initiative was announced in the 2012 National Budget (MOF 2011). It seeks to provide fast-track services to companies with a good track record for tax and customs compliance.
the businesses in the country, paying taxes remains a time-consuming and arduous process.
Dispute resolution remains slow. The rule of law index of the Worldwide Governance Indicators (WGI) reflects perceptions about the extent to which people have confidence in and abide by the rules of society, particularly those governing the quality of contract enforcement, property rights, the police, and the courts as well as the likelihood of being affected by crime and violence. The indicator shows that Fiji’s percentile rank has declined from being above the median to the bottom quartile (Figure 2.3 Panel D). As in the case of political stability and government effectiveness, the two drops occurred around the time of the two coups in 2000 and 2006. The decline in 2009 was likely due to the abrogation of the Constitution and the disbanding of the judiciary. A shift to a decree system might have led to perceptions of increased arbitrariness in decisions as well as concerns about inconsistent
Table 2.3: Tax Rates and Administrative Burden in 2014, Fiji and Comparator Countries
FSM = Federated States of Micronesia, PNG = Papua New Guinea, VCT = Saint Vincent and the Grenadines.Notes: Select taxes comprise taxes that are collected by the Fiji Revenue and Customs Authority. From the list of taxes and payments included in the World Bank’s Doing Business survey, the following are included in the list of select taxes: corporate income tax, capital gains tax, fringe benefit tax, and value-added tax. For this set of select taxes, the number of payments and time taken to be tax compliant on similar taxes in other countries are obtained to allow for comparison across countries. Frontier for time taken to pay taxes is defined as the least time taken to pay among the countries that levy three major taxes: profit tax, labor taxes and mandatory contributions, and value-added or sales tax. Source: World Bank. Doing Business. http://www.doingbusiness.org (accessed December 2014).
All Taxes Select Taxes
CountryRank (out of 189
countries)Total Tax Rate
(% profit)Payments (number
per year)Time (hours
per year)Payments
(number per year)Time
(hours per year)
Paci
fic
Fiji 107 31.1 38 195 21 127Kiribati 14 32.7 7 120 5 48Marshall Islands 128 64.8 21 128 4 32FSM 114 60.5 21 128 16 32Samoa 96 18.4 37 224 11 128Solomon Islands 58 32.0 34 80 17 50Tonga 73 30.1 29 200 13 152Vanuatu 48 8.5 31 120 12 96PNG 110 39.3 32 207 13 199Timor-Leste 55 11.0 18 276 5 132
Indi
an
Oce
an Maldives 134 31.5 30 413 15 325
Mauritius 13 24.5 8 152 2 104
Carib
bean Dominica 94 37.0 37 117 17 69
Grenada 106 45.3 30 140 13 68VCT 93 38.6 36 108 16 59
Benc
hmar
k co
untr
ies Korea, Republic of 25 32.4 10 187 3 107
Malaysia 32 39.2 13 133 7 56Singapore 5 18.4 5 82 2 72Thailand 62 26.9 22 264 3 216
Frontier 26.1 3 49
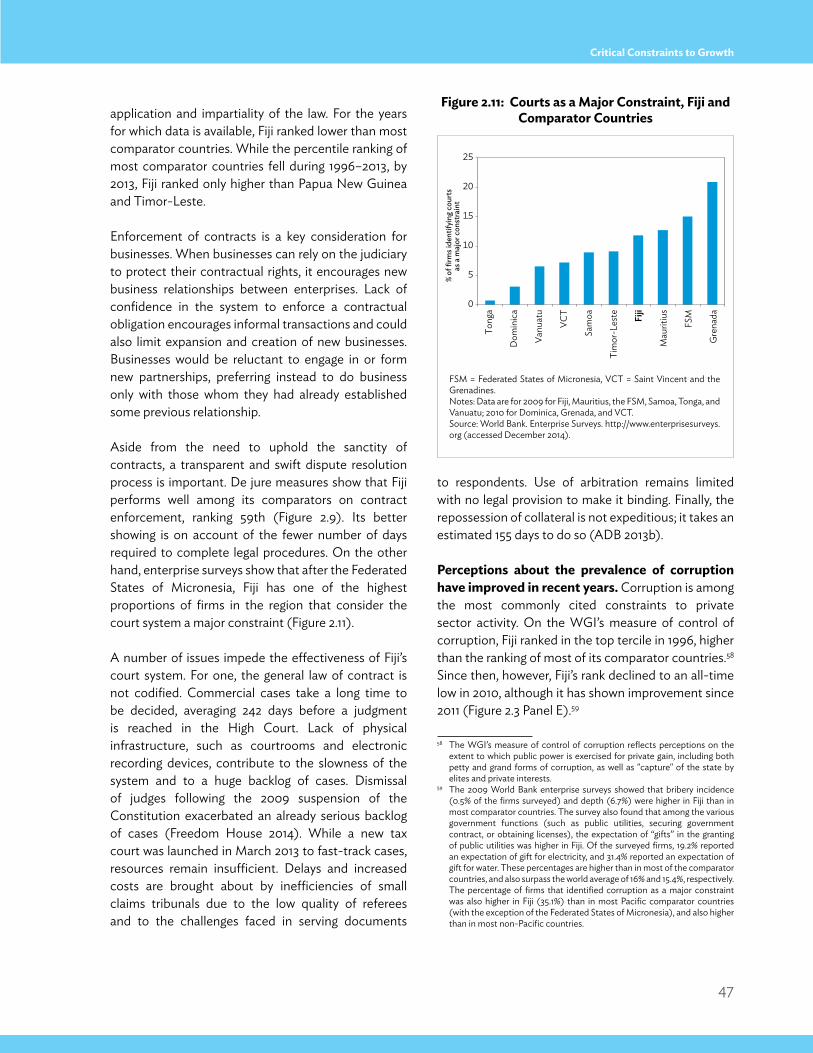
47
Critical Constraints to Growth
application and impartiality of the law. For the years for which data is available, Fiji ranked lower than most comparator countries. While the percentile ranking of most comparator countries fell during 1996–2013, by 2013, Fiji ranked only higher than Papua New Guinea and Timor-Leste.
Enforcement of contracts is a key consideration for businesses. When businesses can rely on the judiciary to protect their contractual rights, it encourages new business relationships between enterprises. Lack of confidence in the system to enforce a contractual obligation encourages informal transactions and could also limit expansion and creation of new businesses. Businesses would be reluctant to engage in or form new partnerships, preferring instead to do business only with those whom they had already established some previous relationship.
Aside from the need to uphold the sanctity of contracts, a transparent and swift dispute resolution process is important. De jure measures show that Fiji performs well among its comparators on contract enforcement, ranking 59th (Figure 2.9). Its better showing is on account of the fewer number of days required to complete legal procedures. On the other hand, enterprise surveys show that after the Federated States of Micronesia, Fiji has one of the highest proportions of firms in the region that consider the court system a major constraint (Figure 2.11).
A number of issues impede the effectiveness of Fiji’s court system. For one, the general law of contract is not codified. Commercial cases take a long time to be decided, averaging 242 days before a judgment is reached in the High Court. Lack of physical infrastructure, such as courtrooms and electronic recording devices, contribute to the slowness of the system and to a huge backlog of cases. Dismissal of judges following the 2009 suspension of the Constitution exacerbated an already serious backlog of cases (Freedom House 2014). While a new tax court was launched in March 2013 to fast-track cases, resources remain insufficient. Delays and increased costs are brought about by inefficiencies of small claims tribunals due to the low quality of referees and to the challenges faced in serving documents
to respondents. Use of arbitration remains limited with no legal provision to make it binding. Finally, the repossession of collateral is not expeditious; it takes an estimated 155 days to do so (ADB 2013b).
Perceptions about the prevalence of corruption have improved in recent years. Corruption is among the most commonly cited constraints to private sector activity. On the WGI’s measure of control of corruption, Fiji ranked in the top tercile in 1996, higher than the ranking of most of its comparator countries.58 Since then, however, Fiji’s rank declined to an all-time low in 2010, although it has shown improvement since 2011 (Figure 2.3 Panel E).59
58 The WGI’s measure of control of corruption reflects perceptions on the extent to which public power is exercised for private gain, including both petty and grand forms of corruption, as well as "capture" of the state by elites and private interests.
59 The 2009 World Bank enterprise surveys showed that bribery incidence (0.5% of the firms surveyed) and depth (6.7%) were higher in Fiji than in most comparator countries. The survey also found that among the various government functions (such as public utilities, securing government contract, or obtaining licenses), the expectation of “gifts” in the granting of public utilities was higher in Fiji. Of the surveyed firms, 19.2% reported an expectation of gift for electricity, and 31.4% reported an expectation of gift for water. These percentages are higher than in most of the comparator countries, and also surpass the world average of 16% and 15.4%, respectively. The percentage of firms that identified corruption as a major constraint was also higher in Fiji (35.1%) than in most Pacific comparator countries (with the exception of the Federated States of Micronesia), and also higher than in most non-Pacific countries.
Figure 2.11: Courts as a Major Constraint, Fiji and Comparator Countries
FSM = Federated States of Micronesia, VCT = Saint Vincent and the Grenadines. Notes: Data are for 2009 for Fiji, Mauritius, the FSM, Samoa, Tonga, and Vanuatu; 2010 for Dominica, Grenada, and VCT.Source: World Bank. Enterprise Surveys. http://www.enterprisesurveys.org (accessed December 2014).
0
5
10
15
20
25
Tong
a
Dom
inic
a
Vanu
atu
VCT
Sam
oa
Tim
or-L
este
Fiji
Mau
ritiu
s
FSM
Gre
nada
% of
firm
s ide
ntify
ing
cour
tsas
a m
ajor
con
stra
int
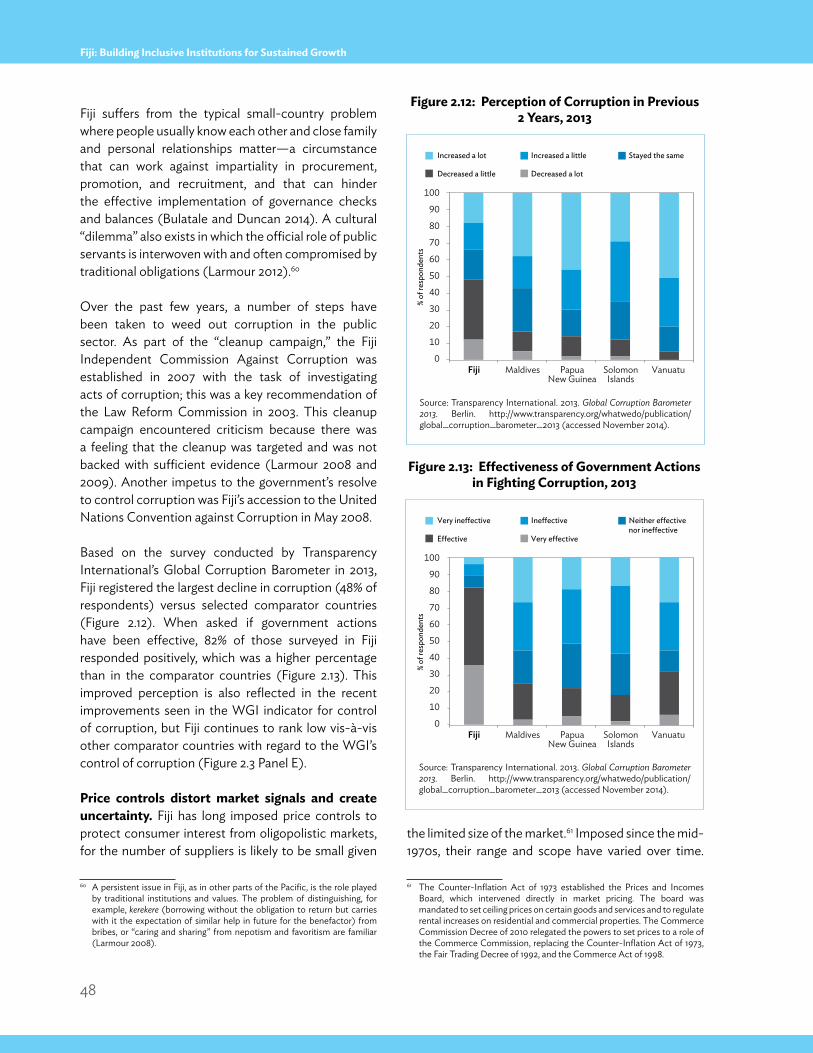
48
Fiji: Building Inclusive Institutions for Sustained Growth
Fiji suffers from the typical small-country problem where people usually know each other and close family and personal relationships matter—a circumstance that can work against impartiality in procurement, promotion, and recruitment, and that can hinder the effective implementation of governance checks and balances (Bulatale and Duncan 2014). A cultural “dilemma” also exists in which the official role of public servants is interwoven with and often compromised by traditional obligations (Larmour 2012).60
Over the past few years, a number of steps have been taken to weed out corruption in the public sector. As part of the “cleanup campaign,” the Fiji Independent Commission Against Corruption was established in 2007 with the task of investigating acts of corruption; this was a key recommendation of the Law Reform Commission in 2003. This cleanup campaign encountered criticism because there was a feeling that the cleanup was targeted and was not backed with sufficient evidence (Larmour 2008 and 2009). Another impetus to the government’s resolve to control corruption was Fiji’s accession to the United Nations Convention against Corruption in May 2008.
Based on the survey conducted by Transparency International’s Global Corruption Barometer in 2013, Fiji registered the largest decline in corruption (48% of respondents) versus selected comparator countries (Figure 2.12). When asked if government actions have been effective, 82% of those surveyed in Fiji responded positively, which was a higher percentage than in the comparator countries (Figure 2.13). This improved perception is also reflected in the recent improvements seen in the WGI indicator for control of corruption, but Fiji continues to rank low vis-à-vis other comparator countries with regard to the WGI’s control of corruption (Figure 2.3 Panel E).
Price controls distort market signals and create uncertainty. Fiji has long imposed price controls to protect consumer interest from oligopolistic markets, for the number of suppliers is likely to be small given
60 A persistent issue in Fiji, as in other parts of the Pacific, is the role played by traditional institutions and values. The problem of distinguishing, for example, kerekere (borrowing without the obligation to return but carries with it the expectation of similar help in future for the benefactor) from bribes, or “caring and sharing” from nepotism and favoritism are familiar (Larmour 2008).
the limited size of the market.61 Imposed since the mid-1970s, their range and scope have varied over time.
61 The Counter-Inflation Act of 1973 established the Prices and Incomes Board, which intervened directly in market pricing. The board was mandated to set ceiling prices on certain goods and services and to regulate rental increases on residential and commercial properties. The Commerce Commission Decree of 2010 relegated the powers to set prices to a role of the Commerce Commission, replacing the Counter-Inflation Act of 1973, the Fair Trading Decree of 1992, and the Commerce Act of 1998.
Figure 2.12: Perception of Corruption in Previous 2 Years, 2013
Figure 2.13: Effectiveness of Government Actions in Fighting Corruption, 2013
Source: Transparency International. 2013. Global Corruption Barometer 2013. Berlin. http://www.transparency.org/whatwedo/publication/global_corruption_barometer_2013 (accessed November 2014).
Source: Transparency International. 2013. Global Corruption Barometer 2013. Berlin. http://www.transparency.org/whatwedo/publication/global_corruption_barometer_2013 (accessed November 2014).
Increased a lot Increased a little Stayed the same
Decreased a little Decreased a lot
0
10
20
30
40
50
60
70
80
90
100
Fiji Maldives PapuaNew Guinea
SolomonIslands
Vanuatu
% of
resp
onde
nts
Very ine�ective Ine�ective Neither e�ectivenor ine�ective
E�ective Very e�ective
0
10
20
30
40
50
60
70
80
90
100
Fiji Maldives PapuaNew Guinea
SolomonIslands
Vanuatu
% of
resp
onde
nts
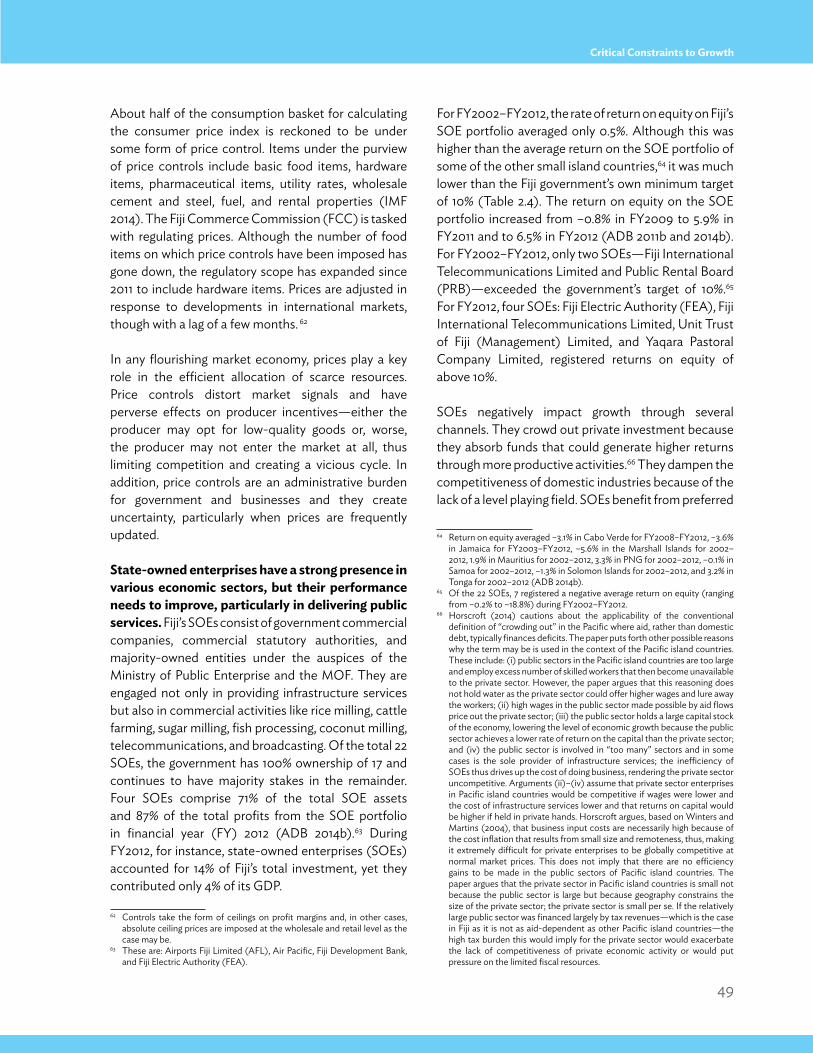
49
Critical Constraints to Growth
About half of the consumption basket for calculating the consumer price index is reckoned to be under some form of price control. Items under the purview of price controls include basic food items, hardware items, pharmaceutical items, utility rates, wholesale cement and steel, fuel, and rental properties (IMF 2014). The Fiji Commerce Commission (FCC) is tasked with regulating prices. Although the number of food items on which price controls have been imposed has gone down, the regulatory scope has expanded since 2011 to include hardware items. Prices are adjusted in response to developments in international markets, though with a lag of a few months. 62
In any flourishing market economy, prices play a key role in the efficient allocation of scarce resources. Price controls distort market signals and have perverse effects on producer incentives—either the producer may opt for low-quality goods or, worse, the producer may not enter the market at all, thus limiting competition and creating a vicious cycle. In addition, price controls are an administrative burden for government and businesses and they create uncertainty, particularly when prices are frequently updated.
State-owned enterprises have a strong presence in various economic sectors, but their performance needs to improve, particularly in delivering public services. Fiji’s SOEs consist of government commercial companies, commercial statutory authorities, and majority-owned entities under the auspices of the Ministry of Public Enterprise and the MOF. They are engaged not only in providing infrastructure services but also in commercial activities like rice milling, cattle farming, sugar milling, fish processing, coconut milling, telecommunications, and broadcasting. Of the total 22 SOEs, the government has 100% ownership of 17 and continues to have majority stakes in the remainder. Four SOEs comprise 71% of the total SOE assets and 87% of the total profits from the SOE portfolio in financial year (FY) 2012 (ADB 2014b).63 During FY2012, for instance, state-owned enterprises (SOEs) accounted for 14% of Fiji’s total investment, yet they contributed only 4% of its GDP.
62 Controls take the form of ceilings on profit margins and, in other cases, absolute ceiling prices are imposed at the wholesale and retail level as the case may be.
63 These are: Airports Fiji Limited (AFL), Air Pacific, Fiji Development Bank, and Fiji Electric Authority (FEA).
For FY2002–FY2012, the rate of return on equity on Fiji’s SOE portfolio averaged only 0.5%. Although this was higher than the average return on the SOE portfolio of some of the other small island countries,64 it was much lower than the Fiji government’s own minimum target of 10% (Table 2.4). The return on equity on the SOE portfolio increased from –0.8% in FY2009 to 5.9% in FY2011 and to 6.5% in FY2012 (ADB 2011b and 2014b). For FY2002–FY2012, only two SOEs—Fiji International Telecommunications Limited and Public Rental Board (PRB)—exceeded the government’s target of 10%.65 For FY2012, four SOEs: Fiji Electric Authority (FEA), Fiji International Telecommunications Limited, Unit Trust of Fiji (Management) Limited, and Yaqara Pastoral Company Limited, registered returns on equity of above 10%.
SOEs negatively impact growth through several channels. They crowd out private investment because they absorb funds that could generate higher returns through more productive activities.66 They dampen the competitiveness of domestic industries because of the lack of a level playing field. SOEs benefit from preferred
64 Return on equity averaged –3.1% in Cabo Verde for FY2008–FY2012, –3.6% in Jamaica for FY2003–FY2012, –5.6% in the Marshall Islands for 2002–2012, 1.9% in Mauritius for 2002–2012, 3.3% in PNG for 2002–2012, –0.1% in Samoa for 2002–2012, –1.3% in Solomon Islands for 2002–2012, and 3.2% in Tonga for 2002–2012 (ADB 2014b).
65 Of the 22 SOEs, 7 registered a negative average return on equity (ranging from –0.2% to –18.8%) during FY2002–FY2012.
66 Horscroft (2014) cautions about the applicability of the conventional definition of “crowding out” in the Pacific where aid, rather than domestic debt, typically finances deficits. The paper puts forth other possible reasons why the term may be is used in the context of the Pacific island countries. These include: (i) public sectors in the Pacific island countries are too large and employ excess number of skilled workers that then become unavailable to the private sector. However, the paper argues that this reasoning does not hold water as the private sector could offer higher wages and lure away the workers; (ii) high wages in the public sector made possible by aid flows price out the private sector; (iii) the public sector holds a large capital stock of the economy, lowering the level of economic growth because the public sector achieves a lower rate of return on the capital than the private sector; and (iv) the public sector is involved in “too many” sectors and in some cases is the sole provider of infrastructure services; the inefficiency of SOEs thus drives up the cost of doing business, rendering the private sector uncompetitive. Arguments (ii)–(iv) assume that private sector enterprises in Pacific island countries would be competitive if wages were lower and the cost of infrastructure services lower and that returns on capital would be higher if held in private hands. Horscroft argues, based on Winters and Martins (2004), that business input costs are necessarily high because of the cost inflation that results from small size and remoteness, thus, making it extremely difficult for private enterprises to be globally competitive at normal market prices. This does not imply that there are no efficiency gains to be made in the public sectors of Pacific island countries. The paper argues that the private sector in Pacific island countries is small not because the public sector is large but because geography constrains the size of the private sector; the private sector is small per se. If the relatively large public sector was financed largely by tax revenues—which is the case in Fiji as it is not as aid-dependent as other Pacific island countries—the high tax burden this would imply for the private sector would exacerbate the lack of competitiveness of private economic activity or would put pressure on the limited fiscal resources.
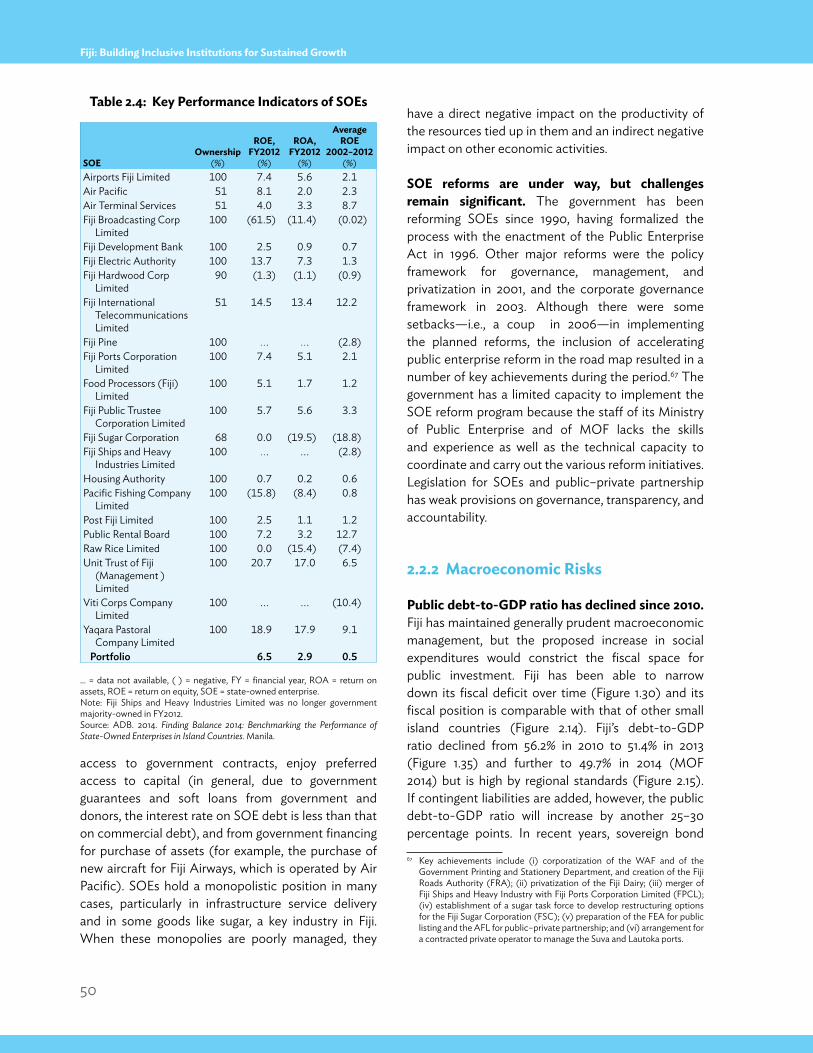
50
Fiji: Building Inclusive Institutions for Sustained Growth
access to government contracts, enjoy preferred access to capital (in general, due to government guarantees and soft loans from government and donors, the interest rate on SOE debt is less than that on commercial debt), and from government financing for purchase of assets (for example, the purchase of new aircraft for Fiji Airways, which is operated by Air Pacific). SOEs hold a monopolistic position in many cases, particularly in infrastructure service delivery and in some goods like sugar, a key industry in Fiji. When these monopolies are poorly managed, they
have a direct negative impact on the productivity of the resources tied up in them and an indirect negative impact on other economic activities.
SOE reforms are under way, but challenges remain significant. The government has been reforming SOEs since 1990, having formalized the process with the enactment of the Public Enterprise Act in 1996. Other major reforms were the policy framework for governance, management, and privatization in 2001, and the corporate governance framework in 2003. Although there were some setbacks—i.e., a coup in 2006—in implementing the planned reforms, the inclusion of accelerating public enterprise reform in the road map resulted in a number of key achievements during the period.67 The government has a limited capacity to implement the SOE reform program because the staff of its Ministry of Public Enterprise and of MOF lacks the skills and experience as well as the technical capacity to coordinate and carry out the various reform initiatives. Legislation for SOEs and public–private partnership has weak provisions on governance, transparency, and accountability.
2.2.2 Macroeconomic Risks
Public debt-to-GDP ratio has declined since 2010. Fiji has maintained generally prudent macroeconomic management, but the proposed increase in social expenditures would constrict the fiscal space for public investment. Fiji has been able to narrow down its fiscal deficit over time (Figure 1.30) and its fiscal position is comparable with that of other small island countries (Figure 2.14). Fiji’s debt-to-GDP ratio declined from 56.2% in 2010 to 51.4% in 2013 (Figure 1.35) and further to 49.7% in 2014 (MOF 2014) but is high by regional standards (Figure 2.15). If contingent liabilities are added, however, the public debt-to-GDP ratio will increase by another 25–30 percentage points. In recent years, sovereign bond
67 Key achievements include (i) corporatization of the WAF and of the Government Printing and Stationery Department, and creation of the Fiji Roads Authority (FRA); (ii) privatization of the Fiji Dairy; (iii) merger of Fiji Ships and Heavy Industry with Fiji Ports Corporation Limited (FPCL); (iv) establishment of a sugar task force to develop restructuring options for the Fiji Sugar Corporation (FSC); (v) preparation of the FEA for public listing and the AFL for public–private partnership; and (vi) arrangement for a contracted private operator to manage the Suva and Lautoka ports.
SOEOwnership
(%)
ROE, FY2012
(%)
ROA, FY2012
(%)
Average ROE
2002–2012(%)
Airports Fiji Limited 100 7.4 5.6 2.1Air Pacific 51 8.1 2.0 2.3Air Terminal Services 51 4.0 3.3 8.7Fiji Broadcasting Corp
Limited100 (61.5) (11.4) (0.02)
Fiji Development Bank 100 2.5 0.9 0.7Fiji Electric Authority 100 13.7 7.3 1.3Fiji Hardwood Corp
Limited90 (1.3) (1.1) (0.9)
Fiji International Telecommunications Limited
51 14.5 13.4 12.2
Fiji Pine 100 …. …. (2.8)Fiji Ports Corporation
Limited100 7.4 5.1 2.1
Food Processors (Fiji) Limited
100 5.1 1.7 1.2
Fiji Public Trustee Corporation Limited
100 5.7 5.6 3.3
Fiji Sugar Corporation 68 0.0 (19.5) (18.8)Fiji Ships and Heavy
Industries Limited100 …. ... (2.8)
Housing Authority 100 0.7 0.2 0.6Pacific Fishing Company
Limited100 (15.8) (8.4) 0.8
Post Fiji Limited 100 2.5 1.1 1.2Public Rental Board 100 7.2 3.2 12.7Raw Rice Limited 100 0.0 (15.4) (7.4)Unit Trust of Fiji
(Management ) Limited
100 20.7 17.0 6.5
Viti Corps Company Limited
100 ... ... (10.4)
Yaqara Pastoral Company Limited
100 18.9 17.9 9.1
Portfolio 6.5 2.9 0.5
Table 2.4: Key Performance Indicators of SOEs
... = data not available, ( ) = negative, FY = financial year, ROA = return on assets, ROE = return on equity, SOE = state-owned enterprise. Note: Fiji Ships and Heavy Industries Limited was no longer government majority-owned in FY2012.Source: ADB. 2014. Finding Balance 2014: Benchmarking the Performance of State-Owned Enterprises in Island Countries. Manila.
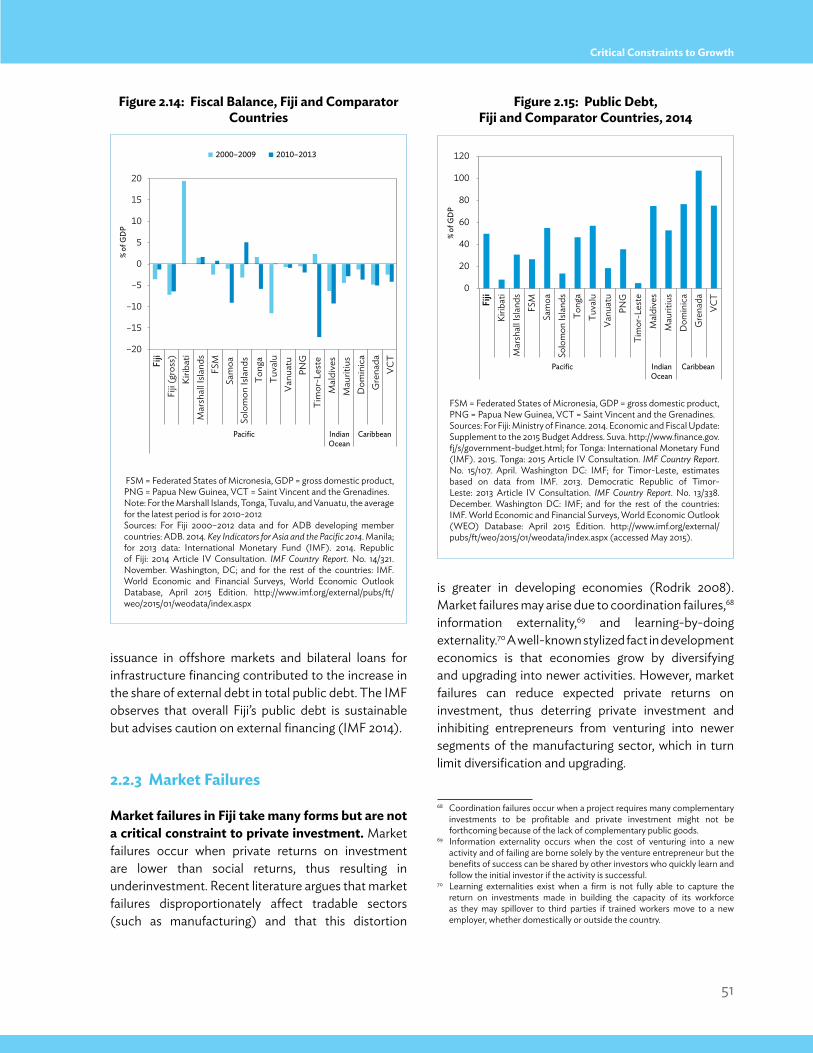
51
Critical Constraints to Growth
issuance in offshore markets and bilateral loans for infrastructure financing contributed to the increase in the share of external debt in total public debt. The IMF observes that overall Fiji’s public debt is sustainable but advises caution on external financing (IMF 2014).
2.2.3 Market Failures
Market failures in Fiji take many forms but are not a critical constraint to private investment. Market failures occur when private returns on investment are lower than social returns, thus resulting in underinvestment. Recent literature argues that market failures disproportionately affect tradable sectors (such as manufacturing) and that this distortion
is greater in developing economies (Rodrik 2008). Market failures may arise due to coordination failures,68 information externality,69 and learning-by-doing externality.70 A well-known stylized fact in development economics is that economies grow by diversifying and upgrading into newer activities. However, market failures can reduce expected private returns on investment, thus deterring private investment and inhibiting entrepreneurs from venturing into newer segments of the manufacturing sector, which in turn limit diversification and upgrading.
68 Coordination failures occur when a project requires many complementary investments to be profitable and private investment might not be forthcoming because of the lack of complementary public goods.
69 Information externality occurs when the cost of venturing into a new activity and of failing are borne solely by the venture entrepreneur but the benefits of success can be shared by other investors who quickly learn and follow the initial investor if the activity is successful.
70 Learning externalities exist when a firm is not fully able to capture the return on investments made in building the capacity of its workforce as they may spillover to third parties if trained workers move to a new employer, whether domestically or outside the country.
–20
–15
–10
–5
0
5
10
15
20
Fiji
Fiji
(gro
ss)
Kirib
ati
Mar
shal
l Isla
nds
FSM
Sa
moa
So
lom
on Is
land
s To
nga
Tu
valu
Va
nuat
u
PNG
Ti
mor
-Les
te
Mal
dive
s M
aurit
ius
Dom
inic
a G
rena
da
VCT
Pacific IndianOcean
Caribbean
% of
GD
P
2000–2009 2010–2013
Figure 2.14: Fiscal Balance, Fiji and Comparator Countries
FSM = Federated States of Micronesia, GDP = gross domestic product, PNG = Papua New Guinea, VCT = Saint Vincent and the Grenadines.Note: For the Marshall Islands, Tonga, Tuvalu, and Vanuatu, the average for the latest period is for 2010-2012Sources: For Fiji 2000–2012 data and for ADB developing member countries: ADB. 2014. Key Indicators for Asia and the Pacific 2014. Manila; for 2013 data: International Monetary Fund (IMF). 2014. Republic of Fiji: 2014 Article IV Consultation. IMF Country Report. No. 14/321. November. Washington, DC; and for the rest of the countries: IMF. World Economic and Financial Surveys, World Economic Outlook Database, April 2015 Edition. http://www.imf.org/external/pubs/ft/weo/2015/01/weodata/index.aspx
Figure 2.15: Public Debt, Fiji and Comparator Countries, 2014
FSM = Federated States of Micronesia, GDP = gross domestic product, PNG = Papua New Guinea, VCT = Saint Vincent and the Grenadines.Sources: For Fiji: Ministry of Finance. 2014. Economic and Fiscal Update: Supplement to the 2015 Budget Address. Suva. http://www.finance.gov.fj/s/government-budget.html; for Tonga: International Monetary Fund (IMF). 2015. Tonga: 2015 Article IV Consultation. IMF Country Report. No. 15/107. April. Washington DC: IMF; for Timor-Leste, estimates based on data from IMF. 2013. Democratic Republic of Timor-Leste: 2013 Article IV Consultation. IMF Country Report. No. 13/338. December. Washington DC: IMF; and for the rest of the countries: IMF. World Economic and Financial Surveys, World Economic Outlook (WEO) Database: April 2015 Edition. http://www.imf.org/external/pubs/ft/weo/2015/01/weodata/index.aspx (accessed May 2015).
0
20
40
60
80
100
120
Fiji
Kirib
ati
Mar
shal
l Isla
nds
FSM
Sa
moa
So
lom
on Is
land
s To
nga
Tuva
lu
Vanu
atu
PNG
Ti
mor
-Les
te
Mal
dive
s M
aurit
ius
Dom
inic
a G
rena
da
VCT
Pacific IndianOcean
Caribbean
% of
GD
P
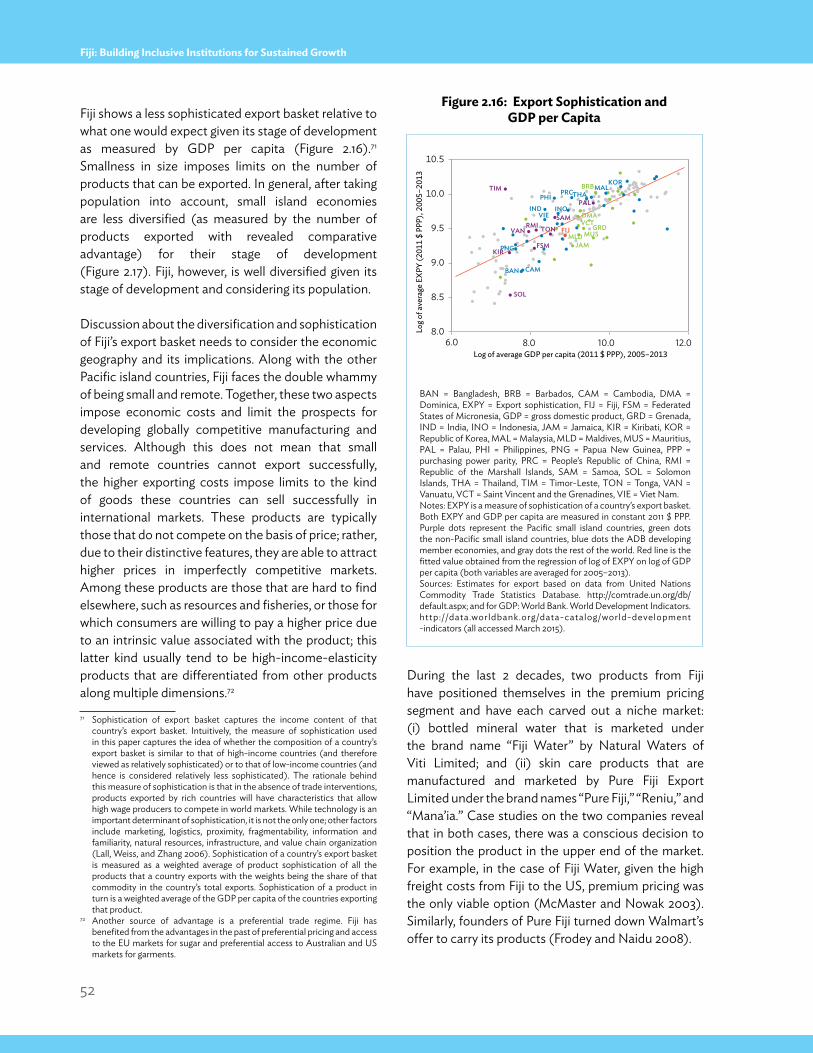
52
Fiji: Building Inclusive Institutions for Sustained Growth
Fiji shows a less sophisticated export basket relative to what one would expect given its stage of development as measured by GDP per capita (Figure 2.16).71 Smallness in size imposes limits on the number of products that can be exported. In general, after taking population into account, small island economies are less diversified (as measured by the number of products exported with revealed comparative advantage) for their stage of development (Figure 2.17). Fiji, however, is well diversified given its stage of development and considering its population.
Discussion about the diversification and sophistication of Fiji’s export basket needs to consider the economic geography and its implications. Along with the other Pacific island countries, Fiji faces the double whammy of being small and remote. Together, these two aspects impose economic costs and limit the prospects for developing globally competitive manufacturing and services. Although this does not mean that small and remote countries cannot export successfully, the higher exporting costs impose limits to the kind of goods these countries can sell successfully in international markets. These products are typically those that do not compete on the basis of price; rather, due to their distinctive features, they are able to attract higher prices in imperfectly competitive markets. Among these products are those that are hard to find elsewhere, such as resources and fisheries, or those for which consumers are willing to pay a higher price due to an intrinsic value associated with the product; this latter kind usually tend to be high-income-elasticity products that are differentiated from other products along multiple dimensions.72
71 Sophistication of export basket captures the income content of that country’s export basket. Intuitively, the measure of sophistication used in this paper captures the idea of whether the composition of a country’s export basket is similar to that of high-income countries (and therefore viewed as relatively sophisticated) or to that of low-income countries (and hence is considered relatively less sophisticated). The rationale behind this measure of sophistication is that in the absence of trade interventions, products exported by rich countries will have characteristics that allow high wage producers to compete in world markets. While technology is an important determinant of sophistication, it is not the only one; other factors include marketing, logistics, proximity, fragmentability, information and familiarity, natural resources, infrastructure, and value chain organization (Lall, Weiss, and Zhang 2006). Sophistication of a country’s export basket is measured as a weighted average of product sophistication of all the products that a country exports with the weights being the share of that commodity in the country’s total exports. Sophistication of a product in turn is a weighted average of the GDP per capita of the countries exporting that product.
72 Another source of advantage is a preferential trade regime. Fiji has benefited from the advantages in the past of preferential pricing and access to the EU markets for sugar and preferential access to Australian and US markets for garments.
During the last 2 decades, two products from Fiji have positioned themselves in the premium pricing segment and have each carved out a niche market: (i) bottled mineral water that is marketed under the brand name “Fiji Water” by Natural Waters of Viti Limited; and (ii) skin care products that are manufactured and marketed by Pure Fiji Export Limited under the brand names “Pure Fiji,” “Reniu,” and “Mana’ia.” Case studies on the two companies reveal that in both cases, there was a conscious decision to position the product in the upper end of the market. For example, in the case of Fiji Water, given the high freight costs from Fiji to the US, premium pricing was the only viable option (McMaster and Nowak 2003). Similarly, founders of Pure Fiji turned down Walmart’s offer to carry its products (Frodey and Naidu 2008).
Figure 2.16: Export Sophistication and GDP per Capita
BAN = Bangladesh, BRB = Barbados, CAM = Cambodia, DMA = Dominica, EXPY = Export sophistication, FIJ = Fiji, FSM = Federated States of Micronesia, GDP = gross domestic product, GRD = Grenada, IND = India, INO = Indonesia, JAM = Jamaica, KIR = Kiribati, KOR = Republic of Korea, MAL = Malaysia, MLD = Maldives, MUS = Mauritius, PAL = Palau, PHI = Philippines, PNG = Papua New Guinea, PPP = purchasing power parity, PRC = People’s Republic of China, RMI = Republic of the Marshall Islands, SAM = Samoa, SOL = Solomon Islands, THA = Thailand, TIM = Timor-Leste, TON = Tonga, VAN = Vanuatu, VCT = Saint Vincent and the Grenadines, VIE = Viet Nam.Notes: EXPY is a measure of sophistication of a country’s export basket. Both EXPY and GDP per capita are measured in constant 2011 $ PPP. Purple dots represent the Pacific small island countries, green dots the non-Pacific small island countries, blue dots the ADB developing member economies, and gray dots the rest of the world. Red line is the fitted value obtained from the regression of log of EXPY on log of GDP per capita (both variables are averaged for 2005–2013).Sources: Estimates for export based on data from United Nations Commodity Trade Statistics Database. http://comtrade.un.org/db/default.aspx; and for GDP: World Bank. World Development Indicators. http://data.worldbank.org/data-catalog/world-development -indicators (all accessed March 2015).
6.0 8.0 10.0 12.0
FIJ
FSMKIR
RMI
PAL
SAM
SOL
TIM
TONVAN
BRB
DMA
GRD
JAMMLD MUS
VCT
BAN CAM
PRC
IND INO
MAL
PNG
PHI
KOR
THA
VIE
8.0
8.5
9.0
9.5
10.0
10.5
Log
of a
vera
ge E
XPY
(201
1 $
PPP)
, 200
5–20
13
Log of average GDP per capita (2011 $ PPP), 2005–2013
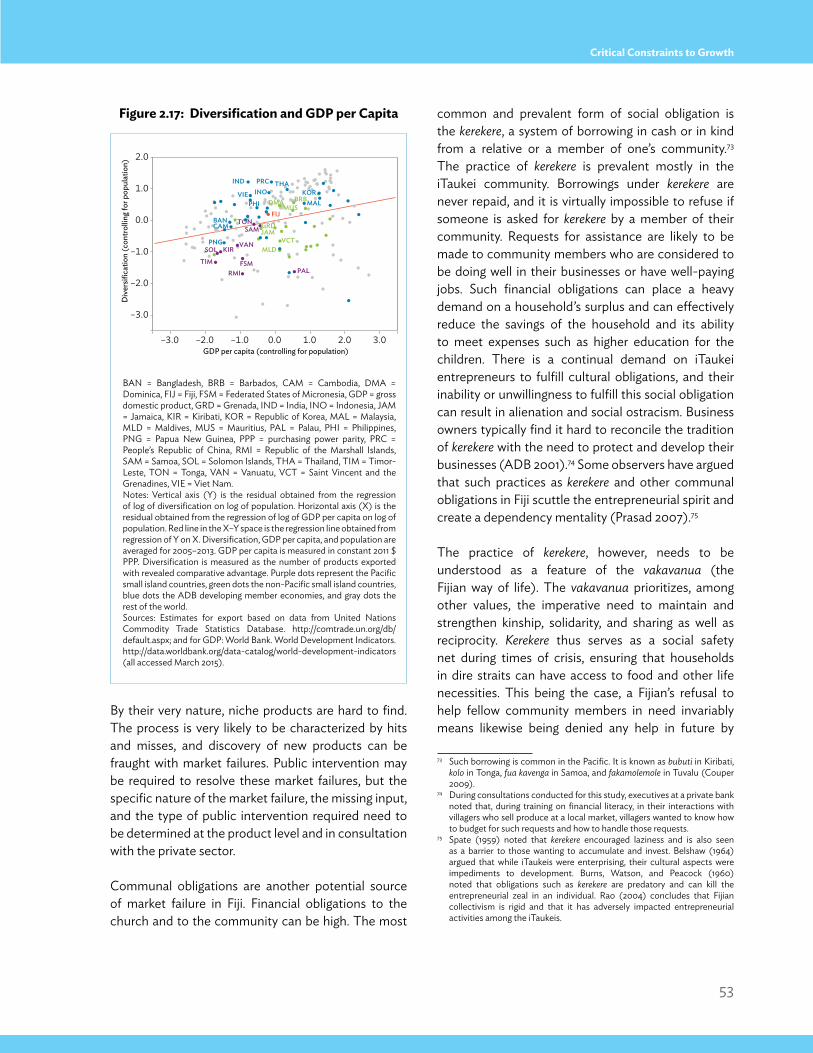
53
Critical Constraints to Growth
By their very nature, niche products are hard to find. The process is very likely to be characterized by hits and misses, and discovery of new products can be fraught with market failures. Public intervention may be required to resolve these market failures, but the specific nature of the market failure, the missing input, and the type of public intervention required need to be determined at the product level and in consultation with the private sector.
Communal obligations are another potential source of market failure in Fiji. Financial obligations to the church and to the community can be high. The most
common and prevalent form of social obligation is the kerekere, a system of borrowing in cash or in kind from a relative or a member of one’s community.73 The practice of kerekere is prevalent mostly in the iTaukei community. Borrowings under kerekere are never repaid, and it is virtually impossible to refuse if someone is asked for kerekere by a member of their community. Requests for assistance are likely to be made to community members who are considered to be doing well in their businesses or have well-paying jobs. Such financial obligations can place a heavy demand on a household’s surplus and can effectively reduce the savings of the household and its ability to meet expenses such as higher education for the children. There is a continual demand on iTaukei entrepreneurs to fulfill cultural obligations, and their inability or unwillingness to fulfill this social obligation can result in alienation and social ostracism. Business owners typically find it hard to reconcile the tradition of kerekere with the need to protect and develop their businesses (ADB 2001).74 Some observers have argued that such practices as kerekere and other communal obligations in Fiji scuttle the entrepreneurial spirit and create a dependency mentality (Prasad 2007).75
The practice of kerekere, however, needs to be understood as a feature of the vakavanua (the Fijian way of life). The vakavanua prioritizes, among other values, the imperative need to maintain and strengthen kinship, solidarity, and sharing as well as reciprocity. Kerekere thus serves as a social safety net during times of crisis, ensuring that households in dire straits can have access to food and other life necessities. This being the case, a Fijian’s refusal to help fellow community members in need invariably means likewise being denied any help in future by
73 Such borrowing is common in the Pacific. It is known as bubuti in Kiribati, kolo in Tonga, fua kavenga in Samoa, and fakamolemole in Tuvalu (Couper 2009).
74 During consultations conducted for this study, executives at a private bank noted that, during training on financial literacy, in their interactions with villagers who sell produce at a local market, villagers wanted to know how to budget for such requests and how to handle those requests.
75 Spate (1959) noted that kerekere encouraged laziness and is also seen as a barrier to those wanting to accumulate and invest. Belshaw (1964) argued that while iTaukeis were enterprising, their cultural aspects were impediments to development. Burns, Watson, and Peacock (1960) noted that obligations such as kerekere are predatory and can kill the entrepreneurial zeal in an individual. Rao (2004) concludes that Fijian collectivism is rigid and that it has adversely impacted entrepreneurial activities among the iTaukeis.
Figure 2.17: Diversification and GDP per Capita
BAN = Bangladesh, BRB = Barbados, CAM = Cambodia, DMA = Dominica, FIJ = Fiji, FSM = Federated States of Micronesia, GDP = gross domestic product, GRD = Grenada, IND = India, INO = Indonesia, JAM = Jamaica, KIR = Kiribati, KOR = Republic of Korea, MAL = Malaysia, MLD = Maldives, MUS = Mauritius, PAL = Palau, PHI = Philippines, PNG = Papua New Guinea, PPP = purchasing power parity, PRC = People’s Republic of China, RMI = Republic of the Marshall Islands, SAM = Samoa, SOL = Solomon Islands, THA = Thailand, TIM = Timor-Leste, TON = Tonga, VAN = Vanuatu, VCT = Saint Vincent and the Grenadines, VIE = Viet Nam.Notes: Vertical axis (Y) is the residual obtained from the regression of log of diversification on log of population. Horizontal axis (X) is the residual obtained from the regression of log of GDP per capita on log of population. Red line in the X–Y space is the regression line obtained from regression of Y on X. Diversification, GDP per capita, and population are averaged for 2005–2013. GDP per capita is measured in constant 2011 $ PPP. Diversification is measured as the number of products exported with revealed comparative advantage. Purple dots represent the Pacific small island countries, green dots the non-Pacific small island countries, blue dots the ADB developing member economies, and gray dots the rest of the world. Sources: Estimates for export based on data from United Nations Commodity Trade Statistics Database. http://comtrade.un.org/db/default.aspx; and for GDP: World Bank. World Development Indicators. http://data.worldbank.org/data-catalog/world-development-indicators (all accessed March 2015).
FIJ
FSM
KIR
RMI PAL
SAM
SOL
TIM
TON
VAN
BRBDMA
GRDJAM
MLD
MUS
VCT
BANCAM
PRCINDINO
MAL
PNG
PHIKOR
THAVIE
–3.0
–2.0
–1.0
0.0
1.0
2.0
Div
ersifi
catio
n (c
ontr
ollin
g fo
r pop
ulat
ion)
–3.0 –2.0 –1.0 0.0 1.0 2.0 3.0GDP per capita (controlling for population)
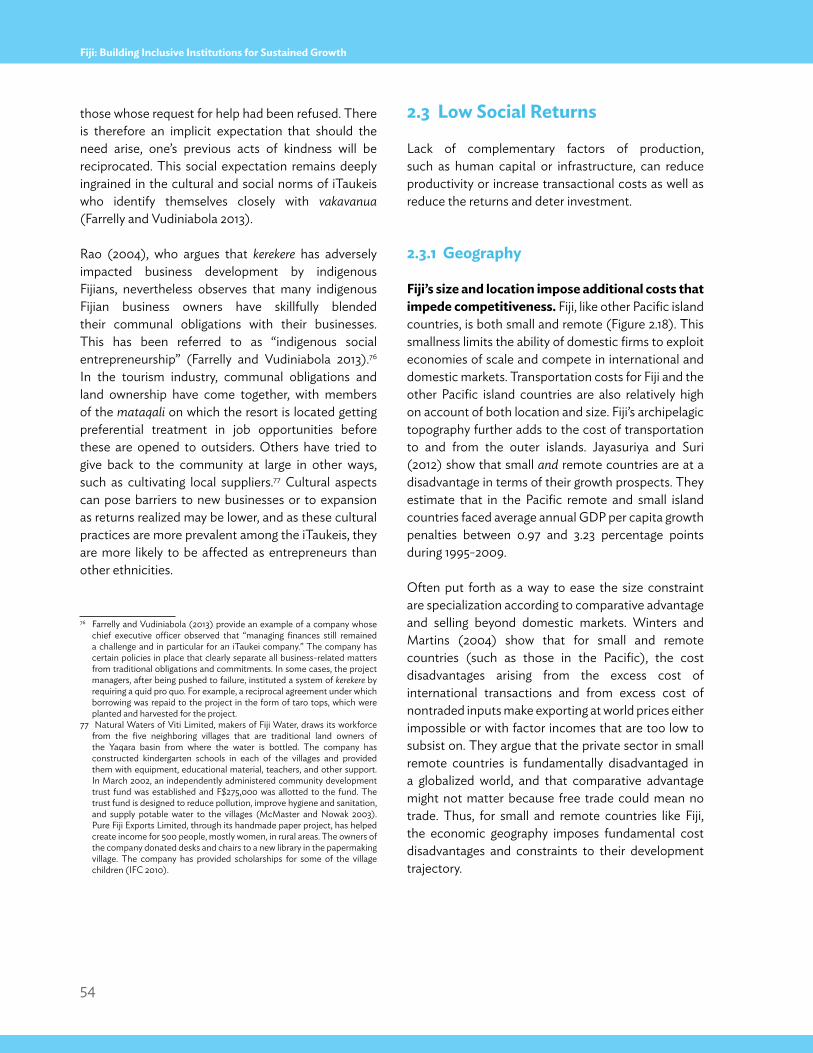
54
Fiji: Building Inclusive Institutions for Sustained Growth
those whose request for help had been refused. There is therefore an implicit expectation that should the need arise, one’s previous acts of kindness will be reciprocated. This social expectation remains deeply ingrained in the cultural and social norms of iTaukeis who identify themselves closely with vakavanua (Farrelly and Vudiniabola 2013).
Rao (2004), who argues that kerekere has adversely impacted business development by indigenous Fijians, nevertheless observes that many indigenous Fijian business owners have skillfully blended their communal obligations with their businesses. This has been referred to as “indigenous social entrepreneurship” (Farrelly and Vudiniabola 2013).76 In the tourism industry, communal obligations and land ownership have come together, with members of the mataqali on which the resort is located getting preferential treatment in job opportunities before these are opened to outsiders. Others have tried to give back to the community at large in other ways, such as cultivating local suppliers.77 Cultural aspects can pose barriers to new businesses or to expansion as returns realized may be lower, and as these cultural practices are more prevalent among the iTaukeis, they are more likely to be affected as entrepreneurs than other ethnicities.
76 Farrelly and Vudiniabola (2013) provide an example of a company whose chief executive officer observed that “managing finances still remained a challenge and in particular for an iTaukei company.” The company has certain policies in place that clearly separate all business-related matters from traditional obligations and commitments. In some cases, the project managers, after being pushed to failure, instituted a system of kerekere by requiring a quid pro quo. For example, a reciprocal agreement under which borrowing was repaid to the project in the form of taro tops, which were planted and harvested for the project.
77 Natural Waters of Viti Limited, makers of Fiji Water, draws its workforce from the five neighboring villages that are traditional land owners of the Yaqara basin from where the water is bottled. The company has constructed kindergarten schools in each of the villages and provided them with equipment, educational material, teachers, and other support. In March 2002, an independently administered community development trust fund was established and F$275,000 was allotted to the fund. The trust fund is designed to reduce pollution, improve hygiene and sanitation, and supply potable water to the villages (McMaster and Nowak 2003). Pure Fiji Exports Limited, through its handmade paper project, has helped create income for 500 people, mostly women, in rural areas. The owners of the company donated desks and chairs to a new library in the papermaking village. The company has provided scholarships for some of the village children (IFC 2010).
2.3 Low Social Returns
Lack of complementary factors of production, such as human capital or infrastructure, can reduce productivity or increase transactional costs as well as reduce the returns and deter investment.
2.3.1 Geography
Fiji’s size and location impose additional costs that impede competitiveness. Fiji, like other Pacific island countries, is both small and remote (Figure 2.18). This smallness limits the ability of domestic firms to exploit economies of scale and compete in international and domestic markets. Transportation costs for Fiji and the other Pacific island countries are also relatively high on account of both location and size. Fiji’s archipelagic topography further adds to the cost of transportation to and from the outer islands. Jayasuriya and Suri (2012) show that small and remote countries are at a disadvantage in terms of their growth prospects. They estimate that in the Pacific remote and small island countries faced average annual GDP per capita growth penalties between 0.97 and 3.23 percentage points during 1995-2009.
Often put forth as a way to ease the size constraint are specialization according to comparative advantage and selling beyond domestic markets. Winters and Martins (2004) show that for small and remote countries (such as those in the Pacific), the cost disadvantages arising from the excess cost of international transactions and from excess cost of nontraded inputs make exporting at world prices either impossible or with factor incomes that are too low to subsist on. They argue that the private sector in small remote countries is fundamentally disadvantaged in a globalized world, and that comparative advantage might not matter because free trade could mean no trade. Thus, for small and remote countries like Fiji, the economic geography imposes fundamental cost disadvantages and constraints to their development trajectory.
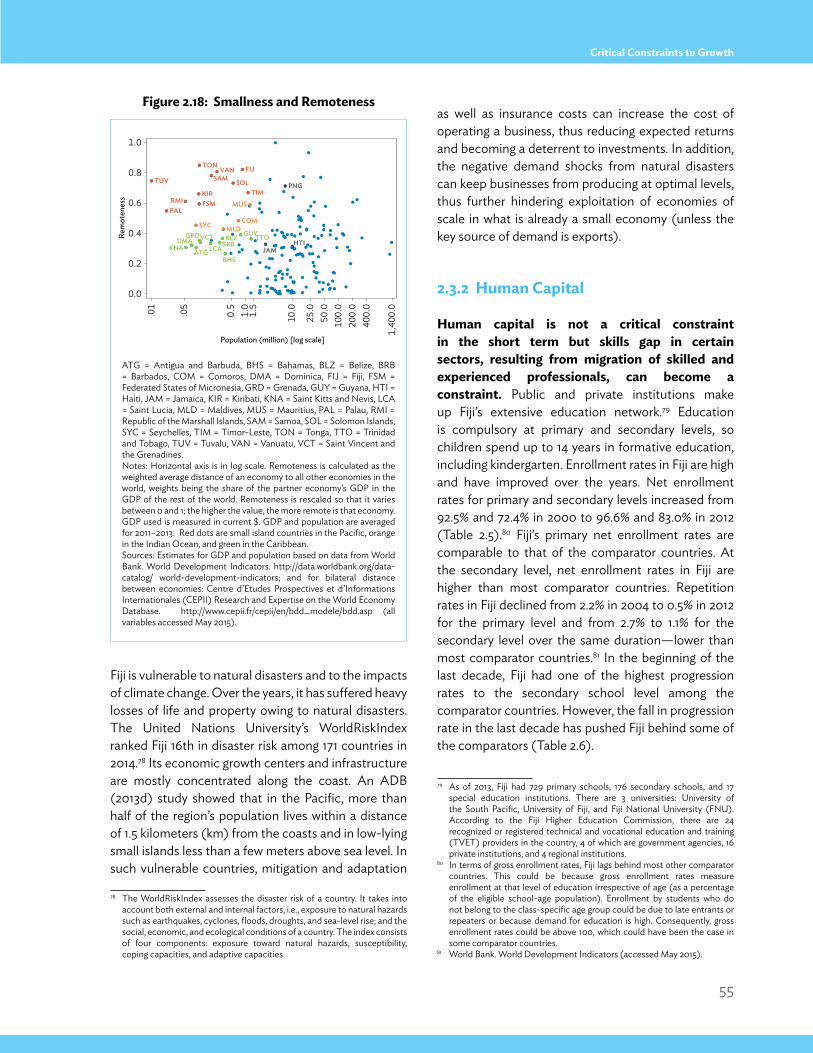
55
Critical Constraints to Growth
Fiji is vulnerable to natural disasters and to the impacts of climate change. Over the years, it has suffered heavy losses of life and property owing to natural disasters. The United Nations University’s WorldRiskIndex ranked Fiji 16th in disaster risk among 171 countries in 2014.78 Its economic growth centers and infrastructure are mostly concentrated along the coast. An ADB (2013d) study showed that in the Pacific, more than half of the region’s population lives within a distance of 1.5 kilometers (km) from the coasts and in low-lying small islands less than a few meters above sea level. In such vulnerable countries, mitigation and adaptation
78 The WorldRiskIndex assesses the disaster risk of a country. It takes into account both external and internal factors, i.e., exposure to natural hazards such as earthquakes, cyclones, floods, droughts, and sea-level rise; and the social, economic, and ecological conditions of a country. The index consists of four components: exposure toward natural hazards, susceptibility, coping capacities, and adaptive capacities.
as well as insurance costs can increase the cost of operating a business, thus reducing expected returns and becoming a deterrent to investments. In addition, the negative demand shocks from natural disasters can keep businesses from producing at optimal levels, thus further hindering exploitation of economies of scale in what is already a small economy (unless the key source of demand is exports).
2.3.2 Human Capital
Human capital is not a critical constraint in the short term but skills gap in certain sectors, resulting from migration of skilled and experienced professionals, can become a constraint. Public and private institutions make up Fiji’s extensive education network.79 Education is compulsory at primary and secondary levels, so children spend up to 14 years in formative education, including kindergarten. Enrollment rates in Fiji are high and have improved over the years. Net enrollment rates for primary and secondary levels increased from 92.5% and 72.4% in 2000 to 96.6% and 83.0% in 2012 (Table 2.5).80 Fiji’s primary net enrollment rates are comparable to that of the comparator countries. At the secondary level, net enrollment rates in Fiji are higher than most comparator countries. Repetition rates in Fiji declined from 2.2% in 2004 to 0.5% in 2012 for the primary level and from 2.7% to 1.1% for the secondary level over the same duration—lower than most comparator countries.81 In the beginning of the last decade, Fiji had one of the highest progression rates to the secondary school level among the comparator countries. However, the fall in progression rate in the last decade has pushed Fiji behind some of the comparators (Table 2.6).
79 As of 2013, Fiji had 729 primary schools, 176 secondary schools, and 17 special education institutions. There are 3 universities: University of the South Pacific, University of Fiji, and Fiji National University (FNU). According to the Fiji Higher Education Commission, there are 24 recognized or registered technical and vocational education and training (TVET) providers in the country, 4 of which are government agencies, 16 private institutions, and 4 regional institutions.
80 In terms of gross enrollment rates, Fiji lags behind most other comparator countries. This could be because gross enrollment rates measure enrollment at that level of education irrespective of age (as a percentage of the eligible school-age population). Enrollment by students who do not belong to the class-specific age group could be due to late entrants or repeaters or because demand for education is high. Consequently, gross enrollment rates could be above 100, which could have been the case in some comparator countries.
81 World Bank. World Development Indicators (accessed May 2015).
Figure 2.18: Smallness and Remoteness
ATG = Antigua and Barbuda, BHS = Bahamas, BLZ = Belize, BRB = Barbados, COM = Comoros, DMA = Dominica, FIJ = Fiji, FSM = Federated States of Micronesia, GRD = Grenada, GUY = Guyana, HTI = Haiti, JAM = Jamaica, KIR = Kiribati, KNA = Saint Kitts and Nevis, LCA = Saint Lucia, MLD = Maldives, MUS = Mauritius, PAL = Palau, RMI = Republic of the Marshall Islands, SAM = Samoa, SOL = Solomon Islands, SYC = Seychelles, TIM = Timor-Leste, TON = Tonga, TTO = Trinidad and Tobago, TUV = Tuvalu, VAN = Vanuatu, VCT = Saint Vincent and the Grenadines.Notes: Horizontal axis is in log scale. Remoteness is calculated as the weighted average distance of an economy to all other economies in the world, weights being the share of the partner economy’s GDP in the GDP of the rest of the world. Remoteness is rescaled so that it varies between 0 and 1; the higher the value, the more remote is that economy. GDP used is measured in current $. GDP and population are averaged for 2011–2013. Red dots are small island countries in the Pacific, orange in the Indian Ocean, and green in the Caribbean.Sources: Estimates for GDP and population based on data from World Bank. World Development Indicators. http://data.worldbank.org/data-catalog/ world-development-indicators; and for bilateral distance between economies: Centre d’Etudes Prospectives et d’Informations Internationales (CEPII) Research and Expertise on the World Economy Database. http://www.cepii.fr/cepii/en/bdd_modele/bdd.asp (all variables accessed May 2015).
1.0
0.8
0.6
0.4
0.2
0.0
Rem
oten
ess
Population (million) [log scale]
HTIJAM
PNG
FIJ
FSMKIR
RMIPAL
SOLTIM
TON
TUVVAN
SAM
ATGBHS
BLZBRBDMA
GRD GUY
KNA LCATTOVCT
COMMLD
MUS
SYC
.01
.05
0.5
1.0
1.5
10.0
25.0
50.0
100.
020
0.0
400.
0
1,40
0.0
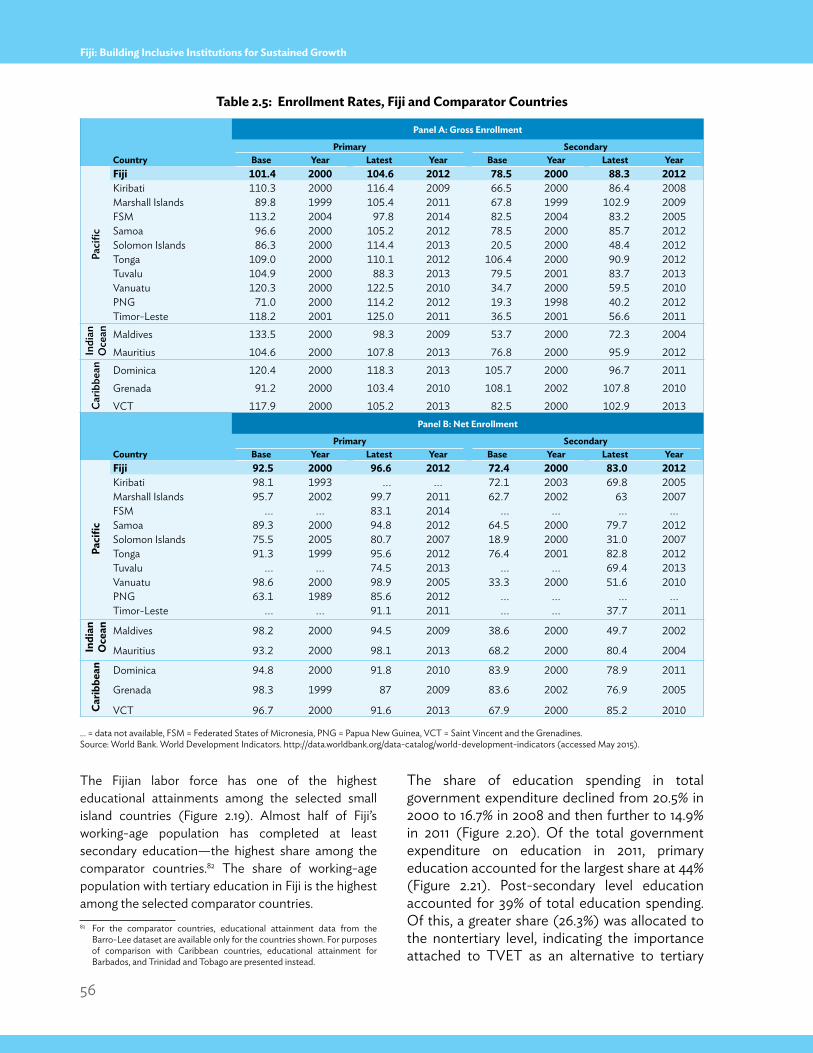
56
Fiji: Building Inclusive Institutions for Sustained Growth
The Fijian labor force has one of the highest educational attainments among the selected small island countries (Figure 2.19). Almost half of Fiji’s working-age population has completed at least secondary education—the highest share among the comparator countries.82 The share of working-age population with tertiary education in Fiji is the highest among the selected comparator countries. 82 For the comparator countries, educational attainment data from the
Barro-Lee dataset are available only for the countries shown. For purposes of comparison with Caribbean countries, educational attainment for Barbados, and Trinidad and Tobago are presented instead.
The share of education spending in total government expenditure declined from 20.5% in 2000 to 16.7% in 2008 and then further to 14.9% in 2011 (Figure 2.20). Of the total government expenditure on education in 2011, primary education accounted for the largest share at 44% (Figure 2.21). Post-secondary level education accounted for 39% of total education spending. Of this, a greater share (26.3%) was allocated to the nontertiary level, indicating the importance attached to TVET as an alternative to tertiary
Table 2.5: Enrollment Rates, Fiji and Comparator Countries
… = data not available, FSM = Federated States of Micronesia, PNG = Papua New Guinea, VCT = Saint Vincent and the Grenadines.Source: World Bank. World Development Indicators. http://data.worldbank.org/data-catalog/world-development-indicators (accessed May 2015).
Panel A: Gross Enrollment
Primary SecondaryCountry Base Year Latest Year Base Year Latest Year
Paci
fic
Fiji 101.4 2000 104.6 2012 78.5 2000 88.3 2012Kiribati 110.3 2000 116.4 2009 66.5 2000 86.4 2008Marshall Islands 89.8 1999 105.4 2011 67.8 1999 102.9 2009FSM 113.2 2004 97.8 2014 82.5 2004 83.2 2005Samoa 96.6 2000 105.2 2012 78.5 2000 85.7 2012Solomon Islands 86.3 2000 114.4 2013 20.5 2000 48.4 2012Tonga 109.0 2000 110.1 2012 106.4 2000 90.9 2012Tuvalu 104.9 2000 88.3 2013 79.5 2001 83.7 2013Vanuatu 120.3 2000 122.5 2010 34.7 2000 59.5 2010PNG 71.0 2000 114.2 2012 19.3 1998 40.2 2012Timor-Leste 118.2 2001 125.0 2011 36.5 2001 56.6 2011
Indi
an
Oce
an Maldives 133.5 2000 98.3 2009 53.7 2000 72.3 2004Mauritius 104.6 2000 107.8 2013 76.8 2000 95.9 2012
Carib
bean Dominica 120.4 2000 118.3 2013 105.7 2000 96.7 2011
Grenada 91.2 2000 103.4 2010 108.1 2002 107.8 2010VCT 117.9 2000 105.2 2013 82.5 2000 102.9 2013
Panel B: Net Enrollment
Primary SecondaryCountry Base Year Latest Year Base Year Latest Year
Paci
fic
Fiji 92.5 2000 96.6 2012 72.4 2000 83.0 2012Kiribati 98.1 1993 ... ... 72.1 2003 69.8 2005Marshall Islands 95.7 2002 99.7 2011 62.7 2002 63 2007FSM ... ... 83.1 2014 ... ... ... ...Samoa 89.3 2000 94.8 2012 64.5 2000 79.7 2012Solomon Islands 75.5 2005 80.7 2007 18.9 2000 31.0 2007Tonga 91.3 1999 95.6 2012 76.4 2001 82.8 2012Tuvalu ... ... 74.5 2013 ... ... 69.4 2013Vanuatu 98.6 2000 98.9 2005 33.3 2000 51.6 2010PNG 63.1 1989 85.6 2012 ... ... ... ...Timor-Leste ... ... 91.1 2011 ... ... 37.7 2011
Indi
an
Oce
an Maldives 98.2 2000 94.5 2009 38.6 2000 49.7 2002
Mauritius 93.2 2000 98.1 2013 68.2 2000 80.4 2004
Carib
bean Dominica 94.8 2000 91.8 2010 83.9 2000 78.9 2011
Grenada 98.3 1999 87 2009 83.6 2002 76.9 2005
VCT 96.7 2000 91.6 2013 67.9 2000 85.2 2010
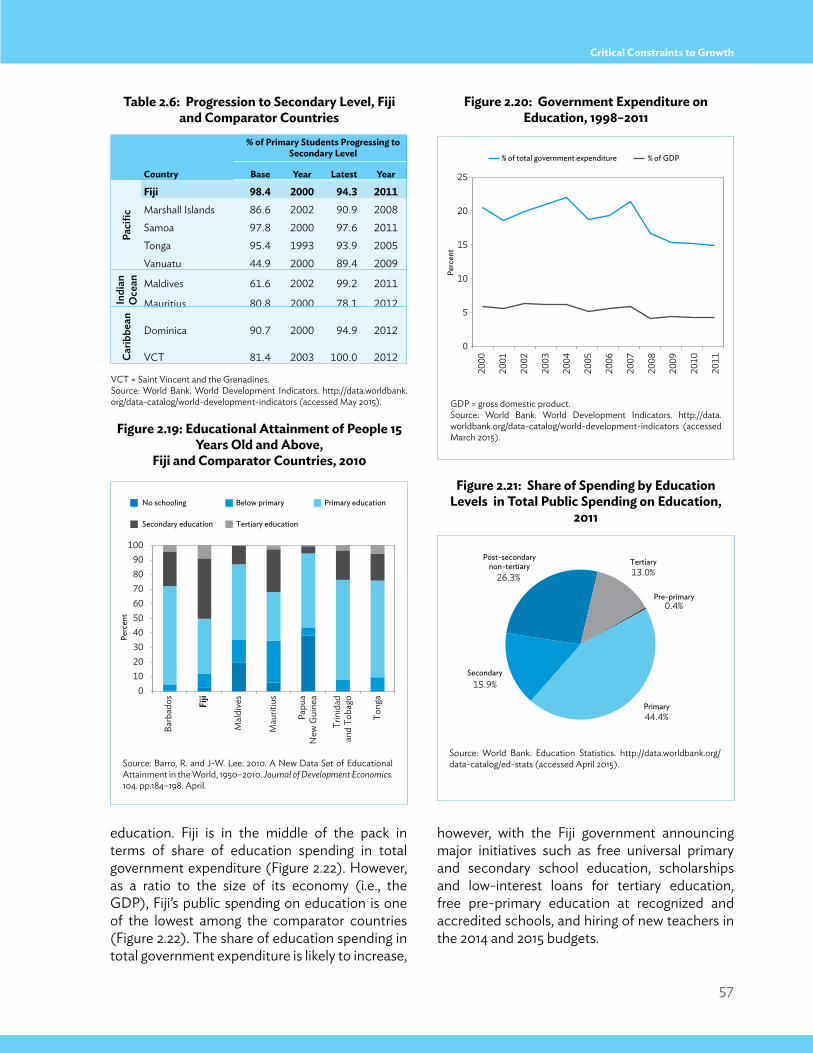
57
Critical Constraints to Growth
education. Fiji is in the middle of the pack in terms of share of education spending in total government expenditure (Figure 2.22). However, as a ratio to the size of its economy (i.e., the GDP), Fiji’s public spending on education is one of the lowest among the comparator countries (Figure 2.22). The share of education spending in total government expenditure is likely to increase,
however, with the Fiji government announcing major initiatives such as free universal primary and secondary school education, scholarships and low-interest loans for tertiary education, free pre-primary education at recognized and accredited schools, and hiring of new teachers in the 2014 and 2015 budgets.
Figure 2.19: Educational Attainment of People 15 Years Old and Above,
Fiji and Comparator Countries, 2010
Source: Barro, R. and J-W. Lee. 2010. A New Data Set of Educational Attainment in the World, 1950–2010. Journal of Development Economics. 104. pp.184–198. April.
Table 2.6: Progression to Secondary Level, Fiji and Comparator Countries
VCT = Saint Vincent and the Grenadines.Source: World Bank. World Development Indicators. http://data.worldbank.org/data-catalog/world-development-indicators (accessed May 2015).
% of Primary Students Progressing to Secondary Level
Country Base Year Latest Year
Paci
fic
Fiji 98.4 2000 94.3 2011Marshall Islands 86.6 2002 90.9 2008Samoa 97.8 2000 97.6 2011Tonga 95.4 1993 93.9 2005Vanuatu 44.9 2000 89.4 2009
Indi
an
Oce
an Maldives 61.6 2002 99.2 2011
Mauritius 80.8 2000 78.1 2012
Carib
bean
Dominica 90.7 2000 94.9 2012
VCT 81.4 2003 100.0 2012
0 10 20 30 40 50 60 70 80 90
100
Barb
ados Fi
ji
Mal
dive
s
Mau
ritiu
s
Papu
aN
ew G
uine
a
Trin
idad
and
Toba
go
Tong
a
Perc
ent
No schooling Below primary
Secondary education Tertiary education
Primary education
Perc
ent
% of total government expenditure % of GDP
0
5
10
15
20
25
2000
2001
2002
2003
2004
2005
2006
2007
2008
2009
2010
2011
Figure 2.20: Government Expenditure on Education, 1998–2011
GDP = gross domestic product.Source: World Bank. World Development Indicators. http://data.worldbank.org/data-catalog/world-development-indicators (accessed March 2015).
Figure 2.21: Share of Spending by Education Levels in Total Public Spending on Education,
2011
Source: World Bank. Education Statistics. http://data.worldbank.org/data-catalog/ed-stats (accessed April 2015).
Pre-primary 0.4%
Primary 44.4%
Secondary 15.9%
Post-secondarynon-tertiary
26.3%
Tertiary 13.0%
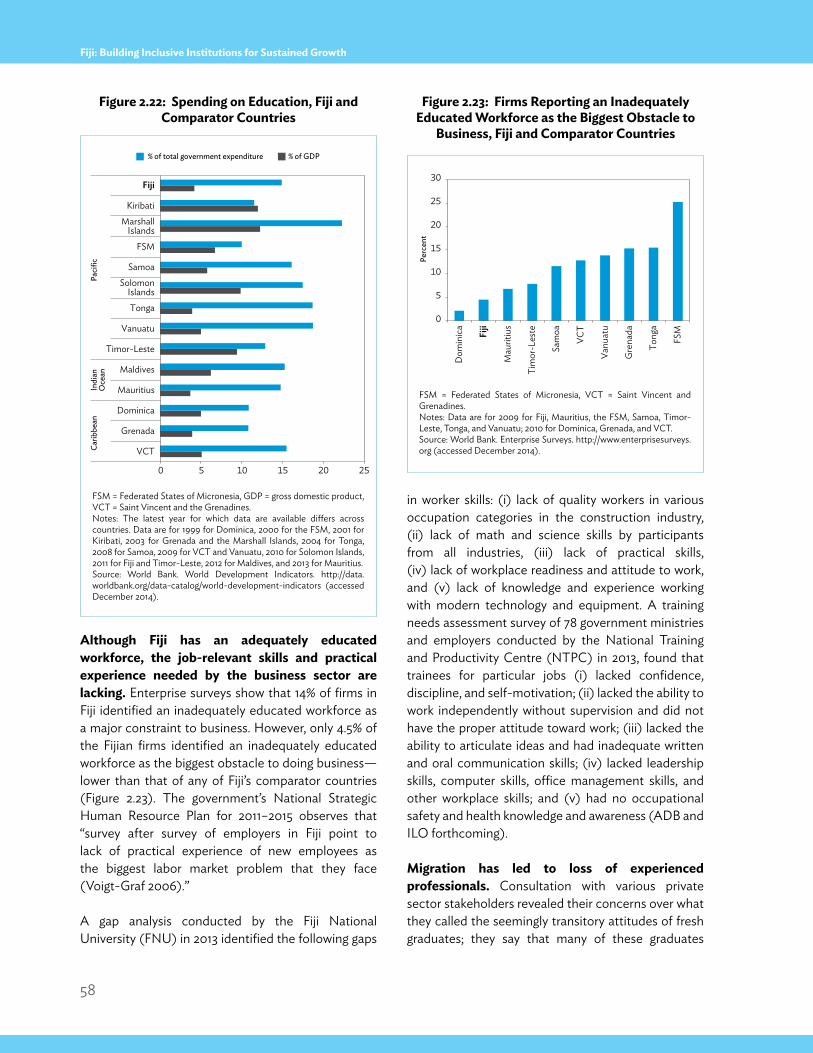
58
Fiji: Building Inclusive Institutions for Sustained Growth
Although Fiji has an adequately educated workforce, the job-relevant skills and practical experience needed by the business sector are lacking. Enterprise surveys show that 14% of firms in Fiji identified an inadequately educated workforce as a major constraint to business. However, only 4.5% of the Fijian firms identified an inadequately educated workforce as the biggest obstacle to doing business—lower than that of any of Fiji’s comparator countries (Figure 2.23). The government’s National Strategic Human Resource Plan for 2011–2015 observes that “survey after survey of employers in Fiji point to lack of practical experience of new employees as the biggest labor market problem that they face (Voigt-Graf 2006).”
A gap analysis conducted by the Fiji National University (FNU) in 2013 identified the following gaps
in worker skills: (i) lack of quality workers in various occupation categories in the construction industry, (ii) lack of math and science skills by participants from all industries, (iii) lack of practical skills, (iv) lack of workplace readiness and attitude to work, and (v) lack of knowledge and experience working with modern technology and equipment. A training needs assessment survey of 78 government ministries and employers conducted by the National Training and Productivity Centre (NTPC) in 2013, found that trainees for particular jobs (i) lacked confidence, discipline, and self-motivation; (ii) lacked the ability to work independently without supervision and did not have the proper attitude toward work; (iii) lacked the ability to articulate ideas and had inadequate written and oral communication skills; (iv) lacked leadership skills, computer skills, office management skills, and other workplace skills; and (v) had no occupational safety and health knowledge and awareness (ADB and ILO forthcoming).
Migration has led to loss of experienced professionals. Consultation with various private sector stakeholders revealed their concerns over what they called the seemingly transitory attitudes of fresh graduates; they say that many of these graduates
Figure 2.22: Spending on Education, Fiji and Comparator Countries
FSM = Federated States of Micronesia, GDP = gross domestic product, VCT = Saint Vincent and the Grenadines.Notes: The latest year for which data are available differs across countries. Data are for 1999 for Dominica, 2000 for the FSM, 2001 for Kiribati, 2003 for Grenada and the Marshall Islands, 2004 for Tonga, 2008 for Samoa, 2009 for VCT and Vanuatu, 2010 for Solomon Islands, 2011 for Fiji and Timor-Leste, 2012 for Maldives, and 2013 for Mauritius.Source: World Bank. World Development Indicators. http://data.worldbank.org/data-catalog/world-development-indicators (accessed December 2014).
0 5 10 15 20 25
VCT
Grenada
Dominica
Mauritius
Maldives
Timor-Leste
Vanuatu
Tonga
SolomonIslands
Samoa
FSM
MarshallIslands
Kiribati
Fiji
Carib
bean
Indi
anO
cean
Paci
fic
% of total government expenditure % of GDP
0
5
10
15
20
25
30
Dom
inic
a
Fiji
Mau
ritiu
s
Tim
or-L
este
Sam
oa
VCT
Vanu
atu
Gre
nada
Tong
a
FSM
Perc
ent
Figure 2.23: Firms Reporting an Inadequately Educated Workforce as the Biggest Obstacle to
Business, Fiji and Comparator Countries
FSM = Federated States of Micronesia, VCT = Saint Vincent and Grenadines.Notes: Data are for 2009 for Fiji, Mauritius, the FSM, Samoa, Timor-Leste, Tonga, and Vanuatu; 2010 for Dominica, Grenada, and VCT. Source: World Bank. Enterprise Surveys. http://www.enterprisesurveys.org (accessed December 2014).
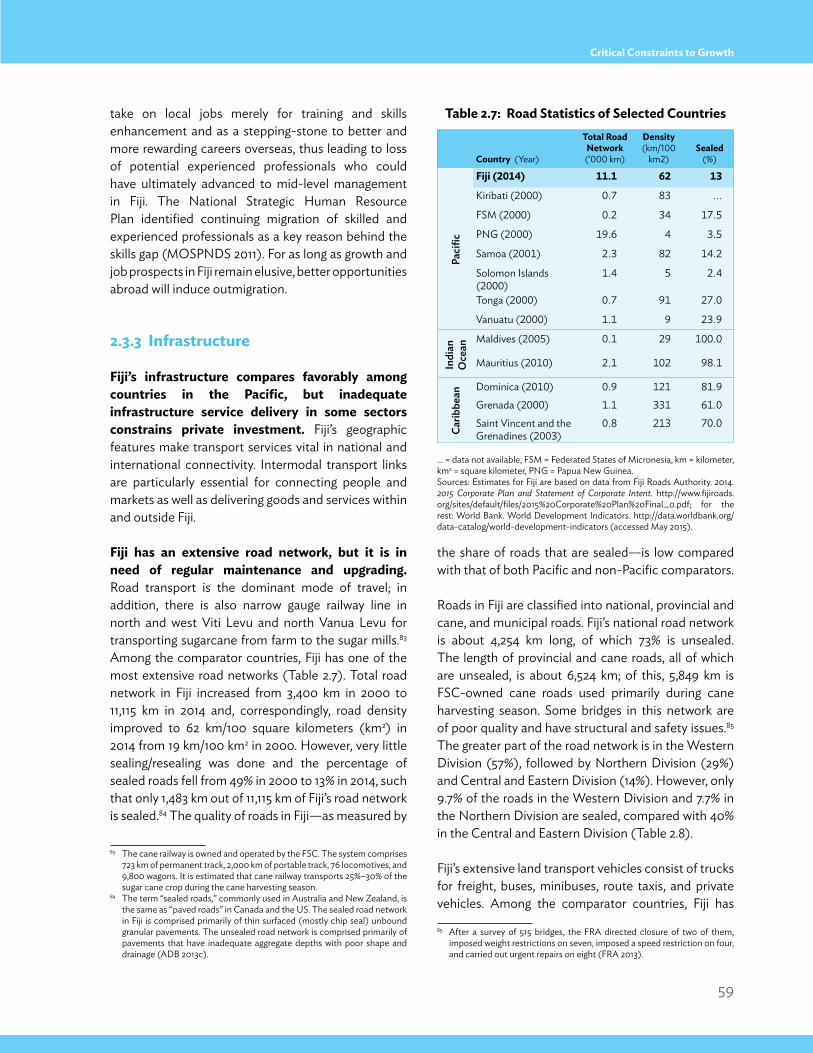
59
Critical Constraints to Growth
take on local jobs merely for training and skills enhancement and as a stepping-stone to better and more rewarding careers overseas, thus leading to loss of potential experienced professionals who could have ultimately advanced to mid-level management in Fiji. The National Strategic Human Resource Plan identified continuing migration of skilled and experienced professionals as a key reason behind the skills gap (MOSPNDS 2011). For as long as growth and job prospects in Fiji remain elusive, better opportunities abroad will induce outmigration.
2.3.3 Infrastructure
Fiji’s infrastructure compares favorably among countries in the Pacific, but inadequate infrastructure service delivery in some sectors constrains private investment. Fiji’s geographic features make transport services vital in national and international connectivity. Intermodal transport links are particularly essential for connecting people and markets as well as delivering goods and services within and outside Fiji.
Fiji has an extensive road network, but it is in need of regular maintenance and upgrading. Road transport is the dominant mode of travel; in addition, there is also narrow gauge railway line in north and west Viti Levu and north Vanua Levu for transporting sugarcane from farm to the sugar mills.83 Among the comparator countries, Fiji has one of the most extensive road networks (Table 2.7). Total road network in Fiji increased from 3,400 km in 2000 to 11,115 km in 2014 and, correspondingly, road density improved to 62 km/100 square kilometers (km2) in 2014 from 19 km/100 km2 in 2000. However, very little sealing/resealing was done and the percentage of sealed roads fell from 49% in 2000 to 13% in 2014, such that only 1,483 km out of 11,115 km of Fiji’s road network is sealed.84 The quality of roads in Fiji—as measured by
83 The cane railway is owned and operated by the FSC. The system comprises 723 km of permanent track, 2,000 km of portable track, 76 locomotives, and 9,800 wagons. It is estimated that cane railway transports 25%–30% of the sugar cane crop during the cane harvesting season.
84 The term “sealed roads,” commonly used in Australia and New Zealand, is the same as “paved roads” in Canada and the US. The sealed road network in Fiji is comprised primarily of thin surfaced (mostly chip seal) unbound granular pavements. The unsealed road network is comprised primarily of pavements that have inadequate aggregate depths with poor shape and drainage (ADB 2013c).
the share of roads that are sealed—is low compared with that of both Pacific and non-Pacific comparators.
Roads in Fiji are classified into national, provincial and cane, and municipal roads. Fiji’s national road network is about 4,254 km long, of which 73% is unsealed. The length of provincial and cane roads, all of which are unsealed, is about 6,524 km; of this, 5,849 km is FSC-owned cane roads used primarily during cane harvesting season. Some bridges in this network are of poor quality and have structural and safety issues.85 The greater part of the road network is in the Western Division (57%), followed by Northern Division (29%) and Central and Eastern Division (14%). However, only 9.7% of the roads in the Western Division and 7.7% in the Northern Division are sealed, compared with 40% in the Central and Eastern Division (Table 2.8).
Fiji’s extensive land transport vehicles consist of trucks for freight, buses, minibuses, route taxis, and private vehicles. Among the comparator countries, Fiji has
85 After a survey of 515 bridges, the FRA directed closure of two of them, imposed weight restrictions on seven, imposed a speed restriction on four, and carried out urgent repairs on eight (FRA 2013).
Table 2.7: Road Statistics of Selected Countries
… = data not available, FSM = Federated States of Micronesia, km = kilometer, km2 = square kilometer, PNG = Papua New Guinea.Sources: Estimates for Fiji are based on data from Fiji Roads Authority. 2014. 2015 Corporate Plan and Statement of Corporate Intent. http://www.fijiroads. org/sites/default/files/2015%20Corporate%20Plan%20Final_0.pdf; for the rest: World Bank. World Development Indicators. http://data.worldbank.org/ data-catalog/world-development-indicators (accessed May 2015).
Country (Year)
Total Road Network (’000 km)
Density(km/100
km2)Sealed
(%)
Paci
fic
Fiji (2014) 11.1 62 13
Kiribati (2000) 0.7 83 ...
FSM (2000) 0.2 34 17.5
PNG (2000) 19.6 4 3.5
Samoa (2001) 2.3 82 14.2
Solomon Islands (2000)
1.4 5 2.4
Tonga (2000) 0.7 91 27.0
Vanuatu (2000) 1.1 9 23.9
Indi
an
Oce
an
Maldives (2005) 0.1 29 100.0
Mauritius (2010) 2.1 102 98.1
Carib
bean
Dominica (2010) 0.9 121 81.9
Grenada (2000) 1.1 331 61.0
Saint Vincent and the Grenadines (2003)
0.8 213 70.0
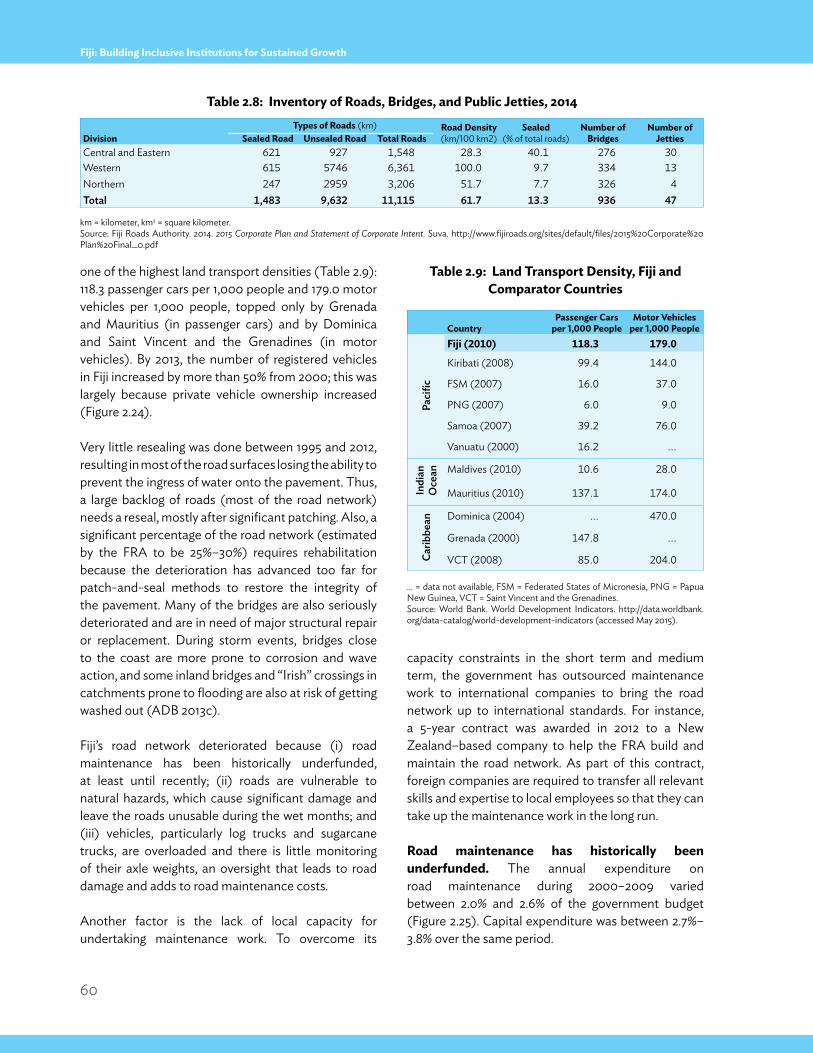
60
Fiji: Building Inclusive Institutions for Sustained Growth
one of the highest land transport densities (Table 2.9): 118.3 passenger cars per 1,000 people and 179.0 motor vehicles per 1,000 people, topped only by Grenada and Mauritius (in passenger cars) and by Dominica and Saint Vincent and the Grenadines (in motor vehicles). By 2013, the number of registered vehicles in Fiji increased by more than 50% from 2000; this was largely because private vehicle ownership increased (Figure 2.24).
Very little resealing was done between 1995 and 2012, resulting in most of the road surfaces losing the ability to prevent the ingress of water onto the pavement. Thus, a large backlog of roads (most of the road network) needs a reseal, mostly after significant patching. Also, a significant percentage of the road network (estimated by the FRA to be 25%–30%) requires rehabilitation because the deterioration has advanced too far for patch-and-seal methods to restore the integrity of the pavement. Many of the bridges are also seriously deteriorated and are in need of major structural repair or replacement. During storm events, bridges close to the coast are more prone to corrosion and wave action, and some inland bridges and “Irish” crossings in catchments prone to flooding are also at risk of getting washed out (ADB 2013c).
Fiji’s road network deteriorated because (i) road maintenance has been historically underfunded, at least until recently; (ii) roads are vulnerable to natural hazards, which cause significant damage and leave the roads unusable during the wet months; and (iii) vehicles, particularly log trucks and sugarcane trucks, are overloaded and there is little monitoring of their axle weights, an oversight that leads to road damage and adds to road maintenance costs.
Another factor is the lack of local capacity for undertaking maintenance work. To overcome its
capacity constraints in the short term and medium term, the government has outsourced maintenance work to international companies to bring the road network up to international standards. For instance, a 5-year contract was awarded in 2012 to a New Zealand–based company to help the FRA build and maintain the road network. As part of this contract, foreign companies are required to transfer all relevant skills and expertise to local employees so that they can take up the maintenance work in the long run.
Road maintenance has historically been underfunded. The annual expenditure on road maintenance during 2000–2009 varied between 2.0% and 2.6% of the government budget (Figure 2.25). Capital expenditure was between 2.7%–3.8% over the same period.
Table 2.8: Inventory of Roads, Bridges, and Public Jetties, 2014
Table 2.9: Land Transport Density, Fiji and Comparator Countries
… = data not available, FSM = Federated States of Micronesia, PNG = Papua New Guinea, VCT = Saint Vincent and the Grenadines. Source: World Bank. World Development Indicators. http://data.worldbank.org/data-catalog/world-development-indicators (accessed May 2015).
Types of Roads (km) Road Density(km/100 km2)
Sealed(% of total roads)
Number of Bridges
Number of JettiesDivision Sealed Road Unsealed Road Total Roads
Central and Eastern 621 927 1,548 28.3 40.1 276 30Western 615 5746 6,361 100.0 9.7 334 13Northern 247 2959 3,206 51.7 7.7 326 4Total 1,483 9,632 11,115 61.7 13.3 936 47
CountryPassenger Cars
per 1,000 PeopleMotor Vehicles
per 1,000 People
Paci
fic
Fiji (2010) 118.3 179.0
Kiribati (2008) 99.4 144.0
FSM (2007) 16.0 37.0
PNG (2007) 6.0 9.0
Samoa (2007) 39.2 76.0
Vanuatu (2000) 16.2 ...
Indi
an
Oce
an Maldives (2010) 10.6 28.0
Mauritius (2010) 137.1 174.0
Carib
bean Dominica (2004) ... 470.0
Grenada (2000) 147.8 ...
VCT (2008) 85.0 204.0
km = kilometer, km2 = square kilometer.Source: Fiji Roads Authority. 2014. 2015 Corporate Plan and Statement of Corporate Intent. Suva. http://www.fijiroads.org/sites/default/files/2015%20Corporate%20Plan%20Final_0.pdf
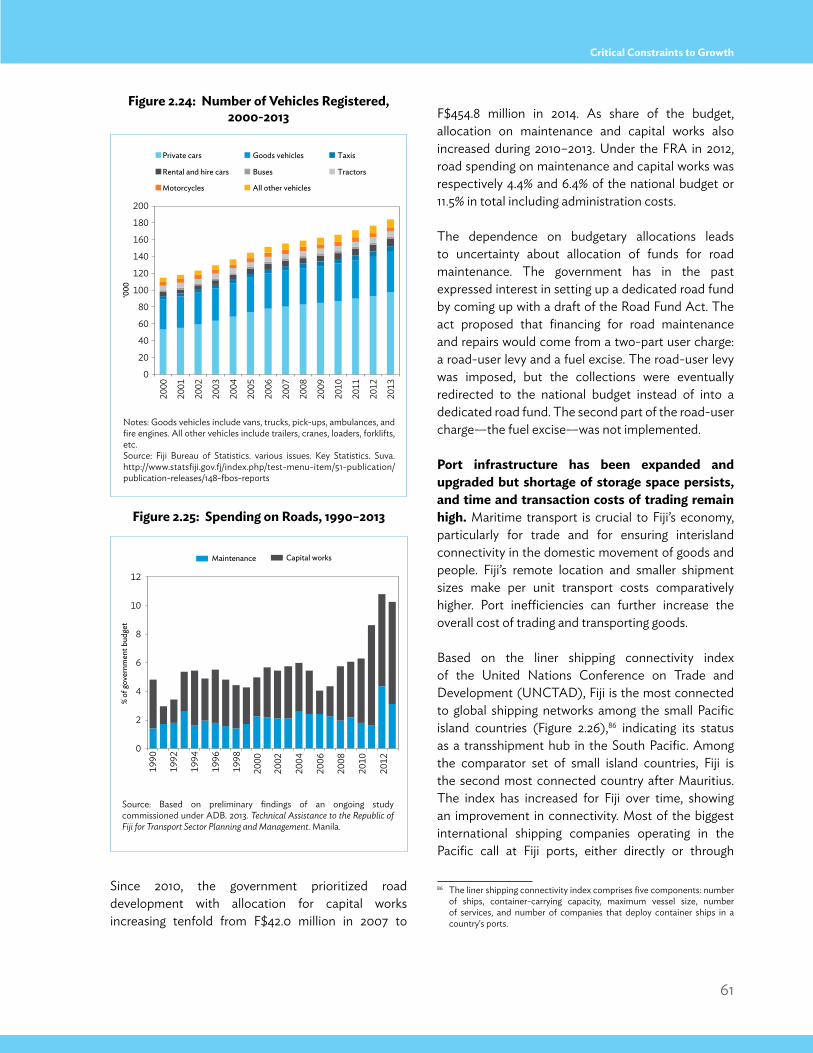
61
Critical Constraints to Growth
Since 2010, the government prioritized road development with allocation for capital works increasing tenfold from F$42.0 million in 2007 to
F$454.8 million in 2014. As share of the budget, allocation on maintenance and capital works also increased during 2010–2013. Under the FRA in 2012, road spending on maintenance and capital works was respectively 4.4% and 6.4% of the national budget or 11.5% in total including administration costs.
The dependence on budgetary allocations leads to uncertainty about allocation of funds for road maintenance. The government has in the past expressed interest in setting up a dedicated road fund by coming up with a draft of the Road Fund Act. The act proposed that financing for road maintenance and repairs would come from a two-part user charge: a road-user levy and a fuel excise. The road-user levy was imposed, but the collections were eventually redirected to the national budget instead of into a dedicated road fund. The second part of the road-user charge—the fuel excise—was not implemented.
Port infrastructure has been expanded and upgraded but shortage of storage space persists, and time and transaction costs of trading remain high. Maritime transport is crucial to Fiji’s economy, particularly for trade and for ensuring interisland connectivity in the domestic movement of goods and people. Fiji’s remote location and smaller shipment sizes make per unit transport costs comparatively higher. Port inefficiencies can further increase the overall cost of trading and transporting goods.
Based on the liner shipping connectivity index of the United Nations Conference on Trade and Development (UNCTAD), Fiji is the most connected to global shipping networks among the small Pacific island countries (Figure 2.26),86 indicating its status as a transshipment hub in the South Pacific. Among the comparator set of small island countries, Fiji is the second most connected country after Mauritius. The index has increased for Fiji over time, showing an improvement in connectivity. Most of the biggest international shipping companies operating in the Pacific call at Fiji ports, either directly or through
86 The liner shipping connectivity index comprises five components: number of ships, container-carrying capacity, maximum vessel size, number of services, and number of companies that deploy container ships in a country's ports.
Figure 2.24: Number of Vehicles Registered, 2000-2013
Figure 2.25: Spending on Roads, 1990–2013
Notes: Goods vehicles include vans, trucks, pick-ups, ambulances, and fire engines. All other vehicles include trailers, cranes, loaders, forklifts, etc. Source: Fiji Bureau of Statistics. various issues. Key Statistics. Suva. http://www.statsfiji.gov.fj/index.php/test-menu-item/51-publication/publication-releases/148-fbos-reports
Source: Based on preliminary findings of an ongoing study commissioned under ADB. 2013. Technical Assistance to the Republic of Fiji for Transport Sector Planning and Management. Manila.
0
20
40
60
80
100
120
140
160
180
200
2000
2001
2002
2003
2004
2005
2006
2007
2008
2009
2010
2011
2012
2013
‘000
Private cars Goods vehicles Taxis
Rental and hire cars Buses Tractors
Motorcycles All other vehicles
0
2
4
6
8
10
12
1990
1992
1994
1996
1998
2000
2002
2004
2006
2008
2010
2012
% of
gov
ernm
ent b
udge
t
Capital worksMaintenance
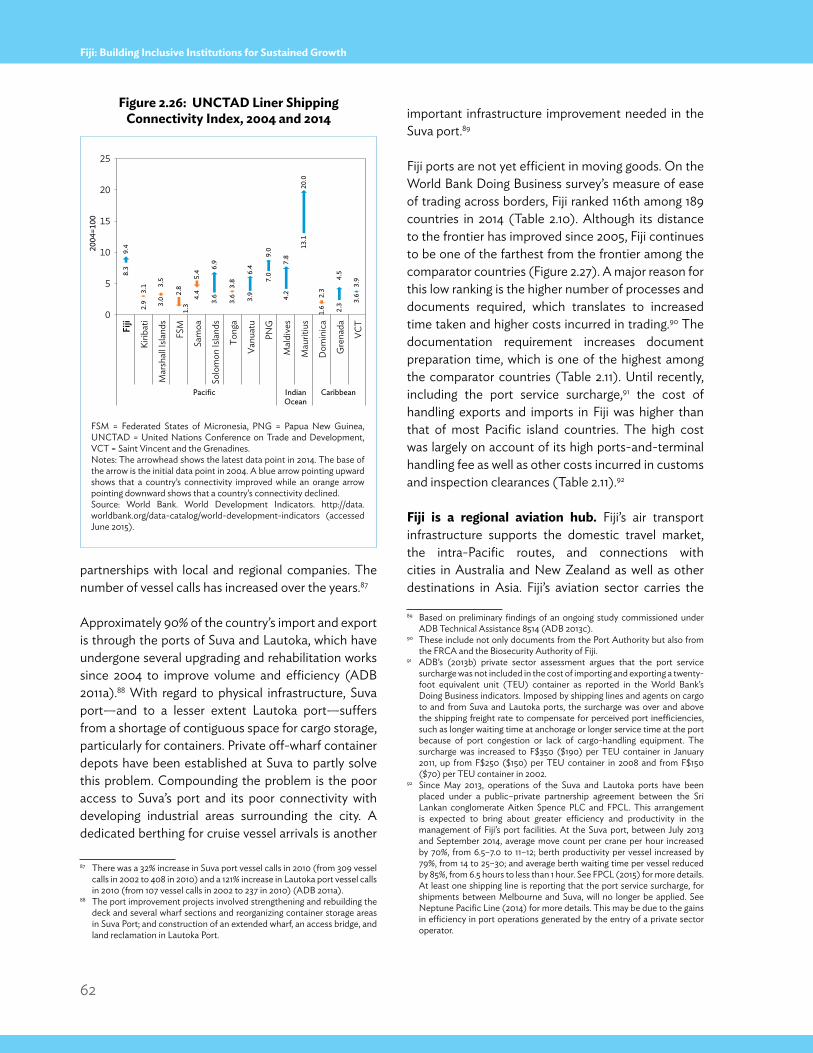
62
Fiji: Building Inclusive Institutions for Sustained Growth
partnerships with local and regional companies. The number of vessel calls has increased over the years.87
Approximately 90% of the country’s import and export is through the ports of Suva and Lautoka, which have undergone several upgrading and rehabilitation works since 2004 to improve volume and efficiency (ADB 2011a).88 With regard to physical infrastructure, Suva port—and to a lesser extent Lautoka port—suffers from a shortage of contiguous space for cargo storage, particularly for containers. Private off-wharf container depots have been established at Suva to partly solve this problem. Compounding the problem is the poor access to Suva’s port and its poor connectivity with developing industrial areas surrounding the city. A dedicated berthing for cruise vessel arrivals is another
87 There was a 32% increase in Suva port vessel calls in 2010 (from 309 vessel calls in 2002 to 408 in 2010) and a 121% increase in Lautoka port vessel calls in 2010 (from 107 vessel calls in 2002 to 237 in 2010) (ADB 2011a).
88 The port improvement projects involved strengthening and rebuilding the deck and several wharf sections and reorganizing container storage areas in Suva Port; and construction of an extended wharf, an access bridge, and land reclamation in Lautoka Port.
important infrastructure improvement needed in the Suva port.89
Fiji ports are not yet efficient in moving goods. On the World Bank Doing Business survey’s measure of ease of trading across borders, Fiji ranked 116th among 189 countries in 2014 (Table 2.10). Although its distance to the frontier has improved since 2005, Fiji continues to be one of the farthest from the frontier among the comparator countries (Figure 2.27). A major reason for this low ranking is the higher number of processes and documents required, which translates to increased time taken and higher costs incurred in trading.90 The documentation requirement increases document preparation time, which is one of the highest among the comparator countries (Table 2.11). Until recently, including the port service surcharge,91 the cost of handling exports and imports in Fiji was higher than that of most Pacific island countries. The high cost was largely on account of its high ports-and-terminal handling fee as well as other costs incurred in customs and inspection clearances (Table 2.11).92
Fiji is a regional aviation hub. Fiji’s air transport infrastructure supports the domestic travel market, the intra-Pacific routes, and connections with cities in Australia and New Zealand as well as other destinations in Asia. Fiji’s aviation sector carries the
89 Based on preliminary findings of an ongoing study commissioned under ADB Technical Assistance 8514 (ADB 2013c).
90 These include not only documents from the Port Authority but also from the FRCA and the Biosecurity Authority of Fiji.
91 ADB’s (2013b) private sector assessment argues that the port service surcharge was not included in the cost of importing and exporting a twenty-foot equivalent unit (TEU) container as reported in the World Bank’s Doing Business indicators. Imposed by shipping lines and agents on cargo to and from Suva and Lautoka ports, the surcharge was over and above the shipping freight rate to compensate for perceived port inefficiencies, such as longer waiting time at anchorage or longer service time at the port because of port congestion or lack of cargo-handling equipment. The surcharge was increased to F$350 ($190) per TEU container in January 2011, up from F$250 ($150) per TEU container in 2008 and from F$150 ($70) per TEU container in 2002.
92 Since May 2013, operations of the Suva and Lautoka ports have been placed under a public–private partnership agreement between the Sri Lankan conglomerate Aitken Spence PLC and FPCL. This arrangement is expected to bring about greater efficiency and productivity in the management of Fiji’s port facilities. At the Suva port, between July 2013 and September 2014, average move count per crane per hour increased by 70%, from 6.5–7.0 to 11–12; berth productivity per vessel increased by 79%, from 14 to 25–30; and average berth waiting time per vessel reduced by 85%, from 6.5 hours to less than 1 hour. See FPCL (2015) for more details. At least one shipping line is reporting that the port service surcharge, for shipments between Melbourne and Suva, will no longer be applied. See Neptune Pacific Line (2014) for more details. This may be due to the gains in efficiency in port operations generated by the entry of a private sector operator.
Figure 2.26: UNCTAD Liner Shipping Connectivity Index, 2004 and 2014
FSM = Federated States of Micronesia, PNG = Papua New Guinea, UNCTAD = United Nations Conference on Trade and Development, VCT = Saint Vincent and the Grenadines.Notes: The arrowhead shows the latest data point in 2014. The base of the arrow is the initial data point in 2004. A blue arrow pointing upward shows that a country’s connectivity improved while an orange arrow pointing downward shows that a country’s connectivity declined. Source: World Bank. World Development Indicators. http://data.worldbank.org/data-catalog/world-development-indicators (accessed June 2015).
Fiji
Kirib
ati
Mar
shal
l Isla
nds
Solo
mon
Isla
nds
FSM
Sam
oa
Tong
a
Vanu
atu
PNG
Mal
dive
s
Mau
ritiu
s
Dom
inic
a
Gre
nada
VCT
Pacific IndianOcean
Caribbean
0
5
10
15
20
25
2004
=100
9.4
3.1 3.
5
1.3
2.8
4.4
5.4 6.
93.
6
3.6 3.9
7.0
4.2
7.89.
0
20.0
13.1
1.6 2.3
4.5
3.9
3.62.
3
6.4
3.8
3.0
2.9
8.3
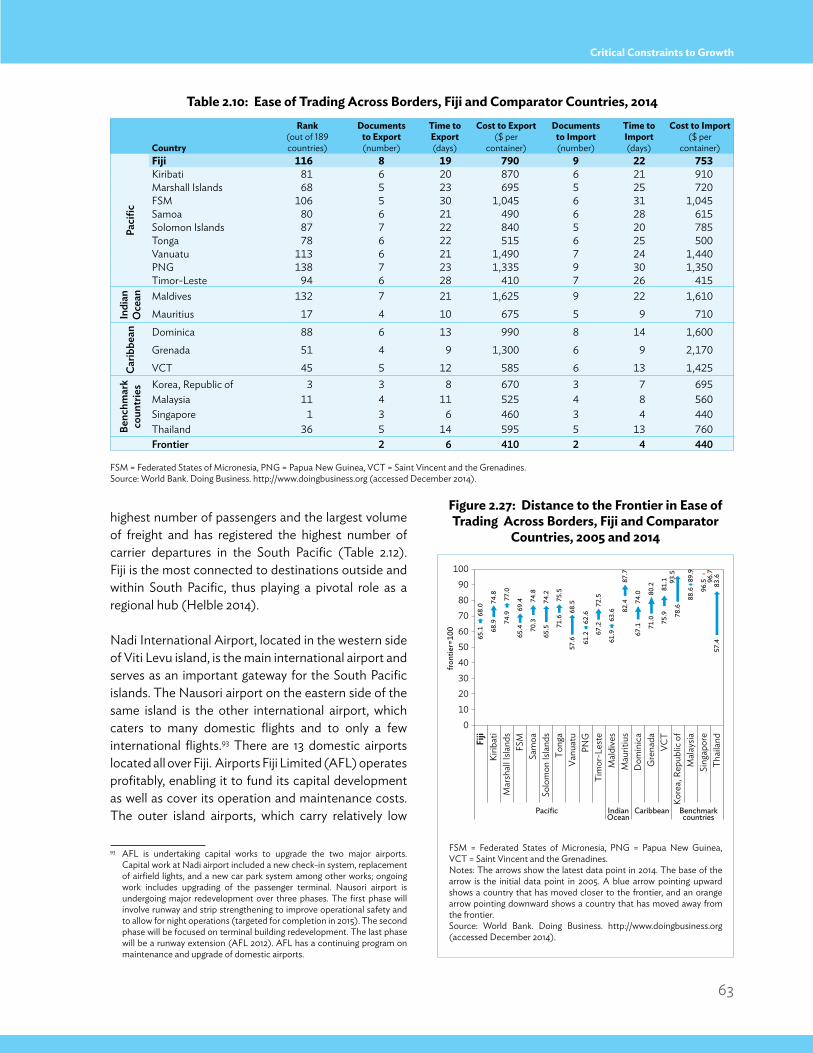
63
Critical Constraints to Growth
highest number of passengers and the largest volume of freight and has registered the highest number of carrier departures in the South Pacific (Table 2.12). Fiji is the most connected to destinations outside and within South Pacific, thus playing a pivotal role as a regional hub (Helble 2014).
Nadi International Airport, located in the western side of Viti Levu island, is the main international airport and serves as an important gateway for the South Pacific islands. The Nausori airport on the eastern side of the same island is the other international airport, which caters to many domestic flights and to only a few international flights.93 There are 13 domestic airports located all over Fiji. Airports Fiji Limited (AFL) operates profitably, enabling it to fund its capital development as well as cover its operation and maintenance costs. The outer island airports, which carry relatively low
93 AFL is undertaking capital works to upgrade the two major airports. Capital work at Nadi airport included a new check-in system, replacement of airfield lights, and a new car park system among other works; ongoing work includes upgrading of the passenger terminal. Nausori airport is undergoing major redevelopment over three phases. The first phase will involve runway and strip strengthening to improve operational safety and to allow for night operations (targeted for completion in 2015). The second phase will be focused on terminal building redevelopment. The last phase will be a runway extension (AFL 2012). AFL has a continuing program on maintenance and upgrade of domestic airports.
FSM = Federated States of Micronesia, PNG = Papua New Guinea, VCT = Saint Vincent and the Grenadines.Notes: The arrows show the latest data point in 2014. The base of the arrow is the initial data point in 2005. A blue arrow pointing upward shows a country that has moved closer to the frontier, and an orange arrow pointing downward shows a country that has moved away from the frontier.Source: World Bank. Doing Business. http://www.doingbusiness.org (accessed December 2014).
Table 2.10: Ease of Trading Across Borders, Fiji and Comparator Countries, 2014
FSM = Federated States of Micronesia, PNG = Papua New Guinea, VCT = Saint Vincent and the Grenadines. Source: World Bank. Doing Business. http://www.doingbusiness.org (accessed December 2014).
Figure 2.27: Distance to the Frontier in Ease of Trading Across Borders, Fiji and Comparator
Countries, 2005 and 2014
Country
Rank(out of 189 countries)
Documents to Export (number)
Time to Export (days)
Cost to Export ($ per
container)
Documents to Import (number)
Time to Import (days)
Cost to Import ($ per
container)
Paci
fic
Fiji 116 8 19 790 9 22 753Kiribati 81 6 20 870 6 21 910Marshall Islands 68 5 23 695 5 25 720FSM 106 5 30 1,045 6 31 1,045Samoa 80 6 21 490 6 28 615Solomon Islands 87 7 22 840 5 20 785Tonga 78 6 22 515 6 25 500Vanuatu 113 6 21 1,490 7 24 1,440PNG 138 7 23 1,335 9 30 1,350Timor-Leste 94 6 28 410 7 26 415
Indi
an
Oce
an Maldives 132 7 21 1,625 9 22 1,610Mauritius 17 4 10 675 5 9 710
Carib
bean Dominica 88 6 13 990 8 14 1,600
Grenada 51 4 9 1,300 6 9 2,170VCT 45 5 12 585 6 13 1,425
Benc
hmar
k co
untr
ies Korea, Republic of 3 3 8 670 3 7 695
Malaysia 11 4 11 525 4 8 560Singapore 1 3 6 460 3 4 440Thailand 36 5 14 595 5 13 760Frontier 2 6 410 2 4 440
0 10 20 30 40 50 60 70 80 90
100
Fiji
Kirib
ati
Mar
shal
l Isla
nds
FSM
Sa
moa
So
lom
on Is
land
s To
nga
Vanu
atu
PNG
Ti
mor
-Les
te
Mal
dive
s M
aurit
ius
Dom
inic
a G
rena
da
VCT
Kore
a, R
epub
lic o
f M
alay
sia
Sing
apor
e Th
aila
nd
Pacific IndianOcean
Caribbean Benchmarkcountries
front
ier=
100
65.1
68.9
74.9
65.4
70.3
65.5
71.6
57.6
61.2
67.2
61.9
82.4
67.1
71.0
75.9
78.6
88.6
96.7
57
.4
68.0
74.8
77.0
69.4
74.8
74.2
75.5
68.5
62.6
72.5
63.6
87.7
74.0
80.2
81.1
93
.5
89.9
96.5
83.6
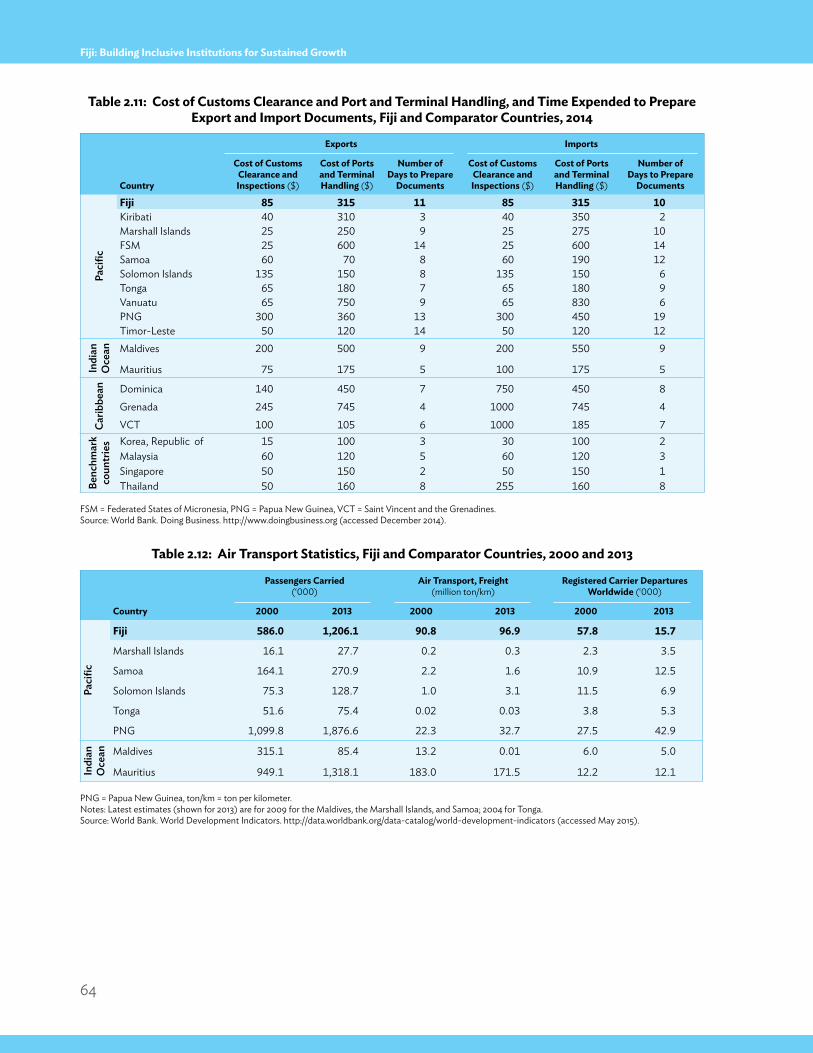
64
Fiji: Building Inclusive Institutions for Sustained Growth
Table 2.12: Air Transport Statistics, Fiji and Comparator Countries, 2000 and 2013
PNG = Papua New Guinea, ton/km = ton per kilometer.Notes: Latest estimates (shown for 2013) are for 2009 for the Maldives, the Marshall Islands, and Samoa; 2004 for Tonga.Source: World Bank. World Development Indicators. http://data.worldbank.org/data-catalog/world-development-indicators (accessed May 2015).
Exports Imports
Country
Cost of Customs Clearance and Inspections ($)
Cost of Ports and Terminal Handling ($)
Number of Days to Prepare
Documents
Cost of Customs Clearance and Inspections ($)
Cost of Ports and Terminal Handling ($)
Number of Days to Prepare
Documents
Paci
fic
Fiji 85 315 11 85 315 10Kiribati 40 310 3 40 350 2Marshall Islands 25 250 9 25 275 10FSM 25 600 14 25 600 14Samoa 60 70 8 60 190 12Solomon Islands 135 150 8 135 150 6Tonga 65 180 7 65 180 9Vanuatu 65 750 9 65 830 6PNG 300 360 13 300 450 19Timor-Leste 50 120 14 50 120 12
Indi
an
Oce
an Maldives 200 500 9 200 550 9
Mauritius 75 175 5 100 175 5
Carib
bean Dominica 140 450 7 750 450 8
Grenada 245 745 4 1000 745 4VCT 100 105 6 1000 185 7
Benc
hmar
k co
untr
ies Korea, Republic of 15 100 3 30 100 2
Malaysia 60 120 5 60 120 3Singapore 50 150 2 50 150 1Thailand 50 160 8 255 160 8
Table 2.11: Cost of Customs Clearance and Port and Terminal Handling, and Time Expended to Prepare Export and Import Documents, Fiji and Comparator Countries, 2014
FSM = Federated States of Micronesia, PNG = Papua New Guinea, VCT = Saint Vincent and the Grenadines. Source: World Bank. Doing Business. http://www.doingbusiness.org (accessed December 2014).
Passengers Carried
(‘000)Air Transport, Freight
(million ton/km)Registered Carrier Departures
Worldwide (‘000)
Country 2000 2013 2000 2013 2000 2013
Paci
fic
Fiji 586.0 1,206.1 90.8 96.9 57.8 15.7
Marshall Islands 16.1 27.7 0.2 0.3 2.3 3.5
Samoa 164.1 270.9 2.2 1.6 10.9 12.5
Solomon Islands 75.3 128.7 1.0 3.1 11.5 6.9
Tonga 51.6 75.4 0.02 0.03 3.8 5.3
PNG 1,099.8 1,876.6 22.3 32.7 27.5 42.9
Indi
an
Oce
an Maldives 315.1 85.4 13.2 0.01 6.0 5.0
Mauritius 949.1 1,318.1 183.0 171.5 12.2 12.1
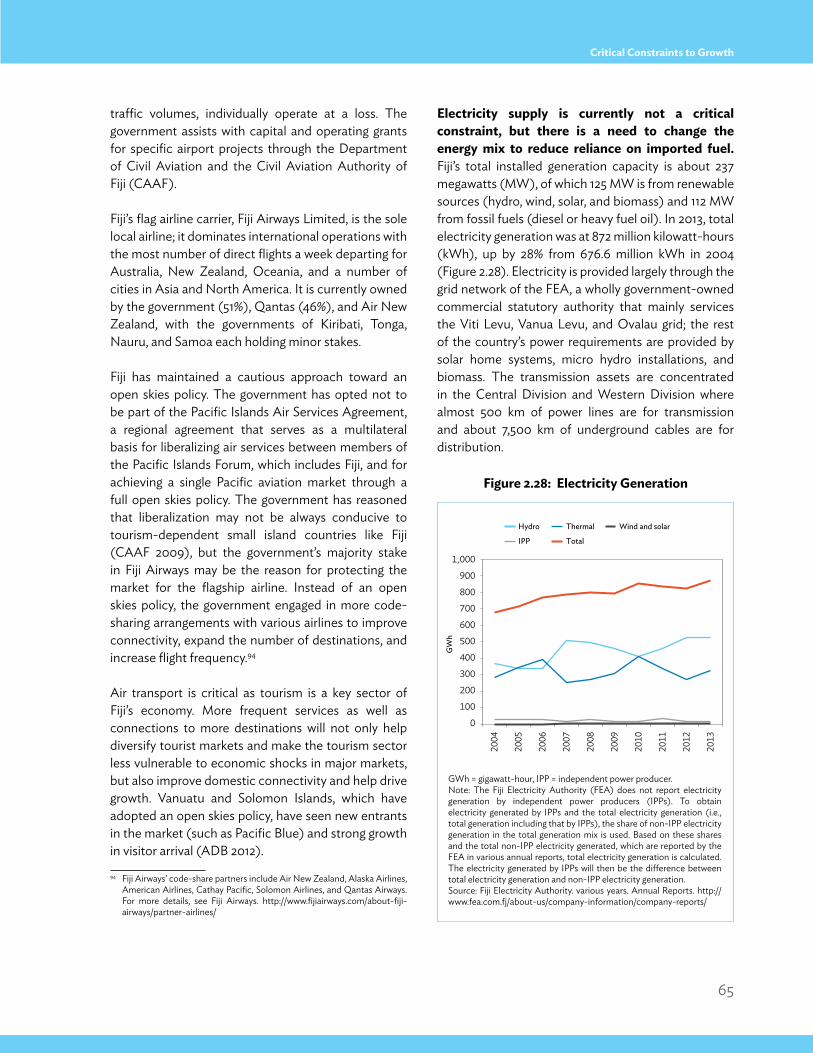
65
Critical Constraints to Growth
traffic volumes, individually operate at a loss. The government assists with capital and operating grants for specific airport projects through the Department of Civil Aviation and the Civil Aviation Authority of Fiji (CAAF).
Fiji’s flag airline carrier, Fiji Airways Limited, is the sole local airline; it dominates international operations with the most number of direct flights a week departing for Australia, New Zealand, Oceania, and a number of cities in Asia and North America. It is currently owned by the government (51%), Qantas (46%), and Air New Zealand, with the governments of Kiribati, Tonga, Nauru, and Samoa each holding minor stakes.
Fiji has maintained a cautious approach toward an open skies policy. The government has opted not to be part of the Pacific Islands Air Services Agreement, a regional agreement that serves as a multilateral basis for liberalizing air services between members of the Pacific Islands Forum, which includes Fiji, and for achieving a single Pacific aviation market through a full open skies policy. The government has reasoned that liberalization may not be always conducive to tourism-dependent small island countries like Fiji (CAAF 2009), but the government’s majority stake in Fiji Airways may be the reason for protecting the market for the flagship airline. Instead of an open skies policy, the government engaged in more code-sharing arrangements with various airlines to improve connectivity, expand the number of destinations, and increase flight frequency.94
Air transport is critical as tourism is a key sector of Fiji’s economy. More frequent services as well as connections to more destinations will not only help diversify tourist markets and make the tourism sector less vulnerable to economic shocks in major markets, but also improve domestic connectivity and help drive growth. Vanuatu and Solomon Islands, which have adopted an open skies policy, have seen new entrants in the market (such as Pacific Blue) and strong growth in visitor arrival (ADB 2012).
94 Fiji Airways’ code-share partners include Air New Zealand, Alaska Airlines, American Airlines, Cathay Pacific, Solomon Airlines, and Qantas Airways. For more details, see Fiji Airways. http://www.fijiairways.com/about-fiji-airways/partner-airlines/
Electricity supply is currently not a critical constraint, but there is a need to change the energy mix to reduce reliance on imported fuel. Fiji’s total installed generation capacity is about 237 megawatts (MW), of which 125 MW is from renewable sources (hydro, wind, solar, and biomass) and 112 MW from fossil fuels (diesel or heavy fuel oil). In 2013, total electricity generation was at 872 million kilowatt-hours (kWh), up by 28% from 676.6 million kWh in 2004 (Figure 2.28). Electricity is provided largely through the grid network of the FEA, a wholly government-owned commercial statutory authority that mainly services the Viti Levu, Vanua Levu, and Ovalau grid; the rest of the country’s power requirements are provided by solar home systems, micro hydro installations, and biomass. The transmission assets are concentrated in the Central Division and Western Division where almost 500 km of power lines are for transmission and about 7,500 km of underground cables are for distribution.
0
100
200
300
400
500
600
700
800
900
1,000
2004
2005
2006
2007
2008
2009
2010
2011
2012
2013
GW
h
IPP Total
Hydro Thermal Wind and solar
Figure 2.28: Electricity Generation
GWh = gigawatt-hour, IPP = independent power producer.Note: The Fiji Electricity Authority (FEA) does not report electricity generation by independent power producers (IPPs). To obtain electricity generated by IPPs and the total electricity generation (i.e., total generation including that by IPPs), the share of non-IPP electricity generation in the total generation mix is used. Based on these shares and the total non-IPP electricity generated, which are reported by the FEA in various annual reports, total electricity generation is calculated. The electricity generated by IPPs will then be the difference between total electricity generation and non-IPP electricity generation.Source: Fiji Electricity Authority. various years. Annual Reports. http://www.fea.com.fj/about-us/company-information/company-reports/
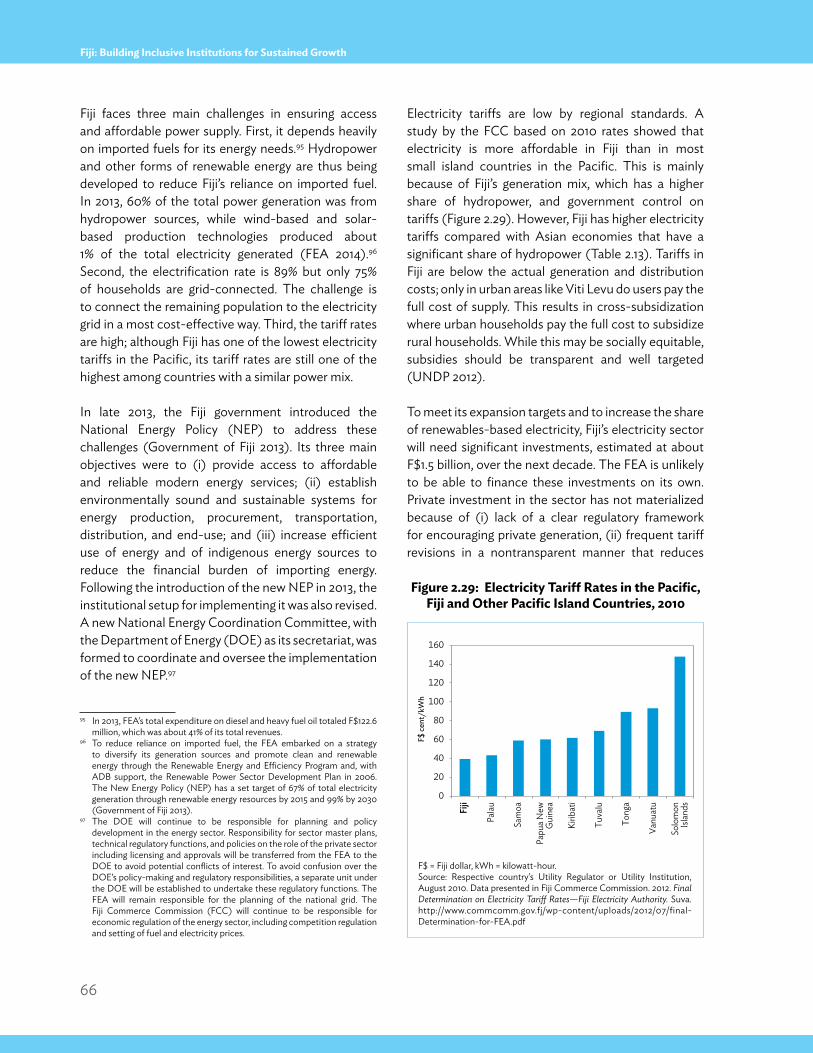
66
Fiji: Building Inclusive Institutions for Sustained Growth
Fiji faces three main challenges in ensuring access and affordable power supply. First, it depends heavily on imported fuels for its energy needs.95 Hydropower and other forms of renewable energy are thus being developed to reduce Fiji’s reliance on imported fuel. In 2013, 60% of the total power generation was from hydropower sources, while wind-based and solar-based production technologies produced about 1% of the total electricity generated (FEA 2014).96 Second, the electrification rate is 89% but only 75% of households are grid-connected. The challenge is to connect the remaining population to the electricity grid in a most cost-effective way. Third, the tariff rates are high; although Fiji has one of the lowest electricity tariffs in the Pacific, its tariff rates are still one of the highest among countries with a similar power mix.
In late 2013, the Fiji government introduced the National Energy Policy (NEP) to address these challenges (Government of Fiji 2013). Its three main objectives were to (i) provide access to affordable and reliable modern energy services; (ii) establish environmentally sound and sustainable systems for energy production, procurement, transportation, distribution, and end-use; and (iii) increase efficient use of energy and of indigenous energy sources to reduce the financial burden of importing energy. Following the introduction of the new NEP in 2013, the institutional setup for implementing it was also revised. A new National Energy Coordination Committee, with the Department of Energy (DOE) as its secretariat, was formed to coordinate and oversee the implementation of the new NEP.97
95 In 2013, FEA’s total expenditure on diesel and heavy fuel oil totaled F$122.6 million, which was about 41% of its total revenues.
96 To reduce reliance on imported fuel, the FEA embarked on a strategy to diversify its generation sources and promote clean and renewable energy through the Renewable Energy and Efficiency Program and, with ADB support, the Renewable Power Sector Development Plan in 2006. The New Energy Policy (NEP) has a set target of 67% of total electricity generation through renewable energy resources by 2015 and 99% by 2030 (Government of Fiji 2013).
97 The DOE will continue to be responsible for planning and policy development in the energy sector. Responsibility for sector master plans, technical regulatory functions, and policies on the role of the private sector including licensing and approvals will be transferred from the FEA to the DOE to avoid potential conflicts of interest. To avoid confusion over the DOE’s policy-making and regulatory responsibilities, a separate unit under the DOE will be established to undertake these regulatory functions. The FEA will remain responsible for the planning of the national grid. The Fiji Commerce Commission (FCC) will continue to be responsible for economic regulation of the energy sector, including competition regulation and setting of fuel and electricity prices.
Electricity tariffs are low by regional standards. A study by the FCC based on 2010 rates showed that electricity is more affordable in Fiji than in most small island countries in the Pacific. This is mainly because of Fiji’s generation mix, which has a higher share of hydropower, and government control on tariffs (Figure 2.29). However, Fiji has higher electricity tariffs compared with Asian economies that have a significant share of hydropower (Table 2.13). Tariffs in Fiji are below the actual generation and distribution costs; only in urban areas like Viti Levu do users pay the full cost of supply. This results in cross-subsidization where urban households pay the full cost to subsidize rural households. While this may be socially equitable, subsidies should be transparent and well targeted (UNDP 2012).
To meet its expansion targets and to increase the share of renewables-based electricity, Fiji’s electricity sector will need significant investments, estimated at about F$1.5 billion, over the next decade. The FEA is unlikely to be able to finance these investments on its own. Private investment in the sector has not materialized because of (i) lack of a clear regulatory framework for encouraging private generation, (ii) frequent tariff revisions in a nontransparent manner that reduces
Figure 2.29: Electricity Tariff Rates in the Pacific, Fiji and Other Pacific Island Countries, 2010
F$ = Fiji dollar, kWh = kilowatt-hour.Source: Respective country’s Utility Regulator or Utility Institution, August 2010. Data presented in Fiji Commerce Commission. 2012. Final Determination on Electricity Tariff Rates—Fiji Electricity Authority. Suva. http://www.commcomm.gov.fj/wp-content/uploads/2012/07/final-Determination-for-FEA.pdf
0
20
40
60
80
100
120
140
160
Fiji
Palau
Sam
oa
Papu
a New
Gui
nea
Kirib
ati
Tuva
lu
Tong
a
Vanu
atu
Solo
mon
Islan
ds
F$ c
ent/
kWh
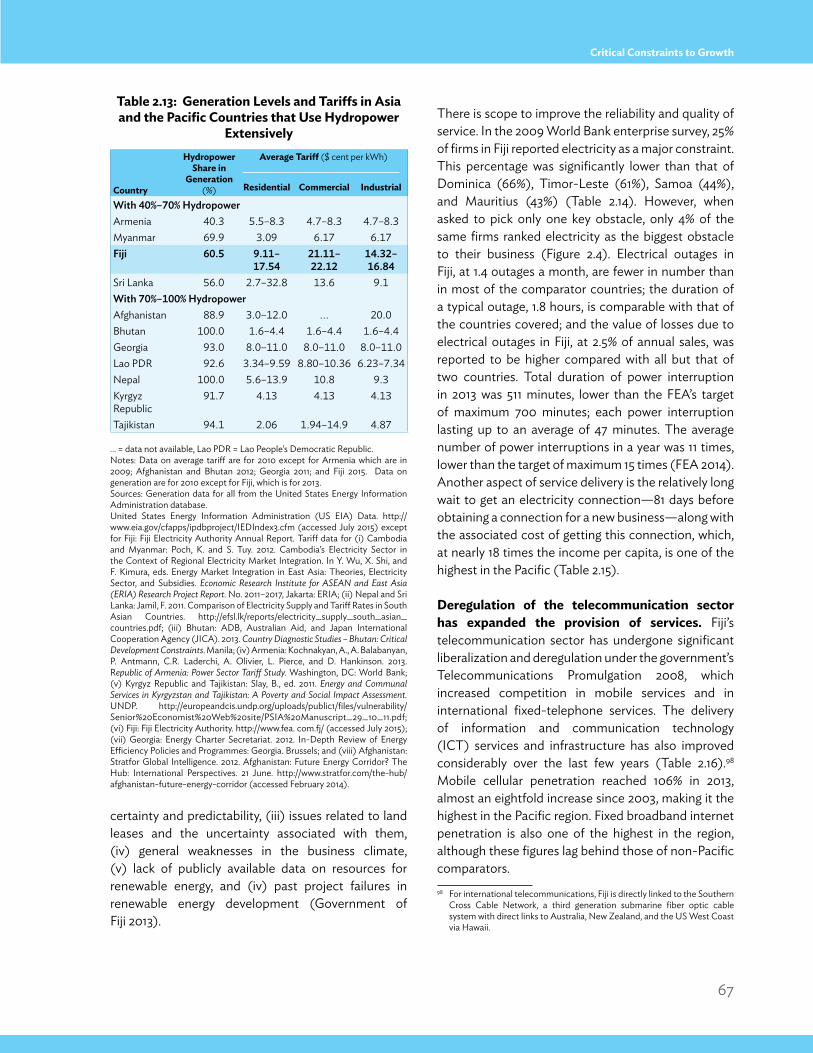
67
Critical Constraints to Growth
certainty and predictability, (iii) issues related to land leases and the uncertainty associated with them, (iv) general weaknesses in the business climate, (v) lack of publicly available data on resources for renewable energy, and (iv) past project failures in renewable energy development (Government of Fiji 2013).
There is scope to improve the reliability and quality of service. In the 2009 World Bank enterprise survey, 25% of firms in Fiji reported electricity as a major constraint. This percentage was significantly lower than that of Dominica (66%), Timor-Leste (61%), Samoa (44%), and Mauritius (43%) (Table 2.14). However, when asked to pick only one key obstacle, only 4% of the same firms ranked electricity as the biggest obstacle to their business (Figure 2.4). Electrical outages in Fiji, at 1.4 outages a month, are fewer in number than in most of the comparator countries; the duration of a typical outage, 1.8 hours, is comparable with that of the countries covered; and the value of losses due to electrical outages in Fiji, at 2.5% of annual sales, was reported to be higher compared with all but that of two countries. Total duration of power interruption in 2013 was 511 minutes, lower than the FEA’s target of maximum 700 minutes; each power interruption lasting up to an average of 47 minutes. The average number of power interruptions in a year was 11 times, lower than the target of maximum 15 times (FEA 2014). Another aspect of service delivery is the relatively long wait to get an electricity connection—81 days before obtaining a connection for a new business—along with the associated cost of getting this connection, which, at nearly 18 times the income per capita, is one of the highest in the Pacific (Table 2.15).
Deregulation of the telecommunication sector has expanded the provision of services. Fiji’s telecommunication sector has undergone significant liberalization and deregulation under the government’s Telecommunications Promulgation 2008, which increased competition in mobile services and in international fixed-telephone services. The delivery of information and communication technology (ICT) services and infrastructure has also improved considerably over the last few years (Table 2.16).98 Mobile cellular penetration reached 106% in 2013, almost an eightfold increase since 2003, making it the highest in the Pacific region. Fixed broadband internet penetration is also one of the highest in the region, although these figures lag behind those of non-Pacific comparators.98 For international telecommunications, Fiji is directly linked to the Southern
Cross Cable Network, a third generation submarine fiber optic cable system with direct links to Australia, New Zealand, and the US West Coast via Hawaii.
Table 2.13: Generation Levels and Tariffs in Asia and the Pacific Countries that Use Hydropower
Extensively
… = data not available, Lao PDR = Lao People’s Democratic Republic.Notes: Data on average tariff are for 2010 except for Armenia which are in 2009; Afghanistan and Bhutan 2012; Georgia 2011; and Fiji 2015. Data on generation are for 2010 except for Fiji, which is for 2013.Sources: Generation data for all from the United States Energy Information Administration database. United States Energy Information Administration (US EIA) Data. http://www.eia.gov/cfapps/ipdbproject/IEDIndex3.cfm (accessed July 2015) except for Fiji: Fiji Electricity Authority Annual Report. Tariff data for (i) Cambodia and Myanmar: Poch, K. and S. Tuy. 2012. Cambodia’s Electricity Sector in the Context of Regional Electricity Market Integration. In Y. Wu, X. Shi, and F. Kimura, eds. Energy Market Integration in East Asia: Theories, Electricity Sector, and Subsidies. Economic Research Institute for ASEAN and East Asia (ERIA) Research Project Report. No. 2011–2017, Jakarta: ERIA; (ii) Nepal and Sri Lanka: Jamil, F. 2011. Comparison of Electricity Supply and Tariff Rates in South Asian Countries. http://efsl.lk/reports/electricity_supply_south_asian_countries.pdf; (iii) Bhutan: ADB, Australian Aid, and Japan International Cooperation Agency (JICA). 2013. Country Diagnostic Studies – Bhutan: Critical Development Constraints. Manila; (iv) Armenia: Kochnakyan, A., A. Balabanyan, P. Antmann, C.R. Laderchi, A. Olivier, L. Pierce, and D. Hankinson. 2013. Republic of Armenia: Power Sector Tariff Study. Washington, DC: World Bank; (v) Kyrgyz Republic and Tajikistan: Slay, B., ed. 2011. Energy and Communal Services in Kyrgyzstan and Tajikistan: A Poverty and Social Impact Assessment. UNDP. http://europeandcis.undp.org/uploads/public1/files/vulnerability/Senior%20Economist%20Web%20site/PSIA%20Manuscript_29_10_11.pdf; (vi) Fiji: Fiji Electricity Authority. http://www.fea. com.fj/ (accessed July 2015); (vii) Georgia: Energy Charter Secretariat. 2012. In-Depth Review of Energy Efficiency Policies and Programmes: Georgia. Brussels; and (viii) Afghanistan: Stratfor Global Intelligence. 2012. Afghanistan: Future Energy Corridor? The Hub: International Perspectives. 21 June. http://www.stratfor.com/the-hub/afghanistan-future-energy-corridor (accessed February 2014).
Country
Hydropower Share in
Generation (%)
Average Tariff ($ cent per kWh)
Residential Commercial Industrial
With 40%–70% HydropowerArmenia 40.3 5.5–8.3 4.7–8.3 4.7–8.3Myanmar 69.9 3.09 6.17 6.17Fiji 60.5 9.11–
17.5421.11–22.12
14.32–16.84
Sri Lanka 56.0 2.7–32.8 13.6 9.1With 70%–100% HydropowerAfghanistan 88.9 3.0–12.0 ... 20.0Bhutan 100.0 1.6–4.4 1.6–4.4 1.6–4.4Georgia 93.0 8.0–11.0 8.0–11.0 8.0–11.0Lao PDR 92.6 3.34–9.59 8.80–10.36 6.23–7.34Nepal 100.0 5.6–13.9 10.8 9.3Kyrgyz Republic
91.7 4.13 4.13 4.13
Tajikistan 94.1 2.06 1.94–14.9 4.87
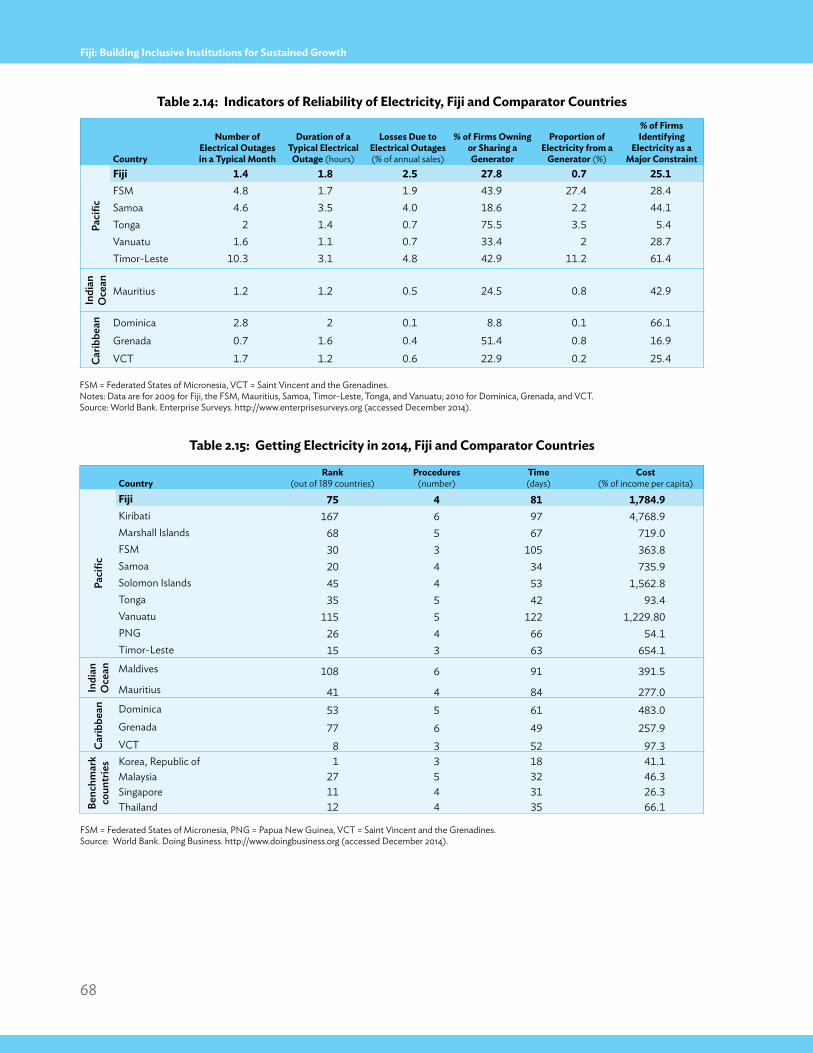
68
Fiji: Building Inclusive Institutions for Sustained Growth
Country
Number of Electrical Outages in a Typical Month
Duration of a Typical Electrical
Outage (hours)
Losses Due to Electrical Outages (% of annual sales)
% of Firms Owning or Sharing a Generator
Proportion of Electricity from a
Generator (%)
% of Firms Identifying
Electricity as a Major Constraint
Paci
fic
Fiji 1.4 1.8 2.5 27.8 0.7 25.1FSM 4.8 1.7 1.9 43.9 27.4 28.4Samoa 4.6 3.5 4.0 18.6 2.2 44.1Tonga 2 1.4 0.7 75.5 3.5 5.4Vanuatu 1.6 1.1 0.7 33.4 2 28.7Timor-Leste 10.3 3.1 4.8 42.9 11.2 61.4
Indi
an
Oce
an
Mauritius 1.2 1.2 0.5 24.5 0.8 42.9
Carib
bean Dominica 2.8 2 0.1 8.8 0.1 66.1
Grenada 0.7 1.6 0.4 51.4 0.8 16.9VCT 1.7 1.2 0.6 22.9 0.2 25.4
Table 2.14: Indicators of Reliability of Electricity, Fiji and Comparator Countries
Table 2.15: Getting Electricity in 2014, Fiji and Comparator Countries
FSM = Federated States of Micronesia, VCT = Saint Vincent and the Grenadines.Notes: Data are for 2009 for Fiji, the FSM, Mauritius, Samoa, Timor-Leste, Tonga, and Vanuatu; 2010 for Dominica, Grenada, and VCT.Source: World Bank. Enterprise Surveys. http://www.enterprisesurveys.org (accessed December 2014).
FSM = Federated States of Micronesia, PNG = Papua New Guinea, VCT = Saint Vincent and the Grenadines.Source: World Bank. Doing Business. http://www.doingbusiness.org (accessed December 2014).
CountryRank
(out of 189 countries)Procedures
(number)Time(days)
Cost (% of income per capita)
Paci
fic
Fiji 75 4 81 1,784.9Kiribati 167 6 97 4,768.9Marshall Islands 68 5 67 719.0FSM 30 3 105 363.8Samoa 20 4 34 735.9Solomon Islands 45 4 53 1,562.8Tonga 35 5 42 93.4Vanuatu 115 5 122 1,229.80PNG 26 4 66 54.1Timor-Leste 15 3 63 654.1
Indi
an
Oce
an Maldives 108 6 91 391.5Mauritius 41 4 84 277.0
Carib
bean Dominica 53 5 61 483.0
Grenada 77 6 49 257.9VCT 8 3 52 97.3
Benc
hmar
k co
untr
ies Korea, Republic of 1 3 18 41.1
Malaysia 27 5 32 46.3Singapore 11 4 31 26.3Thailand 12 4 35 66.1
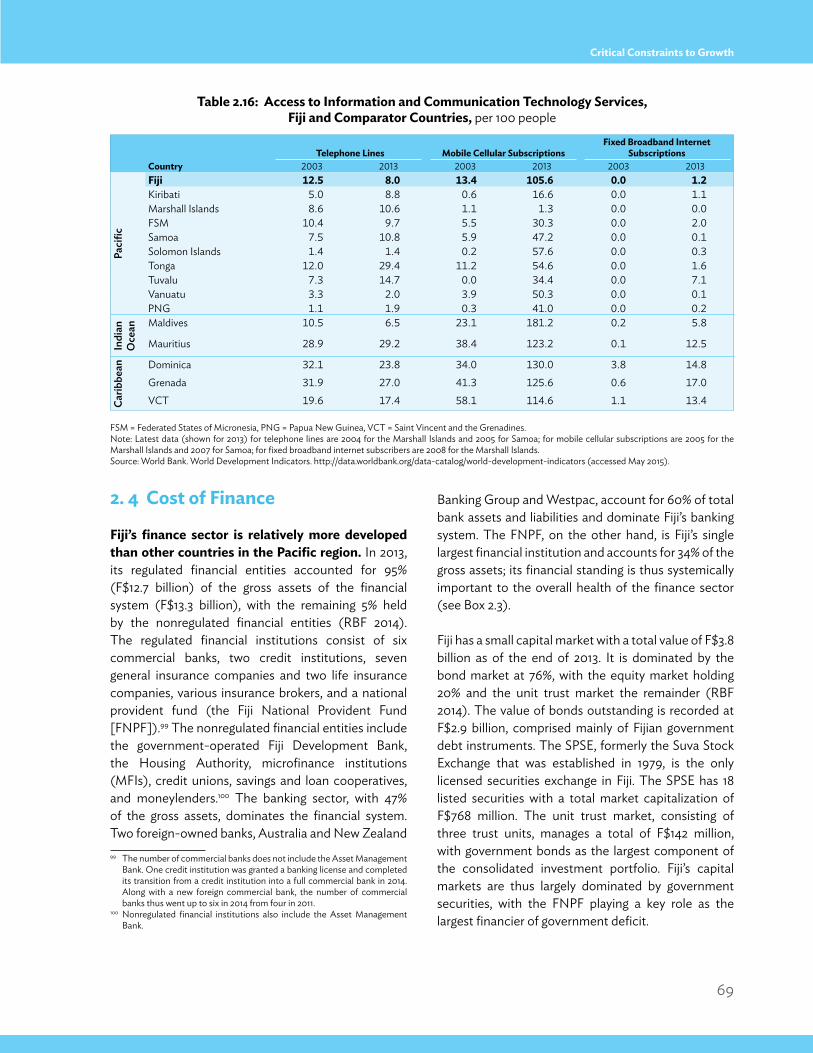
69
Critical Constraints to Growth
2. 4 Cost of Finance
Fiji’s finance sector is relatively more developed than other countries in the Pacific region. In 2013, its regulated financial entities accounted for 95% (F$12.7 billion) of the gross assets of the financial system (F$13.3 billion), with the remaining 5% held by the nonregulated financial entities (RBF 2014). The regulated financial institutions consist of six commercial banks, two credit institutions, seven general insurance companies and two life insurance companies, various insurance brokers, and a national provident fund (the Fiji National Provident Fund [FNPF]).99 The nonregulated financial entities include the government-operated Fiji Development Bank, the Housing Authority, microfinance institutions (MFIs), credit unions, savings and loan cooperatives, and moneylenders.100 The banking sector, with 47% of the gross assets, dominates the financial system. Two foreign-owned banks, Australia and New Zealand 99 The number of commercial banks does not include the Asset Management
Bank. One credit institution was granted a banking license and completed its transition from a credit institution into a full commercial bank in 2014. Along with a new foreign commercial bank, the number of commercial banks thus went up to six in 2014 from four in 2011.
100 Nonregulated financial institutions also include the Asset Management Bank.
Banking Group and Westpac, account for 60% of total bank assets and liabilities and dominate Fiji’s banking system. The FNPF, on the other hand, is Fiji’s single largest financial institution and accounts for 34% of the gross assets; its financial standing is thus systemically important to the overall health of the finance sector (see Box 2.3).
Fiji has a small capital market with a total value of F$3.8 billion as of the end of 2013. It is dominated by the bond market at 76%, with the equity market holding 20% and the unit trust market the remainder (RBF 2014). The value of bonds outstanding is recorded at F$2.9 billion, comprised mainly of Fijian government debt instruments. The SPSE, formerly the Suva Stock Exchange that was established in 1979, is the only licensed securities exchange in Fiji. The SPSE has 18 listed securities with a total market capitalization of F$768 million. The unit trust market, consisting of three trust units, manages a total of F$142 million, with government bonds as the largest component of the consolidated investment portfolio. Fiji’s capital markets are thus largely dominated by government securities, with the FNPF playing a key role as the largest financier of government deficit.
Table 2.16: Access to Information and Communication Technology Services, Fiji and Comparator Countries, per 100 people
FSM = Federated States of Micronesia, PNG = Papua New Guinea, VCT = Saint Vincent and the Grenadines.Note: Latest data (shown for 2013) for telephone lines are 2004 for the Marshall Islands and 2005 for Samoa; for mobile cellular subscriptions are 2005 for the Marshall Islands and 2007 for Samoa; for fixed broadband internet subscribers are 2008 for the Marshall Islands. Source: World Bank. World Development Indicators. http://data.worldbank.org/data-catalog/world-development-indicators (accessed May 2015).
Telephone Lines Mobile Cellular SubscriptionsFixed Broadband Internet
SubscriptionsCountry 2003 2013 2003 2013 2003 2013
Paci
fic
Fiji 12.5 8.0 13.4 105.6 0.0 1.2Kiribati 5.0 8.8 0.6 16.6 0.0 1.1Marshall Islands 8.6 10.6 1.1 1.3 0.0 0.0FSM 10.4 9.7 5.5 30.3 0.0 2.0Samoa 7.5 10.8 5.9 47.2 0.0 0.1Solomon Islands 1.4 1.4 0.2 57.6 0.0 0.3Tonga 12.0 29.4 11.2 54.6 0.0 1.6Tuvalu 7.3 14.7 0.0 34.4 0.0 7.1Vanuatu 3.3 2.0 3.9 50.3 0.0 0.1PNG 1.1 1.9 0.3 41.0 0.0 0.2
Indi
an
Oce
an Maldives 10.5 6.5 23.1 181.2 0.2 5.8
Mauritius 28.9 29.2 38.4 123.2 0.1 12.5
Carib
bean Dominica 32.1 23.8 34.0 130.0 3.8 14.8
Grenada 31.9 27.0 41.3 125.6 0.6 17.0VCT 19.6 17.4 58.1 114.6 1.1 13.4
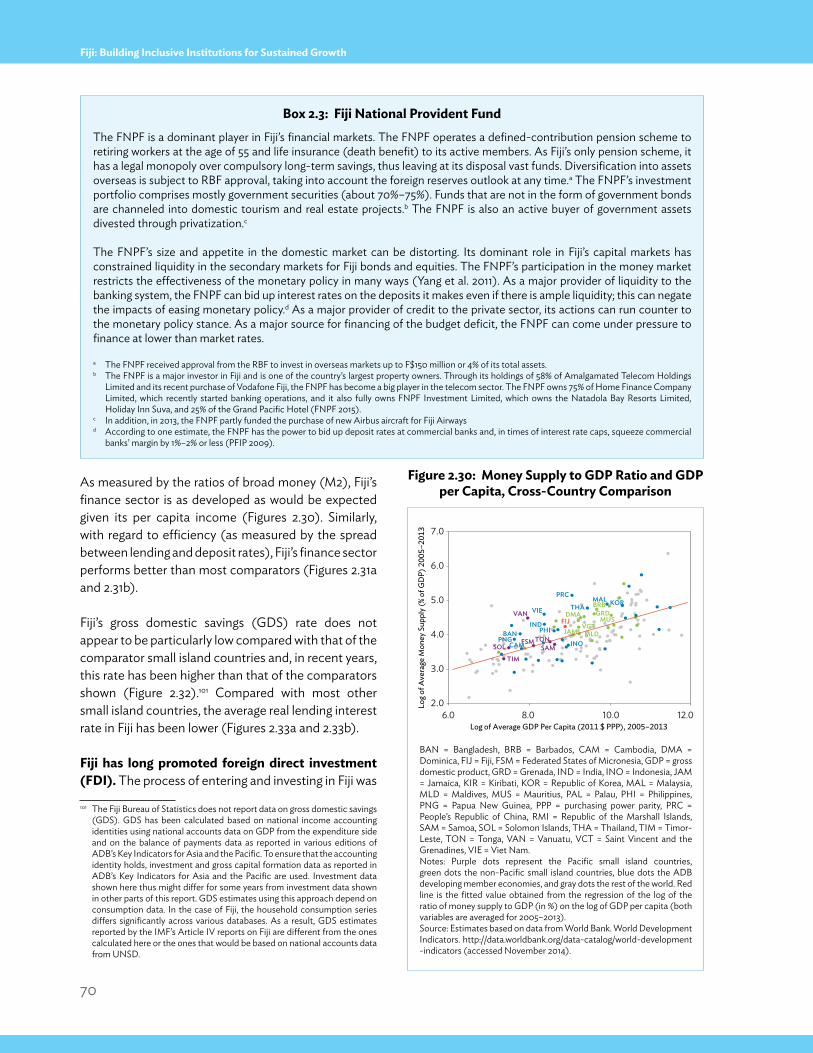
70
Fiji: Building Inclusive Institutions for Sustained Growth
As measured by the ratios of broad money (M2), Fiji’s finance sector is as developed as would be expected given its per capita income (Figures 2.30). Similarly, with regard to efficiency (as measured by the spread between lending and deposit rates), Fiji’s finance sector performs better than most comparators (Figures 2.31a and 2.31b).
Fiji’s gross domestic savings (GDS) rate does not appear to be particularly low compared with that of the comparator small island countries and, in recent years, this rate has been higher than that of the comparators shown (Figure 2.32).101 Compared with most other small island countries, the average real lending interest rate in Fiji has been lower (Figures 2.33a and 2.33b).
Fiji has long promoted foreign direct investment (FDI). The process of entering and investing in Fiji was
101 The Fiji Bureau of Statistics does not report data on gross domestic savings (GDS). GDS has been calculated based on national income accounting identities using national accounts data on GDP from the expenditure side and on the balance of payments data as reported in various editions of ADB’s Key Indicators for Asia and the Pacific. To ensure that the accounting identity holds, investment and gross capital formation data as reported in ADB’s Key Indicators for Asia and the Pacific are used. Investment data shown here thus might differ for some years from investment data shown in other parts of this report. GDS estimates using this approach depend on consumption data. In the case of Fiji, the household consumption series differs significantly across various databases. As a result, GDS estimates reported by the IMF’s Article IV reports on Fiji are different from the ones calculated here or the ones that would be based on national accounts data from UNSD.
Box 2.3: Fiji National Provident FundThe FNPF is a dominant player in Fiji’s financial markets. The FNPF operates a defined-contribution pension scheme to retiring workers at the age of 55 and life insurance (death benefit) to its active members. As Fiji’s only pension scheme, it has a legal monopoly over compulsory long-term savings, thus leaving at its disposal vast funds. Diversification into assets overseas is subject to RBF approval, taking into account the foreign reserves outlook at any time.a The FNPF’s investment portfolio comprises mostly government securities (about 70%–75%). Funds that are not in the form of government bonds are channeled into domestic tourism and real estate projects.b The FNPF is also an active buyer of government assets divested through privatization.c
The FNPF’s size and appetite in the domestic market can be distorting. Its dominant role in Fiji’s capital markets has constrained liquidity in the secondary markets for Fiji bonds and equities. The FNPF’s participation in the money market restricts the effectiveness of the monetary policy in many ways (Yang et al. 2011). As a major provider of liquidity to the banking system, the FNPF can bid up interest rates on the deposits it makes even if there is ample liquidity; this can negate the impacts of easing monetary policy.d As a major provider of credit to the private sector, its actions can run counter to the monetary policy stance. As a major source for financing of the budget deficit, the FNPF can come under pressure to finance at lower than market rates.
a The FNPF received approval from the RBF to invest in overseas markets up to F$150 million or 4% of its total assets.b The FNPF is a major investor in Fiji and is one of the country’s largest property owners. Through its holdings of 58% of Amalgamated Telecom Holdings
Limited and its recent purchase of Vodafone Fiji, the FNPF has become a big player in the telecom sector. The FNPF owns 75% of Home Finance Company Limited, which recently started banking operations, and it also fully owns FNPF Investment Limited, which owns the Natadola Bay Resorts Limited, Holiday Inn Suva, and 25% of the Grand Pacific Hotel (FNPF 2015).
c In addition, in 2013, the FNPF partly funded the purchase of new Airbus aircraft for Fiji Airwaysd According to one estimate, the FNPF has the power to bid up deposit rates at commercial banks and, in times of interest rate caps, squeeze commercial
banks’ margin by 1%–2% or less (PFIP 2009).
Figure 2.30: Money Supply to GDP Ratio and GDP per Capita, Cross-Country Comparison
BAN = Bangladesh, BRB = Barbados, CAM = Cambodia, DMA = Dominica, FIJ = Fiji, FSM = Federated States of Micronesia, GDP = gross domestic product, GRD = Grenada, IND = India, INO = Indonesia, JAM = Jamaica, KIR = Kiribati, KOR = Republic of Korea, MAL = Malaysia, MLD = Maldives, MUS = Mauritius, PAL = Palau, PHI = Philippines, PNG = Papua New Guinea, PPP = purchasing power parity, PRC = People’s Republic of China, RMI = Republic of the Marshall Islands, SAM = Samoa, SOL = Solomon Islands, THA = Thailand, TIM = Timor-Leste, TON = Tonga, VAN = Vanuatu, VCT = Saint Vincent and the Grenadines, VIE = Viet Nam.Notes: Purple dots represent the Pacific small island countries, green dots the non-Pacific small island countries, blue dots the ADB developing member economies, and gray dots the rest of the world. Red line is the fitted value obtained from the regression of the log of the ratio of money supply to GDP (in %) on the log of GDP per capita (both variables are averaged for 2005–2013).Source: Estimates based on data from World Bank. World Development Indicators. http://data.worldbank.org/data-catalog/world-development -indicators (accessed November 2014).
FIJ
FSMSAMSOL
TIM
TON
VANBRB
DMA GRD
JAM MLD
MUSVCT
BANCAM
PRC
IND
INO
MAL
PNGPHI
KORTHAVIE
6.0 8.0 10.0 12.02.0
3.0
4.0
5.0
6.0
7.0
Log
of A
vera
ge M
oney
Sup
ply (
% of
GD
P) 2
005–
2013
Log of Average GDP Per Capita (2011 $ PPP), 2005–2013
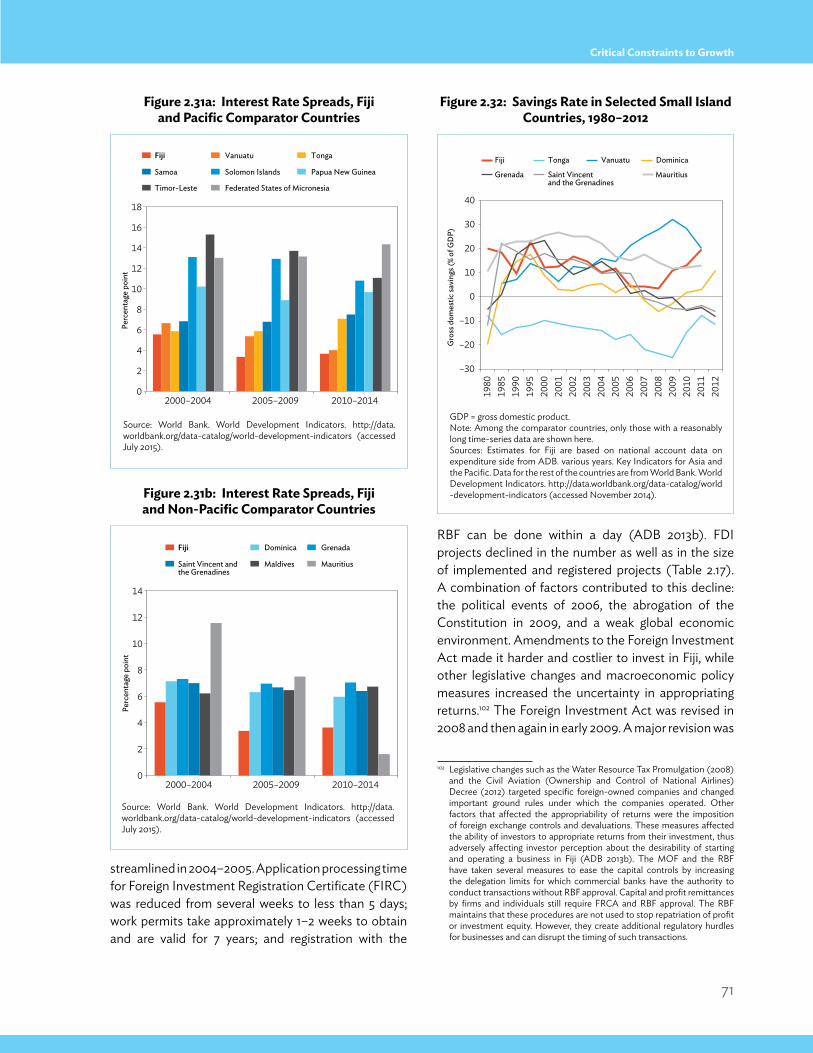
71
Critical Constraints to Growth
streamlined in 2004–2005. Application processing time for Foreign Investment Registration Certificate (FIRC) was reduced from several weeks to less than 5 days; work permits take approximately 1–2 weeks to obtain and are valid for 7 years; and registration with the
RBF can be done within a day (ADB 2013b). FDI projects declined in the number as well as in the size of implemented and registered projects (Table 2.17). A combination of factors contributed to this decline: the political events of 2006, the abrogation of the Constitution in 2009, and a weak global economic environment. Amendments to the Foreign Investment Act made it harder and costlier to invest in Fiji, while other legislative changes and macroeconomic policy measures increased the uncertainty in appropriating returns.102 The Foreign Investment Act was revised in 2008 and then again in early 2009. A major revision was
102 Legislative changes such as the Water Resource Tax Promulgation (2008) and the Civil Aviation (Ownership and Control of National Airlines) Decree (2012) targeted specific foreign-owned companies and changed important ground rules under which the companies operated. Other factors that affected the appropriability of returns were the imposition of foreign exchange controls and devaluations. These measures affected the ability of investors to appropriate returns from their investment, thus adversely affecting investor perception about the desirability of starting and operating a business in Fiji (ADB 2013b). The MOF and the RBF have taken several measures to ease the capital controls by increasing the delegation limits for which commercial banks have the authority to conduct transactions without RBF approval. Capital and profit remittances by firms and individuals still require FRCA and RBF approval. The RBF maintains that these procedures are not used to stop repatriation of profit or investment equity. However, they create additional regulatory hurdles for businesses and can disrupt the timing of such transactions.
Figure 2.31a: Interest Rate Spreads, Fiji and Pacific Comparator Countries
Figure 2.32: Savings Rate in Selected Small Island Countries, 1980–2012
Figure 2.31b: Interest Rate Spreads, Fiji and Non-Pacific Comparator Countries
Source: World Bank. World Development Indicators. http://data.worldbank.org/data-catalog/world-development-indicators (accessed July 2015).
GDP = gross domestic product.Note: Among the comparator countries, only those with a reasonably long time-series data are shown here.Sources: Estimates for Fiji are based on national account data on expenditure side from ADB. various years. Key Indicators for Asia and the Pacific. Data for the rest of the countries are from World Bank. World Development Indicators. http://data.worldbank.org/data-catalog/world -development-indicators (accessed November 2014).
Source: World Bank. World Development Indicators. http://data.worldbank.org/data-catalog/world-development-indicators (accessed July 2015).
0
2
4
6
8
10
12
14
16
18
2000–2004 2005–2009 2010–2014
Perc
enta
ge p
oint
Fiji Vanuatu Tonga
Samoa Solomon Islands Papua New Guinea
Timor-Leste Federated States of Micronesia
0
2
4
6
8
10
12
14
2000–2004 2005–2009 2010–2014
Perc
enta
ge p
oint
Fiji Dominica Grenada
Saint Vincent andthe Grenadines
Maldives Mauritius
–30
–20
–10
0
10
20
30
40
1980
19
85
1990
19
95
2000
20
01
2002
20
03
2004
20
05
2006
20
07
2008
20
09
2010
20
11
2012
Gro
ss d
omes
tic sa
ving
s (%
of G
DP)
Grenada MauritiusSaint Vincentand the Grenadines
Fiji Tonga Vanuatu Dominica
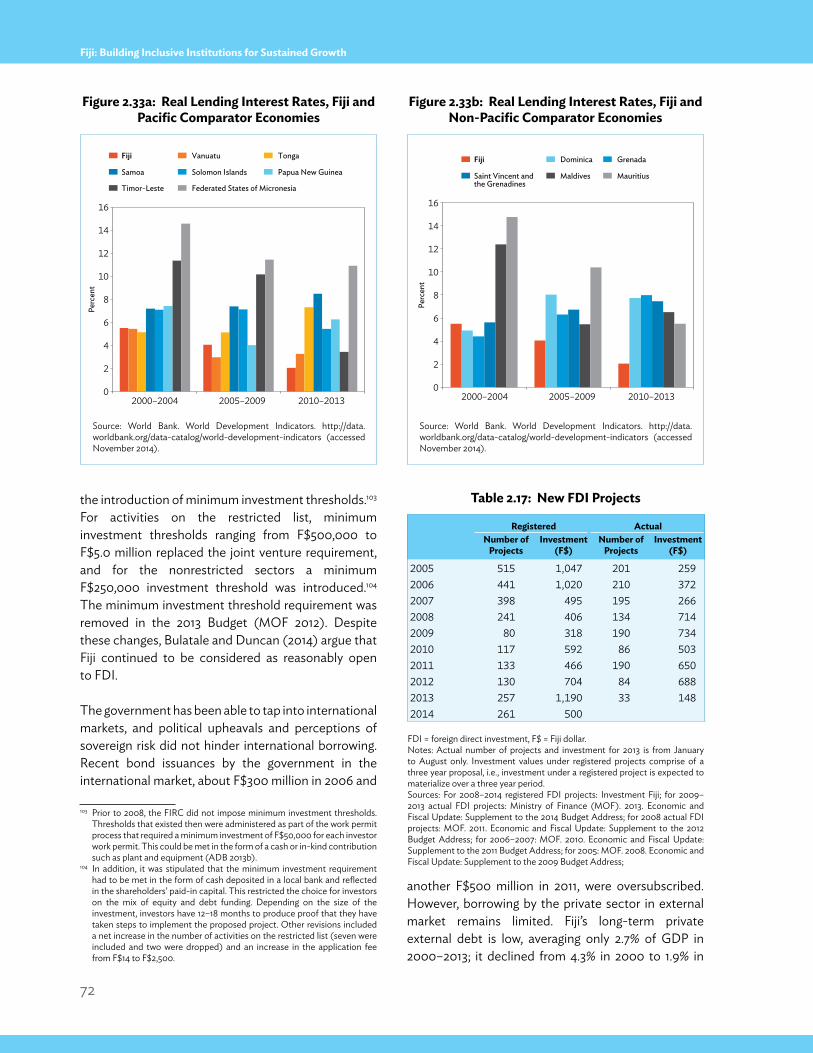
72
Fiji: Building Inclusive Institutions for Sustained Growth
the introduction of minimum investment thresholds.103 For activities on the restricted list, minimum investment thresholds ranging from F$500,000 to F$5.0 million replaced the joint venture requirement, and for the nonrestricted sectors a minimum F$250,000 investment threshold was introduced.104 The minimum investment threshold requirement was removed in the 2013 Budget (MOF 2012). Despite these changes, Bulatale and Duncan (2014) argue that Fiji continued to be considered as reasonably open to FDI.
The government has been able to tap into international markets, and political upheavals and perceptions of sovereign risk did not hinder international borrowing. Recent bond issuances by the government in the international market, about F$300 million in 2006 and
103 Prior to 2008, the FIRC did not impose minimum investment thresholds. Thresholds that existed then were administered as part of the work permit process that required a minimum investment of F$50,000 for each investor work permit. This could be met in the form of a cash or in-kind contribution such as plant and equipment (ADB 2013b).
104 In addition, it was stipulated that the minimum investment requirement had to be met in the form of cash deposited in a local bank and reflected in the shareholders’ paid-in capital. This restricted the choice for investors on the mix of equity and debt funding. Depending on the size of the investment, investors have 12–18 months to produce proof that they have taken steps to implement the proposed project. Other revisions included a net increase in the number of activities on the restricted list (seven were included and two were dropped) and an increase in the application fee from F$14 to F$2,500.
another F$500 million in 2011, were oversubscribed. However, borrowing by the private sector in external market remains limited. Fiji’s long-term private external debt is low, averaging only 2.7% of GDP in 2000–2013; it declined from 4.3% in 2000 to 1.9% in
Figure 2.33b: Real Lending Interest Rates, Fiji and Non-Pacific Comparator Economies
Figure 2.33a: Real Lending Interest Rates, Fiji and Pacific Comparator Economies
Source: World Bank. World Development Indicators. http://data.worldbank.org/data-catalog/world-development-indicators (accessed November 2014).
Source: World Bank. World Development Indicators. http://data.worldbank.org/data-catalog/world-development-indicators (accessed November 2014).
0
2
4
6
8
10
12
14
16
2000–2004 2005–2009 2010–2013
Perc
ent
Fiji Vanuatu Tonga
Samoa Solomon Islands Papua New Guinea
Timor-Leste Federated States of Micronesia
0
2
4
6
8
10
12
14
16
2000–2004 2005–2009 2010–2013
Perc
ent
Fiji Dominica Grenada
Saint Vincent andthe Grenadines
Maldives Mauritius
Table 2.17: New FDI Projects
FDI = foreign direct investment, F$ = Fiji dollar.Notes: Actual number of projects and investment for 2013 is from January to August only. Investment values under registered projects comprise of a three year proposal, i.e., investment under a registered project is expected to materialize over a three year period.Sources: For 2008–2014 registered FDI projects: Investment Fiji; for 2009–2013 actual FDI projects: Ministry of Finance (MOF). 2013. Economic and Fiscal Update: Supplement to the 2014 Budget Address; for 2008 actual FDI projects: MOF. 2011. Economic and Fiscal Update: Supplement to the 2012 Budget Address; for 2006–2007: MOF. 2010. Economic and Fiscal Update: Supplement to the 2011 Budget Address; for 2005: MOF. 2008. Economic and Fiscal Update: Supplement to the 2009 Budget Address;
Registered ActualNumber of
ProjectsInvestment
(F$)Number of
ProjectsInvestment
(F$)
2005 515 1,047 201 2592006 441 1,020 210 3722007 398 495 195 2662008 241 406 134 7142009 80 318 190 7342010 117 592 86 5032011 133 466 190 6502012 130 704 84 6882013 257 1,190 33 1482014 261 500
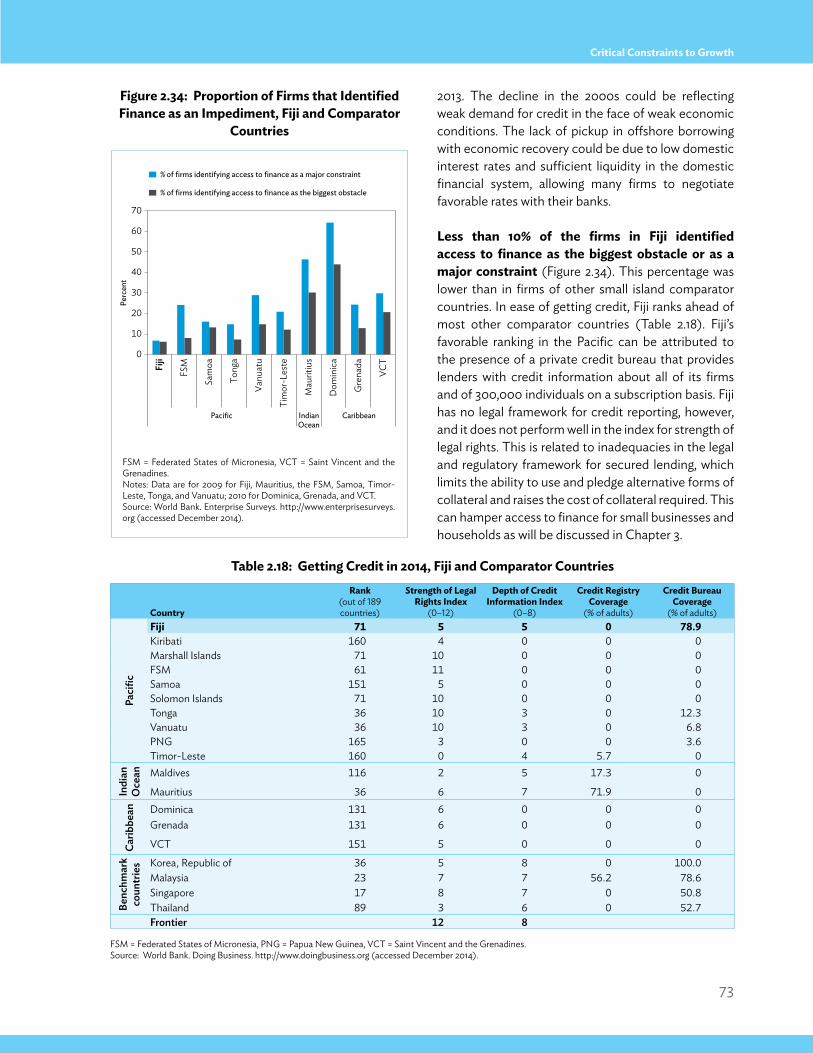
73
Critical Constraints to Growth
2013. The decline in the 2000s could be reflecting weak demand for credit in the face of weak economic conditions. The lack of pickup in offshore borrowing with economic recovery could be due to low domestic interest rates and sufficient liquidity in the domestic financial system, allowing many firms to negotiate favorable rates with their banks.
Less than 10% of the firms in Fiji identified access to finance as the biggest obstacle or as a major constraint (Figure 2.34). This percentage was lower than in firms of other small island comparator countries. In ease of getting credit, Fiji ranks ahead of most other comparator countries (Table 2.18). Fiji’s favorable ranking in the Pacific can be attributed to the presence of a private credit bureau that provides lenders with credit information about all of its firms and of 300,000 individuals on a subscription basis. Fiji has no legal framework for credit reporting, however, and it does not perform well in the index for strength of legal rights. This is related to inadequacies in the legal and regulatory framework for secured lending, which limits the ability to use and pledge alternative forms of collateral and raises the cost of collateral required. This can hamper access to finance for small businesses and households as will be discussed in Chapter 3.
0
10
20
30
40
50
60
70
Fiji
FSM
Sam
oa
Tong
a
Vanu
atu
Tim
or-L
este
Mau
ritiu
s
Dom
inic
a
Gre
nada
VCT
Pacific IndianOcean
Caribbean
Perc
ent
% of firms identifying access to finance as a major constraint
% of firms identifying access to finance as the biggest obstacle
Figure 2.34: Proportion of Firms that Identified Finance as an Impediment, Fiji and Comparator
Countries
Table 2.18: Getting Credit in 2014, Fiji and Comparator Countries
FSM = Federated States of Micronesia, VCT = Saint Vincent and the Grenadines.Notes: Data are for 2009 for Fiji, Mauritius, the FSM, Samoa, Timor-Leste, Tonga, and Vanuatu; 2010 for Dominica, Grenada, and VCT. Source: World Bank. Enterprise Surveys. http://www.enterprisesurveys.org (accessed December 2014).
FSM = Federated States of Micronesia, PNG = Papua New Guinea, VCT = Saint Vincent and the Grenadines.Source: World Bank. Doing Business. http://www.doingbusiness.org (accessed December 2014).
Country
Rank(out of 189 countries)
Strength of Legal Rights Index
(0–12)
Depth of Credit Information Index
(0–8)
Credit Registry Coverage
(% of adults)
Credit Bureau Coverage
(% of adults)
Paci
fic
Fiji 71 5 5 0 78.9Kiribati 160 4 0 0 0Marshall Islands 71 10 0 0 0FSM 61 11 0 0 0Samoa 151 5 0 0 0Solomon Islands 71 10 0 0 0Tonga 36 10 3 0 12.3Vanuatu 36 10 3 0 6.8PNG 165 3 0 0 3.6Timor-Leste 160 0 4 5.7 0
Indi
an
Oce
an Maldives 116 2 5 17.3 0
Mauritius 36 6 7 71.9 0
Carib
bean Dominica 131 6 0 0 0
Grenada 131 6 0 0 0
VCT 151 5 0 0 0
Benc
hmar
k co
untr
ies Korea, Republic of 36 5 8 0 100.0
Malaysia 23 7 7 56.2 78.6Singapore 17 8 7 0 50.8Thailand 89 3 6 0 52.7Frontier 12 8
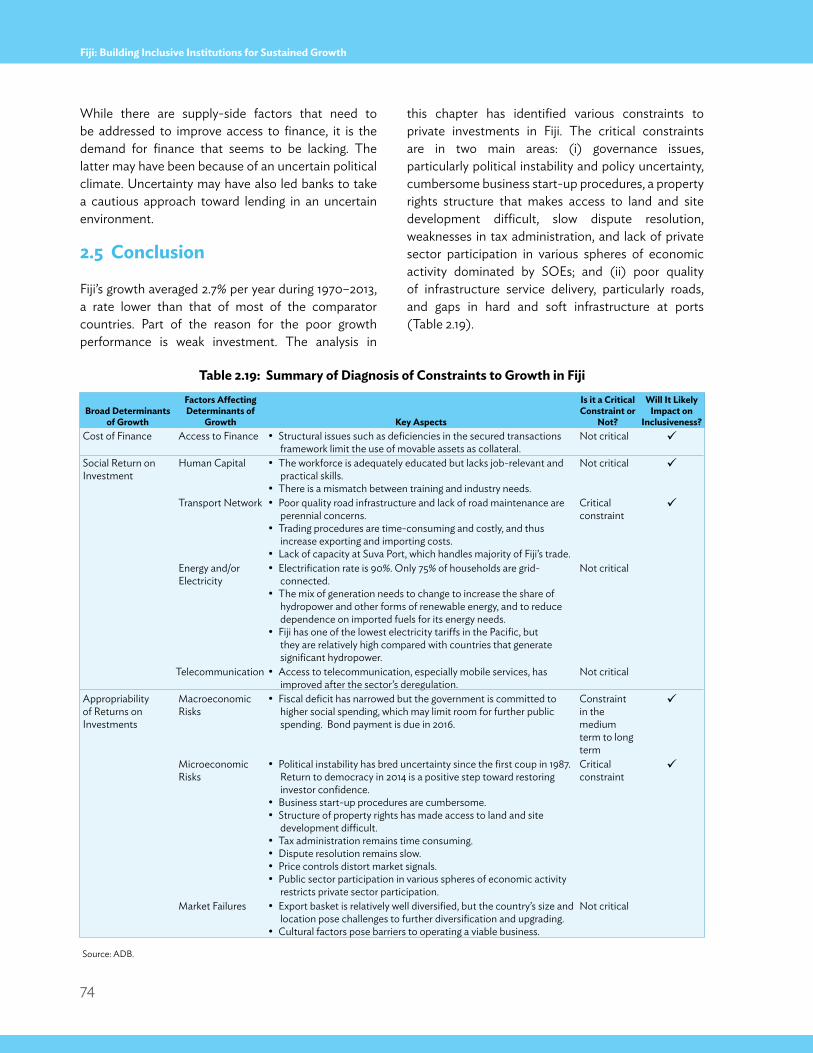
74
Fiji: Building Inclusive Institutions for Sustained Growth
While there are supply-side factors that need to be addressed to improve access to finance, it is the demand for finance that seems to be lacking. The latter may have been because of an uncertain political climate. Uncertainty may have also led banks to take a cautious approach toward lending in an uncertain environment.
2.5 Conclusion
Fiji’s growth averaged 2.7% per year during 1970–2013, a rate lower than that of most of the comparator countries. Part of the reason for the poor growth performance is weak investment. The analysis in
this chapter has identified various constraints to private investments in Fiji. The critical constraints are in two main areas: (i) governance issues, particularly political instability and policy uncertainty, cumbersome business start-up procedures, a property rights structure that makes access to land and site development difficult, slow dispute resolution, weaknesses in tax administration, and lack of private sector participation in various spheres of economic activity dominated by SOEs; and (ii) poor quality of infrastructure service delivery, particularly roads, and gaps in hard and soft infrastructure at ports (Table 2.19).
Table 2.19: Summary of Diagnosis of Constraints to Growth in Fiji
Broad Determinants of Growth
Factors Affecting Determinants of
Growth Key Aspects
Is it a Critical Constraint or
Not?
Will It Likely Impact on
Inclusiveness?Cost of Finance Access to Finance • Structural issues such as deficiencies in the secured transactions
framework limit the use of movable assets as collateral. Not critical ü
Social Return on Investment
Human Capital • The workforce is adequately educated but lacks job-relevant and practical skills.
• There is a mismatch between training and industry needs.
Not critical ü
Transport Network • Poor quality road infrastructure and lack of road maintenance are perennial concerns.
• Trading procedures are time-consuming and costly, and thus increase exporting and importing costs.
• Lack of capacity at Suva Port, which handles majority of Fiji’s trade.
Critical constraint
ü
Energy and/or Electricity
• Electrification rate is 90%. Only 75% of households are grid-connected.
• The mix of generation needs to change to increase the share of hydropower and other forms of renewable energy, and to reduce dependence on imported fuels for its energy needs.
• Fiji has one of the lowest electricity tariffs in the Pacific, but they are relatively high compared with countries that generate significant hydropower.
Not critical
Telecommunication • Access to telecommunication, especially mobile services, has improved after the sector’s deregulation.
Not critical
Appropriability of Returns on Investments
Macroeconomic Risks
• Fiscal deficit has narrowed but the government is committed to higher social spending, which may limit room for further public spending. Bond payment is due in 2016.
Constraint in the medium term to long term
ü
Microeconomic Risks
• Political instability has bred uncertainty since the first coup in 1987. Return to democracy in 2014 is a positive step toward restoring investor confidence.
• Business start-up procedures are cumbersome.• Structure of property rights has made access to land and site
development difficult.• Tax administration remains time consuming.• Dispute resolution remains slow.• Price controls distort market signals.• Public sector participation in various spheres of economic activity
restricts private sector participation.
Critical constraint
ü
Market Failures • Export basket is relatively well diversified, but the country’s size and location pose challenges to further diversification and upgrading.
• Cultural factors pose barriers to operating a viable business.
Not critical
Source: ADB.
75
Critical Constraints to Inclusiveness
Chapter 3critical constraints to Inclusiveness
negligible levels as one of the strategic priorities in its road map for 2010–2014 (MOSPNDS 2010).
Using the poverty and inequality reduction diagnostic framework (Box 3.1), this chapter identifies lack of productive job opportunities and an unequal access to opportunities as the key constraints to making growth inclusive in Fiji.
3.2 poverty and inequality in Fiji
national poverty incidence masks spatial variation in poverty. Nearly 31% of Fiji’s population is still below the national poverty line (Figure 1.36). Spatial disparities are prevalent, with poverty incidence higher in rural areas and less urbanized divisions. The two main divisions, Central and Western, show lower poverty rates than the Eastern and Northern divisions. Further disaggregation of the divisions into rural and urban reveals the complexity of the changes in poverty incidence (Figure 3.1). As shown in this section, though poverty rates are higher in Eastern and Northern divisions, nearly 66%–70% of the poor are in Central and Western divisions. Part of the reason for increase in overall rural poverty incidence could be that a larger share of the nonpoor than of the poor migrated from the rural to the urban areas, thus making the number of poor left behind bigger against the dwindled population. Between the two major ethnicities, iTaukeis show a slightly lower poverty incidence than the Indo-Fijians both in the urban and rural areas
3.1 introduction
Growth is considered inclusive when all members of society can equally participate in and benefit from the growth process, regardless of their individual circumstances (Ali and Zhuang 2007). This means that inclusive growth must go beyond simply creating job opportunities. It must also purposively seek to improve access to social services (such as education and health), infrastructure services, and productive assets like land and credit. Adequate social safety nets must be provided to those not fortunate enough to have the means or access to these benefits and opportunities (Zhuang 2008). Making growth inclusive is crucial to improving social mobility and ensuring that inequalities in income and opportunity are not entrenched across generations.105
A development strategy based on the inclusive growth concept is thus anchored on three policy pillars: (i) creating and expanding economic opportunities through high and sustained growth; (ii) ensuring equal access to opportunities for all members of society; and (iii) providing adequate social safety nets to ensure that no person goes below a minimum level of economic well-being (Zhuang 2008). In the case of Fiji, the government has made reducing poverty to 105 A country’s growth should be inclusive. Otherwise, the resulting inequality
could undermine the gains from that growth (Zhuang, Kanbur, and Rhee 2014). Recent literature on the subject shows that countries with more equality in income distribution see longer growth spells (Berg and Ostry 2011 and Ostry, Berg, and Tsangarides 2014).For this reason, practically every country in the world is emphasizing quality of growth in their long-term strategic planning.
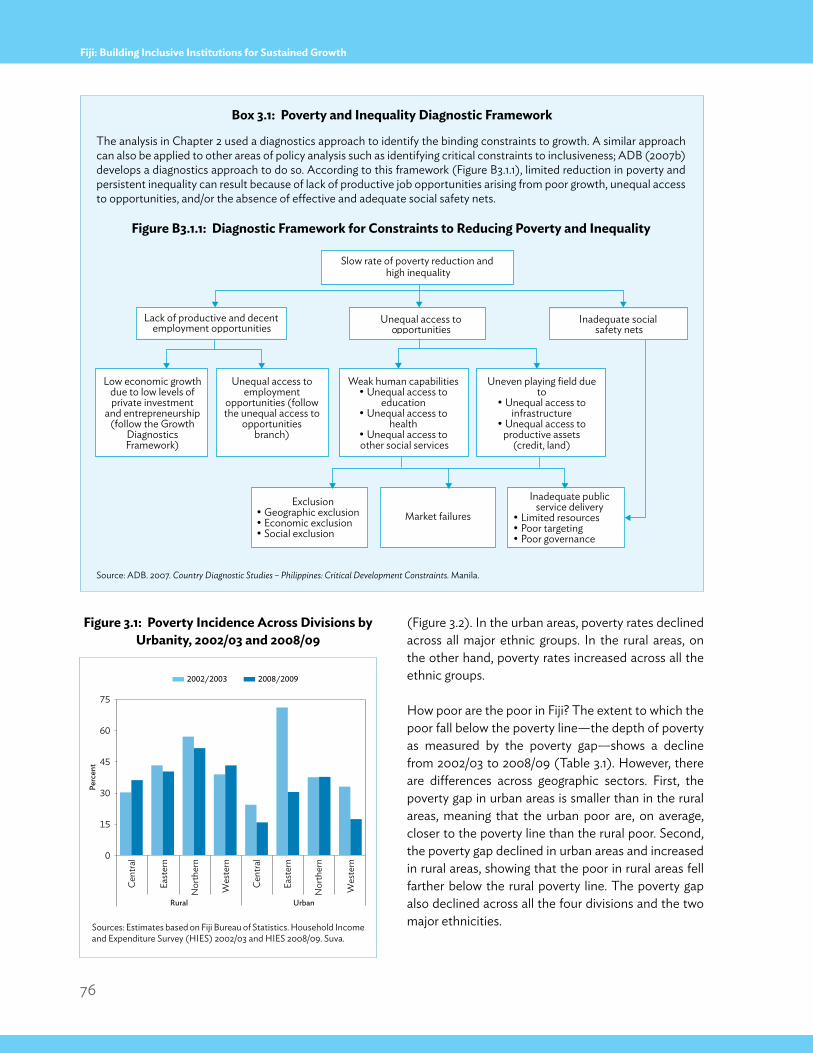
76
Fiji: Building Inclusive Institutions for Sustained Growth
(Figure 3.2). In the urban areas, poverty rates declined across all major ethnic groups. In the rural areas, on the other hand, poverty rates increased across all the ethnic groups.
How poor are the poor in Fiji? The extent to which the poor fall below the poverty line—the depth of poverty as measured by the poverty gap—shows a decline from 2002/03 to 2008/09 (Table 3.1). However, there are differences across geographic sectors. First, the poverty gap in urban areas is smaller than in the rural areas, meaning that the urban poor are, on average, closer to the poverty line than the rural poor. Second, the poverty gap declined in urban areas and increased in rural areas, showing that the poor in rural areas fell farther below the rural poverty line. The poverty gap also declined across all the four divisions and the two major ethnicities.
The analysis in Chapter 2 used a diagnostics approach to identify the binding constraints to growth. A similar approach can also be applied to other areas of policy analysis such as identifying critical constraints to inclusiveness; ADB (2007b) develops a diagnostics approach to do so. According to this framework (Figure B3.1.1), limited reduction in poverty and persistent inequality can result because of lack of productive job opportunities arising from poor growth, unequal access to opportunities, and/or the absence of effective and adequate social safety nets.
Figure B3.1.1: Diagnostic Framework for Constraints to Reducing poverty and inequality
Source: ADB. 2007. Country Diagnostic Studies – Philippines: Critical Development Constraints. Manila.
Box 3.1: poverty and inequality Diagnostic FrameworkCe
ntra
l
East
ern
Nor
ther
n
Wes
tern
Cent
ral
East
ern
Nor
ther
n
Wes
tern
Rural Urban
0
15
30
45
60
75
Perc
ent
2002/2003 2008/2009
Figure 3.1: poverty incidence Across Divisions by Urbanity, 2002/03 and 2008/09
Sources: Estimates based on Fiji Bureau of Statistics. Household Income and Expenditure Survey (HIES) 2002/03 and HIES 2008/09. Suva.
Slow rate of poverty reduction and high inequality
Unequal access to opportunities
Lack of productive and decent employment opportunities
Inadequate social safety nets
Low economic growth due to low levels of private investment
and entrepreneurship (follow the Growth
Diagnostics Framework)
Unequal access to employment
opportunities (follow the unequal access to
opportunities branch)
Weak human capabilities• Unequal access to
education• Unequal access to
health• Unequal access to other social services
Exclusion• Geographic exclusion• Economic exclusion• Social exclusion
Inadequate public service delivery
• Limited resources• Poor targeting• Poor governance
Market failures
Uneven playing field due to
• Unequal access to infrastructure
• Unequal access to productive assets
(credit, land)
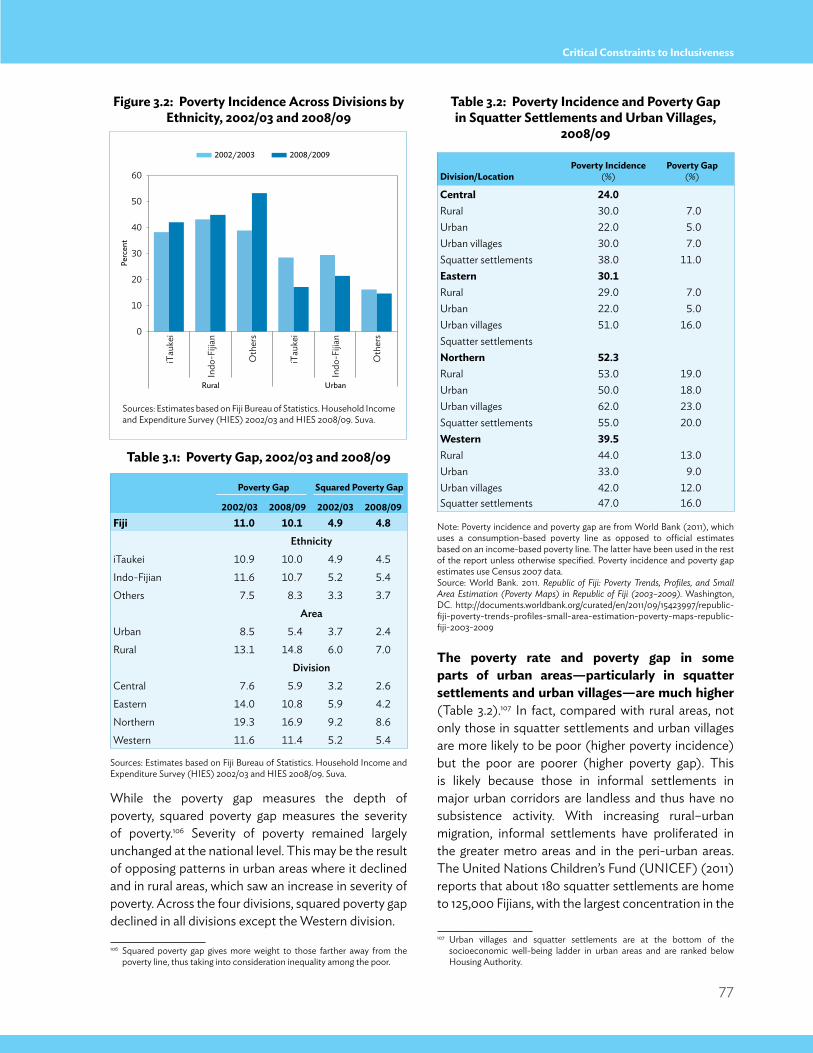
77
Critical Constraints to Inclusiveness
While the poverty gap measures the depth of poverty, squared poverty gap measures the severity of poverty.106 Severity of poverty remained largely unchanged at the national level. This may be the result of opposing patterns in urban areas where it declined and in rural areas, which saw an increase in severity of poverty. Across the four divisions, squared poverty gap declined in all divisions except the Western division.
106 Squared poverty gap gives more weight to those farther away from the poverty line, thus taking into consideration inequality among the poor.
the poverty rate and poverty gap in some parts of urban areas—particularly in squatter settlements and urban villages—are much higher (Table 3.2).107 In fact, compared with rural areas, not only those in squatter settlements and urban villages are more likely to be poor (higher poverty incidence) but the poor are poorer (higher poverty gap). This is likely because those in informal settlements in major urban corridors are landless and thus have no subsistence activity. With increasing rural–urban migration, informal settlements have proliferated in the greater metro areas and in the peri-urban areas. The United Nations Children’s Fund (UNICEF) (2011) reports that about 180 squatter settlements are home to 125,000 Fijians, with the largest concentration in the
107 Urban villages and squatter settlements are at the bottom of the socioeconomic well-being ladder in urban areas and are ranked below Housing Authority.
Figure 3.2: poverty incidence Across Divisions by ethnicity, 2002/03 and 2008/09
table 3.2: poverty incidence and poverty Gap in squatter settlements and Urban villages,
2008/09
table 3.1: poverty Gap, 2002/03 and 2008/09
Sources: Estimates based on Fiji Bureau of Statistics. Household Income and Expenditure Survey (HIES) 2002/03 and HIES 2008/09. Suva.
Note: Poverty incidence and poverty gap are from World Bank (2011), which uses a consumption-based poverty line as opposed to official estimates based on an income-based poverty line. The latter have been used in the rest of the report unless otherwise specified. Poverty incidence and poverty gap estimates use Census 2007 data.Source: World Bank. 2011. Republic of Fiji: Poverty Trends, Profiles, and Small Area Estimation (Poverty Maps) in Republic of Fiji (2003–2009). Washington, DC. http://documents.worldbank.org/curated/en/2011/09/15423997/republic-fiji-poverty-trends-profiles-small-area-estimation-poverty-maps-republic-fiji-2003-2009
Sources: Estimates based on Fiji Bureau of Statistics. Household Income and Expenditure Survey (HIES) 2002/03 and HIES 2008/09. Suva.
iTau
kei
Indo
-Fijia
n
Oth
ers
iTau
kei
Indo
-Fijia
n
Oth
ers
Rural Urban
0
20
10
30
40
50
60
Perc
ent
2002/2003 2008/2009
poverty Gap squared poverty Gap
2002/03 2008/09 2002/03 2008/09Fiji 11.0 10.1 4.9 4.8
EthnicityiTaukei 10.9 10.0 4.9 4.5Indo-Fijian 11.6 10.7 5.2 5.4Others 7.5 8.3 3.3 3.7
AreaUrban 8.5 5.4 3.7 2.4Rural 13.1 14.8 6.0 7.0
DivisionCentral 7.6 5.9 3.2 2.6Eastern 14.0 10.8 5.9 4.2Northern 19.3 16.9 9.2 8.6Western 11.6 11.4 5.2 5.4
Division/locationpoverty incidence
(%)poverty Gap
(%)
Central 24.0Rural 30.0 7.0Urban 22.0 5.0Urban villages 30.0 7.0Squatter settlements 38.0 11.0eastern 30.1Rural 29.0 7.0Urban 22.0 5.0Urban villages 51.0 16.0Squatter settlementsnorthern 52.3Rural 53.0 19.0Urban 50.0 18.0Urban villages 62.0 23.0Squatter settlements 55.0 20.0Western 39.5Rural 44.0 13.0Urban 33.0 9.0Urban villages 42.0 12.0Squatter settlements 47.0 16.0
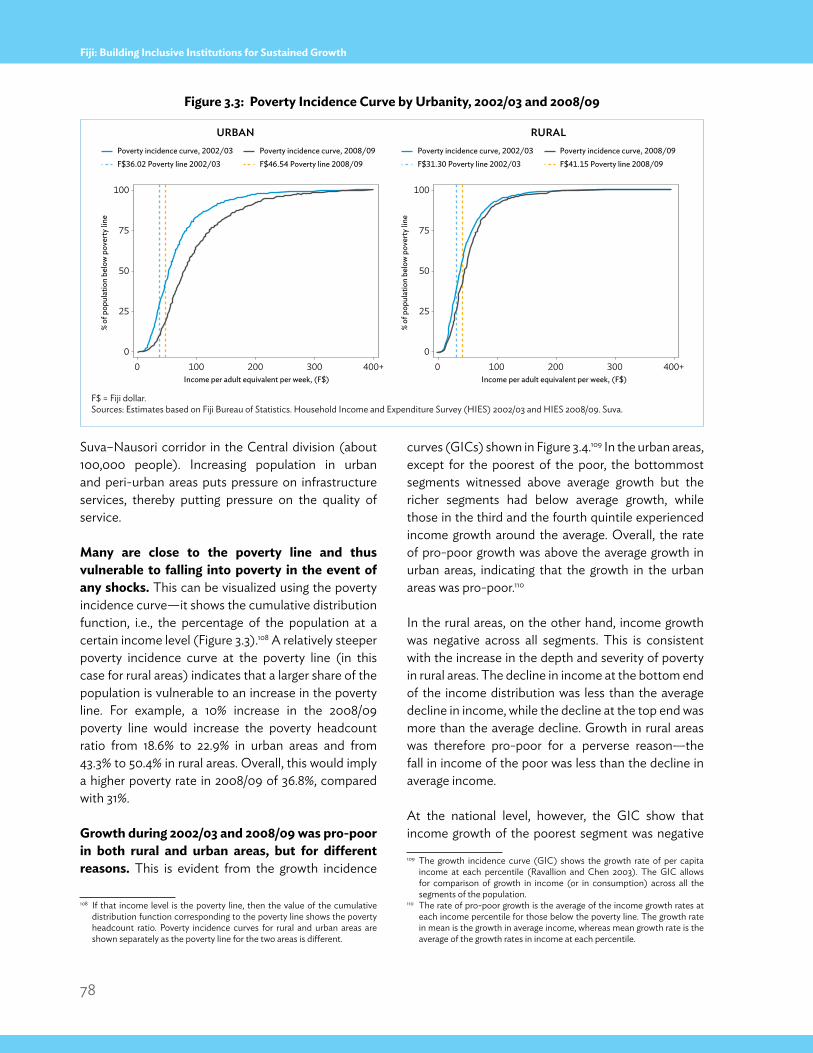
78
Fiji: Building Inclusive Institutions for Sustained Growth
Suva–Nausori corridor in the Central division (about 100,000 people). Increasing population in urban and peri-urban areas puts pressure on infrastructure services, thereby putting pressure on the quality of service.
many are close to the poverty line and thus vulnerable to falling into poverty in the event of any shocks. This can be visualized using the poverty incidence curve—it shows the cumulative distribution function, i.e., the percentage of the population at a certain income level (Figure 3.3).108 A relatively steeper poverty incidence curve at the poverty line (in this case for rural areas) indicates that a larger share of the population is vulnerable to an increase in the poverty line. For example, a 10% increase in the 2008/09 poverty line would increase the poverty headcount ratio from 18.6% to 22.9% in urban areas and from 43.3% to 50.4% in rural areas. Overall, this would imply a higher poverty rate in 2008/09 of 36.8%, compared with 31%.
Growth during 2002/03 and 2008/09 was pro-poor in both rural and urban areas, but for different reasons. This is evident from the growth incidence
108 If that income level is the poverty line, then the value of the cumulative distribution function corresponding to the poverty line shows the poverty headcount ratio. Poverty incidence curves for rural and urban areas are shown separately as the poverty line for the two areas is different.
curves (GICs) shown in Figure 3.4.109 In the urban areas, except for the poorest of the poor, the bottommost segments witnessed above average growth but the richer segments had below average growth, while those in the third and the fourth quintile experienced income growth around the average. Overall, the rate of pro-poor growth was above the average growth in urban areas, indicating that the growth in the urban areas was pro-poor.110
In the rural areas, on the other hand, income growth was negative across all segments. This is consistent with the increase in the depth and severity of poverty in rural areas. The decline in income at the bottom end of the income distribution was less than the average decline in income, while the decline at the top end was more than the average decline. Growth in rural areas was therefore pro-poor for a perverse reason—the fall in income of the poor was less than the decline in average income.
At the national level, however, the GIC show that income growth of the poorest segment was negative
109 The growth incidence curve (GIC) shows the growth rate of per capita income at each percentile (Ravallion and Chen 2003). The GIC allows for comparison of growth in income (or in consumption) across all the segments of the population.
110 The rate of pro-poor growth is the average of the income growth rates at each income percentile for those below the poverty line. The growth rate in mean is the growth in average income, whereas mean growth rate is the average of the growth rates in income at each percentile.
Figure 3.3: poverty incidence Curve by Urbanity, 2002/03 and 2008/09
urBAN rurAL
F$ = Fiji dollar.Sources: Estimates based on Fiji Bureau of Statistics. Household Income and Expenditure Survey (HIES) 2002/03 and HIES 2008/09. Suva.
0
25
50
75
100
% of
pop
ulat
ion
belo
w p
over
ty li
ne
0 100 200 300 400+Income per adult equivalent per week, (F$)
F$31.30 Poverty line 2002/03 F$41.15 Poverty line 2008/09Poverty incidence curve, 2002/03 Poverty incidence curve, 2008/09
0
25
50
75
100
% of
pop
ulat
ion
belo
w p
over
ty li
ne
0 100 200 300 400+Income per adult equivalent per week, (F$)
F$36.02 Poverty line 2002/03 F$46.54 Poverty line 2008/09Poverty incidence curve, 2002/03 Poverty incidence curve, 2008/09
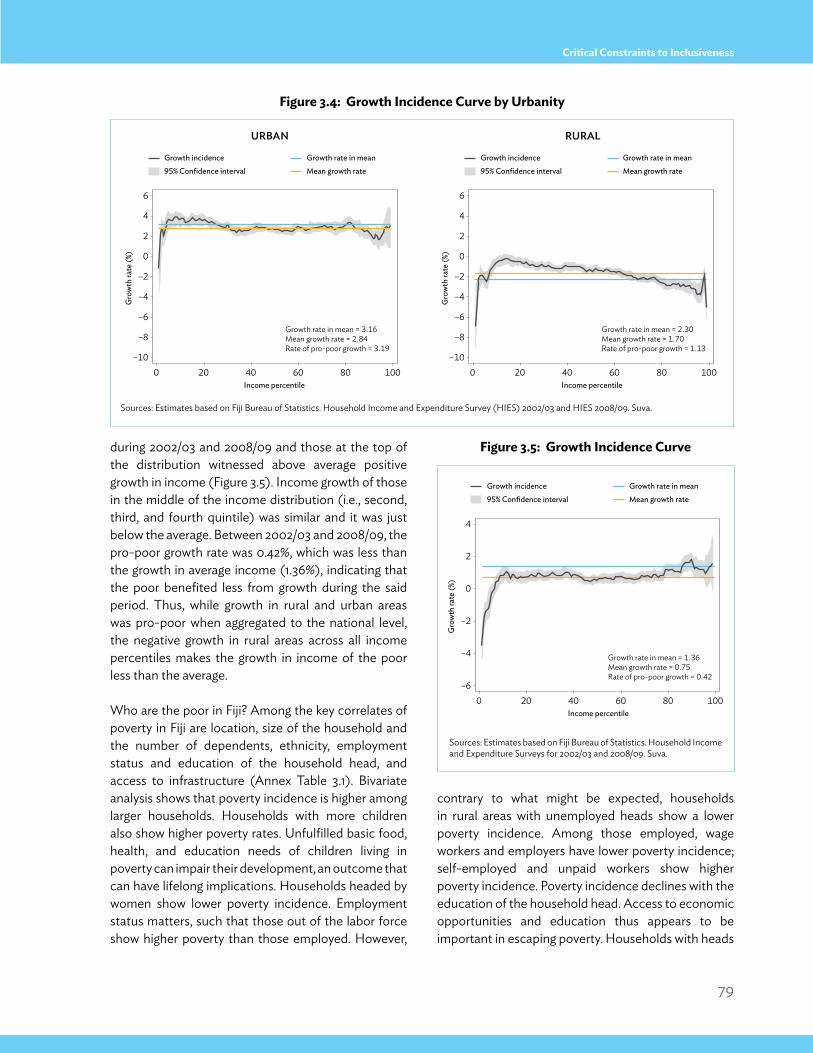
79
Critical Constraints to Inclusiveness
during 2002/03 and 2008/09 and those at the top of the distribution witnessed above average positive growth in income (Figure 3.5). Income growth of those in the middle of the income distribution (i.e., second, third, and fourth quintile) was similar and it was just below the average. Between 2002/03 and 2008/09, the pro-poor growth rate was 0.42%, which was less than the growth in average income (1.36%), indicating that the poor benefited less from growth during the said period. Thus, while growth in rural and urban areas was pro-poor when aggregated to the national level, the negative growth in rural areas across all income percentiles makes the growth in income of the poor less than the average.
Who are the poor in Fiji? Among the key correlates of poverty in Fiji are location, size of the household and the number of dependents, ethnicity, employment status and education of the household head, and access to infrastructure (Annex Table 3.1). Bivariate analysis shows that poverty incidence is higher among larger households. Households with more children also show higher poverty rates. Unfulfilled basic food, health, and education needs of children living in poverty can impair their development, an outcome that can have lifelong implications. Households headed by women show lower poverty incidence. Employment status matters, such that those out of the labor force show higher poverty than those employed. However,
contrary to what might be expected, households in rural areas with unemployed heads show a lower poverty incidence. Among those employed, wage workers and employers have lower poverty incidence; self-employed and unpaid workers show higher poverty incidence. Poverty incidence declines with the education of the household head. Access to economic opportunities and education thus appears to be important in escaping poverty. Households with heads
Figure 3.4: Growth incidence Curve by Urbanity
Sources: Estimates based on Fiji Bureau of Statistics. Household Income and Expenditure Survey (HIES) 2002/03 and HIES 2008/09. Suva.
–10
–6
–8
–2
–4
0
2
6
4
Gro
wth
rate
(%)
0 20 40 60 80 100Income percentile
95% Confidence interval Mean growth rate
Growth rate in mean = 2.30Mean growth rate = 1.70Rate of pro-poor growth = 1.13
Growth incidence Growth rate in mean
–10
–6
–8
–2
–4
0
2
6
4
Gro
wth
rate
(%)
0 20 40 60 80 100Income percentile
95% Confidence interval Mean growth rate
Growth rate in mean = 3.16Mean growth rate = 2.84Rate of pro-poor growth = 3.19
Growth incidence Growth rate in mean
–6
–2
–4
0
2
4
Gro
wth
rate
(%)
0 20 40 60 80 100Income percentile
95% Confidence interval Mean growth rate
Growth rate in mean = 1.36Mean growth rate = 0.75Rate of pro-poor growth = 0.42
Growth incidence Growth rate in mean
Figure 3.5: Growth incidence Curve
Sources: Estimates based on Fiji Bureau of Statistics. Household Income and Expenditure Surveys for 2002/03 and 2008/09. Suva.
urBAN rurAL
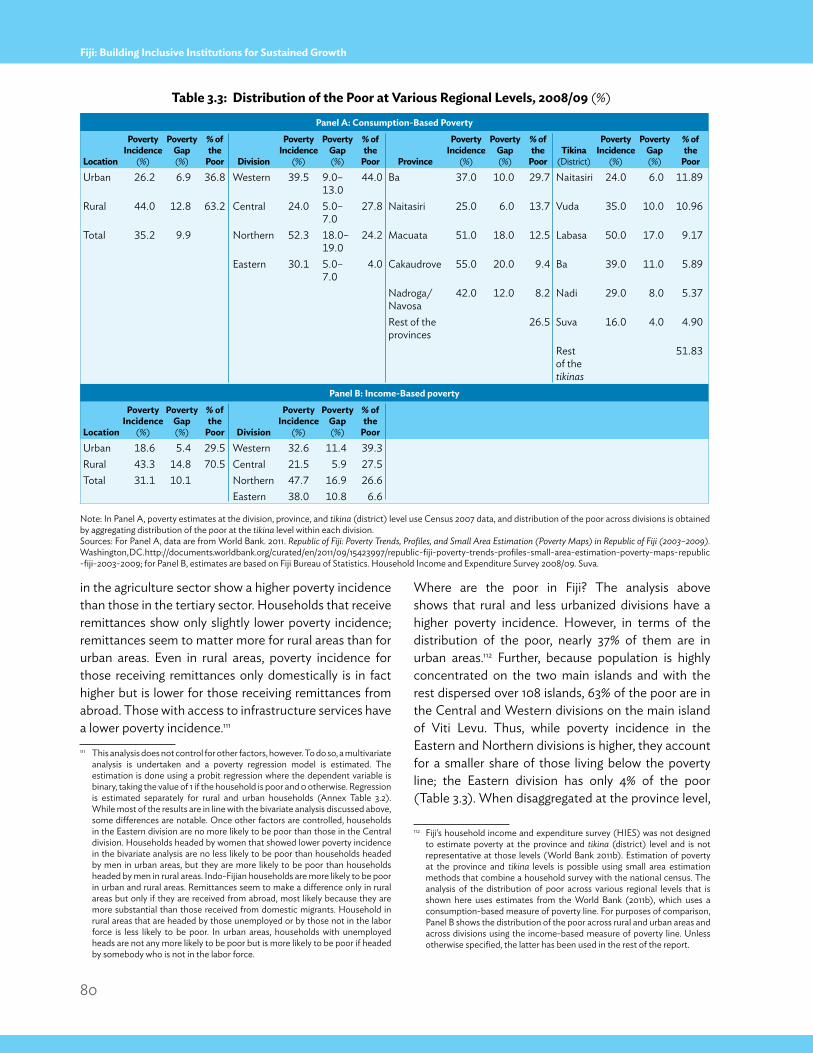
80
Fiji: Building Inclusive Institutions for Sustained Growth
in the agriculture sector show a higher poverty incidence than those in the tertiary sector. Households that receive remittances show only slightly lower poverty incidence; remittances seem to matter more for rural areas than for urban areas. Even in rural areas, poverty incidence for those receiving remittances only domestically is in fact higher but is lower for those receiving remittances from abroad. Those with access to infrastructure services have a lower poverty incidence.111
111 This analysis does not control for other factors, however. To do so, a multivariate analysis is undertaken and a poverty regression model is estimated. The estimation is done using a probit regression where the dependent variable is binary, taking the value of 1 if the household is poor and 0 otherwise. Regression is estimated separately for rural and urban households (Annex Table 3.2). While most of the results are in line with the bivariate analysis discussed above, some differences are notable. Once other factors are controlled, households in the Eastern division are no more likely to be poor than those in the Central division. Households headed by women that showed lower poverty incidence in the bivariate analysis are no less likely to be poor than households headed by men in urban areas, but they are more likely to be poor than households headed by men in rural areas. Indo-Fijian households are more likely to be poor in urban and rural areas. Remittances seem to make a difference only in rural areas but only if they are received from abroad, most likely because they are more substantial than those received from domestic migrants. Household in rural areas that are headed by those unemployed or by those not in the labor force is less likely to be poor. In urban areas, households with unemployed heads are not any more likely to be poor but is more likely to be poor if headed by somebody who is not in the labor force.
Where are the poor in Fiji? The analysis above shows that rural and less urbanized divisions have a higher poverty incidence. However, in terms of the distribution of the poor, nearly 37% of them are in urban areas.112 Further, because population is highly concentrated on the two main islands and with the rest dispersed over 108 islands, 63% of the poor are in the Central and Western divisions on the main island of Viti Levu. Thus, while poverty incidence in the Eastern and Northern divisions is higher, they account for a smaller share of those living below the poverty line; the Eastern division has only 4% of the poor (Table 3.3). When disaggregated at the province level,
112 Fiji’s household income and expenditure survey (HIES) was not designed to estimate poverty at the province and tikina (district) level and is not representative at those levels (World Bank 2011b). Estimation of poverty at the province and tikina levels is possible using small area estimation methods that combine a household survey with the national census. The analysis of the distribution of poor across various regional levels that is shown here uses estimates from the World Bank (2011b), which uses a consumption-based measure of poverty line. For purposes of comparison, Panel B shows the distribution of the poor across rural and urban areas and across divisions using the income-based measure of poverty line. Unless otherwise specified, the latter has been used in the rest of the report.
table 3.3: Distribution of the poor at various Regional levels, 2008/09 (%)
Note: In Panel A, poverty estimates at the division, province, and tikina (district) level use Census 2007 data, and distribution of the poor across divisions is obtained by aggregating distribution of the poor at the tikina level within each division.Sources: For Panel A, data are from World Bank. 2011. Republic of Fiji: Poverty Trends, Profiles, and Small Area Estimation (Poverty Maps) in Republic of Fiji (2003–2009). Washington, DC. http://documents.worldbank.org/curated/en/2011/09/15423997/republic-fiji-poverty-trends-profiles-small-area-estimation-poverty-maps- republic -fiji-2003-2009; for Panel B, estimates are based on Fiji Bureau of Statistics. Household Income and Expenditure Survey 2008/09. Suva.
panel A: Consumption-Based poverty
location
poverty incidence
(%)
poverty Gap (%)
% of the
poor Division
poverty incidence
(%)
poverty Gap (%)
% of the
poor province
poverty incidence
(%)
poverty Gap (%)
% of the
poortikina
(District)
poverty incidence
(%)
poverty Gap (%)
% of the
poorUrban 26.2 6.9 36.8 Western 39.5 9.0–
13.044.0 Ba 37.0 10.0 29.7 Naitasiri 24.0 6.0 11.89
Rural 44.0 12.8 63.2 Central 24.0 5.0–7.0
27.8 Naitasiri 25.0 6.0 13.7 Vuda 35.0 10.0 10.96
Total 35.2 9.9 Northern 52.3 18.0–19.0
24.2 Macuata 51.0 18.0 12.5 Labasa 50.0 17.0 9.17
Eastern 30.1 5.0–7.0
4.0 Cakaudrove 55.0 20.0 9.4 Ba 39.0 11.0 5.89
Nadroga/Navosa
42.0 12.0 8.2 Nadi 29.0 8.0 5.37
Rest of the provinces
26.5 Suva 16.0 4.0 4.90
Rest of the tikinas
51.83
panel B: income-Based poverty
location
poverty incidence
(%)
poverty Gap (%)
% of the
poor Division
poverty incidence
(%)
poverty Gap (%)
% of the
poorUrban 18.6 5.4 29.5 Western 32.6 11.4 39.3Rural 43.3 14.8 70.5 Central 21.5 5.9 27.5Total 31.1 10.1 Northern 47.7 16.9 26.6
Eastern 38.0 10.8 6.6
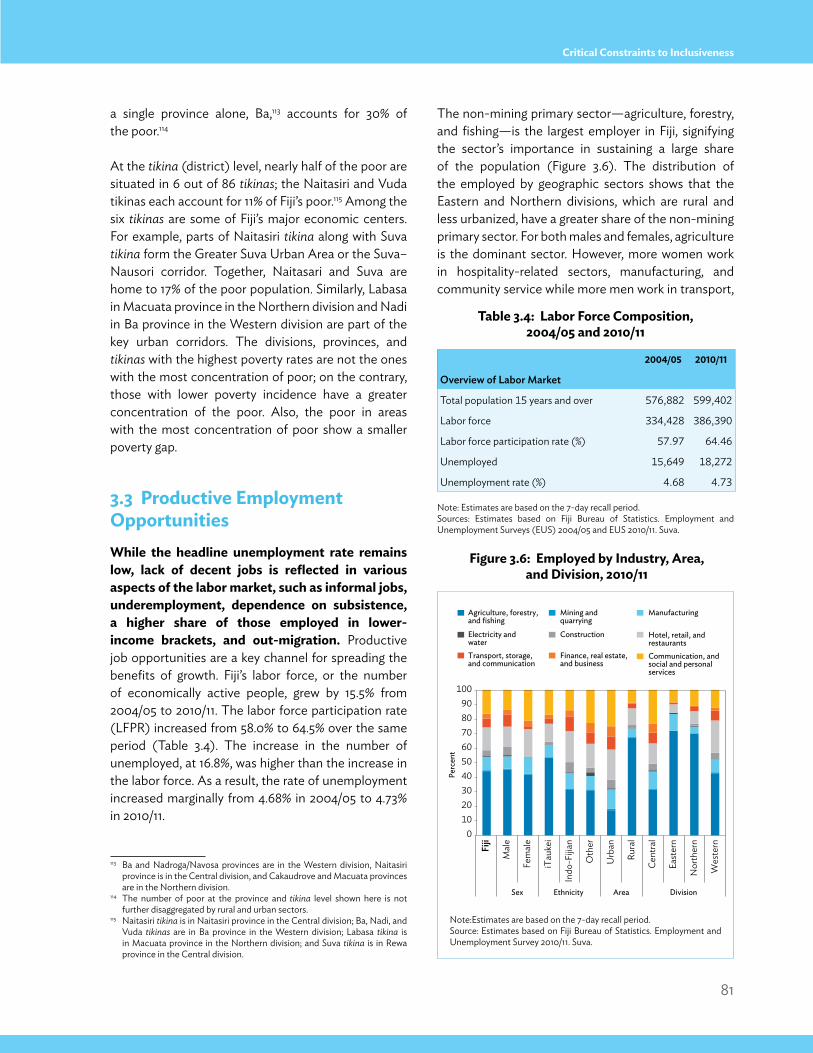
81
Critical Constraints to Inclusiveness
a single province alone, Ba,113 accounts for 30% of the poor.114
At the tikina (district) level, nearly half of the poor are situated in 6 out of 86 tikinas; the Naitasiri and Vuda tikinas each account for 11% of Fiji’s poor.115 Among the six tikinas are some of Fiji’s major economic centers. For example, parts of Naitasiri tikina along with Suva tikina form the Greater Suva Urban Area or the Suva–Nausori corridor. Together, Naitasari and Suva are home to 17% of the poor population. Similarly, Labasa in Macuata province in the Northern division and Nadi in Ba province in the Western division are part of the key urban corridors. The divisions, provinces, and tikinas with the highest poverty rates are not the ones with the most concentration of poor; on the contrary, those with lower poverty incidence have a greater concentration of the poor. Also, the poor in areas with the most concentration of poor show a smaller poverty gap.
3.3 productive employment opportunitiesWhile the headline unemployment rate remains low, lack of decent jobs is reflected in various aspects of the labor market, such as informal jobs, underemployment, dependence on subsistence, a higher share of those employed in lower-income brackets, and out-migration. Productive job opportunities are a key channel for spreading the benefits of growth. Fiji’s labor force, or the number of economically active people, grew by 15.5% from 2004/05 to 2010/11. The labor force participation rate (LFPR) increased from 58.0% to 64.5% over the same period (Table 3.4). The increase in the number of unemployed, at 16.8%, was higher than the increase in the labor force. As a result, the rate of unemployment increased marginally from 4.68% in 2004/05 to 4.73% in 2010/11.
113 Ba and Nadroga/Navosa provinces are in the Western division, Naitasiri province is in the Central division, and Cakaudrove and Macuata provinces are in the Northern division.
114 The number of poor at the province and tikina level shown here is not further disaggregated by rural and urban sectors.
115 Naitasiri tikina is in Naitasiri province in the Central division; Ba, Nadi, and Vuda tikinas are in Ba province in the Western division; Labasa tikina is in Macuata province in the Northern division; and Suva tikina is in Rewa province in the Central division.
The non-mining primary sector—agriculture, forestry, and fishing—is the largest employer in Fiji, signifying the sector’s importance in sustaining a large share of the population (Figure 3.6). The distribution of the employed by geographic sectors shows that the Eastern and Northern divisions, which are rural and less urbanized, have a greater share of the non-mining primary sector. For both males and females, agriculture is the dominant sector. However, more women work in hospitality-related sectors, manufacturing, and community service while more men work in transport,
table 3.4: labor Force Composition, 2004/05 and 2010/11
Note: Estimates are based on the 7-day recall period.Sources: Estimates based on Fiji Bureau of Statistics. Employment and Unemployment Surveys (EUS) 2004/05 and EUS 2010/11. Suva.
2004/05 2010/11
Overview of Labor Market
Total population 15 years and over 576,882 599,402
Labor force 334,428 386,390
Labor force participation rate (%) 57.97 64.46
Unemployed 15,649 18,272
Unemployment rate (%) 4.68 4.73
0102030405060708090
100
Perc
ent
Agriculture, forestry,and fishing
Mining andquarrying
Manufacturing
Electricity andwater
Construction Hotel, retail, andrestaurants
Transport, storage,and communication
Finance, real estate,and business
Communication, andsocial and personalservices
Fiji
Mal
e
Fem
ale
iTau
kei
Indo
-Fijia
n
Oth
er
Urb
an
Rura
l
Cent
ral
East
ern
Nor
ther
n
Wes
tern
Sex Ethnicity Area Division
Figure 3.6: employed by industry, Area, and Division, 2010/11
Note:Estimates are based on the 7-day recall period.Source: Estimates based on Fiji Bureau of Statistics. Employment and Unemployment Survey 2010/11. Suva.
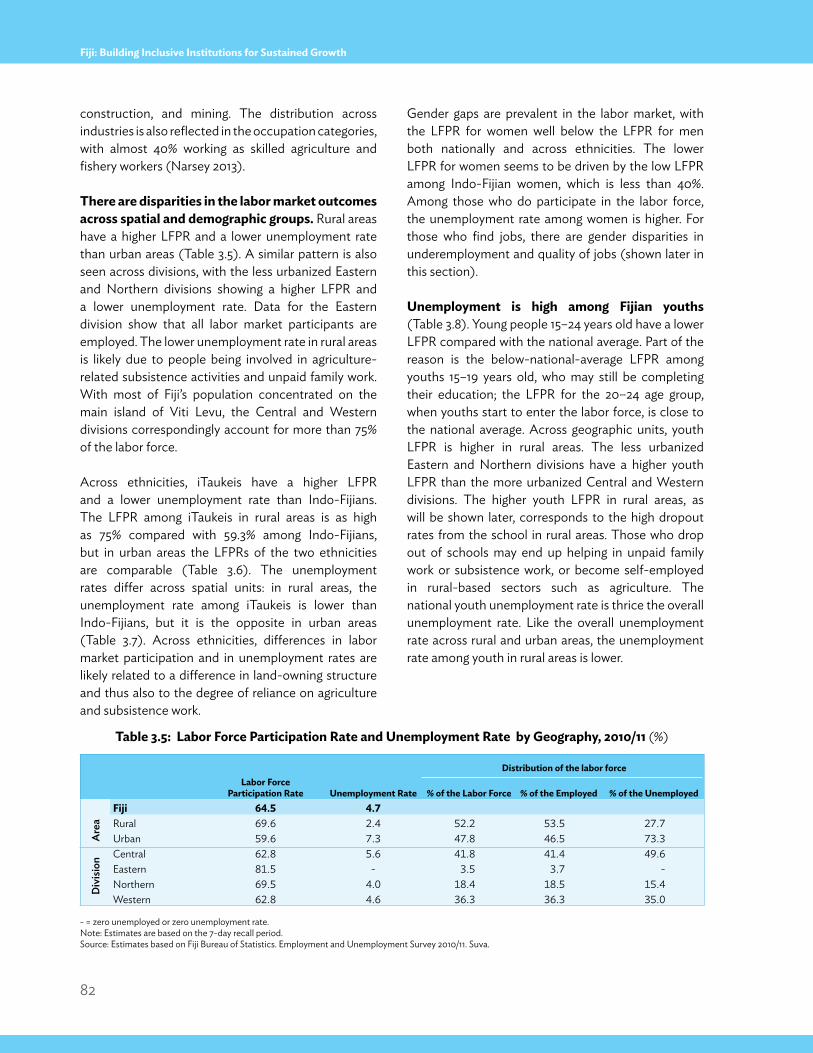
82
Fiji: Building Inclusive Institutions for Sustained Growth
construction, and mining. The distribution across industries is also reflected in the occupation categories, with almost 40% working as skilled agriculture and fishery workers (Narsey 2013).
there are disparities in the labor market outcomes across spatial and demographic groups. Rural areas have a higher LFPR and a lower unemployment rate than urban areas (Table 3.5). A similar pattern is also seen across divisions, with the less urbanized Eastern and Northern divisions showing a higher LFPR and a lower unemployment rate. Data for the Eastern division show that all labor market participants are employed. The lower unemployment rate in rural areas is likely due to people being involved in agriculture-related subsistence activities and unpaid family work. With most of Fiji’s population concentrated on the main island of Viti Levu, the Central and Western divisions correspondingly account for more than 75% of the labor force.
Across ethnicities, iTaukeis have a higher LFPR and a lower unemployment rate than Indo-Fijians. The LFPR among iTaukeis in rural areas is as high as 75% compared with 59.3% among Indo-Fijians, but in urban areas the LFPRs of the two ethnicities are comparable (Table 3.6). The unemployment rates differ across spatial units: in rural areas, the unemployment rate among iTaukeis is lower than Indo-Fijians, but it is the opposite in urban areas (Table 3.7). Across ethnicities, differences in labor market participation and in unemployment rates are likely related to a difference in land-owning structure and thus also to the degree of reliance on agriculture and subsistence work.
Gender gaps are prevalent in the labor market, with the LFPR for women well below the LFPR for men both nationally and across ethnicities. The lower LFPR for women seems to be driven by the low LFPR among Indo-Fijian women, which is less than 40%. Among those who do participate in the labor force, the unemployment rate among women is higher. For those who find jobs, there are gender disparities in underemployment and quality of jobs (shown later in this section).
Unemployment is high among Fijian youths (Table 3.8). Young people 15–24 years old have a lower LFPR compared with the national average. Part of the reason is the below-national-average LFPR among youths 15–19 years old, who may still be completing their education; the LFPR for the 20–24 age group, when youths start to enter the labor force, is close to the national average. Across geographic units, youth LFPR is higher in rural areas. The less urbanized Eastern and Northern divisions have a higher youth LFPR than the more urbanized Central and Western divisions. The higher youth LFPR in rural areas, as will be shown later, corresponds to the high dropout rates from the school in rural areas. Those who drop out of schools may end up helping in unpaid family work or subsistence work, or become self-employed in rural-based sectors such as agriculture. The national youth unemployment rate is thrice the overall unemployment rate. Like the overall unemployment rate across rural and urban areas, the unemployment rate among youth in rural areas is lower.
table 3.5: labor Force participation Rate and Unemployment Rate by Geography, 2010/11 (%)
- = zero unemployed or zero unemployment rate.Note: Estimates are based on the 7-day recall period. Source: Estimates based on Fiji Bureau of Statistics. Employment and Unemployment Survey 2010/11. Suva.
Distribution of the labor forcelabor Force
participation Rate Unemployment Rate % of the labor Force % of the employed % of the UnemployedFiji 64.5 4.7
Are
a Rural 69.6 2.4 52.2 53.5 27.7Urban 59.6 7.3 47.8 46.5 73.3
Div
ision
Central 62.8 5.6 41.8 41.4 49.6Eastern 81.5 - 3.5 3.7 -Northern 69.5 4.0 18.4 18.5 15.4Western 62.8 4.6 36.3 36.3 35.0
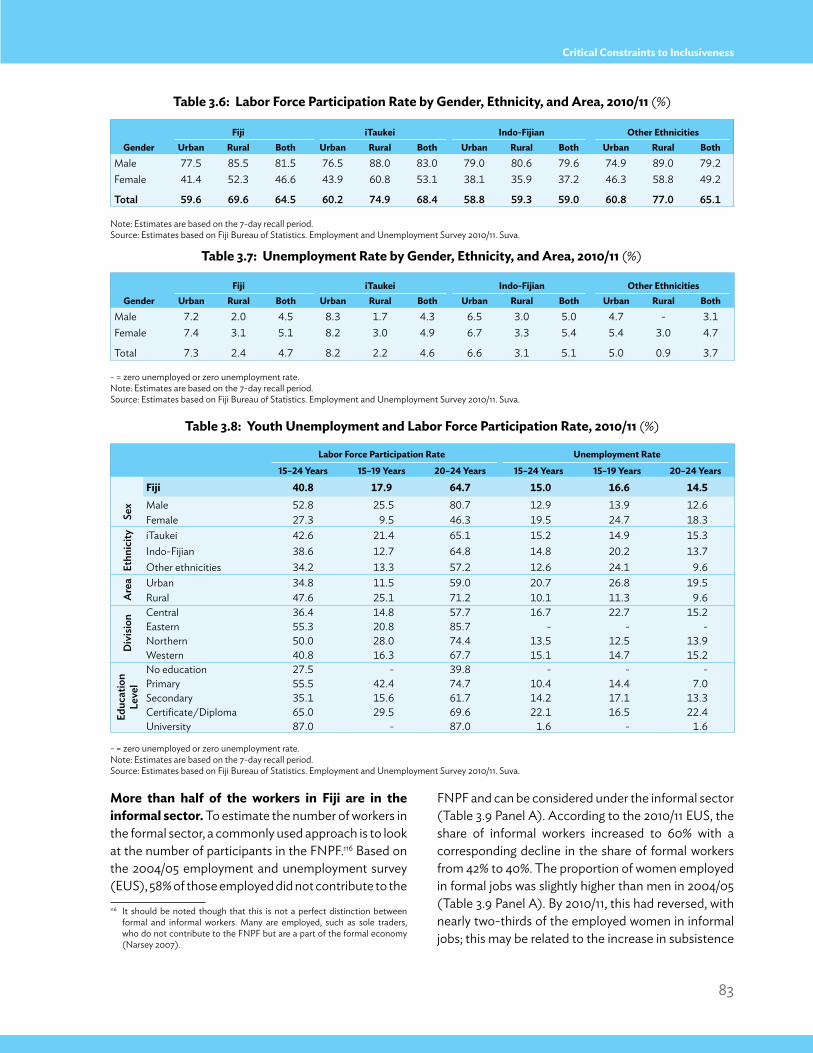
83
Critical Constraints to Inclusiveness
FNPF and can be considered under the informal sector (Table 3.9 Panel A). According to the 2010/11 EUS, the share of informal workers increased to 60% with a corresponding decline in the share of formal workers from 42% to 40%. The proportion of women employed in formal jobs was slightly higher than men in 2004/05 (Table 3.9 Panel A). By 2010/11, this had reversed, with nearly two-thirds of the employed women in informal jobs; this may be related to the increase in subsistence
more than half of the workers in Fiji are in the informal sector. To estimate the number of workers in the formal sector, a commonly used approach is to look at the number of participants in the FNPF.116 Based on the 2004/05 employment and unemployment survey (EUS), 58% of those employed did not contribute to the 116 It should be noted though that this is not a perfect distinction between
formal and informal workers. Many are employed, such as sole traders, who do not contribute to the FNPF but are a part of the formal economy (Narsey 2007).
table 3.7: Unemployment Rate by Gender, ethnicity, and Area, 2010/11 (%)
Note: Estimates are based on the 7-day recall period. Source: Estimates based on Fiji Bureau of Statistics. Employment and Unemployment Survey 2010/11. Suva.
table 3.6: labor Force participation Rate by Gender, ethnicity, and Area, 2010/11 (%)
table 3.8: Youth Unemployment and labor Force participation Rate, 2010/11 (%)
- = zero unemployed or zero unemployment rate.Note: Estimates are based on the 7-day recall period.Source: Estimates based on Fiji Bureau of Statistics. Employment and Unemployment Survey 2010/11. Suva.
- = zero unemployed or zero unemployment rate.Note: Estimates are based on the 7-day recall period.Source: Estimates based on Fiji Bureau of Statistics. Employment and Unemployment Survey 2010/11. Suva.
GenderFiji itaukei indo-Fijian other ethnicities
Urban Rural Both Urban Rural Both Urban Rural Both Urban Rural BothMale 77.5 85.5 81.5 76.5 88.0 83.0 79.0 80.6 79.6 74.9 89.0 79.2Female 41.4 52.3 46.6 43.9 60.8 53.1 38.1 35.9 37.2 46.3 58.8 49.2
Total 59.6 69.6 64.5 60.2 74.9 68.4 58.8 59.3 59.0 60.8 77.0 65.1
GenderFiji itaukei indo-Fijian other ethnicities
Urban Rural Both Urban Rural Both Urban Rural Both Urban Rural BothMale 7.2 2.0 4.5 8.3 1.7 4.3 6.5 3.0 5.0 4.7 - 3.1Female 7.4 3.1 5.1 8.2 3.0 4.9 6.7 3.3 5.4 5.4 3.0 4.7
Total 7.3 2.4 4.7 8.2 2.2 4.6 6.6 3.1 5.1 5.0 0.9 3.7
labor Force participation Rate Unemployment Rate
15–24 Years 15–19 Years 20–24 Years 15–24 Years 15–19 Years 20–24 Years
Fiji 40.8 17.9 64.7 15.0 16.6 14.5
Sex Male 52.8 25.5 80.7 12.9 13.9 12.6
Female 27.3 9.5 46.3 19.5 24.7 18.3
Ethn
icity iTaukei 42.6 21.4 65.1 15.2 14.9 15.3
Indo-Fijian 38.6 12.7 64.8 14.8 20.2 13.7Other ethnicities 34.2 13.3 57.2 12.6 24.1 9.6
Are
a Urban 34.8 11.5 59.0 20.7 26.8 19.5Rural 47.6 25.1 71.2 10.1 11.3 9.6
Div
ision
Central 36.4 14.8 57.7 16.7 22.7 15.2Eastern 55.3 20.8 85.7 - - -Northern 50.0 28.0 74.4 13.5 12.5 13.9Western 40.8 16.3 67.7 15.1 14.7 15.2
Educ
atio
n Le
vel
No education 27.5 - 39.8 - - -Primary 55.5 42.4 74.7 10.4 14.4 7.0Secondary 35.1 15.6 61.7 14.2 17.1 13.3Certificate/Diploma 65.0 29.5 69.6 22.1 16.5 22.4University 87.0 - 87.0 1.6 - 1.6
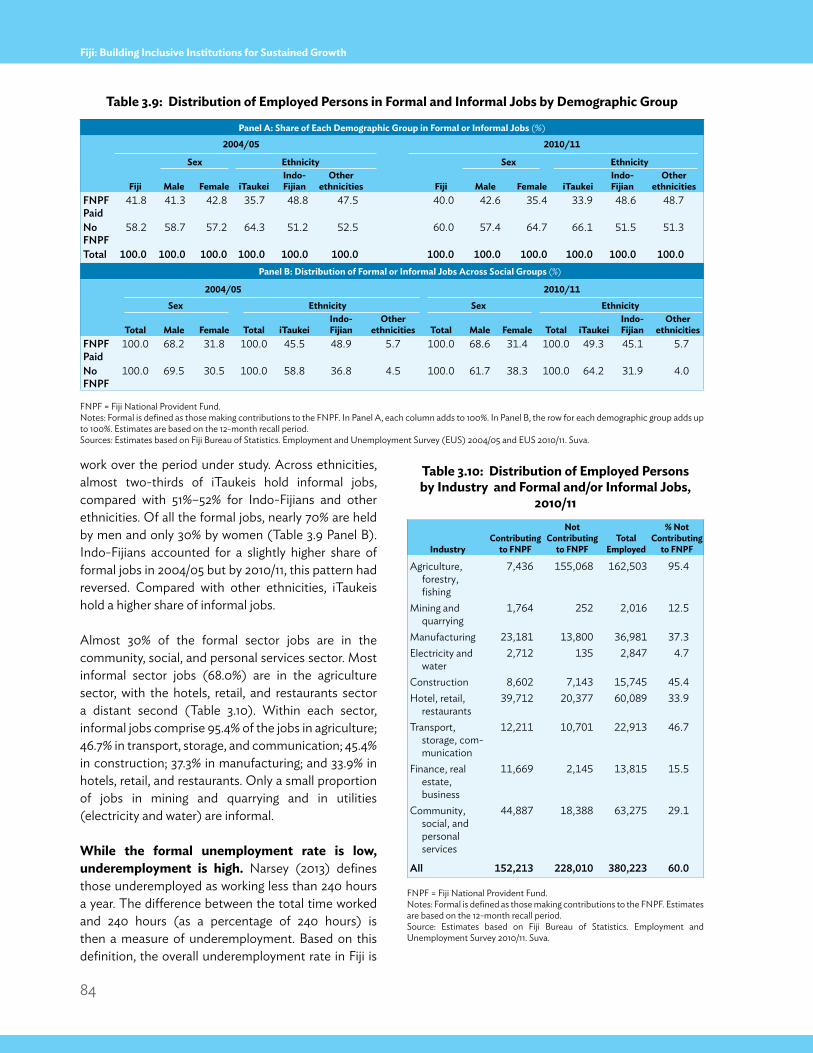
84
Fiji: Building Inclusive Institutions for Sustained Growth
work over the period under study. Across ethnicities, almost two-thirds of iTaukeis hold informal jobs, compared with 51%–52% for Indo-Fijians and other ethnicities. Of all the formal jobs, nearly 70% are held by men and only 30% by women (Table 3.9 Panel B). Indo-Fijians accounted for a slightly higher share of formal jobs in 2004/05 but by 2010/11, this pattern had reversed. Compared with other ethnicities, iTaukeis hold a higher share of informal jobs.
Almost 30% of the formal sector jobs are in the community, social, and personal services sector. Most informal sector jobs (68.0%) are in the agriculture sector, with the hotels, retail, and restaurants sector a distant second (Table 3.10). Within each sector, informal jobs comprise 95.4% of the jobs in agriculture; 46.7% in transport, storage, and communication; 45.4% in construction; 37.3% in manufacturing; and 33.9% in hotels, retail, and restaurants. Only a small proportion of jobs in mining and quarrying and in utilities (electricity and water) are informal.
While the formal unemployment rate is low, underemployment is high. Narsey (2013) defines those underemployed as working less than 240 hours a year. The difference between the total time worked and 240 hours (as a percentage of 240 hours) is then a measure of underemployment. Based on this definition, the overall underemployment rate in Fiji is
table 3.9: Distribution of employed persons in Formal and informal Jobs by Demographic Group
FNPF = Fiji National Provident Fund.Notes: Formal is defined as those making contributions to the FNPF. In Panel A, each column adds to 100%. In Panel B, the row for each demographic group adds up to 100%. Estimates are based on the 12-month recall period.Sources: Estimates based on Fiji Bureau of Statistics. Employment and Unemployment Survey (EUS) 2004/05 and EUS 2010/11. Suva.
table 3.10: Distribution of employed persons by industry and Formal and/or informal Jobs,
2010/11
FNPF = Fiji National Provident Fund.Notes: Formal is defined as those making contributions to the FNPF. Estimates are based on the 12-month recall period.Source: Estimates based on Fiji Bureau of Statistics. Employment and Unemployment Survey 2010/11. Suva.
panel A: share of each Demographic Group in Formal or informal Jobs (%)
2004/05 2010/11
Fiji
sex ethnicity
Fiji
sex ethnicity
male Female itaukeiindo-Fijian
other ethnicities male Female itaukei
indo-Fijian
other ethnicities
FNPF Paid
41.8 41.3 42.8 35.7 48.8 47.5 40.0 42.6 35.4 33.9 48.6 48.7
No FNPF
58.2 58.7 57.2 64.3 51.2 52.5 60.0 57.4 64.7 66.1 51.5 51.3
Total 100.0 100.0 100.0 100.0 100.0 100.0 100.0 100.0 100.0 100.0 100.0 100.0panel B: Distribution of Formal or informal Jobs Across social Groups (%)
2004/05 2010/11sex ethnicity sex ethnicity
total male Female total itaukeiindo-Fijian
other ethnicities total male Female total itaukei
indo-Fijian
other ethnicities
FNPF Paid
100.0 68.2 31.8 100.0 45.5 48.9 5.7 100.0 68.6 31.4 100.0 49.3 45.1 5.7
No FNPF
100.0 69.5 30.5 100.0 58.8 36.8 4.5 100.0 61.7 38.3 100.0 64.2 31.9 4.0
industryContributing
to FnpF
not Contributing
to FnpFtotal
employed
% not Contributing
to FnpF
Agriculture, forestry, fishing
7,436 155,068 162,503 95.4
Mining and quarrying
1,764 252 2,016 12.5
Manufacturing 23,181 13,800 36,981 37.3Electricity and
water2,712 135 2,847 4.7
Construction 8,602 7,143 15,745 45.4Hotel, retail,
restaurants39,712 20,377 60,089 33.9
Transport, storage, com-munication
12,211 10,701 22,913 46.7
Finance, real estate, business
11,669 2,145 13,815 15.5
Community, social, and personal services
44,887 18,388 63,275 29.1
All 152,213 228,010 380,223 60.0
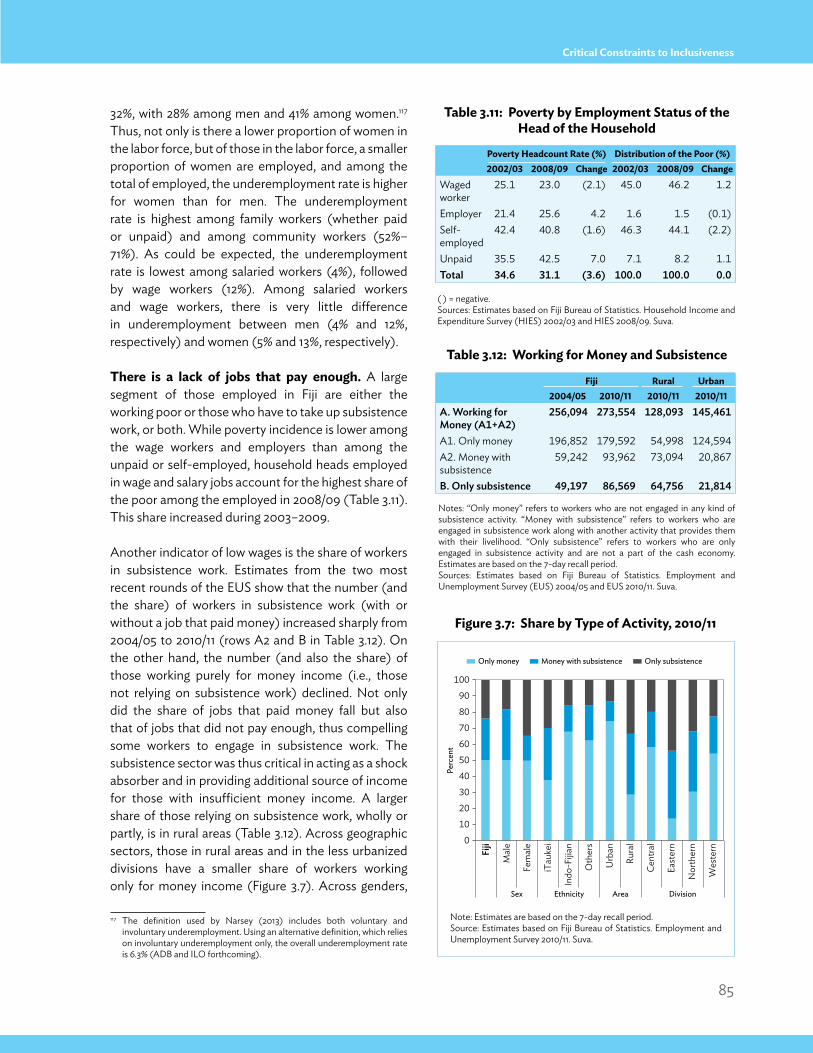
85
Critical Constraints to Inclusiveness
32%, with 28% among men and 41% among women.117 Thus, not only is there a lower proportion of women in the labor force, but of those in the labor force, a smaller proportion of women are employed, and among the total of employed, the underemployment rate is higher for women than for men. The underemployment rate is highest among family workers (whether paid or unpaid) and among community workers (52%–71%). As could be expected, the underemployment rate is lowest among salaried workers (4%), followed by wage workers (12%). Among salaried workers and wage workers, there is very little difference in underemployment between men (4% and 12%, respectively) and women (5% and 13%, respectively).
there is a lack of jobs that pay enough. A large segment of those employed in Fiji are either the working poor or those who have to take up subsistence work, or both. While poverty incidence is lower among the wage workers and employers than among the unpaid or self-employed, household heads employed in wage and salary jobs account for the highest share of the poor among the employed in 2008/09 (Table 3.11). This share increased during 2003–2009.
Another indicator of low wages is the share of workers in subsistence work. Estimates from the two most recent rounds of the EUS show that the number (and the share) of workers in subsistence work (with or without a job that paid money) increased sharply from 2004/05 to 2010/11 (rows A2 and B in Table 3.12). On the other hand, the number (and also the share) of those working purely for money income (i.e., those not relying on subsistence work) declined. Not only did the share of jobs that paid money fall but also that of jobs that did not pay enough, thus compelling some workers to engage in subsistence work. The subsistence sector was thus critical in acting as a shock absorber and in providing additional source of income for those with insufficient money income. A larger share of those relying on subsistence work, wholly or partly, is in rural areas (Table 3.12). Across geographic sectors, those in rural areas and in the less urbanized divisions have a smaller share of workers working only for money income (Figure 3.7). Across genders,
117 The definition used by Narsey (2013) includes both voluntary and involuntary underemployment. Using an alternative definition, which relies on involuntary underemployment only, the overall underemployment rate is 6.3% (ADB and ILO forthcoming).
table 3.11: poverty by employment status of the Head of the Household
table 3.12: Working for money and subsistence
( ) = negative.Sources: Estimates based on Fiji Bureau of Statistics. Household Income and Expenditure Survey (HIES) 2002/03 and HIES 2008/09. Suva.
Notes: “Only money” refers to workers who are not engaged in any kind of subsistence activity. “Money with subsistence” refers to workers who are engaged in subsistence work along with another activity that provides them with their livelihood. “Only subsistence” refers to workers who are only engaged in subsistence activity and are not a part of the cash economy. Estimates are based on the 7-day recall period. Sources: Estimates based on Fiji Bureau of Statistics. Employment and Unemployment Survey (EUS) 2004/05 and EUS 2010/11. Suva.
poverty Headcount Rate (%) Distribution of the poor (%)2002/03 2008/09 Change 2002/03 2008/09 Change
Waged worker
25.1 23.0 (2.1) 45.0 46.2 1.2
Employer 21.4 25.6 4.2 1.6 1.5 (0.1)Self-employed
42.4 40.8 (1.6) 46.3 44.1 (2.2)
Unpaid 35.5 42.5 7.0 7.1 8.2 1.1Total 34.6 31.1 (3.6) 100.0 100.0 0.0
Fiji Rural Urban2004/05 2010/11 2010/11 2010/11
A. working for Money (A1+A2)
256,094 273,554 128,093 145,461
A1. Only money 196,852 179,592 54,998 124,594A2. Money with subsistence
59,242 93,962 73,094 20,867
B. Only subsistence 49,197 86,569 64,756 21,814
Figure 3.7: share by type of Activity, 2010/11
Note: Estimates are based on the 7-day recall period. Source: Estimates based on Fiji Bureau of Statistics. Employment and Unemployment Survey 2010/11. Suva.
Only money Money with subsistence Only subsistence
0
10
20
30
40
50
60
70
80
90
100
Perc
ent
Fiji
Mal
e
Fem
ale
iTau
kei
Indo
-Fijia
n
Oth
ers
Urb
an
Rura
l
Cent
ral
East
ern
Nor
ther
n
Wes
tern
Sex Ethnicity DivisionArea
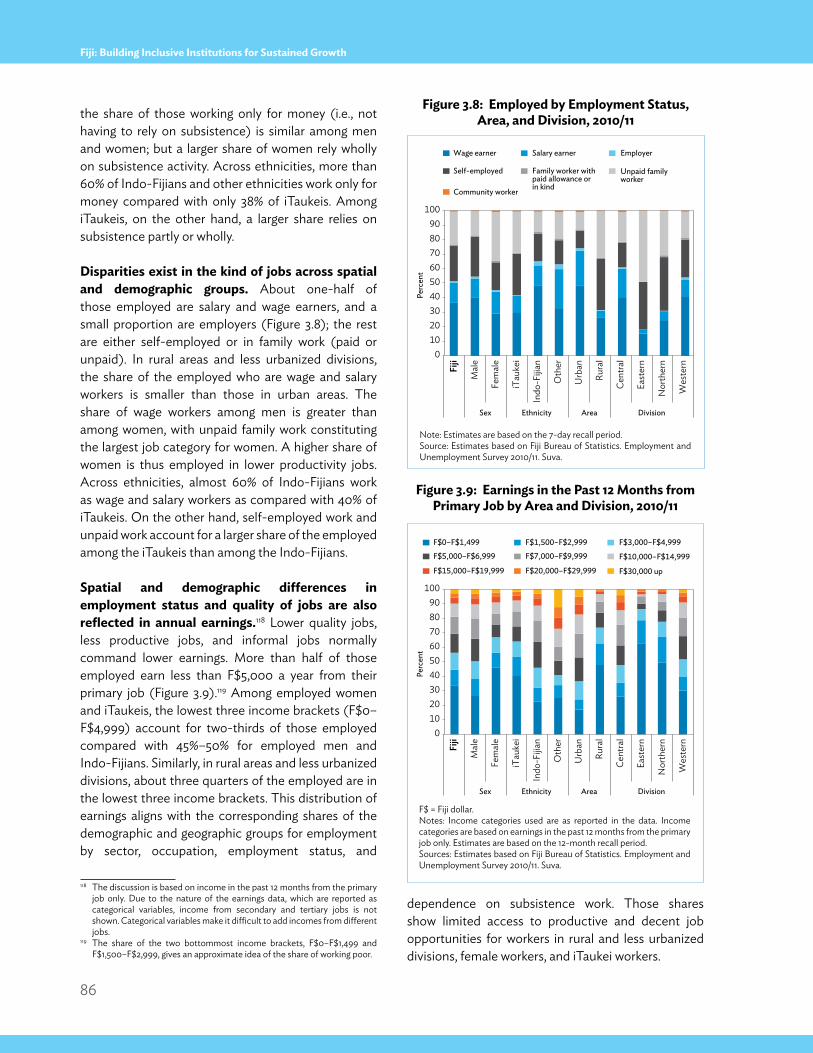
86
Fiji: Building Inclusive Institutions for Sustained Growth
the share of those working only for money (i.e., not having to rely on subsistence) is similar among men and women; but a larger share of women rely wholly on subsistence activity. Across ethnicities, more than 60% of Indo-Fijians and other ethnicities work only for money compared with only 38% of iTaukeis. Among iTaukeis, on the other hand, a larger share relies on subsistence partly or wholly.
Disparities exist in the kind of jobs across spatial and demographic groups. About one-half of those employed are salary and wage earners, and a small proportion are employers (Figure 3.8); the rest are either self-employed or in family work (paid or unpaid). In rural areas and less urbanized divisions, the share of the employed who are wage and salary workers is smaller than those in urban areas. The share of wage workers among men is greater than among women, with unpaid family work constituting the largest job category for women. A higher share of women is thus employed in lower productivity jobs. Across ethnicities, almost 60% of Indo-Fijians work as wage and salary workers as compared with 40% of iTaukeis. On the other hand, self-employed work and unpaid work account for a larger share of the employed among the iTaukeis than among the Indo-Fijians.
spatial and demographic differences in employment status and quality of jobs are also reflected in annual earnings.118 Lower quality jobs, less productive jobs, and informal jobs normally command lower earnings. More than half of those employed earn less than F$5,000 a year from their primary job (Figure 3.9).119 Among employed women and iTaukeis, the lowest three income brackets (F$0–F$4,999) account for two-thirds of those employed compared with 45%–50% for employed men and Indo-Fijians. Similarly, in rural areas and less urbanized divisions, about three quarters of the employed are in the lowest three income brackets. This distribution of earnings aligns with the corresponding shares of the demographic and geographic groups for employment by sector, occupation, employment status, and
118 The discussion is based on income in the past 12 months from the primary job only. Due to the nature of the earnings data, which are reported as categorical variables, income from secondary and tertiary jobs is not shown. Categorical variables make it difficult to add incomes from different jobs.
119 The share of the two bottommost income brackets, F$0–F$1,499 and F$1,500–F$2,999, gives an approximate idea of the share of working poor.
dependence on subsistence work. Those shares show limited access to productive and decent job opportunities for workers in rural and less urbanized divisions, female workers, and iTaukei workers.
Figure 3.9: earnings in the past 12 months from primary Job by Area and Division, 2010/11
F$ = Fiji dollar.Notes: Income categories used are as reported in the data. Income categories are based on earnings in the past 12 months from the primary job only. Estimates are based on the 12-month recall period.Sources: Estimates based on Fiji Bureau of Statistics. Employment and Unemployment Survey 2010/11. Suva.
Figure 3.8: employed by employment status, Area, and Division, 2010/11
Note: Estimates are based on the 7-day recall period. Source: Estimates based on Fiji Bureau of Statistics. Employment and Unemployment Survey 2010/11. Suva.
0102030405060708090
100
Perc
ent
Wage earner Salary earner Employer
Self-employed Family worker withpaid allowance orin kind
Unpaid familyworker
Community worker
Fiji
Mal
e
Fem
ale
iTau
kei
Indo
-Fijia
n
Oth
er
Urb
an
Rura
l
Cent
ral
East
ern
Nor
ther
n
Wes
tern
Sex Ethnicity Area Division
0102030405060708090
100
Perc
ent
F$0–F$1,499 F$1,500–F$2,999 F$3,000–F$4,999
F$5,000–F$6,999 F$7,000–F$9,999 F$10,000–F$14,999
F$15,000–F$19,999 F$20,000–F$29,999 F$30,000 up
Fiji
Mal
e
Fem
ale
iTau
kei
Indo
-Fijia
n
Oth
er
Urb
an
Rura
l
Cent
ral
East
ern
Nor
ther
n
Wes
tern
Sex Ethnicity Area Division
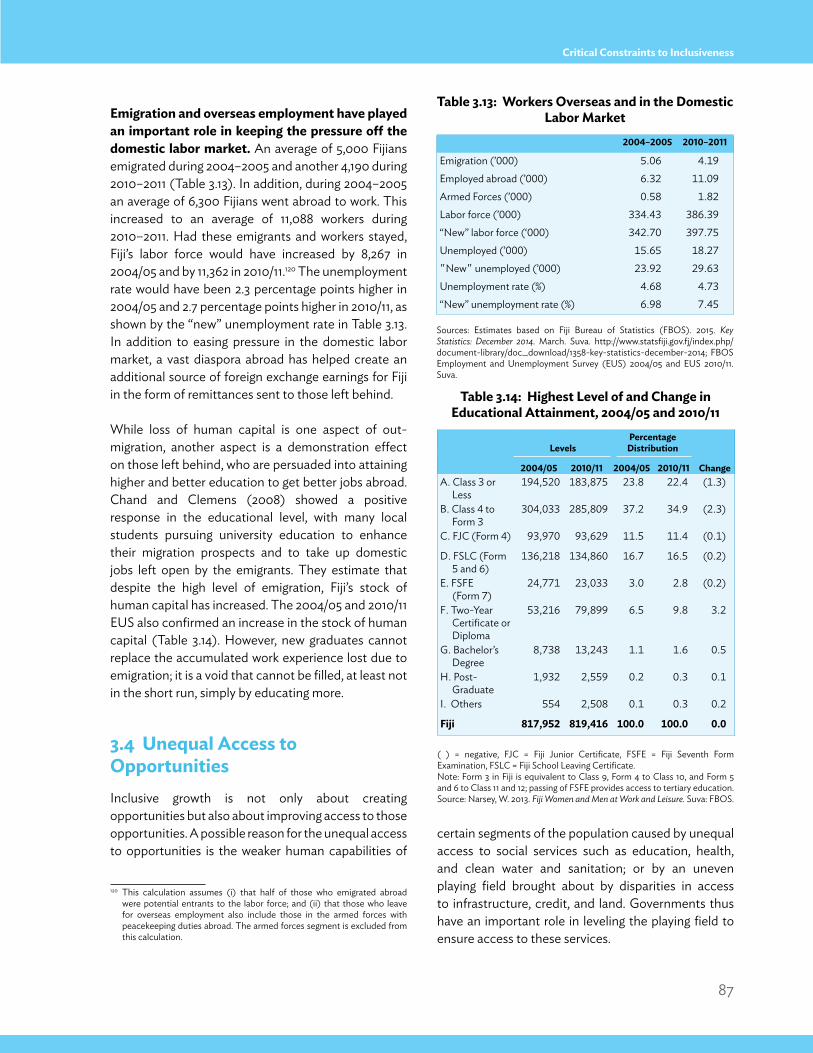
87
Critical Constraints to Inclusiveness
emigration and overseas employment have played an important role in keeping the pressure off the domestic labor market. An average of 5,000 Fijians emigrated during 2004–2005 and another 4,190 during 2010–2011 (Table 3.13). In addition, during 2004–2005 an average of 6,300 Fijians went abroad to work. This increased to an average of 11,088 workers during 2010–2011. Had these emigrants and workers stayed, Fiji’s labor force would have increased by 8,267 in 2004/05 and by 11,362 in 2010/11.120 The unemployment rate would have been 2.3 percentage points higher in 2004/05 and 2.7 percentage points higher in 2010/11, as shown by the “new” unemployment rate in Table 3.13. In addition to easing pressure in the domestic labor market, a vast diaspora abroad has helped create an additional source of foreign exchange earnings for Fiji in the form of remittances sent to those left behind.
While loss of human capital is one aspect of out-migration, another aspect is a demonstration effect on those left behind, who are persuaded into attaining higher and better education to get better jobs abroad. Chand and Clemens (2008) showed a positive response in the educational level, with many local students pursuing university education to enhance their migration prospects and to take up domestic jobs left open by the emigrants. They estimate that despite the high level of emigration, Fiji’s stock of human capital has increased. The 2004/05 and 2010/11 EUS also confirmed an increase in the stock of human capital (Table 3.14). However, new graduates cannot replace the accumulated work experience lost due to emigration; it is a void that cannot be filled, at least not in the short run, simply by educating more.
3.4 Unequal Access to opportunitiesInclusive growth is not only about creating opportunities but also about improving access to those opportunities. A possible reason for the unequal access to opportunities is the weaker human capabilities of
120 This calculation assumes (i) that half of those who emigrated abroad were potential entrants to the labor force; and (ii) that those who leave for overseas employment also include those in the armed forces with peacekeeping duties abroad. The armed forces segment is excluded from this calculation.
certain segments of the population caused by unequal access to social services such as education, health, and clean water and sanitation; or by an uneven playing field brought about by disparities in access to infrastructure, credit, and land. Governments thus have an important role in leveling the playing field to ensure access to these services.
table 3.13: Workers overseas and in the Domestic labor market
Sources: Estimates based on Fiji Bureau of Statistics (FBOS). 2015. Key Statistics: December 2014. March. Suva. http://www.statsfiji.gov.fj/index.php/document-library/doc_download/1358-key-statistics-december-2014; FBOS Employment and Unemployment Survey (EUS) 2004/05 and EUS 2010/11. Suva.
2004–2005 2010–2011
Emigration (’000) 5.06 4.19Employed abroad (’000) 6.32 11.09Armed Forces (’000) 0.58 1.82Labor force (’000) 334.43 386.39“New” labor force (‘000) 342.70 397.75Unemployed (’000) 15.65 18.27"New" unemployed (’000) 23.92 29.63Unemployment rate (%) 4.68 4.73“New” unemployment rate (%) 6.98 7.45
table 3.14: Highest level of and Change in educational Attainment, 2004/05 and 2010/11
( ) = negative, FJC = Fiji Junior Certificate, FSFE = Fiji Seventh Form Examination, FSLC = Fiji School Leaving Certificate.Note: Form 3 in Fiji is equivalent to Class 9, Form 4 to Class 10, and Form 5 and 6 to Class 11 and 12; passing of FSFE provides access to tertiary education.Source: Narsey, W. 2013. Fiji Women and Men at Work and Leisure. Suva: FBOS.
levelspercentage
Distribution 2004/05 2010/11 2004/05 2010/11 Change
A. Class 3 or Less
194,520 183,875 23.8 22.4 (1.3)
B. Class 4 to Form 3
304,033 285,809 37.2 34.9 (2.3)
C. FJC (Form 4) 93,970 93,629 11.5 11.4 (0.1)
D. FSLC (Form 5 and 6)
136,218 134,860 16.7 16.5 (0.2)
E. FSFE (Form 7)
24,771 23,033 3.0 2.8 (0.2)
F. Two-Year Certificate or Diploma
53,216 79,899 6.5 9.8 3.2
G. Bachelor’s Degree
8,738 13,243 1.1 1.6 0.5
H. Post-Graduate
1,932 2,559 0.2 0.3 0.1
I. Others 554 2,508 0.1 0.3 0.2
Fiji 817,952 819,416 100.0 100.0 0.0
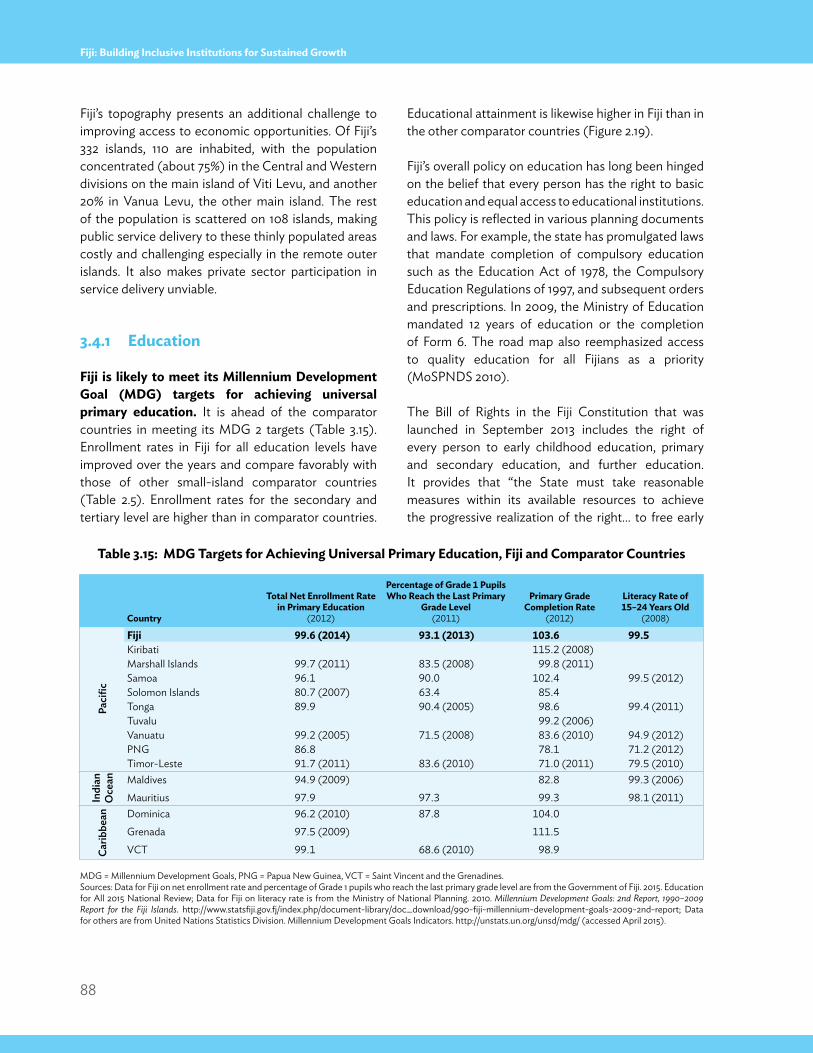
88
Fiji: Building Inclusive Institutions for Sustained Growth
Fiji’s topography presents an additional challenge to improving access to economic opportunities. Of Fiji’s 332 islands, 110 are inhabited, with the population concentrated (about 75%) in the Central and Western divisions on the main island of Viti Levu, and another 20% in Vanua Levu, the other main island. The rest of the population is scattered on 108 islands, making public service delivery to these thinly populated areas costly and challenging especially in the remote outer islands. It also makes private sector participation in service delivery unviable.
3.4.1 education Fiji is likely to meet its millennium Development Goal (mDG) targets for achieving universal primary education. It is ahead of the comparator countries in meeting its MDG 2 targets (Table 3.15). Enrollment rates in Fiji for all education levels have improved over the years and compare favorably with those of other small-island comparator countries (Table 2.5). Enrollment rates for the secondary and tertiary level are higher than in comparator countries.
Educational attainment is likewise higher in Fiji than in the other comparator countries (Figure 2.19).
Fiji’s overall policy on education has long been hinged on the belief that every person has the right to basic education and equal access to educational institutions. This policy is reflected in various planning documents and laws. For example, the state has promulgated laws that mandate completion of compulsory education such as the Education Act of 1978, the Compulsory Education Regulations of 1997, and subsequent orders and prescriptions. In 2009, the Ministry of Education mandated 12 years of education or the completion of Form 6. The road map also reemphasized access to quality education for all Fijians as a priority (MoSPNDS 2010).
The Bill of Rights in the Fiji Constitution that was launched in September 2013 includes the right of every person to early childhood education, primary and secondary education, and further education. It provides that “the State must take reasonable measures within its available resources to achieve the progressive realization of the right… to free early
table 3.15: mDG targets for Achieving Universal primary education, Fiji and Comparator Countries
MDG = Millennium Development Goals, PNG = Papua New Guinea, VCT = Saint Vincent and the Grenadines.Sources: Data for Fiji on net enrollment rate and percentage of Grade 1 pupils who reach the last primary grade level are from the Government of Fiji. 2015. Education for All 2015 National Review; Data for Fiji on literacy rate is from the Ministry of National Planning. 2010. Millennium Development Goals: 2nd Report, 1990–2009 Report for the Fiji Islands. http://www.statsfiji.gov.fj/index.php/document-library/doc_download/990-fiji-millennium-development-goals-2009-2nd-report; Data for others are from United Nations Statistics Division. Millennium Development Goals Indicators. http://unstats.un.org/unsd/mdg/ (accessed April 2015).
Country
total net enrollment Rate in primary education
(2012)
percentage of Grade 1 pupils Who Reach the last primary
Grade level (2011)
primary Grade Completion Rate
(2012)
literacy Rate of 15–24 Years old
(2008)
Paci
fic
Fiji 99.6 (2014) 93.1 (2013) 103.6 99.5Kiribati 115.2 (2008)Marshall Islands 99.7 (2011) 83.5 (2008) 99.8 (2011)Samoa 96.1 90.0 102.4 99.5 (2012)Solomon Islands 80.7 (2007) 63.4 85.4Tonga 89.9 90.4 (2005) 98.6 99.4 (2011)Tuvalu 99.2 (2006)Vanuatu 99.2 (2005) 71.5 (2008) 83.6 (2010) 94.9 (2012)PNG 86.8 78.1 71.2 (2012)Timor-Leste 91.7 (2011) 83.6 (2010) 71.0 (2011) 79.5 (2010)
Indi
an
Oce
an Maldives 94.9 (2009) 82.8 99.3 (2006)Mauritius 97.9 97.3 99.3 98.1 (2011)
carib
bean Dominica 96.2 (2010) 87.8 104.0
Grenada 97.5 (2009) 111.5VCT 99.1 68.6 (2010) 98.9
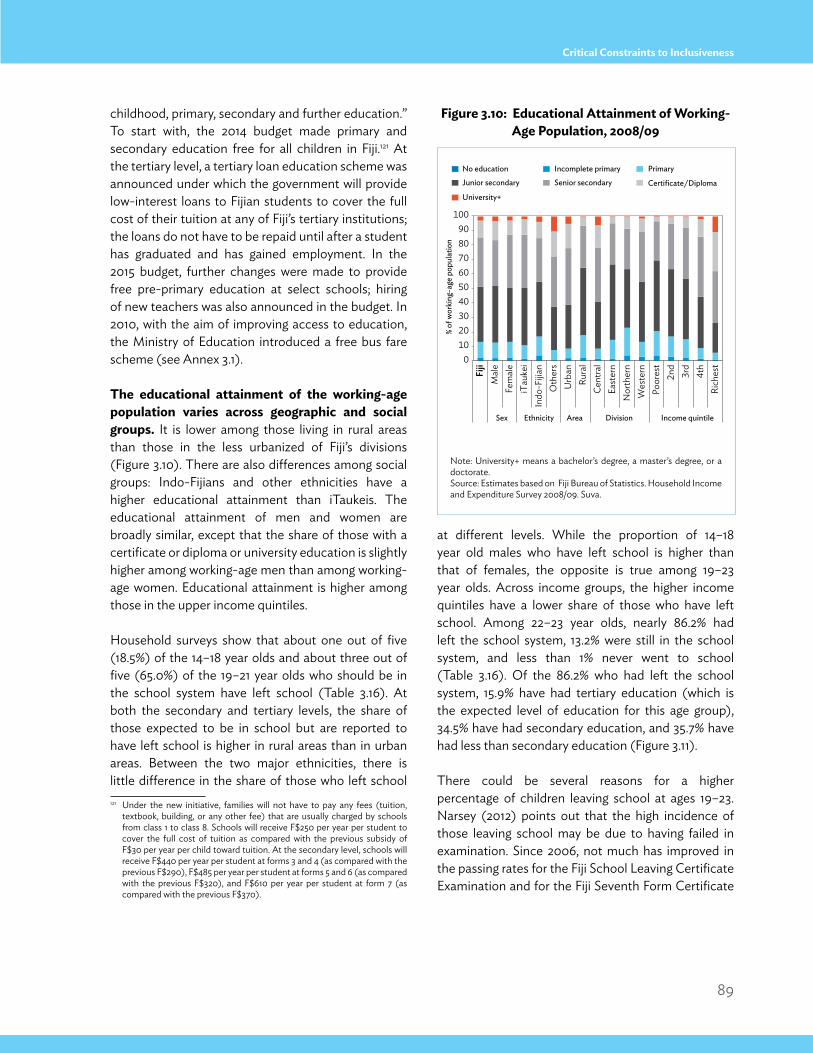
89
Critical Constraints to Inclusiveness
childhood, primary, secondary and further education.” To start with, the 2014 budget made primary and secondary education free for all children in Fiji.121 At the tertiary level, a tertiary loan education scheme was announced under which the government will provide low-interest loans to Fijian students to cover the full cost of their tuition at any of Fiji’s tertiary institutions; the loans do not have to be repaid until after a student has graduated and has gained employment. In the 2015 budget, further changes were made to provide free pre-primary education at select schools; hiring of new teachers was also announced in the budget. In 2010, with the aim of improving access to education, the Ministry of Education introduced a free bus fare scheme (see Annex 3.1).
the educational attainment of the working-age population varies across geographic and social groups. It is lower among those living in rural areas than those in the less urbanized of Fiji’s divisions (Figure 3.10). There are also differences among social groups: Indo-Fijians and other ethnicities have a higher educational attainment than iTaukeis. The educational attainment of men and women are broadly similar, except that the share of those with a certificate or diploma or university education is slightly higher among working-age men than among working-age women. Educational attainment is higher among those in the upper income quintiles.
Household surveys show that about one out of five (18.5%) of the 14–18 year olds and about three out of five (65.0%) of the 19–21 year olds who should be in the school system have left school (Table 3.16). At both the secondary and tertiary levels, the share of those expected to be in school but are reported to have left school is higher in rural areas than in urban areas. Between the two major ethnicities, there is little difference in the share of those who left school 121 Under the new initiative, families will not have to pay any fees (tuition,
textbook, building, or any other fee) that are usually charged by schools from class 1 to class 8. Schools will receive F$250 per year per student to cover the full cost of tuition as compared with the previous subsidy of F$30 per year per child toward tuition. At the secondary level, schools will receive F$440 per year per student at forms 3 and 4 (as compared with the previous F$290), F$485 per year per student at forms 5 and 6 (as compared with the previous F$320), and F$610 per year per student at form 7 (as compared with the previous F$370).
at different levels. While the proportion of 14–18 year old males who have left school is higher than that of females, the opposite is true among 19–23 year olds. Across income groups, the higher income quintiles have a lower share of those who have left school. Among 22–23 year olds, nearly 86.2% had left the school system, 13.2% were still in the school system, and less than 1% never went to school (Table 3.16). Of the 86.2% who had left the school system, 15.9% have had tertiary education (which is the expected level of education for this age group), 34.5% have had secondary education, and 35.7% have had less than secondary education (Figure 3.11).
There could be several reasons for a higher percentage of children leaving school at ages 19–23. Narsey (2012) points out that the high incidence of those leaving school may be due to having failed in examination. Since 2006, not much has improved in the passing rates for the Fiji School Leaving Certificate Examination and for the Fiji Seventh Form Certificate
Figure 3.10: educational Attainment of Working-Age population, 2008/09
Note: University+ means a bachelor’s degree, a master’s degree, or a doctorate.Source: Estimates based on Fiji Bureau of Statistics. Household Income and Expenditure Survey 2008/09. Suva.
0102030405060708090
100
% of
wor
king
-age
pop
ulat
ion
No education Incomplete primary Primary
Junior secondary Senior secondary Certificate/Diploma
University+
Fiji
Mal
eFe
mal
eiT
auke
iIn
do-F
ijian
Oth
ers
Urb
anRu
ral
Cent
ral
East
ern
Nor
ther
nW
este
rnPo
ores
t2n
d3r
d4t
hRi
ches
t
Sex Ethnicity Area Income quintileDivision
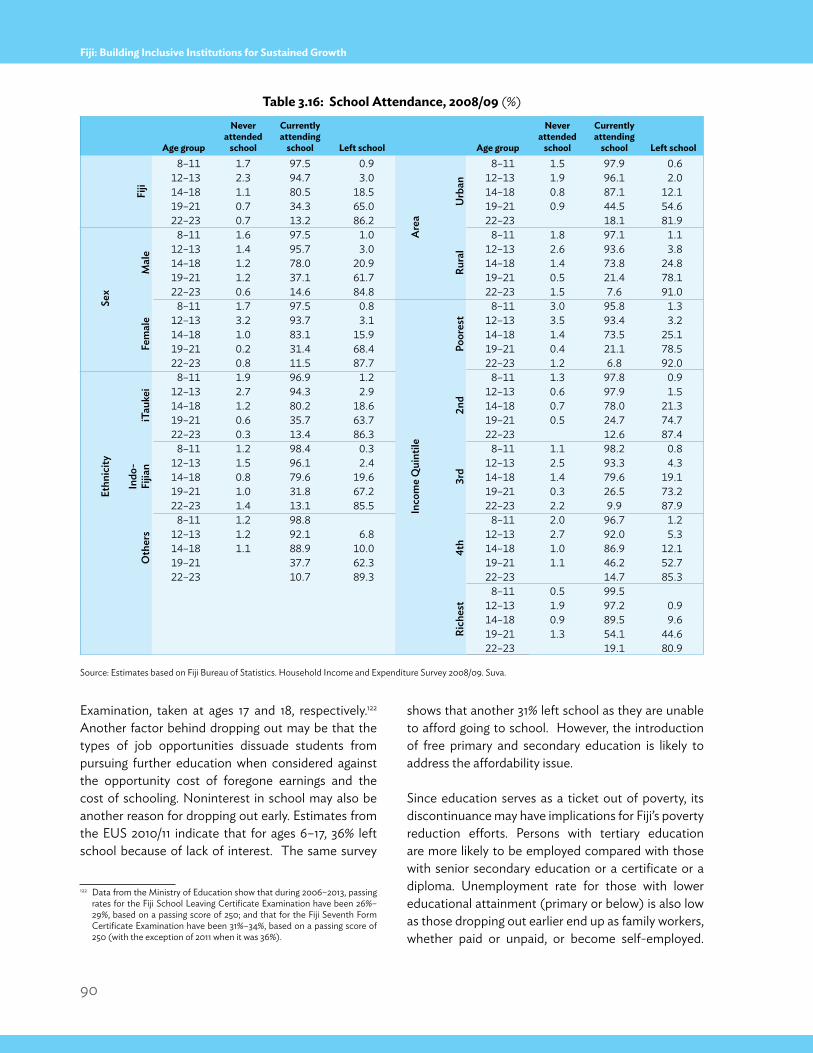
90
Fiji: Building Inclusive Institutions for Sustained Growth
Examination, taken at ages 17 and 18, respectively.122 Another factor behind dropping out may be that the types of job opportunities dissuade students from pursuing further education when considered against the opportunity cost of foregone earnings and the cost of schooling. Noninterest in school may also be another reason for dropping out early. Estimates from the EUS 2010/11 indicate that for ages 6–17, 36% left school because of lack of interest. The same survey
122 Data from the Ministry of Education show that during 2006–2013, passing rates for the Fiji School Leaving Certificate Examination have been 26%–29%, based on a passing score of 250; and that for the Fiji Seventh Form Certificate Examination have been 31%–34%, based on a passing score of 250 (with the exception of 2011 when it was 36%).
shows that another 31% left school as they are unable to afford going to school. However, the introduction of free primary and secondary education is likely to address the affordability issue.
Since education serves as a ticket out of poverty, its discontinuance may have implications for Fiji’s poverty reduction efforts. Persons with tertiary education are more likely to be employed compared with those with senior secondary education or a certificate or a diploma. Unemployment rate for those with lower educational attainment (primary or below) is also low as those dropping out earlier end up as family workers, whether paid or unpaid, or become self-employed.
table 3.16: school Attendance, 2008/09 (%)
Source: Estimates based on Fiji Bureau of Statistics. Household Income and Expenditure Survey 2008/09. Suva.
Age group
never attended
school
Currently attending
school left school Age group
never attended
school
Currently attending
school left schoolFi
ji
8–11 1.7 97.5 0.9
Are
a
urb
an
8–11 1.5 97.9 0.612–13 2.3 94.7 3.0 12–13 1.9 96.1 2.014–18 1.1 80.5 18.5 14–18 0.8 87.1 12.119–21 0.7 34.3 65.0 19–21 0.9 44.5 54.622–23 0.7 13.2 86.2 22–23 18.1 81.9
Sex
Mal
e
8–11 1.6 97.5 1.0
rura
l
8–11 1.8 97.1 1.112–13 1.4 95.7 3.0 12–13 2.6 93.6 3.814–18 1.2 78.0 20.9 14–18 1.4 73.8 24.819–21 1.2 37.1 61.7 19–21 0.5 21.4 78.122–23 0.6 14.6 84.8 22–23 1.5 7.6 91.0
Fem
ale
8–11 1.7 97.5 0.8
Inco
me
Qui
ntile
Poor
est
8–11 3.0 95.8 1.312–13 3.2 93.7 3.1 12–13 3.5 93.4 3.214–18 1.0 83.1 15.9 14–18 1.4 73.5 25.119–21 0.2 31.4 68.4 19–21 0.4 21.1 78.522–23 0.8 11.5 87.7 22–23 1.2 6.8 92.0
Ethn
icity
iTau
kei
8–11 1.9 96.9 1.2
2nd
8–11 1.3 97.8 0.912–13 2.7 94.3 2.9 12–13 0.6 97.9 1.514–18 1.2 80.2 18.6 14–18 0.7 78.0 21.319–21 0.6 35.7 63.7 19–21 0.5 24.7 74.722–23 0.3 13.4 86.3 22–23 12.6 87.4
Indo
- Fi
jian
8–11 1.2 98.4 0.33r
d8–11 1.1 98.2 0.8
12–13 1.5 96.1 2.4 12–13 2.5 93.3 4.314–18 0.8 79.6 19.6 14–18 1.4 79.6 19.119–21 1.0 31.8 67.2 19–21 0.3 26.5 73.222–23 1.4 13.1 85.5 22–23 2.2 9.9 87.9
Oth
ers
8–11 1.2 98.8
4th
8–11 2.0 96.7 1.212–13 1.2 92.1 6.8 12–13 2.7 92.0 5.314–18 1.1 88.9 10.0 14–18 1.0 86.9 12.119–21 37.7 62.3 19–21 1.1 46.2 52.722–23 10.7 89.3 22–23 14.7 85.3
rich
est
8–11 0.5 99.512–13 1.9 97.2 0.914–18 0.9 89.5 9.619–21 1.3 54.1 44.622–23 19.1 80.9
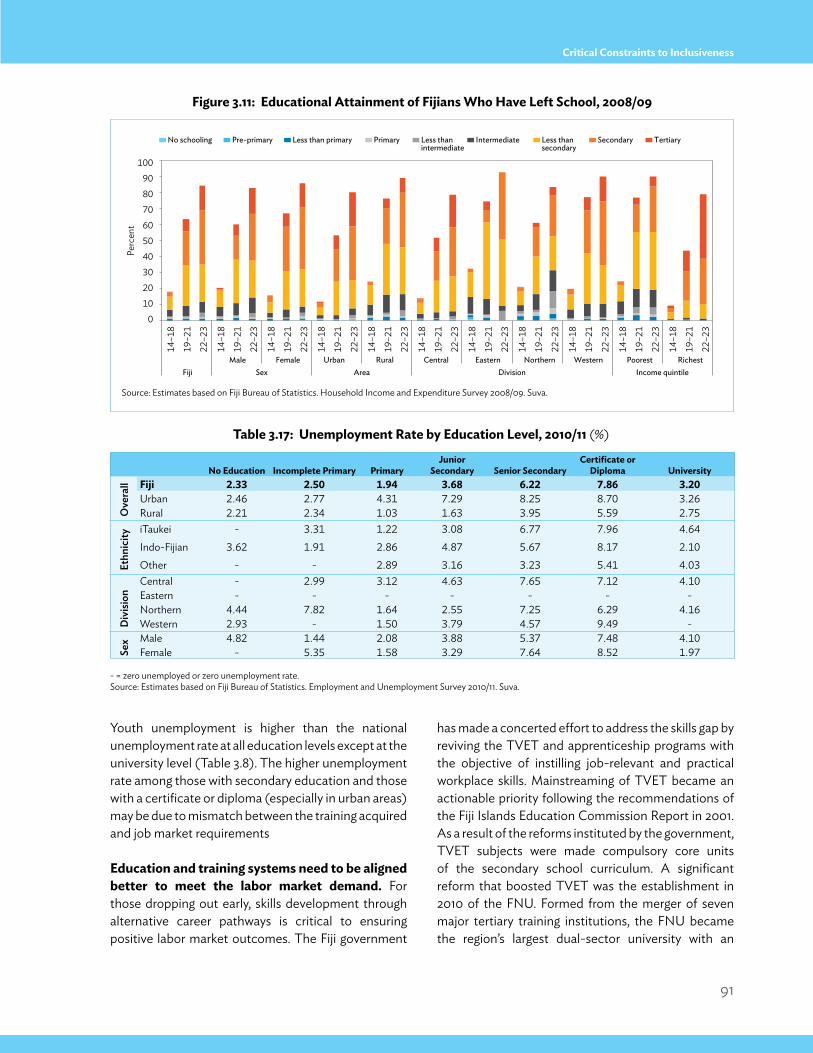
91
Critical Constraints to Inclusiveness
Youth unemployment is higher than the national unemployment rate at all education levels except at the university level (Table 3.8). The higher unemployment rate among those with secondary education and those with a certificate or diploma (especially in urban areas) may be due to mismatch between the training acquired and job market requirements
education and training systems need to be aligned better to meet the labor market demand. For those dropping out early, skills development through alternative career pathways is critical to ensuring positive labor market outcomes. The Fiji government
has made a concerted effort to address the skills gap by reviving the TVET and apprenticeship programs with the objective of instilling job-relevant and practical workplace skills. Mainstreaming of TVET became an actionable priority following the recommendations of the Fiji Islands Education Commission Report in 2001. As a result of the reforms instituted by the government, TVET subjects were made compulsory core units of the secondary school curriculum. A significant reform that boosted TVET was the establishment in 2010 of the FNU. Formed from the merger of seven major tertiary training institutions, the FNU became the region’s largest dual-sector university with an
Figure 3.11: educational Attainment of Fijians Who Have left school, 2008/09
table 3.17: Unemployment Rate by education level, 2010/11 (%)
Source: Estimates based on Fiji Bureau of Statistics. Household Income and Expenditure Survey 2008/09. Suva.
- = zero unemployed or zero unemployment rate.Source: Estimates based on Fiji Bureau of Statistics. Employment and Unemployment Survey 2010/11. Suva.
Perc
ent
No schooling Pre-primary Less than primary Primary Less thanintermediate
Less thansecondary
Intermediate Secondary Tertiary
0102030405060708090
10014
–18
19–2
1
22–2
3
Male Female Urban Rural Central Eastern Northern Western Poorest RichestFiji Sex Area Division Income quintile
14–1
8
19–2
1
22–2
3
14–1
8
19–2
1
22–2
3
14–1
8
19–2
1
22–2
3
14–1
8
19–2
1
22–2
3
14–1
8
19–2
1
22–2
3
14–1
8
19–2
1
22–2
3
14–1
8
19–2
1
22–2
3
14–1
8
19–2
1
22–2
3
14–1
8
19–2
1
22–2
3
14–1
8
19–2
1
22–2
3
no education incomplete primary primaryJunior
secondary senior secondaryCertificate or
Diploma University
Ove
rall Fiji 2.33 2.50 1.94 3.68 6.22 7.86 3.20
Urban 2.46 2.77 4.31 7.29 8.25 8.70 3.26Rural 2.21 2.34 1.03 1.63 3.95 5.59 2.75
Ethn
icity
iTaukei - 3.31 1.22 3.08 6.77 7.96 4.64Indo-Fijian 3.62 1.91 2.86 4.87 5.67 8.17 2.10Other - - 2.89 3.16 3.23 5.41 4.03
Div
ision
Central - 2.99 3.12 4.63 7.65 7.12 4.10Eastern - - - - - - -Northern 4.44 7.82 1.64 2.55 7.25 6.29 4.16Western 2.93 - 1.50 3.79 4.57 9.49 -
Sex Male 4.82 1.44 2.08 3.88 5.37 7.48 4.10
Female - 5.35 1.58 3.29 7.64 8.52 1.97
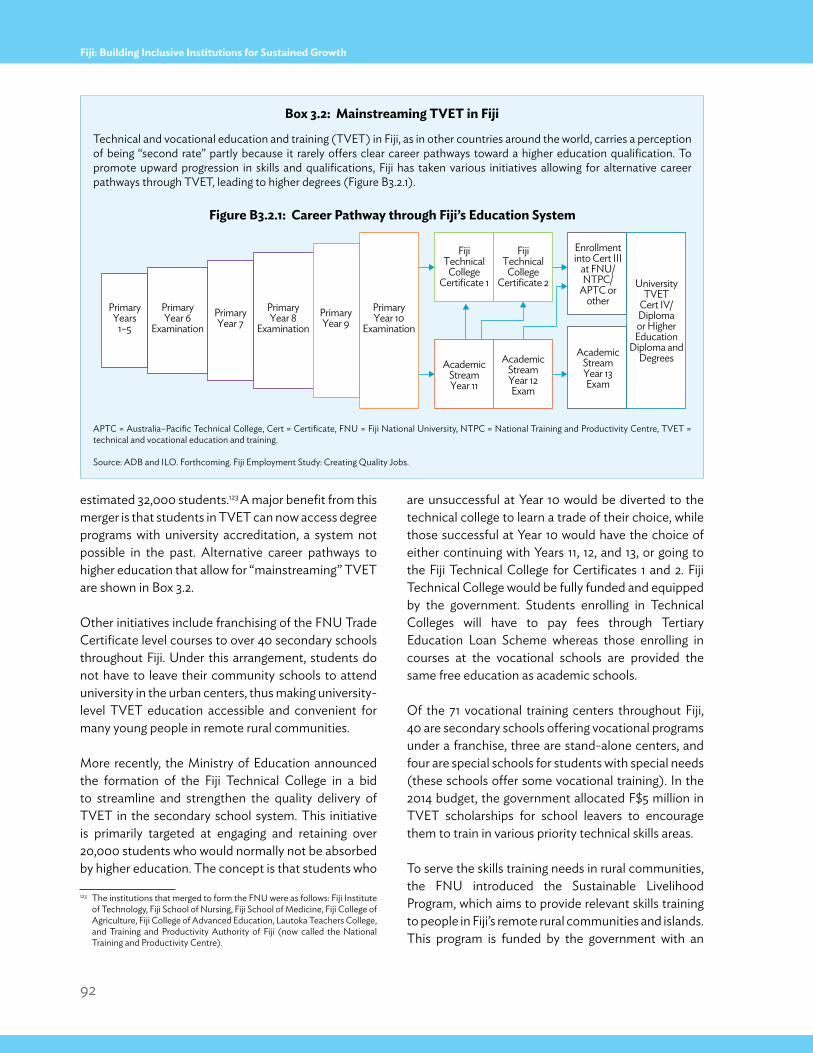
92
Fiji: Building Inclusive Institutions for Sustained Growth
estimated 32,000 students.123 A major benefit from this merger is that students in TVET can now access degree programs with university accreditation, a system not possible in the past. Alternative career pathways to higher education that allow for “mainstreaming” TVET are shown in Box 3.2.
Other initiatives include franchising of the FNU Trade Certificate level courses to over 40 secondary schools throughout Fiji. Under this arrangement, students do not have to leave their community schools to attend university in the urban centers, thus making university-level TVET education accessible and convenient for many young people in remote rural communities.
More recently, the Ministry of Education announced the formation of the Fiji Technical College in a bid to streamline and strengthen the quality delivery of TVET in the secondary school system. This initiative is primarily targeted at engaging and retaining over 20,000 students who would normally not be absorbed by higher education. The concept is that students who
123 The institutions that merged to form the FNU were as follows: Fiji Institute of Technology, Fiji School of Nursing, Fiji School of Medicine, Fiji College of Agriculture, Fiji College of Advanced Education, Lautoka Teachers College, and Training and Productivity Authority of Fiji (now called the National Training and Productivity Centre).
are unsuccessful at Year 10 would be diverted to the technical college to learn a trade of their choice, while those successful at Year 10 would have the choice of either continuing with Years 11, 12, and 13, or going to the Fiji Technical College for Certificates 1 and 2. Fiji Technical College would be fully funded and equipped by the government. Students enrolling in Technical Colleges will have to pay fees through Tertiary Education Loan Scheme whereas those enrolling in courses at the vocational schools are provided the same free education as academic schools.
Of the 71 vocational training centers throughout Fiji, 40 are secondary schools offering vocational programs under a franchise, three are stand-alone centers, and four are special schools for students with special needs (these schools offer some vocational training). In the 2014 budget, the government allocated F$5 million in TVET scholarships for school leavers to encourage them to train in various priority technical skills areas.
To serve the skills training needs in rural communities, the FNU introduced the Sustainable Livelihood Program, which aims to provide relevant skills training to people in Fiji’s remote rural communities and islands. This program is funded by the government with an
Box 3.2: mainstreaming tvet in Fiji
Technical and vocational education and training (TVET) in Fiji, as in other countries around the world, carries a perception of being “second rate” partly because it rarely offers clear career pathways toward a higher education qualification. To promote upward progression in skills and qualifications, Fiji has taken various initiatives allowing for alternative career pathways through TVET, leading to higher degrees (Figure B3.2.1).
Figure B3.2.1: Career pathway through Fiji’s education system
APTC = Australia–Pacific Technical College, Cert = Certificate, FNU = Fiji National University, NTPC = National Training and Productivity Centre, TVET = technical and vocational education and training.
Source: ADB and ILO. Forthcoming. Fiji Employment Study: Creating Quality Jobs.
PrimaryYears
1–5
PrimaryYear 6
Examination
PrimaryYear 8
Examination
FijiTechnical
CollegeCertificate 1
AcademicStreamYear 11
AcademicStreamYear 12Exam
AcademicStreamYear 13Exam
UniversityTVET
Cert IV/Diplomaor HigherEducation
Diploma andDegrees
FijiTechnical
CollegeCertificate 2
Enrollmentinto Cert III
at FNU/NTPC/
APTC orother
PrimaryYear 7
PrimaryYear 10
ExaminationPrimaryYear 9
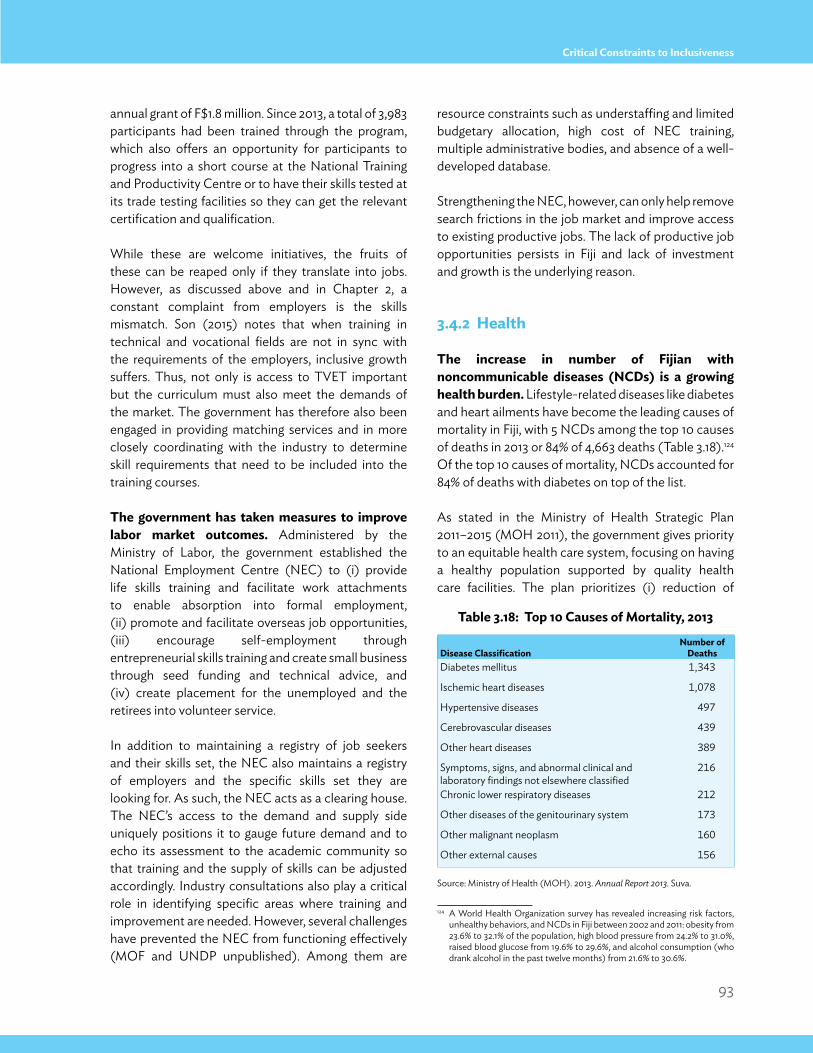
93
Critical Constraints to Inclusiveness
annual grant of F$1.8 million. Since 2013, a total of 3,983 participants had been trained through the program, which also offers an opportunity for participants to progress into a short course at the National Training and Productivity Centre or to have their skills tested at its trade testing facilities so they can get the relevant certification and qualification.
While these are welcome initiatives, the fruits of these can be reaped only if they translate into jobs. However, as discussed above and in Chapter 2, a constant complaint from employers is the skills mismatch. Son (2015) notes that when training in technical and vocational fields are not in sync with the requirements of the employers, inclusive growth suffers. Thus, not only is access to TVET important but the curriculum must also meet the demands of the market. The government has therefore also been engaged in providing matching services and in more closely coordinating with the industry to determine skill requirements that need to be included into the training courses.
the government has taken measures to improve labor market outcomes. Administered by the Ministry of Labor, the government established the National Employment Centre (NEC) to (i) provide life skills training and facilitate work attachments to enable absorption into formal employment, (ii) promote and facilitate overseas job opportunities, (iii) encourage self-employment through entrepreneurial skills training and create small business through seed funding and technical advice, and (iv) create placement for the unemployed and the retirees into volunteer service.
In addition to maintaining a registry of job seekers and their skills set, the NEC also maintains a registry of employers and the specific skills set they are looking for. As such, the NEC acts as a clearing house. The NEC’s access to the demand and supply side uniquely positions it to gauge future demand and to echo its assessment to the academic community so that training and the supply of skills can be adjusted accordingly. Industry consultations also play a critical role in identifying specific areas where training and improvement are needed. However, several challenges have prevented the NEC from functioning effectively (MOF and UNDP unpublished). Among them are
resource constraints such as understaffing and limited budgetary allocation, high cost of NEC training, multiple administrative bodies, and absence of a well-developed database.
Strengthening the NEC, however, can only help remove search frictions in the job market and improve access to existing productive jobs. The lack of productive job opportunities persists in Fiji and lack of investment and growth is the underlying reason.
3.4.2 Health
the increase in number of Fijian with noncommunicable diseases (nCDs) is a growing health burden. Lifestyle-related diseases like diabetes and heart ailments have become the leading causes of mortality in Fiji, with 5 NCDs among the top 10 causes of deaths in 2013 or 84% of 4,663 deaths (Table 3.18).124 Of the top 10 causes of mortality, NCDs accounted for 84% of deaths with diabetes on top of the list.
As stated in the Ministry of Health Strategic Plan 2011–2015 (MOH 2011), the government gives priority to an equitable health care system, focusing on having a healthy population supported by quality health care facilities. The plan prioritizes (i) reduction of
124 A World Health Organization survey has revealed increasing risk factors, unhealthy behaviors, and NCDs in Fiji between 2002 and 2011: obesity from 23.6% to 32.1% of the population, high blood pressure from 24.2% to 31.0%, raised blood glucose from 19.6% to 29.6%, and alcohol consumption (who drank alcohol in the past twelve months) from 21.6% to 30.6%.
Disease Classificationnumber of
DeathsDiabetes mellitus 1,343
Ischemic heart diseases 1,078
Hypertensive diseases 497
Cerebrovascular diseases 439
Other heart diseases 389
Symptoms, signs, and abnormal clinical and laboratory findings not elsewhere classified
216
Chronic lower respiratory diseases 212
Other diseases of the genitourinary system 173
Other malignant neoplasm 160
Other external causes 156
table 3.18: top 10 Causes of mortality, 2013
Source: Ministry of Health (MOH). 2013. Annual Report 2013. Suva.
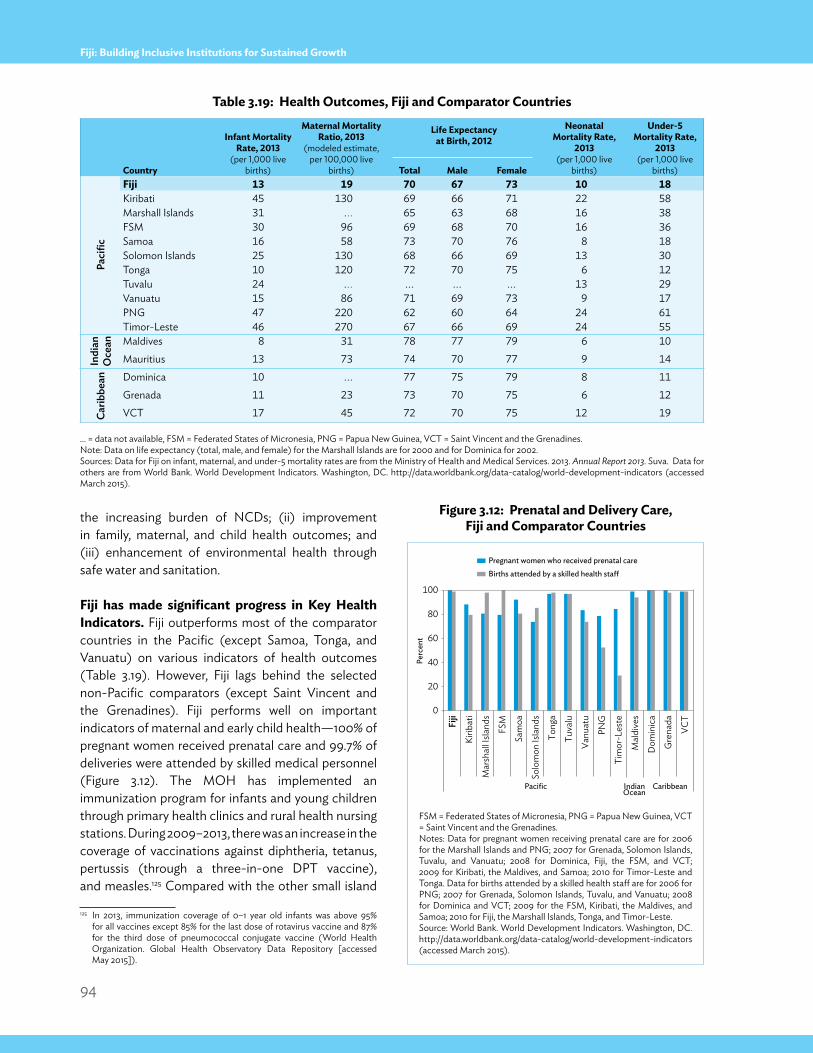
94
Fiji: Building Inclusive Institutions for Sustained Growth
the increasing burden of NCDs; (ii) improvement in family, maternal, and child health outcomes; and (iii) enhancement of environmental health through safe water and sanitation.
Fiji has made significant progress in key Health indicators. Fiji outperforms most of the comparator countries in the Pacific (except Samoa, Tonga, and Vanuatu) on various indicators of health outcomes (Table 3.19). However, Fiji lags behind the selected non-Pacific comparators (except Saint Vincent and the Grenadines). Fiji performs well on important indicators of maternal and early child health—100% of pregnant women received prenatal care and 99.7% of deliveries were attended by skilled medical personnel (Figure 3.12). The MOH has implemented an immunization program for infants and young children through primary health clinics and rural health nursing stations. During 2009–2013, there was an increase in the coverage of vaccinations against diphtheria, tetanus, pertussis (through a three-in-one DPT vaccine), and measles.125 Compared with the other small island
125 In 2013, immunization coverage of 0–1 year old infants was above 95% for all vaccines except 85% for the last dose of rotavirus vaccine and 87% for the third dose of pneumococcal conjugate vaccine (World Health Organization. Global Health Observatory Data Repository [accessed May 2015]).
Figure 3.12: prenatal and Delivery Care, Fiji and Comparator Countries
FSM = Federated States of Micronesia, PNG = Papua New Guinea, VCT = Saint Vincent and the Grenadines. Notes: Data for pregnant women receiving prenatal care are for 2006 for the Marshall Islands and PNG; 2007 for Grenada, Solomon Islands, Tuvalu, and Vanuatu; 2008 for Dominica, Fiji, the FSM, and VCT; 2009 for Kiribati, the Maldives, and Samoa; 2010 for Timor-Leste and Tonga. Data for births attended by a skilled health staff are for 2006 for PNG; 2007 for Grenada, Solomon Islands, Tuvalu, and Vanuatu; 2008 for Dominica and VCT; 2009 for the FSM, Kiribati, the Maldives, and Samoa; 2010 for Fiji, the Marshall Islands, Tonga, and Timor-Leste.Source: World Bank. World Development Indicators. Washington, DC. http://data.worldbank.org/data-catalog/world-development-indicators (accessed March 2015).
table 3.19: Health outcomes, Fiji and Comparator Countries
… = data not available, FSM = Federated States of Micronesia, PNG = Papua New Guinea, VCT = Saint Vincent and the Grenadines.Note: Data on life expectancy (total, male, and female) for the Marshall Islands are for 2000 and for Dominica for 2002.Sources: Data for Fiji on infant, maternal, and under-5 mortality rates are from the Ministry of Health and Medical Services. 2013. Annual Report 2013. Suva. Data for others are from World Bank. World Development Indicators. Washington, DC. http://data.worldbank.org/data-catalog/world-development-indicators (accessed March 2015).
Country
infant mortality Rate, 2013
(per 1,000 live births)
maternal mortality Ratio, 2013
(modeled estimate, per 100,000 live
births)
life expectancy at Birth, 2012
neonatal mortality Rate,
2013(per 1,000 live
births)
Under-5 mortality Rate,
2013 (per 1,000 live
births)total male Female
Paci
fic
Fiji 13 19 70 67 73 10 18Kiribati 45 130 69 66 71 22 58Marshall Islands 31 .… 65 63 68 16 38FSM 30 96 69 68 70 16 36Samoa 16 58 73 70 76 8 18Solomon Islands 25 130 68 66 69 13 30Tonga 10 120 72 70 75 6 12Tuvalu 24 .… ... ... ... 13 29Vanuatu 15 86 71 69 73 9 17PNG 47 220 62 60 64 24 61Timor-Leste 46 270 67 66 69 24 55
Indi
an
Oce
an Maldives 8 31 78 77 79 6 10Mauritius 13 73 74 70 77 9 14
carib
bean Dominica 10 ... 77 75 79 8 11
Grenada 11 23 73 70 75 6 12VCT 17 45 72 70 75 12 19
0
20
40
60
80
100
Fiji
Kirib
ati
Mar
shal
l Isla
nds
FSM
Sam
oa
Solo
mon
Isla
nds
Tong
a
Vanu
atu
Tuva
lu
PNG
Tim
or-L
este
Mal
dive
s
Dom
inic
a
Gre
nada
VCT
Pacific IndianOcean
Caribbean
Perc
ent
Pregnant women who received prenatal careBirths attended by a skilled health sta�
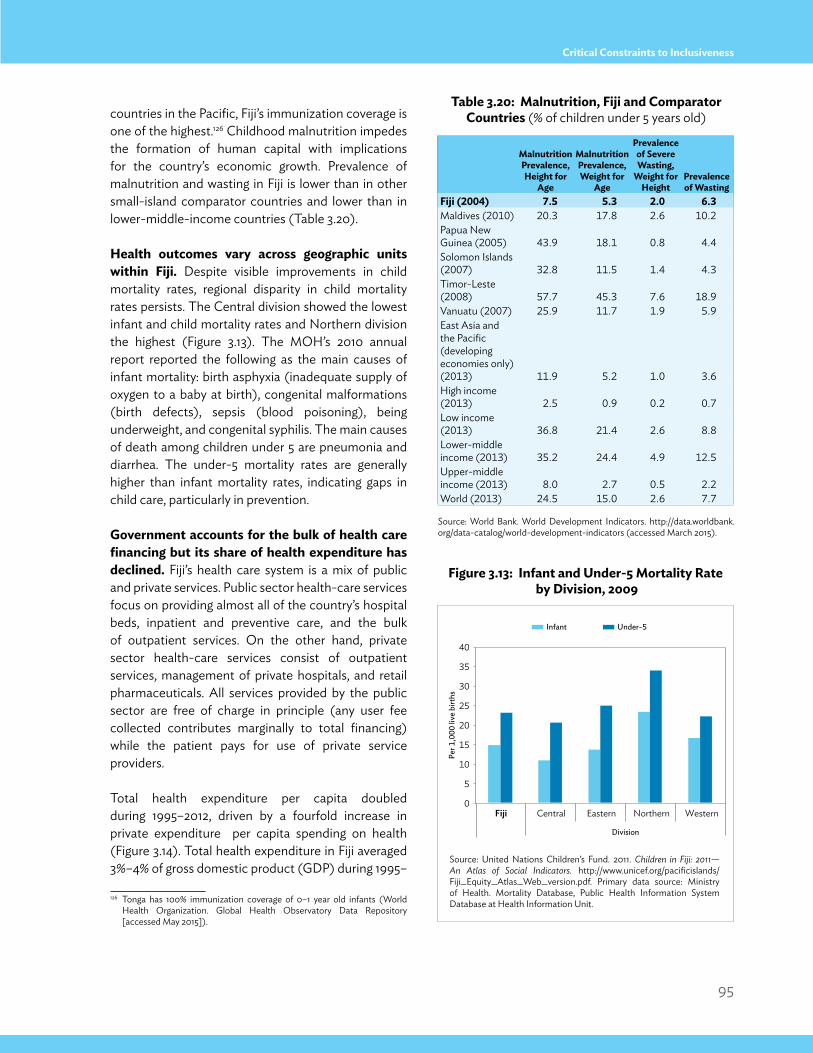
95
Critical Constraints to Inclusiveness
countries in the Pacific, Fiji’s immunization coverage is one of the highest.126 Childhood malnutrition impedes the formation of human capital with implications for the country’s economic growth. Prevalence of malnutrition and wasting in Fiji is lower than in other small-island comparator countries and lower than in lower-middle-income countries (Table 3.20).
Health outcomes vary across geographic units within Fiji. Despite visible improvements in child mortality rates, regional disparity in child mortality rates persists. The Central division showed the lowest infant and child mortality rates and Northern division the highest (Figure 3.13). The MOH’s 2010 annual report reported the following as the main causes of infant mortality: birth asphyxia (inadequate supply of oxygen to a baby at birth), congenital malformations (birth defects), sepsis (blood poisoning), being underweight, and congenital syphilis. The main causes of death among children under 5 are pneumonia and diarrhea. The under-5 mortality rates are generally higher than infant mortality rates, indicating gaps in child care, particularly in prevention.
Government accounts for the bulk of health care financing but its share of health expenditure has declined. Fiji’s health care system is a mix of public and private services. Public sector health-care services focus on providing almost all of the country’s hospital beds, inpatient and preventive care, and the bulk of outpatient services. On the other hand, private sector health-care services consist of outpatient services, management of private hospitals, and retail pharmaceuticals. All services provided by the public sector are free of charge in principle (any user fee collected contributes marginally to total financing) while the patient pays for use of private service providers.
Total health expenditure per capita doubled during 1995–2012, driven by a fourfold increase in private expenditure per capita spending on health (Figure 3.14). Total health expenditure in Fiji averaged 3%–4% of gross domestic product (GDP) during 1995–
126 Tonga has 100% immunization coverage of 0–1 year old infants (World Health Organization. Global Health Observatory Data Repository [accessed May 2015]).
table 3.20: malnutrition, Fiji and Comparator Countries (% of children under 5 years old)
Source: World Bank. World Development Indicators. http://data.worldbank.org/data-catalog/world-development-indicators (accessed March 2015).
Figure 3.13: infant and Under-5 mortality Rate by Division, 2009
Source: United Nations Children’s Fund. 2011. Children in Fiji: 2011—An Atlas of Social Indicators. http://www.unicef.org/pacificislands/Fiji_Equity_Atlas_Web_version.pdf. Primary data source: Ministry of Health. Mortality Database, Public Health Information System Database at Health Information Unit.
malnutrition prevalence, Height for
Age
malnutrition prevalence, Weight for
Age
prevalence of severe Wasting,
Weight for Height
prevalence of Wasting
Fiji (2004) 7.5 5.3 2.0 6.3Maldives (2010) 20.3 17.8 2.6 10.2Papua New Guinea (2005) 43.9 18.1 0.8 4.4Solomon Islands (2007) 32.8 11.5 1.4 4.3Timor-Leste (2008) 57.7 45.3 7.6 18.9Vanuatu (2007) 25.9 11.7 1.9 5.9East Asia and the Pacific (developing economies only) (2013) 11.9 5.2 1.0 3.6High income (2013) 2.5 0.9 0.2 0.7Low income (2013) 36.8 21.4 2.6 8.8Lower-middle income (2013) 35.2 24.4 4.9 12.5Upper-middle income (2013) 8.0 2.7 0.5 2.2World (2013) 24.5 15.0 2.6 7.7
Fiji Central Eastern Northern Western
Division
0
20
15
10
5
25
30
35
40
Per 1
,000
live
birt
hs
Infant Under-5
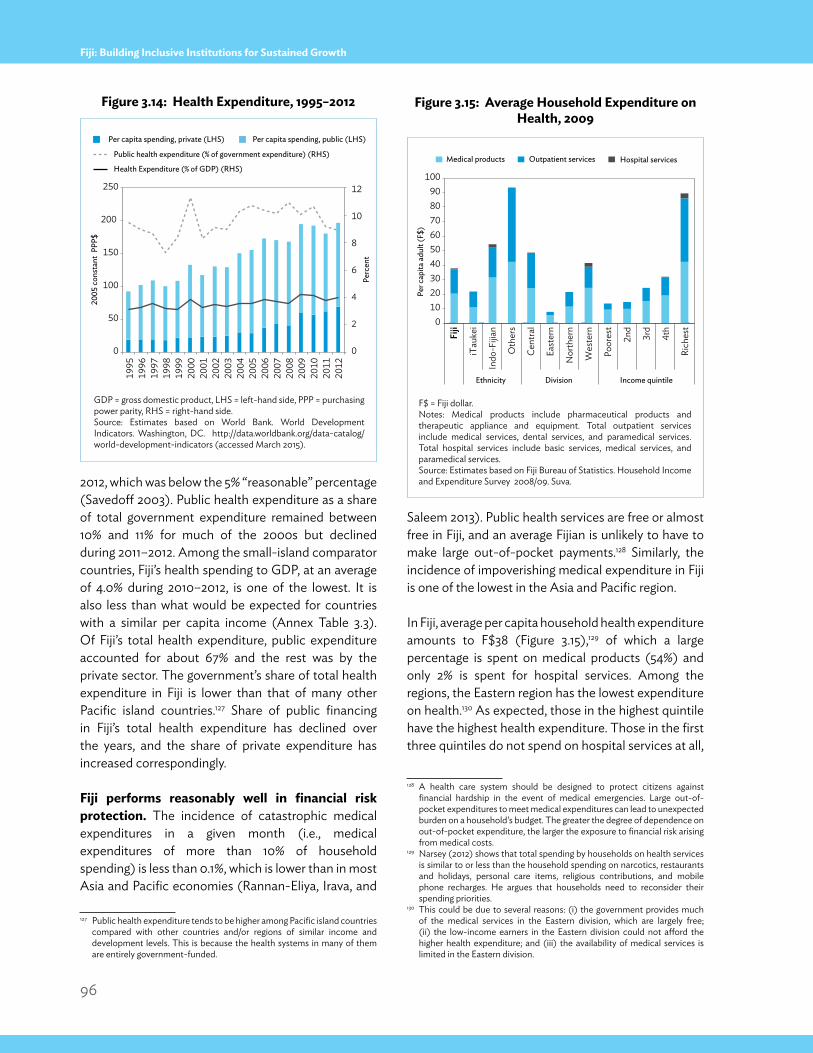
96
Fiji: Building Inclusive Institutions for Sustained Growth
2012, which was below the 5% “reasonable” percentage (Savedoff 2003). Public health expenditure as a share of total government expenditure remained between 10% and 11% for much of the 2000s but declined during 2011–2012. Among the small-island comparator countries, Fiji’s health spending to GDP, at an average of 4.0% during 2010–2012, is one of the lowest. It is also less than what would be expected for countries with a similar per capita income (Annex Table 3.3). Of Fiji’s total health expenditure, public expenditure accounted for about 67% and the rest was by the private sector. The government’s share of total health expenditure in Fiji is lower than that of many other Pacific island countries.127 Share of public financing in Fiji’s total health expenditure has declined over the years, and the share of private expenditure has increased correspondingly.
Fiji performs reasonably well in financial risk protection. The incidence of catastrophic medical expenditures in a given month (i.e., medical expenditures of more than 10% of household spending) is less than 0.1%, which is lower than in most Asia and Pacific economies (Rannan-Eliya, Irava, and
127 Public health expenditure tends to be higher among Pacific island countries compared with other countries and/or regions of similar income and development levels. This is because the health systems in many of them are entirely government-funded.
Saleem 2013). Public health services are free or almost free in Fiji, and an average Fijian is unlikely to have to make large out-of-pocket payments.128 Similarly, the incidence of impoverishing medical expenditure in Fiji is one of the lowest in the Asia and Pacific region.
In Fiji, average per capita household health expenditure amounts to F$38 (Figure 3.15),129 of which a large percentage is spent on medical products (54%) and only 2% is spent for hospital services. Among the regions, the Eastern region has the lowest expenditure on health.130 As expected, those in the highest quintile have the highest health expenditure. Those in the first three quintiles do not spend on hospital services at all,
128 A health care system should be designed to protect citizens against financial hardship in the event of medical emergencies. Large out-of-pocket expenditures to meet medical expenditures can lead to unexpected burden on a household’s budget. The greater the degree of dependence on out-of-pocket expenditure, the larger the exposure to financial risk arising from medical costs.
129 Narsey (2012) shows that total spending by households on health services is similar to or less than the household spending on narcotics, restaurants and holidays, personal care items, religious contributions, and mobile phone recharges. He argues that households need to reconsider their spending priorities.
130 This could be due to several reasons: (i) the government provides much of the medical services in the Eastern division, which are largely free; (ii) the low-income earners in the Eastern division could not afford the higher health expenditure; and (iii) the availability of medical services is limited in the Eastern division.
Figure 3.15: Average Household expenditure on Health, 2009
F$ = Fiji dollar.Notes: Medical products include pharmaceutical products and therapeutic appliance and equipment. Total outpatient services include medical services, dental services, and paramedical services. Total hospital services include basic services, medical services, and paramedical services.Source: Estimates based on Fiji Bureau of Statistics. Household Income and Expenditure Survey 2008/09. Suva.
Figure 3.14: Health expenditure, 1995–2012
GDP = gross domestic product, LHS = left-hand side, PPP = purchasing power parity, RHS = right-hand side.Source: Estimates based on World Bank. World Development Indicators. Washington, DC. http://data.worldbank.org/data-catalog/world-development-indicators (accessed March 2015).
0 0
50
100
150
200
250 12
10
8
6
4
2
2005
con
stan
t PP
P$
Perc
ent
Per capita spending, private (LHS) Per capita spending, public (LHS)
Public health expenditure (% of government expenditure) (RHS)
Health Expenditure (% of GDP) (RHS)
1995
1996
1997
1998
1999
2000
2001
2002
2003
2004
2005
2006
2007
2008
2009
2010
2011
2012
0102030405060708090
100
Per c
apita
adu
lt (F
$)
Fiji
iTau
kei
Indo
-Fijia
n
Oth
ers
Cent
ral
East
ern
Nor
ther
n
Wes
tern
Poor
est
2nd
3rd
4th
Rich
est
Ethnicity Income quintileDivision
Medical products Outpatient services Hospital services
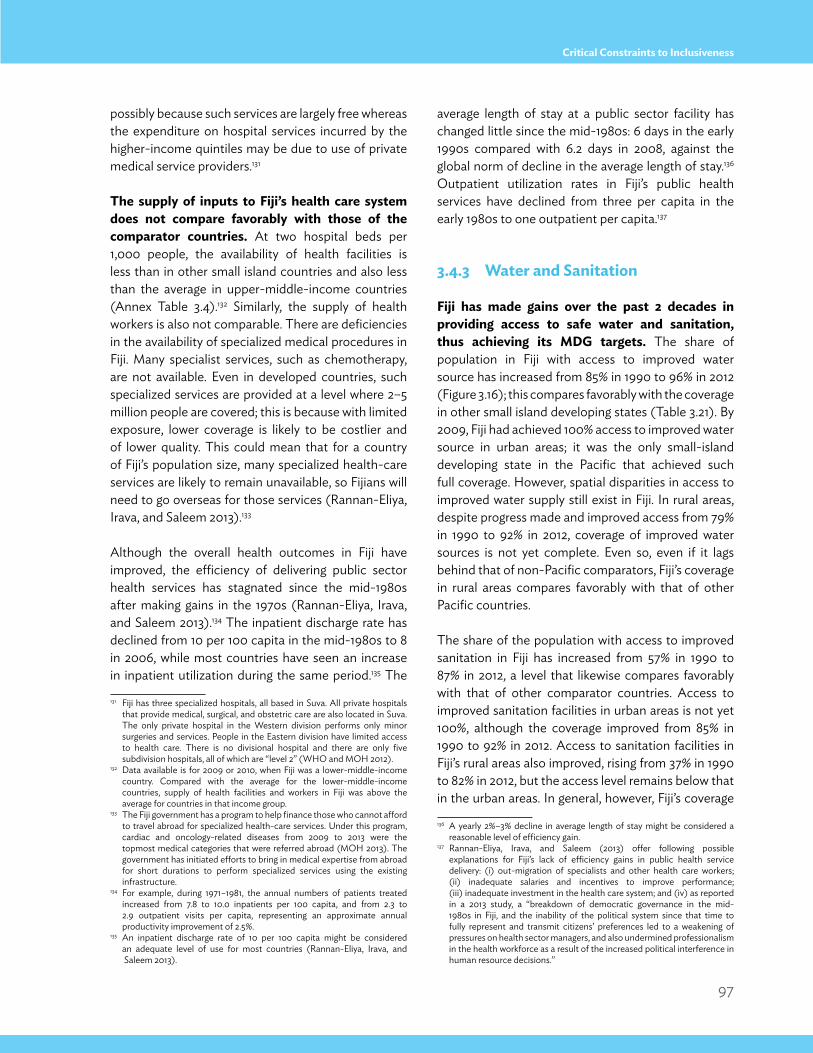
97
Critical Constraints to Inclusiveness
possibly because such services are largely free whereas the expenditure on hospital services incurred by the higher-income quintiles may be due to use of private medical service providers.131
the supply of inputs to Fiji’s health care system does not compare favorably with those of the comparator countries. At two hospital beds per 1,000 people, the availability of health facilities is less than in other small island countries and also less than the average in upper-middle-income countries (Annex Table 3.4).132 Similarly, the supply of health workers is also not comparable. There are deficiencies in the availability of specialized medical procedures in Fiji. Many specialist services, such as chemotherapy, are not available. Even in developed countries, such specialized services are provided at a level where 2–5 million people are covered; this is because with limited exposure, lower coverage is likely to be costlier and of lower quality. This could mean that for a country of Fiji’s population size, many specialized health-care services are likely to remain unavailable, so Fijians will need to go overseas for those services (Rannan-Eliya, Irava, and Saleem 2013).133
Although the overall health outcomes in Fiji have improved, the efficiency of delivering public sector health services has stagnated since the mid-1980s after making gains in the 1970s (Rannan-Eliya, Irava, and Saleem 2013).134 The inpatient discharge rate has declined from 10 per 100 capita in the mid-1980s to 8 in 2006, while most countries have seen an increase in inpatient utilization during the same period.135 The
131 Fiji has three specialized hospitals, all based in Suva. All private hospitals that provide medical, surgical, and obstetric care are also located in Suva. The only private hospital in the Western division performs only minor surgeries and services. People in the Eastern division have limited access to health care. There is no divisional hospital and there are only five subdivision hospitals, all of which are “level 2” (WHO and MOH 2012).
132 Data available is for 2009 or 2010, when Fiji was a lower-middle-income country. Compared with the average for the lower-middle-income countries, supply of health facilities and workers in Fiji was above the average for countries in that income group.
133 The Fiji government has a program to help finance those who cannot afford to travel abroad for specialized health-care services. Under this program, cardiac and oncology-related diseases from 2009 to 2013 were the topmost medical categories that were referred abroad (MOH 2013). The government has initiated efforts to bring in medical expertise from abroad for short durations to perform specialized services using the existing infrastructure.
134 For example, during 1971–1981, the annual numbers of patients treated increased from 7.8 to 10.0 inpatients per 100 capita, and from 2.3 to 2.9 outpatient visits per capita, representing an approximate annual productivity improvement of 2.5%.
135 An inpatient discharge rate of 10 per 100 capita might be considered an adequate level of use for most countries (Rannan-Eliya, Irava, and Saleem 2013).
average length of stay at a public sector facility has changed little since the mid-1980s: 6 days in the early 1990s compared with 6.2 days in 2008, against the global norm of decline in the average length of stay.136 Outpatient utilization rates in Fiji’s public health services have declined from three per capita in the early 1980s to one outpatient per capita.137
3.4.3 Water and sanitation
Fiji has made gains over the past 2 decades in providing access to safe water and sanitation, thus achieving its mDG targets. The share of population in Fiji with access to improved water source has increased from 85% in 1990 to 96% in 2012 (Figure 3.16); this compares favorably with the coverage in other small island developing states (Table 3.21). By 2009, Fiji had achieved 100% access to improved water source in urban areas; it was the only small-island developing state in the Pacific that achieved such full coverage. However, spatial disparities in access to improved water supply still exist in Fiji. In rural areas, despite progress made and improved access from 79% in 1990 to 92% in 2012, coverage of improved water sources is not yet complete. Even so, even if it lags behind that of non-Pacific comparators, Fiji’s coverage in rural areas compares favorably with that of other Pacific countries.
The share of the population with access to improved sanitation in Fiji has increased from 57% in 1990 to 87% in 2012, a level that likewise compares favorably with that of other comparator countries. Access to improved sanitation facilities in urban areas is not yet 100%, although the coverage improved from 85% in 1990 to 92% in 2012. Access to sanitation facilities in Fiji’s rural areas also improved, rising from 37% in 1990 to 82% in 2012, but the access level remains below that in the urban areas. In general, however, Fiji’s coverage
136 A yearly 2%–3% decline in average length of stay might be considered a reasonable level of efficiency gain.
137 Rannan-Eliya, Irava, and Saleem (2013) offer following possible explanations for Fiji’s lack of efficiency gains in public health service delivery: (i) out-migration of specialists and other health care workers; (ii) inadequate salaries and incentives to improve performance; (iii) inadequate investment in the health care system; and (iv) as reported in a 2013 study, a “breakdown of democratic governance in the mid-1980s in Fiji, and the inability of the political system since that time to fully represent and transmit citizens’ preferences led to a weakening of pressures on health sector managers, and also undermined professionalism in the health workforce as a result of the increased political interference in human resource decisions.”
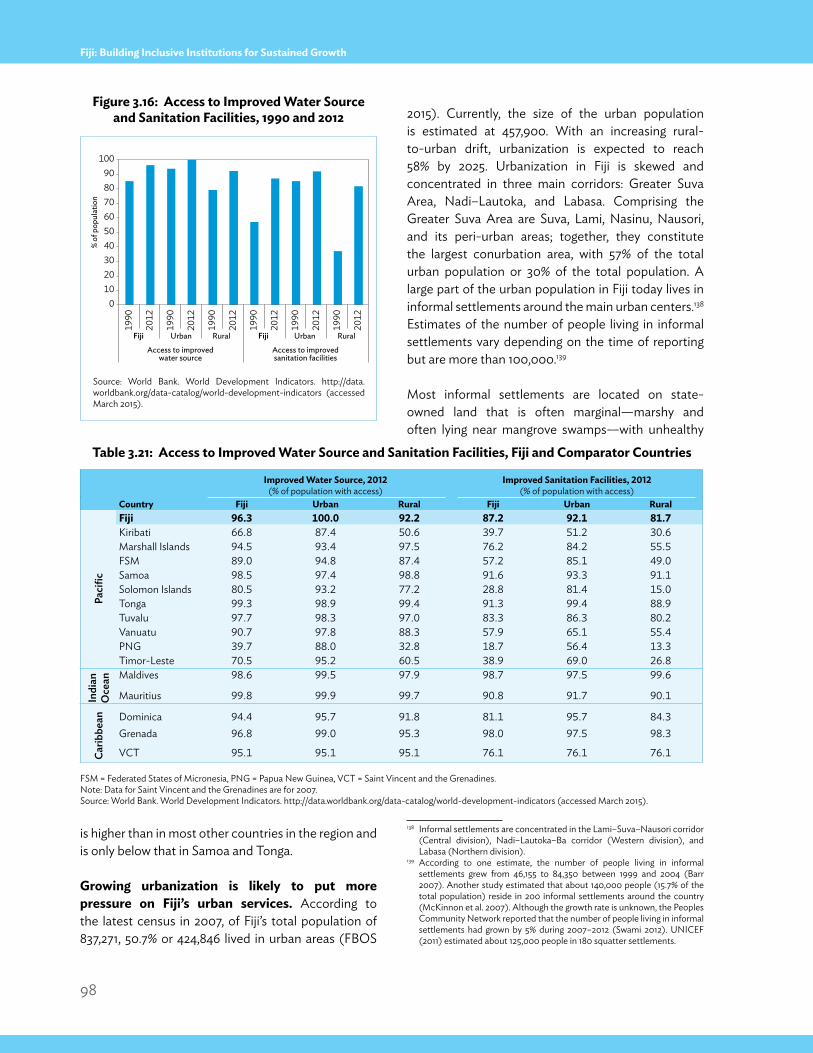
98
Fiji: Building Inclusive Institutions for Sustained Growth
is higher than in most other countries in the region and is only below that in Samoa and Tonga.
Growing urbanization is likely to put more pressure on Fiji’s urban services. According to the latest census in 2007, of Fiji’s total population of 837,271, 50.7% or 424,846 lived in urban areas (FBOS
2015). Currently, the size of the urban population is estimated at 457,900. With an increasing rural-to-urban drift, urbanization is expected to reach 58% by 2025. Urbanization in Fiji is skewed and concentrated in three main corridors: Greater Suva Area, Nadi–Lautoka, and Labasa. Comprising the Greater Suva Area are Suva, Lami, Nasinu, Nausori, and its peri-urban areas; together, they constitute the largest conurbation area, with 57% of the total urban population or 30% of the total population. A large part of the urban population in Fiji today lives in informal settlements around the main urban centers.138 Estimates of the number of people living in informal settlements vary depending on the time of reporting but are more than 100,000.139
Most informal settlements are located on state-owned land that is often marginal—marshy and often lying near mangrove swamps—with unhealthy
138 Informal settlements are concentrated in the Lami–Suva–Nausori corridor (Central division), Nadi–Lautoka–Ba corridor (Western division), and Labasa (Northern division).
139 According to one estimate, the number of people living in informal settlements grew from 46,155 to 84,350 between 1999 and 2004 (Barr 2007). Another study estimated that about 140,000 people (15.7% of the total population) reside in 200 informal settlements around the country (McKinnon et al. 2007). Although the growth rate is unknown, the Peoples Community Network reported that the number of people living in informal settlements had grown by 5% during 2007–2012 (Swami 2012). UNICEF (2011) estimated about 125,000 people in 180 squatter settlements.
table 3.21: Access to improved Water source and sanitation Facilities, Fiji and Comparator Countries
FSM = Federated States of Micronesia, PNG = Papua New Guinea, VCT = Saint Vincent and the Grenadines.Note: Data for Saint Vincent and the Grenadines are for 2007.Source: World Bank. World Development Indicators. http://data.worldbank.org/data-catalog/world-development-indicators (accessed March 2015).
Figure 3.16: Access to improved Water source and sanitation Facilities, 1990 and 2012
Source: World Bank. World Development Indicators. http://data.worldbank.org/data-catalog/world-development-indicators (accessed March 2015).
improved Water source, 2012(% of population with access)
improved sanitation Facilities, 2012(% of population with access)
Country Fiji Urban Rural Fiji Urban Rural
Paci
fic
Fiji 96.3 100.0 92.2 87.2 92.1 81.7Kiribati 66.8 87.4 50.6 39.7 51.2 30.6Marshall Islands 94.5 93.4 97.5 76.2 84.2 55.5FSM 89.0 94.8 87.4 57.2 85.1 49.0Samoa 98.5 97.4 98.8 91.6 93.3 91.1Solomon Islands 80.5 93.2 77.2 28.8 81.4 15.0Tonga 99.3 98.9 99.4 91.3 99.4 88.9Tuvalu 97.7 98.3 97.0 83.3 86.3 80.2Vanuatu 90.7 97.8 88.3 57.9 65.1 55.4PNG 39.7 88.0 32.8 18.7 56.4 13.3Timor-Leste 70.5 95.2 60.5 38.9 69.0 26.8
Indi
an
Oce
an Maldives 98.6 99.5 97.9 98.7 97.5 99.6
Mauritius 99.8 99.9 99.7 90.8 91.7 90.1
carib
bean Dominica 94.4 95.7 91.8 81.1 95.7 84.3
Grenada 96.8 99.0 95.3 98.0 97.5 98.3
VCT 95.1 95.1 95.1 76.1 76.1 76.1
1990
2012
1990
2012
1990
2012
1990
2012
1990
2012
1990
2012
Fiji Urban Rural Fiji Urban Rural
Access to improvedwater source
Access to improvedsanitation facilities
0102030405060708090
100
% of
pop
ulat
ion
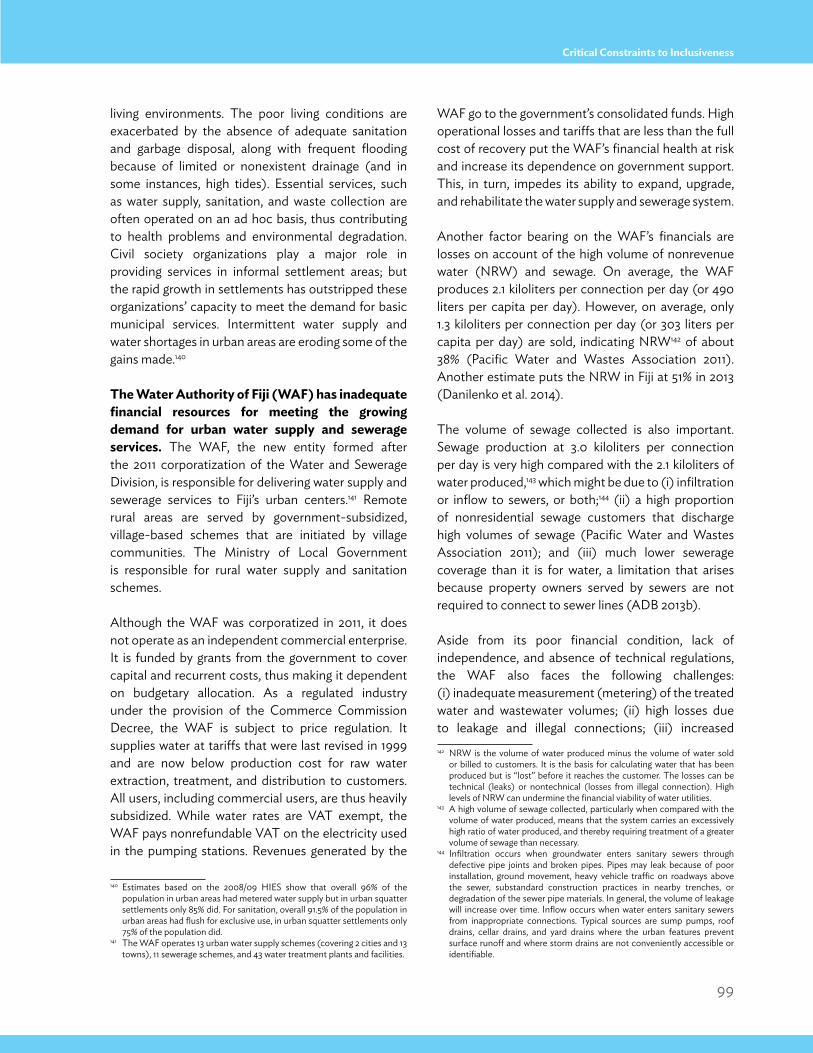
99
Critical Constraints to Inclusiveness
living environments. The poor living conditions are exacerbated by the absence of adequate sanitation and garbage disposal, along with frequent flooding because of limited or nonexistent drainage (and in some instances, high tides). Essential services, such as water supply, sanitation, and waste collection are often operated on an ad hoc basis, thus contributing to health problems and environmental degradation. Civil society organizations play a major role in providing services in informal settlement areas; but the rapid growth in settlements has outstripped these organizations’ capacity to meet the demand for basic municipal services. Intermittent water supply and water shortages in urban areas are eroding some of the gains made.140
the Water Authority of Fiji (WAF) has inadequate financial resources for meeting the growing demand for urban water supply and sewerage services. The WAF, the new entity formed after the 2011 corporatization of the Water and Sewerage Division, is responsible for delivering water supply and sewerage services to Fiji’s urban centers.141 Remote rural areas are served by government-subsidized, village-based schemes that are initiated by village communities. The Ministry of Local Government is responsible for rural water supply and sanitation schemes.
Although the WAF was corporatized in 2011, it does not operate as an independent commercial enterprise. It is funded by grants from the government to cover capital and recurrent costs, thus making it dependent on budgetary allocation. As a regulated industry under the provision of the Commerce Commission Decree, the WAF is subject to price regulation. It supplies water at tariffs that were last revised in 1999 and are now below production cost for raw water extraction, treatment, and distribution to customers. All users, including commercial users, are thus heavily subsidized. While water rates are VAT exempt, the WAF pays nonrefundable VAT on the electricity used in the pumping stations. Revenues generated by the
140 Estimates based on the 2008/09 HIES show that overall 96% of the population in urban areas had metered water supply but in urban squatter settlements only 85% did. For sanitation, overall 91.5% of the population in urban areas had flush for exclusive use, in urban squatter settlements only 75% of the population did.
141 The WAF operates 13 urban water supply schemes (covering 2 cities and 13 towns), 11 sewerage schemes, and 43 water treatment plants and facilities.
WAF go to the government’s consolidated funds. High operational losses and tariffs that are less than the full cost of recovery put the WAF’s financial health at risk and increase its dependence on government support. This, in turn, impedes its ability to expand, upgrade, and rehabilitate the water supply and sewerage system.
Another factor bearing on the WAF’s financials are losses on account of the high volume of nonrevenue water (NRW) and sewage. On average, the WAF produces 2.1 kiloliters per connection per day (or 490 liters per capita per day). However, on average, only 1.3 kiloliters per connection per day (or 303 liters per capita per day) are sold, indicating NRW142 of about 38% (Pacific Water and Wastes Association 2011). Another estimate puts the NRW in Fiji at 51% in 2013 (Danilenko et al. 2014).
The volume of sewage collected is also important. Sewage production at 3.0 kiloliters per connection per day is very high compared with the 2.1 kiloliters of water produced,143 which might be due to (i) infiltration or inflow to sewers, or both;144 (ii) a high proportion of nonresidential sewage customers that discharge high volumes of sewage (Pacific Water and Wastes Association 2011); and (iii) much lower sewerage coverage than it is for water, a limitation that arises because property owners served by sewers are not required to connect to sewer lines (ADB 2013b).
Aside from its poor financial condition, lack of independence, and absence of technical regulations, the WAF also faces the following challenges: (i) inadequate measurement (metering) of the treated water and wastewater volumes; (ii) high losses due to leakage and illegal connections; (iii) increased 142 NRW is the volume of water produced minus the volume of water sold
or billed to customers. It is the basis for calculating water that has been produced but is “lost” before it reaches the customer. The losses can be technical (leaks) or nontechnical (losses from illegal connection). High levels of NRW can undermine the financial viability of water utilities.
143 A high volume of sewage collected, particularly when compared with the volume of water produced, means that the system carries an excessively high ratio of water produced, and thereby requiring treatment of a greater volume of sewage than necessary.
144 Infiltration occurs when groundwater enters sanitary sewers through defective pipe joints and broken pipes. Pipes may leak because of poor installation, ground movement, heavy vehicle traffic on roadways above the sewer, substandard construction practices in nearby trenches, or degradation of the sewer pipe materials. In general, the volume of leakage will increase over time. Inflow occurs when water enters sanitary sewers from inappropriate connections. Typical sources are sump pumps, roof drains, cellar drains, and yard drains where the urban features prevent surface runoff and where storm drains are not conveniently accessible or identifiable.
100
Fiji: Building Inclusive Institutions for Sustained Growth
responsibility of designing and operating nonviable water supplies for rural areas and outer islands; (iv) an under-resourced water quality laboratory; (v) high reliance on electricity for operations and high cost of electricity; and (vi) regulatory and environmental compliance (ADB 2014a).145
3.5 leveling the playing Field
To ensure equal access to opportunities, there is a need in Fiji for equal access to infrastructure and to productive assets like land and credit.
3.5.1 Access to infrastructure
limited access to infrastructure outside the two main islands restricts access to markets and services. Improving connectivity and access to transport services is essential to lower the cost of accessing markets and social services; this can also increase economic opportunities such that urban drift can be reduced. Although Fiji has a fairly well-developed infrastructure compared with other Pacific island countries, providing adequate infrastructure services to less populated and remotely located islands remains a major challenge. This hinders the development of Fiji’s outer islands that may have agricultural or tourism potential.
maritime transport plays a critical role in ensuring access to remote outer islands. In addition to Lautoka, Suva, and the specialized ports, there are about 40 smaller island wharves and jetties and a few river landings that are served by a mixture of conventional passenger and/or cargo vessels and landings. These minor ports provide only basic services for coastal traffic and are often constrained by weather and tidal conditions. Coastal shipping lanes and access channels to ports are generally poorly equipped with navigational aids. Safety measures and infrastructure at most of the smaller ports are rudimentary, with ship operators taking their own measures to maintain operational safety. A further complication to safety
145 Regulatory responsibility for water quality is with the MOH, and that for sewerage rests with the Department of Environment. However, these two agencies lack the capacity to implement their regulatory responsibility (ADB 2013b). For sewerage, there are no formal regulations for effluent standards.
is the inaccuracy in maritime charts, where the location of many islands and hazards—in fact the very existence of some—is still unclear. The Maritime Safety Authority of Fiji is taking steps to address these deficiencies.
Four commercial operators are engaged in domestic shipping and provide main interisland roll-on/roll-off shipping services between Viti Levu (Suva, Natovi, and Ellington) and Vanua Levu (Nabouwalu and Savusavu), and also call at Ovalau (Levuka), Taveuni, Koro, and Kadavu (Vunisea and Kavala). Daily and weekly services are provided.
In 1996, the government introduced a subsidized Fiji Franchise Shipping Scheme that provides some assurance of a minimum service to the outer islands, which commercial operators would otherwise not serve.146 These services provide essential links for domestic freight and passengers, for some limited return export cargo (e.g., bêche-de-mer, dalo, etc.), and for a small but significant and growing tourist trade. Six vessels operate 10 franchise routes. The franchise scheme faces challenges over (i) the quality of ships and capacity of crew, (ii) lack of proper documentation of sailings and of financial accounting, (iii) inadequacy of franchise rates, and (iv) lack of standby vessels when the scheduled vessels are undergoing maintenance.147
A third component of domestic shipping is the Government Shipping Service (GSS), which operates three roll-on/roll-off services and two conventional vessels under direct government funding. These vessels carry development cargoes to coastal and outer-island locations. Space permitting, however, these ships also carry passengers and general cargo at a concessionary tariff that undercuts commercial operators, who have complained about this practice. The GSS has undergone fleet rationalization, selling off several older vessels and purchasing two new vessels. The GSS is also responsible for operating and maintaining mandatory marine navigational aids and for providing professional and vocational maritime training.
146 Service franchises are tendered for a fixed time period, service schedule, and tariff structure, with the lowest qualifying bidder awarded the contract to operate.
147 Based on preliminary findings of an ongoing study commissioned under ADB. 2013c. Technical Assistance to Fiji for Transport Sector Planning and Management. Manila (TA 8514-FIJ).
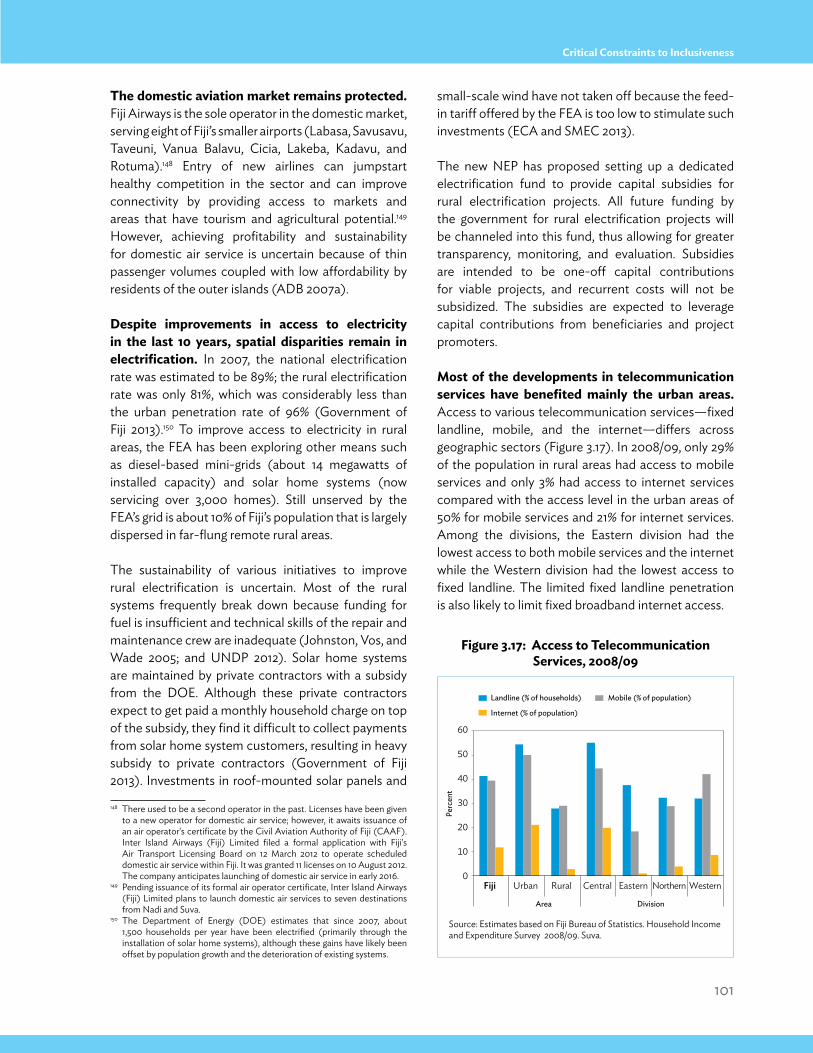
101
Critical Constraints to Inclusiveness
the domestic aviation market remains protected. Fiji Airways is the sole operator in the domestic market, serving eight of Fiji’s smaller airports (Labasa, Savusavu, Taveuni, Vanua Balavu, Cicia, Lakeba, Kadavu, and Rotuma).148 Entry of new airlines can jumpstart healthy competition in the sector and can improve connectivity by providing access to markets and areas that have tourism and agricultural potential.149 However, achieving profitability and sustainability for domestic air service is uncertain because of thin passenger volumes coupled with low affordability by residents of the outer islands (ADB 2007a).
Despite improvements in access to electricity in the last 10 years, spatial disparities remain in electrification. In 2007, the national electrification rate was estimated to be 89%; the rural electrification rate was only 81%, which was considerably less than the urban penetration rate of 96% (Government of Fiji 2013).150 To improve access to electricity in rural areas, the FEA has been exploring other means such as diesel-based mini-grids (about 14 megawatts of installed capacity) and solar home systems (now servicing over 3,000 homes). Still unserved by the FEA’s grid is about 10% of Fiji’s population that is largely dispersed in far-flung remote rural areas.
The sustainability of various initiatives to improve rural electrification is uncertain. Most of the rural systems frequently break down because funding for fuel is insufficient and technical skills of the repair and maintenance crew are inadequate (Johnston, Vos, and Wade 2005; and UNDP 2012). Solar home systems are maintained by private contractors with a subsidy from the DOE. Although these private contractors expect to get paid a monthly household charge on top of the subsidy, they find it difficult to collect payments from solar home system customers, resulting in heavy subsidy to private contractors (Government of Fiji 2013). Investments in roof-mounted solar panels and
148 There used to be a second operator in the past. Licenses have been given to a new operator for domestic air service; however, it awaits issuance of an air operator's certificate by the Civil Aviation Authority of Fiji (CAAF). Inter Island Airways (Fiji) Limited filed a formal application with Fiji's Air Transport Licensing Board on 12 March 2012 to operate scheduled domestic air service within Fiji. It was granted 11 licenses on 10 August 2012. The company anticipates launching of domestic air service in early 2016.
149 Pending issuance of its formal air operator certificate, Inter Island Airways (Fiji) Limited plans to launch domestic air services to seven destinations from Nadi and Suva.
150 The Department of Energy (DOE) estimates that since 2007, about 1,500 households per year have been electrified (primarily through the installation of solar home systems), although these gains have likely been offset by population growth and the deterioration of existing systems.
small-scale wind have not taken off because the feed-in tariff offered by the FEA is too low to stimulate such investments (ECA and SMEC 2013).
The new NEP has proposed setting up a dedicated electrification fund to provide capital subsidies for rural electrification projects. All future funding by the government for rural electrification projects will be channeled into this fund, thus allowing for greater transparency, monitoring, and evaluation. Subsidies are intended to be one-off capital contributions for viable projects, and recurrent costs will not be subsidized. The subsidies are expected to leverage capital contributions from beneficiaries and project promoters.
most of the developments in telecommunication services have benefited mainly the urban areas. Access to various telecommunication services—fixed landline, mobile, and the internet—differs across geographic sectors (Figure 3.17). In 2008/09, only 29% of the population in rural areas had access to mobile services and only 3% had access to internet services compared with the access level in the urban areas of 50% for mobile services and 21% for internet services. Among the divisions, the Eastern division had the lowest access to both mobile services and the internet while the Western division had the lowest access to fixed landline. The limited fixed landline penetration is also likely to limit fixed broadband internet access.
Figure 3.17: Access to telecommunication services, 2008/09
Source: Estimates based on Fiji Bureau of Statistics. Household Income and Expenditure Survey 2008/09. Suva.
0
10
20
30
40
50
60
Perc
ent
Landline (% of households) Mobile (% of population)
Internet (% of population)
Fiji Urban Rural Central Eastern Northern Western
Area Division
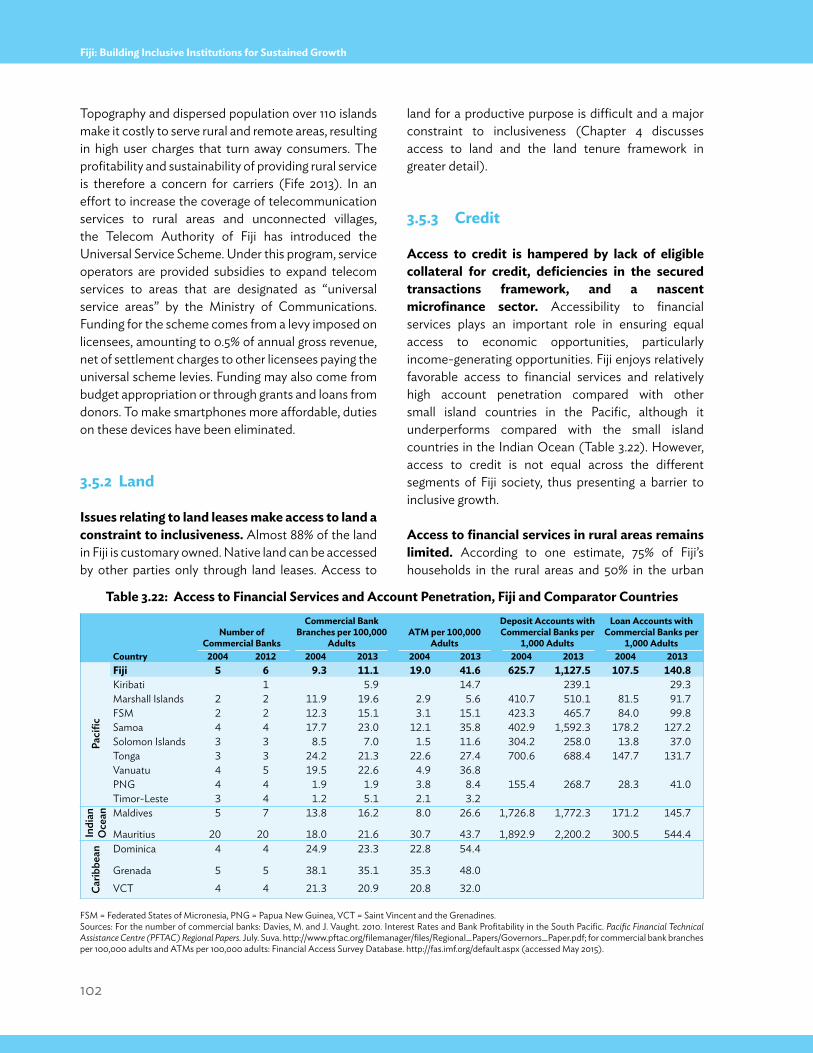
102
Fiji: Building Inclusive Institutions for Sustained Growth
Topography and dispersed population over 110 islands make it costly to serve rural and remote areas, resulting in high user charges that turn away consumers. The profitability and sustainability of providing rural service is therefore a concern for carriers (Fife 2013). In an effort to increase the coverage of telecommunication services to rural areas and unconnected villages, the Telecom Authority of Fiji has introduced the Universal Service Scheme. Under this program, service operators are provided subsidies to expand telecom services to areas that are designated as “universal service areas” by the Ministry of Communications. Funding for the scheme comes from a levy imposed on licensees, amounting to 0.5% of annual gross revenue, net of settlement charges to other licensees paying the universal scheme levies. Funding may also come from budget appropriation or through grants and loans from donors. To make smartphones more affordable, duties on these devices have been eliminated.
3.5.2 land
issues relating to land leases make access to land a constraint to inclusiveness. Almost 88% of the land in Fiji is customary owned. Native land can be accessed by other parties only through land leases. Access to
land for a productive purpose is difficult and a major constraint to inclusiveness (Chapter 4 discusses access to land and the land tenure framework in greater detail).
3.5.3 Credit
Access to credit is hampered by lack of eligible collateral for credit, deficiencies in the secured transactions framework, and a nascent microfinance sector. Accessibility to financial services plays an important role in ensuring equal access to economic opportunities, particularly income-generating opportunities. Fiji enjoys relatively favorable access to financial services and relatively high account penetration compared with other small island countries in the Pacific, although it underperforms compared with the small island countries in the Indian Ocean (Table 3.22). However, access to credit is not equal across the different segments of Fiji society, thus presenting a barrier to inclusive growth. Access to financial services in rural areas remains limited. According to one estimate, 75% of Fiji’s households in the rural areas and 50% in the urban
table 3.22: Access to Financial services and Account penetration, Fiji and Comparator Countries
FSM = Federated States of Micronesia, PNG = Papua New Guinea, VCT = Saint Vincent and the Grenadines. Sources: For the number of commercial banks: Davies, M. and J. Vaught. 2010. Interest Rates and Bank Profitability in the South Pacific. Pacific Financial Technical Assistance Centre (PFTAC) Regional Papers. July. Suva. http://www.pftac.org/filemanager/files/Regional_Papers/Governors_Paper.pdf; for commercial bank branches per 100,000 adults and ATMs per 100,000 adults: Financial Access Survey Database. http://fas.imf.org/default.aspx (accessed May 2015).
Country
number of Commercial Banks
Commercial Bank Branches per 100,000
AdultsAtm per 100,000
Adults
Deposit Accounts with Commercial Banks per
1,000 Adults
loan Accounts with Commercial Banks per
1,000 Adults2004 2012 2004 2013 2004 2013 2004 2013 2004 2013
Paci
fic
Fiji 5 6 9.3 11.1 19.0 41.6 625.7 1,127.5 107.5 140.8Kiribati 1 5.9 14.7 239.1 29.3Marshall Islands 2 2 11.9 19.6 2.9 5.6 410.7 510.1 81.5 91.7FSM 2 2 12.3 15.1 3.1 15.1 423.3 465.7 84.0 99.8Samoa 4 4 17.7 23.0 12.1 35.8 402.9 1,592.3 178.2 127.2Solomon Islands 3 3 8.5 7.0 1.5 11.6 304.2 258.0 13.8 37.0Tonga 3 3 24.2 21.3 22.6 27.4 700.6 688.4 147.7 131.7Vanuatu 4 5 19.5 22.6 4.9 36.8PNG 4 4 1.9 1.9 3.8 8.4 155.4 268.7 28.3 41.0Timor-Leste 3 4 1.2 5.1 2.1 3.2
Indi
an
Oce
an Maldives 5 7 13.8 16.2 8.0 26.6 1,726.8 1,772.3 171.2 145.7
Mauritius 20 20 18.0 21.6 30.7 43.7 1,892.9 2,200.2 300.5 544.4
carib
bean Dominica 4 4 24.9 23.3 22.8 54.4
Grenada 5 5 38.1 35.1 35.3 48.0VCT 4 4 21.3 20.9 20.8 32.0
103
Critical Constraints to Inclusiveness
areas have no access to banking services (PFIP 2009). Among the reasons for this limited banking penetration are (i) the high cost of setting up bank branches in remote and rural areas; (ii) the low population density outside the main areas; and (iii) dependence on subsistence, sharing, and noncash trading in rural areas. Penetration of ATMs and of electronic funds transfer at points-of-sale machines has increased, thus helping improve access to financial services. This improvement has been complemented by increased interchangeability at both ATMs and electronic funds transfer at points-of-sale machines. The use of information and communication technology has also widened the reach of financial services.151
Deficiencies in the secured transactions framework limit the use of movable assets as collateral. Regardless of who is being provided credit, all lenders naturally want to be certain that they will be repaid. Collateral (i.e., a property of the debtor pledged to the creditor to secure payment) thus provides an important part of the assurance that lenders require. ADB’s private sector assessment (ADB 2013b) notes that large businesses with an established track record are usually able to raise money from the banks or the stock market; however, access to credit for small businesses is more likely to be limited. For banks, the usually preferred forms of collateral are land, land leases, and buildings. Like most of the other Pacific countries, however, Fiji’s land ownership structure restricts the use of land or land leases as collateral. This makes the ability to borrow, as well as the willingness of lenders to lend, critically dependent on alternative forms of collateral like movable property. Laws governing such forms of collateral are thus important.
Lending against movable assets is typically governed by a secured transaction framework.152 The existing legal framework in Fiji allows creditors to enter
151 These include initiatives such as (i) the collaboration between Westpac and the Department of Social Welfare (DSW) in creating bank accounts for close to 20,000 low-income people who receive social transfers, (ii) the decision by the iTaukei Land Trust Board (TLTB) requiring all of its landowners to establish bank accounts, and (iii) the introduction of SMS banking. The launch of new services by mobile telephone companies, the MPAiSA by Vodafone and Mobile Money by Digicel, has also helped spread the reach of financial services to those without access to banks.
152 A secured transaction framework is the legal framework that allows for pledging movable assets as collateral against which firms can borrow and the conditions under which, in case of default, lenders may repossess the assets. Examples of movable assets are machinery, tools, inventory crops, accounts receivables, future earnings, land rents, royalties, vehicles, vessels, and airplanes (ADB 2014d).
into a secured loan by creating a security interest against a debtor’s property. There are several gaps in Fiji’s secured transactions framework in the areas of creation, prioritization, and public registration of security interest, as well as in enforcement in the event of default (see Box 3.3).153 Deficiencies in the securitization system, along with the inability to use land lease as collateral as well as poor credit information and slow enforcement, keep the value of collateral required in Fiji as high as over 200% of the loaned amount (Figure 3.18).154
Greater financial inclusion is one of the government’s key priorities. The microfinance sector in Fiji is largely homegrown—driven by the government with support from donors. A microfinance unit, established in 1999 under the MOF, was tasked to conduct pilot projects on microfinance activities and set national microfinance targets. In 2004, the microfinance unit was placed under the National Centre for Small and Micro Enterprise Development (NCSMED), a quasi-governmental entity mandated to promote and accelerate the development and growth of small and micro enterprises in Fiji (ADB 2010, and Fischer and Bruett 2010).
With the objective of achieving greater financial inclusion, a national microfinance workshop was organized in 2009 to formulate the Medium Term Strategy for Financial Inclusion in Fiji. The workshop set the goal of reaching 150,000 unbanked clients by 2014—a target that was achieved that year. The workshop recommended (i) forming a financial inclusion taskforce, (ii) collecting national baseline data
153 In the last few years, the Federated States of Micronesia, the Marshall Islands, Solomon Islands, Tonga, and Vanuatu have undertaken reforms in the area of securitization and are currently near best practice in the strength of legal rights (ADB 2014d).
154 To support small and medium-sized enterprises (SMEs), the government introduced the SME Credit Guarantee Scheme in 2012. The scheme is administered by the RBF and the government has provided an allocation of F$4 million to fund the scheme. Under this scheme, in the event of default on eligible SME loans, the government guarantees to pay 50% of the principal amount outstanding up to a maximum of F$50,000 per business. To be eligible for claims under the scheme, the interest rate on SME loans should not exceed 10% per annum (the rate is subject to periodic review by the RBF). By the end of 2013, 460 SME loans valued at F$27.2 million were covered under the scheme compared with 187 SME loans valued at F$10.3 million in 2012. No claims were received by the RBF in 2013. Such credit guarantee schemes can partly help address concerns about lack of a good collateral and high collateral requirement. While this is a welcome initiative that can help raise seed money, performance measures and sunset clauses should accompany this kind of support with the aim of government ultimately withdrawing and the firm being able to provide collateral as well as the firm being able to raise money from the market.
104
Fiji: Building Inclusive Institutions for Sustained Growth
Box 3.3: secured transactions Framework in Fiji
There is by now extensive literature documenting positive relationship financial development, growth, and productivity (see Zhuang et al. 2009 for a literature review). Compared with large businesses, there are more constraints to Fiji’s micro, small, and medium-sized enterprises in being able to attract funding, more so in their infant stages; only once past the initial phase are these businesses able to attract financing. Funding for smaller businesses is thus at the outset restricted to equity, retained earnings, and trade credit. This reduces the efficiency and the competitiveness of smaller businesses, which are forced to economize on inventory and capital investment such as equipment. Another constraint is the difficulty in using land and other communal assets as collateral. Thus, being able to borrow against other forms of collateral acquires importance as does the legal framework, i.e., the secured transactions framework, that facilitates such borrowing. Using firm-level survey data from 73 countries, Love, Peria and Singh (2014) show that the introduction of registries for movable assets is associated with (i) an increase in the likelihood that a firm has a bank loan, a line of credit, or overdraft, (ii) a rise in the share of the firm’s working capital and fixed assets financed by banks, (iii) a reduction in the interest rates paid on loans, and (iv) an increase in the maturity of bank loans. They find that registry reform increases access to bank finance by almost 10 percentage points, and access to loans by 8 percentage points. The effect is larger for smaller and younger firms.
Fiji’s existing framework allows for creating a security against a borrower’s property. For example, a company charge under the Companies Act,a bill of sale under the Bills of Sale Act, and crop liens under the Crop Liens Act. Several gaps in various aspects of the legal setup hinder an effective and efficient secured lending process. These deficiencies are in the key areas essential to a sound secured transactions framework, namely the creation, prioritization, and registration of security interests and the enforcement of claims. • Creation. Borrowers enter into a secured loan by establishing a security in the collateral. In Fiji, the effective use of
secured transactions is constrained by limited coverage, high transaction costs, and arrangements that tend to be biased to lenders. There is limited coverage in lending and in the types of people or businesses that can establish secured transactions. For example, only registered companies can secure assets under company charge, leaving unincorporated businesses outside its ambit and limiting the latter’s access to finance. In the case of unincorporated businesses, only the purchase of new goods is allowed in transactions under the Bills of Sale Act. Another example is that the use of crop liens is limited because of strict requirements imposed for using future crops as collateral. The arrangement is also biased in favor of lenders because they can obtain possession of all properties that have been pledged as collateral even if the default is small. With collateral requirements being almost double the loan value (Figure 3.18), this arrangement substantially increases the borrower’s risks.
• priority. Prioritization establishes priority of a lender’s security interest over all other claims to the asset. In cases where it is difficult to establish priority, secured lending will not take place at all. There are several reasons why conflict of priority is likely to arise under the existing legal set-up. Fiji’s laws on prioritization are ambiguous on the ranking of priority of lenders and are silent on the possible conflict between lenders under different laws. Another source of confusion is this: for both movable and real estate property, the law provides for prioritization from the date of registration; in the case of a company charge, however, the law grants priority from the time of creation and allows for a charge to be filed within 42 days of creation. Also, Fiji law grants priority by notice and does not provide any ranking of priority by registration in the case of accounts receivable financing; this severely limits its use because a potential borrower may show accounts free of an existing assignment to a second potential lender.
• Registration. Best practices call for priority of the security interest to be made publicly available in a registry—preferably in the form of an electronic filing system. The laws in Fiji allow for a registration system that files the entire security agreement, a system that is costly, time-consuming, and prone to error. Because too much information is filed in the system, public access to the registry is operationally difficult to implement.
• enforcement. When the borrower defaults, the lender seizes and sells the collateral to satisfy the secured claim. But the laws do not grant lenders the right to repossess the pledged property by themselves or through the assistance of law enforcement officials. Instead, the enforcement of most secured transactions is left to the judicial system, which often involves a long collection process. This constrains lenders to demand collateral with a value several times larger than the loan.
a A new Companies Act was enacted by the Parliament in May 2015. The discussion in this section does not reflect all the changes under the new act unless specifically referred to.
Source: ADB. 2013. Re-invigorating Private Sector Investment: A Private Sector Assessment for Fiji. Manila.
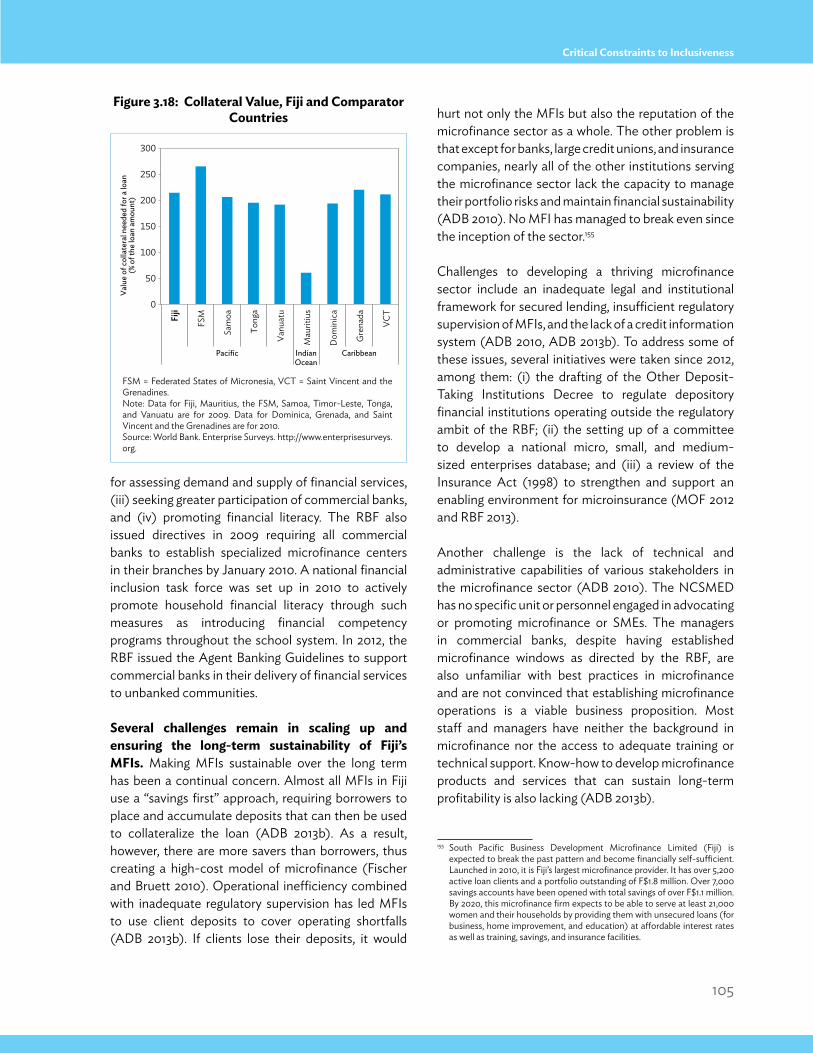
105
Critical Constraints to Inclusiveness
for assessing demand and supply of financial services, (iii) seeking greater participation of commercial banks, and (iv) promoting financial literacy. The RBF also issued directives in 2009 requiring all commercial banks to establish specialized microfinance centers in their branches by January 2010. A national financial inclusion task force was set up in 2010 to actively promote household financial literacy through such measures as introducing financial competency programs throughout the school system. In 2012, the RBF issued the Agent Banking Guidelines to support commercial banks in their delivery of financial services to unbanked communities.
several challenges remain in scaling up and ensuring the long-term sustainability of Fiji’s mFis. Making MFIs sustainable over the long term has been a continual concern. Almost all MFIs in Fiji use a “savings first” approach, requiring borrowers to place and accumulate deposits that can then be used to collateralize the loan (ADB 2013b). As a result, however, there are more savers than borrowers, thus creating a high-cost model of microfinance (Fischer and Bruett 2010). Operational inefficiency combined with inadequate regulatory supervision has led MFIs to use client deposits to cover operating shortfalls (ADB 2013b). If clients lose their deposits, it would
hurt not only the MFIs but also the reputation of the microfinance sector as a whole. The other problem is that except for banks, large credit unions, and insurance companies, nearly all of the other institutions serving the microfinance sector lack the capacity to manage their portfolio risks and maintain financial sustainability (ADB 2010). No MFI has managed to break even since the inception of the sector.155
Challenges to developing a thriving microfinance sector include an inadequate legal and institutional framework for secured lending, insufficient regulatory supervision of MFIs, and the lack of a credit information system (ADB 2010, ADB 2013b). To address some of these issues, several initiatives were taken since 2012, among them: (i) the drafting of the Other Deposit-Taking Institutions Decree to regulate depository financial institutions operating outside the regulatory ambit of the RBF; (ii) the setting up of a committee to develop a national micro, small, and medium-sized enterprises database; and (iii) a review of the Insurance Act (1998) to strengthen and support an enabling environment for microinsurance (MOF 2012 and RBF 2013).
Another challenge is the lack of technical and administrative capabilities of various stakeholders in the microfinance sector (ADB 2010). The NCSMED has no specific unit or personnel engaged in advocating or promoting microfinance or SMEs. The managers in commercial banks, despite having established microfinance windows as directed by the RBF, are also unfamiliar with best practices in microfinance and are not convinced that establishing microfinance operations is a viable business proposition. Most staff and managers have neither the background in microfinance nor the access to adequate training or technical support. Know-how to develop microfinance products and services that can sustain long-term profitability is also lacking (ADB 2013b).
155 South Pacific Business Development Microfinance Limited (Fiji) is expected to break the past pattern and become financially self-sufficient. Launched in 2010, it is Fiji’s largest microfinance provider. It has over 5,200 active loan clients and a portfolio outstanding of F$1.8 million. Over 7,000 savings accounts have been opened with total savings of over F$1.1 million. By 2020, this microfinance firm expects to be able to serve at least 21,000 women and their households by providing them with unsecured loans (for business, home improvement, and education) at affordable interest rates as well as training, savings, and insurance facilities.
Figure 3.18: Collateral value, Fiji and Comparator Countries
FSM = Federated States of Micronesia, VCT = Saint Vincent and the Grenadines.Note: Data for Fiji, Mauritius, the FSM, Samoa, Timor-Leste, Tonga, and Vanuatu are for 2009. Data for Dominica, Grenada, and Saint Vincent and the Grenadines are for 2010. Source: World Bank. Enterprise Surveys. http://www.enterprisesurveys.org.
Fiji
FSM
Sam
oa
Tong
a
Vanu
atu
Mau
ritiu
s
Dom
inic
a
Gre
nada
VCT
Pacific IndianOcean
Caribbean
0
100
50
150
200
250
300
Valu
e of
col
late
ral n
eede
d fo
r a lo
an(%
of t
he lo
an a
mou
nt)
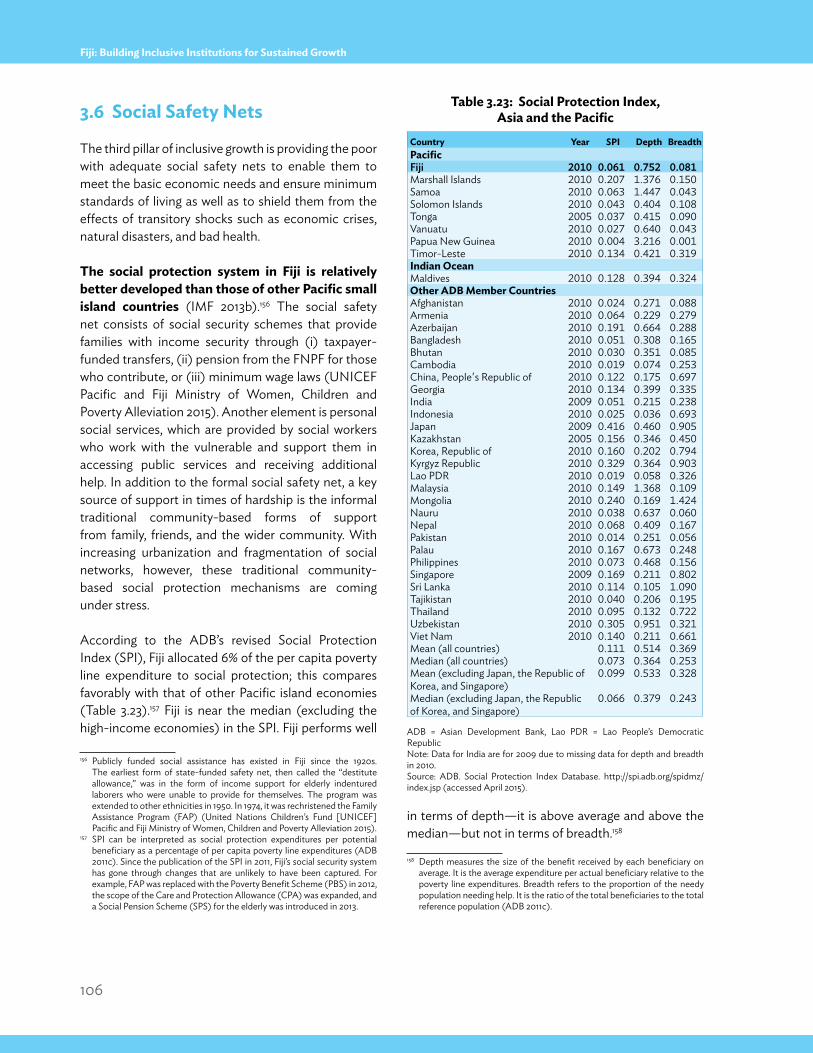
106
Fiji: Building Inclusive Institutions for Sustained Growth
3.6 social safety nets
The third pillar of inclusive growth is providing the poor with adequate social safety nets to enable them to meet the basic economic needs and ensure minimum standards of living as well as to shield them from the effects of transitory shocks such as economic crises, natural disasters, and bad health.
the social protection system in Fiji is relatively better developed than those of other pacific small island countries (IMF 2013b).156 The social safety net consists of social security schemes that provide families with income security through (i) taxpayer-funded transfers, (ii) pension from the FNPF for those who contribute, or (iii) minimum wage laws (UNICEF Pacific and Fiji Ministry of Women, Children and Poverty Alleviation 2015). Another element is personal social services, which are provided by social workers who work with the vulnerable and support them in accessing public services and receiving additional help. In addition to the formal social safety net, a key source of support in times of hardship is the informal traditional community-based forms of support from family, friends, and the wider community. With increasing urbanization and fragmentation of social networks, however, these traditional community-based social protection mechanisms are coming under stress.
According to the ADB’s revised Social Protection Index (SPI), Fiji allocated 6% of the per capita poverty line expenditure to social protection; this compares favorably with that of other Pacific island economies (Table 3.23).157 Fiji is near the median (excluding the high-income economies) in the SPI. Fiji performs well
156 Publicly funded social assistance has existed in Fiji since the 1920s. The earliest form of state-funded safety net, then called the “destitute allowance,” was in the form of income support for elderly indentured laborers who were unable to provide for themselves. The program was extended to other ethnicities in 1950. In 1974, it was rechristened the Family Assistance Program (FAP) (United Nations Children’s Fund [UNICEF] Pacific and Fiji Ministry of Women, Children and Poverty Alleviation 2015).
157 SPI can be interpreted as social protection expenditures per potential beneficiary as a percentage of per capita poverty line expenditures (ADB 2011c). Since the publication of the SPI in 2011, Fiji’s social security system has gone through changes that are unlikely to have been captured. For example, FAP was replaced with the Poverty Benefit Scheme (PBS) in 2012, the scope of the Care and Protection Allowance (CPA) was expanded, and a Social Pension Scheme (SPS) for the elderly was introduced in 2013.
in terms of depth—it is above average and above the median—but not in terms of breadth.158
158 Depth measures the size of the benefit received by each beneficiary on average. It is the average expenditure per actual beneficiary relative to the poverty line expenditures. Breadth refers to the proportion of the needy population needing help. It is the ratio of the total beneficiaries to the total reference population (ADB 2011c).
table 3.23: social protection index, Asia and the pacific
ADB = Asian Development Bank, Lao PDR = Lao People’s Democratic RepublicNote: Data for India are for 2009 due to missing data for depth and breadth in 2010.Source: ADB. Social Protection Index Database. http://spi.adb.org/spidmz/index.jsp (accessed April 2015).
Country Year spi Depth BreadthpacificFiji 2010 0.061 0.752 0.081Marshall Islands 2010 0.207 1.376 0.150Samoa 2010 0.063 1.447 0.043Solomon Islands 2010 0.043 0.404 0.108Tonga 2005 0.037 0.415 0.090Vanuatu 2010 0.027 0.640 0.043Papua New Guinea 2010 0.004 3.216 0.001Timor-Leste 2010 0.134 0.421 0.319indian oceanMaldives 2010 0.128 0.394 0.324other ADB member CountriesAfghanistan 2010 0.024 0.271 0.088Armenia 2010 0.064 0.229 0.279Azerbaijan 2010 0.191 0.664 0.288Bangladesh 2010 0.051 0.308 0.165Bhutan 2010 0.030 0.351 0.085Cambodia 2010 0.019 0.074 0.253China, People's Republic of 2010 0.122 0.175 0.697Georgia 2010 0.134 0.399 0.335India 2009 0.051 0.215 0.238Indonesia 2010 0.025 0.036 0.693Japan 2009 0.416 0.460 0.905Kazakhstan 2005 0.156 0.346 0.450Korea, Republic of 2010 0.160 0.202 0.794Kyrgyz Republic 2010 0.329 0.364 0.903Lao PDR 2010 0.019 0.058 0.326Malaysia 2010 0.149 1.368 0.109Mongolia 2010 0.240 0.169 1.424Nauru 2010 0.038 0.637 0.060Nepal 2010 0.068 0.409 0.167Pakistan 2010 0.014 0.251 0.056Palau 2010 0.167 0.673 0.248Philippines 2010 0.073 0.468 0.156Singapore 2009 0.169 0.211 0.802Sri Lanka 2010 0.114 0.105 1.090Tajikistan 2010 0.040 0.206 0.195Thailand 2010 0.095 0.132 0.722Uzbekistan 2010 0.305 0.951 0.321Viet Nam 2010 0.140 0.211 0.661Mean (all countries) 0.111 0.514 0.369Median (all countries) 0.073 0.364 0.253Mean (excluding Japan, the Republic of Korea, and Singapore)
0.099 0.533 0.328
Median (excluding Japan, the Republic of Korea, and Singapore)
0.066 0.379 0.243
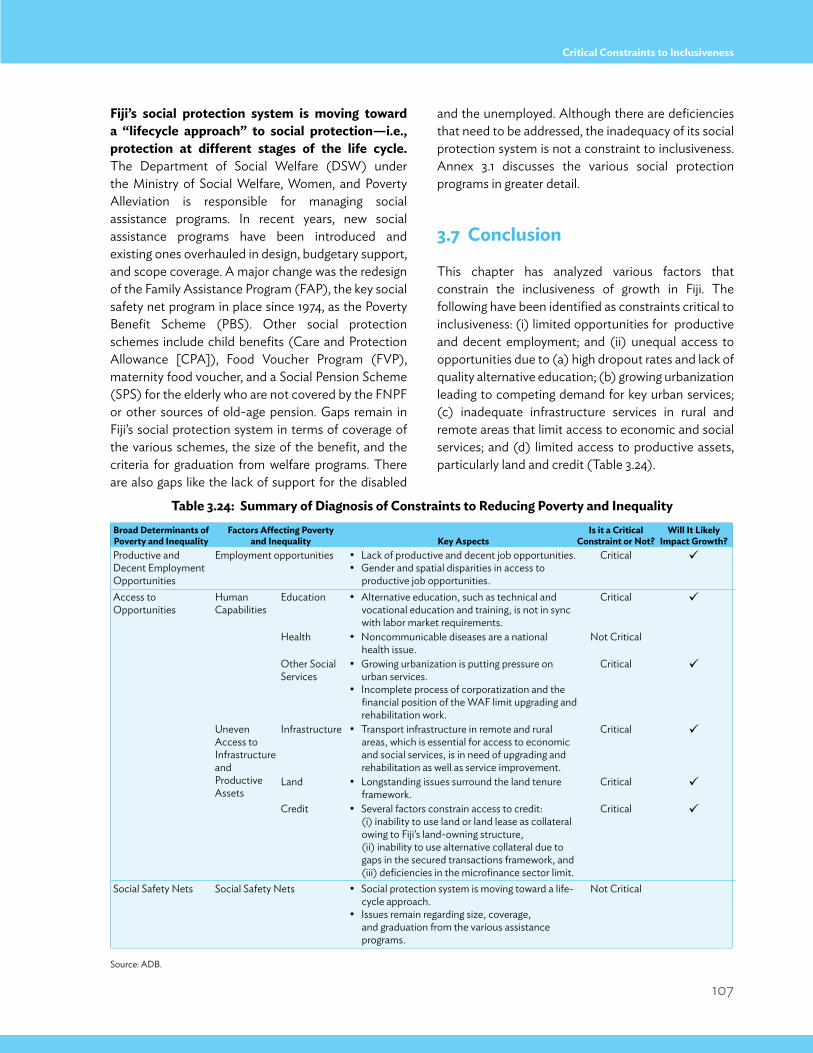
107
Critical Constraints to Inclusiveness
Broad Determinants of poverty and inequality
Factors Affecting povertyand inequality key Aspects
is it a Critical Constraint or not?
Will it likely impact Growth?
Productive and Decent Employment Opportunities
Employment opportunities • Lack of productive and decent job opportunities. • Gender and spatial disparities in access to
productive job opportunities.
Critical ü
Access to Opportunities
Human Capabilities
Education • Alternative education, such as technical and vocational education and training, is not in sync with labor market requirements.
Critical ü
Health • Noncommunicable diseases are a national health issue.
Not Critical
Other Social Services
• Growing urbanization is putting pressure on urban services.
• Incomplete process of corporatization and the financial position of the WAF limit upgrading and rehabilitation work.
Critical ü
Uneven Access to Infrastructure and Productive Assets
Infrastructure • Transport infrastructure in remote and rural areas, which is essential for access to economic and social services, is in need of upgrading and rehabilitation as well as service improvement.
Critical ü
Land • Longstanding issues surround the land tenure framework.
Critical ü
Credit • Several factors constrain access to credit: (i) inability to use land or land lease as collateral owing to Fiji’s land-owning structure, (ii) inability to use alternative collateral due to gaps in the secured transactions framework, and (iii) deficiencies in the microfinance sector limit.
Critical ü
Social Safety Nets Social Safety Nets • Social protection system is moving toward a life-cycle approach.
• Issues remain regarding size, coverage, and graduation from the various assistance programs.
Not Critical
Fiji’s social protection system is moving toward a “lifecycle approach” to social protection—i.e., protection at different stages of the life cycle. The Department of Social Welfare (DSW) under the Ministry of Social Welfare, Women, and Poverty Alleviation is responsible for managing social assistance programs. In recent years, new social assistance programs have been introduced and existing ones overhauled in design, budgetary support, and scope coverage. A major change was the redesign of the Family Assistance Program (FAP), the key social safety net program in place since 1974, as the Poverty Benefit Scheme (PBS). Other social protection schemes include child benefits (Care and Protection Allowance [CPA]), Food Voucher Program (FVP), maternity food voucher, and a Social Pension Scheme (SPS) for the elderly who are not covered by the FNPF or other sources of old-age pension. Gaps remain in Fiji’s social protection system in terms of coverage of the various schemes, the size of the benefit, and the criteria for graduation from welfare programs. There are also gaps like the lack of support for the disabled
and the unemployed. Although there are deficiencies that need to be addressed, the inadequacy of its social protection system is not a constraint to inclusiveness. Annex 3.1 discusses the various social protection programs in greater detail.
3.7 Conclusion
This chapter has analyzed various factors that constrain the inclusiveness of growth in Fiji. The following have been identified as constraints critical to inclusiveness: (i) limited opportunities for productive and decent employment; and (ii) unequal access to opportunities due to (a) high dropout rates and lack of quality alternative education; (b) growing urbanization leading to competing demand for key urban services; (c) inadequate infrastructure services in rural and remote areas that limit access to economic and social services; and (d) limited access to productive assets, particularly land and credit (Table 3.24).
table 3.24: summary of Diagnosis of Constraints to Reducing poverty and inequality
Source: ADB.
108
Fiji: Building Inclusive Institutions for Sustained Growth
Annex 3.1: social protection system in Fiji
The following programs comprise the social protection system in Fiji:
1. poverty Benefit scheme. Introduced in 2012, the PBS replaced the nearly 4-decade-old FAP.159 The PBS introduced a proxy-means-testing–based approach for assistance to target the poorest 10% of the population.160 Under the new scheme, the total amount of assistance provided is F$30 per household member per month (up to a maximum of four members) for each household that qualifies to receive social transfers under the scheme, with no support for additional household members beyond four.
159 The redesign was the outcome of a World Bank (2011a) study, which highlighted the need to improve coverage and targeting of the program and recommended redesigning of the FAP. The report concluded that (i) the FAP did a good job of excluding nonpoor individuals from benefiting from the program; (ii) the coverage of the program was only 3% of the population directly benefiting from the program and 13% of the population gaining indirect benefits (including all household members to which the recipient belongs); (iii) coverage among the bottom 30% of the population who can be considered poor was 27.8%; coverage in the poorest quintile was 36.8%, which dropped to 13.2% for the second quintile; (iv) the FAP was considered to be well-targeted, with 71.5% of the total beneficiaries being among the poorest 30% and 76.7% belonging to the lowest two income quintiles; (v) 73.8% of the benefit amount went to the poor and 79% of the FAP benefit went to the two lowest quintiles; (vi) the FAP made a positive impact on the lives of individual beneficiaries or households with the benefit contributing about 22% of the per capita income of the beneficiary households in the poorest quintile. The report concluded that the FAP’s low coverage (on account of the double-filter eligibility criteria) prevented the benefit from reaching those not in the vulnerable categories and the small benefit size (i.e., only one person in the household could be a recipient) that prevented achieving an even larger poverty reduction impact. To address the needs of the elderly and the disabled, the report proposed combining a proxy-means-testing–based (PMT) poverty benefit program with old-age pension and disability benefit.
160 This approach is in contrast to the “double filter” eligibility criterion that was previously used under the FAP. The FAP targeted social assistance to certain categories of individuals (elderly [those 65 years old and above], permanently disabled, chronically ill [the latter two were subject to verification], and female-headed households). In the second step, the household to which they belonged was evaluated using a subjective means test. Thus, if a household did not have any member belonging to one of the eligible categories, it did not qualify for assistance under the FAP. As a result, some poor households were excluded and a chronically-ill criterion was often used as a way to qualify. World Bank (2011a) reports an exclusion error of 20%; i.e., those who applied may have been eligible for assistance under the FAP. The PBS uses an objective assessment tool based on the Household Income and Expenditure Survey. The tool calculates a “score” based on various indicators that influence household welfare. The score then determines whether a household qualifies for assistance under the PBS. This objective assessment is supplemented with home visits by welfare officers who visit all those who have applied for assistance. Female-headed households with children were to be recertified and transferred to the CPA.
Depending on the household size, assistance could thus range from F$30 to F$120 per month.161
In addition to the transfer under the PBS, each beneficiary household also receives food vouchers under the FVP.162 By the end of 2014, a total of 18,093 households were receiving assistance under the PBS plus an additional transfer through the FVP.163 In 2014, the program had a budget of F$22 million.
2. Care and protection Allowance. Started in 1990 to assist children in residential or foster care, the program served just 422 children in 2010. With the reform of the FAP, the scope of the program was expanded in 2012. The Care and Protection Allowance (CPA) is a monthly allowance targeted at families with children who face the risk of being deprived of food, education, health, and basic necessities. Covered are single parents, deserted spouses, widows, prisoners’ dependents (some of whom previously benefited under the FAP), and children in foster and institutional care. The monthly allowance is paid to the guardian of the child. For children of school-going age, school attendance is an eligibility criterion and a letter from the school is required as supporting documentation.164 The size of the benefit is determined by the school level of the school-going child.165 In 2014, the CPA program had a
161 Under the FAP, assistance was limited to only one individual per household. Transfers under the FAP ranged from F$60 to F$110 per month depending on the degree of hardship; in practice, however, the usual transfer amount was F$60 per month.
162 Beginning 2010, FAP beneficiaries also received an additional F$30 per month (increase to F$50 in 2015) as food vouchers. More details are provided later in this section.
163 Each household is registered under a particular member of that household, usually the head, who has to obtain her/his TIN registration to open bank accounts with Westpac Banking Corporation, where the money is transferred electronically each month (except in rural and maritime areas where manual vouchers are still being used).
164 Caregivers are expected to submit letters from the school, and the children’s school reports annually. This would make the allowance a conditional cash transfer program. A review of the program notes that the requirement of school attendance does not seem to be enforced strictly (UNICEF Pacific and Fiji Ministry of Women, Children and Poverty Alleviation 2015). The same study also notes that many of the beneficiaries were unaware of this requirement or that the grant could be discontinued if their children did not attend school.
165 The benefit scale is as follows: F$25 per month if the child does not go to school; F$30 per month if the child is in primary school; F$40 per month if the child is in secondary school; and F$60 per month if the child is disabled. A fixed allowance of F$100 is provided per child per month for those children in institutional care (increased from F$60 until recently). The size of the benefits for other categories of vulnerable children has not changed since the inception of the program. Benefits are capped at a maximum of F$110 per household or institution per month.
109
Critical Constraints to Inclusiveness
budget of F$4.53 million. There were 5,500 children in 2,309 families that received assistance through CPA in 2014. The number of beneficiaries is expected to increase substantially as those who were previously under the FAP are being transferred to the CPA. Each CPA beneficiary also receives a food voucher.
A recent assessment of the CPA finds the allowance to be an essential form of support but insufficient to materially improve the precarious existence of the beneficiaries (UNICEF Pacific and Fiji Ministry of Women, Children and Poverty Alleviation 2015). The study reports that the allowance is crucial in supporting recipient households in (i) planning their monthly expenditure; (ii) better meeting the needs of children in their care; (iii) helping caregivers to deal with shocks and in addressing, to some extent, a number of the vulnerabilities facing children; and (iv) improving relations in the household. The assessment noted that cash assistance under the CPA, though fungible, is spent on expenditures contributing to child welfare. The review found no evidence of inappropriate expenditure and there was little evidence of negative impacts of the program.
The assessment identified a number of factors that limited the impact of the program in addressing child poverty and vulnerability. First, the coverage is limited—it finds that the scheme reaches only 2% of the children nationwide despite the fact that 35% of them were estimated to be living in poverty in 2008/09. For example, the CPA does not include children in two-parent households, those in households where the caregiver is a male, and caregivers with children under 6 years old. Less than 10% of the beneficiaries are in the 0–5 years old age range, even though the first 1,000 days of life are considered to be the most critical and any setback to child development during this period can have a lasting impact. Second, the size of the benefit is limited. At F$40, the current benefit is only 20% of the urban poverty line and 22% of the rural poverty line; as such, the benefit has only a transient impact on living conditions. The value of the transfer has not been revised since the inception of the program (except that the allowance for those in institutional care had been increased) and as a result, the purchasing power of the allowance has fallen.
3. social insurance
Fiji national provident Fund. The pension system in Fiji comprises the FNPF, which provides pension cover for formal sector workers and those outside the formal sector who make voluntary contributions. The FNPF provides transfers to individuals post-retirement based on the contributions they and their employers had made during the individual’s working lifetime. Withdrawals are permitted for contingencies such as disability, death benefits, maternity, and unemployment. State pension is provided for civil servants and military personnel. Contribution to the FNPF for casual workers, who are hired to work continuously, even if only for a few months, was made mandatory to provide them temporary security.
social pension scheme. Following the reform of the FAP (in which old age was one of the eligibility criteria), an old-age social pension scheme was introduced in 2013; no social insurance scheme was provided for the elderly before then. People outside the formal sector are vulnerable to lack of income security in old age. Before the introduction of the SPS, it was estimated that 70% of the elderly (60 years old and above) were not covered either by FAP or by the FNPF pension. This lack of income in old age could be one of the reasons for higher poverty incidence among households with elderly people. Under the SPS, an allowance of F$30 per month is provided to all elderly citizens 70 years old and above who have no source of income and are not receiving any pension from the FNPF, from the government, or from the military. The program was budgeted at $3 million in 2014 and benefited 11,615 elderly citizens.
While the pension scheme for the elderly has been introduced, a separate support for the disabled has not yet been implemented, although the latter was one of the targeted groups under the former FAP.
4. Food voucher program
The Food Voucher Program (FVP) was introduced in 2010 to cushion the impact of an increase in the VAT on the poorest. Under this program, food vouchers worth F$30 per month per household (increased to
110
Fiji: Building Inclusive Institutions for Sustained Growth
F$50 in 2015) are issued. Initially, this was limited to beneficiaries of the FAP and was an additional benefit on top of the FAP assistance. In 2011, however, the FVP coverage was extended to recipients of the CPA and subsequently also to those covered under the PBS and the SPS. Households in maritime areas receive cash assistance rather than the food voucher.
A new food voucher program, the Expanded FVP for Rural Pregnant Mothers, was introduced in 2014. Although under the mandate of the MOH, it is administered by the DSW. This program provides F$30 (increased to F$50 in 2015) of food vouchers to pregnant women in rural areas for the term of pregnancy and for the first month post-delivery. The food vouchers are delivered through the district health centers to encourage women to access health services during their pregnancy. In 2014, the program had a budget of F$3 million and benefited 1,673 rural pregnant mothers.
The food voucher is earmarked for specific types of food items, typically on staples, meat, fish, and some vegetables, to provide stability and essential inputs to a family’s meal, thereby freeing up resources for other expenses. In addition to the restriction on the choice of commodities, there is also a restriction on outlets where the voucher can be used. The food voucher can be used only at large supermarkets rather than local markets or producers. This also increases the cost of transaction as transport costs may need to be incurred to travel to the designated outlet; cost is also incurred to travel to the DSW offices to obtain the vouchers. The restrictions on the use of the food vouchers are in contrast to the rural food vouchers for pregnant women; they come as cash vouchers for use in local markets.
5. Welfare Graduation programs
The government has made graduation from welfare to workfare a key component of Fiji’s two main welfare programs, the PBS and the CPA, so as to reduce dependence on welfare. Under the PBS, for example, the government approves assistance for 3 years for each household. The household head of each beneficiary household, at the time the household comes under welfare support, is expected to identify
able-bodied individuals for training in basic skills for income-generating projects. After training, the trainees are provided seed funding of F$1,600 per person for their projects. This program is run in partnership with the NCSMED. During 2013, a total of 149 people underwent training and 70 of them were provided with seed funding. If the projects are considered to be doing “well” within the first 6 months, the recipients are graduated from state support. A review of the CPA provides evidence that some households get removed from the scheme even if there is no sustainable improvement in their circumstances or income security, thus ending up in a worse financial position (UNICEF Pacific and Fiji Ministry of Women, Children and Poverty Alleviation 2015).166
6. education and Health services
The government also provides free or almost-free health services as discussed. Starting 2014, primary and secondary education was provided for free to ensure that the weak financial capacity of parents or caregivers does not become a barrier to education.
7. Bus Fare and taxi Concessions
The Ministry of Education introduced a free bus-fare scheme in 2010 to improve access to education for children coming from low-income households (defined as children whose parents’ salaries total less than F$15,000 per annum). In 2014, this program had a budget of F$20.8 million benefiting 64,910 primary and 36,658 secondary students.
The DSW also introduced a bus fare and taxi concession scheme in 2011 for the elderly and the disabled. Elderly citizens 60 years old and above are entitled to 50% bus fare concessions, and the disabled can use the bus services for free; a 20% rebate on taxi fare for all journeys within a radius of 20 kilometers was also introduced for the elderly, disabled, and those receiving food and family assistance from the Ministry
166 Some considerations in redesigning exit from the welfare graduation program could include (i) increasing the size of the seed funding, (ii) mentoring the recipients of the seed funding, (iii) ensuring that the project becomes a sustainable source of income (6 months might be too short a period on which to base that judgment), and (iv) delinking enrollment in the welfare graduation program from exit from the CPA (the latter should depend on the needs and the age of the child).
111
Critical Constraints to Inclusiveness
of Social Welfare. This program had a budget of F$0.19 million in 2014 benefiting 41,365 elderly citizens and 1,669 persons with disabilities.
8. low-Cost Housing
Providing low-cost housing for the poor and the vulnerable has long been an important public policy agenda.167 The government runs various social housing initiatives, mainly in urban and peri-urban areas. These have assumed greater importance owing to the growing urbanization and rural-to-urban migration, a situation that has given rise to increasing informal settlements in urban and peri-urban areas. Among these social housing initiatives are the Housing Assistance Relief Trust (HART),168 the Public Rental Board (PRB),169 and the Housing Authority.170 In 167 Discussion on housing draws heavily on UNICEF Pacific and Fiji Ministry of
Women, Children and Poverty Alleviation (2015).168 HART is a charitable organization fully funded by the government through
the Ministry of Housing. HART provides homes for the destitute and attends to their welfare needs, particularly women and children. There are 772 HART homes. Tenants pay between F$0.50 to F$5.00 a week depending on the type of house they live in. As the tenants are poor, rents have not been increased in the last 10 years. To help tenants graduate to PRB-run housing and to equip them with income-generation skills, 33 workshops on basic sewing, creative tailoring skills, and sewing-machine maintenance skills were conducted in 2013 for tenants as a joint initiative of HART, the government, and the private sector. A weakness of the HART is the low graduation rate to PRB when the children of tenants are able to secure employment.
169 The PRB provides housing for workers in the low-income bracket. The PRB was carved out of the Housing Authority in 1989. It is registered as a statutory board owned by the government and managed by a Board of Directors. In 1997, the PRB was declared a commercial statutory authority and was required to operate along commercial lines. At the time of separation in 1989, the PRB had 24 rental estates and 1,753 rental flats; today the number has been reduced to 20 rental estates and 1,345 rental flats. Tenants pay a weekly rent ranging from $40 to $111 a week depending on the type of house and its age of development. The PRB has continued to report a shortfall in the supply of rental units especially in the greater Suva area. Many tenants are 4th generation, which suggests that very little graduation to the next level occurs; i.e., Housing Authority-provided houses.
170 The Housing Authority was established in 1958. Initially, it aimed to provide housing to rural dwellers moving to urban areas to work. However, this changed over time and the coverage was expanded to include all workers earning up to F$50,000 per annum regardless of where they are residing in Fiji. Like the PRB, the Housing Authority is registered as a commercial statutory authority and is required to operate along commercial lines. Monthly repayment is dependent on the type of housing and its age of development. Upon full payment of the debt, the tenant becomes a house owner. Since 2011, the Housing Authority has operated a grant scheme to assist vulnerable households with their debt repayments to prevent those without a regular income from losing their house (disabled, retired, and the unemployed whose annual income is below $5,000 for a single owner and below $10,000 for two owners). Those who have paid at least 1.5 times the loan amount can have their outstanding debt written off. The budget for this scheme from the government was F$0.5 million in 2011; F$2 million in 2012; F$1 million in 2013; and F$1 million in 2014. The actual cost of the scheme is more than this because the Housing Authority writes off the rest of the loan; in 2011, for example, the cost was actually F$1.3 million.
the order of their mention here, each initiative is considered to be the next higher level to the one before it, and the tenants are expected to graduate from their current level to the next higher level.
9. support to nongovernment organizations
In addition to the direct support to individual and households being provided through various welfare programs, the DSW also provides annual grants to registered nongovernment organizations (NGOs) that provide welfare services to the vulnerable and disadvantaged groups. In 2014, this program had a budget of F$200,000 and support was extended to 20 NGOs.
10. minimum Wage laws
In 2012, sector minimum wages were introduced under the 2012 wage regulation orders, which specified a minimum wage in 10 sectors. In 2014, under the National Minimum Wage Policy, a national minimum wage was also introduced; it coexists with the sector minimum wage.
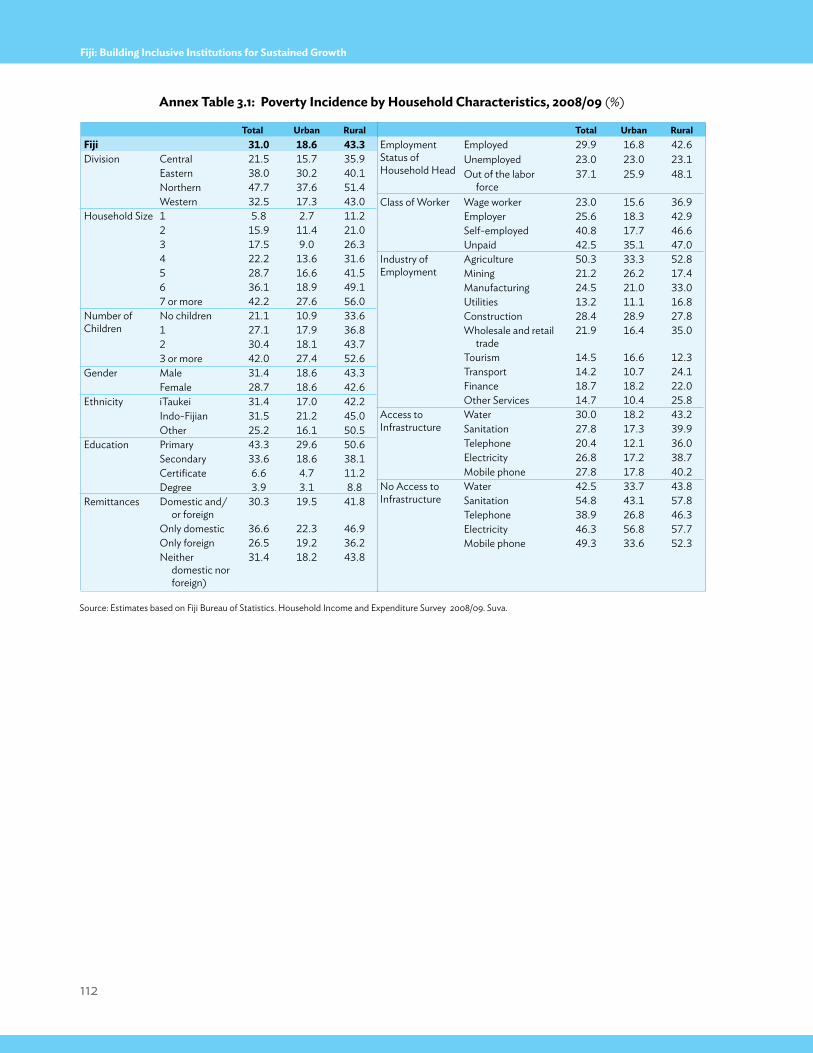
112
Fiji: Building Inclusive Institutions for Sustained Growth
total Urban RuralFiji 31.0 18.6 43.3Division Central 21.5 15.7 35.9
Eastern 38.0 30.2 40.1Northern 47.7 37.6 51.4Western 32.5 17.3 43.0
Household Size 1 5.8 2.7 11.22 15.9 11.4 21.03 17.5 9.0 26.34 22.2 13.6 31.65 28.7 16.6 41.56 36.1 18.9 49.17 or more 42.2 27.6 56.0
Number of Children
No children 21.1 10.9 33.61 27.1 17.9 36.82 30.4 18.1 43.73 or more 42.0 27.4 52.6
Gender Male 31.4 18.6 43.3Female 28.7 18.6 42.6
Ethnicity iTaukei 31.4 17.0 42.2Indo-Fijian 31.5 21.2 45.0Other 25.2 16.1 50.5
Education Primary 43.3 29.6 50.6Secondary 33.6 18.6 38.1Certificate 6.6 4.7 11.2Degree 3.9 3.1 8.8
Remittances Domestic and/or foreign
30.3 19.5 41.8
Only domestic 36.6 22.3 46.9Only foreign 26.5 19.2 36.2Neither
domestic nor foreign)
31.4 18.2 43.8
total Urban RuralEmployment Status of Household Head
Employed 29.9 16.8 42.6Unemployed 23.0 23.0 23.1Out of the labor
force37.1 25.9 48.1
Class of Worker Wage worker 23.0 15.6 36.9Employer 25.6 18.3 42.9Self-employed 40.8 17.7 46.6Unpaid 42.5 35.1 47.0
Industry of Employment
Agriculture 50.3 33.3 52.8Mining 21.2 26.2 17.4Manufacturing 24.5 21.0 33.0Utilities 13.2 11.1 16.8Construction 28.4 28.9 27.8Wholesale and retail
trade21.9 16.4 35.0
Tourism 14.5 16.6 12.3Transport 14.2 10.7 24.1Finance 18.7 18.2 22.0Other Services 14.7 10.4 25.8
Access to Infrastructure
Water 30.0 18.2 43.2Sanitation 27.8 17.3 39.9Telephone 20.4 12.1 36.0Electricity 26.8 17.2 38.7Mobile phone 27.8 17.8 40.2
No Access to Infrastructure
Water 42.5 33.7 43.8Sanitation 54.8 43.1 57.8Telephone 38.9 26.8 46.3Electricity 46.3 56.8 57.7Mobile phone 49.3 33.6 52.3
Annex table 3.1: poverty incidence by Household Characteristics, 2008/09 (%)
Source: Estimates based on Fiji Bureau of Statistics. Household Income and Expenditure Survey 2008/09. Suva.
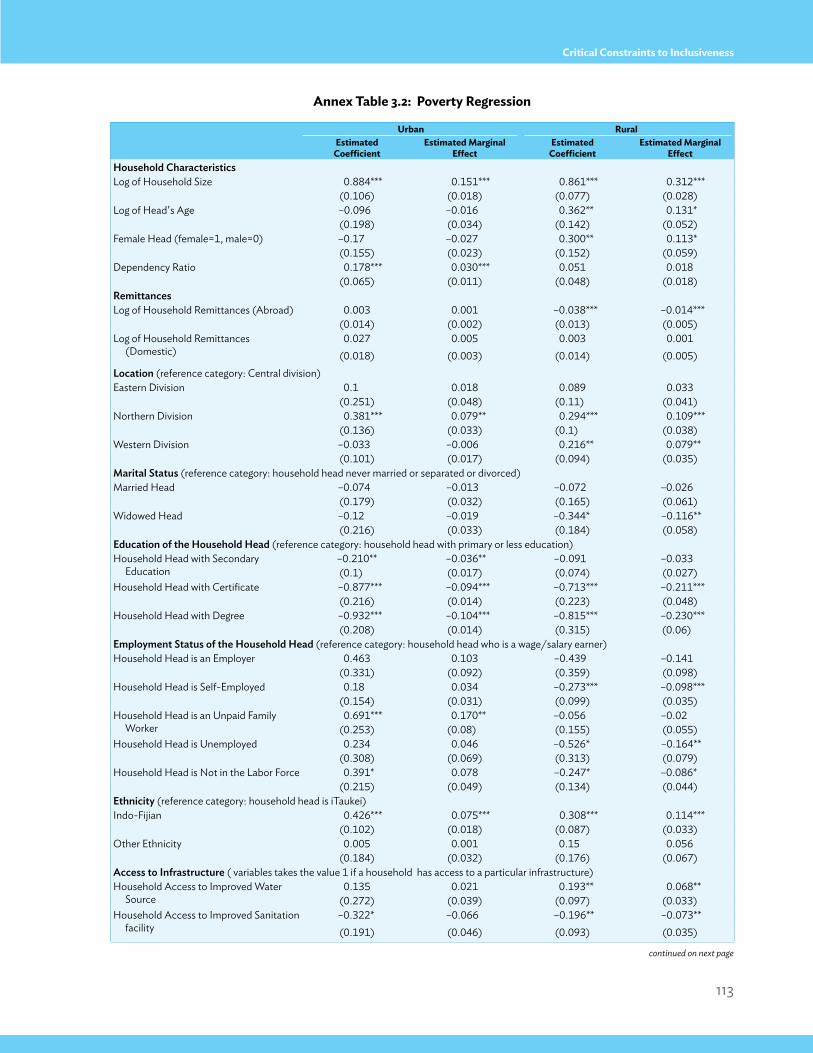
113
Critical Constraints to Inclusiveness
Annex table 3.2: poverty Regression
Urban Rural
estimated
Coefficientestimated marginal
effectestimated
Coefficientestimated marginal
effecthousehold characteristicsLog of Household Size 0.884*** 0.151*** 0.861*** 0.312***
(0.106) (0.018) (0.077) (0.028)Log of Head's Age –0.096 –0.016 0.362** 0.131*
(0.198) (0.034) (0.142) (0.052)Female Head (female=1, male=0) –0.17 –0.027 0.300** 0.113*
(0.155) (0.023) (0.152) (0.059)Dependency Ratio 0.178*** 0.030*** 0.051 0.018
(0.065) (0.011) (0.048) (0.018)remittancesLog of Household Remittances (Abroad) 0.003 0.001 –0.038*** –0.014***
(0.014) (0.002) (0.013) (0.005)Log of Household Remittances
(Domestic)0.027 0.005 0.003 0.001
(0.018) (0.003) (0.014) (0.005)Location (reference category: Central division)Eastern Division 0.1 0.018 0.089 0.033
(0.251) (0.048) (0.11) (0.041)Northern Division 0.381*** 0.079** 0.294*** 0.109***
(0.136) (0.033) (0.1) (0.038)Western Division –0.033 –0.006 0.216** 0.079**
(0.101) (0.017) (0.094) (0.035)Marital Status (reference category: household head never married or separated or divorced)Married Head –0.074 –0.013 –0.072 –0.026
(0.179) (0.032) (0.165) (0.061)Widowed Head –0.12 –0.019 –0.344* –0.116**
(0.216) (0.033) (0.184) (0.058)Education of the household head (reference category: household head with primary or less education)Household Head with Secondary
Education–0.210** –0.036** –0.091 –0.033(0.1) (0.017) (0.074) (0.027)
Household Head with Certificate –0.877*** –0.094*** –0.713*** –0.211***(0.216) (0.014) (0.223) (0.048)
Household Head with Degree –0.932*** –0.104*** –0.815*** –0.230***(0.208) (0.014) (0.315) (0.06)
Employment Status of the household head (reference category: household head who is a wage/salary earner)Household Head is an Employer 0.463 0.103 –0.439 –0.141
(0.331) (0.092) (0.359) (0.098)Household Head is Self-Employed 0.18 0.034 –0.273*** –0.098***
(0.154) (0.031) (0.099) (0.035)Household Head is an Unpaid Family
Worker 0.691*** 0.170** –0.056 –0.02
(0.253) (0.08) (0.155) (0.055)Household Head is Unemployed 0.234 0.046 –0.526* –0.164**
(0.308) (0.069) (0.313) (0.079)Household Head is Not in the Labor Force 0.391* 0.078 –0.247* –0.086*
(0.215) (0.049) (0.134) (0.044)Ethnicity (reference category: household head is iTaukei)Indo-Fijian 0.426*** 0.075*** 0.308*** 0.114***
(0.102) (0.018) (0.087) (0.033)Other Ethnicity 0.005 0.001 0.15 0.056
(0.184) (0.032) (0.176) (0.067)Access to Infrastructure ( variables takes the value 1 if a household has access to a particular infrastructure)Household Access to Improved Water
Source0.135 0.021 0.193** 0.068**
(0.272) (0.039) (0.097) (0.033)Household Access to Improved Sanitation
facility–0.322* –0.066 –0.196** –0.073**(0.191) (0.046) (0.093) (0.035)
continued on next page
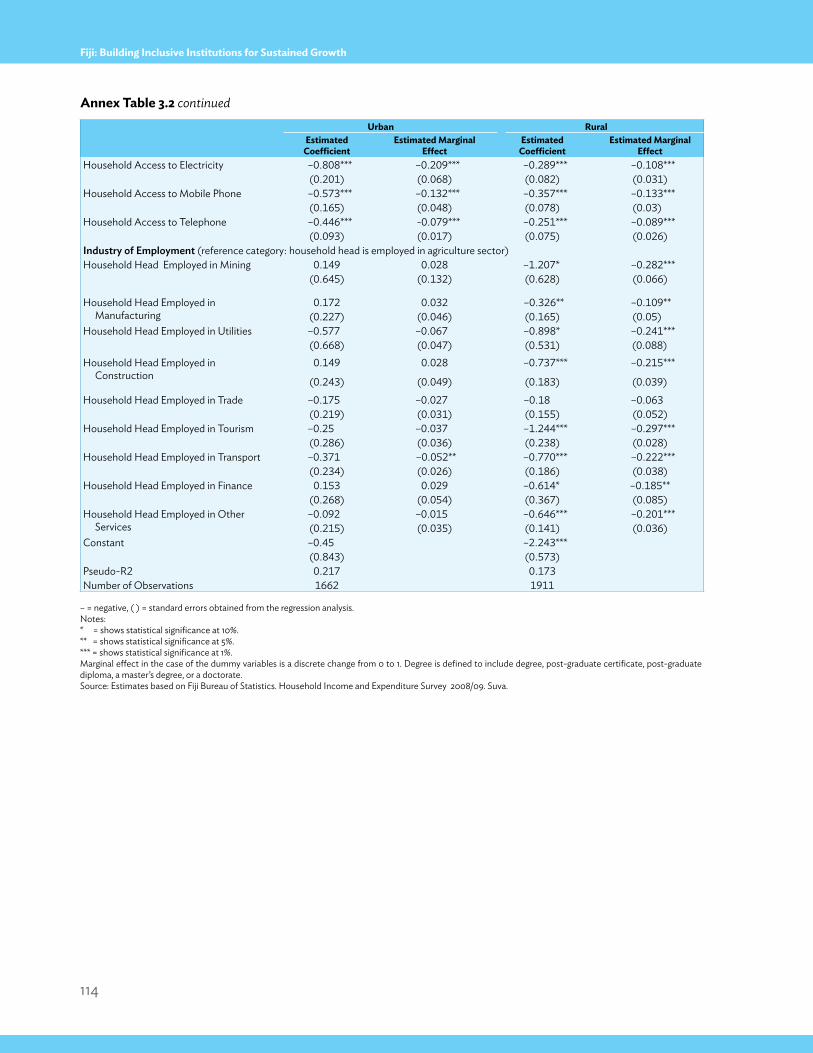
114
Fiji: Building Inclusive Institutions for Sustained Growth
Urban Ruralestimated
Coefficientestimated marginal
effectestimated
Coefficientestimated marginal
effectHousehold Access to Electricity –0.808*** –0.209*** –0.289*** –0.108***
(0.201) (0.068) (0.082) (0.031)Household Access to Mobile Phone –0.573*** –0.132*** –0.357*** –0.133***
(0.165) (0.048) (0.078) (0.03)Household Access to Telephone –0.446*** -0.079*** –0.251*** –0.089***
(0.093) (0.017) (0.075) (0.026)Industry of Employment (reference category: household head is employed in agriculture sector)Household Head Employed in Mining 0.149 0.028 –1.207* –0.282***
(0.645) (0.132) (0.628) (0.066)
Household Head Employed in Manufacturing
0.172 0.032 –0.326** –0.109**(0.227) (0.046) (0.165) (0.05)
Household Head Employed in Utilities –0.577 –0.067 –0.898* –0.241***(0.668) (0.047) (0.531) (0.088)
Household Head Employed in Construction
0.149 0.028 –0.737*** –0.215***
(0.243) (0.049) (0.183) (0.039)Household Head Employed in Trade –0.175 –0.027 –0.18 –0.063
(0.219) (0.031) (0.155) (0.052)Household Head Employed in Tourism –0.25 –0.037 –1.244*** –0.297***
(0.286) (0.036) (0.238) (0.028)Household Head Employed in Transport –0.371 –0.052** –0.770*** –0.222***
(0.234) (0.026) (0.186) (0.038)Household Head Employed in Finance 0.153 0.029 –0.614* –0.185**
(0.268) (0.054) (0.367) (0.085)Household Head Employed in Other
Services–0.092 –0.015 –0.646*** –0.201***(0.215) (0.035) (0.141) (0.036)
Constant –0.45 –2.243***(0.843) (0.573)
Pseudo-R2 0.217 0.173Number of Observations 1662 1911
– = negative, ( ) = standard errors obtained from the regression analysis.Notes:* = shows statistical significance at 10%.** = shows statistical significance at 5%.*** = shows statistical significance at 1%. Marginal effect in the case of the dummy variables is a discrete change from 0 to 1. Degree is defined to include degree, post-graduate certificate, post-graduate diploma, a master’s degree, or a doctorate.Source: Estimates based on Fiji Bureau of Statistics. Household Income and Expenditure Survey 2008/09. Suva.
Annex table 3.2 continued
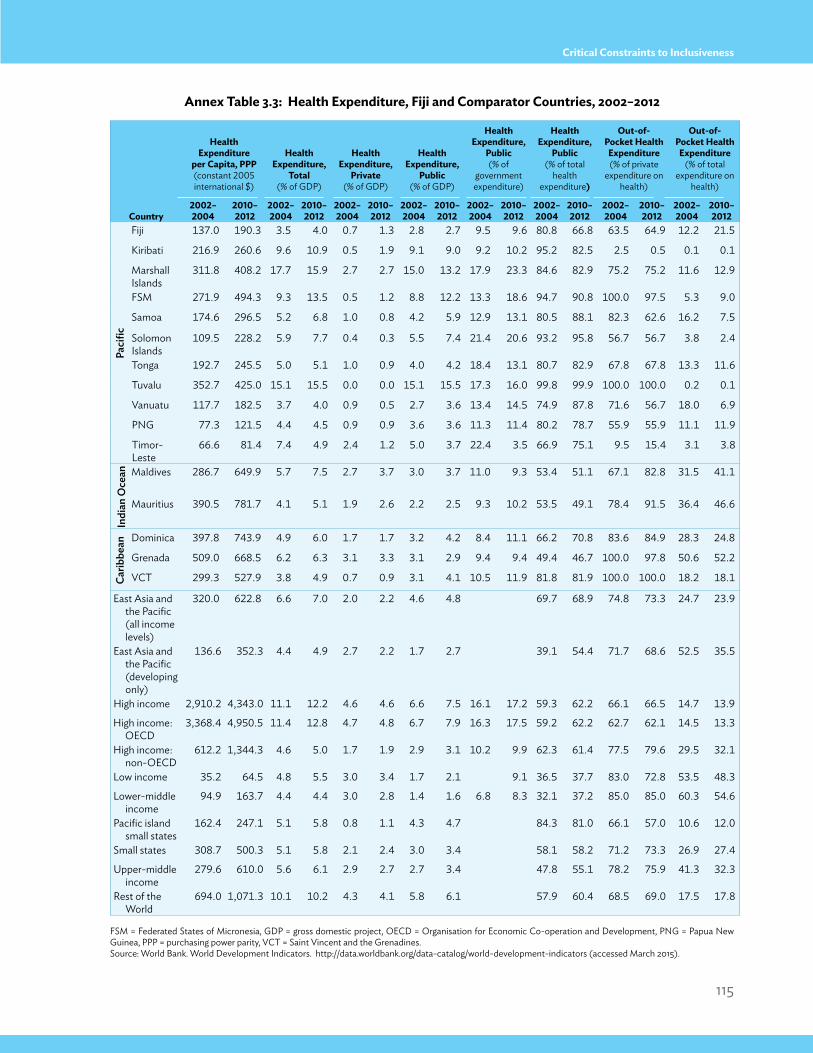
115
Critical Constraints to Inclusiveness
FSM = Federated States of Micronesia, GDP = gross domestic project, OECD = Organisation for Economic Co-operation and Development, PNG = Papua New Guinea, PPP = purchasing power parity, VCT = Saint Vincent and the Grenadines.Source: World Bank. World Development Indicators. http://data.worldbank.org/data-catalog/world-development-indicators (accessed March 2015).
Annex table 3.3: Health expenditure, Fiji and Comparator Countries, 2002–2012
Health expenditure
per Capita, ppp (constant 2005 international $)
Health expenditure,
total (% of GDP)
Health expenditure,
private (% of GDP)
Health expenditure,
public (% of GDP)
Health expenditure,
public (% of
government expenditure)
Health expenditure,
public (% of total
health expenditure)
out-of-pocket Health expenditure (% of private
expenditure on health)
out-of-pocket Health expenditure
(% of total expenditure on
health)
Country2002–2004
2010–2012
2002–2004
2010–2012
2002–2004
2010–2012
2002–2004
2010–2012
2002–2004
2010–2012
2002–2004
2010–2012
2002–2004
2010–2012
2002–2004
2010–2012
Paci
fic
Fiji 137.0 190.3 3.5 4.0 0.7 1.3 2.8 2.7 9.5 9.6 80.8 66.8 63.5 64.9 12.2 21.5
Kiribati 216.9 260.6 9.6 10.9 0.5 1.9 9.1 9.0 9.2 10.2 95.2 82.5 2.5 0.5 0.1 0.1
Marshall Islands
311.8 408.2 17.7 15.9 2.7 2.7 15.0 13.2 17.9 23.3 84.6 82.9 75.2 75.2 11.6 12.9
FSM 271.9 494.3 9.3 13.5 0.5 1.2 8.8 12.2 13.3 18.6 94.7 90.8 100.0 97.5 5.3 9.0
Samoa 174.6 296.5 5.2 6.8 1.0 0.8 4.2 5.9 12.9 13.1 80.5 88.1 82.3 62.6 16.2 7.5
Solomon Islands
109.5 228.2 5.9 7.7 0.4 0.3 5.5 7.4 21.4 20.6 93.2 95.8 56.7 56.7 3.8 2.4
Tonga 192.7 245.5 5.0 5.1 1.0 0.9 4.0 4.2 18.4 13.1 80.7 82.9 67.8 67.8 13.3 11.6
Tuvalu 352.7 425.0 15.1 15.5 0.0 0.0 15.1 15.5 17.3 16.0 99.8 99.9 100.0 100.0 0.2 0.1
Vanuatu 117.7 182.5 3.7 4.0 0.9 0.5 2.7 3.6 13.4 14.5 74.9 87.8 71.6 56.7 18.0 6.9
PNG 77.3 121.5 4.4 4.5 0.9 0.9 3.6 3.6 11.3 11.4 80.2 78.7 55.9 55.9 11.1 11.9
Timor-Leste
66.6 81.4 7.4 4.9 2.4 1.2 5.0 3.7 22.4 3.5 66.9 75.1 9.5 15.4 3.1 3.8
Indi
an O
cean Maldives 286.7 649.9 5.7 7.5 2.7 3.7 3.0 3.7 11.0 9.3 53.4 51.1 67.1 82.8 31.5 41.1
Mauritius 390.5 781.7 4.1 5.1 1.9 2.6 2.2 2.5 9.3 10.2 53.5 49.1 78.4 91.5 36.4 46.6
carib
bean Dominica 397.8 743.9 4.9 6.0 1.7 1.7 3.2 4.2 8.4 11.1 66.2 70.8 83.6 84.9 28.3 24.8
Grenada 509.0 668.5 6.2 6.3 3.1 3.3 3.1 2.9 9.4 9.4 49.4 46.7 100.0 97.8 50.6 52.2
VCT 299.3 527.9 3.8 4.9 0.7 0.9 3.1 4.1 10.5 11.9 81.8 81.9 100.0 100.0 18.2 18.1
East Asia and the Pacific (all income levels)
320.0 622.8 6.6 7.0 2.0 2.2 4.6 4.8 69.7 68.9 74.8 73.3 24.7 23.9
East Asia and the Pacific (developing only)
136.6 352.3 4.4 4.9 2.7 2.2 1.7 2.7 39.1 54.4 71.7 68.6 52.5 35.5
High income 2,910.2 4,343.0 11.1 12.2 4.6 4.6 6.6 7.5 16.1 17.2 59.3 62.2 66.1 66.5 14.7 13.9
High income: OECD
3,368.4 4,950.5 11.4 12.8 4.7 4.8 6.7 7.9 16.3 17.5 59.2 62.2 62.7 62.1 14.5 13.3
High income: non-OECD
612.2 1,344.3 4.6 5.0 1.7 1.9 2.9 3.1 10.2 9.9 62.3 61.4 77.5 79.6 29.5 32.1
Low income 35.2 64.5 4.8 5.5 3.0 3.4 1.7 2.1 9.1 36.5 37.7 83.0 72.8 53.5 48.3
Lower-middle income
94.9 163.7 4.4 4.4 3.0 2.8 1.4 1.6 6.8 8.3 32.1 37.2 85.0 85.0 60.3 54.6
Pacific island small states
162.4 247.1 5.1 5.8 0.8 1.1 4.3 4.7 84.3 81.0 66.1 57.0 10.6 12.0
Small states 308.7 500.3 5.1 5.8 2.1 2.4 3.0 3.4 58.1 58.2 71.2 73.3 26.9 27.4
Upper-middle income
279.6 610.0 5.6 6.1 2.9 2.7 2.7 3.4 47.8 55.1 78.2 75.9 41.3 32.3
Rest of the World
694.0 1,071.3 10.1 10.2 4.3 4.1 5.8 6.1 57.9 60.4 68.5 69.0 17.5 17.8
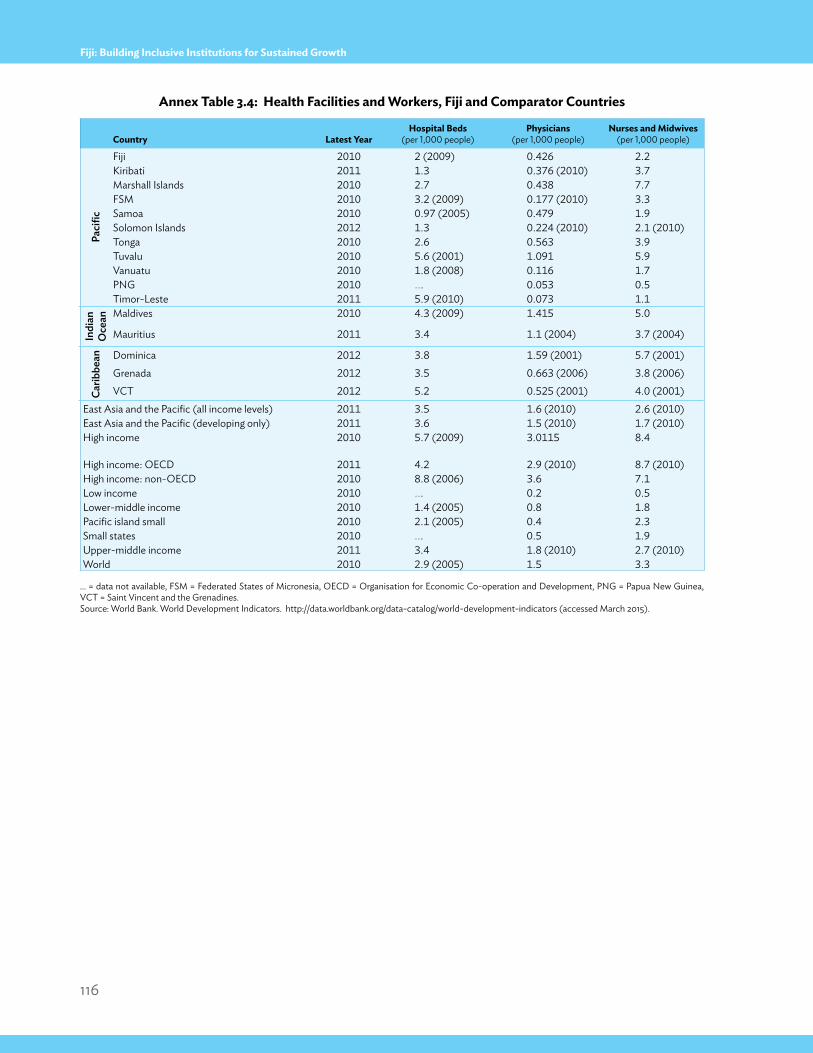
116
Fiji: Building Inclusive Institutions for Sustained Growth
Country latest YearHospital Beds
(per 1,000 people)physicians
(per 1,000 people)nurses and midwives
(per 1,000 people)
Paci
fic
Fiji 2010 2 (2009) 0.426 2.2Kiribati 2011 1.3 0.376 (2010) 3.7Marshall Islands 2010 2.7 0.438 7.7FSM 2010 3.2 (2009) 0.177 (2010) 3.3Samoa 2010 0.97 (2005) 0.479 1.9Solomon Islands 2012 1.3 0.224 (2010) 2.1 (2010)Tonga 2010 2.6 0.563 3.9Tuvalu 2010 5.6 (2001) 1.091 5.9Vanuatu 2010 1.8 (2008) 0.116 1.7PNG 2010 …. 0.053 0.5Timor-Leste 2011 5.9 (2010) 0.073 1.1
Indi
an
Oce
an Maldives 2010 4.3 (2009) 1.415 5.0
Mauritius 2011 3.4 1.1 (2004) 3.7 (2004)
carib
bean Dominica 2012 3.8 1.59 (2001) 5.7 (2001)
Grenada 2012 3.5 0.663 (2006) 3.8 (2006)VCT 2012 5.2 0.525 (2001) 4.0 (2001)
East Asia and the Pacific (all income levels) 2011 3.5 1.6 (2010) 2.6 (2010)East Asia and the Pacific (developing only) 2011 3.6 1.5 (2010) 1.7 (2010)High income 2010 5.7 (2009) 3.0115 8.4
High income: OECD 2011 4.2 2.9 (2010) 8.7 (2010)High income: non-OECD 2010 8.8 (2006) 3.6 7.1Low income 2010 …. 0.2 0.5Lower-middle income 2010 1.4 (2005) 0.8 1.8Pacific island small 2010 2.1 (2005) 0.4 2.3Small states 2010 …. 0.5 1.9Upper-middle income 2011 3.4 1.8 (2010) 2.7 (2010)World 2010 2.9 (2005) 1.5 3.3
Annex table 3.4: Health Facilities and Workers, Fiji and Comparator Countries
… = data not available, FSM = Federated States of Micronesia, OECD = Organisation for Economic Co-operation and Development, PNG = Papua New Guinea, VCT = Saint Vincent and the Grenadines.Source: World Bank. World Development Indicators. http://data.worldbank.org/data-catalog/world-development-indicators (accessed March 2015).
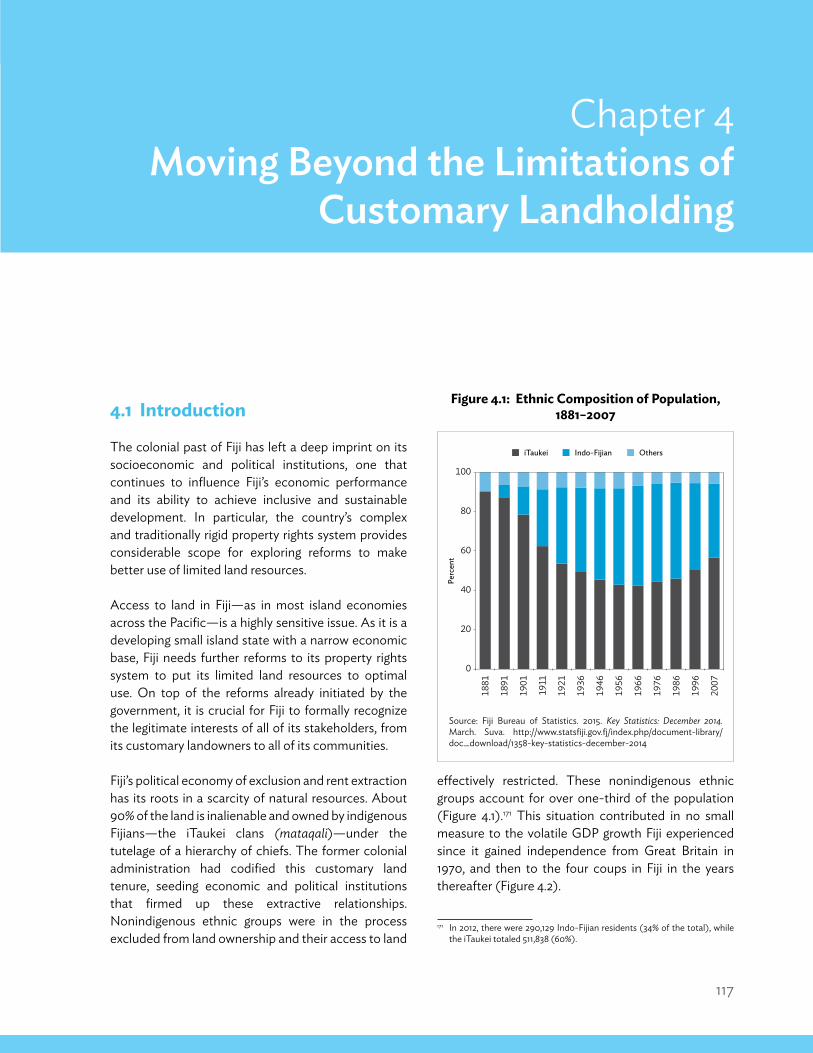
117
Moving Beyond the Limitations of Customary Landholding
Chapter 4Moving Beyond the Limitations of
customary Landholding
effectively restricted. These nonindigenous ethnic groups account for over one-third of the population (Figure 4.1).171 This situation contributed in no small measure to the volatile GDP growth Fiji experienced since it gained independence from Great Britain in 1970, and then to the four coups in Fiji in the years thereafter (Figure 4.2).
171 In 2012, there were 290,129 Indo-Fijian residents (34% of the total), while the iTaukei totaled 511,838 (60%).
4.1 introduction
The colonial past of Fiji has left a deep imprint on its socioeconomic and political institutions, one that continues to influence Fiji’s economic performance and its ability to achieve inclusive and sustainable development. In particular, the country’s complex and traditionally rigid property rights system provides considerable scope for exploring reforms to make better use of limited land resources.
Access to land in Fiji—as in most island economies across the Pacific—is a highly sensitive issue. As it is a developing small island state with a narrow economic base, Fiji needs further reforms to its property rights system to put its limited land resources to optimal use. On top of the reforms already initiated by the government, it is crucial for Fiji to formally recognize the legitimate interests of all of its stakeholders, from its customary landowners to all of its communities. Fiji’s political economy of exclusion and rent extraction has its roots in a scarcity of natural resources. About 90% of the land is inalienable and owned by indigenous Fijians—the iTaukei clans (mataqali)—under the tutelage of a hierarchy of chiefs. The former colonial administration had codified this customary land tenure, seeding economic and political institutions that firmed up these extractive relationships. Nonindigenous ethnic groups were in the process excluded from land ownership and their access to land
Figure 4.1: ethnic Composition of population, 1881–2007
Source: Fiji Bureau of Statistics. 2015. Key Statistics: December 2014. March. Suva. http://www.statsfiji.gov.fj/index.php/document-library/doc_download/1358-key-statistics-december-2014
0
20
40
60
80
10018
81
1891
1901
1911
1921
1936
1946
1956
1966
1976
1986
1996
2007
Perc
ent
Others Indo-Fijian iTaukei
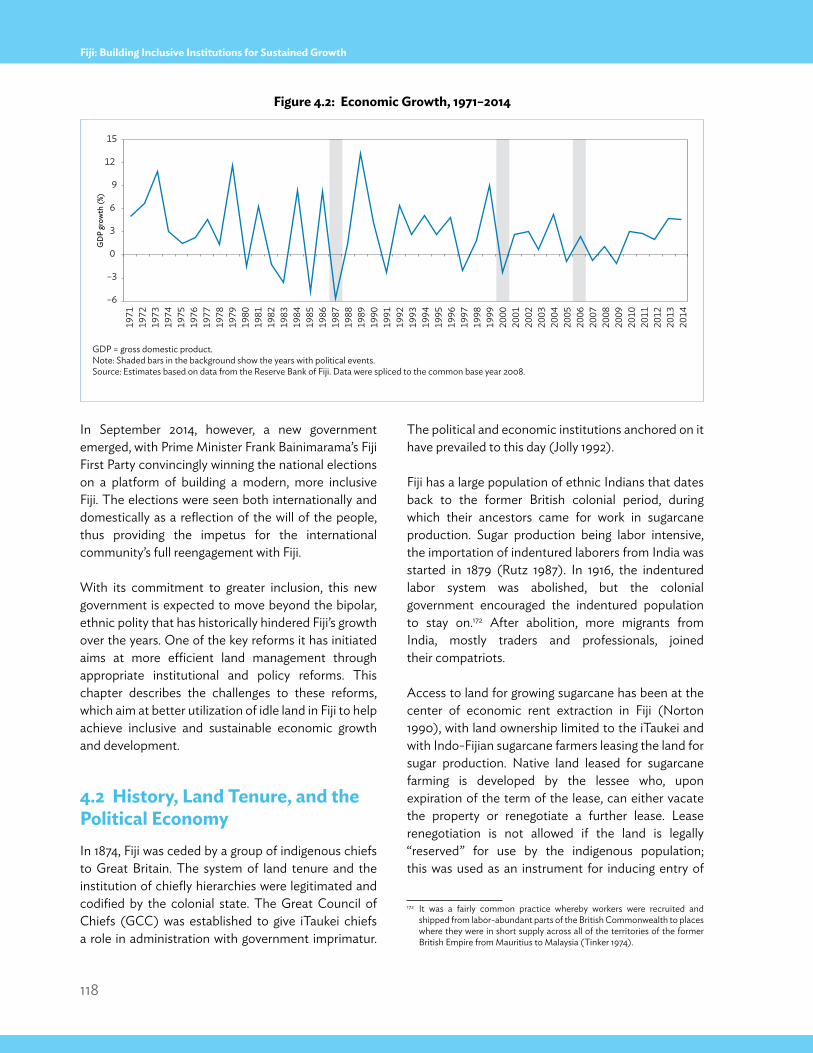
118
Fiji: Building Inclusive Institutions for Sustained Growth
In September 2014, however, a new government emerged, with Prime Minister Frank Bainimarama’s Fiji First Party convincingly winning the national elections on a platform of building a modern, more inclusive Fiji. The elections were seen both internationally and domestically as a reflection of the will of the people, thus providing the impetus for the international community’s full reengagement with Fiji.
With its commitment to greater inclusion, this new government is expected to move beyond the bipolar, ethnic polity that has historically hindered Fiji’s growth over the years. One of the key reforms it has initiated aims at more efficient land management through appropriate institutional and policy reforms. This chapter describes the challenges to these reforms, which aim at better utilization of idle land in Fiji to help achieve inclusive and sustainable economic growth and development.
4.2 History, land tenure, and the political economyIn 1874, Fiji was ceded by a group of indigenous chiefs to Great Britain. The system of land tenure and the institution of chiefly hierarchies were legitimated and codified by the colonial state. The Great Council of Chiefs (GCC) was established to give iTaukei chiefs a role in administration with government imprimatur.
The political and economic institutions anchored on it have prevailed to this day (Jolly 1992).
Fiji has a large population of ethnic Indians that dates back to the former British colonial period, during which their ancestors came for work in sugarcane production. Sugar production being labor intensive, the importation of indentured laborers from India was started in 1879 (Rutz 1987). In 1916, the indentured labor system was abolished, but the colonial government encouraged the indentured population to stay on.172 After abolition, more migrants from India, mostly traders and professionals, joined their compatriots.
Access to land for growing sugarcane has been at the center of economic rent extraction in Fiji (Norton 1990), with land ownership limited to the iTaukei and with Indo-Fijian sugarcane farmers leasing the land for sugar production. Native land leased for sugarcane farming is developed by the lessee who, upon expiration of the term of the lease, can either vacate the property or renegotiate a further lease. Lease renegotiation is not allowed if the land is legally “reserved” for use by the indigenous population; this was used as an instrument for inducing entry of
172 It was a fairly common practice whereby workers were recruited and shipped from labor-abundant parts of the British Commonwealth to places where they were in short supply across all of the territories of the former British Empire from Mauritius to Malaysia (Tinker 1974).
Figure 4.2: economic Growth, 1971–2014
GDP = gross domestic product.Note: Shaded bars in the background show the years with political events.Source: Estimates based on data from the Reserve Bank of Fiji. Data were spliced to the common base year 2008.
–6
–3
0
3
6
9
12
15
GD
P gr
owth
(%)
1980
1981
1982
1983
1984
1985
1986
1987
1988
1989
1971
1972
1973
1974
1975
1976
1977
1978
1979
1990
1991
1992
1993
1994
1995
1996
1997
1998
1999
2000
2001
2002
2003
2004
2005
2006
2007
2008
2009
2010
2011
2012
2014
2013
119
Moving Beyond the Limitations of Customary Landholding
indigenous Fijians into sugarcane farming (Brookfield, Ellis, and Ward 1985). The iTaukei Lands Trust Board (TLTB), formerly Native Land Trust Board,173 a statutory corporation established in 1940, acted as the instrument for rent extraction (Rutz 1987). It was overseen by a board composed of a majority of chiefs. Disputes over the fair distribution of the proceeds from sugar between indigenous landowners and Indo-Fijian cane farmers have historically fueled the interethnic rivalry in Fiji (Kurer 2001), often leading to suboptimal levels of production from the given land and labor.
Ownership of land defines the iTaukei and, as already noted, it has taken central stage within the country’s ethnic relations and political economy. By the time of Fiji’s independence, the chiefs “had become a modernizing elite committed to the accumulation of capital,” while “a few foreign multinational corporations and banks, together with a handful of Indo-Fijian mercantile firms, owned most of the industrial and commercial capital of the country” (Rutz 1987). Dominated by the chiefs on its board, the TLTB held a monopoly over leasing native lands. This “turned chiefs into effective landowners, an inversion of Fijian culture, which places ownership into the hands of the commoners” (Knapman and Walter 1980, p. 205).
With this backdrop, the ethnic divide played an important role in politics. By independence, both the iTaukeis and Indo-Fijians comprised nearly half of the population. National politics provided incentives for candidates to use ethnically divisive strategies to garner support. The two major political contestants for government posts have historically drawn the majority of their support on the basis of ethnicity. The National Farmers Union and its affiliation with the Fiji Labour Party has had a strong following among Indo-Fijian growers, while the National Alliance Party, and later the Soqosoqo Duavata ni Lewenivanua Party, had its majority support within the iTaukei community.
The TLTB presented the landowners as a united front, which in turn provided an incentive for tenants to unite and take an adversarial stance. The land lease system
173 In September 2011, the Native Land Trust Board was renamed the iTaukei Land Trust Board (TLTB).
came about as a result of political bargaining between the two major ethnic groups in parliament. For example, the Agricultural Landlord and Tenants Act (ALTA) of 1976 defined the 30-year term of agricultural leases, the rights of tenants and landowners, a rental formula, and a dispute settlement mechanism. The confrontation can be thought of as a landowner–tenant tussle, but this was compounded by an electoral system that allocated seats in Parliament on the basis of ethnicity (Chand 2011 and 2014).
The Fijian military was another major player in politics. After independence, a new formal institution emerged that gradually tilted the balance of power between the chiefs, the church, and the rest of society. This institution was the Republic of Fiji Military Forces (RFMF), which was composed almost exclusively of iTaukeis. The RFMF oversaw the formation of senior staff, consisting entirely of iTaukeis during the first few years after independence. The RFMF’s main mission was to guarantee internal security by assisting the police whenever necessary in maintaining or restoring law and order. It also participated in rural and youth development, though mostly for iTaukeis. The command of the RFMF remained close to the government and this new political equilibrium has had a direct bearing on Fiji’s politics (Chand 2014).
The 1987 national election saw the National Alliance Party—headed by Ratu Sir Kamisese Mara, a chief from Eastern Fiji—lose to a coalition of the pro-Indo-Fijian Fiji Labour Party and the National Federation Party. As the new government threatened the positions of the traditional iTaukei leadership, tensions grew, culminating in the first military coup, led by Colonel Sitiveni Rabuka, on 14 May 1987. A second coup, also by Colonel Rabuka on 28 September 1987, led to the reinstallation of Ratu Mara as the interim Prime Minister. Following the adoption of the new Constitution in 1990, Rabuka was elected Prime Minister in 1992 and held the position until 1999.
Two more coups followed: the first on 19 May 2000 to oust the Fiji Labour Party, which won the national elections in 1999, and the second on 5 December 2006, which overthrew the narrowly elected pro-iTaukei Soqosoqo Duavata ni Lewenivanua government because of its plan to offer pardons to
120
Fiji: Building Inclusive Institutions for Sustained Growth
some of the plotters of the 2000 coup (Fraenkel, Firth, and Lal 2009).
The four military coups adversely impacted Fiji’s economic growth and investment. In particular, the 1987 coups led to an exodus of largely professional and technically proficient Indo-Fijians, who moved with their immediate families to Australia, Canada, New Zealand, and the US.174
4.3 Reforms to increase efficiency of land UseLand tenure remains a very sensitive issue in Fiji politics. Land in Fiji, as in the case of other natural resources including marine resources, are customary owned, such that access by nonindigenous parties is possible only with the permission of the indigenous Fijian owners.
The key difference between the customary land-holding in Fiji and other types of land tenure is “inalienability.” About 88% of the land is classified and registered as “native land” in the Register of Native Lands. The ownership of native land lies with the mataqali (tribal group), not with the individual. However, individual membership in the mataqali is recorded separately in the Vola ni Kawa Bula (register of iTaukei landowners). About 8% of the land is freehold and held individually, and the rest, about 4%, is held by the state.
The use of native land requires the majority approval of the members of a mataqali, aged 21 and above. The Land Sales Act requires nonresidents purchasing freehold land greater than one acre to obtain consent from the Minister of Lands. The policy is in place to keep individual foreign citizens from accumulating extensive areas of land. However, the process for obtaining consent is time-consuming and subject to policy or administrative discretion, or both (ADB 2012). To curb foreign demand to own residential properties in Fiji and to make housing more affordable for Fijians, the government announced an increase in the stamp duty to 10% on transfer for nonresident strata title 174 In the short-term, while the exodus initially depleted existing human
capital, it also brought increased investment in training by those wishing to migrate. Somewhat ironically, the net effect on tertiary-trained personnel turned out to be positive (Chand and Clemens 2008).
property buyers and to 5% on nonresident strata mortgages in the 2015 budget. In yet another measure to increase the demand and value of iTaukei land and thus ensure benefits to the land-owning mataqali, the Land Sales Act was amended to restrict nonresidents from buying freehold land or leasing state land for residential purposes (although they can still purchase strata title property on these two categories of land). No such restrictions, however, would apply to the leasing of iTaukei land for residential purposes.
Nonindigenous parties have access to native land only through leases. The iTaukei Land Trust Act (ILTA)175 provides the framework for managing native land; the ALTA regulates the leasing of all agricultural land, including freehold and state land. Since 1940, the TLTB has been the only agency responsible for managing native land and for obtaining and administering leases to it—the agricultural leases through ALTA and the nonagricultural through the ILTA.
Some of the issues related to land leasing regimes are long-standing. Among them are (i) cumbersome leasing procedures, (ii) the duration of leases, (iii) rent and its distribution among members of the mataqali, (iv) approvals to make improvements to the land, (v) the amount of compensation on approved investments, and (vi) disputes related to unapproved investments (ADB 2013b).
The leasing process is reported to be long and complicated, posing hurdles to businesses. It usually takes about 4 to 5 months to obtain an “agreement to lease” from the TLTB after submitting the application (ADB 2012). If the customary landowners want to directly mobilize native land as a wealth resource, they must first lease the land to themselves, after which the lease can be used as collateral. In an effort to streamline the administrative process and reduce uncertainties for potential investors, the TLTB has used a tender process to make selected areas of native land available for lease from 2006 onward. It identifies land with high development potential, and completes preparatory work before inviting interested investors to submit offers. The highest offer, which must be above a set minimum, is then accepted.
175 Formerly the Native Land Trust Act.
121
Moving Beyond the Limitations of Customary Landholding
Agricultural leases are granted for at least 30 years. Prior to revisions to the ALTA in 1977, most agricultural leases were for 10 years. However, as already mentioned, the uncertainty about the lease extension became a source of ethnic divide and political tension, leading to legal bargaining between the landowners’ group and the farmers. Following revisions to the ALTA, the majority of those holding 10-year leases under the Agricultural Landlord and Tenants Ordinance were entitled to a single extension of 20 years. Leases for other purposes could be up to 99 years.
Legislation also prescribes rents on leased native land. For agricultural land, rental is set at a maximum of 6% of unimproved capital value of the land under ALTA. The ILTA requires a market value approach to setting rents. Because of a lack of a market for inalienable customary land, however, the TLTB has also adopted the unimproved capital value approach for its nonagricultural leases. In practice, the TLTB sets rents at 2.5% to 3% of the unimproved capital value. This is partly because the government, as a matter of policy, has collected this much or less under its ALTA and Crown Lands Act leases (Pacific Islands Forum Secretariat 2008).
The TLTB deducts as a fee a significant portion of the proceeds from rent of land, while the chiefs of varying ranks claim another significant share of the total rental income, leaving only the limited balance for the rest of the members of the mataqali, or clan (Ward and Kingdon 1995). Until a 2012 change in the formula by the administration, the TLTB had been collecting an administration fee amounting to 15% of the rental income, retaining an additional 5% of the total income in a collective trust fund. Of the remaining 80%, as per the ILTA, 30% was distributed to the chiefs and the remainder to the landowners.
Because of the cumbersome process of obtaining a TLTB lease as well as the uncertainty around lease renewals, majority of the native land in Fiji is idle. Along with low rents, unequal distribution of rents, and rental arrears, this process and uncertainty have been sources of discontent among customary landowners. Some bypass the TLTB and opt for informal leases to avoid TLTB administration costs, but leases obtained this way have the disadvantage of being less secure. For a long time, indeed, this situation may have contributed
to less inclusive institutions in which maintaining the status quo was in the interest of the chiefs, who had been benefiting from a higher share of rents. However, reforms that have been in place since 2010 may be beginning to change this.
The interim government that took office in 2006 has since initiated a number of reforms. The government launched a “clean up” campaign to eradicate corruption in the public service and in statutory corporations, as earlier mentioned. It also created a Civil and Military Affairs division within the RFMF to expose “deceptive fallacies surrounding the vanua [land], lotu [religion], and matanitu [state] which the military alleged has fooled indigenous Fijians for generations and has been the root cause of political instability and the ‘coup culture’” (Bulatale and Duncan 2014).
In recent years under the interim government, access to land and the coastal waters for economic development has taken center stage, along with the politics surrounding the issue. The nonrenewal of land leases following their expiration in 1997 added uncertainty to the business climate, as access to land was seen as insecure. Bulatale and Duncan (2014) note that this insecurity of land tenure creates a business risk for private investors and makes banks hesitant to lend.
The fundamental objectives of customary landholding have been to preserve the cultural identity of the iTaukeis and to ensure their economic sustenance with land ownership.176 However, it is questionable whether this goal has been achieved under the existing system.
Customary tenure with communally owned land that is held in perpetual trust for future generations, and so made inalienable, was “an invented tradition” (Rutz 1987). It is not clear, however, whether inalienability is actually in the interest of iTaukei landowners. The major beneficiaries of the land tenure system were by and large the old elites (Jolly 1992), who consolidated their positions and have since had a large influence on the nation’s political economy.
176 For the Fijian community, their land is an extension of themselves. It is part of the Fijian soul, and the concept of vanua —the land and the people—lies at the heart of Fijian identity. Land represents life and sustenance, race and culture, and Fijians cling fiercely to their ownership of it. See Volavola (1995).
122
Fiji: Building Inclusive Institutions for Sustained Growth
Reforms that were often seen as challenges to the traditional virtues—building on the power of vanua (the chief or the land), matanitu (provincial government), and lotu (church)—have been met by resistance. This is because loyalty and reverence for these powers are deeply ingrained in traditional Fijian culture. This suggests that any successful reform process requires extensive community involvement and consultation, and that a long time is needed to gradually change cultural norms and social understanding.
Recent reforms are aimed at improving utilization of idle land for economic development. The most significant reform to land tenure was introduced through the Land Use Decree in 2010, which created the Land Bank with associated regulations. The decree established a Land Use Unit and a register of land use within the Ministry of Lands and Mineral Resources. The Land Use Unit can lease idle land that is registered through the unit, independent of the TLTB. The Prime Minister has discretion to designate such land held under either customary tenure or state-owned for development.
The reform also accompanied an important institutional change that prompted a power shift from the TLTB and the GCC to the government. The Native Land Trust (Amendment) Decree in 2010 changed the composition of the TLTB board. Under the decree, the minister of iTaukei Affairs (currently the Prime Minister) was made the chair of the TLTB (who was previously the President of Fiji and was, in turn, appointed by the GCC). The minister is now empowered to appoint 7 of 10 board members and to set aside land as native reserve. With this change, power has shifted from the GCC to the government. The government also disbanded the GCC through legislation introduced in 2013, which gives all members of the landowning clan an equal share of proceeds from land rents.
The Land Bank allows the government to intermediate between landowning clans and investors in providing leases of up to 99 years, thus giving investors access to vacant, productive land. Under the Land Use Decree of 2010, a total of 8,599.22 ha (21,249.12 acres) of land owned by 79 landowning units have been
designated by the Prime Minister to the Land Bank from 2011 to April 2015. As of April 2015, a total of 33 leases have been issued by the Land Bank, including 28 leases covering 2,051.27 ha (5,068.80 acres) of land; 1 license for soil extraction (2.70 ha or 6.67 acres); and 4 awaiting acceptance of lease offers (78.83 ha or 194.79 acres). One of these leases covers over 687 ha for agricultural use on a 99-year lease, which was previously impossible under the ALTA. The Land Bank also administers a total of 18,153 leases for the state-owned land.
Importantly, the state underwrites the Land Bank leases, and the Land Bank grants all receipts to the landowners. Aside from this, the Land Bank offers more beneficial terms than the TLTB to both the native landowners and tenants. To the former, it offers a higher rental rate (10% of unimproved capital value against a maximum of 6% under the TLTB), higher rental payment (100% of the total under the Land Bank goes to the landowners as opposed to 80% under the TLTB), and greater control over rent distribution (landowners are given full freedom over how to distribute the rent as opposed to no control under the TLTB). With the Land Bank, tenants also have security of long-term tenure, with lease periods of up to 99 years allowed, irrespective of the purpose, compared with the maximum of 30 years for agricultural uses through ALTA under the TLTB.
The TLTB continues to collect rents from land leased through the institution and charges 15% as a service fee. Historically, the remaining rent has been divided between the chiefs and the “commoners.” But legislation in 2014 stipulates equal distribution of proceeds from land rents within the landowning mataqali and provides greater protection to the lessees. The equal distribution of rental proceeds removes the extractive authority of iTaukei chiefs. The Prime Minister, who is also chairman of the TLTB, said on 5 November 2013:
All Mataqali members have equal access and benefit to the proceeds from the Mataqali land leases. Protection for landowners through protection of ownership and now a requirement to have fair and equitable
123
Moving Beyond the Limitations of Customary Landholding
rent paid to land owners compliments the constitutional protection for the rights and interests of land lessees and tenants. No law must diminish or adversely affect those rights and interests. Lessees and tenants also have the right not to have their leases and tenancies arbitrarily and illegally terminated.177
The Land Bank is intended to make the land market more competitive by offering an alternative leasing mechanism to the one administered by the TLTB; native owners will be encouraged to use their property for development and be able to lease them at market rates. However, the Land Bank faces a number of challenges to become a viable alternative. First, there is a legal contention challenging its legitimacy because as opposed to the establishment of the TLTB being rooted in the Fiji Constitution, the Land Bank is created only by decree. Extensive privacy clauses also render it impossible for landowners to enforce their rights against the State (ADB 2013). Second, the Land Bank has yet to generate sufficient public confidence in its system. The TLTB noted that designating native land and leasing it to the Land Bank might make the connection between the customary owners and the land even more tenuous than under the practices of the traditional regime (ADB 2013). Lack of legal certainty also compounds the insufficient public confidence in the Land Bank. Third, the Land Bank’s institutional capacity for administering the new initiative is still weak. It can issue leases only for land that is registered. Moreover, the registration process is very inefficient because most of it is done manually and takes a long time.
The new land registration and leases made through the Land Bank still account for a very small portion of the total native land registered and leased by the TLTB. As of May 2015, the TLTB administers a total of 35,568 leases for iTaukei land. Bulatale and Duncan (2014) argue that ultimately, the true measure of success of the Land Bank will depend on whether commercial banks have sufficient confidence in using land leases as collateral for loans, which in turn will depend on whether the leases are transferable and whether the government will honor them. 177 See Chandar (2013) and Gibson (2013).
Going forward, reforms are needed for both the TLTB and the Land Bank. The TLTB needs to improve its lease management services for landowners and tenants. It needs to review its lease terms and procedures to allow for more flexibility and increase administrative efficiency in response to market demand. It also needs to review its administrative fee structure and land valuation system as well as address the approval and ownership of the improvements made to the land. A clear legal framework and a more efficient land registry system are needed by the Land Bank so it can attract more native land under its regime. In particular, it will be useful to introduce an electronic registry system and involve the private sector in the registry operation.
4.4 Conclusion
For a long-term leasing regime to be viable, the needs of both lessors and lessees have to be considered. For their part, iTaukei lessors want their customary objectives to remain respected; on the part of the predominantly Indo-Fijian lessees, they want to ensure that their tenure is secure and durable. Meeting both of these demands will need further reforms guided by the following three principles:
• Property rights must be effectively enforced, which is not always the case in practice, to help increase security of tenure.
• Statutory duties of consent and accountability must hold firm. Lack of consent and incompatibility with customs are the primary causes of land disputes. However, when landowners consent to leasing and are assured that their wishes will be respected, they, in turn, will tend to respect the property rights that are granted, thus assuring the durability and security of the leases.
• An institution perceived as neutral must be established with sufficient authority to lease and control both state and iTaukei land. A strong legal and institutional structure is a prerequisite to resolving the issues of iTaukei land and leasing.
124
Fiji: Building Inclusive Institutions for Sustained Growth
Reforms on land tenure, governance, and privatization of state-owned enterprises are inherently challenging, particularly in a country like Fiji where the traditional virtues are revered as the foundations of its society and culture. Changing cultural norms and reaching a new social consensus may take a long time and they require community involvement and consultation. The ultimate challenge is to create inclusive, flexible, and innovative institutions, that reflect the views of all stakeholders and build consensus, to effectively bridge Fiji’s historical divisions for stronger growth.
125
Summary and Policy Recommendations
Chapter 5Summary and Policy
recommendations
• Deficiencies in infrastructure provision, particularly inadequate upgrading and maintenance of roads, shortage of capacity at the main ports, time-consuming and extensive export and import documentation requirements, unrehabilitated infrastructure in remote areas and in the outer islands, and inadequate provision of urban services commensurate to growing urbanization.
• Uneven access to productive assets, particularly to land and finance.
• Lack of productive and adequately paying job opportunities; limited opportunities for pursuing alternative career pathways for those dropping-out at secondary level of education; and a mismatch between training and market demand that leads to poor labor market outcomes.
This chapter recommends policy options for addressing the above critical constraints. Some of these are already part of the government’s development agenda (Annex 5.1 summarizes some of the key policy measures introduced by the government). As part of the reform process, the government needs to consider establishing formal mechanisms for regular consultations with the private sector to enhance its responsiveness to the latter’s needs, to obtain private
5.1 summary
Fiji’s economy has made a turnaround since 2010 under a government strongly committed to reform. That period saw Fiji experiencing one of the few episodes of sustained growth in its post-independence economic history, averaging 3.3% annually or nearly four times the average growth during 2000–2009. Its successful national elections and return to democracy in 2014 boosted investor sentiment. A key challenge for Fiji now is to create an environment conducive to greater private sector activity so it can sustain its growth momentum and make its growth more inclusive. This study, using an inclusive growth framework, has identified the critical constraints that Fiji needs to address to strengthen investor sentiment even further and achieve inclusive growth. In summary, those critical constraints are as follows:
• Weaknesses in the regulatory ecosystem that adversely affect the business climate. These include cumbersome procedures for starting a new business, weak tax administration, lengthy judicial processes and onerous contract enforcement procedures, price controls, difficulties in accessing land and in seeking site development approvals, and deficiencies in legal and policy framework for facilitating private participation in activities currently dominated by SOEs.
126
Fiji: Building Inclusive Institutions for Sustained Growth
sector buy-in to the various reforms it is pursuing, and to bring greater transparency and certainty to the reform process.
5.2 Business Climate
Simplify business start-up procedures
A major hurdle to business creation in Fiji is its long, cumbersome, and costly business start-up procedures. These procedures increase the transaction cost of setting up a new business, to a level that could force small businesses in particular to remain in the informal sector instead. By simplifying those procedures, the government can encourage more entrepreneurs to start new businesses, register them, and keep them in the formal sector. This is desirable because typically, formal sector firms create better paying jobs, find it easier to access funding for expansion, and are better able to take legal recourse in case of disputes. With the formal sector’s growth and expansion, the government gets the added benefit of expanding the tax base. Some measures to encourage business start-ups include:
• Expedite the launch of the web-based portal for online investment approval based on current procedures. The government has announced the launch of such a portal but it has been delayed.178 The investment approval process also has to be brought in line with international best practices.
• Introduce an integrated online system for company registration. The online application system has to be a consolidated application process covering all registration requirements, thus minimizing time-consuming, in-person visits to several agencies. The facility could later be expanded to allow an online archive filing system.
• Currently, there is an online database with business names, although, the information available is incomplete; for example, names and contact details of legal owners or representatives are not available in the online database. Also, the database needs to be updated to reflect only
178 A single window clearance was launched on 9 July 2015. It allows online approvals from "tier one" agencies – the FRCA, the RBF, the Investment Fiji, and the ORC.
currently existing businesses. Make the updated and complete business registration information readily available through electronic means. Once online registration is introduced, the database can be made searchable for a fee.179
• Introduce a common business identifier across agencies. Compliance enforcement is compromised because the various agencies involved in business registration have their own independent and self-contained registries. For better enforcement and coordination, these registries have to be interlinked with one another and use just one unique identifier for each business seeking registration.
• Review the business license regime to bring it in line with the best practices, particularly in the issuance of the general business license. The license issuance function has to be restricted to managing limited resources and safeguarding public interest instead of being used to raise revenues or to ensure compliance with other regulatory requirements. A common licensing regime and administration have to be introduced across the country to avoid duplication of license requirements.
• Complete the review of the Companies Act and proceed to update and modernize it.180
Reduce the administrative burden of filing taxes
The number of payments and the time spent by firms in Fiji to meet all tax requirements are more than that in other small island countries. By making tax systems easy to navigate, the time spent and the costs incurred in achieving tax compliance can be reduced. Moreover, by making tax procedures business-friendly, the government will encourage more firms to be tax compliant, while discourage firms from remaining in the informal sector; this will bring more firms into the tax net and expand the tax base. Some measures to reduce the tax-filing burden:
179 ADB (2013b) notes that this would require implementation of legislation that enables electronic payments. While a decree was promulgated in 2008, it has not been implemented as it requires review of and amendments to other legislation.
180 A new Companies Bill was passed and enacted into law on 22 May 2015.
127
Summary and Policy Recommendations
• Improve the predictability and transparency of the tax system by harmonizing the tax administration laws and by minimizing the current exemptions. Fiji’s tax payment procedures need to be benchmarked against best practices to identify time-consuming steps and procedures. FRCA and Fiji Institute of Accountants are working on the tax interpretations and practical implementation issues to some of the tax policies and legislation. FRCA is working on the recommendation of the Fiji Institute of Accountants to make operational changes to enhance compliance and efficiency.
• Expand priority tax service initiatives, such as the Gold Card facility, which is currently being made available only to big taxpayers. The coverage of the Gold Card priority tax service needs to be expanded to cover taxpayers with a strong compliance record irrespective of the size or their contribution to national revenue.
Expedite dispute resolution and strengthen contract law enforcement
Businesses need to feel assured that the sanctity of contracts will be upheld and that dispute resolution will be transparent and swift. Some action steps needed to expedite dispute resolution are as follows: • Increase the capacity of the judicial system to
speedily resolve commercial cases and to clear the backlog of cases. This can be accomplished by appointing adequately skilled and experienced judges and by strengthening the small-claims tribunals through better referee training. In addition, the number of court rooms needs to be increased to allow for more cases to be heard.
• Strengthen and promote alternative dispute resolution mechanisms by making their outcomes legally binding, thus encouraging disputants to avail of the process widely.
• Establish procedures for the expeditious and low-cost seizure of collateral.
• Codify the contract law in a manner that states in the form of broad principles the existing rules
of common law and equity, thus improving its effectiveness and the general understanding of it.
Remove price controls
In any flourishing market economy, prices play a key role in the efficient allocation of scarce resources. Price controls are an administrative burden to both government and businesses, and they can create uncertainty and possible perverse effects on producer incentives. Some measures to address price controls are as follows:
• Ideally, all price controls are best removed. For the poorer and low-income sections of society, they can be replaced by targeted social transfers that would mitigate the impact of the removal of the price controls. If the option of a safety net does not exist, price controls need to be removed or limited to a few basic commodities consumed by the poor.
• Review and strengthen the legal framework and push for stronger antitrust policies so as to foster market competition and promote consumer welfare.
Continue pursuing the SOE reform agenda through better monitoring or divestments, or both
Reforms of SOEs have to be vigorously pursued to allow for entry of the private sector in activities currently dominated by the public sector; such modalities as service or management contracts, partial divestments, and public–private partnerships can be used for this purpose. The reforms will foster competition, improve public service delivery, increase efficiency gains, and help promote fiscal discipline. Some needed initiatives in pursuing SOE reforms are as follows:
• Review and revise the various policy and legal frameworks governing SOEs and public–private partnerships, particularly the Public Enterprise Act and the Public Private Partnerships Act, and bring them in line with global best practices.
• Develop a policy framework to guide privatization efforts and to identify SOEs for reforms.
128
Fiji: Building Inclusive Institutions for Sustained Growth
• Build capacity in the Ministry of Public Enterprises to better monitor the performance of SOEs and their reform process as well as to more effectively handle public–private partnership projects.
Improve access to iTaukei land and expedite approval for site development
• Undertake a review of the regulations and procedures for leasing land in Fiji in a way that protects the interests of both lessors and lessees and in accordance with the new Constitution that reaffirms that the ownership of all customary land shall remain with the customary landowners. The review needs to address longstanding issues such as lease term, setting of rents, frequency and quantum of rent review, and handling of improvements to land.
• Clarify the steps and standard operating
procedures for obtaining site development approvals to speed up the process, and furnish the DTCP, the town councils, and the regional local authorities with manuals that clearly spell out the standard operating procedures. This will strengthen their capability for giving approvals at their respective levels, and also do away, for example, with the DTCP’s practice of getting comments from other agencies before giving site development approval even if legislation does not require it to do this.
5.3 infrastructure services
Encourage greater private sector participation in infrastructure service delivery
Although Fiji’s physical infrastructure compares favorably with other countries in the region, there is a pressing need to improve infrastructure service delivery as the quality of Fiji’s infrastructure has fallen over the years. The government has taken some steps in recent years to encourage private sector participation through various modalities, but the provision of infrastructure and service delivery continues to be the domain of the public sector, with little private sector participation.
Specifically, the government needs to pursue the following initiatives: • Consider private financing of infrastructure
through public–private partnerships, with the long-term ownership of transport assets remaining with the government or eventually reverting to the government and its state-owned enterprises. Recommendations to strengthen the public–private partnership framework were discussed earlier in this chapter.
• Review and strengthen the antitrust framework or consider alternatives like a multisector regulator. The domain of the multisector regulator and the sectors under its purview will need to be clearly defined to avoid overlapping with the role of the FCC. This will also entail reviewing the current role of the FCC in infrastructure subsectors. Any price-setting function, whether it remains with the FCC or is transferred to the multisector regulator, has to be made more transparent. The government is already exploring options for such a multi-sector regulator.
• Build regulatory capacity and formulate new
regulatory standards to ensure quality of service delivery. This can fall under the purview of the multisector regulator mentioned in the preceding action step.
Continue to upgrade and rehabilitate the road network
• Encourage greater private sector participation through such modalities such as build–operate–transfer arrangements where private entities finance road construction in return for a concession to charge toll.
• Build domestic capacity to reduce reliance on foreign private contractors and to help reduce costs.
• Consider setting up a dedicated road fund to reduce dependence on budgetary allocations for road projects and to cover operating and
129
Summary and Policy Recommendations
maintenance costs. This would reduce uncertainty about getting an allocation for road maintenance.
• Improve sustainability of investments by increasing monitoring and enforcement of vehicle loads and encouraging the use of load-spreading suspensions and axle combinations.
Improve hard and soft port infrastructure
• Undertake the preparation of the Ports Master Plan that will identify priority port investments that can expand the physical capacity of the country’s main ports.
• Undertake a due diligence exercise to determine the feasibility and viability of a port at the Rokobili reclamation project, which has long been envisioned as part of the overall expansion plan for the Suva port. Partial divestments or other modalities may be considered to raise financing for the expansion.
• Undertake a time–cost analysis of the procedures to obtain export–import clearances and identify areas for improvement. In setting the objective for improvement, it would be useful to benchmark against major transshipment hubs.
Improve and strengthen infrastructure and transport services for the outer islands to enhance access to markets and social services
About 40 smaller island wharves and jetties and a few river landings are critical to connecting Fiji’s remote and smaller islands with the two main islands. Poor facilities that have fallen into disrepair have led to erratic shipping services that constrain outer island development where agricultural and tourism potential exists. Some measures needed to improve access to markets and social services and to help discourage rural–urban migration are as follows:
• Equip ports with proper navigational aids to improve access to coastal shipping lanes and access channels to ports, and improve safety and infrastructure at smaller ports.
• Complete the ongoing work on improving the accuracy of maritime charts.
• Undertake a review of the various forms of support to domestic shipping, fare setting, and route licensing.
• Limit the role of the GSS to carry development cargo as originally intended. The GSS should be disallowed from undercutting commercial operators by charging concessionary tariffs for passengers and general cargo. Rationalizing GSS functions may be considered by contracting commercial operators to ship development cargoes to coastal and outer-island locations, particularly routes that commercial operators are already serving.
• Provide capacity building and training to improve technical skills and administrative skills like documentation of sailings and financial accounting.
Enhance provision of key urban infrastructure services
• Complete the reform process in the water supply and sanitation sector. Make the WAF an independent commercial entity to complete the process of corporatization that started in 2011.
• Set performance indicators to monitor and reduce nonrevenue water, and both technical and nontechnical losses.
• Rationalize tariffs to allow for cost recovery, consider cross-subsidization or subsidized tariffs for low-income households, and allow WAF to charge VAT on its tariffs. And also consider exempting WAF from paying VAT on electricity charges. Together, these measures will reduce WAF dependence on government budget and improve its financial viability.
• Formulate regulatory standards for water quality, sewage disposal, and effluent standards.
130
Fiji: Building Inclusive Institutions for Sustained Growth
• Consider separating asset ownership from operating functions and maintenance and service delivery functions by allowing private sector participation through performance-based management contracts.
• Expand the coverage of the water supply and sanitation system and provide adequate investment for its maintenance and upgrading.
5.4 Access to Finance
Fiji has one of the most developed financial systems among the Pacific island countries, with lower real lending interest rates and interest rate spreads. Although large businesses are able to attract and raise funding, however, new and small businesses find it difficult to do so. Structural factors constrain access to funding. These include Fiji’s land-owning structure that limits the ability to use land or land lease as collateral, shortcomings of Fiji’s legal frameworks governing the use of movable collateral for raising finance and credit reporting, and slow contract enforcement, and the long process of repossession in the event of default.
Over the past few years, the government has taken several steps to extend the reach of financial services and made greater financial inclusion a key priority, but the effort has been constrained by challenges in scaling up and in developing the long-term sustainability of MFIs. Below are some key measures that need to be undertaken to enhance access to finance in Fiji:
Address shortcomings in the secured transactions framework and strengthen credit information systems
• Review, update, and modernize the secured transactions framework to allow effective use of movable assets as collateral. The framework has to address shortcomings on creation of charges, provide clarity on prioritization of charges, and allow for an electronic registry that makes archive filing and searching easy.
• Introduce credit bureau legislation. At present, a private credit bureau solely provides credit
information on most companies and on 300,000 individuals on a subscription basis. Legislation will help address criticism and questions about the legality of disclosures made and of potential legal challenges.
Implement measures to enhance the sustainability of Fiji’s MFIs
• Provide technical assistance to enhance understanding of the workings of microfinance and to improve the capacity of microfinance institutions.
• Strengthen regulatory supervision of the microfinance sector.
• Consider setting up a new microfinance bank and allow cooperatives and credit unions to play a bigger role in the provision of microfinance.
5.5 labor market outcomes
Create productive employment opportunities and address the mismatch between training and demand
Productive and well-paying jobs hold the key to creating and making growth more inclusive. In the past, job creation in Fiji had largely been in the informal and less productive sectors of the economy. There is a high level of youth inactivity—young people are neither in education or skills training nor in productive jobs. Gender gaps prevail in the labor market as well, with a large fraction of women with high level of educational attainment not gainfully employed and involved mainly in household duties.
Fiji has a relatively high educational attainment compared with some of the other small island countries. However, there are regional disparities in educational attainment especially beyond the secondary level. The student dropout rates are high in rural areas and in Fiji’s less urbanized divisions; in the past, part of the reason was the high cost of education, but this has been partly addressed when free primary and secondary education were introduced in Fiji in 2014.
131
Summary and Policy Recommendations
However, the cost of tertiary education continues to be a deterrent for low-income households, which may not find the investment worthwhile due to the lack of employment opportunities that could ensure recovery of the investment. The Tertiary Education Loan Scheme (TELS) partly addresses this cost constraint, but challenges related to access and employment opportunities remain. Initiatives that Fiji needs to pursue to improve its labor market outcomes are as follows: • Facilitate SME development by streamlining
business regulations and start-up procedures and by improving access to finance for SMEs, and provide entrepreneurial skills training and business mentoring to cultivate local entrepreneurs.
• Strengthen and improve the quality of the TVET system by promoting alternative career pathways leading to higher education and by developing a curriculum aligned with the needs of labor markets both locally and globally.
• Facilitate school-to-work transitions for youth by fostering stronger links between education/training institutions and work places.
• Strengthen placement agencies like the NEC to enable them to attract skilled employees with analytical and negotiating skills.
• Promote stronger coordination between education and training and skills development providers, on one hand, and between employers and the education and training sector, on the other. Currently, a number of agencies involved in the areas of education, training, and skills development are working in relative isolation of one another; this points to the need to consolidate and coordinate policies and activities across the various agencies. There is also room for greater coordination between international partners and organizations engaged in this area. To further improve Fiji’s labor market outcomes, the NEC in particular also has to develop its capabilities to identify the immediate and future needs of employers, develop a training curriculum in
consultation with employers, and promote itself to employers as the recruitment medium of choice.
• Develop a comprehensive and centralized database for human resources information that captures labor market information from various government agencies, tertiary institutions, and employers. This would allow for effective labor market policies in terms of manpower planning and allocation of scarce resources for training and scholarships. An overarching framework also needs to be developed to align job creation and training programs currently being coordinated by different agencies.
• NEC, which also provides skills training, can explore training partnerships with established institutions like the FNU and other established tertiary institutions. This will help NEC reduce costs incurred in providing training as these institutions already have the facilities to provide such training. Training at established institutes will carry brand-name recognition and increase the value and prestige of the training, which in turn will also encourage trainees to take the training seriously.
• Allow the NEC to eventually collect a recruitment service fee for its services to reduce its dependence on budgetary allocation.
• Review continually the education curriculum, teaching content, and methodologies, with the view of improving teaching and learning outcomes. The quality of the education system should be continuously reviewed through the National Curriculum Framework and audited by the industry and private sector to meet the ever-changing market demands.
• Encourage more volunteer or apprenticeship schemes to address youth unemployment to improve labor market outcomes. Incentives can be offered to eventually absorb the volunteers and apprentices into full time employment after gaining enough work experience.
132
Fiji: Building Inclusive Institutions for Sustained Growth
5.6 Conclusion
In the medium term, the country is likely to enjoy the economic and political boost provided by its return to democracy, its policy continuity with the election of a reform-minded government, and the revitalization of its relationships with development partners. Fiji can build further on these achievements and sustain its economic momentum by attracting private investments to help unlock the full potential of its productive sectors. Private investment will assume even more importance in the light of Fiji’s limited fiscal space to undertake more public investment. More investment is also the key to stimulating job creation that can make Fiji’s growth truly inclusive.
Due to Fiji’s small size and remote location, its business sector has to contend with higher costs arising from lack of economies of scale and from higher transportation costs. One possible route for escaping this scale-and-remoteness trap is finding niche products and services for which a higher price can be charged without becoming uncompetitive in international markets. The private sector is likely to play a key role in identifying and exploring such high value-added investment opportunities, and doing so will require strongly and purposively encouraging private investment. Indeed, fully addressing Fiji’s critical constraints to private investment and growth will take time, and any reforms in this respect will need to be fully backed by a government that is committed to implementing reforms.
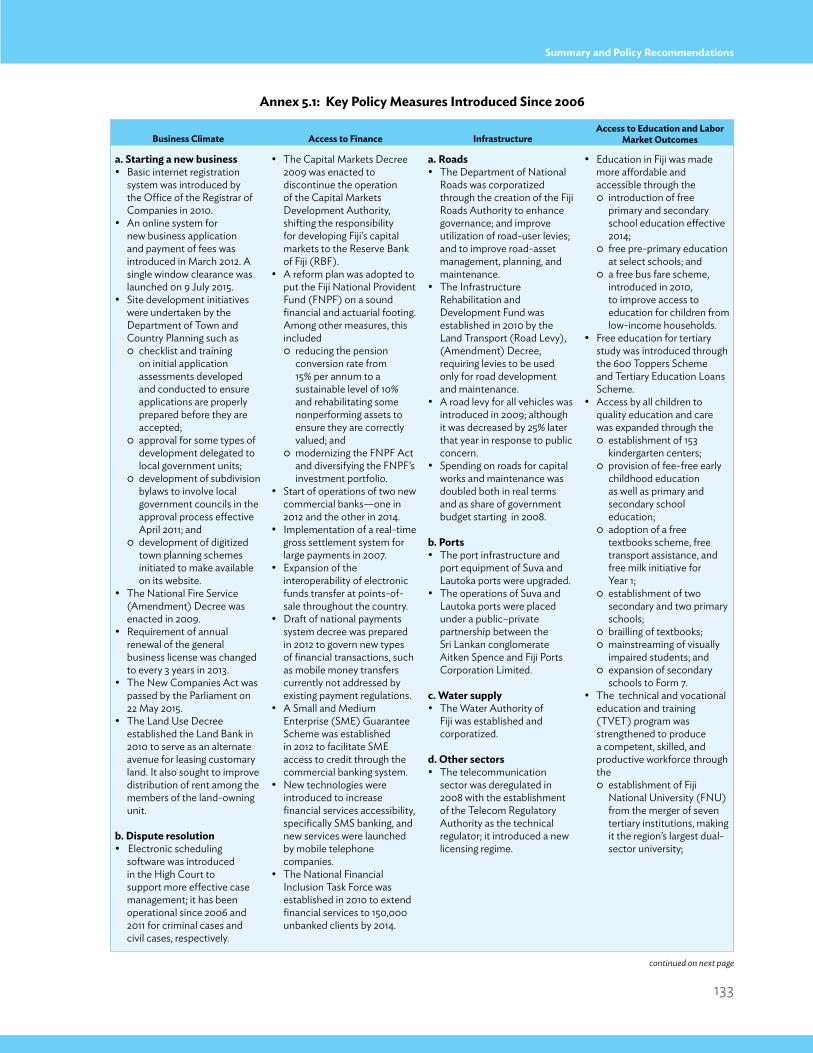
133
Summary and Policy Recommendations
Annex 5.1: key policy measures introduced since 2006
Business Climate Access to Finance infrastructure Access to education and labor
market outcomes
a. starting a new business• Basic internet registration
system was introduced by the Office of the Registrar of Companies in 2010.
• An online system for new business application and payment of fees was introduced in March 2012. A single window clearance was launched 0n 9 July 2015.
• Site development initiatives were undertaken by the Department of Town and Country Planning such as� checklist and training
on initial application assessments developed and conducted to ensure applications are properly prepared before they are accepted;
� approval for some types of development delegated to local government units;
� development of subdivision bylaws to involve local government councils in the approval process effective April 2011; and
� development of digitized town planning schemes initiated to make available on its website.
• The National Fire Service (Amendment) Decree was enacted in 2009.
• Requirement of annual renewal of the general business license was changed to every 3 years in 2013.
• The New Companies Act was passed by the Parliament on 22 May 2015.
• The Land Use Decree established the Land Bank in 2010 to serve as an alternate avenue for leasing customary land. It also sought to improve distribution of rent among the members of the land-owning unit.
b. Dispute resolution• Electronic scheduling
software was introduced in the High Court to support more effective case management; it has been operational since 2006 and 2011 for criminal cases and civil cases, respectively.
a. Roads• The Department of National
Roads was corporatized through the creation of the Fiji Roads Authority to enhance governance; and improve utilization of road-user levies; and to improve road-asset management, planning, and maintenance.
• The Infrastructure Rehabilitation and Development Fund was established in 2010 by the Land Transport (Road Levy), (Amendment) Decree, requiring levies to be used only for road development and maintenance.
• A road levy for all vehicles was introduced in 2009; although it was decreased by 25% later that year in response to public concern.
• Spending on roads for capital works and maintenance was doubled both in real terms and as share of government budget starting in 2008.
b. ports• The port infrastructure and
port equipment of Suva and Lautoka ports were upgraded.
• The operations of Suva and Lautoka ports were placed under a public–private partnership between the Sri Lankan conglomerate Aitken Spence and Fiji Ports Corporation Limited.
c. Water supply• The Water Authority of
Fiji was established and corporatized.
d. other sectors• The telecommunication
sector was deregulated in 2008 with the establishment of the Telecom Regulatory Authority as the technical regulator; it introduced a new licensing regime.
• Education in Fiji was made more affordable and accessible through the� introduction of free
primary and secondary school education effective 2014;
� free pre-primary education at select schools; and
� a free bus fare scheme, introduced in 2010, to improve access to education for children from low-income households.
• Free education for tertiary study was introduced through the 600 Toppers Scheme and Tertiary Education Loans Scheme.
• Access by all children to quality education and care was expanded through the� establishment of 153
kindergarten centers;� provision of fee-free early
childhood education as well as primary and secondary school education;
� adoption of a free textbooks scheme, free transport assistance, and free milk initiative for Year 1;
� establishment of two secondary and two primary schools;
� brailling of textbooks;� mainstreaming of visually
impaired students; and� expansion of secondary
schools to Form 7.• The technical and vocational
education and training (TVET) program was strengthened to produce a competent, skilled, and productive workforce through the� establishment of Fiji
National University (FNU) from the merger of seven tertiary institutions, making it the region’s largest dual-sector university;
• The Capital Markets Decree 2009 was enacted to discontinue the operation of the Capital Markets Development Authority, shifting the responsibility for developing Fiji's capital markets to the Reserve Bank of Fiji (RBF).
• A reform plan was adopted to put the Fiji National Provident Fund (FNPF) on a sound financial and actuarial footing. Among other measures, this included� reducing the pension
conversion rate from 15% per annum to a sustainable level of 10% and rehabilitating some nonperforming assets to ensure they are correctly valued; and
� modernizing the FNPF Act and diversifying the FNPF’s investment portfolio.
• Start of operations of two new commercial banks—one in 2012 and the other in 2014.
• Implementation of a real-time gross settlement system for large payments in 2007.
• Expansion of the interoperability of electronic funds transfer at points-of-sale throughout the country.
• Draft of national payments system decree was prepared in 2012 to govern new types of financial transactions, such as mobile money transfers currently not addressed by existing payment regulations.
• A Small and Medium Enterprise (SME) Guarantee Scheme was established in 2012 to facilitate SME access to credit through the commercial banking system.
• New technologies were introduced to increase financial services accessibility, specifically SMS banking, and new services were launched by mobile telephone companies.
• The National Financial Inclusion Task Force was established in 2010 to extend financial services to 150,000 unbanked clients by 2014.
continued on next page
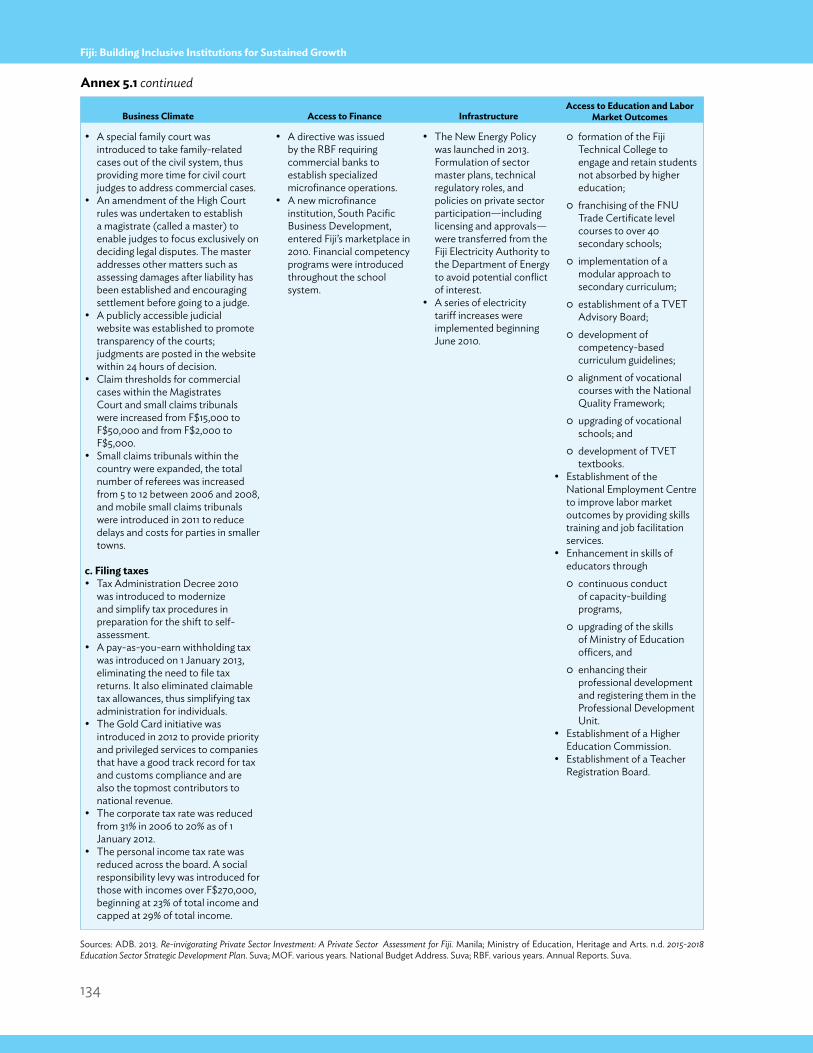
134
Fiji: Building Inclusive Institutions for Sustained Growth
Annex 5.1 continued
Sources: ADB. 2013. Re-invigorating Private Sector Investment: A Private Sector Assessment for Fiji. Manila; Ministry of Education, Heritage and Arts. n.d. 2015-2018 Education Sector Strategic Development Plan. Suva; MOF. various years. National Budget Address. Suva; RBF. various years. Annual Reports. Suva.
Business Climate Access to Finance infrastructure Access to education and labor
market outcomes
• A special family court was introduced to take family-related cases out of the civil system, thus providing more time for civil court judges to address commercial cases.
• An amendment of the High Court rules was undertaken to establish a magistrate (called a master) to enable judges to focus exclusively on deciding legal disputes. The master addresses other matters such as assessing damages after liability has been established and encouraging settlement before going to a judge.
• A publicly accessible judicial website was established to promote transparency of the courts; judgments are posted in the website within 24 hours of decision.
• Claim thresholds for commercial cases within the Magistrates Court and small claims tribunals were increased from F$15,000 to F$50,000 and from F$2,000 to F$5,000.
• Small claims tribunals within the country were expanded, the total number of referees was increased from 5 to 12 between 2006 and 2008, and mobile small claims tribunals were introduced in 2011 to reduce delays and costs for parties in smaller towns.
c. Filing taxes• Tax Administration Decree 2010
was introduced to modernize and simplify tax procedures in preparation for the shift to self-assessment.
• A pay-as-you-earn withholding tax was introduced on 1 January 2013, eliminating the need to file tax returns. It also eliminated claimable tax allowances, thus simplifying tax administration for individuals.
• The Gold Card initiative was introduced in 2012 to provide priority and privileged services to companies that have a good track record for tax and customs compliance and are also the topmost contributors to national revenue.
• The corporate tax rate was reduced from 31% in 2006 to 20% as of 1 January 2012.
• The personal income tax rate was reduced across the board. A social responsibility levy was introduced for those with incomes over F$270,000, beginning at 23% of total income and capped at 29% of total income.
• The New Energy Policy was launched in 2013. Formulation of sector master plans, technical regulatory roles, and policies on private sector participation—including licensing and approvals—were transferred from the Fiji Electricity Authority to the Department of Energy to avoid potential conflict of interest.
• A series of electricity tariff increases were implemented beginning June 2010.
� formation of the Fiji Technical College to engage and retain students not absorbed by higher education;
� franchising of the FNU Trade Certificate level courses to over 40 secondary schools;
� implementation of a modular approach to secondary curriculum;
� establishment of a TVET Advisory Board;
� development of competency-based curriculum guidelines;
� alignment of vocational courses with the National Quality Framework;
� upgrading of vocational schools; and
� development of TVET textbooks.
• Establishment of the National Employment Centre to improve labor market outcomes by providing skills training and job facilitation services.
• Enhancement in skills of educators through� continuous conduct
of capacity-building programs,
� upgrading of the skills of Ministry of Education officers, and
� enhancing their professional development and registering them in the Professional Development Unit.
• Establishment of a Higher Education Commission.
• Establishment of a Teacher Registration Board.
• A directive was issued by the RBF requiring commercial banks to establish specialized microfinance operations.
• A new microfinance institution, South Pacific Business Development, entered Fiji’s marketplace in 2010. Financial competency programs were introduced throughout the school system.
135
References
references
Acemoglu, D., S. Johnson, and J. A. Robinson. 2001. The Colonial Origins of Comparative Development: An Empirical Investigation. American Economic Review. 91 (5). pp. 1369–1401.
Airports Fiji Limited. 2012. Annual Report 2011. http://www.airportsfiji.com/gallery/pic/afl_annual_reprt_2011.pdf Aizenman, J., M. Chinn, and H. Ito. 2008. Assessing the Emerging Global Financial Architecture: Measuring the
Trilemma's Configurations over Time. National Bureau of Economic Research Working Paper. No. 14533. Cambridge.
———. 2013. The “Impossible Trinity” Hypothesis in an Era of Global Imbalances: Measurement and Testing. Review of International Economics. 21 (3). pp. 447–458.
Ali, I. and J. Zhuang. 2007. Inclusive Growth Toward a Prosperous Asia. Economics and Research Department Working Paper Series. No. 97. Manila: ADB.
Asian Development Bank (ADB). 2001. Financial Sector Development in the Pacific Developing Member Countries. Manila.
———. 2007a. Pacific Studies Series: Oceanic Voyages: Aviation in the Pacific. Manila. ———. 2007b. Country Diagnostic Studies – Philippines: Critical Development Constraints. Manila. ———. 2010. Microfinance in Fiji: Challenges and Opportunities. Consultant's report. Manila (TA 6353-REG).———. 2011a. Performance Evaluation Report: Fiji Ports Development Project in Fiji. Manila. ———. 2011b. Finding Balance 2011: Benchmarking the Performance of State-Owned Enterprises in Fiji, the Marshall
Islands, Samoa, Solomon Islands, and Tonga. Manila. ———. 2011c. The Revised Social Protection Index: Methodology and Handbook. Manila. ———. 2012. Pacific Studies Series: Fiji 2012: Revitalizing the Fiji Economy. Manila. ———. 2013a. Asian Development Outlook 2013 Update. Manila. ———. 2013b. Re-invigorating Private Sector Investment: A Private Sector Assessment for Fiji. Manila. ———. 2013c. Technical Assistance to the Republic of Fiji for Transport Sector Planning and Management. Manila. ———. 2013d. The Economics of Climate Change in the Pacific. Manila. ———. 2014a. Country Partnership Strategy: Fiji 2014–2018. Manila. ———. 2014b. Finding Balance 2014: Benchmarking the Performance of State-Owned Enterprises in Island Countries.
Manila. ———. 2014c. Key Indicators for Asia and the Pacific 2014. Manila. ———. 2014d. Unlocking Finance for Growth: Secured Transactions Reform in Pacific Island Economies. Manila. ———. various years. Key Indicators for Asia and the Pacific. Manila. ———. Social Protection Index Database. http://spi.adb.org/spidmz/index.jspADB, Australian Aid, and Japan International Cooperation Agency (JICA). 2013. Country Diagnostic Studies
– Bhutan: Critical Development Constraints. Manila. ADB and International Labour Organization. Forthcoming. Fiji Employment Analysis: Creating Quality Jobs.
136
References
ADB and International Labour Organization (ILO). Forthcoming. Fiji Employment Study: Creating Quality Jobs.Barr, K. J. 2007. Squatters in Fiji: The Need for Attitudinal Change. CCF Housing and Social Exclusion Policy
Dialogue Paper. No. 1. Suva: Citizen’s Constitutional Forum.Barro, R. and J-W. Lee. 2010. A New Data Set of Educational Attainment in the World, 1950–2010. Journal of
Development Economics. 104. pp.184–198. April.Belshaw, C. 1964. Under the lvi Tree: Society and Economic Growth in Rural Fiji. Berkeley: University of California
Press.Berg, A. G. and J. D. Ostry. 2011. Inequality and Unsustainable Growth: Two Sides of the Same Coin? IMF Staff
Discussion Note. SDN/11/08. Bloom, N., M. Kose, and M. Terrones. 2013. Held Back by Uncertainty. IMF Finance and Development. 50 (1).
pp. 36–41. Brookfield, H. C., F. Ellis, and R. G. Ward. 1985. Land, Cane, and Coconuts: Papers on the Rural Economy of Fiji.
Canberra: Research School of Pacific Studies, Australian National University.Bulatale, R. and R. Duncan. 2014. Binding Constraints to Economic Growth in Fiji. In R. Duncan, H. Codippily,
E. Duituturaga, and R. Bulatale. Identifying Binding Constraints in Pacific Island Economies. East–West Center Working Papers: Pacific Islands Development Series. No. 18. November. Honolulu: East–West Center.
Burns, A., T. Watson, and A. Peacock. 1960. Report of the Commission of Enquiry into the Natural Resources and Population Trends of the Colony of Fiji, 1959. Legislative Council Paper. No. 1. Suva: Government Press.
Centre d'Etudes Prospectives et d'Informations Internationales (CEPII) Research and Expertise on the World Economy Database. http://www.cepii.fr/cepii/en/bdd_modele/bdd.asp
Chand, S. 2011. The Political Economy of Sugar Rents in Fiji. In R. Duncan, ed. Pacific Studies Series: The Political Economy of Economic Reform in the Pacific. Manila: ADB.
Chand, S. 2014. The Political Economy of Economic Growth in Fiji. Background paper commissioned for the Fiji Country Diagnostic Study under ADB Technical Assistance for Diagnosing Critical Constraints to Growth and Structural Transformation in Selected Developing Members Countries (TA 7686). Manila.
Chand, S. and M. Clemens. 2008. Skilled Emigration and Skill Creation: A Quasi-Experiment. Center for Global Development Working Paper. No. 152. September.
Chandar, R. 2013. Equal and Fair Share for Landowners: PM. FijiLive. 5 November. http://fijilive.com/news/2013/11/equal-and-fair-share-for-landowners-pm/55554/
Civil Aviation Authority of Fiji (CAAF). 2009. Socio-economic Dynamics of Civil Aviation: Fiji’s Experiences. Presentation during a Seminar on Socio-Economic Dynamics of Civil Aviation in the Asia and Pacific Region by Ernest Fernando Dutta, Board Chairman, CAAF. Bangkok. 14 July. http://www.icao.int/APAC/Documents/60th/fiji.pdf
Couper, A. 2009. Sailors and Traders: A Maritime History of the Pacific Peoples. Honolulu: University of Hawai’i Press. Quoted in T. Farrelly and A. Vudiniabola. 2013. Kerekere and Indigenous Social Entrepreneurship. Journal of Social Anthropology and Cultural Studies. 10 (2). pp. 1–29.
Danilenko, A., C. van den Berg, B. Macheve, and L. J. Moffitt. 2014. The IBNET Water Supply and Sanitation Blue Book 2014: The International Benchmarking Network for Water and Sanitation Utilities Data Book. Washington, DC: World Bank Group.
Davies, M. and J. Vaught. 2010. Interest Rates and Bank Profitability in the South Pacific. Pacific Financial Technical Assistance Centre (PFTAC) Regional Papers. July. Suva. http://www.pftac.org/filemanager/files/Regional_Papers/Governors_Paper.pdf
Department of Foreign Affairs Trade, Economic Analytical Unit. 2003. Future Directions for Fiji's Garment Industry: Scoping Study. August.
Economic Consulting Associates (ECA) and SMEC (New Zealand). 2013. Review of the Fiji National Energy Policy: Draft Strategic Action Plan. August. http://prdrse4all.spc.int/production/system/files/draft_strategic_action_plan_2013.pdf
Energy Charter Secretariat. 2012. In-Depth Review of Energy Efficiency Policies and Programmes: Georgia. Brussels. Background paper on the EU proposal to denounce the Sugar Protocol and market access for ACP sugar under EPAs. 14 September. http://trade.ec.europa.eu/doclib/docs/2007/september/tradoc_135921.pdf
European Commission. 2007. Background paper on the EU proposal to denounce the Sugar Protocol and market access for ACP sugar under EPAs. 14 September. http://trade.ec.europa.eu/doclib/docs/ 2007/september/tradoc_135921.pdf
137
References
European Union (EU), Delegation of the European Union to Barbados and the Eastern Caribbean. n. d. Sugar Protocol. http://eeas.europa.eu/delegations/barbados/eu_barbados/development_coop/sugar_protocol/index_en.htm
Farrelly, T. and A. Vudiniabola. 2013. Kerekere and Indigenous Social Entrepreneurship. Journal of Social Anthropology and Cultural Studies. 10 (2). pp. 1–29.
Fife, E., ed. 2013. Broadband in Fiji: A Micromarket Case Study. Pacific Telecommunications Council (PTC) Broadband Reports. No. 1. Honolulu: PTC.
Fiji-Budget-Vacations.com. Visitor Arrivals by Country of Residences by Month. http://www.fiji-budget-vacations.com/support-files/fiji-tourist-figures.pdf
Fiji Bureau of Statistics (FBOS). 2013. Key Statistics: June 2013. September. Suva. http://www.statsfiji.gov.fj/index.php/document-library/doc_download/1305-key-statistics-june-2013
———. 2015. Key Statistics: December 2014. March. Suva. http://www.statsfiji.gov.fj/index.php/document-library/doc_download/1358-key-statistics-december-2014
———. various issues. Key Statistics. Suva. http://www.statsfiji.gov.fj/index.php/test-menu-item/51-publication/publication-releases/148-fbos-reports
———. Employment and Unemployment Survey 2004/05. Suva.———. Employment and Unemployment Survey 2010/11. Suva. ———. Household Income and Expenditure Survey 2002/03. Suva.———. Household Income and Expenditure Survey 2008/09. Suva.Fiji Commerce Commission. 2012. Final Determination on Electricity Tariff Rates—Fiji Electricity Authority. Suva.
http://www.commcomm.gov.fj/wp-content/uploads/2012/07/final-Determination-for-FEA.pdf Fiji Electricity Authority (FEA). 2014. Annual Report 2013. Suva. http://www.fea.com.fj/wp-content/uploads/
2014/08/FEA-Annual-Report-2013.pdf ———. various years. Annual Reports. http://www.fea.com.fj/about-us/company-information/company-reports/ Fiji National Provident Fund (FNPF). 2015. 2014 Annual Report: Engaging and Empowering Members. Suva. http://
www.fnpf.com.fj/images/files/Annual_Reports/2014-annual-report-v2.pdf Fiji Ports Corporation Limited (FPCL). 2015. Brief Presentation on Fiji Ports during the ADB–FPCL Meeting. Suva.
9 March. Fiji Roads Authority. 2013. 2014 Corporate Plan and Statement of Corporate Intent. Suva. http://www.fijiroads.org/
sites/default/files/FRA%20CORPORATE%20PLAN%202014.pdf———. 2014. 2015 Corporate Plan and Statement of Corporate Intent. Suva. http://www.fijiroads.org/sites/default/
files/2015%20Corporate%20Plan%20Final_0.pdfFiji Sugar Corporation (FSC). 2011. Annual Report 2011. http://www.fsc.com.fj/reports/Annual_Report_2011.pdf ———. 2014. Annual Report 2014. http://www.fsc.com.fj/reports/Annual_Report_2014.pdf Fischer, D. and T. Bruett. 2010. Can Fiji’s MFIs be Sustainable? Pacific Financial Inclusion Programme Focus Note.
No. 1. August. Suva: United Nations Development Programme (UNDP) Pacific Centre.Food and Agriculture Organization of the United Nations Statistics Division. FAOSTAT. http://faostat3.fao.org/
home/EFraenkel, J., S. Firth, and B. Lal, eds. 2009. The 2006 Military Takeover in Fiji: A Coup to End All Coups? Canberra:
Australian National University Press.Freedom House. Fiji: Freedom in the World 2014. https://freedomhouse.org/report/freedom-world/2014/fiji#.
VXaxpM-qpHx Frodey, C. and Y. Naidu. 2008. Pure Fiji Export Limited: A Skin Care Company in Harmony with Nature and
Culture. Journal of Business Case Studies. 4 (2). pp. 19–30. Garcia-Duran, P. and E. Casanova. 2009. After the Sugar Protocol. Trade Negotiations Insights. 8 (7). http://www.
ictsd.org/bridges-news/trade-negotiations-insights/news/after-the-sugar-protocol Gibson, D. 2013. Fair Share for All. The Fiji Times Online. 6 November. Government of Fiji. 2015. Education for All 2015 National Review.Government of Fiji, National Energy Policy Review Advisory Committee. 2013. Fiji National Energy Policy 2013–
2020 Final Draft. Suva.Government of Fiji, Pacific Integrated Water Resources Management (IWRM), Secretariat of the Pacific
Community (SOPAC), and Global Environment Facility (GEF). n. d. Mid-Term Report of the Fiji GEF Pacific IWRM Demonstration Project – Environmental and Socio-Economic Protection in Fiji: Integrated Flood Risk Management in the Nadi River Basin. http://www.pacific-iwrm.org/mid-term-reports/GEF-Pacific-IWRM-Fiji-Draft-Mid-Term-Report.pdf
138
References
Hallward-Driemeier, M. and L. Pritchett. 2011. How Business is Done and the ‘Doing Business' Indicators: The Investment Climate When Firms have Climate Control. World Bank Policy Research Working Paper Series. No. 5563.
Hausmann, R., D. Rodrik, and A. Velasco. 2005. Growth Diagnostics. Cambridge, MA: John F. Kennedy School of Government, Harvard University.
Helble, M. 2014. The Pacific’s Connectivity and its Trade Implications. Asian Development Bank Institute (ADBI) Working Paper Series. No. 499. Tokyo.
Horowitz, D. 1985. Ethnic Groups in Conflict. Berkeley: University of California Press.Horscroft, V. 2014. Public Sectors in the Pacific Islands: Are They ‘Too Big’ and Do They ‘Crowd Out’ the Private
Sector? Policy Research Working Paper. No. WPS 7102. November. Washington, DC: World Bank Group. Huh, H. and C-Y. Park. Forthcoming. An Empirical Examination of the Trilemma Hypothesis and Policy
Implications for Fiji.Inter Island Airways Fiji Limited. http://www.avianaair.com/inter-island-airways-fiji-limited.html International Finance Corporation (IFC). 2010. Economic Opportunities for Women in the Pacific. Washington DC. International Monetary Fund (IMF). 2013a. Democratic Republic of Timor-Leste: 2013 Article IV Consultation.
IMF Country Report. No. 13/338. December. Washington DC: IMF. ———. 2013b. Republic of Fiji: 2013 Article IV Consultation. IMF Country Report. No. 13/370. December.
Washington DC: IMF. ———. 2014. Republic of Fiji: 2014 Article IV Consultation. IMF Country Report. No. 14/321. November.
Washington DC: IMF. ———. 2015. Tonga: 2015 Article IV Consultation. IMF Country Report. No. 15/107. April. Washington DC: IMF. ———. Financial Access Survey Database. http://fas.imf.org/default.aspx ———. World Economic and Financial Surveys, World Economic Outlook (WEO) Database: April 2015 Edition.
http://www.imf.org/external/pubs/ft/weo/2015/01/weodata/index.aspxInternational Sugar Organization (ISO). 2014. The EU Sugar Market Post 2017. ISO Study – Market Evaluation
Consumption and Statistics Committee. (14) 5. April. Ito, H. and M. Kawai. 2014. New Measures of the Trilemma Hypothesis: Implications for Asia. In M. Kawai, M. B.
Lamberte, and P. J. Morgan, eds. Reform of the International Monetary System: An Asian Perspective. ADBI and Springer Japan. pp. 73–104.
Jamil, F. 2011. Comparison of Electricity Supply and Tariff Rates in South Asian Countries. http://efsl.lk/reports/electricity_supply_south_asian_countries.pdf
Jayasuriya, D. and V. Suri. 2012. Impact of Smallness and Remoteness on Growth: The Special Case of the Pacific Island Countries. Working Paper. https://cde.buseco.monash.edu/ site/DefaultSite/filesystem/documents/ADEW/Jayasuria-Suri-Smallness%20and%20Remoteness%20Paper%20Working%20Paper%20-%2028032012.pdf
Johnston, P., J. Vos, and H. Wade. 2005. Pacific Islands Renewable Energy Project: Pacific Regional Energy Assessment 2004. Fiji National Report Volume 4. Apia, Samoa: Secretariat of the Pacific Regional Environment Programme.
Jolly, M. 1992. Custom and the Way of Land: Past and Present in Vanuatu and Fiji. In M. Jolly and N. Thomas, eds. The Politics of Tradition in the Pacific, Oceania Special Issue. 62 (4). pp. 330–354.
Keefer, P. and S. Knack. 2007. Boondoggles, Rent-Seeking, and Political Checks and Balances: Public Investment under Unaccountable Governments. The Review of Economics and Statistics. 89 (3). pp. 566–572.
Knapman, B. and M. A. H. B. Walter. 1980. The Way of the Land and the Path of Money: the Generation of Economic Inequality in Eastern Fiji. Journal of Developing Areas. 14 (2). pp. 201–222.
Kochnakyan, A., A. Balabanyan, P. Antmann, C. R. Laderchi, A. Olivier, L. Pierce, and D. Hankinson. 2013. Republic of Armenia: Power Sector Tariff Study. Washington, DC: World Bank.
Kurer, O. 2001. Land Tenure and Sugar Production in Fiji: Property Rights and Economic Performance. Pacific Economic Bulletin. 16 (2). pp. 94–105.
Lall, S., J. Weiss, and J. Zhang. 2006. The ‘Sophistication’ of Exports: A New Measure of Product Characteristics. World Development. 34 (2). pp. 222–237.
Larmour, P. 2008. Guarding the Guardians: Accountability and Anticorruption in Fiji’s Cleanup Campaign. Pacific Islands Policy. No. 4. Honolulu: East West Center.
———. 2009. From Clean up to Fiji Independent Commission Against Corruption (FICAC): Anticorruption in Fiji’s Post-Coup Politics. Crime, Law, and Social Change. 53 (1). pp. 55–66.
139
References
———. 2012. Corruption and the Concept of Culture: Evidence from the Pacific Islands. In Barcham, M., B. Hindess, and P. Larmour, eds. 2012. Corruption: Expanding the Focus. Canberra: Australian National University E Press. http://press.anu.edu.au/wp-content/uploads/2012/09/whole.pdf
LMC International and Overseas Development Institute (LMC–ODI). 2012. The Impact of EU Sugar Policy Reform on Developing Countries. February. UK: Department for International Development of the United Kingdom. http://r4d.dfid.gov.uk/pdf/outputs/TradePolicy/LMC-ODI_SugarReportPublicVersion(Final).pdf
Love, I., M. S. M. Peria, and S. Singh. 2014. Collateral Registries for Movable Assets: Does Their Introduction Spur Firms’ Access to Bank Finance? University of Hawai`i at Mānoa Department of Economics Working Paper Series. No. 14-22. Honolulu.
Mahadevan, R. 2008. The High Price of Sweetness: The Twin Challenges of Efficiency and Soil Erosion in Fiji's Sugar Industry. Ecological Economics, Elsevier. 66 (2–3). pp. 468–477.
———. 2009. The Less than Sweet Solution to Fiji's Sugar Industry Problems. Journal of International Development. 21 (1). pp 126–136.
McKinnon, J., S. Whitehead, M. Chung, and L. Taylor. 2007. Report of the Fiji Informal Settlements Scoping Mission. Wellington: New Zealand Agency for International Development.
McMaster, J. and J. Nowak. 2003. Natural Waters of Viti Limited—Pioneering a New Industry in the Fiji Islands. Journal of the Australian and New Zealand Academy of Management. 9 (2). pp. 37–46.
Ministry of Finance (MOF). 2011. 2012 National Budget Address. Suva. http://www.finance.gov.fj/s/government-budget.html
———. 2012. 2013 National Budget Address. Suva. http://www.finance.gov.fj/s/government-budget.html ———. 2013. 2014 National Budget Address. Suva. http://www.finance.gov.fj/s/government-budget.html ———. 2014. Economic and Fiscal Update: Supplement to the 2015 Budget Address. Suva. http://www.finance.
gov.fj/s/government-budget.html ———. various years. Economic and Fiscal Update: Supplement to the [2004–2015] Budget Address. Suva. http://
www.finance.gov.fj/s/government-budget.html ———. various years. National Budget Address. Suva.Ministry of Health (MOH). 2011. The Ministry of Health Strategic Plan 2011–2015. Suva. ———. 2013. Annual Report 2013. Suva. ———. Mortality Database, Public Health Information System Database at Health Information Unit.Ministry of Finance and United Nations Development Programme (MOF and UNDP). Employment Acceleration.
Unpublished.Ministry of National Planning. 2010. Millennium Development Goals: 2nd Report, 1990–2009 Report for the Fiji
Islands. http://www.statsfiji.gov.fj/index.php/document-library/doc_download/990-fiji-millennium-development-goals-2009-2nd-report
Ministry of Strategic Planning, National Development, and Statistics (MoSPNDS). 2010. Roadmap for Democracy and Sustainable Socio-Economic Development 2010–2014. Suva.
———. 2011. National Strategic Human Resource Plan 2011–2015. Suva. http://www.planning.gov.fj/images/stories/National%20Strategic%20human%20Resource%20Plan%202011-2015.pdf
Narsey, W. 2007. Report on the 2004–2005 Employment and Unemployment Survey. May. FBOS. Suva: Vanuavou Publications.
———. 2012. Poverty in Fiji: Changes 2002–03 to 2008–09 and Policy Implications. Suva: FBOS. ———. 2013. Fiji Women and Men at Work and Leisure. Suva: FBOS.Neptune Pacific Line. 2014. Notice to Shippers: Congestion Surcharge. 29 September. http://www.neptunepacific.
com/pdf/Congestion%20Surcharge%20Fiji-Australia.pdfNorth, D. C. 1991. Institutions. The Journal of Economic Perspectives. 5 (1). pp. 97–112. Norton, R. 1990. Race and Politics in Fiji. 2nd ed. St Lucia: University of Queensland Press.Ostry, J. D., A. Berg, and C. G. Tsangarides. 2014. Redistribution, Inequality, and Growth. IMF Staff Discussion Note.
SDN/14/02. Pacific Financial Inclusion Program (PFIP). 2009. Fiji Financial Services Sector Assessment, August 2009. Suva: PFIP,
United Nations Pacific Development Centre. Pacific Islands Forum Secretariat. 2008. Review of Financial Management of Customary and Other Land in the
Pacific. Suva.
140
References
Pacific Water and Wastes Association (PWWA). 2011. Benchmarking Report: Development of a Water Utility Benchmarking System. December.
Poch, K. and S. Tuy. 2012. Cambodia’s Electricity Sector in the Context of Regional Electricity Market Integration. In Y. Wu, X. Shi, and F. Kimura, eds. Energy Market Integration in East Asia: Theories, Electricity Sector and Subsidies. Economic Research Institute for ASEAN and East Asia (ERIA) Research Project Report. No. 2011–17. Jakarta: ERIA.
Prasad, S. 2007. Perpetual Kerekere will Only Entrench Dependency on Aid. The Fiji Times Online. 5 May. Rannan-Eliya, R. P., W. Irava, and S. Saleem. 2013. Assessment of Social Health Insurance Feasibility and Desirability
in Fiji. June. Ministry of Health and World Health Organization (WHO). http://www.health.gov.fj/PDFs/Health%20Finance/Fiji%20Social%20Health%20Insurance%202013.pdf
Rao, D. 2004. Culture and Entrepreneurship in Fiji’s Small Tourism Business Sector. PhD Thesis. Victoria University, Australia.
Ravallion, M. and S. Chen. 2003. Measuring Pro-poor Growth. Economics Letters. 78 (1). pp. 93–99. Reddy, M. 2003. Farm Productivity, Efficiency and Profitability in Fiji's Sugar Industry. Fijian Studies. 1 (2). pp.
225–240.Reserve Bank of Fiji (RBF). 2008. Reserve Bank of Fiji Quarterly Review June 2008. Suva. ———. 2012. Annual Report 2011: Forging Ahead. Suva.———. 2013. Reserve Bank of Fiji Annual Report 2012. Suva.———. 2014. Reserve Bank of Fiji Annual Report 2013. Suva.———. 2015a. Reserve Bank of Fiji Quarterly Review March 2015. Suva. ———. 2015b. Statistical Annex April 2015. Suva. ———. 2015c. Statistical Annex February 2015. Suva. ———. 2015d. The Fijian Economy. Presentation at the ADB Roundtable Discussion with Development Partners
and Government Agencies. Suva. 10 March.———. various years. Annual Reports. Suva.———. various issues. Statistical Annex. Suva. Rodrik, D. 1991. Policy Uncertainty and Private Investment in Developing Countries. Journal of Development
Economics. 36 (2). pp. 229–242. ———. 2008. The Real Exchange Rate and Economic Growth. Brookings Papers on Economic Activity 39 (2). pp.
365–439.Rodrik, D., A. Subramanian, and F. Trebbi. 2004. Institutions Rule: The Primacy of Institutions over Geography and
Integration in Economic Development. Journal of Economic Growth. 9 (2). pp. 131–165. Rutz, H. J. 1987. Capitalizing on Culture: Moral Ironies in Urban Fiji. Comparative Study of Society and History. 29
(3). pp. 533–557.Savedoff, W. 2003. How Much Should Countries Spend on Health? EIP [Evidence and Information for Policy
Cluster] and FER [Health System Financing, Expenditure and Resource Allocation Department] Discussion Paper. No. 2–2003. Geneva: WHO.
Schultz, J. T. and P. T. Vatucawaqa. 2009. Report: 2008 Micronutrient Status of Children: 6 Months –<5 Years in Fiji. August. Suva: National Food and Nutrition Centre.
Slay, B., ed. 2011. Energy and Communal Services in Kyrgyzstan and Tajikistan: A Poverty and Social Impact Assessment. UNDP. http://europeandcis.undp.org/uploads/public1/files/ vulnerability/Senior%20Economist%20Web%20site/PSIA%20Manuscript_29_10_11.pdf
Son, H. H. 2015. Why Recalibrating Technical and Vocational Education Training Matters for Inclusive Growth. Asian Development Blog. 16 April. http://blogs.adb.org/blog/why-recalibrating-technical-and-vocational-education-training-matters-inclusive-growth
Spate, O. 1959. The Fijian People: Economic Problems and Prospects. Legislative Council Paper. No. 13. Suva: Government Press.
Storey, D. 2004. The Fiji Garment Industry. Oxfam. http://www.oxfam.org.nz/sites/default/files/ reports/Oxfam%20Fiji%20Garment%20Study.pdf
Stratfor Global Intelligence. 2012. Afghanistan: Future Energy Corridor? The Hub: International Perspectives. 21 June. http://www.stratfor.com/the-hub/afghanistan-future-energy-corridor
Swami, N. 2012. Squatters Up by 5pc. The Fiji Times Online. 30 June.
141
References
Tinker, H. 1974. A New System of Slavery: The Export of Indian Labour Overseas, 1830–1920. London: Oxford University Press.
Transparency International. 2013. Global Corruption Barometer 2013. Berlin. http://www.transparency.org/whatwedo/publication/global_corruption_barometer_2013
United Nations Children's Fund (UNICEF). 2011. Children in Fiji: 2011—An Atlas of Social Indicators. http://www.unicef.org/pacificislands/Fiji_Equity_Atlas_Web_version.pdf
UNICEF Pacific and Fiji Ministry of Women, Children and Poverty Alleviation. 2015. Child-Sensitive Social Protection in Fiji: Assessment of the Care and Protection Allowance. February.
United Nations Commodity Trade Statistics Database (UN Comtrade). http://comtrade.un.org/ db/default.aspx
UNDP. 2012. The Pacific Response: Electrifying Isolated Islands. Bangkok. http://www.asia-pacific.undp.org/content/dam/rbap/docs/Research%20&%20Publications/environment_energy/energy-plus/EE-2012-Case7-FREP.pdf
United Nations Statistics Division (UNSD). National Accounts Main Aggregates Database. http://unstats.un.org/unsd/snaama/Introduction.asp
———. Millennium Development Goals Indicators. http://unstats.un.org/unsd/mdg/United States Department of Agriculture (USDA). Sugar and Sweeteners Yearbook Tables. http://www.ers.usda.
gov/data-products/sugar-and-sweeteners-yearbook-tables.aspx United States Energy Information Administration (US EIA) Data. http://www.eia.gov/cfapps/
ipdbproject/IEDIndex3.cfm Voigt-Graf, C. 2006. Analysis of Skilled Employment Demand and Opportunities in the Pacific Labour Market.
Economics Department Working Paper. No. 11. Suva: University of the South Pacific.Volavola, R. M. 1995. The Native Land Trust Board of Fiji. In R. Crocombe, ed. Customary Land Tenure and
Sustainable Development: Complementarity or Conflict? Suva and Noumea: Institute of Pacific Studies and South Pacific Commission.
Ward, G. and E. Kingdon. 1995. Land Custom and Practice in the South Pacific. Cambridge: Cambridge University Press.
Winters, L. A. and P. M. G. Martins. 2004. When Comparative Advantage is Not Enough: Business Costs in Small Remote Economies. World Trade Review. 3 (3). pp. 347–383.
World Bank. 2009. A Handbook for Tax Simplification. Washington, DC: World Bank.———. 2011a. Fiji: Assessment of the Social Protection System in Fiji and Recommendations for Policy Changes.
Washington DC: World Bank. http://documents.worldbank.org/curated/en/2011/12/15785008/fiji-assessment-social-protection-system-fiji-recommendations-policy-changes
———. 2011b. Republic of Fiji: Poverty Trends, Profiles, and Small Area Estimation (Poverty Maps) in Republic of Fiji (2003–2009). Washington, DC. http://documents.worldbank.org/curated/en/2011/09/15423997/republic-fiji-poverty-trends-profiles-small-area-estimation-poverty-maps-republic-fiji-2003-2009
———. 2014. Doing Business 2015: Going Beyond Efficiency—Economy Profile 2015: Fiji. Washington, DC. http://www.doingbusiness.org/data/exploreeconomies/fiji/~/media/giawb/doing%20business/documents/profiles/country/FJI.pdf?ver=2
———. World Bank Commodity Price Data (The Pink Sheet). ———. Doing Business. http://www.doingbusiness.org/———. Education Statistics. http://data.worldbank.org/data-catalog/ed-stats———. Enterprise Surveys. http://www.enterprisesurveys.org/———. World Development Indicators. http://data.worldbank.org/data-catalog/world-development-indicators ———. Worldwide Governance Indicators. http://info.worldbank.org/governance/wgi/index.aspx#homeWorld Bank and IMF. 2007. Financial Sector Assessment: Fiji. Washington, DC. http://documents.worldbank.org/
curated/en/2007/10/8665695/fiji-financial-sector-assessment World Health Organization (WHO). Vaccine-Preventable Diseases: Monitoring System, 2015 Global Summary.
http://apps.who.int/immunization_monitoring/globalsummary/countries?countrycriteria%5Bcountry%5D%5B%5D
———. STEPwise Approach to Chronic Disease Risk Factor Surveillance: Preliminary Fact Sheet 2011.WHO and MOH. 2012. Health Service Delivery Profile Fiji 2012. http://www.wpro.who.int/health_services/service_delivery_profile_fiji.pdf
142
References
Yang, Y., M. Davies, S. Wang, J. Dunn, and Y. Wu. 2011. Monetary Policy Transmission Mechanisms in Pacific Island Countries. IMF Working Paper. No. 11/96.
Zhuang, J. 2008. Inclusive Growth Toward a Harmonious Society in the People’s Republic of China: Policy Implications. Asian Development Review. 25 (1 and 2). Manila: ADB.
Zhuang, J., H. Gunatilake, Y. Niimi, M. E. Khan, Y. Jiang, R. Hasan, N. Khor, A. S. Lagman-Martin, P. Bracey, and B. Huang. 2009. Financial Sector Development, Economic Growth, and Poverty Reduction: A Literature Review. Economics and Research Department Working Paper Series. No. 173. Manila: ADB.
Zhuang, J., R. Kanbur, and C. Rhee. 2014. Rising Inequality in Asia and Policy Implications. ADBI Working Paper Series. No. 463. February. Tokyo.
Fiji: Building Inclusive Institutions for Sustained growthCountry Diagnostic Study
From 2010 onward, Fiji witnessed one of its strongest spells of economic growth since independence. Extreme poverty is in the single digits, but nearly a third of the population is unable to meet basic needs. Fiji thus faces two major challenges: to create a business environment that can attract more private investment to help sustain its growth momentum, and to make that growth inclusive so that all of Fiji can benefit. This country diagnostic study undertaken by the Asian Development Bank identifies the critical constraints to inclusive growth in Fiji and proposes policy options for addressing them.
About the Asian Development Bank
ADB’s vision is an Asia and Pacific region free of poverty. Its mission is to help its developing member countries reduce poverty and improve the quality of life of their people. Despite the region’s many successes, it remains home to the majority of the world’s poor. ADB is committed to reducing poverty through inclusive economic growth, environmentally sustainable growth, and regional integration.
Based in Manila, ADB is owned by 67 members, including 48 from the region. Its main instruments for helping its developing member countries are policy dialogue, loans, equity investments, guarantees, grants, and technical assistance.
AsiAn Development BAnk6 ADB Avenue, Mandaluyong City1550 Metro Manila, Philippineswww.adb.org


