Embed Size (px)
Citation preview
Citation: Rivera Flores, V.K.;
DeMarsh, T.A.; Gibney, P.A.; Alcaine,
S.D. Fermentation of Dairy-Relevant
Sugars by Saccharomyces,
Kluyveromyces, and Brettanomyces: An
Exploratory Study with Implications
for the Utilization of Acid Whey, Part
II. Fermentation 2022, 8, 257.
https://doi.org/10.3390/
fermentation8060257
Academic Editor: Ana Susmozas
Received: 10 May 2022
Accepted: 26 May 2022
Published: 28 May 2022
Publisher’s Note: MDPI stays neutral
with regard to jurisdictional claims in
published maps and institutional affil-
iations.
Copyright: © 2022 by the authors.
Licensee MDPI, Basel, Switzerland.
This article is an open access article
distributed under the terms and
conditions of the Creative Commons
Attribution (CC BY) license (https://
creativecommons.org/licenses/by/
4.0/).
fermentation
Article
Fermentation of Dairy-Relevant Sugars by Saccharomyces,Kluyveromyces, and Brettanomyces: An Exploratory Study withImplications for the Utilization of Acid Whey, Part IIViviana K. Rivera Flores , Timothy A. DeMarsh , Patrick A. Gibney and Samuel D. Alcaine *
Department of Food Science, Cornell University, Ithaca, NY 14853, USA; [email protected] (V.K.R.F.);[email protected] (T.A.D.); [email protected] (P.A.G.)* Correspondence: [email protected]; Tel.: +1-607-255-9183
Abstract: In Greek-style yogurt production, every kilogram of product yields 2 to 3 kg of acid whey(YAW); this coproduct’s composition and low pH pose challenges for its proper valorization andreinsertion into the food supply chain. However, 240 mL of YAW contains over 9 g of lactose andrepresents a good source of minerals; these traits can be leveraged to develop nutritious fermentedbeverages. The purpose of this study is to investigate the aerobic fermentation of dairy sugars bydifferent yeasts by characterizing these processes and their products. This will determine whethersuch methods provide viable options for the production of acetic-acid-containing beverages fromYAW. To achieve this, yeast nitrogen base was used to prepare four growth media formulations, eachsupplemented with lactose, glucose, galactose, or a 1:1 mix of glucose and galactose (GLU:GAL),and each adjusted to a pH of 4.20. Fermentations were performed by pure cultures of S. cerevisiae,K. marxianus, B. claussenii, or B. bruxellensis, and were held at 25 ◦C with agitation at 185 rpm. Foreach treatment, density, pH, and microbial enumeration were measured over time to obtain processprofiles, while ethanol, organic acids, and sugars were analyzed at the beginning and the end of eachfermentation via HPLC, to determine resulting products. ANOVA and Tukey’s honest significantdifference test at a significance level of 0.05 were used to compare residual sugars and fermentationproducts. Variable rates of sugar consumption were observed for each species. In GLU:GAL, B.claussenii consumed all of the glucose, left behind most of the galactose, and produced a highconcentration of acetic acid. These results suggest the potential to develop versatile processes thattarget glucose for acetic acid production, while leaving available galactose to confer products withprebiotic properties. The development of processes for the conversion of YAW into beverages withorganic acids and other healthful components not only aligns with consumers’ demands for better-for-you products, but also promotes the valorization of this otherwise underutilized dairy coproduct.
Keywords: acid whey valorization; acetic acid beverage
1. Introduction
During the production of Greek-style yogurt, every kilogram of product yields2 to 3 kg of acid whey (YAW) [1]. In the United States, Greek-style yogurt accounted forapproximately 44% of yogurt sales in 2020 [2], translating into 1.8–2.7 billion kg of YAW [3].For this reason, multiple strategies for the industrial utilization of YAW have been inves-tigated over the years [1,4–7]. The present study focuses on strategies to take advantageof this dairy coproduct’s nutritional characteristics by revalorizing it into novel beveragesthrough its fermentation by yeasts. While in Part I of this project, Rivera Flores et al. [8]assessed the anaerobic fermentation of the sugars present in YAW by multiple yeasts, PartII, presented here, focuses on comparable fermentation processes under oxic conditions.
It has been reported that 240 mL of YAW contains over 9 g of lactose and representsa good source of various minerals considered essential for human nutrition [9,10]; these
Fermentation 2022, 8, 257. https://doi.org/10.3390/fermentation8060257 https://www.mdpi.com/journal/fermentation
Fermentation 2022, 8, 257 2 of 16
attributes can be leveraged to develop nutritious beverages. Depending on its origin, YAWcan contain approximately 30%, 24%, and 9% of the respective recommended daily intakesfor calcium, phosphorus, and potassium per 240 mL [9,11]. Its vitamin profile includespantothenic acid (0.36 mg/100 g), important in the production of hemoglobin; riboflavin(0.09 mg/100 g), beneficial for blood and brain health; and thiamine (0.08 mg/100 g), criticalfor nerve function [9,11]. Ferruzzi et al. [12] highlighted the role of beverages in the DietaryGuidelines for Americans; they emphasized the importance of dairy nutrients in the humandiet, and the need for nutrient-dense, low-in-sugar beverage alternatives. Thus, developingbeverages that take advantage of the natural nutrient profile of YAW could not only addvalue to this coproduct, but it could also benefit such beverages’ potential consumers. Thesepotential benefits become more attractive when combined with the increased sustainabilityof food systems, and the overall reduction in environmental impact that would result fromredirecting YAW back into the food supply.
Functional beverages are rising in popularity within the beverage market, as con-sumers aim to stay healthy while keeping up with their hectic lives [13]. Moreover, nowa-days, more consumers recognize fermented drinks as being functional [14], and are inter-ested in low-alcohol products and products high in acetic acid such as kefir and kombucha.
Acetic-acid-containing beverages are good examples of functional products. Theyoffer multiple benefits to consumers beyond satisfaction or nutrition [14]; acetic acidcan decrease hepatic glucose production, increase insulin secretion, and promote weightreduction [15]. These recognized benefits have resulted in an increased interest in acetic-acid-containing beverages, and in the potential substrates and microbes that can be used todevelop such drinks.
Researchers such as Marcus et al. [16] and Luo et al. [17] have studied various organ-isms that could be employed to metabolize the sugars present in dairy coproducts, withthe greater aim of the development of unique fermented beverages. Their findings identi-fied yeasts of the Brettanomyces and Kluyveromyces genera as potential candidates for thisendeavor, due to the ability of some species within these genera to metabolize lactose andproduce acetic acid and ethanol. In part I of this study, we discussed the rationale behindselecting Brettanomyces claussenii, Kluyveromyces marxianus, and Saccharomyces cerevisiaefor our investigations [8]. In Part II, we also considered Brettanomyces bruxellensis and itspotential for high acetic acid production, as demonstrated by multiple authors [7,18,19].For instance, Freer [18] reported the production of 0.43 g acetate/g glucose by a strain ofm in a basal medium with an initial concentration of 100 g glucose per liter; this level ofproduction of acetate accounts for approximately 64% of the theoretical maximum, andhighlights B. bruxellensis as a potentially valuable point of comparison with the other speciesinvestigated in the current study, with regard to acetic acid production.
The present work aims to assess the processes and products that result when differentbiotechnologically attractive yeasts metabolize dairy-relevant sugars in the presence ofoxygen. Assessment will be conducted by means of the investigation of pertinent processparameters in order to ultimately explore the potential for manufacturing acetic-acid-containing beverages from YAW. A nonselective medium will be used for these investiga-tions, as, although findings will inform the use of YAW as the ultimate intended substrate,YAW’s more complex matrix may interfere with the clear observation of the yeasts’ habitsof sugar utilization [8]. Considerations such as density, pH, and microbial concentrationprofiles, as well as sugar consumption and produced compounds are discussed in order tocharacterize potential processes that could assist in taking advantage of YAW.
Part I of this study [1] explored anaerobic fermentation processes to propose alterna-tives for ethanol production and the development of alcohol-containing beverages fromYAW. The present observations are intended to complement that set of conclusions, andfurther expand the body of knowledge regarding potential for manufacturing fermentedbeverages. With these two publications, we hope to provide valuable insights for producersof dairy, food, and beverages; to promote the application of fermentation as a novel means
Fermentation 2022, 8, 257 3 of 16
to revalorize YAW; and to propose biotechnological processes that food manufacturers canalso consider for the reutilization of other dairy coproducts.
2. Materials and Methods2.1. Materials
Yeast nitrogen base with amino acids, D-glucose, D-galactose, D-lactose monohydrate,lactic acid (90%), and chloramphenicol were all acquired from Sigma-Aldrich (St. Louis,MO, USA). The commercial yeasts B. claussenii and B. bruxellensis (products OYL-201 andOYL-202, respectively) were each purchased from Omega Yeast Labs (Chicago, IL, USA)in the form of a slurry; these were subcultured and cryopreserved at −80 ◦C. DehydratedS. cerevisiae (IOC BE FRUITS) was purchased from Lallemand Oenology (Edwardstown,South Australia), and K. marxianus (FSL B9-0008) was obtained from the Food SafetyLaboratory at Cornell University; the latter organism had been isolated from a dairysample [20] and had been cryopreserved at −80 ◦C.
2.2. Fermentation Media
Yeast nitrogen base with amino acids was used to obtain a base medium in whichthe types and concentrations of sugars available for fermentation could be individualizedfor different treatments. The dehydrated medium was reconstituted to a concentration of1× using water that had been filtered through a Milli-Q Advantage A10 system (Millipore-Sigma, Burlington, MA, USA), and 40 g/L of either glucose (GLU), galactose (GAL), lactose(LAC), or a 1:1 mixture of glucose and galactose (GLU:GAL) was used to obtain four differ-ent media formulations, each with a different source of fermentable carbon. These distinctcarbon sources were aimed at representing all the possible types of fermentable sugarspresent in YAW at the total sugar concentration typically observed in this coproduct [8].These preparations were adjusted to a pH of 4.2000 ± 0.0050 with a solution of lactic acid(22.5% v/v), using an ICinac analyzer (AMS Alliance, Rome, Italy); the final concentrationof acid per treatment after this adjustment was approximately 0.10 g/L. Lastly, these mediawere filter-sterilized using 0.45 µm polyethersulfone vacuum membrane filters (VWR In-ternational, Radnor, PA, USA), and were stored at 4 ◦C until use. Each biological replicatewas performed in freshly prepared media.
2.3. Yeast Cultures
Resuscitation of frozen isolates was performed by streaking the cultures onto potatodextrose agar (Hardy Diagnostics, Santa Maria, CA, USA) supplemented with chloram-phenicol at a concentration of 25 mg/L. Isolates were incubated at 30 ◦C for 2 days in thecase of K. marxianus, and 6 days for both B. claussenii and B. bruxellensis. Single coloniesof each isolate were then subcultured in test tubes each containing 5 mL of a sterile 12%(w/v) suspension of commercial dry malt extract (Briess Malt and Ingredients Company,Chilton, WI, USA). They were incubated for 48 h at 30 ◦C with constant agitation (200 rpm).A subsequent propagation step was then performed, in which these cultures were eachtransferred to an individual flask containing 50 mL of additional sterile dry malt extractmedium. They were then incubated at the same temperature and agitation until reachinga cell concentration greater than 3.2 × 10⁸ cfu/mL (approximately 2 days for all species).Cell concentrations were monitored daily by counting 1/20 dilutions of each culture usinga hemocytometer and a microscope. These dilutions were prepared by first combining eachculture with 1× phosphate buffered saline for a 1/10 dilution, and then combining thatdilution with a 0.1% (v/v) methylene blue solution (Ward’s Natural Science, Rochester,NY, USA), at a 1:1 ratio; the methylene blue also served for assessment of cell viability [21].New cultures were propagated for each biological replicate. Preparation of the S. cerevisiaeculture was conducted according to the manufacturer’s recommendations, as explained indetail below.
Fermentation 2022, 8, 257 4 of 16
2.4. Fermentation Setup
Each yeast species investigated was paired with each type of medium as a uniquetreatment, for a total of 16 fermentations. Each vessel received a volume of the appropriateculture, the concentration of which allowed for an inoculation level of 4 × 10⁶ cfu/mL. Toprepare the tubes that would serve as the inocula, two processes were followed. The yeastcells in the cultures grown in dry malt extract suspension—i.e., B. bruxellensis, B. claussenii,and K. marxianus—were separated from this medium by centrifugation at 3220× g for2 min, then cell pellets were resuspended in 10 mL of sterile Milli-Q water. Alternatively,with regard to the S. cerevisiae culture, 200 mg of active dried yeast was transferred to eachof four inoculation tubes, and each aliquot of culture was rehydrated in sterile Milli-Qwater for 30 min prior to the inoculation; the resulting inocula provided the desired cellconcentration level for each appropriate flask. Each fermentation was carried out in 500 mLof medium in a 1-L Erlenmeyer flask topped with sterile aluminum foil. The treatmentswere incubated at 25 ◦C, with a shaking at 185 rpm, which produced vigorous agitationof the liquid. For each biological replicate of this experiment, the respective fermentationtreatments were initially established on a Monday. The durations of the fermentationsvaried between species, as they were each defined by the time point at which the densitymeasurements became constant (see Section 3.1.1).
2.5. Data Collection2.5.1. Density, pH, and Microbial Enumeration
As stated, each biological replicate of this experiment was initially set up on a Mon-day; samples of each fermentate were taken each day Monday through Friday, until eachtreatment’s fermentation ceased, as discussed below. All such samples were measured induplicate. On each sampling day, a total volume of 11.5 mL was collected from each fer-mentate for these analyses, and this sample was distributed in the following way: 7 mL fordensity measurements, 4 mL for pH measurements, and 0.5 mL for microbial enumeration.Density samples were sonicated for 20 min using an ultrasonic bath (VWR, Radnor, PA,USA) in order to remove any gas resulting from the fermentation; they were then analyzedwith a DMA 35 density meter (Anton Paar, Graz, Austria) at a temperature of 20 ◦C. For pHmeasurements, samples were dispensed into test tubes measuring 16 × 125 mm, and weremeasured using the ICinac analyzer. For microbial enumeration, the spread plate techniquewas used: following serial dilutions with 1× phosphate buffered saline solution, sampleswere plated onto potato dextrose agar that was supplemented with chloramphenicol at aconcentration of 25 mg/L. The plates were incubated at 30 ◦C for 144 h in the case of theBrettanomyces species, 24 h in the case of K. marxianus, and 48 h in the case of S. cerevisiae.After these respective incubation periods, microbial counts, in cfu/mL, were obtainedusing a Color Q-Count model 530 (Advanced Instruments Inc., Norwood, MA, USA).
2.5.2. Analyses of Sugars, Organic Acids, and Ethanol
With regard to each fermentate, a total of 20 mL was collected at both the beginning andthe end of the fermentation to measure the concentrations of sugars (lactose, glucose, andgalactose, in g/L); organic acids (lactic and acetic acids, in g/L); and ethanol (% v/v). Theseanalyses were performed by the Wine Analytical Laboratory (Cornell Agritech, Geneva,NY, USA) according to the same procedure previously described by Rivera Flores et al. [8].
2.6. Statistical Analysis2.6.1. General Analyses
All statistical analyses were performed using JMP software version 16.0.0 (SAS In-stitute, Cary, NC, USA), with an established significance level of 0.05. The comparisonsof means of samples taken at the same time point were made via Analysis of Variance(ANOVA) and Tuckey’s honest significant difference test. The “matched pairs” functionwas used for dependent data points in time series analyses. Except for the treatmentsfermented by K. marxianus—for which a fourth replicate was executed—all fermentations
Fermentation 2022, 8, 257 5 of 16
were carried out in biological triplicates. Unless stated otherwise, as presented in all graphsand tables, each data point represents the mean among these replicates; error bars representstandard deviations. Microbial concentration measurements were log-transformed andanalyzed using a linear scale.
2.6.2. Nonlinear Density Modeling
Nonlinear modeling was carried out as proposed by Rivera Flores et al. [8] using theFit Curve function in JMP. The data were segregated by species, using the average densityas the response, time as the regressor, and carbon source as the group. All density profileswere fitted using a total of four models: logistic models of three and four parameters,and exponential models of two and three parameters. The best fit for each species wasselected using the model comparison tool in the Fit Curve platform: for the Brettanomycesspecies, this was a logistic four-parameter model; for K. marxianus and S. cerevisiae, anexponential three-parameter model. Table S1 in the Supplemental Materials presents thepredictive equation for each model, and Table S2 presents the estimated parameters forthese equations, as regards each treatment.
After all of the density curves corresponding to the fermentations of an individualspecies were successfully fitted, the growth rate parameters of these curves were comparedacross treatments via analysis of means; this methodology was made available by thecompare parameter estimates function. The upper and lower decision limits of this analysiswere computed using a significance level of 0.05, and they served to identify significantdifferences between treatments fermented by the same species.
3. Results and Discussion3.1. Fermentation Characterization3.1.1. Density
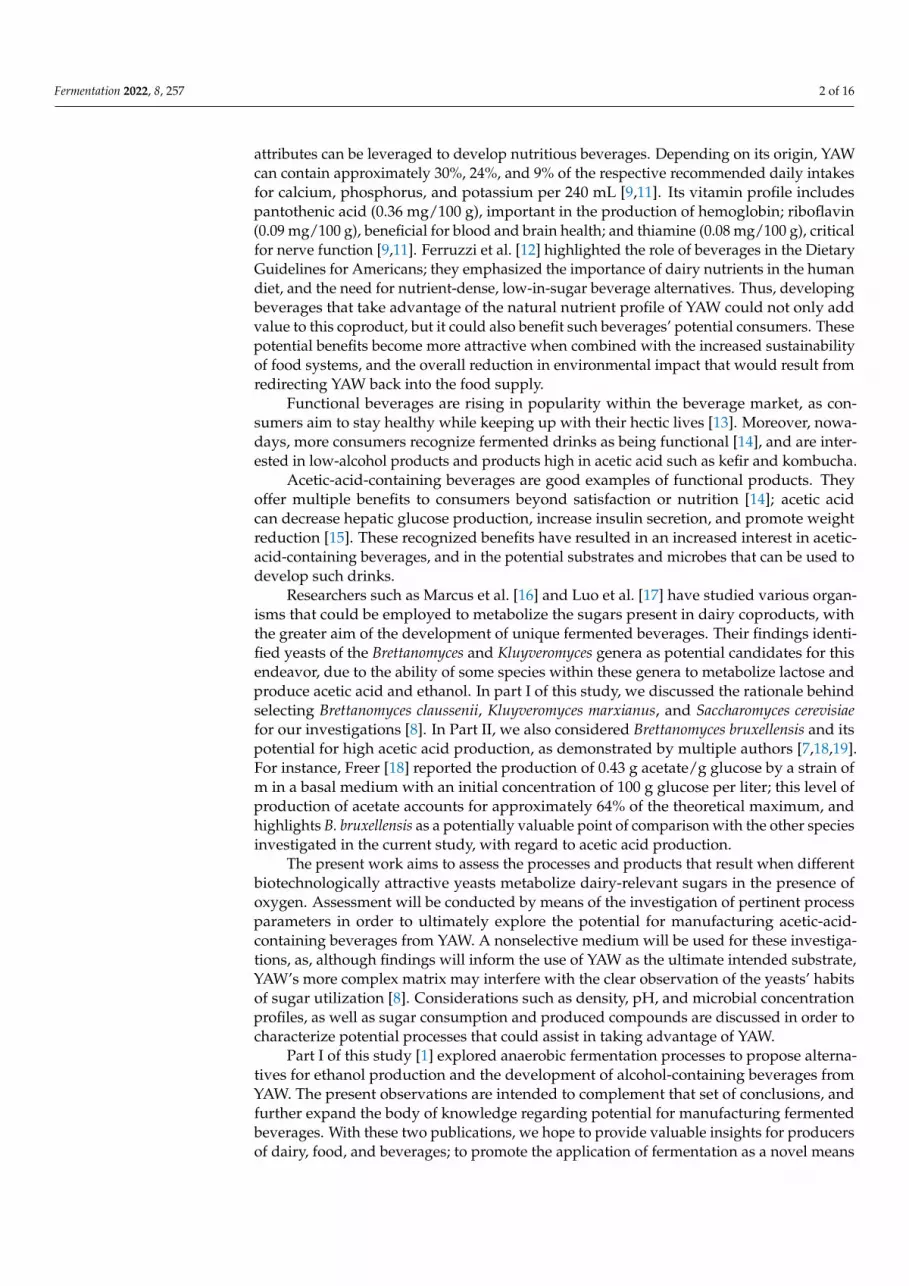
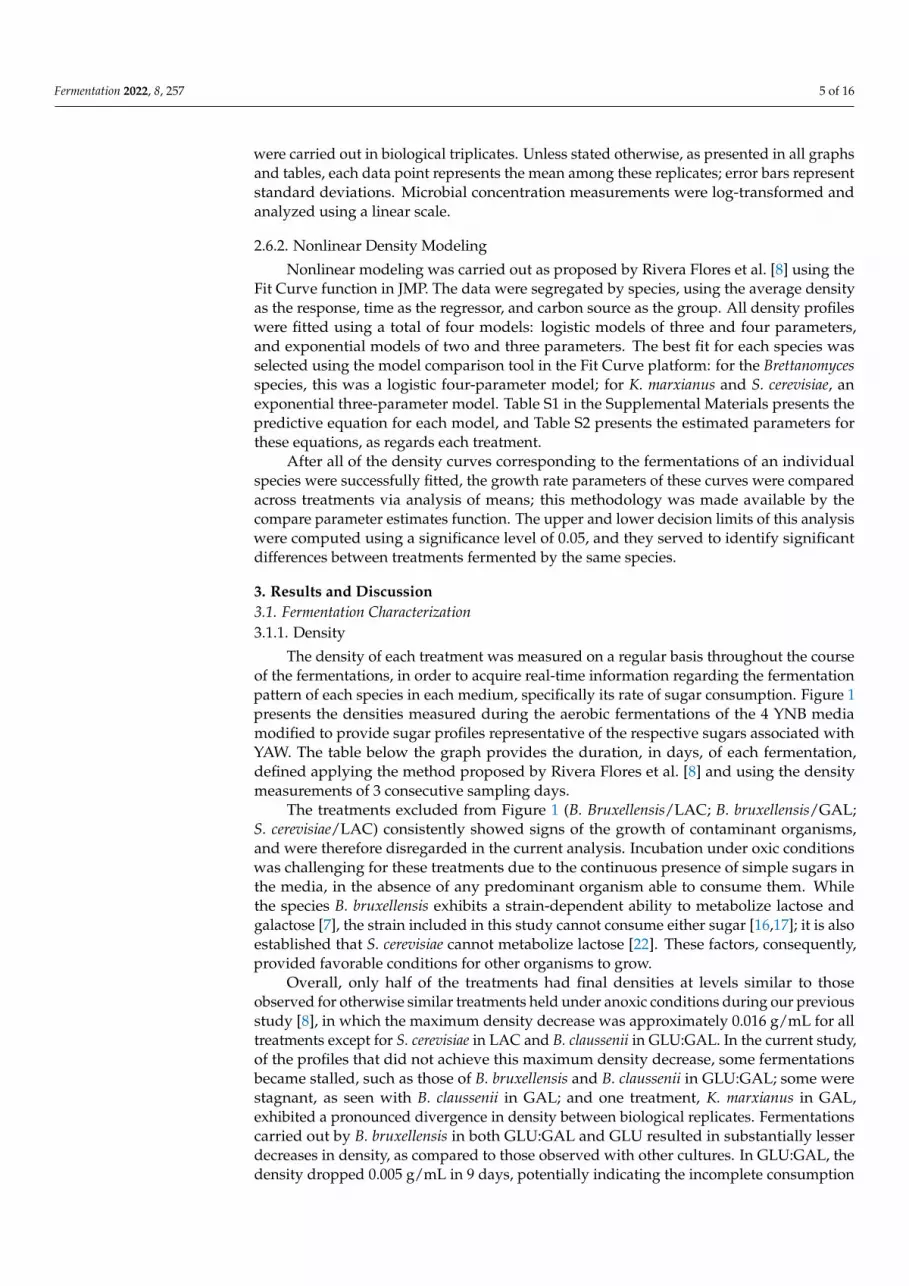
The density of each treatment was measured on a regular basis throughout the courseof the fermentations, in order to acquire real-time information regarding the fermentationpattern of each species in each medium, specifically its rate of sugar consumption. Figure 1presents the densities measured during the aerobic fermentations of the 4 YNB mediamodified to provide sugar profiles representative of the respective sugars associated withYAW. The table below the graph provides the duration, in days, of each fermentation,defined applying the method proposed by Rivera Flores et al. [8] and using the densitymeasurements of 3 consecutive sampling days.
The treatments excluded from Figure 1 (B. Bruxellensis/LAC; B. bruxellensis/GAL;S. cerevisiae/LAC) consistently showed signs of the growth of contaminant organisms,and were therefore disregarded in the current analysis. Incubation under oxic conditionswas challenging for these treatments due to the continuous presence of simple sugars inthe media, in the absence of any predominant organism able to consume them. Whilethe species B. bruxellensis exhibits a strain-dependent ability to metabolize lactose andgalactose [7], the strain included in this study cannot consume either sugar [16,17]; it is alsoestablished that S. cerevisiae cannot metabolize lactose [22]. These factors, consequently,provided favorable conditions for other organisms to grow.
Overall, only half of the treatments had final densities at levels similar to thoseobserved for otherwise similar treatments held under anoxic conditions during our previousstudy [8], in which the maximum density decrease was approximately 0.016 g/mL for alltreatments except for S. cerevisiae in LAC and B. claussenii in GLU:GAL. In the current study,of the profiles that did not achieve this maximum density decrease, some fermentationsbecame stalled, such as those of B. bruxellensis and B. claussenii in GLU:GAL; some werestagnant, as seen with B. claussenii in GAL; and one treatment, K. marxianus in GAL,exhibited a pronounced divergence in density between biological replicates. Fermentationscarried out by B. bruxellensis in both GLU:GAL and GLU resulted in substantially lesserdecreases in density, as compared to those observed with other cultures. In GLU:GAL, thedensity dropped 0.005 g/mL in 9 days, potentially indicating the incomplete consumption
Fermentation 2022, 8, 257 6 of 16
of either glucose or galactose. Fourteen days into GLU fermentation, the overall decrease indensity was exactly twice as much as that seen in GLU:GAL, suggesting galactose remainedunconsumed. Nevertheless, the change in density over time associated with B. bruxellensisin GLU was slower than the more rapid consumption by other species. Thus, under theconditions studied, B. bruxellensis seemed to metabolize glucose much more slowly than didthe other organisms that were investigated. It has been reported that this species generallyrequires longer fermentation times, thus being better suited for inclusion in sequentialmulti-species fermentations [23,24].
Fermentation 2022, 8, x FOR PEER REVIEW 6 of 16
Figure 1. Density measurements of fermentates containing sugars associated with acid whey; fer-
mentates were held at 25 °C and subjected to shaking at 185 rpm. Investigated sugars, supplemented
at an initial concentration of 40 g/L: glucose (GLU); galactose (GAL); 1:1 ratio of glucose and galac-
tose (GLU:GAL); and lactose (LAC). Three biological replicates are presented for each treatment,
with the exception of those involving K. marxianus, for which a fourth biological replicate was exe-
cuted and presented. Below the graph is a table which indicates the number of days necessary for
each fermentation to reach a stable density, which has been defined as the end of the fermentation.
Three treatments (B. bruxellensis/LAC; B. bruxellensis/GAL; S. cerevisiae/LAC) have been excluded
here and in all subsequent figures and tables, as those treatments consistently showed signs of con-
tamination. The results of K. marxianus in GAL have been subcategorized into treatments GAL(A)
and GAL(B), based on the different trends observed in this substrate.
The treatments excluded from Figure 1 (B. Bruxellensis/LAC; B. bruxellensis/GAL; S.
cerevisiae/LAC) consistently showed signs of the growth of contaminant organisms, and
were therefore disregarded in the current analysis. Incubation under oxic conditions was
challenging for these treatments due to the continuous presence of simple sugars in the
media, in the absence of any predominant organism able to consume them. While the spe-
cies B. bruxellensis exhibits a strain-dependent ability to metabolize lactose and galactose
[7], the strain included in this study cannot consume either sugar [16,17]; it is also estab-
lished that S. cerevisiae cannot metabolize lactose [22]. These factors, consequently, pro-
vided favorable conditions for other organisms to grow.
Overall, only half of the treatments had final densities at levels similar to those ob-
served for otherwise similar treatments held under anoxic conditions during our previous
study [8], in which the maximum density decrease was approximately 0.016 g/mL for all
treatments except for S. cerevisiae in LAC and B. claussenii in GLU:GAL. In the current
study, of the profiles that did not achieve this maximum density decrease, some fermen-
tations became stalled, such as those of B. bruxellensis and B. claussenii in GLU:GAL; some
were stagnant, as seen with B. claussenii in GAL; and one treatment, K. marxianus in GAL,
exhibited a pronounced divergence in density between biological replicates. Fermenta-
tions carried out by B. bruxellensis in both GLU:GAL and GLU resulted in substantially
lesser decreases in density, as compared to those observed with other cultures. In
GLU:GAL, the density dropped 0.005 g/mL in 9 days, potentially indicating the
Figure 1. Density measurements of fermentates containing sugars associated with acid whey; fermen-tates were held at 25 ◦C and subjected to shaking at 185 rpm. Investigated sugars, supplemented atan initial concentration of 40 g/L: glucose (GLU); galactose (GAL); 1:1 ratio of glucose and galactose(GLU:GAL); and lactose (LAC). Three biological replicates are presented for each treatment, withthe exception of those involving K. marxianus, for which a fourth biological replicate was executedand presented. Below the graph is a table which indicates the number of days necessary for eachfermentation to reach a stable density, which has been defined as the end of the fermentation. Threetreatments (B. bruxellensis/LAC; B. bruxellensis/GAL; S. cerevisiae/LAC) have been excluded here andin all subsequent figures and tables, as those treatments consistently showed signs of contamination.The results of K. marxianus in GAL have been subcategorized into treatments GAL(A) and GAL(B),based on the different trends observed in this substrate.
B. claussenii generated distinct density profiles for the various carbon sources presentin the media. In GLU, it reduced the density to its nadir by day 8; in both LAC and GAL itcaused a very minimal decrease; and in GLU:GAL, it caused a more substantial but stillincomplete reduction in density. In the last treatment, this species produced a densitycurve similar to the one observed in Part I of this study, in which the total density decreasewas approximately half of that seen in GLU [8]. In that paper, the authors determinedthat the unique density curve for B. claussenii in GLU:GAL resulted from the incompleteconsumption of that treatment’s sugars; specifically, almost all of the galactose remained
Fermentation 2022, 8, 257 7 of 16
unconsumed at the end of the fermentation. Refer to Section 3.2 for the initial and finalsugar concentrations of the various treatments.
In general, treatments fermented by K. marxianus exhibited rapid and complete de-creases in density, each taking no longer than 4 days to display the maximum expecteddecrease. However, in GAL, among the density trends of the initial three biological repli-cates performed, one curve diverged significantly from the other two (these trends arepresented in Figure 1 as curves A and B, respectively). For that reason, a fourth replicatewas executed to determine if these dissimilar results could be reproduced; this fourthreplicate generated a density curve that followed the same pattern as that of trend A. Inspite of these results being unanticipated, they do correlate with the concentrations ofresidual sugars observed in both sets of replicates; at the ends of these fermentations,GAL(A) retained a mean concentration of 19 g/L of residual galactose, while the GAL(B)replicates showed no evidence of residual galactose (see Section 3.2).
Finally, S. cerevisiae brought about a rapid drop in density in all of its treatments,although the overall time taken for the various density curves of the four media to reachtheir respective lowest points and stabilize was more than that observed under anoxicconditions (8 vs. 6 days for GLU:GAL, 4 vs. 3 for GLU, and 7 vs. 4 for GAL, comparingaerobic and anaerobic growth conditions, respectively) [8].
Nonlinear Density Modeling
Density curves were also analyzed using a nonlinear modeling approach, whichserved as a more formal methodology to determine any differences between individualfermentation rates. For each species, all density curves were fitted using the same model,thus allowing for comparisons of the equation parameters of the various investigatedcarbon sources, as fermented by the same organism.
Based on our data, the experimental curves pertaining to the treatments fermentedby the Brettanomyces species were best fitted with a logistic model with four parameters:lower asymptote (a), upper asymptote (b), growth rate (c), and inflection point (d). On theother hand, the fermentations of K. marxianus and S. cerevisiae were best modeled by anexponential equation with three parameters: asymptote (a), scale (b), and growth rate (c).Each of these equation parameters estimates a specific fermentation characteristic describedpreviously by Rivera Flores et al. [8].
The indicated asymptotes represent the delimiting density values either at the begin-ning (highest density, upper asymptote) or at the end (lowest density, lower asymptote)of each fermentation, as expressed in g/mL. The growth rate represents the change indensity units per unit of time (g mL−1 day−1)—an estimation of the fermentation speedduring the phase of active fermentation. The inflection point represents the moment atwhich each fermentation reached its maximum speed and after which its activity graduallydecreased, and is expressed in days. Details concerning these equations can be found inTables S1 and S2, as well as in Figure S1, all in the Supplementary Materials.
The analysis of means for the growth rates of the density curves associated withdifferent carbon sources fermented by the same species revealed no significant differencesfor both species of Brettanomyces, nor for K. marxianus (Figure S2). Statistically speaking,the only significantly superior growth rate estimate was that of S. cerevisiae in GLU. Inthis treatment, glucose was consumed significantly faster than were the other investigatedcarbon sources in their respective media; moreover, GLU also exhibited a lower “a” valueestimate (lower asymptote), indicating a larger density decrease in overall less time.
Parts I and II of the present study propose a methodology for the real-time assess-ment of the rate of reduction in density for each of multiple fermentations; these densitymeasurements are used as a surrogate for the consumption of sugars over time. For thecurrent study, the realization of this methodology was slightly hindered due to staffinglimitations, which necessitated gaps in the sampling schedule that resulted in the omissionof data points that may have brought greater clarity to our analyses. Thus, more frequentand consistent sampling, as well as a larger number of replicates, would help to minimize
Fermentation 2022, 8, 257 8 of 16
the standard errors of the equations’ estimates, and improve the descriptive power ofeach model. To the best of our knowledge, no other study has compared the estimates ofnonlinear model parameters of density curves using analysis of means.
3.1.2. pH
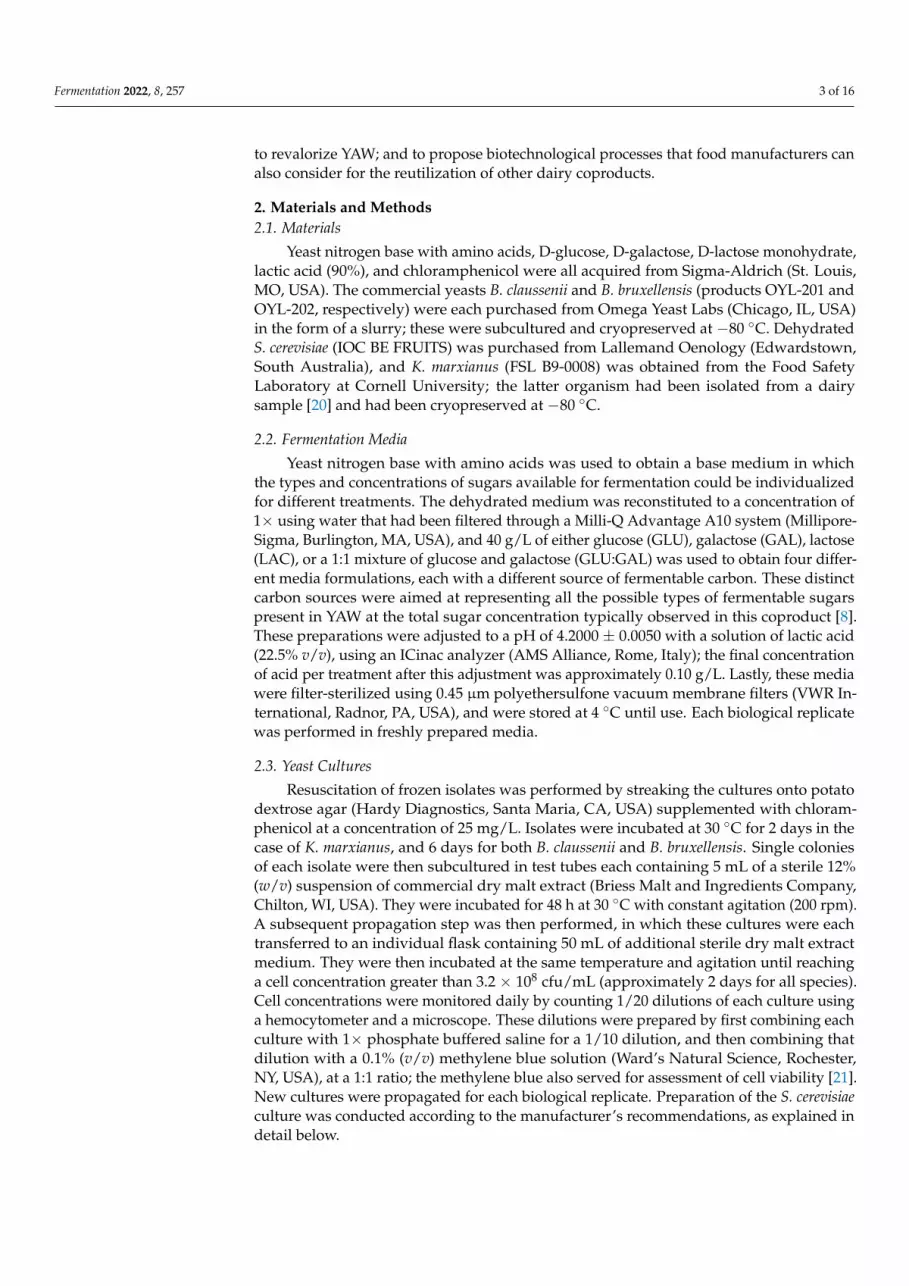
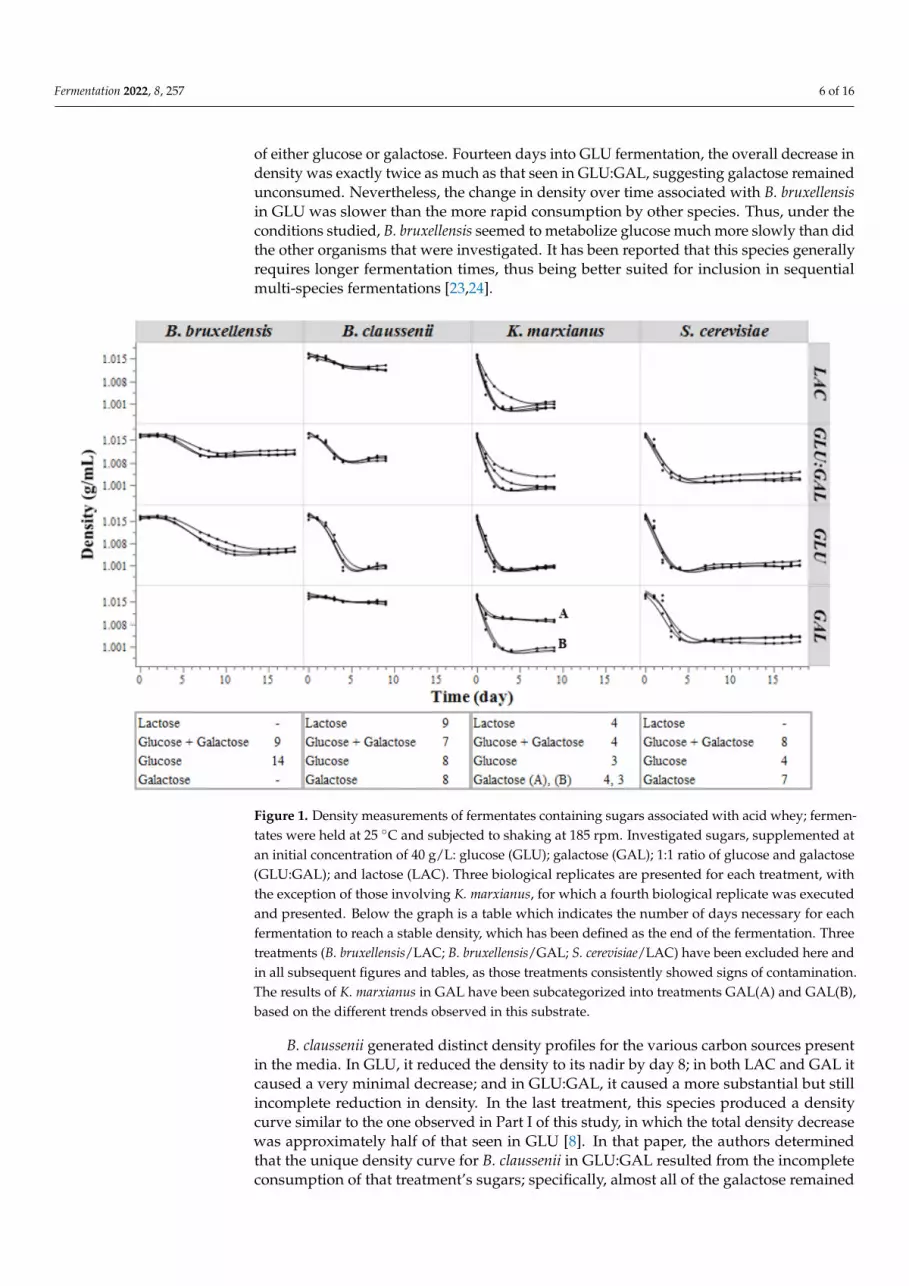
The pH measurements obtained during the investigated yeasts’ aerobic fermentationsof dairy-relevant sugars under conditions similar to those of YAW are shown in Figure 2.In general, an exponential decrease in the initial pH (4.2) was observed, followed bystabilization near pH 2.4. This general phenomenon was observed, with some slightlevel of variation, for each species, and it held true even for treatments that failed toundergo a complete decrease in density, except in the cases of B. claussenii in LAC and GAL,respectively, in which final pH values above 2.6 were observed.
Fermentation 2022, 8, x FOR PEER REVIEW 8 of 16
decreased, and is expressed in days. Details concerning these equations can be found in
Tables S1 and S2, as well as in Figure S1, all in the supplementary material.
The analysis of means for the growth rates of the density curves associated with dif-
ferent carbon sources fermented by the same species revealed no significant differences
for both species of Brettanomyces, nor for K. marxianus (Figure S2). Statistically speaking,
the only significantly superior growth rate estimate was that of S. cerevisiae in GLU. In this
treatment, glucose was consumed significantly faster than were the other investigated car-
bon sources in their respective media; moreover, GLU also exhibited a lower “a” value
estimate (lower asymptote), indicating a larger density decrease in overall less time.
Parts I and II of the present study propose a methodology for the real-time assess-
ment of the rate of reduction in density for each of multiple fermentations; these density
measurements are used as a surrogate for the consumption of sugars over time. For the
current study, the realization of this methodology was slightly hindered due to staffing
limitations, which necessitated gaps in the sampling schedule that resulted in the omis-
sion of data points that may have brought greater clarity to our analyses. Thus, more fre-
quent and consistent sampling, as well as a larger number of replicates, would help to
minimize the standard errors of the equations’ estimates, and improve the descriptive
power of each model. To the best of our knowledge, no other study has compared the
estimates of nonlinear model parameters of density curves using analysis of means.
3.1.2. pH
The pH measurements obtained during the investigated yeasts’ aerobic fermenta-
tions of dairy-relevant sugars under conditions similar to those of YAW are shown in Fig-
ure 2. In general, an exponential decrease in the initial pH (4.2) was observed, followed
by stabilization near pH 2.4. This general phenomenon was observed, with some slight
level of variation, for each species, and it held true even for treatments that failed to un-
dergo a complete decrease in density, except in the cases of B. claussenii in LAC and GAL,
respectively, in which final pH values above 2.6 were observed.
Figure 2. pH measurements of fermentates containing sugars associated with acid whey; fermen-
tates were held at 25 °C and subjected to shaking at 185 rpm. Investigated sugars, supplemented at
an initial concentration of 40 g/L: glucose (GLU); galactose (GAL); 1:1 ratio of glucose and galactose
(GLU:GAL); and lactose (LAC). Error bars represent the standard deviations of three biological rep-
licates, with the exception of K. marxianus, for which a fourth replicate was included. The results of
K. marxianus in GAL have been subcategorized into treatments GAL(A) and GAL(B), based on the
trends observed in this treatment’s density results.
It is known that the production of organic acids during aerobic metabolism by yeasts
leads to a reduction of the extracellular pH. Although the current study was primarily
concerned with monitoring the concentrations of lactic acid and acetic acid, additional
organic acids are produced during yeast metabolism, and those acids appeared to play a
role in the changes in pH observed here [25]. Such is the case for the K. marxianus treat-
ments, in which very low levels of both lactic and acetic acid were observed at the end of
Figure 2. pH measurements of fermentates containing sugars associated with acid whey; fermentateswere held at 25 ◦C and subjected to shaking at 185 rpm. Investigated sugars, supplemented at aninitial concentration of 40 g/L: glucose (GLU); galactose (GAL); 1:1 ratio of glucose and galactose(GLU:GAL); and lactose (LAC). Error bars represent the standard deviations of three biologicalreplicates, with the exception of K. marxianus, for which a fourth replicate was included. The resultsof K. marxianus in GAL have been subcategorized into treatments GAL(A) and GAL(B), based on thetrends observed in this treatment’s density results.
It is known that the production of organic acids during aerobic metabolism by yeastsleads to a reduction of the extracellular pH. Although the current study was primarilyconcerned with monitoring the concentrations of lactic acid and acetic acid, additionalorganic acids are produced during yeast metabolism, and those acids appeared to play arole in the changes in pH observed here [25]. Such is the case for the K. marxianus treatments,in which very low levels of both lactic and acetic acid were observed at the end of eachrespective fermentation (see Section 3.3.2); nevertheless, these fermentates’ pH values didnot significantly differ from those seen in the media fermented by other species. Lukondehet al. [26] reported the presence of acids such as pyruvic, malic, acetic, citric, propionic, andfumaric acids in lactose media that had been batch cultured with K. marxianus FII 510700.
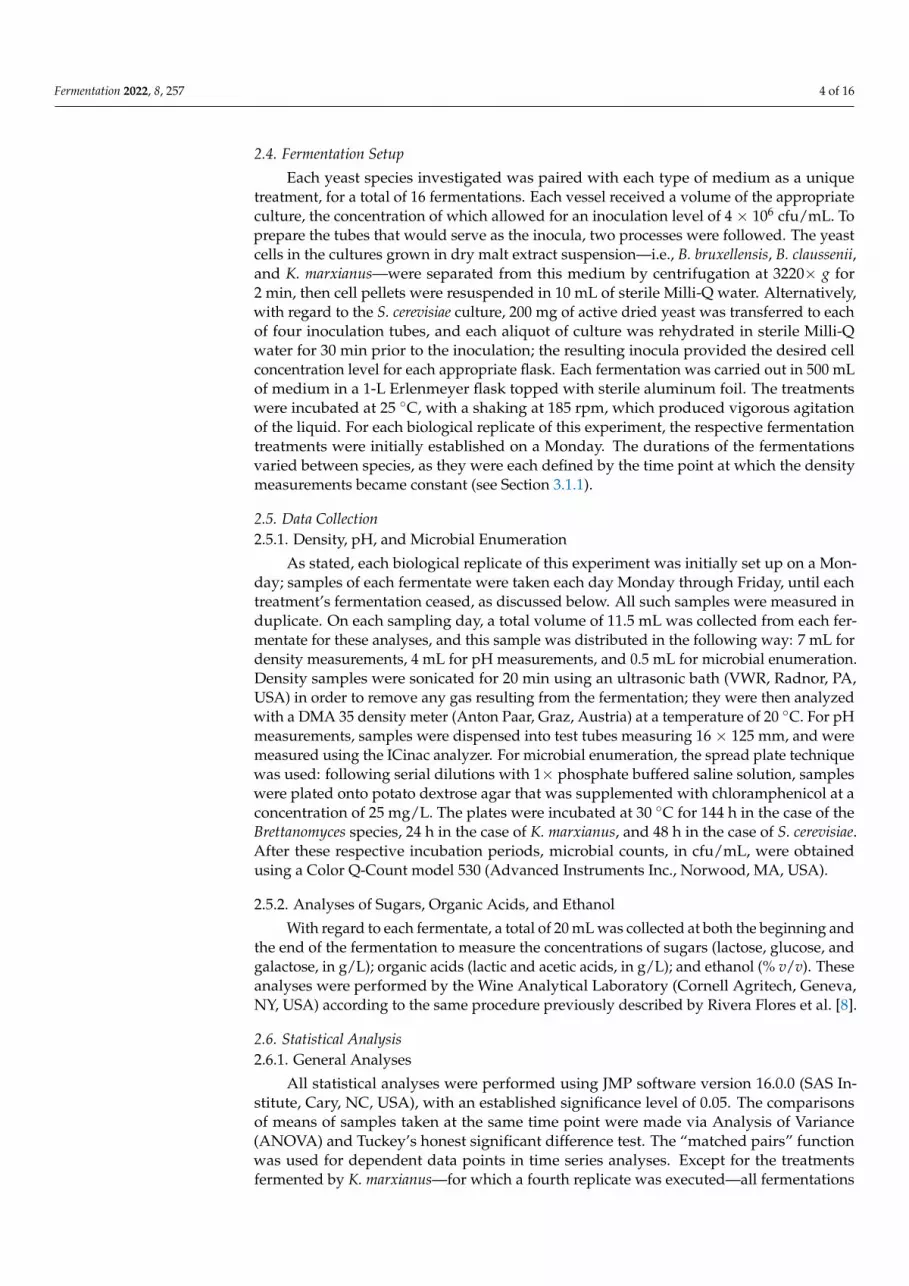
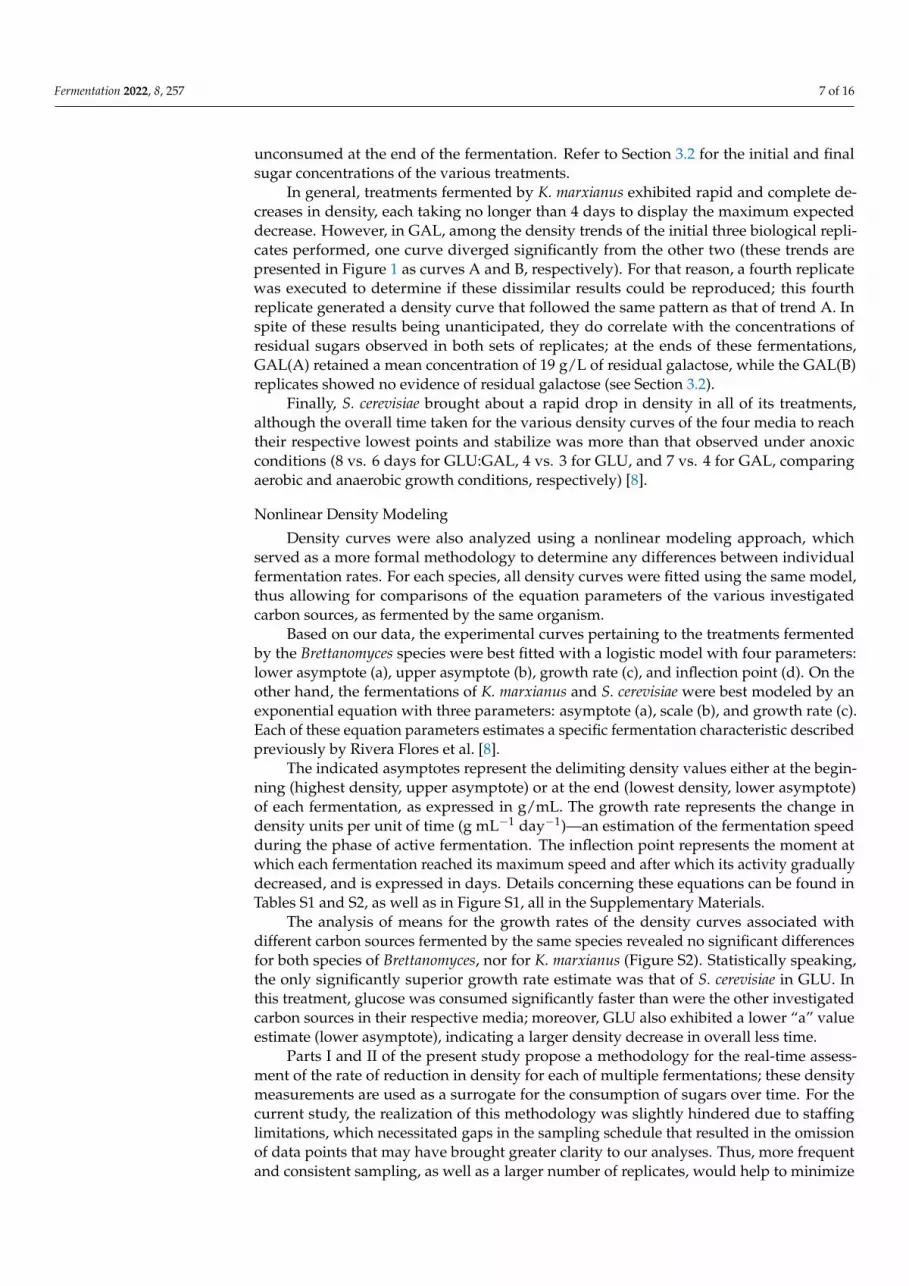
3.1.3. Microbial Concentration
Changes in microbial concentration during the fermentation process are presentedin Figure 3. The maximum cell concentration achieved by each yeast was approximately8 log cfu/mL, which represented an increase of 2 log cfu/mL compared to the concentrationat the time of each fermentate’s initial inoculation. The maximum concentration was seentoward the end of the exponential segment of each density curve.
Fermentation 2022, 8, 257 9 of 16
Fermentation 2022, 8, x FOR PEER REVIEW 9 of 16
each respective fermentation (see Section 3.3.2); nevertheless, these fermentates’ pH val-
ues did not significantly differ from those seen in the media fermented by other species.
Lukondeh et al. [26] reported the presence of acids such as pyruvic, malic, acetic, citric,
propionic, and fumaric acids in lactose media that had been batch cultured with K. marx-
ianus FII 510700.
3.1.3. Microbial Concentration
Changes in microbial concentration during the fermentation process are presented in
Figure 3. The maximum cell concentration achieved by each yeast was approximately 8
log cfu/mL, which represented an increase of 2 log cfu/mL compared to the concentration
at the time of each fermentate’s initial inoculation. The maximum concentration was seen
toward the end of the exponential segment of each density curve.
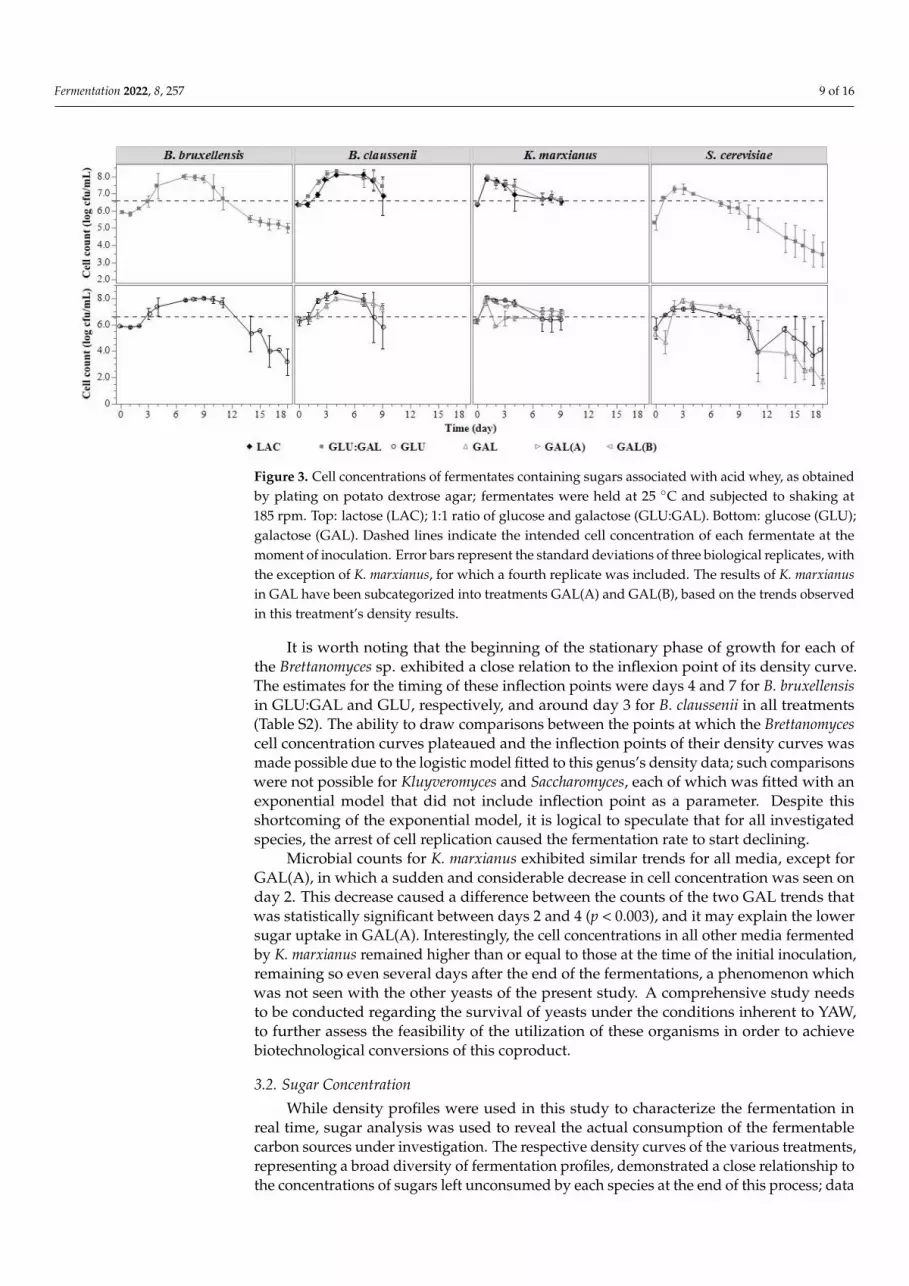
Figure 3. Cell concentrations of fermentates containing sugars associated with acid whey, as ob-
tained by plating on potato dextrose agar; fermentates were held at 25 °C and subjected to shaking
at 185 rpm. Top: lactose (LAC); 1:1 ratio of glucose and galactose (GLU:GAL). Bottom: glucose
(GLU); galactose (GAL). Dashed lines indicate the intended cell concentration of each fermentate at
the moment of inoculation. Error bars represent the standard deviations of three biological repli-
cates, with the exception of K. marxianus, for which a fourth replicate was included. The results of
K. marxianus in GAL have been subcategorized into treatments GAL(A) and GAL(B), based on the
trends observed in this treatment’s density results.
It is worth noting that the beginning of the stationary phase of growth for each of the
Brettanomyces sp. exhibited a close relation to the inflexion point of its density curve. The
estimates for the timing of these inflection points were days 4 and 7 for B. bruxellensis in
GLU:GAL and GLU, respectively, and around day 3 for B. claussenii in all treatments (Ta-
ble S2). The ability to draw comparisons between the points at which the Brettanomyces
cell concentration curves plateaued and the inflection points of their density curves was
made possible due to the logistic model fitted to this genus’s density data; such compari-
sons were not possible for Kluyveromyces and Saccharomyces, each of which was fitted with
an exponential model that did not include inflection point as a parameter. Despite this
shortcoming of the exponential model, it is logical to speculate that for all investigated
species, the arrest of cell replication caused the fermentation rate to start declining.
Microbial counts for K. marxianus exhibited similar trends for all media, except for
GAL(A), in which a sudden and considerable decrease in cell concentration was seen on
day 2. This decrease caused a difference between the counts of the two GAL trends that
was statistically significant between days 2 and 4 (p < 0.003), and it may explain the lower
sugar uptake in GAL(A). Interestingly, the cell concentrations in all other media
Figure 3. Cell concentrations of fermentates containing sugars associated with acid whey, as obtainedby plating on potato dextrose agar; fermentates were held at 25 ◦C and subjected to shaking at185 rpm. Top: lactose (LAC); 1:1 ratio of glucose and galactose (GLU:GAL). Bottom: glucose (GLU);galactose (GAL). Dashed lines indicate the intended cell concentration of each fermentate at themoment of inoculation. Error bars represent the standard deviations of three biological replicates, withthe exception of K. marxianus, for which a fourth replicate was included. The results of K. marxianusin GAL have been subcategorized into treatments GAL(A) and GAL(B), based on the trends observedin this treatment’s density results.
It is worth noting that the beginning of the stationary phase of growth for each ofthe Brettanomyces sp. exhibited a close relation to the inflexion point of its density curve.The estimates for the timing of these inflection points were days 4 and 7 for B. bruxellensisin GLU:GAL and GLU, respectively, and around day 3 for B. claussenii in all treatments(Table S2). The ability to draw comparisons between the points at which the Brettanomycescell concentration curves plateaued and the inflection points of their density curves wasmade possible due to the logistic model fitted to this genus’s density data; such comparisonswere not possible for Kluyveromyces and Saccharomyces, each of which was fitted with anexponential model that did not include inflection point as a parameter. Despite thisshortcoming of the exponential model, it is logical to speculate that for all investigatedspecies, the arrest of cell replication caused the fermentation rate to start declining.
Microbial counts for K. marxianus exhibited similar trends for all media, except forGAL(A), in which a sudden and considerable decrease in cell concentration was seen onday 2. This decrease caused a difference between the counts of the two GAL trends thatwas statistically significant between days 2 and 4 (p < 0.003), and it may explain the lowersugar uptake in GAL(A). Interestingly, the cell concentrations in all other media fermentedby K. marxianus remained higher than or equal to those at the time of the initial inoculation,remaining so even several days after the end of the fermentations, a phenomenon whichwas not seen with the other yeasts of the present study. A comprehensive study needsto be conducted regarding the survival of yeasts under the conditions inherent to YAW,to further assess the feasibility of the utilization of these organisms in order to achievebiotechnological conversions of this coproduct.
3.2. Sugar Concentration
While density profiles were used in this study to characterize the fermentation inreal time, sugar analysis was used to reveal the actual consumption of the fermentablecarbon sources under investigation. The respective density curves of the various treatments,representing a broad diversity of fermentation profiles, demonstrated a close relationship tothe concentrations of sugars left unconsumed by each species at the end of this process; data
Fermentation 2022, 8, 257 10 of 16
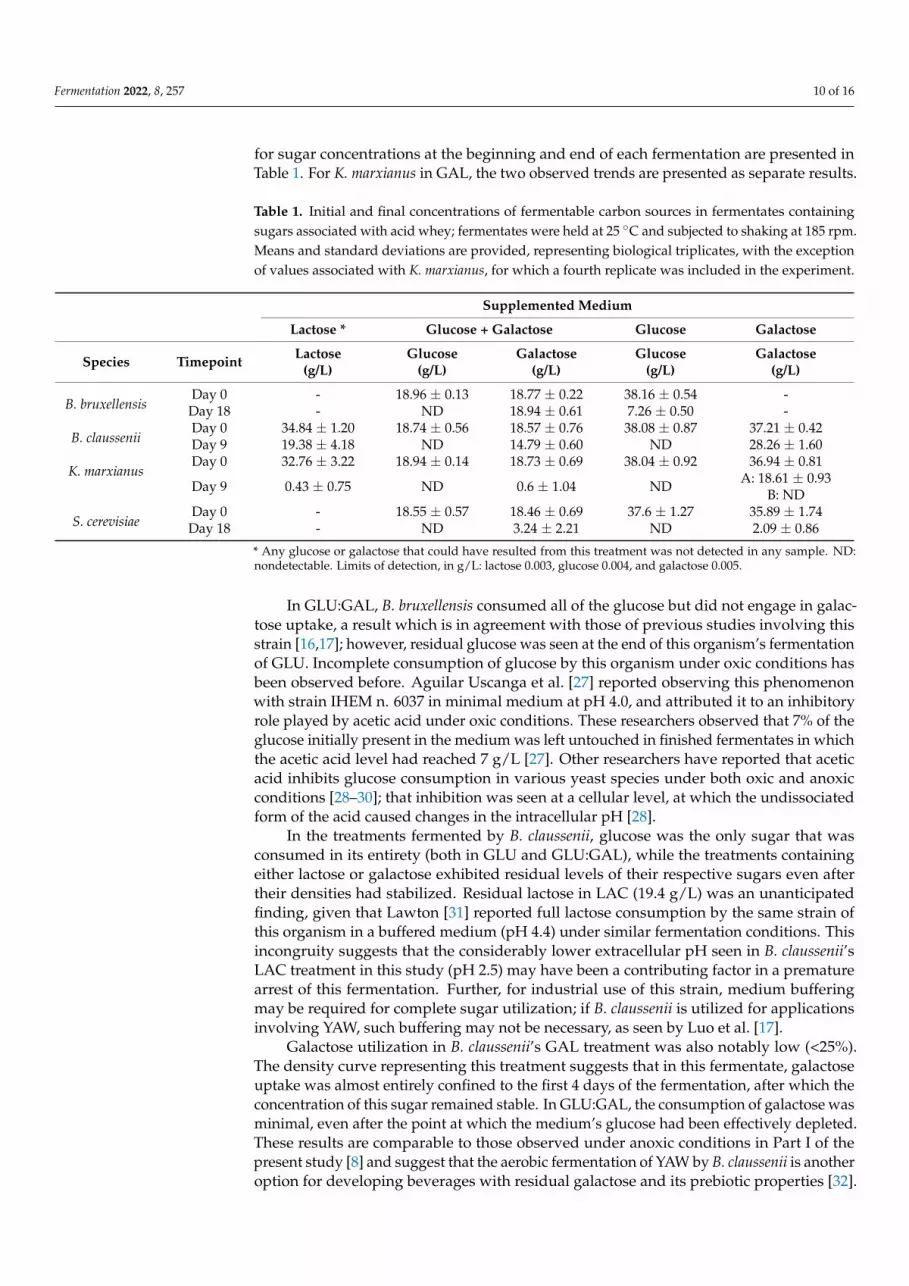
for sugar concentrations at the beginning and end of each fermentation are presented inTable 1. For K. marxianus in GAL, the two observed trends are presented as separate results.
Table 1. Initial and final concentrations of fermentable carbon sources in fermentates containingsugars associated with acid whey; fermentates were held at 25 ◦C and subjected to shaking at 185 rpm.Means and standard deviations are provided, representing biological triplicates, with the exceptionof values associated with K. marxianus, for which a fourth replicate was included in the experiment.
Supplemented Medium
Lactose * Glucose + Galactose Glucose Galactose
Species Timepoint Lactose(g/L)
Glucose(g/L)
Galactose(g/L)
Glucose(g/L)
Galactose(g/L)
B. bruxellensisDay 0 - 18.96 ± 0.13 18.77 ± 0.22 38.16 ± 0.54 -
Day 18 - ND 18.94 ± 0.61 7.26 ± 0.50 -
B. clausseniiDay 0 34.84 ± 1.20 18.74 ± 0.56 18.57 ± 0.76 38.08 ± 0.87 37.21 ± 0.42Day 9 19.38 ± 4.18 ND 14.79 ± 0.60 ND 28.26 ± 1.60
K. marxianusDay 0 32.76 ± 3.22 18.94 ± 0.14 18.73 ± 0.69 38.04 ± 0.92 36.94 ± 0.81
Day 9 0.43 ± 0.75 ND 0.6 ± 1.04 ND A: 18.61 ± 0.93B: ND
S. cerevisiaeDay 0 - 18.55 ± 0.57 18.46 ± 0.69 37.6 ± 1.27 35.89 ± 1.74Day 18 - ND 3.24 ± 2.21 ND 2.09 ± 0.86
* Any glucose or galactose that could have resulted from this treatment was not detected in any sample. ND:nondetectable. Limits of detection, in g/L: lactose 0.003, glucose 0.004, and galactose 0.005.
In GLU:GAL, B. bruxellensis consumed all of the glucose but did not engage in galac-tose uptake, a result which is in agreement with those of previous studies involving thisstrain [16,17]; however, residual glucose was seen at the end of this organism’s fermentationof GLU. Incomplete consumption of glucose by this organism under oxic conditions hasbeen observed before. Aguilar Uscanga et al. [27] reported observing this phenomenonwith strain IHEM n. 6037 in minimal medium at pH 4.0, and attributed it to an inhibitoryrole played by acetic acid under oxic conditions. These researchers observed that 7% of theglucose initially present in the medium was left untouched in finished fermentates in whichthe acetic acid level had reached 7 g/L [27]. Other researchers have reported that aceticacid inhibits glucose consumption in various yeast species under both oxic and anoxicconditions [28–30]; that inhibition was seen at a cellular level, at which the undissociatedform of the acid caused changes in the intracellular pH [28].
In the treatments fermented by B. claussenii, glucose was the only sugar that wasconsumed in its entirety (both in GLU and GLU:GAL), while the treatments containingeither lactose or galactose exhibited residual levels of their respective sugars even aftertheir densities had stabilized. Residual lactose in LAC (19.4 g/L) was an unanticipatedfinding, given that Lawton [31] reported full lactose consumption by the same strain ofthis organism in a buffered medium (pH 4.4) under similar fermentation conditions. Thisincongruity suggests that the considerably lower extracellular pH seen in B. claussenii’sLAC treatment in this study (pH 2.5) may have been a contributing factor in a prematurearrest of this fermentation. Further, for industrial use of this strain, medium bufferingmay be required for complete sugar utilization; if B. claussenii is utilized for applicationsinvolving YAW, such buffering may not be necessary, as seen by Luo et al. [17].
Galactose utilization in B. claussenii’s GAL treatment was also notably low (<25%).The density curve representing this treatment suggests that in this fermentate, galactoseuptake was almost entirely confined to the first 4 days of the fermentation, after which theconcentration of this sugar remained stable. In GLU:GAL, the consumption of galactose wasminimal, even after the point at which the medium’s glucose had been effectively depleted.These results are comparable to those observed under anoxic conditions in Part I of thepresent study [8] and suggest that the aerobic fermentation of YAW by B. claussenii is anotheroption for developing beverages with residual galactose and its prebiotic properties [32].
Fermentation 2022, 8, 257 11 of 16
If this trend continues to be observed in other dairy streams, such as sweet whey andpermeates, multiple novel fermented beverages could be developed, each of which couldprovide attractive opportunities for the valorization of these coproducts.
Analyses of the different media fermented by S. cerevisiae revealed that this organismconsumed all of the glucose in its entirety in all treatments that contained it, and left behindonly low concentrations of galactose in the treatments that contained that sugar; this iswithin the range of normal behavior for this species.
Regarding K. marxianus, our results show the full consumption of sugars in all treat-ments except for GAL, for which divergent results were obtained. The final galactoseconcentration in GAL(A) (18.6 g/L) was approximately half of its initial level, while GAL(B)contained no residual sugar at the end of its fermentation. As brought up before, theseresults correlate highly with their respective density curves, which depict a drop in densityin GAL(A) which is less than half of that seen in GAL(B).
On the heterogeneity of K. marxianus. No indication of the presence of genotypic sub-populations of K. marxianus FSL B9-0008 was found with regard to the isolate used in thepresent study. We investigated this possibility by streaking this isolate out on rich mediumand then generating replica plates on the following media: yeast extract peptone dextrose(used as a control rich medium); yeast extract peptone galactose (to identify colonies’ dif-ferential growth when dextrose is replaced with galactose as the sole fermentable carbonsource); yeast extract peptone glycerol ethanol (to identify colonies’ differences in respi-ratory growth); and synthetic dextrose and synthetic galactose (to identify colonies thatrepresent auxotrophs). All colonies grew similarly on all of these media. Based on thisobservation, it appears that the data collected for GAL(A) were the result of an instanceof nongenetic heterogeneity—a phenomenon in which genetically identical cells exposedto the same environmental conditions exhibit differences in their behavior and cellularstructures [33]. A documented example of such a phenomenon is the inheritance of a prionstate in cells of S. cerevisiae; this prion state causes changes in the cell’s phenotype in theabsence of changes to the nucleotide sequence of any of its nuclear genes [34]. These prionscan be considered epigenetic determinants that modify cellular processes as a result ofchanges in the environment, without the introduction of changes in the sequence and thefunction of the genome [34]. For example, the [GAR+] prion state converts S. cerevisiae frommetabolic specialists into generalists able to consume alternate carbon sources in the pres-ence of glucose [35]. In another example of nongenetic heterogeneity, Dawson et al. [36]have discussed bacterial and fungal subpopulations capable of surviving antimicrobialtreatments; it has been determined that these subpopulations, labeled “persister cells,” arephenotypic variants that have originated from genetically identical cells [37,38]. Whilethe mechanisms involved in this phenomenon are still under investigation, in a docu-mented instance with S. cerevisiae, the nutrient environment was found to influence thedevelopment of a persister-like state that affects regulation of metabolism and glucosesensing/signaling [39,40].
3.3. Production of Ethanol and Organic Acids3.3.1. Ethanol
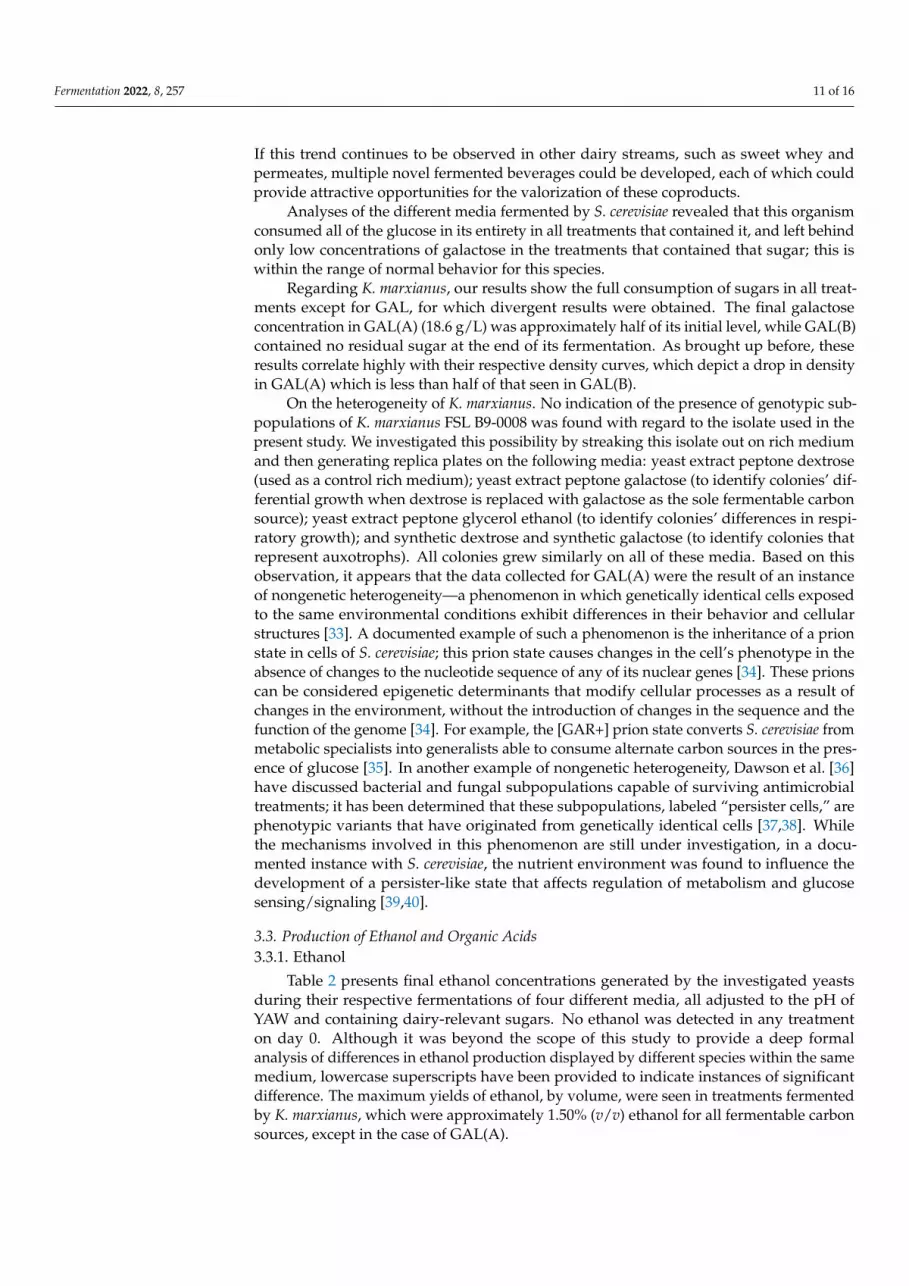
Table 2 presents final ethanol concentrations generated by the investigated yeastsduring their respective fermentations of four different media, all adjusted to the pH ofYAW and containing dairy-relevant sugars. No ethanol was detected in any treatmenton day 0. Although it was beyond the scope of this study to provide a deep formalanalysis of differences in ethanol production displayed by different species within the samemedium, lowercase superscripts have been provided to indicate instances of significantdifference. The maximum yields of ethanol, by volume, were seen in treatments fermentedby K. marxianus, which were approximately 1.50% (v/v) ethanol for all fermentable carbonsources, except in the case of GAL(A).
Fermentation 2022, 8, 257 12 of 16
Table 2. Final concentrations of ethanol (% v/v) in fermentates containing sugars associated withacid whey; fermentates were held at 25 ◦C and subjected to shaking at 185 rpm. Means and standarddeviations are provided, representing biological triplicates, with the exception of values associatedwith K. marxianus, for which a fourth replicate was included in the experiment.
Ethanol (% v/v)
Species Timepoint Lactose Glucose + Galactose Glucose Galactose
B. bruxellensis Day 18 - 0.20 ± 0.02 Bc 0.59 ± 0.05 Ac -B. claussenii Day 9 0.11 ± 0.08 Bb 0.42 ± 0.13 Bbc 1.47 ± 0.18 Aa ND
K. marxianus Day 9 1.48 ± 0.32 Aa 1.52 ± 0.19 Aa 1.43 ± 0.09 Aa A: 0.600 ± 0.033 Bb
B: 1.576 ± 0.922 Aa
S. cerevisiae Day 18 - 0.63 ± 0.08 Ab 0.95 ± 0.19 Ab 0.62 ± 0.35 Ab
ND: nondetectable. Limit of detection: 0.009% v/v. Different superscripts indicate significant differences (p < 0.05)in ethanol concentration: uppercase, within each row, across media fermented by the same species; lowercase,within each column, across species that fermented the same medium.
In each B. bruxellensis treatment presented, the phenomenon of ethanol production ap-pears to be in conformity with the amount of sugar(s) consumed; i.e., a significantly higheramount of ethanol was produced in GLU, compared to the concentration in GLU:GAL.Aside from a lower level of consumption of glucose in GLU:GAL, the lower ethanol con-centration may also be a consequence of the prodigious production of acetic acid by B.bruxellensis in this treatment (see Section 3.3.2); the acetic acid may have been synthesizedat the expense of ethanol. Freer [18] studied the conversion of both glucose and ethanolinto acetic acid by several Brettanomyces species; the majority of investigated species couldproduce acetic acid when ethanol was used as an energy source, with B. bruxellensis NRRLY-17525 yielding acetic acid concentrations as high as 33 g/L.
In a similar way, B. claussenii exhibited more efficient production of ethanol in GLUthan it did in GLU:GAL, which was in part balanced by a higher acetic acid yield in thelatter treatment. Additionally, very minimal to no ethanol production was seen with thisorganism in LAC and GAL, as was expected based on the minimal uptake of sugar seen ineach of these treatments.
As mentioned before, the treatments fermented by K. marxianus had the highest ethanolconcentrations at the ends of their respective fermentations, with the exception of GAL(A).Although this species is less associated with ethanol production under oxic conditions ascompared to anoxic environments, its ability to synthesize this product in the presence ofoxygen has been reported before [41,42]. K. marxianus and its effective ethanol productioneven during aerobic growth served as a reference for the amount of ethanol that could beproduced from lactose under the conditions of the present study.
Regarding S. cerevisiae, overall ethanol concentrations on day 18 were low in all treat-ments. This product could have been used as a respiratory carbon source close to the endsof the fermentations, when preferred fermentable sugars were almost completely depleted.
3.3.2. Organic Acids
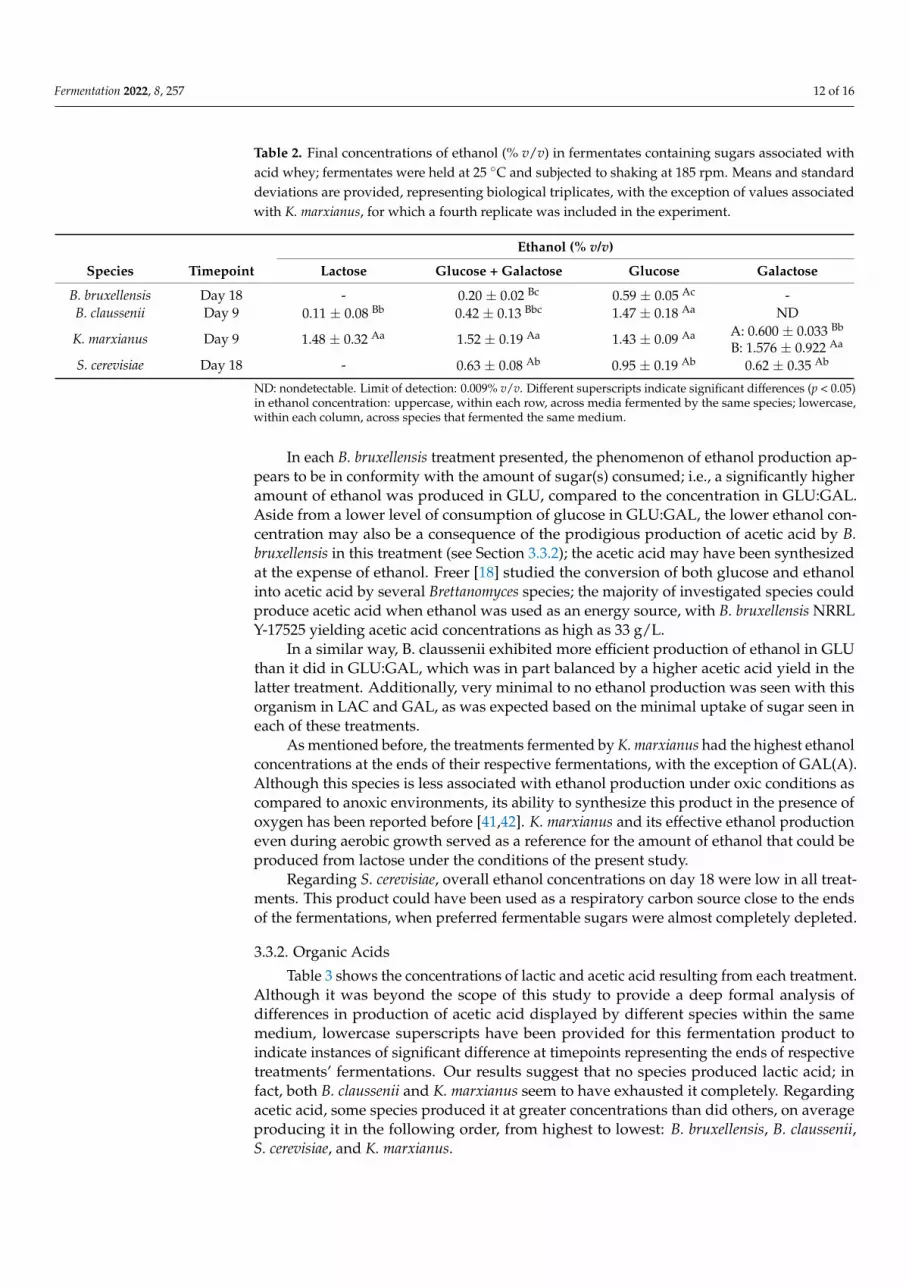
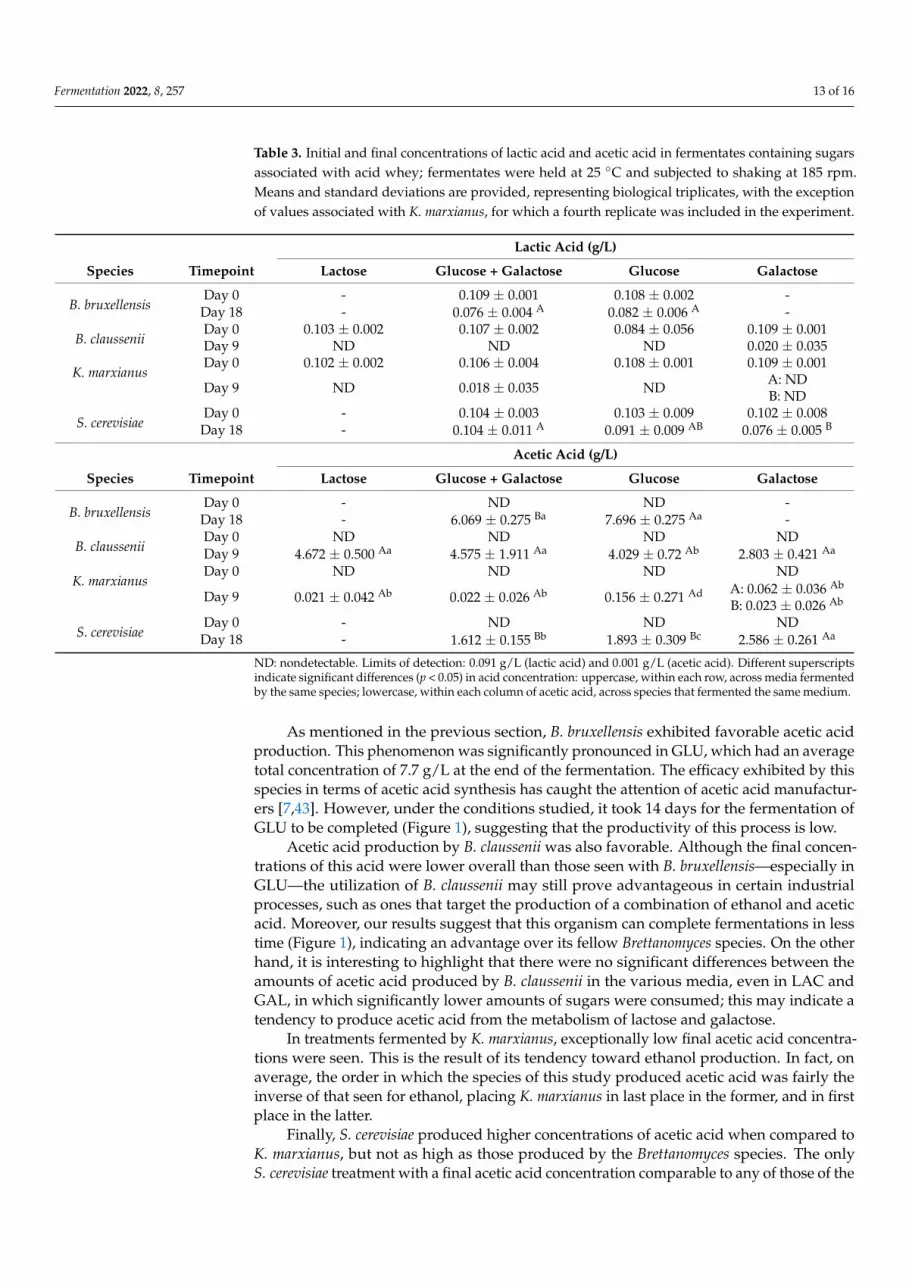
Table 3 shows the concentrations of lactic and acetic acid resulting from each treatment.Although it was beyond the scope of this study to provide a deep formal analysis ofdifferences in production of acetic acid displayed by different species within the samemedium, lowercase superscripts have been provided for this fermentation product toindicate instances of significant difference at timepoints representing the ends of respectivetreatments’ fermentations. Our results suggest that no species produced lactic acid; infact, both B. claussenii and K. marxianus seem to have exhausted it completely. Regardingacetic acid, some species produced it at greater concentrations than did others, on averageproducing it in the following order, from highest to lowest: B. bruxellensis, B. claussenii,S. cerevisiae, and K. marxianus.
Fermentation 2022, 8, 257 13 of 16
Table 3. Initial and final concentrations of lactic acid and acetic acid in fermentates containing sugarsassociated with acid whey; fermentates were held at 25 ◦C and subjected to shaking at 185 rpm.Means and standard deviations are provided, representing biological triplicates, with the exceptionof values associated with K. marxianus, for which a fourth replicate was included in the experiment.
Lactic Acid (g/L)
Species Timepoint Lactose Glucose + Galactose Glucose Galactose
B. bruxellensisDay 0 - 0.109 ± 0.001 0.108 ± 0.002 -
Day 18 - 0.076 ± 0.004 A 0.082 ± 0.006 A -
B. clausseniiDay 0 0.103 ± 0.002 0.107 ± 0.002 0.084 ± 0.056 0.109 ± 0.001Day 9 ND ND ND 0.020 ± 0.035
K. marxianusDay 0 0.102 ± 0.002 0.106 ± 0.004 0.108 ± 0.001 0.109 ± 0.001
Day 9 ND 0.018 ± 0.035 ND A: NDB: ND
S. cerevisiaeDay 0 - 0.104 ± 0.003 0.103 ± 0.009 0.102 ± 0.008
Day 18 - 0.104 ± 0.011 A 0.091 ± 0.009 AB 0.076 ± 0.005 B
Acetic Acid (g/L)
Species Timepoint Lactose Glucose + Galactose Glucose Galactose
B. bruxellensisDay 0 - ND ND -
Day 18 - 6.069 ± 0.275 Ba 7.696 ± 0.275 Aa -
B. clausseniiDay 0 ND ND ND NDDay 9 4.672 ± 0.500 Aa 4.575 ± 1.911 Aa 4.029 ± 0.72 Ab 2.803 ± 0.421 Aa
K. marxianusDay 0 ND ND ND ND
Day 9 0.021 ± 0.042 Ab 0.022 ± 0.026 Ab 0.156 ± 0.271 Ad A: 0.062 ± 0.036 Ab
B: 0.023 ± 0.026 Ab
S. cerevisiaeDay 0 - ND ND ND
Day 18 - 1.612 ± 0.155 Bb 1.893 ± 0.309 Bc 2.586 ± 0.261 Aa
ND: nondetectable. Limits of detection: 0.091 g/L (lactic acid) and 0.001 g/L (acetic acid). Different superscriptsindicate significant differences (p < 0.05) in acid concentration: uppercase, within each row, across media fermentedby the same species; lowercase, within each column of acetic acid, across species that fermented the same medium.
As mentioned in the previous section, B. bruxellensis exhibited favorable acetic acidproduction. This phenomenon was significantly pronounced in GLU, which had an averagetotal concentration of 7.7 g/L at the end of the fermentation. The efficacy exhibited by thisspecies in terms of acetic acid synthesis has caught the attention of acetic acid manufactur-ers [7,43]. However, under the conditions studied, it took 14 days for the fermentation ofGLU to be completed (Figure 1), suggesting that the productivity of this process is low.
Acetic acid production by B. claussenii was also favorable. Although the final concen-trations of this acid were lower overall than those seen with B. bruxellensis—especially inGLU—the utilization of B. claussenii may still prove advantageous in certain industrialprocesses, such as ones that target the production of a combination of ethanol and aceticacid. Moreover, our results suggest that this organism can complete fermentations in lesstime (Figure 1), indicating an advantage over its fellow Brettanomyces species. On the otherhand, it is interesting to highlight that there were no significant differences between theamounts of acetic acid produced by B. claussenii in the various media, even in LAC andGAL, in which significantly lower amounts of sugars were consumed; this may indicate atendency to produce acetic acid from the metabolism of lactose and galactose.
In treatments fermented by K. marxianus, exceptionally low final acetic acid concentra-tions were seen. This is the result of its tendency toward ethanol production. In fact, onaverage, the order in which the species of this study produced acetic acid was fairly theinverse of that seen for ethanol, placing K. marxianus in last place in the former, and in firstplace in the latter.
Finally, S. cerevisiae produced higher concentrations of acetic acid when compared toK. marxianus, but not as high as those produced by the Brettanomyces species. The onlyS. cerevisiae treatment with a final acetic acid concentration comparable to any of those of the
Fermentation 2022, 8, 257 14 of 16
Brettanomyces species was GAL (~2.6 g/L), which was comparable to that of B. claussenii inthe same medium (~2.8 g/L); however, S. cerevisiae consumed substantially more galactosethan B. claussenii.
4. Conclusions
The main goal of this study was to assess the aerobic fermentation of dairy-relevantsugars by different yeasts, in order to explore the manufacture of acetic-acid-containingbeverages using YAW as an input, as a strategy to add value to this dairy coproduct. Ourresults show that B. bruxellensis produced acetic acid at favorable levels, but exhibiteda sluggish fermentation profile. On the other hand, B. claussenii proved to metabolizesugars faster, with satisfactory acetic acid production, and a more versatile metabolism thatcan also be directed toward ethanol production, or toward products containing residualgalactose for added prebiotic properties. A time-series analysis focused on acetic acidproduction by these two species would help to more clearly determine the suitability ofeither or both for industrial processes aimed at generating acetic acid from dairy coproductslike YAW. Overall, the anaerobic and aerobic fermentations observed in the first and secondparts of this study suggest promising applications for the biotechnological conversion ofresidual sugars in YAW, in order to revalorize this dairy coproduct.
Supplementary Materials: The following are available online at https://doi.org/10.7298/f38g-ge82,Table S1: Prediction models for density curves of aerobic fermentations by different yeasts, inyeast nitrogen base with amino acids supplemented with lactose, glucose, and galactose; Table S2:Estimated parameters of fitted models for density curves of aerobic fermentations by different yeasts;Figure S1: Model plots for density curves of aerobic fermentations by different yeasts, in nonselectivemedium supplemented with sugars commonly found in acid whey; Figure S2: Analysis of mean(ANOM) of growth rate parameters obtained per carbon source for each yeast species.
Author Contributions: Conceptualization, S.D.A. and T.A.D.; methodology, T.A.D. and S.D.A.;software, V.K.R.F.; validation, V.K.R.F. and T.A.D.; formal analysis, V.K.R.F. and T.A.D.; investiga-tion, V.K.R.F. and T.A.D.; resources, S.D.A.; data curation, V.K.R.F. and T.A.D.; writing—originaldraft preparation, V.K.R.F. and T.A.D.; writing—review and editing, V.K.R.F., T.A.D., S.D.A. andP.A.G.; visualization, V.K.R.F. and T.A.D.; supervision, S.D.A. and P.A.G.; project administration,S.D.A.; funding acquisition, S.D.A. All authors have read and agreed to the published version ofthe manuscript.
Funding: This research was funded by the New York State Dairy Promotion Advisory Board, ap-pointed by the New York State Department of Agriculture and Markets (Albany, NY, USA).
Institutional Review Board Statement: Not applicable.
Informed Consent Statement: Not applicable.
Data Availability Statement: The data presented in this study are available on request from thecorresponding author.
Acknowledgments: The researchers of this study would like to thank the New York State DairyPromotion Advisory Board, appointed by the New York State Department of Agriculture and Markets(Albany, NY, USA), for funding this research. We also thank the Cornell Craft Beverage AnalyticalLaboratory (Geneva, NY, USA), especially its laboratory manager, Pamela Raes, for performing thequantifications of sugars, ethanol, and organic acids via HPLC.
Conflicts of Interest: Sam Alcaine, the head researcher of this investigation, is the cofounder ofNorwhey Brewing, a startup company that produces hard seltzers from yogurt whey.
References1. Erickson, B. Acid Whey: Is the Waste Product an Untapped Goldmine? Available online: https://cen.acs.org/articles/95/i6
/Acid-whey-waste-product-untapped.html (accessed on 18 March 2022).2. Statista. Statista Dossier on Greek Yogurt in the U.S.; Statista: Hamburg, Germany, 2021. Available online: https://www-statista-
com.proxy.library.cornell.edu/study/25622/greek-yogurt-statista-dossier/ (accessed on 18 March 2022).
Fermentation 2022, 8, 257 15 of 16
3. Shahbandeh, M. Annual Domestic Consumption of Yogurt in the United States from 2000 to 2020 (in Million Pounds)*; Statista:Hamburg, Germany, 2021. Available online: https://www.statista.com/statistics/1066974/us-yogurt-consumption/ (accessedon 18 March 2022).
4. Jelen, P. WHEY PROCESSING|Utilization and Products. In Encyclopedia of Dairy Sciences, 2nd ed.; Fuquay, J.W., Ed.; Elsevier:Amsterdam, The Netherlands, 2011; pp. 731–737.
5. Ketterings, Q.; Czymmek, K.; Gami, S.; Godwin, G.; Ganoe, K. Guidelines for land application of acid whey. Dep. Anim. Sci.Publ. Ser. 2017, 247, 1–18.
6. Rocha-Mendoza, D.; Kosmerl, E.; Krentz, A.; Zhang, L.; Badiger, S.; Miyagusuku-Cruzado, G.; Mayta-Apaza, A.; Giusti, M.;Jiménez-Flores, R.; García-Cano, I. Invited review: Acid whey trends and health benefits. J. Dairy Sci. 2021, 104, 1262–1275.[CrossRef] [PubMed]
7. Lawton, M.R.; deRiancho, D.L.; Alcaine, S.D. Lactose utilization by Brettanomyces claussenii expands potential for valorization ofdairy by-products to functional beverages through fermentation. Curr. Opin. Food Sci. 2021, 42, 93–101. [CrossRef]
8. Rivera Flores, V.K.; DeMarsh, T.A.; Gibney, P.A.; Alcaine, S.D. Fermentation of dairy-relevant sugars by Saccharomyces,Kluyveromyces, and Brettanomyces: An exploratory study with implications for the utilization of acid whey, Part I. Fermentation2021, 7, 266. [CrossRef]
9. Menchik, P.; Zuber, T.; Zuber, A.; Moraru, C.I. Short communication: Composition of coproduct streams from dairy processing:Acid whey and milk permeate. J. Dairy Sci. 2019, 102, 3978–3984. [CrossRef]
10. Comerford, K.B.; Miller, G.D.; Boileau, A.C.; Masiello Schuette, S.N.; Giddens, J.C.; Brown, K.A. Global Review of DairyRecommendations in Food-Based Dietary Guidelines. Front. Nutr. 2021, 8, 671999. [CrossRef]
11. Harvard Medical School. Listing of Vitamins. Available online: https://www.health.harvard.edu/staying-healthy/listing_of_vitamins (accessed on 25 October 2021).
12. Ferruzzi, M.G.; Tanprasertsuk, J.; Kris-Etherton, P.; Weaver, C.M.; Johnson, E.J. Perspective: The Role of Beverages as a Source ofNutrients and Phytonutrients. Adv. Nutr. 2020, 11, 507–523. [CrossRef]
13. Fior Markets. Global Functional Beverages Market Is Expected to Reach USD 216.7 Billion by 2028: Fior Markets. Availableonline: https://www.globenewswire.com/en/news-release/2021/05/24/2234940/0/en/Global-Functional-Beverages-Market-Is-Expected-to-Reach-USD-216-7-billion-by-2028-Fior-Markets.html (accessed on 13 August 2021).
14. Istrati, D.I.; Pricop, E.M.; Profir, A.G.; Vizireanu, C. Fermented Functional Beverages. In Functional Foods; Lagouri, V., Ed.;IntechOpen: London, UK, 2019.
15. Valdes, D.S.; So, D.; Gill, P.A.; Kellow, N.J. Effect of Dietary Acetic Acid Supplementation on Plasma Glucose, Lipid Profiles, andBody Mass Index in Human Adults: A Systematic Review and Meta-analysis. J. Acad. Nutr. Diet 2021, 121, 895–914. [CrossRef]
16. Marcus, J.F.; DeMarsh, T.A.; Alcaine, S.D. Upcycling of Whey Permeate through Yeast- and Mold-Driven Fermentations underAnoxic and Oxic Conditions. Fermentation 2021, 7, 16. [CrossRef]
17. Luo, S.; DeMarsh, T.A.; deRiancho, D.; Stelick, A.; Alcaine, S.D. Characterization of the Fermentation and Sensory Profiles ofNovel Yeast-Fermented Acid Whey Beverages. Foods 2021, 10, 1204. [CrossRef]
18. Freer, S.N. Acetic acid production by Dekkera/Brettanomyces yeasts. World J. Microbiol. Biotechnol. 2002, 18, 271–275. [CrossRef]19. Freer, S.N.; Dien, B.; Matsuda, S. Production of acetic acid by Dekkera/Brettanomyces yeasts under conditions of constant pH. World
J. Microbiol. Biotechnol. 2003, 19, 101–105. [CrossRef]20. Buehler, A.J.; Evanowski, R.L.; Martin, N.H.; Boor, K.J.; Wiedmann, M. Internal transcribed spacer (ITS) sequencing reveals
considerable fungal diversity in dairy products. J. Dairy Sci. 2017, 100, 8814–8825. [CrossRef] [PubMed]21. Painting, K.; Kirsop, B. A quick method for estimating the percentage of viable cells in a yeast population, using methylene blue
staining. World J. Microbiol. Biotechnol. 1990, 6, 346–347. [CrossRef] [PubMed]22. Roman, W. Yeasts, 1st ed.; Junk: The Hague, The Netherlands, 1957.23. Michel, M.; Meier-Dörnberg, T.; Jacob, F.; Methner, F.J.; Wagner, R.S.; Hutzler, M. Review: Pure non-Saccharomyces starter cultures
for beer fermentation with a focus on secondary metabolites and practical applications. J. Inst. Brew. 2016, 122, 569–587. [CrossRef]24. Burini, J.A.; Eizaguirre, J.I.; Loviso, C.; Libkind, D. Levaduras no convencionales como herramientas de innovación y diferen-
ciación en la producción de cerveza. Rev. Argent. Microbiol. 2021, 53, 359–377. [CrossRef] [PubMed]25. Rodrigues, F.; Ludovico, P.; Leão, C. Sugar Metabolism in Yeasts: An Overview of Aerobic and Anaerobic Glucose Catabolism. In
Biodiversity and Ecophysiology of Yeasts; Springer: Berlin/Heidelberg, Germany, 2006; Volume 101–121. [CrossRef]26. Lukondeh, T.; Ashbolt, N.J.; Rogers, P.L. Fed-batch fermentation for production of Kluyveromyces marxianus FII 510700 cultivated
on a lactose-based medium. J. Ind. Microbiol. Biotechnol. 2005, 32, 284–288. [CrossRef]27. Aguilar Uscanga, M.G.; Délia, M.L.; Strehaiano, P. Brettanomyces bruxellensis: Effect of oxygen on growth and acetic acid production.
Appl. Microbiol. Biotechnol. 2003, 61, 157–162. [CrossRef]28. Pampulha, M.E.; Loureiro-Dias, M.C. Combined effect of acetic acid, pH and ethanol on intracellular pH of fermenting yeast.
Appl. Microbiol. Biotechnol. 1989, 31–31, 547–550. [CrossRef]29. Rasmussen, J.E.; Schultz, E.E.; Snyder, R.E.; Jones, R.S.; Smith, C.R.J. Acetic Acid as a Causative Agent in Producing Stuck
Fermentations. Am. J. Enol. Vitic. 1995, 46, 278–280.30. Taherzadeh, M.J.; Niklasson, C.; Lidén, G. Acetic acid—friend or foe in anaerobic batch conversion of glucose to ethanol by
Saccharomyces cerevisiae? Chem. Eng. Sci. 1997, 52, 2653–2659. [CrossRef]31. Lawton, M. Biotechnological Approaches for Combating Food Waste in the Dairy Industry; Cornell University: Ithaca, NY, USA, 2021.
Fermentation 2022, 8, 257 16 of 16
32. Torres, D.P.M.; Gonçalves, M.D.P.F.; Teixeira, J.A.; Rodrigues, L.R. Galacto-Oligosaccharides: Production, Properties, Applications,and Significance as Prebiotics. Compr. Rev. Food Sci. Food Saf. 2010, 9, 438–454. [CrossRef] [PubMed]
33. Levy, S.F.; Ziv, N.; Siegal, M.L. Bet hedging in yeast by heterogeneous, age-correlated expression of a stress protectant. PLoS Biol.2012, 10, e1001325. [CrossRef] [PubMed]
34. Tuite, M.F.; Serio, T.R. The prion hypothesis: From biological anomaly to basic regulatory mechanism. Nat. Rev. Mol. Cell Biol.2010, 11, 823–833. [CrossRef] [PubMed]
35. Jarosz, D.; Lancaster, A.; Brown, J.; Lindquist, S. An Evolutionarily Conserved Prion-like Element Converts Wild Fungi fromMetabolic Specialists to Generalists. Cell 2014, 158, 1072–1082. [CrossRef]
36. Dawson, C.C.; Intapa, C.; Jabra-Rizk, M.A. “Persisters”: Survival at the cellular level. PLoS Pathog. 2011, 7, e1002121. [CrossRef]37. Lewis, K. Multidrug Tolerance of Biofilms and Persister Cells. In Current Topics in Microbiology and Immunology; Ahmed, R., Akira,
S., Casadevall, A., Galan, J.E., Garcia-Sastre, A., Malissen, B., Rappuoli, R., Eds.; Springer: Berlin/Heidelberg, Germany, 2008;pp. 107–131.
38. Roberts, M.E.; Stewart, P.S. Modelling protection from antimicrobial agents in biofilms through the formation of persister cells.Microbiology 2005, 151, 75–80. [CrossRef]
39. Van Heerden, J.H.; Wortel, M.T.; Bruggeman, F.J.; Heijnen, J.J.; Bollen, Y.J.M.; Planqué, R.; Hulshof, J.; O’Toole, T.G.; Wahl, S.A.;Teusink, B. Lost in Transition: Start-Up of Glycolysis Yields Subpopulations of Nongrowing Cells. Science 2014, 343, 1245114.[CrossRef]
40. Gibney, P.A.; Chen, A.; Schieler, A.; Chen, J.C.; Xu, Y.; Hendrickson, D.G.; McIsaac, R.S.; Rabinowitz, J.D.; Botstein, D. A tps1∆persister-like state in Saccharomyces cerevisiae is regulated by MKT1. PLoS ONE 2020, 15, e0233779. [CrossRef]
41. Margaritis, A.; Bajpai, P. Direct Fermentation of D-Xylose to Ethanol by Kluyveromyces marxianus Strains. Appl. Environ. Microbiol.1982, 44, 1039–1041. [CrossRef]
42. Silveira, W.B.; Passos, F.J.V.; Mantovani, H.C.; Passos, F.M.L. Ethanol production from cheese whey permeate by Kluyveromycesmarxianus UFV-3: A flux analysis of oxido-reductive metabolism as a function of lactose concentration and oxygen levels. EnzymeMicrob. Technol. 2005, 36, 930–936. [CrossRef]
43. Steensels, J.; Daenen, L.; Malcorps, P.; Derdelinckx, G.; Verachtert, H.; Verstrepen, K.J. Brettanomyces yeasts—From spoilageorganisms to valuable contributors to industrial fermentations. Int. J. Food Microbiol. 2015, 206, 24–38. [CrossRef] [PubMed]


