Embed Size (px)
Citation preview
Femoral Component Insertion Monitoring Using Human Cadaveric Specimens
Andrew Crisman1, Nathanael Yoder2, Molly McCuskey3, Michael Meneghini4, and
Phillip Cornwell5
1Dept. Biomedical Engineering, Rose-Hulman Institute of Technology, 5500 Wabash Avenue, Terre Haute, IN 47803 2Dept. Mechanical Engineering, Purdue University, 400 Centennial Mall Drive, West Lafayette, IN 47907
3Dept. Civil Engineering, University of New Mexico, 1 University Blvd., Albuquerque, NM 87121 4St. Vincent Center for Joint Replacement, 8402 Harcourt Rd., Suite 128, Indianapolis, IN 46260
5Dept. Mechanical Engineering, Rose-Hulman Institute of Technology, 5500 Wabash Avenue, Terre Haute, IN 47803 ABSTRACT The purpose of this study is to identify a means to supplement a surgeon’s tactile and auditory senses by monitoring the insertion of a tapered cementless femoral component and to identify features that indicate when the femoral component is optimally seated prior to intraoperative fracture from further impacts. This work is motivated by anecdotal evidence of an increase in fractures associated with the insertion of the component when using emerging minimally invasive surgical techniques. In this study, human cadaveric specimen femurs were prepared for a cementless femoral component by an orthopedic surgeon using standard implant-specific instrumentation. The femoral component was instrumented with accelerometers and acceleration data was obtained as the femoral component was being impacted. Acoustic measurements were also taken during impaction using a microphone. The experimental setup and protocol are explained. Results from the cadaveric femur testing are presented. Several signal processing techniques are discussed that were implemented to look for features in the data that were functions of the distance to seating. The signal processing techniques were applied to the data from this study as well as to data from a previous replicate composite femur study. 1. Introduction According to the Arthritis Foundation, arthritis is the most prevalent chronic health condition and the most reported cause of disability in the United States [1]. The most pervasive form of arthritis is osteoarthritis, a degenerative joint disease in which the cartilage that covers the ends of bones deteriorates causing loss of movement and pain as the bones of the joint begin to rub against each other [1]. Severely damaged osteoarthritic hip joints may be replaced by total hip arthroplasty. Over 200,000 hip replacements are performed each year in the United States [2]. Hip arthroplasty is performed by seating either a cemented or uncemented femoral component into the femur. During cemented hip arthroplasty, an area larger than the prosthesis is reamed out using rasps in the proximal femur and the implant is attached to the bone with bone cement. Uncemented hip arthroplasty is more common in the United States. The uncemented surgery relies on residual stresses in the bone to hold the prosthesis. After the femur is reamed out, the femoral component is seated in the bone using an impactor handle and mallet. The surgeon determines proper seating of the femoral component. Surgeons rely on tactile senses including the motion of the prosthesis and the change in pitch emitted while striking the mallet to assess proper seating of the implant [3]. In the late 1990s, the practice of minimally invasive hip replacement surgery became widespread in the United States [4]. Minimally invasive hip arthroplasty is generally categorized by an incision between 6 cm and 10 cm [4]. Due to the reduction in trauma during minimally invasive surgery, intraoperative blood loss, patient recovery time, and rehabilitation time have all been improved [2]. Studies of uncemented total hip arthroplasties have documented a wide range of interoperative fracture occurrence. These studies have documented fracture occurrence anywhere from 4% to 28% [5], [6], [7]. Anecdotal evidence suggests the increase in interoperative fractures are a result of the reduction in incision size and the subsequent reduction of tactile and auditory feedback to the surgeon [4].

This study is motivated by a desire to decrease the rate of femoral fracture during total hip arthroplasty while limiting micromotion in uncemented minimally invasive total hip arthroplasty. In order to accomplish this goal, the surgeon must have a quantifiable way of determining when the femoral prosthesis is properly seated so that the prosthesis is neither over- nor under-impacted. During total hip arthroplasty it is imperative for the prosthesis to be impacted fully into the proximal femur. This impaction produces a press fit, introducing enough residual stress to hold the stem in place, which reduces micromotion and allows bone in growth. However, the bone must not be over impacted as this may cause femoral fracture as a result of exceeding the maximum hoop stress of the bone. This is a large problem as any unrecognized fractures that occur during surgery can allow movement of the prosthesis during recovery. This motion may prohibit in growth of bone into the prosthesis as well as contribute to propagation of the fracture [8]. Because of these problems, it is clear that it is very important to determine when the femoral stem is properly seated. Surgeons who are less experienced with this procedure have a higher tendency for over/under and inconsistent impaction of the femoral stem as studies suggest that operative experience greatly reduces the amount of intraoperative fractures [9]. This problem is only exacerbated by the current trend towards minimally invasive surgery which offers the surgeon reduced visibility and tactile feedback. The implantation process is envisioned to be eventually aided by a commercially available real time dynamic seating indicator with fully removable sensing hardware. 2. Background Extensive research has been conducted to characterize the intraoperative fracture phenomenon associated with hip arthroplasty. Many cadaver studies have been performed to characterize the stress associated with prosthesis seating in the femur using strain gages mounted on harvested and prepared femurs [3], [5], [6], [7]. The majority of strain research focuses on the quantification of hoop stresses [3], [5], [6], [7]. Herwurm, et. al. [7] found that the most common location for fracture during implant seating was near the calcar femorale. Zhou, Walker and Robertson [10] measured the strains associated with uncemented prosthesis insertion pre and post operatively using a photoelastic coating method to generate continuous strain data. Herzwurm [7] also investigated the feasibility of preventative femoral broach insertion during initial implant to increase hoop stress resistance. Cerclage cables are generally the technique used in femur fracture repair. More recently, vibration-based methods of femur implant seating detection have been tested using accelerometers with impact hammer excitation during simulated femoral prosthesis impaction [3], [8]. Giardini et. al. [3], [8] collected acceleration data on various test structures used to model hip arthroplasty. Giardini’s [8] data showed a shifting frequency as the implant became seated in the test structure, indicating a potential metric. Giardini’s research shows a potential application of vibration-based analysis on femoral implant detection. Other research includes Abou-Trabi et. al. [12], in which five replicate composite femurs were impacted. Acceleration data and impedance measurements with a PZT patch were taken. Abou-Trabi found promising metrics to show insertion depth and seating of the implant as a function of hit number. That replicate composite study recommended that human bone and more realistic boundary conditions be used in future work. In Elias’s strain research [6] they found that the variability of the bones had more of an impact on the strain distribution than the implantation technique. These previous studies suggest that testing on human cadavers must be conducted to validate the vibration-based research, because of the material property inconsistencies between human femurs and the difficultly in modeling surrounding tissues. 3. Experimental Setup and Procedure Cadaveric specimens were obtained through the University of California San Diego (UCSD) and were prepared for femoral implant insertion by a surgeon. Institute review of the cadaveric study was accomplished and subsequently approved. Five fresh frozen, unpreserved, cadaveric specimens were used for the implantation of femoral components during total hip arthroplasty. There were a total of 8 hips tested in the study, of which 6 full data sets were collected. The specimens were thawed in advance of testing to ensure proper temperature and simulation of in vivo bone and soft-tissue characteristics. The cadavers ranged in age from 59 - 97 years; ranged in weight from 127 - 160 lbs, and included two males and three females. Confidentiality of the cadavers was maintained throughout the study. The cadavers were screened for HIV and Hepatitis before the study and universal precautions were implemented during the study. The cadavers were used for a dermatology course at UCSD prior to this study and consequently the cadavers had superficial damage to the dermis and epidermis from the course. The cadavers had no damage or pathologies present at the hip joint area of interest.

Figure 2: Instrumented hammer (right) with designed tip compared to surgeon’s hammer (left).
The implants used were tapered cementless femoral stem components of standard sizes (obtained from Zimmer Inc, Warsaw, IN). The implants are made of a titanium alloy with a porous titanium mesh around the circumference of the proximal half of the stem. A reusable bolted 6061 aluminum fixture was used to mount the accelerometers onto the proximal end of the implant as shown in Figure 1. The coordinate system used throughout the study is also shown in Figure 1. The accelerometer fixture was tightened with a bolt and locking washer providing a rigid connection to the implant.
Figure 1: Accelerometer fixture attached to the implant. The implant was instrumented using a reusable fixture with 3 accelerometers mounted in the x, y, and z directions. In the x and y directions PCB model 353B13 accelerometers were used. These two accelerometers had nominal sensitivities of about 5 mV/g, a measurement range of 2,000 g’s, and a frequency range of 20 KHz. In the z direction a shock accelerometer model PCB 352B01 was used. It had a nominal sensitivity of 1mV/g, a measurement range of 10,000 g’s, and a frequency range of 20 kHz. A Bruel and Kjaer type 4188 microphone, with an approximate sensitivity of 30 mV/Pa and frequency range of 8 Hz - 12.5 kHz, connected to a Bruel and Kjaer preamplifier type 2671 was suspended vertically above the replicate femur to record acoustic signals. The microphone was used because the surgeon indicated that there is qualitative evidence that when the implant is becoming seated, there is a perceivable change in pitch. A hammer instrumented with an integrated force transducer, PCB model number 086C05 with sensitivity of 1 mV/lbf, frequency range of 5,000 Hz and amplitude range of 5,000 lbf, was used in place of the surgeon’s hammer to record the force input. This hammer can be seen in Figure 2. A hard tip was designed and manufactured for the instrumented hammer to more closely mimic the surgeon’s hammer. This tip would excite higher frequencies than the hammer used in previous studies [12]. This tip can also be seen in Figure 2. A punch that is used in the operating room in conjunction with the hammer to impact the implant was also used in this study. The bottom end of the punch fits into a slot in the top of the implant, and is struck on its top end by the hammer. This arrangement is shown in Figure 3. Acceleration time history, acoustic time history, and input force were recorded during each hit.
+X +Y
+Z
Impact Hammer
Custom Hammer Tip
Surgeon’s Hammer

Figure 3: Punch used to impact the prosthesis.
All data was acquired using an eight channel Dactron Spectrabook Dynamic Signal Analyzer and a laptop computer running the RT Pro data acquisition software [11]. Data was acquired using 8192 data points at a sampling frequency of 40,960 Hz. These data acquisition settings yielded approximately 0.2 seconds of data. The signal from the instrumented hammer was used as a trigger for the measurements. There were 56 pre-trigger data points recorded. In addition to the acceleration time history and force input, the frequency response functions (FRF’s) and coherence were determined. FRF’s were calculated with the hammer as the input and with each of the three accelerometers as the outputs. Acoustic time history data were also measured. Figure 4 shows the set-up of the lab including the operating area in the foreground and the data acquisition set-up in the back. The specimens were prepared by an orthopedic surgeon who is fellowship-trained and specializes in adult hip and knee arthroplasty. Each specimen was placed in the lateral decubitus position and a standard anterolateral approach to the hip was utilized to expose and dislocate the hip, as it occurs during total hip arthroplasty. Dislocation was performed after an anterior capsulotomy and was achieved with hip flexion, adduction and external rotation. The operative leg was then positioned over the contralateral extremity to adequately expose the proximal femur. Radiographic evaluation was unavailable prior to the procedure. Therefore, the femoral neck osteotomy and femoral preparation were performed without the benefit of preoperatively assessing the femoral size, canal shape, anatomy identification, and overall bone quality. The femoral neck osteotomy was made approximately one finger-width above the lesser trochanter, which was visualized directly. The removed femoral neck was sent to a laboratory for further analysis of bone quality including bone mineral density (BMD). A box osteotome was used to enter the proximal femur and ensure adequate removal of the lateral femoral neck. The T-handled Charnley awl was then used by hand to establish intramedullary access and alignment. Reamers were not used during any portion of the femoral preparation. Broaching of the femur was then performed utilizing broaches of increasing sizes until appropriate axial and rotational stability was obtained as determined by the performing surgeon. The broaches were always inserted in an orientation that approximated the femoral neck anteversion. Once the final broach was determined, the identical sized femoral implant was selected.

Figure 4: Laboratory set-up (image was altered to protect anonymity of cadaver donor)
The surgeon placed the implant, with accelerometers attached, into the proximal femur and pressed it in as far as possible by hand. A depth measurement was then taken using calipers from the most superior aspect of the femoral trunnion to the most medial aspect of the medial femoral calcar at the location of the osteotomy as shown in Figure 5. The implant was then impacted once with the hammer and punch, during which acceleration response and the acoustic signal were recorded. The distance was measured and recorded immediately after each impaction and the progression and degree of component seating into the proximal femur was documented. The surgeon, based on his experience and by failure of the implant to advance visibly into the femur with consecutive impacts, stated when the implant was seated. This point was noted and then the femoral component was impacted further with the intention of creating a periprosthetic fracture. In certain cases, progressive seating of the implant occurred well below the level of the medial neck osteotomy and failed to produce a fracture. The lack of fracture likely indicated an implant undersized relative to the femoral anatomy. In the remaining cases, progressive seating occurred followed by periprosthetic fracture of femur as shown in Figure 6. This fracture point was also noted. After the data were collected they were exported to MATLAB and analyzed. During several tests additional bone had to be chipped away to allow space for the accelerometers on specimens in which the prosthesis seated more deeply than expected. However, in these cases effort was taken to insure that bone strength was not excessively compromised.
Figure 5: Caliper measurement of depth of femoral implant

Figure 6: Typical periprosthetic fracture of the femur (arrow points to fracture line) 4. Data Table 1 shows sex, age, height, bone mass density (BMD) and test outcome for each tested hip joint. The specimens are listed as 1R-5L, corresponding to specimen 1’s right hip through specimen 5’s left hip. Four sets of data of the ten cases were not complete. Specimen #2’s right hip had an existing hip replacement and therefore the specimen was not eligible for testing. Specimen #5’s right hip was fractured during the reaming process and thus could not be used for testing. The z-direction accelerometer became detached from the prosthetic during impaction after seating occurred in specimen #4’s left hip and again before seating in specimen #5’s left hip due to failure of the epoxy used for mounting the accelerometer. Of the six remaining specimens the surgeon was able to impact the prosthesis up to the point of femoral fracture in four of them. In three of the specimens the surgeon determined the prosthesis to be seated prior to fracture.
Table 1: Cadaveric Specimen Characteristics Specimen Sex Age Height (m) Weight (kg) BMD Outcome 1R Female 87 Unknown Unknown TBD Fractured 1L Female 87 Unknown Unknown TBD Fractured 2 R Female 84 1.65 57.61 TBD Fractured 2 L Female 84 1.65 57.61 TBD Incomplete 3 R Male 97 1.68 72.57 TBD Unable to Fracture 3 L Male 97 1.68 72.57 TBD Unable to Fracture 4 R Male 75 1.57 63.5 TBD Incomplete 4 L Male 75 1.57 63.5 TBD Fractured 5 R Female 59 1.73 68.04 TBD Incomplete 5 L Female 59 1.73 68.04 TBD Incomplete
During data collection Channels 1 (impact hammer), 2 (accelerometer y-direction), 3 (accelerometer z-direction) and 4 (accelerometer x-direction) all overloaded during some of the tests and the impact hammer occasionally showed unrealistic negative force readings during some of the data collection. Channel 1 overloaded on 3% of the hits, Channel 2 overloaded on 14% of the hits, Channel 3 overloaded on 11% of the hits, Channel 4 overloaded on 3% of the hits while the microphone in Channel 5 experienced lower level responses and did not overload. The impact hammer showed a large negative force on 6% of the hits. The large negative forces lead us to believe that the force transducer might be faulty. We therefore deemed the data questionable and the input data was not used exclusively during signal processing. Overloading of the channels is a result of the large force required to seat the prosthetic and the sensitivity of the accelerometers. Due to the unexpectedly large magnitude of force used by the surgeon during impaction, overload prediction proved challenging. The force hammer time history is shown in Figure 7. The maximum force reading typically ranged from about 1500 to 6000 lbf in force. There is a second hit that is discernable at 0.01 seconds that lines up with the second response in the acceleration time histories. The steel hammer tip, which is harder than the soft tip used in the previous research [12], may be the cause for the sharp response and high frequency excited. The peak is often not clean and has multiple smaller peaks following the first impact at approximately 0.002 seconds.

Figure 7: Typical force time history for one impaction hit
A typical z direction acceleration time history is shown in Figure 8. It shows an initial acceleration in the negative z direction because of the hammer impact. The response magnitudes generally were around 3,000 g’s and decayed in about 0.004 seconds. There is a characteristic second response at approximately 0.01 seconds that is smaller than the initial response and is due to the second hammer impact. It appears there is more high frequency content and more damping in this direction than in the x and y directions. The z direction acceleration was used in multiple metrics, including the sum of the acceleration divided by the sum of the force of each hit, and the time to 99% total norm during each hit using the first 300 points.
Figure 8: Typical z-direction acceleration time history for one impaction hit
Figure 9 shows typical x and y direction acceleration time histories. As expected they show much lower magnitude acceleration than the z direction time history as they are orthogonal to the impact. Once again the response due to the second impact is seen at approximately 0.01 seconds and is smaller then the initial response. While higher frequencies dominate at the beginning of the signal, lower frequencies become predominant after about 0.004 seconds.
0 0.002 0.004 0.006 0.008 0.01 0.012 0.014 0.016 0.018 0.02-3000
-2000
-1000
0
1000
2000
3000
Time (s)
Acc
eler
atio
n (g
)
0 0.002 0.004 0.006 0.008 0.01 0.012 0.014 0.016 0.018 0.02-200
0
200
400
600
800
1000
1200
1400
1600
1800
Time (s)Fo
rce
(lbf)
Force Input (Z-Direction)
0 0.002 0.004 0.006 0.008 0.01 0.012 0.014 0.016 0.018 0.02-200
0
200
400
600
800
1000
1200
1400
1600
1800
Time (s)Fo
rce
(lbf)
Force Input (Z-Direction)

Figure 9: Typical x and y direction acceleration time histories
The acoustic time history shown in Figure 10 is typical of the recorded responses. This sound pressure was acquired with the microphone hanging vertically down over the operating table at about the level of the surgeon’s head. As can be seen, it took a much longer time for the acoustic response levels to decay and full decay only occurred after 0.2 seconds of data was collected. The frequency content was varied and of low magnitudes. No features that corresponded to the seating of the prosthesis were found from the corresponding spectra or the acoustic time history.
Figure 10: Typical acoustic time history response
5. Signal Processing Techniques Many different signal processing techniques were investigated in an attempt to extract a feature from the data that corresponded to the seating of the prosthesis. FRF’s were computed from our input and output data. These FRF’s appeared degraded and didn’t provide characteristics or features that could be extracted to use to describe the system. These degraded functions may be due to lack of averaging and to damping from the punch. Error! Reference source not found. contains a short description of the methods that were applied to the data collected from both the cadaveric specimens as well as the previously collected data from the replicate femurs. In Table 2 the methods applied to both sets of data are also categorized by the physical property that each method attempts to understand. A more detailed explanation of all the methods that were used to calculate metrics can be found in the listed references.
0 0.002 0.004 0.006 0.008 0.01 0.012 0.014 0.016 0.018 0.02-800
-600
-400
-200
0
200
400
600
Time (s)
Acc
eler
atio
n (g
)
Acceleration (Y-Direction)
0 0.002 0.004 0.006 0.008 0.01 0.012 0.014 0.016 0.018 0.02-1000
-800
-600
-400
-200
0
200
400
600
800
1000
Time (s)
Acc
eler
atio
n (g
)
Acceleration (X-Direction)
0.01 0.02 0.03 0.04 0.05 0.06 0.07 0.08 0.09 0.1
-10
-5
0
5
10
15
Time (s)
Pres
sure
(Pa)

Table 2: Summary of signal processing techniques that were applied to collected data. Correlation
factor of 2 = strong correlation to prosthesis seating, 1 = weak correlation to prosthesis seating, 0 = no correlation to prosthesis seating
Characteristic Replicate
Correlation Factor
Cadaver Correlation
Factor Frequency 0 0
Dominant frequency via continuous wavelet transform [15][16][17] 1 0 Energy in high vs. low frequency bands 2 0 Mean frequency of highest RMS Intrinsic Mode Function [18][19] 0 0 Mean square value of signal in frequency band 0 0 Mean of cross power spectral density between subsequent hits 0 0 Variance of cross power spectral density between subsequent hits 0 0 Static stiffness via the FRFs from accelerations 0 0
Time History 0 0 Norm of acceleration / Norm of force 2 0 Mobility [14] 2 0 Max transverse accel./max z-direction accel. 0 0 Inverse of complexity [14] 0 0
Signal Stationarity 1 0 Signal stationarity via Hilbert Huang Transform [18] 0 0
Interrelation 0 0 Area under coherence function between subsequent hits 0 0 Transmissibility between transverse accelerometers [20] 0 0 Maximum cross correlation 0 0
Neural Network 0 0 Artificial neural network trained with wavelet decomposed signal [21] 1 0
Energy Dissipation 0 0 Time to 99% of total norm 0 2 Decay of highest RMS Intrinsic Mode Function via Hilbert Transform [18][19] 0 0 Changes in system parameters via FRFs 0 0 Damping estimate via continuous wavelet transform [15][16][17] 2 0 Coulomb and viscous damping of filtered signal [13] 0 0
A Matlab Graphical User Interface (GUI) was developed in order to aid in the analysis of the collected data and is shown in Figure 11. It applies the signal processing techniques shown in Table 2 to the selected test data and displays the calculated metrics as well as the time histories. It has a graphs tab, which is shown in the GUI, as well as a settings tab, which is not shown. The settings tab has various parameters for the different metrics which can be set and varied during data analysis. On the graphs tab, the time histories of the acceleration in each of the three orthogonal directions can be selected via a drop down menu and viewed independently. The time history of the acoustic response can also be viewed independently. The time histories of all the hits are concatenated together to provide an overall view of one specimen; the response channel histories are located in the second window from the top of the GUI. The force input for all the hits are also concatenated together and shown in the top window. In the bottom window, time-frequency analysis is performed and plotted for all hits concatenated together. In this GUI screenshot, the continuous wavelet transform (CWT) is selected and is shown in the bottom window. The CWT shows time versus frequency for all hits concatenated together with intensity shown in the color. The calculated metrics can be selected via checkboxes at the left of the GUI. Each metric was normalized to coincide with a scale from 0 to 100 percent; these can be seen in the third window from the top of the GUI. The perfect metric curve would follow the normalized depth to seating curve closely, in essence falling from 100 percent down to 0 percent with successive hits. The metric and depth curves plotted on the same graph can be seen in the results section for the time to 99% norm metric.
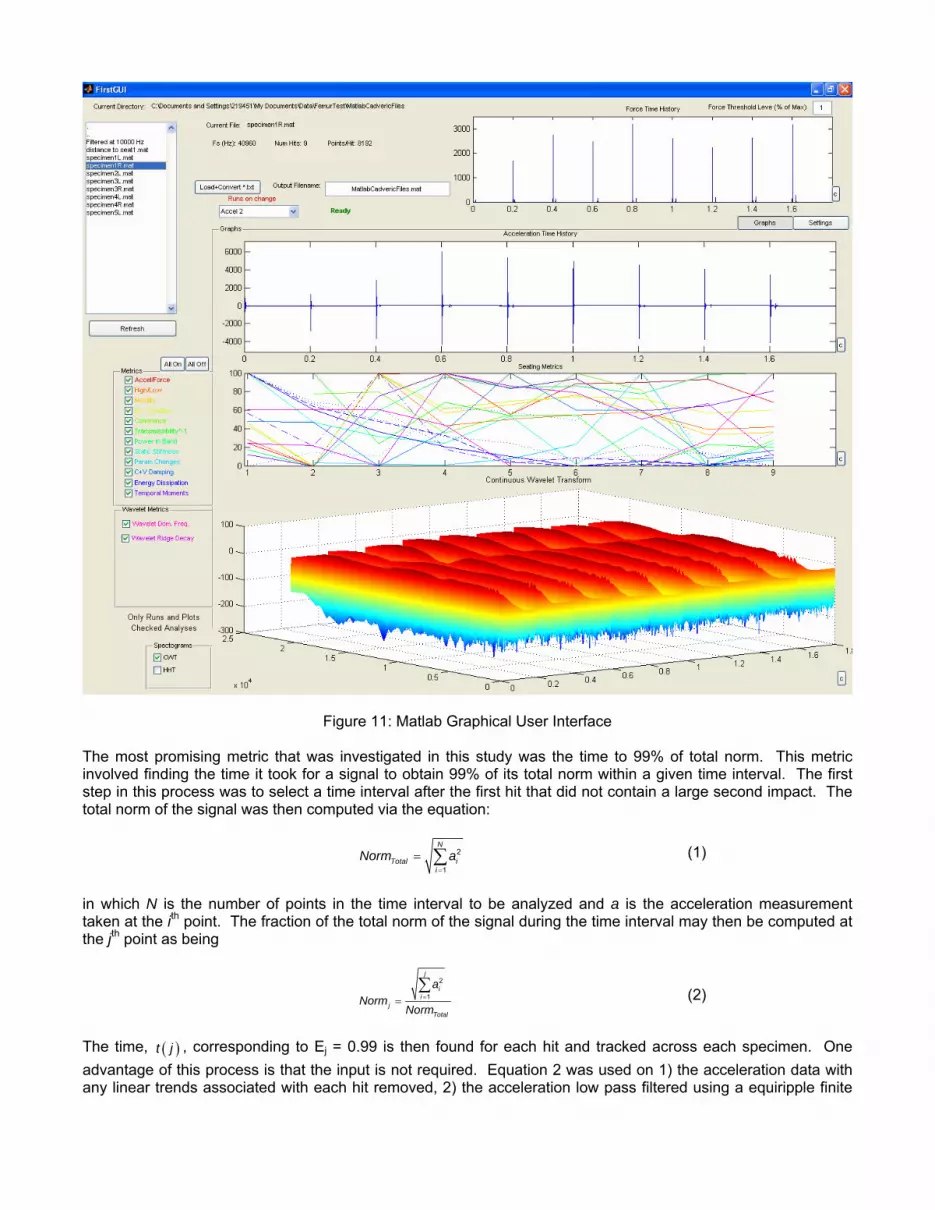
Figure 11: Matlab Graphical User Interface The most promising metric that was investigated in this study was the time to 99% of total norm. This metric involved finding the time it took for a signal to obtain 99% of its total norm within a given time interval. The first step in this process was to select a time interval after the first hit that did not contain a large second impact. The total norm of the signal was then computed via the equation:
2
1
N
Total ii
Norm a=
= ∑ (1)
in which N is the number of points in the time interval to be analyzed and a is the acceleration measurement taken at the ith point. The fraction of the total norm of the signal during the time interval may then be computed at the jth point as being
2
1
j
ii
jTotal
aNorm
Norm==∑ (2)
The time, ( )t j , corresponding to Ej = 0.99 is then found for each hit and tracked across each specimen. One advantage of this process is that the input is not required. Equation 2 was used on 1) the acceleration data with any linear trends associated with each hit removed, 2) the acceleration low pass filtered using a equiripple finite

impulse response filter with a cutoff frequency of 10 kHz to remove high frequency noise, and 3) the Intrinsic Mode Function (IMF) with the highest root mean squared value (RMS) over the selected time interval. The IMF was found using Empirical Modal Decomposition as described by Huang et. al. [18]. However, the feature produced by processes 2 and 3 were not significantly more correlated with the seating of the prosthesis and thus the feature from the detrended acceleration data will be discussed from this point forward. While this metric was computed for each channel, the results from the z-direction acceleration were found to correspond most closely to the seating of the prosthesis for most trials. This metric can be associated with an increase in damping that occurs as the prosthesis becomes more seated in the bone. It should be noted that none of the data analysis techniques worked on the acoustic response data or the x and y direction acceleration data. 6. Results Of the metrics that were tried on the data from the replicate composite femur study [12], there were some successful metrics that determined seating. The most promising metrics on the replicate data included the energy in high vs. low frequency bands, the norm of acceleration divided by the norm of the force, the damping estimate via continuous wavelet transform, and the mobility. During signal processing of the replicate femurs it was discovered that the z-direction response data exhibited a secondary response in between the first and second hit of the impact hammer. We believe that this is due to the replicate femur compressing the foam and striking the table. In the cadaveric data, only the time to 99% of total norm from hit to hit correlated with the seating of the prosthesis. It should be noted that this metric did not work for the replicate composite femurs, as none of the metrics that worked for the replicates worked for the cadaveric data. This may be due to one or more of the differences between these two studies. The same general protocol including the same surgical instruments and the same sensitivity accelerometers were used in both studies. The differences between the replicate composite femurs study and the cadaveric specimen study included: more variability in test specimens for the cadaveric study, different boundary conditions, and a different force hammer with a different tip. Furthermore, the force transducer of the hammer used in the cadaveric study was faulty and generated unreliable data. The time to 99% total norm metric using the z-direction acceleration data was the most promising technique to pursue for the data analysis on the cadaveric data. This method was able to control for the variability of each specimen and the variability of each input force by focusing solely on relative changes in the z-direction acceleration signal. This metric was not successful when used on the replicate femur data. This feature was selected because it demonstrates a decreasing trend that corresponds to the seating of the prosthesis into the specimen for most cadaver femurs. Figure 12 shows a plot of percent norm, percent distance to final position and seated interval for specimens 1L, 1R, 2L, 3R, 3L and 4L. Due to epoxy failure of the z-direction accelerometer, the results for specimens 5L and 4R were not analyzed. Percent distance to final position represents the distance of the prosthesis to the final seating distance measured from the top to the prosthesis to the opening of the femoral canal. Areas where the distance to final position curve flattens out represent small movements with each hit. Due to the subjective nature of when the surgeon considers the prosthesis to be seated, we defined a range of hits to be the seated interval where the prosthesis is considered seated. The seated interval was determined to be one hit before the surgeon identified the specimen to be seated and one hit after the surgeon identified the prosthesis to be seated. In specimens where the femur fractured before seating was determined, the seated interval was determined to be the hit before fracture and the two hits prior to that; this was the case for specimens 1R and 4L.

Figure 12: Percent norm, percent distance to final position and seated interval for specimen 1L, 1R, 2L, 3R, 3L, and 4L
As the prosthesis becomes seated the displacement per hit of the prosthesis decreases. This decrease in displacement is shown by the leveling out of the dashed line in Figure 12. In the majority of the specimens, the leveling out of the percent distance to final position curve flattens out in the seated interval. Even after this seating interval, many prostheses moved with further impacts. Percent norm also shows a flattening out of the curve in the seated interval in some of the results shown in Figure 12. Specimens 1L, 2L, and 4L’s 99 percent of total norm curve most closely followed the seating of the prosthesis. The other specimens’ norm curves were not as accurate in following the seating of the prosthesis. Specimen 3R’s percent norm curve has a large spike at the point of seating. During seating of 3R at hit 15 the surgeon noticed that the accelerometer fixture was hitting

against the top of the bone. The surgeon chipped away some of the bone at the top of the femur to allow free motion of the accelerometer fixture into the femoral canal. This spike may be attributed to the accelerometer fixture’s contact with the femur. A real time metric was developed to predict seating of the prosthesis during impaction. This metric indicated seating by an increase in time to 99% of total norm after two point moving average filter was applied. The results from this moving average filter indication can be seen in Table 3. Seating was predicted prior to fracture in all cases, however in some of the cases seating was predicted well before the seating interval was reached.
Table 3: Real time metric of total norm after two point moving average filter prediction vs. actual seating
Specimen Seating Interval Predicted Hit Seated1R Hits 6-8 Hit 8 1L Hits 9-11 Hit 6 2L Hits 8-10 Hit 12 3L Hits 6-8 Hit 10 3R Hits 14-16 Hit 9 4L Hits 6-8 Hit 8
7. Conclusions This paper has explored many potential methods of feature extraction on acceleration and acoustic signals gathered during hip arthroplasty surgery performed on cadaveric specimens and on data gathered from previous research efforts on replicate femurs [12]. The successful signal processing techniques performed on the replicate femurs and the cadaveric specimens proved to be completely different therefore suggesting that the variation encountered with cadaveric specimens cannot be reproduced in a lab and must be approached very differently. The percent norm signal processing technique proved to be a successful method for determining proper seating of a femoral prosthesis into the femoral canal during hip arthroplasty in the cadaveric study. This signal processing technique could be used real-time in the operating room and the surgeon’s hammer would not have to be instrumented with a transducer. There are several possibilities for future work. More cadaveric testing should be performed. The cadaver sample size of the study was small, so to increase confidence and statistical significance, additional cadaveric testing should increase the number of specimens. Further cadaveric testing should also be done to investigate all the features and metrics described earlier and to test the robustness of the time to 99% of total norm metric. In future work, a real time dynamic seating indicator should be implemented during testing. The surgeon during this study was made to pause after being limited to a single hit, to allow time for a depth measurement to be taken, before being allowed to hit again. In future studies, the surgeon should be allowed to do his/her normal impaction process. Instead of taking depth measurements by hand with a caliper after each hit, this could be automated and made more precise, with a high resolution image taken after each hit. These images could later be analyzed for insertion depth information. Also, the removable sensing hardware, aka the aluminum accelerometer fixture, should be refined. The force hammer tip should be investigated further as well; using both a softer tip, as in the replicate study, and a harder tip, as used in this study for comparison to the cadaveric data already taken. Further, an instrumented punch and regular surgical hammer could replace the current punch and instrumented hammer. This instrumented punch will still provide input force data while allowing the surgeon to use the regular surgical hammer. This may also give a better measurement of the actual force input to the prosthesis, since the measurement point would be closer to the prosthesis. 8. Acknowledgements This project was conducted as part of the Los Alamos Dynamics Summer School, which is part of the Los Alamos National Laboratory/University of California,San Diego Engineering Institute. Los Alamos National Laboratory provided funding for this project. The authors would like to express their gratitude to their mentor Dr. Phillip Cornwell for his advice and guidance, as well as Dr. Michael Meneghini for his time and surgical expertise. The authors would also like to express their gratitude to the UCSD Medical School for their assistance during cadaveric testing and to Zimmer Inc. for providing the implants and surgical equipment for the testing. The following companies generously provided the software for the summer school: Vibrant Technologies (MEScope experimental modal analysis software), The Mathworks, Inc. (MATLAB numerical analysis software, Simulink, and XPCTarget), and ABAQUS, Inc. (ABAQUS finite element software).

References
[1] Arthritis Foundation, website: http://www.arthritis.org, 2006.
[2] Kurtz, S. et. al. “Prevalence of Primary and Revision Total Hip and Knee Arthroplasty in the United States From 1990 Through 2002,” The Journal of Bone and Joint Surgery, 87A(7): pp. 1487-1497. 2005.
[3] Giardini, S., P.J. Cornwell and R. M. Meneghini. “Monitoring Femoral Component Installation Using
Vibration Testing,” Biomedical Sciences, 41 pp.13-18. 2005. [4] Berry, D.J. et. al. “Symposium: Minimally Invasive Total Hip Arthroplasty. Development, Early Results and
a Critical Analysis,” Journal of Bone and Joint Surgery (Am.) 85(11) pp. 2235-2246. 2003. [5] Jasty, M., R. Henshaw, D. O’Conner and D. Harris. “High Assembly Strains and Femoral Fracture
Produced During Insertion of Uncemented Femoral Components, A Cadaver Study,” The Journal of Arthroplasty, 8(5) pp. 479-487. 1992.
[6] Elias, J.J. et. al. “Medial Cortex Strain Distribution During Noncemented Total Hip Arthroplasty,” Clinical
Orthopaedics and Related Research, 370 pp. 250-258. 2000. [7] Herzwurm, P.J., J. Walsh, K. Pettine and F. Ebert, “Prophylactic Cerclage: A Method of Preventing Femur
Fracture in Uncemented Total Hip Arthroplasty,” Orthopedics 15(2) pp. 143-6. 1992. [8] Giardini, S., D. Laney, A. Rutherford and C. Farrar “Monitoring Femoral Component Insertion in
Cementless Total Hip Arthroplasty, ” Proceedings of The 23rd International Modal Analysis Conference (IMAC) Orlando, Florida, 2005.
[9] Schwartz, J.T., J.G. Mayer, and C.A. Engh. “Femoral Fracture during Non-Cemented Total Hip
Anthroplasty,” The Journal of Bone and Joint Surgery, Volume 78, Issue 8, p.1135-1142. 1989.
[10] Zhou, X.M., P.S. Walker, D.D. Robertson, “Effect of Press-fit Femoral Stems on Strains in the Femur: A Photoelastic Coating Study,” The Journal of Arthroplasty, pp 71-82. 1990.
[11] Dactron Spectrabook User’s Manual
[12] Abou-Trabi, D. et. al. “Monitoring Femoral Component Insertion During Uncemented Total Hip
Arthroplasty,” Proceedings of The 24th International Modal Analysis Conference (IMAC) St. Louis, MO January, 2006.
[13] Feeny, B. F., and Liang, J.-W. "A Decrement Method for the Simultaneous Estimation of Coulomb and
Viscous Friction," Journal of Sound and Vibration, 195(1) pp. 149-154. 1996.
[14] Bo Hjorth, “EEG Analysis Based on Time Domain Properties”, Electroencephalography and Clinical Neurophysiology, 1970, 29: 306-310.
[15] Kijewski, T. and Kareem, “A. Wavelet Transforms for System Identification in Civil Engineering,”
Computer-Aided Civil and Infrastructure Engineering, 18: 339-355. 2003. [16] Ruzzene, M., Fasana, A., Garibaldi, L., and Piombo, B. “Natural Frequencies and Damping Identification
Using Wavelet Tansform: Application to Real Data,” Mechanical Systems and Signal Processing , 11(2): 207-218. 1997.
[17] Slavič J., Simonovski I., and Boltežar M. “Damping Identification Using a Continuous Wavelet Transform:
Application to Real Data,” Journal of Sound and Vibration 262: 291-307. 2003.

[18] N.E. Huang, Z. Shen, S.R. Long, M.L. Wu, H.H. Shih, Q. Zheng, N.C. Yen, C.C. Tung and H.H. Liu, “The Empirical Mode Decomposition and Hilbert Spectrum for Nonlinear and Non-stationary Time Series Analysis,” Proc. Roy. Soc. London A, Vol. 454, pp. 903–995, 1998.
[19] Huang, N. E., Wu, M. L., Long, S. R., Shen, S. S. P., Qu, W. D., Gloersen, P. and Fan, K. L. “A
Confidence Limit for the Empirical Mode Decomposition and the Hilbert Spectral Analysis,” Proc. of Roy. Soc. London A, Vol. 459, 2317-2345, 2003.
[20] Johnson T J and Adams D E, “Transmissibility as a differential indicator of structural damage,” Journal of
Vibrations and Acoustics 124(4) pp. 634–41. 2002.
[21] Reda Taha, M.M., A. Noureldin, A. Osman and N. El-Sheimy. “Introduction to the Use of Wavelet Multi Resolution Analysis for Intelligent Structural Health Monitoring,” Canadian Journal of Civil Engineering. 31(5): 719-731. 2004.


![[Management of ipsilateral femoral neck and shaft fractures]](https://img.dokumen.tips/doc/110x75/6356c196debc1859f6037d64/management-of-ipsilateral-femoral-neck-and-shaft-fractures.jpg)


