Embed Size (px)
Citation preview
Feature-Based Attention Elic
Current Biology 24, 1985–1988, September 8, 2014 ª2014 Elsevier Ltd All rights reserved http://dx.doi.org/10.1016/j.cub.2014.07.030
Reportits
Surround Suppression in Feature Space
Viola S. Stormer1,* and George A. Alvarez1
1Department of Psychology, Harvard University,33 Kirkland Street, Cambridge, MA 02138, USA
Summary
It is known that focusing attention on a particular feature
(e.g., the color red) facilitates the processing of all objectsin the visual field containing that feature [1–7]. Here, we
show that such feature-based attention not only facilitatesprocessing but also actively inhibits processing of similar,
but not identical, features globally across the visual field.We combined behavior and electrophysiological recordings
of frequency-tagged potentials in human observers to mea-
sure this inhibitory surround in feature space. We foundthat sensory signals of an attended color (e.g., red) were
enhanced, whereas sensory signals of colors similar to thetarget color (e.g., orange) were suppressed relative to colors
more distinct from the target color (e.g., yellow). Importantly,this inhibitory effect spreads globally across the visual field,
thus operating independently of location. These findingssuggest that feature-based attention comprises an excit-
atory peak surrounded by a narrow inhibitory zone in colorspace to attenuate the most distracting and potentially
confusable stimuli during visual perception. This selectionprofile is akin to what has been reported for location-based
attention [8–10] and thus suggests that such center-sur-round mechanisms are an overarching principle of attention
across different domains in the human brain.
Results
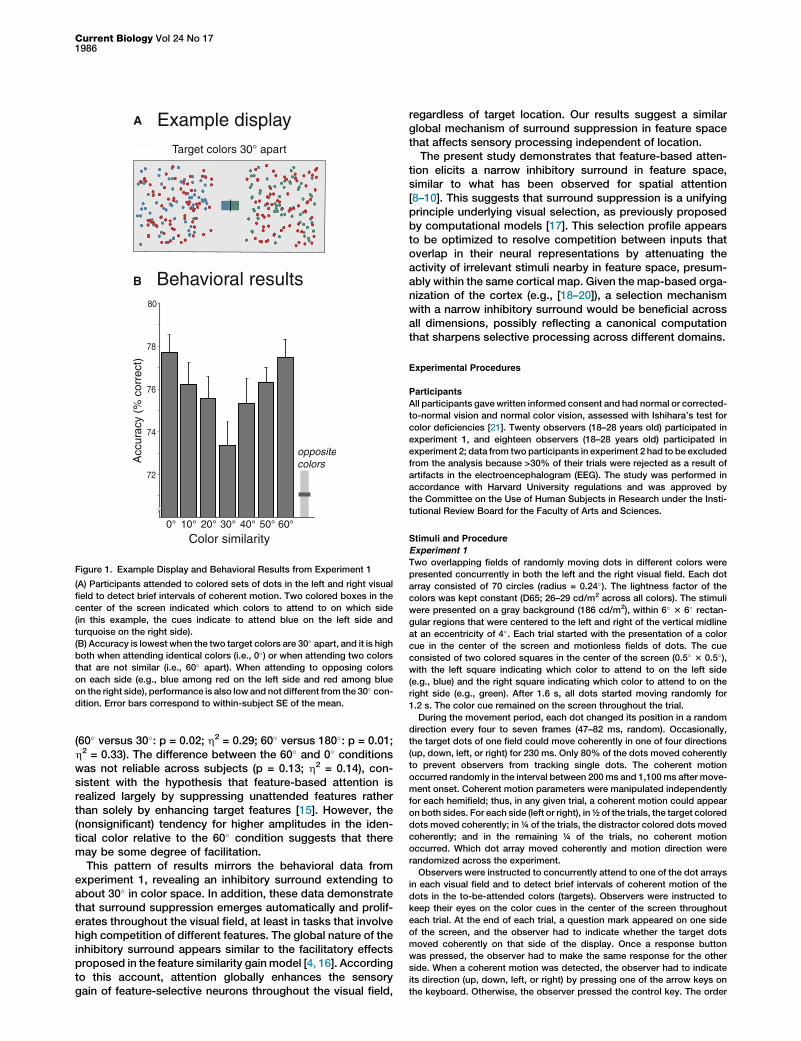
Observers viewed overlapping sets of colored dots in the leftvisual field (e.g., blue among red dots) and the right visual field(e.g., green among red dots) (Figure 1A). Each dot moved in arandom, haphazard fashion. Observers concurrently attendedto one of the dot arrays in each visual field to detect briefintervals of coherent motion in the target colors. The colorsof the dot arrays varied randomly from trial to trial. A targetcolor for one side of the display was determined by choosinga random hue on a color wheel from CIELAB color space.The target color for the opposite side of the display wasdetermined by rotating this hue, such that in a given trial, itcould match the other side’s target color (0� apart) or differfrom that target color in steps of 10� on the color wheel(up to 60�). The distractor color for both sides was always180� apart from one of the target colors and was identicalacross both hemifields.
We found that it is more difficult to select two colors that aresimilar (but not identical) to each other than it is to select twodistinct colors. Detection accuracy was highest when thetwo target colors were identical, and it decreased as the differ-ence in color increased, reaching a minimum at 30� (0� versus30�; t(19) = 3.7; p = 0.002; h2 = 0.42). Performance graduallyincreased when the target colors became more distinct from
*Correspondence: [email protected]
each other (30� versus 60�; t(19) = 2.7; p = 0.01; h2 = 0.28),with performance at 60� no worse than when attending to asingle color (p = 0.87; Figure 1B). To better understand themagnitude of the performance decrease at 30�, we comparedaccuracy in that condition to a condition in which participantsattended to opposing colors in each hemifield (e.g., blueamong red on one side and red among blue on the otherside), which eliminates any benefits of feature-based attention[2]. Performance at 30� was similar to this baseline (p = 0.23).These behavioral data suggest that feature-based selection
contains an inhibitory surround in color space: selecting twotargets nearby in color space places those targets withineach other’s suppressive zones, interfering with the selectionof both target colors. In contrast, selecting two targets farapart in color space places them outside of those zones,enabling both targets to be selected without interference.Although this experiment did not reveal the exact nature ofthis interference, it is possible that suppression either reducedthe motion response of the target dots or increased confus-ability between targets and distractors. We found the sameresults using a visual search task (see Figure S1 and Supple-mental Experimental Procedures available online).
Direct Measure of Center-Surround Activation in Feature
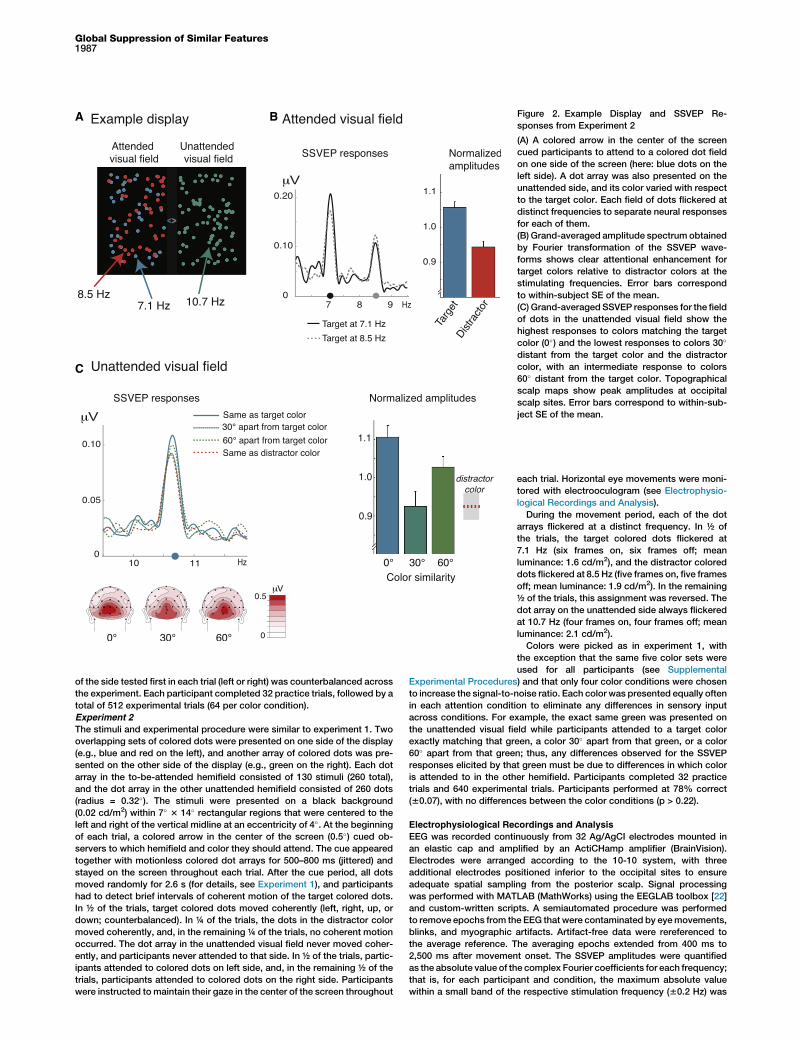
Space with SSVEPsIn a second experiment, we measured the neurophysiologicalresponse to colors in unattended regions of the visual field thatwere perceptually close or far from a to-be-attended color.Participants performed a task similar to experiment 1 butattended to only one color in either the left or the right hemi-field. An array of colored dots that was task irrelevant waspresented in the unattended visual field at the same time.The colors of these unattended dots matched the target color,diverged 30� or 60� from the target color, or matched the dis-tractor color in the attended visual field. During each trial,target and distractor dots flickered at distinct frequencies(7.1 Hz and 8.5 Hz or vice versa), and the task-irrelevant dotsflickered at yet another frequency (10.7 Hz; Figure 2A). Thus,each dot array elicited distinguishable steady-state visualevoked potentials (SSVEPs). The SSVEP is the oscillatoryresponse of the visual cortex to flickering stimuli: it has thesame frequency as the driving stimulus, and its amplitude islarger for attended stimuli relative to unattended stimuli [11].In the attended visual field, SSVEP amplitudes over occip-
ital cortex were larger for targets relative to distractors (t(15) =3.34; p = 0.004; h2 = 0.43; Figure 2B), consistent with researchshowing that early visual processing of attended features isfacilitated [3, 12–14]. In the unattended visual field, we foundsubstantial differences in SSVEP amplitudes depending onthe perceptual similarity to the target color (F(3,45) = 6.92;p = 0.001; h2 = 0.32; Figure 2C). Amplitudes were largestfor dot arrays matching the target color, and they weredecreased for arrays 30� apart from the target color (0� versus30�: p = 0.002; h2 = 0.48) and for arrays matching the dis-tractor color (0� versus 180�: p = 0.0002; h2 = 0.61), with nodifference between the latter two (30� versus 180�: p = 0.57;h2 = 0.02). SSVEPs elicited by dot arrays 60� apart fromthe target color showed an intermediate amplitude, whichwas significantly larger relative to the 30� and 180� conditions
72
74
76
78
80
oppositecolors
A Example display
B Behavioral results
Acc
urac
y (%
cor
rect
)
Color similarity0° 10° 20° 30° 40° 50° 60°
Target colors 30° apart
Figure 1. Example Display and Behavioral Results from Experiment 1
(A) Participants attended to colored sets of dots in the left and right visual
field to detect brief intervals of coherent motion. Two colored boxes in the
center of the screen indicated which colors to attend to on which side
(in this example, the cues indicate to attend blue on the left side and
turquoise on the right side).
(B) Accuracy is lowest when the two target colors are 30� apart, and it is high
both when attending identical colors (i.e., 0�) or when attending two colors
that are not similar (i.e., 60� apart). When attending to opposing colors
on each side (e.g., blue among red on the left side and red among blue
on the right side), performance is also low and not different from the 30� con-dition. Error bars correspond to within-subject SE of the mean.
Current Biology Vol 24 No 171986
(60� versus 30�: p = 0.02; h2 = 0.29; 60� versus 180�: p = 0.01;h2 = 0.33). The difference between the 60� and 0� conditionswas not reliable across subjects (p = 0.13; h2 = 0.14), con-sistent with the hypothesis that feature-based attention isrealized largely by suppressing unattended features ratherthan solely by enhancing target features [15]. However, the(nonsignificant) tendency for higher amplitudes in the iden-tical color relative to the 60� condition suggests that theremay be some degree of facilitation.
This pattern of results mirrors the behavioral data fromexperiment 1, revealing an inhibitory surround extending toabout 30� in color space. In addition, these data demonstratethat surround suppression emerges automatically and prolif-erates throughout the visual field, at least in tasks that involvehigh competition of different features. The global nature of theinhibitory surround appears similar to the facilitatory effectsproposed in the feature similarity gainmodel [4, 16]. Accordingto this account, attention globally enhances the sensorygain of feature-selective neurons throughout the visual field,
regardless of target location. Our results suggest a similarglobal mechanism of surround suppression in feature spacethat affects sensory processing independent of location.The present study demonstrates that feature-based atten-
tion elicits a narrow inhibitory surround in feature space,similar to what has been observed for spatial attention[8–10]. This suggests that surround suppression is a unifyingprinciple underlying visual selection, as previously proposedby computational models [17]. This selection profile appearsto be optimized to resolve competition between inputs thatoverlap in their neural representations by attenuating theactivity of irrelevant stimuli nearby in feature space, presum-ably within the same cortical map. Given the map-based orga-nization of the cortex (e.g., [18–20]), a selection mechanismwith a narrow inhibitory surround would be beneficial acrossall dimensions, possibly reflecting a canonical computationthat sharpens selective processing across different domains.
Experimental Procedures
Participants
All participants gavewritten informed consent and had normal or corrected-
to-normal vision and normal color vision, assessed with Ishihara’s test for
color deficiencies [21]. Twenty observers (18–28 years old) participated in
experiment 1, and eighteen observers (18–28 years old) participated in
experiment 2; data from two participants in experiment 2 had to be excluded
from the analysis because >30% of their trials were rejected as a result of
artifacts in the electroencephalogram (EEG). The study was performed in
accordance with Harvard University regulations and was approved by
the Committee on the Use of Human Subjects in Research under the Insti-
tutional Review Board for the Faculty of Arts and Sciences.
Stimuli and Procedure
Experiment 1
Two overlapping fields of randomly moving dots in different colors were
presented concurrently in both the left and the right visual field. Each dot
array consisted of 70 circles (radius = 0.24�). The lightness factor of the
colors was kept constant (D65; 26–29 cd/m2 across all colors). The stimuli
were presented on a gray background (186 cd/m2), within 6� 3 6� rectan-
gular regions that were centered to the left and right of the vertical midline
at an eccentricity of 4�. Each trial started with the presentation of a color
cue in the center of the screen and motionless fields of dots. The cue
consisted of two colored squares in the center of the screen (0.5� 3 0.5�),with the left square indicating which color to attend to on the left side
(e.g., blue) and the right square indicating which color to attend to on the
right side (e.g., green). After 1.6 s, all dots started moving randomly for
1.2 s. The color cue remained on the screen throughout the trial.
During the movement period, each dot changed its position in a random
direction every four to seven frames (47–82 ms, random). Occasionally,
the target dots of one field could move coherently in one of four directions
(up, down, left, or right) for 230 ms. Only 80% of the dots moved coherently
to prevent observers from tracking single dots. The coherent motion
occurred randomly in the interval between 200ms and 1,100ms after move-
ment onset. Coherent motion parameters were manipulated independently
for each hemifield; thus, in any given trial, a coherent motion could appear
on both sides. For each side (left or right), in ½ of the trials, the target colored
dots moved coherently; in ¼ of the trials, the distractor colored dots moved
coherently; and in the remaining ¼ of the trials, no coherent motion
occurred. Which dot array moved coherently and motion direction were
randomized across the experiment.
Observers were instructed to concurrently attend to one of the dot arrays
in each visual field and to detect brief intervals of coherent motion of the
dots in the to-be-attended colors (targets). Observers were instructed to
keep their eyes on the color cues in the center of the screen throughout
each trial. At the end of each trial, a question mark appeared on one side
of the screen, and the observer had to indicate whether the target dots
moved coherently on that side of the display. Once a response button
was pressed, the observer had to make the same response for the other
side. When a coherent motion was detected, the observer had to indicate
its direction (up, down, left, or right) by pressing one of the arrow keys on
the keyboard. Otherwise, the observer pressed the control key. The order
A B
C
Figure 2. Example Display and SSVEP Re-
sponses from Experiment 2
(A) A colored arrow in the center of the screen
cued participants to attend to a colored dot field
on one side of the screen (here: blue dots on the
left side). A dot array was also presented on the
unattended side, and its color varied with respect
to the target color. Each field of dots flickered at
distinct frequencies to separate neural responses
for each of them.
(B) Grand-averaged amplitude spectrumobtained
by Fourier transformation of the SSVEP wave-
forms shows clear attentional enhancement for
target colors relative to distractor colors at the
stimulating frequencies. Error bars correspond
to within-subject SE of the mean.
(C) Grand-averaged SSVEP responses for the field
of dots in the unattended visual field show the
highest responses to colors matching the target
color (0�) and the lowest responses to colors 30�
distant from the target color and the distractor
color, with an intermediate response to colors
60� distant from the target color. Topographical
scalp maps show peak amplitudes at occipital
scalp sites. Error bars correspond to within-sub-
ject SE of the mean.
Global Suppression of Similar Features1987
of the side tested first in each trial (left or right) was counterbalanced across
the experiment. Each participant completed 32 practice trials, followed by a
total of 512 experimental trials (64 per color condition).
Experiment 2
The stimuli and experimental procedure were similar to experiment 1. Two
overlapping sets of colored dots were presented on one side of the display
(e.g., blue and red on the left), and another array of colored dots was pre-
sented on the other side of the display (e.g., green on the right). Each dot
array in the to-be-attended hemifield consisted of 130 stimuli (260 total),
and the dot array in the other unattended hemifield consisted of 260 dots
(radius = 0.32�). The stimuli were presented on a black background
(0.02 cd/m2) within 7� 3 14� rectangular regions that were centered to the
left and right of the vertical midline at an eccentricity of 4�. At the beginning
of each trial, a colored arrow in the center of the screen (0.5�) cued ob-
servers to which hemifield and color they should attend. The cue appeared
together with motionless colored dot arrays for 500–800 ms (jittered) and
stayed on the screen throughout each trial. After the cue period, all dots
moved randomly for 2.6 s (for details, see Experiment 1), and participants
had to detect brief intervals of coherent motion of the target colored dots.
In ½ of the trials, target colored dots moved coherently (left, right, up, or
down; counterbalanced). In ¼ of the trials, the dots in the distractor color
moved coherently, and, in the remaining ¼ of the trials, no coherent motion
occurred. The dot array in the unattended visual field never moved coher-
ently, and participants never attended to that side. In ½ of the trials, partic-
ipants attended to colored dots on left side, and, in the remaining ½ of the
trials, participants attended to colored dots on the right side. Participants
were instructed to maintain their gaze in the center of the screen throughout
each trial. Horizontal eye movements were moni-
tored with electrooculogram (see Electrophysio-
logical Recordings and Analysis).
During the movement period, each of the dot
arrays flickered at a distinct frequency. In ½ of
the trials, the target colored dots flickered at
7.1 Hz (six frames on, six frames off; mean
luminance: 1.6 cd/m2), and the distractor colored
dots flickered at 8.5 Hz (five frames on, five frames
off; mean luminance: 1.9 cd/m2). In the remaining
½ of the trials, this assignment was reversed. The
dot array on the unattended side always flickered
at 10.7 Hz (four frames on, four frames off; mean
luminance: 2.1 cd/m2).
Colors were picked as in experiment 1, with
the exception that the same five color sets were
used for all participants (see Supplemental
Experimental Procedures) and that only four color conditions were chosen
to increase the signal-to-noise ratio. Each color was presented equally often
in each attention condition to eliminate any differences in sensory input
across conditions. For example, the exact same green was presented on
the unattended visual field while participants attended to a target color
exactly matching that green, a color 30� apart from that green, or a color
60� apart from that green; thus, any differences observed for the SSVEP
responses elicited by that green must be due to differences in which color
is attended to in the other hemifield. Participants completed 32 practice
trials and 640 experimental trials. Participants performed at 78% correct
(60.07), with no differences between the color conditions (p > 0.22).
Electrophysiological Recordings and Analysis
EEG was recorded continuously from 32 Ag/AgCI electrodes mounted in
an elastic cap and amplified by an ActiCHamp amplifier (BrainVision).
Electrodes were arranged according to the 10-10 system, with three
additional electrodes positioned inferior to the occipital sites to ensure
adequate spatial sampling from the posterior scalp. Signal processing
was performed with MATLAB (MathWorks) using the EEGLAB toolbox [22]
and custom-written scripts. A semiautomated procedure was performed
to remove epochs from the EEG that were contaminated by eyemovements,
blinks, and myographic artifacts. Artifact-free data were rereferenced to
the average reference. The averaging epochs extended from 400 ms to
2,500 ms after movement onset. The SSVEP amplitudes were quantified
as the absolute value of the complex Fourier coefficients for each frequency;
that is, for each participant and condition, the maximum absolute value
within a small band of the respective stimulation frequency (60.2 Hz) was
Current Biology Vol 24 No 171988
chosen and then averaged across 11 posterior electrodes (I3, Iz, I4, O1, Oz,
O2, PO3, PO4, PO7, PO8, POz). For the attended visual field, SSVEP
amplitudes were normalized for target and distractor color by dividing the
amplitude by the mean amplitude of target and distractor color for each fre-
quency separately for each participant [23]. The normalized amplitudes
were collapsed across frequencies to reveal amplitude values for targets
and distractors. Similarly, the SSVEP amplitudes were normalized for the
dot array in the unattended visual field by dividing the amplitude for each
condition by the mean amplitude across all four conditions. The same
pattern was observed when we analyzed only lateralized electrodes,
excluding any possible contribution from the midline responses (see Sup-
plemental Experimental Procedures).
Pairwise t tests were conducted to examine the SSVEP amplitudes
for target and distractor colors in the attended visual field. The SSVEP
responses in the unattended visual field were analyzed by a repeated-
measures ANOVA with the factor color similarity (with respect to the target
color). After establishing a main effect of color similarity, pairwise t tests
were performed.
Supplemental Information
Supplemental Information includes Supplemental Experimental Procedures
and one figure and can be found with this article online at http://dx.doi.org/
10.1016/j.cub.2014.07.030.
Acknowledgments
This work was supported by a Marie Curie Fellowship (EU Grant PIOF-GA-
2012-329920 to V.S.S.) and by a National Science Foundation CAREER
Award (BCS-0953730 to G.A.A.). We thank Timothy Brady for helpful com-
ments on the manuscript.
Received: June 4, 2014
Revised: July 10, 2014
Accepted: July 11, 2014
Published: August 21, 2014
References
1. Egeth, H.E., Virzi, R.A., and Garbart, H. (1984). Searching for con-
junctively defined targets. J. Exp. Psychol. Hum. Percept. Perform. 10,
32–39.
2. Saenz, M., Buracas, G.T., and Boynton, G.M. (2003). Global feature-
based attention for motion and color. Vision Res. 43, 629–637.
3. Motter, B.C. (1994). Neural correlates of feature selective memory and
pop-out in extrastriate area V4. J. Neurosci. 14, 2190–2199.
4. Treue, S., and Martınez Trujillo, J.C. (1999). Feature-based attention
influences motion processing gain in macaque visual cortex. Nature
399, 575–579.
5. Saenz, M., Buracas, G.T., and Boynton, G.M. (2002). Global effects
of feature-based attention in human visual cortex. Nat. Neurosci. 5,
631–632.
6. Hopf, J.M., Boelmans, K., Schoenfeld, M.A., Luck, S.J., and Heinze, H.J.
(2004). Attention to features precedes attention to locations in visual
search: evidence from electromagnetic brain responses in humans.
J. Neurosci. 24, 1822–1832.
7. Zhang, W., and Luck, S.J. (2009). Feature-based attention modulates
feedforward visual processing. Nat. Neurosci. 12, 24–25.
8. Hopf, J.M., Boehler, C.N., Luck, S.J., Tsotsos, J.K., Heinze, H.J., and
Schoenfeld, M.A. (2006). Direct neurophysiological evidence for spatial
suppression surrounding the focus of attention in vision. Proc. Natl.
Acad. Sci. USA 103, 1053–1058.
9. Mounts, J.R. (2000). Attentional capture by abrupt onsets and feature
singletons produces inhibitory surrounds. Percept. Psychophys. 62,
1485–1493.
10. Muller, N.G., and Kleinschmidt, A. (2004). The attentional ‘spotlight’s’
penumbra: center-surround modulation in striate cortex. Neuroreport
15, 977–980.
11. Andersen, S.K., Muller, M.M., and Hillyard, S.A. (2011). In Cognitive
Neuroscience of Attention, M.I. Posner, ed. (New York: Guilford),
pp. 197–216.
12. Chelazzi, L., Miller, E.K., Duncan, J., and Desimone, R. (1993). A
neural basis for visual search in inferior temporal cortex. Nature 363,
345–347.
13. Treue, S., and Maunsell, J.H.R. (1996). Attentional modulation of visual
motion processing in cortical areas MT and MST. Nature 382, 539–541.
14. Muller, M.M., Andersen, S., Trujillo, N.J., Valdes-Sosa, P., Malinowski,
P., and Hillyard, S.A. (2006). Feature-selective attention enhances color
signals in early visual areas of the human brain. Proc. Natl. Acad. Sci.
USA 103, 14250–14254.
15. Moher, J., Lakshmanan, B.M., Egeth, H.E., and Ewen, J.B. (2014).
Inhibition drives early feature-based attention. Psychol. Sci. 25,
315–324.
16. Maunsell, J.H., and Treue, S. (2006). Feature-based attention in visual
cortex. Trends Neurosci. 29, 317–322.
17. Tsotsos, J.K., Culhane, S.M., Kei Wai, W.Y., Lai, Y., Davis, N., and Nuflo,
F. (1995). Modeling visual attention via selective tuning. Artif. Intell. 78,
507–545.
18. Mountcastle, V.B. (1997). The columnar organization of the neocortex.
Brain 120, 701–722.
19. Da Costa, S., van der Zwaag, W., Marques, J.P., Frackowiak, R.S.,
Clarke, S., and Saenz, M. (2011). Human primary auditory cortex follows
the shape of Heschl’s gyrus. J. Neurosci. 31, 14067–14075.
20. Tanaka, K. (2003). Columns for complex visual object features in the
inferotemporal cortex: clustering of cells with similar but slightly
different stimulus selectivities. Cereb. Cortex 13, 90–99.
21. Ishihara, S. (1936). The Series of Plates Designed as Tests for Colour-
Blindness (Tokyo: Kanehara & Co.).
22. Delorme, A., andMakeig, S. (2004). EEGLAB: an open source toolbox for
analysis of single-trial EEGdynamics including independent component
analysis. J. Neurosci. Methods 134, 9–21.
23. Andersen, S.K., Fuchs, S., and Muller, M.M. (2011). Effects of feature-
selective and spatial attention at different stages of visual processing.
J. Cogn. Neurosci. 23, 238–246.

Current Biology, Volume 24
Supplemental Information
Feature-Based Attention Elicits
Surround Suppression in Feature Space
Viola S. Störmer and George A. Alvarez
1
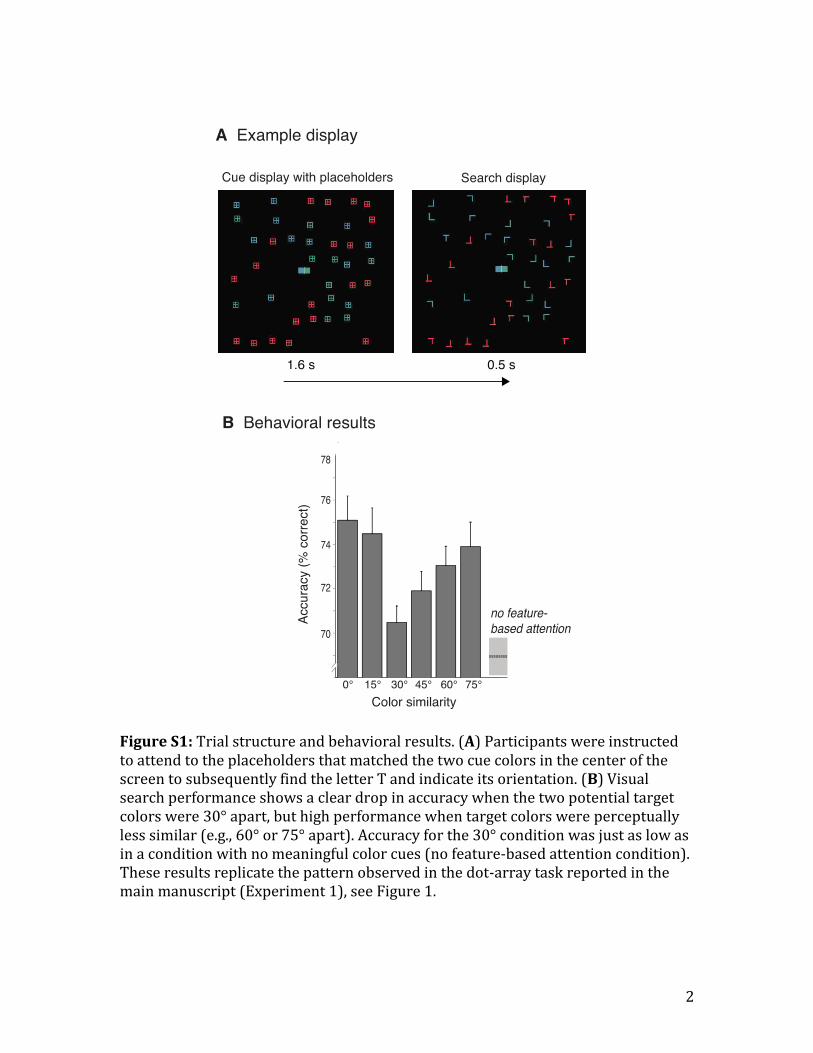
Supplemental Data
We tested whether the suppressive surround measured in Experiment 1
would also be observed in a visual search task. It is well known that observers can
tune their attention to particular colors, effectively limiting visual search to the
subset of items that match the target color (Egeth et al., 1984). Here we tested
whether it is possible to tune attention to multiple target colors at once, and
whether the effectiveness of this attentional selection is limited by the same
surround suppression as the motion task used in Experiments 1 and 2. As shown in
Figure S1B, search accuracy was highest when participants were cued to one color
only (0°), and decreased as the difference between the two target colors increased,
reaching a minimum at 30° (0° vs. 30°, t(19)=4.25; p<0.0001; 2=.48). Performance
gradually increased when the target colors became more distinct from each other
(i.e., 30° vs. 45°; t(19)=1.1; p=0.29; 2=.06; 30° vs. 60°; t(19)=2.2; p=0.04; 2=.21;
30° vs. 75°; t(19)=2.4; p=0.02; 2=.23), with performance at 75° similar to when
attending to a single color (p=.51). To approximate the magnitude of the drop in
performance for the 30°-apart condition, accuracy in that condition was compared
to accuracy in the condition in which all stimuli were in the same color and
participants could not focus on specific colors in the cueing interval. Participants’
performance in the 30°-apart condition was just as low as with no meaningful color
cues (p=.36), indicating that observers failed to efficiently select two perceptually
similar colors. Overall, the pattern of results matches the pattern of results
observed in Experiment 1. Selecting two perceptually similar colors is more difficult
than selecting two perceptually distinct colors.
2
3
Supplemental Experimental Methods
Visual search experiment
Participants. Twenty observers (age range: 18-28 years) participated in the Visual
Search experiment.
Stimuli and Procedure. The task was to find a target letter (T) among distractor
letters (Ls). Each display consisted of 40 colored stimuli that were presented within
17° x 17° rectangular regions of the screen. The background color was black
throughout the experiment (0.02 cd/m2). Each stimulus subtended 0.7° x 0.7°, and
was presented at random locations with the constraint of a minimum distance of 1°
(border to border).
Figure S1A illustrates a single trial of the experiment. Similar to Experiment
1, each trial started with the presentation of two colored squares in the center of the
screen, indicating the potential target color (e.g., blue or green). Importantly, the
two colored squares did not indicate the location (e.g., side of the visual field), but
only the color of the target stimulus. Together with the cues, colored waffle-shaped
placeholders were presented. The placeholders had the same colors as the letters in
the subsequent search display. Participants were instructed to attend to the
placeholders that matched the cue colors and were informed that the target would
appear within the cued subset. The color cues were 100% valid. The placeholders
disappeared after 1.6 s to reveal the letters. On each search display one target letter
T was presented in one of the two potential target colors (e.g., either green or blue),
and was either tilted upright or inverted. Half of the distractors were randomly
oriented Ls (“easy distractors”), with half of them colored in one of the potential
4
target colors (e.g., blue), and the other half colored in the other potential target color
(e.g., green). The remaining half of the distractors had the vertical line shifted to
look more similar to the letter T (“difficult distractors”), and appeared in a color
180° apart from the mean of the potential target colors. Because the distractors
within the cued color set were "easy distractors", this design encouraged
participants to use the color information in the cue display to attend to the potential
target colors to enable finding the target quickly. The search display was presented
very briefly (500 ms) to further push participants to select relevant colors during
the cueing display (see Figure 1A, for an example trial sequence).
The colors were selected as in Experiment 1, with the only difference that the
to-be-attended colors differed in steps of 15° on the color wheel, and up to 75°
apart, revealing six different color attention conditions. Furthermore, we added a
baseline condition in which all stimuli had the same color, such that participants
could not use feature-based attention to find the target more efficiently.
SSVEP experiment (Exp. 2)
Color selection. The following RGB values correspond to the target colors of the five
color sets: 255, 121, 168; 238, 169, 54; 238, 150, 71; 148, 183, 69; 47, 102, 117;
Analysis of SSVEP responses at lateralized electrode sites. The SSVEP responses were
examined separately at lateralized electrode sites I3, I4, O1, O2, PO7, PO8. These
electrode sites pick up SSVEP signals from the flickering dots most distant from the
vertical midline, and the SSVEP responses at these lateralized electrodes should
thus not be driven by the flickering dots nearby the midline. Similar to the main
analysis reported in the paper, we found a main effect of color similarity
(F(3,45)=9.03, p=0.0002, 2=0.37); pairwise comparisons showed the same pattern
as reported in the main paper: 0° vs. 30°: p=0.002; 0° vs. 180°: p=0.0005; 60° vs. 30°:
p=0.005; 60° vs. 180°: p=0.002, with no reliable differences between 60° and 0° , and
30° vs. 180°. This additional analysis shows that we observe an inhibitory surround
even at electrode sites that mostly pick up activation from dots at more distant
locations from the midline, supporting the conclusion that suppression spreads
globally throughout the visual field.
5


