Embed Size (px)
Citation preview
International Journal of Business and Management Invention
ISSN (Online): 2319 – 8028, ISSN (Print): 2319 – 801X
www.ijbmi.org || Volume 4 Issue 1 || January. 2015 || PP.72-86
www.ijbmi.org 72 | Page
Factors Affecting Performance: A Modification Of Vrooms
Theory (Studies In Certified Lecturer In Private University In
East Java)
1,Fathorrahman ,
2,Eka Afnan Troena ,
3,Fatchur Rohman ,
4,Mintarti Rahayu
1,Department of Management, College of Economics ASIA Malang,
2)3)
4,Department of Management, Faculty of Economics and Business, University of Brawijaya Malang.
ABSTRACT : Aim of the study is to re-examine and modify Vrooms theory by analyzing the Influence of
motivation, competence, and organizational commitment to performance. Sample size was 153 respondents
consisting of lecturer who have been certified in 44 accredited study program spread over 10 private
universities in East Java. The technique sample of this study was multistage random sampling. Data were
obtained through questionnaire distribution and collection, then analyzed using a structural model with GeSCA
program. From the three hypotheses testing and discussion the result indicated that motivation can significantly
positive effect on performance, competence have a significantly positive effect on performance, organizational
commitment have a significantly positive effect on performance, the relationships model between variables were
studied could generate motivation, competence, organizational commitment have a significant relationship to
the performance of certified lecturers in private university in east Java.
KEYWORDS: motivation, competence, organizational commitment, performance
I. INTRODUCTION Background : Globalization has meant to connect the world with each other in a variety of life, both in its
political dimension, technological, social, cultural, and economic (Giddens, 2001: 5). Globalization becomes
very heavy because of the findings in the fields of technology, communication and information. In fact,
globalization has changed the world economic order and characteristics of the business environment. The impact
of globalization started to spread into many areas of life, not least in education, including college. Public
demand for the quality of higher education as a result of globalization is something that is fair, that the solution
can’t be delayed any longer. This means that the learning process in universities must be qualified and meet the
established standards. The existence and the challenges of the college were very dependent on the assessment of
the quality of higher education stakeholders.
The key component in determining the quality of the college consists of many components, such as the
quality of the academic program (starting from input, learning process, and output of graduates), human
resources, infrastructure and academic environment. From those components of the human factor, there is the
lecturer to be something very important to improve the quality of higher education. Lecturers is one of important
element in the college has a strategic role to improve the quality of education in Indonesia. Hence, lecturer in the
college play importance role, focus on the performance of lecturers in their profession is very important and
needs to be addressed. Human resources as an important asset that must be owned by the organization
constantly be aware of the needs and desires that are expected to produce a high performance organization that
can ultimately achieve the various goals of the organization. To achievethese objectives, human resources
management that is able to manage in ways humane and highly motivated and dedicated to the organization.
Without the people who have the motivation, then the organization will not run properly. In this case the
leadership needs to find the best way to improve the quality of human resources, to be able to improve their
performance.
To encourage high-performing employees required capabilities that leaders can motivate employees in
order to improve performance so that organizational goals can be achieved. Employees who are motivated
usually stick with the job in a relatively long time, because of his job or the tasks given by the management,
employees have the expectation of reward obtained in accordance with the business or the sacrifice incurred.
Motivation is something that exists in someone who can push his desire to perform certain activities to achieve
goals. According to Robbins (2003: 135), motivation is a process that will determine the direction, intensity and
persistence of individuals in an effort to achieve the goal. While Gibson et al. (1996) motivation is the force that
drives a person who is raise / directing behavior, or a process where energy is given and directed behavior.
Factors Affecting Performance: A Modification…
www.ijbmi.org 73 | Page
Thus it can be said that motivation is a process that can lead an individual to voluntarily issue a higher
level of effort in the performance to meet the needs of life. Motivation is influenced by two factors there is
internal and external factors, while the individuals behaviors is generally motivated by a desire to achieve
certain goals in order to make the needs of life. One of the needs of the individual is the primary needfor the
requirement that must be filled, such as the need for a salary, wage, food, drink, clothing and housing, while
other needs are secondary needs that need security and safety, relationships with others, self-esteem, status,
affection, fair treatment, respect, achievement, opportunities to develop themselves. Each of these needs may
vary from period of time and each person differently.
Motivational variables as expressed by Maslow in the theory of needs to have an important role to
improve the performance of employees, where the presence of motivational factors can be a decisive element for
the achievement of organizational goals. Basically, everyone has expectations between motivation and
achievement shows that the magnitude of individual perception held by employee motivation will affect the
achievement of employee performance. In line with this motivation is the urge, the desire, so they did something
or the activities of their best work in both time and energy to achieve the goal.Porter and Lawler in Luthans
(1992: 165) states that: "Start with the premise that motivation (effort or force) does not equal to satisfaction and
/ or performance. Motivations, satisfaction and performance are all separate variables and relate in ways
different from what was traditionally assumed. Basically in daily life between motivation, job satisfaction, and
performance is something apart from each other and keep in touch. Motivation is the nudge someone to meet
their needs, that can be said to be good if the perceived satisfaction as expected. In general, if a person has
obtained satisfaction as expected it will be able to create a more optimal performance, but this is simply due to
the emergence of a new spirit to gain more leverage than ever before.
Anderson and Butzin model in As'ad (2001: 62) argued that, all theories about job performance in
which individual motivation is involved the calculation of the possibility of achievement a person, so it is not a
measure of performance of existing ones. Therefore, a formula that has been proposed is not unusual to measure
performance in the context of the post assessment. However, if they have obtained the actual performance of the
sector, and also owned a score of ability or motivation, it would be expected the level of one of the others
(motivation or ability) are not yet known, using the formula. Ability intended as the ability of employees to
carry out the work. This ability involves a variety of elements such as cognitive ability and technical ability,
even to the characteristic owned. Here, the ability refers to an individual's capacity to perform various tasks in a
job (Gibson et al. 1996), the ability of a trait (innate or learned) that allows a person carrying out an action or
mental or physical work. Capability consists of two basic elements: intellectual ability and physical abilities.
Intellectual ability required to perform mental activities, such as activities that are complex and require thought.
While the physical abilities necessary lead to the ability to perform tasks demanding stamina, dexterity, strength,
and similar skills. Research conducted by Palumbo et al. (2005) stated that cognitive ability affects the
performance of employees.
Vrooms argued that a person's performance is a function of motivation and ability. While Robbins
(2003; 218) suggests that employee performance is a function and interaction between ability, motivation, and
opportunity, that can be formulated that performance (P) = f (A x M x O). In this study, researchers modified by
inserted the variable of organizational commitment and discard opportunity variable. The reason why
researchers replace the commitment variables with the variable of organizational commitment as a variable that
can affects performance is for an employee, an opportunity variables are variables that can affect from the
outside of them rise and fall of a person's performance. This means that if employees see an opportunity / good
chance then they will perform better, otherwise if not then he will be poor performers. However, organizational
commitment variable is a variable that resides in them that could affect the rise and fall of a person's
performance as well as the motivation and competence variables. This means that employees who feel
committed to the high organizational commitment thus they will perform better, otherwise if not they will be
poor performers. Therefore, in this study, other factors are equally important to improve the employees
performance is organizational commitment. In general, organizational commitment is defined as the engagement
of employees in the organization in which the employee works. There are three components of organizational
commitment, namely affective commitment, rational / continuity commitment and normative commitment
(Allen & Meyer, 1990; Meyer & Allen, 1997). Affective commitment associated with the presence of
emotional, identification and involvement of employees in the organization. Rational or sustainability
commitment (continuance commitment) related to the cost-benefit considerations if the employee leaves the
organization. And, normative commitment related to the existence of obligation feeling on the employee to
continue working in the organization.
Factors Affecting Performance: A Modification…
www.ijbmi.org 74 | Page
Related to employee performance, showed that if the employee has high commitment it will be able to
improve their performance, which in turn can improve organizational performance. This is in line with DeCotiis
and Summers(1987) who found that organizational commitment is a strong predictor of employee performance
and Jaramillo et al., (2005) who found that organizational commitment and performance have a positive
relationship for sales and non-sales employees. Similar results were also shown of Chen and Francesco (2003)
and Sudiro (2008). Meanwhile, Yiing and Zaman (2009) find instead that the commitment does not affect the
employee performance. While, Both Steers (1977) and Wiener and Vardi (1980) concluded that organizational
commitment has no apparent relationship to performance. Based on the theoretical view and empirical findings
it is important to conduct a study related to the factors that affect performance. From the description presented a
study entitled "Factors affecting performance. (Studies in certified lecturer in Private University in East Java)
Problem Identification
Based on the description on the background and the title, then the formulation of the problem can be
posed in a studies in certified lecturer in private university in East Java :
[1] Does motivation affect the performance of certified lecturers?
[2] Does competence affect the performance of certified lecturer?
[3] Does organizational commitment affect theperformance of certified lecturer?
II. LITERATURE REVIEWAND HYPOTHESES LITERATURE REVIEW
Performance : The success of an organization can be achieved with the efforts of human resources quality.
Efforts were made to the form of the development, improvement of work systems, compensation and etc, finally
the performance appraisal. According to the dictionary of management terms (1981: 203), work performance is
the activity of duty or performance. While, notion of performance based on Armstrong and Baron (1998: 15) is
defined as the performancewhich is the result of work from strong relationship with the organization's strategic
goals. From these opinions can be concluded that the work achievement similar with performance.
Job performance is the result of the relationship between effort, ability, and perceptual tasks, Byars and
Leslie (1997: 311). According Soeprihantono, (1998: 64) that performance is the result of work an employee for
a certain period compared with a range of possibilities, such as standards, targets / objectives / criteria are
predetermined and agreement. Meanwhile, according Schermerhon et al, (1991: 59) that the performance as the
number and quality of tasks who solved by individuals, groups or organizational. From the definition it is clear
that performance is the result of work accomplished by a worker with carrying out the work or activity in time
period, which must meet the standards of quality and quantity of work which set by the company. Job
performance is the driving force to improve the performance of an organization, because the performance of an
organization is a set of achievements given by all sections related to business activities. According to Steers
(1999: 164) performance is defined as follows: performance is the level of success in completing the task and in
accordance with the objectives. Which can be interpreted performance is the level of success to complete the
task and fit for purpose. Prawirosentono (1999: 2) argued that performance is the result of work that can be
achieved by person or groups in an organization.
Performance management is expected to fulfill its function both at the level of individuals and
organizations. From the perspective of performance management organization will organize people within the
organization by managing the priorities of management and staff to plan the organization / business,
organizational goals and integrate the work of the individual presses and stimulate strong performance,
providing a framework for the setting of communication with the executive. While the individual perspective,
performance management enables employees and management to have a clear awareness of the objectives and
understand what to expect, looking at his own performance against the objectives of the organization and
recognizes its own performance through the identification and regular evaluation.
Motivation : Motivation is a psychological process that occurs in a person and reflects the interaction between
attitudes, needs, perceptions, and etc. Motivation is there in a person are not the same between one and another.
Luthans (2006: 270) defines motivation is a process that starts with a physiological or psychological efficiency
that drives behavior or encouragement aimed at a goal or incentive. This will lead to the motivation process.
Robbins (2006: 213) defines the term motivation is a process that will determine the intensity, direction, and
persistence of individuals in an effort to achieve the goals. It means that motivation within the individual or a
person to achieve his goal. Gibson et al. (1996: 185) defines motivation is a concept we use to describe impulses
arising on individual that drives and directs behavior. That is the power that drives an employee who raises and
directs behavior.
Factors Affecting Performance: A Modification…
www.ijbmi.org 75 | Page
Competence : Competence implies possession of knowledge, skills, and abilities required by the particular
position (Rustyah, 1982). Competence is also interpreted as knowledge, skills, and basic values are reflected in
the habit of thinking and acting. Competence can also be intended as the ability to execute a task gained through
education and / or training (Herrera, 1998). While in Indonesian dictionary, competence is the authority (power)
to determine or decide something. Finch and Crunkilton in Mulyasa (2004: 38) that the definition of competence
is the mastery of a task, skill, attitude, and appreciation necessary for the success. It shows that competence
includes tasks, skills and attitude of appreciation that should possess learners to be able to carry out the task of
learning according to the specific type of job.
Meanwhile Competence according to Law No. 13/2003 Article 1 (10), states that "Competence is the
ability of each individual that covers aspects of knowledge, skills and attitudes that fit the standard set". While
in Law No. 14 Year 2005 on Teachers and Lecturers Article 1, Section 10 states that competence is a set of
knowledge, skills, and behaviors that must be owned, lived, ruled, and actualized by the teacher or lecturer in
performing the duties of professionalism. Competencies required of teachers and lecturers include pedagogical
competence, personal competence, social competence, and professional competence. Pedagogic competence is
the ability to manage the learners that includes an understanding of the learners, the design and implementation
of learning, evaluation of learning outcomes, and the development of learners to actualize different potentials.
Personal competence, the ability of the personality of a solid, stable, mature, wise and dignified, become role
models for students and noble. Social competence is the ability of teachers to communicate and interact
effectively and efficiently with students, fellow teachers, parents / guardians of students, and the community.
Professional competence is the ability of teachers in the mastery of the subject matter is broad and deep that
allows guiding learners to meet the standards of competence set out in the National Standards.
Organizational Commitment : The concept of commitment is essentially direct a person to categorize
individual differences in values and motives more simply. Benkhoff (1997: 3) defines commitment as the degree
of employee awareness and their contribution to organizational success. Mowday et al. (1982: 27) argued that
organizational commitment as the relative strength and the individual to identify their involvement in the
organization. It is characterized by three things: (1) Acceptance of employee toward the values of the
organization. (2) The readiness and willingness of employees to try and sincerely on behalf of the organization,
and (3) the desire of employees to maintain their membership in the organization (being part of the
organization).Another view of the organization's commitment proposed by Steers (1999: 50), that is a sense of
identification (belief in the values of organization), and loyalty (the desire to remain to be a member of the
organization) are expressed by an employee of the organization. Steers argues that organizational commitment is
a condition in which the employees are very interested in the goals, value, and objectives of the organization's
commitment to the organization means more than just a formal membership, because predilection to the
organizational and willingness to try maximum effort for the organization in achieving its objectives.
Commitment to the organization, according to Greenberg and Baron (2000: 182), commitment concept
to the organizational related to the extent to which an individual identifies themselves and they desire to remain
in the organization. This means that employee loyalty is needed by the organization to achieve organizational
goals. Buchanan (in Gibson et al., 1996: 186) argues that employee commitment to the organization include the
suitability of the self (self-identification) employees with organizational objectives, employee psychological
attachment in organizational tasks shown by the unwillingness of employees to leave the organization. This
shows that level of employee loyalty to an organization's workplace.Davis (1996: 259) states that organizational
commitment of employees also referred to employee loyalty that is a level or degree of self-identification with
the organization's employees. This means that employee loyalty will be measured by the organization through
the power of attributes attached to the employee's personal self. Organizational commitment is like a magnetic
force to attract other objects into the magnet, which is one of measurement the employee wishes to remain in the
organization.
Research Hypothesis :Based on the background, problem identification, literature review, framework of
thought processes, and the conceptual framework in this study, a combined hypothesi the relationship between
variables is as follows:
Motivation and Performance Lecturer relationship :Motivation is a mental state that encourages activate,
mobilize efforts and channel behavior, attitudes and behavior with a strong-willed person to do something that is
always associated with the achievement of goals, both organizational goals and personal goals of each member.
Building the positive perception an employeeto the organization, are theoretically building the determinants of
high motivation.
Factors Affecting Performance: A Modification…
www.ijbmi.org 76 | Page
Perspective of human resource development that if could put a potential worker resource in
organization are very important, it will be able to provide optimum benefits for the organization. If leaders can
create conditions of work that can motivate employees to perform better, especially when leaders can integrate
with the company's goals through personal goals as well as provide greater opportunities to the employee's
participation to manage the organization, work performance will increase (Nimran, 1997: 40).According to
Orpen (2001) motivation has a different role to influence employee performance. This effect is moderated by
personal control. Employees with high motivation, when employees have high personal control, high motivation
will increase performance of the employee. However, where employees with high motivation have a low
personal control, this thing will actually degrade the performance of the employee because of employee's
inability to make changes in order to enhance the performance of employees. While low motivation of
employees will still degrade the performance of the employee in the absence of a desire to be better.Based on
theoretical and empirical studies of the relationship between motivation and performance above, the following
hypotheses can be proposed:
H1: The higher motivation of lecturers will improve the performance of certified lecturer
Competence and Performance Lecturer Relationship : Robbins (2003; 218) suggests that employee
performance is a function and interaction between ability, motivation, and opportunity that can be formulated as
performance (P) = f (A x M x O). Ability is the potential or mastery of a skill, which is used to do something
that realized through actions. One basic requirement for someone to be able as master a skill is ability of the
acquired basic knowledge in a practical and theoretical, as well as supported by the expertise (skills).Spencer
(1993: 9) says that the ability is as individual characteristics of the person and underlying causes of performance
or productivity able to demonstrate effective or superior work in a job or ability to cope with problems or work
in certain situations. First: basic characteristic is the ability to be fundamental and includes a person's personality
and can predict a person's attitude in certain situations which vary in certain work activities, Second: the ability
means of a causal relationship can lead to or be used to predict the performance a person with intention, third:
criterion reference is real ability to predict someone will be able to work better or worse, as measured on
specific criteria or standards of individual work performed.
According Kolz et al. (1998), which is based on sufficient empirical evidence suggest that ability is the
most important determinant of performance and have stable effect over time. Mulyana (2005) results of the
analysis indicate that there is a positive direction and a significant relationship between ability and performance
on the object of this study, thus supporting the relationship between two variables.Based on theoretical and
empirical studies the relationship between competence and performance above, the following hypotheses can be
proposed:
H2: The better competence of lecturers will improve performance of certified lecturer
Organizational Commitment and Performance Lecturer Relationship : Allen and Meyer (1990), argue that
each component has a different basic commitment. Employees with high effective components, still join the
organization because of the desire to remain as member of the organization is pretty high. Meanwhile,
employees with high continuance component, still join it because they need the organization. Furthermore,
employees with high normative component, remained a member of the organization as a whole because they
feel the need to do so. Based on Cichy (2009) organizational commitment can be explained through two
viewpoints. First describe individual desire or preference to remain in the old organization. Second, show the
individual's attitude towards the organization and is reflected in the individual's relationship with the company.
So with high organizational commitment, then the individual will strive with all his company's ability to
improve performance, which in turn will improve the performance of the company.Based on theoretical and
empirical studies the relationship between organizational commitment and performance above, the following
hypotheses can be proposed:
H3: The stronger organizational commitment of lecturers will improve performance of certified lecturer.
III. RESEARCH METHOD Data Collection : The data obtained in this study through a procedure in the form of questionnaires.
Questionnaires conducted directly by visiting the object of research (private universities) and directly submit
questionnaires to lecturers certified. All the variables in this study were measured using a Likert scale. Used an
interval scale has a range of 1 to 5. In this case, made the following order: Strongly Disagree (Score 1), Disagree
(Score 2), Neutral (Score 3), Agree (score 4), and Strongly Agree (Score 5)
Factors Affecting Performance: A Modification…
www.ijbmi.org 77 | Page
Sampling Techniques and Sample Size : Samples are part of the entire population (all lecturers certified) in
private universities in East Java. The technique sample of this study was multistage random sampling magnitude
of the sample in this study was determined by using the formula of Slovin (in Umar; 2000) with amount of 195
respondents. 195 questionnaires distributed to respondents, who returns to complete and can be analyzed is 153
questionnaires, or 78.5%.
Operational Definition of Variables : Operational definitions of variables consists of exogenous variables are
independent variables, moderating variables and the endogenous variable is the dependent variable, operational
definition in this study are as follows:
[1] Motivation (X1) is an impulse that exist within the individual that the individual could moves in an
effort to achieve personal goals and satisfaction. This variable refers to the motivational factors of the
two-factor theory of Herzberg et.al (1959), and studies of Mawoli, MA and Babandako, AY (2011).
Motivational variables measured by the following indicators: Achievement, Award (Recognition), work
itself (working conditions), Responsibility, Advancement (future), and Growth.
[2] Competence (X2) is the knowledge, skills, and attitudes that can increase a person's effectiveness in
completing the work. This variable refers to UUGD, PP 37 year 2009 about lecturer and Sumardjoko
(2006). Competence variables formed by four dimensions with several sub-variables as follows:
Pedagogic Competence; Professional Competence; Personality Competence; and Social Competence.
[3] Organizational Commitment (X3) is as the individual relative strength to identify them self in the part of
the organization's involvement or the degree of caring lecturer and its contribution to organizational
success. This variable refers to the organizational commitment questionnaire (OCQ) from Allen &
Meyer (1983) organizational commitment variable is measured by several indicators, as follows:
Affective Commitment; Sustainability Commitment and Normative Commitment.
[4] Performance of Certified lecturer (Y1) is the result of the behavior / work that can be achieved by a
professor in an organization (department or college). This variable are refers to, and modify this variable
from the PP 37 year 2009 about lecturer, Technical Evaluation Instructions (BKD2010), the operational
guidelines for assessment of credit points lecturer (2009), and studies of Mawoli, MA and Babandako,
AY (2011). Performance of certified lecturer variable measured by four indicators as follows: education
and teaching performance; research areas performace; Field performance of community service; and
support field performance of lecturer professions.
Validity and reliability : Validity test is to see whether the questionnaire instrument consistent in
measurement. Valid instrument or not an item can be determined by comparing the correlation index of Pearson
product moment with a significance level of 5% with a critical value where r (correlation coefficient) at the
significance level of alpha (α) of 0.05. The validity of the test results of all the items in this research is a valid
variable. Reliability test was also intended to determine the consistency of measuring instruments or in other
words the instruments have consistent results when used repeatedly at different times. Data reliability test using
Cronbach Alpha method approaches, by comparing the value of alpha (α) with 0.6. If the alpha value> 0.6, the
items on the questionnaire stated reliable, otherwise if the alpha value <0.6, the items on the questionnaire
declared unreliable. The reliability test results of all the items in this study are reliable.
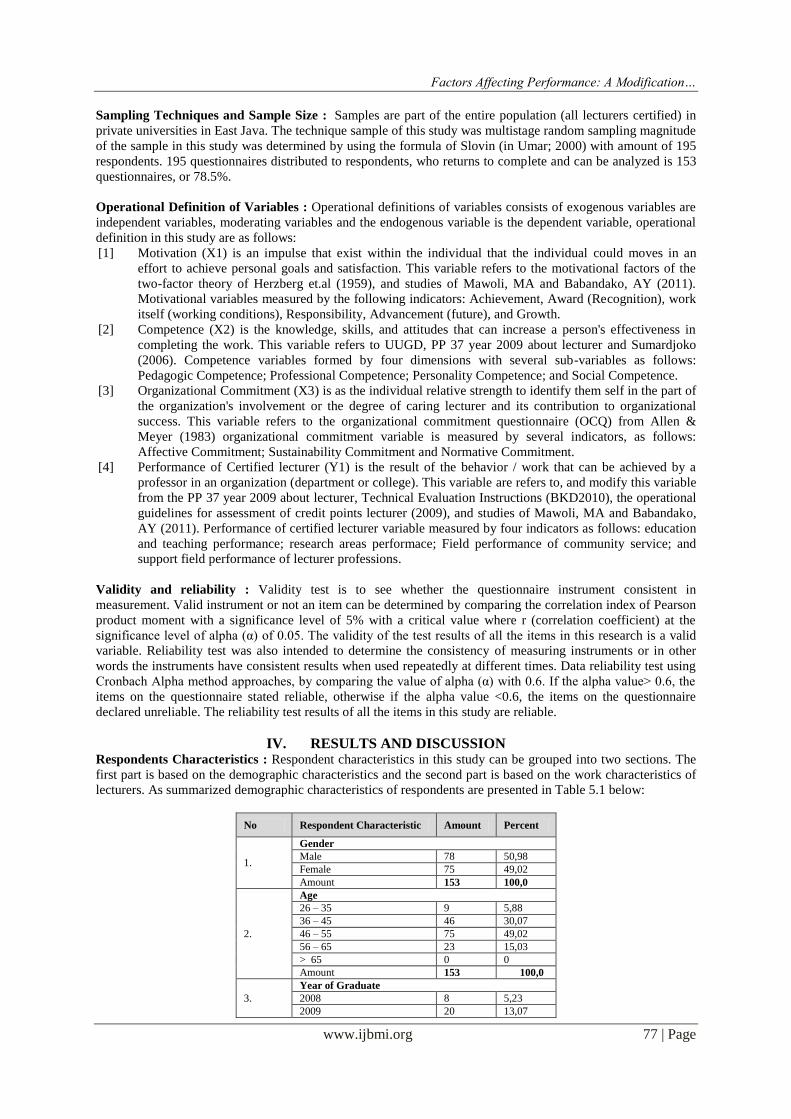
IV. RESULTS AND DISCUSSION Respondents Characteristics : Respondent characteristics in this study can be grouped into two sections. The
first part is based on the demographic characteristics and the second part is based on the work characteristics of
lecturers. As summarized demographic characteristics of respondents are presented in Table 5.1 below:
No Respondent Characteristic Amount Percent
1.
Gender
Male 78 50,98
Female 75 49,02
Amount 153 100,0
2.
Age
26 – 35 9 5,88
36 – 45 46 30,07
46 – 55 75 49,02
56 – 65 23 15,03
> 65 0 0
Amount 153 100,0
3.
Year of Graduate
2008 8 5,23
2009 20 13,07
Factors Affecting Performance: A Modification…
www.ijbmi.org 78 | Page
2010 38 24,84
2011 87 56,86
Amount 153 100,0
4.
Education
Bachelor 0 0
Master 128 83,66
Doctorate 25 16,34
Amount 153 100,0
5.
Process of study
In process study 25 16,34
Not study 128 83,66
Amount 153 100,0
6.
Source of study
BPPS 9 36,00
Institution 10 40,00
Own source 6 24,00
Amount 25 100,0
7.
Marital Status
Single 9 5,88
Married 139 90,85
Widower 5 3,27
Amount 153 100,0
Table 5.1 shows that demographic characteristics of respondents based on gender are 50.98% male and
49.02% female. This result indicated that between men and women there is no difference to that profession of
lecturers can be run by anyone who has the ability and meet the academic requirements as a lecturer and not
depend on a specific gender.Demographic characteristics of respondents based on age lecturer, shows most of
the respondents aged between 46 to 55 years as much as 49.02%. At this age, including the productive age and a
full duty is still long, so has potential source to make development (promotion of structural and functional).
While, age less than 45 years as much as 35.95% a young age, the experience is still lacking, but very energetic
and productive to continue to grow. While the age of 55 years are 15.03%, usually relatively less productive but
already very mature as an educator.
Based on years passed the certification of the respondents, indicated that the majority of respondents
passed the certification of lecturers in the year 2011 are 56.86%. This is similar with the characteristics of the
lecturer at 36-55 years old with functional associate professor and expert assistant. Meanwhile, the available
quota from the government for the implementation of certified lecturer ranging in 2010 and 2011, it was due in
2008 and 2009 were years of initial certification lecturers.Characteristics of respondents based on education
shows that 83.66% of respondents aremaster, which is similar with the objectives of this study, that the object of
study is certified lecturer who has require minimum education master or bachelor with functional associate
professor. The number of respondents were educated doctorate is only 16.34%, which is consistent with the
number of lecturers with doctorate in private university in East Java is still less (according to the director
general of Higher Education in 2013, nationally the number of doctoral degrees are 5168 and private university
are 10.598).
Characteristics of respondents based on the advanced study showed that most of the respondents were
not in advanced study as many as 83.66%, while respondents who are advanced studies to doctorate are only
16.34%. This result suggests that interest lecturers to improve the level of education are low, and they are quite
satisfied with the education and certification status obtained at this time. This is probably because one of them is
the cost factor, limited access to scholarships or other personal factors. In the coming years the possibility of
advanced studies who want to continue doctorate program will be even greater given access to advanced studies
scholarship (BPPDN and BPPLN) is getting easier with the ever increasing quotas as well as a change in the
rules (Permenpan No. 17 of 2013) that the lecturer is not doctorate can’t improve functional and academic ranks
to the post of professor. Sources of study used by lecturer in advanced study showsthat 40% using the cost of
institutional sources, 36% used BPPS cost sources and the remaining 24% using independent sources. This
indicates that the college's commitment to support their lecturer doing advanced studies to a higher level of
consciousness that is large enough and to improve the education quality, lecturer quality and lecturers should
also institute asset that must be nurtured and satisfaction.Characteristics of respondents by marital status shows
that the number of respondents who are married reaches 90.85% it was similar with an average age of 35 years
old. This can increase the motivation of lecturers and professors in their profession's commitment to getting
better as a form of responsibility to the family.
Factors Affecting Performance: A Modification…
www.ijbmi.org 79 | Page
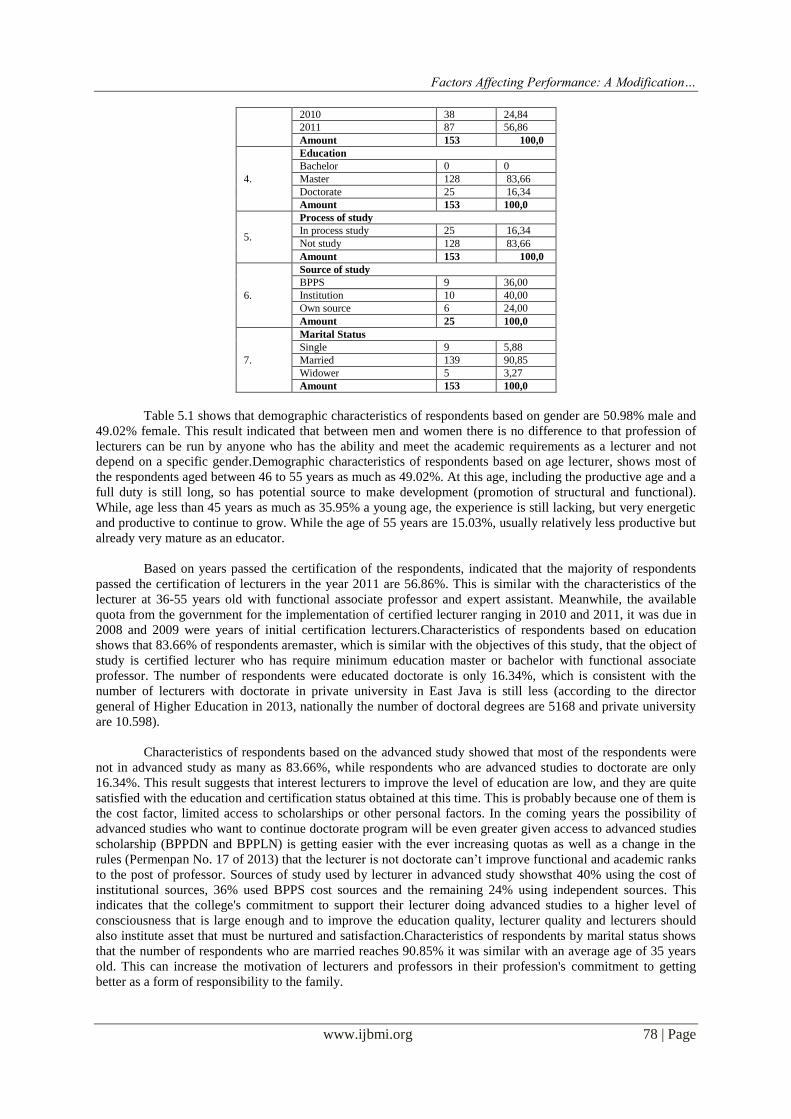
The work characteristics of respondents are presented in Table 5.2 below:
No Respondent Characteristc Amount Percent
1.
Employee Status
Foundation lecturer (non-civil) 118 77,12
Public Officer lecturer 35 22,88
Amount 153 100,0
2.
Academic functional occupation
Experts assistant 21 13,73
Associate 61 39,87
Head of associate 68 44,44
Professor 3 1,96
Amount 153 100,0
3.
Working Life
<10 years 21 13,73
11– 20years 55 35,95
21 – 30 years 69 45,10
>30years 8 5,23
Amount 153 100
Table 5.2 shows that based on employment status, most of the respondents 77.12% are foundation
lecturer (non-civil) and 22.88% are public officer of lecturer. This similar with the object of this study is the
university as a private individual institution lecturer. That's because private university is fully established and
managed by the community (legal entity foundation) so that the elevation of lecturers into the full authority of
foundations and government help to give public officer of lecturer in limited amounts in accordance with the
ability of the government and applicable rules.Based on the functional academic position indicate that 44.44%
of respondents have a functional lecturer as head of Associate Professor and 39.87% are associate professor.
This is similar with conditions of respondent average age ranged from 36-55 years. This indicates that the level
of maturity and experience to be a lecturer is high enough so that if their educational performance and continues
to evolve in the next 10 years, it is potential to achieve professor.Characteristics of respondents based on
experience / tenure indicates that 45.10% of the respondents had work experiences ranging at 21-30 years. This
gives the sense that working life of such compositions, most of which are in the mature work period, with spread
pattern is no different from the age distribution pattern and functional positions of certified lecturer. This
indicates that level of experience being a lecturer is quite high then the lecturer can continue to develop their
knowledge, transfer of knowledge and improve their skills to makes a better performance.
GeSCA Model testing result
Single Factor Model : The first step before testing the full model will be analyzed first of confirmatory factor
analysis (CFA) of each latent variable. The aims of CFA model analysis or unidimensional evaluation for each
variable are to determine the validity and reliability indicators. If the indicator is found with a low loading
factor, which is worth less than the value of 0.50, it is considered a weak indicator to measure the latent variable
and will be removed from the model (Igbaria et al, 1997 in Wijanto, 2008). Unidimensional is a necessary
condition for the analysis of reliability and construct validity (Anderson and Gerbing, 1991 in Ferdinand, 2000).
Confirmatory factor analysis (CFA) model can be used to check variable unidimensional. In latent constructs
with a reflexive relationship to be able to use the indicator of goodness of fit index (GFI) to measure the
feasibility of the model. Minimum expected value for the GFI is 0.90 (Hair, 1995). So that when the results of
the calculation of GFI 0.90 or it is means that all indicators had acceptable reliability. Hair et al. (2003)
recommends that the weighted factors above 0.5 indicate a strong validation of an indicator to measure a latent
variable.
Profile Variables : The actual condition of respondents' perceptions of each indicators that are important to
consider in reflecting variable can be determined from the descriptive results is mean score. Mean scores will
give more meaning when compared to the value of loading factor, where loading factor as variation value of
each indicator has a dominant contribution to reflect or shaping a variable. An important indicator of the actual
condition of each variable and the indicator can be seen in the following table.
Factors Affecting Performance: A Modification…
www.ijbmi.org 80 | Page
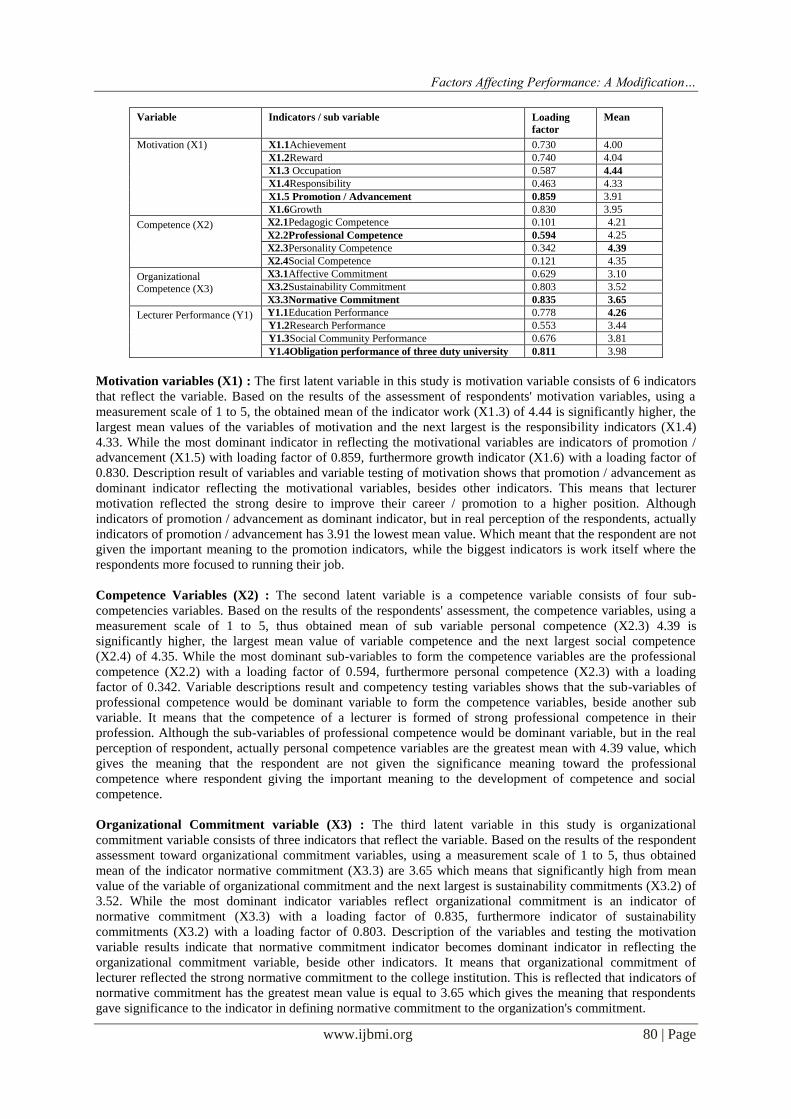
Variable Indicators / sub variable Loading
factor
Mean
Motivation (X1) X1.1Achievement 0.730 4.00
X1.2Reward 0.740 4.04
X1.3 Occupation 0.587 4.44
X1.4Responsibility 0.463 4.33
X1.5 Promotion / Advancement 0.859 3.91
X1.6Growth 0.830 3.95
Competence (X2) X2.1Pedagogic Competence 0.101 4.21
X2.2Professional Competence 0.594 4.25
X2.3Personality Competence 0.342 4.39
X2.4Social Competence 0.121 4.35
Organizational Competence (X3)
X3.1Affective Commitment 0.629 3.10
X3.2Sustainability Commitment 0.803 3.52
X3.3Normative Commitment 0.835 3.65
Lecturer Performance (Y1) Y1.1Education Performance 0.778 4.26
Y1.2Research Performance 0.553 3.44
Y1.3Social Community Performance 0.676 3.81
Y1.4Obligation performance of three duty university 0.811 3.98
Motivation variables (X1) : The first latent variable in this study is motivation variable consists of 6 indicators
that reflect the variable. Based on the results of the assessment of respondents' motivation variables, using a
measurement scale of 1 to 5, the obtained mean of the indicator work (X1.3) of 4.44 is significantly higher, the
largest mean values of the variables of motivation and the next largest is the responsibility indicators (X1.4)
4.33. While the most dominant indicator in reflecting the motivational variables are indicators of promotion /
advancement (X1.5) with loading factor of 0.859, furthermore growth indicator (X1.6) with a loading factor of
0.830. Description result of variables and variable testing of motivation shows that promotion / advancement as
dominant indicator reflecting the motivational variables, besides other indicators. This means that lecturer
motivation reflected the strong desire to improve their career / promotion to a higher position. Although
indicators of promotion / advancement as dominant indicator, but in real perception of the respondents, actually
indicators of promotion / advancement has 3.91 the lowest mean value. Which meant that the respondent are not
given the important meaning to the promotion indicators, while the biggest indicators is work itself where the
respondents more focused to running their job.
Competence Variables (X2) : The second latent variable is a competence variable consists of four sub-
competencies variables. Based on the results of the respondents' assessment, the competence variables, using a
measurement scale of 1 to 5, thus obtained mean of sub variable personal competence (X2.3) 4.39 is
significantly higher, the largest mean value of variable competence and the next largest social competence
(X2.4) of 4.35. While the most dominant sub-variables to form the competence variables are the professional
competence (X2.2) with a loading factor of 0.594, furthermore personal competence (X2.3) with a loading
factor of 0.342. Variable descriptions result and competency testing variables shows that the sub-variables of
professional competence would be dominant variable to form the competence variables, beside another sub
variable. It means that the competence of a lecturer is formed of strong professional competence in their
profession. Although the sub-variables of professional competence would be dominant variable, but in the real
perception of respondent, actually personal competence variables are the greatest mean with 4.39 value, which
gives the meaning that the respondent are not given the significance meaning toward the professional
competence where respondent giving the important meaning to the development of competence and social
competence.
Organizational Commitment variable (X3) : The third latent variable in this study is organizational
commitment variable consists of three indicators that reflect the variable. Based on the results of the respondent
assessment toward organizational commitment variables, using a measurement scale of 1 to 5, thus obtained
mean of the indicator normative commitment (X3.3) are 3.65 which means that significantly high from mean
value of the variable of organizational commitment and the next largest is sustainability commitments (X3.2) of
3.52. While the most dominant indicator variables reflect organizational commitment is an indicator of
normative commitment (X3.3) with a loading factor of 0.835, furthermore indicator of sustainability
commitments (X3.2) with a loading factor of 0.803. Description of the variables and testing the motivation
variable results indicate that normative commitment indicator becomes dominant indicator in reflecting the
organizational commitment variable, beside other indicators. It means that organizational commitment of
lecturer reflected the strong normative commitment to the college institution. This is reflected that indicators of
normative commitment has the greatest mean value is equal to 3.65 which gives the meaning that respondents
gave significance to the indicator in defining normative commitment to the organization's commitment.
Factors Affecting Performance: A Modification…
www.ijbmi.org 81 | Page
Lecturer Performance Variables (Y1) : The fourth latent variable in this study is composed of lecturer
performance variables on 4 indicators that reflect the variable. Based on the results of respondents' assessment
of lecturer performance variables, using a measurement scale of 1 to 5, thus obtained mean of teaching
performance indicators (Y1.1) of 4.26 is significantly higher and the largest mean value of the variable
performance. The next largest indicator of the lecturer performanceis obligation performance of three duty
university(Y1.4) of 3.98. While the most dominant indicator reflecting the lecturer performance variable also
obligation performance of three duty university(Y1.4) with a loading factor of 0.811, thus teaching performance
indicators (Y1.1) with a loading factor of 0.778. Description of the variables and testing the results of lecturer
performance variables showed that lecturer performance indicators of obligation performance of three duty
universitiesbecame the dominant indicator reflecting the variable performance of lecturers, in addition to other
indicators. This means that the performance of a lecturer reflected the strong desire to be actively involved in
activities / scientific seminars and committees on campus as supporting three duty universities. Although the
performance indicators supporting three duty universities became the dominant indicator, but the respondents'
perception of reality is precisely this teaching performance indicators have the highest mean value is 4.26 which
meant that respondents considered it important to improve and refine the performance of teaching and after the
new attention to the performance of field investigations three duty universities. While the performance of
research and community service had received less important attention for most of the lecturers.
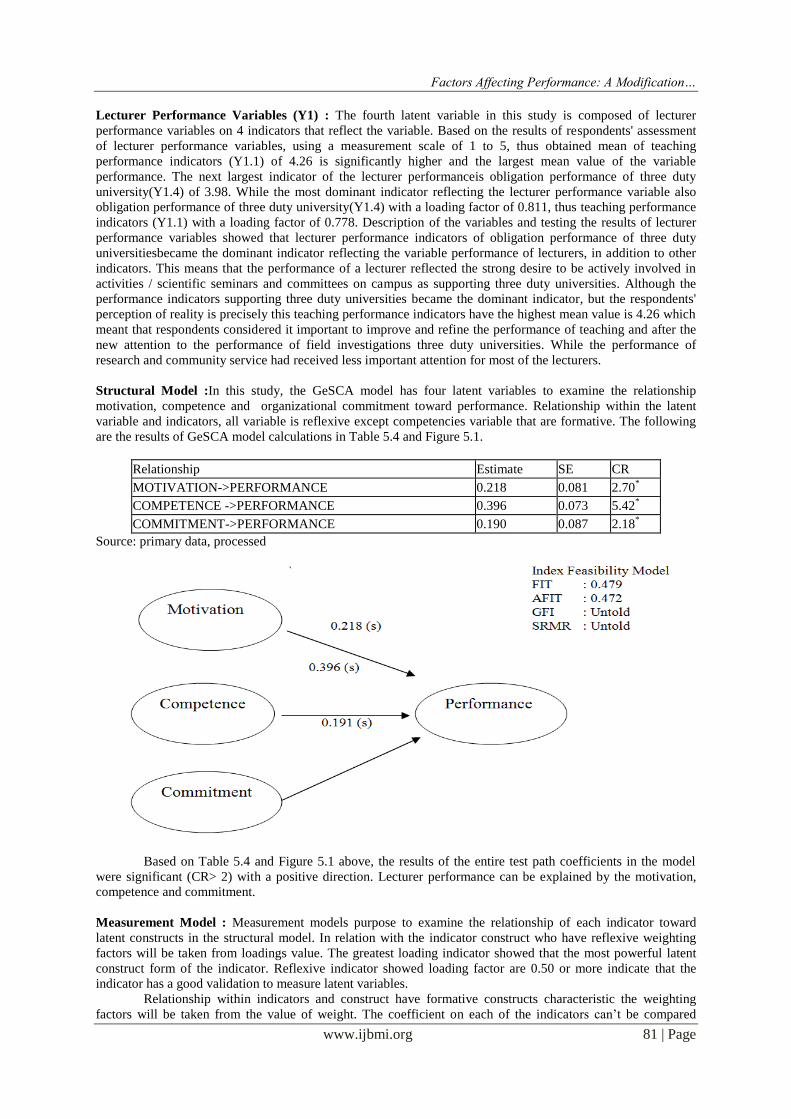
Structural Model :In this study, the GeSCA model has four latent variables to examine the relationship
motivation, competence and organizational commitment toward performance. Relationship within the latent
variable and indicators, all variable is reflexive except competencies variable that are formative. The following
are the results of GeSCA model calculations in Table 5.4 and Figure 5.1.
Relationship Estimate SE CR
MOTIVATION->PERFORMANCE 0.218 0.081 2.70*
COMPETENCE ->PERFORMANCE 0.396 0.073 5.42*
COMMITMENT->PERFORMANCE 0.190 0.087 2.18*
Source: primary data, processed
Based on Table 5.4 and Figure 5.1 above, the results of the entire test path coefficients in the model
were significant (CR> 2) with a positive direction. Lecturer performance can be explained by the motivation,
competence and commitment.
Measurement Model : Measurement models purpose to examine the relationship of each indicator toward
latent constructs in the structural model. In relation with the indicator construct who have reflexive weighting
factors will be taken from loadings value. The greatest loading indicator showed that the most powerful latent
construct form of the indicator. Reflexive indicator showed loading factor are 0.50 or more indicate that the
indicator has a good validation to measure latent variables.
Relationship within indicators and construct have formative constructs characteristic the weighting
factors will be taken from the value of weight. The coefficient on each of the indicators can’t be compared
Factors Affecting Performance: A Modification…
www.ijbmi.org 82 | Page
because there are not standard. Latent constructs formed by a significant indicator (CR> 2). Formative
relationship only exists in relation of lecturer competence. The calculation of value of the square multiple
correlations (SMC) are only on reflexive indicator. Interpretation of SMC is the magnitude of the contribution in
the form of latent variable indicators. Here is a table of measurement results of GeSCA models:
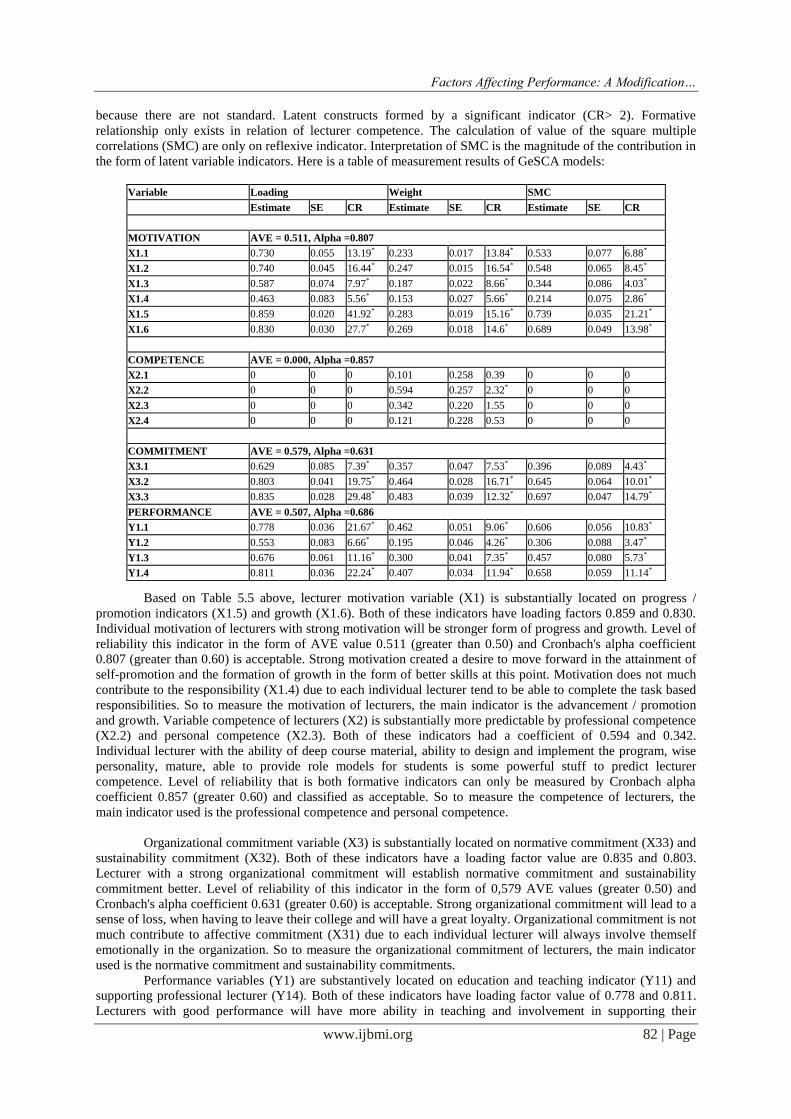
Variable Loading Weight SMC
Estimate SE CR Estimate SE CR Estimate SE CR
MOTIVATION AVE = 0.511, Alpha =0.807
X1.1 0.730 0.055 13.19* 0.233 0.017 13.84* 0.533 0.077 6.88*
X1.2 0.740 0.045 16.44* 0.247 0.015 16.54* 0.548 0.065 8.45*
X1.3 0.587 0.074 7.97* 0.187 0.022 8.66* 0.344 0.086 4.03*
X1.4 0.463 0.083 5.56* 0.153 0.027 5.66* 0.214 0.075 2.86*
X1.5 0.859 0.020 41.92* 0.283 0.019 15.16* 0.739 0.035 21.21*
X1.6 0.830 0.030 27.7* 0.269 0.018 14.6* 0.689 0.049 13.98*
COMPETENCE AVE = 0.000, Alpha =0.857
X2.1 0 0 0 0.101 0.258 0.39 0 0 0
X2.2 0 0 0 0.594 0.257 2.32* 0 0 0
X2.3 0 0 0 0.342 0.220 1.55 0 0 0
X2.4 0 0 0 0.121 0.228 0.53 0 0 0
COMMITMENT AVE = 0.579, Alpha =0.631
X3.1 0.629 0.085 7.39* 0.357 0.047 7.53* 0.396 0.089 4.43*
X3.2 0.803 0.041 19.75* 0.464 0.028 16.71* 0.645 0.064 10.01*
X3.3 0.835 0.028 29.48* 0.483 0.039 12.32* 0.697 0.047 14.79*
PERFORMANCE AVE = 0.507, Alpha =0.686
Y1.1 0.778 0.036 21.67* 0.462 0.051 9.06* 0.606 0.056 10.83*
Y1.2 0.553 0.083 6.66* 0.195 0.046 4.26* 0.306 0.088 3.47*
Y1.3 0.676 0.061 11.16* 0.300 0.041 7.35* 0.457 0.080 5.73*
Y1.4 0.811 0.036 22.24* 0.407 0.034 11.94* 0.658 0.059 11.14*
Based on Table 5.5 above, lecturer motivation variable (X1) is substantially located on progress /
promotion indicators (X1.5) and growth (X1.6). Both of these indicators have loading factors 0.859 and 0.830.
Individual motivation of lecturers with strong motivation will be stronger form of progress and growth. Level of
reliability this indicator in the form of AVE value 0.511 (greater than 0.50) and Cronbach's alpha coefficient
0.807 (greater than 0.60) is acceptable. Strong motivation created a desire to move forward in the attainment of
self-promotion and the formation of growth in the form of better skills at this point. Motivation does not much
contribute to the responsibility (X1.4) due to each individual lecturer tend to be able to complete the task based
responsibilities. So to measure the motivation of lecturers, the main indicator is the advancement / promotion
and growth. Variable competence of lecturers (X2) is substantially more predictable by professional competence
(X2.2) and personal competence (X2.3). Both of these indicators had a coefficient of 0.594 and 0.342.
Individual lecturer with the ability of deep course material, ability to design and implement the program, wise
personality, mature, able to provide role models for students is some powerful stuff to predict lecturer
competence. Level of reliability that is both formative indicators can only be measured by Cronbach alpha
coefficient 0.857 (greater 0.60) and classified as acceptable. So to measure the competence of lecturers, the
main indicator used is the professional competence and personal competence.
Organizational commitment variable (X3) is substantially located on normative commitment (X33) and
sustainability commitment (X32). Both of these indicators have a loading factor value are 0.835 and 0.803.
Lecturer with a strong organizational commitment will establish normative commitment and sustainability
commitment better. Level of reliability of this indicator in the form of 0,579 AVE values (greater 0.50) and
Cronbach's alpha coefficient 0.631 (greater 0.60) is acceptable. Strong organizational commitment will lead to a
sense of loss, when having to leave their college and will have a great loyalty. Organizational commitment is not
much contribute to affective commitment (X31) due to each individual lecturer will always involve themself
emotionally in the organization. So to measure the organizational commitment of lecturers, the main indicator
used is the normative commitment and sustainability commitments.
Performance variables (Y1) are substantively located on education and teaching indicator (Y11) and
supporting professional lecturer (Y14). Both of these indicators have loading factor value of 0.778 and 0.811.
Lecturers with good performance will have more ability in teaching and involvement in supporting their
Factors Affecting Performance: A Modification…
www.ijbmi.org 83 | Page
profession. The reliability level of fourth indicator with AVE value0.507 (greater than 0.50) and Cronbach's
alpha coefficient 0.686 (greater than 0.60) is acceptable. Lecturer with good performance will form the ability to
educate and teach better along caused high involvement to engage in various professional activities.
Performance is not much contribute to the research (Y12) due to each individual lecturer tend to be able to
complete the task in accordance responsibilities. So to measure the performance of the lecturer, the main
indicator used is teaching and supporting professional lecturer.
Hypothesis Testing : In this study has five hypothesis, the first four hypotheses related to the direct effect,
while the fifth hypothesis states alleged that the award system will moderate the relationship of performance and
job satisfaction. The following are the results of tests on the fifth hypothesis.
H1: The higher motivation of lecturers will improve performance of lecturer
Path coefficient 0.218 (CR = 2.70) from motivation to the performance of lecturer is significant with a
positive direction. Lecturer with higher motivation will have a better performance, so that the hypothesis H1 is
accepted in.
H2: The better competence of lecturers will improve performance of lecturer
Path coefficient 0.396 (CR = 5.24) from competence to the performance of lecturer is significant with a
positive direction. More competent lecturers will have better performance, so that hypothesis H2 is accepted.
H3: The stronger organizational commitment of lecturers will improve performance of lecturer
Path coefficient 0.191 (CR = 2.06) from organizational commitment to the performance of lecturer is
significant with a positive direction. Performance of lecturer will increase if lecturers have better organizational
commitment, so the hypothesis H3 is acceptable.
V. DISCUSSION From hypothesis testing result, the researchers can examine the influence of each variable in this study
are as follows:
The Effect of Motivation on Performance (X1 Y1)
From the results of testing the first hypothesis, the path coefficient 0.218 (CR = 2.70) from motivation
to the performance is significant with positive direction. It means that the first hypothesis, which states the
higher motivation of lecturers will improve the performance of certified lecturer is acceptable. Path coefficient
is positive,it means that in theoretically the influence of work motivation on performance is same direction. This
indicates that the lecturer who have high motivation to work, have better performance. Otherwise, lecturer who
has low work motivation, then performance will be lower / down.
Finding of the result in this study is supported by Newstrom and Davis (1997: 117) that performance is
a function of ability (abilities) and motivation. Performance appraisal involves the determination of the level of
individual contribution or performance expressed in the completion of the tasks which they are responsible.
These results are also consistent with Tekinkus Karatepe (2006), Anderson and Butzin in As'ad (2001: 62) states
that internal motivation can affect significantly the performance of employees. Findings from this study also
support the results from Orpen (2001) which states that motivation has a different role in to influence employee
performance. This effect is moderated by personal control. These results are also consistent with the results of
Kustiningsih (2007) who concluded that the employee activities in completing the work is necessary to get the
motivation / encouragement to be able to work effectively and efficiently. The most important factors that have
an influence motivation are personal needs, goals and perceptions of the person or group concerned. This means
that if the employees like their work, they assume that the task was challenging, then they will to carry out their
work with enthusiasm. This means that with high motivation performance will be achieved.
The findings of the study is also consistent with the opinion of McClelland, Murray, Miller and Gordon
in the Mangkunegara (2005: 20) based on the results of the study concluded that there is a positive relationship
between motivation and achievement. It means that employees who have high motivation tend to have adequate
high job performance and job performance instead they are low due to low motivation. Furthermore McClelland
in AREP and Cape (2004: 93) says that the achievements are a source of motivation. The higher level of
motivation could increase job performance. Thus, these findings can be accepted as true, because if any
professors who are motivated to achieve the performance, then the performance will be better. The findings of
the study is also consistent with the results of the study Burdahyat (2009) stated that the results of their research
motivation nurses in the General Hospital of Sumedang is low, so affected on nurses performance. This means
Factors Affecting Performance: A Modification…
www.ijbmi.org 84 | Page
that this study showed a significant relationship between the variables of motivation and performance, thus
supporting the relationship between two variables. Significant relationship between these two variables, then if
increased motivation will improve the performance and vice versa.
The Effect of Competence on Performance (X2 Y1)
From the results of testing the second hypothesis, the path coefficient 0.396 (CR = 5.24) from
competence of lecturers on performance is significant with a positive direction. Means the second hypothesis,
which states that better competence of lecturers will improve the performance of lecturer is acceptable. Path
coefficient are positive, it means that in theoretically the influence of competence on performance is same
direction. This indicates that the more competent lecturers will have better performance. In contrast, less
competent lecturers will have poor performance.
The results are consistent with Pitoyo, 2000 (in Amelia 2009) indicating that the appearance of a nurse,
the ability of nurses, nurse motivation nurses and leadership style associated with the performance of nurses in
implementing public health care at the health center, district of Semarang regency. This means that there is a
relationship between ability and performance variables at the health center, so this study supports the
relationship between the two variables. This finding is also similar with Mulyana (2005) results of the analysis
indicate that there are positive relationships between employee capabilities, organizational climate, and
motivation with high quality of health care, tend to be followed by the creation of a better service quality in the
District General Hospital Semarang. This means that there is a positive direction and a significant relationship
between ability and performance on the object of this study, thus supporting the relationship between the two
variables. These findings are also consistent with the findings Kolz et al. (1998), that ability is the most
important determinant of performance and effect stable over time.. However, this result is not consistent with
the results of Schneider (1977)in Chow (1986) who argues otherwise is not required when automation
capabilities occur. The ability of individuals do not mean when routine by the machine has occurredand then the
ability will still be required to operate the machine, so that doesn’t occur more often of human error
The Effect of Organizational Commitment on Performance (X3 Y1)
From the results of testing the third hypothesis, the path coefficient 0.191 (CR = 2.06) from
organizational commitment on performance is significant with positive direction. Means that the third
hypothesis, which states that stronger organizational commitment will improve the performance of certified
lecturer are acceptable. Path coefficient is positive, it means that in theoretically the influence of organizational
commitment on performance is same direction. This indicates that lecturer who has a strong organizational
commitment can increase performance. Otherwise, lecturer who has weak committed organizationally could
decrease performance. As a result of the findings, this research similar with Darwito (2008), the research results
indicate that there is positive effect of organizational commitment on employee performance. This means that if
you see these studies specifically on the relationship organizational commitment and performance variables,
then there is a positive and significant relationship. In addition, this study is also in line with Burton (2002),
Jaramillo, et al (2005), and Sudiro (2008), which states that organizational commitment was related to
organizational performance. However, in contrast with Yiing and Zaman (2009) found that organizational
commitment does not significantly affect the performance. Thus Both Steers (1977) and Wiener and Vardi
(1980) concluded that organizational commitment has no apparent relationship to performance.
Limitations of Research
Based on the findings in this study, it was realized that it is not able to provide a comprehensive answer
to the problems discussed. The results of this study still have limitations in terms of:
[1] The scope of this study not cover all private universities in East Java, but only for private colleges
accredited study programs in the region VII East Java. Though there are many lecturer who are already
certified are also measurable factors that affect the performance and work satisfaction is not a
respondent in this study because they are not in accredited program.
[2] In the process of implementing the deployment of questionnaires to the respondents, the researcher is
rather difficult to be able to meet in person and conduct in-depth interviews with respondents. Therefore
in some majors, researchers disseminate questionnaires through the head of department head and
interview with head of department. Deployment questionnaire through this department head allows the
biased perception of the respondents to the questionnaire that are given.
[3] This study is a moment that is only when distributed questionnaires can’t be recognized continuously
changes the performance of a certified lecturer, therefore these results can’t be generalized as motivation
variable relationship, competence and organizational commitment to performance in the long run.
Factors Affecting Performance: A Modification…
www.ijbmi.org 85 | Page
VI. CLOSING Conclusion : Based on the background of the problem, problem identification, the purpose of the study,
hypothesis, hypothesis verification and discussion that has been done, then following conclusions may be drawn
up:
[1] Motivation has significantly positive can effect on the performance of certified lecturers in private
universities in East Java. This indicates that the certified lecturer who has high motivation, it will be have
better performance. Otherwise, lecturer who has low work motivation, then performance will be lower /
down.
[2] Competence has significantly positive can effect on the performance of certified lecturers in private
universities in East Java. This indicates that better competence of lecturers will increase performance. In
contrast, less competent lecturers will have a poor performance.
[3] Organizational Commitment has significantly positive effect on the performance of certified lecturers in
private universities in East Java. This indicates that lecturers with high organizational commitment will
have higher performance. Conversely, lecturer with low organizational commitment, then the
performance will decrease.
Suggestions
Based on the conclusions that have been made in this study, then delivered the following suggestions:
[1] For the future research is expected that the results of this study can be useful to use as a reference for the
study with the same objects but variables and indicators are more refined.
[2] For further research is expected to expand its scope not only in accredited study programs, but covering
the whole entire private college in East Java.
[3] Assessment of the variables of motivation, competence, organizational commitment becomes more
attractive for development on the other as the research object Vrooms theory development, considering the
fact that a significant effect on performance variables of lecturer.
[4] Through performance and organizational commitment variable is very interesting to be conducted further
research, especially to see the effect of alternating (reciprocal) thus enriching subsequent studies.
REFFERENCE [1] Allen, N. J., and Meyer, J.P. 1990,The measurement and antecedents of affective, continuance, and normative commitment to
organization. Journal of occupational psychology, 63, 1–18.
[2] Amelia, Rina, 2009,Pengaruh Motivasi Berpretasi Terhadap Kinerja Perawat Dalam Asuhan Keperawatan Pasien di Rumah Sakit
Jiwa Di Medan Propinsi Sumatera Utara. http://repository.usu.ac.id/bitstream/123456789/6657/7/Chapter%20I.pdf
[3] Arep, Ishak dan Tanjung, Hendri, 2004. Manajemen Motivasi. Jakarta: PT. Grasindo. [4] As’ad, Moch, 1995. Psikologi Industri. Edisi kelima. Cetakan kedua. Yogyakarta: Liberty.
[5] Benkhoff, B., 1997, Ignoring commitment is costly: New approaches establish the missing link between commitment and
performance’. Human Relations. 50, 701-726. [6] Burdahyat, 2009, Hubungan Budaya Organisasi Dengan Kinerja Perawat Pelaksana Di Instalasi Rawat Inap Rumah Sakit Umum
Daerah Sumedang.
http://www.google.co.id/#q=hubungan+antara+motivasi+kerja+dan+komitmen+organisasional+serta+kinerja+di+rumah+sakit+daerah&hl=id&prmd=ivns&ei=SRliTYbdFYbxrQe5yC6Ag&start=10&sa=N&fp=1853621f595215f6
[7] Burton, E., Gene, 2002,Jepang vs Amerika Serikat: Sebuah Perbandingan Lingkungan Perusahaan dan Karakteristik, Manusia
Manajemen Sistem, 8 (2), 167-173. [8] Chen, Z.X. and Francesco, C., 2003, The relationship between the three components of commitment and employee performance in
china. Journal of Vacational Behaviour, Vol. 62 No. 3, pp. 490-510
[9] Chow, L., Siu, 1986,Automatic detection, consistent mapping, and trainingOriginally. http://cogprints.org/2959/1/Automaticity.pdf [10] Cichy, RF. 2009,The relationship between organizational commitment and contextual performance among private club leaders.
IJHM; 28; 53-62.
[11] Darwito, 2008,Analisis Pengaruh Gaya Kepemimpinan Terhadap Kepuasan Kerja Dan Komitmen Organisasi Untuk Meningkatkan Kinerja karyawan (Studi Pada RSUD Kota Semarang).
[12] http://eprints.undip.ac.id/16933/1/DARWITO.pdf
[13] Davis, Keith, 1996,Human Resource and Personnel Management, 4 Ed, International Edition, Singapore: Mc Graw Hill Book Co. [14] DeCotiis, T. and Summers, T., 1987, A path analysis of a model of the antecedents and consequences of organizational
commitment. Human Relations, Vol. 40, pp. 445-70.
[15] Ferdinand, A., 2000, SEM-Structural Equation Modeling AMOS 4.0, Semarang: Penerbit Universitas Diponegoro. [16] Gibson, James L., James H, Donnelly Jr. and Ivancebich, John M., 1996, Organisational Behavior, structure, process.8th Edition.
Alih bahasa: Adiardini, Editor Saputa.Binarupa AksaraJakarta. [17] Giddens, A., 2001, Runaway Word, London: Profile Books Ltd
[18] Greenberg, J., & Baron, R.A. 2000,Behavior in organizations: Understanding and managing the human side of work (5th Ed.),
Upper Saddle River, NJ: Prentice Hall. [19] Herzberg, F., Mausner, B. and Snyderman, B., 1959, The motivation to work. 2nd ed, Wiley, New York, NY
[20] Jaramillo F., J.P. Mulki, and G.W. Marshall,2005, A Meta-analysis of the relationship between organizational commitment and
salesperson job performance: 25 years of research.Journal of Business Research 58,pp.705-714 [21] Karatepe M.O. and Tekinkus M.,2006,The effects of work family conflict, emotional exhaustion, and intrinsic motivation on job
outcomes of front line employees.International Journal of Bank Marketing, Vol. 24 no. 3, pp. 173-193.
[22] Kolz, Arno, R., Lynn, A. Mc Farland and Stanley B. Silverman, 1998,Cognitive Ability and Job Experience as Predictor of Work Performance, The Journal of Psychology, 132(5), 1998, 539-548.
Factors Affecting Performance: A Modification…
www.ijbmi.org 86 | Page
[23] Luthans, Fred, 1992. Organizational Behavior, Sixth Edition, Singapore: Mc Grow Hill Book Co
[24] __________, 2006. Perilaku Organisasi. Diterjemahkan: Yuwono, Vivin Andhika; Purwanti, Shekar; Arie P, Th; Rosari, Winong.
Yogyakarta: Penerbit Andi. [25] Mawoli, M.A and Babandako, A.Y ,2011, An Evaluation of Staff Motivation, Dissatisfaction and Job Performance in an Academic
Setting. Australian Journal of Business and Management Research, Vol. 1 No. 9, Desember 2011
[26] Meyer, J.P. and N.J. Allen, 1997, Commitment in the workplace: Theory, Research, and Application. Thousand Oaks, CA: Sage Publication, Inc
[27] Mulyana, Agung, Didik, 2005, Studi Tentang Kemampuan Kerja, Iklim Organisasi, dan Motivasi Terhadap Kualitas Pelayanan
Kesehatan Di Rumah Sakit Umum Daerah Kota Semarang.http://eprints.undip.ac.id/14750/1/img-517074358.pdf [28] Nimran, Umar, 1997, Perilaku Organisasi, Cetakan pertama, Surabaya: Citra Media.
[29] Orpen, Christopher, 2001, Interactive effects of work motivation and personal control on employee job performance and
satisfaction.Journal of Social Psychology; 134(6); 855-6. [30] Palumbo V. Mark, C.E. Miller, V.L. Shalin, 2005,The Impact of Job Knowledge in the Cognitive Ability-Performance
Relationship.Applied HRM Research, Volume 10 Number 1, 13-20
[31] Permenpan Nomor 17 Tahun 2013, tentang Jabatan Fungsional Dosen dan Angka Kreditnya, Berita Acara Republik Indonesia Tahun 2013 Nomor 466.
[32] Prawirosentono, Suyadi, 1999, Manajemen Sumber Daya Manusia: Kebijakan Kinerja Karyawan, Edisi Pertama, Yogyakarta:
BPFE. [33] Robbins, Stephen P.,, 2003. Organizational Behavior: New Jersey: Printice Hall, Inc upper Saddle River.
[34] Schermerhon, John R., Hunt, James G., and Osbon Richard N.,1991. Managing Organizational Behavior. Fourth ed. New York:
John Wiley and Son, Inc. [35] Soeprihantono J, 1998. Penilaian Pelaksanan Pekerjaan dan Pengembangan Karyawan. Yogyakarta: BPFE.
[36] Steers, R.M., 1999, Efektivitas Organisasi, Terjemahan Jakarta: Erlangga.
[37] Sudiro Achmad, 2008, Pengaruh Timbal Balik Anatara Kepuasan Kerja dengan Kepuasan Keluarga dan Komitmen Kerja serta Dampaknya terhadap Prestasi Kerja dan Karier Dosen,Jurnal Manajemen dan Kewirausahaan, Vol. 10 No.1, hal. 38-49,
Universitas Kristen Petra Surabaya.
[38] Undang-Undang Nomor 23 Tahun 2003 tentang Ketenagakerjaan, Lembaran Negara Republik Indonesia Tahun 2005 Nomor 4279. [39] Undang-Undang Nomor 14 Tahun 2005 tentang Guru dan Dosen, Lembaran Negara Republik Indonesia Tahun 2005 Nomor 157.
[40] Wiener, Y. & Vardi, Y. 1980. Relationships between job organization and career commitment and work outcomes-an integrative
approach. Organizational Behavior and Human Performance, pp 81-96. [41] Yiing H.Lee. and K. Zaman Bin Ahmad, 2009, The moderating effects of organizational culture on the relationships between
leadership behavior and organizational commitment and between organizational commitment and job satisfaction and
performance.Leadership & Organization Development Journal, vol. 30 No. 1, pp. 53-86.