Embed Size (px)
Citation preview
99
Factor analysis of the AutismSpectrum ScreeningQuestionnaire
B R I T T P O S S E R U D Centre for Child and Adolescent Mental Health,University of Bergen, Norway
A S T R I J . L U N D E RV O L D Centre for Child and AdolescentMental Health, and Department of Biological and medical Psychology, University of Bergen,Norway
M A A I K E C . S T E I J N E N Centre for Child and AdolescentMental Health, University of Bergen, Norway
S O P H I E V E R H O E V E N Centre for Child and Adolescent MentalHealth, University of Bergen, Norway
K J E L L M O R T E N S T O R M A R K Centre for Child andAdolescent Mental Health, University of Bergen, Norway
C H R I S T O P H E R G I L L B E R G Child and AdolescentPsychiatry, Göteburg University, Sweden
A B S T R A C T The present study investigated the factor structure ofparent and teacher Autism Spectrum Screening Questionnaire (ASSQ) ina population of 7–9 years old children. For validation purposes, factorsderived were correlated with results on the Strengths and DifficultiesQuestionnaire (SDQ). A three-factor solution was identified on bothparent and teacher ASSQ. Most of the variance was explained by onefactor including measures of social function, validated by a high corre-lation with the SDQ peer problems scale. The second factor includedmeasures of autism-associated problems. The items allocated to the thirdfactor were more specific for a cognitive style typically found in high-functioning individuals with autism/Asperger syndrome. This factordid not correlate highly with any of the SDQ subscales. The results indi-cated that the screening efficiency of ASSQ could be increased by closerexamination of the individual profile of factor scores.
A D D R E S S Correspondence should be addressed to: B R I T T P O S S E RU D , Centre forChild and Adolescent Mental Health, University of Bergen, Box 7800, 5020 Bergen,Norway. e-mail: [email protected]
autism © 2008SAGE Publicationsand The National
Autistic SocietyVol 12(1) 99–112; 085268
1362-3613(200801)12:1
© 2008 SAGE Publications (Los Angeles, London, New Delhi and Singapore)DOI: 10.1177/1362361307085268
K E Y W O R D S
Aspergersyndrome;
AutismSpectrumScreening
Questionnaire;factor
analysis;Norway;screening
at Universitetsbiblioteket i Bergen on March 6, 2015aut.sagepub.comDownloaded from

Introduction
Autism spectrum disorders (ASDs) are characterized by social and com-munication difficulties that are associated with repetitive behaviours andstereotypies. Early identification is important to avoid unnecessary suffer-ing for the children and families involved, and – possibly – to improveoutcome (Filipek et al., 1999). One of the major challenges for early inter-vention is that the clinical picture in autism is very heterogeneous, and that,in milder variants, it can take time to recognize the difficulties, even forexperienced clinicians. Asperger syndrome (AS) is often not recognizeduntil 11 years of age or later, even though most of these children havedifficulties long before that age (Howlin and Asgharian, 1999; Gillberg andCederlund, 2005). Screening programs have been suggested, and severalscreening instruments do exist, but few of these have been geared towardsscreening of individuals with high-functioning autism (HFA) or AS,probably due to the confusion over diagnostic criteria for these disorders,and the (historically) relatively short period that they have been recognizedas ‘separate’ disorders (Howlin, 2000). One of the major obstacles forscreening has been this lack of adequate screening instruments with soundpsychometric properties (Campbell, 2005).
Of the instruments specifically developed as screens for higher-functioning children with ASDs, only the Childhood Asperger SyndromeTest (CAST: Scott et al., 2002) and the Autism Spectrum Screening Ques-tionnaire (ASSQ) (Ehlers and Gillberg, 1993; Williams et al., 2005) havebeen used in mainstream primary schools. The CAST has reported verypromising results, with specificity (the capacity to yield a negative resultfor a person not having the target condition) of 97 percent and sensitivity(the capacity to yield a positive test result for a person with the targetcondition) of 100 percent when screening in mainstream schools, but theresponse rate was only 26 percent. Among participants, a random 5 percentof low-scoring children were invited for assessment, but no other methodfor case ascertainment among low scorers and non-responders was used,which may have resulted in an overestimate of sensitivity. Data on internalconsistency, interrater reliability, construct and content validity have not yetbeen published.
One major shortcoming of the CAST is that it is only intended forparents, as some items concern early development, and the CAST can there-fore not be used by teachers or other educational professionals.
The high-functioning Autism Spectrum Screening Questionnaire (ASSQ),previously known as the Asperger Syndrome and High-Functioning AutismScreening Questionnaire, was developed by Ehlers and Gillberg and hasbeen in extensive use in screening for autistic symptoms across northern
A U T I S M 12(1)
100
at Universitetsbiblioteket i Bergen on March 6, 2015aut.sagepub.comDownloaded from
Europe and the UK during the last decade (Bilenberg et al., 2005; Ehlerset al., 1999; Lesinskiene, 2002; Webb et al., 2003). It covers a wide rangeof symptoms predictive of a diagnosis within the autism spectrum. In theoriginal studies, logistic regression showed that some items were morepredictive of a diagnosis of Asperger syndrome (Ehlers, 1997), but theASSQ has not previously been subjected to factor analysis. The cutoff scoregenerally used with ASSQ is 19 for parents and 22 for teachers, correspond-ing to a specificity of 0.90 (parent and teacher reports) and a sensitivity of0.62 (parent reports) and 0.70 (teacher reports) in the original study of aclinical sample. When interpreting such values of sensitivity and specificity,it is important to take the rarity of ASD into account. When screening fora rare disorder in a total population, the low prevalence creates poor predic-tive value for the test, in spite of high sensitivity and specificity (Clark andHarrington, 1999; Haynes et al., 2006). If a test has specificity and sensi-tivity of 0.90 and the disorder it screens for has a prevalence of 1 percent,the positive predictive value of the test will be 8.3 percent, meaning that1 out of 12 screen positive will have the disorder screened for. If the preva-lence is 10 percent, the positive predictive value becomes 50 percent and1 out of 2 screen positive will have the disorder screened for. This meansthat when using any test in a non-referred sample, for example in a normalschool population, the predictive value of a test decreases dramaticallycompared to what is found when using the test in a sample of childrenreferred to a child mental health clinic (Haynes et al., 2006).
There have been no published data on the specificity and sensitivity ofthe ASSQ in a general population screen, but Ehlers recommended a lowercutoff of 13 for parent reports and 11 for teacher reports, correspondingto a sensitivity of 0.91 (parents) and 0.90 (teachers) for use in settingswhere one wants to minimize loss of potential cases (Ehlers et al., 1999).This lower cutoff yielded a high rate of false positives, the specificity beingonly 0.23 (parent reports) and 0.45 (teacher reports), with most of thefalse positives being children with clear social impairment but below cutofffor ASD or with another disorder, mainly ADHD and learning disabilities.ADHD is commonly associated with autistic features (Clark et al., 1999) andmost other psychiatric disorders in children also lead to some social impair-ment (Rutter and Taylor, 2002). Because ASD is a relatively rare condition,the ability to separate cases of ASD from far more frequent instances of socialimpairment due to other causes is of major importance for any screeninginstrument in the field.
The heterogeneous clinical picture which often comprises ASD warrantsa multi-factorial assessment, and the ASSQ contains items targeting differ-ent aspects of ASD. The purpose of this study was therefore to explore thefactorial structure of the ASSQ. Apart from more autism-specific items,
P O S S E R U D E T A L . : A S S Q F A C T O R A N A L Y S I S
101
at Universitetsbiblioteket i Bergen on March 6, 2015aut.sagepub.comDownloaded from
several items of the ASSQ refer to social difficulties that may occur in thecontext of ‘non-autism’ psychiatric disorders, and some items concern ticsand motor difficulties. We therefore hypothesized that the ASSQ containsboth a more ‘autism-specific’ factor and one or several non-specific factors.The existence of such factors would suggest that the efficacy of the ASSQas a screening instrument could be improved by going beyond the use ofa flat cutoff for the ASSQ sum score. To provide content validity of thefactors obtained, we examined the intercorrelations between the separatefactors of the ASSQ and the Strengths and Difficulties Questionnaire (SDQ:Goodman et al., 2001), which yields scores on four mental health problemareas (emotional problems, conduct problems, hyperactivity, peer problems)and a separate subscale on prosocial skills. If the social difficulties items onthe ASSQ are inherent in all mental health problems, one would expect highintercorrelations with all problem areas covered by the SDQ, while itemsloading on more unique symptoms would correlate less with these sub-scale scores. The factor structure of the ASSQ was evaluated in a populationof Norwegian children. A population setting was selected because the ASSQwas originally developed as a screening measure rather than a clinicalinstrument to confirm the diagnosis of an ASD.
Material and methods
SampleThe present study used data from the screening phase of the Bergen ChildStudy (BCS). The BCS is a longitudinal follow-up study of 9430 Norwegianschool children who attended second to fourth grades (average age ofchildren 8 years) in public, private and special schools in Bergen at thestart of the study (October 2002). The study is described in more detailin an earlier study (Posserud et al., 2006), but a brief description will berepeated here.
The BCS screening questionnaire consisted of the ASSQ, the Strengthsand Difficulties Questionnaire (SDQ) (Goodman, 1997), and the DSM-IVcriteria for ADHD and ODD. These portions of the BCS questionnaire wereidentical for parents and teachers. The questionnaire also included addi-tional key questions relating to learning problems, obsessive compulsivedisorder (OCD), tics, eating and sleeping habits (parent questionnaire only),selective mutism (teacher questionnaire only), hypoactivity (teacher ques-tionnaire only), physical health problems and items relating to use of healthand educational services. Parents of all children received written informationabout the study, and were asked to complete the BCS questionnaire and givetheir consent for further participation in the study. Teachers completed
A U T I S M 12(1)
102
at Universitetsbiblioteket i Bergen on March 6, 2015aut.sagepub.comDownloaded from

questionnaires for all children, but the identity was disclosed to theresearchers only for those children whose parents had provided informedconsent. The response rate was 97.2 percent (N = 9155) for teachers and74.3 percent (N = 7007) for parents. The analyses in this paper were doneon the sample of N = 6229, which constituted all the identified childrenwho had had both a parent and a teacher ASSQ completed for them.
The ASSQ is a questionnaire designed to identify school age childrenwho may need a more comprehensive evaluation because of suspected ASD.Identical versions of the ASSQ exist for parents and teachers. The instru-ment consists of 27 items on a three-point scale; ‘not true’ (0), ‘sometimestrue’ (1) and ‘certainly true’ (2). The items cover social interaction, verbaland non-verbal communication, restricted and repetitive behaviours andmotor clumsiness. The questionnaire was designed for completion by layinformants in school and home settings. The range of possible scores is0–54. The ASSQ has been proven a reliable and valid instrument for screen-ing high-functioning individuals with ASD in a clinical setting. Test–reteststability (over a 2 week period) was 0.94 (teachers) and 0.96 (parents).Parent–teacher correlation was r = 0.66 in the clinical setting (Ehlers et al.,1999) and agreement measured by weighted kappa was 0.40 in a generalpopulation setting (Posserud et al., 2006). Descriptive data from the ASSQin the BCS have been published elsewhere (Posserud et al., 2006). TheASSQ is available in the publications by Ehlers and Gillberg (1993) andEhlers et al. (1999).
The SDQ is a brief behavioural parent/teacher screening questionnairefor children aged 4–16 years. It consists of 25 attributes (both positive andnegative) that are scored on a three-point scale (same as the ASSQ). Theattributes are divided across five subscales, each containing five items:conduct problems, inattention-hyperactivity, emotional problems, peerproblems and prosocial behaviour (Goodman and Scott, 1999). All sub-scales except prosocial behaviour are summed to generate a total difficultiesscore. The SDQ is a reliable and valid instrument for screening for psychi-atric disorders in children. Factor analysis has confirmed the five-subscalestructure, and the total difficulties score had an internal consistency of 0.87for the teacher and 0.82 for the parent version. The mean retest stability(over a 4 to 6 month period) was 0.62. Parent–teacher agreement on thepeer problems subscale was 0.37 (Goodman, 2001). The SDQ is availableat the internet site www.sdqinfo.com.
External validity of factorsThe ASSQ factors were correlated with the SDQ subscales to provide externalinformation on the content validity of the factors.
P O S S E R U D E T A L . : A S S Q F A C T O R A N A L Y S I S
103
at Universitetsbiblioteket i Bergen on March 6, 2015aut.sagepub.comDownloaded from

Statistical analysisThe results of exploratory factor analysis are highly dependent on methodand interpretation. The material was analysed by way of several differentmethods in order to look for a stable solution. The data were first analysedwith both principal component analysis (PCA) and a factor analysis method,referred to as principal factor analysis (PFA). PCA is often used for factoranalysis, but differs from other types of factor analysis in that it analysesall variance. In most types of factor analysis only shared variance isanalysed. Unique item variance and error variance are excluded prior tofactor extraction (Lawley and Maxwell, 1971; Tabachnik and Fidell, 2007).Different extraction methods use different methodologies to estimate theunique and error variance part of the total variance. It has been shown thatthe loading onto factors is lower in most forms of factor analysis ascompared with PCA (Fabrigar et al., 1999). A lower threshold was there-fore chosen to accept items into a factor when performing PFA.
PCA makes no assumptions about the structure of the data and wastherefore the method of choice in our study, but PFA was used for compari-son. Only items loading 0.4 or higher were accepted into the componentsolution when using PCA. When using PFA, item loading had to be 0.3 orhigher for acceptance of the item into the factor solution. Every factorsolution was rotated with both promax and varimax rotation so as toobtain a clearer pattern of the factor loadings, and easier interpretation ofthe factors. Promax is an oblique rotational method that does not requirefactors to be uncorrelated (Hendrickson and White, 1964). Varimaxrotation is the most commonly used method but is an orthogonal rotationmethod that assumes uncorrelated factors and may yield less clear solu-tions in situations where there are highly correlated factors (Kaiser, 1958;University of Texas, 1995).
An eigenvalue exceeding 1 was the initial criterion for extraction offactors, but in order to decide on the optimal number of factors for thefinal solution, we also looked at scree plots. In a scree plot, factors areexcluded if there is a point on the curve with a sharp bend, indicating thatthe next and subsequent factors explain little of the common variance, evenwhen the eigenvalue exceeds 1 (Tabachnik and Fidell, 2007). All analyseswere performed using the SPSS package 13.0.
Results
Internal consistencyThe internal consistency for the entire ASSQ was good, with Cronbach’salpha of 0.89 for teachers and 0.86 for parents.
A U T I S M 12(1)
104
at Universitetsbiblioteket i Bergen on March 6, 2015aut.sagepub.comDownloaded from

Adequacy of factor analysisThe Kaiser–Meyer–Olkin measure for sampling adequacy for the ASSQ was0.92 for both parents and teachers, indicating a structure of data suitablefor factor analysis. The skewness of the variables included were median3.74 (range 0.81–12.38) for parents and 5.20 (range 2.18–14.08) forteachers.
Extraction methodPCA and PFA yielded very similar solutions. Eigenvalues indicated that upto six factors could be extracted on the parent questionnaire, and amaximum of five factors had eigenvalues exceeding 1 on the teacher ASSQ.Scree plots for both parent and teacher ASSQ had two bending points, oneat two factors and one at four factors, indicating a solution of either oneor three factors for both informants. The PCA factor scores plotted againstPAF factors showed convergence in three factors, and both methods yieldedidentical solutions in the three-factor model. There was also convergenceacross informants in the three-factor model, but when choosing four orfive factors, parents and teachers had somewhat different interpretations.The three-factor model was supported by scree plots and eigenvalues, andwas the most stable solution across methods and informants. Therefore itwas chosen as the final solution. The factor solutions were rotated withboth varimax and promax. We found only minor differences across varimaxand promax. In the three-factor model, varimax rotation gave the clearestpattern of factor loadings, and was chosen for interpretation of the factorstructure. The variances explained by each factor down to six factors areshown in Table 1.
The three-factor solution explained 36 percent of the variance forparents and 41 percent of the variance for teachers. The factor loadings ofindividual items are shown in Table 2 (varimax rotation). Items 8 (‘has adifferent voice or speech’) and 24 (‘shows idiosyncratic attachment toobjects’) obtained loadings below the threshold and were not included inany factor. As can be learned from Table 2, parents and teachers differed on
P O S S E R U D E T A L . : A S S Q F A C T O R A N A L Y S I S
105
Table 1 Percentage variance explained down to six factors
Teacher ASSQ Parent ASSQ
Factor 1 27.9 24.2Factor 2 6.9 6.3Factor 3 6.2 5.9Factor 4 4.7 4.1Factor 5 4.0 3.8Factor 6 3.6 3.7
at Universitetsbiblioteket i Bergen on March 6, 2015aut.sagepub.comDownloaded from
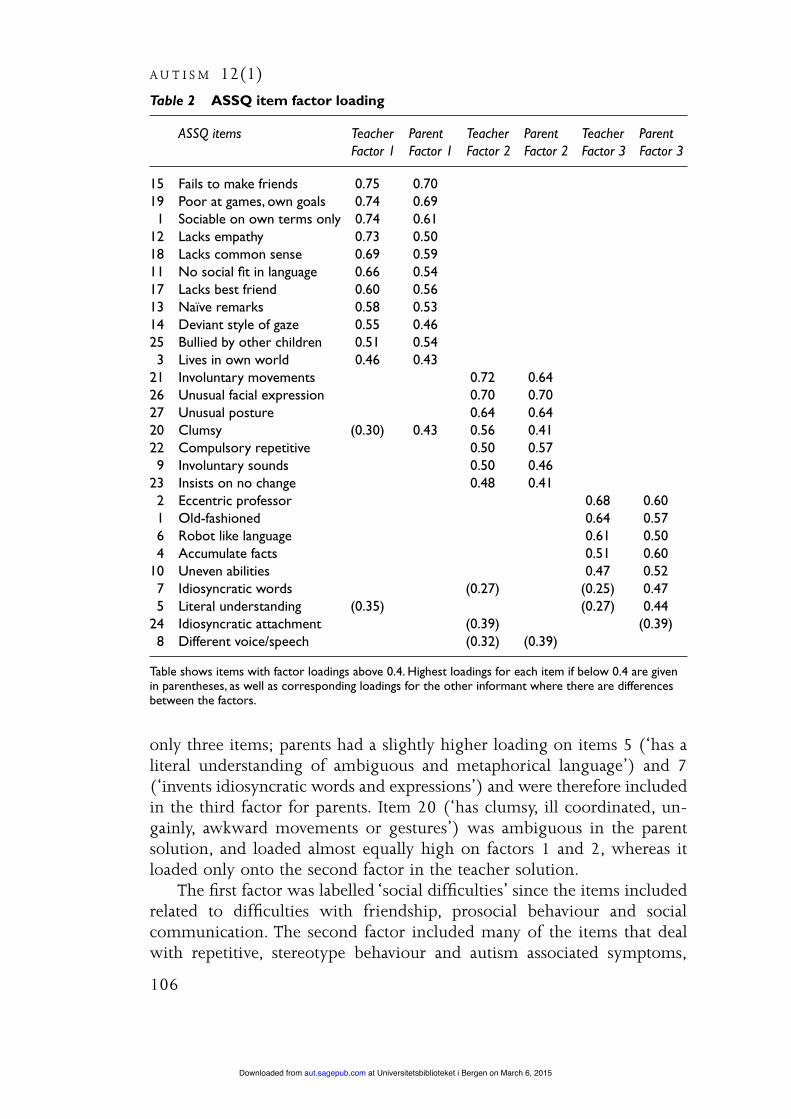
only three items; parents had a slightly higher loading on items 5 (‘has aliteral understanding of ambiguous and metaphorical language’) and 7(‘invents idiosyncratic words and expressions’) and were therefore includedin the third factor for parents. Item 20 (‘has clumsy, ill coordinated, un-gainly, awkward movements or gestures’) was ambiguous in the parentsolution, and loaded almost equally high on factors 1 and 2, whereas itloaded only onto the second factor in the teacher solution.
The first factor was labelled ‘social difficulties’ since the items includedrelated to difficulties with friendship, prosocial behaviour and socialcommunication. The second factor included many of the items that dealwith repetitive, stereotype behaviour and autism associated symptoms,
A U T I S M 12(1)
106
Table 2 ASSQ item factor loading
ASSQ items Teacher Parent Teacher Parent Teacher ParentFactor 1 Factor 1 Factor 2 Factor 2 Factor 3 Factor 3
15 Fails to make friends 0.75 0.7019 Poor at games, own goals 0.74 0.691 Sociable on own terms only 0.74 0.61
12 Lacks empathy 0.73 0.5018 Lacks common sense 0.69 0.5911 No social fit in language 0.66 0.5417 Lacks best friend 0.60 0.5613 Naïve remarks 0.58 0.5314 Deviant style of gaze 0.55 0.4625 Bullied by other children 0.51 0.543 Lives in own world 0.46 0.43
21 Involuntary movements 0.72 0.6426 Unusual facial expression 0.70 0.7027 Unusual posture 0.64 0.6420 Clumsy (0.30) 0.43 0.56 0.4122 Compulsory repetitive 0.50 0.579 Involuntary sounds 0.50 0.46
23 Insists on no change 0.48 0.412 Eccentric professor 0.68 0.601 Old-fashioned 0.64 0.576 Robot like language 0.61 0.504 Accumulate facts 0.51 0.60
10 Uneven abilities 0.47 0.527 Idiosyncratic words (0.27) (0.25) 0.475 Literal understanding (0.35) (0.27) 0.44
24 Idiosyncratic attachment (0.39) (0.39)8 Different voice/speech (0.32) (0.39)
Table shows items with factor loadings above 0.4. Highest loadings for each item if below 0.4 are givenin parentheses, as well as corresponding loadings for the other informant where there are differencesbetween the factors.
at Universitetsbiblioteket i Bergen on March 6, 2015aut.sagepub.comDownloaded from

such as motor difficulties and tics, and was called ‘tics/motor/OCD’ (inthe six-factor model this factor effectively split up into these three parts).The third factor was labelled ‘autistic style’ because several of the itemsincluded appear to denote a kind of social-cognitive style and languagecharacteristics often seen in high-functioning individuals with autism andAS. The item loading highest for both parents and teachers within thethird factor was ‘regarded as an “eccentric professor” by other children’.This factor split up into two parts in the six-factor model, where theprofessor item and ‘old-fashioned or precocious’ formed a separate factor.
Table 3 shows the correlations between the ASSQ factors and the SDQsubscales (using summated scores). The factor labelled ‘social difficulties’yielded a high correlation with the SDQ peer problems score in both teacherand parent reports. The correlations with the SDQ prosocial score werenegative because the SDQ prosocial score is a strengths scale, whereas theASSQ items are scored as difficulties. The total ASSQ score correlated highestwith the SDQ peer problems subscale, with 0.67 for teachers and 6.0 forparents (p < 0.001). Correlations with all other SDQ subscales were weakto intermediate. The highest correlation for both the second and the thirdASSQ factor was with the peer problems subscale on both parent andteacher reports. All correlations were statistically significant at p < 0.001,except between SDQ prosocial and the third factor in the parent reportswhere r was –0.06 (p < 0.01). This correlation was not considered clini-cally significant, but is statistically significant due to the large sample.
P O S S E R U D E T A L . : A S S Q F A C T O R A N A L Y S I S
107
Table 3 Cronbach’s alpha for ASSQ factors and correlation with SDQ subscales
Teacher factors Parent factors
Social Motor/ Autistic Social Motor/ Autistic difficulties tics/OCD style difficulties tics/OCD style
Cronbach’s alpha 0.88 0.73 0.55 0.83 0.63 0.63
Pearson correlationSDQ peer 0.71 0.39 0.30 0.66 0.31 0.35SDQ prosocial –0.51 –0.24 –0.13 –0.31 –0.14 –0.06*SDQ emotional 0.46 0.33 0.21 0.44 0.26 0.30SDQ hyperactivity 0.54 0.33 0.11 0.48 0.26 0.23SDQ conduct 0.63 0.29 0.16 0.50 0.25 0.27
* p < 0.01; for all other values, p < 0.001.
at Universitetsbiblioteket i Bergen on March 6, 2015aut.sagepub.comDownloaded from
Discussion
Summary of findingsThe present study showed that the internal consistency of the ASSQ itemswas good, with Cronbach alpha values of 0.89 (teacher reports) and 0.86(parent reports). The factor analysis of the ASSQ revealed a highly stablethree-factor structure for both parents and teachers, supporting the goodcross-informant reliability found previously (Ehlers et al., 1999). Thefactors were named ‘social difficulties’, ‘tics/motor/OCD’ and ‘autistic style’based on the item loading on each factor. The validity of the factors wasfurther established through correlation with the SDQ subscales. As expected,both the total ASSQ score and the ‘social difficulties’ factor were found tobe highly correlated to the SDQ peer problems subscale. The ‘tics/motor/OCD’ factor and the ‘autistic style’ both correlated highest with the peerproblems subscale, but the correlations were only in the intermediaterange. Item 20 (clumsy movements) had an ambiguous loading in theparent solution. In the age group studied, many social activities focus onphysical games, which could explain why this item loads onto ‘social diffi-culties’ as well as onto ‘tics/motor/OCD’.
ImplicationsThe ASSQ is a widely used screening instrument for AS and HFA withestablished good validity and reliability, but no measure of internal consist-ency has been reported previously (Campbell, 2005). We found goodinternal consistency and consistent results across informants, supportingthe previous findings of ASSQ as a useful screening instrument for ASD inhigher-functioning individuals.
We calculated Cronbach’s alpha for the three ASSQ factors as well. Thevalues for factors 2 and 3 were lower than those recommended for scales,but they were not improved by deleting any of the factor items. The ratherlow value of alpha may indicate that the factors are not unidimensional, aswe also found a possible six-factor solution where factors 2 and 3 breakup into three and two factors respectively. In addition, Cronbach’s alpha ishighly dependent upon the distribution of data and the number of itemsincluded in a scale. It will always increase with more items included (giventhat they are related), and the skewness of our variables will also lower thealpha value (Pedhazur and Schmelkin, 1991). A low Cronbach’s alphashould therefore not be taken as the only reason to reject a scale. Severalof the subscales with five items from the SDQ have similar Cronbach’s alphavalues and yet have been used widely with good results (Goodman, 2001).
The factor structure reveals that most items of the ASSQ target socialdifficulties. The second factor contains many of the items labelled ‘motor’
A U T I S M 12(1)
108
at Universitetsbiblioteket i Bergen on March 6, 2015aut.sagepub.comDownloaded from

and ‘associated symptoms’ in the original publication by Ehlers, whereasthe third factor includes items that seem to describe many cognitive charac-teristics typical of high-functioning children with ASD. This factor couldrepresent a set of items that are more specific for children with autismspectrum disorders as opposed to children with social difficulties for otherreasons, and might be used to further enhance the screening efficacy of theASSQ. This is also reflected in relation to the SDQ, since the strongest corre-lations were obtained between the social difficulties factor and the peerproblem factor of the SDQ, while the factor with items more specific ofASD correlated less with the peer problem subscale of the SDQ, eventhough this correlation – due to the large sample size – was also statisti-cally significant. Although social difficulties are the sine qua non symptom ofautism, they are not pathognomonic of autism, and autism is also adisorder with many additional facets. Most screening instruments containitems targeting several different aspects of ASD, but use a flat cutoff whenscreening. This is a simple and straightforward method, but carries the riskof losing important information that could help distinguish children withASD from children with other neuropsychiatric disorders, mental retarda-tion and social difficulties due to other disorders.
The factor structure found in our study indicates that the informationin the ASSQ could be used more differentially and suggests that combiningthe flat cutoff with a closer examination of the response profile of screenpositives could be a useful strategy to improve the positive predictive valueof the instrument when screening larger populations, by requiring highscorers to score a minimum on the items included in the ‘autistic style’factor before considering further assessment.
LimitationsAlthough multivariate normal distribution is assumed when performingPCA and PFA, the ASSQ data were not normally distributed but rather areskewed. The amount of variance explained by the model was not very high,as expected when examining a rare phenomenon in a general population.Results should therefore be interpreted cautiously. However, the largenumbers and the consistent results across methods are reassuring.
The analysis was performed in a large general population of children,and the findings must not be interpreted as an analysis of dimensionswithin autism. The results should not be compared with results of factoranalysis obtained in clinical populations with autism (Miranda-Linne andMelin, 2002; Stella et al., 1999; Szatmari et al., 2002; Tadevosyan-Leyferet al., 2003).
Finally, exploratory factor analysis is a useful technique when trying toreduce the number of variables in a large set, but in the process, judgements
P O S S E R U D E T A L . : A S S Q F A C T O R A N A L Y S I S
109
at Universitetsbiblioteket i Bergen on March 6, 2015aut.sagepub.comDownloaded from
about interpretability are made whenever there are no definitive criteria.Different analysis methods were used to minimize the effects of such bias.
ConclusionWe have found that the ASSQ has good internal consistency and that thereare three main factors within the ASSQ, the largest one measuring ‘socialdifficulties’. The results were consistent across parents and teachers,supporting previous findings of good interrater reliability of the instru-ment. The finding of three factors – one of which seemed to be indicativeof a more specific ‘autistic style’ – suggests that the screening properties ofthe ASSQ could be further enhanced by examining the response profile inaddition to the use of a flat cutoff. This hypothesis should be explored infurther studies on clinical samples.
AcknowledgementsWe thank Stein Atle Lie, Kerstin J. Plessen and Jim Stevenson for valuablecomments and important discussions. The study was supported by theCentre for Child and Adolescent Mental Health at the University of Bergen.
ReferencesB I L E N B E R G, N. , P E T E R S E N, D. J. , H O E R D E R , K . & G I L L B E R G, C. (2005) ‘The
Prevalence of Child-Psychiatric Disorders among 8–9-year-old Children in DanishMainstream Schools’, Acta Psychiatrica Scandinavica 111 (1): 59–67.
C A M P B E L L , J.M . (2005) ‘Diagnostic Assessment of Asperger’s Disorder: A Review ofFive Third-Party Rating Scales’, Journal of Autism and Developmental Disorders 35 (1): 25–35.
C L A R K, A . & H A R R I N G TO N, R . (1999) ‘On Diagnosing Rare Disorders Rarely:Appropriate Use of Screening Instruments’, Journal of Child Psychology and Psychiatry40 (2): 287–90.
C L A R K, T. , F E E H A N, C. , T I N L I N E , C. & VO S TA N I S , P. (1999) ‘Autistic Symptoms inChildren with Attention Deficit-Hyperactivity Disorder’, European Child and AdolescentPsychiatry 8 (1): 50–5.
E H L E R S , S . (1997) ‘Asperger Syndrome: Epidemiological, Cognitive, Language andNeurobiological Aspect’. Department of Child and Adolescent Psychiatry, GöteborgUniversity.
E H L E R S , S . & G I L L B E R G, C. (1993) ‘The Epidemiology of Asperger Syndrome: ATotal Population Study’, Journal of Child Psychology and Psychiatry 34 (8): 1327–50.
E H L E R S , S . , G I L L B E R G, C. & W I N G, L . (1999) ‘A Screening Questionnaire forAsperger Syndrome and Other High-Functioning Autism Spectrum Disorders inSchool Age Children’, Journal of Autism and Developmental Disorders 29 (2): 129–41.
FA B R I G A R, L . -R . , W E G E N E R , D. -T. , M AC C A L L U M, R . -C. & S T R A H A N, E . - J.(1999) ‘Evaluating the Use of Exploratory Factor Analysis in PsychologicalResearch’, Psychological Methods 4 (3): 272–99.
F I L I P E K , P.A . , AC C A R D O, P. J. , B A R A N E K, G.T. , C O O K, E .H . J R , DAW S O N, G. ,G O R D O N, B. , E T A L . (1999) ‘The Screening and Diagnosis of Autistic SpectrumDisorders’, Journal of Autism and Developmental Disorders 29 (6): 439–84.
A U T I S M 12(1)
110
at Universitetsbiblioteket i Bergen on March 6, 2015aut.sagepub.comDownloaded from
G I L L B E R G, G. & C E D E R L U N D, C. (2005) ‘Asperger Syndrome: Familiar and Pre- andPerinatal Factors’, Journal of Autism and Developmental Disorders 35 (2):159–66.
G O O D M A N, R . (1997) ‘The Strengths and Difficulties Questionnaire: A ResearchNote’, Journal of Child Psychology and Psychiatry 38 (5): 581–6.
G O O D M A N, R . (2001) ‘Psychometric Properties of the Strengths and DifficultiesQuestionnaire’, Journal of the American Academy for Child and Adolescent Psychiatry 40:1337–45.
G O O D M A N, R . & S C OT T, S . (1999) ‘Comparing the Strengths and DifficultiesQuestionnaire and the Child Behavior Checklist: Is Small Beautiful?’, Journal ofAbnormal Child Psychology 27: 17–24.
H AY N E S , R .B. , S AC K E T T, D. L . , G U YAT T, G.H . & T U G W E L L , P. (2006) ClinicalEpidemiology: How to Do Clinical Practice Research, 3rd edn. Philadelphia: LippincottWilliams & Wilkins.
H E N D R I C K S O N, A . E . & W H I T E , P.O. (1964) ‘Promax: A Quick Method for Rotationto Oblique Simple Structure’, The British Journal of Statistical Psychology 17 (1): 65–70.
H OW L I N, P. (2000) ‘Assessment Instruments for Asperger Syndrome’, Child Psychologyand Psychiatry Review 5 (3): 120–9.
H OW L I N, P. & A S G H A R I A N, A . (1999) ‘The Diagnosis of Autism and AspergerSyndrome: Findings from a Survey of 770 Families’, Developmental Medicine and ChildNeurology 41 (12): 834–9.
K A I S E R , H . F. (1958) ‘The Varimax Criterion for Analytic Rotation in Factor Analysis’,Psychometrika 23 (3): 187–200.
L AW L E Y, D.N. & M A X W E L L , A . E . (1971) Factor Analysis as a Statistical Method, 2nd edn.London: Butterworth.
L E S I N S K I E N E , S . (2002) ‘Children with Asperger Syndrome: Specific Aspects of TheirDrawings’, International Journal of Circumpolar Health, 61 supp. (2): 90–6.
M I R A N DA-L I N N E , F.M. & M E L I N, L . (2002) ‘A Factor Analytic Study of the AutismBehavior Checklist’, Journal of Autism and Developmental Disorders 32 (3): 181–8.
P E D H A Z U R, E . J. & S C H M E L K I N, L . P. (1991) Reliability in Measurement, Design and Analysis:An Integrated Approach, 1st edn, vol. 1, pp. 81–117. Hillsdale: Erlbaum.
P O S S E RU D, M.B. , L U N D E RVO L D, A . J. & G I L L B E R G, C. (2006) ‘Autistic Features in aTotal Population of 7–9-year-old Children Assessed by the ASSQ (Autism SpectrumScreening Questionnaire)’, Journal of Child Psychology and Psychiatry 47 (2): 167–75.
RU T T E R , M. & TAY L O R, E . (eds) (2002) Child and Adolescent Psychiatry, 4th edn. Bath:Blackwell Science.
S C OT T, F. J. , B A RO N C O H E N, S . , B O LTO N, P. & B R AY N E , C. (2002) ‘The CAST(Childhood Asperger Syndrome Test): Preliminary Development of a UK Screen forMainstream Primary-School-Age Children’, Autism 6 (1): 9–31.
S T E L L A , J. , M U N DY, P. & T U C H M A N, R . (1999) ‘Social and Nonsocial Factors in theChildhood Autism Rating Scale’, Journal of Autism and Developmental Disorders 29 (4):307–17.
S Z AT M A R I , P. , M E R E T T E , C. , B RYS O N, S . E . , T H I V I E R G E , J. , ROY, M.A . , C AY E R , M.E T A L . (2002) ‘Quantifying Dimensions in Autism: A Factor-Analytic Study’, Journalof the American Academy for Child and Adolescent Psychiatry 41 (4): 467–74.
TA B AC H N I K , B.G. & F I D E L L , L . S . (2007) ‘Principal Components and Factor Analysis’,in Using Multivariate Statistics, 5th international edn. New York: Allyn and Bacon.
TA D E VO S YA N-L E Y F E R , O. , D OW D, M. , M A N KO S K I , R . , W I N K L O S K Y, B. ,P U T NA M, S . , M C G R AT H, L . , E T A L . (2003) ‘A Principal Components Analysis ofthe Autism Diagnostic Interview–Revised’, Journal of the American Academy for Child andAdolescent Psychiatry 42 (7): 864–72.
P O S S E R U D E T A L . : A S S Q F A C T O R A N A L Y S I S
111
at Universitetsbiblioteket i Bergen on March 6, 2015aut.sagepub.comDownloaded from

U N I V E R S I T Y O F T E X A S (1995) ‘Factor Analysis Using SAS PROC FACTOR’.http://www.utexas.edu/cc/docs/stat53.html.
W E B B , E . , M O R E Y, J. , T H O M P S O N, W. , B U T L E R , C. , B A R B O R, M. & F R A S E R , W. I .(2003) ‘Prevalence of Autistic Spectrum Disorder in Children AttendingMainstream Schools in a Welsh Education Authority’, Developmental Medicine and ChildNeurology 45 (6): 377–84.
W I L L I A M S , J. , S C OT T, F. , S TOT T, C. , A L L I S O N, C. , B O LTO N, P. ,B A RO N-C O H E N, S . , E T A L . (2005) ‘The CAST (Childhood Asperger SyndromeTest): Test Accuracy’, Autism 9 (1): 45–68.
A U T I S M 12(1)
112
at Universitetsbiblioteket i Bergen on March 6, 2015aut.sagepub.comDownloaded from


