Embed Size (px)
Citation preview
EXTERNAL QUALITY REVIEW ANNUAL REPORT State Fiscal Years 2016-2017 (July 1, 2015-June 30, 2017)
Illinois Department of Healthcare and Family Services Division of Medical Programs
Contents
Page | i
Summary of Contents
1 Executive Summary Overview ............................................................................................................................... 1-1 Performance Snapshot ......................................................................................................... 1-4 Recommendations for Improvement .................................................................................. 1-6
2 Performance Measures Overview ............................................................................................................................... 2-1 Summary of Performance ................................................................................................... 2-6 Improvement Initiatives and Follow-Up on Prior Recommendations ............................. 2-54
3 Satisfaction with Care Overview ............................................................................................................................... 3-1 Summary of Performance ................................................................................................... 3-4 Overall Findings and Conclusions .................................................................................... 3-13
4 Performance Improvement Projects Overview ............................................................................................................................... 4-1 Summary of Performance ................................................................................................... 4-2 Recommendations .............................................................................................................. 4-27
5 Structure and Operations Compliance and Readiness Reviews ................................................................................... 5-3 Centers for Medicare & Medicaid Services (CMS) Home- and Community-Based Services (HCBS) Waiver Performance Measures Record Reviews .............................. 5-15 Provider Network Capacity Reviews ............................................................................... 5-25 Care Coordination/Care Management ............................................................................ 5-28 Monthly and Quarterly Managed Care Meetings .......................................................... 5-31 Technical Assistance (TA) to HFS and Health Plans ...................................................... 5-32
6 Appendices A1—Summary of Performance Measure Results A2—Executive Summary Appendix B, C, D, E, F—Performance Measure Methodology and Results G—Satisfaction Survey Methodology and Results H—Performance Improvement Projects Methodology and Results I—Structure and Operations
Page | 1-1
1. Executive Summary
Overview Since June 2002, Health Services Advisory Group, Inc. (HSAG), has served as the external quality review organization (EQRO) for the Illinois Department of Healthcare and Family Services (HFS). As required by the Code of Federal Regulations (CFR) at Title 42, Section (§)438.364, HFS contracted with HSAG to prepare an annual, independent technical report that provides a description of how the data from all activities conducted in accordance with §438.358 were aggregated and analyzed, and conclusions were drawn as to the quality and timeliness of, and access to the care furnished by the Medicaid managed care health plans (health plans). The CFR requires that states contract with an EQRO to conduct an annual evaluation of health plans that serve Medicaid beneficiaries to determine each health plan’s compliance with federal quality assessment and performance improvement (QAPI) standards.
Executive Summary
Page | 1-2
Purpose of This Report The Centers for Medicare & Medicaid Services (CMS) regulates requirements and procedures for the EQRO. This state fiscal year (SFY) 2016 –SFY 2017 EQR Technical Report focuses on federally mandated EQR activities that HSAG performed over a 24-month period (July 1, 2015, to June 30, 2017). See the federal requirements for this report in Appendix A2.
Scope of Report Mandatory activities included:
• Validation of performance measures (in accordance with §438.358(b)(2)).
• Compliance monitoring (as set forth in 42 CFR 438.358).
• Validation of performance improvement projects (PIPs) (for compliance with requirements set forth in 42 CFR 438.330[b][1]).
Administration of quality of care consumer surveys (or CAHPS®)1-1 is one of the optional EQR activities described at 42 CFR §438.358(c)(2). Additional optional EQR activities are described in Appendix A2.
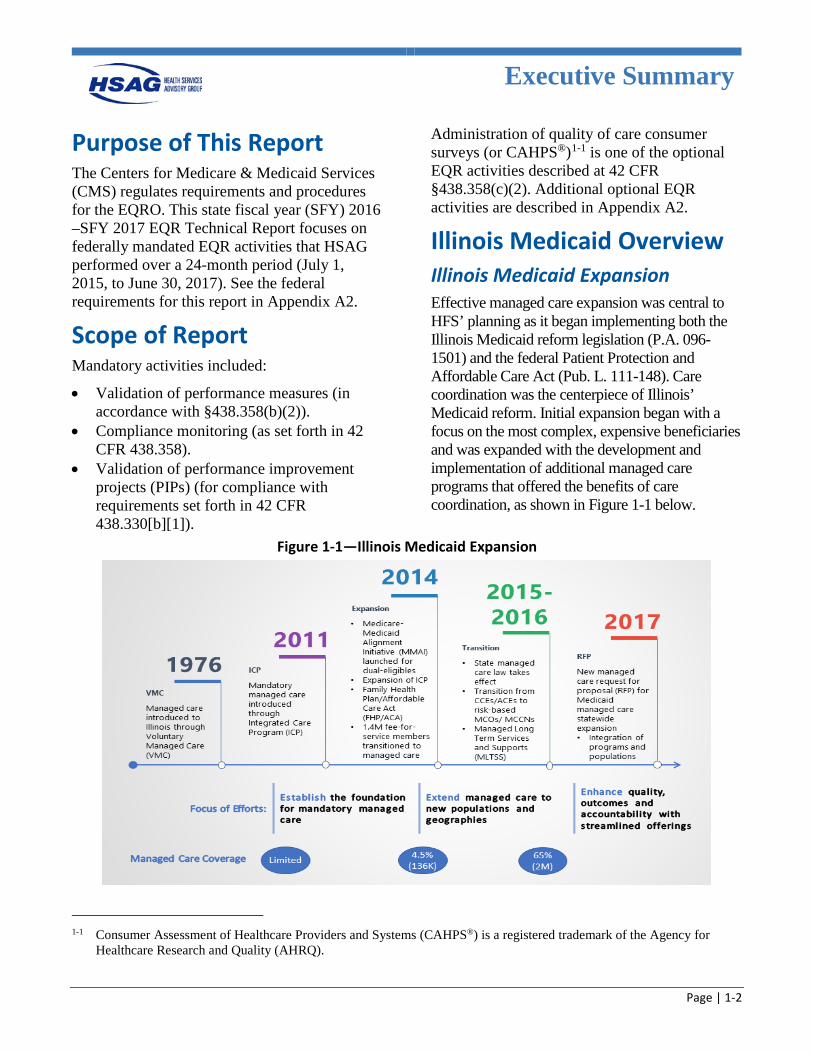
Illinois Medicaid Overview Illinois Medicaid Expansion Effective managed care expansion was central to HFS’ planning as it began implementing both the Illinois Medicaid reform legislation (P.A. 096-1501) and the federal Patient Protection and Affordable Care Act (Pub. L. 111-148). Care coordination was the centerpiece of Illinois’ Medicaid reform. Initial expansion began with a focus on the most complex, expensive beneficiaries and was expanded with the development and implementation of additional managed care programs that offered the benefits of care coordination, as shown in Figure 1-1 below.
Figure 1-1—Illinois Medicaid Expansion
1-1 Consumer Assessment of Healthcare Providers and Systems (CAHPS®) is a registered trademark of the Agency for
Healthcare Research and Quality (AHRQ).
Executive Summary
Page | 1-3
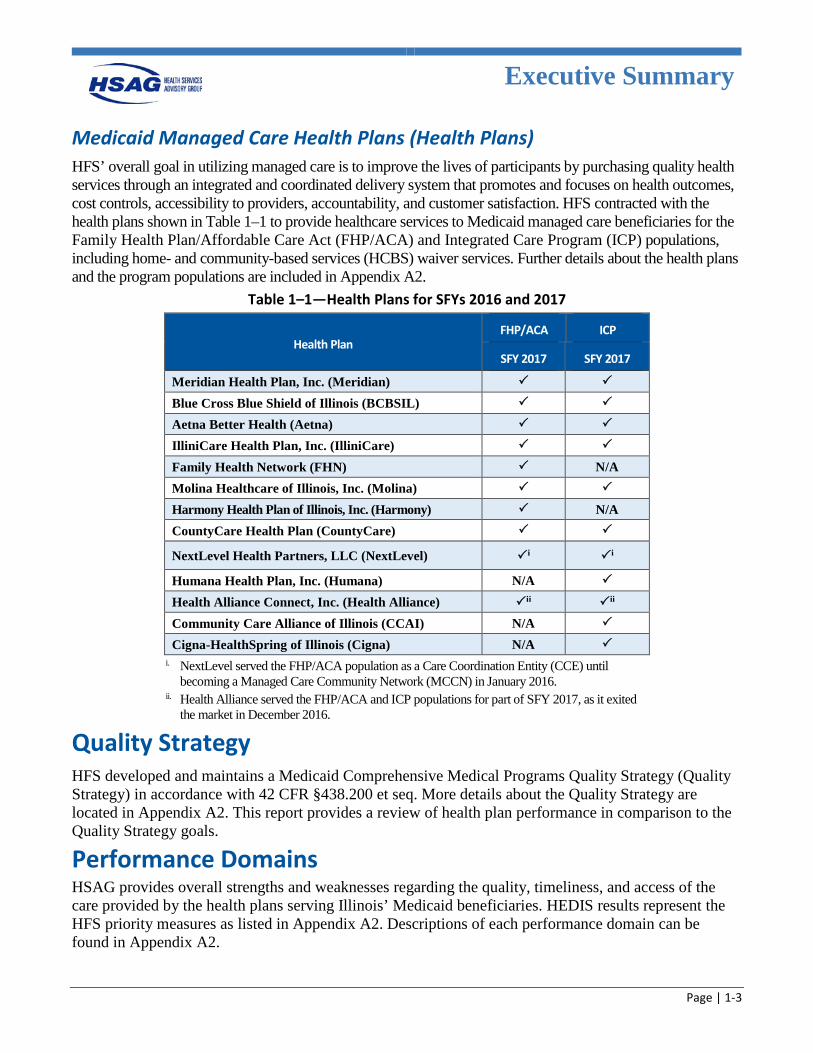
Medicaid Managed Care Health Plans (Health Plans) HFS’ overall goal in utilizing managed care is to improve the lives of participants by purchasing quality health services through an integrated and coordinated delivery system that promotes and focuses on health outcomes, cost controls, accessibility to providers, accountability, and customer satisfaction. HFS contracted with the health plans shown in Table 1–1 to provide healthcare services to Medicaid managed care beneficiaries for the Family Health Plan/Affordable Care Act (FHP/ACA) and Integrated Care Program (ICP) populations, including home- and community-based services (HCBS) waiver services. Further details about the health plans and the program populations are included in Appendix A2.
Table 1–1—Health Plans for SFYs 2016 and 2017
Health Plan FHP/ACA ICP
SFY 2017 SFY 2017
Meridian Health Plan, Inc. (Meridian)
Blue Cross Blue Shield of Illinois (BCBSIL)
Aetna Better Health (Aetna) IlliniCare Health Plan, Inc. (IlliniCare)
Family Health Network (FHN) N/A Molina Healthcare of Illinois, Inc. (Molina) Harmony Health Plan of Illinois, Inc. (Harmony) N/A CountyCare Health Plan (CountyCare)
NextLevel Health Partners, LLC (NextLevel) i i
Humana Health Plan, Inc. (Humana) N/A
Health Alliance Connect, Inc. (Health Alliance) ii ii Community Care Alliance of Illinois (CCAI) N/A
Cigna-HealthSpring of Illinois (Cigna) N/A i. NextLevel served the FHP/ACA population as a Care Coordination Entity (CCE) until
becoming a Managed Care Community Network (MCCN) in January 2016. ii. Health Alliance served the FHP/ACA and ICP populations for part of SFY 2017, as it exited
the market in December 2016.
Quality Strategy
HFS developed and maintains a Medicaid Comprehensive Medical Programs Quality Strategy (Quality Strategy) in accordance with 42 CFR §438.200 et seq. More details about the Quality Strategy are located in Appendix A2. This report provides a review of health plan performance in comparison to the Quality Strategy goals.
Performance Domains HSAG provides overall strengths and weaknesses regarding the quality, timeliness, and access of the care provided by the health plans serving Illinois’ Medicaid beneficiaries. HEDIS results represent the HFS priority measures as listed in Appendix A2. Descriptions of each performance domain can be found in Appendix A2.
Executive Summary
Page | 1-4
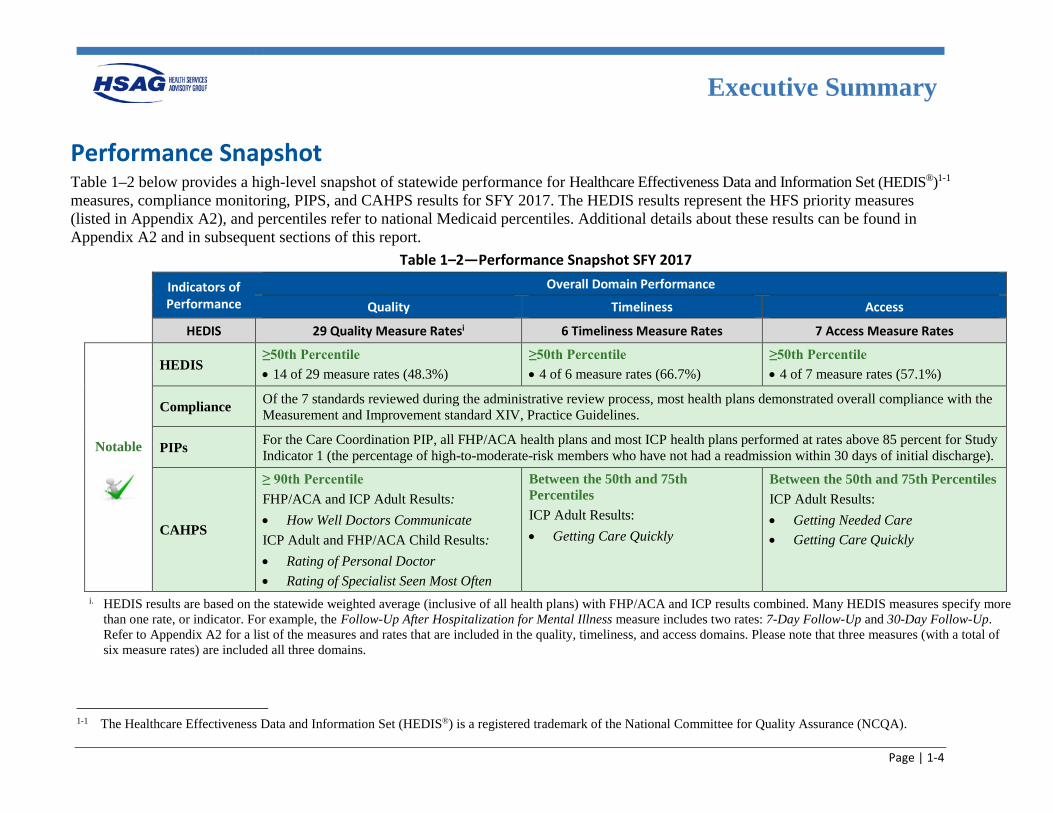
Performance Snapshot Table 1–2 below provides a high-level snapshot of statewide performance for Healthcare Effectiveness Data and Information Set (HEDIS®)1-1 measures, compliance monitoring, PIPS, and CAHPS results for SFY 2017. The HEDIS results represent the HFS priority measures (listed in Appendix A2), and percentiles refer to national Medicaid percentiles. Additional details about these results can be found in Appendix A2 and in subsequent sections of this report.
Table 1–2—Performance Snapshot SFY 2017
Indicators of Performance
Overall Domain Performance
Quality Timeliness Access
HEDIS 29 Quality Measure Ratesi 6 Timeliness Measure Rates 7 Access Measure Rates
Notable
HEDIS ≥50th Percentile • 14 of 29 measure rates (48.3%)
≥50th Percentile • 4 of 6 measure rates (66.7%)
≥50th Percentile • 4 of 7 measure rates (57.1%)
Compliance Of the 7 standards reviewed during the administrative review process, most health plans demonstrated overall compliance with the Measurement and Improvement standard XIV, Practice Guidelines.
PIPs For the Care Coordination PIP, all FHP/ACA health plans and most ICP health plans performed at rates above 85 percent for Study Indicator 1 (the percentage of high-to-moderate-risk members who have not had a readmission within 30 days of initial discharge).
CAHPS
≥ 90th Percentile FHP/ACA and ICP Adult Results: • How Well Doctors Communicate ICP Adult and FHP/ACA Child Results: • Rating of Personal Doctor • Rating of Specialist Seen Most Often
Between the 50th and 75th Percentiles ICP Adult Results: • Getting Care Quickly
Between the 50th and 75th Percentiles ICP Adult Results: • Getting Needed Care • Getting Care Quickly
i. HEDIS results are based on the statewide weighted average (inclusive of all health plans) with FHP/ACA and ICP results combined. Many HEDIS measures specify more than one rate, or indicator. For example, the Follow-Up After Hospitalization for Mental Illness measure includes two rates: 7-Day Follow-Up and 30-Day Follow-Up. Refer to Appendix A2 for a list of the measures and rates that are included in the quality, timeliness, and access domains. Please note that three measures (with a total of six measure rates) are included all three domains.
1-1 The Healthcare Effectiveness Data and Information Set (HEDIS®) is a registered trademark of the National Committee for Quality Assurance (NCQA).
Executive Summary
Page | 1-5
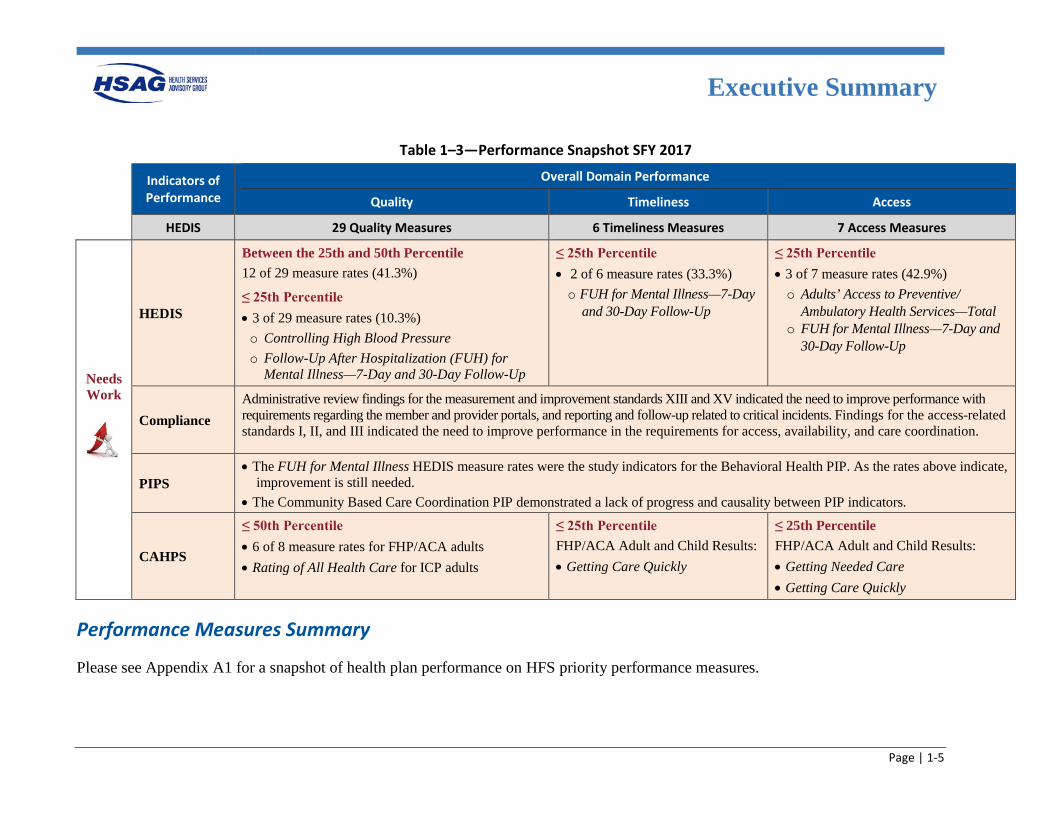
Table 1–3—Performance Snapshot SFY 2017
Indicators of Performance
Overall Domain Performance
Quality Timeliness Access
HEDIS 29 Quality Measures 6 Timeliness Measures 7 Access Measures
Needs Work
HEDIS
Between the 25th and 50th Percentile
12 of 29 measure rates (41.3%)
≤ 25th Percentile • 3 of 29 measure rates (10.3%) o Controlling High Blood Pressure o Follow-Up After Hospitalization (FUH) for
Mental Illness—7-Day and 30-Day Follow-Up
≤ 25th Percentile • 2 of 6 measure rates (33.3%) o FUH for Mental Illness—7-Day
and 30-Day Follow-Up
≤ 25th Percentile • 3 of 7 measure rates (42.9%) o Adults’ Access to Preventive/
Ambulatory Health Services—Total o FUH for Mental Illness—7-Day and
30-Day Follow-Up
Compliance Administrative review findings for the measurement and improvement standards XIII and XV indicated the need to improve performance with requirements regarding the member and provider portals, and reporting and follow-up related to critical incidents. Findings for the access-related standards I, II, and III indicated the need to improve performance in the requirements for access, availability, and care coordination.
PIPS • The FUH for Mental Illness HEDIS measure rates were the study indicators for the Behavioral Health PIP. As the rates above indicate,
improvement is still needed. • The Community Based Care Coordination PIP demonstrated a lack of progress and causality between PIP indicators.
CAHPS
≤ 50th Percentile • 6 of 8 measure rates for FHP/ACA adults • Rating of All Health Care for ICP adults
≤ 25th Percentile FHP/ACA Adult and Child Results: • Getting Care Quickly
≤ 25th Percentile FHP/ACA Adult and Child Results: • Getting Needed Care • Getting Care Quickly
Performance Measures Summary
Please see Appendix A1 for a snapshot of health plan performance on HFS priority performance measures.
Executive Summary
Page | 1-6
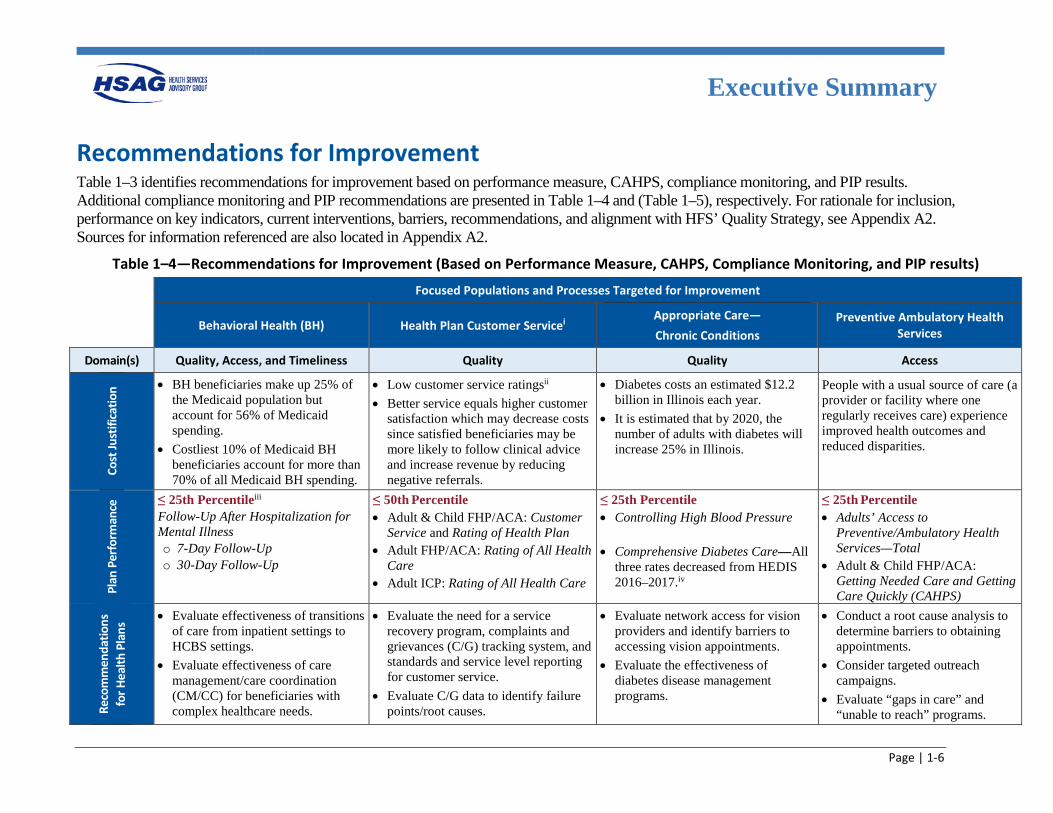
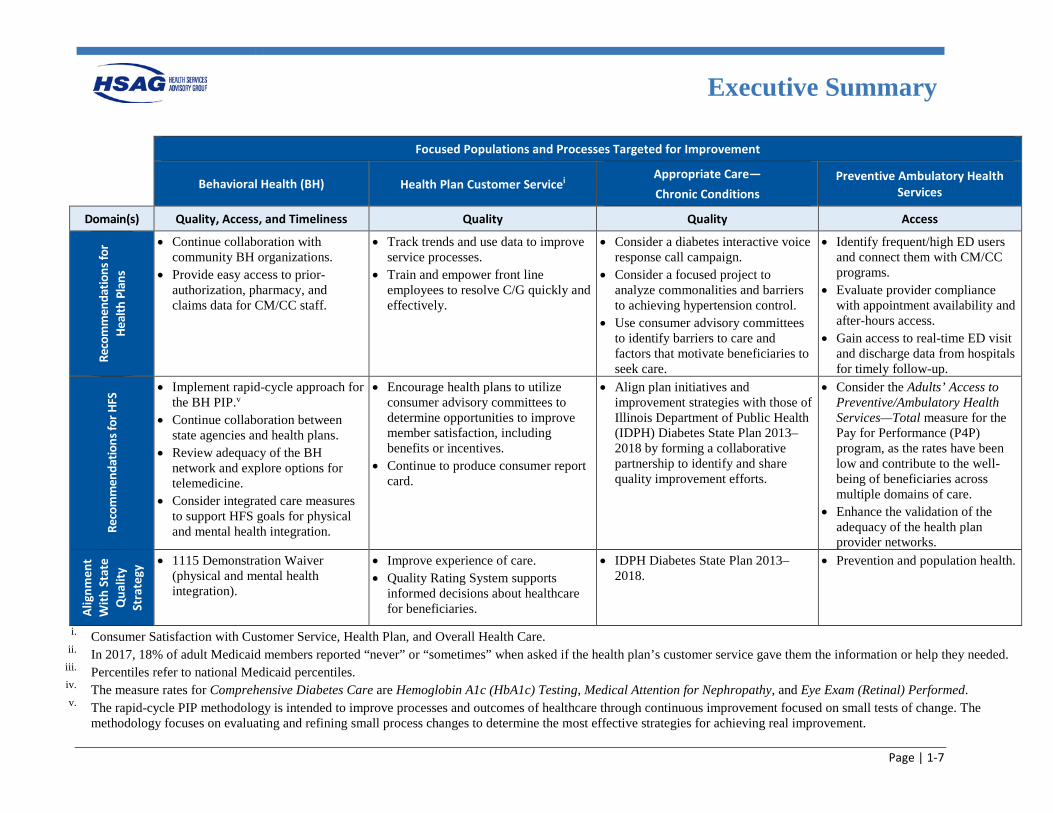
Recommendations for Improvement Table 1–3 identifies recommendations for improvement based on performance measure, CAHPS, compliance monitoring, and PIP results. Additional compliance monitoring and PIP recommendations are presented in Table 1–4 and (Table 1–5), respectively. For rationale for inclusion, performance on key indicators, current interventions, barriers, recommendations, and alignment with HFS’ Quality Strategy, see Appendix A2. Sources for information referenced are also located in Appendix A2.
Table 1–4—Recommendations for Improvement (Based on Performance Measure, CAHPS, Compliance Monitoring, and PIP results)
Focused Populations and Processes Targeted for Improvement
Behavioral Health (BH) Health Plan Customer Servicei Appropriate Care— Chronic Conditions
Preventive Ambulatory Health Services
Domain(s) Quality, Access, and Timeliness Quality Quality Access
Cost
Just
ifica
tion • BH beneficiaries make up 25% of
the Medicaid population but account for 56% of Medicaid spending.
• Costliest 10% of Medicaid BH beneficiaries account for more than 70% of all Medicaid BH spending.
• Low customer service ratingsii • Better service equals higher customer
satisfaction which may decrease costs since satisfied beneficiaries may be more likely to follow clinical advice and increase revenue by reducing negative referrals.
• Diabetes costs an estimated $12.2 billion in Illinois each year.
• It is estimated that by 2020, the number of adults with diabetes will increase 25% in Illinois.
People with a usual source of care (a provider or facility where one regularly receives care) experience improved health outcomes and reduced disparities.
Plan
Per
form
ance
≤ 25th Percentileiii Follow-Up After Hospitalization for Mental Illness o 7-Day Follow-Up o 30-Day Follow-Up
≤ 50th Percentile • Adult & Child FHP/ACA: Customer
Service and Rating of Health Plan • Adult FHP/ACA: Rating of All Health
Care • Adult ICP: Rating of All Health Care
≤ 25th Percentile • Controlling High Blood Pressure
• Comprehensive Diabetes Care—All
three rates decreased from HEDIS 2016–2017.iv
≤ 25th Percentile • Adults’ Access to
Preventive/Ambulatory Health Services—Total
• Adult & Child FHP/ACA: Getting Needed Care and Getting Care Quickly (CAHPS)
Reco
mm
enda
tions
fo
r Hea
lth P
lans
• Evaluate effectiveness of transitions of care from inpatient settings to HCBS settings.
• Evaluate effectiveness of care management/care coordination (CM/CC) for beneficiaries with complex healthcare needs.
• Evaluate the need for a service recovery program, complaints and grievances (C/G) tracking system, and standards and service level reporting for customer service.
• Evaluate C/G data to identify failure points/root causes.
• Evaluate network access for vision providers and identify barriers to accessing vision appointments.
• Evaluate the effectiveness of diabetes disease management programs.
• Conduct a root cause analysis to determine barriers to obtaining appointments.
• Consider targeted outreach campaigns.
• Evaluate “gaps in care” and “unable to reach” programs.
Executive Summary
Page | 1-7
Focused Populations and Processes Targeted for Improvement
Behavioral Health (BH) Health Plan Customer Servicei Appropriate Care— Chronic Conditions
Preventive Ambulatory Health Services
Domain(s) Quality, Access, and Timeliness Quality Quality Access
Reco
mm
enda
tions
for
Heal
th P
lans
• Continue collaboration with community BH organizations.
• Provide easy access to prior-authorization, pharmacy, and claims data for CM/CC staff.
• Track trends and use data to improve service processes.
• Train and empower front line employees to resolve C/G quickly and effectively.
• Consider a diabetes interactive voice response call campaign.
• Consider a focused project to analyze commonalities and barriers to achieving hypertension control.
• Use consumer advisory committees to identify barriers to care and factors that motivate beneficiaries to seek care.
• Identify frequent/high ED users and connect them with CM/CC programs.
• Evaluate provider compliance with appointment availability and after-hours access.
• Gain access to real-time ED visit and discharge data from hospitals for timely follow-up.
Reco
mm
enda
tions
for H
FS • Implement rapid-cycle approach for
the BH PIP.v • Continue collaboration between
state agencies and health plans. • Review adequacy of the BH
network and explore options for telemedicine.
• Consider integrated care measures to support HFS goals for physical and mental health integration.
• Encourage health plans to utilize consumer advisory committees to determine opportunities to improve member satisfaction, including benefits or incentives.
• Continue to produce consumer report card.
• Align plan initiatives and improvement strategies with those of Illinois Department of Public Health (IDPH) Diabetes State Plan 2013–2018 by forming a collaborative partnership to identify and share quality improvement efforts.
• Consider the Adults’ Access to Preventive/Ambulatory Health Services—Total measure for the Pay for Performance (P4P) program, as the rates have been low and contribute to the well-being of beneficiaries across multiple domains of care.
• Enhance the validation of the adequacy of the health plan provider networks.
Alig
nmen
t W
ith S
tate
Q
ualit
y St
rate
gy • 1115 Demonstration Waiver
(physical and mental health integration).
• Improve experience of care. • Quality Rating System supports
informed decisions about healthcare for beneficiaries.
• IDPH Diabetes State Plan 2013–2018.
• Prevention and population health.
i. Consumer Satisfaction with Customer Service, Health Plan, and Overall Health Care. ii. In 2017, 18% of adult Medicaid members reported “never” or “sometimes” when asked if the health plan’s customer service gave them the information or help they needed.
iii. Percentiles refer to national Medicaid percentiles. iv. The measure rates for Comprehensive Diabetes Care are Hemoglobin A1c (HbA1c) Testing, Medical Attention for Nephropathy, and Eye Exam (Retinal) Performed. v. The rapid-cycle PIP methodology is intended to improve processes and outcomes of healthcare through continuous improvement focused on small tests of change. The
methodology focuses on evaluating and refining small process changes to determine the most effective strategies for achieving real improvement.
Executive Summary
Page | 1-8
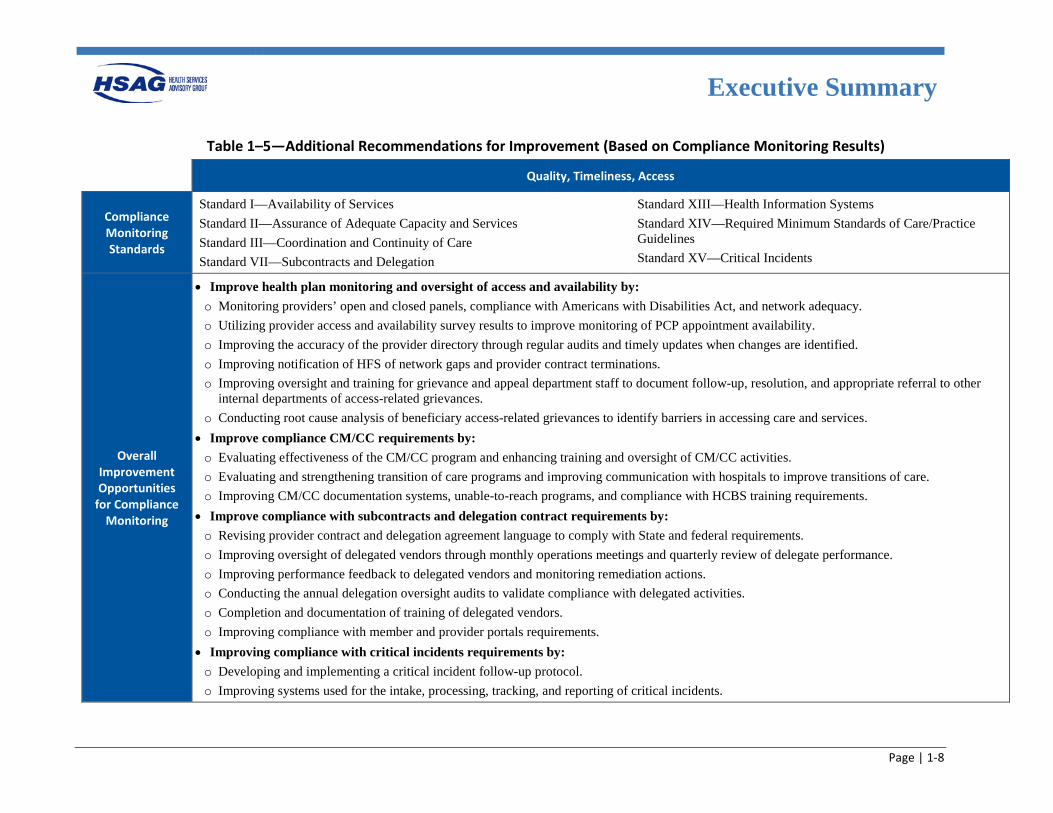
Table 1–5—Additional Recommendations for Improvement (Based on Compliance Monitoring Results)
Quality, Timeliness, Access
Compliance Monitoring Standards
Standard I—Availability of Services Standard II—Assurance of Adequate Capacity and Services Standard III—Coordination and Continuity of Care Standard VII—Subcontracts and Delegation
Standard XIII—Health Information Systems Standard XIV—Required Minimum Standards of Care/Practice Guidelines Standard XV—Critical Incidents
Overall Improvement Opportunities
for Compliance Monitoring
• Improve health plan monitoring and oversight of access and availability by: o Monitoring providers’ open and closed panels, compliance with Americans with Disabilities Act, and network adequacy. o Utilizing provider access and availability survey results to improve monitoring of PCP appointment availability. o Improving the accuracy of the provider directory through regular audits and timely updates when changes are identified. o Improving notification of HFS of network gaps and provider contract terminations. o Improving oversight and training for grievance and appeal department staff to document follow-up, resolution, and appropriate referral to other
internal departments of access-related grievances. o Conducting root cause analysis of beneficiary access-related grievances to identify barriers in accessing care and services.
• Improve compliance CM/CC requirements by: o Evaluating effectiveness of the CM/CC program and enhancing training and oversight of CM/CC activities. o Evaluating and strengthening transition of care programs and improving communication with hospitals to improve transitions of care. o Improving CM/CC documentation systems, unable-to-reach programs, and compliance with HCBS training requirements.
• Improve compliance with subcontracts and delegation contract requirements by: o Revising provider contract and delegation agreement language to comply with State and federal requirements. o Improving oversight of delegated vendors through monthly operations meetings and quarterly review of delegate performance. o Improving performance feedback to delegated vendors and monitoring remediation actions. o Conducting the annual delegation oversight audits to validate compliance with delegated activities. o Completion and documentation of training of delegated vendors. o Improving compliance with member and provider portals requirements.
• Improving compliance with critical incidents requirements by: o Developing and implementing a critical incident follow-up protocol. o Improving systems used for the intake, processing, tracking, and reporting of critical incidents.
Executive Summary
Page | 1-9
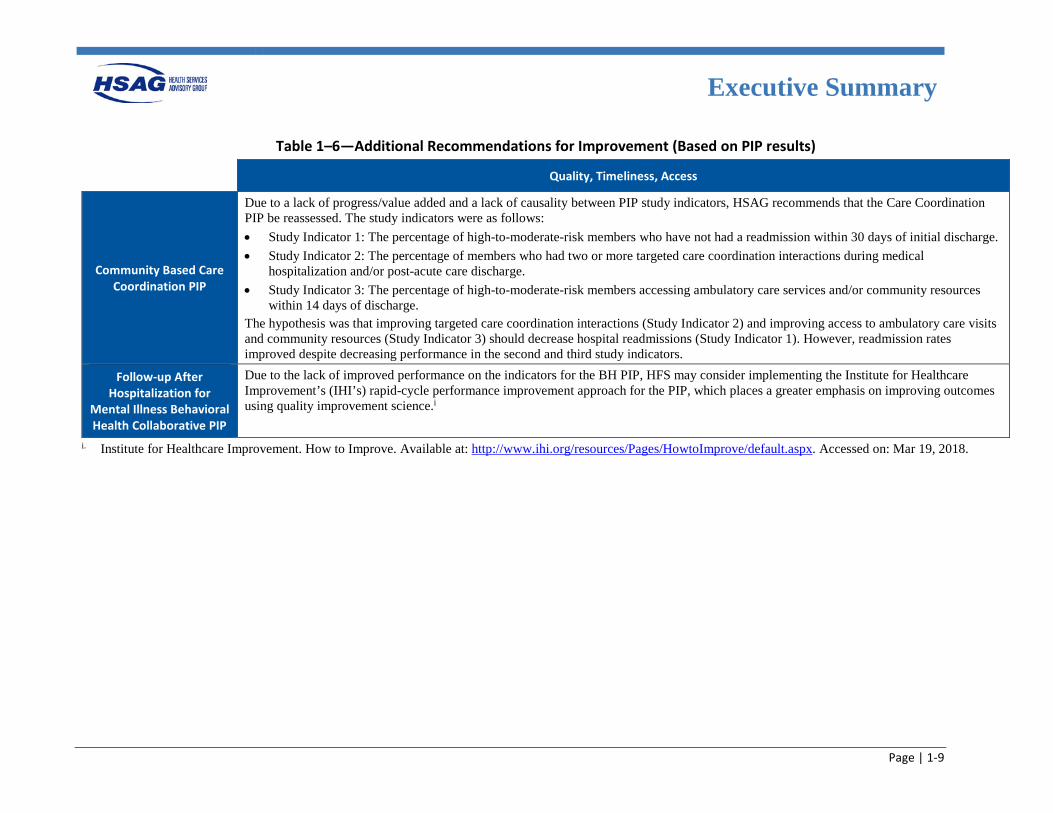
Table 1–6—Additional Recommendations for Improvement (Based on PIP results)
Quality, Timeliness, Access
Community Based Care Coordination PIP
Due to a lack of progress/value added and a lack of causality between PIP study indicators, HSAG recommends that the Care Coordination PIP be reassessed. The study indicators were as follows: • Study Indicator 1: The percentage of high-to-moderate-risk members who have not had a readmission within 30 days of initial discharge. • Study Indicator 2: The percentage of members who had two or more targeted care coordination interactions during medical
hospitalization and/or post-acute care discharge. • Study Indicator 3: The percentage of high-to-moderate-risk members accessing ambulatory care services and/or community resources
within 14 days of discharge. The hypothesis was that improving targeted care coordination interactions (Study Indicator 2) and improving access to ambulatory care visits and community resources (Study Indicator 3) should decrease hospital readmissions (Study Indicator 1). However, readmission rates improved despite decreasing performance in the second and third study indicators.
Follow-up After Hospitalization for
Mental Illness Behavioral Health Collaborative PIP
Due to the lack of improved performance on the indicators for the BH PIP, HFS may consider implementing the Institute for Healthcare Improvement’s (IHI’s) rapid-cycle performance improvement approach for the PIP, which places a greater emphasis on improving outcomes using quality improvement science.i
i. Institute for Healthcare Improvement. How to Improve. Available at: http://www.ihi.org/resources/Pages/HowtoImprove/default.aspx. Accessed on: Mar 19, 2018.
Page |2-1
2. Performance Measures
Overview The Illinois Department of Healthcare and Family Services (HFS) assesses strengths, needs, and challenges to identify target populations and prioritize improvement efforts.
In alignment with HFS’ Quality Strategy, results from selected Healthcare Effectiveness Data and Information Set (HEDIS) measures are presented in this section to provide a snapshot of performance of Illinois’ Medicaid health plans in these areas:
• Access/Utilization of Care • Preventive Care • Child & Adolescent Care • Women's Health • Appropriate Care • Behavioral Health
HFS also contracts with Health Services Advisory Group, Inc. (HSAG), to conduct an annual validation of performance measures for the Primary Care Case Management (PCCM) Program and the Children’s Health Insurance Program Reauthorization Act (CHIPRA). These results, along with additional measures and performance results, are presented in the appendices of this report.
Performance Results
Understanding Results
Page | 2-2
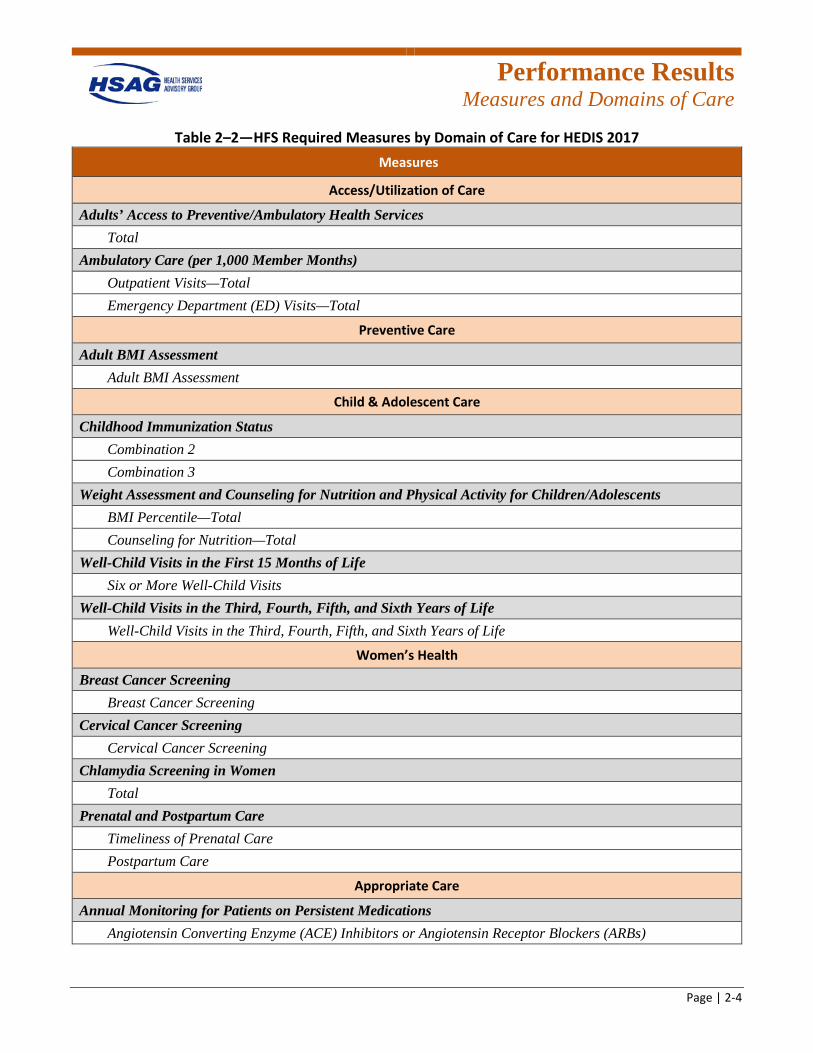
Understanding Results HEDIS is a nationally recognized set of performance measures used by more than 90 percent of America’s health plans to measure performance on important dimensions of care and service.2-1 To evaluate performance levels and to provide an objective, comparative review of Illinois health plans’ quality-of-care outcomes and performance measures, HFS required its health plans to report results following the National Committee for Quality Assurance’s (NCQA’s) HEDIS protocols. A key element of improving healthcare services is easily understood, comparable information on the performance of health plans. Systematically measuring performance provides a common language based on numeric values and allows the establishment of benchmarks, or points of reference, for performance. Performance measure results allow health plans to make informed judgments about the effectiveness of existing processes, identify opportunities for improvement, and determine if interventions or redesigned processes are meeting objectives. HFS requires health plans to monitor and evaluate the quality of care using HEDIS and HFS-defined performance measures. This section of the report displays results for measures selected by HFS that demonstrate health plan performance in domains of care that HFS prioritizes for improvement. Table 2–2 identifies the measures in each of the domains of care. Descriptions are provided for each domain of care and each performance measure to indicate what is measured and why it is important. Due to the statewide expansion request for proposal (RFP) process, only seven health plans will continue to serve Illinois Medicaid beneficiaries in 2018. To allow HFS optimum
2-1 National Committee for Quality Assurance. HEDIS & Performance Measurement. Available at:
http://www.ncqa.org/hedis-quality-measurement. Accessed on: Feb 8, 2018.
use of the results for future quality improvement considerations, HSAG has included results only for those seven plans in this section. However, results for all health plans are presented in Appendix D and Appendix E. In this report, Illinois health plans’ performance for required HEDIS 2017 measures is compared to NCQA’s Quality Compass national Medicaid health maintenance organization (HMO) percentiles (national Medicaid percentiles), when available, which is an indicator of health plan performance on a national level. Of note, rates for the Medication Management for People With Asthma—Medication Compliance 50%—Total and Statin Therapy for People With Diabetes measures were compared to NCQA’s Audit Means and Percentiles national Medicaid HMO percentiles since these indicators are not published in Quality Compass. For purposes of reporting and comparing the results, the data have been combined for the Family Health Plan/Affordable Care Act (FHP/ACA) and Integrated Care Program (ICP) health plans, where appropriate. To combine the FHP/ACA and ICP rates for a health plan, a combined mean is calculated, weighted by the size of the eligible population within each population. This formula is used to compute the combined mean (Xc) for each applicable measure:
𝑋𝑋𝑐𝑐 = 𝑛𝑛1 𝑋𝑋1 + 𝑛𝑛2 𝑋𝑋2
𝑛𝑛1 + 𝑛𝑛2
Where: n1 = number of ICP members in the eligible population n2 = number of FHP/ACA members in the eligible population
𝑋𝑋1 = ICP population rate 𝑋𝑋2 = FHP/ACA population rate
Performance Results
Measures and Domains of Care
Page | 2-3
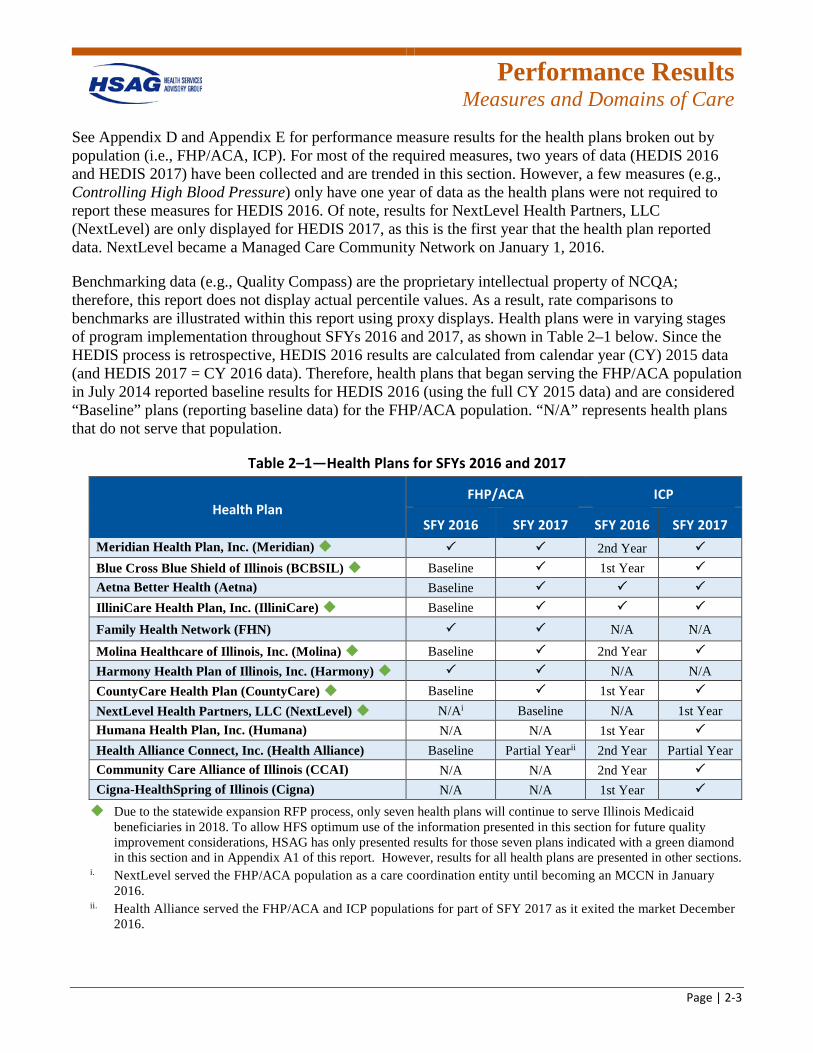
See Appendix D and Appendix E for performance measure results for the health plans broken out by population (i.e., FHP/ACA, ICP). For most of the required measures, two years of data (HEDIS 2016 and HEDIS 2017) have been collected and are trended in this section. However, a few measures (e.g., Controlling High Blood Pressure) only have one year of data as the health plans were not required to report these measures for HEDIS 2016. Of note, results for NextLevel Health Partners, LLC (NextLevel) are only displayed for HEDIS 2017, as this is the first year that the health plan reported data. NextLevel became a Managed Care Community Network on January 1, 2016.
Benchmarking data (e.g., Quality Compass) are the proprietary intellectual property of NCQA; therefore, this report does not display actual percentile values. As a result, rate comparisons to benchmarks are illustrated within this report using proxy displays. Health plans were in varying stages of program implementation throughout SFYs 2016 and 2017, as shown in Table 2–1 below. Since the HEDIS process is retrospective, HEDIS 2016 results are calculated from calendar year (CY) 2015 data (and HEDIS 2017 = CY 2016 data). Therefore, health plans that began serving the FHP/ACA population in July 2014 reported baseline results for HEDIS 2016 (using the full CY 2015 data) and are considered “Baseline” plans (reporting baseline data) for the FHP/ACA population. “N/A” represents health plans that do not serve that population.
Table 2–1—Health Plans for SFYs 2016 and 2017
Health Plan FHP/ACA ICP
SFY 2016 SFY 2017 SFY 2016 SFY 2017 Meridian Health Plan, Inc. (Meridian) 2nd Year Blue Cross Blue Shield of Illinois (BCBSIL) Baseline 1st Year Aetna Better Health (Aetna) Baseline IlliniCare Health Plan, Inc. (IlliniCare) Baseline
Family Health Network (FHN) N/A N/A
Molina Healthcare of Illinois, Inc. (Molina) Baseline 2nd Year Harmony Health Plan of Illinois, Inc. (Harmony) N/A N/A CountyCare Health Plan (CountyCare) Baseline 1st Year NextLevel Health Partners, LLC (NextLevel) N/Ai Baseline N/A 1st Year Humana Health Plan, Inc. (Humana) N/A N/A 1st Year Health Alliance Connect, Inc. (Health Alliance) Baseline Partial Yearii 2nd Year Partial Year Community Care Alliance of Illinois (CCAI) N/A N/A 2nd Year Cigna-HealthSpring of Illinois (Cigna) N/A N/A 1st Year
Due to the statewide expansion RFP process, only seven health plans will continue to serve Illinois Medicaid beneficiaries in 2018. To allow HFS optimum use of the information presented in this section for future quality improvement considerations, HSAG has only presented results for those seven plans indicated with a green diamond in this section and in Appendix A1 of this report. However, results for all health plans are presented in other sections.
i. NextLevel served the FHP/ACA population as a care coordination entity until becoming an MCCN in January 2016.
ii. Health Alliance served the FHP/ACA and ICP populations for part of SFY 2017 as it exited the market December 2016.
Performance Results
Measures and Domains of Care
Page | 2-4
Table 2–2—HFS Required Measures by Domain of Care for HEDIS 2017 Measures
Access/Utilization of Care
Adults’ Access to Preventive/Ambulatory Health Services Total
Ambulatory Care (per 1,000 Member Months) Outpatient Visits—Total Emergency Department (ED) Visits—Total
Preventive Care
Adult BMI Assessment Adult BMI Assessment
Child & Adolescent Care
Childhood Immunization Status Combination 2 Combination 3
Weight Assessment and Counseling for Nutrition and Physical Activity for Children/Adolescents BMI Percentile—Total Counseling for Nutrition—Total
Well-Child Visits in the First 15 Months of Life Six or More Well-Child Visits
Well-Child Visits in the Third, Fourth, Fifth, and Sixth Years of Life Well-Child Visits in the Third, Fourth, Fifth, and Sixth Years of Life
Women’s Health
Breast Cancer Screening Breast Cancer Screening
Cervical Cancer Screening Cervical Cancer Screening
Chlamydia Screening in Women Total
Prenatal and Postpartum Care Timeliness of Prenatal Care Postpartum Care
Appropriate Care
Annual Monitoring for Patients on Persistent Medications Angiotensin Converting Enzyme (ACE) Inhibitors or Angiotensin Receptor Blockers (ARBs)
Performance Results
Measures and Domains of Care
Page | 2-5
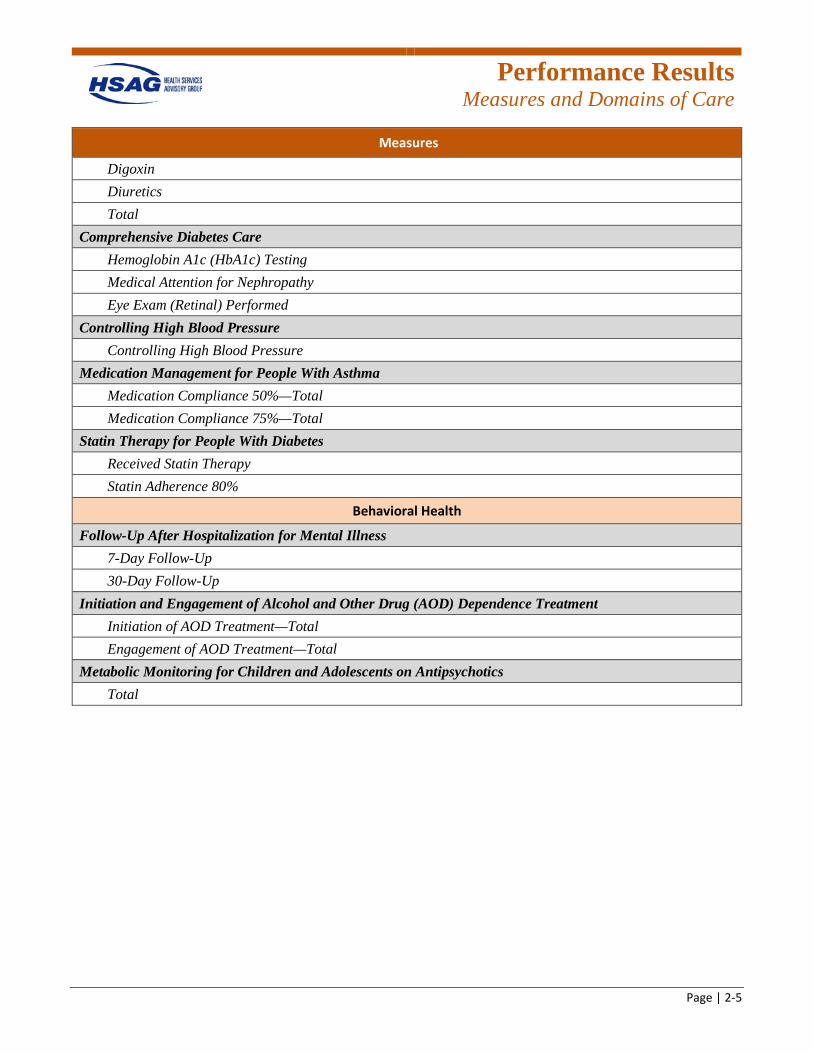
Measures
Digoxin Diuretics Total
Comprehensive Diabetes Care Hemoglobin A1c (HbA1c) Testing Medical Attention for Nephropathy Eye Exam (Retinal) Performed
Controlling High Blood Pressure Controlling High Blood Pressure
Medication Management for People With Asthma Medication Compliance 50%—Total Medication Compliance 75%—Total
Statin Therapy for People With Diabetes Received Statin Therapy Statin Adherence 80%
Behavioral Health
Follow-Up After Hospitalization for Mental Illness 7-Day Follow-Up 30-Day Follow-Up
Initiation and Engagement of Alcohol and Other Drug (AOD) Dependence Treatment Initiation of AOD Treatment—Total Engagement of AOD Treatment—Total
Metabolic Monitoring for Children and Adolescents on Antipsychotics Total
Performance Results
Access/Utilization of Care
Page | 2-6
Summary of Performance Access/Utilization of Care
The access and utilization of primary care is essential for Illinois Medicaid beneficiaries to achieve the best health outcomes. Obtaining good access to care often requires Medicaid beneficiaries to find a trusted primary care provider to meet their needs. Medicaid beneficiaries should utilize their primary care provider to help them prevent illnesses and encourage healthy behaviors through needed services.2-2
This section presents the three-required access/utilization of care measure rates reported by the health plans. Additional access/utilization of care measure results can be found in Appendix D and Appendix E.
2-2 Agency for Healthcare Research and Quality. National Healthcare Disparities Report, 2011. Available at:
https://archive.ahrq.gov/research/findings/nhqrdr/nhdr11/chap9.html#. Accessed on: Feb 8, 2018.
Performance Results
Access/Utilization of Care
Page | 2-7
Adults’ Access to Preventive/Ambulatory Health Services—Total
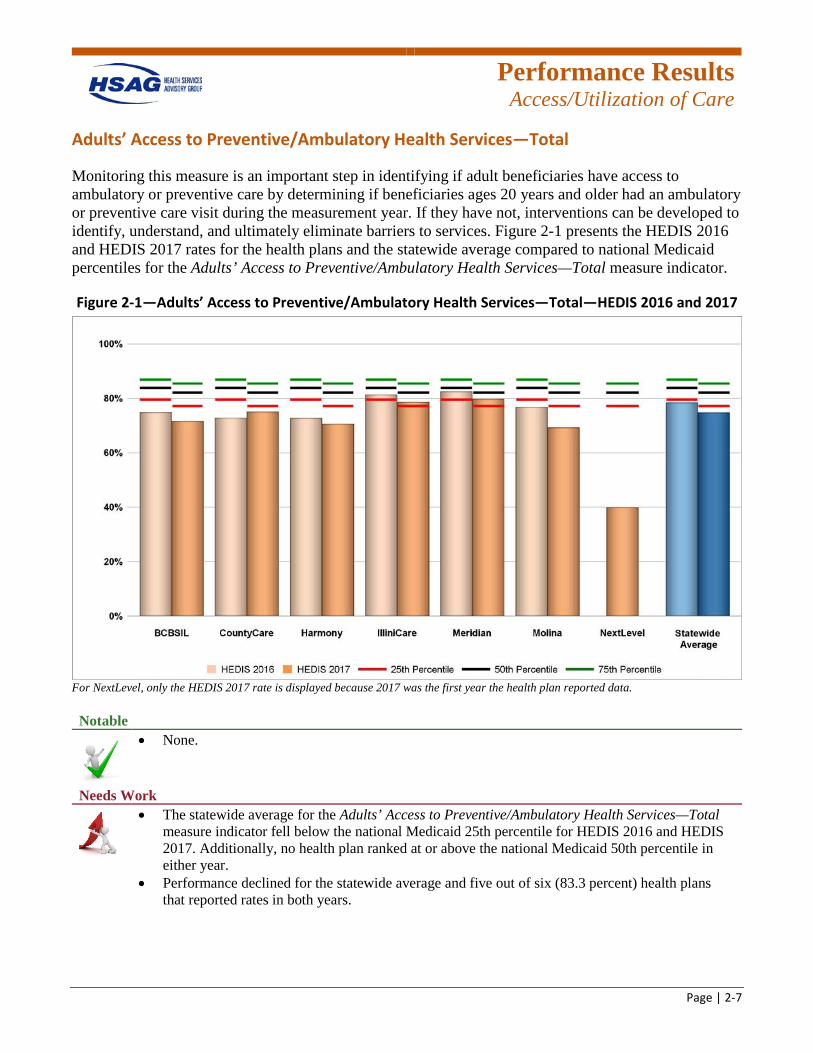
Monitoring this measure is an important step in identifying if adult beneficiaries have access to ambulatory or preventive care by determining if beneficiaries ages 20 years and older had an ambulatory or preventive care visit during the measurement year. If they have not, interventions can be developed to identify, understand, and ultimately eliminate barriers to services. Figure 2-1 presents the HEDIS 2016 and HEDIS 2017 rates for the health plans and the statewide average compared to national Medicaid percentiles for the Adults’ Access to Preventive/Ambulatory Health Services—Total measure indicator.
Figure 2-1—Adults’ Access to Preventive/Ambulatory Health Services—Total—HEDIS 2016 and 2017
For NextLevel, only the HEDIS 2017 rate is displayed because 2017 was the first year the health plan reported data. Notable
• None.
Needs Work
• The statewide average for the Adults’ Access to Preventive/Ambulatory Health Services—Total measure indicator fell below the national Medicaid 25th percentile for HEDIS 2016 and HEDIS 2017. Additionally, no health plan ranked at or above the national Medicaid 50th percentile in either year.
• Performance declined for the statewide average and five out of six (83.3 percent) health plans that reported rates in both years.
Performance Results
Access/Utilization of Care
Page | 2-8
Ambulatory Care (per 1,000 Member Months)
Outpatient Visits
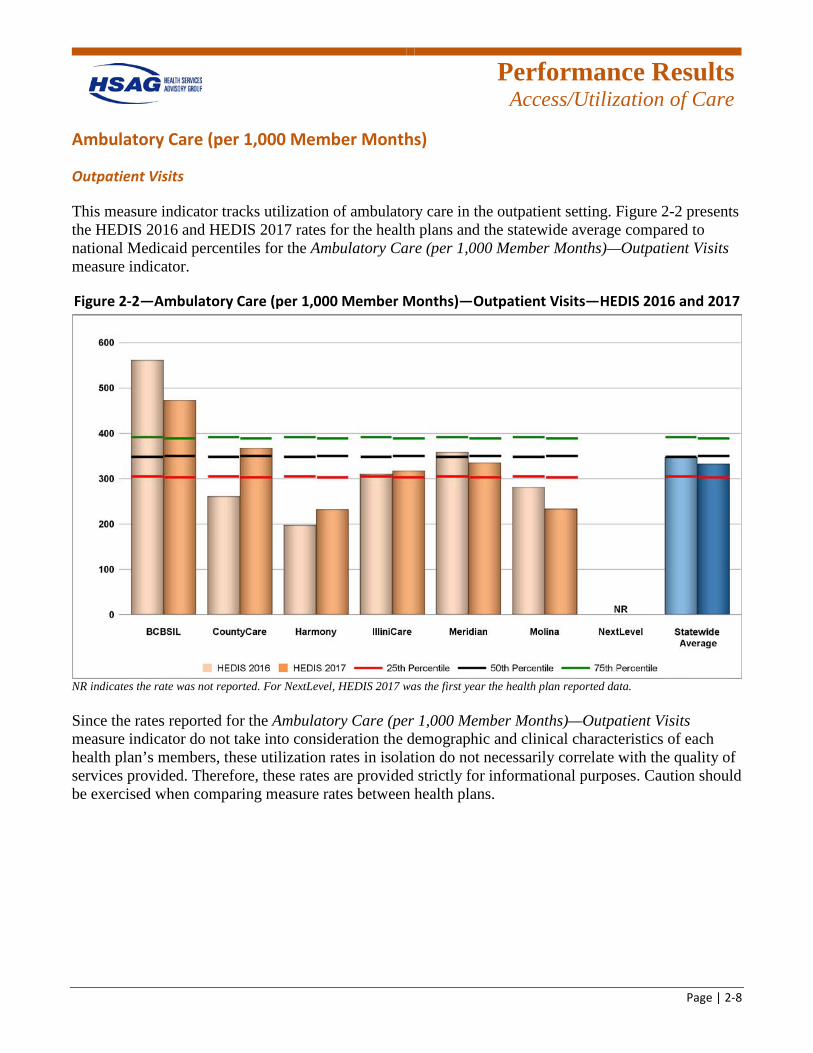
This measure indicator tracks utilization of ambulatory care in the outpatient setting. Figure 2-2 presents the HEDIS 2016 and HEDIS 2017 rates for the health plans and the statewide average compared to national Medicaid percentiles for the Ambulatory Care (per 1,000 Member Months)—Outpatient Visits measure indicator.
Figure 2-2—Ambulatory Care (per 1,000 Member Months)—Outpatient Visits—HEDIS 2016 and 2017
NR indicates the rate was not reported. For NextLevel, HEDIS 2017 was the first year the health plan reported data.
Since the rates reported for the Ambulatory Care (per 1,000 Member Months)—Outpatient Visits measure indicator do not take into consideration the demographic and clinical characteristics of each health plan’s members, these utilization rates in isolation do not necessarily correlate with the quality of services provided. Therefore, these rates are provided strictly for informational purposes. Caution should be exercised when comparing measure rates between health plans.
Performance Results
Access/Utilization of Care
Page | 2-9
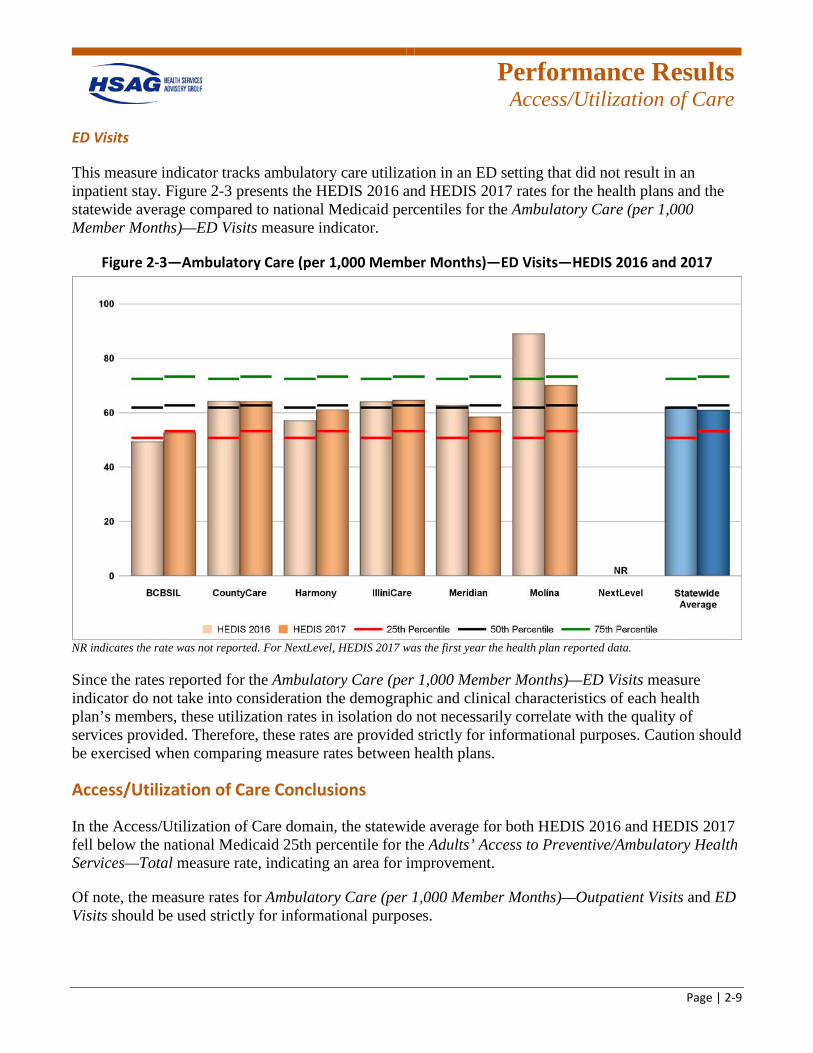
ED Visits
This measure indicator tracks ambulatory care utilization in an ED setting that did not result in an inpatient stay. Figure 2-3 presents the HEDIS 2016 and HEDIS 2017 rates for the health plans and the statewide average compared to national Medicaid percentiles for the Ambulatory Care (per 1,000 Member Months)—ED Visits measure indicator.
Figure 2-3—Ambulatory Care (per 1,000 Member Months)—ED Visits—HEDIS 2016 and 2017
NR indicates the rate was not reported. For NextLevel, HEDIS 2017 was the first year the health plan reported data.
Since the rates reported for the Ambulatory Care (per 1,000 Member Months)—ED Visits measure indicator do not take into consideration the demographic and clinical characteristics of each health plan’s members, these utilization rates in isolation do not necessarily correlate with the quality of services provided. Therefore, these rates are provided strictly for informational purposes. Caution should be exercised when comparing measure rates between health plans.
Access/Utilization of Care Conclusions
In the Access/Utilization of Care domain, the statewide average for both HEDIS 2016 and HEDIS 2017 fell below the national Medicaid 25th percentile for the Adults’ Access to Preventive/Ambulatory Health Services—Total measure rate, indicating an area for improvement.
Of note, the measure rates for Ambulatory Care (per 1,000 Member Months)—Outpatient Visits and ED Visits should be used strictly for informational purposes.
Performance Results
Preventive Care
Page | 2-10
Preventive Care
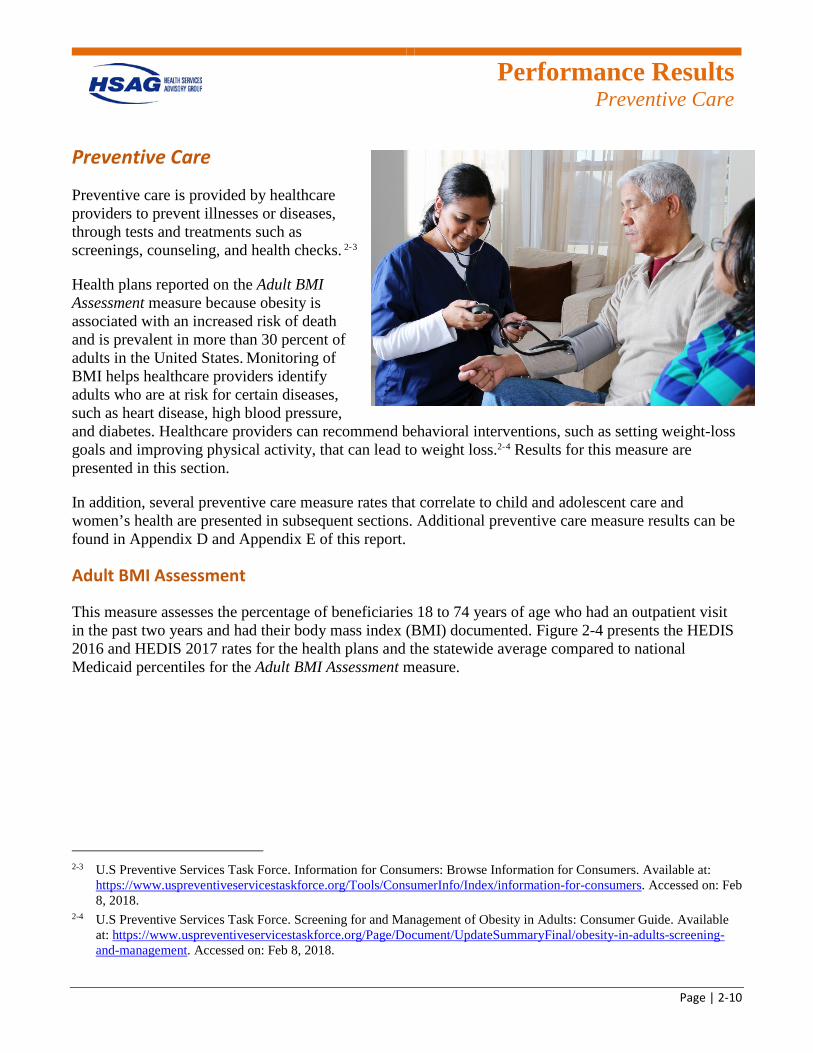
Preventive care is provided by healthcare providers to prevent illnesses or diseases, through tests and treatments such as screenings, counseling, and health checks. 2-3
Health plans reported on the Adult BMI Assessment measure because obesity is associated with an increased risk of death and is prevalent in more than 30 percent of adults in the United States. Monitoring of BMI helps healthcare providers identify adults who are at risk for certain diseases, such as heart disease, high blood pressure, and diabetes. Healthcare providers can recommend behavioral interventions, such as setting weight-loss goals and improving physical activity, that can lead to weight loss.2-4 Results for this measure are presented in this section.
In addition, several preventive care measure rates that correlate to child and adolescent care and women’s health are presented in subsequent sections. Additional preventive care measure results can be found in Appendix D and Appendix E of this report.
Adult BMI Assessment
This measure assesses the percentage of beneficiaries 18 to 74 years of age who had an outpatient visit in the past two years and had their body mass index (BMI) documented. Figure 2-4 presents the HEDIS 2016 and HEDIS 2017 rates for the health plans and the statewide average compared to national Medicaid percentiles for the Adult BMI Assessment measure.
2-3 U.S Preventive Services Task Force. Information for Consumers: Browse Information for Consumers. Available at:
https://www.uspreventiveservicestaskforce.org/Tools/ConsumerInfo/Index/information-for-consumers. Accessed on: Feb 8, 2018.
2-4 U.S Preventive Services Task Force. Screening for and Management of Obesity in Adults: Consumer Guide. Available at: https://www.uspreventiveservicestaskforce.org/Page/Document/UpdateSummaryFinal/obesity-in-adults-screening-and-management. Accessed on: Feb 8, 2018.
Performance Results
Preventive Care
Page | 2-11
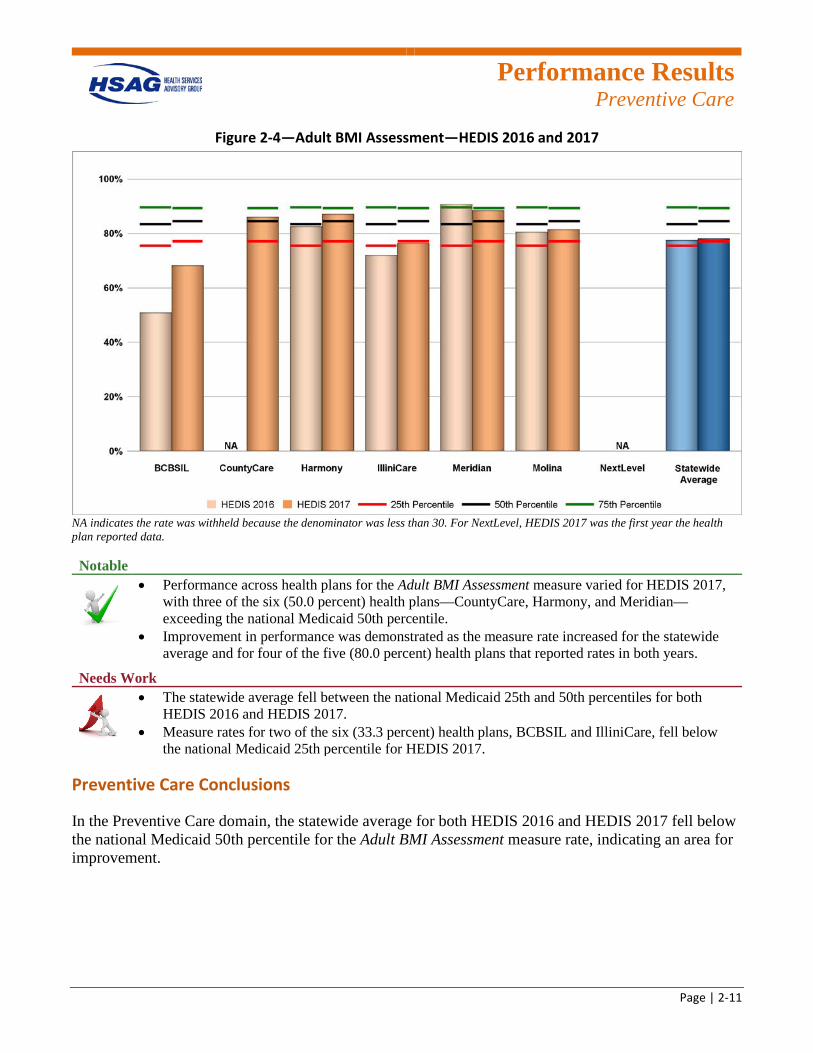
Figure 2-4—Adult BMI Assessment—HEDIS 2016 and 2017
NA indicates the rate was withheld because the denominator was less than 30. For NextLevel, HEDIS 2017 was the first year the health plan reported data. Notable
• Performance across health plans for the Adult BMI Assessment measure varied for HEDIS 2017, with three of the six (50.0 percent) health plans—CountyCare, Harmony, and Meridian—exceeding the national Medicaid 50th percentile.
• Improvement in performance was demonstrated as the measure rate increased for the statewide average and for four of the five (80.0 percent) health plans that reported rates in both years.
Needs Work
• The statewide average fell between the national Medicaid 25th and 50th percentiles for both HEDIS 2016 and HEDIS 2017.
• Measure rates for two of the six (33.3 percent) health plans, BCBSIL and IlliniCare, fell below the national Medicaid 25th percentile for HEDIS 2017.
Preventive Care Conclusions
In the Preventive Care domain, the statewide average for both HEDIS 2016 and HEDIS 2017 fell below the national Medicaid 50th percentile for the Adult BMI Assessment measure rate, indicating an area for improvement.
Performance Results
Child & Adolescent Care
Page | 2-12
Child & Adolescent Care
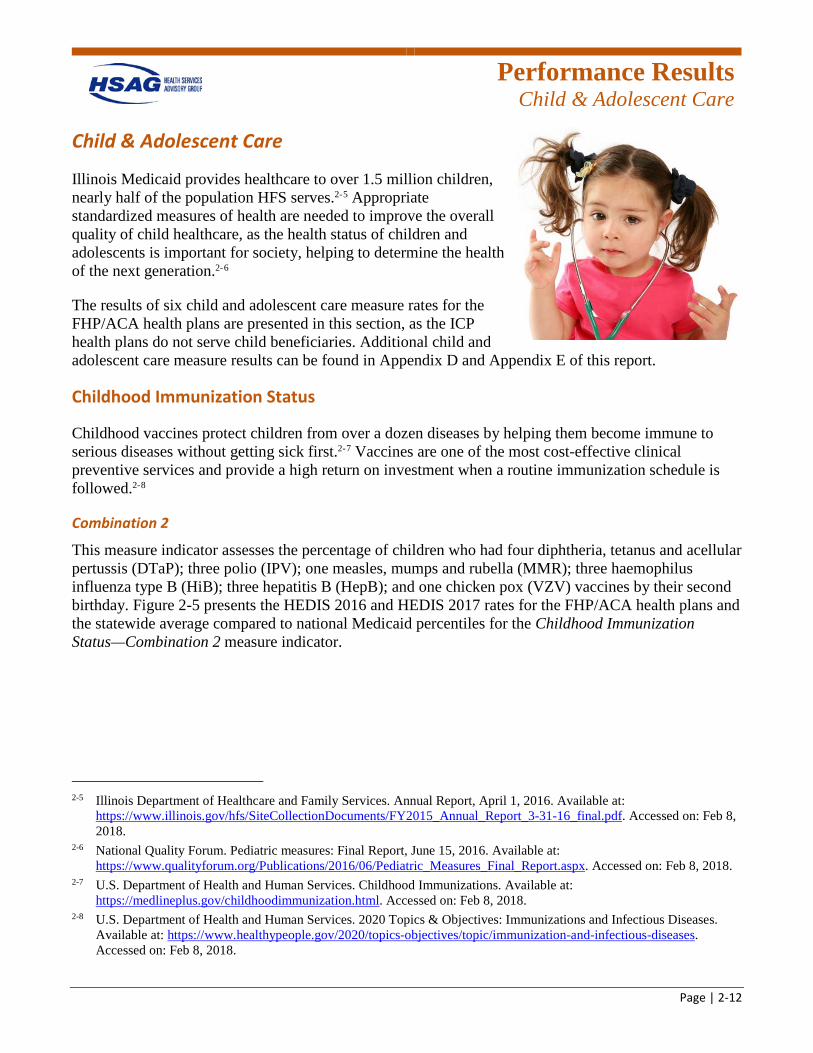
Illinois Medicaid provides healthcare to over 1.5 million children, nearly half of the population HFS serves.2-5 Appropriate standardized measures of health are needed to improve the overall quality of child healthcare, as the health status of children and adolescents is important for society, helping to determine the health of the next generation.2-6
The results of six child and adolescent care measure rates for the FHP/ACA health plans are presented in this section, as the ICP health plans do not serve child beneficiaries. Additional child and adolescent care measure results can be found in Appendix D and Appendix E of this report.
Childhood Immunization Status
Childhood vaccines protect children from over a dozen diseases by helping them become immune to serious diseases without getting sick first.2-7 Vaccines are one of the most cost-effective clinical preventive services and provide a high return on investment when a routine immunization schedule is followed.2-8
Combination 2
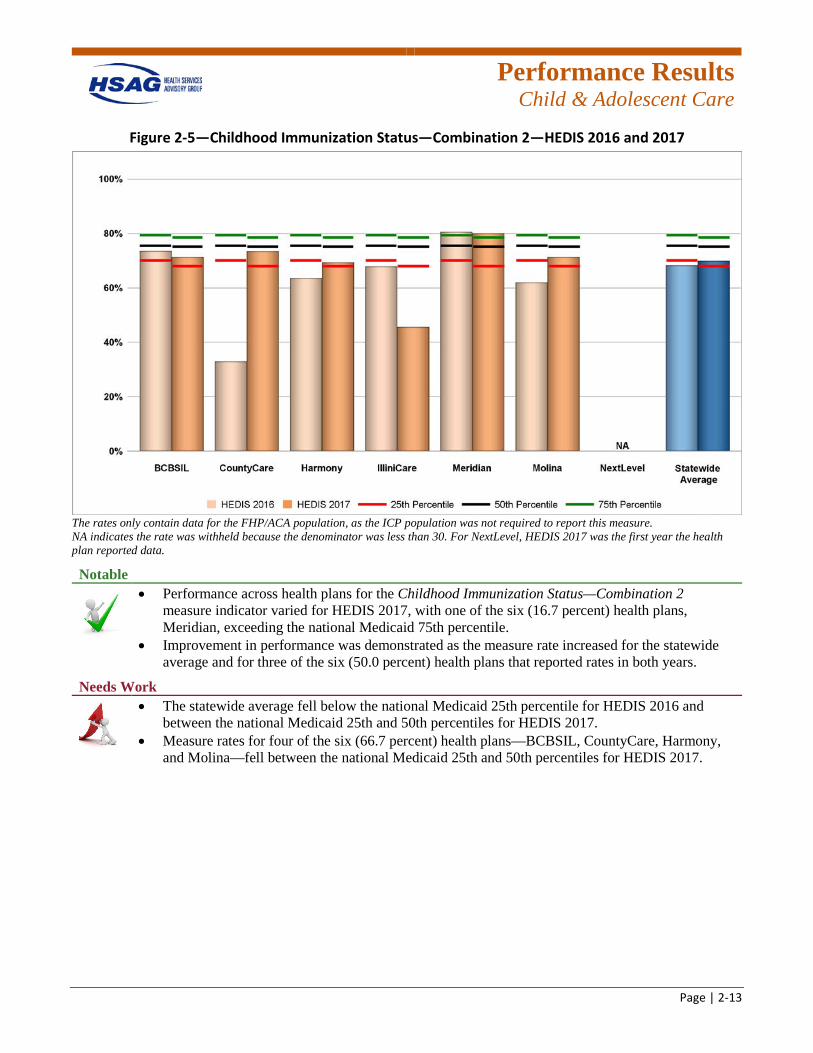
This measure indicator assesses the percentage of children who had four diphtheria, tetanus and acellular pertussis (DTaP); three polio (IPV); one measles, mumps and rubella (MMR); three haemophilus influenza type B (HiB); three hepatitis B (HepB); and one chicken pox (VZV) vaccines by their second birthday. Figure 2-5 presents the HEDIS 2016 and HEDIS 2017 rates for the FHP/ACA health plans and the statewide average compared to national Medicaid percentiles for the Childhood Immunization Status—Combination 2 measure indicator.
2-5 Illinois Department of Healthcare and Family Services. Annual Report, April 1, 2016. Available at:
https://www.illinois.gov/hfs/SiteCollectionDocuments/FY2015_Annual_Report_3-31-16_final.pdf. Accessed on: Feb 8, 2018.
2-6 National Quality Forum. Pediatric measures: Final Report, June 15, 2016. Available at: https://www.qualityforum.org/Publications/2016/06/Pediatric_Measures_Final_Report.aspx. Accessed on: Feb 8, 2018.
2-7 U.S. Department of Health and Human Services. Childhood Immunizations. Available at: https://medlineplus.gov/childhoodimmunization.html. Accessed on: Feb 8, 2018.
2-8 U.S. Department of Health and Human Services. 2020 Topics & Objectives: Immunizations and Infectious Diseases. Available at: https://www.healthypeople.gov/2020/topics-objectives/topic/immunization-and-infectious-diseases. Accessed on: Feb 8, 2018.
Performance Results
Child & Adolescent Care
Page | 2-13
Figure 2-5—Childhood Immunization Status—Combination 2—HEDIS 2016 and 2017
The rates only contain data for the FHP/ACA population, as the ICP population was not required to report this measure. NA indicates the rate was withheld because the denominator was less than 30. For NextLevel, HEDIS 2017 was the first year the health plan reported data.
Notable
• Performance across health plans for the Childhood Immunization Status—Combination 2 measure indicator varied for HEDIS 2017, with one of the six (16.7 percent) health plans, Meridian, exceeding the national Medicaid 75th percentile.
• Improvement in performance was demonstrated as the measure rate increased for the statewide average and for three of the six (50.0 percent) health plans that reported rates in both years.
Needs Work
• The statewide average fell below the national Medicaid 25th percentile for HEDIS 2016 and between the national Medicaid 25th and 50th percentiles for HEDIS 2017.
• Measure rates for four of the six (66.7 percent) health plans—BCBSIL, CountyCare, Harmony, and Molina—fell between the national Medicaid 25th and 50th percentiles for HEDIS 2017.
Performance Results
Child & Adolescent Care
Page | 2-14
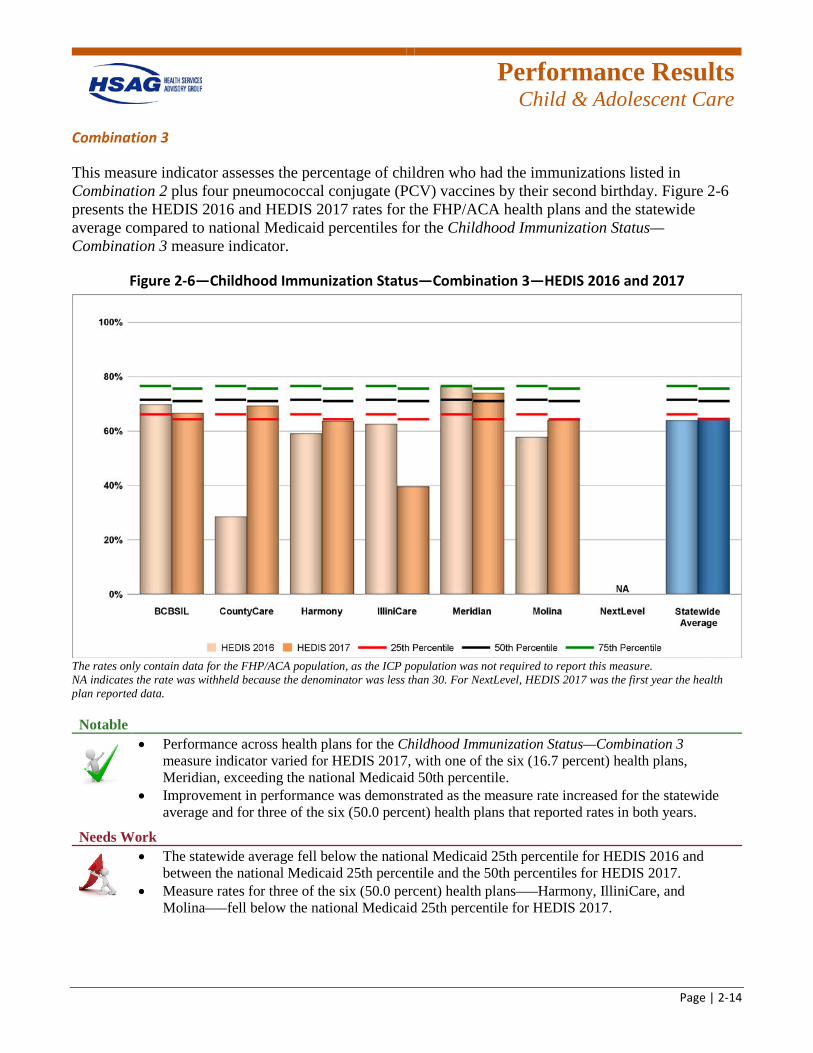
Combination 3
This measure indicator assesses the percentage of children who had the immunizations listed in Combination 2 plus four pneumococcal conjugate (PCV) vaccines by their second birthday. Figure 2-6 presents the HEDIS 2016 and HEDIS 2017 rates for the FHP/ACA health plans and the statewide average compared to national Medicaid percentiles for the Childhood Immunization Status—Combination 3 measure indicator.
Figure 2-6—Childhood Immunization Status—Combination 3—HEDIS 2016 and 2017
The rates only contain data for the FHP/ACA population, as the ICP population was not required to report this measure. NA indicates the rate was withheld because the denominator was less than 30. For NextLevel, HEDIS 2017 was the first year the health plan reported data. Notable
• Performance across health plans for the Childhood Immunization Status—Combination 3 measure indicator varied for HEDIS 2017, with one of the six (16.7 percent) health plans, Meridian, exceeding the national Medicaid 50th percentile.
• Improvement in performance was demonstrated as the measure rate increased for the statewide average and for three of the six (50.0 percent) health plans that reported rates in both years.
Needs Work
• The statewide average fell below the national Medicaid 25th percentile for HEDIS 2016 and between the national Medicaid 25th percentile and the 50th percentiles for HEDIS 2017.
• Measure rates for three of the six (50.0 percent) health plans—–Harmony, IlliniCare, and Molina—–fell below the national Medicaid 25th percentile for HEDIS 2017.
Performance Results
Child & Adolescent Care
Page | 2-15
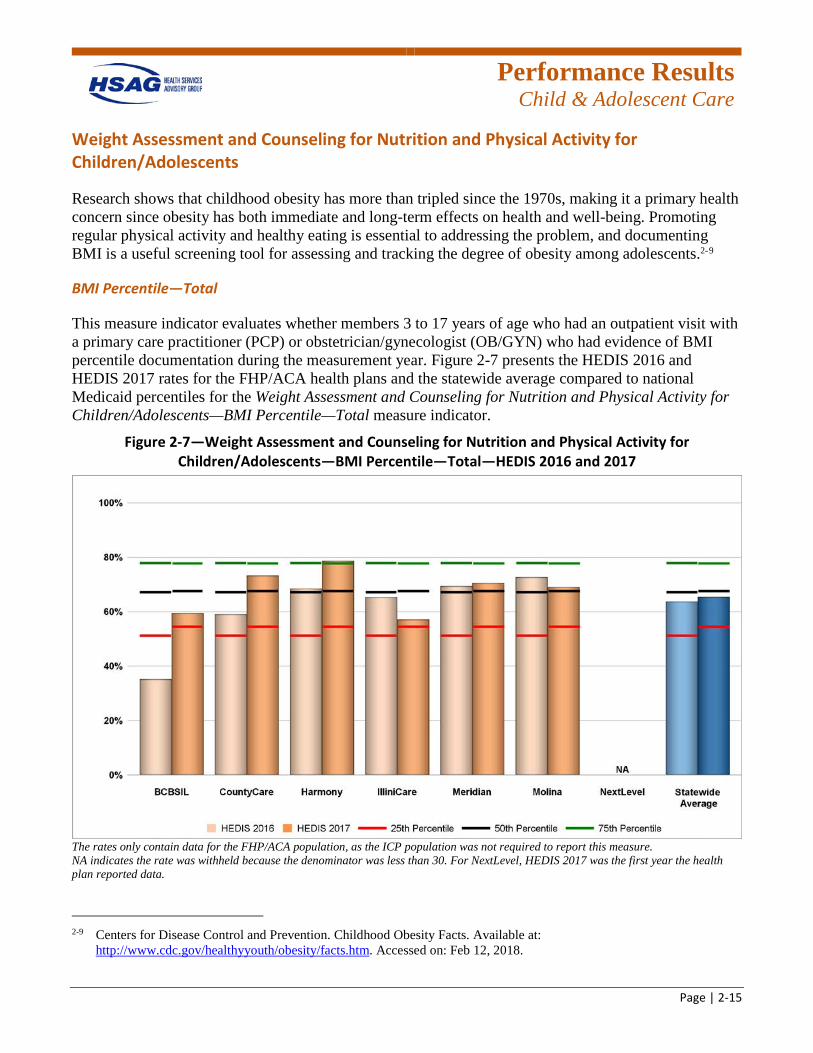
Weight Assessment and Counseling for Nutrition and Physical Activity for Children/Adolescents
Research shows that childhood obesity has more than tripled since the 1970s, making it a primary health concern since obesity has both immediate and long-term effects on health and well-being. Promoting regular physical activity and healthy eating is essential to addressing the problem, and documenting BMI is a useful screening tool for assessing and tracking the degree of obesity among adolescents.2-9
BMI Percentile—Total
This measure indicator evaluates whether members 3 to 17 years of age who had an outpatient visit with a primary care practitioner (PCP) or obstetrician/gynecologist (OB/GYN) who had evidence of BMI percentile documentation during the measurement year. Figure 2-7 presents the HEDIS 2016 and HEDIS 2017 rates for the FHP/ACA health plans and the statewide average compared to national Medicaid percentiles for the Weight Assessment and Counseling for Nutrition and Physical Activity for Children/Adolescents—BMI Percentile—Total measure indicator.
Figure 2-7—Weight Assessment and Counseling for Nutrition and Physical Activity for Children/Adolescents—BMI Percentile—Total—HEDIS 2016 and 2017
The rates only contain data for the FHP/ACA population, as the ICP population was not required to report this measure. NA indicates the rate was withheld because the denominator was less than 30. For NextLevel, HEDIS 2017 was the first year the health plan reported data.
2-9 Centers for Disease Control and Prevention. Childhood Obesity Facts. Available at:
http://www.cdc.gov/healthyyouth/obesity/facts.htm. Accessed on: Feb 12, 2018.
Performance Results
Child & Adolescent Care
Page | 2-16
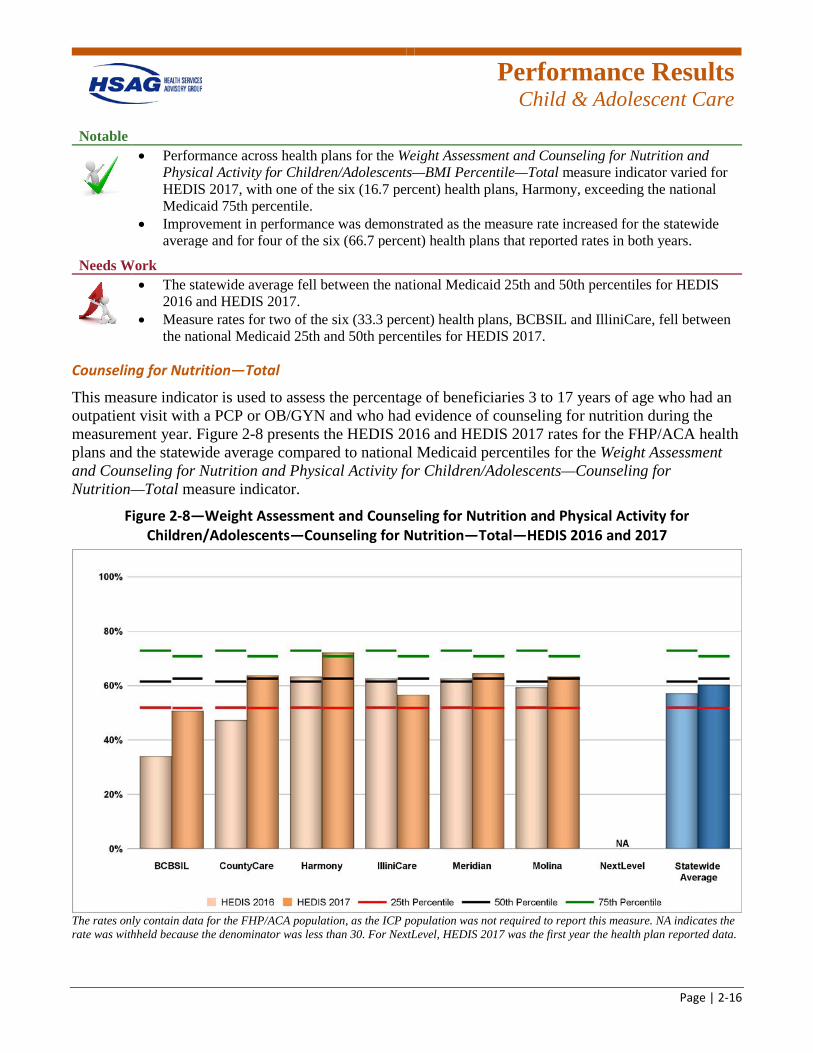
Notable
• Performance across health plans for the Weight Assessment and Counseling for Nutrition and Physical Activity for Children/Adolescents—BMI Percentile—Total measure indicator varied for HEDIS 2017, with one of the six (16.7 percent) health plans, Harmony, exceeding the national Medicaid 75th percentile.
• Improvement in performance was demonstrated as the measure rate increased for the statewide average and for four of the six (66.7 percent) health plans that reported rates in both years.
Needs Work
• The statewide average fell between the national Medicaid 25th and 50th percentiles for HEDIS 2016 and HEDIS 2017.
• Measure rates for two of the six (33.3 percent) health plans, BCBSIL and IlliniCare, fell between the national Medicaid 25th and 50th percentiles for HEDIS 2017.
Counseling for Nutrition—Total
This measure indicator is used to assess the percentage of beneficiaries 3 to 17 years of age who had an outpatient visit with a PCP or OB/GYN and who had evidence of counseling for nutrition during the measurement year. Figure 2-8 presents the HEDIS 2016 and HEDIS 2017 rates for the FHP/ACA health plans and the statewide average compared to national Medicaid percentiles for the Weight Assessment and Counseling for Nutrition and Physical Activity for Children/Adolescents—Counseling for Nutrition—Total measure indicator.
Figure 2-8—Weight Assessment and Counseling for Nutrition and Physical Activity for Children/Adolescents—Counseling for Nutrition—Total—HEDIS 2016 and 2017
The rates only contain data for the FHP/ACA population, as the ICP population was not required to report this measure. NA indicates the rate was withheld because the denominator was less than 30. For NextLevel, HEDIS 2017 was the first year the health plan reported data.
Performance Results
Child & Adolescent Care
Page | 2-17
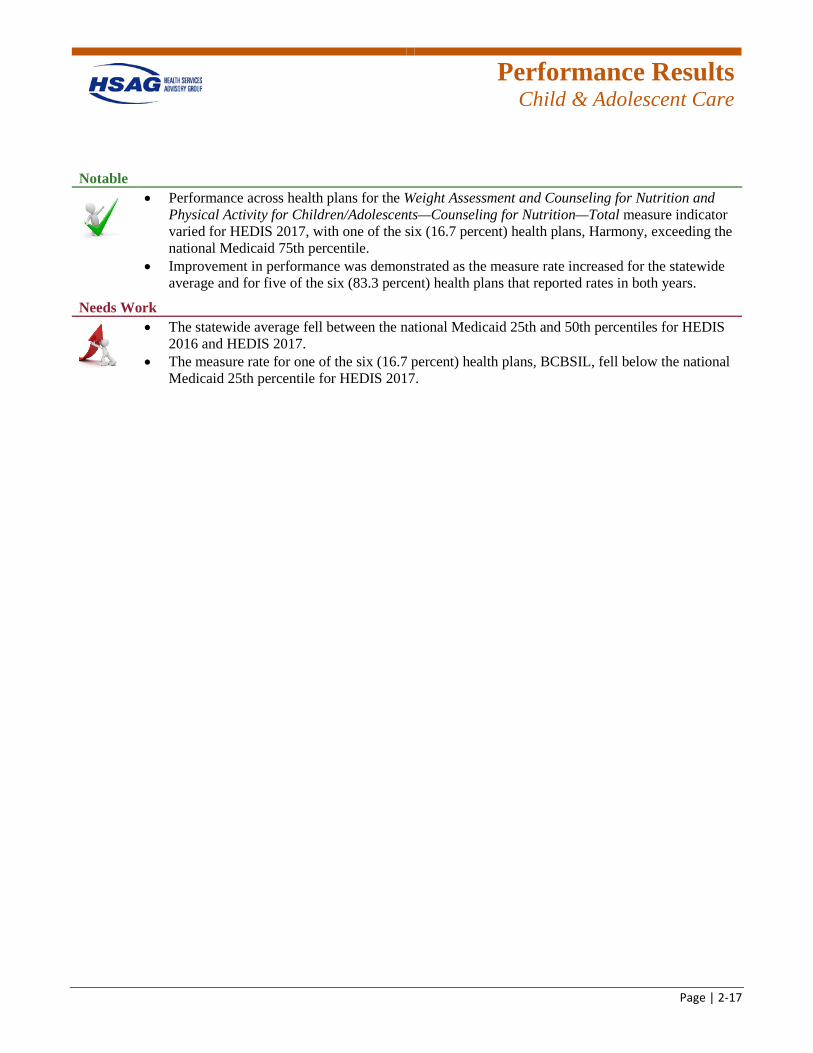
Notable
• Performance across health plans for the Weight Assessment and Counseling for Nutrition and Physical Activity for Children/Adolescents—Counseling for Nutrition—Total measure indicator varied for HEDIS 2017, with one of the six (16.7 percent) health plans, Harmony, exceeding the national Medicaid 75th percentile.
• Improvement in performance was demonstrated as the measure rate increased for the statewide average and for five of the six (83.3 percent) health plans that reported rates in both years.
Needs Work
• The statewide average fell between the national Medicaid 25th and 50th percentiles for HEDIS 2016 and HEDIS 2017.
• The measure rate for one of the six (16.7 percent) health plans, BCBSIL, fell below the national Medicaid 25th percentile for HEDIS 2017.
Performance Results
Child & Adolescent Care
Page | 2-18
Well-Child Visits
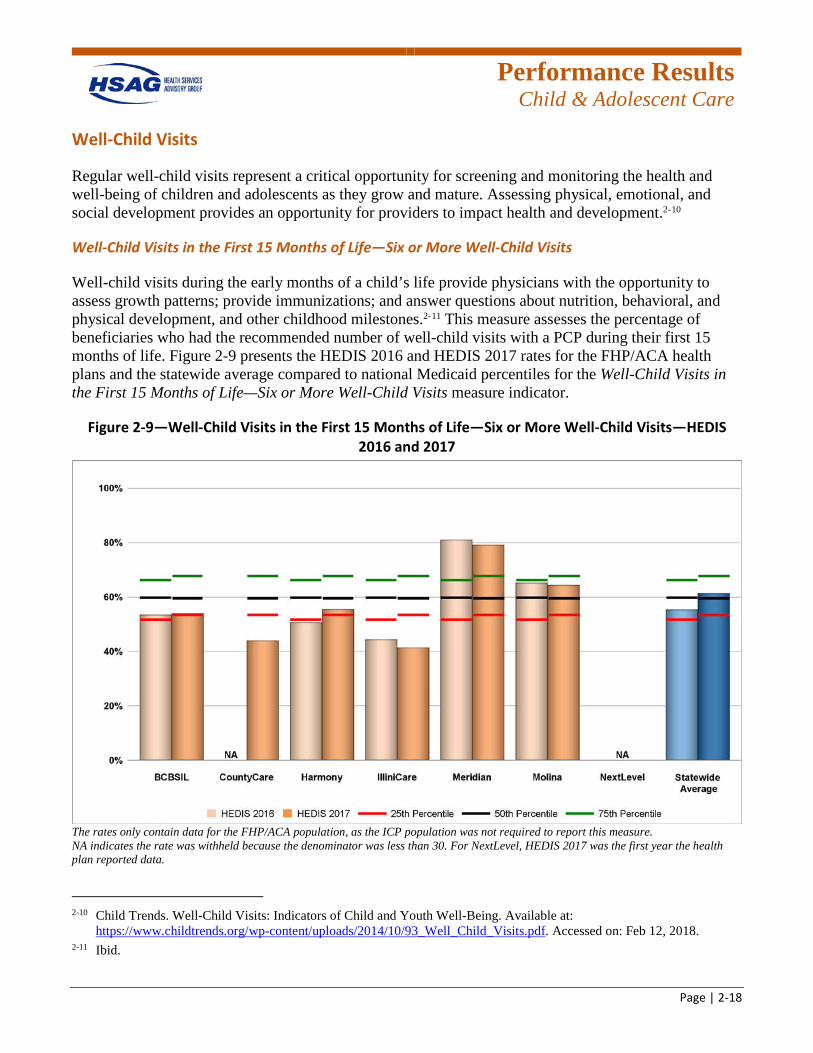
Regular well-child visits represent a critical opportunity for screening and monitoring the health and well-being of children and adolescents as they grow and mature. Assessing physical, emotional, and social development provides an opportunity for providers to impact health and development.2-10
Well-Child Visits in the First 15 Months of Life—Six or More Well-Child Visits
Well-child visits during the early months of a child’s life provide physicians with the opportunity to assess growth patterns; provide immunizations; and answer questions about nutrition, behavioral, and physical development, and other childhood milestones.2-11 This measure assesses the percentage of beneficiaries who had the recommended number of well-child visits with a PCP during their first 15 months of life. Figure 2-9 presents the HEDIS 2016 and HEDIS 2017 rates for the FHP/ACA health plans and the statewide average compared to national Medicaid percentiles for the Well-Child Visits in the First 15 Months of Life—Six or More Well-Child Visits measure indicator.
Figure 2-9—Well-Child Visits in the First 15 Months of Life—Six or More Well-Child Visits—HEDIS 2016 and 2017
The rates only contain data for the FHP/ACA population, as the ICP population was not required to report this measure. NA indicates the rate was withheld because the denominator was less than 30. For NextLevel, HEDIS 2017 was the first year the health plan reported data.
2-10 Child Trends. Well-Child Visits: Indicators of Child and Youth Well-Being. Available at:
https://www.childtrends.org/wp-content/uploads/2014/10/93_Well_Child_Visits.pdf. Accessed on: Feb 12, 2018. 2-11 Ibid.
Performance Results
Child & Adolescent Care
Page | 2-19
Notable
• The statewide average for the Well-Child Visits in the First 15 Months of Life—Six or More Well-Child Visits measure indicator fell between the national Medicaid 50th and 75th percentiles for HEDIS 2017.
• Performance across health plans varied for HEDIS 2017, with one of the six (16.7 percent) health plans, Meridian, exceeding the national Medicaid 75th percentile.
• Improvement in performance was demonstrated as the measure rate increased for the statewide average and for two of the five (40.0 percent) health plans that reported rates in both years.
Needs Work
• Measure rates for two of the six (33.3 percent) health plans, CountyCare and IlliniCare, fell below the national Medicaid 25th percentile for HEDIS 2017.
Performance Results
Child & Adolescent Care
Page | 2-20
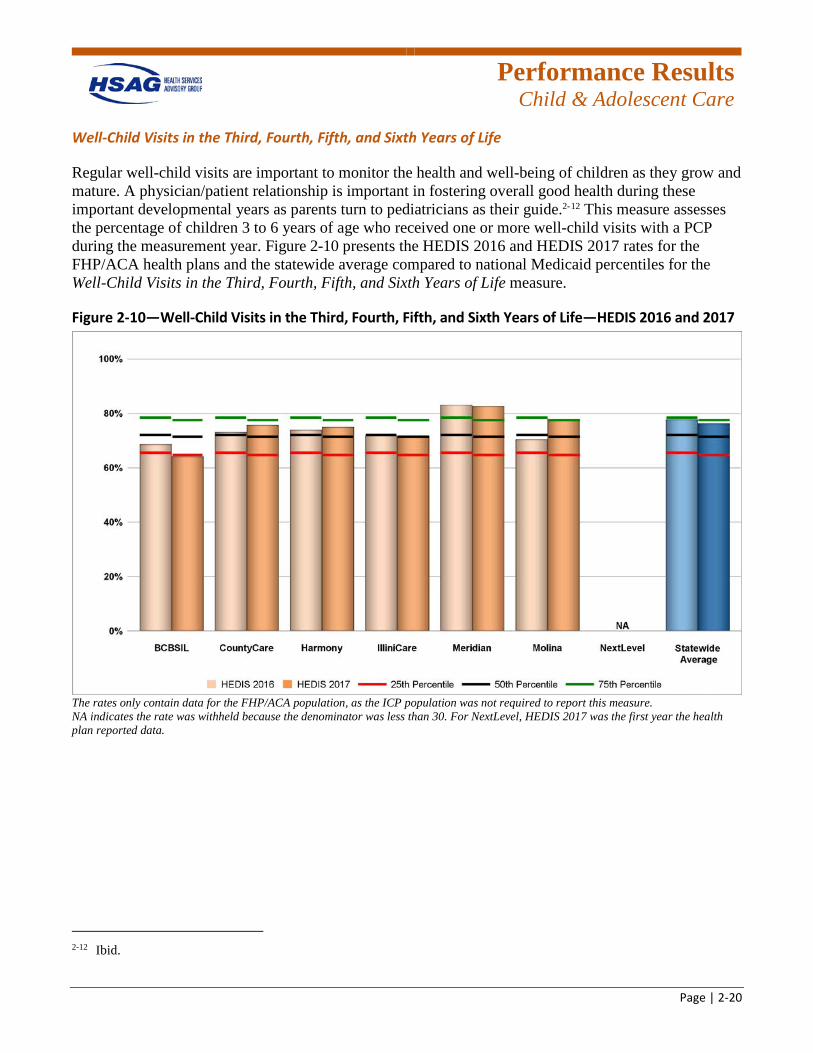
Well-Child Visits in the Third, Fourth, Fifth, and Sixth Years of Life
Regular well-child visits are important to monitor the health and well-being of children as they grow and mature. A physician/patient relationship is important in fostering overall good health during these important developmental years as parents turn to pediatricians as their guide.2-12 This measure assesses the percentage of children 3 to 6 years of age who received one or more well-child visits with a PCP during the measurement year. Figure 2-10 presents the HEDIS 2016 and HEDIS 2017 rates for the FHP/ACA health plans and the statewide average compared to national Medicaid percentiles for the Well-Child Visits in the Third, Fourth, Fifth, and Sixth Years of Life measure.
Figure 2-10—Well-Child Visits in the Third, Fourth, Fifth, and Sixth Years of Life—HEDIS 2016 and 2017
The rates only contain data for the FHP/ACA population, as the ICP population was not required to report this measure. NA indicates the rate was withheld because the denominator was less than 30. For NextLevel, HEDIS 2017 was the first year the health plan reported data.
2-12 Ibid.
Performance Results
Child & Adolescent Care
Page | 2-21
Notable
• The statewide average for the Well-Child Visits in the Third, Fourth, Fifth, and Sixth Years of Life measure fell between the national Medicaid 50th and 75th percentiles for HEDIS 2016 and HEDIS 2017.
• Performance across health plans varied for HEDIS 2017, with two of the six (33.3 percent) health plans, Meridian and Molina, exceeding the national Medicaid 75th percentile.
Needs Work
• The measure rate for one of the six (16.7 percent) health plans, BCBSIL, fell below the national Medicaid 25th percentile for HEDIS 2017.
• Decline in performance was demonstrated as the measure rate decreased for the statewide average and for three of the six (50.0 percent) health plans that reported rates in both years.
Child & Adolescent Care Conclusions
In the Child & Adolescent Care domain, the statewide average for HEDIS 2017 fell below the national Medicaid 50th percentile for the following measure rates: Childhood Immunization Status—Combination 2 and Combination 3; and Weight Assessment and Counseling for Nutrition and Physical Activity for Children/Adolescents—BMI Percentile—Total and Counseling for Nutrition—Total. Additionally, a decrease in performance from HEDIS 2016 to HEDIS 2017 was demonstrated for the Well-Child Visits in the Third, Fourth, Fifth, and Sixth Years of Life measure rate. Therefore, there are opportunities for the health plans to increase immunizations for children, monitor and document potential weight-related issues, and increase the number of well-child visits for children 3 to 6 years of age.
Performance Results
Women’s Health
Page | 2-22
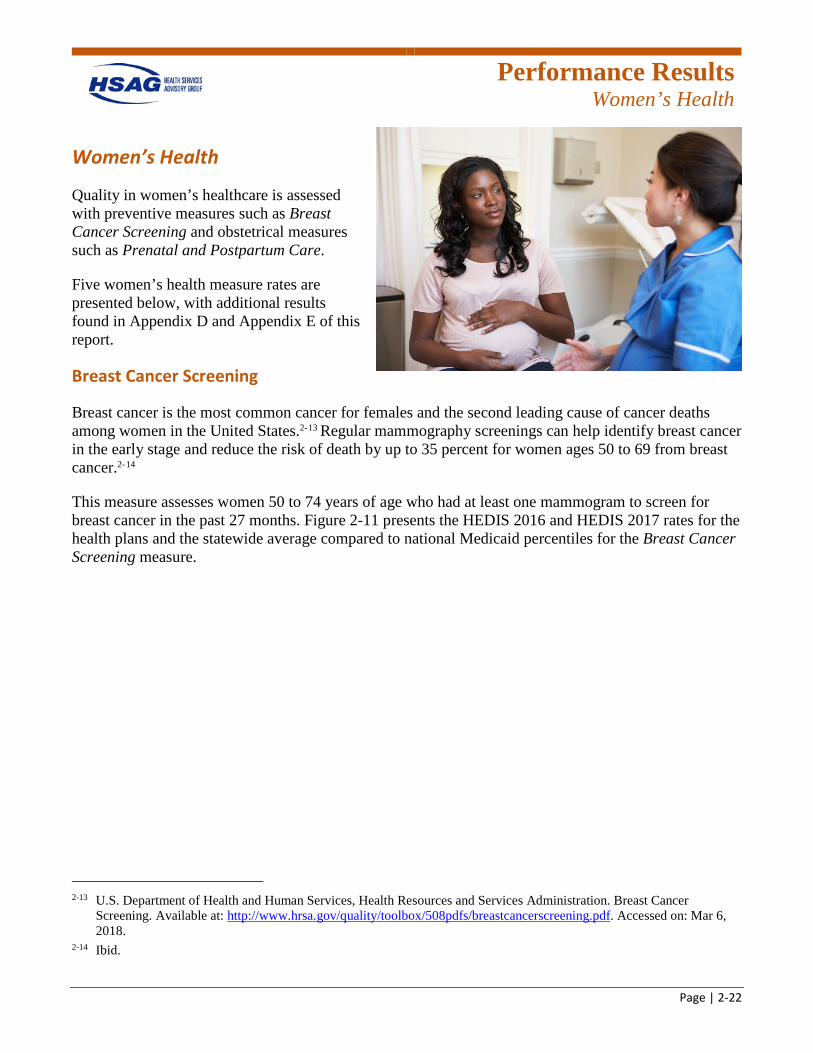
Women’s Health
Quality in women’s healthcare is assessed with preventive measures such as Breast Cancer Screening and obstetrical measures such as Prenatal and Postpartum Care.
Five women’s health measure rates are presented below, with additional results found in Appendix D and Appendix E of this report.
Breast Cancer Screening
Breast cancer is the most common cancer for females and the second leading cause of cancer deaths among women in the United States.2-13 Regular mammography screenings can help identify breast cancer in the early stage and reduce the risk of death by up to 35 percent for women ages 50 to 69 from breast cancer.2-14
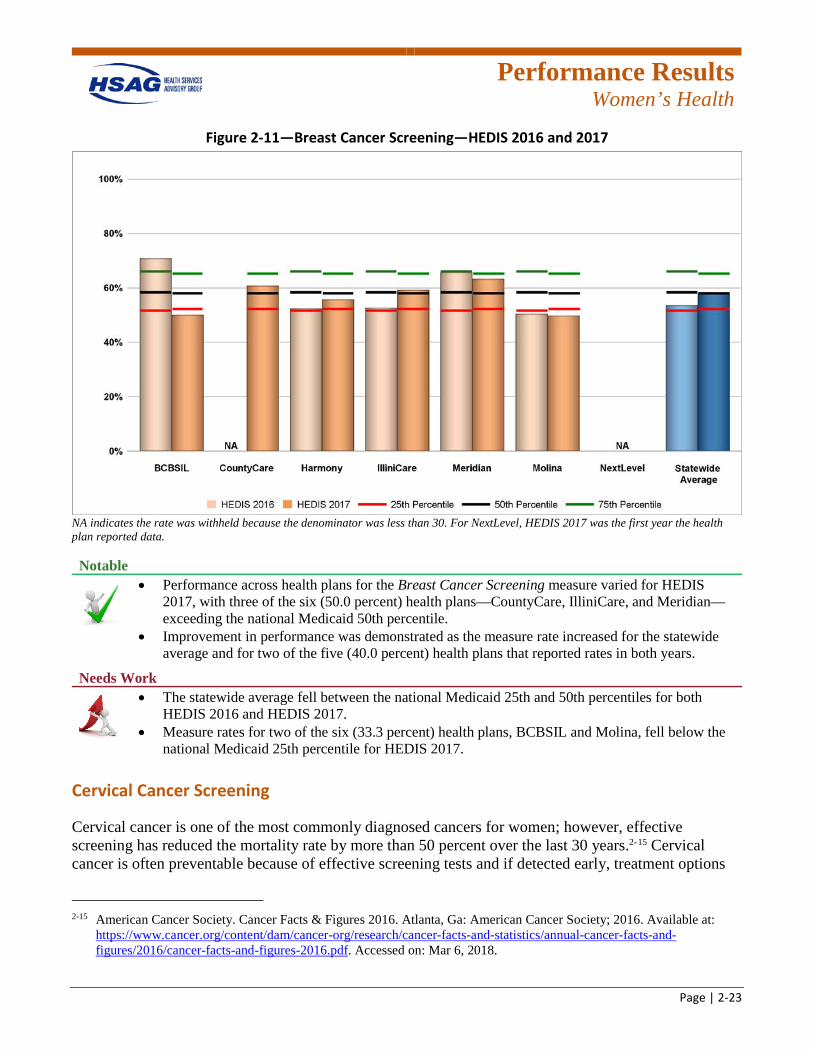
This measure assesses women 50 to 74 years of age who had at least one mammogram to screen for breast cancer in the past 27 months. Figure 2-11 presents the HEDIS 2016 and HEDIS 2017 rates for the health plans and the statewide average compared to national Medicaid percentiles for the Breast Cancer Screening measure.
2-13 U.S. Department of Health and Human Services, Health Resources and Services Administration. Breast Cancer
Screening. Available at: http://www.hrsa.gov/quality/toolbox/508pdfs/breastcancerscreening.pdf. Accessed on: Mar 6, 2018.
2-14 Ibid.
Performance Results
Women’s Health
Page | 2-23
Figure 2-11—Breast Cancer Screening—HEDIS 2016 and 2017
NA indicates the rate was withheld because the denominator was less than 30. For NextLevel, HEDIS 2017 was the first year the health plan reported data. Notable
• Performance across health plans for the Breast Cancer Screening measure varied for HEDIS 2017, with three of the six (50.0 percent) health plans—CountyCare, IlliniCare, and Meridian—exceeding the national Medicaid 50th percentile.
• Improvement in performance was demonstrated as the measure rate increased for the statewide average and for two of the five (40.0 percent) health plans that reported rates in both years.
Needs Work
• The statewide average fell between the national Medicaid 25th and 50th percentiles for both HEDIS 2016 and HEDIS 2017.
• Measure rates for two of the six (33.3 percent) health plans, BCBSIL and Molina, fell below the national Medicaid 25th percentile for HEDIS 2017.
Cervical Cancer Screening
Cervical cancer is one of the most commonly diagnosed cancers for women; however, effective screening has reduced the mortality rate by more than 50 percent over the last 30 years.2-15 Cervical cancer is often preventable because of effective screening tests and if detected early, treatment options
2-15 American Cancer Society. Cancer Facts & Figures 2016. Atlanta, Ga: American Cancer Society; 2016. Available at:
https://www.cancer.org/content/dam/cancer-org/research/cancer-facts-and-statistics/annual-cancer-facts-and-figures/2016/cancer-facts-and-figures-2016.pdf. Accessed on: Mar 6, 2018.
Performance Results
Women’s Health
Page | 2-24
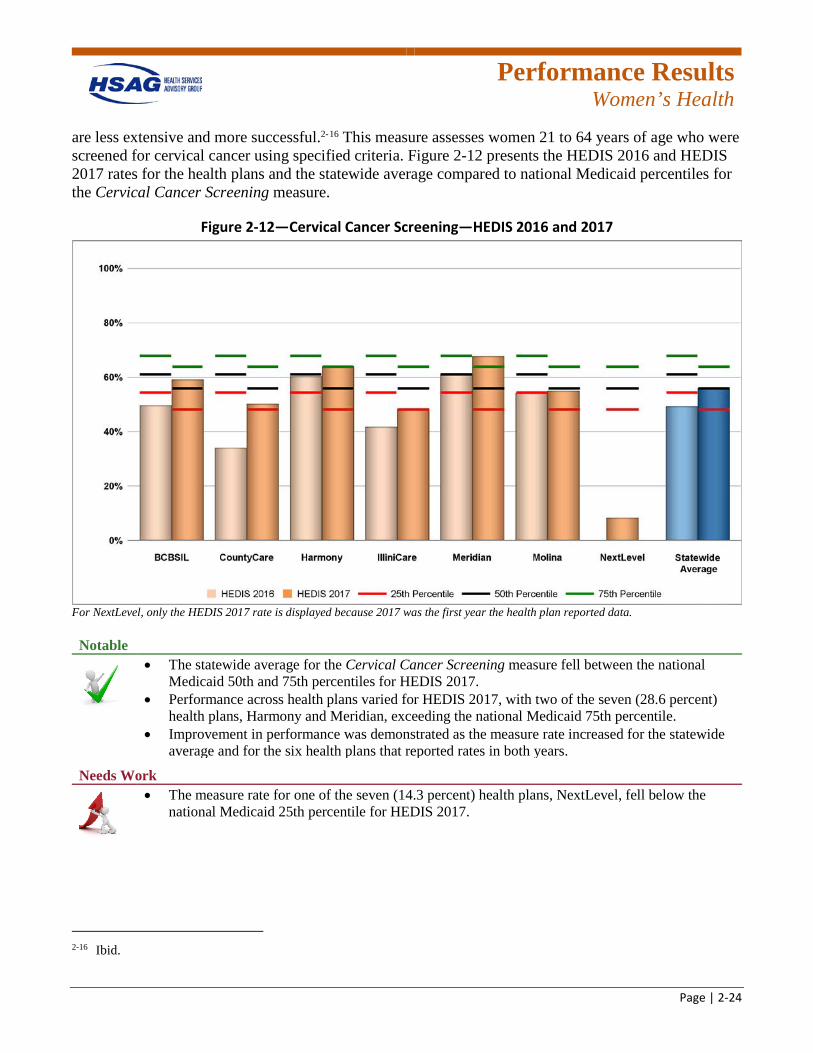
are less extensive and more successful.2-16 This measure assesses women 21 to 64 years of age who were screened for cervical cancer using specified criteria. Figure 2-12 presents the HEDIS 2016 and HEDIS 2017 rates for the health plans and the statewide average compared to national Medicaid percentiles for the Cervical Cancer Screening measure.
Figure 2-12—Cervical Cancer Screening—HEDIS 2016 and 2017
For NextLevel, only the HEDIS 2017 rate is displayed because 2017 was the first year the health plan reported data. Notable
• The statewide average for the Cervical Cancer Screening measure fell between the national Medicaid 50th and 75th percentiles for HEDIS 2017.
• Performance across health plans varied for HEDIS 2017, with two of the seven (28.6 percent) health plans, Harmony and Meridian, exceeding the national Medicaid 75th percentile.
• Improvement in performance was demonstrated as the measure rate increased for the statewide average and for the six health plans that reported rates in both years.
Needs Work
• The measure rate for one of the seven (14.3 percent) health plans, NextLevel, fell below the national Medicaid 25th percentile for HEDIS 2017.
2-16 Ibid.
Performance Results
Women’s Health
Page | 2-25
Chlamydia Screening in Women—Total
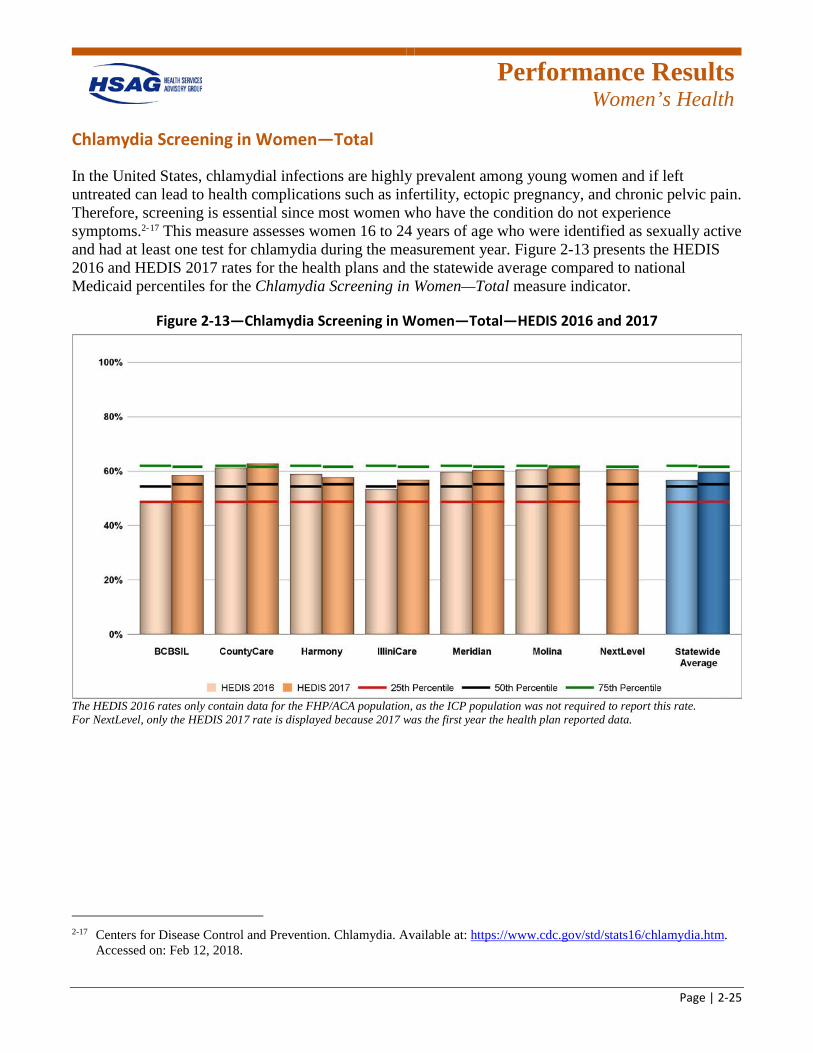
In the United States, chlamydial infections are highly prevalent among young women and if left untreated can lead to health complications such as infertility, ectopic pregnancy, and chronic pelvic pain. Therefore, screening is essential since most women who have the condition do not experience symptoms.2-17 This measure assesses women 16 to 24 years of age who were identified as sexually active and had at least one test for chlamydia during the measurement year. Figure 2-13 presents the HEDIS 2016 and HEDIS 2017 rates for the health plans and the statewide average compared to national Medicaid percentiles for the Chlamydia Screening in Women—Total measure indicator.
Figure 2-13—Chlamydia Screening in Women—Total—HEDIS 2016 and 2017
The HEDIS 2016 rates only contain data for the FHP/ACA population, as the ICP population was not required to report this rate. For NextLevel, only the HEDIS 2017 rate is displayed because 2017 was the first year the health plan reported data.
2-17 Centers for Disease Control and Prevention. Chlamydia. Available at: https://www.cdc.gov/std/stats16/chlamydia.htm.
Accessed on: Feb 12, 2018.
Performance Results
Women’s Health
Page | 2-26
Notable
• The statewide average for the Chlamydia Screening in Women—Total measure indicator fell between the national Medicaid 50th and 75th percentiles for HEDIS 2016 and HEDIS 2017.
• Performance across health plans was positive for HEDIS 2017, with one of the seven (14.3 percent) health plans, CountyCare, exceeding the national Medicaid 75th percentile and six of the seven (85.7 percent) health plans—BCBSIL, Harmony, IlliniCare, Meridian, Molina, and NextLevel—falling between the national Medicaid 50th percentile and the 75th percentiles.
• Improvement in performance was demonstrated as the measure rate increased for the statewide average and for five of the six (83.3 percent) health plans that reported rates in both years.
Needs Work
• None.
Prenatal and Postpartum Care
Prenatal care is important for women to keep themselves and their baby healthy.2-18 After a child’s birth, effective postpartum care includes managing the mother’s physical and mental well-being.2-19
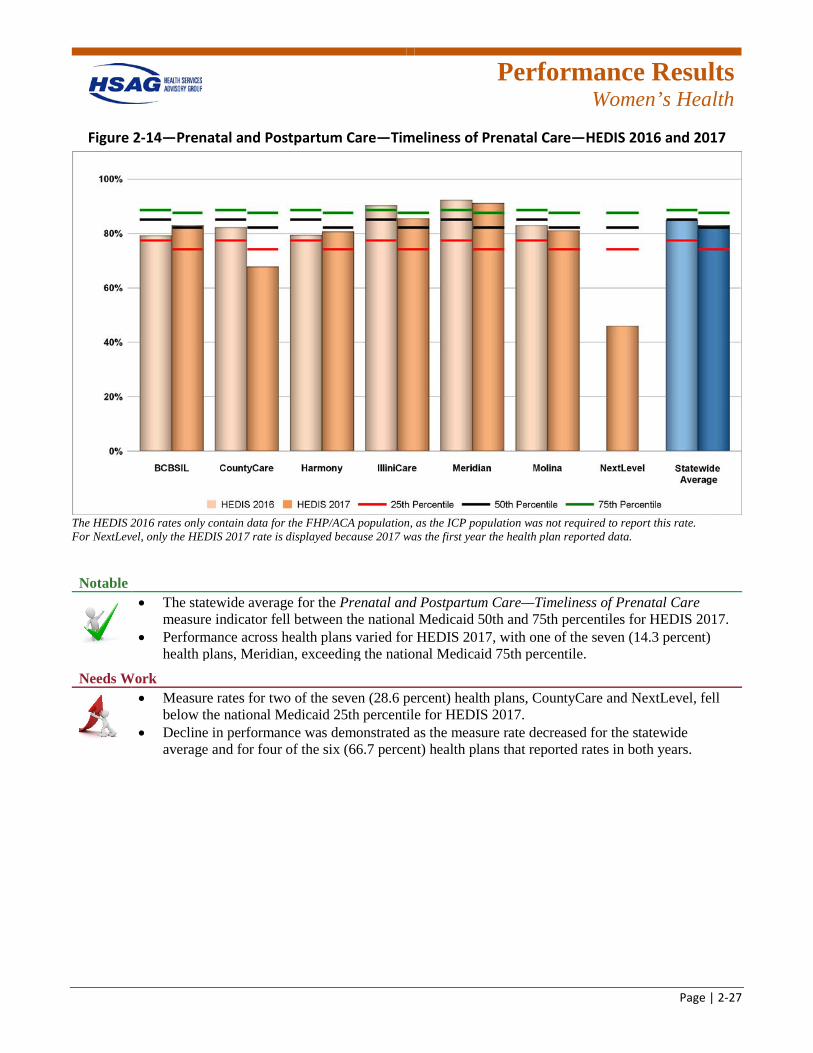
Timeliness of Prenatal Care
This measure indicator assesses the percentage of deliveries resulting in live births that received a prenatal care visit in the first trimester or within 42 days of enrollment in the health plan. Figure 2-14 presents the HEDIS 2016 and HEDIS 2017 rates for the health plans and the statewide average compared to national Medicaid percentiles for the Prenatal and Postpartum Care—Timeliness of Prenatal Care measure indicator.
2-18 U.S. Department of Health and Human Services. Prenatal Care. Available at: https://medlineplus.gov/prenatalcare.html.
Accessed on: Feb 13, 2018. 2-19 Mayo Clinic. Postpartum Care. Available at: https://www.mayoclinic.org/healthy-lifestyle/labor-and-
delivery/basics/postpartum-care/hlv-20049465. Accessed on: Feb 12, 2018.
Performance Results
Women’s Health
Page | 2-27
Figure 2-14—Prenatal and Postpartum Care—Timeliness of Prenatal Care—HEDIS 2016 and 2017
The HEDIS 2016 rates only contain data for the FHP/ACA population, as the ICP population was not required to report this rate. For NextLevel, only the HEDIS 2017 rate is displayed because 2017 was the first year the health plan reported data.
Notable
• The statewide average for the Prenatal and Postpartum Care—Timeliness of Prenatal Care measure indicator fell between the national Medicaid 50th and 75th percentiles for HEDIS 2017.
• Performance across health plans varied for HEDIS 2017, with one of the seven (14.3 percent) health plans, Meridian, exceeding the national Medicaid 75th percentile.
Needs Work
• Measure rates for two of the seven (28.6 percent) health plans, CountyCare and NextLevel, fell below the national Medicaid 25th percentile for HEDIS 2017.
• Decline in performance was demonstrated as the measure rate decreased for the statewide average and for four of the six (66.7 percent) health plans that reported rates in both years.
Performance Results
Women’s Health
Page | 2-28
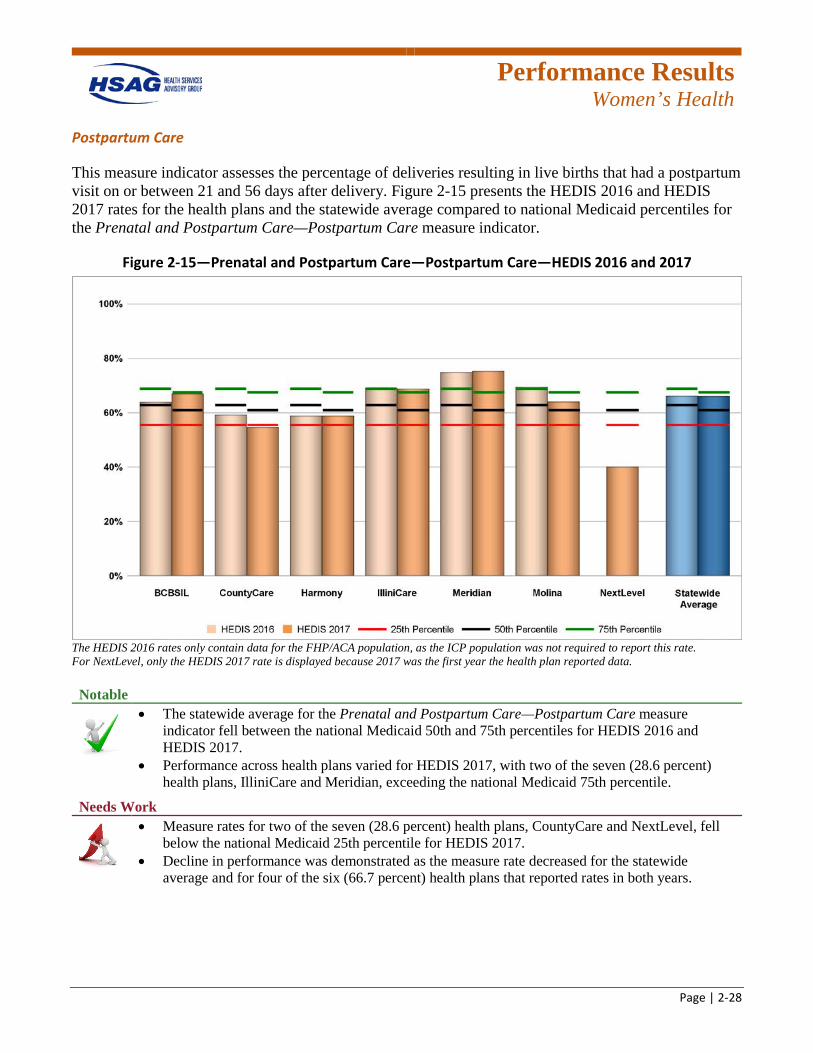
Postpartum Care
This measure indicator assesses the percentage of deliveries resulting in live births that had a postpartum visit on or between 21 and 56 days after delivery. Figure 2-15 presents the HEDIS 2016 and HEDIS 2017 rates for the health plans and the statewide average compared to national Medicaid percentiles for the Prenatal and Postpartum Care—Postpartum Care measure indicator.
Figure 2-15—Prenatal and Postpartum Care—Postpartum Care—HEDIS 2016 and 2017
The HEDIS 2016 rates only contain data for the FHP/ACA population, as the ICP population was not required to report this rate. For NextLevel, only the HEDIS 2017 rate is displayed because 2017 was the first year the health plan reported data. Notable
• The statewide average for the Prenatal and Postpartum Care—Postpartum Care measure indicator fell between the national Medicaid 50th and 75th percentiles for HEDIS 2016 and HEDIS 2017.
• Performance across health plans varied for HEDIS 2017, with two of the seven (28.6 percent) health plans, IlliniCare and Meridian, exceeding the national Medicaid 75th percentile.
Needs Work
• Measure rates for two of the seven (28.6 percent) health plans, CountyCare and NextLevel, fell below the national Medicaid 25th percentile for HEDIS 2017.
• Decline in performance was demonstrated as the measure rate decreased for the statewide average and for four of the six (66.7 percent) health plans that reported rates in both years.
Performance Results
Women’s Health
Page | 2-29
Women’s Health Conclusions
In the Women’s Health domain, the statewide average for HEDIS 2017 fell below the national Medicaid 50th percentile for the Breast Cancer Screening measure rate. Additionally, a decrease in performance from HEDIS 2016 to HEDIS 2017 was demonstrated for the Prenatal and Postpartum Care—Timeliness of Prenatal Care and Postpartum Care measure rates. Therefore, there are opportunities for the health plans to increase screenings for breast cancer in women and ensure women are receiving prenatal and postpartum care.
Performance Results
Care for Chronic Conditions
Page | 2-30
Appropriate Care
Appropriate healthcare is when the health benefits outweigh the expected negative effects. Appropriate care requires effective treatment options, quality clinical skills, upfront communication, and a justification for the type and extent of care.2-20
The results of 12 appropriate care measure rates for the health plans are presented in this section. The results for additional appropriate care measure results can be found in Appendix D and Appendix E of this report.
Annual Monitoring for Patients on Persistent Medications
Patients with long-term medication use and who take multiple medications are at increased risk of preventable adverse drug events, which contribute to health complications and high costs but can be reduced through appropriate monitoring.2-21 This measure assesses the percentage of adults 18 years of age and older who received at least 180 treatment days of ambulatory medication therapy for a select therapeutic agent during the measurement year and received at least one therapeutic monitoring event for the therapeutic agent in the measurement year. Results for this measure are reported as three rates separately and as a total rate.
2-20 What do we mean by appropriate health care? Report of a working group prepared for the Director of Research and
Development of the NHS Management Executive. Quality in Health Care. 1993;2(2):117-123. Available at: http://europepmc.org/backend/ptpmcrender.fcgi?accid=PMC1055096&blobtype=pdf. Accessed on: Feb 13, 2018.
2-21 National Committee for Quality Assurance. Annual Monitoring for Patients on Persistent Medications. Available at: https://www.ncqa.org/report-cards/health-plans/state-of-health-care-quality/2017-table-of-contents/persistent-medications. Accessed on: Feb 15, 2018.
Performance Results
Care for Chronic Conditions
Page | 2-31
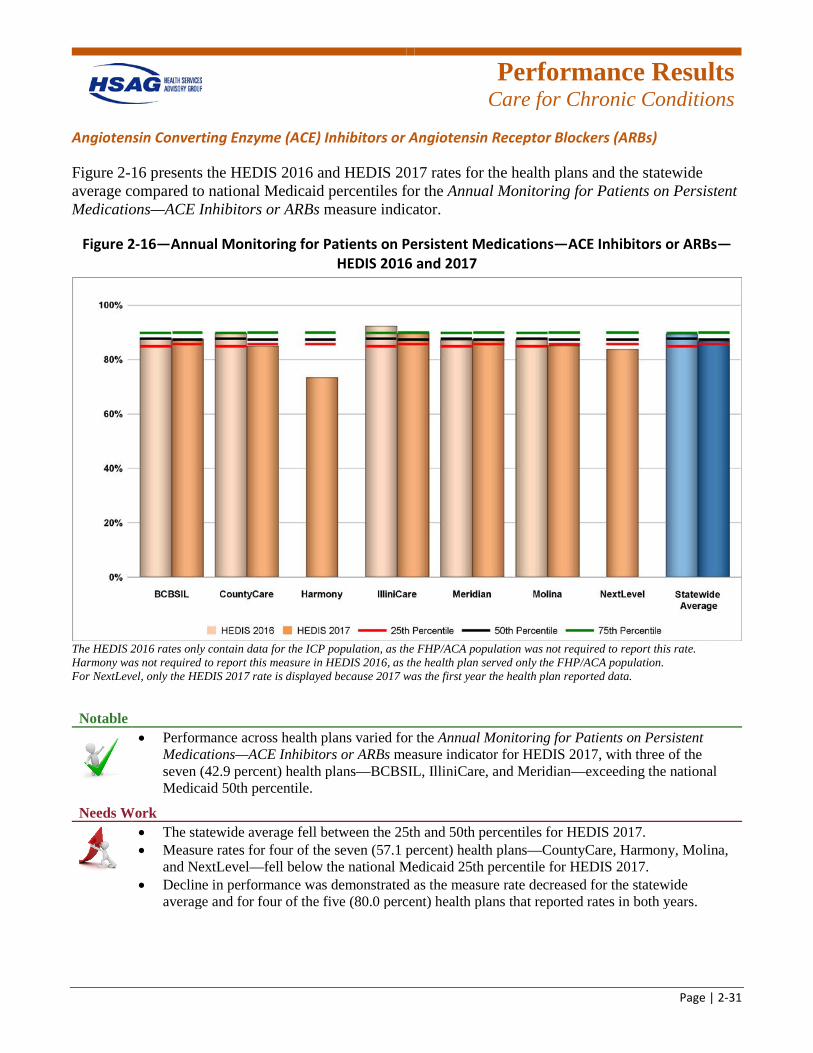
Angiotensin Converting Enzyme (ACE) Inhibitors or Angiotensin Receptor Blockers (ARBs)
Figure 2-16 presents the HEDIS 2016 and HEDIS 2017 rates for the health plans and the statewide average compared to national Medicaid percentiles for the Annual Monitoring for Patients on Persistent Medications—ACE Inhibitors or ARBs measure indicator.
Figure 2-16—Annual Monitoring for Patients on Persistent Medications—ACE Inhibitors or ARBs—HEDIS 2016 and 2017
The HEDIS 2016 rates only contain data for the ICP population, as the FHP/ACA population was not required to report this rate. Harmony was not required to report this measure in HEDIS 2016, as the health plan served only the FHP/ACA population. For NextLevel, only the HEDIS 2017 rate is displayed because 2017 was the first year the health plan reported data.
Notable
• Performance across health plans varied for the Annual Monitoring for Patients on Persistent Medications—ACE Inhibitors or ARBs measure indicator for HEDIS 2017, with three of the seven (42.9 percent) health plans—BCBSIL, IlliniCare, and Meridian—exceeding the national Medicaid 50th percentile.
Needs Work
• The statewide average fell between the 25th and 50th percentiles for HEDIS 2017. • Measure rates for four of the seven (57.1 percent) health plans—CountyCare, Harmony, Molina,
and NextLevel—fell below the national Medicaid 25th percentile for HEDIS 2017. • Decline in performance was demonstrated as the measure rate decreased for the statewide
average and for four of the five (80.0 percent) health plans that reported rates in both years.
Performance Results
Care for Chronic Conditions
Page | 2-32
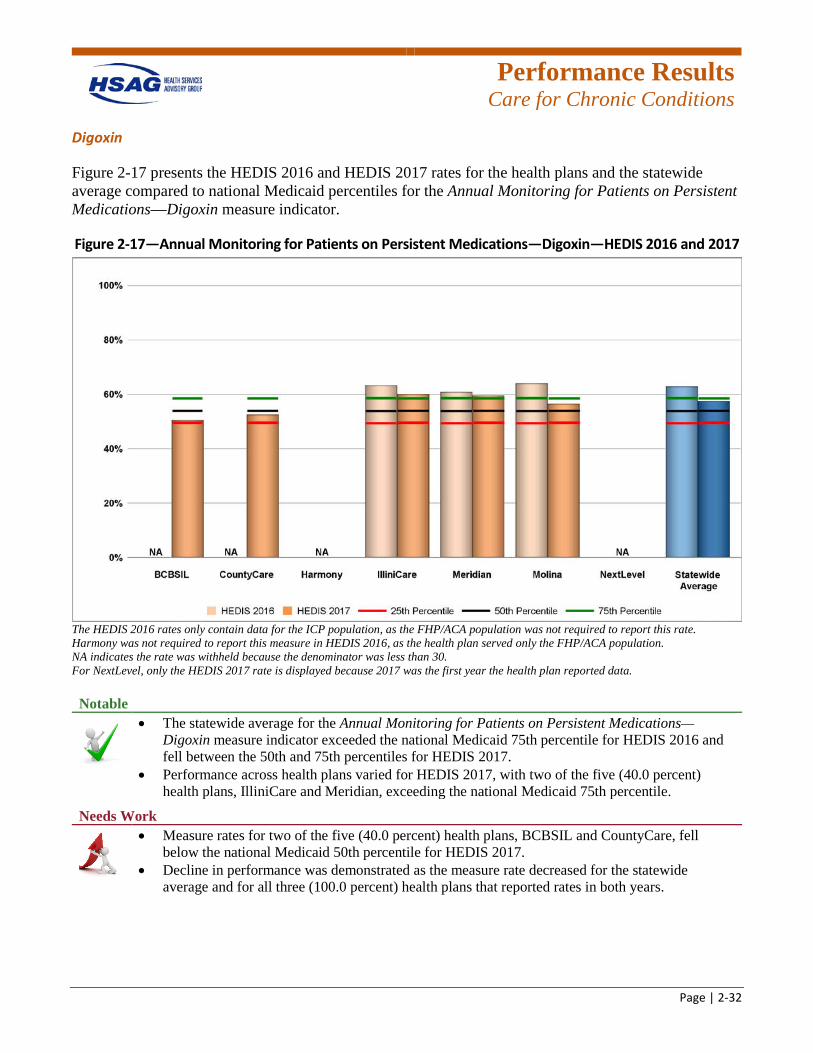
Digoxin
Figure 2-17 presents the HEDIS 2016 and HEDIS 2017 rates for the health plans and the statewide average compared to national Medicaid percentiles for the Annual Monitoring for Patients on Persistent Medications—Digoxin measure indicator.
Figure 2-17—Annual Monitoring for Patients on Persistent Medications—Digoxin—HEDIS 2016 and 2017
The HEDIS 2016 rates only contain data for the ICP population, as the FHP/ACA population was not required to report this rate. Harmony was not required to report this measure in HEDIS 2016, as the health plan served only the FHP/ACA population. NA indicates the rate was withheld because the denominator was less than 30. For NextLevel, only the HEDIS 2017 rate is displayed because 2017 was the first year the health plan reported data. Notable
• The statewide average for the Annual Monitoring for Patients on Persistent Medications—Digoxin measure indicator exceeded the national Medicaid 75th percentile for HEDIS 2016 and fell between the 50th and 75th percentiles for HEDIS 2017.
• Performance across health plans varied for HEDIS 2017, with two of the five (40.0 percent) health plans, IlliniCare and Meridian, exceeding the national Medicaid 75th percentile.
Needs Work
• Measure rates for two of the five (40.0 percent) health plans, BCBSIL and CountyCare, fell below the national Medicaid 50th percentile for HEDIS 2017.
• Decline in performance was demonstrated as the measure rate decreased for the statewide average and for all three (100.0 percent) health plans that reported rates in both years.
Performance Results
Care for Chronic Conditions
Page | 2-33
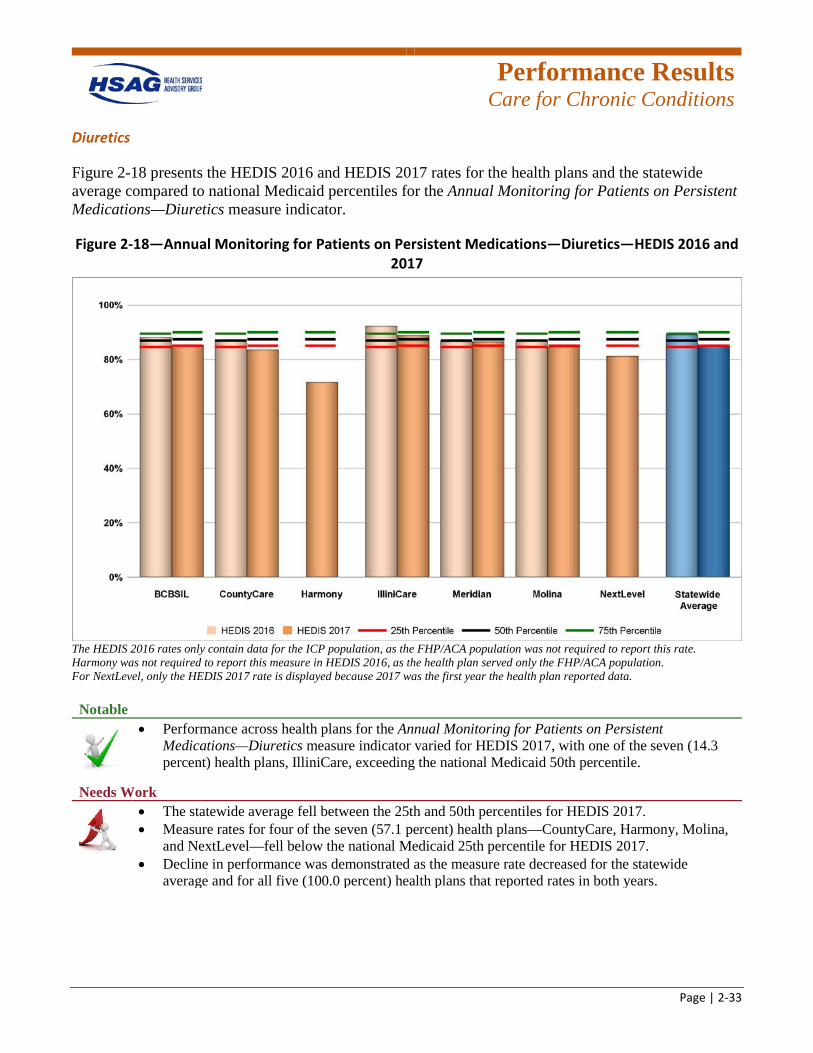
Diuretics
Figure 2-18 presents the HEDIS 2016 and HEDIS 2017 rates for the health plans and the statewide average compared to national Medicaid percentiles for the Annual Monitoring for Patients on Persistent Medications—Diuretics measure indicator.
Figure 2-18—Annual Monitoring for Patients on Persistent Medications—Diuretics—HEDIS 2016 and 2017
The HEDIS 2016 rates only contain data for the ICP population, as the FHP/ACA population was not required to report this rate. Harmony was not required to report this measure in HEDIS 2016, as the health plan served only the FHP/ACA population. For NextLevel, only the HEDIS 2017 rate is displayed because 2017 was the first year the health plan reported data. Notable
• Performance across health plans for the Annual Monitoring for Patients on Persistent Medications—Diuretics measure indicator varied for HEDIS 2017, with one of the seven (14.3 percent) health plans, IlliniCare, exceeding the national Medicaid 50th percentile.
Needs Work
• The statewide average fell between the 25th and 50th percentiles for HEDIS 2017. • Measure rates for four of the seven (57.1 percent) health plans—CountyCare, Harmony, Molina,
and NextLevel—fell below the national Medicaid 25th percentile for HEDIS 2017. • Decline in performance was demonstrated as the measure rate decreased for the statewide
average and for all five (100.0 percent) health plans that reported rates in both years.
Performance Results
Care for Chronic Conditions
Page | 2-34
Total
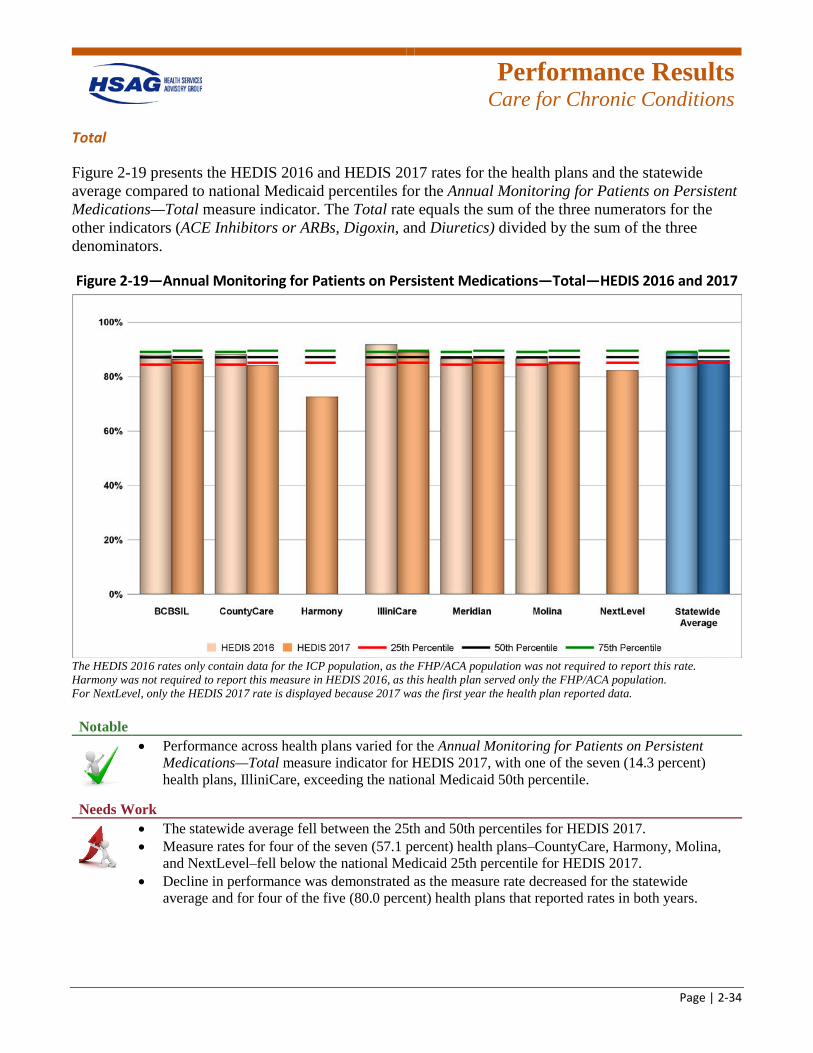
Figure 2-19 presents the HEDIS 2016 and HEDIS 2017 rates for the health plans and the statewide average compared to national Medicaid percentiles for the Annual Monitoring for Patients on Persistent Medications—Total measure indicator. The Total rate equals the sum of the three numerators for the other indicators (ACE Inhibitors or ARBs, Digoxin, and Diuretics) divided by the sum of the three denominators.
Figure 2-19—Annual Monitoring for Patients on Persistent Medications—Total—HEDIS 2016 and 2017
The HEDIS 2016 rates only contain data for the ICP population, as the FHP/ACA population was not required to report this rate. Harmony was not required to report this measure in HEDIS 2016, as this health plan served only the FHP/ACA population. For NextLevel, only the HEDIS 2017 rate is displayed because 2017 was the first year the health plan reported data. Notable
• Performance across health plans varied for the Annual Monitoring for Patients on Persistent Medications—Total measure indicator for HEDIS 2017, with one of the seven (14.3 percent) health plans, IlliniCare, exceeding the national Medicaid 50th percentile.
Needs Work
• The statewide average fell between the 25th and 50th percentiles for HEDIS 2017. • Measure rates for four of the seven (57.1 percent) health plans–CountyCare, Harmony, Molina,
and NextLevel–fell below the national Medicaid 25th percentile for HEDIS 2017. • Decline in performance was demonstrated as the measure rate decreased for the statewide
average and for four of the five (80.0 percent) health plans that reported rates in both years.
Performance Results
Care for Chronic Conditions
Page | 2-35
Comprehensive Diabetes Care
Diabetes is a highly prevalent chronic disease in the United States and the country’s seventh leading cause of death.2-22 The Comprehensive Diabetes Care measure includes rates for several distinct components of care that are critical to maintaining a healthy lifestyle.
Hemoglobin A1c (HbA1c) Testing
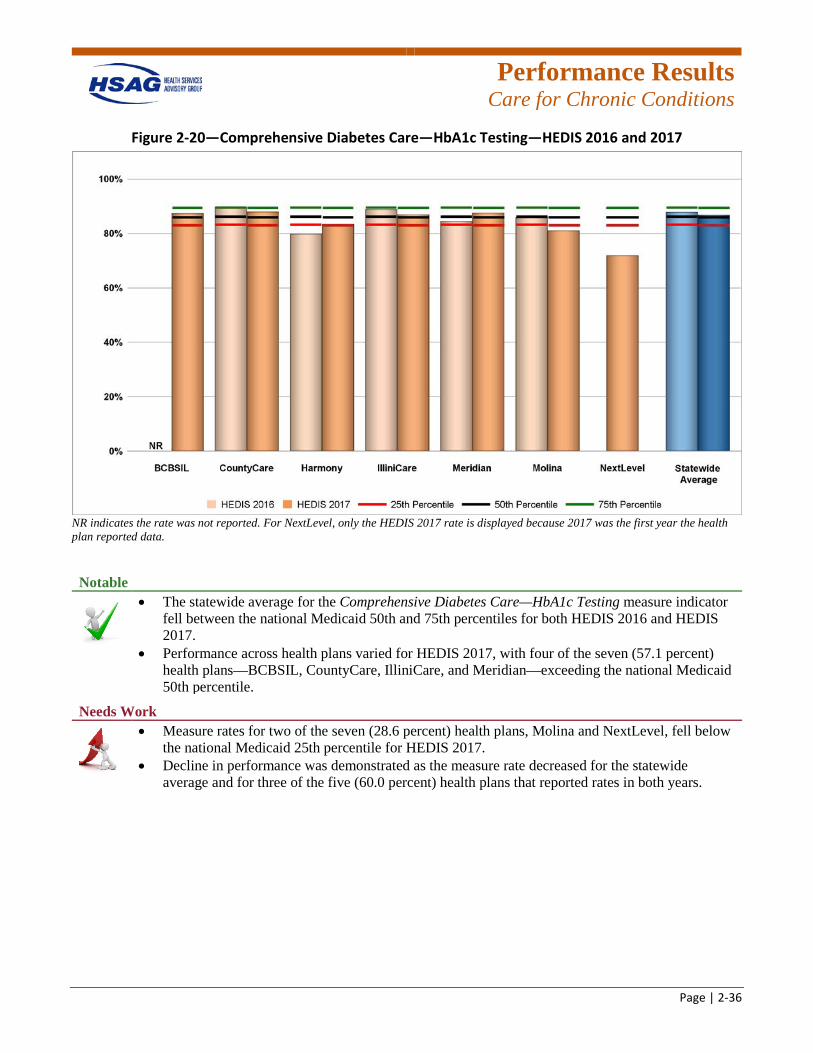
The HbA1c test presents information about a person’s levels of blood glucose from the previous three months. The test can be performed at any time of the day and does not require fasting, making it more convenient for people to manage their diabetes.2-23 This measure indicator assesses the percentage of beneficiaries 18 to 75 years of age with diabetes (type 1 and type 2) who had an HbA1c test performed during the measurement year. Figure 2-20 presents the HEDIS 2016 and HEDIS 2017 rates for the health plans and the statewide average compared to national Medicaid percentiles for the Comprehensive Diabetes Care—HbA1c Testing measure indicator.
2-22 U.S. Department of Health and Human Services. 2020 Topics & Objectives: Diabetes. Available at:
https://www.healthypeople.gov/2020/topics-objectives/topic/diabetes. Accessed on: Feb 13, 2018. 2-23 National Institute of Diabetes and Digestive and Kidney Diseases. The A1C Test & Diabetes. Available at:
https://www.niddk.nih.gov/health-information/diabetes/overview/tests-diagnosis/a1c-test. Accessed on: Feb 13, 2018.
Performance Results
Care for Chronic Conditions
Page | 2-36
Figure 2-20—Comprehensive Diabetes Care—HbA1c Testing—HEDIS 2016 and 2017
NR indicates the rate was not reported. For NextLevel, only the HEDIS 2017 rate is displayed because 2017 was the first year the health plan reported data. Notable
• The statewide average for the Comprehensive Diabetes Care—HbA1c Testing measure indicator fell between the national Medicaid 50th and 75th percentiles for both HEDIS 2016 and HEDIS 2017.
• Performance across health plans varied for HEDIS 2017, with four of the seven (57.1 percent) health plans—BCBSIL, CountyCare, IlliniCare, and Meridian—exceeding the national Medicaid 50th percentile.
Needs Work
• Measure rates for two of the seven (28.6 percent) health plans, Molina and NextLevel, fell below the national Medicaid 25th percentile for HEDIS 2017.
• Decline in performance was demonstrated as the measure rate decreased for the statewide average and for three of the five (60.0 percent) health plans that reported rates in both years.
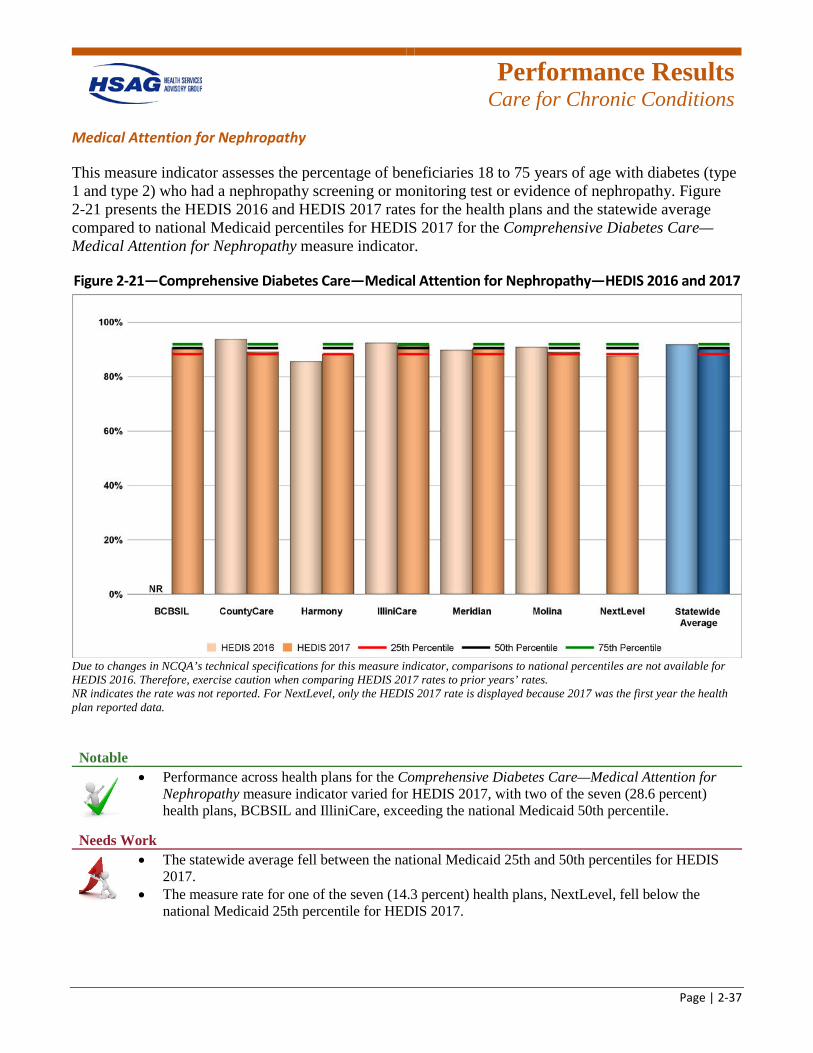
Performance Results
Care for Chronic Conditions
Page | 2-37
Medical Attention for Nephropathy
This measure indicator assesses the percentage of beneficiaries 18 to 75 years of age with diabetes (type 1 and type 2) who had a nephropathy screening or monitoring test or evidence of nephropathy. Figure 2-21 presents the HEDIS 2016 and HEDIS 2017 rates for the health plans and the statewide average compared to national Medicaid percentiles for HEDIS 2017 for the Comprehensive Diabetes Care—Medical Attention for Nephropathy measure indicator.
Figure 2-21—Comprehensive Diabetes Care—Medical Attention for Nephropathy—HEDIS 2016 and 2017
Due to changes in NCQA’s technical specifications for this measure indicator, comparisons to national percentiles are not available for HEDIS 2016. Therefore, exercise caution when comparing HEDIS 2017 rates to prior years’ rates. NR indicates the rate was not reported. For NextLevel, only the HEDIS 2017 rate is displayed because 2017 was the first year the health plan reported data. Notable
• Performance across health plans for the Comprehensive Diabetes Care—Medical Attention for Nephropathy measure indicator varied for HEDIS 2017, with two of the seven (28.6 percent) health plans, BCBSIL and IlliniCare, exceeding the national Medicaid 50th percentile.
Needs Work
• The statewide average fell between the national Medicaid 25th and 50th percentiles for HEDIS 2017.
• The measure rate for one of the seven (14.3 percent) health plans, NextLevel, fell below the national Medicaid 25th percentile for HEDIS 2017.
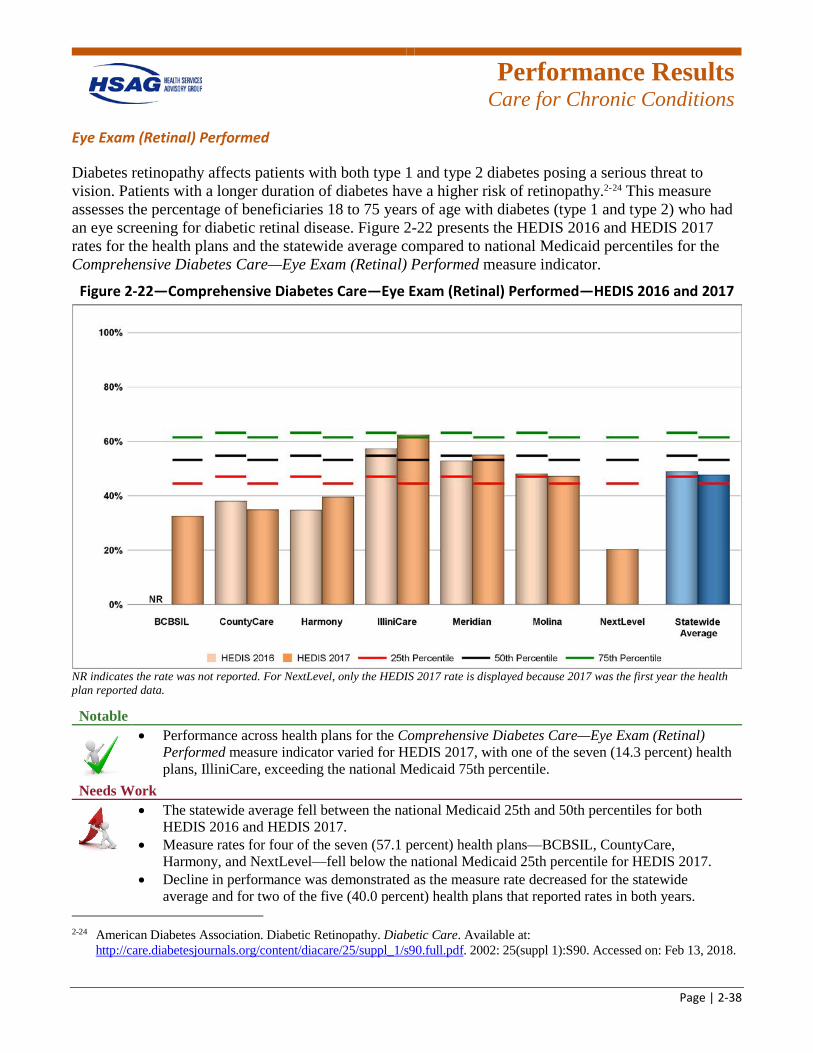
Performance Results
Care for Chronic Conditions
Page | 2-38
Eye Exam (Retinal) Performed
Diabetes retinopathy affects patients with both type 1 and type 2 diabetes posing a serious threat to vision. Patients with a longer duration of diabetes have a higher risk of retinopathy.2-24 This measure assesses the percentage of beneficiaries 18 to 75 years of age with diabetes (type 1 and type 2) who had an eye screening for diabetic retinal disease. Figure 2-22 presents the HEDIS 2016 and HEDIS 2017 rates for the health plans and the statewide average compared to national Medicaid percentiles for the Comprehensive Diabetes Care—Eye Exam (Retinal) Performed measure indicator.
Figure 2-22—Comprehensive Diabetes Care—Eye Exam (Retinal) Performed—HEDIS 2016 and 2017
NR indicates the rate was not reported. For NextLevel, only the HEDIS 2017 rate is displayed because 2017 was the first year the health plan reported data.
Notable
• Performance across health plans for the Comprehensive Diabetes Care—Eye Exam (Retinal) Performed measure indicator varied for HEDIS 2017, with one of the seven (14.3 percent) health plans, IlliniCare, exceeding the national Medicaid 75th percentile.
Needs Work
• The statewide average fell between the national Medicaid 25th and 50th percentiles for both HEDIS 2016 and HEDIS 2017.
• Measure rates for four of the seven (57.1 percent) health plans—BCBSIL, CountyCare, Harmony, and NextLevel—fell below the national Medicaid 25th percentile for HEDIS 2017.
• Decline in performance was demonstrated as the measure rate decreased for the statewide average and for two of the five (40.0 percent) health plans that reported rates in both years.
2-24 American Diabetes Association. Diabetic Retinopathy. Diabetic Care. Available at:
http://care.diabetesjournals.org/content/diacare/25/suppl_1/s90.full.pdf. 2002: 25(suppl 1):S90. Accessed on: Feb 13, 2018.
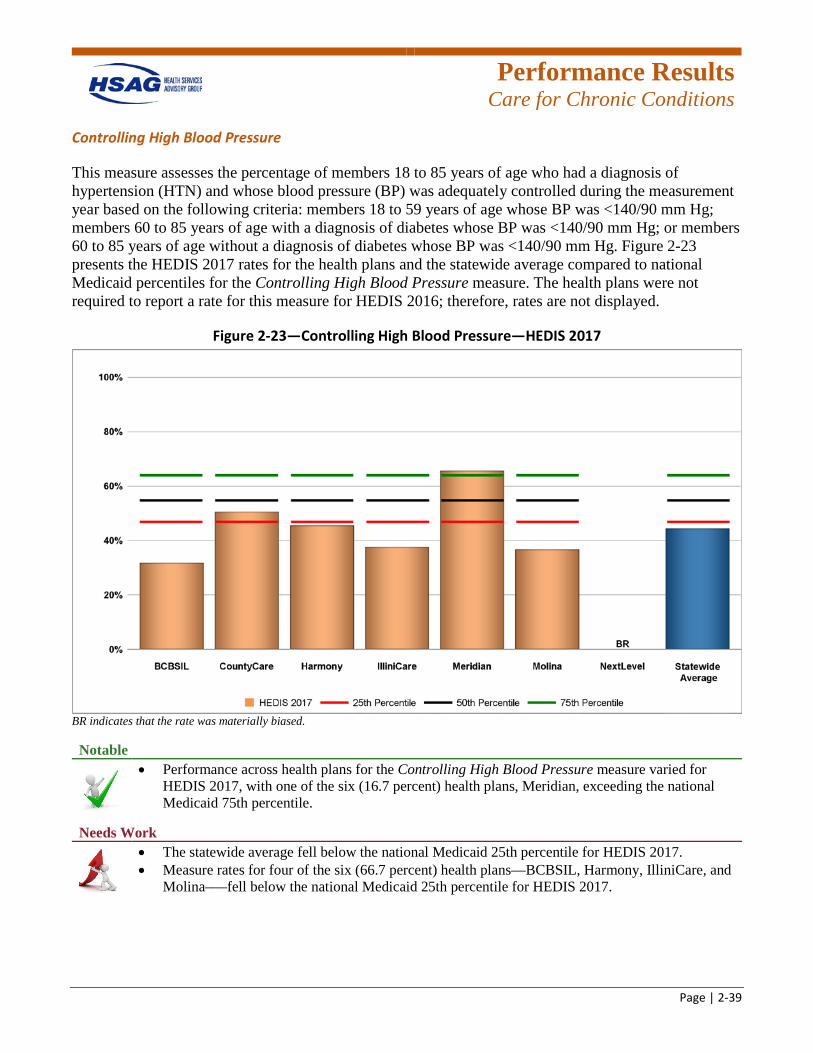
Performance Results
Care for Chronic Conditions
Page | 2-39
Controlling High Blood Pressure
This measure assesses the percentage of members 18 to 85 years of age who had a diagnosis of hypertension (HTN) and whose blood pressure (BP) was adequately controlled during the measurement year based on the following criteria: members 18 to 59 years of age whose BP was <140/90 mm Hg; members 60 to 85 years of age with a diagnosis of diabetes whose BP was <140/90 mm Hg; or members 60 to 85 years of age without a diagnosis of diabetes whose BP was <140/90 mm Hg. Figure 2-23 presents the HEDIS 2017 rates for the health plans and the statewide average compared to national Medicaid percentiles for the Controlling High Blood Pressure measure. The health plans were not required to report a rate for this measure for HEDIS 2016; therefore, rates are not displayed.
Figure 2-23—Controlling High Blood Pressure—HEDIS 2017
BR indicates that the rate was materially biased. Notable
• Performance across health plans for the Controlling High Blood Pressure measure varied for HEDIS 2017, with one of the six (16.7 percent) health plans, Meridian, exceeding the national Medicaid 75th percentile.
Needs Work
• The statewide average fell below the national Medicaid 25th percentile for HEDIS 2017. • Measure rates for four of the six (66.7 percent) health plans—BCBSIL, Harmony, IlliniCare, and
Molina–—fell below the national Medicaid 25th percentile for HEDIS 2017.
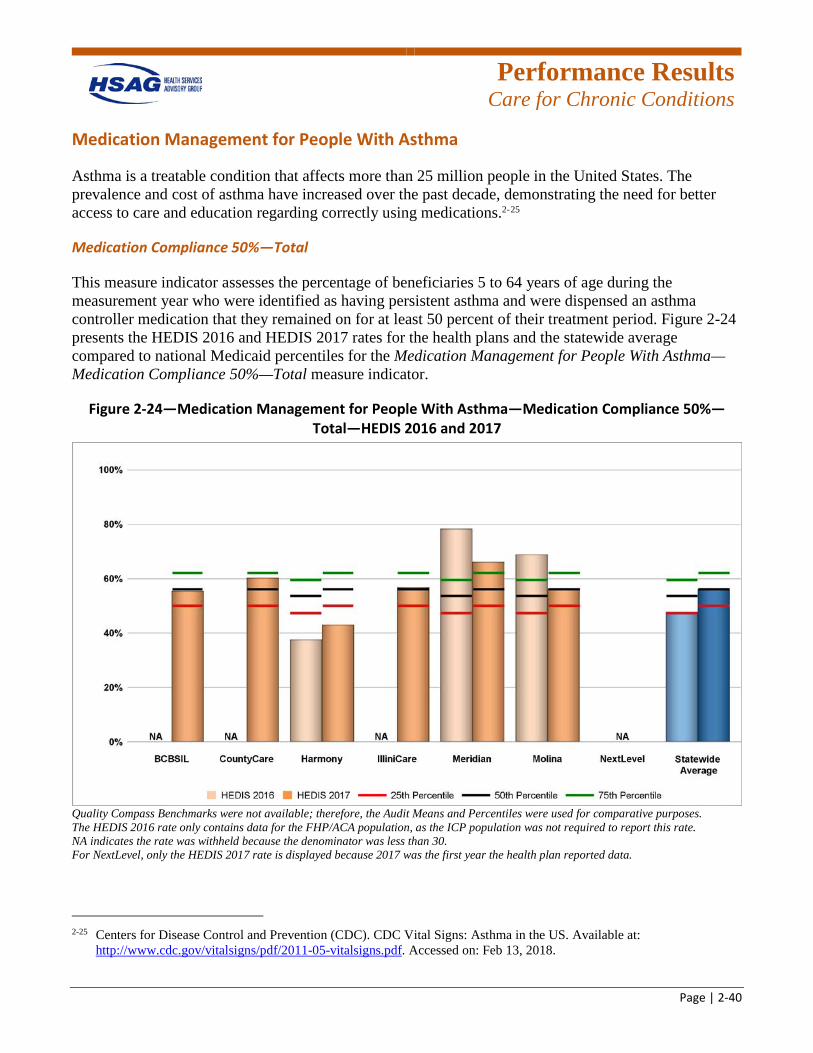
Performance Results
Care for Chronic Conditions
Page | 2-40
Medication Management for People With Asthma
Asthma is a treatable condition that affects more than 25 million people in the United States. The prevalence and cost of asthma have increased over the past decade, demonstrating the need for better access to care and education regarding correctly using medications.2-25
Medication Compliance 50%—Total
This measure indicator assesses the percentage of beneficiaries 5 to 64 years of age during the measurement year who were identified as having persistent asthma and were dispensed an asthma controller medication that they remained on for at least 50 percent of their treatment period. Figure 2-24 presents the HEDIS 2016 and HEDIS 2017 rates for the health plans and the statewide average compared to national Medicaid percentiles for the Medication Management for People With Asthma—Medication Compliance 50%—Total measure indicator.
Figure 2-24—Medication Management for People With Asthma—Medication Compliance 50%—Total—HEDIS 2016 and 2017
Quality Compass Benchmarks were not available; therefore, the Audit Means and Percentiles were used for comparative purposes. The HEDIS 2016 rate only contains data for the FHP/ACA population, as the ICP population was not required to report this rate. NA indicates the rate was withheld because the denominator was less than 30. For NextLevel, only the HEDIS 2017 rate is displayed because 2017 was the first year the health plan reported data.
2-25 Centers for Disease Control and Prevention (CDC). CDC Vital Signs: Asthma in the US. Available at:
http://www.cdc.gov/vitalsigns/pdf/2011-05-vitalsigns.pdf. Accessed on: Feb 13, 2018.
Performance Results
Care for Chronic Conditions
Page | 2-41
Notable
• The statewide average for the Medication Management for People With Asthma—Medication Compliance 50%—Total measure indicator met the 50th percentile for HEDIS 2017.
• Performance across health plans varied for HEDIS 2017, with one of the six (16.7 percent) health plans, Meridian, exceeding the national Medicaid 75th percentile.
• Improvement in performance was demonstrated as the measure rate increased for the statewide average and for one of the three (33.3 percent) health plans that reported rates in both years.
Needs Work
• The measure rate for one of the six (16.7 percent) health plans, Harmony, fell below the national Medicaid 25th percentile for HEDIS 2017.
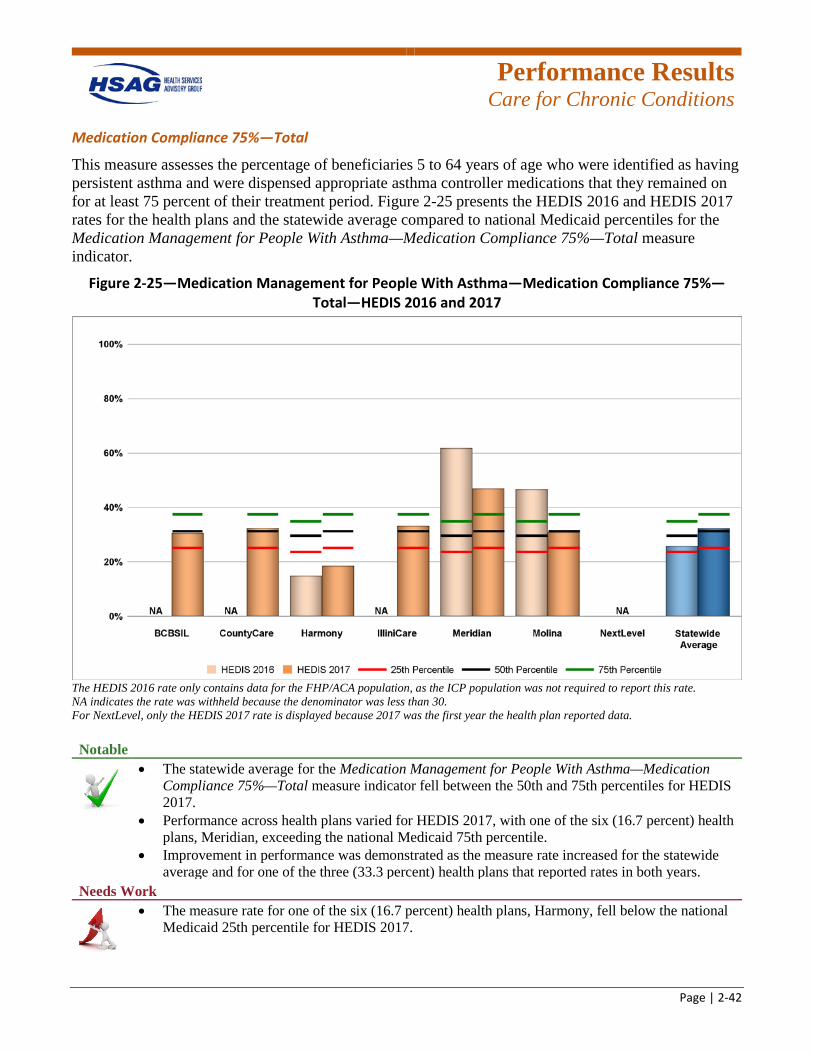
Performance Results
Care for Chronic Conditions
Page | 2-42
Medication Compliance 75%—Total
This measure assesses the percentage of beneficiaries 5 to 64 years of age who were identified as having persistent asthma and were dispensed appropriate asthma controller medications that they remained on for at least 75 percent of their treatment period. Figure 2-25 presents the HEDIS 2016 and HEDIS 2017 rates for the health plans and the statewide average compared to national Medicaid percentiles for the Medication Management for People With Asthma—Medication Compliance 75%—Total measure indicator.
Figure 2-25—Medication Management for People With Asthma—Medication Compliance 75%—Total—HEDIS 2016 and 2017
The HEDIS 2016 rate only contains data for the FHP/ACA population, as the ICP population was not required to report this rate. NA indicates the rate was withheld because the denominator was less than 30. For NextLevel, only the HEDIS 2017 rate is displayed because 2017 was the first year the health plan reported data. Notable
• The statewide average for the Medication Management for People With Asthma—Medication Compliance 75%—Total measure indicator fell between the 50th and 75th percentiles for HEDIS 2017.
• Performance across health plans varied for HEDIS 2017, with one of the six (16.7 percent) health plans, Meridian, exceeding the national Medicaid 75th percentile.
• Improvement in performance was demonstrated as the measure rate increased for the statewide average and for one of the three (33.3 percent) health plans that reported rates in both years.
Needs Work
• The measure rate for one of the six (16.7 percent) health plans, Harmony, fell below the national Medicaid 25th percentile for HEDIS 2017.
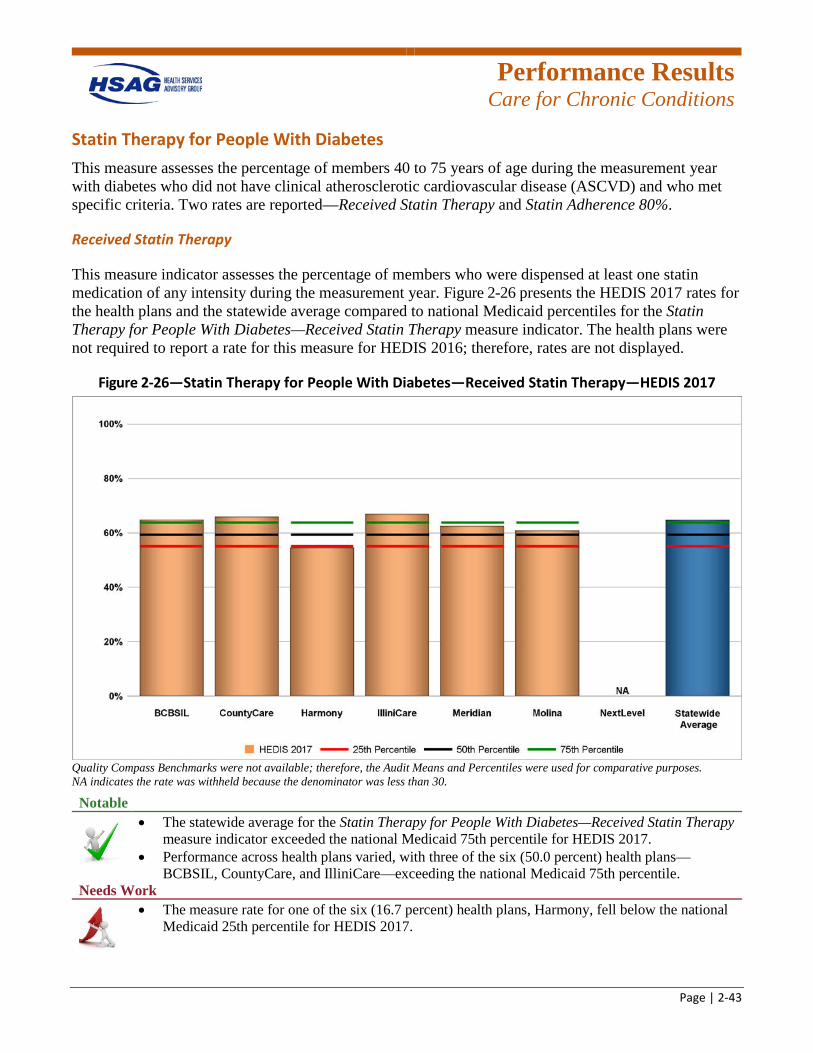
Performance Results
Care for Chronic Conditions
Page | 2-43
Statin Therapy for People With Diabetes This measure assesses the percentage of members 40 to 75 years of age during the measurement year with diabetes who did not have clinical atherosclerotic cardiovascular disease (ASCVD) and who met specific criteria. Two rates are reported—Received Statin Therapy and Statin Adherence 80%.
Received Statin Therapy
This measure indicator assesses the percentage of members who were dispensed at least one statin medication of any intensity during the measurement year. Figure 2-26 presents the HEDIS 2017 rates for the health plans and the statewide average compared to national Medicaid percentiles for the Statin Therapy for People With Diabetes—Received Statin Therapy measure indicator. The health plans were not required to report a rate for this measure for HEDIS 2016; therefore, rates are not displayed.
Figure 2-26—Statin Therapy for People With Diabetes—Received Statin Therapy—HEDIS 2017
Quality Compass Benchmarks were not available; therefore, the Audit Means and Percentiles were used for comparative purposes. NA indicates the rate was withheld because the denominator was less than 30.
Notable
• The statewide average for the Statin Therapy for People With Diabetes—Received Statin Therapy measure indicator exceeded the national Medicaid 75th percentile for HEDIS 2017.
• Performance across health plans varied, with three of the six (50.0 percent) health plans—BCBSIL, CountyCare, and IlliniCare—exceeding the national Medicaid 75th percentile.
Needs Work
• The measure rate for one of the six (16.7 percent) health plans, Harmony, fell below the national Medicaid 25th percentile for HEDIS 2017.
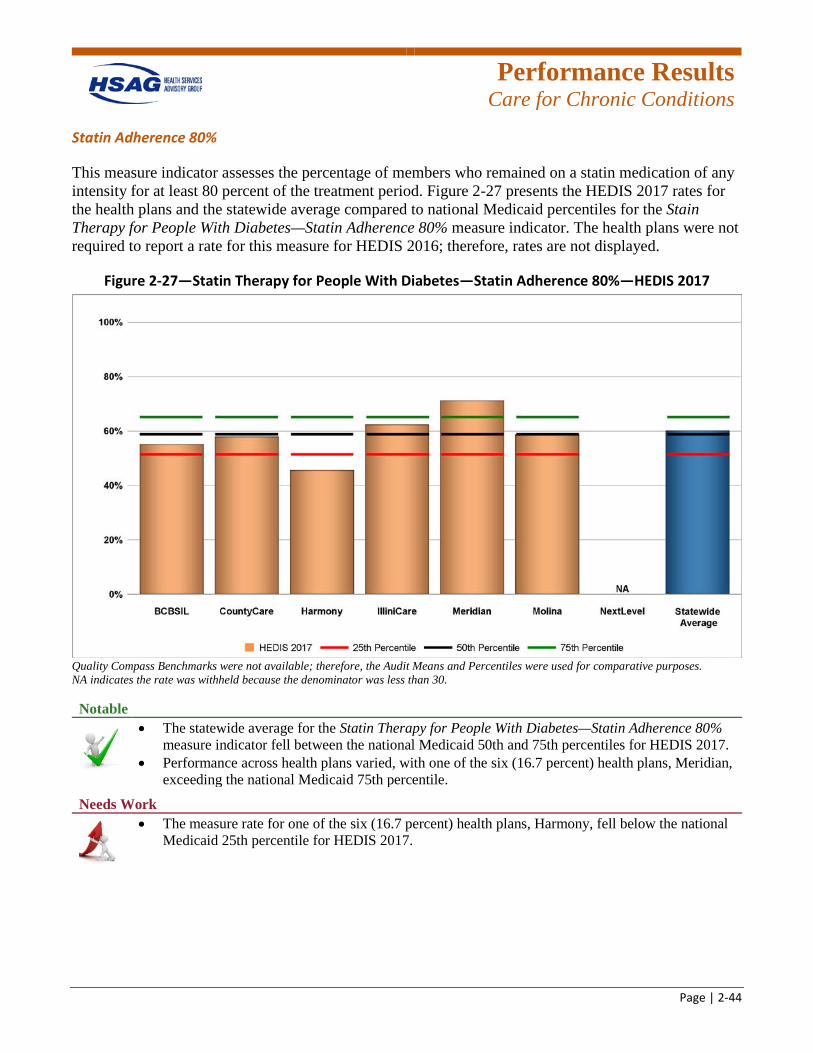
Performance Results
Care for Chronic Conditions
Page | 2-44
Statin Adherence 80%
This measure indicator assesses the percentage of members who remained on a statin medication of any intensity for at least 80 percent of the treatment period. Figure 2-27 presents the HEDIS 2017 rates for the health plans and the statewide average compared to national Medicaid percentiles for the Stain Therapy for People With Diabetes—Statin Adherence 80% measure indicator. The health plans were not required to report a rate for this measure for HEDIS 2016; therefore, rates are not displayed.
Figure 2-27—Statin Therapy for People With Diabetes—Statin Adherence 80%—HEDIS 2017
Quality Compass Benchmarks were not available; therefore, the Audit Means and Percentiles were used for comparative purposes. NA indicates the rate was withheld because the denominator was less than 30. Notable
• The statewide average for the Statin Therapy for People With Diabetes—Statin Adherence 80% measure indicator fell between the national Medicaid 50th and 75th percentiles for HEDIS 2017.
• Performance across health plans varied, with one of the six (16.7 percent) health plans, Meridian, exceeding the national Medicaid 75th percentile.
Needs Work
• The measure rate for one of the six (16.7 percent) health plans, Harmony, fell below the national Medicaid 25th percentile for HEDIS 2017.
Performance Results
Care for Chronic Conditions
Page | 2-45
Appropriate Care Conclusions
In the Appropriate Care domain, the statewide average for HEDIS 2017 fell below the national Medicaid 25th percentile for the Controlling High Blood Pressure measure rate. Additionally, the statewide average for HEDIS 2017 fell below the national Medicaid 50th percentile for the following measure rates: Annual Monitoring for Patients on Persistent Medications—ACE Inhibitors or ARBs, Diuretics, and Total; and Comprehensive Diabetes Care—Medical Attention for Nephropathy and Eye Exam (Retinal) Performed. Further, a decrease in performance from HEDIS 2016 to HEDIS 2017 was
demonstrated for all available measure rates except the Medication Management for People With Asthma measure. Therefore, there are opportunities for the health plans to increase services and improve performance for members with diabetes, high blood pressure, and those with persistent medication use.
Performance Results
Behavioral Health Care
Page | 2-46
Behavioral Health
A healthy state of mental health is important for productivity, building relationships, and personal well-being. Mental illnesses, such as anxiety and depression, affect physical health by hindering health-promoting behaviors.2-26
The results of five behavioral health measure rates for the health plans are presented in this section. Additional measure results can be found in Appendix D and Appendix E of this report.
Follow-Up After Hospitalization for Mental Illness
Lifetime anxiety disorders most commonly begin around age 6 and over 10 percent of children have been diagnosed with attention deficit hyperactivity disorder (ADHD).2-27 Approximately one in five adults in the United States experiences a mental health issue in a given year.2-28 Timely follow-up after hospitalization for a mental illness is an important step toward recovery and may reduce rehospitalization and promote better health outcomes.2-29
2-26 U.S. Department of Health and Human Services. 2020 Topics & Objectives: Mental Health and Mental Disorders.
Available at: https://www.healthypeople.gov/2020/topics-objectives/topic/mental-health-and-mental-disorders. Accessed on: Feb 12, 2018.
2-27 Substance Abuse and Mental Health Services Administration. Mental and Substance Use Disorders. Available at: https://www.samhsa.gov/disorders. Accessed on: Feb 13, 2018.
2-28 Substance Abuse and Mental Health Services Administration. Behavioral Health Trends in the United States: Results from the 2014 National Survey on Drug Use and Health. Available at: https://www.samhsa.gov/data/sites/default/files/NSDUH-FRR1-2014/NSDUH-FRR1-2014.htm#fn4. Accessed on: Feb 13, 2018.
2-29 Carson NJ, Vesper A, Chen C-N, et al. Quality of Follow-Up After Hospitalization for Mental Illness Among Patients From Racial-Ethnic Minority Groups. Psychiatric Services. 2014; 65(7):888-896.
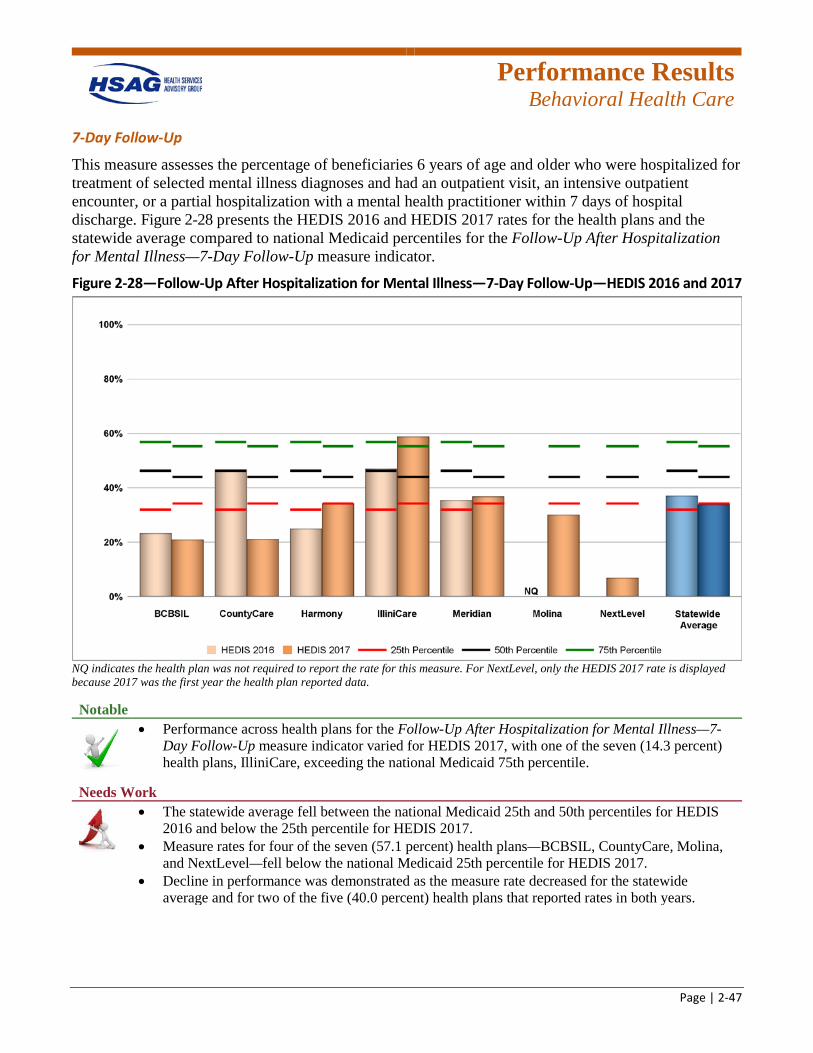
Performance Results
Behavioral Health Care
Page | 2-47
7-Day Follow-Up
This measure assesses the percentage of beneficiaries 6 years of age and older who were hospitalized for treatment of selected mental illness diagnoses and had an outpatient visit, an intensive outpatient encounter, or a partial hospitalization with a mental health practitioner within 7 days of hospital discharge. Figure 2-28 presents the HEDIS 2016 and HEDIS 2017 rates for the health plans and the statewide average compared to national Medicaid percentiles for the Follow-Up After Hospitalization for Mental Illness—7-Day Follow-Up measure indicator.
Figure 2-28—Follow-Up After Hospitalization for Mental Illness—7-Day Follow-Up—HEDIS 2016 and 2017
NQ indicates the health plan was not required to report the rate for this measure. For NextLevel, only the HEDIS 2017 rate is displayed because 2017 was the first year the health plan reported data. Notable
• Performance across health plans for the Follow-Up After Hospitalization for Mental Illness—7-Day Follow-Up measure indicator varied for HEDIS 2017, with one of the seven (14.3 percent) health plans, IlliniCare, exceeding the national Medicaid 75th percentile.
Needs Work
• The statewide average fell between the national Medicaid 25th and 50th percentiles for HEDIS 2016 and below the 25th percentile for HEDIS 2017.
• Measure rates for four of the seven (57.1 percent) health plans—BCBSIL, CountyCare, Molina, and NextLevel—fell below the national Medicaid 25th percentile for HEDIS 2017.
• Decline in performance was demonstrated as the measure rate decreased for the statewide average and for two of the five (40.0 percent) health plans that reported rates in both years.
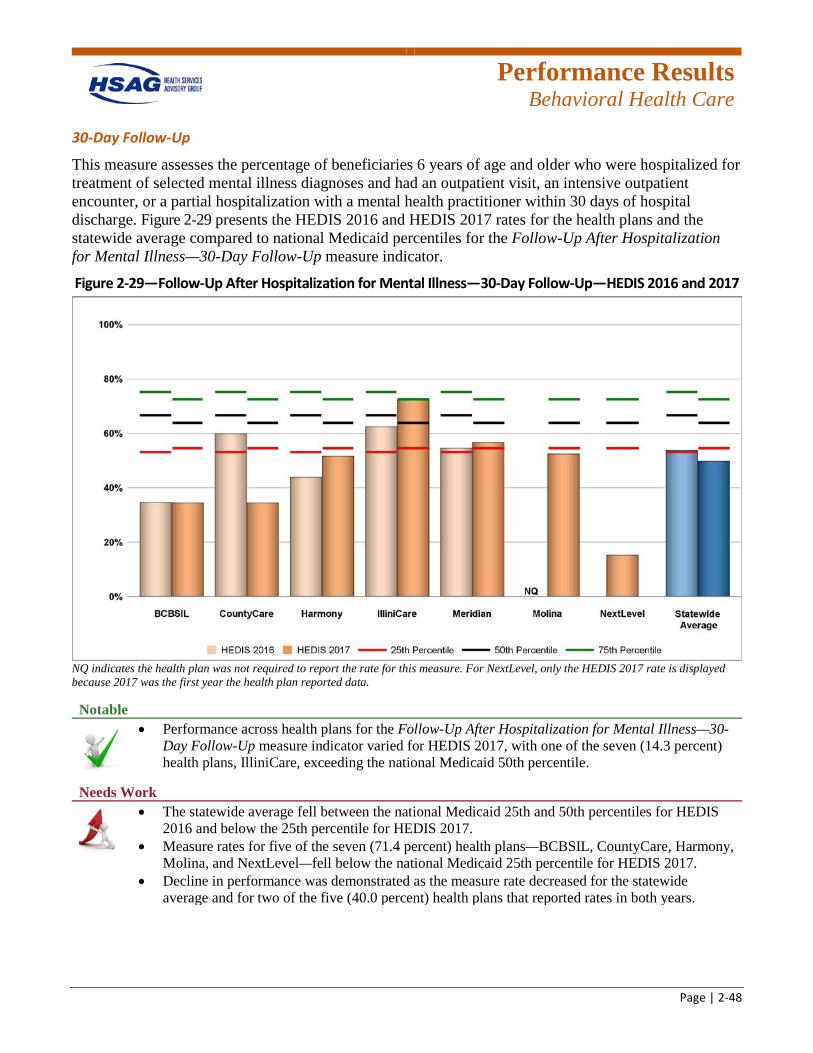
Performance Results
Behavioral Health Care
Page | 2-48
30-Day Follow-Up
This measure assesses the percentage of beneficiaries 6 years of age and older who were hospitalized for treatment of selected mental illness diagnoses and had an outpatient visit, an intensive outpatient encounter, or a partial hospitalization with a mental health practitioner within 30 days of hospital discharge. Figure 2-29 presents the HEDIS 2016 and HEDIS 2017 rates for the health plans and the statewide average compared to national Medicaid percentiles for the Follow-Up After Hospitalization for Mental Illness—30-Day Follow-Up measure indicator.
Figure 2-29—Follow-Up After Hospitalization for Mental Illness—30-Day Follow-Up—HEDIS 2016 and 2017
NQ indicates the health plan was not required to report the rate for this measure. For NextLevel, only the HEDIS 2017 rate is displayed because 2017 was the first year the health plan reported data. Notable
• Performance across health plans for the Follow-Up After Hospitalization for Mental Illness—30-Day Follow-Up measure indicator varied for HEDIS 2017, with one of the seven (14.3 percent) health plans, IlliniCare, exceeding the national Medicaid 50th percentile.
Needs Work
• The statewide average fell between the national Medicaid 25th and 50th percentiles for HEDIS 2016 and below the 25th percentile for HEDIS 2017.
• Measure rates for five of the seven (71.4 percent) health plans—BCBSIL, CountyCare, Harmony, Molina, and NextLevel—fell below the national Medicaid 25th percentile for HEDIS 2017.
• Decline in performance was demonstrated as the measure rate decreased for the statewide average and for two of the five (40.0 percent) health plans that reported rates in both years.
Performance Results
Behavioral Health Care
Page | 2-49
Initiation and Engagement of Alcohol and Other Drug (AOD) Dependence Treatment
AOD dependence is an illness that can affect anyone. There are several types of treatment options available such as inpatient, outpatient, intensive outpatient, and partial hospitalization. The length of treatment varies, but the longer a person stays in treatment the more likely that person will have a successful recovery.2-30 The growing misuse of drugs and related health consequences caused by substance abuse place a huge burden on the healthcare system.2-31
Initiation of AOD Treatment—Total
This measure indicator assesses the percentage of adolescent and adult beneficiaries with a new episode of AOD dependence who initiate treatment through an inpatient AOD admission, outpatient visit, intensive outpatient encounter or partial hospitalization within 14 days of the diagnosis. Figure 2-30 presents the HEDIS 2016 and HEDIS 2017 rates for the health plans and the statewide average compared to national Medicaid percentiles for the Initiation and Engagement of AOD Dependence Treatment—Initiation of AOD Treatment—Total measure indicator.
2-30 Substance Abuse and Mental Health Services Administration. What is Substance Abuse? (Publication No. (SMA) 08-
4126). Available at: https://store.samhsa.gov/shin/content//SMA08-4126/SMA08-4126.pdf. Accessed on: Feb 13, 2018. 2-31 National Institute on Drug Abuse. Trends & Statistics. Available at: https://www.drugabuse.gov/related-topics/trends-
statistics#supplemental-references-for-economic-costs. Accessed on: Feb 13, 2018.
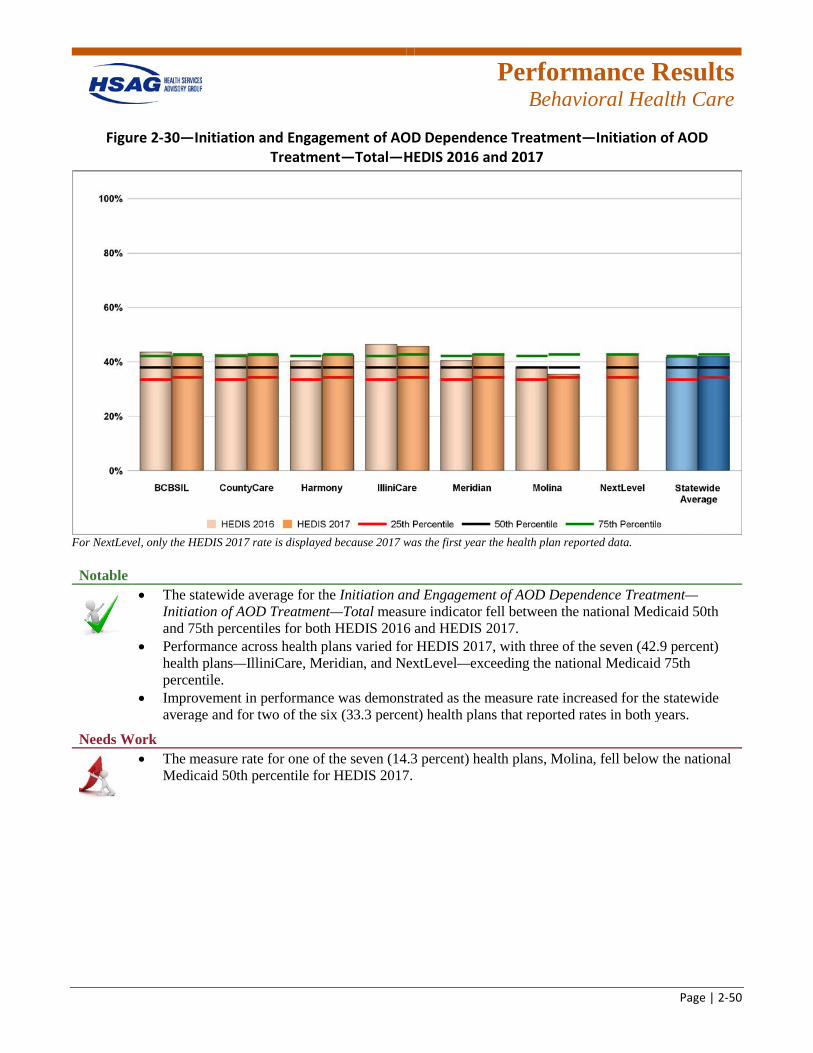
Performance Results
Behavioral Health Care
Page | 2-50
Figure 2-30—Initiation and Engagement of AOD Dependence Treatment—Initiation of AOD Treatment—Total—HEDIS 2016 and 2017
For NextLevel, only the HEDIS 2017 rate is displayed because 2017 was the first year the health plan reported data. Notable
• The statewide average for the Initiation and Engagement of AOD Dependence Treatment—Initiation of AOD Treatment—Total measure indicator fell between the national Medicaid 50th and 75th percentiles for both HEDIS 2016 and HEDIS 2017.
• Performance across health plans varied for HEDIS 2017, with three of the seven (42.9 percent) health plans—IlliniCare, Meridian, and NextLevel—exceeding the national Medicaid 75th percentile.
• Improvement in performance was demonstrated as the measure rate increased for the statewide average and for two of the six (33.3 percent) health plans that reported rates in both years.
Needs Work
• The measure rate for one of the seven (14.3 percent) health plans, Molina, fell below the national Medicaid 50th percentile for HEDIS 2017.
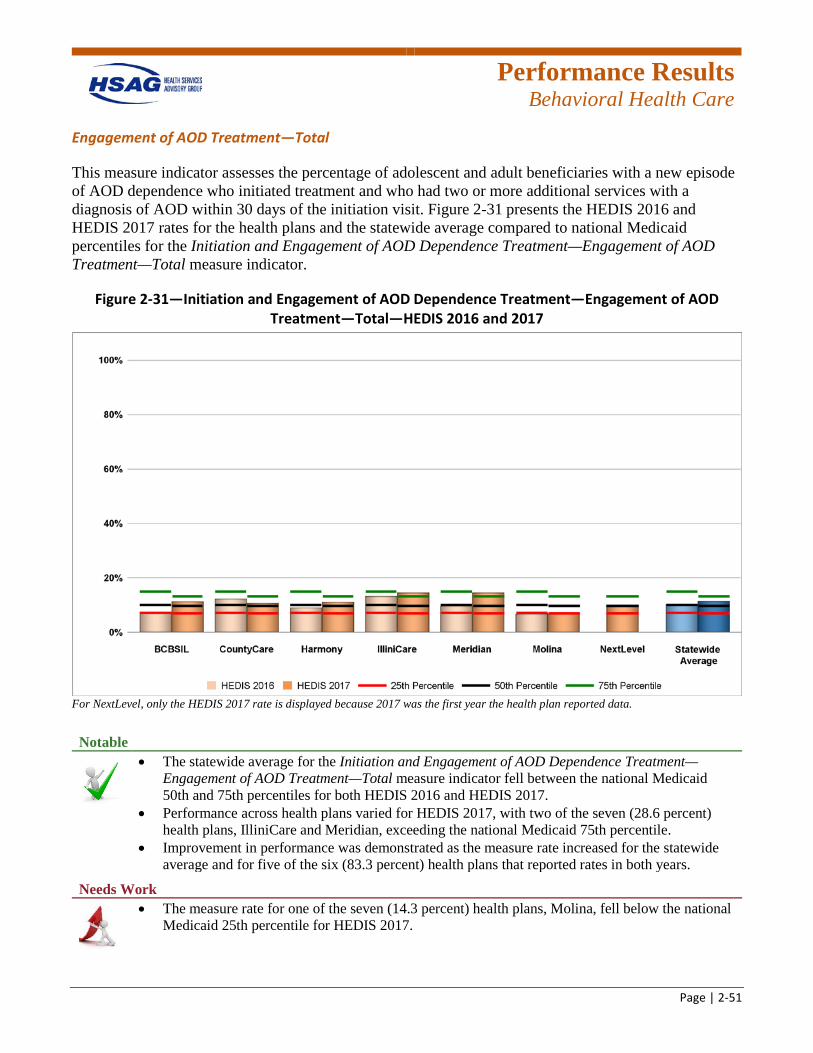
Performance Results
Behavioral Health Care
Page | 2-51
Engagement of AOD Treatment—Total
This measure indicator assesses the percentage of adolescent and adult beneficiaries with a new episode of AOD dependence who initiated treatment and who had two or more additional services with a diagnosis of AOD within 30 days of the initiation visit. Figure 2-31 presents the HEDIS 2016 and HEDIS 2017 rates for the health plans and the statewide average compared to national Medicaid percentiles for the Initiation and Engagement of AOD Dependence Treatment—Engagement of AOD Treatment—Total measure indicator.
Figure 2-31—Initiation and Engagement of AOD Dependence Treatment—Engagement of AOD Treatment—Total—HEDIS 2016 and 2017
For NextLevel, only the HEDIS 2017 rate is displayed because 2017 was the first year the health plan reported data. Notable
• The statewide average for the Initiation and Engagement of AOD Dependence Treatment—Engagement of AOD Treatment—Total measure indicator fell between the national Medicaid 50th and 75th percentiles for both HEDIS 2016 and HEDIS 2017.
• Performance across health plans varied for HEDIS 2017, with two of the seven (28.6 percent) health plans, IlliniCare and Meridian, exceeding the national Medicaid 75th percentile.
• Improvement in performance was demonstrated as the measure rate increased for the statewide average and for five of the six (83.3 percent) health plans that reported rates in both years.
Needs Work
• The measure rate for one of the seven (14.3 percent) health plans, Molina, fell below the national Medicaid 25th percentile for HEDIS 2017.
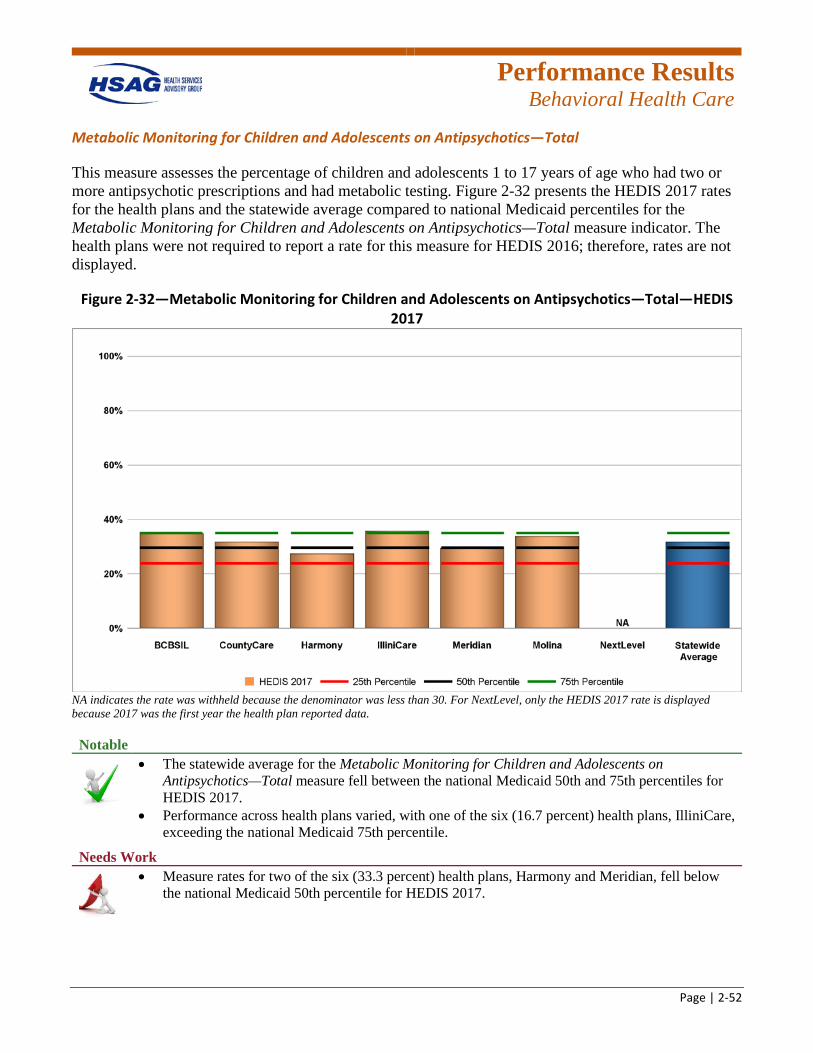
Performance Results
Behavioral Health Care
Page | 2-52
Metabolic Monitoring for Children and Adolescents on Antipsychotics—Total
This measure assesses the percentage of children and adolescents 1 to 17 years of age who had two or more antipsychotic prescriptions and had metabolic testing. Figure 2-32 presents the HEDIS 2017 rates for the health plans and the statewide average compared to national Medicaid percentiles for the Metabolic Monitoring for Children and Adolescents on Antipsychotics—Total measure indicator. The health plans were not required to report a rate for this measure for HEDIS 2016; therefore, rates are not displayed.
Figure 2-32—Metabolic Monitoring for Children and Adolescents on Antipsychotics—Total—HEDIS 2017
NA indicates the rate was withheld because the denominator was less than 30. For NextLevel, only the HEDIS 2017 rate is displayed because 2017 was the first year the health plan reported data. Notable
• The statewide average for the Metabolic Monitoring for Children and Adolescents on Antipsychotics—Total measure fell between the national Medicaid 50th and 75th percentiles for HEDIS 2017.
• Performance across health plans varied, with one of the six (16.7 percent) health plans, IlliniCare, exceeding the national Medicaid 75th percentile.
Needs Work
• Measure rates for two of the six (33.3 percent) health plans, Harmony and Meridian, fell below the national Medicaid 50th percentile for HEDIS 2017.
Performance Results
Behavioral Health Care
Page | 2-53
Behavioral Health Care Conclusions
In the Behavioral Health Care domain, the statewide average for HEDIS 2017 fell below the national Medicaid 25th percentile for the Follow-Up After Hospitalization for Mental Illness—7-Day Follow-Up and 30-Day Follow-Up measure rates. Further, a decrease in performance from HEDIS 2016 to HEDIS 2017 was demonstrated for this measure. Therefore, there are opportunities for the health plans to increase follow-up care for members following discharge from the hospital for mental illness.
Performance Results
Follow-up and Recommendations
Page | 2-54
Improvement Initiatives and Follow-Up on Prior Recommendations As this is the first year of reporting measure rates for the health plans as combined FHP/ACA and ICP populations, no previous recommendations were provided for the domains of care presented in this section. In subsequent reports, improvement initiatives and prior recommendations will be evaluated.
Recommendations for Improving Performance Measure Rates HSAG recommends that HFS work with the health plans to analyze and identify components for the measure rates noted in this section that would lead to improved care for beneficiaries and improved measure rates. Health plans should conduct a root cause analysis of measure indicators that have been identified as areas of low performance to determine the nature and scope of problems, identify causes and their interrelationships, identify specific populations for targeted interventions, and establish potential performance improvement strategies and solutions.
2-32 Institute for Healthcare Improvement. Plan-Do-Study-Act (PDSA) Worksheet. Available at:
http://www.ihi.org/resources/Pages/Tools/PlanDoStudyActWorksheet.aspx. Accessed on: Mar 6, 2018.
Further, health plans are encouraged to use the Plan-Do-Study-Act (PDSA) worksheet for any interventions.2-32 HSAG recommends that the health plan frequently measure and monitor targeted interventions to provide timely, ongoing feedback regarding the effectiveness of interventions in achieving desired results.
Page 3-1
3. Beneficiary Satisfaction With Care Overview A key Illinois Department of Healthcare and Family Services (HFS) strategy for the oversight of health plans is to conduct an annual satisfaction survey of Medicaid beneficiaries. Consumer Assessment of Healthcare Providers and Systems (CAHPS®) surveys are designed to capture beneficiary perspectives on healthcare quality. HFS uses CAHPS results to monitor health plan and provider performance, measure beneficiary satisfaction with services and access to care, and evaluate program characteristics.
Each year, managed care beneficiaries rate their overall satisfaction with their health plans, health care services, personal doctor, and specialists. They also answer questions related to different aspects of care, such as getting the care they need, timeliness of care, and how well their doctors communicate. Beneficiary satisfaction is assessed through the evaluation of nine performance measures.
Health plans are required to independently administer satisfaction surveys which provide HFS with important feedback on performance and are used to initiate changes to improve beneficiary satisfaction with the managed care programs. Additional details about CAHPS results are presented in Appendix G of this report.
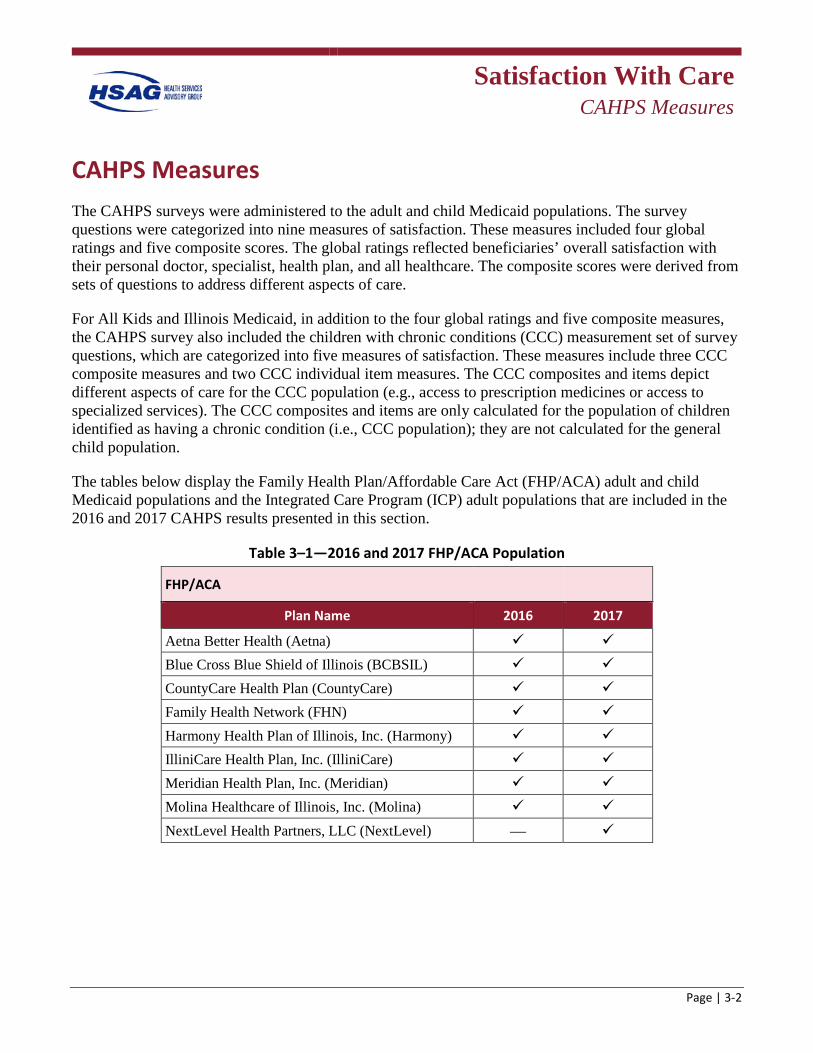
Satisfaction With Care
CAHPS Measures
Page | 3-2
CAHPS Measures The CAHPS surveys were administered to the adult and child Medicaid populations. The survey questions were categorized into nine measures of satisfaction. These measures included four global ratings and five composite scores. The global ratings reflected beneficiaries’ overall satisfaction with their personal doctor, specialist, health plan, and all healthcare. The composite scores were derived from sets of questions to address different aspects of care.
For All Kids and Illinois Medicaid, in addition to the four global ratings and five composite measures, the CAHPS survey also included the children with chronic conditions (CCC) measurement set of survey questions, which are categorized into five measures of satisfaction. These measures include three CCC composite measures and two CCC individual item measures. The CCC composites and items depict different aspects of care for the CCC population (e.g., access to prescription medicines or access to specialized services). The CCC composites and items are only calculated for the population of children identified as having a chronic condition (i.e., CCC population); they are not calculated for the general child population.
The tables below display the Family Health Plan/Affordable Care Act (FHP/ACA) adult and child Medicaid populations and the Integrated Care Program (ICP) adult populations that are included in the 2016 and 2017 CAHPS results presented in this section.
Table 3–1—2016 and 2017 FHP/ACA Population
FHP/ACA Plan Name 2016 2017
Aetna Better Health (Aetna) Blue Cross Blue Shield of Illinois (BCBSIL) CountyCare Health Plan (CountyCare) Family Health Network (FHN) Harmony Health Plan of Illinois, Inc. (Harmony) IlliniCare Health Plan, Inc. (IlliniCare) Meridian Health Plan, Inc. (Meridian) Molina Healthcare of Illinois, Inc. (Molina) NextLevel Health Partners, LLC (NextLevel) —
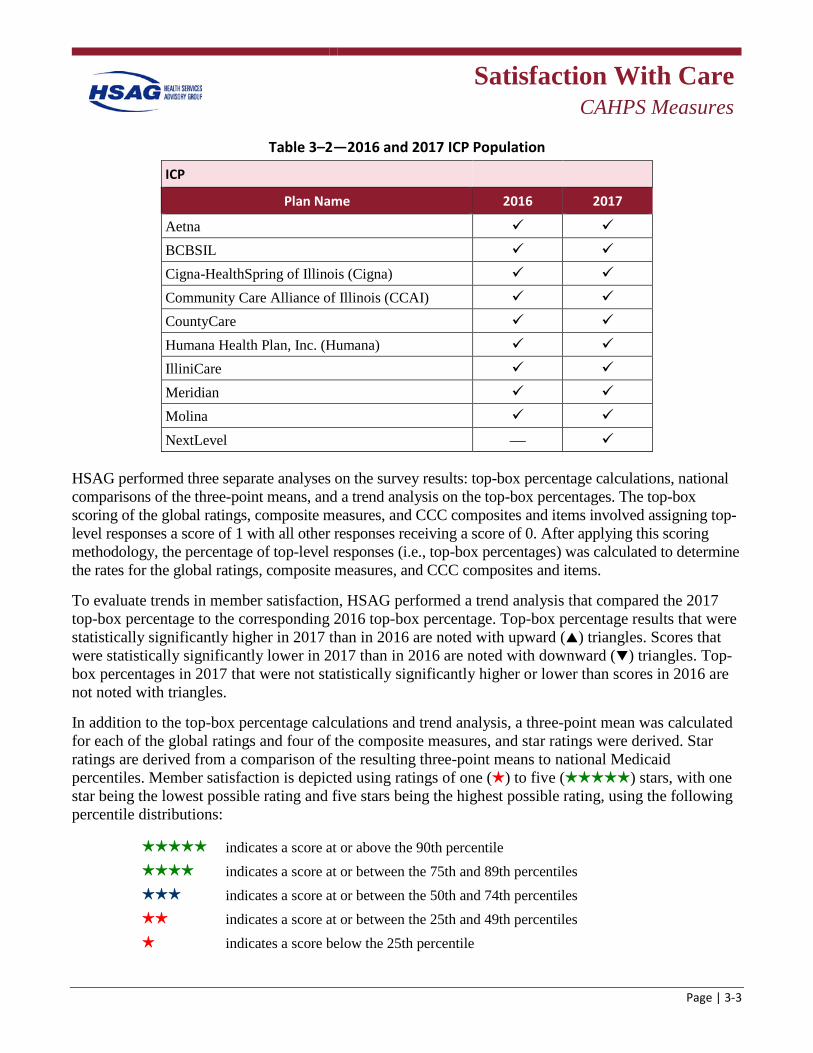
Satisfaction With Care
CAHPS Measures
Page | 3-3
Table 3–2—2016 and 2017 ICP Population
ICP
Plan Name 2016 2017
Aetna BCBSIL Cigna-HealthSpring of Illinois (Cigna) Community Care Alliance of Illinois (CCAI) CountyCare Humana Health Plan, Inc. (Humana) IlliniCare Meridian Molina NextLevel —
HSAG performed three separate analyses on the survey results: top-box percentage calculations, national comparisons of the three-point means, and a trend analysis on the top-box percentages. The top-box scoring of the global ratings, composite measures, and CCC composites and items involved assigning top-level responses a score of 1 with all other responses receiving a score of 0. After applying this scoring methodology, the percentage of top-level responses (i.e., top-box percentages) was calculated to determine the rates for the global ratings, composite measures, and CCC composites and items.
To evaluate trends in member satisfaction, HSAG performed a trend analysis that compared the 2017 top-box percentage to the corresponding 2016 top-box percentage. Top-box percentage results that were statistically significantly higher in 2017 than in 2016 are noted with upward () triangles. Scores that were statistically significantly lower in 2017 than in 2016 are noted with downward () triangles. Top-box percentages in 2017 that were not statistically significantly higher or lower than scores in 2016 are not noted with triangles.
In addition to the top-box percentage calculations and trend analysis, a three-point mean was calculated for each of the global ratings and four of the composite measures, and star ratings were derived. Star ratings are derived from a comparison of the resulting three-point means to national Medicaid percentiles. Member satisfaction is depicted using ratings of one () to five () stars, with one star being the lowest possible rating and five stars being the highest possible rating, using the following percentile distributions:
indicates a score at or above the 90th percentile indicates a score at or between the 75th and 89th percentiles indicates a score at or between the 50th and 74th percentiles indicates a score at or between the 25th and 49th percentiles indicates a score below the 25th percentile
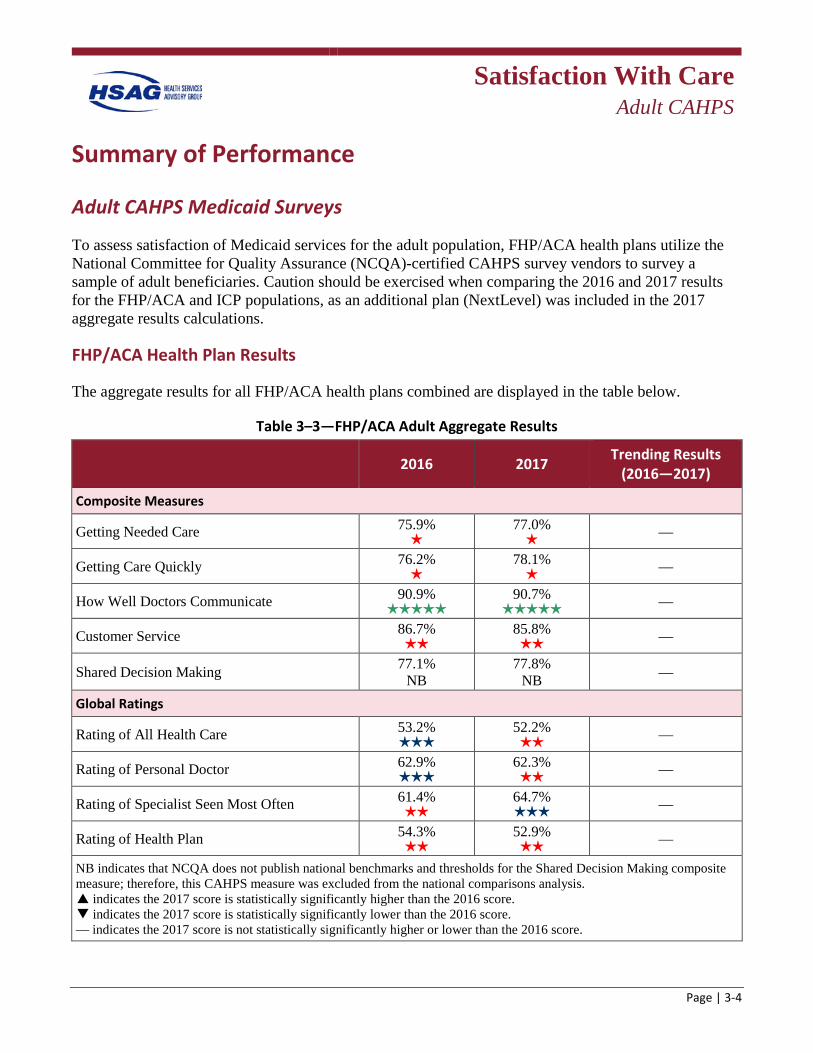
Satisfaction With Care
Adult CAHPS
Page | 3-4
Summary of Performance
Adult CAHPS Medicaid Surveys
To assess satisfaction of Medicaid services for the adult population, FHP/ACA health plans utilize the National Committee for Quality Assurance (NCQA)-certified CAHPS survey vendors to survey a sample of adult beneficiaries. Caution should be exercised when comparing the 2016 and 2017 results for the FHP/ACA and ICP populations, as an additional plan (NextLevel) was included in the 2017 aggregate results calculations.
FHP/ACA Health Plan Results
The aggregate results for all FHP/ACA health plans combined are displayed in the table below.
Table 3–3—FHP/ACA Adult Aggregate Results
2016 2017 Trending Results (2016—2017)
Composite Measures
Getting Needed Care 75.9%
77.0% —
Getting Care Quickly 76.2%
78.1% —
How Well Doctors Communicate 90.9%
90.7% —
Customer Service 86.7%
85.8% —
Shared Decision Making 77.1% NB
77.8% NB —
Global Ratings
Rating of All Health Care 53.2%
52.2% —
Rating of Personal Doctor 62.9%
62.3% —
Rating of Specialist Seen Most Often 61.4%
64.7% —
Rating of Health Plan 54.3%
52.9% —
NB indicates that NCQA does not publish national benchmarks and thresholds for the Shared Decision Making composite measure; therefore, this CAHPS measure was excluded from the national comparisons analysis. p indicates the 2017 score is statistically significantly higher than the 2016 score. q indicates the 2017 score is statistically significantly lower than the 2016 score. — indicates the 2017 score is not statistically significantly higher or lower than the 2016 score.
Satisfaction With Care
Adult CAHPS
Page | 3-5
Notable
• Compared to national Medicaid percentiles, 2017 satisfaction survey results indicated that FHP/ACA adult beneficiaries were generally satisfied with how well their doctors communicate.
• Star ratings improved from 2016 to 2017 for Rating of Specialist Seen Most Often.
Needs Work
• Compared to national Medicaid percentiles, 2017 satisfaction survey results indicated that FHP/ACA adult beneficiaries were generally dissatisfied with their ability to get needed care, their ability to get care quickly, the customer service provided by their health plan, their overall health care, their personal doctor, and their overall health plan.
• Star ratings declined from 2016 to 2017 for Rating of All Health Care and Rating of Personal Doctor.
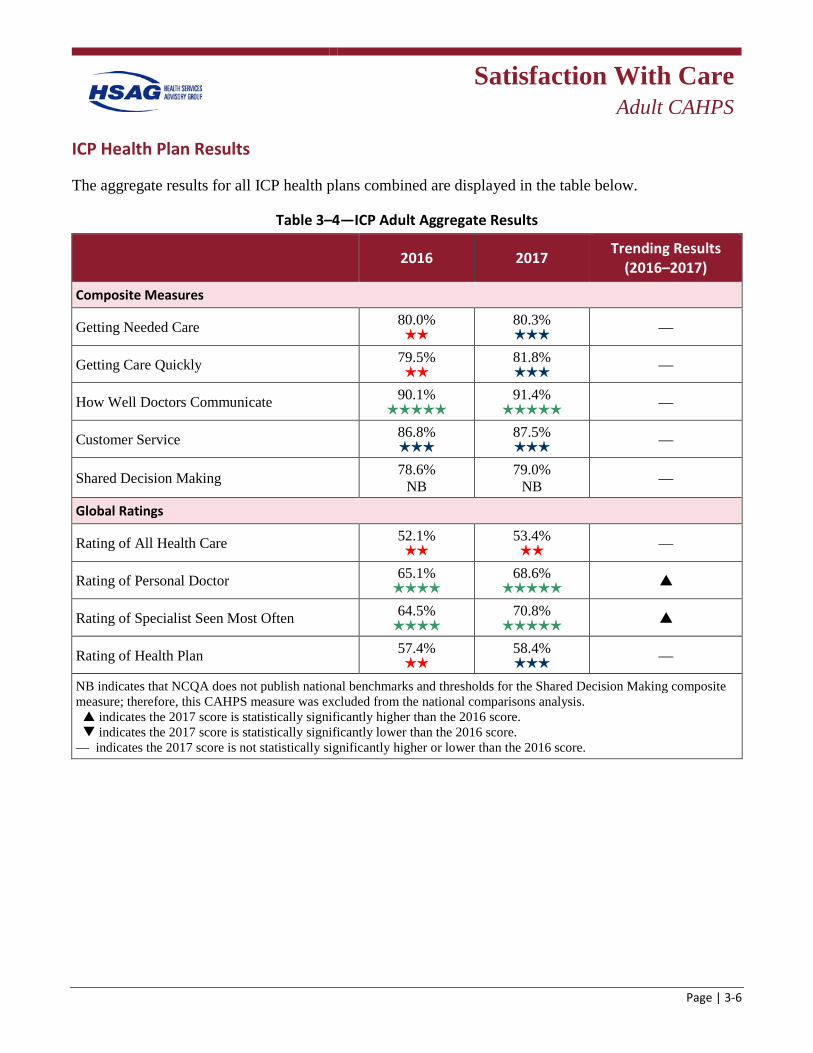
Satisfaction With Care
Adult CAHPS
Page | 3-6
ICP Health Plan Results
The aggregate results for all ICP health plans combined are displayed in the table below.
Table 3–4—ICP Adult Aggregate Results
2016 2017 Trending Results (2016–2017)
Composite Measures
Getting Needed Care 80.0%
80.3% —
Getting Care Quickly 79.5%
81.8% —
How Well Doctors Communicate 90.1%
91.4% —
Customer Service 86.8%
87.5% —
Shared Decision Making 78.6% NB
79.0% NB —
Global Ratings
Rating of All Health Care 52.1%
53.4% —
Rating of Personal Doctor 65.1%
68.6% p
Rating of Specialist Seen Most Often 64.5%
70.8% p
Rating of Health Plan 57.4%
58.4% —
NB indicates that NCQA does not publish national benchmarks and thresholds for the Shared Decision Making composite measure; therefore, this CAHPS measure was excluded from the national comparisons analysis. p indicates the 2017 score is statistically significantly higher than the 2016 score. q indicates the 2017 score is statistically significantly lower than the 2016 score. — indicates the 2017 score is not statistically significantly higher or lower than the 2016 score.
Satisfaction With Care
Adult CAHPS
Page | 3-7
Notable
• Compared to national Medicaid percentiles, 2017 satisfaction survey results indicated that ICP adult beneficiaries were generally satisfied with how well their doctors communicate, their personal doctor, and the specialist they see most often.
• Star ratings improved from 2016 to 2017 for Getting Needed Care, Getting Care Quickly, Rating of Personal Doctor, Rating of Specialist Seen Most Often, and Rating of Health Plan.
• The 2017 scores were statistically significantly higher than the 2016 scores for Rating of Personal Doctor and Rating of Specialist Seen Most Often.
Needs Work
• Compared to national Medicaid percentiles, 2017 satisfaction survey results indicated that ICP adult beneficiaries were generally dissatisfied with their overall health care.
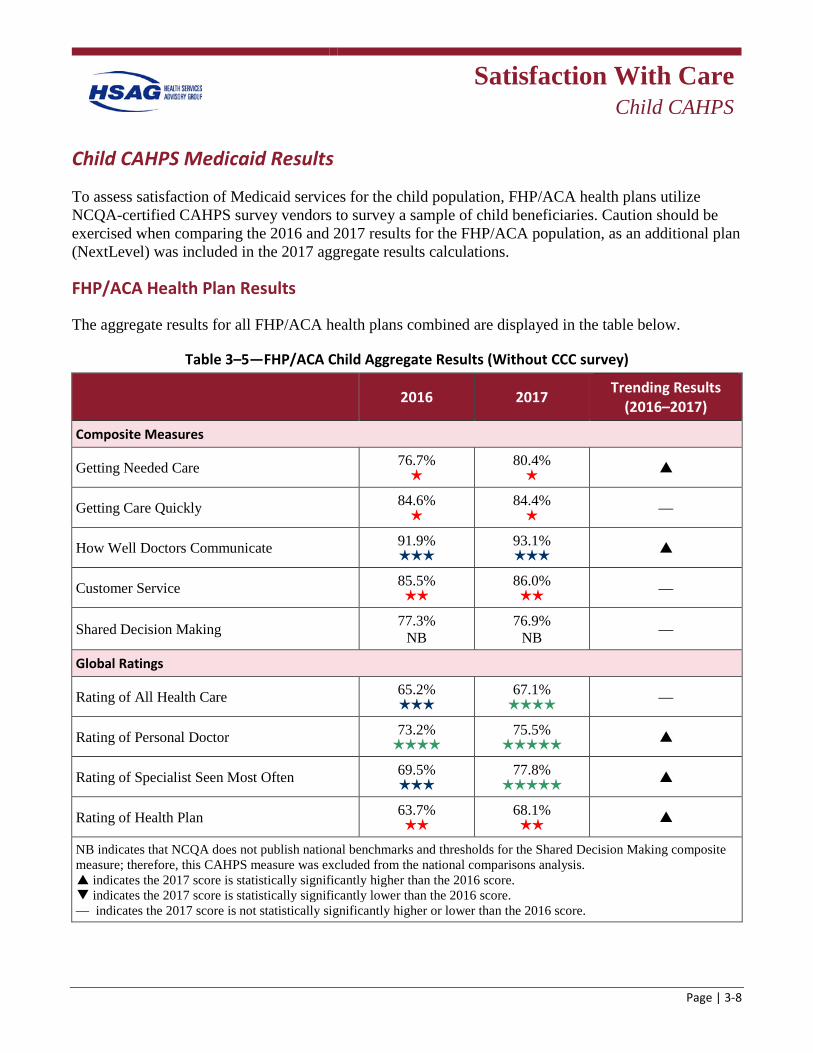
Satisfaction With Care
Child CAHPS
Page | 3-8
Child CAHPS Medicaid Results
To assess satisfaction of Medicaid services for the child population, FHP/ACA health plans utilize NCQA-certified CAHPS survey vendors to survey a sample of child beneficiaries. Caution should be exercised when comparing the 2016 and 2017 results for the FHP/ACA population, as an additional plan (NextLevel) was included in the 2017 aggregate results calculations.
FHP/ACA Health Plan Results
The aggregate results for all FHP/ACA health plans combined are displayed in the table below.
Table 3–5—FHP/ACA Child Aggregate Results (Without CCC survey)
2016 2017 Trending Results (2016–2017)
Composite Measures
Getting Needed Care 76.7%
80.4% p
Getting Care Quickly 84.6%
84.4% —
How Well Doctors Communicate 91.9%
93.1% p
Customer Service 85.5%
86.0% —
Shared Decision Making 77.3% NB
76.9% NB —
Global Ratings
Rating of All Health Care 65.2%
67.1% —
Rating of Personal Doctor 73.2%
75.5% p
Rating of Specialist Seen Most Often 69.5%
77.8% p
Rating of Health Plan 63.7%
68.1% p
NB indicates that NCQA does not publish national benchmarks and thresholds for the Shared Decision Making composite measure; therefore, this CAHPS measure was excluded from the national comparisons analysis. p indicates the 2017 score is statistically significantly higher than the 2016 score. q indicates the 2017 score is statistically significantly lower than the 2016 score. — indicates the 2017 score is not statistically significantly higher or lower than the 2016 score.
Satisfaction With Care
Child CAHPS
Page | 3-9
Notable
• Compared to national Medicaid percentiles, 2017 satisfaction survey results indicated that FHP/ACA parents/caretakers were generally satisfied with their child’s overall health care, their child’s personal doctor, and their child’s specialist.
• Star ratings improved from 2016 to 2017 for Rating of All Health Care, Rating of Personal Doctor, and Rating of Specialist Seen Most Often.
• The 2017 scores were statistically significantly higher than the 2016 scores for Getting Needed Care, How Well Doctors Communicate, Rating of Personal Doctor, Rating of Specialist Seen Most Often, and Rating of Health Plan.
Needs Work
• Similar to the adult population, 2017 satisfaction survey results indicated that compared to national Medicaid percentiles, FHP/ACA parents/caretakers were generally dissatisfied with the ability to get needed care for their child and to get it quickly, the customer service provided by their child’s health plan, and their child’s overall health plan.
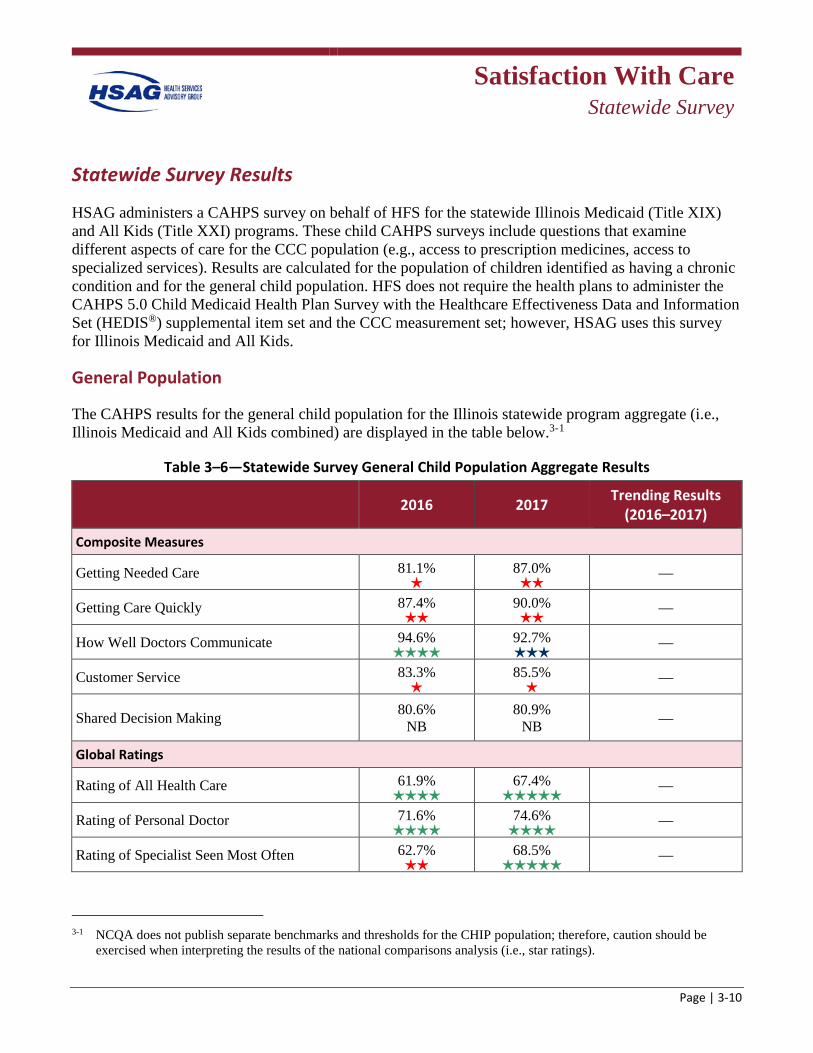
Satisfaction With Care
Statewide Survey
Page | 3-10
Statewide Survey Results
HSAG administers a CAHPS survey on behalf of HFS for the statewide Illinois Medicaid (Title XIX) and All Kids (Title XXI) programs. These child CAHPS surveys include questions that examine different aspects of care for the CCC population (e.g., access to prescription medicines, access to specialized services). Results are calculated for the population of children identified as having a chronic condition and for the general child population. HFS does not require the health plans to administer the CAHPS 5.0 Child Medicaid Health Plan Survey with the Healthcare Effectiveness Data and Information Set (HEDIS®) supplemental item set and the CCC measurement set; however, HSAG uses this survey for Illinois Medicaid and All Kids.
General Population
The CAHPS results for the general child population for the Illinois statewide program aggregate (i.e., Illinois Medicaid and All Kids combined) are displayed in the table below.3-1
Table 3–6—Statewide Survey General Child Population Aggregate Results
2016 2017 Trending Results (2016–2017)
Composite Measures
Getting Needed Care 81.1%
87.0%
—
Getting Care Quickly 87.4%
90.0%
—
How Well Doctors Communicate 94.6%
92.7%
—
Customer Service 83.3%
85.5%
—
Shared Decision Making 80.6% NB
80.9% NB —
Global Ratings
Rating of All Health Care 61.9%
67.4%
—
Rating of Personal Doctor 71.6%
74.6%
—
Rating of Specialist Seen Most Often 62.7%
68.5%
—
3-1 NCQA does not publish separate benchmarks and thresholds for the CHIP population; therefore, caution should be
exercised when interpreting the results of the national comparisons analysis (i.e., star ratings).
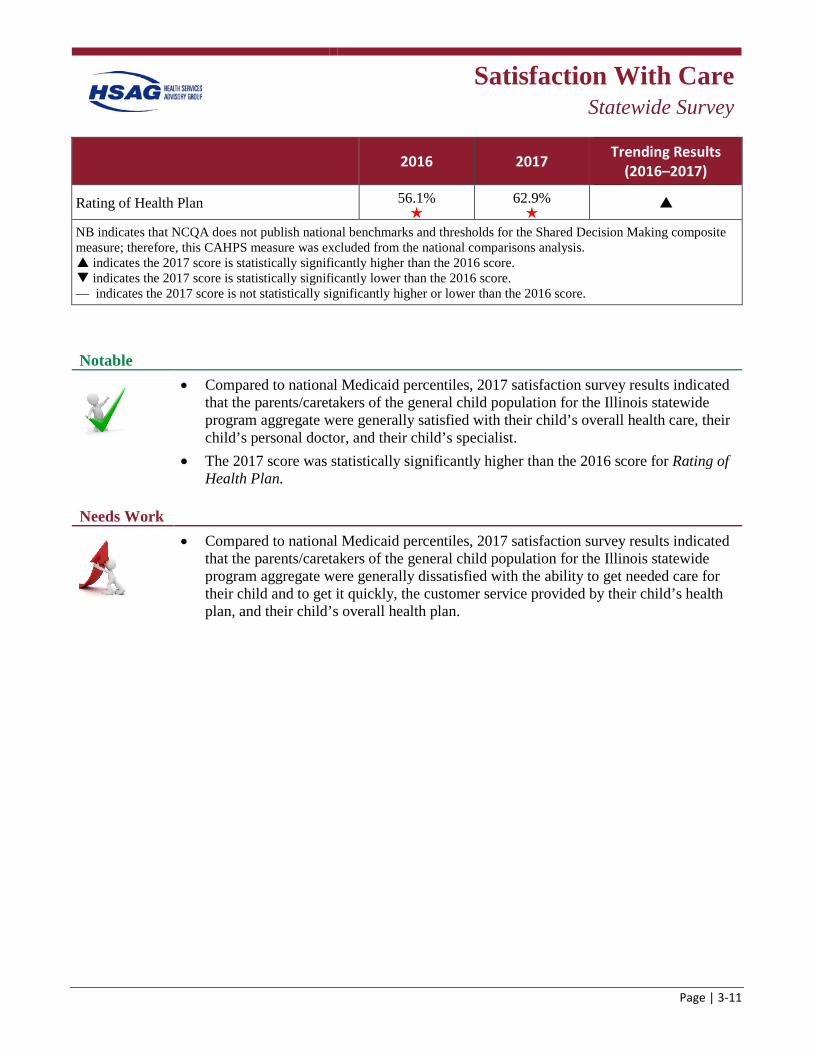
Satisfaction With Care
Statewide Survey
Page | 3-11
2016 2017 Trending Results (2016–2017)
Rating of Health Plan 56.1%
62.9%
p
NB indicates that NCQA does not publish national benchmarks and thresholds for the Shared Decision Making composite measure; therefore, this CAHPS measure was excluded from the national comparisons analysis. p indicates the 2017 score is statistically significantly higher than the 2016 score. q indicates the 2017 score is statistically significantly lower than the 2016 score. — indicates the 2017 score is not statistically significantly higher or lower than the 2016 score.
Notable
• Compared to national Medicaid percentiles, 2017 satisfaction survey results indicated that the parents/caretakers of the general child population for the Illinois statewide program aggregate were generally satisfied with their child’s overall health care, their child’s personal doctor, and their child’s specialist.
• The 2017 score was statistically significantly higher than the 2016 score for Rating of Health Plan.
Needs Work
• Compared to national Medicaid percentiles, 2017 satisfaction survey results indicated that the parents/caretakers of the general child population for the Illinois statewide program aggregate were generally dissatisfied with the ability to get needed care for their child and to get it quickly, the customer service provided by their child’s health plan, and their child’s overall health plan.
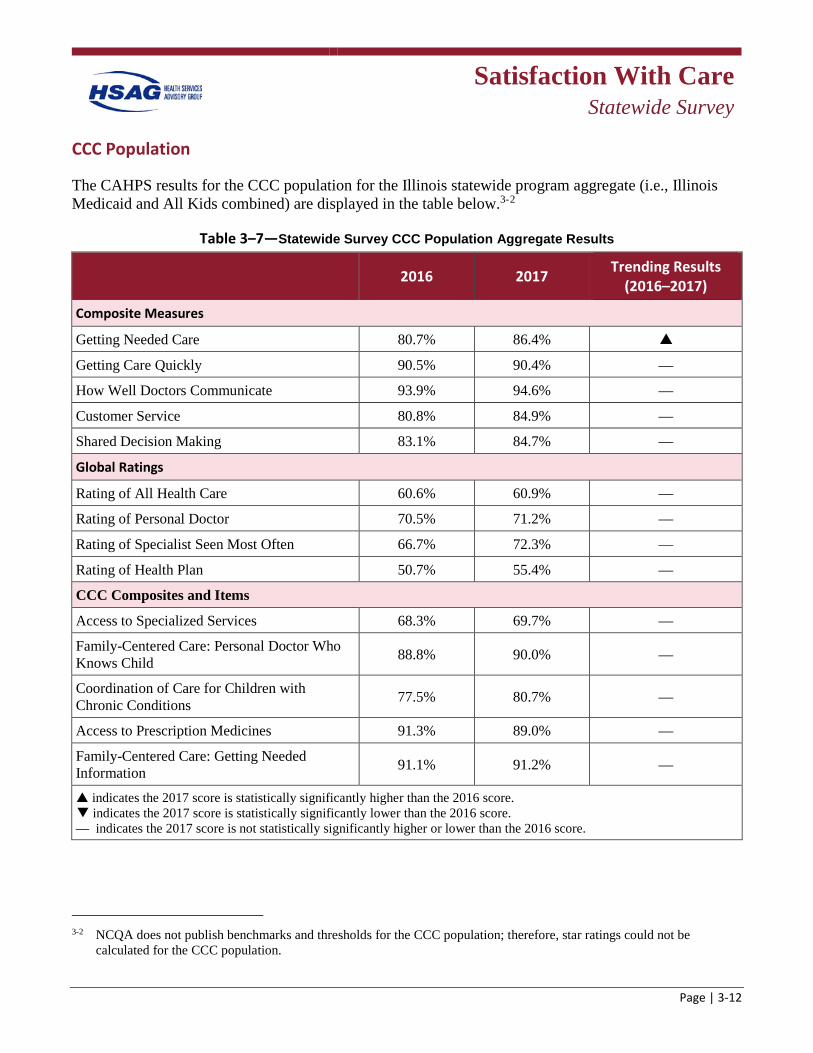
Satisfaction With Care
Statewide Survey
Page | 3-12
CCC Population
The CAHPS results for the CCC population for the Illinois statewide program aggregate (i.e., Illinois Medicaid and All Kids combined) are displayed in the table below.3-2
Table 3–7—Statewide Survey CCC Population Aggregate Results
2016 2017 Trending Results (2016–2017)
Composite Measures
Getting Needed Care 80.7% 86.4% p
Getting Care Quickly 90.5% 90.4% —
How Well Doctors Communicate 93.9% 94.6% —
Customer Service 80.8% 84.9% —
Shared Decision Making 83.1% 84.7% —
Global Ratings
Rating of All Health Care 60.6% 60.9% —
Rating of Personal Doctor 70.5% 71.2% —
Rating of Specialist Seen Most Often 66.7% 72.3% —
Rating of Health Plan 50.7% 55.4% —
CCC Composites and Items
Access to Specialized Services 68.3% 69.7% —
Family-Centered Care: Personal Doctor Who Knows Child 88.8% 90.0% —
Coordination of Care for Children with Chronic Conditions 77.5% 80.7% —
Access to Prescription Medicines 91.3% 89.0% —
Family-Centered Care: Getting Needed Information 91.1% 91.2% —
indicates the 2017 score is statistically significantly higher than the 2016 score. q indicates the 2017 score is statistically significantly lower than the 2016 score. — indicates the 2017 score is not statistically significantly higher or lower than the 2016 score.
3-2 NCQA does not publish benchmarks and thresholds for the CCC population; therefore, star ratings could not be
calculated for the CCC population.
Satisfaction With Care
Statewide Survey
Page | 3-13
Notable
• Top-box rates increased substantially from 2016 to 2017 (i.e., increased by 5 percentage points or more from the previous year) for the Illinois statewide program aggregate for two measures: Getting Needed Care and Rating of Specialist Seen Most Often.
• The 2017 score was statistically significantly higher than the 2016 score for Getting Needed Care.
Needs Work
• None of the top-box rates decreased substantially from 2016 to 2017 (i.e., decreased by 5 percentage points or more from the previous year) for the Illinois statewide program aggregate for any of the measures; therefore, there are no specific areas that need work for the CCC population.
Overall Findings and Conclusions When comparing the results for the FHP/ACA population to the ICP population, the ICP aggregate results were generally higher. This could be a result of having a greater number of members engaged in care coordination within the ICP population than the FHP/ACA population, which allows for an intermediary to help coordinate care, address issues with access, and schedule appointments for the ICP population. Furthermore, the FHP/ACA population has fewer members receiving care coordination services; therefore, this may be driving the lower satisfaction scores.
For the adult ICP health plans, the 2017 scores for two global ratings (Rating of Personal Doctor and Rating of Specialist Seen Most Often) were statistically significantly higher than the 2016 scores; and when compared to national Medicaid benchmarks, the 2017 scores for these two measures were at or above the 90th percentile, indicating ICP members’ satisfaction with their personal doctor and specialist seen most often are improving. However, ICP members were less satisfied with their overall health care, as the score for this measure was below the 50th percentile compared to national Medicaid benchmarks.
For the adult FHP/ACA health plans, none of the measures were statistically significantly higher or lower in 2017 than in 2016; however, six measures (Getting Needed Care, Getting Care Quickly, Customer Service, Rating of All Health Care, Rating of Personal Doctor, and Rating of Health Plan) scored below the 50th percentiles compared to national Medicaid benchmarks. For the child FHP/ACA health plans, the 2017 scores were statistically significantly higher than the 2016 scores for two composite measures (Getting Needed Care and How Well Doctors Communicate) and three global ratings (Rating of Personal Doctor, Rating of Specialist Seen Most Often, and Rating of Health Plan). However, four measures (Getting Needed Care, Getting Care Quickly, Customer Service, and Rating of Health Plan) scored below the 50th percentile compared to national Medicaid benchmarks. Adult
Satisfaction With Care
Statewide Survey
Page | 3-14
members and parents/caretakers of child members of FHP/ACA health plans rated their experiences with their health plan, access to care, and customer service similarly.
For the general child population for the Illinois Statewide Program Aggregate, the 2017 score was statistically significantly higher than the 2016 score for one global rating (Rating of Health Plan); however, the 2017 score for this measure fell below the 25th percentile compared to national Medicaid benchmarks. When compared to national benchmarks, four measures (Getting Needed Care, Getting Care Quickly, Customer Service, and Rating of Health Plan) performed poorly, falling below the 50th percentile for the general child population for the Illinois Statewide Program Aggregate. Furthermore, for the CCC population for the Illinois Statewide Program Aggregate, the 2017 score was statistically significantly higher than the 2016 score for one composite measure (Getting Needed Care).
Based on these results for both the adult and child populations, FHP/ACA health plans and the Illinois Statewide Program Aggregate have an opportunity for improvement regarding members’ access to care and customer service skills. Improvements in these areas may increase members’ overall rating of their health plan.
Page | 4-1
4. Performance Improvement Projects
Overview As part of its quality assessment and performance improvement program, the Illinois Department of Healthcare and Family Services (HFS) requires each health plan to conduct performance improvement projects (PIPs) in accordance with the Code of Federal Regulations (CFR) at 42 §438.330.
The purpose of a PIP is to achieve, through ongoing measurement and intervention, significant improvements in clinical and nonclinical areas of care that are sustained over time. This structured method of assessing and improving health plan processes can have a favorable effect on health outcomes and member satisfaction. Federal requirements for PIPs include:
• Measuring performance using objective quality indicators. • Implementation of systematic interventions to achieve improvement in quality. • Evaluation of the effectiveness of the interventions. • Planning and initiation of activities for increasing or sustaining improvement.
Additional details about PIPs results are presented in Appendix H of this report.
Performance Improvement Projects
Page | 4-2
Summary of Performance
Statewide Mandatory PIPs
Conducting statewide PIPs allows HFS to focus health plans’ improvement efforts toward areas of concern with the goal of statewide improvement. In addition to improving the quality, access, or timeliness of service delivery, the process of completing a PIP functions as a learning opportunity for the health plans. The processes required in PIPs, such as indicator development, root cause analysis, and intervention development are transferable and can lead to improvement in other health areas. HFS required participation from all health plans in two mandatory statewide PIPs: the Community Based Care Coordination PIP and Follow-up After Hospitalization for Mental Illness Behavioral Health Collaborative PIP.
Community Based Care Coordination PIP (Care Coordination PIP)
The Care Coordination PIP focused on the relationship between care coordination, timely ambulatory care services, reducing readmission rates within 30 days of discharge, improving care coordination during hospitalization and post-acute care discharge, and improving access to community care resources. The study population included members stratified as high and moderate risk with a recent hospital discharge.
Evidence suggests an increased risk for relapse and readmission within a one-year period of time under traditional discharge arrangements and instructions, which fail to provide connection to and collaboration with community resources. Evidence has also identified a direct correlation between early outpatient follow-up and decreased hospital readmission rates.4-1 Three study indicators were established to examine readmission rates, care coordination interactions, and access to community resources post-discharge.
For this collaborative PIP, the health plans met and identified the importance of community alliances and provider collaborations to meet the goals. The health plans continued to identify enhancements to care coordination efforts to effect readmission rates.
Follow-up After Hospitalization for Mental Illness Behavioral Health Collaborative PIP (Behavioral Health PIP)
The Behavioral Health PIP is a new collaborative PIP. The clinical significance of the PIP, according to national statistics, is that approximately one in five adults in the United States experience a mental illness. Those who experience a mental illness are often less likely to use medical care and follow treatment plans. and nearly 60 percent of adults with a mental illness do not receive the mental health services they need.4-2 Without the proper care, those with mental illness can expect to see a decline in
4-1 Viggiano T, et al. Care transition interventions in mental health. Current Opinion in Psychiatry 25:551–558, 2012 4-2 National Alliance on Mental Illness (NAMI). “Mental Health Facts in America.” Available at:
https://www.nami.org/NAMI/media/NAMI-Media/Infographics/GeneralMHFacts.pdf. Accessed on: Mar 12, 2017.
Performance Improvement Projects
Page | 4-3
their overall health and well-being. With proper follow-up care, health outcomes are more likely to improve.
Evidence suggests that the rate of avoidable behavioral health-related rehospitalization can be reduced with various interventions. The Healthcare Effectiveness Data and Information Set (HEDIS) measure Follow-up After Hospitalization Measure for Mental Illness (FUH) was chosen as the study indicator for this PIP. This is an industry standard for measurement of transitions in care between inpatient and behavioral health outpatient levels of care. The goals of this PIP were to improve the rate of beneficiaries receiving follow-up appointments within seven days and 30 days of discharge from an inpatient stay for mental health treatment.
For this collaborative PIP, the health plans formed a joint effort called the Illinois Behavioral Health Collaboration Project (the Collaboration), and met monthly throughout state fiscal years (SFYs) 2016 and 2017. The Collaboration identified the importance of community alliances and provider collaborations to meet its goals. Accordingly, the Collaboration met with a variety of provider and community groups to provide information about quality issues in behavioral health; share ideas on how to collaborate; and learn about other initiatives in areas such as housing, outreach, and care coordination. In addition, the Collaboration created a provider list to guide outreach efforts and designed an introductory/informational letter to include in association newsletters such as the Illinois Association of School Social Workers. The Collaboration met monthly and presented quarterly updates to HFS. As specific issues were identified, subgroups (called workgroups) were formed to review the issue and report back to the collaborative group.
Evaluation of PIPs
Validation
As one of the mandatory external quality review (EQR) activities under the Balanced Budget Act of 1997 (BBA), the State is required to validate the PIPs conducted by its health plans. HFS contracts with Health Services Advisory Group, Inc. (HSAG), to meet this validation requirement. The primary objective of PIP validation is to determine each health plan’s compliance with federal requirements.
• HSAG validates PIPs according to the Centers for Medicare & Medicaid Services (CMS) PIP Protocol, which includes 10 required activities such as selecting a study topic, use of sound sampling techniques, assessing for real improvement, etc. Each required activity was evaluated on one or more elements that form a valid PIP, for a total of 37 evaluation elements. HSAG designated 10 of the evaluation elements pivotal to the PIP process as critical elements.
• Using the methodology described in Appendix H of this report, HSAG calculated a validation status of Met, Partially Met, or Not Met and an overall percentage score for all evaluation elements (including critical elements) for each PIP. The goal of HSAG’s PIP validation is to ensure that the State and key stakeholders can have confidence that any reported improvement can be directly linked to the quality improvement strategies and interventions conducted by the health plan for the duration of the PIP.
Performance Improvement Projects
Page | 4-4
– Met: High confidence/confidence in reported PIP results. All critical evaluation elements were Met, and 80 to 100 percent of all evaluation elements were Met across all activities.
– Partially Met: Low confidence in reported PIP results. All critical evaluation elements were Met, and 60 to 79 percent of all evaluation elements were Met across all activities; or one or more critical evaluation elements were Partially Met.
– Not Met: All critical evaluation elements were Met, and less than 60 percent of all evaluation elements were Met across all activities; or one or more critical evaluation elements were Not Met.
Outcomes
PIPs include measurements of performance using objective quality indicators, the implementation of system interventions to achieve improvement in quality, evaluation of the effectiveness of the interventions, and planning and initiation of activities for increasing or sustaining improvement. To determine study indicator outcomes, HSAG evaluates for real and sustained improvement based on reported results and statistical testing. Sustained improvement is achieved when outcomes exhibit statistical improvement over the baseline and sustain this improvement with a subsequent measurement period.
Barriers/Interventions
The identification of barriers through a causal/barrier analysis, and the selection of corresponding interventions to address these barriers, is necessary to improve outcomes. The health plan’s choice of interventions, combination of intervention types, timing and sequence of implementation, and the evaluation of effectiveness of each intervention are essential to the health plan’s overall success in achieving the desired outcomes.
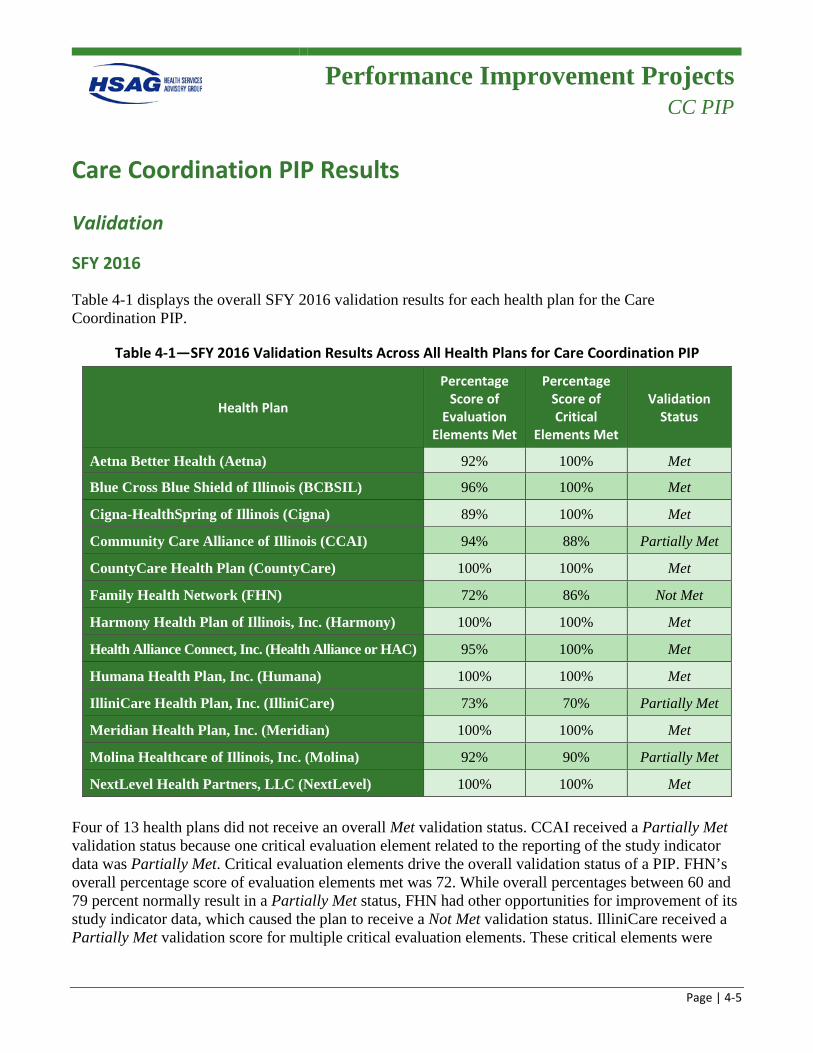
Performance Improvement Projects
CC PIP
Page | 4-5
Care Coordination PIP Results
Validation
SFY 2016
Table 4-1 displays the overall SFY 2016 validation results for each health plan for the Care Coordination PIP.
Table 4-1—SFY 2016 Validation Results Across All Health Plans for Care Coordination PIP
Health Plan
Percentage Score of
Evaluation Elements Met
Percentage Score of Critical
Elements Met
Validation Status
Aetna Better Health (Aetna) 92% 100% Met
Blue Cross Blue Shield of Illinois (BCBSIL) 96% 100% Met
Cigna-HealthSpring of Illinois (Cigna) 89% 100% Met
Community Care Alliance of Illinois (CCAI) 94% 88% Partially Met
CountyCare Health Plan (CountyCare) 100% 100% Met
Family Health Network (FHN) 72% 86% Not Met
Harmony Health Plan of Illinois, Inc. (Harmony) 100% 100% Met
Health Alliance Connect, Inc. (Health Alliance or HAC) 95% 100% Met
Humana Health Plan, Inc. (Humana) 100% 100% Met
IlliniCare Health Plan, Inc. (IlliniCare) 73% 70% Partially Met
Meridian Health Plan, Inc. (Meridian) 100% 100% Met
Molina Healthcare of Illinois, Inc. (Molina) 92% 90% Partially Met
NextLevel Health Partners, LLC (NextLevel) 100% 100% Met
Four of 13 health plans did not receive an overall Met validation status. CCAI received a Partially Met validation status because one critical evaluation element related to the reporting of the study indicator data was Partially Met. Critical evaluation elements drive the overall validation status of a PIP. FHN’s overall percentage score of evaluation elements met was 72. While overall percentages between 60 and 79 percent normally result in a Partially Met status, FHN had other opportunities for improvement of its study indicator data, which caused the plan to receive a Not Met validation status. IlliniCare received a Partially Met validation score for multiple critical evaluation elements. These critical elements were
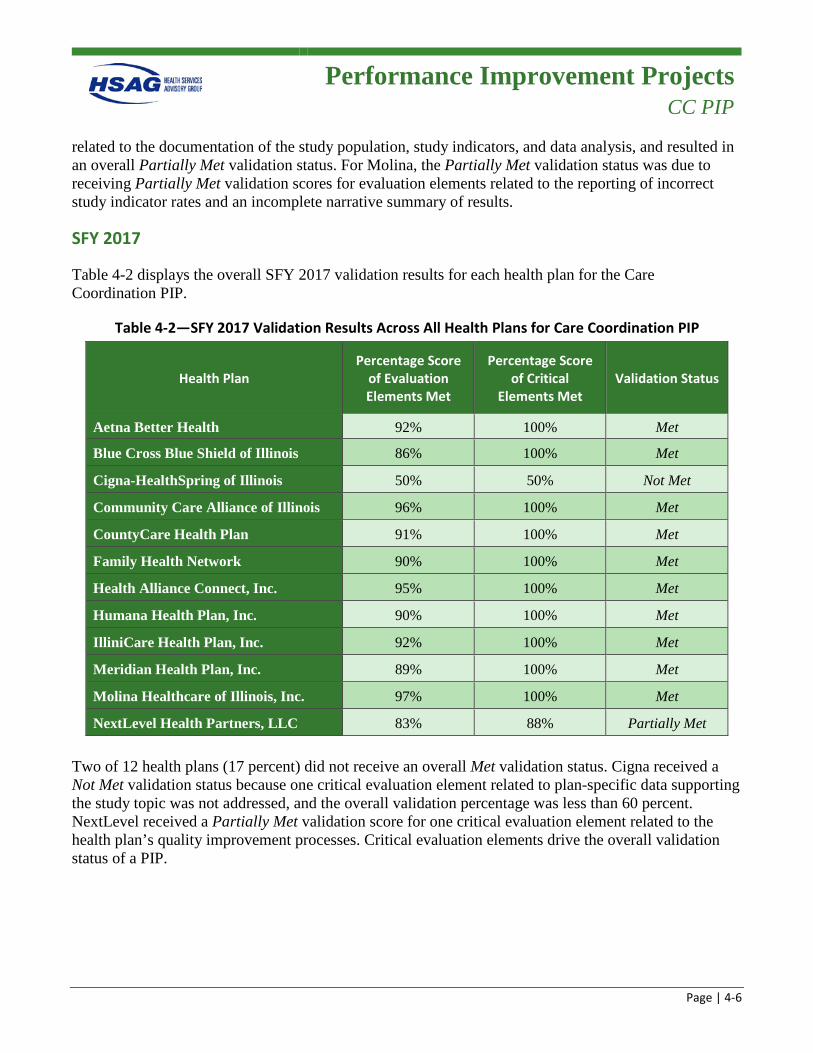
Performance Improvement Projects
CC PIP
Page | 4-6
related to the documentation of the study population, study indicators, and data analysis, and resulted in an overall Partially Met validation status. For Molina, the Partially Met validation status was due to receiving Partially Met validation scores for evaluation elements related to the reporting of incorrect study indicator rates and an incomplete narrative summary of results.
SFY 2017
Table 4-2 displays the overall SFY 2017 validation results for each health plan for the Care Coordination PIP.
Table 4-2—SFY 2017 Validation Results Across All Health Plans for Care Coordination PIP
Health Plan Percentage Score
of Evaluation Elements Met
Percentage Score of Critical
Elements Met Validation Status
Aetna Better Health 92% 100% Met
Blue Cross Blue Shield of Illinois 86% 100% Met
Cigna-HealthSpring of Illinois 50% 50% Not Met
Community Care Alliance of Illinois 96% 100% Met
CountyCare Health Plan 91% 100% Met
Family Health Network 90% 100% Met
Health Alliance Connect, Inc. 95% 100% Met
Humana Health Plan, Inc. 90% 100% Met
IlliniCare Health Plan, Inc. 92% 100% Met
Meridian Health Plan, Inc. 89% 100% Met
Molina Healthcare of Illinois, Inc. 97% 100% Met
NextLevel Health Partners, LLC 83% 88% Partially Met
Two of 12 health plans (17 percent) did not receive an overall Met validation status. Cigna received a Not Met validation status because one critical evaluation element related to plan-specific data supporting the study topic was not addressed, and the overall validation percentage was less than 60 percent. NextLevel received a Partially Met validation score for one critical evaluation element related to the health plan’s quality improvement processes. Critical evaluation elements drive the overall validation status of a PIP.
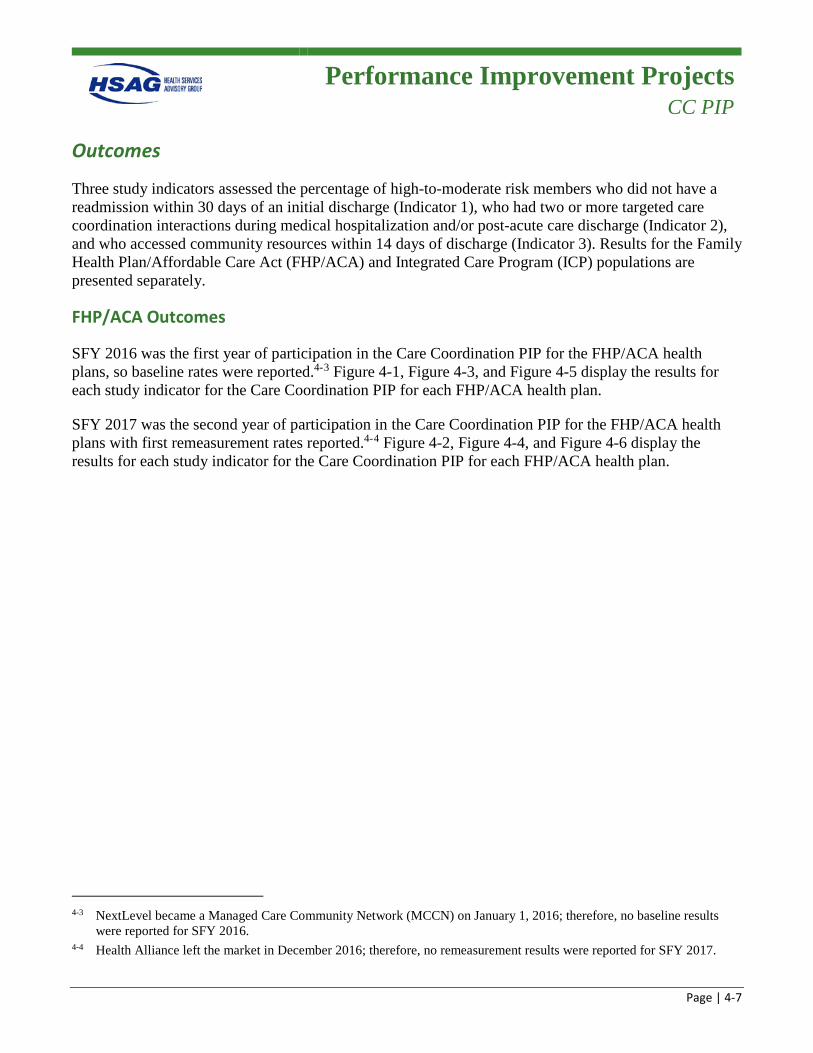
Performance Improvement Projects
CC PIP
Page | 4-7
Outcomes
Three study indicators assessed the percentage of high-to-moderate risk members who did not have a readmission within 30 days of an initial discharge (Indicator 1), who had two or more targeted care coordination interactions during medical hospitalization and/or post-acute care discharge (Indicator 2), and who accessed community resources within 14 days of discharge (Indicator 3). Results for the Family Health Plan/Affordable Care Act (FHP/ACA) and Integrated Care Program (ICP) populations are presented separately.
FHP/ACA Outcomes
SFY 2016 was the first year of participation in the Care Coordination PIP for the FHP/ACA health plans, so baseline rates were reported.4-3 Figure 4-1, Figure 4-3, and Figure 4-5 display the results for each study indicator for the Care Coordination PIP for each FHP/ACA health plan.
SFY 2017 was the second year of participation in the Care Coordination PIP for the FHP/ACA health plans with first remeasurement rates reported.4-4 Figure 4-2, Figure 4-4, and Figure 4-6 display the results for each study indicator for the Care Coordination PIP for each FHP/ACA health plan.
4-3 NextLevel became a Managed Care Community Network (MCCN) on January 1, 2016; therefore, no baseline results
were reported for SFY 2016. 4-4 Health Alliance left the market in December 2016; therefore, no remeasurement results were reported for SFY 2017.
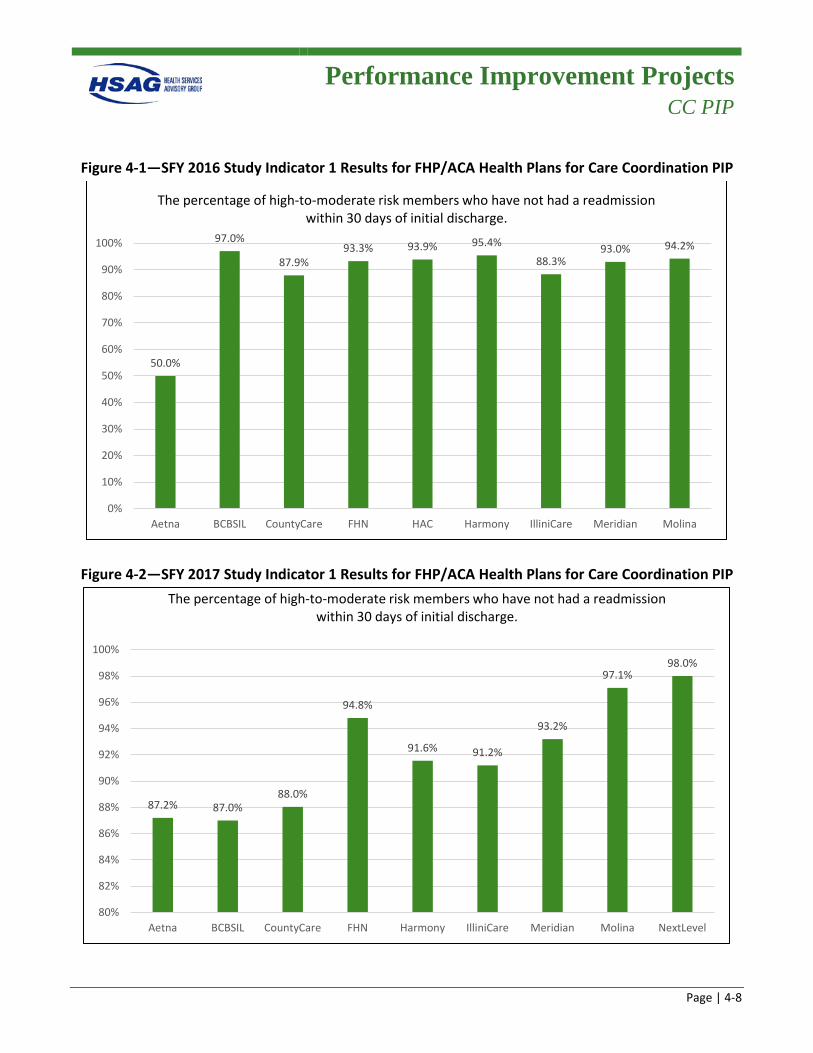
Performance Improvement Projects
CC PIP
Page | 4-8
Figure 4-1—SFY 2016 Study Indicator 1 Results for FHP/ACA Health Plans for Care Coordination PIP
Figure 4-2—SFY 2017 Study Indicator 1 Results for FHP/ACA Health Plans for Care Coordination PIP
50.0%
97.0%
87.9%93.3% 93.9% 95.4%
88.3%93.0% 94.2%
0%
10%
20%
30%
40%
50%
60%
70%
80%
90%
100%
Aetna BCBSIL CountyCare FHN HAC Harmony IlliniCare Meridian Molina
The percentage of high-to-moderate risk members who have not had a readmission within 30 days of initial discharge.
87.2% 87.0%88.0%
94.8%
91.6% 91.2%
93.2%
97.1%98.0%
80%
82%
84%
86%
88%
90%
92%
94%
96%
98%
100%
Aetna BCBSIL CountyCare FHN Harmony IlliniCare Meridian Molina NextLevel
The percentage of high-to-moderate risk members who have not had a readmission within 30 days of initial discharge.
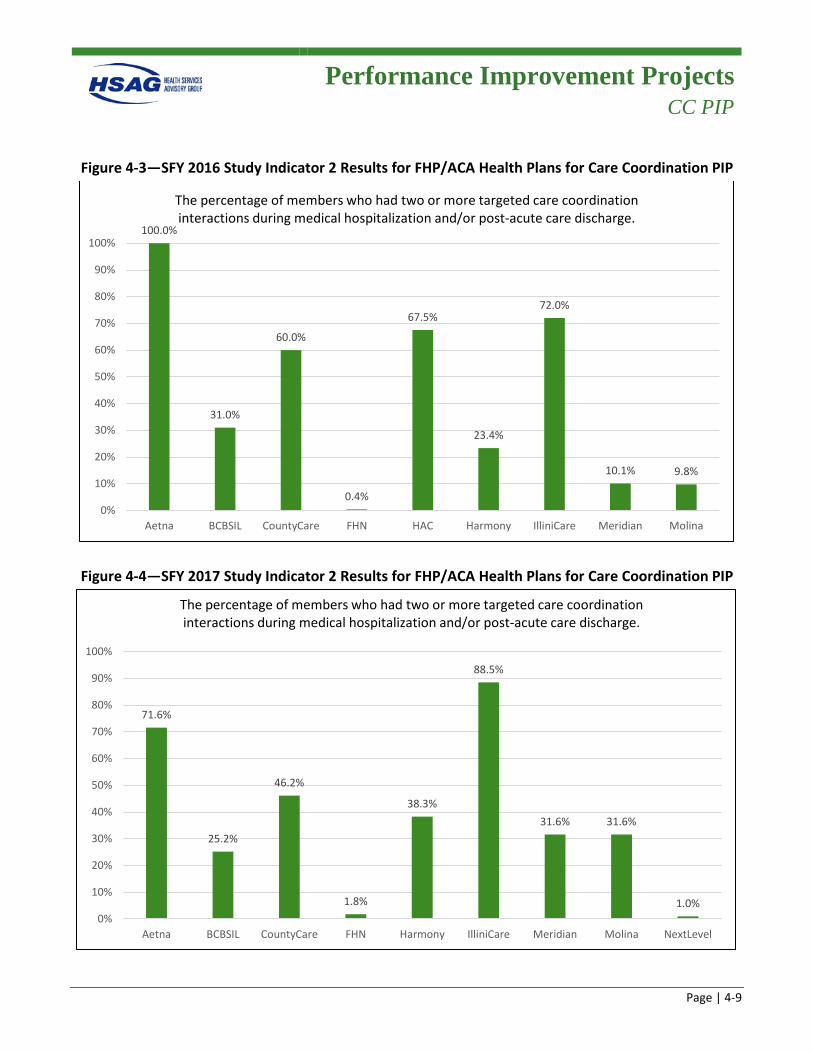
Performance Improvement Projects
CC PIP
Page | 4-9
Figure 4-3—SFY 2016 Study Indicator 2 Results for FHP/ACA Health Plans for Care Coordination PIP
Figure 4-4—SFY 2017 Study Indicator 2 Results for FHP/ACA Health Plans for Care Coordination PIP
100.0%
31.0%
60.0%
0.4%
67.5%
23.4%
72.0%
10.1% 9.8%
0%
10%
20%
30%
40%
50%
60%
70%
80%
90%
100%
Aetna BCBSIL CountyCare FHN HAC Harmony IlliniCare Meridian Molina
The percentage of members who had two or more targeted care coordination interactions during medical hospitalization and/or post-acute care discharge.
71.6%
25.2%
46.2%
1.8%
38.3%
88.5%
31.6% 31.6%
1.0%0%
10%
20%
30%
40%
50%
60%
70%
80%
90%
100%
Aetna BCBSIL CountyCare FHN Harmony IlliniCare Meridian Molina NextLevel
The percentage of members who had two or more targeted care coordination interactions during medical hospitalization and/or post-acute care discharge.
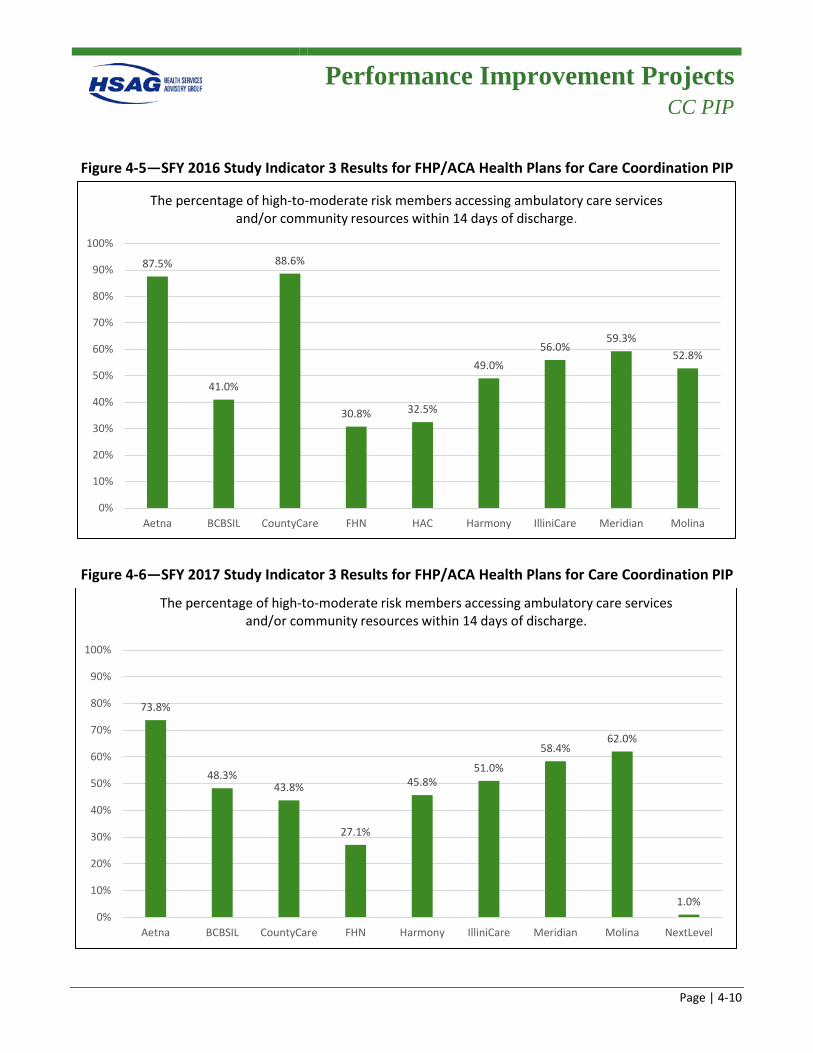
Performance Improvement Projects
CC PIP
Page | 4-10
Figure 4-5—SFY 2016 Study Indicator 3 Results for FHP/ACA Health Plans for Care Coordination PIP
Figure 4-6—SFY 2017 Study Indicator 3 Results for FHP/ACA Health Plans for Care Coordination PIP
87.5%
41.0%
88.6%
30.8% 32.5%
49.0%56.0%
59.3%52.8%
0%
10%
20%
30%
40%
50%
60%
70%
80%
90%
100%
Aetna BCBSIL CountyCare FHN HAC Harmony IlliniCare Meridian Molina
The percentage of high-to-moderate risk members accessing ambulatory care services and/or community resources within 14 days of discharge.
73.8%
48.3%43.8%
27.1%
45.8%51.0%
58.4%62.0%
1.0%0%
10%
20%
30%
40%
50%
60%
70%
80%
90%
100%
Aetna BCBSIL CountyCare FHN Harmony IlliniCare Meridian Molina NextLevel
The percentage of high-to-moderate risk members accessing ambulatory care services and/or community resources within 14 days of discharge.
Performance Improvement Projects
CC PIP
Page | 4-11
2016 FHP/ACA Summary
Notable
• Six of the nine health plans realized rates of over 90 percent for Study Indicator 1 (the percentage of high-to-moderate risk members who have not had a readmission within 30 days of initial discharge).
Needs Work
• Overall, the health plans averaged 42 percent for Study Indicator 2 (the percentage of members who had two or more targeted care coordination interactions during medical hospitalization and/or post-acute care discharge). Five of the nine health plans performed at rates less than the overall overage.
• Overall, the health plans averaged 55 percent for Study Indicator 3 (the percentage of high-to-moderate risk members accessing ambulatory care services and/or community resources within 14 days of discharge). Five of the nine health plans performed at rates less than the overall average.
2017 FHP/ACA Summary
Notable
• All nine health plans performed at rates above 85 percent for Study Indicator 1 (the percentage of high-to-moderate risk members who have not had a readmission within 30 days of initial discharge). Six of the nine performed at rates above 90 percent.
• The overall average performance for Study Indicator 1 improved from 88 percent in the first reporting year to 92 percent in the second reporting year.
Needs Work
• Overall, the health plans averaged 37 percent for Study Indicator 2 (the percentage of members who had two or more targeted care coordination interactions during medical hospitalization and/or post-acute care discharge), a decrease of 5 percentage points from the first reporting year. Five of the nine health plans performed at rates less than the overall overage.
• Overall, the health plans averaged 46 percent for Study Indicator 3 (the percentage of high-to-moderate risk members accessing ambulatory care services and/or community resources within 14 days of discharge), a decrease of 9 percentage points from the first reporting year. Four of the nine health plans performed at rates less than or equal to the overall average. Only two plans realized increased performance from the first reporting year.
Performance Improvement Projects
CC PIP
Page | 4-12
ICP Outcomes
SFY 2016 was the fourth year of participation for Aetna and IlliniCare, and trended results are presented in Appendix H of this report. It was the first year of participation for the other ICP health plans, so baseline rates were reported.4-5 Figure 4-7, Figure 4-9, and Figure 4-11 display the SFY 2016 results for each study indicator for the Care Coordination PIP for each ICP health plan.
SFY 2017 was the fifth year of participation for Aetna and IlliniCare, and trended results are presented in Appendix H of this report. It was only the second year of participation for the other ICP health plans with first remeasurement rates reported. Figure 4-8, Figure 4-10, and Figure 4-12 display the SFY 2017 results for each study indicator for the Care Coordination PIP for each ICP health plan.
4-5 NextLevel became a MCCN on January 1, 2016; therefore, no baseline results were reported for SFY 2016.
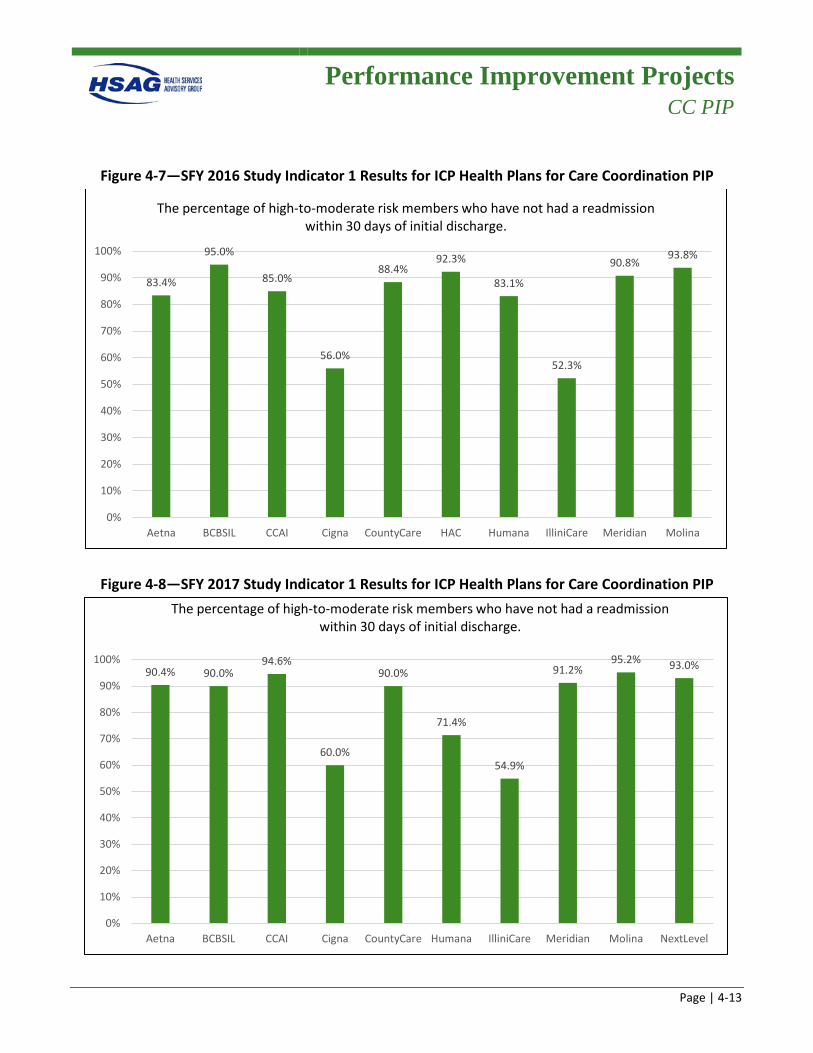
Performance Improvement Projects
CC PIP
Page | 4-13
Figure 4-7—SFY 2016 Study Indicator 1 Results for ICP Health Plans for Care Coordination PIP
Figure 4-8—SFY 2017 Study Indicator 1 Results for ICP Health Plans for Care Coordination PIP
83.4%
95.0%
85.0%
56.0%
88.4%92.3%
83.1%
52.3%
90.8%93.8%
0%
10%
20%
30%
40%
50%
60%
70%
80%
90%
100%
Aetna BCBSIL CCAI Cigna CountyCare HAC Humana IlliniCare Meridian Molina
The percentage of high-to-moderate risk members who have not had a readmission within 30 days of initial discharge.
90.4% 90.0%94.6%
60.0%
90.0%
71.4%
54.9%
91.2%95.2% 93.0%
0%
10%
20%
30%
40%
50%
60%
70%
80%
90%
100%
Aetna BCBSIL CCAI Cigna CountyCare Humana IlliniCare Meridian Molina NextLevel
The percentage of high-to-moderate risk members who have not had a readmission within 30 days of initial discharge.
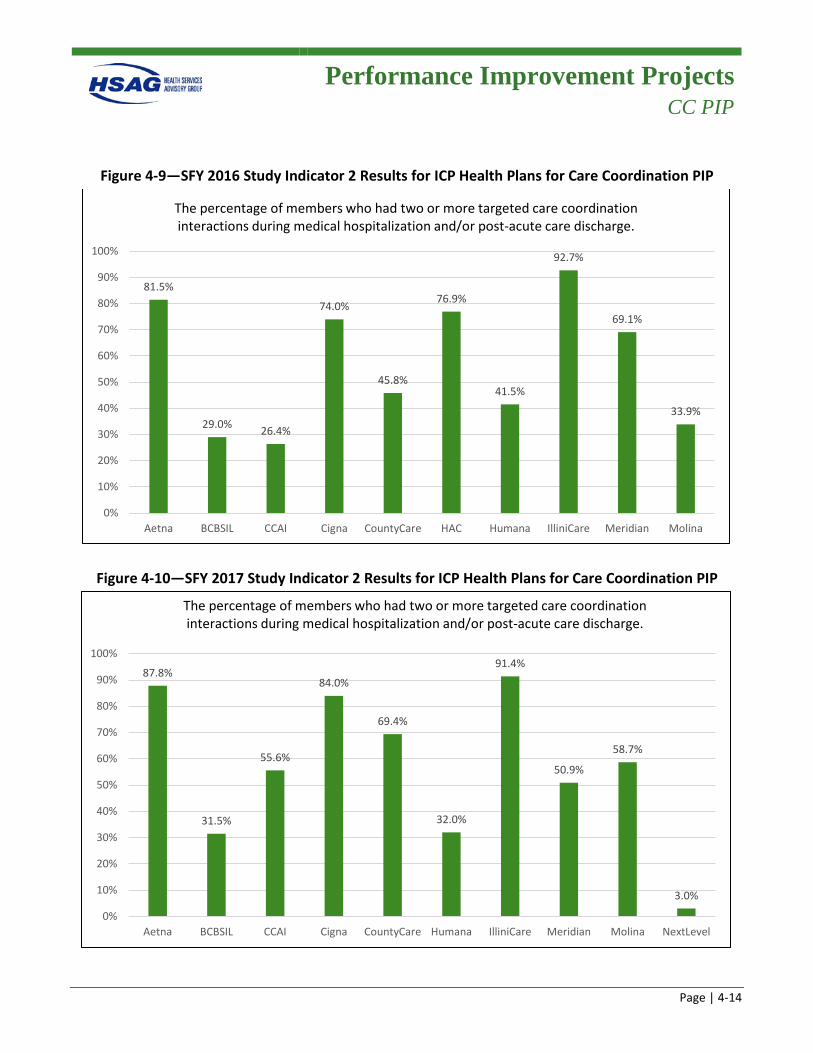
Performance Improvement Projects
CC PIP
Page | 4-14
Figure 4-9—SFY 2016 Study Indicator 2 Results for ICP Health Plans for Care Coordination PIP
Figure 4-10—SFY 2017 Study Indicator 2 Results for ICP Health Plans for Care Coordination PIP
81.5%
29.0% 26.4%
74.0%
45.8%
76.9%
41.5%
92.7%
69.1%
33.9%
0%
10%
20%
30%
40%
50%
60%
70%
80%
90%
100%
Aetna BCBSIL CCAI Cigna CountyCare HAC Humana IlliniCare Meridian Molina
The percentage of members who had two or more targeted care coordination interactions during medical hospitalization and/or post-acute care discharge.
87.8%
31.5%
55.6%
84.0%
69.4%
32.0%
91.4%
50.9%
58.7%
3.0%
0%
10%
20%
30%
40%
50%
60%
70%
80%
90%
100%
Aetna BCBSIL CCAI Cigna CountyCare Humana IlliniCare Meridian Molina NextLevel
The percentage of members who had two or more targeted care coordination interactions during medical hospitalization and/or post-acute care discharge.
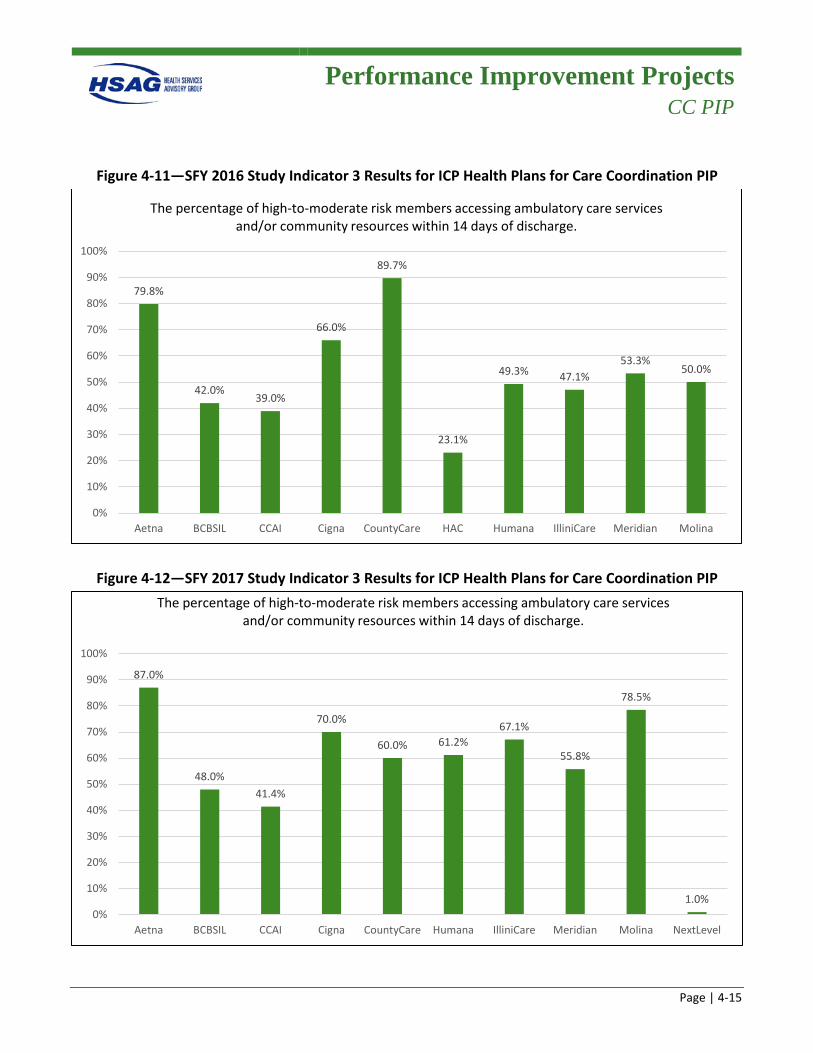
Performance Improvement Projects
CC PIP
Page | 4-15
Figure 4-11—SFY 2016 Study Indicator 3 Results for ICP Health Plans for Care Coordination PIP
Figure 4-12—SFY 2017 Study Indicator 3 Results for ICP Health Plans for Care Coordination PIP
79.8%
42.0%39.0%
66.0%
89.7%
23.1%
49.3% 47.1%53.3%
50.0%
0%
10%
20%
30%
40%
50%
60%
70%
80%
90%
100%
Aetna BCBSIL CCAI Cigna CountyCare HAC Humana IlliniCare Meridian Molina
The percentage of high-to-moderate risk members accessing ambulatory care services and/or community resources within 14 days of discharge.
87.0%
48.0%41.4%
70.0%
60.0% 61.2%67.1%
55.8%
78.5%
1.0%0%
10%
20%
30%
40%
50%
60%
70%
80%
90%
100%
Aetna BCBSIL CCAI Cigna CountyCare Humana IlliniCare Meridian Molina NextLevel
The percentage of high-to-moderate risk members accessing ambulatory care services and/or community resources within 14 days of discharge.
Performance Improvement Projects
CC PIP
Page | 4-16
2016 ICP Summary
Notable
• Four of the 10 health plans realized rates of over 90 percent for Study Indicator 1 (the percentage of high-to-moderate risk members who have not had a readmission within 30 days of initial discharge).
Needs Work
• Overall, the health plans averaged 57 percent for Study Indicator 2 (the percentage of members who had two or more targeted care coordination interactions during medical hospitalization and/or post-acute care discharge). Five of the 10 health plans performed at rates less than the overall overage.
• Overall, the health plans averaged 54 percent for Study Indicator 3 (the percentage of high-to-moderate risk members accessing ambulatory care services and/or community resources within 14 days of discharge). Seven of the 10 health plans performed at rates less than or equal to the overall average.
2017 ICP Summary
Notable
• Seven of the 10 health plans realized rates at or above 90 percent for Study Indicator 1 (the percentage of high-to-moderate risk members who have not had a readmission within 30 days of initial discharge).
• Six health plans realized improvements from reporting year one to reporting year two for Study Indicator 2 (the percentage of members who had two or more targeted care coordination interactions during medical hospitalization and/or post-acute care discharge).
• The overall average performance for Study Indicator 3 (the percentage of high-to-moderate risk members accessing ambulatory care services and/or community resources within 14 days of discharge) improved from 57 percent in the first reporting year to 63 percent in the second reporting year. 4-6
• Eight health plans realized improvements from reporting year one to reporting year two for Study Indicator 3.
4-6 Health Alliance and NextLevel results were not included in overall average since they did not report both years.
Performance Improvement Projects
CC PIP
Page | 4-17
Needs Work
• Overall, the health plans averaged 62 percent for Study Indicator 2 (the percentage of members who had two or more targeted care coordination interactions during medical hospitalization and/or post-acute care discharge).4-7 Six of the 10 health plans performed at rates less than or equal to the overall overage.
• Overall, the health plans averaged 63 percent for Study Indicator 3 (the percentage of high-to-moderate risk members accessing ambulatory care services and/or community resources within 14 days of discharge).4-7 Six of the 10 health plans performed at rates less than or equal to the overall average.
Barriers/Interventions
The following are barriers that were common across all health plans:
• Lack of communication between hospital, health plan, and provider staff regarding discharge planning and timeliness of hospitalization notification, including lack of awareness of member admission to or discharge from acute care facilities.
• Ineffective processes to receive discharge instructions from acute care facilities. • Ineffective communication processes between utilization management and care coordination staff
regarding member hospitalizations. • Members’ lack of awareness and education regarding the importance of follow-up care and disease
self-management. • Members’ lack of understanding regarding their discharge plan. • Lack of robust transition of care processes to mitigate barriers.
The following are interventions common across all health plans:
• Developed and conducted training and education to clinical staff and network providers. • Developed a system program to identify member(s) in the hospital prior to discharge so outreach
could be conducted. • Established a partnership and collaborated with hospitals/inpatient facilities. • Implemented and revised current programs for high-risk population(s). • Participated in community outreach events to have face-to-face outreach with members.
4-7 NextLevel results were not included in overall average since 2017 was baseline reporting year.
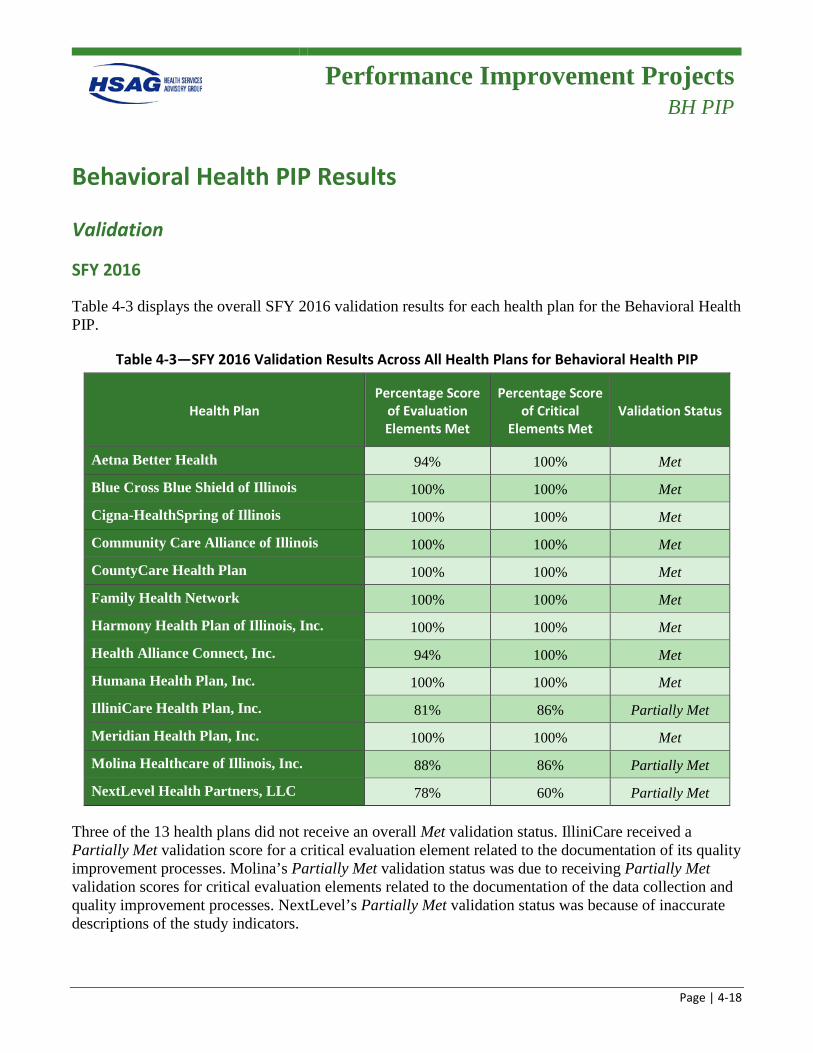
Performance Improvement Projects
BH PIP
Page | 4-18
Behavioral Health PIP Results
Validation
SFY 2016
Table 4-3 displays the overall SFY 2016 validation results for each health plan for the Behavioral Health PIP.
Table 4-3—SFY 2016 Validation Results Across All Health Plans for Behavioral Health PIP
Health Plan Percentage Score
of Evaluation Elements Met
Percentage Score of Critical
Elements Met Validation Status
Aetna Better Health 94% 100% Met Blue Cross Blue Shield of Illinois 100% 100% Met Cigna-HealthSpring of Illinois 100% 100% Met Community Care Alliance of Illinois 100% 100% Met CountyCare Health Plan 100% 100% Met Family Health Network 100% 100% Met Harmony Health Plan of Illinois, Inc. 100% 100% Met Health Alliance Connect, Inc. 94% 100% Met Humana Health Plan, Inc. 100% 100% Met IlliniCare Health Plan, Inc. 81% 86% Partially Met Meridian Health Plan, Inc. 100% 100% Met Molina Healthcare of Illinois, Inc. 88% 86% Partially Met NextLevel Health Partners, LLC 78% 60% Partially Met
Three of the 13 health plans did not receive an overall Met validation status. IlliniCare received a Partially Met validation score for a critical evaluation element related to the documentation of its quality improvement processes. Molina’s Partially Met validation status was due to receiving Partially Met validation scores for critical evaluation elements related to the documentation of the data collection and quality improvement processes. NextLevel’s Partially Met validation status was because of inaccurate descriptions of the study indicators.
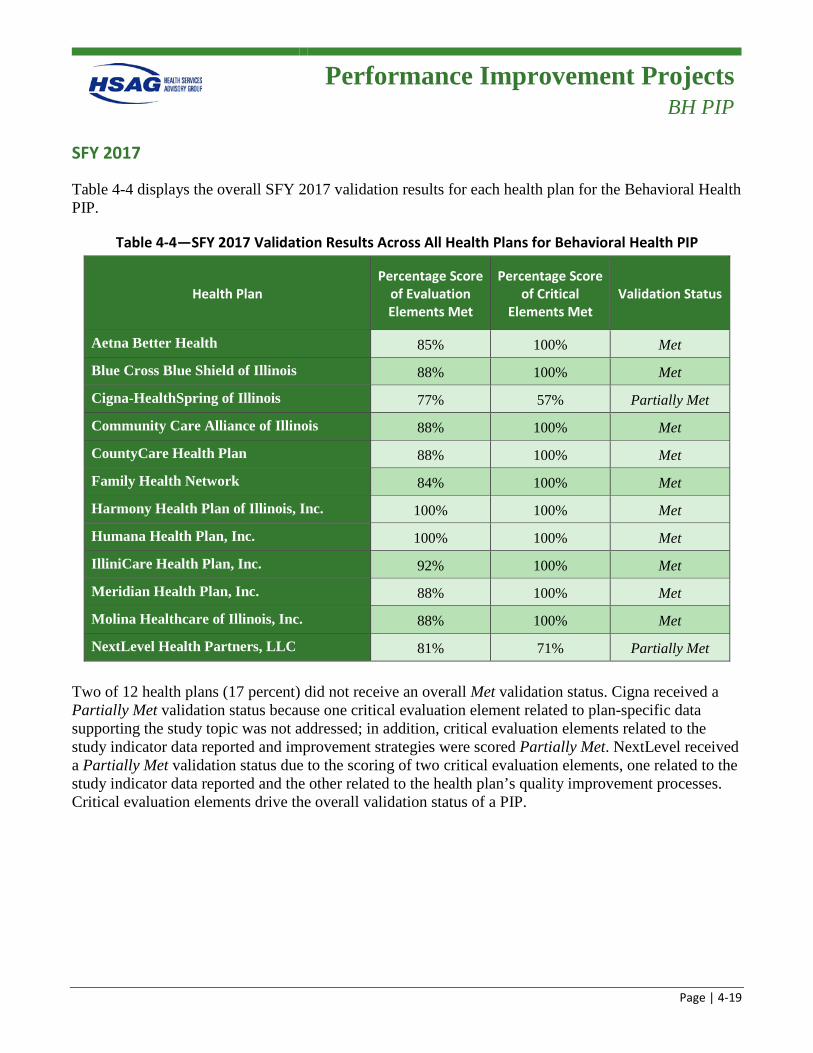
Performance Improvement Projects
BH PIP
Page | 4-19
SFY 2017
Table 4-4 displays the overall SFY 2017 validation results for each health plan for the Behavioral Health PIP.
Table 4-4—SFY 2017 Validation Results Across All Health Plans for Behavioral Health PIP
Health Plan Percentage Score
of Evaluation Elements Met
Percentage Score of Critical
Elements Met Validation Status
Aetna Better Health 85% 100% Met Blue Cross Blue Shield of Illinois 88% 100% Met Cigna-HealthSpring of Illinois 77% 57% Partially Met Community Care Alliance of Illinois 88% 100% Met CountyCare Health Plan 88% 100% Met Family Health Network 84% 100% Met Harmony Health Plan of Illinois, Inc. 100% 100% Met Humana Health Plan, Inc. 100% 100% Met IlliniCare Health Plan, Inc. 92% 100% Met Meridian Health Plan, Inc. 88% 100% Met Molina Healthcare of Illinois, Inc. 88% 100% Met NextLevel Health Partners, LLC 81% 71% Partially Met
Two of 12 health plans (17 percent) did not receive an overall Met validation status. Cigna received a Partially Met validation status because one critical evaluation element related to plan-specific data supporting the study topic was not addressed; in addition, critical evaluation elements related to the study indicator data reported and improvement strategies were scored Partially Met. NextLevel received a Partially Met validation status due to the scoring of two critical evaluation elements, one related to the study indicator data reported and the other related to the health plan’s quality improvement processes. Critical evaluation elements drive the overall validation status of a PIP.
Performance Improvement Projects
BH PIP
Page | 4-20
Outcomes
Two study indicators for this PIP tracked health plan performance on HEDIS measures that assess the rate of beneficiaries receiving follow-up appointments within seven days (Study Indicator 1) and 30 days (Study Indicator 2) of discharge from an inpatient stay for mental health treatment (FUH). The PIP goal for both HEDIS measures was to achieve at least the 50th percentile based on HEDIS benchmarks. SFY 2016 was the first year of participation in the Behavioral Health PIP for all health plans, so baseline rates were reported.4-8 FHP/ACA and ICP results are presented separately. Trended results are included in Appendix H of this report.
FHP/ACA Outcomes
Figure 4-13 through Figure 4-16 display the results for each study indicator for the Behavioral Health PIP for the FHP/ACA health plans for SFYs 2016 and 2017.
4-8 NextLevel became a MCCN on January 1, 2016; therefore, no baseline results were reported for SFY 2016.
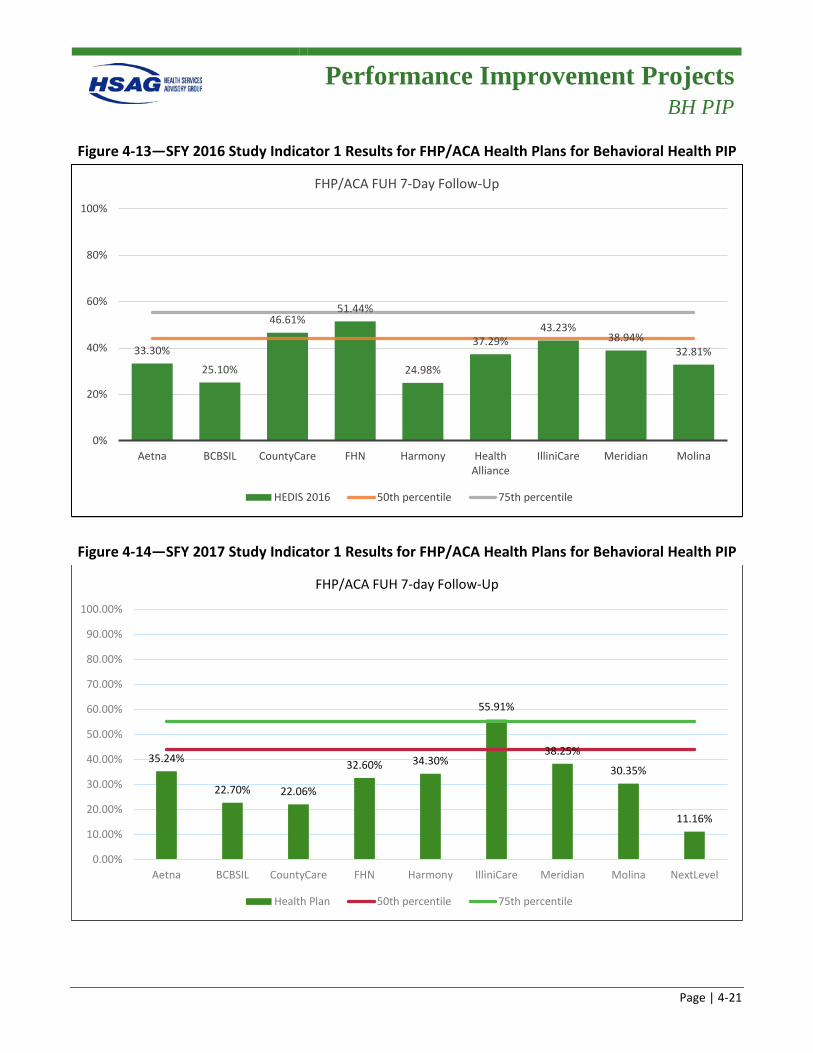
Performance Improvement Projects
BH PIP
Page | 4-21
Figure 4-13—SFY 2016 Study Indicator 1 Results for FHP/ACA Health Plans for Behavioral Health PIP
Figure 4-14—SFY 2017 Study Indicator 1 Results for FHP/ACA Health Plans for Behavioral Health PIP
33.30%
25.10%
46.61%51.44%
24.98%
37.29%43.23%
38.94%32.81%
0%
20%
40%
60%
80%
100%
Aetna BCBSIL CountyCare FHN Harmony HealthAlliance
IlliniCare Meridian Molina
FHP/ACA FUH 7-Day Follow-Up
HEDIS 2016 50th percentile 75th percentile
35.24%
22.70% 22.06%
32.60% 34.30%
55.91%
38.25%
30.35%
11.16%
0.00%
10.00%
20.00%
30.00%
40.00%
50.00%
60.00%
70.00%
80.00%
90.00%
100.00%
Aetna BCBSIL CountyCare FHN Harmony IlliniCare Meridian Molina NextLevel
FHP/ACA FUH 7-day Follow-Up
Health Plan 50th percentile 75th percentile
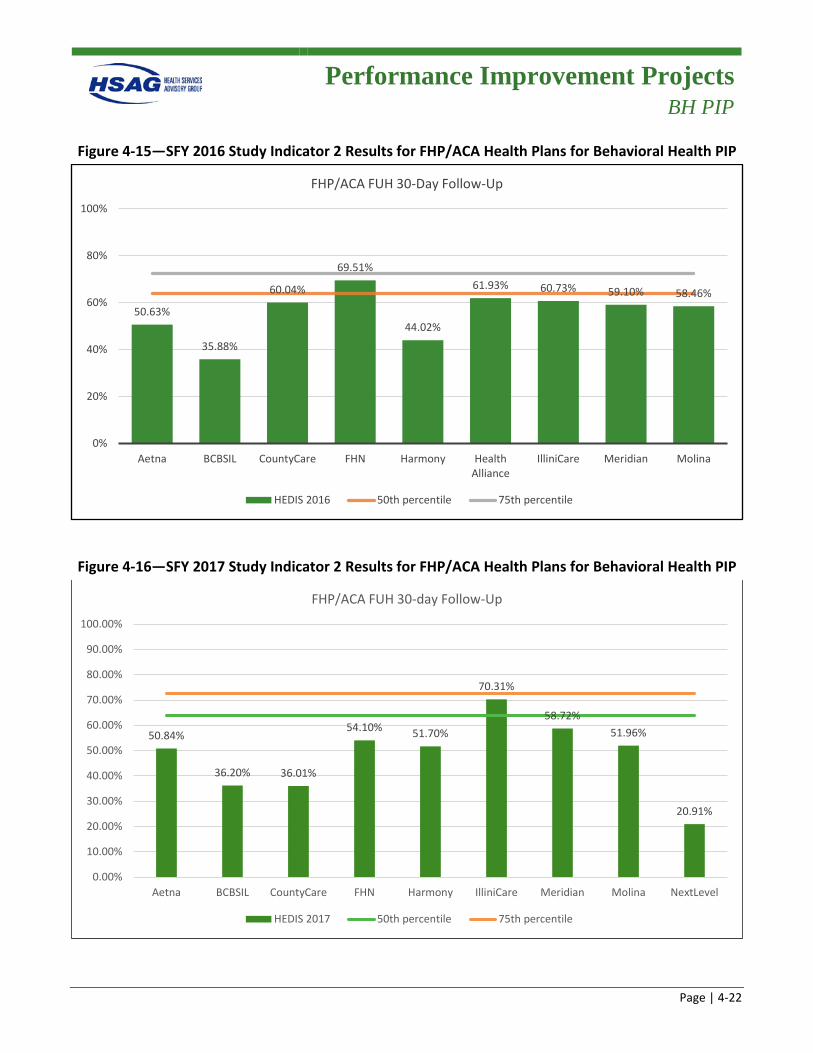
Performance Improvement Projects
BH PIP
Page | 4-22
Figure 4-15—SFY 2016 Study Indicator 2 Results for FHP/ACA Health Plans for Behavioral Health PIP
Figure 4-16—SFY 2017 Study Indicator 2 Results for FHP/ACA Health Plans for Behavioral Health PIP
50.63%
35.88%
60.04%
69.51%
44.02%
61.93% 60.73% 59.10% 58.46%
0%
20%
40%
60%
80%
100%
Aetna BCBSIL CountyCare FHN Harmony HealthAlliance
IlliniCare Meridian Molina
FHP/ACA FUH 30-Day Follow-Up
HEDIS 2016 50th percentile 75th percentile
50.84%
36.20% 36.01%
54.10% 51.70%
70.31%
58.72%51.96%
20.91%
0.00%
10.00%
20.00%
30.00%
40.00%
50.00%
60.00%
70.00%
80.00%
90.00%
100.00%
Aetna BCBSIL CountyCare FHN Harmony IlliniCare Meridian Molina NextLevel
FHP/ACA FUH 30-day Follow-Up
HEDIS 2017 50th percentile 75th percentile
Performance Improvement Projects
BH PIP
Page | 4-23
SFY 2016 FHP/ACA Summary
Notable
• Two of the nine health plans performed above the 50th percentile for Study Indicator 1 (7-day follow-up).
• One of the nine health plans performed above the 50th percentile for Study Indicator 2 (30-day follow-up).
Needs Work
• Overall, the health plans averaged 37 percent for Study Indicator 1: (7-day follow-up). Seven of the nine health plans performed below the 50th percentile.
• Overall, the health plans averaged 56 percent for Study Indicator 2 (30-day follow-up). Eight of the nine health plans performed below the 50th percentile.
SFY 2017 FHP/ACA Summary
Notable
• One of the nine health plans performed above the 50th percentile for Study Indicator 1 (7-day follow-up).
• Three health plans realized improved rates from reporting year one to reporting year two for Study Indicator 1.
• One of the nine health plans performed above the 50th percentile for Study Indicator 2 (30-day follow-up).
• Four health plans realized improved rates from reporting year one to reporting year two for Study Indicator 2.
Needs Work
• Overall, the health plans averaged 31 percent for Study Indicator 1 (7-day follow-up), a decrease of 6 percentage points from the first reporting year. Eight of the nine health plans performed below the 50th percentile.
• Five health plans demonstrated decreased rates from reporting year one to reporting year two for Study Indicator 1.
• Overall, the health plans averaged 48 percent for Study Indicator 2 (30-day follow-up), a decrease of 8 percentage points from the first reporting year. Eight of the nine health plans performed below the 50th percentile.
• Four health plans demonstrated decreased rates from reporting year one to reporting year two.
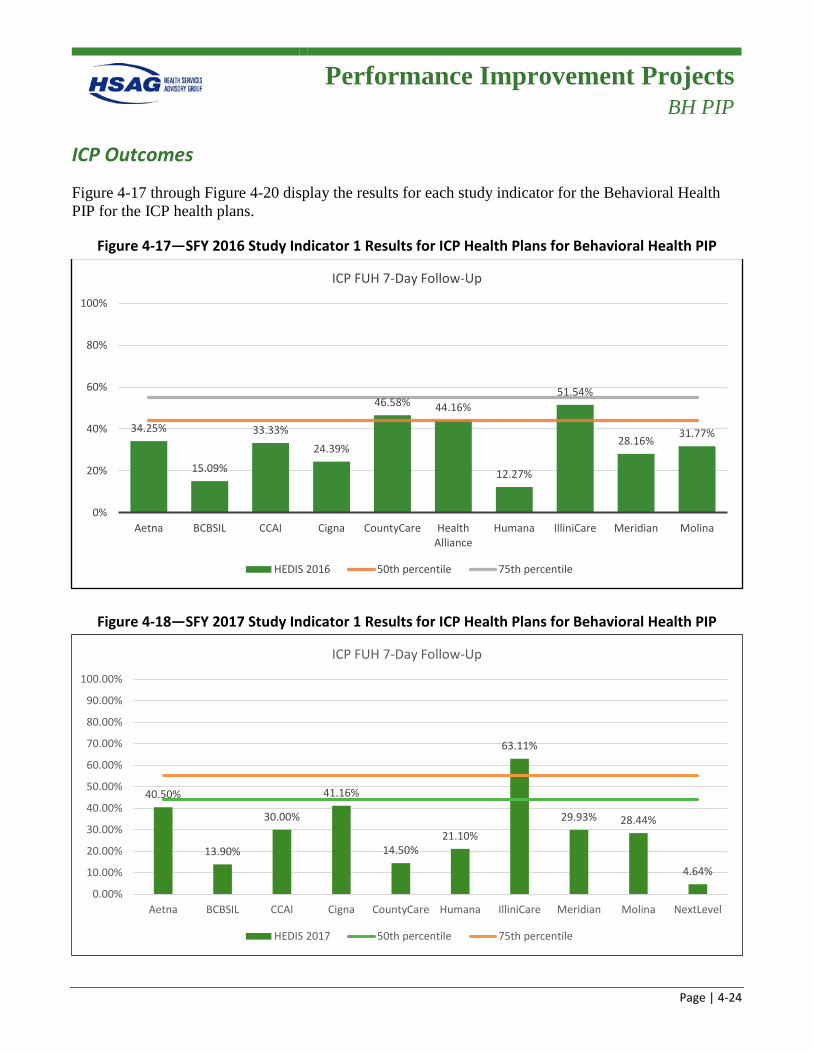
Performance Improvement Projects
BH PIP
Page | 4-24
ICP Outcomes
Figure 4-17 through Figure 4-20 display the results for each study indicator for the Behavioral Health PIP for the ICP health plans.
Figure 4-17—SFY 2016 Study Indicator 1 Results for ICP Health Plans for Behavioral Health PIP
Figure 4-18—SFY 2017 Study Indicator 1 Results for ICP Health Plans for Behavioral Health PIP
34.25%
15.09%
33.33%24.39%
46.58% 44.16%
12.27%
51.54%
28.16% 31.77%
0%
20%
40%
60%
80%
100%
Aetna BCBSIL CCAI Cigna CountyCare HealthAlliance
Humana IlliniCare Meridian Molina
ICP FUH 7-Day Follow-Up
HEDIS 2016 50th percentile 75th percentile
40.50%
13.90%
30.00%
41.16%
14.50%21.10%
63.11%
29.93% 28.44%
4.64%
0.00%
10.00%
20.00%
30.00%
40.00%
50.00%
60.00%
70.00%
80.00%
90.00%
100.00%
Aetna BCBSIL CCAI Cigna CountyCare Humana IlliniCare Meridian Molina NextLevel
ICP FUH 7-Day Follow-Up
HEDIS 2017 50th percentile 75th percentile
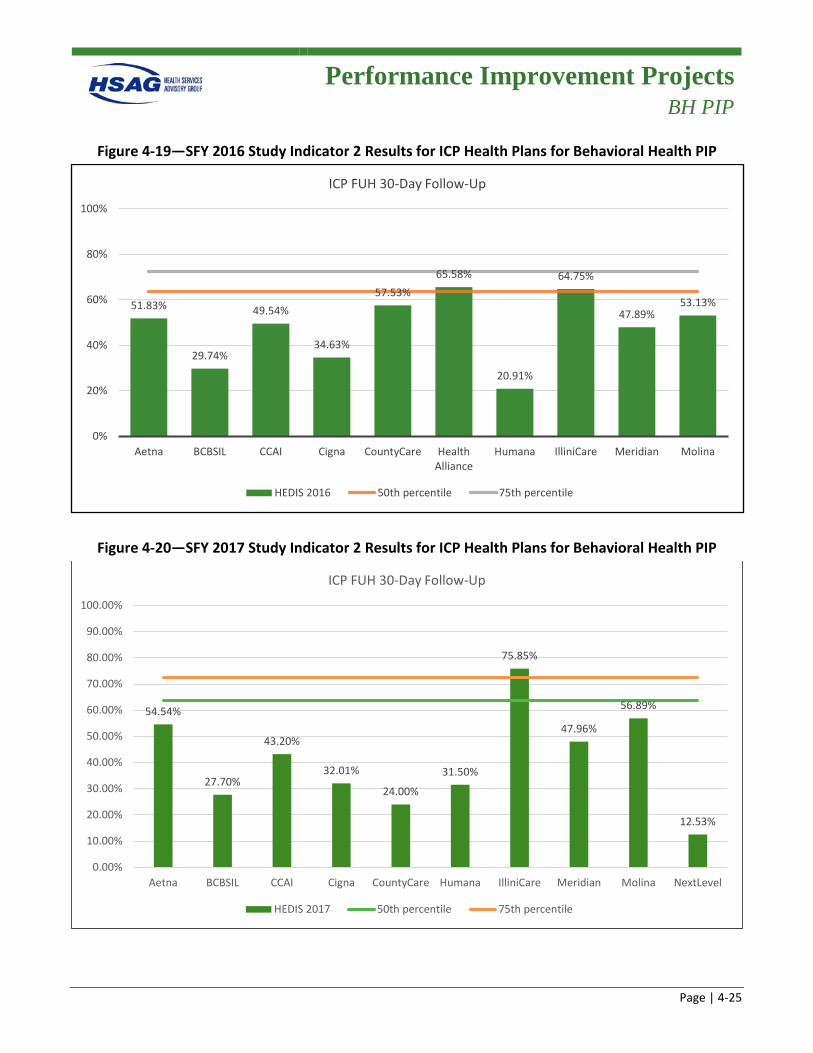
Performance Improvement Projects
BH PIP
Page | 4-25
Figure 4-19—SFY 2016 Study Indicator 2 Results for ICP Health Plans for Behavioral Health PIP
Figure 4-20—SFY 2017 Study Indicator 2 Results for ICP Health Plans for Behavioral Health PIP
51.83%
29.74%
49.54%
34.63%
57.53%65.58%
20.91%
64.75%
47.89%53.13%
0%
20%
40%
60%
80%
100%
Aetna BCBSIL CCAI Cigna CountyCare HealthAlliance
Humana IlliniCare Meridian Molina
ICP FUH 30-Day Follow-Up
HEDIS 2016 50th percentile 75th percentile
54.54%
27.70%
43.20%
32.01%
24.00%
31.50%
75.85%
47.96%
56.89%
12.53%
0.00%
10.00%
20.00%
30.00%
40.00%
50.00%
60.00%
70.00%
80.00%
90.00%
100.00%
Aetna BCBSIL CCAI Cigna CountyCare Humana IlliniCare Meridian Molina NextLevel
ICP FUH 30-Day Follow-Up
HEDIS 2017 50th percentile 75th percentile
Performance Improvement Projects
BH PIP
Page | 4-26
SFY 2016 ICP Summary
Notable
• Three of the 10 health plans performed above the 50th percentile for Study Indicator 1 (7-day follow-up).
• Two of the 10 health plans performed above the 50th percentile for Study Indicator 2 (30-day follow-up).
Needs Work
• Overall, the health plans averaged 32 percent for Study Indicator 1 (7-day follow-up). Seven of the 10 health plans performed below the 50th percentile.
• Overall, the health plans averaged 48 percent for Study Indicator 2 (30-day follow-up). Eight of the 10 health plans performed below the 50th percentile.
SFY 2017 ICP Summary
Notable
• One of the 10 health plans performed above the 75th percentile for Study Indicator 1 (7-day follow-up).
• Five health plans realized improved rates from reporting year one to reporting year two for Study Indicator 1.
• One of the 10 health plans performed above the 75th percentile for Study Indicator 2 (30-day follow-up).
• Five health plans realized improved rates from reporting year one to reporting year two for Study Indicator 2.
Needs Work
• Overall, the health plans averaged 29 percent for Study Indicator 1 (7-day follow-up), a decrease of 3 percentage points from the first reporting year. Nine of the 10 health plans performed below the 50th percentile.
• Four health plans demonstrated decreased rates from reporting year one to reporting year two for Study Indicator 1.
• Overall, the health plans averaged 41 percent for Study Indicator 2 (30-day follow-up), a decrease of 7 percentage points from the first reporting year. Nine of the 10 health plans performed below the 50th percentile.
• Four health plans demonstrated decreased rates from reporting year one to reporting year two for Study Indicator 2.
Performance Improvement Projects
BH PIP
Page | 4-27
Barriers/Interventions
The following are barriers that were common across all health plans:
• Aftercare planning is not occurring early in the members’ inpatient stay. • The behavioral health network may not be adequate to meet the timeliness requirements of the 7-
and 30-day performance measures. • Workflow processes need to be assessed and redirected to ensure there are adequate clinical
resources available to address timely aftercare discharge planning. • The identification of, and access to, hospital discharge staff needs to be streamlined with a single
point of entry or contact. • Network practitioners, providers, and facilities are unaware of the FUH measure requirements. • Members lack an understanding for the importance of follow-up care and how to address physical
barriers (i.e., lack of transportation). • Members with co-morbid/co-occurring mental health and substance use disorders or issues may be
more treatment-ambivalent due to the comorbidity illness and their current stage of change. • Members’ lack of adherence to their psychotropic medication regimen due to the side effects
experienced.
The following are interventions common across all health plans:
• Established multiple connections with community agencies to support access to behavioral health care, including pre-discharge community agency connection and in-home assessments.
• The Behavioral Health Care Transitions Teams worked with hospitals/inpatient facilities to have hospital discharge staff start the discharge coordination planning process early in the member’s inpatient stay.
• Educated providers, inpatient facilities, and community agencies on the FUH HEDIS measure and its standards.
• Held community events to promote healthy behaviors and self-management of illness. • Conducted member outreach to educate on the importance of post-hospital discharge follow-up,
medication adherence, and self-management of behavioral health illness.
Recommendations Due to a lack of progress/value added and a lack of causality between PIP study indicators, HSAG recommends that the Care Coordination PIP be retired.
Due to the lack of improved performance related to the Behavioral Health PIP indicators, HFS may consider implementing the Institute for Healthcare Improvement’s (IHI’s) rapid-cycle performance
Performance Improvement Projects
BH PIP
Page | 4-28
improvement approach4-9 for the PIP, which places greater emphasis on improving outcomes using quality improvement science.
4-9 Institute for Healthcare Improvement. Science of Improvement: How to Improve. Available at:
http://www.ihi.org/resources/Pages/HowtoImprove/ScienceofImprovementHowtoImprove.aspx. Accessed on: Mar 27, 2018.
Page | 5-1
5. Structure and Operations
This section presents a brief description of the activities Health Services Advisory Group, Inc. (HSAG), conducted to assess and monitor the health plans’ structure and operations as required by federal regulations and by request of the Illinois Department of Healthcare and Family Services (HFS) as well as a high-level summary of the results of those activities.
Structure and Operations
Section Contents
Page | 5-2
Section Contents Compliance and Readiness Reviews ....................................................................................................... 5-3
Centers for Medicare & Medicaid Services (CMS) home and community based services (HCBS) Waiver Performance Measures Record Reviews ................................................................................... 5-15
Provider Network Capacity Reviews ..................................................................................................... 5-25
Care Coordination/Care Management ................................................................................................... 5-28
Monthly and Quarterly Managed Care Meetings .................................................................................. 5-31
Quality Strategy Guidance ..................................................................................................................... 5-31
Technical Assistance (TA) to HFS and Health Plans ............................................................................ 5-32
Follow up on Prior Year EQR Recommendations ................................................................................. 5-33
Structure and Operations
Compliance and Readiness Reviews
Page | 5-3
Compliance and Readiness Reviews
Introduction
The Code of Federal Regulations (CFR) at 42 CFR Part 438 Subpart E requires that specific review activities be performed by an external quality review organization (EQRO) related to required external quality reviews of a health plan’s compliance with state and federal standards. During state fiscal year (SFY) 2016–2017, HFS’ EQRO, HSAG, worked with HFS to conduct compliance reviews for all health plans serving the Illinois Medicaid population, which included Family Health Plan/Affordable Care Act (FHP/ACA) health plans, Integrated Care Program (ICP) health plans, and Medicare-Medicaid Alignment Initiative (MMAI) health plans.
HSAG also conducted a readiness review process in SFY 2016 for health plan mergers that occurred as a result of P.A. 98-104 and State budget changes. The legislation required Accountable Care Entities (ACEs) and Care Coordination Entities (CCEs) to take steps to become a licensed health maintenance organization (HMO) or managed care community network (MCCN) within 18 months of being approved and accepting enrollment as an ACE/CCE. Due to State budget changes, the timeline was accelerated and HFS discontinued per member per month (PMPM) payments to ACEs and CCEs as of January 1, 2016. Several ACEs and CCEs partnered with an existing health plan to continue care coordination services to members. One ACE opted to transition to an MCCN, so HSAG conducted an operational readiness review for this process as well.
Also in SFY 2016, HSAG conducted desk readiness reviews for the Managed Long Term Services and Supports (MLTSS) program. Beginning July 1, 2016, the MLTSS program became mandatory for dual eligibles receiving institutional or community-based long-term services and supports (LTSS) in the Greater Chicago Region who opted out of MMAI. HFS contracted with four health plans to manage MLTSS enrollees’ care management and LTSS services, as well as certain mental health, substance abuse, and transportation services.
Compliance Review Process
The methodology, activities, and objectives of the compliance review process, as well as the standards assessed and the technical methods of data collection, are detailed in Appendix I of this report. Table 5–1 details the compliance reviews conducted in SFYs 2016 and 2017.
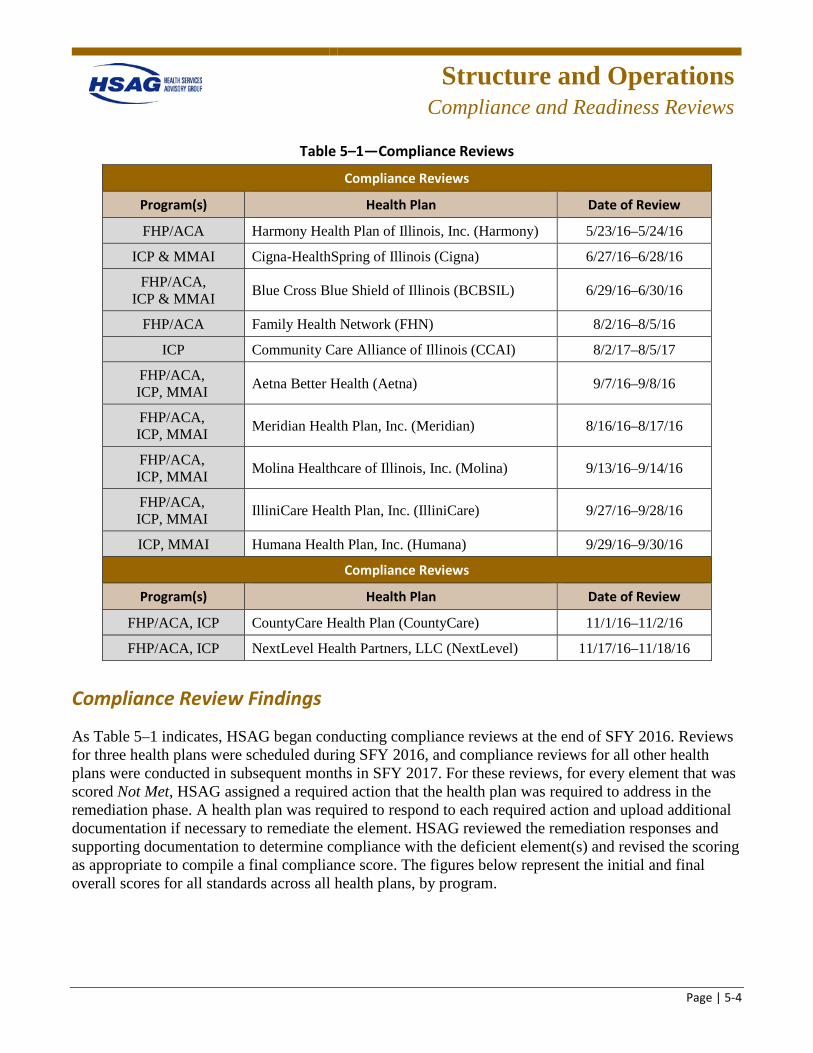
Structure and Operations
Compliance and Readiness Reviews
Page | 5-4
Table 5–1—Compliance Reviews
Compliance Reviews
Program(s) Health Plan Date of Review
FHP/ACA Harmony Health Plan of Illinois, Inc. (Harmony) 5/23/16–5/24/16
ICP & MMAI Cigna-HealthSpring of Illinois (Cigna) 6/27/16–6/28/16
FHP/ACA, ICP & MMAI Blue Cross Blue Shield of Illinois (BCBSIL) 6/29/16–6/30/16
FHP/ACA Family Health Network (FHN) 8/2/16–8/5/16
ICP Community Care Alliance of Illinois (CCAI) 8/2/17–8/5/17
FHP/ACA, ICP, MMAI Aetna Better Health (Aetna) 9/7/16–9/8/16
FHP/ACA, ICP, MMAI Meridian Health Plan, Inc. (Meridian) 8/16/16–8/17/16
FHP/ACA, ICP, MMAI Molina Healthcare of Illinois, Inc. (Molina) 9/13/16–9/14/16
FHP/ACA, ICP, MMAI IlliniCare Health Plan, Inc. (IlliniCare) 9/27/16–9/28/16
ICP, MMAI Humana Health Plan, Inc. (Humana) 9/29/16–9/30/16
Compliance Reviews
Program(s) Health Plan Date of Review
FHP/ACA, ICP CountyCare Health Plan (CountyCare) 11/1/16–11/2/16
FHP/ACA, ICP NextLevel Health Partners, LLC (NextLevel) 11/17/16–11/18/16
Compliance Review Findings
As Table 5–1 indicates, HSAG began conducting compliance reviews at the end of SFY 2016. Reviews for three health plans were scheduled during SFY 2016, and compliance reviews for all other health plans were conducted in subsequent months in SFY 2017. For these reviews, for every element that was scored Not Met, HSAG assigned a required action that the health plan was required to address in the remediation phase. A health plan was required to respond to each required action and upload additional documentation if necessary to remediate the element. HSAG reviewed the remediation responses and supporting documentation to determine compliance with the deficient element(s) and revised the scoring as appropriate to compile a final compliance score. The figures below represent the initial and final overall scores for all standards across all health plans, by program.
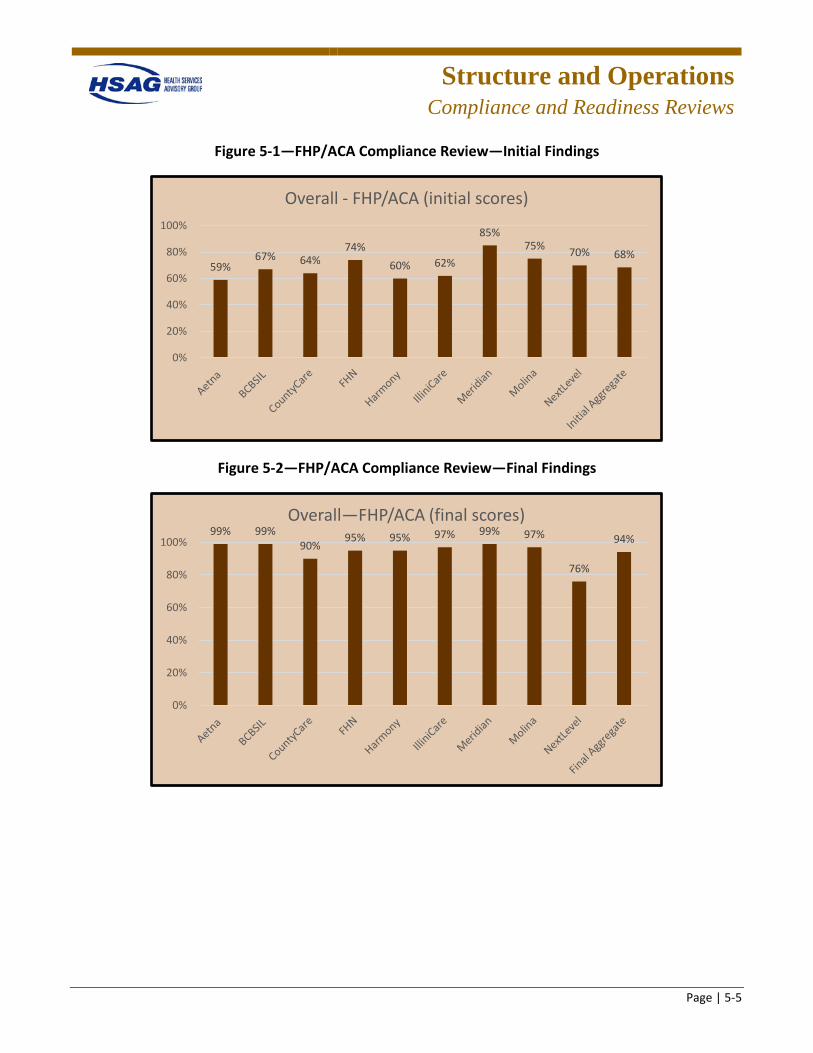
Structure and Operations
Compliance and Readiness Reviews
Page | 5-5
Figure 5-1—FHP/ACA Compliance Review—Initial Findings
Figure 5-2—FHP/ACA Compliance Review—Final Findings
59%67% 64%
74%60% 62%
85%75% 70% 68%
0%
20%
40%
60%
80%
100%
Overall - FHP/ACA (initial scores)
99% 99%90%
95% 95% 97% 99% 97%
76%
94%
0%
20%
40%
60%
80%
100%
Overall—FHP/ACA (final scores)
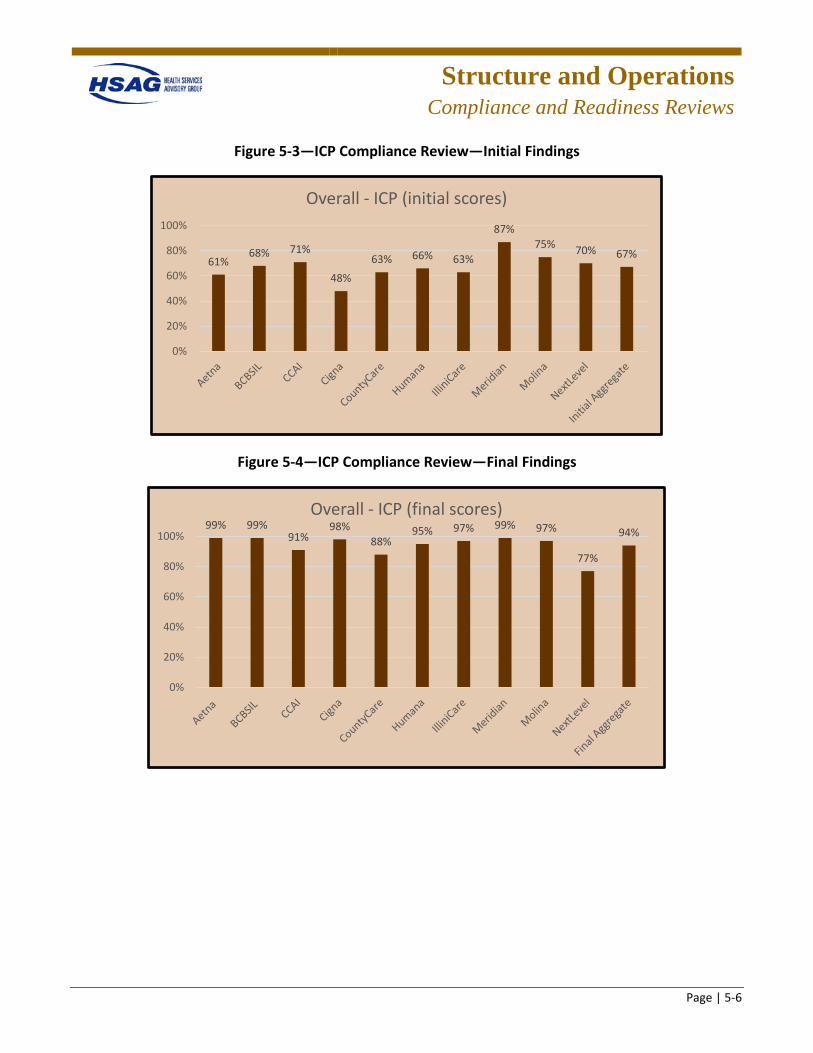
Structure and Operations
Compliance and Readiness Reviews
Page | 5-6
Figure 5-3—ICP Compliance Review—Initial Findings
Figure 5-4—ICP Compliance Review—Final Findings
61%68% 71%
48%63% 66% 63%
87%75% 70% 67%
0%
20%
40%
60%
80%
100%
Overall - ICP (initial scores)
99% 99%91%
98%88%
95% 97% 99% 97%
77%
94%
0%
20%
40%
60%
80%
100%
Overall - ICP (final scores)
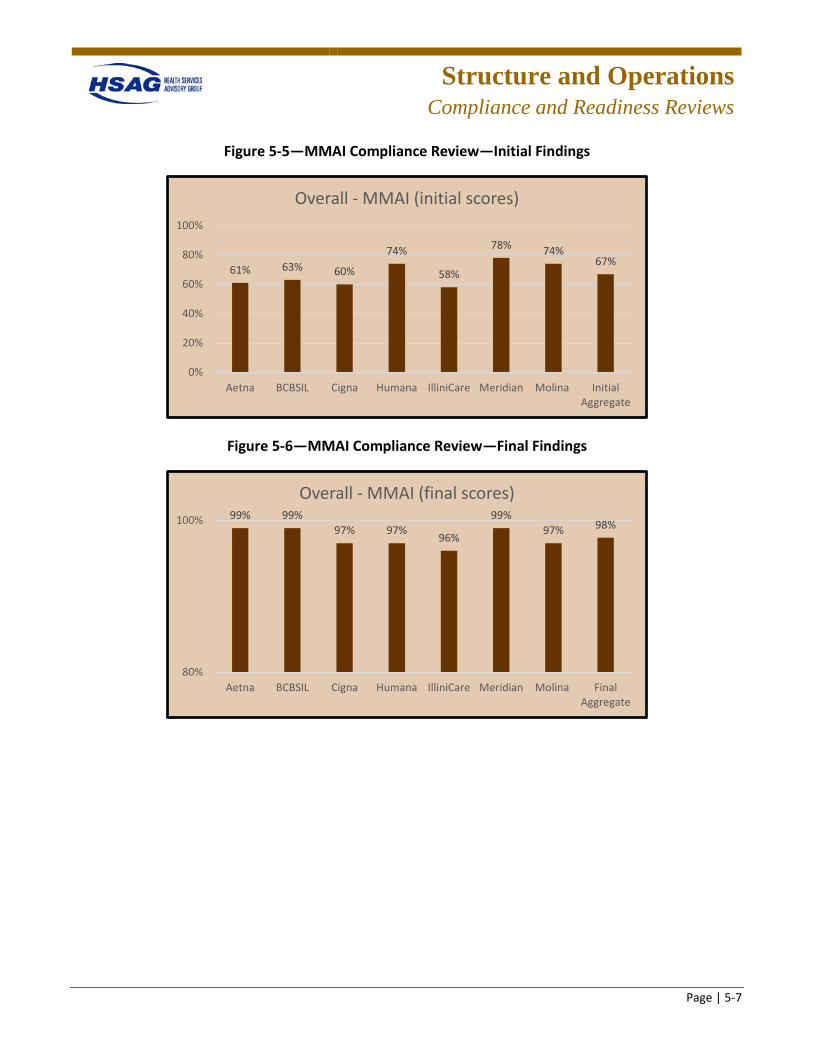
Structure and Operations
Compliance and Readiness Reviews
Page | 5-7
Figure 5-5—MMAI Compliance Review—Initial Findings
Figure 5-6—MMAI Compliance Review—Final Findings
61% 63% 60%
74%
58%
78% 74%67%
0%
20%
40%
60%
80%
100%
Aetna BCBSIL Cigna Humana IlliniCare Meridian Molina InitialAggregate
Overall - MMAI (initial scores)
99% 99%97% 97%
96%
99%97% 98%
80%
100%
Aetna BCBSIL Cigna Humana IlliniCare Meridian Molina FinalAggregate
Overall - MMAI (final scores)
Structure and Operations
Compliance and Readiness Reviews
Page | 5-8
Compliance Review Conclusions
Access Standards • Standard I—Availability of Services • Standard II—Assurance of Adequate Capacity and Services • Standard III—Coordination and Continuity of Care (Including Transition of Care)
Overall improvement opportunities identified for all health plans for the access and availability and care management/care coordination operational requirements included:
• Improve health plan monitoring and oversight of access and availability requirements by: – Using provider access and availability surveys to assess appointment availability and after-hours
access and following up with noncompliant providers. – Improving oversight of compliance with the Americans with Disabilities Act (ADA) in provider
offices. – Improving monitoring of open and closed panels for the primary care provider (PCP) network. – Improving the provider directory audit process to verify the accuracy of the online provider
directory and improve timeliness of corrections to the directory. – Conducting a root cause analysis of member access-related grievances. – Improving training for grievance and appeals department staff on resolution of access-related
grievances and the appropriate referral process, if necessary, to care management and/or provider services.
– Developing methods to monitor network adequacy of the HCBS and homebound providers. – Improving compliance with notification of HFS when network gaps are identified.
• Improve compliance with care management/care coordination (CM/CC) contract requirements by: – Improving compliance with CM/CC requirements through improvement of enhanced training
and oversight of CM/CC activities. – Implementing methods to evaluate the effectiveness of the CM/CC program. – Strengthening transition of care programs and implementing methods to evaluate the
effectiveness of care transitions. – Improving compliance with HCBS qualifications and training requirements for CM/CC staff. – Improving care management documentation systems and providing CM/CC staff access to prior-
authorization, pharmacy, and claims data. – Improving unable-to-reach programs to locate members.
Structure and Operations
Compliance and Readiness Reviews
Page | 5-9
Structure and Operations Standards • Standard VII—Subcontracts and Delegation
Overall improvement opportunities identified for all health plans for the subcontracts and delegation included:
• Improve compliance with Subcontracts and Delegation contract requirements by: – Revising language in provider contracts to comply with contract requirements. – Revising delegation agreements to comply with contract requirements. – Improving oversight of delegated vendors to ensure compliance with delegated services. – Improving documentation of required training of delegated vendors. – Improving compliance with required monthly operations meetings. – Improving compliance with predelegation, quarterly performance review, and annual delegation
oversight audits. – Improving oversight and accountability of the delegation oversight committee.
Measurement and Improvement Standards • Standard XIII—Health Information Systems • Standard XIV—Required Minimum Standards of Care/Practice Guidelines • Standard XV—Critical Incidents
Overall improvement opportunities identified for all health plans for health information systems, critical incidents, and practice guidelines included:
• Improving compliance with health information systems requirements by improving compliance with member and provider portals requirements.
• Improving compliance with critical incidents requirements by: – Developing and implementing a critical incident follow-up protocol to ensure the health, safety,
and welfare of a member following a critical incident. – Improving systems used for the intake, processing, tracking, and reporting of critical incidents.
Practice guidelines requirements received a high compliance rating for the health plans, and there were no overall improvements identified.
Structure and Operations
Compliance and Readiness Reviews
Page | 5-10
Readiness Review Process for Health Plan Mergers
Background
In 2011, HFS began implementing both the Illinois Medicaid reform legislation (P.A. 096-1501) and the federal Patient Protection and Affordable Care Act (Pub. L. 111-148), with emphasis on service delivery reforms (access to care), cost containment strategies (structure and operations), program integrity enhancements, and agency efficiencies (quality measurement improvement). P.A. 096-1501 (also known as "Medicaid Reform") required that 50 percent of Medicaid clients be enrolled in care coordination (managed care) programs by 2015. As part of the effort to implement the act, HFS launched several new models of care as described below. HFS contracted with HSAG to conduct readiness reviews to assess health plans’ processes, care coordination, provider network, staffing, contract oversight, and systems to ensure the capacity to serve new enrollment.
Care Coordination Entities (CCEs)
HFS launched the Coordinated Care Innovations Project in 2011. A goal of the Innovations Project was to allow providers to design and offer care coordination models other than traditional managed care organizations (MCOs), while supporting recipients as they transitioned from a fee-for-service (FFS) program into managed care. In 2012, HFS awarded six provider groups to become part of the Innovations Project, including My Health Care Coordination (MHCC) and Precedence CCE. The provider groups chosen formed CCEs to coordinate and deliver services to seniors and adults with disabilities using holistic, cost-efficient approaches.
Accountable Care Entity (ACE)
An ACE was a new model of care coordination created under SB26, passed by the General Assembly in May 2013, and signed into law on July 22, 2013 (Public Act 98-104). This model coordinated a network of Medicaid services for children and their family members (initially), as well as ACA Medicaid adults. The State sought a redesigned healthcare delivery system that would provide integrated and accountable care, improve health outcomes, and enhance patient access.
Health Plan Partnerships
The ACE/CCE programs were originally designed as a phased approach with an ACE initially providing care coordination services within a FFS system, moving to pre-paid capitation with partial risk and, thus, under Illinois law, operating as health plans by month 19, and moving to full-risk capitation by the fourth year of operation. Health plans include HMOs and MCCNs. HMOs are licensed by the Department of Insurance, and MCCNs are provider-owned governed entities that operate like HMOs but are certified by HFS rather than the Department of Insurance. Except for financial solvency and licensing requirements, HMOs and MCCNs have the same contractual requirements. As pursuant to
Structure and Operations
Compliance and Readiness Reviews
Page | 5-11
P.A. 98-104, the ACEs/CCEs were required to take steps to become a licensed HMO or MCCN within 18 months of being approved and accepting enrollment. Due to State budgetary constraints, HFS accelerated this timeline. HFS gave ACEs/CCEs the option either to become an MCCN or to establish partnerships with existing health plans to continue care coordination services for existing ACE/CCE clients as well as individuals enrolled with the health plan in need of care coordination services.
ACEs/CCEs created strategic partnerships with health plans with the goal of leveraging the expertise of the community-based ACEs/CCEs and their relationships with the members they served. ACEs/CCEs entered into agreements with health plans for members to be accepted by the health plan under a full risk contract that continued to provide access to quality care to members while the ACE/CCE continued to provide an array of ACE/CCE services, including care coordination, to members and maintain a provider-led approach. ACE and CCE transitions were expected to enhance the ability of provider-based organizations to improve care coordination services through increased access to data and additional services for members. In addition to continuing to coordinate care for their previous membership, some ACEs and CCEs will coordinate care for additional health plan members.
Scope of the Readiness Reviews The objectives and procedures for the readiness review process and data collection and analysis are detailed in Appendix I. The readiness review included a desk review and a separate network validation review. The readiness review tools addressed key areas that directly impact a client’s ability to receive services including, but not limited to assessment processes, care coordination, provider network, staffing, and systems to ensure that the organization has the capacity to handle the increase in enrollment.
The readiness reviews for the ACE/CCE/health plan partnerships included a review of key functional areas of health plan operations related to implementation of the services agreement with the CCEs/ACEs, including the following:
• Operations Administration • Service Delivery • Financial Management (HFS was responsible for assessing this functional area) • Health Information Systems
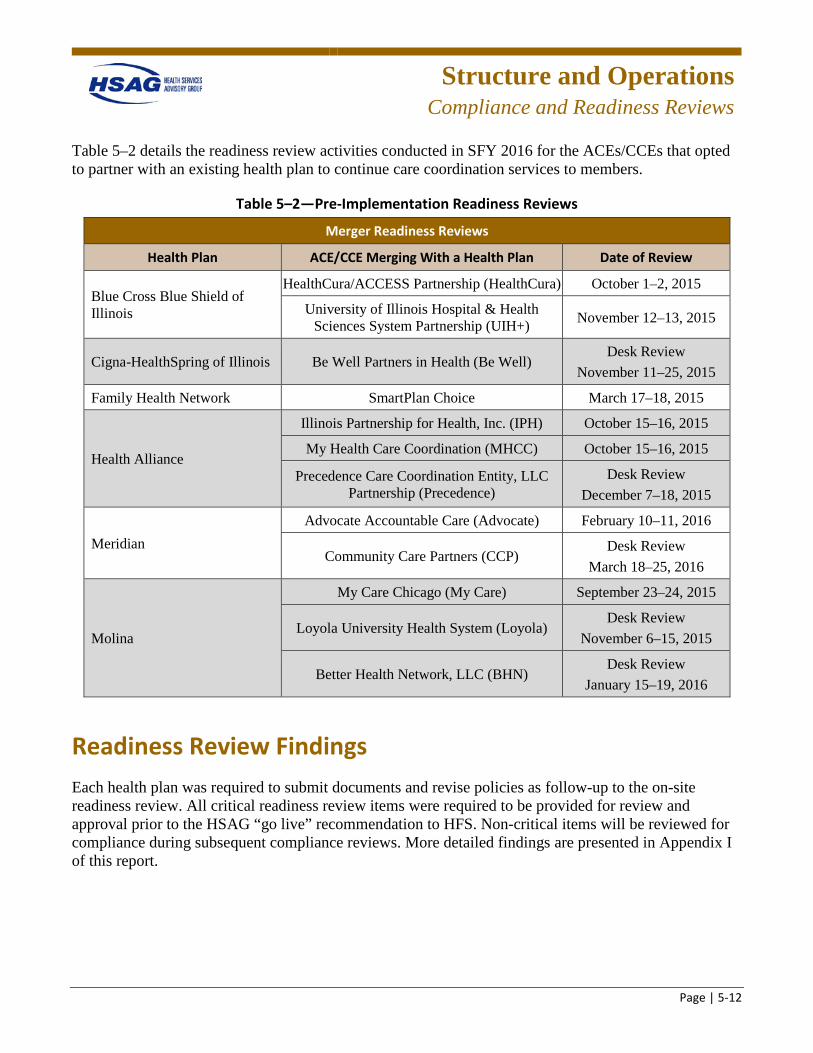
Structure and Operations
Compliance and Readiness Reviews
Page | 5-12
Table 5–2 details the readiness review activities conducted in SFY 2016 for the ACEs/CCEs that opted to partner with an existing health plan to continue care coordination services to members.
Table 5–2—Pre-Implementation Readiness Reviews
Merger Readiness Reviews
Health Plan ACE/CCE Merging With a Health Plan Date of Review
Blue Cross Blue Shield of Illinois
HealthCura/ACCESS Partnership (HealthCura) October 1–2, 2015
University of Illinois Hospital & Health Sciences System Partnership (UIH+) November 12–13, 2015
Cigna-HealthSpring of Illinois Be Well Partners in Health (Be Well) Desk Review
November 11–25, 2015
Family Health Network SmartPlan Choice March 17–18, 2015
Health Alliance
Illinois Partnership for Health, Inc. (IPH) October 15–16, 2015
My Health Care Coordination (MHCC) October 15–16, 2015
Precedence Care Coordination Entity, LLC Partnership (Precedence)
Desk Review December 7–18, 2015
Meridian Advocate Accountable Care (Advocate) February 10–11, 2016
Community Care Partners (CCP) Desk Review
March 18–25, 2016
Molina
My Care Chicago (My Care) September 23–24, 2015
Loyola University Health System (Loyola) Desk Review
November 6–15, 2015
Better Health Network, LLC (BHN) Desk Review
January 15–19, 2016
Readiness Review Findings Each health plan was required to submit documents and revise policies as follow-up to the on-site readiness review. All critical readiness review items were required to be provided for review and approval prior to the HSAG “go live” recommendation to HFS. Non-critical items will be reviewed for compliance during subsequent compliance reviews. More detailed findings are presented in Appendix I of this report.
Structure and Operations
Compliance and Readiness Reviews
Page | 5-13
Readiness Review Process for CCE Transition to MCCN
Background
Prior to January 1, 2016, NextLevel Health Partners, LLC (NextLevel) was serving FHP/ACA and ICP members as a CCE. As pursuant to P.A. 98-104, CCEs were required to take steps to become a licensed HMO or MCCN within 18 months of being approved and accepting enrollment. HSAG was contracted to conduct a readiness review to ensure NextLevel’s readiness to assume operation as an MCCN. The task was to evaluate, prior to client enrollment, whether NextLevel’s internal organizational structure, health information systems, staffing, and oversight were sufficient to ensure that NextLevel had the readiness and system capacity needed to enroll recipients in their designated service areas.
Findings
NextLevel was required to submit documents and revise policies as follow-up to the on-site readiness review before assuming operation as an MCCN. After the programs launched, HSAG will conduct a post-implementation administrative review to evaluate NextLevel’s progress following one year of operation. More detailed findings are presented in Appendix I of this report.
Desk Readiness Review Process for Managed Long Term Services and Supports (MLTSS) Program
Background
The Managed Long Term Services and Supports (MLTSS) program was meant to complement the Medicare-Medicaid Alignment Initiative (MMAI). Through the MMAI, HFS and the Centers for Medicare & Medicaid Services (CMS) entered into contracts with health plans in contracting areas where the MLTSS program was implemented to provide Medicare and Medicaid benefits and services to enrollees who are dual-eligible participants. Dual eligibles enrolled in MLTSS receive some Medicaid-covered services from their MLTSS health plan, including long-term care, waiver services, behavioral health services, nonemergency transportation, and care coordination, and receive their Medicare-covered services such as hospitalization, doctor visits, therapies, prescriptions, laboratory and x-rays, and medical supplies through Medicare FFS, Medicare Part D, or Medicare Advantage. Participants retained the choice to opt out of MMAI at any time. Beginning July 1, 2016, the MLTSS program became mandatory for dual-eligible participants who elected to opt out of MMAI but who received institutional or community-based long-term services and supports (LTSS), unless otherwise exempt.
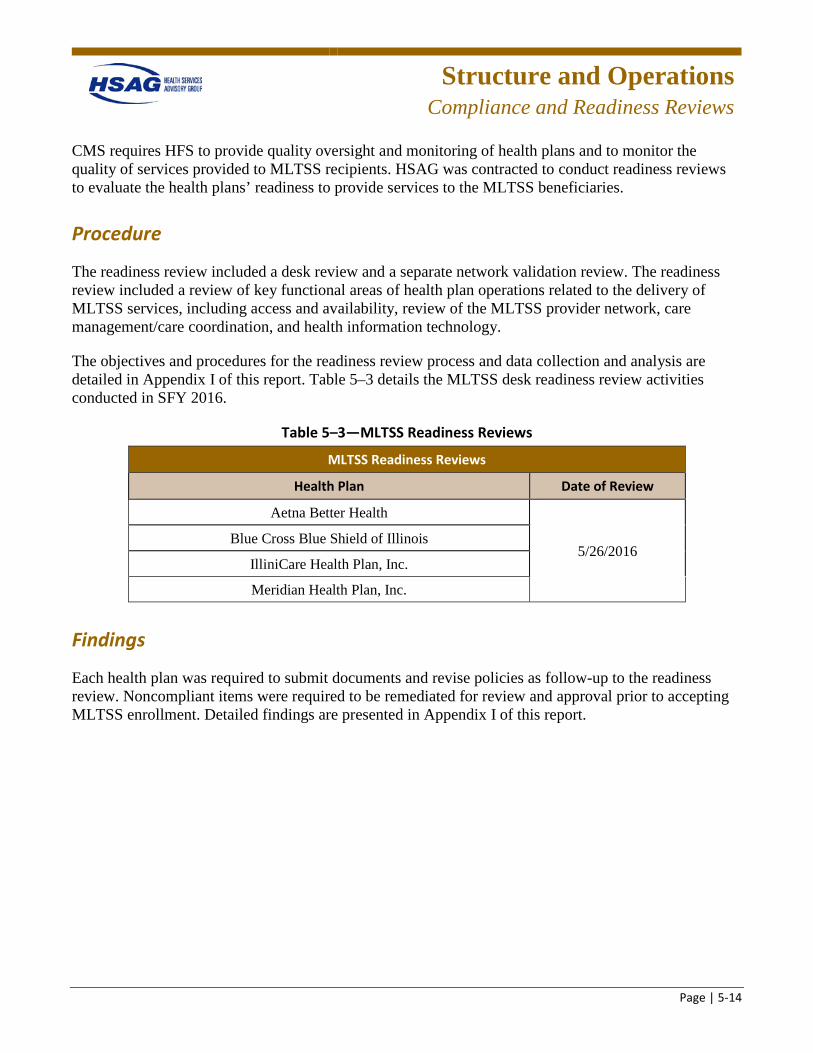
Structure and Operations
Compliance and Readiness Reviews
Page | 5-14
CMS requires HFS to provide quality oversight and monitoring of health plans and to monitor the quality of services provided to MLTSS recipients. HSAG was contracted to conduct readiness reviews to evaluate the health plans’ readiness to provide services to the MLTSS beneficiaries.
Procedure
The readiness review included a desk review and a separate network validation review. The readiness review included a review of key functional areas of health plan operations related to the delivery of MLTSS services, including access and availability, review of the MLTSS provider network, care management/care coordination, and health information technology.
The objectives and procedures for the readiness review process and data collection and analysis are detailed in Appendix I of this report. Table 5–3 details the MLTSS desk readiness review activities conducted in SFY 2016.
Table 5–3—MLTSS Readiness Reviews
MLTSS Readiness Reviews
Health Plan Date of Review
Aetna Better Health
5/26/2016 Blue Cross Blue Shield of Illinois
IlliniCare Health Plan, Inc.
Meridian Health Plan, Inc.
Findings
Each health plan was required to submit documents and revise policies as follow-up to the readiness review. Noncompliant items were required to be remediated for review and approval prior to accepting MLTSS enrollment. Detailed findings are presented in Appendix I of this report.
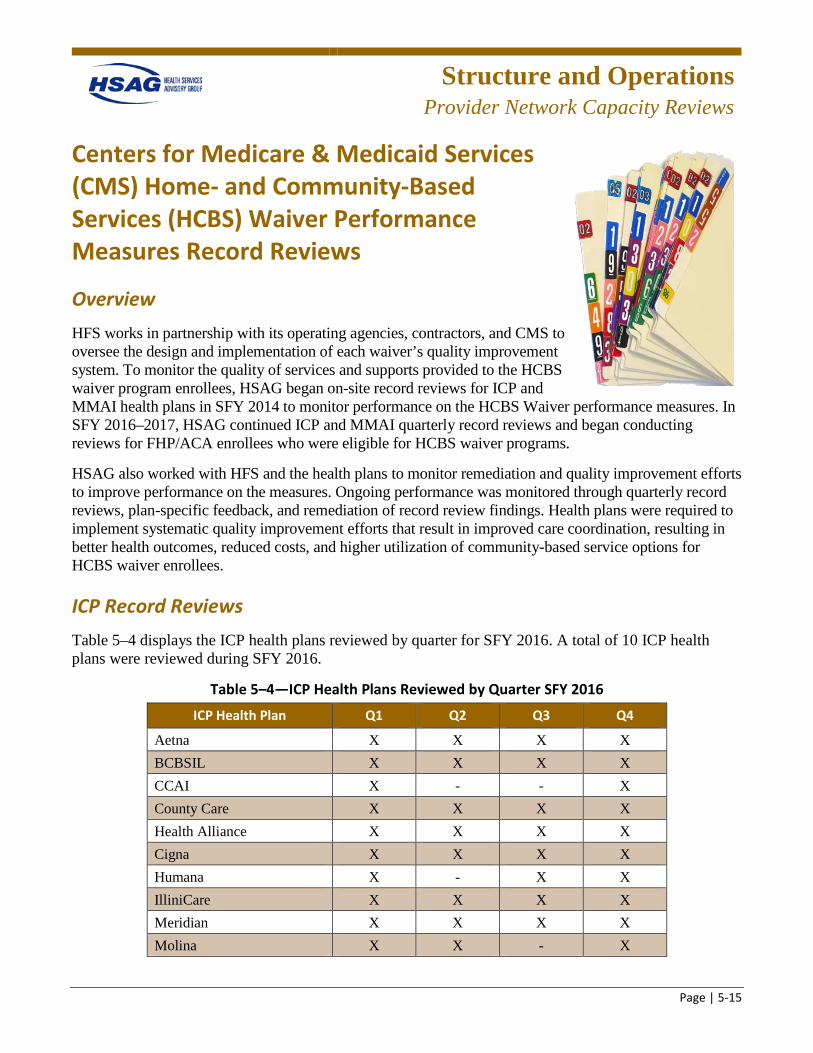
Structure and Operations
Provider Network Capacity Reviews
Page | 5-15
Centers for Medicare & Medicaid Services (CMS) Home- and Community-Based Services (HCBS) Waiver Performance Measures Record Reviews
Overview HFS works in partnership with its operating agencies, contractors, and CMS to oversee the design and implementation of each waiver’s quality improvement system. To monitor the quality of services and supports provided to the HCBS waiver program enrollees, HSAG began on-site record reviews for ICP and MMAI health plans in SFY 2014 to monitor performance on the HCBS Waiver performance measures. In SFY 2016–2017, HSAG continued ICP and MMAI quarterly record reviews and began conducting reviews for FHP/ACA enrollees who were eligible for HCBS waiver programs.
HSAG also worked with HFS and the health plans to monitor remediation and quality improvement efforts to improve performance on the measures. Ongoing performance was monitored through quarterly record reviews, plan-specific feedback, and remediation of record review findings. Health plans were required to implement systematic quality improvement efforts that result in improved care coordination, resulting in better health outcomes, reduced costs, and higher utilization of community-based service options for HCBS waiver enrollees.
ICP Record Reviews Table 5–4 displays the ICP health plans reviewed by quarter for SFY 2016. A total of 10 ICP health plans were reviewed during SFY 2016.
Table 5–4—ICP Health Plans Reviewed by Quarter SFY 2016
ICP Health Plan Q1 Q2 Q3 Q4
Aetna X X X X BCBSIL X X X X CCAI X - - X County Care X X X X Health Alliance X X X X Cigna X X X X Humana X - X X IlliniCare X X X X Meridian X X X X Molina X X - X
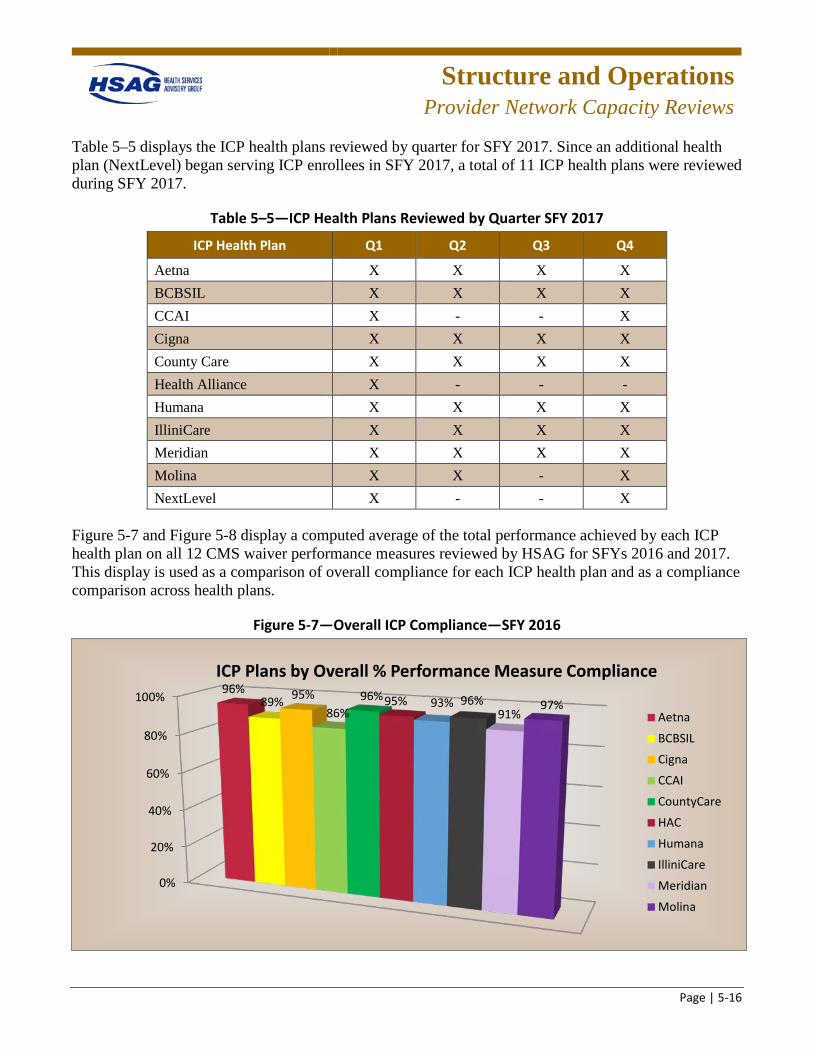
Structure and Operations
Provider Network Capacity Reviews
Page | 5-16
Table 5–5 displays the ICP health plans reviewed by quarter for SFY 2017. Since an additional health plan (NextLevel) began serving ICP enrollees in SFY 2017, a total of 11 ICP health plans were reviewed during SFY 2017.
Table 5–5—ICP Health Plans Reviewed by Quarter SFY 2017
ICP Health Plan Q1 Q2 Q3 Q4
Aetna X X X X BCBSIL X X X X CCAI X - - X Cigna X X X X County Care X X X X Health Alliance X - - - Humana X X X X IlliniCare X X X X Meridian X X X X Molina X X - X NextLevel X - - X
Figure 5-7 and Figure 5-8 display a computed average of the total performance achieved by each ICP health plan on all 12 CMS waiver performance measures reviewed by HSAG for SFYs 2016 and 2017. This display is used as a comparison of overall compliance for each ICP health plan and as a compliance comparison across health plans.
Figure 5-7—Overall ICP Compliance—SFY 2016
0%
20%
40%
60%
80%
100% 96%89% 95%
86%96%95% 93% 96%
91%97%
ICP Plans by Overall % Performance Measure Compliance
Aetna
BCBSIL
Cigna
CCAI
CountyCare
HAC
Humana
IlliniCare
Meridian
Molina
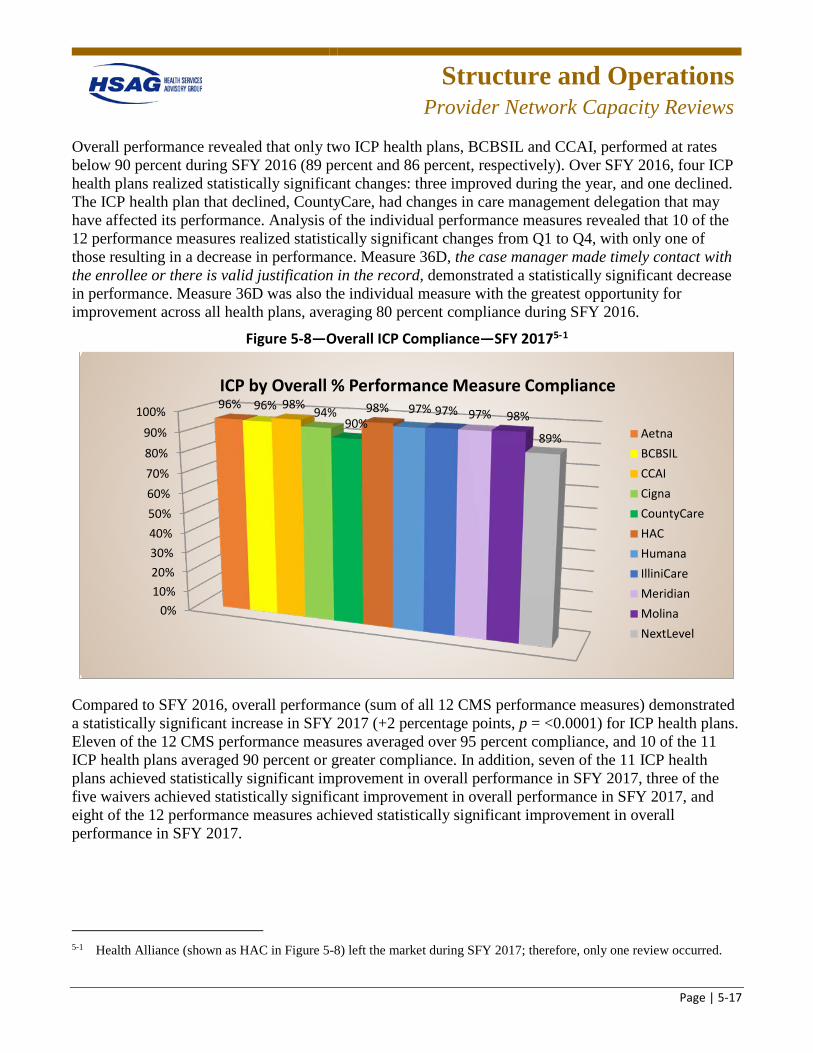
Structure and Operations
Provider Network Capacity Reviews
Page | 5-17
Overall performance revealed that only two ICP health plans, BCBSIL and CCAI, performed at rates below 90 percent during SFY 2016 (89 percent and 86 percent, respectively). Over SFY 2016, four ICP health plans realized statistically significant changes: three improved during the year, and one declined. The ICP health plan that declined, CountyCare, had changes in care management delegation that may have affected its performance. Analysis of the individual performance measures revealed that 10 of the 12 performance measures realized statistically significant changes from Q1 to Q4, with only one of those resulting in a decrease in performance. Measure 36D, the case manager made timely contact with the enrollee or there is valid justification in the record, demonstrated a statistically significant decrease in performance. Measure 36D was also the individual measure with the greatest opportunity for improvement across all health plans, averaging 80 percent compliance during SFY 2016.
Figure 5-8—Overall ICP Compliance—SFY 20175-1
Compared to SFY 2016, overall performance (sum of all 12 CMS performance measures) demonstrated a statistically significant increase in SFY 2017 (+2 percentage points, p = <0.0001) for ICP health plans. Eleven of the 12 CMS performance measures averaged over 95 percent compliance, and 10 of the 11 ICP health plans averaged 90 percent or greater compliance. In addition, seven of the 11 ICP health plans achieved statistically significant improvement in overall performance in SFY 2017, three of the five waivers achieved statistically significant improvement in overall performance in SFY 2017, and eight of the 12 performance measures achieved statistically significant improvement in overall performance in SFY 2017.
5-1 Health Alliance (shown as HAC in Figure 5-8) left the market during SFY 2017; therefore, only one review occurred.
0%10%20%30%40%50%60%70%80%90%
100% 96% 96% 98% 94%90%
98% 97% 97% 97% 98%
89%
ICP by Overall % Performance Measure Compliance
AetnaBCBSILCCAICignaCountyCareHACHumanaIlliniCareMeridianMolinaNextLevel
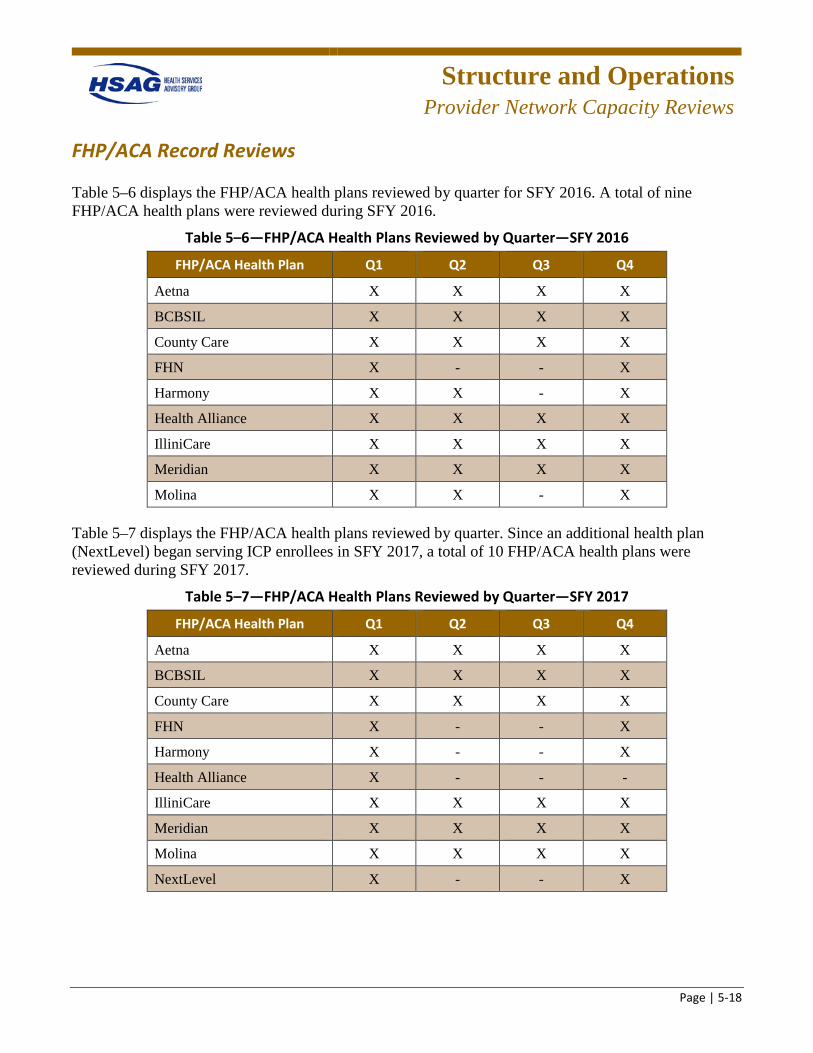
Structure and Operations
Provider Network Capacity Reviews
Page | 5-18
FHP/ACA Record Reviews
Table 5–6 displays the FHP/ACA health plans reviewed by quarter for SFY 2016. A total of nine FHP/ACA health plans were reviewed during SFY 2016.
Table 5–6—FHP/ACA Health Plans Reviewed by Quarter—SFY 2016
FHP/ACA Health Plan Q1 Q2 Q3 Q4
Aetna X X X X
BCBSIL X X X X
County Care X X X X
FHN X - - X
Harmony X X - X
Health Alliance X X X X
IlliniCare X X X X
Meridian X X X X
Molina X X - X
Table 5–7 displays the FHP/ACA health plans reviewed by quarter. Since an additional health plan (NextLevel) began serving ICP enrollees in SFY 2017, a total of 10 FHP/ACA health plans were reviewed during SFY 2017.
Table 5–7—FHP/ACA Health Plans Reviewed by Quarter—SFY 2017
FHP/ACA Health Plan Q1 Q2 Q3 Q4
Aetna X X X X
BCBSIL X X X X
County Care X X X X
FHN X - - X
Harmony X - - X
Health Alliance X - - -
IlliniCare X X X X
Meridian X X X X
Molina X X X X
NextLevel X - - X
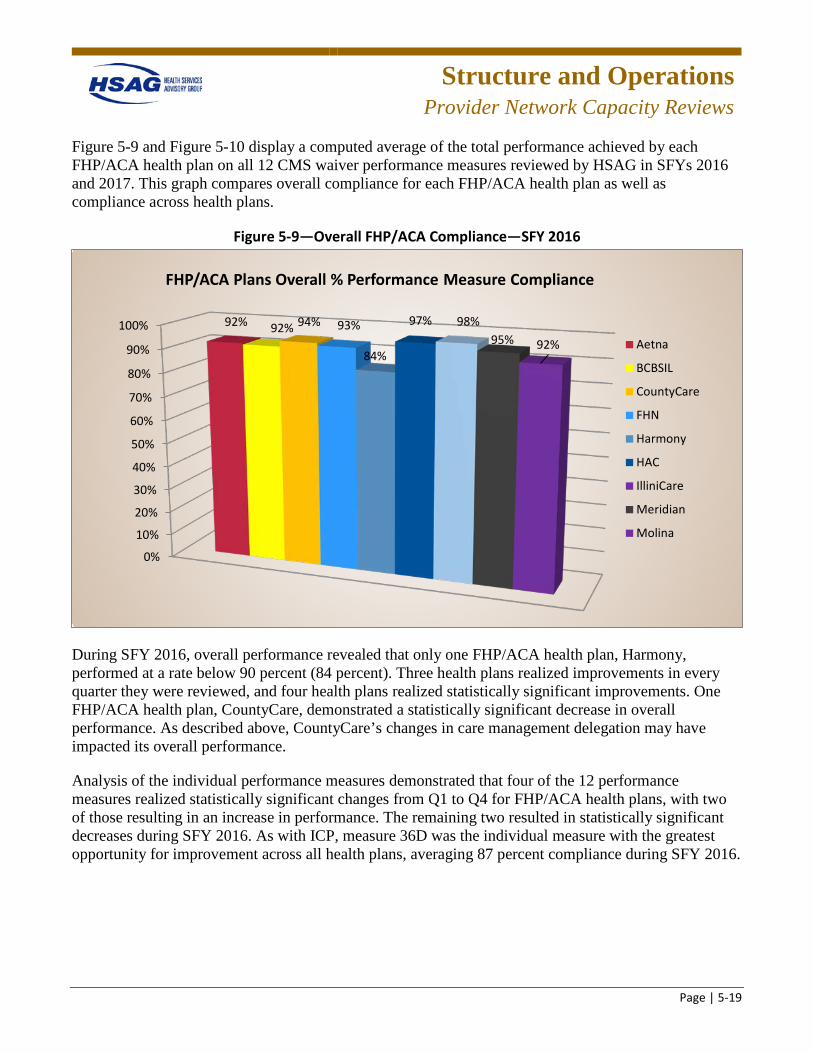
Structure and Operations
Provider Network Capacity Reviews
Page | 5-19
Figure 5-9 and Figure 5-10 display a computed average of the total performance achieved by each FHP/ACA health plan on all 12 CMS waiver performance measures reviewed by HSAG in SFYs 2016 and 2017. This graph compares overall compliance for each FHP/ACA health plan as well as compliance across health plans.
Figure 5-9—Overall FHP/ACA Compliance—SFY 2016
During SFY 2016, overall performance revealed that only one FHP/ACA health plan, Harmony, performed at a rate below 90 percent (84 percent). Three health plans realized improvements in every quarter they were reviewed, and four health plans realized statistically significant improvements. One FHP/ACA health plan, CountyCare, demonstrated a statistically significant decrease in overall performance. As described above, CountyCare’s changes in care management delegation may have impacted its overall performance.
Analysis of the individual performance measures demonstrated that four of the 12 performance measures realized statistically significant changes from Q1 to Q4 for FHP/ACA health plans, with two of those resulting in an increase in performance. The remaining two resulted in statistically significant decreases during SFY 2016. As with ICP, measure 36D was the individual measure with the greatest opportunity for improvement across all health plans, averaging 87 percent compliance during SFY 2016.
0%
10%
20%
30%
40%
50%
60%
70%
80%
90%
100% 92% 92% 94% 93%
84%
97% 98%95% 92%
FHP/ACA Plans Overall % Performance Measure Compliance
Aetna
BCBSIL
CountyCare
FHN
Harmony
HAC
IlliniCare
Meridian
Molina
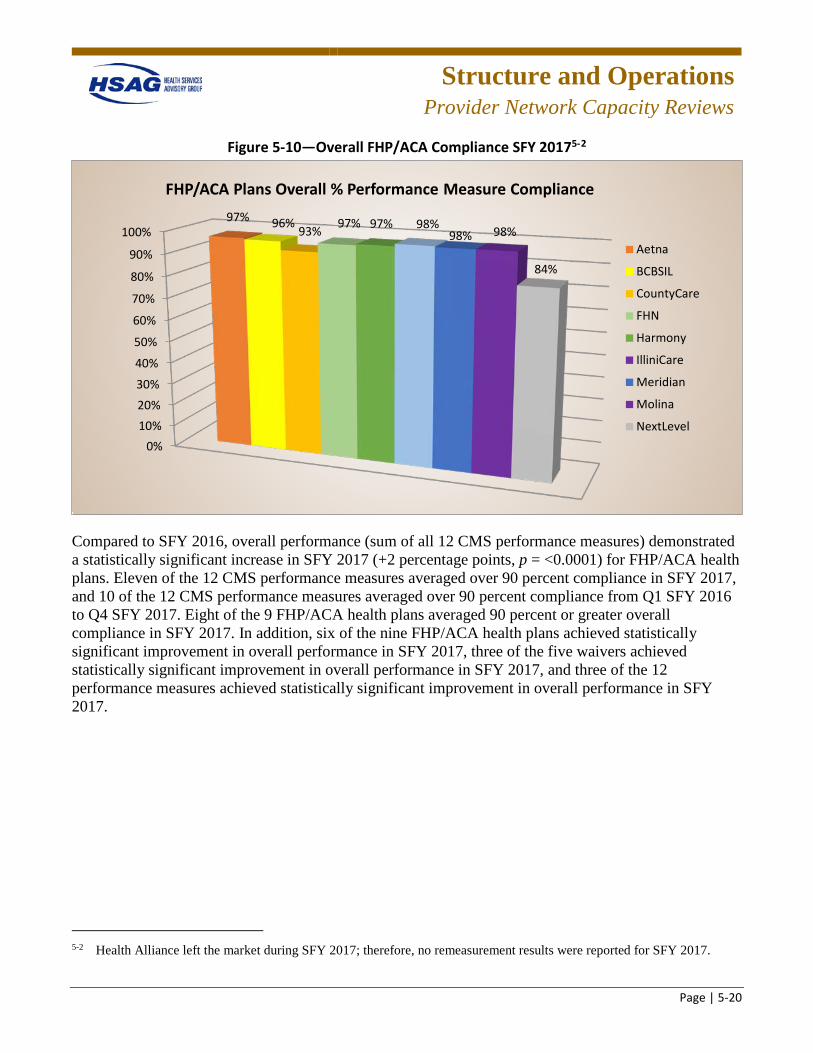
Structure and Operations
Provider Network Capacity Reviews
Page | 5-20
Figure 5-10—Overall FHP/ACA Compliance SFY 20175-2
Compared to SFY 2016, overall performance (sum of all 12 CMS performance measures) demonstrated a statistically significant increase in SFY 2017 (+2 percentage points, p = <0.0001) for FHP/ACA health plans. Eleven of the 12 CMS performance measures averaged over 90 percent compliance in SFY 2017, and 10 of the 12 CMS performance measures averaged over 90 percent compliance from Q1 SFY 2016 to Q4 SFY 2017. Eight of the 9 FHP/ACA health plans averaged 90 percent or greater overall compliance in SFY 2017. In addition, six of the nine FHP/ACA health plans achieved statistically significant improvement in overall performance in SFY 2017, three of the five waivers achieved statistically significant improvement in overall performance in SFY 2017, and three of the 12 performance measures achieved statistically significant improvement in overall performance in SFY 2017.
5-2 Health Alliance left the market during SFY 2017; therefore, no remeasurement results were reported for SFY 2017.
0%10%20%30%
40%
50%
60%
70%
80%
90%
100%97% 96% 93% 97% 97% 98%
98% 98%
84%
FHP/ACA Plans Overall % Performance Measure Compliance
Aetna
BCBSIL
CountyCare
FHN
Harmony
IlliniCare
Meridian
Molina
NextLevel
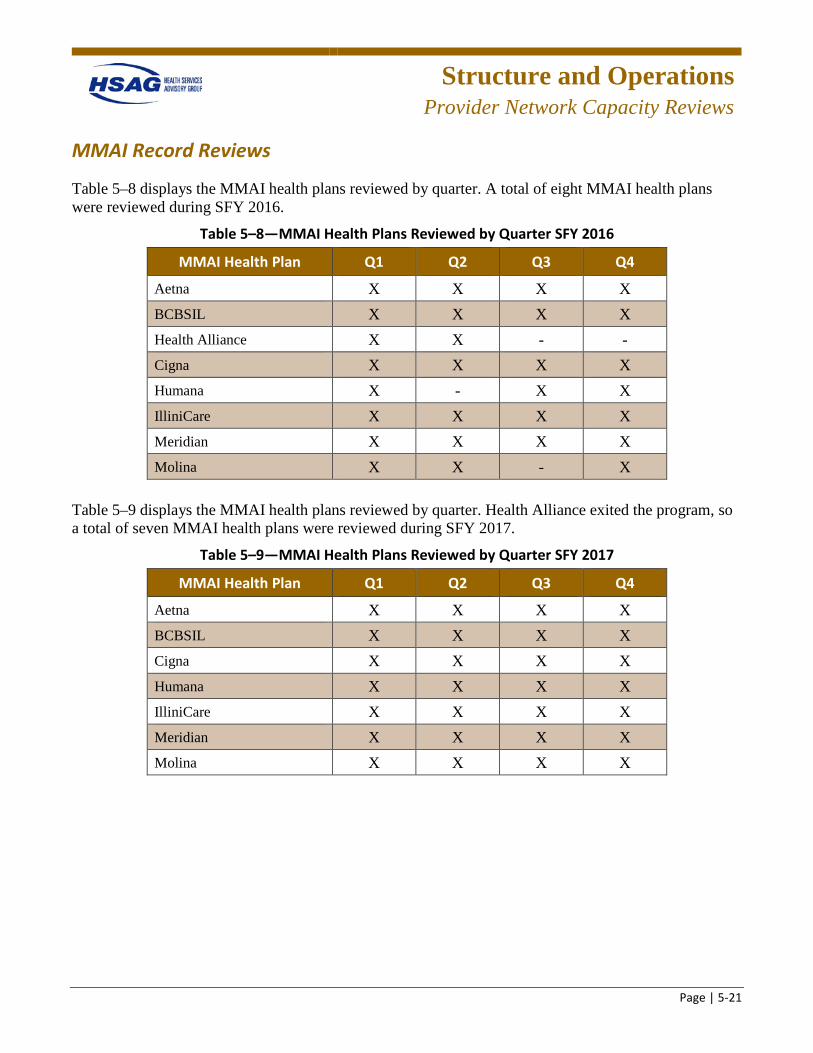
Structure and Operations
Provider Network Capacity Reviews
Page | 5-21
MMAI Record Reviews
Table 5–8 displays the MMAI health plans reviewed by quarter. A total of eight MMAI health plans were reviewed during SFY 2016.
Table 5–8—MMAI Health Plans Reviewed by Quarter SFY 2016
MMAI Health Plan Q1 Q2 Q3 Q4
Aetna X X X X BCBSIL X X X X Health Alliance X X - - Cigna X X X X Humana X - X X IlliniCare X X X X Meridian X X X X Molina X X - X
Table 5–9 displays the MMAI health plans reviewed by quarter. Health Alliance exited the program, so a total of seven MMAI health plans were reviewed during SFY 2017.
Table 5–9—MMAI Health Plans Reviewed by Quarter SFY 2017
MMAI Health Plan Q1 Q2 Q3 Q4
Aetna X X X X BCBSIL X X X X Cigna X X X X Humana X X X X IlliniCare X X X X Meridian X X X X Molina X X X X
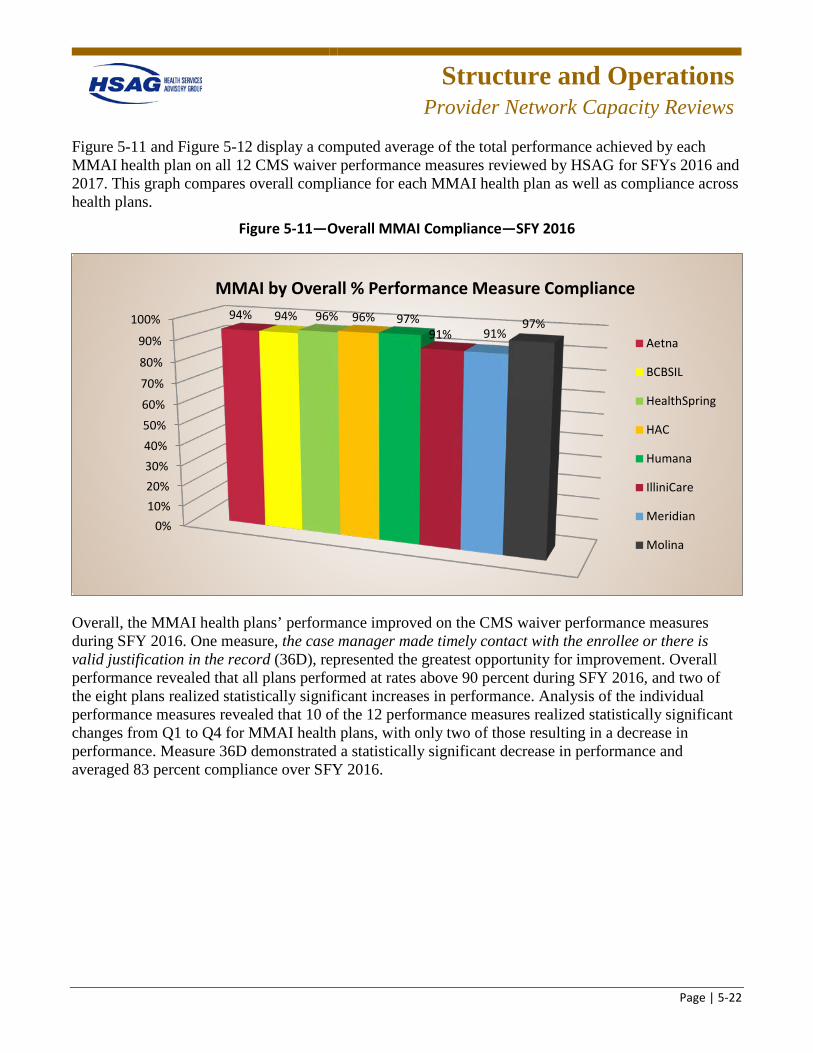
Structure and Operations
Provider Network Capacity Reviews
Page | 5-22
Figure 5-11 and Figure 5-12 display a computed average of the total performance achieved by each MMAI health plan on all 12 CMS waiver performance measures reviewed by HSAG for SFYs 2016 and 2017. This graph compares overall compliance for each MMAI health plan as well as compliance across health plans.
Figure 5-11—Overall MMAI Compliance—SFY 2016
Overall, the MMAI health plans’ performance improved on the CMS waiver performance measures during SFY 2016. One measure, the case manager made timely contact with the enrollee or there is valid justification in the record (36D), represented the greatest opportunity for improvement. Overall performance revealed that all plans performed at rates above 90 percent during SFY 2016, and two of the eight plans realized statistically significant increases in performance. Analysis of the individual performance measures revealed that 10 of the 12 performance measures realized statistically significant changes from Q1 to Q4 for MMAI health plans, with only two of those resulting in a decrease in performance. Measure 36D demonstrated a statistically significant decrease in performance and averaged 83 percent compliance over SFY 2016.
0%10%20%30%40%50%60%
70%
80%
90%
100% 94% 94% 96% 96% 97%91% 91%
97%
MMAI by Overall % Performance Measure Compliance
Aetna
BCBSIL
HealthSpring
HAC
Humana
IlliniCare
Meridian
Molina
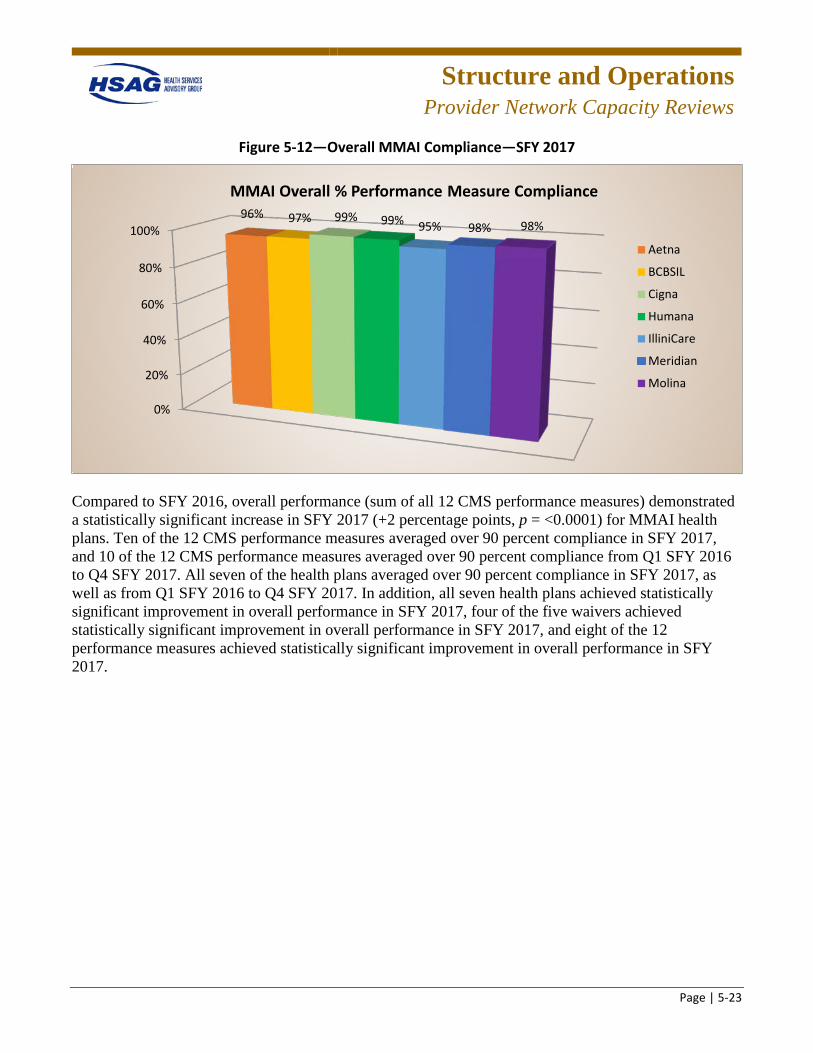
Structure and Operations
Provider Network Capacity Reviews
Page | 5-23
Figure 5-12—Overall MMAI Compliance—SFY 2017
Compared to SFY 2016, overall performance (sum of all 12 CMS performance measures) demonstrated a statistically significant increase in SFY 2017 (+2 percentage points, p = <0.0001) for MMAI health plans. Ten of the 12 CMS performance measures averaged over 90 percent compliance in SFY 2017, and 10 of the 12 CMS performance measures averaged over 90 percent compliance from Q1 SFY 2016 to Q4 SFY 2017. All seven of the health plans averaged over 90 percent compliance in SFY 2017, as well as from Q1 SFY 2016 to Q4 SFY 2017. In addition, all seven health plans achieved statistically significant improvement in overall performance in SFY 2017, four of the five waivers achieved statistically significant improvement in overall performance in SFY 2017, and eight of the 12 performance measures achieved statistically significant improvement in overall performance in SFY 2017.
0%
20%
40%
60%
80%
100%96% 97% 99% 99% 95% 98% 98%
MMAI Overall % Performance Measure Compliance
Aetna
BCBSIL
Cigna
Humana
IlliniCare
Meridian
Molina
Structure and Operations
Provider Network Capacity Reviews
Page | 5-24
Remediation, Health Plan Interventions, and Process Improvements
Remediation
In SFYs 2016 and 2017, the health plans were required to document all actions taken to address each of the noncompliant findings from the record reviews in the remediation tracking database. The health plans received training on how to use database and were required to remediate individual record review findings within the required time frames. HFS and the health plans received a report of findings subsequent to each on-site record review. The health plans were required to remediate the noncompliant findings and implement performance improvement strategies to improve the quality of care management/care coordination activities for HCBS waiver enrollees; documentation of such was considered remediation. Compliance with remediation of these findings was monitored by the EQRO within 30, 60, and 90 days as required by CMS and HFS.
In SFY 2016, for performance measures requiring remediation within 30 days, seven of nine FHP/ACA health plans demonstrated full compliance, all ICP health plans demonstrated full compliance, and six of eight MMAI health plans demonstrated full compliance. For performance measures requiring remediation within 60 days, all FHP/ACA, ICP, and MMAI health plans demonstrated full compliance.
In SFY 2017, for performance measures requiring remediation within 30 days, all FHP/ACA, ICP, and MMAI health plans demonstrated full compliance. For performance measures requiring remediation within 60 days, all FHP/ACA and MMAI health plans demonstrated full compliance; eight of nine ICP health plans demonstrated full compliance.
Health Plan Interventions and Process Improvements
The SFY 2016-to-2017 comparative analysis revealed many improvements in performance scores. These improvements resulted from the health plans’ efforts to address HSAG’s recommendations following the conclusion of SFYs 2016 and 2017 reviews, to incorporate TA received during on-site reviews, and to integrate HFS guidance into internal processes. Although it is not possible to definitively determine causal relationships, some of the health plans’ improvement efforts are listed below.
• Retraining of case management/care coordination staff. • Most health plans indicated that noncompliant findings were addressed either individually with the
case manager/care coordinator involved with the finding, or training was provided to all staff; however, the health plans did not indicate that root cause analysis was completed on noncompliant findings.
• Health plans provided information to support remediation actions during their remediation validation reviews.
• Revised documentation/forms and some online documentation systems were also enhanced. • Internal audit tools were created or revised to address findings of the quarterly record reviews.
Structure and Operations
Provider Network Capacity Reviews
Page | 5-25
HCBS Provider Network Monitoring As described in more detail below, HSAG validates and monitors the network of HCBS providers for each health plan serving HCBS waiver enrollees.
Provider Network Capacity Reviews At the request of HFS, HSAG established a process for health plans to submit provider network data quarterly for each of their service areas. HSAG evaluated and monitored a health plan’s progress of contracting and credentialing providers to ensure sufficient network capacity. HSAG also used the provider network submissions to identify potential network gaps and to monitor the health plan’s progress toward establishing an adequate provider network for beneficiaries. The network analysis allowed HFS to evaluate provider network capacity across the health plans using a multifaceted, iterative, standardized approach. These data were used to support ongoing monitoring, assessment, and reporting activities to evaluate provider network adequacy. Details about the submission process and submission guidance are included in Appendix I of this report.
HSAG is also contracted to conduct an analysis of the health plans’ provider networks as a key component of pre- and post-implementation readiness reviews. The purpose of the provider network review prior to implementation is to evaluate the progress of each health plan in contracting and credentialing providers to ensure sufficient network capacity to serve enrollees in the expansion areas. The network analysis allows HFS to evaluate the provider network across the health plans using a standardized approach. This process ensures that the health plans’ networks are reviewed with a consistent methodology that allows for fair comparisons, and that each health plan has a broad range of PCPs, specialists, outpatient facilities, and hospitals to provide access to care and services to its enrollees.
Structure and Operations
Provider Network Capacity Reviews
Page | 5-26
Findings
Overall findings across programs and plans included:
• Improved accuracy in the identification of provider types in the network data. • Improved accuracy in the identification of duplicate providers in the network data. • Improved compliance with the use of the Provider Data Dictionary to accurately identify provider
types within the network data. • Obtained provider rosters from the federally qualified health centers (FQHCs) and community
mental health centers (CMHCs) to more accurately reflect the individual providers within the facilities.
• Continued to improve identification of skilled nursing facilities (SNFs) and supportive living facilities in the network data.
• Inconsistent monitoring of open and closed PCP panels and a process to update the online provider directory to accurately identify PCP panel status.
• Lack of oversight of updating the online provider directory and compliance with inclusion of the required data fields.
• Lack of methods to identify nonparticipating providers and updating the provider directory to accurately reflect participating providers.
• Lack of oversight of appointment availability for PCP and specialty providers. • Lack of the availability of oral surgeons continued to be a barrier to providing access to these
providers. • Lack of established methods for analysis of access-related grievances to identify barriers that are
impeding access to care. • Continued challenges for some health plans in submission of accurate network data, especially
during staff turnover.
Recommendations for Health Plans
Overall recommendations across programs and plans included:
• Improve monitoring of PCP open and closed panels. • Improve audit methods to validate the accuracy of the online provider directory (for example, active
participation, address, hours of operation, open and closed panels, ADA compliance, and transportation).
• Improve timeliness of updating the online provider directory. • Evaluate methods currently in place for network providers to update information needed to maintain
an accurate online directory.
Structure and Operations
Provider Network Capacity Reviews
Page | 5-27
• Establish a routine process to monitor provider compliance with appointment and after-hours contact standards including follow-up with providers found noncompliant with the requirements.
• Improve current methods to verify that network providers comply with ADA requirements. • Establish methods to monitor adequacy of HCBS and homebound providers. • Continue to improve the accuracy of network data included in the quarterly provider data file
submitted to HSAG/HFS. • Continue contracting efforts to improve network adequacy for the following provider types:
behavioral health providers, oral surgeons, and home health agencies. • Improve compliance with the requirements of notifying HFS of network gaps and provider contract
terminations. • Continue to improve the identification of pediatric providers within the network and include these
providers in the quarterly network data.
Recommendations for HFS
HFS may consider additional validation activities to validate health plan compliance with access standards, including:
• Conduct a time and distance analysis to evaluate plan compliance with the geographic location of providers.
• Conduct an access and availability survey to evaluate plan compliance with appointment availability and after-hours contact standards.
• Conduct an audit of the health plans’ online provider directories to verify accuracy of the online directories.
• Based on the network validation findings, evaluate the need to modify existing access standards.
Structure and Operations
Care Coordination/Care Management
Page | 5-28
Care Coordination/Care Management
Care Coordination Staffing Reviews
HSAG was contracted by HFS to conduct a care management/care coordination(CM/CC) staffing, qualifications, and training review of state-selected requirements for the Medicaid managed care plans. These requirements are included in Appendix I of this report. The CM/CC staffing, qualifications, and training evaluation included review of the contract requirements for the ICP and FHP/ACA waiver and non-waiver programs. In addition, HSAG also conducted a review of CM/CC staffing for health plans that had delegated care management/care coordination activities.
HSAG reviewed the educational qualifications, related experience, annual training hours, full time equivalency (FTE) allocation, and caseloads of CM/CC staff serving the Medicaid managed care population against the FHP/ACA, ICP, and CMS HCBS contract requirements. Caseloads, training, and qualifications categories were scored as either Met or Not Met. Health plans were required to follow up on any required actions associated with Not Met elements to ensure compliance.
As described above, HSAG’s annual care coordination staffing review included care coordinators that serve HCBS enrollees. The workbook for the HCBS review also contained formulas that calculate the staffing ratios for specific waiver types and staff ratios by program type. In addition, HSAG developed an HCBS Training Requirements Review Tool to capture the training requirements specific to each waiver type.
During SFY 2016, the staffing, qualifications, and training review identified that, for most health plans, staff providing care coordination services to waiver and non-waiver enrollees met the education, experience, and qualifications requirements. Review of the training materials provided by most health plans identified that the health plans also met the requirements for both general, non-waiver training content requirements and waiver-specific training content requirements. One health plan was out of compliance with caseload requirements for the ICP and FHP/ACA non-waiver populations, with 21 of
Structure and Operations
Care Coordination/Care Management
Page | 5-29
the 89 staff members exceeding the maximum of 600. Caseloads above the maximum 600 weighted limit needed to be redistributed to care coordinators with lower caseload points, and the health plan was required to reassess the care coordination staff caseloads. All other health plans were found to be in compliance with waiver and non-waiver caseload requirements.
For SFY 2017, 11 of the 12 health plans reviewed had a deficiency in one or more key leadership positions, such as noncompliance with FTE requirements. Of the 11 health plans with internal CM/CC staff, nine were identified as noncompliant with contract requirements for CM/CC staffing. Three health plans employed staff who did not have the credentials/qualifications required to manage waiver caseloads and who were found to be lacking the related experience requirements for staff managing human immunodeficiency virus/ acquired immune deficiency syndrome (HIV/AIDS) waiver caseloads; in addition, eight health plans were found to be noncompliant with one or more of the caseload requirements for CM/CC staff managing HIV/AIDS and brain injury (BI) waiver caseloads. Four health plans had noncompliant findings related to weighted caseloads. Based on the findings of the staffing analysis across health plans, HSAG identified the following recommendations for HFS:
• Review contractual licensure requirements to identify whether revisions are needed for specific key leadership positions (e.g., quality management coordinator).
• Examine implications for health plans not meeting requirements for key leadership positions. • Follow up with those health plans employing CM/CC staff who do not meet qualification
requirements for managing waiver caseloads. • Follow up with health plans employing CM/CC staff who do not meet the related experience
requirements for staff managing HIV/AIDS waiver caseloads. • Provide direction to the health plans related to caseload requirements for CM/CCs managing HIV
and BI waiver members. Discussion with health plans identified that the health plans interpret the contract to mean that the 30-caseload limit pertains only to HIV and/or BI caseloads, as opposed to CM/CC total caseload (which may include other waiver and non-waiver cases).
• Follow up with health plans with noncompliant findings related to managing weighted caseloads above 600.
• Follow up with health plans with noncompliant findings related to caseload volumes. • Provide direction to health plans related to caseload limits for CM/CC staff who manage
beneficiaries across multiple product lines. • Follow up with health plans who have delegate(s) with noncompliant findings related to CM/CC
staffing to ensure appropriate follow-up of expectations related to caseload limits. • Review staffing analysis findings against other available data to determine additional improvement
opportunities for specific health plans.
Structure and Operations
Care Coordination/Care Management
Page | 5-30
Accountable Care Entities (ACEs) and Care Coordination Entities (CCEs) In SFY 2015, HSAG conducted a staffing, qualifications, and training evaluation of the ACEs and CCEs to assess and monitor staffing efforts during program implementation. HSAG developed a standardized data collection tool to gather data for the staffing, qualifications, training, and FTE allocations of the care coordination, decision support, quality committee, and call center staff. The tool collected the names and credentials of staff members, as well as information such as their positions, hire dates, education, related experience, training completion, licensures and certifications, languages spoken, and FTE allocations.
HSAG calculated the data to produce a dashboard which displayed the staffing trends for each ACE and CCE so that staffing ratios could be easily monitored as the ACEs and CCEs completed hiring to implement their programs. The dashboard reports were used to ensure the ACEs and CCEs were complying with contract requirements for staff qualifications, training, and FTE ratios.
During SFY 2016, HSAG worked with the health plans and HFS extensively to clarify reporting requirements. The ACE and CCE contracts did not identify specific requirements for caseload ratios, training, or staff qualifications. Therefore, HSAG worked with HFS to provide clarification to the ACEs and CCEs regarding contract language and reporting tools, and the entities’ interpretations of requirements and tools.
The ACEs/CCEs submitted care coordination and utilization reports. The care coordination reports collected information about enrollment, risk stratifications completed, and tracking of comprehensive assessments and enrollee care plans completed. The utilization reports collected enrollment, emergency department (ED) visits, inpatient admissions, inpatient length of stay, and the average length of stay. ACEs and CCEs were required to submit these reports monthly. HSAG developed a dashboard for HFS that displayed each plan’s performance, which HFS and HSAG used to monitor services provided by the entities and compliance with requirements. HSAG worked with the ACEs and CCEs to ensure information was being reported in a consistent manner. For example, HSAG found that at first some entities were recording the number of health risk assessments completed as assessments that were actually completed with members, while some were recording a mailed assessment form as “completed.”
HSAG worked with HFS and the ACEs/CCEs to determine challenges that presented barriers. For example, for utilization reporting, the ACEs/CCEs did not pay claims, so there was a significant lag (up to six months) in the data reporting. For care coordination reporting, each ACE and CCE had a unique operating structure which presented a challenge for the consistent reporting of data across entities. For example, some entities had staff embedded in clinics, some had centralized staffing, some delegated the care coordination staffing, and some had telephonic staff.
HSAG considered all the challenges of the data reporting and assessment process and worked with HFS and the ACEs/CCEs to design methods of comparison. To ensure HFS had an accurate picture of each ACE/CCE’s staffing, HSAG eventually developed a Microsoft Access database staffing report that collected specific information about each staff member including position, staffing area, hire date, education, licensure, certification, related experience, training dates, and FTE equivalency. This allowed HFS to review at a glance the staffing efforts of each ACE/CCE.
In SFY 2017, each ACE/CCE transitioned to merge with an existing health plan or become an MCCN.
Structure and Operations
State Guidance
Page | 5-31
Monthly and Quarterly Managed Care Meetings HSAG met regularly with HFS throughout the term of its EQRO contract to partner effectively and efficiently with the State. HSAG assisted and attended HFS’ on-site quarterly meetings with the health plans as well as the monthly teleconference meetings. The purpose of these meetings was to review all current and upcoming EQR activities, discuss any barriers or progress, design solutions or a course of action, and review the goals of the quality strategy. The meetings included discussion of compliance with the State’s quality strategy, ongoing monitoring of performance of Medicaid programs, program changes or additions, readiness reviews, and future initiatives. In addition, the on-site quarterly meetings served as a forum for review of the health plans’ progress in managing their quality assessment and performance improvement (QAPI) programs, as well as provided time for TA and training sessions provided by HSAG.
For both monthly and quarterly meetings, HSAG was responsible for consulting with HFS in selecting meeting content, preparing the agenda and any necessary meeting materials, forwarding materials to participants in advance of the meeting, and facilitating the meeting. Meeting materials included worksheets, Microsoft PowerPoint presentations, slide handouts, or technical demonstrations. Subject matter experts, including clinical and analytical staff as required, were involved in the development of meeting content; and appropriate staff provided the instruction and/or facilitation, as appropriate. Following each meeting, HSAG prepared meeting minutes and, upon HFS’ approval, forwarded them to all meeting participants. As part of this process, HSAG created an action item list and then followed up with the health plans and HFS to ensure timely completion of those items. HSAG provided status updates to HFS so it could track health plan progress on completing follow-up items.
Quality Strategy Guidance HSAG understands that HFS must update its Quality Strategy as necessary based on health plan performance; stakeholder input and feedback; achievement of goals; changes resulting from legislative, State, federal, or other regulatory authority; and/or significant changes to the programmatic structure of the Medicaid program.
To assist with Quality Strategy development, HSAG facilitated stakeholder meetings, monitored project progress according to the proposed time frames to ensure the Quality Strategy was completed on time for CMS submission, provided feedback and guidance on drafts, and assisted with graphic design and editing. This TA helps HFS design a Quality Strategy that provides an effective framework to accomplish HFS’ goals and objectives.
HSAG stays abreast of CMS requirements for states’ Quality Strategy and advised HFS on the development of its Quality Strategy in accordance with CMS’ Quality Strategy Toolkit for States.5-3 In addition, HSAG prepared presentations and briefs to update states on new regulations affecting the Quality Strategy.
5-3 Centers for Medicare & Medicaid Services. Quality Strategy Toolkit for States. Available at:
https://www.medicaid.gov/medicaid/quality-of-care/downloads/quality-strategy-toolkit-for-states.pdf. Accessed on: Mar 19, 2018.
Structure and Operations
Technical Assistance
Page | 5-32
Technical Assistance (TA) to HFS and Health Plans At the State’s direction, the EQRO may provide technical guidance to Medicaid agencies and health plans as described at 42 CFR §438.358(d). HSAG has provided a variety of TA to HFS that has led to quality outcomes, including TA in the following areas: PIPs, grievance and appeals process, care
management/care coordination programs, CAHPS sampling and development of CAHPS supplemental questions, pay-for-performance (P4P) program measures, health plan compliance and readiness reviews, identification and selection of program-specific performance measures, developing and implementing new Medicaid programs, HCBS waiver program requirements, and much more.
HSAG understood the importance of providing ongoing and specific TA to each health plan, as needed, and provided consultation, expertise, suggestions, and advice to assist with decision making and strategic planning. HSAG worked in partnership and collaboration with HFS and health plans to ensure that it delivered effective technical support that facilitated the delivery of quality health services to Illinois
Medicaid members. As requested by HFS, HSAG continued to provide technical guidance to the health plans to assist them in conducting the mandatory EQR activities—particularly, to establish scientifically sound PIPs and develop effective corrective action plans (CAPs). HSAG worked with HFS and the health plans to develop models of stakeholder collaboration for quality improvement projects which were essential for identifying and implementing sustainable activities that lead to improved preventive and developmental services.
A detailed review of TA provided to HFS and health plans is provided in Appendix I of this report.
Structure and Operations
Follow up on Previous EQR Recommendations
Page | 5-33
Follow-Up on Prior Year EQR Recommendations In accordance with CFR §438.364(a)(5), this technical report includes an assessment of the degree to which each health plan effectively addressed the recommendations for quality improvement made by the EQRO during the previous year’s EQR.
This section reports on health plans’ follow-up to the EQR recommendations from SFY 2015.
Readiness Reviews
During SFY 2015, HSAG focused on working with HFS to develop and conduct the readiness review process for the FHP/ACA, CCEs, and ACEs as part of the expansion of managed care. As a result, health plans were given recommendations for remediation. The most common follow-up areas identified during the readiness reviews were as follows:
• Access Standards – Assurance of Adequate Capacity and Services – Coordination and Continuity of Care
• Structure and Operations Requirements – Enrollee Information/Enrollee Rights
• Measurement and Improvement Requirements – Quality Assessment and Performance Improvement Program – Health Information Systems
For the access standards, health plans were often required to submit additional network capacity reports, provide facility lists, submit or revise procedures and policies, revise or submit training materials, and revise survey tools. To follow up on coordination and continuity of care recommendations, health plans submitted organizational charts, case management/care coordination productivity reports, and implementation plans. To remediate enrollee information/enrollee rights deficiencies, health plans submitted organizational charts, submitted staff training and documented training completion, developed policies and procedures, obtained HFS approval on member materials, and submitted call center scripts. To meet measurement and improvement requirements, health plans need to revise or develop practice guidelines, submit enrollment file testing results, develop and/or revise policies and procedures, revise the QAPI plan and submit QAPI workplans, submit/revise a Cultural Competency Plan, and provide an overview of the process for identifying particular populations within the health information system.
Structure and Operations
Follow up on Previous EQR Recommendations
Page | 5-34
Specific Health Plan Follow-Up
In the SFY 2015 EQR report, HSAG also provided recommendations for improving performance measure and PIP results, and consumer satisfaction rates. In their annual reports, health plans reported on follow-up improvement efforts.
Aetna
Initiatives to improve performance included:
• Emergency Department (ED) Education Program—Member education about appropriate treatment alternatives to ED for nonemergent conditions.
• Provider Gaps in Care Report—An online monthly report summarizing practice performance and member detail that identifies gaps in care.
• Member Gift Card Initiative. • Text4Health—Text messaging program through Voxiva, links with the federally subsidized cellular
phone initiative through SafeLink (now Lifeline). • Population Health Program—Provides solutions to social determinants of health using a local
community partnership model of care. A technology platform (CareUnify) gives providers a 360° view of the member delivering actionable data at the point of care.
• Home Care—Partnered with Addus who reports any health changes to a member’s care manager to coordinate healthcare needs.
• Telemonitoring—Care providers remotely interact with members for timely detection of health changes.
• Provider Engagement Visits—Provides education and openly discusses best practices, quality measure performance, and operational barriers.
• HealthTag in partnership with CVS—Provides messaging to members at point of sale. Messages are focused on three general categories: clinical gaps, preventive services, and plan benefit awareness.
• Well-Woman Birthday Cards—Every woman receives a well-woman reminder card each year during her birthday month.
• Behavioral Health Census—100 percent inpatient behavioral health census is referred to care management.
BCBSIL
Initiatives to improve performance included:
• The Medicaid Quality Workgroup—Developed to report and track quality initiatives that are conducted to affect the care given to members. The workgroup actively reviews the Medicaid Quality Dashboards and currently meets two times a month to discuss the quality/performance status and initiatives across the Medicaid programs.
Structure and Operations
Follow up on Previous EQR Recommendations
Page | 5-35
• Outbound Call Campaign—For noncompliant members who are not in care coordination. • Special Beginnings (SB) Maternity Program—Utilizes an auto-referral to the program if the member
answers “yes” to currently pregnant on a screening questionnaire. The SB program also receives alerts from physicians’ offices for pregnant women, for members with a prenatal vitamin prescription, and when a woman is admitted to the ED for any pregnancy-related concern. The SB staff then reaches out to the member to educate and enroll her in the program.
• Feet on the Street (FOTS) Team—FOTS staff members go into a community without appointments to introduce care coordination. The FOTS Team averages over 3,600 member outreaches per month and completes on average nearly 500 health risk screenings (HRSs) monthly for an average HRS completion rate of 13.34 percent.
• Readmission Reduction Initiative—Implemented in June 2016 to provide high touch care coordination to ICP and FHP members with select diagnoses to identify and intervene with members deemed to be high risk for readmission.
• High Cost Claimant/High Utilizer—The pilot was implemented from March through May 2016 and converted to an operational program in June 2016. The program has been developed to manage high-risk members across all business lines, with a dedicated focus on those members with claims over $250,000. Program interventions include more frequent face-to-face care coordination visits and biweekly medical rounds with multiple departments and medical directors.
CountyCare
Initiatives to improve performance included:
• Third Party Administrator (TPA) and Benefits Management Migration—The most significant accomplishment for CountyCare was the successful transition of its TPA and procurement of pharmacy, dental, transportation, and vision benefits managers.
• “In House” Quality Improvement Program (QIP)—On April 1, 2016, CountyCare transitioned to its “in house” QIP, hiring five staff members to continue development of the QIP.
• Provider-Led Care Coordination—Redefined the approach to care coordination and quality oversight. Developed the policies and procedures, and lay the groundwork for transitioning of all care coordination support from centralized, health plan-led systems to provider-based interventions. This move eliminated the care function activities from the day-to-day operations of the plan and moved them closer to care where members are most impacted.
• TPA Infrastructure—Investment resulted in new tools such as the Vision quality dashboard, which will support implementation of a provider incentive program. The incentive program will align provider and plan goals to drive performance to meet targets. Vision allows key stakeholders and provider groups’ access to their HEDIS performance daily. The application is updated monthly and readily identifies members with care gaps so that the medical homes know who to target to meet specific measure goals.
• Behavioral Health Services—Eliminated the third-party behavioral health benefits management structure and launched the Behavioral Health Consortium. The BH Consortium provides a network of six community mental health and drug treatment providers who have agreed to streamline access
Structure and Operations
Follow up on Previous EQR Recommendations
Page | 5-36
for care. Additionally, the BH Consortium is establishing a single point of intake for members, and will develop and lead a behavioral health learning collaborative for CountyCare’s PCPs. The learning collaborative is expected to launch in 2017.
FHN
Initiatives to improve performance included:
• Claims Department—Launched a fully functional, service-oriented Claims Department. Led by the chief administrative officer, the claims department has a staff of over 60 employees who manage end-to-end transactions for nearly 80 percent of FHN’s network. This allows daily refreshes to FHN’s data reporting warehouse, as well as to the customer service and care management systems. Most importantly, it allows FHN direct control to manage real-time data accuracy requirements and claims adjudication. This advancement in data access and integrity also provides a direct storage repository and much more robust reporting capability.
• New Member Portal—Launched April 2016, this tool provides members with direct access to a wide range of health-related resources, including a searchable provider directory, health education materials based on the latest accepted practice guidelines, extra benefits notifications, as well as protected access to their own health profile where members can complete a health appraisal and receive feedback on needed services for achieving better health.
• Upgrade to Care Management System—Completed in October 2015, the new functionality allows enhanced care planning and documentation features, an improved user interface for navigating member health records, as well as additional reporting and workflow management capabilities.
• Continued Member- and Provider-Oriented Initiatives—Including FHN Member Incentive Program, Brighter Beginnings Program for pregnant members, immunization incentive, diabetes screening incentive, Text4Baby, and behavioral health intensive care management. Continued the provider incentive for early notification of pregnant members and increased incentive per initial notification of pregnancy.
• Provider Dashboards—Detailed and granular provider dashboards were developed and rolled out which provide detail on care gap closure, incentive earnings, and potential.
Harmony
Initiatives to improve performance included:
• Provider Scorecards—Highlighted quality and utilization metrics reported at both an individual and group level. Quarterly meetings with Harmony’s medical director, QI senior director, and senior director of health services occurred with key provider groups to emphasize the power of collaboration, discuss best practices, and share available resources.
• Town Hall Meetings—Held in Metro Chicago and Metro East (downstate Illinois). Medical and behavioral health providers met with Harmony leadership and provider representatives for a “meet and greet” and to identify barriers, promote best practices, discuss opportunities to improve provider satisfaction, and announce upcoming initiatives.
Structure and Operations
Follow up on Previous EQR Recommendations
Page | 5-37
• Monthly Secure EHR Flat File Submission—Selected HEDIS metrics and demographic data from providers.
• EmPowerHer Campaign—Initiated in 2nd Quarter 2016; encourages women to empower themselves and take control of their own healthcare needs, while influencing the ones they love to do the same and to take action. The primary focus is on women’s health and encompasses 11 HEDIS measures.
• Continued Member-Oriented Initiatives—Including Hugs Maternal-Child Health Program and care gap calls.
Health Alliance
Initiatives to improve performance included:
• Quality Improvement Operational Teams—Teams developed for three key areas (prevention and screening, respiratory conditions, and chronic disease and management). Each team is multidisciplinary to include a focus on all populations across all lines of business.
• Behavioral Health Workgroup—Oversees and monitors data for behavioral health-related conditions.
IlliniCare
Initiatives to improve performance included:
• Exam-One (Quest Diagnostics)—A new venture to visit members in-home to complete the diabetic labs needed for the Comprehensive Diabetes Care (CDC) measure.
• Continued partnership with HealPros to complete vision screenings. • HEDIS Steering Committee—Composed of senior management to review results, conduct barrier
analysis, and create an action plan for interventions that address opportunities identified. • Incentive Programs—Analyzed the effectiveness of the 2015 incentive programs and began
developing an ongoing incentive program for 2016. • Medical Record Audits—On-site in provider offices for Healthy Kids. • Care Coordination Outreach—Care coordination team reaches out to members prior to discharge for
follow-up visits.
Meridian
Initiatives to improve performance included:
• At-Home Testing—Distribution of at-home testing kits for HbA1c testing. • Remote Records Access—Gained remote access to electronic medical records system access for
several major health systems to improve timeliness and completeness of HEDIS reporting.
Structure and Operations
Follow up on Previous EQR Recommendations
Page | 5-38
• On-site Records Abstractions—Conducted numerous on-site abstractions for medical records throughout the reporting year to a larger number of offices and added regional abstraction positions to allow better coverage of offices outside of Cook County.
• Continued Member Oriented Initiatives—Including outreach campaigns promoting immunization for children using telephonic and postcard communication, implementation of a time-dependent process for outreach to unable-to-reach prenatal and postpartum members, well-child visit and adult access reminder telephonic campaigns, targeted follow-up for members recently discharged from the hospital, and community-based contact with members in long-term care.
Molina
Initiatives to improve performance included:
• Skilled Nursing Facility Specialist (SNFist) Program—Through the Care Connections Molina SNFist Program Model, the SNFist program is structured utilizing care managers and nurse practitioners to provide quality care management and resources for as many members as possible. The SNFist program provides oversight, communication with members and families, PCPs, and nursing facility administration.
• Illinois Behavioral Health Home Coalition (IBHHC) Pilot—IBHHC sites offer a variety of integrated care solutions, including on-site FQHC partnerships in some cases. The IBHHC team members work closely with Molina care coordinators to engage members in wraparound care. The IBHHC pilot has provided outcomes demonstrated for members who are among the most vulnerable members, often those who have depression, schizophrenia, and other severe mental illness, and frequently who also have co-occurring substance use disorders and multiple medical co-morbidities. The rates of inpatient admissions decreased by 51 percent, the rates of ED visits decreased by 25 percent, and the overall per member per month costs (medical and pharmacy, combined) decreased by 30 percent for the 79 members enrolled in the pilot during the first six months of the program. Expansion is being explored with possible growth of the program to approximately 2,000 members residing among the 18 downstate counties.
• Motherhood Matters Program—For members who are identified as having a high-risk pregnancy, this program was implemented in 2016 and extended by the Pregnancy Rewards Program, which offers an incentive involving member outreaches, member incentive points, and member and provider education and awareness. The main focus of the Pregnancy Rewards Program is to motivate women to receive necessary preventive prenatal exams and screenings for their/their babies’ improved health outcomes.
• Electronic Visit Verification (EVV)—In 2016, Molina began enforcement of EVV for individual providers serving waiver members, in assessing the authorized use of service plan hours, including monitoring for violations.
Structure and Operations
Follow up on Previous EQR Recommendations
Page | 5-39
Cigna
Initiatives to improve performance included:
• Utilization Management Strategy Meetings—Interdisciplinary, customer–focused telephonic rounds were implemented for comprehensive stakeholder coordination and treatment planning. This time- and labor-intensive strategy is reserved for enrollees with repeated behavioral health inpatient admissions that are seemingly not benefitting from those hospitalizations, as measured by the ability to sustain gains and utilize community-based services.
• Behavioral Health “One Sheets”—These are aimed at helping to identify and manage high utilizing behavioral health enrollees.
• “Brown Bag” Initiative—All ICP and MMP customers received reusable canvas tote bags with a letter encouraging use of the bag to take medications to PCP visits. This initiative provided education on the importance of medication adherence and the benefits of reviewing current medications at each doctor’s visit. The plan also communicated to the network PCPs about the intent of the initiative so that they could further reinforce the importance of medication adherence.
• Adopt-a-Senior Building—The Community Outreach team identified a new initiative and worked extensively with the Health Services and Provider Relations Departments to develop a unique member retention program aimed at assisting and engaging Cigna-HealthSpring members. When implemented (by 2017), the initiative will identify the Cigna-HealthSpring membership in senior facilities in Cook County and will focus on building relationships with the buildings’ service coordinators and other staff.
• Welcome Call Team—The team worked diligently to contact the newest Cigna-HealthSpring members who were originally assigned to Be Well with the goal of welcoming the members, educating them on benefits and how to utilize them, and answering any questions that may have occurred during the transition. The team was able to make first contact with 456 recipients or their care representatives.

Page | A1-1
Appendix A1. Summary of Performance Measure Results
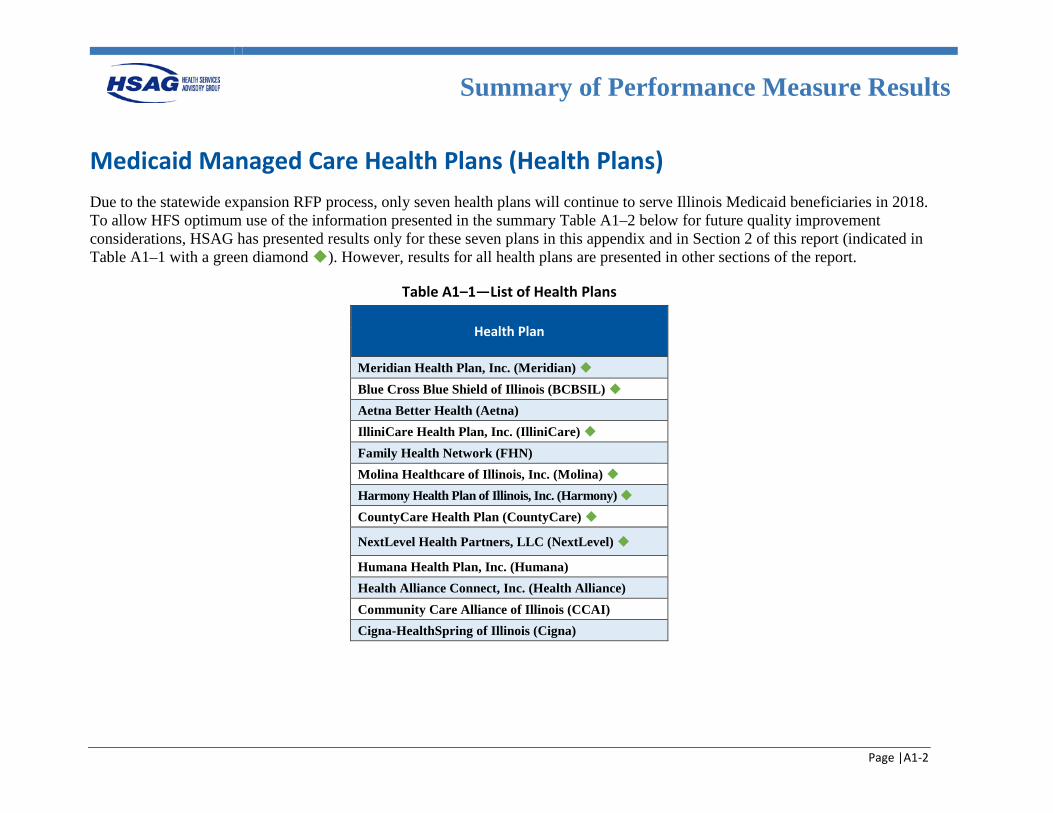
Summary of Performance Measure Results
Page |A1-2
Medicaid Managed Care Health Plans (Health Plans) Due to the statewide expansion RFP process, only seven health plans will continue to serve Illinois Medicaid beneficiaries in 2018. To allow HFS optimum use of the information presented in the summary Table A1–2 below for future quality improvement considerations, HSAG has presented results only for these seven plans in this appendix and in Section 2 of this report (indicated in Table A1–1 with a green diamond ). However, results for all health plans are presented in other sections of the report.
Table A1–1—List of Health Plans
Health Plan
Meridian Health Plan, Inc. (Meridian) Blue Cross Blue Shield of Illinois (BCBSIL) Aetna Better Health (Aetna) IlliniCare Health Plan, Inc. (IlliniCare) Family Health Network (FHN) Molina Healthcare of Illinois, Inc. (Molina) Harmony Health Plan of Illinois, Inc. (Harmony) CountyCare Health Plan (CountyCare)
NextLevel Health Partners, LLC (NextLevel)
Humana Health Plan, Inc. (Humana) Health Alliance Connect, Inc. (Health Alliance) Community Care Alliance of Illinois (CCAI) Cigna-HealthSpring of Illinois (Cigna)
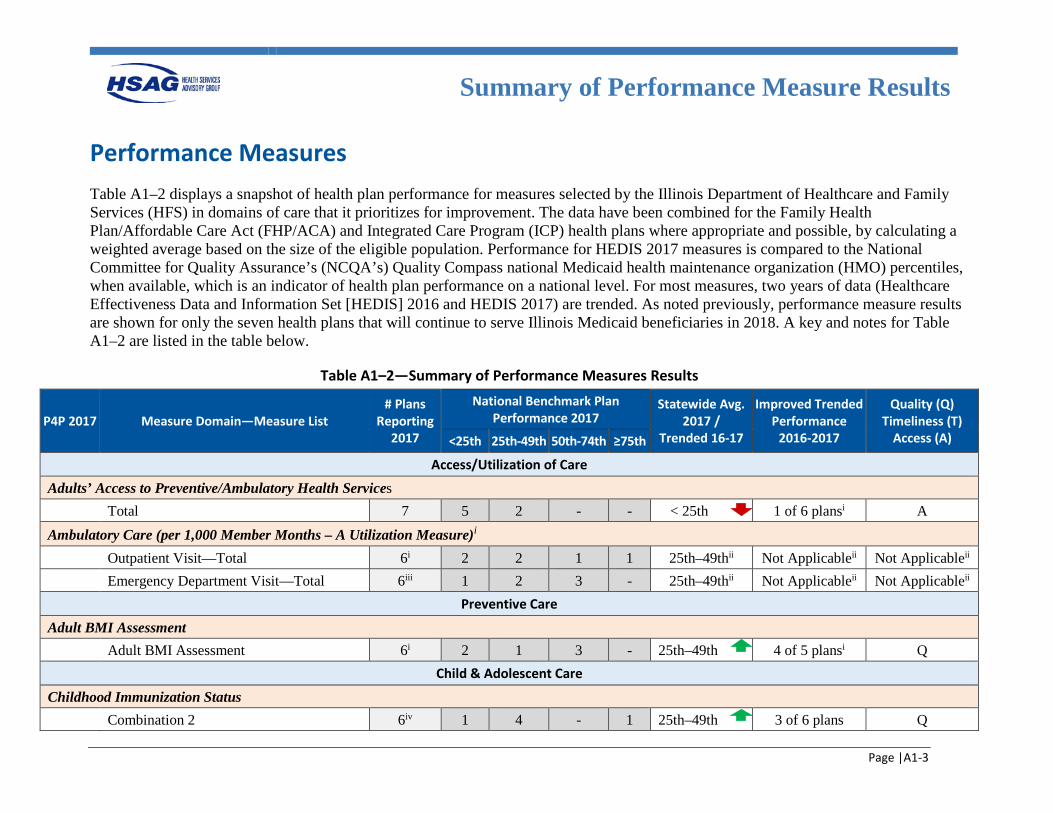
Summary of Performance Measure Results
Page |A1-3
Performance Measures Table A1–2 displays a snapshot of health plan performance for measures selected by the Illinois Department of Healthcare and Family Services (HFS) in domains of care that it prioritizes for improvement. The data have been combined for the Family Health Plan/Affordable Care Act (FHP/ACA) and Integrated Care Program (ICP) health plans where appropriate and possible, by calculating a weighted average based on the size of the eligible population. Performance for HEDIS 2017 measures is compared to the National Committee for Quality Assurance’s (NCQA’s) Quality Compass national Medicaid health maintenance organization (HMO) percentiles, when available, which is an indicator of health plan performance on a national level. For most measures, two years of data (Healthcare Effectiveness Data and Information Set [HEDIS] 2016 and HEDIS 2017) are trended. As noted previously, performance measure results are shown for only the seven health plans that will continue to serve Illinois Medicaid beneficiaries in 2018. A key and notes for Table A1–2 are listed in the table below.
Table A1–2—Summary of Performance Measures Results
P4P 2017 Measure Domain—Measure List # Plans
Reporting 2017
National Benchmark Plan Performance 2017
Statewide Avg. 2017 /
Trended 16-17
Improved Trended Performance
2016-2017
Quality (Q) Timeliness (T)
Access (A) <25th 25th-49th 50th-74th ≥75th
Access/Utilization of Care
Adults’ Access to Preventive/Ambulatory Health Services Total 7 5 2 - - < 25th 1 of 6 plansi A Ambulatory Care (per 1,000 Member Months – A Utilization Measure)i Outpatient Visit—Total 6i 2 2 1 1 25th–49thii Not Applicableii Not Applicableii Emergency Department Visit—Total 6iii 1 2 3 - 25th–49thii Not Applicableii Not Applicableii
Preventive Care
Adult BMI Assessment Adult BMI Assessment 6i 2 1 3 - 25th–49th 4 of 5 plansi
Q Child & Adolescent Care
Childhood Immunization Status Combination 2 6iv 1 4 - 1 25th–49th 3 of 6 plans Q
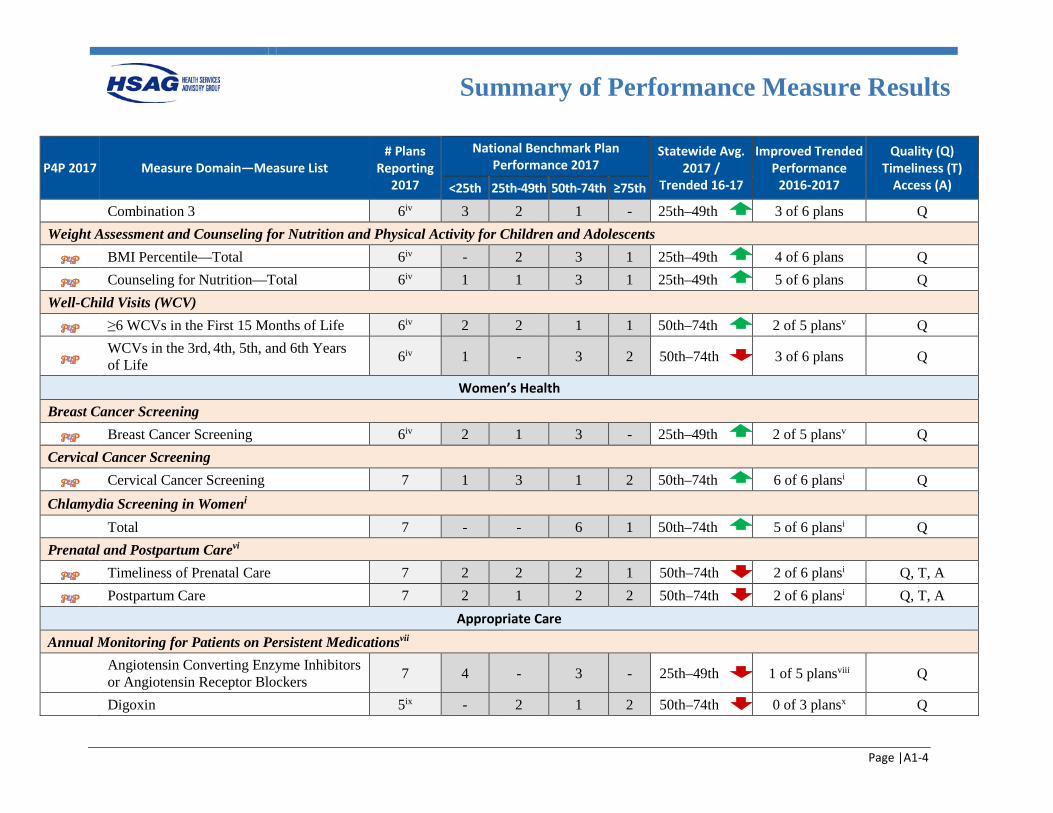
Summary of Performance Measure Results
Page |A1-4
P4P 2017 Measure Domain—Measure List # Plans
Reporting 2017
National Benchmark Plan Performance 2017
Statewide Avg. 2017 /
Trended 16-17
Improved Trended Performance
2016-2017
Quality (Q) Timeliness (T)
Access (A) <25th 25th-49th 50th-74th ≥75th
Combination 3 6iv 3 2 1 - 25th–49th 3 of 6 plans Q Weight Assessment and Counseling for Nutrition and Physical Activity for Children and Adolescents
BMI Percentile—Total 6iv - 2 3 1 25th–49th 4 of 6 plans Q
Counseling for Nutrition—Total 6iv 1 1 3 1 25th–49th 5 of 6 plans Q Well-Child Visits (WCV)
≥6 WCVs in the First 15 Months of Life 6iv 2 2 1 1 50th–74th 2 of 5 plansv Q
WCVs in the 3rd, 4th, 5th, and 6th Years of Life 6iv 1 - 3 2 50th–74th 3 of 6 plans Q
Women’s Health
Breast Cancer Screening Breast Cancer Screening 6iv 2 1 3 - 25th–49th 2 of 5 plansv Q
Cervical Cancer Screening Cervical Cancer Screening 7 1 3 1 2 50th–74th 6 of 6 plansi Q
Chlamydia Screening in Womeni Total 7 - - 6 1 50th–74th 5 of 6 plansi Q Prenatal and Postpartum Carevi
Timeliness of Prenatal Care 7 2 2 2 1 50th–74th 2 of 6 plansi Q, T, A
Postpartum Care 7 2 1 2 2 50th–74th 2 of 6 plansi Q, T, A Appropriate Care
Annual Monitoring for Patients on Persistent Medicationsvii
Angiotensin Converting Enzyme Inhibitors or Angiotensin Receptor Blockers 7 4 - 3 - 25th–49th 1 of 5 plansviii Q
Digoxin 5ix - 2 1 2 50th–74th 0 of 3 plansx Q
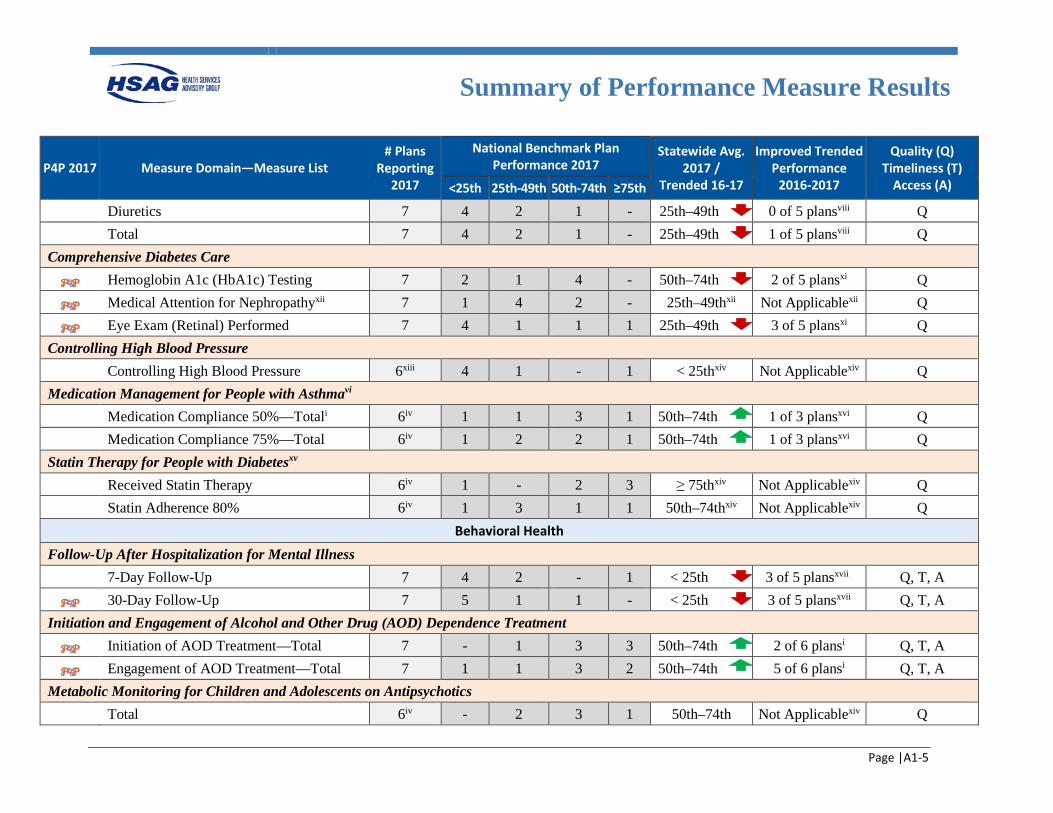
Summary of Performance Measure Results
Page |A1-5
P4P 2017 Measure Domain—Measure List # Plans
Reporting 2017
National Benchmark Plan Performance 2017
Statewide Avg. 2017 /
Trended 16-17
Improved Trended Performance
2016-2017
Quality (Q) Timeliness (T)
Access (A) <25th 25th-49th 50th-74th ≥75th
Diuretics 7 4 2 1 - 25th–49th 0 of 5 plansviii Q Total 7 4 2 1 - 25th–49th 1 of 5 plansviii Q Comprehensive Diabetes Care
Hemoglobin A1c (HbA1c) Testing 7 2 1 4 - 50th–74th 2 of 5 plansxi Q
Medical Attention for Nephropathyxii 7 1 4 2 - 25th–49thxii Not Applicablexii Q
Eye Exam (Retinal) Performed 7 4 1 1 1 25th–49th 3 of 5 plansxi Q Controlling High Blood Pressure Controlling High Blood Pressure 6xiii 4 1 - 1 < 25thxiv Not Applicablexiv Q Medication Management for People with Asthmavi Medication Compliance 50%—Totali 6iv 1 1 3 1 50th–74th 1 of 3 plansxvi Q Medication Compliance 75%—Total 6iv 1 2 2 1 50th–74th 1 of 3 plansxvi Q Statin Therapy for People with Diabetesxv Received Statin Therapy 6iv 1 - 2 3 ≥ 75thxiv Not Applicablexiv Q Statin Adherence 80% 6iv 1 3 1 1 50th–74thxiv Not Applicablexiv Q
Behavioral Health
Follow-Up After Hospitalization for Mental Illness 7-Day Follow-Up 7 4 2 - 1 < 25th 3 of 5 plansxvii Q, T, A
30-Day Follow-Up 7 5 1 1 - < 25th 3 of 5 plansxvii Q, T, A Initiation and Engagement of Alcohol and Other Drug (AOD) Dependence Treatment
Initiation of AOD Treatment—Total 7 - 1 3 3 50th–74th 2 of 6 plansi Q, T, A
Engagement of AOD Treatment—Total 7 1 1 3 2 50th–74th 5 of 6 plansi Q, T, A Metabolic Monitoring for Children and Adolescents on Antipsychotics Total 6iv - 2 3 1 50th–74th Not Applicablexiv Q
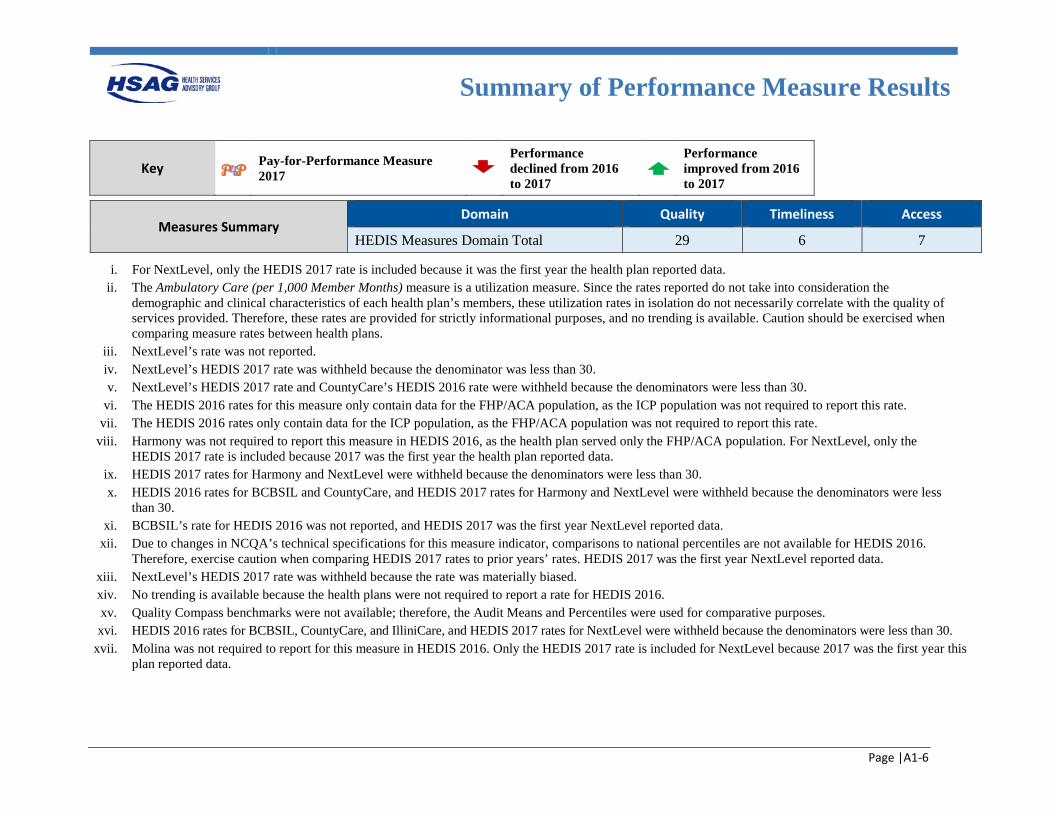
Summary of Performance Measure Results
Page |A1-6
Key Pay-for-Performance Measure 2017
Performance declined from 2016 to 2017
Performance improved from 2016 to 2017
Measures Summary Domain Quality Timeliness Access
HEDIS Measures Domain Total 29 6 7
i. For NextLevel, only the HEDIS 2017 rate is included because it was the first year the health plan reported data. ii. The Ambulatory Care (per 1,000 Member Months) measure is a utilization measure. Since the rates reported do not take into consideration the
demographic and clinical characteristics of each health plan’s members, these utilization rates in isolation do not necessarily correlate with the quality of services provided. Therefore, these rates are provided for strictly informational purposes, and no trending is available. Caution should be exercised when comparing measure rates between health plans.
iii. NextLevel’s rate was not reported. iv. NextLevel’s HEDIS 2017 rate was withheld because the denominator was less than 30. v. NextLevel’s HEDIS 2017 rate and CountyCare’s HEDIS 2016 rate were withheld because the denominators were less than 30.
vi. The HEDIS 2016 rates for this measure only contain data for the FHP/ACA population, as the ICP population was not required to report this rate. vii. The HEDIS 2016 rates only contain data for the ICP population, as the FHP/ACA population was not required to report this rate.
viii. Harmony was not required to report this measure in HEDIS 2016, as the health plan served only the FHP/ACA population. For NextLevel, only the HEDIS 2017 rate is included because 2017 was the first year the health plan reported data.
ix. HEDIS 2017 rates for Harmony and NextLevel were withheld because the denominators were less than 30. x. HEDIS 2016 rates for BCBSIL and CountyCare, and HEDIS 2017 rates for Harmony and NextLevel were withheld because the denominators were less
than 30. xi. BCBSIL’s rate for HEDIS 2016 was not reported, and HEDIS 2017 was the first year NextLevel reported data.
xii. Due to changes in NCQA’s technical specifications for this measure indicator, comparisons to national percentiles are not available for HEDIS 2016. Therefore, exercise caution when comparing HEDIS 2017 rates to prior years’ rates. HEDIS 2017 was the first year NextLevel reported data.
xiii. NextLevel’s HEDIS 2017 rate was withheld because the rate was materially biased. xiv. No trending is available because the health plans were not required to report a rate for HEDIS 2016. xv. Quality Compass benchmarks were not available; therefore, the Audit Means and Percentiles were used for comparative purposes. xvi. HEDIS 2016 rates for BCBSIL, CountyCare, and IlliniCare, and HEDIS 2017 rates for NextLevel were withheld because the denominators were less than 30.
xvii. Molina was not required to report for this measure in HEDIS 2016. Only the HEDIS 2017 rate is included for NextLevel because 2017 was the first year this plan reported data.
Page | A2-1
Appendix A2. Executive Summary Appendix
Executive Summary Appendix
Page | A2-2
Federal Requirements for External Quality Review (EQR) Technical Report This report addresses the following for each external quality review (EQR)-related activity conducted in accordance with the Code of Federal Regulations (CFR) at Title 42, Section (§)438.358:
• Objectives. • Technical methods of data collection and analysis. • Description of data obtained, including validated performance measurement data for each activity
conducted in accordance with §438.358(b)(1)(i) and (ii). • Conclusions drawn from the data.
As described in the CFR, the report also offers:
• An assessment of each health plan’s strengths and weaknesses for the quality and timeliness of, and access to health care services furnished to Medicaid beneficiaries.
• Recommendations for improving the quality of health care services furnished by each health plan, including how the State can target goals and objectives in the quality strategy, under §438.340, to better support improvement in the quality and timeliness of, and access to health care services furnished to Medicaid beneficiaries.
• Methodologically appropriate, comparative information about all health plans, consistent with guidance included in the EQR protocols issued in accordance with §438.352(e).
• An assessment of the degree to which each health plan has effectively addressed the recommendations for quality improvement made by the external quality review organization (EQRO) during the previous year’s EQR.
This report also offers recommendations for improving the quality of healthcare services furnished by each health plan, makes comparisons of plan performance, and describes performance improvement efforts. Information released in this technical report does not disclose the identity of any beneficiary, in accordance with §438.350(f) and §438.364(a)(b).
Executive Summary Appendix
Page | A2-3
Scope of Report Mandatory activities for state fiscal years (SFYs) 2016 and 2017 included:
• Compliance Monitoring—As set forth in 42 CFR 438.358, the state or its designee conducts a review within the previous three-year period to determine the health plan’s compliance with the standards established by the state for access to care, structure and operations, and quality measurement and improvement. The EQR technical report must include information on the reviews conducted within the previous three-year period to determine the health plans’ compliance with the standards established by the state.
• Validation of Performance Measures—In accordance with §438.358(b)(2), the EQR technical report must include information on the validation of health plan performance measures (as required by the state) or health plan performance measures calculated by the state during the preceding 12 months.
• Validation of Performance Improvement Projects (PIPs)—Health Services Advisory Group, Inc. (HSAG) validated PIPs conducted by the health plans regarding compliance with requirements set forth in 42 CFR 438.330(b)(1).
Optional activities for SFYs 2016 and 2017 included:
• Validation of Performance Measures—HSAG conducted a review of the Primary Care Case Management (PCCM) and Children's Health Insurance Program Reauthorization Act (CHIPRA) programs for a select set of performance measures, following the Performance Measure Validation protocol outlined by CMS.A2-1
• Provider Network Capacity Reviews—As described in §438.68, states must develop and enforce network adequacy standards consistent with this section. The Illinois Department of Healthcare and Family Services (HFS) contracted HSAG to evaluate and monitor health plans’ progress of contracting and credentialing providers to ensure sufficient network capacity. HSAG also used the provider network submissions to identify potential network gaps and to monitor each health plan’s progress towards establishing an adequate provider network for members.
• CMS Home- and Community-Based Services (HCBS) Waiver Performance Measures Record Reviews—To monitor the quality of services and supports provided to the HCBS waiver program enrollees, HSAG continued on-site record reviews for Integrated Care Program (ICP) and Medicare-Medicaid Alignment Initiative (MMAI) health plans to monitor performance on the HCBS waiver performance measures and began conducting reviews for Family Health Plan/Affordable Care Act (FHP/ACA) health plans.
A2-1 Department of Health and Human Services, Centers for Medicare & Medicaid Services. EQR Protocol 2: Validation of
Performance Measures Reported by the MCO: A Mandatory Protocol for External Quality Review (EQR), Version 2.0, September 2012. Available at: https://www.medicaid.gov/medicaid/quality-of-care/downloads/eqr-protocol-2.pdf. Accessed on: Mar 13, 2018.
Executive Summary Appendix
Page | A2-4
Medicaid Managed Care Programs
FHP/ACA
In July 2014, Illinois transitioned from voluntary managed care (VMC) in select counties to FHP/ACA with mandatory managed care regions that covered most of the State. This allowed additional health plans to serve the FHP/ACA population.
ICP
FHP/ACA expansion also provided the opportunity for additional health plans to serve the ICP population. Two health plans have served the ICP population since 2011, while Healthcare Effectiveness Data and Information Set (HEDIS) 2015 was the first or second year of reporting data for newer ICP health plans.
HCBS
The ICP Service Package II, which included management of the HCBS waiver populations, was initiated in 2013. In addition to the ICP, some enrollees receive their HCBS waiver services through FHP/ACA. All health plans served the HCBS waiver population.
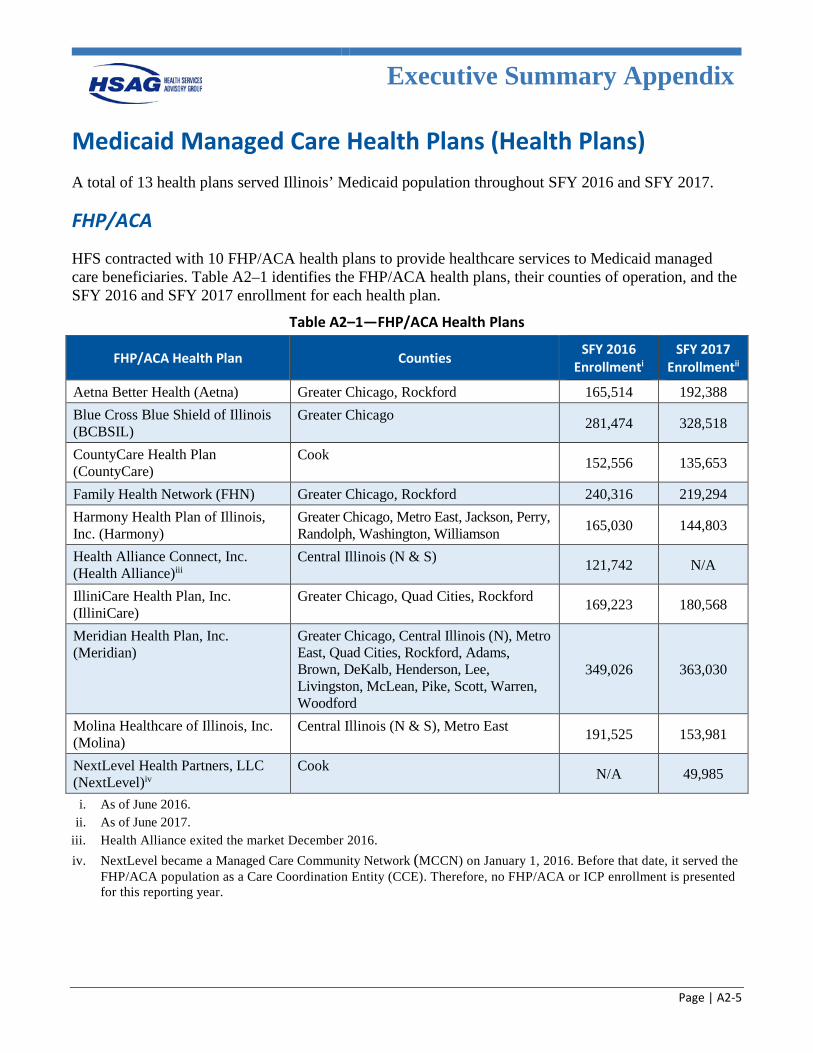
Executive Summary Appendix
Page | A2-5
Medicaid Managed Care Health Plans (Health Plans) A total of 13 health plans served Illinois’ Medicaid population throughout SFY 2016 and SFY 2017.
FHP/ACA
HFS contracted with 10 FHP/ACA health plans to provide healthcare services to Medicaid managed care beneficiaries. Table A2–1 identifies the FHP/ACA health plans, their counties of operation, and the SFY 2016 and SFY 2017 enrollment for each health plan.
Table A2–1—FHP/ACA Health Plans
FHP/ACA Health Plan Counties SFY 2016 Enrollmenti
SFY 2017 Enrollmentii
Aetna Better Health (Aetna) Greater Chicago, Rockford 165,514 192,388 Blue Cross Blue Shield of Illinois (BCBSIL)
Greater Chicago 281,474 328,518
CountyCare Health Plan (CountyCare)
Cook 152,556 135,653
Family Health Network (FHN) Greater Chicago, Rockford 240,316 219,294 Harmony Health Plan of Illinois, Inc. (Harmony)
Greater Chicago, Metro East, Jackson, Perry, Randolph, Washington, Williamson 165,030 144,803
Health Alliance Connect, Inc. (Health Alliance)iii
Central Illinois (N & S) 121,742 N/A
IlliniCare Health Plan, Inc. (IlliniCare)
Greater Chicago, Quad Cities, Rockford 169,223 180,568
Meridian Health Plan, Inc. (Meridian)
Greater Chicago, Central Illinois (N), Metro East, Quad Cities, Rockford, Adams, Brown, DeKalb, Henderson, Lee, Livingston, McLean, Pike, Scott, Warren, Woodford
349,026 363,030
Molina Healthcare of Illinois, Inc. (Molina)
Central Illinois (N & S), Metro East 191,525 153,981
NextLevel Health Partners, LLC (NextLevel)iv
Cook N/A 49,985
i. As of June 2016. ii. As of June 2017.
iii. Health Alliance exited the market December 2016. iv. NextLevel became a Managed Care Community Network (MCCN) on January 1, 2016. Before that date, it served the
FHP/ACA population as a Care Coordination Entity (CCE). Therefore, no FHP/ACA or ICP enrollment is presented for this reporting year.
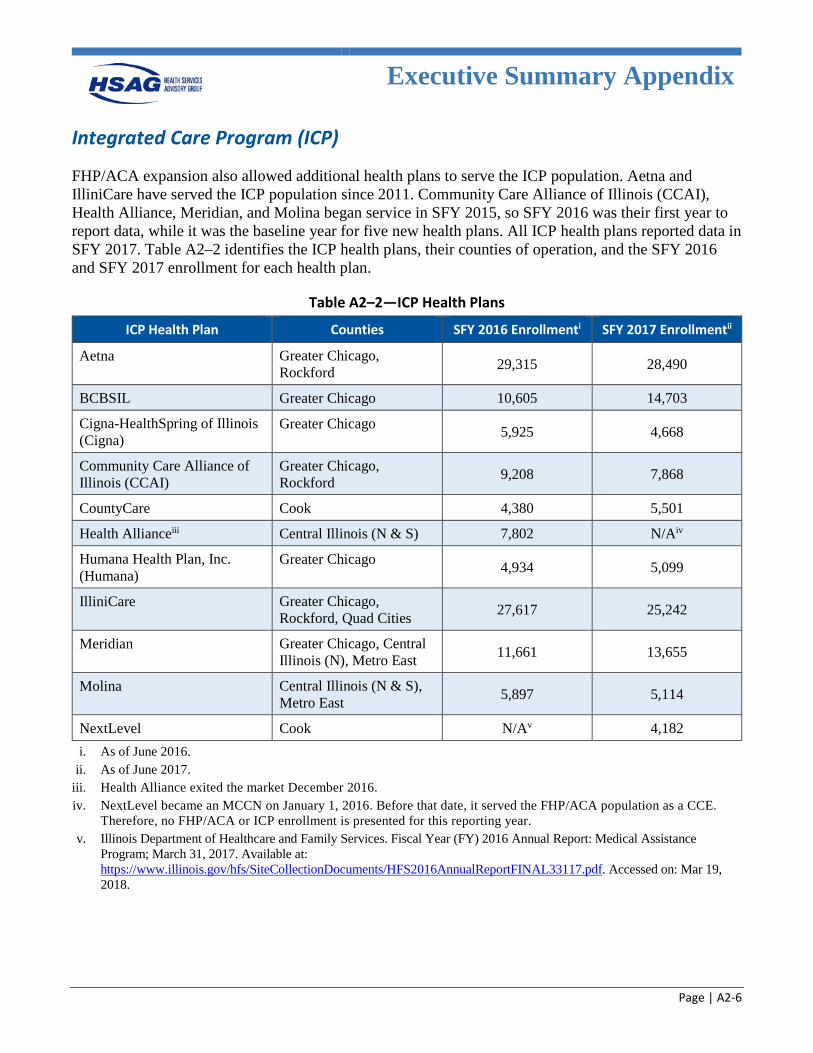
Executive Summary Appendix
Page | A2-6
Integrated Care Program (ICP)
FHP/ACA expansion also allowed additional health plans to serve the ICP population. Aetna and IlliniCare have served the ICP population since 2011. Community Care Alliance of Illinois (CCAI), Health Alliance, Meridian, and Molina began service in SFY 2015, so SFY 2016 was their first year to report data, while it was the baseline year for five new health plans. All ICP health plans reported data in SFY 2017. Table A2–2 identifies the ICP health plans, their counties of operation, and the SFY 2016 and SFY 2017 enrollment for each health plan.
Table A2–2—ICP Health Plans
ICP Health Plan Counties SFY 2016 Enrollmenti SFY 2017 Enrollmentii
Aetna Greater Chicago, Rockford 29,315 28,490
BCBSIL Greater Chicago 10,605 14,703
Cigna-HealthSpring of Illinois (Cigna)
Greater Chicago 5,925 4,668
Community Care Alliance of Illinois (CCAI)
Greater Chicago, Rockford 9,208 7,868
CountyCare Cook 4,380 5,501
Health Allianceiii Central Illinois (N & S) 7,802 N/Aiv
Humana Health Plan, Inc. (Humana)
Greater Chicago 4,934 5,099
IlliniCare Greater Chicago, Rockford, Quad Cities 27,617 25,242
Meridian Greater Chicago, Central Illinois (N), Metro East 11,661 13,655
Molina Central Illinois (N & S), Metro East 5,897 5,114
NextLevel Cook N/Av 4,182 i. As of June 2016.
ii. As of June 2017. iii. Health Alliance exited the market December 2016. iv. NextLevel became an MCCN on January 1, 2016. Before that date, it served the FHP/ACA population as a CCE.
Therefore, no FHP/ACA or ICP enrollment is presented for this reporting year. v. Illinois Department of Healthcare and Family Services. Fiscal Year (FY) 2016 Annual Report: Medical Assistance
Program; March 31, 2017. Available at: https://www.illinois.gov/hfs/SiteCollectionDocuments/HFS2016AnnualReportFINAL33117.pdf. Accessed on: Mar 19, 2018.
Executive Summary Appendix
Page | A2-7
Quality Strategy The Quality Strategy provides a framework to accomplish HFS’ mission of empowering individuals enrolled in the Medicaid program to improve their health status while simultaneously containing costs and maintaining program integrity. HFS worked with stakeholders and identified the following goals for quality improvement.A2-2
• Goal 1: Ensure adequate access to care and services for Illinois Medicaid beneficiaries that is appropriate, cost effective, safe, and timely.
• Goal 2: Ensure the quality of care and services delivered to Illinois Medicaid beneficiaries. • Goal 3: Integrated care delivery—the right care, right time, right setting, right provider. • Goal 4: Ensure beneficiary safety, satisfaction, access to, and quality of care and services delivered
to Illinois Medicaid beneficiaries in select care coordination and managed care programs. • Goal 5: Ensure efficient and effective administration of Illinois Medicaid managed care programs
Performance Domains
Quality
CMS defines “quality” in the final rule at 42 CFR 438.320 as follows: Quality, as it pertains to external quality review, means the degree to which a managed care organization (MCO) or prepaid impatient health plan (PIHP) increases the likelihood of desired health outcomes of its enrollees through its structural and operational characteristics, through the provision of services consistent with current professional evidence-based knowledge, and through interventions for performance improvement.A2-3
Access
CMS defines “access” in the final 2016 regulations at 42 CFR 438.320 as follows: Access, as it pertains to external quality review, means the timely use of services to achieve optimal outcomes, as evidenced by managed care plans successfully demonstrating and reporting on outcome information for the availability and timeliness elements defined under §438.68 (network adequacy standards) and §438.206 (availability of services)A2-4.
A2-2 Illinois Department of Healthcare and Family Services. FY 2016 Annual Report: Medical Assistance Program; March
31, 2017. Available at: https://www.illinois.gov/hfs/SiteCollectionDocuments/HFS2016AnnualReportFINAL33117.pdf. Accessed on: Mar 19, 2018.
A2-3 Department of Health and Human Services, Centers for Medicare & Medicaid Services. Federal Register. Code of Federal Regulations. Title 42, Volume 81, May 6, 2016.
A2-4 Ibid.
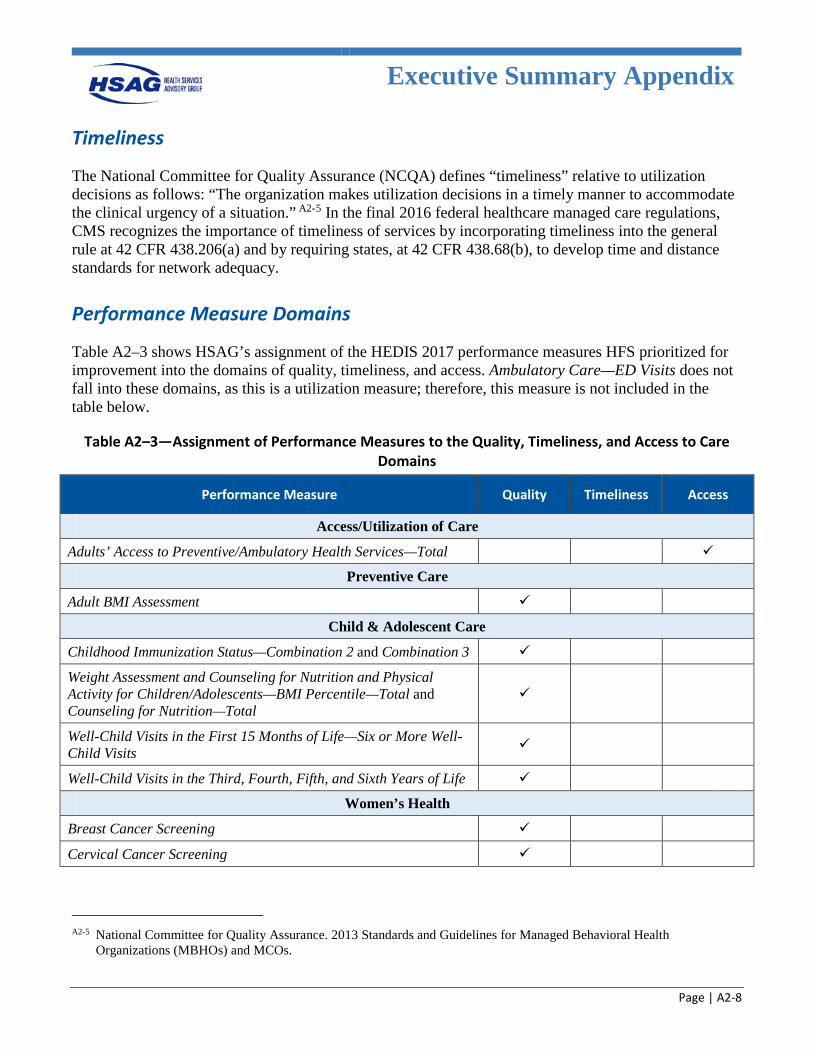
Executive Summary Appendix
Page | A2-8
Timeliness
The National Committee for Quality Assurance (NCQA) defines “timeliness” relative to utilization decisions as follows: “The organization makes utilization decisions in a timely manner to accommodate the clinical urgency of a situation.” A2-5 In the final 2016 federal healthcare managed care regulations, CMS recognizes the importance of timeliness of services by incorporating timeliness into the general rule at 42 CFR 438.206(a) and by requiring states, at 42 CFR 438.68(b), to develop time and distance standards for network adequacy.
Performance Measure Domains
Table A2–3 shows HSAG’s assignment of the HEDIS 2017 performance measures HFS prioritized for improvement into the domains of quality, timeliness, and access. Ambulatory Care—ED Visits does not fall into these domains, as this is a utilization measure; therefore, this measure is not included in the table below.
Table A2–3—Assignment of Performance Measures to the Quality, Timeliness, and Access to Care Domains
Performance Measure Quality Timeliness Access
Access/Utilization of Care
Adults’ Access to Preventive/Ambulatory Health Services—Total
Preventive Care
Adult BMI Assessment
Child & Adolescent Care
Childhood Immunization Status—Combination 2 and Combination 3
Weight Assessment and Counseling for Nutrition and Physical Activity for Children/Adolescents—BMI Percentile—Total and Counseling for Nutrition—Total
Well-Child Visits in the First 15 Months of Life—Six or More Well-Child Visits
Well-Child Visits in the Third, Fourth, Fifth, and Sixth Years of Life
Women’s Health
Breast Cancer Screening
Cervical Cancer Screening
A2-5 National Committee for Quality Assurance. 2013 Standards and Guidelines for Managed Behavioral Health
Organizations (MBHOs) and MCOs.
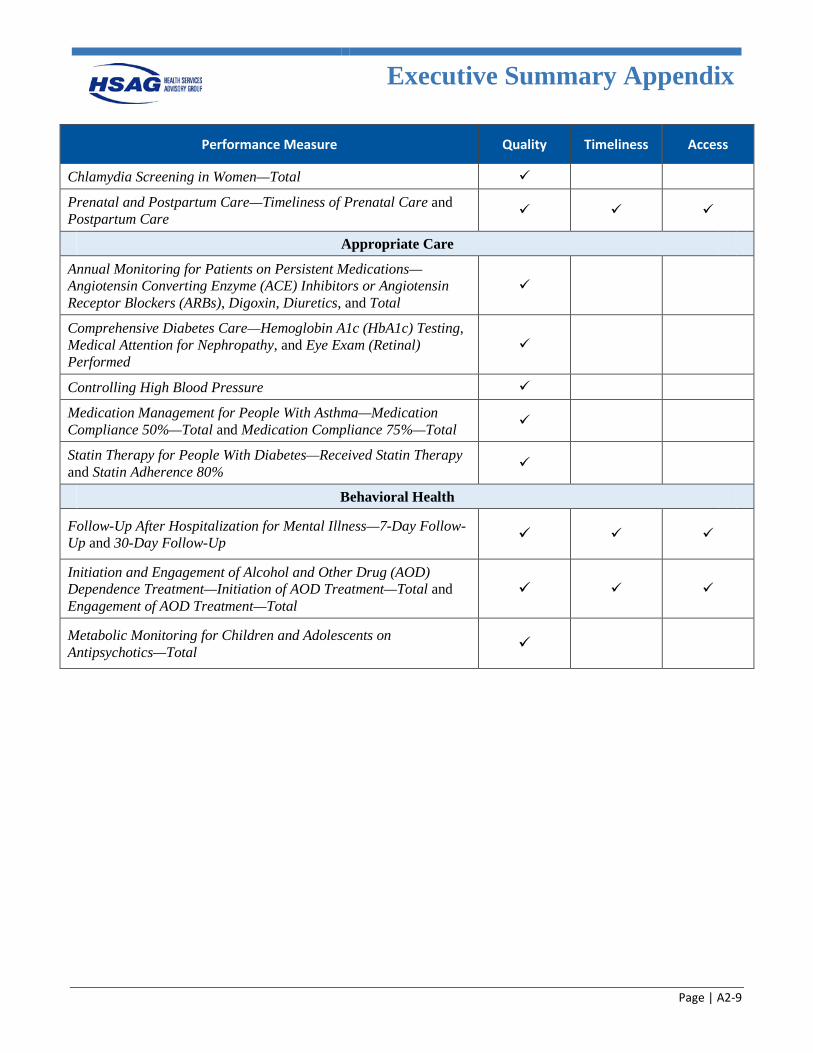
Executive Summary Appendix
Page | A2-9
Performance Measure Quality Timeliness Access
Chlamydia Screening in Women—Total
Prenatal and Postpartum Care—Timeliness of Prenatal Care and Postpartum Care
Appropriate Care
Annual Monitoring for Patients on Persistent Medications— Angiotensin Converting Enzyme (ACE) Inhibitors or Angiotensin Receptor Blockers (ARBs), Digoxin, Diuretics, and Total
Comprehensive Diabetes Care—Hemoglobin A1c (HbA1c) Testing, Medical Attention for Nephropathy, and Eye Exam (Retinal) Performed
Controlling High Blood Pressure
Medication Management for People With Asthma—Medication Compliance 50%—Total and Medication Compliance 75%—Total
Statin Therapy for People With Diabetes—Received Statin Therapy and Statin Adherence 80%
Behavioral Health
Follow-Up After Hospitalization for Mental Illness—7-Day Follow-Up and 30-Day Follow-Up
Initiation and Engagement of Alcohol and Other Drug (AOD) Dependence Treatment—Initiation of AOD Treatment—Total and Engagement of AOD Treatment—Total
Metabolic Monitoring for Children and Adolescents on Antipsychotics—Total
Executive Summary Appendix
Page | A2-10
Performance Snapshot
Performance Measures
Thirty measure rates were compared to national benchmarks. Overall, 14 of 30 measure rates (46.7 percent) for HEDIS 2017 ranked at or above the national Medicaid 50th percentile. Conversely, four of 30 measure rates (13.3 percent) fell below the national Medicaid 25th percentile for HEDIS 2017.
Quality Measures
Within the quality domain, 14 of 29 measure rates (48.3 percent) ranked at or above the national Medicaid 50th percentile, with three rates (Controlling High Blood Pressure; and Follow-Up After Hospitalization for Mental Illness—7-Day Follow-Up and 30-Day Follow-Up) falling below the 25th percentile. The measure rate for Statin Therapy for Patients With Diabetes—Received Statin Therapy exceeded the national Medicaid 75th percentile (64.77 percent). 12 of 25 measure rates (48.0 percent) with two years of data demonstrated a decrease in performance from HEDIS 2016 to HEDIS 2017, indicating opportunities for improvement for the health plans. HFS may want to consider the following information to improve performance statewide for the quality domain:
• The Centers for Disease Control and Prevention (CDC) recommends that children get multiple doses of 10 different vaccinations prior to the age of 2 to prevent 14 illnesses that are associated with severe complications, some of which could affect the child for life.A2-6 The statewide aggregate and most health plans’ rates for the Childhood Immunization Status—Combination 2 and Combination 3 measure indicators fell below the 50th percentile, suggesting poor performance statewide. These measures are time-sensitive, so the health plans might be successful in implementing a process to reach out to members prior to their second birthday to ensure vaccinations are completed, as opposed to reviewing retrospectively. Additionally, plans might work with high-volume pediatric providers to ensure they have programs to vaccinate prior to the second birthday (some offices/receptionists think that vaccinations should not be given until the child turned 2 years old). Health plans could also conduct analysis to determine whether there are any specific vaccines have been missed and determine vaccination-specific barriers, and implement improvement projects to positively affect rates.
• The Controlling High Blood Pressure measure rate fell below the national Medicaid 25th percentile for HEDIS 2017. Studies have shown that one-third of adults have hypertension, which is associated with an increased risk of a first heart attack, first stroke, chronic heart failure, and kidney disease. Additionally, treating high blood pressure costs approximately 46 billion dollars annually, showing this is a high-impact area for the health plans to focus improvement efforts.A2-7 As this is a hybrid
A2-6 Centers for Disease Control and Prevention. 2018 Recommended Immunizations for Children from Birth Through 6
Years Old. Available at: https://www.cdc.gov/vaccines/parents/downloads/parent-ver-sch-0-6yrs.pdf. Accessed on: March 2, 2018.
A2-7 Centers for Disease Control and Prevention. High Blood Pressure Facts. Available at: https://www.cdc.gov/bloodpressure/facts.htm. Accessed on: Mar 2, 2018.
Executive Summary Appendix
Page | A2-11
measure, there may be barriers to obtaining information from providers during attempts to obtain medical records.
• Performance for the Comprehensive Diabetes Care measure indicators suggests opportunities for focused efforts, as all three rates decreased from HEDIS 2016 to HEDIS 2017. Additionally, the measure rate for Eye Exam (Retinal) Performed fell below the national Medicaid 50th percentile. HSAG recommends that HFS and its health plans focus on improving testing and monitoring services for diabetic members to reduce further health issues.
Timeliness Measures
For timeliness, four of six measure rates (66.7 percent) ranked at or above the national Medicaid 50th percentile, including: Prenatal and Postpartum Care—Timeliness of Prenatal Care and Postpartum Care, and Initiation and Engagement of AOD Dependence Treatment—Initiation of AOD Treatment—Total and Engagement of AOD Treatment—Total. The remaining two measure rates, Follow-Up After Hospitalization for Mental Illness—7-Day Follow-Up and 30-Day Follow-Up, fell below the national Medicaid 25th percentile. To improve statewide performance in the timeliness domain, HFS may want to consider the following: • Performance for the Follow-Up After Hospitalization for Mental Illness measure suggests that only
about half of members hospitalized for mental illness received appropriate follow-up within 30 days. Research related to hospitalization for mental illness indicates that appropriate discharge planning and follow-up visits are contributing factors to lowering readmission rates, suggesting emphasis should be directed to this area.A2-8 The current behavioral health (BH) PIP further demonstrated the lack of follow-up with these members.
Access Measures For the access domain, four of seven measure rates (57.1 percent) ranked at or above the national Medicaid 50th percentile, with the remaining three (Adults’ Access to Preventive/Ambulatory Health Services—Total; and Follow-Up After Hospitalization for Mental Illness—7-Day Follow-Up and 30-Day Follow-Up) falling below the national Medicaid 25th percentile. Of note, five of these measure rates showed a decline from HEDIS 2016 to HEDIS 2017. HFS may want to consider the following to improve statewide performance in the access domain: • Performance across the access domain (as demonstrated by low measure rates for Adults’ Access to
Preventive/Ambulatory Health Services—Total and low performance compared to national benchmarks for the Getting Needed Care and Getting Care Quickly satisfaction survey results) suggests that beneficiaries may have a difficult time obtaining necessary preventive care services. Of note, the Rating of Personal Doctor showed positive results; therefore, an increase in access to care could result in increased satisfaction by members. Additionally, the high utilization rates seen in the Ambulatory Care—Emergency Department (ED) Visits measure indicator further quantify that members may not be using services appropriately, either due to lack of access to preventive care or lack of understanding of the appropriate location to receive care.
A2-8 Lien, Lars. Are readmission rates influenced by how psychiatric services are organized? Nordic Journal of Psychiatry.
Vol. 56, Iss. 1, 2002.
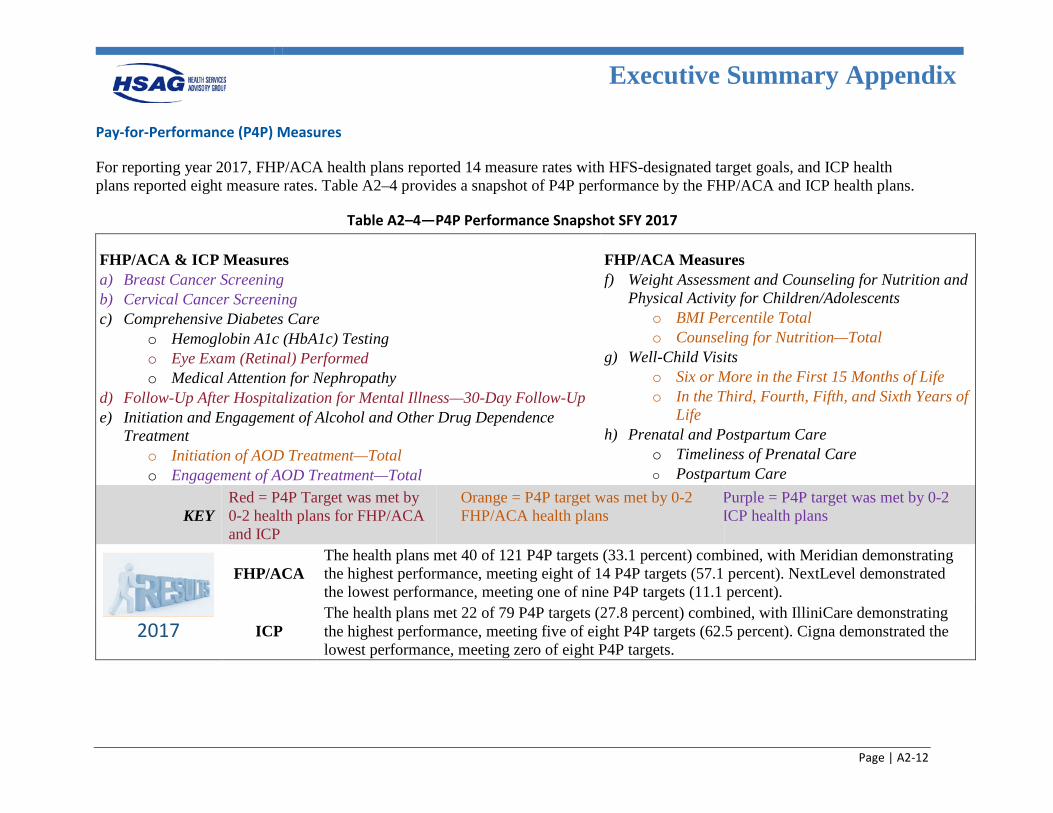
Executive Summary Appendix
Page | A2-12
Pay-for-Performance (P4P) Measures
For reporting year 2017, FHP/ACA health plans reported 14 measure rates with HFS-designated target goals, and ICP health plans reported eight measure rates. Table A2–4 provides a snapshot of P4P performance by the FHP/ACA and ICP health plans.
Table A2–4—P4P Performance Snapshot SFY 2017
FHP/ACA & ICP Measures a) Breast Cancer Screening b) Cervical Cancer Screening c) Comprehensive Diabetes Care
o Hemoglobin A1c (HbA1c) Testing o Eye Exam (Retinal) Performed o Medical Attention for Nephropathy
d) Follow-Up After Hospitalization for Mental Illness—30-Day Follow-Up e) Initiation and Engagement of Alcohol and Other Drug Dependence
Treatment o Initiation of AOD Treatment—Total o Engagement of AOD Treatment—Total
FHP/ACA Measures f) Weight Assessment and Counseling for Nutrition and
Physical Activity for Children/Adolescents o BMI Percentile Total o Counseling for Nutrition—Total
g) Well-Child Visits o Six or More in the First 15 Months of Life o In the Third, Fourth, Fifth, and Sixth Years of
Life h) Prenatal and Postpartum Care
o Timeliness of Prenatal Care o Postpartum Care
KEY Red = P4P Target was met by 0-2 health plans for FHP/ACA and ICP
Orange = P4P target was met by 0-2 FHP/ACA health plans
Purple = P4P target was met by 0-2 ICP health plans
2017
FHP/ACA The health plans met 40 of 121 P4P targets (33.1 percent) combined, with Meridian demonstrating the highest performance, meeting eight of 14 P4P targets (57.1 percent). NextLevel demonstrated the lowest performance, meeting one of nine P4P targets (11.1 percent).
ICP The health plans met 22 of 79 P4P targets (27.8 percent) combined, with IlliniCare demonstrating the highest performance, meeting five of eight P4P targets (62.5 percent). Cigna demonstrated the lowest performance, meeting zero of eight P4P targets.
Executive Summary Appendix
Page | A2-13
Operational Readiness and Administrative Reviews
During 2015 and 2016, HSAG conducted both operational readiness reviews and administrative reviews for each of the health plans.
Managed Long-Term Services and Supports (MLTSS) Operational Readiness Review
Four health plans (Aetna, BCBSIL, IlliniCare, and Meridian) were selected to serve dual-eligible individuals receiving Medicaid benefits who opted-out of MMAI and resided in a nursing facility or received waiver services. The purpose of the MLTSS operational readiness review was to assess that each health plan participating in the MLTSS program had the structural and operational capacity to perform the Medicaid managed care functions described in the MLTSS managed care contract and ensure appropriate and timely access to quality healthcare services for MLTSS enrollees. In addition, HSAG also conducted a review of network adequacy for MLTSS providers. While health plans were required to remediate deficient elements, there did not appear to be operational deficiencies that would significantly impact each health plan’s ability and capacity to perform the MLTSS managed care responsibilities as outlined in the contract with HFS.
Administrative Compliance Review
The primary objective of HSAG’s administrative compliance review was to provide meaningful information to HFS and the health plans regarding compliance with federal managed care regulations and contract requirements. The areas selected for compliance review included standards listed below under the areas of Access, Structure and Operations, Measurement and Improvement, and Practice Guidelines. The remaining administrative review standards are scheduled for review in 2017. Practice guidelines requirements received a high compliance rating for the health plans and there were no overall improvements identified. See more detailed recommendations for achieving improvement in each area in Section 5 and Appendix I.
Specific recommendations for achieving improvement in each area of compliance review are listed below.
Access Standards
• Standard I—Availability of Services. • Standard II—Assurance of Adequate Capacity and Services. • Standard III—Coordination and Continuity of Care (Including Transition of Care). Overall improvement opportunities identified for all health plans for the access and availability and care management/care coordination (CM/CC) operational requirements included:
• Improve health plan monitoring and oversight of access and availability requirements by: – Using provider access and availability surveys to assess appointment availability and after-hours
access and following up with providers found to be non-compliant.
Executive Summary Appendix
Page | A2-14
– Improving oversight of compliance with the Americans with Disabilities Act (ADA) in provider offices.
– Improving monitoring of open and closed panels for the primary care provider (PCP) network. – Improving the provider directory audit process to verify the accuracy of the online provider
directory and improve timeliness of corrections to the directory. – Conducting a root cause analysis of member access-related grievances. – Improving training for grievance and appeals department staff on resolution of access-related
grievances and the appropriate referral process, if necessary, to care management and/or provider services.
– Developing methods to monitor network adequacy of the HCBS and homebound providers. – Improving compliance with notifying HFS when network gaps are identified.
Improve compliance with CM/CC contract requirements by:
• Improving compliance with CM/CC requirements through improvement of enhanced training and oversight of CM/CC activities.
• Implementing methods to evaluate the effectiveness of the CM/CC program. • Strengthening transition of care programs and implementing methods to evaluate the effectiveness of
care transitions. • Improving compliance with HCBS qualifications and training requirements for CM/CC staff. • Improving care management documentation systems and providing CM/CC staff access to prior-
authorization, pharmacy, and claims data. • Improving unable-to-reach programs to locate members.
Structure and Operations Standards
• Standard VII—Subcontracts and Delegation.
Overall improvement opportunities identified for all health plans for subcontracts and delegation included:
• Improve compliance with Subcontracts and Delegation contract requirements by: – Revising language in provider contracts to comply with contract requirements. – Revising delegation agreements to comply with contract requirements. – Improving oversight of delegated vendors to ensure compliance with delegated services. – Improving documentation of required training of delegated vendors. – Improving compliance with required monthly operations meetings. – Improving compliance with pre-delegation, quarterly performance review, and annual delegation
oversight audits. – Improving oversight and accountability of the delegation oversight committee.
Executive Summary Appendix
Page | A2-15
Measurement and Improvement Standards
• Standard XIII—Health Information System. • Standard XIV—Required Minimum Standards of Care/Practice Guidelines. • Standard XV—Critical Incidents.
Overall improvement opportunities identified for all health plans for health information systems, critical incidents, and practice guidelines included:
• Improving compliance with health information systems requirements by improving compliance with member and provider portals requirements.
• Improving compliance with critical incidents requirements by: – Developing and implementing a critical incident follow-up protocol to ensure the health, safety,
and welfare of a member following a critical incident. – Improving systems used for the intake, processing, tracking, and reporting of critical incidents.
Practice guidelines requirements received a high compliance rating for the health plans and there were no overall improvements identified.
Refer to Section 5 and Appendix I of this report for additional detail on operational readiness and administrative compliance reviews.
Consumer Satisfaction Measures
In SFYs 2016 and 2017, health plans were responsible for obtaining a Consumer Assessment of Healthcare Providers and Systems (CAHPS) vendor to administer the CAHPS surveys and forward results to HSAG for analysis. For the statewide Illinois Medicaid (Title XIX) and All Kids (Title XXI) programs, HSAG administered the CAHPS survey and performed the analysis and reporting on behalf of HFS.
CAHPS surveys revealed that FHP/ACA adults were generally dissatisfied with many aspects of their healthcare. Of the eight measures of satisfaction that could be compared to national Medicaid percentiles, 2017 satisfaction survey results for FHP/ACA adults were below the 50th percentile for six measures. Two access-related measures (Getting Needed Care and Getting Care Quickly) scored below the 25th percentile. However, FHP/ACA adult beneficiaries were generally satisfied with how well their doctors communicate (survey results at or above the 90th percentile). When comparing the results for the FHP/ACA population to the ICP population, the ICP aggregate results were generally higher. Only one measure, Rating of All Health Care, for the 2017 satisfaction results scored below the 50th percentile for the ICP population. This could be a result of having a greater number of members engaged in care coordination within the ICP population than the FHP/ACA population. Refer to Section 3 and Appendix G of this report for additional details on consumer satisfaction performance ratings.
Executive Summary Appendix
Page | A2-16
Home- and Community-Based Services (HCBS) Waiver Record Reviews
Compared to SFY 2016, overall performance for SFY 2017 demonstrated a statistically significant increase (+2 percentage points, p=<0.0001) for FHP/ACA health plans. Eleven of the 12 CMS performance measures averaged over 90 percent compliance in SFY 2017, and 10 of the 12 CMS performance measures averaged over 90 percent compliance from Quarter 1 (Q1) SFY 2016 to Q4 SFY 2017. Eight of the nine FHP/ACA health plans averaged 90 percent or greater overall compliance in SFY 2017. In addition, in SFY 2017, six of the nine FHP/ACA health plans achieved statistically significant improvements on overall performance, three of the five waivers achieved statistically significant improvements on overall performance, and three of the 12 performance measures achieved statistically significant improvements on overall performance.
For ICP health plans, overall performance (sum of all 12 CMS performance measures) demonstrated a statistically significant increase in SFY 2017 (+2 percentage points, p = <0.0001) compared to SFY 2016. 11 of the 12 CMS performance measures averaged over 95 percent compliance and 10 of the 11 ICP health plans averaged 90 percent or greater compliance for SFY 2017. In addition, in SFY 2017, seven of the 11 ICP health plans achieved statistically significant improvements on overall performance, three of the five waivers achieved statistically significant improvements in overall performance, and eight of the 12 performance measures achieved statistically significant improvements in overall performance.
Refer to Section 5 and Appendix I of this report for additional detail on HCBS waiver record reviews.
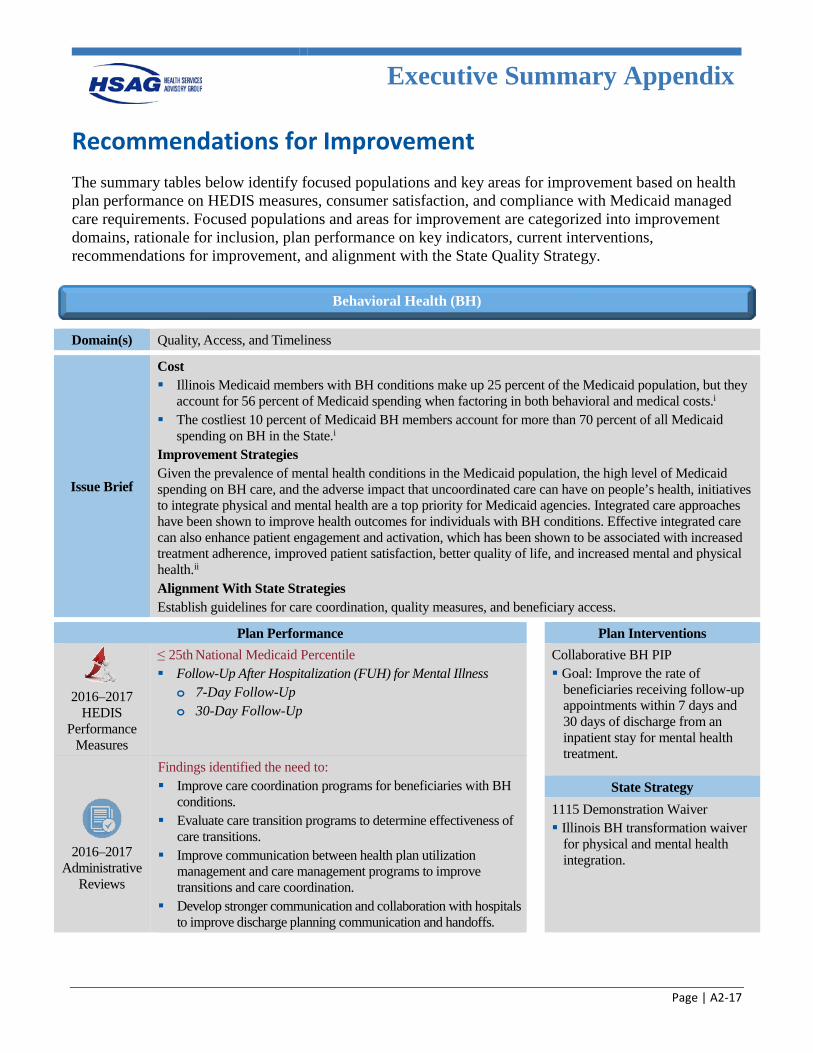
Executive Summary Appendix
Page | A2-17
Recommendations for Improvement The summary tables below identify focused populations and key areas for improvement based on health plan performance on HEDIS measures, consumer satisfaction, and compliance with Medicaid managed care requirements. Focused populations and areas for improvement are categorized into improvement domains, rationale for inclusion, plan performance on key indicators, current interventions, recommendations for improvement, and alignment with the State Quality Strategy.
Domain(s) Quality, Access, and Timeliness
Issue Brief
Cost Illinois Medicaid members with BH conditions make up 25 percent of the Medicaid population, but they
account for 56 percent of Medicaid spending when factoring in both behavioral and medical costs.i The costliest 10 percent of Medicaid BH members account for more than 70 percent of all Medicaid
spending on BH in the State.i Improvement Strategies Given the prevalence of mental health conditions in the Medicaid population, the high level of Medicaid spending on BH care, and the adverse impact that uncoordinated care can have on people’s health, initiatives to integrate physical and mental health are a top priority for Medicaid agencies. Integrated care approaches have been shown to improve health outcomes for individuals with BH conditions. Effective integrated care can also enhance patient engagement and activation, which has been shown to be associated with increased treatment adherence, improved patient satisfaction, better quality of life, and increased mental and physical health.ii Alignment With State Strategies Establish guidelines for care coordination, quality measures, and beneficiary access.
Plan Performance Plan Interventions
2016–2017
HEDIS Performance
Measures
≤ 25th National Medicaid Percentile Follow-Up After Hospitalization (FUH) for Mental Illness
o 7-Day Follow-Up o 30-Day Follow-Up
Collaborative BH PIP Goal: Improve the rate of
beneficiaries receiving follow-up appointments within 7 days and 30 days of discharge from an inpatient stay for mental health treatment.
2016–2017
Administrative Reviews
Findings identified the need to: Improve care coordination programs for beneficiaries with BH
conditions. Evaluate care transition programs to determine effectiveness of
care transitions. Improve communication between health plan utilization
management and care management programs to improve transitions and care coordination.
Develop stronger communication and collaboration with hospitals to improve discharge planning communication and handoffs.
State Strategy
1115 Demonstration Waiver Illinois BH transformation waiver
for physical and mental health integration.
Behavioral Health (BH)
Executive Summary Appendix
Page | A2-18
Recommendations for Health Plans Evaluate the effectiveness of health plan transition of care programs to determine the effectiveness of transitions of care
from inpatient settings to home- and community-based settings.iii o Establish transition of care evaluation measures. o Evaluate compliance with standardized forms, tools, and methods for transitions of care. o Utilize surveys and data collection tools, and engage consumer advisory committees to identify root causes of
ineffective transitions and patient/member satisfaction with transitions including an understanding of the care plan. o Consider dedicated transition of care teams to manage transitions of care for beneficiaries with BH/complex
healthcare needs. o Include evaluation of readmission rates and emergency department (ED) utilization in evaluation of the
effectiveness of transition of care and care coordination programs. Evaluate CM/CC programs to determine the effectiveness of care coordination for beneficiaries with complex
healthcare needs. Continue collaboration efforts with community BH organizations. Provide easy access to prior-authorization, pharmacy, and claims data for CM/CC staff. These data are critical for the
CM/CC to understand the health status, medication compliance, receipt of services, risks, and needs of members assigned to care management.
Other Considerations for Health Plans and HFS Health plans may consider evidence-based transition of care models to improve patient outcomes (see references). Health plans should utilize their consumer advisory committees to determine opportunities to improve transition of care
programs and beneficiary satisfaction with transitions. Health plans may consider programming online databases/programs to flag members who need medical/BH visits, high
ED utilizers, and hard-to-reach members. o Allows member services, the nurse advise line, and care managers to address the flag during contact with the
member. Health plans should continue to strengthen linkages with community-based services and resources through partnerships
with community mental health centers (CMHCs), psychiatric hospitals, and State initiatives to develop a culture of shared accountability.
Health plans should continue to focus on ancillary services (e.g., transportation and housing). HFS may consider implementing the Institute for Healthcare Improvement’s (IHI’s) rapid cycle performance
improvement approach for the health plan BH PIP, which places a greater emphasis on improving outcomes using quality improvement science.
HFS should continue to build a collaborative learning environment between State agencies and health plans to leverage best practices.
HFS may consider review of the adequacy of the BH network through validation of adequacy of the existing network, and availability of timely appointments. o Explore options for telemedicine which can remove access barriers by allowing patients to receive access to
specialists, regardless of their location. HFS may consider identifying integrated care measures that support the State’s performance outcome goals in
improving physical and mental health integration. Consider data collection and measurement strategies.
Executive Summary Appendix
Page | A2-19
Barriers to Improvement Identified by Health Plans The following barriers to improvement were identified by the health plans: Aftercare planning is not occurring early in the beneficiaries' inpatient stay. The BH network may not be adequate to meet the timeliness requirements of the 7- and 30-day performance measures. Workflow processes need to be assessed and redirected to ensure there are adequate clinical resources available to address
timely aftercare discharge planning. The identification of, and access to, hospital discharge staff needs to be streamlined with a single point of entry or contact. Network practitioners, providers, and facilities are unaware of the HEDIS FUH measure requirements. Members lack an understanding for the importance of follow-up care and how to address physical barriers. Members with comorbid/co-occurring mental health and substance use disorders may be more treatment-ambivalent due to
the comorbidity illness and their current stage of change. Members’ lack of adherence to their psychotropic medication regimen due to side effects.
Current Health Plan Initiatives Established multiple connections with community agencies to support access to BH care, including pre-discharge
community agency connection and in-home assessments. BH transitions teams work with hospitals/inpatient facilities to have hospital discharge staff initiate the discharge
coordination planning process early in the member’s inpatient stay. Educated providers, inpatient facilities, and community agencies on the FUH HEDIS measure standards. Conducted member outreach to educate on the importance of post-hospital discharge follow-up, mediation adherence, and
self-management of BH illness. Held community events to promote healthy behaviors and self-management of illness.
Current State Initiatives Application for an 1115 Waiver
o “Our [HHS’] transformation puts a strong new focus on prevention and public health; pays for value and outcomes rather than volume and services; makes evidence-based and data-driven decisions; and moves individuals from institutions to community care to keep them more closely connected with their families and communities.”iv
o Consistent with the IHI Triple Aim, the HHS transformation seeks to improve population health, improve experience of care, and reduce costs. It is grounded in five themes: v − Prevention and population health − Paying for value, quality, and outcomes − Rebalancing from institutional to community care − Data integration and predictive analytics − Education and self-sufficiency
i. Illinois Department of Healthcare and Family Services. “Illinois’ Behavioral Health Transformation: Section 1115 Demonstration Waiver.” Available at: https://www.illinois.gov/hfs/SiteCollectionDocuments/20160902_1115_Waiver_for_Public_Comment_ vF.pdf. Accessed on: Mar 14, 2018.
ii. E. Edwards, Assessing Changes to Medicaid Managed Care Regulations: Facilitating Integration of Physical and Behavioral Health Care. The Commonwealth Fund, October 2017. Available at: http://www.commonwealthfund.org/publications/issue-briefs/2017/oct/medicaid-managed-care-behavioral-health. Accessed on: Mar 14, 2018.
iii. The Joint Commission. “Hot Topics in Health Care. Transitions of Care: The need for a more effective approach to continuing patient care.” Available at: https://www.jointcommission.org/assets/1/18/Hot_Topics_Transitions_of_Care.pdf. Accessed on: Mar 14, 2018.
iv. Illinois.gov. HHS Transformation. Available at: https://www2.illinois.gov/sites/hhstransformation/overview/Pages/default.aspx. Accessed on: Mar 14, 2018.
v. Illinois Department of Healthcare and Family Services. Frequently Asked Questions (FAQs): Illinois’ Behavioral Health Transformation. Available at: https://www.illinois.gov/hfs/SiteCollectionDocuments/20160826_FAQs_vF.pdf. Accessed on: Mar 14, 2018.
Executive Summary Appendix
Page | A2-20
Domain(s) Quality
Issue Brief
In 2017, approximately 18 percent of Medicaid health plan members reported “never” or “sometimes” when asked whether the plan’s customer service gave them the information or help they needed.i
Better service translates into higher satisfaction for the patient, and dissatisfied members can generate potential new costs since they may be less likely to follow clinical advice (and develop worse outcomes) and are likely to share their negative stories with friends and family members.i o Marketing studies confirm that only 50 percent of unhappy customers will complain to
the service organization, but 96 percent will tell at least nine friends about their bad experience.i
Plan Performance Plan Interventions
CAHPS
2017 FHP/ACA Child and Adult and ICP
Adult Survey Results
≤ 50th National Medicaid Percentile Adult FHP/ACA health plans—Customer Service, Rating
of All Health Care, and Rating of Health Plan Child FHP/ACA health plans—Customer Service and
Rating of Health Plan Adult ICP plans—Rating of All Health Care
Call center service-level reporting.
2016–2017
Administrative Reviews (and complaint/
grievance file review)
Findings identified the need to: Evaluate staffing resources for grievance and appeals
departments. Improve training of customer service and grievance and
appeals staff on handling member complaints/grievances. Involve other departments within the health plan to
resolve member complaints/grievances. Involve senior leadership in review of member
complaints/grievances. Establish a consistent process to track the source of the
complaints/grievances to identify the correct improvement strategies.
HFS Interventions Consumer Report Card According to 42 CFR
§438.334, produced the Illinois Report Card using Illinois Medicaid plans’ HEDIS performance measure data and CAHPS survey results.ii
Recommendationsiii for Health Plans Evaluate the need for a service recovery program. National experts in service recovery recommend a well-tested process
for service recovery. “Excellent service recovery programs are an effective tool for retaining members or patients and improving their level of satisfaction. Good service recovery programs can turn frustrated, disgruntled, or even furious patients or members into loyal ones.”iv
Resolve member complaints/grievances quickly and effectively by training and empowering front-line employees. Evaluate complaints/grievances tracking systems/database. The system should have the capacity to track timelines and
generate regular reports to operational staff and management. Evaluate complaints/grievances data to identify failure points that are root causes of low satisfaction. Track trends and use information to improve service processes. Evaluate standards and service-level reporting for customer service.
Consumer Satisfaction With Customer Service, Health Plan, and Overall Health Care
Executive Summary Appendix
Page | A2-21
Other Considerations For the FHP/ACA population:
o Health plans could analyze data for gender or age differences to determine if targeted outreach might affect satisfaction.
o Health plans may reexamine population needs to determine if additional care coordination programs may be warranted to assist membership with access to care and satisfaction.
For both the FHP/ACA and ICP programs, health plans might utilize their consumer advisory committees to determine opportunities to improve overall satisfaction with the health plan, including benefits or incentives offered.
Current State Initiatives HFS developed a consumer report card to support HFS’ public reporting of plan performance information to be used by individuals to make informed decisions about their healthcare. The report card evaluated individual plan performance in key areas (e.g., how well doctors involved members in decisions about their care, if children regularly received checkups and important shots that helped protect them against serious illness), allowing beneficiaries the opportunity to be better informed when making decisions about their healthcare. For example, if a member has a chronic condition, the member may use the Access to Care and Living With Illness performance areas to determine which plan had the best performance to help determine which plan is best for them. The report card, which was made publicly available in November 2016 and again in 2017, included an overview, description of the performance areas, and plan-specific results, as well as background information for assisting individuals in choosing a Medicaid plan. i. Agency for Healthcare Research and Quality. The CAHPS Ambulatory Care Improvement Guide: Practical Strategies for
Improving Patient Experience; December 2017. Available at: https://www.ahrq.gov/sites/default/files/wysiwyg/cahps/quality-improvement/improvement-guide/cahps-ambulatory-care-guide-full.pdf. Accessed on: Mar 14, 2018.
The Illinois Report Card may meet the requirement for a quality rating system (QRS) with CMS approval. The report card presents an easy-to-read “picture” of quality performance across the plans in the following key performance areas: Doctors’ Communication and Patient Engagement, Access to Care, Women’s Health, Living With Illness, Behavioral Health, and Keeping Kids Healthy.
ii. The report card presented results for each plan using a five-level rating scale that clearly emphasized differences between plans (i.e., from a level one rating up to a level five rating) in the above key performance areas to assist members when selecting a plan. The report card was developed to support HFS’ public reporting of plan performance information to be used by members to make informed decisions about their healthcare. Because the report card evaluated individual plan performance in key areas (e.g., how well doctors involved members in decisions about their care, if children regularly received checkups, and important shots that helped protect them against serious illness), members have an opportunity to be better informed when making decisions about their healthcare.
iii. Agency for Healthcare Research and Quality. The CAHPS Ambulatory Care Improvement Guide: Practical Strategies for Improving Patient Experience; December 2017. Available at: https://www.ahrq.gov/sites/default/files/wysiwyg/cahps/quality-improvement/improvement-guide/cahps-ambulatory-care-guide-full.pdf. Accessed on: Mar 14, 2018.
iv. Ibid.
Executive Summary Appendix
Page | A2-22
Domain(s) Quality
Issue Brief
Cost Diabetes costs an estimated $12.2 billion in Illinois each year due to serious health complications
(heart disease, stroke, amputation, end stage kidney disease, blindness—and death).i Due to the medical costs associated with diabetes, 17.6 percent of persons living with diabetes in Illinois reported avoiding medical care in 2011.ii
The annual cost of potentially avoidable complications is $6.5 billion for those with Medicaid coverage. The total dollars spent on potentially avoidable complications amounted to 28 percent of total diabetes episode costs in the Medicaid population, which represents a sizeable opportunity for both quality improvement to reduce the prevalence of complications and cost compression overall.ii
Studies have shown that one-third of adults have hypertension, which is associated with an increased risk of a first heart attack, first stroke, chronic heart failure, and kidney disease. Additionally, treating high blood pressure costs approximately 46 billion dollars annually, showing this is a high-impact area for improvement. iv
Facts The Illinois adult mortality rate for diabetes in 2007 was 23.7 per 100,000 compared to the U.S.
rate of 22.2 per 100,000. African Americans in Illinois with diabetes have the highest mortality rate for both females (33.2 per 100,000) and males (30.2 per 100,000), according to the Illinois Department of Public Health’s Center for Health Statistics. Death rates also vary by sex and race.iii
It is estimated that by 2020, the number of adults with diabetes will increase 43 percent nationally and 25 percent in Illinois.iii
Plan Performance Plan Interventions
2016–2017
HEDIS Performance
Measure
Comprehensive Diabetes Care—All three rates decreased from HEDIS 2016–2017. o Hemoglobin A1c (HbA1c) Testing o Medical Attention for Nephropathy o Eye Exam (Retinal) Performed fell below
the 50th percentile. Controlling High Blood Pressure measure rate
fell below the national Medicaid 25th percentile for HEDIS 2017.
Reminder calls for annual diabetic eye exams conducted by vision vendor.
Targeted care coordination outreach to diabetic members not enrolled in care coordination.
HFS Interventions Illinois Department of Public Health (IDPH) Illinois Diabetes State Plan 2013–2018.
2016–2017
Administrative Reviews
Findings identified the need to: Conduct a review of the accuracy of
information within the online provider directory specifically for vision providers.
Evaluate disease management programs to determine effectiveness of disease management for individuals with chronic diseases.
Appropriate Care—Chronic Conditions Comprehensive Diabetes Care and Controlling High Blood Pressure Measures
Executive Summary Appendix
Page | A2-23
Recommendations for Health Plans Evaluate network access for vision providers and identify barriers to accessing vision appointments.
o Conduct a review of the online provider directory for vision providers. o Conduct a root cause analysis of beneficiaries who do not have eye exams performed to determine barriers to
accessing vision appointments. Evaluate the effectiveness of diabetes disease management programs to determine effectiveness of educational
materials for diabetes care. Consider a diabetes interactive voice response call campaign to provide information on diabetes self-management and
warm transfer to care management staff. Utilize health plan consumer advisory committees to identify barriers to care and factors that motivate beneficiaries to
seek diabetes care. For the Controlling High Blood Pressure measure, health plans could consider a focused project to analyze
commonalities and/or barriers to achieving hypertension control. For instance, they may consider focused outreach to those members with diabetes, those members without hypertensive medications prescribed, or outreach to providers to determine barriers to achieving success with this measure.
Other Considerations for Health Plans and HFS Align plan initiatives and improvement strategies with those of IDPH Illinois Diabetes State Plan 2013–2018. Partner with community organizations and health departments to share goals and strategies for preventing and
controlling diabetes. Consider diabetes-specific care coordination teams to reach out to diabetic members not enrolled in care coordination.
Current State Initiatives Illinois Diabetes State Plan 2013–2018 The vision of the IDPH Illinois Diabetes State Plan is to assist Illinois organizations with reaching Healthy People 2020
goals, including: o Attaining high-quality, longer lives free of preventable disease, disability, injury, and premature death. o Achieving health equity, eliminating disparities, and improving the health of all groups. o Creating social and physical environments that promote good health. o Promoting quality of life, healthy development, and healthy behaviors across all life stages.v
i. Illinois Department of Public Health. Chronic Disease Burden Update: National Diabetes Month November 2016. Available at: http://www.dph.illinois.gov/sites/default/files/Publications_OHPm_Vol%205%20Issue%204%20Diabetes.pdf. Accessed on: Apr 16, 2018.
ii. Illinois Department of Public Health. Illinois Diabetes State Plan. Available at: http://www.dph.illinois.gov/sites/default/files/publications/illinois-diabetes-state-plan-2013-2018.pdf. Accessed on: Mar 2, 2018.
iii. Illinois Department of Public Health. The Burden of Diabetes in Illinois: Prevalence, Mortality, and Risk Factors 2012. Available at: http://www.idph.state.il.us/diabetes/pdf/8-27-12_Diabetes_Burden.pdf. Accessed on: Apr 16, 2018.
iv. Bailey, Elizabeth, et al. Identifying Sources of Variation in Diabetes Episodes of Care with PROMETHEUS Analytics©. Available at: http://www.hci3.org/wp-content/uploads/2016/03/Diabetes_BRIEF.pdf. Accessed on: Mar 2, 2018.
v. Centers for Disease Control and Prevention. High Blood Pressure Facts. Available at: https://www.cdc.gov/bloodpressure/facts.htm. Accessed on: Mar 2, 2018.
vi. HealthyPeople.gov. Overarching Goals. Available at: https://www.healthypeople.gov/2020/About-Healthy-People. Accessed on: Mar 14, 2018.
Executive Summary Appendix
Page | A2-24
Domain(s) Access
Issue Brief
Cost From the Agency for Healthcare Research and Quality’s (AHRQ’s) 2011 National Healthcare
Disparities Report, “People with a usual source of care (a provider or facility where one regularly receives care) experience improved health outcomes and reduced disparities (smaller differences between groups) (Starfield & Shi, 2004) and costs (De Maeseneer, et al., 2003).”i
Facts The 2010 AHRQ State Snapshot for Ambulatory Care Quality includes measures that assess the
quality of care provided to patients with specific conditions when they are treated in doctors' offices, clinics, and other sites of walk-in care. This measure is reported as weak for Illinois when compared to other states.ii
Efforts that combine targeted access to preventive services with more comprehensive programs to improve community health may yield significant cost savings. An investment of $10 per person per year for proven community-based disease prevention programs that improve physical activity and nutrition and lower smoking rates in communities could save Illinois Medicaid $120 million annually in the first one to two years, some $700 million annually within five years, and more than 7.5 million annually in 10 to 20 years. Early detection and prompt intervention to control a problem or disease and minimize the consequences of a disease are more cost effective if they are targeted to at-risk populations. Physical activity, nutrition, and smoking are three of the most important areas to target for prevention to generate a significant return both in terms of health and financial savings.iii
Medicaid beneficiaries use the ED at an almost two-fold higher rate than the privately insured. Non-urgent visits comprise only about 10 percent of all ED visits by Medicaid beneficiaries, and suggest that higher utilization may be in part due to unmet health needs and lack of access to appropriate settings. In this context, as most states have recognized, efforts to reduce ED use should focus not on merely reducing the number of ED visits, but also on promoting continuous coverage for eligible individuals and improving access to appropriate care settings to better address the health needs of the population.iv
Plan Performance
2016–2017 HEDIS and
CAHPS Performance
Measures
≤ 25th National Medicaid Percentile Adults’ Access to Preventive/Ambulatory Health Services—Total
o Statewide average decreased from 2016–2017. Getting Needed Care and Getting Care Quickly satisfaction survey results. Performance across the access domain (as demonstrated by HEDIS and CAHPS rates noted above)
suggests that beneficiaries may have a difficult time obtaining necessary preventive care services. Additionally, the high utilization rates seen in the Ambulatory Care—ED Visits measure indicator further quantify that members may not be using services appropriately, either due to lack of access to preventive care or lack of understanding of the appropriate location to receive care.
Access to Care—Preventive Ambulatory Health Services
Executive Summary Appendix
Page | A2-25
Plan Performance
Plan Interventions
2016–2017
Administrative Reviews
Findings identified the need to: Evaluate grievances related to access to care to identify
opportunities for improving access to care. Conduct training with grievance and appeal staff to
appropriately assist beneficiaries with resolution of access grievances (for example, assisting with scheduling appointments and locating a provider).
Conduct an annual access and availability survey to evaluate provider compliance with appointment and after-hours access. o Follow up with noncompliant providers.
Monitor provider open and closed panels and update the online provider directory.
Improve the frequency of directory audits and timeliness of updates to improve the accuracy of the online provider directories.
Evaluate unable-to-reach programs, as plans report the location rate continues to be low.
Member education on appropriate
treatment alternatives to use of the ED for nonemergent conditions.
Care coordination programs for high utilizers including post-ED visit assessments.
Delegated care coordination for children with complex needs to La Rabida Children’s Hospital and reduced ED visits and inpatient admissions.
Electronic connection with hospital systems to obtain admission, discharge, and ED data to equip providers and care teams with real-time information.
ED diversion programs: Six health plans reported on their ED programs in their annual reports.
Unable-to-reach programs.
Recommendations for Health Plans Conduct a root cause analysis of beneficiaries who do not access preventive care services to determine barriers to
obtaining appointments. Consider targeted outreach campaigns for members who have not accessed preventive care services. Evaluate the effectiveness of the health plans’ “Gaps in Care” programs and the role of the PCP in closing care gaps. Utilize health plan consumer advisory committees to identify barriers to care and motivating factors to obtaining
preventive care services. Identify frequent/high ED users and connect them with CM/CC programs.
o Share high utilizer information with the beneficiaries’ PCPs. Utilize the results of the annual access and availability survey to evaluate provider compliance with appointment
availability and after-hours telephone access and follow up with providers who are noncompliant with appointment standards.
Share best practices for improving preventive care visits and ED diversion programs. Work with hospital systems to gain access to real-time ED visit information to allow for timely follow-up with members
accessing the ED. Provide easy access to prior authorization, pharmacy, and claims data for CM/CC staff. These data are critical for
understanding the health status, medication compliance, receipt of services, risks, and needs of members assigned to CM/CC.
Enhance discharge communication between the utilization and care management departments through real-time alerts to facilitate transitions of care and appointment follow-up after an inpatient admission.
Evaluate unable-to-reach programs to identify innovative strategies to improve outreach to locate hard-to-reach members. o Enhance outreach efforts through claims, utilization data, and obtaining beneficiary contact information from local
community organizations. o Consider the use of health navigators who live in the community and who may be better equipped to find hard-to-
locate members, gain trust, and build relationships. o Send staff to last known address for the member.
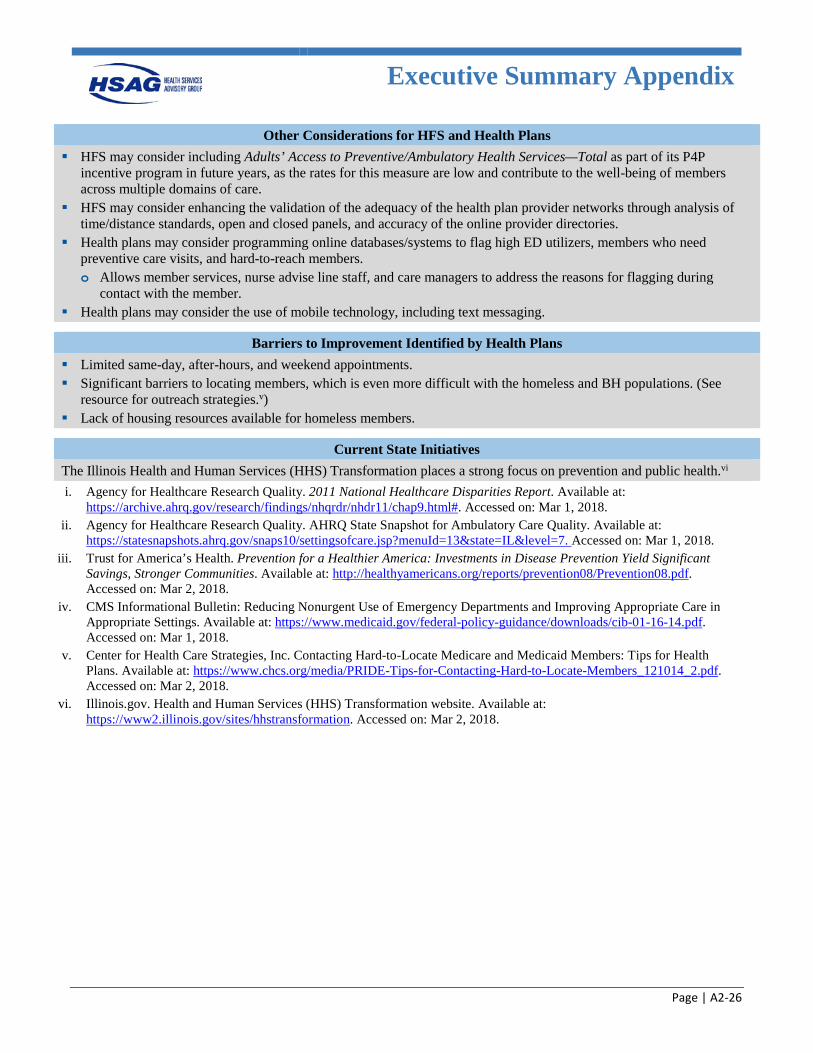
Executive Summary Appendix
Page | A2-26
Other Considerations for HFS and Health Plans HFS may consider including Adults’ Access to Preventive/Ambulatory Health Services—Total as part of its P4P
incentive program in future years, as the rates for this measure are low and contribute to the well-being of members across multiple domains of care.
HFS may consider enhancing the validation of the adequacy of the health plan provider networks through analysis of time/distance standards, open and closed panels, and accuracy of the online provider directories.
Health plans may consider programming online databases/systems to flag high ED utilizers, members who need preventive care visits, and hard-to-reach members. o Allows member services, nurse advise line staff, and care managers to address the reasons for flagging during
contact with the member. Health plans may consider the use of mobile technology, including text messaging.
Barriers to Improvement Identified by Health Plans Limited same-day, after-hours, and weekend appointments. Significant barriers to locating members, which is even more difficult with the homeless and BH populations. (See
resource for outreach strategies.v) Lack of housing resources available for homeless members.
Current State Initiatives The Illinois Health and Human Services (HHS) Transformation places a strong focus on prevention and public health.vi i. Agency for Healthcare Research Quality. 2011 National Healthcare Disparities Report. Available at:
https://archive.ahrq.gov/research/findings/nhqrdr/nhdr11/chap9.html#. Accessed on: Mar 1, 2018. ii. Agency for Healthcare Research Quality. AHRQ State Snapshot for Ambulatory Care Quality. Available at:
https://statesnapshots.ahrq.gov/snaps10/settingsofcare.jsp?menuId=13&state=IL&level=7. Accessed on: Mar 1, 2018. iii. Trust for America’s Health. Prevention for a Healthier America: Investments in Disease Prevention Yield Significant
Savings, Stronger Communities. Available at: http://healthyamericans.org/reports/prevention08/Prevention08.pdf. Accessed on: Mar 2, 2018.
iv. CMS Informational Bulletin: Reducing Nonurgent Use of Emergency Departments and Improving Appropriate Care in Appropriate Settings. Available at: https://www.medicaid.gov/federal-policy-guidance/downloads/cib-01-16-14.pdf. Accessed on: Mar 1, 2018.
v. Center for Health Care Strategies, Inc. Contacting Hard-to-Locate Medicare and Medicaid Members: Tips for Health Plans. Available at: https://www.chcs.org/media/PRIDE-Tips-for-Contacting-Hard-to-Locate-Members_121014_2.pdf. Accessed on: Mar 2, 2018.
vi. Illinois.gov. Health and Human Services (HHS) Transformation website. Available at: https://www2.illinois.gov/sites/hhstransformation. Accessed on: Mar 2, 2018.
Page | B-1
Appendix B. 2015–2016 Performance Measure Methodology
2015–2016 Performance
Measure Methodology
Page | B-2
NCQA HEDIS Compliance Audit
Objectives
This section describes the evaluation of the Medicaid managed care health plans’ (health plans’) ability to collect and report on the performance measures accurately. The Healthcare Effectiveness Data and Information Set (HEDIS) performance measures are a nationally recognized set of performance measures developed by National Committee for Quality Assurance (NCQA). Healthcare purchasers use these measures to assess the quality and timeliness of care and service delivery to members of managed care delivery systems.
A key element of improving healthcare services is the ability to provide easily understood, comparable information on the performance of the health plans. Systematically measuring performance provides a common language based on numeric values and allows the establishment of benchmarks, or points of reference, for performance. Performance measure results allow the health plan to make informed judgments about the effectiveness of existing processes and procedures, identify opportunities for improvement, and determine if interventions or redesigned processes are meeting objectives. The Illinois Department of Healthcare and Family Services (HFS) requires the health plans to monitor and evaluate the quality of care using HEDIS and HFS-defined performance measures. The health plans must establish methods to determine if the administrative data are accurate for each measure. In addition, the health plans are required by contract to track and monitor each performance measure and applicable performance goal on an ongoing basis, and to implement a quality improvement initiative addressing compliance until the health plans meet the performance goal.
NCQA licenses organizations and certifies selected employees of licensed organizations to conduct performance measure audits using NCQA’s standardized audit methodology. The NCQA HEDIS Compliance Audit indicates the extent to which health plans have adequate and sound capabilities for processing medical, member, and provider information for accurate and automated performance measurement, including HEDIS reporting. The validation addresses the technical aspects of producing HEDIS data, including information practices and control procedures, sampling methods and procedures, data integrity, compliance with HEDIS specifications, and analytic file production.
Technical Methods of Data Collection and Analysis
HFS required that an NCQA-licensed audit organization conduct an independent audit of each health plan’s measurement year (MY) 2015 data. HFS contracted with Health Services Advisory Group, Inc. (HSAG) to conduct an audit for each Family Health Plan/Affordable Care Act (FHP/ACA) and Integrated Care Program (ICP) health plan. The audits were conducted in a manner consistent with NCQA’s HEDIS 2016, Volume 5: HEDIS Compliance Audit: Standards, Policies and Procedures. The audit incorporated two main components:
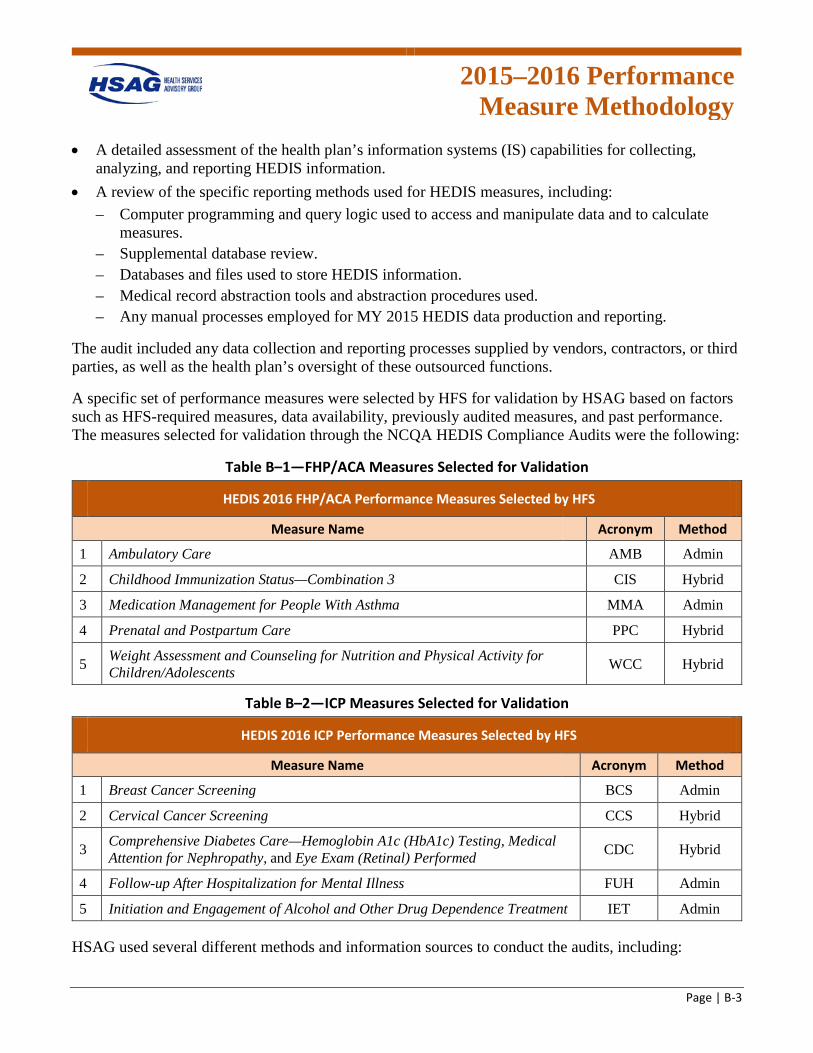
2015–2016 Performance
Measure Methodology
Page | B-3
• A detailed assessment of the health plan’s information systems (IS) capabilities for collecting, analyzing, and reporting HEDIS information.
• A review of the specific reporting methods used for HEDIS measures, including: – Computer programming and query logic used to access and manipulate data and to calculate
measures. – Supplemental database review. – Databases and files used to store HEDIS information. – Medical record abstraction tools and abstraction procedures used. – Any manual processes employed for MY 2015 HEDIS data production and reporting.
The audit included any data collection and reporting processes supplied by vendors, contractors, or third parties, as well as the health plan’s oversight of these outsourced functions.
A specific set of performance measures were selected by HFS for validation by HSAG based on factors such as HFS-required measures, data availability, previously audited measures, and past performance. The measures selected for validation through the NCQA HEDIS Compliance Audits were the following:
Table B–1—FHP/ACA Measures Selected for Validation
HEDIS 2016 FHP/ACA Performance Measures Selected by HFS Measure Name Acronym Method
1 Ambulatory Care AMB Admin
2 Childhood Immunization Status—Combination 3 CIS Hybrid
3 Medication Management for People With Asthma MMA Admin
4 Prenatal and Postpartum Care PPC Hybrid
5 Weight Assessment and Counseling for Nutrition and Physical Activity for Children/Adolescents WCC Hybrid
Table B–2—ICP Measures Selected for Validation
HEDIS 2016 ICP Performance Measures Selected by HFS Measure Name Acronym Method
1 Breast Cancer Screening BCS Admin
2 Cervical Cancer Screening CCS Hybrid
3 Comprehensive Diabetes Care—Hemoglobin A1c (HbA1c) Testing, Medical Attention for Nephropathy, and Eye Exam (Retinal) Performed CDC Hybrid
4 Follow-up After Hospitalization for Mental Illness FUH Admin
5 Initiation and Engagement of Alcohol and Other Drug Dependence Treatment IET Admin
HSAG used several different methods and information sources to conduct the audits, including:
2015–2016 Performance
Measure Methodology
Page | B-4
• Teleconference calls with health plan personnel and vendor representatives, as necessary. • Detailed review of each health plan’s completed responses to the HEDIS 2016 Record of
Administration, Data Management and Processes (Roadmap) published by NCQA as Appendix 2 to NCQA’s HEDIS 2016, Volume 5: HEDIS Compliance Audit: Standards, Policies and Procedures, and updated information communicated by NCQA to the audit team directly.
• On-site meetings in the health plans’ offices, including staff interviews, live system and procedure documentation, documentation review and requests for additional information, primary HEDIS data source verification, programming logic review and inspection of dated job logs, computer database and file structure review, and discussion and feedback sessions.
• Detailed evaluation of computer programming used to access administrative data sets and calculate HEDIS measures.
• If the hybrid method was used, an abstraction of a sample of medical records selected by the auditors was compared to the results of the health plan’s review determinations for the same records.
• If supplemental data were used, primary source verification (PSV) of a sample of records was conducted from any nonstandard and member-reported databases.
• Requests for corrective actions and modifications to the health plan’s HEDIS data collection and reporting processes and data samples, as necessary, and verification that actions were taken.
• Accuracy checks of the final HEDIS rates completed by the health plan. • A variety of interviews with individuals whose department or responsibilities played a role in the
production of HEDIS data. Typically, such individuals included the HEDIS manager, IS director, quality management director, enrollment and provider data manager, medical records staff, claims processing staff, programmers, analysts, and others involved in the HEDIS preparation process. Representatives of vendors that calculated HEDIS 2016 (and earlier) performance measure data may also have been interviewed and asked to provide documentation of their work.
Each of the performance measures reviewed by HSAG were assigned a final audit result consistent with the NCQA categories listed below in Table B–3.
Table B–3—Performance Measure Audit Results and Definitions
Result Definition
R Reportable. A reportable rate was submitted for the measure. NR Not Reported. The organization chose not to report the measure.
NA Small Denominator. The organization followed the specifications, but the denominator was too small (<30) to report a valid rate.
NB No Benefit. The organization did not offer the health benefit required by the measure (e.g., mental health, chemical dependency).
NQ Not Required. The organization was not required to report the measure. BR Biased Rate. The calculated rate was materially biased.
UN Un-Audited. The organization chose to report a measure that is not required to be audited. This result applies only to a limited set of measures (e.g., measures collected using electronic clinical data systems).
2015–2016 Performance
Measure Methodology
Page | B-5
For measures reported as percentages, NCQA has defined significant bias as a deviation of more than 5 percentage points from the true percentage. (For certain measures, a deviation of more than 10 percentage points in the number of reported events determines a significant bias.)
For some measures, more than one rate is required for HEDIS reporting (e.g., Childhood Immunization Status and Prenatal and Postpartum Care). It is possible that the health plan prepared some of the rates required by the measure appropriately but had significant bias in others. According to NCQA guidelines, the health plan would receive a reportable result for the measure as a whole, but significantly biased rates within the measure would receive a BR result in the Interactive Data Submission System (IDSS), where appropriate.
Upon completion of the audit, HSAG submitted a final audit report (FAR) to HFS and each health plan that included a completed and signed final audit statement.
For the medical record review validation (MRRV) portion of the audit, NCQA policies and procedures require auditors to perform two steps: (1) review the medical record review (MRR) processes employed by the health plan, including MRR staff qualifications, training, data collection instruments/tools, accuracy of data collection, vendor oversight, and the method used for combining MRR data with administrative data; and (2) complete MRRV, which involves the validation of the health plan’s abstraction accuracy for a sample of cases across the NCQA-designated measure groups and a comparison of HSAG’s validation results to the health plan’s abstraction results.
HSAG reviewed the processes in place at each health plan for MRR performance for all measures reported using the hybrid method. HSAG reviewed data collection tools and training materials to verify that all key HEDIS data elements were captured. Feedback was provided to each health plan if the data collection tools appeared to be missing necessary data elements.
HSAG completed the MRRV process and reabstracted sample records across the appropriate measure groups and compared the results to each health plan’s findings for the same medical records. This process provided an assessment of actual reviewer accuracy. HSAG randomly selected 16 cases from the MRR numerator positives as identified by each health plan. If fewer than 16 medical records were found to meet numerator compliance, all records were reviewed or additional records from another measure within the same group were added to equal 16 cases. If an abstraction discrepancy was noted, only critical errors were considered errors. A critical error is defined as an abstraction error that affected the final outcome of the numerator event (i.e., changed a positive event to a negative one or vice versa). If one critical error was noted, HSAG was required to retest a second sample of 16 records that did not include the original sampled records. If the second sample was free of errors, the measure and measure group passed. If one or more errors were detected, the measure and measure group did not pass validation and could not be reported until all errors were corrected and reviewed by the auditor. If there was not enough time to correct all errors, the health plan was not allowed to report the measure via the hybrid methodology.
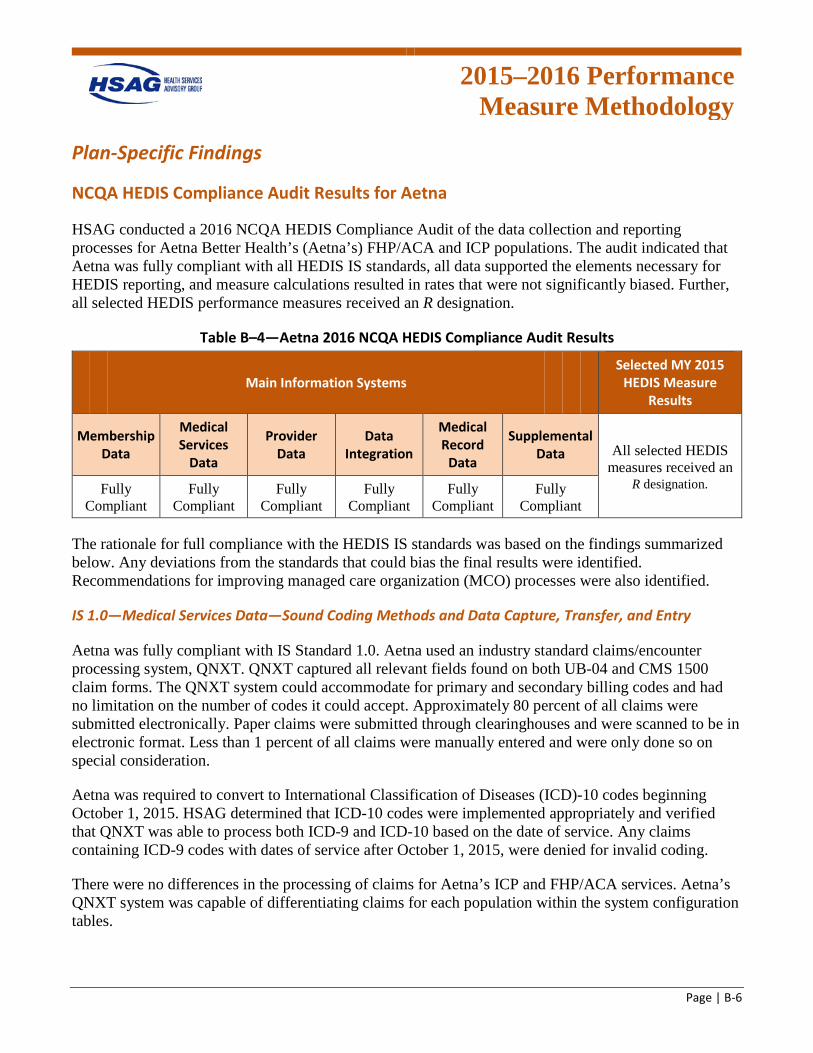
2015–2016 Performance
Measure Methodology
Page | B-6
Plan-Specific Findings
NCQA HEDIS Compliance Audit Results for Aetna
HSAG conducted a 2016 NCQA HEDIS Compliance Audit of the data collection and reporting processes for Aetna Better Health’s (Aetna’s) FHP/ACA and ICP populations. The audit indicated that Aetna was fully compliant with all HEDIS IS standards, all data supported the elements necessary for HEDIS reporting, and measure calculations resulted in rates that were not significantly biased. Further, all selected HEDIS performance measures received an R designation.
Table B–4—Aetna 2016 NCQA HEDIS Compliance Audit Results
Main Information Systems Selected MY 2015
HEDIS Measure Results
Membership Data
Medical Services
Data
Provider Data
Data Integration
Medical Record
Data
Supplemental Data All selected HEDIS
measures received an Fully
Compliant Fully
Compliant Fully
Compliant Fully
Compliant Fully
Compliant Fully
Compliant R designation.
The rationale for full compliance with the HEDIS IS standards was based on the findings summarized below. Any deviations from the standards that could bias the final results were identified. Recommendations for improving managed care organization (MCO) processes were also identified.
IS 1.0—Medical Services Data—Sound Coding Methods and Data Capture, Transfer, and Entry
Aetna was fully compliant with IS Standard 1.0. Aetna used an industry standard claims/encounter processing system, QNXT. QNXT captured all relevant fields found on both UB-04 and CMS 1500 claim forms. The QNXT system could accommodate for primary and secondary billing codes and had no limitation on the number of codes it could accept. Approximately 80 percent of all claims were submitted electronically. Paper claims were submitted through clearinghouses and were scanned to be in electronic format. Less than 1 percent of all claims were manually entered and were only done so on special consideration.
Aetna was required to convert to International Classification of Diseases (ICD)-10 codes beginning October 1, 2015. HSAG determined that ICD-10 codes were implemented appropriately and verified that QNXT was able to process both ICD-9 and ICD-10 based on the date of service. Any claims containing ICD-9 codes with dates of service after October 1, 2015, were denied for invalid coding.
There were no differences in the processing of claims for Aetna’s ICP and FHP/ACA services. Aetna’s QNXT system was capable of differentiating claims for each population within the system configuration tables.
2015–2016 Performance
Measure Methodology
Page | B-7
IS 2.0—Enrollment Data—Data Capture, Transfer, and Entry
Aetna was fully compliant with IS Standard 2.0. Aetna’s enrollment information was stored in the QNXT system.
Membership was determined by the State and transmitted to Aetna by Automated Health Systems, the State’s eligibility broker. There was no manual entry of enrollment data except for the occasional online entry that did not appear on the electronic file.
Members were assigned unique identification numbers. If more than one member existed under the same identification number, it would constitute an enrollment error from the State file, rather than Aetna’s processing error. Aetna would promptly contact the State to rectify duplicate member numbers. The State would provide back the correct identification number to use and Aetna would merge the two records, using the correct identification number. Aetna would search for these errors using reports showing duplicate members.
Enrollment files were sent to external vendors such as vision and pharmacy at least monthly.
Final rate review did not reveal any issues related to the enrollment data.
IS 3.0—Practitioner Data—Data Capture, Transfer, and Entry
Aetna was fully compliant with IS Standard 3.0. HSAG reviewed the specialty mappings and approved them without revisions. HFS provided guidance to all Illinois health plans to qualify all federally qualified health centers (FQHCs) as PCPs. Aetna followed that guidance and created a PCP specialty type for all FQHCs with which it contracts. Aetna advised that for other services provided by the FQHCs, Aetna captures the individual servicing providers’ specialty codes.
All data were housed in QNXT. QNXT captured multiple identifiers for each provider including tax identification, national provider identifier, and an internal QNXT number.
Aetna performed several audits of its provider data to ensure all data were accurate and up to date. Daily provider reconciliations were completed on records using a provider change request (PCR) process. Accuracy checks for each provider data specialist (PDS) analyst were conducted daily, and reports were provided to PDS management monthly. Analysts were required to review the accuracy reports and make any needed corrections to satisfy the audit.
Final rate review did not reveal any issues with measures mapping to provider specialties.
IS 4.0—Medical Record Review Processes—Training, Sampling, Abstraction, and Oversight
Aetna was fully compliant with IS Standard 4.0 requirements. HSAG reviewed Aetna’s IS 4 Roadmap pertaining to the policies and procedures for IS standards 4.1, 4.2, 4.3, 4.4, and 4.5. The Roadmap review found these policies and procedures to be consistent with NCQA’s current guidelines.
2015–2016 Performance
Measure Methodology
Page | B-8
Aetna sampled according to the HEDIS sampling guidelines and assigned an appropriate measure-specific oversample. Provider chase logic was reviewed and determined appropriate across all hybrid measures.
Aetna staff used Quality Spectrum Hybrid Reporter (QSHR) hybrid medical record abstraction tools. HSAG participated in a live vendor demonstration of the QSHR tools and instructions. All fields, edits, and drop-down boxes were reviewed for accuracy against NCQA’s current technical specifications.
Aetna utilized internal staff to conduct MRR and quality assurance. Staff members were sufficiently qualified and trained in the current year's HEDIS technical specifications and the use of QSHR’s abstraction tools to accurately conduct MRR. Aetna maintained appropriate quality assurance of reviews, including over-reads of all abstraction resulting in numerator positives or exclusions, and a random sample of numerator negatives. HSAG reviewed Aetna’s training abstraction manual and found no concerns.
Since this was Aetna’s first year reporting hybrid measures, a full convenience sample was required. HSAG completed the convenience sample review and did not find any issues.
Aetna passed the MRRV process for the following measure groups:
• Group A: Biometrics (BMI, BP) & Maternity—PPC—Timeliness of Prenatal Care • Group A: Biometrics (BMI, BP) & Maternity—PPC—Postpartum Care • Group B: Anticipatory Guidance & Counseling—WCC—Counseling for Physical Activity • Group C: Laboratory—CCS • Group C: Laboratory—CDC—HbA1c Testing • Group D: Immunization & Other Screenings—CIS—Combination 3 • Group F: Exclusions
IS 5.0—Supplemental Data—Capture, Transfer, and Entry
Aetna was fully compliant with IS Standard 5.0.
Aetna used three standard supplemental databases that impacted both ICP and FHP/ACA populations. Standard supplemental data were accepted by Aetna through various lab and dental vendors. The vendors submitted data regularly, and all external data files were submitted on standard file layouts. HSAG’s review of the standard data sources did not reveal any issues, and they were approved for HEDIS 2016 reporting.
Aetna also used one internal nonstandard supplemental data source which impacted both ICP and FHP/ACA populations. HSAG conducted PSV, and proof-of-service documentation passed the validation process.
All standard and nonstandard supplemental data sources were reviewed and approved prior to the March 31, 2016, deadline.
2015–2016 Performance
Measure Methodology
Page | B-9
Impact reports were compared to final rates, and no issues were found.
IS 6.0—Member Call Center Data—Capture, Transfer, and Entry
IS Standard 6.0 was not applicable to the measures under the scope of the audit.
IS 7.0—Data Integration—Accurate Reporting, Control Procedures That Support Measure Reporting Integrity
Aetna was fully compliant with IS Standard 7.0. Aetna had several source files feeding into its internal HEDIS data repository. Files were received from external vendors, supplemental data sources, internal MRR and State encounter files. All data sources were staged in the data warehouse before being extracted to the certified measures vendor, Inovalon. Aetna ensured all data passed validation checks before loading. Part of the validation process included monitoring appropriate service and diagnosis codes. Additional validation examined valid member and provider identifiers. Aetna performed additional validation on file log loads to determine data extract errors. HSAG reviewed the data sources and data warehouse and determined them to be compliant for reporting.
HSAG conducted record tracing verification for all measures under review and did not find any issues. HSAG asked Aetna to upload the verification records to HSAG’s secure file transfer protocol (FTP) site for documentation.
Final rates were compared to benchmarks and previous year’s rates where applicable. Aetna Better Health did not have any issues with reporting any measures.
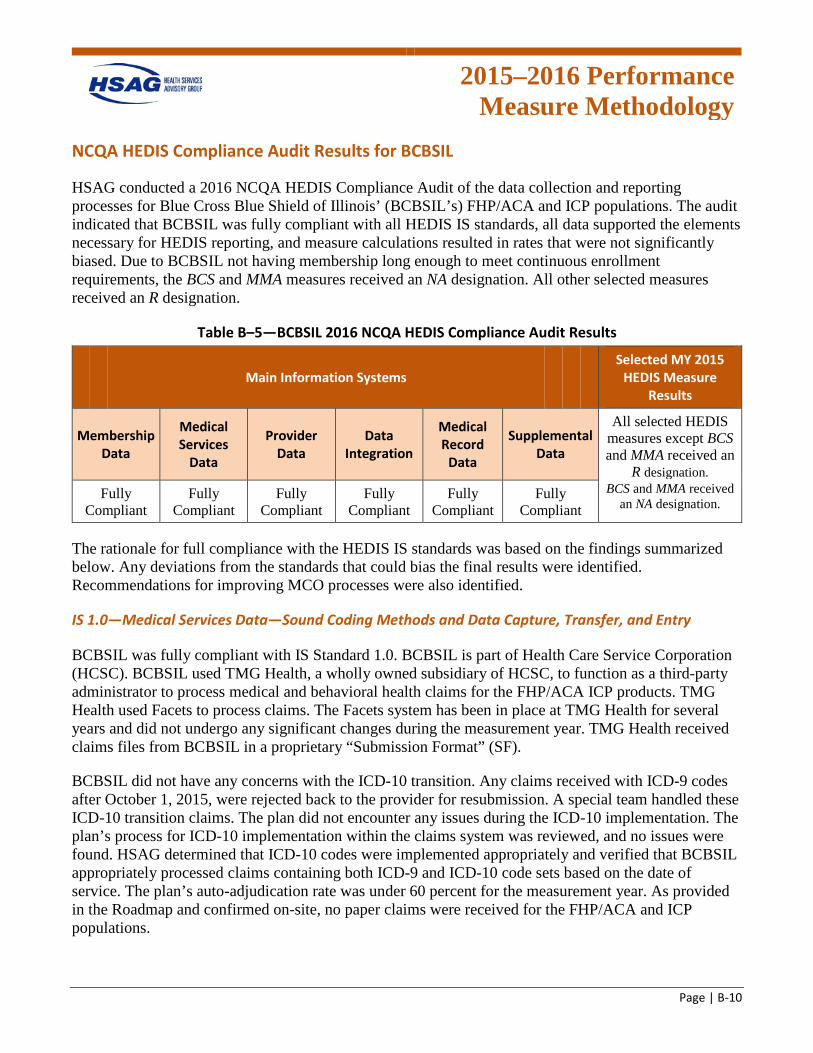
2015–2016 Performance
Measure Methodology
Page | B-10
NCQA HEDIS Compliance Audit Results for BCBSIL
HSAG conducted a 2016 NCQA HEDIS Compliance Audit of the data collection and reporting processes for Blue Cross Blue Shield of Illinois’ (BCBSIL’s) FHP/ACA and ICP populations. The audit indicated that BCBSIL was fully compliant with all HEDIS IS standards, all data supported the elements necessary for HEDIS reporting, and measure calculations resulted in rates that were not significantly biased. Due to BCBSIL not having membership long enough to meet continuous enrollment requirements, the BCS and MMA measures received an NA designation. All other selected measures received an R designation.
Table B–5—BCBSIL 2016 NCQA HEDIS Compliance Audit Results
Main Information Systems Selected MY 2015
HEDIS Measure Results
Membership Data
Medical Services
Data
Provider Data
Data Integration
Medical Record
Data
Supplemental Data
All selected HEDIS measures except BCS and MMA received an
R designation. Fully
Compliant Fully
Compliant Fully
Compliant Fully
Compliant Fully
Compliant Fully
Compliant BCS and MMA received
an NA designation.
The rationale for full compliance with the HEDIS IS standards was based on the findings summarized below. Any deviations from the standards that could bias the final results were identified. Recommendations for improving MCO processes were also identified.
IS 1.0—Medical Services Data—Sound Coding Methods and Data Capture, Transfer, and Entry
BCBSIL was fully compliant with IS Standard 1.0. BCBSIL is part of Health Care Service Corporation (HCSC). BCBSIL used TMG Health, a wholly owned subsidiary of HCSC, to function as a third-party administrator to process medical and behavioral health claims for the FHP/ACA ICP products. TMG Health used Facets to process claims. The Facets system has been in place at TMG Health for several years and did not undergo any significant changes during the measurement year. TMG Health received claims files from BCBSIL in a proprietary “Submission Format” (SF).
BCBSIL did not have any concerns with the ICD-10 transition. Any claims received with ICD-9 codes after October 1, 2015, were rejected back to the provider for resubmission. A special team handled these ICD-10 transition claims. The plan did not encounter any issues during the ICD-10 implementation. The plan’s process for ICD-10 implementation within the claims system was reviewed, and no issues were found. HSAG determined that ICD-10 codes were implemented appropriately and verified that BCBSIL appropriately processed claims containing both ICD-9 and ICD-10 code sets based on the date of service. The plan’s auto-adjudication rate was under 60 percent for the measurement year. As provided in the Roadmap and confirmed on-site, no paper claims were received for the FHP/ACA and ICP populations.
2015–2016 Performance
Measure Methodology
Page | B-11
All BCBSIL providers were fee-for-service (FFS) for the FHP/ACA and ICP products; therefore, data completeness was not a concern. This was noted in the Roadmap and confirmed during the on-site visit. HSAG verified on-site via systems demonstration that Facets had integrated logic which verified valid procedure and diagnosis codes as part of the adjudication process. HSAG also verified that Facets captured enough diagnosis and procedure codes to meet HEDIS reporting requirements. Rendering provider data were checked for on the claim. BCBSIL did not employ nonstandard coding or use nonstandard claims forms for the FHP/ACA and ICP products. While some nonstandard codes were used for waiver services such as homemaker services or transportation, these codes were not relevant to or mapped for HEDIS measure calculation.
IS 2.0—Enrollment Data—Data Capture, Transfer, and Entry
BCBSIL was fully compliant with IS Standard 2.0. BCBSIL received a daily State file from MAXIMUS that contained enrollment and PCP information. The daily file from the State was considered the source of truth. BCBSIL also received a monthly 834 audit file to reconcile with the daily files. BCBSIL received a separate enrollment file for each product (FHP/ACA and ICP). BCBSIL used separate plan identifiers (IDs) to identify the different products. Newborns were processed and included as enrolled only after they were received on the State file. They were enrolled from the beginning of the month but were considered eligible only as of the actual date of birth.
Membership was maintained in Facets. Facets assigned a unique member ID and captured the Medicaid ID in a separate field. The Facets ID was used as the Enrollee ID. In general, a member can have only one enrollee ID. BCBSIL experienced a relatively low volume of retro-enrollment. BCBSIL did not experience significant volatility, and enrollment was stable during the measurement year. The plan matched the enrollment data with the 820 capitation file to verify accurate counts of enrollees. If members were not present on the 820 file, the plan would research the State Medicaid system via its Web portal. If the member was in fact not a Medicaid enrollee, the system would be updated with this information. Membership data were reviewed in the Facets system during the on-site. The end date fields were blank denoting that a member was still actively enrolled with the plan. There were specific codes used to designate members as FHP/ACA and ICP. Using these specific indicators, BCBSIL was able to identify the appropriate population for measure reporting. Enrollment data were made available to other vendors such as TMG Health and Davis Vision.
IS 3.0—Practitioner Data—Data Capture, Transfer, and Entry
BCBSIL was fully compliant with IS Standard 3.0. BCBSIL used Vistar to maintain provider credentialing data. Credentialing was maintained at the enterprise level housed in Richardson, Texas. The Council for Affordable Quality Healthcare’s (CAQH) ProView system was leveraged to complete credentialing. The medical director approved applications that were marked as Category 1. Any applications marked as Category 2, which were applications with some issues, must be approved by the medical director and the Credentialing Committee. Approved application notifications were made available to the network management team via queues in Vistar. Recredentialing was done every three years with an annual review for Board certification. A special delegation oversight program for FHP/ACA and ICP providers was in place.
2015–2016 Performance
Measure Methodology
Page | B-12
Provider network contracting and tracking were completed manually in Premier Provider Web, which was an online tool. An audit team would review at least 20 percent of the data input into the system. An additional internal audit team conducted quarterly quality audits for the provider data upload accuracy. This same system was also used by members to search for a provider.
For multispecialty clinics such as FQHCs, the providers were mapped to PCPs appropriately based on individual provider specialty.
Provider data were uploaded to Facets for claims payment. TMG Health and BCBSIL had adequate ongoing verification processes in place to ensure accuracy of the provider file upload to Facets.
IS 4.0—Medical Record Review Processes—Training, Sampling, Abstraction, and Oversight
BCBSIL was fully compliant with IS Standard 4.0 requirements. HSAG reviewed BCBSIL’s IS 4 Roadmap pertaining to the policies and procedures for IS standards 4.1, 4.2, 4.3, 4.4, and 4.5. The Roadmap review found these policies and procedures to be consistent with NCQA’s HEDIS 2016, Volume 5, HEDIS Compliance Audit: Standards, Policies and Procedures.
BCBSIL sampled according to the HEDIS sampling guidelines and assigned an appropriate measure-specific oversample. Provider chase logic was reviewed and determined appropriate across all hybrid measures.
BCBSIL staff used QSHR hybrid medical record abstraction tools. HSAG participated in a live vendor demonstration of the QSHR tools and instructions. All fields, edits, and drop-down boxes were reviewed for accuracy against NCQA’s HEDIS 2016, Volume 2, Technical Specifications for Health Plans. HSAG reviewed BCBSIL’s training abstraction manual and found no concerns.
BCBSIL utilized internal staff members to conduct MRRs and quality assurance. Staff members were sufficiently qualified and trained in the current year’s HEDIS technical specifications and the use of QSHR’s abstraction tools to accurately conduct MRRs.
BCBSIL maintained appropriate quality assurance of reviews, including over-reads of all abstractions resulting in a numerator positive or exclusions, and a random sample of numerator negatives.
Since this was the first year for BCBSIL to report hybrid rates, a full convenience sample was required. HSAG completed the convenience sample review and did not identify any issues.
BCBSIL passed the MRRV process for the following measure groups:
• Group A: Biometrics (BMI, BP) & Maternity—PPC—Timeliness of Prenatal Care • Group B: Anticipatory Guidance & Counseling—WCC—Counseling for Physical Activity • Group C: Laboratory—CCS • Group D: Immunization & Other Screenings—CDC—Eye Exam (Retinal) Performed • Group D: Immunization & Other Screenings—CIS—Combination 3
BCBSIL did not pass the MRRV process for the following measure groups:
2015–2016 Performance
Measure Methodology
Page | B-13
• Group C: Laboratory—CDC—HbA1c Testing • Group D: Immunization & Other Screenings—CDC—Eye Exam (Retinal) Performed
BCBSIL self-identified various errors for CDC—HbA1c Testing and CDC—Eye Exam (Retinal) Performed and all exclusions. BCBSIL provided documentation of the analysis on the nature of the errors and the remediation plan. The plan confirmed that this was an error based on some inappropriate records made available for extraction and was not reflective of the entire MRR process. The measure sample passed, and the noncompliant records were removed. BCBSIL made a corporate decision to not include any exclusions.
IS 5.0—Supplemental Data—Capture, Transfer, and Entry
BCBSIL was fully compliant with IS Standard 5.0. BCBSIL only used two standard supplemental data sources for the purposes of reporting the FHP/ACA and ICP measures under review. The two lab data sources, LabCorp and Quest Diagnostics, were both considered external, standard databases and had been validated. BCBSIL had sufficient processes in place to ensure these data were loaded correctly, appropriately validated, and provided the required documentation for the databases.
IS 6.0—Member Call Center Data—Capture, Transfer, and Entry
IS Standard 6.0 was not applicable to the measures under the scope of this audit.
IS 7.0—Data Integration—Accurate Reporting, Control Procedures That Support Measure Reporting Integrity
BCBSIL was fully compliant with IS Standard 7.0. BCBSIL used Inovalon’s software for HEDIS 2016 measure rate calculation. BCBSIL data warehouse teams worked closely with the Inovalon team to ensure data integrity and measure calculation accuracy.
Paid claims extracts (PCEs) were sent by TMG Health to the BCBSIL Blue Gateway. Duplicate check triggers were activated to ensure that the exact same files were not loaded twice. Basic edits for group and dollar amounts were conducted. Claims headers and details were matched. An email with any data inconsistencies was sent back to TMG Health to facilitate resubmission of correct files. In addition to the PCEs, TMG Health sent a financial file though a Web application. The Blue Gateway matched these files. After the data were verified, they were loaded into the enterprise data warehouse (EDW).
Other vendor files, such as vision files from Davis Vision, were received into Axway. The files are formatted and made available directly in the EDW as well.
Each year a file layout was received from Inovalon with documentation for source-to-target mapping. QSI software was maintained in-house with updates and patches received from Inovalon as needed. The plan was recommended to run rates regularly to ensure that rates were consistent with expected results based on membership and claim volume.
In addition to conducting the queries, record tracing verification was conducted on-site for all measures under review.
2015–2016 Performance
Measure Methodology
Page | B-14
NCQA HEDIS Compliance Audit Results for CountyCare
HSAG conducted a 2016 NCQA HEDIS Compliance Audit of the data collection and reporting processes for CountyCare Health Plan’s (CountyCare’s) FHP/ACA and ICP populations. The audit indicated that CountyCare was fully compliant with the HEDIS IS standards for membership data, medical record data, and supplemental data. CountyCare was partially compliant with the HEDIS IS standards for medical data and data integration; however, HSAG determined there was no impact to reporting. Due to an issue with mapping FQHCs to PCPs, CountyCare was also partially compliant with the HEDIS IS standard for provider data. HSAG determined the impact on reporting to be minimal; however, the plan must revise its mapping for future reporting years. Due to CountyCare not having membership long enough to meet continuous enrollment requirements, the BCS and MMA measures received an NA designation. All other selected measures received an R designation.
Table B–6—CountyCare 2016 NCQA HEDIS Compliance Audit Results
Main Information Systems Selected MY 2015
HEDIS Measure Results
Membership Data
Medical Services
Data
Provider Data
Data Integration
Medical Record
Data
Supplemental Data
All selected HEDIS measures except BCS and MMA received an
R designation. Fully
Compliant Partially
Compliant Partially
Compliant Partially
Compliant Fully
Compliant Fully
Compliant BCS and MMA received
an NA designation.
The rationale for full or partial compliance with the HEDIS IS standards was based on the findings summarized below. Any deviations from the standards that could bias the final results were identified. Recommendations for improving MCO processes were also identified.
IS 1.0—Medical Services Data—Sound Coding Methods and Data Capture, Transfer, and Entry
CountyCare was partially compliant with IS Standard 1.0. CountyCare provides services to FHP/ACA and ICP populations under a managed care contract with HFS. CountyCare had approximately 160,000 members covered under its FHP/ACA population when it began operations on July 1, 2014, and approximately 3,000 ICP members as of March 2015. CountyCare delegated most health plan operations to IlliniCare Health Plan Inc. (IlliniCare) during 2015. Delegated functions related to HEDIS reporting included claims/encounter data processing, enrollment, provider, medical record, supplemental data, data integration, and the production of HEDIS performance measure rates. Both CountyCare and IlliniCare staff members participated in the on-site audit.
CountyCare used a primarily FFS delivery system during 2015, which provided support for data completeness. IlliniCare used AMISYS as its claims transactional system and had a high rate of electronic claims submission along with a fairly high auto-adjudication rate for CountyCare during 2015.
2015–2016 Performance
Measure Methodology
Page | B-15
IlliniCare only accepted the submission of industry-standard claims forms. In addition, IlliniCare did not accept or use any nonstandard coding schemes; therefore, there was no code mapping.
IlliniCare used an optical character recognition (OCR) vendor to scan paper claims. There was no manual data entry of paper claims except for addressing indistinguishable OCR information. There was appropriate oversight and monitoring of the OCR vendor, and the plan met its performance standards during 2015.
IlliniCare used its automated workflow distributor (AWD) to monitor claims processing. During the on-site audit, the plan provided a systems demonstration of AMISYS and the AWD dashboard, which was used to monitor claims volume, workload distribution, and claims aging. While IlliniCare experienced a claims backlog during the July 2015 time frame, the backlog was not associated with the processing of CountyCare claims.
IlliniCare used Claims XTen (CXT) as its front-end editor. In some circumstances CXT issued a denial line with a replacement line. As part of this process, CXT used historical information and rules to create the replacement lines. CXT only used codes related to age, and evaluation and management codes were replaced. This process was set up to reduce some of the administrative burden on providers, who had an option to review and disagree with any edits. IlliniCare clarified that it did not replace obsolete or invalid codes as part of the CXT process. IlliniCare denied claims for invalid or obsolete codes.
IlliniCare staff members noted a fairly smooth implementation of ICD-10 coding, which was likely due to significant planning and preparation.
All IlliniCare vendors were covered under the umbrella of its larger corporate entity, the Centene Corporation. IlliniCare vendors included the use of US Scripts for pharmacy, OptiCare for vision services, and Cenpatico for behavioral health services. Encounter data files were submitted to IlliniCare for pharmacy and vision services; however, behavioral health data were processed in a separate AMISYS system. During 2015, IlliniCare did not have a formal process for monitoring the receipt and volume of vendor encounter files; however, the plan did indicate intent to develop and formalize this process. The auditor recommended that the plan move forward with the implementation of this process. The auditor also determined that the lack of formal monitoring of vendor volume did not have any impact on HEDIS 2016 rates.
IS 2.0—Enrollment Data—Data Capture, Transfer, and Entry
CountyCare was fully compliant with IS Standard 2.0. IlliniCare processed daily files from MAXIMUS and from HFS for each FHP/ACA and ICP population. Each 834 file was received through an automated process. The MAXIMUS file provided member demographic information and PCP selection while the HFS file included the eligibility information. In addition to the daily file that contained additions, terminations, and changes, the plan received and processed a full monthly file from HFS. During 2015, IlliniCare implemented its unified member view (UMV) to capture enrollment information. UMV fed information into AMISYS. UMV allowed for greater functionality, including the capture of Medicare and Medicaid members in one view. IlliniCare captured the Medicaid client identification number (CIN) and also generated a unique member identification (ID) number.
2015–2016 Performance
Measure Methodology
Page | B-16
The plan provided a systems demonstration of UMV and AMISYS during the on-site review. The plan demonstrated the capture of product line in the Department Number field. IlliniCare kept newborn information under the mother’s ID for the first 90 days after delivery, after which the newborn received his/her own ID number. The mother and baby were linked by head of household in the system; however, IlliniCare did not use this linkage to capture the first Hepatitis B shot given to the newborn at birth for the Childhood Immunization Status measure, which may result in underreporting. The auditor recommended that the plan explore options for capturing services for the newborn that were placed under the mother’s ID for the first 90 days as a mechanism to improve HEDIS data reporting in the future.
There were no concerns with the processing of enrollment data.
IS 3.0—Practitioner Data—Data Capture, Transfer, and Entry
CountyCare was partially compliant with IS Standard 3.0. IlliniCare demonstrated its Portico system for the capture of provider specialty information during the on-site visit. The plan described its process flow for obtaining all provider information into Portico for delegated vision services and then providing that information to the software vendor.
The provider crosswalk was reviewed, and the auditor noted that the plan mapped FQHCs to a PCP specialty. To assess impact, the auditor received all providers and specialties participating at the FQHCs. All but five providers met the provider type requirements for PCP. The auditor further noted only one FQHC was mapped to a behavioral health provider and determined the impact to be minimal to HEDIS 2016 reporting. The plan must revise its mapping in future years or provide provider specialties for each FQHC mapped as a PCP for mapping approval. According to NCQA’s response to this issue, the plan cannot map multispecialty FQHCs to the PCP provider type, and this mapping will not be approved in future years.
IS 4.0—Medical Record Review Processes—Training, Sampling, Abstraction, and Oversight
CountyCare was fully compliant with IS Standard 4.0. HSAG reviewed CountyCare’s IS 4 Roadmap pertaining to the policies and procedures for IS standards 4.1, 4.2, 4.3, 4.4, and 4.5. The Roadmap review found these policies and procedures to be consistent with NCQA’s HEDIS 2016 Volume 5, HEDIS Compliance Audit: Standards, Policies and Procedures.
CountyCare sampled according to the HEDIS sampling guidelines and assigned an appropriate measure-specific oversample. Provider chase logic was reviewed and determined appropriate across all hybrid measures.
CountyCare contracted with the medical record vendor Altegra Health to procure and abstract medical records. HSAG participated in a live vendor demonstration of the Altegra Health tools and instructions. All fields, edits, and drop-down boxes were reviewed for accuracy against NCQA’s HEDIS 2016, Volume 2, Technical Specifications for Health Plans. HSAG reviewed Altegra Health’s training abstraction manual and found no concerns.
2015–2016 Performance
Measure Methodology
Page | B-17
CountyCare conducted appropriate oversight of its vendor through appropriate quality assurance of reviews, including over-reads of all abstractions resulting in numerator positives or exclusions, and a random sample of numerator negatives.
A full convenience sample was required since this was the first year for CountyCare to report hybrid measures. CountyCare provided all requested samples except PPC—Timeliness of Prenatal Care as the plan did not have any numerator positive hits available at that time. Nonetheless, PPC—Timeliness of Prenatal Care was selected for MRRV, and all numerator positive records for this indicator (five) were validated during the MRRV process.
CountyCare passed the MRRV process for the following measure groups:
• Group A: Biometrics (BMI, BP) & Maternity—PPC—Timeliness of Prenatal Care • Group A: Biometrics (BMI, BP) & Maternity—PPC—Postpartum Care • Group A: Biometrics (BMI, BP) & Maternity—WCC—BMI Percentile Documentation • Group B: Anticipatory Guidance & Counseling—WCC—Counseling for Physical Activity • Group C: Laboratory—CCS • Group D: Immunization & Other Screenings—CIS—Combination 3 • Group F: Exclusions
IS 5.0—Supplemental Data—Capture, Transfer, and Entry
CountyCare was fully compliant with IS Standard 5.0. IlliniCare used LabCorp as a supplemental data source. The Roadmap was submitted and reviewed prior to the on-site review. There was no mapping of lab data, and the data source was considered standard supplemental data. The data source was formally approved for HEDIS 2016 reporting.
IS 6.0—Member Call Center Data—Capture, Transfer, and Entry
This standard was not applicable to the measures under the scope of the audit.
IS 7.0—Data Integration—Accurate Reporting, Control Procedures That Support Measure Reporting Integrity
CountyCare was partially compliant with IS Standard 7.0. IlliniCare contracted with Inovalon as its software vendor for HEDIS 2016 reporting. The auditor reviewed the flow of data from its EDW to Inovalon. Data from both physical health and behavioral health flowed into EDW from IlliniCare and Cenpatico. Pharmacy, vision, and supplemental data were also accounted for in the data flow. The plan used its unique system-generated ID for HEDIS reporting.
During the on-site audit, it was unclear whether the plan addressed pharmacy reversals prior to the pharmacy data being sent to Inovalon, which may overstate the pharmacy measures. The plan reported a significant number of pharmacy reversals; however, since the plan had no members who met the
2015–2016 Performance
Measure Methodology
Page | B-18
continuous enrollment criteria for the MMA measure, there was no impact to HEDIS 2016 reporting for the measures covered under the scope of the review. However, the plan needs to develop a process to reconcile pharmacy reversals prior to data integration in future years to ensure that pharmacy measures are not at risk for bias due to the potential of overstatement.
IlliniCare had appropriate processes in place to differentiate ICD-9 and ICD-10 codes within its own data set and did not have any issues with formatting the data into the Inovalon layout. The auditor requested a copy of the data load/error report, and no issues were identified.
The auditor conducted a review of Query #1—Enrollment by Product Line during the on-site, and no concerns were identified. The auditor conducted a review of Query #3—Drill Down and Record Tracing Verification during the on-site audit. The WCC and PPC measures were reviewed for the FHP/ACA population, and no concerns were identified. In addition, the auditor reviewed the CDC—HbA1c Testing and FUH—7-Day Follow-Up measure indicators for the ICP population, and no concerns were identified.
The auditor conducted a review of Queries #2, #4, #5, and #6 off-site, and no issues were identified.
2015–2016 Performance
Measure Methodology
Page | B-19
NCQA HEDIS Compliance Audit Results for FHN
HSAG conducted a 2016 NCQA HEDIS Compliance Audit of the data collection and reporting processes for Family Health Network’s (FHN’s) FHP/ACA population. The audit indicated that FHN was fully compliant with all HEDIS IS standards, all data supported the elements necessary for HEDIS reporting, and measure calculations resulted in rates that were not significantly biased. Further, all selected HEDIS performance measures received an R designation.
Table B–7—FHN 2016 NCQA HEDIS Compliance Audit Results
Main Information Systems Selected MY 2015
HEDIS Measure Results
Membership Data
Medical Services
Data
Provider Data
Data Integration
Medical Record
Data
Supplemental Data
All selected HEDIS measures received an
R designation. Fully
Compliant Fully
Compliant Fully
Compliant Fully
Compliant Fully
Compliant Fully
Compliant
The rationale for full compliance with the HEDIS IS standards was based on the findings summarized below. Any deviations from the standards that could bias the final results were identified. Recommendations for improving MCO processes were also identified.
IS 1.0—Medical Services Data—Sound Coding Methods and Data Capture, Transfer, and Entry
FHN was fully compliant with IS Standard 1.0. FHN continued to use several sources for claims and encounter processing during the measurement year. FHN reduced the number of management service organizations (MSOs) that process claims on its behalf during 2015. During 2014, FHN utilized CMSO, APEX, Lawndale, Apogee, NAM, Med3000, and ACME to process claims. In 2015, the only MSO remaining was APEX. Most claims were processed through its internal data systems: VidaCounter, APEX, and CheckRegister. VidaCounter and CheckRegister were used for tracking encounters while APEX, an MSO, was phased out during 2016 to bring all processing in-house. All encounters were processed through VidaCounter. VidaCounter contained appropriate Health Insurance Portability and Accountability Act (HIPAA) edits which validated procedure and diagnosis codes as well as member and provider identifiers.
On October 1, 2015, FHN implemented ICD-10 coding. HSAG validated that ICD-10 codes were present in the VidaCounter system, and FHN demonstrated during the on-site audit that ICD-10 codes were not active before October 1, 2015, and that ICD-9 codes were terminated after October 1, 2015. HSAG did not find any issues with the ICD-10 implementation.
FHN had processes in place for balancing claims submissions against financial reports to substantiate claims costs for the State. VidaCounter was used to aggregate all data for loading to Verisk software. FHN also performed annual oversight of its remaining MSOs and monitored them for accuracy and
2015–2016 Performance
Measure Methodology
Page | B-20
timeliness. FHN made significant improvements to its claims/encounter processing since the prior year’s audit by effectively reducing the number of external claims processing MSOs. No additional changes were made to the claims process.
IS 2.0—Enrollment Data—Data Capture, Transfer, and Entry
FHN was fully compliant with IS Standard 2.0. FHN continued to use its internal enrollment system, VidaBility, during 2015. FHN provided the State with daily enrollment files and a full roster at the end of the month. All files were transmitted in standard 834 format. FHN only manually manipulated the enrollment files when authorized by the State, which was very seldom.
FHN’s VidaBility system ensured that members were only assigned one unique identifier. Daily reports were run to determine if duplicate member identifiers existed, and if found, they were rectified by enrollment staff after verifying enrollment information with the State’s Medicaid system.
FHN ran several queries for HSAG during the on-site audit to determine the average number of members by month, age, and gender. Final rate review did not reveal any issues related to the enrollment process.
IS 3.0—Practitioner Data—Data Capture, Transfer, and Entry
FHN was fully compliant with IS Standard 3.0. There were no changes to FHN’s provider data processes during 2015. FHN continued to use VidaPro for provider data processing, and VidaPro did not experience any upgrades or changes during the measurement year. HSAG reviewed the VidaPro system on-site and determined that it captured all relevant information for HEDIS reporting. HSAG verified that provider specialties were being appropriately captured in VidaPro and required FHN to provide a frequency distribution list of all obstetrics specialties to determine accuracy of mapping. HSAG did not identify any issues with the specialties. Final rate review did not reveal any issues with provider specialty mapping.
IS 4.0—Medical Record Review Processes—Training, Sampling, Abstraction, and Oversight
FHN was fully compliant with IS Standard 4.0 requirements. HSAG reviewed FHN’s IS 4 Roadmap pertaining to the policies and procedures for IS standards 4.1, 4.2, 4.3, 4.4, and 4.5. The Roadmap review found these policies and procedures to be consistent with NCQA’s HEDIS 2016, Volume 5, HEDIS Compliance Audit: Standards, Policies and Procedures.
FHN sampled according to the HEDIS sampling guidelines and assigned an appropriate measure-specific oversample. Provider chase logic was reviewed and determined to be appropriate across all hybrid measures.
FHN staff used Verisk hybrid medical record abstraction tools. HSAG participated in a live vendor demonstration of the Verisk tools and instructions. All fields, edits, and drop-down boxes were reviewed for accuracy against NCQA’s HEDIS 2016, Volume 2, Technical Specifications for Health Plans. HSAG reviewed FHN’s training abstraction manual and found no concerns.
2015–2016 Performance
Measure Methodology
Page | B-21
FHN utilized internal staff members to conduct MRRs and quality assurance. Staff members were sufficiently qualified and trained in the current year’s HEDIS technical specifications and the use of Verisk’s abstraction tools to accurately conduct MRRs. FHN maintained appropriate quality assurance of reviews, including over-reads of all abstractions resulting in numerator positives or exclusions, and a random sample of numerator negatives.
A convenience sample was required for the WCC measure since it was a new state-required measure for 2016. HSAG completed the convenience sample review and did not find any issues.
FHN passed the MRRV process for the following measure groups:
• Group A: Biometrics (BMI, BP) & Maternity—PPC—Timelines of Prenatal Care • Group B: Anticipatory Guidance & Counseling—WCC—Counseling for Physical Activity • Group D: Immunization & Other Screenings—CIS—Combination 3 • Group F: Exclusions
Upon validation of the CIS—Combination 3 measure, errors were detected. According to the NCQA MRRV protocol, validation of a second sample was required and subsequently passed.
IS 5.0—Supplemental Data—Capture, Transfer, and Entry
FHN was fully compliant with IS Standard 5.0. FHN initially submitted several supplemental data Roadmap sections for standard and nonstandard supplemental data. During the on-site visit, HSAG reviewed the supplemental data sources with FHN and determined that several were not relevant to the measures under the scope of the audit. FHN decided to retract several of the supplemental databases. The remaining databases (Healthy Kids and State Historical) were considered standard supplemental databases.
FHN’s supplemental data sources met all standards for mapping and oversight. FHN regularly monitored the supplemental data submissions from its external vendors and frequently monitored, trended, and tracked data components within the data feeds.
HSAG finalized and approved the standard supplemental data sources presented by FHN prior to the March 31, 2016, deadline. FHN provided supplemental data impact reports as well, and no issues were identified.
IS 6.0—Member Call Center Data—Capture, Transfer, and Entry
IS Standard 6.0 was not applicable to the measures under the scope of the audit.
IS 7.0—Data Integration—Accurate Reporting, Control Procedures That Support Measure Reporting Integrity
FHN was fully compliant with IS Standard 7.0. There were no changes to FHN’s data warehouse or software vendor during the measurement year. FHN used Verisk to produce its HEDIS measure rates.
2015–2016 Performance
Measure Methodology
Page | B-22
Verisk’s 2016 HEDIS measures passed NCQA’s certification for all measures under review. FHN used a SQL server database to house 35 of its source files used for HEDIS reporting. The database structure was a relational table model which contained primary and foreign keys that linked data to form unique records. The data structure was reviewed by HSAG on-site and found to be compliant with NCQA’s HEDIS guidelines.
During the on-site visit, FHN ran several queries for HSAG, and HSAG conducted record tracing verification for all measures under review. HSAG did not identify any issues with the queries or verification. FHN was able to demonstrate source and target verification without any issues. FHN continued to demonstrate proficiency in data warehousing and navigation.
Final rate review and impact report review did not reveal any issues. Hybrid hits were examined for accuracy and also did not reveal any concerns.
2015–2016 Performance
Measure Methodology
Page | B-23
NCQA HEDIS Compliance Audit Results for Harmony
HSAG conducted a 2016 NCQA HEDIS Compliance Audit of the data collection and reporting processes for Harmony Health Plan of Illinois, Inc.’s (Harmony’s) FHP/ACA population. The audit indicated that Harmony was fully compliant with all HEDIS IS standards, all data supported the elements necessary for HEDIS reporting, and measure calculations resulted in rates that were not significantly biased. Further, all selected HEDIS performance measures received an R designation.
Table B–8—Harmony 2016 NCQA HEDIS Compliance Audit Results
Main Information Systems Selected MY 2015
HEDIS Measure Results
Membership Data
Medical Services
Data
Provider Data
Data Integration
Medical Record
Data
Supplemental Data
All selected HEDIS measures received an
R designation. Fully
Compliant Fully
Compliant Fully
Compliant Fully
Compliant Fully
Compliant Fully
Compliant
The rationale for full compliance with the HEDIS IS standards was based on the findings summarized below. Any deviations from the standards that could bias the final results were identified. Recommendations for improving MCO processes were also identified.
IS 1.0—Medical Services Data—Sound Coding Methods and Data Capture, Transfer, and Entry
Harmony was fully compliant with IS Standard 1.0. Harmony continues to use its core system, Xcelys, to process claims. Harmony has used this system for many years and has managed the system very well. System configuration analysts ensured that ICD-10 codes were implemented on October 1, 2015, as required by CMS. During the on-site audit, HSAG was able to confirm that the ICD-10 codes has been implemented, and the ICD-9 codes were terminated by October 1, 2015. HSAG staff confirmed that Harmony’s Xcelys claim system captured each of the required HEDIS data elements such as provider, member, and claim detailed information. Xcelys was able to process both professional and institutional claims without issue. There were no significant changes to the Xcelys system except for terminating ICD-9 codes on September 30, 2015.
Harmony conducted annual delegation audits to ensure all external encounters were captured and received in a timely manner. Delegation audits ensured that external entities were capturing appropriate information on claims/encounters. Harmony indicated that no issues were found during its delegation audits in 2015.
Additionally, Harmony conducted internal and external readiness reviews annually to ensure operational reports and benefits were set up correctly in both internal and external systems.
2015–2016 Performance
Measure Methodology
Page | B-24
IS 2.0—Enrollment Data—Data Capture, Transfer, and Entry
Harmony was fully compliant with IS Standard 2.0. Harmony received daily enrollment files from the State. This process has been in place over the last several years. Harmony received the daily enrollment files in a standard HIPAA-compliant 834 electronic format and loaded these files directly into Xcelys. Harmony reconciled the daily files with a monthly file, also provided by the State, to ensure data were accurate prior to enrolling the member.
HSAG reviewed the Xcelys system during the on-site audit and confirmed that each enrollment span was captured. Additionally, HSAG reviewed several enrollment records to ensure that all HEDIS-required data elements were present and accurate.
Harmony conducted appropriate oversight of the enrollment process through ongoing internal audits and communication with the State enrollment authority. HSAG confirmed there were no changes to Harmony’s enrollment data process since the previous year’s review.
IS 3.0—Practitioner Data—Data Capture, Transfer, and Entry
Harmony was fully compliant with IS Standard 3.0. Harmony utilized Xcelys to capture all provider data for claims processing. Harmony utilized both direct contracted and delegated entities to enroll providers. Harmony used an internal software tracking mechanism (Omniflow) to manage its provider information. Omniflow was used to send provider data to Harmony’s Credentialing department for provider management prior to loading into Xcelys. Once the provider information flowed through Omniflow, the data were then loaded into Xcelys. A unique provider identifier was created along with provider specialties. Harmony’s credentialing staff would ensure provider specialties were appropriate by validating the provider’s education and specialty assignment authorized by the issuing provider board.
HSAG verified that the required HEDIS reporting elements were present in Xcelys and that provider specialties were accurate based on the provider mapping documents submitted with Harmony’s Roadmap.
Final rate review did not reveal any issues with provider mapping on any of the measures under review.
IS 4.0—Medical Record Review Processes—Training, Sampling, Abstraction, and Oversight
HSAG reviewed Harmony’s IS 4 Roadmap pertaining to the policies and procedures for IS standards 4.1, 4.2, 4.3, 4.4, and 4.5. The Roadmap review found these policies and procedures to be consistent with the NCQA’s HEDIS 2016, Volume 5, HEDIS Compliance Audit: Standards, Policies and Procedures.
Harmony sampled according to the HEDIS sampling guidelines and assigned an appropriate measure-specific oversample. Provider chase logic was reviewed and determined appropriate across all hybrid measures.
2015–2016 Performance
Measure Methodology
Page | B-25
Harmony contracted with the medical record vendor, Altegra Health (Altegra), to procure and abstract medical records. HSAG participated in a live vendor demonstration of Altegra’s tools and instructions. All fields, edits, and drop-down boxes were reviewed for accuracy against NCQA’s HEDIS 2016, Volume 2, Technical Specifications for Health Plans. HSAG reviewed Altegra’s training abstraction manual and found no concerns.
Harmony conducted appropriate oversight of its vendor through appropriate quality assurance of reviews, including over-reads of all abstractions resulting in numerator positives or exclusions, and a random sample of numerator negatives.
Due to errors found during the HEDIS 2015 validation, a convenience sample was required for the PPC—Timeliness of Prenatal Care measure indicator. A convenience sample was also required for WCC since it was a new state-required measure for 2016. HSAG completed the convenience sample review and did not find any issues.
Harmony passed the MRRV process for the following measure groups:
• Group A: Biometrics (BMI, BP) & Maternity—PPC—Timeliness of Prenatal Care • Group B: Anticipatory Guidance & Counseling—WCC—Counseling for Physical Activity • Group D: Immunization & Other Screenings—CIS—Combination 3 • Group F: Exclusions
IS 5.0—Supplemental Data—Capture, Transfer, and Entry
Harmony was fully compliant with IS Standard 5.0. Harmony used several standard supplemental data sources such as laboratory (lab) results, and immunization and encounter files from HFS. Harmony also utilized two nonstandard supplemental data sources which required PSV.
All supplemental data sources met the HEDIS requirements for supplemental data use. Harmony provided file layouts, coding transformation documents, and training documents with its HEDIS Roadmap submission.
The two nonstandard data sources, Interactive HEDIS Online Portal (IHOP) and Pseudo Claims, both passed the proof-of-service validation with no errors identified.
There were no changes to the supplemental data sources since the previous year’s audit. Harmony invested much time and effort ensuring data in the supplemental data sources were accurate and processed in a timely manner. Harmony conducted audits on its supplemental data intermittently throughout the year to ensure there were minimal errors or issues. When issues were discovered, they were promptly rectified.
Harmony had several standard and nonstandard databases. Standard databases were complete, and each standard source was accompanied with file layouts and mapping documents. Nonstandard data sources were approved following proof-of-service (POS) review.
2015–2016 Performance
Measure Methodology
Page | B-26
All supplemental databases were approved prior to March 31, 2016, and supplemental data impact reports were examined against final rates.
IS 6.0—Member Call Center Data—Capture, Transfer, and Entry
IS Standard 6.0 was not applicable to the measures under the scope of the audit.
IS 7.0—Data Integration—Accurate Reporting, Control Procedures That Support Measure Reporting Integrity
Harmony was fully compliant with IS Standard 7.0. Harmony continued to use its internal data warehouse to combine all files for extraction into the Inovalon certified measures software. The internal data warehouse combined data from all applicable systems and external data into tables for consolidation prior to loading into Inovalon’s file layouts. Most information was derived from the Xcelys system, while external data such as supplemental and vendor files were loaded directly into the data warehouse tables. HSAG conducted a review of the HEDIS data warehouse and found it to be compliant. Harmony had several staff involved with the process who had many years of experience in dealing with data extractions, transformations, and loading. The warehouse was managed well, and access was only granted when required for job duties. HSAG conducted PSV and did not encounter any issues during the source review. Member data matched Xcelys as well as the data warehouse and Inovalon numerator events.
HSAG also conducted a series of NCQA-required queries during the on-site audit and did not identify any issues. HSAG also reviewed Harmony’s preliminary rates and did not identify any immediate issues. There were no changes to Harmony’s systems or data integration processes since the previous year’s HEDIS review.
Final rate review and hybrid verification did not reveal any issues. Final rates were compared against benchmarks and the prior year’s rates. No issues were revealed.
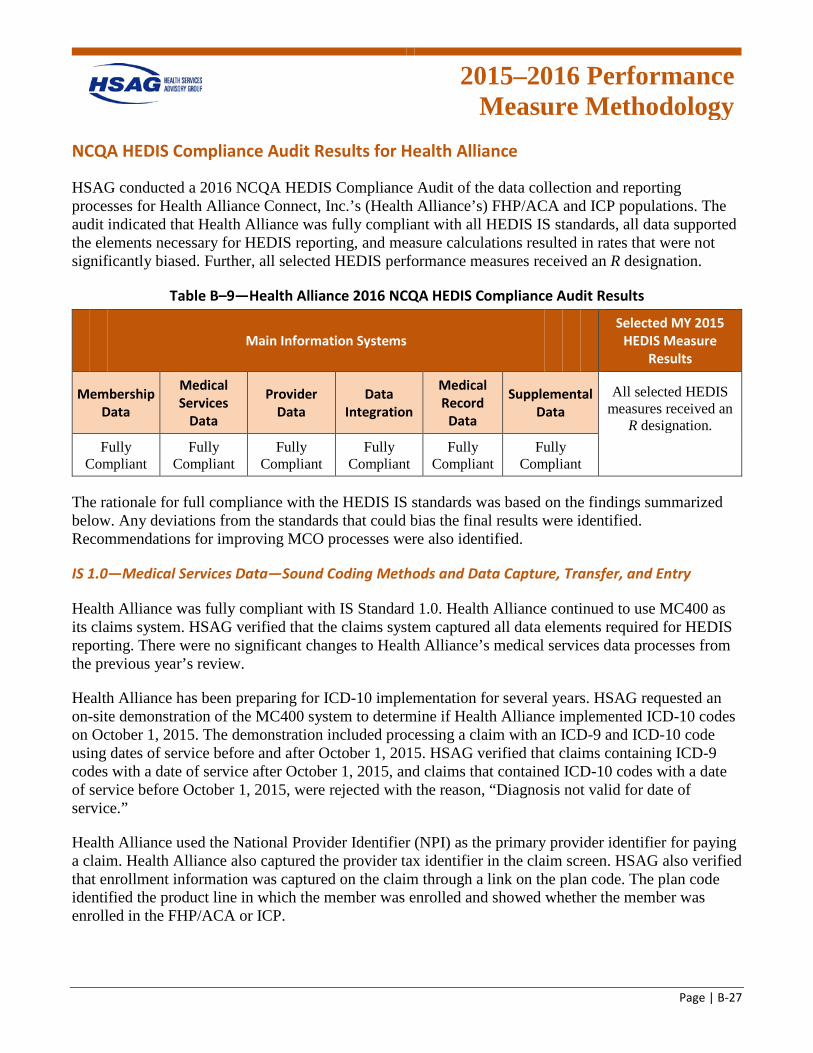
2015–2016 Performance
Measure Methodology
Page | B-27
NCQA HEDIS Compliance Audit Results for Health Alliance
HSAG conducted a 2016 NCQA HEDIS Compliance Audit of the data collection and reporting processes for Health Alliance Connect, Inc.’s (Health Alliance’s) FHP/ACA and ICP populations. The audit indicated that Health Alliance was fully compliant with all HEDIS IS standards, all data supported the elements necessary for HEDIS reporting, and measure calculations resulted in rates that were not significantly biased. Further, all selected HEDIS performance measures received an R designation.
Table B–9—Health Alliance 2016 NCQA HEDIS Compliance Audit Results
Main Information Systems Selected MY 2015
HEDIS Measure Results
Membership Data
Medical Services
Data
Provider Data
Data Integration
Medical Record
Data
Supplemental Data
All selected HEDIS measures received an
R designation. Fully
Compliant Fully
Compliant Fully
Compliant Fully
Compliant Fully
Compliant Fully
Compliant
The rationale for full compliance with the HEDIS IS standards was based on the findings summarized below. Any deviations from the standards that could bias the final results were identified. Recommendations for improving MCO processes were also identified.
IS 1.0—Medical Services Data—Sound Coding Methods and Data Capture, Transfer, and Entry
Health Alliance was fully compliant with IS Standard 1.0. Health Alliance continued to use MC400 as its claims system. HSAG verified that the claims system captured all data elements required for HEDIS reporting. There were no significant changes to Health Alliance’s medical services data processes from the previous year’s review.
Health Alliance has been preparing for ICD-10 implementation for several years. HSAG requested an on-site demonstration of the MC400 system to determine if Health Alliance implemented ICD-10 codes on October 1, 2015. The demonstration included processing a claim with an ICD-9 and ICD-10 code using dates of service before and after October 1, 2015. HSAG verified that claims containing ICD-9 codes with a date of service after October 1, 2015, and claims that contained ICD-10 codes with a date of service before October 1, 2015, were rejected with the reason, “Diagnosis not valid for date of service.”
Health Alliance used the National Provider Identifier (NPI) as the primary provider identifier for paying a claim. Health Alliance also captured the provider tax identifier in the claim screen. HSAG also verified that enrollment information was captured on the claim through a link on the plan code. The plan code identified the product line in which the member was enrolled and showed whether the member was enrolled in the FHP/ACA or ICP.
2015–2016 Performance
Measure Methodology
Page | B-28
HSAG confirmed that MC400 captured primary versus secondary diagnosis codes (diagnosis type “BK” indicates primary diagnosis code; diagnosis type “BF” indicates secondary diagnosis code).
Health Alliance’s support department received paper claims daily. The paper claims were sorted, counted, scanned, and then sent to Eagle Innovations for data entry. Some paper claims were submitted on nonstandard claim forms. These nonstandard claims were for transportation providers only and had no impact on HEDIS reporting. Very few medical claims were submitted on paper; however, they were transmitted into electronic format by Eagle Innovations. Health Alliance conducted internal audits to ensure data accuracy and turnaround requirements are met by Eagle Innovations, and Health Alliance required Eagle Innovations to meet these requirements. There were no issues with the Eagle Innovations audits during the measurement year.
Relay Health was the main clearinghouse for all electronic claims. Claims were submitted to Health Alliance in standard HIPAA 837 format. Pharmacy claims were submitted by Catamaran daily for loading into the MC400 system.
Health Alliance enhanced the Claims Edit System on June 13, 2015, to include facility claims editing (previously only professional claims were included). Additional fields were added to claims screens to capture National Drug Code (NDC) data, Accident Date, transportation data elements, detailed dental and orthodontia data, additional provider NPI, tax identification number (TIN) and taxonomy information, as well as treatment authorizations and service facility information for CMS 1500 claims. HSAG did not identify any data issues with the additional claims fields.
IS 2.0—Enrollment Data—Data Capture, Transfer, and Entry
Health Alliance was fully compliant with IS Standard 2.0. Health Alliance received enrollment files daily from HFS’ enrollment vendor, MAXIMUS, as well as from HFS. The State file was used to determine eligibility for the following month. Additionally, a full enrollment file was retrieved from HFS monthly which was used to reconcile the daily files and served as the final data used to determine eligibility for the month.
HSAG requested an on-site demonstration of the MC400 enrollment system and verified enrollment effective and termination dates were present for each member. The system review demonstrated that Health Alliance captured the Medicaid identification number as well as a system-generated identifier. All members were grouped by FHP/ACA or ICP and assigned a group identifier to distinguish the separate populations for rate calculation. The MC400 system captured enrollment history which was required for continuous enrollment criteria, and it also captured date of birth, gender, and additional demographic information.
All enrollment files were automated with the 834 file. Health Alliance pulled enrollment reports daily and reconciled them with the 834 file. Any errors were manually corrected after verifying the information in the State’s Medical Electronic Data Interchange (MEDI) system.
HSAG also confirmed that daily enrollment files are sent to Catamaran, Health Alliance’s pharmacy vendor, as well as other external vendors. There were no changes to Health Alliance’s encounter data
2015–2016 Performance
Measure Methodology
Page | B-29
processes during the measurement year, and no manual steps were involved with the processing of Medicaid members.
IS 3.0—Practitioner Data—Data Capture, Transfer, and Entry
Health Alliance was fully compliant with IS Standard 3.0. During the on-site system demonstration, HSAG reviewed a provider record associated with a psychiatrist and did not find any data issues. Primary and secondary specialties were captured for the provider and were indicated with a “P” for primary and “S” for secondary. HSAG also reviewed additional PCP specialties and did not identify any issues with mapping. HSAG confirmed that all fields required for HEDIS reporting were being captured. Providers with multiple locations maintained the same identifier.
Health Alliance used Visual Cactus for provider credentialing; however, no data were transferred between the two systems. Once provider data were entered in Visual Cactus and the providers credentialed, the data were sent to the configuration department for data entry into MC400. Although the process was manual, Health Alliance had good processes and controls in place to ensure the data are accurate, including frequent audits of the data in the MC400 system. Health Alliance audited 5 percent of all credentialed and recredentialed providers, and specialties were verified monthly. Health Alliance’s standard for accuracy was 99 percent, and results were 99 percent or higher.
HSAG also reviewed FQHC provider type in the MC400 system. FQHCs could be assigned as a PCP for members. HSAG’s audit of the MC400 showed that FQHCs for FHP/ACA and ICP members are categorized as PCPs using PCP flag = “Y.” When FQHCs billed the encounter file T1015 with modifier code AJ, the claim was captured as a mental health provider. FQHC specialties were also validated for each FQHC to ensure billing was appropriate for the modifier and procedure codes submitted. HSAG did not find any issues with the MC400 or Visual Cactus systems or with Health Alliance’s provider data processes.
IS 4.0—Medical Record Review Processes—Training, Sampling, Abstraction, and Oversight
Health Alliance was fully compliant with IS Standard 4.0. HSAG reviewed Health Alliance’s IS 4 Roadmap pertaining to the policies and procedures for IS standards 4.1, 4.2, 4.3, 4.4, and 4.5. The Roadmap review found these policies and procedures to be consistent with NCQA’s HEDIS 2016, Volume 5, HEDIS Compliance Audit: Standards, Policies and Procedures.
HSAG reviewed Table 4.1 of Roadmap Section 4 provided by Health Alliance and determined that the plan sampled according to the HEDIS sampling guidelines and assigned an appropriate measure-specific oversample. Provider chase logic was reviewed and determined appropriate across all hybrid measures.
Health Alliance staff used McKesson’s Compliance Reporter hybrid medical record abstraction tools. HSAG participated in a live vendor demonstration of the Compliance Reporter tools and instructions. All fields, edits, and drop-down boxes were reviewed for accuracy against NCQA’s HEDIS 2016, Volume 2, Technical Specifications for Health Plans. HSAG reviewed Health Alliance’s training abstraction manual and found no concerns.
2015–2016 Performance
Measure Methodology
Page | B-30
Health Alliance utilized internal staff members to conduct MRRs and quality assurance. Staff members were sufficiently qualified and trained in the current year’s HEDIS technical specifications and the use of McKesson’s compliance reporter abstraction tools to accurately conduct MRRs. Health Alliance maintained appropriate quality assurance of reviews, including over-reads of all abstractions resulting in numerator positives or exclusions, and a random sample of numerator negatives.
This was the first year for Health Alliance to report hybrid measures; therefore, a full convenience sample was required. HSAG completed the convenience sample review and did not find any issues.
Health Alliance passed the MRRV process for the following measure groups:
• Group A: Biometrics (BMI, BP) & Maternity—PPC—Timeliness of Prenatal Care • Group B: Anticipatory Guidance & Counseling—WCC—Counseling for Physical Activity • Group C: Laboratory—CCS • Group C: Laboratory—CDC—HbA1c Testing • Group D: Immunization & Other Screenings—CDC—Eye Exam (Retinal) Performed • Group D: Immunization & Other Screenings—CIS—Combination 3 • Group F: Exclusions
Upon validation of the PPC—Timeliness of Prenatal Care measure, errors were detected. According to the NCQA MRRV protocol, a validation of a second sample was required and subsequently passed.
IS 5.0—Supplemental Data—Capture, Transfer, and Entry
Health Alliance was fully compliant with IS Standard 5.0. During the on-site review, HSAG confirmed with Health Alliance that the following standard supplemental databases will be used for HEDIS 2016 reporting:
• CCA Lab • CCCD Claims • Lab Corp • Memorial Lab • OSFLAB • Pseudo Claims McKesson Software • Springfield Lab (SPC)
Each standard lab data source used a single standard lab file layout which contained lab results, CAT-II codes, member identifiers, member names, and dates of service (all data elements required for a claim).
CCCD Claims were standard supplemental data provided to all Illinois health plans by HFS. Pseudo Claims from McKesson were the previous years’ audited medical record retrievals and exclusions for mammography and cervical cancer screening.
2015–2016 Performance
Measure Methodology
Page | B-31
Some supplemental data sources that were submitted in the Roadmap were removed by Health Alliance as they were not relevant to the measures under the scope of the review.
HSAG discussed impact report requirements with Health Alliance, and the plan submitted these prior to final rate review approval. All standard supplemental data were approved to use for HEDIS 2016 reporting. Health Alliance did not use any nonstandard supplemental data sources that were applicable to the measures under the scope of the audit.
IS 6.0—Member Call Center Data—Capture, Transfer, and Entry
IS Standard 6.0 was not applicable to the measures under the scope of the audit.
IS 7.0—Data Integration—Accurate Reporting, Control Procedures That Support Measure Reporting Integrity
Health Alliance was fully compliant with IS Standard 7.0. HSAG confirmed with Health Alliance that all data were submitted directly to McKesson as individual extracts from MC400; there was no internal HEDIS warehouse.
McKesson’s software provided detailed member-level reporting as well as aggregated rates for each measure. Upon review of the McKesson software, HSAG was able to drill down to the member and claim levels to determine compliance with HEDIS specifications. HSAG conducted PSV on-site for a random selection of measures, and all random member sections were found to be compliant with the measure specifications.
Health Alliance secured the HEDIS data internally through role-based access, and access was only granted to specific members of the team who required it. Additionally, McKesson software was housed in a web-based environment with controlled access as additional security.
Health Alliance had adequate controls in place to ensure data were kept safe and were backed up regularly. For HEDIS measure production, Health Alliance conducted multiple administrative refreshes. Each administrative data refresh resulted in full recalculation of all administrative measure rates, including determination of denominators and numerators.
Final rate review showed that the rates were acceptable, and no issues were found.
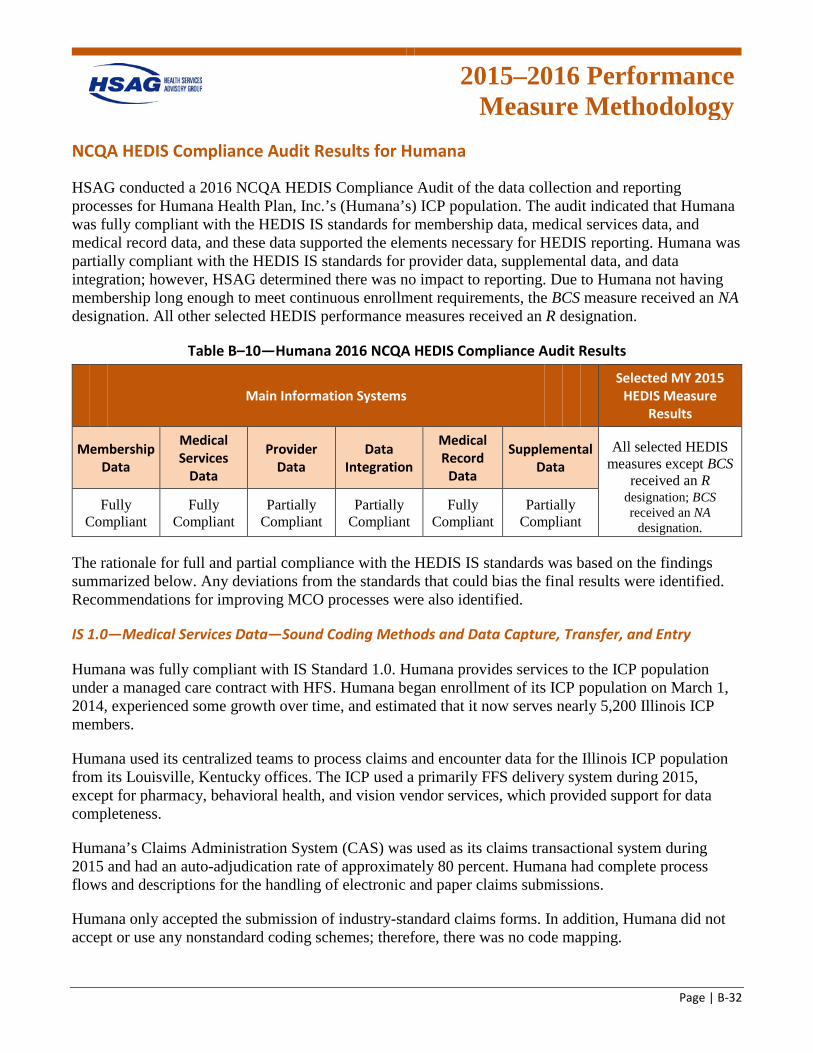
2015–2016 Performance
Measure Methodology
Page | B-32
NCQA HEDIS Compliance Audit Results for Humana
HSAG conducted a 2016 NCQA HEDIS Compliance Audit of the data collection and reporting processes for Humana Health Plan, Inc.’s (Humana’s) ICP population. The audit indicated that Humana was fully compliant with the HEDIS IS standards for membership data, medical services data, and medical record data, and these data supported the elements necessary for HEDIS reporting. Humana was partially compliant with the HEDIS IS standards for provider data, supplemental data, and data integration; however, HSAG determined there was no impact to reporting. Due to Humana not having membership long enough to meet continuous enrollment requirements, the BCS measure received an NA designation. All other selected HEDIS performance measures received an R designation.
Table B–10—Humana 2016 NCQA HEDIS Compliance Audit Results
Main Information Systems Selected MY 2015
HEDIS Measure Results
Membership Data
Medical Services
Data
Provider Data
Data Integration
Medical Record
Data
Supplemental Data
All selected HEDIS measures except BCS
received an R Fully
Compliant Fully
Compliant Partially
Compliant Partially
Compliant Fully
Compliant Partially
Compliant
designation; BCS received an NA
designation.
The rationale for full and partial compliance with the HEDIS IS standards was based on the findings summarized below. Any deviations from the standards that could bias the final results were identified. Recommendations for improving MCO processes were also identified.
IS 1.0—Medical Services Data—Sound Coding Methods and Data Capture, Transfer, and Entry
Humana was fully compliant with IS Standard 1.0. Humana provides services to the ICP population under a managed care contract with HFS. Humana began enrollment of its ICP population on March 1, 2014, experienced some growth over time, and estimated that it now serves nearly 5,200 Illinois ICP members.
Humana used its centralized teams to process claims and encounter data for the Illinois ICP population from its Louisville, Kentucky offices. The ICP used a primarily FFS delivery system during 2015, except for pharmacy, behavioral health, and vision vendor services, which provided support for data completeness.
Humana’s Claims Administration System (CAS) was used as its claims transactional system during 2015 and had an auto-adjudication rate of approximately 80 percent. Humana had complete process flows and descriptions for the handling of electronic and paper claims submissions.
Humana only accepted the submission of industry-standard claims forms. In addition, Humana did not accept or use any nonstandard coding schemes; therefore, there was no code mapping.
2015–2016 Performance
Measure Methodology
Page | B-33
CAS captured primary and secondary codes and other required claims fields. Humana had robust, mature processes for claims edits including the use of Claims Xten, McKesson, iHealth, and Verisk software which addressed different stages of coding review.
While Humana did use some global billing and per diem pricing schemes, all dates of services and claims detail were captured within CAS.
Humana used Xerox as its paper claims scanning vendor. Xerox had adequate processes in place to assign a document control number to paper claims received and had a clean desk policy. Xerox primarily used OCR software to obtain information on the claims and transfer it into an electronic data interchange (EDI) format. Manual keying was completed for unreadable images. There was adequate oversight and monitoring of Xerox, including the report of internal accuracy results with a 99 percent contract standard and monthly review of results. Humana identified no concerns with Xerox.
Humana staff members noted a fairly smooth implementation of ICD-10 coding, which was likely due to significant planning and preparation. Humana staff described its process for planning and testing, including end-to-end testing with providers and facilities. Humana indicated some issues with vendors during the first week of implementation, but those issues were resolved.
Humana monitored claims timeliness and workflow through its MACESS system. The system allowed the directing of certain claims types by claims processor skillset. During the on-site audit, the ICP demonstrated the MACESS system, which included a review of some reports such as claims aging and timeliness processing reports. No backlogs in claims processing was noted during 2015.
Humana contracted with Beacon to provide behavioral health services and process claims. Beacon used a FFS delivery system for the Illinois ICP population. Humana noted some concerns with Beacon’s claims timeliness payment performance. While the ICP initiated a corrective action plan, results for whether claims processing issues were resolved during 2015 were pending the formal annual delegation audit. The auditor requested, received, and reviewed the volume of pended claims with a 2015 date of service, and the count was insignificant to HEDIS reporting.
Humana contracted with EyeMed to provide vision services and to process claims. EyeMed used a FFS delivery system for the Illinois ICP population. There were no concerns with claims processing and encounter data submission.
Pharmacy data were received from Humana’s contracted pharmacy benefit manager, Argus, and these data were loaded routinely into the data warehouse. Humana received paid, rejected, and reversed claims from Argus. For data integration, only the final pharmacy claims status was used to reconcile the rejected claims from the paid claims.
The auditor clarified the request for Query Group #2—Data Loading Reports to obtain the total monthly counts of encounter data which was reviewed off-site, and no issues were identified.
Humana staff members demonstrated the CAS system during the on-site audit and provided an example of how manual claims edits were handled for two pended claims, one involving a missing rendering
2015–2016 Performance
Measure Methodology
Page | B-34
provider and the other involving an authorization review. There were no concerns identified with the systems demonstration.
IS 2.0—Enrollment Data—Data Capture, Transfer, and Entry
Humana was fully compliant with IS Standard 2.0. Humana processed enrollment files received from HFS for its ICP population daily. Each 834 file was received and processed by a centralized enrollment team through an automated process. In addition, the ICP received and processed a monthly audit file from HFS. The monthly audit file was used for reconciliation against the State eligibility information. In addition, Humana received enrollment files from MAXIMUS that contained information regarding the member’s selected PCP.
Humana captured enrollment information within the customer interface (CI) system, which included the current and historical enrollment spans, the State CIN, as well as a universal member identification (UMID) number that was automatically generated by the ICP. An interface between CI and CAS was used for claims payment.
The ICP conducted a systems demonstration of CI during the on-site audit. The ICP demonstrated the use of a group number field to designate the Illinois ICP population from other product lines.
There were no concerns with the processing of enrollment data.
IS 3.0—Practitioner Data—Data Capture, Transfer, and Entry
Humana was partially compliant with IS Standard 3.0. During 2015, Humana used two systems to capture provider data, Provider Single Point and Apex. Humana intends to replace Provider Single Point with Apex in the future. Both systems contained all provider data, and there was a combination of manual data entry and some automated population of fields from delegate rosters. Both systems fed into CAS. Both systems contained provider credentialed specialty(s). Oversight of data entry included the audit and peer review of a percentage of tasks performed. The auditor requested a copy of the audit results during 2015 and identified no concerns.
For vendors Beacon and EyeMed, to whom credentialing was delegated, the ICP received the data for loading into the provider directory; however, these data were not loaded into Provider Single Point or Apex. Beacon clarified that the State requires ICPs to use organizations that were certified by the State. Therefore, the contracted provider was typically the organization and not the individual provider. Many providers for the IL ICP population were community mental health centers. The State did allow for the use of some bachelor’s level services to be billed under Medicaid and the rendering provider billed as the organization and not the individual provider.
The auditor did a preliminary review of the provider type crosswalk and noted some concerns with multispecialty provider groups being mapped to provider types, which was inappropriate. The auditor determined that the multispecialty provider group mapping had no impact on the measures under the scope of the review; however, the plan should revise its mapping in future years to be compliant with provider mapping rules and to avoid impacting measure reporting in the future.
2015–2016 Performance
Measure Methodology
Page | B-35
IS 4.0—Medical Record Review Processes—Training, Sampling, Abstraction, and Oversight
Humana was fully compliant with IS Standard 4.0. HSAG reviewed Humana’s IS 4 Roadmap pertaining to the policies and procedures for IS standards 4.1, 4.2, 4.3, 4.4, and 4.5. The Roadmap review found these policies and procedures to be consistent with NCQA’s HEDIS 2016, Volume 5, HEDIS Compliance Audit: Standards, Policies and Procedures.
Humana sampled according to the HEDIS sampling guidelines and assigned an appropriate measure-specific oversample. Provider chase logic was reviewed and determined appropriate across all hybrid measures.
Humana staff used Verisk hybrid medical record abstraction tools. HSAG participated in a live vendor demonstration of the Verisk tools and instructions. All fields, edits, and drop-down boxes were reviewed for accuracy against NCQA’s HEDIS 2016, Volume 2, Technical Specifications for Health Plans. HSAG reviewed Humana’s training abstraction manual and found no concerns.
Humana utilized internal staff members to conduct MRRs and quality assurance. Staff members were sufficiently qualified and trained in the current year’s HEDIS technical specifications and the use of Verisk’s abstraction tools to accurately conduct MRRs.
Humana maintained appropriate quality assurance of reviews, including over-reads of all abstractions resulting in numerator positives or exclusions, and a random sample of numerator negatives.
Since this was the first year for Humana to report hybrid measures, a full convenience sample was required. HSAG reviewed the convenience sample records and did not find any issues.
Humana passed the MRRV process for the following measure groups:
• Group C: Laboratory—CCS • Group C: Laboratory—CDC—HbA1c Testing • Group D: Immunization & Other Screenings—CDC—Eye Exam (Retinal) Performed • Group F: Exclusions
IS 5.0—Supplemental Data—Capture, Transfer, and Entry
Humana was partially compliant with IS Standard 5.0. During the on-site audit, the ICP clarified all outstanding questions related to the lab supplemental data sources and the review of a sample provider crosswalk of lab data. This review included the process for the identification of Logical Observation Identifiers Names and Codes (LOINC) based on various factors. The process was well defined, and there were no concerns identified.
The on-site audit also revealed that an additional source for supplemental data was used for the Illinois ICP population contributing to numerator hits from HFS historical claims data and electronic medical record data. The data source was discussed and considered standard, supplemental data. The ICP agreed
2015–2016 Performance
Measure Methodology
Page | B-36
to provide Roadmap Section 5 documentation for review and a determination for use in HEDIS 2016 reporting. The impact of supplemental data on HEDIS reporting was insignificant, and the data source was formally approved for use. The auditor indicated that for future years, the plan needs to submit a separate Section 5 Roadmap for HFS data.
A review of Query Group #6—Lab Values consisting of HbA1c values during 2015 was provided and reviewed on-site. The ICP demonstrated adequate control over the quality of lab data with the distribution of data within acceptable values for reporting.
IS 6.0—Member Call Center Data—Capture, Transfer, and Entry
IS Standard 6.0 was not applicable to the measures under the scope of the audit.
IS 7.0—Data Integration—Accurate Reporting, Control Procedures That Support Measure Reporting Integrity
Humana was partially compliant with IS Standard 7.0. Humana contracted with Verisk as its software vendor for production of 2016 HEDIS rates.
During the on-site audit, the ICP discussed the process flow of enrollment, provider, claims, vendor, and lab supplemental data for integration for measure production.
The auditor reviewed Query Group #3—Drill Down Enrollment and Record Tracing Verification for the FUH and CCS measures, and the CDC—Eye Exam (Retinal) Performed measure indicator. There were no issues identified for the CCS or CDC measures; however, for one case reviewed for the FUH measure, the ICP was not able to identify the mental health provider who performed the seven-day follow-up visit during the on-site; however, additional documentation was provided and no further issues were identified. Query Group #5—Cross Measure Checks was not applicable given the limited scope of the audit; however, the auditor performed a review of eligible populations from its enrollment information and no issues were identified.
During the audit process, Humana discovered that some pharmacy data were not de-duplicated, accounting for 6.74 percent of total pharmacy claims, which could overstate some pharmacy measures; however, no measures under the scope of the HEDIS 2016 audit were impacted. The auditor recommended that the plan ensure a process to de-duplicate pharmacy claims prior to data integration in future years.
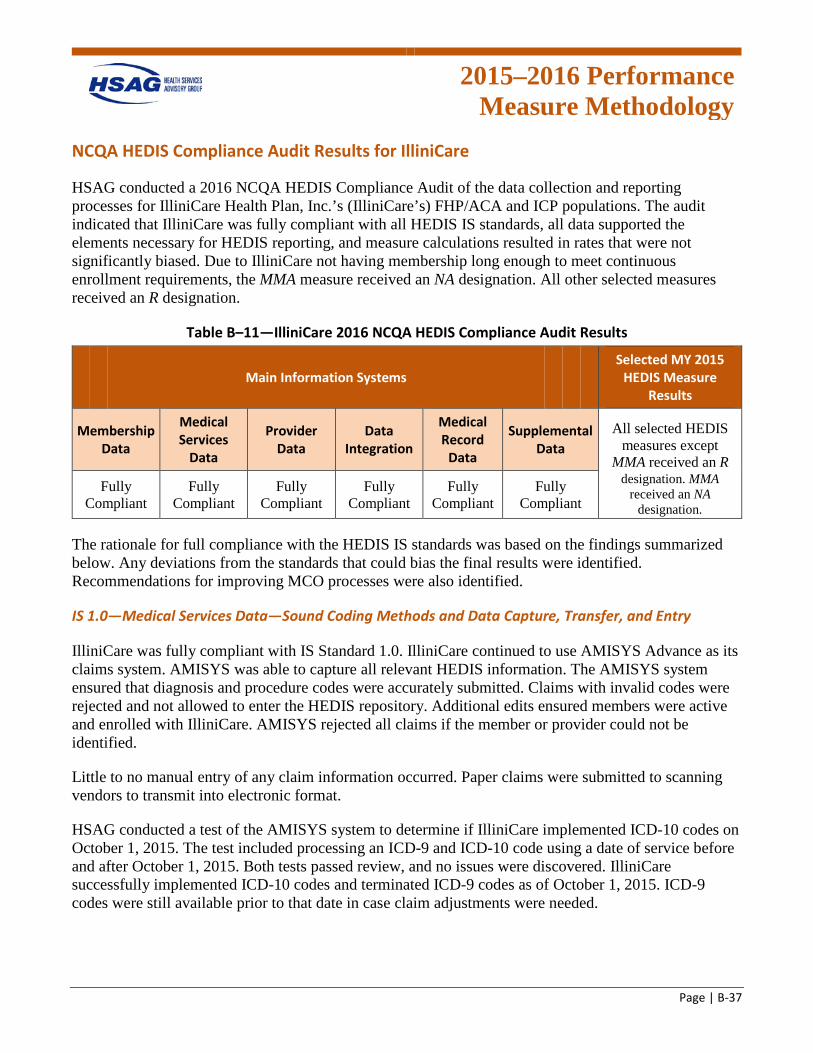
2015–2016 Performance
Measure Methodology
Page | B-37
NCQA HEDIS Compliance Audit Results for IlliniCare
HSAG conducted a 2016 NCQA HEDIS Compliance Audit of the data collection and reporting processes for IlliniCare Health Plan, Inc.’s (IlliniCare’s) FHP/ACA and ICP populations. The audit indicated that IlliniCare was fully compliant with all HEDIS IS standards, all data supported the elements necessary for HEDIS reporting, and measure calculations resulted in rates that were not significantly biased. Due to IlliniCare not having membership long enough to meet continuous enrollment requirements, the MMA measure received an NA designation. All other selected measures received an R designation.
Table B–11—IlliniCare 2016 NCQA HEDIS Compliance Audit Results
Main Information Systems Selected MY 2015
HEDIS Measure Results
Membership Data
Medical Services
Data
Provider Data
Data Integration
Medical Record
Data
Supplemental Data
All selected HEDIS measures except
MMA received an R Fully
Compliant Fully
Compliant Fully
Compliant Fully
Compliant Fully
Compliant Fully
Compliant
designation. MMA received an NA
designation.
The rationale for full compliance with the HEDIS IS standards was based on the findings summarized below. Any deviations from the standards that could bias the final results were identified. Recommendations for improving MCO processes were also identified.
IS 1.0—Medical Services Data—Sound Coding Methods and Data Capture, Transfer, and Entry
IlliniCare was fully compliant with IS Standard 1.0. IlliniCare continued to use AMISYS Advance as its claims system. AMISYS was able to capture all relevant HEDIS information. The AMISYS system ensured that diagnosis and procedure codes were accurately submitted. Claims with invalid codes were rejected and not allowed to enter the HEDIS repository. Additional edits ensured members were active and enrolled with IlliniCare. AMISYS rejected all claims if the member or provider could not be identified.
Little to no manual entry of any claim information occurred. Paper claims were submitted to scanning vendors to transmit into electronic format.
HSAG conducted a test of the AMISYS system to determine if IlliniCare implemented ICD-10 codes on October 1, 2015. The test included processing an ICD-9 and ICD-10 code using a date of service before and after October 1, 2015. Both tests passed review, and no issues were discovered. IlliniCare successfully implemented ICD-10 codes and terminated ICD-9 codes as of October 1, 2015. ICD-9 codes were still available prior to that date in case claim adjustments were needed.
2015–2016 Performance
Measure Methodology
Page | B-38
IS 2.0—Enrollment Data—Data Capture, Transfer, and Entry
IlliniCare was fully compliant with IS Standard 2.0. All enrollment data were provided by the State in daily and monthly enrollment files. All files were submitted electronically to IlliniCare through standard 834 format. Daily files were reconciled against the monthly final file. Any members that were added or deleted from the monthly file were updated in AMISYS prior to the beginning of the following month. Little to no manual data entry was completed by internal staff.
AMISYS captured all relevant fields for HEDIS reporting. IlliniCare ensured that each member had a unique identifier and checked for duplicate members regularly.
HSAG conducted several NCQA queries examining enrollment and eligibility for measures under review. Each record reviewed was error free. IlliniCare’s process for enrolling members was automated, and very few errors were encountered in the process.
The AMISYS system was capable of linking members who, on rare occasions, had multiple identification numbers. This was demonstrated without issue during the on-site audit.
IlliniCare has improved significantly over the last several years in its overall HEDIS processes.
IS 3.0—Practitioner Data—Data Capture, Transfer, and Entry
IlliniCare was fully compliant with IS Standard 3.0. IlliniCare, and its provider data systems contained all relevant HEDIS fields required for reporting. PORTICO was the source system which updates AMISYS. When a change occurred on a provider record, it was first updated in PORTICO and then submitted to AMISYS. Reconciliations were conducted on provider systems daily through electronic means. IlliniCare frequently audited the two systems to manage any discrepancies.
IlliniCare's AMISYS system contained all relevant information for HEDIS reporting. All specialties and provider identifiers were captured and documented appropriately.
IlliniCare’s PORTICO system and AMISYS system were reviewed during the on-site audit, and NCQA queries were conducted on the provider specialties. There were no issues encountered during the review.
IlliniCare’s provider capture was fully automated, and oversight was done at the corporate level. Since its inception, IlliniCare has made significant improvements in demonstrating provider validation and specialty mapping during the on-site visits.
HSAG did not find any issues or concerns with provider processing.
IS 4.0—Medical Record Review Processes—Training, Sampling, Abstraction, and Oversight
IlliniCare was fully compliant with IS Standard 4.0 requirements. HSAG reviewed IlliniCare’s IS 4 Roadmap pertaining to the policies and procedures for IS standards 4.1, 4.2, 4.3, 4.4, and 4.5. The Roadmap review found these policies and procedures to be consistent with NCQA’s HEDIS 2016, Volume 5, HEDIS Compliance Audit: Standards, Policies and Procedures.
2015–2016 Performance
Measure Methodology
Page | B-39
IlliniCare provided a completed Table 4.1 to demonstrate it sampled according to the HEDIS sampling guidelines and assigned an appropriate measure-specific oversample. Provider chase logic was reviewed and determined appropriate across all hybrid measures.
For HEDIS 2016, IlliniCare contracted with the medical record vendor Altegra Health to procure and abstract medical records. HSAG participated in a live vendor demonstration of Altegra Health’s tools and instructions. All fields, edits, and drop-down boxes were reviewed for accuracy against NCQA’s HEDIS 2016, Volume 2, Technical Specifications for Health Plans. Altegra Health staff members were sufficiently qualified and trained in the current year’s HEDIS technical specifications. HSAG reviewed Altegra Health’s training manual and found no concerns.
IlliniCare provided documentation that supported its process to maintain appropriate quality assurance of reviews, including over-reads of all abstractions resulting in numerator positives or exclusions, and a random sample of numerator negatives.
Since this was the first year for IlliniCare to report hybrid measures, a full convenience sample was required. IlliniCare had one record that was questionable for CDC—Eye Exam (Retinal) Performed during the convenience sample review. Interrater review was conducted on the convenience sample; however, there was no determination that the record was noncompliant. During MRRV, the record reviewed under the convenience sample was not selected in the final MRRV sample. All records in the CDC—Eye Exam (Retinal) Performed final sample passed without issue. Given that the convenience sample could have contained a potential error that was never resolved, the rate would have dropped only 0.5 percentage points and would not have materially biased the final rate.
IlliniCare passed the MRRV process for the following measure groups:
• Group A: Biometrics (BMI, BP) & Maternity—PPC—Timeliness of Prenatal Care • Group B: Anticipatory Guidance & Counseling—WCC—Counseling for Physical Activity • Group C: Laboratory—CCS • Group C: Laboratory—CDC—HbA1c Testing • Group D: Immunization & Other Screenings—CDC—Eye Exam (Retinal) Performed • Group D: Immunization & Other Screenings—CIS—Combination 3 • Group F: Exclusions
IS 5.0—Supplemental Data—Capture, Transfer, and Entry
IlliniCare was fully compliant with IS Standard 5.0. IlliniCare submitted several standard supplemental data sources and one nonstandard supplemental data source for review. Standard supplemental sources included lab, pharmacy, behavioral health, and State historical claim data. The nonstandard data source POS documents passed review and were approved prior to March 31, 2016.
The supplemental data sources were the same for IlliniCare’s FHP/ACA and ICP populations.
2015–2016 Performance
Measure Methodology
Page | B-40
All supplemental data sources were accompanied by mapping documents, file layouts, and supplemental data impact reports. Additionally, HSAG reviewed each system to ensure data captured were appropriate for use in HEDIS measures. IlliniCare ensured that fields requiring numeric values did not contain extraneous textual information and vice versa. All supplemental data sources were reviewed and approved prior to March 31, 2016.
IS 6.0—Member Call Center Data—Capture, Transfer, and Entry
IS Standard 6.0 was not applicable to the measures under the scope of the audit.
IS 7.0—Data Integration—Accurate Reporting, Control Procedures That Support Measure Reporting Integrity
IlliniCare was fully compliant with IS Standard 7.0. IlliniCare used Inovalon, a software vendor with NCQA-certified HEDIS measures. IlliniCare used several external data sources that it integrated into the HEDIS repository. External sources included pharmacy claims, lab results, dental encounters, and behavioral health claims. All external sources, except for dental, were wholly owned and operated by Centene, the parent company of IlliniCare.
All vendor data were monitored regularly through various trending reports and annual vendor audits.
Data from the different source systems were loaded and integrated into the EDW. Extracts were created by the Information Technology (IT) team using the SQL package to create flat files. The flat files were loaded into QSI which was housed at Centene. The data were mapped using a static SQL package. Initial mapping was completed with input and guidance from Inovalon and expert knowledge of the data within the EDW. Validation occurred to determine the accuracy of the mapping. Benchmarking over the past three years has supported the accuracy of the mapping.
HSAG also conducted queries along with record tracing verification during the on-site audit. Verification data were uploaded to HSAG’s secure FTP site for documentation. There were no issues discovered during the query and record tracing verification review.
Final rate review did not reveal any issues with reporting. Supplemental data impact reports were examined against reported rates, and hybrid hits were found to be accurate.
HSAG reviewed measure benchmarks and the prior year’s rates, where applicable.
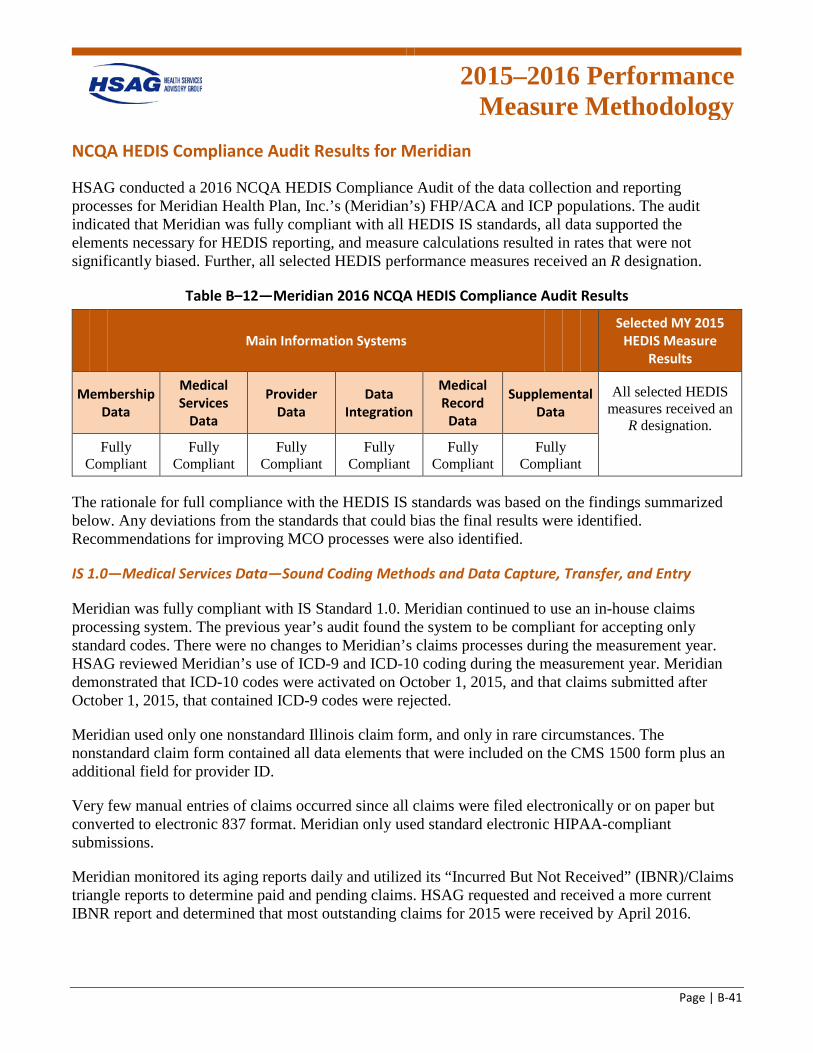
2015–2016 Performance
Measure Methodology
Page | B-41
NCQA HEDIS Compliance Audit Results for Meridian
HSAG conducted a 2016 NCQA HEDIS Compliance Audit of the data collection and reporting processes for Meridian Health Plan, Inc.’s (Meridian’s) FHP/ACA and ICP populations. The audit indicated that Meridian was fully compliant with all HEDIS IS standards, all data supported the elements necessary for HEDIS reporting, and measure calculations resulted in rates that were not significantly biased. Further, all selected HEDIS performance measures received an R designation.
Table B–12—Meridian 2016 NCQA HEDIS Compliance Audit Results
Main Information Systems Selected MY 2015
HEDIS Measure Results
Membership Data
Medical Services
Data
Provider Data
Data Integration
Medical Record
Data
Supplemental Data
All selected HEDIS measures received an
R designation. Fully
Compliant Fully
Compliant Fully
Compliant Fully
Compliant Fully
Compliant Fully
Compliant
The rationale for full compliance with the HEDIS IS standards was based on the findings summarized below. Any deviations from the standards that could bias the final results were identified. Recommendations for improving MCO processes were also identified.
IS 1.0—Medical Services Data—Sound Coding Methods and Data Capture, Transfer, and Entry
Meridian was fully compliant with IS Standard 1.0. Meridian continued to use an in-house claims processing system. The previous year’s audit found the system to be compliant for accepting only standard codes. There were no changes to Meridian’s claims processes during the measurement year. HSAG reviewed Meridian’s use of ICD-9 and ICD-10 coding during the measurement year. Meridian demonstrated that ICD-10 codes were activated on October 1, 2015, and that claims submitted after October 1, 2015, that contained ICD-9 codes were rejected.
Meridian used only one nonstandard Illinois claim form, and only in rare circumstances. The nonstandard claim form contained all data elements that were included on the CMS 1500 form plus an additional field for provider ID.
Very few manual entries of claims occurred since all claims were filed electronically or on paper but converted to electronic 837 format. Meridian only used standard electronic HIPAA-compliant submissions.
Meridian monitored its aging reports daily and utilized its “Incurred But Not Received” (IBNR)/Claims triangle reports to determine paid and pending claims. HSAG requested and received a more current IBNR report and determined that most outstanding claims for 2015 were received by April 2016.
2015–2016 Performance
Measure Methodology
Page | B-42
No vendors, other than electronic claims clearinghouses, were involved with processing claims. All clearinghouses provided HIPAA edit checks prior to supplying the electronic claims to Meridian.
IS 2.0—Enrollment Data—Data Capture, Transfer, and Entry
Meridian was fully compliant with IS Standard 2.0. Meridian did not have any changes to enrollment processes from the previous year’s review. Meridian did not experience any difficulties in processing enrollments for the measurement year. Meridian relied on the State to supply it with accurate information on the monthly files. Due to the nature of the FHP/ACA and ICP populations that Meridian services, changes in demographic information were frequently found in enrollment files received and were updated by Meridian regularly; however, this did not have an impact on enrollment data processing.
Meridian received an enrollment file daily from HFS, which was loaded into its Managed Care System (MCS) for claims/encounter processing. This file contained all enrollment information required for Medicaid. All transactions were processed through the enrollment files produced by HFS. Meridian retrieved the HFS files daily from the secure FTP site. All enrollment files that were submitted to HFS and received from HFS were logged, and a reconciliation report was generated for the audit file. Audits were conducted monthly at a minimum. Meridian’s MCS system contained all applicable fields relevant for HEDIS reporting. It maintained a unique identifier for each member and captured the Medicaid and family identifiers.
No manual steps or vendors were involved with the enrollment process. Little to no manual entry of enrollment data occurred as the enrollment files were received electronically; however, manual updates were made when changing demographic information. On-site, HSAG reviewed enrollment by month and gender-specific queries for Meridian’s FHP/ACA and ICP populations. Age ranges and gender specifications were appropriate.
IS 3.0—Practitioner Data—Data Capture, Transfer, and Entry
Meridian was fully compliant with IS Standard 3.0. There were no significant changes to the provider systems and processes used during the measurement year. MCS captured all credentialing information from its providers and was able to capture primary and secondary specialties. During the on-site audit, HSAG confirmed neurology as a valid mental health specialty for Meridian. Meridian’s MCS system captured all fields required for HEDIS reporting, as outlined its Roadmap Section 3, Table 3B.A. MCS was a fully integrated, robust system. No transfers of data from one system to another occurred, eliminating any opportunity for loss of data. All specialties were fully documented.
Provider specialties—neurology and FQHCs—were approved by the HSAG auditor for use for mental health/behavioral health measures. Appendix 3 from NCQA’s HEDIS 2016, Volume 2, Technical Specifications for Health Plans includes neurology as an approved specialty for the FUH measure. FQHCs were required by HFS for billing of mental health services. To meet the qualifications for FQHCs, certain criteria must be met, including offering mental health services. Meridian updated its Roadmap to include a letter from HFS showing that FQHCs must offer mental health services and they must be rendered by a psychiatrist, psychologist, licensed clinical social worker (LCSW), licensed clinical professional counselor (LCPC), or licensed marriage and family therapist (LMFT).
2015–2016 Performance
Measure Methodology
Page | B-43
HSAG conducted several queries of provider specialties including mental health, primary care, and obstetrics. All specialties matched appropriately.
IS 4.0—Medical Record Review Processes—Training, Sampling, Abstraction, and Oversight
Meridian was fully compliant with IS Standard 4.0 requirements. HSAG reviewed Meridian’s IS 4 Roadmap pertaining to the policies and procedures for IS standards 4.1, 4.2, 4.3, 4.4, and 4.5. The Roadmap review found these policies and procedures to be consistent with NCQA’s HEDIS 2016, Volume 5, HEDIS Compliance Audit: Standards, Policies and Procedures.
Meridian sampled according to the HEDIS sampling guidelines and assigned an appropriate measure-specific oversample. Provider chase logic was reviewed and determined appropriate across all hybrid measures.
Medical record pursuit and data collection were conducted by Meridian staff using proprietary data abstraction tools. HSAG participated in a live demonstration of the hybrid tools and instructions. All fields, edits, and drop-down boxes were reviewed for accuracy against NCQA’s HEDIS 2016, Volume 2, Technical Specifications for Health Plans. HSAG reviewed Meridian’s training abstraction manual and found no concerns.
Staff members were sufficiently qualified and trained in the current year’s HEDIS technical specifications. Meridian maintained appropriate quality assurance of reviews, including over-reads of all abstractions resulting in numerator positives or exclusions, and a random sample of numerator negatives.
Due to new state-required measures for 2016, a convenience sample was required for the following measures: WCC—BMI Percentile Documentation, Counseling for Nutrition, and Counseling for Physical Activity; CCS; and CDC—HbA1c Testing, Medical Attention for Nephropathy, and Eye Exam (Retinal) Performed. HSAG completed the convenience sample review and did not find any issues.
Meridian passed the MRRV process for the following measure groups:
• Group A: Biometrics (BMI, BP) & Maternity—PPC—Timeliness of Prenatal Care • Group A: Biometrics (BMI, BP) & Maternity—PPC—Postpartum Care • Group B: Anticipatory Guidance & Counseling—WCC—Counseling for Physical Activity • Group C: Laboratory—CDC—HbA1c Testing • Group D: Immunization & Other Screenings—CDC—Eye Exam (Retinal) Performed • Group D: Immunization & Other Screenings—CIS—Combination 3
Upon validation of the PPC—Timeliness of Prenatal Care and Postpartum Care, and CIS—Combination 3 measure indicators, errors were detected. According to the NCQA MRRV protocol, validation of a second sample was required and subsequently passed for each of these measures.
IS 5.0—Supplemental Data—Capture, Transfer, and Entry
Meridian was fully compliant with IS Standard 5.0.
2015–2016 Performance
Measure Methodology
Page | B-44
Meridian used two standard supplemental databases, which HSAG reviewed during the on-site visit. The databases contained standard file layouts and were not manipulated in any way. The data were loaded directly into the HEDIS repository for use in the MCS system’s HEDIS measure production.
Meridian also used an internal nonstandard supplemental data source. HSAG conducted PSV on a random sample for this data source. Proof-of-service documents passed review, and the nonstandard database was approved to use for HEDIS 2016 reporting.
All standard and nonstandard supplemental data sources were reviewed and approved prior to the March 31, 2016, deadline. All data sources met IS Standard 5.0 requirements. There were no issues identified in the supplemental data, and impact reports were sufficient for reporting.
IS 6.0—Member Call Center Data—Capture, Transfer, and Entry
IS Standard 6.0 was not applicable to the measures under the scope of the audit.
IS 7.0—Data Integration—Accurate Reporting, Control Procedures That Support Measure Reporting Integrity
Meridian was fully compliant with IS Standard 7.0. There were no changes to Meridian’s HEDIS data integration processes since the previous year's review.
Meridian's HEDIS repository structure contained all relevant fields for reporting. The HEDIS repository pulled data directly from MCS, maintaining the same data. There was no manipulation of the data.
Meridian continued to use internally developed source code to produce the required measures. The source code used to produce the measures validated numerators, denominators, and continuous enrollment appropriately. Dates of services played an integral role in the development of the code and measures. Source code was reviewed and approved by HSAG for all FHP/ACA and ICP measures under the scope of the audit.
Prior to the on-site audit, HSAG provided a list of queries in accordance with the requirements outlined in Appendix 11 of NCQA’s HEDIS 2016, Volume 5, HEDIS Compliance Audit: Standards, Policies and Procedures. HSAG selected one query from each query group. HSAG conducted the NCQA-required queries during the on-site audit and found no issues.
Record tracing verification was conducted on-site for multiple FHP/ACA and ICP measures, and Meridian easily passed the review with no errors.
Preliminary rates and final rates were conducted with no complications. Final rates were approved prior to June 15, 2016, and all measures were reportable.
NCQA HEDIS Compliance Audit Results for Molina
HSAG conducted a 2016 NCQA HEDIS Compliance Audit of the data collection and reporting processes for Molina Healthcare of Illinois, Inc.’s (Molina’s) FHP/ACA and ICP populations. The audit indicated that Molina was fully compliant with all HEDIS IS standards, all data supported the elements
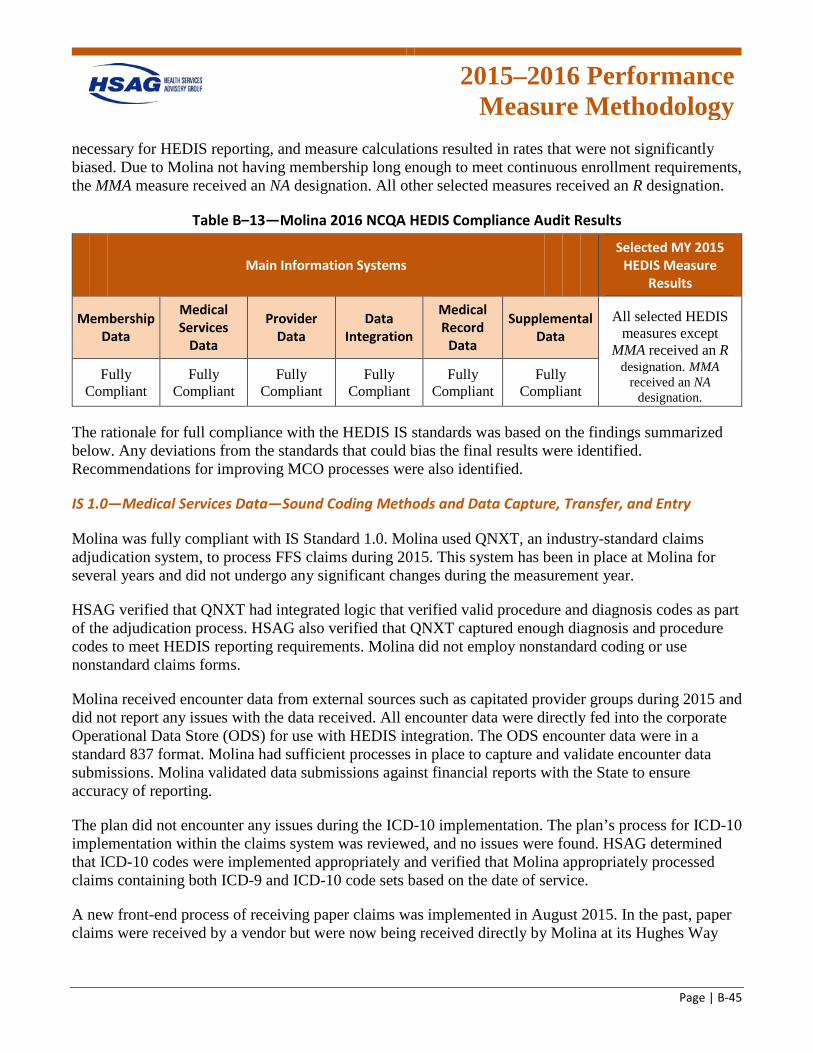
2015–2016 Performance
Measure Methodology
Page | B-45
necessary for HEDIS reporting, and measure calculations resulted in rates that were not significantly biased. Due to Molina not having membership long enough to meet continuous enrollment requirements, the MMA measure received an NA designation. All other selected measures received an R designation.
Table B–13—Molina 2016 NCQA HEDIS Compliance Audit Results
Main Information Systems Selected MY 2015
HEDIS Measure Results
Membership Data
Medical Services
Data
Provider Data
Data Integration
Medical Record
Data
Supplemental Data
All selected HEDIS measures except
MMA received an R Fully
Compliant Fully
Compliant Fully
Compliant Fully
Compliant Fully
Compliant Fully
Compliant
designation. MMA received an NA
designation.
The rationale for full compliance with the HEDIS IS standards was based on the findings summarized below. Any deviations from the standards that could bias the final results were identified. Recommendations for improving MCO processes were also identified.
IS 1.0—Medical Services Data—Sound Coding Methods and Data Capture, Transfer, and Entry
Molina was fully compliant with IS Standard 1.0. Molina used QNXT, an industry-standard claims adjudication system, to process FFS claims during 2015. This system has been in place at Molina for several years and did not undergo any significant changes during the measurement year.
HSAG verified that QNXT had integrated logic that verified valid procedure and diagnosis codes as part of the adjudication process. HSAG also verified that QNXT captured enough diagnosis and procedure codes to meet HEDIS reporting requirements. Molina did not employ nonstandard coding or use nonstandard claims forms.
Molina received encounter data from external sources such as capitated provider groups during 2015 and did not report any issues with the data received. All encounter data were directly fed into the corporate Operational Data Store (ODS) for use with HEDIS integration. The ODS encounter data were in a standard 837 format. Molina had sufficient processes in place to capture and validate encounter data submissions. Molina validated data submissions against financial reports with the State to ensure accuracy of reporting.
The plan did not encounter any issues during the ICD-10 implementation. The plan’s process for ICD-10 implementation within the claims system was reviewed, and no issues were found. HSAG determined that ICD-10 codes were implemented appropriately and verified that Molina appropriately processed claims containing both ICD-9 and ICD-10 code sets based on the date of service.
A new front-end process of receiving paper claims was implemented in August 2015. In the past, paper claims were received by a vendor but were now being received directly by Molina at its Hughes Way
2015–2016 Performance
Measure Methodology
Page | B-46
location in Long Beach, California. Paper claims were counted, batched, scanned, and sent to Emdeon for OCR processing. The Emdeon process had not changed. There was no manual input of data. This was a seamless implementation and had no significant impact for processing claims. The plan had a good verification process in place to ensure data accuracy.
IS 2.0—Enrollment Data—Data Capture, Transfer, and Entry
Molina was fully compliant with IS Standard 2.0. Molina received two 834 files from the State for each line of business (FHP/ACA and ICP), two from the State and two files from MAXIMUS. The files were auto-posted to a secure SharePoint site in the “month/year” folder.
Error reports were generated for any records that were incomplete or could not be loaded to the system. Molina received the EDI error reports, processed the enrollment records, and reviewed them. Once the error reports were worked through, the records were loaded to the QNXT system.
The enrollment files were received via text format and converted to a Microsoft Excel file. Molina received its demographics, eligibility date, and rate codes via these files. Molina did not receive the rate code on the daily rate files. The capitation rate indicator would tell Molina the region where the member is located and if the member is in an ICP program.
The files received from MAXIMUS contained the same information as the State file except for the rate code indicators since members need to go through MAXIMUS to sign up for a health plan as opposed to going directly to the State. There was a lag between the information received from the State versus MAXIMUS, and some members did not appear on either file.
The rate indicator identified whether the member is enrolled in the ICP or FHP/ACA and in Temporary Assistance for Needy Families (TANF) products. Molina received separate files from the State, and the file naming convention would identify the file as either an FHP/ACA or ICP file. Molina could use the rate code to determine whether the member is an FHP/ACA or ICP enrollee. Molina had the capability to correctly identify members for different product lines for reporting.
IS 3.0—Practitioner Data—Data Capture, Transfer, and Entry
Molina was fully compliant with IS Standard 3.0. There were no changes to Molina’s provider processing systems during the measurement year. HSAG reviewed the provider mapping documents provided in the Roadmap and found no issues during the on-site review.
Molina maintained all providers in the QNXT system and contracted with individual doctors and physician groups; data exchanged between all entities were complete and accurate. All required fields for HEDIS processing were present. QNXT had the ability to capture multiple identification numbers. A unique identifier linked the records with multiple identification numbers together. There were no issues encountered with this practice of maintaining multiple identifiers.
Monthly, Molina audited the provider data in QNXT to ensure completion of specialties, license type, and professional degree. This internal audit included review of practitioner locations and ZIP codes.
2015–2016 Performance
Measure Methodology
Page | B-47
Molina used several delegated entities to process practitioner information. The delegated entities were monitored annually, and no significant issues were found. Audited delegated entities were within 95 percent accuracy thresholds in 2015.
IS 4.0—Medical Record Review Processes—Training, Sampling, Abstraction, and Oversight
Molina was fully compliant with IS Standard 4.0 requirements. HSAG reviewed Molina’s IS 4 Roadmap pertaining to the policies and procedures for IS standards 4.1, 4.2, 4.3, 4.4, and 4.5. The Roadmap review found these policies and procedures to be consistent with the current year’s guidelines.
Molina sampled according to the HEDIS sampling guidelines and assigned an appropriate measure-specific oversample. Provider chase logic was reviewed and determined appropriate across all hybrid measures.
Molina staff used QSHR hybrid medical record abstraction tools. HSAG participated in a live vendor demonstration of the QSHR tools and instructions. All fields, edits, and drop-down boxes were reviewed for accuracy against the current year’s technical specifications.
Molina utilized internal staff members to conduct MRRs and quality assurance. Staff members were sufficiently qualified and trained in the current year’s HEDIS technical specifications and the use of QSHR’s abstraction tools to accurately conduct MRRs. Molina maintained appropriate quality assurance of reviews, including over-reads of all abstractions resulting in a numerator positive or exclusions, and a random sample of numerator negatives. HSAG reviewed Molina’s training abstraction manual and found no concerns.
Since this was the first year for Molina to report hybrid measures, a full convenience sample was required. HSAG completed the convenience sample review and did not identify any major issues.
Molina passed the MRRV process for the following measure groups:
• Group A: Biometrics (BMI, BP) & Maternity—PPC—Timeliness of Prenatal Care • Group A: Biometrics (BMI, BP) & Maternity—PPC—Postpartum Care • Group B: Anticipatory Guidance & Counseling—WCC—Counseling for Physical Activity • Group C: Laboratory—CCS • Group C: Laboratory—CDC—HbA1c Testing • Group D: Immunization & Other Screenings—CIS—Combination 3 • Group F: Exclusions
IS 5.0—Supplemental Data—Capture, Transfer, and Entry
Molina was fully compliant with IS Standard 5.0. Molina uploaded several Roadmap Section 5s that were missing much information. HSAG requested that Molina provide updated and complete information to determine which supplemental data sources apply to the FHP/ACA and ICP measures under review.
2015–2016 Performance
Measure Methodology
Page | B-48
HSAG provided Molina with a preliminary report that included a list of supplemental databases based on the Section 5s that were uploaded and requested that Molina provide updated and complete information.
Molina utilized a total of five standard supplemental data sources for the measurement year. Standard supplemental sources included lab results, the prior year’s audited medical records, State immunization registries, and historical claims from the State. There were no issues identified with the standard supplemental sources. PSV was exempt according to NCQA guidelines. All standard sources were approved for reporting. Detailed review of each supplemental data source was conducted, and approval of all supplemental data sources was provided to the MCP by the March 31, 2016, deadline.
There were two nonstandard supplemental sources, Prior Medical Record Review (PMRR) and Supplemental Data Capturing Tool (SDCT), for which Molina provided documentation. These databases underwent PSV, and final determination was made upon completion of Molina’s POS documentation review.
IS 6.0—Member Call Center Data—Capture, Transfer, and Entry
IS Standard 6.0 was not applicable to the measures under the scope of this audit.
IS 7.0—Data Integration—Accurate Reporting, Control Procedures That Support Measure Reporting Integrity
Molina was fully compliant with IS Standard 7.0. Molina continued to use Inovalon’s software for HEDIS 2016 measure rate calculation. Molina’s Illinois staff worked with Molina Corporate for management of the Inovalon product. Molina Corporate’s processes were reviewed during the on-site visit and were found to be sufficient for HEDIS 2016 processing. Molina's staff was proficient in data warehousing and demonstrated during the on-site that record counts and volumes were monitored. Molina continued to meet with Inovalon regularly to discuss file loading and processing.
Molina has been monitoring provider data submissions and tracking those volumes for each submission over time. These volumes were compared to expected per member per month (PMPM) counts to determine if data were missing. Molina continued to monitor and had oversight of external entities.
2015–2016 Performance
Measure Methodology
Page | B-49
Validation of State Performance Measures for Primary Care Case Management (PCCM)/Children's Health Insurance Program Reauthorization Act (CHIPRA)
Introduction
HFS contracts with HSAG to conduct a review of the PCCM and CHIPRA programs for a selected set of performance measures.
HSAG’s role in the validation of performance measures is to ensure that the validation activities are conducted as outlined in CMS’ publication, EQR Protocol 2, Validation of Performance Measures Reported by the MCO: A Mandatory Protocol for External Quality Review (EQR), Version 2.0, September 2012. HSAG also uses NCQA’s HEDIS 2016, Volume 5: HEDIS Compliance Audit: Standards, Policies and Procedures.
Conducting the Review
The primary objectives of the performance measure validation (PMV) process are to:
• Evaluate the processes used to collect the performance measure data by HFS. • Determine the extent to which the specific performance measures calculated by HFS followed the
specifications established for each performance measure.
HFS identifies the performance measurement period for validation for each program for the reporting year. HFS selected NCQA HEDIS measures as well as CMS Adult Core Set and Child Core Set performance measures for the PCCM and CHIPRA programs. Most measures used the HEDIS 2016 Technical Specifications. For measures that were both HEDIS and Core Set measures, HSAG reviewed source code according to both the HEDIS 2016 specifications, the April 2015 Adult Core Set, and the March 2015 Child Core Set. This was acceptable since the specifications for most, if not all, of the HEDIS measures were the same as the Core Set, except for the age breakouts. The Use of Appropriate Medications for People with Asthma (ASM) measure was retired from the HEDIS measure set for HEDIS 2015. As a result, the HEDIS 2015 specifications were used for source code review and validation for this measure. For a list of the validated measures and their corresponding rates, see Appendix F. PCCM/CHIPRA Performance Measure Validation.

2015–2016 Performance
Measure Methodology
Page | B-50
Pre-Audit Activities
HSAG requests that HFS submit a list of measures under the scope of the audit, a completed Information Systems Capabilities Assessment Tool (ISCAT), source code for each performance measure, and any additional supporting documentation necessary to complete the audit. A conference call is conducted to answer questions and prepare for the audit.
Data Collection and Analysis
The CMS PMV protocol identifies key types of data that should be reviewed as part of the validation process. The following list describes the type of data collected and how HSAG conducted an analysis of these data:
• ISCAT: HFS was responsible for completing and submitting the ISCAT document to HSAG. Upon receipt, HSAG conducted a cursory review of the ISCAT to ensure that HFS completed all sections and included all needed attachments. The validation team then reviewed all ISCAT documents, noting issues or items that needed further follow-up. The validation team used the information in the ISCAT to complete the review tools, as applicable.
• Source code (programming language) for performance measures: HSAG requested source code from HFS for all performance measures. HSAG source code reviewers completed a line-by-line code review and evaluation of program logic flow to ensure compliance with the specifications required by HFS. The source code reviewers identified areas of deviation and shared them with HFS for adjustment. The source code reviewers also informed the audit team of any deviations from the measure specifications so the team could evaluate the impact of the deviation on the measure and assess the degree of bias (if any).
• Supporting documentation: HSAG requested documentation and data queries that provided reviewers with additional information to complete the validation process, including policies and procedures, file layouts, system flow diagrams, system log files, and data collection process descriptions. The validation team reviewed all supporting documentation, identifying issues or clarifications for follow-up.
Performance Measure Validation Findings
To validate the performance measures, data from various sources, including provider data, claims/encounter systems, and enrollment data, must be audited. The auditor scrutinizes these processes and makes a determination as to the validity of the data collected. HSAG uses a variety of audit methods, including analysis of computer programs, PSV, and staff member interviews to determine a result for each measure.
Each of the performance measures reviewed by HSAG were assigned a final audit result consistent with the designations identified in the CMS PMV Protocol listed below in Table B–14.
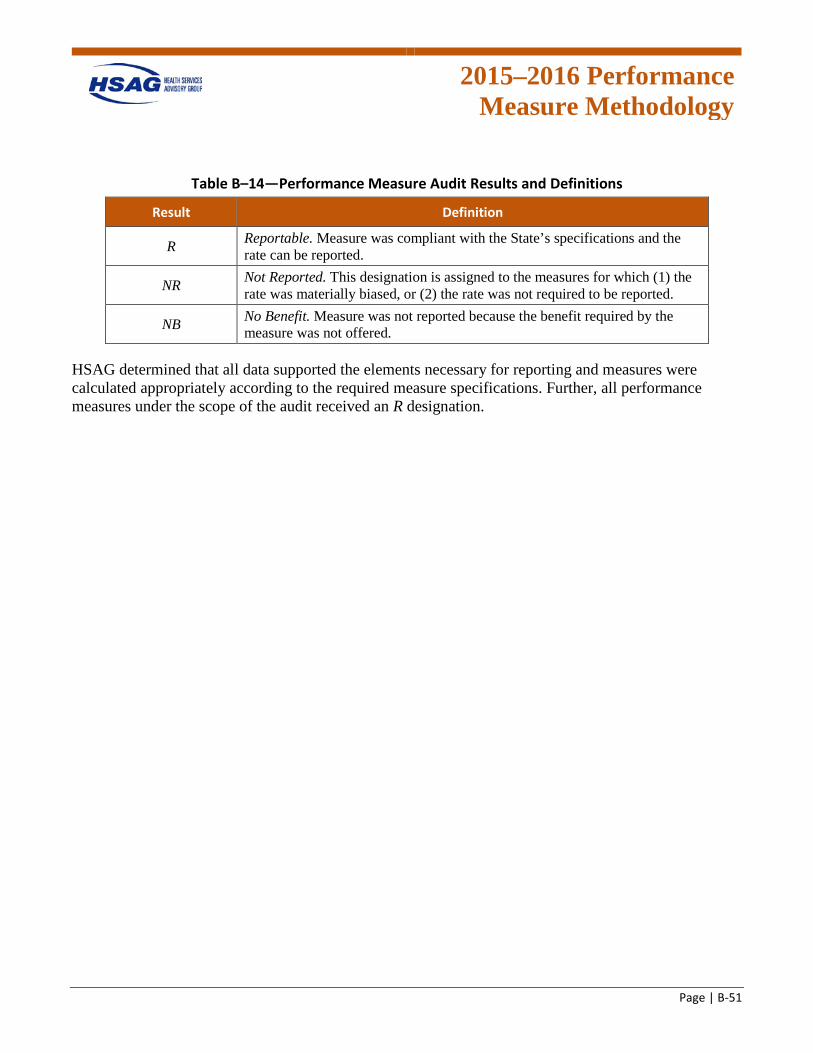
2015–2016 Performance
Measure Methodology
Page | B-51
Table B–14—Performance Measure Audit Results and Definitions
Result Definition
R Reportable. Measure was compliant with the State’s specifications and the rate can be reported.
NR Not Reported. This designation is assigned to the measures for which (1) the rate was materially biased, or (2) the rate was not required to be reported.
NB No Benefit. Measure was not reported because the benefit required by the measure was not offered.
HSAG determined that all data supported the elements necessary for reporting and measures were calculated appropriately according to the required measure specifications. Further, all performance measures under the scope of the audit received an R designation.
Page | C-1
Appendix C. 2016–2017 Performance Measure Methodology
2016–2017 Performance
Measure Methodology
Page | C-2
NCQA HEDIS Compliance Audit
Objectives
This section describes the evaluation of the Medicaid managed care health plans’ (health plans’) ability to collect and report on the performance measures accurately. The Healthcare Effectiveness Data and Information Set (HEDIS) performance measures are a nationally recognized set of performance measures developed by National Committee for Quality Assurance (NCQA). Healthcare purchasers use these measures to assess the quality and timeliness of care and service delivery to members of managed care delivery systems.
A key element of improving healthcare services is the ability to provide easily understood, comparable information on the performance of the health plans. Systematically measuring performance provides a common language based on numeric values and allows the establishment of benchmarks, or points of reference, for performance. Performance measure results allow the health plan to make informed judgments about the effectiveness of existing processes and procedures, identify opportunities for improvement, and determine if interventions or redesigned processes are meeting objectives. The Illinois Department of Healthcare and Family Services (HFS) requires the health plans to monitor and evaluate the quality of care using HEDIS and HFS-defined performance measures. The health plans must establish methods to determine if the administrative data are accurate for each measure. In addition, the health plans are required by contract to track and monitor each performance measure and applicable performance goal on an ongoing basis, and to implement a quality improvement initiative addressing compliance until the health plans meet the performance goal.
NCQA licenses organizations and certifies selected employees of licensed organizations to conduct performance measure audits using NCQA’s standardized audit methodology. The NCQA HEDIS Compliance Audit indicates the extent to which health plans have adequate and sound capabilities for processing medical, member, and provider information for accurate and automated performance measurement, including HEDIS reporting. The validation addresses the technical aspects of producing HEDIS data, including information practices and control procedures, sampling methods and procedures, data integrity, compliance with HEDIS specifications, and analytic file production.
Technical Methods of Data Collection and Analysis
HFS required that an NCQA-licensed audit organization conduct an independent audit of each health plan’s measurement year (MY) 2016 data. HFS contracted with Health Services Advisory Group, Inc. (HSAG) to conduct an audit for each Family Health Plan/Affordable Care Act (FHP/ACA) and Integrated Care Program (ICP) health plan. The audits were conducted in a manner consistent with NCQA’s HEDIS 2017, Volume 5: HEDIS Compliance Audit: Standards, Policies and Procedures. The audit incorporated two main components:
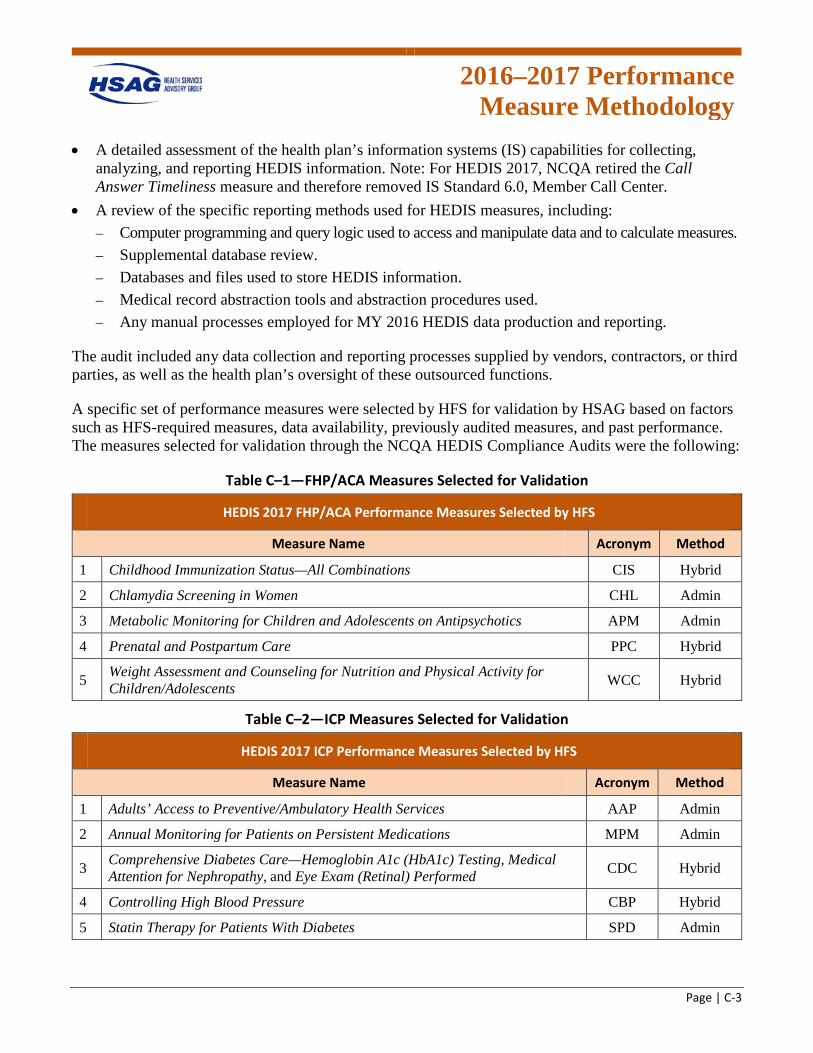
2016–2017 Performance
Measure Methodology
Page | C-3
• A detailed assessment of the health plan’s information systems (IS) capabilities for collecting, analyzing, and reporting HEDIS information. Note: For HEDIS 2017, NCQA retired the Call Answer Timeliness measure and therefore removed IS Standard 6.0, Member Call Center.
• A review of the specific reporting methods used for HEDIS measures, including: – Computer programming and query logic used to access and manipulate data and to calculate measures. – Supplemental database review. – Databases and files used to store HEDIS information. – Medical record abstraction tools and abstraction procedures used. – Any manual processes employed for MY 2016 HEDIS data production and reporting.
The audit included any data collection and reporting processes supplied by vendors, contractors, or third parties, as well as the health plan’s oversight of these outsourced functions.
A specific set of performance measures were selected by HFS for validation by HSAG based on factors such as HFS-required measures, data availability, previously audited measures, and past performance. The measures selected for validation through the NCQA HEDIS Compliance Audits were the following:
Table C–1—FHP/ACA Measures Selected for Validation
HEDIS 2017 FHP/ACA Performance Measures Selected by HFS Measure Name Acronym Method
1 Childhood Immunization Status—All Combinations CIS Hybrid
2 Chlamydia Screening in Women CHL Admin
3 Metabolic Monitoring for Children and Adolescents on Antipsychotics APM Admin
4 Prenatal and Postpartum Care PPC Hybrid
5 Weight Assessment and Counseling for Nutrition and Physical Activity for Children/Adolescents WCC Hybrid
Table C–2—ICP Measures Selected for Validation
HEDIS 2017 ICP Performance Measures Selected by HFS Measure Name Acronym Method
1 Adults’ Access to Preventive/Ambulatory Health Services AAP Admin
2 Annual Monitoring for Patients on Persistent Medications MPM Admin
3 Comprehensive Diabetes Care—Hemoglobin A1c (HbA1c) Testing, Medical Attention for Nephropathy, and Eye Exam (Retinal) Performed CDC Hybrid
4 Controlling High Blood Pressure CBP Hybrid
5 Statin Therapy for Patients With Diabetes SPD Admin
2016–2017 Performance
Measure Methodology
Page | C-4
HSAG used several different methods and information sources to conduct the audits, including:
• Teleconference calls with health plan personnel and vendor representatives, as necessary. • Detailed review of each health plan’s completed responses to the HEDIS 2017 Record of
Administration, Data Management and Processes (Roadmap) published by NCQA as Appendix 2 to NCQA’s HEDIS 2017, Volume 5: HEDIS Compliance Audit: Standards, Policies and Procedures, and updated information communicated by NCQA to the audit team directly.
• On-site meetings in the health plans’ offices, including staff interviews, live system and procedure documentation, documentation review and requests for additional information, primary HEDIS data source verification, programming logic review and inspection of dated job logs, computer database and file structure review, and discussion and feedback sessions.
• Detailed evaluation of computer programming used to access administrative data sets and calculate HEDIS measures.
• If the hybrid method was used, an abstraction of a sample of medical records selected by the auditors was compared to the results of the health plan’s review determinations for the same records.
• If supplemental data were used, primary source verification (PSV) of a sample of records was conducted from any nonstandard supplemental data sources.
• Requests for corrective actions and modifications to the health plan’s HEDIS data collection and reporting processes and data samples, as necessary, and verification that actions were taken.
• Accuracy checks of the final HEDIS rates completed by the health plan. • A variety of interviews with individuals whose department or responsibilities played a role in the
production of HEDIS data. Typically, such individuals included the HEDIS manager, IS director, quality management director, enrollment and provider data manager, medical records staff, claims processing staff, programmers, analysts, and others involved in the HEDIS preparation process. Representatives of vendors that calculated HEDIS 2017 (and earlier) performance measure data may also have been interviewed and asked to provide documentation of their work.
Each of the performance measures reviewed by HSAG were assigned a final audit result consistent with the NCQA categories listed below in Table C–3.
Table C–3—Performance Measure Audit Results and Definitions
Result Definition
R Reportable. A reportable rate was submitted for the measure. NR Not Reported. The organization chose not to report the measure.
NA Small Denominator. The organization followed the specifications, but the denominator was too small (<30) to report a valid rate.
NB No Benefit. The organization did not offer the health benefit required by the measure (e.g., mental health, chemical dependency).
NQ Not Required. The organization was not required to report the measure. BR Biased Rate. The calculated rate was materially biased.
UN Un-Audited. The organization chose to report a measure that is not required to be audited. This result applies only to a limited set of measures (e.g., measures collected using electronic clinical data systems).
2016–2017 Performance
Measure Methodology
Page | C-5
For measures reported as percentages, NCQA has defined significant bias as a deviation of more than 5 percentage points from the true percentage. (For certain measures, a deviation of more than 10 percentage points in the number of reported events determines a significant bias.)
For some measures, more than one rate is required for HEDIS reporting (e.g., Childhood Immunization Status and Prenatal and Postpartum Care). It is possible that the health plan prepared some of the rates required by the measure appropriately but had significant bias in others. According to NCQA guidelines, the health plan would receive a reportable result for the measure as a whole, but significantly biased rates within the measure would receive a BR result, where appropriate.
Upon completion of the audit, HSAG submitted a final audit report (FAR) to HFS and each health plan that included a completed and signed final audit statement.
For the MRRV portion of the audit, NCQA policies and procedures require auditors to perform two steps: (1) review the MRR processes employed by the health plan, including MRR staff qualifications, training, data collection instruments/tools, accuracy of data collection, vendor oversight, and the method used for combining MRR data with administrative data; and (2) complete MRRV, which involves the validation of the health plan’s abstraction accuracy for a sample of cases across the NCQA-designated measure groups and a comparison of HSAG’s validation results to the health plan’s abstraction results.
HSAG reviewed the processes in place at each health plan for MRR performance for all measures reported using the hybrid method. HSAG reviewed data collection tools and training materials to verify that all key HEDIS data elements were captured. Feedback was provided to each health plan if the data collection tools appeared to be missing necessary data elements.
HSAG completed the MRRV process and reabstracted sample records across the appropriate measure groups and compared the results to each health plan’s findings for the same medical records. This process provided an assessment of actual reviewer accuracy. HSAG randomly selected 16 cases from the MRR numerator positives as identified by each health plan. If fewer than 16 medical records were found to meet numerator compliance, all records were reviewed or additional records from another measure within the same group were added to equal 16 cases. If an abstraction discrepancy was noted, only critical errors were considered errors. A critical error is defined as an abstraction error that affected the final outcome of the numerator event (i.e., changed a positive event to a negative one or vice versa). If one critical error was noted, HSAG was required to retest a second sample of 16 records that did not include the original sampled records. If the second sample was free of errors, the measure and measure group passed. If one or more errors were detected, the measure and measure group did not pass validation and could not be reported until all errors were corrected and reviewed by the auditor. If there was not enough time to correct all errors, the health plan was not allowed to report the measure via the hybrid methodology.
2016–2017 Performance
Measure Methodology
Page | C-6
Plan-Specific Findings
NCQA HEDIS Compliance Audit Results for Aetna
HSAG conducted a 2017 NCQA HEDIS Compliance Audit of the data collection and reporting processes for Aetna Better Health’s (Aetna’s) FHP/ACA and ICP populations. The audit indicated that Aetna was fully compliant with the HEDIS IS standards for medical services data, membership data, provider data, medical record data, and supplemental data; all data for these IS standards supported the elements necessary for HEDIS reporting. Except for the SPD—Statin Adherence 80 Percent indicator for the ICP population, all HEDIS performance measures received an R designation and measure calculations resulted in rates that were not significantly biased. Due to an issue identified with a partial duplication of transaction data for the SPD—Statin Adherence 80 Percent indicator, there was a degree of bias that could not be determined prior to the data submission deadline, resulting in a designation of BR; therefore, HSAG determined Aetna was partially compliant with the HEDIS IS standard for data integration.
Table C–4—Aetna 2017 NCQA HEDIS Compliance Audit Results
Main Information Systems Selected MY 2016
HEDIS Measure Results
Membership Data
Medical Services
Data
Provider Data
Data Integration
Medical Record
Data
Supplemental Data
All selected HEDIS measures except SPD-
Statin Adherence
Fully Compliant
Fully Compliant
Fully Compliant
Partially Compliant
Fully Compliant
Fully Compliant
80% received an R designation. SPD—
Statin Adherence 80% received a BR designation.
The rationale for full compliance with the HEDIS IS standards was based on the findings summarized below. Any deviations from the standards that could bias the final results were identified. Recommendations for improving MCO processes were also identified.
IS 1.0—Medical Services Data—Sound Coding Methods and Data Capture, Transfer, and Entry
Aetna was fully compliant with IS Standard 1.0. Aetna processed claims through a longstanding process that included electronic submission in 837 format. Validation of member, provider, diagnosis codes, and procedure codes were conducted. Approximately 88 percent of claims were mass adjudicated and required no manual processing. Monthly oversight audits and weekly meetings were conducted with Change Healthcare, Aetna’s imaging vendor. The same vendor has been used for over 10 years and routinely meets service standards. No deficiencies were experienced, and no corrective actions were required during 2016.
2016–2017 Performance
Measure Methodology
Page | C-7
Global billing codes were received for maternity services. The date of service provided with the claims varied depending on the care provided. In instances where the same provider provided care through the entire pregnancy, the date of the first service was used.
Pharmacy data from CVS Caremark were monitored through several routine meetings and reporting. Data were loaded into the plan audit data tables and reviewed for accuracy and completeness through a standard set of reports that included volume and accuracy testing. Quarterly rebate reports were reviewed to reconcile payments with encounters received. During 2016, corrective actions were put in place to correct deficiencies (e.g., rejected claims).
Quest Lab data services were captured through the standard claims processing system and paid on a fee-for-service (FFS) basis.
As a follow-up to the on-site visit, Aetna provided a report documenting claim processing times. The report stated that 97.39 percent of the claims processed manually during 2017 were finalized within 30 days of receipt.
IS 2.0—Enrollment Data—Data Capture, Transfer, and Entry
Aetna was fully compliant with IS Standard 2.0. Enrollment data were maintained in the QNXT system. The data structure included fields for all data elements necessary to support HEDIS reporting. The system walkthrough during the on-site demonstrated that all relevant data fields were populated and that sufficient enrollment history is maintained.
Monthly and daily 834 files were received from the State and processed. Validation controls were in place to identify inconsistencies and changes in data. Exception reports were produced and worked manually by plan staff. The typical exception rate was approximately 1 to 5 percent. Monthly files were used for full reconciliations. In addition, capitation payment was reconciled against enrollment files quarterly and showed an average concordance of 99.5 percent.
Newborn records were received in monthly files. Typically, newborns were assigned the mother’s ID with an "NB" attached to the beginning of the ID and were updated when the newborn received a unique ID from the State. Unique ID numbers were added to the enrollment records when provided by the State, and all enrollment and claims history was linked.
FHP/ACA membership has been increasing while the ICP membership has remained steady. Overall membership and demographic characteristics of the plan’s membership during 2016 was examined through the Group 1: Overall Demographics query. For both the FHP/ACA and ICP populations, the query results provided by the plan revealed only small and reasonable shifts in member counts across the age bands throughout the year.
IS 3.0—Practitioner Data—Data Capture, Transfer, and Entry
Aetna was fully compliant with IS Standard 3.0. Practitioner data were managed through the provider change request (PCR) process and the PDS Department. Provider additions, modifications, and
2016–2017 Performance
Measure Methodology
Page | C-8
terminations were made through this process. All PCR work requisitions were audited by the initiator when complete, and performance was reported/monitored through weekly team meetings. A sample PDS Summary by Plan Department report was provided as an example of how the plan monitored the accuracy of the PCR processing. For PCRs submitted from January 1, 2016, through September 30, 2016, the accuracy rate reported was 99.45 percent. The average turnaround time for completion was approximately three days.
Provider groups delegated for credentialing were added and changed in the QNXT system through the PCR process. Delegates provided monthly addition/termination files, and a quarterly reconciliation was conducted.
For the ICP product, the plan reported a significant increase in the number of primary care providers (PCPs) from 2015 to 2016. The plan indicated during on-site interviews that the numbers reported in the Roadmap may have included providers outside the ICP provider panel. The plan submitted corrected numbers which still appeared disproportionate to the changes in membership during 2016. The plan provided corrected numbers in a revised Section 3b. The restated numbers were in line with the prior year and with membership changes during 2016.
As a follow-up to the on-site visit, Aetna stated that 26 percent of the provider network is contracted through a delegated provider group.
As part of the data validation process of the audit, Aetna was asked to submit results for the Group 6: Mapping Result Checks query to confirm accurate implementation of the approved provider specialty to HEDIS provider type crosswalk. Aetna provided the provider table from Inovalon’s Quality Spectrum Insight (QSI) software for review. No anomalies were found in the data provided by the plan.
IS 4.0—Medical Record Review Processes—Training, Sampling, Abstraction, and Oversight
Aetna was fully compliant with IS Standard 4.0. HSAG reviewed Aetna’s IS 4 Roadmap pertaining to the policies and procedures for IS Standard 4.0. The Roadmap review found these policies and procedures to be consistent with IS 4.0 requirements.
Aetna sampled according to the HEDIS sampling guidelines and assigned measure-specific oversamples. Provider chase logic was reviewed and determined appropriate across the hybrid measures.
Aetna staff used Inovalon’s Quality Spectrum Hybrid Reporter (QSHR) hybrid medical record abstraction tools. HSAG participated in a live vendor demonstration of the QSHR abstraction tools and instructions. All fields, edits, and drop-down boxes were reviewed for accuracy against NCQA’s HEDIS 2017, Volume 2, Technical Specifications for Health Plans. HSAG reviewed and approved QSHR’s hybrid tools and instructions on January 20, 2017.
Aetna utilized internal staff to conduct MRR and quality assurance. Staff members were sufficiently qualified and trained in the current year’s HEDIS technical specifications and the use of QSHR’s abstraction tools to accurately conduct MRR. Aetna maintained appropriate quality assurance of reviews, including over-reads of all abstractions resulting in numerator positives or exclusions, and a
2016–2017 Performance
Measure Methodology
Page | C-9
random sample of numerator negatives. HSAG reviewed Aetna’s abstraction training manual and found no concerns.
Aetna passed the MRRV in 2016 and did not make any significant changes to its staff, systems, or processes used for medical record review in 2017; therefore, a convenience sample was not required.
Aetna passed the MRRV process for the following measures and corresponding measure groups:
• Group A: Biometrics (BMI, BP) and Maternity—CBP • Group B: Anticipatory Guidance and Counseling—WCC—Counseling for Nutrition • Group C: Laboratory—CDC—HbA1c Testing • Group C: Laboratory—CDC—Medical Attention for Nephropathy • Group D: Immunizations and Other Screenings—CDC—Eye Exam (Retinal) Performed • Group D: Immunizations and Other Screenings—CIS—Combination 10 • Group F: Exclusions—All medical record exclusions
Of note, for CDC—Eye Exam (Retinal) Performed, critical errors were identified in the first sample and, therefore, a second sample was required; however, the second sample passed.
IS 5.0—Supplemental Data—Capture, Transfer, and Entry
Aetna was fully compliant with IS Standard 5.0.
Aetna used five supplemental databases. The auditor determined that four of the five databases were standard supplemental databases, and one was a nonstandard supplemental database and required PSV. At the time the Roadmap was submitted, Table 5.6 and Attachment 5.7 of the Roadmap were incomplete in all five Section 5s.
Aetna followed the same routine transfer, receipt, process, verification, reconciliation, and data integration steps for each of the five supplemental databases.
Quest Lab—For this data source, complete documentation was received prior to the March 31, 2017, deadline for supplemental data approval. Aetna received weekly lab result files for members identified through the eligibility roster provided to Quest by the plan. Data were loaded into the plan data audit tables. Files were received with member keys, and no manual transformations were required. Review of the database showed all relevant fields were included (i.e., member, Logical Observation Identifiers Names and Codes [LOINC], Current Procedural Terminology [CPT]). The volume of records received was reconciled with record counts through the plan’s Complete, Accurate, Timely (CAT) reports. No meaningful discrepancies were observed. Review of raw data during the on-site found all relevant fields were populated.
State Encounter Files (Medical/Institutional)—For this data source, complete documentation was received prior to the March 31, 2017, deadline for supplemental data approval.
2016–2017 Performance
Measure Methodology
Page | C-10
Cornerstone and Illinois Comprehensive Automated Immunization Registry Exchange (I-CARE) Immunization Registry—For this data source, complete documentation was received prior to the March 31, 2017, deadline for supplemental data approval. Data files contained descriptions of antigens which were mapped using a state-provided crosswalk which the plan provided during the on-site review.
Year Round MRR—Complete Roadmap documentation was received for all five sources, including updated Section 5s for each source with final rate impact calculations. For the one nonstandard data source, Year Round MRR, the data file provided by the plan for determining the sample of records for proof-of-service (POS) documentation showed that data for the CDC, CHL, CIS, PPC, and WCC measures were collected through this database. A sample of 50 records from the 2,790 records related to these measures was requested for validation. Aetna provided POS documentation for all 50 records and no issues were found. This data source was approved to include for HEDIS 2017 reporting.
March Vision Supplemental Encounters—For this data source, complete documentation was received prior to the March 31, 2017, deadline for supplemental data approval.
IS 7.0—Data Integration—Accurate Reporting, Control Procedures That Support Measure Reporting Integrity
Aetna was partially compliant with IS Standard 7.0. Aetna integrated several supplemental data sources with transaction data sources, including external encounter data, immunization registry data, and lab results data. All data were extracted from the enterprise data warehouse (EDW) and loaded into the Inovalon tool. Data integration was well documented through the CAT reporting system which provided balancing comparisons between data records in the warehouse and those loaded into the tool. On-site queries tracing members in measure populations through data files in the Inovalon tool, EDW, and source systems were conducted. No anomalies were found. The final CAT report submitted by Aetna was accepted in lieu of the Group 2: Data Loading Checks data loading query.
Aetna loaded state-provided pharmacy encounter data into the QSI repository as core encounter data were causing partial duplication of transactions. The impact of the duplicate data caused a degree of bias in the ICP SPD—Statin Adherence 80 Percent measure indicator that could not be determined prior to the June 15, 2017 submission deadline. An audit designation of BR was issued for this measure indicator for the ICP population.
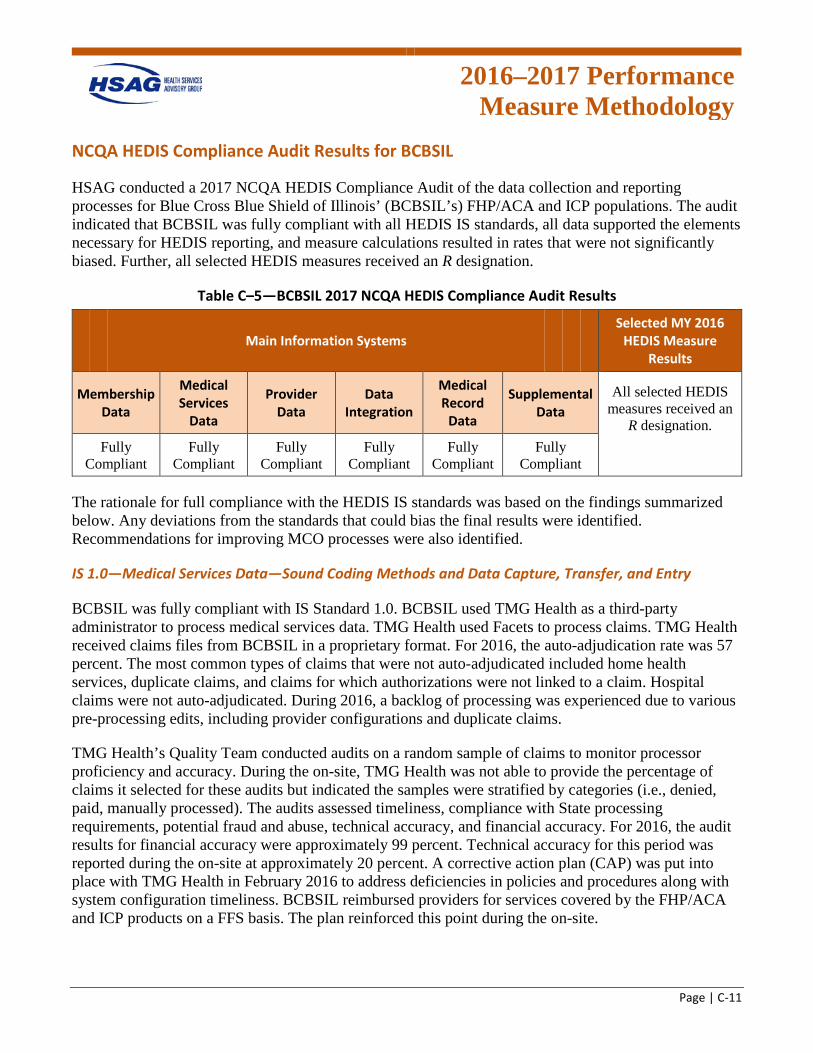
2016–2017 Performance
Measure Methodology
Page | C-11
NCQA HEDIS Compliance Audit Results for BCBSIL
HSAG conducted a 2017 NCQA HEDIS Compliance Audit of the data collection and reporting processes for Blue Cross Blue Shield of Illinois’ (BCBSIL’s) FHP/ACA and ICP populations. The audit indicated that BCBSIL was fully compliant with all HEDIS IS standards, all data supported the elements necessary for HEDIS reporting, and measure calculations resulted in rates that were not significantly biased. Further, all selected HEDIS measures received an R designation.
Table C–5—BCBSIL 2017 NCQA HEDIS Compliance Audit Results
Main Information Systems Selected MY 2016
HEDIS Measure Results
Membership Data
Medical Services
Data
Provider Data
Data Integration
Medical Record
Data
Supplemental Data
All selected HEDIS measures received an
R designation. Fully
Compliant Fully
Compliant Fully
Compliant Fully
Compliant Fully
Compliant Fully
Compliant
The rationale for full compliance with the HEDIS IS standards was based on the findings summarized below. Any deviations from the standards that could bias the final results were identified. Recommendations for improving MCO processes were also identified.
IS 1.0—Medical Services Data—Sound Coding Methods and Data Capture, Transfer, and Entry
BCBSIL was fully compliant with IS Standard 1.0. BCBSIL used TMG Health as a third-party administrator to process medical services data. TMG Health used Facets to process claims. TMG Health received claims files from BCBSIL in a proprietary format. For 2016, the auto-adjudication rate was 57 percent. The most common types of claims that were not auto-adjudicated included home health services, duplicate claims, and claims for which authorizations were not linked to a claim. Hospital claims were not auto-adjudicated. During 2016, a backlog of processing was experienced due to various pre-processing edits, including provider configurations and duplicate claims.
TMG Health’s Quality Team conducted audits on a random sample of claims to monitor processor proficiency and accuracy. During the on-site, TMG Health was not able to provide the percentage of claims it selected for these audits but indicated the samples were stratified by categories (i.e., denied, paid, manually processed). The audits assessed timeliness, compliance with State processing requirements, potential fraud and abuse, technical accuracy, and financial accuracy. For 2016, the audit results for financial accuracy were approximately 99 percent. Technical accuracy for this period was reported during the on-site at approximately 20 percent. A corrective action plan (CAP) was put into place with TMG Health in February 2016 to address deficiencies in policies and procedures along with system configuration timeliness. BCBSIL reimbursed providers for services covered by the FHP/ACA and ICP products on a FFS basis. The plan reinforced this point during the on-site.
2016–2017 Performance
Measure Methodology
Page | C-12
During the on-site, TMG Health provided a system walk-through to demonstrate the ability of the Facets system to capture data elements required to support HEDIS reporting. The walk-through confirmed that Facets had processes to validate procedure codes, diagnosis codes, eligibility, and provider affiliation.
As part of the audit query process, monthly pharmacy record counts by product for 2016 loaded into the QSI data repository were reviewed for the Group 2: Data Loading Checks query. Data provided by the plan demonstrated consistent monthly record counts for both products documenting accurate and complete pharmacy data.
IS 2.0—Enrollment Data—Data Capture, Transfer, and Entry
BCBSIL was fully compliant with IS Standard 2.0. BCBSIL received daily enrollment files with additions, terminations, and PCP information. Monthly 834 audit files were also received from the State and were reconciled with the information received in the daily files and then loaded in Facets. Separate files were received for each product (i.e., FHP/ACA, ICP). Approximately 98 percent of the records contained in the State files loaded without any issues. The most common issues causing records to require correction were related to discrepancies in member contact information (name, phone number). The TMG Quality Team monitored the accuracy of the enrollment data, in part, through the TMG Monthly Enrollment Recon Report.
BCBSIL conducted routine oversight of membership data processed by TMG through a set of “Absent on Recon” (AOR) with a re-review monthly. AOR identified members who failed to load into Facets. BCBSIL investigated issues and provided corrected information back to TMG for correction.
Facets enrollment screens and the process for editing enrollment data were demonstrated during the on-site review. All data elements required to support HEDIS reporting were present in the Facets system. Member eligibility history was present and product-specific identifiers were confirmed during the demonstration.
Overall membership and demographic characteristics of the plan’s membership during 2016 were examined through the Group 1: Overall Demographics query. The query results provided by the plan revealed only small, reasonable shifts in member counts across the age bands throughout the year.
IS 3.0—Practitioner Data—Data Capture, Transfer, and Entry
BCBSIL was fully compliant with IS Standard 3.0. BCBSIL maintained practitioner data in Premier Provider and Facets. Credentialing and contracting data were maintained in the Premier Provider system. Daily files were exported and transferred to TMG Health via a file transfer protocol (FTP) site. Weekly reports (Control 77 Premier—Facets Error Report) were produced and reviewed to ensure agreement between the two systems. The report compared the full set of practitioner data in each system. The agreement rate between the two systems was consistently over 95 percent. In 2016, both the FHP/ACA and ICP provider network grew significantly to accommodate the increase in membership. During the on-site, system demonstrations were conducted for both the Premier Provider and Facets provider systems. Two providers were reviewed in both systems to verify agreement of the data in the
2016–2017 Performance
Measure Methodology
Page | C-13
systems. All data elements, including specialty and active contract segments, matched across the two systems.
During the review of the plan’s native provider specialty codes to HEDIS provider type crosswalk, 61 of the 1,483 records were identified for closer review. These records were found to be noncompliant with the technical specifications. Further investigation was conducted to evaluate the potential bias these records introduced into measures with provider specialty requirements. The plan provided counts of denominator and numerator compliance by native specialty code for the PPC, CDC, and WCC measures. Based on the investigation, the bias on the reported population rate with no change in the provider specialty mappings was found to be less than 0.00, 1.89, and 0.29 percentage points for each measure, respectively. Additional investigation was conducted to determine the impact on the final reported rate for the sample. For all three measures, no sample members were found to have claims from providers with noncompliant specialty mappings. The Group 6: Mapping Result Checks query was conducted to verify no changes were made to the approved provider specialty to provider type crosswalk.
IS 4.0—Medical Record Review Processes—Training, Sampling, Abstraction, and Oversight
BCBSIL was fully compliant with IS Standard 4.0. HSAG reviewed BCBSIL’s IS 4 Roadmap pertaining to the policies and procedures for IS Standard 4.0. The Roadmap review found these policies and procedures to be consistent with IS 4.0 requirements.
BCBSIL sampled according to the HEDIS sampling guidelines and assigned measure-specific oversamples. Provider chase logic was reviewed and determined appropriate across the hybrid measures.
BCBSIL staff used Inovalon’s medical record abstraction tool, QSHR. HSAG participated in a live vendor demonstration of the QSHR tool and instructions. All fields, edits, and drop-down boxes were reviewed for accuracy against NCQA’s HEDIS 2017, Volume 2, Technical Specifications for Health Plans. HSAG reviewed and approved QSHR’s hybrid tool and instructions on January 20, 2017.
BCBSIL utilized internal staff members to conduct MRRs and quality assurance. Staff members were sufficiently qualified and trained in the current year’s HEDIS technical specifications and the use of QSHR’s abstraction tool to accurately conduct MRRs. HSAG reviewed BCBSIL’s training manual and had no concerns.
BCBSIL maintained appropriate quality assurance of reviews, including over-reads of all abstractions resulting in numerator positives or exclusions, and a random sample of numerator negatives.
Due to revisions to several measure specifications for 2017 and a new measure for BCBSIL, a convenience sample was requested for the following measures:
• CBP • PPC—Timeliness of Prenatal Care and Postpartum Care • WCC—BMI Percentile, Counseling for Nutrition, and Counseling for Physical Activity
2016–2017 Performance
Measure Methodology
Page | C-14
• CDC—HbA1c Testing, Medical Attention for Nephropathy, and Eye Exam (Retinal) Performed • CIS
Critical errors were identified with CDC—HbA1c Testing during the convenience sample process; however, a resample was performed and no issues were identified. All other convenience samples passed.
BCBSIL passed the MRRV process for the following measures and corresponding measure groups:
• Group A: Biometrics (BMI, BP) and Maternity—CBP • Group B: Anticipatory Guidance and Counseling—WCC—Counseling for Nutrition • Group C: Laboratory—CDC—HbA1c Testing • Group C: Laboratory—CDC—Medical Attention for Nephropathy • Group D: Immunizations and Other Screenings—CIS—Combination 10
There were no exclusions to validate.
IS 5.0—Supplemental Data—Capture, Transfer, and Entry
BCBSIL was fully compliant with IS Standard 5.0. BCBSIL submitted documentation for two standard supplemental data sources for the purposes of reporting the FHP/ACA and ICP measures. Complete documentation was provided with the Roadmap. Both data sources met the requirements to be reviewed as external, standard data. BCBSIL had sufficient processes in place to ensure these data were loaded correctly and had appropriate validation processes. Both the LabCorp and Quest Diagnostic data sources were approved to use for HEDIS 2017 reporting.
IS 7.0—Data Integration—Accurate Reporting, Control Procedures That Support Measure Reporting Integrity
BCBSIL was fully compliant with IS Standard 7.0. Claims data from TMG Health and Prime Therapeutics, and supplemental data from lab vendors were maintained in the plan’s EDW. The files were formatted and made available directly in the EDW as well. BCBSIL data warehouse teams followed industry standard processes for validating data transfers into the EDW.
For HEDIS 2017, BCBSIL used Inovalon’s QSI software. BCBSIL had a sound process for validating data loads into the QSI repository and tracking record counts for each data source through a simple spreadsheet referred to as the Data Quality Report (“DQR”). During the load process, the standard reports produced by QSI were reviewed. During the on-site, a demonstration of the process was performed and a review of the QSI load validation reports was provided. Monthly data refreshes and rate calculations were performed and reviewed for reasonability and accuracy based on prior month reports.
On-site queries included record tracing for members for the CIS and MPM measures. For each member, enrollment data and administrative data in the QSI repository were reviewed to confirm compliance with
2016–2017 Performance
Measure Methodology
Page | C-15
measure specifications; then, the data elements used to meet the specifications were viewed in the source systems to confirm agreement.
The provider specialty to HEDIS provider type crosswalk was reviewed during the on-site to address some possible changes to a subset of provider specialties being mapped to a PCP. To assess the impact on the measures with specialty requirements, BCBSIL was asked to provide counts of claims and associated procedure codes for the specialties being questioned. The plan provided counts of denominator and numerator compliance by native specialty code for the PPC, CDC, and WCC measures. Based on the investigation, the bias on the reported population rate with no change in the provider specialty mappings was found to be less than 0.00, 1.89, and 0.29 percentage points for each measure, respectively. Additional investigation was conducted to determine the impact on the final reported rate for the sample. For all three measures, no sample members were found to have claims from providers with noncompliant specialty mappings. The Group 6: Mapping Result Checks query was conducted to verify no changes were made to the approved provider specialty to provider type crosswalk.
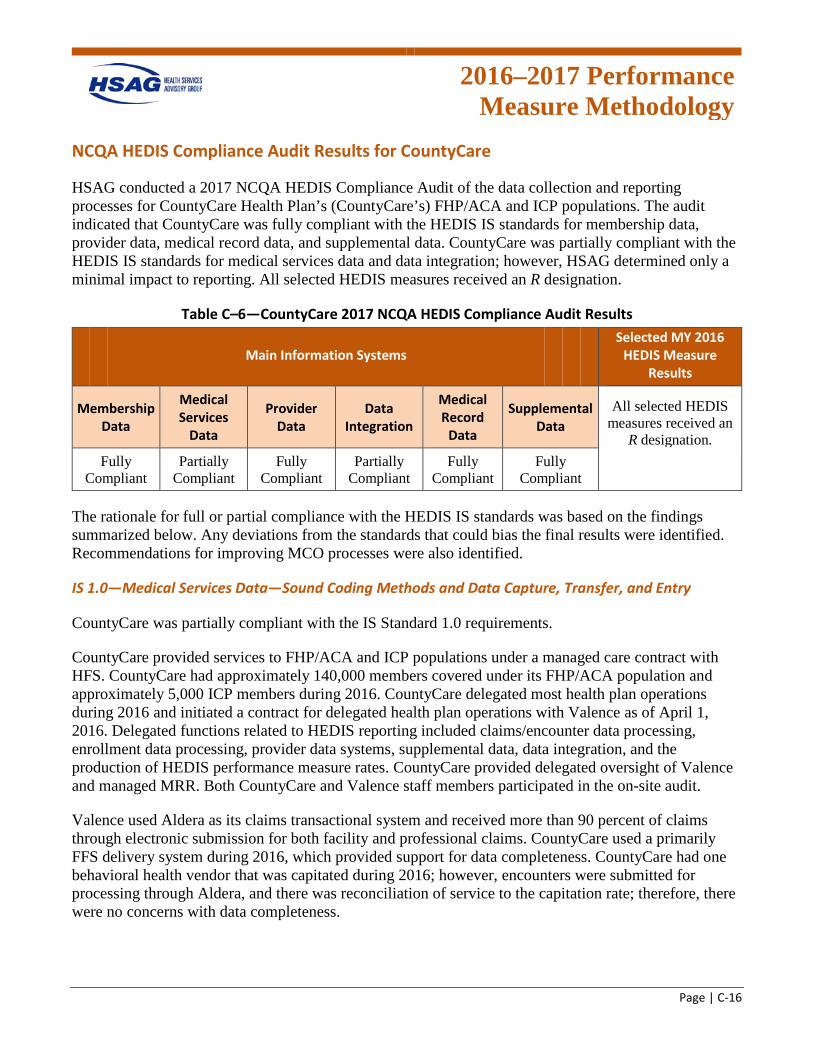
2016–2017 Performance
Measure Methodology
Page | C-16
NCQA HEDIS Compliance Audit Results for CountyCare
HSAG conducted a 2017 NCQA HEDIS Compliance Audit of the data collection and reporting processes for CountyCare Health Plan’s (CountyCare’s) FHP/ACA and ICP populations. The audit indicated that CountyCare was fully compliant with the HEDIS IS standards for membership data, provider data, medical record data, and supplemental data. CountyCare was partially compliant with the HEDIS IS standards for medical services data and data integration; however, HSAG determined only a minimal impact to reporting. All selected HEDIS measures received an R designation.
Table C–6—CountyCare 2017 NCQA HEDIS Compliance Audit Results
Main Information Systems Selected MY 2016
HEDIS Measure Results
Membership Data
Medical Services
Data
Provider Data
Data Integration
Medical Record
Data
Supplemental Data
All selected HEDIS measures received an
R designation. Fully
Compliant Partially
Compliant Fully
Compliant Partially
Compliant Fully
Compliant Fully
Compliant
The rationale for full or partial compliance with the HEDIS IS standards was based on the findings summarized below. Any deviations from the standards that could bias the final results were identified. Recommendations for improving MCO processes were also identified.
IS 1.0—Medical Services Data—Sound Coding Methods and Data Capture, Transfer, and Entry
CountyCare was partially compliant with the IS Standard 1.0 requirements.
CountyCare provided services to FHP/ACA and ICP populations under a managed care contract with HFS. CountyCare had approximately 140,000 members covered under its FHP/ACA population and approximately 5,000 ICP members during 2016. CountyCare delegated most health plan operations during 2016 and initiated a contract for delegated health plan operations with Valence as of April 1, 2016. Delegated functions related to HEDIS reporting included claims/encounter data processing, enrollment data processing, provider data systems, supplemental data, data integration, and the production of HEDIS performance measure rates. CountyCare provided delegated oversight of Valence and managed MRR. Both CountyCare and Valence staff members participated in the on-site audit.
Valence used Aldera as its claims transactional system and received more than 90 percent of claims through electronic submission for both facility and professional claims. CountyCare used a primarily FFS delivery system during 2016, which provided support for data completeness. CountyCare had one behavioral health vendor that was capitated during 2016; however, encounters were submitted for processing through Aldera, and there was reconciliation of service to the capitation rate; therefore, there were no concerns with data completeness.
2016–2017 Performance
Measure Methodology
Page | C-17
Valence only accepted the submission of industry-standard claims forms. In addition, Valence did not accept or use any nonstandard coding schemes; therefore, there was no code mapping. The plan did have some maternity codes included under global billing but in general used a FFS reimbursement methodology for most maternity services.
For the small amount of paper claims received, Valence used HealthChange to scan the paper claims using optical character recognition (OCR) software. Paper claims were formatted into an electronic claims file for processing into Aldera. There was appropriate oversight and monitoring of the scanning process.
Valence had appropriate edits in place at the clearinghouse level for formatting as well as member validation within the Aldera system for appropriate codes and required fields. Aldera used a grouper for the purposes of claims payment; however, all codes submitted on the claims were retained for HEDIS reporting.
Valence noted a backlog of claims during 2016 impacting data completeness for fourth quarter data. Most of the backlog was addressed in December 2016, with the backlog completed in January 2017. The impact to HEDIS reporting for the measures under the scope of the audit included the PPC measure. The auditor requested that Valence produce the volume of maternity facility claims with a January–November 2016 date of service that were still in a pended status. The volume was reviewed, and the impact to HEDIS reporting was minimal for the measures under the scope of the audit.
Claims processing handled prior to April 1, 2016, was managed by IlliniCare Health Plan, Inc., using the same processes in place during the prior measurement year, and no concerns with this process were identified.
Valence managed the processing of all behavioral health claims through Aldera, and behavioral health claims followed the same process as medical service claims.
Vision services were managed by a vendor, EyeQuest, during 2016. The proprietary code mapping was reviewed and approved. There was adequate oversight of the claims processing vendor, and no concerns were identified.
As of April 1, 2016, CountyCare used a new pharmacy benefit manager (PBM), OptumRx. There was adequate monitoring and oversight of OptumRx, and there were no concerns identified. Historical pharmacy data were received and loaded to the data warehouse for HEDIS reporting with sufficient reconciliation, and there were no concerns with data loss.
IS 2.0—Enrollment Data—Data Capture, Transfer, and Entry
CountyCare was fully compliant with the IS Standard 2.0 requirements. Valence processed separate daily files received from HFS for the FHP/ACA and ICP populations. Each 834 file was received through an automated process and loaded into Aldera. In addition to the daily file that contained additions, terminations, and changes, Valence received and processed a full monthly file from HFS. Valence used the Medicaid identification (ID) number provided by the State as its unique member ID for
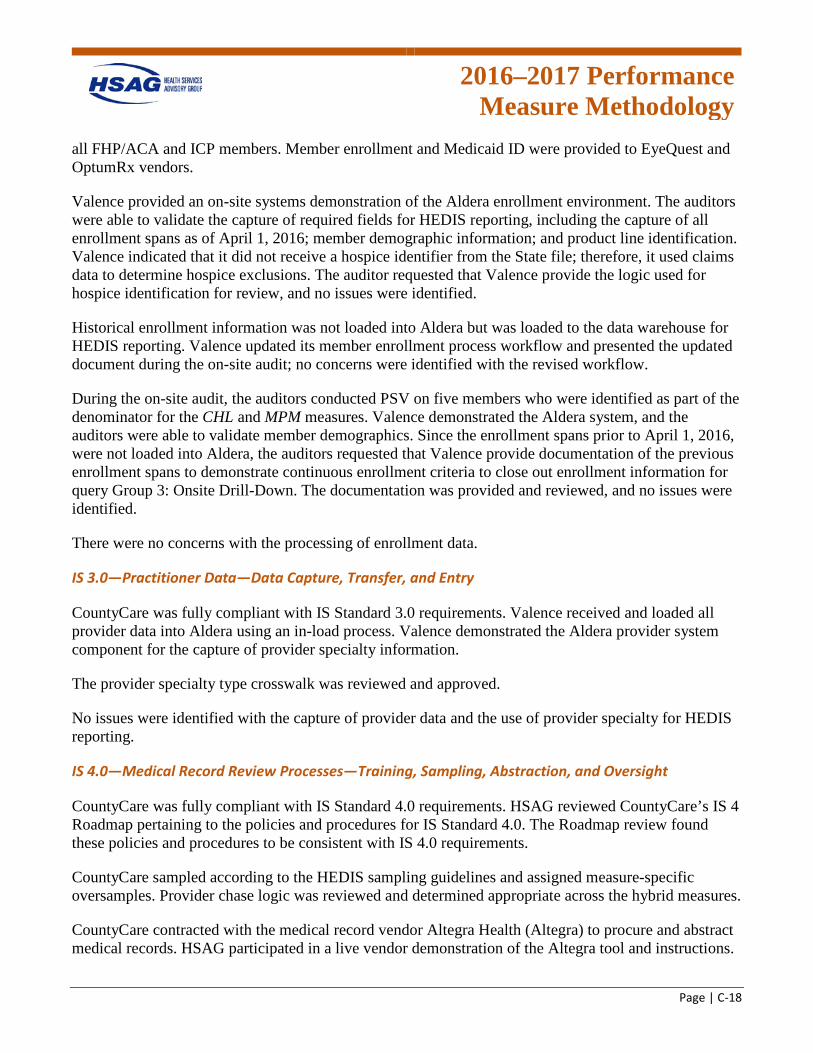
2016–2017 Performance
Measure Methodology
Page | C-18
all FHP/ACA and ICP members. Member enrollment and Medicaid ID were provided to EyeQuest and OptumRx vendors.
Valence provided an on-site systems demonstration of the Aldera enrollment environment. The auditors were able to validate the capture of required fields for HEDIS reporting, including the capture of all enrollment spans as of April 1, 2016; member demographic information; and product line identification. Valence indicated that it did not receive a hospice identifier from the State file; therefore, it used claims data to determine hospice exclusions. The auditor requested that Valence provide the logic used for hospice identification for review, and no issues were identified.
Historical enrollment information was not loaded into Aldera but was loaded to the data warehouse for HEDIS reporting. Valence updated its member enrollment process workflow and presented the updated document during the on-site audit; no concerns were identified with the revised workflow.
During the on-site audit, the auditors conducted PSV on five members who were identified as part of the denominator for the CHL and MPM measures. Valence demonstrated the Aldera system, and the auditors were able to validate member demographics. Since the enrollment spans prior to April 1, 2016, were not loaded into Aldera, the auditors requested that Valence provide documentation of the previous enrollment spans to demonstrate continuous enrollment criteria to close out enrollment information for query Group 3: Onsite Drill-Down. The documentation was provided and reviewed, and no issues were identified.
There were no concerns with the processing of enrollment data.
IS 3.0—Practitioner Data—Data Capture, Transfer, and Entry
CountyCare was fully compliant with IS Standard 3.0 requirements. Valence received and loaded all provider data into Aldera using an in-load process. Valence demonstrated the Aldera provider system component for the capture of provider specialty information.
The provider specialty type crosswalk was reviewed and approved.
No issues were identified with the capture of provider data and the use of provider specialty for HEDIS reporting.
IS 4.0—Medical Record Review Processes—Training, Sampling, Abstraction, and Oversight
CountyCare was fully compliant with IS Standard 4.0 requirements. HSAG reviewed CountyCare’s IS 4 Roadmap pertaining to the policies and procedures for IS Standard 4.0. The Roadmap review found these policies and procedures to be consistent with IS 4.0 requirements.
CountyCare sampled according to the HEDIS sampling guidelines and assigned measure-specific oversamples. Provider chase logic was reviewed and determined appropriate across the hybrid measures.
CountyCare contracted with the medical record vendor Altegra Health (Altegra) to procure and abstract medical records. HSAG participated in a live vendor demonstration of the Altegra tool and instructions.
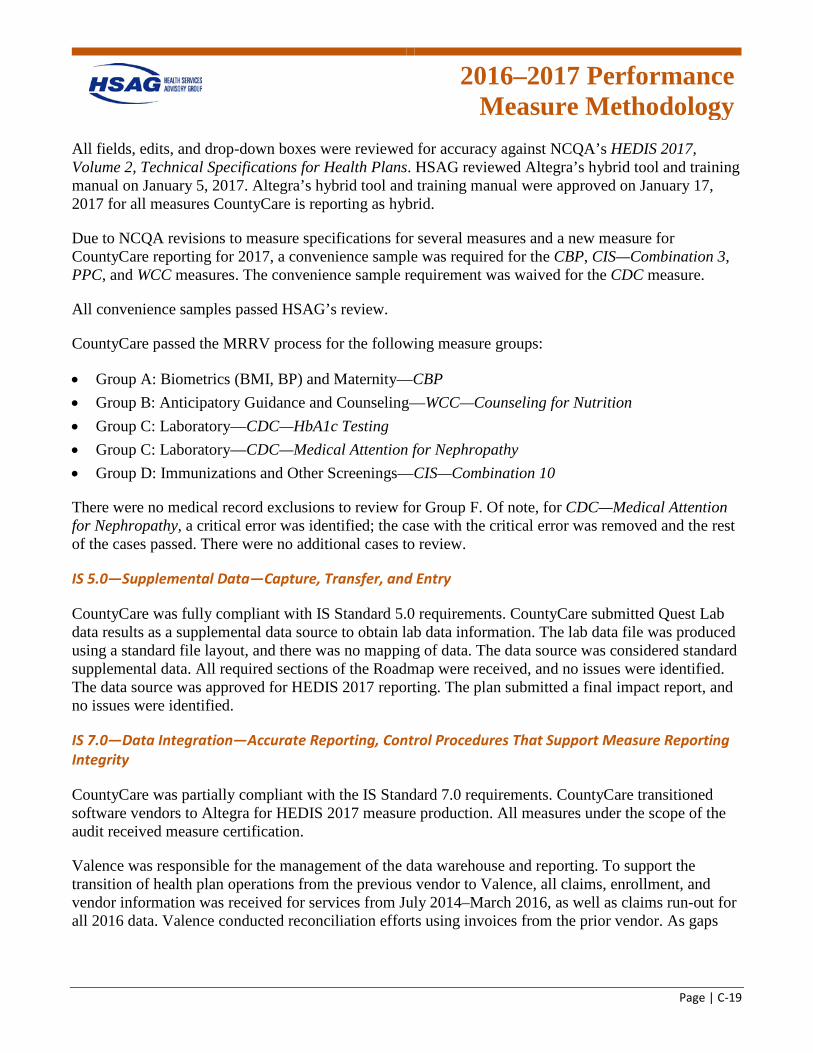
2016–2017 Performance
Measure Methodology
Page | C-19
All fields, edits, and drop-down boxes were reviewed for accuracy against NCQA’s HEDIS 2017, Volume 2, Technical Specifications for Health Plans. HSAG reviewed Altegra’s hybrid tool and training manual on January 5, 2017. Altegra’s hybrid tool and training manual were approved on January 17, 2017 for all measures CountyCare is reporting as hybrid.
Due to NCQA revisions to measure specifications for several measures and a new measure for CountyCare reporting for 2017, a convenience sample was required for the CBP, CIS—Combination 3, PPC, and WCC measures. The convenience sample requirement was waived for the CDC measure.
All convenience samples passed HSAG’s review.
CountyCare passed the MRRV process for the following measure groups:
• Group A: Biometrics (BMI, BP) and Maternity—CBP • Group B: Anticipatory Guidance and Counseling—WCC—Counseling for Nutrition • Group C: Laboratory—CDC—HbA1c Testing • Group C: Laboratory—CDC—Medical Attention for Nephropathy • Group D: Immunizations and Other Screenings—CIS—Combination 10
There were no medical record exclusions to review for Group F. Of note, for CDC—Medical Attention for Nephropathy, a critical error was identified; the case with the critical error was removed and the rest of the cases passed. There were no additional cases to review.
IS 5.0—Supplemental Data—Capture, Transfer, and Entry
CountyCare was fully compliant with IS Standard 5.0 requirements. CountyCare submitted Quest Lab data results as a supplemental data source to obtain lab data information. The lab data file was produced using a standard file layout, and there was no mapping of data. The data source was considered standard supplemental data. All required sections of the Roadmap were received, and no issues were identified. The data source was approved for HEDIS 2017 reporting. The plan submitted a final impact report, and no issues were identified.
IS 7.0—Data Integration—Accurate Reporting, Control Procedures That Support Measure Reporting Integrity
CountyCare was partially compliant with the IS Standard 7.0 requirements. CountyCare transitioned software vendors to Altegra for HEDIS 2017 measure production. All measures under the scope of the audit received measure certification.
Valence was responsible for the management of the data warehouse and reporting. To support the transition of health plan operations from the previous vendor to Valence, all claims, enrollment, and vendor information was received for services from July 2014–March 2016, as well as claims run-out for all 2016 data. Valence conducted reconciliation efforts using invoices from the prior vendor. As gaps
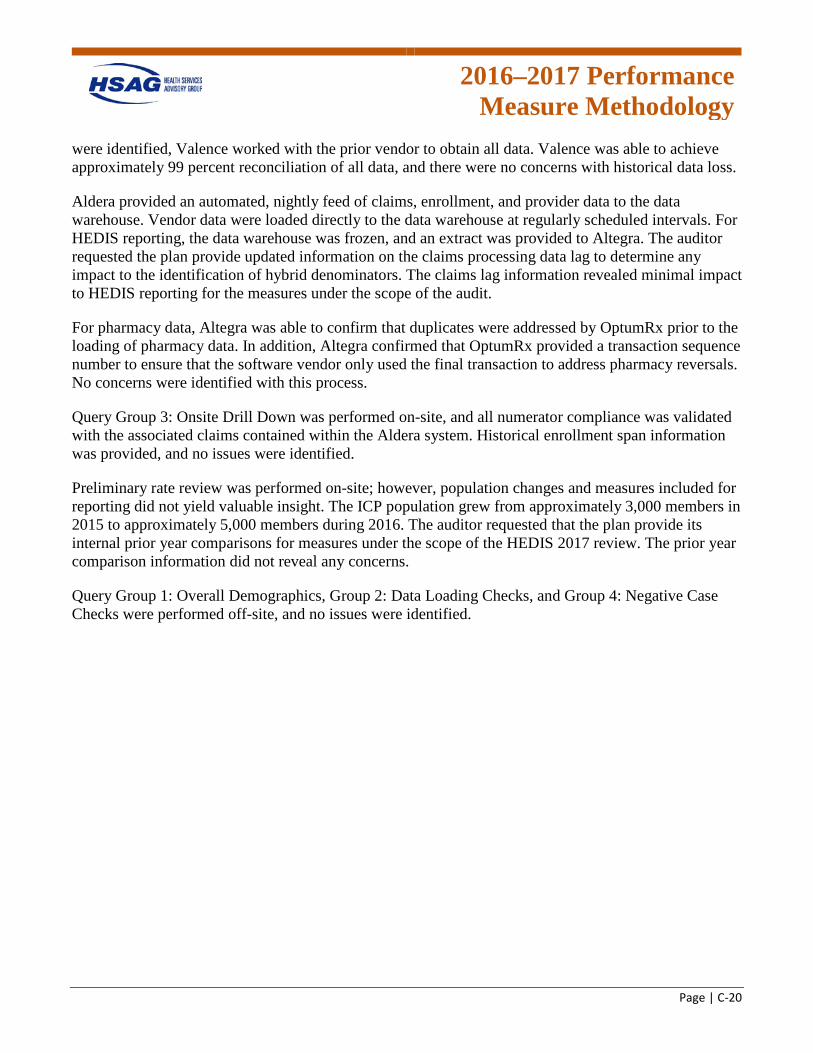
2016–2017 Performance
Measure Methodology
Page | C-20
were identified, Valence worked with the prior vendor to obtain all data. Valence was able to achieve approximately 99 percent reconciliation of all data, and there were no concerns with historical data loss.
Aldera provided an automated, nightly feed of claims, enrollment, and provider data to the data warehouse. Vendor data were loaded directly to the data warehouse at regularly scheduled intervals. For HEDIS reporting, the data warehouse was frozen, and an extract was provided to Altegra. The auditor requested the plan provide updated information on the claims processing data lag to determine any impact to the identification of hybrid denominators. The claims lag information revealed minimal impact to HEDIS reporting for the measures under the scope of the audit.
For pharmacy data, Altegra was able to confirm that duplicates were addressed by OptumRx prior to the loading of pharmacy data. In addition, Altegra confirmed that OptumRx provided a transaction sequence number to ensure that the software vendor only used the final transaction to address pharmacy reversals. No concerns were identified with this process.
Query Group 3: Onsite Drill Down was performed on-site, and all numerator compliance was validated with the associated claims contained within the Aldera system. Historical enrollment span information was provided, and no issues were identified.
Preliminary rate review was performed on-site; however, population changes and measures included for reporting did not yield valuable insight. The ICP population grew from approximately 3,000 members in 2015 to approximately 5,000 members during 2016. The auditor requested that the plan provide its internal prior year comparisons for measures under the scope of the HEDIS 2017 review. The prior year comparison information did not reveal any concerns.
Query Group 1: Overall Demographics, Group 2: Data Loading Checks, and Group 4: Negative Case Checks were performed off-site, and no issues were identified.
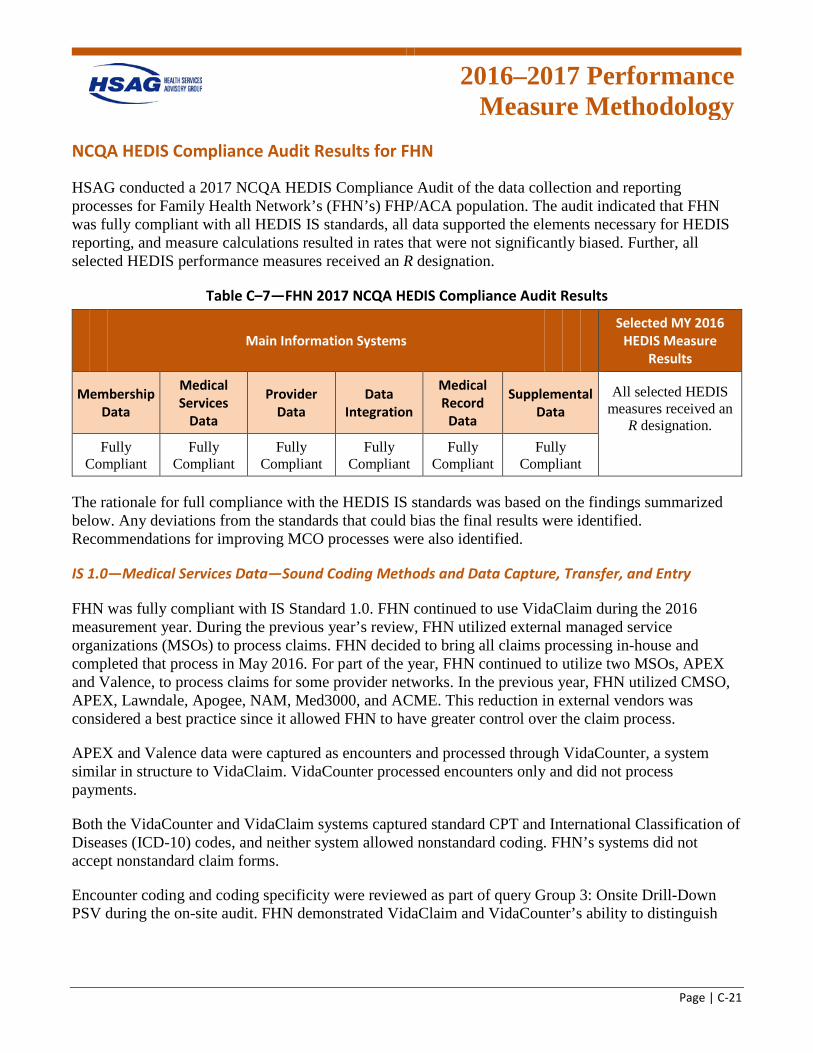
2016–2017 Performance
Measure Methodology
Page | C-21
NCQA HEDIS Compliance Audit Results for FHN
HSAG conducted a 2017 NCQA HEDIS Compliance Audit of the data collection and reporting processes for Family Health Network’s (FHN’s) FHP/ACA population. The audit indicated that FHN was fully compliant with all HEDIS IS standards, all data supported the elements necessary for HEDIS reporting, and measure calculations resulted in rates that were not significantly biased. Further, all selected HEDIS performance measures received an R designation.
Table C–7—FHN 2017 NCQA HEDIS Compliance Audit Results
Main Information Systems Selected MY 2016
HEDIS Measure Results
Membership Data
Medical Services
Data
Provider Data
Data Integration
Medical Record
Data
Supplemental Data
All selected HEDIS measures received an
R designation. Fully
Compliant Fully
Compliant Fully
Compliant Fully
Compliant Fully
Compliant Fully
Compliant
The rationale for full compliance with the HEDIS IS standards was based on the findings summarized below. Any deviations from the standards that could bias the final results were identified. Recommendations for improving MCO processes were also identified.
IS 1.0—Medical Services Data—Sound Coding Methods and Data Capture, Transfer, and Entry
FHN was fully compliant with IS Standard 1.0. FHN continued to use VidaClaim during the 2016 measurement year. During the previous year’s review, FHN utilized external managed service organizations (MSOs) to process claims. FHN decided to bring all claims processing in-house and completed that process in May 2016. For part of the year, FHN continued to utilize two MSOs, APEX and Valence, to process claims for some provider networks. In the previous year, FHN utilized CMSO, APEX, Lawndale, Apogee, NAM, Med3000, and ACME. This reduction in external vendors was considered a best practice since it allowed FHN to have greater control over the claim process.
APEX and Valence data were captured as encounters and processed through VidaCounter, a system similar in structure to VidaClaim. VidaCounter processed encounters only and did not process payments.
Both the VidaCounter and VidaClaim systems captured standard CPT and International Classification of Diseases (ICD-10) codes, and neither system allowed nonstandard coding. FHN’s systems did not accept nonstandard claim forms.
Encounter coding and coding specificity were reviewed as part of query Group 3: Onsite Drill-Down PSV during the on-site audit. FHN demonstrated VidaClaim and VidaCounter’s ability to distinguish
2016–2017 Performance
Measure Methodology
Page | C-22
between primary and secondary codes. Additionally, FHN demonstrated VidaClaim and VidaCounter’s ability to capture modifier codes.
FHN had sufficient processes in place, including encounters audits, submission frequency counts, and annual monitoring of vendors, to ensure complete data capture. FHN performed annual oversight of its remaining MSOs and monitored them for accuracy and timeliness.
FHN has made significant improvements to its claims/encounter processing since the prior year’s audit by effectively reducing the number of external claims processing MSOs.
IS 2.0—Enrollment Data—Data Capture, Transfer, and Entry
FHN was fully compliant with IS Standard 2.0. FHN continued to use its internal enrollment system, VidaBility, during 2016. FHN received a daily and monthly enrollment file from the State. The daily and monthly files were transmitted in standard 834 format and electronically uploaded to VidaBility. There were a few circumstances where FHN manually manipulated the enrollment files; however, this occurred in less than 1 percent of the overall enrollment capture.
FHN’s VidaBility system captured all relevant fields outlined in the HEDIS Roadmap. FHN had sufficient processes in place to ensure all data files were captured and processed in a timely manner. VidaBility and the general audit process ensured that members were only assigned one unique identifier. FHN continued to validate and audit daily change files to ensure duplicate member identifiers were not created.
FHN ran several queries during the on-site audit to determine monthly member volume by age and gender. No issues were identified during the query process that would impact reporting.
IS 3.0—Practitioner Data—Data Capture, Transfer, and Entry
FHN was fully compliant with IS Standard 3.0. During the on-site audit, FHN indicated that no changes were made to its provider data process since the previous year’s review. FHN’s contracted providers increased 7.4 percent. Some of the increase was due to the Accountable Care Entity (ACE) acquisition. Most of the increase in contracting was due to expansion of the provider network efforts.
Although FHN exited the Rockford market, there was no mass deletion of provider contracts. FHN did not terminate any provider contracts in case they were to expand back into Rockford.
VidaPro assigned identification numbers for each provider. Some providers were able to have more than one identification number depending on address or affiliation. The practitioner data system flowchart included in FHN’s Roadmap submission was reviewed, and no issues were found in the process flow.
Audits were conducted on the provider data against the credentialing system and against the network master to determine if the name, National Provider Identifier (NPI), CAQH number, and specialties were accurate. The audit process had not changed since the prior year. FHN indicated that it will be transitioning to the Cactus system for credentialing during 2017.
2016–2017 Performance
Measure Methodology
Page | C-23
FHN used Gemini Diversified Services, a credentials verification organization (CVO) for credentialing. The CVO provided FHN with the credentialing information. FHN and the CVO set up an FTP site to send credentialing information daily. The daily files were reviewed and audited regularly. FHN’s internal credentialing team reviewed all files from the CVO and checked to ensure all credentialing data were present and matched the provider’s education. FHN ensured that provider data were only entered into VidaPro after credentialing was completed. FHN indicated that there were no significant issues with provider data processing.
Dental and vision providers, since delegated, were not housed in VidaPro. EyeQuest and DentaQuest providers were captured in the HEDIS repository and were loaded directly into Verscend for HEDIS reporting.
Federally qualified health centers (FQHCs) were credentialed as standalone; however, FQHCs could be assigned to a member as a PCP. FQHC assignment is a State requirement. FHN indicated that it is receiving the rendering provider identifier on the claim.
FHN’s provider specialty list was reviewed, and no issues were identified. PCPs were assigned for the following specialties: family practice, general practice, internal medicine, and pediatrics.
IS 4.0—Medical Record Review Processes—Training, Sampling, Abstraction, and Oversight
FHN was fully compliant with IS Standard 4.0. HSAG reviewed FHN’s IS 4 Roadmap pertaining to the policies and procedures for IS Standard 4.0. The Roadmap review found these policies and procedures to be consistent with IS 4.0 requirements.
FHN sampled according to the HEDIS sampling guidelines and assigned measure-specific oversamples. Provider chase logic was reviewed and determined appropriate across the hybrid measures.
For HEDIS 2017, FHN used internal staff members to abstract data into Verscend’s (formerly Verisk Health’s) medical record abstraction tool. HSAG participated in a live demonstration of Verscend’s tool and instructions. All fields, edits, and drop-down boxes were reviewed for accuracy against NCQA’s HEDIS 2017, Volume 2, Technical Specifications for Health Plans. HSAG reviewed and approved Verscend’s hybrid tool and instructions on January 6, 2017.
HSAG reviewed FHN’s abstraction training manual and found no concerns. Reviewer qualifications, training, and oversight by FHN of its review staff were appropriate.
HSAG requested a convenience sample that included one measure with errors noted during the prior year’s MRRV and one measure that was requested by the auditor:
• PPC—Timeliness of Prenatal Care • CIS—Combination 3
All convenience samples passed HSAG’s review.
2016–2017 Performance
Measure Methodology
Page | C-24
FHN passed the MRRV process for the following measures and corresponding measure groups:
• Group A: Biometrics (BMI, BP) and Maternity—PPC—Postpartum Care • Group A: Biometrics (BMI, BP) and Maternity—PPC—Timeliness of Prenatal Care • Group B: Anticipatory Guidance and Counseling—WCC—Counseling for Nutrition • Group D: Immunizations and Other Screenings—CIS—Three Inactivated Polio Vaccine (IPV)
There were no medical record exclusions to review.
IS 5.0—Supplemental Data—Capture, Transfer, and Entry
FHN was fully compliant with IS Standard 5.0. FHN provided nine standard supplemental databases in its HEDIS Roadmap submission. There were no nonstandard supplemental databases submitted for HEDIS reporting. Most of the data sources were for laboratory services. All supplemental data sources included in the Roadmap met HEDIS requirements and contained appropriate file layouts and expectations for standard supplemental data.
FHN met all specifications for supplemental data and did not have any issues. All standard supplemental data sources were approved to use for HEDIS 2017 reporting.
IS 7.0—Data Integration—Accurate Reporting, Control Procedures That Support Measure Reporting Integrity
FHN was fully compliant with IS Standard 7.0. FHN indicated that the process for data integration did not change from the previous year apart from adding EyeQuest as a delegated service provider. EyeQuest and DentaQuest submitted encounters directly to FHN on a scheduled basis. Both delegates’ encounters were captured in the VidaCounter system at least monthly.
All FFS claims were captured in the VidaClaim system, then processed through VidaCounter. This process ensured a single source was used for data extracts in the same format. Extracts to the data warehouse were pulled from the single source, VidaCounter.
The auditor reviewed several SQL server tables and queries, and conducted query Group 3: Onsite Drill-Down (PSV), during the on-site audit to identify any issues with the Extract, Transform, and Load (ETL) process. All numerators were accurately captured, and there were no issues with the process.
The auditor further reviewed Roadmap tables 1.7, 2.2, 3A.2, and 3B.3 to ensure all required data elements were captured. No issues were found during this audit review.
FHN did not use nonstandard coding for any measures. FHN did use global billing codes for maternity; however, the PPC measure is hybrid, and global billing has no impact on rates for this measure.
Report production for FHN was handled by the certified measure vendor, Verscend, and the repository structure appeared to be satisfactory.
2016–2017 Performance
Measure Methodology
Page | C-25
FHN data were backed up nightly in Arizona, and FHN did not need to restore any data during the measurement year.
Data loads from the HEDIS repository to Verscend were reviewed during the on-site audit. FHN used an internal tracking system to capture all data load row counts. FHN compared the data loads to extracts and explained any data discrepancies. Discrepancies from the examination on-site included enrollment files that did not load. The records that did not load were due to member disenrollment.
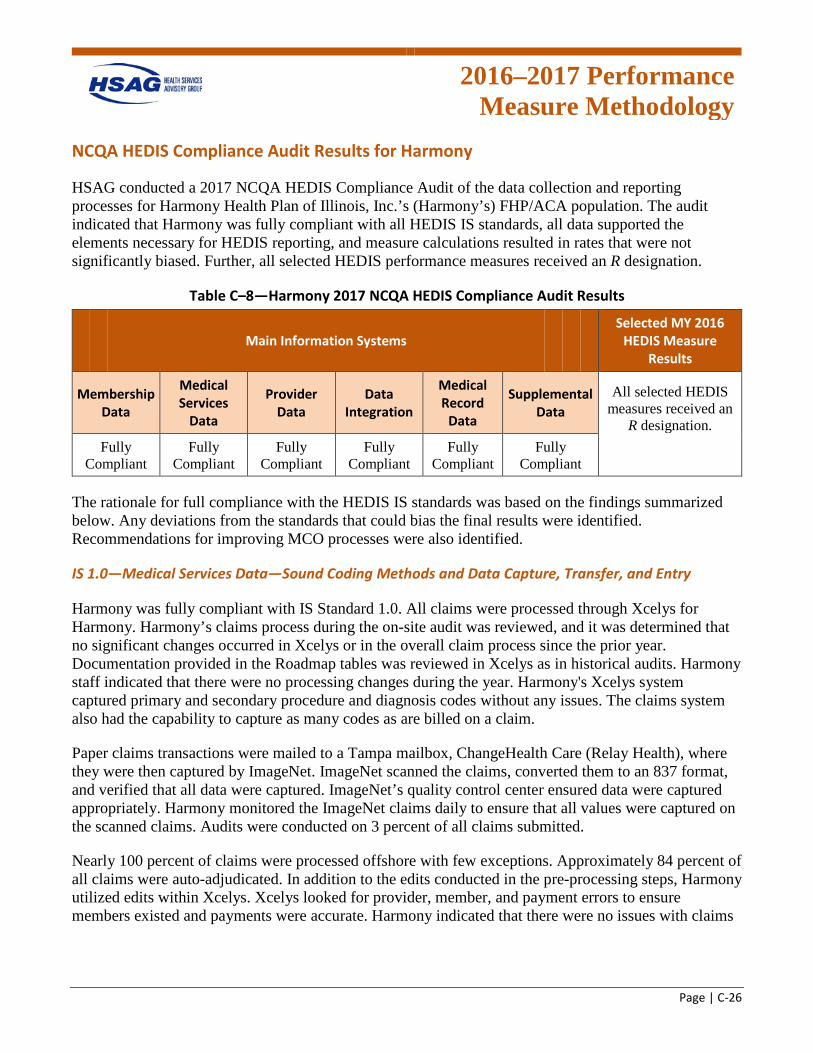
2016–2017 Performance
Measure Methodology
Page | C-26
NCQA HEDIS Compliance Audit Results for Harmony
HSAG conducted a 2017 NCQA HEDIS Compliance Audit of the data collection and reporting processes for Harmony Health Plan of Illinois, Inc.’s (Harmony’s) FHP/ACA population. The audit indicated that Harmony was fully compliant with all HEDIS IS standards, all data supported the elements necessary for HEDIS reporting, and measure calculations resulted in rates that were not significantly biased. Further, all selected HEDIS performance measures received an R designation.
Table C–8—Harmony 2017 NCQA HEDIS Compliance Audit Results
Main Information Systems Selected MY 2016
HEDIS Measure Results
Membership Data
Medical Services
Data
Provider Data
Data Integration
Medical Record
Data
Supplemental Data
All selected HEDIS measures received an
R designation. Fully
Compliant Fully
Compliant Fully
Compliant Fully
Compliant Fully
Compliant Fully
Compliant
The rationale for full compliance with the HEDIS IS standards was based on the findings summarized below. Any deviations from the standards that could bias the final results were identified. Recommendations for improving MCO processes were also identified.
IS 1.0—Medical Services Data—Sound Coding Methods and Data Capture, Transfer, and Entry
Harmony was fully compliant with IS Standard 1.0. All claims were processed through Xcelys for Harmony. Harmony’s claims process during the on-site audit was reviewed, and it was determined that no significant changes occurred in Xcelys or in the overall claim process since the prior year. Documentation provided in the Roadmap tables was reviewed in Xcelys as in historical audits. Harmony staff indicated that there were no processing changes during the year. Harmony's Xcelys system captured primary and secondary procedure and diagnosis codes without any issues. The claims system also had the capability to capture as many codes as are billed on a claim.
Paper claims transactions were mailed to a Tampa mailbox, ChangeHealth Care (Relay Health), where they were then captured by ImageNet. ImageNet scanned the claims, converted them to an 837 format, and verified that all data were captured. ImageNet’s quality control center ensured data were captured appropriately. Harmony monitored the ImageNet claims daily to ensure that all values were captured on the scanned claims. Audits were conducted on 3 percent of all claims submitted.
Nearly 100 percent of claims were processed offshore with few exceptions. Approximately 84 percent of all claims were auto-adjudicated. In addition to the edits conducted in the pre-processing steps, Harmony utilized edits within Xcelys. Xcelys looked for provider, member, and payment errors to ensure members existed and payments were accurate. Harmony indicated that there were no issues with claims
2016–2017 Performance
Measure Methodology
Page | C-27
processing in 2016. All claims were captured within two days, and 99 percent were captured within one day.
Harmony also captured encounter data from capitated vendors. Encounters included dental, transportation, and vision. While these encounters were not captured in Xcelys, they underwent edits in Edifecs (XEngine), which looked for valid billing codes and member information.
IS 2.0—Enrollment Data—Data Capture, Transfer, and Entry
Harmony was fully compliant with IS Standard 2.0. Harmony received daily enrollment files from the State. This process has been in place over the last several years. Harmony received the daily enrollment files in a standard Health Insurance Portability and Accountability Act (HIPAA)-compliant 834 electronic format and loaded the files directly into Xcelys. Harmony reconciled the daily files with a monthly file, also provided by the State, to ensure data were accurate prior to enrolling the member.
The Xcelys system was reviewed during the on-site audit, and it was confirmed that each enrollment span was captured. Additionally, several enrollment records were reviewed to ensure that all HEDIS-required data elements were present and accurate.
On-site queries were conducted of average member enrollments, and no issues were identified. The average member was continuously enrolled for approximately 11 months or more. There was a program change with the State that required members to select a plan for a full year, rather than being able to change health plans once per month.
Harmony conducted appropriate oversight of the enrollment process through ongoing internal audits and communication with the State enrollment authority. It was confirmed that no changes had been made to Harmony’s enrollment data process since the previous year’s review.
IS 3.0—Practitioner Data—Data Capture, Transfer, and Entry
Harmony was fully compliant with IS Standard 3.0. Harmony utilized Xcelys to capture all provider data for claims processing. Harmony utilized both direct contracted and delegated entities to enroll providers. Harmony used an internal software tracking mechanism (Omniflow) to manage its provider information. Omniflow was used to send provider data to Harmony’s Credentialing Department for provider management prior to loading into Xcelys. Once the provider information flowed through Omniflow, the data were then loaded into Xcelys. A unique provider identifier was created along with provider specialties. Harmony’s credentialing staff ensured provider specialties were appropriate by validating the provider's education and specialty assignment authorized by the issuing provider board.
HEDIS reporting elements were present in Xcelys, and provider specialties were accurate based on the provider mapping documents submitted with Harmony’s Roadmap. Additionally, on-site queries were conducted around provider specialties, and no issues were identified.
2016–2017 Performance
Measure Methodology
Page | C-28
IS 4.0—Medical Record Review Processes—Training, Sampling, Abstraction, and Oversight
Harmony was fully compliant with IS Standard 4.0. HSAG reviewed Harmony’s IS 4 Roadmap pertaining to the policies and procedures for IS Standard 4.0. The Roadmap review found these policies and procedures to be consistent with IS 4.0 requirements.
Harmony sampled according to the HEDIS sampling guidelines and assigned measure-specific oversamples. Provider chase logic was reviewed and determined appropriate across the hybrid measures.
Harmony contracted with Altegra and Ciox Health, LLC (HealthPort) to retrieve medical records. Harmony’s internal staff and Altegra abstracted medical records using Altegra’s medical record abstraction tools. HSAG participated in a live vendor demonstration of the Altegra tools and instructions. All fields, edits, and drop-down boxes were reviewed for accuracy against NCQA’s HEDIS 2017, Volume 2, Technical Specifications for Health Plans. HSAG reviewed and approved the Altegra tools and instructions on March 3, 2017.
Harmony maintained appropriate quality assurance of reviews, including over-reads of all abstractions resulting in numerator positives or exclusions, and a random sample of numerator negatives. Harmony’s internal staff and Altegra staff were sufficiently qualified and trained on the current year’s HEDIS technical specifications and the use of the Altegra abstraction tools to conduct MRRs accurately.
Based on the auditor’s request for a convenience sample for select measures and since new measures were reported by Harmony, a convenience sample was required for the following measures:
• CBP • PPC—Timeliness of Prenatal Care and Postpartum Care • CDC—HbA1c Testing and Eye Exam (Retinal) Performed
All convenience samples passed HSAG’s review.
Harmony passed the MRRV process for the following measures and corresponding measure groups:
• Group A: Biometrics (BMI, BP) and Maternity—PPC—Postpartum Care • Group B: Anticipatory Guidance and Counseling—WCC—Counseling for Nutrition • Group D: Immunizations and Other Screenings—CIS—Combination 3 • Group F: Exclusions—All medical record exclusions
IS 5.0—Supplemental Data—Capture, Transfer, and Entry
Harmony was fully compliant with IS Standard 5.0. Harmony used five standard supplemental data sources, which included laboratory results, and immunization and encounter files from HFS. Harmony also used two nonstandard supplemental data sources which required PSV.
2016–2017 Performance
Measure Methodology
Page | C-29
All supplemental data sources met the HEDIS requirements for supplemental data use. Harmony provided file layouts, coding transformation documents, and training documents with its HEDIS Roadmap submission.
There were no changes to the supplemental data sources since the previous year’s audit. Harmony invested much time and effort ensuring data in the supplemental data sources were accurate and processed in a timely manner. Harmony conducted audits on its supplemental data intermittently throughout the year to ensure minimal errors or issues. When issues were discovered, they were promptly rectified.
Concerns were identified with the Roadmap submission for supplemental data sources. Since WellCare, Harmony’s parent company, completed the Roadmap Section 5, supplemental data sources were included that were not applicable to the scope of the audit. Future audits need to clearly indicate only the supplemental data sources that are applicable to the scope of the audit.
Both nonstandard data sources passed the POS validation with no significant errors identified. All standard and nonstandard supplemental data sources were approved to use for HEDIS 2017 reporting.
IS 7.0—Data Integration—Accurate Reporting, Control Procedures That Support Measure Reporting Integrity
Harmony was fully compliant with IS Standard 7.0. Harmony continued to use its internal data warehouse to combine all files for extraction into the Inovalon certified measures software. The internal data warehouse combined all systems and external data into tables for consolidation prior to loading into Inovalon’s file layouts. Most information was derived from the Xcelys system while external data such as supplemental and vendor files were loaded directly into the data warehouse tables. A review of the HEDIS data warehouse was conducted on-site and found to be compliant. Harmony had several staff members involved with the process who have many years of experience in dealing with data extractions, transformations, and loading. The warehouse was managed well, and access was only granted when required for job duties. While on-site, Query Group 3 (PSV) was conducted, and no issues were encountered during the validation. Member data matched Xcelys as well as the data warehouse and Inovalon numerator events.
In addition, a series of NCQA-required queries were reviewed during the on-site audit, and no issues were identified. Harmony’s preliminary rates were reviewed while on-site, and no immediate issues were identified. There were no changes to Harmony’s systems or data integration processes since the previous year’s HEDIS review.
2016–2017 Performance
Measure Methodology
Page | C-30
NCQA HEDIS Compliance Audit Results for Humana
HSAG conducted a 2017 NCQA HEDIS Compliance Audit of the data collection and reporting processes for Humana Health Plan, Inc.’s (Humana’s) ICP population. The audit indicated that Humana was fully compliant with the HEDIS IS standards for membership data, medical services data, provider data, supplemental data, and medical record data, and these data supported the elements necessary for HEDIS reporting. Humana was partially compliant with the HEDIS IS standard for data integration; however, HSAG determined only minimal impact to reporting. All selected HEDIS performance measures received an R designation.
Table C–9—Humana 2017 NCQA HEDIS Compliance Audit Results
Main Information Systems Selected MY 2016
HEDIS Measure Results
Membership Data
Medical Services
Data
Provider Data
Data Integration
Medical Record
Data
Supplemental Data
All selected HEDIS measures received an
R designation. Fully
Compliant Fully
Compliant Fully
Compliant Partially
Compliant Fully
Compliant Fully
Compliant
The rationale for full and partial compliance with the HEDIS IS standards was based on the findings summarized below. Any deviations from the standards that could bias the final results were identified. Recommendations for improving MCO processes were also identified.
IS 1.0—Medical Services Data—Sound Coding Methods and Data Capture, Transfer, and Entry
Humana was fully compliant with the IS Standard 1.0 requirements. Humana provides services to the ICP population under a managed care contract with HFS.
Humana used its centralized teams for the processing of claims and encounter data for the Illinois ICP population from its Louisville, Kentucky offices. The ICP used a primarily FFS delivery system during 2016, with approximately 5 percent of services paid under a capitation agreement for some transportation, primary care, and therapy services. The FFS delivery systems supported data completeness since a claim was required by Humana in order to process payment.
Humana used its Claims Administration System (CAS) as its claims transactional system during 2016, and there were no substantive changes in the processing of claims data between 2015 and 2016. Humana had complete process flows and descriptions for the handling of electronic and paper claims submissions. Capitated provider encounter data were received and processed within CAS, and all system edits were applied to the encounter data.
Humana only accepted the submission of industry-standard claims forms. In addition, the ICP did not accept or use any nonstandard coding schemes; therefore, there was no code mapping.
2016–2017 Performance
Measure Methodology
Page | C-31
CAS captured primary and secondary codes and other required claims fields. Humana had robust, mature processes for claims edits including the use of Claims Xten, McKesson, iHealth, and Verisk software which addressed different stages of coding review. Humana used some All Patients Refined-Diagnosis Related Groups (APR-DRGs) for inpatient claims; however, all claims diagnosis and procedures codes were retained for HEDIS reporting. The individual claims lines for diagnosis, procedure, and revenue codes were all appropriately brought in for HEDIS reporting.
Humana used Xerox as its paper claims scanning vendor. Xerox had adequate processes in place to assign a document control number to paper claims received and also had a clean desk policy. Xerox primarily used OCR software to obtain information on the claims and transfer it into an electronic data interchange (EDI) format. Manual keying was completed only to correct images that were unreadable by the OCR software. There was adequate oversight and monitoring of Xerox. Humana identified no concerns with Xerox during 2016.
Humana monitored claims timeliness and workflow through its MACESS system. The system allows the directing of certain claim types by claims processor skill-set. No backlogs in claims processing were noted during 2016.
Humana contracted with Beacon to provide behavioral health services and process claims. Beacon used a FFS delivery system for the ICP population. Humana noted that Beacon resolved prior year concerns with claims timeliness and overall had met claims timeliness processing and accuracy targets. Humana did indicate that Beacon had some issues with inpatient claims processing related to certain revenue codes; however, since the measures under the scope of the review did not include inpatient claims, there was no impact to measure reporting. The auditor requested a more recent version of Beacon's claims lag for 2016 for review, and no issues were identified.
Humana contracted with EyeMed to provide vision services and process claims. EyeMed used a FFS delivery system for the ICP population. HSAG had no concerns with claims processing and encounter data submission. There was adequate delegation oversight of the vendor.
Pharmacy data were received from Humana’s contracted PBM, Argus, and these data were loaded routinely into the EDW. Humana received paid, rejected, and reversed claims from Argus. For data integration, only the final pharmacy claims status was used to reconcile the rejected from the paid. Argus provided pharmacy data with all standard and required fields for HEDIS processing including National Drug Codes (NDCs). Humana did apply some pharmacy code mapping which was reviewed and approved.
During the on-site audit, claims data were reviewed for a portion of Query Group 3: Onsite Drill-Down. Humana demonstrated the CAS system for five members selected for review by the auditor from Humana’s universe of administrative numerator compliant members for the AAP and MPM measures. No concerns were identified.
2016–2017 Performance
Measure Methodology
Page | C-32
IS 2.0—Enrollment Data—Data Capture, Transfer, and Entry
Humana was fully compliant with IS Standard 2.0 requirements. Humana processed enrollment files received from HFS for its ICP population daily. Each 834 file was received and processed by a centralized enrollment team through an automated process. In addition, the ICP received and processed a monthly audit file from HFS. The monthly audit file was used for reconciliation against the State eligibility information.
Humana captured enrollment information within the customer interface (CI) system, which included the capture of current and historical enrollment spans, the State client identification number (CIN), as well as a Humana member identification number that was automatically generated by the ICP. An interface between CI and CAS was used for claims payment.
The ICP conducted a systems demonstration of CI during the on-site audit. The ICP demonstrated the capture of a hospice indicator provided by the HFS enrollment file.
A portion of query Group 3: Onsite Drill-Down was conducted during the on-site audit. Five members from the AAP and MPM measures were reviewed to confirm eligibility for denominator criteria. No concerns were identified. In addition, the auditor conducted query Group 4: Negative Case Checks and reviewed five members who had a diagnosis of diabetes but were not included in the CDC measure due to continuous eligibility requirements not being met. No concerns were identified.
IS 3.0—Practitioner Data—Data Capture, Transfer, and Entry
Humana was fully compliant with the IS Standard 3.0 requirements. During 2016, Humana loaded provider data into Patient Information Management System (PIMS) and CAS for claims payment. CAS created a unique CAS identifier for each provider. The CAS ID captured a primary specialty. For providers that practiced with multiple specialties, another record was created in CAS and during claims payment, the claims examiner selected the appropriate provider specialty for claims payment. For HEDIS 2017, Verscend used CMS’ taxonomy codes and mapped those codes to the Verscend HEDIS provider-type mapping. The provider-type mapping was reviewed and approved.
IS 4.0—Medical Record Review Processes—Training, Sampling, Abstraction, and Oversight
Humana was fully compliant with the IS Standard 4.0 requirements. HSAG reviewed Humana’s IS 4 Roadmap pertaining to the policies and procedures for IS Standard 4.0. The Roadmap review found these policies and procedures to be consistent with IS 4.0 requirements.
For HEDIS 2017, Humana staff procured and abstracted medical records into Verscend’s medical record abstraction tool. HSAG participated in a live vendor demonstration of Verscend’s tool and instructions. All fields, edits, and drop-down boxes were reviewed for accuracy against NCQA’s HEDIS 2017, Volume 2, Technical Specifications for Health Plans. HSAG reviewed and approved Verscend’s hybrid tool and instructions on January 6, 2017.
2016–2017 Performance
Measure Methodology
Page | C-33
HSAG reviewed the abstraction training manuals and found no issues. Reviewer qualifications, training, and oversight by Humana of its review staff were appropriate.
HSAG requested a convenience sample for CBP since this was a new measure being reported by Humana for HEDIS 2017. The convenience samples passed HSAG’s validation.
Humana passed the MRRV process for the following measures and corresponding measure groups:
• Group A: Biometrics (BMI, BP) and Maternity—CBP • Group C: Laboratory—CDC—HbA1c Testing • Group C: Laboratory—CDC—Medical Attention for Nephropathy • Group D: Immunizations and Other Screenings—CDC—Eye Exam (Retinal) Performed • Group F: Exclusions—All medical record exclusions
IS 5.0—Supplemental Data—Capture, Transfer, and Entry
Humana was fully compliant with IS 5.0 standards. For HEDIS 2017, Humana submitted three data sources for review and approval. The first data source contained HFS historical claims data and was considered standard supplemental data since data were received in a standard format and no mapping of data occurred. The second data source was Lab Data Connections, which contained lab data in a standard format. No mapping of data occurred. Finally, the National Language Processing data source was submitted for use of the CDC measure, and data were considered standard data. No issues were identified with these supplemental data sources.
The supplemental data sources were approved for HEDIS 2017 reporting. The final supplemental data impact report was provided and reviewed, and no issues were identified.
IS 7.0—Data Integration—Accurate Reporting, Control Procedures That Support Measure Reporting Integrity
Humana was partially complaint with IS Standard 7.0 requirements. Humana contracted with Verscend as its software vendor to produce the 2017 HEDIS measure rates. During the on-site audit, the ICP discussed the integration process flow of enrollment, provider, claims, vendor, medical record, and supplemental data for measure production.
Humana conducted a monthly prospective data run during 2016. Claims, encounter, provider, and enrollment data were loaded from CAS—except for pharmacy data, which were loaded from the EDW. Humana did a full HEDIS production run in January. During the on-site audit, the auditor reviewed the data loading report provided by Verscend. No unexplained issues were identified. Humana staff members conducted a variety of data reasonability and quality checks on the monthly prospective data runs; therefore, the full HEDIS production run was within the plan’s expectations.
Humana confirmed that no members were excluded from HEDIS reporting outside of hospice exclusions and measure-specific exclusions.
2016–2017 Performance
Measure Methodology
Page | C-34
The auditor requested additional clarification from the vendor to describe the process for integrating data for the CBP measure when more than one record was received and contained both a representative blood pressure and a blood pressure reading after the confirmation of a diagnosis of hypertension. The vendor confirmed that if two records were received, the software would select the last blood pressure reading during 2016. The auditor indicated that moving forward, Humana should develop a process by which it determines which provider is managing the hypertension and flag that chart for the measure. The auditor reviewed the chart chase logic and did not identify any concerns; however, it is possible that the plan received records from two separate providers and obtained the last reading regardless of a determination as to which provider was managing the hypertension. The plan must correct this process for HEDIS 2018. The impact to reporting is minimal for HEDIS 2017.

2016–2017 Performance
Measure Methodology
Page | C-35
NCQA HEDIS Compliance Audit Results for IlliniCare
HSAG conducted a 2017 NCQA HEDIS Compliance Audit of the data collection and reporting processes for IlliniCare Health Plan, Inc.’s (IlliniCare’s) FHP/ACA and ICP populations. The audit indicated that IlliniCare was fully compliant with the HEDIS IS standards for membership data, medical services data, data integration, medical record data, and supplemental data; all data for these standards supported the elements necessary for HEDIS reporting, and measure calculations resulted in rates that were not significantly biased. IlliniCare was partially compliant with the HEDIS IS standard for provider data; however, HSAG determined the impact to reporting was minimal. All selected HEDIS measures received an R designation.
Table C–10—IlliniCare 2017 NCQA HEDIS Compliance Audit Results
Main Information Systems Selected MY 2016
HEDIS Measure Results
Membership Data
Medical Services
Data
Provider Data
Data Integration
Medical Record
Data
Supplemental Data
All selected HEDIS measures received an
R designation. Fully
Compliant Fully
Compliant Partially
Compliant Fully
Compliant Fully
Compliant Fully
Compliant
The rationale for full compliance with the HEDIS IS standards was based on the findings summarized below. Any deviations from the standards that could bias the final results were identified. Recommendations for improving MCO processes were also identified.
IS 1.0—Medical Services Data—Sound Coding Methods and Data Capture, Transfer, and Entry
IlliniCare was fully compliant with IS Standard 1.0. IlliniCare received nearly all claims through EDI feeds, which were processed through to adjudication automatically. Systems for loading EDI claims included reviews for HIPAA and business rules and returned rejected claims through industry standard processes. During the auto-adjudication process, standard field-level, eligibility, provider, authorization, benefit, and pricing validations were performed. Approximately 90 percent of claims were auto-adjudicated. Pended claims were distributed to processors through the automated workflow distributor (AWD) queue system.
For the small percentage of claims needing manual intervention, the following processes were in place to ensure accuracy:
• Monthly processor audits—10 claims for each processor were reviewed daily to evaluate processing and financial accuracy.
• The high-dollar team reviewed over 5,000 professional claims and 10,000 hospital claims. • A monthly internal audit of a sample of all claims processed to validate procedural, financial, and
clinical information was conducted. The sample size was variable and determined through an
2016–2017 Performance
Measure Methodology
Page | C-36
algorithm designed to establish a statistically valid sample size based on the volume of claims for the period.
During 2016, the internal audit reported results of 99.8 percent and 95.3 percent for financial and payment accuracy, respectively.
As part of the audit query process, monthly pharmacy record counts by product for 2016 loaded into the QSI data repository were reviewed for the Group 2: Data Loading Checks. Data provided by the plan demonstrated consistent monthly record counts for both products documenting accurate and complete pharmacy data.
IS 2.0—Enrollment Data—Data Capture, Transfer, and Entry
IlliniCare was fully compliant with IS Standard 2.0. The plan received daily and monthly enrollment files from the State. A separate enrollment file was provided for each product, including the ICP and FHP/ACA populations. The enrollment files were loaded into AMISYS through a combined load process. Monthly files provided complete enrollment history and were reconciled against data maintained in the AMISYS system. During the process for loading the daily and monthly files, business rule logic was applied to identify records with fatal errors or records that required review (warnings) at several points in the load process. These reports included the “Queued Error Report” which identified errors that had to be corrected before the data could proceed. The volume of records with errors that were identified was small (30–100 records) with the most common reason being related to eligibility of newborns. Additional validations were performed when the data were loaded into the AMYSIS system. The UMV-AMISYS Member Load Error Report identified issues related to invalid dates and PCP affiliation as the data were loaded. All errors on this report had to be corrected before the automated production load job could be scheduled in the Cypress Web application. Successful processing was documented through an automated email that included notification that the JELG500 “completed normally.”
Overall membership and demographic characteristics of the plan’s membership during 2016 were examined through the Group 1: Overall Demographics query. The query results provided by the plan revealed only small, reasonable shifts in member counts across the age bands throughout the year.
IS 3.0—Practitioner Data—Data Capture, Transfer, and Entry
IlliniCare was partially compliant with IS Standard 3.0. Practitioner data used for HEDIS reporting were maintained in the Portico system. IlliniCare contracted directly with approximately 70 percent of the practitioners in the network. Individual practitioner data were set up in the Portico system as inactive when a provider submitted an application. Contract and credentialing information was added in the system when the practitioner was approved to be a participating provider.
Thirty percent of network practitioners were contracted through groups that were delegated for contracting and credentialing. Delegation contracts required these groups to submit monthly rosters of new and terminated practitioners and complete rosters quarterly. A standard layout for roster information was used to facilitate loading the data into the Portico system. Complete reconciliation
2016–2017 Performance
Measure Methodology
Page | C-37
between the data in Portico and the quarterly rosters was done to ensure accuracy. IlliniCare maintained a list of large groups for routine focused validations.
IlliniCare had comprehensive validation and reconciliation processes in place. Portico-to-AMISYS Comparison (PTAC) reports were monitored daily to identify discrepancies between data in the Portico and AMISYS systems, and a mismatch of 2 percent or more triggered an investigation. In addition, between 50 and 100 “Find-a-provider” audits were performed. Data for selected providers in each system were reviewed for accuracy.
During the review of the plan’s native provider specialty codes to HEDIS provider type crosswalk, 34 of the 355 records were identified for closer review. These records were found to be noncompliant with the technical specifications, and further investigation was conducted to evaluate the potential bias these records introduced into measures with provider specialty requirements. The plan provided counts of denominator and numerator compliance by native specialty code for the impacted PPC measure. Based on the investigation, the bias on the reported population rate with no change in the provider specialty mappings was found to be 0.03 percentage points. The Group 6: Mapping Result Checks query was conducted to verify no changes were made to the approved provider specialty to provider type crosswalk.
IS 4.0—Medical Record Review Processes—Training, Sampling, Abstraction, and Oversight
IlliniCare was fully compliant with IS Standard 4.0. HSAG reviewed IlliniCare’s IS 4 Roadmap pertaining to the policies and procedures for IS Standard 4.0. The Roadmap review found these policies and procedures to be consistent with IS 4.0 requirements.
IlliniCare sampled according to the HEDIS sampling guidelines and assigned measure-specific oversamples. Provider chase logic was reviewed and determined appropriate across the hybrid measures.
For HEDIS 2017, IlliniCare contracted with the medical record vendor, Altegra Health, to procure and abstract medical records. Altegra Health’s abstractors used Altegra Health’s medical record abstraction tool. HSAG participated in a live vendor demonstration of the Altegra Health tool and instructions. All fields, edits, and drop-down boxes were reviewed for accuracy against NCQA’s HEDIS 2017, Volume 2, Technical Specifications for Health Plans. Altegra Health staff members were sufficiently qualified and trained in the current year’s HEDIS technical specifications. HSAG reviewed and approved Altegra Health’s hybrid tool, instructions, and training manual on March 3, 2017.
IlliniCare maintained appropriate quality assurance reviews, including over-reads of all abstractions resulting in numerator positives or exclusions, and a random sample of numerator negatives.
Due to reporting of a new measure this year and several changes to the 2017 measure specifications, a convenience sample was required for the following measures:
• CBP • PPC—Timeliness of Prenatal Care and Postpartum Care • WCC
2016–2017 Performance
Measure Methodology
Page | C-38
• CDC—HbA1c Testing, Medical Attention for Nephropathy, and Eye Exam (Retinal) Performed • CIS
All convenience samples passed HSAG’s review.
IlliniCare passed the MRRV process for the following measures and corresponding measure groups:
• Group A: Biometrics (BMI, BP) and Maternity—CBP • Group A: Biometrics (BMI, BP) and Maternity—WCC—BMI Percentile • Group B: Anticipatory Guidance and Counseling—WCC—Counseling for Nutrition • Group D: Immunizations and Other Screenings—CIS
There were no medical record exclusions to validate.
IS 5.0—Supplemental Data—Capture, Transfer, and Entry
IlliniCare was fully compliant with IS Standard 5.0. IlliniCare had a standard process for the acquisition, validation, and warehousing of supplemental data. Supplemental data, including encounter and laboratory data, were received in a standard, prescribed layout. An ETL process was used to load data into the IT QI server. The process “normalized” the data and applied business logic and validations during the load process. During the on-site visit, IlliniCare provided a walkthrough of the system. The dashboard provided easy access to counts of rows received, rows with errors, and valid rows. In addition, log files were maintained and available to document the counts and types of errors for each file. During the system demonstration, data for all supplemental data sources submitted for review were examined to ensure the availability of required data elements. On-site review of the system and data along with the submitted documentation demonstrated that all three standard supplemental data sources (Envolve Vision, LabCorp, Inc., and USMM Lab Services) met the requirements to be used for HEDIS 2017.
The plan incorporated one nonstandard supplemental database—HEDIS User Interface (HUI) database. The plan used the same process used for the standard supplemental data sources to collect, warehouse, and incorporate data into the QSI repository. PSV was performed on 50 of the 4,478 records, and all records were found to be compliant.
IS 7.0—Data Integration—Accurate Reporting, Control Procedures That Support Measure Reporting Integrity
IlliniCare was fully compliant with IS Standard 7.0. IlliniCare provided a walkthrough of the data integration processes and Inovalon’s QSI system. IlliniCare used external data sources that were integrated into the HEDIS repository. External sources included pharmacy claims and lab results. The corporate Centene team refreshed the QSI data and produced rates monthly. Standard validation workbooks were created with reconciliations between the source and the QSI repository data as part of this process. In addition, the IlliniCare team reviewed the workbook and rates.
2016–2017 Performance
Measure Methodology
Page | C-39
All vendor data were monitored regularly through various trending reports and annual vendor audits.
During the on-site visit, queries were conducted to trace records through the system to provide end-to-end data validation. Five members for the APM and CIS measures were selected for the query Group 3: Onsite Drill-Down. For each member selected, the member enrollment and claims history in the QSI repository was reviewed for compliance with the technical specifications; then; the relevant data elements were verified in the source data systems. No issues were identified through these queries.

2016–2017 Performance
Measure Methodology
Page | C-40
NCQA HEDIS Compliance Audit Results for Meridian
HSAG conducted a 2017 NCQA HEDIS Compliance Audit of the data collection and reporting processes for Meridian Health Plan, Inc.’s (Meridian’s) FHP/ACA and ICP populations. The audit indicated that Meridian was fully compliant with all HEDIS IS standards, all data supported the elements necessary for HEDIS reporting, and measure calculations resulted in rates that were not significantly biased. Further, all selected HEDIS performance measures received an R designation.
Table C–11—Meridian 2017 NCQA HEDIS Compliance Audit Results
Main Information Systems Selected MY 2016
HEDIS Measure Results
Membership Data
Medical Services
Data
Provider Data
Data Integration
Medical Record
Data
Supplemental Data
All selected HEDIS measures received an
R designation. Fully
Compliant Fully
Compliant Fully
Compliant Fully
Compliant Fully
Compliant Fully
Compliant
The rationale for full compliance with the HEDIS IS standards was based on the findings summarized below. Any deviations from the standards that could bias the final results were identified. Recommendations for improving MCO processes were also identified.
IS 1.0—Medical Services Data—Sound Coding Methods and Data Capture, Transfer, and Entry
Meridian was fully compliant with IS Standard 1.0. Meridian continued to use its internally developed claims system, Managed Care System (MCS). This system is more robust than many external industry standard systems. MCS was able to capture and manage attachments for claims utilizing its graphical user interface buttons. Additionally, claims that were scanned in-house were accessible from MCS with the click of a button. This assisted the Meridian MCS staff and audit team with conducting primary source review and validation efforts.
Meridian monitored its aging reports daily and utilized industry standard Incurred But Not Received (IBNR)/Claims triangle reports to determine paid and pending claims. An IBNR report was requested and provided for the claims paid through March 2017.
No vendors, other than electronic claims clearinghouses, were involved with processing claims. All clearinghouses provided HIPAA edit checks prior to supplying the electronic claims to Meridian. Meridian’s claim process was very clean, with 90 percent of all claims submitted electronically. Meridian continued to receive some paper claims (approximately 10 percent), which the internal staff scanned and vertexed. The time to process a claim was within Meridian’s standard of 30 days.
Meridian indicated that there were no backlogs of claims during the measurement year, which was confirmed through the IBNR tracking log.
2016–2017 Performance
Measure Methodology
Page | C-41
IS 2.0—Enrollment Data—Data Capture, Transfer, and Entry
Meridian was fully compliant with IS Standard 2.0. Meridian’s enrollment data were staged in the MCS system. Data were updated daily and confirmed monthly from the State’s enrollment files. Meridian experienced significant growth in enrollment due to acquiring two Accountable Care Entities (ACEs), Advocate and Northshore. The ACE acquisition resulted in 124,000 new members enrolled in the FHP/ACA program. Meridian had no issues with the acquisition of the additional membership from the external ACE entities.
As with past reviews, Meridian did not manually enter any enrollment information, except for special circumstances. Special circumstances arise only when the State provides a request to enroll a member following the final submission of the enrollment file.
Meridian did not have any changes to its enrollment processes from the previous year’s review. Meridian did not experience any difficulties in processing enrollments for the measurement year.
Meridian relied on the State to supply accurate information on the monthly enrollment files. There were no manual steps or vendors involved with the enrollment process.
Due to the nature of the FHP/ACA and ICP populations that Meridian served, the plan reported it was often difficult to keep up with changes in member demographic data. Demographic data changed often and were updated regularly; however, this did not have an impact on enrollment data processing.
Meridian received an enrollment file daily from HFS, which was loaded into its MCS claims/encounter processing system. This file contained all enrollment information required for Medicaid. Monthly, Meridian also verified enrollment using the State’s full roster. The full roster provided Meridian with additions, changes, or deletions that were previously reported on the daily files.
Meridian’s MCS system contained all applicable fields relevant for HEDIS reporting. MCS maintained a unique identifier for each member and captured the Medicaid and Family identifiers.
Specific enrollment queries by month and gender were conducted during the on-site audit for Meridian’s FHP/ACA and ICP populations. Age ranges and gender specifications were found to be appropriate.
IS 3.0—Practitioner Data—Data Capture, Transfer, and Entry
Meridian was fully compliant with IS Standard 3.0. There were no significant changes to the provider systems and processes used during the measurement year. MCS captured all credentialing information from Meridian’s providers and was able to capture primary and secondary specialties. During the on-site audit, plan staff confirmed neurology as a valid mental health specialty for Meridian. Meridian’s MCS captured all fields required for HEDIS reporting, as outlined in Roadmap Section 3, Table 3B.A.
The provider specialties mapping assigned to FQHCs as mental health providers was approved by the auditor for use in the mental/behavioral health measures. FQHCs can provide both primary care and mental health services to Medicaid members in the State of Illinois. Appendix 3 from the NCQA’s
2016–2017 Performance
Measure Methodology
Page | C-42
HEDIS 2017, Volume 2, Technical Specifications for Health Plans allows for mapping of specialties that are required under State regulations. To meet the qualifications for being an FQHC, certain criteria must be met, including offering mental health services. Meridian updated its Roadmap to include a letter from HFS showing that FQHCs must offer mental health services and that these services must be rendered by a psychiatrist, psychologist, licensed clinical social worker (LCSW), licensed clinical professional counselor (LCPC), or licensed marriage and family therapist (LMFT).
MCS was a fully integrated, robust health information system. No transfers of data from one system to another occurred, eliminating any opportunity for loss of data. All specialties were fully documented.
IS 4.0—Medical Record Review Processes—Training, Sampling, Abstraction, and Oversight
Meridian was fully compliant with IS Standard 4.0. HSAG reviewed Meridian’s IS 4 Roadmap pertaining to the policies and procedures for IS Standard 4.0. The Roadmap review found these policies and procedures to be consistent with IS 4.0 requirements.
Meridian sampled according to the HEDIS sampling guidelines and assigned measure-specific oversamples. Provider chase logic was reviewed and determined appropriate across the hybrid measures.
Medical record pursuit and data collection were conducted by Meridian staff using proprietary data abstraction tools. HSAG participated in a live demonstration of the hybrid tools and instructions. All fields, edits, and drop-down boxes were reviewed for accuracy against NCQA’s HEDIS 2017, Volume 2, Technical Specifications for Health Plans. HSAG reviewed and approved Meridian’s hybrid tools and instructions on January 31, 2017. HSAG reviewed Meridian’s abstraction training manual on February 1, 2017, and found no concerns.
Staff members were sufficiently qualified and trained in the current year’s HEDIS technical specifications. Meridian maintained appropriate quality assurance of reviews, including over-reads of all abstractions resulting in numerator positives or exclusions, and a random sample of numerator negatives.
Given that CBP was added as a new hybrid measure for 2017 ICP reporting, Meridian was requested to complete a convenience sample for this measure. Due to errors noted in the prior year’s validation, a convenience sample was also requested for PPC—Timeliness of Prenatal Care and CIS—Combination 3. All convenience samples passed HSAG’s review.
Meridian passed the MRRV process for the following measures and corresponding measure groups:
• Group A: Biometrics (BMI, BP) and Maternity—CBP • Group A: Biometrics (BMI, BP) and Maternity—PPC—Postpartum Care • Group B: Anticipatory Guidance and Counseling—WCC—Counseling for Nutrition • Group C: Laboratory—CDC—HbA1c Testing • Group C: Laboratory—CDC—Medical Attention for Nephropathy • Group D: Immunizations and Other Screenings—CDC—Eye Exam (Retinal) Performed
2016–2017 Performance
Measure Methodology
Page | C-43
• Group D: Immunizations and Other Screenings—CIS—Combination 3
Of note, there were no medical record exclusions to review.
IS 5.0—Supplemental Data—Capture, Transfer, and Entry
Meridian was fully compliant with IS Standard 5.0. Meridian presented five supplemental databases for consideration in its Roadmap. Two were new supplemental data sources for the reporting year, Centegra electronic health record (EHR) and Advocate EHR. An interview with plan staff during the on-site audit identified that Meridian decided against using the Centegra and Advocate data because these data sources were not ready in time to use for HEDIS 2017 reporting. The two new supplemental databases were removed from HSAG’s consideration for 2017 HEDIS reporting.
Meridian also provided Roadmap sections for Meridian Health Plan (MHP) Internal, a nonstandard internal supplemental database; Quest Laboratories, a standard external database; and Historical Claims, another external standard database.
MHP Internal was reviewed against the POS documents, and no issues were found. This MHP Internal database was approved for use in HEDIS 2017.
The two standard databases were reviewed and approved for use in HEDIS 2017.
IS 7.0—Data Integration—Accurate Reporting, Control Procedures That Support Measure Reporting Integrity
Meridian was fully compliant with IS Standard 7.0. Meridian’s HEDIS repository structure contained all relevant fields for reporting. The HEDIS repository pulled data directly from MCS, maintaining all of the same data. No manual manipulation of the data occurred.
Meridian continued to use internally developed source code to produce the required measures. The source code used to produce the measures validated numerators, denominators, and continuous enrollment appropriately. It was confirmed that Meridian had some source code changes which eliminated duplicate steps for acquiring continuous enrollment. At the time of the audit, Meridian was still undergoing source code review by HSAG. Dates of service played an integral role in the development of the code and measures. All source code was approved on April 3, 2017.
Prior to the on-site audit, a list of queries in accordance with the requirements outlined in Appendix 11 of NCQA’s HEDIS 2017, Volume 5, HEDIS Compliance Audit: Standards, Policies and Procedures was requested for review.
Query Group 3: Onsite Drill-Down PSV was conducted on-site for multiple FHP/ACA and ICP measures, and Meridian passed the review with no errors.
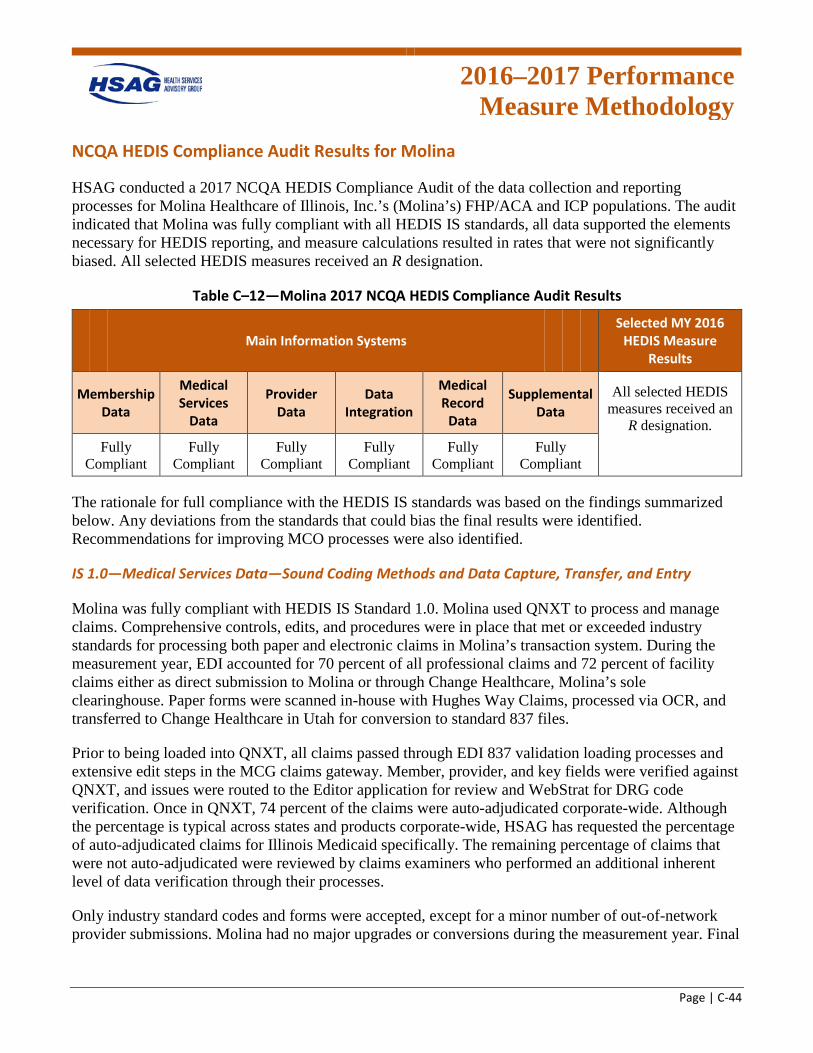
2016–2017 Performance
Measure Methodology
Page | C-44
NCQA HEDIS Compliance Audit Results for Molina
HSAG conducted a 2017 NCQA HEDIS Compliance Audit of the data collection and reporting processes for Molina Healthcare of Illinois, Inc.’s (Molina’s) FHP/ACA and ICP populations. The audit indicated that Molina was fully compliant with all HEDIS IS standards, all data supported the elements necessary for HEDIS reporting, and measure calculations resulted in rates that were not significantly biased. All selected HEDIS measures received an R designation.
Table C–12—Molina 2017 NCQA HEDIS Compliance Audit Results
Main Information Systems Selected MY 2016
HEDIS Measure Results
Membership Data
Medical Services
Data
Provider Data
Data Integration
Medical Record
Data
Supplemental Data
All selected HEDIS measures received an
R designation. Fully
Compliant Fully
Compliant Fully
Compliant Fully
Compliant Fully
Compliant Fully
Compliant
The rationale for full compliance with the HEDIS IS standards was based on the findings summarized below. Any deviations from the standards that could bias the final results were identified. Recommendations for improving MCO processes were also identified.
IS 1.0—Medical Services Data—Sound Coding Methods and Data Capture, Transfer, and Entry
Molina was fully compliant with HEDIS IS Standard 1.0. Molina used QNXT to process and manage claims. Comprehensive controls, edits, and procedures were in place that met or exceeded industry standards for processing both paper and electronic claims in Molina’s transaction system. During the measurement year, EDI accounted for 70 percent of all professional claims and 72 percent of facility claims either as direct submission to Molina or through Change Healthcare, Molina’s sole clearinghouse. Paper forms were scanned in-house with Hughes Way Claims, processed via OCR, and transferred to Change Healthcare in Utah for conversion to standard 837 files.
Prior to being loaded into QNXT, all claims passed through EDI 837 validation loading processes and extensive edit steps in the MCG claims gateway. Member, provider, and key fields were verified against QNXT, and issues were routed to the Editor application for review and WebStrat for DRG code verification. Once in QNXT, 74 percent of the claims were auto-adjudicated corporate-wide. Although the percentage is typical across states and products corporate-wide, HSAG has requested the percentage of auto-adjudicated claims for Illinois Medicaid specifically. The remaining percentage of claims that were not auto-adjudicated were reviewed by claims examiners who performed an additional inherent level of data verification through their processes.
Only industry standard codes and forms were accepted, except for a minor number of out-of-network provider submissions. Molina had no major upgrades or conversions during the measurement year. Final
2016–2017 Performance
Measure Methodology
Page | C-45
claims were exported from QNXT into Molina’s Operational Data Storage (ODS) and transferred to the Enterprise Reporting Repository (ERR), along with encounters and vendor data used for HEDIS reporting. HSAG reviewed the steps in the transfer processes to ensure data integrity.
Molina did not process encounters into its QNXT transaction system, but instead loaded them into Molina’s ODS and ERR. Encounters, claims, and vendor data were stored in the ERR. Edits and data verification were completed in ODS, similar to edits MCG used for pre-processing claims verification. Encounter load reports, edits, and procedures also met or exceeded industry standards for ensuring data quality. During the measurement year, EDI accounted for 31 percent of all professional encounters as direct submissions to Molina or through Change Healthcare, the sole clearinghouse. There were no facility encounters. All Molina facility providers received FFS reimbursement.
Similar to claims, paper encounter forms were scanned in-house with Hughes Way Claims, processed via OCR, and transferred to Change Healthcare in Utah for conversion to standard 837 files. Encounters were received on standard forms with industry standard codes. Encounter processing was stable during the measurement year, and no major conversions or changes occurred.
Molina enterprise had several vision vendors, but only March Vision Care eyeManager provided services for Illinois Medicaid members. Only FFS claims were received, and 97 percent were electronic. Edits and verification processes were in place during the measurement year that met or exceeded industry standards for both electronic and paper claims. Claims were processed in a timely manner, weekly pre-payment audits and monthly examiner quality audits were conducted, and no major issues were identified. Molina provided March Vision Care with daily eligibility files, and a daily and weekly verification occurred, as well as a monthly reconciliation performed after the State monthly enrollment was processed and reconciled.
Pharmacy data provided by CVS Caremark were closely monitored through comprehensive quality assurance and control procedures. Molina performed pre-loading edits and verification in ODS before the pharmacy data were loaded into ERR. Additional assurance of data quality was performed by its extensive use within Molina for quality improvement efforts, utilization and quality review, and the Medicare STAR quality program. Molina provided CVS Caremark with daily eligibility files, and a daily and weekly verification occurred, as well as a monthly reconciliation performed after the State monthly enrollment was processed and reconciled.
IS 2.0—Enrollment Data—Data Capture, Transfer, and Entry
Molina was fully compliant with HEDIS IS Standard 2.0. Molina downloaded monthly and daily membership files from the State for both membership products (FHP/ACA and ICP) in HIPAA-compliant format. Molina conducted a series of tracking and monitoring processes to assure complete data transmissions and QNXT imports. The State also provided daily update files with changes throughout the month. Eligibility, reconciliation, and error reports were produced with each download, and all issues were resolved on an ongoing basis.
Annual ICP membership increased by 5 percent, while there was a significant increase in the FHP/ACA membership during the measurement year. However, no backlogs or delays were identified in
2016–2017 Performance
Measure Methodology
Page | C-46
processing member data for either product lines. During the on-site visit, it was confirmed that all required data elements for HEDIS reporting were captured. Enrollment segments and historical member enrollment history were captured, and measure enrollment eligibility could be determined.
IS 3.0—Practitioner Data—Data Capture, Transfer, and Entry
Molina was fully compliant with HEDIS IS Standard 3.0. During the measurement year, Molina provider services maintained two provider databases, Cactus for credentialing and the QNXT transaction system. There were comprehensive oversight and reconciliation protocols in place to maintain provider information in both data systems. The provider directory was maintained routinely on the website and generated biannually from QNXT after it was moved downstream into ODS and ERR. Distribution of the provider directory helped to ensure that accurate physician information was reviewed by both providers and members.
The transactional system, QNXT, could identify the rendering provider and type of specialty, which met requirements for reporting the measures under the scope of the audit.
IS 4.0—Medical Record Review Processes—Training, Sampling, Abstraction, and Oversight
Molina was fully compliant with HEDIS IS Standard 4.0. HSAG reviewed Molina’s IS 4 Roadmap pertaining to the policies and procedures for IS Standard 4.0. The Roadmap review found these policies and procedures to be consistent with IS 4.0 requirements.
Molina sampled according to the HEDIS sampling guidelines and assigned measure-specific oversamples. Provider chase logic was reviewed and determined appropriate across the hybrid measures.
For HEDIS 2017, Molina used internal staff members to abstract data into Inovalon’s medical record abstraction tool, QSHR. HSAG participated in a live vendor demonstration of the QSHR tool and instructions. All fields, edits, and drop-down boxes were reviewed for accuracy against NCQA’s HEDIS 2017, Volume 2, Technical Specifications for Health Plans. HSAG reviewed and approved QSHR’s hybrid tool and instructions on January 20, 2017.
HSAG reviewed Molina’s abstraction training manual and found no concerns. Reviewer qualifications, training, and oversight by Molina of its review staff were appropriate.
HSAG requested a convenience sample for measures recently revised by NCQA or measures that had not recently been selected for validation:
• CBP • PPC—Timeliness of Prenatal Care and Postpartum Care • WCC—Counseling for Nutrition • CDC—Medical Attention for Nephropathy
All convenience samples passed HSAG's review.
2016–2017 Performance
Measure Methodology
Page | C-47
Molina passed the MRRV process for the following measure groups:
• Group A: Biometrics (BMI, BP) and Maternity—CBP • Group B: Anticipatory Guidance and Counseling—WCC—BMI Percentile • Group C: Laboratory—WCC—Counseling for Nutrition • Group D: Immunizations and Other Screenings—CIS—Hepatitis B (HepB)
Of note, for CIS—HepB, a critical error was identified in the first sample set; therefore, a second sample was required. However, the second sample passed. There were no medical record exclusions to validate.
IS 5.0—Supplemental Data—Capture, Transfer, and Entry
Molina was fully compliant with IS Standard 5.0. Molina utilized a wide variety of standard supplemental databases from multiple sources which included historical claims, laboratory results, and vision data. Molina also used two nonstandard supplemental databases, Supplemental Data Capturing Tool (SDCT) and Prospective Medical Record Review (PMRR); both contained electronic health records data from medical groups used for in-house medical record abstraction. All supplemental databases, standard and nonstandard, have been used in prior years. Originally, another database, Joint Venture Hospital Laboratories, was included for reporting year 2017 but later withdrawn.
Molina utilized historical claims from CMS; a standard database was received monthly and went through routine loading and verification procedures. Supplemental laboratory data included two standard databases, Quest Diagnostics and LabCorp. March Vision Care supplied dilated retinal eye exam results for CDC. All four databases have been used previously, data files were received routinely, processes were well established, and industry standard codes were used.
Two nonstandard supplemental databases were well established within Molina. SDCT and PMRR contained medical record abstracted data, managed and monitored by the Illinois and corporate quality improvement teams. The PMRR dataset successfully passed primary source validation and POS documentation review and was approved for 2017 HEDIS reporting. Dates of service inconsistency was identified in the first PSV sample for the SDCT supplemental dataset. However, no issues were identified in the second PSV sample of 50 records.
IS 7.0—Data Integration—Accurate Reporting, Control Procedures That Support Measure Reporting Integrity
Molina was fully compliant with IS Standard 7.0. Molina used Inovalon’s certified measures to generate its HEDIS performance measure rates. Inovalon has been the certified measure vendor for Molina for over four years and has a thorough knowledge of the application, required data files, quality checks, and procedures. Inovalon provided Molina with comprehensive documentation, needed support, and reference manuals. Molina also met with Inovalon regularly to discuss file loading and data processing. Molina had a detailed process in place for preparing files for data integration using the vendor’s specifications.
2016–2017 Performance
Measure Methodology
Page | C-48
Both Molina and Inovalon reviewed the loaded-to-expected file volumes to ensure the repository accurately reflected the transaction files that were submitted. In addition to the quality assurance and control procedures in place when uploading data into the Inovalon application, Molina conducted routine analysis on the resulting data, examining temporal trends and continuous enrollment, and identifying any anomalies and significant changes.
During the on-site visit, query Group 3, onsite Drill-Down PSV was conducted, and no issues were identified. As part of the Group 3 query on-site, HSAG reviewed the file structure, database management, naming conventions, version control, and verification processes.
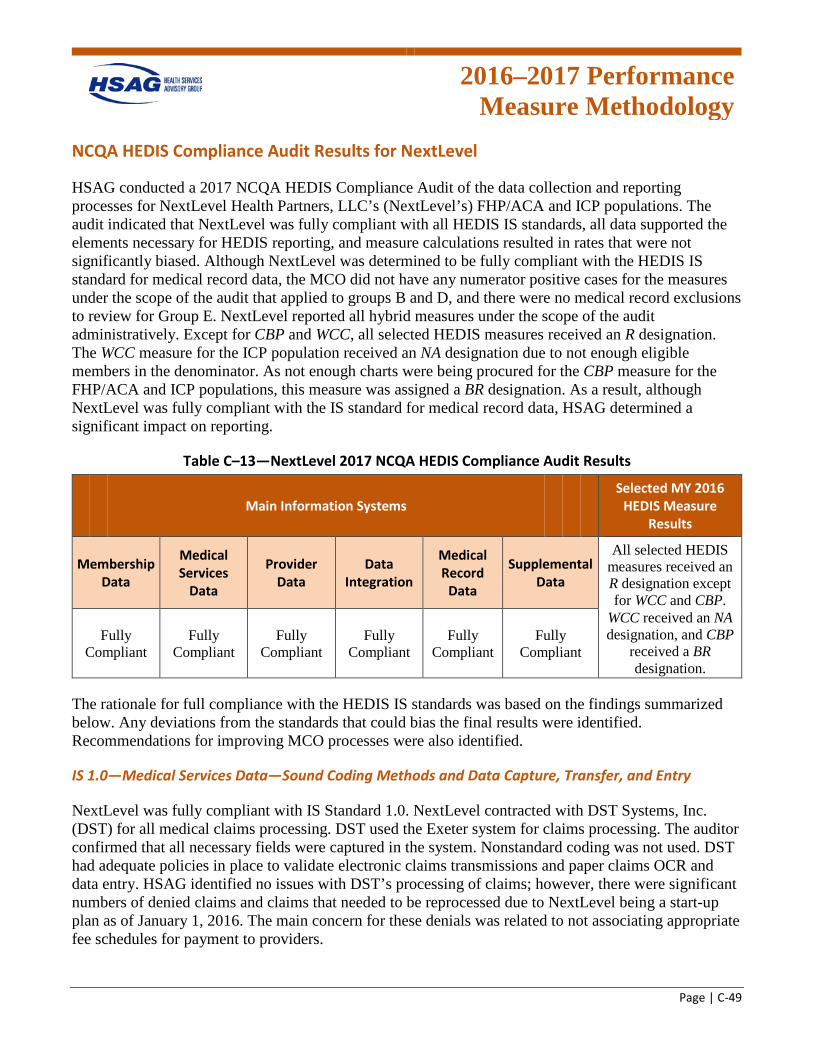
2016–2017 Performance
Measure Methodology
Page | C-49
NCQA HEDIS Compliance Audit Results for NextLevel
HSAG conducted a 2017 NCQA HEDIS Compliance Audit of the data collection and reporting processes for NextLevel Health Partners, LLC’s (NextLevel’s) FHP/ACA and ICP populations. The audit indicated that NextLevel was fully compliant with all HEDIS IS standards, all data supported the elements necessary for HEDIS reporting, and measure calculations resulted in rates that were not significantly biased. Although NextLevel was determined to be fully compliant with the HEDIS IS standard for medical record data, the MCO did not have any numerator positive cases for the measures under the scope of the audit that applied to groups B and D, and there were no medical record exclusions to review for Group E. NextLevel reported all hybrid measures under the scope of the audit administratively. Except for CBP and WCC, all selected HEDIS measures received an R designation. The WCC measure for the ICP population received an NA designation due to not enough eligible members in the denominator. As not enough charts were being procured for the CBP measure for the FHP/ACA and ICP populations, this measure was assigned a BR designation. As a result, although NextLevel was fully compliant with the IS standard for medical record data, HSAG determined a significant impact on reporting.
Table C–13—NextLevel 2017 NCQA HEDIS Compliance Audit Results
Main Information Systems Selected MY 2016
HEDIS Measure Results
Membership Data
Medical Services
Data
Provider Data
Data Integration
Medical Record
Data
Supplemental Data
All selected HEDIS measures received an R designation except for WCC and CBP.
Fully Compliant
Fully Compliant
Fully Compliant
Fully Compliant
Fully Compliant
Fully Compliant
WCC received an NA designation, and CBP
received a BR designation.
The rationale for full compliance with the HEDIS IS standards was based on the findings summarized below. Any deviations from the standards that could bias the final results were identified. Recommendations for improving MCO processes were also identified.
IS 1.0—Medical Services Data—Sound Coding Methods and Data Capture, Transfer, and Entry
NextLevel was fully compliant with IS Standard 1.0. NextLevel contracted with DST Systems, Inc. (DST) for all medical claims processing. DST used the Exeter system for claims processing. The auditor confirmed that all necessary fields were captured in the system. Nonstandard coding was not used. DST had adequate policies in place to validate electronic claims transmissions and paper claims OCR and data entry. HSAG identified no issues with DST’s processing of claims; however, there were significant numbers of denied claims and claims that needed to be reprocessed due to NextLevel being a start-up plan as of January 1, 2016. The main concern for these denials was related to not associating appropriate fee schedules for payment to providers.
2016–2017 Performance
Measure Methodology
Page | C-50
NextLevel was 100 percent FFS, which provided support for data completeness.
NextLevel and DST had excellent auditing processes in place, and accuracy rates met industry standards. DST audited five claims per day per examiner. In addition, 124 claims were randomly selected for audit each month. All errors were corrected. DST provided the accuracy reports for 2016 to NextLevel. The reports showed 99 percent procedural accuracy and 98.7 percent financial accuracy. The overall accuracy goal was 98 percent.
NextLevel is currently working on service level requirements with DST. Data were captured from all ancillary vendors with no issues.
IS 2.0—Enrollment Data—Data Capture, Transfer, and Entry
NextLevel was fully compliant with IS Standard 2.0. NextLevel began receiving enrollment for members in the ICP and ACA populations on January 1, 2016. NextLevel began receiving enrollment for members in the FHP population on April 1, 2016. Overall FHP/ACA enrollment increased from 15,227 at the beginning of the year to more than 52,000 by December 2016. ICP enrollment increased slightly from 4,163 on January 1, 2016, to 4,489 by December 2016.
NextLevel contracted with DST for enrollment data processing. DST used the Membership and Billing (MAB) and Exeter systems for processing enrollment data. The auditor confirmed that all necessary fields were captured in Exeter. DST had adequate policies in place to validate electronic enrollment file transmissions. The State provided daily enrollment updates as well as a monthly full file. Reconciliations were run weekly, primarily to validate member termination dates. There were no issues with timeliness, and time to process standards were met.
NextLevel and DST had excellent auditing processes in place. The organizations reported no significant issues or problems with the data received from the State.
IS 3.0—Practitioner Data—Data Capture, Transfer, and Entry
NextLevel was fully compliant with IS Standard 3.0. NextLevel used Microsoft (MS) Excel files to maintain credentialing data. All credentialing was performed in-house. The auditor confirmed that all necessary practitioner data fields were captured in Exeter. NextLevel and DST had auditing processes in place for populating Exeter and the MS Excel files. DST audited the Exeter data entry, and NextLevel validated all changes made in Exeter. NextLevel provided the provider specialty mapping document prior to the on-site. All questions were resolved, and no significant issues were identified.
IS 4.0—Medical Record Review Processes—Training, Sampling, Abstraction and Oversight
NextLevel was fully compliant with IS Standard 4.0. HSAG reviewed NextLevel’s IS 4 Roadmap pertaining to the policies and procedures for IS Standard 4.0. The Roadmap review found these policies and procedures to be consistent with IS 4.0 requirements.
2016–2017 Performance
Measure Methodology
Page | C-51
NextLevel sampled according to the HEDIS sampling guidelines and assigned measure-specific oversamples. Provider chase logic was reviewed and determined appropriate across the hybrid measures.
For HEDIS 2017, NextLevel used internal staff members to abstract data into DST’s CareAnalyzer medical record abstraction tool. HSAG participated in a live vendor demonstration of DST’s tool and instructions. All fields, edits, and drop-down boxes were reviewed for accuracy against NCQA’s HEDIS 2017, Volume 2, Technical Specifications for Health Plans. HSAG reviewed and approved DST’s hybrid tool and instructions on February 21, 2017.
HSAG reviewed NextLevel’s abstraction training manual and found no concerns. Reviewer qualifications, training, and oversight by NextLevel of its review staff were appropriate.
Since NextLevel was a new Medicaid plan and this was its first year being audited, a full convenience sample was required for all measures under the scope of the audit. However, the plan did not have any numerator positive cases for WCC, CIS, CDC—Eye Exam (Retinal) Performed, or CDC—Medical Attention for Nephropathy; therefore, these measures could not be reviewed. All reviewed convenience samples passed HSAG validation.
NextLevel passed the MRRV process for the following measures and corresponding measure groups:
• Group A: Biometrics (BMI, BP) and Maternity—CBP • Group A: Biometrics (BMI, BP) and Maternity—PPC—Timeliness of Prenatal Care and
Postpartum Care • Group C: Laboratory—CDC—HbA1c Testing • Group C: Laboratory—CDC—Medical Attention for Nephropathy
The plan did not have any numerator positive cases for the measures under the scope of the audit that applied to groups B and D, and there were no medical record exclusions to review for Group F.
NextLevel confirmed that the MRR project was not completed and not enough charts were procured to achieve reportable rates. All hybrid measures under the scope of the audit were reported using the administrative only method. The CBP measure received a BR designation.
IS 5.0—Supplemental Data—Capture, Transfer, and Entry
NextLevel was fully compliant with IS Standard 5.0. NextLevel utilized one source of supplemental data, historical claims data from the State. The auditor considered this to be a standard supplemental database. Standard coding was used, and no changes were made to the data when reformatting for upload to CareAnalyzer. Monthly file transmissions were monitored by NextLevel. The auditor did not identify any issues with the State’s data. NextLevel’s standard supplemental database was approved for HEDIS 2017 reporting.
2016–2017 Performance
Measure Methodology
Page | C-52
IS 7.0—Data Integration—Accurate Reporting, Control Procedures That Support Measure Reporting Integrity
NextLevel was fully compliant with IS Standard 7.0. NextLevel included all necessary data sources in the data load to CareAnalyzer. Testing was performed in the fall, and the first data load for HEDIS 2017 was completed in early February 2017. An additional data load was performed in early March. CareAnalyzer data load reports were produced; however, as part of the query Group 2: Data Loading Checks review, some data errors were identified that needed to be researched. The errors included missing discharge dates and admit dates that appeared to be birthdates. NextLevel researched and corrected the identified errors. The missing discharge dates were interim bills for skilled nursing where discharge had not yet occurred. These were set to a December 31 discharge. The admit dates that appeared to be birthdates were data entry errors. These were corrected before reporting.
The auditor completed query Group 3: Onsite Drill-Down PSV during the on-site for CHL, CDC—Eye Exam (Retinal) Performed, and CDC—HbA1c Testing. The auditor found no errors. Query Group 6: Mapping Result Checks PSV was completed for the CDC—Eye Exam (Retinal) Performed measure indicator with no errors. Query Group 1: Overall Demographics PSV was completed off-site with a review of the membership reports and the CareAnalyzer Enrollment by Product Line (ENP) results. No issues were identified.
2016–2017 Performance
Measure Methodology
Page | C-53
Validation of State Performance Measures for Primary Care Case Management (PCCM)/Children's Health Insurance Program Reauthorization Act (CHIPRA)
Introduction
HFS contracts with HSAG to conduct a review of the PCCM and CHIPRA programs for a selected set of performance measures.
HSAG’s role in the validation of performance measures is to ensure that the validation activities are conducted as outlined in the CMS publication, EQR Protocol 2, Validation of Performance Measures Reported by the MCO: A Mandatory Protocol for External Quality Review, Version 2.0, September 2012. HSAG also uses the NCQA manual, HEDIS 2017, Volume 5, HEDIS Compliance Audit: Standards, Policies and Procedures.
Conducting the Review
The primary objectives of the performance measure validation (PMV) process are to:
• Evaluate the processes used to collect the performance measure data by HFS. • Determine the extent to which the specific performance measures calculated by HFS followed the
specifications established for each performance measure.
HFS identifies the performance measurement period for validation for each program for the reporting year. HFS selected NCQA HEDIS measures as well as CMS Adult Core Set and Child Core Set performance measures for the PCCM and CHIPRA programs. Most measures used the HEDIS 2017 Technical Specifications. For measures that were both HEDIS and Core Set measures, HSAG reviewed source code according to both the HEDIS 2017 Technical Specifications, the June 2016 Adult Core Set, and the June 2016 Child Core Set. This was acceptable since the specifications for most, if not all, of the HEDIS measures were the same as the Core Set, except for the age breakouts. There were also measures which utilized the Maternal and Infant Health Initiative (MIHI) Contraceptive Care Measures technical specifications and the Data Definitions technical specifications produced by HFS. For a list of the validated measures and their corresponding rates, see Appendix F of this report.
2016–2017 Performance
Measure Methodology
Page | C-54
Pre-Audit Activities
HSAG requests that HFS submit a list of measures under the scope of the audit, a completed Information Systems Capabilities Assessment Tool (ISCAT), source code for each performance measure, and any additional supporting documentation necessary to complete the audit. A conference call is conducted to answer questions and prepare for the audit.
Data Collection and Analysis
The CMS PMV protocol identifies key types of data that should be reviewed as part of the validation process. The following list describes the type of data collected and how HSAG conducted an analysis of these data:
• ISCAT: HFS was responsible for completing and submitting the ISCAT document to HSAG. Upon receipt, HSAG conducted a cursory review of the ISCAT to ensure that HFS completed all sections and included all needed attachments. The validation team then reviewed all ISCAT documents, noting issues or items that needed further follow-up. The validation team used the information in the ISCAT to complete the review tools, as applicable.
• Source code (programming language) for performance measures: HSAG requested source code from HFS for all performance measures. HSAG source code reviewers completed a line-by-line code review and evaluation of program logic flow to ensure compliance with the specifications required by HFS. The source code reviewers identified areas of deviation and shared them with HFS for adjustment. The source code reviewers also informed the audit team of any deviations from the measure specifications so the team could evaluate the impact of the deviation on the measure and assess the degree of bias (if any).
• Supporting documentation: HSAG requested documentation and data queries that provided reviewers with additional information to complete the validation process, including policies and procedures, file layouts, system flow diagrams, system log files, and data collection process descriptions. The validation team reviewed all supporting documentation, identifying issues or clarifications for follow-up.
Performance Measure Validation Findings
To validate the performance measures, data from various sources, including provider data, claims/encounter systems, and enrollment data, must be audited. The auditor scrutinizes these processes and makes a determination as to the validity of the data collected. HSAG uses a variety of audit methods, including analysis of computer programs, PSV, and staff member interviews to determine a result for each measure.
Each of the performance measures reviewed by HSAG were assigned a final audit result consistent with the designations identified in the CMS PMV Protocol listed below in Table C–14.
2016–2017 Performance
Measure Methodology
Page | C-55
Table C–14—Performance Measure Audit Results and Definitions
Result Definition
R Reportable. Measure was compliant with the State’s specifications and the rate can be reported.
NR Not Reported. This designation is assigned to measures for which (1) the rate was materially biased, or (2) the rate was not required to be reported.
NB No Benefit. Measure was not reported because the benefit required by the measure was not offered.
HSAG determined that all data supported the elements necessary for reporting and measures were calculated appropriately according to the required measure specifications. Further, all performance measures under the scope of the audit received an R designation.
Page | D-1
Appendix D. 2015–2016 Performance Measure Results
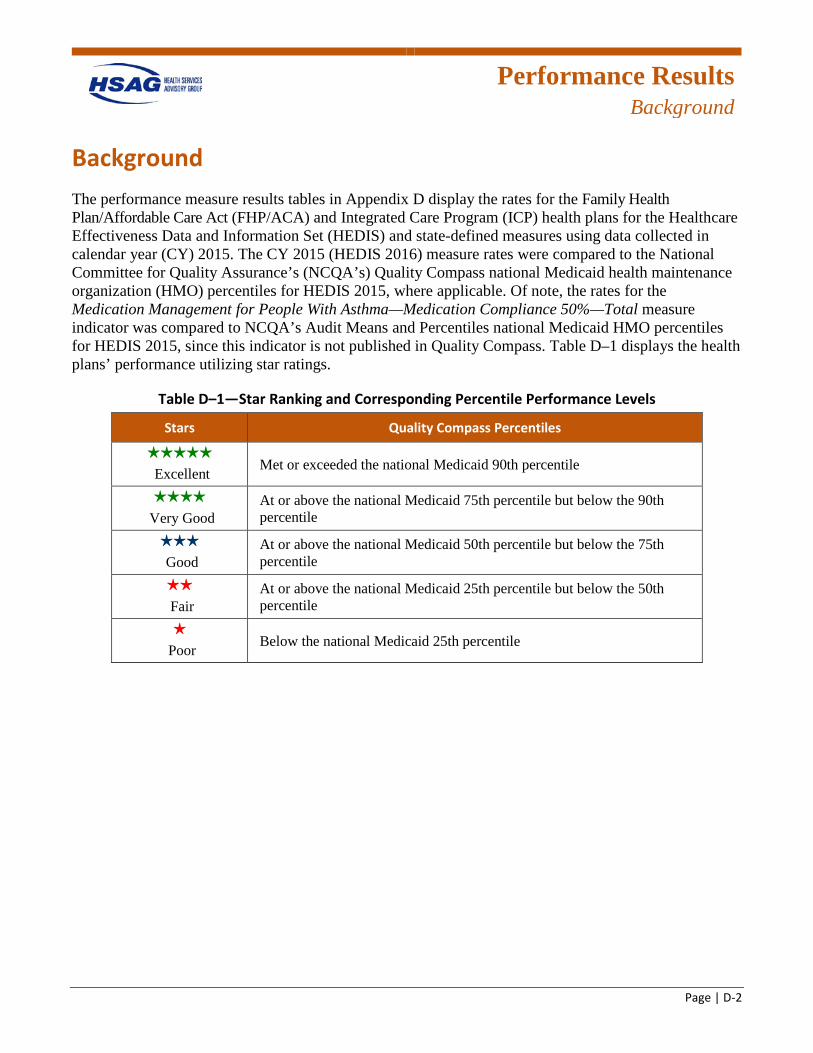
Performance Results
Background
Page | D-2
Background The performance measure results tables in Appendix D display the rates for the Family Health Plan/Affordable Care Act (FHP/ACA) and Integrated Care Program (ICP) health plans for the Healthcare Effectiveness Data and Information Set (HEDIS) and state-defined measures using data collected in calendar year (CY) 2015. The CY 2015 (HEDIS 2016) measure rates were compared to the National Committee for Quality Assurance’s (NCQA’s) Quality Compass national Medicaid health maintenance organization (HMO) percentiles for HEDIS 2015, where applicable. Of note, the rates for the Medication Management for People With Asthma—Medication Compliance 50%—Total measure indicator was compared to NCQA’s Audit Means and Percentiles national Medicaid HMO percentiles for HEDIS 2015, since this indicator is not published in Quality Compass. Table D–1 displays the health plans’ performance utilizing star ratings.
Table D–1—Star Ranking and Corresponding Percentile Performance Levels
Stars Quality Compass Percentiles
Excellent Met or exceeded the national Medicaid 90th percentile
Very Good At or above the national Medicaid 75th percentile but below the 90th percentile
Good At or above the national Medicaid 50th percentile but below the 75th percentile
Fair At or above the national Medicaid 25th percentile but below the 50th percentile
Poor Below the national Medicaid 25th percentile
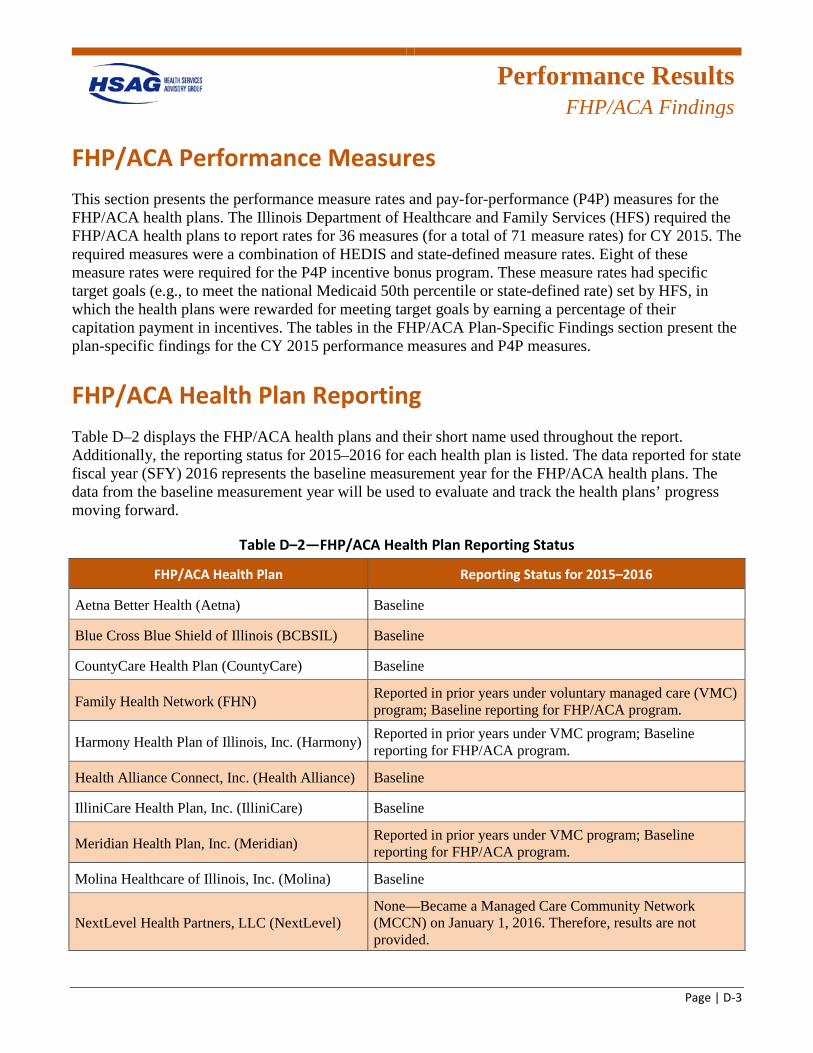
Performance Results
FHP/ACA Findings
Page | D-3
FHP/ACA Performance Measures This section presents the performance measure rates and pay-for-performance (P4P) measures for the FHP/ACA health plans. The Illinois Department of Healthcare and Family Services (HFS) required the FHP/ACA health plans to report rates for 36 measures (for a total of 71 measure rates) for CY 2015. The required measures were a combination of HEDIS and state-defined measure rates. Eight of these measure rates were required for the P4P incentive bonus program. These measure rates had specific target goals (e.g., to meet the national Medicaid 50th percentile or state-defined rate) set by HFS, in which the health plans were rewarded for meeting target goals by earning a percentage of their capitation payment in incentives. The tables in the FHP/ACA Plan-Specific Findings section present the plan-specific findings for the CY 2015 performance measures and P4P measures.
FHP/ACA Health Plan Reporting Table D–2 displays the FHP/ACA health plans and their short name used throughout the report. Additionally, the reporting status for 2015–2016 for each health plan is listed. The data reported for state fiscal year (SFY) 2016 represents the baseline measurement year for the FHP/ACA health plans. The data from the baseline measurement year will be used to evaluate and track the health plans’ progress moving forward.
Table D–2—FHP/ACA Health Plan Reporting Status
FHP/ACA Health Plan Reporting Status for 2015–2016
Aetna Better Health (Aetna) Baseline
Blue Cross Blue Shield of Illinois (BCBSIL) Baseline
CountyCare Health Plan (CountyCare) Baseline
Family Health Network (FHN) Reported in prior years under voluntary managed care (VMC) program; Baseline reporting for FHP/ACA program.
Harmony Health Plan of Illinois, Inc. (Harmony) Reported in prior years under VMC program; Baseline reporting for FHP/ACA program.
Health Alliance Connect, Inc. (Health Alliance) Baseline
IlliniCare Health Plan, Inc. (IlliniCare) Baseline
Meridian Health Plan, Inc. (Meridian) Reported in prior years under VMC program; Baseline reporting for FHP/ACA program.
Molina Healthcare of Illinois, Inc. (Molina) Baseline
NextLevel Health Partners, LLC (NextLevel) None—Became a Managed Care Community Network (MCCN) on January 1, 2016. Therefore, results are not provided.
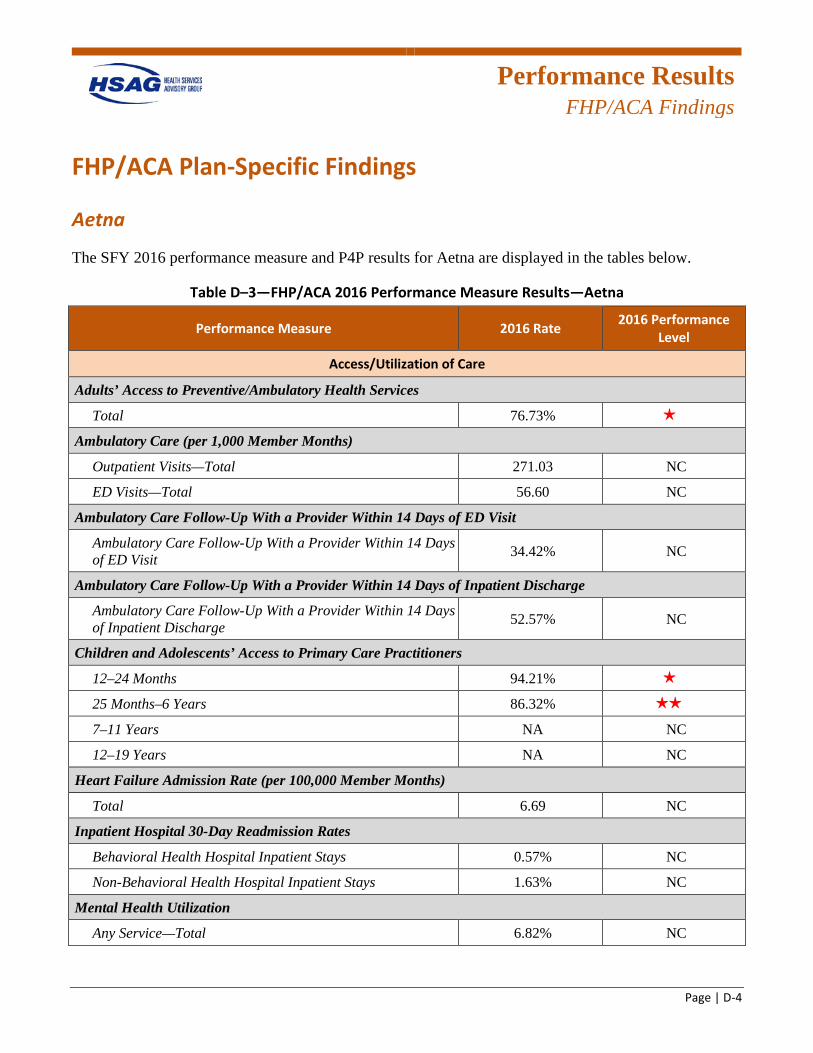
Performance Results
FHP/ACA Findings
Page | D-4
FHP/ACA Plan-Specific Findings
Aetna
The SFY 2016 performance measure and P4P results for Aetna are displayed in the tables below.
Table D–3—FHP/ACA 2016 Performance Measure Results—Aetna
Performance Measure 2016 Rate 2016 Performance Level
Access/Utilization of Care
Adults’ Access to Preventive/Ambulatory Health Services
Total 76.73% 1 star
Ambulatory Care (per 1,000 Member Months)
Outpatient Visits—Total 271.03 NC
ED Visits—Total 56.60 NC
Ambulatory Care Follow-Up With a Provider Within 14 Days of ED Visit
Ambulatory Care Follow-Up With a Provider Within 14 Days of ED Visit 34.42% NC
Ambulatory Care Follow-Up With a Provider Within 14 Days of Inpatient Discharge
Ambulatory Care Follow-Up With a Provider Within 14 Days of Inpatient Discharge 52.57% NC
Children and Adolescents’ Access to Primary Care Practitioners
12–24 Months 94.21% 1 star
25 Months–6 Years 86.32% 2 stars
7–11 Years NA NC
12–19 Years NA NC
Heart Failure Admission Rate (per 100,000 Member Months)
Total 6.69 NC
Inpatient Hospital 30-Day Readmission Rates
Behavioral Health Hospital Inpatient Stays 0.57% NC
Non-Behavioral Health Hospital Inpatient Stays 1.63% NC
Mental Health Utilization
Any Service—Total 6.82% NC
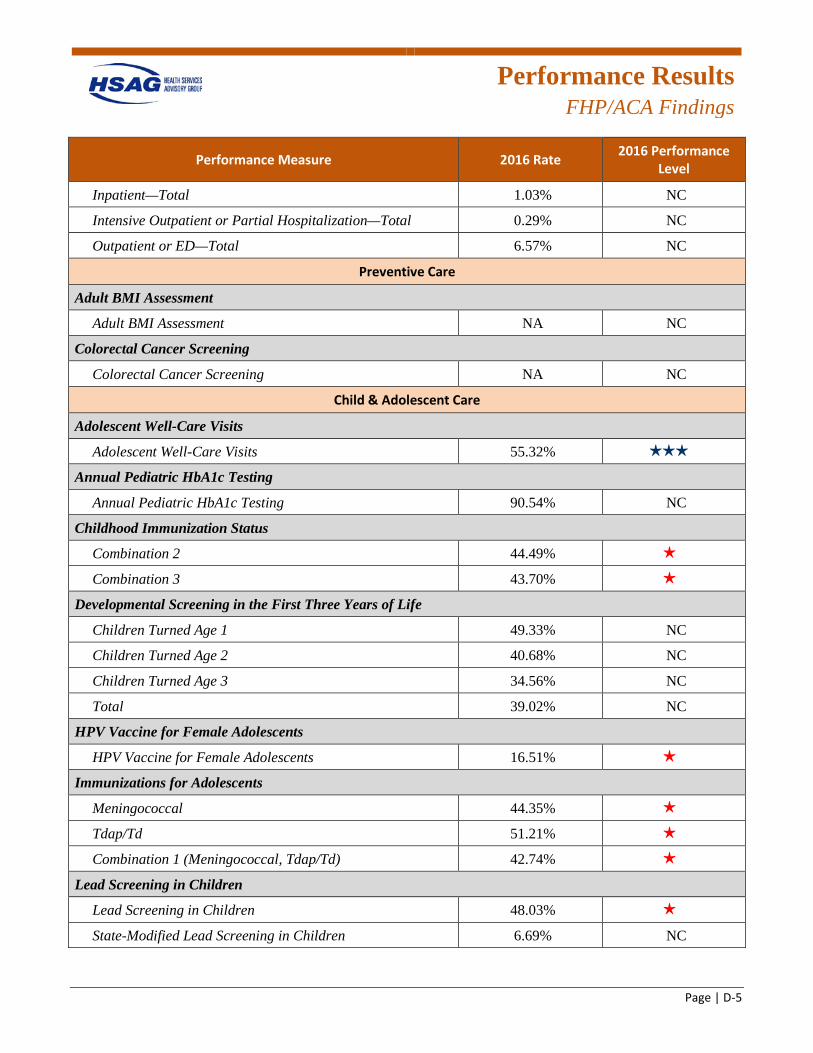
Performance Results
FHP/ACA Findings
Page | D-5
Performance Measure 2016 Rate 2016 Performance Level
Inpatient—Total 1.03% NC
Intensive Outpatient or Partial Hospitalization—Total 0.29% NC
Outpatient or ED—Total 6.57% NC
Preventive Care
Adult BMI Assessment
Adult BMI Assessment NA NC
Colorectal Cancer Screening
Colorectal Cancer Screening NA NC
Child & Adolescent Care
Adolescent Well-Care Visits
Adolescent Well-Care Visits 55.32% 3 stars
Annual Pediatric HbA1c Testing
Annual Pediatric HbA1c Testing 90.54% NC
Childhood Immunization Status
Combination 2 44.49% 1 star
Combination 3 43.70% 1 star
Developmental Screening in the First Three Years of Life
Children Turned Age 1 49.33% NC
Children Turned Age 2 40.68% NC
Children Turned Age 3 34.56% NC
Total 39.02% NC
HPV Vaccine for Female Adolescents
HPV Vaccine for Female Adolescents 16.51% 1 star
Immunizations for Adolescents
Meningococcal 44.35% 1 star
Tdap/Td 51.21% 1 star
Combination 1 (Meningococcal, Tdap/Td) 42.74% 1 star
Lead Screening in Children
Lead Screening in Children 48.03% 1 star
State-Modified Lead Screening in Children 6.69% NC
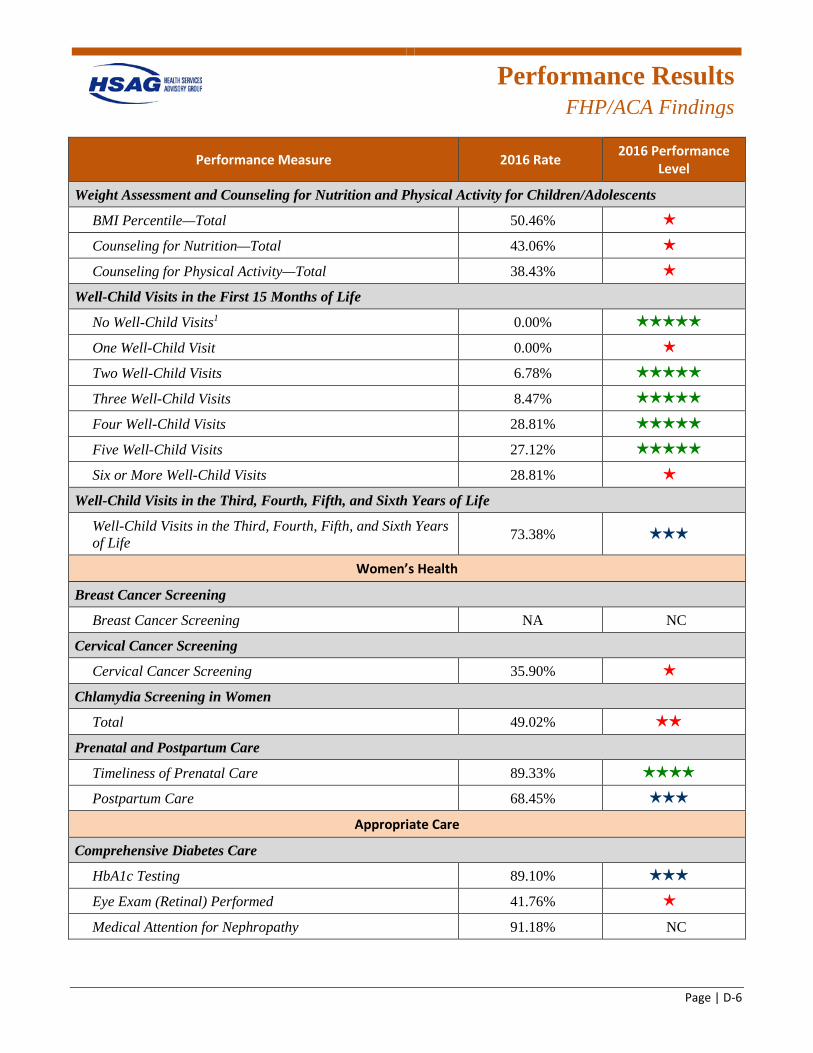
Performance Results
FHP/ACA Findings
Page | D-6
Performance Measure 2016 Rate 2016 Performance Level
Weight Assessment and Counseling for Nutrition and Physical Activity for Children/Adolescents
BMI Percentile—Total 50.46% 1 star
Counseling for Nutrition—Total 43.06% 1 star
Counseling for Physical Activity—Total 38.43% 1 star
Well-Child Visits in the First 15 Months of Life
No Well-Child Visits1 0.00% 5 stars
One Well-Child Visit 0.00% 1 star
Two Well-Child Visits 6.78% 5 stars
Three Well-Child Visits 8.47% 5 stars
Four Well-Child Visits 28.81% 5 stars
Five Well-Child Visits 27.12% 5 stars
Six or More Well-Child Visits 28.81% 1 star
Well-Child Visits in the Third, Fourth, Fifth, and Sixth Years of Life
Well-Child Visits in the Third, Fourth, Fifth, and Sixth Years of Life 73.38% 3 stars
Women’s Health
Breast Cancer Screening
Breast Cancer Screening NA NC
Cervical Cancer Screening
Cervical Cancer Screening 35.90% 1 star
Chlamydia Screening in Women
Total 49.02% 2 stars
Prenatal and Postpartum Care
Timeliness of Prenatal Care 89.33% 4 stars
Postpartum Care 68.45% 3 stars
Appropriate Care
Comprehensive Diabetes Care
HbA1c Testing 89.10% 3 stars
Eye Exam (Retinal) Performed 41.76% 1 star
Medical Attention for Nephropathy 91.18% NC
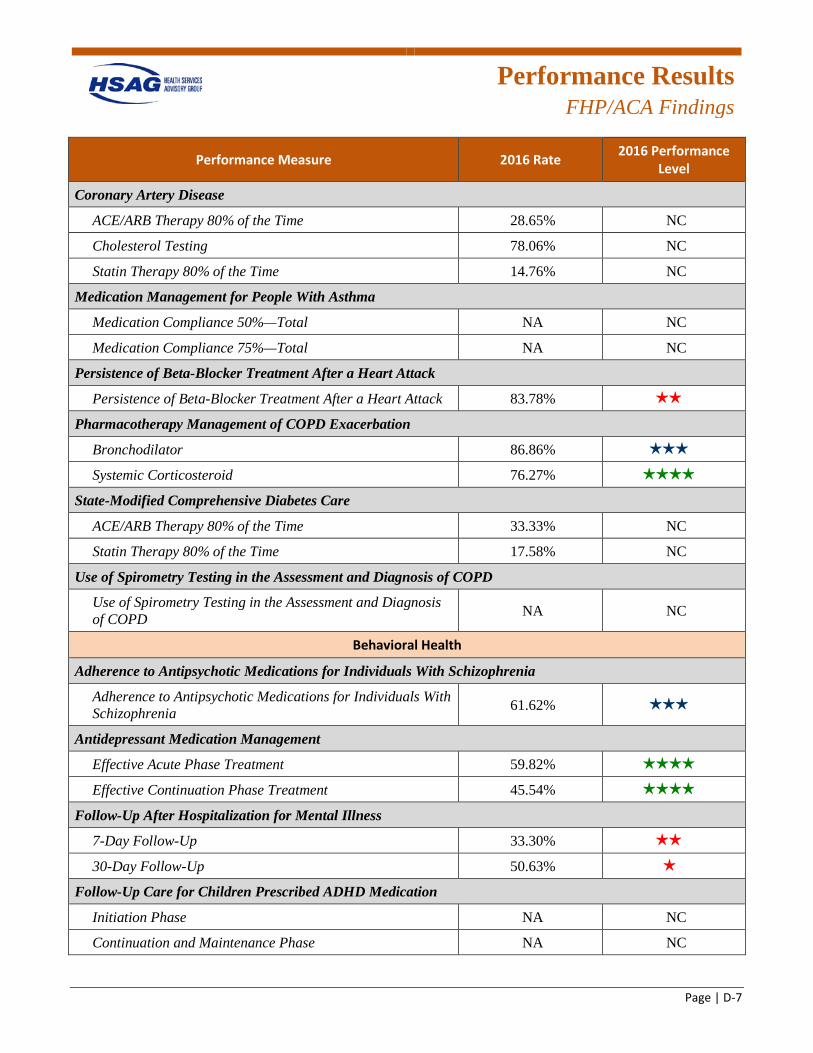
Performance Results
FHP/ACA Findings
Page | D-7
Performance Measure 2016 Rate 2016 Performance Level
Coronary Artery Disease
ACE/ARB Therapy 80% of the Time 28.65% NC
Cholesterol Testing 78.06% NC
Statin Therapy 80% of the Time 14.76% NC
Medication Management for People With Asthma
Medication Compliance 50%—Total NA NC
Medication Compliance 75%—Total NA NC
Persistence of Beta-Blocker Treatment After a Heart Attack
Persistence of Beta-Blocker Treatment After a Heart Attack 83.78% 2 stars
Pharmacotherapy Management of COPD Exacerbation
Bronchodilator 86.86% 3 stars
Systemic Corticosteroid 76.27% 4 stars
State-Modified Comprehensive Diabetes Care
ACE/ARB Therapy 80% of the Time 33.33% NC
Statin Therapy 80% of the Time 17.58% NC
Use of Spirometry Testing in the Assessment and Diagnosis of COPD
Use of Spirometry Testing in the Assessment and Diagnosis of COPD NA NC
Behavioral Health
Adherence to Antipsychotic Medications for Individuals With Schizophrenia
Adherence to Antipsychotic Medications for Individuals With Schizophrenia 61.62% 3 stars
Antidepressant Medication Management
Effective Acute Phase Treatment 59.82% 4 stars
Effective Continuation Phase Treatment 45.54% 4 stars
Follow-Up After Hospitalization for Mental Illness
7-Day Follow-Up 33.30% 2 stars
30-Day Follow-Up 50.63% 1 star
Follow-Up Care for Children Prescribed ADHD Medication
Initiation Phase NA NC
Continuation and Maintenance Phase NA NC
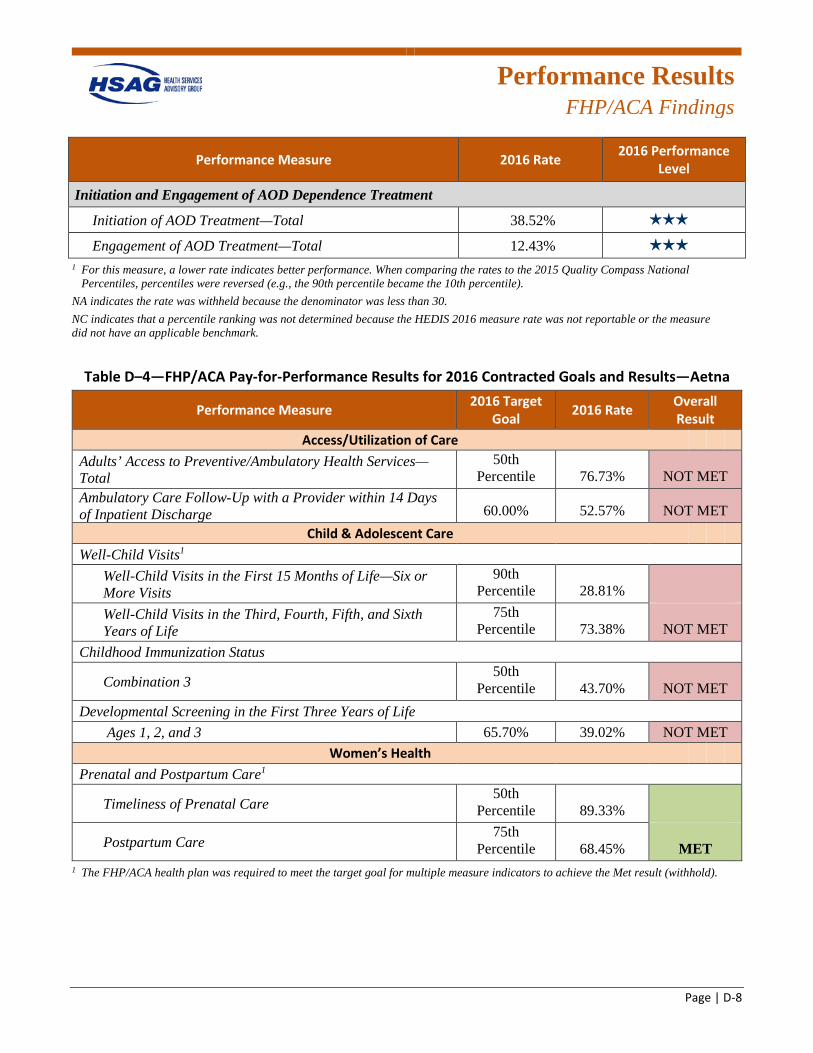
Performance Results
FHP/ACA Findings
Page | D-8
Performance Measure 2016 Rate 2016 Performance Level
Initiation and Engagement of AOD Dependence Treatment
Initiation of AOD Treatment—Total 38.52% 3 stars
Engagement of AOD Treatment—Total 12.43% 3 stars
1 For this measure, a lower rate indicates better performance. When comparing the rates to the 2015 Quality Compass National Percentiles, percentiles were reversed (e.g., the 90th percentile became the 10th percentile).
NA indicates the rate was withheld because the denominator was less than 30. NC indicates that a percentile ranking was not determined because the HEDIS 2016 measure rate was not reportable or the measure did not have an applicable benchmark.
Table D–4—FHP/ACA Pay-for-Performance Results for 2016 Contracted Goals and Results—Aetna
Performance Measure 2016 Target Goal 2016 Rate Overall
Result Access/Utilization of Care
Adults’ Access to Preventive/Ambulatory Health Services—Total
50th Percentile 76.73% NOT MET
Ambulatory Care Follow-Up with a Provider within 14 Days of Inpatient Discharge 60.00% 52.57% NOT MET
Child & Adolescent Care Well-Child Visits1
Well-Child Visits in the First 15 Months of Life—Six or More Visits
90th Percentile 28.81%
Well-Child Visits in the Third, Fourth, Fifth, and Sixth Years of Life
75th Percentile 73.38% NOT MET
Childhood Immunization Status
Combination 3 50th
Percentile 43.70% NOT MET Developmental Screening in the First Three Years of Life
Ages 1, 2, and 3 65.70% 39.02% NOT MET Women’s Health
Prenatal and Postpartum Care1
Timeliness of Prenatal Care 50th
Percentile 89.33%
Postpartum Care 75th
Percentile 68.45% MET 1 The FHP/ACA health plan was required to meet the target goal for multiple measure indicators to achieve the Met result (withhold).
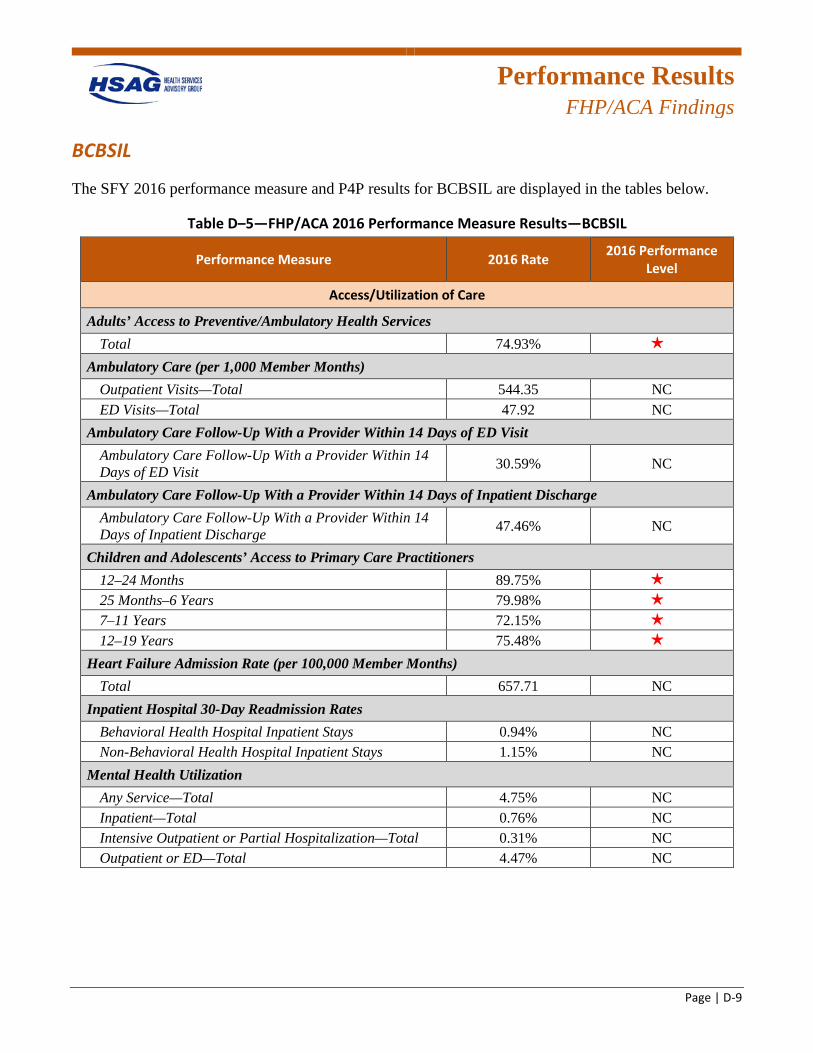
Performance Results
FHP/ACA Findings
Page | D-9
BCBSIL
The SFY 2016 performance measure and P4P results for BCBSIL are displayed in the tables below.
Table D–5—FHP/ACA 2016 Performance Measure Results—BCBSIL
Performance Measure 2016 Rate 2016 Performance Level
Access/Utilization of Care
Adults’ Access to Preventive/Ambulatory Health Services Total 74.93% 1 star
Ambulatory Care (per 1,000 Member Months) Outpatient Visits—Total 544.35 NC ED Visits—Total 47.92 NC
Ambulatory Care Follow-Up With a Provider Within 14 Days of ED Visit Ambulatory Care Follow-Up With a Provider Within 14 Days of ED Visit 30.59% NC
Ambulatory Care Follow-Up With a Provider Within 14 Days of Inpatient Discharge Ambulatory Care Follow-Up With a Provider Within 14 Days of Inpatient Discharge 47.46% NC
Children and Adolescents’ Access to Primary Care Practitioners 12–24 Months 89.75% 1 star
25 Months–6 Years 79.98% 1 star
7–11 Years 72.15% 1 star
12–19 Years 75.48% 1 star
Heart Failure Admission Rate (per 100,000 Member Months) Total 657.71 NC
Inpatient Hospital 30-Day Readmission Rates Behavioral Health Hospital Inpatient Stays 0.94% NC Non-Behavioral Health Hospital Inpatient Stays 1.15% NC
Mental Health Utilization Any Service—Total 4.75% NC Inpatient—Total 0.76% NC Intensive Outpatient or Partial Hospitalization—Total 0.31% NC Outpatient or ED—Total 4.47% NC
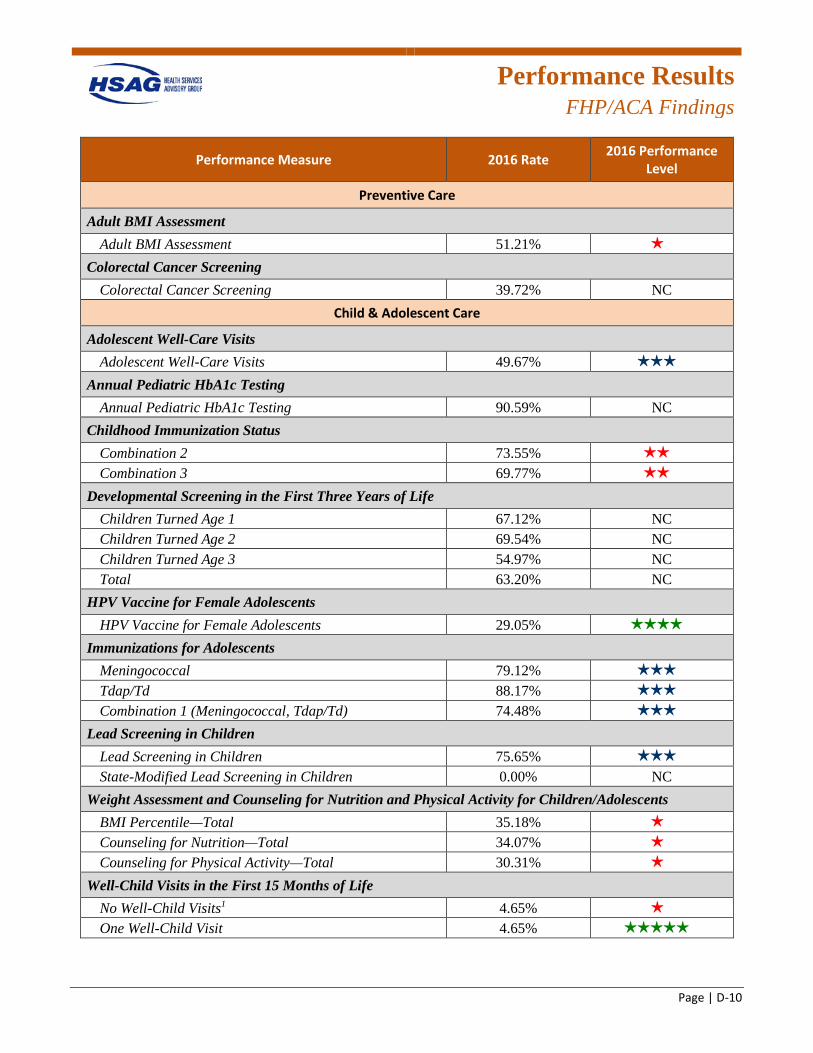
Performance Results
FHP/ACA Findings
Page | D-10
Performance Measure 2016 Rate 2016 Performance Level
Preventive Care
Adult BMI Assessment Adult BMI Assessment 51.21% 1 star
Colorectal Cancer Screening Colorectal Cancer Screening 39.72% NC
Child & Adolescent Care
Adolescent Well-Care Visits Adolescent Well-Care Visits 49.67% 3 stars
Annual Pediatric HbA1c Testing Annual Pediatric HbA1c Testing 90.59% NC
Childhood Immunization Status Combination 2 73.55% 2 stars
Combination 3 69.77% 2 stars
Developmental Screening in the First Three Years of Life Children Turned Age 1 67.12% NC Children Turned Age 2 69.54% NC Children Turned Age 3 54.97% NC Total 63.20% NC
HPV Vaccine for Female Adolescents HPV Vaccine for Female Adolescents 29.05% 4 stars
Immunizations for Adolescents Meningococcal 79.12% 3 stars
Tdap/Td 88.17% 3 stars
Combination 1 (Meningococcal, Tdap/Td) 74.48% 3 stars
Lead Screening in Children Lead Screening in Children 75.65% 3 stars
State-Modified Lead Screening in Children 0.00% NC Weight Assessment and Counseling for Nutrition and Physical Activity for Children/Adolescents
BMI Percentile—Total 35.18% 1 star
Counseling for Nutrition—Total 34.07% 1 star
Counseling for Physical Activity—Total 30.31% 1 star
Well-Child Visits in the First 15 Months of Life No Well-Child Visits1 4.65% 1 star
One Well-Child Visit 4.65% 5 stars
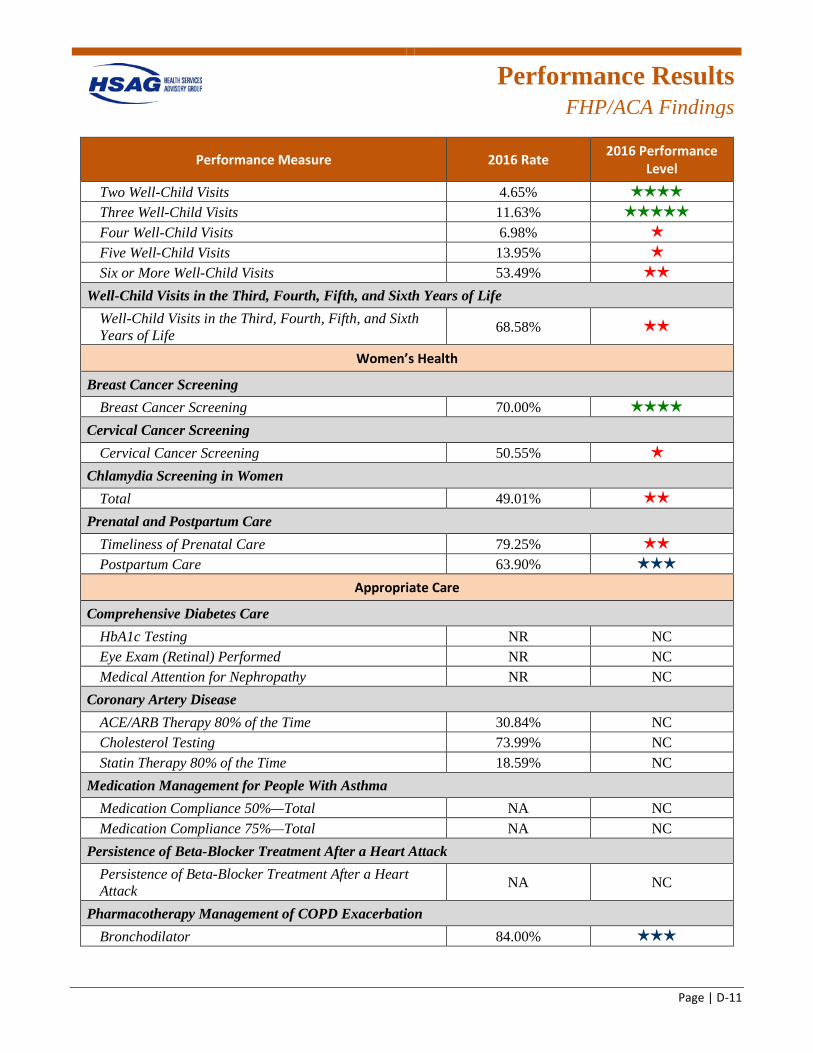
Performance Results
FHP/ACA Findings
Page | D-11
Performance Measure 2016 Rate 2016 Performance Level
Two Well-Child Visits 4.65% 4 stars
Three Well-Child Visits 11.63% 5 stars
Four Well-Child Visits 6.98% 1 star
Five Well-Child Visits 13.95% 1 star
Six or More Well-Child Visits 53.49% 2 stars
Well-Child Visits in the Third, Fourth, Fifth, and Sixth Years of Life Well-Child Visits in the Third, Fourth, Fifth, and Sixth Years of Life 68.58% 2 stars
Women’s Health
Breast Cancer Screening Breast Cancer Screening 70.00% 4 stars
Cervical Cancer Screening Cervical Cancer Screening 50.55% 1 star
Chlamydia Screening in Women Total 49.01% 2 stars
Prenatal and Postpartum Care Timeliness of Prenatal Care 79.25% 2 stars
Postpartum Care 63.90% 3 stars
Appropriate Care
Comprehensive Diabetes Care HbA1c Testing NR NC Eye Exam (Retinal) Performed NR NC Medical Attention for Nephropathy NR NC
Coronary Artery Disease ACE/ARB Therapy 80% of the Time 30.84% NC Cholesterol Testing 73.99% NC Statin Therapy 80% of the Time 18.59% NC
Medication Management for People With Asthma Medication Compliance 50%—Total NA NC Medication Compliance 75%—Total NA NC
Persistence of Beta-Blocker Treatment After a Heart Attack Persistence of Beta-Blocker Treatment After a Heart Attack NA NC
Pharmacotherapy Management of COPD Exacerbation Bronchodilator 84.00% 3 stars
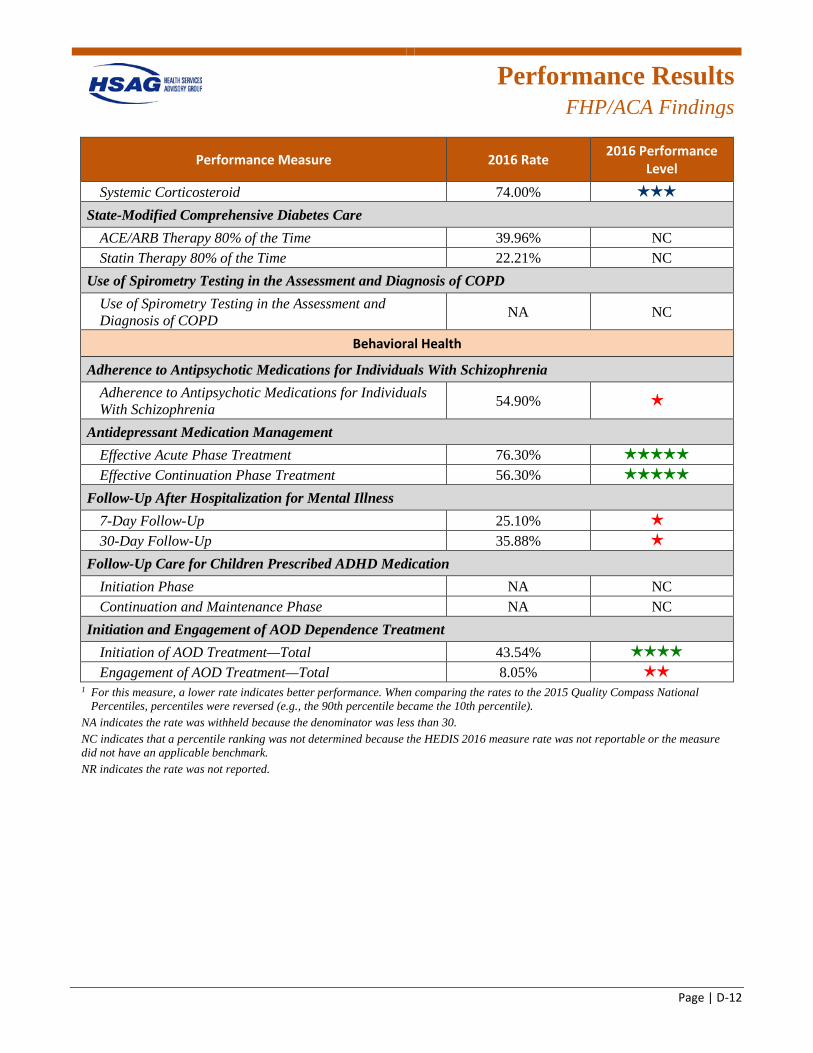
Performance Results
FHP/ACA Findings
Page | D-12
Performance Measure 2016 Rate 2016 Performance Level
Systemic Corticosteroid 74.00% 3 stars
State-Modified Comprehensive Diabetes Care ACE/ARB Therapy 80% of the Time 39.96% NC Statin Therapy 80% of the Time 22.21% NC
Use of Spirometry Testing in the Assessment and Diagnosis of COPD Use of Spirometry Testing in the Assessment and Diagnosis of COPD NA NC
Behavioral Health
Adherence to Antipsychotic Medications for Individuals With Schizophrenia Adherence to Antipsychotic Medications for Individuals With Schizophrenia 54.90% 1 star
Antidepressant Medication Management Effective Acute Phase Treatment 76.30% 5 stars
Effective Continuation Phase Treatment 56.30% 5 stars
Follow-Up After Hospitalization for Mental Illness 7-Day Follow-Up 25.10% 1 star
30-Day Follow-Up 35.88% 1 star
Follow-Up Care for Children Prescribed ADHD Medication Initiation Phase NA NC Continuation and Maintenance Phase NA NC
Initiation and Engagement of AOD Dependence Treatment Initiation of AOD Treatment—Total 43.54% 4 stars
Engagement of AOD Treatment—Total 8.05% 2 stars
1 For this measure, a lower rate indicates better performance. When comparing the rates to the 2015 Quality Compass National Percentiles, percentiles were reversed (e.g., the 90th percentile became the 10th percentile).
NA indicates the rate was withheld because the denominator was less than 30. NC indicates that a percentile ranking was not determined because the HEDIS 2016 measure rate was not reportable or the measure did not have an applicable benchmark. NR indicates the rate was not reported.
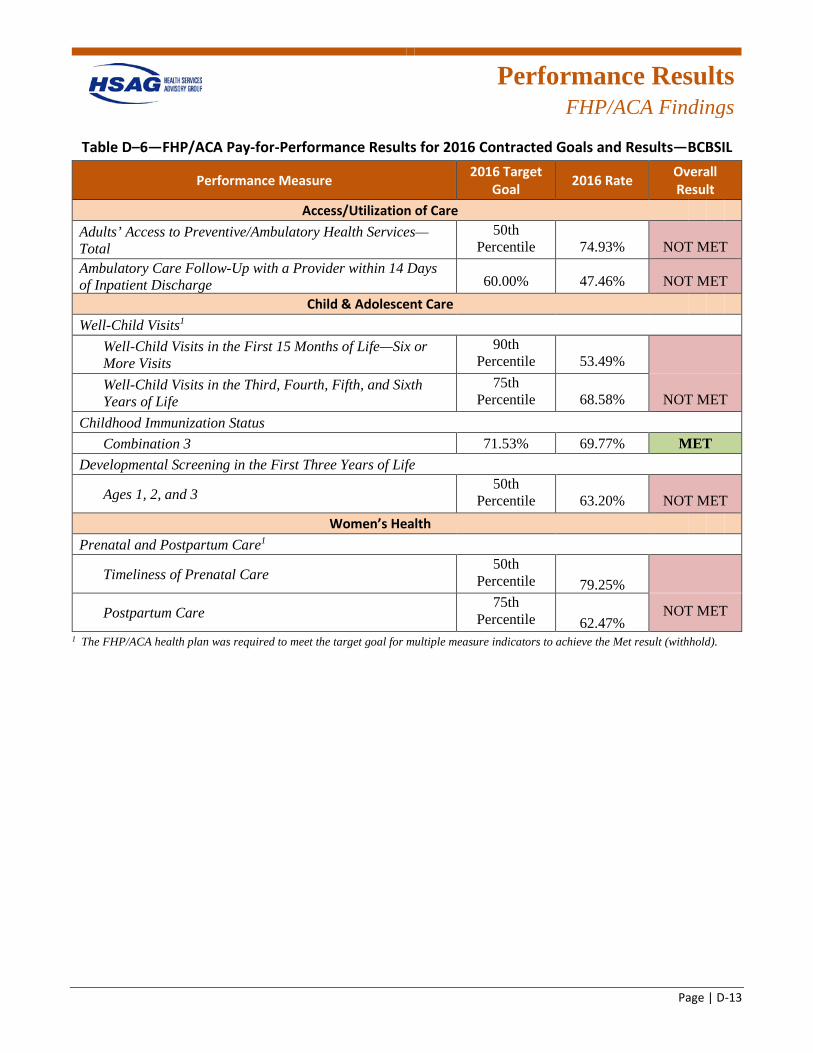
Performance Results
FHP/ACA Findings
Page | D-13
Table D–6—FHP/ACA Pay-for-Performance Results for 2016 Contracted Goals and Results—BCBSIL
Performance Measure 2016 Target Goal 2016 Rate Overall
Result Access/Utilization of Care
Adults’ Access to Preventive/Ambulatory Health Services—Total
50th Percentile 74.93% NOT MET
Ambulatory Care Follow-Up with a Provider within 14 Days of Inpatient Discharge 60.00% 47.46% NOT MET
Child & Adolescent Care Well-Child Visits1
Well-Child Visits in the First 15 Months of Life—Six or More Visits
90th Percentile 53.49%
Well-Child Visits in the Third, Fourth, Fifth, and Sixth Years of Life
75th Percentile 68.58% NOT MET
Childhood Immunization Status Combination 3 71.53% 69.77% MET
Developmental Screening in the First Three Years of Life
Ages 1, 2, and 3 50th
Percentile 63.20% NOT MET Women’s Health
Prenatal and Postpartum Care1
Timeliness of Prenatal Care 50th
Percentile 79.25%
Postpartum Care 75th
Percentile 62.47% NOT MET
1 The FHP/ACA health plan was required to meet the target goal for multiple measure indicators to achieve the Met result (withhold).

Performance Results
FHP/ACA Findings
Page | D-14
CountyCare
The SFY 2016 performance measure and P4P results for CountyCare are displayed in the tables below.
Table D–7—FHP/ACA 2016 Performance Measure Results—CountyCare
Performance Measure 2016 Rate 2016 Performance Level
Access/Utilization of Care
Adults’ Access to Preventive/Ambulatory Health Services Total 72.70% 1 star
Ambulatory Care (per 1,000 Member Months) Outpatient Visits—Total 258.37 NC ED Visits—Total 63.83 NC
Ambulatory Care Follow-Up With a Provider Within 14 Days of ED Visit Ambulatory Care Follow-Up With a Provider Within 14 Days of ED Visit 30.00% NC
Ambulatory Care Follow-Up With a Provider Within 14 Days of Inpatient Discharge Ambulatory Care Follow-Up With a Provider Within 14 Days of Inpatient Discharge 54.44% NC
Children and Adolescents’ Access to Primary Care Practitioners 12–24 Months 92.24% 1 star
25 Months–6 Years 82.96% 1 star
7–11 Years NA NC 12–19 Years NA NC
Heart Failure Admission Rate (per 100,000 Member Months) Total 402.84 NC
Inpatient Hospital 30-Day Readmission Rates Behavioral Health Hospital Inpatient Stays 36.64% NC Non-Behavioral Health Hospital Inpatient Stays 5.02% NC
Mental Health Utilization Any Service—Total 6.19% NC Inpatient—Total 1.04% NC Intensive Outpatient or Partial Hospitalization—Total 0.15% NC Outpatient or ED—Total 5.93% NC
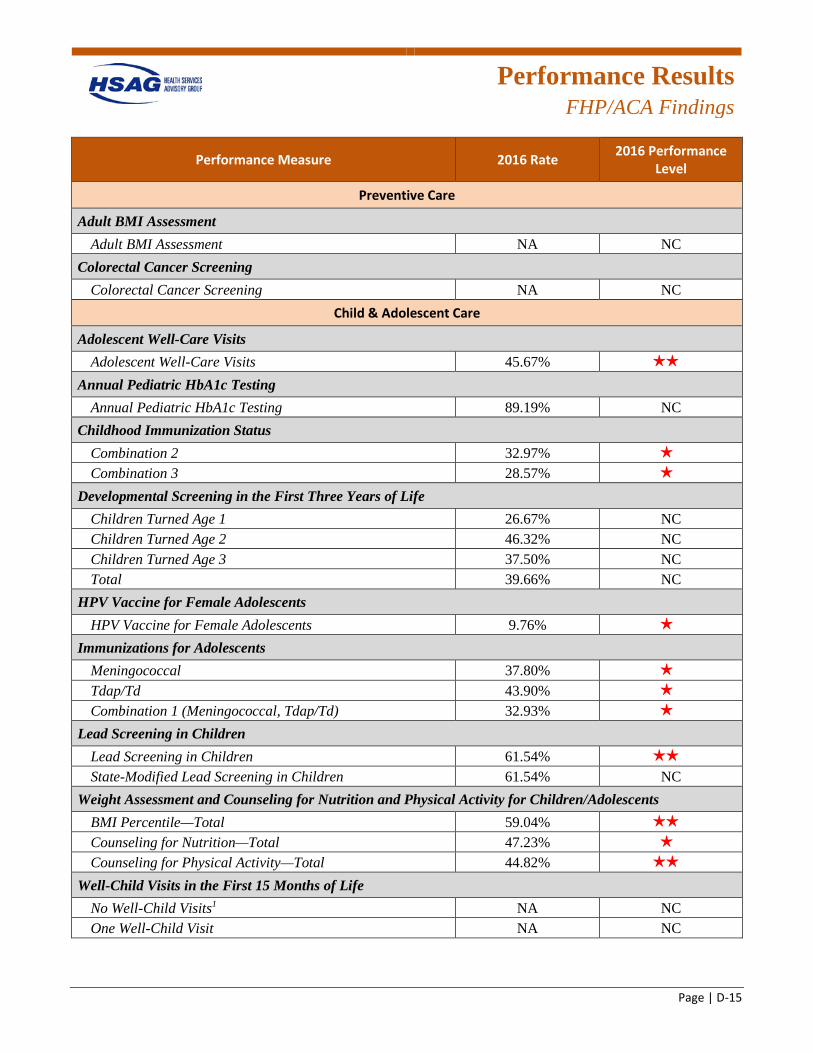
Performance Results
FHP/ACA Findings
Page | D-15
Performance Measure 2016 Rate 2016 Performance Level
Preventive Care
Adult BMI Assessment Adult BMI Assessment NA NC
Colorectal Cancer Screening Colorectal Cancer Screening NA NC
Child & Adolescent Care
Adolescent Well-Care Visits Adolescent Well-Care Visits 45.67% 2 stars
Annual Pediatric HbA1c Testing Annual Pediatric HbA1c Testing 89.19% NC
Childhood Immunization Status Combination 2 32.97% 1 star
Combination 3 28.57% 1 star
Developmental Screening in the First Three Years of Life Children Turned Age 1 26.67% NC Children Turned Age 2 46.32% NC Children Turned Age 3 37.50% NC Total 39.66% NC
HPV Vaccine for Female Adolescents HPV Vaccine for Female Adolescents 9.76% 1 star
Immunizations for Adolescents Meningococcal 37.80% 1 star
Tdap/Td 43.90% 1 star
Combination 1 (Meningococcal, Tdap/Td) 32.93% 1 star
Lead Screening in Children Lead Screening in Children 61.54% 2 stars
State-Modified Lead Screening in Children 61.54% NC Weight Assessment and Counseling for Nutrition and Physical Activity for Children/Adolescents
BMI Percentile—Total 59.04% 2 stars
Counseling for Nutrition—Total 47.23% 1 star
Counseling for Physical Activity—Total 44.82% 2 stars
Well-Child Visits in the First 15 Months of Life No Well-Child Visits1 NA NC One Well-Child Visit NA NC

Performance Results
FHP/ACA Findings
Page | D-16
Performance Measure 2016 Rate 2016 Performance Level
Two Well-Child Visits NA NC Three Well-Child Visits NA NC Four Well-Child Visits NA NC Five Well-Child Visits NA NC Six or More Well-Child Visits NA NC
Well-Child Visits in the Third, Fourth, Fifth, and Sixth Years of Life Well-Child Visits in the Third, Fourth, Fifth, and Sixth Years of Life 73.08% 3 stars
Women’s Health
Breast Cancer Screening Breast Cancer Screening NA NC
Cervical Cancer Screening Cervical Cancer Screening 34.13% 1 star
Chlamydia Screening in Women Total 61.29% 3 stars
Prenatal and Postpartum Care Timeliness of Prenatal Care 82.25% 2 stars
Postpartum Care 59.23% 2 stars
Appropriate Care
Comprehensive Diabetes Care HbA1c Testing 89.79% 4 stars
Eye Exam (Retinal) Performed 38.05% 1 star
Medical Attention for Nephropathy 93.97% NC Coronary Artery Disease
ACE/ARB Therapy 80% of the Time 31.52% NC Cholesterol Testing 73.36% NC Statin Therapy 80% of the Time 12.97% NC
Medication Management for People With Asthma Medication Compliance 50%—Total NA NC Medication Compliance 75%—Total NA NC
Persistence of Beta-Blocker Treatment After a Heart Attack Persistence of Beta-Blocker Treatment After a Heart Attack 49.04% 1 star
Pharmacotherapy Management of COPD Exacerbation Bronchodilator 87.21% 4 stars
Systemic Corticosteroid 71.61% 3 stars
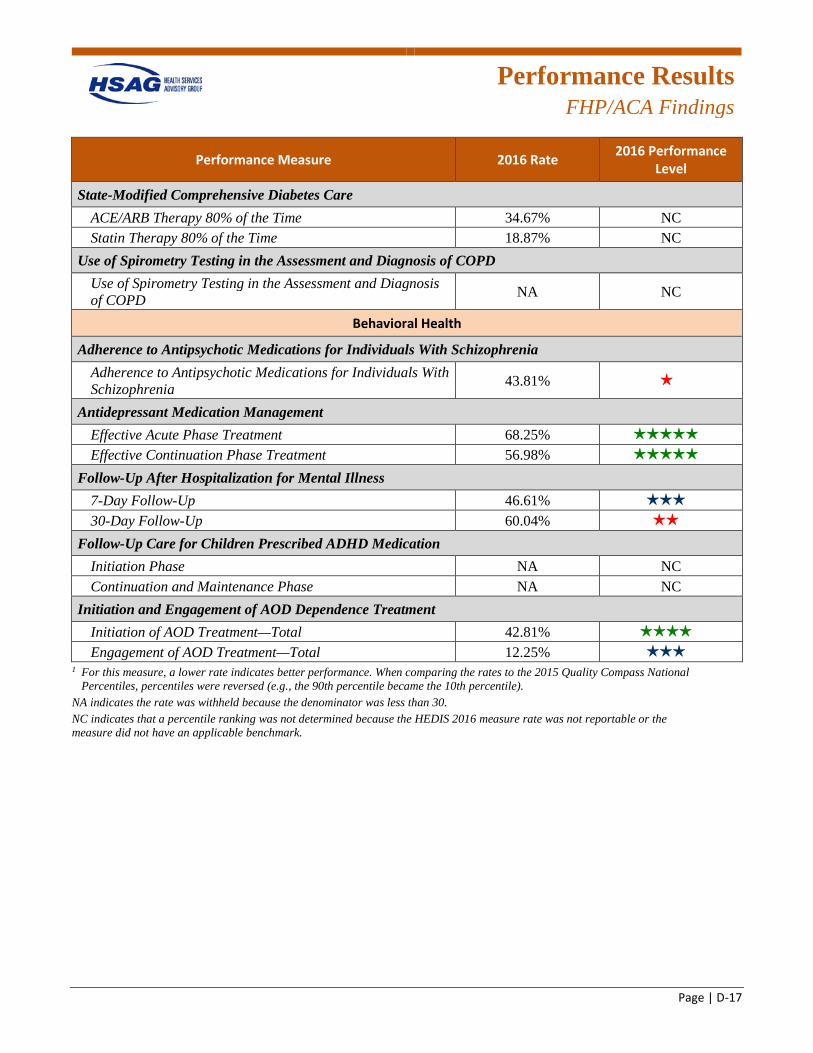
Performance Results
FHP/ACA Findings
Page | D-17
Performance Measure 2016 Rate 2016 Performance Level
State-Modified Comprehensive Diabetes Care ACE/ARB Therapy 80% of the Time 34.67% NC Statin Therapy 80% of the Time 18.87% NC
Use of Spirometry Testing in the Assessment and Diagnosis of COPD Use of Spirometry Testing in the Assessment and Diagnosis of COPD NA NC
Behavioral Health
Adherence to Antipsychotic Medications for Individuals With Schizophrenia Adherence to Antipsychotic Medications for Individuals With Schizophrenia 43.81% 1 star
Antidepressant Medication Management Effective Acute Phase Treatment 68.25% 5 stars
Effective Continuation Phase Treatment 56.98% 5 stars
Follow-Up After Hospitalization for Mental Illness 7-Day Follow-Up 46.61% 3 stars
30-Day Follow-Up 60.04% 2 stars
Follow-Up Care for Children Prescribed ADHD Medication Initiation Phase NA NC Continuation and Maintenance Phase NA NC
Initiation and Engagement of AOD Dependence Treatment Initiation of AOD Treatment—Total 42.81% 4 stars
Engagement of AOD Treatment—Total 12.25% 3 stars
1 For this measure, a lower rate indicates better performance. When comparing the rates to the 2015 Quality Compass National Percentiles, percentiles were reversed (e.g., the 90th percentile became the 10th percentile).
NA indicates the rate was withheld because the denominator was less than 30. NC indicates that a percentile ranking was not determined because the HEDIS 2016 measure rate was not reportable or the measure did not have an applicable benchmark.
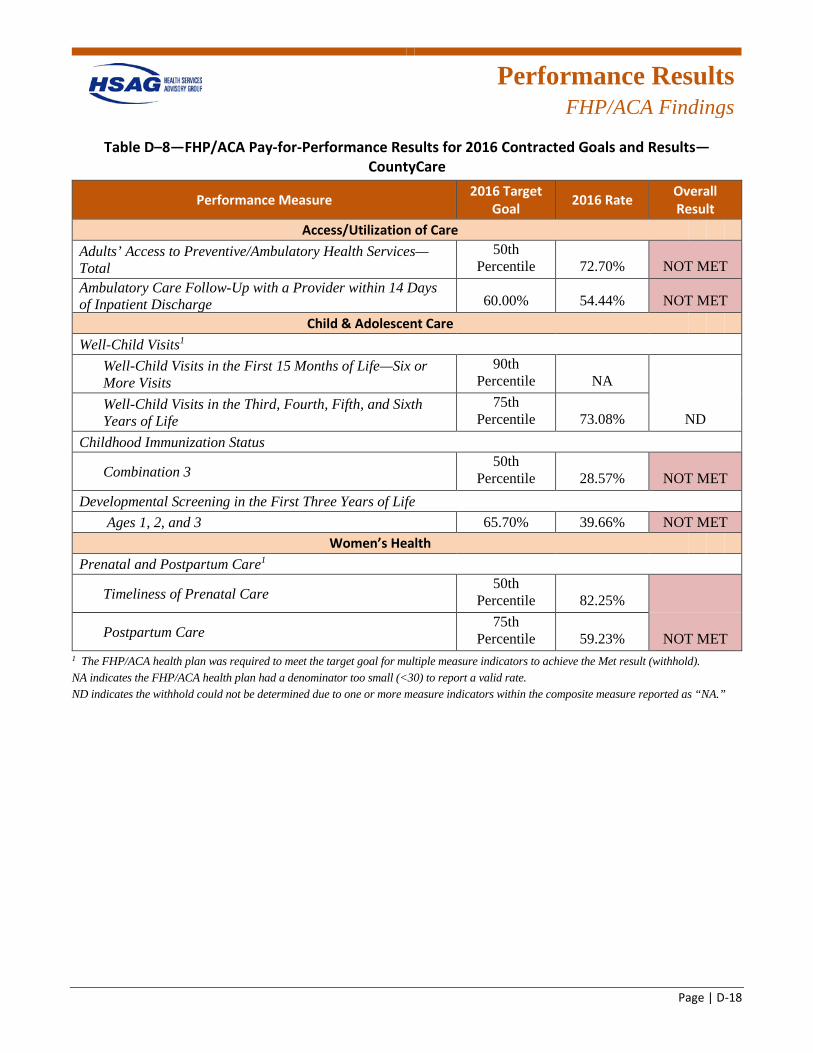
Performance Results
FHP/ACA Findings
Page | D-18
Table D–8—FHP/ACA Pay-for-Performance Results for 2016 Contracted Goals and Results—CountyCare
Performance Measure 2016 Target Goal 2016 Rate Overall
Result Access/Utilization of Care
Adults’ Access to Preventive/Ambulatory Health Services—Total
50th Percentile 72.70% NOT MET
Ambulatory Care Follow-Up with a Provider within 14 Days of Inpatient Discharge 60.00% 54.44% NOT MET
Child & Adolescent Care Well-Child Visits1
Well-Child Visits in the First 15 Months of Life—Six or More Visits
90th Percentile NA
Well-Child Visits in the Third, Fourth, Fifth, and Sixth Years of Life
75th Percentile 73.08% ND
Childhood Immunization Status
Combination 3 50th
Percentile 28.57% NOT MET Developmental Screening in the First Three Years of Life
Ages 1, 2, and 3 65.70% 39.66% NOT MET Women’s Health
Prenatal and Postpartum Care1
Timeliness of Prenatal Care 50th
Percentile 82.25%
Postpartum Care 75th
Percentile 59.23% NOT MET 1 The FHP/ACA health plan was required to meet the target goal for multiple measure indicators to achieve the Met result (withhold). NA indicates the FHP/ACA health plan had a denominator too small (<30) to report a valid rate. ND indicates the withhold could not be determined due to one or more measure indicators within the composite measure reported as “NA.”
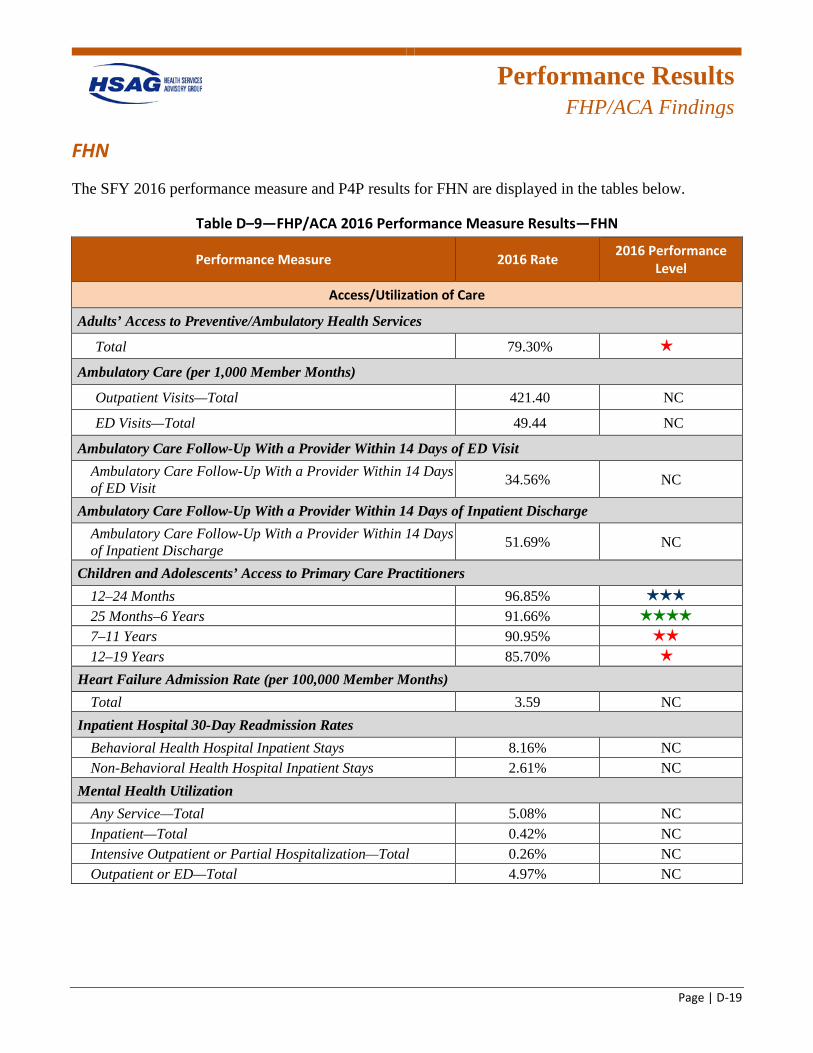
Performance Results
FHP/ACA Findings
Page | D-19
FHN
The SFY 2016 performance measure and P4P results for FHN are displayed in the tables below.
Table D–9—FHP/ACA 2016 Performance Measure Results—FHN
Performance Measure 2016 Rate 2016 Performance Level
Access/Utilization of Care
Adults’ Access to Preventive/Ambulatory Health Services
Total 79.30% 1 star
Ambulatory Care (per 1,000 Member Months)
Outpatient Visits—Total 421.40 NC
ED Visits—Total 49.44 NC
Ambulatory Care Follow-Up With a Provider Within 14 Days of ED Visit Ambulatory Care Follow-Up With a Provider Within 14 Days of ED Visit 34.56% NC
Ambulatory Care Follow-Up With a Provider Within 14 Days of Inpatient Discharge Ambulatory Care Follow-Up With a Provider Within 14 Days of Inpatient Discharge 51.69% NC
Children and Adolescents’ Access to Primary Care Practitioners 12–24 Months 96.85% 3 stars
25 Months–6 Years 91.66% 4 stars
7–11 Years 90.95% 2 stars
12–19 Years 85.70% 1 star
Heart Failure Admission Rate (per 100,000 Member Months) Total 3.59 NC
Inpatient Hospital 30-Day Readmission Rates Behavioral Health Hospital Inpatient Stays 8.16% NC Non-Behavioral Health Hospital Inpatient Stays 2.61% NC
Mental Health Utilization Any Service—Total 5.08% NC Inpatient—Total 0.42% NC Intensive Outpatient or Partial Hospitalization—Total 0.26% NC Outpatient or ED—Total 4.97% NC
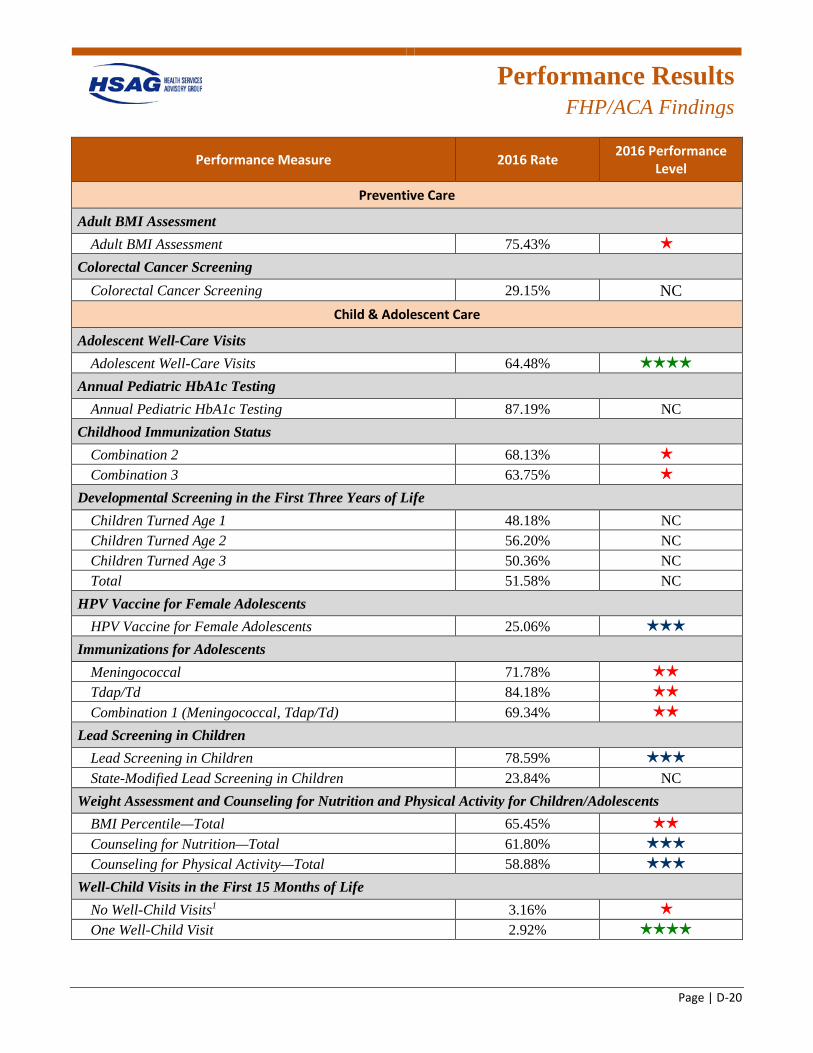
Performance Results
FHP/ACA Findings
Page | D-20
Performance Measure 2016 Rate 2016 Performance Level
Preventive Care
Adult BMI Assessment Adult BMI Assessment 75.43% 1 star
Colorectal Cancer Screening Colorectal Cancer Screening 29.15% NC
Child & Adolescent Care
Adolescent Well-Care Visits Adolescent Well-Care Visits 64.48% 4 stars
Annual Pediatric HbA1c Testing Annual Pediatric HbA1c Testing 87.19% NC
Childhood Immunization Status Combination 2 68.13% 1 star
Combination 3 63.75% 1 star
Developmental Screening in the First Three Years of Life Children Turned Age 1 48.18% NC Children Turned Age 2 56.20% NC Children Turned Age 3 50.36% NC Total 51.58% NC
HPV Vaccine for Female Adolescents HPV Vaccine for Female Adolescents 25.06% 3 stars
Immunizations for Adolescents Meningococcal 71.78% 2 stars
Tdap/Td 84.18% 2 stars
Combination 1 (Meningococcal, Tdap/Td) 69.34% 2 stars
Lead Screening in Children Lead Screening in Children 78.59% 3 stars
State-Modified Lead Screening in Children 23.84% NC Weight Assessment and Counseling for Nutrition and Physical Activity for Children/Adolescents
BMI Percentile—Total 65.45% 2 stars
Counseling for Nutrition—Total 61.80% 3 stars
Counseling for Physical Activity—Total 58.88% 3 stars
Well-Child Visits in the First 15 Months of Life No Well-Child Visits1 3.16% 1 star
One Well-Child Visit 2.92% 4 stars
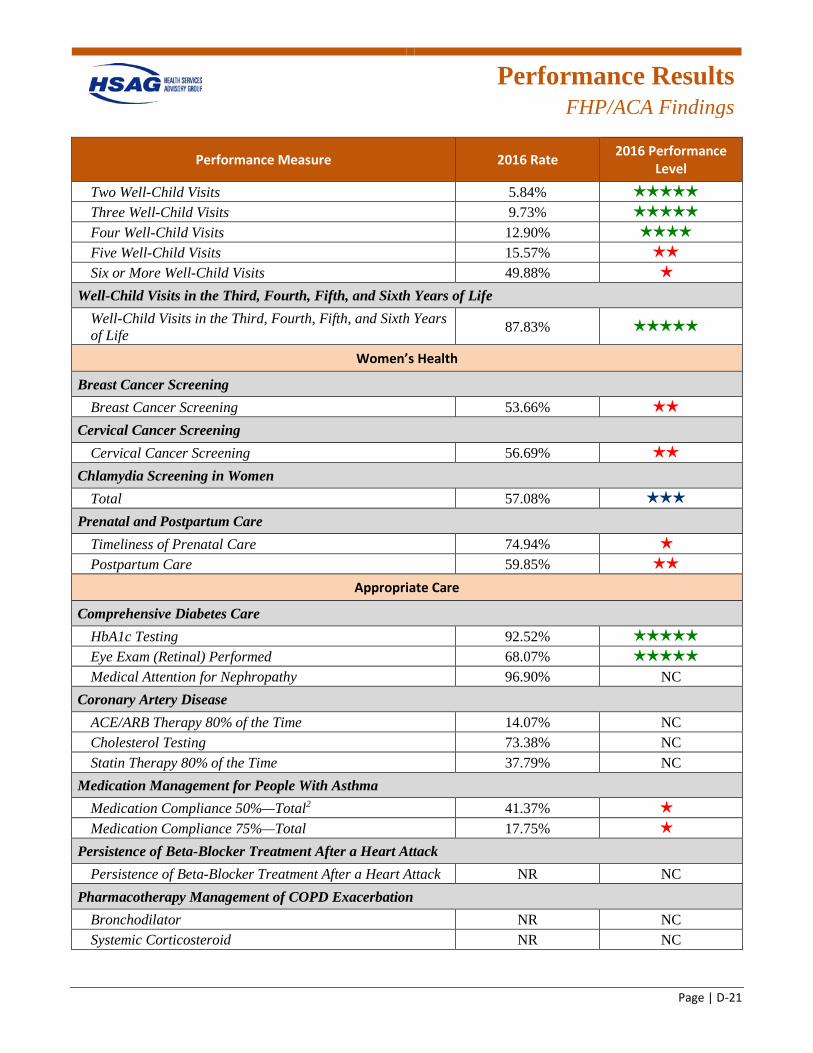
Performance Results
FHP/ACA Findings
Page | D-21
Performance Measure 2016 Rate 2016 Performance Level
Two Well-Child Visits 5.84% 5 stars
Three Well-Child Visits 9.73% 5 stars
Four Well-Child Visits 12.90% 4 stars
Five Well-Child Visits 15.57% 2 stars
Six or More Well-Child Visits 49.88% 1 star
Well-Child Visits in the Third, Fourth, Fifth, and Sixth Years of Life Well-Child Visits in the Third, Fourth, Fifth, and Sixth Years of Life 87.83% 5 stars
Women’s Health
Breast Cancer Screening Breast Cancer Screening 53.66% 2 stars
Cervical Cancer Screening Cervical Cancer Screening 56.69% 2 stars
Chlamydia Screening in Women Total 57.08% 3 stars
Prenatal and Postpartum Care Timeliness of Prenatal Care 74.94% 1 star
Postpartum Care 59.85% 2 stars
Appropriate Care
Comprehensive Diabetes Care HbA1c Testing 92.52% 5 stars
Eye Exam (Retinal) Performed 68.07% 5 stars
Medical Attention for Nephropathy 96.90% NC Coronary Artery Disease
ACE/ARB Therapy 80% of the Time 14.07% NC Cholesterol Testing 73.38% NC Statin Therapy 80% of the Time 37.79% NC
Medication Management for People With Asthma Medication Compliance 50%—Total2 41.37% 1 star
Medication Compliance 75%—Total 17.75% 1 star
Persistence of Beta-Blocker Treatment After a Heart Attack Persistence of Beta-Blocker Treatment After a Heart Attack NR NC
Pharmacotherapy Management of COPD Exacerbation Bronchodilator NR NC Systemic Corticosteroid NR NC
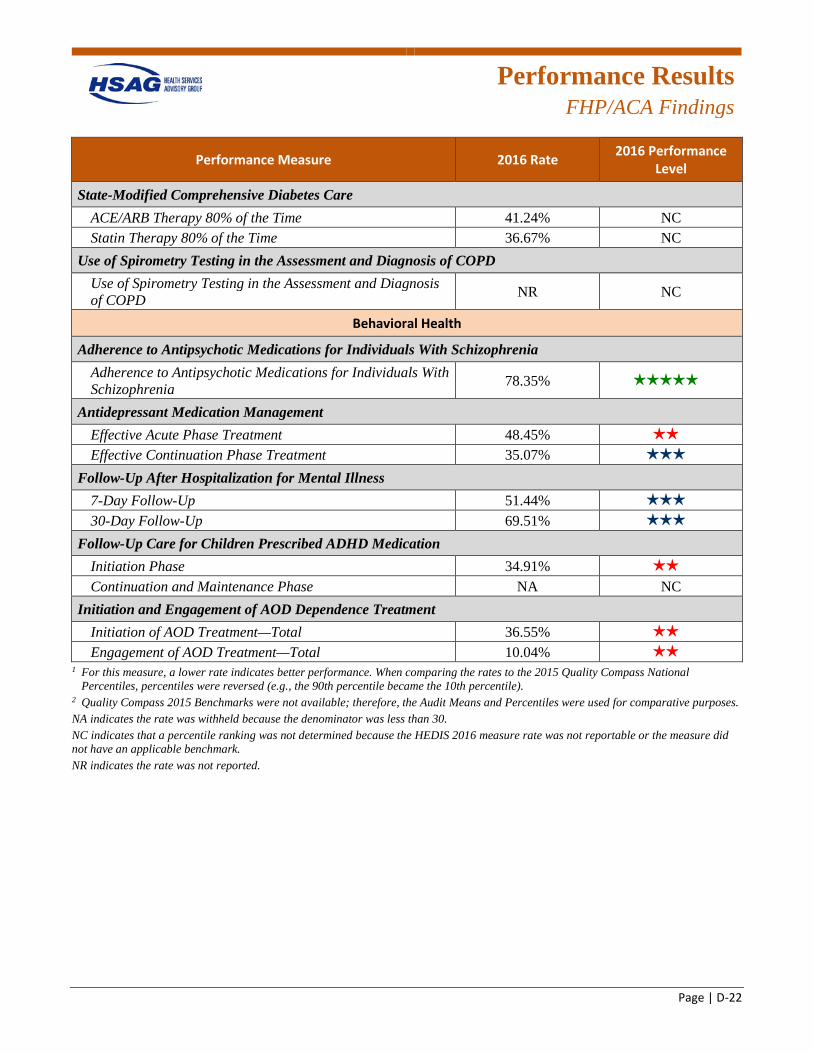
Performance Results
FHP/ACA Findings
Page | D-22
Performance Measure 2016 Rate 2016 Performance Level
State-Modified Comprehensive Diabetes Care ACE/ARB Therapy 80% of the Time 41.24% NC Statin Therapy 80% of the Time 36.67% NC
Use of Spirometry Testing in the Assessment and Diagnosis of COPD Use of Spirometry Testing in the Assessment and Diagnosis of COPD NR NC
Behavioral Health
Adherence to Antipsychotic Medications for Individuals With Schizophrenia Adherence to Antipsychotic Medications for Individuals With Schizophrenia 78.35% 5 stars
Antidepressant Medication Management Effective Acute Phase Treatment 48.45% 2 stars
Effective Continuation Phase Treatment 35.07% 3 stars
Follow-Up After Hospitalization for Mental Illness 7-Day Follow-Up 51.44% 3 stars
30-Day Follow-Up 69.51% 3 stars
Follow-Up Care for Children Prescribed ADHD Medication Initiation Phase 34.91% 2 stars
Continuation and Maintenance Phase NA NC Initiation and Engagement of AOD Dependence Treatment
Initiation of AOD Treatment—Total 36.55% 2 stars
Engagement of AOD Treatment—Total 10.04% 2 stars
1 For this measure, a lower rate indicates better performance. When comparing the rates to the 2015 Quality Compass National Percentiles, percentiles were reversed (e.g., the 90th percentile became the 10th percentile).
2 Quality Compass 2015 Benchmarks were not available; therefore, the Audit Means and Percentiles were used for comparative purposes. NA indicates the rate was withheld because the denominator was less than 30. NC indicates that a percentile ranking was not determined because the HEDIS 2016 measure rate was not reportable or the measure did not have an applicable benchmark. NR indicates the rate was not reported.
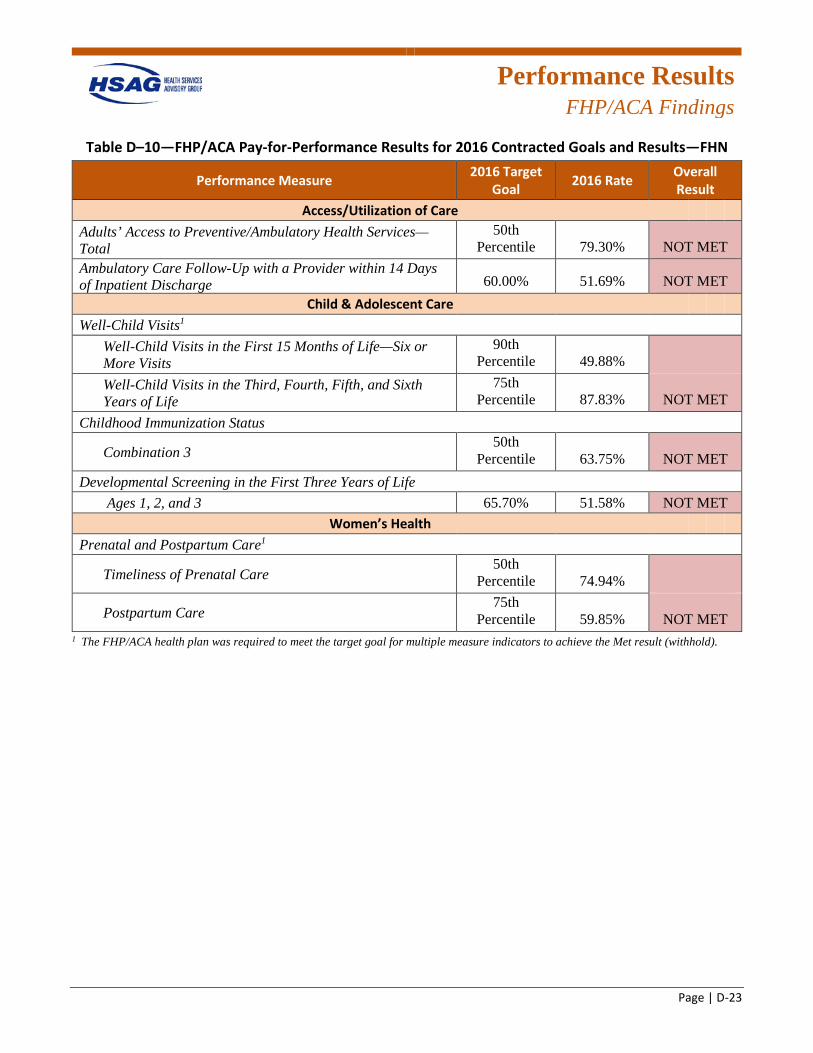
Performance Results
FHP/ACA Findings
Page | D-23
Table D–10—FHP/ACA Pay-for-Performance Results for 2016 Contracted Goals and Results—FHN
Performance Measure 2016 Target Goal 2016 Rate Overall
Result Access/Utilization of Care
Adults’ Access to Preventive/Ambulatory Health Services—Total
50th Percentile 79.30% NOT MET
Ambulatory Care Follow-Up with a Provider within 14 Days of Inpatient Discharge 60.00% 51.69% NOT MET
Child & Adolescent Care Well-Child Visits1
Well-Child Visits in the First 15 Months of Life—Six or More Visits
90th Percentile 49.88%
Well-Child Visits in the Third, Fourth, Fifth, and Sixth Years of Life
75th Percentile 87.83% NOT MET
Childhood Immunization Status
Combination 3 50th
Percentile 63.75% NOT MET Developmental Screening in the First Three Years of Life
Ages 1, 2, and 3 65.70% 51.58% NOT MET Women’s Health
Prenatal and Postpartum Care1
Timeliness of Prenatal Care 50th
Percentile 74.94%
Postpartum Care 75th
Percentile 59.85% NOT MET 1 The FHP/ACA health plan was required to meet the target goal for multiple measure indicators to achieve the Met result (withhold).
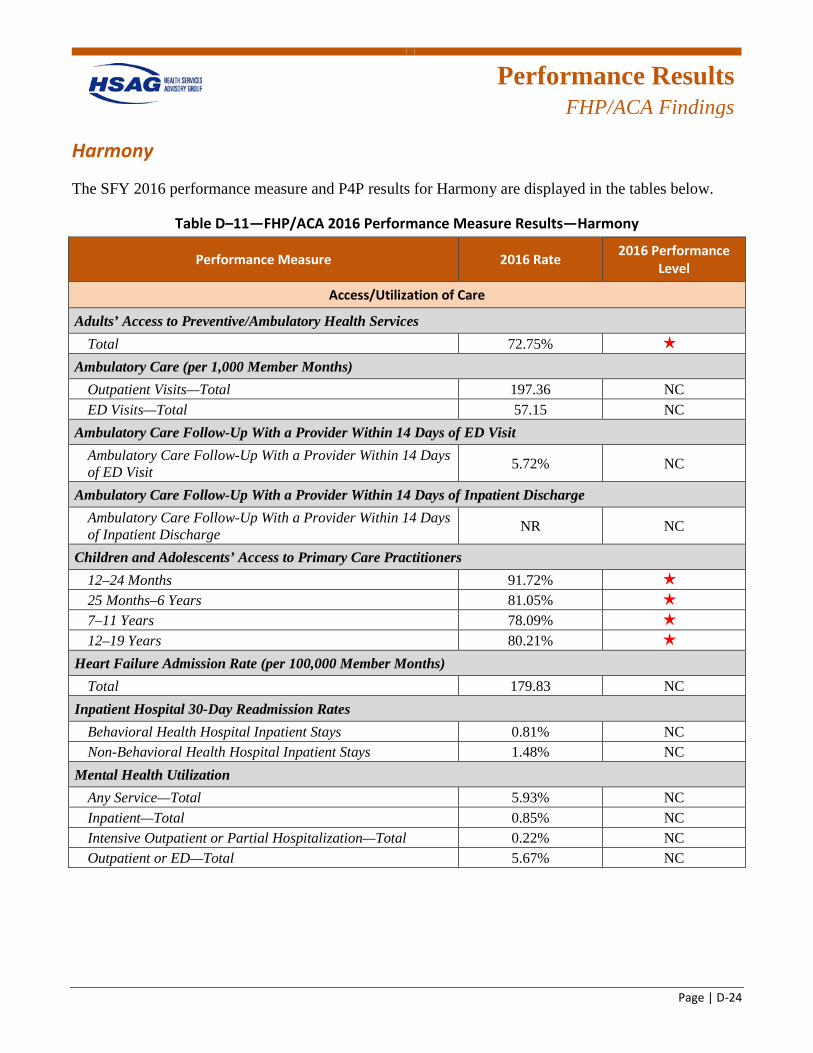
Performance Results
FHP/ACA Findings
Page | D-24
Harmony
The SFY 2016 performance measure and P4P results for Harmony are displayed in the tables below.
Table D–11—FHP/ACA 2016 Performance Measure Results—Harmony
Performance Measure 2016 Rate 2016 Performance Level
Access/Utilization of Care
Adults’ Access to Preventive/Ambulatory Health Services Total 72.75% 1 star
Ambulatory Care (per 1,000 Member Months) Outpatient Visits—Total 197.36 NC ED Visits—Total 57.15 NC
Ambulatory Care Follow-Up With a Provider Within 14 Days of ED Visit Ambulatory Care Follow-Up With a Provider Within 14 Days of ED Visit 5.72% NC
Ambulatory Care Follow-Up With a Provider Within 14 Days of Inpatient Discharge Ambulatory Care Follow-Up With a Provider Within 14 Days of Inpatient Discharge NR NC
Children and Adolescents’ Access to Primary Care Practitioners 12–24 Months 91.72% 1 star
25 Months–6 Years 81.05% 1 star
7–11 Years 78.09% 1 star
12–19 Years 80.21% 1 star
Heart Failure Admission Rate (per 100,000 Member Months) Total 179.83 NC
Inpatient Hospital 30-Day Readmission Rates Behavioral Health Hospital Inpatient Stays 0.81% NC Non-Behavioral Health Hospital Inpatient Stays 1.48% NC
Mental Health Utilization Any Service—Total 5.93% NC Inpatient—Total 0.85% NC Intensive Outpatient or Partial Hospitalization—Total 0.22% NC Outpatient or ED—Total 5.67% NC

Performance Results
FHP/ACA Findings
Page | D-25
Performance Measure 2016 Rate 2016 Performance Level
Preventive Care
Adult BMI Assessment Adult BMI Assessment 82.61% 2 stars
Colorectal Cancer Screening Colorectal Cancer Screening 28.94% NC
Child & Adolescent Care
Adolescent Well-Care Visits Adolescent Well-Care Visits 55.32% 3 stars
Annual Pediatric HbA1c Testing Annual Pediatric HbA1c Testing 79.61% NC
Childhood Immunization Status Combination 2 63.61% 1 star
Combination 3 59.16% 1 star
Developmental Screening in the First Three Years of Life Children Turned Age 1 45.83% NC Children Turned Age 2 54.17% NC Children Turned Age 3 36.81% NC Total 45.60% NC
HPV Vaccine for Female Adolescents HPV Vaccine for Female Adolescents 19.77% 2 stars
Immunizations for Adolescents Meningococcal 75.90% 3 stars
Tdap/Td 86.15% 2 stars
Combination 1 (Meningococcal, Tdap/Td) 74.87% 3 stars
Lead Screening in Children Lead Screening in Children 74.54% 3 stars
State-Modified Lead Screening in Children 29.40% NC Weight Assessment and Counseling for Nutrition and Physical Activity for Children/Adolescents
BMI Percentile—Total 68.46% 3 stars
Counseling for Nutrition—Total 63.32% 3 stars
Counseling for Physical Activity—Total 59.11% 3 stars
Well-Child Visits in the First 15 Months of Life No Well-Child Visits1 3.30% 1 star
One Well-Child Visit 6.13% 5 stars
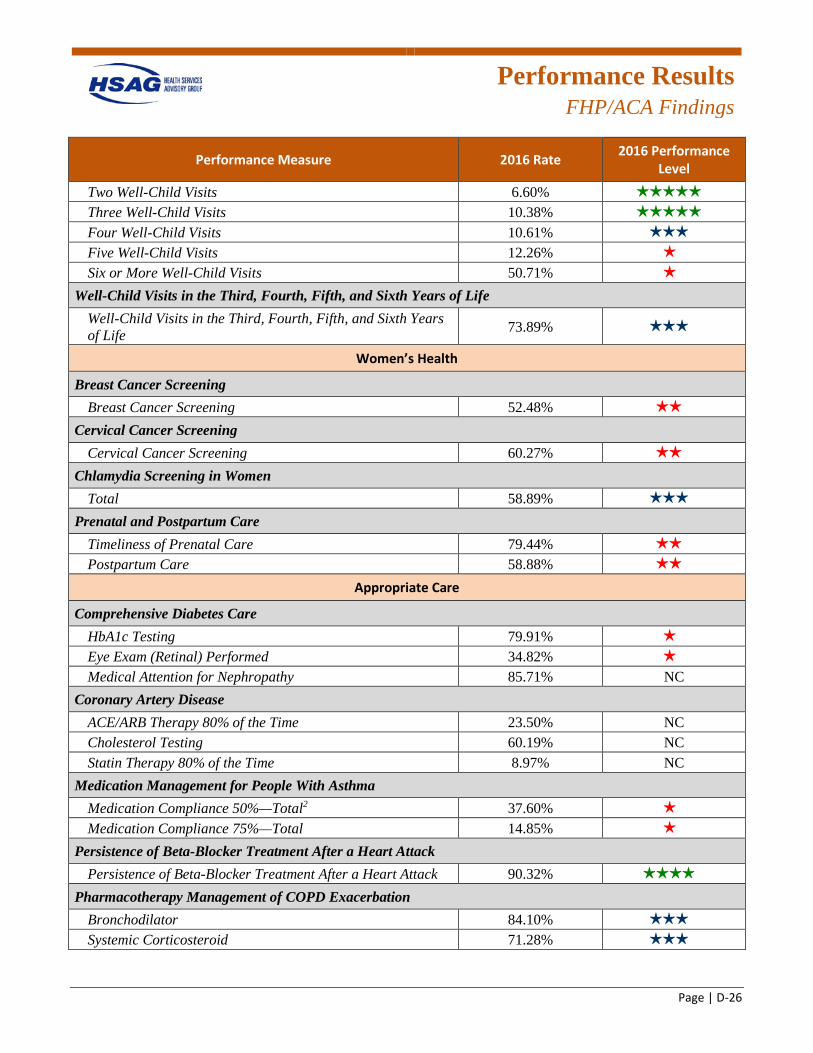
Performance Results
FHP/ACA Findings
Page | D-26
Performance Measure 2016 Rate 2016 Performance Level
Two Well-Child Visits 6.60% 5 stars
Three Well-Child Visits 10.38% 5 stars
Four Well-Child Visits 10.61% 3 stars
Five Well-Child Visits 12.26% 1 star
Six or More Well-Child Visits 50.71% 1 star
Well-Child Visits in the Third, Fourth, Fifth, and Sixth Years of Life Well-Child Visits in the Third, Fourth, Fifth, and Sixth Years of Life 73.89% 3 stars
Women’s Health
Breast Cancer Screening Breast Cancer Screening 52.48% 2 stars
Cervical Cancer Screening Cervical Cancer Screening 60.27% 2 stars
Chlamydia Screening in Women Total 58.89% 3 stars
Prenatal and Postpartum Care Timeliness of Prenatal Care 79.44% 2 stars
Postpartum Care 58.88% 2 stars
Appropriate Care
Comprehensive Diabetes Care HbA1c Testing 79.91% 1 star
Eye Exam (Retinal) Performed 34.82% 1 star
Medical Attention for Nephropathy 85.71% NC Coronary Artery Disease
ACE/ARB Therapy 80% of the Time 23.50% NC Cholesterol Testing 60.19% NC Statin Therapy 80% of the Time 8.97% NC
Medication Management for People With Asthma Medication Compliance 50%—Total2 37.60% 1 star
Medication Compliance 75%—Total 14.85% 1 star
Persistence of Beta-Blocker Treatment After a Heart Attack Persistence of Beta-Blocker Treatment After a Heart Attack 90.32% 4 stars
Pharmacotherapy Management of COPD Exacerbation Bronchodilator 84.10% 3 stars
Systemic Corticosteroid 71.28% 3 stars
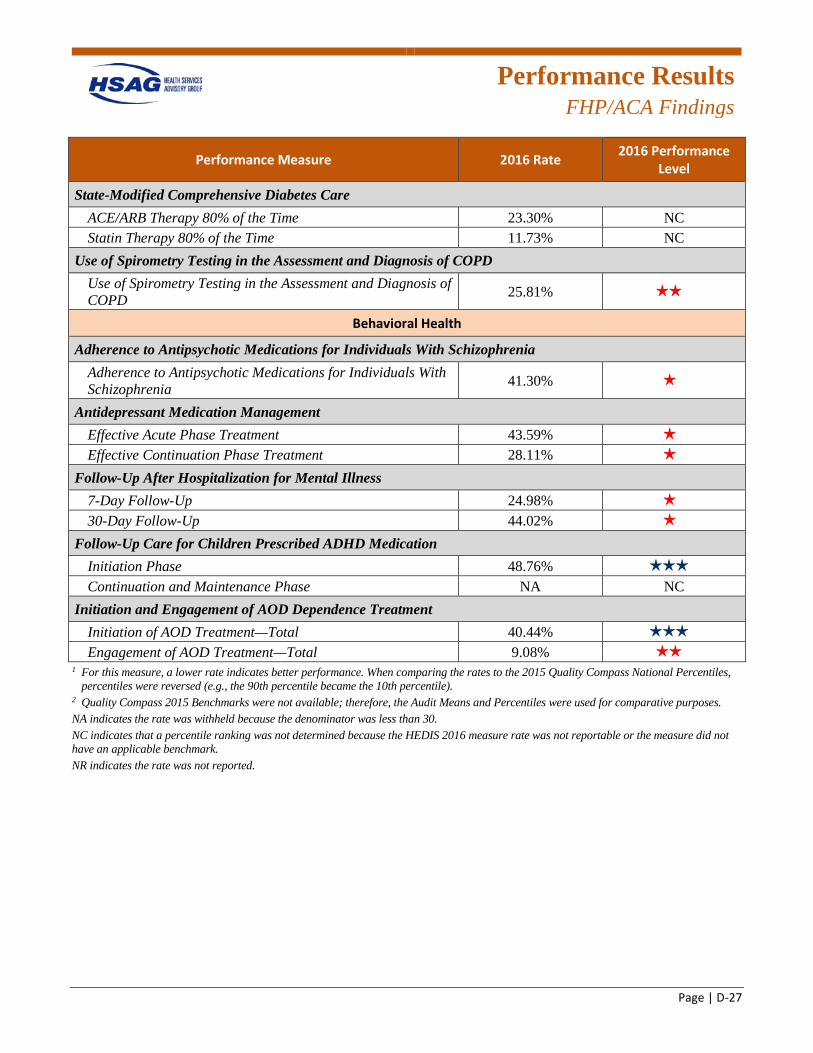
Performance Results
FHP/ACA Findings
Page | D-27
Performance Measure 2016 Rate 2016 Performance Level
State-Modified Comprehensive Diabetes Care ACE/ARB Therapy 80% of the Time 23.30% NC Statin Therapy 80% of the Time 11.73% NC
Use of Spirometry Testing in the Assessment and Diagnosis of COPD Use of Spirometry Testing in the Assessment and Diagnosis of COPD 25.81% 2 stars
Behavioral Health
Adherence to Antipsychotic Medications for Individuals With Schizophrenia Adherence to Antipsychotic Medications for Individuals With Schizophrenia 41.30% 1 star
Antidepressant Medication Management Effective Acute Phase Treatment 43.59% 1 star
Effective Continuation Phase Treatment 28.11% 1 star
Follow-Up After Hospitalization for Mental Illness 7-Day Follow-Up 24.98% 1 star
30-Day Follow-Up 44.02% 1 star
Follow-Up Care for Children Prescribed ADHD Medication Initiation Phase 48.76% 3 stars
Continuation and Maintenance Phase NA NC Initiation and Engagement of AOD Dependence Treatment
Initiation of AOD Treatment—Total 40.44% 3 stars
Engagement of AOD Treatment—Total 9.08% 2 stars
1 For this measure, a lower rate indicates better performance. When comparing the rates to the 2015 Quality Compass National Percentiles, percentiles were reversed (e.g., the 90th percentile became the 10th percentile).
2 Quality Compass 2015 Benchmarks were not available; therefore, the Audit Means and Percentiles were used for comparative purposes. NA indicates the rate was withheld because the denominator was less than 30. NC indicates that a percentile ranking was not determined because the HEDIS 2016 measure rate was not reportable or the measure did not have an applicable benchmark. NR indicates the rate was not reported.

Performance Results
FHP/ACA Findings
Page | D-28
Table D–12—FHP/ACA Pay-for-Performance Results for 2016 Contracted Goals and Results—Harmony
Performance Measure 2016 Target Goal 2016 Rate Overall
Result Access/Utilization of Care
Adults’ Access to Preventive/Ambulatory Health Services—Total
50th Percentile 72.75% NOT MET
Ambulatory Care Follow-Up with a Provider within 14 Days of Inpatient Discharge 60.00% 19.74% NOT MET
Child & Adolescent Care Well-Child Visits1
Well-Child Visits in the First 15 Months of Life—Six or More Visits
90th Percentile 50.71%
Well-Child Visits in the Third, Fourth, Fifth, and Sixth Years of Life
75th Percentile 73.89% NOT MET
Childhood Immunization Status
Combination 3 50th
Percentile 59.16% NOT MET Developmental Screening in the First Three Years of Life
Ages 1, 2, and 3 65.70% 45.60% NOT MET Women’s Health
Prenatal and Postpartum Care1
Timeliness of Prenatal Care 50th
Percentile 79.44%
Postpartum Care 75th
Percentile 58.88% NOT MET 1 The FHP/ACA health plan was required to meet the target goal for multiple measure indicators to achieve the Met result (withhold).
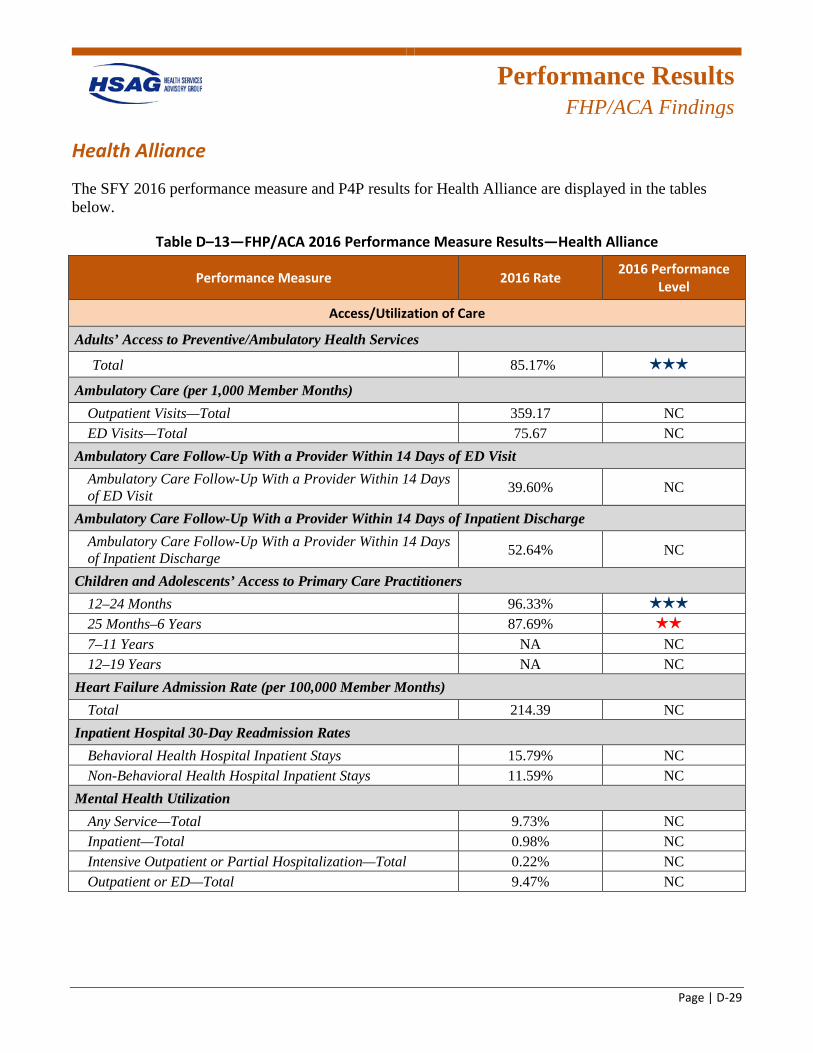
Performance Results
FHP/ACA Findings
Page | D-29
Health Alliance
The SFY 2016 performance measure and P4P results for Health Alliance are displayed in the tables below.
Table D–13—FHP/ACA 2016 Performance Measure Results—Health Alliance
Performance Measure 2016 Rate 2016 Performance Level
Access/Utilization of Care
Adults’ Access to Preventive/Ambulatory Health Services
Total 85.17% 3 stars
Ambulatory Care (per 1,000 Member Months) Outpatient Visits—Total 359.17 NC ED Visits—Total 75.67 NC
Ambulatory Care Follow-Up With a Provider Within 14 Days of ED Visit Ambulatory Care Follow-Up With a Provider Within 14 Days of ED Visit 39.60% NC
Ambulatory Care Follow-Up With a Provider Within 14 Days of Inpatient Discharge Ambulatory Care Follow-Up With a Provider Within 14 Days of Inpatient Discharge 52.64% NC
Children and Adolescents’ Access to Primary Care Practitioners 12–24 Months 96.33% 3 stars
25 Months–6 Years 87.69% 2 stars
7–11 Years NA NC 12–19 Years NA NC
Heart Failure Admission Rate (per 100,000 Member Months) Total 214.39 NC
Inpatient Hospital 30-Day Readmission Rates Behavioral Health Hospital Inpatient Stays 15.79% NC Non-Behavioral Health Hospital Inpatient Stays 11.59% NC
Mental Health Utilization Any Service—Total 9.73% NC Inpatient—Total 0.98% NC Intensive Outpatient or Partial Hospitalization—Total 0.22% NC Outpatient or ED—Total 9.47% NC

Performance Results
FHP/ACA Findings
Page | D-30
Performance Measure 2016 Rate 2016 Performance Level
Preventive Care
Adult BMI Assessment Adult BMI Assessment NA NC
Colorectal Cancer Screening Colorectal Cancer Screening NA NC
Child & Adolescent Care
Adolescent Well-Care Visits Adolescent Well-Care Visits 46.36% 2 stars
Annual Pediatric HbA1c Testing Annual Pediatric HbA1c Testing 77.66% NC
Childhood Immunization Status Combination 2 63.50% 1 star
Combination 3 58.39% 1 star
Developmental Screening in the First Three Years of Life Children Turned Age 1 39.66% NC Children Turned Age 2 31.36% NC Children Turned Age 3 22.68% NC Total 29.92% NC
HPV Vaccine for Female Adolescents HPV Vaccine for Female Adolescents 18.92% 2 stars
Immunizations for Adolescents Meningococcal 69.34% 2 stars
Tdap/Td 82.48% 2 stars
Combination 1 (Meningococcal, Tdap/Td) 67.88% 2 stars
Lead Screening in Children Lead Screening in Children 77.86% 3 stars
State-Modified Lead Screening in Children 9.24% NC Weight Assessment and Counseling for Nutrition and Physical Activity for Children/Adolescents
BMI Percentile—Total 77.62% 3 stars
Counseling for Nutrition—Total 53.77% 2 stars
Counseling for Physical Activity—Total 46.72% 2 stars
Well-Child Visits in the First 15 Months of Life No Well-Child Visits1 1.23% 3 stars
One Well-Child Visit 2.47% 3 stars
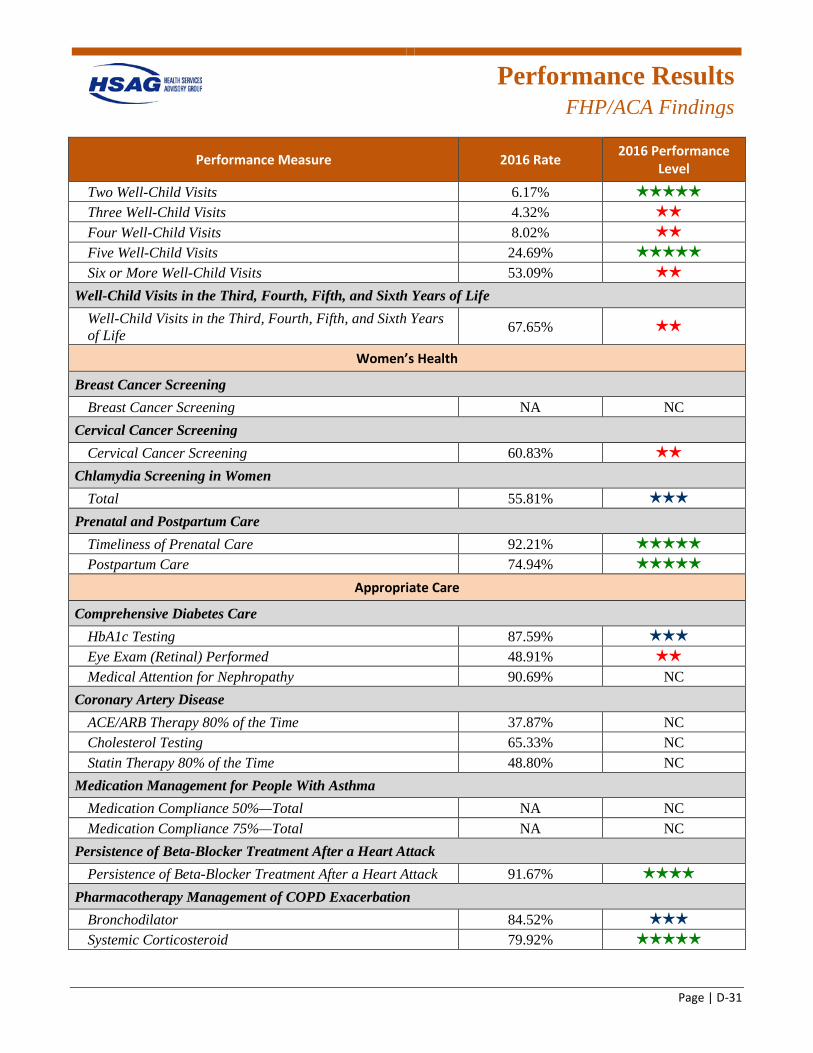
Performance Results
FHP/ACA Findings
Page | D-31
Performance Measure 2016 Rate 2016 Performance Level
Two Well-Child Visits 6.17% 5 stars
Three Well-Child Visits 4.32% 2 stars
Four Well-Child Visits 8.02% 2 stars
Five Well-Child Visits 24.69% 5 stars
Six or More Well-Child Visits 53.09% 2 stars
Well-Child Visits in the Third, Fourth, Fifth, and Sixth Years of Life Well-Child Visits in the Third, Fourth, Fifth, and Sixth Years of Life 67.65% 2 stars
Women’s Health
Breast Cancer Screening Breast Cancer Screening NA NC
Cervical Cancer Screening Cervical Cancer Screening 60.83% 2 stars
Chlamydia Screening in Women Total 55.81% 3 stars
Prenatal and Postpartum Care Timeliness of Prenatal Care 92.21% 5 stars
Postpartum Care 74.94% 5 stars
Appropriate Care
Comprehensive Diabetes Care HbA1c Testing 87.59% 3 stars
Eye Exam (Retinal) Performed 48.91% 2 stars
Medical Attention for Nephropathy 90.69% NC Coronary Artery Disease
ACE/ARB Therapy 80% of the Time 37.87% NC Cholesterol Testing 65.33% NC Statin Therapy 80% of the Time 48.80% NC
Medication Management for People With Asthma Medication Compliance 50%—Total NA NC Medication Compliance 75%—Total NA NC
Persistence of Beta-Blocker Treatment After a Heart Attack Persistence of Beta-Blocker Treatment After a Heart Attack 91.67% 4 stars
Pharmacotherapy Management of COPD Exacerbation Bronchodilator 84.52% 3 stars
Systemic Corticosteroid 79.92% 5 stars
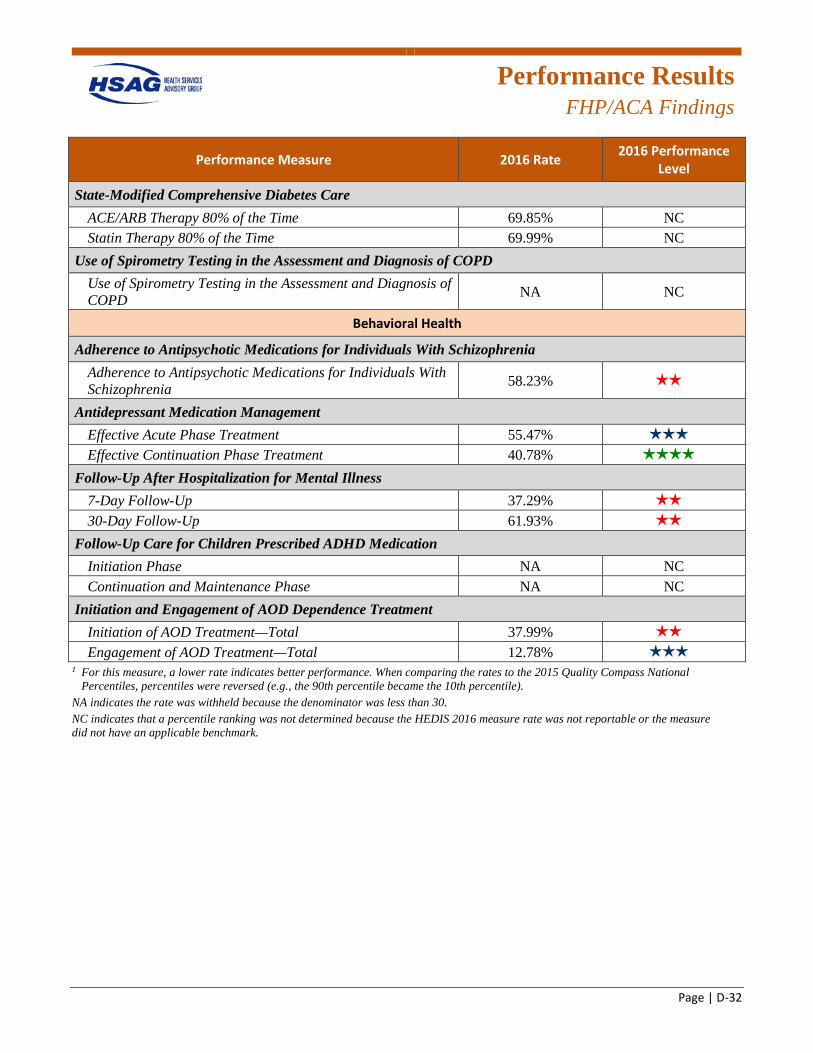
Performance Results
FHP/ACA Findings
Page | D-32
Performance Measure 2016 Rate 2016 Performance Level
State-Modified Comprehensive Diabetes Care ACE/ARB Therapy 80% of the Time 69.85% NC Statin Therapy 80% of the Time 69.99% NC
Use of Spirometry Testing in the Assessment and Diagnosis of COPD Use of Spirometry Testing in the Assessment and Diagnosis of COPD NA NC
Behavioral Health
Adherence to Antipsychotic Medications for Individuals With Schizophrenia Adherence to Antipsychotic Medications for Individuals With Schizophrenia 58.23% 2 stars
Antidepressant Medication Management Effective Acute Phase Treatment 55.47% 3 stars
Effective Continuation Phase Treatment 40.78% 4 stars
Follow-Up After Hospitalization for Mental Illness 7-Day Follow-Up 37.29% 2 stars
30-Day Follow-Up 61.93% 2 stars
Follow-Up Care for Children Prescribed ADHD Medication Initiation Phase NA NC Continuation and Maintenance Phase NA NC
Initiation and Engagement of AOD Dependence Treatment Initiation of AOD Treatment—Total 37.99% 2 stars
Engagement of AOD Treatment—Total 12.78% 3 stars
1 For this measure, a lower rate indicates better performance. When comparing the rates to the 2015 Quality Compass National Percentiles, percentiles were reversed (e.g., the 90th percentile became the 10th percentile).
NA indicates the rate was withheld because the denominator was less than 30. NC indicates that a percentile ranking was not determined because the HEDIS 2016 measure rate was not reportable or the measure did not have an applicable benchmark.

Performance Results
FHP/ACA Findings
Page | D-33
Table D–14—FHP/ACA Pay-for-Performance Results for 2016 Contracted Goals and Results—Health Alliance
Performance Measure 2016 Target Goal 2016 Rate Overall
Result Access/Utilization of Care
Adults’ Access to Preventive/Ambulatory Health Services—Total
50th Percentile 85.17% MET
Ambulatory Care Follow-Up with a Provider within 14 Days of Inpatient Discharge 60.00% 52.64% NOT MET
Child & Adolescent Care Well-Child Visits1
Well-Child Visits in the First 15 Months of Life—Six or More Visits
90th Percentile 53.09%
Well-Child Visits in the Third, Fourth, Fifth, and Sixth Years of Life
75th Percentile 67.65% NOT MET
Childhood Immunization Status
Combination 3 50th
Percentile 58.39% NOT MET Developmental Screening in the First Three Years of Life
Ages 1, 2, and 3 65.70% 29.92% NOT MET Women’s Health
Prenatal and Postpartum Care1
Timeliness of Prenatal Care 50th
Percentile 92.21%
Postpartum Care 75th
Percentile 74.94% MET 1 The FHP/ACA health plan was required to meet the target goal for multiple measure indicators to achieve the Met result (withhold).
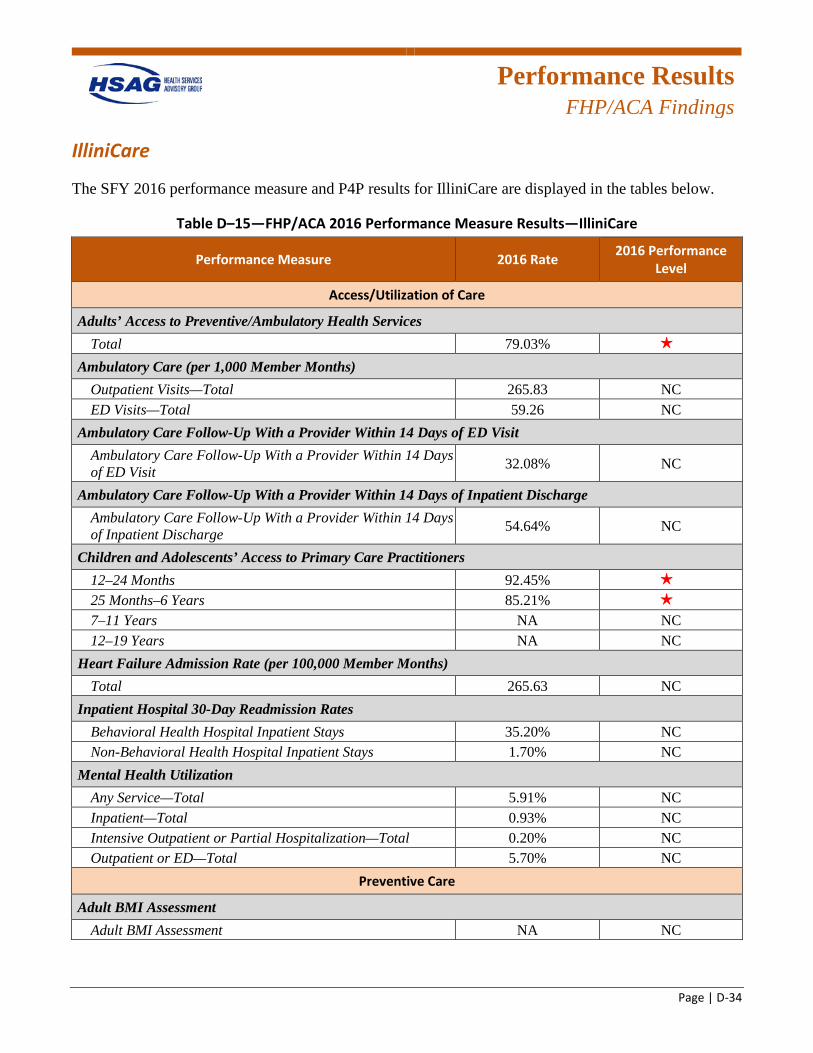
Performance Results
FHP/ACA Findings
Page | D-34
IlliniCare
The SFY 2016 performance measure and P4P results for IlliniCare are displayed in the tables below.
Table D–15—FHP/ACA 2016 Performance Measure Results—IlliniCare
Performance Measure 2016 Rate 2016 Performance Level
Access/Utilization of Care
Adults’ Access to Preventive/Ambulatory Health Services Total 79.03% 1 star
Ambulatory Care (per 1,000 Member Months) Outpatient Visits—Total 265.83 NC ED Visits—Total 59.26 NC
Ambulatory Care Follow-Up With a Provider Within 14 Days of ED Visit Ambulatory Care Follow-Up With a Provider Within 14 Days of ED Visit 32.08% NC
Ambulatory Care Follow-Up With a Provider Within 14 Days of Inpatient Discharge Ambulatory Care Follow-Up With a Provider Within 14 Days of Inpatient Discharge 54.64% NC
Children and Adolescents’ Access to Primary Care Practitioners 12–24 Months 92.45% 1 star
25 Months–6 Years 85.21% 1 star
7–11 Years NA NC 12–19 Years NA NC
Heart Failure Admission Rate (per 100,000 Member Months) Total 265.63 NC
Inpatient Hospital 30-Day Readmission Rates Behavioral Health Hospital Inpatient Stays 35.20% NC Non-Behavioral Health Hospital Inpatient Stays 1.70% NC
Mental Health Utilization Any Service—Total 5.91% NC Inpatient—Total 0.93% NC Intensive Outpatient or Partial Hospitalization—Total 0.20% NC Outpatient or ED—Total 5.70% NC
Preventive Care
Adult BMI Assessment Adult BMI Assessment NA NC
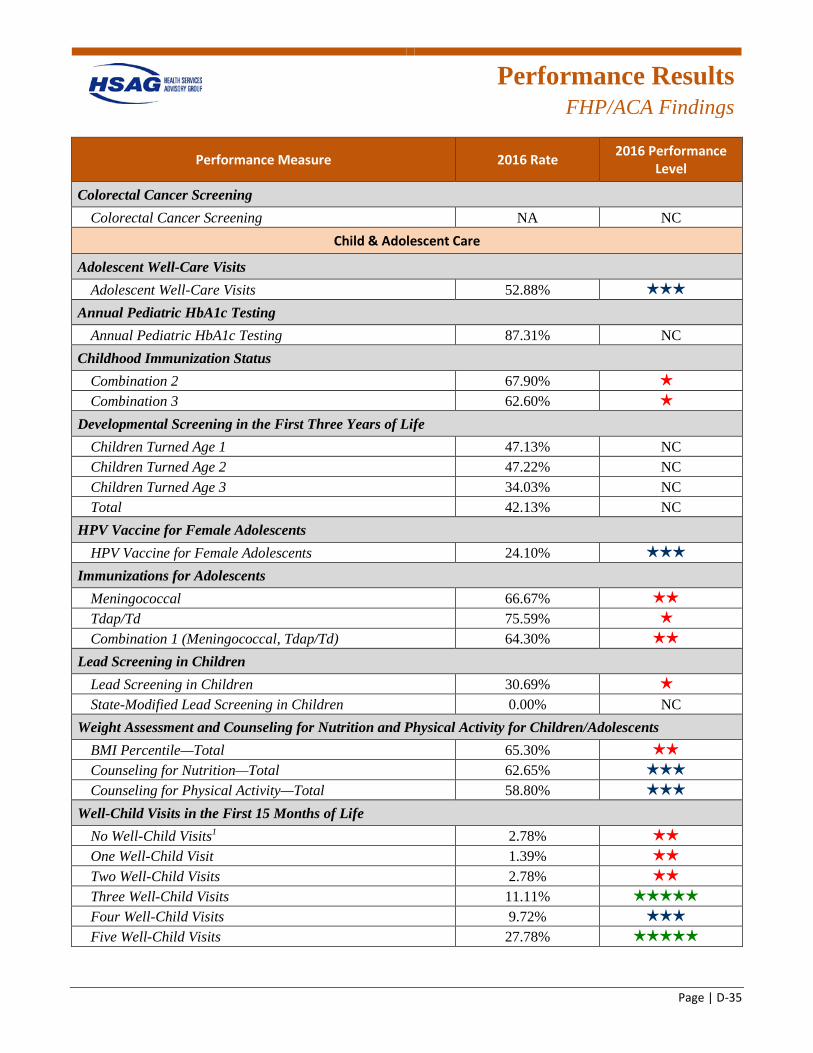
Performance Results
FHP/ACA Findings
Page | D-35
Performance Measure 2016 Rate 2016 Performance Level
Colorectal Cancer Screening Colorectal Cancer Screening NA NC
Child & Adolescent Care
Adolescent Well-Care Visits Adolescent Well-Care Visits 52.88% 3 stars
Annual Pediatric HbA1c Testing Annual Pediatric HbA1c Testing 87.31% NC
Childhood Immunization Status Combination 2 67.90% 1 star
Combination 3 62.60% 1 star
Developmental Screening in the First Three Years of Life Children Turned Age 1 47.13% NC Children Turned Age 2 47.22% NC Children Turned Age 3 34.03% NC Total 42.13% NC
HPV Vaccine for Female Adolescents HPV Vaccine for Female Adolescents 24.10% 3 stars
Immunizations for Adolescents Meningococcal 66.67% 2 stars
Tdap/Td 75.59% 1 star
Combination 1 (Meningococcal, Tdap/Td) 64.30% 2 stars
Lead Screening in Children Lead Screening in Children 30.69% 1 star
State-Modified Lead Screening in Children 0.00% NC Weight Assessment and Counseling for Nutrition and Physical Activity for Children/Adolescents
BMI Percentile—Total 65.30% 2 stars
Counseling for Nutrition—Total 62.65% 3 stars
Counseling for Physical Activity—Total 58.80% 3 stars
Well-Child Visits in the First 15 Months of Life No Well-Child Visits1 2.78% 2 stars
One Well-Child Visit 1.39% 2 stars
Two Well-Child Visits 2.78% 2 stars
Three Well-Child Visits 11.11% 5 stars
Four Well-Child Visits 9.72% 3 stars
Five Well-Child Visits 27.78% 5 stars
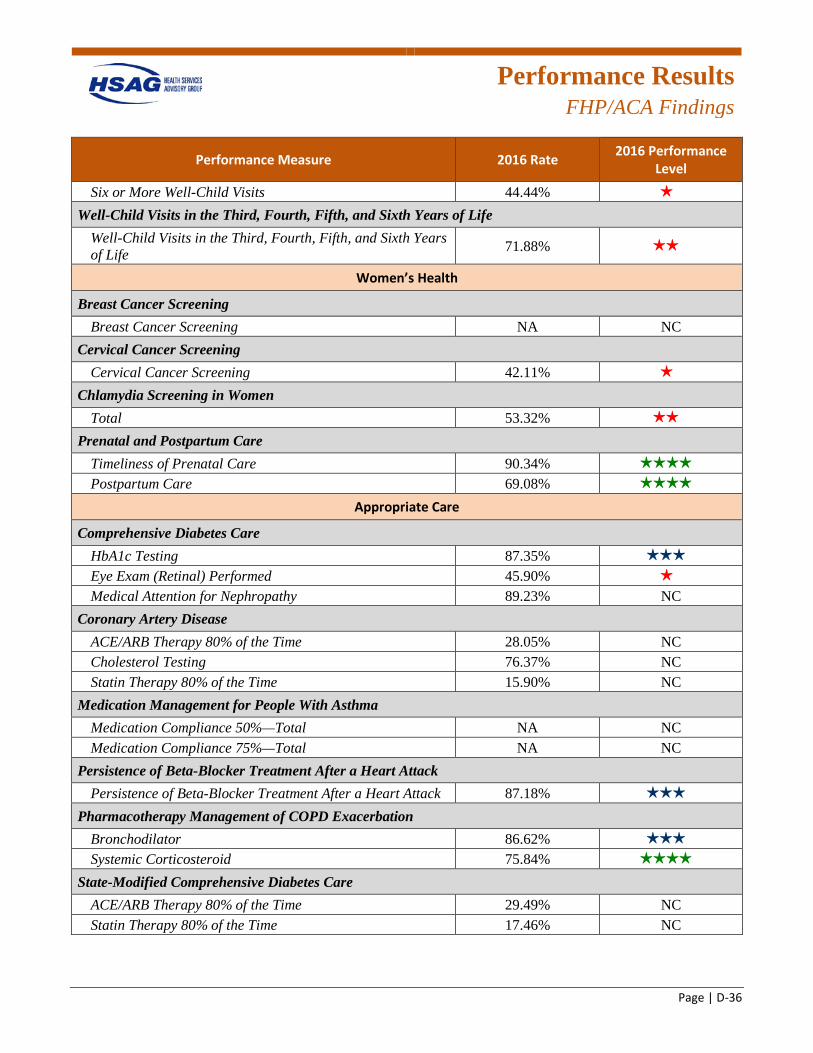
Performance Results
FHP/ACA Findings
Page | D-36
Performance Measure 2016 Rate 2016 Performance Level
Six or More Well-Child Visits 44.44% 1 star
Well-Child Visits in the Third, Fourth, Fifth, and Sixth Years of Life Well-Child Visits in the Third, Fourth, Fifth, and Sixth Years of Life 71.88% 2 stars
Women’s Health
Breast Cancer Screening Breast Cancer Screening NA NC
Cervical Cancer Screening Cervical Cancer Screening 42.11% 1 star
Chlamydia Screening in Women Total 53.32% 2 stars
Prenatal and Postpartum Care Timeliness of Prenatal Care 90.34% 4 stars
Postpartum Care 69.08% 4 stars
Appropriate Care
Comprehensive Diabetes Care HbA1c Testing 87.35% 3 stars
Eye Exam (Retinal) Performed 45.90% 1 star
Medical Attention for Nephropathy 89.23% NC Coronary Artery Disease
ACE/ARB Therapy 80% of the Time 28.05% NC Cholesterol Testing 76.37% NC Statin Therapy 80% of the Time 15.90% NC
Medication Management for People With Asthma Medication Compliance 50%—Total NA NC Medication Compliance 75%—Total NA NC
Persistence of Beta-Blocker Treatment After a Heart Attack Persistence of Beta-Blocker Treatment After a Heart Attack 87.18% 3 stars
Pharmacotherapy Management of COPD Exacerbation Bronchodilator 86.62% 3 stars
Systemic Corticosteroid 75.84% 4 stars
State-Modified Comprehensive Diabetes Care ACE/ARB Therapy 80% of the Time 29.49% NC Statin Therapy 80% of the Time 17.46% NC
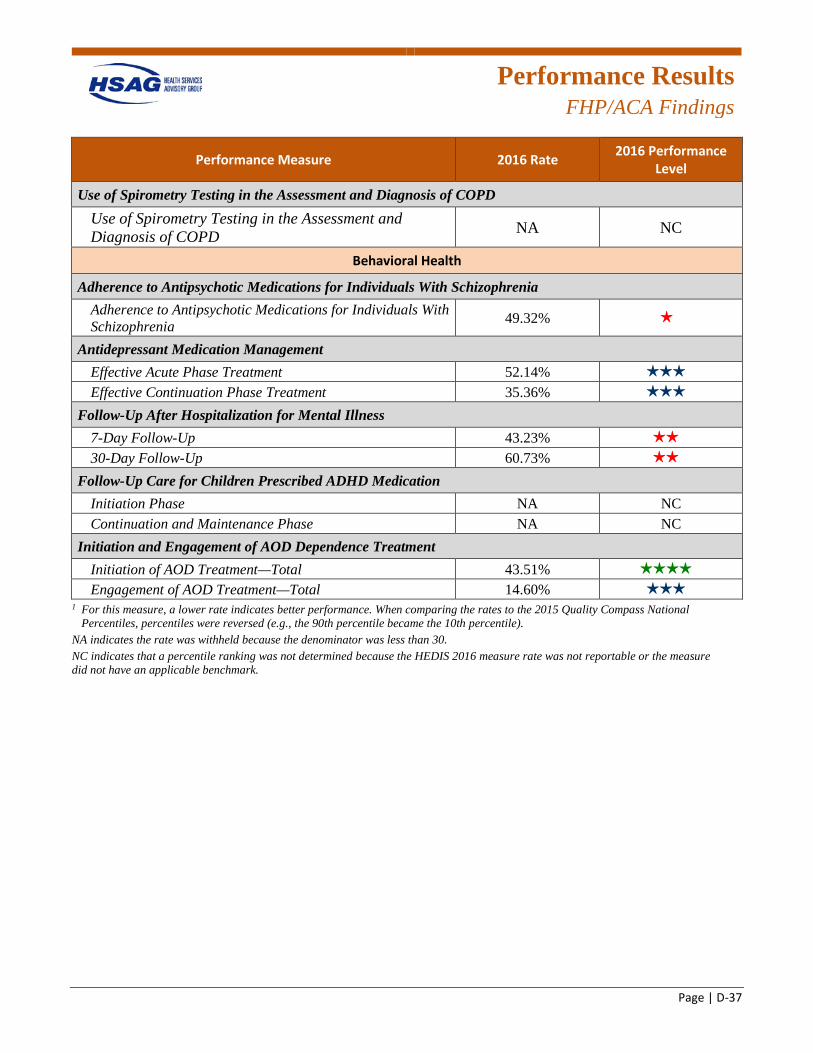
Performance Results
FHP/ACA Findings
Page | D-37
Performance Measure 2016 Rate 2016 Performance Level
Use of Spirometry Testing in the Assessment and Diagnosis of COPD Use of Spirometry Testing in the Assessment and Diagnosis of COPD NA NC
Behavioral Health
Adherence to Antipsychotic Medications for Individuals With Schizophrenia Adherence to Antipsychotic Medications for Individuals With Schizophrenia 49.32% 1 star
Antidepressant Medication Management Effective Acute Phase Treatment 52.14% 3 stars
Effective Continuation Phase Treatment 35.36% 3 stars
Follow-Up After Hospitalization for Mental Illness 7-Day Follow-Up 43.23% 2 stars
30-Day Follow-Up 60.73% 2 stars
Follow-Up Care for Children Prescribed ADHD Medication Initiation Phase NA NC Continuation and Maintenance Phase NA NC
Initiation and Engagement of AOD Dependence Treatment Initiation of AOD Treatment—Total 43.51% 4 stars
Engagement of AOD Treatment—Total 14.60% 3 stars
1 For this measure, a lower rate indicates better performance. When comparing the rates to the 2015 Quality Compass National Percentiles, percentiles were reversed (e.g., the 90th percentile became the 10th percentile).
NA indicates the rate was withheld because the denominator was less than 30. NC indicates that a percentile ranking was not determined because the HEDIS 2016 measure rate was not reportable or the measure did not have an applicable benchmark.
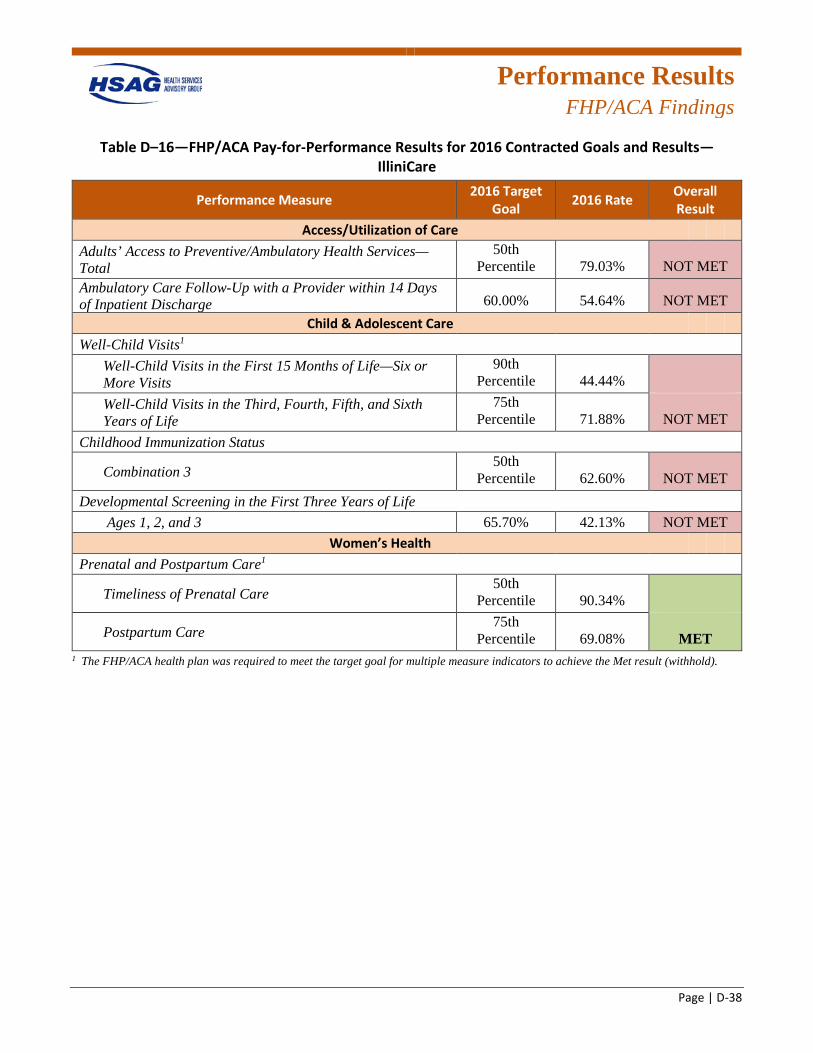
Performance Results
FHP/ACA Findings
Page | D-38
Table D–16—FHP/ACA Pay-for-Performance Results for 2016 Contracted Goals and Results—IlliniCare
Performance Measure 2016 Target Goal 2016 Rate Overall
Result Access/Utilization of Care
Adults’ Access to Preventive/Ambulatory Health Services—Total
50th Percentile 79.03% NOT MET
Ambulatory Care Follow-Up with a Provider within 14 Days of Inpatient Discharge 60.00% 54.64% NOT MET
Child & Adolescent Care Well-Child Visits1
Well-Child Visits in the First 15 Months of Life—Six or More Visits
90th Percentile 44.44%
Well-Child Visits in the Third, Fourth, Fifth, and Sixth Years of Life
75th Percentile 71.88% NOT MET
Childhood Immunization Status
Combination 3 50th
Percentile 62.60% NOT MET Developmental Screening in the First Three Years of Life
Ages 1, 2, and 3 65.70% 42.13% NOT MET Women’s Health
Prenatal and Postpartum Care1
Timeliness of Prenatal Care 50th
Percentile 90.34%
Postpartum Care 75th
Percentile 69.08% MET 1 The FHP/ACA health plan was required to meet the target goal for multiple measure indicators to achieve the Met result (withhold).
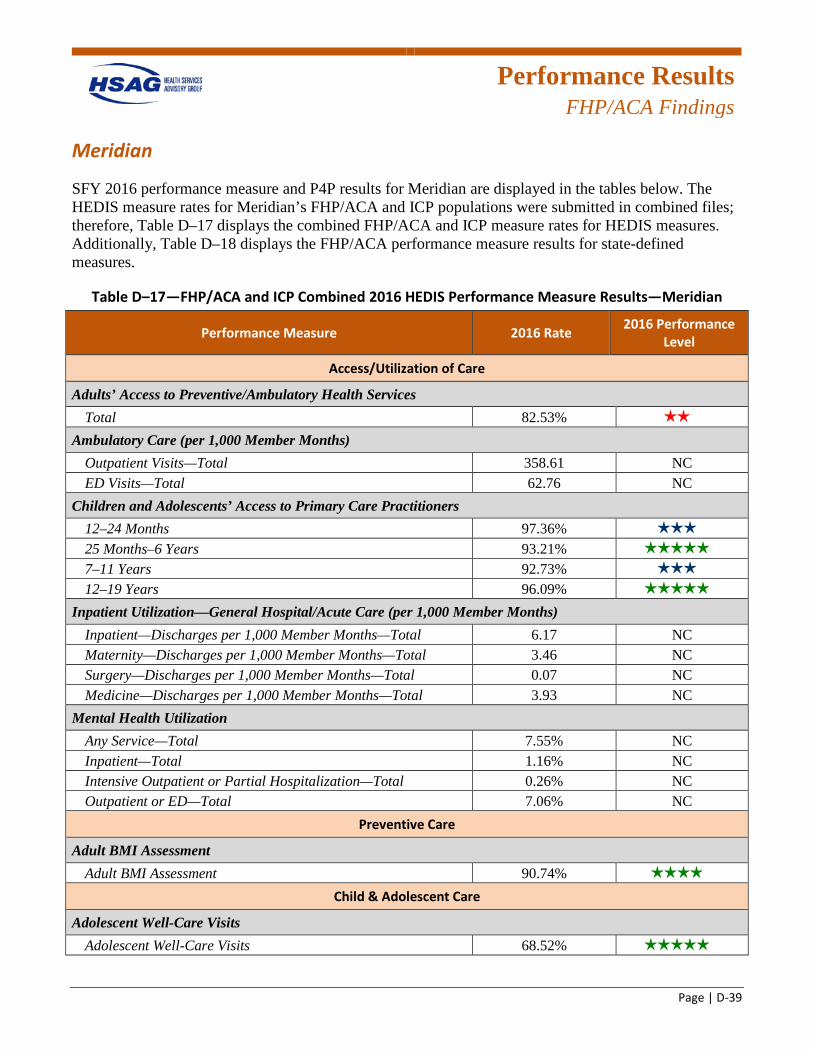
Performance Results
FHP/ACA Findings
Page | D-39
Meridian
SFY 2016 performance measure and P4P results for Meridian are displayed in the tables below. The HEDIS measure rates for Meridian’s FHP/ACA and ICP populations were submitted in combined files; therefore, Table D–17 displays the combined FHP/ACA and ICP measure rates for HEDIS measures. Additionally, Table D–18 displays the FHP/ACA performance measure results for state-defined measures.
Table D–17—FHP/ACA and ICP Combined 2016 HEDIS Performance Measure Results—Meridian
Performance Measure 2016 Rate 2016 Performance Level
Access/Utilization of Care
Adults’ Access to Preventive/Ambulatory Health Services Total 82.53% 2 stars
Ambulatory Care (per 1,000 Member Months) Outpatient Visits—Total 358.61 NC ED Visits—Total 62.76 NC
Children and Adolescents’ Access to Primary Care Practitioners 12–24 Months 97.36% 3 stars
25 Months–6 Years 93.21% 5 stars
7–11 Years 92.73% 3 stars
12–19 Years 96.09% 5 stars
Inpatient Utilization—General Hospital/Acute Care (per 1,000 Member Months) Inpatient—Discharges per 1,000 Member Months—Total 6.17 NC Maternity—Discharges per 1,000 Member Months—Total 3.46 NC Surgery—Discharges per 1,000 Member Months—Total 0.07 NC Medicine—Discharges per 1,000 Member Months—Total 3.93 NC
Mental Health Utilization Any Service—Total 7.55% NC Inpatient—Total 1.16% NC Intensive Outpatient or Partial Hospitalization—Total 0.26% NC Outpatient or ED—Total 7.06% NC
Preventive Care
Adult BMI Assessment Adult BMI Assessment 90.74% 4 stars
Child & Adolescent Care
Adolescent Well-Care Visits Adolescent Well-Care Visits 68.52% 5 stars
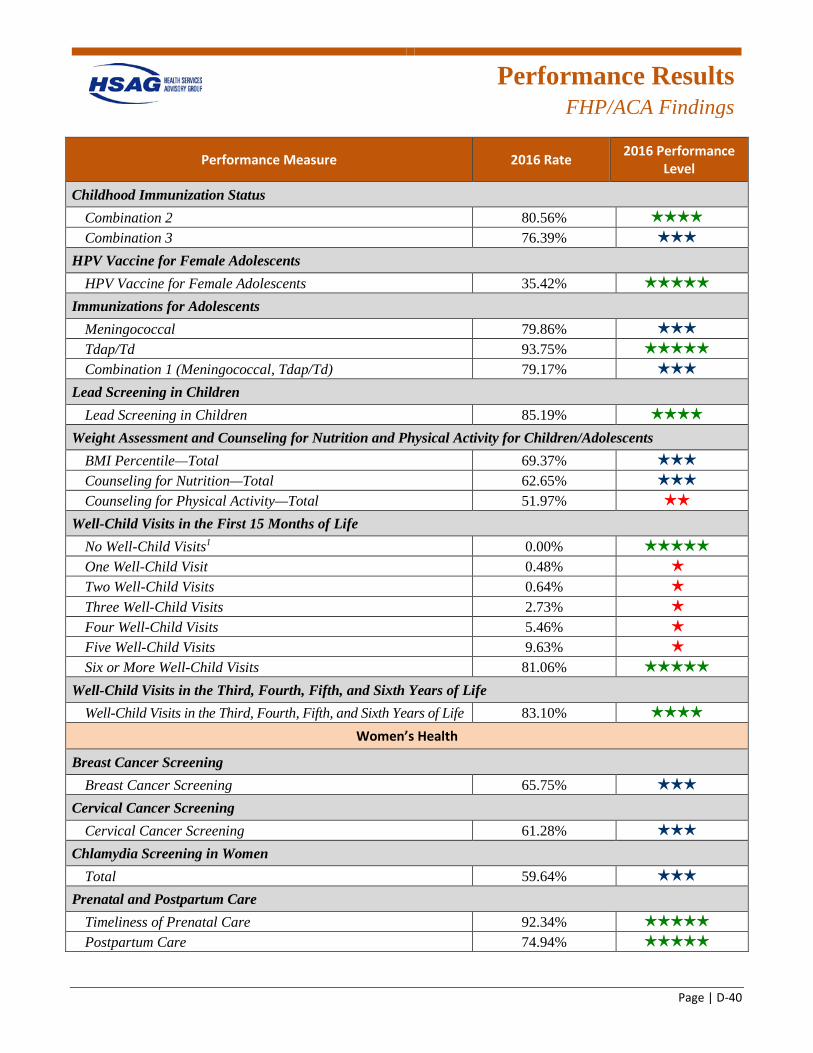
Performance Results
FHP/ACA Findings
Page | D-40
Performance Measure 2016 Rate 2016 Performance Level
Childhood Immunization Status Combination 2 80.56% 4 stars
Combination 3 76.39% 3 stars
HPV Vaccine for Female Adolescents HPV Vaccine for Female Adolescents 35.42% 5 stars
Immunizations for Adolescents Meningococcal 79.86% 3 stars
Tdap/Td 93.75% 5 stars
Combination 1 (Meningococcal, Tdap/Td) 79.17% 3 stars
Lead Screening in Children Lead Screening in Children 85.19% 4 stars
Weight Assessment and Counseling for Nutrition and Physical Activity for Children/Adolescents BMI Percentile—Total 69.37% 3 stars
Counseling for Nutrition—Total 62.65% 3 stars
Counseling for Physical Activity—Total 51.97% 2 stars
Well-Child Visits in the First 15 Months of Life No Well-Child Visits1 0.00% 5 stars
One Well-Child Visit 0.48% 1 star
Two Well-Child Visits 0.64% 1 star
Three Well-Child Visits 2.73% 1 star
Four Well-Child Visits 5.46% 1 star
Five Well-Child Visits 9.63% 1 star
Six or More Well-Child Visits 81.06% 5 stars
Well-Child Visits in the Third, Fourth, Fifth, and Sixth Years of Life Well-Child Visits in the Third, Fourth, Fifth, and Sixth Years of Life 83.10% 4 stars
Women’s Health
Breast Cancer Screening Breast Cancer Screening 65.75% 3 stars
Cervical Cancer Screening Cervical Cancer Screening 61.28% 3 stars
Chlamydia Screening in Women Total 59.64% 3 stars
Prenatal and Postpartum Care Timeliness of Prenatal Care 92.34% 5 stars
Postpartum Care 74.94% 5 stars
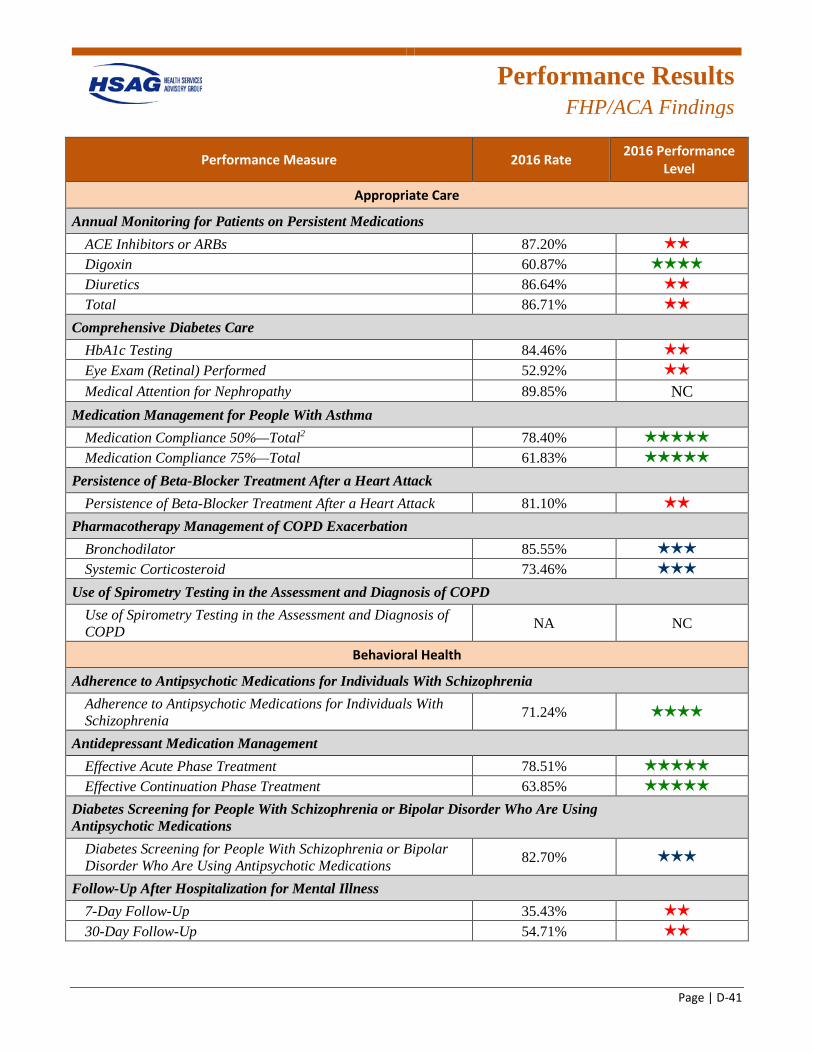
Performance Results
FHP/ACA Findings
Page | D-41
Performance Measure 2016 Rate 2016 Performance Level
Appropriate Care
Annual Monitoring for Patients on Persistent Medications ACE Inhibitors or ARBs 87.20% 2 stars
Digoxin 60.87% 4 stars
Diuretics 86.64% 2 stars
Total 86.71% 2 stars
Comprehensive Diabetes Care HbA1c Testing 84.46% 2 stars
Eye Exam (Retinal) Performed 52.92% 2 stars
Medical Attention for Nephropathy 89.85% NC Medication Management for People With Asthma
Medication Compliance 50%—Total2 78.40% 5 stars
Medication Compliance 75%—Total 61.83% 5 stars
Persistence of Beta-Blocker Treatment After a Heart Attack Persistence of Beta-Blocker Treatment After a Heart Attack 81.10% 2 stars
Pharmacotherapy Management of COPD Exacerbation Bronchodilator 85.55% 3 stars
Systemic Corticosteroid 73.46% 3 stars
Use of Spirometry Testing in the Assessment and Diagnosis of COPD Use of Spirometry Testing in the Assessment and Diagnosis of COPD NA NC
Behavioral Health
Adherence to Antipsychotic Medications for Individuals With Schizophrenia Adherence to Antipsychotic Medications for Individuals With Schizophrenia 71.24% 4 stars
Antidepressant Medication Management Effective Acute Phase Treatment 78.51% 5 stars
Effective Continuation Phase Treatment 63.85% 5 stars
Diabetes Screening for People With Schizophrenia or Bipolar Disorder Who Are Using Antipsychotic Medications
Diabetes Screening for People With Schizophrenia or Bipolar Disorder Who Are Using Antipsychotic Medications 82.70% 3 stars
Follow-Up After Hospitalization for Mental Illness 7-Day Follow-Up 35.43% 2 stars
30-Day Follow-Up 54.71% 2 stars
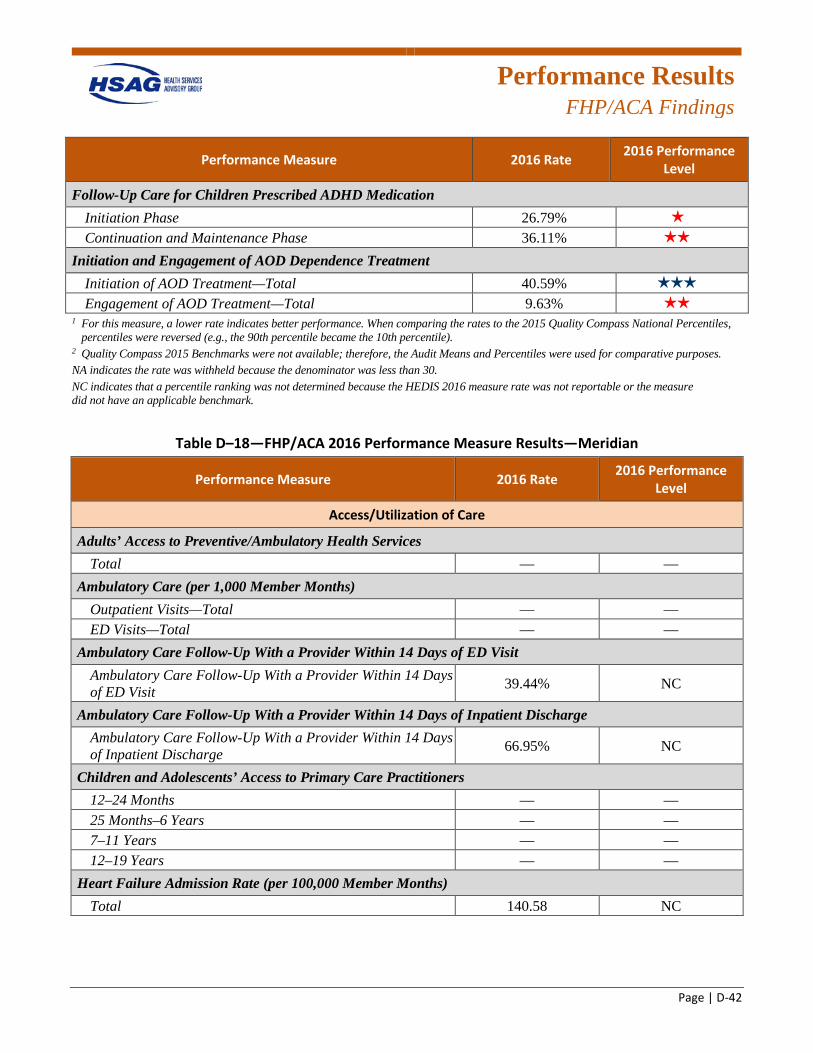
Performance Results
FHP/ACA Findings
Page | D-42
Performance Measure 2016 Rate 2016 Performance Level
Follow-Up Care for Children Prescribed ADHD Medication Initiation Phase 26.79% 1 star
Continuation and Maintenance Phase 36.11% 2 stars
Initiation and Engagement of AOD Dependence Treatment Initiation of AOD Treatment—Total 40.59% 3 stars
Engagement of AOD Treatment—Total 9.63% 2 stars
1 For this measure, a lower rate indicates better performance. When comparing the rates to the 2015 Quality Compass National Percentiles, percentiles were reversed (e.g., the 90th percentile became the 10th percentile).
2 Quality Compass 2015 Benchmarks were not available; therefore, the Audit Means and Percentiles were used for comparative purposes. NA indicates the rate was withheld because the denominator was less than 30. NC indicates that a percentile ranking was not determined because the HEDIS 2016 measure rate was not reportable or the measure did not have an applicable benchmark.
Table D–18—FHP/ACA 2016 Performance Measure Results—Meridian
Performance Measure 2016 Rate 2016 Performance Level
Access/Utilization of Care
Adults’ Access to Preventive/Ambulatory Health Services Total — —
Ambulatory Care (per 1,000 Member Months) Outpatient Visits—Total — — ED Visits—Total — —
Ambulatory Care Follow-Up With a Provider Within 14 Days of ED Visit Ambulatory Care Follow-Up With a Provider Within 14 Days of ED Visit 39.44% NC
Ambulatory Care Follow-Up With a Provider Within 14 Days of Inpatient Discharge Ambulatory Care Follow-Up With a Provider Within 14 Days of Inpatient Discharge 66.95% NC
Children and Adolescents’ Access to Primary Care Practitioners 12–24 Months — — 25 Months–6 Years — — 7–11 Years — — 12–19 Years — —
Heart Failure Admission Rate (per 100,000 Member Months) Total 140.58 NC
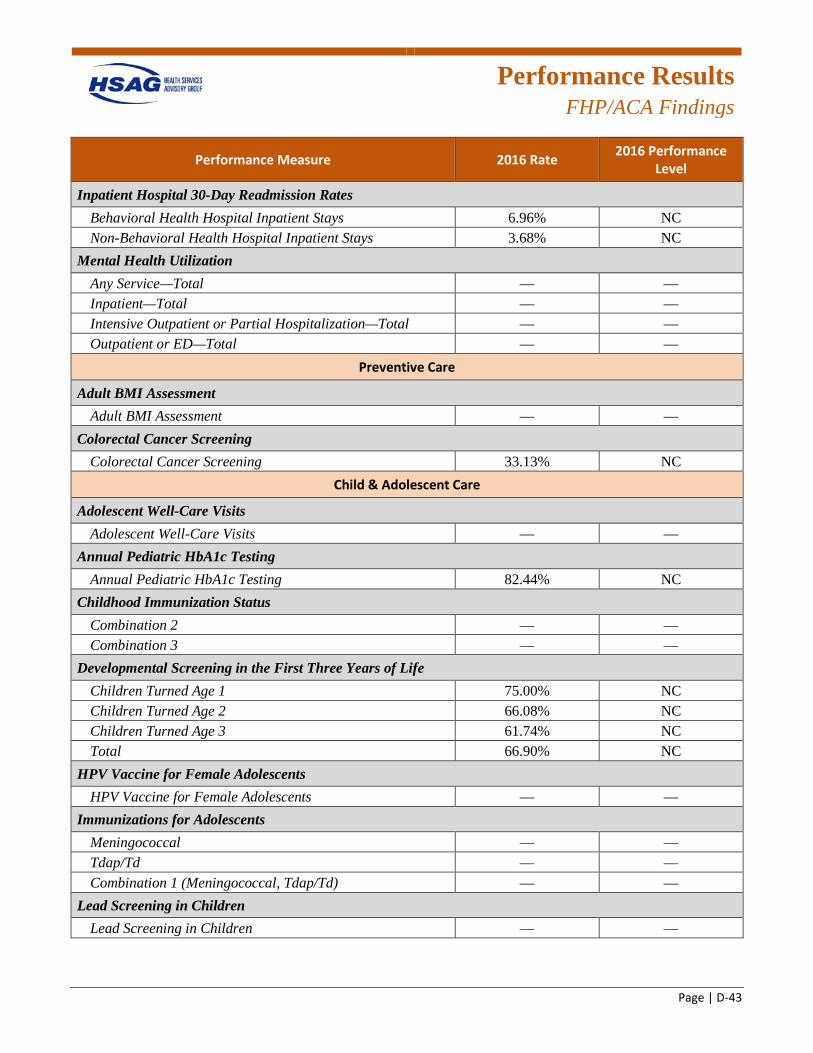
Performance Results
FHP/ACA Findings
Page | D-43
Performance Measure 2016 Rate 2016 Performance Level
Inpatient Hospital 30-Day Readmission Rates Behavioral Health Hospital Inpatient Stays 6.96% NC Non-Behavioral Health Hospital Inpatient Stays 3.68% NC
Mental Health Utilization Any Service—Total — — Inpatient—Total — — Intensive Outpatient or Partial Hospitalization—Total — — Outpatient or ED—Total — —
Preventive Care
Adult BMI Assessment Adult BMI Assessment — —
Colorectal Cancer Screening Colorectal Cancer Screening 33.13% NC
Child & Adolescent Care
Adolescent Well-Care Visits Adolescent Well-Care Visits — —
Annual Pediatric HbA1c Testing Annual Pediatric HbA1c Testing 82.44% NC
Childhood Immunization Status Combination 2 — — Combination 3 — —
Developmental Screening in the First Three Years of Life Children Turned Age 1 75.00% NC Children Turned Age 2 66.08% NC Children Turned Age 3 61.74% NC Total 66.90% NC
HPV Vaccine for Female Adolescents HPV Vaccine for Female Adolescents — —
Immunizations for Adolescents Meningococcal — — Tdap/Td — — Combination 1 (Meningococcal, Tdap/Td) — —
Lead Screening in Children Lead Screening in Children — —
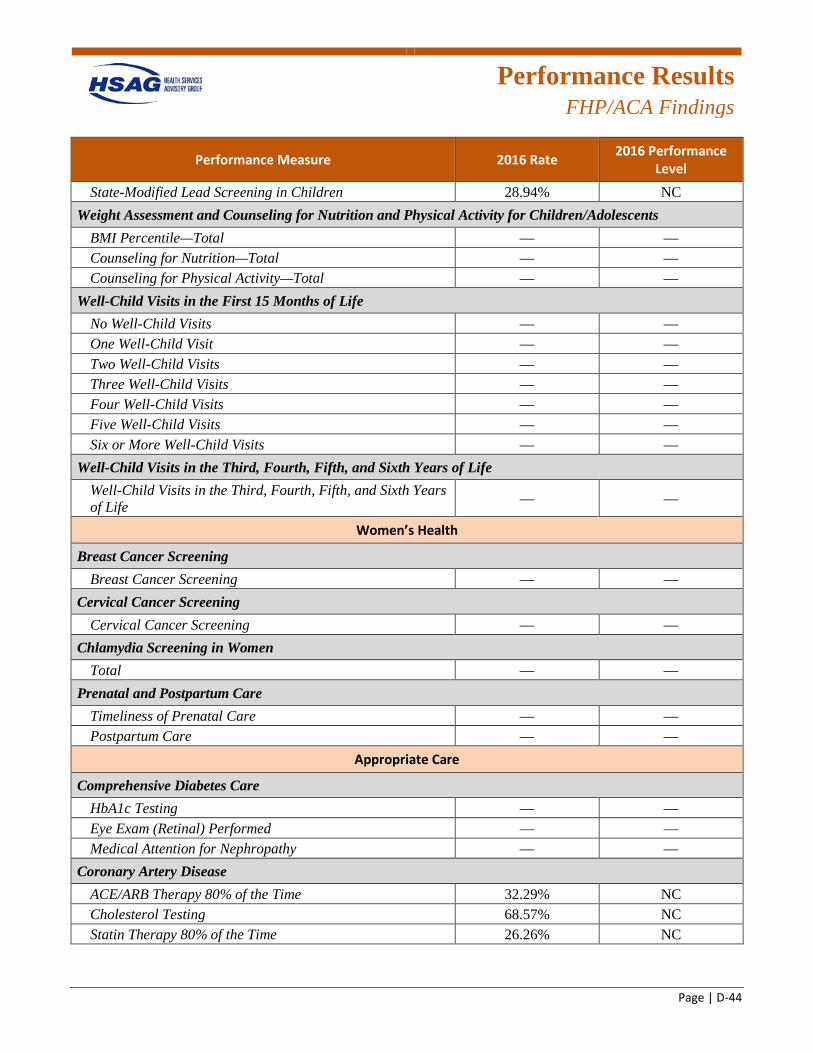
Performance Results
FHP/ACA Findings
Page | D-44
Performance Measure 2016 Rate 2016 Performance Level
State-Modified Lead Screening in Children 28.94% NC Weight Assessment and Counseling for Nutrition and Physical Activity for Children/Adolescents
BMI Percentile—Total — — Counseling for Nutrition—Total — — Counseling for Physical Activity—Total — —
Well-Child Visits in the First 15 Months of Life No Well-Child Visits — — One Well-Child Visit — — Two Well-Child Visits — — Three Well-Child Visits — — Four Well-Child Visits — — Five Well-Child Visits — — Six or More Well-Child Visits — —
Well-Child Visits in the Third, Fourth, Fifth, and Sixth Years of Life Well-Child Visits in the Third, Fourth, Fifth, and Sixth Years of Life — —
Women’s Health
Breast Cancer Screening Breast Cancer Screening — —
Cervical Cancer Screening Cervical Cancer Screening — —
Chlamydia Screening in Women Total — —
Prenatal and Postpartum Care Timeliness of Prenatal Care — — Postpartum Care — —
Appropriate Care
Comprehensive Diabetes Care HbA1c Testing — — Eye Exam (Retinal) Performed — — Medical Attention for Nephropathy — —
Coronary Artery Disease ACE/ARB Therapy 80% of the Time 32.29% NC Cholesterol Testing 68.57% NC Statin Therapy 80% of the Time 26.26% NC
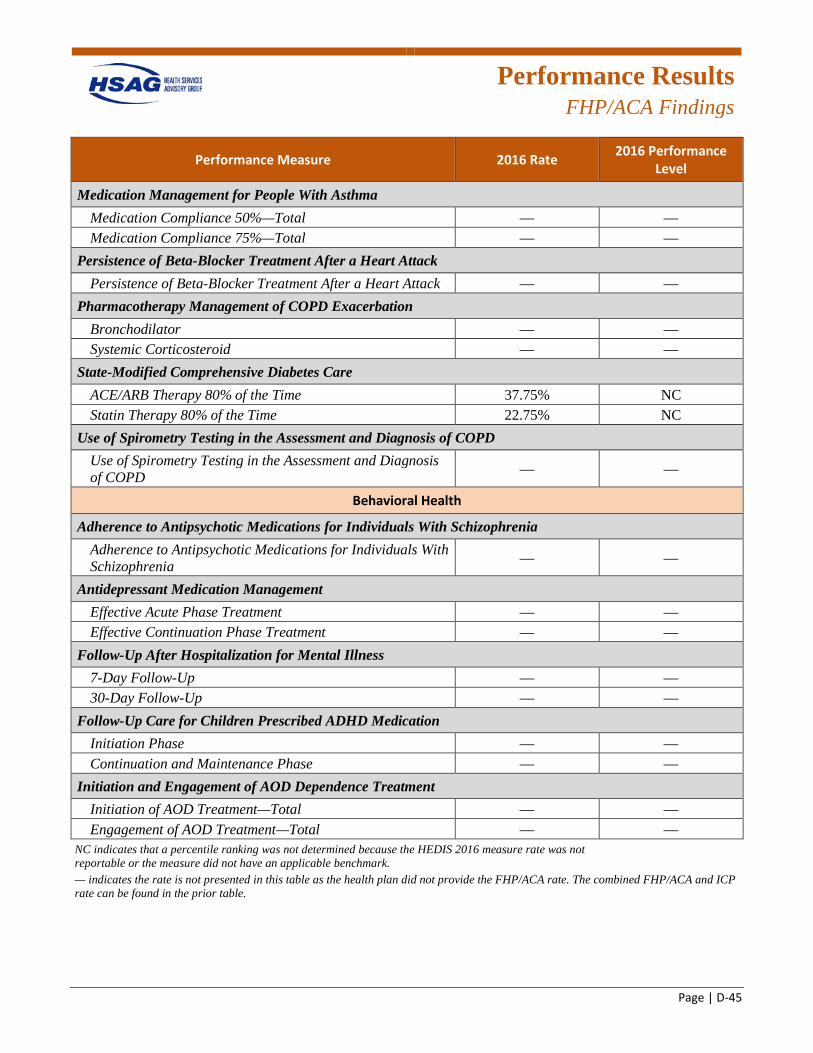
Performance Results
FHP/ACA Findings
Page | D-45
Performance Measure 2016 Rate 2016 Performance Level
Medication Management for People With Asthma Medication Compliance 50%—Total — — Medication Compliance 75%—Total — —
Persistence of Beta-Blocker Treatment After a Heart Attack Persistence of Beta-Blocker Treatment After a Heart Attack — —
Pharmacotherapy Management of COPD Exacerbation Bronchodilator — — Systemic Corticosteroid — —
State-Modified Comprehensive Diabetes Care ACE/ARB Therapy 80% of the Time 37.75% NC Statin Therapy 80% of the Time 22.75% NC
Use of Spirometry Testing in the Assessment and Diagnosis of COPD Use of Spirometry Testing in the Assessment and Diagnosis of COPD — —
Behavioral Health
Adherence to Antipsychotic Medications for Individuals With Schizophrenia Adherence to Antipsychotic Medications for Individuals With Schizophrenia — —
Antidepressant Medication Management Effective Acute Phase Treatment — — Effective Continuation Phase Treatment — —
Follow-Up After Hospitalization for Mental Illness 7-Day Follow-Up — — 30-Day Follow-Up — —
Follow-Up Care for Children Prescribed ADHD Medication Initiation Phase — — Continuation and Maintenance Phase — —
Initiation and Engagement of AOD Dependence Treatment Initiation of AOD Treatment—Total — — Engagement of AOD Treatment—Total — —
NC indicates that a percentile ranking was not determined because the HEDIS 2016 measure rate was not reportable or the measure did not have an applicable benchmark. — indicates the rate is not presented in this table as the health plan did not provide the FHP/ACA rate. The combined FHP/ACA and ICP rate can be found in the prior table.
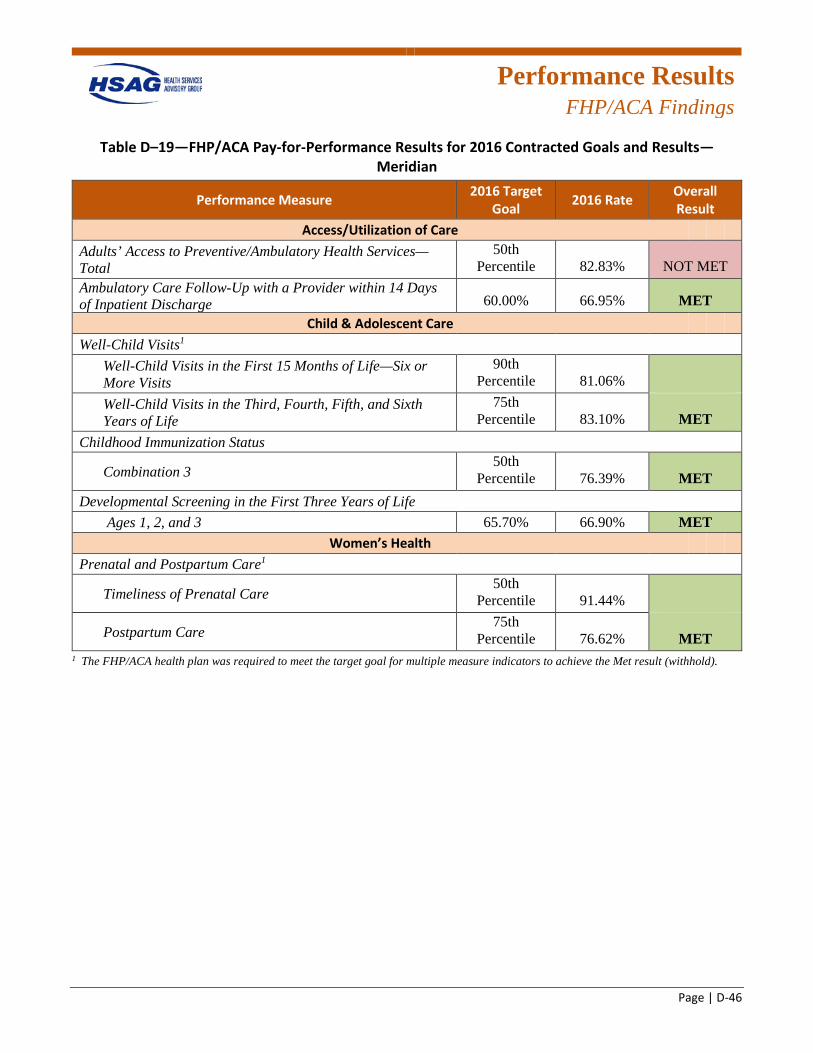
Performance Results
FHP/ACA Findings
Page | D-46
Table D–19—FHP/ACA Pay-for-Performance Results for 2016 Contracted Goals and Results—Meridian
Performance Measure 2016 Target Goal 2016 Rate Overall
Result Access/Utilization of Care
Adults’ Access to Preventive/Ambulatory Health Services—Total
50th Percentile 82.83% NOT MET
Ambulatory Care Follow-Up with a Provider within 14 Days of Inpatient Discharge 60.00% 66.95% MET
Child & Adolescent Care Well-Child Visits1
Well-Child Visits in the First 15 Months of Life—Six or More Visits
90th Percentile 81.06%
Well-Child Visits in the Third, Fourth, Fifth, and Sixth Years of Life
75th Percentile 83.10% MET
Childhood Immunization Status
Combination 3 50th
Percentile 76.39% MET Developmental Screening in the First Three Years of Life
Ages 1, 2, and 3 65.70% 66.90% MET Women’s Health
Prenatal and Postpartum Care1
Timeliness of Prenatal Care 50th
Percentile 91.44%
Postpartum Care 75th
Percentile 76.62% MET 1 The FHP/ACA health plan was required to meet the target goal for multiple measure indicators to achieve the Met result (withhold).
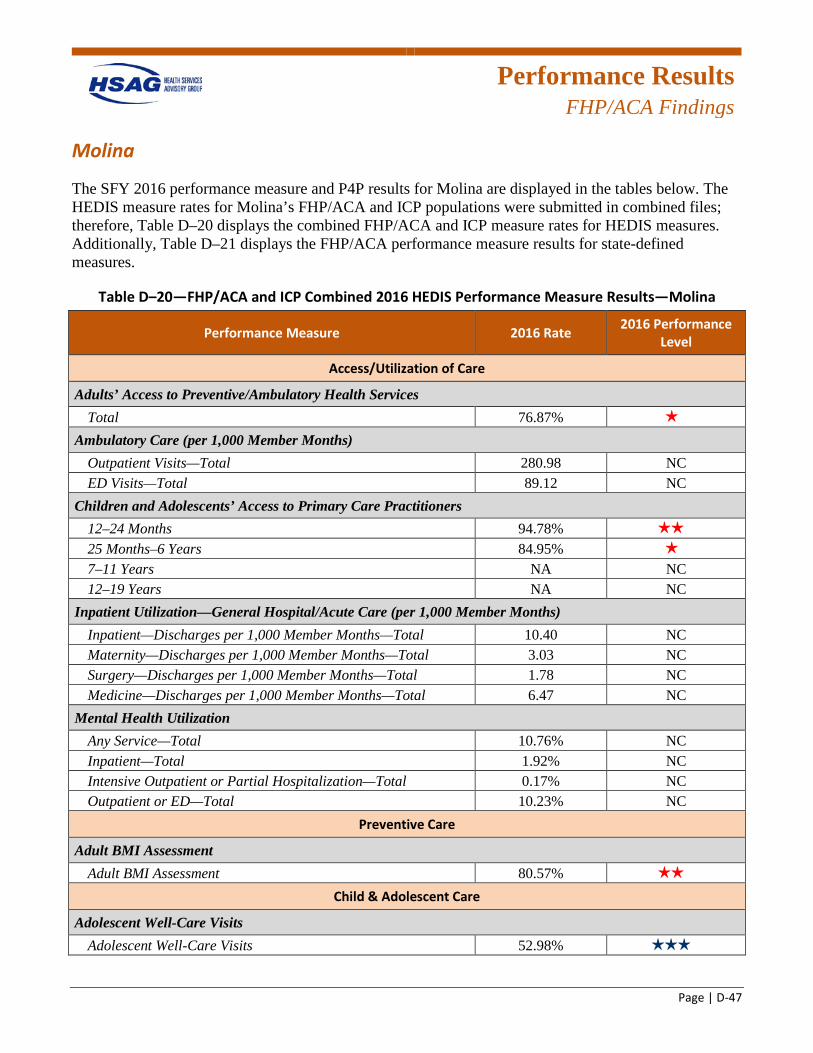
Performance Results
FHP/ACA Findings
Page | D-47
Molina
The SFY 2016 performance measure and P4P results for Molina are displayed in the tables below. The HEDIS measure rates for Molina’s FHP/ACA and ICP populations were submitted in combined files; therefore, Table D–20 displays the combined FHP/ACA and ICP measure rates for HEDIS measures. Additionally, Table D–21 displays the FHP/ACA performance measure results for state-defined measures.
Table D–20—FHP/ACA and ICP Combined 2016 HEDIS Performance Measure Results—Molina
Performance Measure 2016 Rate 2016 Performance Level
Access/Utilization of Care
Adults’ Access to Preventive/Ambulatory Health Services Total 76.87% 1 star
Ambulatory Care (per 1,000 Member Months) Outpatient Visits—Total 280.98 NC ED Visits—Total 89.12 NC
Children and Adolescents’ Access to Primary Care Practitioners 12–24 Months 94.78% 2 stars
25 Months–6 Years 84.95% 1 star
7–11 Years NA NC 12–19 Years NA NC
Inpatient Utilization—General Hospital/Acute Care (per 1,000 Member Months) Inpatient—Discharges per 1,000 Member Months—Total 10.40 NC Maternity—Discharges per 1,000 Member Months—Total 3.03 NC Surgery—Discharges per 1,000 Member Months—Total 1.78 NC Medicine—Discharges per 1,000 Member Months—Total 6.47 NC
Mental Health Utilization Any Service—Total 10.76% NC Inpatient—Total 1.92% NC Intensive Outpatient or Partial Hospitalization—Total 0.17% NC Outpatient or ED—Total 10.23% NC
Preventive Care
Adult BMI Assessment Adult BMI Assessment 80.57% 2 stars
Child & Adolescent Care
Adolescent Well-Care Visits Adolescent Well-Care Visits 52.98% 3 stars
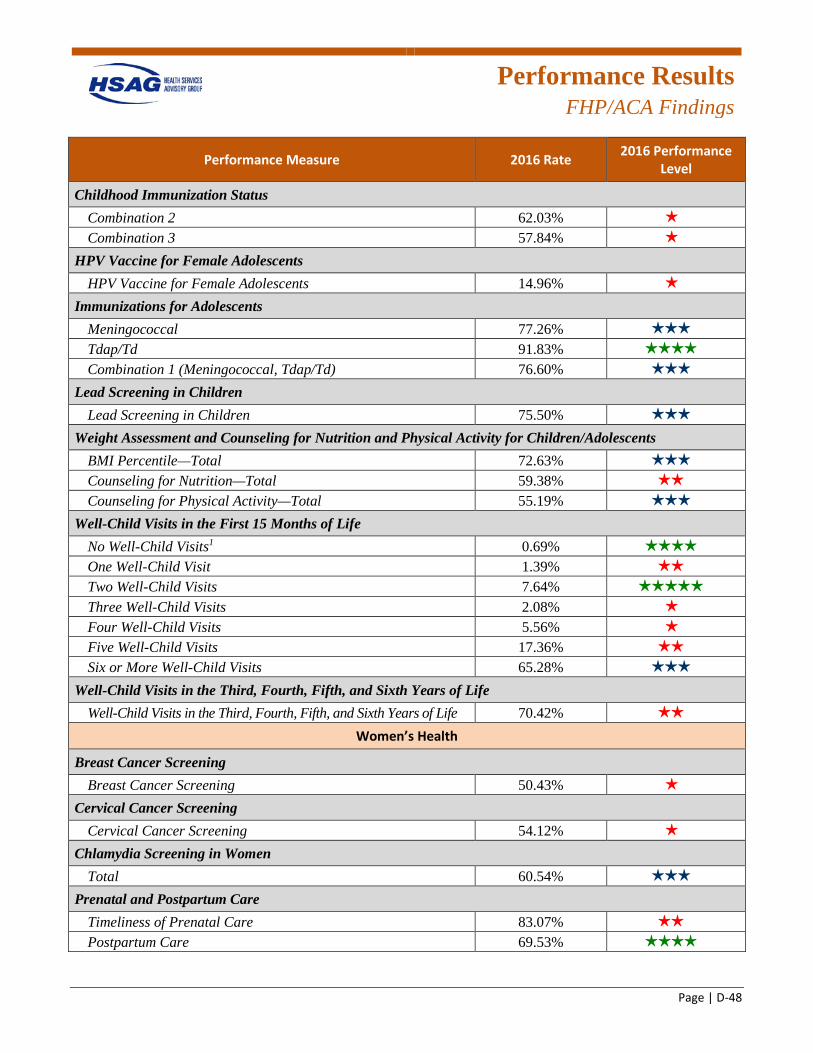
Performance Results
FHP/ACA Findings
Page | D-48
Performance Measure 2016 Rate 2016 Performance Level
Childhood Immunization Status Combination 2 62.03% 1 star
Combination 3 57.84% 1 star
HPV Vaccine for Female Adolescents HPV Vaccine for Female Adolescents 14.96% 1 star
Immunizations for Adolescents Meningococcal 77.26% 3 stars
Tdap/Td 91.83% 4 stars
Combination 1 (Meningococcal, Tdap/Td) 76.60% 3 stars
Lead Screening in Children Lead Screening in Children 75.50% 3 stars
Weight Assessment and Counseling for Nutrition and Physical Activity for Children/Adolescents BMI Percentile—Total 72.63% 3 stars
Counseling for Nutrition—Total 59.38% 2 stars
Counseling for Physical Activity—Total 55.19% 3 stars
Well-Child Visits in the First 15 Months of Life No Well-Child Visits1 0.69% 4 stars
One Well-Child Visit 1.39% 2 stars
Two Well-Child Visits 7.64% 5 stars
Three Well-Child Visits 2.08% 1 star
Four Well-Child Visits 5.56% 1 star
Five Well-Child Visits 17.36% 2 stars
Six or More Well-Child Visits 65.28% 3 stars
Well-Child Visits in the Third, Fourth, Fifth, and Sixth Years of Life Well-Child Visits in the Third, Fourth, Fifth, and Sixth Years of Life 70.42% 2 stars
Women’s Health
Breast Cancer Screening Breast Cancer Screening 50.43% 1 star
Cervical Cancer Screening Cervical Cancer Screening 54.12% 1 star
Chlamydia Screening in Women Total 60.54% 3 stars
Prenatal and Postpartum Care Timeliness of Prenatal Care 83.07% 2 stars
Postpartum Care 69.53% 4 stars
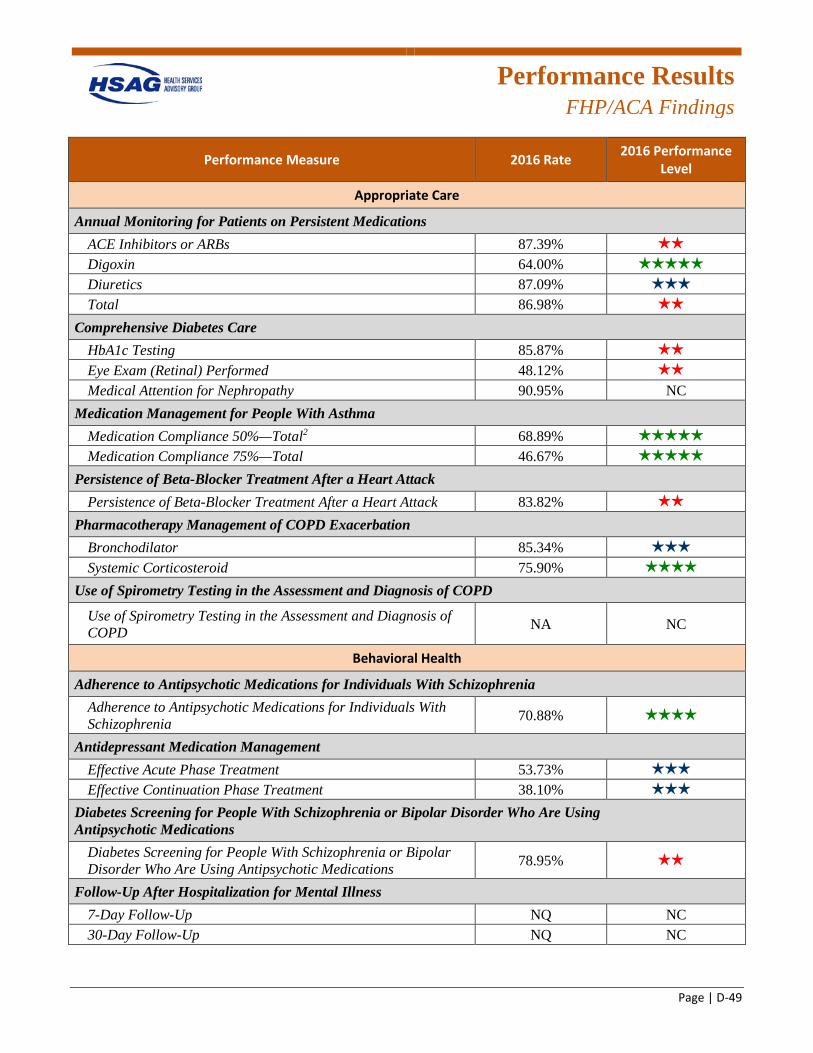
Performance Results
FHP/ACA Findings
Page | D-49
Performance Measure 2016 Rate 2016 Performance Level
Appropriate Care
Annual Monitoring for Patients on Persistent Medications ACE Inhibitors or ARBs 87.39% 2 stars
Digoxin 64.00% 5 stars
Diuretics 87.09% 3 stars
Total 86.98% 2 stars
Comprehensive Diabetes Care HbA1c Testing 85.87% 2 stars
Eye Exam (Retinal) Performed 48.12% 2 stars
Medical Attention for Nephropathy 90.95% NC Medication Management for People With Asthma
Medication Compliance 50%—Total2 68.89% 5 stars
Medication Compliance 75%—Total 46.67% 5 stars
Persistence of Beta-Blocker Treatment After a Heart Attack Persistence of Beta-Blocker Treatment After a Heart Attack 83.82% 2 stars
Pharmacotherapy Management of COPD Exacerbation Bronchodilator 85.34% 3 stars
Systemic Corticosteroid 75.90% 4 stars
Use of Spirometry Testing in the Assessment and Diagnosis of COPD
Use of Spirometry Testing in the Assessment and Diagnosis of COPD NA NC
Behavioral Health
Adherence to Antipsychotic Medications for Individuals With Schizophrenia Adherence to Antipsychotic Medications for Individuals With Schizophrenia 70.88% 4 stars
Antidepressant Medication Management Effective Acute Phase Treatment 53.73% 3 stars
Effective Continuation Phase Treatment 38.10% 3 stars
Diabetes Screening for People With Schizophrenia or Bipolar Disorder Who Are Using Antipsychotic Medications
Diabetes Screening for People With Schizophrenia or Bipolar Disorder Who Are Using Antipsychotic Medications 78.95% 2 stars
Follow-Up After Hospitalization for Mental Illness 7-Day Follow-Up NQ NC 30-Day Follow-Up NQ NC
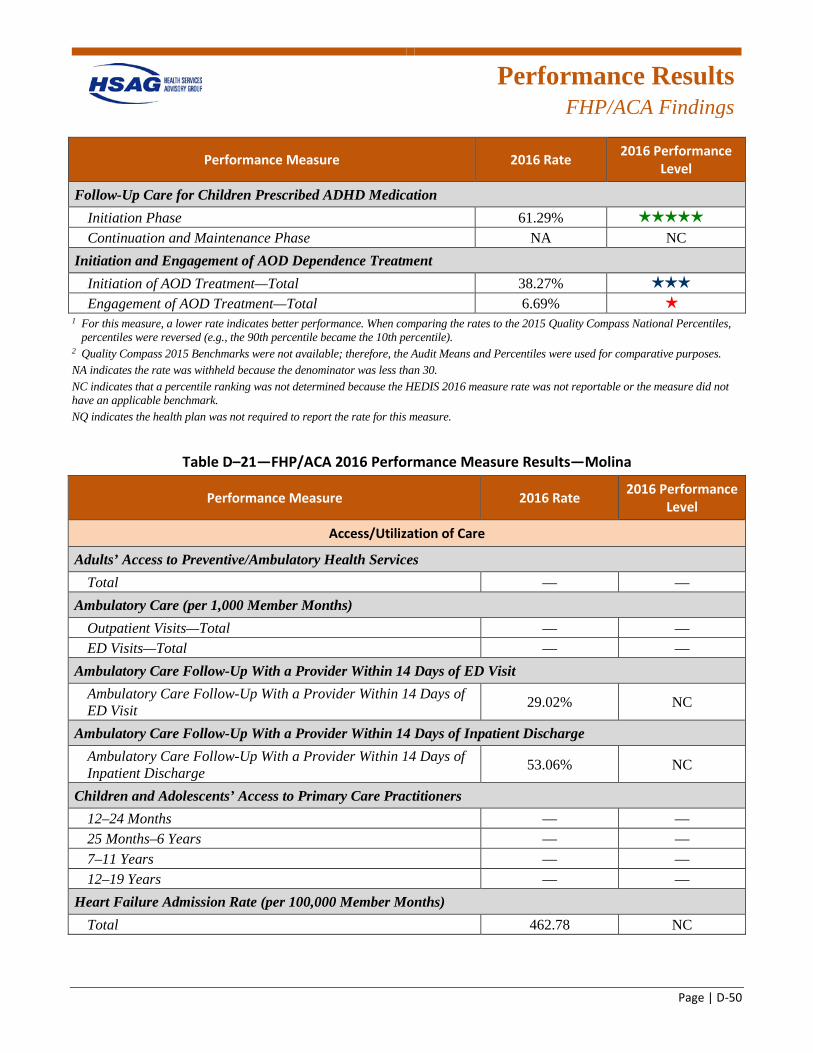
Performance Results
FHP/ACA Findings
Page | D-50
Performance Measure 2016 Rate 2016 Performance Level
Follow-Up Care for Children Prescribed ADHD Medication Initiation Phase 61.29% 5 stars
Continuation and Maintenance Phase NA NC Initiation and Engagement of AOD Dependence Treatment
Initiation of AOD Treatment—Total 38.27% 3 stars
Engagement of AOD Treatment—Total 6.69% 1 star
1 For this measure, a lower rate indicates better performance. When comparing the rates to the 2015 Quality Compass National Percentiles, percentiles were reversed (e.g., the 90th percentile became the 10th percentile).
2 Quality Compass 2015 Benchmarks were not available; therefore, the Audit Means and Percentiles were used for comparative purposes. NA indicates the rate was withheld because the denominator was less than 30. NC indicates that a percentile ranking was not determined because the HEDIS 2016 measure rate was not reportable or the measure did not have an applicable benchmark. NQ indicates the health plan was not required to report the rate for this measure.
Table D–21—FHP/ACA 2016 Performance Measure Results—Molina
Performance Measure 2016 Rate 2016 Performance Level
Access/Utilization of Care
Adults’ Access to Preventive/Ambulatory Health Services Total — —
Ambulatory Care (per 1,000 Member Months) Outpatient Visits—Total — — ED Visits—Total — —
Ambulatory Care Follow-Up With a Provider Within 14 Days of ED Visit Ambulatory Care Follow-Up With a Provider Within 14 Days of ED Visit 29.02% NC
Ambulatory Care Follow-Up With a Provider Within 14 Days of Inpatient Discharge Ambulatory Care Follow-Up With a Provider Within 14 Days of Inpatient Discharge 53.06% NC
Children and Adolescents’ Access to Primary Care Practitioners 12–24 Months — — 25 Months–6 Years — — 7–11 Years — — 12–19 Years — —
Heart Failure Admission Rate (per 100,000 Member Months) Total 462.78 NC

Performance Results
FHP/ACA Findings
Page | D-51
Performance Measure 2016 Rate 2016 Performance Level
Inpatient Hospital 30-Day Readmission Rates Behavioral Health Hospital Inpatient Stays 37.03% NC Non-Behavioral Health Hospital Inpatient Stays 4.78% NC
Mental Health Utilization Any Service—Total — — Inpatient—Total — — Intensive Outpatient or Partial Hospitalization—Total — — Outpatient or ED—Total — —
Preventive Care
Adult BMI Assessment Adult BMI Assessment — —
Colorectal Cancer Screening Colorectal Cancer Screening NA NC
Child & Adolescent Care
Adolescent Well-Care Visits Adolescent Well-Care Visits — —
Annual Pediatric HbA1c Testing Annual Pediatric HbA1c Testing 74.60% NC
Childhood Immunization Status Combination 2 — — Combination 3 — —
Developmental Screening in the First Three Years of Life Children Turned Age 1 85.43% NC Children Turned Age 2 72.85% NC Children Turned Age 3 51.66% NC Total 69.98% NC
HPV Vaccine for Female Adolescents HPV Vaccine for Female Adolescents — —
Immunizations for Adolescents Meningococcal — — Tdap/Td — — Combination 1 (Meningococcal, Tdap/Td) — —
Lead Screening in Children Lead Screening in Children — —
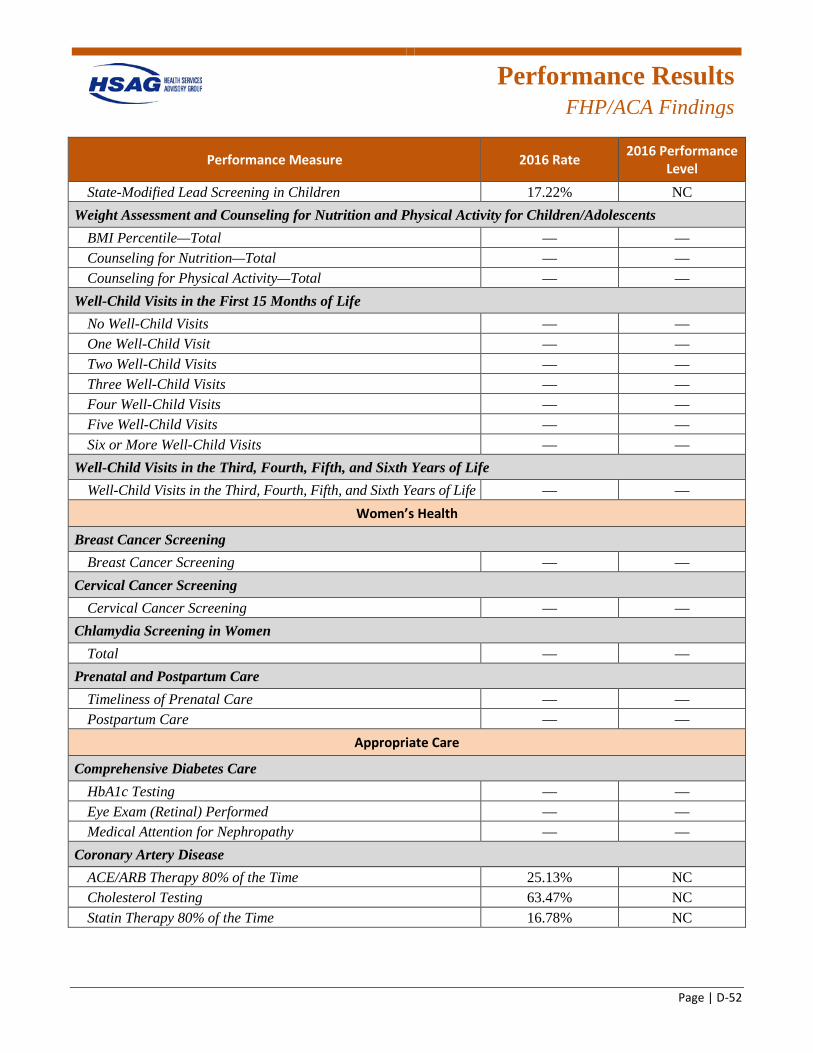
Performance Results
FHP/ACA Findings
Page | D-52
Performance Measure 2016 Rate 2016 Performance Level
State-Modified Lead Screening in Children 17.22% NC Weight Assessment and Counseling for Nutrition and Physical Activity for Children/Adolescents
BMI Percentile—Total — — Counseling for Nutrition—Total — — Counseling for Physical Activity—Total — —
Well-Child Visits in the First 15 Months of Life No Well-Child Visits — — One Well-Child Visit — — Two Well-Child Visits — — Three Well-Child Visits — — Four Well-Child Visits — — Five Well-Child Visits — — Six or More Well-Child Visits — —
Well-Child Visits in the Third, Fourth, Fifth, and Sixth Years of Life Well-Child Visits in the Third, Fourth, Fifth, and Sixth Years of Life — —
Women’s Health
Breast Cancer Screening Breast Cancer Screening — —
Cervical Cancer Screening Cervical Cancer Screening — —
Chlamydia Screening in Women Total — —
Prenatal and Postpartum Care Timeliness of Prenatal Care — — Postpartum Care — —
Appropriate Care
Comprehensive Diabetes Care HbA1c Testing — — Eye Exam (Retinal) Performed — — Medical Attention for Nephropathy — —
Coronary Artery Disease ACE/ARB Therapy 80% of the Time 25.13% NC Cholesterol Testing 63.47% NC Statin Therapy 80% of the Time 16.78% NC
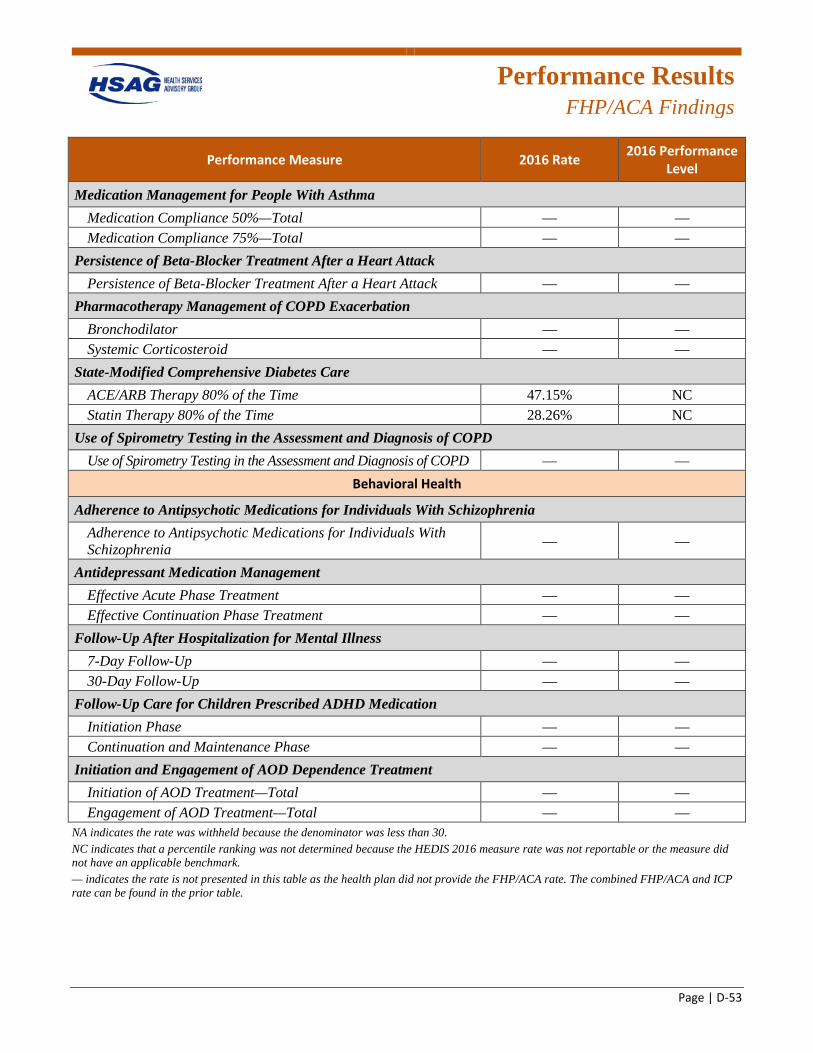
Performance Results
FHP/ACA Findings
Page | D-53
Performance Measure 2016 Rate 2016 Performance Level
Medication Management for People With Asthma Medication Compliance 50%—Total — — Medication Compliance 75%—Total — —
Persistence of Beta-Blocker Treatment After a Heart Attack Persistence of Beta-Blocker Treatment After a Heart Attack — —
Pharmacotherapy Management of COPD Exacerbation Bronchodilator — — Systemic Corticosteroid — —
State-Modified Comprehensive Diabetes Care ACE/ARB Therapy 80% of the Time 47.15% NC Statin Therapy 80% of the Time 28.26% NC
Use of Spirometry Testing in the Assessment and Diagnosis of COPD Use of Spirometry Testing in the Assessment and Diagnosis of COPD — —
Behavioral Health
Adherence to Antipsychotic Medications for Individuals With Schizophrenia Adherence to Antipsychotic Medications for Individuals With Schizophrenia — —
Antidepressant Medication Management Effective Acute Phase Treatment — — Effective Continuation Phase Treatment — —
Follow-Up After Hospitalization for Mental Illness 7-Day Follow-Up — — 30-Day Follow-Up — —
Follow-Up Care for Children Prescribed ADHD Medication Initiation Phase — — Continuation and Maintenance Phase — —
Initiation and Engagement of AOD Dependence Treatment Initiation of AOD Treatment—Total — — Engagement of AOD Treatment—Total — —
NA indicates the rate was withheld because the denominator was less than 30. NC indicates that a percentile ranking was not determined because the HEDIS 2016 measure rate was not reportable or the measure did not have an applicable benchmark. — indicates the rate is not presented in this table as the health plan did not provide the FHP/ACA rate. The combined FHP/ACA and ICP rate can be found in the prior table.
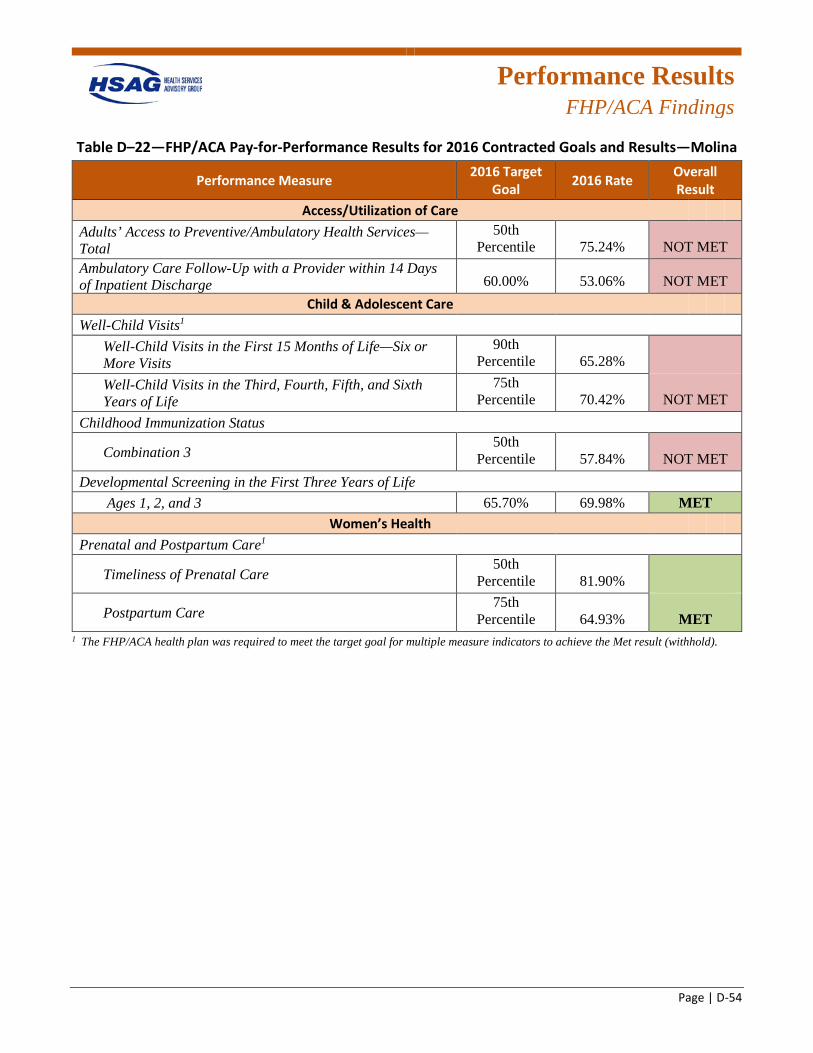
Performance Results
FHP/ACA Findings
Page | D-54
Table D–22—FHP/ACA Pay-for-Performance Results for 2016 Contracted Goals and Results—Molina
Performance Measure 2016 Target Goal 2016 Rate Overall
Result Access/Utilization of Care
Adults’ Access to Preventive/Ambulatory Health Services—Total
50th Percentile 75.24% NOT MET
Ambulatory Care Follow-Up with a Provider within 14 Days of Inpatient Discharge 60.00% 53.06% NOT MET
Child & Adolescent Care Well-Child Visits1
Well-Child Visits in the First 15 Months of Life—Six or More Visits
90th Percentile 65.28%
Well-Child Visits in the Third, Fourth, Fifth, and Sixth Years of Life
75th Percentile 70.42% NOT MET
Childhood Immunization Status
Combination 3 50th
Percentile 57.84% NOT MET Developmental Screening in the First Three Years of Life
Ages 1, 2, and 3 65.70% 69.98% MET Women’s Health
Prenatal and Postpartum Care1
Timeliness of Prenatal Care 50th
Percentile 81.90%
Postpartum Care 75th
Percentile 64.93% MET 1 The FHP/ACA health plan was required to meet the target goal for multiple measure indicators to achieve the Met result (withhold).
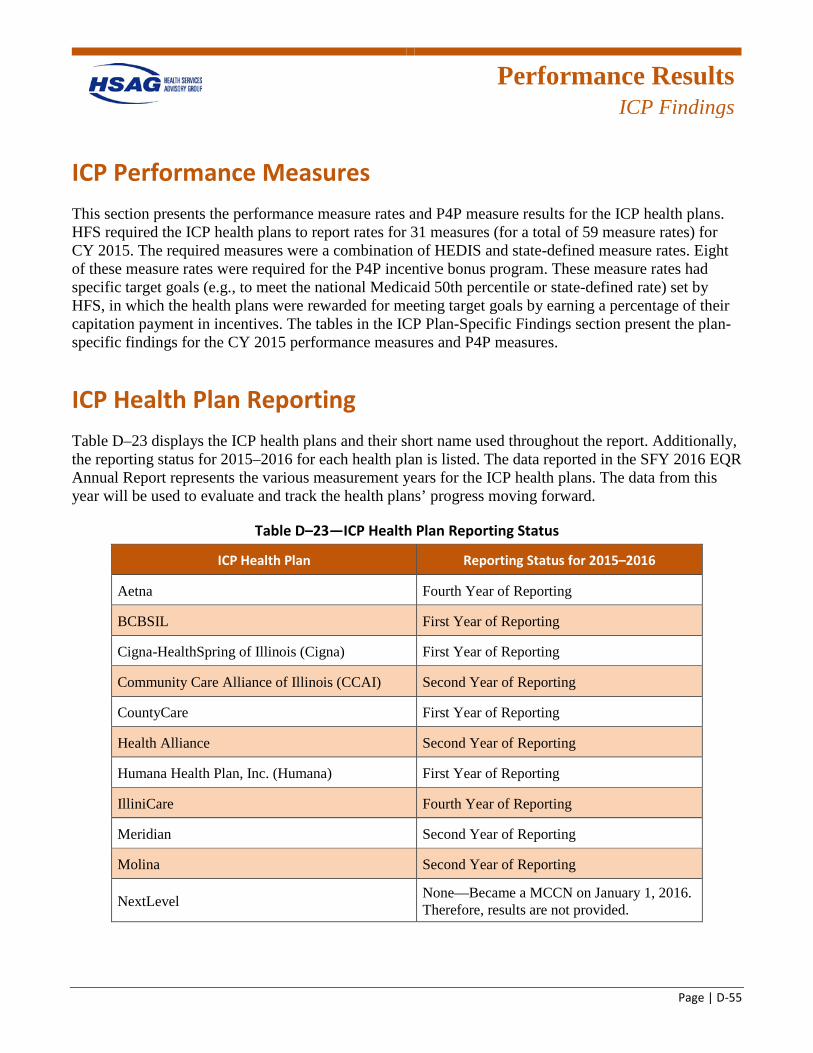
Performance Results
ICP Findings
Page | D-55
ICP Performance Measures This section presents the performance measure rates and P4P measure results for the ICP health plans. HFS required the ICP health plans to report rates for 31 measures (for a total of 59 measure rates) for CY 2015. The required measures were a combination of HEDIS and state-defined measure rates. Eight of these measure rates were required for the P4P incentive bonus program. These measure rates had specific target goals (e.g., to meet the national Medicaid 50th percentile or state-defined rate) set by HFS, in which the health plans were rewarded for meeting target goals by earning a percentage of their capitation payment in incentives. The tables in the ICP Plan-Specific Findings section present the plan-specific findings for the CY 2015 performance measures and P4P measures.
ICP Health Plan Reporting Table D–23 displays the ICP health plans and their short name used throughout the report. Additionally, the reporting status for 2015–2016 for each health plan is listed. The data reported in the SFY 2016 EQR Annual Report represents the various measurement years for the ICP health plans. The data from this year will be used to evaluate and track the health plans’ progress moving forward.
Table D–23—ICP Health Plan Reporting Status
ICP Health Plan Reporting Status for 2015–2016
Aetna Fourth Year of Reporting
BCBSIL First Year of Reporting
Cigna-HealthSpring of Illinois (Cigna) First Year of Reporting
Community Care Alliance of Illinois (CCAI) Second Year of Reporting
CountyCare First Year of Reporting
Health Alliance Second Year of Reporting
Humana Health Plan, Inc. (Humana) First Year of Reporting
IlliniCare Fourth Year of Reporting
Meridian Second Year of Reporting
Molina Second Year of Reporting
NextLevel None—Became a MCCN on January 1, 2016. Therefore, results are not provided.
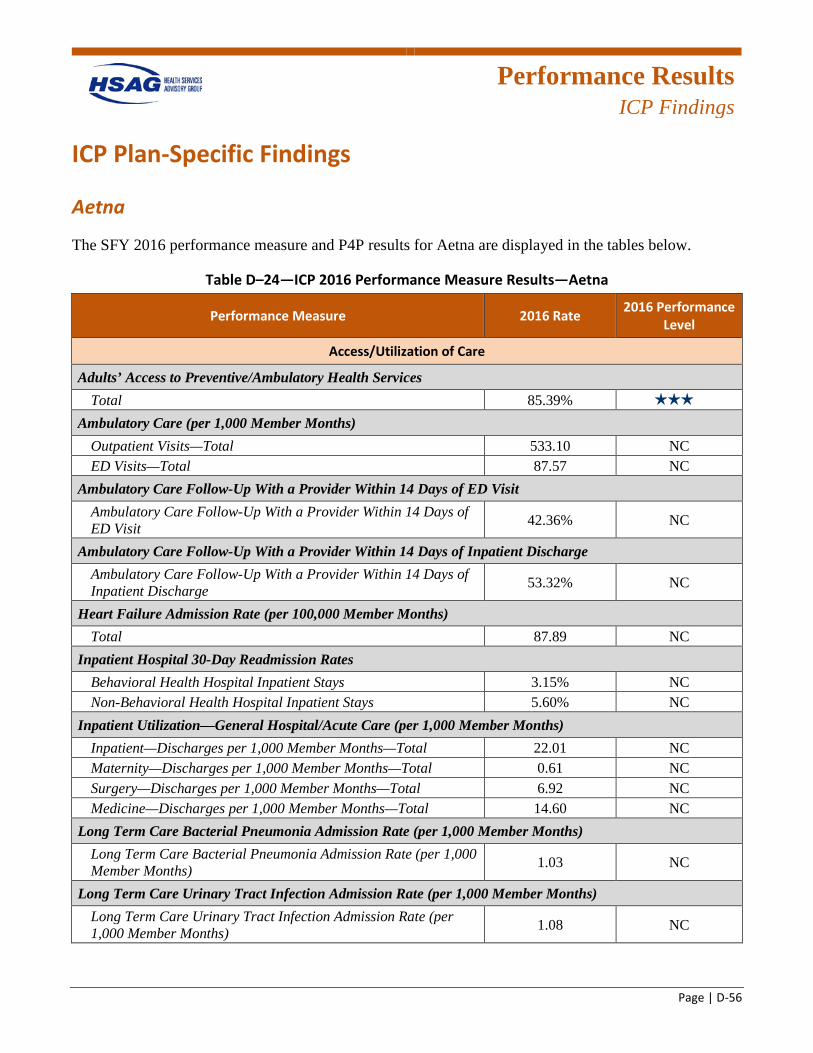
Performance Results
ICP Findings
Page | D-56
ICP Plan-Specific Findings
Aetna
The SFY 2016 performance measure and P4P results for Aetna are displayed in the tables below.
Table D–24—ICP 2016 Performance Measure Results—Aetna
Performance Measure 2016 Rate 2016 Performance Level
Access/Utilization of Care
Adults’ Access to Preventive/Ambulatory Health Services Total 85.39% 3 stars
Ambulatory Care (per 1,000 Member Months) Outpatient Visits—Total 533.10 NC ED Visits—Total 87.57 NC
Ambulatory Care Follow-Up With a Provider Within 14 Days of ED Visit Ambulatory Care Follow-Up With a Provider Within 14 Days of ED Visit 42.36% NC
Ambulatory Care Follow-Up With a Provider Within 14 Days of Inpatient Discharge Ambulatory Care Follow-Up With a Provider Within 14 Days of Inpatient Discharge 53.32% NC
Heart Failure Admission Rate (per 100,000 Member Months) Total 87.89 NC
Inpatient Hospital 30-Day Readmission Rates Behavioral Health Hospital Inpatient Stays 3.15% NC Non-Behavioral Health Hospital Inpatient Stays 5.60% NC
Inpatient Utilization—General Hospital/Acute Care (per 1,000 Member Months) Inpatient—Discharges per 1,000 Member Months—Total 22.01 NC Maternity—Discharges per 1,000 Member Months—Total 0.61 NC Surgery—Discharges per 1,000 Member Months—Total 6.92 NC Medicine—Discharges per 1,000 Member Months—Total 14.60 NC
Long Term Care Bacterial Pneumonia Admission Rate (per 1,000 Member Months) Long Term Care Bacterial Pneumonia Admission Rate (per 1,000 Member Months) 1.03 NC
Long Term Care Urinary Tract Infection Admission Rate (per 1,000 Member Months) Long Term Care Urinary Tract Infection Admission Rate (per 1,000 Member Months) 1.08 NC
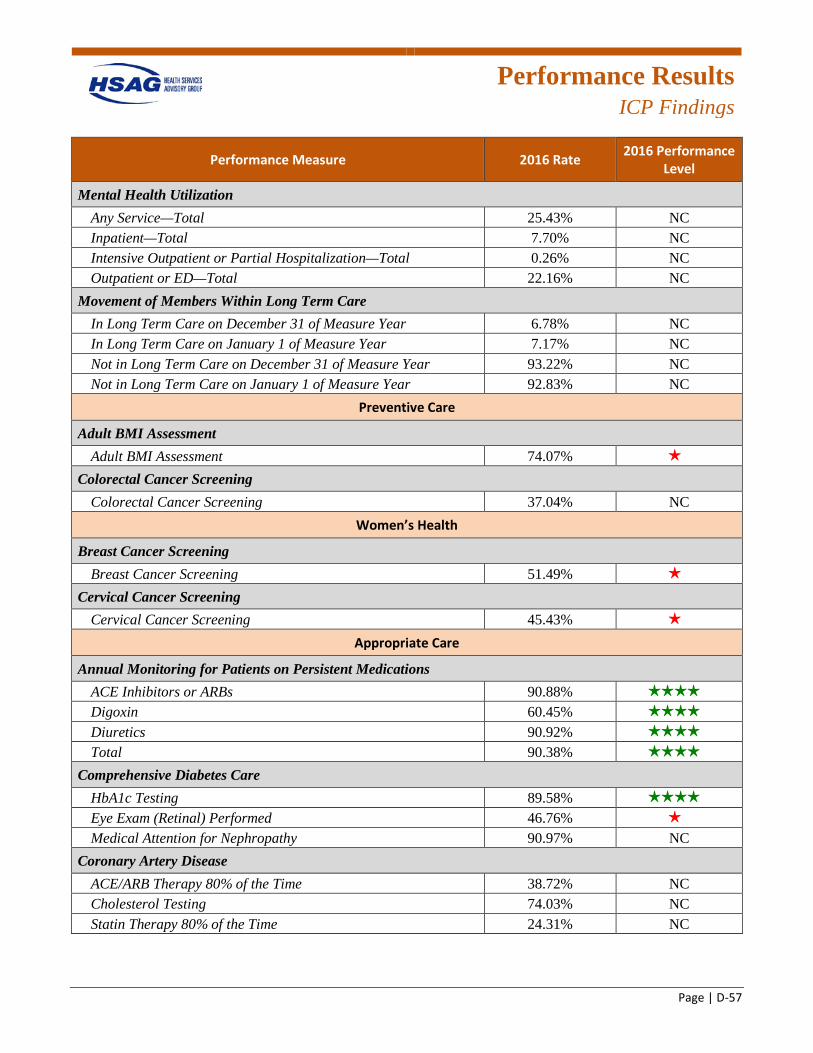
Performance Results
ICP Findings
Page | D-57
Performance Measure 2016 Rate 2016 Performance Level
Mental Health Utilization Any Service—Total 25.43% NC Inpatient—Total 7.70% NC Intensive Outpatient or Partial Hospitalization—Total 0.26% NC Outpatient or ED—Total 22.16% NC
Movement of Members Within Long Term Care In Long Term Care on December 31 of Measure Year 6.78% NC In Long Term Care on January 1 of Measure Year 7.17% NC Not in Long Term Care on December 31 of Measure Year 93.22% NC Not in Long Term Care on January 1 of Measure Year 92.83% NC
Preventive Care
Adult BMI Assessment Adult BMI Assessment 74.07% 1 star
Colorectal Cancer Screening Colorectal Cancer Screening 37.04% NC
Women’s Health
Breast Cancer Screening Breast Cancer Screening 51.49% 1 star
Cervical Cancer Screening Cervical Cancer Screening 45.43% 1 star
Appropriate Care
Annual Monitoring for Patients on Persistent Medications ACE Inhibitors or ARBs 90.88% 4 stars
Digoxin 60.45% 4 stars
Diuretics 90.92% 4 stars
Total 90.38% 4 stars
Comprehensive Diabetes Care HbA1c Testing 89.58% 4 stars
Eye Exam (Retinal) Performed 46.76% 1 star
Medical Attention for Nephropathy 90.97% NC Coronary Artery Disease
ACE/ARB Therapy 80% of the Time 38.72% NC Cholesterol Testing 74.03% NC Statin Therapy 80% of the Time 24.31% NC
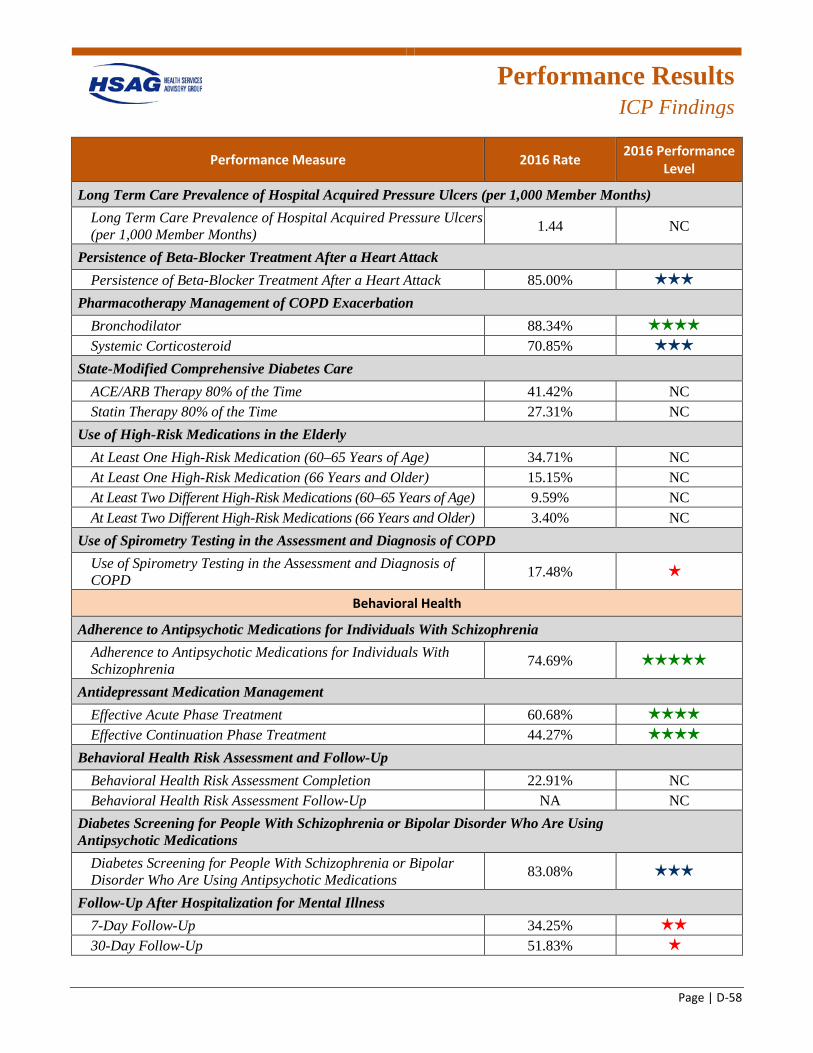
Performance Results
ICP Findings
Page | D-58
Performance Measure 2016 Rate 2016 Performance Level
Long Term Care Prevalence of Hospital Acquired Pressure Ulcers (per 1,000 Member Months) Long Term Care Prevalence of Hospital Acquired Pressure Ulcers (per 1,000 Member Months) 1.44 NC
Persistence of Beta-Blocker Treatment After a Heart Attack Persistence of Beta-Blocker Treatment After a Heart Attack 85.00% 3 stars
Pharmacotherapy Management of COPD Exacerbation Bronchodilator 88.34% 4 stars
Systemic Corticosteroid 70.85% 3 stars
State-Modified Comprehensive Diabetes Care ACE/ARB Therapy 80% of the Time 41.42% NC Statin Therapy 80% of the Time 27.31% NC
Use of High-Risk Medications in the Elderly At Least One High-Risk Medication (60–65 Years of Age) 34.71% NC At Least One High-Risk Medication (66 Years and Older) 15.15% NC At Least Two Different High-Risk Medications (60–65 Years of Age) 9.59% NC At Least Two Different High-Risk Medications (66 Years and Older) 3.40% NC
Use of Spirometry Testing in the Assessment and Diagnosis of COPD Use of Spirometry Testing in the Assessment and Diagnosis of COPD 17.48% 1 star
Behavioral Health
Adherence to Antipsychotic Medications for Individuals With Schizophrenia Adherence to Antipsychotic Medications for Individuals With Schizophrenia 74.69% 5 stars
Antidepressant Medication Management Effective Acute Phase Treatment 60.68% 4 stars
Effective Continuation Phase Treatment 44.27% 4 stars
Behavioral Health Risk Assessment and Follow-Up Behavioral Health Risk Assessment Completion 22.91% NC Behavioral Health Risk Assessment Follow-Up NA NC
Diabetes Screening for People With Schizophrenia or Bipolar Disorder Who Are Using Antipsychotic Medications
Diabetes Screening for People With Schizophrenia or Bipolar Disorder Who Are Using Antipsychotic Medications 83.08% 3 stars
Follow-Up After Hospitalization for Mental Illness 7-Day Follow-Up 34.25% 2 stars
30-Day Follow-Up 51.83% 1 star
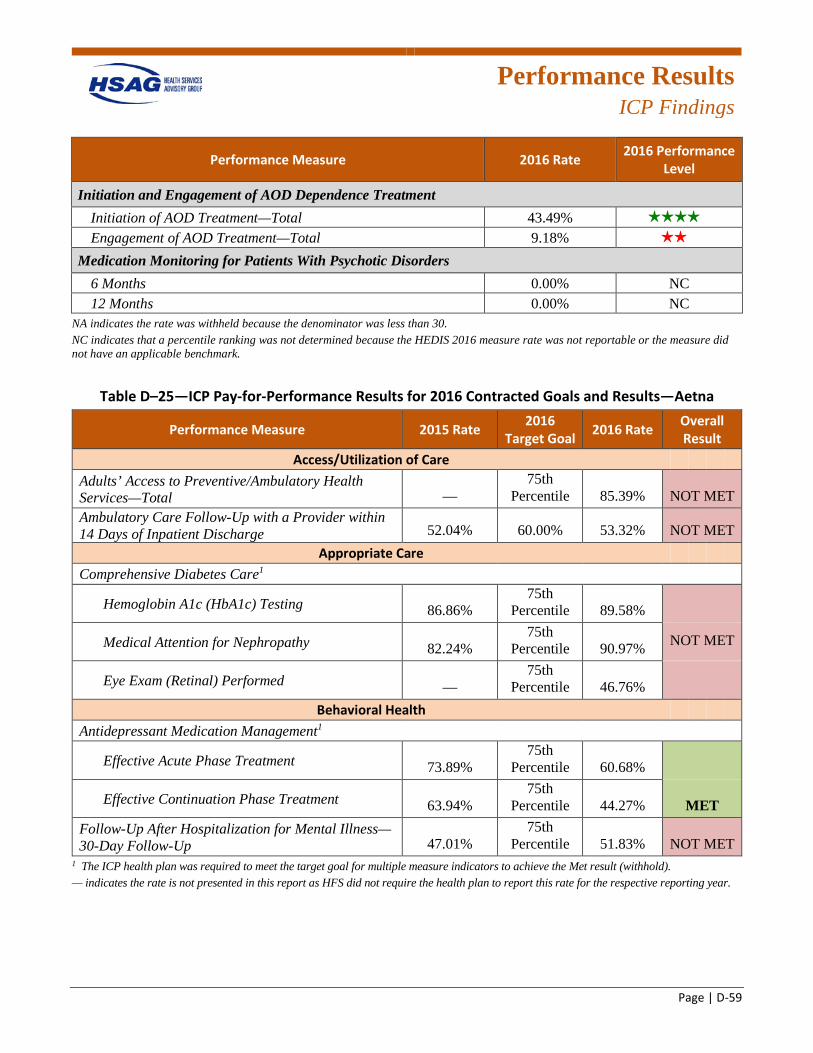
Performance Results
ICP Findings
Page | D-59
Performance Measure 2016 Rate 2016 Performance Level
Initiation and Engagement of AOD Dependence Treatment Initiation of AOD Treatment—Total 43.49% 4 stars
Engagement of AOD Treatment—Total 9.18% 2 stars
Medication Monitoring for Patients With Psychotic Disorders 6 Months 0.00% NC 12 Months 0.00% NC
NA indicates the rate was withheld because the denominator was less than 30. NC indicates that a percentile ranking was not determined because the HEDIS 2016 measure rate was not reportable or the measure did not have an applicable benchmark.
Table D–25—ICP Pay-for-Performance Results for 2016 Contracted Goals and Results—Aetna
Performance Measure 2015 Rate 2016 Target Goal 2016 Rate Overall
Result Access/Utilization of Care
Adults’ Access to Preventive/Ambulatory Health Services—Total —
75th Percentile 85.39% NOT MET
Ambulatory Care Follow-Up with a Provider within 14 Days of Inpatient Discharge 52.04% 60.00% 53.32% NOT MET
Appropriate Care Comprehensive Diabetes Care1
Hemoglobin A1c (HbA1c) Testing 86.86% 75th
Percentile 89.58%
Medical Attention for Nephropathy 82.24% 75th
Percentile 90.97% NOT MET
Eye Exam (Retinal) Performed — 75th
Percentile 46.76% Behavioral Health
Antidepressant Medication Management1
Effective Acute Phase Treatment 73.89% 75th
Percentile 60.68%
Effective Continuation Phase Treatment 63.94% 75th
Percentile 44.27% MET Follow-Up After Hospitalization for Mental Illness—30-Day Follow-Up 47.01%
75th Percentile 51.83% NOT MET
1 The ICP health plan was required to meet the target goal for multiple measure indicators to achieve the Met result (withhold). — indicates the rate is not presented in this report as HFS did not require the health plan to report this rate for the respective reporting year.

Performance Results
ICP Findings
Page | D-60
BCBSIL
The SFY 2016 performance measure and P4P results for BCBSIL are displayed in the tables below.
Table D–26—ICP 2016 Performance Measure Results—BCBSIL
Performance Measure 2016 Rate 2016 Performance Level
Access/Utilization of Care
Adults’ Access to Preventive/Ambulatory Health Services Total 74.67% 1 star
Ambulatory Care (per 1,000 Member Months) Outpatient Visits—Total 983.07 NC ED Visits—Total 85.06 NC
Ambulatory Care Follow-Up With a Provider Within 14 Days of ED Visit Ambulatory Care Follow-Up With a Provider Within 14 Days of ED Visit 33.49% NC
Ambulatory Care Follow-Up With a Provider Within 14 Days of Inpatient Discharge Ambulatory Care Follow-Up With a Provider Within 14 Days of Inpatient Discharge 42.16% NC
Heart Failure Admission Rate (per 100,000 Member Months) Total 7,053.35 NC
Inpatient Hospital 30-Day Readmission Rates Behavioral Health Hospital Inpatient Stays 2.84% NC Non-Behavioral Health Hospital Inpatient Stays 5.82% NC
Inpatient Utilization—General Hospital/Acute Care (per 1,000 Member Months) Inpatient—Discharges per 1,000 Member Months—Total 25.15 NC Maternity—Discharges per 1,000 Member Months—Total 1.02 NC Surgery—Discharges per 1,000 Member Months—Total 6.66 NC Medicine—Discharges per 1,000 Member Months—Total 17.66 NC
Long Term Care Bacterial Pneumonia Admission Rate (per 1,000 Member Months) Long Term Care Bacterial Pneumonia Admission Rate (per 1,000 Member Months) 0.32 NC
Long Term Care Urinary Tract Infection Admission Rate (per 1,000 Member Months) Long Term Care Urinary Tract Infection Admission Rate (per 1,000 Member Months) 0.37 NC
Mental Health Utilization Any Service—Total 16.50% NC Inpatient—Total 4.76% NC
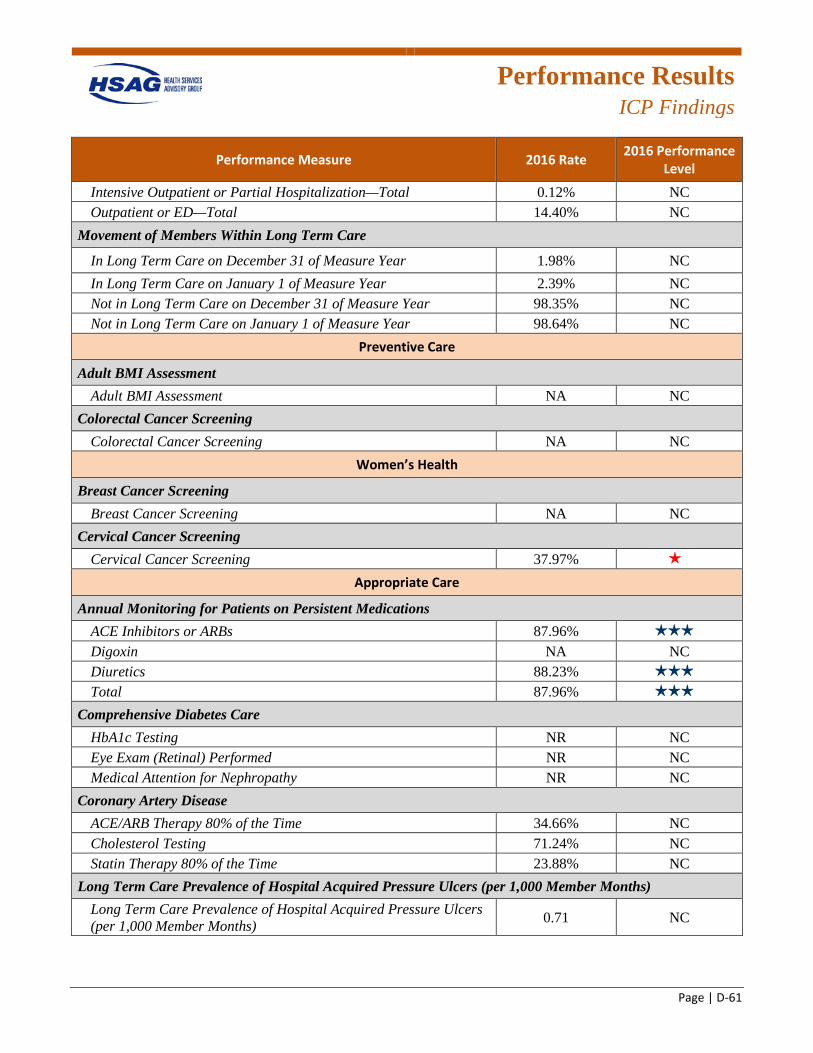
Performance Results
ICP Findings
Page | D-61
Performance Measure 2016 Rate 2016 Performance Level
Intensive Outpatient or Partial Hospitalization—Total 0.12% NC Outpatient or ED—Total 14.40% NC
Movement of Members Within Long Term Care
In Long Term Care on December 31 of Measure Year 1.98% NC In Long Term Care on January 1 of Measure Year 2.39% NC Not in Long Term Care on December 31 of Measure Year 98.35% NC Not in Long Term Care on January 1 of Measure Year 98.64% NC
Preventive Care
Adult BMI Assessment Adult BMI Assessment NA NC
Colorectal Cancer Screening Colorectal Cancer Screening NA NC
Women’s Health
Breast Cancer Screening Breast Cancer Screening NA NC
Cervical Cancer Screening Cervical Cancer Screening 37.97% 1 star
Appropriate Care
Annual Monitoring for Patients on Persistent Medications ACE Inhibitors or ARBs 87.96% 3 stars
Digoxin NA NC Diuretics 88.23% 3 stars
Total 87.96% 3 stars
Comprehensive Diabetes Care HbA1c Testing NR NC Eye Exam (Retinal) Performed NR NC Medical Attention for Nephropathy NR NC
Coronary Artery Disease ACE/ARB Therapy 80% of the Time 34.66% NC Cholesterol Testing 71.24% NC Statin Therapy 80% of the Time 23.88% NC
Long Term Care Prevalence of Hospital Acquired Pressure Ulcers (per 1,000 Member Months) Long Term Care Prevalence of Hospital Acquired Pressure Ulcers (per 1,000 Member Months) 0.71 NC
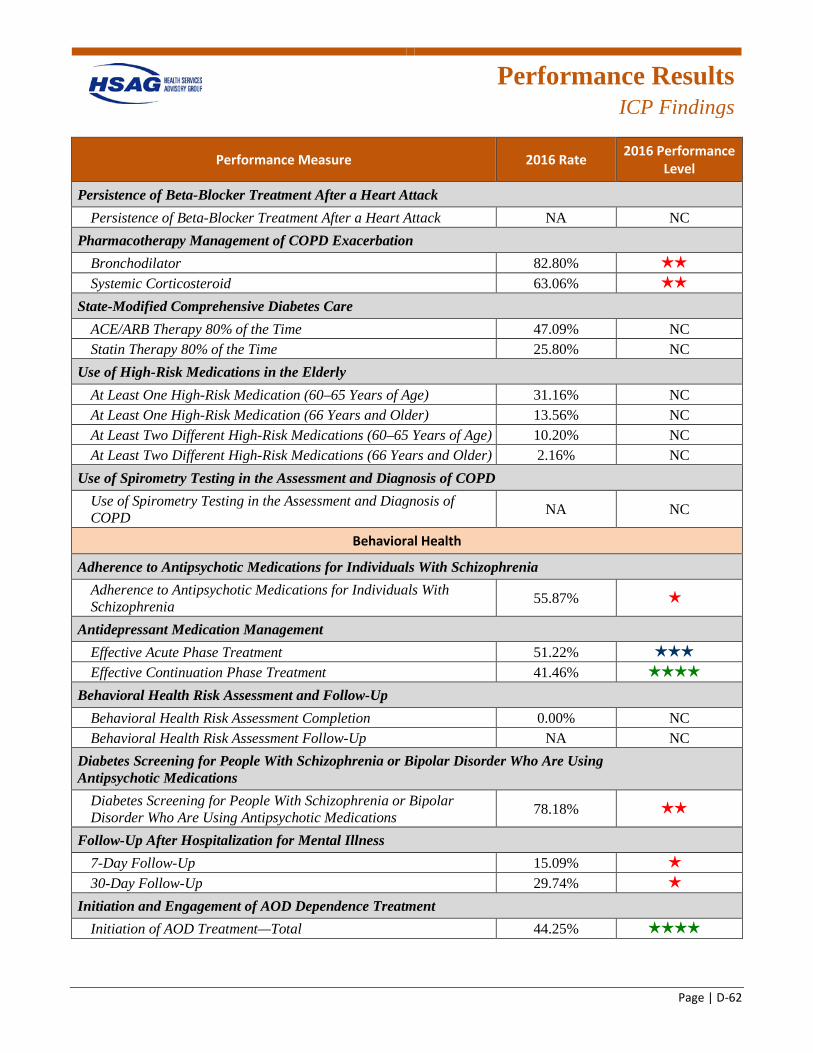
Performance Results
ICP Findings
Page | D-62
Performance Measure 2016 Rate 2016 Performance Level
Persistence of Beta-Blocker Treatment After a Heart Attack Persistence of Beta-Blocker Treatment After a Heart Attack NA NC
Pharmacotherapy Management of COPD Exacerbation Bronchodilator 82.80% 2 stars
Systemic Corticosteroid 63.06% 2 stars
State-Modified Comprehensive Diabetes Care ACE/ARB Therapy 80% of the Time 47.09% NC Statin Therapy 80% of the Time 25.80% NC
Use of High-Risk Medications in the Elderly At Least One High-Risk Medication (60–65 Years of Age) 31.16% NC At Least One High-Risk Medication (66 Years and Older) 13.56% NC At Least Two Different High-Risk Medications (60–65 Years of Age) 10.20% NC At Least Two Different High-Risk Medications (66 Years and Older) 2.16% NC
Use of Spirometry Testing in the Assessment and Diagnosis of COPD Use of Spirometry Testing in the Assessment and Diagnosis of COPD NA NC
Behavioral Health
Adherence to Antipsychotic Medications for Individuals With Schizophrenia Adherence to Antipsychotic Medications for Individuals With Schizophrenia 55.87% 1 star
Antidepressant Medication Management Effective Acute Phase Treatment 51.22% 3 stars
Effective Continuation Phase Treatment 41.46% 4 stars
Behavioral Health Risk Assessment and Follow-Up Behavioral Health Risk Assessment Completion 0.00% NC Behavioral Health Risk Assessment Follow-Up NA NC
Diabetes Screening for People With Schizophrenia or Bipolar Disorder Who Are Using Antipsychotic Medications
Diabetes Screening for People With Schizophrenia or Bipolar Disorder Who Are Using Antipsychotic Medications 78.18% 2 stars
Follow-Up After Hospitalization for Mental Illness 7-Day Follow-Up 15.09% 1 star
30-Day Follow-Up 29.74% 1 star
Initiation and Engagement of AOD Dependence Treatment Initiation of AOD Treatment—Total 44.25% 4 stars
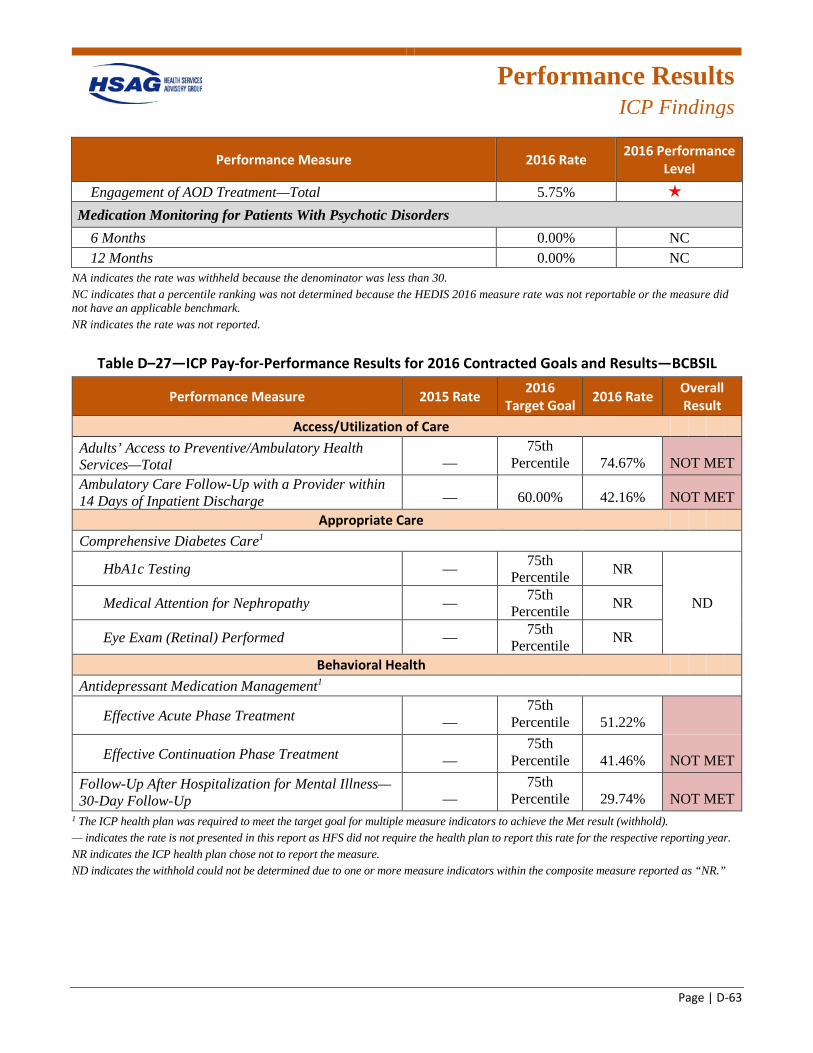
Performance Results
ICP Findings
Page | D-63
Performance Measure 2016 Rate 2016 Performance Level
Engagement of AOD Treatment—Total 5.75% 1 star
Medication Monitoring for Patients With Psychotic Disorders 6 Months 0.00% NC 12 Months 0.00% NC
NA indicates the rate was withheld because the denominator was less than 30. NC indicates that a percentile ranking was not determined because the HEDIS 2016 measure rate was not reportable or the measure did not have an applicable benchmark. NR indicates the rate was not reported.
Table D–27—ICP Pay-for-Performance Results for 2016 Contracted Goals and Results—BCBSIL
Performance Measure 2015 Rate 2016 Target Goal 2016 Rate Overall
Result Access/Utilization of Care
Adults’ Access to Preventive/Ambulatory Health Services—Total —
75th Percentile 74.67% NOT MET
Ambulatory Care Follow-Up with a Provider within 14 Days of Inpatient Discharge — 60.00% 42.16% NOT MET
Appropriate Care Comprehensive Diabetes Care1
HbA1c Testing — 75th Percentile NR
Medical Attention for Nephropathy — 75th Percentile NR ND
Eye Exam (Retinal) Performed — 75th Percentile NR
Behavioral Health Antidepressant Medication Management1
Effective Acute Phase Treatment — 75th
Percentile 51.22%
Effective Continuation Phase Treatment — 75th
Percentile 41.46% NOT MET Follow-Up After Hospitalization for Mental Illness—30-Day Follow-Up —
75th Percentile 29.74% NOT MET
1 The ICP health plan was required to meet the target goal for multiple measure indicators to achieve the Met result (withhold). — indicates the rate is not presented in this report as HFS did not require the health plan to report this rate for the respective reporting year. NR indicates the ICP health plan chose not to report the measure. ND indicates the withhold could not be determined due to one or more measure indicators within the composite measure reported as “NR.”

Performance Results
ICP Findings
Page | D-64
Cigna
The SFY 2016 performance measure and P4P results for Cigna are displayed in the tables below.
Table D–28—ICP 2016 Performance Measure Results—Cigna
Performance Measure 2016 Rate 2016 Performance Level
Access/Utilization of Care
Adults’ Access to Preventive/Ambulatory Health Services Total 66.74% 1 star
Ambulatory Care (per 1,000 Member Months) Outpatient Visits—Total 340.42 NC ED Visits—Total 82.94 NC
Ambulatory Care Follow-Up With a Provider Within 14 Days of ED Visit Ambulatory Care Follow-Up With a Provider Within 14 Days of ED Visit 26.25% NC
Ambulatory Care Follow-Up With a Provider Within 14 Days of Inpatient Discharge Ambulatory Care Follow-Up With a Provider Within 14 Days of Inpatient Discharge 36.82% NC
Heart Failure Admission Rate (per 100,000 Member Months) Total 3,945.22 NC
Inpatient Hospital 30-Day Readmission Rates Behavioral Health Hospital Inpatient Stays 6.71% NC Non-Behavioral Health Hospital Inpatient Stays 44.29% NC
Inpatient Utilization—General Hospital/Acute Care (per 1,000 Member Months) Inpatient—Discharges per 1,000 Member Months—Total 30.86 NC Maternity—Discharges per 1,000 Member Months—Total 0.53 NC Surgery—Discharges per 1,000 Member Months—Total 4.63 NC Medicine—Discharges per 1,000 Member Months—Total 25.78 NC
Long Term Care Bacterial Pneumonia Admission Rate (per 1,000 Member Months) Long Term Care Bacterial Pneumonia Admission Rate (per 1,000 Member Months) 0.37 NC
Long Term Care Urinary Tract Infection Admission Rate (per 1,000 Member Months) Long Term Care Urinary Tract Infection Admission Rate (per 1,000 Member Months) 0.31 NC
Mental Health Utilization Any Service—Total 15.59% NC Inpatient—Total 8.08% NC
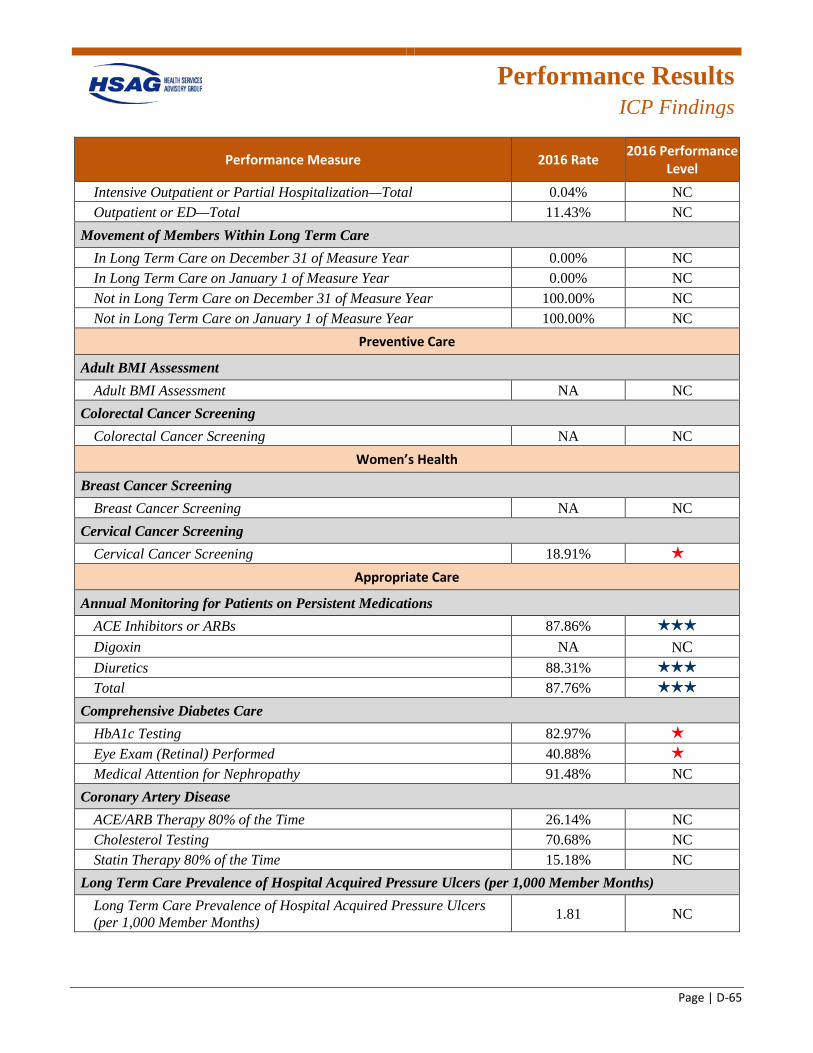
Performance Results
ICP Findings
Page | D-65
Performance Measure 2016 Rate 2016 Performance Level
Intensive Outpatient or Partial Hospitalization—Total 0.04% NC Outpatient or ED—Total 11.43% NC
Movement of Members Within Long Term Care In Long Term Care on December 31 of Measure Year 0.00% NC In Long Term Care on January 1 of Measure Year 0.00% NC Not in Long Term Care on December 31 of Measure Year 100.00% NC Not in Long Term Care on January 1 of Measure Year 100.00% NC
Preventive Care
Adult BMI Assessment Adult BMI Assessment NA NC
Colorectal Cancer Screening Colorectal Cancer Screening NA NC
Women’s Health
Breast Cancer Screening Breast Cancer Screening NA NC
Cervical Cancer Screening Cervical Cancer Screening 18.91% 1 star
Appropriate Care
Annual Monitoring for Patients on Persistent Medications ACE Inhibitors or ARBs 87.86% 3 stars
Digoxin NA NC Diuretics 88.31% 3 stars
Total 87.76% 3 stars
Comprehensive Diabetes Care HbA1c Testing 82.97% 1 star
Eye Exam (Retinal) Performed 40.88% 1 star
Medical Attention for Nephropathy 91.48% NC Coronary Artery Disease
ACE/ARB Therapy 80% of the Time 26.14% NC Cholesterol Testing 70.68% NC Statin Therapy 80% of the Time 15.18% NC
Long Term Care Prevalence of Hospital Acquired Pressure Ulcers (per 1,000 Member Months) Long Term Care Prevalence of Hospital Acquired Pressure Ulcers (per 1,000 Member Months) 1.81 NC
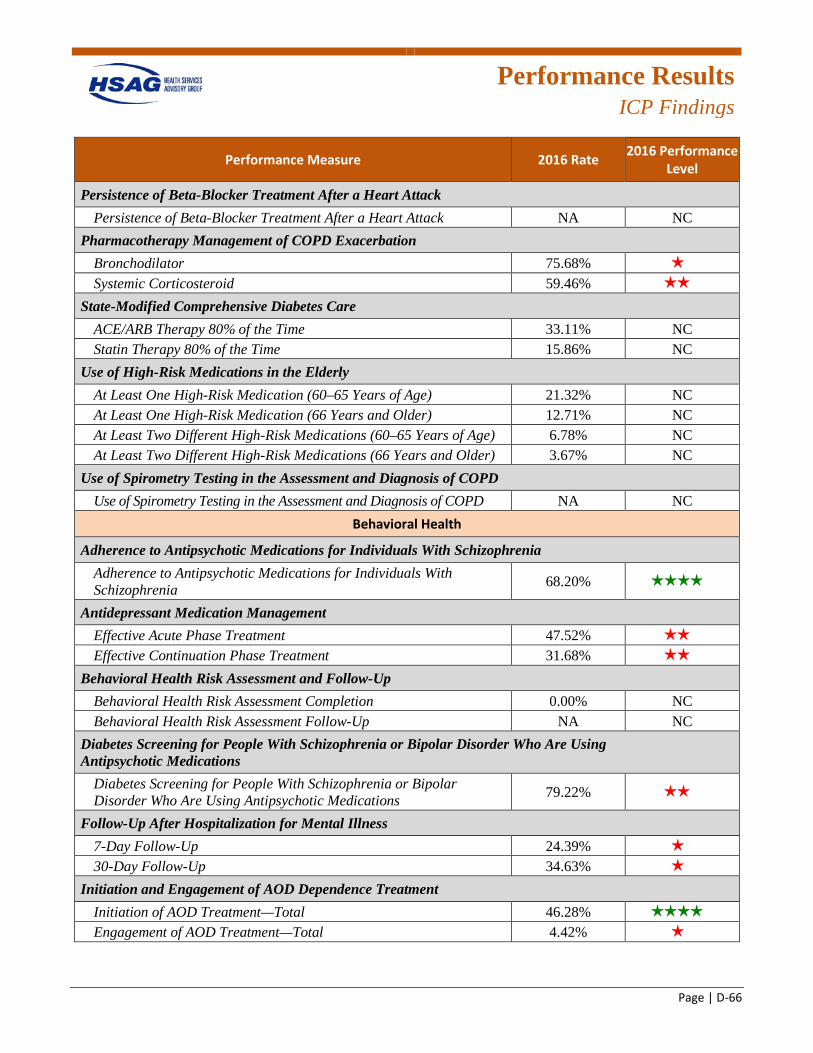
Performance Results
ICP Findings
Page | D-66
Performance Measure 2016 Rate 2016 Performance Level
Persistence of Beta-Blocker Treatment After a Heart Attack Persistence of Beta-Blocker Treatment After a Heart Attack NA NC
Pharmacotherapy Management of COPD Exacerbation Bronchodilator 75.68% 1 star
Systemic Corticosteroid 59.46% 2 stars
State-Modified Comprehensive Diabetes Care ACE/ARB Therapy 80% of the Time 33.11% NC Statin Therapy 80% of the Time 15.86% NC
Use of High-Risk Medications in the Elderly At Least One High-Risk Medication (60–65 Years of Age) 21.32% NC At Least One High-Risk Medication (66 Years and Older) 12.71% NC At Least Two Different High-Risk Medications (60–65 Years of Age) 6.78% NC At Least Two Different High-Risk Medications (66 Years and Older) 3.67% NC
Use of Spirometry Testing in the Assessment and Diagnosis of COPD Use of Spirometry Testing in the Assessment and Diagnosis of COPD NA NC
Behavioral Health
Adherence to Antipsychotic Medications for Individuals With Schizophrenia Adherence to Antipsychotic Medications for Individuals With Schizophrenia 68.20% 4 stars
Antidepressant Medication Management Effective Acute Phase Treatment 47.52% 2 stars
Effective Continuation Phase Treatment 31.68% 2 stars
Behavioral Health Risk Assessment and Follow-Up Behavioral Health Risk Assessment Completion 0.00% NC Behavioral Health Risk Assessment Follow-Up NA NC
Diabetes Screening for People With Schizophrenia or Bipolar Disorder Who Are Using Antipsychotic Medications
Diabetes Screening for People With Schizophrenia or Bipolar Disorder Who Are Using Antipsychotic Medications 79.22% 2 stars
Follow-Up After Hospitalization for Mental Illness 7-Day Follow-Up 24.39% 1 star
30-Day Follow-Up 34.63% 1 star
Initiation and Engagement of AOD Dependence Treatment Initiation of AOD Treatment—Total 46.28% 4 stars
Engagement of AOD Treatment—Total 4.42% 1 star
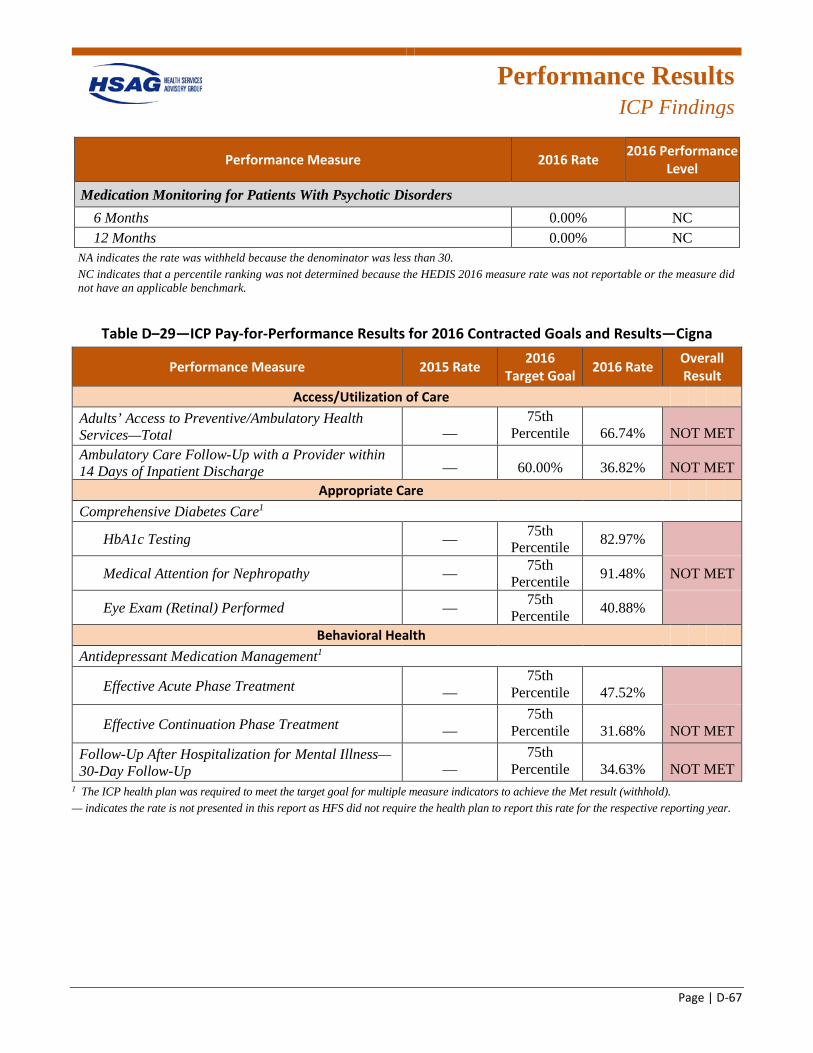
Performance Results
ICP Findings
Page | D-67
Performance Measure 2016 Rate 2016 Performance Level
Medication Monitoring for Patients With Psychotic Disorders 6 Months 0.00% NC 12 Months 0.00% NC
NA indicates the rate was withheld because the denominator was less than 30. NC indicates that a percentile ranking was not determined because the HEDIS 2016 measure rate was not reportable or the measure did not have an applicable benchmark.
Table D–29—ICP Pay-for-Performance Results for 2016 Contracted Goals and Results—Cigna
Performance Measure 2015 Rate 2016 Target Goal 2016 Rate Overall
Result Access/Utilization of Care
Adults’ Access to Preventive/Ambulatory Health Services—Total —
75th Percentile 66.74% NOT MET
Ambulatory Care Follow-Up with a Provider within 14 Days of Inpatient Discharge — 60.00% 36.82% NOT MET
Appropriate Care Comprehensive Diabetes Care1
HbA1c Testing — 75th Percentile 82.97%
Medical Attention for Nephropathy — 75th Percentile 91.48% NOT MET
Eye Exam (Retinal) Performed — 75th Percentile 40.88%
Behavioral Health Antidepressant Medication Management1
Effective Acute Phase Treatment — 75th
Percentile 47.52%
Effective Continuation Phase Treatment — 75th
Percentile 31.68% NOT MET Follow-Up After Hospitalization for Mental Illness—30-Day Follow-Up —
75th Percentile 34.63% NOT MET
1 The ICP health plan was required to meet the target goal for multiple measure indicators to achieve the Met result (withhold). — indicates the rate is not presented in this report as HFS did not require the health plan to report this rate for the respective reporting year.

Performance Results
ICP Findings
Page | D-68
CCAI
The SFY 2016 performance measure and P4P results for CCAI are displayed in the tables below.
Table D–30—ICP 2016 Performance Measure Results—CCAI
Performance Measure 2016 Rate 2016 Performance Level
Access/Utilization of Care
Adults’ Access to Preventive/Ambulatory Health Services Total 77.30% 1 star
Ambulatory Care (per 1,000 Member Months) Outpatient Visits—Total 390.59 NC ED Visits—Total 93.57 NC
Ambulatory Care Follow-Up With a Provider Within 14 Days of ED Visit Ambulatory Care Follow-Up With a Provider Within 14 Days of ED Visit 34.20% NC
Ambulatory Care Follow-Up With a Provider Within 14 Days of Inpatient Discharge Ambulatory Care Follow-Up With a Provider Within 14 Days of Inpatient Discharge 38.96% NC
Heart Failure Admission Rate (per 100,000 Member Months) Total 111.24 NC
Inpatient Hospital 30-Day Readmission Rates Behavioral Health Hospital Inpatient Stays 24.68% NC Non-Behavioral Health Hospital Inpatient Stays 14.97% NC
Inpatient Utilization—General Hospital/Acute Care (per 1,000 Member Months) Inpatient—Discharges per 1,000 Member Months—Total 24.74 NC Maternity—Discharges per 1,000 Member Months—Total 0.88 NC Surgery—Discharges per 1,000 Member Months—Total 5.70 NC Medicine—Discharges per 1,000 Member Months—Total 18.01 NC
Long Term Care Bacterial Pneumonia Admission Rate (per 1,000 Member Months) Long Term Care Bacterial Pneumonia Admission Rate (per 1,000 Member Months) 2.54 NC
Long Term Care Urinary Tract Infection Admission Rate (per 1,000 Member Months) Long Term Care Urinary Tract Infection Admission Rate (per 1,000 Member Months) 1.01 NC
Mental Health Utilization Any Service—Total 16.37% NC Inpatient—Total 3.65% NC
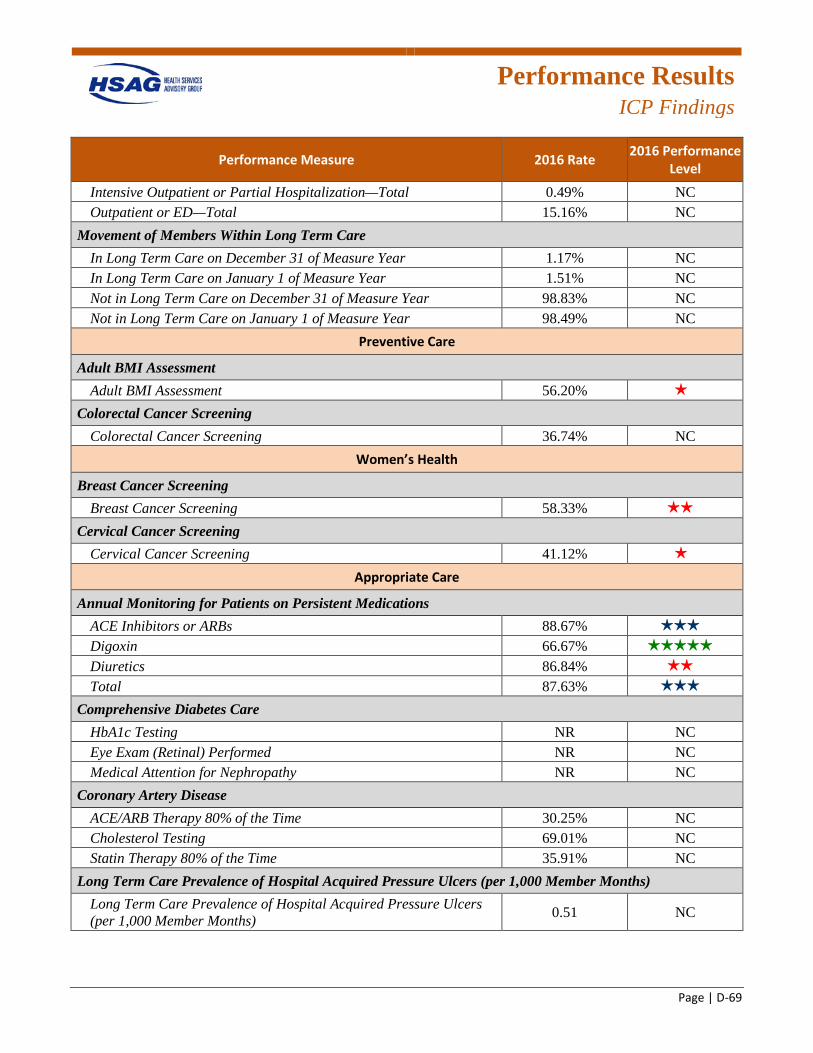
Performance Results
ICP Findings
Page | D-69
Performance Measure 2016 Rate 2016 Performance Level
Intensive Outpatient or Partial Hospitalization—Total 0.49% NC Outpatient or ED—Total 15.16% NC
Movement of Members Within Long Term Care In Long Term Care on December 31 of Measure Year 1.17% NC In Long Term Care on January 1 of Measure Year 1.51% NC Not in Long Term Care on December 31 of Measure Year 98.83% NC Not in Long Term Care on January 1 of Measure Year 98.49% NC
Preventive Care
Adult BMI Assessment Adult BMI Assessment 56.20% 1 star
Colorectal Cancer Screening Colorectal Cancer Screening 36.74% NC
Women’s Health
Breast Cancer Screening Breast Cancer Screening 58.33% 2 stars
Cervical Cancer Screening Cervical Cancer Screening 41.12% 1 star
Appropriate Care
Annual Monitoring for Patients on Persistent Medications ACE Inhibitors or ARBs 88.67% 3 stars
Digoxin 66.67% 5 stars
Diuretics 86.84% 2 stars
Total 87.63% 3 stars
Comprehensive Diabetes Care HbA1c Testing NR NC Eye Exam (Retinal) Performed NR NC Medical Attention for Nephropathy NR NC
Coronary Artery Disease ACE/ARB Therapy 80% of the Time 30.25% NC Cholesterol Testing 69.01% NC Statin Therapy 80% of the Time 35.91% NC
Long Term Care Prevalence of Hospital Acquired Pressure Ulcers (per 1,000 Member Months) Long Term Care Prevalence of Hospital Acquired Pressure Ulcers (per 1,000 Member Months) 0.51 NC
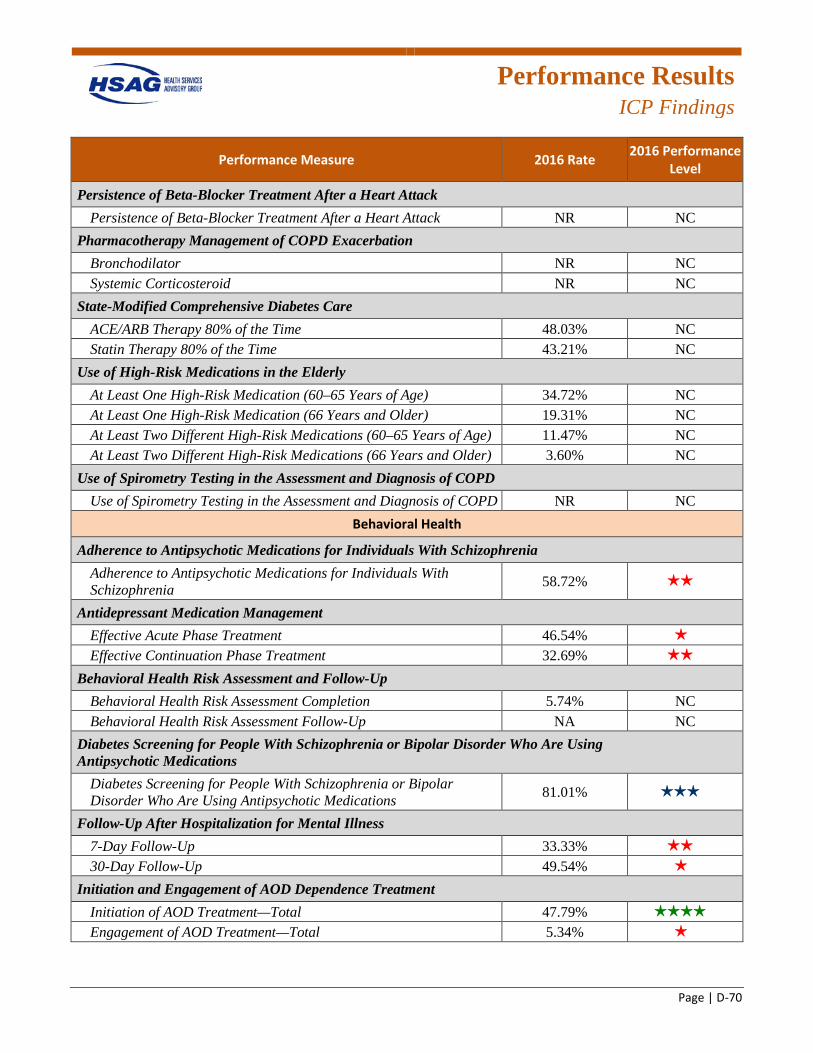
Performance Results
ICP Findings
Page | D-70
Performance Measure 2016 Rate 2016 Performance Level
Persistence of Beta-Blocker Treatment After a Heart Attack Persistence of Beta-Blocker Treatment After a Heart Attack NR NC
Pharmacotherapy Management of COPD Exacerbation Bronchodilator NR NC Systemic Corticosteroid NR NC
State-Modified Comprehensive Diabetes Care ACE/ARB Therapy 80% of the Time 48.03% NC Statin Therapy 80% of the Time 43.21% NC
Use of High-Risk Medications in the Elderly At Least One High-Risk Medication (60–65 Years of Age) 34.72% NC At Least One High-Risk Medication (66 Years and Older) 19.31% NC At Least Two Different High-Risk Medications (60–65 Years of Age) 11.47% NC At Least Two Different High-Risk Medications (66 Years and Older) 3.60% NC
Use of Spirometry Testing in the Assessment and Diagnosis of COPD Use of Spirometry Testing in the Assessment and Diagnosis of COPD NR NC
Behavioral Health
Adherence to Antipsychotic Medications for Individuals With Schizophrenia Adherence to Antipsychotic Medications for Individuals With Schizophrenia 58.72% 2 stars
Antidepressant Medication Management Effective Acute Phase Treatment 46.54% 1 star
Effective Continuation Phase Treatment 32.69% 2 stars
Behavioral Health Risk Assessment and Follow-Up Behavioral Health Risk Assessment Completion 5.74% NC Behavioral Health Risk Assessment Follow-Up NA NC
Diabetes Screening for People With Schizophrenia or Bipolar Disorder Who Are Using Antipsychotic Medications
Diabetes Screening for People With Schizophrenia or Bipolar Disorder Who Are Using Antipsychotic Medications 81.01% 3 stars
Follow-Up After Hospitalization for Mental Illness 7-Day Follow-Up 33.33% 2 stars
30-Day Follow-Up 49.54% 1 star
Initiation and Engagement of AOD Dependence Treatment Initiation of AOD Treatment—Total 47.79% 4 stars
Engagement of AOD Treatment—Total 5.34% 1 star
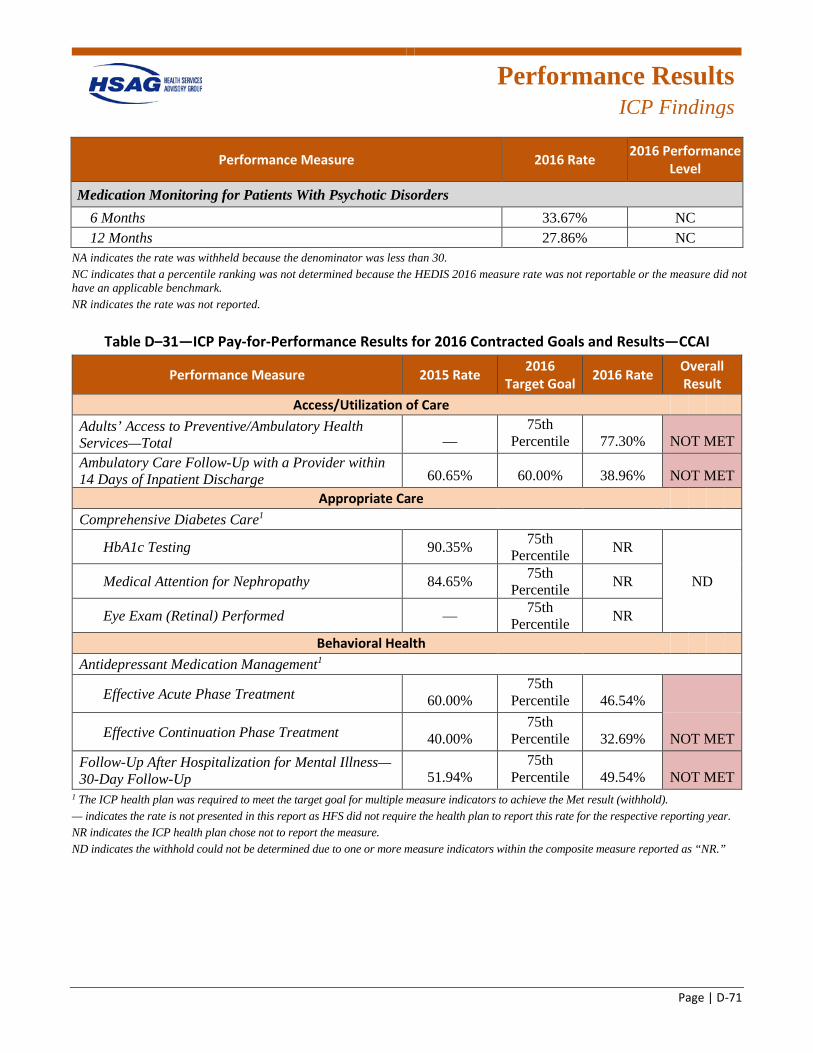
Performance Results
ICP Findings
Page | D-71
Performance Measure 2016 Rate 2016 Performance Level
Medication Monitoring for Patients With Psychotic Disorders 6 Months 33.67% NC 12 Months 27.86% NC
NA indicates the rate was withheld because the denominator was less than 30. NC indicates that a percentile ranking was not determined because the HEDIS 2016 measure rate was not reportable or the measure did not have an applicable benchmark. NR indicates the rate was not reported.
Table D–31—ICP Pay-for-Performance Results for 2016 Contracted Goals and Results—CCAI
Performance Measure 2015 Rate 2016 Target Goal 2016 Rate Overall
Result Access/Utilization of Care
Adults’ Access to Preventive/Ambulatory Health Services—Total —
75th Percentile 77.30% NOT MET
Ambulatory Care Follow-Up with a Provider within 14 Days of Inpatient Discharge 60.65% 60.00% 38.96% NOT MET
Appropriate Care Comprehensive Diabetes Care1
HbA1c Testing 90.35% 75th Percentile NR
Medical Attention for Nephropathy 84.65% 75th Percentile NR ND
Eye Exam (Retinal) Performed — 75th Percentile NR
Behavioral Health Antidepressant Medication Management1
Effective Acute Phase Treatment 60.00% 75th
Percentile 46.54%
Effective Continuation Phase Treatment 40.00% 75th
Percentile 32.69% NOT MET Follow-Up After Hospitalization for Mental Illness—30-Day Follow-Up 51.94%
75th Percentile 49.54% NOT MET
1 The ICP health plan was required to meet the target goal for multiple measure indicators to achieve the Met result (withhold). — indicates the rate is not presented in this report as HFS did not require the health plan to report this rate for the respective reporting year. NR indicates the ICP health plan chose not to report the measure. ND indicates the withhold could not be determined due to one or more measure indicators within the composite measure reported as “NR.”
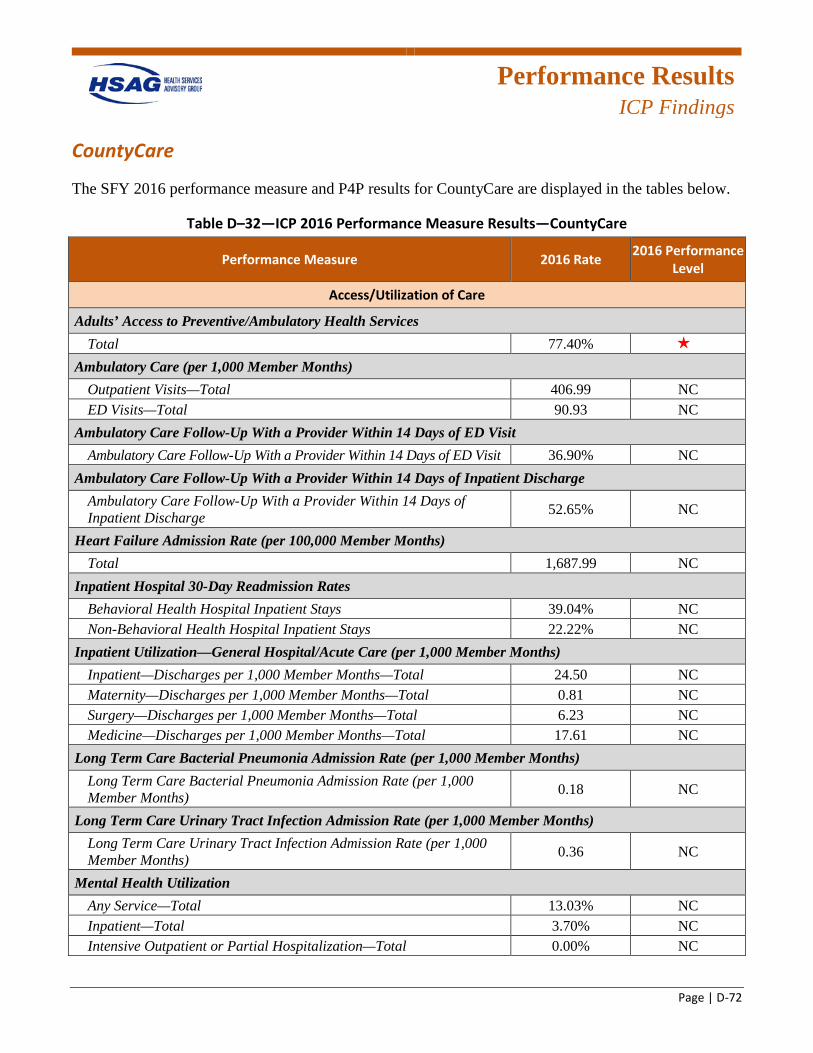
Performance Results
ICP Findings
Page | D-72
CountyCare
The SFY 2016 performance measure and P4P results for CountyCare are displayed in the tables below.
Table D–32—ICP 2016 Performance Measure Results—CountyCare
Performance Measure 2016 Rate 2016 Performance Level
Access/Utilization of Care
Adults’ Access to Preventive/Ambulatory Health Services Total 77.40% 1 star
Ambulatory Care (per 1,000 Member Months) Outpatient Visits—Total 406.99 NC ED Visits—Total 90.93 NC
Ambulatory Care Follow-Up With a Provider Within 14 Days of ED Visit Ambulatory Care Follow-Up With a Provider Within 14 Days of ED Visit 36.90% NC
Ambulatory Care Follow-Up With a Provider Within 14 Days of Inpatient Discharge Ambulatory Care Follow-Up With a Provider Within 14 Days of Inpatient Discharge 52.65% NC
Heart Failure Admission Rate (per 100,000 Member Months) Total 1,687.99 NC
Inpatient Hospital 30-Day Readmission Rates Behavioral Health Hospital Inpatient Stays 39.04% NC Non-Behavioral Health Hospital Inpatient Stays 22.22% NC
Inpatient Utilization—General Hospital/Acute Care (per 1,000 Member Months) Inpatient—Discharges per 1,000 Member Months—Total 24.50 NC Maternity—Discharges per 1,000 Member Months—Total 0.81 NC Surgery—Discharges per 1,000 Member Months—Total 6.23 NC Medicine—Discharges per 1,000 Member Months—Total 17.61 NC
Long Term Care Bacterial Pneumonia Admission Rate (per 1,000 Member Months) Long Term Care Bacterial Pneumonia Admission Rate (per 1,000 Member Months) 0.18 NC
Long Term Care Urinary Tract Infection Admission Rate (per 1,000 Member Months) Long Term Care Urinary Tract Infection Admission Rate (per 1,000 Member Months) 0.36 NC
Mental Health Utilization Any Service—Total 13.03% NC Inpatient—Total 3.70% NC Intensive Outpatient or Partial Hospitalization—Total 0.00% NC
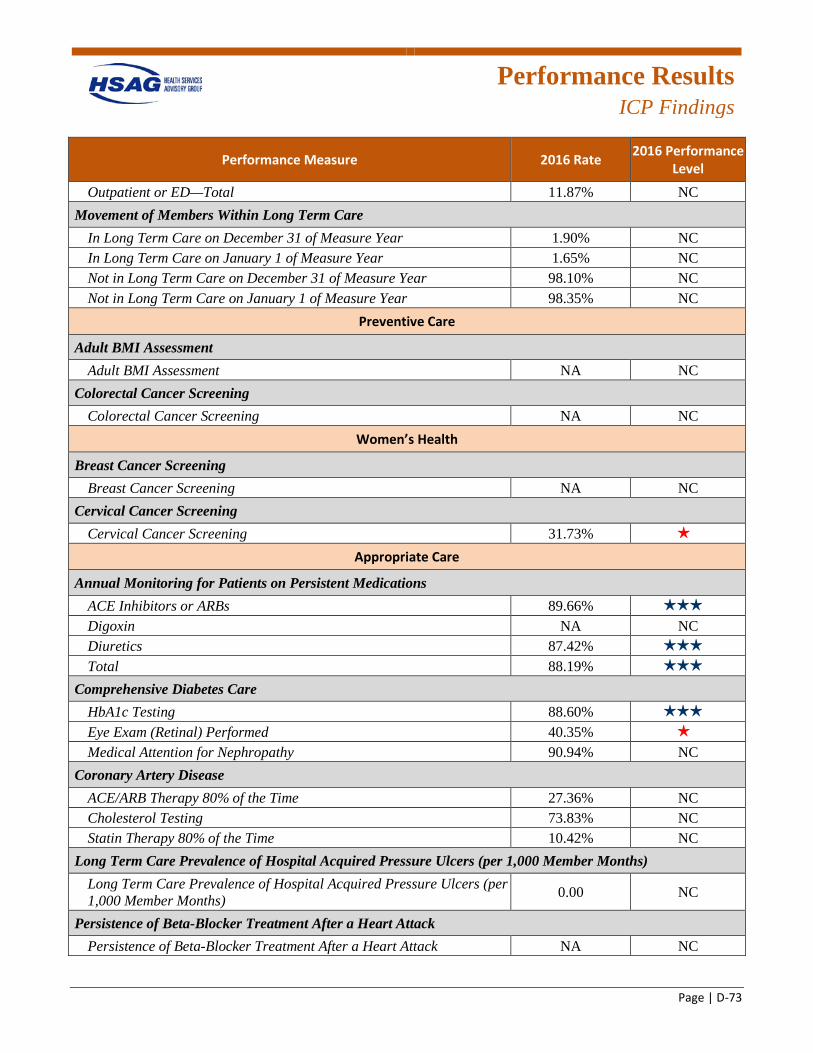
Performance Results
ICP Findings
Page | D-73
Performance Measure 2016 Rate 2016 Performance Level
Outpatient or ED—Total 11.87% NC Movement of Members Within Long Term Care
In Long Term Care on December 31 of Measure Year 1.90% NC In Long Term Care on January 1 of Measure Year 1.65% NC Not in Long Term Care on December 31 of Measure Year 98.10% NC Not in Long Term Care on January 1 of Measure Year 98.35% NC
Preventive Care
Adult BMI Assessment Adult BMI Assessment NA NC
Colorectal Cancer Screening Colorectal Cancer Screening NA NC
Women’s Health
Breast Cancer Screening Breast Cancer Screening NA NC
Cervical Cancer Screening Cervical Cancer Screening 31.73% 1 star
Appropriate Care
Annual Monitoring for Patients on Persistent Medications ACE Inhibitors or ARBs 89.66% 3 stars
Digoxin NA NC Diuretics 87.42% 3 stars
Total 88.19% 3 stars
Comprehensive Diabetes Care HbA1c Testing 88.60% 3 stars
Eye Exam (Retinal) Performed 40.35% 1 star
Medical Attention for Nephropathy 90.94% NC Coronary Artery Disease
ACE/ARB Therapy 80% of the Time 27.36% NC Cholesterol Testing 73.83% NC Statin Therapy 80% of the Time 10.42% NC
Long Term Care Prevalence of Hospital Acquired Pressure Ulcers (per 1,000 Member Months) Long Term Care Prevalence of Hospital Acquired Pressure Ulcers (per 1,000 Member Months) 0.00 NC
Persistence of Beta-Blocker Treatment After a Heart Attack Persistence of Beta-Blocker Treatment After a Heart Attack NA NC
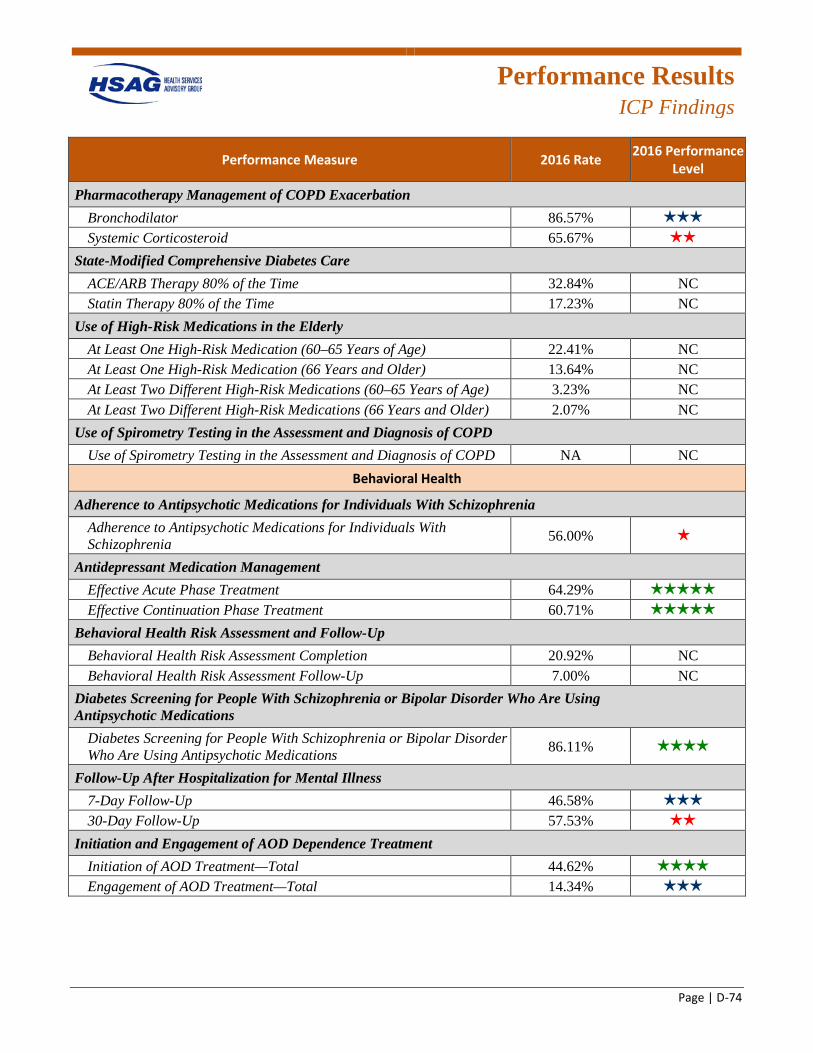
Performance Results
ICP Findings
Page | D-74
Performance Measure 2016 Rate 2016 Performance Level
Pharmacotherapy Management of COPD Exacerbation Bronchodilator 86.57% 3 stars
Systemic Corticosteroid 65.67% 2 stars
State-Modified Comprehensive Diabetes Care ACE/ARB Therapy 80% of the Time 32.84% NC Statin Therapy 80% of the Time 17.23% NC
Use of High-Risk Medications in the Elderly At Least One High-Risk Medication (60–65 Years of Age) 22.41% NC At Least One High-Risk Medication (66 Years and Older) 13.64% NC At Least Two Different High-Risk Medications (60–65 Years of Age) 3.23% NC At Least Two Different High-Risk Medications (66 Years and Older) 2.07% NC
Use of Spirometry Testing in the Assessment and Diagnosis of COPD Use of Spirometry Testing in the Assessment and Diagnosis of COPD NA NC
Behavioral Health
Adherence to Antipsychotic Medications for Individuals With Schizophrenia Adherence to Antipsychotic Medications for Individuals With Schizophrenia 56.00% 1 star
Antidepressant Medication Management Effective Acute Phase Treatment 64.29% 5 stars
Effective Continuation Phase Treatment 60.71% 5 stars
Behavioral Health Risk Assessment and Follow-Up Behavioral Health Risk Assessment Completion 20.92% NC Behavioral Health Risk Assessment Follow-Up 7.00% NC
Diabetes Screening for People With Schizophrenia or Bipolar Disorder Who Are Using Antipsychotic Medications
Diabetes Screening for People With Schizophrenia or Bipolar Disorder Who Are Using Antipsychotic Medications 86.11% 4 stars
Follow-Up After Hospitalization for Mental Illness 7-Day Follow-Up 46.58% 3 stars
30-Day Follow-Up 57.53% 2 stars
Initiation and Engagement of AOD Dependence Treatment Initiation of AOD Treatment—Total 44.62% 4 stars
Engagement of AOD Treatment—Total 14.34% 3 stars
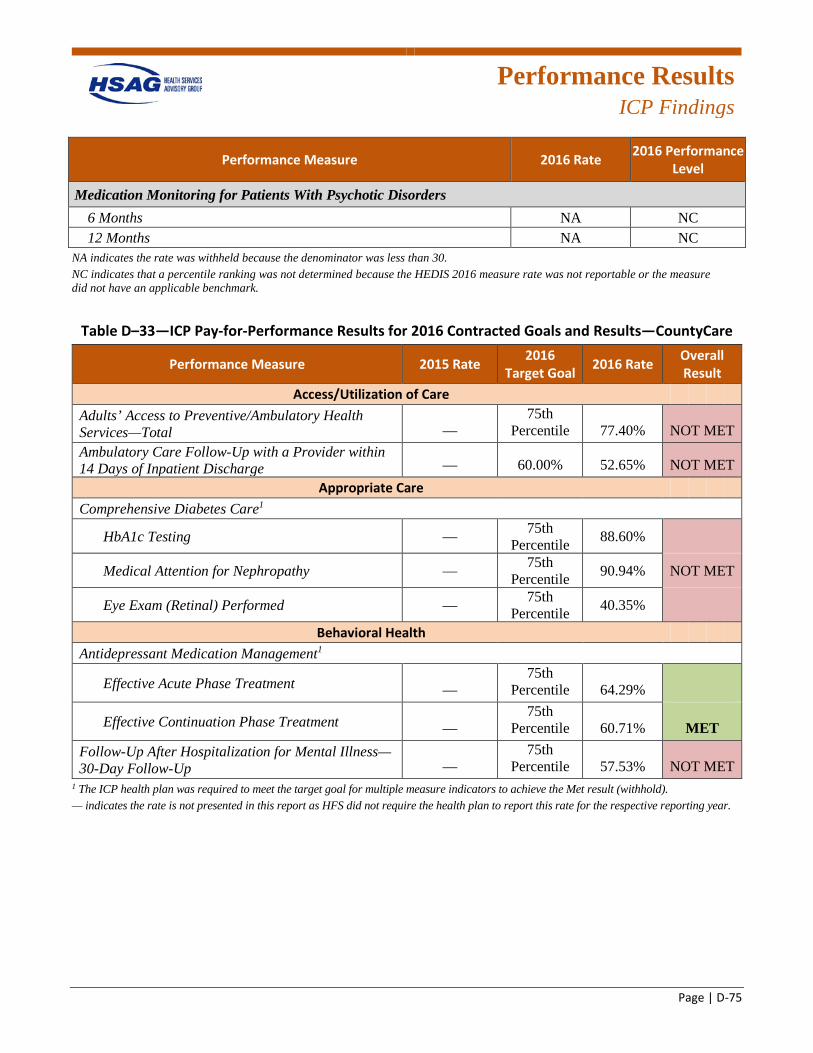
Performance Results
ICP Findings
Page | D-75
Performance Measure 2016 Rate 2016 Performance Level
Medication Monitoring for Patients With Psychotic Disorders 6 Months NA NC 12 Months NA NC
NA indicates the rate was withheld because the denominator was less than 30. NC indicates that a percentile ranking was not determined because the HEDIS 2016 measure rate was not reportable or the measure did not have an applicable benchmark.
Table D–33—ICP Pay-for-Performance Results for 2016 Contracted Goals and Results—CountyCare
Performance Measure 2015 Rate 2016 Target Goal 2016 Rate Overall
Result Access/Utilization of Care
Adults’ Access to Preventive/Ambulatory Health Services—Total —
75th Percentile 77.40% NOT MET
Ambulatory Care Follow-Up with a Provider within 14 Days of Inpatient Discharge — 60.00% 52.65% NOT MET
Appropriate Care Comprehensive Diabetes Care1
HbA1c Testing — 75th Percentile 88.60%
Medical Attention for Nephropathy — 75th Percentile 90.94% NOT MET
Eye Exam (Retinal) Performed — 75th Percentile 40.35%
Behavioral Health Antidepressant Medication Management1
Effective Acute Phase Treatment — 75th
Percentile 64.29%
Effective Continuation Phase Treatment — 75th
Percentile 60.71% MET Follow-Up After Hospitalization for Mental Illness—30-Day Follow-Up —
75th Percentile 57.53% NOT MET
1 The ICP health plan was required to meet the target goal for multiple measure indicators to achieve the Met result (withhold). — indicates the rate is not presented in this report as HFS did not require the health plan to report this rate for the respective reporting year.
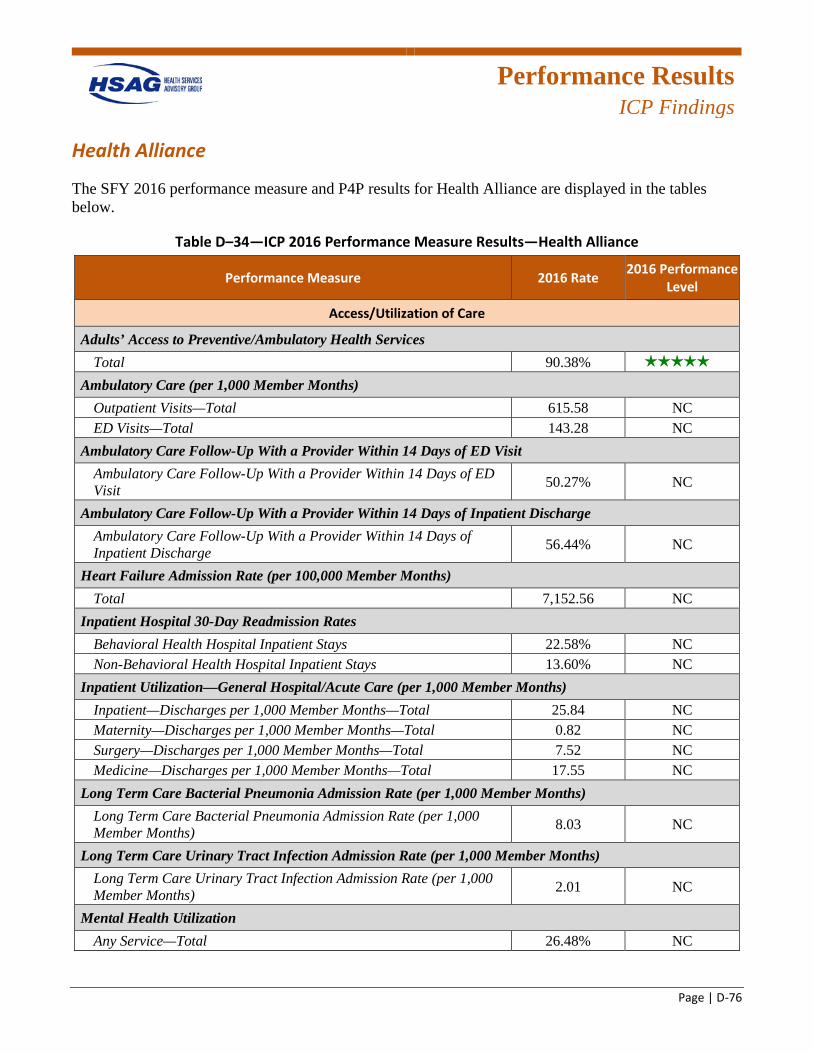
Performance Results
ICP Findings
Page | D-76
Health Alliance
The SFY 2016 performance measure and P4P results for Health Alliance are displayed in the tables below.
Table D–34—ICP 2016 Performance Measure Results—Health Alliance
Performance Measure 2016 Rate 2016 Performance Level
Access/Utilization of Care
Adults’ Access to Preventive/Ambulatory Health Services Total 90.38% 5 stars
Ambulatory Care (per 1,000 Member Months) Outpatient Visits—Total 615.58 NC ED Visits—Total 143.28 NC
Ambulatory Care Follow-Up With a Provider Within 14 Days of ED Visit Ambulatory Care Follow-Up With a Provider Within 14 Days of ED Visit 50.27% NC
Ambulatory Care Follow-Up With a Provider Within 14 Days of Inpatient Discharge Ambulatory Care Follow-Up With a Provider Within 14 Days of Inpatient Discharge 56.44% NC
Heart Failure Admission Rate (per 100,000 Member Months) Total 7,152.56 NC
Inpatient Hospital 30-Day Readmission Rates Behavioral Health Hospital Inpatient Stays 22.58% NC Non-Behavioral Health Hospital Inpatient Stays 13.60% NC
Inpatient Utilization—General Hospital/Acute Care (per 1,000 Member Months) Inpatient—Discharges per 1,000 Member Months—Total 25.84 NC Maternity—Discharges per 1,000 Member Months—Total 0.82 NC Surgery—Discharges per 1,000 Member Months—Total 7.52 NC Medicine—Discharges per 1,000 Member Months—Total 17.55 NC
Long Term Care Bacterial Pneumonia Admission Rate (per 1,000 Member Months) Long Term Care Bacterial Pneumonia Admission Rate (per 1,000 Member Months) 8.03 NC
Long Term Care Urinary Tract Infection Admission Rate (per 1,000 Member Months) Long Term Care Urinary Tract Infection Admission Rate (per 1,000 Member Months) 2.01 NC
Mental Health Utilization Any Service—Total 26.48% NC
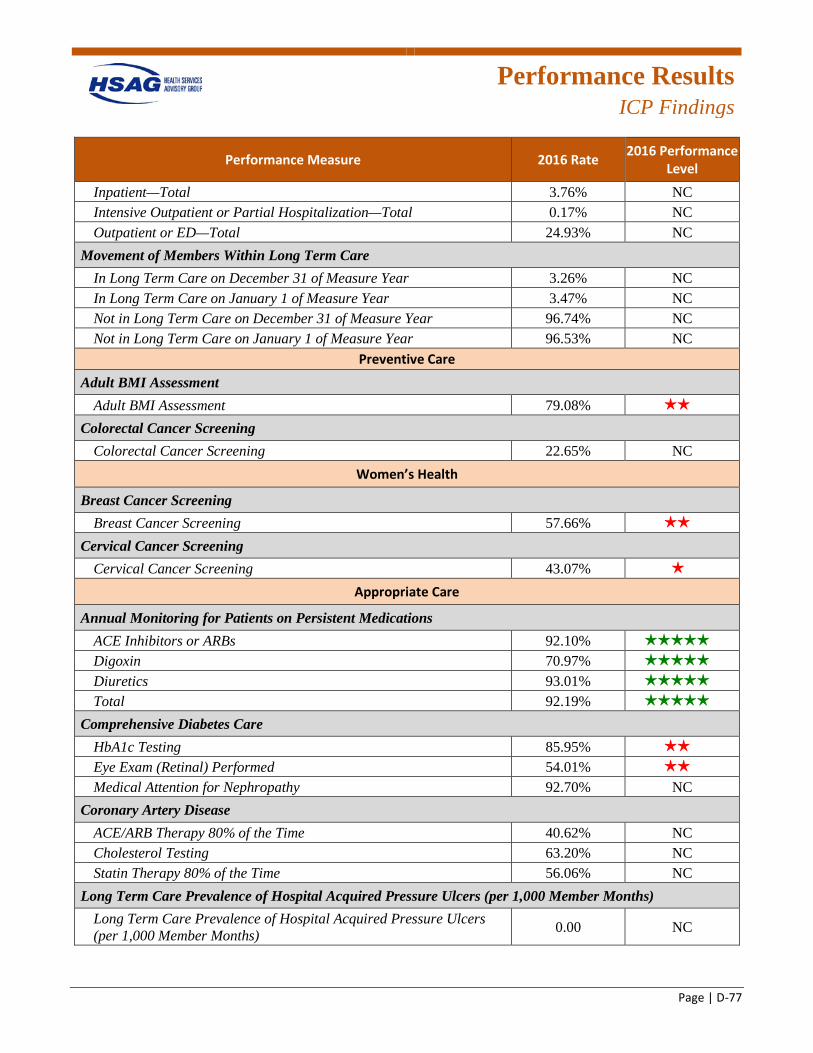
Performance Results
ICP Findings
Page | D-77
Performance Measure 2016 Rate 2016 Performance Level
Inpatient—Total 3.76% NC Intensive Outpatient or Partial Hospitalization—Total 0.17% NC Outpatient or ED—Total 24.93% NC
Movement of Members Within Long Term Care In Long Term Care on December 31 of Measure Year 3.26% NC In Long Term Care on January 1 of Measure Year 3.47% NC Not in Long Term Care on December 31 of Measure Year 96.74% NC Not in Long Term Care on January 1 of Measure Year 96.53% NC
Preventive Care Adult BMI Assessment
Adult BMI Assessment 79.08% 2 stars
Colorectal Cancer Screening Colorectal Cancer Screening 22.65% NC
Women’s Health
Breast Cancer Screening Breast Cancer Screening 57.66% 2 stars
Cervical Cancer Screening Cervical Cancer Screening 43.07% 1 star
Appropriate Care
Annual Monitoring for Patients on Persistent Medications ACE Inhibitors or ARBs 92.10% 5 stars
Digoxin 70.97% 5 stars
Diuretics 93.01% 5 stars
Total 92.19% 5 stars
Comprehensive Diabetes Care HbA1c Testing 85.95% 2 stars
Eye Exam (Retinal) Performed 54.01% 2 stars
Medical Attention for Nephropathy 92.70% NC Coronary Artery Disease
ACE/ARB Therapy 80% of the Time 40.62% NC Cholesterol Testing 63.20% NC Statin Therapy 80% of the Time 56.06% NC
Long Term Care Prevalence of Hospital Acquired Pressure Ulcers (per 1,000 Member Months) Long Term Care Prevalence of Hospital Acquired Pressure Ulcers (per 1,000 Member Months) 0.00 NC
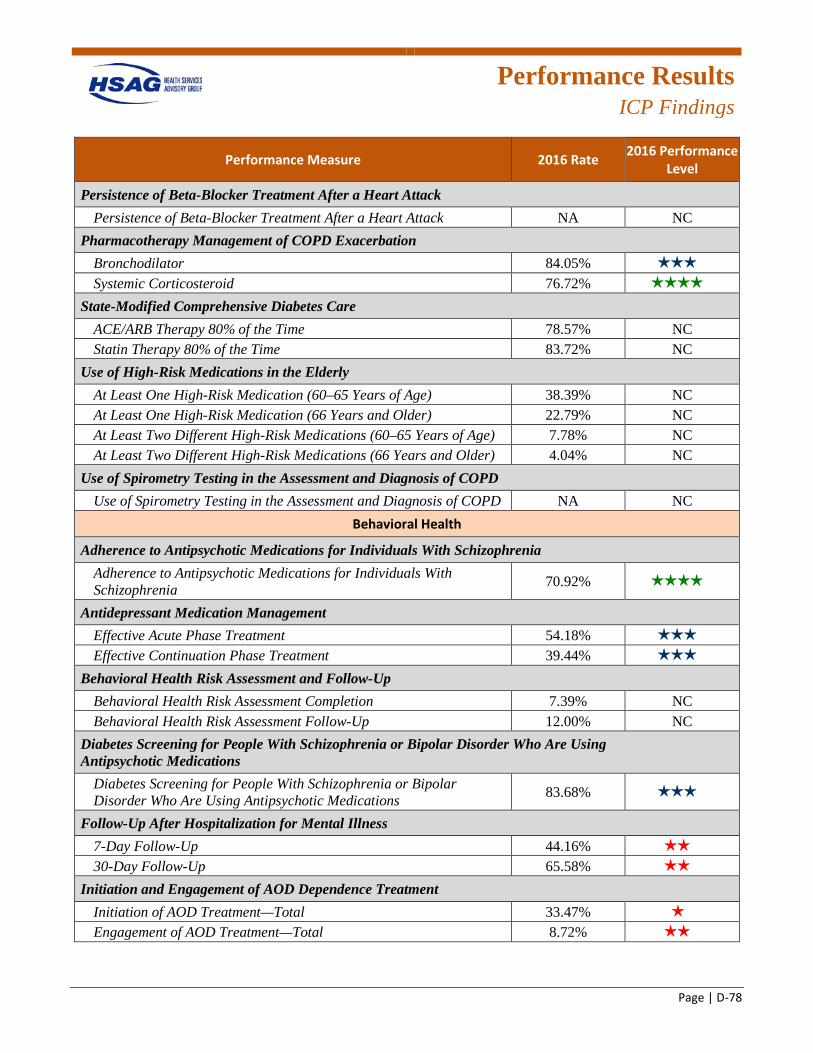
Performance Results
ICP Findings
Page | D-78
Performance Measure 2016 Rate 2016 Performance Level
Persistence of Beta-Blocker Treatment After a Heart Attack Persistence of Beta-Blocker Treatment After a Heart Attack NA NC
Pharmacotherapy Management of COPD Exacerbation Bronchodilator 84.05% 3 stars
Systemic Corticosteroid 76.72% 4 stars
State-Modified Comprehensive Diabetes Care ACE/ARB Therapy 80% of the Time 78.57% NC Statin Therapy 80% of the Time 83.72% NC
Use of High-Risk Medications in the Elderly At Least One High-Risk Medication (60–65 Years of Age) 38.39% NC At Least One High-Risk Medication (66 Years and Older) 22.79% NC At Least Two Different High-Risk Medications (60–65 Years of Age) 7.78% NC At Least Two Different High-Risk Medications (66 Years and Older) 4.04% NC
Use of Spirometry Testing in the Assessment and Diagnosis of COPD Use of Spirometry Testing in the Assessment and Diagnosis of COPD NA NC
Behavioral Health
Adherence to Antipsychotic Medications for Individuals With Schizophrenia Adherence to Antipsychotic Medications for Individuals With Schizophrenia 70.92% 4 stars
Antidepressant Medication Management Effective Acute Phase Treatment 54.18% 3 stars
Effective Continuation Phase Treatment 39.44% 3 stars
Behavioral Health Risk Assessment and Follow-Up Behavioral Health Risk Assessment Completion 7.39% NC Behavioral Health Risk Assessment Follow-Up 12.00% NC
Diabetes Screening for People With Schizophrenia or Bipolar Disorder Who Are Using Antipsychotic Medications
Diabetes Screening for People With Schizophrenia or Bipolar Disorder Who Are Using Antipsychotic Medications 83.68% 3 stars
Follow-Up After Hospitalization for Mental Illness 7-Day Follow-Up 44.16% 2 stars
30-Day Follow-Up 65.58% 2 stars
Initiation and Engagement of AOD Dependence Treatment Initiation of AOD Treatment—Total 33.47% 1 star
Engagement of AOD Treatment—Total 8.72% 2 stars
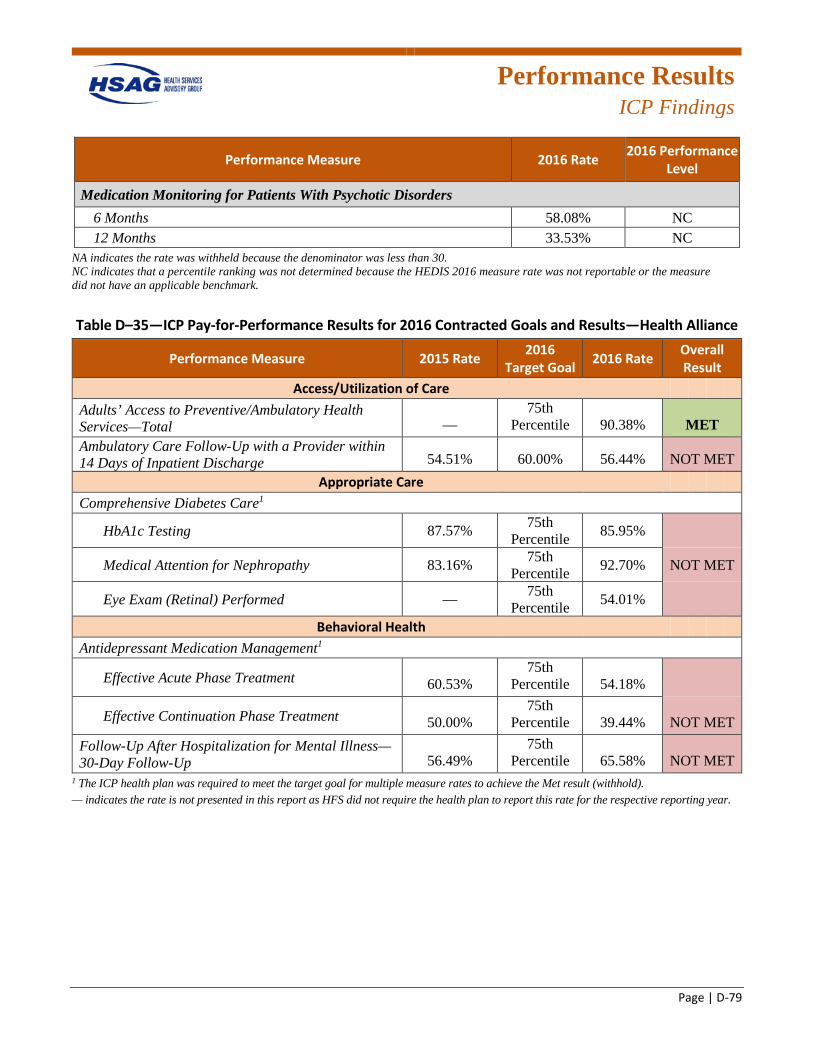
Performance Results
ICP Findings
Page | D-79
Performance Measure 2016 Rate 2016 Performance Level
Medication Monitoring for Patients With Psychotic Disorders 6 Months 58.08% NC 12 Months 33.53% NC
NA indicates the rate was withheld because the denominator was less than 30. NC indicates that a percentile ranking was not determined because the HEDIS 2016 measure rate was not reportable or the measure did not have an applicable benchmark.
Table D–35—ICP Pay-for-Performance Results for 2016 Contracted Goals and Results—Health Alliance
Performance Measure 2015 Rate 2016 Target Goal 2016 Rate Overall
Result Access/Utilization of Care
Adults’ Access to Preventive/Ambulatory Health Services—Total —
75th Percentile 90.38% MET
Ambulatory Care Follow-Up with a Provider within 14 Days of Inpatient Discharge 54.51% 60.00% 56.44% NOT MET
Appropriate Care Comprehensive Diabetes Care1
HbA1c Testing 87.57% 75th Percentile 85.95%
Medical Attention for Nephropathy 83.16% 75th Percentile 92.70% NOT MET
Eye Exam (Retinal) Performed — 75th Percentile 54.01%
Behavioral Health Antidepressant Medication Management1
Effective Acute Phase Treatment 60.53% 75th
Percentile 54.18%
Effective Continuation Phase Treatment 50.00% 75th
Percentile 39.44% NOT MET Follow-Up After Hospitalization for Mental Illness—30-Day Follow-Up 56.49%
75th Percentile 65.58% NOT MET
1 The ICP health plan was required to meet the target goal for multiple measure rates to achieve the Met result (withhold). — indicates the rate is not presented in this report as HFS did not require the health plan to report this rate for the respective reporting year.
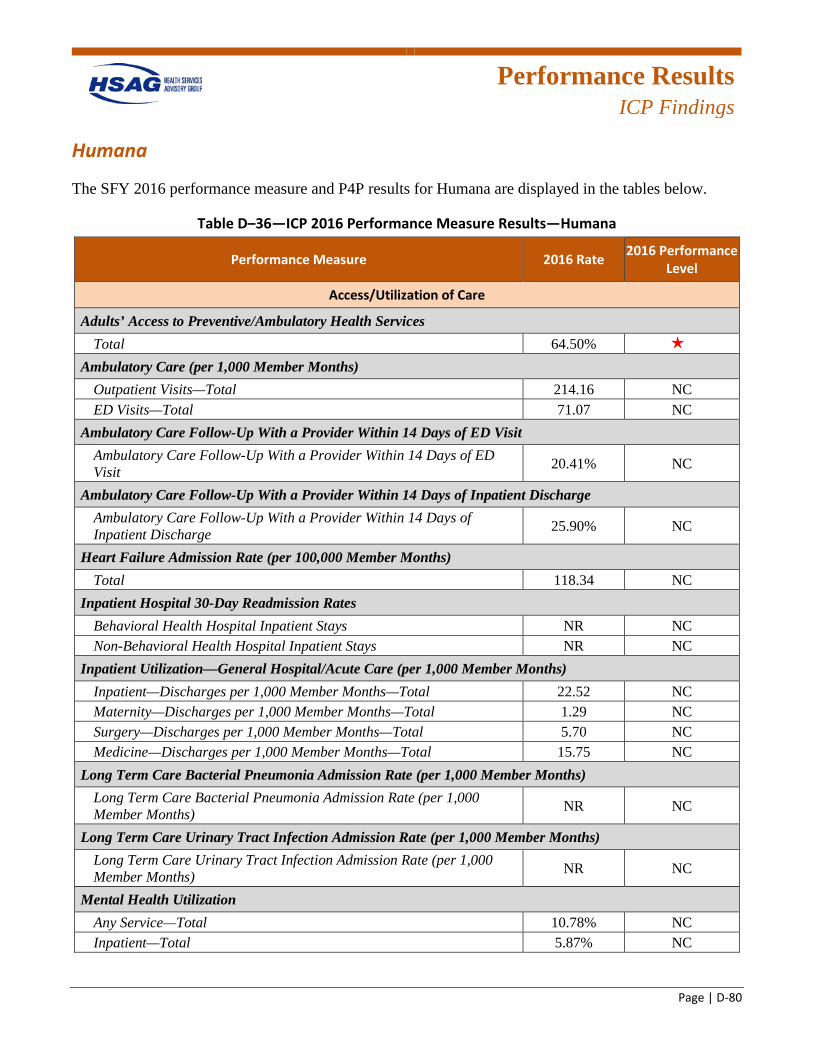
Performance Results
ICP Findings
Page | D-80
Humana
The SFY 2016 performance measure and P4P results for Humana are displayed in the tables below.
Table D–36—ICP 2016 Performance Measure Results—Humana
Performance Measure 2016 Rate 2016 Performance Level
Access/Utilization of Care
Adults’ Access to Preventive/Ambulatory Health Services Total 64.50% 1 star
Ambulatory Care (per 1,000 Member Months) Outpatient Visits—Total 214.16 NC ED Visits—Total 71.07 NC
Ambulatory Care Follow-Up With a Provider Within 14 Days of ED Visit Ambulatory Care Follow-Up With a Provider Within 14 Days of ED Visit 20.41% NC
Ambulatory Care Follow-Up With a Provider Within 14 Days of Inpatient Discharge Ambulatory Care Follow-Up With a Provider Within 14 Days of Inpatient Discharge 25.90% NC
Heart Failure Admission Rate (per 100,000 Member Months) Total 118.34 NC
Inpatient Hospital 30-Day Readmission Rates Behavioral Health Hospital Inpatient Stays NR NC Non-Behavioral Health Hospital Inpatient Stays NR NC
Inpatient Utilization—General Hospital/Acute Care (per 1,000 Member Months) Inpatient—Discharges per 1,000 Member Months—Total 22.52 NC Maternity—Discharges per 1,000 Member Months—Total 1.29 NC Surgery—Discharges per 1,000 Member Months—Total 5.70 NC Medicine—Discharges per 1,000 Member Months—Total 15.75 NC
Long Term Care Bacterial Pneumonia Admission Rate (per 1,000 Member Months) Long Term Care Bacterial Pneumonia Admission Rate (per 1,000 Member Months) NR NC
Long Term Care Urinary Tract Infection Admission Rate (per 1,000 Member Months) Long Term Care Urinary Tract Infection Admission Rate (per 1,000 Member Months) NR NC
Mental Health Utilization Any Service—Total 10.78% NC Inpatient—Total 5.87% NC
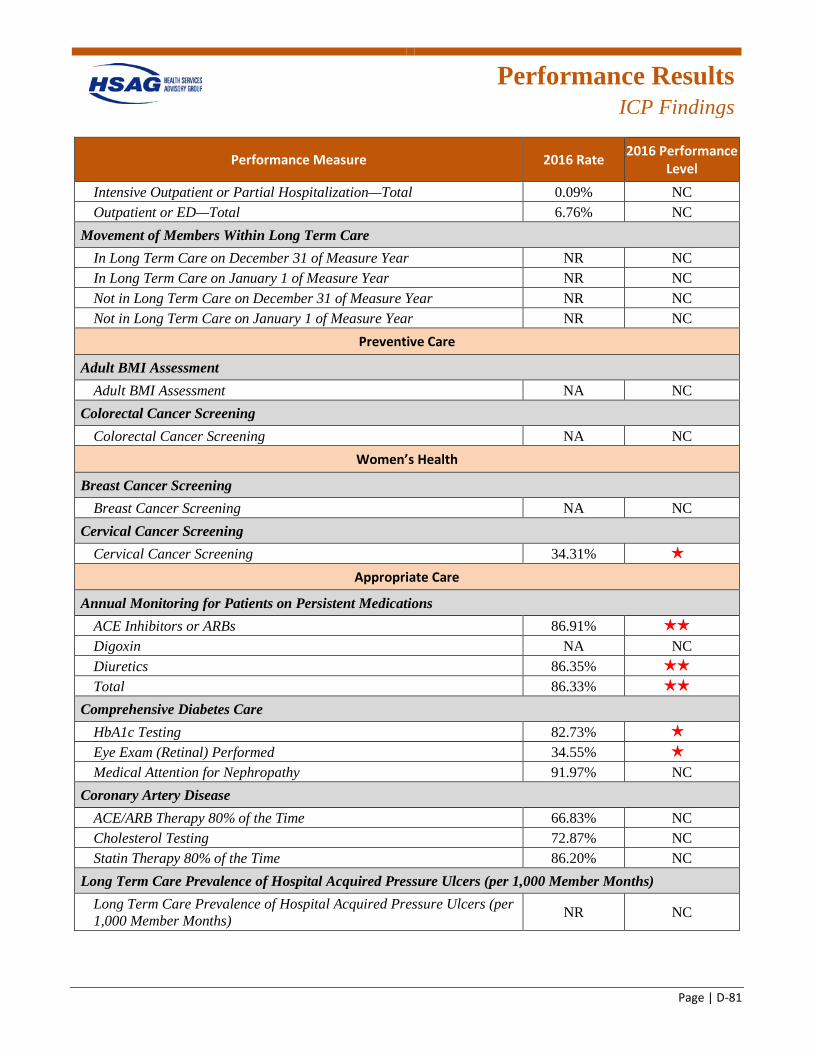
Performance Results
ICP Findings
Page | D-81
Performance Measure 2016 Rate 2016 Performance Level
Intensive Outpatient or Partial Hospitalization—Total 0.09% NC Outpatient or ED—Total 6.76% NC
Movement of Members Within Long Term Care In Long Term Care on December 31 of Measure Year NR NC In Long Term Care on January 1 of Measure Year NR NC Not in Long Term Care on December 31 of Measure Year NR NC Not in Long Term Care on January 1 of Measure Year NR NC
Preventive Care
Adult BMI Assessment Adult BMI Assessment NA NC
Colorectal Cancer Screening Colorectal Cancer Screening NA NC
Women’s Health
Breast Cancer Screening Breast Cancer Screening NA NC
Cervical Cancer Screening Cervical Cancer Screening 34.31% 1 star
Appropriate Care
Annual Monitoring for Patients on Persistent Medications ACE Inhibitors or ARBs 86.91% 2 stars
Digoxin NA NC Diuretics 86.35% 2 stars
Total 86.33% 2 stars
Comprehensive Diabetes Care HbA1c Testing 82.73% 1 star
Eye Exam (Retinal) Performed 34.55% 1 star
Medical Attention for Nephropathy 91.97% NC Coronary Artery Disease
ACE/ARB Therapy 80% of the Time 66.83% NC Cholesterol Testing 72.87% NC Statin Therapy 80% of the Time 86.20% NC
Long Term Care Prevalence of Hospital Acquired Pressure Ulcers (per 1,000 Member Months) Long Term Care Prevalence of Hospital Acquired Pressure Ulcers (per 1,000 Member Months) NR NC
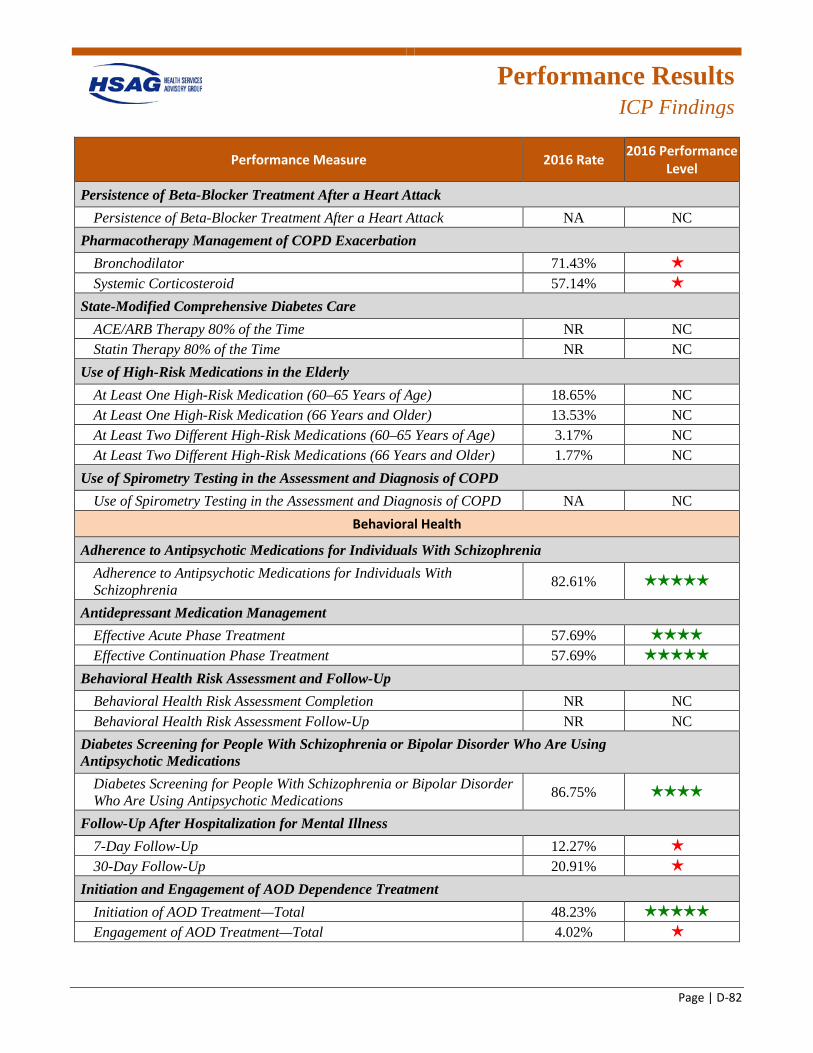
Performance Results
ICP Findings
Page | D-82
Performance Measure 2016 Rate 2016 Performance Level
Persistence of Beta-Blocker Treatment After a Heart Attack Persistence of Beta-Blocker Treatment After a Heart Attack NA NC
Pharmacotherapy Management of COPD Exacerbation Bronchodilator 71.43% 1 star
Systemic Corticosteroid 57.14% 1 star
State-Modified Comprehensive Diabetes Care ACE/ARB Therapy 80% of the Time NR NC Statin Therapy 80% of the Time NR NC
Use of High-Risk Medications in the Elderly At Least One High-Risk Medication (60–65 Years of Age) 18.65% NC At Least One High-Risk Medication (66 Years and Older) 13.53% NC At Least Two Different High-Risk Medications (60–65 Years of Age) 3.17% NC At Least Two Different High-Risk Medications (66 Years and Older) 1.77% NC
Use of Spirometry Testing in the Assessment and Diagnosis of COPD Use of Spirometry Testing in the Assessment and Diagnosis of COPD NA NC
Behavioral Health
Adherence to Antipsychotic Medications for Individuals With Schizophrenia Adherence to Antipsychotic Medications for Individuals With Schizophrenia 82.61% 5 stars
Antidepressant Medication Management Effective Acute Phase Treatment 57.69% 4 stars
Effective Continuation Phase Treatment 57.69% 5 stars
Behavioral Health Risk Assessment and Follow-Up Behavioral Health Risk Assessment Completion NR NC Behavioral Health Risk Assessment Follow-Up NR NC
Diabetes Screening for People With Schizophrenia or Bipolar Disorder Who Are Using Antipsychotic Medications
Diabetes Screening for People With Schizophrenia or Bipolar Disorder Who Are Using Antipsychotic Medications 86.75% 4 stars
Follow-Up After Hospitalization for Mental Illness 7-Day Follow-Up 12.27% 1 star
30-Day Follow-Up 20.91% 1 star
Initiation and Engagement of AOD Dependence Treatment Initiation of AOD Treatment—Total 48.23% 5 stars
Engagement of AOD Treatment—Total 4.02% 1 star
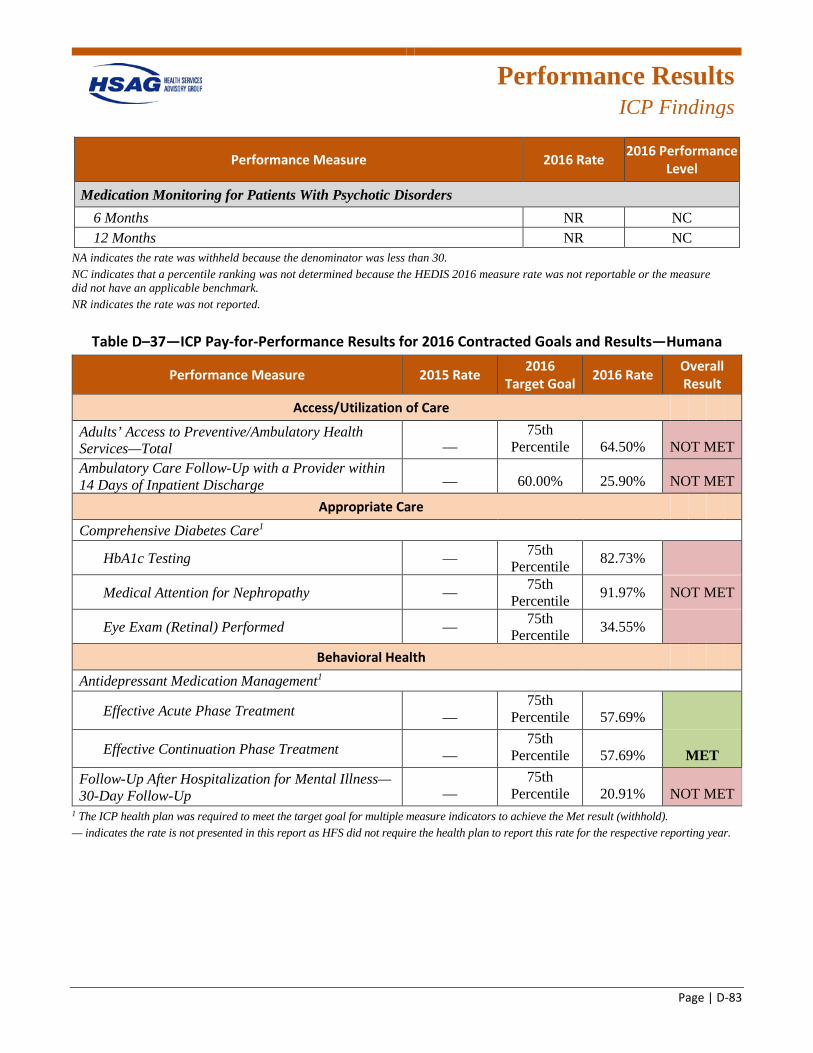
Performance Results
ICP Findings
Page | D-83
Performance Measure 2016 Rate 2016 Performance Level
Medication Monitoring for Patients With Psychotic Disorders 6 Months NR NC 12 Months NR NC
NA indicates the rate was withheld because the denominator was less than 30. NC indicates that a percentile ranking was not determined because the HEDIS 2016 measure rate was not reportable or the measure did not have an applicable benchmark. NR indicates the rate was not reported.
Table D–37—ICP Pay-for-Performance Results for 2016 Contracted Goals and Results—Humana
Performance Measure 2015 Rate 2016 Target Goal 2016 Rate Overall
Result
Access/Utilization of Care
Adults’ Access to Preventive/Ambulatory Health Services—Total —
75th Percentile 64.50% NOT MET
Ambulatory Care Follow-Up with a Provider within 14 Days of Inpatient Discharge — 60.00% 25.90% NOT MET
Appropriate Care
Comprehensive Diabetes Care1
HbA1c Testing — 75th Percentile 82.73%
Medical Attention for Nephropathy — 75th Percentile 91.97% NOT MET
Eye Exam (Retinal) Performed — 75th Percentile 34.55%
Behavioral Health
Antidepressant Medication Management1
Effective Acute Phase Treatment — 75th
Percentile 57.69%
Effective Continuation Phase Treatment — 75th
Percentile 57.69% MET Follow-Up After Hospitalization for Mental Illness—30-Day Follow-Up —
75th Percentile 20.91% NOT MET
1 The ICP health plan was required to meet the target goal for multiple measure indicators to achieve the Met result (withhold). — indicates the rate is not presented in this report as HFS did not require the health plan to report this rate for the respective reporting year.

Performance Results
ICP Findings
Page | D-84
IlliniCare
The SFY 2016 performance measure and P4P results for IlliniCare are displayed in the tables below.
Table D–38—ICP 2016 Performance Measure Results—IlliniCare
Performance Measure 2016 Rate 2016 Performance Level
Access/Utilization of Care
Adults’ Access to Preventive/Ambulatory Health Services Total 84.89% 33 stars
Ambulatory Care (per 1,000 Member Months) Outpatient Visits—Total 560.01 NC ED Visits—Total 91.13 NC
Ambulatory Care Follow-Up With a Provider Within 14 Days of ED Visit Ambulatory Care Follow-Up With a Provider Within 14 Days of ED Visit 43.56% NC
Ambulatory Care Follow-Up With a Provider Within 14 Days of Inpatient Discharge Ambulatory Care Follow-Up With a Provider Within 14 Days of Inpatient Discharge 60.44% NC
Heart Failure Admission Rate (per 100,000 Member Months) Total 2,883.99 NC
Inpatient Hospital 30-Day Readmission Rates Behavioral Health Hospital Inpatient Stays 42.71% NC Non-Behavioral Health Hospital Inpatient Stays 10.32% NC
Inpatient Utilization—General Hospital/Acute Care (per 1,000 Member Months) Inpatient—Discharges per 1,000 Member Months—Total 28.05 NC Maternity—Discharges per 1,000 Member Months—Total 0.56 NC Surgery—Discharges per 1,000 Member Months—Total 7.69 NC Medicine—Discharges per 1,000 Member Months—Total 19.93 NC
Long Term Care Bacterial Pneumonia Admission Rate (per 1,000 Member Months) Long Term Care Bacterial Pneumonia Admission Rate (per 1,000 Member Months) 0.76 NC
Long Term Care Urinary Tract Infection Admission Rate (per 1,000 Member Months) Long Term Care Urinary Tract Infection Admission Rate (per 1,000 Member Months) 0.45 NC
Mental Health Utilization Any Service—Total 20.53% NC Inpatient—Total 7.14% NC
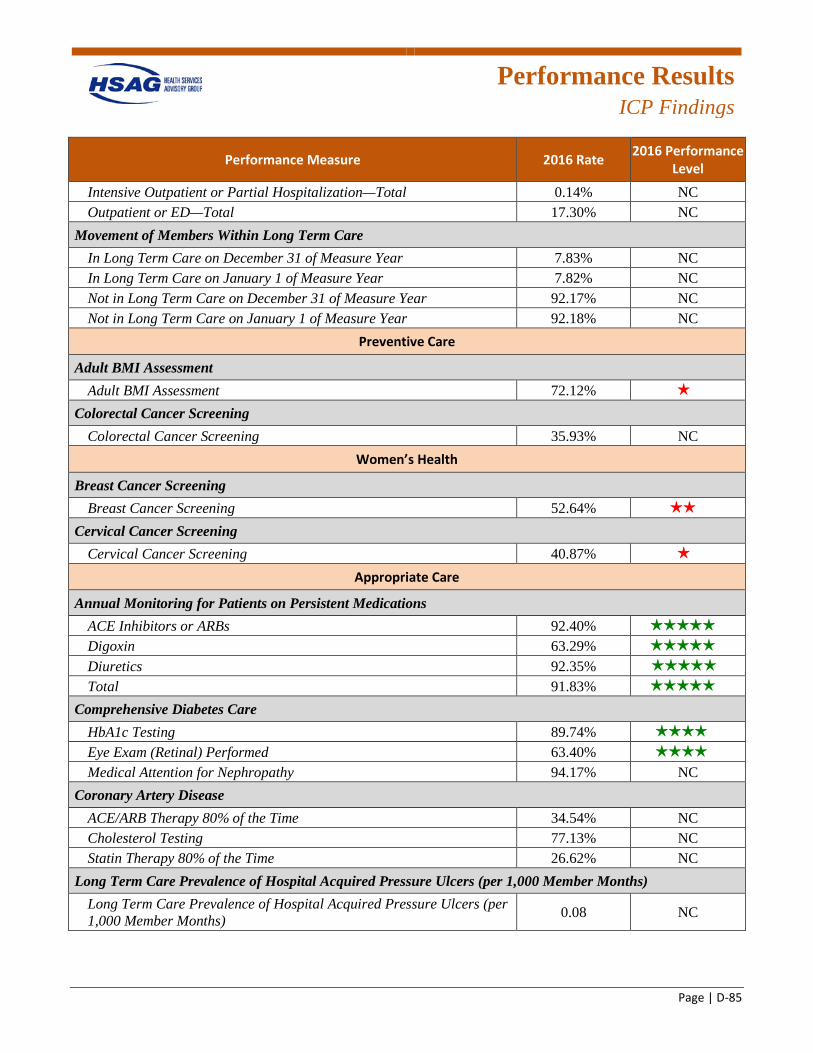
Performance Results
ICP Findings
Page | D-85
Performance Measure 2016 Rate 2016 Performance Level
Intensive Outpatient or Partial Hospitalization—Total 0.14% NC Outpatient or ED—Total 17.30% NC
Movement of Members Within Long Term Care In Long Term Care on December 31 of Measure Year 7.83% NC In Long Term Care on January 1 of Measure Year 7.82% NC Not in Long Term Care on December 31 of Measure Year 92.17% NC Not in Long Term Care on January 1 of Measure Year 92.18% NC
Preventive Care
Adult BMI Assessment Adult BMI Assessment 72.12% 1 star
Colorectal Cancer Screening Colorectal Cancer Screening 35.93% NC
Women’s Health
Breast Cancer Screening Breast Cancer Screening 52.64% 2 stars
Cervical Cancer Screening Cervical Cancer Screening 40.87% 1 star
Appropriate Care
Annual Monitoring for Patients on Persistent Medications ACE Inhibitors or ARBs 92.40% 5 stars
Digoxin 63.29% 5 stars
Diuretics 92.35% stars
Total 91.83% 5 stars
Comprehensive Diabetes Care HbA1c Testing 89.74% 4 4 stars
Eye Exam (Retinal) Performed 63.40% 4 4 stars
Medical Attention for Nephropathy 94.17% NC Coronary Artery Disease
ACE/ARB Therapy 80% of the Time 34.54% NC Cholesterol Testing 77.13% NC Statin Therapy 80% of the Time 26.62% NC
Long Term Care Prevalence of Hospital Acquired Pressure Ulcers (per 1,000 Member Months) Long Term Care Prevalence of Hospital Acquired Pressure Ulcers (per 1,000 Member Months) 0.08 NC
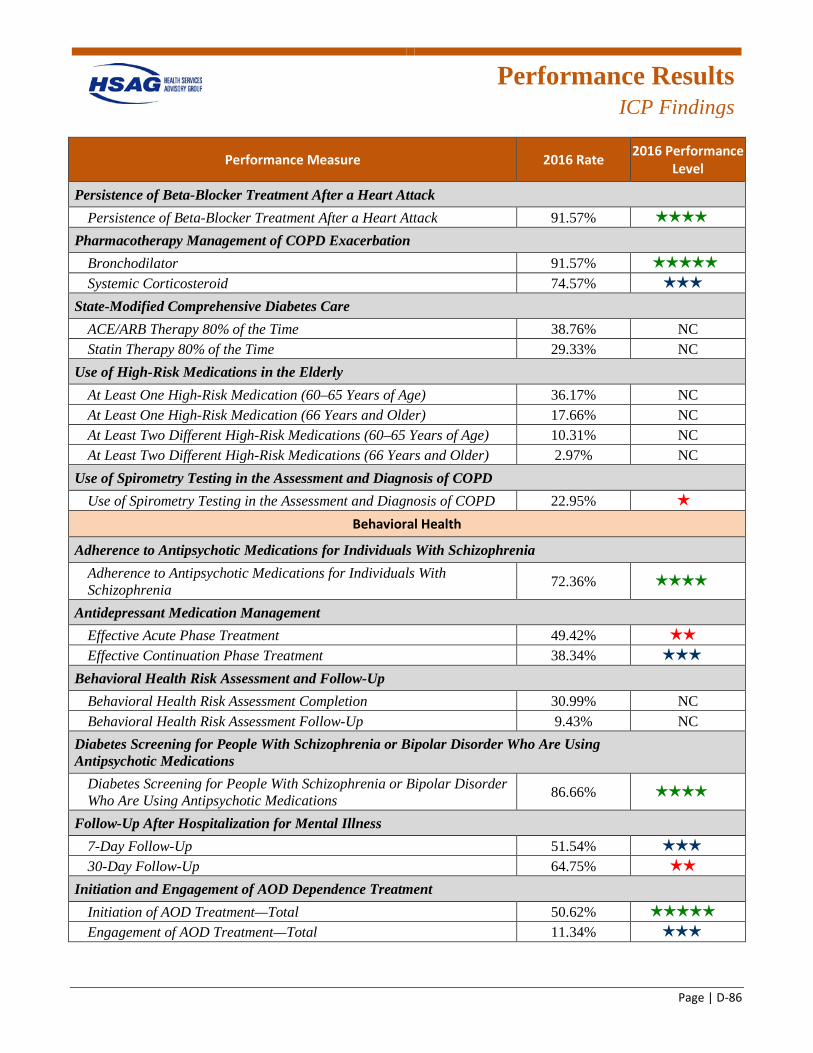
Performance Results
ICP Findings
Page | D-86
Performance Measure 2016 Rate 2016 Performance Level
Persistence of Beta-Blocker Treatment After a Heart Attack Persistence of Beta-Blocker Treatment After a Heart Attack 91.57% 4 4 stars
Pharmacotherapy Management of COPD Exacerbation Bronchodilator 91.57% tars
Systemic Corticosteroid 74.57% 3 stars
State-Modified Comprehensive Diabetes Care ACE/ARB Therapy 80% of the Time 38.76% NC Statin Therapy 80% of the Time 29.33% NC
Use of High-Risk Medications in the Elderly At Least One High-Risk Medication (60–65 Years of Age) 36.17% NC At Least One High-Risk Medication (66 Years and Older) 17.66% NC At Least Two Different High-Risk Medications (60–65 Years of Age) 10.31% NC At Least Two Different High-Risk Medications (66 Years and Older) 2.97% NC
Use of Spirometry Testing in the Assessment and Diagnosis of COPD Use of Spirometry Testing in the Assessment and Diagnosis of COPD 22.95% 1 star
Behavioral Health
Adherence to Antipsychotic Medications for Individuals With Schizophrenia Adherence to Antipsychotic Medications for Individuals With Schizophrenia 72.36% 4 4 stars
Antidepressant Medication Management Effective Acute Phase Treatment 49.42% 2 stars
Effective Continuation Phase Treatment 38.34% 33 stars
Behavioral Health Risk Assessment and Follow-Up Behavioral Health Risk Assessment Completion 30.99% NC Behavioral Health Risk Assessment Follow-Up 9.43% NC
Diabetes Screening for People With Schizophrenia or Bipolar Disorder Who Are Using Antipsychotic Medications
Diabetes Screening for People With Schizophrenia or Bipolar Disorder Who Are Using Antipsychotic Medications 86.66% 4 4 stars
Follow-Up After Hospitalization for Mental Illness 7-Day Follow-Up 51.54% 33 stars
30-Day Follow-Up 64.75% 2 stars
Initiation and Engagement of AOD Dependence Treatment Initiation of AOD Treatment—Total 50.62% 5 stars
Engagement of AOD Treatment—Total 11.34% 33 stars
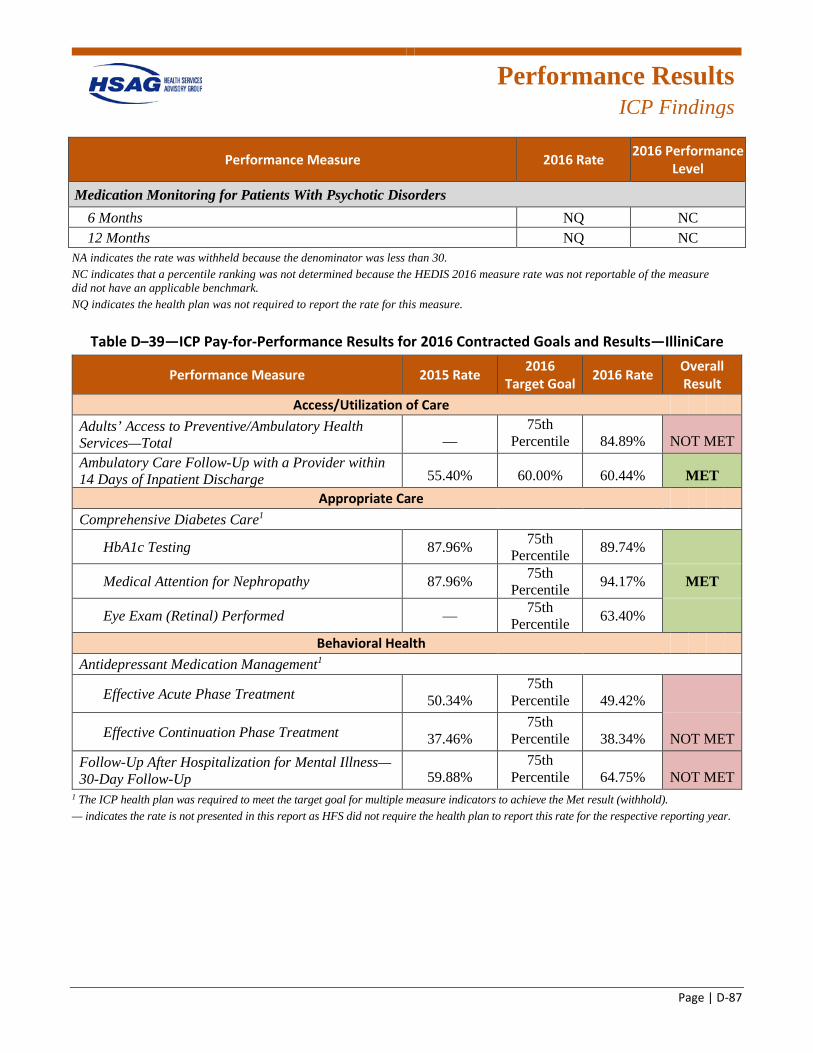
Performance Results
ICP Findings
Page | D-87
Performance Measure 2016 Rate 2016 Performance Level
Medication Monitoring for Patients With Psychotic Disorders 6 Months NQ NC 12 Months NQ NC
NA indicates the rate was withheld because the denominator was less than 30. NC indicates that a percentile ranking was not determined because the HEDIS 2016 measure rate was not reportable of the measure did not have an applicable benchmark. NQ indicates the health plan was not required to report the rate for this measure.
Table D–39—ICP Pay-for-Performance Results for 2016 Contracted Goals and Results—IlliniCare
Performance Measure 2015 Rate 2016 Target Goal 2016 Rate Overall
Result Access/Utilization of Care
Adults’ Access to Preventive/Ambulatory Health Services—Total —
75th Percentile 84.89% NOT MET
Ambulatory Care Follow-Up with a Provider within 14 Days of Inpatient Discharge 55.40% 60.00% 60.44% MET
Appropriate Care Comprehensive Diabetes Care1
HbA1c Testing 87.96% 75th Percentile 89.74%
Medical Attention for Nephropathy 87.96% 75th Percentile 94.17% MET
Eye Exam (Retinal) Performed — 75th Percentile 63.40%
Behavioral Health Antidepressant Medication Management1
Effective Acute Phase Treatment 50.34% 75th
Percentile 49.42%
Effective Continuation Phase Treatment 37.46% 75th
Percentile 38.34% NOT MET Follow-Up After Hospitalization for Mental Illness—30-Day Follow-Up 59.88%
75th Percentile 64.75% NOT MET
1 The ICP health plan was required to meet the target goal for multiple measure indicators to achieve the Met result (withhold). — indicates the rate is not presented in this report as HFS did not require the health plan to report this rate for the respective reporting year.
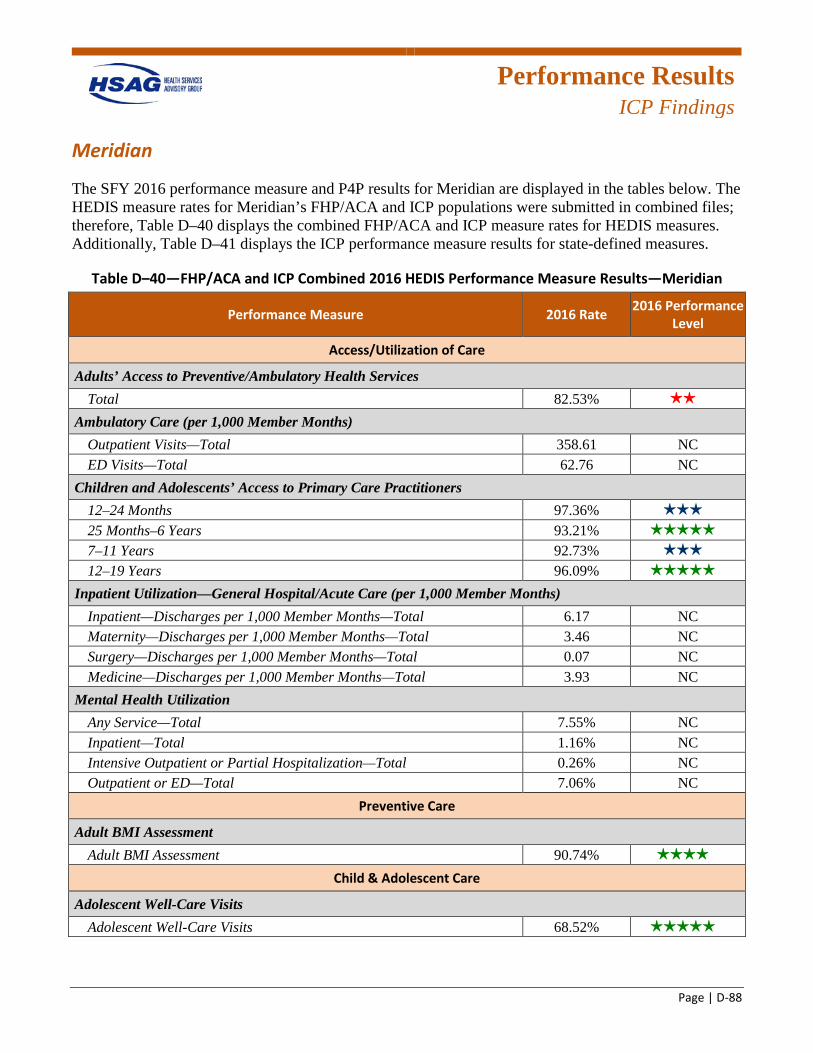
Performance Results
ICP Findings
Page | D-88
Meridian
The SFY 2016 performance measure and P4P results for Meridian are displayed in the tables below. The HEDIS measure rates for Meridian’s FHP/ACA and ICP populations were submitted in combined files; therefore, Table D–40 displays the combined FHP/ACA and ICP measure rates for HEDIS measures. Additionally, Table D–41 displays the ICP performance measure results for state-defined measures.
Table D–40—FHP/ACA and ICP Combined 2016 HEDIS Performance Measure Results—Meridian
Performance Measure 2016 Rate 2016 Performance Level
Access/Utilization of Care
Adults’ Access to Preventive/Ambulatory Health Services Total 82.53% 2 stars
Ambulatory Care (per 1,000 Member Months) Outpatient Visits—Total 358.61 NC ED Visits—Total 62.76 NC
Children and Adolescents’ Access to Primary Care Practitioners 12–24 Months 97.36% 3 stars
25 Months–6 Years 93.21% 5 stars
7–11 Years 92.73% 3 stars
12–19 Years 96.09% 5 stars
Inpatient Utilization—General Hospital/Acute Care (per 1,000 Member Months) Inpatient—Discharges per 1,000 Member Months—Total 6.17 NC Maternity—Discharges per 1,000 Member Months—Total 3.46 NC Surgery—Discharges per 1,000 Member Months—Total 0.07 NC Medicine—Discharges per 1,000 Member Months—Total 3.93 NC
Mental Health Utilization Any Service—Total 7.55% NC Inpatient—Total 1.16% NC Intensive Outpatient or Partial Hospitalization—Total 0.26% NC Outpatient or ED—Total 7.06% NC
Preventive Care
Adult BMI Assessment Adult BMI Assessment 90.74% 4 stars
Child & Adolescent Care
Adolescent Well-Care Visits Adolescent Well-Care Visits 68.52% 5 stars
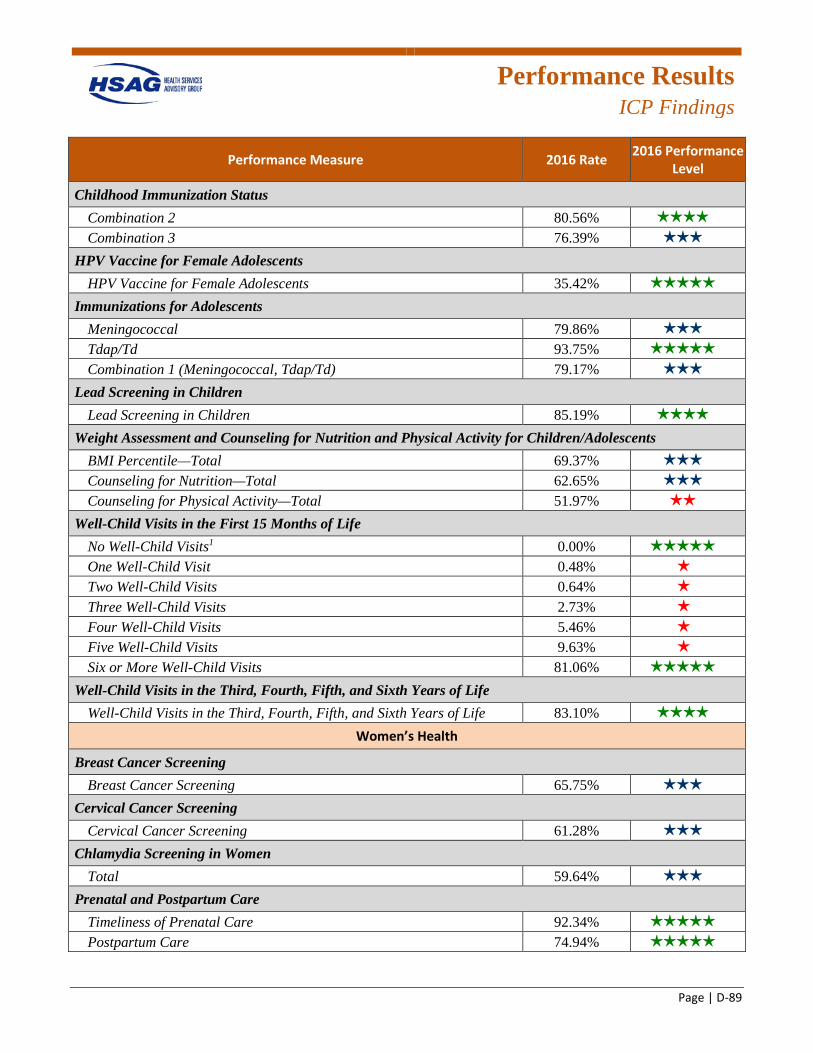
Performance Results
ICP Findings
Page | D-89
Performance Measure 2016 Rate 2016 Performance Level
Childhood Immunization Status Combination 2 80.56% 4 stars
Combination 3 76.39% 3 stars
HPV Vaccine for Female Adolescents HPV Vaccine for Female Adolescents 35.42% 5 stars
Immunizations for Adolescents Meningococcal 79.86% 3 stars
Tdap/Td 93.75% 5 stars
Combination 1 (Meningococcal, Tdap/Td) 79.17% 3 stars
Lead Screening in Children Lead Screening in Children 85.19% 4 stars
Weight Assessment and Counseling for Nutrition and Physical Activity for Children/Adolescents BMI Percentile—Total 69.37% 3 stars
Counseling for Nutrition—Total 62.65% 3 stars
Counseling for Physical Activity—Total 51.97% 2 stars
Well-Child Visits in the First 15 Months of Life No Well-Child Visits1 0.00% 5 stars
One Well-Child Visit 0.48% 1 star
Two Well-Child Visits 0.64% 1 star
Three Well-Child Visits 2.73% 1 star
Four Well-Child Visits 5.46% 1 star
Five Well-Child Visits 9.63% 1 star
Six or More Well-Child Visits 81.06% 5 stars
Well-Child Visits in the Third, Fourth, Fifth, and Sixth Years of Life Well-Child Visits in the Third, Fourth, Fifth, and Sixth Years of Life 83.10% 4 stars
Women’s Health
Breast Cancer Screening Breast Cancer Screening 65.75% 3 stars
Cervical Cancer Screening Cervical Cancer Screening 61.28% 3 stars
Chlamydia Screening in Women Total 59.64% 3 stars
Prenatal and Postpartum Care Timeliness of Prenatal Care 92.34% 5 stars
Postpartum Care 74.94% 5 stars
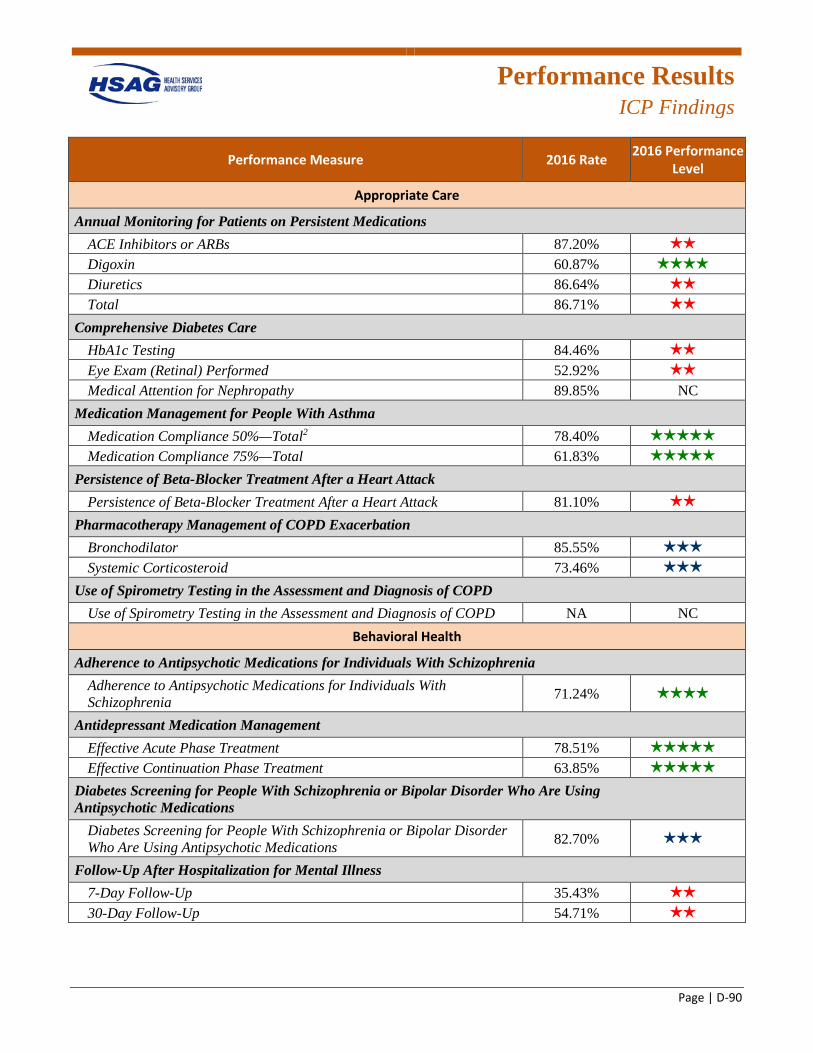
Performance Results
ICP Findings
Page | D-90
Performance Measure 2016 Rate 2016 Performance Level
Appropriate Care
Annual Monitoring for Patients on Persistent Medications ACE Inhibitors or ARBs 87.20% 2 stars
Digoxin 60.87% 4 stars
Diuretics 86.64% 2 stars
Total 86.71% 2 stars
Comprehensive Diabetes Care HbA1c Testing 84.46% 2 stars
Eye Exam (Retinal) Performed 52.92% 2 stars
Medical Attention for Nephropathy 89.85% NC Medication Management for People With Asthma
Medication Compliance 50%—Total2 78.40% 5 stars
Medication Compliance 75%—Total 61.83% 5 stars
Persistence of Beta-Blocker Treatment After a Heart Attack Persistence of Beta-Blocker Treatment After a Heart Attack 81.10% 2 stars
Pharmacotherapy Management of COPD Exacerbation Bronchodilator 85.55% 3 stars
Systemic Corticosteroid 73.46% 3 stars
Use of Spirometry Testing in the Assessment and Diagnosis of COPD Use of Spirometry Testing in the Assessment and Diagnosis of COPD NA NC
Behavioral Health
Adherence to Antipsychotic Medications for Individuals With Schizophrenia Adherence to Antipsychotic Medications for Individuals With Schizophrenia 71.24% 4 stars
Antidepressant Medication Management Effective Acute Phase Treatment 78.51% 5 stars
Effective Continuation Phase Treatment 63.85% 5 stars
Diabetes Screening for People With Schizophrenia or Bipolar Disorder Who Are Using Antipsychotic Medications
Diabetes Screening for People With Schizophrenia or Bipolar Disorder Who Are Using Antipsychotic Medications 82.70% 3 stars
Follow-Up After Hospitalization for Mental Illness 7-Day Follow-Up 35.43% 2 stars
30-Day Follow-Up 54.71% 2 stars
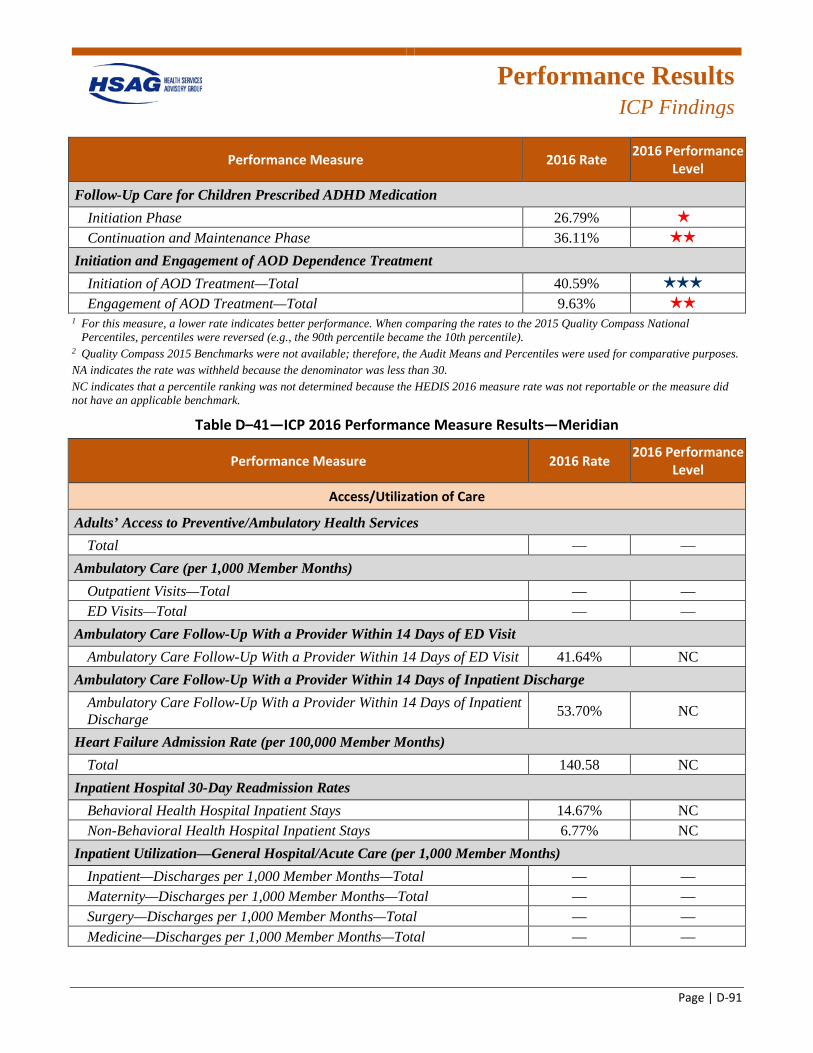
Performance Results
ICP Findings
Page | D-91
Performance Measure 2016 Rate 2016 Performance Level
Follow-Up Care for Children Prescribed ADHD Medication Initiation Phase 26.79% 1 star
Continuation and Maintenance Phase 36.11% 2 stars
Initiation and Engagement of AOD Dependence Treatment Initiation of AOD Treatment—Total 40.59% 3 stars
Engagement of AOD Treatment—Total 9.63% 2 stars
1 For this measure, a lower rate indicates better performance. When comparing the rates to the 2015 Quality Compass National Percentiles, percentiles were reversed (e.g., the 90th percentile became the 10th percentile).
2 Quality Compass 2015 Benchmarks were not available; therefore, the Audit Means and Percentiles were used for comparative purposes. NA indicates the rate was withheld because the denominator was less than 30. NC indicates that a percentile ranking was not determined because the HEDIS 2016 measure rate was not reportable or the measure did not have an applicable benchmark.
Table D–41—ICP 2016 Performance Measure Results—Meridian
Performance Measure 2016 Rate 2016 Performance Level
Access/Utilization of Care
Adults’ Access to Preventive/Ambulatory Health Services Total — —
Ambulatory Care (per 1,000 Member Months) Outpatient Visits—Total — — ED Visits—Total — —
Ambulatory Care Follow-Up With a Provider Within 14 Days of ED Visit Ambulatory Care Follow-Up With a Provider Within 14 Days of ED Visit 41.64% NC
Ambulatory Care Follow-Up With a Provider Within 14 Days of Inpatient Discharge Ambulatory Care Follow-Up With a Provider Within 14 Days of Inpatient Discharge 53.70% NC
Heart Failure Admission Rate (per 100,000 Member Months) Total 140.58 NC
Inpatient Hospital 30-Day Readmission Rates Behavioral Health Hospital Inpatient Stays 14.67% NC Non-Behavioral Health Hospital Inpatient Stays 6.77% NC
Inpatient Utilization—General Hospital/Acute Care (per 1,000 Member Months) Inpatient—Discharges per 1,000 Member Months—Total — — Maternity—Discharges per 1,000 Member Months—Total — — Surgery—Discharges per 1,000 Member Months—Total — — Medicine—Discharges per 1,000 Member Months—Total — —
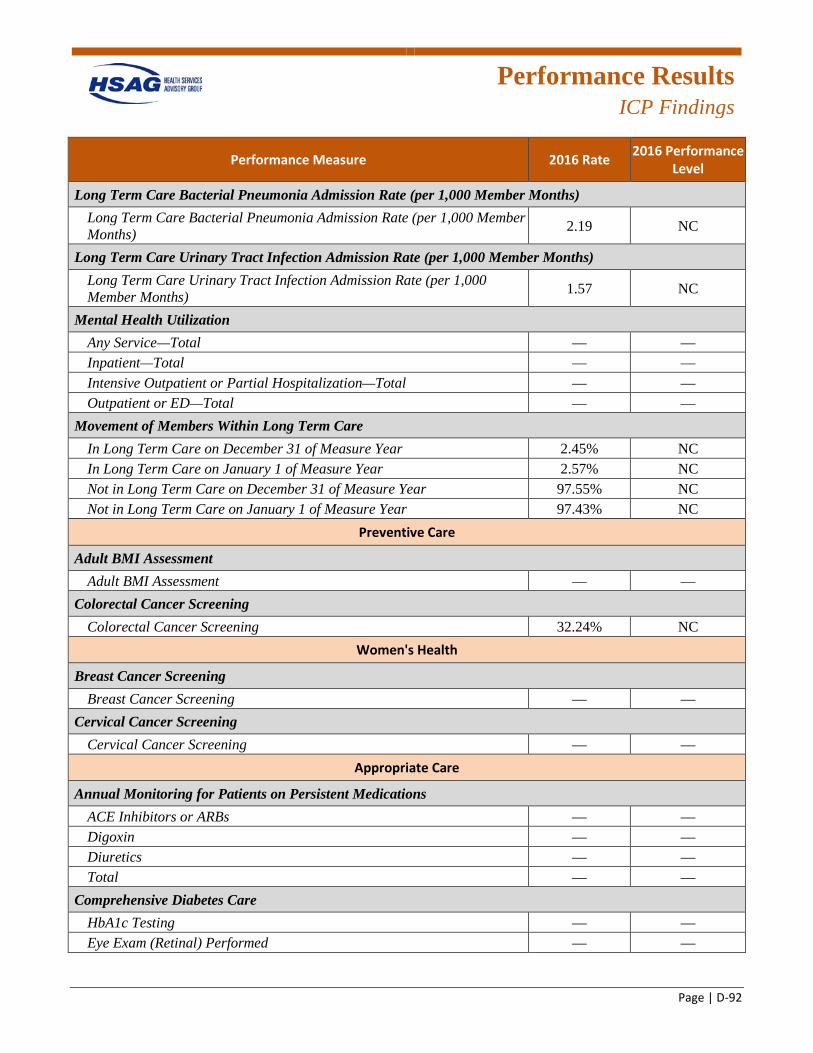
Performance Results
ICP Findings
Page | D-92
Performance Measure 2016 Rate 2016 Performance Level
Long Term Care Bacterial Pneumonia Admission Rate (per 1,000 Member Months) Long Term Care Bacterial Pneumonia Admission Rate (per 1,000 Member Months) 2.19 NC
Long Term Care Urinary Tract Infection Admission Rate (per 1,000 Member Months) Long Term Care Urinary Tract Infection Admission Rate (per 1,000 Member Months) 1.57 NC
Mental Health Utilization Any Service—Total — — Inpatient—Total — — Intensive Outpatient or Partial Hospitalization—Total — — Outpatient or ED—Total — —
Movement of Members Within Long Term Care In Long Term Care on December 31 of Measure Year 2.45% NC In Long Term Care on January 1 of Measure Year 2.57% NC Not in Long Term Care on December 31 of Measure Year 97.55% NC Not in Long Term Care on January 1 of Measure Year 97.43% NC
Preventive Care
Adult BMI Assessment Adult BMI Assessment — —
Colorectal Cancer Screening Colorectal Cancer Screening 32.24% NC
Women's Health
Breast Cancer Screening Breast Cancer Screening — —
Cervical Cancer Screening Cervical Cancer Screening — —
Appropriate Care
Annual Monitoring for Patients on Persistent Medications ACE Inhibitors or ARBs — — Digoxin — — Diuretics — — Total — —
Comprehensive Diabetes Care HbA1c Testing — — Eye Exam (Retinal) Performed — —
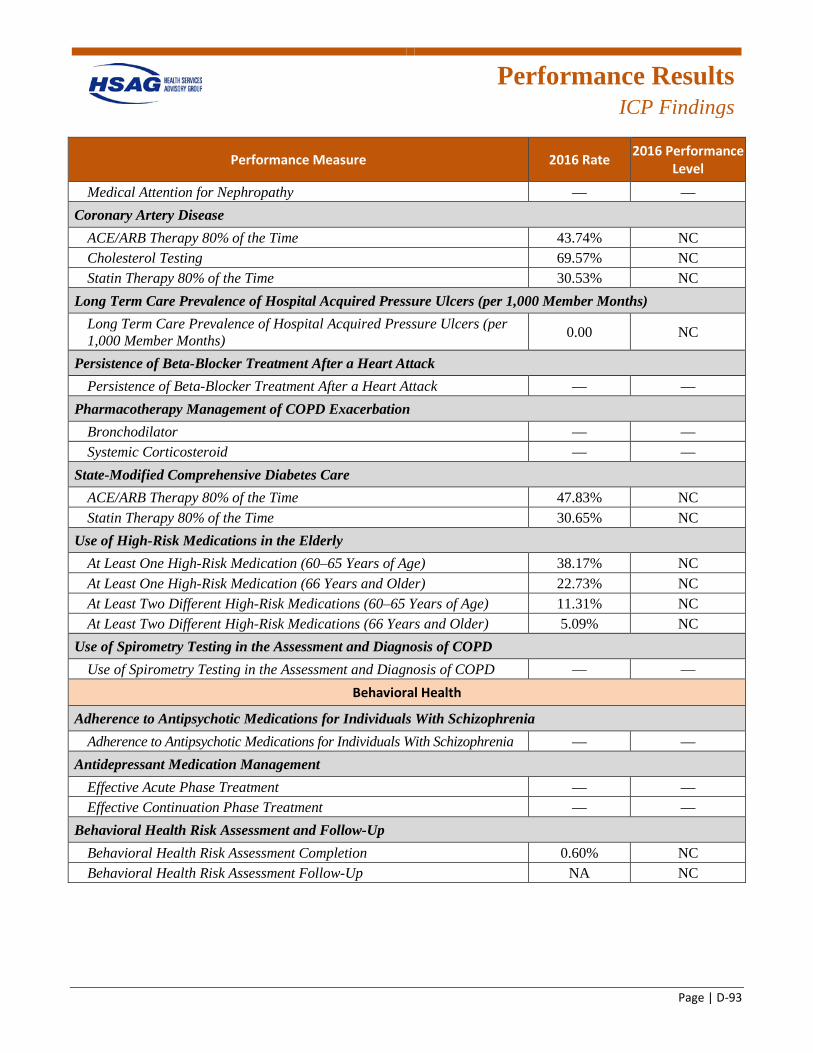
Performance Results
ICP Findings
Page | D-93
Performance Measure 2016 Rate 2016 Performance Level
Medical Attention for Nephropathy — — Coronary Artery Disease
ACE/ARB Therapy 80% of the Time 43.74% NC Cholesterol Testing 69.57% NC Statin Therapy 80% of the Time 30.53% NC
Long Term Care Prevalence of Hospital Acquired Pressure Ulcers (per 1,000 Member Months) Long Term Care Prevalence of Hospital Acquired Pressure Ulcers (per 1,000 Member Months) 0.00 NC
Persistence of Beta-Blocker Treatment After a Heart Attack Persistence of Beta-Blocker Treatment After a Heart Attack — —
Pharmacotherapy Management of COPD Exacerbation Bronchodilator — — Systemic Corticosteroid — —
State-Modified Comprehensive Diabetes Care ACE/ARB Therapy 80% of the Time 47.83% NC Statin Therapy 80% of the Time 30.65% NC
Use of High-Risk Medications in the Elderly At Least One High-Risk Medication (60–65 Years of Age) 38.17% NC At Least One High-Risk Medication (66 Years and Older) 22.73% NC At Least Two Different High-Risk Medications (60–65 Years of Age) 11.31% NC At Least Two Different High-Risk Medications (66 Years and Older) 5.09% NC
Use of Spirometry Testing in the Assessment and Diagnosis of COPD Use of Spirometry Testing in the Assessment and Diagnosis of COPD — —
Behavioral Health
Adherence to Antipsychotic Medications for Individuals With Schizophrenia Adherence to Antipsychotic Medications for Individuals With Schizophrenia — —
Antidepressant Medication Management Effective Acute Phase Treatment — — Effective Continuation Phase Treatment — —
Behavioral Health Risk Assessment and Follow-Up Behavioral Health Risk Assessment Completion 0.60% NC Behavioral Health Risk Assessment Follow-Up NA NC
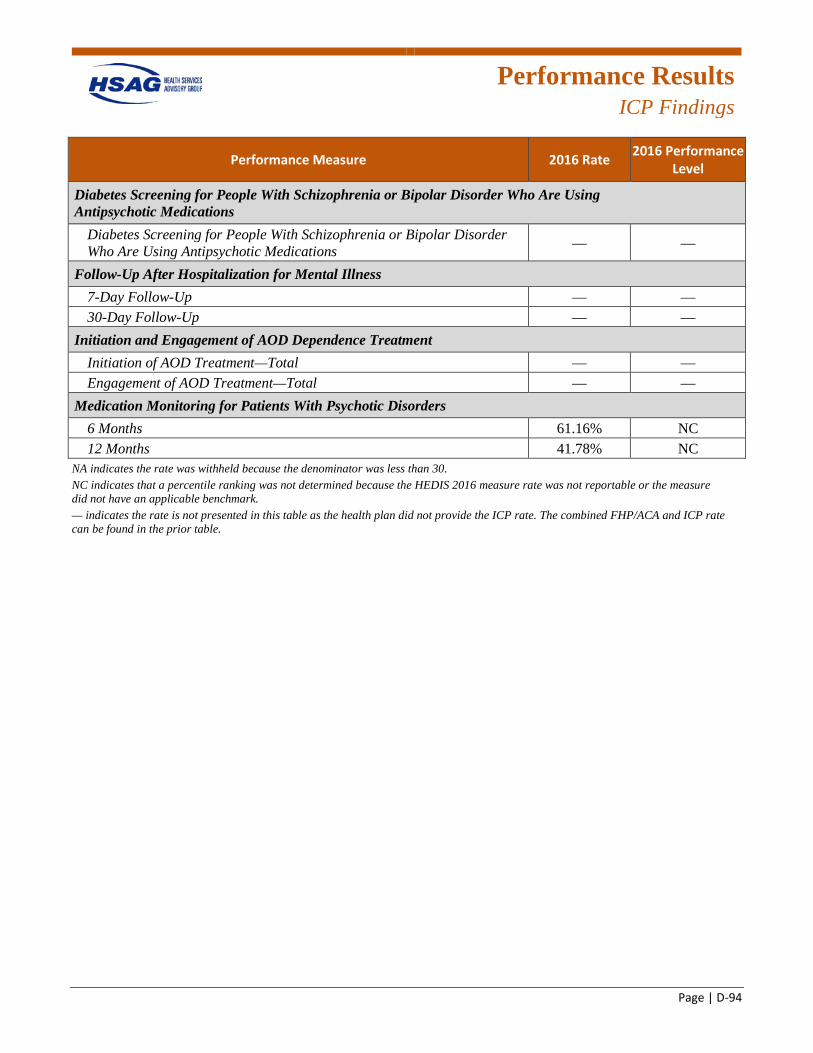
Performance Results
ICP Findings
Page | D-94
Performance Measure 2016 Rate 2016 Performance Level
Diabetes Screening for People With Schizophrenia or Bipolar Disorder Who Are Using Antipsychotic Medications
Diabetes Screening for People With Schizophrenia or Bipolar Disorder Who Are Using Antipsychotic Medications — —
Follow-Up After Hospitalization for Mental Illness 7-Day Follow-Up — — 30-Day Follow-Up — —
Initiation and Engagement of AOD Dependence Treatment Initiation of AOD Treatment—Total — — Engagement of AOD Treatment—Total — —
Medication Monitoring for Patients With Psychotic Disorders 6 Months 61.16% NC 12 Months 41.78% NC
NA indicates the rate was withheld because the denominator was less than 30. NC indicates that a percentile ranking was not determined because the HEDIS 2016 measure rate was not reportable or the measure did not have an applicable benchmark. — indicates the rate is not presented in this table as the health plan did not provide the ICP rate. The combined FHP/ACA and ICP rate can be found in the prior table.
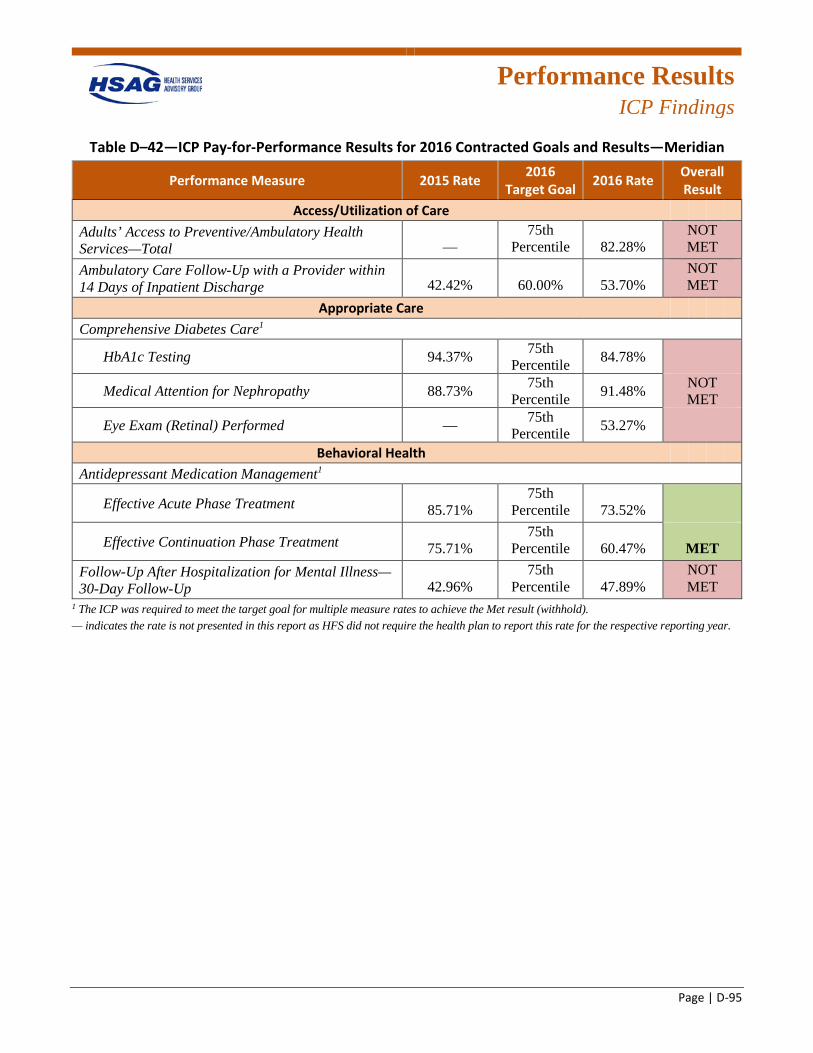
Performance Results
ICP Findings
Page | D-95
Table D–42—ICP Pay-for-Performance Results for 2016 Contracted Goals and Results—Meridian
Performance Measure 2015 Rate 2016 Target Goal 2016 Rate Overall
Result Access/Utilization of Care
Adults’ Access to Preventive/Ambulatory Health Services—Total —
75th Percentile 82.28%
NOT MET
Ambulatory Care Follow-Up with a Provider within 14 Days of Inpatient Discharge 42.42% 60.00% 53.70%
NOT MET
Appropriate Care Comprehensive Diabetes Care1
HbA1c Testing 94.37% 75th Percentile 84.78%
Medical Attention for Nephropathy 88.73% 75th Percentile 91.48% NOT
MET
Eye Exam (Retinal) Performed — 75th Percentile 53.27%
Behavioral Health Antidepressant Medication Management1
Effective Acute Phase Treatment 85.71% 75th
Percentile 73.52%
Effective Continuation Phase Treatment 75.71% 75th
Percentile 60.47% MET Follow-Up After Hospitalization for Mental Illness—30-Day Follow-Up 42.96%
75th Percentile 47.89%
NOT MET
1 The ICP was required to meet the target goal for multiple measure rates to achieve the Met result (withhold). — indicates the rate is not presented in this report as HFS did not require the health plan to report this rate for the respective reporting year.
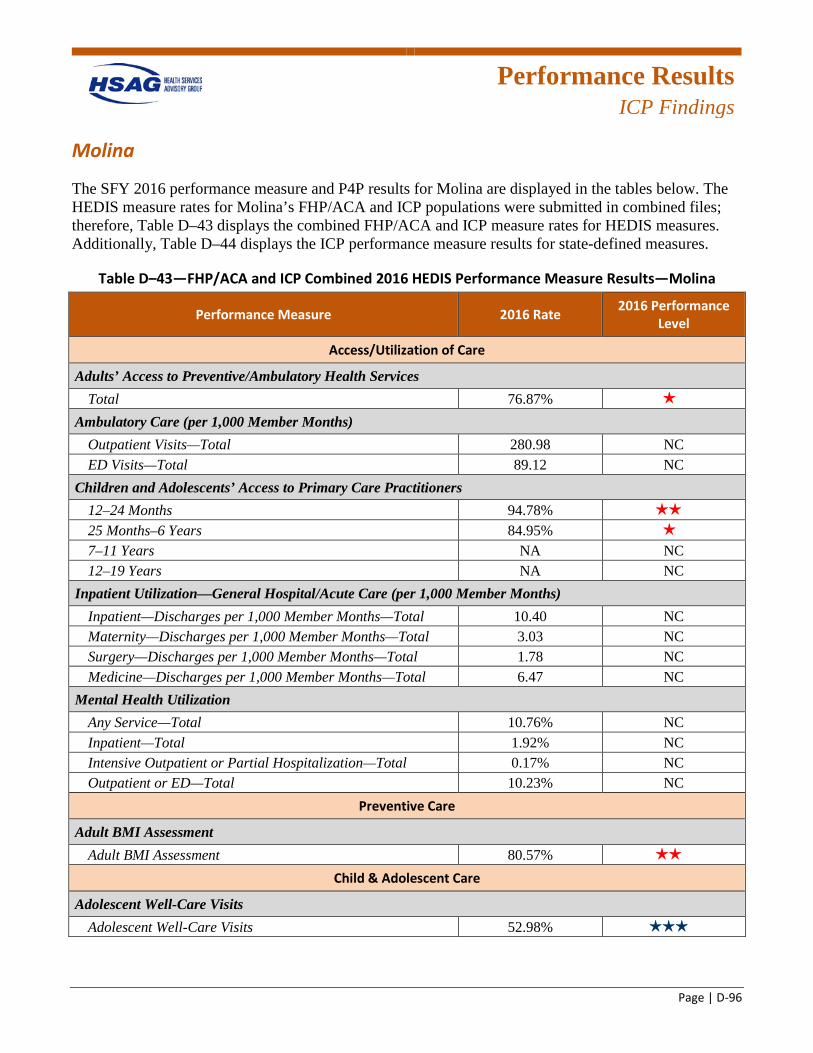
Performance Results
ICP Findings
Page | D-96
Molina
The SFY 2016 performance measure and P4P results for Molina are displayed in the tables below. The HEDIS measure rates for Molina’s FHP/ACA and ICP populations were submitted in combined files; therefore, Table D–43 displays the combined FHP/ACA and ICP measure rates for HEDIS measures. Additionally, Table D–44 displays the ICP performance measure results for state-defined measures.
Table D–43—FHP/ACA and ICP Combined 2016 HEDIS Performance Measure Results—Molina
Performance Measure 2016 Rate 2016 Performance Level
Access/Utilization of Care
Adults’ Access to Preventive/Ambulatory Health Services Total 76.87% 1 star
Ambulatory Care (per 1,000 Member Months) Outpatient Visits—Total 280.98 NC ED Visits—Total 89.12 NC
Children and Adolescents’ Access to Primary Care Practitioners 12–24 Months 94.78% 2 stars
25 Months–6 Years 84.95% 1 star
7–11 Years NA NC 12–19 Years NA NC
Inpatient Utilization—General Hospital/Acute Care (per 1,000 Member Months) Inpatient—Discharges per 1,000 Member Months—Total 10.40 NC Maternity—Discharges per 1,000 Member Months—Total 3.03 NC Surgery—Discharges per 1,000 Member Months—Total 1.78 NC Medicine—Discharges per 1,000 Member Months—Total 6.47 NC
Mental Health Utilization Any Service—Total 10.76% NC Inpatient—Total 1.92% NC Intensive Outpatient or Partial Hospitalization—Total 0.17% NC Outpatient or ED—Total 10.23% NC
Preventive Care
Adult BMI Assessment Adult BMI Assessment 80.57% 2 stars
Child & Adolescent Care
Adolescent Well-Care Visits Adolescent Well-Care Visits 52.98% 3 stars
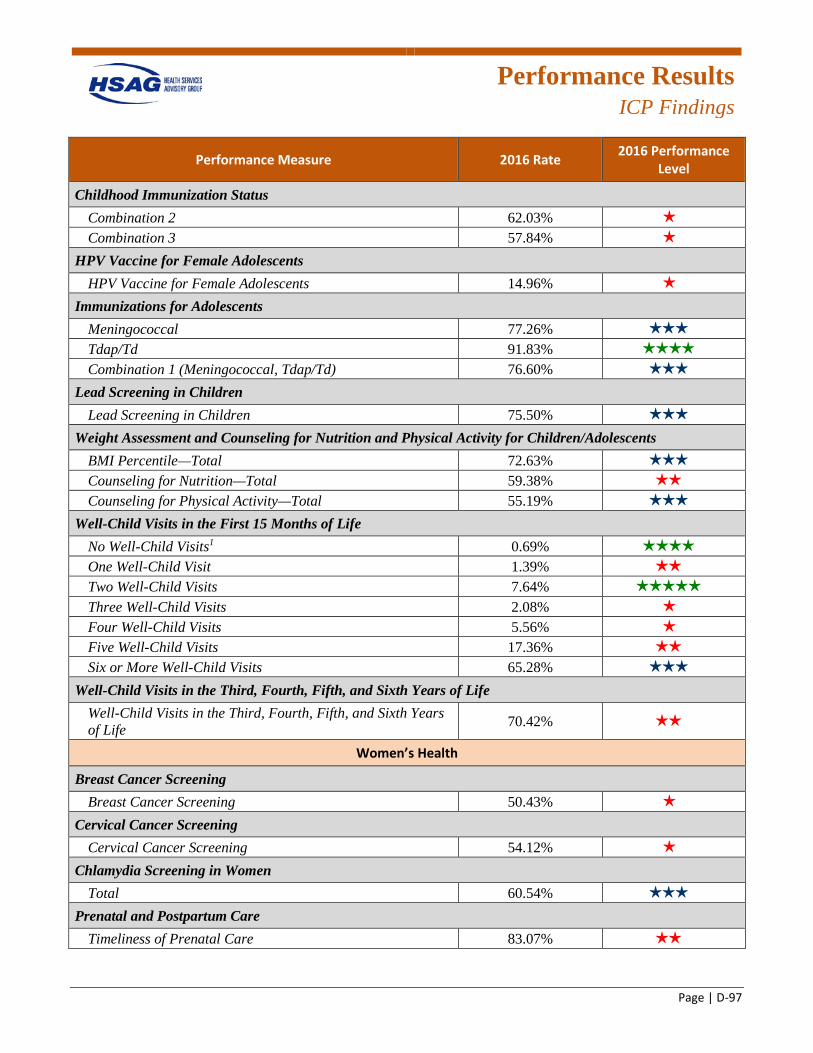
Performance Results
ICP Findings
Page | D-97
Performance Measure 2016 Rate 2016 Performance Level
Childhood Immunization Status Combination 2 62.03% 1 star
Combination 3 57.84% 1 star
HPV Vaccine for Female Adolescents HPV Vaccine for Female Adolescents 14.96% 1 star
Immunizations for Adolescents Meningococcal 77.26% 3 stars
Tdap/Td 91.83% 4 stars
Combination 1 (Meningococcal, Tdap/Td) 76.60% 3 stars
Lead Screening in Children Lead Screening in Children 75.50% 3 stars
Weight Assessment and Counseling for Nutrition and Physical Activity for Children/Adolescents BMI Percentile—Total 72.63% 3 stars
Counseling for Nutrition—Total 59.38% 2 stars
Counseling for Physical Activity—Total 55.19% 3 stars
Well-Child Visits in the First 15 Months of Life No Well-Child Visits1 0.69% 4 stars
One Well-Child Visit 1.39% 2 stars
Two Well-Child Visits 7.64% 5 stars
Three Well-Child Visits 2.08% 1 star
Four Well-Child Visits 5.56% 1 star
Five Well-Child Visits 17.36% 2 stars
Six or More Well-Child Visits 65.28% 3 stars
Well-Child Visits in the Third, Fourth, Fifth, and Sixth Years of Life Well-Child Visits in the Third, Fourth, Fifth, and Sixth Years of Life 70.42% 2 stars
Women’s Health
Breast Cancer Screening Breast Cancer Screening 50.43% 1 star
Cervical Cancer Screening Cervical Cancer Screening 54.12% 1 star
Chlamydia Screening in Women Total 60.54% 3 stars
Prenatal and Postpartum Care Timeliness of Prenatal Care 83.07% 2 stars
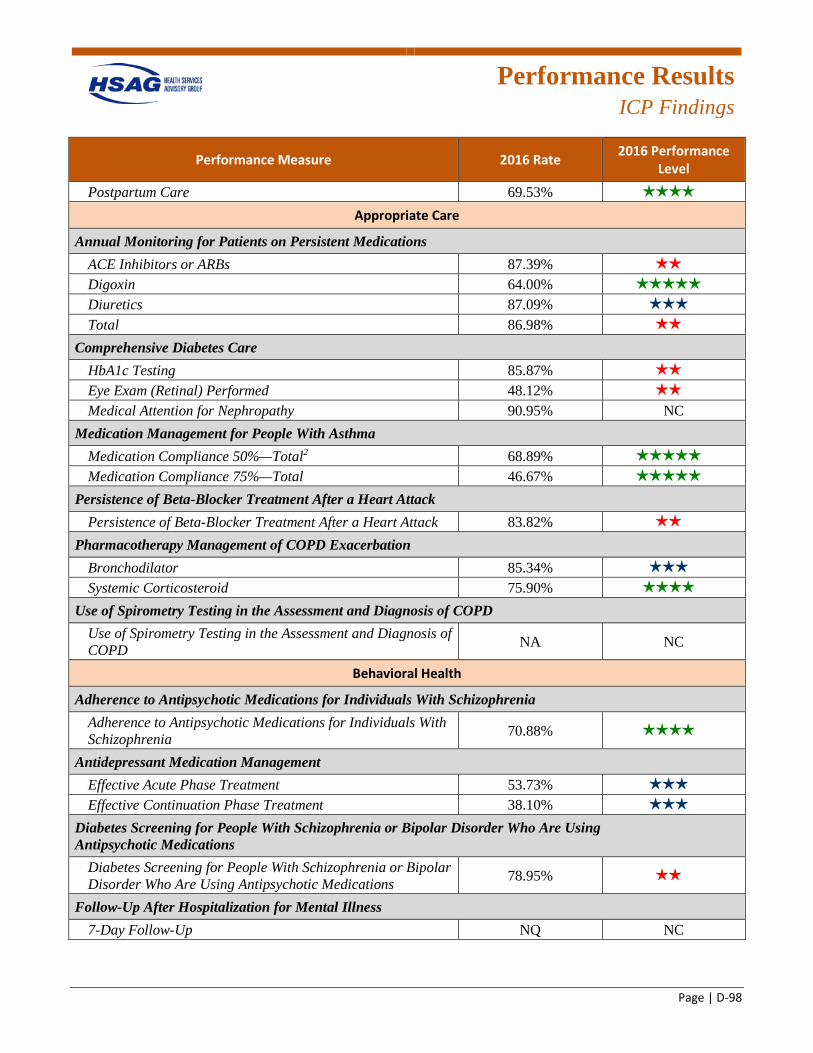
Performance Results
ICP Findings
Page | D-98
Performance Measure 2016 Rate 2016 Performance Level
Postpartum Care 69.53% 4 stars
Appropriate Care
Annual Monitoring for Patients on Persistent Medications ACE Inhibitors or ARBs 87.39% 2 stars
Digoxin 64.00% 5 stars
Diuretics 87.09% 3 stars
Total 86.98% 2 stars
Comprehensive Diabetes Care HbA1c Testing 85.87% 2 stars
Eye Exam (Retinal) Performed 48.12% 2 stars
Medical Attention for Nephropathy 90.95% NC Medication Management for People With Asthma
Medication Compliance 50%—Total2 68.89% 5 stars
Medication Compliance 75%—Total 46.67% 5 stars
Persistence of Beta-Blocker Treatment After a Heart Attack Persistence of Beta-Blocker Treatment After a Heart Attack 83.82% 2 stars
Pharmacotherapy Management of COPD Exacerbation Bronchodilator 85.34% 3 stars
Systemic Corticosteroid 75.90% 4 stars
Use of Spirometry Testing in the Assessment and Diagnosis of COPD Use of Spirometry Testing in the Assessment and Diagnosis of COPD NA NC
Behavioral Health
Adherence to Antipsychotic Medications for Individuals With Schizophrenia Adherence to Antipsychotic Medications for Individuals With Schizophrenia 70.88% 4 stars
Antidepressant Medication Management Effective Acute Phase Treatment 53.73% 3 stars
Effective Continuation Phase Treatment 38.10% 3 stars
Diabetes Screening for People With Schizophrenia or Bipolar Disorder Who Are Using Antipsychotic Medications
Diabetes Screening for People With Schizophrenia or Bipolar Disorder Who Are Using Antipsychotic Medications 78.95% 2 stars
Follow-Up After Hospitalization for Mental Illness 7-Day Follow-Up NQ NC
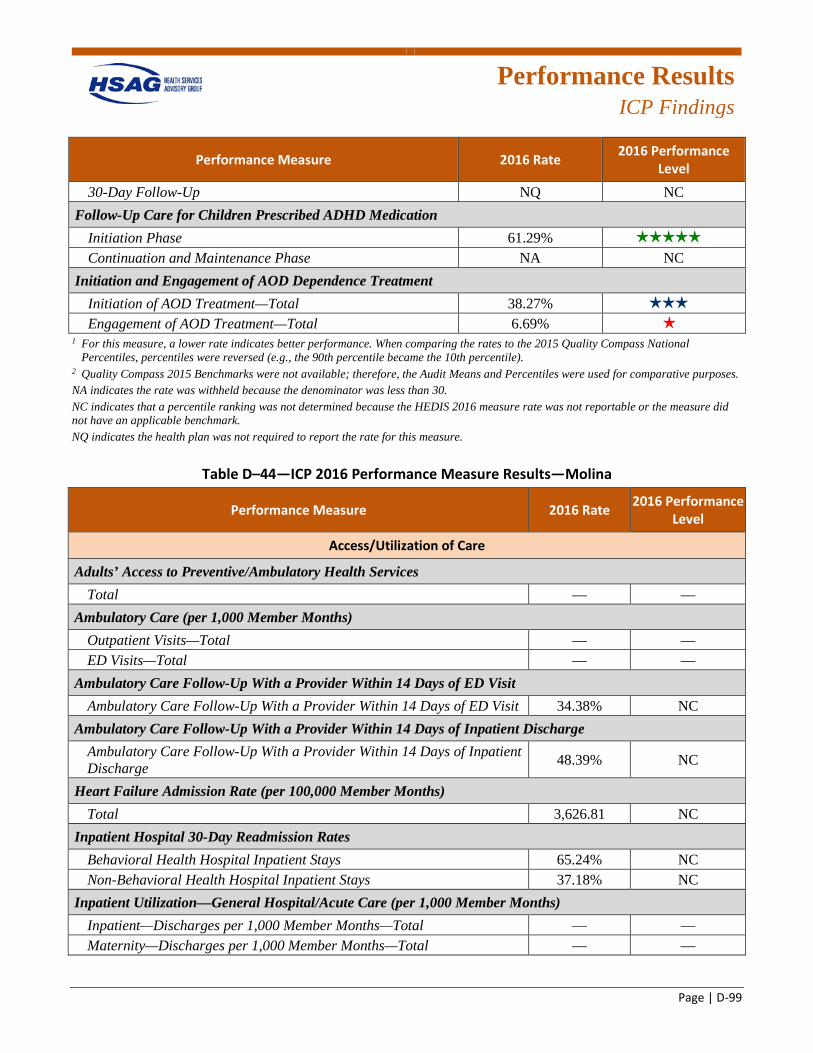
Performance Results
ICP Findings
Page | D-99
Performance Measure 2016 Rate 2016 Performance Level
30-Day Follow-Up NQ NC Follow-Up Care for Children Prescribed ADHD Medication
Initiation Phase 61.29% 5 stars
Continuation and Maintenance Phase NA NC Initiation and Engagement of AOD Dependence Treatment
Initiation of AOD Treatment—Total 38.27% 3 stars
Engagement of AOD Treatment—Total 6.69% 1 star
1 For this measure, a lower rate indicates better performance. When comparing the rates to the 2015 Quality Compass National Percentiles, percentiles were reversed (e.g., the 90th percentile became the 10th percentile).
2 Quality Compass 2015 Benchmarks were not available; therefore, the Audit Means and Percentiles were used for comparative purposes. NA indicates the rate was withheld because the denominator was less than 30. NC indicates that a percentile ranking was not determined because the HEDIS 2016 measure rate was not reportable or the measure did not have an applicable benchmark. NQ indicates the health plan was not required to report the rate for this measure.
Table D–44—ICP 2016 Performance Measure Results—Molina
Performance Measure 2016 Rate 2016 Performance Level
Access/Utilization of Care
Adults’ Access to Preventive/Ambulatory Health Services Total — —
Ambulatory Care (per 1,000 Member Months) Outpatient Visits—Total — — ED Visits—Total — —
Ambulatory Care Follow-Up With a Provider Within 14 Days of ED Visit Ambulatory Care Follow-Up With a Provider Within 14 Days of ED Visit 34.38% NC
Ambulatory Care Follow-Up With a Provider Within 14 Days of Inpatient Discharge Ambulatory Care Follow-Up With a Provider Within 14 Days of Inpatient Discharge 48.39% NC
Heart Failure Admission Rate (per 100,000 Member Months) Total 3,626.81 NC
Inpatient Hospital 30-Day Readmission Rates Behavioral Health Hospital Inpatient Stays 65.24% NC Non-Behavioral Health Hospital Inpatient Stays 37.18% NC
Inpatient Utilization—General Hospital/Acute Care (per 1,000 Member Months) Inpatient—Discharges per 1,000 Member Months—Total — — Maternity—Discharges per 1,000 Member Months—Total — —
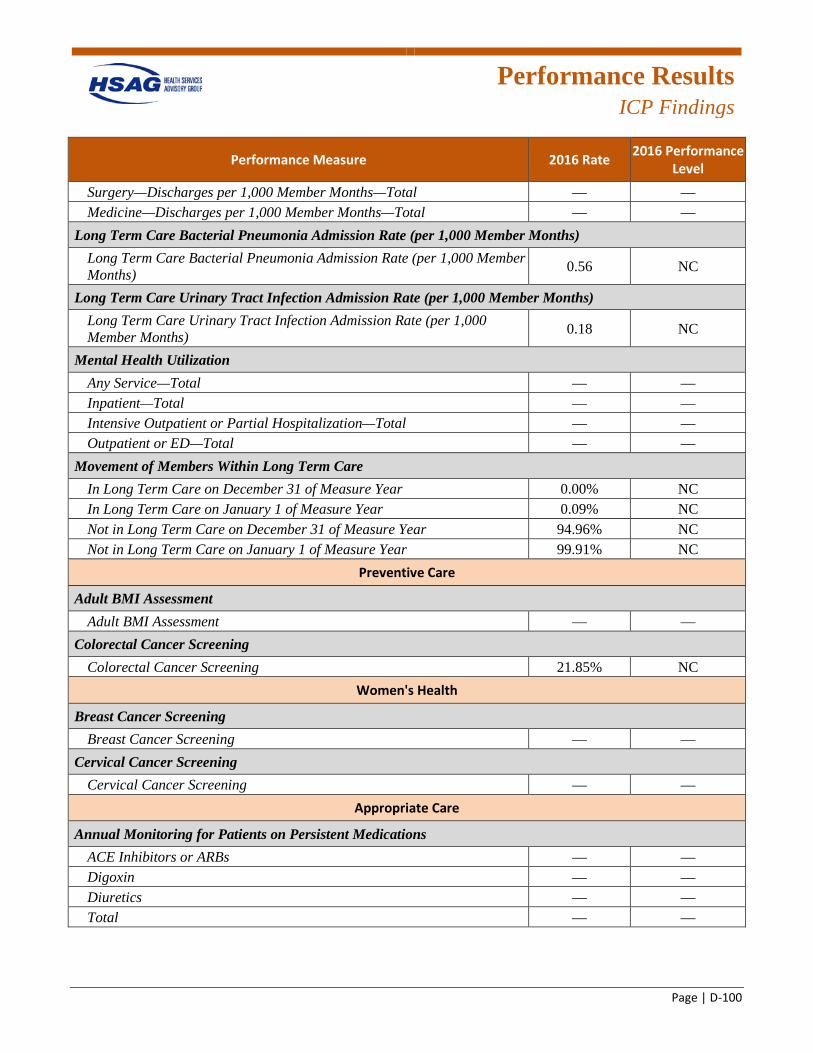
Performance Results
ICP Findings
Page | D-100
Performance Measure 2016 Rate 2016 Performance Level
Surgery—Discharges per 1,000 Member Months—Total — — Medicine—Discharges per 1,000 Member Months—Total — —
Long Term Care Bacterial Pneumonia Admission Rate (per 1,000 Member Months) Long Term Care Bacterial Pneumonia Admission Rate (per 1,000 Member Months) 0.56 NC
Long Term Care Urinary Tract Infection Admission Rate (per 1,000 Member Months) Long Term Care Urinary Tract Infection Admission Rate (per 1,000 Member Months) 0.18 NC
Mental Health Utilization Any Service—Total — — Inpatient—Total — — Intensive Outpatient or Partial Hospitalization—Total — — Outpatient or ED—Total — —
Movement of Members Within Long Term Care In Long Term Care on December 31 of Measure Year 0.00% NC In Long Term Care on January 1 of Measure Year 0.09% NC Not in Long Term Care on December 31 of Measure Year 94.96% NC Not in Long Term Care on January 1 of Measure Year 99.91% NC
Preventive Care
Adult BMI Assessment Adult BMI Assessment — —
Colorectal Cancer Screening Colorectal Cancer Screening 21.85% NC
Women's Health
Breast Cancer Screening Breast Cancer Screening — —
Cervical Cancer Screening Cervical Cancer Screening — —
Appropriate Care
Annual Monitoring for Patients on Persistent Medications ACE Inhibitors or ARBs — — Digoxin — — Diuretics — — Total — —
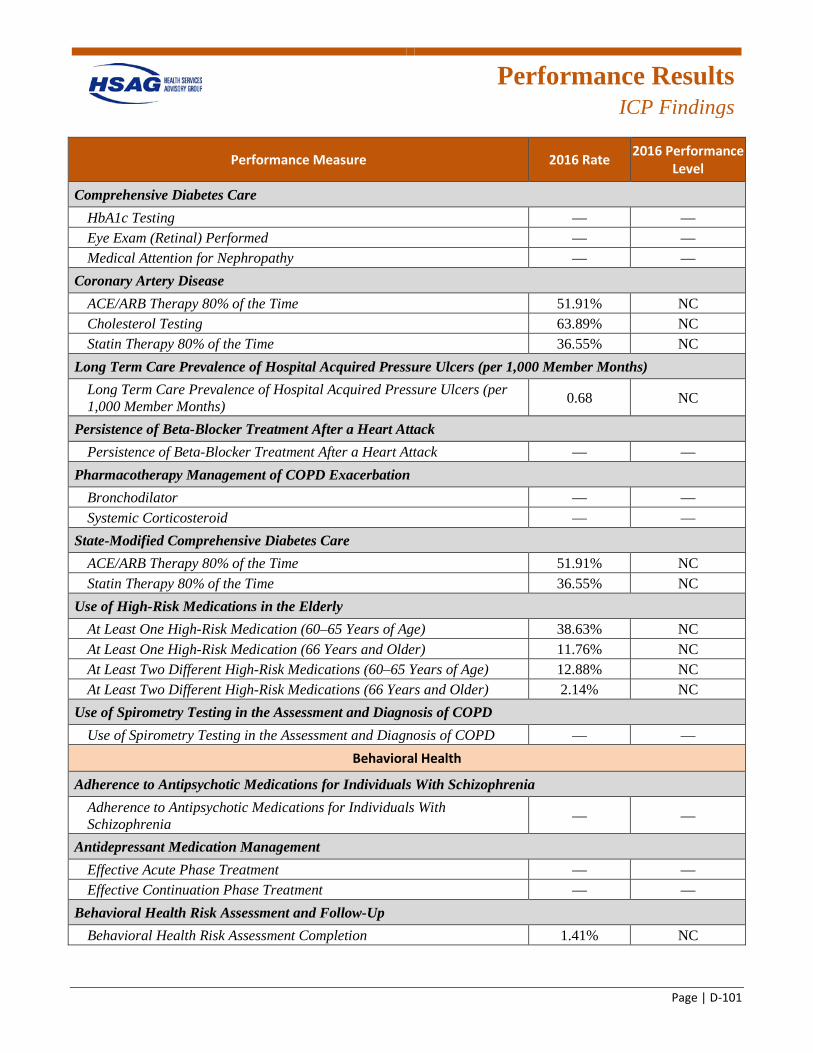
Performance Results
ICP Findings
Page | D-101
Performance Measure 2016 Rate 2016 Performance Level
Comprehensive Diabetes Care HbA1c Testing — — Eye Exam (Retinal) Performed — — Medical Attention for Nephropathy — —
Coronary Artery Disease ACE/ARB Therapy 80% of the Time 51.91% NC Cholesterol Testing 63.89% NC Statin Therapy 80% of the Time 36.55% NC
Long Term Care Prevalence of Hospital Acquired Pressure Ulcers (per 1,000 Member Months) Long Term Care Prevalence of Hospital Acquired Pressure Ulcers (per 1,000 Member Months) 0.68 NC
Persistence of Beta-Blocker Treatment After a Heart Attack Persistence of Beta-Blocker Treatment After a Heart Attack — —
Pharmacotherapy Management of COPD Exacerbation Bronchodilator — — Systemic Corticosteroid — —
State-Modified Comprehensive Diabetes Care ACE/ARB Therapy 80% of the Time 51.91% NC Statin Therapy 80% of the Time 36.55% NC
Use of High-Risk Medications in the Elderly At Least One High-Risk Medication (60–65 Years of Age) 38.63% NC At Least One High-Risk Medication (66 Years and Older) 11.76% NC At Least Two Different High-Risk Medications (60–65 Years of Age) 12.88% NC At Least Two Different High-Risk Medications (66 Years and Older) 2.14% NC
Use of Spirometry Testing in the Assessment and Diagnosis of COPD Use of Spirometry Testing in the Assessment and Diagnosis of COPD — —
Behavioral Health
Adherence to Antipsychotic Medications for Individuals With Schizophrenia Adherence to Antipsychotic Medications for Individuals With Schizophrenia — —
Antidepressant Medication Management Effective Acute Phase Treatment — — Effective Continuation Phase Treatment — —
Behavioral Health Risk Assessment and Follow-Up Behavioral Health Risk Assessment Completion 1.41% NC
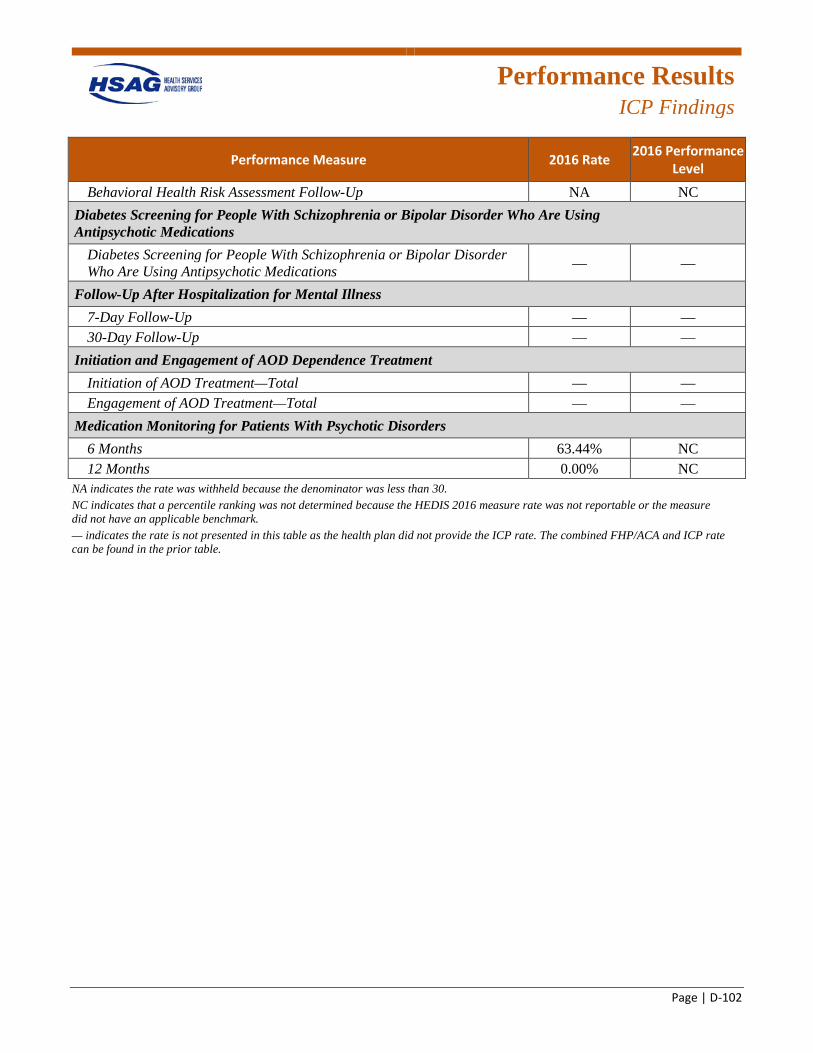
Performance Results
ICP Findings
Page | D-102
Performance Measure 2016 Rate 2016 Performance Level
Behavioral Health Risk Assessment Follow-Up NA NC Diabetes Screening for People With Schizophrenia or Bipolar Disorder Who Are Using Antipsychotic Medications
Diabetes Screening for People With Schizophrenia or Bipolar Disorder Who Are Using Antipsychotic Medications — —
Follow-Up After Hospitalization for Mental Illness 7-Day Follow-Up — — 30-Day Follow-Up — —
Initiation and Engagement of AOD Dependence Treatment Initiation of AOD Treatment—Total — — Engagement of AOD Treatment—Total — —
Medication Monitoring for Patients With Psychotic Disorders 6 Months 63.44% NC 12 Months 0.00% NC
NA indicates the rate was withheld because the denominator was less than 30. NC indicates that a percentile ranking was not determined because the HEDIS 2016 measure rate was not reportable or the measure did not have an applicable benchmark. — indicates the rate is not presented in this table as the health plan did not provide the ICP rate. The combined FHP/ACA and ICP rate can be found in the prior table.
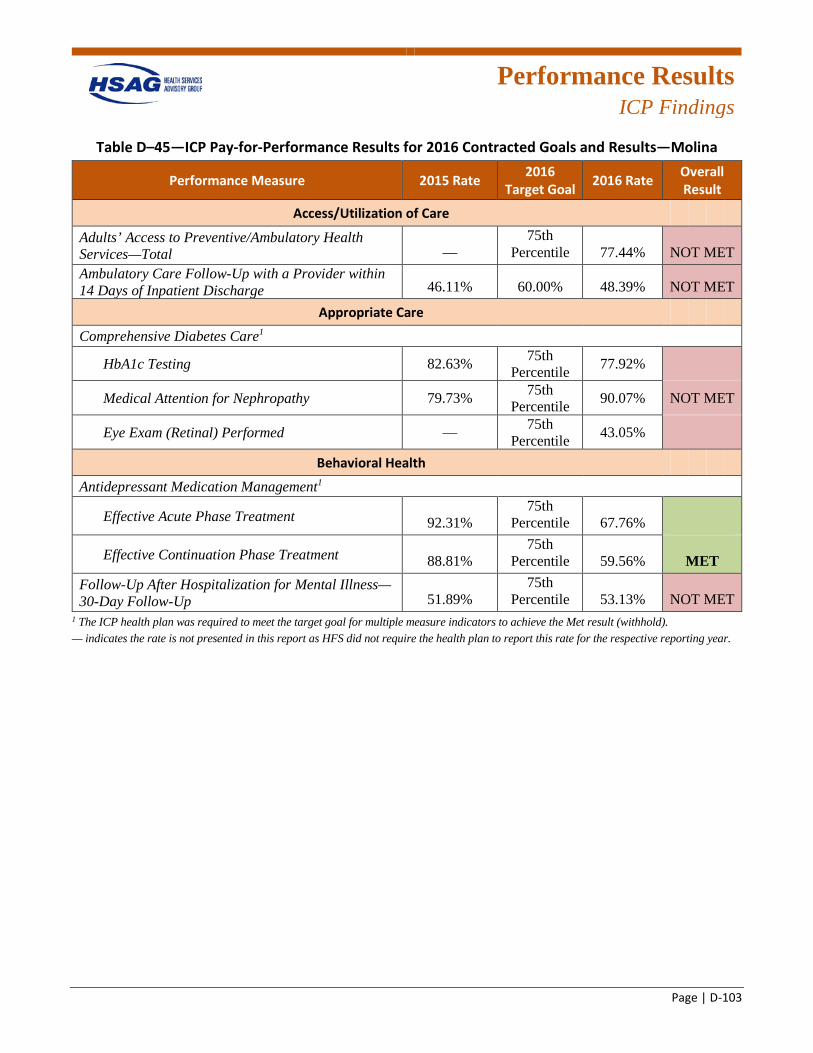
Performance Results
ICP Findings
Page | D-103
Table D–45—ICP Pay-for-Performance Results for 2016 Contracted Goals and Results—Molina
Performance Measure 2015 Rate 2016 Target Goal 2016 Rate Overall
Result
Access/Utilization of Care
Adults’ Access to Preventive/Ambulatory Health Services—Total —
75th Percentile 77.44% NOT MET
Ambulatory Care Follow-Up with a Provider within 14 Days of Inpatient Discharge 46.11% 60.00% 48.39% NOT MET
Appropriate Care
Comprehensive Diabetes Care1
HbA1c Testing 82.63% 75th Percentile 77.92%
Medical Attention for Nephropathy 79.73% 75th Percentile 90.07% NOT MET
Eye Exam (Retinal) Performed — 75th Percentile 43.05%
Behavioral Health
Antidepressant Medication Management1
Effective Acute Phase Treatment 92.31% 75th
Percentile 67.76%
Effective Continuation Phase Treatment 88.81% 75th
Percentile 59.56% MET Follow-Up After Hospitalization for Mental Illness—30-Day Follow-Up 51.89%
75th Percentile 53.13% NOT MET
1 The ICP health plan was required to meet the target goal for multiple measure indicators to achieve the Met result (withhold). — indicates the rate is not presented in this report as HFS did not require the health plan to report this rate for the respective reporting year.
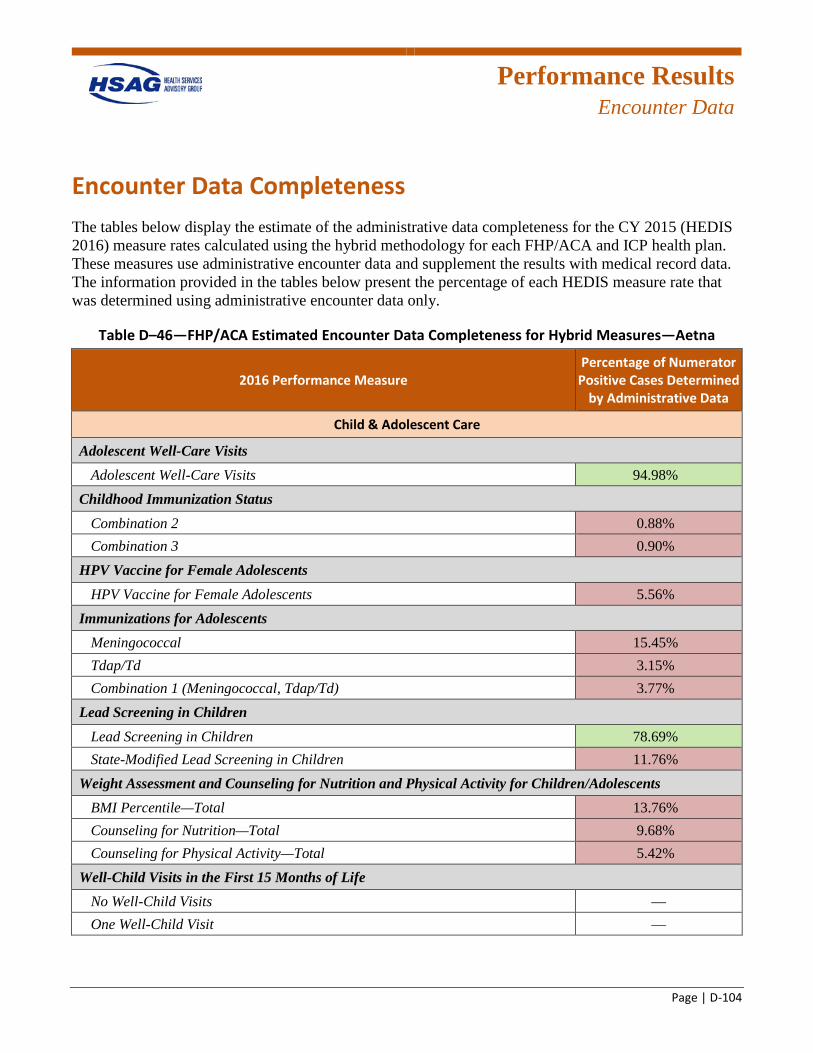
Performance Results
Encounter Data
Page | D-104
Encounter Data Completeness The tables below display the estimate of the administrative data completeness for the CY 2015 (HEDIS 2016) measure rates calculated using the hybrid methodology for each FHP/ACA and ICP health plan. These measures use administrative encounter data and supplement the results with medical record data. The information provided in the tables below present the percentage of each HEDIS measure rate that was determined using administrative encounter data only.
Table D–46—FHP/ACA Estimated Encounter Data Completeness for Hybrid Measures—Aetna
2016 Performance Measure Percentage of Numerator
Positive Cases Determined by Administrative Data
Child & Adolescent Care
Adolescent Well-Care Visits Adolescent Well-Care Visits 94.98%G
Childhood Immunization Status Combination 2 0.88%R Combination 3 0.90%R
HPV Vaccine for Female Adolescents HPV Vaccine for Female Adolescents 5.56%R
Immunizations for Adolescents Meningococcal 15.45%R Tdap/Td 3.15%R Combination 1 (Meningococcal, Tdap/Td) 3.77%R
Lead Screening in Children Lead Screening in Children 78.69%G State-Modified Lead Screening in Children 11.76%R
Weight Assessment and Counseling for Nutrition and Physical Activity for Children/Adolescents BMI Percentile—Total 13.76%R Counseling for Nutrition—Total 9.68%R Counseling for Physical Activity—Total 5.42%R
Well-Child Visits in the First 15 Months of Life No Well-Child Visits — One Well-Child Visit —
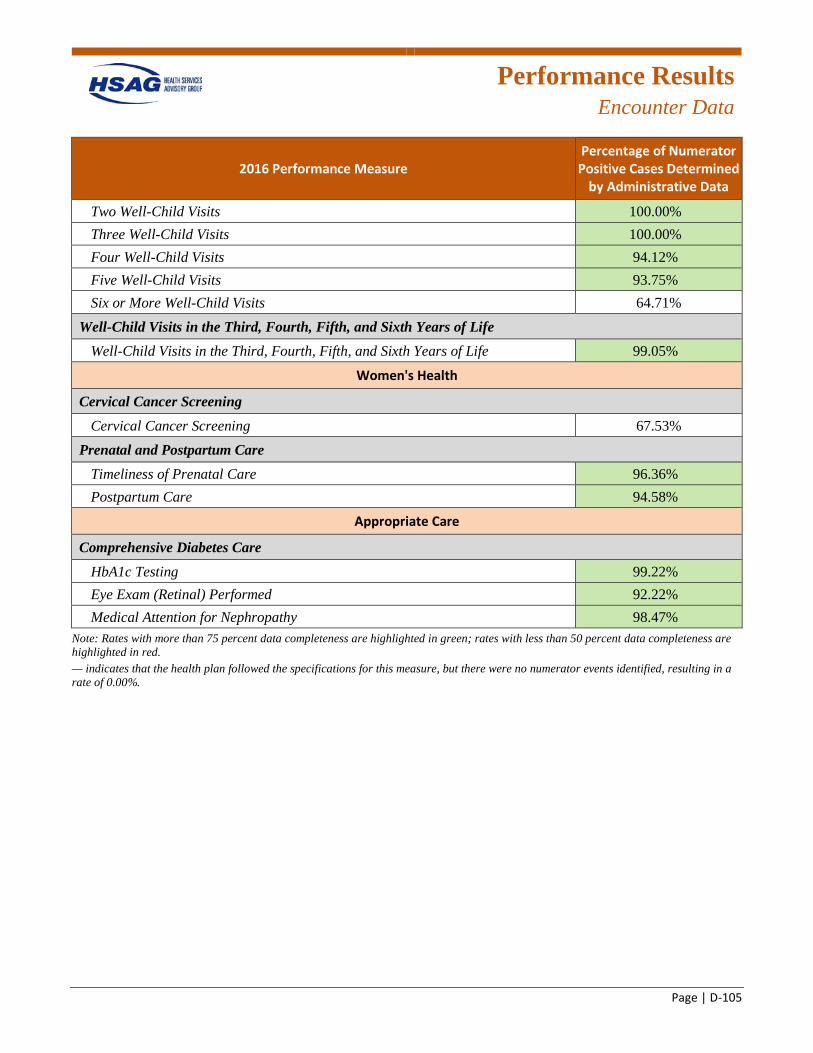
Performance Results
Encounter Data
Page | D-105
2016 Performance Measure Percentage of Numerator
Positive Cases Determined by Administrative Data
Two Well-Child Visits 100.00%G Three Well-Child Visits 100.00%G Four Well-Child Visits 94.12%G Five Well-Child Visits 93.75%G Six or More Well-Child Visits 64.71%
Well-Child Visits in the Third, Fourth, Fifth, and Sixth Years of Life Well-Child Visits in the Third, Fourth, Fifth, and Sixth Years of Life 99.05%G
Women's Health
Cervical Cancer Screening Cervical Cancer Screening 67.53%
Prenatal and Postpartum Care Timeliness of Prenatal Care 96.36%G Postpartum Care 94.58%G
Appropriate Care
Comprehensive Diabetes Care HbA1c Testing 99.22%G Eye Exam (Retinal) Performed 92.22%G Medical Attention for Nephropathy 98.47%G
Note: Rates with more than 75 percent data completeness are highlighted in green; rates with less than 50 percent data completeness are highlighted in red. — indicates that the health plan followed the specifications for this measure, but there were no numerator events identified, resulting in a rate of 0.00%.
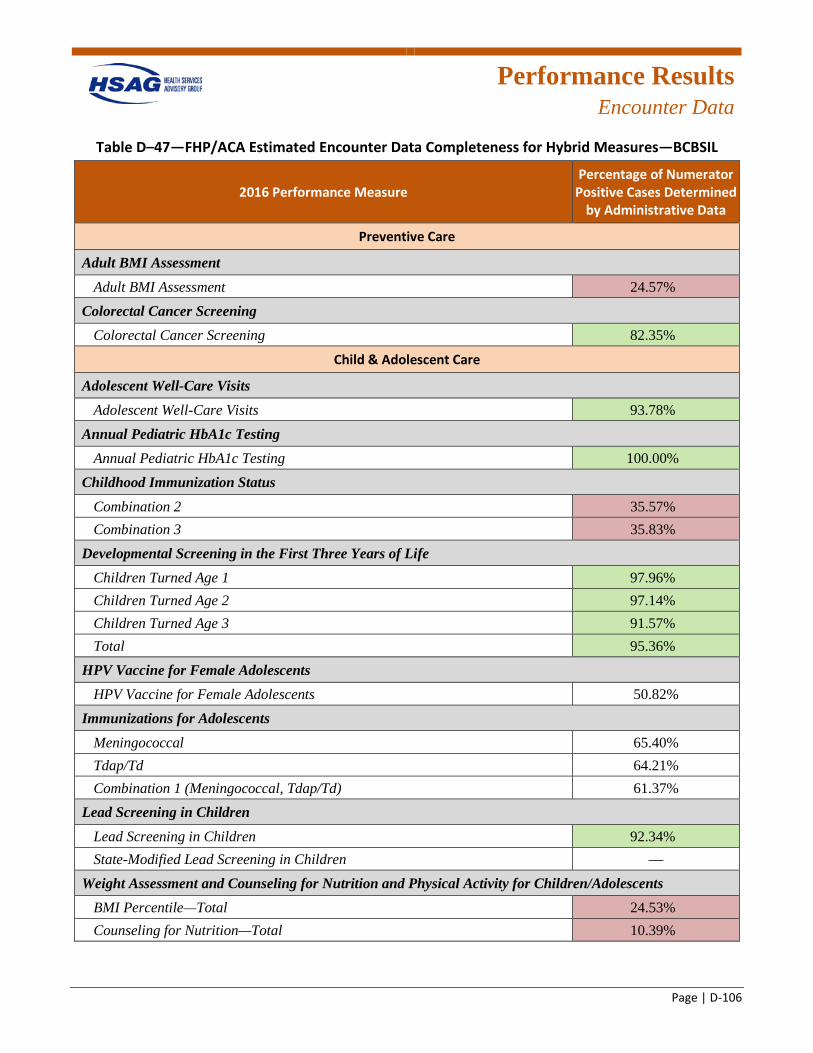
Performance Results
Encounter Data
Page | D-106
Table D–47—FHP/ACA Estimated Encounter Data Completeness for Hybrid Measures—BCBSIL
2016 Performance Measure Percentage of Numerator
Positive Cases Determined by Administrative Data
Preventive Care
Adult BMI Assessment Adult BMI Assessment 24.57%R
Colorectal Cancer Screening Colorectal Cancer Screening 82.35%G
Child & Adolescent Care
Adolescent Well-Care Visits Adolescent Well-Care Visits 93.78%G
Annual Pediatric HbA1c Testing Annual Pediatric HbA1c Testing 100.00%G
Childhood Immunization Status Combination 2 35.57%R Combination 3 35.83%R
Developmental Screening in the First Three Years of Life Children Turned Age 1 97.96%G Children Turned Age 2 97.14%G Children Turned Age 3 91.57%G Total 95.36%G
HPV Vaccine for Female Adolescents HPV Vaccine for Female Adolescents 50.82%
Immunizations for Adolescents Meningococcal 65.40% Tdap/Td 64.21% Combination 1 (Meningococcal, Tdap/Td) 61.37%
Lead Screening in Children Lead Screening in Children 92.34%G State-Modified Lead Screening in Children —
Weight Assessment and Counseling for Nutrition and Physical Activity for Children/Adolescents BMI Percentile—Total 24.53%R Counseling for Nutrition—Total 10.39%R
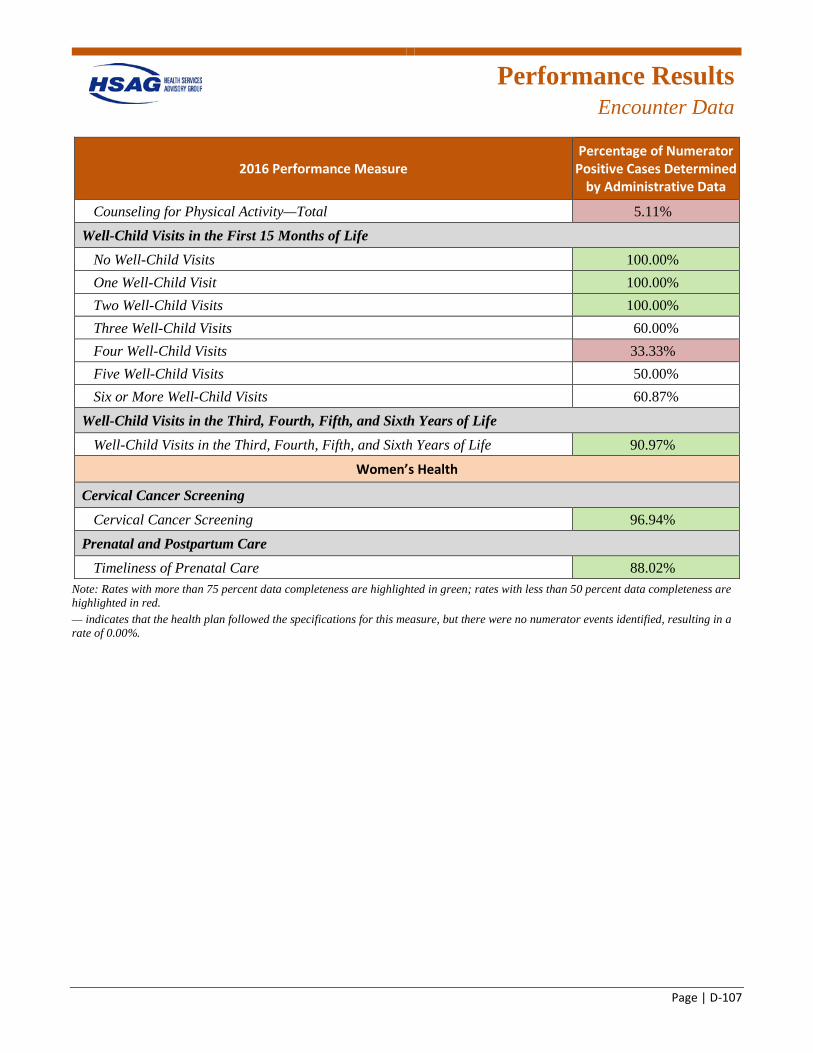
Performance Results
Encounter Data
Page | D-107
2016 Performance Measure Percentage of Numerator
Positive Cases Determined by Administrative Data
Counseling for Physical Activity—Total 5.11%R Well-Child Visits in the First 15 Months of Life
No Well-Child Visits 100.00%G One Well-Child Visit 100.00%G Two Well-Child Visits 100.00%G Three Well-Child Visits 60.00% Four Well-Child Visits 33.33%R Five Well-Child Visits 50.00% Six or More Well-Child Visits 60.87%
Well-Child Visits in the Third, Fourth, Fifth, and Sixth Years of Life Well-Child Visits in the Third, Fourth, Fifth, and Sixth Years of Life 90.97%G
Women’s Health
Cervical Cancer Screening Cervical Cancer Screening 96.94%G
Prenatal and Postpartum Care Timeliness of Prenatal Care 88.02%G
Note: Rates with more than 75 percent data completeness are highlighted in green; rates with less than 50 percent data completeness are highlighted in red. — indicates that the health plan followed the specifications for this measure, but there were no numerator events identified, resulting in a rate of 0.00%.
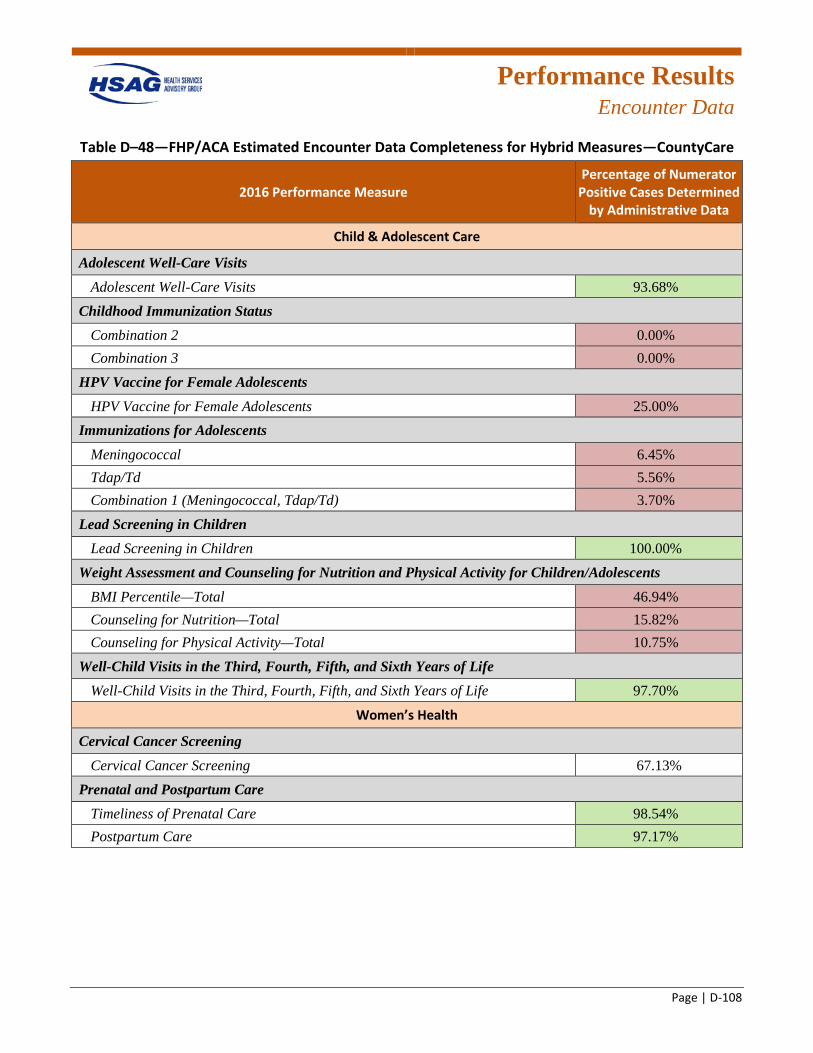
Performance Results
Encounter Data
Page | D-108
Table D–48—FHP/ACA Estimated Encounter Data Completeness for Hybrid Measures—CountyCare
2016 Performance Measure Percentage of Numerator
Positive Cases Determined by Administrative Data
Child & Adolescent Care
Adolescent Well-Care Visits Adolescent Well-Care Visits 93.68%G
Childhood Immunization Status Combination 2 0.00%R Combination 3 0.00%R
HPV Vaccine for Female Adolescents HPV Vaccine for Female Adolescents 25.00%R
Immunizations for Adolescents Meningococcal 6.45%R Tdap/Td 5.56%R Combination 1 (Meningococcal, Tdap/Td) 3.70%R
Lead Screening in Children Lead Screening in Children 100.00%G
Weight Assessment and Counseling for Nutrition and Physical Activity for Children/Adolescents BMI Percentile—Total 46.94%R Counseling for Nutrition—Total 15.82%R Counseling for Physical Activity—Total 10.75%R
Well-Child Visits in the Third, Fourth, Fifth, and Sixth Years of Life Well-Child Visits in the Third, Fourth, Fifth, and Sixth Years of Life 97.70%G
Women’s Health
Cervical Cancer Screening Cervical Cancer Screening 67.13%
Prenatal and Postpartum Care Timeliness of Prenatal Care 98.54%G Postpartum Care 97.17%G
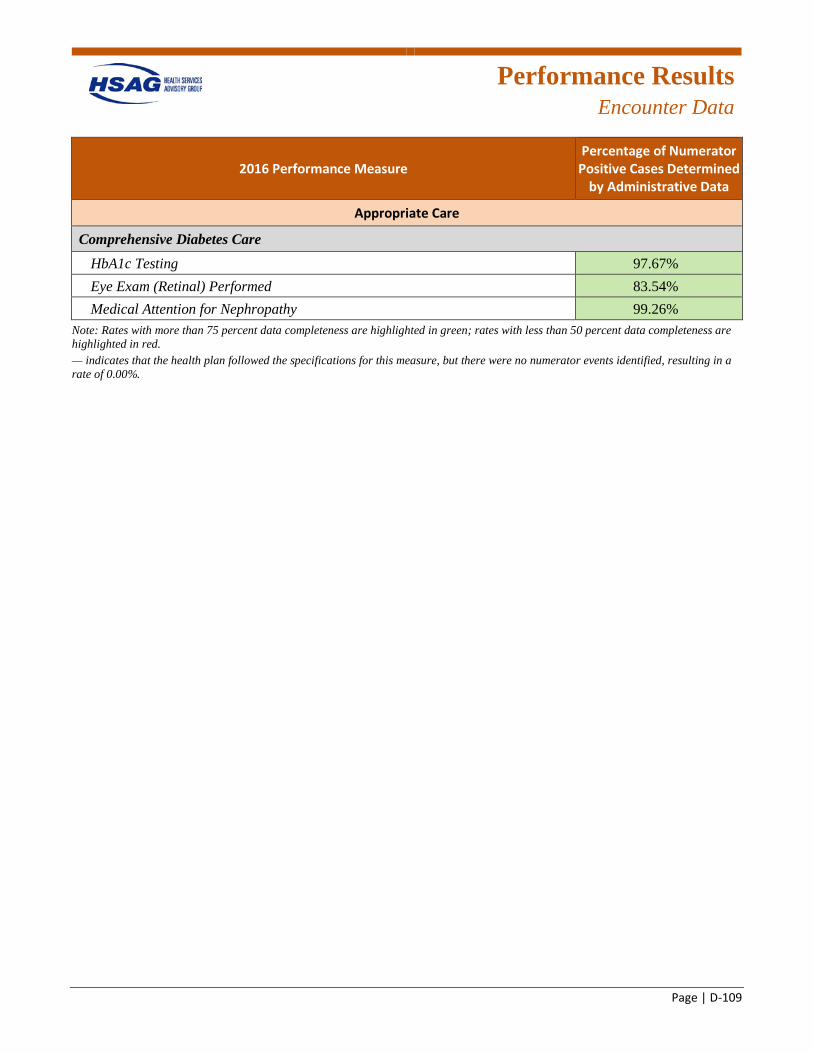
Performance Results
Encounter Data
Page | D-109
2016 Performance Measure Percentage of Numerator
Positive Cases Determined by Administrative Data
Appropriate Care
Comprehensive Diabetes Care HbA1c Testing 97.67%G Eye Exam (Retinal) Performed 83.54%G Medical Attention for Nephropathy 99.26%G
Note: Rates with more than 75 percent data completeness are highlighted in green; rates with less than 50 percent data completeness are highlighted in red. — indicates that the health plan followed the specifications for this measure, but there were no numerator events identified, resulting in a rate of 0.00%.
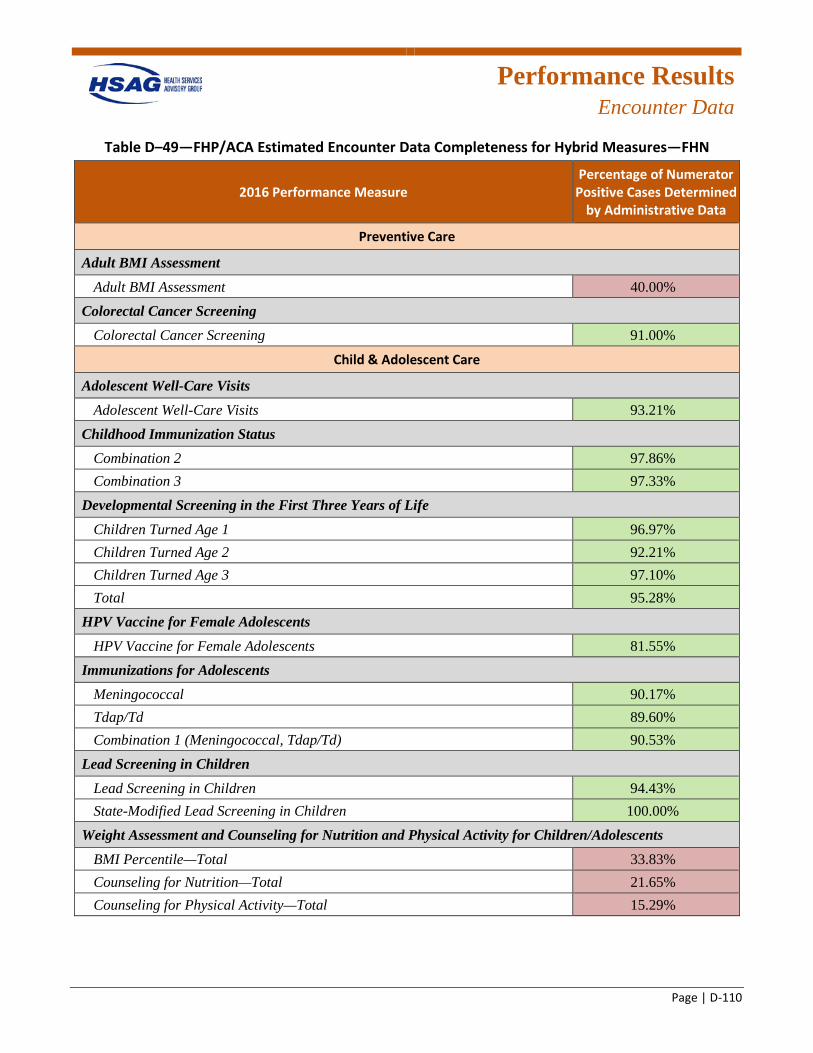
Performance Results
Encounter Data
Page | D-110
Table D–49—FHP/ACA Estimated Encounter Data Completeness for Hybrid Measures—FHN
2016 Performance Measure Percentage of Numerator
Positive Cases Determined by Administrative Data
Preventive Care
Adult BMI Assessment Adult BMI Assessment 40.00%R
Colorectal Cancer Screening Colorectal Cancer Screening 91.00%G
Child & Adolescent Care
Adolescent Well-Care Visits Adolescent Well-Care Visits 93.21%G
Childhood Immunization Status Combination 2 97.86%G Combination 3 97.33%G
Developmental Screening in the First Three Years of Life Children Turned Age 1 96.97%G Children Turned Age 2 92.21%G Children Turned Age 3 97.10%G Total 95.28%G
HPV Vaccine for Female Adolescents HPV Vaccine for Female Adolescents 81.55%G
Immunizations for Adolescents Meningococcal 90.17%G Tdap/Td 89.60%G Combination 1 (Meningococcal, Tdap/Td) 90.53%G
Lead Screening in Children Lead Screening in Children 94.43%G State-Modified Lead Screening in Children 100.00%G
Weight Assessment and Counseling for Nutrition and Physical Activity for Children/Adolescents BMI Percentile—Total 33.83%R Counseling for Nutrition—Total 21.65%R Counseling for Physical Activity—Total 15.29%R
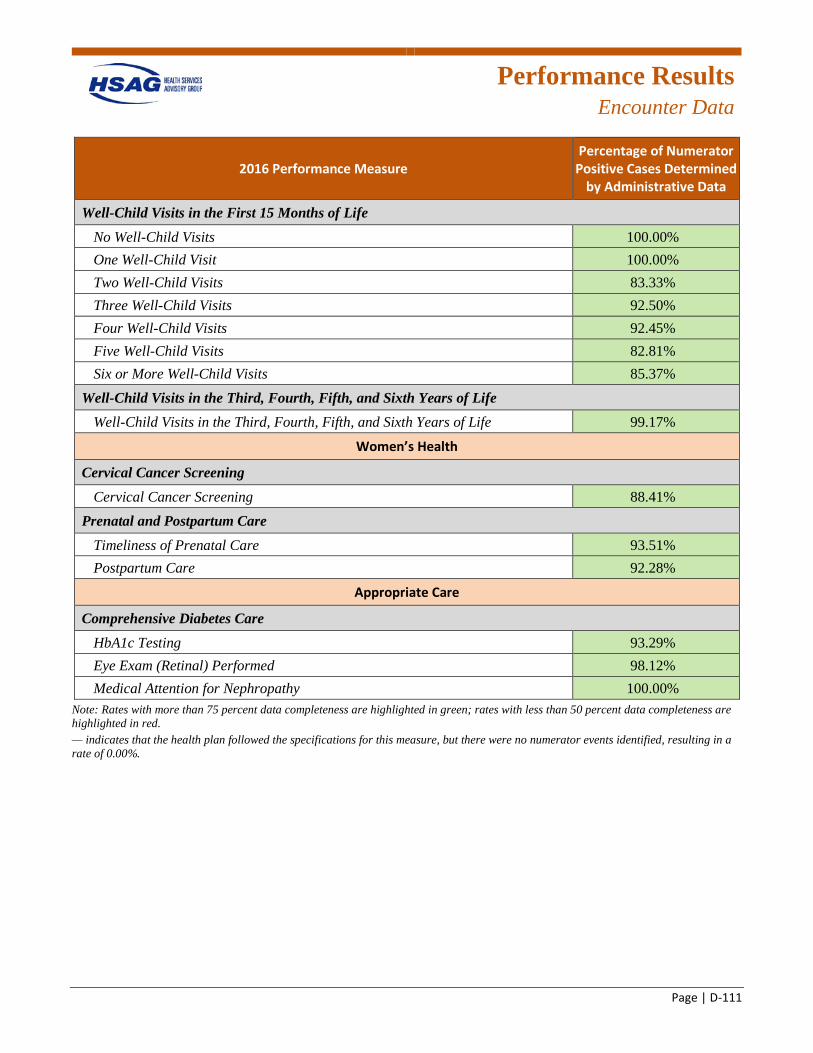
Performance Results
Encounter Data
Page | D-111
2016 Performance Measure Percentage of Numerator
Positive Cases Determined by Administrative Data
Well-Child Visits in the First 15 Months of Life No Well-Child Visits 100.00%G One Well-Child Visit 100.00%G Two Well-Child Visits 83.33%G Three Well-Child Visits 92.50%G Four Well-Child Visits 92.45%G Five Well-Child Visits 82.81%G Six or More Well-Child Visits 85.37%G
Well-Child Visits in the Third, Fourth, Fifth, and Sixth Years of Life Well-Child Visits in the Third, Fourth, Fifth, and Sixth Years of Life 99.17%G
Women’s Health
Cervical Cancer Screening Cervical Cancer Screening 88.41%G
Prenatal and Postpartum Care Timeliness of Prenatal Care 93.51%G Postpartum Care 92.28%G
Appropriate Care
Comprehensive Diabetes Care HbA1c Testing 93.29%G Eye Exam (Retinal) Performed 98.12%G Medical Attention for Nephropathy 100.00%G
Note: Rates with more than 75 percent data completeness are highlighted in green; rates with less than 50 percent data completeness are highlighted in red. — indicates that the health plan followed the specifications for this measure, but there were no numerator events identified, resulting in a rate of 0.00%.
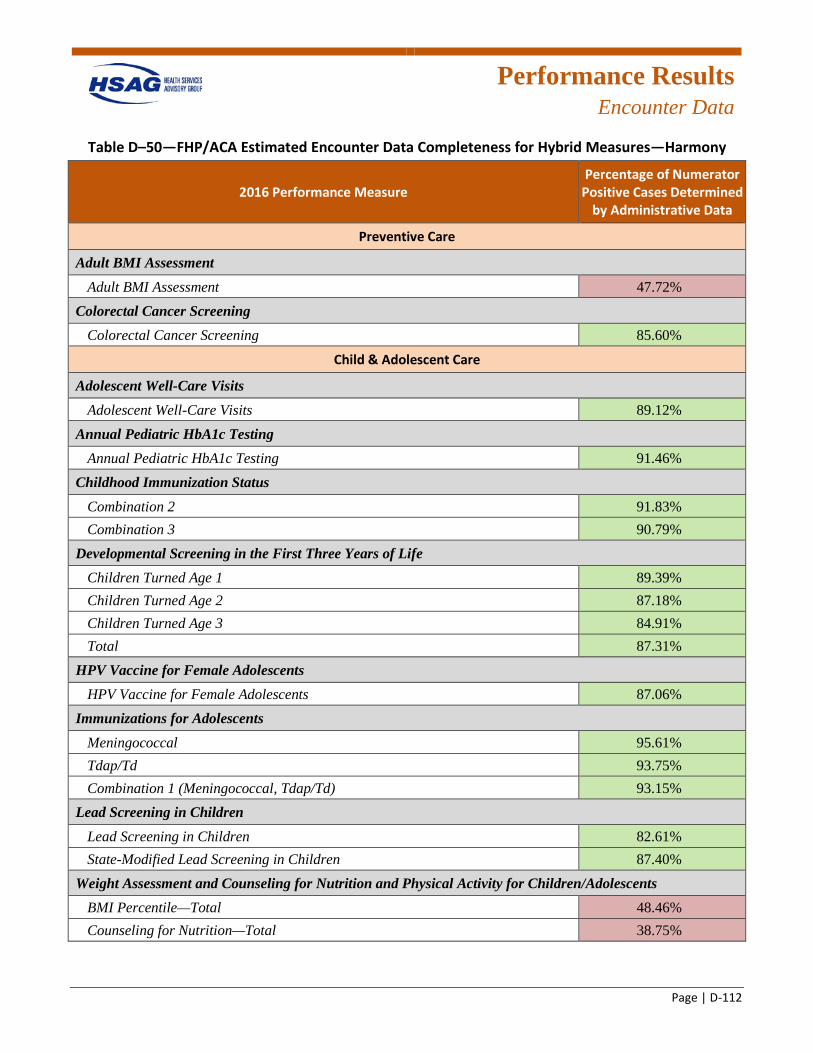
Performance Results
Encounter Data
Page | D-112
Table D–50—FHP/ACA Estimated Encounter Data Completeness for Hybrid Measures—Harmony
2016 Performance Measure Percentage of Numerator
Positive Cases Determined by Administrative Data
Preventive Care
Adult BMI Assessment Adult BMI Assessment 47.72%R
Colorectal Cancer Screening Colorectal Cancer Screening 85.60%G
Child & Adolescent Care
Adolescent Well-Care Visits Adolescent Well-Care Visits 89.12%G
Annual Pediatric HbA1c Testing Annual Pediatric HbA1c Testing 91.46%G
Childhood Immunization Status Combination 2 91.83%G Combination 3 90.79%G
Developmental Screening in the First Three Years of Life Children Turned Age 1 89.39%G Children Turned Age 2 87.18%G Children Turned Age 3 84.91%G Total 87.31%G
HPV Vaccine for Female Adolescents HPV Vaccine for Female Adolescents 87.06%G
Immunizations for Adolescents Meningococcal 95.61%G Tdap/Td 93.75%G Combination 1 (Meningococcal, Tdap/Td) 93.15%G
Lead Screening in Children Lead Screening in Children 82.61%G State-Modified Lead Screening in Children 87.40%G
Weight Assessment and Counseling for Nutrition and Physical Activity for Children/Adolescents BMI Percentile—Total 48.46%R Counseling for Nutrition—Total 38.75%R
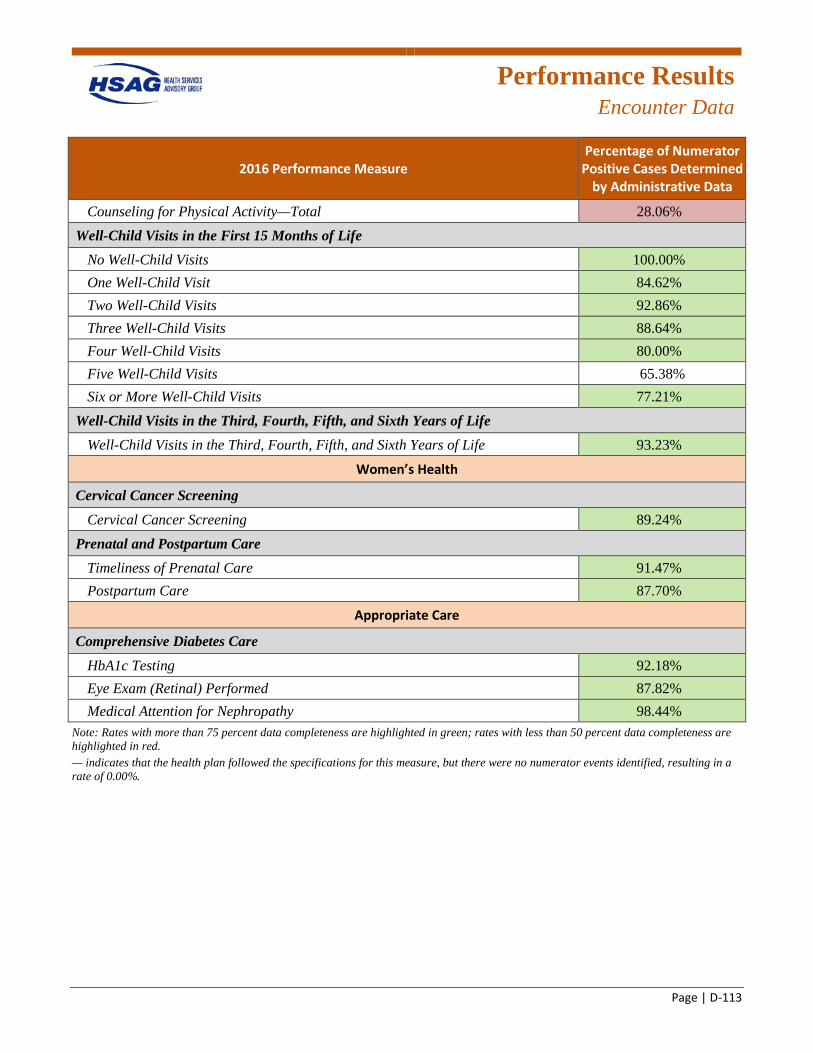
Performance Results
Encounter Data
Page | D-113
2016 Performance Measure Percentage of Numerator
Positive Cases Determined by Administrative Data
Counseling for Physical Activity—Total 28.06%R Well-Child Visits in the First 15 Months of Life
No Well-Child Visits 100.00%G One Well-Child Visit 84.62%G Two Well-Child Visits 92.86%G Three Well-Child Visits 88.64%G Four Well-Child Visits 80.00%G Five Well-Child Visits 65.38% Six or More Well-Child Visits 77.21%G
Well-Child Visits in the Third, Fourth, Fifth, and Sixth Years of Life Well-Child Visits in the Third, Fourth, Fifth, and Sixth Years of Life 93.23%G
Women’s Health
Cervical Cancer Screening Cervical Cancer Screening 89.24%G
Prenatal and Postpartum Care Timeliness of Prenatal Care 91.47%G Postpartum Care 87.70%G
Appropriate Care
Comprehensive Diabetes Care HbA1c Testing 92.18%G Eye Exam (Retinal) Performed 87.82%G Medical Attention for Nephropathy 98.44%G
Note: Rates with more than 75 percent data completeness are highlighted in green; rates with less than 50 percent data completeness are highlighted in red. — indicates that the health plan followed the specifications for this measure, but there were no numerator events identified, resulting in a rate of 0.00%.
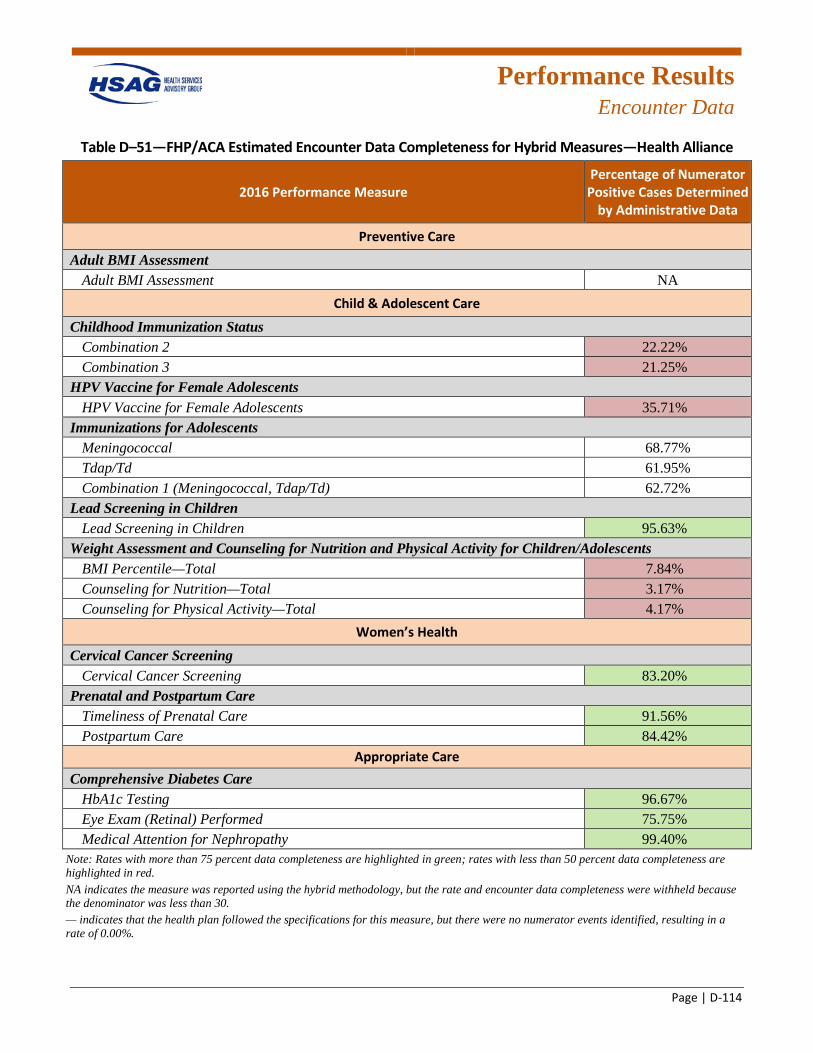
Performance Results
Encounter Data
Page | D-114
Table D–51—FHP/ACA Estimated Encounter Data Completeness for Hybrid Measures—Health Alliance
2016 Performance Measure Percentage of Numerator
Positive Cases Determined by Administrative Data
Preventive Care
Adult BMI Assessment Adult BMI Assessment NA
Child & Adolescent Care Childhood Immunization Status
Combination 2 22.22%R Combination 3 21.25%R
HPV Vaccine for Female Adolescents HPV Vaccine for Female Adolescents 35.71%R
Immunizations for Adolescents Meningococcal 68.77% Tdap/Td 61.95% Combination 1 (Meningococcal, Tdap/Td) 62.72%
Lead Screening in Children Lead Screening in Children 95.63%G
Weight Assessment and Counseling for Nutrition and Physical Activity for Children/Adolescents BMI Percentile—Total 7.84%R Counseling for Nutrition—Total 3.17%R Counseling for Physical Activity—Total 4.17%R
Women’s Health Cervical Cancer Screening
Cervical Cancer Screening 83.20%G Prenatal and Postpartum Care
Timeliness of Prenatal Care 91.56%G Postpartum Care 84.42%G
Appropriate Care Comprehensive Diabetes Care
HbA1c Testing 96.67%G Eye Exam (Retinal) Performed 75.75%G Medical Attention for Nephropathy 99.40%G
Note: Rates with more than 75 percent data completeness are highlighted in green; rates with less than 50 percent data completeness are highlighted in red. NA indicates the measure was reported using the hybrid methodology, but the rate and encounter data completeness were withheld because the denominator was less than 30. — indicates that the health plan followed the specifications for this measure, but there were no numerator events identified, resulting in a rate of 0.00%.
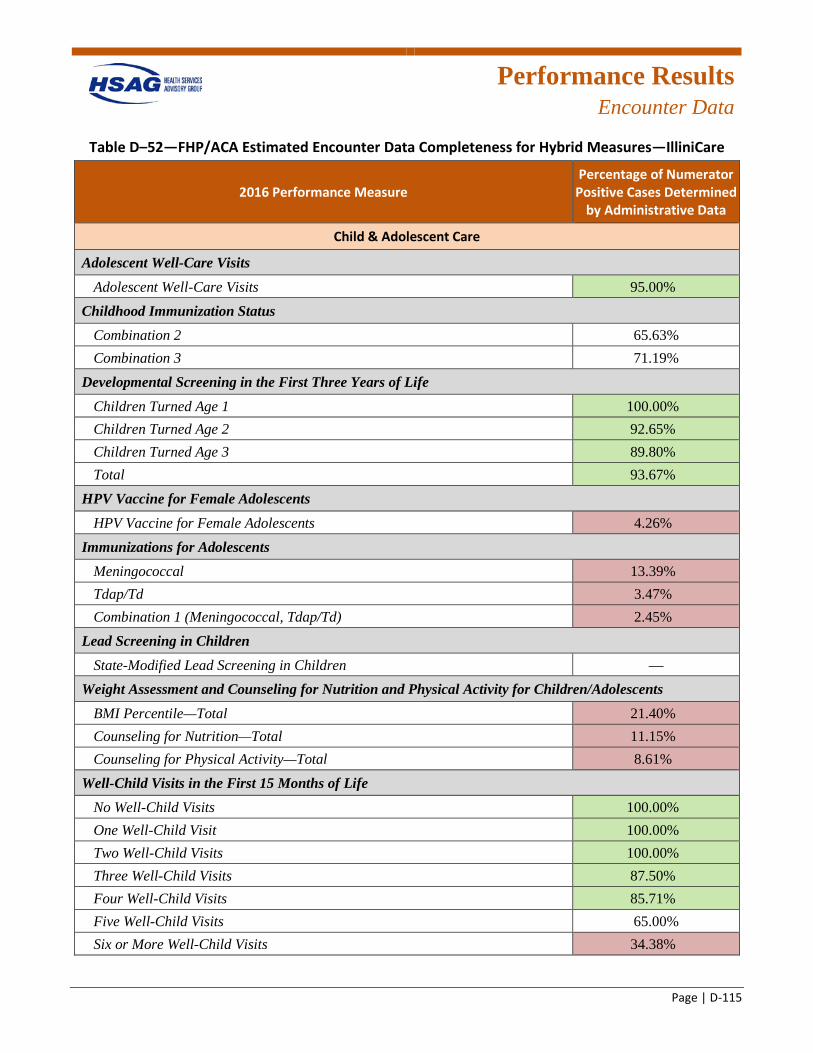
Performance Results
Encounter Data
Page | D-115
Table D–52—FHP/ACA Estimated Encounter Data Completeness for Hybrid Measures—IlliniCare
2016 Performance Measure Percentage of Numerator
Positive Cases Determined by Administrative Data
Child & Adolescent Care
Adolescent Well-Care Visits Adolescent Well-Care Visits 95.00%G
Childhood Immunization Status Combination 2 65.63% Combination 3 71.19%
Developmental Screening in the First Three Years of Life Children Turned Age 1 100.00%G Children Turned Age 2 92.65%G Children Turned Age 3 89.80%G Total 93.67%G
HPV Vaccine for Female Adolescents HPV Vaccine for Female Adolescents 4.26%R
Immunizations for Adolescents Meningococcal 13.39%R Tdap/Td 3.47%R Combination 1 (Meningococcal, Tdap/Td) 2.45%R
Lead Screening in Children State-Modified Lead Screening in Children —
Weight Assessment and Counseling for Nutrition and Physical Activity for Children/Adolescents BMI Percentile—Total 21.40%R Counseling for Nutrition—Total 11.15%R Counseling for Physical Activity—Total 8.61%R
Well-Child Visits in the First 15 Months of Life No Well-Child Visits 100.00%G One Well-Child Visit 100.00%G Two Well-Child Visits 100.00%G Three Well-Child Visits 87.50%G Four Well-Child Visits 85.71%G Five Well-Child Visits 65.00% Six or More Well-Child Visits 34.38%R
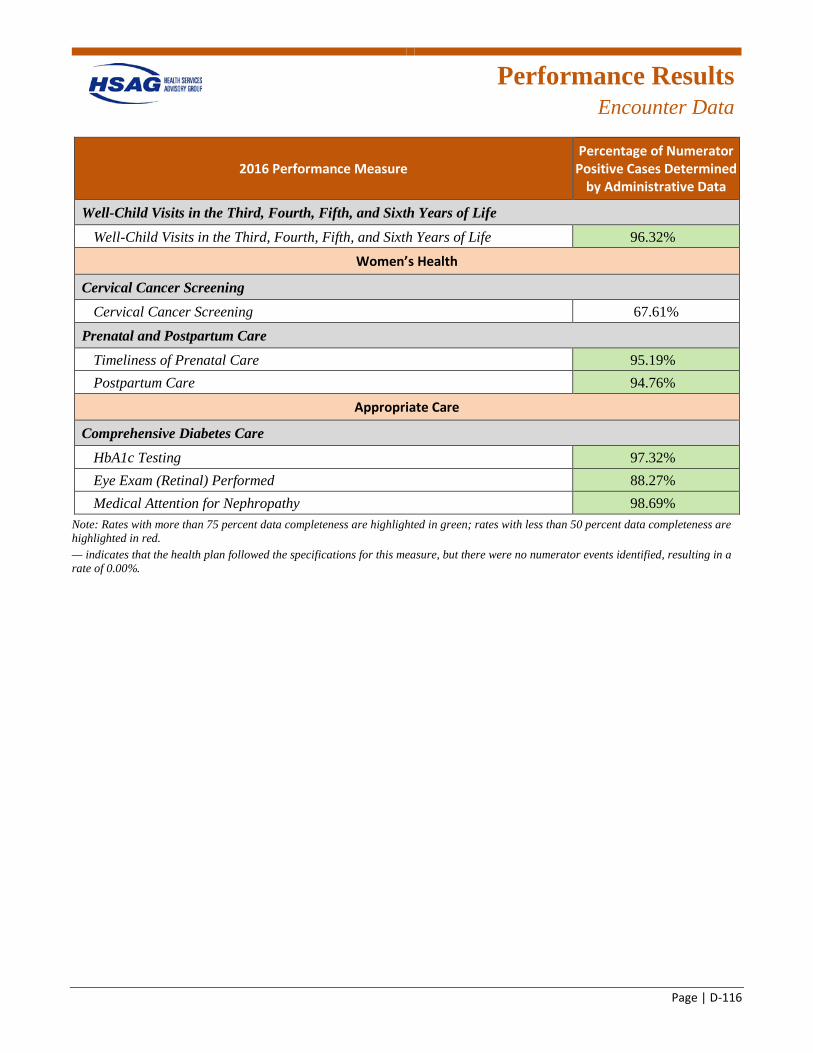
Performance Results
Encounter Data
Page | D-116
2016 Performance Measure Percentage of Numerator
Positive Cases Determined by Administrative Data
Well-Child Visits in the Third, Fourth, Fifth, and Sixth Years of Life Well-Child Visits in the Third, Fourth, Fifth, and Sixth Years of Life 96.32%G
Women’s Health
Cervical Cancer Screening Cervical Cancer Screening 67.61%
Prenatal and Postpartum Care Timeliness of Prenatal Care 95.19%G Postpartum Care 94.76%G
Appropriate Care
Comprehensive Diabetes Care HbA1c Testing 97.32%G Eye Exam (Retinal) Performed 88.27%G Medical Attention for Nephropathy 98.69%G
Note: Rates with more than 75 percent data completeness are highlighted in green; rates with less than 50 percent data completeness are highlighted in red. — indicates that the health plan followed the specifications for this measure, but there were no numerator events identified, resulting in a rate of 0.00%.
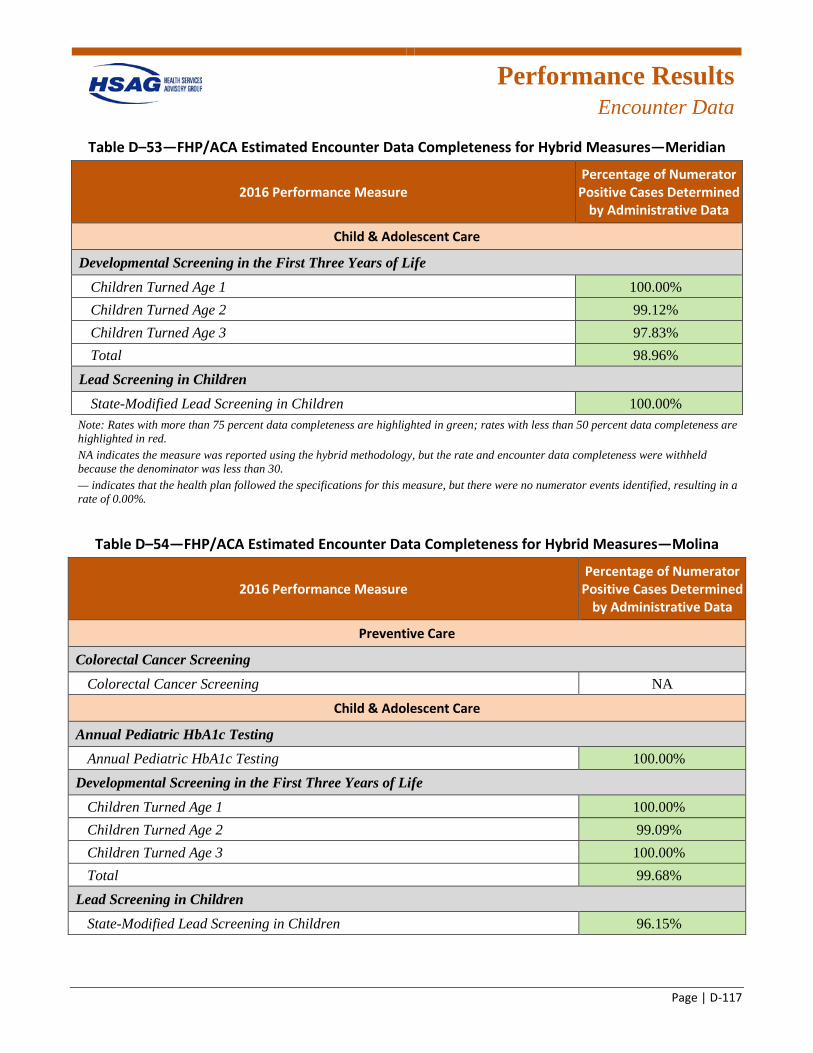
Performance Results
Encounter Data
Page | D-117
Table D–53—FHP/ACA Estimated Encounter Data Completeness for Hybrid Measures—Meridian
2016 Performance Measure Percentage of Numerator
Positive Cases Determined by Administrative Data
Child & Adolescent Care
Developmental Screening in the First Three Years of Life Children Turned Age 1 100.00%G Children Turned Age 2 99.12%G Children Turned Age 3 97.83%G Total 98.96%G
Lead Screening in Children State-Modified Lead Screening in Children 100.00%G
Note: Rates with more than 75 percent data completeness are highlighted in green; rates with less than 50 percent data completeness are highlighted in red. NA indicates the measure was reported using the hybrid methodology, but the rate and encounter data completeness were withheld because the denominator was less than 30. — indicates that the health plan followed the specifications for this measure, but there were no numerator events identified, resulting in a rate of 0.00%.
Table D–54—FHP/ACA Estimated Encounter Data Completeness for Hybrid Measures—Molina
2016 Performance Measure Percentage of Numerator
Positive Cases Determined by Administrative Data
Preventive Care
Colorectal Cancer Screening Colorectal Cancer Screening NA
Child & Adolescent Care
Annual Pediatric HbA1c Testing Annual Pediatric HbA1c Testing 100.00%G
Developmental Screening in the First Three Years of Life Children Turned Age 1 100.00%G Children Turned Age 2 99.09%G Children Turned Age 3 100.00%G Total 99.68%G
Lead Screening in Children State-Modified Lead Screening in Children 96.15%G
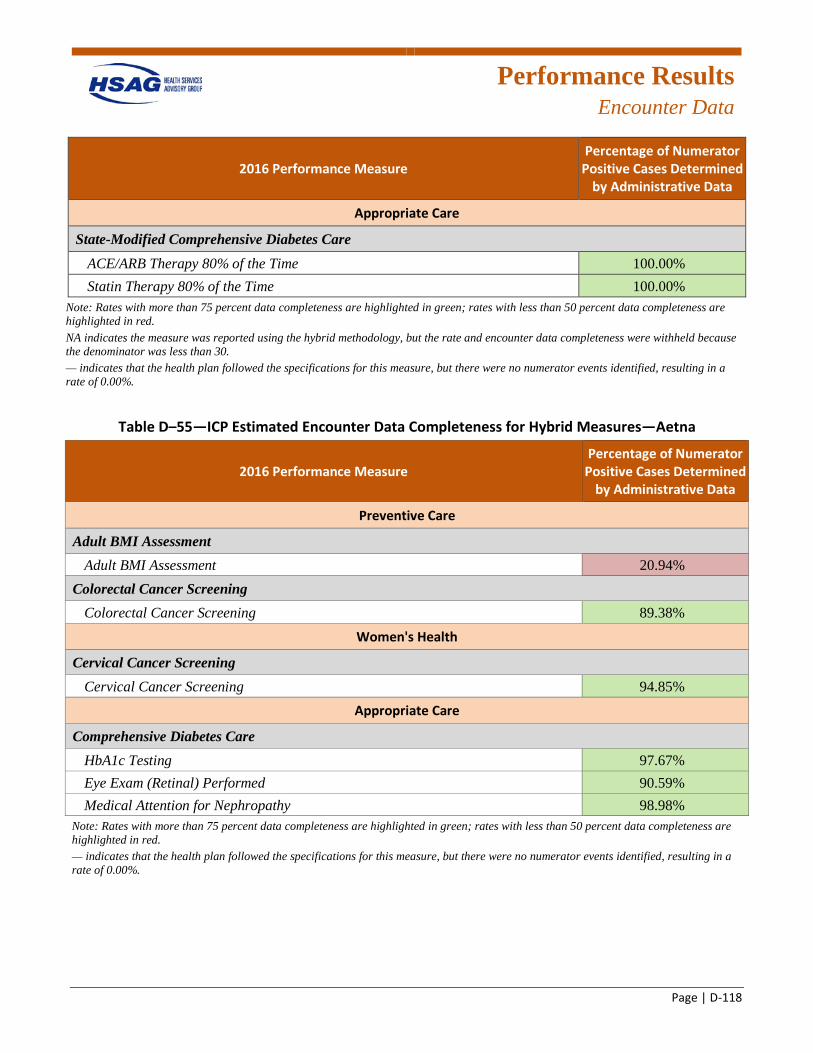
Performance Results
Encounter Data
Page | D-118
2016 Performance Measure Percentage of Numerator
Positive Cases Determined by Administrative Data
Appropriate Care
State-Modified Comprehensive Diabetes Care ACE/ARB Therapy 80% of the Time 100.00%G Statin Therapy 80% of the Time 100.00%G
Note: Rates with more than 75 percent data completeness are highlighted in green; rates with less than 50 percent data completeness are highlighted in red. NA indicates the measure was reported using the hybrid methodology, but the rate and encounter data completeness were withheld because the denominator was less than 30. — indicates that the health plan followed the specifications for this measure, but there were no numerator events identified, resulting in a rate of 0.00%.
Table D–55—ICP Estimated Encounter Data Completeness for Hybrid Measures—Aetna
2016 Performance Measure Percentage of Numerator
Positive Cases Determined by Administrative Data
Preventive Care
Adult BMI Assessment Adult BMI Assessment 20.94%R
Colorectal Cancer Screening Colorectal Cancer Screening 89.38%G
Women's Health
Cervical Cancer Screening Cervical Cancer Screening 94.85%G
Appropriate Care
Comprehensive Diabetes Care HbA1c Testing 97.67%G Eye Exam (Retinal) Performed 90.59%G Medical Attention for Nephropathy 98.98%G
Note: Rates with more than 75 percent data completeness are highlighted in green; rates with less than 50 percent data completeness are highlighted in red. — indicates that the health plan followed the specifications for this measure, but there were no numerator events identified, resulting in a rate of 0.00%.
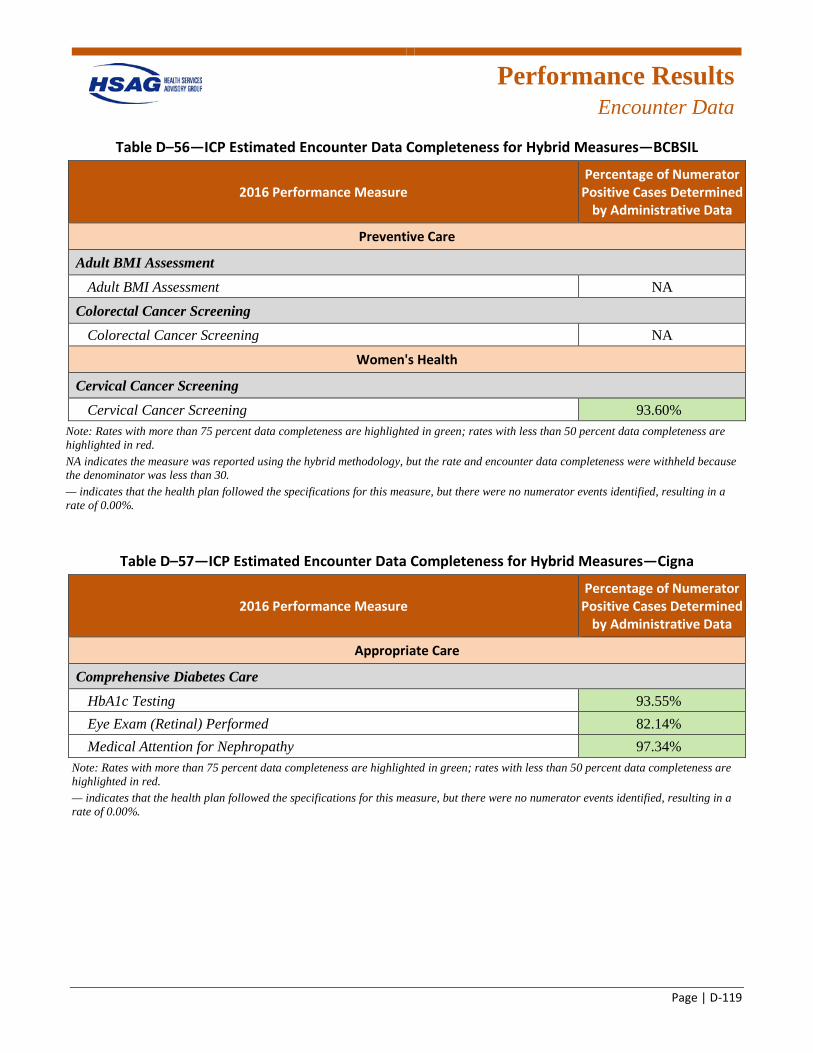
Performance Results
Encounter Data
Page | D-119
Table D–56—ICP Estimated Encounter Data Completeness for Hybrid Measures—BCBSIL
2016 Performance Measure Percentage of Numerator
Positive Cases Determined by Administrative Data
Preventive Care
Adult BMI Assessment Adult BMI Assessment NA
Colorectal Cancer Screening Colorectal Cancer Screening NA
Women's Health
Cervical Cancer Screening Cervical Cancer Screening 93.60%G
Note: Rates with more than 75 percent data completeness are highlighted in green; rates with less than 50 percent data completeness are highlighted in red. NA indicates the measure was reported using the hybrid methodology, but the rate and encounter data completeness were withheld because the denominator was less than 30. — indicates that the health plan followed the specifications for this measure, but there were no numerator events identified, resulting in a rate of 0.00%.
Table D–57—ICP Estimated Encounter Data Completeness for Hybrid Measures—Cigna
2016 Performance Measure Percentage of Numerator
Positive Cases Determined by Administrative Data
Appropriate Care
Comprehensive Diabetes Care HbA1c Testing 93.55%G Eye Exam (Retinal) Performed 82.14%G Medical Attention for Nephropathy 97.34%G
Note: Rates with more than 75 percent data completeness are highlighted in green; rates with less than 50 percent data completeness are highlighted in red. — indicates that the health plan followed the specifications for this measure, but there were no numerator events identified, resulting in a rate of 0.00%.
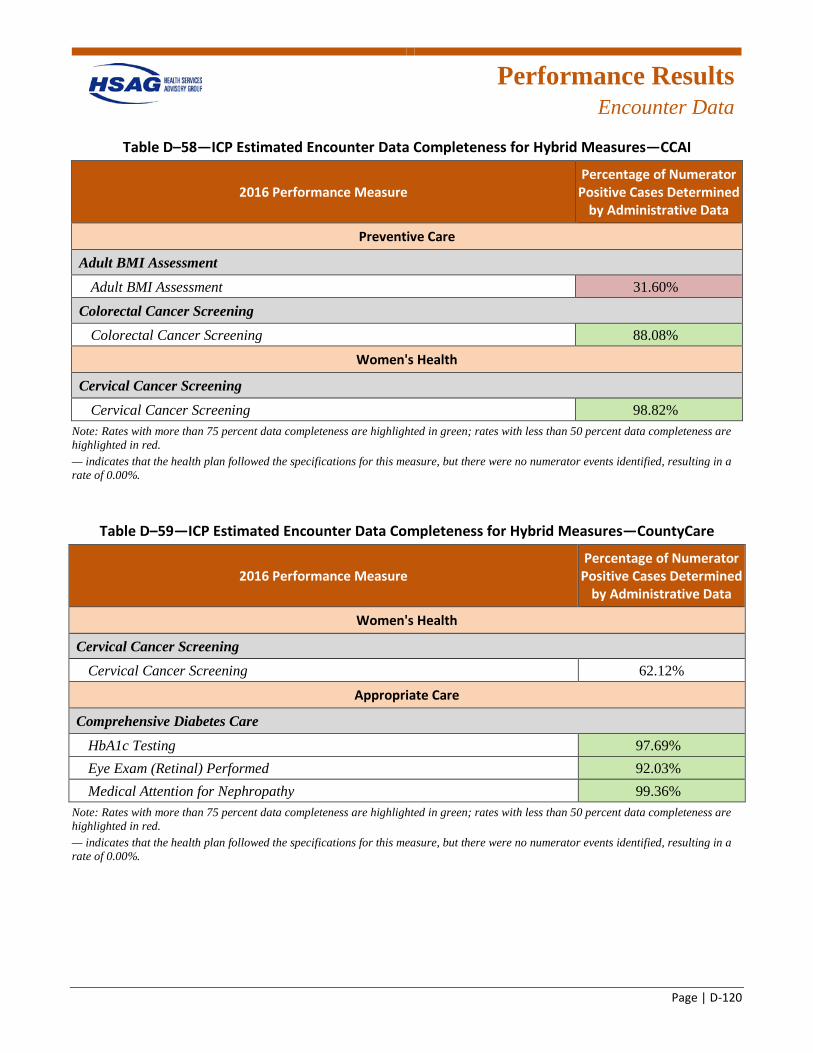
Performance Results
Encounter Data
Page | D-120
Table D–58—ICP Estimated Encounter Data Completeness for Hybrid Measures—CCAI
2016 Performance Measure Percentage of Numerator
Positive Cases Determined by Administrative Data
Preventive Care
Adult BMI Assessment Adult BMI Assessment 31.60%R
Colorectal Cancer Screening Colorectal Cancer Screening 88.08%G
Women's Health
Cervical Cancer Screening Cervical Cancer Screening 98.82%G
Note: Rates with more than 75 percent data completeness are highlighted in green; rates with less than 50 percent data completeness are highlighted in red. — indicates that the health plan followed the specifications for this measure, but there were no numerator events identified, resulting in a rate of 0.00%.
Table D–59—ICP Estimated Encounter Data Completeness for Hybrid Measures—CountyCare
2016 Performance Measure Percentage of Numerator
Positive Cases Determined by Administrative Data
Women's Health
Cervical Cancer Screening Cervical Cancer Screening 62.12%
Appropriate Care
Comprehensive Diabetes Care HbA1c Testing 97.69%G Eye Exam (Retinal) Performed 92.03%G Medical Attention for Nephropathy 99.36%G
Note: Rates with more than 75 percent data completeness are highlighted in green; rates with less than 50 percent data completeness are highlighted in red. — indicates that the health plan followed the specifications for this measure, but there were no numerator events identified, resulting in a rate of 0.00%.
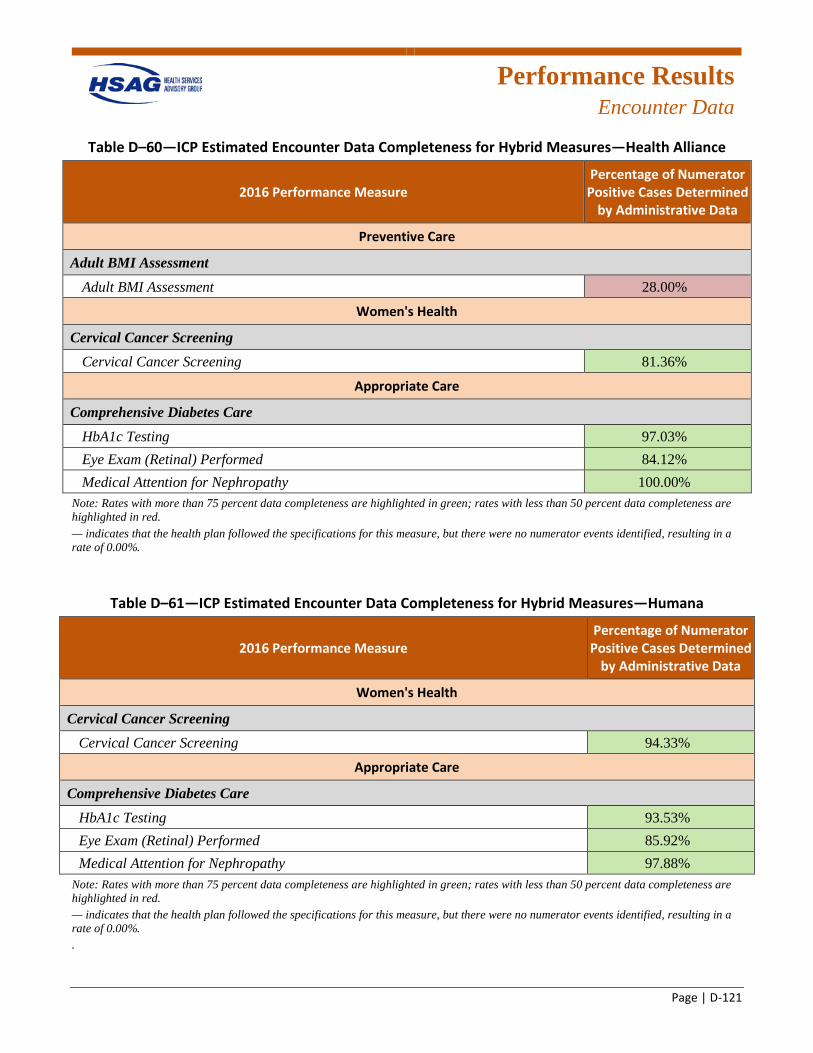
Performance Results
Encounter Data
Page | D-121
Table D–60—ICP Estimated Encounter Data Completeness for Hybrid Measures—Health Alliance
2016 Performance Measure Percentage of Numerator
Positive Cases Determined by Administrative Data
Preventive Care
Adult BMI Assessment Adult BMI Assessment 28.00%R
Women's Health
Cervical Cancer Screening Cervical Cancer Screening 81.36%G
Appropriate Care
Comprehensive Diabetes Care HbA1c Testing 97.03%G Eye Exam (Retinal) Performed 84.12%G Medical Attention for Nephropathy 100.00%G
Note: Rates with more than 75 percent data completeness are highlighted in green; rates with less than 50 percent data completeness are highlighted in red. — indicates that the health plan followed the specifications for this measure, but there were no numerator events identified, resulting in a rate of 0.00%.
Table D–61—ICP Estimated Encounter Data Completeness for Hybrid Measures—Humana
2016 Performance Measure Percentage of Numerator
Positive Cases Determined by Administrative Data
Women's Health
Cervical Cancer Screening Cervical Cancer Screening 94.33%G
Appropriate Care
Comprehensive Diabetes Care HbA1c Testing 93.53%G Eye Exam (Retinal) Performed 85.92%G Medical Attention for Nephropathy 97.88%G
Note: Rates with more than 75 percent data completeness are highlighted in green; rates with less than 50 percent data completeness are highlighted in red. — indicates that the health plan followed the specifications for this measure, but there were no numerator events identified, resulting in a rate of 0.00%. .
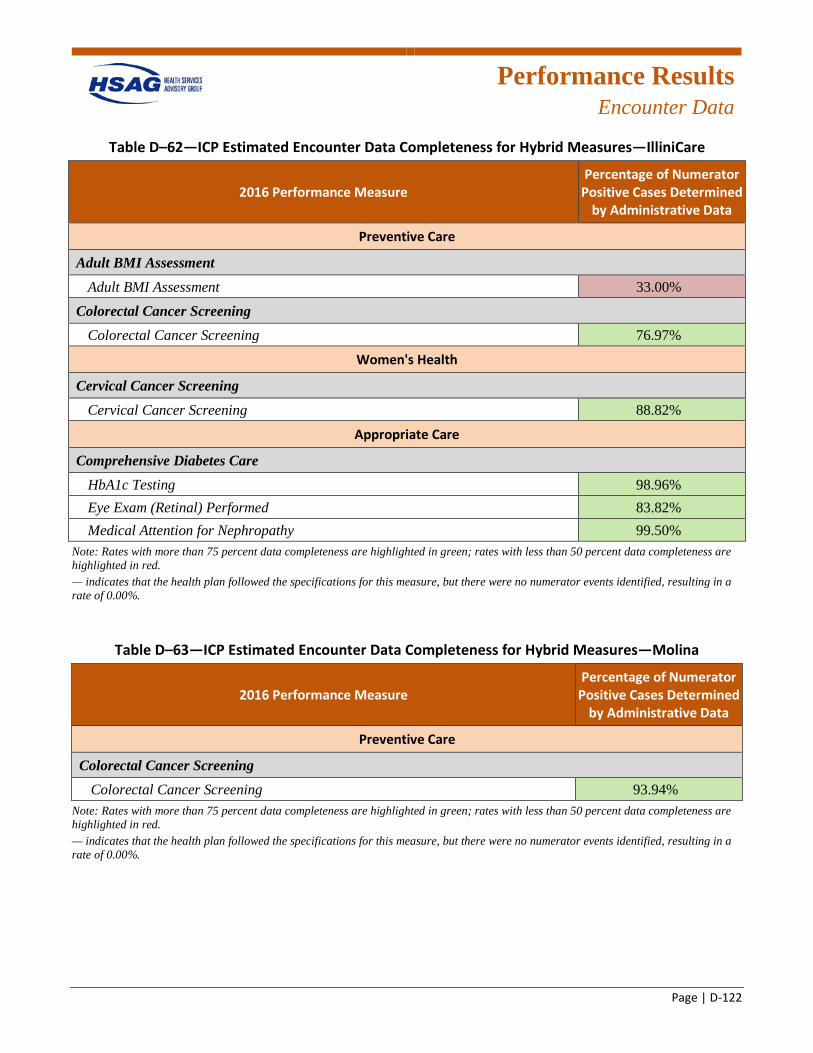
Performance Results
Encounter Data
Page | D-122
Table D–62—ICP Estimated Encounter Data Completeness for Hybrid Measures—IlliniCare
2016 Performance Measure Percentage of Numerator
Positive Cases Determined by Administrative Data
Preventive Care
Adult BMI Assessment Adult BMI Assessment 33.00%R
Colorectal Cancer Screening Colorectal Cancer Screening 76.97%G
Women's Health
Cervical Cancer Screening Cervical Cancer Screening 88.82%G
Appropriate Care
Comprehensive Diabetes Care HbA1c Testing 98.96%G Eye Exam (Retinal) Performed 83.82%G Medical Attention for Nephropathy 99.50%G
Note: Rates with more than 75 percent data completeness are highlighted in green; rates with less than 50 percent data completeness are highlighted in red. — indicates that the health plan followed the specifications for this measure, but there were no numerator events identified, resulting in a rate of 0.00%.
Table D–63—ICP Estimated Encounter Data Completeness for Hybrid Measures—Molina
2016 Performance Measure Percentage of Numerator
Positive Cases Determined by Administrative Data
Preventive Care
Colorectal Cancer Screening Colorectal Cancer Screening 93.94%G
Note: Rates with more than 75 percent data completeness are highlighted in green; rates with less than 50 percent data completeness are highlighted in red. — indicates that the health plan followed the specifications for this measure, but there were no numerator events identified, resulting in a rate of 0.00%.
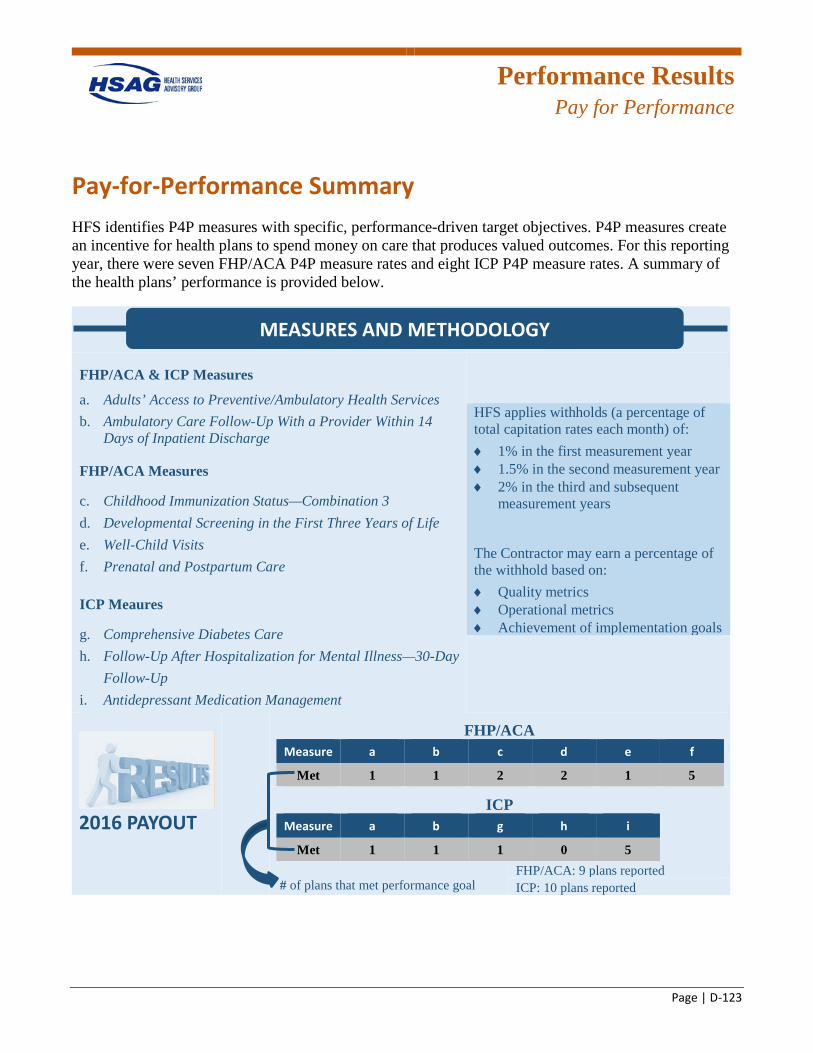
Performance Results
Pay for Performance
Page | D-123
Pay-for-Performance Summary HFS identifies P4P measures with specific, performance-driven target objectives. P4P measures create an incentive for health plans to spend money on care that produces valued outcomes. For this reporting year, there were seven FHP/ACA P4P measure rates and eight ICP P4P measure rates. A summary of the health plans’ performance is provided below.
FHP/ACA & ICP Measures
a. Adults’ Access to Preventive/Ambulatory Health Services b. Ambulatory Care Follow-Up With a Provider Within 14
Days of Inpatient Discharge
FHP/ACA Measures
c. Childhood Immunization Status—Combination 3 d. Developmental Screening in the First Three Years of Life e. Well-Child Visits f. Prenatal and Postpartum Care
ICP Meaures
g. Comprehensive Diabetes Care h. Follow-Up After Hospitalization for Mental Illness—30-Day
Follow-Up i. Antidepressant Medication Management
HFS applies withholds (a percentage of total capitation rates each month) of: ♦ 1% in the first measurement year ♦ 1.5% in the second measurement year ♦ 2% in the third and subsequent
measurement years
The Contractor may earn a percentage of the withhold based on: ♦ Quality metrics ♦ Operational metrics ♦ Achievement of implementation goals
2016 PAYOUT
FHP/ACA Measure a b c d e f
Met 1 1 2 2 1 5
ICP Measure a b g h i
Met 1 1 1 0 5
# of plans that met performance goal
FHP/ACA: 9 plans reported ICP: 10 plans reported
MEASURES AND METHODOLOGY
Page | E-1
Appendix E. 2016–2017 Performance Measure Results
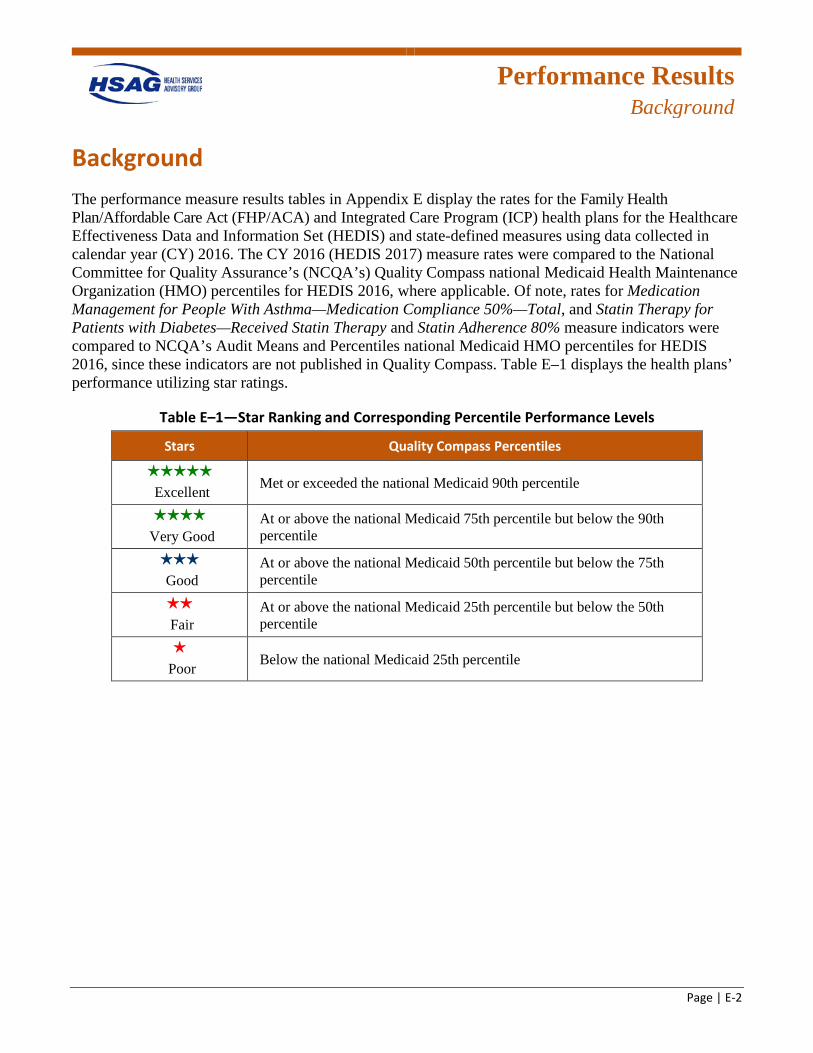
Performance Results
Background
Page | E-2
Background The performance measure results tables in Appendix E display the rates for the Family Health Plan/Affordable Care Act (FHP/ACA) and Integrated Care Program (ICP) health plans for the Healthcare Effectiveness Data and Information Set (HEDIS) and state-defined measures using data collected in calendar year (CY) 2016. The CY 2016 (HEDIS 2017) measure rates were compared to the National Committee for Quality Assurance’s (NCQA’s) Quality Compass national Medicaid Health Maintenance Organization (HMO) percentiles for HEDIS 2016, where applicable. Of note, rates for Medication Management for People With Asthma—Medication Compliance 50%—Total, and Statin Therapy for Patients with Diabetes—Received Statin Therapy and Statin Adherence 80% measure indicators were compared to NCQA’s Audit Means and Percentiles national Medicaid HMO percentiles for HEDIS 2016, since these indicators are not published in Quality Compass. Table E–1 displays the health plans’ performance utilizing star ratings.
Table E–1—Star Ranking and Corresponding Percentile Performance Levels
Stars Quality Compass Percentiles
Excellent Met or exceeded the national Medicaid 90th percentile
Very Good At or above the national Medicaid 75th percentile but below the 90th percentile
Good At or above the national Medicaid 50th percentile but below the 75th percentile
Fair At or above the national Medicaid 25th percentile but below the 50th percentile
Poor Below the national Medicaid 25th percentile
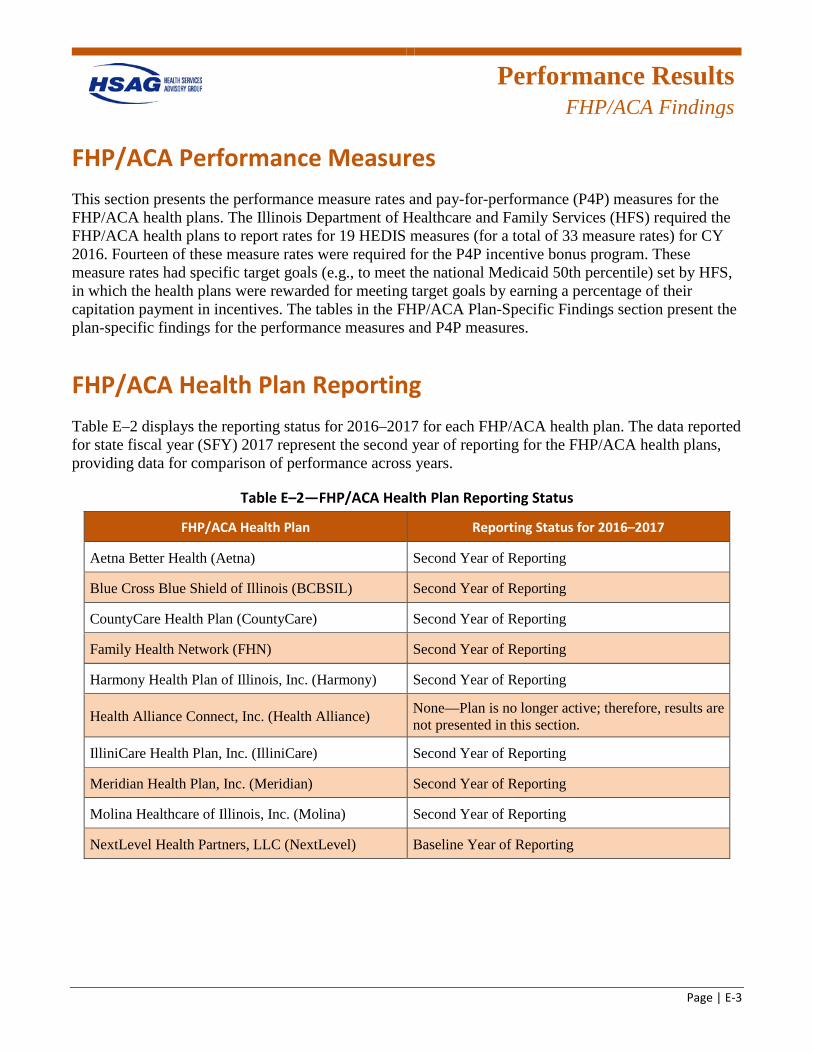
Performance Results
FHP/ACA Findings
Page | E-3
FHP/ACA Performance Measures This section presents the performance measure rates and pay-for-performance (P4P) measures for the FHP/ACA health plans. The Illinois Department of Healthcare and Family Services (HFS) required the FHP/ACA health plans to report rates for 19 HEDIS measures (for a total of 33 measure rates) for CY 2016. Fourteen of these measure rates were required for the P4P incentive bonus program. These measure rates had specific target goals (e.g., to meet the national Medicaid 50th percentile) set by HFS, in which the health plans were rewarded for meeting target goals by earning a percentage of their capitation payment in incentives. The tables in the FHP/ACA Plan-Specific Findings section present the plan-specific findings for the performance measures and P4P measures.
FHP/ACA Health Plan Reporting Table E–2 displays the reporting status for 2016–2017 for each FHP/ACA health plan. The data reported for state fiscal year (SFY) 2017 represent the second year of reporting for the FHP/ACA health plans, providing data for comparison of performance across years.
Table E–2—FHP/ACA Health Plan Reporting Status
FHP/ACA Health Plan Reporting Status for 2016–2017
Aetna Better Health (Aetna) Second Year of Reporting
Blue Cross Blue Shield of Illinois (BCBSIL) Second Year of Reporting
CountyCare Health Plan (CountyCare) Second Year of Reporting
Family Health Network (FHN) Second Year of Reporting
Harmony Health Plan of Illinois, Inc. (Harmony) Second Year of Reporting
Health Alliance Connect, Inc. (Health Alliance) None—Plan is no longer active; therefore, results are not presented in this section.
IlliniCare Health Plan, Inc. (IlliniCare) Second Year of Reporting
Meridian Health Plan, Inc. (Meridian) Second Year of Reporting
Molina Healthcare of Illinois, Inc. (Molina) Second Year of Reporting
NextLevel Health Partners, LLC (NextLevel) Baseline Year of Reporting
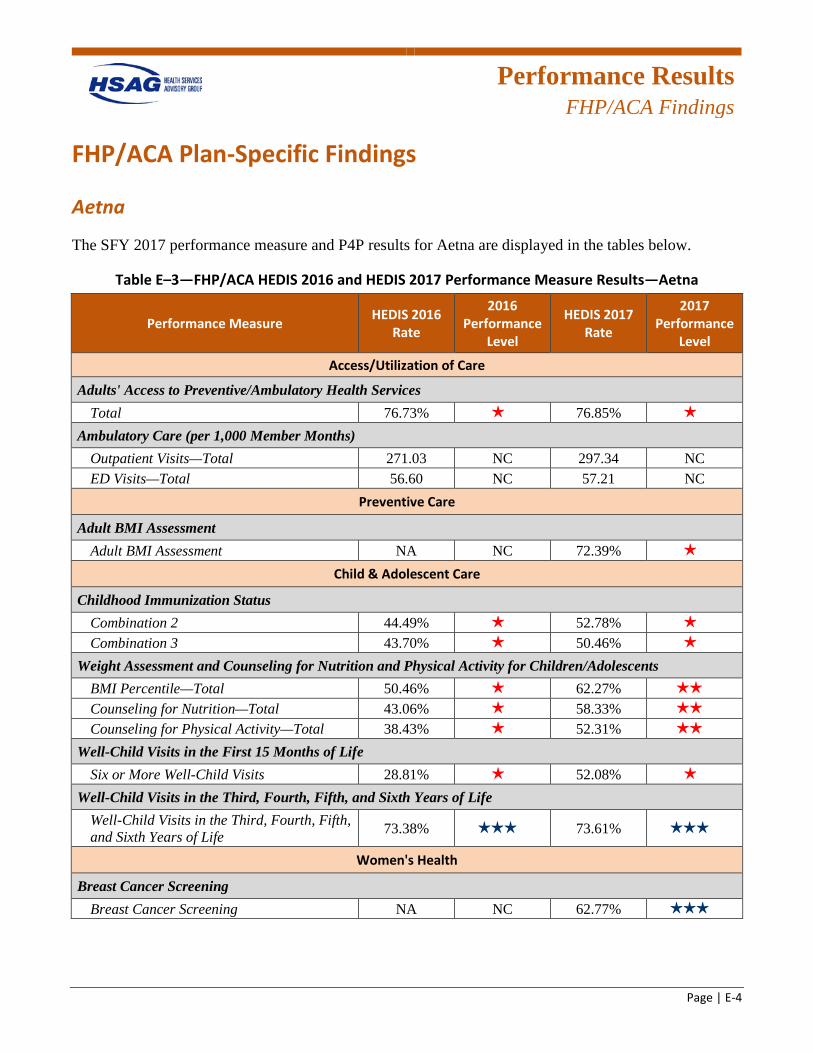
Performance Results
FHP/ACA Findings
Page | E-4
FHP/ACA Plan-Specific Findings
Aetna
The SFY 2017 performance measure and P4P results for Aetna are displayed in the tables below.
Table E–3—FHP/ACA HEDIS 2016 and HEDIS 2017 Performance Measure Results—Aetna
Performance Measure HEDIS 2016 Rate
2016 Performance
Level
HEDIS 2017 Rate
2017 Performance
Level
Access/Utilization of Care
Adults' Access to Preventive/Ambulatory Health Services Total 76.73% 1 star 76.85% 1 star
Ambulatory Care (per 1,000 Member Months) Outpatient Visits—Total 271.03 NC 297.34 NC ED Visits—Total 56.60 NC 57.21 NC
Preventive Care
Adult BMI Assessment Adult BMI Assessment NA NC 72.39% 1 star
Child & Adolescent Care
Childhood Immunization Status Combination 2 44.49% 1 star 52.78% 1 star
Combination 3 43.70% 1 star 50.46% 1 star
Weight Assessment and Counseling for Nutrition and Physical Activity for Children/Adolescents BMI Percentile—Total 50.46% 1 star 62.27% 2 stars
Counseling for Nutrition—Total 43.06% 1 star 58.33% 2 stars
Counseling for Physical Activity—Total 38.43% 1 star 52.31% 2 stars
Well-Child Visits in the First 15 Months of Life Six or More Well-Child Visits 28.81% 1 star 52.08% 1 star
Well-Child Visits in the Third, Fourth, Fifth, and Sixth Years of Life Well-Child Visits in the Third, Fourth, Fifth, and Sixth Years of Life 73.38% 3 stars 73.61% 3 stars
Women's Health
Breast Cancer Screening Breast Cancer Screening NA NC 62.77% 3 stars
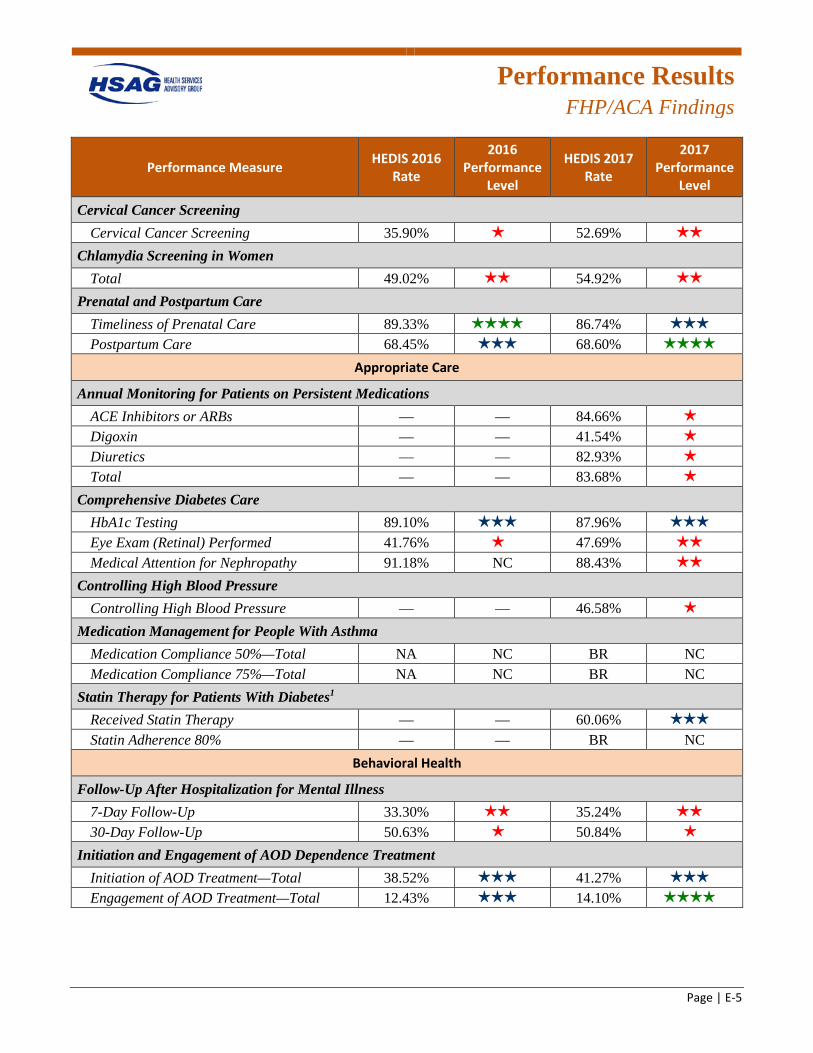
Performance Results
FHP/ACA Findings
Page | E-5
Performance Measure HEDIS 2016 Rate
2016 Performance
Level
HEDIS 2017 Rate
2017 Performance
Level
Cervical Cancer Screening Cervical Cancer Screening 35.90% 1 star 52.69% 2 stars
Chlamydia Screening in Women Total 49.02% 2 stars 54.92% 2 stars
Prenatal and Postpartum Care Timeliness of Prenatal Care 89.33% 4 stars 86.74% 3 stars
Postpartum Care 68.45% 3 stars 68.60% 4 stars
Appropriate Care
Annual Monitoring for Patients on Persistent Medications ACE Inhibitors or ARBs — — 84.66% 1 star
Digoxin — — 41.54% 1 star
Diuretics — — 82.93% 1 star
Total — — 83.68% 1 star
Comprehensive Diabetes Care HbA1c Testing 89.10% 3 stars 87.96% 3 stars
Eye Exam (Retinal) Performed 41.76% 1 star 47.69% 2 stars
Medical Attention for Nephropathy 91.18% NC 88.43% 2 stars
Controlling High Blood Pressure Controlling High Blood Pressure — — 46.58% 1 star
Medication Management for People With Asthma Medication Compliance 50%—Total NA NC BR NC Medication Compliance 75%—Total NA NC BR NC
Statin Therapy for Patients With Diabetes1 Received Statin Therapy — — 60.06% 3 stars
Statin Adherence 80% — — BR NC Behavioral Health
Follow-Up After Hospitalization for Mental Illness 7-Day Follow-Up 33.30% 2 stars 35.24% 2 stars
30-Day Follow-Up 50.63% 1 star 50.84% 1 star
Initiation and Engagement of AOD Dependence Treatment Initiation of AOD Treatment—Total 38.52% 3 stars 41.27% 3 stars
Engagement of AOD Treatment—Total 12.43% 3 stars 14.10% 4 stars
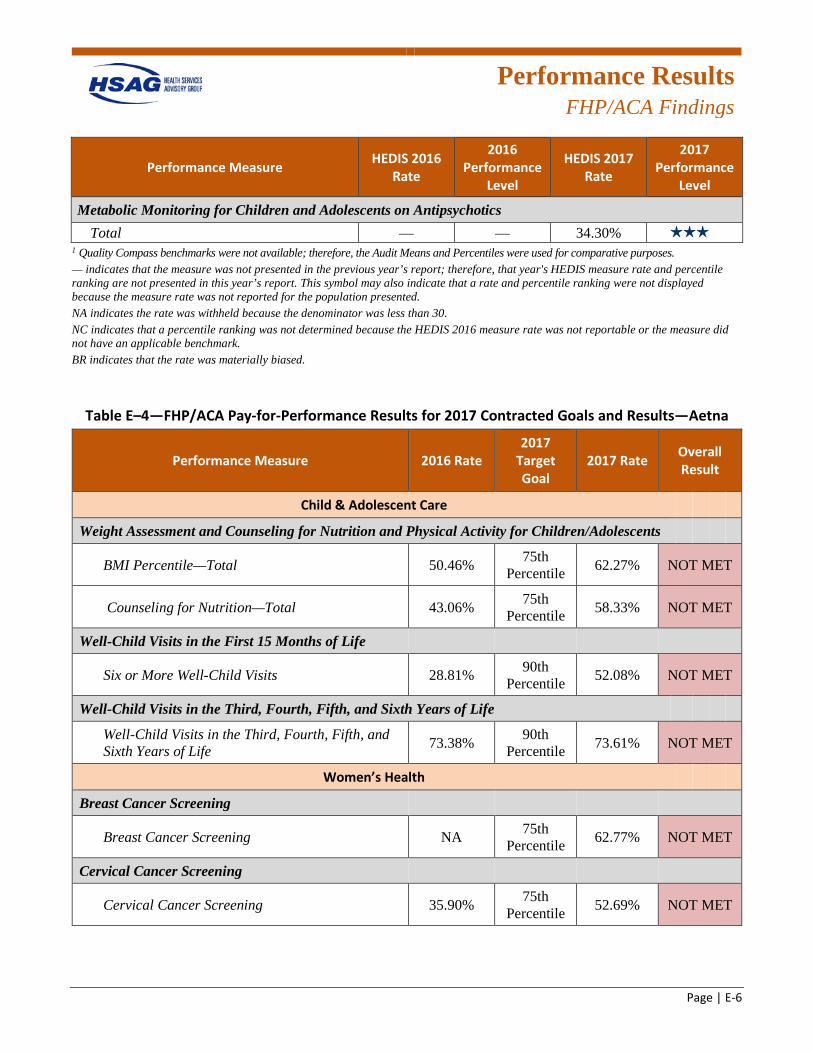
Performance Results
FHP/ACA Findings
Page | E-6
Performance Measure HEDIS 2016 Rate
2016 Performance
Level
HEDIS 2017 Rate
2017 Performance
Level
Metabolic Monitoring for Children and Adolescents on Antipsychotics Total — — 34.30% 3 stars
1 Quality Compass benchmarks were not available; therefore, the Audit Means and Percentiles were used for comparative purposes. — indicates that the measure was not presented in the previous year’s report; therefore, that year's HEDIS measure rate and percentile ranking are not presented in this year’s report. This symbol may also indicate that a rate and percentile ranking were not displayed because the measure rate was not reported for the population presented. NA indicates the rate was withheld because the denominator was less than 30. NC indicates that a percentile ranking was not determined because the HEDIS 2016 measure rate was not reportable or the measure did not have an applicable benchmark. BR indicates that the rate was materially biased.
Table E–4—FHP/ACA Pay-for-Performance Results for 2017 Contracted Goals and Results—Aetna
Performance Measure 2016 Rate 2017
Target Goal
2017 Rate Overall Result
Child & Adolescent Care
Weight Assessment and Counseling for Nutrition and Physical Activity for Children/Adolescents
BMI Percentile—Total 50.46% 75th Percentile 62.27% NOT MET
Counseling for Nutrition—Total 43.06% 75th Percentile 58.33% NOT MET
Well-Child Visits in the First 15 Months of Life
Six or More Well-Child Visits 28.81% 90th Percentile 52.08% NOT MET
Well-Child Visits in the Third, Fourth, Fifth, and Sixth Years of Life
Well-Child Visits in the Third, Fourth, Fifth, and Sixth Years of Life 73.38% 90th
Percentile 73.61% NOT MET
Women’s Health
Breast Cancer Screening
Breast Cancer Screening NA 75th Percentile 62.77% NOT MET
Cervical Cancer Screening
Cervical Cancer Screening 35.90% 75th Percentile 52.69% NOT MET
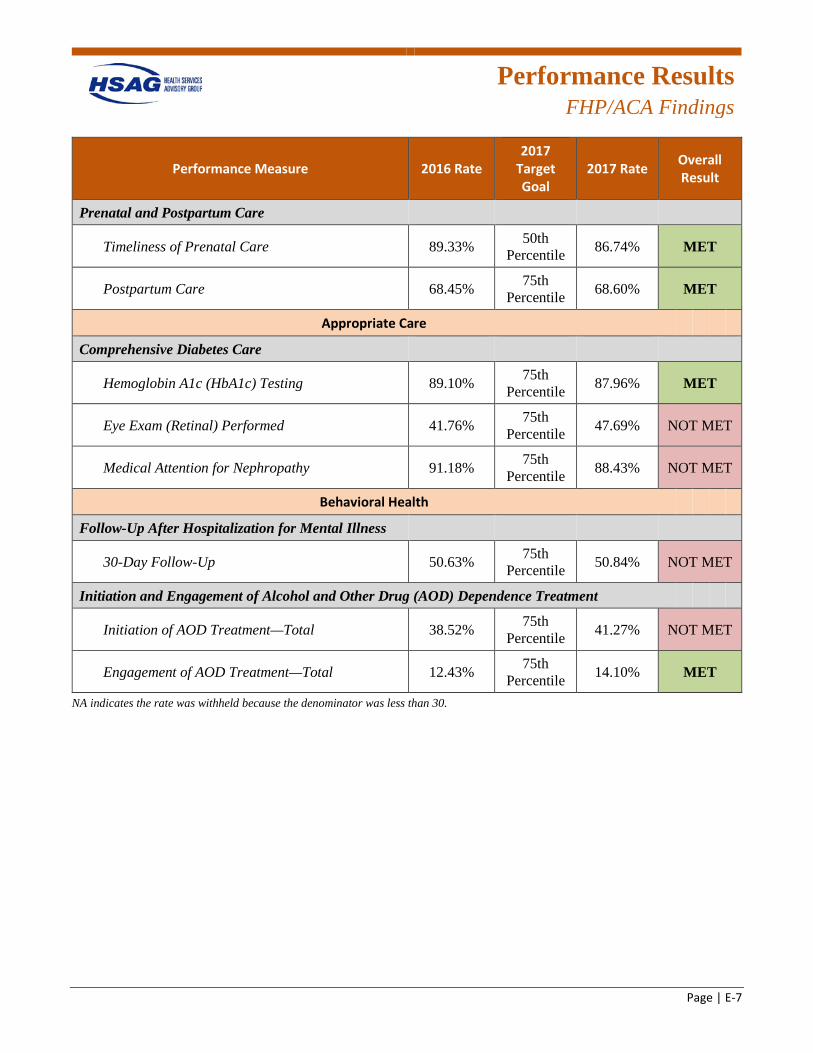
Performance Results
FHP/ACA Findings
Page | E-7
Performance Measure 2016 Rate 2017
Target Goal
2017 Rate Overall Result
Prenatal and Postpartum Care
Timeliness of Prenatal Care 89.33% 50th Percentile 86.74% MET
Postpartum Care 68.45% 75th Percentile 68.60% MET
Appropriate Care
Comprehensive Diabetes Care
Hemoglobin A1c (HbA1c) Testing 89.10% 75th Percentile 87.96% MET
Eye Exam (Retinal) Performed 41.76% 75th Percentile 47.69% NOT MET
Medical Attention for Nephropathy 91.18% 75th Percentile 88.43% NOT MET
Behavioral Health
Follow-Up After Hospitalization for Mental Illness
30-Day Follow-Up 50.63% 75th Percentile 50.84% NOT MET
Initiation and Engagement of Alcohol and Other Drug (AOD) Dependence Treatment
Initiation of AOD Treatment—Total 38.52% 75th Percentile 41.27% NOT MET
Engagement of AOD Treatment—Total 12.43% 75th Percentile 14.10% MET
NA indicates the rate was withheld because the denominator was less than 30.
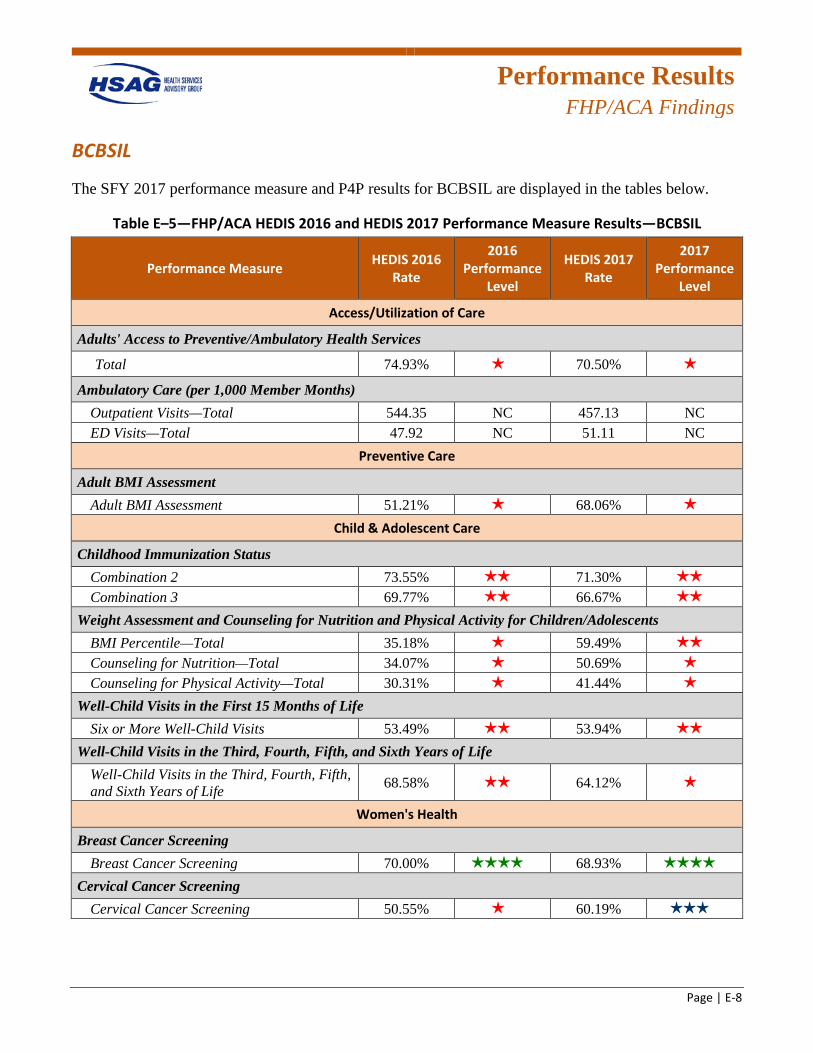
Performance Results
FHP/ACA Findings
Page | E-8
BCBSIL
The SFY 2017 performance measure and P4P results for BCBSIL are displayed in the tables below.
Table E–5—FHP/ACA HEDIS 2016 and HEDIS 2017 Performance Measure Results—BCBSIL
Performance Measure HEDIS 2016 Rate
2016 Performance
Level
HEDIS 2017 Rate
2017 Performance
Level
Access/Utilization of Care
Adults' Access to Preventive/Ambulatory Health Services
Total 74.93% 1 star 70.50% 1 star
Ambulatory Care (per 1,000 Member Months) Outpatient Visits—Total 544.35 NC 457.13 NC ED Visits—Total 47.92 NC 51.11 NC
Preventive Care
Adult BMI Assessment Adult BMI Assessment 51.21% 1 star 68.06% 1 star
Child & Adolescent Care
Childhood Immunization Status Combination 2 73.55% 2 stars 71.30% 2 stars
Combination 3 69.77% 2 stars 66.67% 2 stars
Weight Assessment and Counseling for Nutrition and Physical Activity for Children/Adolescents BMI Percentile—Total 35.18% 1 star 59.49% 2 stars
Counseling for Nutrition—Total 34.07% 1 star 50.69% 1 star
Counseling for Physical Activity—Total 30.31% 1 star 41.44% 1 star
Well-Child Visits in the First 15 Months of Life Six or More Well-Child Visits 53.49% 2 stars 53.94% 2 stars
Well-Child Visits in the Third, Fourth, Fifth, and Sixth Years of Life Well-Child Visits in the Third, Fourth, Fifth, and Sixth Years of Life 68.58% 2 stars 64.12% 1 star
Women's Health
Breast Cancer Screening Breast Cancer Screening 70.00% 4 stars 68.93% 4 stars
Cervical Cancer Screening Cervical Cancer Screening 50.55% 1 star 60.19% 3 stars
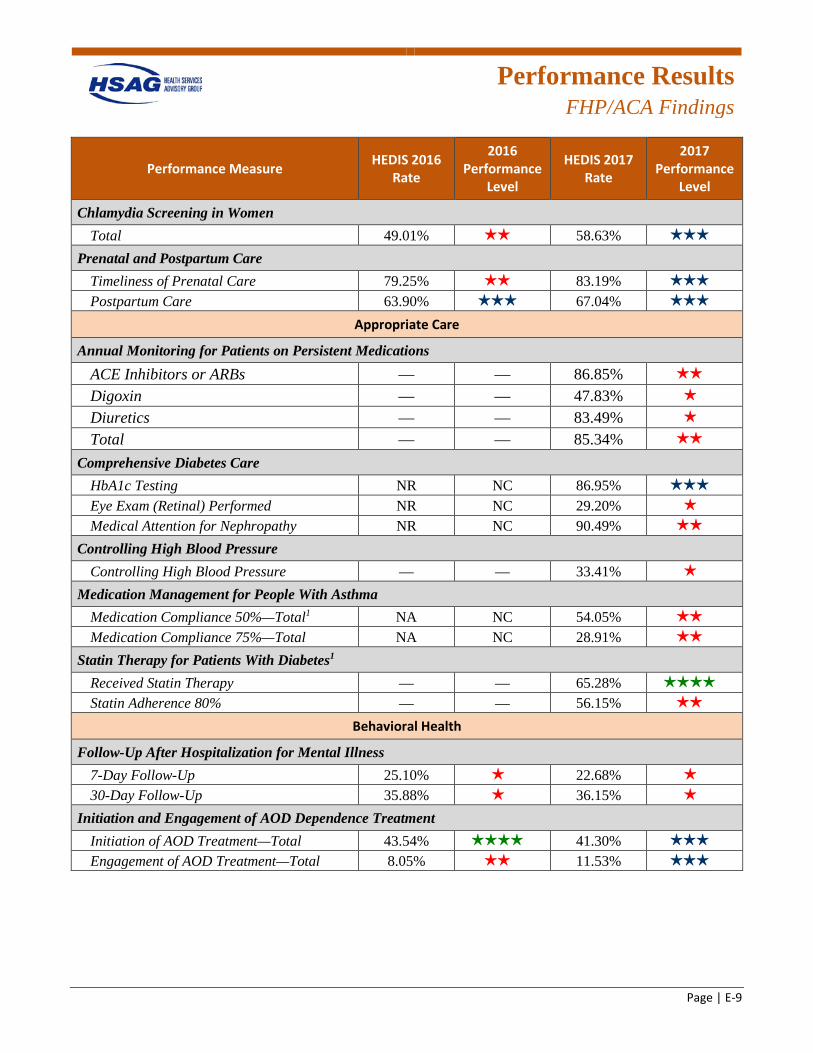
Performance Results
FHP/ACA Findings
Page | E-9
Performance Measure HEDIS 2016 Rate
2016 Performance
Level
HEDIS 2017 Rate
2017 Performance
Level
Chlamydia Screening in Women Total 49.01% 2 stars 58.63% 3 stars
Prenatal and Postpartum Care Timeliness of Prenatal Care 79.25% 2 stars 83.19% 3 stars
Postpartum Care 63.90% 3 stars 67.04% 3 stars
Appropriate Care
Annual Monitoring for Patients on Persistent Medications ACE Inhibitors or ARBs — — 86.85% 2 stars
Digoxin — — 47.83% 1 star
Diuretics — — 83.49% 1 star
Total — — 85.34% 2 stars
Comprehensive Diabetes Care HbA1c Testing NR NC 86.95% 3 stars
Eye Exam (Retinal) Performed NR NC 29.20% 1 star
Medical Attention for Nephropathy NR NC 90.49% 2 stars
Controlling High Blood Pressure Controlling High Blood Pressure — — 33.41% 1 star
Medication Management for People With Asthma Medication Compliance 50%—Total1 NA NC 54.05% 2 stars
Medication Compliance 75%—Total NA NC 28.91% 2 stars
Statin Therapy for Patients With Diabetes1 Received Statin Therapy — — 65.28% 4 stars
Statin Adherence 80% — — 56.15% 2 stars
Behavioral Health
Follow-Up After Hospitalization for Mental Illness 7-Day Follow-Up 25.10% 1 star 22.68% 1 star
30-Day Follow-Up 35.88% 1 star 36.15% 1 star
Initiation and Engagement of AOD Dependence Treatment Initiation of AOD Treatment—Total 43.54% 4 stars 41.30% 3 stars
Engagement of AOD Treatment—Total 8.05% 2 stars 11.53% 3 stars
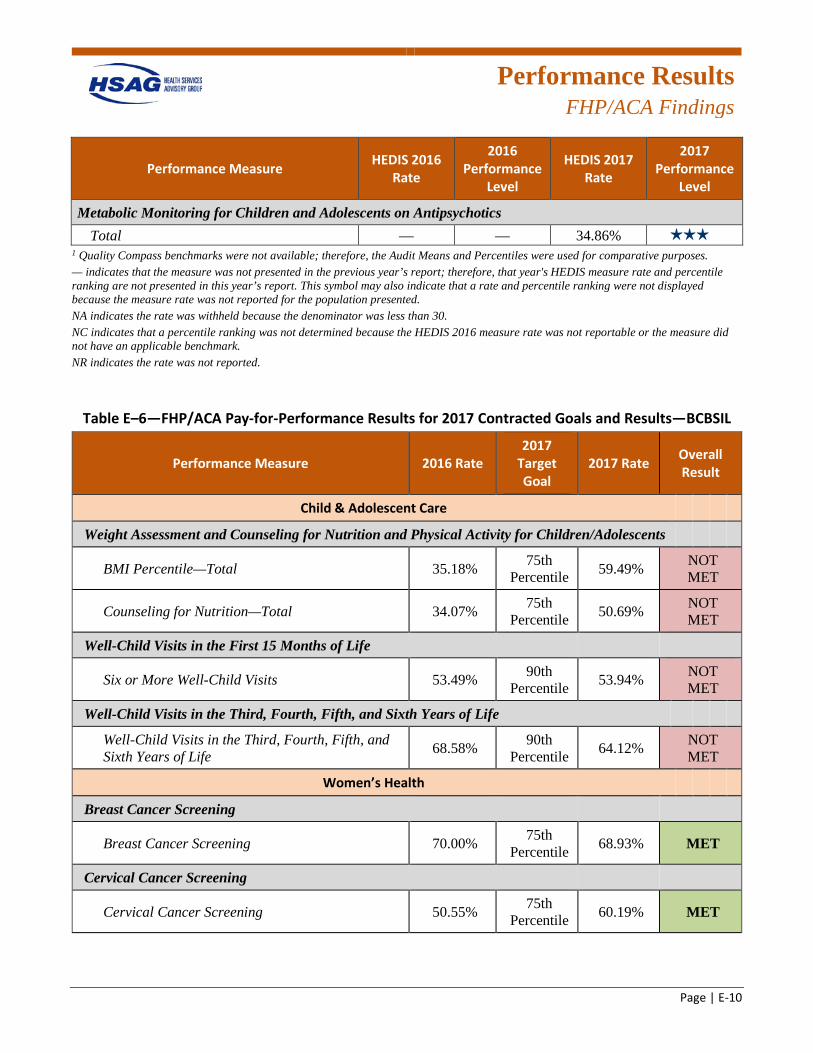
Performance Results
FHP/ACA Findings
Page | E-10
Performance Measure HEDIS 2016 Rate
2016 Performance
Level
HEDIS 2017 Rate
2017 Performance
Level
Metabolic Monitoring for Children and Adolescents on Antipsychotics Total — — 34.86% 3 stars
1 Quality Compass benchmarks were not available; therefore, the Audit Means and Percentiles were used for comparative purposes. — indicates that the measure was not presented in the previous year’s report; therefore, that year's HEDIS measure rate and percentile ranking are not presented in this year’s report. This symbol may also indicate that a rate and percentile ranking were not displayed because the measure rate was not reported for the population presented. NA indicates the rate was withheld because the denominator was less than 30. NC indicates that a percentile ranking was not determined because the HEDIS 2016 measure rate was not reportable or the measure did not have an applicable benchmark. NR indicates the rate was not reported.
Table E–6—FHP/ACA Pay-for-Performance Results for 2017 Contracted Goals and Results—BCBSIL
Performance Measure 2016 Rate 2017
Target Goal
2017 Rate Overall Result
Child & Adolescent Care
Weight Assessment and Counseling for Nutrition and Physical Activity for Children/Adolescents
BMI Percentile—Total 35.18% 75th Percentile 59.49% NOT
MET
Counseling for Nutrition—Total 34.07% 75th Percentile 50.69% NOT
MET
Well-Child Visits in the First 15 Months of Life
Six or More Well-Child Visits 53.49% 90th Percentile 53.94% NOT
MET
Well-Child Visits in the Third, Fourth, Fifth, and Sixth Years of Life
Well-Child Visits in the Third, Fourth, Fifth, and Sixth Years of Life 68.58% 90th
Percentile 64.12% NOT MET
Women’s Health
Breast Cancer Screening
Breast Cancer Screening 70.00% 75th Percentile 68.93% MET
Cervical Cancer Screening
Cervical Cancer Screening 50.55% 75th Percentile 60.19% MET
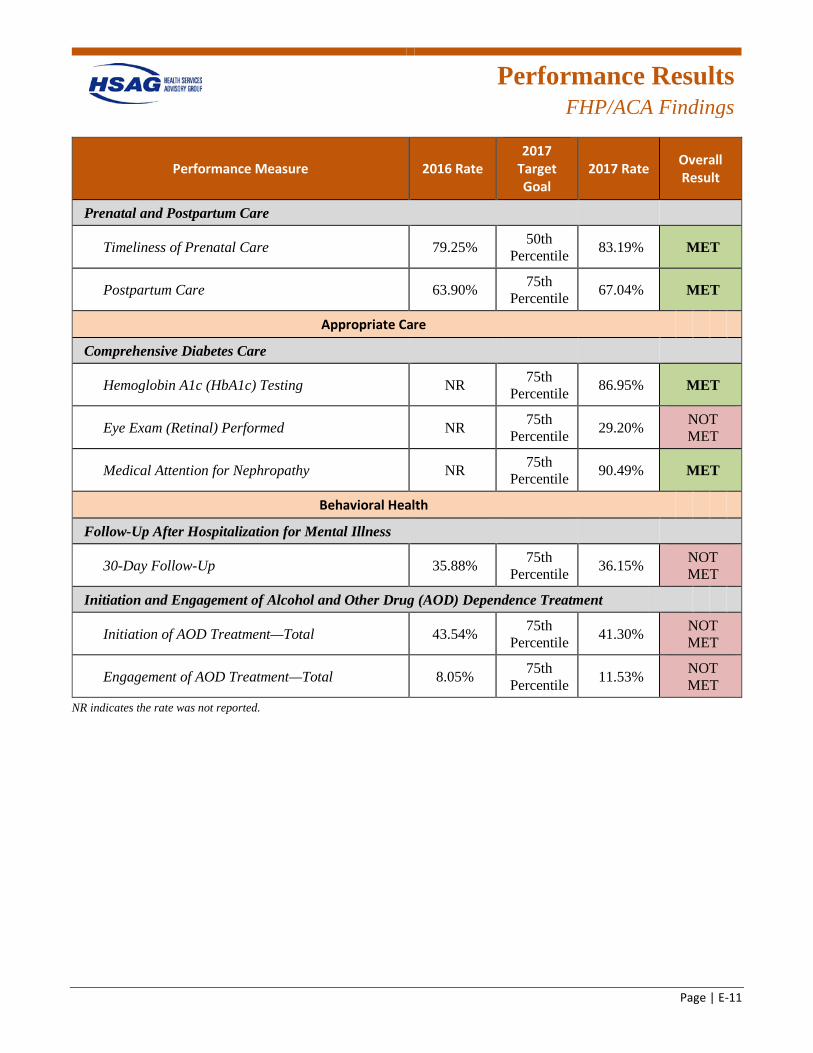
Performance Results
FHP/ACA Findings
Page | E-11
Performance Measure 2016 Rate 2017
Target Goal
2017 Rate Overall Result
Prenatal and Postpartum Care
Timeliness of Prenatal Care 79.25% 50th Percentile 83.19% MET
Postpartum Care 63.90% 75th Percentile 67.04% MET
Appropriate Care
Comprehensive Diabetes Care
Hemoglobin A1c (HbA1c) Testing NR 75th Percentile 86.95% MET
Eye Exam (Retinal) Performed NR 75th Percentile 29.20% NOT
MET
Medical Attention for Nephropathy NR 75th Percentile 90.49% MET
Behavioral Health
Follow-Up After Hospitalization for Mental Illness
30-Day Follow-Up 35.88% 75th Percentile 36.15% NOT
MET
Initiation and Engagement of Alcohol and Other Drug (AOD) Dependence Treatment
Initiation of AOD Treatment—Total 43.54% 75th Percentile 41.30% NOT
MET
Engagement of AOD Treatment—Total 8.05% 75th Percentile 11.53% NOT
MET NR indicates the rate was not reported.
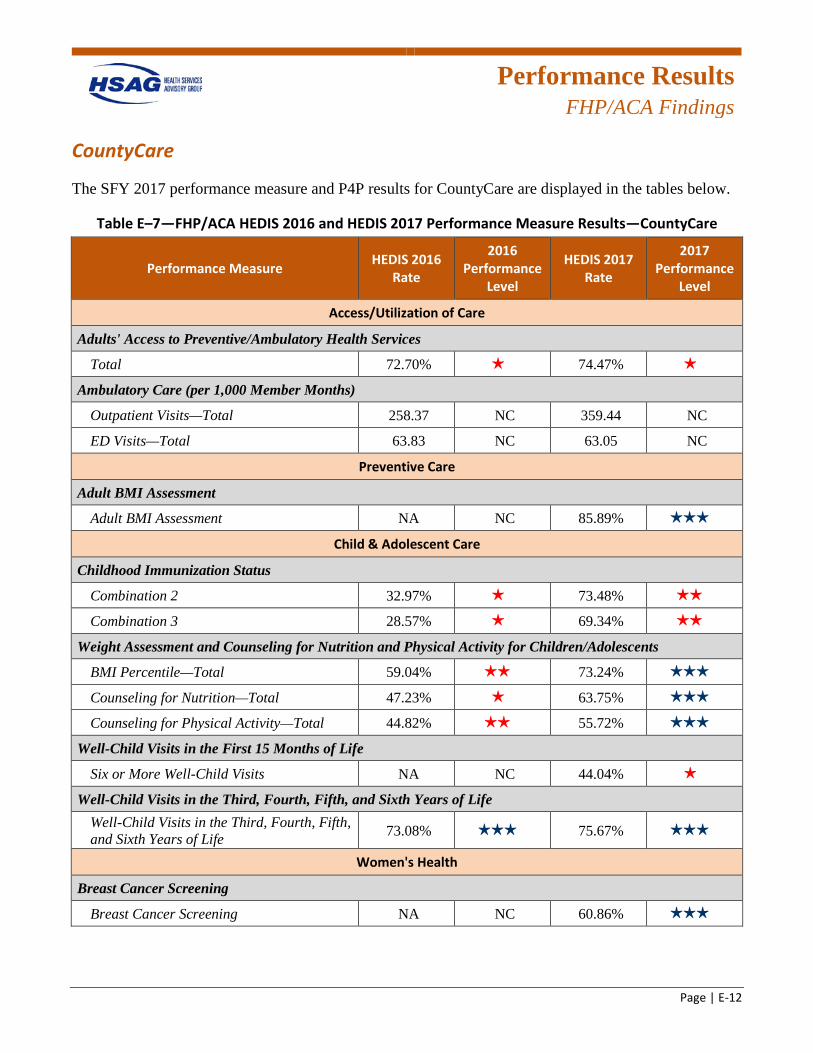
Performance Results
FHP/ACA Findings
Page | E-12
CountyCare
The SFY 2017 performance measure and P4P results for CountyCare are displayed in the tables below.
Table E–7—FHP/ACA HEDIS 2016 and HEDIS 2017 Performance Measure Results—CountyCare
Performance Measure HEDIS 2016 Rate
2016 Performance
Level
HEDIS 2017 Rate
2017 Performance
Level
Access/Utilization of Care
Adults' Access to Preventive/Ambulatory Health Services
Total 72.70% 1 star 74.47% 1 star
Ambulatory Care (per 1,000 Member Months)
Outpatient Visits—Total 258.37 NC 359.44 NC
ED Visits—Total 63.83 NC 63.05 NC
Preventive Care
Adult BMI Assessment
Adult BMI Assessment NA NC 85.89% 3 stars
Child & Adolescent Care
Childhood Immunization Status
Combination 2 32.97% 1 star 73.48% 2 stars
Combination 3 28.57% 1 star 69.34% 2 stars
Weight Assessment and Counseling for Nutrition and Physical Activity for Children/Adolescents
BMI Percentile—Total 59.04% 2 stars 73.24% 3 stars
Counseling for Nutrition—Total 47.23% 1 star 63.75% 3 stars
Counseling for Physical Activity—Total 44.82% 2 stars 55.72% 3 stars
Well-Child Visits in the First 15 Months of Life
Six or More Well-Child Visits NA NC 44.04% 1 star
Well-Child Visits in the Third, Fourth, Fifth, and Sixth Years of Life Well-Child Visits in the Third, Fourth, Fifth, and Sixth Years of Life 73.08% 3 stars 75.67% 3 stars
Women's Health
Breast Cancer Screening
Breast Cancer Screening NA NC 60.86% 3 stars
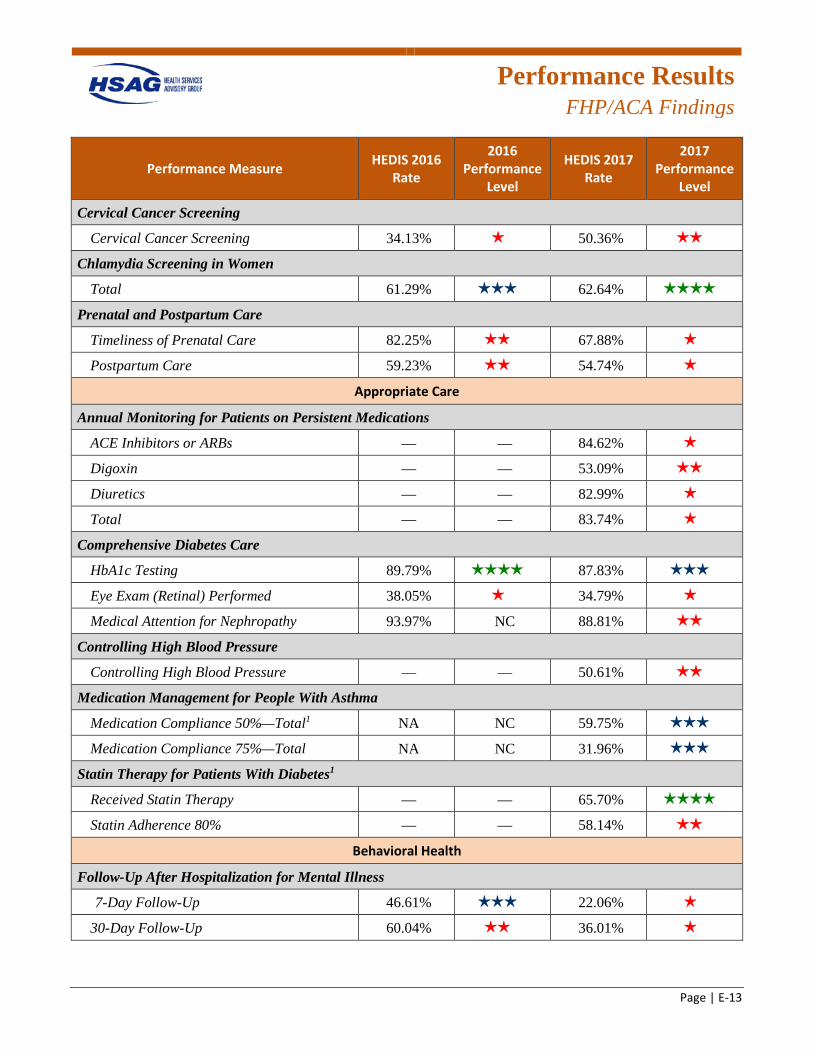
Performance Results
FHP/ACA Findings
Page | E-13
Performance Measure HEDIS 2016 Rate
2016 Performance
Level
HEDIS 2017 Rate
2017 Performance
Level
Cervical Cancer Screening
Cervical Cancer Screening 34.13% 1 star 50.36% 2 stars
Chlamydia Screening in Women
Total 61.29% 3 stars 62.64% 4 stars
Prenatal and Postpartum Care
Timeliness of Prenatal Care 82.25% 2 stars 67.88% 1 star
Postpartum Care 59.23% 2 stars 54.74% 1 star
Appropriate Care
Annual Monitoring for Patients on Persistent Medications
ACE Inhibitors or ARBs — — 84.62% 1 star
Digoxin — — 53.09% 2 stars
Diuretics — — 82.99% 1 star
Total — — 83.74% 1 star
Comprehensive Diabetes Care
HbA1c Testing 89.79% 4 stars 87.83% 3 stars
Eye Exam (Retinal) Performed 38.05% 1 star 34.79% 1 star
Medical Attention for Nephropathy 93.97% NC 88.81% 2 stars
Controlling High Blood Pressure
Controlling High Blood Pressure — — 50.61% 2 stars
Medication Management for People With Asthma
Medication Compliance 50%—Total1 NA NC 59.75% 3 stars
Medication Compliance 75%—Total NA NC 31.96% 3 stars
Statin Therapy for Patients With Diabetes1
Received Statin Therapy — — 65.70% 4 stars
Statin Adherence 80% — — 58.14% 2 stars
Behavioral Health
Follow-Up After Hospitalization for Mental Illness
7-Day Follow-Up 46.61% 3 stars 22.06% 1 star
30-Day Follow-Up 60.04% 2 stars 36.01% 1 star
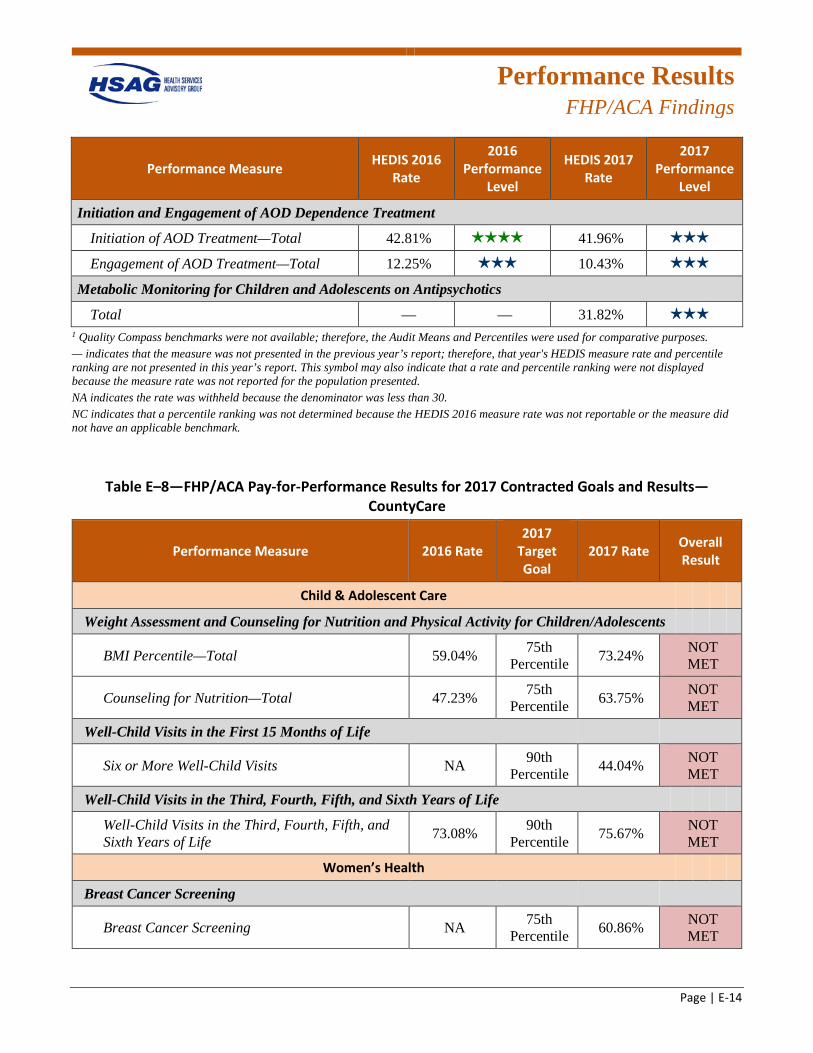
Performance Results
FHP/ACA Findings
Page | E-14
Performance Measure HEDIS 2016 Rate
2016 Performance
Level
HEDIS 2017 Rate
2017 Performance
Level
Initiation and Engagement of AOD Dependence Treatment
Initiation of AOD Treatment—Total 42.81% 4 stars 41.96% 3 stars
Engagement of AOD Treatment—Total 12.25% 3 stars 10.43% 3 stars
Metabolic Monitoring for Children and Adolescents on Antipsychotics
Total — — 31.82% 3 stars
1 Quality Compass benchmarks were not available; therefore, the Audit Means and Percentiles were used for comparative purposes. — indicates that the measure was not presented in the previous year’s report; therefore, that year's HEDIS measure rate and percentile ranking are not presented in this year’s report. This symbol may also indicate that a rate and percentile ranking were not displayed because the measure rate was not reported for the population presented. NA indicates the rate was withheld because the denominator was less than 30. NC indicates that a percentile ranking was not determined because the HEDIS 2016 measure rate was not reportable or the measure did not have an applicable benchmark.
Table E–8—FHP/ACA Pay-for-Performance Results for 2017 Contracted Goals and Results—CountyCare
Performance Measure 2016 Rate 2017
Target Goal
2017 Rate Overall Result
Child & Adolescent Care
Weight Assessment and Counseling for Nutrition and Physical Activity for Children/Adolescents
BMI Percentile—Total 59.04% 75th Percentile 73.24% NOT
MET
Counseling for Nutrition—Total 47.23% 75th Percentile 63.75% NOT
MET
Well-Child Visits in the First 15 Months of Life
Six or More Well-Child Visits NA 90th Percentile 44.04% NOT
MET
Well-Child Visits in the Third, Fourth, Fifth, and Sixth Years of Life
Well-Child Visits in the Third, Fourth, Fifth, and Sixth Years of Life 73.08% 90th
Percentile 75.67% NOT MET
Women’s Health
Breast Cancer Screening
Breast Cancer Screening NA 75th Percentile 60.86% NOT
MET
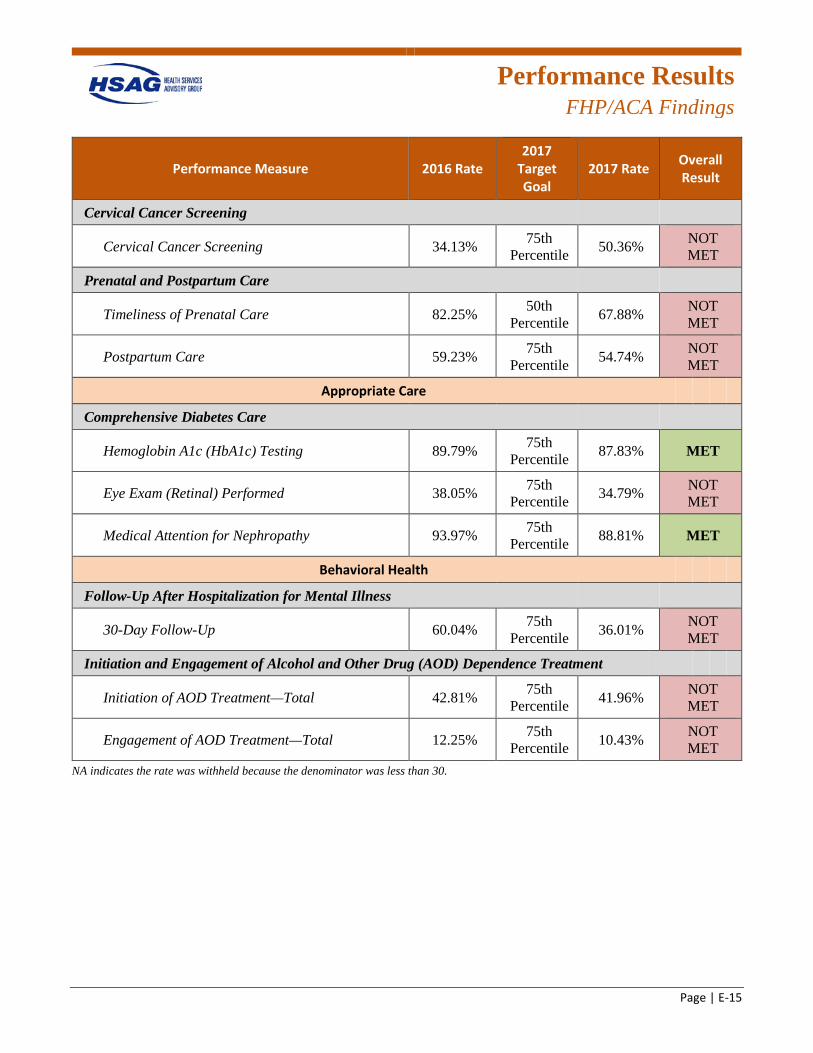
Performance Results
FHP/ACA Findings
Page | E-15
Performance Measure 2016 Rate 2017
Target Goal
2017 Rate Overall Result
Cervical Cancer Screening
Cervical Cancer Screening 34.13% 75th Percentile 50.36% NOT
MET
Prenatal and Postpartum Care
Timeliness of Prenatal Care 82.25% 50th Percentile 67.88% NOT
MET
Postpartum Care 59.23% 75th Percentile 54.74% NOT
MET
Appropriate Care
Comprehensive Diabetes Care
Hemoglobin A1c (HbA1c) Testing 89.79% 75th Percentile 87.83% MET
Eye Exam (Retinal) Performed 38.05% 75th Percentile 34.79% NOT
MET
Medical Attention for Nephropathy 93.97% 75th Percentile 88.81% MET
Behavioral Health
Follow-Up After Hospitalization for Mental Illness
30-Day Follow-Up 60.04% 75th Percentile 36.01% NOT
MET
Initiation and Engagement of Alcohol and Other Drug (AOD) Dependence Treatment
Initiation of AOD Treatment—Total 42.81% 75th Percentile 41.96% NOT
MET
Engagement of AOD Treatment—Total 12.25% 75th Percentile 10.43% NOT
MET NA indicates the rate was withheld because the denominator was less than 30.

Performance Results
FHP/ACA Findings
Page | E-16
FHN
The SFY 2017 performance measure and P4P results for FHN are displayed in the tables below.
Table E–9—FHP/ACA HEDIS 2016 and HEDIS 2017 Performance Measure Results—FHN
Performance Measure HEDIS 2016 Rate
2016 Performance
Level
HEDIS 2017 Rate
2017 Performance
Level
Access/Utilization of Care
Adults' Access to Preventive/Ambulatory Health Services
Total 79.30% 1 star 77.34% 2 stars
Ambulatory Care (per 1,000 Member Months)
Outpatient Visits—Total 421.40 NC 277.44 NC
ED Visits—Total 49.44 NC 58.49 NC
Preventive Care
Adult BMI Assessment
Adult BMI Assessment 75.43% 1 star 56.45% 1 star
Child & Adolescent Care
Childhood Immunization Status
Combination 2 68.13% 1 star 75.67% 3 stars
Combination 3 63.75% 1 star 71.78% 3 stars
Weight Assessment and Counseling for Nutrition and Physical Activity for Children/Adolescents
BMI Percentile—Total 65.45% 2 stars 58.15% 2 stars
Counseling for Nutrition—Total 61.80% 3 stars 56.20% 2 stars
Counseling for Physical Activity—Total 58.88% 3 stars 49.15% 2 stars
Well-Child Visits in the First 15 Months of Life
Six or More Well-Child Visits 49.88% 1 star 70.32% 4 stars
Well-Child Visits in the Third, Fourth, Fifth, and Sixth Years of Life
Well-Child Visits in the Third, Fourth, Fifth, and Sixth Years of Life 87.83% 5 stars 84.43% 5 stars
Women's Health
Breast Cancer Screening
Breast Cancer Screening 53.66% 2 stars 63.02% 3 stars
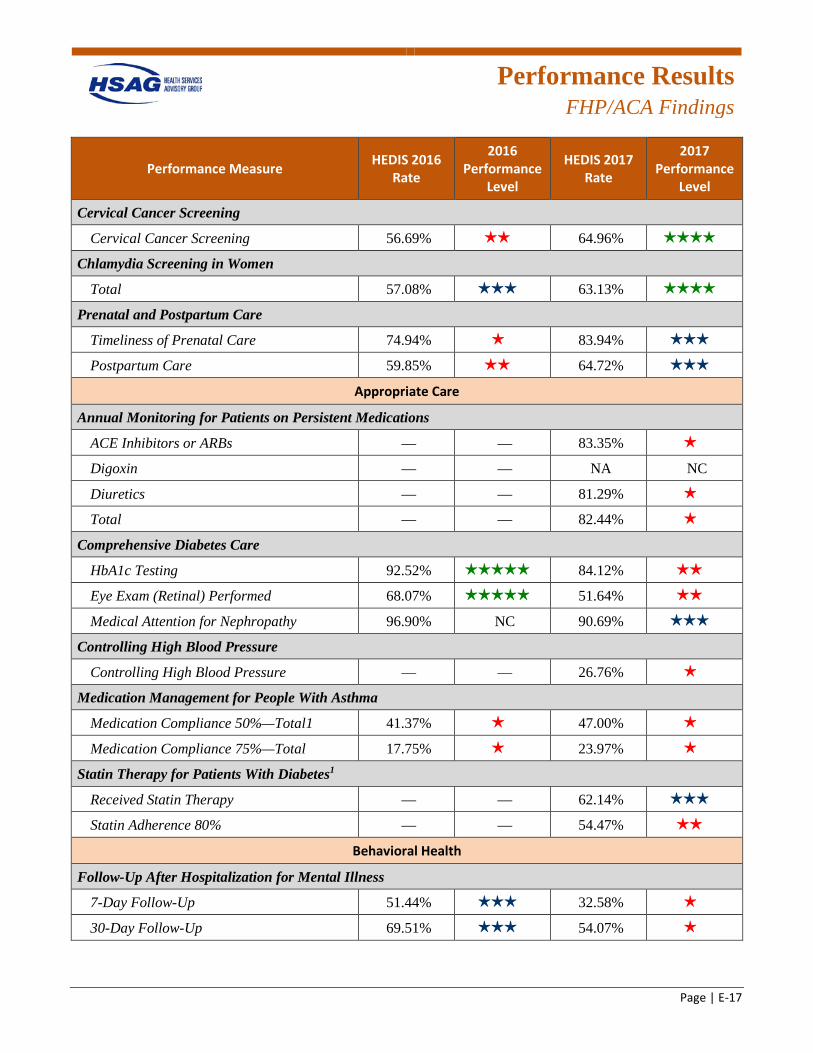
Performance Results
FHP/ACA Findings
Page | E-17
Performance Measure HEDIS 2016 Rate
2016 Performance
Level
HEDIS 2017 Rate
2017 Performance
Level
Cervical Cancer Screening
Cervical Cancer Screening 56.69% 2 stars 64.96% 4 stars
Chlamydia Screening in Women
Total 57.08% 3 stars 63.13% 4 stars
Prenatal and Postpartum Care
Timeliness of Prenatal Care 74.94% 1 star 83.94% 3 stars
Postpartum Care 59.85% 2 stars 64.72% 3 stars
Appropriate Care
Annual Monitoring for Patients on Persistent Medications
ACE Inhibitors or ARBs — — 83.35% 1 star
Digoxin — — NA NC
Diuretics — — 81.29% 1 star
Total — — 82.44% 1 star
Comprehensive Diabetes Care
HbA1c Testing 92.52% 5 stars 84.12% 2 stars
Eye Exam (Retinal) Performed 68.07% 5 stars 51.64% 2 stars
Medical Attention for Nephropathy 96.90% NC 90.69% 3 stars
Controlling High Blood Pressure
Controlling High Blood Pressure — — 26.76% 1 star
Medication Management for People With Asthma
Medication Compliance 50%—Total1 41.37% 1 star 47.00% 1 star
Medication Compliance 75%—Total 17.75% 1 star 23.97% 1 star
Statin Therapy for Patients With Diabetes1
Received Statin Therapy — — 62.14% 3 stars
Statin Adherence 80% — — 54.47% 2 stars
Behavioral Health
Follow-Up After Hospitalization for Mental Illness
7-Day Follow-Up 51.44% 3 stars 32.58% 1 star
30-Day Follow-Up 69.51% 3 stars 54.07% 1 star
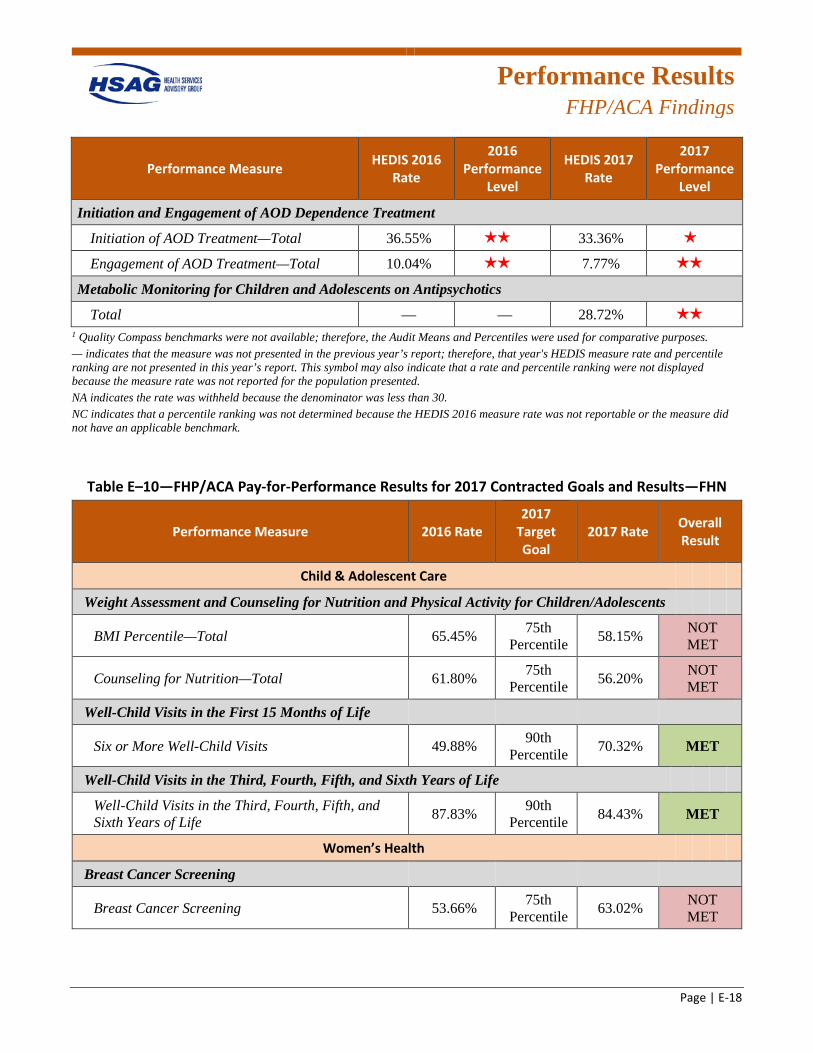
Performance Results
FHP/ACA Findings
Page | E-18
Performance Measure HEDIS 2016 Rate
2016 Performance
Level
HEDIS 2017 Rate
2017 Performance
Level
Initiation and Engagement of AOD Dependence Treatment
Initiation of AOD Treatment—Total 36.55% 2 stars 33.36% 1 star
Engagement of AOD Treatment—Total 10.04% 2 stars 7.77% 2 stars
Metabolic Monitoring for Children and Adolescents on Antipsychotics
Total — — 28.72% 2 stars
1 Quality Compass benchmarks were not available; therefore, the Audit Means and Percentiles were used for comparative purposes. — indicates that the measure was not presented in the previous year’s report; therefore, that year's HEDIS measure rate and percentile ranking are not presented in this year’s report. This symbol may also indicate that a rate and percentile ranking were not displayed because the measure rate was not reported for the population presented. NA indicates the rate was withheld because the denominator was less than 30. NC indicates that a percentile ranking was not determined because the HEDIS 2016 measure rate was not reportable or the measure did not have an applicable benchmark.
Table E–10—FHP/ACA Pay-for-Performance Results for 2017 Contracted Goals and Results—FHN
Performance Measure 2016 Rate 2017
Target Goal
2017 Rate Overall Result
Child & Adolescent Care
Weight Assessment and Counseling for Nutrition and Physical Activity for Children/Adolescents
BMI Percentile—Total 65.45% 75th Percentile 58.15% NOT
MET
Counseling for Nutrition—Total 61.80% 75th Percentile 56.20% NOT
MET
Well-Child Visits in the First 15 Months of Life
Six or More Well-Child Visits 49.88% 90th Percentile 70.32% MET
Well-Child Visits in the Third, Fourth, Fifth, and Sixth Years of Life
Well-Child Visits in the Third, Fourth, Fifth, and Sixth Years of Life 87.83% 90th
Percentile 84.43% MET
Women’s Health
Breast Cancer Screening
Breast Cancer Screening 53.66% 75th Percentile 63.02% NOT
MET
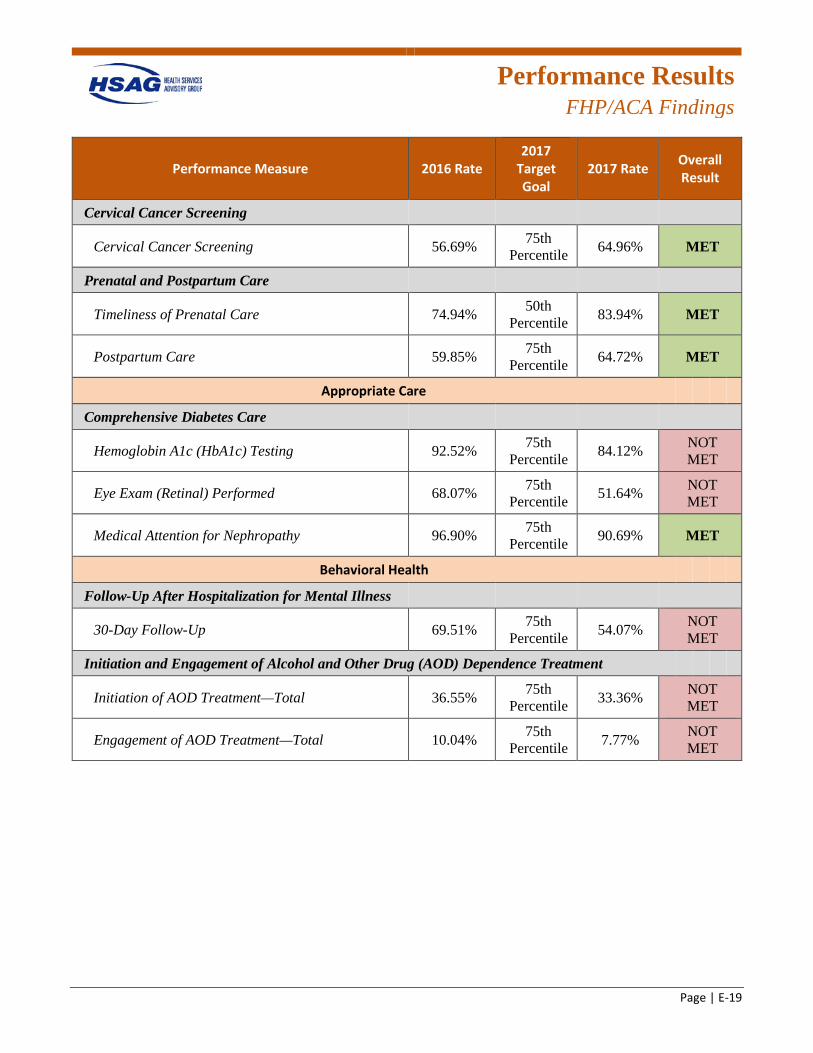
Performance Results
FHP/ACA Findings
Page | E-19
Performance Measure 2016 Rate 2017
Target Goal
2017 Rate Overall Result
Cervical Cancer Screening
Cervical Cancer Screening 56.69% 75th Percentile 64.96% MET
Prenatal and Postpartum Care
Timeliness of Prenatal Care 74.94% 50th Percentile 83.94% MET
Postpartum Care 59.85% 75th Percentile 64.72% MET
Appropriate Care
Comprehensive Diabetes Care
Hemoglobin A1c (HbA1c) Testing 92.52% 75th Percentile 84.12% NOT
MET
Eye Exam (Retinal) Performed 68.07% 75th Percentile 51.64% NOT
MET
Medical Attention for Nephropathy 96.90% 75th Percentile 90.69% MET
Behavioral Health
Follow-Up After Hospitalization for Mental Illness
30-Day Follow-Up 69.51% 75th Percentile 54.07% NOT
MET
Initiation and Engagement of Alcohol and Other Drug (AOD) Dependence Treatment
Initiation of AOD Treatment—Total 36.55% 75th Percentile 33.36% NOT
MET
Engagement of AOD Treatment—Total 10.04% 75th Percentile 7.77% NOT
MET
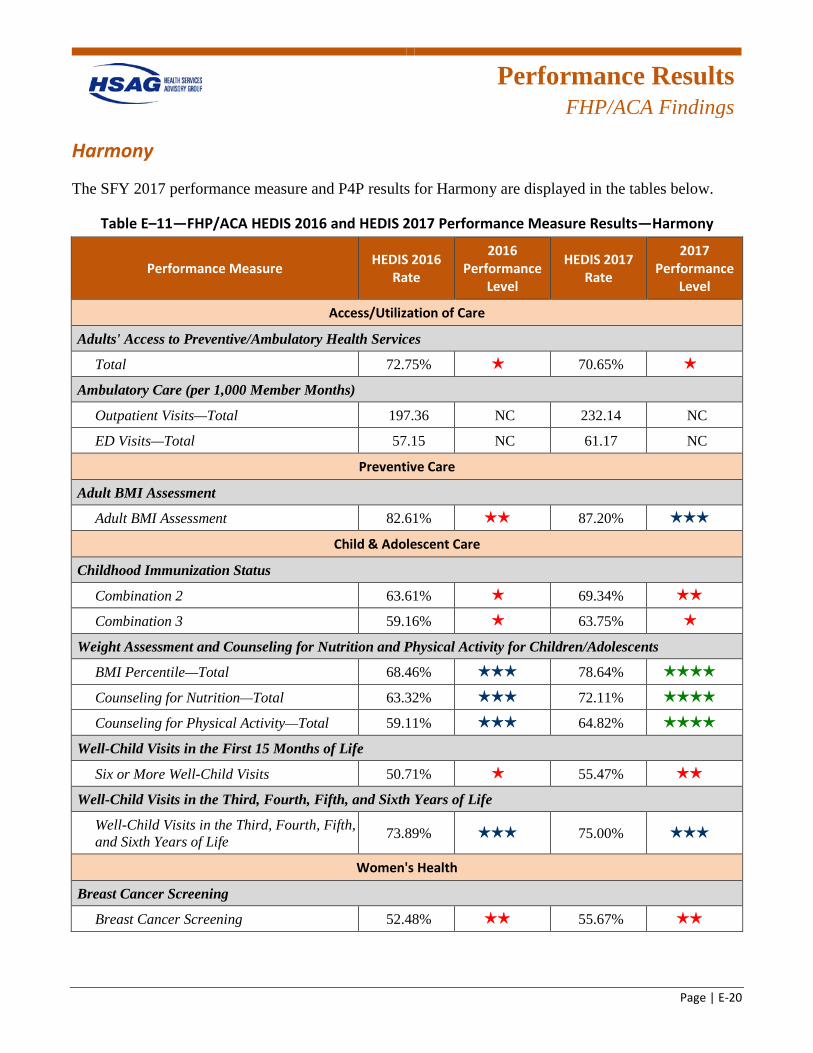
Performance Results
FHP/ACA Findings
Page | E-20
Harmony
The SFY 2017 performance measure and P4P results for Harmony are displayed in the tables below.
Table E–11—FHP/ACA HEDIS 2016 and HEDIS 2017 Performance Measure Results—Harmony
Performance Measure HEDIS 2016 Rate
2016 Performance
Level
HEDIS 2017 Rate
2017 Performance
Level
Access/Utilization of Care
Adults' Access to Preventive/Ambulatory Health Services
Total 72.75% 1 star 70.65% 1 star
Ambulatory Care (per 1,000 Member Months)
Outpatient Visits—Total 197.36 NC 232.14 NC
ED Visits—Total 57.15 NC 61.17 NC
Preventive Care
Adult BMI Assessment
Adult BMI Assessment 82.61% 2 stars 87.20% 3 stars
Child & Adolescent Care
Childhood Immunization Status
Combination 2 63.61% 1 star 69.34% 2 stars
Combination 3 59.16% 1 star 63.75% 1 star
Weight Assessment and Counseling for Nutrition and Physical Activity for Children/Adolescents
BMI Percentile—Total 68.46% 3 stars 78.64% 4 stars
Counseling for Nutrition—Total 63.32% 3 stars 72.11% 4 stars
Counseling for Physical Activity—Total 59.11% 3 stars 64.82% 4 stars
Well-Child Visits in the First 15 Months of Life
Six or More Well-Child Visits 50.71% 1 star 55.47% 2 stars
Well-Child Visits in the Third, Fourth, Fifth, and Sixth Years of Life
Well-Child Visits in the Third, Fourth, Fifth, and Sixth Years of Life 73.89% 3 stars 75.00% 3 stars
Women's Health
Breast Cancer Screening
Breast Cancer Screening 52.48% 2 stars 55.67% 2 stars

Performance Results
FHP/ACA Findings
Page | E-21
Performance Measure HEDIS 2016 Rate
2016 Performance
Level
HEDIS 2017 Rate
2017 Performance
Level
Cervical Cancer Screening
Cervical Cancer Screening 60.27% 2 stars 64.05% 4 stars
Chlamydia Screening in Women
Total 58.89% 3 stars 57.76% 3 stars
Prenatal and Postpartum Care
Timeliness of Prenatal Care 79.44% 2 stars 80.65% 2 stars
Postpartum Care 58.88% 2 stars 58.81% 2 stars
Appropriate Care
Annual Monitoring for Patients on Persistent Medications
ACE Inhibitors or ARBs — — 73.44% 1 star
Digoxin — — NA NC
Diuretics — — 71.79% 1 star
Total — — 72.66% 1 star
Comprehensive Diabetes Care
HbA1c Testing 79.91% 1 star 83.45% 2 stars
Eye Exam (Retinal) Performed 34.82% 1 star 39.66% 1 star
Medical Attention for Nephropathy 85.71% NC 88.32% 2 stars
Controlling High Blood Pressure
Controlling High Blood Pressure — — 45.50% 1 star
Medication Management for People With Asthma
Medication Compliance 50%—Total1 37.60% 1 star 43.06% 1 star
Medication Compliance 75%—Total 14.85% 1 star 18.55% 1 star
Statin Therapy for Patients With Diabetes1
Received Statin Therapy — — 54.61% 1 star
Statin Adherence 80% — — 45.63% 1 star
Behavioral Health
Follow-Up After Hospitalization for Mental Illness
7-Day Follow-Up 24.98% 1 star 34.30% 2 stars
30-Day Follow-Up 44.02% 1 star 51.70% 1 star
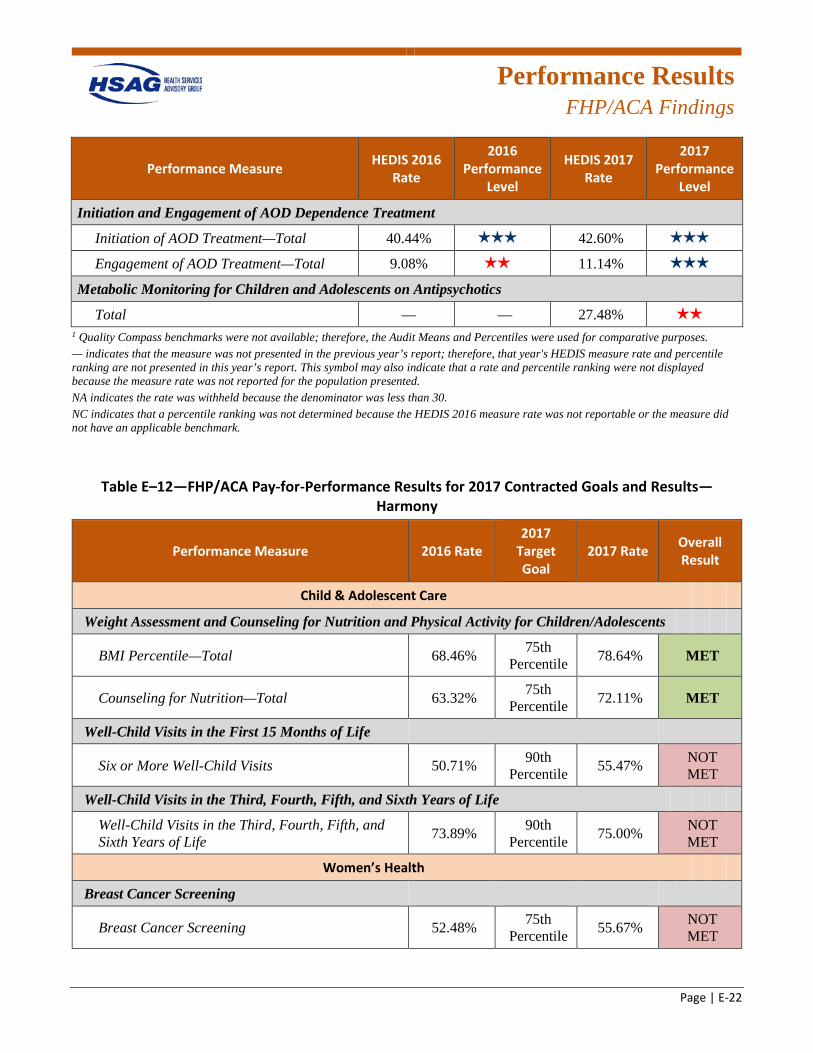
Performance Results
FHP/ACA Findings
Page | E-22
Performance Measure HEDIS 2016 Rate
2016 Performance
Level
HEDIS 2017 Rate
2017 Performance
Level
Initiation and Engagement of AOD Dependence Treatment
Initiation of AOD Treatment—Total 40.44% 3 stars 42.60% 3 stars
Engagement of AOD Treatment—Total 9.08% 2 stars 11.14% 3 stars
Metabolic Monitoring for Children and Adolescents on Antipsychotics
Total — — 27.48% 2 stars
1 Quality Compass benchmarks were not available; therefore, the Audit Means and Percentiles were used for comparative purposes. — indicates that the measure was not presented in the previous year’s report; therefore, that year's HEDIS measure rate and percentile ranking are not presented in this year’s report. This symbol may also indicate that a rate and percentile ranking were not displayed because the measure rate was not reported for the population presented. NA indicates the rate was withheld because the denominator was less than 30. NC indicates that a percentile ranking was not determined because the HEDIS 2016 measure rate was not reportable or the measure did not have an applicable benchmark.
Table E–12—FHP/ACA Pay-for-Performance Results for 2017 Contracted Goals and Results—Harmony
Performance Measure 2016 Rate 2017
Target Goal
2017 Rate Overall Result
Child & Adolescent Care
Weight Assessment and Counseling for Nutrition and Physical Activity for Children/Adolescents
BMI Percentile—Total 68.46% 75th Percentile 78.64% MET
Counseling for Nutrition—Total 63.32% 75th Percentile 72.11% MET
Well-Child Visits in the First 15 Months of Life
Six or More Well-Child Visits 50.71% 90th Percentile 55.47% NOT
MET
Well-Child Visits in the Third, Fourth, Fifth, and Sixth Years of Life
Well-Child Visits in the Third, Fourth, Fifth, and Sixth Years of Life 73.89% 90th
Percentile 75.00% NOT MET
Women’s Health
Breast Cancer Screening
Breast Cancer Screening 52.48% 75th Percentile 55.67% NOT
MET
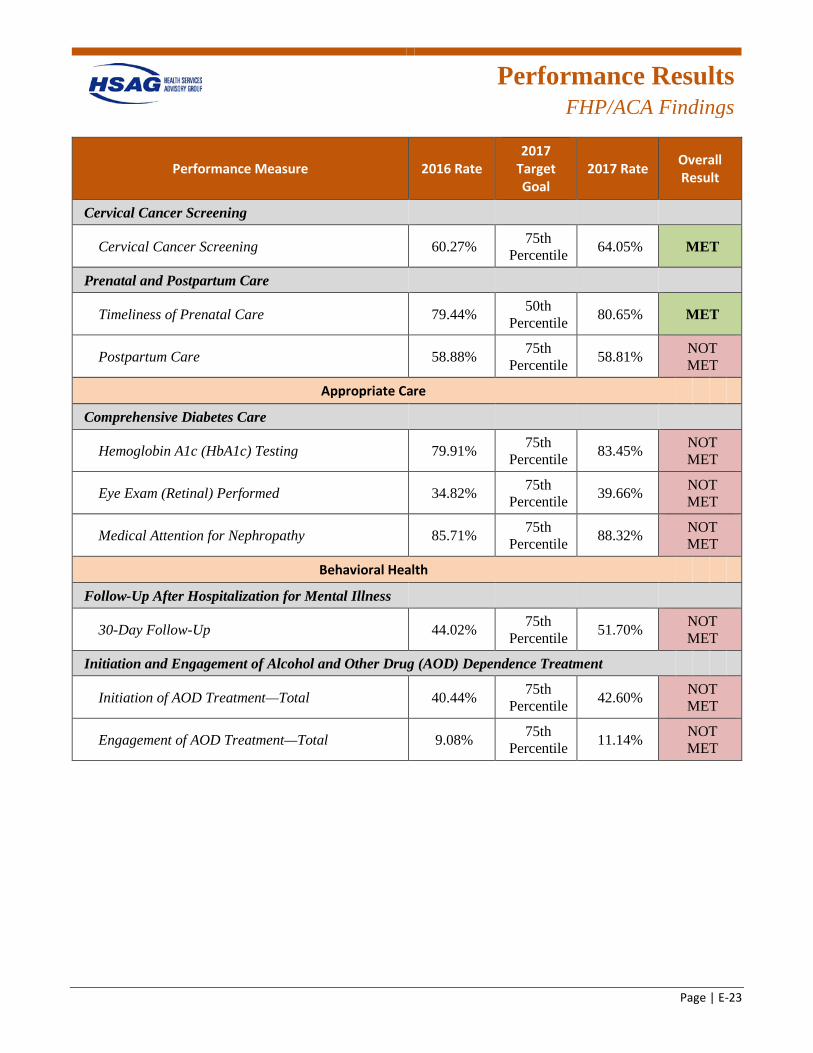
Performance Results
FHP/ACA Findings
Page | E-23
Performance Measure 2016 Rate 2017
Target Goal
2017 Rate Overall Result
Cervical Cancer Screening
Cervical Cancer Screening 60.27% 75th Percentile 64.05% MET
Prenatal and Postpartum Care
Timeliness of Prenatal Care 79.44% 50th Percentile 80.65% MET
Postpartum Care 58.88% 75th Percentile 58.81% NOT
MET
Appropriate Care
Comprehensive Diabetes Care
Hemoglobin A1c (HbA1c) Testing 79.91% 75th Percentile 83.45% NOT
MET
Eye Exam (Retinal) Performed 34.82% 75th Percentile 39.66% NOT
MET
Medical Attention for Nephropathy 85.71% 75th Percentile 88.32% NOT
MET
Behavioral Health
Follow-Up After Hospitalization for Mental Illness
30-Day Follow-Up 44.02% 75th Percentile 51.70% NOT
MET
Initiation and Engagement of Alcohol and Other Drug (AOD) Dependence Treatment
Initiation of AOD Treatment—Total 40.44% 75th Percentile 42.60% NOT
MET
Engagement of AOD Treatment—Total 9.08% 75th Percentile 11.14% NOT
MET
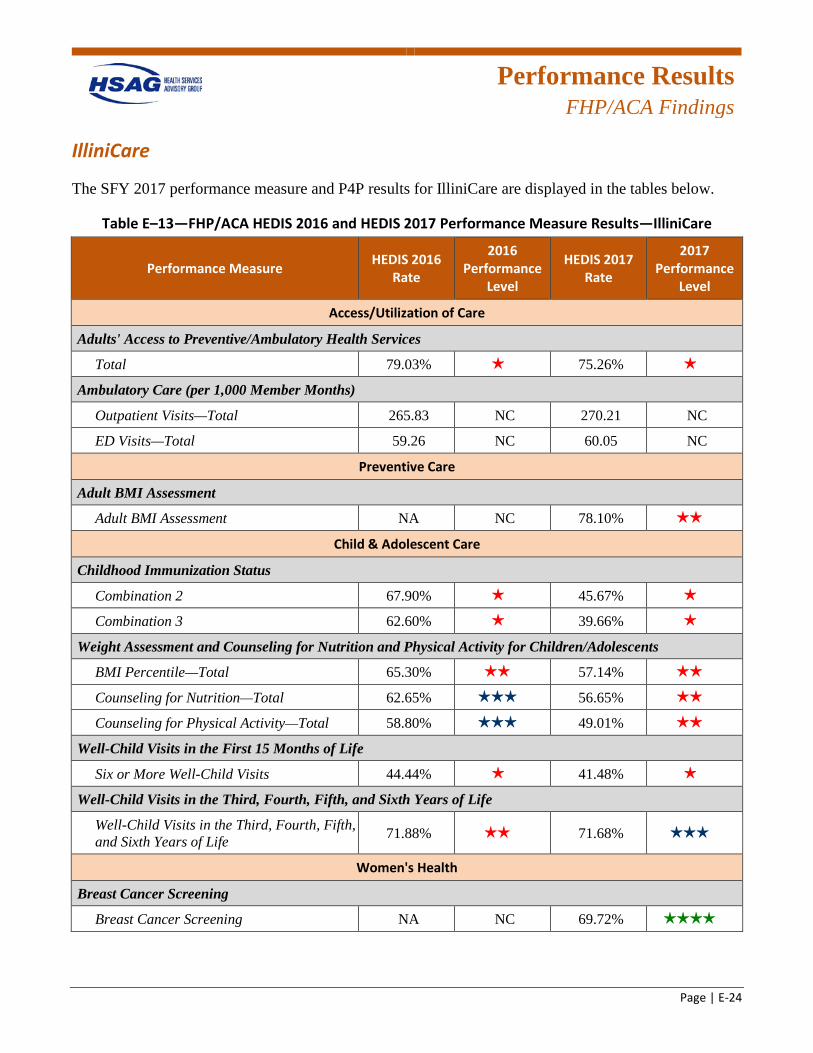
Performance Results
FHP/ACA Findings
Page | E-24
IlliniCare
The SFY 2017 performance measure and P4P results for IlliniCare are displayed in the tables below.
Table E–13—FHP/ACA HEDIS 2016 and HEDIS 2017 Performance Measure Results—IlliniCare
Performance Measure HEDIS 2016 Rate
2016 Performance
Level
HEDIS 2017 Rate
2017 Performance
Level
Access/Utilization of Care
Adults' Access to Preventive/Ambulatory Health Services
Total 79.03% 1 star 75.26% 1 star
Ambulatory Care (per 1,000 Member Months)
Outpatient Visits—Total 265.83 NC 270.21 NC
ED Visits—Total 59.26 NC 60.05 NC
Preventive Care
Adult BMI Assessment
Adult BMI Assessment NA NC 78.10% 2 stars
Child & Adolescent Care
Childhood Immunization Status
Combination 2 67.90% 1 star 45.67% 1 star
Combination 3 62.60% 1 star 39.66% 1 star
Weight Assessment and Counseling for Nutrition and Physical Activity for Children/Adolescents
BMI Percentile—Total 65.30% 2 stars 57.14% 2 stars
Counseling for Nutrition—Total 62.65% 3 stars 56.65% 2 stars
Counseling for Physical Activity—Total 58.80% 3 stars 49.01% 2 stars
Well-Child Visits in the First 15 Months of Life
Six or More Well-Child Visits 44.44% 1 star 41.48% 1 star
Well-Child Visits in the Third, Fourth, Fifth, and Sixth Years of Life
Well-Child Visits in the Third, Fourth, Fifth, and Sixth Years of Life 71.88% 2 stars 71.68% 3 stars
Women's Health
Breast Cancer Screening
Breast Cancer Screening NA NC 69.72% 4 stars
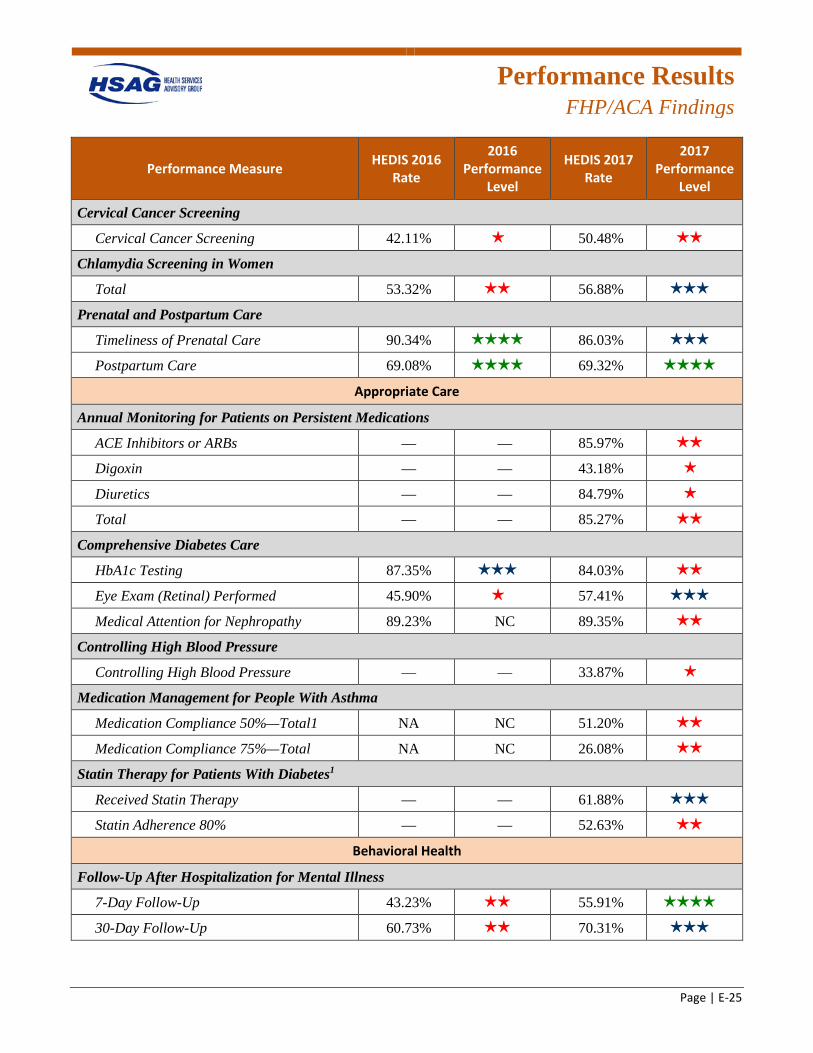
Performance Results
FHP/ACA Findings
Page | E-25
Performance Measure HEDIS 2016 Rate
2016 Performance
Level
HEDIS 2017 Rate
2017 Performance
Level
Cervical Cancer Screening
Cervical Cancer Screening 42.11% 1 star 50.48% 2 stars
Chlamydia Screening in Women
Total 53.32% 2 stars 56.88% 3 stars
Prenatal and Postpartum Care
Timeliness of Prenatal Care 90.34% 4 stars 86.03% 3 stars
Postpartum Care 69.08% 4 stars 69.32% 4 stars
Appropriate Care
Annual Monitoring for Patients on Persistent Medications
ACE Inhibitors or ARBs — — 85.97% 2 stars
Digoxin — — 43.18% 1 star
Diuretics — — 84.79% 1 star
Total — — 85.27% 2 stars
Comprehensive Diabetes Care
HbA1c Testing 87.35% 3 stars 84.03% 2 stars
Eye Exam (Retinal) Performed 45.90% 1 star 57.41% 3 stars
Medical Attention for Nephropathy 89.23% NC 89.35% 2 stars
Controlling High Blood Pressure
Controlling High Blood Pressure — — 33.87% 1 star
Medication Management for People With Asthma
Medication Compliance 50%—Total1 NA NC 51.20% 2 stars
Medication Compliance 75%—Total NA NC 26.08% 2 stars
Statin Therapy for Patients With Diabetes1
Received Statin Therapy — — 61.88% 3 stars
Statin Adherence 80% — — 52.63% 2 stars
Behavioral Health
Follow-Up After Hospitalization for Mental Illness
7-Day Follow-Up 43.23% 2 stars 55.91% 4 stars
30-Day Follow-Up 60.73% 2 stars 70.31% 3 stars
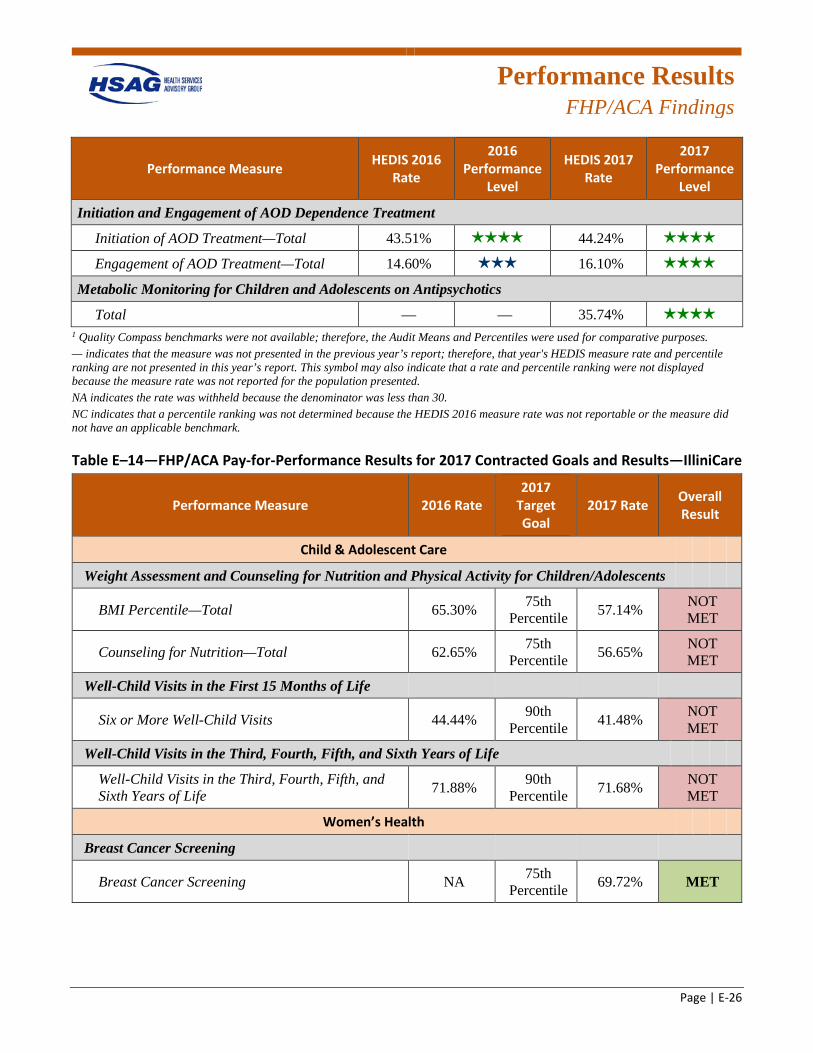
Performance Results
FHP/ACA Findings
Page | E-26
Performance Measure HEDIS 2016 Rate
2016 Performance
Level
HEDIS 2017 Rate
2017 Performance
Level
Initiation and Engagement of AOD Dependence Treatment
Initiation of AOD Treatment—Total 43.51% 4 stars 44.24% 4 stars
Engagement of AOD Treatment—Total 14.60% 3 stars 16.10% 4 stars
Metabolic Monitoring for Children and Adolescents on Antipsychotics
Total — — 35.74% 4 stars
1 Quality Compass benchmarks were not available; therefore, the Audit Means and Percentiles were used for comparative purposes. — indicates that the measure was not presented in the previous year’s report; therefore, that year's HEDIS measure rate and percentile ranking are not presented in this year’s report. This symbol may also indicate that a rate and percentile ranking were not displayed because the measure rate was not reported for the population presented. NA indicates the rate was withheld because the denominator was less than 30. NC indicates that a percentile ranking was not determined because the HEDIS 2016 measure rate was not reportable or the measure did not have an applicable benchmark.
Table E–14—FHP/ACA Pay-for-Performance Results for 2017 Contracted Goals and Results—IlliniCare
Performance Measure 2016 Rate 2017
Target Goal
2017 Rate Overall Result
Child & Adolescent Care
Weight Assessment and Counseling for Nutrition and Physical Activity for Children/Adolescents
BMI Percentile—Total 65.30% 75th Percentile 57.14% NOT
MET
Counseling for Nutrition—Total 62.65% 75th Percentile 56.65% NOT
MET
Well-Child Visits in the First 15 Months of Life
Six or More Well-Child Visits 44.44% 90th Percentile 41.48% NOT
MET
Well-Child Visits in the Third, Fourth, Fifth, and Sixth Years of Life
Well-Child Visits in the Third, Fourth, Fifth, and Sixth Years of Life 71.88% 90th
Percentile 71.68% NOT MET
Women’s Health
Breast Cancer Screening
Breast Cancer Screening NA 75th Percentile 69.72% MET
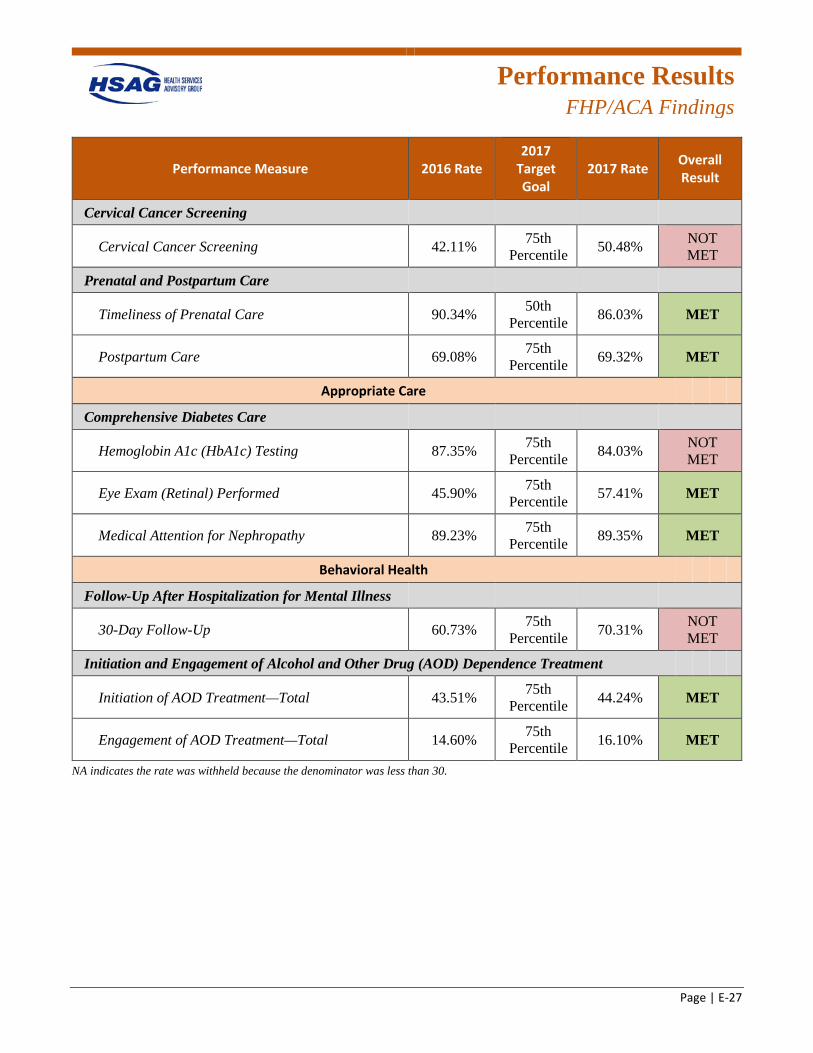
Performance Results
FHP/ACA Findings
Page | E-27
Performance Measure 2016 Rate 2017
Target Goal
2017 Rate Overall Result
Cervical Cancer Screening
Cervical Cancer Screening 42.11% 75th Percentile 50.48% NOT
MET
Prenatal and Postpartum Care
Timeliness of Prenatal Care 90.34% 50th Percentile 86.03% MET
Postpartum Care 69.08% 75th Percentile 69.32% MET
Appropriate Care
Comprehensive Diabetes Care
Hemoglobin A1c (HbA1c) Testing 87.35% 75th Percentile 84.03% NOT
MET
Eye Exam (Retinal) Performed 45.90% 75th Percentile 57.41% MET
Medical Attention for Nephropathy 89.23% 75th Percentile 89.35% MET
Behavioral Health
Follow-Up After Hospitalization for Mental Illness
30-Day Follow-Up 60.73% 75th Percentile 70.31% NOT
MET
Initiation and Engagement of Alcohol and Other Drug (AOD) Dependence Treatment
Initiation of AOD Treatment—Total 43.51% 75th Percentile 44.24% MET
Engagement of AOD Treatment—Total 14.60% 75th Percentile 16.10% MET
NA indicates the rate was withheld because the denominator was less than 30.
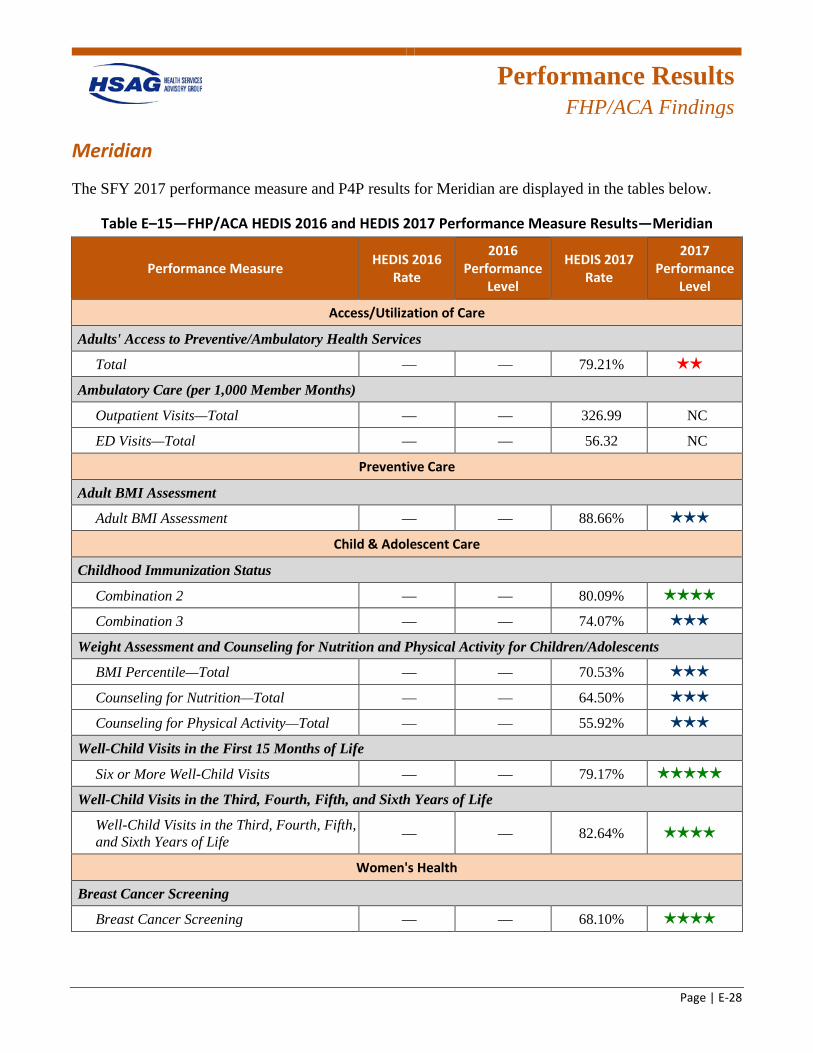
Performance Results
FHP/ACA Findings
Page | E-28
Meridian
The SFY 2017 performance measure and P4P results for Meridian are displayed in the tables below.
Table E–15—FHP/ACA HEDIS 2016 and HEDIS 2017 Performance Measure Results—Meridian
Performance Measure HEDIS 2016 Rate
2016 Performance
Level
HEDIS 2017 Rate
2017 Performance
Level
Access/Utilization of Care
Adults' Access to Preventive/Ambulatory Health Services
Total — — 79.21% 2 stars
Ambulatory Care (per 1,000 Member Months)
Outpatient Visits—Total — — 326.99 NC
ED Visits—Total — — 56.32 NC
Preventive Care
Adult BMI Assessment
Adult BMI Assessment — — 88.66% 3 stars
Child & Adolescent Care
Childhood Immunization Status
Combination 2 — — 80.09% 4 stars
Combination 3 — — 74.07% 3 stars
Weight Assessment and Counseling for Nutrition and Physical Activity for Children/Adolescents
BMI Percentile—Total — — 70.53% 3 stars
Counseling for Nutrition—Total — — 64.50% 3 stars
Counseling for Physical Activity—Total — — 55.92% 3 stars
Well-Child Visits in the First 15 Months of Life
Six or More Well-Child Visits — — 79.17% 5 stars
Well-Child Visits in the Third, Fourth, Fifth, and Sixth Years of Life
Well-Child Visits in the Third, Fourth, Fifth, and Sixth Years of Life — — 82.64% 4 stars
Women's Health
Breast Cancer Screening
Breast Cancer Screening — — 68.10% 4 stars
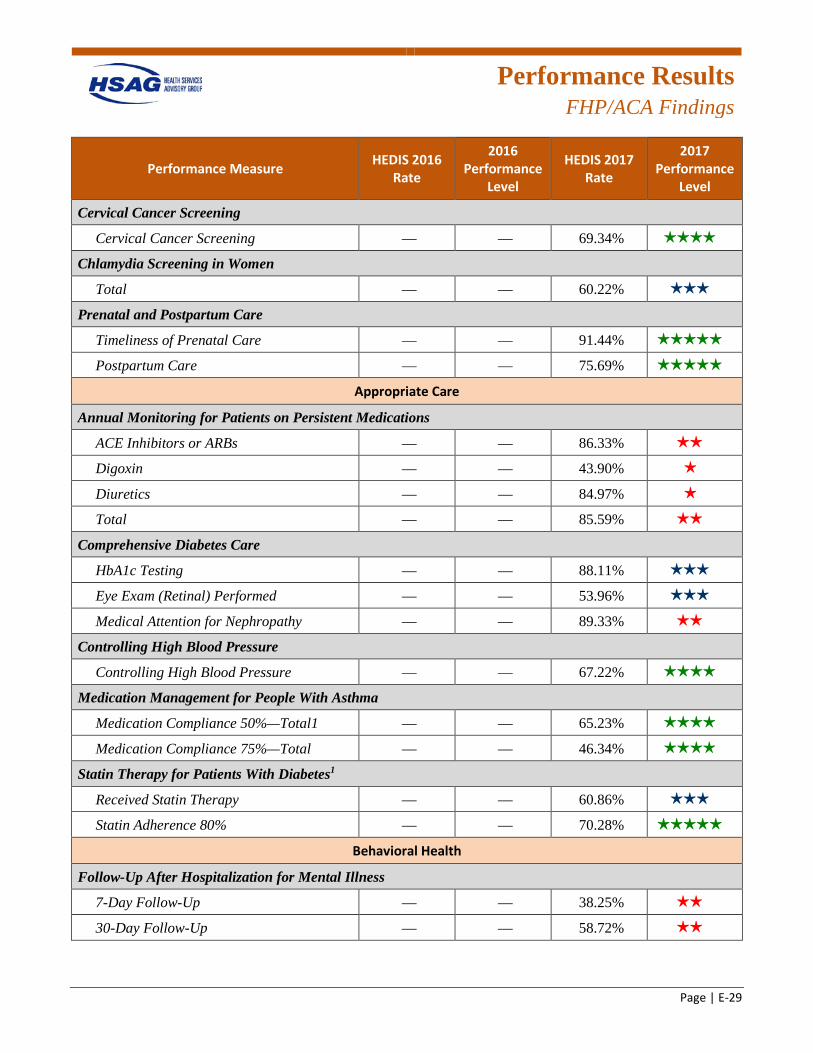
Performance Results
FHP/ACA Findings
Page | E-29
Performance Measure HEDIS 2016 Rate
2016 Performance
Level
HEDIS 2017 Rate
2017 Performance
Level
Cervical Cancer Screening
Cervical Cancer Screening — — 69.34% 4 stars
Chlamydia Screening in Women
Total — — 60.22% 3 stars
Prenatal and Postpartum Care
Timeliness of Prenatal Care — — 91.44% 5 stars
Postpartum Care — — 75.69% 5 stars
Appropriate Care
Annual Monitoring for Patients on Persistent Medications
ACE Inhibitors or ARBs — — 86.33% 2 stars
Digoxin — — 43.90% 1 star
Diuretics — — 84.97% 1 star
Total — — 85.59% 2 stars
Comprehensive Diabetes Care
HbA1c Testing — — 88.11% 3 stars
Eye Exam (Retinal) Performed — — 53.96% 3 stars
Medical Attention for Nephropathy — — 89.33% 2 stars
Controlling High Blood Pressure
Controlling High Blood Pressure — — 67.22% 4 stars
Medication Management for People With Asthma
Medication Compliance 50%—Total1 — — 65.23% 4 stars
Medication Compliance 75%—Total — — 46.34% 4 stars
Statin Therapy for Patients With Diabetes1
Received Statin Therapy — — 60.86% 3 stars
Statin Adherence 80% — — 70.28% 5 stars
Behavioral Health
Follow-Up After Hospitalization for Mental Illness
7-Day Follow-Up — — 38.25% 2 stars
30-Day Follow-Up — — 58.72% 2 stars
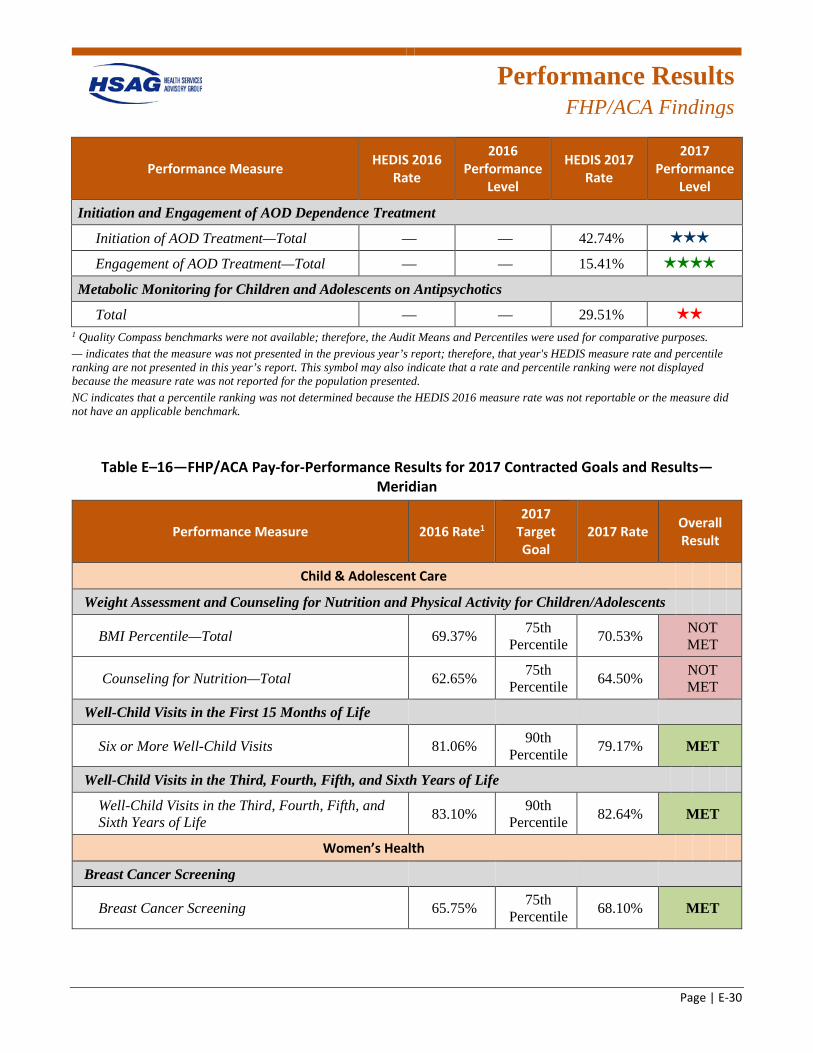
Performance Results
FHP/ACA Findings
Page | E-30
Performance Measure HEDIS 2016 Rate
2016 Performance
Level
HEDIS 2017 Rate
2017 Performance
Level
Initiation and Engagement of AOD Dependence Treatment
Initiation of AOD Treatment—Total — — 42.74% 3 stars
Engagement of AOD Treatment—Total — — 15.41% 4 stars
Metabolic Monitoring for Children and Adolescents on Antipsychotics
Total — — 29.51% 2 stars
1 Quality Compass benchmarks were not available; therefore, the Audit Means and Percentiles were used for comparative purposes. — indicates that the measure was not presented in the previous year’s report; therefore, that year's HEDIS measure rate and percentile ranking are not presented in this year’s report. This symbol may also indicate that a rate and percentile ranking were not displayed because the measure rate was not reported for the population presented. NC indicates that a percentile ranking was not determined because the HEDIS 2016 measure rate was not reportable or the measure did not have an applicable benchmark.
Table E–16—FHP/ACA Pay-for-Performance Results for 2017 Contracted Goals and Results—Meridian
Performance Measure 2016 Rate1 2017
Target Goal
2017 Rate Overall Result
Child & Adolescent Care
Weight Assessment and Counseling for Nutrition and Physical Activity for Children/Adolescents
BMI Percentile—Total 69.37% 75th Percentile 70.53% NOT
MET
Counseling for Nutrition—Total 62.65% 75th Percentile 64.50% NOT
MET
Well-Child Visits in the First 15 Months of Life
Six or More Well-Child Visits 81.06% 90th Percentile 79.17% MET
Well-Child Visits in the Third, Fourth, Fifth, and Sixth Years of Life
Well-Child Visits in the Third, Fourth, Fifth, and Sixth Years of Life 83.10% 90th
Percentile 82.64% MET
Women’s Health
Breast Cancer Screening
Breast Cancer Screening 65.75% 75th Percentile 68.10% MET
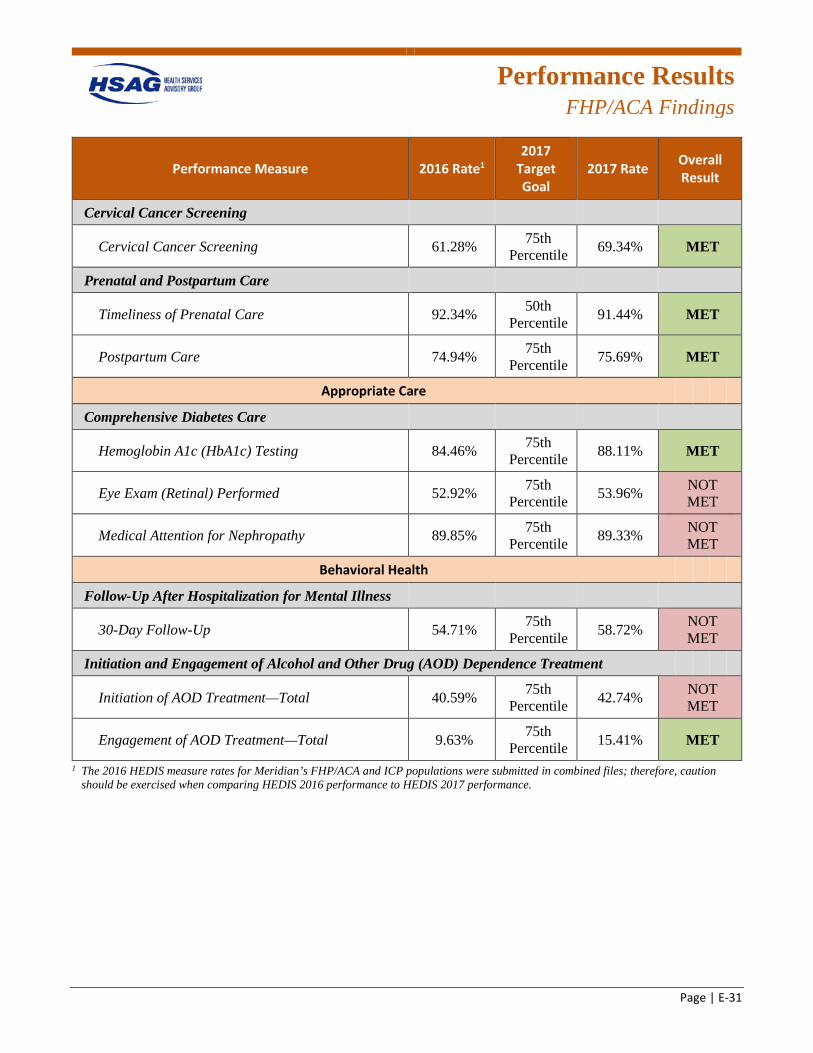
Performance Results
FHP/ACA Findings
Page | E-31
Performance Measure 2016 Rate1 2017
Target Goal
2017 Rate Overall Result
Cervical Cancer Screening
Cervical Cancer Screening 61.28% 75th Percentile 69.34% MET
Prenatal and Postpartum Care
Timeliness of Prenatal Care 92.34% 50th Percentile 91.44% MET
Postpartum Care 74.94% 75th Percentile 75.69% MET
Appropriate Care
Comprehensive Diabetes Care
Hemoglobin A1c (HbA1c) Testing 84.46% 75th Percentile 88.11% MET
Eye Exam (Retinal) Performed 52.92% 75th Percentile 53.96% NOT
MET
Medical Attention for Nephropathy 89.85% 75th Percentile 89.33% NOT
MET
Behavioral Health
Follow-Up After Hospitalization for Mental Illness
30-Day Follow-Up 54.71% 75th Percentile 58.72% NOT
MET
Initiation and Engagement of Alcohol and Other Drug (AOD) Dependence Treatment
Initiation of AOD Treatment—Total 40.59% 75th Percentile 42.74% NOT
MET
Engagement of AOD Treatment—Total 9.63% 75th Percentile 15.41% MET
1 The 2016 HEDIS measure rates for Meridian’s FHP/ACA and ICP populations were submitted in combined files; therefore, caution should be exercised when comparing HEDIS 2016 performance to HEDIS 2017 performance.
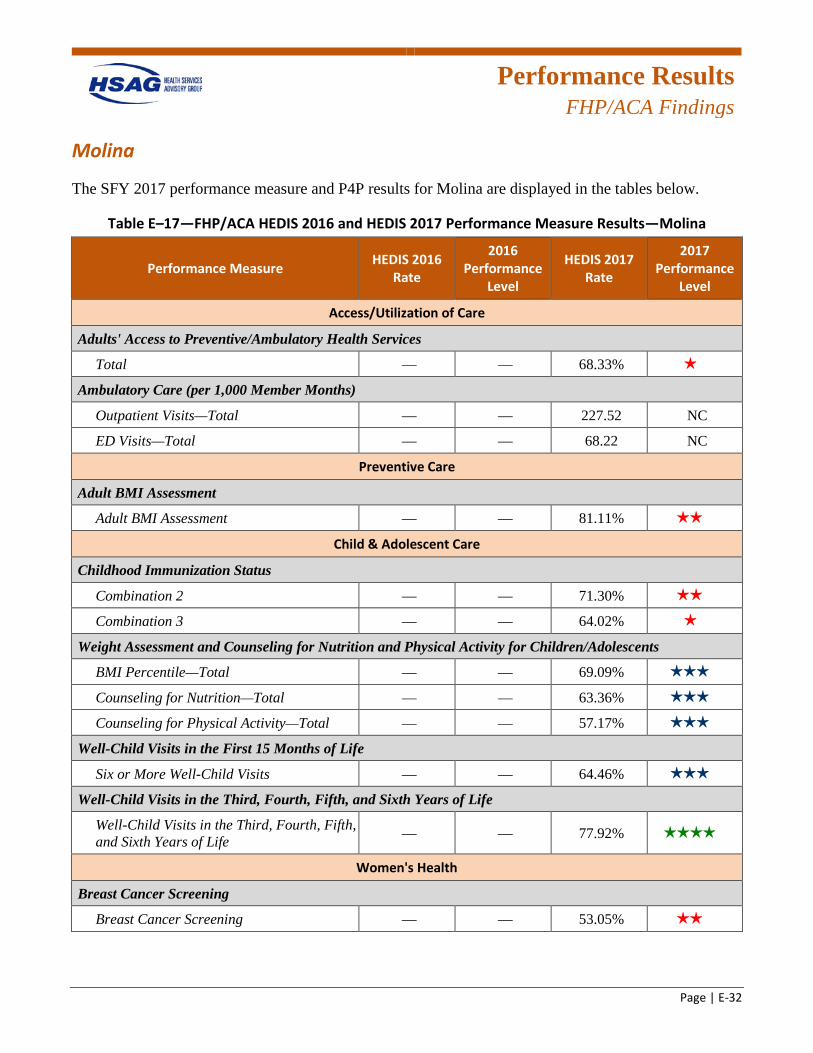
Performance Results
FHP/ACA Findings
Page | E-32
Molina
The SFY 2017 performance measure and P4P results for Molina are displayed in the tables below.
Table E–17—FHP/ACA HEDIS 2016 and HEDIS 2017 Performance Measure Results—Molina
Performance Measure HEDIS 2016 Rate
2016 Performance
Level
HEDIS 2017 Rate
2017 Performance
Level
Access/Utilization of Care
Adults' Access to Preventive/Ambulatory Health Services
Total — — 68.33% 1 star
Ambulatory Care (per 1,000 Member Months)
Outpatient Visits—Total — — 227.52 NC
ED Visits—Total — — 68.22 NC
Preventive Care
Adult BMI Assessment
Adult BMI Assessment — — 81.11% 2 stars
Child & Adolescent Care
Childhood Immunization Status
Combination 2 — — 71.30% 2 stars
Combination 3 — — 64.02% 1 star
Weight Assessment and Counseling for Nutrition and Physical Activity for Children/Adolescents
BMI Percentile—Total — — 69.09% 3 stars
Counseling for Nutrition—Total — — 63.36% 3 stars
Counseling for Physical Activity—Total — — 57.17% 3 stars
Well-Child Visits in the First 15 Months of Life
Six or More Well-Child Visits — — 64.46% 3 stars
Well-Child Visits in the Third, Fourth, Fifth, and Sixth Years of Life
Well-Child Visits in the Third, Fourth, Fifth, and Sixth Years of Life — — 77.92% 4 stars
Women's Health
Breast Cancer Screening
Breast Cancer Screening — — 53.05% 2 stars
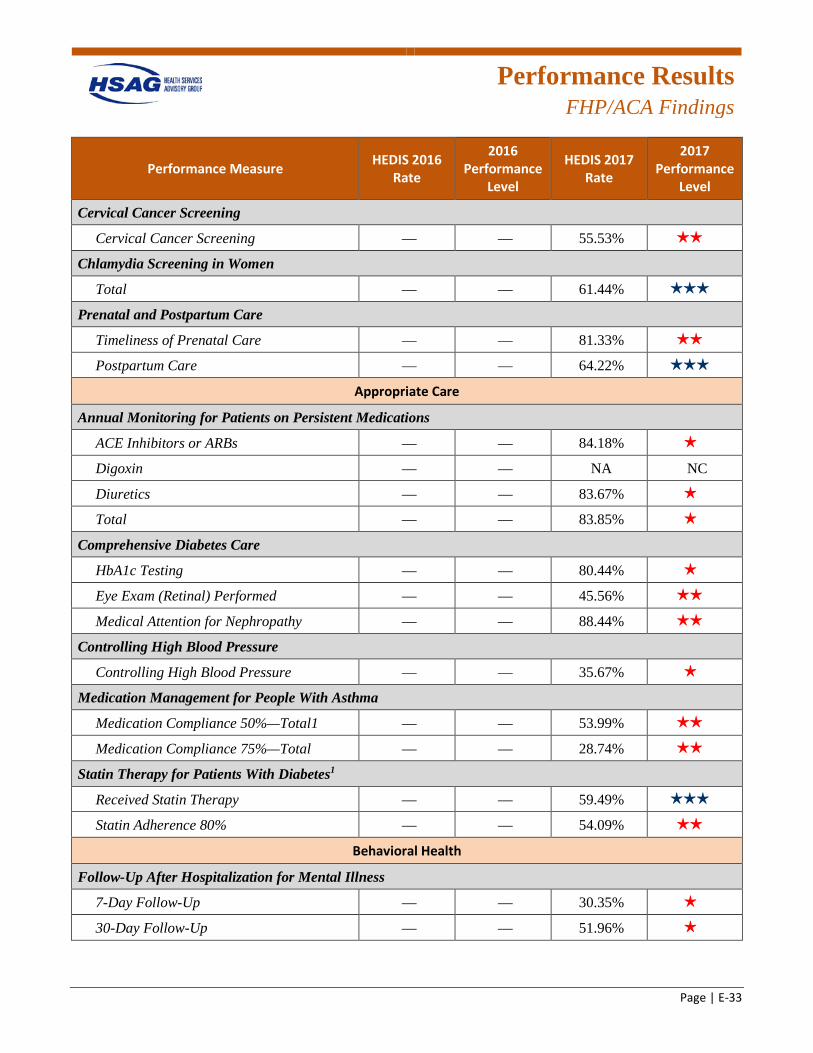
Performance Results
FHP/ACA Findings
Page | E-33
Performance Measure HEDIS 2016 Rate
2016 Performance
Level
HEDIS 2017 Rate
2017 Performance
Level
Cervical Cancer Screening
Cervical Cancer Screening — — 55.53% 2 stars
Chlamydia Screening in Women
Total — — 61.44% 3 stars
Prenatal and Postpartum Care
Timeliness of Prenatal Care — — 81.33% 2 stars
Postpartum Care — — 64.22% 3 stars
Appropriate Care
Annual Monitoring for Patients on Persistent Medications
ACE Inhibitors or ARBs — — 84.18% 1 star
Digoxin — — NA NC
Diuretics — — 83.67% 1 star
Total — — 83.85% 1 star
Comprehensive Diabetes Care
HbA1c Testing — — 80.44% 1 star
Eye Exam (Retinal) Performed — — 45.56% 2 stars
Medical Attention for Nephropathy — — 88.44% 2 stars
Controlling High Blood Pressure
Controlling High Blood Pressure — — 35.67% 1 star
Medication Management for People With Asthma
Medication Compliance 50%—Total1 — — 53.99% 2 stars
Medication Compliance 75%—Total — — 28.74% 2 stars
Statin Therapy for Patients With Diabetes1
Received Statin Therapy — — 59.49% 3 stars
Statin Adherence 80% — — 54.09% 2 stars
Behavioral Health
Follow-Up After Hospitalization for Mental Illness
7-Day Follow-Up — — 30.35% 1 star
30-Day Follow-Up — — 51.96% 1 star
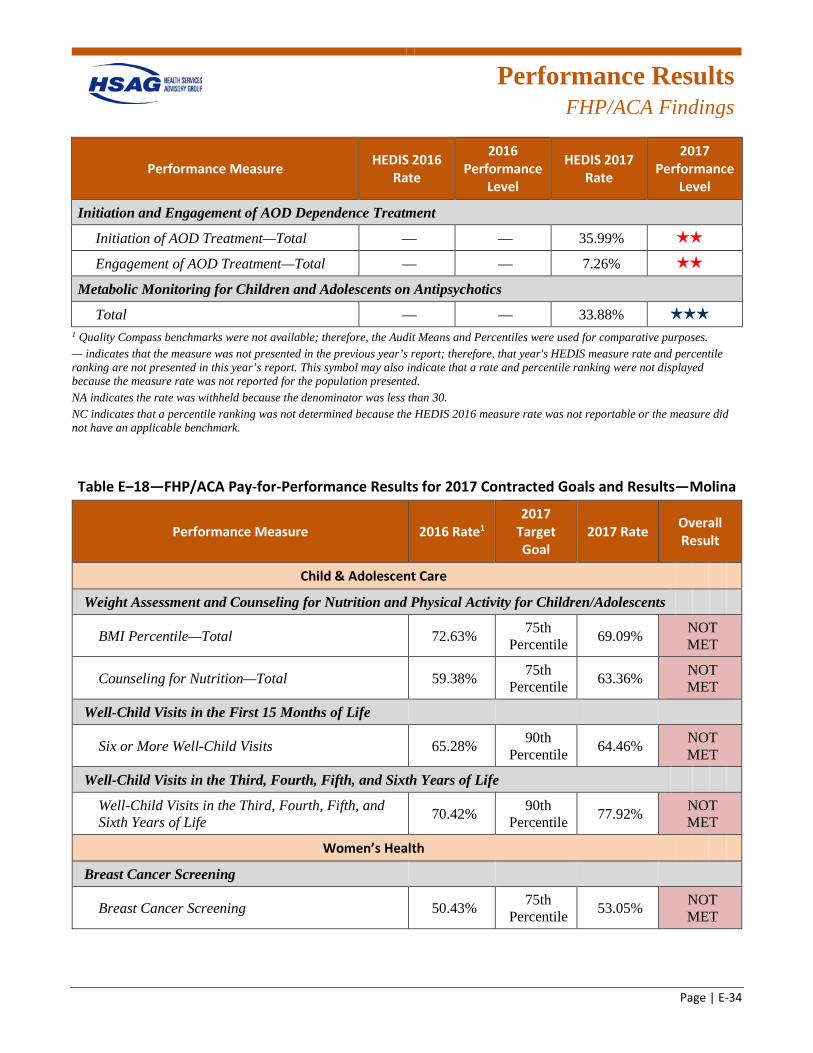
Performance Results
FHP/ACA Findings
Page | E-34
Performance Measure HEDIS 2016 Rate
2016 Performance
Level
HEDIS 2017 Rate
2017 Performance
Level
Initiation and Engagement of AOD Dependence Treatment
Initiation of AOD Treatment—Total — — 35.99% 2 stars
Engagement of AOD Treatment—Total — — 7.26% 2 stars
Metabolic Monitoring for Children and Adolescents on Antipsychotics
Total — — 33.88% 3 stars
1 Quality Compass benchmarks were not available; therefore, the Audit Means and Percentiles were used for comparative purposes. — indicates that the measure was not presented in the previous year’s report; therefore, that year's HEDIS measure rate and percentile ranking are not presented in this year’s report. This symbol may also indicate that a rate and percentile ranking were not displayed because the measure rate was not reported for the population presented. NA indicates the rate was withheld because the denominator was less than 30. NC indicates that a percentile ranking was not determined because the HEDIS 2016 measure rate was not reportable or the measure did not have an applicable benchmark.
Table E–18—FHP/ACA Pay-for-Performance Results for 2017 Contracted Goals and Results—Molina
Performance Measure 2016 Rate1 2017
Target Goal
2017 Rate Overall Result
Child & Adolescent Care
Weight Assessment and Counseling for Nutrition and Physical Activity for Children/Adolescents
BMI Percentile—Total 72.63% 75th Percentile 69.09% NOT
MET
Counseling for Nutrition—Total 59.38% 75th Percentile 63.36% NOT
MET
Well-Child Visits in the First 15 Months of Life
Six or More Well-Child Visits 65.28% 90th Percentile 64.46% NOT
MET
Well-Child Visits in the Third, Fourth, Fifth, and Sixth Years of Life
Well-Child Visits in the Third, Fourth, Fifth, and Sixth Years of Life 70.42% 90th
Percentile 77.92% NOT MET
Women’s Health
Breast Cancer Screening
Breast Cancer Screening 50.43% 75th Percentile 53.05% NOT
MET
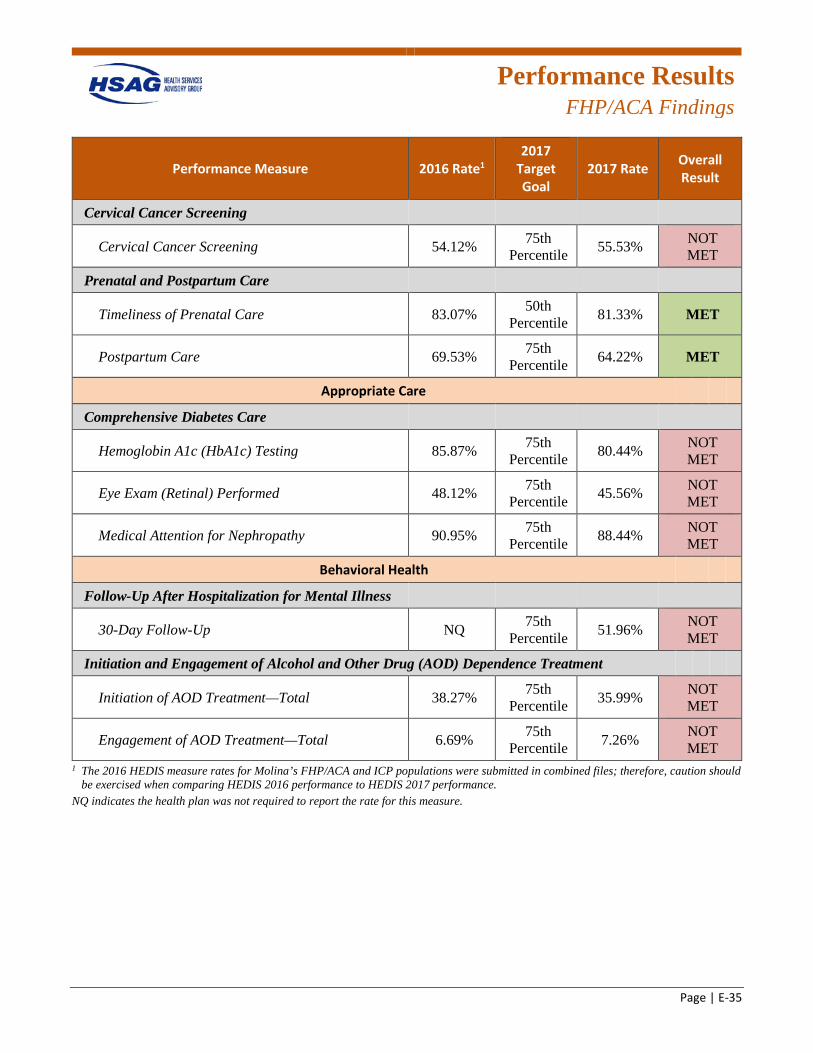
Performance Results
FHP/ACA Findings
Page | E-35
Performance Measure 2016 Rate1 2017
Target Goal
2017 Rate Overall Result
Cervical Cancer Screening
Cervical Cancer Screening 54.12% 75th Percentile 55.53% NOT
MET
Prenatal and Postpartum Care
Timeliness of Prenatal Care 83.07% 50th Percentile 81.33% MET
Postpartum Care 69.53% 75th Percentile 64.22% MET
Appropriate Care
Comprehensive Diabetes Care
Hemoglobin A1c (HbA1c) Testing 85.87% 75th Percentile 80.44% NOT
MET
Eye Exam (Retinal) Performed 48.12% 75th Percentile 45.56% NOT
MET
Medical Attention for Nephropathy 90.95% 75th Percentile 88.44% NOT
MET
Behavioral Health
Follow-Up After Hospitalization for Mental Illness
30-Day Follow-Up NQ 75th Percentile 51.96% NOT
MET
Initiation and Engagement of Alcohol and Other Drug (AOD) Dependence Treatment
Initiation of AOD Treatment—Total 38.27% 75th Percentile 35.99% NOT
MET
Engagement of AOD Treatment—Total 6.69% 75th Percentile 7.26% NOT
MET 1 The 2016 HEDIS measure rates for Molina’s FHP/ACA and ICP populations were submitted in combined files; therefore, caution should
be exercised when comparing HEDIS 2016 performance to HEDIS 2017 performance. NQ indicates the health plan was not required to report the rate for this measure.
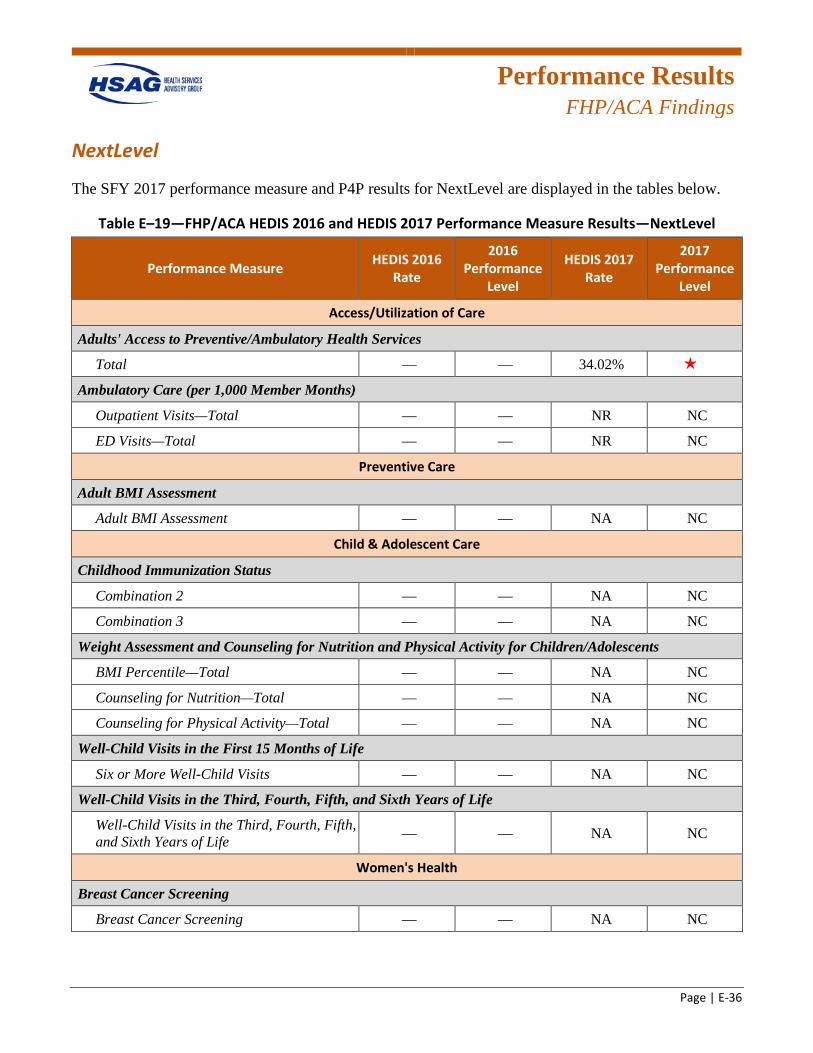
Performance Results
FHP/ACA Findings
Page | E-36
NextLevel
The SFY 2017 performance measure and P4P results for NextLevel are displayed in the tables below.
Table E–19—FHP/ACA HEDIS 2016 and HEDIS 2017 Performance Measure Results—NextLevel
Performance Measure HEDIS 2016 Rate
2016 Performance
Level
HEDIS 2017 Rate
2017 Performance
Level
Access/Utilization of Care
Adults' Access to Preventive/Ambulatory Health Services
Total — — 34.02% 1 star
Ambulatory Care (per 1,000 Member Months)
Outpatient Visits—Total — — NR NC
ED Visits—Total — — NR NC
Preventive Care
Adult BMI Assessment
Adult BMI Assessment — — NA NC
Child & Adolescent Care
Childhood Immunization Status
Combination 2 — — NA NC
Combination 3 — — NA NC
Weight Assessment and Counseling for Nutrition and Physical Activity for Children/Adolescents
BMI Percentile—Total — — NA NC
Counseling for Nutrition—Total — — NA NC
Counseling for Physical Activity—Total — — NA NC
Well-Child Visits in the First 15 Months of Life
Six or More Well-Child Visits — — NA NC
Well-Child Visits in the Third, Fourth, Fifth, and Sixth Years of Life
Well-Child Visits in the Third, Fourth, Fifth, and Sixth Years of Life — — NA NC
Women's Health
Breast Cancer Screening
Breast Cancer Screening — — NA NC

Performance Results
FHP/ACA Findings
Page | E-37
Performance Measure HEDIS 2016 Rate
2016 Performance
Level
HEDIS 2017 Rate
2017 Performance
Level
Cervical Cancer Screening
Cervical Cancer Screening — — 8.46% 1 star
Chlamydia Screening in Women
Total — — 61.84% 4 stars
Prenatal and Postpartum Care
Timeliness of Prenatal Care — — 47.89% 1 star
Postpartum Care — — 42.25% 1 star
Appropriate Care
Annual Monitoring for Patients on Persistent Medications
ACE Inhibitors or ARBs — — 78.24% 1 star
Digoxin — — NA NC
Diuretics — — 75.96% 1 star
Total — — 76.73% 1 star
Comprehensive Diabetes Care
HbA1c Testing — — 71.25% 1 star
Eye Exam (Retinal) Performed — — 15.31% 1 star
Medical Attention for Nephropathy — — 88.60% 2 stars
Controlling High Blood Pressure
Controlling High Blood Pressure — — BR NC
Medication Management for People With Asthma
Medication Compliance 50%—Total — — NA NC
Medication Compliance 75%—Total — — NA NC
Statin Therapy for Patients With Diabetes1
Received Statin Therapy — — NA NC
Statin Adherence 80% — — NA NC
Behavioral Health
Follow-Up After Hospitalization for Mental Illness
7-Day Follow-Up — — 9.09% 1 star
30-Day Follow-Up — — 17.92% 1 star
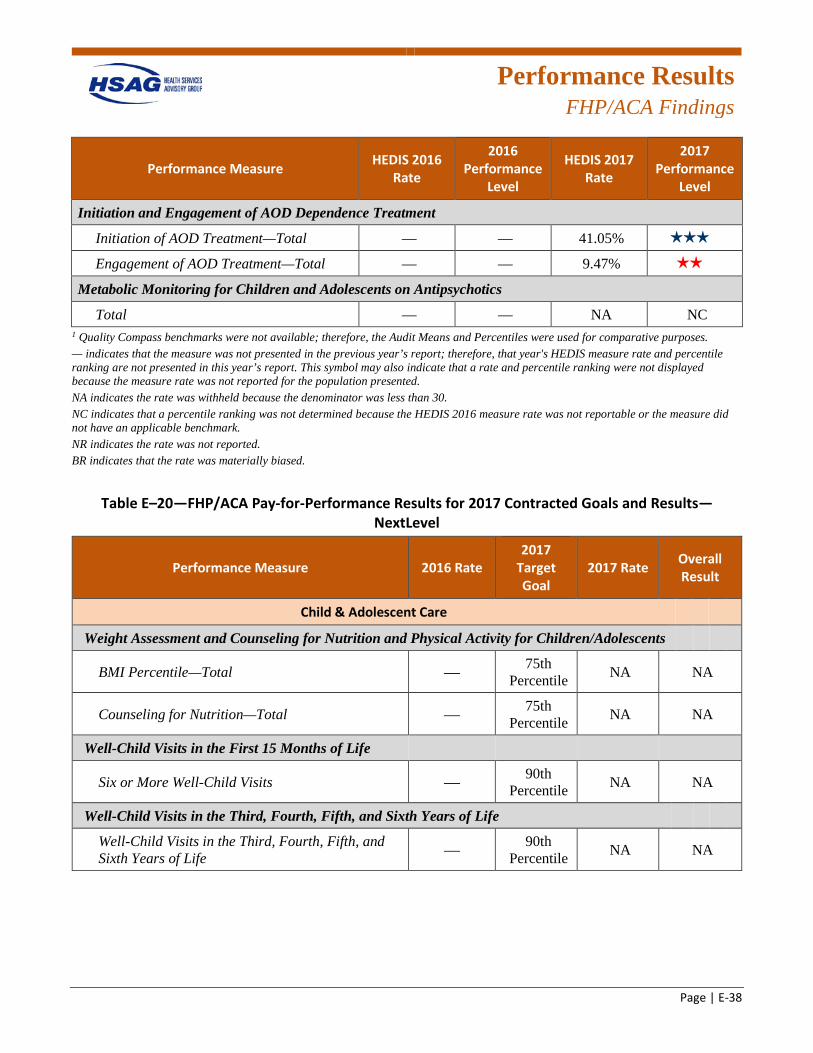
Performance Results
FHP/ACA Findings
Page | E-38
Performance Measure HEDIS 2016 Rate
2016 Performance
Level
HEDIS 2017 Rate
2017 Performance
Level
Initiation and Engagement of AOD Dependence Treatment
Initiation of AOD Treatment—Total — — 41.05% 3 stars
Engagement of AOD Treatment—Total — — 9.47% 2 stars
Metabolic Monitoring for Children and Adolescents on Antipsychotics
Total — — NA NC 1 Quality Compass benchmarks were not available; therefore, the Audit Means and Percentiles were used for comparative purposes. — indicates that the measure was not presented in the previous year’s report; therefore, that year's HEDIS measure rate and percentile ranking are not presented in this year’s report. This symbol may also indicate that a rate and percentile ranking were not displayed because the measure rate was not reported for the population presented. NA indicates the rate was withheld because the denominator was less than 30. NC indicates that a percentile ranking was not determined because the HEDIS 2016 measure rate was not reportable or the measure did not have an applicable benchmark. NR indicates the rate was not reported. BR indicates that the rate was materially biased.
Table E–20—FHP/ACA Pay-for-Performance Results for 2017 Contracted Goals and Results—NextLevel
Performance Measure 2016 Rate 2017
Target Goal
2017 Rate Overall Result
Child & Adolescent Care
Weight Assessment and Counseling for Nutrition and Physical Activity for Children/Adolescents
BMI Percentile—Total — 75th Percentile NA NA
Counseling for Nutrition—Total — 75th Percentile NA NA
Well-Child Visits in the First 15 Months of Life
Six or More Well-Child Visits — 90th Percentile NA NA
Well-Child Visits in the Third, Fourth, Fifth, and Sixth Years of Life
Well-Child Visits in the Third, Fourth, Fifth, and Sixth Years of Life — 90th
Percentile NA NA
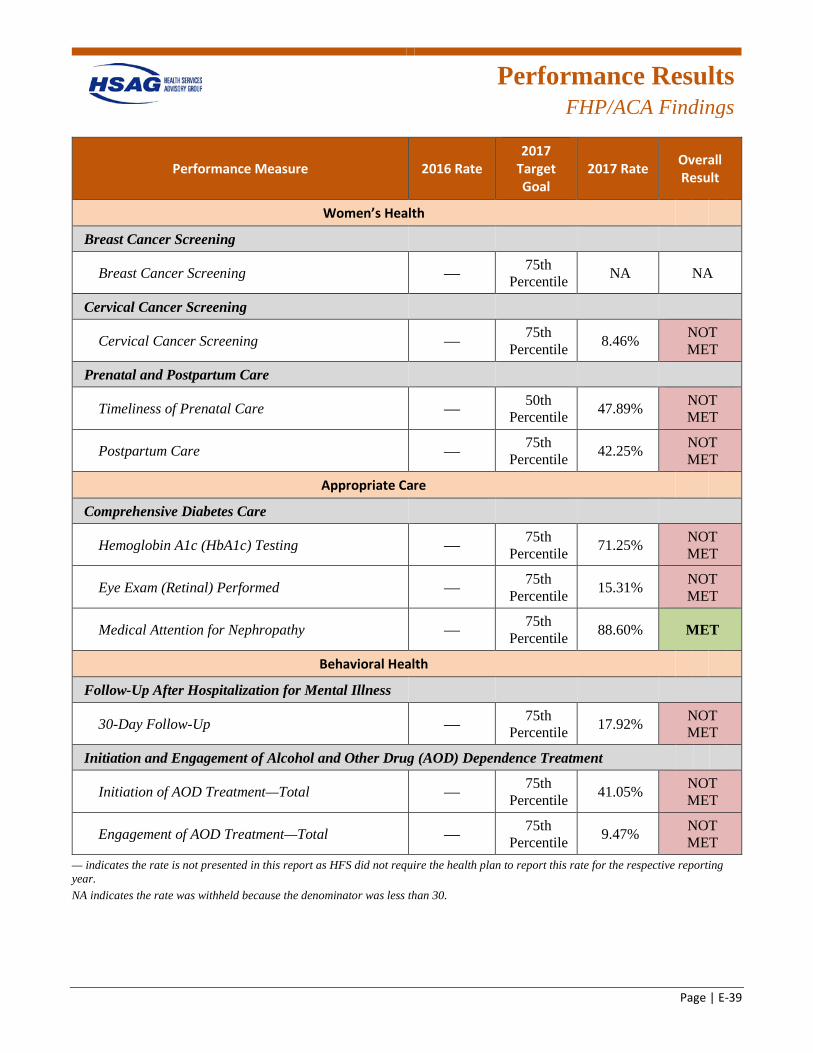
Performance Results
FHP/ACA Findings
Page | E-39
Performance Measure 2016 Rate 2017
Target Goal
2017 Rate Overall Result
Women’s Health
Breast Cancer Screening
Breast Cancer Screening — 75th Percentile NA NA
Cervical Cancer Screening
Cervical Cancer Screening — 75th Percentile 8.46% NOT
MET
Prenatal and Postpartum Care
Timeliness of Prenatal Care — 50th Percentile 47.89% NOT
MET
Postpartum Care — 75th Percentile 42.25% NOT
MET
Appropriate Care
Comprehensive Diabetes Care
Hemoglobin A1c (HbA1c) Testing — 75th Percentile 71.25% NOT
MET
Eye Exam (Retinal) Performed — 75th Percentile 15.31% NOT
MET
Medical Attention for Nephropathy — 75th Percentile 88.60% MET
Behavioral Health
Follow-Up After Hospitalization for Mental Illness
30-Day Follow-Up — 75th Percentile 17.92% NOT
MET
Initiation and Engagement of Alcohol and Other Drug (AOD) Dependence Treatment
Initiation of AOD Treatment—Total — 75th Percentile 41.05% NOT
MET
Engagement of AOD Treatment—Total — 75th Percentile 9.47% NOT
MET — indicates the rate is not presented in this report as HFS did not require the health plan to report this rate for the respective reporting year. NA indicates the rate was withheld because the denominator was less than 30.
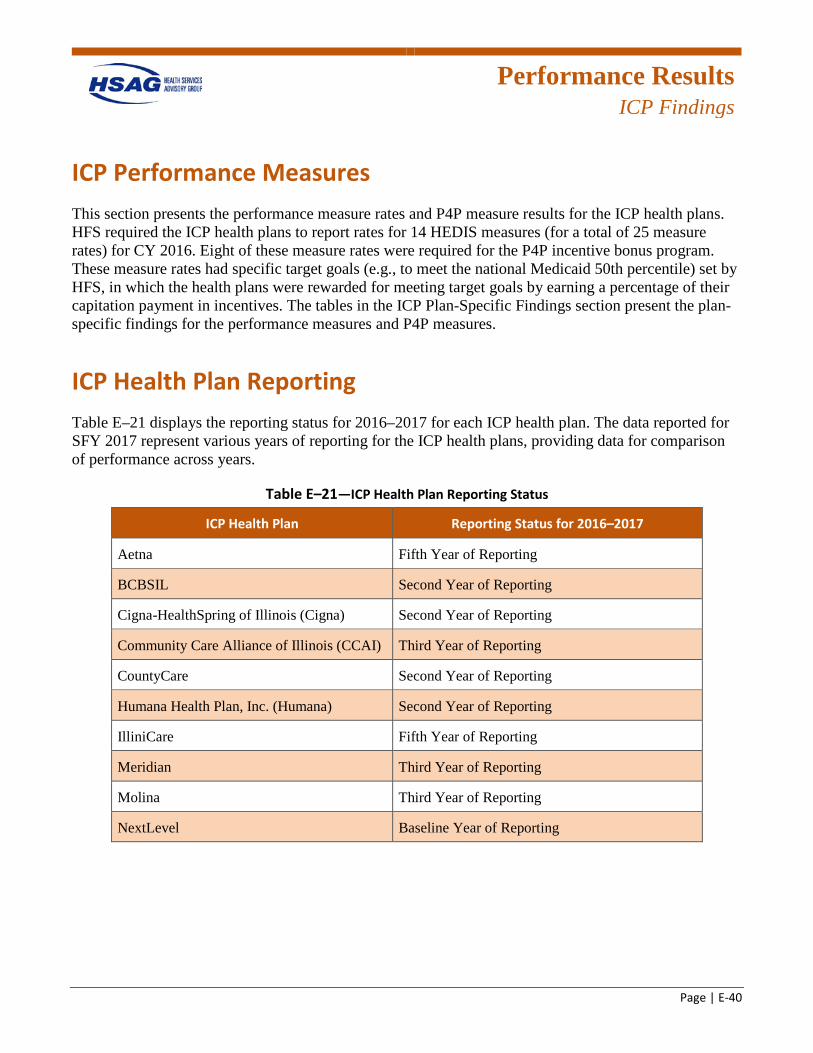
Performance Results
ICP Findings
Page | E-40
ICP Performance Measures This section presents the performance measure rates and P4P measure results for the ICP health plans. HFS required the ICP health plans to report rates for 14 HEDIS measures (for a total of 25 measure rates) for CY 2016. Eight of these measure rates were required for the P4P incentive bonus program. These measure rates had specific target goals (e.g., to meet the national Medicaid 50th percentile) set by HFS, in which the health plans were rewarded for meeting target goals by earning a percentage of their capitation payment in incentives. The tables in the ICP Plan-Specific Findings section present the plan-specific findings for the performance measures and P4P measures.
ICP Health Plan Reporting Table E–21 displays the reporting status for 2016–2017 for each ICP health plan. The data reported for SFY 2017 represent various years of reporting for the ICP health plans, providing data for comparison of performance across years.
Table E–21—ICP Health Plan Reporting Status
ICP Health Plan Reporting Status for 2016–2017
Aetna Fifth Year of Reporting
BCBSIL Second Year of Reporting
Cigna-HealthSpring of Illinois (Cigna) Second Year of Reporting
Community Care Alliance of Illinois (CCAI) Third Year of Reporting
CountyCare Second Year of Reporting
Humana Health Plan, Inc. (Humana) Second Year of Reporting
IlliniCare Fifth Year of Reporting
Meridian Third Year of Reporting
Molina Third Year of Reporting
NextLevel Baseline Year of Reporting
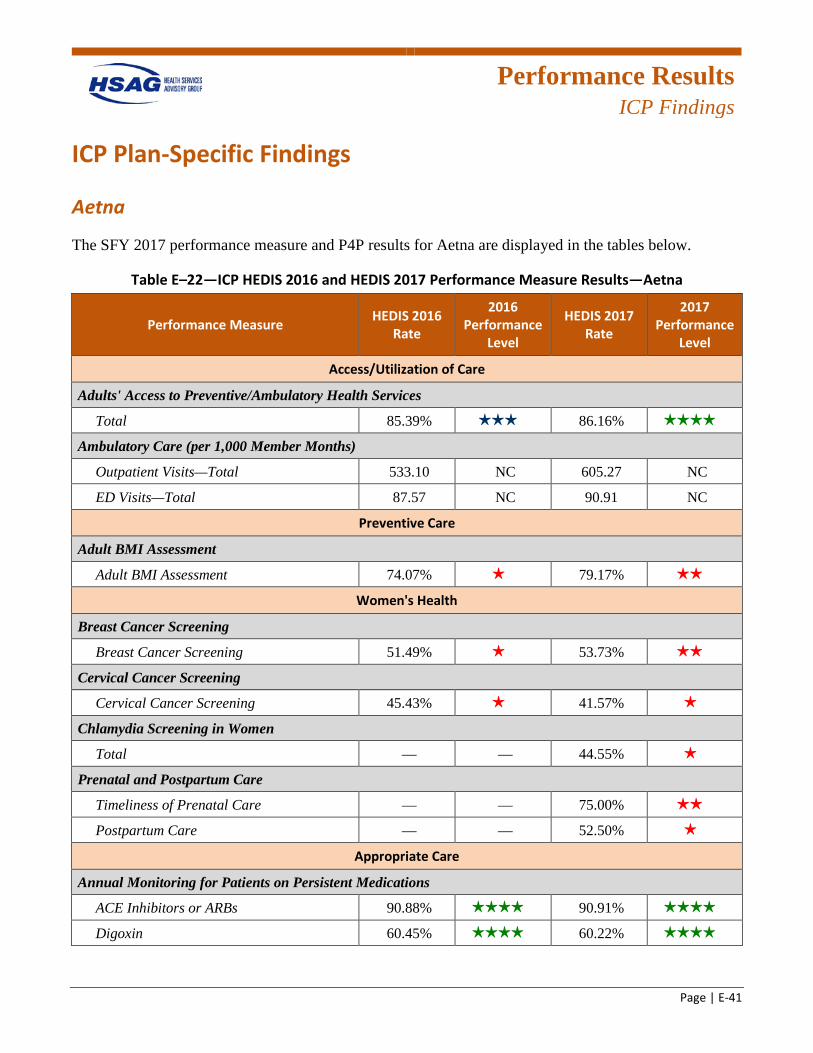
Performance Results
ICP Findings
Page | E-41
ICP Plan-Specific Findings
Aetna
The SFY 2017 performance measure and P4P results for Aetna are displayed in the tables below.
Table E–22—ICP HEDIS 2016 and HEDIS 2017 Performance Measure Results—Aetna
Performance Measure HEDIS 2016 Rate
2016 Performance
Level
HEDIS 2017 Rate
2017 Performance
Level
Access/Utilization of Care
Adults' Access to Preventive/Ambulatory Health Services
Total 85.39% 3 stars 86.16% 4 stars
Ambulatory Care (per 1,000 Member Months)
Outpatient Visits—Total 533.10 NC 605.27 NC
ED Visits—Total 87.57 NC 90.91 NC
Preventive Care
Adult BMI Assessment
Adult BMI Assessment 74.07% 1 star 79.17% 2 stars
Women's Health
Breast Cancer Screening
Breast Cancer Screening 51.49% 1 star 53.73% 2 stars
Cervical Cancer Screening
Cervical Cancer Screening 45.43% 1 star 41.57% 1 star
Chlamydia Screening in Women
Total — — 44.55% 1 star
Prenatal and Postpartum Care
Timeliness of Prenatal Care — — 75.00% 2 stars
Postpartum Care — — 52.50% 1 star
Appropriate Care
Annual Monitoring for Patients on Persistent Medications
ACE Inhibitors or ARBs 90.88% 4 stars 90.91% 4 stars
Digoxin 60.45% 4 stars 60.22% 4 stars
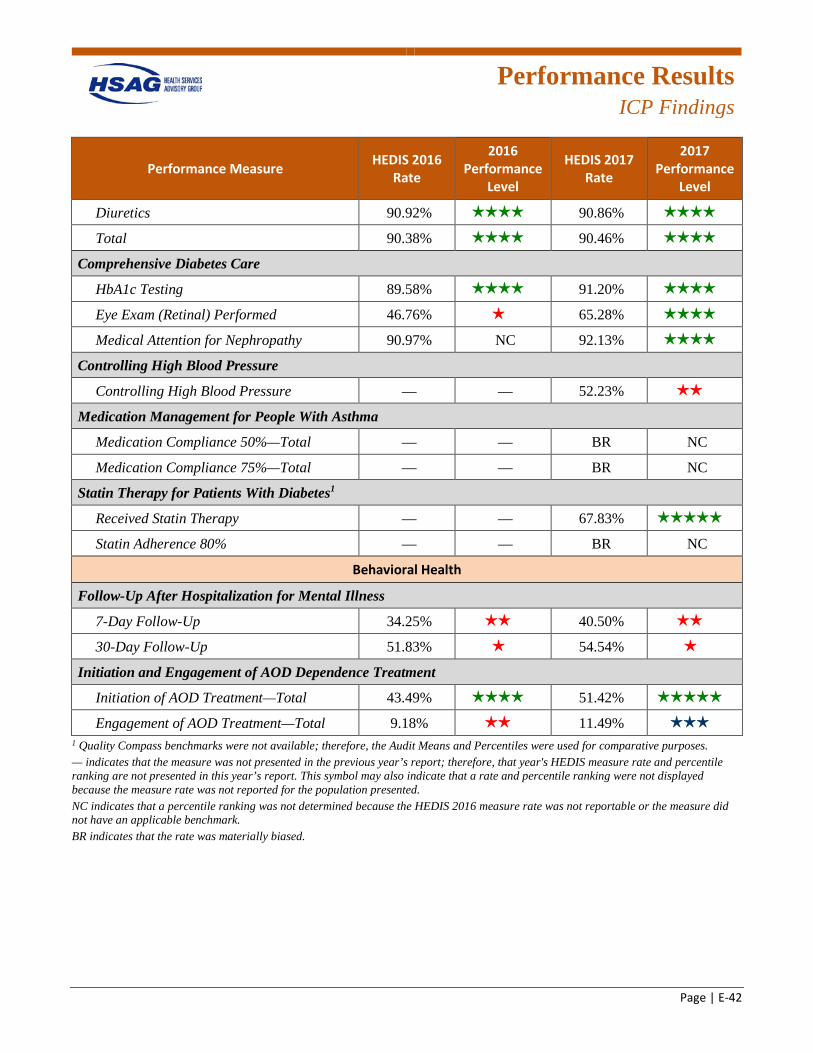
Performance Results
ICP Findings
Page | E-42
Performance Measure HEDIS 2016 Rate
2016 Performance
Level
HEDIS 2017 Rate
2017 Performance
Level
Diuretics 90.92% 4 stars 90.86% 4 stars
Total 90.38% 4 stars 90.46% 4 stars
Comprehensive Diabetes Care
HbA1c Testing 89.58% 4 stars 91.20% 4 stars
Eye Exam (Retinal) Performed 46.76% 1 star 65.28% 4 stars
Medical Attention for Nephropathy 90.97% NC 92.13% 4 stars
Controlling High Blood Pressure
Controlling High Blood Pressure — — 52.23% 2 stars
Medication Management for People With Asthma
Medication Compliance 50%—Total — — BR NC
Medication Compliance 75%—Total — — BR NC
Statin Therapy for Patients With Diabetes1
Received Statin Therapy — — 67.83% 5 stars
Statin Adherence 80% — — BR NC
Behavioral Health
Follow-Up After Hospitalization for Mental Illness
7-Day Follow-Up 34.25% 2 stars 40.50% 2 stars
30-Day Follow-Up 51.83% 1 star 54.54% 1 star
Initiation and Engagement of AOD Dependence Treatment
Initiation of AOD Treatment—Total 43.49% 4 stars 51.42% 5 stars
Engagement of AOD Treatment—Total 9.18% 2 stars 11.49% 3 stars
1 Quality Compass benchmarks were not available; therefore, the Audit Means and Percentiles were used for comparative purposes. — indicates that the measure was not presented in the previous year’s report; therefore, that year's HEDIS measure rate and percentile ranking are not presented in this year’s report. This symbol may also indicate that a rate and percentile ranking were not displayed because the measure rate was not reported for the population presented. NC indicates that a percentile ranking was not determined because the HEDIS 2016 measure rate was not reportable or the measure did not have an applicable benchmark. BR indicates that the rate was materially biased.
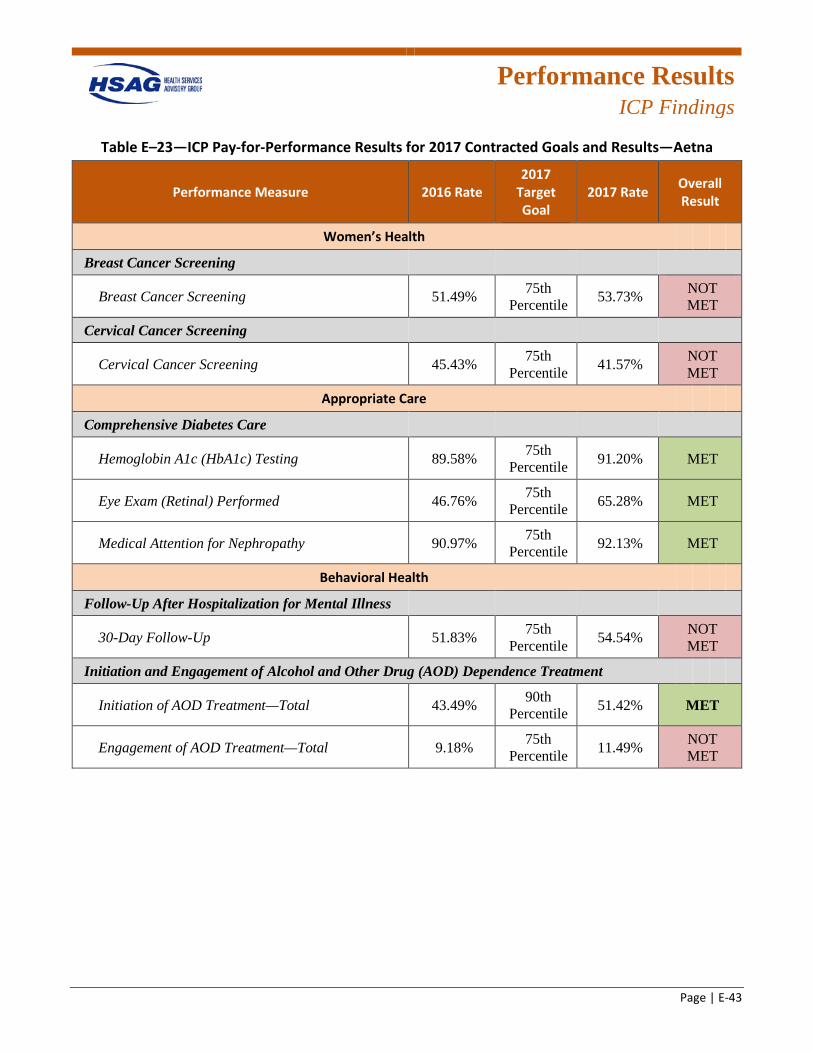
Performance Results
ICP Findings
Page | E-43
Table E–23—ICP Pay-for-Performance Results for 2017 Contracted Goals and Results—Aetna
Performance Measure 2016 Rate 2017
Target Goal
2017 Rate Overall Result
Women’s Health
Breast Cancer Screening
Breast Cancer Screening 51.49% 75th Percentile 53.73% NOT
MET
Cervical Cancer Screening
Cervical Cancer Screening 45.43% 75th Percentile 41.57% NOT
MET
Appropriate Care
Comprehensive Diabetes Care
Hemoglobin A1c (HbA1c) Testing 89.58% 75th Percentile 91.20% MET
Eye Exam (Retinal) Performed 46.76% 75th Percentile 65.28% MET
Medical Attention for Nephropathy 90.97% 75th Percentile 92.13% MET
Behavioral Health
Follow-Up After Hospitalization for Mental Illness
30-Day Follow-Up 51.83% 75th Percentile 54.54% NOT
MET
Initiation and Engagement of Alcohol and Other Drug (AOD) Dependence Treatment
Initiation of AOD Treatment—Total 43.49% 90th Percentile 51.42% MET
Engagement of AOD Treatment—Total 9.18% 75th Percentile 11.49% NOT
MET
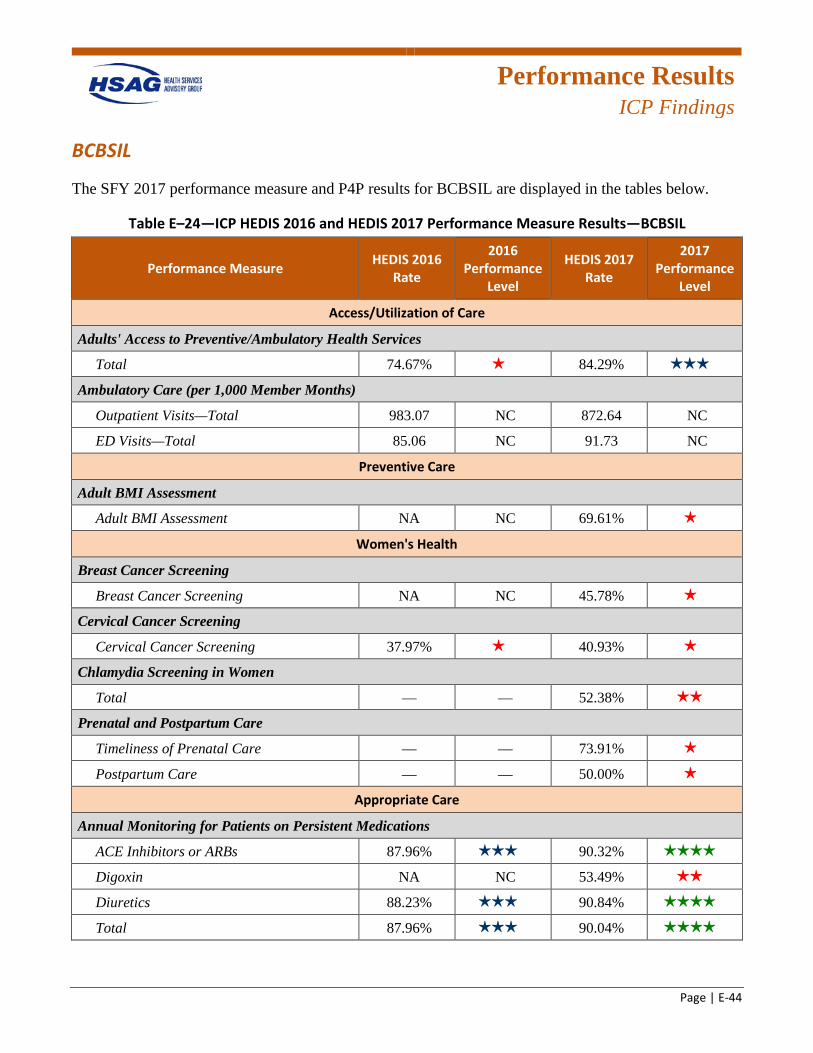
Performance Results
ICP Findings
Page | E-44
BCBSIL
The SFY 2017 performance measure and P4P results for BCBSIL are displayed in the tables below.
Table E–24—ICP HEDIS 2016 and HEDIS 2017 Performance Measure Results—BCBSIL
Performance Measure HEDIS 2016 Rate
2016 Performance
Level
HEDIS 2017 Rate
2017 Performance
Level
Access/Utilization of Care
Adults' Access to Preventive/Ambulatory Health Services
Total 74.67% 1 star 84.29% 3 stars
Ambulatory Care (per 1,000 Member Months)
Outpatient Visits—Total 983.07 NC 872.64 NC
ED Visits—Total 85.06 NC 91.73 NC
Preventive Care
Adult BMI Assessment
Adult BMI Assessment NA NC 69.61% 1 star
Women's Health
Breast Cancer Screening
Breast Cancer Screening NA NC 45.78% 1 star
Cervical Cancer Screening
Cervical Cancer Screening 37.97% 1 star 40.93% 1 star
Chlamydia Screening in Women
Total — — 52.38% 2 stars
Prenatal and Postpartum Care
Timeliness of Prenatal Care — — 73.91% 1 star
Postpartum Care — — 50.00% 1 star
Appropriate Care
Annual Monitoring for Patients on Persistent Medications
ACE Inhibitors or ARBs 87.96% 3 stars 90.32% 4 stars
Digoxin NA NC 53.49% 2 stars
Diuretics 88.23% 3 stars 90.84% 4 stars
Total 87.96% 3 stars 90.04% 4 stars
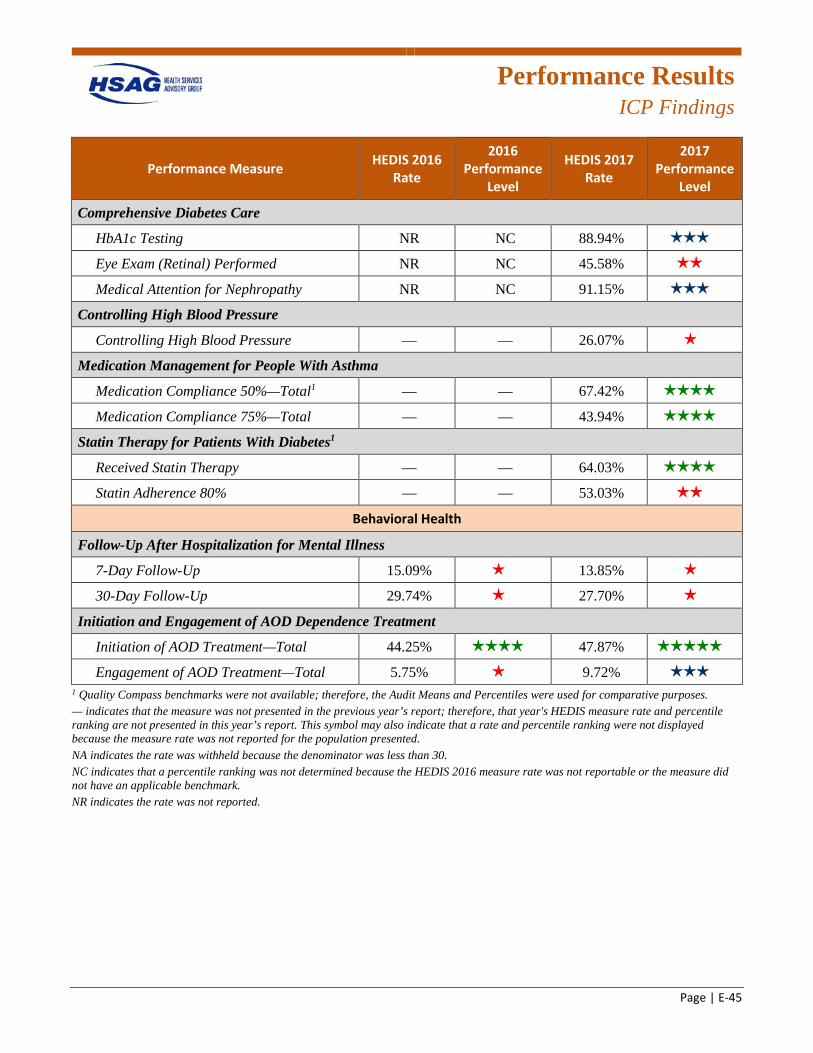
Performance Results
ICP Findings
Page | E-45
Performance Measure HEDIS 2016 Rate
2016 Performance
Level
HEDIS 2017 Rate
2017 Performance
Level
Comprehensive Diabetes Care
HbA1c Testing NR NC 88.94% 3 stars
Eye Exam (Retinal) Performed NR NC 45.58% 2 stars
Medical Attention for Nephropathy NR NC 91.15% 3 stars
Controlling High Blood Pressure
Controlling High Blood Pressure — — 26.07% 1 star
Medication Management for People With Asthma
Medication Compliance 50%—Total1 — — 67.42% 4 stars
Medication Compliance 75%—Total — — 43.94% 4 stars
Statin Therapy for Patients With Diabetes1
Received Statin Therapy — — 64.03% 4 stars
Statin Adherence 80% — — 53.03% 2 stars
Behavioral Health
Follow-Up After Hospitalization for Mental Illness
7-Day Follow-Up 15.09% 1 star 13.85% 1 star
30-Day Follow-Up 29.74% 1 star 27.70% 1 star
Initiation and Engagement of AOD Dependence Treatment
Initiation of AOD Treatment—Total 44.25% 4 stars 47.87% 5 stars
Engagement of AOD Treatment—Total 5.75% 1 star 9.72% 3 stars
1 Quality Compass benchmarks were not available; therefore, the Audit Means and Percentiles were used for comparative purposes. — indicates that the measure was not presented in the previous year’s report; therefore, that year's HEDIS measure rate and percentile ranking are not presented in this year’s report. This symbol may also indicate that a rate and percentile ranking were not displayed because the measure rate was not reported for the population presented. NA indicates the rate was withheld because the denominator was less than 30. NC indicates that a percentile ranking was not determined because the HEDIS 2016 measure rate was not reportable or the measure did not have an applicable benchmark. NR indicates the rate was not reported.
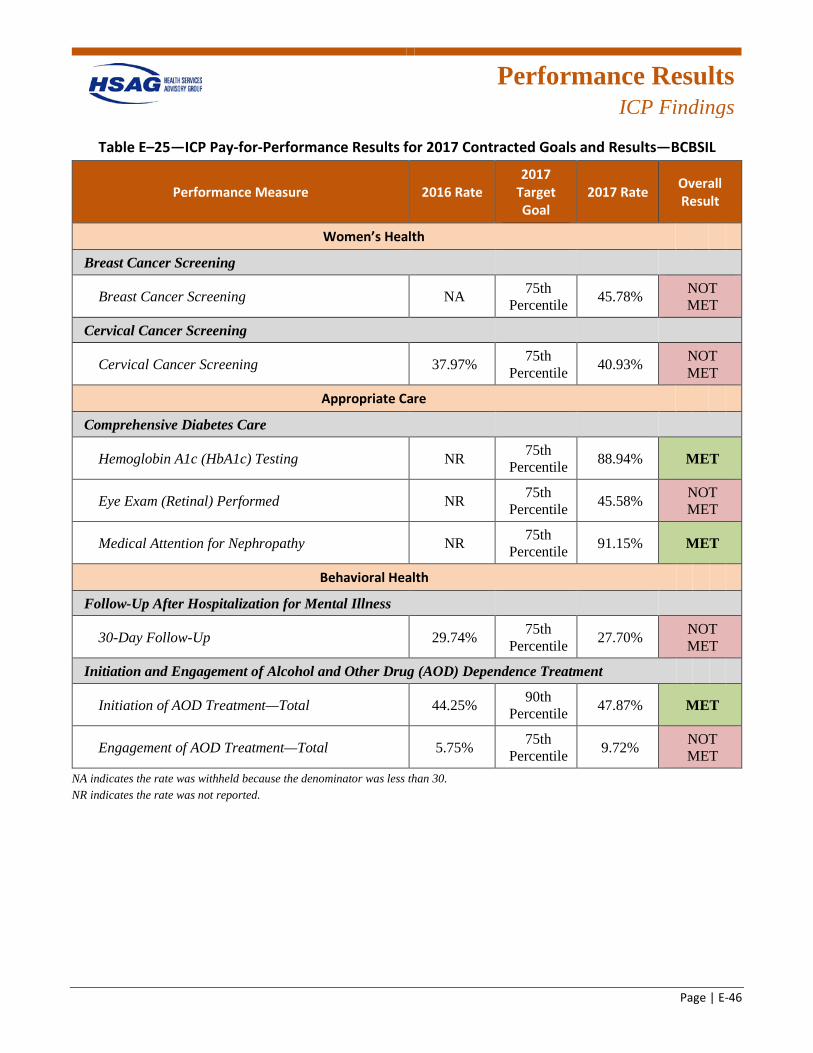
Performance Results
ICP Findings
Page | E-46
Table E–25—ICP Pay-for-Performance Results for 2017 Contracted Goals and Results—BCBSIL
Performance Measure 2016 Rate 2017
Target Goal
2017 Rate Overall Result
Women’s Health
Breast Cancer Screening
Breast Cancer Screening NA 75th Percentile 45.78% NOT
MET
Cervical Cancer Screening
Cervical Cancer Screening 37.97% 75th Percentile 40.93% NOT
MET
Appropriate Care
Comprehensive Diabetes Care
Hemoglobin A1c (HbA1c) Testing NR 75th Percentile 88.94% MET
Eye Exam (Retinal) Performed NR 75th Percentile 45.58% NOT
MET
Medical Attention for Nephropathy NR 75th Percentile 91.15% MET
Behavioral Health
Follow-Up After Hospitalization for Mental Illness
30-Day Follow-Up 29.74% 75th Percentile 27.70% NOT
MET
Initiation and Engagement of Alcohol and Other Drug (AOD) Dependence Treatment
Initiation of AOD Treatment—Total 44.25% 90th Percentile 47.87% MET
Engagement of AOD Treatment—Total 5.75% 75th Percentile 9.72% NOT
MET NA indicates the rate was withheld because the denominator was less than 30. NR indicates the rate was not reported.
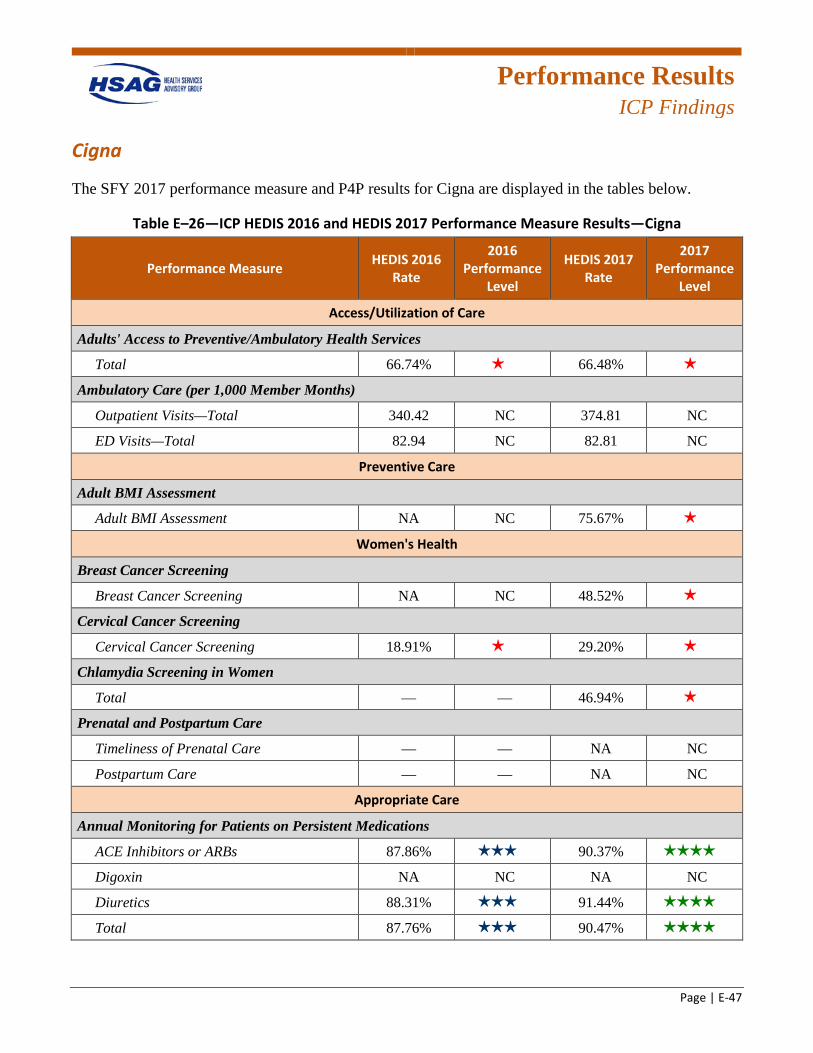
Performance Results
ICP Findings
Page | E-47
Cigna
The SFY 2017 performance measure and P4P results for Cigna are displayed in the tables below.
Table E–26—ICP HEDIS 2016 and HEDIS 2017 Performance Measure Results—Cigna
Performance Measure HEDIS 2016 Rate
2016 Performance
Level
HEDIS 2017 Rate
2017 Performance
Level
Access/Utilization of Care
Adults' Access to Preventive/Ambulatory Health Services
Total 66.74% 1 star 66.48% 1 star
Ambulatory Care (per 1,000 Member Months)
Outpatient Visits—Total 340.42 NC 374.81 NC
ED Visits—Total 82.94 NC 82.81 NC
Preventive Care
Adult BMI Assessment
Adult BMI Assessment NA NC 75.67% 1 star
Women's Health
Breast Cancer Screening
Breast Cancer Screening NA NC 48.52% 1 star
Cervical Cancer Screening
Cervical Cancer Screening 18.91% 1 star 29.20% 1 star
Chlamydia Screening in Women
Total — — 46.94% 1 star
Prenatal and Postpartum Care
Timeliness of Prenatal Care — — NA NC
Postpartum Care — — NA NC
Appropriate Care
Annual Monitoring for Patients on Persistent Medications
ACE Inhibitors or ARBs 87.86% 3 stars 90.37% 4 stars
Digoxin NA NC NA NC
Diuretics 88.31% 3 stars 91.44% 4 stars
Total 87.76% 3 stars 90.47% 4 stars
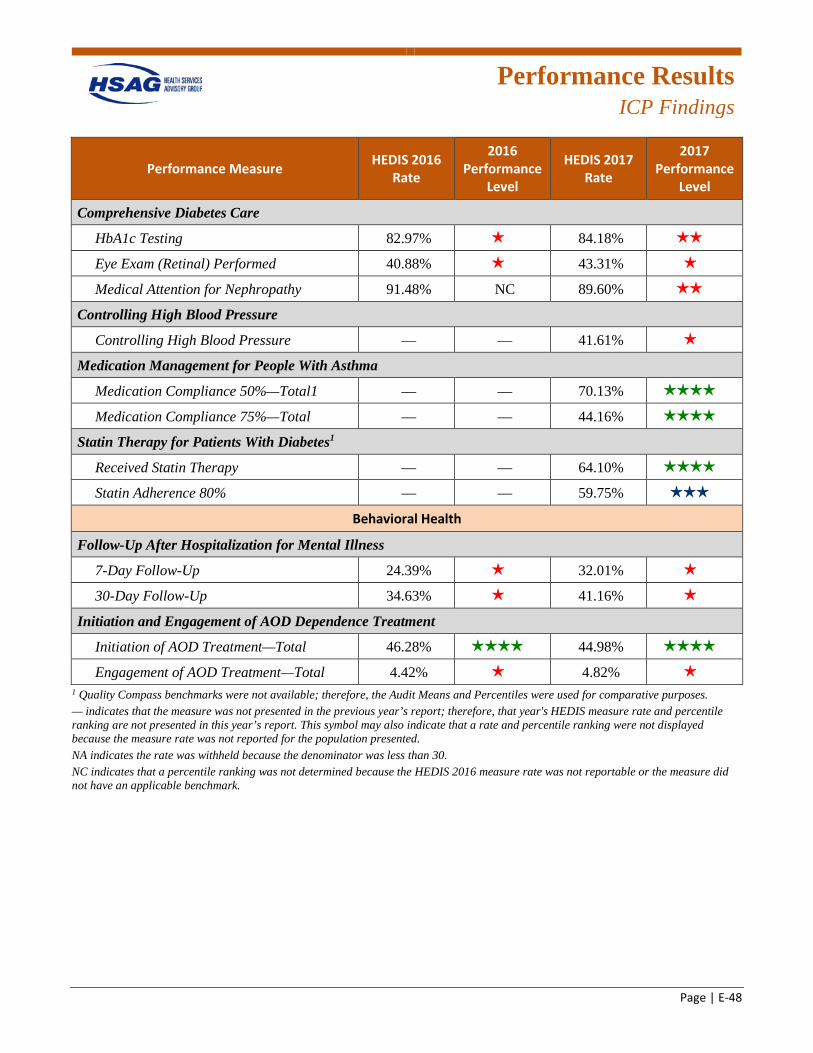
Performance Results
ICP Findings
Page | E-48
Performance Measure HEDIS 2016 Rate
2016 Performance
Level
HEDIS 2017 Rate
2017 Performance
Level
Comprehensive Diabetes Care
HbA1c Testing 82.97% 1 star 84.18% 2 stars
Eye Exam (Retinal) Performed 40.88% 1 star 43.31% 1 star
Medical Attention for Nephropathy 91.48% NC 89.60% 2 stars
Controlling High Blood Pressure
Controlling High Blood Pressure — — 41.61% 1 star
Medication Management for People With Asthma
Medication Compliance 50%—Total1 — — 70.13% 4 stars
Medication Compliance 75%—Total — — 44.16% 4 stars
Statin Therapy for Patients With Diabetes1
Received Statin Therapy — — 64.10% 4 stars
Statin Adherence 80% — — 59.75% 3 stars
Behavioral Health
Follow-Up After Hospitalization for Mental Illness
7-Day Follow-Up 24.39% 1 star 32.01% 1 star
30-Day Follow-Up 34.63% 1 star 41.16% 1 star
Initiation and Engagement of AOD Dependence Treatment
Initiation of AOD Treatment—Total 46.28% 4 stars 44.98% 4 stars
Engagement of AOD Treatment—Total 4.42% 1 star 4.82% 1 star
1 Quality Compass benchmarks were not available; therefore, the Audit Means and Percentiles were used for comparative purposes. — indicates that the measure was not presented in the previous year’s report; therefore, that year's HEDIS measure rate and percentile ranking are not presented in this year’s report. This symbol may also indicate that a rate and percentile ranking were not displayed because the measure rate was not reported for the population presented. NA indicates the rate was withheld because the denominator was less than 30. NC indicates that a percentile ranking was not determined because the HEDIS 2016 measure rate was not reportable or the measure did not have an applicable benchmark.
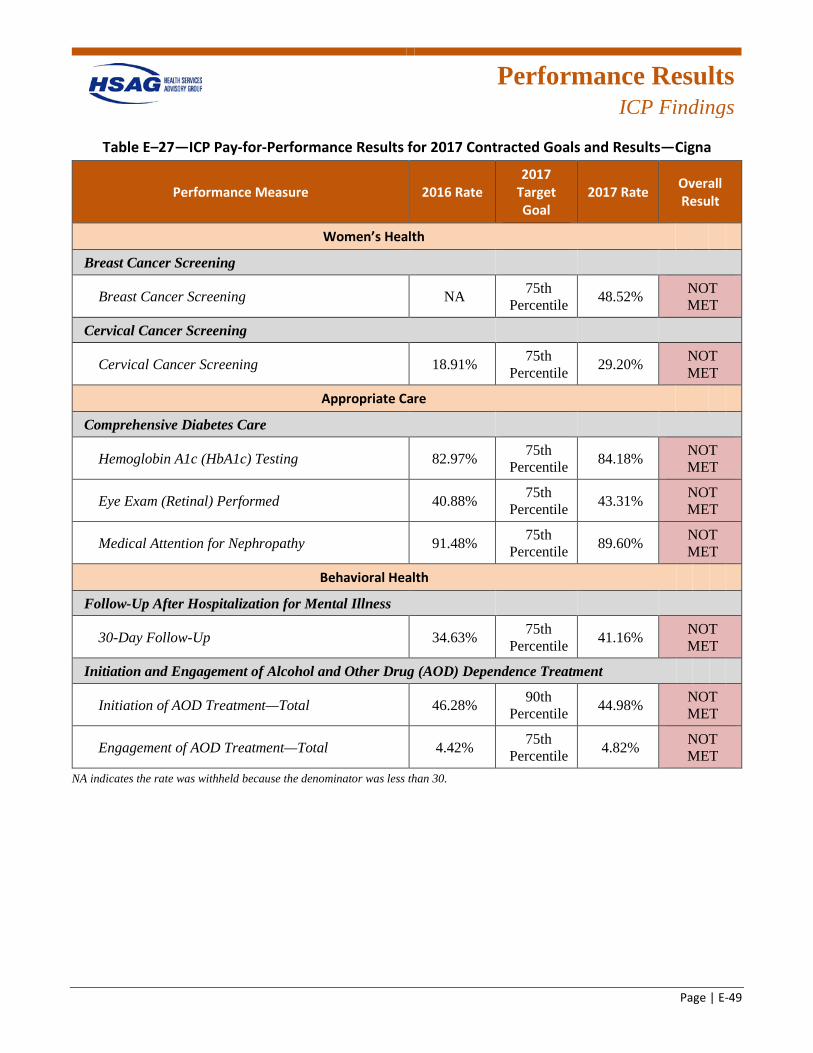
Performance Results
ICP Findings
Page | E-49
Table E–27—ICP Pay-for-Performance Results for 2017 Contracted Goals and Results—Cigna
Performance Measure 2016 Rate 2017
Target Goal
2017 Rate Overall Result
Women’s Health
Breast Cancer Screening
Breast Cancer Screening NA 75th Percentile 48.52% NOT
MET
Cervical Cancer Screening
Cervical Cancer Screening 18.91% 75th Percentile 29.20% NOT
MET
Appropriate Care
Comprehensive Diabetes Care
Hemoglobin A1c (HbA1c) Testing 82.97% 75th Percentile 84.18% NOT
MET
Eye Exam (Retinal) Performed 40.88% 75th Percentile 43.31% NOT
MET
Medical Attention for Nephropathy 91.48% 75th Percentile 89.60% NOT
MET
Behavioral Health
Follow-Up After Hospitalization for Mental Illness
30-Day Follow-Up 34.63% 75th Percentile 41.16% NOT
MET
Initiation and Engagement of Alcohol and Other Drug (AOD) Dependence Treatment
Initiation of AOD Treatment—Total 46.28% 90th Percentile 44.98% NOT
MET
Engagement of AOD Treatment—Total 4.42% 75th Percentile 4.82% NOT
MET NA indicates the rate was withheld because the denominator was less than 30.

Performance Results
ICP Findings
Page | E-50
CCAI
The SFY 2017 performance measure and P4P results for CCAI are displayed in the tables below.
Table E–28—ICP HEDIS 2016 and HEDIS 2017 Performance Measure Results—CCAI
Performance Measure HEDIS 2016 Rate
2016 Performance
Level
HEDIS 2017 Rate
2017 Performance
Level
Access/Utilization of Care
Adults' Access to Preventive/Ambulatory Health Services
Total 77.30% 1 star 79.44% 2 stars
Ambulatory Care (per 1,000 Member Months)
Outpatient Visits—Total 390.59 NC 430.20 NC
ED Visits—Total 93.57 NC 97.35 NC
Preventive Care
Adult BMI Assessment
Adult BMI Assessment 56.20% 1 star 61.56% 1 star
Women's Health
Breast Cancer Screening
Breast Cancer Screening 58.33% 2 stars 55.71% 2 stars
Cervical Cancer Screening
Cervical Cancer Screening 41.12% 1 star 45.50% 1 star
Chlamydia Screening in Women
Total — — 68.18% 4 stars
Prenatal and Postpartum Care
Timeliness of Prenatal Care — — 55.17% 1 star
Postpartum Care — — 37.93% 1 star
Appropriate Care
Annual Monitoring for Patients on Persistent Medications
ACE Inhibitors or ARBs 88.67% 3 stars 90.24% 4 stars
Digoxin 66.67% 5 stars 71.43% 5 stars
Diuretics 86.84% 2 stars 89.93% 3 stars
Total 87.63% 3 stars 89.89% 4 stars

Performance Results
ICP Findings
Page | E-51
Performance Measure HEDIS 2016 Rate
2016 Performance
Level
HEDIS 2017 Rate
2017 Performance
Level
Comprehensive Diabetes Care
HbA1c Testing NR NC 85.89% 2 stars
Eye Exam (Retinal) Performed NR NC 45.99% 2 stars
Medical Attention for Nephropathy NR NC 91.24% 3 stars
Controlling High Blood Pressure
Controlling High Blood Pressure — — 29.93% 1 star
Medication Management for People With Asthma
Medication Compliance 50%—Total1 — — 59.61% 3 stars
Medication Compliance 75%—Total — — 36.45% 3 stars
Statin Therapy for Patients With Diabetes1
Received Statin Therapy — — 67.89% 5 stars
Statin Adherence 80% — — 57.47% 2 stars
Behavioral Health
Follow-Up After Hospitalization for Mental Illness
7-Day Follow-Up 33.33% 2 stars 29.95% 1 star
30-Day Follow-Up 49.54% 1 star 43.24% 1 star
Initiation and Engagement of AOD Dependence Treatment
Initiation of AOD Treatment—Total 47.79% 4 stars 43.94% 4 stars
Engagement of AOD Treatment—Total 5.34% 1 star 9.21% 2 stars
1 Quality Compass benchmarks were not available; therefore, the Audit Means and Percentiles were used for comparative purposes. — indicates that the measure was not presented in the previous year’s report; therefore, that year's HEDIS measure rate and percentile ranking are not presented in this year’s report. This symbol may also indicate that a rate and percentile ranking were not displayed because the measure rate was not reported for the population presented. NC indicates that a percentile ranking was not determined because the HEDIS 2016 measure rate was not reportable or the measure did not have an applicable benchmark. NR indicates the rate was not reported.
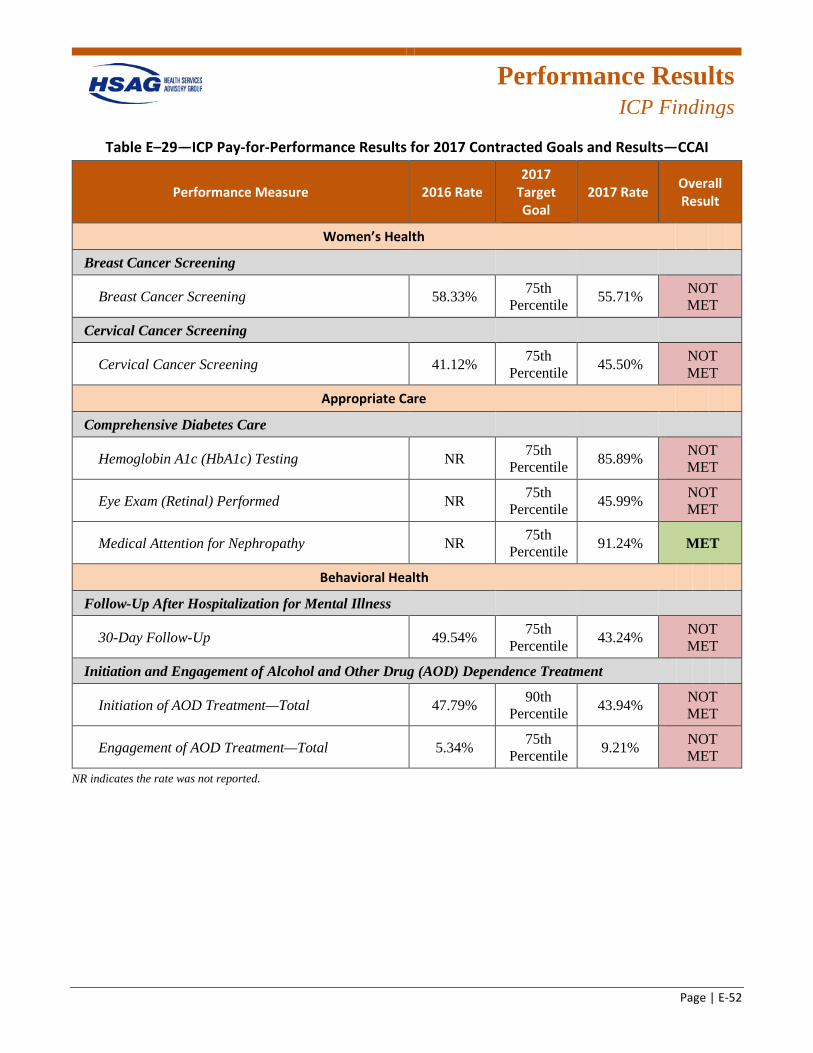
Performance Results
ICP Findings
Page | E-52
Table E–29—ICP Pay-for-Performance Results for 2017 Contracted Goals and Results—CCAI
Performance Measure 2016 Rate 2017
Target Goal
2017 Rate Overall Result
Women’s Health
Breast Cancer Screening
Breast Cancer Screening 58.33% 75th Percentile 55.71% NOT
MET
Cervical Cancer Screening
Cervical Cancer Screening 41.12% 75th Percentile 45.50% NOT
MET
Appropriate Care
Comprehensive Diabetes Care
Hemoglobin A1c (HbA1c) Testing NR 75th Percentile 85.89% NOT
MET
Eye Exam (Retinal) Performed NR 75th Percentile 45.99% NOT
MET
Medical Attention for Nephropathy NR 75th Percentile 91.24% MET
Behavioral Health
Follow-Up After Hospitalization for Mental Illness
30-Day Follow-Up 49.54% 75th Percentile 43.24% NOT
MET
Initiation and Engagement of Alcohol and Other Drug (AOD) Dependence Treatment
Initiation of AOD Treatment—Total 47.79% 90th Percentile 43.94% NOT
MET
Engagement of AOD Treatment—Total 5.34% 75th Percentile 9.21% NOT
MET NR indicates the rate was not reported.
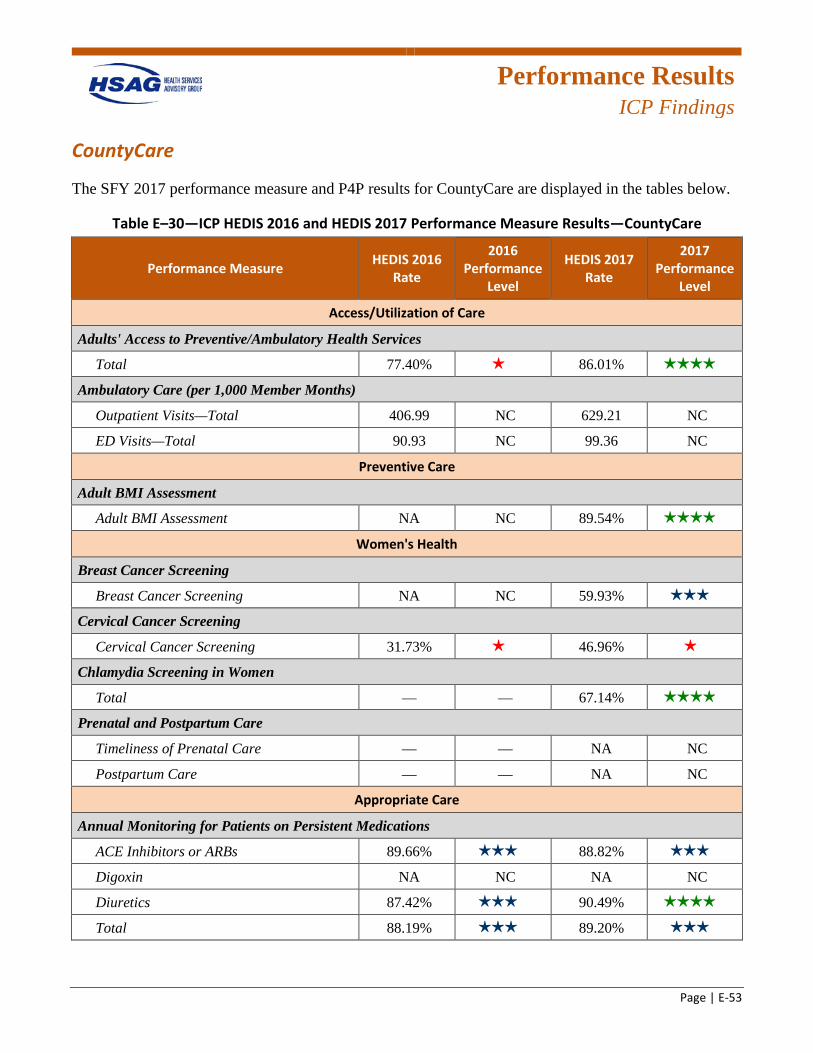
Performance Results
ICP Findings
Page | E-53
CountyCare
The SFY 2017 performance measure and P4P results for CountyCare are displayed in the tables below.
Table E–30—ICP HEDIS 2016 and HEDIS 2017 Performance Measure Results—CountyCare
Performance Measure HEDIS 2016 Rate
2016 Performance
Level
HEDIS 2017 Rate
2017 Performance
Level
Access/Utilization of Care
Adults' Access to Preventive/Ambulatory Health Services
Total 77.40% 1 star 86.01% 4 stars
Ambulatory Care (per 1,000 Member Months)
Outpatient Visits—Total 406.99 NC 629.21 NC
ED Visits—Total 90.93 NC 99.36 NC
Preventive Care
Adult BMI Assessment
Adult BMI Assessment NA NC 89.54% 4 stars
Women's Health
Breast Cancer Screening
Breast Cancer Screening NA NC 59.93% 3 stars
Cervical Cancer Screening
Cervical Cancer Screening 31.73% 1 star 46.96% 1 star
Chlamydia Screening in Women
Total — — 67.14% 4 stars
Prenatal and Postpartum Care
Timeliness of Prenatal Care — — NA NC
Postpartum Care — — NA NC
Appropriate Care
Annual Monitoring for Patients on Persistent Medications
ACE Inhibitors or ARBs 89.66% 3 stars 88.82% 3 stars
Digoxin NA NC NA NC
Diuretics 87.42% 3 stars 90.49% 4 stars
Total 88.19% 3 stars 89.20% 3 stars
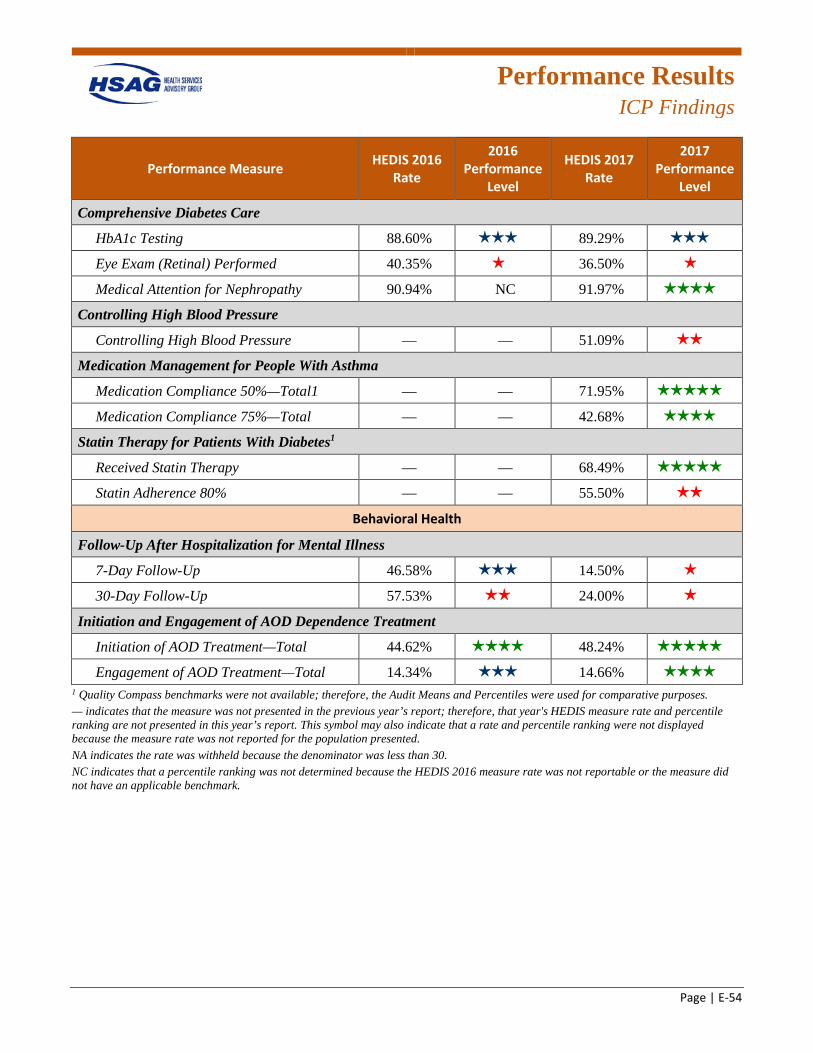
Performance Results
ICP Findings
Page | E-54
Performance Measure HEDIS 2016 Rate
2016 Performance
Level
HEDIS 2017 Rate
2017 Performance
Level
Comprehensive Diabetes Care
HbA1c Testing 88.60% 3 stars 89.29% 3 stars
Eye Exam (Retinal) Performed 40.35% 1 star 36.50% 1 star
Medical Attention for Nephropathy 90.94% NC 91.97% 4 stars
Controlling High Blood Pressure
Controlling High Blood Pressure — — 51.09% 2 stars
Medication Management for People With Asthma
Medication Compliance 50%—Total1 — — 71.95% 5 stars
Medication Compliance 75%—Total — — 42.68% 4 stars
Statin Therapy for Patients With Diabetes1
Received Statin Therapy — — 68.49% 5 stars
Statin Adherence 80% — — 55.50% 2 stars
Behavioral Health
Follow-Up After Hospitalization for Mental Illness
7-Day Follow-Up 46.58% 3 stars 14.50% 1 star
30-Day Follow-Up 57.53% 2 stars 24.00% 1 star
Initiation and Engagement of AOD Dependence Treatment
Initiation of AOD Treatment—Total 44.62% 4 stars 48.24% 5 stars
Engagement of AOD Treatment—Total 14.34% 3 stars 14.66% 4 stars
1 Quality Compass benchmarks were not available; therefore, the Audit Means and Percentiles were used for comparative purposes. — indicates that the measure was not presented in the previous year’s report; therefore, that year's HEDIS measure rate and percentile ranking are not presented in this year’s report. This symbol may also indicate that a rate and percentile ranking were not displayed because the measure rate was not reported for the population presented. NA indicates the rate was withheld because the denominator was less than 30. NC indicates that a percentile ranking was not determined because the HEDIS 2016 measure rate was not reportable or the measure did not have an applicable benchmark.
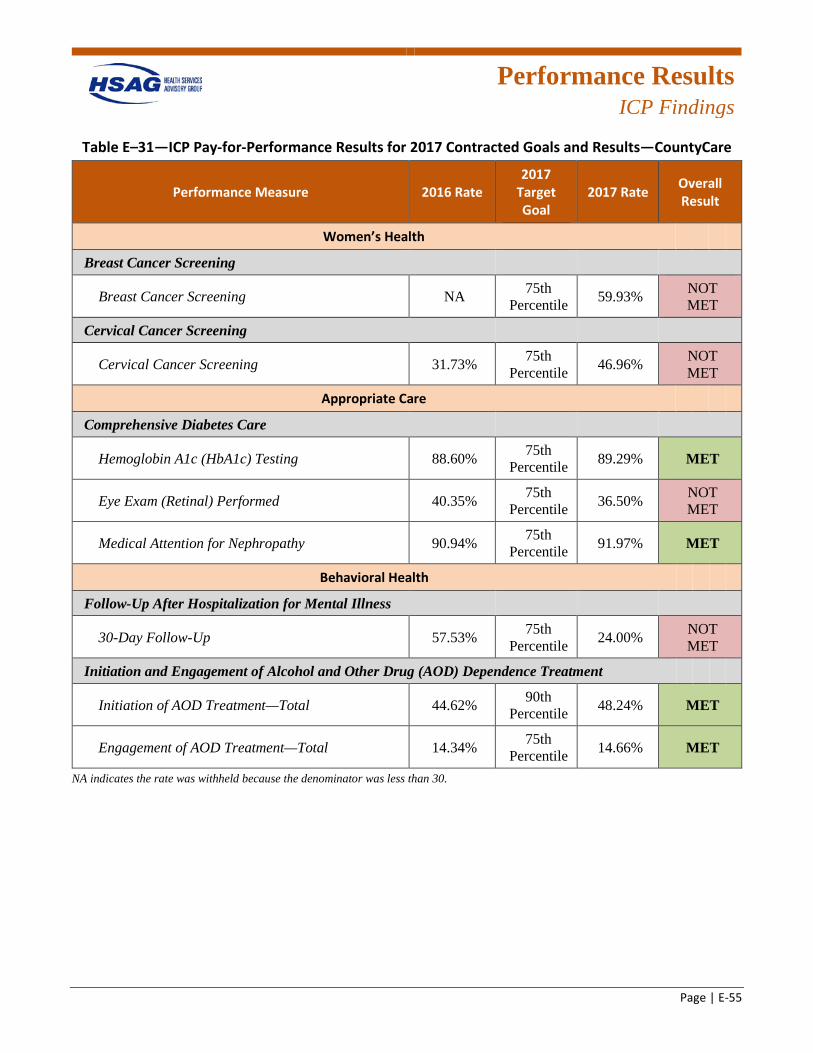
Performance Results
ICP Findings
Page | E-55
Table E–31—ICP Pay-for-Performance Results for 2017 Contracted Goals and Results—CountyCare
Performance Measure 2016 Rate 2017
Target Goal
2017 Rate Overall Result
Women’s Health
Breast Cancer Screening
Breast Cancer Screening NA 75th Percentile 59.93% NOT
MET
Cervical Cancer Screening
Cervical Cancer Screening 31.73% 75th Percentile 46.96% NOT
MET
Appropriate Care
Comprehensive Diabetes Care
Hemoglobin A1c (HbA1c) Testing 88.60% 75th Percentile 89.29% MET
Eye Exam (Retinal) Performed 40.35% 75th Percentile 36.50% NOT
MET
Medical Attention for Nephropathy 90.94% 75th Percentile 91.97% MET
Behavioral Health
Follow-Up After Hospitalization for Mental Illness
30-Day Follow-Up 57.53% 75th Percentile 24.00% NOT
MET
Initiation and Engagement of Alcohol and Other Drug (AOD) Dependence Treatment
Initiation of AOD Treatment—Total 44.62% 90th Percentile 48.24% MET
Engagement of AOD Treatment—Total 14.34% 75th Percentile 14.66% MET
NA indicates the rate was withheld because the denominator was less than 30.
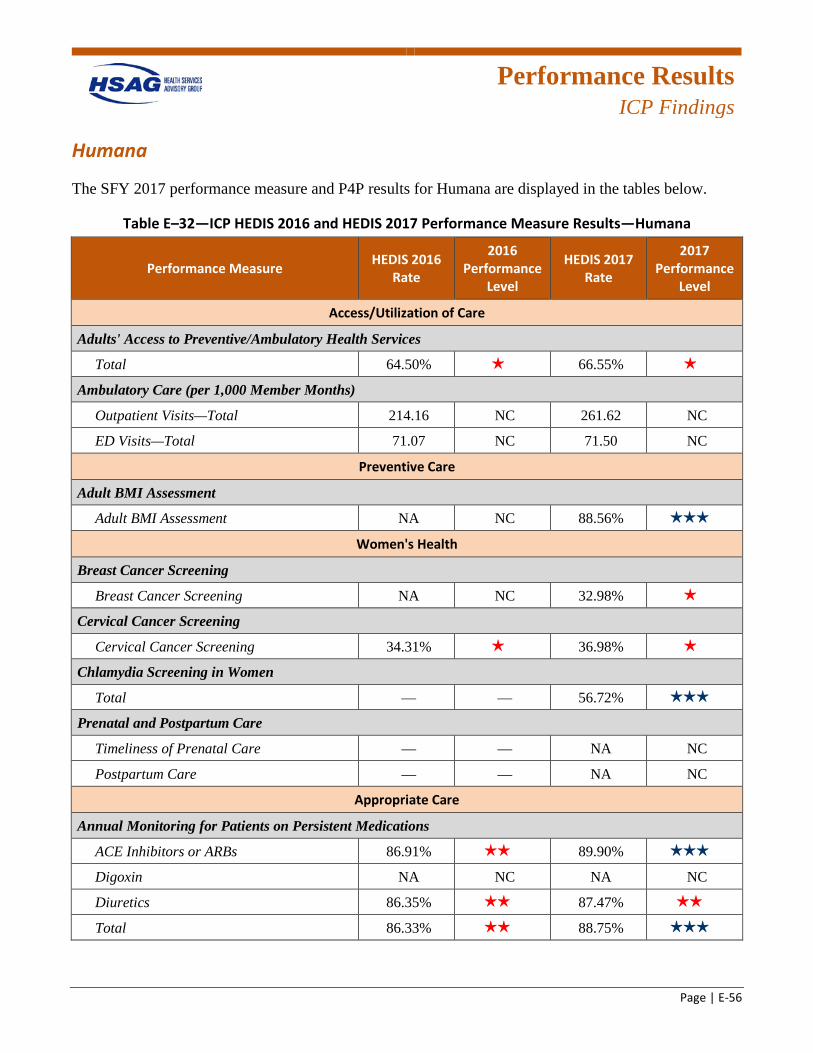
Performance Results
ICP Findings
Page | E-56
Humana
The SFY 2017 performance measure and P4P results for Humana are displayed in the tables below.
Table E–32—ICP HEDIS 2016 and HEDIS 2017 Performance Measure Results—Humana
Performance Measure HEDIS 2016 Rate
2016 Performance
Level
HEDIS 2017 Rate
2017 Performance
Level
Access/Utilization of Care
Adults' Access to Preventive/Ambulatory Health Services
Total 64.50% 1 star 66.55% 1 star
Ambulatory Care (per 1,000 Member Months)
Outpatient Visits—Total 214.16 NC 261.62 NC
ED Visits—Total 71.07 NC 71.50 NC
Preventive Care
Adult BMI Assessment
Adult BMI Assessment NA NC 88.56% 3 stars
Women's Health
Breast Cancer Screening
Breast Cancer Screening NA NC 32.98% 1 star
Cervical Cancer Screening
Cervical Cancer Screening 34.31% 1 star 36.98% 1 star
Chlamydia Screening in Women
Total — — 56.72% 3 stars
Prenatal and Postpartum Care
Timeliness of Prenatal Care — — NA NC
Postpartum Care — — NA NC
Appropriate Care
Annual Monitoring for Patients on Persistent Medications
ACE Inhibitors or ARBs 86.91% 2 stars 89.90% 3 stars
Digoxin NA NC NA NC
Diuretics 86.35% 2 stars 87.47% 2 stars
Total 86.33% 2 stars 88.75% 3 stars
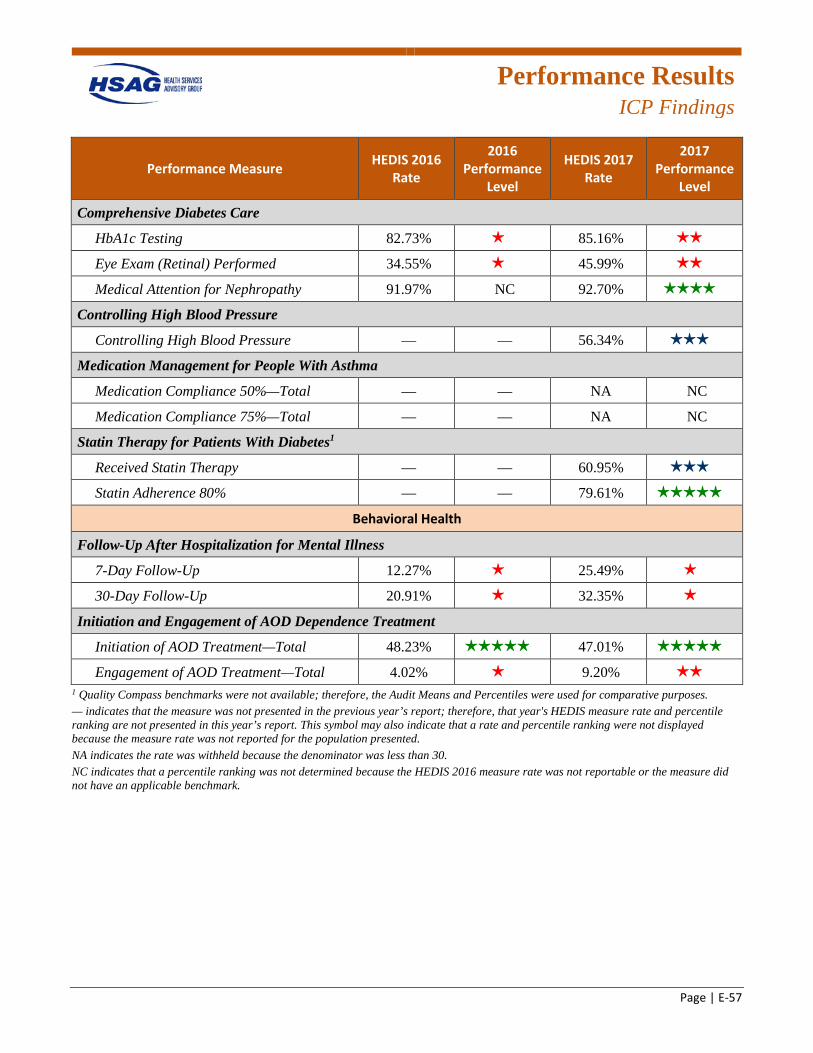
Performance Results
ICP Findings
Page | E-57
Performance Measure HEDIS 2016 Rate
2016 Performance
Level
HEDIS 2017 Rate
2017 Performance
Level
Comprehensive Diabetes Care
HbA1c Testing 82.73% 1 star 85.16% 2 stars
Eye Exam (Retinal) Performed 34.55% 1 star 45.99% 2 stars
Medical Attention for Nephropathy 91.97% NC 92.70% 4 stars
Controlling High Blood Pressure
Controlling High Blood Pressure — — 56.34% 3 stars
Medication Management for People With Asthma
Medication Compliance 50%—Total — — NA NC
Medication Compliance 75%—Total — — NA NC
Statin Therapy for Patients With Diabetes1
Received Statin Therapy — — 60.95% 3 stars
Statin Adherence 80% — — 79.61% 5 stars
Behavioral Health
Follow-Up After Hospitalization for Mental Illness
7-Day Follow-Up 12.27% 1 star 25.49% 1 star
30-Day Follow-Up 20.91% 1 star 32.35% 1 star
Initiation and Engagement of AOD Dependence Treatment
Initiation of AOD Treatment—Total 48.23% 5 stars 47.01% 5 stars
Engagement of AOD Treatment—Total 4.02% 1 star 9.20% 2 stars
1 Quality Compass benchmarks were not available; therefore, the Audit Means and Percentiles were used for comparative purposes. — indicates that the measure was not presented in the previous year’s report; therefore, that year's HEDIS measure rate and percentile ranking are not presented in this year’s report. This symbol may also indicate that a rate and percentile ranking were not displayed because the measure rate was not reported for the population presented. NA indicates the rate was withheld because the denominator was less than 30. NC indicates that a percentile ranking was not determined because the HEDIS 2016 measure rate was not reportable or the measure did not have an applicable benchmark.

Performance Results
ICP Findings
Page | E-58
Table E–33—ICP Pay-for-Performance Results for 2017 Contracted Goals and Results—Humana
Performance Measure 2016 Rate 2017
Target Goal
2017 Rate Overall Result
Women’s Health
Breast Cancer Screening
Breast Cancer Screening NA 75th Percentile 32.98% NOT
MET
Cervical Cancer Screening
Cervical Cancer Screening 34.31% 75th Percentile 36.98% NOT
MET
Appropriate Care
Comprehensive Diabetes Care
Hemoglobin A1c (HbA1c) Testing 82.73% 75th Percentile 85.16% NOT
MET
Eye Exam (Retinal) Performed 34.55% 75th Percentile 45.99% NOT
MET
Medical Attention for Nephropathy 91.97% 75th Percentile 92.70% MET
Behavioral Health
Follow-Up After Hospitalization for Mental Illness
30-Day Follow-Up 20.91% 75th Percentile 32.35% NOT
MET
Initiation and Engagement of Alcohol and Other Drug (AOD) Dependence Treatment
Initiation of AOD Treatment—Total 48.23% 90th Percentile 47.01% MET
Engagement of AOD Treatment—Total 4.02% 75th Percentile 9.20% NOT
MET NA indicates the rate was withheld because the denominator was less than 30.
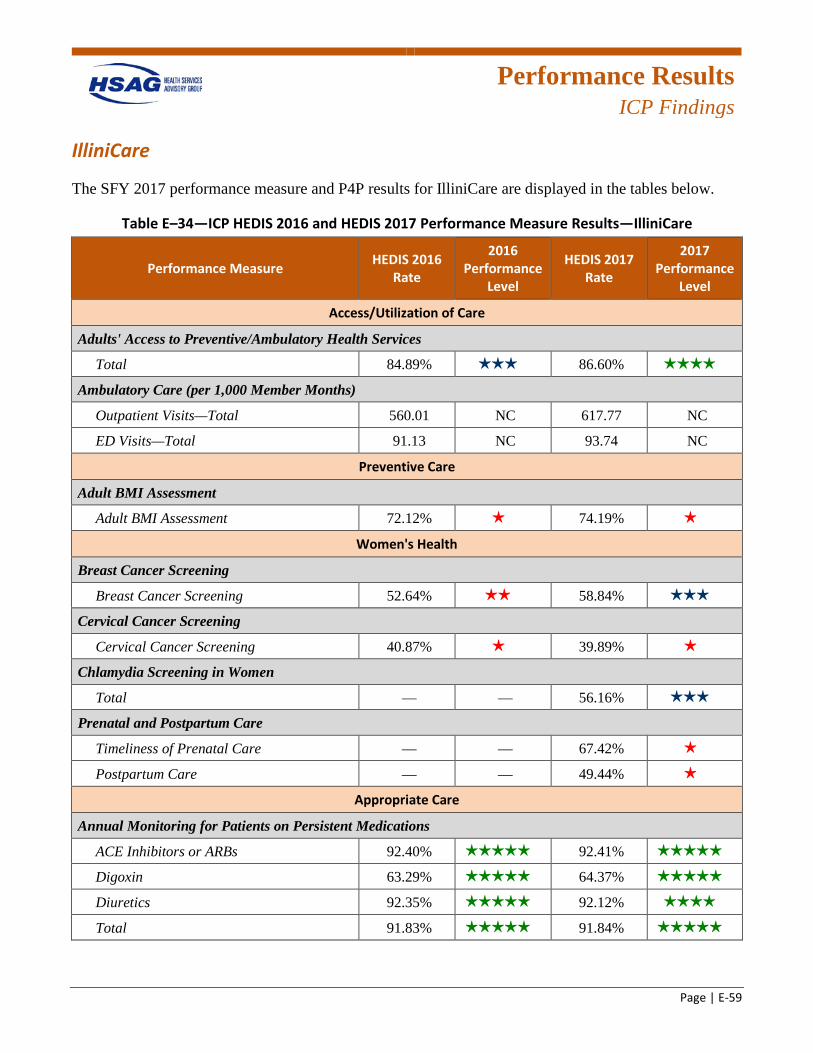
Performance Results
ICP Findings
Page | E-59
IlliniCare
The SFY 2017 performance measure and P4P results for IlliniCare are displayed in the tables below.
Table E–34—ICP HEDIS 2016 and HEDIS 2017 Performance Measure Results—IlliniCare
Performance Measure HEDIS 2016 Rate
2016 Performance
Level
HEDIS 2017 Rate
2017 Performance
Level
Access/Utilization of Care
Adults' Access to Preventive/Ambulatory Health Services
Total 84.89% 3 stars 86.60% 4 stars
Ambulatory Care (per 1,000 Member Months)
Outpatient Visits—Total 560.01 NC 617.77 NC
ED Visits—Total 91.13 NC 93.74 NC
Preventive Care
Adult BMI Assessment
Adult BMI Assessment 72.12% 1 star 74.19% 1 star
Women's Health
Breast Cancer Screening
Breast Cancer Screening 52.64% 2 stars 58.84% 3 stars
Cervical Cancer Screening
Cervical Cancer Screening 40.87% 1 star 39.89% 1 star
Chlamydia Screening in Women
Total — — 56.16% 3 stars
Prenatal and Postpartum Care
Timeliness of Prenatal Care — — 67.42% 1 star
Postpartum Care — — 49.44% 1 star
Appropriate Care
Annual Monitoring for Patients on Persistent Medications
ACE Inhibitors or ARBs 92.40% 5 stars 92.41% 5 stars
Digoxin 63.29% 5 stars 64.37% 5 stars
Diuretics 92.35% 5 stars 92.12% 4 stars
Total 91.83% 5 stars 91.84% 5 stars
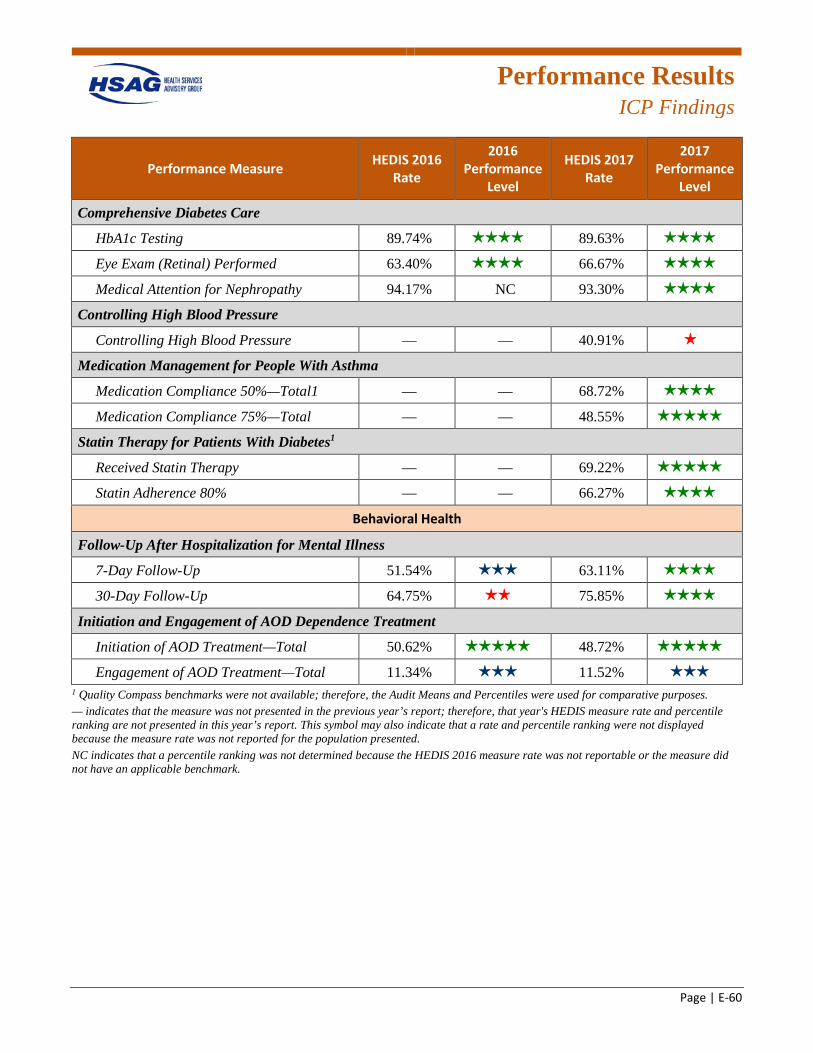
Performance Results
ICP Findings
Page | E-60
Performance Measure HEDIS 2016 Rate
2016 Performance
Level
HEDIS 2017 Rate
2017 Performance
Level
Comprehensive Diabetes Care
HbA1c Testing 89.74% 4 stars 89.63% 4 stars
Eye Exam (Retinal) Performed 63.40% 4 stars 66.67% 4 stars
Medical Attention for Nephropathy 94.17% NC 93.30% 4 stars
Controlling High Blood Pressure
Controlling High Blood Pressure — — 40.91% 1 star
Medication Management for People With Asthma
Medication Compliance 50%—Total1 — — 68.72% 4 stars
Medication Compliance 75%—Total — — 48.55% 5 stars
Statin Therapy for Patients With Diabetes1
Received Statin Therapy — — 69.22% 5 stars
Statin Adherence 80% — — 66.27% 4 stars
Behavioral Health
Follow-Up After Hospitalization for Mental Illness
7-Day Follow-Up 51.54% 3 stars 63.11% 4 stars
30-Day Follow-Up 64.75% 2 stars 75.85% 4 stars
Initiation and Engagement of AOD Dependence Treatment
Initiation of AOD Treatment—Total 50.62% 5 stars 48.72% 5 stars
Engagement of AOD Treatment—Total 11.34% 3 stars 11.52% 3 stars
1 Quality Compass benchmarks were not available; therefore, the Audit Means and Percentiles were used for comparative purposes. — indicates that the measure was not presented in the previous year’s report; therefore, that year's HEDIS measure rate and percentile ranking are not presented in this year’s report. This symbol may also indicate that a rate and percentile ranking were not displayed because the measure rate was not reported for the population presented. NC indicates that a percentile ranking was not determined because the HEDIS 2016 measure rate was not reportable or the measure did not have an applicable benchmark.
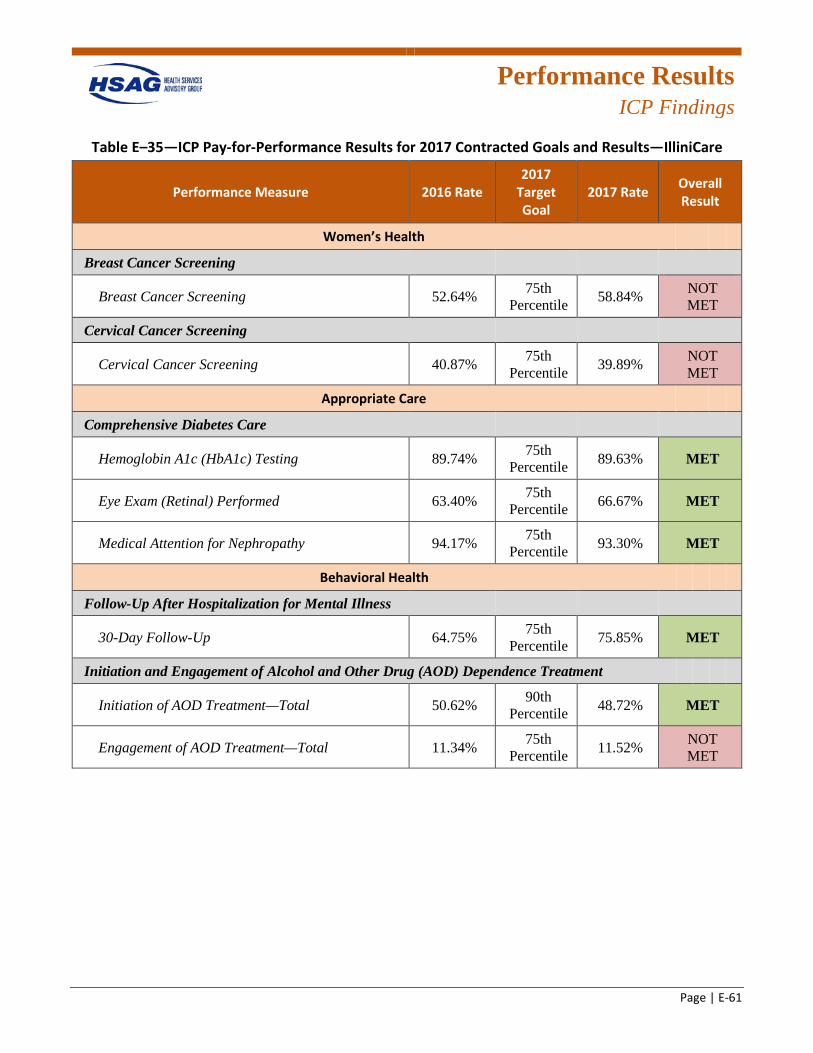
Performance Results
ICP Findings
Page | E-61
Table E–35—ICP Pay-for-Performance Results for 2017 Contracted Goals and Results—IlliniCare
Performance Measure 2016 Rate 2017
Target Goal
2017 Rate Overall Result
Women’s Health
Breast Cancer Screening
Breast Cancer Screening 52.64% 75th Percentile 58.84% NOT
MET
Cervical Cancer Screening
Cervical Cancer Screening 40.87% 75th Percentile 39.89% NOT
MET
Appropriate Care
Comprehensive Diabetes Care
Hemoglobin A1c (HbA1c) Testing 89.74% 75th Percentile 89.63% MET
Eye Exam (Retinal) Performed 63.40% 75th Percentile 66.67% MET
Medical Attention for Nephropathy 94.17% 75th Percentile 93.30% MET
Behavioral Health
Follow-Up After Hospitalization for Mental Illness
30-Day Follow-Up 64.75% 75th Percentile 75.85% MET
Initiation and Engagement of Alcohol and Other Drug (AOD) Dependence Treatment
Initiation of AOD Treatment—Total 50.62% 90th Percentile 48.72% MET
Engagement of AOD Treatment—Total 11.34% 75th Percentile 11.52% NOT
MET
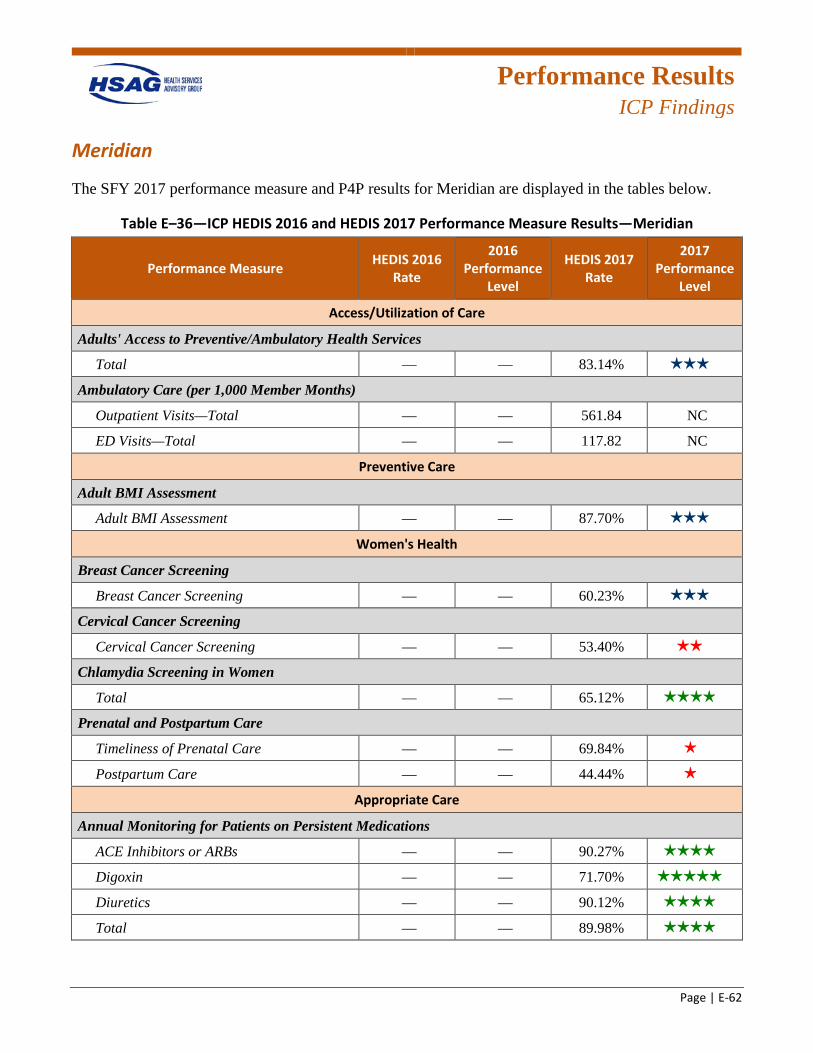
Performance Results
ICP Findings
Page | E-62
Meridian
The SFY 2017 performance measure and P4P results for Meridian are displayed in the tables below.
Table E–36—ICP HEDIS 2016 and HEDIS 2017 Performance Measure Results—Meridian
Performance Measure HEDIS 2016 Rate
2016 Performance
Level
HEDIS 2017 Rate
2017 Performance
Level
Access/Utilization of Care
Adults' Access to Preventive/Ambulatory Health Services
Total — — 83.14% 3 stars
Ambulatory Care (per 1,000 Member Months)
Outpatient Visits—Total — — 561.84 NC
ED Visits—Total — — 117.82 NC
Preventive Care
Adult BMI Assessment
Adult BMI Assessment — — 87.70% 3 stars
Women's Health
Breast Cancer Screening
Breast Cancer Screening — — 60.23% 3 stars
Cervical Cancer Screening
Cervical Cancer Screening — — 53.40% 2 stars
Chlamydia Screening in Women
Total — — 65.12% 4 stars
Prenatal and Postpartum Care
Timeliness of Prenatal Care — — 69.84% 1 star
Postpartum Care — — 44.44% 1 star
Appropriate Care
Annual Monitoring for Patients on Persistent Medications
ACE Inhibitors or ARBs — — 90.27% 4 stars
Digoxin — — 71.70% 5 stars
Diuretics — — 90.12% 4 stars
Total — — 89.98% 4 stars
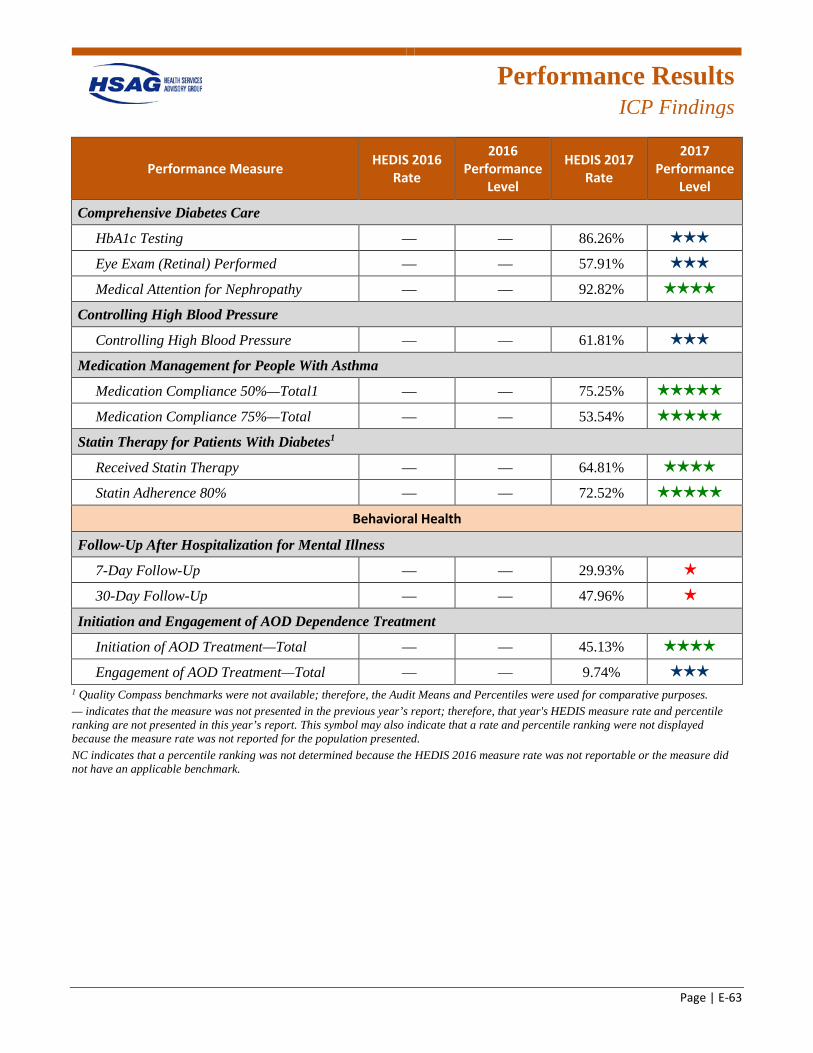
Performance Results
ICP Findings
Page | E-63
Performance Measure HEDIS 2016 Rate
2016 Performance
Level
HEDIS 2017 Rate
2017 Performance
Level
Comprehensive Diabetes Care
HbA1c Testing — — 86.26% 3 stars
Eye Exam (Retinal) Performed — — 57.91% 3 stars
Medical Attention for Nephropathy — — 92.82% 4 stars
Controlling High Blood Pressure
Controlling High Blood Pressure — — 61.81% 3 stars
Medication Management for People With Asthma
Medication Compliance 50%—Total1 — — 75.25% 5 stars
Medication Compliance 75%—Total — — 53.54% 5 stars
Statin Therapy for Patients With Diabetes1
Received Statin Therapy — — 64.81% 4 stars
Statin Adherence 80% — — 72.52% 5 stars
Behavioral Health
Follow-Up After Hospitalization for Mental Illness
7-Day Follow-Up — — 29.93% 1 star
30-Day Follow-Up — — 47.96% 1 star
Initiation and Engagement of AOD Dependence Treatment
Initiation of AOD Treatment—Total — — 45.13% 4 stars
Engagement of AOD Treatment—Total — — 9.74% 3 stars
1 Quality Compass benchmarks were not available; therefore, the Audit Means and Percentiles were used for comparative purposes. — indicates that the measure was not presented in the previous year’s report; therefore, that year's HEDIS measure rate and percentile ranking are not presented in this year’s report. This symbol may also indicate that a rate and percentile ranking were not displayed because the measure rate was not reported for the population presented. NC indicates that a percentile ranking was not determined because the HEDIS 2016 measure rate was not reportable or the measure did not have an applicable benchmark.

Performance Results
ICP Findings
Page | E-64
Table E–37—ICP Pay-for-Performance Results for 2017 Contracted Goals and Results—Meridian
Performance Measure 2016 Rate1 2017
Target Goal
2017 Rate Overall Result
Women’s Health
Breast Cancer Screening
Breast Cancer Screening 65.75% 75th Percentile 60.23% NOT
MET
Cervical Cancer Screening
Cervical Cancer Screening 61.28% 75th Percentile 53.40% NOT
MET
Appropriate Care
Comprehensive Diabetes Care
Hemoglobin A1c (HbA1c) Testing 84.46% 75th Percentile 86.26% NOT
MET
Eye Exam (Retinal) Performed 52.92% 75th Percentile 57.91% NOT
MET
Medical Attention for Nephropathy 89.85% 75th Percentile 92.82% MET
Behavioral Health
Follow-Up After Hospitalization for Mental Illness
30-Day Follow-Up 54.71% 75th Percentile 47.96% NOT
MET
Initiation and Engagement of Alcohol and Other Drug (AOD) Dependence Treatment
Initiation of AOD Treatment—Total 40.59% 90th Percentile 45.13% NOT
MET
Engagement of AOD Treatment—Total 9.63% 75th Percentile 9.74% NOT
MET 1 The 2016 HEDIS measure rates for Meridian’s FHP/ACA and ICP populations were submitted in combined files; therefore, caution
should be exercised when comparing HEDIS 2016 performance to HEDIS 2017 performance.
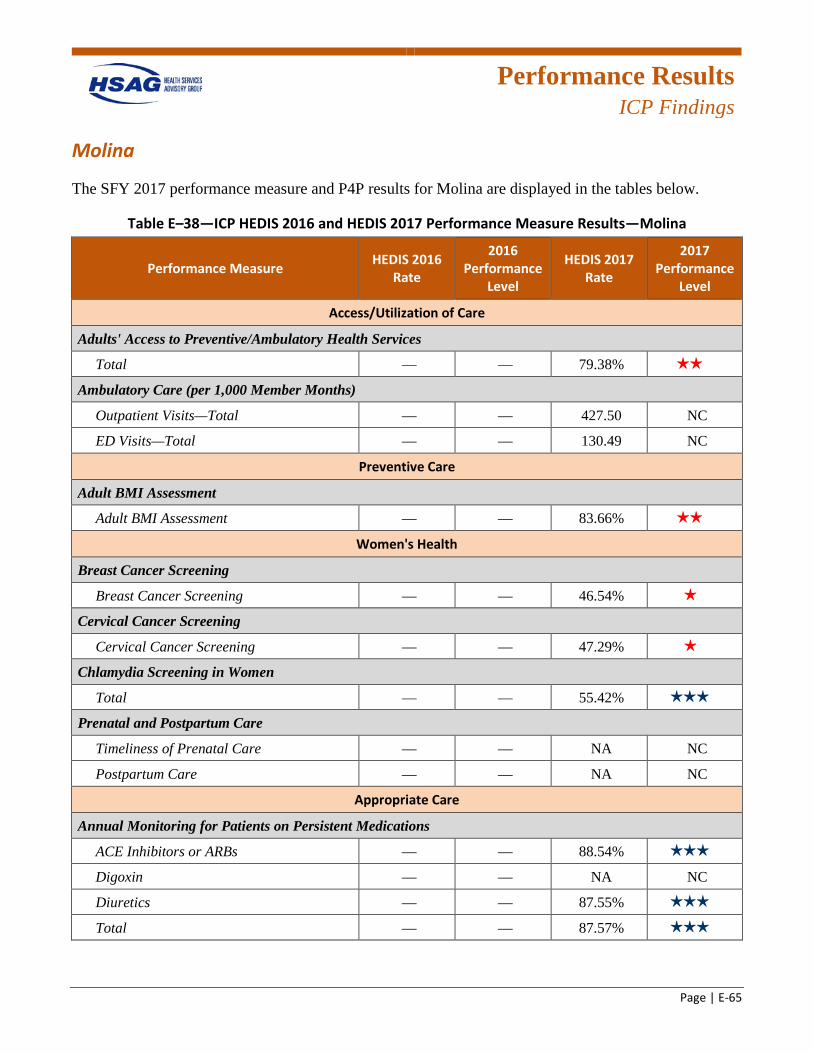
Performance Results
ICP Findings
Page | E-65
Molina
The SFY 2017 performance measure and P4P results for Molina are displayed in the tables below.
Table E–38—ICP HEDIS 2016 and HEDIS 2017 Performance Measure Results—Molina
Performance Measure HEDIS 2016 Rate
2016 Performance
Level
HEDIS 2017 Rate
2017 Performance
Level
Access/Utilization of Care
Adults' Access to Preventive/Ambulatory Health Services
Total — — 79.38% 2 stars
Ambulatory Care (per 1,000 Member Months)
Outpatient Visits—Total — — 427.50 NC
ED Visits—Total — — 130.49 NC
Preventive Care
Adult BMI Assessment
Adult BMI Assessment — — 83.66% 2 stars
Women's Health
Breast Cancer Screening
Breast Cancer Screening — — 46.54% 1 star
Cervical Cancer Screening
Cervical Cancer Screening — — 47.29% 1 star
Chlamydia Screening in Women
Total — — 55.42% 3 stars
Prenatal and Postpartum Care
Timeliness of Prenatal Care — — NA NC
Postpartum Care — — NA NC
Appropriate Care
Annual Monitoring for Patients on Persistent Medications
ACE Inhibitors or ARBs — — 88.54% 3 stars
Digoxin — — NA NC
Diuretics — — 87.55% 3 stars
Total — — 87.57% 3 stars
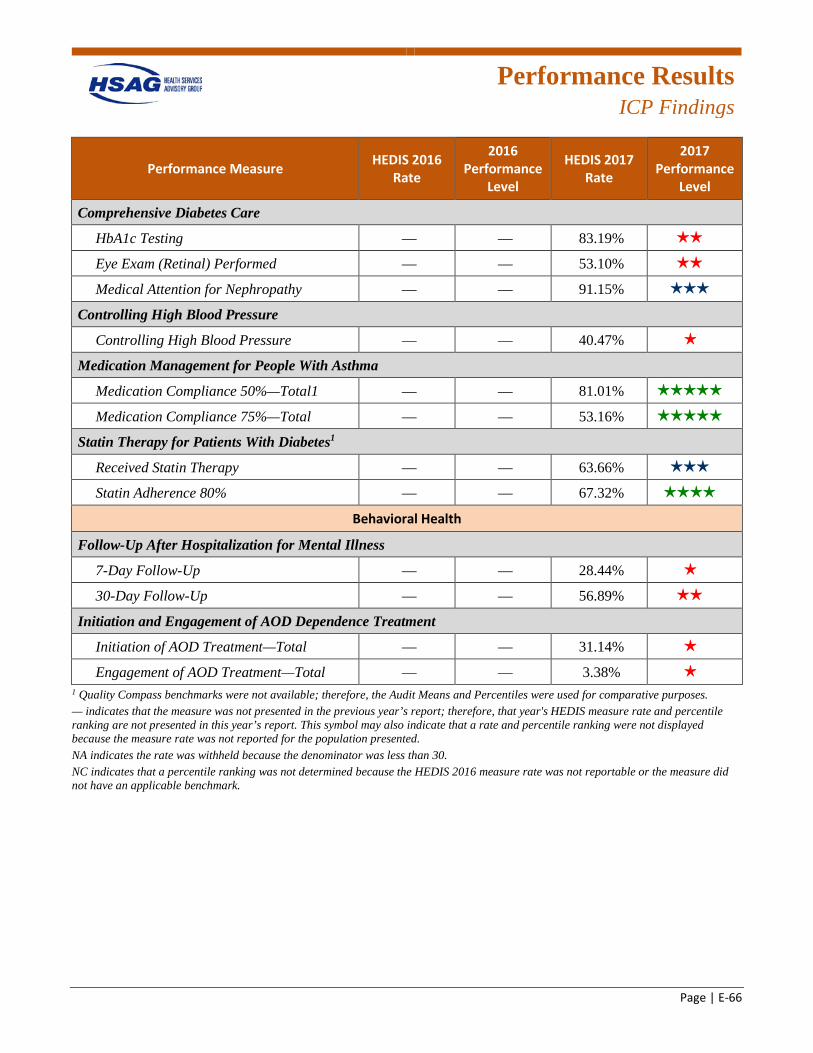
Performance Results
ICP Findings
Page | E-66
Performance Measure HEDIS 2016 Rate
2016 Performance
Level
HEDIS 2017 Rate
2017 Performance
Level
Comprehensive Diabetes Care
HbA1c Testing — — 83.19% 2 stars
Eye Exam (Retinal) Performed — — 53.10% 2 stars
Medical Attention for Nephropathy — — 91.15% 3 stars
Controlling High Blood Pressure
Controlling High Blood Pressure — — 40.47% 1 star
Medication Management for People With Asthma
Medication Compliance 50%—Total1 — — 81.01% 5 stars
Medication Compliance 75%—Total — — 53.16% 5 stars
Statin Therapy for Patients With Diabetes1
Received Statin Therapy — — 63.66% 3 stars
Statin Adherence 80% — — 67.32% 4 stars
Behavioral Health
Follow-Up After Hospitalization for Mental Illness
7-Day Follow-Up — — 28.44% 1 star
30-Day Follow-Up — — 56.89% 2 stars
Initiation and Engagement of AOD Dependence Treatment
Initiation of AOD Treatment—Total — — 31.14% 1 star
Engagement of AOD Treatment—Total — — 3.38% 1 star
1 Quality Compass benchmarks were not available; therefore, the Audit Means and Percentiles were used for comparative purposes. — indicates that the measure was not presented in the previous year’s report; therefore, that year's HEDIS measure rate and percentile ranking are not presented in this year’s report. This symbol may also indicate that a rate and percentile ranking were not displayed because the measure rate was not reported for the population presented. NA indicates the rate was withheld because the denominator was less than 30. NC indicates that a percentile ranking was not determined because the HEDIS 2016 measure rate was not reportable or the measure did not have an applicable benchmark.
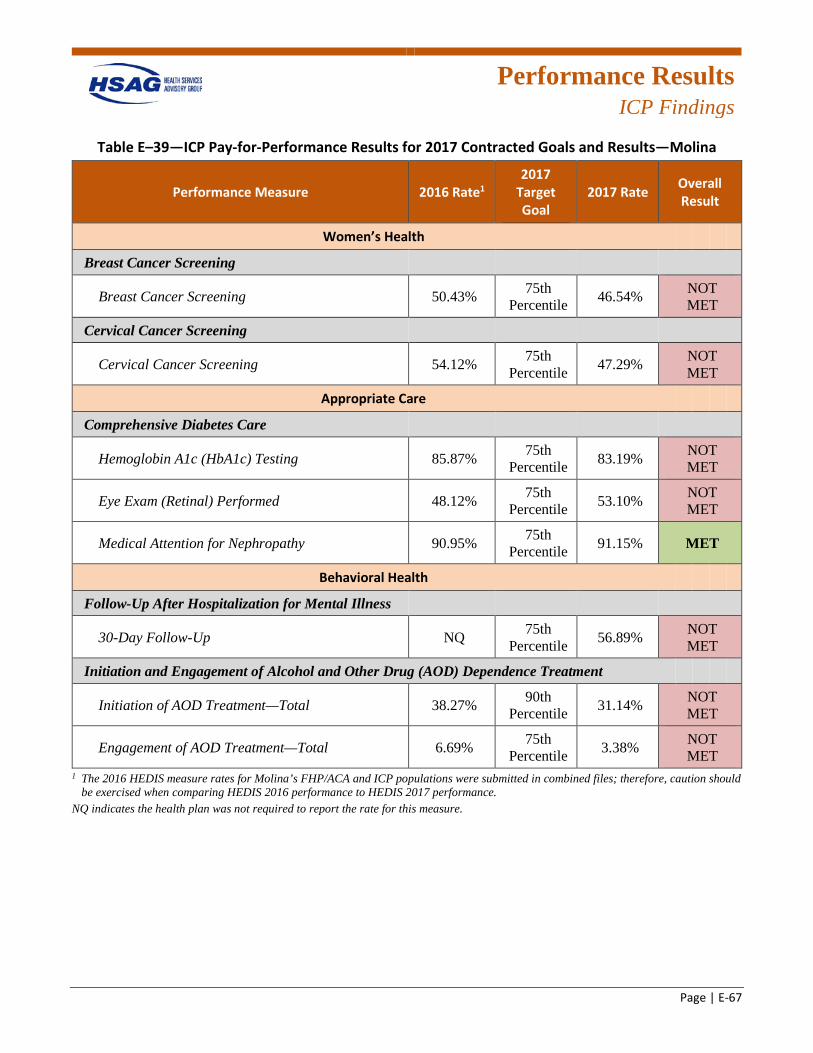
Performance Results
ICP Findings
Page | E-67
Table E–39—ICP Pay-for-Performance Results for 2017 Contracted Goals and Results—Molina
Performance Measure 2016 Rate1 2017
Target Goal
2017 Rate Overall Result
Women’s Health
Breast Cancer Screening
Breast Cancer Screening 50.43% 75th Percentile 46.54% NOT
MET
Cervical Cancer Screening
Cervical Cancer Screening 54.12% 75th Percentile 47.29% NOT
MET
Appropriate Care
Comprehensive Diabetes Care
Hemoglobin A1c (HbA1c) Testing 85.87% 75th Percentile 83.19% NOT
MET
Eye Exam (Retinal) Performed 48.12% 75th Percentile 53.10% NOT
MET
Medical Attention for Nephropathy 90.95% 75th Percentile 91.15% MET
Behavioral Health
Follow-Up After Hospitalization for Mental Illness
30-Day Follow-Up NQ 75th Percentile 56.89% NOT
MET
Initiation and Engagement of Alcohol and Other Drug (AOD) Dependence Treatment
Initiation of AOD Treatment—Total 38.27% 90th Percentile 31.14% NOT
MET
Engagement of AOD Treatment—Total 6.69% 75th Percentile 3.38% NOT
MET 1 The 2016 HEDIS measure rates for Molina’s FHP/ACA and ICP populations were submitted in combined files; therefore, caution should
be exercised when comparing HEDIS 2016 performance to HEDIS 2017 performance. NQ indicates the health plan was not required to report the rate for this measure.
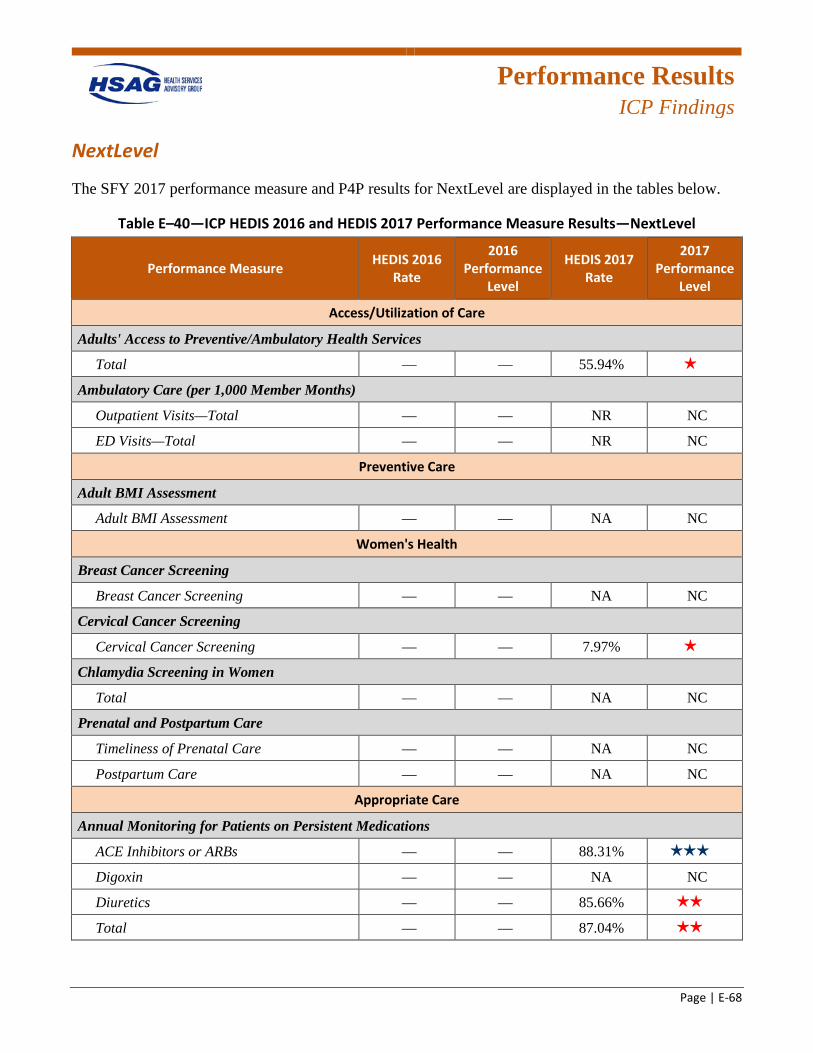
Performance Results
ICP Findings
Page | E-68
NextLevel
The SFY 2017 performance measure and P4P results for NextLevel are displayed in the tables below.
Table E–40—ICP HEDIS 2016 and HEDIS 2017 Performance Measure Results—NextLevel
Performance Measure HEDIS 2016 Rate
2016 Performance
Level
HEDIS 2017 Rate
2017 Performance
Level
Access/Utilization of Care
Adults' Access to Preventive/Ambulatory Health Services
Total — — 55.94% 1 star
Ambulatory Care (per 1,000 Member Months)
Outpatient Visits—Total — — NR NC
ED Visits—Total — — NR NC
Preventive Care
Adult BMI Assessment
Adult BMI Assessment — — NA NC
Women's Health
Breast Cancer Screening
Breast Cancer Screening — — NA NC
Cervical Cancer Screening
Cervical Cancer Screening — — 7.97% 1 star
Chlamydia Screening in Women
Total — — NA NC
Prenatal and Postpartum Care
Timeliness of Prenatal Care — — NA NC
Postpartum Care — — NA NC
Appropriate Care
Annual Monitoring for Patients on Persistent Medications
ACE Inhibitors or ARBs — — 88.31% 3 stars
Digoxin — — NA NC
Diuretics — — 85.66% 2 stars
Total — — 87.04% 2 stars
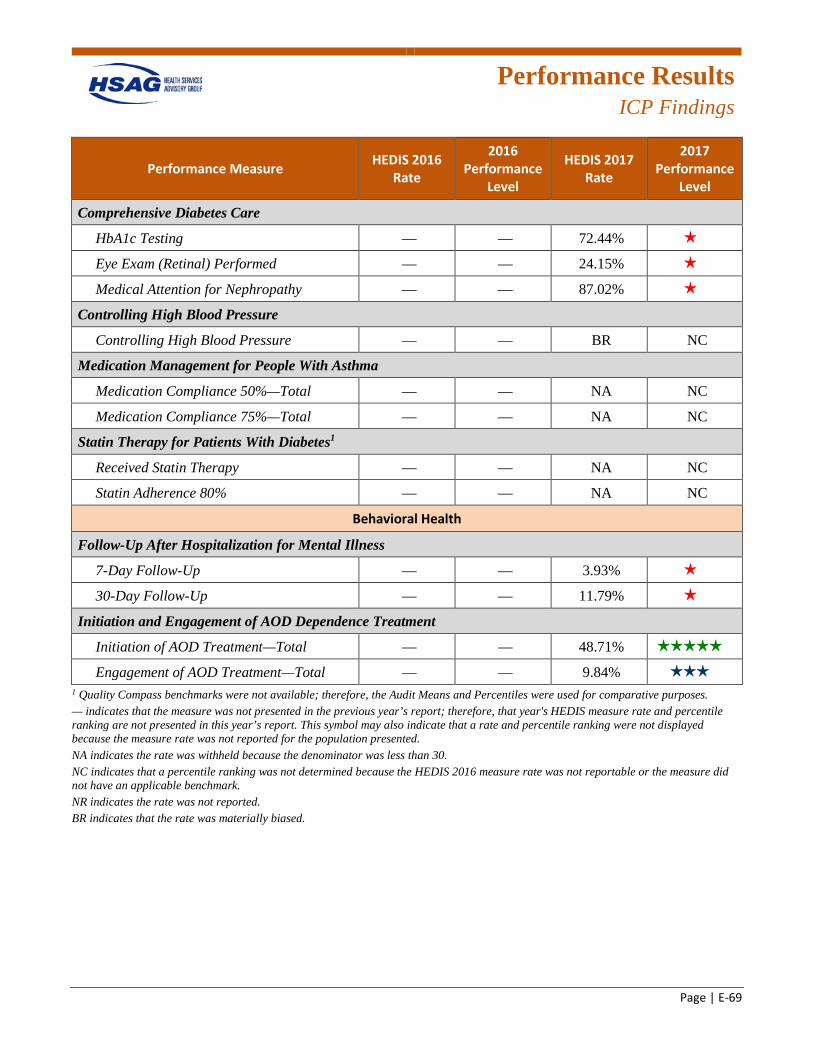
Performance Results
ICP Findings
Page | E-69
Performance Measure HEDIS 2016 Rate
2016 Performance
Level
HEDIS 2017 Rate
2017 Performance
Level
Comprehensive Diabetes Care
HbA1c Testing — — 72.44% 1 star
Eye Exam (Retinal) Performed — — 24.15% 1 star
Medical Attention for Nephropathy — — 87.02% 1 star
Controlling High Blood Pressure
Controlling High Blood Pressure — — BR NC
Medication Management for People With Asthma
Medication Compliance 50%—Total — — NA NC
Medication Compliance 75%—Total — — NA NC
Statin Therapy for Patients With Diabetes1
Received Statin Therapy — — NA NC
Statin Adherence 80% — — NA NC
Behavioral Health
Follow-Up After Hospitalization for Mental Illness
7-Day Follow-Up — — 3.93% 1 star
30-Day Follow-Up — — 11.79% 1 star
Initiation and Engagement of AOD Dependence Treatment
Initiation of AOD Treatment—Total — — 48.71% 5 stars
Engagement of AOD Treatment—Total — — 9.84% 3 stars
1 Quality Compass benchmarks were not available; therefore, the Audit Means and Percentiles were used for comparative purposes. — indicates that the measure was not presented in the previous year’s report; therefore, that year's HEDIS measure rate and percentile ranking are not presented in this year’s report. This symbol may also indicate that a rate and percentile ranking were not displayed because the measure rate was not reported for the population presented. NA indicates the rate was withheld because the denominator was less than 30. NC indicates that a percentile ranking was not determined because the HEDIS 2016 measure rate was not reportable or the measure did not have an applicable benchmark. NR indicates the rate was not reported. BR indicates that the rate was materially biased.
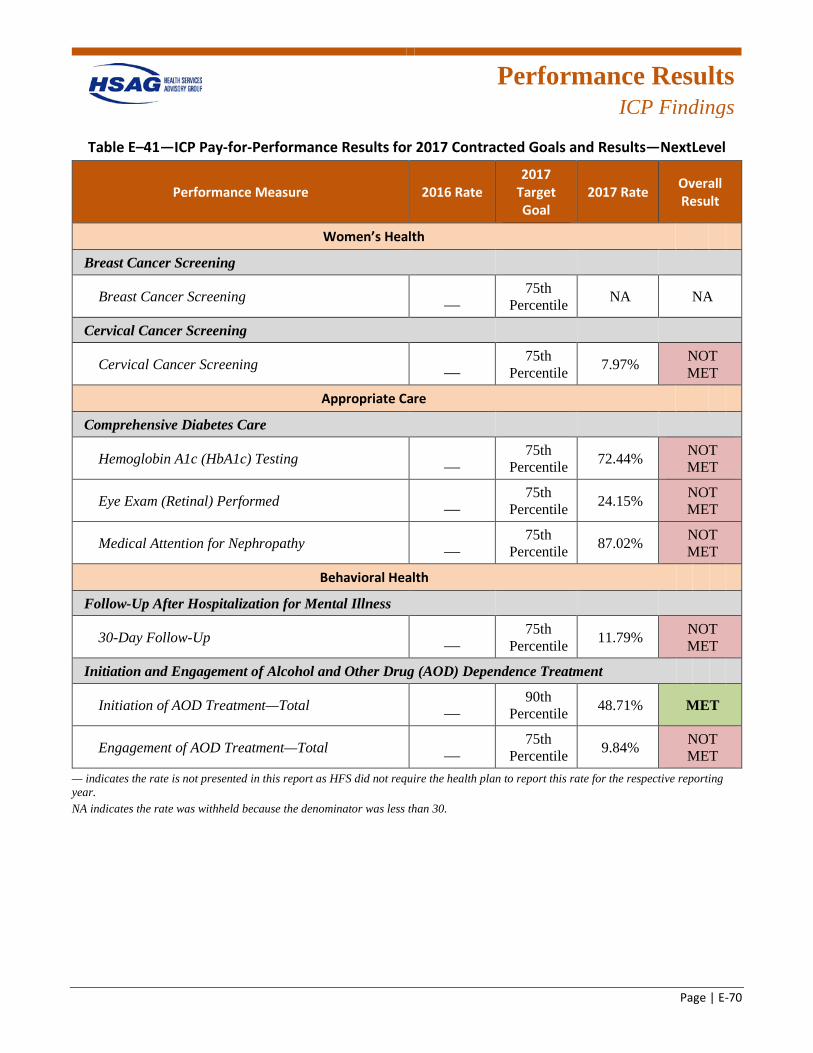
Performance Results
ICP Findings
Page | E-70
Table E–41—ICP Pay-for-Performance Results for 2017 Contracted Goals and Results—NextLevel
Performance Measure 2016 Rate 2017
Target Goal
2017 Rate Overall Result
Women’s Health
Breast Cancer Screening
Breast Cancer Screening — 75th
Percentile NA NA
Cervical Cancer Screening
Cervical Cancer Screening — 75th
Percentile 7.97% NOT MET
Appropriate Care
Comprehensive Diabetes Care
Hemoglobin A1c (HbA1c) Testing — 75th
Percentile 72.44% NOT MET
Eye Exam (Retinal) Performed — 75th
Percentile 24.15% NOT MET
Medical Attention for Nephropathy — 75th
Percentile 87.02% NOT MET
Behavioral Health
Follow-Up After Hospitalization for Mental Illness
30-Day Follow-Up — 75th
Percentile 11.79% NOT MET
Initiation and Engagement of Alcohol and Other Drug (AOD) Dependence Treatment
Initiation of AOD Treatment—Total — 90th
Percentile 48.71% MET
Engagement of AOD Treatment—Total — 75th
Percentile 9.84% NOT MET
— indicates the rate is not presented in this report as HFS did not require the health plan to report this rate for the respective reporting year. NA indicates the rate was withheld because the denominator was less than 30.
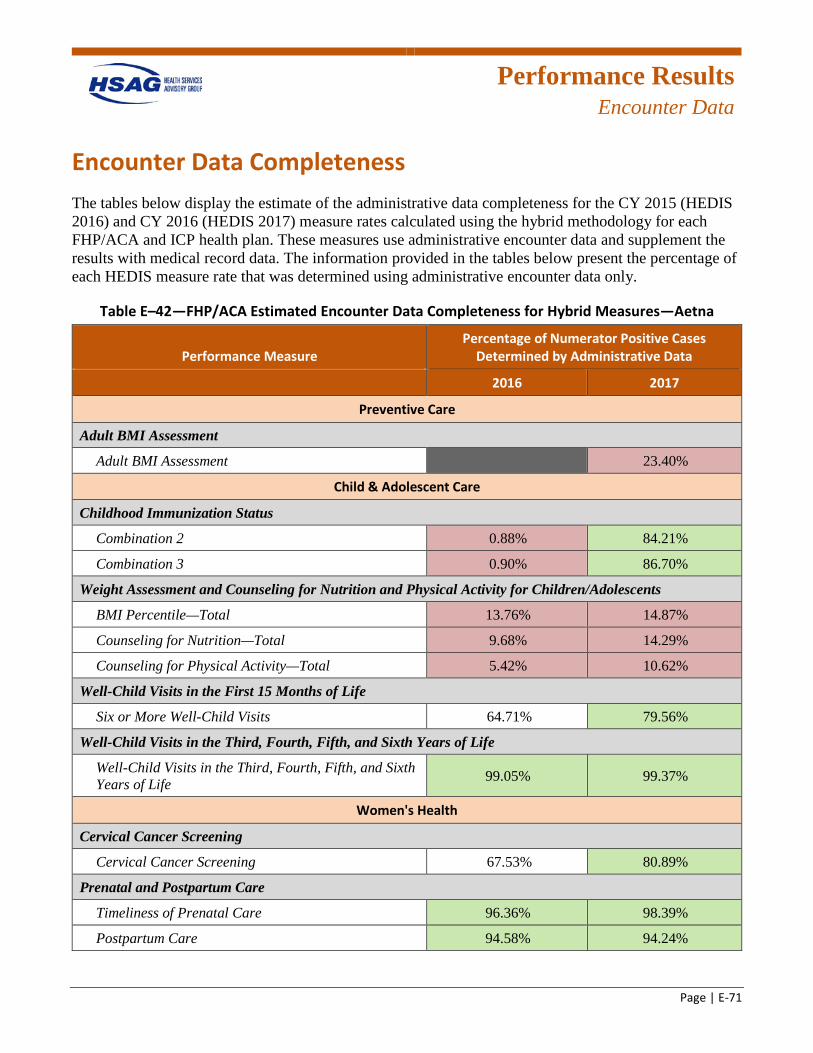
Performance Results
Encounter Data
Page | E-71
Encounter Data Completeness The tables below display the estimate of the administrative data completeness for the CY 2015 (HEDIS 2016) and CY 2016 (HEDIS 2017) measure rates calculated using the hybrid methodology for each FHP/ACA and ICP health plan. These measures use administrative encounter data and supplement the results with medical record data. The information provided in the tables below present the percentage of each HEDIS measure rate that was determined using administrative encounter data only.
Table E–42—FHP/ACA Estimated Encounter Data Completeness for Hybrid Measures—Aetna
Performance Measure Percentage of Numerator Positive Cases
Determined by Administrative Data
2016 2017
Preventive Care
Adult BMI Assessment
Adult BMI Assessment GREY 23.40%R
Child & Adolescent Care
Childhood Immunization Status
Combination 2 0.88%R 84.21%G
Combination 3 0.90%R 86.70%G
Weight Assessment and Counseling for Nutrition and Physical Activity for Children/Adolescents
BMI Percentile—Total 13.76%R 14.87%R
Counseling for Nutrition—Total 9.68%R 14.29%R
Counseling for Physical Activity—Total 5.42%R 10.62%R
Well-Child Visits in the First 15 Months of Life
Six or More Well-Child Visits 64.71% 79.56%G
Well-Child Visits in the Third, Fourth, Fifth, and Sixth Years of Life
Well-Child Visits in the Third, Fourth, Fifth, and Sixth Years of Life 99.05%G 99.37%G
Women's Health
Cervical Cancer Screening
Cervical Cancer Screening 67.53% 80.89%G
Prenatal and Postpartum Care
Timeliness of Prenatal Care 96.36%G 98.39%G
Postpartum Care 94.58%G 94.24%G
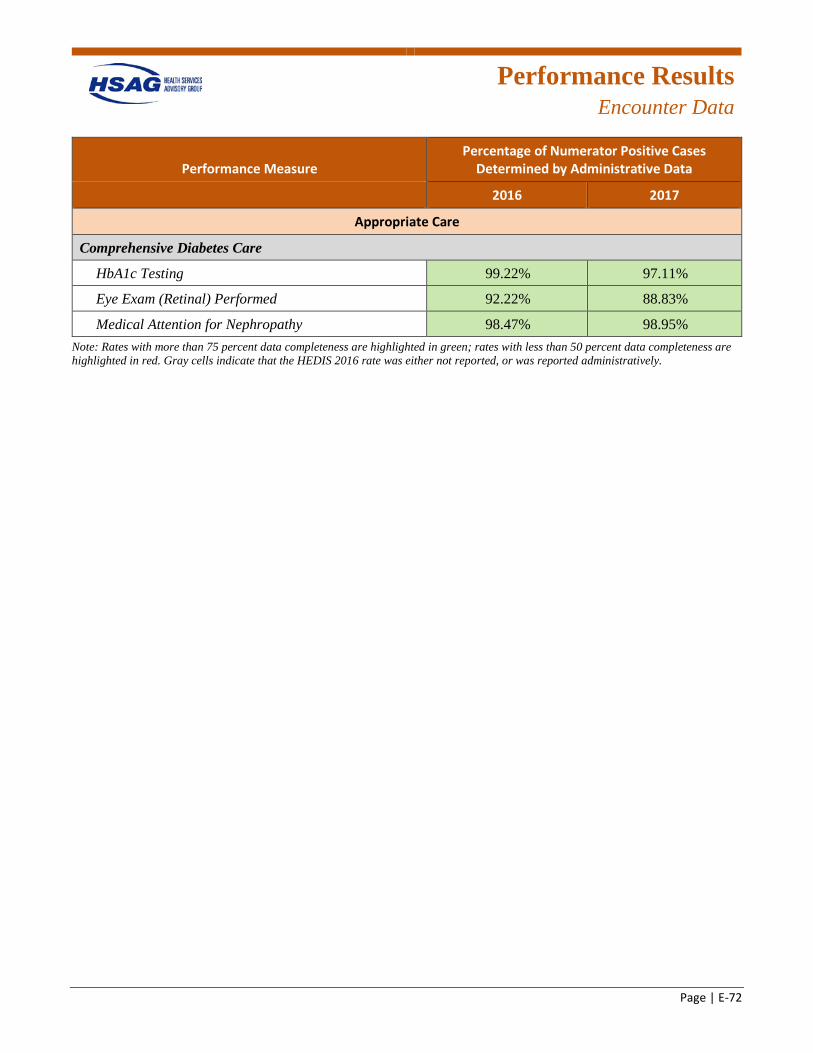
Performance Results
Encounter Data
Page | E-72
Performance Measure Percentage of Numerator Positive Cases
Determined by Administrative Data
2016 2017
Appropriate Care
Comprehensive Diabetes Care
HbA1c Testing 99.22%G 97.11%G
Eye Exam (Retinal) Performed 92.22%G 88.83%G
Medical Attention for Nephropathy 98.47%G 98.95%G
Note: Rates with more than 75 percent data completeness are highlighted in green; rates with less than 50 percent data completeness are highlighted in red. Gray cells indicate that the HEDIS 2016 rate was either not reported, or was reported administratively.
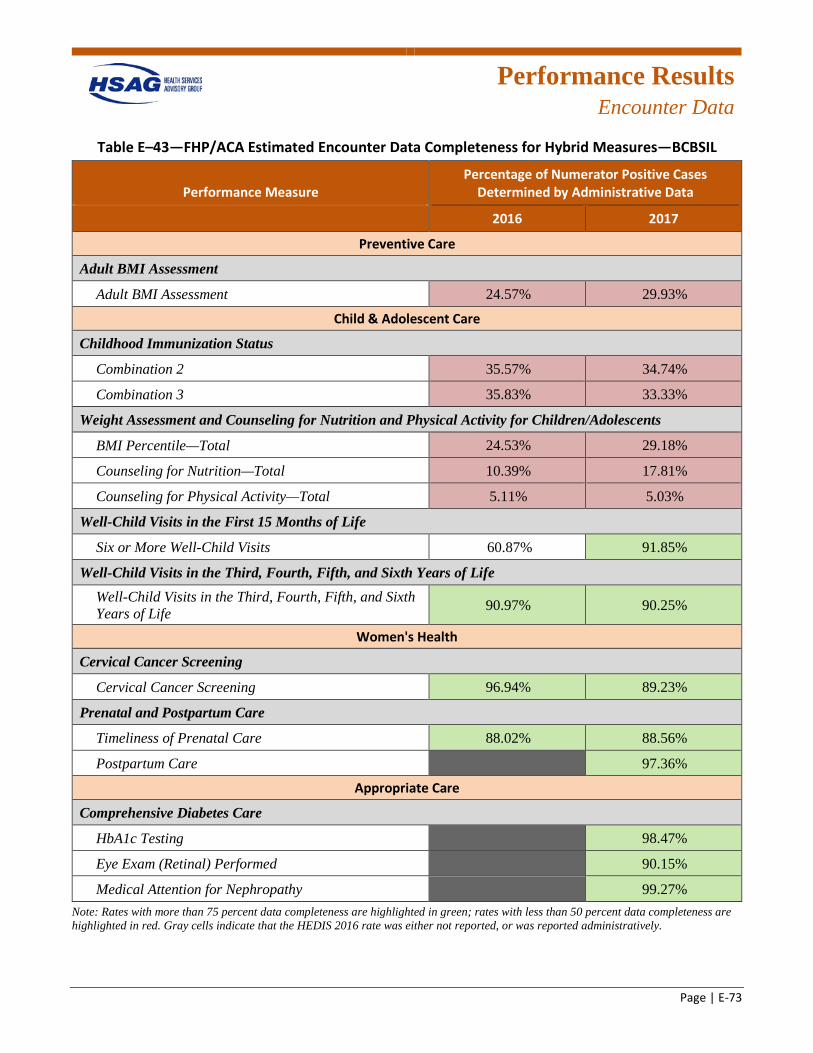
Performance Results
Encounter Data
Page | E-73
Table E–43—FHP/ACA Estimated Encounter Data Completeness for Hybrid Measures—BCBSIL
Performance Measure Percentage of Numerator Positive Cases
Determined by Administrative Data
2016 2017
Preventive Care
Adult BMI Assessment
Adult BMI Assessment 24.57%R 29.93%R
Child & Adolescent Care
Childhood Immunization Status
Combination 2 35.57%R 34.74%R
Combination 3 35.83%R 33.33%R
Weight Assessment and Counseling for Nutrition and Physical Activity for Children/Adolescents
BMI Percentile—Total 24.53%R 29.18%R
Counseling for Nutrition—Total 10.39%R 17.81%R
Counseling for Physical Activity—Total 5.11%R 5.03%R
Well-Child Visits in the First 15 Months of Life
Six or More Well-Child Visits 60.87% 91.85%G
Well-Child Visits in the Third, Fourth, Fifth, and Sixth Years of Life Well-Child Visits in the Third, Fourth, Fifth, and Sixth Years of Life 90.97%G 90.25%G
Women's Health
Cervical Cancer Screening
Cervical Cancer Screening 96.94%G 89.23%G
Prenatal and Postpartum Care
Timeliness of Prenatal Care 88.02%G 88.56%G
Postpartum Care GREY 97.36%G
Appropriate Care
Comprehensive Diabetes Care
HbA1c Testing GREY 98.47%G
Eye Exam (Retinal) Performed GREY 90.15%G
Medical Attention for Nephropathy GREY 99.27%G
Note: Rates with more than 75 percent data completeness are highlighted in green; rates with less than 50 percent data completeness are highlighted in red. Gray cells indicate that the HEDIS 2016 rate was either not reported, or was reported administratively.
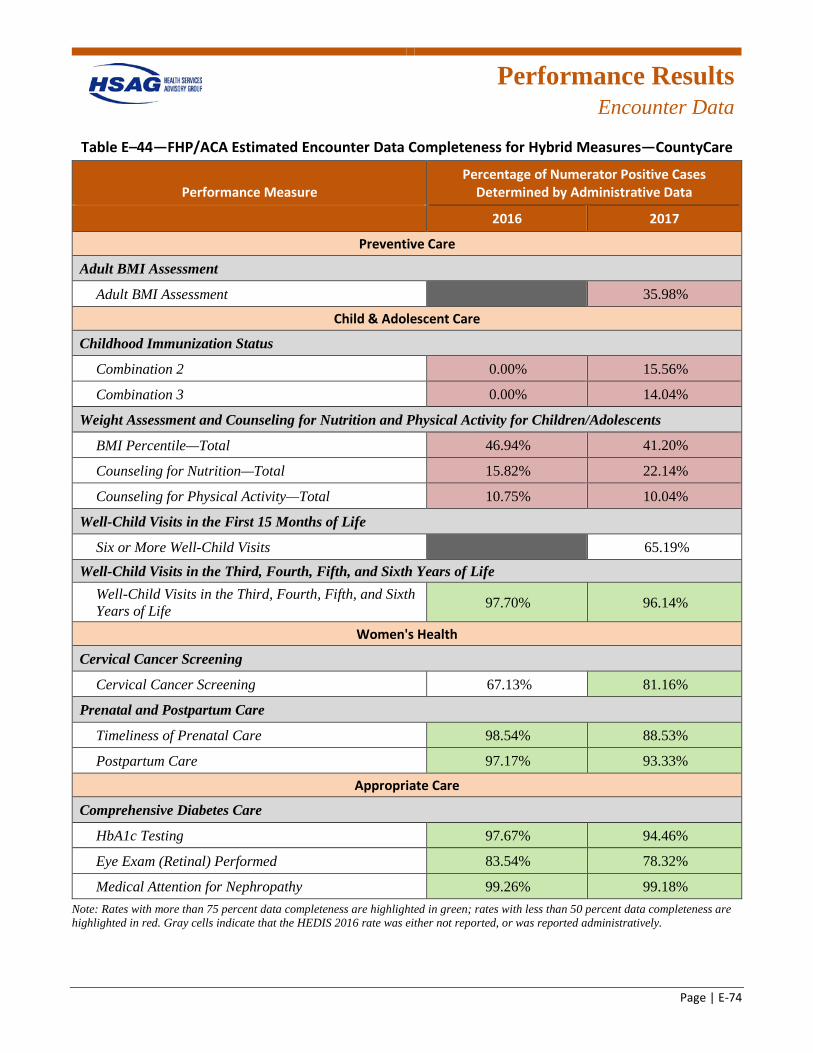
Performance Results
Encounter Data
Page | E-74
Table E–44—FHP/ACA Estimated Encounter Data Completeness for Hybrid Measures—CountyCare
Performance Measure Percentage of Numerator Positive Cases
Determined by Administrative Data
2016 2017
Preventive Care
Adult BMI Assessment
Adult BMI Assessment GREY 35.98%R
Child & Adolescent Care
Childhood Immunization Status
Combination 2 0.00%R 15.56%R
Combination 3 0.00%R 14.04%R
Weight Assessment and Counseling for Nutrition and Physical Activity for Children/Adolescents
BMI Percentile—Total 46.94%R 41.20%R
Counseling for Nutrition—Total 15.82%R 22.14%R
Counseling for Physical Activity—Total 10.75%R 10.04%R
Well-Child Visits in the First 15 Months of Life
Six or More Well-Child Visits GREY 65.19% Well-Child Visits in the Third, Fourth, Fifth, and Sixth Years of Life
Well-Child Visits in the Third, Fourth, Fifth, and Sixth Years of Life 97.70%G 96.14%G
Women's Health
Cervical Cancer Screening
Cervical Cancer Screening 67.13% 81.16%G
Prenatal and Postpartum Care
Timeliness of Prenatal Care 98.54%G 88.53%G
Postpartum Care 97.17%G 93.33%G
Appropriate Care
Comprehensive Diabetes Care
HbA1c Testing 97.67%G 94.46%G
Eye Exam (Retinal) Performed 83.54%G 78.32%G
Medical Attention for Nephropathy 99.26%G 99.18%G
Note: Rates with more than 75 percent data completeness are highlighted in green; rates with less than 50 percent data completeness are highlighted in red. Gray cells indicate that the HEDIS 2016 rate was either not reported, or was reported administratively.
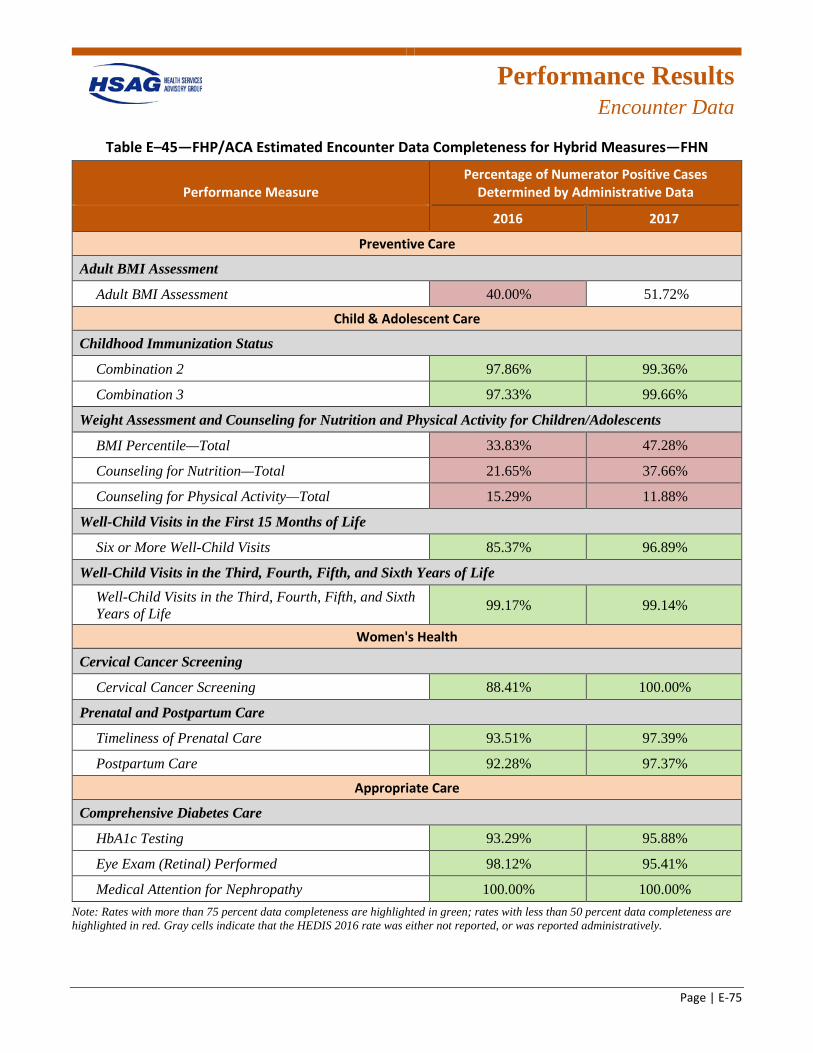
Performance Results
Encounter Data
Page | E-75
Table E–45—FHP/ACA Estimated Encounter Data Completeness for Hybrid Measures—FHN
Performance Measure Percentage of Numerator Positive Cases
Determined by Administrative Data
2016 2017
Preventive Care
Adult BMI Assessment
Adult BMI Assessment 40.00%R 51.72%
Child & Adolescent Care
Childhood Immunization Status
Combination 2 97.86%G 99.36%G
Combination 3 97.33%G 99.66%G
Weight Assessment and Counseling for Nutrition and Physical Activity for Children/Adolescents
BMI Percentile—Total 33.83%R 47.28%R
Counseling for Nutrition—Total 21.65%R 37.66%R
Counseling for Physical Activity—Total 15.29%R 11.88%R
Well-Child Visits in the First 15 Months of Life
Six or More Well-Child Visits 85.37%G 96.89%G
Well-Child Visits in the Third, Fourth, Fifth, and Sixth Years of Life Well-Child Visits in the Third, Fourth, Fifth, and Sixth Years of Life 99.17%G 99.14%G
Women's Health
Cervical Cancer Screening
Cervical Cancer Screening 88.41%G 100.00%G
Prenatal and Postpartum Care
Timeliness of Prenatal Care 93.51%G 97.39%G
Postpartum Care 92.28%G 97.37%G
Appropriate Care
Comprehensive Diabetes Care
HbA1c Testing 93.29%G 95.88%G
Eye Exam (Retinal) Performed 98.12%G 95.41%G
Medical Attention for Nephropathy 100.00%G 100.00%G
Note: Rates with more than 75 percent data completeness are highlighted in green; rates with less than 50 percent data completeness are highlighted in red. Gray cells indicate that the HEDIS 2016 rate was either not reported, or was reported administratively.
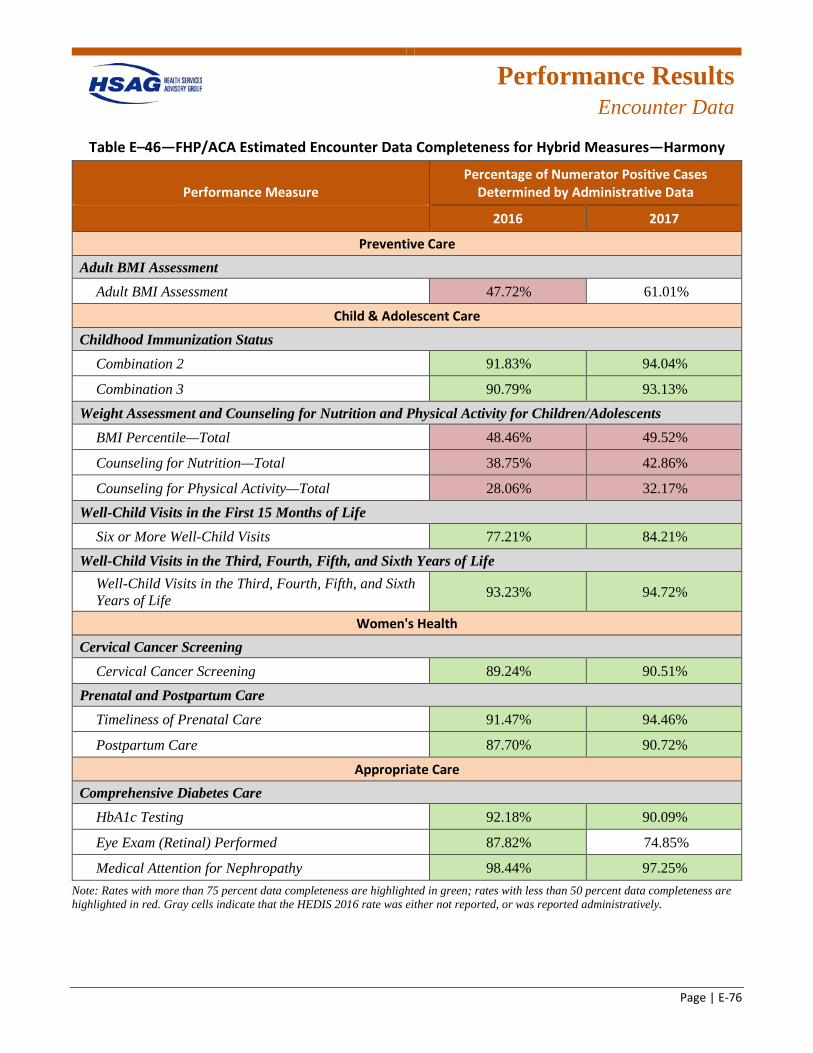
Performance Results
Encounter Data
Page | E-76
Table E–46—FHP/ACA Estimated Encounter Data Completeness for Hybrid Measures—Harmony
Performance Measure Percentage of Numerator Positive Cases
Determined by Administrative Data
2016 2017
Preventive Care
Adult BMI Assessment Adult BMI Assessment 47.72%R 61.01%
Child & Adolescent Care
Childhood Immunization Status Combination 2 91.83%G 94.04%G
Combination 3 90.79%G 93.13%G
Weight Assessment and Counseling for Nutrition and Physical Activity for Children/Adolescents BMI Percentile—Total 48.46%R 49.52%R
Counseling for Nutrition—Total 38.75%R 42.86%R
Counseling for Physical Activity—Total 28.06%R 32.17%R
Well-Child Visits in the First 15 Months of Life Six or More Well-Child Visits 77.21%G 84.21%G
Well-Child Visits in the Third, Fourth, Fifth, and Sixth Years of Life Well-Child Visits in the Third, Fourth, Fifth, and Sixth Years of Life 93.23%G 94.72%G
Women's Health
Cervical Cancer Screening Cervical Cancer Screening 89.24%G 90.51%G
Prenatal and Postpartum Care Timeliness of Prenatal Care 91.47%G 94.46%G
Postpartum Care 87.70%G 90.72%G
Appropriate Care
Comprehensive Diabetes Care HbA1c Testing 92.18%G 90.09%G
Eye Exam (Retinal) Performed 87.82%G 74.85%
Medical Attention for Nephropathy 98.44%G 97.25%G
Note: Rates with more than 75 percent data completeness are highlighted in green; rates with less than 50 percent data completeness are highlighted in red. Gray cells indicate that the HEDIS 2016 rate was either not reported, or was reported administratively.
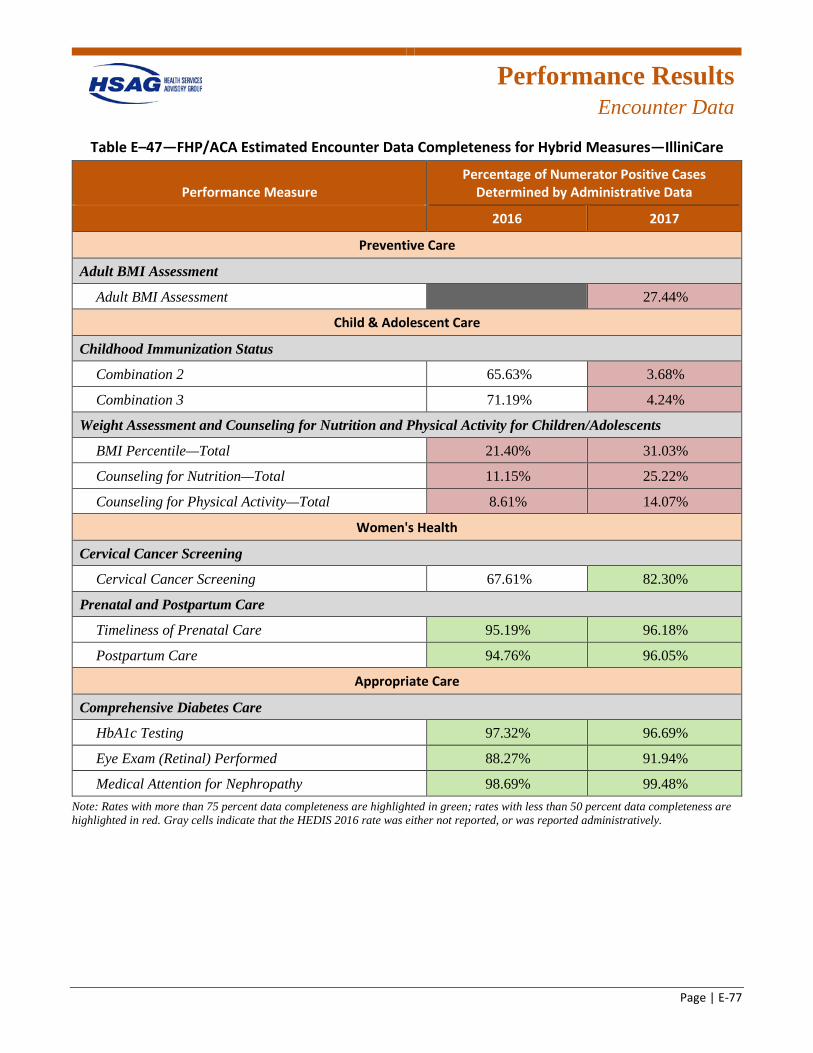
Performance Results
Encounter Data
Page | E-77
Table E–47—FHP/ACA Estimated Encounter Data Completeness for Hybrid Measures—IlliniCare
Performance Measure Percentage of Numerator Positive Cases
Determined by Administrative Data
2016 2017
Preventive Care
Adult BMI Assessment
Adult BMI Assessment GREY 27.44%R
Child & Adolescent Care
Childhood Immunization Status
Combination 2 65.63% 3.68%R
Combination 3 71.19% 4.24%R
Weight Assessment and Counseling for Nutrition and Physical Activity for Children/Adolescents
BMI Percentile—Total 21.40%R 31.03%R
Counseling for Nutrition—Total 11.15%R 25.22%R
Counseling for Physical Activity—Total 8.61%R 14.07%R
Women's Health
Cervical Cancer Screening
Cervical Cancer Screening 67.61% 82.30%G
Prenatal and Postpartum Care
Timeliness of Prenatal Care 95.19%G 96.18%G
Postpartum Care 94.76%G 96.05%G
Appropriate Care
Comprehensive Diabetes Care
HbA1c Testing 97.32%G 96.69%G
Eye Exam (Retinal) Performed 88.27%G 91.94%G
Medical Attention for Nephropathy 98.69%G 99.48%G
Note: Rates with more than 75 percent data completeness are highlighted in green; rates with less than 50 percent data completeness are highlighted in red. Gray cells indicate that the HEDIS 2016 rate was either not reported, or was reported administratively.

Performance Results
Encounter Data
Page | E-78
Table E–48—FHP/ACA Estimated Encounter Data Completeness for Hybrid Measures—Meridian
Performance Measure Percentage of Numerator Positive Cases
Determined by Administrative Data
2016 2017
Preventive Care
Adult BMI Assessment Adult BMI Assessment GREY 33.16%R
Child & Adolescent Care
Childhood Immunization Status Combination 2 GREY 95.38%G
Combination 3 GREY 95.63%G
Weight Assessment and Counseling for Nutrition and Physical Activity for Children/Adolescents BMI Percentile—Total GREY 37.17%R
Counseling for Nutrition—Total GREY 30.58%R
Counseling for Physical Activity—Total GREY 17.43%R
Well-Child Visits in the First 15 Months of Life Six or More Well-Child Visits GREY 97.37%G
Well-Child Visits in the Third, Fourth, Fifth, and Sixth Years of Life Well-Child Visits in the Third, Fourth, Fifth, and Sixth Years of Life
GREY 98.04%G
Women's Health
Cervical Cancer Screening Cervical Cancer Screening GREY 97.62%G
Prenatal and Postpartum Care Timeliness of Prenatal Care GREY 98.73%G
Postpartum Care GREY 94.50%G
Appropriate Care
Comprehensive Diabetes Care HbA1c Testing GREY 99.83%G
Eye Exam (Retinal) Performed GREY 97.74%G
Medical Attention for Nephropathy GREY 99.66%G
Note: Rates with more than 75 percent data completeness are highlighted in green; rates with less than 50 percent data completeness are highlighted in red. Gray cells indicate that the HEDIS 2016 rate was either not reported, or was reported administratively.
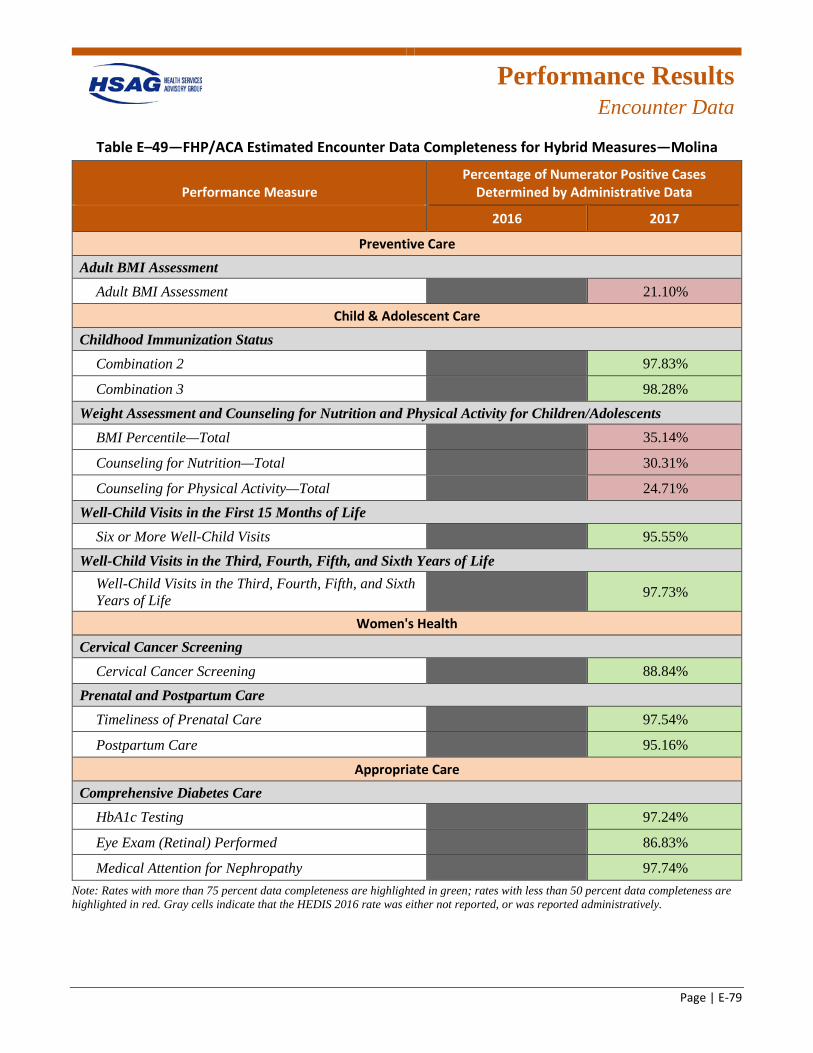
Performance Results
Encounter Data
Page | E-79
Table E–49—FHP/ACA Estimated Encounter Data Completeness for Hybrid Measures—Molina
Performance Measure Percentage of Numerator Positive Cases
Determined by Administrative Data
2016 2017
Preventive Care
Adult BMI Assessment Adult BMI Assessment GREY 21.10%R
Child & Adolescent Care
Childhood Immunization Status Combination 2 GREY 97.83%G
Combination 3 GREY 98.28%G
Weight Assessment and Counseling for Nutrition and Physical Activity for Children/Adolescents BMI Percentile—Total GREY 35.14%R
Counseling for Nutrition—Total GREY 30.31%R
Counseling for Physical Activity—Total GREY 24.71%R
Well-Child Visits in the First 15 Months of Life Six or More Well-Child Visits GREY 95.55%G
Well-Child Visits in the Third, Fourth, Fifth, and Sixth Years of Life Well-Child Visits in the Third, Fourth, Fifth, and Sixth Years of Life
GREY 97.73%G
Women's Health
Cervical Cancer Screening Cervical Cancer Screening GREY 88.84%G
Prenatal and Postpartum Care Timeliness of Prenatal Care GREY 97.54%G
Postpartum Care GREY 95.16%G
Appropriate Care
Comprehensive Diabetes Care HbA1c Testing GREY 97.24%G
Eye Exam (Retinal) Performed GREY 86.83%G
Medical Attention for Nephropathy GREY 97.74%G
Note: Rates with more than 75 percent data completeness are highlighted in green; rates with less than 50 percent data completeness are highlighted in red. Gray cells indicate that the HEDIS 2016 rate was either not reported, or was reported administratively.
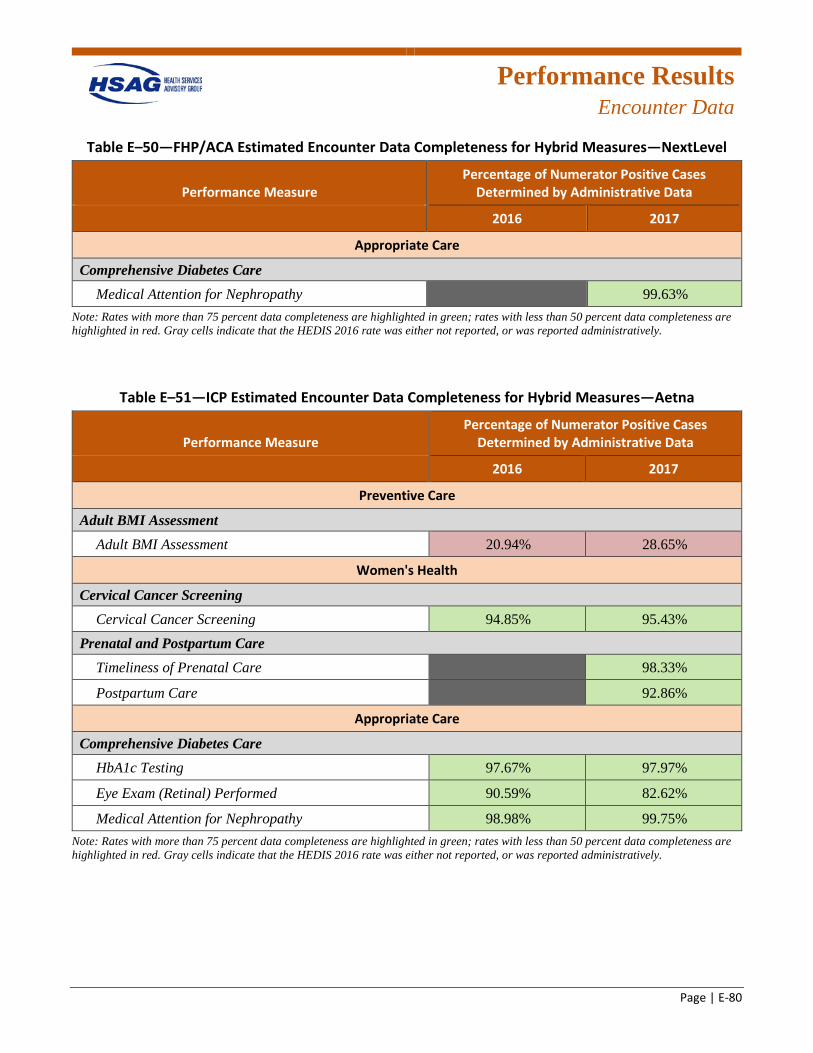
Performance Results
Encounter Data
Page | E-80
Table E–50—FHP/ACA Estimated Encounter Data Completeness for Hybrid Measures—NextLevel
Performance Measure Percentage of Numerator Positive Cases
Determined by Administrative Data
2016 2017
Appropriate Care
Comprehensive Diabetes Care Medical Attention for Nephropathy GREY 99.63%G
Note: Rates with more than 75 percent data completeness are highlighted in green; rates with less than 50 percent data completeness are highlighted in red. Gray cells indicate that the HEDIS 2016 rate was either not reported, or was reported administratively.
Table E–51—ICP Estimated Encounter Data Completeness for Hybrid Measures—Aetna
Performance Measure Percentage of Numerator Positive Cases
Determined by Administrative Data
2016 2017
Preventive Care
Adult BMI Assessment Adult BMI Assessment 20.94%R 28.65%R
Women's Health
Cervical Cancer Screening Cervical Cancer Screening 94.85%G 95.43%G
Prenatal and Postpartum Care Timeliness of Prenatal Care GREY 98.33%G
Postpartum Care GREY 92.86%G
Appropriate Care
Comprehensive Diabetes Care HbA1c Testing 97.67%G 97.97%G
Eye Exam (Retinal) Performed 90.59%G 82.62%G
Medical Attention for Nephropathy 98.98%G 99.75%G
Note: Rates with more than 75 percent data completeness are highlighted in green; rates with less than 50 percent data completeness are highlighted in red. Gray cells indicate that the HEDIS 2016 rate was either not reported, or was reported administratively.
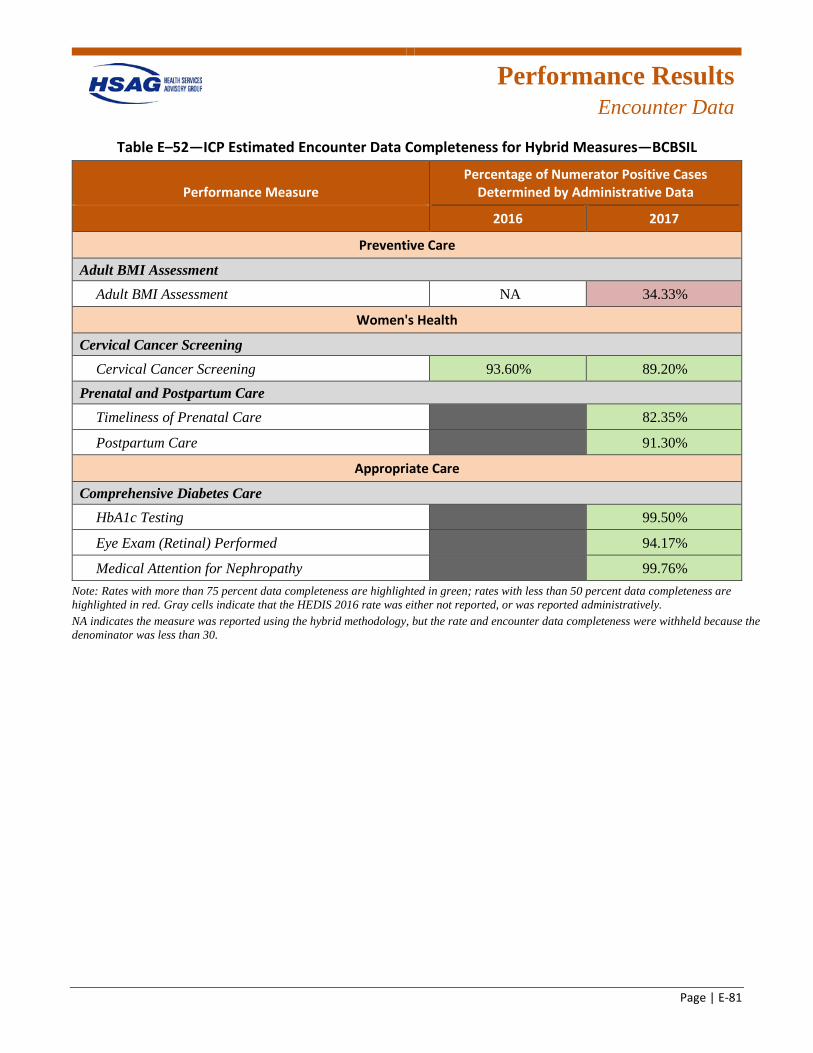
Performance Results
Encounter Data
Page | E-81
Table E–52—ICP Estimated Encounter Data Completeness for Hybrid Measures—BCBSIL
Performance Measure Percentage of Numerator Positive Cases
Determined by Administrative Data
2016 2017
Preventive Care
Adult BMI Assessment Adult BMI Assessment NA 34.33%R
Women's Health
Cervical Cancer Screening Cervical Cancer Screening 93.60%G 89.20%G
Prenatal and Postpartum Care Timeliness of Prenatal Care GREY 82.35%G
Postpartum Care GREY 91.30%G
Appropriate Care
Comprehensive Diabetes Care HbA1c Testing GREY 99.50%G
Eye Exam (Retinal) Performed GREY 94.17%G
Medical Attention for Nephropathy GREY 99.76%G
Note: Rates with more than 75 percent data completeness are highlighted in green; rates with less than 50 percent data completeness are highlighted in red. Gray cells indicate that the HEDIS 2016 rate was either not reported, or was reported administratively. NA indicates the measure was reported using the hybrid methodology, but the rate and encounter data completeness were withheld because the denominator was less than 30.
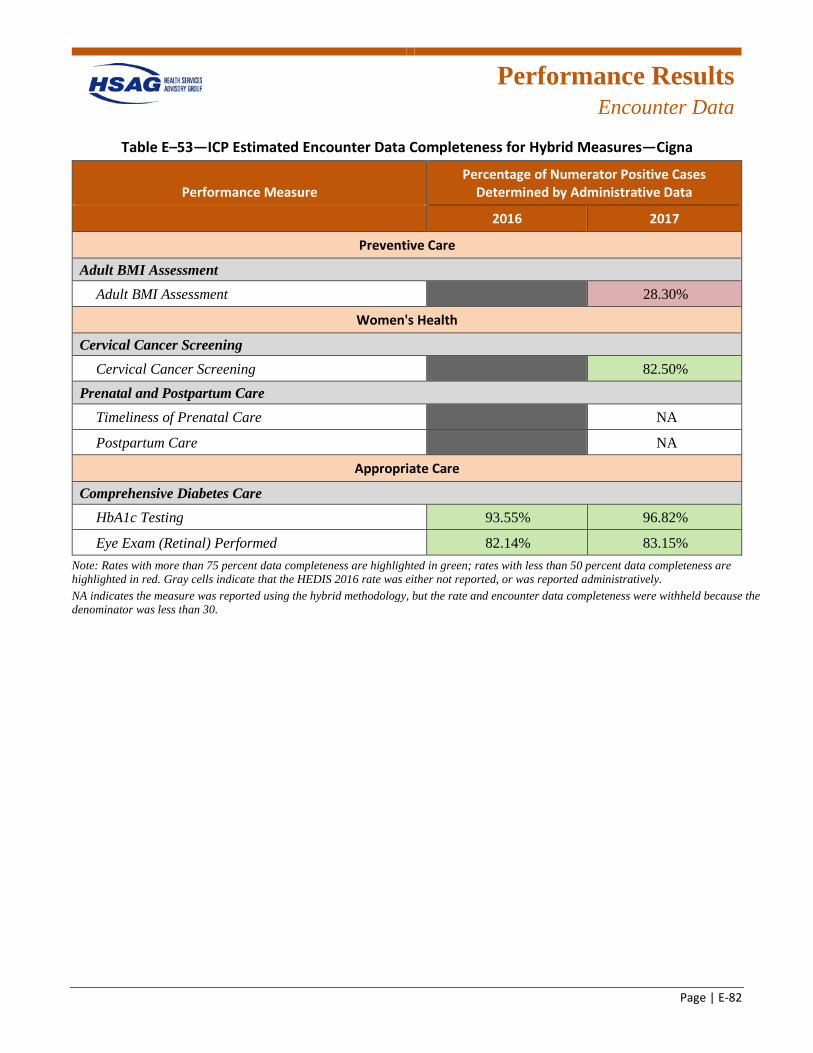
Performance Results
Encounter Data
Page | E-82
Table E–53—ICP Estimated Encounter Data Completeness for Hybrid Measures—Cigna
Performance Measure Percentage of Numerator Positive Cases
Determined by Administrative Data
2016 2017
Preventive Care
Adult BMI Assessment Adult BMI Assessment GREY 28.30%R
Women's Health
Cervical Cancer Screening Cervical Cancer Screening GREY 82.50%G
Prenatal and Postpartum Care Timeliness of Prenatal Care GREY NA
Postpartum Care GREY NA
Appropriate Care
Comprehensive Diabetes Care HbA1c Testing 93.55%G 96.82%G
Eye Exam (Retinal) Performed 82.14%G 83.15%G
Note: Rates with more than 75 percent data completeness are highlighted in green; rates with less than 50 percent data completeness are highlighted in red. Gray cells indicate that the HEDIS 2016 rate was either not reported, or was reported administratively. NA indicates the measure was reported using the hybrid methodology, but the rate and encounter data completeness were withheld because the denominator was less than 30.
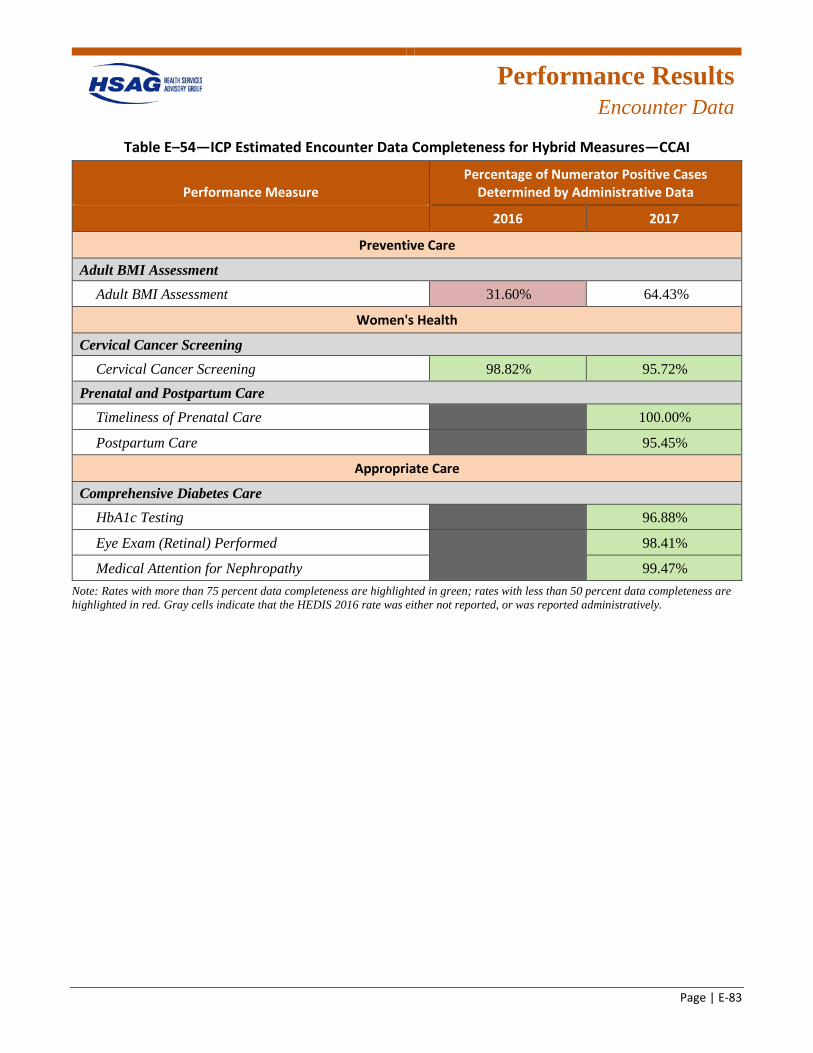
Performance Results
Encounter Data
Page | E-83
Table E–54—ICP Estimated Encounter Data Completeness for Hybrid Measures—CCAI
Performance Measure Percentage of Numerator Positive Cases
Determined by Administrative Data
2016 2017
Preventive Care
Adult BMI Assessment Adult BMI Assessment 31.60%R 64.43%
Women's Health
Cervical Cancer Screening Cervical Cancer Screening 98.82%G 95.72%G
Prenatal and Postpartum Care Timeliness of Prenatal Care GREY 100.00%G
Postpartum Care GREY 95.45%G
Appropriate Care
Comprehensive Diabetes Care HbA1c Testing GREY 96.88%G
Eye Exam (Retinal) Performed GREY 98.41%G
Medical Attention for Nephropathy GREY 99.47%G
Note: Rates with more than 75 percent data completeness are highlighted in green; rates with less than 50 percent data completeness are highlighted in red. Gray cells indicate that the HEDIS 2016 rate was either not reported, or was reported administratively.
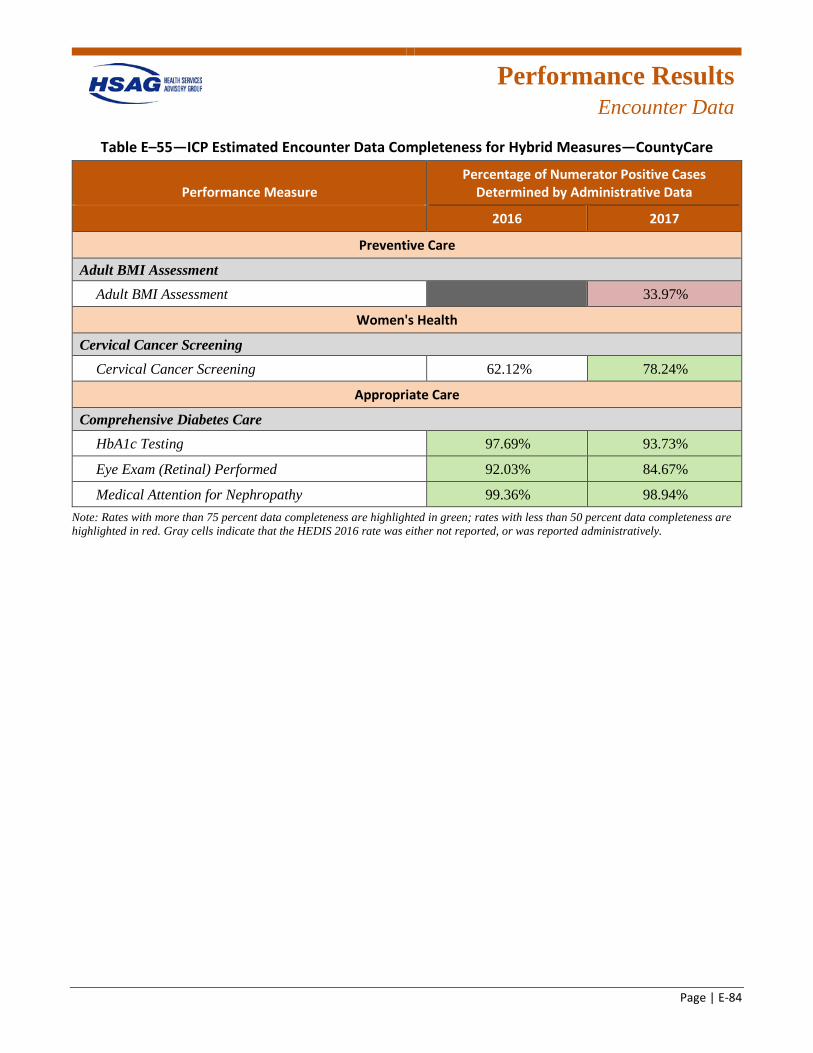
Performance Results
Encounter Data
Page | E-84
Table E–55—ICP Estimated Encounter Data Completeness for Hybrid Measures—CountyCare
Performance Measure Percentage of Numerator Positive Cases
Determined by Administrative Data
2016 2017
Preventive Care
Adult BMI Assessment Adult BMI Assessment GREY 33.97%R
Women's Health
Cervical Cancer Screening Cervical Cancer Screening 62.12% 78.24%G
Appropriate Care
Comprehensive Diabetes Care HbA1c Testing 97.69%G 93.73%G
Eye Exam (Retinal) Performed 92.03%G 84.67%G
Medical Attention for Nephropathy 99.36%G 98.94%G
Note: Rates with more than 75 percent data completeness are highlighted in green; rates with less than 50 percent data completeness are highlighted in red. Gray cells indicate that the HEDIS 2016 rate was either not reported, or was reported administratively.
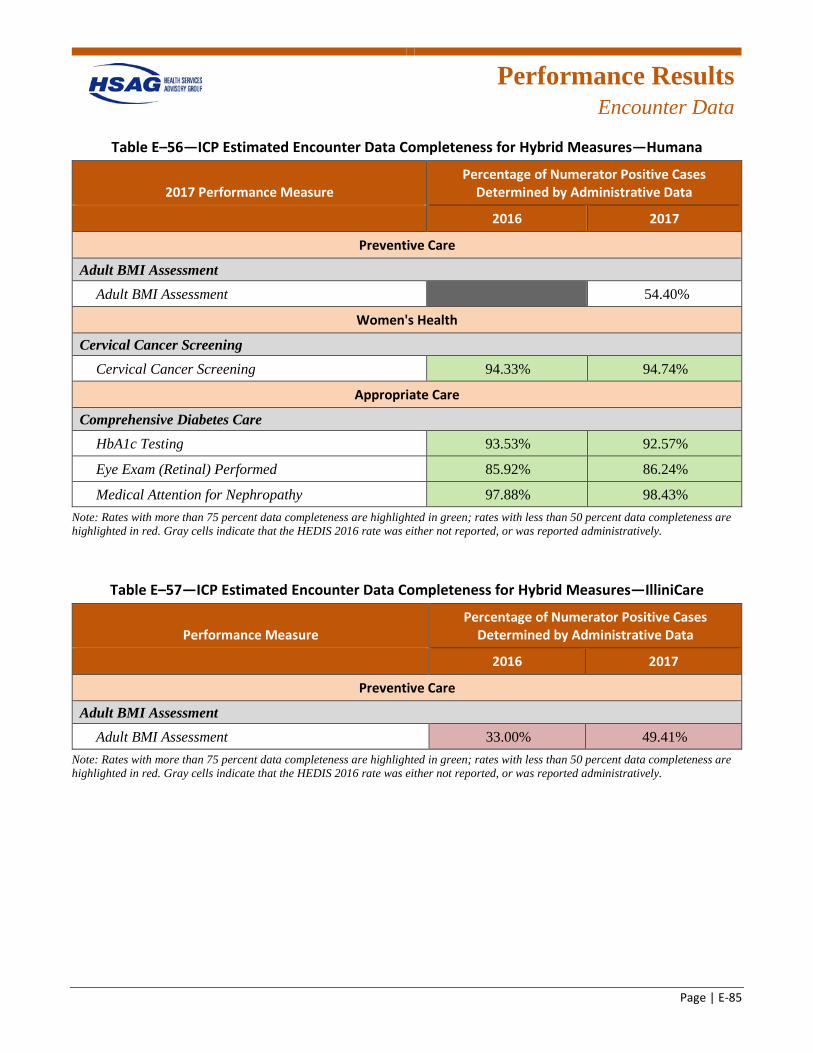
Performance Results
Encounter Data
Page | E-85
Table E–56—ICP Estimated Encounter Data Completeness for Hybrid Measures—Humana
2017 Performance Measure Percentage of Numerator Positive Cases
Determined by Administrative Data
2016 2017
Preventive Care
Adult BMI Assessment Adult BMI Assessment GREY 54.40%
Women's Health
Cervical Cancer Screening Cervical Cancer Screening 94.33%G 94.74%G
Appropriate Care
Comprehensive Diabetes Care HbA1c Testing 93.53%G 92.57%G
Eye Exam (Retinal) Performed 85.92%G 86.24%G
Medical Attention for Nephropathy 97.88%G 98.43%G
Note: Rates with more than 75 percent data completeness are highlighted in green; rates with less than 50 percent data completeness are highlighted in red. Gray cells indicate that the HEDIS 2016 rate was either not reported, or was reported administratively.
Table E–57—ICP Estimated Encounter Data Completeness for Hybrid Measures—IlliniCare
Performance Measure Percentage of Numerator Positive Cases
Determined by Administrative Data
2016 2017
Preventive Care
Adult BMI Assessment Adult BMI Assessment 33.00%R 49.41%R
Note: Rates with more than 75 percent data completeness are highlighted in green; rates with less than 50 percent data completeness are highlighted in red. Gray cells indicate that the HEDIS 2016 rate was either not reported, or was reported administratively.
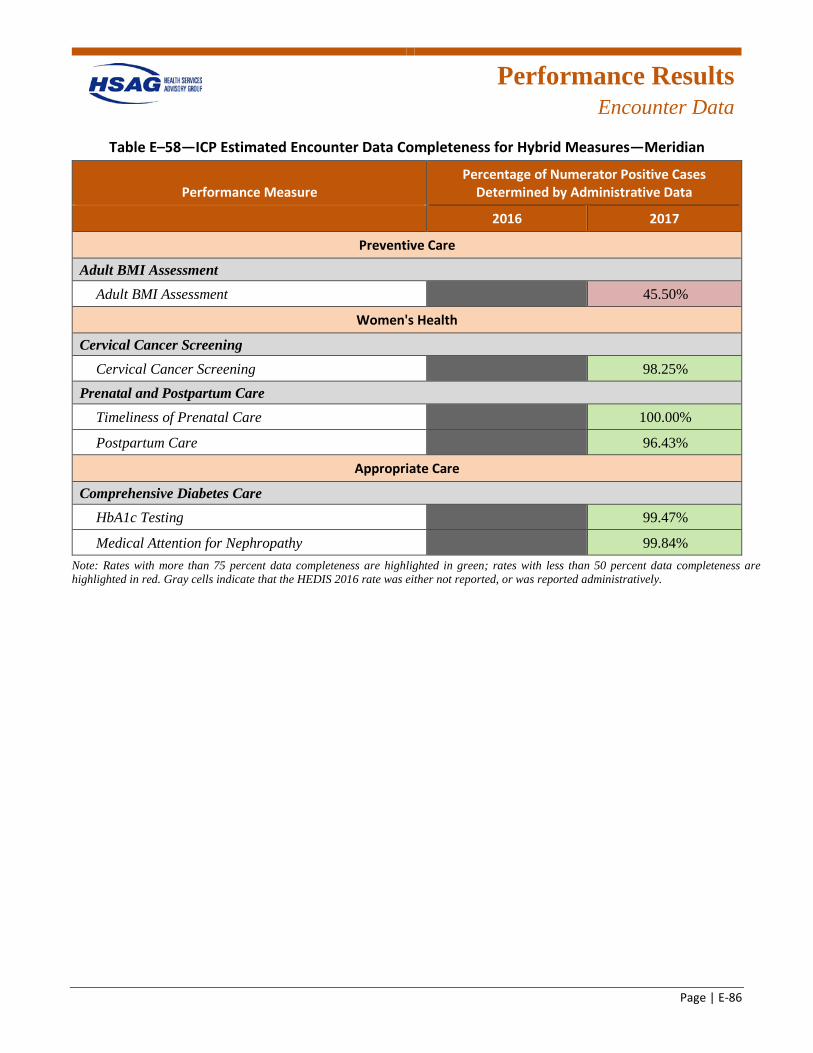
Performance Results
Encounter Data
Page | E-86
Table E–58—ICP Estimated Encounter Data Completeness for Hybrid Measures—Meridian
Performance Measure Percentage of Numerator Positive Cases
Determined by Administrative Data
2016 2017
Preventive Care
Adult BMI Assessment Adult BMI Assessment GREY 45.50%R
Women's Health
Cervical Cancer Screening Cervical Cancer Screening GREY 98.25%G
Prenatal and Postpartum Care Timeliness of Prenatal Care GREY 100.00%G
Postpartum Care GREY 96.43%G
Appropriate Care
Comprehensive Diabetes Care HbA1c Testing GREY 99.47%G
Medical Attention for Nephropathy GREY 99.84%G
Note: Rates with more than 75 percent data completeness are highlighted in green; rates with less than 50 percent data completeness are highlighted in red. Gray cells indicate that the HEDIS 2016 rate was either not reported, or was reported administratively.
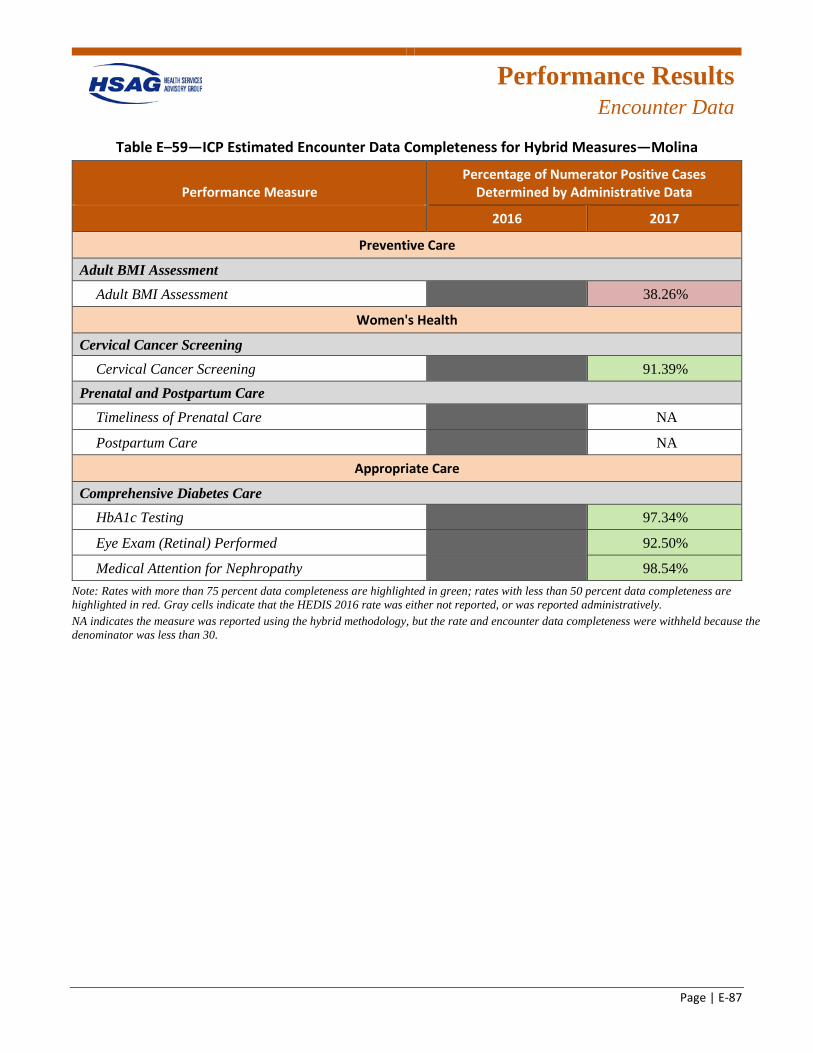
Performance Results
Encounter Data
Page | E-87
Table E–59—ICP Estimated Encounter Data Completeness for Hybrid Measures—Molina
Performance Measure Percentage of Numerator Positive Cases
Determined by Administrative Data
2016 2017
Preventive Care
Adult BMI Assessment Adult BMI Assessment GREY 38.26%R
Women's Health
Cervical Cancer Screening Cervical Cancer Screening GREY 91.39%G
Prenatal and Postpartum Care Timeliness of Prenatal Care GREY NA
Postpartum Care GREY NA
Appropriate Care
Comprehensive Diabetes Care HbA1c Testing GREY 97.34%G
Eye Exam (Retinal) Performed GREY 92.50%G
Medical Attention for Nephropathy GREY 98.54%G
Note: Rates with more than 75 percent data completeness are highlighted in green; rates with less than 50 percent data completeness are highlighted in red. Gray cells indicate that the HEDIS 2016 rate was either not reported, or was reported administratively. NA indicates the measure was reported using the hybrid methodology, but the rate and encounter data completeness were withheld because the denominator was less than 30.
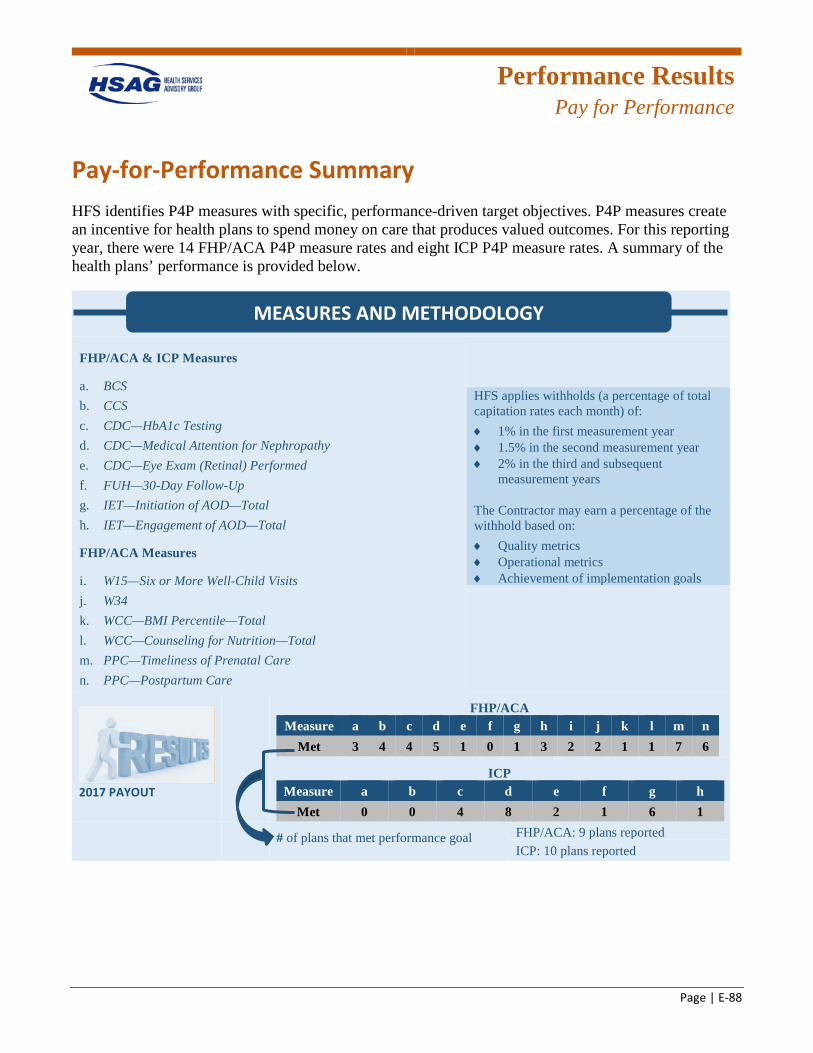
Performance Results
Pay for Performance
Page | E-88
Pay-for-Performance Summary HFS identifies P4P measures with specific, performance-driven target objectives. P4P measures create an incentive for health plans to spend money on care that produces valued outcomes. For this reporting year, there were 14 FHP/ACA P4P measure rates and eight ICP P4P measure rates. A summary of the health plans’ performance is provided below.
FHP/ACA & ICP Measures
a. BCS b. CCS c. CDC—HbA1c Testing d. CDC—Medical Attention for Nephropathy e. CDC—Eye Exam (Retinal) Performed f. FUH—30-Day Follow-Up g. IET—Initiation of AOD—Total h. IET—Engagement of AOD—Total
FHP/ACA Measures
i. W15—Six or More Well-Child Visits j. W34 k. WCC—BMI Percentile—Total l. WCC—Counseling for Nutrition—Total m. PPC—Timeliness of Prenatal Care n. PPC—Postpartum Care
HFS applies withholds (a percentage of total capitation rates each month) of: ♦ 1% in the first measurement year ♦ 1.5% in the second measurement year ♦ 2% in the third and subsequent
measurement years
The Contractor may earn a percentage of the withhold based on: ♦ Quality metrics ♦ Operational metrics ♦ Achievement of implementation goals
2017 PAYOUT
FHP/ACA Measure a b c d e f g h i j k l m n
Met 3 4 4 5 1 0 1 3 2 2 1 1 7 6
ICP Measure a b c d e f g h
Met 0 0 4 8 2 1 6 1
# of plans that met performance goal FHP/ACA: 9 plans reported ICP: 10 plans reported
MEASURES AND METHODOLOGY
Page | F-1
Appendix F. PCCM/CHIPRA Performance Measure Validation Results
Performance Results
PCCM/CHIPRA PMV
Page | F-2
Overview Health Services Advisory Group, Inc. (HSAG), conducted a review of the Primary Care Case Management (PCCM) and the Children’s Health Insurance Program Reauthorization Act (CHIPRA) programs for a select set of performance measures, following the Performance Measure Validation (PMV) protocol outlined by the Centers for Medicare & Medicaid Services (CMS). Using the most recent data available at the time, HSAG evaluated the processes the Illinois Department of Healthcare and Family Services (HFS) used to collect the performance measure data and determined the extent to which the performance measures followed the established specifications. See Appendix B and Appendix C for more details regarding the performance measure validation process.
CY 2015 Performance Measures The calendar year (CY) 2015 performance measures selected by HFS included a combination of the Healthcare Effectiveness Data and Information Set (HEDIS) and non-HEDIS measures. The non-HEDIS measures consisted of Adult Core Set and Child Core Set measures, as well as measures that were defined by HFS. All HEDIS measures, except the Use of Appropriate Medications for People with Asthma (ASM) measure were reviewed for compliance with the HEDIS 2016 technical specifications. Since the ASM measure was retired from the HEDIS measure set for HEDIS 2016, HSAG reviewed this measure for compliance with the HEDIS 2015 technical specifications. The non-HEDIS measures were reviewed for compliance with either the April 2015 Adult Core Set, the March 2015 Child Core Set, or specifications that were provided by HFS. For measures that were both HEDIS and Core Set measures, HSAG reviewed the age stratifications required by both the HEDIS and Core Set specifications.
Although the PCCM and CHIPRA measure sets contained different measures, some measures applied to both populations.
CY 2015 Results Multiple data sources were validated by the auditor to make a determination as to the validity of the data collected by HFS. HSAG determined that the data supported the elements necessary for reporting, and measures were calculated appropriately according to the required measure specifications. As a result, all performance measures audited received an audit designation of Reportable (R). Table F–1 displays the CY 2015 rates for the PCCM and CHIPRA performance measures validated by HSAG.
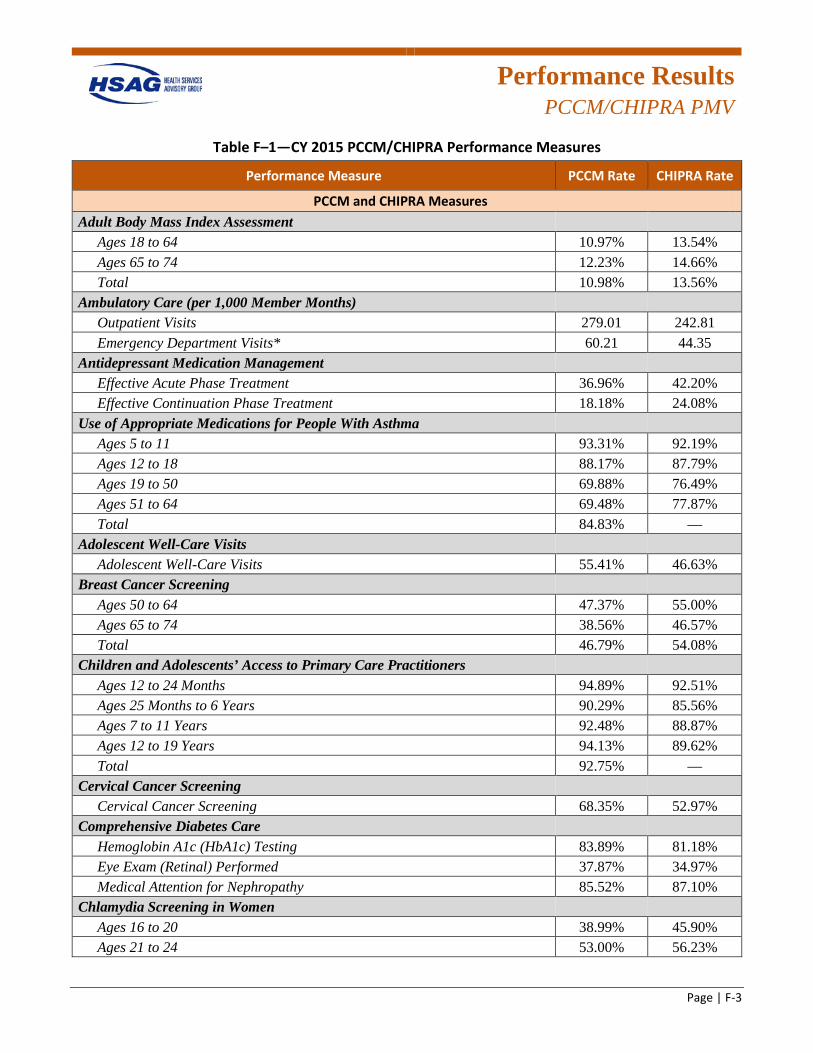
Performance Results
PCCM/CHIPRA PMV
Page | F-3
Table F–1—CY 2015 PCCM/CHIPRA Performance Measures
Performance Measure PCCM Rate CHIPRA Rate
PCCM and CHIPRA Measures Adult Body Mass Index Assessment
Ages 18 to 64 10.97% 13.54% Ages 65 to 74 12.23% 14.66% Total 10.98% 13.56%
Ambulatory Care (per 1,000 Member Months) Outpatient Visits 279.01 242.81 Emergency Department Visits* 60.21 44.35
Antidepressant Medication Management Effective Acute Phase Treatment 36.96% 42.20% Effective Continuation Phase Treatment 18.18% 24.08%
Use of Appropriate Medications for People With Asthma Ages 5 to 11 93.31% 92.19% Ages 12 to 18 88.17% 87.79% Ages 19 to 50 69.88% 76.49% Ages 51 to 64 69.48% 77.87% Total 84.83% —
Adolescent Well-Care Visits Adolescent Well-Care Visits 55.41% 46.63%
Breast Cancer Screening Ages 50 to 64 47.37% 55.00% Ages 65 to 74 38.56% 46.57% Total 46.79% 54.08%
Children and Adolescents’ Access to Primary Care Practitioners Ages 12 to 24 Months 94.89% 92.51% Ages 25 Months to 6 Years 90.29% 85.56% Ages 7 to 11 Years 92.48% 88.87% Ages 12 to 19 Years 94.13% 89.62% Total 92.75% —
Cervical Cancer Screening Cervical Cancer Screening 68.35% 52.97%
Comprehensive Diabetes Care Hemoglobin A1c (HbA1c) Testing 83.89% 81.18% Eye Exam (Retinal) Performed 37.87% 34.97% Medical Attention for Nephropathy 85.52% 87.10%
Chlamydia Screening in Women Ages 16 to 20 38.99% 45.90% Ages 21 to 24 53.00% 56.23%
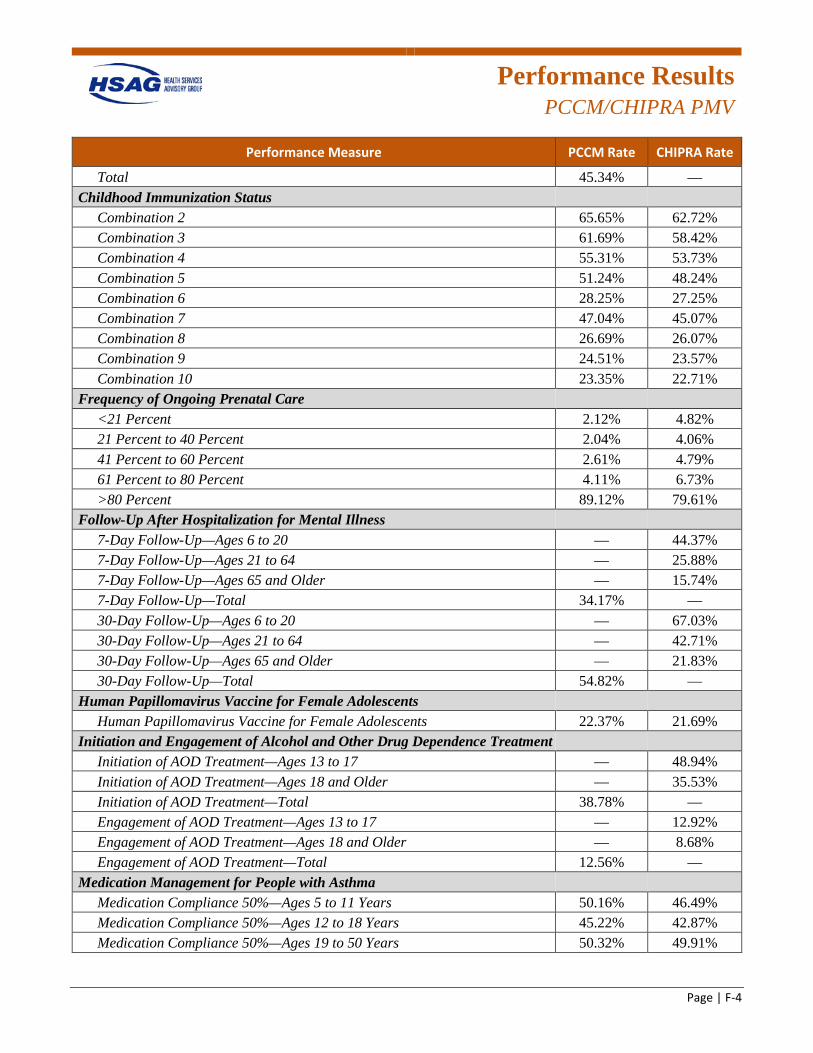
Performance Results
PCCM/CHIPRA PMV
Page | F-4
Performance Measure PCCM Rate CHIPRA Rate
Total 45.34% — Childhood Immunization Status
Combination 2 65.65% 62.72% Combination 3 61.69% 58.42% Combination 4 55.31% 53.73% Combination 5 51.24% 48.24% Combination 6 28.25% 27.25% Combination 7 47.04% 45.07% Combination 8 26.69% 26.07% Combination 9 24.51% 23.57% Combination 10 23.35% 22.71%
Frequency of Ongoing Prenatal Care <21 Percent 2.12% 4.82% 21 Percent to 40 Percent 2.04% 4.06% 41 Percent to 60 Percent 2.61% 4.79% 61 Percent to 80 Percent 4.11% 6.73% >80 Percent 89.12% 79.61%
Follow-Up After Hospitalization for Mental Illness 7-Day Follow-Up—Ages 6 to 20 — 44.37% 7-Day Follow-Up—Ages 21 to 64 — 25.88% 7-Day Follow-Up—Ages 65 and Older — 15.74% 7-Day Follow-Up—Total 34.17% — 30-Day Follow-Up—Ages 6 to 20 — 67.03% 30-Day Follow-Up—Ages 21 to 64 — 42.71% 30-Day Follow-Up—Ages 65 and Older — 21.83% 30-Day Follow-Up—Total 54.82% —
Human Papillomavirus Vaccine for Female Adolescents Human Papillomavirus Vaccine for Female Adolescents 22.37% 21.69%
Initiation and Engagement of Alcohol and Other Drug Dependence Treatment Initiation of AOD Treatment—Ages 13 to 17 — 48.94% Initiation of AOD Treatment—Ages 18 and Older — 35.53% Initiation of AOD Treatment—Total 38.78% — Engagement of AOD Treatment—Ages 13 to 17 — 12.92% Engagement of AOD Treatment—Ages 18 and Older — 8.68% Engagement of AOD Treatment—Total 12.56% —
Medication Management for People with Asthma Medication Compliance 50%—Ages 5 to 11 Years 50.16% 46.49% Medication Compliance 50%—Ages 12 to 18 Years 45.22% 42.87% Medication Compliance 50%—Ages 19 to 50 Years 50.32% 49.91%
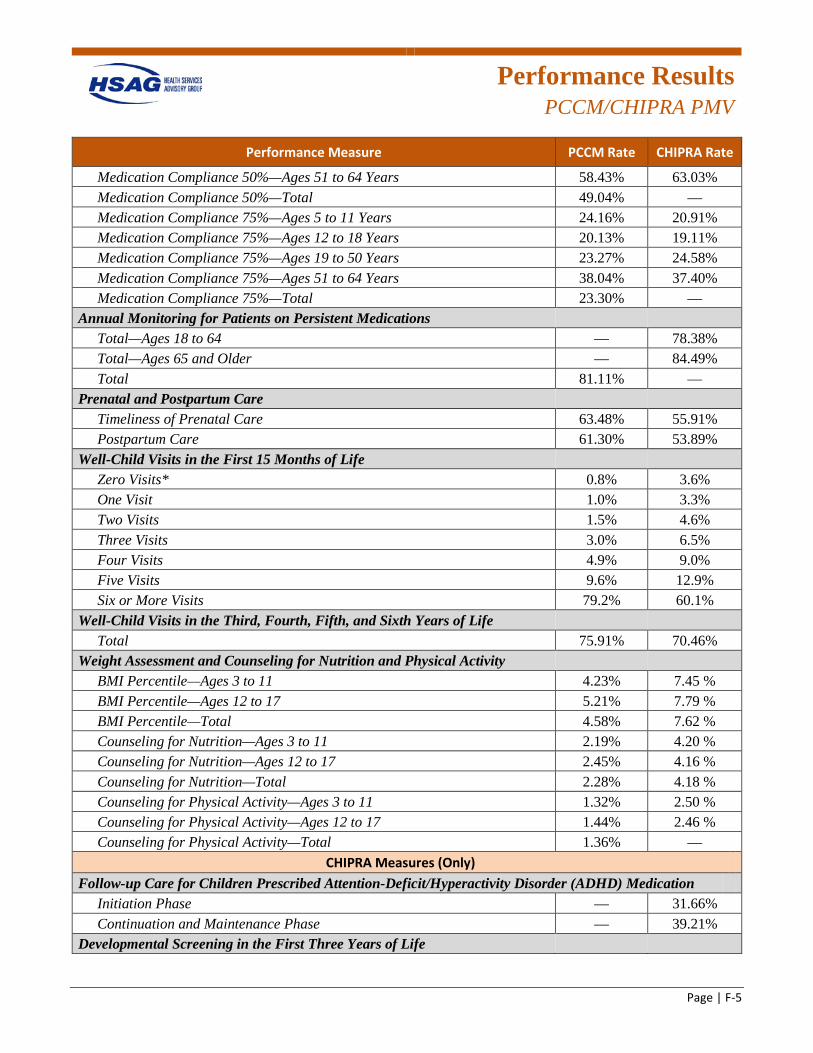
Performance Results
PCCM/CHIPRA PMV
Page | F-5
Performance Measure PCCM Rate CHIPRA Rate
Medication Compliance 50%—Ages 51 to 64 Years 58.43% 63.03% Medication Compliance 50%—Total 49.04% — Medication Compliance 75%—Ages 5 to 11 Years 24.16% 20.91% Medication Compliance 75%—Ages 12 to 18 Years 20.13% 19.11% Medication Compliance 75%—Ages 19 to 50 Years 23.27% 24.58% Medication Compliance 75%—Ages 51 to 64 Years 38.04% 37.40% Medication Compliance 75%—Total 23.30% —
Annual Monitoring for Patients on Persistent Medications Total—Ages 18 to 64 — 78.38% Total—Ages 65 and Older — 84.49% Total 81.11% —
Prenatal and Postpartum Care Timeliness of Prenatal Care 63.48% 55.91% Postpartum Care 61.30% 53.89%
Well-Child Visits in the First 15 Months of Life Zero Visits* 0.8% 3.6% One Visit 1.0% 3.3% Two Visits 1.5% 4.6% Three Visits 3.0% 6.5% Four Visits 4.9% 9.0% Five Visits 9.6% 12.9% Six or More Visits 79.2% 60.1%
Well-Child Visits in the Third, Fourth, Fifth, and Sixth Years of Life Total 75.91% 70.46%
Weight Assessment and Counseling for Nutrition and Physical Activity BMI Percentile—Ages 3 to 11 4.23% 7.45 % BMI Percentile—Ages 12 to 17 5.21% 7.79 % BMI Percentile—Total 4.58% 7.62 % Counseling for Nutrition—Ages 3 to 11 2.19% 4.20 % Counseling for Nutrition—Ages 12 to 17 2.45% 4.16 % Counseling for Nutrition—Total 2.28% 4.18 % Counseling for Physical Activity—Ages 3 to 11 1.32% 2.50 % Counseling for Physical Activity—Ages 12 to 17 1.44% 2.46 % Counseling for Physical Activity—Total 1.36% —
CHIPRA Measures (Only) Follow-up Care for Children Prescribed Attention-Deficit/Hyperactivity Disorder (ADHD) Medication
Initiation Phase — 31.66% Continuation and Maintenance Phase — 39.21%
Developmental Screening in the First Three Years of Life
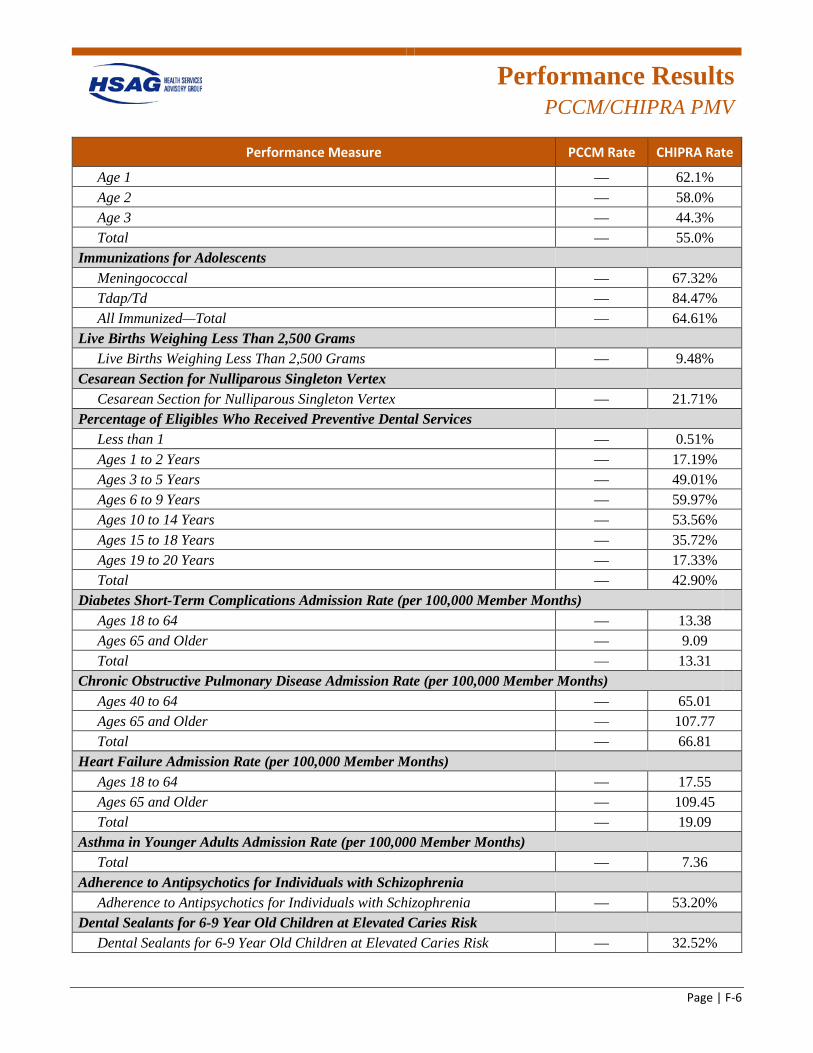
Performance Results
PCCM/CHIPRA PMV
Page | F-6
Performance Measure PCCM Rate CHIPRA Rate
Age 1 — 62.1% Age 2 — 58.0% Age 3 — 44.3% Total — 55.0%
Immunizations for Adolescents Meningococcal — 67.32% Tdap/Td — 84.47% All Immunized—Total — 64.61%
Live Births Weighing Less Than 2,500 Grams Live Births Weighing Less Than 2,500 Grams — 9.48%
Cesarean Section for Nulliparous Singleton Vertex Cesarean Section for Nulliparous Singleton Vertex — 21.71%
Percentage of Eligibles Who Received Preventive Dental Services Less than 1 — 0.51% Ages 1 to 2 Years — 17.19% Ages 3 to 5 Years — 49.01% Ages 6 to 9 Years — 59.97% Ages 10 to 14 Years — 53.56% Ages 15 to 18 Years — 35.72% Ages 19 to 20 Years — 17.33% Total — 42.90%
Diabetes Short-Term Complications Admission Rate (per 100,000 Member Months) Ages 18 to 64 — 13.38 Ages 65 and Older — 9.09 Total — 13.31
Chronic Obstructive Pulmonary Disease Admission Rate (per 100,000 Member Months) Ages 40 to 64 — 65.01 Ages 65 and Older — 107.77 Total — 66.81
Heart Failure Admission Rate (per 100,000 Member Months) Ages 18 to 64 — 17.55 Ages 65 and Older — 109.45 Total — 19.09
Asthma in Younger Adults Admission Rate (per 100,000 Member Months) Total — 7.36
Adherence to Antipsychotics for Individuals with Schizophrenia Adherence to Antipsychotics for Individuals with Schizophrenia — 53.20%
Dental Sealants for 6-9 Year Old Children at Elevated Caries Risk Dental Sealants for 6-9 Year Old Children at Elevated Caries Risk — 32.52%
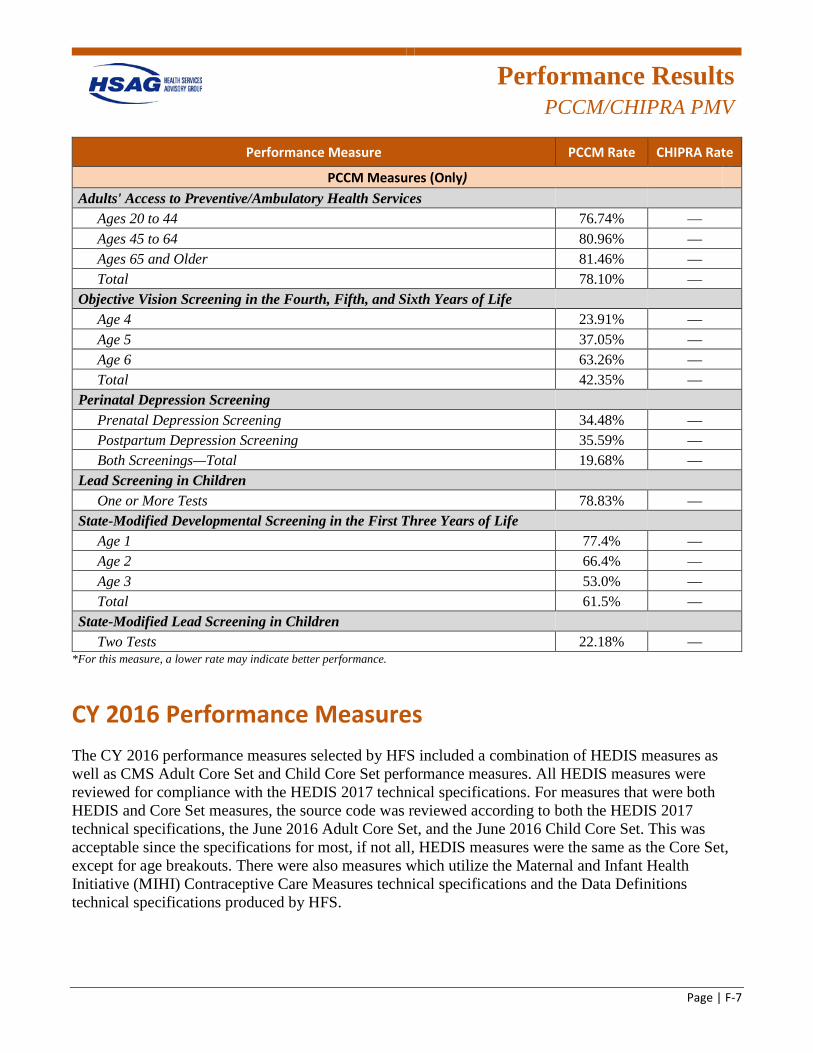
Performance Results
PCCM/CHIPRA PMV
Page | F-7
Performance Measure PCCM Rate CHIPRA Rate
PCCM Measures (Only) Adults' Access to Preventive/Ambulatory Health Services
Ages 20 to 44 76.74% — Ages 45 to 64 80.96% — Ages 65 and Older 81.46% — Total 78.10% —
Objective Vision Screening in the Fourth, Fifth, and Sixth Years of Life Age 4 23.91% — Age 5 37.05% — Age 6 63.26% — Total 42.35% —
Perinatal Depression Screening Prenatal Depression Screening 34.48% — Postpartum Depression Screening 35.59% — Both Screenings—Total 19.68% —
Lead Screening in Children One or More Tests 78.83% —
State-Modified Developmental Screening in the First Three Years of Life Age 1 77.4% — Age 2 66.4% — Age 3 53.0% — Total 61.5% —
State-Modified Lead Screening in Children Two Tests 22.18% —
*For this measure, a lower rate may indicate better performance.
CY 2016 Performance Measures The CY 2016 performance measures selected by HFS included a combination of HEDIS measures as well as CMS Adult Core Set and Child Core Set performance measures. All HEDIS measures were reviewed for compliance with the HEDIS 2017 technical specifications. For measures that were both HEDIS and Core Set measures, the source code was reviewed according to both the HEDIS 2017 technical specifications, the June 2016 Adult Core Set, and the June 2016 Child Core Set. This was acceptable since the specifications for most, if not all, HEDIS measures were the same as the Core Set, except for age breakouts. There were also measures which utilize the Maternal and Infant Health Initiative (MIHI) Contraceptive Care Measures technical specifications and the Data Definitions technical specifications produced by HFS.
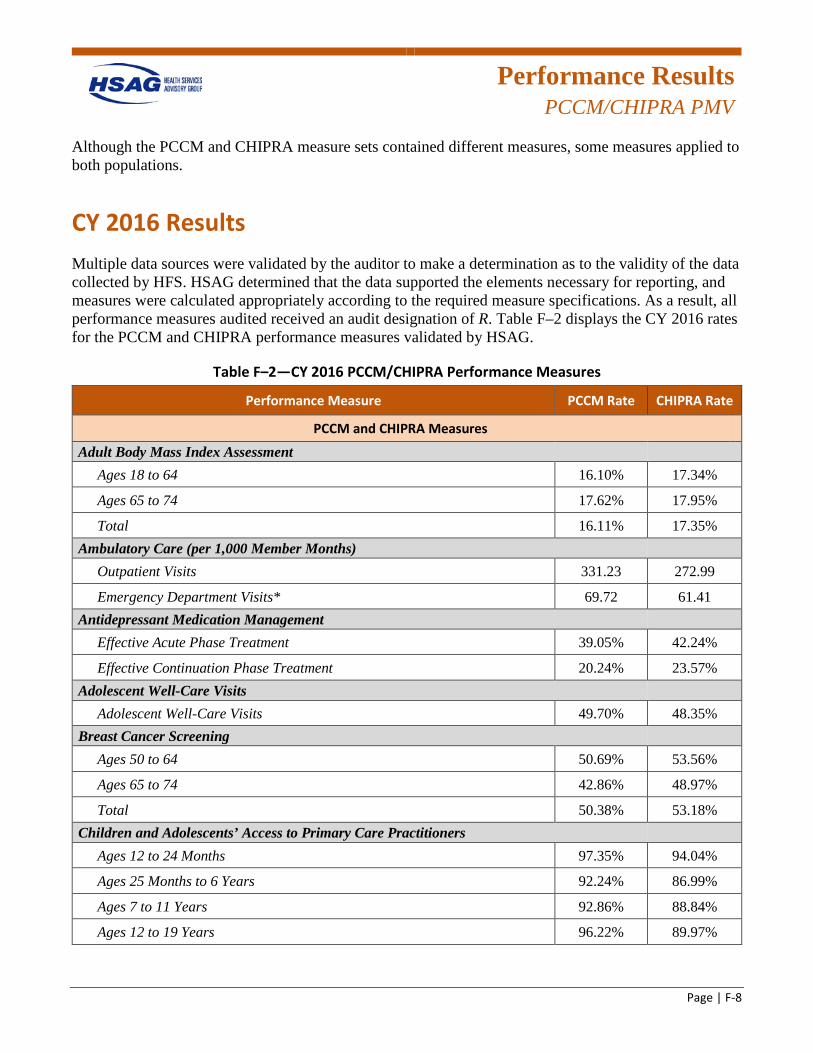
Performance Results
PCCM/CHIPRA PMV
Page | F-8
Although the PCCM and CHIPRA measure sets contained different measures, some measures applied to both populations.
CY 2016 Results Multiple data sources were validated by the auditor to make a determination as to the validity of the data collected by HFS. HSAG determined that the data supported the elements necessary for reporting, and measures were calculated appropriately according to the required measure specifications. As a result, all performance measures audited received an audit designation of R. Table F–2 displays the CY 2016 rates for the PCCM and CHIPRA performance measures validated by HSAG.
Table F–2—CY 2016 PCCM/CHIPRA Performance Measures
Performance Measure PCCM Rate CHIPRA Rate
PCCM and CHIPRA Measures Adult Body Mass Index Assessment
Ages 18 to 64 16.10% 17.34%
Ages 65 to 74 17.62% 17.95%
Total 16.11% 17.35% Ambulatory Care (per 1,000 Member Months)
Outpatient Visits 331.23 272.99
Emergency Department Visits* 69.72 61.41 Antidepressant Medication Management
Effective Acute Phase Treatment 39.05% 42.24%
Effective Continuation Phase Treatment 20.24% 23.57% Adolescent Well-Care Visits
Adolescent Well-Care Visits 49.70% 48.35% Breast Cancer Screening
Ages 50 to 64 50.69% 53.56%
Ages 65 to 74 42.86% 48.97%
Total 50.38% 53.18% Children and Adolescents’ Access to Primary Care Practitioners
Ages 12 to 24 Months 97.35% 94.04%
Ages 25 Months to 6 Years 92.24% 86.99%
Ages 7 to 11 Years 92.86% 88.84%
Ages 12 to 19 Years 96.22% 89.97%
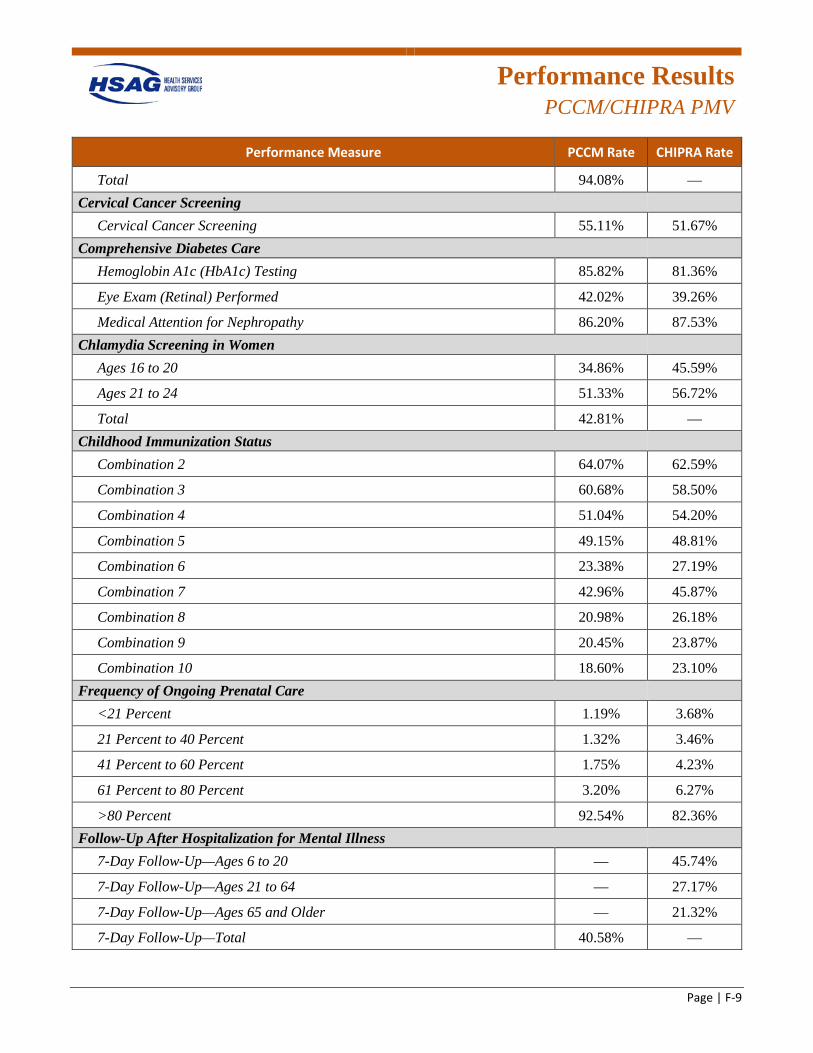
Performance Results
PCCM/CHIPRA PMV
Page | F-9
Performance Measure PCCM Rate CHIPRA Rate
Total 94.08% — Cervical Cancer Screening
Cervical Cancer Screening 55.11% 51.67% Comprehensive Diabetes Care
Hemoglobin A1c (HbA1c) Testing 85.82% 81.36%
Eye Exam (Retinal) Performed 42.02% 39.26%
Medical Attention for Nephropathy 86.20% 87.53% Chlamydia Screening in Women
Ages 16 to 20 34.86% 45.59%
Ages 21 to 24 51.33% 56.72%
Total 42.81% — Childhood Immunization Status
Combination 2 64.07% 62.59%
Combination 3 60.68% 58.50%
Combination 4 51.04% 54.20%
Combination 5 49.15% 48.81%
Combination 6 23.38% 27.19%
Combination 7 42.96% 45.87%
Combination 8 20.98% 26.18%
Combination 9 20.45% 23.87%
Combination 10 18.60% 23.10% Frequency of Ongoing Prenatal Care
<21 Percent 1.19% 3.68%
21 Percent to 40 Percent 1.32% 3.46%
41 Percent to 60 Percent 1.75% 4.23%
61 Percent to 80 Percent 3.20% 6.27%
>80 Percent 92.54% 82.36% Follow-Up After Hospitalization for Mental Illness
7-Day Follow-Up—Ages 6 to 20 — 45.74%
7-Day Follow-Up—Ages 21 to 64 — 27.17%
7-Day Follow-Up—Ages 65 and Older — 21.32%
7-Day Follow-Up—Total 40.58% —
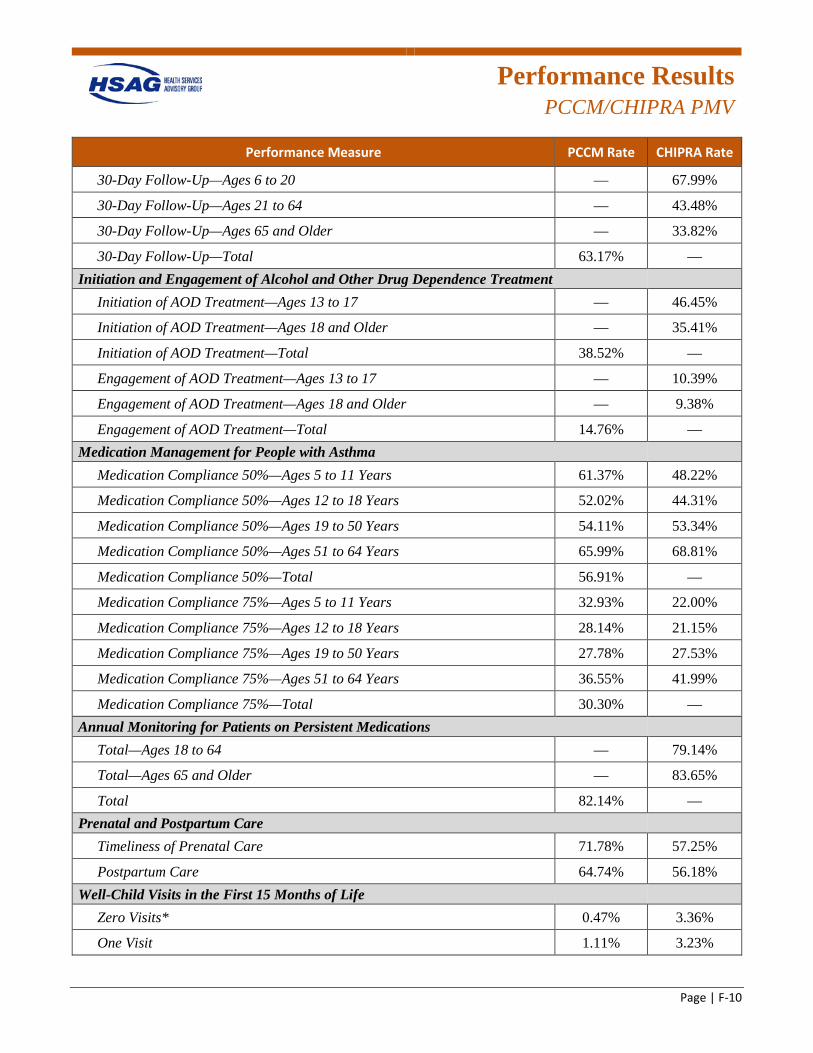
Performance Results
PCCM/CHIPRA PMV
Page | F-10
Performance Measure PCCM Rate CHIPRA Rate
30-Day Follow-Up—Ages 6 to 20 — 67.99%
30-Day Follow-Up—Ages 21 to 64 — 43.48%
30-Day Follow-Up—Ages 65 and Older — 33.82%
30-Day Follow-Up—Total 63.17% — Initiation and Engagement of Alcohol and Other Drug Dependence Treatment
Initiation of AOD Treatment—Ages 13 to 17 — 46.45%
Initiation of AOD Treatment—Ages 18 and Older — 35.41%
Initiation of AOD Treatment—Total 38.52% —
Engagement of AOD Treatment—Ages 13 to 17 — 10.39%
Engagement of AOD Treatment—Ages 18 and Older — 9.38%
Engagement of AOD Treatment—Total 14.76% — Medication Management for People with Asthma
Medication Compliance 50%—Ages 5 to 11 Years 61.37% 48.22%
Medication Compliance 50%—Ages 12 to 18 Years 52.02% 44.31%
Medication Compliance 50%—Ages 19 to 50 Years 54.11% 53.34%
Medication Compliance 50%—Ages 51 to 64 Years 65.99% 68.81%
Medication Compliance 50%—Total 56.91% —
Medication Compliance 75%—Ages 5 to 11 Years 32.93% 22.00%
Medication Compliance 75%—Ages 12 to 18 Years 28.14% 21.15%
Medication Compliance 75%—Ages 19 to 50 Years 27.78% 27.53%
Medication Compliance 75%—Ages 51 to 64 Years 36.55% 41.99%
Medication Compliance 75%—Total 30.30% — Annual Monitoring for Patients on Persistent Medications
Total—Ages 18 to 64 — 79.14%
Total—Ages 65 and Older — 83.65%
Total 82.14% — Prenatal and Postpartum Care
Timeliness of Prenatal Care 71.78% 57.25%
Postpartum Care 64.74% 56.18% Well-Child Visits in the First 15 Months of Life
Zero Visits* 0.47% 3.36%
One Visit 1.11% 3.23%
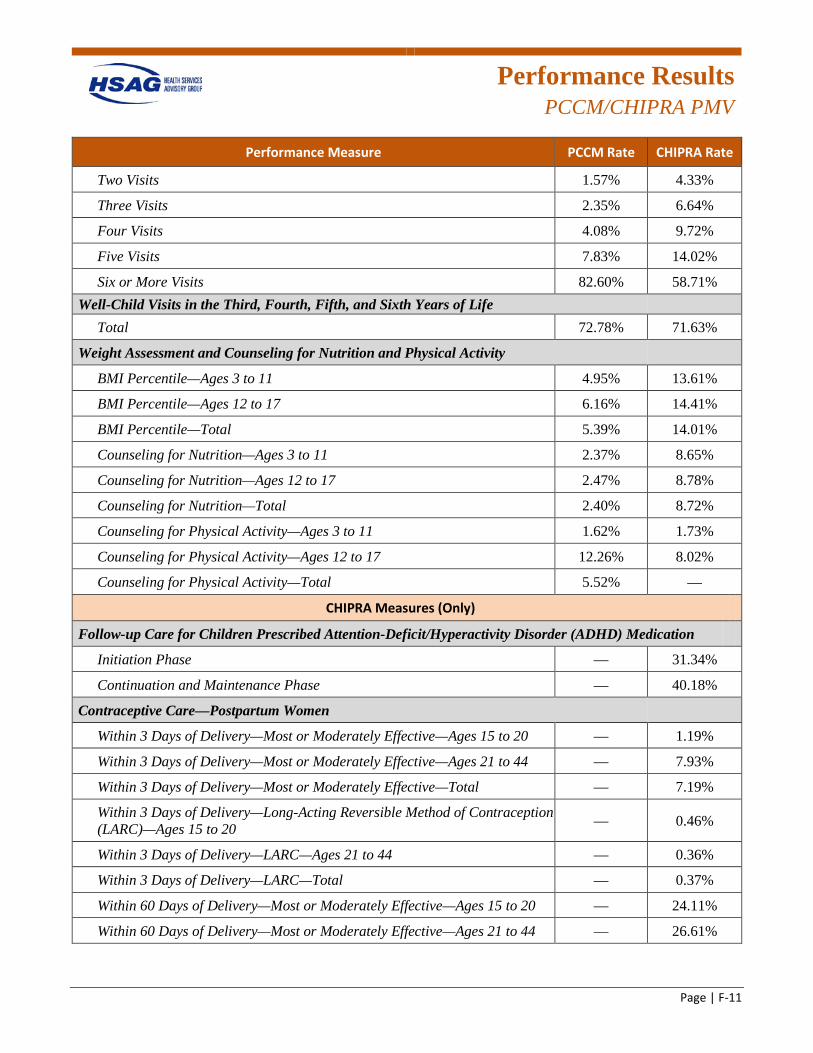
Performance Results
PCCM/CHIPRA PMV
Page | F-11
Performance Measure PCCM Rate CHIPRA Rate
Two Visits 1.57% 4.33%
Three Visits 2.35% 6.64%
Four Visits 4.08% 9.72%
Five Visits 7.83% 14.02%
Six or More Visits 82.60% 58.71% Well-Child Visits in the Third, Fourth, Fifth, and Sixth Years of Life
Total 72.78% 71.63%
Weight Assessment and Counseling for Nutrition and Physical Activity
BMI Percentile—Ages 3 to 11 4.95% 13.61%
BMI Percentile—Ages 12 to 17 6.16% 14.41%
BMI Percentile—Total 5.39% 14.01%
Counseling for Nutrition—Ages 3 to 11 2.37% 8.65%
Counseling for Nutrition—Ages 12 to 17 2.47% 8.78%
Counseling for Nutrition—Total 2.40% 8.72%
Counseling for Physical Activity—Ages 3 to 11 1.62% 1.73%
Counseling for Physical Activity—Ages 12 to 17 12.26% 8.02%
Counseling for Physical Activity—Total 5.52% —
CHIPRA Measures (Only)
Follow-up Care for Children Prescribed Attention-Deficit/Hyperactivity Disorder (ADHD) Medication
Initiation Phase — 31.34%
Continuation and Maintenance Phase — 40.18%
Contraceptive Care—Postpartum Women
Within 3 Days of Delivery—Most or Moderately Effective—Ages 15 to 20 — 1.19%
Within 3 Days of Delivery—Most or Moderately Effective—Ages 21 to 44 — 7.93%
Within 3 Days of Delivery—Most or Moderately Effective—Total — 7.19%
Within 3 Days of Delivery—Long-Acting Reversible Method of Contraception (LARC)—Ages 15 to 20 — 0.46%
Within 3 Days of Delivery—LARC—Ages 21 to 44 — 0.36%
Within 3 Days of Delivery—LARC—Total — 0.37%
Within 60 Days of Delivery—Most or Moderately Effective—Ages 15 to 20 — 24.11%
Within 60 Days of Delivery—Most or Moderately Effective—Ages 21 to 44 — 26.61%
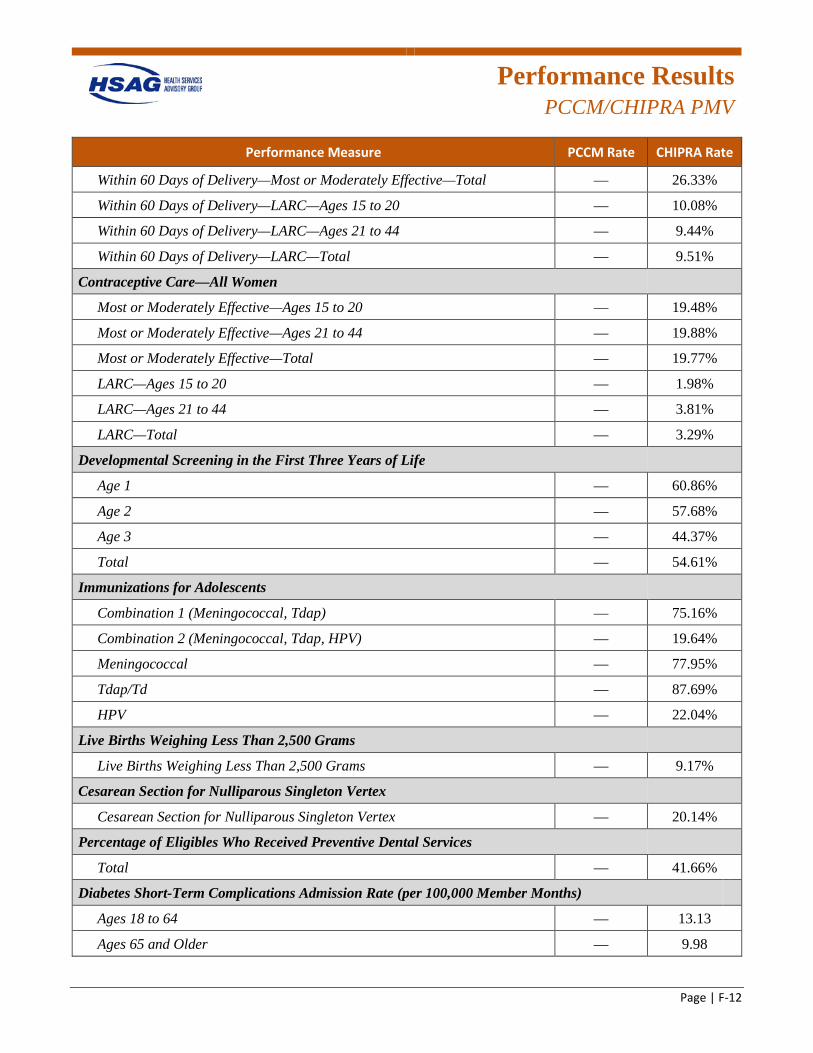
Performance Results
PCCM/CHIPRA PMV
Page | F-12
Performance Measure PCCM Rate CHIPRA Rate
Within 60 Days of Delivery—Most or Moderately Effective—Total — 26.33%
Within 60 Days of Delivery—LARC—Ages 15 to 20 — 10.08%
Within 60 Days of Delivery—LARC—Ages 21 to 44 — 9.44%
Within 60 Days of Delivery—LARC—Total — 9.51%
Contraceptive Care—All Women
Most or Moderately Effective—Ages 15 to 20 — 19.48%
Most or Moderately Effective—Ages 21 to 44 — 19.88%
Most or Moderately Effective—Total — 19.77%
LARC—Ages 15 to 20 — 1.98%
LARC—Ages 21 to 44 — 3.81%
LARC—Total — 3.29%
Developmental Screening in the First Three Years of Life
Age 1 — 60.86%
Age 2 — 57.68%
Age 3 — 44.37%
Total — 54.61%
Immunizations for Adolescents
Combination 1 (Meningococcal, Tdap) — 75.16%
Combination 2 (Meningococcal, Tdap, HPV) — 19.64%
Meningococcal — 77.95%
Tdap/Td — 87.69%
HPV — 22.04%
Live Births Weighing Less Than 2,500 Grams
Live Births Weighing Less Than 2,500 Grams — 9.17%
Cesarean Section for Nulliparous Singleton Vertex
Cesarean Section for Nulliparous Singleton Vertex — 20.14%
Percentage of Eligibles Who Received Preventive Dental Services
Total — 41.66%
Diabetes Short-Term Complications Admission Rate (per 100,000 Member Months)
Ages 18 to 64 — 13.13
Ages 65 and Older — 9.98
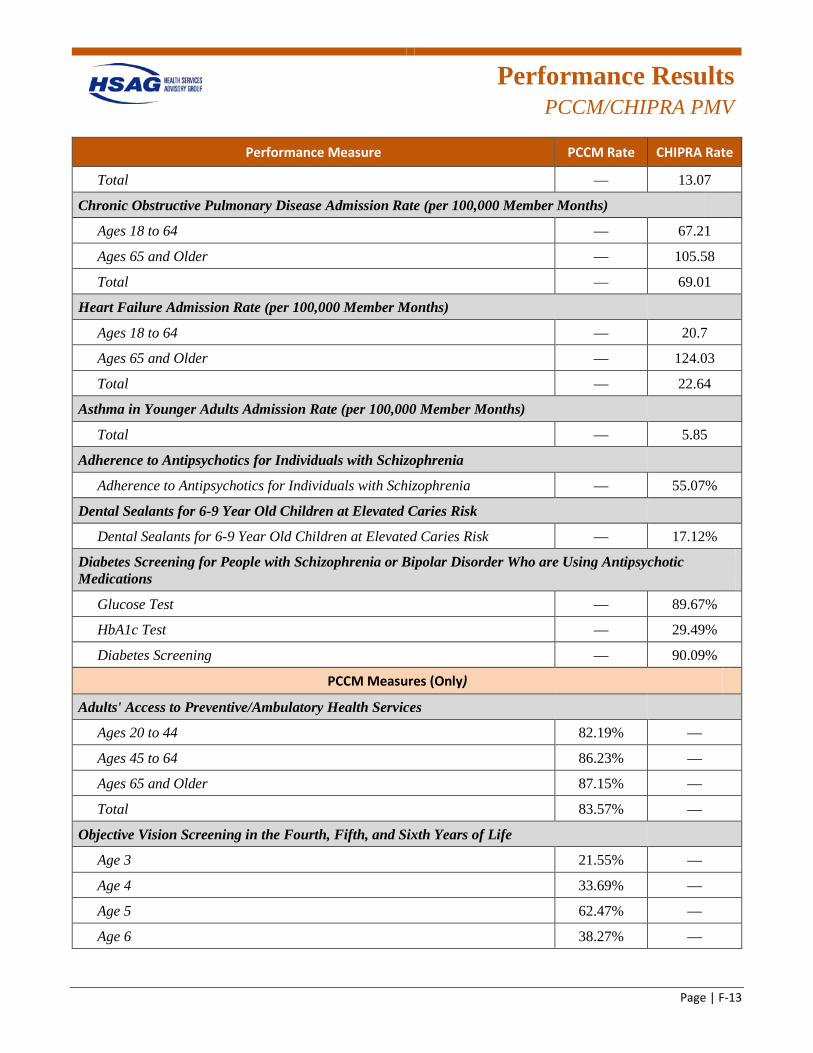
Performance Results
PCCM/CHIPRA PMV
Page | F-13
Performance Measure PCCM Rate CHIPRA Rate
Total — 13.07
Chronic Obstructive Pulmonary Disease Admission Rate (per 100,000 Member Months)
Ages 18 to 64 — 67.21
Ages 65 and Older — 105.58
Total — 69.01
Heart Failure Admission Rate (per 100,000 Member Months)
Ages 18 to 64 — 20.7
Ages 65 and Older — 124.03
Total — 22.64
Asthma in Younger Adults Admission Rate (per 100,000 Member Months)
Total — 5.85
Adherence to Antipsychotics for Individuals with Schizophrenia
Adherence to Antipsychotics for Individuals with Schizophrenia — 55.07%
Dental Sealants for 6-9 Year Old Children at Elevated Caries Risk
Dental Sealants for 6-9 Year Old Children at Elevated Caries Risk — 17.12%
Diabetes Screening for People with Schizophrenia or Bipolar Disorder Who are Using Antipsychotic Medications
Glucose Test — 89.67%
HbA1c Test — 29.49%
Diabetes Screening — 90.09%
PCCM Measures (Only)
Adults' Access to Preventive/Ambulatory Health Services
Ages 20 to 44 82.19% —
Ages 45 to 64 86.23% —
Ages 65 and Older 87.15% —
Total 83.57% —
Objective Vision Screening in the Fourth, Fifth, and Sixth Years of Life
Age 3 21.55% —
Age 4 33.69% —
Age 5 62.47% —
Age 6 38.27% —
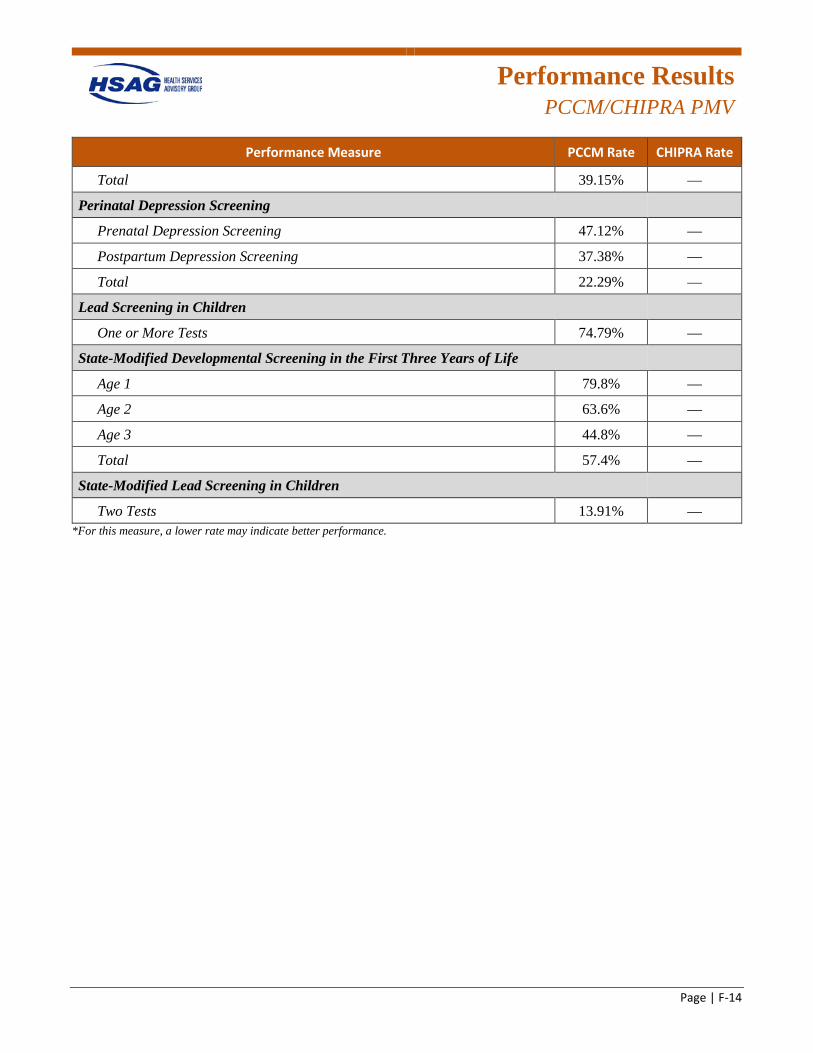
Performance Results
PCCM/CHIPRA PMV
Page | F-14
Performance Measure PCCM Rate CHIPRA Rate
Total 39.15% —
Perinatal Depression Screening
Prenatal Depression Screening 47.12% —
Postpartum Depression Screening 37.38% —
Total 22.29% —
Lead Screening in Children
One or More Tests 74.79% —
State-Modified Developmental Screening in the First Three Years of Life
Age 1 79.8% —
Age 2 63.6% —
Age 3 44.8% —
Total 57.4% —
State-Modified Lead Screening in Children
Two Tests 13.91% — *For this measure, a lower rate may indicate better performance.
Page | G-1
Appendix G. Beneficiary Satisfaction With Care Methodology and Results
Satisfaction With Care
Methodology
Page | G-2
Beneficiary Satisfaction Surveys
Objectives
The Consumer Assessment of Healthcare Providers and Systems (CAHPS) surveys ask members to report on and evaluate their experiences with healthcare. These surveys cover topics that are important to consumers, such as the communication skills of providers and the accessibility of services. Aetna Better Health (Aetna), Blue Cross Blue Shield of Illinois (BCBSIL), Cigna-HealthSpring of Illinois (Cigna), Community Care Alliance of Illinois (CCAI), CountyCare Health Plan (CountyCare), Family Health Network (FHN), Harmony Health Plan of Illinois, Inc. (Harmony), Humana Health Plan, Inc. (Humana), IlliniCare Health Plan, Inc. (IlliniCare), Meridian Health Plan, Inc. (Meridian), Molina Healthcare of Illinois, Inc. (Molina), and NextLevel Health Partners, LLC (NextLevel) were responsible for contracting with a CAHPS vendor to administer the CAHPS surveys on their behalf. Results for all 12 plans were forwarded to Health Services Advisory Group, Inc. (HSAG), for analysis. For the statewide Illinois Medicaid (i.e., children covered under Title XIX) and All Kids (i.e., children covered under Title XXI/Children’s Health Insurance Program [CHIP]) programs, HSAG administered the CAHPS survey and performed the analysis and reporting on behalf of the Illinois Department of Healthcare and Family Services (HFS).
The CAHPS results are presented by program type and population. Under the Family Health Plan/Affordable Care Act (FHP/ACA), the adult Medicaid and child Medicaid populations were surveyed for Aetna, BCBSIL, CountyCare, FHN, Harmony, IlliniCare, Meridian, Molina, and NextLevel.G-1 Under the Integrated Care Program (ICP), the adult Medicaid population was surveyed for Aetna, BCBSIL, Cigna, CCAI, CountyCare, Humana, IlliniCare, Meridian, Molina, and NextLevel.G-2 Under the Statewide Survey, a statewide sample of child members enrolled in the All Kids and Illinois Medicaid programs were surveyed.G-3
The overarching objective of the CAHPS surveys was to effectively and efficiently obtain information on members’ levels of satisfaction with their healthcare experiences.
G-1 SPH Analytics administered the CAHPS surveys on behalf of CountyCare, FHN, Harmony, and Molina. Morpace
administered the CAHPS surveys on behalf of BCBSIL, IlliniCare, Meridian, and NextLevel. The Center for the Study of Services (CSS) administered the CAHPS surveys on behalf of Aetna.
G-2 Morpace administered the CAHPS surveys on behalf of BCBSIL, Cigna, IlliniCare, Meridian, and NextLevel. SPH Analytics administered the CAHPS surveys on behalf of CCAI, CountyCare, and Molina. CSS administered the CAHPS survey on behalf of Aetna. DSS Research administered the CAHPS survey on behalf of Humana.
G-3 The Illinois statewide program aggregate results presented in this report represent the results of the All Kids and Illinois Medicaid programs combined.
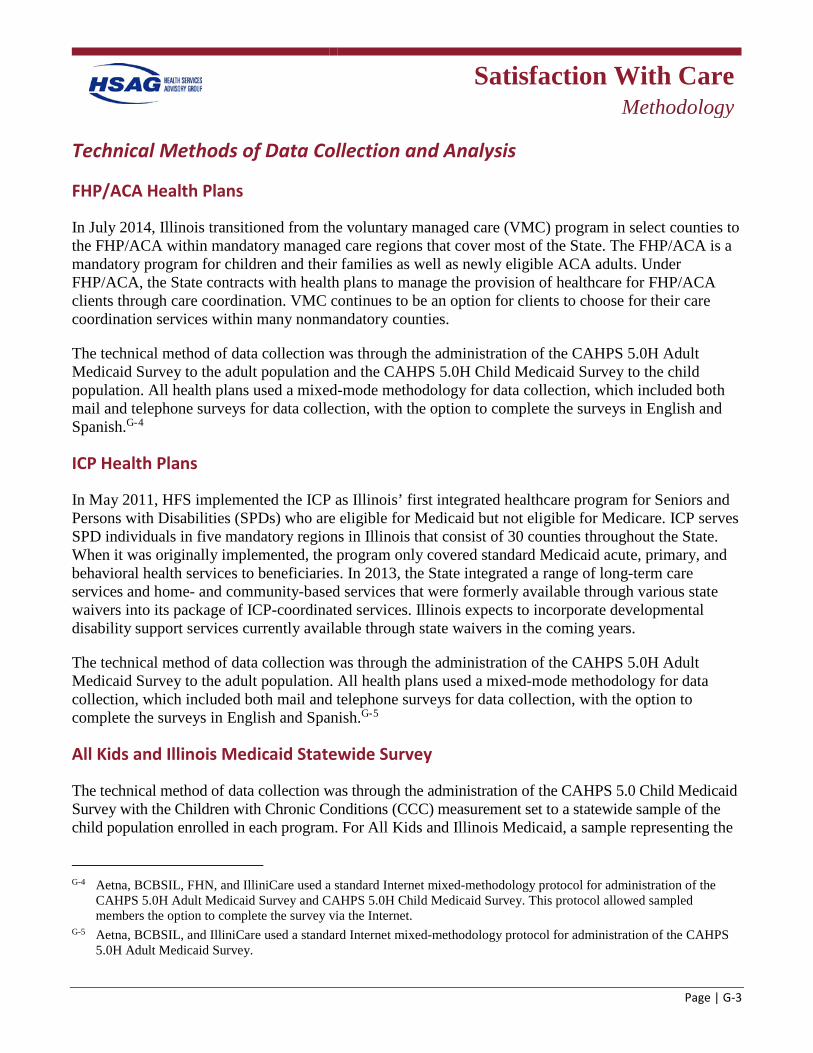
Satisfaction With Care
Methodology
Page | G-3
Technical Methods of Data Collection and Analysis
FHP/ACA Health Plans
In July 2014, Illinois transitioned from the voluntary managed care (VMC) program in select counties to the FHP/ACA within mandatory managed care regions that cover most of the State. The FHP/ACA is a mandatory program for children and their families as well as newly eligible ACA adults. Under FHP/ACA, the State contracts with health plans to manage the provision of healthcare for FHP/ACA clients through care coordination. VMC continues to be an option for clients to choose for their care coordination services within many nonmandatory counties.
The technical method of data collection was through the administration of the CAHPS 5.0H Adult Medicaid Survey to the adult population and the CAHPS 5.0H Child Medicaid Survey to the child population. All health plans used a mixed-mode methodology for data collection, which included both mail and telephone surveys for data collection, with the option to complete the surveys in English and Spanish.G-4
ICP Health Plans
In May 2011, HFS implemented the ICP as Illinois’ first integrated healthcare program for Seniors and Persons with Disabilities (SPDs) who are eligible for Medicaid but not eligible for Medicare. ICP serves SPD individuals in five mandatory regions in Illinois that consist of 30 counties throughout the State. When it was originally implemented, the program only covered standard Medicaid acute, primary, and behavioral health services to beneficiaries. In 2013, the State integrated a range of long-term care services and home- and community-based services that were formerly available through various state waivers into its package of ICP-coordinated services. Illinois expects to incorporate developmental disability support services currently available through state waivers in the coming years.
The technical method of data collection was through the administration of the CAHPS 5.0H Adult Medicaid Survey to the adult population. All health plans used a mixed-mode methodology for data collection, which included both mail and telephone surveys for data collection, with the option to complete the surveys in English and Spanish.G-5
All Kids and Illinois Medicaid Statewide Survey
The technical method of data collection was through the administration of the CAHPS 5.0 Child Medicaid Survey with the Children with Chronic Conditions (CCC) measurement set to a statewide sample of the child population enrolled in each program. For All Kids and Illinois Medicaid, a sample representing the
G-4 Aetna, BCBSIL, FHN, and IlliniCare used a standard Internet mixed-methodology protocol for administration of the
CAHPS 5.0H Adult Medicaid Survey and CAHPS 5.0H Child Medicaid Survey. This protocol allowed sampled members the option to complete the survey via the Internet.
G-5 Aetna, BCBSIL, and IlliniCare used a standard Internet mixed-methodology protocol for administration of the CAHPS 5.0H Adult Medicaid Survey.
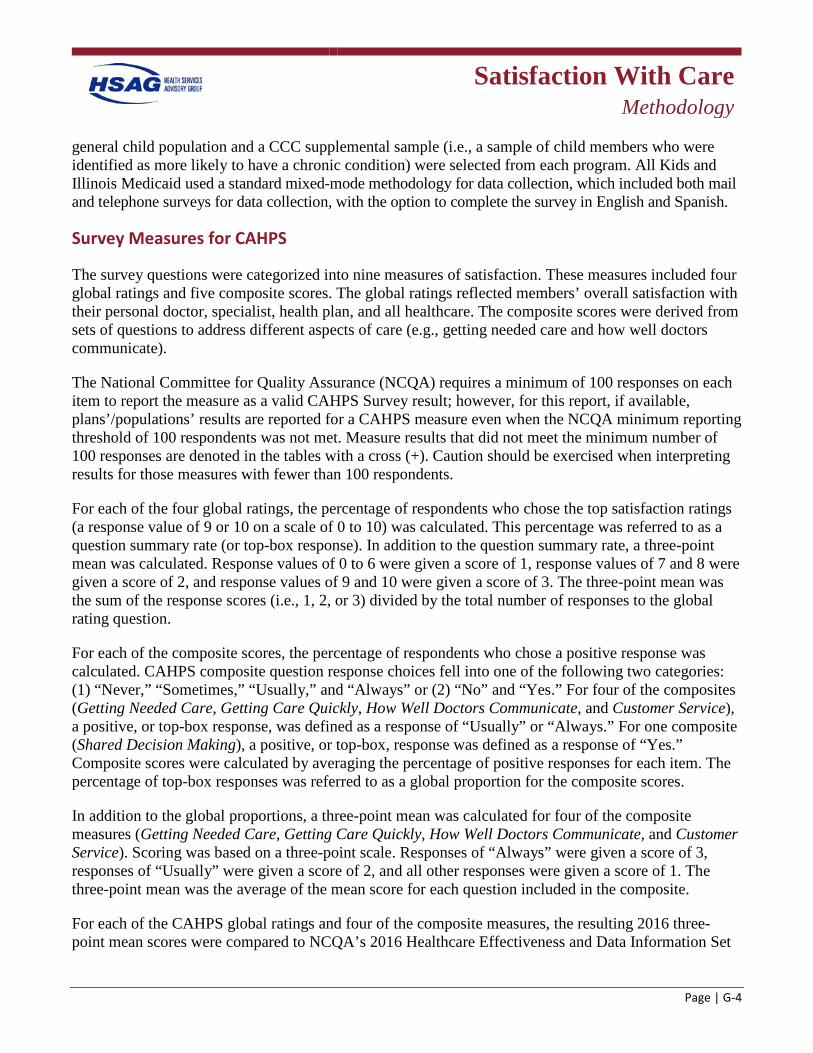
Satisfaction With Care
Methodology
Page | G-4
general child population and a CCC supplemental sample (i.e., a sample of child members who were identified as more likely to have a chronic condition) were selected from each program. All Kids and Illinois Medicaid used a standard mixed-mode methodology for data collection, which included both mail and telephone surveys for data collection, with the option to complete the survey in English and Spanish.
Survey Measures for CAHPS
The survey questions were categorized into nine measures of satisfaction. These measures included four global ratings and five composite scores. The global ratings reflected members’ overall satisfaction with their personal doctor, specialist, health plan, and all healthcare. The composite scores were derived from sets of questions to address different aspects of care (e.g., getting needed care and how well doctors communicate).
The National Committee for Quality Assurance (NCQA) requires a minimum of 100 responses on each item to report the measure as a valid CAHPS Survey result; however, for this report, if available, plans’/populations’ results are reported for a CAHPS measure even when the NCQA minimum reporting threshold of 100 respondents was not met. Measure results that did not meet the minimum number of 100 responses are denoted in the tables with a cross (+). Caution should be exercised when interpreting results for those measures with fewer than 100 respondents.
For each of the four global ratings, the percentage of respondents who chose the top satisfaction ratings (a response value of 9 or 10 on a scale of 0 to 10) was calculated. This percentage was referred to as a question summary rate (or top-box response). In addition to the question summary rate, a three-point mean was calculated. Response values of 0 to 6 were given a score of 1, response values of 7 and 8 were given a score of 2, and response values of 9 and 10 were given a score of 3. The three-point mean was the sum of the response scores (i.e., 1, 2, or 3) divided by the total number of responses to the global rating question.
For each of the composite scores, the percentage of respondents who chose a positive response was calculated. CAHPS composite question response choices fell into one of the following two categories: (1) “Never,” “Sometimes,” “Usually,” and “Always” or (2) “No” and “Yes.” For four of the composites (Getting Needed Care, Getting Care Quickly, How Well Doctors Communicate, and Customer Service), a positive, or top-box response, was defined as a response of “Usually” or “Always.” For one composite (Shared Decision Making), a positive, or top-box, response was defined as a response of “Yes.” Composite scores were calculated by averaging the percentage of positive responses for each item. The percentage of top-box responses was referred to as a global proportion for the composite scores.
In addition to the global proportions, a three-point mean was calculated for four of the composite measures (Getting Needed Care, Getting Care Quickly, How Well Doctors Communicate, and Customer Service). Scoring was based on a three-point scale. Responses of “Always” were given a score of 3, responses of “Usually” were given a score of 2, and all other responses were given a score of 1. The three-point mean was the average of the mean score for each question included in the composite.
For each of the CAHPS global ratings and four of the composite measures, the resulting 2016 three-point mean scores were compared to NCQA’s 2016 Healthcare Effectiveness and Data Information Set
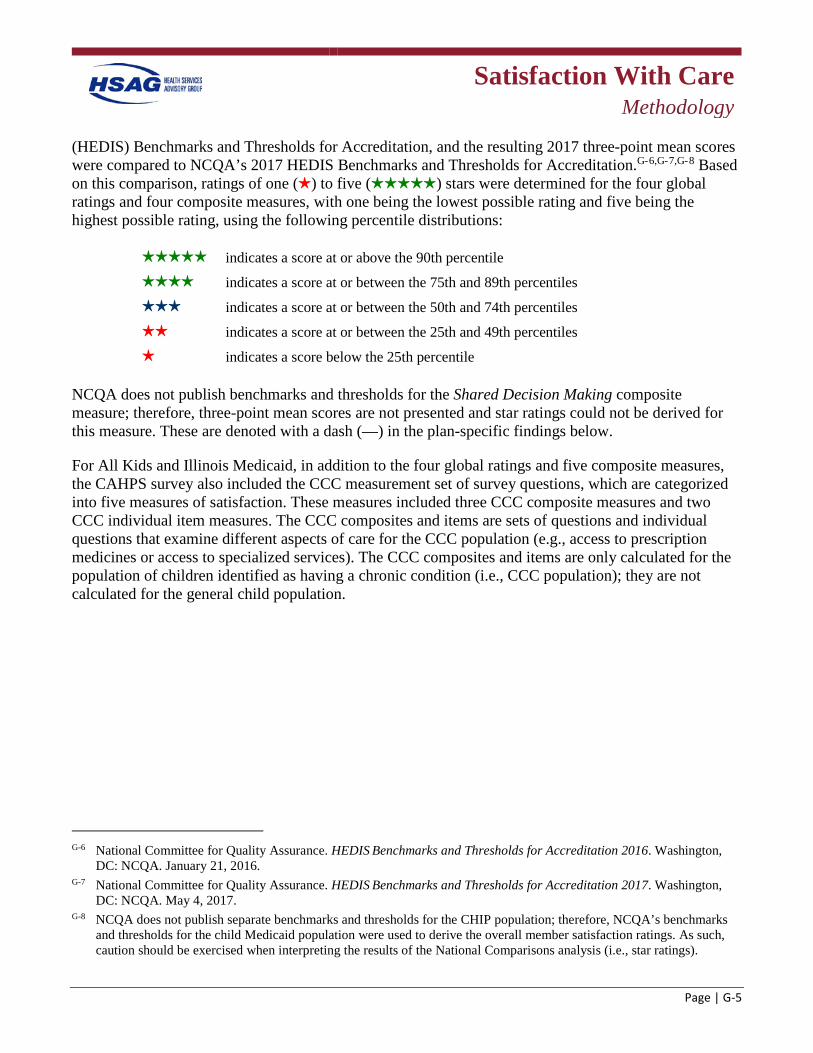
Satisfaction With Care
Methodology
Page | G-5
(HEDIS) Benchmarks and Thresholds for Accreditation, and the resulting 2017 three-point mean scores were compared to NCQA’s 2017 HEDIS Benchmarks and Thresholds for Accreditation.G-6,G-7,G-8 Based on this comparison, ratings of one () to five () stars were determined for the four global ratings and four composite measures, with one being the lowest possible rating and five being the highest possible rating, using the following percentile distributions:
indicates a score at or above the 90th percentile indicates a score at or between the 75th and 89th percentiles indicates a score at or between the 50th and 74th percentiles indicates a score at or between the 25th and 49th percentiles indicates a score below the 25th percentile
NCQA does not publish benchmarks and thresholds for the Shared Decision Making composite measure; therefore, three-point mean scores are not presented and star ratings could not be derived for this measure. These are denoted with a dash (—) in the plan-specific findings below.
For All Kids and Illinois Medicaid, in addition to the four global ratings and five composite measures, the CAHPS survey also included the CCC measurement set of survey questions, which are categorized into five measures of satisfaction. These measures included three CCC composite measures and two CCC individual item measures. The CCC composites and items are sets of questions and individual questions that examine different aspects of care for the CCC population (e.g., access to prescription medicines or access to specialized services). The CCC composites and items are only calculated for the population of children identified as having a chronic condition (i.e., CCC population); they are not calculated for the general child population.
G-6 National Committee for Quality Assurance. HEDIS Benchmarks and Thresholds for Accreditation 2016. Washington,
DC: NCQA. January 21, 2016. G-7 National Committee for Quality Assurance. HEDIS Benchmarks and Thresholds for Accreditation 2017. Washington,
DC: NCQA. May 4, 2017. G-8 NCQA does not publish separate benchmarks and thresholds for the CHIP population; therefore, NCQA’s benchmarks
and thresholds for the child Medicaid population were used to derive the overall member satisfaction ratings. As such, caution should be exercised when interpreting the results of the National Comparisons analysis (i.e., star ratings).
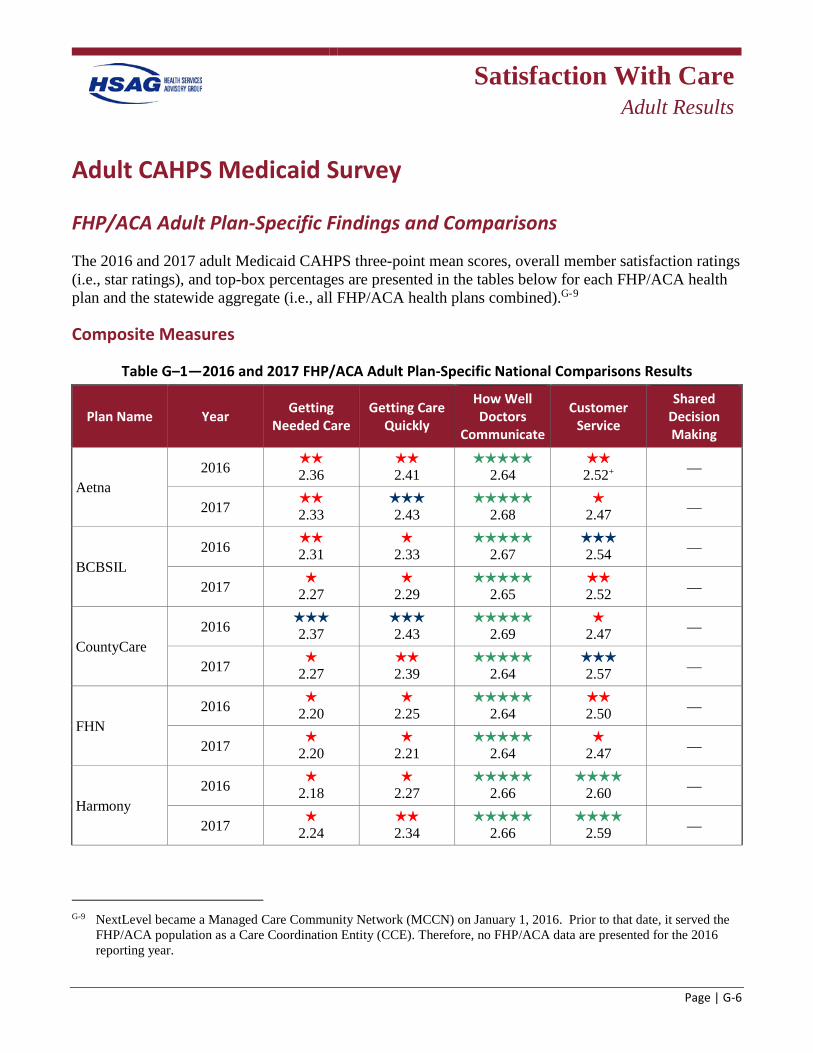
Satisfaction With Care
Adult Results
Page | G-6
Adult CAHPS Medicaid Survey
FHP/ACA Adult Plan-Specific Findings and Comparisons
The 2016 and 2017 adult Medicaid CAHPS three-point mean scores, overall member satisfaction ratings (i.e., star ratings), and top-box percentages are presented in the tables below for each FHP/ACA health plan and the statewide aggregate (i.e., all FHP/ACA health plans combined).G-9
Composite Measures
Table G–1—2016 and 2017 FHP/ACA Adult Plan-Specific National Comparisons Results
Plan Name Year Getting Needed Care
Getting Care Quickly
How Well Doctors
Communicate
Customer Service
Shared Decision Making
Aetna 2016
2.36 2.41
2.64
2.52+ —
2017 2.33
2.43
2.68
2.47 —
BCBSIL 2016
2.31
2.33
2.67 2.54 —
2017 2.27
2.29
2.65
2.52 —
CountyCare 2016
2.37 2.43
2.69
2.47 —
2017 2.27
2.39
2.64
2.57 —
FHN 2016
2.20
2.25
2.64 2.50 —
2017 2.20
2.21
2.64
2.47 —
Harmony 2016
2.18
2.27
2.66
2.60 —
2017 2.24
2.34
2.66
2.59 —
G-9 NextLevel became a Managed Care Community Network (MCCN) on January 1, 2016. Prior to that date, it served the
FHP/ACA population as a Care Coordination Entity (CCE). Therefore, no FHP/ACA data are presented for the 2016 reporting year.
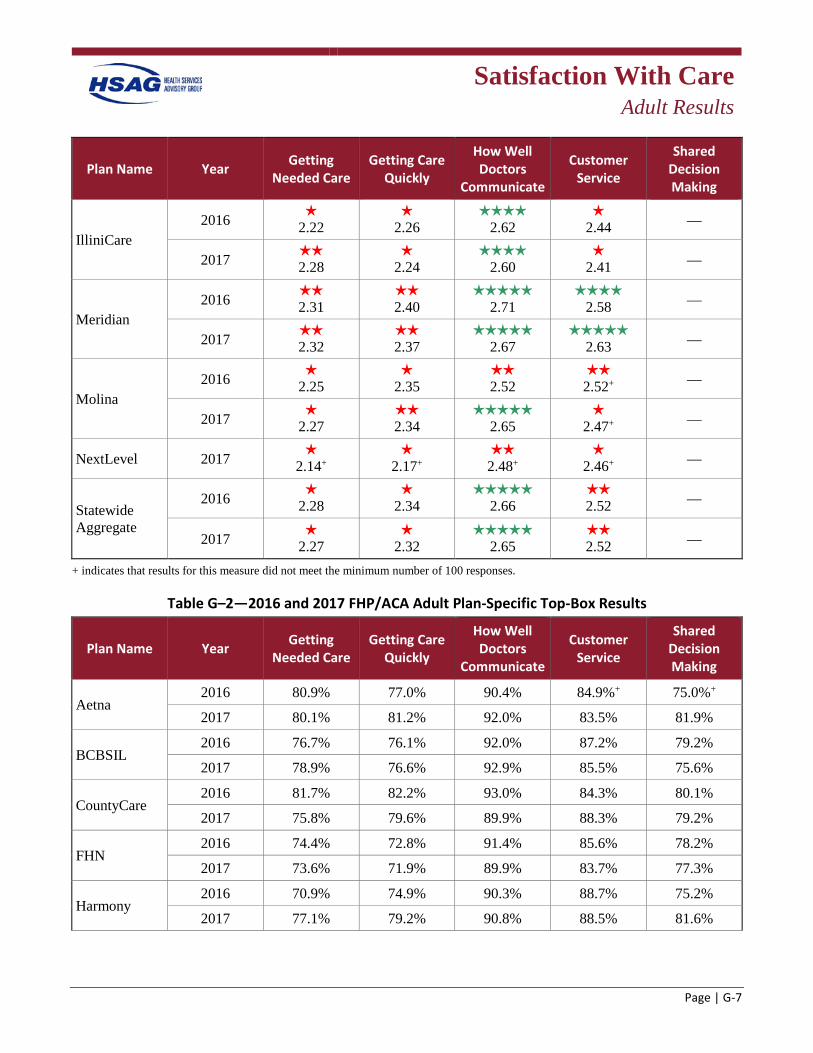
Satisfaction With Care
Adult Results
Page | G-7
Plan Name Year Getting Needed Care
Getting Care Quickly
How Well Doctors
Communicate
Customer Service
Shared Decision Making
IlliniCare 2016
2.22
2.26
2.62
2.44 —
2017 2.28
2.24
2.60
2.41 —
Meridian 2016
2.31 2.40
2.71
2.58 —
2017 2.32
2.37
2.67
2.63 —
Molina 2016
2.25
2.35 2.52
2.52+ —
2017 2.27
2.34
2.65
2.47+ —
NextLevel 2017 2.14+
2.17+
2.48+
2.46+ —
Statewide Aggregate
2016 2.28
2.34
2.66
2.52 —
2017 2.27
2.32
2.65
2.52 —
+ indicates that results for this measure did not meet the minimum number of 100 responses.
Table G–2—2016 and 2017 FHP/ACA Adult Plan-Specific Top-Box Results
Plan Name Year Getting Needed Care
Getting Care Quickly
How Well Doctors
Communicate
Customer Service
Shared Decision Making
Aetna 2016 80.9% 77.0% 90.4% 84.9%+ 75.0%+
2017 80.1% 81.2% 92.0% 83.5% 81.9%
BCBSIL 2016 76.7% 76.1% 92.0% 87.2% 79.2%
2017 78.9% 76.6% 92.9% 85.5% 75.6%
CountyCare 2016 81.7% 82.2% 93.0% 84.3% 80.1%
2017 75.8% 79.6% 89.9% 88.3% 79.2%
FHN 2016 74.4% 72.8% 91.4% 85.6% 78.2%
2017 73.6% 71.9% 89.9% 83.7% 77.3%
Harmony 2016 70.9% 74.9% 90.3% 88.7% 75.2%
2017 77.1% 79.2% 90.8% 88.5% 81.6%
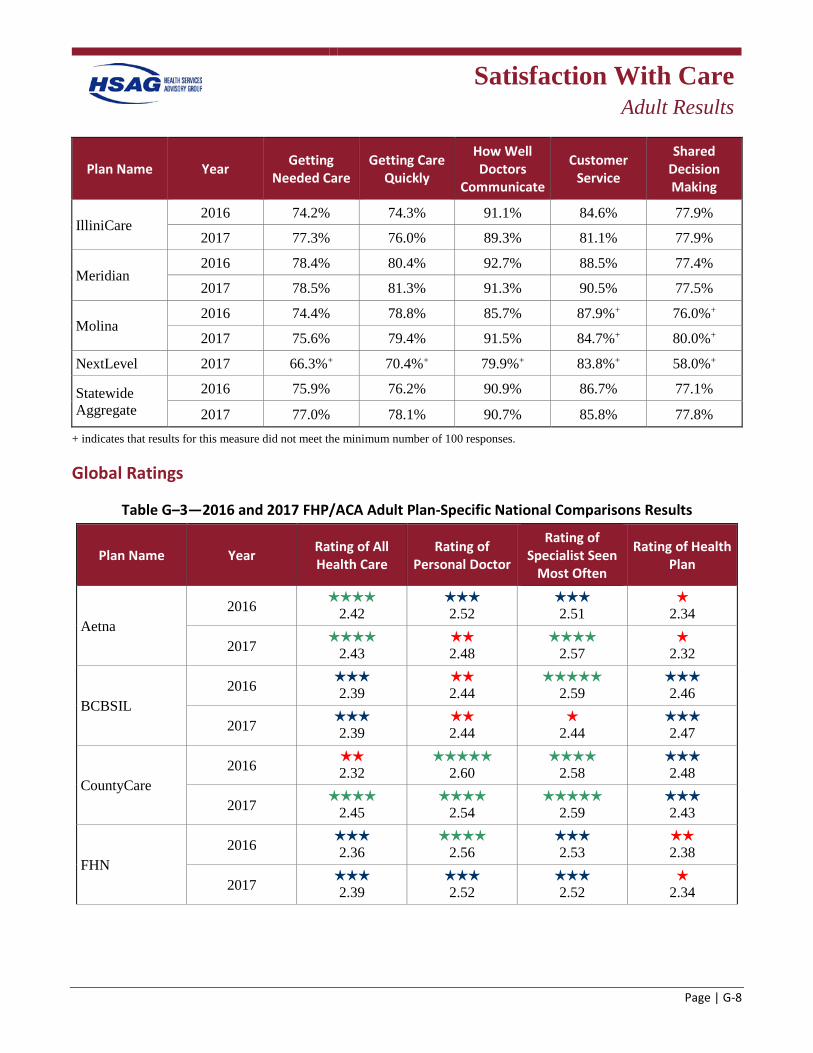
Satisfaction With Care
Adult Results
Page | G-8
Plan Name Year Getting Needed Care
Getting Care Quickly
How Well Doctors
Communicate
Customer Service
Shared Decision Making
IlliniCare 2016 74.2% 74.3% 91.1% 84.6% 77.9%
2017 77.3% 76.0% 89.3% 81.1% 77.9%
Meridian 2016 78.4% 80.4% 92.7% 88.5% 77.4%
2017 78.5% 81.3% 91.3% 90.5% 77.5%
Molina 2016 74.4% 78.8% 85.7% 87.9%+ 76.0%+
2017 75.6% 79.4% 91.5% 84.7%+ 80.0%+
NextLevel 2017 66.3%+ 70.4%+ 79.9%+ 83.8%+ 58.0%+
Statewide Aggregate
2016 75.9% 76.2% 90.9% 86.7% 77.1%
2017 77.0% 78.1% 90.7% 85.8% 77.8% + indicates that results for this measure did not meet the minimum number of 100 responses.
Global Ratings
Table G–3—2016 and 2017 FHP/ACA Adult Plan-Specific National Comparisons Results
Plan Name Year Rating of All Health Care
Rating of Personal Doctor
Rating of Specialist Seen
Most Often
Rating of Health Plan
Aetna 2016
2.42 h 2.52
h 2.51
h 2.34
2017 h 2.43
h 2.48
h 2.57
h 2.32
BCBSIL 2016 h
2.39 h 2.44
2.59
h 2.46
2017 h 2.39
h 2.44
h 2.44
h 2.47
CountyCare 2016 h
2.32 h
2.60 h
2.58 h 2.48
2017 h 2.45
h 2.54
h 2.59
h 2.43
FHN 2016 h
2.36 h
2.56 h 2.53
2.38
2017 h 2.39
h 2.52
h 2.52
h 2.34
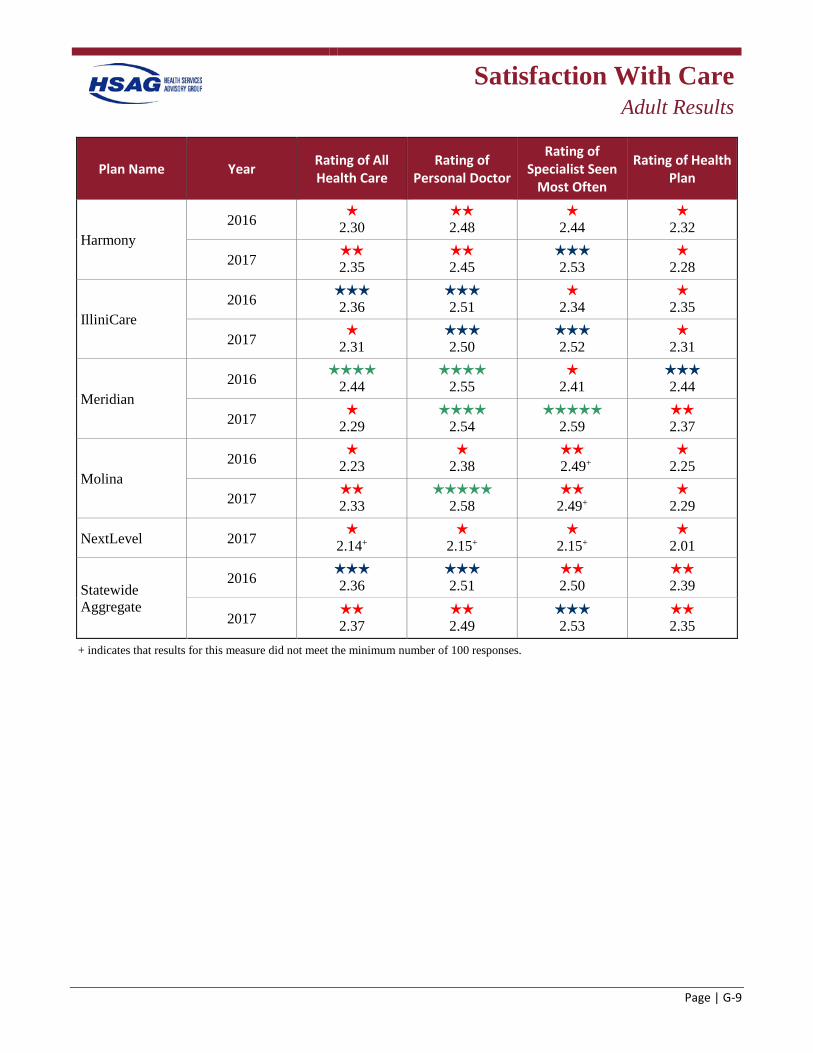
Satisfaction With Care
Adult Results
Page | G-9
Plan Name Year Rating of All Health Care
Rating of Personal Doctor
Rating of Specialist Seen
Most Often
Rating of Health Plan
Harmony 2016 h
2.30 2.48
h 2.44
h 2.32
2017 2.35
2.45
h 2.53
h 2.28
IlliniCare 2016 h
2.36 h 2.51
h 2.34
h 2.35
2017 h 2.31
h 2.50
h 2.52
h 2.31
Meridian 2016 h
2.44 h
2.55 h
2.41 h 2.44
2017 h 2.29
h 2.54
h 2.59
2.37
Molina 2016 h
2.23 h
2.38
2.49+ h
2.25
2017 2.33
h 2.58
2.49+
h 2.29
NextLevel 2017 h 2.14+
h 2.15+
h 2.15+
h 2.01
Statewide Aggregate
2016 2.36
h 2.51
2.50
2.39
2017 2.37
2.49
h 2.53
2.35
+ indicates that results for this measure did not meet the minimum number of 100 responses.
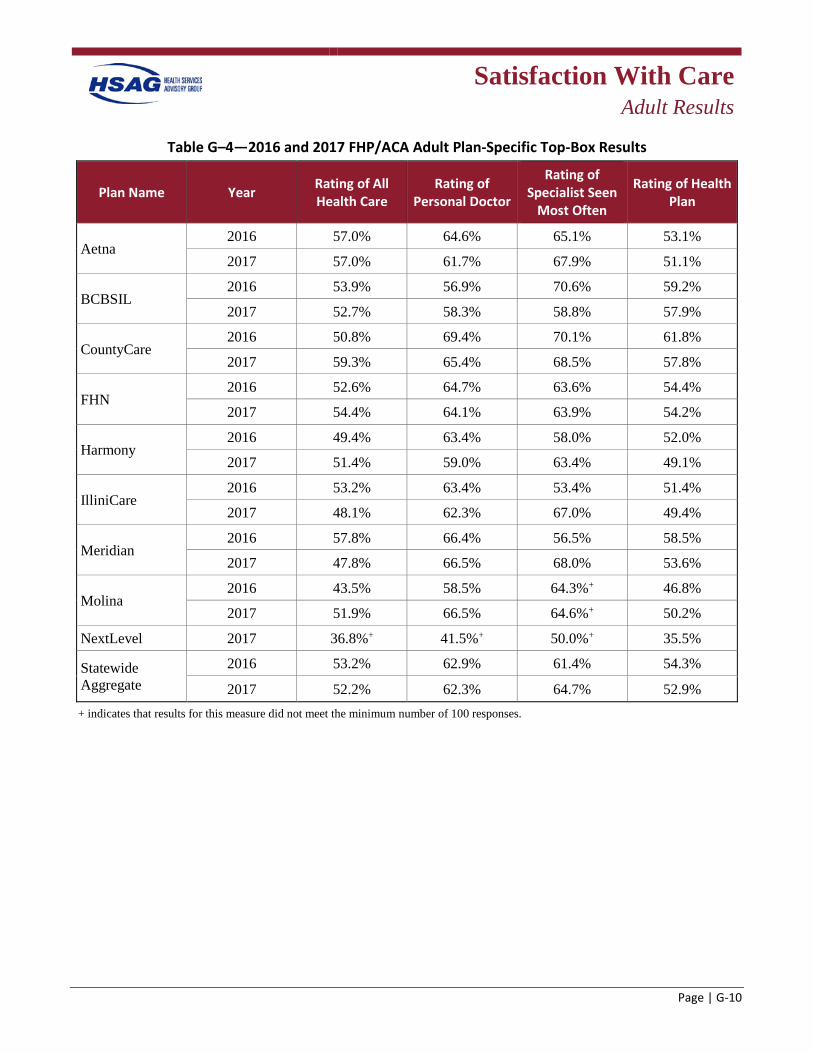
Satisfaction With Care
Adult Results
Page | G-10
Table G–4—2016 and 2017 FHP/ACA Adult Plan-Specific Top-Box Results
Plan Name Year Rating of All Health Care
Rating of Personal Doctor
Rating of Specialist Seen
Most Often
Rating of Health Plan
Aetna 2016 57.0% 64.6% 65.1% 53.1%
2017 57.0% 61.7% 67.9% 51.1%
BCBSIL 2016 53.9% 56.9% 70.6% 59.2%
2017 52.7% 58.3% 58.8% 57.9%
CountyCare 2016 50.8% 69.4% 70.1% 61.8%
2017 59.3% 65.4% 68.5% 57.8%
FHN 2016 52.6% 64.7% 63.6% 54.4%
2017 54.4% 64.1% 63.9% 54.2%
Harmony 2016 49.4% 63.4% 58.0% 52.0%
2017 51.4% 59.0% 63.4% 49.1%
IlliniCare 2016 53.2% 63.4% 53.4% 51.4%
2017 48.1% 62.3% 67.0% 49.4%
Meridian 2016 57.8% 66.4% 56.5% 58.5%
2017 47.8% 66.5% 68.0% 53.6%
Molina 2016 43.5% 58.5% 64.3%+ 46.8%
2017 51.9% 66.5% 64.6%+ 50.2%
NextLevel 2017 36.8%+ 41.5%+ 50.0%+ 35.5%
Statewide Aggregate
2016 53.2% 62.9% 61.4% 54.3%
2017 52.2% 62.3% 64.7% 52.9% + indicates that results for this measure did not meet the minimum number of 100 responses.
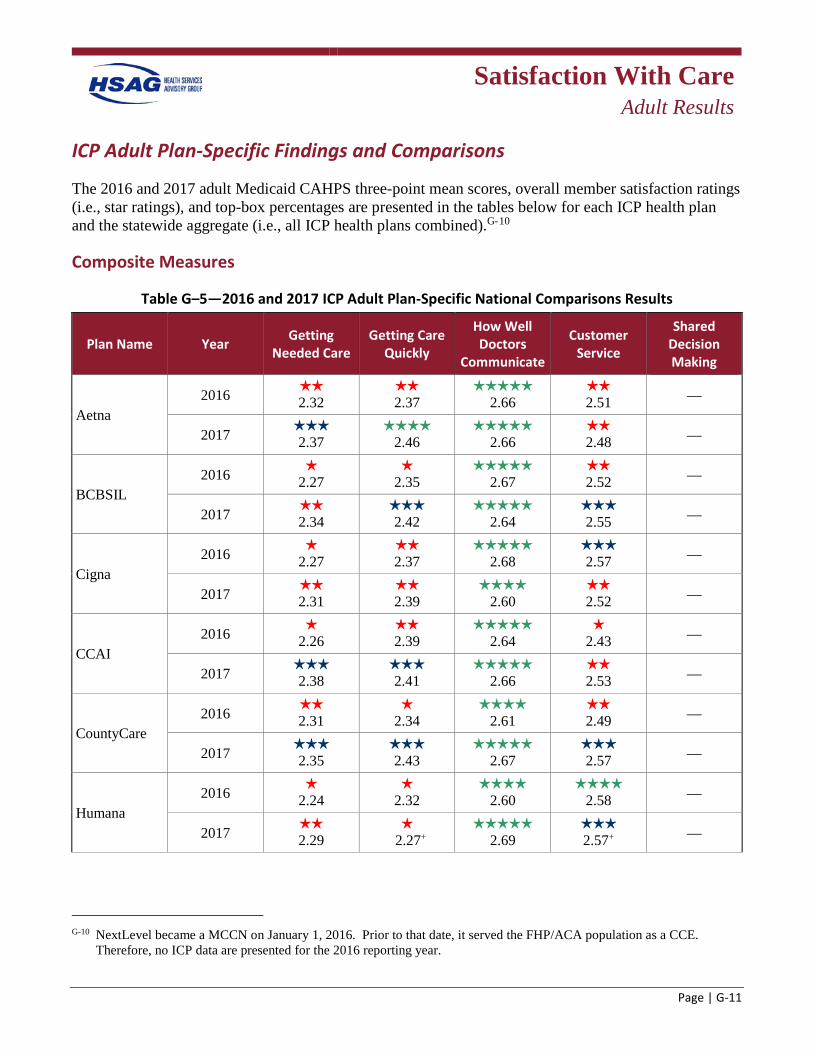
Satisfaction With Care
Adult Results
Page | G-11
ICP Adult Plan-Specific Findings and Comparisons
The 2016 and 2017 adult Medicaid CAHPS three-point mean scores, overall member satisfaction ratings (i.e., star ratings), and top-box percentages are presented in the tables below for each ICP health plan and the statewide aggregate (i.e., all ICP health plans combined).G-10
Composite Measures
Table G–5—2016 and 2017 ICP Adult Plan-Specific National Comparisons Results
Plan Name Year Getting Needed Care
Getting Care Quickly
How Well Doctors
Communicate
Customer Service
Shared Decision Making
Aetna 2016 h
2.32 2.37
h 2.66
2.51 —
2017 h 2.37
h 2.46
2.66
2.48 —
BCBSIL 2016 h
2.27 h
2.35
2.67 2.52 —
2017 h 2.34
2.42
2.64
h 2.55 —
Cigna 2016 h
2.27 h 2.37
2.68
h 2.57 —
2017 h 2.31
h 2.39
2.60
2.52 —
CCAI 2016 h
2.26 2.39
2.64
h 2.43 —
2017 h 2.38
2.41
2.66
2.53 —
CountyCare 2016 h
2.31 h
2.34
2.61 2.49 —
2017 h 2.35
2.43
2.67
h 2.57 —
Humana 2016 h
2.24 h
2.32
2.60 h
2.58 —
2017 2.29
h 2.27+
2.69
h 2.57+ —
G-10 NextLevel became a MCCN on January 1, 2016. Prior to that date, it served the FHP/ACA population as a CCE.
Therefore, no ICP data are presented for the 2016 reporting year.
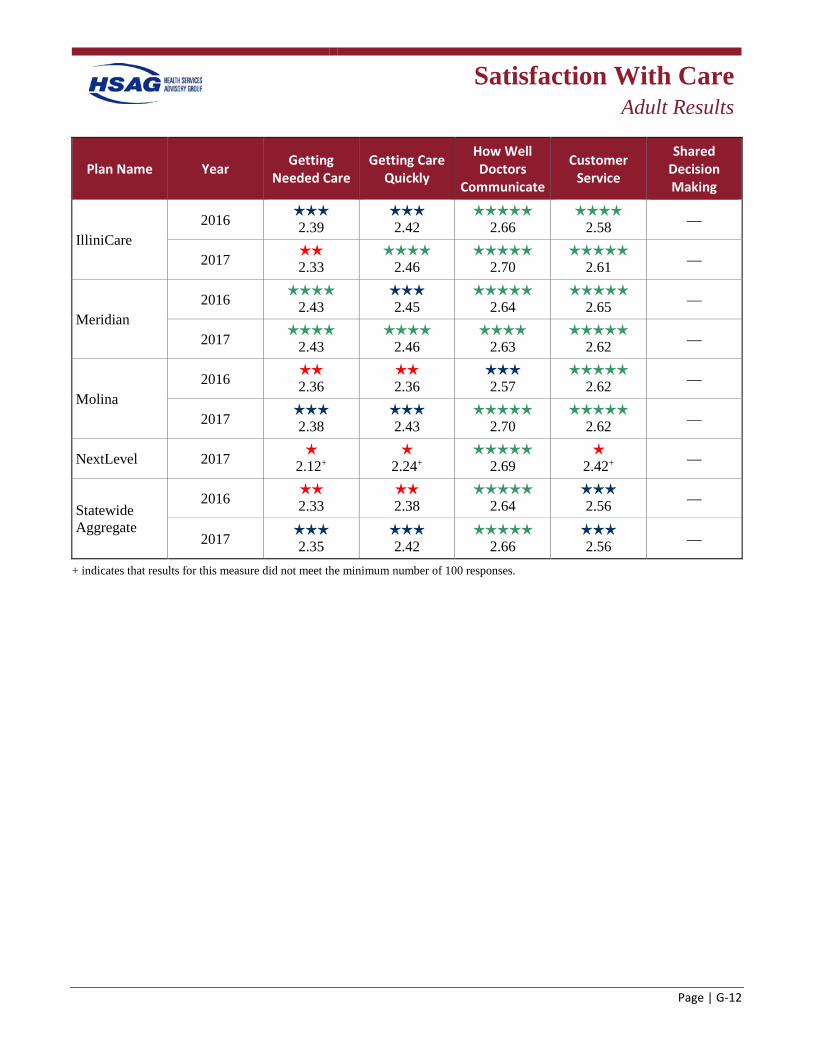
Satisfaction With Care
Adult Results
Page | G-12
Plan Name Year Getting Needed Care
Getting Care Quickly
How Well Doctors
Communicate
Customer Service
Shared Decision Making
IlliniCare 2016
2.39 h 2.42
2.66
2.58 —
2017 2.33
2.46
2.70
2.61 —
Meridian 2016
2.43 2.45
2.64
h 2.65 —
2017 2.43
h 2.46
2.63
2.62 —
Molina 2016
2.36 2.36
h 2.57
2.62 —
2017 2.38
2.43
2.70
2.62 —
NextLevel 2017 h 2.12+
h 2.24+
2.69
h 2.42+ —
Statewide Aggregate
2016 h 2.33
2.38
h 2.64
2.56 —
2017 2.35
2.42
h 2.66
2.56 —
+ indicates that results for this measure did not meet the minimum number of 100 responses.
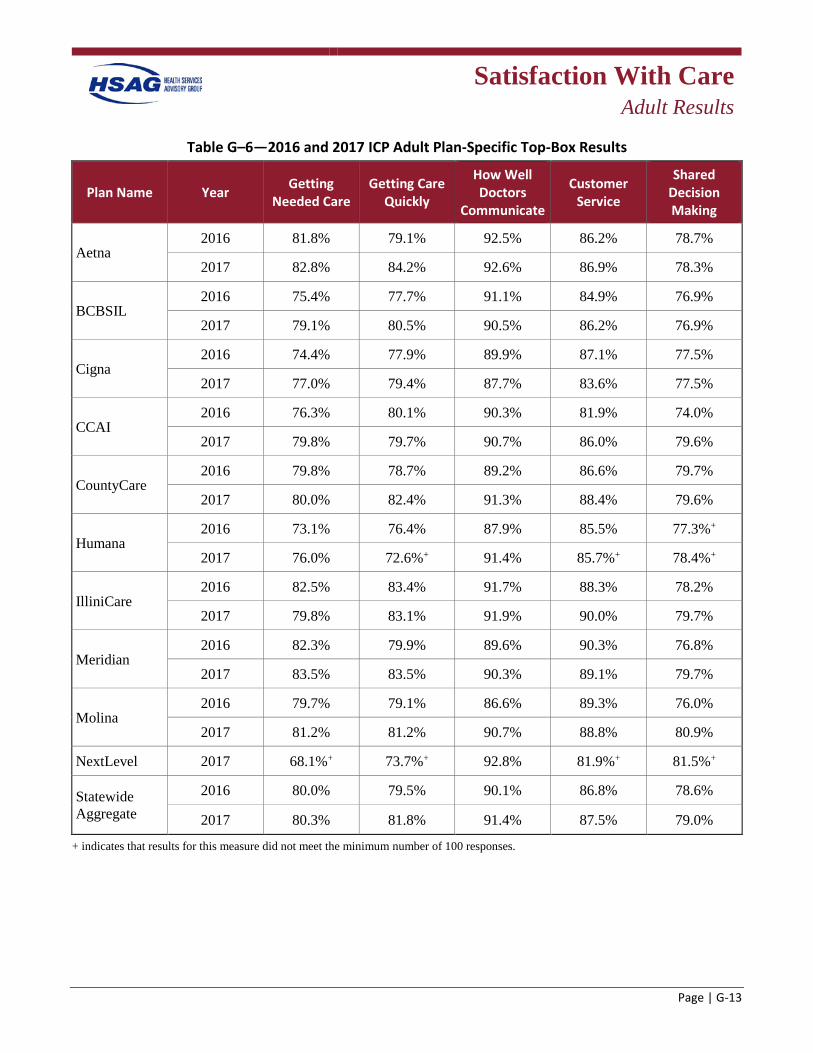
Satisfaction With Care
Adult Results
Page | G-13
Table G–6—2016 and 2017 ICP Adult Plan-Specific Top-Box Results
Plan Name Year Getting Needed Care
Getting Care Quickly
How Well Doctors
Communicate
Customer Service
Shared Decision Making
Aetna 2016 81.8% 79.1% 92.5% 86.2% 78.7%
2017 82.8% 84.2% 92.6% 86.9% 78.3%
BCBSIL 2016 75.4% 77.7% 91.1% 84.9% 76.9%
2017 79.1% 80.5% 90.5% 86.2% 76.9%
Cigna 2016 74.4% 77.9% 89.9% 87.1% 77.5%
2017 77.0% 79.4% 87.7% 83.6% 77.5%
CCAI 2016 76.3% 80.1% 90.3% 81.9% 74.0%
2017 79.8% 79.7% 90.7% 86.0% 79.6%
CountyCare 2016 79.8% 78.7% 89.2% 86.6% 79.7%
2017 80.0% 82.4% 91.3% 88.4% 79.6%
Humana 2016 73.1% 76.4% 87.9% 85.5% 77.3%+
2017 76.0% 72.6%+ 91.4% 85.7%+ 78.4%+
IlliniCare 2016 82.5% 83.4% 91.7% 88.3% 78.2%
2017 79.8% 83.1% 91.9% 90.0% 79.7%
Meridian 2016 82.3% 79.9% 89.6% 90.3% 76.8%
2017 83.5% 83.5% 90.3% 89.1% 79.7%
Molina 2016 79.7% 79.1% 86.6% 89.3% 76.0%
2017 81.2% 81.2% 90.7% 88.8% 80.9%
NextLevel 2017 68.1%+ 73.7%+ 92.8% 81.9%+ 81.5%+
Statewide Aggregate
2016 80.0% 79.5% 90.1% 86.8% 78.6%
2017 80.3% 81.8% 91.4% 87.5% 79.0%
+ indicates that results for this measure did not meet the minimum number of 100 responses.
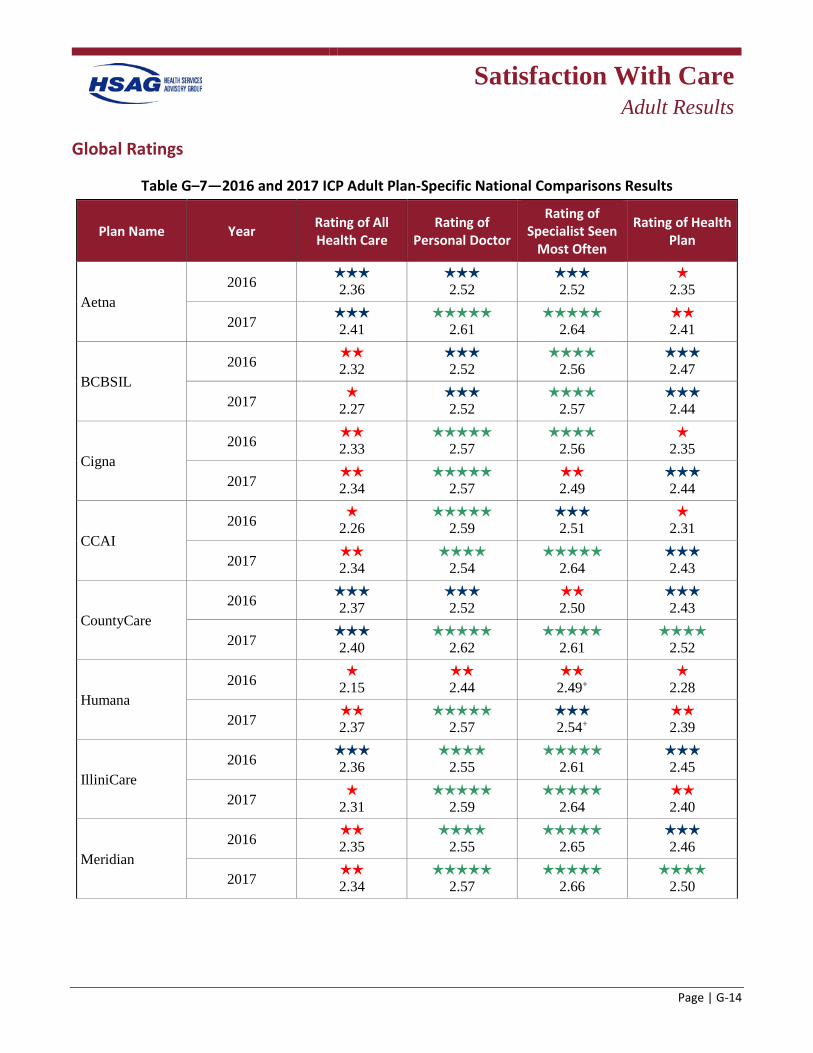
Satisfaction With Care
Adult Results
Page | G-14
Global Ratings
Table G–7—2016 and 2017 ICP Adult Plan-Specific National Comparisons Results
Plan Name Year Rating of All Health Care
Rating of Personal Doctor
Rating of Specialist Seen
Most Often
Rating of Health Plan
Aetna 2016
2.36 2.52
2.52
h 2.35
2017 2.41
2.61
2.64
h 2.41
BCBSIL 2016
2.32 2.52
2.56
h 2.47
2017 h 2.27
2.52
2.57
h 2.44
Cigna 2016
2.33
2.57
2.56 h
2.35
2017 2.34
2.57
2.49
h 2.44
CCAI 2016 h
2.26
2.59 h 2.51
h 2.31
2017 2.34
h 2.54
h 2.64
2.43
CountyCare 2016
2.37 h 2.52
h 2.50
2.43
2017 2.40
2.62
2.61
h 2.52
Humana 2016 h
2.15 2.44
2.49+
h 2.28
2017 h 2.37
2.57
h 2.54+
h 2.39
IlliniCare 2016 h
2.36
2.55 h
2.61 h 2.45
2017 h 2.31
2.59
2.64
h 2.40
Meridian 2016
2.35
2.55
2.65 2.46
2017 2.34
2.57
2.66
2.50
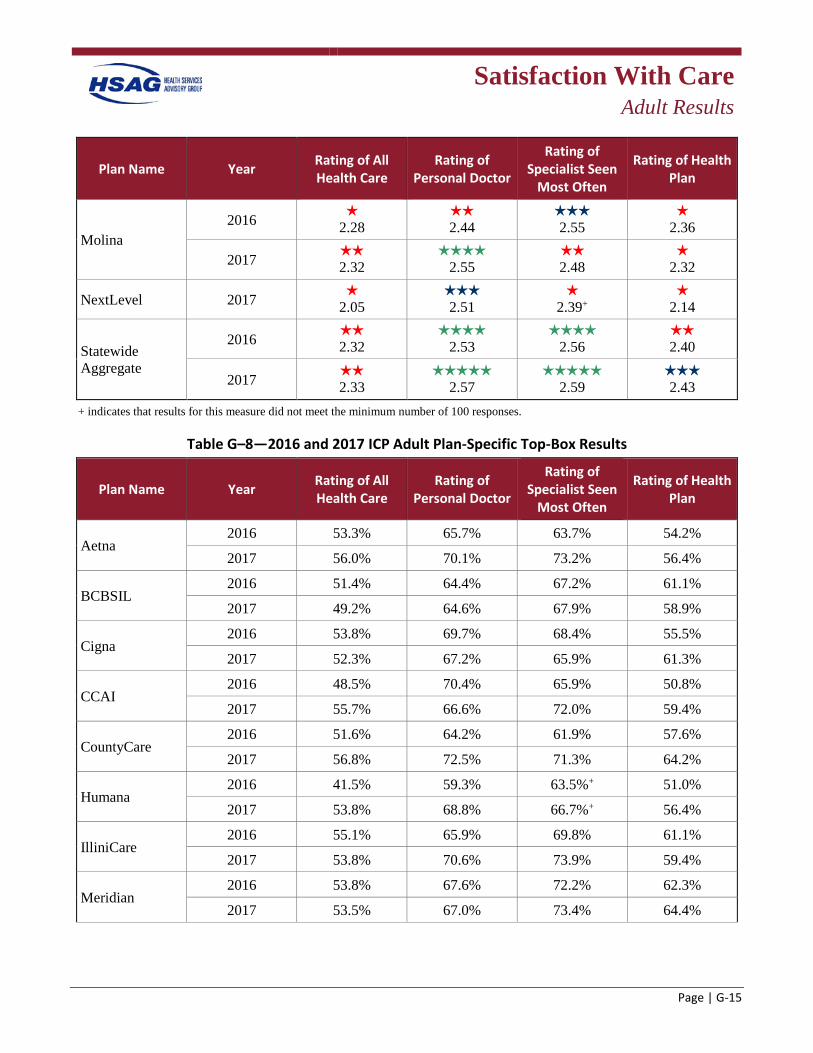
Satisfaction With Care
Adult Results
Page | G-15
Plan Name Year Rating of All Health Care
Rating of Personal Doctor
Rating of Specialist Seen
Most Often
Rating of Health Plan
Molina 2016 h
2.28 2.44
2.55
h 2.36
2017 2.32
2.55
h 2.48
h 2.32
NextLevel 2017 h 2.05
2.51
h 2.39+
h 2.14
Statewide Aggregate
2016 2.32
2.53
h 2.56
2.40
2017 2.33
2.57
2.59
2.43
+ indicates that results for this measure did not meet the minimum number of 100 responses.
Table G–8—2016 and 2017 ICP Adult Plan-Specific Top-Box Results
Plan Name Year Rating of All Health Care
Rating of Personal Doctor
Rating of Specialist Seen
Most Often
Rating of Health Plan
Aetna 2016 53.3% 65.7% 63.7% 54.2%
2017 56.0% 70.1% 73.2% 56.4%
BCBSIL 2016 51.4% 64.4% 67.2% 61.1%
2017 49.2% 64.6% 67.9% 58.9%
Cigna 2016 53.8% 69.7% 68.4% 55.5%
2017 52.3% 67.2% 65.9% 61.3%
CCAI 2016 48.5% 70.4% 65.9% 50.8%
2017 55.7% 66.6% 72.0% 59.4%
CountyCare 2016 51.6% 64.2% 61.9% 57.6%
2017 56.8% 72.5% 71.3% 64.2%
Humana 2016 41.5% 59.3% 63.5%+ 51.0%
2017 53.8% 68.8% 66.7%+ 56.4%
IlliniCare 2016 55.1% 65.9% 69.8% 61.1%
2017 53.8% 70.6% 73.9% 59.4%
Meridian 2016 53.8% 67.6% 72.2% 62.3%
2017 53.5% 67.0% 73.4% 64.4%
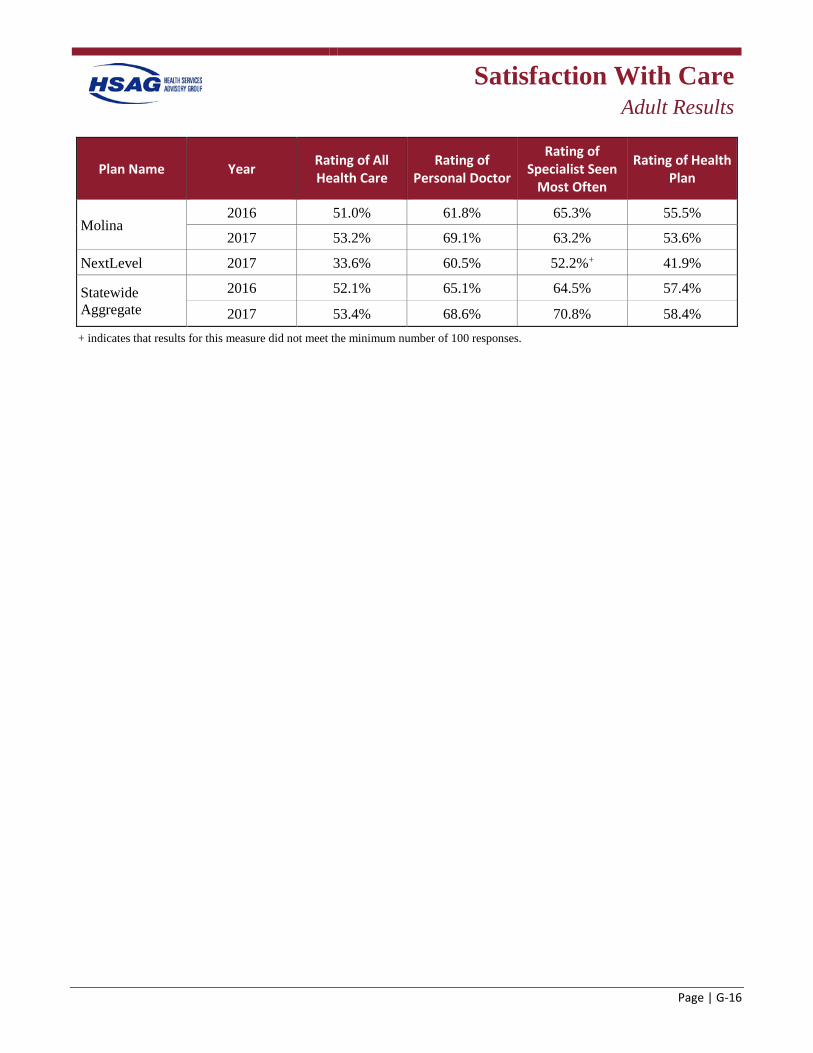
Satisfaction With Care
Adult Results
Page | G-16
Plan Name Year Rating of All Health Care
Rating of Personal Doctor
Rating of Specialist Seen
Most Often
Rating of Health Plan
Molina 2016 51.0% 61.8% 65.3% 55.5%
2017 53.2% 69.1% 63.2% 53.6%
NextLevel 2017 33.6% 60.5% 52.2%+ 41.9%
Statewide Aggregate
2016 52.1% 65.1% 64.5% 57.4%
2017 53.4% 68.6% 70.8% 58.4% + indicates that results for this measure did not meet the minimum number of 100 responses.
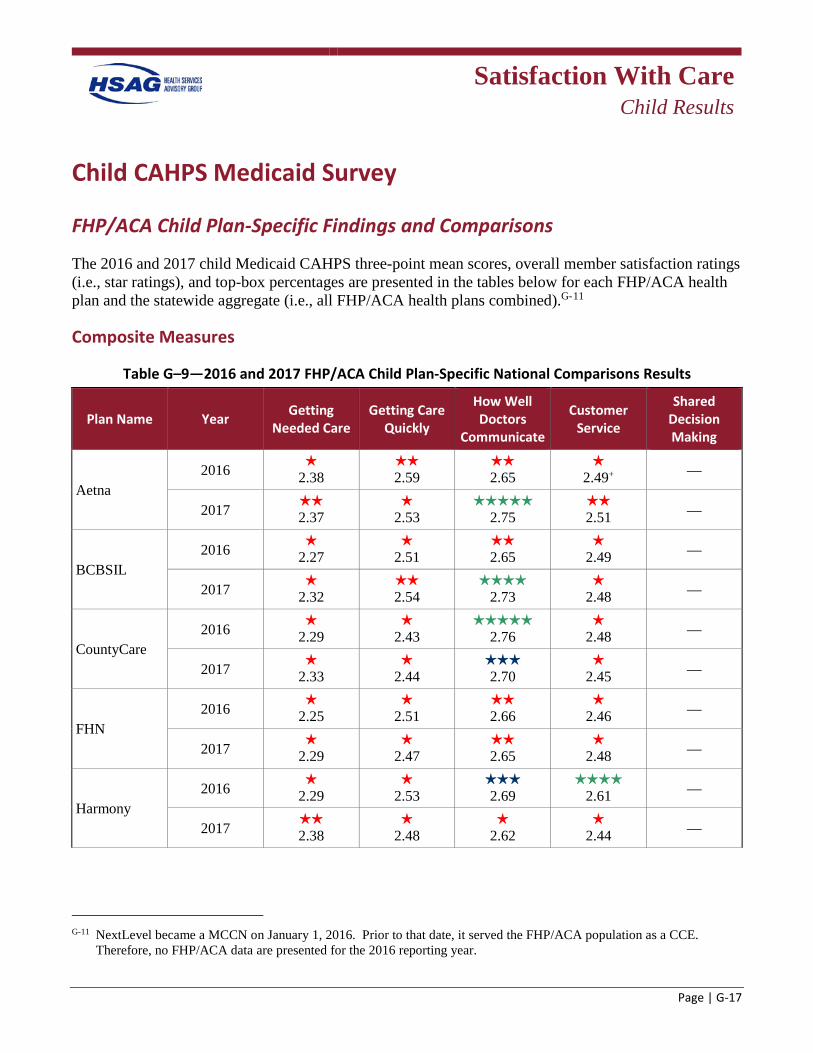
Satisfaction With Care
Child Results
Page | G-17
Child CAHPS Medicaid Survey
FHP/ACA Child Plan-Specific Findings and Comparisons
The 2016 and 2017 child Medicaid CAHPS three-point mean scores, overall member satisfaction ratings (i.e., star ratings), and top-box percentages are presented in the tables below for each FHP/ACA health plan and the statewide aggregate (i.e., all FHP/ACA health plans combined).G-11
Composite Measures
Table G–9—2016 and 2017 FHP/ACA Child Plan-Specific National Comparisons Results
Plan Name Year Getting Needed Care
Getting Care Quickly
How Well Doctors
Communicate
Customer Service
Shared Decision Making
Aetna 2016
2.38 2.59
2.65
2.49+ —
2017 2.37
2.53
h 2.75
2.51 —
BCBSIL 2016
2.27
2.51 2.65
2.49 —
2017 2.32
2.54
2.73
2.48 —
CountyCare 2016
2.29
2.43
2.76
2.48 —
2017 2.33
2.44
2.70
2.45 —
FHN 2016
2.25
2.51 2.66
2.46 —
2017 2.29
2.47
2.65
2.48 —
Harmony 2016
2.29
2.53 2.69
2.61 —
2017 2.38
2.48
2.62
2.44 —
G-11 NextLevel became a MCCN on January 1, 2016. Prior to that date, it served the FHP/ACA population as a CCE.
Therefore, no FHP/ACA data are presented for the 2016 reporting year.
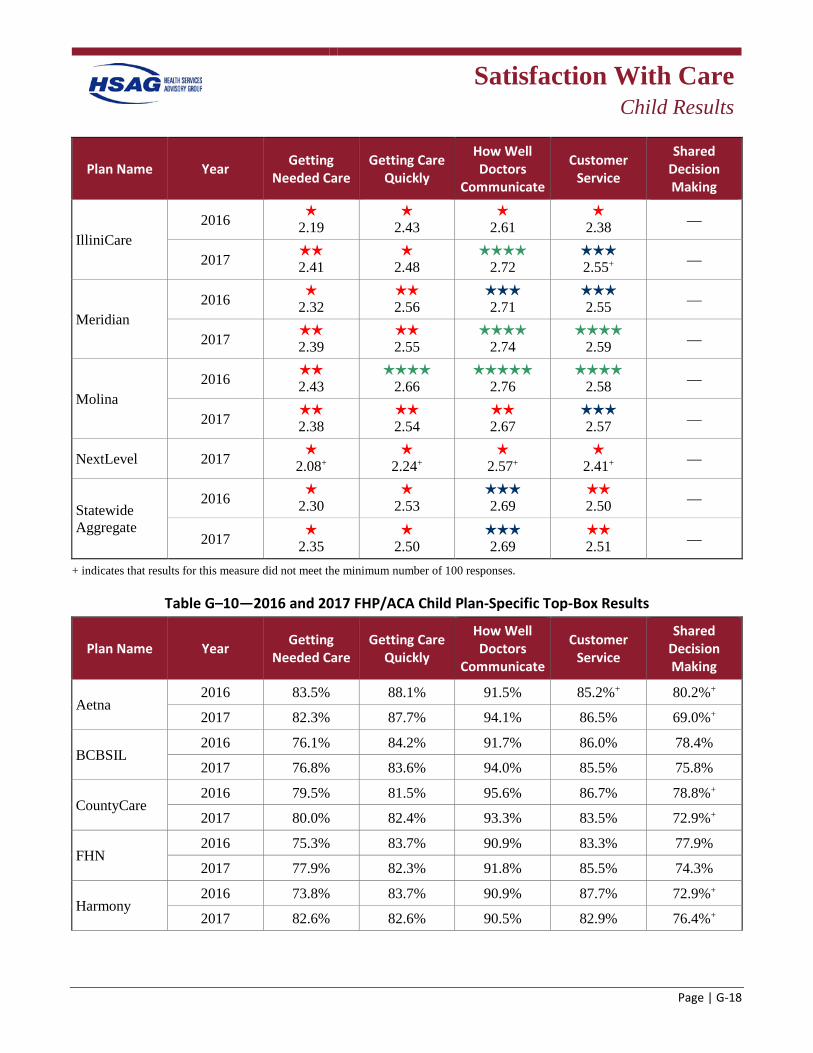
Satisfaction With Care
Child Results
Page | G-18
Plan Name Year Getting Needed Care
Getting Care Quickly
How Well Doctors
Communicate
Customer Service
Shared Decision Making
IlliniCare 2016
2.19
2.43
2.61
2.38 —
2017 2.41
2.48
2.72
2.55+ —
Meridian 2016
2.32 2.56
2.71
2.55 —
2017 2.39
2.55
2.74
2.59 —
Molina 2016
2.43
2.66
2.76
2.58 —
2017 2.38
2.54
2.67
2.57 —
NextLevel 2017 2.08+
2.24+
2.57+
2.41+ —
Statewide Aggregate
2016 2.30
2.53
2.69
2.50 —
2017 2.35
2.50
2.69
2.51 —
+ indicates that results for this measure did not meet the minimum number of 100 responses.
Table G–10—2016 and 2017 FHP/ACA Child Plan-Specific Top-Box Results
Plan Name Year Getting Needed Care
Getting Care Quickly
How Well Doctors
Communicate
Customer Service
Shared Decision Making
Aetna 2016 83.5% 88.1% 91.5% 85.2%+ 80.2%+
2017 82.3% 87.7% 94.1% 86.5% 69.0%+
BCBSIL 2016 76.1% 84.2% 91.7% 86.0% 78.4%
2017 76.8% 83.6% 94.0% 85.5% 75.8%
CountyCare 2016 79.5% 81.5% 95.6% 86.7% 78.8%+
2017 80.0% 82.4% 93.3% 83.5% 72.9%+
FHN 2016 75.3% 83.7% 90.9% 83.3% 77.9%
2017 77.9% 82.3% 91.8% 85.5% 74.3%
Harmony 2016 73.8% 83.7% 90.9% 87.7% 72.9%+
2017 82.6% 82.6% 90.5% 82.9% 76.4%+
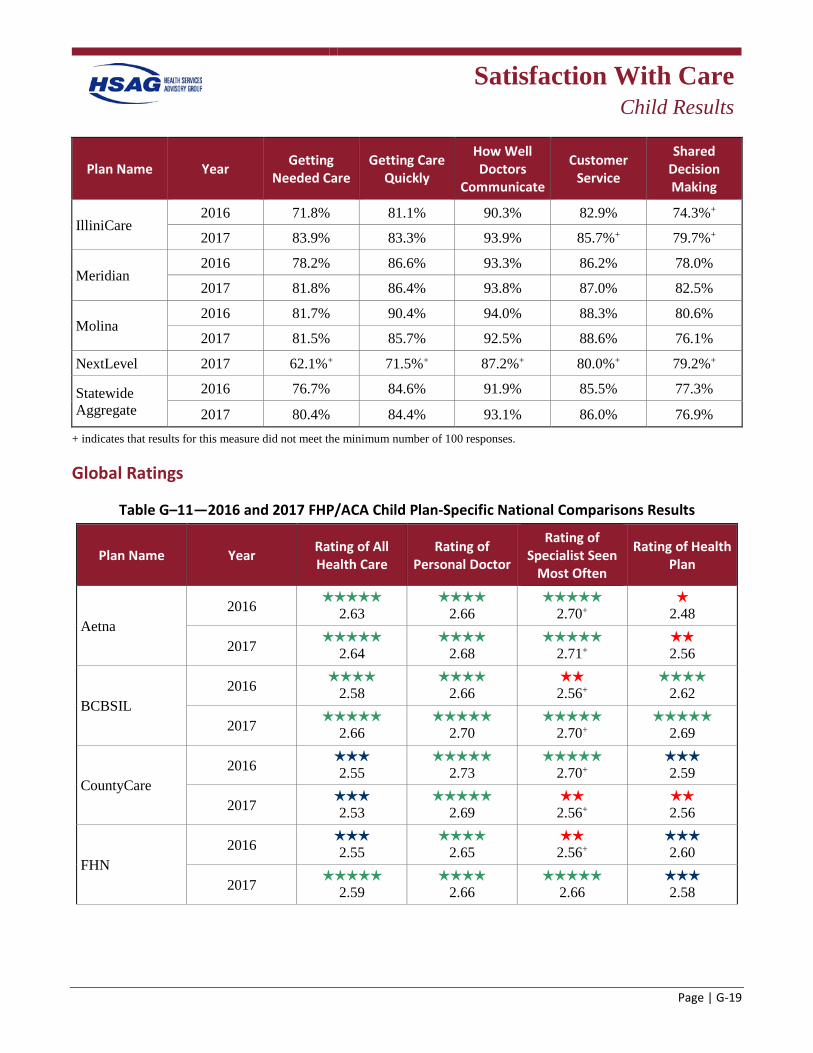
Satisfaction With Care
Child Results
Page | G-19
Plan Name Year Getting Needed Care
Getting Care Quickly
How Well Doctors
Communicate
Customer Service
Shared Decision Making
IlliniCare 2016 71.8% 81.1% 90.3% 82.9% 74.3%+
2017 83.9% 83.3% 93.9% 85.7%+ 79.7%+
Meridian 2016 78.2% 86.6% 93.3% 86.2% 78.0%
2017 81.8% 86.4% 93.8% 87.0% 82.5%
Molina 2016 81.7% 90.4% 94.0% 88.3% 80.6%
2017 81.5% 85.7% 92.5% 88.6% 76.1%
NextLevel 2017 62.1%+ 71.5%+ 87.2%+ 80.0%+ 79.2%+
Statewide Aggregate
2016 76.7% 84.6% 91.9% 85.5% 77.3%
2017 80.4% 84.4% 93.1% 86.0% 76.9% + indicates that results for this measure did not meet the minimum number of 100 responses.
Global Ratings
Table G–11—2016 and 2017 FHP/ACA Child Plan-Specific National Comparisons Results
Plan Name Year Rating of All Health Care
Rating of Personal Doctor
Rating of Specialist Seen
Most Often
Rating of Health Plan
Aetna 2016
2.63
2.66
2.70+ h
2.48
2017 2.64
2.68
2.71+
2.56
BCBSIL 2016
2.58
2.66 2.56+
2.62
2017 2.66
2.70
2.70+
2.69
CountyCare 2016
2.55
2.73
2.70+ 2.59
2017 2.53
2.69
2.56+
2.56
FHN 2016
2.55
2.65 2.56+
2.60
2017 h 2.59
2.66
2.66
2.58
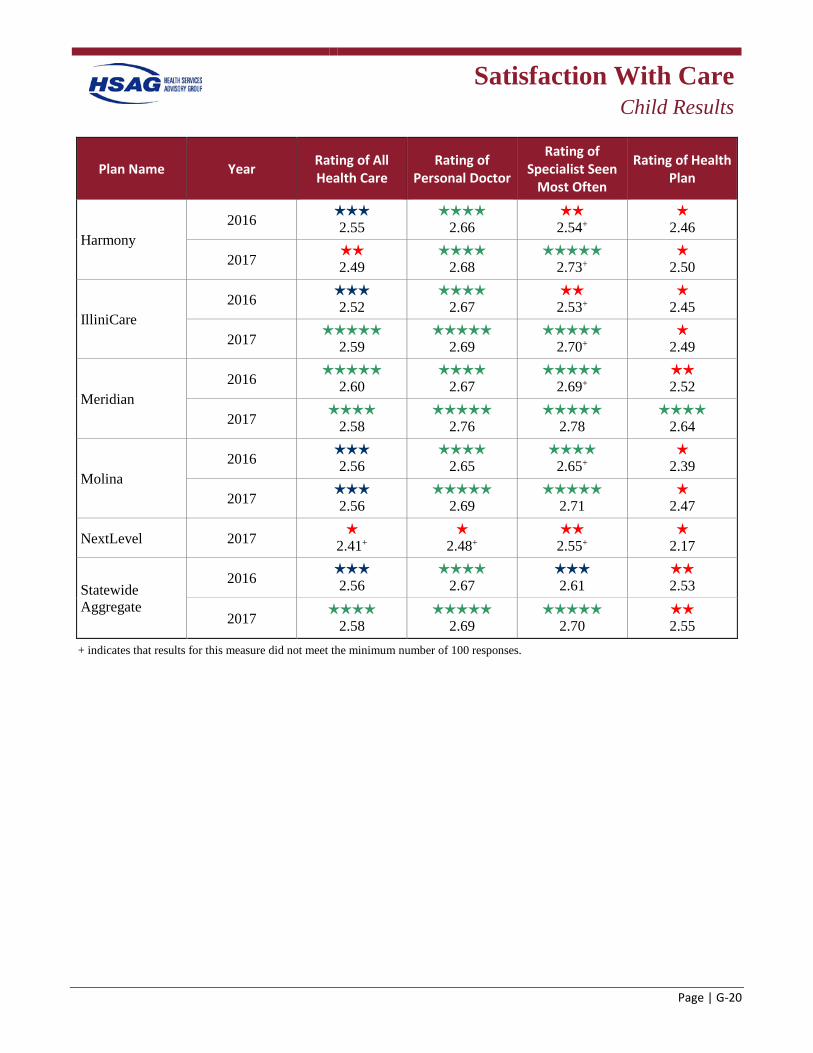
Satisfaction With Care
Child Results
Page | G-20
Plan Name Year Rating of All Health Care
Rating of Personal Doctor
Rating of Specialist Seen
Most Often
Rating of Health Plan
Harmony 2016
2.55
2.66 2.54+
h 2.46
2017 h 2.49
2.68
2.73+
h 2.50
IlliniCare 2016
2.52
2.67 2.53+
h 2.45
2017 2.59
2.69
2.70+
h 2.49
Meridian 2016
2.60
2.67
2.69+ h 2.52
2017 2.58
2.76
2.78
2.64
Molina 2016
2.56
2.65
2.65+ h
2.39
2017 2.56
2.69
2.71
h 2.47
NextLevel 2017 h 2.41+
h 2.48+
2.55+
h 2.17
Statewide Aggregate
2016 2.56
2.67
2.61
2.53
2017 2.58
2.69
2.70
2.55
+ indicates that results for this measure did not meet the minimum number of 100 responses.
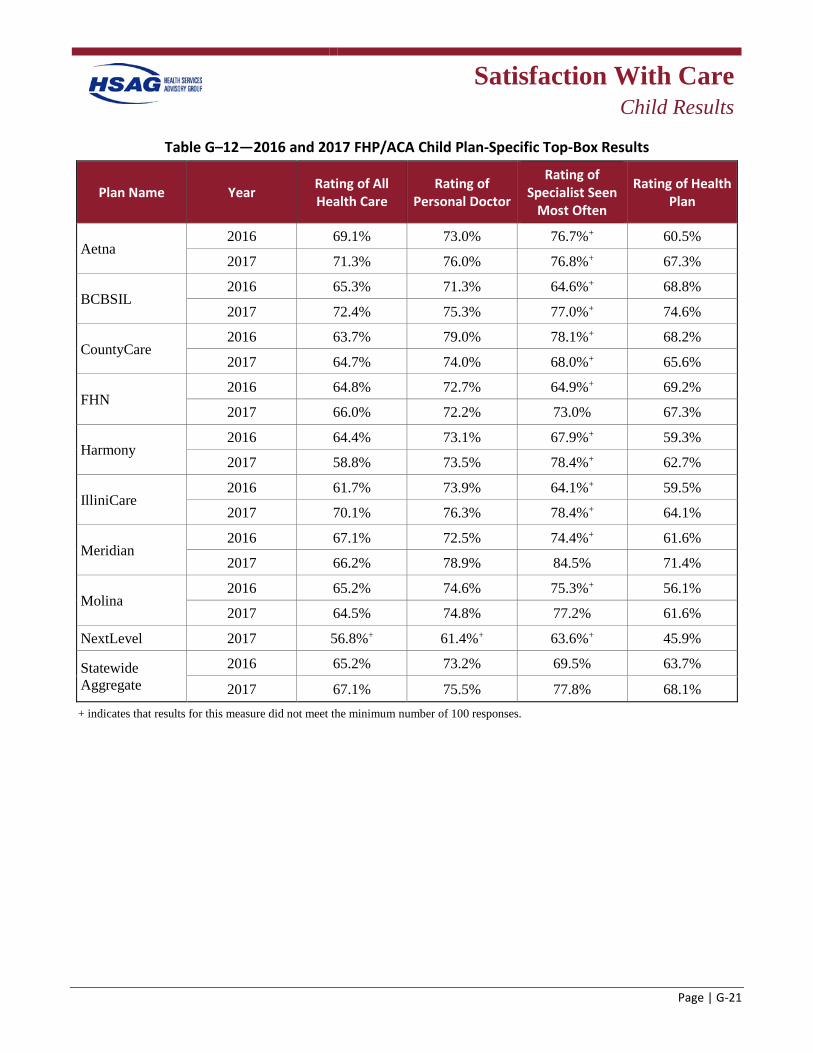
Satisfaction With Care
Child Results
Page | G-21
Table G–12—2016 and 2017 FHP/ACA Child Plan-Specific Top-Box Results
Plan Name Year Rating of All Health Care
Rating of Personal Doctor
Rating of Specialist Seen
Most Often
Rating of Health Plan
Aetna 2016 69.1% 73.0% 76.7%+ 60.5%
2017 71.3% 76.0% 76.8%+ 67.3%
BCBSIL 2016 65.3% 71.3% 64.6%+ 68.8%
2017 72.4% 75.3% 77.0%+ 74.6%
CountyCare 2016 63.7% 79.0% 78.1%+ 68.2%
2017 64.7% 74.0% 68.0%+ 65.6%
FHN 2016 64.8% 72.7% 64.9%+ 69.2%
2017 66.0% 72.2% 73.0% 67.3%
Harmony 2016 64.4% 73.1% 67.9%+ 59.3%
2017 58.8% 73.5% 78.4%+ 62.7%
IlliniCare 2016 61.7% 73.9% 64.1%+ 59.5%
2017 70.1% 76.3% 78.4%+ 64.1%
Meridian 2016 67.1% 72.5% 74.4%+ 61.6%
2017 66.2% 78.9% 84.5% 71.4%
Molina 2016 65.2% 74.6% 75.3%+ 56.1%
2017 64.5% 74.8% 77.2% 61.6%
NextLevel 2017 56.8%+ 61.4%+ 63.6%+ 45.9%
Statewide Aggregate
2016 65.2% 73.2% 69.5% 63.7%
2017 67.1% 75.5% 77.8% 68.1% + indicates that results for this measure did not meet the minimum number of 100 responses.
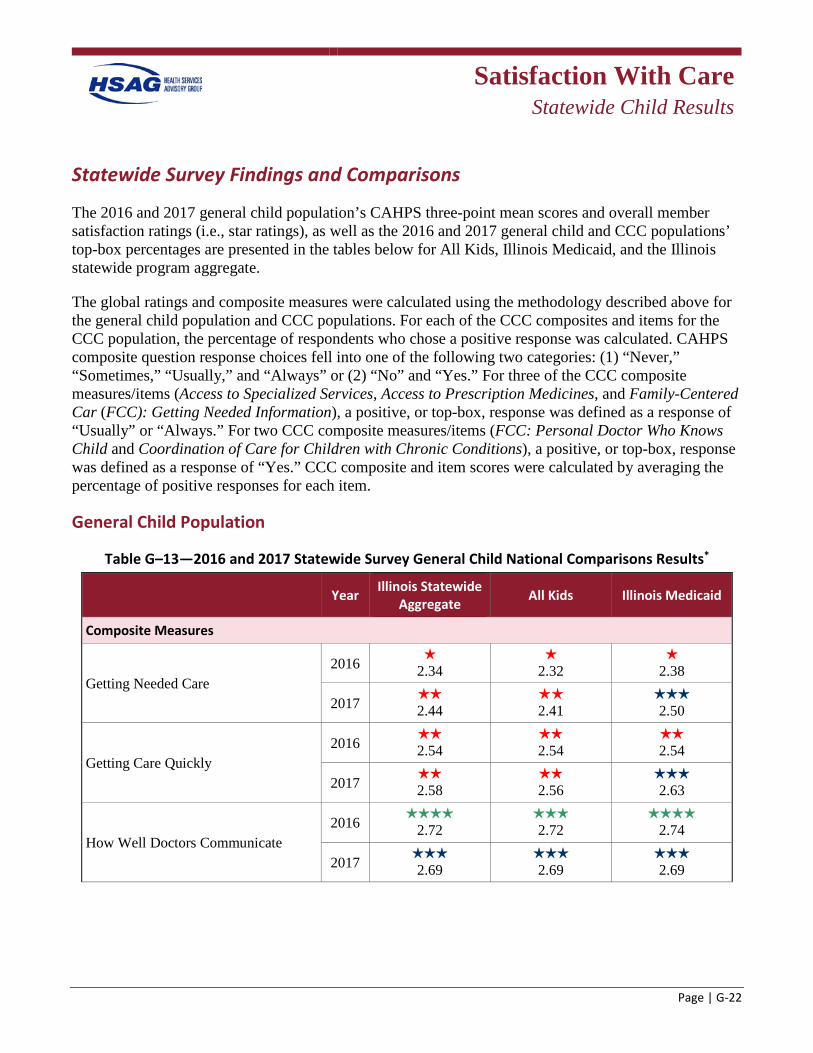
Satisfaction With Care
Statewide Child Results
Page | G-22
Statewide Survey Findings and Comparisons
The 2016 and 2017 general child population’s CAHPS three-point mean scores and overall member satisfaction ratings (i.e., star ratings), as well as the 2016 and 2017 general child and CCC populations’ top-box percentages are presented in the tables below for All Kids, Illinois Medicaid, and the Illinois statewide program aggregate.
The global ratings and composite measures were calculated using the methodology described above for the general child population and CCC populations. For each of the CCC composites and items for the CCC population, the percentage of respondents who chose a positive response was calculated. CAHPS composite question response choices fell into one of the following two categories: (1) “Never,” “Sometimes,” “Usually,” and “Always” or (2) “No” and “Yes.” For three of the CCC composite measures/items (Access to Specialized Services, Access to Prescription Medicines, and Family-Centered Car (FCC): Getting Needed Information), a positive, or top-box, response was defined as a response of “Usually” or “Always.” For two CCC composite measures/items (FCC: Personal Doctor Who Knows Child and Coordination of Care for Children with Chronic Conditions), a positive, or top-box, response was defined as a response of “Yes.” CCC composite and item scores were calculated by averaging the percentage of positive responses for each item.
General Child Population
Table G–13—2016 and 2017 Statewide Survey General Child National Comparisons Results*
Year Illinois Statewide Aggregate All Kids Illinois Medicaid
Composite Measures
Getting Needed Care 2016 h
2.34 h
2.32 h
2.38
2017 2.44
h h 2.41
2.50
Getting Care Quickly 2016
2.54 2.54
2.54
2017 2.58
2.56
2.63
How Well Doctors Communicate 2016
2.72 2.72
2.74
2017 2.69
h 2.69
2.69
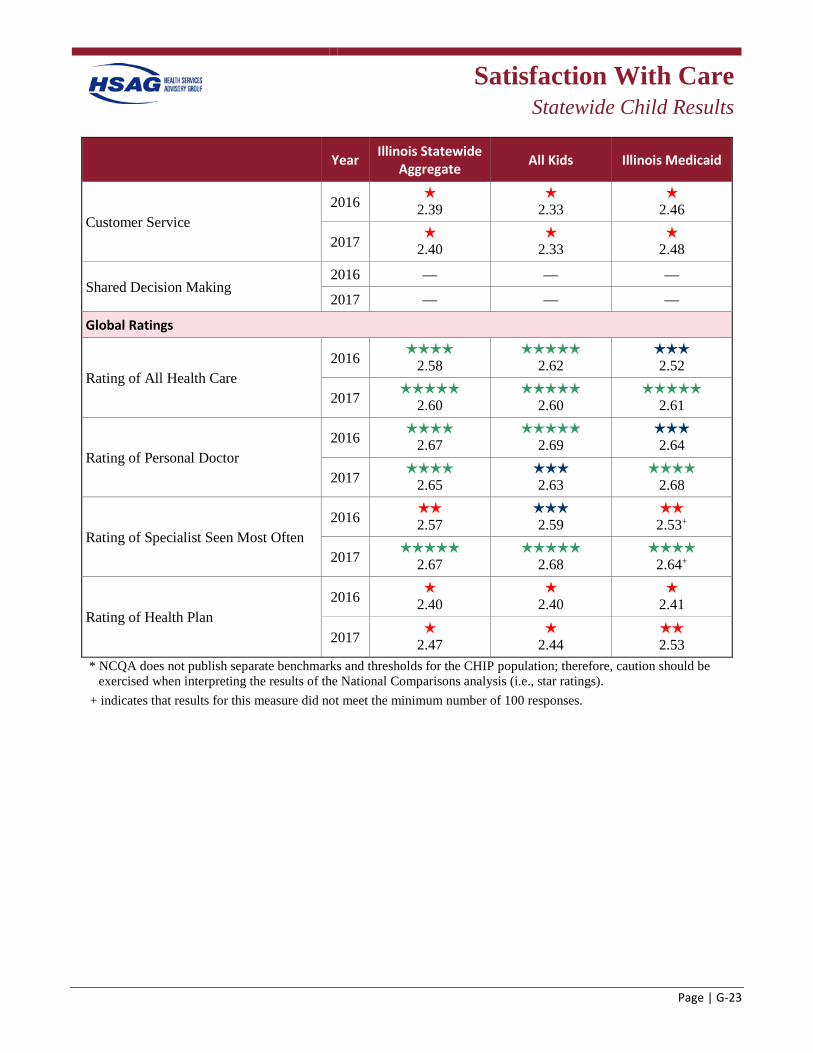
Satisfaction With Care
Statewide Child Results
Page | G-23
Year Illinois Statewide Aggregate All Kids Illinois Medicaid
Customer Service 2016 h
2.39 h
2.33 h
2.46
2017 h 2.40
h 2.33
h 2.48
Shared Decision Making 2016 — — —
2017 — — —
Global Ratings
Rating of All Health Care 2016
2.58
2.62 2.52
2017 2.60
2.60
2.61
Rating of Personal Doctor 2016
2.67
2.69 2.64
2017 2.65
h 2.63
2.68
Rating of Specialist Seen Most Often 2016
2.57 2.59
2.53+
2017 2.67
h 2.68
2.64+
Rating of Health Plan 2016 h
2.40 h
2.40 h
2.41
2017 h 2.47
h 2.44
2.53
* NCQA does not publish separate benchmarks and thresholds for the CHIP population; therefore, caution should be exercised when interpreting the results of the National Comparisons analysis (i.e., star ratings).
+ indicates that results for this measure did not meet the minimum number of 100 responses.
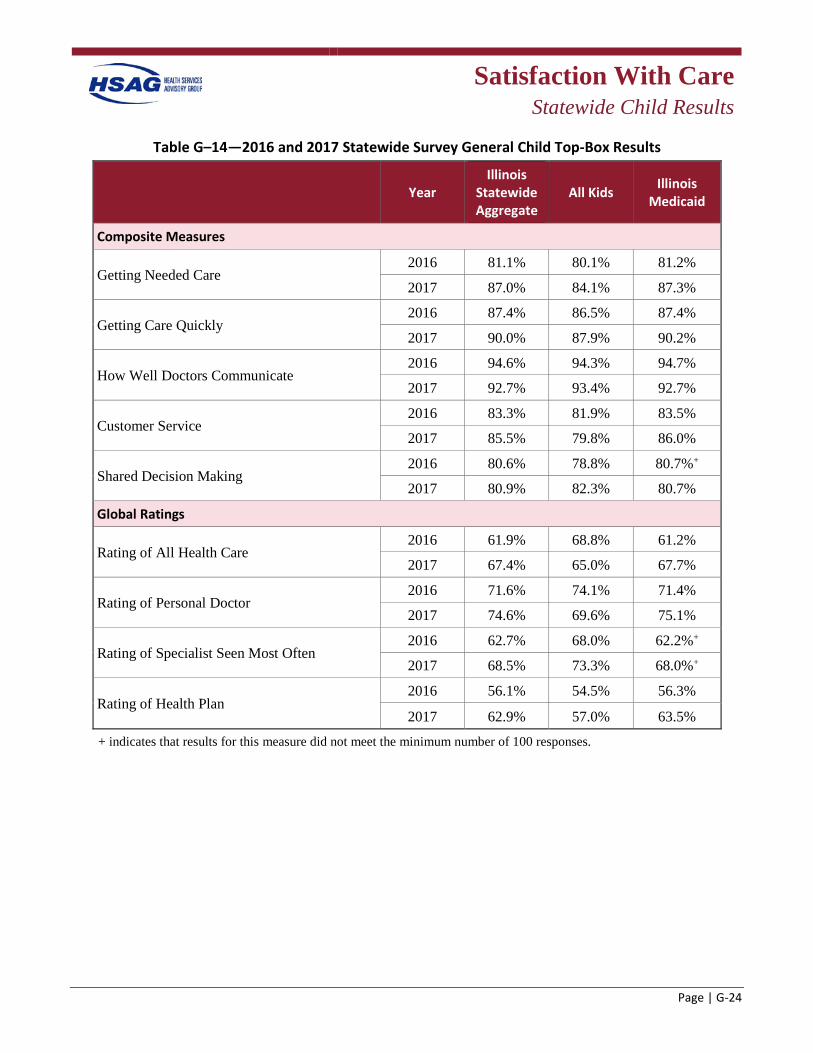
Satisfaction With Care
Statewide Child Results
Page | G-24
Table G–14—2016 and 2017 Statewide Survey General Child Top-Box Results
Year Illinois
Statewide Aggregate
All Kids Illinois Medicaid
Composite Measures
Getting Needed Care 2016 81.1% 80.1% 81.2%
2017 87.0% 84.1% 87.3%
Getting Care Quickly 2016 87.4% 86.5% 87.4%
2017 90.0% 87.9% 90.2%
How Well Doctors Communicate 2016 94.6% 94.3% 94.7%
2017 92.7% 93.4% 92.7%
Customer Service 2016 83.3% 81.9% 83.5%
2017 85.5% 79.8% 86.0%
Shared Decision Making 2016 80.6% 78.8% 80.7%+
2017 80.9% 82.3% 80.7%
Global Ratings
Rating of All Health Care 2016 61.9% 68.8% 61.2%
2017 67.4% 65.0% 67.7%
Rating of Personal Doctor 2016 71.6% 74.1% 71.4%
2017 74.6% 69.6% 75.1%
Rating of Specialist Seen Most Often 2016 62.7% 68.0% 62.2%+
2017 68.5% 73.3% 68.0%+
Rating of Health Plan 2016 56.1% 54.5% 56.3%
2017 62.9% 57.0% 63.5%
+ indicates that results for this measure did not meet the minimum number of 100 responses.
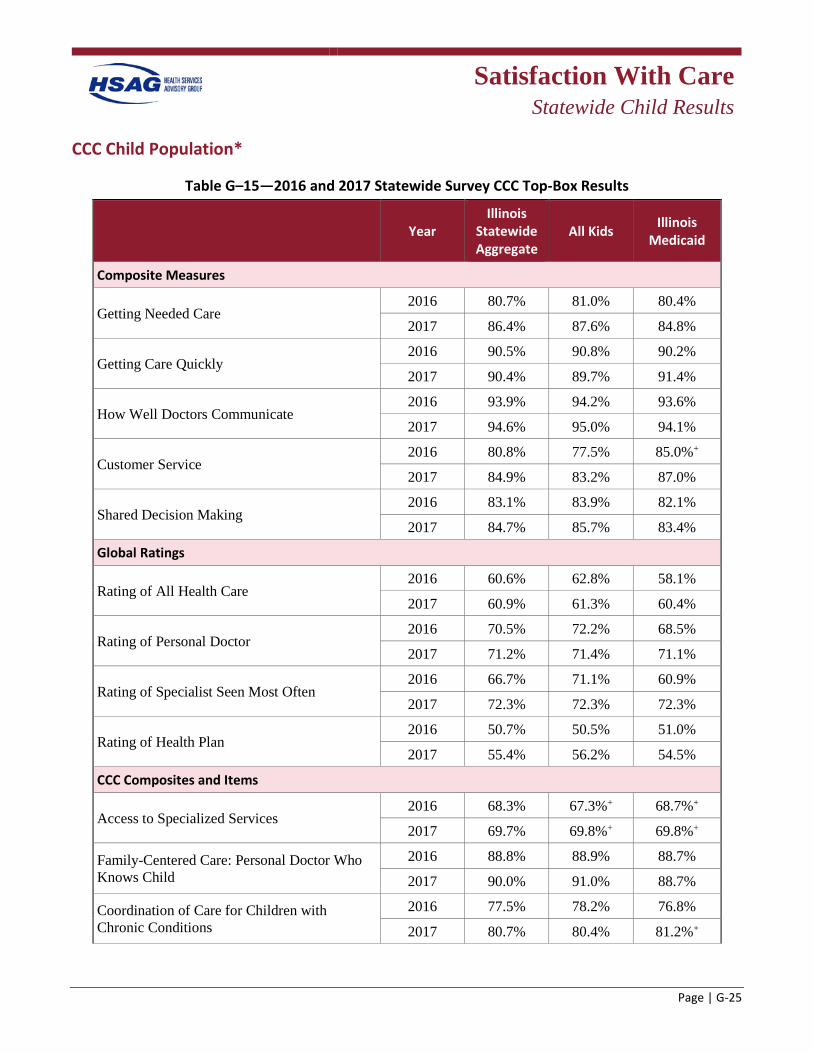
Satisfaction With Care
Statewide Child Results
Page | G-25
CCC Child Population*
Table G–15—2016 and 2017 Statewide Survey CCC Top-Box Results
Year Illinois
Statewide Aggregate
All Kids Illinois Medicaid
Composite Measures
Getting Needed Care 2016 80.7% 81.0% 80.4%
2017 86.4% 87.6% 84.8%
Getting Care Quickly 2016 90.5% 90.8% 90.2%
2017 90.4% 89.7% 91.4%
How Well Doctors Communicate 2016 93.9% 94.2% 93.6%
2017 94.6% 95.0% 94.1%
Customer Service 2016 80.8% 77.5% 85.0%+
2017 84.9% 83.2% 87.0%
Shared Decision Making 2016 83.1% 83.9% 82.1%
2017 84.7% 85.7% 83.4%
Global Ratings
Rating of All Health Care 2016 60.6% 62.8% 58.1%
2017 60.9% 61.3% 60.4%
Rating of Personal Doctor 2016 70.5% 72.2% 68.5%
2017 71.2% 71.4% 71.1%
Rating of Specialist Seen Most Often 2016 66.7% 71.1% 60.9%
2017 72.3% 72.3% 72.3%
Rating of Health Plan 2016 50.7% 50.5% 51.0%
2017 55.4% 56.2% 54.5%
CCC Composites and Items
Access to Specialized Services 2016 68.3% 67.3%+ 68.7%+
2017 69.7% 69.8%+ 69.8%+
Family-Centered Care: Personal Doctor Who Knows Child
2016 88.8% 88.9% 88.7%
2017 90.0% 91.0% 88.7%
Coordination of Care for Children with Chronic Conditions
2016 77.5% 78.2% 76.8%
2017 80.7% 80.4% 81.2%+
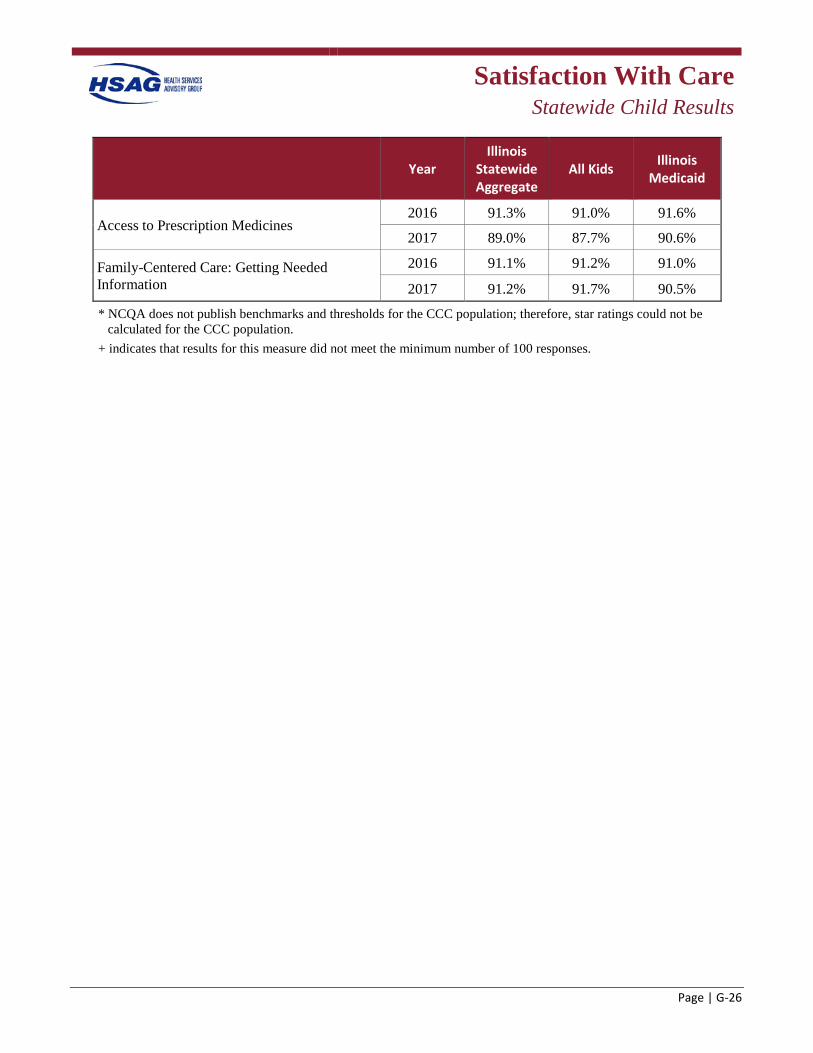
Satisfaction With Care
Statewide Child Results
Page | G-26
Year Illinois
Statewide Aggregate
All Kids Illinois Medicaid
Access to Prescription Medicines 2016 91.3% 91.0% 91.6%
2017 89.0% 87.7% 90.6%
Family-Centered Care: Getting Needed Information
2016 91.1% 91.2% 91.0%
2017 91.2% 91.7% 90.5%
* NCQA does not publish benchmarks and thresholds for the CCC population; therefore, star ratings could not be calculated for the CCC population.
+ indicates that results for this measure did not meet the minimum number of 100 responses.

Page | H-1
Appendix H. Performance Improvement Projects Methodology and Results
Performance Improvement Projects
Methodology
Page | H-2
Objective To evaluate and validate the health plans’ PIPs, Health Services Advisory Group, Inc. (HSAG), used the Department of Health and Human Services, Centers for Medicare & Medicaid Services (CMS) publication, EQR Protocol 3: Validating Performance Improvement Projects (PIPs): A Mandatory Protocol for External Quality Review (EQR), Version 2.0, September 2012.H-1 The primary objective of PIP validation is to determine each health plan’s compliance with requirements set forth in the code of federal regulations (CFR) at 42 §438.330.
Conducting the Review For PIPs to achieve real improvement in care and member satisfaction, as well as confidence in the reported results, PIPs must be designed, conducted, and reported using a sound methodology. At a minimum, each PIP must include a baseline and two annual remeasurements. The remeasurement study indicator outcomes were compared to the baseline to determine if real and sustained improvement was achieved.
HSAG evaluates the following components of the quality improvement process:
1. The technical structure of the PIPs to ensure the health plan designed, conducted, and reported PIPs using sound methodology consistent with the CMS protocol for conducting PIPs. HSAG’s review determined whether a PIP could reliably measure outcomes. Successful execution of this component ensures that reported PIP results are accurate and capable of measuring real and sustained improvement.
2. The outcomes of the PIPs. Once designed, a PIP’s effectiveness in improving outcomes depends on the systematic identification of barriers and the subsequent development of relevant interventions. Evaluation of each PIP’s outcomes determined whether the health plan improved its rates through the implementation of effective processes (i.e., barrier analyses, intervention design, and evaluation of results) and, through these processes, achieved statistically significant improvement over the baseline rate.
Technical Methods of Data Collection and Analysis
Using the CMS protocol, HSAG, in collaboration with HFS, developed the PIP Summary Form, which each health plan completed and submitted to HSAG for validation. The PIP Summary Form standardized the process for submitting information regarding PIPs and ensured that the projects
H-1 Department of Health and Human Services, Centers for Medicare & Medicaid Services. EQR Protocol 3: Validating
Performance Improvement Projects (PIPs): A Mandatory Protocol for External Quality Review (EQR), Version 2.0, September 2012. Available at: http://www.medicaid.gov/Medicaid-CHIP-Program-Information/By-Topics/Quality-of-Care/Quality-of-Care-External-Quality-Review.html. Accessed on: Feb 19, 2013.
Performance Improvement Projects
Methodology
Page | H-3
addressed CMS requirements. HSAG, with input and approval from HFS, developed a PIP Validation Tool to ensure uniform validation of PIPs. Using this tool, HSAG reviewed each of the PIPs for the following 10 CMS PIP protocol activities:
• Activity I. Select the Study Topic • Activity II. Define the Study Question(s) • Activity III. Select the Study Indicator(s) • Activity IV. Use a Representative and Generalizable Study Population • Activity V. Use Sound Sampling Techniques (if Sampling Was Used) • Activity VI. Reliably Collect Data • Activity VII. Analyze and Interpret Study Results • Activity VIII. Implement Intervention and Improvement Strategies • Activity IX. Assess for Real Improvement • Activity X. Assess for Sustained Improvement
HSAG calculated the percentage score of evaluation elements met for each health plan by dividing the total elements Met by the total elements Met, Partially Met, and Not Met. Any evaluation element that received a Not Applicable or Not Assessed designation was not included in the overall score. While all elements are important in assessing a PIP, HSAG designated some elements as critical to producing valid and reliable results and for demonstrating high confidence in the PIP findings. These critical elements must be Met for the PIP to be in compliance. If one critical evaluation element receives a Partially Met score, the overall PIP validation status will be Partially Met. Similarly, if one critical evaluation element receives a Not Met score, the overall PIP validation status will be Not Met. HSAG’s PIP Validation Tool also provides, for informational purposes, the percentage of critical elements met, which is calculated by dividing the total Met critical elements by the total critical elements Met, Partially Met, and Not Met.
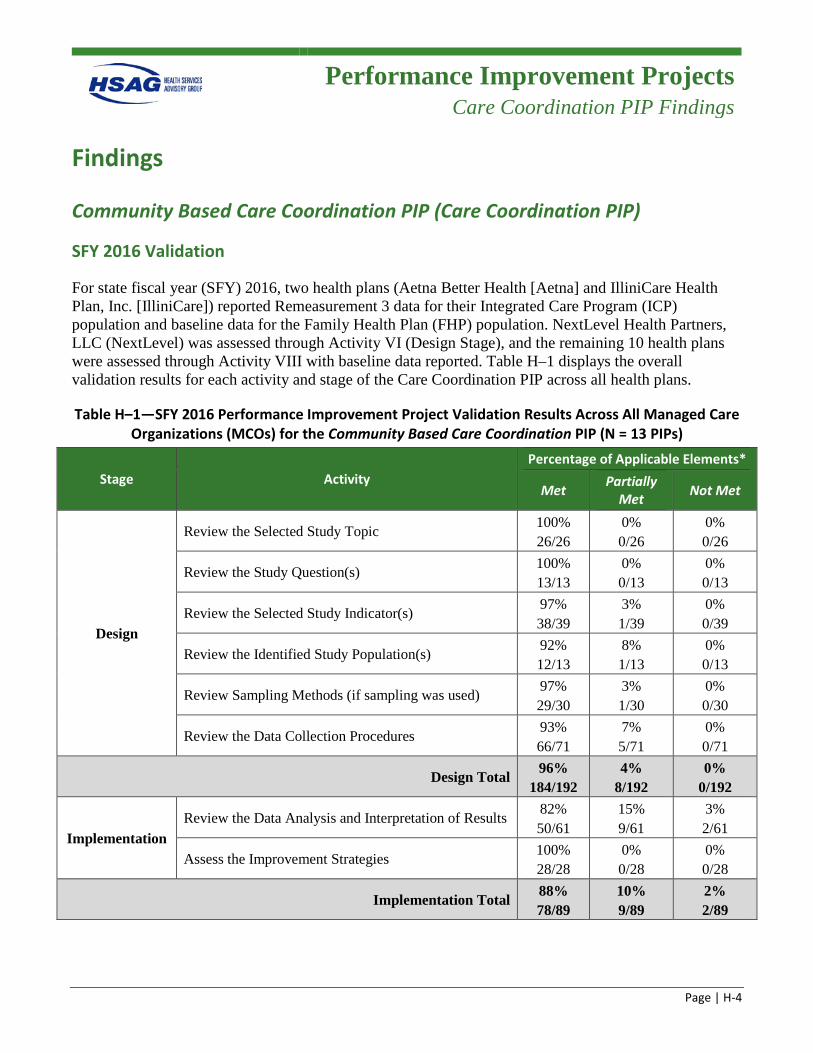
Performance Improvement Projects
Care Coordination PIP Findings
Page | H-4
Findings
Community Based Care Coordination PIP (Care Coordination PIP)
SFY 2016 Validation
For state fiscal year (SFY) 2016, two health plans (Aetna Better Health [Aetna] and IlliniCare Health Plan, Inc. [IlliniCare]) reported Remeasurement 3 data for their Integrated Care Program (ICP) population and baseline data for the Family Health Plan (FHP) population. NextLevel Health Partners, LLC (NextLevel) was assessed through Activity VI (Design Stage), and the remaining 10 health plans were assessed through Activity VIII with baseline data reported. Table H–1 displays the overall validation results for each activity and stage of the Care Coordination PIP across all health plans.
Table H–1—SFY 2016 Performance Improvement Project Validation Results Across All Managed Care Organizations (MCOs) for the Community Based Care Coordination PIP (N = 13 PIPs)
Stage Activity Percentage of Applicable Elements*
Met Partially Met Not Met
Design
Review the Selected Study Topic 100% 26/26
0% 0/26
0% 0/26
Review the Study Question(s) 100% 13/13
0% 0/13
0% 0/13
Review the Selected Study Indicator(s) 97% 38/39
3% 1/39
0% 0/39
Review the Identified Study Population(s) 92% 12/13
8% 1/13
0% 0/13
Review Sampling Methods (if sampling was used) 97% 29/30
3% 1/30
0% 0/30
Review the Data Collection Procedures 93% 66/71
7% 5/71
0% 0/71
Design Total 96% 184/192
4% 8/192
0% 0/192
Implementation Review the Data Analysis and Interpretation of Results 82%
50/61 15% 9/61
3% 2/61
Assess the Improvement Strategies 100% 28/28
0% 0/28
0% 0/28
Implementation Total 88% 78/89
10% 9/89
2% 2/89
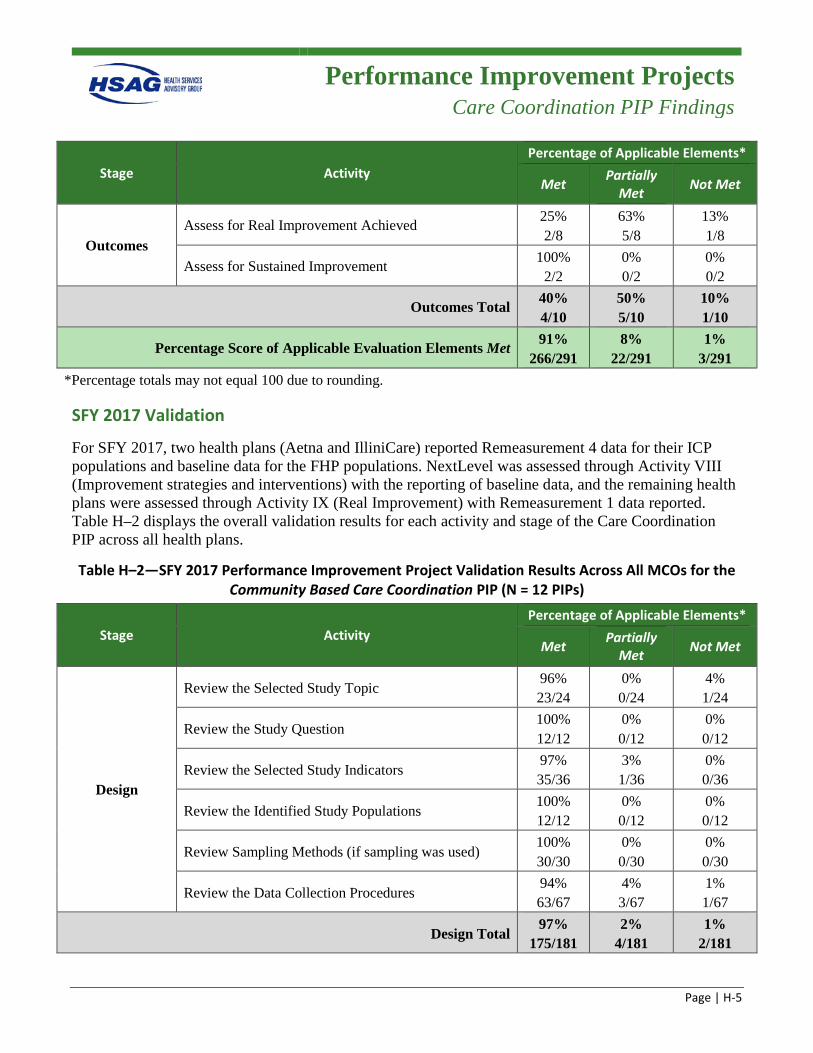
Performance Improvement Projects
Care Coordination PIP Findings
Page | H-5
Stage Activity Percentage of Applicable Elements*
Met Partially Met Not Met
Outcomes Assess for Real Improvement Achieved 25%
2/8 63% 5/8
13% 1/8
Assess for Sustained Improvement 100% 2/2
0% 0/2
0% 0/2
Outcomes Total 40% 4/10
50% 5/10
10% 1/10
Percentage Score of Applicable Evaluation Elements Met 91% 266/291
8% 22/291
1% 3/291
*Percentage totals may not equal 100 due to rounding.
SFY 2017 Validation
For SFY 2017, two health plans (Aetna and IlliniCare) reported Remeasurement 4 data for their ICP populations and baseline data for the FHP populations. NextLevel was assessed through Activity VIII (Improvement strategies and interventions) with the reporting of baseline data, and the remaining health plans were assessed through Activity IX (Real Improvement) with Remeasurement 1 data reported. Table H–2 displays the overall validation results for each activity and stage of the Care Coordination PIP across all health plans.
Table H–2—SFY 2017 Performance Improvement Project Validation Results Across All MCOs for the Community Based Care Coordination PIP (N = 12 PIPs)
Stage Activity Percentage of Applicable Elements*
Met Partially Met Not Met
Design
Review the Selected Study Topic 96% 23/24
0% 0/24
4% 1/24
Review the Study Question 100% 12/12
0% 0/12
0% 0/12
Review the Selected Study Indicators 97% 35/36
3% 1/36
0% 0/36
Review the Identified Study Populations 100% 12/12
0% 0/12
0% 0/12
Review Sampling Methods (if sampling was used) 100% 30/30
0% 0/30
0% 0/30
Review the Data Collection Procedures 94% 63/67
4% 3/67
1% 1/67
Design Total 97%
175/181 2%
4/181 1%
2/181
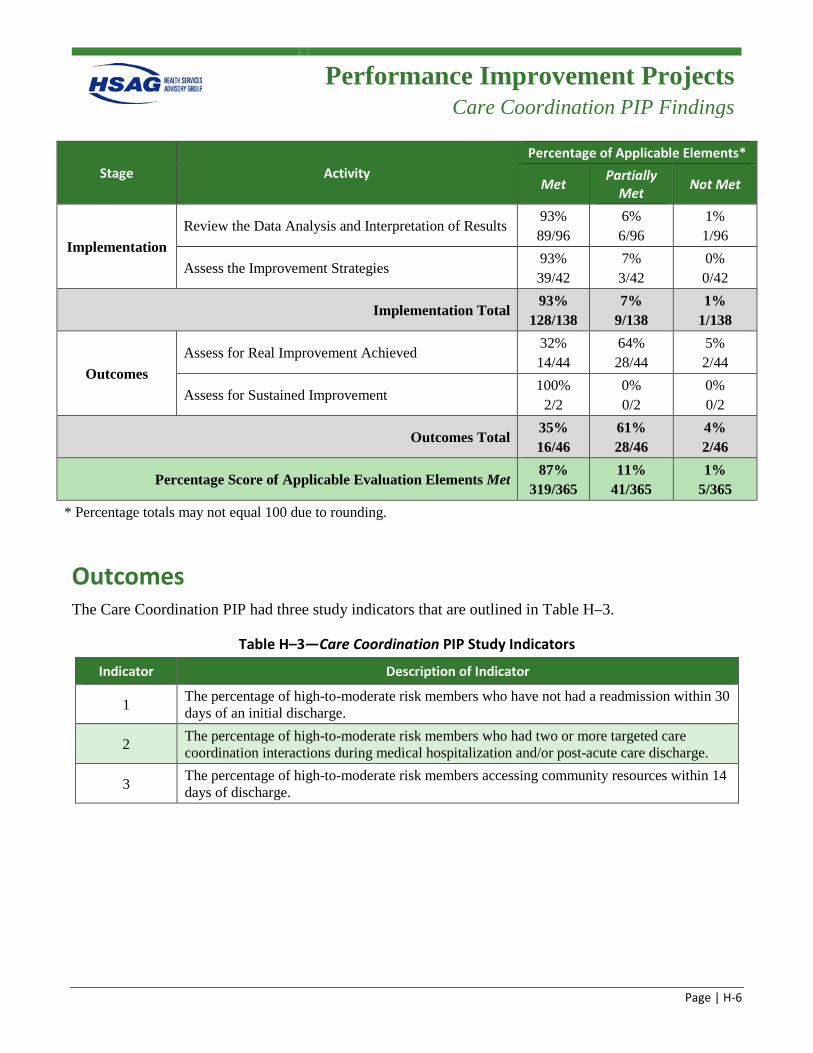
Performance Improvement Projects
Care Coordination PIP Findings
Page | H-6
Stage Activity Percentage of Applicable Elements*
Met Partially Met Not Met
Implementation Review the Data Analysis and Interpretation of Results
93% 89/96
6% 6/96
1% 1/96
Assess the Improvement Strategies 93% 39/42
7% 3/42
0% 0/42
Implementation Total 93%
128/138 7%
9/138 1%
1/138
Outcomes Assess for Real Improvement Achieved
32% 14/44
64% 28/44
5% 2/44
Assess for Sustained Improvement 100%
2/2 0% 0/2
0% 0/2
Outcomes Total 35% 16/46
61% 28/46
4% 2/46
Percentage Score of Applicable Evaluation Elements Met 87%
319/365 11%
41/365 1%
5/365 * Percentage totals may not equal 100 due to rounding.
Outcomes The Care Coordination PIP had three study indicators that are outlined in Table H–3.
Table H–3—Care Coordination PIP Study Indicators
Indicator Description of Indicator
1 The percentage of high-to-moderate risk members who have not had a readmission within 30 days of an initial discharge.
2 The percentage of high-to-moderate risk members who had two or more targeted care coordination interactions during medical hospitalization and/or post-acute care discharge.
3 The percentage of high-to-moderate risk members accessing community resources within 14 days of discharge.
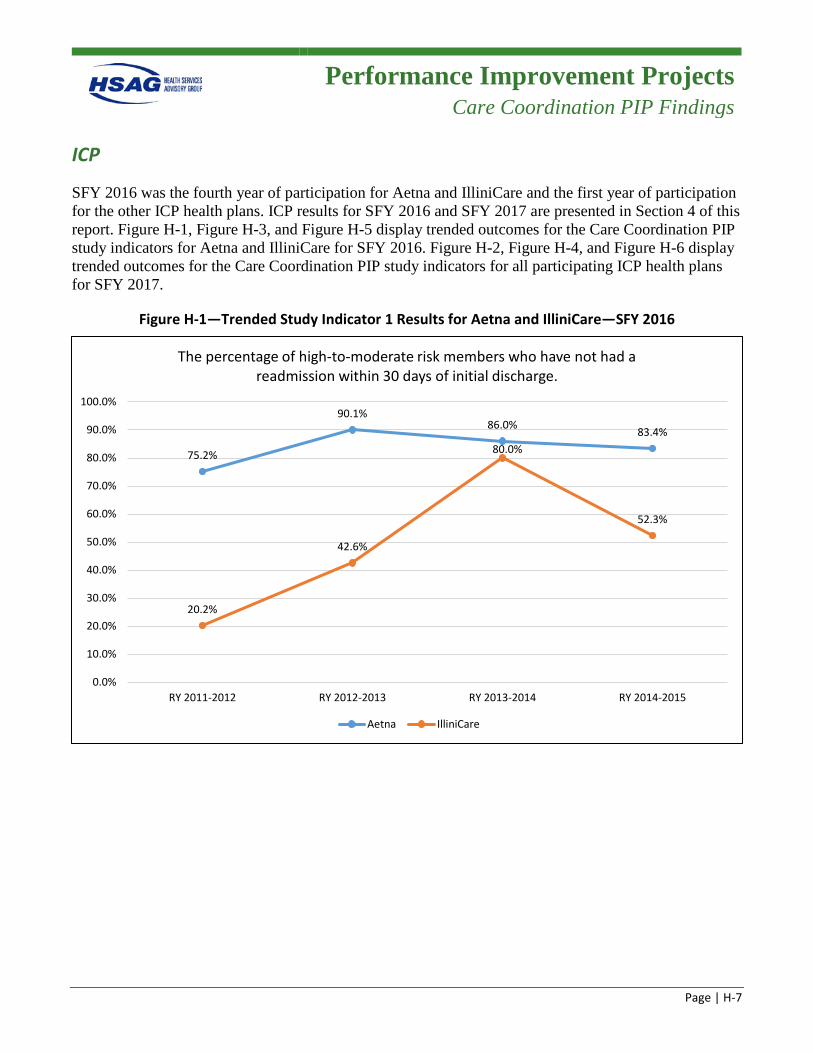
Performance Improvement Projects
Care Coordination PIP Findings
Page | H-7
ICP
SFY 2016 was the fourth year of participation for Aetna and IlliniCare and the first year of participation for the other ICP health plans. ICP results for SFY 2016 and SFY 2017 are presented in Section 4 of this report. Figure H-1, Figure H-3, and Figure H-5 display trended outcomes for the Care Coordination PIP study indicators for Aetna and IlliniCare for SFY 2016. Figure H-2, Figure H-4, and Figure H-6 display trended outcomes for the Care Coordination PIP study indicators for all participating ICP health plans for SFY 2017.
Figure H-1—Trended Study Indicator 1 Results for Aetna and IlliniCare—SFY 2016
75.2%
90.1%86.0% 83.4%
20.2%
42.6%
80.0%
52.3%
0.0%
10.0%
20.0%
30.0%
40.0%
50.0%
60.0%
70.0%
80.0%
90.0%
100.0%
RY 2011-2012 RY 2012-2013 RY 2013-2014 RY 2014-2015
The percentage of high-to-moderate risk members who have not had a readmission within 30 days of initial discharge.
Aetna IlliniCare
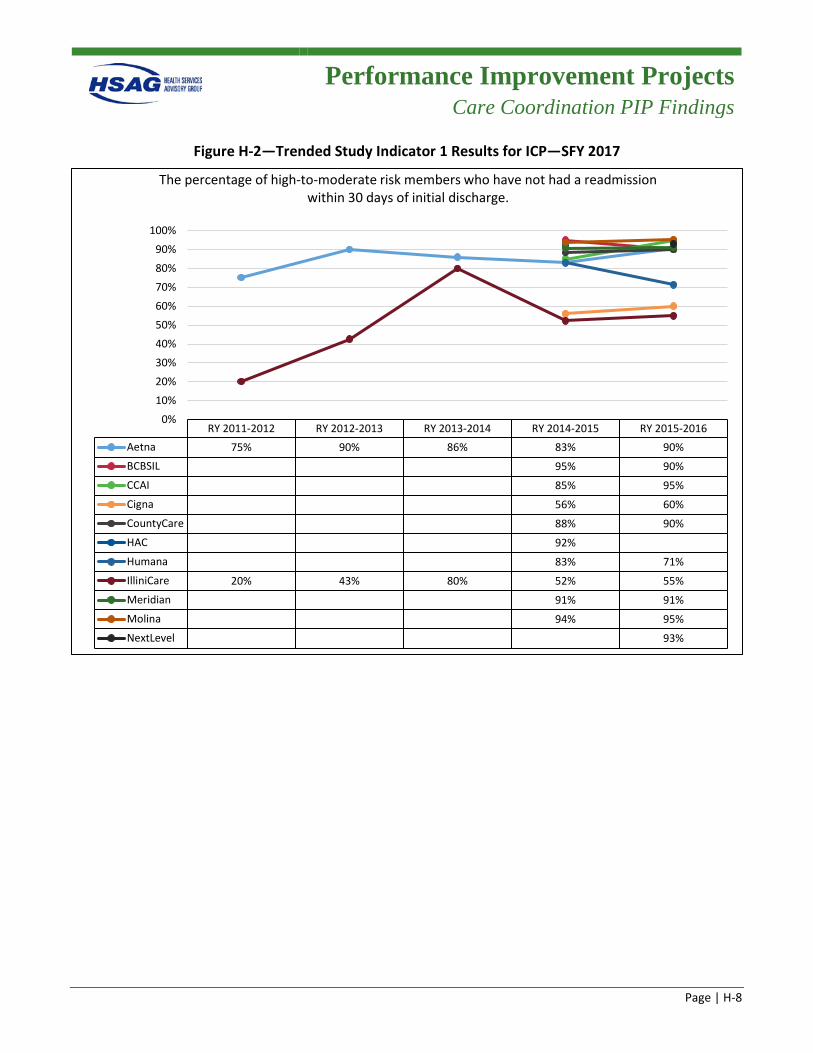
Performance Improvement Projects
Care Coordination PIP Findings
Page | H-8
Figure H-2—Trended Study Indicator 1 Results for ICP—SFY 2017
RY 2011-2012 RY 2012-2013 RY 2013-2014 RY 2014-2015 RY 2015-2016Aetna 75% 90% 86% 83% 90%BCBSIL 95% 90%CCAI 85% 95%Cigna 56% 60%CountyCare 88% 90%HAC 92%Humana 83% 71%IlliniCare 20% 43% 80% 52% 55%Meridian 91% 91%Molina 94% 95%NextLevel 93%
0%10%20%30%40%50%60%70%80%90%
100%
The percentage of high-to-moderate risk members who have not had a readmission within 30 days of initial discharge.
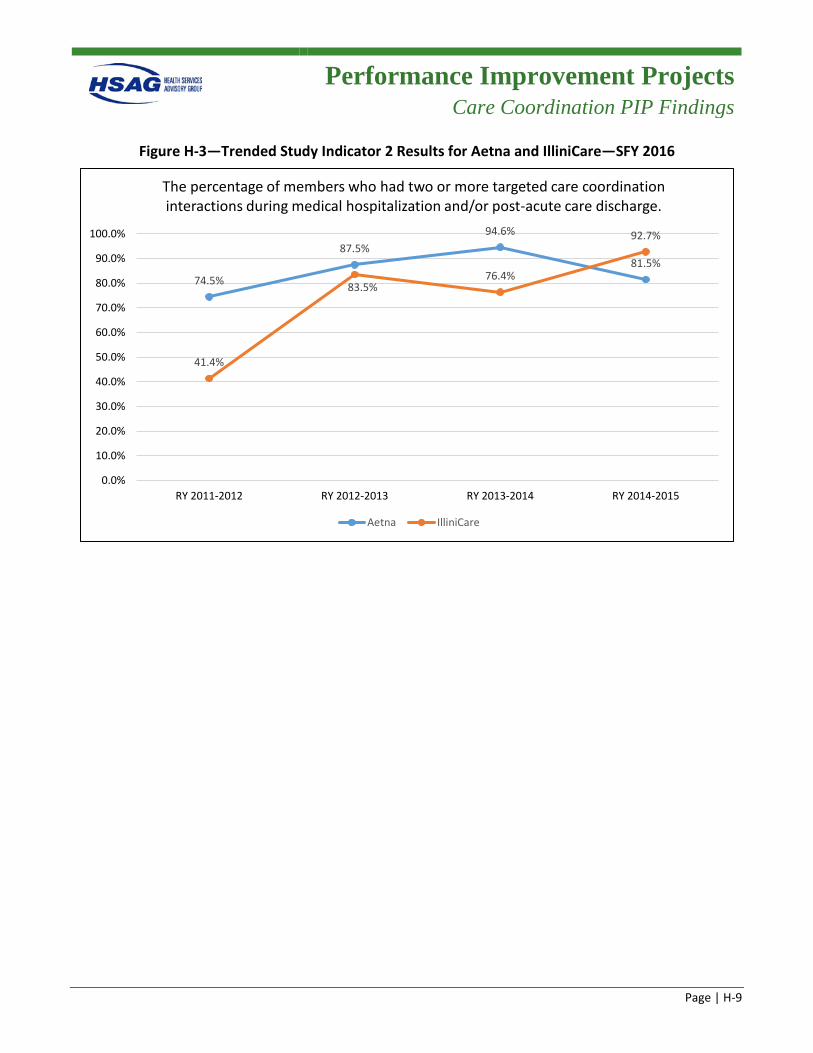
Performance Improvement Projects
Care Coordination PIP Findings
Page | H-9
Figure H-3—Trended Study Indicator 2 Results for Aetna and IlliniCare—SFY 2016
74.5%
87.5%94.6%
81.5%
41.4%
83.5%76.4%
92.7%
0.0%
10.0%
20.0%
30.0%
40.0%
50.0%
60.0%
70.0%
80.0%
90.0%
100.0%
RY 2011-2012 RY 2012-2013 RY 2013-2014 RY 2014-2015
The percentage of members who had two or more targeted care coordination interactions during medical hospitalization and/or post-acute care discharge.
Aetna IlliniCare
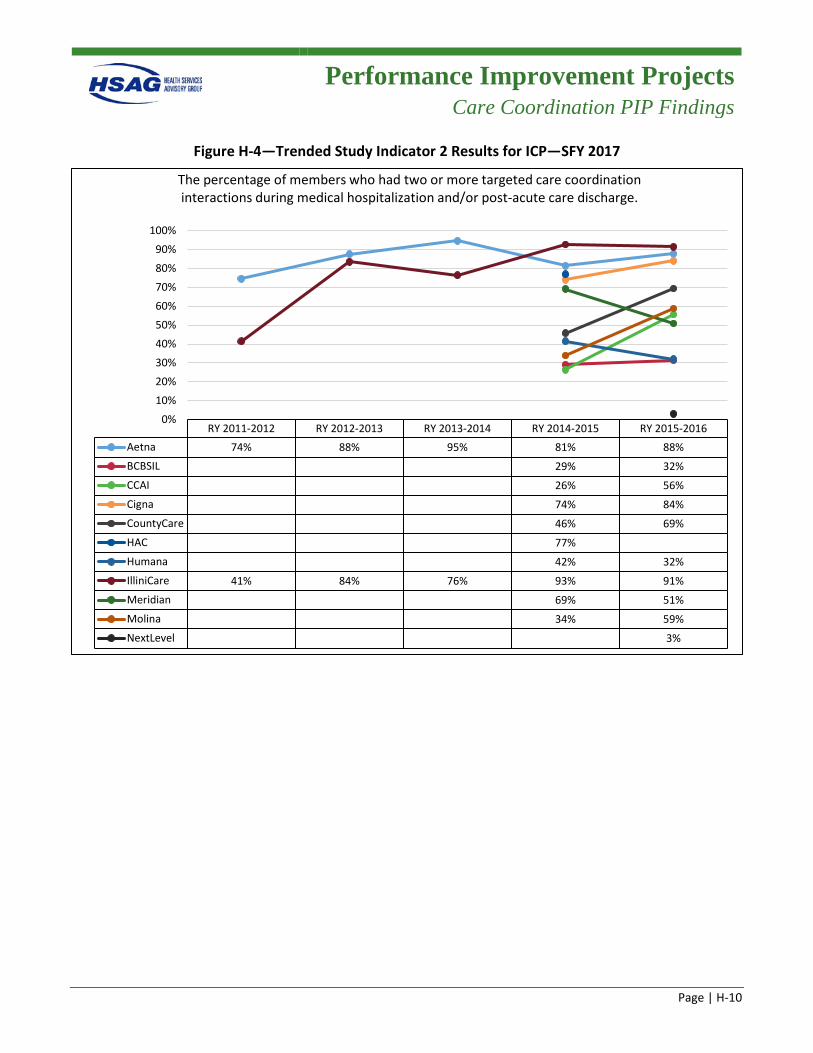
Performance Improvement Projects
Care Coordination PIP Findings
Page | H-10
Figure H-4—Trended Study Indicator 2 Results for ICP—SFY 2017
RY 2011-2012 RY 2012-2013 RY 2013-2014 RY 2014-2015 RY 2015-2016Aetna 74% 88% 95% 81% 88%BCBSIL 29% 32%CCAI 26% 56%Cigna 74% 84%CountyCare 46% 69%HAC 77%Humana 42% 32%IlliniCare 41% 84% 76% 93% 91%Meridian 69% 51%Molina 34% 59%NextLevel 3%
0%10%20%30%40%50%60%70%80%90%
100%
The percentage of members who had two or more targeted care coordination interactions during medical hospitalization and/or post-acute care discharge.
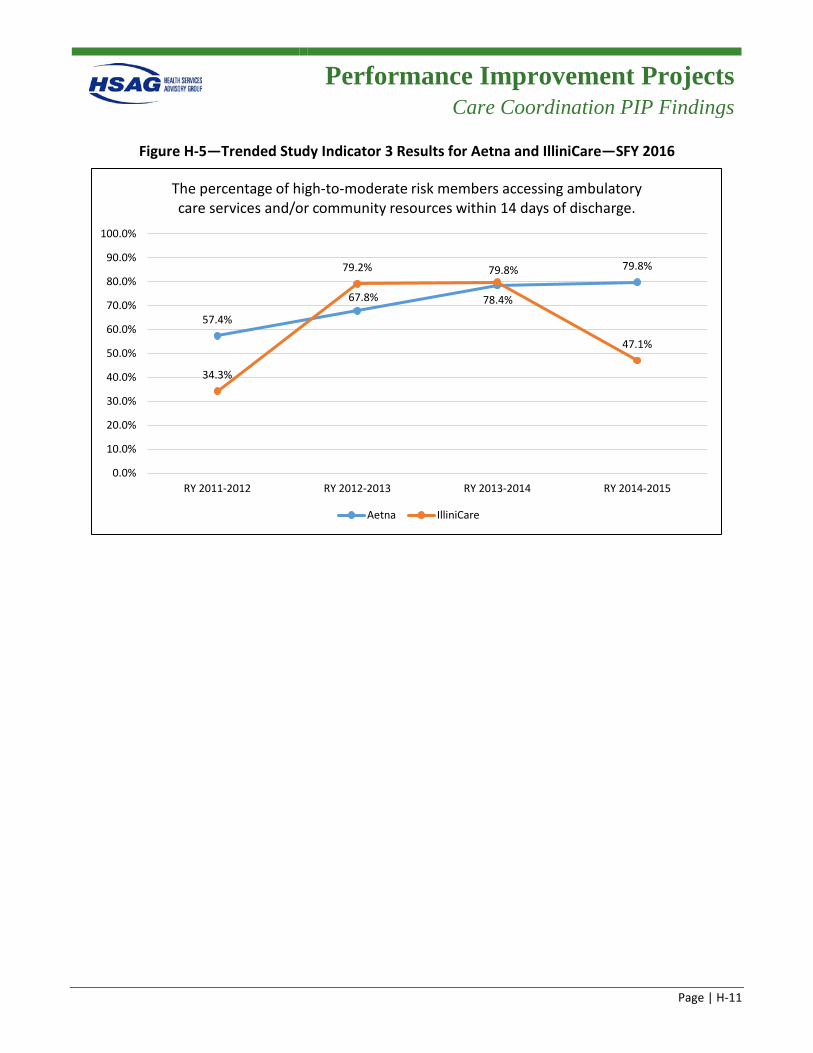
Performance Improvement Projects
Care Coordination PIP Findings
Page | H-11
Figure H-5—Trended Study Indicator 3 Results for Aetna and IlliniCare—SFY 2016
57.4%
67.8% 78.4%
79.8%
34.3%
79.2% 79.8%
47.1%
0.0%
10.0%
20.0%
30.0%
40.0%
50.0%
60.0%
70.0%
80.0%
90.0%
100.0%
RY 2011-2012 RY 2012-2013 RY 2013-2014 RY 2014-2015
The percentage of high-to-moderate risk members accessing ambulatory care services and/or community resources within 14 days of discharge.
Aetna IlliniCare
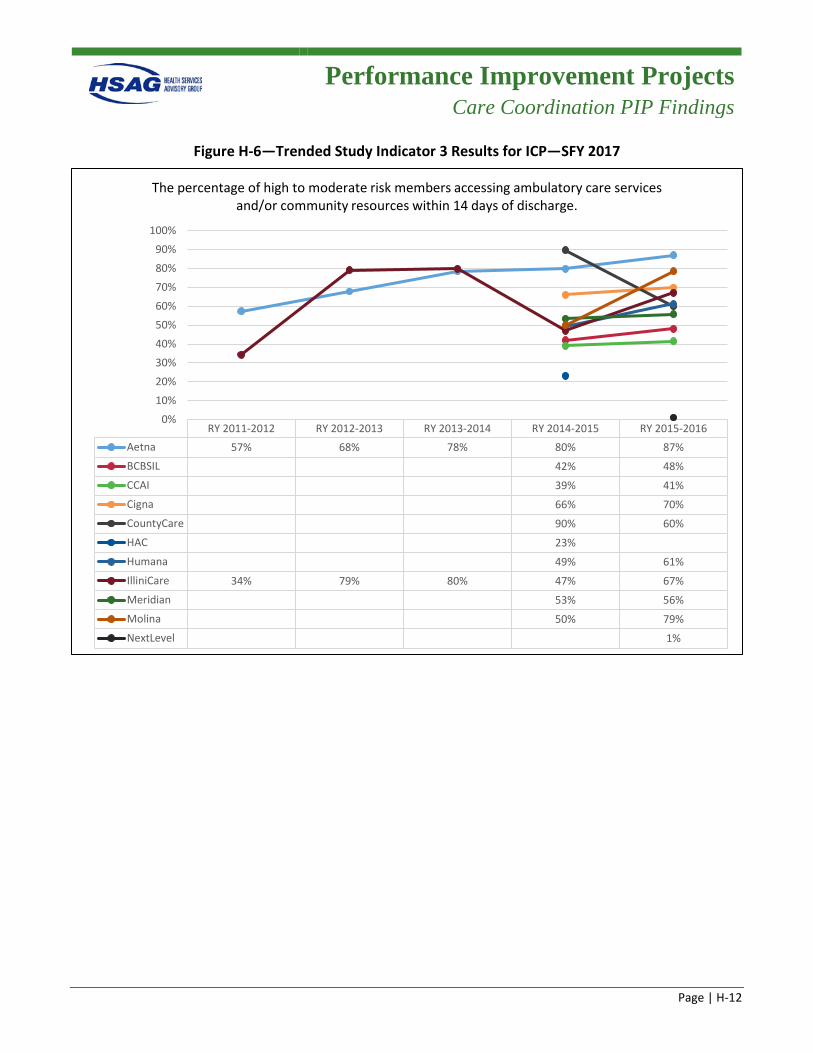
Performance Improvement Projects
Care Coordination PIP Findings
Page | H-12
Figure H-6—Trended Study Indicator 3 Results for ICP—SFY 2017
RY 2011-2012 RY 2012-2013 RY 2013-2014 RY 2014-2015 RY 2015-2016Aetna 57% 68% 78% 80% 87%BCBSIL 42% 48%CCAI 39% 41%Cigna 66% 70%CountyCare 90% 60%HAC 23%Humana 49% 61%IlliniCare 34% 79% 80% 47% 67%Meridian 53% 56%Molina 50% 79%NextLevel 1%
0%10%20%30%40%50%60%70%80%90%
100%
The percentage of high to moderate risk members accessing ambulatory care services and/or community resources within 14 days of discharge.
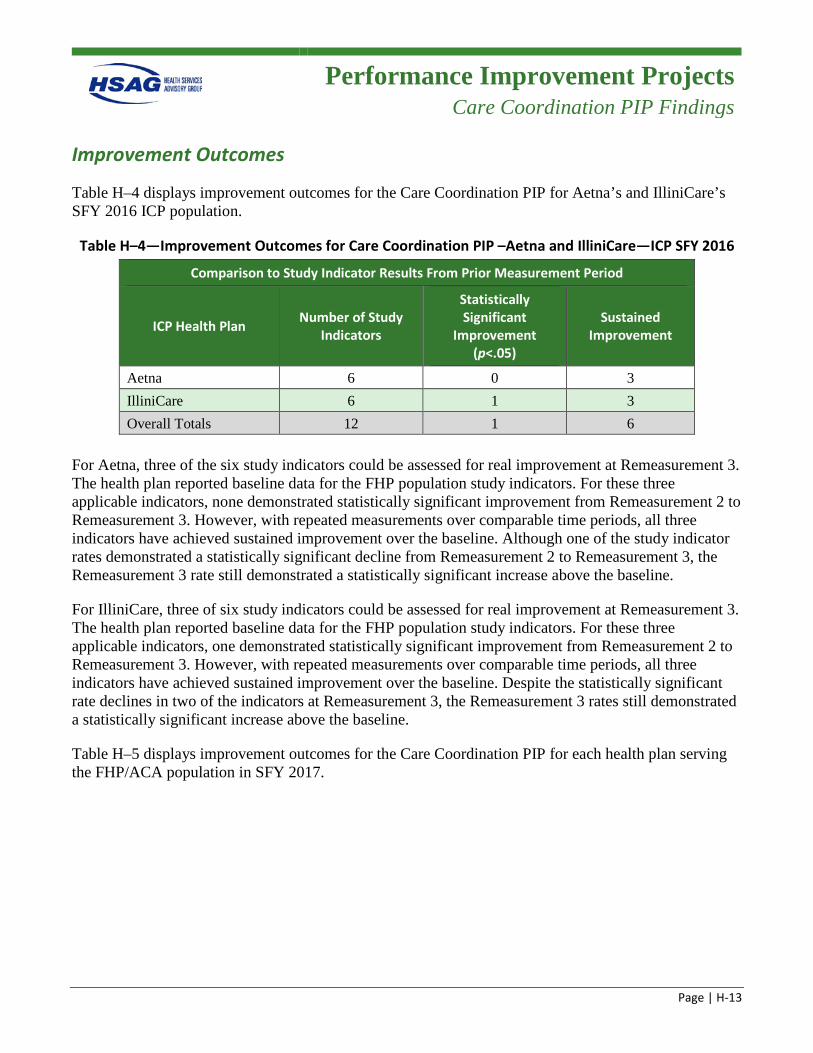
Performance Improvement Projects
Care Coordination PIP Findings
Page | H-13
Improvement Outcomes
Table H–4 displays improvement outcomes for the Care Coordination PIP for Aetna’s and IlliniCare’s SFY 2016 ICP population.
Table H–4—Improvement Outcomes for Care Coordination PIP –Aetna and IlliniCare—ICP SFY 2016
Comparison to Study Indicator Results From Prior Measurement Period
ICP Health Plan Number of Study Indicators
Statistically Significant
Improvement (p<.05)
Sustained Improvement
Aetna 6 0 3 IlliniCare 6 1 3 Overall Totals 12 1 6
For Aetna, three of the six study indicators could be assessed for real improvement at Remeasurement 3. The health plan reported baseline data for the FHP population study indicators. For these three applicable indicators, none demonstrated statistically significant improvement from Remeasurement 2 to Remeasurement 3. However, with repeated measurements over comparable time periods, all three indicators have achieved sustained improvement over the baseline. Although one of the study indicator rates demonstrated a statistically significant decline from Remeasurement 2 to Remeasurement 3, the Remeasurement 3 rate still demonstrated a statistically significant increase above the baseline.
For IlliniCare, three of six study indicators could be assessed for real improvement at Remeasurement 3. The health plan reported baseline data for the FHP population study indicators. For these three applicable indicators, one demonstrated statistically significant improvement from Remeasurement 2 to Remeasurement 3. However, with repeated measurements over comparable time periods, all three indicators have achieved sustained improvement over the baseline. Despite the statistically significant rate declines in two of the indicators at Remeasurement 3, the Remeasurement 3 rates still demonstrated a statistically significant increase above the baseline.
Table H–5 displays improvement outcomes for the Care Coordination PIP for each health plan serving the FHP/ACA population in SFY 2017.
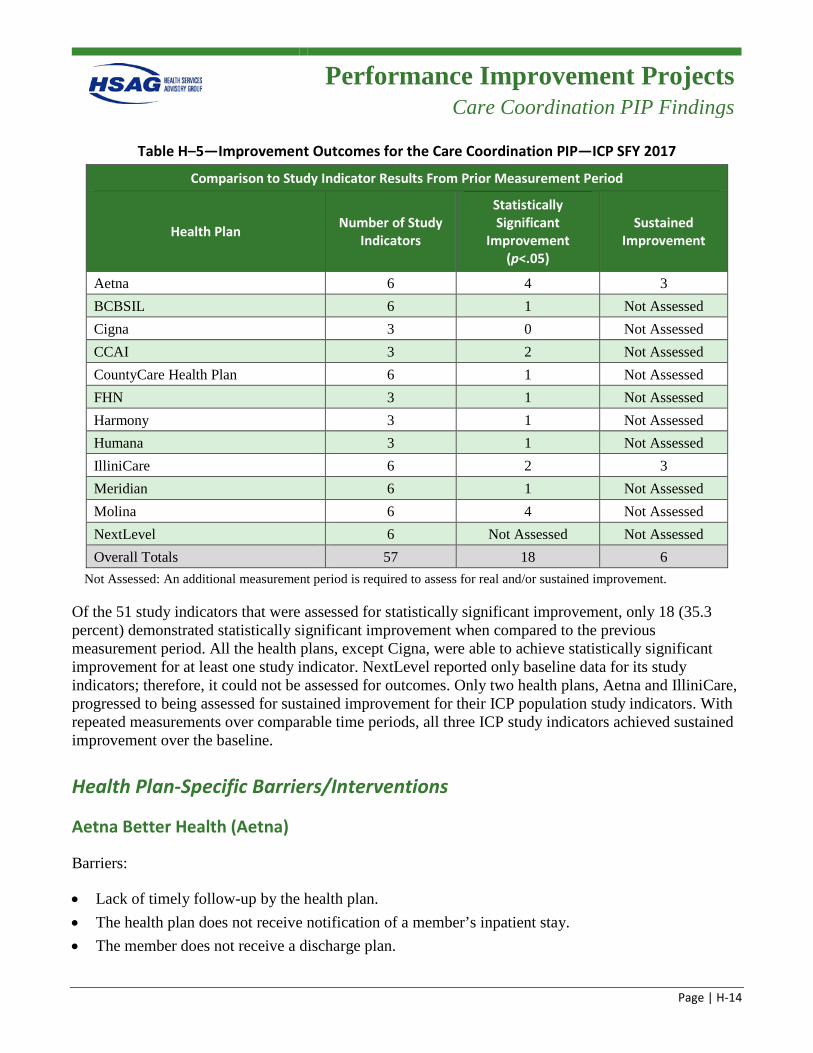
Performance Improvement Projects
Care Coordination PIP Findings
Page | H-14
Table H–5—Improvement Outcomes for the Care Coordination PIP—ICP SFY 2017
Comparison to Study Indicator Results From Prior Measurement Period
Health Plan Number of Study Indicators
Statistically Significant
Improvement (p<.05)
Sustained Improvement
Aetna 6 4 3 BCBSIL 6 1 Not Assessed Cigna 3 0 Not Assessed CCAI 3 2 Not Assessed CountyCare Health Plan 6 1 Not Assessed FHN 3 1 Not Assessed Harmony 3 1 Not Assessed Humana 3 1 Not Assessed IlliniCare 6 2 3 Meridian 6 1 Not Assessed Molina 6 4 Not Assessed NextLevel 6 Not Assessed Not Assessed Overall Totals 57 18 6
Not Assessed: An additional measurement period is required to assess for real and/or sustained improvement.
Of the 51 study indicators that were assessed for statistically significant improvement, only 18 (35.3 percent) demonstrated statistically significant improvement when compared to the previous measurement period. All the health plans, except Cigna, were able to achieve statistically significant improvement for at least one study indicator. NextLevel reported only baseline data for its study indicators; therefore, it could not be assessed for outcomes. Only two health plans, Aetna and IlliniCare, progressed to being assessed for sustained improvement for their ICP population study indicators. With repeated measurements over comparable time periods, all three ICP study indicators achieved sustained improvement over the baseline.
Health Plan-Specific Barriers/Interventions
Aetna Better Health (Aetna)
Barriers:
• Lack of timely follow-up by the health plan. • The health plan does not receive notification of a member’s inpatient stay. • The member does not receive a discharge plan.
Performance Improvement Projects
Care Coordination PIP Findings
Page | H-15
• Unable to contact the member due to inaccurate phone numbers and addresses.
Interventions:
• Case management follow-up within 14 days of discharge from a hospital. • Sharing the inpatient census with three different provider groups. • 7 Hills Health Care visiting physicians group is deployed to the member’s home if:
– It is noted during the post-discharge call that no follow-up appointment was scheduled for the member.
– There is no established relationship with a primary care provider. • The discharge planning team, composed of medical and behavioral health case managers, identifies
those members in the hospital and contacts the member and/or family prior to discharge.
Blue Cross Blue Shield of Illinois (BCBSIL)
Barriers:
• Lack of collaboration between the hospital, health plan, and provider. • Life circumstances and lack of social support for members. • Unable to reach members. • Lack of provider appointment availability.
Interventions:
• Implemented a new care management system that addresses population health. • Implemented a new Care Gap web-system. • Implemented a new utilization management process. • Implemented the Community Care Center Pilot. • Continued the Feet on the Street Program.
Cigna-HealthSpring of Illinois (Cigna)
Barriers:
• Members’ noncompliance with the discharge plan due to lack of understanding. • Poor communication regarding the member’s discharge from inpatient facility. • The care coordination system lacks the adaptability to interface and share information with
providers. • Community resources are at capacity.
Performance Improvement Projects
Care Coordination PIP Findings
Page | H-16
Interventions:
• Culturally appropriate materials are used to educate members on their discharge plan and interpreters attend home visits, as needed.
• Telephonic outreach is conducted by care coordinators to hospitalized members to discuss hospitalizations and failed outpatient plan, and provide education on the importance of notifying their care coordinator when they are discharged.
• Care coordination efforts are deployed to link members to ambulatory care and community services. • The care coordination team shares care plans with provider offices and works with providers to
make follow-up appointments as needed.
Community Care Alliance of Illinois (CCAI)
Barriers:
• Lack of identified internal processes/workflows to delineate channels of communication with hospitalized members.
• Untimely or lack of discharge planning while the member is still hospitalized. • Unsuccessful transitions of care. • Member’s lack of transportation or unaddressed barriers such as housing, financial means, and
healthcare support.
Interventions:
• Care coordinators are notified of an inpatient admission within 48–72 hours of a request for authorization of an inpatient admission.
• Care coordinators perform discharge planning sessions with hospitalized members and document successful (member reached) interaction in the Care Management System Interaction log.
• Care coordinators attempt to complete a health risk assessment (HRA) and care plan for members not actively enrolled in care coordination while the member is still hospitalized to facilitate interdisciplinary team meetings, if necessary.
• Care coordinators or transition of care coordinators reach out to discharged members within 48–72 hours of notification of discharge and complete a post-discharge follow-up, which may include a HRA for members currently not enrolled in care coordination. This interaction also encompasses ensuring that an appointment for a follow-up visit within 14 days has been scheduled.
CountyCare Health Plan (CountyCare)
Barriers:
• The member has low literacy and understanding of symptom management. • The member has difficulty managing medication(s).
Performance Improvement Projects
Care Coordination PIP Findings
Page | H-17
• Members’ social determinants. • The care coordinator is unaware of the member’s hospital admission.
Interventions:
• After a member is hospitalized, care managers are prompted by a worklist within care management software to reach out to the member within seven days and conduct a reassessment with the member.
• Implemented a delegate care management model that enables specialized care coordination with complex needs within a variety of settings.
• Care coordination staff are made aware, in-real time, of the member’s admission into the hospital and emergency department, and can assist with discharge planning, medication management upon discharge, and scheduling follow-up care.
Family Health Network (FHN)
Barriers:
• Lack of discharge planning. • Unsuccessful transitions of care. • Poor collaboration between the inpatient facility and the health plan. • Members’ lack understanding of the resources available and of the importance of follow-up with a
PCP within 14 days of discharge. • Social determinants.
Interventions:
• Care coordinators are notified of an inpatient admission within 48–72 hours of a request for the authorization of an inpatient admission.
• Care coordinators perform discharge planning sessions with hospitalized members and document successful (member reached) interaction in the Care Management System Interaction log.
• Care coordinators attempt to complete an HRA and care plan for members not actively enrolled in care coordination while the member is still hospitalized to facilitate interdisciplinary team meetings, if necessary.
• Care coordinators or transition of care coordinators reach out to discharged members within 48–72 hours of notification of discharge and complete a post-discharge follow-up, which may include an HRA for members currently not enrolled in care coordination. This interaction also encompasses ensuring that an appointment for a follow-up visit within 14 days has been scheduled.
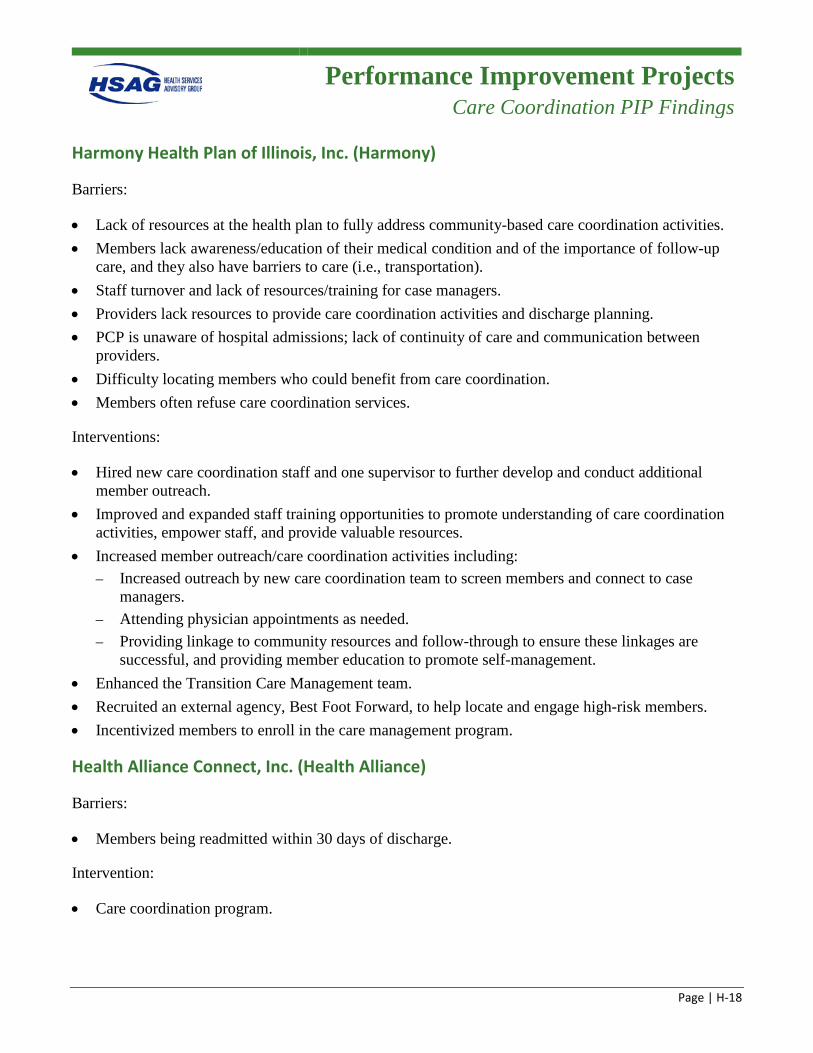
Performance Improvement Projects
Care Coordination PIP Findings
Page | H-18
Harmony Health Plan of Illinois, Inc. (Harmony)
Barriers:
• Lack of resources at the health plan to fully address community-based care coordination activities. • Members lack awareness/education of their medical condition and of the importance of follow-up
care, and they also have barriers to care (i.e., transportation). • Staff turnover and lack of resources/training for case managers. • Providers lack resources to provide care coordination activities and discharge planning. • PCP is unaware of hospital admissions; lack of continuity of care and communication between
providers. • Difficulty locating members who could benefit from care coordination. • Members often refuse care coordination services.
Interventions:
• Hired new care coordination staff and one supervisor to further develop and conduct additional member outreach.
• Improved and expanded staff training opportunities to promote understanding of care coordination activities, empower staff, and provide valuable resources.
• Increased member outreach/care coordination activities including: – Increased outreach by new care coordination team to screen members and connect to case
managers. – Attending physician appointments as needed. – Providing linkage to community resources and follow-through to ensure these linkages are
successful, and providing member education to promote self-management. • Enhanced the Transition Care Management team. • Recruited an external agency, Best Foot Forward, to help locate and engage high-risk members. • Incentivized members to enroll in the care management program.
Health Alliance Connect, Inc. (Health Alliance)
Barriers:
• Members being readmitted within 30 days of discharge.
Intervention:
• Care coordination program.
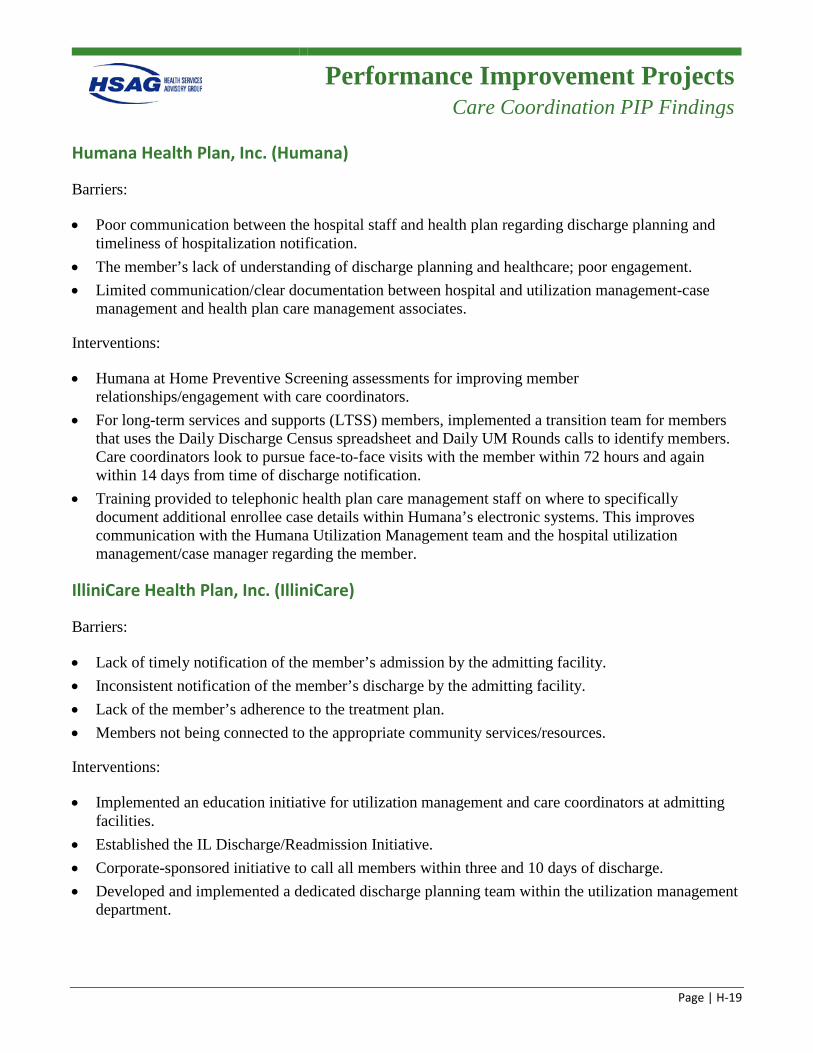
Performance Improvement Projects
Care Coordination PIP Findings
Page | H-19
Humana Health Plan, Inc. (Humana)
Barriers:
• Poor communication between the hospital staff and health plan regarding discharge planning and timeliness of hospitalization notification.
• The member’s lack of understanding of discharge planning and healthcare; poor engagement. • Limited communication/clear documentation between hospital and utilization management-case
management and health plan care management associates.
Interventions:
• Humana at Home Preventive Screening assessments for improving member relationships/engagement with care coordinators.
• For long-term services and supports (LTSS) members, implemented a transition team for members that uses the Daily Discharge Census spreadsheet and Daily UM Rounds calls to identify members. Care coordinators look to pursue face-to-face visits with the member within 72 hours and again within 14 days from time of discharge notification.
• Training provided to telephonic health plan care management staff on where to specifically document additional enrollee case details within Humana’s electronic systems. This improves communication with the Humana Utilization Management team and the hospital utilization management/case manager regarding the member.
IlliniCare Health Plan, Inc. (IlliniCare)
Barriers:
• Lack of timely notification of the member’s admission by the admitting facility. • Inconsistent notification of the member’s discharge by the admitting facility. • Lack of the member’s adherence to the treatment plan. • Members not being connected to the appropriate community services/resources.
Interventions:
• Implemented an education initiative for utilization management and care coordinators at admitting facilities.
• Established the IL Discharge/Readmission Initiative. • Corporate-sponsored initiative to call all members within three and 10 days of discharge. • Developed and implemented a dedicated discharge planning team within the utilization management
department.
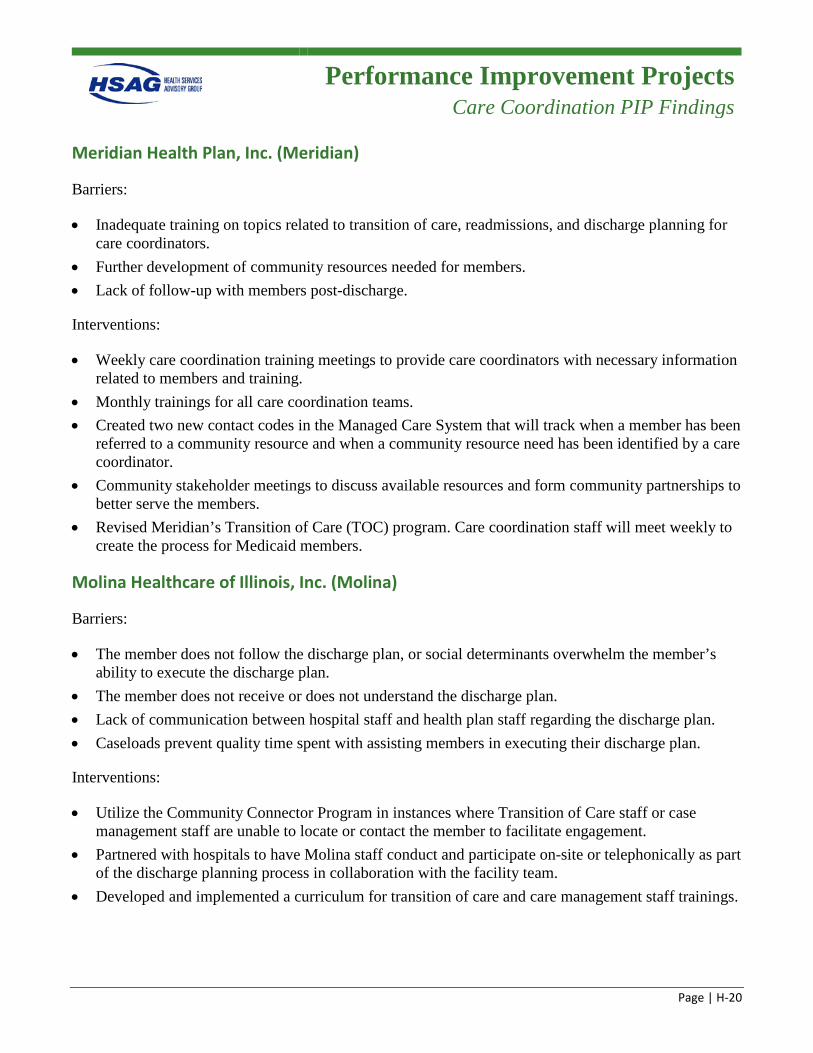
Performance Improvement Projects
Care Coordination PIP Findings
Page | H-20
Meridian Health Plan, Inc. (Meridian)
Barriers:
• Inadequate training on topics related to transition of care, readmissions, and discharge planning for care coordinators.
• Further development of community resources needed for members. • Lack of follow-up with members post-discharge.
Interventions:
• Weekly care coordination training meetings to provide care coordinators with necessary information related to members and training.
• Monthly trainings for all care coordination teams. • Created two new contact codes in the Managed Care System that will track when a member has been
referred to a community resource and when a community resource need has been identified by a care coordinator.
• Community stakeholder meetings to discuss available resources and form community partnerships to better serve the members.
• Revised Meridian’s Transition of Care (TOC) program. Care coordination staff will meet weekly to create the process for Medicaid members.
Molina Healthcare of Illinois, Inc. (Molina)
Barriers:
• The member does not follow the discharge plan, or social determinants overwhelm the member’s ability to execute the discharge plan.
• The member does not receive or does not understand the discharge plan. • Lack of communication between hospital staff and health plan staff regarding the discharge plan. • Caseloads prevent quality time spent with assisting members in executing their discharge plan.
Interventions:
• Utilize the Community Connector Program in instances where Transition of Care staff or case management staff are unable to locate or contact the member to facilitate engagement.
• Partnered with hospitals to have Molina staff conduct and participate on-site or telephonically as part of the discharge planning process in collaboration with the facility team.
• Developed and implemented a curriculum for transition of care and care management staff trainings.
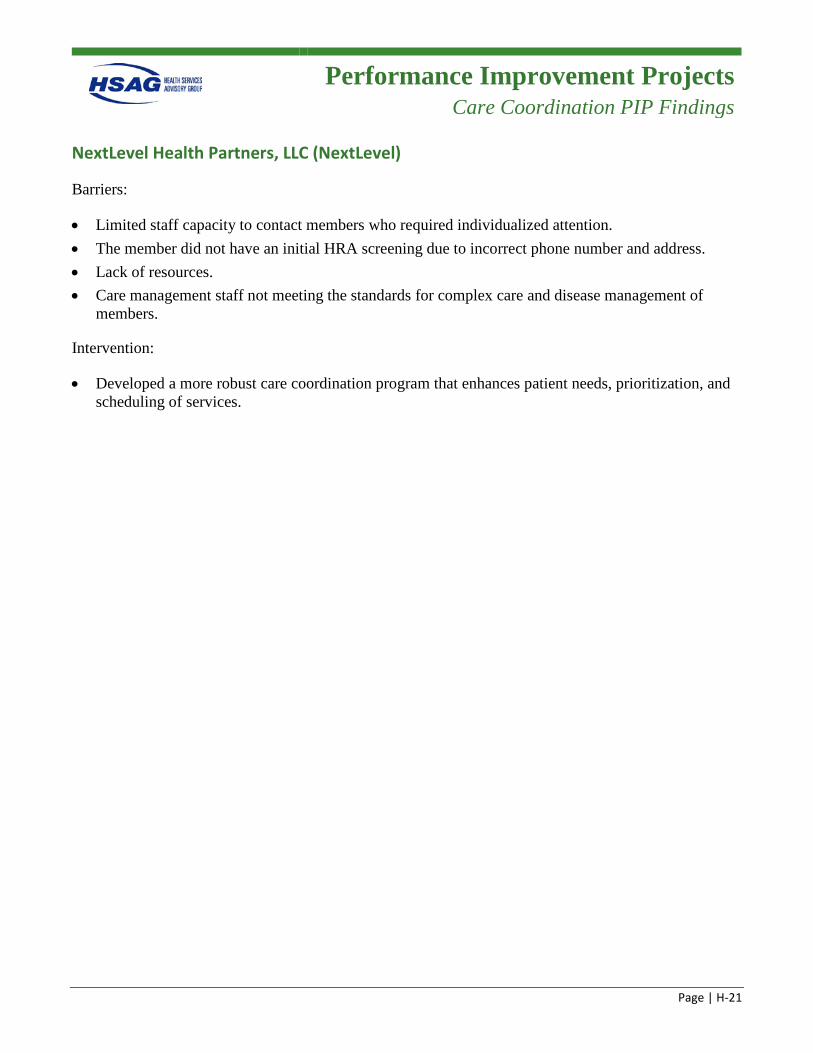
Performance Improvement Projects
Care Coordination PIP Findings
Page | H-21
NextLevel Health Partners, LLC (NextLevel)
Barriers:
• Limited staff capacity to contact members who required individualized attention. • The member did not have an initial HRA screening due to incorrect phone number and address. • Lack of resources. • Care management staff not meeting the standards for complex care and disease management of
members.
Intervention:
• Developed a more robust care coordination program that enhances patient needs, prioritization, and scheduling of services.
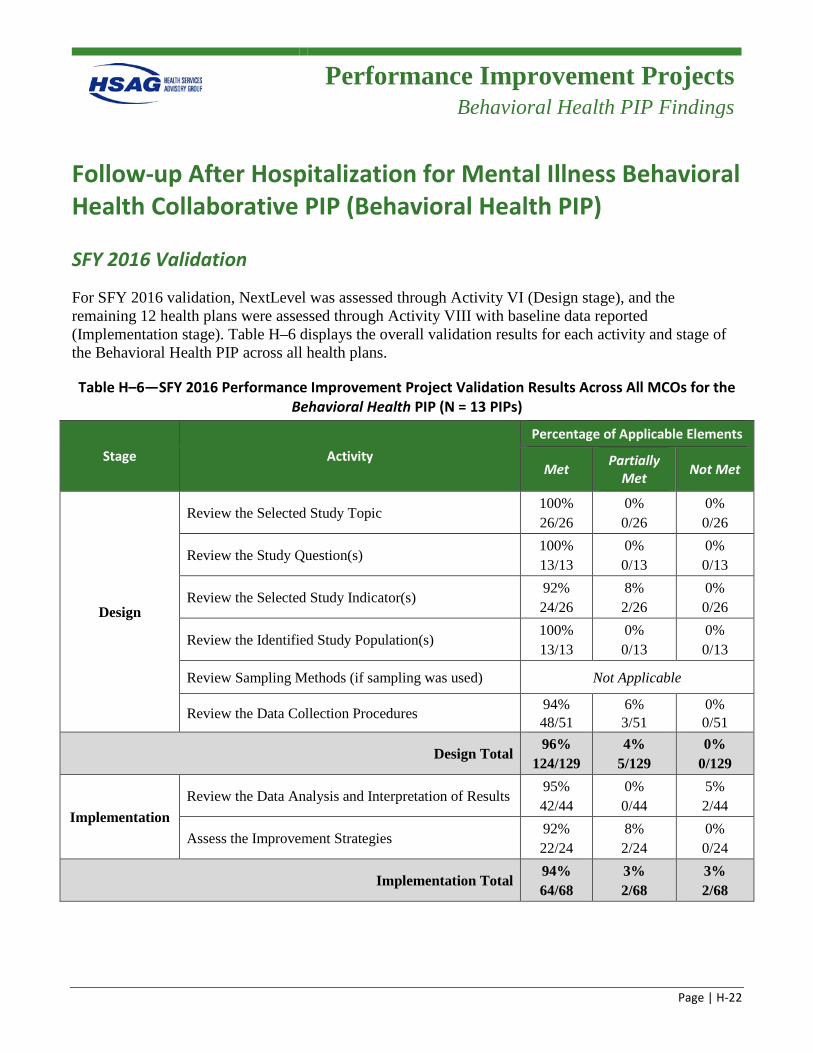
Performance Improvement Projects
Behavioral Health PIP Findings
Page | H-22
Follow-up After Hospitalization for Mental Illness Behavioral Health Collaborative PIP (Behavioral Health PIP)
SFY 2016 Validation
For SFY 2016 validation, NextLevel was assessed through Activity VI (Design stage), and the remaining 12 health plans were assessed through Activity VIII with baseline data reported (Implementation stage). Table H–6 displays the overall validation results for each activity and stage of the Behavioral Health PIP across all health plans.
Table H–6—SFY 2016 Performance Improvement Project Validation Results Across All MCOs for the Behavioral Health PIP (N = 13 PIPs)
Stage Activity Percentage of Applicable Elements
Met Partially Met Not Met
Design
Review the Selected Study Topic 100% 26/26
0% 0/26
0% 0/26
Review the Study Question(s) 100% 13/13
0% 0/13
0% 0/13
Review the Selected Study Indicator(s) 92% 24/26
8% 2/26
0% 0/26
Review the Identified Study Population(s) 100% 13/13
0% 0/13
0% 0/13
Review Sampling Methods (if sampling was used) Not Applicable
Review the Data Collection Procedures 94% 48/51
6% 3/51
0% 0/51
Design Total 96%
124/129 4%
5/129 0%
0/129
Implementation Review the Data Analysis and Interpretation of Results
95% 42/44
0% 0/44
5% 2/44
Assess the Improvement Strategies 92% 22/24
8% 2/24
0% 0/24
Implementation Total 94% 64/68
3% 2/68
3% 2/68
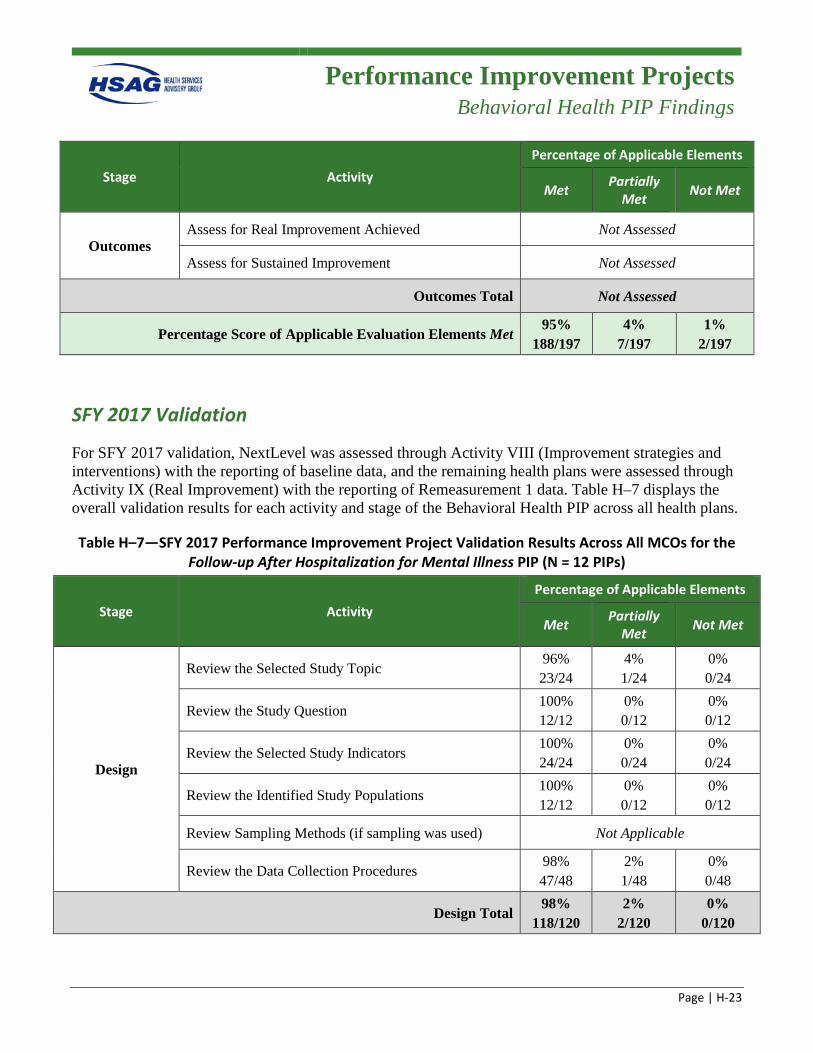
Performance Improvement Projects
Behavioral Health PIP Findings
Page | H-23
Stage Activity Percentage of Applicable Elements
Met Partially Met Not Met
Outcomes Assess for Real Improvement Achieved Not Assessed
Assess for Sustained Improvement Not Assessed
Outcomes Total Not Assessed
Percentage Score of Applicable Evaluation Elements Met 95%
188/197 4%
7/197 1%
2/197
SFY 2017 Validation
For SFY 2017 validation, NextLevel was assessed through Activity VIII (Improvement strategies and interventions) with the reporting of baseline data, and the remaining health plans were assessed through Activity IX (Real Improvement) with the reporting of Remeasurement 1 data. Table H–7 displays the overall validation results for each activity and stage of the Behavioral Health PIP across all health plans.
Table H–7—SFY 2017 Performance Improvement Project Validation Results Across All MCOs for the Follow-up After Hospitalization for Mental Illness PIP (N = 12 PIPs)
Stage Activity Percentage of Applicable Elements
Met Partially Met Not Met
Design
Review the Selected Study Topic 96% 23/24
4% 1/24
0% 0/24
Review the Study Question 100% 12/12
0% 0/12
0% 0/12
Review the Selected Study Indicators 100% 24/24
0% 0/24
0% 0/24
Review the Identified Study Populations 100% 12/12
0% 0/12
0% 0/12
Review Sampling Methods (if sampling was used) Not Applicable
Review the Data Collection Procedures 98% 47/48
2% 1/48
0% 0/48
Design Total 98%
118/120 2%
2/120 0%
0/120
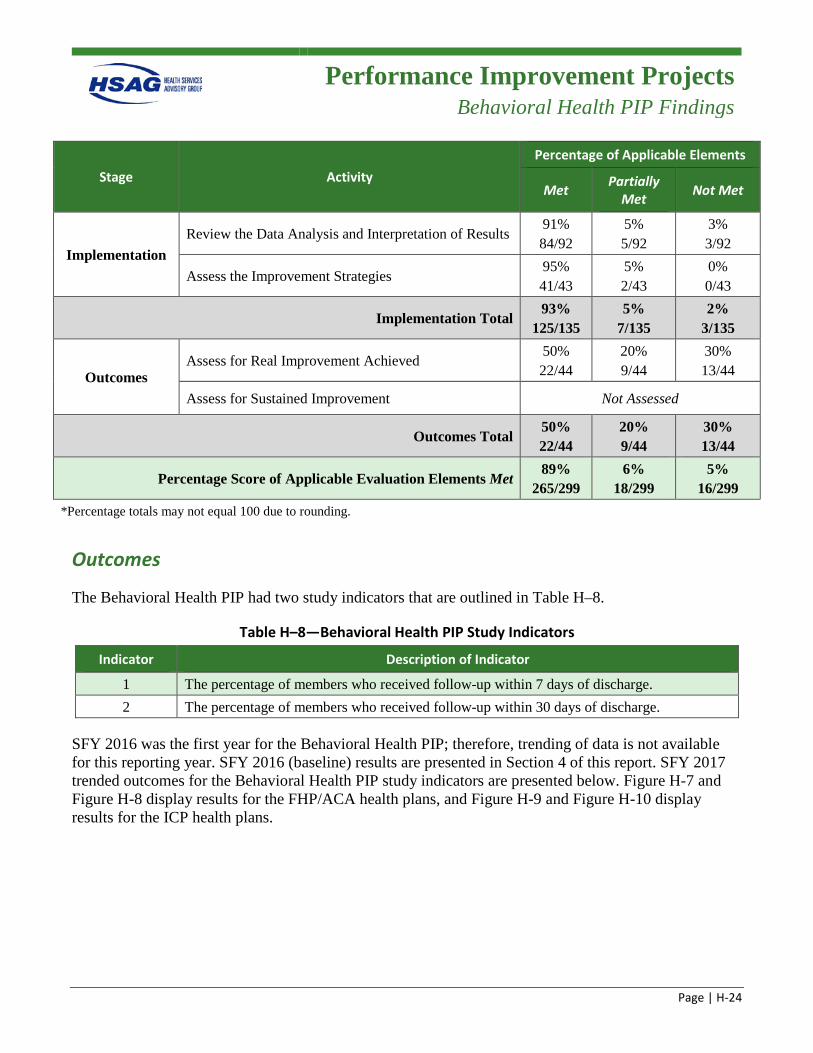
Performance Improvement Projects
Behavioral Health PIP Findings
Page | H-24
Stage Activity Percentage of Applicable Elements
Met Partially Met Not Met
Implementation Review the Data Analysis and Interpretation of Results
91% 84/92
5% 5/92
3% 3/92
Assess the Improvement Strategies 95% 41/43
5% 2/43
0% 0/43
Implementation Total 93%
125/135 5%
7/135 2%
3/135
Outcomes Assess for Real Improvement Achieved
50% 22/44
20% 9/44
30% 13/44
Assess for Sustained Improvement Not Assessed
Outcomes Total 50% 22/44
20% 9/44
30% 13/44
Percentage Score of Applicable Evaluation Elements Met 89%
265/299 6%
18/299 5%
16/299 *Percentage totals may not equal 100 due to rounding.
Outcomes
The Behavioral Health PIP had two study indicators that are outlined in Table H–8.
Table H–8—Behavioral Health PIP Study Indicators
Indicator Description of Indicator
1 The percentage of members who received follow-up within 7 days of discharge. 2 The percentage of members who received follow-up within 30 days of discharge.
SFY 2016 was the first year for the Behavioral Health PIP; therefore, trending of data is not available for this reporting year. SFY 2016 (baseline) results are presented in Section 4 of this report. SFY 2017 trended outcomes for the Behavioral Health PIP study indicators are presented below. Figure H-7 and Figure H-8 display results for the FHP/ACA health plans, and Figure H-9 and Figure H-10 display results for the ICP health plans.
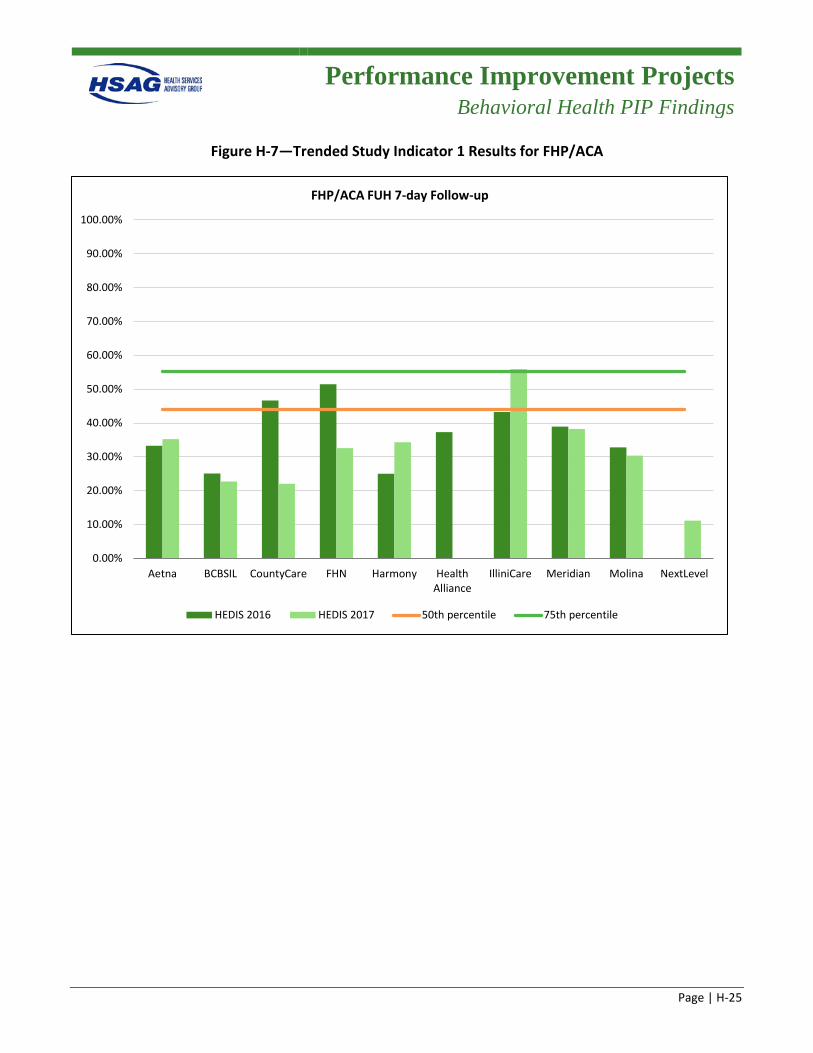
Performance Improvement Projects
Behavioral Health PIP Findings
Page | H-25
Figure H-7—Trended Study Indicator 1 Results for FHP/ACA
0.00%
10.00%
20.00%
30.00%
40.00%
50.00%
60.00%
70.00%
80.00%
90.00%
100.00%
Aetna BCBSIL CountyCare FHN Harmony HealthAlliance
IlliniCare Meridian Molina NextLevel
FHP/ACA FUH 7-day Follow-up
HEDIS 2016 HEDIS 2017 50th percentile 75th percentile
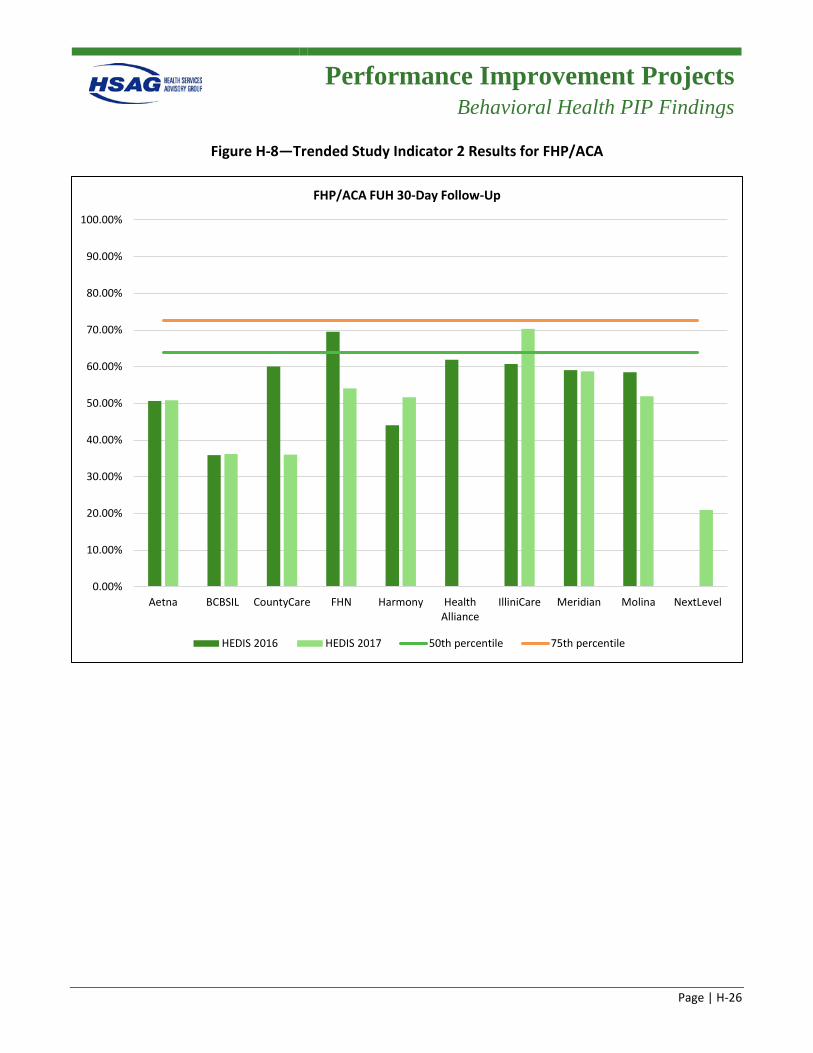
Performance Improvement Projects
Behavioral Health PIP Findings
Page | H-26
Figure H-8—Trended Study Indicator 2 Results for FHP/ACA
0.00%
10.00%
20.00%
30.00%
40.00%
50.00%
60.00%
70.00%
80.00%
90.00%
100.00%
Aetna BCBSIL CountyCare FHN Harmony HealthAlliance
IlliniCare Meridian Molina NextLevel
FHP/ACA FUH 30-Day Follow-Up
HEDIS 2016 HEDIS 2017 50th percentile 75th percentile
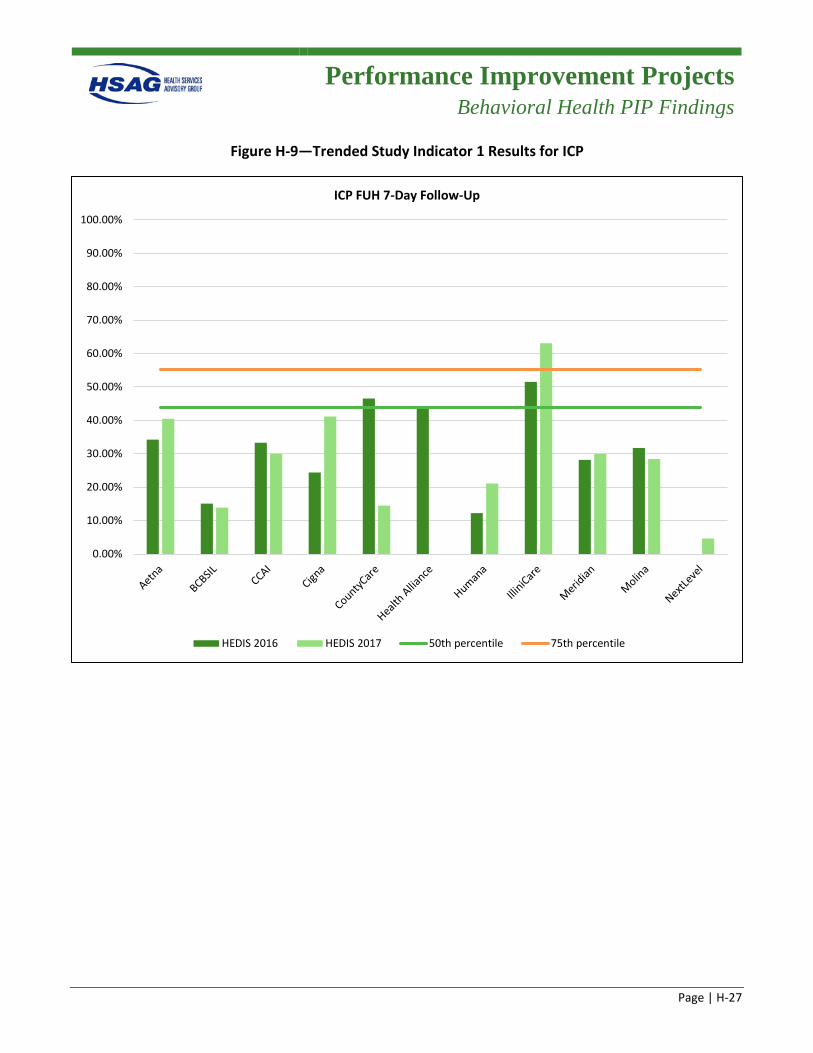
Performance Improvement Projects
Behavioral Health PIP Findings
Page | H-27
Figure H-9—Trended Study Indicator 1 Results for ICP
0.00%
10.00%
20.00%
30.00%
40.00%
50.00%
60.00%
70.00%
80.00%
90.00%
100.00%
ICP FUH 7-Day Follow-Up
HEDIS 2016 HEDIS 2017 50th percentile 75th percentile
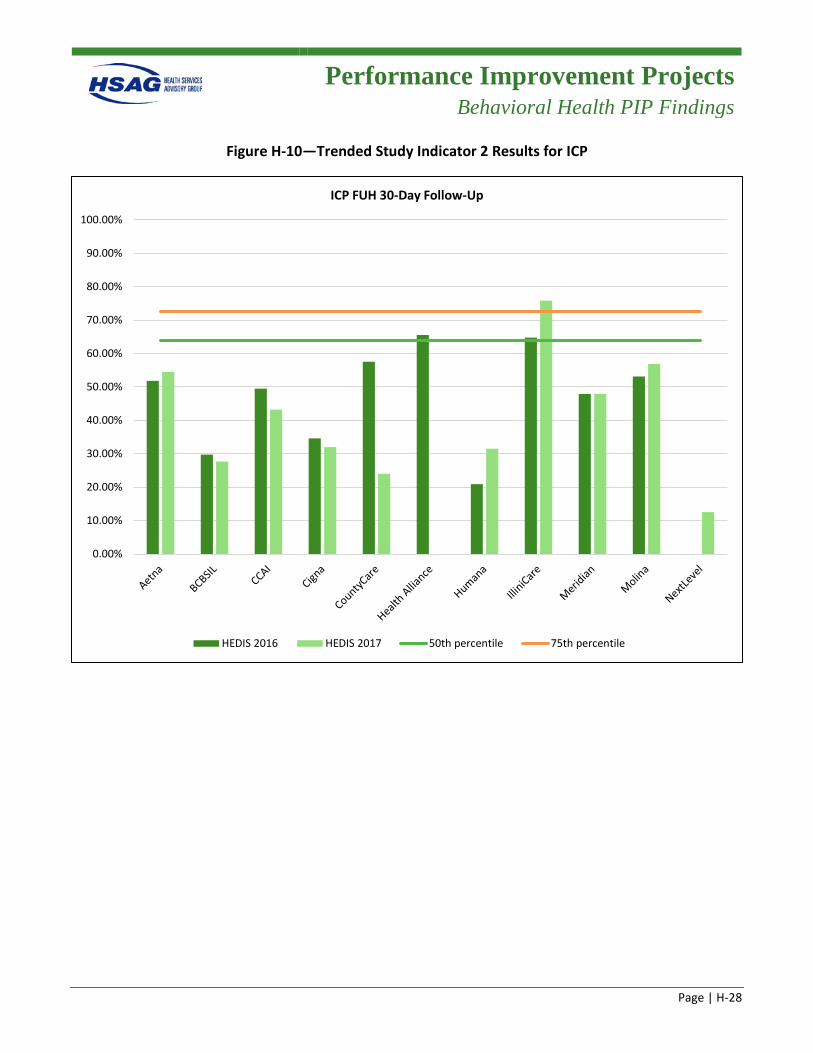
Performance Improvement Projects
Behavioral Health PIP Findings
Page | H-28
Figure H-10—Trended Study Indicator 2 Results for ICP
0.00%
10.00%
20.00%
30.00%
40.00%
50.00%
60.00%
70.00%
80.00%
90.00%
100.00%
ICP FUH 30-Day Follow-Up
HEDIS 2016 HEDIS 2017 50th percentile 75th percentile
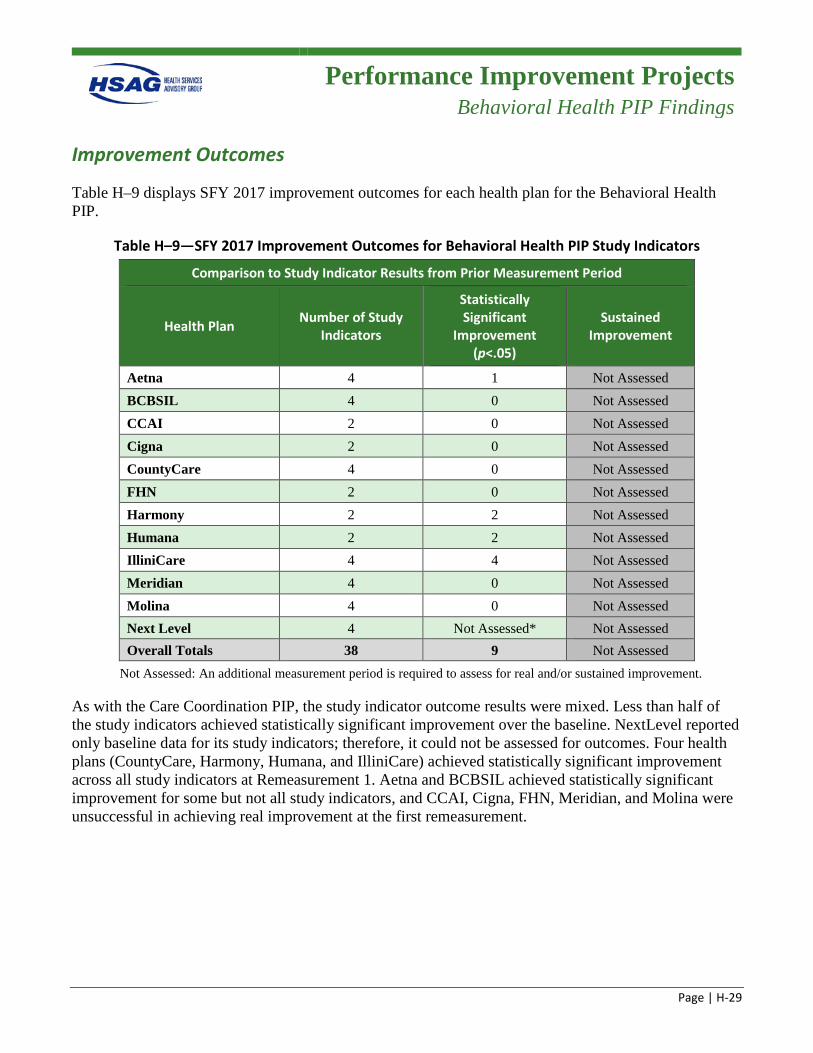
Performance Improvement Projects
Behavioral Health PIP Findings
Page | H-29
Improvement Outcomes
Table H–9 displays SFY 2017 improvement outcomes for each health plan for the Behavioral Health PIP.
Table H–9—SFY 2017 Improvement Outcomes for Behavioral Health PIP Study Indicators
Comparison to Study Indicator Results from Prior Measurement Period
Health Plan Number of Study Indicators
Statistically Significant
Improvement (p<.05)
Sustained Improvement
Aetna 4 1 Not Assessed BCBSIL 4 0 Not Assessed CCAI 2 0 Not Assessed Cigna 2 0 Not Assessed CountyCare 4 0 Not Assessed FHN 2 0 Not Assessed Harmony 2 2 Not Assessed Humana 2 2 Not Assessed IlliniCare 4 4 Not Assessed Meridian 4 0 Not Assessed Molina 4 0 Not Assessed Next Level 4 Not Assessed* Not Assessed Overall Totals 38 9 Not Assessed
Not Assessed: An additional measurement period is required to assess for real and/or sustained improvement.
As with the Care Coordination PIP, the study indicator outcome results were mixed. Less than half of the study indicators achieved statistically significant improvement over the baseline. NextLevel reported only baseline data for its study indicators; therefore, it could not be assessed for outcomes. Four health plans (CountyCare, Harmony, Humana, and IlliniCare) achieved statistically significant improvement across all study indicators at Remeasurement 1. Aetna and BCBSIL achieved statistically significant improvement for some but not all study indicators, and CCAI, Cigna, FHN, Meridian, and Molina were unsuccessful in achieving real improvement at the first remeasurement.
Performance Improvement Projects
Behavioral Health PIP Findings
Page | H-30
Health Plan-Specific Barriers/Interventions
Aetna
Barriers:
• Discharge planning is not occurring early in the member’s inpatient stay. • The behavioral health network may not be adequate to meet the timeliness requirements of seven-
and 30-day follow-up. • Providers lack knowledge of the Healthcare Effectiveness Data and Information Set (HEDIS)
Follow-Up After Emergency Department Visit for Mental Illness (FUM) measure requirements. • Members lack understanding of the importance of post-discharge follow-up, medication adherence,
and disease self-management.
Interventions:
• The Behavioral Health Care Transitions Team works with each hospital unit and administration to better identify how to quickly access hospital discharge staff to begin early coordination of discharge planning.
• Established multiple connections with community agencies to support access to behavioral health care including pre-discharge community agency connection and in-home assessments.
• Increased provider visits to behavioral health inpatient and community agencies to discuss the Follow-Up After Hospitalization for Mental Illness (FUH) and provide education and training of the HEDIS FUH measure standards.
• Staff participated in several community events to promote member healthy behaviors, improve self-management of behavioral health illness, and provide helpful tips on how to take an active role in aftercare planning upon discharge from the inpatient mental health facility.
BCBSIL
Barriers:
• Inadequate discharge planning. Discharge planning is not occurring early in the member’s inpatient stay.
• Members’ lack of awareness for keeping a follow-up appointment or other barriers such as lack of transportation.
• Members with comorbid/co-occurring mental health and substance use disorders may be more treatment-ambivalent due to the comorbidity of their substance use disorder or issues, and their current stage of change.
• Lack of provider availability within seven and 30 days following discharge. • Limited member support system.
Performance Improvement Projects
Behavioral Health PIP Findings
Page | H-31
Interventions:
• Care Coordination Early Intervention (CCEI) Program staff connect with members discharging from facilities and assist with aftercare follow-up needs and education (i.e., transportation).
• Select high-volume mental health facilities offered to take part in a performance tier-based monetary incentive program.
• Behavioral health network provider, facility, and staff training on FUH measure requirements.
Cigna
Barriers:
• Discharge planning is not occurring early in the member’s inpatient stay. • The behavioral health network is not adequate to meet the timeliness requirements of the seven- and
30-day follow-up. • Network practitioners, providers, and facilities are unaware of the FUH performance measure and its
requirements. • Members lack understanding of the importance of post discharge follow-up, medication adherence,
and disease self-management.
Interventions:
• Coordinated aftercare planning between the facility and health plan case manager upon inpatient mental health admission or upon concurrent notification of the admission.
• Developed and implemented provider and facility staff trainings to promote understanding of the importance of seven- and 30-day aftercare follow-up in the effective treatment of mental illness.
• Developed and implemented member outreach activities to promote healthy behaviors, and to improve members' self-management of their behavioral health illness and to take an active role in their aftercare planning upon discharge from the inpatient mental health facility.
• Strengthened the relationship and defined expectations with Thresholds (community partner), to engage with complex-chronic behavioral health members to promote follow-up and adherence to the treatment regimen.
Community Care Alliance of Illinois
Barriers:
• Lack of discharge planning. • Members lack understanding of the importance of scheduling a seven- and 30-day follow-up with a
mental health provider. • The vendor does not always follow the required workflows while assisting members with their
transition of care and scheduling of the seven- and 30-day follow-up appointments.
Performance Improvement Projects
Behavioral Health PIP Findings
Page | H-32
Interventions:
• Coordinated discharge planning between the facility and health plan case manager upon inpatient mental health admission or upon concurrent notification of the admission.
• Ongoing provider and facility education of the FUH measure specifications and the impact on members’ behavioral health outcomes.
• Consolidating successful transitions of care and scheduling follow-up appointments through face-to-face discharge planning meetings.
• Follow up with each discharged member within 72 hours of notification of discharge to ensure all discharge needs are met, and identify any existing barriers preventing the member from being compliant with the treatment plan.
CountyCare
Barriers:
• Network providers and facility staff are unaware of the FUH performance measure and its requirements.
• Medical homes are unaware when members are hospitalized and discharged. • Lack of information about members and timeliness to obtain records due to not having proper
authorization on file to share records between the hospital and the medical home or behavioral health agency.
• Network inadequacy for access and availability to behavioral health providers and appointments for members.
• Members lack rapport with the medical home, behavioral health agencies, and/or medical home.
Interventions:
• Coordination of discharge planning. With the notification of admission, utilization management staff begin immediately to inquire about discharge plans.
• Distribution of the Provider Education packet developed by the IL MCO Collaboration. Provider and facility staff training sessions on other topics, such as overview of managed care and medical necessity criteria. The same process and contact persons can be utilized for education to the top 10 inpatient providers of mental healthcare on the importance of follow-up post-hospitalization for mental illness.
• Inpatient behavioral health admissions are referred to health plan case management staff. If the member is not contacted while still inpatient, case management conducts outreach to the member after discharge to remind the member of the upcoming appointment, reviews resolutions to any barriers (such as transportation), and uses motivational interviewing to address ambivalence about adherence to the follow-up appointment.
Performance Improvement Projects
Behavioral Health PIP Findings
Page | H-33
Family Health Network
Barriers:
• Untimely or inadequate discharge planning. • Members lack understanding of the importance of post-discharge follow-up, medication adherence,
and disease self-management. • Members with co-morbid/co-occurring mental health and substance use disorders may be more
treatment-ambivalent due to the comorbidity of their substance use disorder or issues, and their current stage of change.
• Behavioral health networks are not adequately prepared for seven- and 30-day follow-up visits.
Interventions:
• Care coordinators are notified of an inpatient mental health admission within 72 hours of request for the authorization of an inpatient admission. Care coordinators collaborate with the transition of care coordinators (TOCCs) and establish contact with the hospitalized members to begin discharge planning.
• Provider, staff, and facility training on the HEDIS FUH measure requirements. • Consolidated discharge planning and follow-up visits through one network (Lutheran Services). • Member outreach by care coordination staff within 72 hours of discharge.
Harmony
Barriers:
• Lack of transition planning prior to the member’s discharge. • The behavioral health network may not be adequate to meet the timeliness requirements of seven-
and 30-day follow-up. • Providers lack knowledge of the HEDIS FUM measure requirements. • The member’s lack of understanding on the importance of follow-up visits. • Members’ social determinants.
Interventions:
• Improved and expanded provider and facility staff trainings to promote the understanding of needed seven- and 30-day follow-up visits.
• Expanded the network to include additional behavioral health providers, community mental health agencies, and federally qualified health centers.
• A collaboration workgroup provided outreach to nontraditional groups and associations to increase overall network capacity.
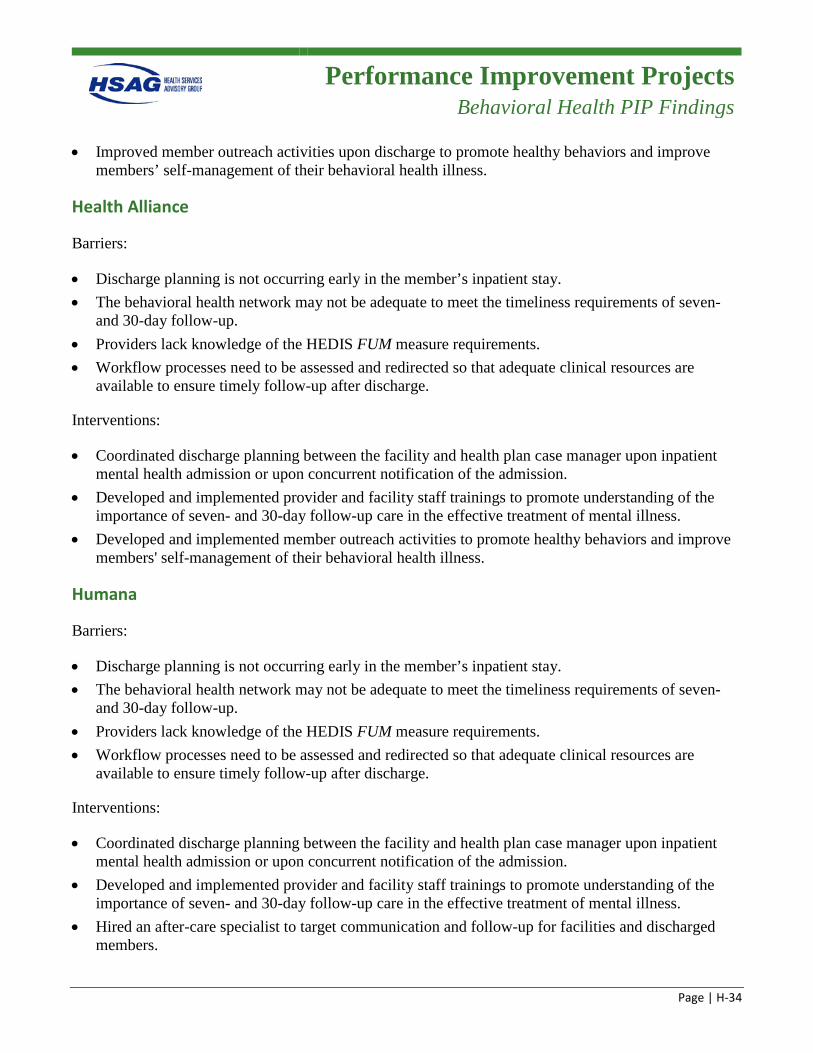
Performance Improvement Projects
Behavioral Health PIP Findings
Page | H-34
• Improved member outreach activities upon discharge to promote healthy behaviors and improve members’ self-management of their behavioral health illness.
Health Alliance
Barriers:
• Discharge planning is not occurring early in the member’s inpatient stay. • The behavioral health network may not be adequate to meet the timeliness requirements of seven-
and 30-day follow-up. • Providers lack knowledge of the HEDIS FUM measure requirements. • Workflow processes need to be assessed and redirected so that adequate clinical resources are
available to ensure timely follow-up after discharge.
Interventions:
• Coordinated discharge planning between the facility and health plan case manager upon inpatient mental health admission or upon concurrent notification of the admission.
• Developed and implemented provider and facility staff trainings to promote understanding of the importance of seven- and 30-day follow-up care in the effective treatment of mental illness.
• Developed and implemented member outreach activities to promote healthy behaviors and improve members' self-management of their behavioral health illness.
Humana
Barriers:
• Discharge planning is not occurring early in the member’s inpatient stay. • The behavioral health network may not be adequate to meet the timeliness requirements of seven-
and 30-day follow-up. • Providers lack knowledge of the HEDIS FUM measure requirements. • Workflow processes need to be assessed and redirected so that adequate clinical resources are
available to ensure timely follow-up after discharge.
Interventions:
• Coordinated discharge planning between the facility and health plan case manager upon inpatient mental health admission or upon concurrent notification of the admission.
• Developed and implemented provider and facility staff trainings to promote understanding of the importance of seven- and 30-day follow-up care in the effective treatment of mental illness.
• Hired an after-care specialist to target communication and follow-up for facilities and discharged members.
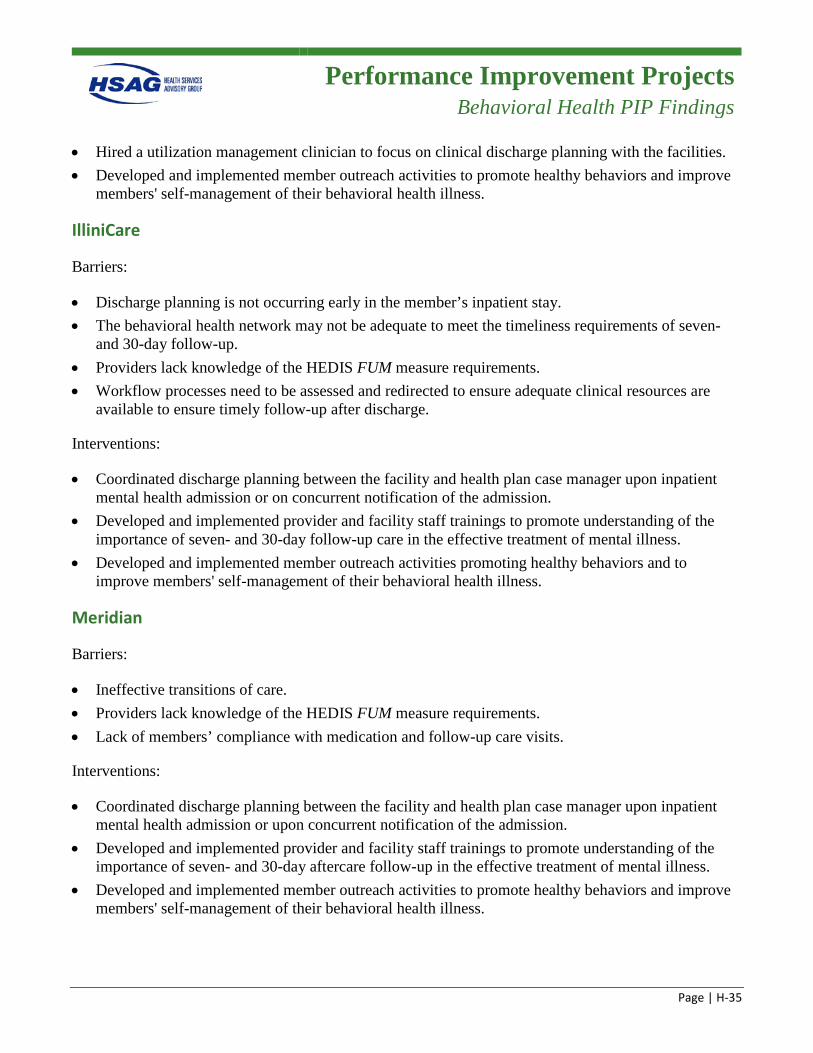
Performance Improvement Projects
Behavioral Health PIP Findings
Page | H-35
• Hired a utilization management clinician to focus on clinical discharge planning with the facilities. • Developed and implemented member outreach activities to promote healthy behaviors and improve
members' self-management of their behavioral health illness.
IlliniCare
Barriers:
• Discharge planning is not occurring early in the member’s inpatient stay. • The behavioral health network may not be adequate to meet the timeliness requirements of seven-
and 30-day follow-up. • Providers lack knowledge of the HEDIS FUM measure requirements. • Workflow processes need to be assessed and redirected to ensure adequate clinical resources are
available to ensure timely follow-up after discharge.
Interventions:
• Coordinated discharge planning between the facility and health plan case manager upon inpatient mental health admission or on concurrent notification of the admission.
• Developed and implemented provider and facility staff trainings to promote understanding of the importance of seven- and 30-day follow-up care in the effective treatment of mental illness.
• Developed and implemented member outreach activities promoting healthy behaviors and to improve members' self-management of their behavioral health illness.
Meridian
Barriers:
• Ineffective transitions of care. • Providers lack knowledge of the HEDIS FUM measure requirements. • Lack of members’ compliance with medication and follow-up care visits.
Interventions:
• Coordinated discharge planning between the facility and health plan case manager upon inpatient mental health admission or upon concurrent notification of the admission.
• Developed and implemented provider and facility staff trainings to promote understanding of the importance of seven- and 30-day aftercare follow-up in the effective treatment of mental illness.
• Developed and implemented member outreach activities to promote healthy behaviors and improve members' self-management of their behavioral health illness.
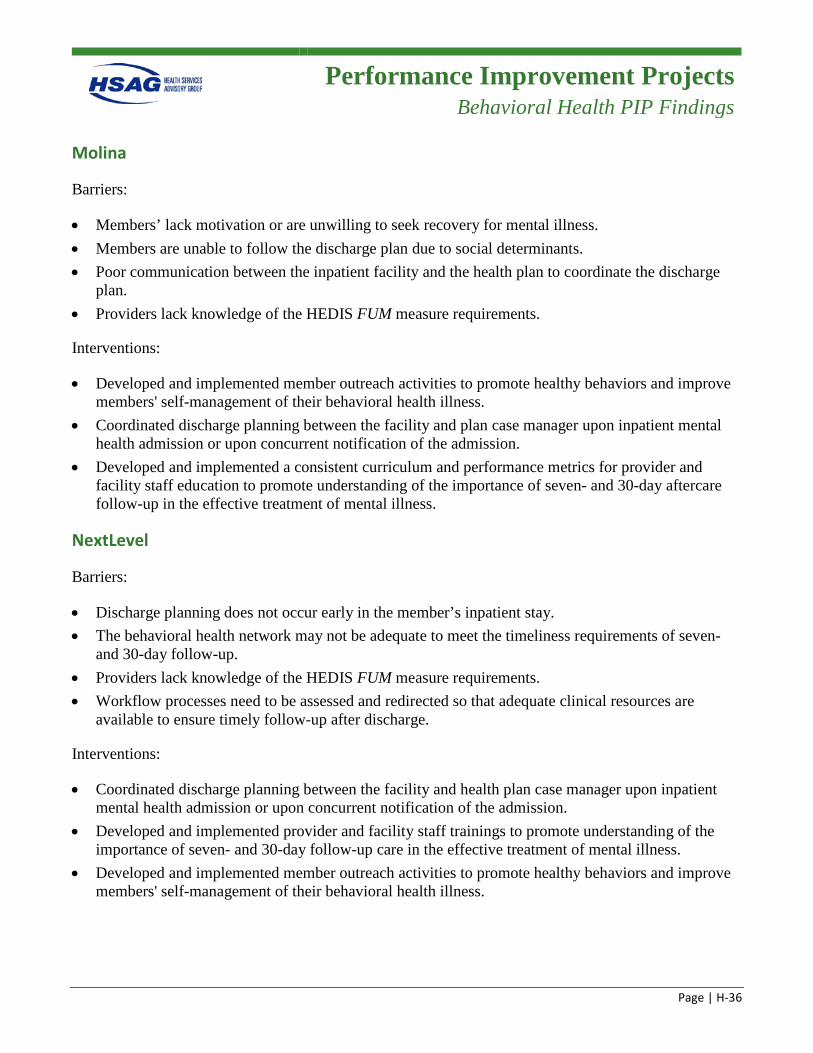
Performance Improvement Projects
Behavioral Health PIP Findings
Page | H-36
Molina
Barriers:
• Members’ lack motivation or are unwilling to seek recovery for mental illness. • Members are unable to follow the discharge plan due to social determinants. • Poor communication between the inpatient facility and the health plan to coordinate the discharge
plan. • Providers lack knowledge of the HEDIS FUM measure requirements.
Interventions:
• Developed and implemented member outreach activities to promote healthy behaviors and improve members' self-management of their behavioral health illness.
• Coordinated discharge planning between the facility and plan case manager upon inpatient mental health admission or upon concurrent notification of the admission.
• Developed and implemented a consistent curriculum and performance metrics for provider and facility staff education to promote understanding of the importance of seven- and 30-day aftercare follow-up in the effective treatment of mental illness.
NextLevel
Barriers:
• Discharge planning does not occur early in the member’s inpatient stay. • The behavioral health network may not be adequate to meet the timeliness requirements of seven-
and 30-day follow-up. • Providers lack knowledge of the HEDIS FUM measure requirements. • Workflow processes need to be assessed and redirected so that adequate clinical resources are
available to ensure timely follow-up after discharge.
Interventions:
• Coordinated discharge planning between the facility and health plan case manager upon inpatient mental health admission or upon concurrent notification of the admission.
• Developed and implemented provider and facility staff trainings to promote understanding of the importance of seven- and 30-day follow-up care in the effective treatment of mental illness.
• Developed and implemented member outreach activities to promote healthy behaviors and improve members' self-management of their behavioral health illness.

Page | I-1
Appendix I. Structure and Operations Methodology and Additional Information
Structure and Operations
Compliance Reviews
Page | I-2
Overview This section presents the methodology and detailed descriptions of the activities Health Services Advisory Group, Inc. (HSAG), conducted to assess and monitor the health plan’s structure and operations as required by federal regulations and by request of the Illinois Department of Healthcare and Family Services (HFS).
Section Contents Administrative Compliance and Readiness Reviews ............................................................................... I-2
Centers for Medicare & Medicaid Services (CMS) Home- and Community-Based Services (HCBS) Waiver Performance Measure Record Reviews ..................................................................................... I-34
Provider Network Capacity Reviews ...................................................................................................... I-49
Care Coordination/Care Management (CC/CM) .................................................................................... I-50
Technical Assistance (TA) to HFS and Health Plans ............................................................................. I-54
Administrative Compliance and Operational Readiness Reviews
Introduction
As set forth in 42 Code of Federal Regulations (CFR) §438.358(3), states are required to conduct an administrative compliance review of each health plan, within the previous three-year period, to determine health plan compliance with federal regulatory provisions, state standards, and contract requirements. HFS has an annual monitoring process in place to ensure the CFR and Balanced Budget Act (BBA) requirements are met over a three-year period. HSAG reviews health plan compliance with the state standards, and in accordance with 42 CFR §438.204(g), these standards are as stringent as the federal Medicaid managed care standards described in 42 CFR §438.206–42 CFR §438.242, which address requirements related to access, structure and operations, and measurement and improvement standards. Compliance is also determined through review of individual files to evaluate implementation of standards.
Structure and Operations
Compliance Reviews
Page | I-3
Compliance Review Process
Background
The BBA of 1997 requires that states contract with an external quality review organization (EQRO) to conduct an evaluation of their health plans to determine compliance with standards related to access, measurement and improvement, structure and operations, and program integrity. The U.S. Department of Health and Human Services (HHS), Centers for Medicare & Medicaid Services (CMS), regulates procedures for external quality review (EQR). Oversight activities of the EQRO focus on evaluating quality outcomes and the timeliness of, and access to, care and services provided to Medicaid beneficiaries.
Private accreditation organizations, state licensing and Medicaid agencies, and the federal Medicare program all recognize that having standards for quality healthcare is only the first step in promoting safe and effective healthcare. Making sure that the standards are followed is the second step. The CMS protocols for external quality review of Medicaid managed care organizations and prepaid inpatient health plans describe the second step.I-1
Objectives
The primary objective of HSAG’s compliance review was to provide meaningful information to HFS and the health plans regarding compliance with federal managed care regulations and contract requirements. The compliance review areas selected included standards listed below under the four areas of Access, Structure and Operations, Measurement and Improvement, and Practice Guidelines. The remaining Administrative Review standards are scheduled for review in 2017.
To complete the compliance review, HSAG assembled a team to:
• Collaborate with HFS to determine the scope of the review and scoring methodology, data collection methods, schedules for the desk review and on-site review activities, and the agenda for the on-site review.
• Collect and review data and documents before and during the on-site review. • Aggregate and analyze the data and information collected. • Prepare the report of its findings. • Standards
I-1 Department of Health and Human Services, Centers for Medicare & Medicaid Services. EQR Protocols. Available at: https://www.medicaid.gov/medicaid/quality-of-care/medicaid-managed-care/external-quality-review/index.html. Accessed on: Mar 14, 2018.
Structure and Operations
Compliance Reviews
Page | I-4
The compliance review tool included requirements that addressed the following operational areas. The information and findings from HSAG’s reviews were used by HFS and each health plan to:
• Evaluate the quality and timeliness of, and access to, care and services furnished to members. • Identify, implement, and monitor interventions to improve the quality, accessibility, and timeliness
of services.
Access Standards • Standard I—Availability of Services • Standard II—Assurance of Adequate Capacity and Services • Standard III—Coordination and Continuity of Care (Including Transition of Care)
Structure and Operations Standards • Standard VII—Subcontracts and Delegation
Measurement and Improvement Standards • Standard XIII—Health Information Systems • Standard XIV—Required Minimum Standards of Care/Practice Guidelines • Standard XV—Critical Incidents
Practice Guidelines • Standard XIV—Practice Guidelines and Required Minimum Standards of Care
Review Activities and Technical Methods of Data Collection
The compliance review process was divided into the following seven phases.
• Phase 1: Preparation • Phase 2: Health plan desk review • Phase 3: HSAG desk review • Phase 4: HSAG on-site review • Phase 5: Health plan reporting and remediation review • Phase 6: HSAG remediation review • Phase 7: Final report
Throughout preparation for the compliance review and performance of the activities during the on-site review, HSAG worked closely with HFS and the health plan to ensure a coordinated and supportive approach to completing the required activities. HSAG also followed the guidelines in the CMS’ EQR
Structure and Operations
Compliance Reviews
Page | I-5
Protocol 1: Assessment of Compliance with Medicaid Managed Care Regulations: A Mandatory Protocol for External Quality Review (EQR), Version 2.0, September 2012.I-2
Web-Based Administrative Tool
The Administrative Review Web-Based Tool (review tool) was developed for HFS by HSAG. The review tool is a web-based application that contains the standards, elements, and scoring for each standard. The web-based tool is used to record the desk review findings, on-site review findings, remediation actions (if needed), and evaluation of remediation actions. Health plans use the web-based tool to submit documentation to support compliance with each standard/element during the desk review, view the report of findings following the on-site review, and respond to noncompliant elements through documentation of the remediation plan and submission of documents to support the remediation plan.
Pre-On-Site Activities
Prior to the on-site administrative compliance review, the health plan participated in weekly conference calls with HFS and HSAG to review the preparation for implementation of the program. A list of mandatory documents required for approval before the “go live” date was provided to the health plan. The mandatory document list was determined based on HFS contractual requirements. HSAG reviewers used the documentation to gain insight into each health plan’s structure and operations, access to care for its members, and quality assessment and performance improvement program. HSAG also used the documentation to begin compiling the information and preliminary findings before the on-site portion of the review. During the desk review process, reviewers documented findings from the review of the materials submitted as evidence of compliance with the requirements, identified areas and issues requiring further clarification during the on-site interviews, and identified additional documentation for request during the on-site visit.
HFS, with assistance from HSAG, reviewed and approved all mandatory documentation prior to implementation of the program. Throughout this desk review process, the health plan was required to revise any documents not meeting the federal, State, and contract requirements and resubmit them for approval.
On-Site Activities
During the on-site portion of the review, health plan staff members were available to answer questions and to assist the HSAG review team in locating specific documents or other sources of information. During the on-site review, HSAG used interviews to obtain a complete picture of compliance with contract requirements, to explore any issues not fully addressed in the documents, and to increase overall understanding of the health plan’s performance. HSAG also reviewed information, documentation, and systems demonstrations. Throughout the on-site review process, reviewers used the
I-2 Department of Health and Human Services, Centers for Medicare & Medicaid Services. EQR Protocol 1: Assessment of
Compliance with Medicaid Managed Care Regulations: A Mandatory Protocol for External Quality Review (EQR), Version 2.0, September 2012. Available at: https://www.medicaid.gov/medicaid/quality-of-care/downloads/eqr-protocol-1.pdf. Accessed on: Mar 14, 2018.
Structure and Operations
Compliance Reviews
Page | I-6
review tool to identify relevant information sources and to document findings regarding compliance with the standards.
HSAG received and reviewed files designated for the file reviews. HSAG generated unique record review samples based on data files supplied by the health plans and HFS. Reviewers used standardized monitoring tools to review records and to document findings regarding compliance with contract requirements and the health plans’ policies and procedures. As a final step for the on-site review, HSAG reviewers met with staff members from the health plan and HFS to provide a high-level summary of the preliminary findings.
Provider Network Analysis for Compliance Reviews
As set forth in 42 Code of Federal Regulations (CFR) §438.358(3), states are required to conduct a compliance review of each health plan, within the previous three-year period, to determine health plan compliance with federal regulatory provisions, State standards, and contract requirements. HSAG develops tools and documents using specific criteria from applicable CFRs, as well as state statutes and contracts. HSAG uses the tool to assess reviews of health plans’ compliance with applicable standards.
The administrative reviews include assessment of availability of services and assurance of adequate capacity and service. HSAG’s provider network analyses help HSAG determine health plans’ compliance with network adequacy standards. HSAG reviews health plan activities for oversight of their networks and validates those activities as part of the administrative review process including review of health plan internal oversight and monitoring procedures and review of network capacity reporting. HSAG conducts several specific file reviews to determine compliance with access and availability standards as described below.
• Provider Directory Review—A more in-depth analysis of the accuracy of the health plans’ searchable online provider network. Health plans are required to monitor the accuracy of the online provider directory and hardcopy provider directory. For this review, health plans were required to provide the most recent “open/closed panel report,” which is a listing of all notifications the plan has received from its providers regarding providers’ availability to accept new patients. HSAG selected a random sample of network providers to evaluate 13 data elements for each sampled provider. HSAG analyzed the provider directory information to determine the degree to which each health plan’s provider directory complied with contract requirements.
• Access-Related Grievance File Review—HSAG developed a review tool to determine compliance with contract standards regarding the intake and processing of grievances. Health plans were required to submit all access-related grievances for the calendar year. HSAG sorted this file by type of access-related grievance to determine the number of grievances by category as identified, and randomly selected 10 files among the grievance categories.
• Review of Provider Contracts—HSAG performed a review of contracts for the following provider types: ancillary, facility, federally qualified health center (FQHC), hospital, physician hospital organization (PHO), and provider. For each provider type, HSAG reviewed a template contract against 15 elements to determine compliance with requirements.
Structure and Operations
Compliance Reviews
Page | I-7
• Review of Access and Availability Reports—HSAG reviewed health plan provider access and appointment availability audit results to assess health plans’ monitoring of provider compliance with appointment availability and after-hours access standards. The review includes comparing health plan monitoring procedures against access and availability standards including procedures to follow up with providers found noncompliant.
Scoring
Based on the results from the comprehensive compliance review tool and conclusions from the review activities, HSAG assigned each element within the standards in the compliance monitoring tool a score of Met, Not Met, or Not Applicable (NA). HSAG used scores of Met and Not Met to indicate the degree of compliance with the requirements by the health plan. HSAG used a designation of NA when a requirement was not applicable to an organization during the period covered by the review. This scoring methodology was consistent with CMS’ EQR Protocol 1: Assessment of Compliance with Medicaid Managed Care Regulations: A Mandatory Protocol for External Quality Review (EQR), Version 2.0, September 2012.
Health Plan Descriptions
Harmony Health Plan of Illinois, Inc. (Harmony)
WellCare Health Plans, Inc., Harmony’s parent company, provides managed care services targeted to government-sponsored healthcare programs, focusing on Medicaid and Medicare. Headquartered in Tampa, Fla., WellCare offers a variety of health plans for families; children; and the aged, blind, and disabled (ABD) population. It also provides prescription drug plans. As a subsidiary, Harmony works with doctors, hospitals, governments, and communities to provide quality, cost-effective healthcare solutions.
Cigna-HealthSpring of Illinois (Cigna)
Cigna has various locations, but most of the operational areas such as customer service, network operations and contracting, compliance, service coordination, and utilization management (UM) are in Chicago. Cigna’s claims are processed and managed in Baltimore, MD. Cigna’s person-centered care management program includes medical, behavioral, and social services, with the key initiatives focusing on individual needs and keeping the member in the least restrictive environment. Cigna’s registered nurses (RNs), those with master of social work (MSW) degrees, and licensed clinical professional counsellors (LCPCs) work remotely, reside in the same ZIP code as members, and utilize specialty vendors to enhance the service provided to members focusing on unable-to-locate members. The tables below present a summary of Cigna’s initial compliance review results for the Integrated Care Program (ICP) and Medicare-Medicaid Alignment Initiative (MMAI).
Structure and Operations
Compliance Reviews
Page | I-8
Blue Cross Blue Shield of Illinois (BCBSIL)
BCBSIL is an Illinois-based division of Health Care Service Corporation (HCSC), a Mutual Legal Reserve Company, established and licensed in 1936. The organization was founded when a group of local civic leaders, hospital officials, and physicians came together during the Great Depression to find a solution to the problem of affordable healthcare. In 1936, they pooled resources and incorporated as Hospital Services Corporation to offer prepaid benefits, under the statutes of the State of Illinois. BCBSIL is the largest operating health plan within HCSC, with 8.19 million members out of a total of 14.90 million. HCSC employs 19,000 people, of which 9,500 are in Illinois in 17 locations throughout the State. Today, BCBSIL is Illinois’ largest insurer and continues to partner with providers and communities to implement innovative new models of care that improve value and quality of health for all Illinois residents.
Family Health Network (FHN)
Family Health Network (FHN), is a not-for-profit MCO founded in 1994 as a Managed Care Community Network (MCCN) sponsored by several Chicago-based safety net hospitals. Over the past 22 years, those hospitals have become Norwegian American Hospital, Sinai Health System, Saint Anthony Hospital, Saint Bernard Hospital, and Presence Health. On June 29, 2015, FHN became an Illinois-licensed health maintenance organization (HMO). As of April 2017, FHN acquired its National Committee for Quality Assurance (NCQA) accreditation. There are two Medicaid populations currently served by FHN, the Family Health Plan (FHP) population, formerly known as the Temporary Assistance for Needy Families (TANF) population (consisting of primarily women and children) and the Affordable Care Act (ACA) population. In response to a new Illinois Medicaid Innovations initiative in 2013, FHN created a wholly owned subsidiary, Community Care Alliance of Illinois (CCAI). This MCCN provides managed healthcare to the Integrated Care Program participants, formerly known as the ABD population. The two companies, FHN and CCAI, established and maintain many shared departments to provide consistent and documented processes within both organizations.
Community Care Alliance of Illinois (CCAI)
Community Care Alliance of Illinois (CCAI) is a wholly owned subsidiary of Family Health Network. CCAI is an MCCN organized under Illinois statute in 2013 as part of the Department of Healthcare and Family Services (HFS) Integrated Care Program. CCAI provides managed health services to seniors and adults with disabilities under the Illinois Medicaid program. In April 2017, CCAI acquired its NCQA accreditation. CCAI offers a Medicaid product through the ICP, which consists of older adults and adults with disabilities who are enrolled in Medicaid, but not Medicare.
Structure and Operations
Compliance Reviews
Page | I-9
Aetna Better Health (Aetna)
Aetna has provided service to HFS’ ICP membership since May 2011. The plan added FHP/ACA membership in the winter of 2014 and added the MMAI demonstration project (membership in Cook, DuPage, Kane, Kankakee and Will counties) in the early spring of 2015.
Meridian Health Plan, Inc. (Meridian)
Family owned and operated, Meridian has been a Medicaid HMO since 2000. Meridian was founded by Dr. David Cotton in 1997 as a Medicaid health plan in Michigan. Over the years, Meridian has expanded into other states including Illinois, Indiana, Kentucky, Michigan, and Ohio. Meridian expanded into Illinois in 2008 and currently serves the IL Medicaid FHP/ACA, ICP, and MMAI populations in all mandatory managed care regions in counties across Illinois.
Molina Healthcare of Illinois, Inc. (Molina)
Molina was founded more than 35 years ago by Dr. C. David Molina, an emergency room (ER) physician. Dr. Molina opened the first medical clinic to serve the patients he frequently treated in the ER simply because they did not have their own primary care doctor. From that clinic, Molina Healthcare continued to grow for the next three decades to become what it is now—a national healthcare company that provides care through government-sponsored programs across the country. Today, Molina Healthcare serves the diverse needs of members across the United States through programs such as Medicaid, Medicare, and Health Insurance Marketplace. Molina also offers health information management and business process outsourcing solutions for state Medicaid programs through its subsidiary, Molina Medicaid Solutions. Additionally, Molina continues to expand its primary care clinics across the country through Molina Medical.
IlliniCare Health Plan, Inc. (IlliniCare)
IlliniCare, a managed care organization founded in 2011, is contracted with the State of Illinois to provide healthcare services to the Medicaid and Medicare populations. In 2014, IlliniCare launched a variety of commercial health insurance plans, which are available for purchase on the Health Insurance Marketplace. IlliniCare aims to improve healthcare outcomes and quality of care, partner with providers, and control costs.
Humana Health Plan, Inc. (Humana)
Founded in 1961 and headquartered in Louisville, KY, Humana’s 43,000 associates focus on helping approximately 12 million members achieve lifelong well-being. Humana’s commitment to Illinois is best exemplified by its 30 years of experience participating in the Medicare Advantage and M+C programs. Humana has developed longstanding shared responsibility relationships with some of the largest and most respected provider groups and hospital systems in Illinois. Humana leveraged many of
Structure and Operations
Compliance Reviews
Page | I-10
these relationships and developed new partnerships for the launch of both the MMAI and ICP programs in March 2014 with new partners, Independent Living Systems (ILS) and Beacon Health Options.
CountyCare Health Plan (CountyCare)
In fall 2012, the Cook County Health & Hospitals System (CCHHS) launched CountyCare as a demonstration project through a CMS 1115 Waiver granted to the State of Illinois Medicaid agency to early-enroll eligible low-income Cook County adults (ACA adults) into a Medicaid managed care program. In July 2014, CountyCare transitioned from the federal waiver authority and subsequently became a Medicaid managed care plan under the State’s County MCCN rules. This transition allowed CountyCare to expand beyond the newly eligible ACA adult population to include traditional Medicaid populations in FHP and Seniors and Persons with Disabilities (SPD) coverage. The CountyCare provider network includes all CCHHS facilities, every FQHC in Cook County, and more than 30 hospitals. CountyCare also covers approved HCBS and allows members to fill prescriptions at local pharmacies or use CCHHS’ mail order system.
NextLevel Health Partners, LLC (NextLevel)
NextLevel became operational by July 2014. Over the next year, NextLevel grew quickly in membership, expanding its membership to serve not only SPD members, but also to serve newly eligible ACA adults. Additionally, NextLevel’s service area grew to include all of Cook County, with its provider network growing to almost 500 primary care providers (PCPs), and strong partnerships with hospitals, FQHCs, community mental health centers (CMHCs), and other needed ancillary providers.
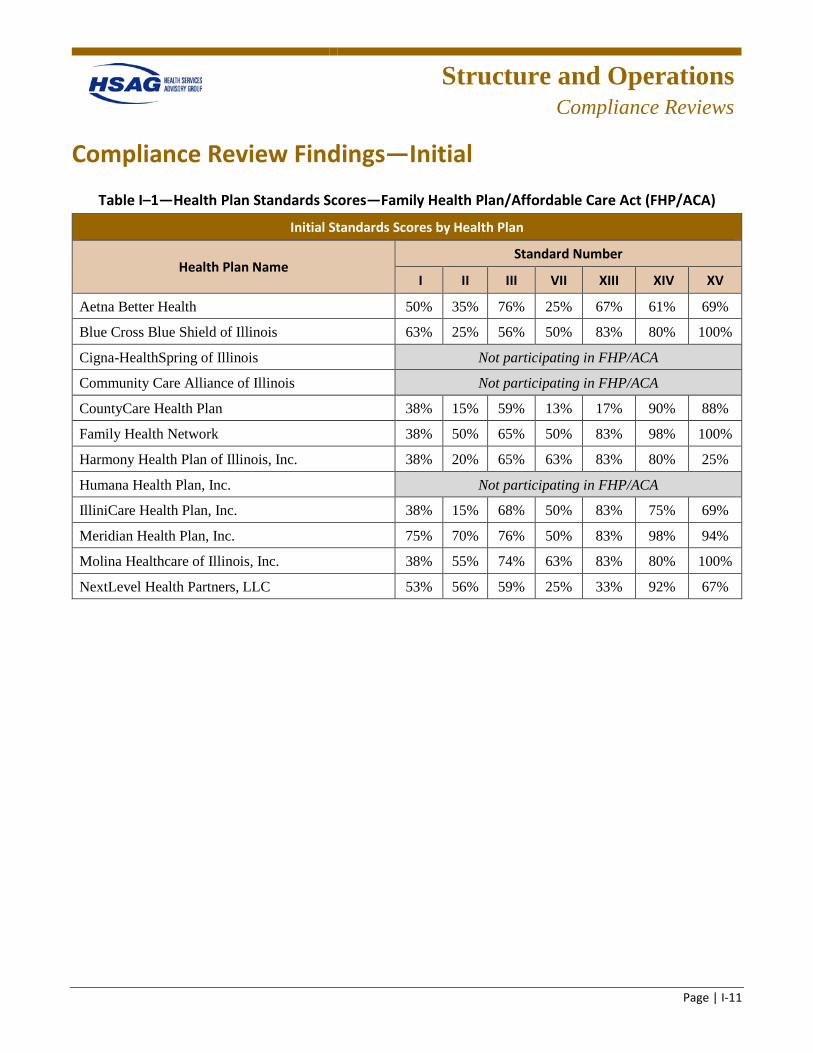
Structure and Operations
Compliance Reviews
Page | I-11
Compliance Review Findings—Initial
Table I–1—Health Plan Standards Scores—Family Health Plan/Affordable Care Act (FHP/ACA)
Initial Standards Scores by Health Plan
Health Plan Name Standard Number
I II III VII XIII XIV XV
Aetna Better Health 50% 35% 76% 25% 67% 61% 69%
Blue Cross Blue Shield of Illinois 63% 25% 56% 50% 83% 80% 100%
Cigna-HealthSpring of Illinois Not participating in FHP/ACA
Community Care Alliance of Illinois Not participating in FHP/ACA
CountyCare Health Plan 38% 15% 59% 13% 17% 90% 88%
Family Health Network 38% 50% 65% 50% 83% 98% 100%
Harmony Health Plan of Illinois, Inc. 38% 20% 65% 63% 83% 80% 25%
Humana Health Plan, Inc. Not participating in FHP/ACA
IlliniCare Health Plan, Inc. 38% 15% 68% 50% 83% 75% 69%
Meridian Health Plan, Inc. 75% 70% 76% 50% 83% 98% 94%
Molina Healthcare of Illinois, Inc. 38% 55% 74% 63% 83% 80% 100%
NextLevel Health Partners, LLC 53% 56% 59% 25% 33% 92% 67%

Structure and Operations
Compliance Reviews
Page | I-12
Table I–2—Health Plan Standards Scores—Integrated Care Program (ICP)
Initial Standards Scores by Health Plan
Health Plan Standard Number
I II III VII XIII XIV XV
Aetna Better Health 50% 44% 76% 25% 67% 61% 67%
Blue Cross Blue Shield of Illinois 75% 33% 53% 50% 67% 80% 100%
Cigna-HealthSpring of Illinois 63% 35% 62% 38% 83% 30% 87%
Community Care Alliance of Illinois 13% 33% 65% 50% 83% 30% 87%
CountyCare Health Plan 38% 11% 59% 13% 17% 90% 87%
Family Health Network Not participating in ICP
Harmony Health Plan of Illinois, Inc. Not participating in ICP
Humana Health Plan, Inc. 75% 78% 76% 38% 67% 49% 100%
IlliniCare Health Plan, Inc. 38% 17% 65% 50% 83% 75% 73%
Meridian Health Plan, Inc. 75% 67% 85% 50% 83% 75% 73%
Molina Healthcare of Illinois, Inc. 38% 50% 71% 63% 83% 80% 100%
NextLevel Health Partners, LLC 63% 56% 59% 25% 33% 92% 67%
Table I–3—Health Plan Standards Scores—Medicare Medicaid Alignment Initiative (MMAI)
Initial Standards Scores by Health Plan
Health Plan Standard Number
I II III VII XIII XIV XV
Aetna Better Health 38% 37% 79% 13% 100% 78% 67%
Blue Cross Blue Shield of Illinois 63% 37% 55% 50% 100% 78% 100%
Cigna-HealthSpring of Illinois 50% 26% 67% 50% 80% 67% 87%
Community Care Alliance of Illinois Not participating in MMAI
CountyCare Health Plan Not participating in MMAI
Family Health Network Not participating in MMAI
Harmony Health Plan of Illinois, Inc. Not participating in MMAI
Humana Health Plan, Inc. 75% 63% 73% 50% 80% 78% 100%
IlliniCare Health Plan, Inc. 25% 16% 70% 25% 100% 100% 73%
Meridian Health Plan, Inc. 75% 68% 79% 38% 100% 100% 93%
Molina Healthcare of Illinois, Inc. 38% 53% 73% 63% 100% 89% 100%
NextLevel Health Partners, LLC Not participating in MMAI
Structure and Operations
Compliance Reviews
Page | I-13
Standard I. Availability of Services
This standard included eight elements reviewed for requirements of covered services, appointment standards, time/distance standards, access to providers, after-hours availability, choice of PCP, and provider education. The plans had established policies and procedures that addressed network adequacy and availability of services that were generally compliant with federal Medicaid managed care regulations, State rules, and the associated HFS contract requirements for access standards. As part of this standard, HSAG also reviewed member and provider handbooks, the plan’s website, Geo-access reports, annual access and availability survey results, and provider education.
Overall program/plan findings included:
• Lack of a formal process for the annual access and availability survey, specifically regarding remediation of noncompliant providers.
• Lack of assessment and monitoring of the Americans with Disabilities Act (ADA) compliance of provider offices.
• Lack of documentation indicating that pregnant enrollees, enrollees with chronic conditions, disabilities, or special healthcare needs are given the option to choose a specialist as a PCP.
Standard II. Assurance of Adequate Capacity and Services
This standard included 20 elements reviewed for requirements of provider-to-enrollee ratio, network capacity, provider panel, family planning services, provider directory, medical home, specialist provider, access-related grievances, and HCBS waiver services. The plans had established policies and procedures that addressed network adequacy and availability of services that were generally compliant with federal Medicaid managed care regulations, State rules, and the associated HFS contract requirements for access standards. As part of this standard, HSAG also reviewed network adequacy reports, open and closed panel reports, and provider directories. This standard included both the provider directory and access-related grievance file reviews, which were performed while on-site.
Overall program/plan findings included:
• Lack of a process to monitor open and closed panels. • Lack of a process to monitor homebound providers to meet the needs of enrollees with mobility
restrictions. • Lack of an audit process to validate the accuracy of the information maintained in the provider
directory. • Lack of documentation of timely communication and follow-up with the appropriate departments to
investigate and resolve member grievances. • Lack of a process to monitor hospitalists and skilled nursing facility specialists (SNFists). • Lack of sufficient monitoring of nursing facilities and supported living facilities to ensure enrollees
have choices within each county of the contracting area.
Structure and Operations
Compliance Reviews
Page | I-14
• Lack of monitoring HCBS covered service requirements.
Standard III. Coordination and Continuity of Care (Including Transition of Care)
Standard III is composed of 34 elements for care coordination and care management (CC/CM). In determining compliance, reviews were conducted with policies, practices, program descriptions, member identification, predictive modeling and stratification systems, care plans, and member case files.
Aetna and Meridian received the highest CC/CM compliance score for FHP/ACA and MMAI. Meridian scored highest in compliance for ICP. BCBSIL received the lowest compliance score in all three programs.
FHP/ACA Standard III Findings
The average CC/CM compliance score for FHP/ACA across nine health plans was 66.44 percent. Aetna and Meridian achieved the highest score at 76 percent; BCBSIL received the lowest score at 56 percent.
An overview of noncompliance scores indicated trends across plans, with all results of high, low, and average scores. The following elements in the CC/CM standard and file reviews were consistently noncompliant in the FHP/ACA review:
• Provider Entity Name to the Department • Contact Standards • Health Risk Screening • Health Risk Assessment • Enrollee Care Plan Reassessment • Individualized Care Plans/Service Plans • Transition of Care Plan
ICP Standard III Findings
Ten health plans provided care for ICP members and had an average CC/CM compliance score of 67.10 percent. Meridian scored highest at 85 percent; BCBSIL received the lowest score at 53 percent. CC/CM file review elements consistently requiring remediation across all health plans included:
• Health Risk Assessment • Enrollee Care Plan Reassessment • Care Plan Additional Elements • Transition of Care Plan
Structure and Operations
Compliance Reviews
Page | I-15
Other ICP elements warranting a review for improvement in CC/CM services across many plans included Care Coordinators’ Qualifications, Contact Standards, and Health Risk Screening.
MMAI Standard III Findings
MMAI services were provided by seven health plans and scored an average CC/CM compliance score of 70.86 percent. Aetna and Meridian scored highest at 79 percent; BCBSIL received the lowest score at 55 percent.
Elements for CC/CM file reviews that consistently scored noncompliant for MMAI members included:
• Health Risk Assessment • Enrollee Care Plan • Enrollee Care Plan Reassessment
Other CC/CM elements that did not fare high scores and that warrant continued monitoring included Contact Standards, Care Plan Additional Elements, and Transition of Care Plan.
Standard VII. Subcontractual Relationships and Delegation
This standard included eight elements reviewed for requirements of monitoring delegated entities and activities, and provider agreements and subcontracts. The plans had established policies and procedures that addressed network adequacy and availability of services that were generally compliant with federal Medicaid managed care regulations, State rules, and the associated HFS contract requirements for access standards. In addition to policies and procedures, HSAG also reviewed joint operating meeting minutes, quarterly delegation oversight meeting minutes, pre-and annual delegation audits, and template provider and service agreements. This standard included both contract and delegation file reviews, which were performed while on-site.
Overall program/plan findings included:
• Missing key provisions of the written delegation agreement. • Lack of documentation of required training for delegated vendors. • Lack of routine record/file reviews of delegated vendors. • Lack of documentation to support regular monitoring of enrollee complaints, grievances, provider
complaints, and quality of care concerns for the delegated entities. • Lack of a summary of the outcomes of the delegation audits in the annual Quality
Assurance/Utilization Review/Peer Review (QA/UR/PR) report to the HFS. • Missing key provisions of the written provider agreements.
Structure and Operations
Compliance Reviews
Page | I-16
Standard XIII. Health Information Systems
This standard included six elements reviewed for requirements of Management Information System director, coordination tools, enrollee portal, and reporting requirements. Overall program findings included:
• Lack of compliance with some member and provider portals requirements. • Need to improve care management documentation systems and provide care management staff
access to prior-authorization, pharmacy, and claims data.
Standard XIV. Practice Guidelines and Required Minimum Standards of Care
This standard received one of the highest ratings across all plans and programs, and minimal remediation was required across the plans.
Standard XV. Critical Incidents
This standard included 16 elements reviewed for requirements of health, safety, and welfare monitoring; critical incident reporting; HCBS waiver reporting; training of providers, employees, subcontractors, enrollees, and enrollees’ family members; protocols for assuring health and safety; internal reporting system, and unauthorized use of restraints or restrictive interventions. In addition to a review of policies and procedures, training materials were also reviewed. During the on-site audit, plan staff demonstrated internal reporting systems for critical incidents and health, safety, and welfare monitoring and tracking, and provided a case review of a reported ANE case from the monthly HFS report.
Overall program/plan findings included:
• Plans lacked documentation of follow-up with enrollees to ensure their health and safety following incidents.
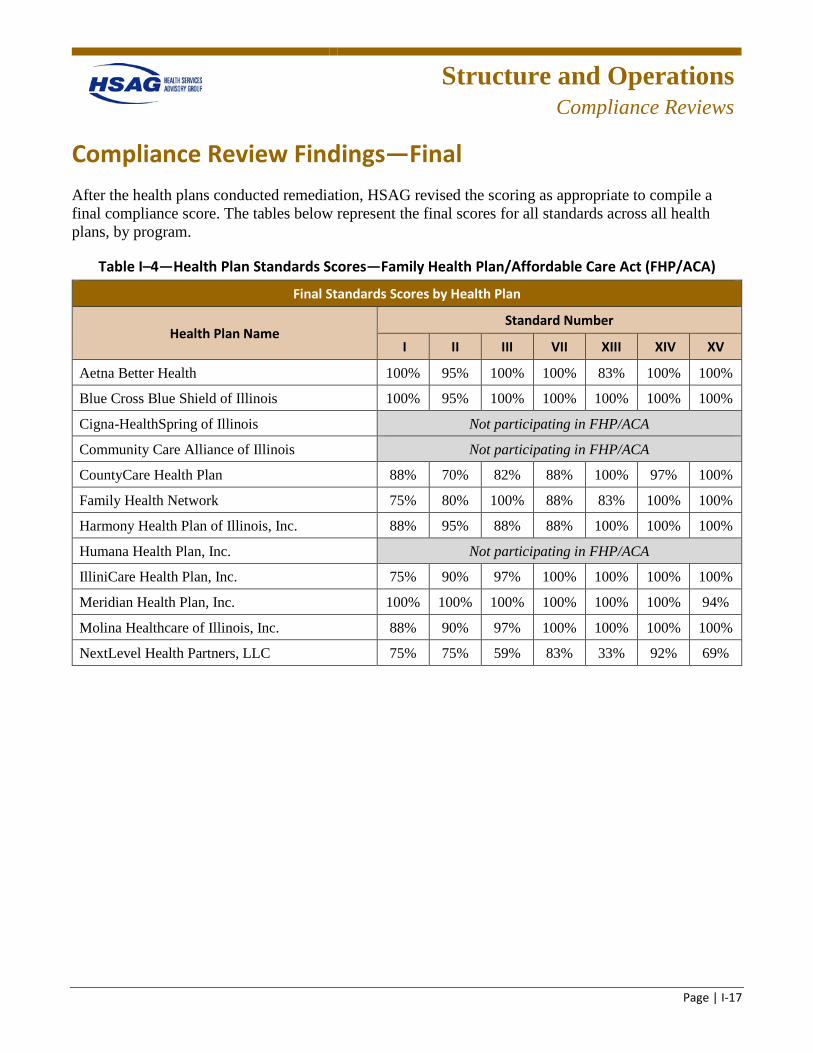
Structure and Operations
Compliance Reviews
Page | I-17
Compliance Review Findings—Final After the health plans conducted remediation, HSAG revised the scoring as appropriate to compile a final compliance score. The tables below represent the final scores for all standards across all health plans, by program.
Table I–4—Health Plan Standards Scores—Family Health Plan/Affordable Care Act (FHP/ACA)
Final Standards Scores by Health Plan
Health Plan Name Standard Number
I II III VII XIII XIV XV
Aetna Better Health 100% 95% 100% 100% 83% 100% 100%
Blue Cross Blue Shield of Illinois 100% 95% 100% 100% 100% 100% 100%
Cigna-HealthSpring of Illinois Not participating in FHP/ACA
Community Care Alliance of Illinois Not participating in FHP/ACA
CountyCare Health Plan 88% 70% 82% 88% 100% 97% 100%
Family Health Network 75% 80% 100% 88% 83% 100% 100%
Harmony Health Plan of Illinois, Inc. 88% 95% 88% 88% 100% 100% 100%
Humana Health Plan, Inc. Not participating in FHP/ACA
IlliniCare Health Plan, Inc. 75% 90% 97% 100% 100% 100% 100%
Meridian Health Plan, Inc. 100% 100% 100% 100% 100% 100% 94%
Molina Healthcare of Illinois, Inc. 88% 90% 97% 100% 100% 100% 100%
NextLevel Health Partners, LLC 75% 75% 59% 83% 33% 92% 69%
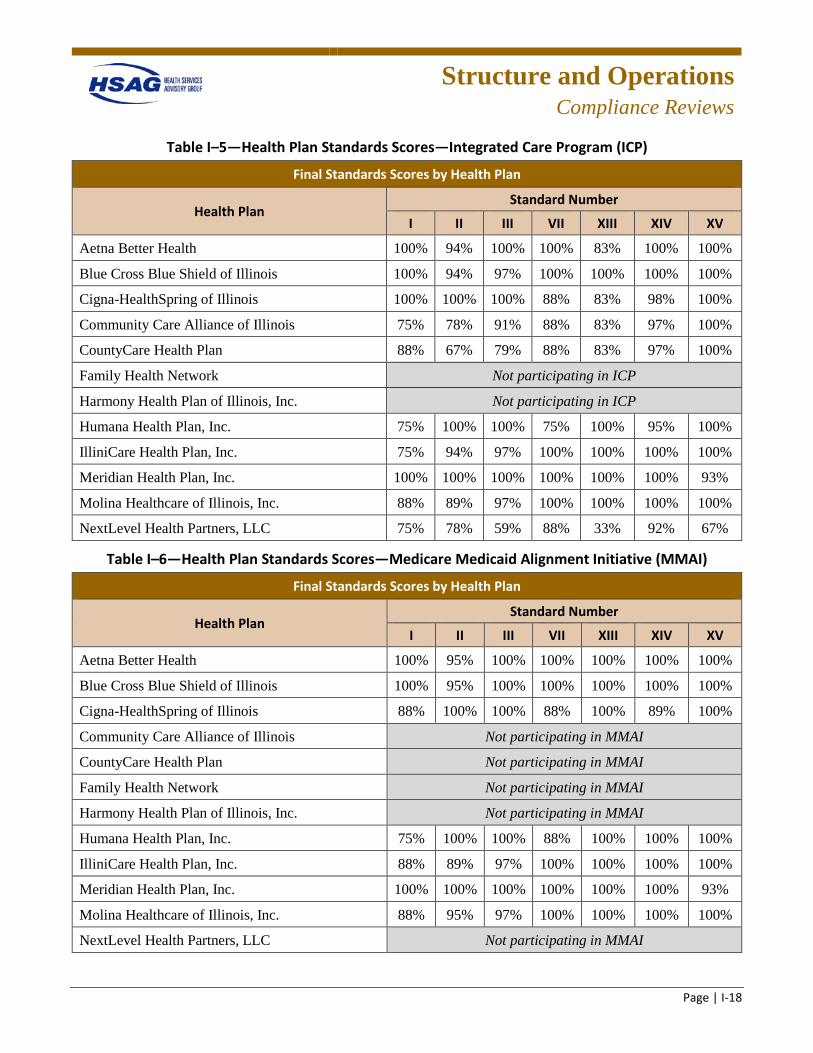
Structure and Operations
Compliance Reviews
Page | I-18
Table I–5—Health Plan Standards Scores—Integrated Care Program (ICP)
Final Standards Scores by Health Plan
Health Plan Standard Number
I II III VII XIII XIV XV
Aetna Better Health 100% 94% 100% 100% 83% 100% 100%
Blue Cross Blue Shield of Illinois 100% 94% 97% 100% 100% 100% 100%
Cigna-HealthSpring of Illinois 100% 100% 100% 88% 83% 98% 100%
Community Care Alliance of Illinois 75% 78% 91% 88% 83% 97% 100%
CountyCare Health Plan 88% 67% 79% 88% 83% 97% 100%
Family Health Network Not participating in ICP
Harmony Health Plan of Illinois, Inc. Not participating in ICP
Humana Health Plan, Inc. 75% 100% 100% 75% 100% 95% 100%
IlliniCare Health Plan, Inc. 75% 94% 97% 100% 100% 100% 100%
Meridian Health Plan, Inc. 100% 100% 100% 100% 100% 100% 93%
Molina Healthcare of Illinois, Inc. 88% 89% 97% 100% 100% 100% 100%
NextLevel Health Partners, LLC 75% 78% 59% 88% 33% 92% 67%
Table I–6—Health Plan Standards Scores—Medicare Medicaid Alignment Initiative (MMAI)
Final Standards Scores by Health Plan
Health Plan Standard Number
I II III VII XIII XIV XV
Aetna Better Health 100% 95% 100% 100% 100% 100% 100%
Blue Cross Blue Shield of Illinois 100% 95% 100% 100% 100% 100% 100%
Cigna-HealthSpring of Illinois 88% 100% 100% 88% 100% 89% 100%
Community Care Alliance of Illinois Not participating in MMAI
CountyCare Health Plan Not participating in MMAI
Family Health Network Not participating in MMAI
Harmony Health Plan of Illinois, Inc. Not participating in MMAI
Humana Health Plan, Inc. 75% 100% 100% 88% 100% 100% 100%
IlliniCare Health Plan, Inc. 88% 89% 97% 100% 100% 100% 100%
Meridian Health Plan, Inc. 100% 100% 100% 100% 100% 100% 93%
Molina Healthcare of Illinois, Inc. 88% 95% 97% 100% 100% 100% 100%
NextLevel Health Partners, LLC Not participating in MMAI
Structure and Operations
Compliance Reviews
Page | I-19
Readiness Review Process for Health Plan Mergers
Procedure
The primary objective of HSAG’s readiness reviews was to evaluate implementation of merged functions by the health plans and readiness to provide services and/or to ensure that health plans had the system capacity needed to enroll recipients in their designated service areas. HSAG, in collaboration with HFS, determined the scope of the review, data collection methods, schedules, and agendas for the desk and on-site review activities. The process used for the readiness reviews was a combination of:
• Collection and review of documents in comparison to a specified set of criteria. • On-site demonstrations and discussions with health plan staff. • Aggregation and analysis of data and information collected. • Preparation of implementation grids to track progress and reports, and based on a compilation of all
findings.
To complete the readiness review, HSAG assembled a team to:
• Collaborate with HFS to determine the scope of the review and scoring methodology, data collection methods, schedules for the desk review and on-site review activities, and the agenda for the on-site review.
• Collect and review data and documents before and during the on-site review. • Aggregate and analyze the data and information collected. • Report the team’s findings.
To accomplish its objective, and based on the results of collaborative planning with HFS, HSAG developed standardized data collection tools and processes to assess and document each health plan’s compliance with federal Medicaid managed care regulations, State rules, and the associated HFS contract requirements. HSAG developed tools and documents using specific criteria from applicable CFRs, the Illinois Compiled Statutes (ILCS), HFS contracts, and the related Requests for Proposal (RFPs).
Each health plan received a pre-assessment form and document checklist and a customized set of readiness review tools which facilitated the preparation for the review. The pre-assessment form and document checklist contained detailed instructions for preparing for each area of review (e.g., documents to collect, staff to interview). The readiness review tool included requirements that addressed operational areas necessary to service the targeted population and ensure that health plans had the system capacity needed to enroll recipients in their designated service areas. The health plan was expected to describe in detail and provide supporting policies and procedures for the operational areas identified in the tool.
Structure and Operations
Compliance Reviews
Page | I-20
Data Collection and Analysis
Throughout preparation for readiness reviews and performance of on-site reviews, HSAG worked closely with HFS and the health plans to ensure a coordinated, informed approach to completing the required activities. Pre-on-site review activities consisted of scheduling and developing timelines for the site reviews and report development; developing data collection tools, report templates, and on-site agendas; and reviewing documents prior to the on-site portion of the review. The desk review assisted in determining areas that required additional focus during the on-site review.
On-site review activities included a review of additional documents, policies, and committee minutes to determine compliance with federal healthcare regulations and implementation of the organizations’ policies. HSAG conducted an opening conference to review the agenda and objectives of the site review and to allow the health plans to present any important information to assist the reviewers in understanding the unique attributes of each organization. HSAG used the on-site interviews to provide clarity and perspective to the documents reviewed both prior to the site review and on-site, to obtain further information to determine the health plan’s compliance with contract requirements, and to review systems demonstrations. HSAG then conducted a closing conference to summarize preliminary findings, anticipated recommendations, and opportunities for improvement.
Upon completion of the on-site review, HSAG aggregated all information obtained. HSAG analyzed the findings from the document and record reviews and from the interviews. HSAG analyzed the review information to determine the organization’s performance and used the designations Met, Partially Met, and Not Met to document the degree to which the health plan complied with the requirements. Certain elements were designated by HFS and HSAG as critical and had to be in compliance prior to a health plan receiving enrollment.
HSAG noted any elements that were identified as Partially Met and Not Met and the corrective action the health plan needed to take to bring the requirement into compliance. HSAG used the standardized monitoring tools to document follow-up on any elements that required corrective action. Corrective actions were monitored by HSAG and HFS until successfully completed.
Using information obtained during the on-site readiness review and desk review, HSAG and HFS determined, prior to client enrollment, whether each health plan’s internal organizational structure, health information systems, staffing, and oversight were sufficient to ensure compliance with contract requirements, quality oversight, and monitoring. Once the health plan began enrollment, monthly reports on care coordination, enrollment, network development, and staffing were submitted to both HFS and HSAG. The reports were reviewed and analyzed by HSAG and HFS. Ongoing feedback was provided by HSAG and HFS to the health plans following review of the required reports.
Findings
The information below is a summary of the readiness review findings for the Care Coordination Entity/Accountable Care Entity (CCE/ACE) mergers with health plans. The background information for each health plan was submitted to HSAG by the health plans in their pre-on-site review documents.
Structure and Operations
Compliance Reviews
Page | I-21
BCBSIL Review
HealthCura and UI Health Plus (UIH+) both chose to partner with BCBSIL to provide care management/care coordination services for the FHP/ACA population. HealthCura entered into a services agreement with BCBSIL on June 25, 2015, and UIH+ on September 1, 2015. BCBSIL assumed HealthCura and UIH+’s Medicaid members. HSAG conducted on-site readiness reviews to assess if BCBSIL had the assessment processes, care coordination, provider network, staffing, contract oversight, and systems to ensure the health plan’s capacity to handle the increase in enrollment.
HealthCura/ACCESS Partnership
HealthCura is led by Access Community Health Network (ACCESS), a critical safety net provider organization with a long history of providing healthcare to Medicaid beneficiaries, and a leader in delivering high-quality and culturally appropriate care in communities with the highest need.
ACCESS has a 20-year history of responding directly to community need by providing community-based care to underserved communities. Initially a provider organization with health centers located in public housing, ACCESS has followed the trajectory of these Medicaid recipients as individuals have moved from concentrated housing units to scatter site housing in Chicago and suburbs. In 1991, ACCESS was incorporated as an FQHC organization.
ACCESS has made strategic investments in serving as an anchor for patients, families, and communities. ACCESS is one of the largest FQHC networks in the country with an annual budget of $117 million. ACCESS’ ability to manage large initiatives such as these that reach deep into the community to address the needs of high-risk patients provides a strong platform for the HealthCura network.
University of Illinois Hospital & Health Sciences System Partnership (UIH+)
UIH+ includes the clinical operations of a 495-bed hospital, over 23 outpatient care clinics, 12 FQHC sites, and seven health sciences colleges (medicine, nursing, dentistry, pharmacy, public health, social work, and applied health sciences), and employs over 8,000 people. Together, these centers, clinics and practices provide comprehensive patient care in the Chicago area and statewide. They believe everyone should have access to world-class healthcare, which is why they aim to be more accessible, and more reliable, all while providing the best care.
UIH+’s ACE created a unique kind of Medicaid managed care entity led entirely by providers. Joining forces with BCBSIL will allow both plans to build on the successes of UIH+, with the added support and infrastructure of an established health plan. UIH+, including Mile Square Health Center, will remain the medical home for the ACE population, and UIH+ will continue to be responsible for coordinating care for the most vulnerable enrollees. Members will have access to the expanded benefits available in the Blue Cross Community Family Health Plan, such as no copays for prescriptions and clinic visits. They will also be able to seek care anywhere in the Blue Cross Community FHP network, which means that as an organization, UIH+ must be as committed as ever to providing a good patient experience. UIH+ is confident the future changes bring great promise to UIH+ patients. UIH+ will continue to focus
Structure and Operations
Compliance Reviews
Page | I-22
on what they do best—delivering high-quality care—while continuing to develop capabilities in care management and coordination.
BCBSIL Findings
BCBSIL needed to revise its contract to remediate findings including language that described performance audits; required delegate reporting, due date, and frequency of the delegate reports; caseload requirements monitoring; and language specific to the health screening requirements. Contract revisions or amendments were reviewed and approved prior to go-live recommendation.
Initially, the ACCESS/HealthCura predelegation audit did not include a care coordination record review due to the inability of BCBSIL staff to access the Epic system (ACCESS care management system). This review was completed after the HSAG on-site review, and a remediation letter was sent to the plan with findings that needed to be addressed prior to the go-live recommendation. HSAG was provided ongoing remediation progress reports from BCBSIL, and all critical items were completed prior to the go-live recommendation.
A predelegation audit was performed by BCBSIL for UIH+, which included an audit of care coordination records in Cerner (UIH+’s care coordination system). This review was completed prior to the HSAG on-site review, and a remediation letter was sent to the plan with findings that needed to be addressed prior to the go-live recommendation. HSAG was provided ongoing remediation progress reports from BCBSIL, and all critical items were completed prior to the go-live recommendation.
BCBSIL was required to submit an ongoing implementation and transition plan that mapped out a clear plan for enrollee transition and data integration/exchange activities between the two entities. This plan showed the progression of the different activities as well as completion due dates. Any items due to be completed after the go-live date were scheduled for review during the administrative review.
Cigna Review
Be Well Partners in Health (Be Well)
Be Well Partners in Health, LLC, was founded in 2010 by four equal partners: MADO Healthcare, Bethany Homes/Methodist Hospital, Norwegian American Hospital, and Neumann Family Services. Be Well’s vision is to become the “choice” coordinated care network providing access and care to adults with serious mental illness (SMI). Be Well’s value proposition provides meaningful assistance to adults with SMI who need support to manage their health, communicate with providers/families, and self-manage their health conditions and related psychosocial problems. Coordination of care among multiple health and community providers, bridging gaps in care, ensuring that members receive the appropriate level of care, and achieving a higher quality of life are highly important.
Cigna Findings
Cigna revised its care coordination agreement to include a list of specific reporting requirements and include predelegation audits, care management/care coordination record audits, and the annual
Structure and Operations
Compliance Reviews
Page | I-23
delegation oversight. Cigna also needed to update the Quality Improvement Program Description to include care coordination as a delegated program function and submit an organizational chart depicting the participation of Be Well in quality improvement activities and committees. During the readiness review, a project timeline was used to identify activities for data integration and transfer. Many of these activities were scheduled to be implemented after the go-live date; therefore, they were scheduled for follow-up during the administrative review. Be Well was also required to submit results of the predelegation audit to Cigna and provide evidence of Be Well’s training on fraud, waste, and abuse; cultural competency; and health and safety training. For any staff assigned to HCBS waiver enrollees, Cigna had to submit evidence that each Be Well staff care coordinator met the qualifications and training requirements. An ongoing oversight and monitoring plan for Be Well care coordination files to validate compliance with the contract oversight requirements was also submitted.
Cigna was required to submit an ongoing implementation and transition plan that mapped out a clear plan for enrollee transition and data integration/exchange activities between the entity. This plan showed the progression of the different activities as well as completion due dates. Any items due to be completed after the go-live date were scheduled for review during the administrative review.
Family Health Network (FHN) Review
FHN
FHN is a not-for-profit provider-sponsored HMO founded in 1995 and directed by local healthcare providers. FHN’s mission is to provide cost-effective, quality care for people who could not otherwise afford it. FHN’s Board of Directors is composed of the chief executive officer (CEO) or designated senior executive of the following sponsor hospitals: St. Bernard’s Hospital, St. Anthony’s Hospital, Sinai Health System, Norwegian American Hospital, and Presence Health Network.
SmartPlan Choice
SmartPlan Choice, an Illinois not-for-profit corporation, serves FHP/ACA adults. SmartPlan’s primary and governing members are Presence Health Partners, LLC (PHP) and Independent Physicians Alliance of Illinois, LLC (IPA). PHP is a clinical integration and accountable subsidiary of Presence Health, the largest Catholic healthcare system in Illinois. IPA is a 100 percent physician-owned organization whose goal is to increase the quality of care to its patients while also reducing the overall health expenditures for patients who are Medicare fee-for service beneficiaries. SmartPlan Choice is committed to improving the health status of the Medicaid population while reducing unnecessary costs.
FHN Findings
Following the on-site review, HFS put the FHN-SmartPlan Choice partnership on hold. Therefore, FHN was not provided with a readiness review follow-up grid or required to submit additional documentation.
Structure and Operations
Compliance Reviews
Page | I-24
Health Alliance Connect, Inc. (Health Alliance) Review
Illinois Partnership for Health, Inc. (IPH), My Health Care Coordination (MHCC), and Precedence CCE choose to partner with Health Alliance. IPH entered into a service agreement with Health Alliance on July 15, 2015. Health Alliance assumed IPH’s Medicaid members in Central Illinois, Quad Cities, and Rockford Regions, as well as certain assets related to the operation of the Medicaid business. Health Alliance provided CM/CC services for the FHP/ACA population for MHCC and Precedence CCE. For the partnership between Health Alliance and MHCC, a review of the IPH readiness review was completed while on-site. HSAG conducted a desk readiness review to evaluate Health Alliance’s implementation of its service agreement with Precedence CCE to provide care coordination services and assess readiness and capacity of the health plan to handle the increase in enrollment as a result of the partnership.
Health Alliance
Health Alliance was founded in 1979 as CarleCare, an Illinois not-for-profit health maintenance organization. In February 1988, CarleCare converted to for-profit status; and in November 1989, Health Alliance was reorganized as a for-profit Illinois domestic stock insurance company owned by a single shareholder, Carle Clinic Association. Health Alliance maintains a comprehensive network of medical providers and home and long-term support services to meet the needs of its membership. Health Alliance serves FHP members in the Central Illinois service area.
Illinois Partnership for Health, Inc. (IPH)
IPH began operation in July 21, 2014. IPH was founded by nine like-minded, Illinois-based provider organizations (collectively referred to as the “Founders”). The nine Founders, including their hospitals, employed providers, and many of their affiliated providers, agreed to work collaboratively to coordinate care and improve outcomes for Medicaid recipients across the State of Illinois. The fundamental goal of the IPH was to develop an integrated care delivery system built on the shared vision of improving population health, improving quality, and lowering costs. The scope of services offered through the IPH includes primary care (internal medicine, family medicine, and pediatrics), obstetric care, adult specialty care, pediatric subspecialty care, mental health services, substance abuse services, hospital services, and tertiary care services. IPH brought together providers across Central Illinois, Quad Cities, and Rockford regions to offer a full range of medical services and coordinate care for approximately 26,000 Medicaid enrollees.
My Health Care Coordination (MHCC)
MHCC, through a contract with HFS, was provided an opportunity to develop and implement a care coordination program. MHCC has developed and implemented an evidence-based care coordination program built on over 20 years of care coordination demonstrations and research. MHCC has developed an extensive provider network that covers Macon and the surrounding counties. MHCC’s provider network spans the continuum of healthcare and social service and support organizations.
Structure and Operations
Compliance Reviews
Page | I-25
Precedence Care Coordination Entity, LLC Partnership (Precedence CCE)
Precedence CCE is a collaboration of providers and community organizations located in a nine-county region in northwest and central Illinois. This care coordination entity creates a governance structure to enable a range of accountable care strategies, including innovative care coordination activities envisioned by the DHFS Innovations Project 2013-24-002 and Section 2703 of the federal Affordable Care Act. There are three major geographical hubs. The first hub, Rock Island and Mercer counties, is home to the Robert Young Community Mental Health Center, which has an affiliation with UnityPoint Health Trinity Hospital along with a partnership with the local FQHC, Community Health, Inc. The second hub, Bureau, Putnam, and LaSalle counties, is home to North Central Behavioral Health Center, which has partnered with St. Margaret’s and Illinois Valley Community Hospitals. Their primary care partner is the Hygienic Institute of Community Health Center. The third hub, the counties of Whiteside, Carroll, Ogle, and Lee, is home to Sinnissippi Behavioral Health Center, which has partnered with the KSB hospital and KSB clinics in these counties.
Health Alliance Findings
Health Alliance was required to submit evidence of a member services staffing resources evaluation that demonstrates adequate coverage for the new membership; revise policy to describe monthly oversight, quarterly audits, or monitoring of enrollee complaints as described in the contract; provide training outlines and a plan for the care coordination staff members to validate that they understand the health plan CM/CC contact requirements; and submit documentation indicating that these entities participated in monthly joint operational meetings.
Health Alliance was required to submit an ongoing implementation and transition plan that mapped out a clear plan for enrollee transition and data integration/exchange activities between the entities. This plan showed the progression of the different activities as well as completion due dates. Any items due to be completed after the go-live date were scheduled to be reviewed during the administrative review.
Meridian Health Plan, Inc. (Meridian) Review
Advocate and CCP choose to partner with Meridian to provide CM/CC services for the FHP/ACA population. Advocate entered into a service agreement with Meridian on April 1, 2016, and CCP on March 30, 2016. Meridian assumed Advocate’s and CCP’s Medicaid members in greater Chicago, as well as certain assets related to the operation of the Medicaid business. HSAG conducted an on-site readiness review to assess Meridian’s processes, care coordination, provider network, staffing, contract oversight, and systems to ensure the health plan’s capacity to handle the increase in enrollment.
Meridian
Meridian’s mission is to continuously improve the quality of care in a low-resource environment. As a physician-owned and member-focused organization, Meridian and its affiliates blend innovative proprietary technologies with a commitment to premier customer service in support of their mission. When more expert care delivery is necessary, Meridian relies on relationships with contracted care partners. From behavioral health to HCBS, Meridian believes in a person-centered, holistic approach to
Structure and Operations
Compliance Reviews
Page | I-26
care coordination to seamlessly integrate care delivery for all members by integrating physical, behavioral, pharmacy, and LTSS benefits. As a centralized administrator of member benefits, Meridian provides seamless coordination for members and providers, allowing for one single point accountability for information and local expert care when required.
Advocate Accountable Care (Advocate)
Advocate was incorporated on May 19, 1995, as an Illinois not-for-profit corporation. Primary members include the 10-member physician hospital organizations (PHOs) representing each Advocate hospital and over 4,500 employed and independent physicians.
The Advocate network includes two employed medical groups—Advocate Medical Group and Dreyer Medical Clinic. Member physicians include over 1,200 primary care physicians and 3,300 specialists including behavioral health. The Advocate Clinical Integration (CI) program was formally established in 2004 to improve quality and lower cost. Advocate serves over 553,000 patients in full-risk and shared savings contracts (commercial payers and Medicare). Other partial-risk and CI contracts reach another 500,000 commercial patients.
Community Care Partners (CCP)
CCP is composed of four dedicated partners: NorthShore Physician Associates, Erie Family Health, Lake County Health Department and Community Center, and Vista Heath System. CCP strategically aligned with partners that have had success in managing Medicaid patients; complemented CCP’s capabilities; and have a strong community presence, including behavioral health integration and providing culturally and linguistically appropriate care. The CCP model leverages key learnings from partners across the entire network to create a system that supports best practices and continuous learning. The vision of CCP is to provide end-to-end care and support through a well-coordinated and patient-centric system. Through the Experienced Partner Network, Integrated Care Model, and advanced health information technology (HIT), CCP provides the access, capabilities, and expertise to deliver high-quality, cost-effective care to Medicaid members in its service area, regardless of where care is received.
Meridian Findings
Meridian updated its Quality Improvement Program Description to include the ACE/CCE entities. Activities included abiding by Meridian policies and procedures, participating in Meridian’s Healthcare Effectiveness Data and Information Set (HEDIS) program, reviewing clinical practice guidelines and medical policies, offering feedback related to the Quality Improvement Program, participating in committees, and collaborating with Meridian staff to ensure access to care and services. Meridian was also required to submit an organizational chart that clearly describes the reporting and oversight of the delegated partner.
Meridian was required to submit an ongoing implementation and transition plan that mapped out a clear plan for enrollee transition and data integration/exchange activities between the entities. This plan
Structure and Operations
Compliance Reviews
Page | I-27
showed the progression of the different activities as well as completion due dates. Any items due to be completed after the go-live date were scheduled to be reviewed during the administrative review.
Molina Healthcare of Illinois, Inc. (Molina) Review
MyCare and Loyola chose to partner with Molina to provide CM/CC services for the FHP/ACA population. Molina entered into a service agreement with MyCare on July 15, 2015, and with Loyola on October 8, 2015. Better Health Network (BHN) decided not to provide CM/CC activities for Molina and instead completed an asset purchase agreement with Molina signed November 25, 2015. Molina assumed MyCare’s, Loyola’s and BHN’s Medicaid members in Cook County, Illinois, as well as certain assets related to the operation of the Medicaid business. MyCare and Loyola continued to operate their provider networks and coordinate care for certain enrollees through a service agreement with Molina.
Molina
Molina Healthcare, Inc., the parent organization of Molina Healthcare of Illinois, is a multistate healthcare organization focused exclusively on Medicaid, Medicare, and other government-sponsored healthcare programs for low-income families and individuals. Molina Healthcare, Inc., is a publicly traded Fortune 500 company. It was founded under the name Molina Medical Centers in 1980 by C. David Molina, MD, an ER physician, as a safety net provider for Medicaid patients. The initial clinic sites started by Dr. Molina served patients who had previously turned to ERs for care because they lacked adequate access to primary care services.
Currently, Molina arranges for the delivery of healthcare services for millions of individuals and families who receive their care through Medicaid, Medicare, and other government-funded programs in 16 states. Molina plans provide comprehensive quality benefits and programs including access to a large selection of doctors, hospitals, and other healthcare providers at little or no out-of-pocket cost.
MyCare Chicago (My Care)
MyCare, formerly known as Accountable Care Chicago, LLC, began operation in September 8, 2014. The healthcare providers who came together to form MyCare saw great value in a collaboration with high-quality providers to improve access to services, reduce costs, and provide improved coordination of care. MyCare brought together three safety net hospitals, five FQHCs, one FQHC “look-alike,” and a significant network of primary care physicians, behavioral and substance abuse care providers, and specialty physicians. The members of MyCare had worked together for many years, but hoped that by forming an ACE they would be able to provide even more comprehensive care to their patients, to provide additional services, and to maximize the strengths of all members. The combination of hospitals and FQHCs provided a large primary care base to create access to primary care. The specialty networks of employed physicians and other independent specialists created access to high-quality specialty services, and the hospitals and Community Counseling Centers of Chicago provided access to the behavioral health services needed by MyCare’s clients.
Structure and Operations
Compliance Reviews
Page | I-28
Loyola University Health System (Loyola)
Loyola began operation in September 8, 2014. Rooted in the Jesuit and Catholic tradition of knowledge serving humanity, Loyola has historically cared for many underserved people including the uninsured and Medicaid clients. Loyola cares for a wide spectrum of Medicaid patients including pregnant women, children, families, and persons with disabilities. Since the inception of the Illinois Health Connect program, Loyola has provided a medical home to a large number of Medicaid clients. Loyola serves as the regional perinatal center and also houses the Ronald McDonald Children’s Hospital. Loyola has embraced the concept of the “medical neighborhood.” Loyola employs over 550 physicians across all specialties who are all connected with a single, integrated electronic health record (EHR).
Better Health Network, LLC (BHN)
BHN, formerly known as Chicago South Side Accountable Care Entity (ACE), LLC, is an ACE incorporated in the State of Illinois and registered with the Secretary of State’s Office as a limited liability corporation. BHN’s mission is to ensure that residents with limited financial resources living in the south and west communities of Chicago and Southern Cook County have access to a network of quality, comprehensive, coordinated, person-centered, and reliable health, behavioral, specialty and social care.
BHN is composed of four community hospitals: St. Bernard Hospital and Health Care Center, Roseland Community Hospital, South Shore Hospital, and Loretto Hospital; one physicians’ group, Partners in Health; and two FQHCs located in the south and west communities of Chicago, Aunt Martha’s Youth Center and Beloved Community Family Wellness Center. Each of these primary ACE members has considerable experience providing community-based primary care, specialty care, obstetrics/gynecology (OB/GYN), and behavioral health services to Medicaid populations.
Molina Findings
A predelegation audit was completed; however, due to an issue with obtaining previous records from MyCare’s delegated care coordination entity, a file review was not completed. A planned file review was completed after the go-live date as part of oversight and monitoring of MyCare’s care coordination activities and documentation. Molina staff members verified that they will continue to work on solutions to exchanging data with Loyola and that these efforts will continue after the transition of Loyola enrollees. Molina revised the delegated services agreement to include the specific reporting requirements and submitted a communication plan specific to the acquisitions. Molina was also required to do the following:
• Complete and submit the results of the credentialing predelegation audit and the minutes of the meeting documenting review and approval of the predelegated credentialing audit.
• Submit evidence of training for care coordinators including person-centered care planning training. • Submit additional documentation to support ongoing oversight of the care coordination activities. • Submit current caseloads of care coordinators of the entities. • Submit a quality program description that describes oversight and accountability for the delegated
vendors.
Structure and Operations
Compliance Reviews
Page | I-29
• Submit and update organizational charts. • Submit documentation on how data will be shared between Molina and the entities.
Molina was required to submit an ongoing implementation and transition plan that clearly detailed the plan for enrollee transition, enrollee and provider communication, contracting and credentialing of providers, and delegate oversight and monitoring.
Readiness Review Process for CCE Transition to MCCN
Procedure
To assess NextLevel’s readiness to assume operation as an MCCN, HSAG assembled a team to:
• Collaborate with HFS to determine the scope of the review and scoring methodology, data collection methods, schedules for the desk review and on-site review activities, and the agenda for the on-site review.
• Collect and review data and documents before and during the on-site review. • Aggregate and analyze the data and information collected. • Prepare a post-readiness review implementation grid to track progress toward implementation.
To accomplish its objective, and based on the results of collaborative planning with HFS, HSAG developed a standardized readiness review data collection tool and processes to assess and document each MCO’s compliance with federal Medicaid managed care regulations, State rules, and the associated HFS contract requirements.
The pre-implementation readiness review included a review of these key functional areas of health plan operations related to the delivery of Medicaid services.
• Organizational structure and staffing • Performance and quality improvement • Provider network capacity, contracting, and credentialing • UM • CM/CC • Enrollee and provider communications • Enrollee protections • Confidentiality • Systems (e.g., claims, enrollment, payment)
The readiness review included a desk review, site visit, systems review, and a network validation review.
Structure and Operations
Compliance Reviews
Page | I-30
Findings
As a result of the readiness review findings, NextLevel was required to approve program descriptions and policies and procedures, staffing, training, systems, predictive modeling, stratification, and work flows to ensure compliance with MCCN program requirements. NextLevel submitted committee meeting minutes to evidence approval. In addition, NextLevel had to develop CM/CC policies and procedures, including revisions to the frequency of health risk screenings and assessments and care plan reviews, to align with requirements. Several care management-related documents were required for submission including a Children with Special Health Care Needs (CSHCN) plan, care and disease management program descriptions, and a transition of care plan. In the area of UM, NextLevel was required to:
• Develop UM policies and procedures to support the functions of the UM program. • Submit the quality assurance, utilization review, peer review, and health education plans. • Approve the UM Program Description and associated policies and procedures, staffing, training,
systems, and workflows. • Submit the pharmacy formulary for approval. • Update the program description and policy to include State fair hearing and external independent
review process for appeals.
Several findings required remediation for the Quality Assessment and Performance Improvement (QAPI) Program, including the development and submission of policies, clinical practice and preventive services guidelines, compliance plan, cultural competency plan, organizational charts, annual quality workplan, and identification of the committee(s) that would be responsible for reviewing grievances. To ensure the adequacy of NextLevel’s provider network, the plan had to continue to submit network capacity reports to HSAG, submit model contracts and provider agreements, develop and revise policies, complete development of the provider portal, and establish a method to identify providers who would provide home visits to homebound enrollees. To meet the delegation requirements, NextLevel was required to make several revisions to its written delegation agreements; submit executed delegation agreements; and submit Delegation Oversight Committee meeting minutes to demonstrate the review and approval of the delegates and their policies, procedures, and program descriptions, as well as demonstrate monthly meetings with delegates. NextLevel continued to work with HFS on approval of materials such as the member handbook and notification letters, as well as policies and procedures for provider call centers and member services, to meet enrollee information and rights requirements. During NextLevel’s early implementation phase, HSAG suggested weekly monitoring of grievances to assist the plan with early identification and resolution of issues unique to the implementation process. NextLevel also had to complete the development and approval process for grievance and appeal template letters and policies. Overall, there were no significant concerns with the health information processes and systems.
Structure and Operations
Compliance Reviews
Page | I-31
Desk Readiness Review Process for Managed Long Term Services and Supports (MLTSS) Program
Procedure
The primary objective of HSAG’s MLTSS desk readiness review was to evaluate the health plan’s readiness to provide services to the MLTSS beneficiaries.
To complete the readiness review, HSAG assembled a team to:
• Collaborate with HFS to determine the scope of the review and scoring methodology, data collection methods, and schedules for the desk review.
• Develop a standardized review tool. • Collect and review data and documents for the desk review. • Aggregate and analyze the data and information collected. • Track progress toward implementation of the MLTSS contract requirements using the MLTSS
readiness review tool. • Track progress toward implementation of the MLTSS provider network necessary to provide the
covered services as outlined in the MLTSS contract using the PFL.
To accomplish its objective, and based on the results of collaborative planning with HFS, HSAG developed standardized desk readiness review data collection tools and processes to assess and document health plan compliance with federal Medicaid managed care regulations, State rules, and the associated HFS contract requirements. The readiness review included a review of key functional areas of health plan operations related to the delivery of MLTSS services, including:
• Access and availability including review of the MLTSS provider network. • CM/CC. • HIT.
Provider Network Review
Health plans providing MLTSS services were required to submit their provider network data periodically prior to implementation of the MLTSS program and quarterly following program implementation by completing the PFL. The PFL provides a roadmap for health plans to submit the data necessary for HSAG to validate the capacity of the MLTSS network. HFS developed a MLTSS Provider Network Data Submission Instruction Manual to provide detailed guidance to ensure all health plans submitted accurate network data using a consistent file format. HSAG also developed a data dictionary to define all provider types required for submission. Health plans were also required to submit provider network data for MLTSS facilities (CMHCs and skilled nursing facilities [SNFs]) as well as MLTSS
Structure and Operations
Compliance Reviews
Page | I-32
behavioral health services such as social work and psychologist services. The purpose of the provider network review prior to implementation was to evaluate the progress of each health plan in contracting and credentialing providers to ensure sufficient network capacity to serve MLTSS enrollees in the Greater Chicago Region. Following implementation, HFS used quarterly provider network submissions to support ongoing monitoring, assessment, and reporting activities to evaluate the adequacy of the provider network for the MLTSS population.
MLTSS Readiness Review Findings
The information below is a summary of the desk readiness review findings for the health plans serving MLTSS enrollees.
Aetna Better Health (Aetna) Findings
Aetna’s submitted documentation evidenced compliance with the requirements for Access and Availability.
Compliance with Coordination and Continuity of Care standards was also evidenced. Aetna’s policies for Health and Information Technology standards did not initially meet a requirement for administering a HRS to all new enrollees within 60 days after enrollment to collect information about the enrollee’s physical, psychological, and social health. However, Aetna revised this policy so it was compliant with contract requirements. Aetna submitted its first PFL for review on May 13, 2016, and submitted a total of five PFLs prior to accepting enrollment. Through this process, Aetna demonstrated an adequate network of contracted, credentialed, approved, and loaded providers to serve the MLTSS population. HFS approved Aetna for MLTSS program in the Greater Chicago Region on May 26, 2016, and MLTSS enrollment began on July 1, 2016.
Blue Cross Blue Shield of Illinois (BCBSIL) Findings
BCBSIL’s submitted documentation evidenced compliance with the requirements for Access and Availability and Health and Information Technology standards. BCBSIL’s policies for Coordination and Continuity of Care standards did not initially meet a requirement for the transition of enrollees, so BCBSIL revised this policy for compliance with contract requirements. BCBSIL submitted the first PFL on May 13, 2016, and submitted a total of three PFLs prior to accepting enrollment. Through this process, BCBSIL demonstrated an adequate network of contracted, credentialed, approved, and loaded providers to serve the MLTSS population. HFS approved BCBSIL for MLTSS in the Greater Chicago Region on May 26, 201,6 and began mailing enrollment letters to eligible enrollees on June 1, 2016. BCBSIL began accepting MLTSS enrollment on July 1, 2016.
IlliniCare Health Plan, Inc. (IlliniCare) Findings
IlliniCare’s policies submitted for the Access and Availability standards did not describe quality standards or the notification to the contracting provider regarding the quality standards within 90 days of the start of the contract. The policies also failed to describe contracting with CMCHs. Therefore,
Structure and Operations
Compliance Reviews
Page | I-33
IlliniCare did not meet contract requirements for MLTSS Contract 2017-24-002, Section 5.5.1.3, and was required to revise its network adequacy policy for compliance. IlliniCare’s submitted documentation evidenced compliance with the requirements for Coordination and Continuity of Care standards. For Health and Information Technology standards, IlliniCare did not initially meet the requirements for administering the HRS to all new enrollees within 60 days after enrollment to collect information about the enrollee’s physical, psychological, and social health. IlliniCare revised its policy to be compliant with contract requirements. IlliniCare submitted its first PFL for review on May 13, 2016, and submitted a total of five PFLs prior to accepting enrollment. Through this process, IlliniCare demonstrated an adequate network of contracted, credentialed, approved, and loaded providers to serve the MLTSS population. HFS approved IlliniCare for the MLTSS program in the Greater Chicago Region on May 26, 2016, and began mailing enrollment letters to eligible enrollees on June 1, 2016. IlliniCare began accepting MLTSS enrollment on July 1, 2016.
Meridian Health Plan, Inc. (Meridian) Findings
Meridian’s policies submitted for the Access and Availability standards evidenced compliance. However, its policies submitted for Coordination and Continuity of Care standards did not initially meet requirements for Meridian’s collaboration with other MCOs, agencies, and providers as necessary to coordinate enrollee care and to ensure the documentation of care provided to enrollees by other organizations. The policies also did not meet requirements for using care coordination tools to coordinate with any other entities involved in managing or coordinating each enrollee’s care. Meridian updated and revised the policies as necessary to meet compliance. For the Health and Information Technology standards, Meridian was required to update some policies to include the MTLSS program, but did comply with requirements. Meridian submitted its first PFL for review on May 13, 2016, and submitted a total of three PFLs prior to accepting enrollment. Through this process, Meridian demonstrated an adequate network of contracted, credentialed, approved, and loaded providers to serve the MLTSS population. HFS approved Meridian for the MLTSS program in the Greater Chicago Region on May 26, 2016, and began mailing enrollment letters to eligible enrollees on June 1, 2016. Meridian began accepting MLTSS enrollment on July 1, 2016.
Structure and Operations
HCBS Waiver Record Reviews
Page | I-34
Centers for Medicare & Medicaid Services (CMS) Home- and Community-Based Services (HCBS) Waiver Performance Measure Record Reviews
Sampling Methodology
ICP and FHP/ACA
HSAG conducted a single-stage, proportional random sample for each population group by waiver program and stratified by health plan. Using the finite population correction to account for small population sizes, HSAG first selected a proportional random sample by waiver program based on the distribution of health plans for each population group. The overall sample sizes within each population group were determined based on the number of eligible members in each waiver program. Once the required sample sizes were identified, a proportional random sample was selected based on the distribution of the health plans’ population within each designated waiver program. Each sample was selected to ensure a 95 percent confidence level and 5 percent margin of error at the waiver program level. Additionally, a 10 percent oversample based on the proportional distribution of enrollees across health plans was selected to replace ineligible cases.
MMAI
A two-step protocol for selecting a statistically valid representative sample of waiver enrollees was developed to account for small waiver population sizes in some of the health plans. Based on enrollment data received from HFS, HSAG first determined the appropriate sample size by health plan and by waiver. Next, the appropriate sample size by waiver program based on the health plan distribution was determined. Once the required sample sizes were determined, the larger of the two sample sizes from each health plan-waiver combination was used to generate the final sample size, which ensures that the minimum required confidence level (95 percent) and margin of error (5 percent) were maintained when the samples were combined. Additionally, a 10 percent oversample based on the proportional distribution of enrollees across health plans was selected.
Sample Selection
The samples were selected in July 2015 and included waiver members enrolled as of July 1, 2015. In October 2015, HFS requested a reduction in overall sample size. HSAG provided a revised sample, using the same sampling methodology, that maintained the 95 percent confidence level and 5 percent margin of error with a maximum sample population of 5,000 cases across the FHP/ACA, ICP, and MMAI waiver enrollees. The reduction in sample size did not affect the method of data collection.
Structure and Operations
HCBS Waiver Record Reviews
Page | I-35
Scoring Methodology
HSAG uses a two-point scoring methodology. Each requirement is scored as Met or Not Met. These scores indicate the health plan’s compliance with the requirements. A designation of Not Applicable (NA) is used if the requirement is not applicable to a record—for example, if needs did not change during the review period, if the measure is only applicable to specific waiver populations, etc.
HSAG calculates the score by adding the score from each eligible case and dividing the summed scores by the total number of eligible cases. HSAG aggregates the results across all records by health plan, by waiver population, and by performance measure. Noncompliant measures (findings) are provided to each health plan for remediation actions.
Web-Based Abstraction Tool and Reporting Database
HSAG utilizes an electronic web-based abstraction tool and reporting database to collect and store the data gathered during on-site record reviews. The automated tool includes all waiver performance measures gathered from the review of records, as well as ICP, FHP/ACA, and MMAI contract requirements. It was modeled after the current tool used by the State to monitor the fee-for-service population to ensure waiver enrollees are monitored in a similar manner.
Interrater Reliability (IRR)
The IRR reviews were conducted by HSAG’s senior project manager for 10 percent of all records completed by each individual reviewer. An accuracy rate of 95 percent was required, with retraining completed if required. Reviews were completed across all review quarters, waivers, program types, and health plans to ensure continued compliance to the 95 percent accuracy rate standard. All four members of the HSAG review team maintained a rate above 95 percent during SFY 2016.
Remediation Tracking
HSAG’s report of findings was submitted to the State within 30 days of each review. Findings were reported for each health plan reviewed and as a summary by waiver. Once approved by the State, the report of findings was forwarded to each health plan for remediation. HSAG utilizes a remediation tracking database which details findings related to waiver performance measures, as well as ICP, FHP/ACA, and MMAI contract requirements. The remediation tracking database tracks the date the health plan was notified of findings, the date the remediation action was completed (as reported by the health plan), and the number of days from notification of the finding until the remediation action was completed. Health plans have access to their respective reports and the remediation tracking database via the HSAG Web portal, all which can be accessed by HFS.
Structure and Operations
HCBS Waiver Record Reviews
Page | I-36
Remediation Validation
Remediation validation for the health plans was conducted on-site during the Quarter 3 and Quarter 4 SFY 2016 waiver performance measure reviews. A random sample was drawn in two groupings: by health plan and by performance measure using only members for whom remediation actions were completed. For health plans with an initial sample of 32 cases or greater, a validation sample of 16 cases was completed. For health plans with an initial sample of less than 32 cases, the full validation sample was completed.
All health plans received their remediation sample 10 days prior to on-site remediation validation review, and they were responsible for ensuring all necessary remediation documentation was available during the on-site review. Remediation validation included review of each record in the sample and supporting documentation, to ensure the action taken and completion date documented in the remediation tracking database were consistent with the information in the health plan’s care management record and/or staff training records.
Multiple causative factors for noncompliance were identified, including incorrect data entry into the HSAG database and lack of documentation to validate completion of care coordinator training. HSAG provided technical assistance and database training to each health plan to mitigate future noncompliance. Remediation validation reviews will continue in SFY 2017.
Waiver Programs Included in SFYs 2016 and 2017 Reviews
The following HCBS waiver programs were included in the CMS performance measures record reviews:
• Persons with Physical Disabilities (PD) • Persons with human immunodeficiency virus/acquired immunodeficiency syndrome (HIV/AIDS)
(HIV) • Persons with Brain Injury (BI) • Persons who are Elderly (ELD) • Persons in a Supportive Living Facility (SLF)
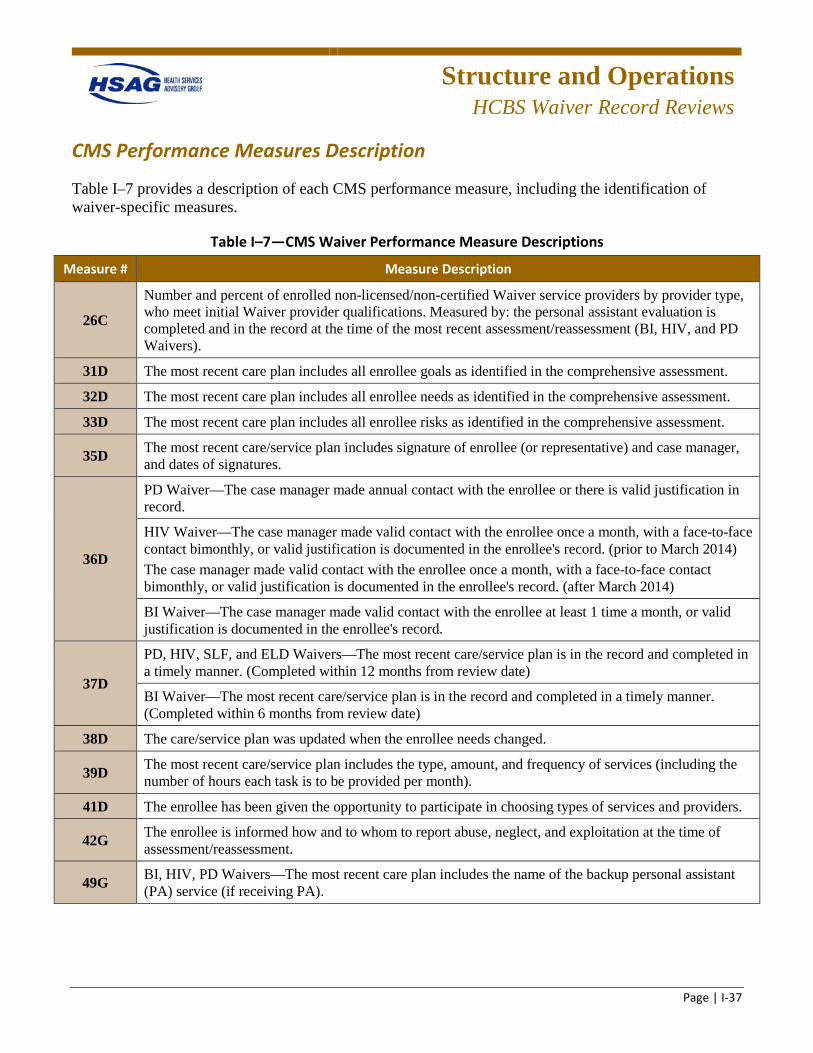
Structure and Operations
HCBS Waiver Record Reviews
Page | I-37
CMS Performance Measures Description
Table I–7 provides a description of each CMS performance measure, including the identification of waiver-specific measures.
Table I–7—CMS Waiver Performance Measure Descriptions
Measure # Measure Description
26C
Number and percent of enrolled non-licensed/non-certified Waiver service providers by provider type, who meet initial Waiver provider qualifications. Measured by: the personal assistant evaluation is completed and in the record at the time of the most recent assessment/reassessment (BI, HIV, and PD Waivers).
31D The most recent care plan includes all enrollee goals as identified in the comprehensive assessment.
32D The most recent care plan includes all enrollee needs as identified in the comprehensive assessment.
33D The most recent care plan includes all enrollee risks as identified in the comprehensive assessment.
35D The most recent care/service plan includes signature of enrollee (or representative) and case manager, and dates of signatures.
36D
PD Waiver—The case manager made annual contact with the enrollee or there is valid justification in record.
HIV Waiver—The case manager made valid contact with the enrollee once a month, with a face-to-face contact bimonthly, or valid justification is documented in the enrollee's record. (prior to March 2014) The case manager made valid contact with the enrollee once a month, with a face-to-face contact bimonthly, or valid justification is documented in the enrollee's record. (after March 2014)
BI Waiver—The case manager made valid contact with the enrollee at least 1 time a month, or valid justification is documented in the enrollee's record.
37D
PD, HIV, SLF, and ELD Waivers—The most recent care/service plan is in the record and completed in a timely manner. (Completed within 12 months from review date)
BI Waiver—The most recent care/service plan is in the record and completed in a timely manner. (Completed within 6 months from review date)
38D The care/service plan was updated when the enrollee needs changed.
39D The most recent care/service plan includes the type, amount, and frequency of services (including the number of hours each task is to be provided per month).
41D The enrollee has been given the opportunity to participate in choosing types of services and providers.
42G The enrollee is informed how and to whom to report abuse, neglect, and exploitation at the time of assessment/reassessment.
49G BI, HIV, PD Waivers—The most recent care plan includes the name of the backup personal assistant (PA) service (if receiving PA).
Structure and Operations
HCBS Waiver Record Reviews
Page | I-38
ICP Detailed Findings
SFY 2016
Statistical significance testing was performed to compare each health plan’s overall compliance from Quarter 1 (Q1) to Quarter 4 (Q4). The following health plans realized statistically significant changes:
• Aetna realized a statistically significant increase in overall performance (p = 0.0386) from Q1 (95 percent) to Q4 (96 percent).
• BCBSIL realized a statistically significant increase in overall performance (p = 0.0156) from Q1 (89 percent) to Q4 (97 percent).
• CountyCare demonstrated a statistically significant decrease in overall performance (p = <0.0001) from Q1 (100 percent) to Q4 (65 percent).
• IlliniCare realized a statistically significant increase in overall performance (p = 0.0008) from Q1 (94 percent) to Q4 (97 percent).
Trending
Of the nine health plans that were reviewed in both reporting years (SFY 2015 and SFY 2016), eight demonstrated statistically significant changes from year to year:
• Aetna achieved a statistically significant increase in overall compliance from 77 percent in SFY 15 to 96 percent in SFY16 (p = <0.0001).
• BCBSIL achieved a statistically significant increase in overall compliance from 83 percent in SFY 15 to 89 percent in SFY16 (p = <0.0001).
• CCAI achieved a statistically significant increase in overall compliance from 80 percent in SFY 15 to 86 percent in SFY 16 (p = <0.0001).
• Health Alliance achieved a statistically significant increase in overall compliance from 89 percent in SFY 15 to 95 percent in SFY 16 (p = <0.0001).
• Cigna achieved a statistically significant increase in overall compliance from 86 percent in SFY 15 to 95 percent in SFY 16 (p = <0.0001).
• IlliniCare achieved a statistically significant increase in overall compliance from 84 percent in SFY 15 to 96 percent in SFY 16 (p = <0.0001).
• Molina achieved a statistically significant increase in overall compliance from 93 percent in SFY 15 to 97 percent in SFY 16 (p = 0.0005).
• Meridian demonstrated a statistically significant decrease in overall compliance from 94 percent in SFY 15 to 91 percent in SFY 16 (p = 0.0003).
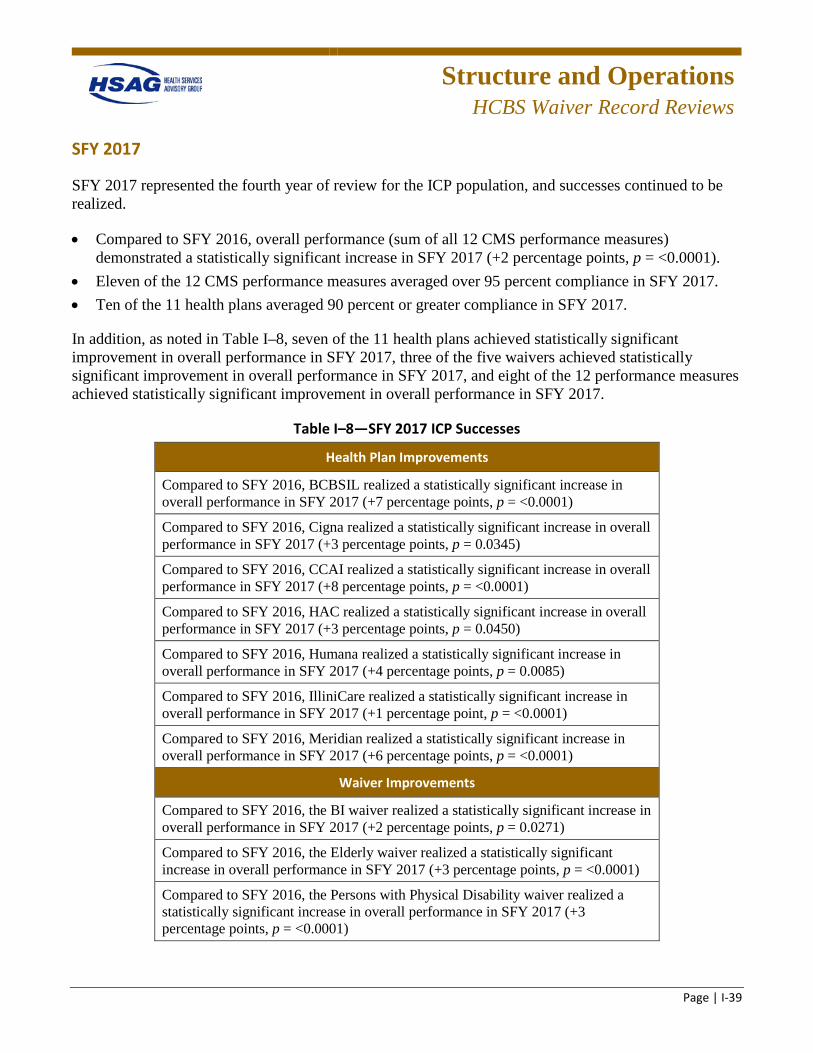
Structure and Operations
HCBS Waiver Record Reviews
Page | I-39
SFY 2017
SFY 2017 represented the fourth year of review for the ICP population, and successes continued to be realized.
• Compared to SFY 2016, overall performance (sum of all 12 CMS performance measures) demonstrated a statistically significant increase in SFY 2017 (+2 percentage points, p = <0.0001).
• Eleven of the 12 CMS performance measures averaged over 95 percent compliance in SFY 2017. • Ten of the 11 health plans averaged 90 percent or greater compliance in SFY 2017.
In addition, as noted in Table I–8, seven of the 11 health plans achieved statistically significant improvement in overall performance in SFY 2017, three of the five waivers achieved statistically significant improvement in overall performance in SFY 2017, and eight of the 12 performance measures achieved statistically significant improvement in overall performance in SFY 2017.
Table I–8—SFY 2017 ICP Successes
Health Plan Improvements
Compared to SFY 2016, BCBSIL realized a statistically significant increase in overall performance in SFY 2017 (+7 percentage points, p = <0.0001)
Compared to SFY 2016, Cigna realized a statistically significant increase in overall performance in SFY 2017 (+3 percentage points, p = 0.0345)
Compared to SFY 2016, CCAI realized a statistically significant increase in overall performance in SFY 2017 (+8 percentage points, p = <0.0001)
Compared to SFY 2016, HAC realized a statistically significant increase in overall performance in SFY 2017 (+3 percentage points, p = 0.0450)
Compared to SFY 2016, Humana realized a statistically significant increase in overall performance in SFY 2017 (+4 percentage points, p = 0.0085)
Compared to SFY 2016, IlliniCare realized a statistically significant increase in overall performance in SFY 2017 (+1 percentage point, p = <0.0001)
Compared to SFY 2016, Meridian realized a statistically significant increase in overall performance in SFY 2017 (+6 percentage points, p = <0.0001)
Waiver Improvements
Compared to SFY 2016, the BI waiver realized a statistically significant increase in overall performance in SFY 2017 (+2 percentage points, p = 0.0271)
Compared to SFY 2016, the Elderly waiver realized a statistically significant increase in overall performance in SFY 2017 (+3 percentage points, p = <0.0001)
Compared to SFY 2016, the Persons with Physical Disability waiver realized a statistically significant increase in overall performance in SFY 2017 (+3 percentage points, p = <0.0001)
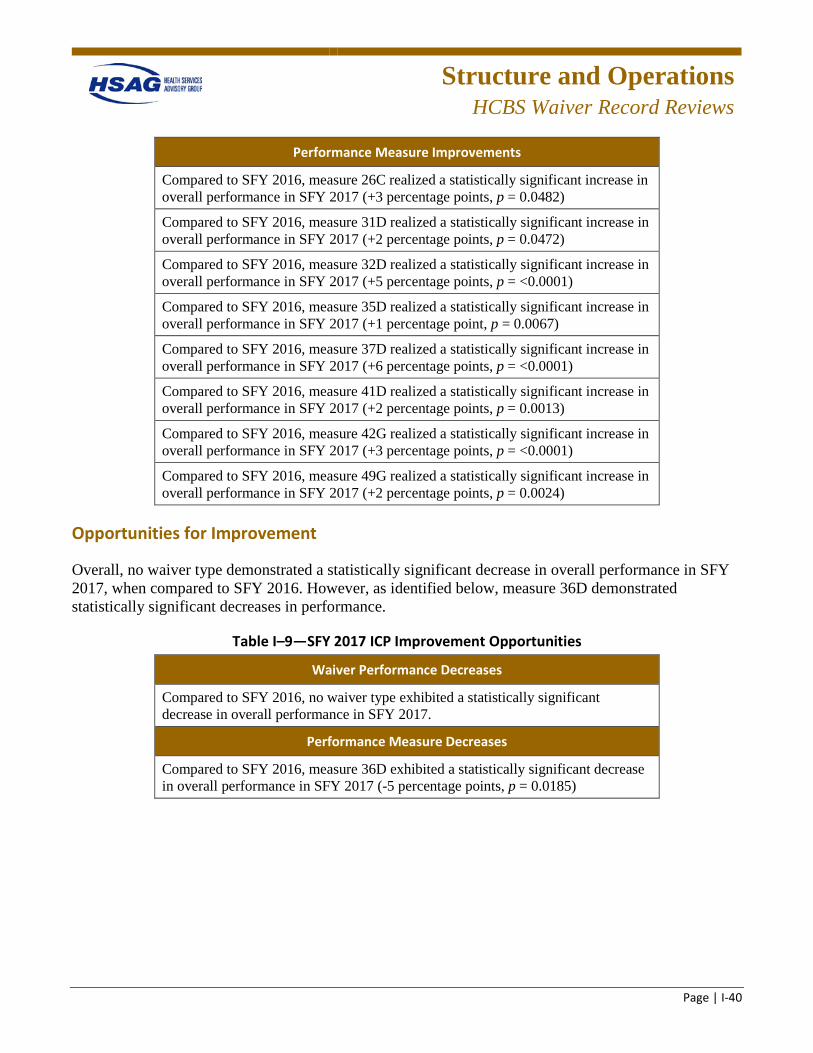
Structure and Operations
HCBS Waiver Record Reviews
Page | I-40
Performance Measure Improvements
Compared to SFY 2016, measure 26C realized a statistically significant increase in overall performance in SFY 2017 (+3 percentage points, p = 0.0482)
Compared to SFY 2016, measure 31D realized a statistically significant increase in overall performance in SFY 2017 (+2 percentage points, p = 0.0472)
Compared to SFY 2016, measure 32D realized a statistically significant increase in overall performance in SFY 2017 (+5 percentage points, p = <0.0001)
Compared to SFY 2016, measure 35D realized a statistically significant increase in overall performance in SFY 2017 (+1 percentage point, p = 0.0067)
Compared to SFY 2016, measure 37D realized a statistically significant increase in overall performance in SFY 2017 (+6 percentage points, p = <0.0001)
Compared to SFY 2016, measure 41D realized a statistically significant increase in overall performance in SFY 2017 (+2 percentage points, p = 0.0013)
Compared to SFY 2016, measure 42G realized a statistically significant increase in overall performance in SFY 2017 (+3 percentage points, p = <0.0001)
Compared to SFY 2016, measure 49G realized a statistically significant increase in overall performance in SFY 2017 (+2 percentage points, p = 0.0024)
Opportunities for Improvement
Overall, no waiver type demonstrated a statistically significant decrease in overall performance in SFY 2017, when compared to SFY 2016. However, as identified below, measure 36D demonstrated statistically significant decreases in performance.
Table I–9—SFY 2017 ICP Improvement Opportunities
Waiver Performance Decreases
Compared to SFY 2016, no waiver type exhibited a statistically significant decrease in overall performance in SFY 2017.
Performance Measure Decreases
Compared to SFY 2016, measure 36D exhibited a statistically significant decrease in overall performance in SFY 2017 (-5 percentage points, p = 0.0185)
Structure and Operations
HCBS Waiver Record Reviews
Page | I-41
Review of SFY 2017 performance identified the following opportunities for improvement:
• Measure 36D, the case manager made timely contact with the enrollee or there is valid justification in the record, averaged 75 percent compliance in SFY 2017. HAC performed at 100 percent during SFY 2017. The remaining 10 health plans’ rates ranged from 52 percent to 89 percent.
• NextLevel performed at an overall rate of 89 percent during SFY 2017 (representing 23 cases).
FHP/ACA Detailed Findings
SFY 2016
Statistical significance testing was performed to compare each health plan’s overall compliance from Q1 to Q4. The following health plans realized statistically significant changes:
Statistical significance testing was performed to compare each plan’s overall compliance from Q1 to Q4. Aetna, Meridian, and Molina realized improvements in every quarter they were reviewed. The following health plans realized statistically significant changes:
• Aetna realized a statistically significant increase in overall performance (p = 0.0115) from Q1 (89 percent) to Q4 (97 percent).
• BCBSIL realized a statistically significant increase in overall performance (p = 0.0005) from Q1 (86 percent) to Q4 (99 percent).
• CountyCare demonstrated a statistically significant decrease in overall performance (p = 0.0006) from Q1 (97 percent) to Q4 (90 percent).
• Harmony realized a statistically significant increase in overall performance (p = 0.0500) from Q1 (84 percent) to Q4 (93 percent).
• Meridian realized a statistically significant increase in overall performance (p = 0.0316) from Q1 (92 percent) to Q4 (98 percent).
SFY 2017
SFY 2017 represented the second year of review for the FHP/ACA population, and several successes were identified.
• Compared to SFY 2016, overall performance (sum of all 12 CMS performance measures) demonstrated a statistically significant increase in SFY 2017 (+2 percentage points, p = <0.0001).
• Eleven of the 12 CMS performance measures averaged over 90 percent compliance in SFY 2017, and 10 of the 12 CMS performance measures averaged over 90 percent compliance from Q1 SFY 2016 to Q4 SFY 2017.
• Nine of the 10 health plans averaged 90 percent or greater compliance in SFY 2017, as well as from Q1 SFY 2016 to Q4 SFY 2017.
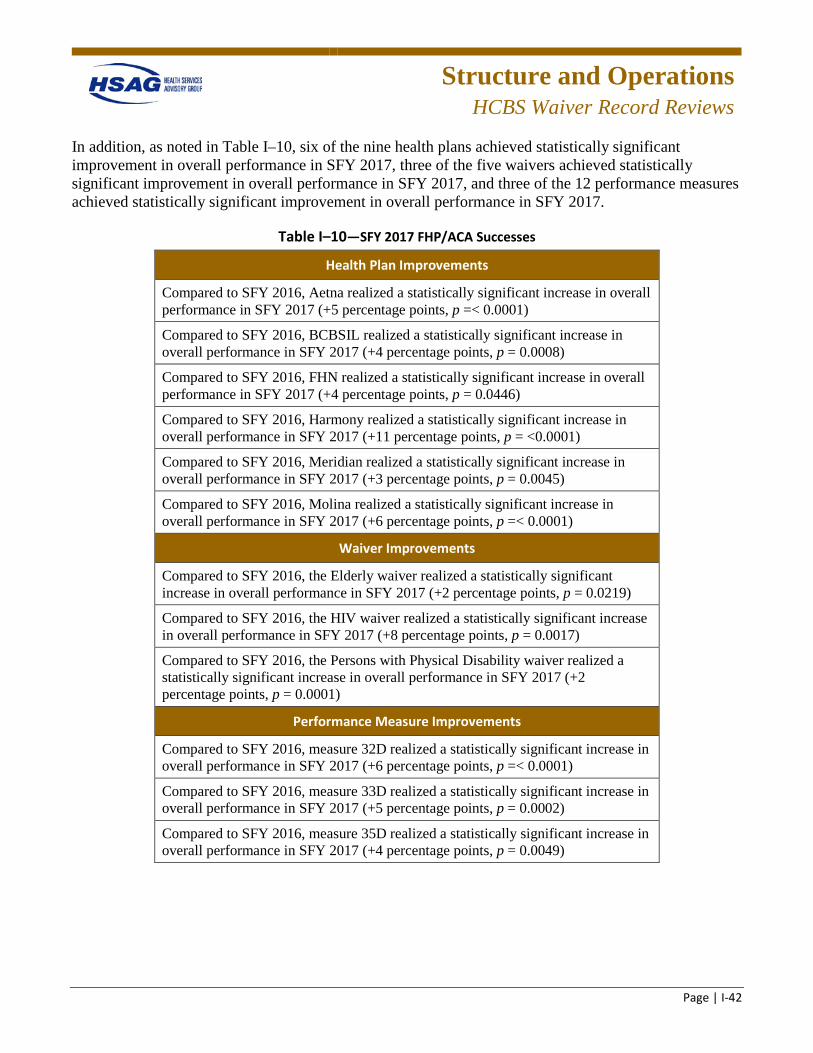
Structure and Operations
HCBS Waiver Record Reviews
Page | I-42
In addition, as noted in Table I–10, six of the nine health plans achieved statistically significant improvement in overall performance in SFY 2017, three of the five waivers achieved statistically significant improvement in overall performance in SFY 2017, and three of the 12 performance measures achieved statistically significant improvement in overall performance in SFY 2017.
Table I–10—SFY 2017 FHP/ACA Successes
Health Plan Improvements
Compared to SFY 2016, Aetna realized a statistically significant increase in overall performance in SFY 2017 (+5 percentage points, p =< 0.0001)
Compared to SFY 2016, BCBSIL realized a statistically significant increase in overall performance in SFY 2017 (+4 percentage points, p = 0.0008)
Compared to SFY 2016, FHN realized a statistically significant increase in overall performance in SFY 2017 (+4 percentage points, p = 0.0446)
Compared to SFY 2016, Harmony realized a statistically significant increase in overall performance in SFY 2017 (+11 percentage points, p = <0.0001)
Compared to SFY 2016, Meridian realized a statistically significant increase in overall performance in SFY 2017 (+3 percentage points, p = 0.0045)
Compared to SFY 2016, Molina realized a statistically significant increase in overall performance in SFY 2017 (+6 percentage points, p =< 0.0001)
Waiver Improvements
Compared to SFY 2016, the Elderly waiver realized a statistically significant increase in overall performance in SFY 2017 (+2 percentage points, p = 0.0219)
Compared to SFY 2016, the HIV waiver realized a statistically significant increase in overall performance in SFY 2017 (+8 percentage points, p = 0.0017)
Compared to SFY 2016, the Persons with Physical Disability waiver realized a statistically significant increase in overall performance in SFY 2017 (+2 percentage points, p = 0.0001)
Performance Measure Improvements
Compared to SFY 2016, measure 32D realized a statistically significant increase in overall performance in SFY 2017 (+6 percentage points, p =< 0.0001)
Compared to SFY 2016, measure 33D realized a statistically significant increase in overall performance in SFY 2017 (+5 percentage points, p = 0.0002)
Compared to SFY 2016, measure 35D realized a statistically significant increase in overall performance in SFY 2017 (+4 percentage points, p = 0.0049)
Structure and Operations
HCBS Waiver Record Reviews
Page | I-43
Opportunities for Improvement
Overall, no health plan, waiver type, or performance measure demonstrated a statistically significant decrease in overall performance in SFY 2017, when compared to SFY 2016. Review of SFY 2017 performance identified the following opportunities for improvement:
• Measure 36D, the case manager made timely contact with the enrollee or there is valid justification in the record, averaged 88 percent compliance in SFY 2017. Five of the 10 health plans averaged over 90 percent compliance; the remaining five health plans’ rates ranged from 67 percent to 86 percent.
MMAI Detailed Findings
SFY 2016
Statistical significance testing was performed to compare each health plan’s overall compliance from Q1 to Q4. The following health plans realized statistically significant changes:
• Aetna realized a statistically significant increase in overall performance (p =< 0.0001) from Q1 (91 percent) to Q4 (98 percent).
• BCBSIL realized a statistically significant increase in overall performance (p =< 0.0001) from Q1 (91 percent) to Q4 (96 percent).
Trending
Eight health plans were reviewed between SFY 2015 and SFY 2016. The following health plans demonstrated statistically significant changes from year to year:
• Aetna achieved a statistically significant increase in overall compliance from 74 percent in SFY 15 to 94 percent in SFY 16 (p =< 0.0001).
• BCBSIL achieved a statistically significant increase in overall compliance from 89 percent in SFY 15 to 94 percent in SFY 16 (p =< . 0001).
• Cigna achieved a statistically significant increase in overall compliance from 83 percent in SFY 15 to 96 percent in SFY 16 (p = <0.0001).
• Humana achieved a statistically significant increase in overall compliance from 93 percent in SFY 15 to 97 percent in SFY 16 (p = <0.0001).
• Molina achieved a statistically significant increase in overall compliance from 93 percent in SFY 15 to 97 percent in SFY 16 (p = 0.0002).
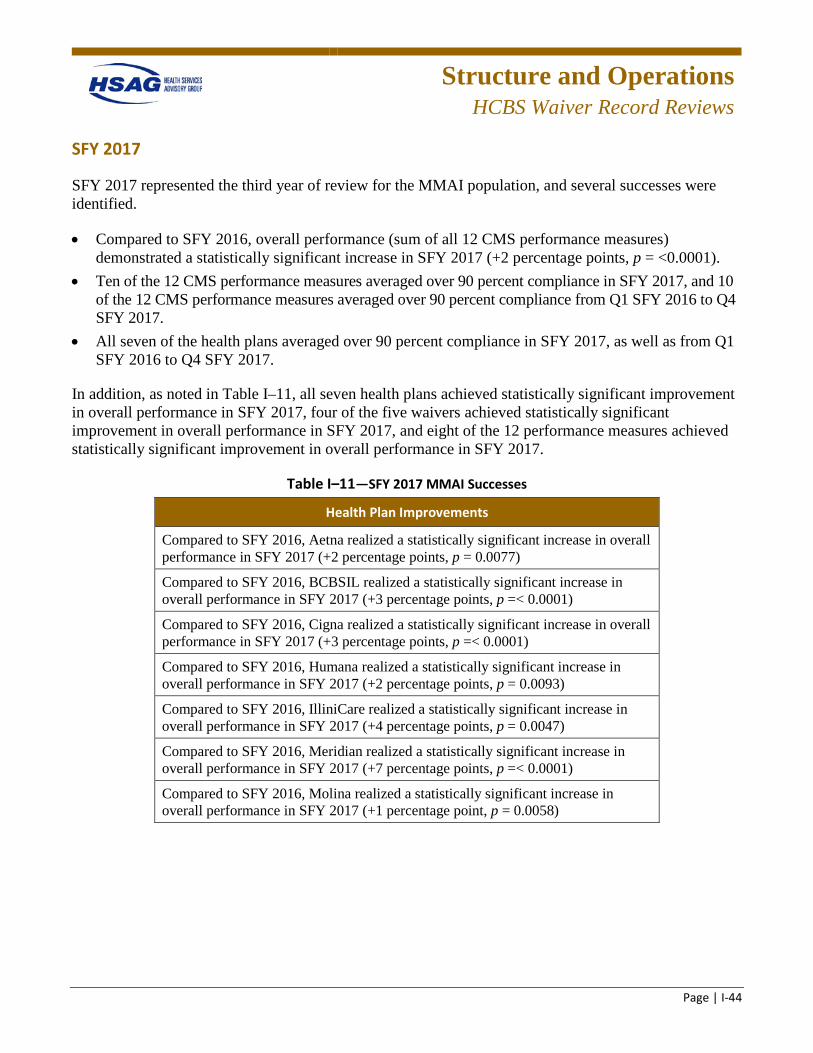
Structure and Operations
HCBS Waiver Record Reviews
Page | I-44
SFY 2017
SFY 2017 represented the third year of review for the MMAI population, and several successes were identified.
• Compared to SFY 2016, overall performance (sum of all 12 CMS performance measures) demonstrated a statistically significant increase in SFY 2017 (+2 percentage points, p = <0.0001).
• Ten of the 12 CMS performance measures averaged over 90 percent compliance in SFY 2017, and 10 of the 12 CMS performance measures averaged over 90 percent compliance from Q1 SFY 2016 to Q4 SFY 2017.
• All seven of the health plans averaged over 90 percent compliance in SFY 2017, as well as from Q1 SFY 2016 to Q4 SFY 2017.
In addition, as noted in Table I–11, all seven health plans achieved statistically significant improvement in overall performance in SFY 2017, four of the five waivers achieved statistically significant improvement in overall performance in SFY 2017, and eight of the 12 performance measures achieved statistically significant improvement in overall performance in SFY 2017.
Table I–11—SFY 2017 MMAI Successes
Health Plan Improvements
Compared to SFY 2016, Aetna realized a statistically significant increase in overall performance in SFY 2017 (+2 percentage points, p = 0.0077)
Compared to SFY 2016, BCBSIL realized a statistically significant increase in overall performance in SFY 2017 (+3 percentage points, p =< 0.0001)
Compared to SFY 2016, Cigna realized a statistically significant increase in overall performance in SFY 2017 (+3 percentage points, p =< 0.0001)
Compared to SFY 2016, Humana realized a statistically significant increase in overall performance in SFY 2017 (+2 percentage points, p = 0.0093)
Compared to SFY 2016, IlliniCare realized a statistically significant increase in overall performance in SFY 2017 (+4 percentage points, p = 0.0047)
Compared to SFY 2016, Meridian realized a statistically significant increase in overall performance in SFY 2017 (+7 percentage points, p =< 0.0001)
Compared to SFY 2016, Molina realized a statistically significant increase in overall performance in SFY 2017 (+1 percentage point, p = 0.0058)
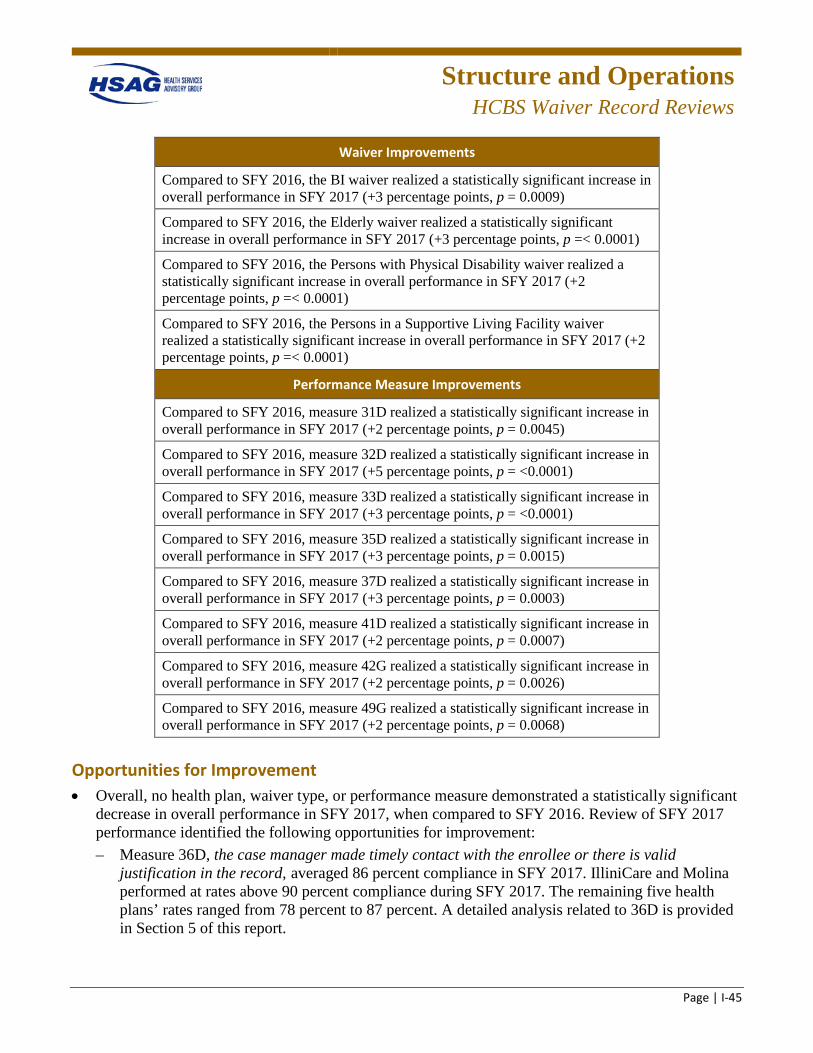
Structure and Operations
HCBS Waiver Record Reviews
Page | I-45
Waiver Improvements
Compared to SFY 2016, the BI waiver realized a statistically significant increase in overall performance in SFY 2017 (+3 percentage points, p = 0.0009)
Compared to SFY 2016, the Elderly waiver realized a statistically significant increase in overall performance in SFY 2017 (+3 percentage points, p =< 0.0001)
Compared to SFY 2016, the Persons with Physical Disability waiver realized a statistically significant increase in overall performance in SFY 2017 (+2 percentage points, p =< 0.0001)
Compared to SFY 2016, the Persons in a Supportive Living Facility waiver realized a statistically significant increase in overall performance in SFY 2017 (+2 percentage points, p =< 0.0001)
Performance Measure Improvements
Compared to SFY 2016, measure 31D realized a statistically significant increase in overall performance in SFY 2017 (+2 percentage points, p = 0.0045)
Compared to SFY 2016, measure 32D realized a statistically significant increase in overall performance in SFY 2017 (+5 percentage points, p = <0.0001)
Compared to SFY 2016, measure 33D realized a statistically significant increase in overall performance in SFY 2017 (+3 percentage points, p = <0.0001)
Compared to SFY 2016, measure 35D realized a statistically significant increase in overall performance in SFY 2017 (+3 percentage points, p = 0.0015)
Compared to SFY 2016, measure 37D realized a statistically significant increase in overall performance in SFY 2017 (+3 percentage points, p = 0.0003)
Compared to SFY 2016, measure 41D realized a statistically significant increase in overall performance in SFY 2017 (+2 percentage points, p = 0.0007)
Compared to SFY 2016, measure 42G realized a statistically significant increase in overall performance in SFY 2017 (+2 percentage points, p = 0.0026)
Compared to SFY 2016, measure 49G realized a statistically significant increase in overall performance in SFY 2017 (+2 percentage points, p = 0.0068)
Opportunities for Improvement • Overall, no health plan, waiver type, or performance measure demonstrated a statistically significant
decrease in overall performance in SFY 2017, when compared to SFY 2016. Review of SFY 2017 performance identified the following opportunities for improvement: – Measure 36D, the case manager made timely contact with the enrollee or there is valid
justification in the record, averaged 86 percent compliance in SFY 2017. IlliniCare and Molina performed at rates above 90 percent compliance during SFY 2017. The remaining five health plans’ rates ranged from 78 percent to 87 percent. A detailed analysis related to 36D is provided in Section 5 of this report.
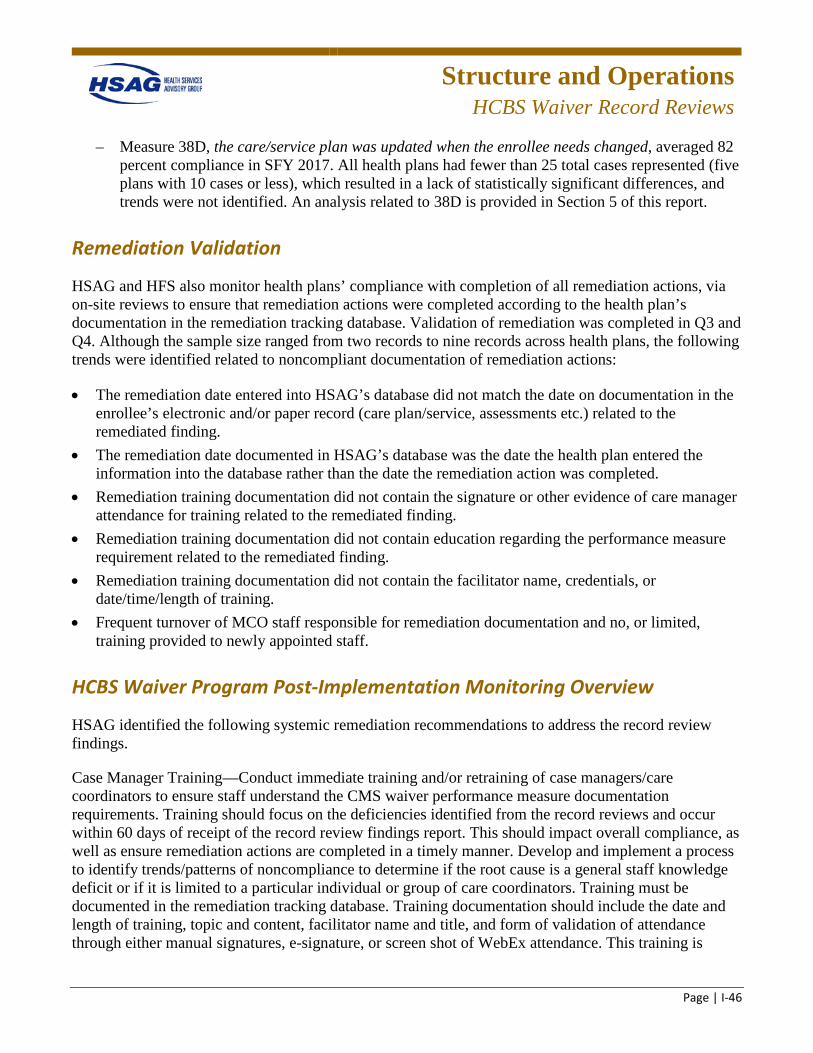
Structure and Operations
HCBS Waiver Record Reviews
Page | I-46
– Measure 38D, the care/service plan was updated when the enrollee needs changed, averaged 82 percent compliance in SFY 2017. All health plans had fewer than 25 total cases represented (five plans with 10 cases or less), which resulted in a lack of statistically significant differences, and trends were not identified. An analysis related to 38D is provided in Section 5 of this report.
Remediation Validation
HSAG and HFS also monitor health plans’ compliance with completion of all remediation actions, via on-site reviews to ensure that remediation actions were completed according to the health plan’s documentation in the remediation tracking database. Validation of remediation was completed in Q3 and Q4. Although the sample size ranged from two records to nine records across health plans, the following trends were identified related to noncompliant documentation of remediation actions:
• The remediation date entered into HSAG’s database did not match the date on documentation in the enrollee’s electronic and/or paper record (care plan/service, assessments etc.) related to the remediated finding.
• The remediation date documented in HSAG’s database was the date the health plan entered the information into the database rather than the date the remediation action was completed.
• Remediation training documentation did not contain the signature or other evidence of care manager attendance for training related to the remediated finding.
• Remediation training documentation did not contain education regarding the performance measure requirement related to the remediated finding.
• Remediation training documentation did not contain the facilitator name, credentials, or date/time/length of training.
• Frequent turnover of MCO staff responsible for remediation documentation and no, or limited, training provided to newly appointed staff.
HCBS Waiver Program Post-Implementation Monitoring Overview
HSAG identified the following systemic remediation recommendations to address the record review findings.
Case Manager Training—Conduct immediate training and/or retraining of case managers/care coordinators to ensure staff understand the CMS waiver performance measure documentation requirements. Training should focus on the deficiencies identified from the record reviews and occur within 60 days of receipt of the record review findings report. This should impact overall compliance, as well as ensure remediation actions are completed in a timely manner. Develop and implement a process to identify trends/patterns of noncompliance to determine if the root cause is a general staff knowledge deficit or if it is limited to a particular individual or group of care coordinators. Training must be documented in the remediation tracking database. Training documentation should include the date and length of training, topic and content, facilitator name and title, and form of validation of attendance through either manual signatures, e-signature, or screen shot of WebEx attendance. This training is
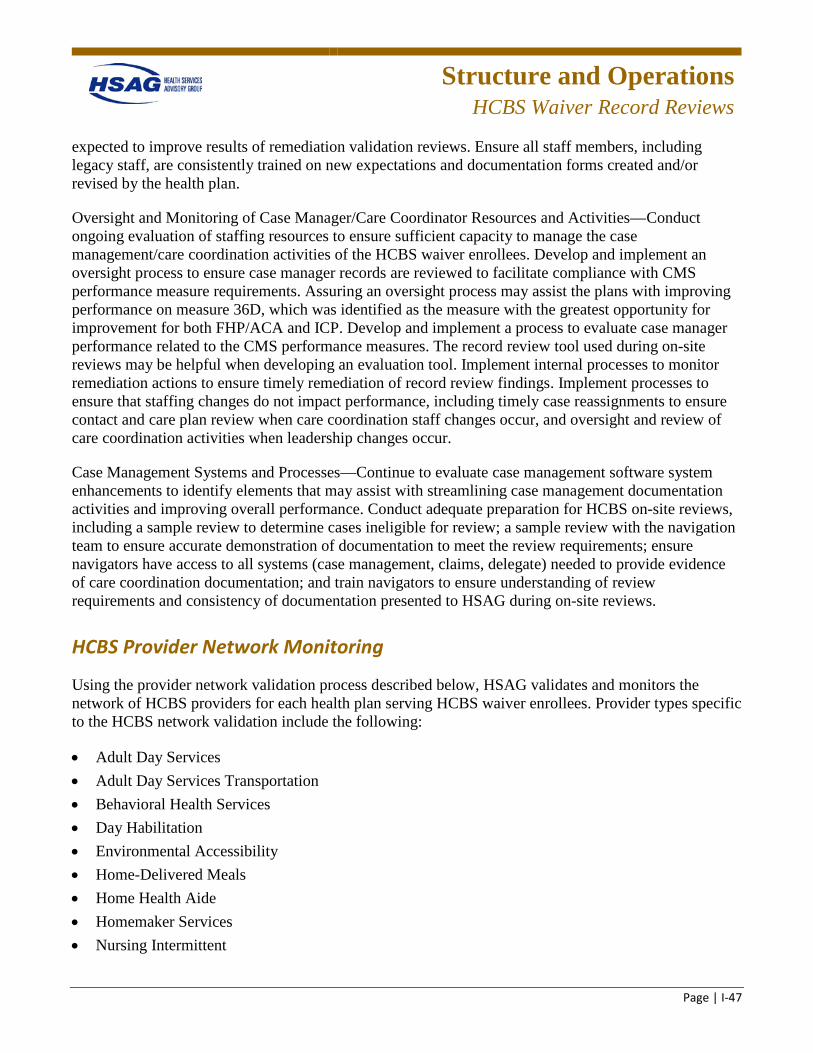
Structure and Operations
HCBS Waiver Record Reviews
Page | I-47
expected to improve results of remediation validation reviews. Ensure all staff members, including legacy staff, are consistently trained on new expectations and documentation forms created and/or revised by the health plan.
Oversight and Monitoring of Case Manager/Care Coordinator Resources and Activities— Conduct ongoing evaluation of staffing resources to ensure sufficient capacity to manage the case management/care coordination activities of the HCBS waiver enrollees. Develop and implement an oversight process to ensure case manager records are reviewed to facilitate compliance with CMS performance measure requirements. Assuring an oversight process may assist the plans with improving performance on measure 36D, which was identified as the measure with the greatest opportunity for improvement for both FHP/ACA and ICP. Develop and implement a process to evaluate case manager performance related to the CMS performance measures. The record review tool used during on-site reviews may be helpful when developing an evaluation tool. Implement internal processes to monitor remediation actions to ensure timely remediation of record review findings. Implement processes to ensure that staffing changes do not impact performance, including timely case reassignments to ensure contact and care plan review when care coordination staff changes occur, and oversight and review of care coordination activities when leadership changes occur.
Case Management Systems and Processes—Continue to evaluate case management software system enhancements to identify elements that may assist with streamlining case management documentation activities and improving overall performance. Conduct adequate preparation for HCBS on-site reviews, including a sample review to determine cases ineligible for review; a sample review with the navigation team to ensure accurate demonstration of documentation to meet the review requirements; ensure navigators have access to all systems (case management, claims, delegate) needed to provide evidence of care coordination documentation; and train navigators to ensure understanding of review requirements and consistency of documentation presented to HSAG during on-site reviews.
HCBS Provider Network Monitoring
Using the provider network validation process described below, HSAG validates and monitors the network of HCBS providers for each health plan serving HCBS waiver enrollees. Provider types specific to the HCBS network validation include the following:
• Adult Day Services • Adult Day Services Transportation • Behavioral Health Services • Day Habilitation • Environmental Accessibility • Home-Delivered Meals • Home Health Aide • Homemaker Services • Nursing Intermittent
Structure and Operations
HCBS Waiver Record Reviews
Page | I-48
• Nursing Skilled • Occupational Therapy • Personal Emergency Response System • Physical Therapy • Pre-vocational Services • Respite Care Services • Specialized Medical Equipment • Speech Therapy
Structure and Operations
Provider Network Capacity Reviews
Page | I-49
Provider Network Capacity Reviews
Submission Process
HSAG worked extensively with HFS and the health plans to standardize the format that the health plans use to report on the providers in their networks. The standardized format includes standardized provider categories, a protocol to detect and minimize duplications of providers, and expanded provider network reporting including counts of providers by counties within the health plan.
Health plans are required to submit their provider network data quarterly by completing a standardized PFL, which is a Microsoft (MS) Excel workbook. Health plans are required to adhere to specific submission instructions for provider network data. The PFL consists of these tabs (worksheets): contracted, credentialed, approved by credentialing committee, and loaded in the provider directory.
Submission Guidance
HSAG developed a Provider Network Data Submission Instruction Manual (manual) to provide detailed guidance to ensure all health plans submit accurate network capacity data using a consistent file format. The manual accompanied the PFL, and health plans were required to adhere to this guidance when submitting provider network data. The manual included the following sections:
• Section 1—Introduction, describes the purpose of the manual and its organization as well as an overview of the PFL.
• Section 2—Provider File Layout Instruction, provides detailed guidance on properly completing the PFL including the file naming conventions, provider type specifications and definitions, and a description of the data submission elements needed to complete each field of the PFL.
• Section 3—Submission Process, describes the procedure health plans will use to submit their PFL quarterly.
• Appendix A—Data Dictionary, defines all provider types required for submission. • Appendix B—HCBS Waiver Definitions, defines HCBS service types required for submission. • Appendix C—Provider File Layout MS Excel workbook template.
Structure and Operations
Care Coordination/Care Management
Page | I-50
Care Coordination/Care Management (CC/CM)
Annual Care Coordination Staffing Reviews
Methodology
HSAG developed review criteria; an evaluation tool to standardize the review process; and a project timeline for conducting the CM/CC staffing, qualifications, and training review. HSAG provided a standardized data collection MS Excel workbook to collect data for the staffing, qualifications, training, full-time equivalency (FTE) allocations, and caseloads of the health plans’ CM/CC staff. The data collection workbook collected the names and credentials of staff members, as well as their positions, hire dates, education, related experience, licensures, and FTE allocations. The workbook auto-calculated the cumulative weighted caseload for each staff member across programs and indicated when the weighted caseload total exceeded contract requirements. The workbook also contained formulas that calculated the staffing ratios for specific waiver types and staff ratios by program type.
Health plans were required to complete the data collection workbook and submit it to the HSAG FTP website. Upon receipt, HSAG reviewed the workbook for completeness and notified health plans if information was missing that was necessary for data analysis. This communication ensured health plans were aware of any outstanding documentation that was required. HSAG reviewed the educational qualifications, related experience, annual training hours, FTE allocation, and caseloads of CC/CM staff serving the Medicaid managed care population against the FHP/ACA, ICP, and CMS HCBS contract requirements.
To determine the total FTE allocation serving the high-, moderate-, and low-risk populations for each program, HSAG requested that health plans provide the FTE equivalent of each staff member assigned to the varying risk levels for both waiver and non-waiver enrollees. When a staff member was assigned to both waiver and non-waiver enrollees, then the health plan provided the portion of that staff member's FTE that was allocated to the waiver and non-waiver assignment.
In addition to staffing allocations, the review assessed caseload requirements to ensure each care coordinator responsible for enrollees with varying risk levels had an overall caseload that met requirements for case limits and case mix. Health plans were required to report on the caseload of each staff member assigned to the waiver and non-waiver populations.
HSAG also reviewed the non-waiver qualifications and training requirements for the care coordinator program manager and care coordinators as applicable to each of the programs. To evaluate if health plans met the training requirements, HSAG reviewed the number of annual training hours completed by non-waiver and HCBS waiver staff. HSAG developed an HCBS Training Requirements Review Tool to capture the waiver training requirements. The elements of the tool for the training topics were specific to each waiver. HSAG reviewed the number of annual training hours completed by staff, the training curriculum, and the employee training sign-in sheets. The data and documentation were reviewed and compared to program requirements for mandated training. Training categories were scored as either
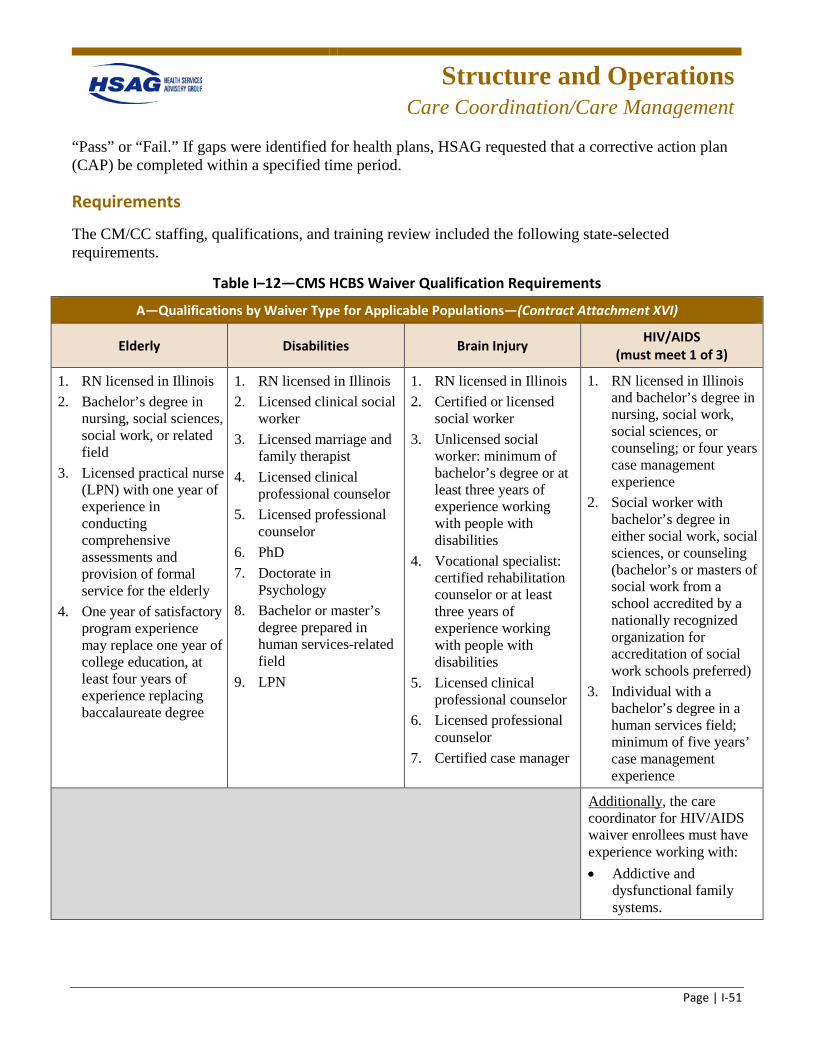
Structure and Operations
Care Coordination/Care Management
Page | I-51
“Pass” or “Fail.” If gaps were identified for health plans, HSAG requested that a corrective action plan (CAP) be completed within a specified time period.
Requirements
The CM/CC staffing, qualifications, and training review included the following state-selected requirements.
Table I–12—CMS HCBS Waiver Qualification Requirements
A—Qualifications by Waiver Type for Applicable Populations—(Contract Attachment XVI)
Elderly Disabilities Brain Injury HIV/AIDS (must meet 1 of 3)
1. RN licensed in Illinois 2. Bachelor’s degree in
nursing, social sciences, social work, or related field
3. Licensed practical nurse (LPN) with one year of experience in conducting comprehensive assessments and provision of formal service for the elderly
4. One year of satisfactory program experience may replace one year of college education, at least four years of experience replacing baccalaureate degree
1. RN licensed in Illinois 2. Licensed clinical social
worker 3. Licensed marriage and
family therapist 4. Licensed clinical
professional counselor 5. Licensed professional
counselor 6. PhD 7. Doctorate in
Psychology 8. Bachelor or master’s
degree prepared in human services-related field
9. LPN
1. RN licensed in Illinois 2. Certified or licensed
social worker 3. Unlicensed social
worker: minimum of bachelor’s degree or at least three years of experience working with people with disabilities
4. Vocational specialist: certified rehabilitation counselor or at least three years of experience working with people with disabilities
5. Licensed clinical professional counselor
6. Licensed professional counselor
7. Certified case manager
1. RN licensed in Illinois and bachelor’s degree in nursing, social work, social sciences, or counseling; or four years case management experience
2. Social worker with bachelor’s degree in either social work, social sciences, or counseling (bachelor’s or masters of social work from a school accredited by a nationally recognized organization for accreditation of social work schools preferred)
3. Individual with a bachelor’s degree in a human services field; minimum of five years’ case management experience
Additionally, the care coordinator for HIV/AIDS waiver enrollees must have experience working with: • Addictive and
dysfunctional family systems.
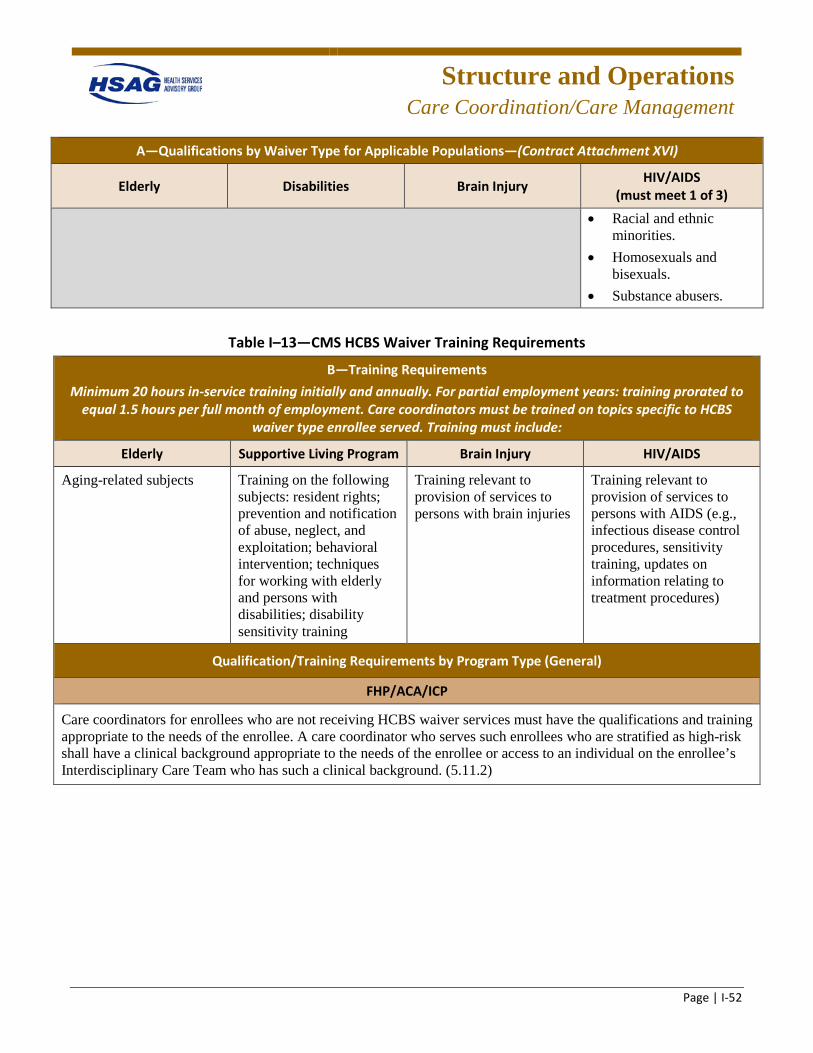
Structure and Operations
Care Coordination/Care Management
Page | I-52
A—Qualifications by Waiver Type for Applicable Populations—(Contract Attachment XVI)
Elderly Disabilities Brain Injury HIV/AIDS (must meet 1 of 3)
• Racial and ethnic minorities.
• Homosexuals and bisexuals.
• Substance abusers.
Table I–13—CMS HCBS Waiver Training Requirements
B—Training Requirements Minimum 20 hours in-service training initially and annually. For partial employment years: training prorated to
equal 1.5 hours per full month of employment. Care coordinators must be trained on topics specific to HCBS waiver type enrollee served. Training must include:
Elderly Supportive Living Program Brain Injury HIV/AIDS
Aging-related subjects Training on the following subjects: resident rights; prevention and notification of abuse, neglect, and exploitation; behavioral intervention; techniques for working with elderly and persons with disabilities; disability sensitivity training
Training relevant to provision of services to persons with brain injuries
Training relevant to provision of services to persons with AIDS (e.g., infectious disease control procedures, sensitivity training, updates on information relating to treatment procedures)
Qualification/Training Requirements by Program Type (General)
FHP/ACA/ICP
Care coordinators for enrollees who are not receiving HCBS waiver services must have the qualifications and training appropriate to the needs of the enrollee. A care coordinator who serves such enrollees who are stratified as high-risk shall have a clinical background appropriate to the needs of the enrollee or access to an individual on the enrollee’s Interdisciplinary Care Team who has such a clinical background. (5.11.2)
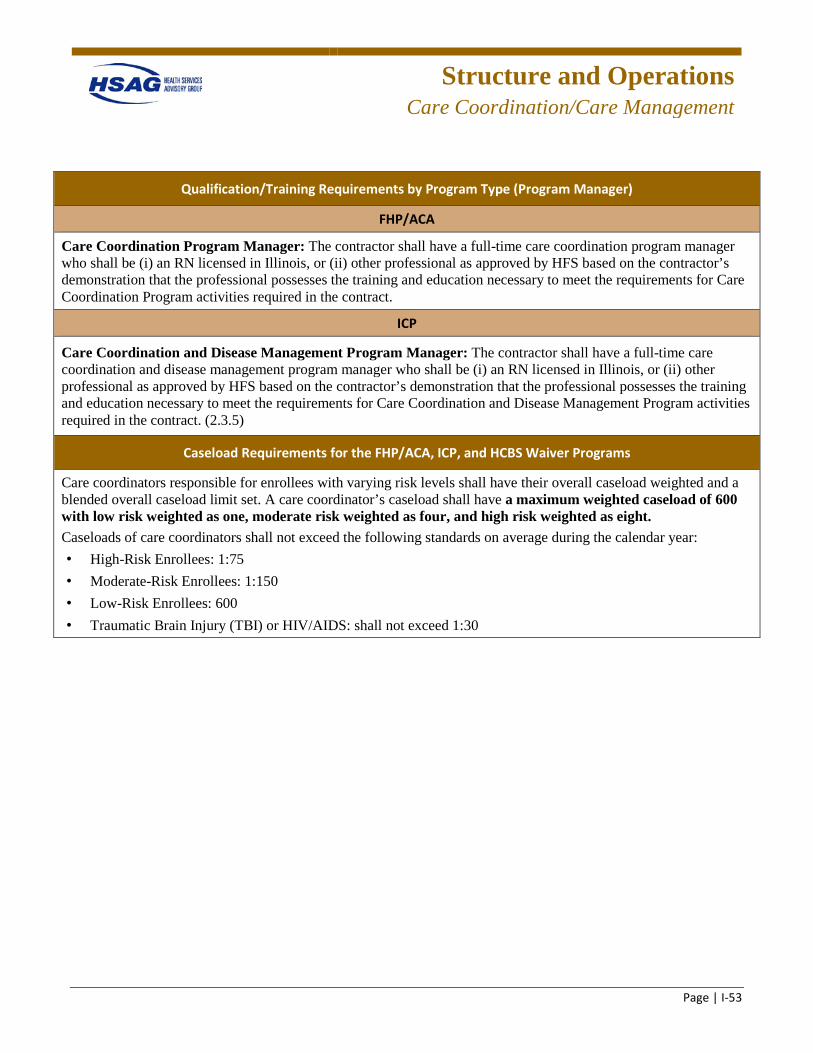
Structure and Operations
Care Coordination/Care Management
Page | I-53
Qualification/Training Requirements by Program Type (Program Manager)
FHP/ACA
Care Coordination Program Manager: The contractor shall have a full-time care coordination program manager who shall be (i) an RN licensed in Illinois, or (ii) other professional as approved by HFS based on the contractor’s demonstration that the professional possesses the training and education necessary to meet the requirements for Care Coordination Program activities required in the contract.
ICP
Care Coordination and Disease Management Program Manager: The contractor shall have a full-time care coordination and disease management program manager who shall be (i) an RN licensed in Illinois, or (ii) other professional as approved by HFS based on the contractor’s demonstration that the professional possesses the training and education necessary to meet the requirements for Care Coordination and Disease Management Program activities required in the contract. (2.3.5)
Caseload Requirements for the FHP/ACA, ICP, and HCBS Waiver Programs
Care coordinators responsible for enrollees with varying risk levels shall have their overall caseload weighted and a blended overall caseload limit set. A care coordinator’s caseload shall have a maximum weighted caseload of 600 with low risk weighted as one, moderate risk weighted as four, and high risk weighted as eight. Caseloads of care coordinators shall not exceed the following standards on average during the calendar year: • High-Risk Enrollees: 1:75 • Moderate-Risk Enrollees: 1:150 • Low-Risk Enrollees: 600 • Traumatic Brain Injury (TBI) or HIV/AIDS: shall not exceed 1:30
Structure and Operations
Technical Assistance
Page | I-54
Technical Assistance (TA) to HFS and Health Plans
TA to HFS
Specific examples of TA topics covered to assist the health plans in SFYs 2016 and 2017 are described below.
Ad Hoc Network Capacity Reporting
HSAG produces ad hoc network capacity reports at the request of its clients. For the IL technical report, these reports included a range of topics (e.g., samples of HCBS and specialty providers for particular enrollee populations, specific ZIP code analysis, and county-specific analysis for individual provider types. With its flexible ability to provide ad hoc network capacity reports, HSAG provides analyses which focus on areas of concern.
HSAG produced numerous ad hoc network capacity reports for HFS. HSAG developed multiple reports during the reporting year to monitor the continued development of provider networks in each of the Medicaid managed care regions. The reports were requested by HFS throughout the expansion process and during the readiness and implementation processes. The reports covered a range of topics, including:
• Regional analysis for PCPs, specialists, and hospitals. • Regional and statewide analysis of CMHCs, FQHCs, and psychiatric hospitals. • Health plan-specific analyses and comparisons. • Regional or county-specific analysis for specified provider types including behavioral health,
substance abuse, orthopedic specialists, and OB/GYNs. • Medicare network serving MMAI. • MLTSS and HCBS providers. • Nursing facilities.
Research
To remain informed about national policies and current standards, HFS occasionally requested that HSAG conduct research and analysis on various topics of interest such as:
• Provider dispute resolution policies. • Crosswalk of HFS member letters against NCQA accreditation requirements. • Analyzing NCQA Consumer Assessment of Healthcare Providers and Systems (CAHPS) and
HEDIS reporting requirements for health plans with multiple Medicaid product lines. • Access and availability research for Illinois House Bill 5559. • HIV viral load research.
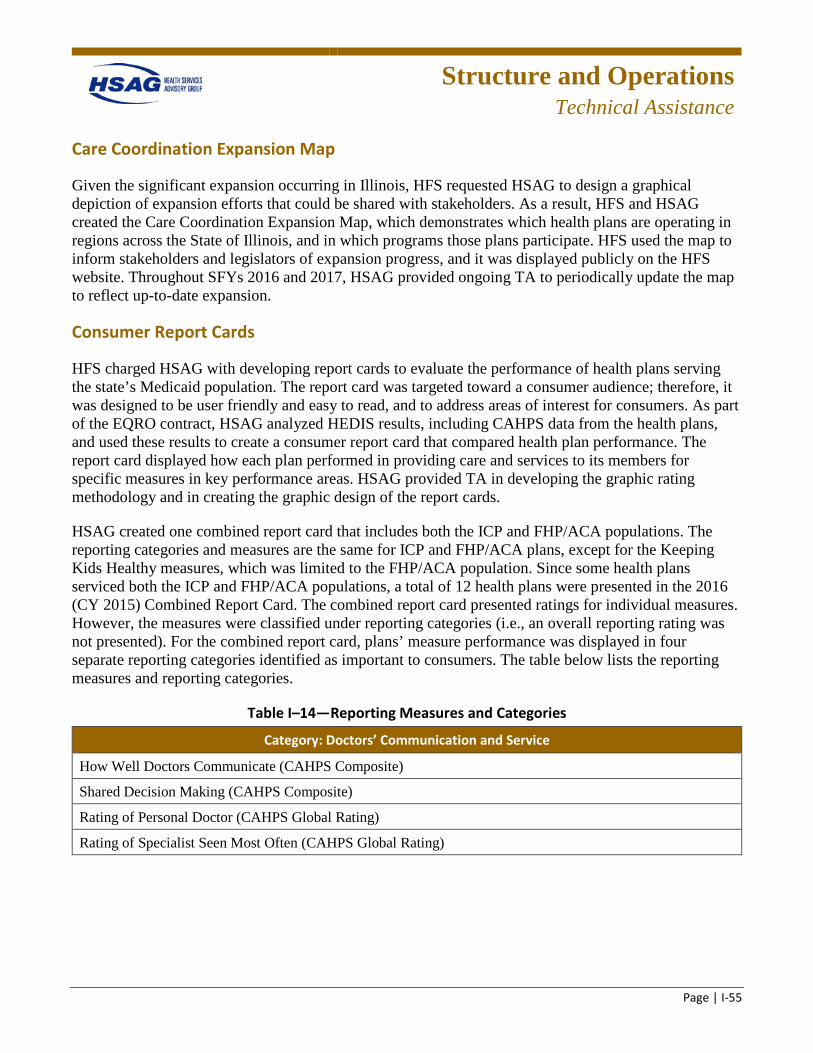
Structure and Operations
Technical Assistance
Page | I-55
Care Coordination Expansion Map
Given the significant expansion occurring in Illinois, HFS requested HSAG to design a graphical depiction of expansion efforts that could be shared with stakeholders. As a result, HFS and HSAG created the Care Coordination Expansion Map, which demonstrates which health plans are operating in regions across the State of Illinois, and in which programs those plans participate. HFS used the map to inform stakeholders and legislators of expansion progress, and it was displayed publicly on the HFS website. Throughout SFYs 2016 and 2017, HSAG provided ongoing TA to periodically update the map to reflect up-to-date expansion.
Consumer Report Cards
HFS charged HSAG with developing report cards to evaluate the performance of health plans serving the state’s Medicaid population. The report card was targeted toward a consumer audience; therefore, it was designed to be user friendly and easy to read, and to address areas of interest for consumers. As part of the EQRO contract, HSAG analyzed HEDIS results, including CAHPS data from the health plans, and used these results to create a consumer report card that compared health plan performance. The report card displayed how each plan performed in providing care and services to its members for specific measures in key performance areas. HSAG provided TA in developing the graphic rating methodology and in creating the graphic design of the report cards.
HSAG created one combined report card that includes both the ICP and FHP/ACA populations. The reporting categories and measures are the same for ICP and FHP/ACA plans, except for the Keeping Kids Healthy measures, which was limited to the FHP/ACA population. Since some health plans serviced both the ICP and FHP/ACA populations, a total of 12 health plans were presented in the 2016 (CY 2015) Combined Report Card. The combined report card presented ratings for individual measures. However, the measures were classified under reporting categories (i.e., an overall reporting rating was not presented). For the combined report card, plans’ measure performance was displayed in four separate reporting categories identified as important to consumers. The table below lists the reporting measures and reporting categories.
Table I–14—Reporting Measures and Categories
Category: Doctors’ Communication and Service
How Well Doctors Communicate (CAHPS Composite)
Shared Decision Making (CAHPS Composite)
Rating of Personal Doctor (CAHPS Global Rating)
Rating of Specialist Seen Most Often (CAHPS Global Rating)
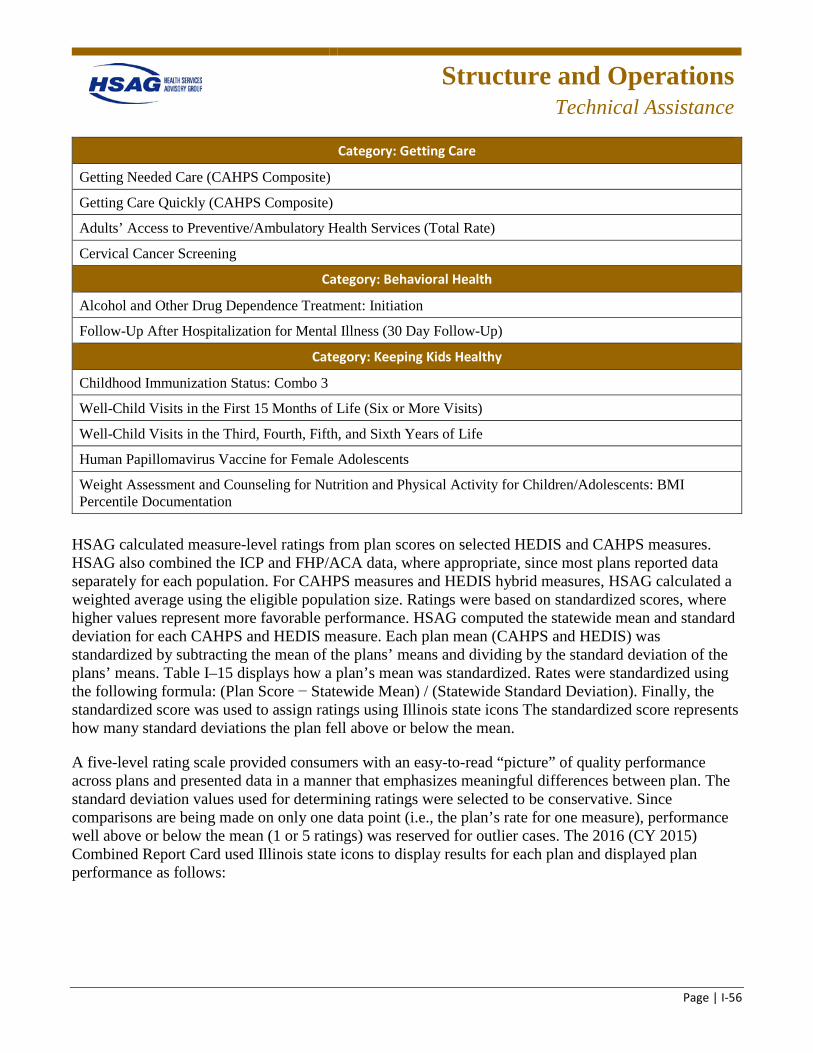
Structure and Operations
Technical Assistance
Page | I-56
Category: Getting Care
Getting Needed Care (CAHPS Composite)
Getting Care Quickly (CAHPS Composite)
Adults’ Access to Preventive/Ambulatory Health Services (Total Rate)
Cervical Cancer Screening
Category: Behavioral Health
Alcohol and Other Drug Dependence Treatment: Initiation
Follow-Up After Hospitalization for Mental Illness (30 Day Follow-Up)
Category: Keeping Kids Healthy
Childhood Immunization Status: Combo 3
Well-Child Visits in the First 15 Months of Life (Six or More Visits)
Well-Child Visits in the Third, Fourth, Fifth, and Sixth Years of Life
Human Papillomavirus Vaccine for Female Adolescents
Weight Assessment and Counseling for Nutrition and Physical Activity for Children/Adolescents: BMI Percentile Documentation
HSAG calculated measure-level ratings from plan scores on selected HEDIS and CAHPS measures. HSAG also combined the ICP and FHP/ACA data, where appropriate, since most plans reported data separately for each population. For CAHPS measures and HEDIS hybrid measures, HSAG calculated a weighted average using the eligible population size. Ratings were based on standardized scores, where higher values represent more favorable performance. HSAG computed the statewide mean and standard deviation for each CAHPS and HEDIS measure. Each plan mean (CAHPS and HEDIS) was standardized by subtracting the mean of the plans’ means and dividing by the standard deviation of the plans’ means. Table I–15 displays how a plan’s mean was standardized. Rates were standardized using the following formula: (Plan Score − Statewide Mean) / (Statewide Standard Deviation). Finally, the standardized score was used to assign ratings using Illinois state icons The standardized score represents how many standard deviations the plan fell above or below the mean.
A five-level rating scale provided consumers with an easy-to-read “picture” of quality performance across plans and presented data in a manner that emphasizes meaningful differences between plan. The standard deviation values used for determining ratings were selected to be conservative. Since comparisons are being made on only one data point (i.e., the plan’s rate for one measure), performance well above or below the mean (1 or 5 ratings) was reserved for outlier cases. The 2016 (CY 2015) Combined Report Card used Illinois state icons to display results for each plan and displayed plan performance as follows:
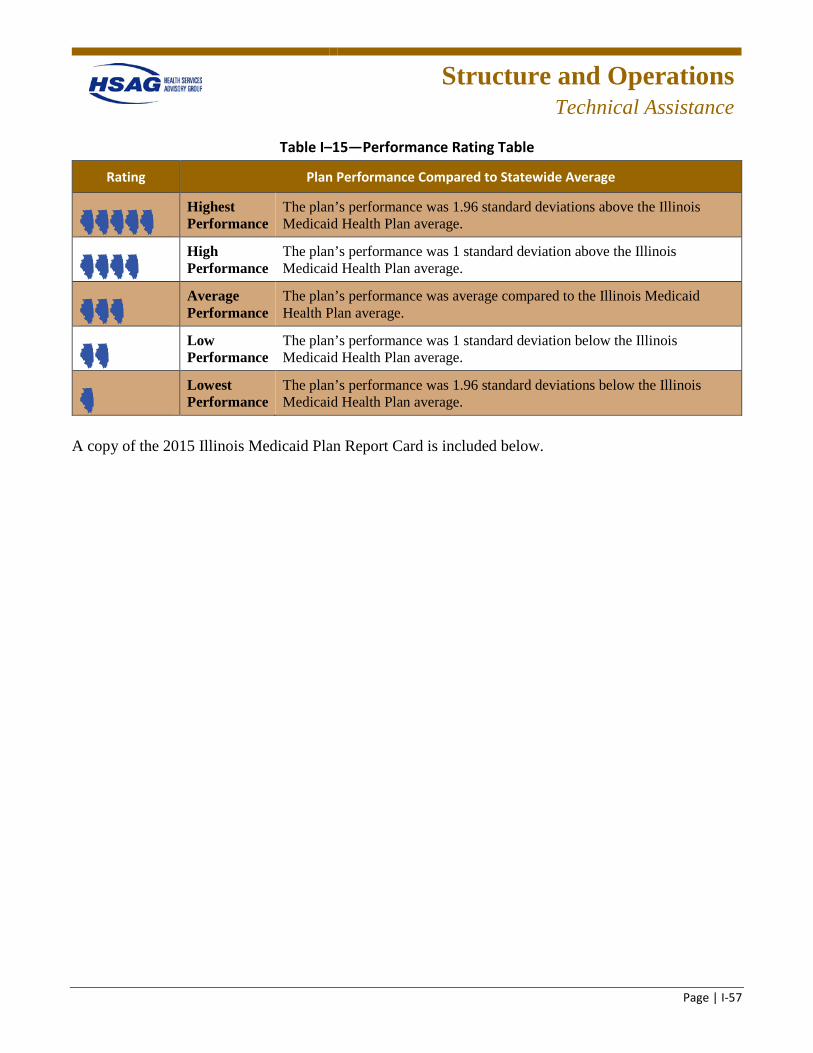
Structure and Operations
Technical Assistance
Page | I-57
Table I–15—Performance Rating Table
Rating Plan Performance Compared to Statewide Average
Highest Performance
The plan’s performance was 1.96 standard deviations above the Illinois Medicaid Health Plan average.
High Performance
The plan’s performance was 1 standard deviation above the Illinois Medicaid Health Plan average.
Average Performance
The plan’s performance was average compared to the Illinois Medicaid Health Plan average.
Low Performance
The plan’s performance was 1 standard deviation below the Illinois Medicaid Health Plan average.
Lowest Performance
The plan’s performance was 1.96 standard deviations below the Illinois Medicaid Health Plan average.
A copy of the 2015 Illinois Medicaid Plan Report Card is included below.
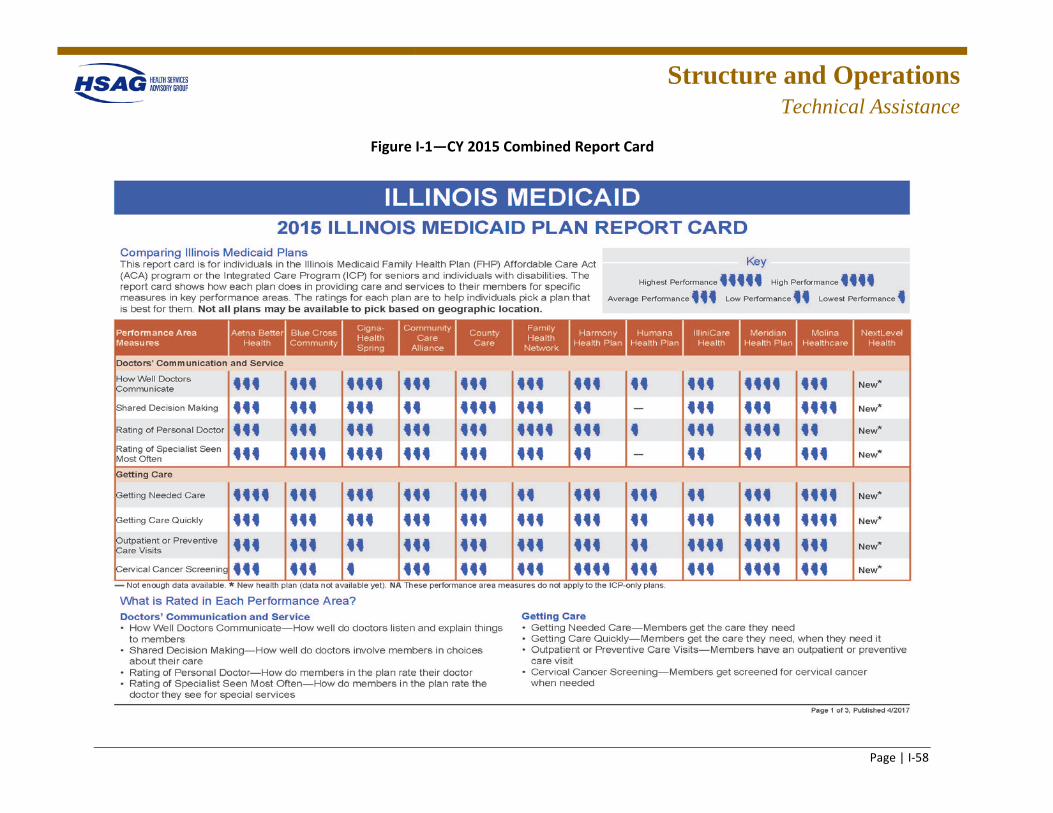
Structure and Operations
Technical Assistance
Page | I-58
Figure I-1—CY 2015 Combined Report Card
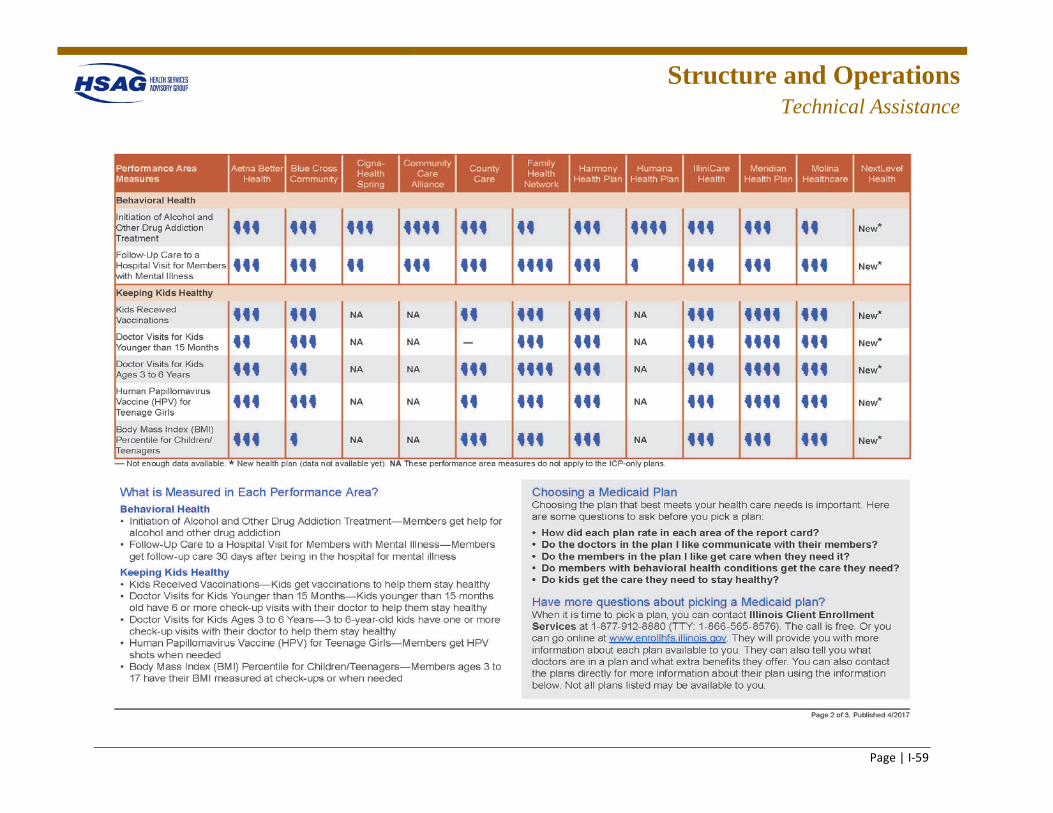
Structure and Operations
Technical Assistance
Page | I-59
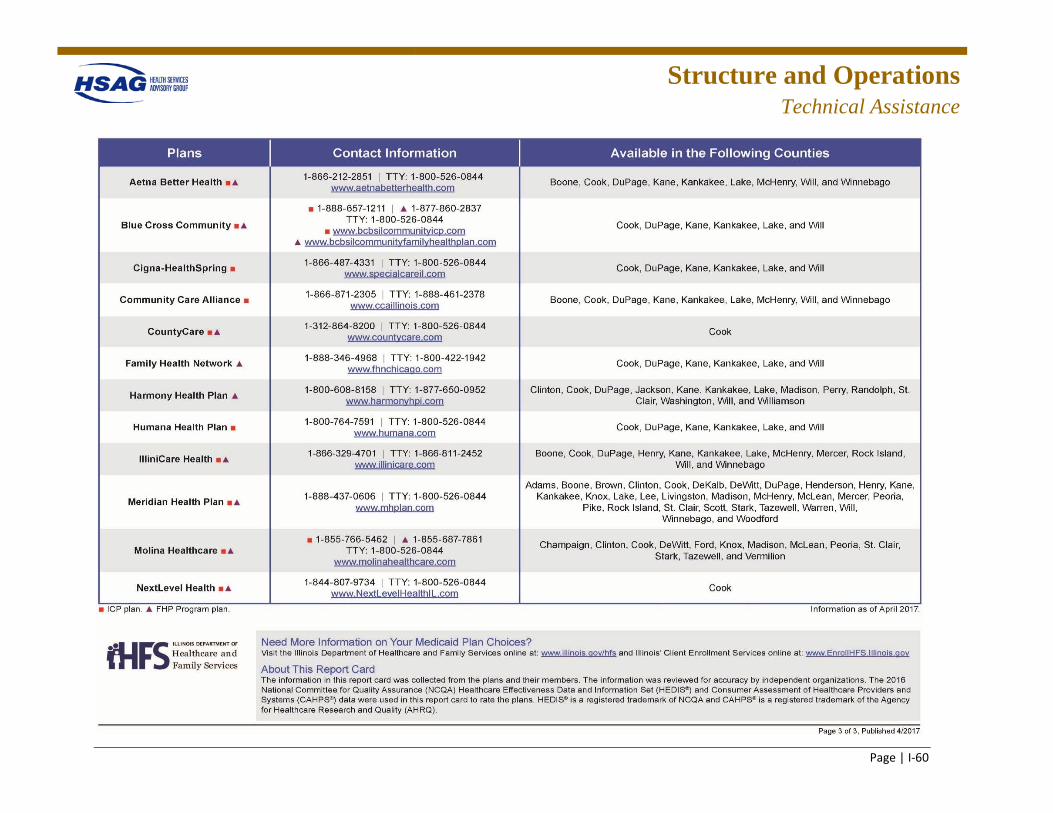
Structure and Operations
Technical Assistance
Page | I-60
Structure and Operations
Technical Assistance
Page | I-61
CAHPS Reviews
HFS requested that HSAG assist with reviewing the CAHPS supplemental questions, researching NCQA requirements, reporting for health plans with multiple Medicaid product lines, and CAHPS sampling.
Stakeholder Presentations
HSAG assisted HFS in developing and preparing professional presentations for stakeholders, legislators, and health plans. For example, in SFY 2016, HSAG helped to develop presentations for the Medicaid Legislative Oversight Committee and HFS’ Quality Committee.
Contracts
HSAG advised HFS on specific questions regarding contract language. HSAG created a crosswalk between the care coordination agreements of several health plans for analysis by the Medicaid director. HSAG also reviewed and conducted a comparative analysis between the MMAI contract and the contracts for FHP/ACA and ICP. To assist HFS with revising its contract and ensuring the HFS contract met federal requirements, HSAG researched substance abuse contract requirements and provided HFS with recommendations.
Development of Performance Measures
Throughout SFYs 2016 and 2017, HSAG continued to assist HFS in developing performance measures that would meet the unique demands of Illinois Medicaid programs. HSAG worked collaboratively with HFS to identify and develop performance measures specific to each of the programs and the populations they currently serve as part of the care coordination expansion. HSAG provided TA in the development and selection of performance measures in the following areas:
• Development of P4P measures and goals for FHP/ACA, ICP, and MMAI • Performance measures research • Validation of MMAI performance measures • Establishing benchmarks for P4P measures for PCCM • Revising the FHP/ACA and ICP performance measure specifications
Provider Manual Revision
As part of HFS’ revision process of the State’s Medicaid provider manual, HFS requested that HSAG develop specific descriptions of all provider types. In response, HSAG created a data dictionary which organized all provider types (e.g., family practice, nurse midwife, homebound provider) into categories (e.g., PCPs, mid-level practitioners, homebound services) and provided detailed definitions of each provider type. For example, a “nurse midwife” was defined as “a registered nurse who has earned a
Structure and Operations
Technical Assistance
Page | I-62
master's degree in nursing and met other requirements.” HFS was able to use the data dictionary to revise the provider manual to include complete definitions of all provider types.
TA to Health Plans
Specific examples of TA topics conducted to assist the health plans in SFY 2016 are described below.
Conducting PIPs
HSAG conducted ongoing TA with the health plans to provide training in the PIP activities identified below to ensure that the health plans’ PIPs were designed, conducted, and reported in a methodologically sound manner.
• Sampling methods • Data collection/analyses • Assessment of quality improvement strategies • Sustained improvement
Corrective Action Plans
As a result of readiness review findings, deficiencies were identified for three health plans that required immediate remediation. HSAG worked with HFS and the health plans to develop CAP templates and completion instructions (including submission of supporting documentation), provide training on CAP development to the health plans, and prepare a timeline for improvement which includes health plans’ submission of CAPs, HSAG review and reporting, and follow-up. HSAG evaluated the CAP submissions to assess the sufficiency of the proposed interventions/activities and timelines to determine whether, if implemented, they could reasonably be anticipated to bring performance into full compliance with the requirements. HSAG provided feedback to the health plans and conducted reevaluation of the CAP implementation to review their progress. Monitoring and reevaluation were continued until the health plan achieved compliance in the deficient area. Final follow-up review reports were then produced for each health plan. Throughout the CAP process, HSAG provided extensive TA and support to the health plans.


