Embed Size (px)
Citation preview

Project 2024
S. TSU SAN JOSE STATE 'J UNIVERSITY
8 California State University t t • C t· Transpor a 10n onsor mm
1MINETA TRANSPORTATION
INSTITUTE
Exploring the Relationship Between Mandatory Helmet Use Regulations and Adult Cyclists’ Behavior in California Using Hybrid Machine Learning Models
Fatemeh Davoudi Kakhki, PhD Maria Chierichetti, PhD
C S U T R A N S P O R T A T I O N C O N S O R T I U M transweb.sjsu.edu/csutc
October 2021

__________________________________________________________________________________
Mineta Transportation Institute Founded in 1991, the Mineta Transportation Institute (MTI), an organized research and training unitin partnership with the Lucas College and Graduate School of Business at San José State University (SJSU), increases mobility for all by improving the safety, efficiency, accessibility, and convenience of our nation’s transportation system. Through research, education, workforce development, and technology transfer, we help create a connected world. MTI leads the Mineta Consortium for Transportation Mobility (MCTM) funded by the U.S. Department of Transportation and the California State University Transportation Consortium (CSUTC) funded by the State of California through Senate Bill 1. MTI focuses on three primary responsibilities:
Research Master of Science in Transportation Management, plus graduate certificates that
MTI conducts multi-disciplinary research include High-Speed and Intercity Rail focused on surface transportation that Management and Transportation Security contributes to effective decision making. Management. These flexible programs offer Research areas include: active transportation; live online classes so that working planning and policy; security and transportation professionals can pursue an counterterrorism; sustainable transportation advanced degree regardless of their location. and land use; transit and passenger rail; transportation engineering; transportation Information and Technology Transfer finance; transportation technology; and workforce and labor. MTI research MTI utilizes a diverse array of dissemination publications undergo expert peer review to methods and media to ensure research results ensure the quality of the research. reach those responsible for managing change.
These methods include publication, seminars, Education and Workforce workshops, websites, social media, webinars,
and other technology transfer mechanisms. To ensure the efficient movement of people and Additionally, MTI promotes the availability of products, we must prepare a new cohort of completed research to professional transportation professionals who are ready to organizations and works to integrate the lead a more diverse, inclusive, and equitable research findings into the graduate education transportation industry. To help achieve this, program. MTI’s extensive collection of MTI sponsors a suite of workforce transportation-related publications is development and education opportunities. The integrated into San José State University’s Institute supports educational programs offered world-class Martin Luther King, Jr. Library. by the Lucas Graduate School of Business: a
Disclaimer
The contents of this report reflect the views of the authors, who are responsible for the facts and accuracyof the information presented herein. This document is disseminated in the interest of information exchange. MTI’s research is funded, partially or entirely, by grants from the California Department of Transportation, the California State University Office of the Chancellor, the U.S. Department of Homeland Security, and the U.S. Department of Transportation, who assume no liability for the contents or use thereof. This report does not constitute a standard specification, design standard, or regulation.

Report 21-26
Exploring the Relationship Between Mandatory Helmet Use Regulations and Adult
Cyclists’ Behavior in California Using Hybrid Machine Learning Models
Fatemeh Davoudi Kakhki, PhD
Maria Chierichetti, PhD
October 2021
A publication of theMineta Transportation InstituteCreated by Congress in 1991
College of BusinessSan José State UniversitySan José, CA 95192-0219

I
TECHNICAL REPORT DOCUMENTATION PAGE
1. Report No.21-26
2. Government Accession No. 3. Recipient’s Catalog No.
4. Title and Subtitle Exploring the Relationship Between Mandatory Helmet Use Regulations and Adult Cyclists’ Behavior in California Using Hybrid Machine Learning Models
5. Report DateOctober 2021
6. Performing Organization Code
7. Authors Fatemeh Davoudi Kakhki, PhD 0000-0001-8088-7948Maria Chierichetti, PhD 0000-0002-9093-8697
8. Performing Organization ReportCA-MTI-2024
9. Performing Organization Name and AddressMineta Transportation InstituteCollege of BusinessSan José State UniversitySan José, CA 95192-0219
10. Work Unit No.
11. Contract or Grant No. ZSB12017-SJAUX
12. Sponsoring Agency Name and AddressState of California SB1 2017/2018Trustees of the California StateUniversitySponsored Programs Administration401 Golden Shore, 5th
Long Beach, CA 90802
U.S. Department of TransportationOffice of the Assistant Secretary forResearch and TechnologyUniversity Transportation Centers Program
13. Type of Report and Period Covered
14. Sponsoring Agency Code
15. Supplemental Notes 10.31979/mti.2021.2024
16. Abstract At the end of 2019, the National Transportation Safety Board recommended the introduction of all-ages helmet law, to reduce fatalities involving cyclists. Even though the benefits of wearing helmets in protecting cyclists against trauma in cycling crashes has been documented, the use of helmets is still limited, and there is opposition against mandatory helmet use, particularly for adults. Therefore, exploring perceptions of adult cyclists regarding mandatory helmet use is a key element to understand cyclists’ behavior, and determine the impact of mandatory helmet use on their cycling rates. The goal of this research is to identify sociodemographic characteristics and cycling behaviors that are associated with the use and non-use of bicycle helmets among adults, and to assess if the enforcement of a bicycle helmet law will result in a change in cycling rates. This research develops hybrid machine learning models to pinpoint the driving factors that explain adult cyclists’ behavior regarding helmet use laws.
17. Key WordsCyclists’ behavior; machine learningclassifiers; statistical analysis
18. Distribution Statement No restrictions. This document is available to the public throughThe National Technical Information Service, Springfield, VA 22161.
19. Security Classif. (of this report) Unclassified
20. Security Classif. (of this page) Unclassified
21. No. of Pages 79
22. Price
Form DOT F 1700.7 (8-72)

Copyright © 2021
by Mineta Transportation Institute
All rights reserved.
DOI: 10.31979/mti.2021.2024
Mineta Transportation InstituteCollege of Business
San José State UniversitySan José, CA 95192-0219
Tel: (408) 924-7560Fax: (408) 924-7565
Email: [email protected]
transweb.sjsu.edu/research/2024

ACKNOWLEDGMENTS
The authors would like to extend their gratitude to MTI’s Director of Research and Technology Transfer, Dr. Hilary Nixon, for her consistent support and guidance during the proposal submission and study. The authors would like to thank Karl Auer and Poojitha Vurtur Badarinathfor their help throughout the data collection and analysis. Additionally, we are thankful to MTI’s staff for their editorial services and assistance in processing this report.
The content of this report reflects the views of authors, who are responsible for the facts and accuracy of the information presented herein. This report does not necessarily reflect the official views of the Mineta Transportation Institute, who assume no liability for contents or use thereof.The report does not constitute a standard regulation or policy.
M I N E T A T R A N S P O R T A T I O N I N S T I T U T E iv

CONTENTS
Acknowledgments ................................................................................................................... iv List of Figures ......................................................................................................................... vi List of Tables .......................................................................................................................... vii Executive Summary ................................................................................................................ 1 1. Introduction ........................................................................................................................ 3 2. Literature Review................................................................................................................. 5
2.1 Effects of Mandatory Helmet Laws on Helmet Wearing............................................... 7 2.2 Effects of Mandatory Helmet Laws on Crash Severity and Frequency........................... 8 2.3 Effects of Mandatory Helmet Laws on Number of Cyclists........................................... 11 2.4 Helmet Usage and Risk Taking ..................................................................................... 12
3. Methodology ....................................................................................................................... 14 3.1 Survey Development...................................................................................................... 14 3.2 Survey Distribution........................................................................................................ 14 3.3 Three tiered analysis approach ....................................................................................... 15 3.4 Data cleaning................................................................................................................. 17
4. Discussion of Results ........................................................................................................... 18 4.1 Tier One Data Analysis: Survey Demographics ............................................................. 18
4.1.1 Analysis of Sociodemographic and Cycling Factors............................................... 18 4.1.2 Cyclists’ Attitude toward a Mandatory Helmet Law ............................................. 22
4.2 Tier Two Data Analysis: Regression Analysis................................................................ 23 4.2.1 Explanator Factor Analysis of Bicycle Helmet Use Belief...................................... 24 4.2.2 Multiple Logistic Regression Analysis................................................................... 28
4.3 Tier Three Data Analysis............................................................................................... 31 4.3.1 Latent Class Analysis ............................................................................................ 31 4.3.2 Decision Tree Classifier ........................................................................................ 34 4.3.3 Sensitivity Analysis ............................................................................................... 36
5. Summary of Findings & Conclusions................................................................................... 38 Appendix A ............................................................................................................................. 41 Bibliography ............................................................................................................................ 63 About the Authors................................................................................................................... 69
M I N E T A T R A N S P O R T A T I O N I N S T I T U T E

LIST OF FIGURES
Figure 1. Frequency analysis of highest degree obtained by the responders............................... 20 Figure 2. Frequency analysis of marital status of the responders ............................................... 20 Figure 3. Frequency analysis of the income level of the responders........................................... 21 Figure 4. Distribution of the responders’ age (total of 770 responses)....................................... 22 Figure 5: ROC curve and AUC values for Training Data ........................................................ 35
: ROC curve and AUC values for Test Data ............................................................... 36 Figure 6Figure 7: Sensitivity analysis based on Bootstrap Forest model................................................. 37
M I N E T A T R A N S P O R T A T I O N I N S T I T U T E vi

LIST OF TABLES
Table 1. Frequency analysis of socioeconomic factors of the responders ................................... 19 Table 2. Frequency analysis of biking frequency versus helmet law agreement.......................... 23 Table 3: KMO and Bartlett’s Test ........................................................................................... 24 Table 4: Communality Scores for Likert-scale Items................................................................ 25 Table 5: Summary of Results from the EFA (Factor Loadings >0.40 are in bold). ................... 27 Table 6: Estimates from the first multiple logistic regression model......................................... 29 Table 7: Estimates from the second multiple logistic regression model .................................... 30 Table 8: Detailed Estimate from the Second MLR Model. ..................................................... 31 Table 9: BIC values for choosing best number of clusters......................................................... 32 Table 10: Contributing factors in differentiating clusters. ........................................................ 32 Table 11: Conditional probability of input variables in each sub-class. ..................................... 34
M I N E T A T R A N S P O R T A T I O N I N S T I T U T E vii

Executive Summary In California, bike fatalities have increased by 8.1% from 2015 to 2016. Even though the benefits of wearing helmets in protecting cyclists against trauma in cycling crash has been determined, the use of helmets is still limited, and there is opposition against mandatory helmet use, particularly for adults. Therefore, exploring the perceptions of adult cyclists regarding mandatory helmet use is a key element in understanding cyclists’ behavior, and determining the impact of mandatory helmet use on their cycling rate.
The goal of this research was to identify sociodemographic characteristics and cycling behaviors associated with the use and non-use of bicycle helmets among adults, and to assess if the enforcement of a bicycle helmet law will result in a change in cycling rates.
This research used a survey questionnaire to extract data and conduct a three-tier analysis using quantitative methods, including frequency analysis, explanatory factor analysis, multiple logisticregression, latent class analysis and hybrid machine learning models, to pinpoint the driving factorsthat explain adult cyclists’ behavior regarding helmet use laws.
The first tier of data analysis, regarding sociodemographic factors and cycling-related factors, wasconducted by preparing and distributing a survey questionnaire among adult cyclists in California.The major takeaways from the tier one analysis are:
• The majority of respondents do not support implementation of a mandatory bicyclehelmet law in California.
The cyclists with the highest frequency of bicycle use (nearly daily or 1–4 times per week) constitute the highest proportion of opposers to a mandatory bicycle helmet law.
The second tier of data analysis sought to explore the effects of the sociodemographic factors on the perceptions of adult cyclists regarding a mandatory bicycle helmet law. The tier two analysis showed that:
• Perceptions of helmet use benefits, cycling risks, and group norms implying the use ofhelmets, are among encouraging factors for using a helmet while cycling.
• Aesthetic and comfort of helmets, as well as riding situations, are among the barriers ofwearing helmets among cyclists.
Cyclists’ gender, education level, perception of helmet use benefits and cycling risks, frequency of helmet use, type of bicycle, and frequency of bicycle use regardless of the purpose of riding either for work/commute or recreation, affect the perception of cyclists for the implementation of a mandatory helmet law in California.
M I N E T A T R A N S P O R T A T I O N I N S T I T U T E 1

The third tier of data analysis used a clustering approach to extract the pattern of sociodemographicand cycling-related factors for opponents and proponents of a mandatory bicycle helmet law and assessed their effect on the cycling rate. The major takeaways from the tier three analysis are:
• The most distinguishing factors separating the survey respondents into two profiles were their education level, marital status, and positive/negative perception of a mandatory helmet law.
• Frequency of helmet use, education level, gender and marital status, as well as beliefs about helmet use, and age are the most significant predictors of changing cycling rate should a mandatory helmet law be implemented.
M I N E T A T R A N S P O R T A T I O N I N S T I T U T E 2

1. IntroductionAt the end of 2019, the National Transportation Safety Board recommended the introduction of all-ages helmet law, to reduce fatalities involving cyclists. The discussion on the benefits of bicycle helmet laws (BHL) is however very complex and controversial. The available evidence indicates that helmet use mitigates cycling head injuries in case of a fall or crash, and that bicycle helmet legislation increases helmet wearing rates; therefore, BHL are associated with reductions in cyclinghead injury (Macpherson and Spinks 2008; Carpenter and Stehr 2011; Kraemer 2016). Two major opposing arguments to BHL, however, state that introducing bicycle helmet legislation reduces cycling and that wearing a helmet promotes hazardous behaviors, thereby offsetting the benefits offered by the helmet. A recent review, however, suggests that helmet laws might result in cycling reduction, but that the effect should not be large or long-lasting (Hoye 2018). It is also believed that helmet usage is connected to different sociodemographic factors, and that universal recommendations for the usefulness of BHL are difficult (Ledesma et al. 2019). Therefore, a specific assessment for the state of California is necessary.
In 1994, California was one of the first states to mandate the use of bicycle safety helmets to bicyclists under 18 years old while riding on public property, with fines up to $25. The current bicycle helmet legislation in California has been associated with an average reduction of 18% in the proportion of traumatic brain injuries among the youth, with differences due to race, gender, and geographical regions. However, no studies have been able to demonstrate if the 1994 law actually resulted in drop of cycling rates or not (Lee, Schofer, and Koppelman 2005). In 2015, California Senator Liu proposed bill SB 192 requiring all-ages helmet usage, but due to firm opposition from bicycle associations, the bill has been abandoned.
The primary objective of this research is to identify sociodemographic characteristics and cycling behaviors that are associated with the use and non-use of bicycle helmets among adults, and to assess if the enforcement of a bicycle helmet law would result in a change in cycling rates. The project addresses the lack of empirical data regarding helmet use and non-use in California throughthe development and distribution of a detailed survey questionnaire that collects data on various sociodemographic and cycling behavior factors, as well as Californian’s perception of mandatory helmet use and its impact on their cycling frequency and type.
In addition, the collected data is used to develop statistical models and create advanced decision-making algorithms to address cycling and mandatory helmet regulations. These models investigate the relationship between the role of mandatory helmet use regulations and cyclists behavioral, demographics and other influential factors, which are not simply determined using traditional traffic safety analysis. . Lastly, the project identifies potential barriers to helmet usage among adults in the presence of an all-ages helmet mandate, and whether such a law will result in significant reduction in cycling rates.
M I N E T A T R A N S P O R T A T I O N I N S T I T U T E 3

The comprehensive results of this project contribute to understanding the factors affecting beliefsthat facilitate or deter cyclists from using a helmet during various cycling conditions in urban streets in California in the presence of a mandatory helmet use regulation. In addition, the project provides useful insights for legislators to consider specific details in helmet use regulations that address characteristics of various cycling groups and encourage cycling as a safe and healthy mode of transportation in California.
M I N E T A T R A N S P O R T A T I O N I N S T I T U T E 4

2. Literature Review While studies find that wearing a helmet does significantly decrease the chances of head injury(Attewell, Glase, and McFadden 2001), the topic of making helmets mandatory by law is a highlydebated topic. In order to investigate the reasoning behind both sides, for and against the implementation of mandatory helmet laws, researchers commonly use surveys to gain valuable insight. The National Survey of Bicyclist and Pedestrian Attitudes and Behaviors from the National Highway Traffic and Safety Administration (NHSTA) is a good example of a survey which helped researchers understand how different age groups supported mandatory helmet laws for children and adults. Overall, 90% of the surveyed individuals supported helmet laws for children while only 62% supported helmet laws for adults (Royal and Miller-Steiger 2008). Not having a helmet, helmets being too uncomfortable and hot, and the short length of their trips, were the most common reasons why respondents said they didn’t wear a helmet when riding. This survey was answered by 9,616 adults living in America in 2008. The survey was distributed using a random digital dial (RDD) sample design and required participants to be over 16 years of age. The use of a RDD does ensure random sampling, but the age cutoff would exclude children from answering the survey (Royal and Miller-Steiger 2008). Interestingly, when travelling overseas, people are very likely to wear helmets regardless of helmet laws. One study indicated that 65.6%of survey respondents would wear a helmet overseas even if the country they were in didn’t require it (King, Franklin, and Leggat 2019). Another survey distributed in Italy by the "Federazione Italiana Amici della Bicicletta", an Italian cycling organization, aimed to investigate the main reasons behind helmet wearing behaviors. They found that 50.6% of responders wore helmets, while 49.4% didn’t. The survey found that women didn’t wear helmets because they were too uncomfortable, not stylish, and too hot. These reasons are also seen in the responses from the NHSTA survey, which means that they are significant deterrents. Although the reasons revealed by this survey are useful to the topic of mandatory helmet laws, the paper failed to provide any reasons as to why the male responders didn’t wear helmets. This is problematic because it only allows readers to understand 37%, the percentage of female responders, of the total number of respondents reasoning against helmet usage (Ferraro et al. 2018). A survey from the European union revealed that 25% of women and 16% of men believe that wearing a helmet will mess up their hair, which deters helmet usage (Valero-Mora et al. 2018).
A survey in Northern Colorado attempted to identify trends between college students’ helmet wearing rates and their parental influence. While the study did not ask participants whether their parents wore helmets, the researchers indicated that literature strongly suggested that parental helmet use influences helmet use among adolescents (Kakefuda, Henry, and Stallones 2009). Another college-based study discovered that having a friend or family member who had crashed while cycling positively corresponded to helmet use (Kakefuda, Stallones, and Gibbs 2009). In order to learn more about helmet usage and reasoning by teenagers in Finland, researchers Lajunen
M I N E T A T R A N S P O R T A T I O N I N S T I T U T E 5
& Räsänen (2001) sent out surveys to Finnish secondary comprehensive and upper secondary schools. Students were asked about their helmet usage, crash history, beliefs about helmets, familyand peer pressure regarding helmets, lifestyle and hobbies, and background (Lajunen and Räsänen2001). The researchers discovered that “51.8% of the secondary comprehensive school students had a helmet, whereas 66.2% never used their helmets… (and) upper secondary school students were 24.3% for ownership and 81.5% for nonuse” (Lajunen and Räsänen 2001). The researchers also determined that parental influence was responsible for positive helmet usage views and that peer influence was responsible for negative helmet usage views (Lajunen and Räsänen 2001). A similar survey was conducted to gain information about the perceptions of helmet usage byAustralian teenagers. Of the respondents, 83.8% believed that people should wear helmets, while only 23.2% of teenagers believed that helmets should be worn while cycling at home (Finch 1996). The most common reasons for not wearing a helmet were “I find it uncomfortable/annoying” and “it’s not fashionable” (Finch 1996). In addition, “71% reported that helmets looked ridiculous and 81% felt that they were hot and uncomfortable” (Finch 1996). Researchers Ledesma et al. (2019) sought to find the most common motives and deterrents behind helmet usage. Of the perceived barriers, the reason ‘‘[h]elmets do not suit my style (or are ugly)” had the highest negativecorrelation with helmet use, followed very closely by the items that measure discomfort (“[h]elmetsget in the way of comfortable head movements” and ‘‘[h]elmets are hot and uncomfortable”) and inconvenience (“[i]t is inconvenient to carry a helmet around”) (Ledesma et al. 2019). Another group of researchers found similar deterrents in students from Valencia, Spain. According to the recorded survey responses, the most common deterrents among students were the lack of peers wearing helmets, believing that helmets aren’t cool, and the hassle of having to carry it around during class (Molina-García and Queralt 2016). Overall, most people who do not wear helmets view helmets as non-aesthetic and uncomfortable.
A survey in Rochester, Minnesota by Finnoff et al. (2001) attempted to find deterrents of helmet use for multiple age groups by posting surveys on trails, and distributing surveys to schools. The results from their surveys indicated the key deterrents among the three age groups. For children, this was lack of comfort and not needing them. Adolescents mainly perceived helmets as annoying and uncomfortable. Lastly, the adults indicated that not owning a helmet and helmets being too hot were their most common deterrents (Finnoff et al. 2001). In order to understand the reasoning behind helmet usage among Canadian students, Otis et al. (1992) sent out a survey questionnaire to 947 students. The results of the survey indicated that support from friends was the most important factor with respect to normative beliefs (Otis et al. 1992). The researchers also indicated the students least motivated to wear a helmet believed that their social group would disapprove ofusing helmets (Otis et al. 1992). Jennifer Rezendes (2006) conducted a literature study regarding the barriers and influences on helmet usage among children. She presented that 60% of children stopped wearing helmets due to comfort and aesthetic issues (Rezendes 2006). Interestingly, thereason why most children believe that others stop wearing helmets is due to their peers not wearing
M I N E T A T R A N S P O R T A T I O N I N S T I T U T E 6

helmets, which shows that peer influence plays a large role in helmet usage (Rezendes 2006). In contrast, the main influence that caused kids to wear a helmet is their parents, as the study noted that 84% of children who wore helmets had parents who also wore helmets (Rezendes 2006). In conclusion, most people support mandatory helmet laws for children, while fewer support it for adults. Most people who do not ride with helmets claim discomfort and aesthetics as their main deterrents.
2.1 Effects of Mandatory Helmet Laws on Helmet Wearing
With the implementation of a mandatory helmet law, helmet usage tends to increase significantly from the pre-legislation period. Multiple countries have seen raises in helmet usage in both child and adult age ranges following mandatory helmet laws. In 2003, Finland implemented a mandatory helmet law which caused cyclists from the Helsinki, the capital of Finland, to increase from 16% helmet use in 1993 to 64% following the legislation. Overall, Finland saw a substantial increase from roughly 10% helmet use in 1993 to 42% following the new mandatory helmet law (Radun and Olivier 2018). Like Finland, Australia saw a large increase in helmet usage among allages following their set of mandatory helmet laws which affected all age groups (Smith et al.,1993). Smith et al. (1993) utilized surveyors to observe cyclists before and after legislation and record helmet wearing rates. The surveyors observed a 49% increase in helmet wearing among New SouthWales students riding to school between 1991 to 1992. Overall, Australian cyclists of all age groupswent from having a 31% helmet wearing rate pre-legislation to a 75% helmet wearing rate post-legislation (Smith et al. 1993). A study analyzing the results of the CDC’s 2012 Summer Consumer Syles survey found positive helmet wearing behaviors among American children in states with bicycle helmet laws. According to the results of the survey, 51% of children from states with mandatory helmet laws reported always wearing a helmet, compared to only 40% of children fromstates without the laws. This supports the hypothesis that mandatory helmet laws cause an increase in helmet use, by using the children from states without mandatory helmet laws as a control group.Additionally, 35% of children from states without mandatory helmet laws reported that they neverwore a helmet, while only 21% of children from states with mandatory helmets laws didn’t (Jewett et al. 2016). A telephone interview survey conducted by Gregory Rodgers (1998) in the United States also compared helmet usage in states with and without helmet laws for children. He found that states with helmet laws had a 72.3% helmet use while states without helmet laws had a 49.6% helmet use (Rodgers 2002). It should be noted that these results may be biased since these resultswere self-reported. Another study found that high school teenagers in Chicago, San Diego, Texas,and Florida had a 4% to 11% increases in helmet usage following the implementation of helmet laws (Kraemer 2016). One of the most significant increases in helmet usage following a mandatory helmet law was observed in New Zealand. The country implemented a mandatory helmet law in 1994, which raised the helmet usage from only 5% in 1980 to 90% in the 2000s. (Macpherson andSpinks 2008). A meta-analysis indicated that average helmet usage rates are 26% in locations with
M I N E T A T R A N S P O R T A T I O N I N S T I T U T E 7

no mandatory helmet use, 27% in locations with partially mandatory helmet use, and 67% in locations with mandatory helmet use (Høye 2018).
In addition, another study reports significant increases in helmet wearing rates following the implementation of helmet laws in multiple countries (Robinson 2006). Following the implementation of helmet laws, Western Australia saw an increase in helmet use from 37% to 82%, New Zealand saw an increase from 40% to 90%, and Halifax saw an increase from 40% to 80% (Robinson 2006). In order to get a better understanding of how helmet legislation affects helmet use, researchers Karkhaneh et al. (2006) performed a systematic review of research papers relevant to their topic of interest. They found that pre-helmet law helmet wearing rates ranged from 4–59% and the post-helmet law wearing rates were between 37–91% (Karkhaneh et al. 2006). Of these increases, one study had less than a 10% increase, four had increased between 10% to 30% , and seven observed a greater than 30% increases (Karkhaneh et al. 2006). While mandatory helmet laws are effective at raising helmet rates, there is evidence that using campaigns can be effective as well. Richard et al. (2013) utilized the French Institute for Prevention and Health Education survey results from 2000, 2005, and 2010 to view how its campaign affected helmet use rates. As time went on, helmet use increased from 7.3% in 2000, to 14.5% in 2005, and finally to 22% in 2010 (Richard, Thélot, and Beck 2013). Another group of researchers aimed to analyze the impacts of British Colombia’s Preventable social marketing campaign. According to the survey they sent out to 400 cyclists, 54% recall hearing one of the slogans of the campaign (Karl et al. 2018). Of this 54%, 63.2% reported that they always wore a helmet, which is higher than the overall 58.9% helmet wearing rate of British Colombians (Karl et al. 2018). Even though mandatory helmet laws increase helmet usage substantially, France and British Colombia demonstrate that campaigns can be just as effective. Overall, the data from the reviewed literature suggests that the implementation of a mandatory helmet law and/or the use of campaigns leads toa higher percentages of helmet use among cyclists nearly unanimously.
2.2 Effects of Mandatory Helmet Laws on Crash Severity and Frequency
After implementing mandatory helmet laws, the crash severities and frequencies of cyclists in the affected area normally result in decreased head injuries and fatalities. One study showed an incredibly strong correlation between mandatory helmet laws and reducing head injuries (Lee et al. 2005). They noted that in Seattle, Washington, cyclists had an 85% reduction in risk for head injuries, and an 88% reduction in risk for brain injuries (Lee, Schofer, and Koppelman 2005). A meta-analysis of multiple studies regarding the effects of helmets on crash severity found similar results of helmets abilities to protect cyclists. The study used odds ratios to describe trends between helmet usage and certain kinds of injuries. When converted to percentages, the odds ratios from the meta-analysis found that wearing a helmet reduces the risk of head injury by at least 45%, braininjury by at least 33%, facial injury by at least 27%, and fatal injury by at least 29% (Attewell, Glase,and McFadden 2001). Australia saw a significant change in crash severity following the
M I N E T A T R A N S P O R T A T I O N I N S T I T U T E 8
implementation of their mandatory helmet law. Walter et al. (2013) observed hospital data beforeand after the mandatory helmet law was implemented in Australia in their study. They found that the ratio between head injuries to arm injuries had changed from -7.5% to 21.1% one year after the law (Walter et al. 2013). Arm injuries were used as a control, as the frequency of arm injuries would theoretically not change before and after a helmet law was implemented. In addition to this, the researchers found an estimated 27.5% to 31% reduction in head injuries after the implementation of the mandatory helmet law. Similar trends were found in a study which looked at hospital data from the United States. The study found that the most common injuries among helmeted riders were contusions, while non-helmeted riders commonly had head, neck, and traumatic brain injuries (McAdams et al. 2018). Another study by Bíl et al (2018) attempted to numerically calculate the efficacy of helmets by looking at Czech cycling fatality data. The researchers discovered that helmet usage could prevent 51.5% of fatal injuries at intersections, 24%of fatal injuries on straight or curved sections, and 62.3% of fatalities where the head was the only injured body part (Bíl et al. 2018).
In addition to reducing head injuries, the United States also saw a reduction in fatalities followingjuvenile mandatory helmet laws. Researchers found that the U.S. saw a 11% decrease in youth fatalities from the helmet laws in the 1990’s and a 19% decrease overall (Carpenter and Stehr 2011). In order to study the effectiveness of Florida’s bicycle helmet laws, researchers Borglund et al. (1999) used Broward General Medical Center’s Pediatric Referral Trauma Center data to study groups of children affected in crashes before and after the helmet law was implemented. In terms of helmet usage, the after-legislation group had 20.8% helmet usage as compared to the before-legislation group’s 5.6% helmet usage (Borglund, Hayes, and Eckes 1999). The number of head injuries went from 25 in the before-legislation to 22 in the after-legislation group, a small decrease(Borglund, Hayes, and Eckes 1999). Since the number of non-helmeted children even after the legislation is large, it makes sense that the decrease in head injuries would be smaller. In order to discover more trends between crash data and helmet usage in children, researchers Kaushik et al. (2015) analyzed public hospital database records from Minnesota children’s hospitals. According to the findings, “[o]f the 500 patients with head injuries, 17.4 % were wearing a helmet, 44.8 % were not wearing a helmet, and 37.8% had no documentation regarding helmet use” (Kaushik et al. 2015). This difference in use shows that those who had head injuries are more likely to be non-helmeted. Meehan et al. (2013) used the U.S. Fatality Analysis Reporting System to find bicycle-motor vehicle fatality rates of children in states with and without helmet laws. They discovered that states with helmet laws saw lower fatality rates, 2.0/1,000,000, as opposed to states without helmet laws, 2.6/1,000,000 (Meehan et al. 2013). Notably, after the researchers “adjust[ed] for other motor vehicle legislation and state specific economic factors, states with helmet laws demonstrated a 20% decrease in the rate of bicycle-motor vehicle related deaths and injuries whencompared with states without helmet laws” (Meehan et al. 2013). This shows a clear positive impact of helmet laws in reducing bicycle-motor vehicle fatalities among children. In order to
M I N E T A T R A N S P O R T A T I O N I N S T I T U T E 9

analyze the effects of a mandatory helmet law implemented in 1994 in New York, Shafi et al. (1998) analyzed the Children’s Hospital of Buffalo data from 1993 to 1995. The researchers found that the helmet usage increased 13 fold following the introduction of the helmet law (Shafi et al. 1998). Overall, there were 104 head injuries among children, only 14 of which were helmeted children (Shafi et al. 1998). While this study does not mention the percentages of children wearinghelmets outside of the hospital, there is a substantially larger number of children without helmets admitted for head injuries than with helmets. To obtain data about head injuries in Japanese junior high schools, Ichikawa and Nakahara (2007) looked at crash data from schools with and without helmet regulations between 2001 and 2004. The ratio of head injuries to non-head injuries for schools without helmet regulations was 8/39 while the ratio for schools with helmet regulations was 6/72, which is much smaller than the former (Ichikawa and Nakahara 2007). Overall, there is a clear trend between helmet laws and decreasing cycling injuries among children.
Wasserman et al. interviewed 516 cyclists about helmet usage and past crashes to find trends among active cyclists. They discovered that 19% of the cyclists owned helmets, while only 8% were wearing one at the time of the interview (Wasserman et al. 1988). Of the cyclists interviewed, 21 cyclists had hit their head in a cycling crash in the past 18 months. Of these 21 cyclists, all 8 cyclists who were wearing helmets at the time of the crash sustained no head injuries while 7 of the 13 non-helmeted cyclists did (Wasserman et al. 1988). These findings indicate that wearing a helmet corresponds to not having a head injury during crashes. In order to find out how many potential head injuries were avoided due to New Zealand’s helmet laws, Scuffham et al. (2000) looked at New Zealand Health Information Service and Land Transport Safety Authority data to predict the number of injuries prevented. The researchers used the NZHIS and LTSA data to find injuryrates and helmet wearing rates respectively. Over the 3 year period following the new helmet law, the researchers estimated that 134 head injuries had been prevented (Scuffham et al. 2000). The large ranges presented for helmet effectiveness at preventing fatality, ranging from 29% to 90%, have led some researchers to call for less biased studies in order to obtain more accurate data (Trégouët 2015).
In order to determine the efficacy of helmets in different positions, researchers from the Universityof Washington recorded 126 recent crash victims’ head shapes, helmet shapes, and position of their helmet during their crash (Rivara et al. 1999). The researchers discovered that children with helmets that were tipped posteriorly had a 52% greater risk than children with normal fitting helmets (Rivara et al. 1999). In addition to this, 47.4% more children with head injuries had their helmets 2 cm wider or more than the control group (Rivara et al. 1999). Essentially, wearing a helmet improperly nearly doubles the chances of head injury. In order to see if helmets assisted protection from facial injury, Thompson et al. (1990) used a control case study which involved hospitalized and GHC member cyclists. Overall, the researchers discovered that, “bicycle helmetsas presently designed have little or no effect on the overall risk of facial injury but appear to providesome protection for serious upper facial injuries” (Thompson et al. 1990). Since helmets do create
M I N E T A T R A N S P O R T A T I O N I N S T I T U T E 10

a small barrier surrounding the top of the head, it makes sense that they could reduce upper facial injury. Similarly, Steir et al. (2016) used the German In-Depth accident study (GIDAS) to look at crash data of cyclists between 1999 and 2011 to determine if helmet usage prevented facial injury. Of the 5,350 cases that they considered, they concluded that helmet usage did increase thechances of a mandibular fracture and decreased maxilla, orbital bone, zygomatic bone and nose fractures, but not by a statistically substantial amount (Stier et al. 2016). Overall, Stier et al. (2016) determined that helmets did not statistically affect facial injury prevention, other than increasing the chances of mandibular fracture. A meta-analysis review indicated that wearing a helmet can reduce risk of skull fractures and intracranial injury by 80% among cyclists with serious head injuries and reduce the risk of facial injury by 28% (Høye 2018). In summary, helmets, when used properly, can marginally decrease the risk of facial injury.
Following the implementation of the 2002 Alberta helmet law in Canada, there was a decrease in head injuries among children in both hospitals and emergency departments (Karkhaneh et al. 2013). Among adolescents, head injuries initially increased following the law, but the number of hospitalized head injuries significantly decreased following the law (Karkhaneh et al. 2013). Macpherson et al. (2002) utilized Canadian Institute of Health Information (CIHI) data to compare injuries in provinces that were and weren’t affected by helmet laws. The crash data from 1994 to 1998 displayed a larger decline in head injuries in provinces with helmet laws than in provinces without them ( Macpherson et al. 2002). However, the trends of injuries other than head injuries did not show any correlation between the provinces ( Macpherson et al. 2002). Following the implementation of a mandatory helmet law for motorcyclists in Taiwan, there was a 14% decrease in motorcycle crash fatalities overall, a 22% decrease in fatalities due to head injuries, anda 20% rise in fatalities due to other parts of the body (Tsai et al. 1999). Lee et al. (2018) conducted a study to calculate helmet effectiveness at preventing injury among motorcycle riders. While motorcycle riders will likely ride faster and encounter different situations than cyclists, the trend among helmet efficacy of motorcyclists and cyclists are similar. The researchers concluded that universal helmet laws reduce motorcyclist fatality by 20.5%, which is similar to that of some bicyclehelmet studies. ( Lee 2018). Overall, there is a clear positive impact on crash severity when helmetlaws are implemented.
2.3 Effects of Mandatory Helmet Laws on Number of Cyclists
While mandatory helmet laws have clear benefits to crash severity, multiple studies argue that the implementation of a mandatory helmet law would lead to a reduction in riders on the road, which would in turn make cycling less safe and prevent many from getting the health benefits that cyclingprovides. After Australia implemented its mandatory helmet laws, the country experienced decreases of cyclists in all age groups. According to Smith et al. (1993), there was a 14% decrease in adult cyclists and a 36% decrease in child cyclists following the implementation of the mandatoryhelmet law. This statistic was obtained from the annual cyclists counts that the surveyors provided
M I N E T A T R A N S P O R T A T I O N I N S T I T U T E 11

the researchers. Despite their observations, the researchers warned that the survey was not created to observe changes in cyclist numbers (Smith et al. 1993). A study done by Bicycle Network analyzed how the mandatory helmet law in Australia affected the number of bicycle trips per year in the country. The number dropped from 86,201 annual bicycle trips in 1986 to 74,451 trips in 1996 after the mandatory helmet law. The data was acquired from the Australian Census, which would explain why the decrease is closer to the 14% decrease among adults rather than the 36% decrease reported among children (Network 2018). Multiple observational surveys in Australia found a 21% reduction in adults and 51% reduction for children cycling, leading to an overall reduction of 29% at intersections (Lemon 2018). Rissel and Wen (2011) conducted a computer assisted telephone interview to gain insight into how Australians viewed helmet laws. They discovered that 22.6% of respondents would ride more if there wasn’t a mandatory helmet law, which correlates to the estimated 25–38% reduction observed after the helmet laws were implemented (Rissel and Wen 2011). In addition, they discovered that 67.3% of respondents supported the implementation of a mandatory helmet law (Rissel and Wen 2011). While some places saw decreases following the implementation of mandatory helmet laws, researchers in Sweden observed the opposite. After Sweden implemented a mandatory helmet law for children in 2005, there was a 10% increase in cyclists within one year of the law and a 19% increase in 2011 (Bonander, Nilson, and Andersson 2014). In addition to Sweden, a study of the Ontario mandatory helmet law saw small increase of the number children cyclists following the helmet law.Macpherson et al. (2001) observed the number of children cyclists from 1993 to 1999 in order to determine the impact of the 1995 mandatory helmet law. They found that children cyclists increased from 4.32 cyclists per hour in 1995 to 6.84 cyclists per hour in 1996 (Macpherson, Parkin, and To 2001). However, this increase was not consistent with time which led the researcher to conclude that “the introduction of legislation did not appear to have an independent effect on children’s cycling” (Macpherson, Parkin, and To 2001). Overall, the impact of mandatory helmet laws tends to decrease the number of active cyclists.
2.4 Helmet Usage and Risk Taking
Since helmets protect riders in the case of a crash, numerous researchers have tried to see if the perceived safety of wearing a helmet would alter a cyclist’s behavior and cause them to ride more dangerously. A large systematic review of 23 different risk compensation research papers found that two studies supported the risk compensation hypothesis, three were mixed, and 18 were did not support the hypothesis (Esmaeilikia et al. 2019). The study had rigorous criteria for which articles were used and narrowed down the 190 database results to 23 included papers. Even though the review found that the risk compensation theory is not likely to be true, the researchers noted that obtaining a causal relationship between helmeted and non-helmeted riding risk association is incredibly difficult (Esmaeilikia et al. 2019). Another study attempted to determine if wearing protective equipment would lead people to make riskier decisions. To do this, researchers mounted
M I N E T A T R A N S P O R T A T I O N I N S T I T U T E 12

cameras to a helmet and a baseball hat and told participants to play a videogame which simulated blowing up a balloon. If risk compensation theory was true, the participants in helmets would make riskier decisions and accidentally blow up the balloons too much and pop them. The data from their tests supported their hypothesis that the people who wore the helmet would act riskier compared to those in wearing the baseball hat. While this study does support the risk compensation theory, in a scenario with helmets and videogames, it isn’t necessarily interchangeable with risk compensation while cycling. With the balloon videogame, there is no real risk presented to the participants, which in turn might make them act less cautiously (Gambleand Walker 2016). The researchers of this paper noted that their conclusion conflicted with another study by Fyhri et al., (2018) which recorded the speeds of cyclists going downhill with andwithout helmets on. In their case, if the risk compensation theory was true, the cyclists with helmets on would ride much faster than the non-helmeted cyclists. However, the researchers found that people who normally rode with helmets took less risks without one, while people who normally rode without helmets rode the same with and without a helmet on (Fyhri et al. 2018). The important part of this study was the behavior of the cyclists who didn’t normally ride with helmets. If risk compensation was true, they would have ridden faster and more dangerous with the helmet on. Since risk compensation is such a hard topic to get definitive data on, this may bethe most relevant paper to the risk associated behavior with helmet use. Even if a cyclist is wearinga helmet and riding safely, drivers may have different endangerment perceptions between helmetedand non-helmeted riders. A study done in the United Kingdom found that drivers overtake closerto cyclists wearing helmets than cyclists without helmets (Walker and Robinson 2019). An Italian study observing crash data indicated that crashes where the vehicle is at fault are more likely to occur if the cyclist is a woman (Prati et al. 2019). This is possibly due to the risk compensation of the drivers, but this cannot be confirmed. Overall, the risk compensation theory among cyclists isa hard theory to prove, but there is evidence that suggests that drivers will drive more dangerouslywhile passing helmeted riders.
M I N E T A T R A N S P O R T A T I O N I N S T I T U T E 13

3. Methodology This project collected data regarding cycling behavior and sociodemographic aspects of the population in California by distributing a survey and analyzing the collected data using a three-tier statistical analysis approach.
3.1 Survey Development
An already existing survey (Ledesma et al. 2019) was modified to make the content more pertinent to the California population. This previous survey had been disseminated between 2013–2015 to investigate the social, behavioral. and perceptual aspects of wearing versus not-wearing a bicycle helmet in 17 countries (12 European countries plus Australia, Brazil, Israel, and Turkey). The existing survey contained questions related to sociodemographic variables, such as gender, age,education, cycling behavior, frequency of bicycle use, cycling purpose, as well as Likert-scale items related to helmet-wearing attitude, such as frequency of helmet use, attitudes toward mandatory use of helmet per age group, convenience, and cycling risk perception. The survey obtained from "Psychosocial factors associated with helmet use by adult cyclists" by Ledesma et. al. (Ledesma et al. 2019) served as a baseline for the purposes of this research.
As the survey was developed to be used in the European Union, a few questions related to geography, income, and occupation were modified to better fit California residents. A consent form was added to notify participants that their personal information would all remain confidentialin the survey results. This was done to reduce response bias as anonymity leads respondents to give more truthful responses.
The survey was developed in Qualtrics XM, a readily available online experience management software. The primary advantages of Qualtrics XM included easy distribution via URL and QR code links to the survey. In addition, Qualtrics XM has multiple built-in tools for data analytics, multivariate analysis, and report generation.
3.2 Survey Distribution
Ideally, the survey would have been distributed through many in-person events such as cycling coalition meetings, transportation board meetings, and potentially local cycling-related events. However, the distribution timeline took place during the peak of COVID-19 related lockdowns and restrictions which made these forms of distribution not possible. The closure of in-person events meant that all survey distribution was done online.
In order to meet the desired sample size, cycling organizations were contacted to distribute the survey internally and externally to their organization. The majority of the organizations that were contacted initially were local partners of the California Bicycle Coalition. These organizations
M I N E T A T R A N S P O R T A T I O N I N S T I T U T E 14

mainly consisted of cycling coalitions, which are organizations that are dedicated to promoting cycling in their communities. Their contact information was obtained from their websites, and emails or inquiries about the survey were promptly sent. The messages contained information about the project, the qualifications for participants, the survey URL, and sample instructions on how to distribute the survey. A large number of cycling organizations agreed to participate in this research effort and distributed the surveys to members of their organization and others.
Later in the survey process, local businesses began to open which allowed for new distribution methods. Local bicycle stores in the area were contacted to see if they would post QR codes inside their store to achieve more survey responses. A few stores in the state appreciated the idea and posted QR codes inside their stores. This new form of distribution served two purposes: to gain a larger sample size and reach new groups of respondents. This benefited the results of this survey by minimizing bias. By having a larger sample size, the survey will have been filled out by a larger population, meaning that a larger percentage of the whole population will be represented in the results. In addition to this, the location itself allows the surveys to reach people who might not be a member of a cycling organization. A total of 857 responses for the whole survey questionnaire were received.
3.3 Three Tiered Analysis Approach
The collected data was analyzed using a three-tier data analysis procedure to identify relationshipsbetween mandatory helmet usage and cycling trends.
The first tier of data analysis was based on descriptive statistics, in which frequency charts, geographical maps and graphs are used to extract the frequency of sociodemographic and cycling-related factors. This step identifies what type of cyclists responded to the survey (classification) as well as which participants are more likely to wear a helmet, in the presence or without the presence of mandatory helmet regulations.
The second step of data analysis established a statistical relationship between key participantcharacteristics and the likelihood of changing their biking habits due to a BHL, by using a logisticregression method to examine relationships between multiple users’ variables and binary-type responses (i.e., yes/no) describing the perceptions of adult cyclists toward mandatory BHL in California, and the impact of BHL to their biking attitude. This mathematical relation allowed the extrapolation of the results of this survey to the rest of the population based on sociodemographic factors and current cycling behavior. The parameters that were considered in the model included gender, age, education, race, income level, frequency of bicycle use, frequency of helmet use, beliefs about helmet use, and history of having and crash while cycling in the past year. The beliefs about helmet use included items related to helmet affordability and convenience,risk perception factors, and law enforcement perception.
M I N E T A T R A N S P O R T A T I O N I N S T I T U T E 15

This step also identifies the relative importance of each sociodemographic factor, as well as cyclingbehavior, to the change in the probability of wearing a helmet under a mandatory BHL, as well asto predict the effect of BHL on cycling rates for the rest of the population.
The third step of data analysis automatically identifies groups of participants with similar sociodemographic features that also share common responses to a BHL. For each cluster of participants, the analysis determines which groups are more likely to wear a helmet and keep cycling if helmet use is mandatory, and, within each group, determines the barriers to wearing a helmet. This knowledge will support the definition of incentives and educational measures to improve helmet usage among adults. To obtain this information, we developed a novel methodology (called hybrid machine learning) that will automatically divide participants in meaningful clusters/groups based on their BHL attitudes. The mathematical methods used in this step are the latent class analysis, in conjunction with optimized decision tree classifiers. This last step will help understand the hidden relationships between various groups of cyclists that share similar responses to BHL and will help to pinpoint the driving factors that explain their behavior.
This tier includes two steps. First, we used clustering analysis to automatically identify groups of participants with similar sociodemographic features that also share common responses/perception to a BHL. For each cluster of participants, the analysis determined which group is more likely to wear a helmet. These clusters are then used together with other factors in the study to identifywhether the participants will keep cycling if helmet use is mandatory, and, within each group, whatare the barriers to wearing a helmet. This knowledge will support the definitions of incentives and educational measures needed to improve helmet usage among adults. To obtain this information, we combined the results from the latent class analysis with other factors from the survey to build an optimized decision tree classifier. This last step contributed to understanding of the hidden relationships between various groups of cyclists that share similar responses to BHL, and to pinpoint the driving factors that explain their behavior.Latent class clustering (LCC) is a probability-based clustering method that is commonly used for identification of optimal homogenous patterns. In clustering approaches, subgroups of the data are extracted based on statistical similarity, where the data in each cluster are dissimilar to the data from other clusters. Among various clustering techniques to categorize the population into subgroups with similar riskprofiles, latent class analysis (LCA) is selected for this study as it is preferred for segmentation purposes when the parameters in the study are categorical. In order to choose the appropriate number of clusters, Bayesian information criterion (BIC) was used as a performance measure for selecting the optimal number of clusters in a whole dataset. The log-likelihood (LL) value was calculated and used to calculate - BIC measures. LL is the logarithm of the likelihood ratio. It is used as a comparative test of models’ fit by examining the predictive power of one model compared to the other.
The final analysis is in this tier is developing a machine learning model to identify how a mandatoryBHL will affect the biking attitude of the adult cyclists who completed this survey. This was asked
M I N E T A T R A N S P O R T A T I O N I N S T I T U T E 16

in question fourteen of the survey as: "how would a mandatory helmet law affect your cycling?", with three options to select:
• My cycling frequency would be the same (encodes as "0")
• My cycling frequency would decrease (encoded as "1")
• My cycling frequency would increase (encoded as "2")
The three levels are the targets for the classification algorithm. Since most machine learning algorithms respond best with binary variables, a specific decision tree machine learning classifier called Bootstrap Forest (BF) was used to account for the three options. The BF model was developed to identify the relationship between the input factors (cluster 1, cluster 2, frequency of helmet use, household income and the four-factor model describing the belief about helmet use that was developed in the previous section for EFA), and the output factor of "how a mandatory BHL would affect one’s’ cycling".
In order to develop a machine learning model, the data should be partitioned into train and test set with 70–30 ratio. The train set is used to develop a specific machine learning model, and the test set is used to evaluate the performance of the built model on the new data. The model accuracyin correctly classifying and predicting an output target variable is then calculated using a confusionmatrix.
3.4 Data Cleaning
The questionnaire has 30 questions, mostly on Liker-scale type, as well as multiple choices, and open-ended questions, and thus, all the variables and their level were encoded. The details of the encoding for each survey question and its levels are presented in Appendix A of this report. The columns for survey recipients’ first/last name, email address, and external reference (all personal identifying information) have been removed. All of the individual responses who did not agree to the consent form at the beginning of the survey were deleted from the data. Eight additionally responses were deleted, seven because they responded “no” to the being an adult in California question, and the other because the responses were not serious/relevant to the survey questions.
M I N E T A T R A N S P O R T A T I O N I N S T I T U T E 17

4. Discussion of Results 4.1 Tier One Data Analysis: Survey Demographics
This section includes the results for the statistical analysis of the survey respondents’ demographics and cycling behavior. We received a total of 857 responses for the whole survey questionnaire. However, not all questions were answered by all respondents. As a consequence, the frequency of responses per category of variables may differ in each question.
4.1.1 Analysis of Sociodemographic and Cycling Factors
This section describes the frequency analysis of the sociodemographic factors and cycling-related factors from the respondents. The socioeconomic factors included in the survey are age, income, gender, highest degree earned, marital status, and if any children. Each factor has several levels. For example, the variable “highest degree earned” has five levels such as “graduate degree or equivalent” and “high school diploma or equivalent”. Frequency analysis on the responses was performed to extract the proportion of each factor and its levels among the responses. The results are shown in Table 1. More than 80% of the respondents have a 4-year college degree or higher, Figure 1. The majority of respondents are married (63%; Figure 2), and 21% have children. More than 60% of the respondents have an income of $100k or more, Figure 3.
M I N E T A T R A N S P O R T A T I O N I N S T I T U T E 18

Table 1. Frequency Analysis of Socioeconomic Factors of the Respondents
Factor Total # Level Count Prob
Highest degree 794 4-year college degree or equivalent Graduate degree or equivalent Post-graduate degree or equivalent 2-year college degree or equivalent High school diploma or equivalent Did not complete high school
306 260 123 60 41 4
0.38539 0.32746 0.15491 0.07557 0.05164 0.00504
Marital Status 794 Married SingleOther Prefer not to say
501 216 53 24
0.63098 0.27204 0.06675 0.03023
Any Children? 792 No Yes
628 164
0.79293 0.20707
Income 755 $200K–more $100K–$200K $50K–$100K Below–$50K
219 278 157 99
0.29007 0.3700 0.22 0.12
M I N E T A T R A N S P O R T A T I O N I N S T I T U T E 19

CJ
Married 63%
Single 27%
Others 7%
Prefer not to say 3%
Figure 1. Frequency Analysis of Highest Degree Obtained by the Responders
4-year college degree or equivalent
39%
Graduate degree or equivalent
33%
Post-graduate degree or equivalent
15%
2-year college
degree or equivalen
t 8%
High school diploma or equivalent
5%
Did not complete high
school 0%
Highest Degree
Figure 2. Frequency Analysis of Marital Status of the Responders
Marital Status
M I N E T A T R A N S P O R T A T I O N I N S T I T U T E 20

Figure 3. Frequency Analysis of the Income Level of the Responders
Income level
$200K-more 29%
$100K-$200K 37%
$50K-$100K 21%
Below $50K 13%
For the age variable, we developed a histogram from a total of 770 responses as shown in Figure 4. Further analyses showed that the average and median age of responders in the survey was 52.7 and 54 years old respectively, with a maximum age of 72 years old. The standard deviation of age was of 14.6 years.
M I N E T A T R A N S P O R T A T I O N I N S T I T U T E 21

15
10
5
0 20 30 40 50
Age
60 70 80
Figure 4. Distribution of the Responders’ Age (total of 770 responses)
4.1.2 Cyclists’ Attitude toward a Mandatory Helmet Law
The survey includes the following question about the participants’ opinion of a BHL: “[d]o you support the implementation of a mandatory bicycle helmet law for adults in California?” Out of total 772 responses, 70% (541 out of 772) answered “no” and 30% (231 out of 772) responded “yes”, as shown in Figure 5.
In order to identify the frequency of responders’ agreement to a mandatory BHL, cycling frequency versus attitude toward such policy was tabulated. The results show that those cyclists with the highest frequency of biking (nearly daily), followed by those who bike one to four times per week, are among the highest proportion of respondents saying “no” to a BHL. The details of the frequency of biking versus the BHL agreement (yes/no) is given in Table 2.
M I N E T A T R A N S P O R T A T I O N I N S T I T U T E 22

Table 2. Frequency Analysis of Biking Frequency Versus Helmet Law Agreement.
Factor Total Level Count Prob Count Prob # (no) (no) (yes) (yes)
BikingFrequency
772 Nearly daily1-4 times per week1-3 times per monthLess than once per monthNever
241 218 34 6 3
0.3409 0.3083 0.0481 0.0085 0.0042
54 116 19 16 0
0.0764 0.1641 0.0269 0.0226 0
4.2 Tier Two Data Analysis: Regression Analysis
The main focus of this section is to address the question: how sociodemographic factors affect theperception on mandatory Bicycle Helmet Laws. Therefore, the purpose of the tier two data analysis is to identify the relationship between the sociodemographics factors as well as cycling-related variables and the perception of the adult cyclists surveyed in the study on the implementation of mandatory BHL.
A multiple logistic regression (MLR) model is developed to understand the relationships betweenmultiple respondents’ variables and binary-type responses (i.e., yes/no) describing their perception of a mandatory BHL. More specifically, the MLR analysis is applied to assess how the sociodemographic factors (gender, age, education, household income, and race) affect the probability of survey participants’ agreement versus disagreement with a mandatory BHL. In addition, cycling-related variables (bicycle type, frequency of helmet use, and bicycle helmet use belief) are also included as independent variables in the MLR model.
The question related to the Bicycle Helmet Use Belief in the survey consists of 26 items, each in form of a sentence that describes a specific belief. For example, item 5 is "helmets are not particularly effective at reducing the severity of head injuries". In order to prepare the data for coding, this sentence is reduced to "helmets won’t reduce head injuries". Each of these 26 items are Likert-type questions, and participants were asked to indicate how much they agree or disagree with each sentence on a 7-point scale as: 1. strongly disagree; 2. disagree; 3. somehow disagree; 4. neither agree nor disagree; 5. Somewhat agree; 6. agree; and 7. strongly agree. In order to use these 26 items as independent/input variables for the MLR model, describing the Bicycle Helmet Use Belief variable, the 26 items were grouped into specific number of factors (each as one new variable) by using a clustering method called Explanatory Factor Analysis (EFA). This step is completed before performing the MLR analysis, the details for which are discussed in the rest of this section.
M I N E T A T R A N S P O R T A T I O N I N S T I T U T E 23

4.2.1 Explanator Factor Analysis of Bicycle Helmet Use Belief
Explanatory Factor Analysis (EFA) is a data reduction technique for grouping Likert-type variables. An EFA was performed on the 26 Likert-scale items assessing beliefs about helmet use. Factors were extracted using the Maximum Likelihood method using a varimax rotation matrix. The varimax orthogonal rotation is used to ensure that the factors cannot be correlated.
In order to have stabilized factors that correctly identify the relationship between the items and group them into meaningful patterns, a sample size between 500 to 1000 is considered very good to excellent. The survey included over 770 replies for this specific question, which ensures that thelatent pattern is reliable in representing the beliefs of the survey respondents about the helmet use.To statistically assess the appropriateness of EFA before conducting the analysis, two tests were completed: the Kaiser-Meyer-Olkin Measure of Sampling Adequacy (KMO) and the Bartlett’s Test of Sphericity. The KMO measure varies between 0 and 1, and values over 0.6 are acceptable, while closer to 1 value are better. As shown in Table 3, the KMO value is 0.94 which means the collected data is highly adequate for use with EFA, and the Bartlett’s test chi-square value is also high with a p-value of 0.000 which confirms the adequacy of the data for EFA.
Table 3: KMO and Bartlett’s Test
Test of Adequacy Measures
KMO test 0.941
Bartlett’s test Chi-Square 8525.59
df* 210
Sig. 0.000*
df*: Degree of Freedom, Sign. 0.000*: Statistically significant at α=0.10.
Another important consideration in EFA should be the communality measure, which is the proportion of each Likert-scale item’s variance that can be explained by the factors. Any item with a communality value of <0.30 should be dropped before conducting EFA. The results of the communality test are shown in Table 4. Based on the results, all items are considered for EFA, except the items "I am likely to have a bicycle crash in the next two years in which my head would hit something"; encoded as "head injury next two years", and "bicycle helmets are expensive"; encoded as "helmets are expensive". The communality score for the dropped items are 0.24 and 0.10 respectively, which make them unsuitable for revealing the factor patterns in the helmet use belief analysis.
M I N E T A T R A N S P O R T A T I O N I N S T I T U T E 24

Table 4: Communality Scores for Likert-scale Items
Item Communality Score
Most people wear helmets 0.80
Help in car-bike impact 0.52
Friends expect me to wear a helmet 0.66
Helmets won’t reduce head injuries 0.44
Hot and uncomfortable 0.54
Helmets are ugly 0.70
Helmets disturb hair 0.50
Inconvenient to carry 0.51
Cycling not risky enough 0.66
Always worn helmet 0.40
Should be compulsory for adults 0.48
Should be compulsory—children 0.40
Reduce head injuries 0.66
Helmets are more important for longer rides 0.30
Reduce cyclists’ deaths 0.67
Used to wearing helmet 0.58
Friends wear helmets 0.84
Beginners need helmets 0.63
Previous crashes -> wearing important 0.70
No helmet = risk 0.68
Experts don’t need helmet 0.34
Wear if near cars 0.54
Wear if bad roads 0.66
Limit head movements 0.53
Head injury next two years 0.25*
Helmets are expensive 0.10*
*items with communality score <0.30 were dropped from EFA.
In the next step, the EFA was conducted. Based on the Maximum Likelihood method and varimax rotation for factor loadings, a four-factor model was selected as an adequate solution in revealing the beliefs about helmet use. The four-factor solution explained around 60% of the total variance.
M I N E T A T R A N S P O R T A T I O N I N S T I T U T E 25

The details of the factors and their items are shown in Table 5. The items belonging to each factor are in bold.
The first factor, F1, accounts for 25% of the total variance and consists of eight items. Considering the items definition, such as "helmets reduce head injuries" or "helmets help in car-bike impact", F1 was renamed as F1benefits and risk reduction. Other items in this factor represent the risks of not wearing helmets and opinions in support of mandatory helmet use (e.g., "helmets should be compulsory for children"). In other words, F1 brings together items that imply a positive evaluation of using helmets for biking considering the risks of not wearing helmets, and the improved safety as a benefit of wearing helmets.
The second factor, F2, accounts for 15% of the total variance and consists of five items. All the five items in F2 represent a negative evaluation of wearing helmets. Items such as "helmets are ugly", "helmets are hard to carry", and other items imply the idea that wearing helmets limits head movement, and helmets are ugly and not easy to carry around. Therefore, this factor was renamed as F2barriers. With similar analysis, factor three contributes 13% to the total variance and includes items that represent the perceptions and expectations of others (such as friends) concerning helmetuse for an individual, and therefore, was renamed as F3others’expectation/norms. The last factor in this model is F4, and includes items that mention wearing helmet depends on a specific situation such as being on road, or near cars, or going on a long ride. Using the items in F4, it was renamed as F4situational. This factor explains 7% of the total variance in the model.
The four factors extracted from this section through EFA analysis were each used as input/independent variables for the next section of the study to develop a multiple logistic regression model.
M I N E T A T R A N S P O R T A T I O N I N S T I T U T E 26

Table 5: Summary of Results from the EFA - (Factor Loadings >0.40 are in bold)
Item F1 F2 F3 F4
Reduce head injuries 0.77 -0.12 0.20 0.11
Reduce cyclists’ deaths 0.76 -0.15 0.21 0.14
No helmet = risk 0.75 -0.22 0.25 0.06
Beginners need helmets 0.70 -0.25 0.25 0.08
Previous crashes -> wearing important 0.70 -0.29 0.35 0.03
Help in car-bike impact 0.67 -0.07 0.20 0.14
Should be compulsory for adults 0.63 -0.25 0.12 -0.07
Should be compulsory—children 0.59 -0.20 0.09 0.01
Helmets are ugly -0.20 0.78 -0.21 0.05
Hot and uncomfortable -0.12 0.70 -0.17 0.01
Helmets disturb hair -0.13 0.68 -0.11 0.10
Limit head movements -0.30 0.62 -0.22 0.03
Inconvenient to carry -0.33 0.61 -0.12 0.11
Cycling not risky enough -0.67 0.38 -0.26 0.00
Experts don’t need helmet -0.37 0.32 -0.31 0.06
Helmets won’t reduce head injuries -0.61 0.12 -0.23 -0.07
Friends wear helmets 0.31 -0.29 0.81 -0.02
Most people wear helmets 0.31 -0.23 0.80 0.01
Friends expect me to wear a helmet 0.41 -0.17 0.68 0.01
Used to wearing helmet 0.38 -0.39 0.53 0.08
Always worn helmet 0.37 -0.35 0.37 -0.02
Wear if bad roads -0.07 0.05 -0.02 0.81
Wear if near cars 0.20 0.07 0.03 0.71
Helmets are more important for longer rides 0.09 0.06 0.01 0.54
M I N E T A T R A N S P O R T A T I O N I N S T I T U T E 27
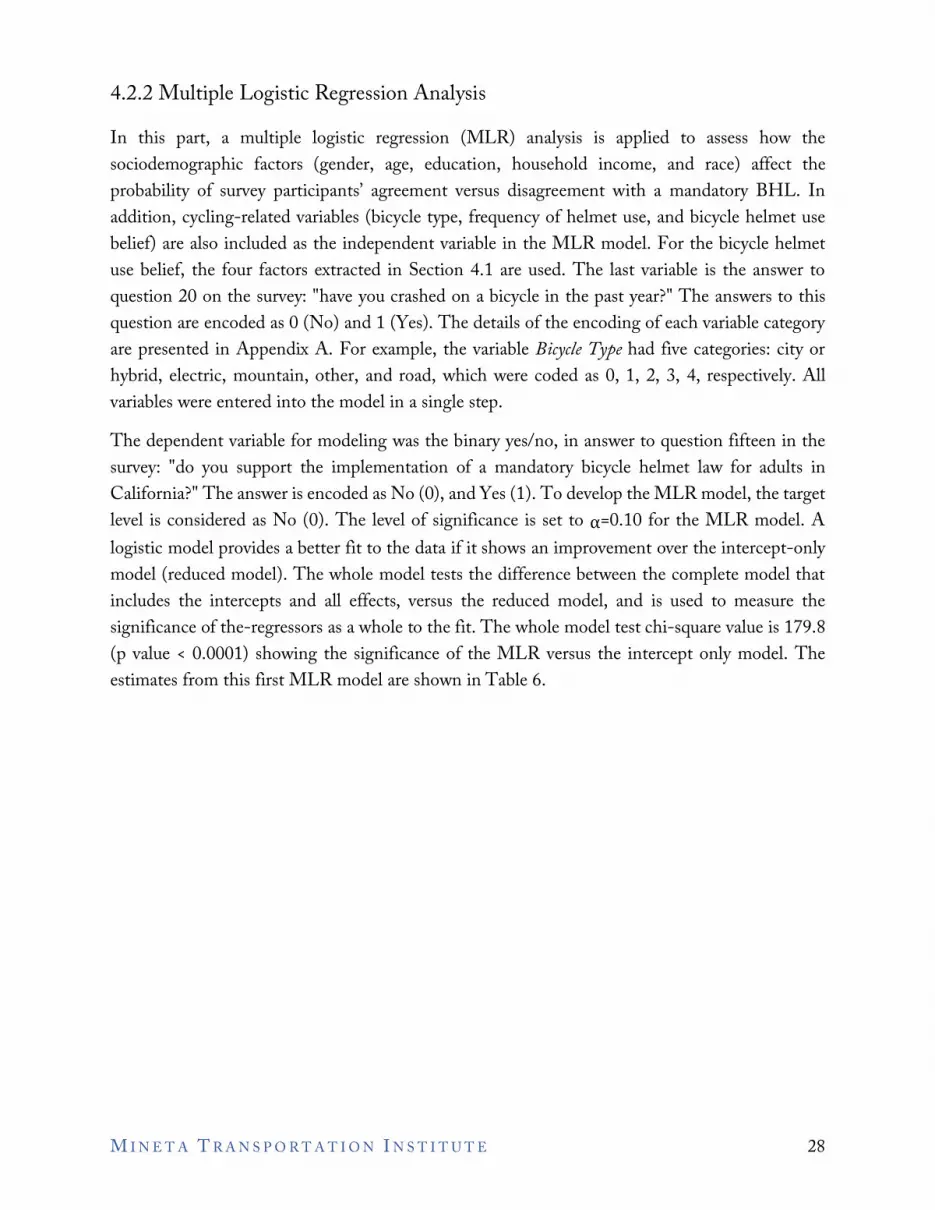
4.2.2 Multiple Logistic Regression Analysis
In this part, a multiple logistic regression (MLR) analysis is applied to assess how the sociodemographic factors (gender, age, education, household income, and race) affect the probability of survey participants’ agreement versus disagreement with a mandatory BHL. In addition, cycling-related variables (bicycle type, frequency of helmet use, and bicycle helmet use belief) are also included as the independent variable in the MLR model. For the bicycle helmet use belief, the four factors extracted in Section 4.1 are used. The last variable is the answer to question 20 on the survey: "have you crashed on a bicycle in the past year?" The answers to this question are encoded as 0 (No) and 1 (Yes). The details of the encoding of each variable category are presented in Appendix A. For example, the variable Bicycle Type had five categories: city or hybrid, electric, mountain, other, and road, which were coded as 0, 1, 2, 3, 4, respectively. All variables were entered into the model in a single step.
The dependent variable for modeling was the binary yes/no, in answer to question fifteen in the survey: "do you support the implementation of a mandatory bicycle helmet law for adults in California?" The answer is encoded as No (0), and Yes (1). To develop the MLR model, the target level is considered as No (0). The level of significance is set to α=0.10 for the MLR model. A logistic model provides a better fit to the data if it shows an improvement over the intercept-only model (reduced model). The whole model tests the difference between the complete model that includes the intercepts and all effects, versus the reduced model, and is used to measure the significance of the-regressors as a whole to the fit. The whole model test chi-square value is 179.8 (p value < 0.0001) showing the significance of the MLR versus the intercept only model. The estimates from this first MLR model are shown in Table 6.
M I N E T A T R A N S P O R T A T I O N I N S T I T U T E 28

Table 6: Estimates from the First Multiple Logistic Regression Model
Variable No. of Parameters DF Wald Chi-Square p-Value
Age 1 1 0.00 1.00
Gender 2 2 3.57 0.17
Education 5 5 22.51 0.0004*
Household Income 9 9 8.79 0.46
Race 7 7 23.54 0.0014*
F1benefits and risk reduction 1 1 1.16 0.28
F2barriers 1 1 0.38 0.54
F3others’expectations/norms 1 1 0.00 0.96
F4situational 1 1 0.00 1.00
Frequency of Helmet Use 1 1 6.06 0.0138*
Bicycle Type 4 4 9.59 0.0480*
Frequency of Bicycle Use 1 1 28.04 < 0.0001*
Crash History 1 1 0.47 0.49
*Statistically significant at α=0.10.
However, to achieve the best model that is descriptive of patterns behind saying "No" to a mandatory BHL, a second MLR was developed, dropping those variables from Table 6 that had a very low Wald Chi-square and very high relevant p values (which indicates they are not statistically significant).
The whole model test Chi-square value of 180 (p value < 0.001) shows that the second MLR is a statistically significant model compared to the previous model, in predicting and describing the factors that affect the perceptions of the adults’ cyclist toward a mandatory BHL in California. The results from the second MLR model are shown in Table 7. According to the second MLR model, gender, education, and race are the most significant sociodemographic factors that are associated with disagreement with a mandatory BHL in California. In addition, all cycling-related behaviors are also significant in such a perception, and when considering the helmet use belief, only F1 was statistically significant.
M I N E T A T R A N S P O R T A T I O N I N S T I T U T E 29

Table 7: Estimates from the Second Multiple Logistic Regression Model
Variable No. of Parameters DF Wald Chi-Square p value
Gender 2 2 6.94 0.0312*
Education 5 5 20.37 0.0011*
Race 8 8 9.66 0.0046*
F1benefits and risk reduction 1 1 3.91 0.0481*
Frequency of Helmet Use 1 1 7.84 0.0051*
Bicycle Type 4 4 7.56 0.0938*
Frequency of Bicycle Use 1 1 23.45 <.0001*
*Statistically significant at α=0.10.
To evaluate the extent of the effect of each subcategory of the main variables on increasing or decreasing the probability of disagreement with a mandatory BHL (the target level is "No" representing the disagreement), the β coefficients were calculated. In order to interpret the effect, the odds ratio values were calculated by transforming the coefficients using the exponential function. The values are shown in Table 8.
Considering the Exp (β), an odds ratio equal to 1 shows no effect; an odds ratio greater than 1 shows the variable in question increases the odds of the outcome target level; and an odds ratio lessthan 1 indicates the variable in question decreases the odds of the outcome target level. From the odds ratio evaluation, the probability of opposition to mandatory BHL is higher in male respondents compared to female; respondents with a graduate degree or equivalent; respondents using city or hybrid bicycle types; and those who uses helmets more frequently.
Considering the race variable, even though it is statistically significant predictor of the perception of the adult cyclists toward a mandatory BHL, no details on the specific race could be provided due to the many levels of the race variable considered in the survey.
M I N E T A T R A N S P O R T A T I O N I N S T I T U T E 30

Table 8: Detailed Estimate from the Second MLR Model
Variable[sub-category] β Exp(β)
Intercept -2.58 0.08
Gender[female] -0.60 0.55
Gender[male] 0.22 1.25
*Gender[prefer not to say] Education[2-year college degree or equivalent] -0.76 0.47
Education[4-year college degree or equivalent] 1.36 3.88
Education[Did not complete high school] -1.39 0.25
Education[Graduate degree or equivalent] 0.59 1.80
*Education[Post-graduate degree or equivalent] Education[High school diploma or equivalent] 0.07 1.07
F1benefits and risk reduction -0.31 0.73
Frequency of helmet use 1.76 5.80
Bicycle type[city or hybrid] 0.76 2.14
Bicycle type[electric] -0.42 0.65
Bicycle type[mountain] -0.73 0.48
Bicycle type[other] 0.39 1.47
*Bicycle type[road] Frequency of bicycle use -5.53 0.00
*Represents the base level in each variable used in the modeling. Therefore, there is no value for β and Exp(β) associated with the base levels.
4.3 Tier Three Data Analysis
4.3.1 Latent Class Analysis
The results of the latent class analysis are presented and discussed here. After removing those variables that were not statistically significant in identifying patterns in latent clusters, a final latentclass model was built using the categorical variables: gender; education; marital status; and supportfor mandatory BHL (yes/no). The analysis showed that a two-cluster model (with the smallest BIC value as in Table 9) best identifies the pattern among the respondents considering their opposition to or support for mandatory BHL.
M I N E T A T R A N S P O R T A T I O N I N S T I T U T E 31
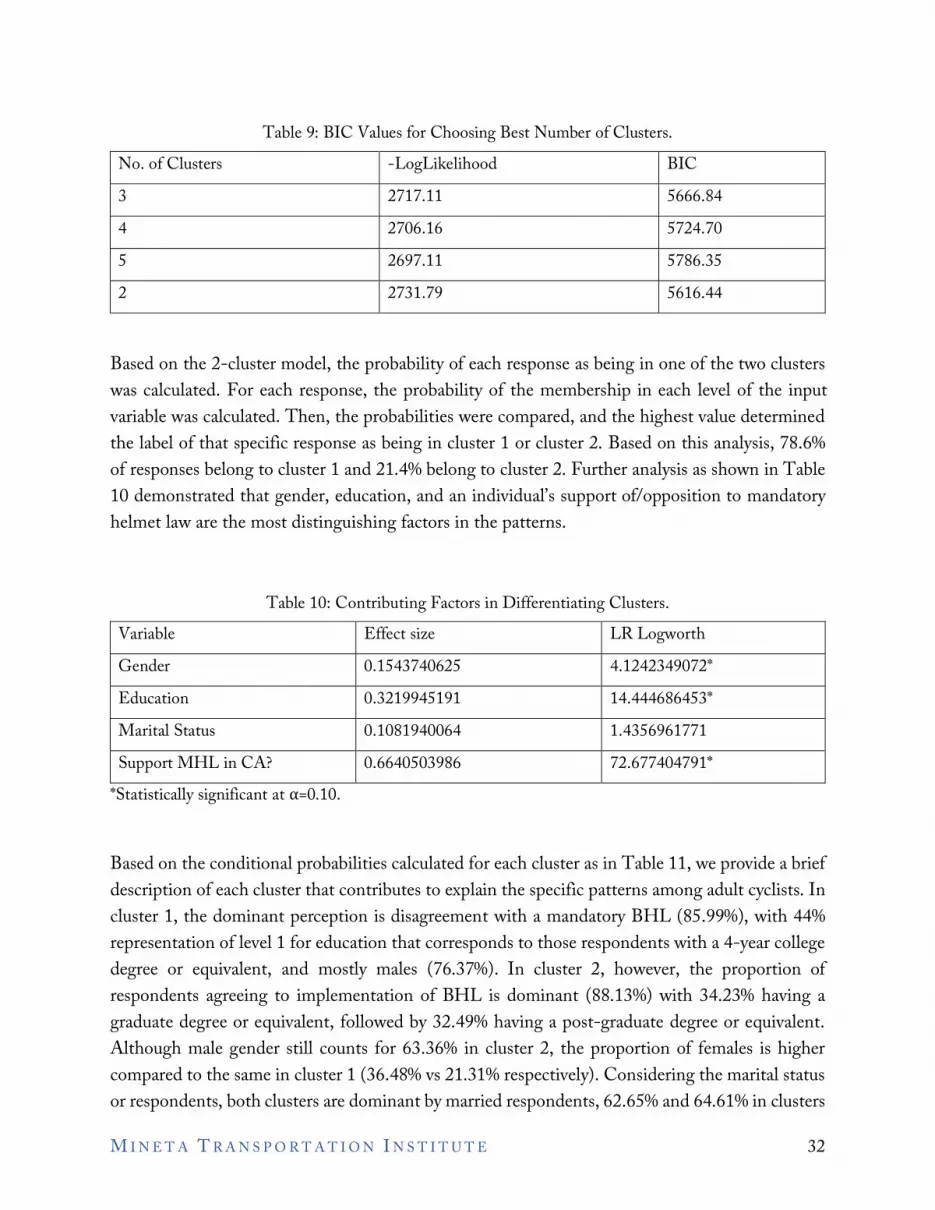
Table 9: BIC Values for Choosing Best Number of Clusters.
No. of Clusters -LogLikelihood BIC
3 2717.11 5666.84
4 2706.16 5724.70
5 2697.11 5786.35
2 2731.79 5616.44
Based on the 2-cluster model, the probability of each response as being in one of the two clusters was calculated. For each response, the probability of the membership in each level of the input variable was calculated. Then, the probabilities were compared, and the highest value determined the label of that specific response as being in cluster 1 or cluster 2. Based on this analysis, 78.6% of responses belong to cluster 1 and 21.4% belong to cluster 2. Further analysis as shown in Table 10 demonstrated that gender, education, and an individual’s support of/opposition to mandatory helmet law are the most distinguishing factors in the patterns.
Table 10: Contributing Factors in Differentiating Clusters.
Variable Effect size LR Logworth
Gender 0.1543740625 4.1242349072*
Education 0.3219945191 14.444686453*
Marital Status 0.1081940064 1.4356961771
Support MHL in CA? 0.6640503986 72.677404791*
*Statistically significant at α=0.10.
Based on the conditional probabilities calculated for each cluster as in Table 11, we provide a briefdescription of each cluster that contributes to explain the specific patterns among adult cyclists. In cluster 1, the dominant perception is disagreement with a mandatory BHL (85.99%), with 44% representation of level 1 for education that corresponds to those respondents with a 4-year collegedegree or equivalent, and mostly males (76.37%). In cluster 2, however, the proportion of respondents agreeing to implementation of BHL is dominant (88.13%) with 34.23% having a graduate degree or equivalent, followed by 32.49% having a post-graduate degree or equivalent. Although male gender still counts for 63.36% in cluster 2, the proportion of females is higher compared to the same in cluster 1 (36.48% vs 21.31% respectively). Considering the marital statusor respondents, both clusters are dominant by married respondents, 62.65% and 64.61% in clusters
M I N E T A T R A N S P O R T A T I O N I N S T I T U T E 32

1 and 2 respectively. Items in bold show the are member of either cluster 1 or 2. For instance, for Gender (0), the probability of belonging to Cluster 2 is 0.3648, compared to 0.2131 in cluster 1. Therefore, cluster two is represented by Gender (0).
M I N E T A T R A N S P O R T A T I O N I N S T I T U T E 33

Table 11: Conditional Probability of Input Variables in Each Sub-class.
Variable Level Cluster 1 Cluster 2
Gender 0 0.2131 0.3648
Gender 1 0.7637 0.6336
Gender 2 0.0232 0.0017
Education 0 0.0671 0.1121
Education 1 0.4486 0.1598
Education 2 0.0018 0.0186
Education 3 0.3246 0.3423
Education 4 0.0531 0.0422
Education 5 0.1048 0.3249
Marital status 0 0.03 0.0672
Marital status 1 0.6265 0.6461
Marital status 2 0.0525 0.0754
Marital status 3 0.2911 0.2113
Support MHL in CA? 0 0.8599 0.1187
Support MHL in CA? 1 0.1401 0.8813
4.3.2 Decision Tree Classifier
The purpose of this section is to understand the effect of mandatory BHL on the biking attitude of the adult cyclists who completed this survey.
We developed a decision tree classifier with three classification levels, encoded as 0, 1, and 2. In the developed BF, the data in the train set included 577 responses and the test set consisted of 189 responses. The assignation of each response to either train or test set is done via stratified random sampling to reduce modeling bias. The values for the confusion matrices are extracted and used tocalculate the model classification accuracy and to build the Receiver Operating Characteristic (ROC) curve. The area under this curve known as AUC values are then used to explain the machine learning model’s predictive power in classifying and predicting a response level. AUC values are between 0 and 1, and closer to 1 means higher predictive power and a more accurate model.
M I N E T A T R A N S P O R T A T I O N I N S T I T U T E 34

-~-~ .2. ·;;;; ·i £ C ., ., V> :,
i!:
1.00
0.90
0.80
0.70
0.60
0.50
0.40
0.30
0.20
0.10
0.00-.;:...~~~~~~~~~~~~~~-,--,l 0.00 0.10 0.20 0.30 0.40 0.50 0.60 0. 70 0.80 0.90 1.00
1-Specificity False Positive
MHLaffects for you
0
2
Area
0.8901 0.8977 0.8574
The BF model overall accuracy on the train and test data is 81% and 82% respectively. In other words, using the input factors in the BF model, 82% of the variation in cycling rate could be attributed and explained by the variables used to build the model.
The ROC curves and the AUC values for both the train and test datasets are given in Figure 6 and Figure 7. The results of the train data show that the BF model has considerable performance in estimating whether one’s cycling rate would decrease (level 1), increase (level 2) or remain the same based on the variables used in building the BF model. Although the results on test data are promising for predicting whether the rate of one’s cycling remains the same or decreases, the model cannot generalize when predicting an increase in cycling rate. The main issue is that for building and developing a machine learning model, many data points (in this case, survey responses) are required. The lack of enough responses, as well as not enough representation of level 2 response are the reasons behind the models low performance on predicting level 2 for cycling rate change.
Figure 5: ROC Curve and AUC Values for Training Data
M I N E T A T R A N S P O R T A T I O N I N S T I T U T E 35

-~-~ .2. ·;;;; ·i £ C ., ., V> :,
i!:
1.00
0.90
0.80
0.70
0.60
0.50
0.40
0.30
0.20
0.10
0.00---...~~~~~~~~~~~~~~~~.,,_...,, 0.00 0.10 0.20 0.30 0.40 0.50 0.60 0. 70 0.80 0.90 1.00
1-Specificity False Positive
MHLaffects for you
0
2
Area
0.8524 0.8528
Figure 6: ROC Curve and AUC Values for Test Data
4.3.3 Sensitivity Analysis
Sensitivity analysis was conducted as part of the machine learning modeling to identify the contribution of the BF input variables in estimating the change in cycling rate. The amount each variable contributed is depicted in Figure 9. The results show that frequency of helmet use and the membership in either cluster 1 or 2 (which is a composition based on gender, education, marital status, and more importantly perception toward mandatory BHL) are the most significant predictors that affect the cycling rate of an individual. The factors related to belief about helmet use, including the benefits and risk perception, barriers to wearing helmet, expectation or group norms, and situational use of helmet are in the next ranks, with household income as the least contributing factor.
M I N E T A T R A N S P O R T A T I O N I N S T I T U T E 36

l 45.00% 5 40.00% ·;; ..5 35.00% ·5 30.00% 5 25.00% u
0 20.00% ~ 15.00% !!! 10.00% C: ~ 5.00% ~ 0.00%
0..
Contribution to change in cycling rate
I I I ■ ■
Input Factors from Survey Responses
Figure 7: Sensitivity Analysis Based on Bootstrap Forest Model
M I N E T A T R A N S P O R T A T I O N I N S T I T U T E 37

5. Summary of Findings & Conclusions The data and analysis for this study was collected and analyzed over a one-year period. The COVID-19 situation affected the type of data collected as well as the number of expected responses, yet more than eight hundred valid responses were gathered through the survey questioner. The following highlights the major findings of the study:
The majority of respondents do not support implementation of a mandatory bicycle helmet law inCalifornia.
• The cyclists with the highest frequency of bicycle use (nearly daily or 1–4 times per week) constitute the highest proportion of opposers to mandatory bicycle helmet law.
• Perceptions of helmet use benefits, cycling risks, and group norms implying the use of helmets are among encouraging factors for using helmet while cycling.
• Aesthetic and comfort of helmets, as well as riding situations, are among the barriers to wearing helmets among cyclists.
• Cyclists’ gender, education level, perception of helmet use benefits and cycling risks, frequency of helmet use, type of bicycle, and frequency of bicycle use, regardless of the purpose of riding either for work/commute or recreation, affected the perception of cyclists for implementation of mandatory helmet law in California.
• The most distinguishing factors separating the survey respondents into two profiles were their education level, marital status and positive/negative perception of mandatory helmet law.
• Frequency of helmet use, education level, gender, marital status, as well as beliefs abouthelmet use and age are the most significant predictors of a change in cycling rate should a bicycle helmet law be implemented.
The results of the study suggest that the majority of the survey respondents, representing the adultpopulation of California, do not support a mandatory helmet law for all ages, and that a BHL willreduce the number of cyclists and the frequency of cycling. These results are in line with previous studies described in Chapter II.
At the same time, the majority of the existing literature suggest that helmet usage is an important factor in preventing severe injuries and fatalities in crashes involving cyclists. Existing helmet laws,such as children helmet laws mandated by many states in the U.S., California included, have beenassociated to a substantial increase in helmet usage among cyclists that belong to the population affected by the law. However, this study suggests that a BHL for adults might result in a substantial decrease in cyclists, which in turn can negatively affect the health of the population and have a
M I N E T A T R A N S P O R T A T I O N I N S T I T U T E 38

negative environmental effect. In addition, BHL will result in increased costs for cyclists as well as require enforcement by the police, increasing inequality and access to transportation across the state of California.
The last question in the survey asked in fact the respondents for open-ended comments, which show that, even if a large number of respondents are supportive of helmet usage, they also opposeits mandate. The main objections against a BHL are:
• Favoring inequality: a BHL will affect financially disadvantaged people and minority groups the most; minorities might also be targeted by law enforcement
• Violates people’s right and freedom of choice: adults should be free of making their own choices.
• Enforcement: a BHL will require additional police resources, and will burden police officers.
• Discourage ridership: a decrease in ridership with an increase in single vehicle occupancy riders will create public health issues and will negatively affect the environment. Bike share program will be particularly Impacted because of the need to carry a personal helmet or the necessity of a helmet shared program, which may create personal and public health concerns.
In alternative to BHL, studies conducted in France and British Columbia suggest that helmet usage campaigns can be effective tools to increase helmet usage. Based on the findings of this study, public service campaigns might be a better tool to increase helmet usage instead of a helmetmandate. The helmet usage campaigns will need to engage the population in conversations and education about helmet usage in order to increase awareness, emphasize consequences and promote correct fitting. Based on the factors identified as most important in determining the belief regarding the BHL (tier-two analysis), the public service campaigns should address the benefits and risk reduction implied by wearing a helmet, in order to increase social awareness of the improved safety of wearing helmets. In addition, the public service campaigns should address the factors considered as barriers (aesthetic belief, inconvenience and discomfort) as well as social perception and norms of wearing a helmet.
Helmet campaigns will need to include educational and marketing materials, funding for local agencies as well as economic incentives to purchase bicycle helmets, helmet giveaways, distributionof free helmet upon bicycle purchase, free helmet programs for the low-income population, etc.
The safety of the biking community will also be improved by investments in public infrastructures,such as safer road designs and separated bike paths from other vehicles, as well as in car-driver education on how to safely operate around cyclists and in promoting less distracted car-driving.
M I N E T A T R A N S P O R T A T I O N I N S T I T U T E 39

In addition to public service campaigns and economic investments to promote helmet usage and cyclist safety, it is important for public officials to engage in repeated data collections and analysis to monitor the effect of their efforts, by tracking the use of helmets among cyclists, the incidence of crash injuries and fatalities as well as the perception of the population about helmet.
M I N E T A T R A N S P O R T A T I O N I N S T I T U T E 40

Appendix A The following encoding was done for cleaning data and preparing data for analysis.
EncodingsQ2. What county do you reside in? – County Alameda • 0 Array • 1 California • 2 Contra Costa • 3 Culver City • 4 El Dorado • 5 Fresno • 6 Humboldt • 7 Imperial • 8 Kern • 9 Lake • 10 Los Angeles • 11 Marin • 12 Merced • 13 Mountain View • 14 Napa • 15 Nevada • 16 Orange • 17 Placer • 18 Riverside • 19 S.F. & Amador • 20 Sacramento • 21 San Bernardino • 22 San Diego • 23 San Francisco • 24 San Joaquin • 25 San Jose • 26 San Luis Obispo • 27 San Mateo • 28 Santa Barbara • 29 Santa Clara • 30 Santa Cruz • 31 Santa Cruz • 32 Shasta • 33 Solano • 34 Sonoma • 35 Stanislaus • 36 Tulare • 37 USA • 38 Ventura • 39
M I N E T A T R A N S P O R T A T I O N I N S T I T U T E 41

Yolo • 40 country costa • 41
Q3. What is your age? – Age No encodings
Q4. What is your marital status? - Marital Status Divorced • 0 Married • 1 Other • 2 Single • 3
Q5. What is your sex? – Sex Female • 0 Male • 1 Prefer not to say • 2
Q6. Do you have children aged 0-18? – Children No encodingsQ7. What is the highest degree or level of school you have completed? – Education 2-year college degree or equivalent • 0 4-year college degree or equivalent • 1 Did not complete high school • 2 Graduate degree or equivalent • 3 High school diploma or equivalent • 4 Post-graduate degree or equivalent • 5
Q8. What is your occupation? – Occupation No encodings
Q9. What is your household income? - Household Income ‘Less than $10,000’• 1,‘$10,000-$14,999’• 2,‘$15,000-$24,999’• 3,‘$25,000-$34,999’• 4,‘$35,000-$49,999’• 5,‘$50,000-$74,999’• 6,‘$75,000-$99,999’• 7,‘$100,000-$149,999’• 8,‘$150,000-$199,999’• 9,‘$200,000 or more’• 10
Q10. Are you of Hispanic, Latino, or Spanish origin? Q11. What is your race? (Select all that apply) – Race
Q13_1. I am likely to have a bicycle crash in the next two years in which my head would hit something - Head injury next two years
M I N E T A T R A N S P O R T A T I O N I N S T I T U T E 42

‘Strongly disagree’• 1,‘Strongly disgaree’• 1,‘Disagree’• 2,‘Somewhat disagree’• 3,‘Neither agree nor disagree’• 4,‘Somewhat agree’• 5,‘Agree’• 6,‘Strongly agree’• 7,‘Strongly Agree’• 7
Q13_2. Helmets are effective at reducing the severity of head injury in car-bicycle crashes - Help in car-bike impact ‘Strongly disagree’• 1,‘Strongly disgaree’• 1,‘Disagree’• 2,‘Somewhat disagree’• 3,‘Neither agree nor disagree’• 4,‘Somewhat agree’• 5,‘Agree’• 6,‘Strongly agree’• 7,‘Strongly Agree’• 7
Q13_3. My friends expect me to wear a helmet - Friends expect me to wear a helmet ‘Strongly disagree’• 1,‘Strongly disgaree’• 1,‘Disagree’• 2,‘Somewhat disagree’• 3,‘Neither agree nor disagree’• 4,‘Somewhat agree’• 5,‘Agree’• 6,‘Strongly agree’• 7,‘Strongly Agree’• 7
Q13_4. Most other people I know wear helmets - Most people wear helmets ‘Strongly disagree’• 1,‘Strongly disgaree’• 1,‘Disagree’• 2,‘Somewhat disagree’• 3,‘Neither agree nor disagree’• 4,‘Somewhat agree’• 5,‘Agree’• 6,‘Strongly agree’• 7,‘Strongly Agree’• 7
Q13_5. Helmets are not particularly effective at reducing the severity of head injuries - Helmets wont reduce head injuries ‘Strongly disagree’• 1,
M I N E T A T R A N S P O R T A T I O N I N S T I T U T E 43

‘Strongly disgaree’• 1,‘Disagree’• 2,‘Somewhat disagree’• 3,‘Neither agree nor disagree’• 4,‘Somewhat agree’• 5,‘Agree’• 6,‘Strongly agree’• 7,‘Strongly Agree’• 7
Q13_6. Helmets are hot and uncomfortable - Hot and uncomfortable ‘Strongly disagree’• 1,‘Strongly disgaree’• 1,‘Disagree’• 2,‘Somewhat disagree’• 3,‘Neither agree nor disagree’• 4,‘Somewhat agree’• 5,‘Agree’• 6,‘Strongly agree’• 7,‘Strongly Agree’• 7
Q13_7. Helmets don’t suit my style (or are ugly) - Helmets are ugly ‘Strongly disagree’• 1,‘Strongly disgaree’• 1,‘Disagree’• 2,‘Somewhat disagree’• 3,‘Neither agree nor disagree’• 4,‘Somewhat agree’• 5,‘Agree’• 6,‘Strongly agree’• 7,‘Strongly Agree’• 7
Q13_8. Helmets are a problem because they disturb your hair - Helmets disturb hair ‘Strongly disagree’• 1,‘Strongly disgaree’• 1,‘Disagree’• 2,‘Somewhat disagree’• 3,‘Neither agree nor disagree’• 4,‘Somewhat agree’• 5,‘Agree’• 6,‘Strongly agree’• 7,‘Strongly Agree’• 7
Q13_9. It is inconvenient to carry a helmet around - Inconvenient to carry ‘Strongly disagree’• 1,‘Strongly disgaree’• 1,‘Disagree’• 2,‘Somewhat disagree’• 3,
M I N E T A T R A N S P O R T A T I O N I N S T I T U T E 44

‘Neither agree nor disagree’• 4,‘Somewhat agree’• 5,‘Agree’• 6,‘Strongly agree’• 7,‘Strongly Agree’• 7
Q13_10. I do not think cycling is risky enough for helmets - Cycling not risky enough ‘Strongly disagree’• 1,‘Strongly disgaree’• 1,‘Disagree’• 2,‘Somewhat disagree’• 3,‘Neither agree nor disagree’• 4,‘Somewhat agree’• 5,‘Agree’• 6,‘Strongly agree’• 7,‘Strongly Agree’• 7
Q13_11. I have always worn a helmet - Always worn helmet ‘Strongly disagree’• 1,‘Strongly disgaree’• 1,‘Disagree’• 2,‘Somewhat disagree’• 3,‘Neither agree nor disagree’• 4,‘Somewhat agree’• 5,‘Agree’• 6,‘Strongly agree’• 7,‘Strongly Agree’• 7
Q13_12. Helmets should be compulsory for adults - Should be compulsory for adults ‘Strongly disagree’• 1,‘Strongly disgaree’• 1,‘Disagree’• 2,‘Somewhat disagree’• 3,‘Neither agree nor disagree’• 4,‘Somewhat agree’• 5,‘Agree’• 6,‘Strongly agree’• 7,‘Strongly Agree’• 7
Q13_13. Helmets should be compulsory for children - Should be compulsory – children ‘Strongly disagree’• 1,‘Strongly disgaree’• 1,‘Disagree’• 2,‘Somewhat disagree’• 3,‘Neither agree nor disagree’• 4,‘Somewhat agree’• 5,‘Agree’• 6,
M I N E T A T R A N S P O R T A T I O N I N S T I T U T E 45

‘Strongly agree’• 7,‘Strongly Agree’• 7
Q13_14. Helmets reduce serious head injuries - Reduce head injuries ‘Strongly disagree’• 1,‘Strongly disgaree’• 1,‘Disagree’• 2,‘Somewhat disagree’• 3,‘Neither agree nor disagree’• 4,‘Somewhat agree’• 5,‘Agree’• 6,‘Strongly agree’• 7,‘Strongly Agree’• 7
Q13_15. Helmets are more important for longer rides - Helmets are more important for longer rides
‘Strongly agree’• 7,‘Strongly Agree’• 7
‘Strongly disagree’• 1, ‘Strongly disgaree’• 1,‘Disagree’• 2,‘Somewhat disagree’• 3,‘Neither agree nor disagree’• 4,‘Somewhat agree’• 5,‘Agree’• 6,
Q13_16. Bicycle helmets are expensive - Helmets are expensive ‘Strongly disagree’• 1,‘Strongly disgaree’• 1,‘Disagree’• 2,‘Somewhat disagree’• 3,‘Neither agree nor disagree’• 4,‘Somewhat agree’• 5,‘Agree’• 6,‘Strongly agree’• 7,‘Strongly Agree’• 7
Q13_17. Helmets reduce cyclists deaths - Reduce cyclists deaths ‘Strongly disagree’• 1,‘Strongly disgaree’• 1,‘Disagree’• 2,‘Somewhat disagree’• 3,‘Neither agree nor disagree’• 4,‘Somewhat agree’• 5,‘Agree’• 6,‘Strongly agree’• 7,‘Strongly Agree’• 7
M I N E T A T R A N S P O R T A T I O N I N S T I T U T E 46

Q13_18. I am used to wearing a bicycle helmet - Used to wearing helmet ‘Strongly disagree’• 1,‘Strongly disgaree’• 1,‘Disagree’• 2,‘Somewhat disagree’• 3,‘Neither agree nor disagree’• 4,‘Somewhat agree’• 5,‘Agree’• 6,‘Strongly agree’• 7,‘Strongly Agree’• 7
Q13_19. My friends wear helmets - Friends wear helmets ‘Strongly disagree’• 1,‘Strongly disgaree’• 1,‘Disagree’• 2,‘Somewhat disagree’• 3,‘Neither agree nor disagree’• 4,‘Somewhat agree’• 5,‘Agree’• 6,‘Strongly agree’• 7,‘Strongly Agree’• 7
Q13_20. Beginner riders need to wear helmets - Beginners need helmets ‘Strongly disagree’• 1,‘Strongly disgaree’• 1,‘Disagree’• 2,‘Somewhat disagree’• 3,‘Neither agree nor disagree’• 4,‘Somewhat agree’• 5,‘Agree’• 6,‘Strongly agree’• 7,‘Strongly Agree’• 7
Q13_21. After being involved/seeing previous crashes, I think wearing a helmet is important -Previous crashes -> wearing important ‘Strongly disagree’• 1,‘Strongly disgaree’• 1,‘Disagree’• 2,‘Somewhat disagree’• 3,‘Neither agree nor disagree’• 4,‘Somewhat agree’• 5,‘Agree’• 6,‘Strongly agree’• 7,‘Strongly Agree’• 7
Q13_22. People who do not wear helmets are taking risks - No helmet = risk
M I N E T A T R A N S P O R T A T I O N I N S T I T U T E 47

‘Strongly disagree’• 1,‘Strongly disgaree’• 1,‘Disagree’• 2,‘Somewhat disagree’• 3,‘Neither agree nor disagree’• 4,‘Somewhat agree’• 5,‘Agree’• 6,‘Strongly agree’• 7,‘Strongly Agree’• 7
Q13_23. Skilled riders do not wear a helmet - Experts dont need helmet ‘Strongly disagree’• 1,‘Strongly disgaree’• 1,‘Disagree’• 2,‘Somewhat disagree’• 3,‘Neither agree nor disagree’• 4,‘Somewhat agree’• 5,‘Agree’• 6,‘Strongly agree’• 7,‘Strongly Agree’• 7
Q13_24. Wearing a helmet is more important if the road/track conditions are bad - Wear if bad roads
‘Strongly agree’• 7,‘Strongly Agree’• 7
‘Strongly disagree’• 1,‘Strongly disgaree’• 1,‘Disagree’• 2,‘Somewhat disagree’• 3,‘Neither agree nor disagree’• 4,‘Somewhat agree’• 5,‘Agree’• 6,
Q13_25. Wearing helmets is more important if you are riding with motor vehicles - Wear if near cars ‘Strongly disagree’• 1,‘Strongly disgaree’• 1,‘Disagree’• 2,‘Somewhat disagree’• 3,‘Neither agree nor disagree’• 4,‘Somewhat agree’• 5,‘Agree’• 6,‘Strongly agree’• 7,‘Strongly Agree’• 7
Q13_26. Helmets get in the way of comfortable head movements - Limit head movements ‘Strongly disagree’• 1,
M I N E T A T R A N S P O R T A T I O N I N S T I T U T E 48

‘Strongly disgaree’• 1,‘Disagree’• 2,‘Somewhat disagree’• 3,‘Neither agree nor disagree’• 4,‘Somewhat agree’• 5,‘Agree’• 6,‘Strongly agree’• 7,‘Strongly Agree’• 7
Q14. How would a mandatory helmet law affect your cycling? - MHL affects for you My cycling frequency would be the same • 0 My cycling frequency would decrease • 1 My cycling frequency would increase • 2 Q15. Do you support the implementation of a mandatory bicycle helmet law for adults in California? - Support adult MHL CA
Yes • 1 No • 0
Q16. Do you own a bicycle helmet? - Own helmet No • 0 Yes • 1
Q17_1. Travelling to work or study - Proportion work/study ‘Never’• 1,‘Almost never’• 2,‘Sometimes’• 3,‘Almost always’• 4,‘Always’• 5
Q17_2. As part of work (e.g. delivery person) - Proportion work (delivery) ‘Never’• 1,‘Almost never’• 2,‘Sometimes’• 3,‘Almost always’• 4,‘Always’• 5
Q17_3. For shopping and errands - Proportion shopping/errands ‘Never’• 1,‘Almost never’• 2,‘Sometimes’• 3,‘Almost always’• 4,‘Always’• 5
Q17_4. Travelling to social activities - Proportion social activities ‘Never’• 1,‘Almost never’• 2,‘Sometimes’• 3,
M I N E T A T R A N S P O R T A T I O N I N S T I T U T E 49

‘Almost always’• 4,‘Always’• 5
Q17_5. For leisure/recreation - Proportion leisure/recreation ‘Never’• 1,‘Almost never’• 2,‘Sometimes’• 3,‘Almost always’• 4,‘Always’• 5
Q17_6. For health and fitness (training) - Proportion health/fitness ‘Never’• 1,‘Almost never’• 2,‘Sometimes’• 3,‘Almost always’• 4,‘Always’• 5
Q18_1. On roads without bike lanes - Proportion roads without bike lanes ‘Never’• 1,‘Almost never’• 2,‘Sometimes’• 3,‘Almost always’• 4,‘Always’• 5
Q18_2. On roads with bike lanes - Proportion roads with bike lanes ‘Never’• 1,‘Almost never’• 2,‘Sometimes’• 3,‘Almost always’• 4,‘Always’• 5
Q18_3. On off-road bicycle-only or bicycle-pedestrian paths - Proportion roads with bike lanes ‘Never’• 1,‘Almost never’• 2,‘Sometimes’• 3,‘Almost always’• 4,‘Always’• 5
Q18_4. On remote bike paths - Proportion remote bike paths ‘Never’• 1,‘Almost never’• 2,‘Sometimes’• 3,‘Almost always’• 4,‘Always’• 5
Q19_1. Riding a bicycle is more risky than driving a car - Cycling risk > driving risk
M I N E T A T R A N S P O R T A T I O N I N S T I T U T E 50

‘Strongly disagree’• 1,‘Strongly disgaree’• 1,‘Disagree’• 2,‘Somewhat disagree’• 3,‘Neither agree nor disagree’• 4,‘Somewhat agree’• 5,‘Agree’• 6,‘Strongly agree’• 7,‘Strongly Agree’• 7
Q19_2. Riding a bicycle is more risky than walking - Cycling risk > walking risk ‘Strongly disagree’• 1,‘Strongly disgaree’• 1,‘Disagree’• 2,‘Somewhat disagree’• 3,‘Neither agree nor disagree’• 4,‘Somewhat agree’• 5,‘Agree’• 6,‘Strongly agree’• 7,‘Strongly Agree’• 7
Q19_3. Riding a bicycle will improve my health - Cycling improves health ‘Strongly disagree’• 1,‘Strongly disgaree’• 1,‘Disagree’• 2,‘Somewhat disagree’• 3,‘Neither agree nor disagree’• 4,‘Somewhat agree’• 5,‘Agree’• 6,‘Strongly agree’• 7,‘Strongly Agree’• 7
Q19_4. I have always ridden a bicycle - Always ridden bicycle ‘Strongly disagree’• 1,‘Strongly disgaree’• 1,‘Disagree’• 2,‘Somewhat disagree’• 3,‘Neither agree nor disagree’• 4,‘Somewhat agree’• 5,‘Agree’• 6,‘Strongly agree’• 7,‘Strongly Agree’• 7
Q19_5. I live close to work (or school or other destinations) - Live close to desination ‘Strongly disagree’• 1,‘Strongly disgaree’• 1,‘Disagree’• 2,
M I N E T A T R A N S P O R T A T I O N I N S T I T U T E 51

‘Somewhat disagree’• 3,‘Neither agree nor disagree’• 4,‘Somewhat agree’• 5,‘Agree’• 6,‘Strongly agree’• 7,‘Strongly Agree’• 7
Q19_6. My friends expect me to ride - Friends expect me to ride ‘Strongly disagree’• 1,‘Strongly disgaree’• 1,‘Disagree’• 2,‘Somewhat disagree’• 3,‘Neither agree nor disagree’• 4,‘Somewhat agree’• 5,‘Agree’• 6,‘Strongly agree’• 7,‘Strongly Agree’• 7
Q19_7. Most other people I know ride bikes - Most acquaintances ride bikes ‘Strongly disagree’• 1,‘Strongly disgaree’• 1,‘Disagree’• 2,‘Somewhat disagree’• 3,‘Neither agree nor disagree’• 4,‘Somewhat agree’• 5,‘Agree’• 6,‘Strongly agree’• 7,‘Strongly Agree’• 7
Q19_8. Riding makes you hot and uncomfortable - Cycling = hot/uncomfortable ‘Strongly disagree’• 1,‘Strongly disgaree’• 1,‘Disagree’• 2,‘Somewhat disagree’• 3,‘Neither agree nor disagree’• 4,‘Somewhat agree’• 5,‘Agree’• 6,‘Strongly agree’• 7,‘Strongly Agree’• 7
Q19_9. I don’t ride when the weather is bad - Bad weather, no cycling ‘Strongly disagree’• 1,‘Strongly disgaree’• 1,‘Disagree’• 2,‘Somewhat disagree’• 3,‘Neither agree nor disagree’• 4,‘Somewhat agree’• 5,
M I N E T A T R A N S P O R T A T I O N I N S T I T U T E 52

‘Agree’• 6,‘Strongly agree’• 7,‘Strongly Agree’• 7
Q19_10. Riding a bicycle does not fit well with my image - Cycling doesnot fit image ‘Strongly disagree’• 1,‘Strongly disgaree’• 1,‘Disagree’• 2,‘Somewhat disagree’• 3,‘Neither agree nor disagree’• 4,‘Somewhat agree’• 5,‘Agree’• 6,‘Strongly agree’• 7,‘Strongly Agree’• 7
Q19_11. It is easier to ride than to drive to work - Easier to cycle than drive to work ‘Strongly disagree’• 1,‘Strongly disgaree’• 1,‘Disagree’• 2,‘Somewhat disagree’• 3,‘Neither agree nor disagree’• 4,‘Somewhat agree’• 5,‘Agree’• 6,‘Strongly agree’• 7,‘Strongly Agree’• 7
Q19_12. It is difficult or expensive to park a car at my work - Parking is expensive ‘Strongly disagree’• 1,‘Strongly disgaree’• 1,‘Disagree’• 2,‘Somewhat disagree’• 3,‘Neither agree nor disagree’• 4,‘Somewhat agree’• 5,‘Agree’• 6,‘Strongly agree’• 7,‘Strongly Agree’• 7
Q19_13. Riding a bicycle is a cheap form of transportation for me - Cycling is cheap ‘Strongly disagree’• 1,‘Strongly disgaree’• 1,‘Disagree’• 2,‘Somewhat disagree’• 3,‘Neither agree nor disagree’• 4,‘Somewhat agree’• 5,‘Agree’• 6,‘Strongly agree’• 7,‘Strongly Agree’• 7
M I N E T A T R A N S P O R T A T I O N I N S T I T U T E 53

Q19_14. I am a skilled rider - Skilled rider ‘Strongly disagree’• 1,‘Strongly disgaree’• 1,‘Disagree’• 2,‘Somewhat disagree’• 3,‘Neither agree nor disagree’• 4,‘Somewhat agree’• 5,‘Agree’• 6,‘Strongly agree’• 7,‘Strongly Agree’• 7
Q19_15. I enjoy riding my bike - Enjoy cycling ‘Strongly disagree’• 1,‘Strongly disgaree’• 1,‘Disagree’• 2,‘Somewhat disagree’• 3,‘Neither agree nor disagree’• 4,‘Somewhat agree’• 5,‘Agree’• 6,‘Strongly agree’• 7,‘Strongly Agree’• 7
Q19_16. I am a fast rider - Fast rider ‘Strongly disagree’• 1,‘Strongly disgaree’• 1,‘Disagree’• 2,‘Somewhat disagree’• 3,‘Neither agree nor disagree’• 4,‘Somewhat agree’• 5,‘Agree’• 6,‘Strongly agree’• 7,‘Strongly Agree’• 7
Q19_17. I ride but would prefer to travel by another method - Prefer other transportation ‘Strongly disagree’• 1,‘Strongly disgaree’• 1,‘Disagree’• 2,‘Somewhat disagree’• 3,‘Neither agree nor disagree’• 4,‘Somewhat agree’• 5,‘Agree’• 6,‘Strongly agree’• 7,‘Strongly Agree’• 7
Q19_18. Riding is more convenient than public transportation for me - Convenient than public transportation
M I N E T A T R A N S P O R T A T I O N I N S T I T U T E 54

‘Strongly disagree’• 1,‘Strongly disgaree’• 1,‘Disagree’• 2,‘Somewhat disagree’• 3,‘Neither agree nor disagree’• 4,‘Somewhat agree’• 5,‘Agree’• 6,‘Strongly agree’• 7,‘Strongly Agree’• 7
Q20. Have you crashed on a bicycle in the past year? - Crashed past year? No • 0 Yes • 1
Q20a_1_1. Had cuts or scrapes that did not require medical attention - Accidents- no medical attention No encodings. Modified few values Yes just needed my own ointment and abx • 1 no • 0 many (mountain biking) • 20(replaced with highest value) Yes • 1 1-2 • 2
Q20a_2_1. Were treated by a nurse or doctor without being admitted to hospital - Treated by professional, no hospitalizationNo encodings. Modified few values No • 0 X • 0
Q20a_3_1. Were admitted to hospital - Hospitalized crash No encodings. Modified few values No • 0 1 broke ribs • 1 broken collar bone • 1
Q20b. For the most serious crash, which term below describes it best: - Describe most serious crash Bicycle into fixed object • 0 Bicycle-bicycle crash • 1 Bicycle-motor vehicle crash • 2 Bicycle-pedestrian crash • 3 Fall off bicycle • 4 Other/Unknown • 5
Q20c. Were you wearing a bicycle helmet at the time of the crash? - Wearing helmet during crash No • 0
M I N E T A T R A N S P O R T A T I O N I N S T I T U T E 55

Yes • 1 Q20d. Was the helmet fastened at the time of the crash? - Helmet fastened at crash No • 0 Yes • 1 Q20e. Do you think that wearing a helmet would have reduced the severity of any head injuries in that crash? - Helmet helped with crash No • 0 Yes • 1 Q21. Do you have a driver’s license? - Have license No • 0 Yes • 1 Q21a. How many years have you held a driver’s license? - Years with license No encodingsQ22_1. Car as driver - Travel by car as driver ‘Nearly daily’• 1,‘1-4 times per week’• 2,‘1-3 times per month’• 3,‘Less than once per month’• 4,‘Never’• 5
Q22_2. Car as passenger - Travel by car as passenger ‘Nearly daily’• 1,‘1-4 times per week’• 2,‘1-3 times per month’• 3,‘Less than once per month’• 4,‘Never’• 5
Q22_3. Motorcycle (>50cc) as driver - Travel by Motorcycle as driver ‘Nearly daily’• 1,‘1-4 times per week’• 2,‘1-3 times per month’• 3,‘Less than once per month’• 4,‘Never’• 5
Q22_4. Motorcycle (>50cc) as passenger - Travel by Motorcycle as passenger ‘Nearly daily’• 1,‘1-4 times per week’• 2,‘1-3 times per month’• 3,‘Less than once per month’• 4,‘Never’• 5
Q22_5. Bicycle - Travel by Bicycle ‘Nearly daily’• 1,‘1-4 times per week’• 2,‘1-3 times per month’• 3,‘Less than once per month’• 4,‘Never’• 5
M I N E T A T R A N S P O R T A T I O N I N S T I T U T E 56

Q22_6. Public transport - Travel by Public transport ‘Nearly daily’• 1,‘1-4 times per week’• 2,‘1-3 times per month’• 3,‘Less than once per month’• 4,‘Never’• 5
Q22_7. Moped (<50cc) as driver - Travel by Moped as driver ‘Nearly daily’• 1,‘1-4 times per week’• 2,‘1-3 times per month’• 3,‘Less than once per month’• 4,‘Never’• 5
Q23. Comparing your cycling in the winter and summer, which statement would you say is mostaccurate? - Winter vs Summer riding Almost all of my riding is in summer • 0 Almost none of my riding is in summer • 1 I ride the same amount in summer and winter • 2 Less than half of my riding is in summer • 3 More than half of my riding is in summer • 4
Q24. The access I have to a bicycle is best described by the following statement: - Bicycle accessibilityI do not own a bicycle, and do not have access to one • 0 I do not own a bicycle, but have access to a public bicycle only • 1 I do not own a bicycle, but have access to public and private bicycles• 2 I own a bicycle • 3
Q25. In which of these years did you ride a bicycle regularly? - Years cycling regularly 2016 • 1 2016,2017 • 2 2016,2017,2018 • 3 2016,2017,2018,2019 • 4 2016,2017,2018,2019,2020 • 5 Almost all my life • 6
Q26_1. Traveling to and from work or study - Weekly biking to and from work or study ‘Never’• 1,‘Sometimes, but less than once a week’• 2,‘One day a week’• 3,‘2-3 days a week’• 4,‘4-5 days a week’• 5,‘Almost everyday’• 6,‘Everyday’• 7,
M I N E T A T R A N S P O R T A T I O N I N S T I T U T E 57

Q26_2. As a part of work (e.g. delivery person) - Weekly biking - As a part of work ‘Never’• 1,‘Sometimes, but less than once a week’• 2,‘One day a week’• 3,‘2-3 days a week’• 4,‘4-5 days a week’• 5,‘Almost everyday’• 6,‘Everyday’• 7,
Q26_3. For shopping and errands - Weekly biking for shopping and errands ‘Never’• 1,‘Sometimes, but less than once a week’• 2,‘One day a week’• 3,‘2-3 days a week’• 4,‘4-5 days a week’• 5,‘Almost everyday’• 6,‘Everyday’• 7,
Q26_4. Traveling to social activities - Weekly biking to social activities ‘Never’• 1,‘Sometimes, but less than once a week’• 2,‘One day a week’• 3,‘2-3 days a week’• 4,‘4-5 days a week’• 5,‘Almost everyday’• 6,‘Everyday’• 7,
Q26_5. For leisure/recreation - Weekly biking for leisure/recreation ‘Never’• 1,‘Sometimes, but less than once a week’• 2,‘One day a week’• 3,‘2-3 days a week’• 4,‘4-5 days a week’• 5,‘Almost everyday’• 6,‘Everyday’• 7,
Q26_6. For health/fitness (training) - Weekly biking for health/fitness (training) ‘Never’• 1,‘Sometimes, but less than once a week’• 2,‘One day a week’• 3,‘2-3 days a week’• 4,‘4-5 days a week’• 5,‘Almost everyday’• 6,‘Everyday’• 7,
Q27_1. On roads without bike lanes - Weekly biking on roads without bike lanes ‘Never’• 1,
M I N E T A T R A N S P O R T A T I O N I N S T I T U T E 58

‘Sometimes, but less than once a week’• 2,‘One day a week’• 3,‘2-3 days a week’• 4,‘4-5 days a week’• 5,‘Almost everyday’• 6,‘Everyday’• 7,
Q27_2. On roads with bike lanes - Weekly biking on roads with bike lanes ‘Never’• 1,‘Sometimes, but less than once a week’• 2,‘One day a week’• 3,‘2-3 days a week’• 4,‘4-5 days a week’• 5,‘Almost everyday’• 6,‘Everyday’• 7,
Q27_3. On off-road bicycle-only or bicycle-pedestrian paths - Weekly biking on off-road bicycle-only or bicycle-pedestrian paths ‘Never’• 1,‘Sometimes, but less than once a week’• 2,‘One day a week’• 3,‘2-3 days a week’• 4,‘4-5 days a week’• 5,‘Almost everyday• 6,‘Everyday’• 7,
Q27_4. Remote bike paths - Weekly biking on remote bike paths ‘Never’• 1,‘Sometimes, but less than once a week’• 2,‘One day a week’• 3,‘2-3 days a week’• 4,‘4-5 days a week’• 5,‘Almost everyday’• 6,‘Everyday’• 7,
Q28_1_1. Travelling to or from work or study - Weekly miles work/study No encodings. Modified few values 60-100 • 100 15-20 • 20 ?? • 0(Row 146) .5 • 0.5 0-1 • 1 retired • 0 NA • 0 >1 • 1 60 (prepandemic) • 60
M I N E T A T R A N S P O R T A T I O N I N S T I T U T E 59

Q28_2_1. As part of work (e.g. delivery person) - Weekly miles work (delivery) No encodings. Modified few values O • 0 1 I • 11 Less than 1 • 1 .5 • 0.5 ?? • 0 NA • 0 n/a • 0 5-15 • 15 0-1 • 1
Q28_3_1. For shopping errands - Weekly miles errands No encodings. Modified few values >1 • 1 .5 • 0.5 .25 • 0.25 1-3 • 3 3-6 • 6 10-20 • 20 2-3 • 3
Q28_4_1. Travelling to social activities - Weekly miles social activities No encodings. Modified few values .5 • 0.5 .25 • 0.25 1-3 • 3 3-5 • 5 5-15 • 15
Q28_5_1. For leisure/recreation - Weekly miles leisure No encodings. Modified few values 30-40 • 40 >1 • 1 10-20 • 20 25/30 • 30 included in above • 0 25-40 • 40 15-20 • 20 50 - 200 • 200 50-100 • 100 1-4 • 4 5-6 • 6 0-10 • 10 20-30 • 30
Q28_6_1. For health and fitness (training) - Weekly miles taining
M I N E T A T R A N S P O R T A T I O N I N S T I T U T E 60

No encodings. Modified few values 30-40 • 40 1-3 • 3 10-20 • 20 15-20 • 20 30/40 • 40 100+ • 100 included in above • 0 25-40 • 40 60-100 • 100 15-30 • 30 75 to100 • 100 50-100 • 100 t0 • 10 1-4 • 4 25-150 • 150 150-200 • 200 20-30 • 30 Same as commute • 100
Q29_1_1. On roads without bicycle lanes - Weekly miles roads without bicycle lanes No encodings. Modified few values ? • 0 1-3 • 3 25-40 • 40 20-40 • 40 10to 15 • 15 IO • 10 50-100 • 100 10-15 • 15 25-150 • 150 100-150 • 150 5-10 •10
Q29_2_1. On roads with bicycle lanes - Weekly miles roads with bicycle lanes No encodings. Modified few values ? • 0 1-3 • 3 100+ • 100 25-40 • 40 30-60 • 60 .5 • 0.5 60+ • 60 IO • 10 35-40 • 40 50-100 • 100 1-4 • 4
M I N E T A T R A N S P O R T A T I O N I N S T I T U T E 61
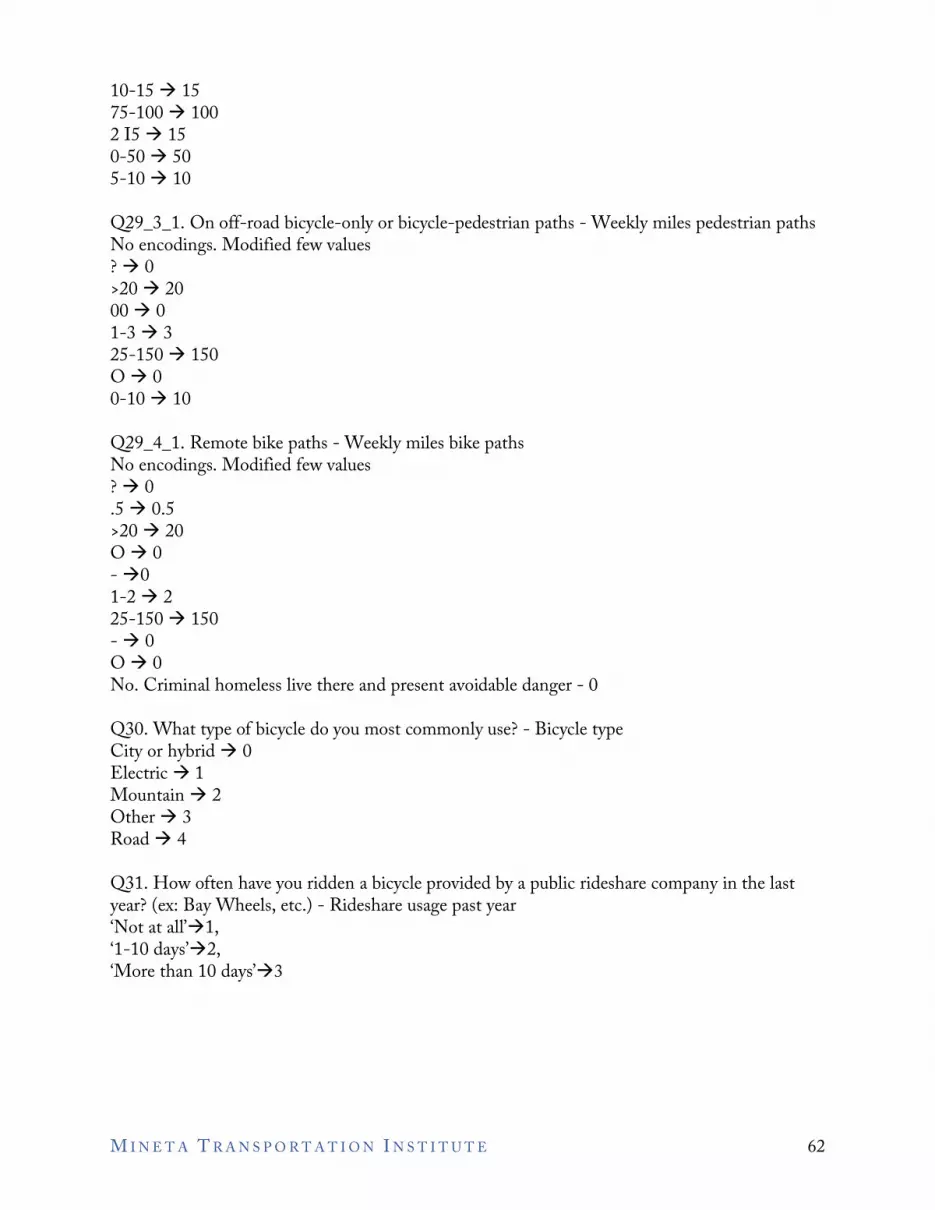
10-15 • 15 75-100 • 100 2 I5 • 15 0-50 • 50 5-10 • 10
Q29_3_1. On off-road bicycle-only or bicycle-pedestrian paths - Weekly miles pedestrian paths No encodings. Modified few values ? • 0
00 • 0
O • 0
>20 • 20
1-3 • 3 25-150 • 150
0-10 • 10
Q29_4_1. Remote bike paths - Weekly miles bike paths No encodings. Modified few values ? • 0
O • 0 - •0
- • 0 O • 0
.5 • 0.5 >20 • 20
1-2 • 2 25-150 • 150
No. Criminal homeless live there and present avoidable danger - 0
Q30. What type of bicycle do you most commonly use? - Bicycle type City or hybrid • 0 Electric • 1 Mountain • 2 Other • 3 Road • 4
Q31. How often have you ridden a bicycle provided by a public rideshare company in the last year? (ex: Bay Wheels, etc.) - Rideshare usage past year ‘Not at all’•1,‘1-10 days’•2,‘More than 10 days’•3
M I N E T A T R A N S P O R T A T I O N I N S T I T U T E 62

Bibliography Attewell, R. G., K. Glase, and M. McFadden. “Bicycle Helmet Efficacy: A Meta-Analysis.”
Accident Analysis and Prevention 33, no. 3 (2001): 345–52.https://doi.org/10.1016/S0001-4575(00)00048-8.
Bíl, Michal, Martin Dobiáš, Richard Andrášik, Martina Bílová, and Petr Hejna. “CyclingFatalities: When a Helmet Is Useless and When It Might Save Your Life.” Safety Science 105, (2018): 71–76. https://doi.org/10.1016/j.ssci.2018.02.005.
Bonander, Carl, Finn Nilson, and Ragnar Andersson. “The Effect of the Swedish BicycleHelmet Law for Children: An Interrupted Time Series Study.” Journal of Safety Research 51, (2014): 15–22. https://doi.org/10.1016/j.jsr.2014.07.001.
Borglund, S. T., J. S. Hayes, and J. M. Eckes. “Florida’s Bicycle Helmet Law and a Bicycle Safety Educational Program: Did They Help?” Journal of Emergency Nursing: JEN : Official Publication of the Emergency Department Nurses Association 25, no. 6 (1999): 496– 500. https://doi.org/10.1016/S0099-1767(99)70013-9.
Carpenter, Christopher S., and Mark Stehr. “Intended and Unintended Consequences of Youth Bicycle Helmet Laws.” The Journal of Law and Economics 54, no. 2 (2011): 305–24. https://doi.org/10.1086/652902.
Esmaeilikia, Mahsa, Igor Radun, Raphael Grzebieta, and Jake Olivier. “Bicycle Helmets and Risky Behaviour: A Systematic Review.” Transportation Research Part F: Traffic Psychology and Behaviour 60, (2019): 299–310. https://doi.org/10.1016/j.trf.2018.10.026.
Ferraro, Ottavia E., Chiara Orsi, Cristina Montomoli, and Anna Morandi. “A Model of Factor Analysis: Reasons for Using a Helmet in a Sample of Non-Competitive Italian Cyclists.” Transportation Research Part F: Traffic Psychology and Behaviour 58, (2018): 994–1004. https://doi.org/10.1016/j.trf.2018.07.021.
Finch, Caroline F. “Teenagers Attitudes towards Bicycle Helmets Three Years after the Introduction of Mandatory Wearing.” Injury Prevention 2, no. 2 (1996): 126–30. https://doi.org/10.1136/ip.2.2.126.
Finnoff, J. T., E. R. Laskowski, K. L. Altman, and N. N. Diehl. “Barriers to Bicycle Helmet Use.” Pediatrics 108, no.1 (2001). https://doi.org/10.1542/peds.108.1.e4.
Fyhri, A., H. B. Sundfør, C. Weber, and R. O. Phillips. “Risk Compensation Theory and Bicycle Helmets – Results from an Experiment of Cycling Speed and Short-TermEffects of Habituation.” Transportation Research Part F: Traffic Psychology and Behaviour 58, (2018): 329–38. https://doi.org/10.1016/j.trf.2018.06.025.
Gamble, Tim, and Ian Walker. “Wearing a Bicycle Helmet Can Increase Risk Taking and
M I N E T A T R A N S P O R T A T I O N I N S T I T U T E 63

Sensation Seeking in Adults.” Psychological Science 27, no. 2 (2016): 289–94. https://doi.org/10.1177/0956797615620784.
Hoye, Alena. “Recommend or Mandate? A Systematic Review and Meta-Analysis of the Effects of Mandatory Bicycle Helmet Legislation.” Accident Analysis and Prevention 120, (2018): 239–49. https://doi.org/10.1016/j.aap.2018.08.001.
Høye, Alena. “Bicycle Helmets – To Wear or Not to Wear? A Meta-Analyses of the Effects of Bicycle Helmets on Injuries.” Accident Analysis and Prevention 117, (2018.): 85–97. https://doi.org/10.1016/j.aap.2018.03.026.
Ichikawa, Masao, and Shinji Nakahara. “School Regulations Governing Bicycle Helmet Use andHead Injuries among Japanese Junior High School Students.” Accident Analysis and Prevention 39, no. 3 (2007): 469–74. https://doi.org/10.1016/j.aap.2006.08.011.
Jewett, Amy, Laurie F. Beck, Christopher Taylor, and Grant Baldwin. “Bicycle Helmet Use among Persons 5 Years and Older in the United States, 2012.” Journal of Safety Research 59, (2016): 1–7. https://doi.org/10.1016/j.jsr.2016.09.001.
Kakefuda, Itsumi, Kimberly L. Henry, and Lorann Stallones. “Associations between Childhood Bicycle Helmet Use, Current Use and Family and Community Factors among CollegeStudents.” Family and Community Health 32, no. 2 (2009): 159–66.https://doi.org/10.1097/FCH.0b013e31819947cf.
Kakefuda, Itsumi, Lorann Stallones, and Julie Gibbs. “Discrepancy in Bicycle Helmet Use among College Students between Two Bicycle Use Purposes: Commuting and Recreation.” Accident Analysis and Prevention 41, no. 3 (2009): 513–21. https://doi.org/10.1016/j.aap.2009.01.014.
Karkhaneh, M., J. C. Kalenga, B. E. Hagel, and B. H. Rowe. “Effectiveness of Bicycle Helmet Legislation to Increase Helmet Use: A Systematic Review.” Injury Prevention 12, no. 2 (2006): 76–82. https://doi.org/10.1136/ip.2005.010942.
Karkhaneh, Mohammad, Brian H. Rowe, L. Duncan Saunders, Don C. Voaklander, and Brent E. Hagel. “Trends in Head Injuries Associated with Mandatory Bicycle HelmetLegislation Targeting Children and Adolescents.” Accident Analysis and Prevention 59, (2013): 206–12. https://doi.org/10.1016/j.aap.2013.05.027.
Karl, Florian M., Jennifer Smith, Shannon Piedt, Kate Turcotte, and Ian Pike. “Applying the Health Action Process Approach to Bicycle Helmet Use and Evaluating a SocialMarketing Campaign.” Injury Prevention 24, no. 4 (2018): 288–95.https://doi.org/10.1136/injuryprev-2017-042399.
Kaushik, Ruchi, Isabelle M. Krisch, Darrell R. Schroeder, Randall Flick, and Michael E. Nemergut. “Pediatric Bicycle-Related Head Injuries: A Population-Based Study in a
M I N E T A T R A N S P O R T A T I O N I N S T I T U T E 64

County without a Helmet Law.” Injury Epidemiology 2, 1 (2015): 1–9. https://doi.org/10.1186/s40621-015-0048-1.
King, Jemma, Richard Franklin, and Peter Leggat. “Cycling Overseas: Decisions Regarding Helmet Use.” Journal of the Australasian College of Road Safety 30, no. 2 (2019): 18–28. https://doi.org/10.33492/jacrs-d-18-00295.
Kraemer, John D. “Helmet Laws, Helmet Use, and Bicycle Ridership.” Journal of Adolescent Health 59, no. 3 (2016): 338–44. https://doi.org/10.1016/j.jadohealth.2016.03.009.
Lajunen, Timo, and Mikko Räsänen. “Why Teenagers Owning a Bicycle Helmet Do Not Use Their Helmets.” Journal of Safety Research 32, no. 3 (2001): 323–32.https://doi.org/10.1016/S0022-4375(01)00056-1.
Ledesma, Rubén D., David Shinar, Pedro M. Valero-Mora, Narelle Haworth, Ottavia E. Ferraro, Anna Morandi, Maria Papadakaki, Guido De Bruyne, Dietmar Otte, and Meltem Saplioglu. “Psychosocial Factors Associated with Helmet Use by Adult Cyclists.”Transportation Research Part F: Traffic Psychology and Behaviour 65, (2019): 376–88. https://doi.org/10.1016/j.trf.2019.08.003.
Lee, Brian Ho Yin, Joseph L. Schofer, and Frank S. Koppelman. “Bicycle Safety Helmet Legislation and Bicycle-Related Non-Fatal Injuries in California.” Accident Analysis and Prevention 37, no. 1 (2005): 93–102. https://doi.org/10.1016/j.aap.2004.07.001.
Lee, Jonathan M.. “Mandatory Helmet Legislation as a Policy Tool for Reducing MotorcycleFatalities: Pinpointing the Efficacy of Universal Helmet Laws.” Accident Analysis and Prevention 111, (2018): 173–83. https://doi.org/10.1016/j.aap.2017.11.042.
Lemon, Jim. “Changes in Participation, Demographics and Hazard Associated with MandatoryBicycle Helmets in New South Wales, Australia.” Journal of Transport and Health 9, (2018): 195–202. https://doi.org/10.1016/j.jth.2018.03.011.
Macpherson, Alison K., P. C. Parkin, and T. M. To. “Mandatory Helmet Legislation and Children’s Exposure to Cycling.” Injury Prevention 7, no. 3 (2001): 228–30. https://doi.org/10.1136/ip.7.3.228.
Macpherson, Alison K., Teresa M. To, Colin Macarthur, Mary L. Chipman, James G. Wright, and Patricia C. Parkin. “Impact of Mandatory Helmet Legislation on Bicycle-Related Head Injuries in Children: A Population-Based Study.” Pediatrics 110, no. 5 (2002). https://doi.org/10.1542/peds.110.5.e60.
Macpherson, Alison, and Anneliese Spinks. “Bicycle Helmet Legislation for the Uptake of Helmet Use and Prevention of Head Injuries.” Cochrane Database of Systematic Reviews, (2008). https://doi.org/10.1002/14651858.CD005401.pub3.
McAdams, Rebecca J., Katherine Swidarski, Roxanne M. Clark, Kristin J. Roberts, Jingzhen
M I N E T A T R A N S P O R T A T I O N I N S T I T U T E 65

Yang, and Lara B. Mckenzie. “Bicycle-Related Injuries among Children Treated in USEmergency Departments, 2006-2015.” Accident Analysis and Prevention 118, (2018): 11– 17. https://doi.org/10.1016/j.aap.2018.05.019.
Meehan, William P., Lois K. Lee, Christopher M. Fischer, and Rebekah C. Mannix. “BicycleHelmet Laws Are Associated with a Lower Fatality Rate from Bicycle-Motor VehicleCollisions.” Journal of Pediatrics 163, no. 3 (2013): 726–29.https://doi.org/10.1016/j.jpeds.2013.03.073.
Molina-García, Javier, and Ana Queralt. “The Impact of Mandatory Helmet-Use Legislation on the Frequency of Cycling to School and Helmet Use among Adolescents.” Journal of Physical Activity and Health 13, no. 6 (2016): 649–53. https://doi.org/10.1123/jpah.2015-0566.
Network, Bicycle. “Australia ‘ s Mandatory Helmet Laws.” October 2018.
Otis, J., D. Lesage, G. Godin, B. Brown, C. Farley, and J. Lambert. “Predicting and Reinforcing Children’s Intentions to Wear Protective Helmets While Bicycling.” Public Health Reports 107, no. 3 (1992): 283–89.
Prati, Gabriele, Federico Fraboni, Marco De Angelis, and Luca Pietrantoni. “Gender Differences in Cyclists’ Crashes: An Analysis of Routinely Recorded Crash Data.” International Journal of Injury Control and Safety Promotion 26, no. 4 (2019): 391–98. https://doi.org/10.1080/17457300.2019.1653930.
Radun, Igor, and Jake Olivier. “Bicycle Helmet Law Does Not Deter Cyclists in Finland.” Transportation Research Part F: Traffic Psychology and Behaviour 58, (2018): 1087–90. https://doi.org/10.1016/j.trf.2018.06.022.
Rezendes, Jennifer L. “Bicycle Helmets: Overcoming Barriers to Use and Increasing Effectiveness.” Journal of Pediatric Nursing 21, no. 1 (2006): 35–44. https://doi.org/10.1016/j.pedn.2005.06.005.
Richard, Jean Baptiste, Bertrand Thélot, and François Beck. “Evolution of Bicycle Helmet Use and Its Determinants in France: 2000-2010.” Accident Analysis and Prevention 60, (2013): 113–20. https://doi.org/10.1016/j.aap.2013.08.008.
Rissel, Chris, and Li Ming Wen. “The Possible Effect on Frequency of Cycling If Mandatory Bicycle Helmet Legislation Was Repealed in Sydney, Australia: A Cross Sectional Survey.” Health Promotion Journal of Australia 22, no. 3 (2011): 178–83. https://doi.org/10.1071/he11178.
Rivara, Frederick P., Susan J. Astley, Sterling K. Clarren, Diane C. Thompson, and Robert S. Thompson. “Fit of Bicycle Safety Helmets and Risk of Head Injuries in Children.” Injury Prevention 5, no. 3 (1999): 194–97. https://doi.org/10.1136/ip.5.3.194.
M I N E T A T R A N S P O R T A T I O N I N S T I T U T E 66

Robinson, D. L. “No Clear Evidence from Countries That Have Enforced the Wearing ofHelmets.” British Medical Journal, (2006). https://doi.org/10.1136/bmj.332.7543.722-a.
Rodgers, Gregory B. “Effects of State Helmet Laws on Bicycle Helmet Use by Children and Adolescents.” Injury Prevention 8, no.1 (2002): 42–46. https://doi.org/10.1136/ip.8.1.42.
Royal, Dawn, and Darby Miller-Steiger. “Volume I: Summary Report National Survey of Bicyclist and Pedestrian Attitudes and Behavior.” Distribution I: 29, (2008).
Scuffham, Paul, Jonathan Alsop, Colin Cryer, and John D. Langley. “Head Injuries to Bicyclists and the New Zealand Bicycle Helmet Law.” Accident Analysis and Prevention 32, no. 4 (2000): 565–73. https://doi.org/10.1016/S0001-4575(99)00081-0.
Shafi, Shahid, James C. Gilbert, Fazlollah Loghmanee, James E. Allen, Michael G. Caty, Philip L. Glick, Susan Carden, and Richard G. Azizkhan. “Impact of Bicycle Helmet Safety Legislation on Children Admitted to a Regional Pediatric Trauma Center.” Journal of Pediatric Surgery 33, (1998):317–21. W.B. Saunders. https://doi.org/10.1016/S0022-3468(98)90454-7.
Smith, Nariida C., Frank W. Milthorpe. “University of Sydney. Institute of Transport Studies., and Roads and Traffic Authority of NSW. Transport and Network Development Branch.” An Observational Survey of Law Compliance and Helmet Wearing by Bicyclists inNew South Wales - 1993. Transport and Network Development Branch, Road and Traffic Authority, N.S.W. 1993.
Stier, Rebecca, Dietmar Otte, Christian Muller, Maximilian Petri, Ralph Gaulke, Christian Krettek, and Stephan Brand. “Effectiveness of Bicycle Safety Helmets in Preventing Facial Injuries in Road Accidents.” Archives of Trauma Research 5, no. 3 (2016). https://doi.org/10.5812/atr.30011.Research.
Thompson, D. C., R. S. Thompson, F. P. Rivara, and M. E. Wolf. “A Case-Control Study of the Effectiveness of Bicycle Safety Helmets in Preventing Facial Injury.” American Journal of Public Health 80, no. 12 (1990): 1471–74. https://doi.org/10.2105/AJPH.80.12.1471.
Trégouët, Paul. “Helmets or Not? Use Science Correctly.” Journal of Medical Ethics 41, no. 8 (2015): 718–19. https://doi.org/10.1136/medethics-2013-101521.
Tsai, Ming-che, David Hemenway, Ming-che Tsai, and David Hemenway. “Effect of the Mandatory Helmet Law in Taiwan,” 1999: 290–92.
Valero-Mora, Pedro, David Shinar, Ruben Ledesma, Narelle Haworth, M. Van Strijp-Houtenbos, A. Schramm, G. De Bruyne, et al. “Why Women Do Not Use the Helmet When Riding a Bicycle.” Proceedings of the Human Factors and Ergonomics Society, 3, (2018):1594–98. Human Factors and Ergonomics Society Inc.https://doi.org/10.1177/1541931218621360.
M I N E T A T R A N S P O R T A T I O N I N S T I T U T E 67

Walker, Ian, and Dorothy L. Robinson. “Bicycle Helmet Wearing Is Associated with CloserOvertaking by Drivers: A Response to Olivier and Walter, 2013.” Accident Analysis and Prevention 123, (2019): 107–13. https://doi.org/10.1016/j.aap.2018.11.015.
Walter, Scott R., Jake Olivier, Tim Churches, and Raphael Grzebieta. “The Impact of Compulsory Helmet Legislation on Cyclist Head Injuries in New South Wales, Australia: A Response.” Accident Analysis and Prevention 52, (2013): 204–9. https://doi.org/10.1016/j.aap.2012.11.028.
Wasserman, R. C., J. A. Waller, M. J. Monty, A. B. Emery, and D. R. Robinson. “Bicyclists, Helmets and Head Injuries: A Rider-Based Study of Helmet Use and Effectiveness.”American Journal of Public Health 78, no. 9 (1988): 1220–21.https://doi.org/10.2105/AJPH.78.9.1220.
M I N E T A T R A N S P O R T A T I O N I N S T I T U T E 68

About the Authors Fatemeh Davoudi, PhD
Dr. Fatemeh Davoudi is an Assistant Professor in the Department of Aviation and Technology inthe College of Engineering at San Jose State University. She has a bachelor degree in Mathematics, a master degree in Engineering and Technology Management, and a PhD in Industrial Technology, with a minor in Statistics. Dr. Davoudi’ s diverse background has trained her to teach,conduct research and produce scholarly literature in areas of statistical survey development, designand analysis of experiments, statistical modeling, and applications of machine learning tools for decision-making to improve safety outcomes in industrial incidents. She has authored several publications that analyze occupational incidents in manufacturing operations to reduce injury severity and enhance occupational safety. She has been teaching undergraduate and graduate level course with focus on statistical analysis for engineering and technology students since 2015. Dr. Davoudi is currently leading the Machine Learning & Safety Analytics Lab at San Jose State University, Technology Department.
Maria Chierichetti, PhD
Dr. Maria Chierichetti is an Assistant Professor in the Department of Aerospace Engineering in the College of Engineering at San Jose State University. Prior to joining SJSU, she was a faculty member at the University of Cincinnati and at Worcester Polytechnic Institute. Dr. Chierichetti holds a PhD and an MS in Aerospace Engineering (with a minor in Mathematics) from the Georgia Institute of Technology, and an MS and a BS in Aeronautical Engineering from Politecnico di Milano, Italy. Her current research interests focus on integrating machine learning with current analysis tools to understand whether structural damage has occurred. She has authored several journal publications and conference proceedings.
M I N E T A T R A N S P O R T A T I O N I N S T I T U T E 69

.. ·)t~~~ . ~ • .. ·:•'-' "''\~· ... · .. • ....
• • • • .......... -~~~~:.--;.\
MINETA TRANSPORTATION
INSTITUTE
MTI FOUNDER Hon. Norman Y. Mineta
MTI BOARD OF TRUSTEES
Founder, HonorableNorman Mineta* Secretary (ret.),US Department of Transportation
Chair,Will KemptonRetired Transportation Executive
Vice Chair,Jeff Morales Managing PrincipalInfraStrategies, LLC
Executive Director,Karen Philbrick, PhD*Mineta Transportation InstituteSan José State University
Winsome Bowen Vice President, Project DevelopmentStrategyWSP
David CastagnettiCo-Founder Mehlman Castagnetti Rosen &Thomas
Maria Cino Vice President, America & U.S. Government Relations Hewlett-Packard Enterprise
Grace Crunican** Owner Crunican LLC
Donna DeMartino Managing DirectorLos Angeles-San Diego-San Luis Obispo Rail Corridor Agency
Directors
Karen Philbrick, PhDExecutive Director
Hilary Nixon, PhDDeputy Executive Director
Asha Weinstein Agrawal, PhDEducation Director National Transportation Finance Center Director
Brian Michael Jenkins National Transportation Security Center Director
John FlahertySenior Fellow Silicon Valley American Leadership Forum
William Flynn *President & CEO Amtrak
Rose Guilbault Board Member Peninsula Corridor Joint Power Board
Ian Jefferies* President & CEO Association of American Railroads
Diane Woodend Jones Principal & Chair of BoardLea & Elliott, Inc.
David S. Kim* SecretaryCalifornia State TransportationAgency (CALSTA)
Therese McMillan Executive Director Metropolitan TransportationCommission (MTC)
Abbas Mohaddes President & COO Econolite Group Inc.
Stephen MorrisseyVice President – Regulatory and PolicyUnited Airlines
Dan Moshavi, PhD*Dean Lucas College and GraduateSchoolof Business, San José State University
Toks Omishakin* Director California Department ofTransportation (Caltrans)
Takayoshi OshimaChairman & CEO Allied Telesis, Inc.
Greg ReganPresident Transportation Trades Department, AFL-CIO
Paul Skoutelas* President & CEO American Public TransportationAssociation (APTA)
Kimberly SlaughterCEO Systra USA
Beverley Swaim-StaleyPresident Union Station RedevelopmentCorporation
Jim Tymon*Executive Director American Association of State Highway and TransportationOfficials (AASHTO)
* = Ex-Officio ** = Past Chair, Board of Trustees