Embed Size (px)
Citation preview
Undergraduate Journal of Psychology Department of Psychology Volume 15 University of North Carolina at Charlotte March 2002 Author(s) Page Articles Neese, Heather 2 The Development of Childhood Fears Robinson, Amanda 9 Influences on Cigarette Smoking Initiation: Parents, Peers, and Siblings Clouse, Kara E. 23 Personality Development: Difference among Siblings Hurley, Matthew R. 29 Is There a Correlation Between Type A Personality and Choice
of College Major? Eige, Stephanie S. 33 Exploring Organization Culture Hurley, Matthew R. 45 A Study on Retail Store Employees on the Use of Illegal Drugs
and Required Drug Testing for the Use of Illegal Drugs. Haymore, Carrie 50 Sadomasochism: The Pleasure of Pain These articles remain the property of the authors. No part may be reproduced without express permission from the author, except in the case of brief quotations in critical reviews or articles. Additional information is available from the: Department of Psychology, UNC Charlotte, 9201 University City Blvd. Charlotte, NC 28223-0001. (704) 687- 4731. Editors: Jane Gaultney, Ph.D. & Paul Foos, Ph.D. Layout and Design: Riedette Daniels
Undergraduate Journal of Psychology 2002 15 2
The Development of Childhood Fears Heather Neese University of North Carolina at Charlotte
Fear Development For any parent who has been awakened in the middle of the night by their frightened youngster, it is a known fact that children will develop various fears throughout their early life. Some fears seem to appear out of nowhere, while other fears may have a legitimate cause. Emotions, especially fear, have been a fascination of humans since the beginning of time. The word fear originated from Old English, faer, meaning sudden danger, and refers to justified fright from real danger (Goodwin, 1983). When a fear becomes so intense that it is irrational, a phobia has developed. Phobia comes from the Greek word Phobos meaning flight, panic, and terror from the deity of that name. According to Goodwin (1983), a phobia is a constant, extreme, unreasonable fear of a particular object, activity, or circumstance that leads to avoidance of the fearful situation. Why do humans and animals develop such fearful reactions to objects, activities, and situations? Many apprehensions seem to occur naturally due to the fact that children have many fears in common. Research over the past few hundred years has enabled scientists to better understand the function of fear. Fear seems to have evolutionary implications that are associated with survival. “Fear is a vital evolutionary legacy that leads an organism to avoid threat, and has obvious survival value. It is an emotion produced by the perceptions or impending danger and is normal in appropriate situations. Without fear, few would survive long under natural conditions” (Marks, 1987, p. 3). An evolutionary point-of-view could explain an individuals development of fear towards harmful creatures in nature, such as insects or reptiles, as opposed to man-made objects. Marks also addressed the fact that fear is a group of reactions that usually occur together. These reactions include internal feelings, physiological changes, and behavior expressions. Unpleasant feelings of terror enact the urge to escape and hide, to cry, cause the heart to pound, make muscles become tense, nausea, and many other symptoms (Marks, 1987). Many scientists have studied the physiological signs of fear by exposing subjects to various fear-evoking stimuli. Some effects have been recorded in the activity of the nervous system. When the nervous system becomes excited, reactions such as pallor, sweating, increased heart rate, and hypertension occur. Accompanying this during fear is rapid breathing, trembling and tension (Marks, 1969). Galvanic skin response, forearm blood flow, and biochemical mechanisms are also affected by fear-evoking stimuli. The sensation of fear is useful since it often leads to a quick response in the face of threat. Therefore, fear can also increase an organism’s motivation to learn and perform socially useful responses. From an evolutionary standpoint, survival requires the environment to satisfy an organism’s basic needs for food, oxygen, water, climate, living space, and shelter, and when these needs are threatened, it causes withdrawal (Marks, 1987). A fearful reaction to aversive stimuli usually increases an organism’s ability to survive. Obviously fear is a necessary function for survival, but how do we actually acquire certain fears? Scientists have learned of various ways that humans obtain particular apprehensions.
Undergraduate Journal of Psychology 2002 15 3
These include genetics, classical conditioning, environmental conditions, social learning, and life experiences. Infants and young children also seem to have common fears that are associated with different stages of development. Genetics could explain characteristics such as emotionality, nervousness, and shyness, as well as depressive personalities and fears of social criticism. Studies have found convincing evidence of genetic contributions to personality traits related to timidity, and genes can also increase the occurrence of anxiety and panic disorders, as well as phobias. According to Marks (1987), genetic and biological factors play a large role in acquiring fears. Individuals within a species vary in their degree of fear of particular stimuli as a
function of their individual genetic makeup and the environment in which it is expressed. Other sources of variation within individuals are due to age, natural selection or particular fear stimuli in a species’ repertoire, and cultural transmission and individual learning.
Marks (1987), also explained that the expression of genes depends largely upon the environment of an individual, and as that environment changes, a modification in the phenotype will occur from fertilization and on. Normal human fear is partly under control from infancy onward. Compared with fraternal twins, identical twins are more similar as infants in their fear of strangers and as children and adults on measures of emotionality… worry, tension, and fears. King, Eleonora, and Ollendick (1998), stated that children’s phobias are probably due to a complex interaction of genetic, constitutional and environmental factors. From a behavioral perspective, early theoretical explanations were confined to direct conditioning. However, it eventually became apparent that childhood phobias may be acquired in indirect ways as well, thus calling for more comprehensive theory of phobia onset. In addition to the genetic argument is the effectiveness of classical conditioning. The usual model for learned fear is classical (Pavlovian) association of a neutral stimulus (the to-be conditioned CS), such as a light or tone, with an aversive stimulus (the unconditioned US), such as a shock (Marks, 1987). After repeated pairings of the CS with the US, an association occurs between the two. The subject now fears the object (CS) that was originally unrelated to the aversion (US). In this example, the subject would be frightened of the light for fear of an electric shock. King, Eleonroa, and Ollendick (1998) explained that for many years, childhood phobias have been explained in terms of traumatic experience and classical aversive conditioning. The likelihood of a conditioned fear developing is increased by confinement, by exposure to high-intensity pain or fear situations and by frequent repetitions of the association between the conditioned stimulus and the pain/fear. In a study conducted by Muris, Merkelbach, and Collaris (1997), results revealed that in general, conditioning was found to be most commonly reported pathway towards acquiring childhood fears. Only for certain types of fear (such as the fear of the unknown, danger and death), was the informational/social-learning pathway more prominent. Development Phases and Common Fears The most logical explanations for acquiring fears and phobias are life experiences and our environmental conditions. Social learning plays a large role in the development of fears, especially in children. According to Goodwin (1983), some people attribute a fear (or phobia, depending on the intensity of the fear) to a single event. However, most phobias are not linked
3
Undergraduate Journal of Psychology 2002 15 4
with a single instance since the victim often cannot recall the situation. Perhaps the individual has forgotten the traumatic event, or it may have happened when he or she was a child (Goodwin, 1983). Sometimes forgetting the event played a more key role in acquiring the fear than the event itself. Goodwin (1983) explains that it is the simple phobias that appear more strongly related to the occurrence of a single traumatic event than do social phobias. Modeling (vicarious learning) occasionally influences the development of certain fears (Marks, 1987). Many times, young children acquire enduring phobias from their parents, and in turn a parent may strengthen the intensity of their phobia after learning that their children share the same fear (Marks, 1969). Children often report that they become fearful of an object or situation after hearing about it from an adult, a peer, or from television (King, Eleonora, & Ollendick, 1997). Animals and humans alike learn by observing others and develop a distinctive culture for their group. Social learning is more flexible in humans. Many fears and prejudices might be communicated through observational learning of cues and reactions, especially during childhood and adolescence (Marks, 1987). Fear of things such as spiders and snakes can be transmitting unchanged across generations. From age two, a child is influenced by observing adult behavior and often imitates it. According to Moracco and Camilleri, (1983), a child learns to respond with fear to range of situations that he or she is exposed to. A fear to the situation may not be readily visible due to imitating the adult. Imitative fear behavior may increase or decrease depending on the parent’s reaction to
the child’s expression. It has been shown that acceptance, independence, and reward by parents result in a low frequency of fears in children, but rejection, dependence, and punishment would result in a high frequency of fears (Moracco & Camilleri, 1983, p.82).
According to Marks (1987), events at all ages can modify fear, but if they happen at certain sensitive phases they have more permanent effects than at other times. Sensitive phases occur during periods of early life and tend to last until adolescence. For example, during the infancy phase children are learning and forming new brain synapses. During this period, it is critical that parents teach socialization skills before the fear of the unfamiliar has emerged. These skills allow a child to adjust more easily to new people and situations. Early experiences also influence later emotion, and unpleasant events in early life may increase learned helplessness and reduce an individual’s ability to deal with disaster. Of course these sensitive phases are species-specific, and within those limits vary with genetic and environmental factors (Marks, 1987). Throughout childhood, several fears can be classified as innate. They have no real basis except that all children seem to exemplify particular fears. A fear that appears at a particular age need is not necessarily related with a special evolutionary danger, but instead may indicate that a child’s perception has matured to a particular point (Marks, 1987). Marks (1969) noted that certain classes of stimuli are more likely to trigger phobias at particular ages, regardless of the frequency of exposure to such stimuli. Several innate fears are expressed in infants. At birth, infants have innate reflex to loud noise. According to Marks (1969), extension of this reflex is seen in the regular fear of sudden noise found in young infants, who show innate fear of any intense, sudden, unexpected or novel stimulus. Age plays a critical role in fear development, and maturation is a key for the emergence of stranger fear and the fear of heights in infants. Apprehensions that children develop can be attributed to exposure to new situations. According to Marks (1969), when a child suddenly becomes afraid of familiar situations, people
Undergraduate Journal of Psychology 2002 15 5
and objects that he or has experienced before without fear, then it’s fear of such stimuli is developmental. Fears are much more common in children than adults. They can begin without apparent reason, and then disappear just as quickly. These fears can also be much more intense than adult fears. Children and adults report many fears throughout development. These fears also seem to follow a developmental path. Fears of small animals, the dark, and separation characterize early childhood. Fears of social evaluation and competence typify middle childhood and adolescence (Ollendick & King, 1991). Given maturational processes and normal background experiences, most members of a species will show fear to a set of evolutionary stimuli on their first encounter (King, Eleonora, & Ollendick, 1998). Some evolutionary stimuli include novel objects, heights, sudden change or movement, smells, sounds, and being alone. One major question that sometimes plagues a parent about their child’s fear is, “How serious are common childhood fears?” Muris, Merkelbach, Mayer and Prins (2000), completed a study in 1998 to try and answer this question. In order to get a more precise picture of the clinical significance of these fears, the
[present] study investigated whether childhood fears are related to clinical phobias and other anxiety disorders. Results showed that fears were associated with subclinical manifestations of anxiety disorders in 49% of the children. Moreover, about one fifth of the children (22.8%) appeared to meet full criteria of an anxiety disorder. Together, the findings strongly suggest that a considerable number of childhood fears qualify for an anxiety disorder.
The results of this study do not necessarily conclude that most children would need treatment for their fears. The data for the connection between specific childhood fears and anxiety disorders suggest that the relationship between dominant childhood fears and anxiety disorders is not very specific (Muris et al, 2000). The instrument used in this experiment was the Fear Survey Schedule for Children (FSSC), which measures 10 separate fears. It was the free choice fears children mentioned that could be categorized as leading to detection of an anxiety disorder. A later study by Muris and Merckelbach (2000), further examined the connection between childhood fears and specific phobias by interviewing children’s parents. Results suggest that a considerable percentage of children met the full criteria for a specific phobia. This study was based on the belief that parent interviews about their children’s fears may provide a “reliable picture” of the severity of such fears.
Many parents often wonder which fears are normal and how many should be expected. Many research studies have discovered that children between the ages of two and six have more than four fears, while between the ages of six and twelve experience an average of seven different fears (Garber, Garber, & Spizman, 1993) Most fears and phobias appear to be developmental since children develop the same fears as others his or her age. For instance, first fears include fear of strangers, of loud noises, and of the dark.
At first, infants do not appear to be alarmed by the novel faces he or she is exposed to on a daily basis. However, at approximately eight months of age, children become frightened in the presence of someone that they do not know (or are not very familiar with). Why this sudden change in disposition? According to Marks (1987), stranger fear in human infants is likely to be evolutionary residue that reflects widespread abuse and infanticide by strangers during the course of history.
5
Undergraduate Journal of Psychology 2002 15 6
According to Garber, Garber, and Spizman (1993), a fear of loud or sudden noises is one of the few fears that children are born with. This fear may be a reaction to unpleasant frequency levels, or a sudden change in the environment may have startled the child.
Another prominent early childhood fear is the fear of the dark. Most children believe the dark to be sinister, cloaking the numerous creatures that hide in their room. Many researchers also believe the fear of the dark is linked with separation anxiety, since darkness hinders the ability to orient oneself with the environment. Nighttime fears can be intensified by what a child is exposed to during the day (Garber, Garber, & Spizman, 1993). These stimuli can include scary television shows and movies, and even the news.
Other fears that children typically develop throughout childhood include (but are not limited to) such things as animals and insects (especially spiders and snakes), as well as fears of transportation. Separation anxiety takes different forms such as babysitter fear and the fear of going to sleep. Most children are afraid of things in nature such as thunderstorms and water, and may also exhibit fears of other children when they are introduced to new peers.
Reducing Childhood Fear
Parents can help their child reduce fear as well as the physical effects. Teaching children to cope with fear can ease their discomfort. For instance, parents can teach their child relaxation techniques like deep breathing exercises and deep muscle relaxation (Garber, Garber, & Spizman, 1993). Also by teaching positive self-talk (self-encouragement), parents help their child be less anxious.
It is important that children eventually overcome their fears. Coping with and overcoming fear is a maturation process that reflects the level of adjustment of a child. A child overcomes fear through reasoning and ‘growing up.’ (Fitzgerald, Rardin, & Sipes, 1985).
Morris and Kratochwill (1983), noted in the book Treating Children’s Fears and Phobias, that parent intervention relies on several considerations. Intervention should take place if the fear is excessive, if it lasts over a relatively long period of time, and if it creates problems in day-to-day living for the parents and the child.
According to Garber, Garber, and Spizman (1993), parents can aid in the process of helping their child overcome their fear by using four methods. First, fear can be overcome by using their imagination. For instance, when a child fears dogs, they imagine that all dogs are ferocious and will attack them. To ease their apprehension, children can use their imagination to attach positive images to their fears. They could imagine themselves playing with a puppy instead of being chased by a snarling Doberman.
Second, parents can give their children information about the object of their fears to view them in a more logical and less scary way. Parents can read literature to their children that will help them rationalize the fear and ease the anxiety. Thirdly, children can observe other children and adults in the frightening situations to see that there is nothing to fear. This is also known as modeling (Morris & Kratochwill, 1983).
Lastly, children can be exposed to the object of their fear. The desensitization process is achieved by revealing the feared situation to the child, in small graduated steps (Morris & Kratochwill, 1983). “Jersild and Holmes (1935) reported 45 years ago that ‘the single largest factor in coping with fear, according to the subject’s account, was the change that came with added growth, repeated contacts with the feared event, and information and experience acquired in the course of a daily life’” (Fitzgerald, Rardin, & Sipes, 1985, p.1222).
Undergraduate Journal of Psychology 2002 15 7
According to DeGiovanni, Garcia, & Graziano (1979), adults seem to minimize the importance of children’s fears, viewing them as common and fleeting, not a particularly serious part of normal development. But children’s fears may not always be temporary, and some may persist as adult problems. However, there seems to be a decrease in percentage of specific fears from young childhood into adolescence. As children mature, they are more able to reason and have more developed defense mechanisms. As children grow older, the range of fear also grows wider, and he or she acquires the ability to dwell on the past and to anticipate the future. Thus many of his or her fears will change to those of an anticipatory nature (DeGiovanni, Garcia, & Graziano, 1979).
DeGiovanni, Garcia, and Graziano (1979), explained that many adults seem to minimize the significance of their child’s fears, and tend to ignore them. Sometimes a fear can persist and become a phobia, even if the parent tries to help their child overcome the fear. If a phobia develops, a parent must seek professional help for their child. Research literature indicates that when fears and phobias are professionally treated by cognitive and behavioral approaches, success rates are high (Garber, Garber, & Spizman, 1993).
The etiology of childhood phobias has been a perplexing issue for researchers and herapists (Eleonara, King, & Ollendick, 1998). Many believe that children’s fears and phobias are most likely due to an intricate interaction of environmental factors and genetics. Therefore a more comprehensive theory of phobia onset is needed to fully explain how children acquire certain fears at predictable stages of development.
References
Camilleri, J., & Moracco, J.C. (1983). A study of fears in elementary school children.
Elementary School Guidance and Counseling, 18, 82-87. Collaris, R., Merckelbach, H., & Muris, P. (1997). Common childhood fears and their origins.
Behavior, Research and Therapy 35, 929-937. DeGiovanni, I. S., Garcia, K., & Graziano, A. M. (1979). Behavioral treatment of children’s
fears: A review. Psychological Bulletin, 86, 804-830. Eleonora, G., King, N.J., Ollendick, T.H. (1998). Etiology of childhood phobias: Current status
of Rachman’s three pathways theory. Behavior, Research and Therapy, 36, 297-309. Fitzgerald, B., Rardin, M., & Sipes, G. (1985). Adolescent recall of childhood fears and coping
strategies. Psychological Reports, 57, 1215-1223. Garber, M. D., Ph.D., Gaber, S. W., Ph.D., & Spizman, R. F. (1993). Monsters under the bed
and other childhood fears. New York: Villard Books. Goodwin, D. W. (1983). Phobia: The facts. New York: Oxford University Press. King, N. J., & Ollendick, T. H. (1991). Origins of childhood fears. Behavior, Research and
Therapy, 29, 117-123. King, N.J., & Ollendick, T. H. (1997). Treatment of childhood phobias. Journal of Child
Psychology and Psychiatry and Allied Disciplines, 38, 389-400. Knell, S. M. (2000). Cognitive-Behavioral play therapy for childhood fears and phobias. In
H.G. Kaduson, & C. E. Schafer (Eds.) Short-term play therapy for children (pp. 3-27). New York: The Guilford Press.
Kratochwill, T.R., & Morris, R.J. (1983). Treating Children’s Fears and obias: A behavioral approach. New York: Pergamon Press.
7
Undergraduate Journal of Psychology 2002 15 8
Marks, I. M. (1969) Fears and Phobias. New York: Academic Press. Marks, I. M. (1987). Fears, Phobias, and Rituals: Panic, Anxiety, and their Disorders. Oxford:
Oxford University Press. Mayer, B., Merckelbach, H., Muris, P., & Prins, E. (2000). How serious are common childhood
fears? Behavior, Research and Therapy, 38. 217-227. Stampfl, T. G. (1991). Analysis of Aversive Events in Human Psychopathology: Fear and
Avoidance. In M.R. Denny (Ed.), Fear, Avoidance and Phobias (pp. 363-393). New Jersey: Lawrence Erlbaum Associates, Publishers.
Undergraduate Journal of Psychology 2002 15 9
Influences on Cigarette Smoking Initiation: Parents, Peers, and Siblings Amanda Robinson University of North Carolina at Charlotte
The present study investigates the degree to which parents, peers, and siblings influenced smoking initiation among a sample of Non-smokers, Regular Smokers, and Former smokers. This experiment specifically distinguishes siblings from parents in the family/parent-child dimension. The final sample consisted of forty-five participants from four different Computer Science classes at the University of North Carolina at Charlotte. A ninety-three item questionnaire on smoking initiation was developed specifically for this study and administered to the participants. Three One-Way ANOVAs showed peers to be the only significant influence on smoking initiation, with peer smoking discriminating between Non-Smokers and Regular Smokers. Parents and siblings seemed to have relatively little influence on smoking initiation among this sample.
Influences on Cigarette Smoking Initiation: Parents, Peers, and Siblings As public health concerns climb the nation’s priority list, more research studies are being
conducted to adequately address these issues. In the United States [U.S.], smoking is the number one leading cause of premature death (Molarius, 2001). In the last decade, beginning in the early 1990’s, cigarette smoking has become one of the most widely studied public health issues, especially among adolescents. According to the U.S. Department of Health and Human Services [DHHS] (2000), approximately 25 percent of persons in the U.S. are habitual daily smokers. Of this 25 percent, an alarming number are under the age of eighteen. Approximately 4.5 million persons ages twelve to seventeen smoke cigarettes (Centers for Disease Control and Prevention [CDC], 1998). Studying the trends of youth smoking is an effective precursor to identifying the multiple influences on smoking initiation in particularly vulnerable, at-risk groups.
The 1999, National Youth Tobacco Survey (CDC, 2000) revealed that the current
number of youth smokers among middle and high school students totals an overwhelming 44 percent. In lieu of the current number of adolescent smokers, analyzing the broader trend over a time period gives a better perspective of these numbers. From 1991-1999, smoking prevalence rates for all race/ethnic groups, ages, genders and grade levels has generally risen. Among high school students, 34.8 percent smoked in 1995 with an increase in 1997 to 36.4 percent, then a decrease to 34.8 percent in 1999. Reports have shown little discrepancy between genders. For males, 35.4 percent smoked in 1995, with an increase in 1997 to 37.7 percent and a decrease in 1999 to 34.7 percent. For females, 34.3 percent smoked in 1995, 34.7 percent in 1997, and 34.9 percent in 1999 (CDC, 2000). In 1991, 12.6 percent of black students and 25.3 percent of Hispanic students reported smoking while a considerable higher number of white students, 30.9 percent engaged in smoking. By 1999, white students, 38.6 percent, were still twice as likely to smoke as African American students, 19.7 percent, and also more likely to smoke than their Hispanic counterpart, 32.7 percent (CDC, 2000). As far as grade levels are concerned, 9th grade
9
Undergraduate Journal of Psychology 2002 15 10
students showed a decline in smoking at the end of the decade. Contrary to this though, 12th grade student smokers showed a steady increase (CDC, 2000).
There are several major conclusions that the statistical data of trends among adolescent
smoking reveals. There does not seem to be much discrepancy between genders regarding the choice to smoke during youth. Fluctuation in smoking trends has occurred the most among minority groups, especially African Americans. Black students showed a disconcerting rise in the middle of the decade but seem to decline later in the decade. White students have consistently been more likely to smoke than African American and Hispanic students. Even so, the numbers do indicate that more minorities seem to be picking up the smoking habit. Grade levels may also play an important role in smoking. This is especially noticeable in the later part of the decade with the difference between rates among 9th and 12th graders. Overall, smoking among teenagers, particularly high school students may be leveling off, but these numbers could be skewed due to the significant decline in male black students (CDC, 2000).
Initiation of smoking among youth under 18 has been steadily increasing compared to
those above 18 years of age. According to the U.S. Surgeon General Report on Preventing Tobacco Use Among Young People (1994), most smokers begin during childhood and adolescence, while youth who graduate from high school seldom begin the habit. The CDC report on Incidence of Initiation of Cigarette Smoking (1998) found that 71 percent of the 89 percent who initiate smoking as a teen become daily smokers by the time they are 18 years old— a crucial indicator of the vulnerability of youth.
Monitoring the evolution of adolescent smoking can greatly aid in the design,
implementation, and modification of prevention and smoking cessation programs. Because cessation programs often fail to render successful results outside of clinical trials (DHHS, 1994), efforts to curtail the smoking habit of our nation is steadily making the transition from cessation programs to prevention programs. Studying smoking trends first allows us to identify the most prevalent ages of on-set for smokers. We can then begin to examine more closely the multiple factors that influence our teenagers to smoke that first cigarette.
There are multiple factors that influence an adolescent to initiate smoking including race/
ethnicity, socioeconomic status, family structure, advertising, and physical and emotional abuse. Studies specifically report that family and peers highly influence one to initiate smoking. Bobo & Husten (2000) noted that if parents, siblings or peers smoke an adolescent is not only more likely to initiate smoking but will do so at an earlier age (as cited in Unger and Chen, 1999). Olds and Thombs (2001) found that peer influence rated substantially higher than parental influence regarding involvement in cigarette smoking. However, the question still remains as to the priority that should be placed upon parent versus peer factors when developing prevention and intervention programs.
The purpose of the present study is to identify the degrees to which parents, peers, and
siblings influence smoking initiation. This study specifically distinguishes siblings from parents in the family/parent-child dimension.
Undergraduate Journal of Psychology 2002 15 11
Methods Participants
The sample was comprised of forty-five participants from four different Computer Science classes at the University of North Carolina at Charlotte. The final number of participants was determined after the data from each participant was collected and reviewed to see if they met the inclusion/exclusion criteria. It was required that each participant have one or more siblings and have commenced smoking before the age of twenty for the data to be included. Two participants’ data were excluded from the final sample. Participants were required to sign a consent form before taking part in the study and immediately went through a debriefing session after the study. Materials
A ninety-three item questionnaire on smoking initiation was developed specifically for this study (see Appendix). The questionnaire is comprised of six sections including items pertaining to demographic information, personal, parental, peer, and sibling smoking preferences, and a final section eliciting the participant’s opinion on a variety of smoking–related issues. The participants came to the study with the variables under investigation predetermined, hence the majority of the questions require the participant to respond with hindsight. Certain questions in the survey were designed to measure the exact degree to which parents, peers and siblings influenced one to initiate smoking. Participants responded to each question using a Likard scale rating of 1-5: 1 – Not at all, 2 – very little, 3 – some, 4 – very much, 5 – a lot. Questions eliciting an “influence to smoke” response (e.g., “I feel because my parents smoked I was influenced to smoke.”) were given a +1, +2, +3, +4, +5 score. Questions eliciting an “influence not to smoke” response (e.g., “I feel because my parents smoked I was influenced not to smoke.”) were given a -1, -2, -3, -4, -5 score. The two scores were then added with each participant receiving a score for the dependent variables of parental, peer, and sibling influence. The scores were further interpreted on a scale from –5 to +5 with a score of –5 indicating a high degree of influence not to smoke, a score of 0 indicating no degree of influence to smoke, and a score of +5 indicating a high degree of influence to smoke. The same researcher designed the study, conducted the actual experiment, analyzed the data, and interpreted/reported the results. The participants were took part in the experiment during their regularly scheduled class time. Design and Procedure
This experiment follows that of a multiple-groups design. The independent variable, smoking status, consist of three levels: 1) Non-Smoker, 2) Regular Smoker, and 3) Former Smoker. The varying degrees to which parents, siblings, and peers influence one to initiate or not initiate smoking will be measured and compared across the three groups. The smoking status of each participant will be measured and assessed based on certain information provided in the survey. Some of the most common levels of smoking status in several past studies include experimental, established, social, current, and habitual/addicted smoker (Choi, Giplin, Farikas, Pierce, 2001; Kiefe, Williams, Lewis, Allison, Sekar,
11
Undergraduate Journal of Psychology 2002 15 12
Wagenknecht, 2001; Olds & Thombs, 2001). This experiment assembled and modified these levels into four groups. Those who respond that they have never taken a puff or they have experimented but did not like it and decided never do it again will be classified as a Non-smoker. Regular Smoker is defined as any person who smokes more than six cigarettes per week. An individual who has smoked at some time during their life but have not smoked in the past ninety days will be placed in the Former Smoker category. This study initially included Occasional Smoker (anyone who smokes one to five cigarettes a week, whether socially or alone, smokes when in social situations, around friends or other people who smoke, or both) in the original design. However, due to insufficient amount of data available Occasional Smoker was excluded from the final analysis.
Given the diversity of family structures across a variety of cultures in the United States, parent(s), as stated on the questionnaire, is defined as “the primary person(s) who raised you and provided for you. This could be biological, step, foster, or adoptive parent(s), or grandparents, aunt/uncle, older brother/sister, etc”. Sibling(s) consist of “any person(s) who you lived in the same household with and considered to be a sibling. This could mean biological, step, half, foster, adoptive, sibling(s) or even a cousin whom you lived with and was being raised by the same person as you”. Peer(s), or friends, includes “anyone who is not directly related to you and is around your age”. For the purpose of data analyses, adolescence includes the years from ages eight to twenty. However, so as not to confuse the participant when taking the survey, they are simply asked to respond looking back on the years from birth to age twenty.
Regardless of any participant’s smoking status, they must meet specific
inclusion/exclusion criteria. A participant must have one or more siblings and have started smoking before the age of twenty for the data to be included in the final sample of participants.
Permission was obtained from the Professor of the Computer Science classes to
administer the questionnaire to their students during class. The experimenter arrived at the time arranged with the professor. At the end of class the students were given the option to stay and participate in the study or leave. The experimenter introduced herself and explained why she was there. The students were given a consent form explaining the purpose of the study, what they would be asked to do, and how long it would take. They were informed that any information they provided would be confidential and anonymous and that their participation was voluntary and they could withdraw from the study at any time without penalty or reprimand. The signed consent forms were collected before administering the questionnaire. The experimenter distributed the questionnaires and went over the instructions. Special emphasis was placed on clearly explaining that most of the questions pertain to the years between birth and age twenty, and when specified in the directions they should answer accordingly. The group was immediately debriefed upon completing the surveys.
Three separate One-Way ANOVAs were conducted to obtain the interactions between the three smoking status levels and parental, sibling, and peer influence. Tukey tests were performed to determine the nature of any significant interactions
Undergraduate Journal of Psychology 2002 15 13
Results
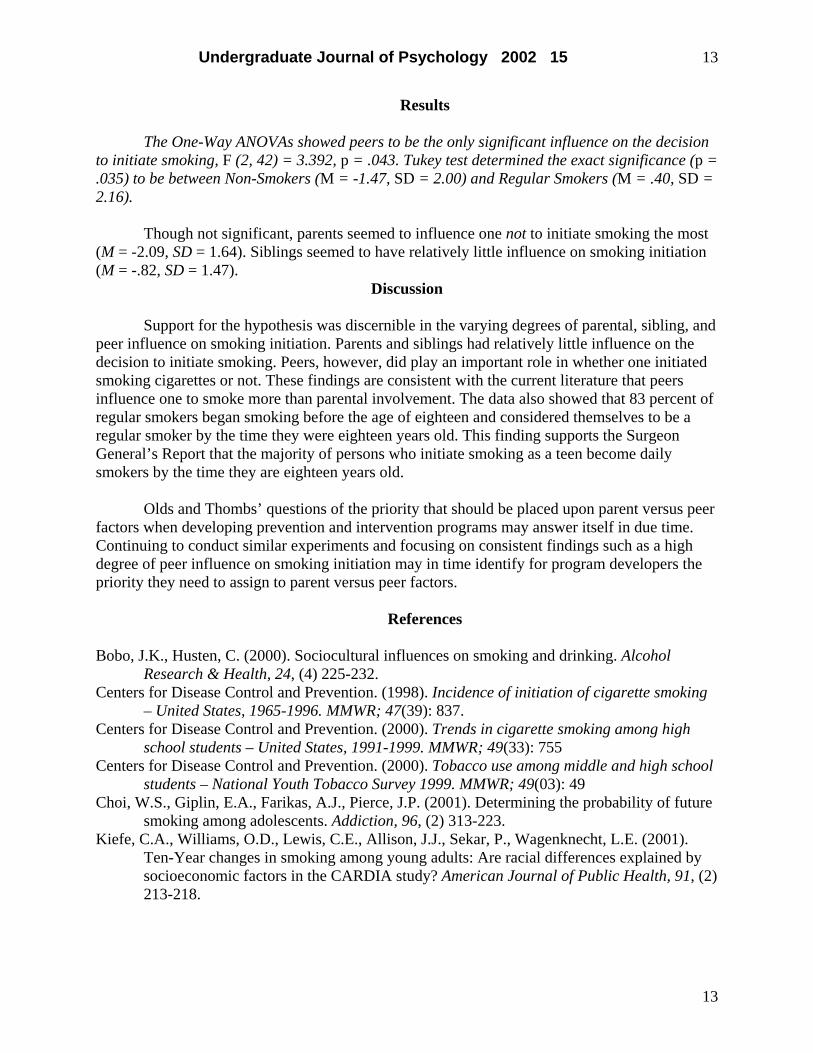
The One-Way ANOVAs showed peers to be the only significant influence on the decision to initiate smoking, F (2, 42) = 3.392, p = .043. Tukey test determined the exact significance (p = .035) to be between Non-Smokers (M = -1.47, SD = 2.00) and Regular Smokers (M = .40, SD = 2.16). Though not significant, parents seemed to influence one not to initiate smoking the most (M = -2.09, SD = 1.64). Siblings seemed to have relatively little influence on smoking initiation (M = -.82, SD = 1.47).
Discussion
Support for the hypothesis was discernible in the varying degrees of parental, sibling, and peer influence on smoking initiation. Parents and siblings had relatively little influence on the decision to initiate smoking. Peers, however, did play an important role in whether one initiated smoking cigarettes or not. These findings are consistent with the current literature that peers influence one to smoke more than parental involvement. The data also showed that 83 percent of regular smokers began smoking before the age of eighteen and considered themselves to be a regular smoker by the time they were eighteen years old. This finding supports the Surgeon General’s Report that the majority of persons who initiate smoking as a teen become daily smokers by the time they are eighteen years old.
Olds and Thombs’ questions of the priority that should be placed upon parent versus peer factors when developing prevention and intervention programs may answer itself in due time. Continuing to conduct similar experiments and focusing on consistent findings such as a high degree of peer influence on smoking initiation may in time identify for program developers the priority they need to assign to parent versus peer factors.
References
Bobo, J.K., Husten, C. (2000). Sociocultural influences on smoking and drinking. Alcohol Research & Health, 24, (4) 225-232.
Centers for Disease Control and Prevention. (1998). Incidence of initiation of cigarette smoking – United States, 1965-1996. MMWR; 47(39): 837.
Centers for Disease Control and Prevention. (2000). Trends in cigarette smoking among high school students – United States, 1991-1999. MMWR; 49(33): 755
Centers for Disease Control and Prevention. (2000). Tobacco use among middle and high school students – National Youth Tobacco Survey 1999. MMWR; 49(03): 49
Choi, W.S., Giplin, E.A., Farikas, A.J., Pierce, J.P. (2001). Determining the probability of future smoking among adolescents. Addiction, 96, (2) 313-223.
Kiefe, C.A., Williams, O.D., Lewis, C.E., Allison, J.J., Sekar, P., Wagenknecht, L.E. (2001). Ten-Year changes in smoking among young adults: Are racial differences explained by socioeconomic factors in the CARDIA study? American Journal of Public Health, 91, (2) 213-218.
13
Undergraduate Journal of Psychology 2002 15 14
Molarius, A., Parsons, R. W., Dobson, A.J., Evans, A., Fortmann, S. P., Jamrozik, K., et al. (2001). Trends in cigarette smoking in 36 populations from the early 1980’s to the mid-1990’s: Findings from the WHO MONICA Project. 91(2): 206-212
Olds, R.S., Thombs, D.L. (2001). The relationship of adolescent perceptions of peer norms and parent involvement to cigarette and alcohol use. Journal of School Health, 71, (6) 223-228.
U.S. Department of Health and Human Services. (2000). New public health service guideline calls on health professionals to make treating tobacco dependence a top priority. HHS News; June 27, 2000. Available at http://www.hhs.gov/news.
U.S. Department of Health and Human Services. (1994). Preventing tobacco use among young people: A report of the Surgeon General. Atlanta, Georgia: U.S. Department of Health and Human Services, Public Health Services, Centers for Disease Control and Prevention, National Center for Chronic Disease Prevention and Health Promotion, Office on Smoking and Health.
Undergraduate Journal of Psychology 2002 15 15
QUESTIONNAIRE
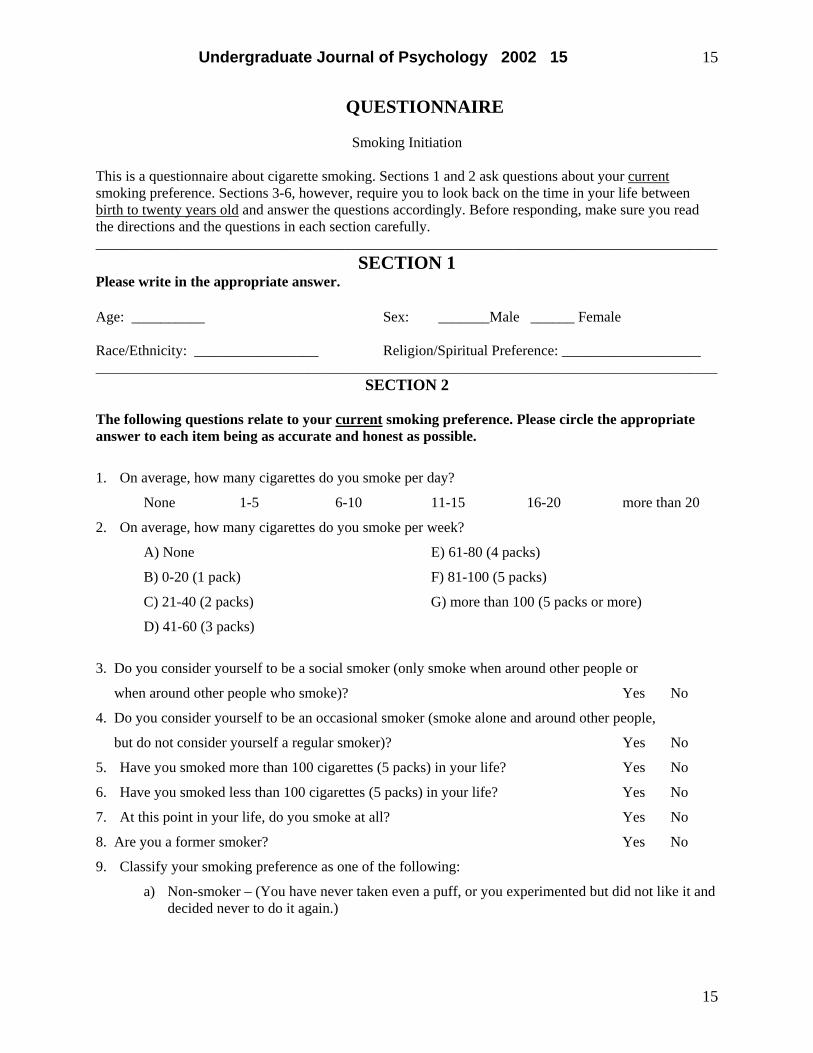
Smoking Initiation This is a questionnaire about cigarette smoking. Sections 1 and 2 ask questions about your current smoking preference. Sections 3-6, however, require you to look back on the time in your life between birth to twenty years old and answer the questions accordingly. Before responding, make sure you read the directions and the questions in each section carefully. _____________________________________________________________________________________
SECTION 1 Please write in the appropriate answer. Age: __________ Sex: _______Male ______ Female Race/Ethnicity: _________________ Religion/Spiritual Preference: ___________________ _____________________________________________________________________________________
SECTION 2
The following questions relate to your current smoking preference. Please circle the appropriate answer to each item being as accurate and honest as possible.
1. On average, how many cigarettes do you smoke per day?
None 1-5 6-10 11-15 16-20 more than 20
2. On average, how many cigarettes do you smoke per week?
A) None E) 61-80 (4 packs)
B) 0-20 (1 pack) F) 81-100 (5 packs)
C) 21-40 (2 packs) G) more than 100 (5 packs or more)
D) 41-60 (3 packs)
3. Do you consider yourself to be a social smoker (only smoke when around other people or
when around other people who smoke)? Yes No
4. Do you consider yourself to be an occasional smoker (smoke alone and around other people,
but do not consider yourself a regular smoker)? Yes No
5. Have you smoked more than 100 cigarettes (5 packs) in your life? Yes No
6. Have you smoked less than 100 cigarettes (5 packs) in your life? Yes No
7. At this point in your life, do you smoke at all? Yes No
8. Are you a former smoker? Yes No
9. Classify your smoking preference as one of the following:
a) Non-smoker – (You have never taken even a puff, or you experimented but did not like it and decided never to do it again.)
15
Undergraduate Journal of Psychology 2002 15 16
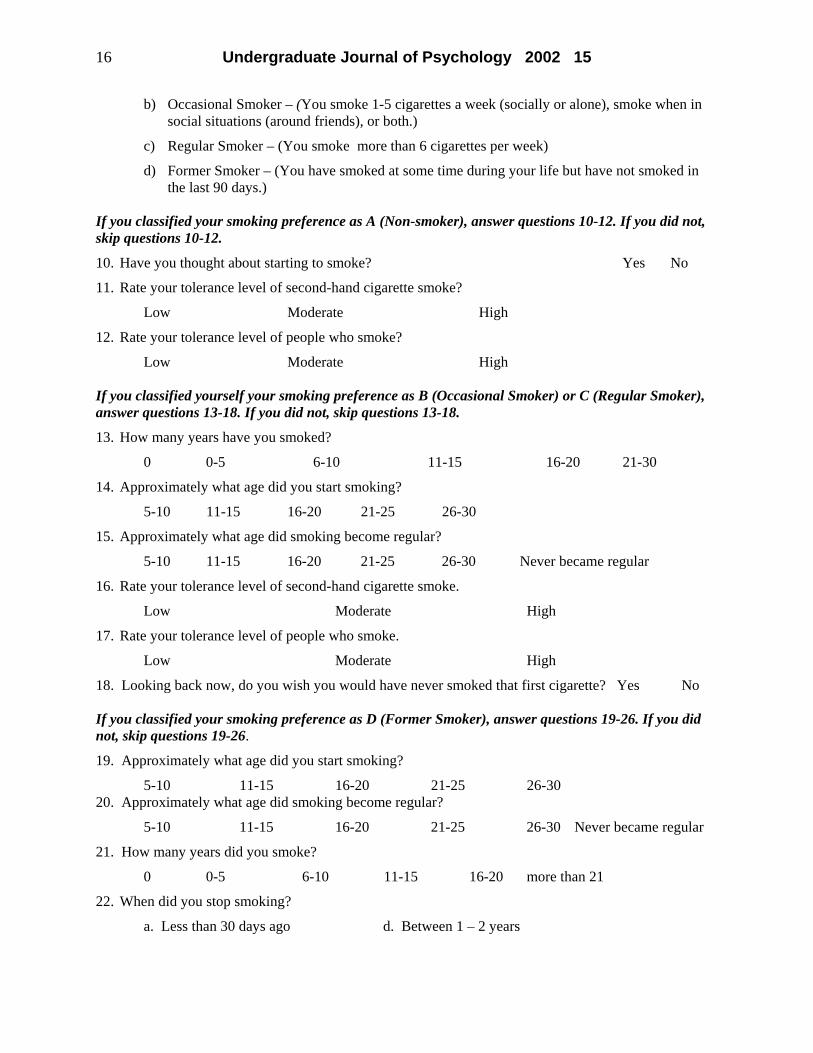
b) Occasional Smoker – (You smoke 1-5 cigarettes a week (socially or alone), smoke when in social situations (around friends), or both.)
c) Regular Smoker – (You smoke more than 6 cigarettes per week)
d) Former Smoker – (You have smoked at some time during your life but have not smoked in the last 90 days.)
If you classified your smoking preference as A (Non-smoker), answer questions 10-12. If you did not, skip questions 10-12.
10. Have you thought about starting to smoke? Yes No
11. Rate your tolerance level of second-hand cigarette smoke?
Low Moderate High
12. Rate your tolerance level of people who smoke?
Low Moderate High If you classified yourself your smoking preference as B (Occasional Smoker) or C (Regular Smoker), answer questions 13-18. If you did not, skip questions 13-18.
13. How many years have you smoked?
0 0-5 6-10 11-15 16-20 21-30
14. Approximately what age did you start smoking?
5-10 11-15 16-20 21-25 26-30
15. Approximately what age did smoking become regular?
5-10 11-15 16-20 21-25 26-30 Never became regular
16. Rate your tolerance level of second-hand cigarette smoke.
Low Moderate High
17. Rate your tolerance level of people who smoke.
Low Moderate High
18. Looking back now, do you wish you would have never smoked that first cigarette? Yes No
If you classified your smoking preference as D (Former Smoker), answer questions 19-26. If you did not, skip questions 19-26.
19. Approximately what age did you start smoking?
5-10 11-15 16-20 21-25 26-30 20. Approximately what age did smoking become regular?
5-10 11-15 16-20 21-25 26-30 Never became regular
21. How many years did you smoke?
0 0-5 6-10 11-15 16-20 more than 21
22. When did you stop smoking?
a. Less than 30 days ago d. Between 1 – 2 years
Undergraduate Journal of Psychology 2002 15 17
b. Less than 90 days ago e. More than 2 years ago
c. Between 3 – 6 months ago
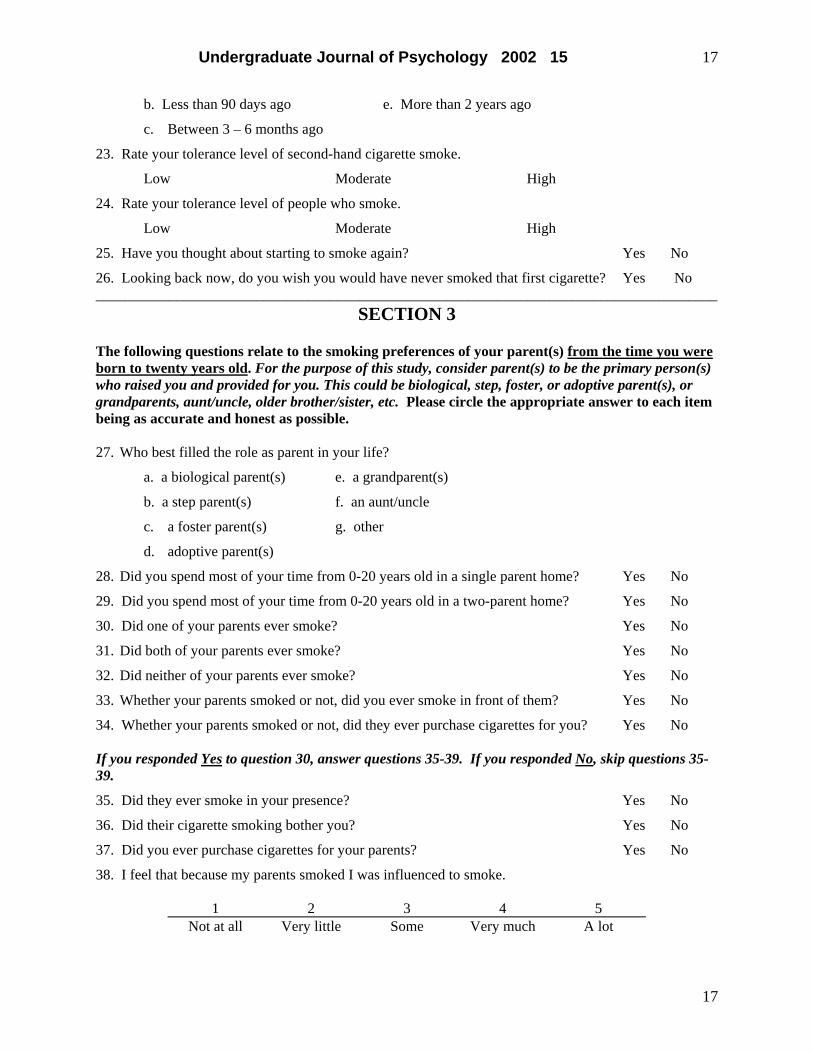
23. Rate your tolerance level of second-hand cigarette smoke.
Low Moderate High
24. Rate your tolerance level of people who smoke.
Low Moderate High
25. Have you thought about starting to smoke again? Yes No
26. Looking back now, do you wish you would have never smoked that first cigarette? Yes No _____________________________________________________________________________________
SECTION 3 The following questions relate to the smoking preferences of your parent(s) from the time you were born to twenty years old. For the purpose of this study, consider parent(s) to be the primary person(s) who raised you and provided for you. This could be biological, step, foster, or adoptive parent(s), or grandparents, aunt/uncle, older brother/sister, etc. Please circle the appropriate answer to each item being as accurate and honest as possible. 27. Who best filled the role as parent in your life?
a. a biological parent(s) e. a grandparent(s)
b. a step parent(s) f. an aunt/uncle
c. a foster parent(s) g. other
d. adoptive parent(s)
28. Did you spend most of your time from 0-20 years old in a single parent home? Yes No
29. Did you spend most of your time from 0-20 years old in a two-parent home? Yes No
30. Did one of your parents ever smoke? Yes No
31. Did both of your parents ever smoke? Yes No
32. Did neither of your parents ever smoke? Yes No
33. Whether your parents smoked or not, did you ever smoke in front of them? Yes No
34. Whether your parents smoked or not, did they ever purchase cigarettes for you? Yes No
If you responded Yes to question 30, answer questions 35-39. If you responded No, skip questions 35-39.
35. Did they ever smoke in your presence? Yes No
36. Did their cigarette smoking bother you? Yes No
37. Did you ever purchase cigarettes for your parents? Yes No
38. I feel that because my parents smoked I was influenced to smoke.
1 2 3 4 5 Not at all Very little Some Very much A lot
17
Undergraduate Journal of Psychology 2002 15 18
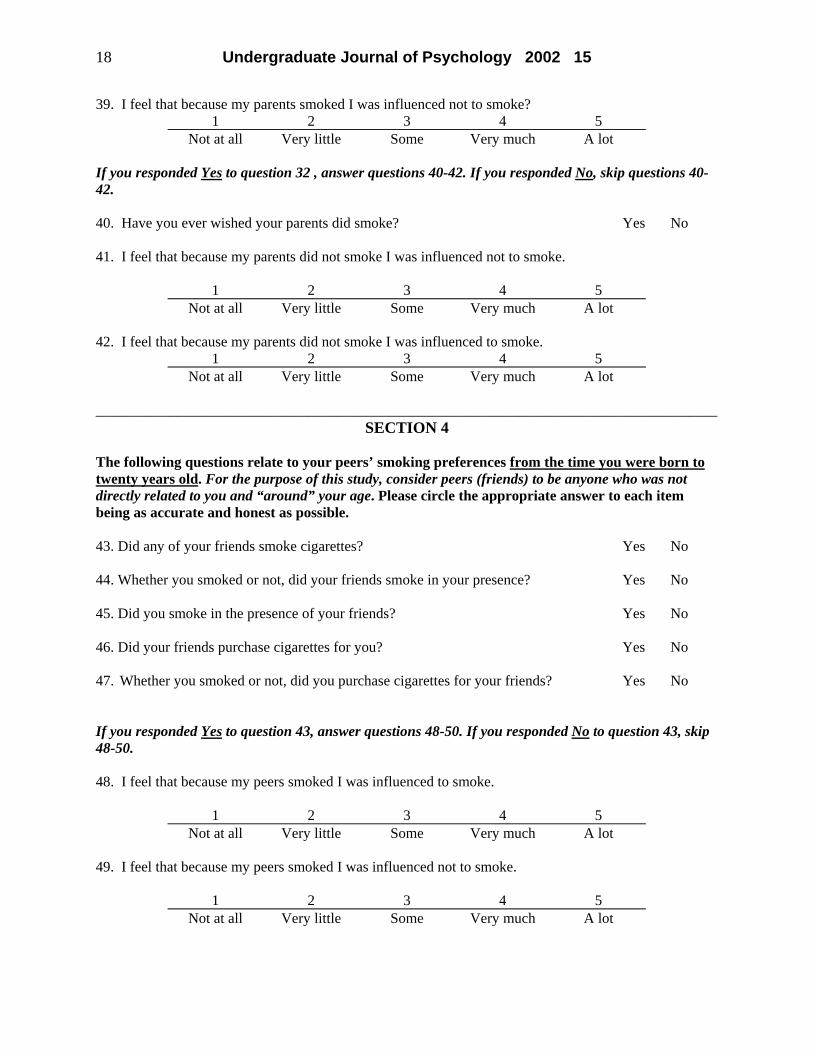
39. I feel that because my parents smoked I was influenced not to smoke? 1 2 3 4 5
Not at all Very little Some Very much A lot If you responded Yes to question 32 , answer questions 40-42. If you responded No, skip questions 40-42. 40. Have you ever wished your parents did smoke? Yes No 41. I feel that because my parents did not smoke I was influenced not to smoke.
1 2 3 4 5 Not at all Very little Some Very much A lot
42. I feel that because my parents did not smoke I was influenced to smoke.
1 2 3 4 5 Not at all Very little Some Very much A lot
_____________________________________________________________________________________
SECTION 4
The following questions relate to your peers’ smoking preferences from the time you were born to twenty years old. For the purpose of this study, consider peers (friends) to be anyone who was not directly related to you and “around” your age. Please circle the appropriate answer to each item being as accurate and honest as possible. 43. Did any of your friends smoke cigarettes? Yes No 44. Whether you smoked or not, did your friends smoke in your presence? Yes No 45. Did you smoke in the presence of your friends? Yes No 46. Did your friends purchase cigarettes for you? Yes No 47. Whether you smoked or not, did you purchase cigarettes for your friends? Yes No If you responded Yes to question 43, answer questions 48-50. If you responded No to question 43, skip 48-50. 48. I feel that because my peers smoked I was influenced to smoke.
1 2 3 4 5 Not at all Very little Some Very much A lot
49. I feel that because my peers smoked I was influenced not to smoke.
1 2 3 4 5 Not at all Very little Some Very much A lot
Undergraduate Journal of Psychology 2002 15 19
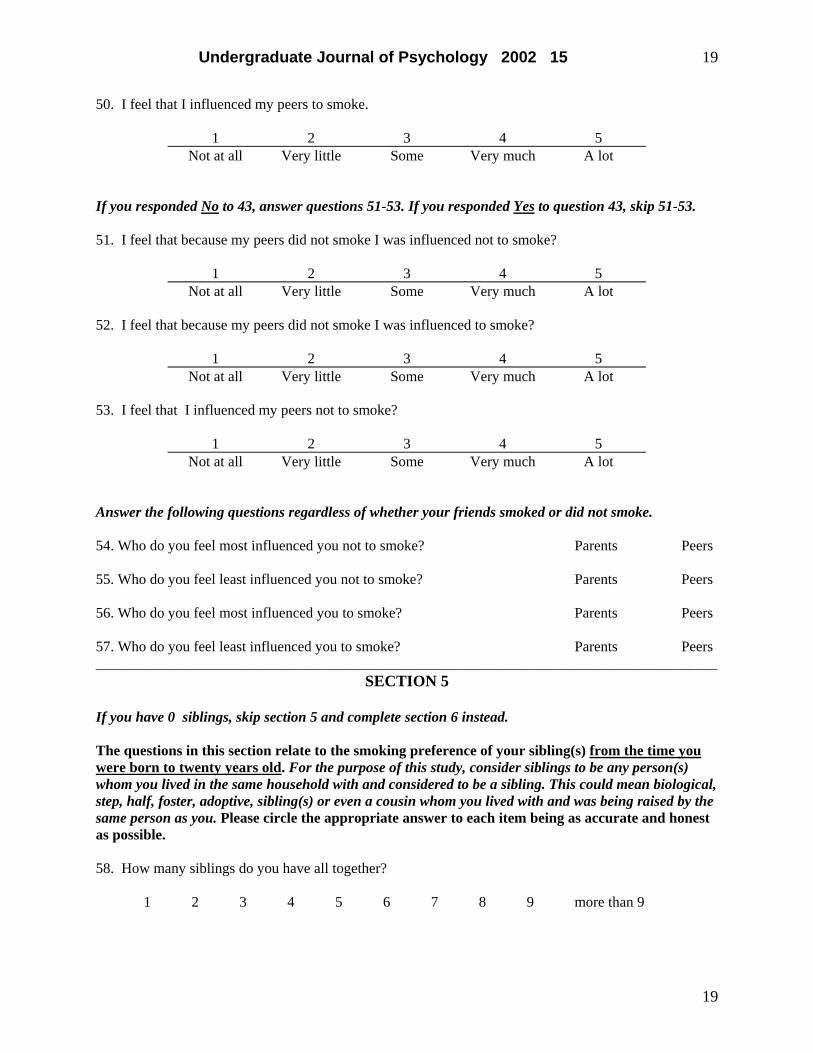
50. I feel that I influenced my peers to smoke.
1 2 3 4 5 Not at all Very little Some Very much A lot
If you responded No to 43, answer questions 51-53. If you responded Yes to question 43, skip 51-53. 51. I feel that because my peers did not smoke I was influenced not to smoke?
1 2 3 4 5 Not at all Very little Some Very much A lot
52. I feel that because my peers did not smoke I was influenced to smoke?
1 2 3 4 5 Not at all Very little Some Very much A lot
53. I feel that I influenced my peers not to smoke?
1 2 3 4 5 Not at all Very little Some Very much A lot
Answer the following questions regardless of whether your friends smoked or did not smoke. 54. Who do you feel most influenced you not to smoke? Parents Peers 55. Who do you feel least influenced you not to smoke? Parents Peers 56. Who do you feel most influenced you to smoke? Parents Peers 57. Who do you feel least influenced you to smoke? Parents Peers _____________________________________________________________________________________
SECTION 5
If you have 0 siblings, skip section 5 and complete section 6 instead. The questions in this section relate to the smoking preference of your sibling(s) from the time you were born to twenty years old. For the purpose of this study, consider siblings to be any person(s) whom you lived in the same household with and considered to be a sibling. This could mean biological, step, half, foster, adoptive, sibling(s) or even a cousin whom you lived with and was being raised by the same person as you. Please circle the appropriate answer to each item being as accurate and honest as possible. 58. How many siblings do you have all together? 1 2 3 4 5 6 7 8 9 more than 9
19
Undergraduate Journal of Psychology 2002 15 20
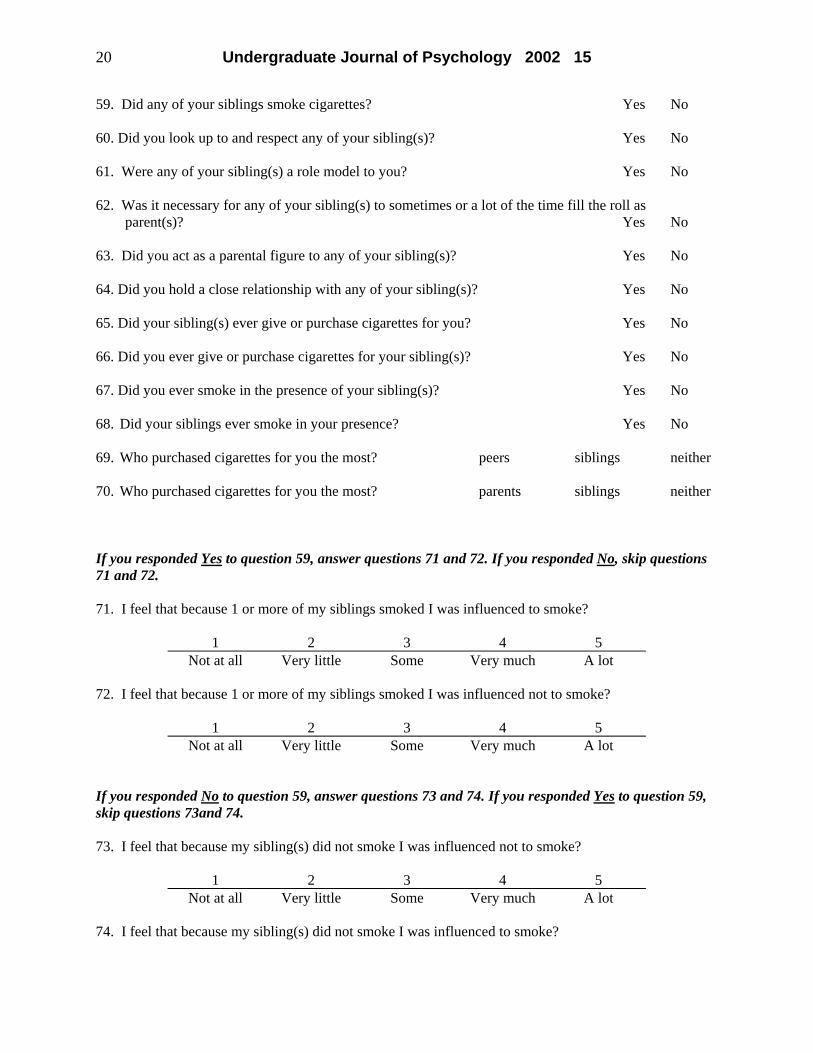
59. Did any of your siblings smoke cigarettes? Yes No 60. Did you look up to and respect any of your sibling(s)? Yes No 61. Were any of your sibling(s) a role model to you? Yes No 62. Was it necessary for any of your sibling(s) to sometimes or a lot of the time fill the roll as parent(s)? Yes No 63. Did you act as a parental figure to any of your sibling(s)? Yes No 64. Did you hold a close relationship with any of your sibling(s)? Yes No 65. Did your sibling(s) ever give or purchase cigarettes for you? Yes No 66. Did you ever give or purchase cigarettes for your sibling(s)? Yes No 67. Did you ever smoke in the presence of your sibling(s)? Yes No 68. Did your siblings ever smoke in your presence? Yes No 69. Who purchased cigarettes for you the most? peers siblings neither 70. Who purchased cigarettes for you the most? parents siblings neither
If you responded Yes to question 59, answer questions 71 and 72. If you responded No, skip questions 71 and 72. 71. I feel that because 1 or more of my siblings smoked I was influenced to smoke?
1 2 3 4 5 Not at all Very little Some Very much A lot
72. I feel that because 1 or more of my siblings smoked I was influenced not to smoke?
1 2 3 4 5 Not at all Very little Some Very much A lot
If you responded No to question 59, answer questions 73 and 74. If you responded Yes to question 59, skip questions 73and 74. 73. I feel that because my sibling(s) did not smoke I was influenced not to smoke?
1 2 3 4 5 Not at all Very little Some Very much A lot
74. I feel that because my sibling(s) did not smoke I was influenced to smoke?
Undergraduate Journal of Psychology 2002 15 21
1 2 3 4 5 Not at all Very little Some Very much A lot
Answer the following questions regardless of whether any of your siblings did or did not smoke. 75. Who do you feel most influenced you not to smoke?
peers siblings parents
76. Who do you feel least influenced you not to smoke?
peers siblings parents 77. Who do you feel most influenced you to smoke?
peers siblings parents 78. Who do you feel least influenced you to smoke?
peers siblings parents 79. Who do you feel most influenced you to smoke? peers siblings 80. Who do you feel least influenced you to smoke? peers siblings 81. Who do you feel most influenced you to smoke? peers parents 82. Who do you feel least influenced you to smoke? peers parents 83. Who do you feel most influenced you to smoke? parents siblings 84. Who do you feel least influenced you to smoke? parents siblings _____________________________________________________________________________________
SECTION 6 If you answered that you have 1 or more siblings skip this section, but make sure you completed section 5. The following questions ask your opinion about different smoking-related issues. Please circle the appropriate answer to each item being as accurate and honest as possible. 85. Do you think cigarette smoking should or should not be allowed in restaurants? should should not 86. Do you think smoking should or should not be allowed in school dormitories?
21
Undergraduate Journal of Psychology 2002 15 22
should should not 87. Do you think cigarette advertisements should or should not be eliminated? should should not 88. How harmful do you think second hand smoke is?
not very harmful kind of harmful very harmful
89. What do you think the legal smoking age should be? 16 17 18 21 there should be no legal age 90. Do you think smoking outside on a public street should or should not be allowed? should should not 91. Do you think it is or is not appealing when a man smokes? is appealing is not appealing 92. Do you think it is or is not appealing when a woman smokes? is appealing is not appealing 93. Who do you think smokes more cigarettes?
women men
Undergraduate Journal of Psychology 2002 15 23
Personality Development: Differences Among Siblings Kara E. Clouse Uiversity of North Carolina at Charlotte Personality Development: Differences Among Siblings
Personality can be defined as “the dynamic organization within the individual of those psychophysical systems that determine his unique adjustment to his environment” (Rothbart, Ahadi, & Evans, 2000). Personality develops from those systems within an individual that will guide how one responds to the environment and to the sensations, emotions, and physical aspects of one’s self. Rothbart and Ahadi (1994) state that the personality domain consists of “patterns of habitual behavior, skills, and the content of individual thought, values, needs, and goals”. Personality also consists of an individual’s temperament and the perception of self, of others and of events. There are as many different personalities as there are different people, but many people share similar personality traits. Examples of such traits are extraversion, neuroticism, openness, agreeableness, and conscientiousness, and some researchers have found these five traits to be the main determinants of personality (Bouchard, 1999).
It now stands to reason that it is both the environment and genetic contribution that form personality. The only question that many still argue over in the nature-nurture debate is which one, environment or genes, has more of an influence on development. The environment and the genes of an individual will both influence personality, yet people are different and thus influenced in different ways. These differences can be seen in the differing personalities among siblings. These personality differences among siblings are often questioned because siblings share some of the same genes and come from the same family. To uncover the cause of personality differences among siblings, the nature of a sibling will be studied and will include the genetic makeup, the influence of genes on the environment and temperament. The environment’s influence on the personality development of a sibling will also be discussed and more specific influences include the non-shared environment, the ordinal position, gender, and age differences in time. Finally, the interaction of an individual’s genetic makeup and environment on personality development will be discussed. One component studied in personality development is the genetic contribution, and in siblings the shared genes are researched. According to Bouchard (1999), the similarity in personalities of biological relatives almost entirely is genetic in origin, which suggests a greater influence of genes on personality development. It has been found in many studies that there is a significant correlation between the IQ scores and personality test scores of biological parents and children who were given up for adoption within two weeks of birth. Hoffman states that it has been shown that there is a similarity in the personalities of biological parents and their offspring that they have not reared, which gives evidence to the influence of the genetic contribution to personality development (1991). An individual’s genome is also the basis for differences among siblings. The “multiplicative effects among several genes contribute to variability in a trait”, which among non-identical siblings leads to their dissimilarity (Turkheimer & Waldron, 2000). The greater the differences in traits among siblings, possibly greater differences in personalities. The influence of the genetic contribution on personality development is also studied through the family environment. Within the family environment, some influences may operate through the non-shared experiences, ordinal position of siblings, gender and age differences in timing of events. Yet some researchers believe that different treatment in the family environment
23
Undergraduate Journal of Psychology 2002 15 24
does not explain personality differences. According to Bouchard (1999), the differences in behavior of children cause parents’ differential treatment, there is a bi-directional flow between the parent and child wherein each influences the other. This bi-directional flow effects each child’s environment. In his studies on the influence of genes on personality development, Bouchard holds that individuals pick and choose from a range of stimuli and events largely on the basis of their genotype. In research on genetic effects in the environment, “children are not passive receptacles for environmental influences — they select, modify, and even create their environments” (Plomin, Reiss, Hetherington & Howe, 1994). In other words, people create a unique set of experiences, and thus create their own environment. According to Plomin et al., the genetic factors that contribute to the behavioral differences among siblings, they can also influence the differences in the siblings’ experiences, including the actual and perceived differences in their parents’ behavior towards them.
Genetic factors that influence the behavior of siblings will also influence their differences in experiences. These differences in experiences also extend to the actual and perceived differences in parental treatment. For example, in a study twins were asked to rate parental treatment. The identical twins were more similar than fraternal twins in how they rated the warmth (from acceptance to rejection) of their mother and father, which suggested a genetic contribution (P10mm et al., 1994). In their studies, Plomin and colleagues found evidence regarding genetic influences that suggest an effect on children’s perception of their parents’ behavior toward them, “because their parents’ behavior is affected by genetically influenced characteristics of the children” and “because genetically influenced characteristics of the children affect their perceptions of parental behavior even if their perceptions bear no relation to parents’ actual behavior”. Therefore, the ways that siblings interact with their environments or the experiences that they have, is influenced by the genetic differences among them. Also within the influence of nature on personality development, is the individual’s temperament. McCrae et al. (2000) defined temperament as “the manner of thinking, behaving, or reacting characteristics of a specific individual”. According to some researchers, temperament comes from our genetic makeup and influences the individual by his/her experiences, so that one of its outcomes is the adult personality (Rothbart, Ahadi & Evans, 2000). In one of their studies, Rothbart et al. found that temperamentally irritable children were more likely to be classified as insecurely attached, and temperamentally non-irritable children were more likely to be classified as securely attached. The reasoning behind this, is that an individual’s temperament will influence the way other’s respond to them. A mother is likely to become more attached to a baby that is less irritable than to one that is irritable. As stated by Teglasi and Epstein (1998), an individual’s temperament will influence how one responds to a stimulus from the environment. Siblings in the same environment may have different experiences, such as stranger fear. One sibling may experience minimal fear, while another experiences great distress. Siblings are going to share only some of the same genes (unless they are monozygotic twins), yet some of the genes will be different — thus creating different temperaments. In their studies, Rothbart and Ahadi (1994) stated that “researchers expect early temperament to provide the within-the-person substrate from which personality develops.” Temperament will follow a course of development that has important influences on personality development, and the development of temperament occurs during the important cognitive development of the growing child (Rothbart & Ahadi, 1994). Therefore, as the personality of a child develops, it will be influenced by the cognitive development that is also occurring. For example, a part of a child’s temperament is how he/she responds to emotions and
Undergraduate Journal of Psychology 2002 15 25
sensations, and these responses will also be affected by the cognitive development as it progresses. As stated before, an individual creates his/her own environment, and this is largely due to the individual’s temperament characteristics. Temperament influences how a sibling perceives the environment, but also how the sibling will create his/her environment. In creating one’s own environment, an individual will choose situations with different levels of stimulation based on his/her own emotional reactivity (Teglasi & Epstein, 1998). Parents and children often have mismatches in situations, which may lead to problems in communication and cooperation (Rothbart & Ahadi, 1994). For example, an infant that requires a low level of stimulation for pleasure may become irritated at a parent that continues to stimulate him/her, and thus effect the behavior of the parent. The different temperaments of siblings will result in the creating of different environments. Therefore, sibling personalities may be different due to the difference in genetic makeup, the differing effects of genetic makeup in the environment and differences in temperament. On the other side of the debate is the influence of the environment on personality development. There are many aspects of the environment that influence personality. In studying the differences among personalities in siblings, the family environment is a big influence. In the typical home there are many differences, such as first born vs. later born children, sons vs. daughters, and the interactions among the siblings (Shaffer, 1999). Siblings are treated differently by parents. In sibling studies it is the nonshared environmental influences that are studied. Those are the life experiences or events not shared by siblings in the same family (Vernon, Jang, Harris & McCarthy, 1997). In one recent study, Vernon and colleagues estimated the magnitude of the heritable and nonheritable effects on popular scales of the environment. They found that the differences in personality traits between monozygotic twins, dizygotic twins, and non-twin siblings can be predicted by the differences in their perceptions of their family and background environments (Vernon et al, 1997). Experiences within the family are perceived differently by siblings. The family environment will be different for each sibling and influence the development of each sibling’s personality differently.
The number of children in a family has also been studied as to its influence on personality. It has been thought that large families provide practice in learning and social skills, whereas small families are believed to allow aloofness and independence (Blake, 1991). Observations showed that relative to children from two-child families, “only” children spent more time engaging in activities such as reading or collecting, whereas children with siblings participated in group-oriented and practical activities such as sports or team activities (Blake, 1991).
The many, yet often overlooked, differences in the family influence the personality development of siblings. An example would be the birth order or ordinal position of siblings. A first-born child will have different experiences in the environment than the second-born (Hoffman, 1991). Hoffman suggests that the parents of a first-born are new parents who have not yet experienced having a baby and their behavior may influence the baby’s behavior. However, the second-born baby’s environment is different — this time the parents are not new and their behavior will be different, and the second born has a sibling. According to Brody and Stoneman (1992), studies have shown that parental behaviors differ toward different children in the same family. For example, results suggest that when parents are with both siblings, the younger child receives higher rates of affectionate, controlling and responsive behavior, possibly because they are not as developed as their older sibling (Hoffman, 1991). Also, the interaction of
25
Undergraduate Journal of Psychology 2002 15 26
siblings is different and perceived differently by the older sibling and the younger sibling. Each one’s environment is different due to the other, so their experiences will be different (Hoffman, 1991). When the oldest sibling was born, he/she was an “only” child and has never experienced having an older sibling. Yet when a second child is born into the family, he/she will never have the experience of being an “only” child — there is always an older sibling. The older sibling may be aggressive to the younger sibling, and the younger sibling may be passive to his/her older sibling (Beer & Horn, 2000).
According to Beer and Horn, the birth order of siblings has also been suggested to influence personality traits by sibling competition for parental resources (2000). Beer and Horn show this sibling competition through an evolutionary model, firstborns learn to identify with their parents thereby securing their position. Whereas, later borns with a dominating older sibling may feel less secure, and lead the later born to try improve his/her position with their parents. According to this sibling competition, firstborns’ security leads them to defend their position with behaviors that are assertive and dominant. To gain the security and attention of their parents, laterborns tend to be more open to experiences, creative, unconventional, and rebellious (Beer & Horn, 2000). Another example of the differences in the family environment is that parents treat sons and daughters differently, yet parents may not admit to this differential treatment or even realize that they do this. It has been found that girls are given more help, and boys are given earlier independence and less restricted opportunities (Hoffman, 1991). Among sons and daughters, there are also differing expectations for achievement and the evaluations for competence are different (Hoffman, 1991). These differing environments will influence each sibling’s personality development.
Other events within the family, such as divorce, death, hospitalization, or illness are experienced differently by each sibling. Each sibling’s age at the time of an event, may have a large influence on personality development (Hoffman, 1991). For example, Hoffman states a divorce within a family is an experience that would be shared by siblings, yet because of their age differences and differing stages of cognitive development, this experience would be interpreted differently and have a differing significance for each sibling. In one study it was shown that adolescents and young adults believed that they had different experiences within their family environment than their siblings (Brody & Stoneman, 1992). Because siblings are born at different times in the family environment, are different ages throughout family events, and may be different genders their environments within the same family will differ.
It has been found that that high a level of differences in treatment of siblings by parents is linked to discrepancies in child adjustment and sibling relationships (Brody & Stoneman, 1992). There are also differences among the outside environment such as peers, the media, and educational systems, all of which have significant influences for each sibling (McCrae et al., 2000). As each sibling develops and grows older, the outside environment will change at different intervals especially in the educational system where peer influence increases over time. The environment is different for each sibling and will influence each one’s personality development differently. And personality is not set in childhood, with different experiences throughout each sibling’s life, their personalities will change.
There is an interaction between nature and nurture that influences development. Genes and environment have both been found to influence the development of personality. “Genetic differences between siblings are very easily confounded with environmental differences” (Turkheimer & Waldron, 2000). The temperament of a difficult baby will influence the behavior
Undergraduate Journal of Psychology 2002 15 27
of the parents, and that environment will in turn influence the baby (Teglasi & Epstein, 1998). It is a continuous circle of interaction. In studying negative emotionality, Brody and Stoneman (1992) found that small differences between siblings in their negative emotionality might elicit higher levels of differential treatment from parents over time. This differential treatment may increase the differences in the negative emotionality of the siblings, which would increase the differential treatment of the parents. Another example of the interaction of nature and nurture on the personality development is that the phenotype of an individual is the final makeup of the developmental interactions of the individual’s genotype and experiences in within the environment (Turkheimer and Waldron, 2000). Siblings from the same family have different personalities because their genetic makeup is different which effects their temperament and their temperament influences their experiences in the environment.
An individual’s personality is a major part of their development, and the development of personality can be influenced in many ways. Genetic influences and environmental influences cause the greatest affects on personality development, yet there is conflicting research as to which one has more of an influence. There may be no way to ever settle that debate, but it is certain that an individual’s genetic makeup and environment influence personality development. Because of these influences, siblings from the same family may have differing personalities. Some genetic influences on differing personalities may be the actual differences in the genes that are shared, the effect of the genetic makeup in the individual’s environment and differing temperaments. In the siblings’ family environment, there are many different influences that a sibling may expenence. Among these are, the ordinal position or rearing order, sex differential treatment by parents, and interactions among siblings. Therefore, siblings from the same family can have different personalities due to their individual genetic makeup and due to their individual experiences within the environment. The greater the differences among genes and environment, the more likely their personalities will differ.
27
Undergraduate Journal of Psychology 2002 15 28
References
Beer, J. & Horn, J. (2000). The influence of rearing order on personality development within two adoption cohorts. Journal of Personality. 68, 789-8 19. Blake, J. (1991). Number of siblings and personality. Family Planning Perspectives, 23 272-274.
Bouchard, T., Jr. (1999). Genes, environment, and personality. In S. Ceci & W. Williams (Eds.), The nature-nurture debate: The essential readings (pp. 98-103). Oxford, UK: Blackwell Publishers.
Brody, G. & Stoneman, Z. (1992). Parental differential treatment of siblings and sibling differences in negative emotionality. Journal of Marriage & the Family. 54, 643-651. Hoffman, L.W. (1991). The influence of the family environment on personality: Accounting for sibling differences. Psychologica1 Bulletin. 110, 187-203.
McCrae, R., Costa, P., Ostendorf, F., Angleitner, A., Hrebickova, M., Avia, M, Sanz, J., Sanchez-Bernardos, M., Kusdil, M., Woodfield, R., Saunders, P. & Smith, P. (2000). Nature over nurture: Temperament, personality, and life span development. Journal of Personality & Social Psycholo2y. 78, 173-186.
Plomin, R., Reiss, D., Hetherington, LX, & Howe, G. (1994). Nature and nurture: Genetic contributions to measures of the family environment. Developmental Psychology. 30, 32-43.
Rothbart, M. & Ahadi, S. (1994). Temperament and the development of personality. Journal of Abnormal Psychology. 103, 55-66.
Rothbart, M., Ahadi, S. & Evans, D. (2000). Temperament and personality: Origins and outcomes. Journal of Personality & Social Psychology, 78, 122-135.
Shaffer, D. (1999). Developmental psychology: Childhood and adolescence (‘5th ed.). Pacific Grove, CA: Brooks/Cole Publishing.
Teglasi, H. & Epstein, S. (1998). Temperament and personality theory: The perspective of cognitive-experiential self-theory. School Psychology Review. 27, 534-550.
Turkheimer, E. & Waldron, M. (2000). Nonshared environment: A theoretical, methodological, and quantitative review. Psychological Bulletin. 126, 78-108.
Vernon, P., Jang, K., Harris, J. & McCarthy, J. (1997). Environmental predictors of personality differences: A twin and sibling study. Journal of Personality & Social Psychology, 72, 177-183.
Undergraduate Journal of Psychology 2002 15 29
Is There a Correlation Between Type A Personality and Choice of a College Major? Matthew R. Hurley University of North Carolina at Charlotte ______________________________________________________________________________ Personality types have been a topic given much attention in the field of psychology. The purpose of this study is to identify the difference (if any) between art and business majors’ personality type. Forty-six participants (twenty-three art, and twenty-three business) were surveyed. The survey was a shortened survey from the Jenkins Activity Survey that originally was used to measure and assess the possibility of coronary heart problems. The process of selecting the participants included distributing the surveys where business and art majors were known to be located on a university campus located in the southeast of the United States. Only business and art majors were allowed to fill out the survey, in order to avoid contamination of the results. The results of the study show that there is no significant difference between personality types of students studying business and art. Another conclusion that may come from this study is that college students may have similar personality types instead of different personality types. ________________________________________________________________________________________________________
Is There a Correlation Between Type A Personality and Choice of a College Major? Personality types have been a subject matter given much consideration in the field of psychology. The two personality types that will be discussed in this study is personality type A and personality type B. Type A personality has been linked to such personality characteristics such as aggressiveness, time conscious, and well structured planners (Omundson & Schroeder, 1996). Type B personalities exhibits traits such as easy going, procrastinators, laziness, and unorganized (Omundson & Schroeder, 1996).
Whether or not personality types may have an effect on one’s choice of college major or eventual career is still subject to debate. Previous findings indicate that some business professions such as accounting tend to be uncreative and unwilling to encounter new ideas without being systematically prepared for a new change, and would prefer that everything would stay at a constant (Omundson & Schroeder, 1996). These are characteristics of Type A personality trait because of the reluctance of change in the work environment and wanted tasks to stay the same scheduled pace. The population involved in business profession shows vocational interest in business and organization, and not in general culture, arts or entertainment (Omundson & Schroeder, 1996). Preceding conclusions have found that type A personalities are more apt to choose business majors such as accounting, banking, and finance (Haemmerlie, Robinson, & Carmen 1991). Business professions such as these coincide with aggressive, competitive, individualistic personality traits that are characteristic of the fast pace and constant change in the business field (Haemmerlie, Robinson, & Carmen 1991). Professions in art such as art design, art historians, and art teaching will involve more social interaction and creativity tend to be more passive and easy going, thus showing type B personality characteristics (Schaubroick, 1995). The purpose of this study is to identify any correlations between personality type and choice of major. If the personality type of the participant were type A, then a business major would be correlated with a type A personality. If the personality type of the participant were type B, then an art major would be correlated with a type B personality. This study will attempt to add more knowledge on personality types (A and B), and more knowledge on student characteristics and choice of major.
29
Undergraduate Journal of Psychology 2002 15 30
Method
Participants A total of 46 participants completed a survey for the study, with twenty-three used for
each major (art and business). All of the participants surveyed were college students at a university located in southeastern United States and at least 18 years of age. Race and gender were not used as factors for participation. Each of the forty-six participants voluntarily answered the survey questions, and was assured that the survey was confidential. Materials
A basic pen-and-paper survey entitled Personality A/B was distributed to each of the participants. The survey contained twenty questions in which personality type was assessed accordingly to Jenkins Activity Survey. This specific survey is an edited version of the Jenkins Activity Survey. The original survey was reduced to accommodate only to the personality type questions for this study. This survey was originally formulated to detect behaviors that can eventually lead to heart attacks due to coronary heart problems (Jenkins, Ayzanski, & Rosenman, 1971). Type A personality generally refers to hard workers who are often preoccupied with schedules and the speed of their performance. Type B personalities may be more creative, imaginative, and philosophical. The test consists of 20 multiple-choice items. The Jenkins activity test measured scores that were based on scale by asking questions that dealt with activity levels, time management, punctuality, and childhood behavior. The test used a quantitative scale to add up the total scores. Scores range from 35 to 380 with the median score being 175. Since the overall scores from the Jenkins Activity survey are complex, and for convenience purposes, a score that was greater than 175 was considered to be type A personality, and a score less than or equal to 174 was to be considered type B personality. Procedure Before participants could even be selected as art or business majors, an operational definition of each major had to be determined. The majors of art and business were defined according to self-report given by the students. Surveys were distributed to the participants in areas where business and art majors were known to be on campus. Before the actual survey was administered to the participant, they were asked if they were a registered business or art major. If they answered “yes” by self-report then they were given the survey to complete. The participants were informed that the purpose of the survey was to see if there were any personality differences between college majors. The participants were also informed that the survey was confidential. There were a total of forty-six participants. Twenty-three of the participants were declared art majors, and the other twenty-three participants were declared business majors. All participants were at least eighteen years old and at least a freshman class standing at a university located in the southeast of the United States. The participants were assured that no personal information was to be disclosed about them. Each participant was notified that the survey would only take about five minutes. The debriefing process informed the participants that once again it the survey was confidential, it was for a research study, and they were given information to contact a faculty member in the psychology department if more information was needed.
Results
Undergraduate Journal of Psychology 2002 15 31
Two types of statistical tests were performed to evaluate the data from the surveys. First,
the means of both the art and business majors’ answers to the questions on the survey were analyzed by the t-test. The art majors (M = 209.48, +- 34.58) did not show a significant difference in their personalities when choosing their major compared to the business majors (M = 209.39, ±- 42.63), t(44) = .008, p> .05. The data were further analyzed by the use of a Chi-square test to compare the relative frequencies of personality type (A or B) across the two levels of the independent variable, choice of major. Among the business majors, 20 were determined to be type A while 3 were type B. Art majors were decided as 19 being type A while only 4 were type B.
Discussion
The main objective of this study is to identify any differences between art and business majors’ personality type, and whether or not personality type correlated with their choice of major. The results of this study suggest that there are no differences in levels of Type A between students who are decided art majors, and those who are declared business majors. Even though results did not show any significant correlation between the personality type and choice of major. Previous studies have shown that personality type may still influence more than just choice of major. Such findings have indicated support for the use of personality to predict and improve college performance and retention (Tross, Harper, Osher, Kneidinger, 2000). But, predicting performance using personality characteristics is not limited to the academic environment either. Personality characteristics also may key role in the work force. Research indicates that employer’s selection decisions on job applicants may also be based on personality tests (Tross, Harper, Osher, Kneidinger, 2000).
The participants have made plans to eventually begin careers in their preferred or specialty fields. This specific study only demonstrates the sample of students who all show type A personality characteristics. It also must be considered that a sample of college students was chosen as participants. There maybe a possibility that most college students show type A personality characteristics because they are goal oriented, and success driven, which are characteristics of a type A personality. This may explain why most of the college students in the study exhibited more of a Type A personality than Type B personality. Most personality Type B individuals may not have the success driven and goal oriented skills necessary to succeed in college.
This study only showed personality type similarities among college students that have different choice of majors. Further studies need to be developed to show if there are similar results in other populations of college students, and other general populations as well. There is not yet a clear substantial difference between Type A and Type B personalities in modern day society. Studies like this hope to provide more knowledge about Type A and Type B personalities in order to gain more understanding about personality characteristics.
31
Undergraduate Journal of Psychology 2002 15 32
References
Haemmerlie, F. M., Robinson, D. A. G., & Carmen, R. C. (1991). “Type A” personality traits and adjustment to college. Journal of College Student Development, 32, 81-82.
Jenkins, C.D., Zyzanski, S.J., & Rosenman, R.H. (1971). Progress toward validation of computer-scored test for the type A coronary-prone behavior pattern. Psychosomatic Medicine, 33, 193-202.
Omundson, J.S., Schroeder, R G. (1996). Type A personality, job satisfaction, and turnover intention among certified public accountants. Hispanic Journal of Behavioral Sciences, 18, 39-5 1.
Schaubroeck, J. (1995). Creative stress. Psychology Today, 28, 14. Tross, S. A., Harper, J. P., Osher, L. W., Kneidinger, L. M., (2000). Not just the usual cast of
characteristics: Using personality to predict college performance and retention. Journal of College Student Development, 41, 323-334.
Undergraduate Journal of Psychology 2002 15 33
EXPLORING ORGANIZATIONAL CULTURE Stephanie S. Eige University of North Carolina at Charlotte The views of organizational culture among teachers and administrators were examined to determine if there is a difference between the views of teachers and administrators. Each participant completed a modified version of the Organizational Culture Survey (Denison, 1990). The results indicated a significant difference in the views of teachers and administrators in decision-making practices, peer team building, and job clarity. Other areas within the organizational culture of the elementary school that were tested in the survey approached significant differences. However, most dimensions indicated agreement between how teachers and administrators perceived their school culture. Inspection of these findings lead to the generalization that differences in the view of the organizational culture may increase the potential for conflict as well as other problem between teachers and administrators.
The information age has arrived in full force and technology along with all of its advancements is here to stay. Even though our businesses seem to be all about numbers and making a fast buck, companies are again realizing the immeasurable significance of their human workforce. The recent awareness of organizational culture theory is evidence that “the time has come to write meaning and emotion back into organizations” (Gabriel, 1991, p.319).
History of Organizational Culture Theory
According to Eisenberg and Goodall, Jr. (2001), there are several factors that contributed to the rise of theories of organizational culture, including parts of world history. After World War II The Depression was over and the United States found itself in an economic boom. The value of the dollar was increasing, natural resources seemed abundant, factories were being built and producing at full steam, and unemployment was being greatly reduced. However, during the same time as this feeling of rejuvenation, there were threats of a nuclear war. These two conflicting factors, the economic boom and the threat of nuclear war, were extremely influential on the values being formed by the new generation (Eisenberg & Goodall, Jr., 2001).
In addition, Eisenberg and Goodall, Jr. (2001) state that the Post-World War II climate was affected by social, ethnic, racial, political, sexual, and economic tensions. By the mid-1960’s the European countries had given up their colonies, redefining the role of Western interest in the political and economic assistance of Third World Countries. Because of the emergence of multinational firms and a world economy that was dominated by capitalism and dependent on cheap labor in Third World countries, organizations were being scrutinized in a manner they never had been before. Companies doing business in other countries became concerned with how to improve cross-cultural communication skills and how to have a better general understanding of the cultures in these other countries. This factor was a major contributor to the cultural approach to industrial/organizational psychology. Furthermore, questions were being raised about topics such as power, participation, domination, and resistance in the workplace by men and women as well as by minority groups like those involved in the Civil Rights Movement (Eisenberg & Goodall, Jr., 2001).
One prominent researcher in the field of organizational culture studies, Edgar H. Schein (1990), believes that Katz and Kahn (1966) built their entire analysis of organizations around
33
Undergraduate Journal of Psychology 2002 15 34
systems theory and systems dynamics. This was the most important theoretical background for later culture studies. The increased growth of business and management schools increased the need for research in organizational psychology. The fields of sociology and anthropology also began to be a significant influence on organizational psychology. Researchers interested in organizations found that they needed the concept of culture to explain variations in patterns of behavior and levels of stability in group and organizational behavior. Recent emphasis on trying to explain why companies in the United States are not performing as well as some of their counterpart companies in other societies, such as Japan, has put the concept of organizational culture in the limelight (Schein, 1990).
Explanation of Organizational Culture Theories
There is a plethora of definitions describing culture in organizations in the field of psychology, just as there are many definitions of culture in the field of anthropology where the study of organizational culture has its roots. Ajiferuke and Boddewyn (1970, as cited in Sackmann, 1991, p. 296) make a good point when they say, “There are as many meanings of ‘culture’ as people using the term.” According to Eisenberg and Goodall, Jr. (2001), most of the research examining organizational culture has focused on five areas of study. These views include comparative management, corporate culture, organizational symbolism, critical and postmodern perspectives, and organizational cognition.
To begin, the comparative management views of organizational culture see culture as something almost concrete that is brought into a company through the societal affiliations of the employees. This approach compares organizations located throughout the world to show how differences in national and local culture are displayed in places of work. Next, in the corporate culture view, culture is seen as something the organization “possesses, manages, and exploits to enhance productivity” (Eisenberg & Goodall, Jr., 2001, p. 126). This approach completely goes against the anthropological view of culture, which argues that culture is “organic, emergent, and impossible to control” (Eisenberg & Goodall, Jr., 2001, p. 127). Another approach, the organizational symbolism view of culture, asserts that culture is revealed in an indirect manner through language, stories, nonverbal messages, and communicative interactions (Eisenberg & Goodall, Jr., 2001).
Recently, a more encompassing view of symbolism looks at all organizational action as possibly having meaning as opposed to the previous view of symbolism, which believed that it was only found in the underlying meanings of company artifacts. The critical and postmodern views of organizational culture indicate that an organizations’ culture is exemplified by numerous differences in connotation and a continual struggle for interpretive control (Eisenberg & Goodall, Jr., 2001).
Lastly, according to Sonja A. Sackmann (1991), the research literature on organizational culture predominately focuses on the organizational cognition perspective. Researchers such as Dyer, Gregory, Hofstede, Schein, and Wilkins have all guided their work by using the organizational cognition view of culture (Sackmann, 1991). This view of organizational culture defines culture as:
The pattern of basic assumptions that a given group has invented, discovered, or developed in learning to cope with its problems of external adaptation and internal integration, and that have worked well enough to be considered valid, and, therefore, to be taught to new members as the correct way to perceive, think, and feel in relation to those problems. (Schein, 1984, as cited in Sackmann, 1991, p. 296)
Undergraduate Journal of Psychology 2002 15 35
It is this last perspective, organizational cognition, which guides much of today’s research on organizational culture. Therefore a clear understanding of the knowledge base in this area requires a familiarity of the common terms used in organizational psychology studies that focus on organizational culture. Eisenberg and Goodall, Jr. (2001) have identified some of these terms as shown in Table 1.
Edgar Schein (1990), one of the most prominent researchers of organizational culture theory using a cognitive view of culture, has identified three essential levels at which culture reveals itself: artifacts, values, and basic assumptions. Artifacts are the most visible aspect of an organization’s culture and range from the visibly observable to the permanent and concrete. Examples of organizational artifacts include physical items such as company records, office layout, and company products as well as abstractions such as a company’s vision statement, the emotional intensity within the organization, and the way employees speak to one another.
Another level in which culture can be seen is in the values held by a company and its employees. Values are apparent in the organizational norms, ideologies, and philosophies. Schein (1990) maintains that basically, how people feel and think is revealed in this second level. Finally, the basic underlying assumptions held by a company determine the perceptions, thought processes, feelings, and behavior of organizational employees. Assumptions usually begin as values that eventually become taken-for-granted. As time passes they are no longer discussed or questioned and end up deeply rooted within the organizational culture (Schein, 1990).
Current Applications of Culture Theories in Organizational Psychology
Organizational culture theory is currently being used in the field of organizational psychology to explore a number of different ideas. A large amount of the literature dealing with organizational culture goes to great lengths to denote organizational culture. Because research on this topic is still limited, there seems to be a great deal of discussion about how to interpret terms and ideas relating to organizational culture theories. It is important to note that within the current literature focusing on organizational culture, researchers usually provide interpretations of commonly used terms and concepts found in organizational culture theory. Table 1 is a good example of a general consensus of these common terms and concepts although there are slight variations among individual studies.
One of the most general and basic applications of organizational culture theory is to attempt to provide insights into organizations. Pettigrew (1979, as cited in Trice & Beyer, 1984) discerned that people need to have a strong sense of what a company is about in order to properly function within that setting. One way organizational members receive this information is through ideologies. As defined by Beyer (1981), ideologies are a shared set of beliefs that provide an explanation of their reality in terms of cause-and-effect relations (as cited in Trice & Beyer, 1984). These beliefs also transmit messages to employees about the correctness of the organizational values and norms over other possible practices attempting to promote a strong and healthy organizational culture (Warner & Lunt as cited in Trice & Beyer, 1984).
When looking at organizational culture, it is important to note that all organizational cultures are not healthy. Kets de Vries and Miller (1986) explore the five dysfunctional types of organizational cultures and examine how they are influenced and perpetuated by the personalities of an organization’s management and executives. Researchers assert that by understanding what makes some organizations successful and others unsuccessful, this knowledge can be used to guide a company in the direction it wishes to go.
35
Undergraduate Journal of Psychology 2002 15 36
Another application of organizational culture is looking at how the organizational culture can be used to guide and shape the climate of an organization. Although both culture and climate are interrelated and are used to describe the circumstances that influence the behavior of individuals, there is a distinction between the terms, according to Tesluk, Farr, and Klein (1997). Schneider, Reichers, Gunnarson, and Niles-Jolly state that “climate refers to the organization members’ shared perceptions of policies and procedures, culture represents the basic values and assumptions that underlie those policies and procedures” (as cited in Tesluk, Farr & Klein, 1997, p. 29). In a recent study, Tesluk, Farr, and Klein (1997) look at how organizational culture and climate influence individual creativity. They examine how an organization’s environment and top management influence the organizational culture in terms of creativity and the assumptions and values that support creativity. Also, this article reviews how the practices, policies, and procedures of an organization communicate the organization’s goals for a creative climate.
Organizational culture being influenced by a particular work industry is yet another area of current research that is applicable to organizational culture theory. Industry characteristics such as the rate of growth and technology used, can be linked to organizational culture according to researchers Chatman and Jehn (1994). Such characteristics could account for similarities in organizational culture among companies working in the same industry. In their research, Chatman and Jehn (1994) also found that the types of people in different industries also accounts for differences in organizational culture.
Other research involving organizational culture examines the influence of culture on the performance of a company. For example, research conducted by Petty & Beadles, II, Chapman, Lowery, & Connell (1995) using twelve organizations at two separate times found that a culture promoting teamwork was strongly correlated to successful company performance. Behaviors found in organizational cultures that emphasize teamwork, such as employees helping each other, sharing information and resources, and working in a team or group seem to heighten organizational performance (Petty & Beadles, II, Chapman, Lowery, & Connell, 1995).
Wilkins and Ouchi (1983) argue that there are certain conditions that encourage the development of cohesive and productive cultures. A long history and stable membership, an absence of institutional alternatives, and interaction among organizational members are imperative for a strong culture to develop that will in turn improve performance. Another study on organizational performance as related to organizational culture determined three conditions necessary to sustain superior financial performance. Barney (1986) believes the culture must be valuable, rare, and imperfectly imitable in order to repeatedly be successful and maintain a competitive advantage. These apparently profitable outcomes exemplify the economic value of researching organizational culture.
A large amount of research using organizational culture theory involves the exploration of person-organization fit. Characteristics most frequently associated with person-organization fit are values and personality traits (Kristof-Brown, 2000). Judge and Cable (1997) found significant relations between personality traits and vocational interests. It is reasonable to surmise then that organizational culture, which is influenced by employees, is affected by personality traits of individuals. Schneider (1987, as cited in O’Reilly, III, Chatman, & Caldwell, 1991) suggested that individuals are often attracted to organizations they believe to have comparable values to their own.
Ashforth and Mael (1989, as cited in O’Reilly, III, Chatman & Caldwell, 1991) examine the psychological process of identity formation where individuals tend to look for a social identity that provides them with meaning and connectedness, which could account for the
Undergraduate Journal of Psychology 2002 15 37
importance of values in organizational culture. Similarly, organizations search for recruits that give the impression of sharing the organizational values. The “congruency between an individual’s values and those of an organization may be at the crux of person-culture fit” (O’Reilly, III, Chatman & Caldwell, 1991, p. 492).
Many researchers believe that how well a person fits into the organization’s culture may be as important as how well a person fits the requirements of a specific job. According to Kristof-Brown (2000), recruiters consider an applicant’s potential organizational fit even in the earliest stages of hiring. She also suggests that training recruiters to look for specific organizational culture qualities may be beneficial, rather than each recruiter relying on their own individual preferences. Organizational culture research also looks at personality traits and their relativity to organizational culture. In addition, research on organizational culture and person-organization fit has studied its influence on organizational commitment and turnover of employees. Van Vianen (2000) found a positive correlation between organizational commitment and employee-organization values congruency.
Furthering the Knowledge Base
Because the literature on organizational culture theory is still relatively limited and tends to focus on unearthing information rather than testing, there are a myriad of possibilities for furthering the current knowledge base. Most of the research focuses on describing and defining organizational culture and its effects on the existing organization and its members and other paths of inquiry need to be followed. “Noncultural approaches to the study of organizations have failed to sensitize researchers to the full range of meanings embodied in many familiar organizational events” (Trice & Beyer, 1984, p. 654).
Webster’s Dictionary (1990) defines an organization as an association of people working together. A school typifies this definition and is an excellent setting to examine the dynamics of organizational culture. In a school setting, employees may be identified in the following manner; the teachers are the front-line “workers” and the administrators are the “managers.” As in most corporations, the administrators or “managers” also have superiors, such as the school superintendent, that they must report to and take instruction from. This hierarchical arrangement of power and order as well as the other facets working within a school corporation are comparable to what most people think of as a typical business.
This study will examine differences between teachers and administrator’s views of their school’s culture. It is hypothesized that the teachers’ view of organizational culture will differ from the administrators’ view of the organizational culture.
Method
Participants Participants in this study all work in the state of Indiana. The schools in which the
participants work include Daleville Elementary (Daleville), Garfield Elementary (Muncie), the Indiana Academy (Muncie), Longfellow Elementary (Muncie), Morrison Mock Elementary (Muncie), South View Elementary (Muncie), and West View Elementary (Muncie). There were 5 participants from Daleville, 5 participants from Garfield, 10 participants from the Indiana Academy, 8 participants from Longfellow, 5 participants from Morrison Mock, 18 participants from South View, and 5 participants from West View.
There were 47 female participants and 9 male participants, and participants ranged in age from 22 to over 60. Both teachers and administrators participated in this study; there were 39
37
Undergraduate Journal of Psychology 2002 15 38
teachers and 17 administrators. Participants were volunteers, and all participants that were given a survey returned a completed survey.
Design and Materials
This study used a modified version of the Organizational Culture Survey (Denison, 1990). The survey consists of 21 sub-scales that represent various areas of interest within an organization’s. Table 2 presents a list of the sub-scales as well as examples of the questions used within each of the sub-scales. In addition, the number of years in education and the number of years in the current job position was asked in order to see if any other important information could be derived from the results of the survey.
Procedure
Copies of the organizational culture survey were given to research assistants to distribute to participants in the different schools throughout Indiana. The research assistants personally handed participants the survey along with an informed consent form so that any preliminary questions could be answered. In order to assure anonymity, an area was designated in each school for participants to return their consent form and their completed survey into separate opaque manila envelopes that were labeled as consent form and survey. When all of the consent forms and surveys were returned at each of the schools, a research assistant personally delivered the sealed envelopes to the researcher.
Results
Category scores for each of the 21 sub-scales were derived from individual items by
summing each category on each survey and dividing by the total number of surveys (54). A series of t-tests was used to test for differences between teachers and administrators on the Organizational Culture Survey. The results are presented in Table 3. Among the 21 dimensions within the survey, the t-tests indicate that 3 categories reached significance and 5 categories approached significance. The other 13 categories did not indicate a significant difference in the views of organizational culture between the teachers and administrators, ts (54) > -1.39, p > .168.
Survey categories that reached significance include Decision-Making Practices, Peer Team Building, and Job Clarity. In the category Decision-Making Practices, teachers’ scores were lower than administrators’ scores, t (48.065) = -3.53, p = .001. This indicated that the degree to which teachers feel the school system’s decisions involve those who will be affected, are made at appropriate levels, and are based on widely shared information is less than that of administrators. In the category Peer Team Building, teachers’ scores were lower than administrators’ scores, t (44.262) = -2.34, p = .024, indicating that teachers do not feel as strongly about the teachers’ emphasis of team goals, idea exchange, and working as team as do administrators feel administrators work together as a team. In the category Job Clarity, teachers’ scores were lower than administrators’ scores, t (45.117) = -2.23, p = .031. This indicated that teachers do not have as clear a sense of their job expectations, as do administrators.
Survey categories approaching significance include Group Functioning, Emphasis on Human Resources, Organization of Work, Absence of Bureaucracy, and Job Reward. In the category Group Functioning, teachers’ scores were lower than administrators’ scores, t (54) =
-1.97, p = .054. This indicated that teachers feel less satisfied with their group members’ planning and coordination, decision-making and problem solving, knowledge of jobs, trust, and
Undergraduate Journal of Psychology 2002 15 39
sharing of information than do administrators. In the category Emphasis on Human Resources, teachers’ scores were lower than administrators’ scores, t (54) = -1.95, p = .057, indicating that teachers are less satisfied with the interest that the school system displays in their welfare and development than are the administrators. In the survey category Organization of Work, teachers’ scores were lower than administrators’ scores, t (53.27) = -1.88, p = .065. This indicated that teachers are not as satisfied with the degree to which their school system’s work methods link the jobs of individuals to organizational objectives, as are administrators. In the category Absence of Bureaucracy, teachers’ scores were higher than administrators’ scores, t (54) = 1.74, p = .087, indicating that teachers feel there are more administrative constraints in the organization’s internal functioning than do the administrators. In the category Job Reward, teachers’ scores were lower than administrators’ scores, t (54) = -1.73, p = .089. This indicated that teachers are less satisfied with the instrumentality of good job performance with regard to recognition, respect, and getting ahead than are administrators.
Discussion
It is important to acknowledge that only 3 of the 21 sub-scales reached significance and 5
of the sub-scales approached significance on the Organizational Culture Survey. However, the statistical results do indicate that there are some significant differences between the teachers’ view and the administrators’ view of the organizational culture within the elementary school setting. The most significant difference was found in the category of Decision-Making Practices. Teachers view the decision-making practices of the elementary school setting less favorably than do administrators. Teachers also feel that when decisions will directly affect them they are not consulted or asked to give input even though the information they could provide would be useful in the decision-making process.
Another area of significant difference in the view of the organizational culture is in the category of Peer Team Building. Although school administrators feel as though the employees at school work as a team and as administrators emphasize a team goal, the teachers do not feel the same way. Additionally, the administrators feel as though the employees at school exchange opinions and ideas, the teachers do not have the same belief. Within the category of Job Clarity, there is also a difference between the view of teachers and administrators. Again, teachers are not as satisfied as administrators. Teachers feel as though there are times when job expectations are unclear or too much is expected from them. It is in these three survey categories that there is a significant difference in the view of organizational culture among teachers and administrators.
In addition, teachers do not feel as though they are appreciated within the educational system and do not believe the system has adequate concern for the welfare and development of the teachers. This relates to the survey category of Emphasis on Human Resources. When analyzing the category of Organization of Work, it appears as though there is a difference in opinion among teachers and administrators in their views on the degree to which the organization’s work methods link the jobs of individuals to organizational objectives. The teachers do not feel as favorably about this concept as do the administrators.
In analyzing the survey category Absence of Bureaucracy, the administrators feel as though there are not too many unnecessary constraints, or “red tape”, in the internal functioning of the educational organization, while the teachers disagree. Teachers feel that there are times when they get referred from person to person when they need help and are given answers based on long-standing rules and regulations that no one seems to be able to explain. The data also
39
Undergraduate Journal of Psychology 2002 15 40
indicate that teachers and administrators disagree in their view in the survey category Job Reward. Teachers feel that they do not receive adequate recognition, rewards, or respect and feel as though there is little opportunity for them to getting ahead.
The survey category that approached significance and came the closest to reaching significance was Group Functioning. The differences between teachers and administrators in this category indicate that the teachers’ view is less favorable than the administrators’ view on topics relative to this category. Group members’ planning and coordination, decision-making and problem solving, knowledge of jobs, trust, and sharing of information are concepts in which there is disagreement among teachers and administrators.
Even though many precautions were taken to eliminate potential problems with this research, it is possible that threats to the internal validity of the study occurred. For example, because the participants answered the survey without the presence of a researcher, it is possible that participants answered the questions in the presence of one another. This could result in interparticipant bias. Basically, just being in the presence of other participants may influence the response of some participants.
Also, it is possible that the research assistants that gave out the survey to participants had an effect on the response of participants. The research assistants had a prior relationship with the participants, which could potentially cause a threat of researcher personal attribute effect. The number of participants that volunteered from each school varies and may also have an effect on the results of this study.
In addition to internal threats to validity, there are also potential threats to the external validity of the study. Since all of the participants in this study were from Indiana, the results may not be applicable to other states in the United States or to other cultures. Also, the participants in this study were volunteers and were not chosen through random selection. The participants may not reflect the true population of teachers and administrators, which may reduce the generalizability of the results due to the use of convenience sampling.
This study contributes to and is consistent with the existing literature on organizational culture. The findings of this study are based on common definitions of the concepts found within the study of organizational culture and support the theories and ideas posited by other researchers in the field. For instance, these findings relate to Chatman and Jehn’s (1994) research on organizational culture being influenced by the industry. In the case of the elementary schools in this study, traditionally the state of Indiana has mandated the decisions. This is not necessarily the case for all school corporations and may have a significant impact on the schools in Indiana and their views of the organizational culture of their school corporation.
Generally, the results of this particular study indicate that in the areas in which there is disagreement among teachers and administrators, the teachers appear to be less satisfied in these areas than do the administrators. The implications of this finding have the potential to be far reaching. On a basic level these differences indicate a continuous threat of potential conflict between teachers and administrators as long as each group feels so differently about these topics. Subsequently, the conflict will more than likely produce a total breakdown of communication between the two groups.
Furthermore, this breakdown in communication can potentially cause the teachers to isolate themselves from other teachers as well as isolate themselves from the administrators. When the teachers become detached they become less motivated to do their job. Additionally, this increases the probability of teachers rejecting the input of others, such as new ideas that are suggested. They may also reject participating in school situations where they could present their
Undergraduate Journal of Psychology 2002 15 41
own ideas and also discuss the circumstances that are causing them to feel dissatisfied with their job and/or school corporation.
There is a great deal of research being done in an effort to link the concept of organizational culture from the theoretical plane to the real world plane. This study is attempting to bridge this gap and provide useful information that will lead to other valuable research in the field of organizational culture. Organizations seem to want to provide a healthy work environment with cohesion among organizational members and understanding organizational culture is an excellent way to begin to achieve this goal.
References
Barney, J.B. (1986). Organizational culture: Can it be a source of sustained competitive advantage? Academy of Management Review, 11, (3), 656-665.
Cayne, B.S. et al. (Ed.). (1990). The New Lexicon Webster’s Dictionary of the English Language (Encyclopedic ed.). New York: Lexicon Publications, Inc.
Chatman, J.A. & Jehn, K.A. (1994). Assessing the relationship between industry characteristics and organizational culture: How different can you be? Academy of Management Journal, 37, (3), 522-553.
Denison, D.R. (1990). Corporate culture and organizational effectiveness. New York, NY: Wiley.
Eisenberg, E.M. & Goodall, Jr., H.L. (2001). Cultural studies of organizations and communication. Organizational communication: Balancing creativity and constraint 3rd ed., (pp.113-137). Boston: Bedford/St. Martin’s.
Gabriel, Y., (1991). Organizations and their discontents: A psychoanalytic contribution to the study of organizational culture. Journal of Applied Behavioral Science, 27, (3), 318-336.
Judge, T.A. & Cable, D.M. (1997). Applicant personality, organizational culture, and organization attraction. Personnel Psychology, 50, (2), 359-395.
Kets De Vries, M.F.R. & Miller, D. (1986). Personality, culture, and organization. Academy of Management Review, 11, (2), 266-279.
Kristof-Brown, A.L. (2000). Perceived applicant fit: Distinguishing between recruiters’ perceptions of person-job and person-organization fit. Personnel Psychology, 53, (3), 643-672.
O’Reilly, III, C.A., Chatman, J., & Caldwell, D.F. (1991). People and organizational culture: A profile comparison approach to assessing person-organization fit. Academy of Management Journal, 34, (3), 487-516.
Petty, M.M. & Beadles, II, N.A., Chapman, D.F., Lowery, C.M., & Connell, D.W. (1995). Relationships between organizational culture and organizational performance. Psychological Reports, 76, (2), 483-492.
Sackmann, S.A., (1991). Uncovering culture in organizations. Journal of Applied Behavioral Science, 27, (3), 295-318.
Schein, E.H., (1990). Organizational culture. American Psychologist, 45, (2), 109-119. Tesluk, P.E., Farr, J.L., & Klein, S.R., (1997). Influences of organizational culture and climate
on individual creativity. Journal of Creative Behavior, 31, (1), 27-41. Trice, H.M. & Beyer, J.M., (1984). Studying organizational culture through rites and
ceremonials. Academy of Management Review, 9, (4), 653-669.
41
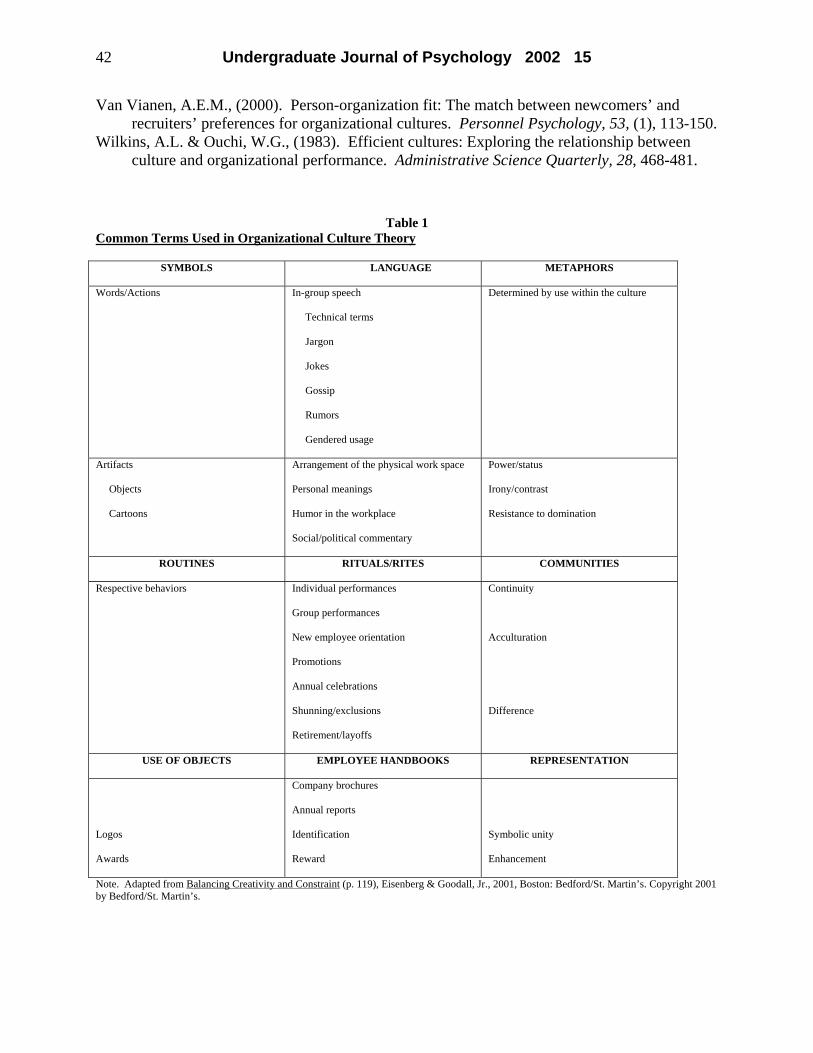
Undergraduate Journal of Psychology 2002 15 42
Van Vianen, A.E.M., (2000). Person-organization fit: The match between newcomers’ and recruiters’ preferences for organizational cultures. Personnel Psychology, 53, (1), 113-150.
Wilkins, A.L. & Ouchi, W.G., (1983). Efficient cultures: Exploring the relationship between culture and organizational performance. Administrative Science Quarterly, 28, 468-481.
Table 1 Common Terms Used in Organizational Culture Theory
SYMBOLS LANGUAGE METAPHORS
Words/Actions In-group speech
Technical terms
Jargon
Jokes
Gossip
Rumors
Gendered usage
Determined by use within the culture
Artifacts
Objects
Cartoons
Arrangement of the physical work space
Personal meanings
Humor in the workplace
Social/political commentary
Power/status
Irony/contrast
Resistance to domination
ROUTINES RITUALS/RITES COMMUNITIES
Respective behaviors Individual performances
Group performances
New employee orientation
Promotions
Annual celebrations
Shunning/exclusions
Retirement/layoffs
Continuity
Acculturation
Difference
USE OF OBJECTS EMPLOYEE HANDBOOKS REPRESENTATION
Logos
Awards
Company brochures
Annual reports
Identification
Reward
Symbolic unity
Enhancement
Note. Adapted from Balancing Creativity and Constraint (p. 119), Eisenberg & Goodall, Jr., 2001, Boston: Bedford/St. Martin’s. Copyright 2001 by Bedford/St. Martin’s.
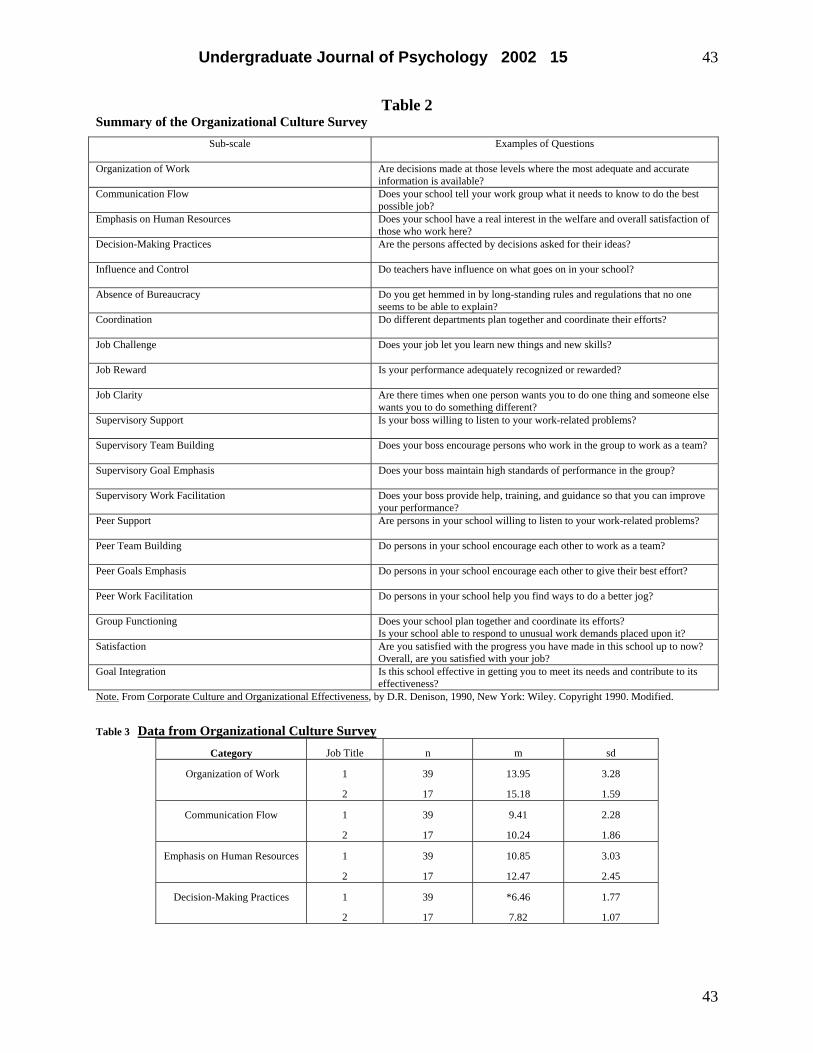
Undergraduate Journal of Psychology 2002 15 43
Table 2 Summary of the Organizational Culture Survey
Sub-scale Examples of Questions
Organization of Work Are decisions made at those levels where the most adequate and accurate information is available?
Communication Flow Does your school tell your work group what it needs to know to do the best possible job?
Emphasis on Human Resources Does your school have a real interest in the welfare and overall satisfaction of those who work here?
Decision-Making Practices Are the persons affected by decisions asked for their ideas?
Influence and Control Do teachers have influence on what goes on in your school?
Absence of Bureaucracy Do you get hemmed in by long-standing rules and regulations that no one seems to be able to explain?
Coordination Do different departments plan together and coordinate their efforts?
Job Challenge Does your job let you learn new things and new skills?
Job Reward Is your performance adequately recognized or rewarded?
Job Clarity Are there times when one person wants you to do one thing and someone else wants you to do something different?
Supervisory Support Is your boss willing to listen to your work-related problems?
Supervisory Team Building Does your boss encourage persons who work in the group to work as a team?
Supervisory Goal Emphasis Does your boss maintain high standards of performance in the group?
Supervisory Work Facilitation Does your boss provide help, training, and guidance so that you can improve your performance?
Peer Support Are persons in your school willing to listen to your work-related problems?
Peer Team Building Do persons in your school encourage each other to work as a team?
Peer Goals Emphasis Do persons in your school encourage each other to give their best effort?
Peer Work Facilitation Do persons in your school help you find ways to do a better jog?
Group Functioning Does your school plan together and coordinate its efforts? Is your school able to respond to unusual work demands placed upon it?
Satisfaction Are you satisfied with the progress you have made in this school up to now? Overall, are you satisfied with your job?
Goal Integration Is this school effective in getting you to meet its needs and contribute to its effectiveness?
Note. From Corporate Culture and Organizational Effectiveness, by D.R. Denison, 1990, New York: Wiley. Copyright 1990. Modified.
Table 3 Data from Organizational Culture SurveyCategory Job Title n m sd
Organization of Work 1
2
39
17
13.95
15.18
3.28
1.59
Communication Flow 1
2
39
17
9.41
10.24
2.28
1.86
Emphasis on Human Resources 1
2
39
17
10.85
12.47
3.03
2.45
Decision-Making Practices 1
2
39
17
*6.46
7.82
1.77
1.07
43
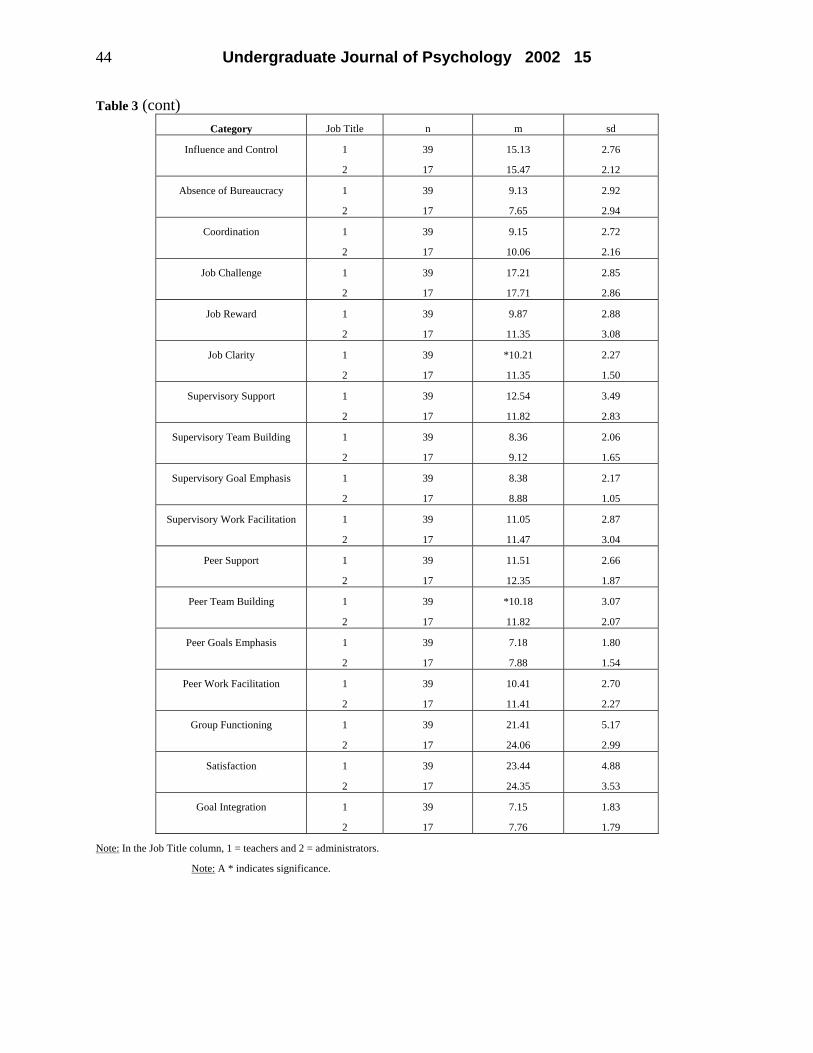
Undergraduate Journal of Psychology 2002 15 44
Table 3 (cont) Category Job Title n m sd
Influence and Control 1
2
39
17
15.13
15.47
2.76
2.12
Absence of Bureaucracy 1
2
39
17
9.13
7.65
2.92
2.94
Coordination 1
2
39
17
9.15
10.06
2.72
2.16
Job Challenge 1
2
39
17
17.21
17.71
2.85
2.86
Job Reward 1
2
39
17
9.87
11.35
2.88
3.08
Job Clarity 1
2
39
17
*10.21
11.35
2.27
1.50
Supervisory Support 1
2
39
17
12.54
11.82
3.49
2.83
Supervisory Team Building 1
2
39
17
8.36
9.12
2.06
1.65
Supervisory Goal Emphasis 1
2
39
17
8.38
8.88
2.17
1.05
Supervisory Work Facilitation 1
2
39
17
11.05
11.47
2.87
3.04
Peer Support 1
2
39
17
11.51
12.35
2.66
1.87
Peer Team Building 1
2
39
17
*10.18
11.82
3.07
2.07
Peer Goals Emphasis 1
2
39
17
7.18
7.88
1.80
1.54
Peer Work Facilitation 1
2
39
17
10.41
11.41
2.70
2.27
Group Functioning 1
2
39
17
21.41
24.06
5.17
2.99
Satisfaction 1
2
39
17
23.44
24.35
4.88
3.53
Goal Integration 1
2
39
17
7.15
7.76
1.83
1.79
Note: In the Job Title column, 1 = teachers and 2 = administrators.
Note: A * indicates significance.
Undergraduate Journal of Psychology 2002 15 45
A Study On Retail Store Employees On The Use Of Illegal Drugs And Required Drug Testing For The Use Of Illegal Drugs Matthew R. Hurley University of North Carolina at Charlotte ______________________________________________________________________________ Illegal drug use has spawned many controversial issues in American society. One major issue is the implementation of a substance abuse policy made by employers, which leads to the requirement of testing for the use of illegal drugs by some areas of the work force. The purpose of this study is to provide further knowledge on the attitudes on the use of illegal drugs and illegal drug testing. A survey was given out reflecting the feelings, and attitudes of illegal drug use, and illegal drug testing into two different retail store environments. One environment included a selection of stores that did not require a test for the use of illegal drugs, and the other environment included the selection of stores that required illegal drug testing. The setting was a selection of retail stores in the southeast of the United States. Sixty participants (thirty from illegal drug test stores, and thirty from no test required stores) were surveyed. The selection of participants were selected at a given retail store with permission from store management to fill out the survey. The results of the study show that there is no significant difference on the attitudes towards illegal drug use, but there is a significant difference in the attitudes towards testing for illegal drug use. Since there are similar attitudes towards the testing for illegal drug use in both conditions, the results of the study suggest that employees that worked in a retail store that required drug testing had viewed drug testing more negatively than the employees that worked in a store that did not require drug testing.
A Study On Retail Store Employees On The Use Of Illegal Drugs And Required Drug Testing For The Use Of Illegal Drugs
Illegal drug use and testing for illegal drug use by employers have generated much attention in fields of research such as psychology, business, and the medical field. Illegal drug use is a subject matter that has always had much social, and ethical considerations and debates for a number of years. The requirement of testing for the use of illegal drugs given by an employer has been an ethical issue since the inception of illegal drug testing in 1988 (Sweda, 1999). Illegal drug use has contributed to many negative consequences in the workplace, such as high numbers in absenteeism, turnover, injuries, and job related accidents (Normand, Salyards, & Mahoney, 1990). The absenteeism rate for known employees that tested positive for the use illegal drugs are an estimated 56.3% higher for employees who tested negative (Normand, Salyards, & Mahoney, 1990). Used properly, drug testing can play a role in the overall management of employee performance (Crown & Rosse 1988). However if used improperly, drug testing can have an extreme negative effect to individual rights (Crown & Rosse 1988). There are many issues that an employer must consider before administering a drug test. Issues involving public safety, confidentiality, and individual rights should be considered by the employer (Crown & Rosse 1988). The purpose of this study is to see if there are different
45
Undergraduate Journal of Psychology 2002 15 46
feelings, and attitudes towards illegal drug use and testing for illegal drugs. The participants used for this study were all employed at a retail store that either required drug testing, or a store that did not require drug testing. If illegal drug use testing is required at a retail store environment, then the attitudes towards illegal drug use will be viewed more negatively, and drug testing would be viewed more positively if the employees were subject to illegal drug testing compared to the retail stores that do not require drug testing. Drug testing maybe viewed more negatively because a certain employees of the retail store may believe that it is an infringement of one’s own rights, consumption of time, and increase of cost for the store to conduct the drug tests. This study will hope to add new knowledge on the feelings and attitudes of illegal drug use, and illegal drug testing.
Method Participants
A total of sixty participants were surveyed for the study, with thirty employed by each store (non-test and test). All of the participants surveyed were at least eighteen years of age. Gender and race did not constitute as factors for participation. All of the participants surveyed were employed at retail stores located in the southeast United States. Each survey was given out with permission granted from each member of the store management team that was present at the time. Each of the sixty participants voluntarily answered the survey, and was assured that the survey was confidential. Materials
A basic pen and paper survey with nine questions were distributed to each of the sixty participants (see Appendix). Each survey had the typed purpose of the survey (attitudes and feelings of illegal drugs and drug testing), an explanation of the nine-point scale that was used, and information about the institution responsible for the survey. Upon receiving the survey, each participant was assured that the researcher would promptly answer any questions regarding the survey.
The survey consisted of nine questions that dealt with the attitudes of the use of illegal drugs and the testing for the use of illegal drugs. The survey was based on a quantitative scale to how each of the participant attitudes was toward illegal drug use and drug testing. A nine-point scale was used for the nine questions (1 meaning definitely “no” and 9 meaning definitely “yes”). The first question (how detrimental illegal drug use is to American society) directly dealt with the attitudes and feelings towards the use of illegal drugs. Questions two and three (imposing on personal rights, and possible wastes due to drug testing) dealt with the attitudes and feelings towards drug testing. The fourth question (drug use effecting job performance) dealt with attitudes and feelings of illegal use in the work environment. Question five (enhancement of employee performance) dealt with attitudes and feelings of the drug test. The sixth question (personal decision) assesses the question of what one does to their own body is their own personal decision. The final three questions (drug testing solving problems, attitude towards drug testing, and drug testing having effect on job outlook) solely reflected the attitudes and feelings towards the testing for the use of illegal drugs.
Procedure
The participants were selected from several locations where retail stores are located. Such locations included shopping malls, and mall strips in the southeastern part of the United States. A total of sixty participants were selected for this study. Thirty devoted to stores that required drug
Undergraduate Journal of Psychology 2002 15 47
testing, and thirty that did not require drug testing. A total of twelve retail stores were used for this study. Six stores were used for each condition (requiring drug test or drug test not required). Five participants were selected from each store to fill out the surveys. Before the surveys were distributed to the participants, an operational definition had to be defined to avoid contamination of the research. Before each survey was handed out, it was assured whether or not the retail stored required drug testing for employment from the manager on duty. Each survey was also distributed to the employees of the retail store with the permission granted from the store manager. Each participant was asked to read and answer the survey questions. The participants were informed that the purpose of the survey was to gain insight on the attitudes on the use of illegal drugs and drug testing. The participants were assured that the survey was confidential, and no personal information was needed. The debriefing process reiterated the purpose of the survey, it was a confidential survey, the survey was a research study, and they were given information to contact a faculty member in the psychology department at local university if more information was needed.
Results A series of independent samples t-test was used to evaluate the results of the study. The scores could range from 1 to 9. In each case below the results are reported from the retail store that did not require a drug test followed by the retail store that did require drug testing. Beliefs about the detriment of illegal drugs in American society (M = 5.63, sd = 2.74) was not significantly different (M = 5.93, sd = 2 02), t(58) = .484, p = .50. Opinions as to whether drug testing imposed on one’s rights (M = 3.97, sd = 2.89) was significantly lower (M = 6.03, sd = 2.79), t(58) = -2.82. p<.O5. The results suggest that there is a significant difference between the attitudes of imposing on one’s own rights is drug testing. The results suggest that employees of a retail store that requires drug testing may have believe more strongly that testing for the use of illegal drugs imposes on one’s own rights. Opinions of whether drug testing was a waste for the employer in non-test stores (M = 3.47, sd = 2.57), was significantly lower than the test stores (M = 5.30, sd = 2 51), t(58) = -2.80. p <.05. These results suggest that employees at a retail store that requires drug testing may have the attitude that the retail store may be wasting time, money, and effort to support drug testing more so than their counterparts. The effect that illegal drug use may have on job performance at stores that did not require drug testing (M = 6.77, sd = 2.47), was not notably different than the stores that required drug testing (M = 6.23, sd = 2.06), t(58) = 0.91, p > .05. Beliefs about drug testing enhancing employee performance (M = 3.77, sd = 3.22), were not significantly different (M = 3.60, sd = 2.27), t(58) = .82, p >.05. Beliefs about what one does to one’s own body (M = 7.10, sd = 2.54), did not differ significantly (M = 7.87, sd = 1.55), t(58) = -1.41, p >.05. Beliefs about drug testing solving problems in the work environment (M = 5.20, sd = 3.02) were slightly more favorable at stores that did not test than at the retail stores that required drug testing (M = 3.93, sd = 2.42), t(58) = 1.79, p <.05. These results suggest that employees working at a non-test store would believe that drug testing would solve some of the problems in the work environment. Attitudes towards drug testing (M = 5.90, sd = 2.56), were significantly more positive in non-test stores than the retail stores that tested for illegal drug use (M = 4.50, sd = 2.33), t(58) = 2.21. p <.05. These results suggest that employees that are employed at a store that requires drug testing have a more negative view on illegal drug testing. Direct effect on job outlook (M = 3.73, sd =
47
Undergraduate Journal of Psychology 2002 15 48
3.49), was not significantly different at the two categories of stores (M = 4.40, sd = 3.37), t(58) = -.75. p >.05.
Discussion The main objective of this study was to identify if there were any differences in attitudes, and feelings about the use of illegal drugs, and drug testing between retail stores that required drug testing, and a retail store that testing was not required. The results of the study show that there was no major significant difference in the feelings towards illegal drug use. Both store environments showed similar negative views on the use of illegal drugs. There was however, a significant difference in the attitudes towards drug testing. The retail stores that required drug testing revealed a more negative attitude towards testing for the use of illegal drugs. The causal factors are unknown as to why the employees at the retail stores that required drug testing had similar views on illegal drug use, but different attitudes on the requirement of illegal drug testing. Only hypothetical reasons exist as to why there lies a difference between the two retail environments. One such reason derived from this study is that drug test imposes on one’s personal rights as a United States citizen. Another reason that is derivative from this study is that drug test maybe a possible waste of time, money, and effort for the employers also. A final reason is the possibility that the individuals who use illegal drugs may choose not work at an establishment that requires illegal drug testing to avoid eventual problems that would arise from a positive test result. This study only showed the attitudes and feelings regarding illegal drugs and drug testing from the perspective of employees in the retail store industry. Further studies need to be developed to show if there are similar results in other populations in the workforce. Illegal drug use, and drug testing are controversial topics in today’s modern United States society and further studies need to be done to gain more knowledge on this topic.
Reference
Crown, D.,& Rosse, J (1988). A critical review of the assumptions underlying drug testing. Journal of Business Psychology,. 3 (1). 22-41.
Normand, J., Salyards, S., & Mahoney, J. (1990) An evaluation of pre-employment drug testing. Journal of Applied Psychology. 75 (6~. 629-639.
Sweda, D. (1999). Effect of Random Drug Testing on Fatal Commercial Truck Accident Rates. International Journal of Drug Testing, 2 1-5.
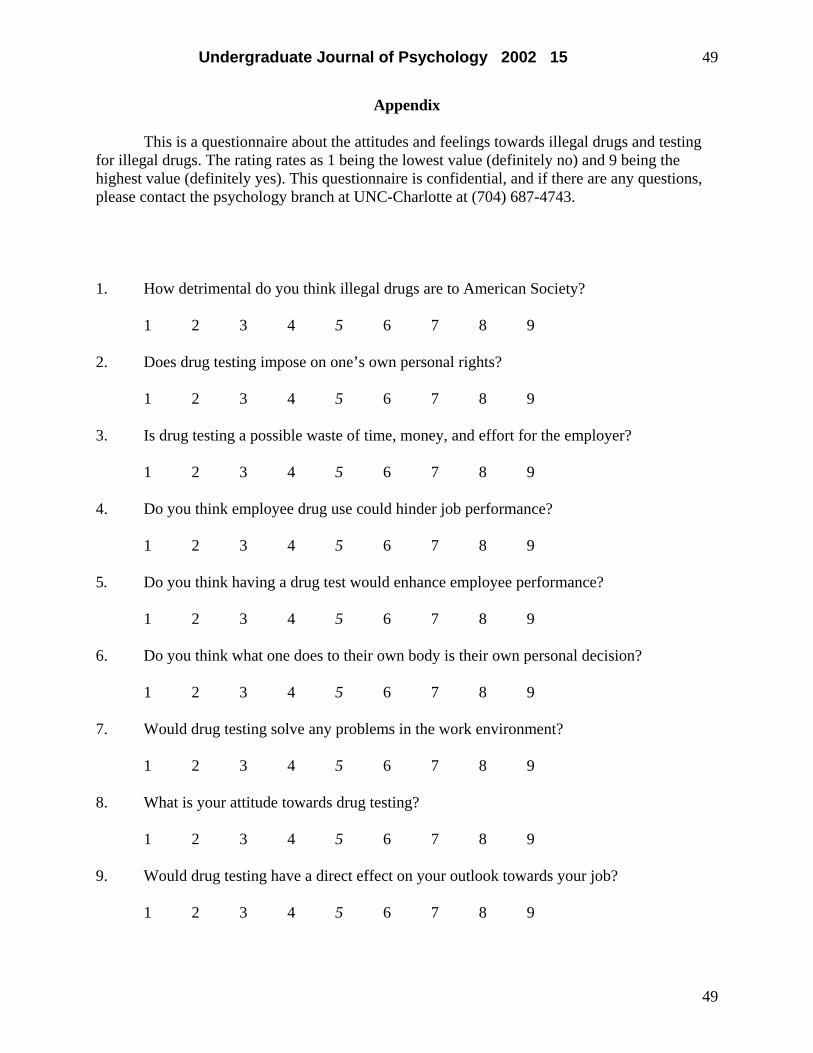
Undergraduate Journal of Psychology 2002 15 49
Appendix
This is a questionnaire about the attitudes and feelings towards illegal drugs and testing for illegal drugs. The rating rates as 1 being the lowest value (definitely no) and 9 being the highest value (definitely yes). This questionnaire is confidential, and if there are any questions, please contact the psychology branch at UNC-Charlotte at (704) 687-4743.
1. How detrimental do you think illegal drugs are to American Society?
1 2 3 4 5 6 7 8 9
2. Does drug testing impose on one’s own personal rights?
1 2 3 4 5 6 7 8 9
3. Is drug testing a possible waste of time, money, and effort for the employer?
1 2 3 4 5 6 7 8 9
4. Do you think employee drug use could hinder job performance?
1 2 3 4 5 6 7 8 9
5. Do you think having a drug test would enhance employee performance?
1 2 3 4 5 6 7 8 9
6. Do you think what one does to their own body is their own personal decision?
1 2 3 4 5 6 7 8 9
7. Would drug testing solve any problems in the work environment?
1 2 3 4 5 6 7 8 9
8. What is your attitude towards drug testing?
1 2 3 4 5 6 7 8 9
9. Would drug testing have a direct effect on your outlook towards your job?
1 2 3 4 5 6 7 8 9
49
Undergraduate Journal of Psychology 2002 15 50
Sadomasochism: The Pleasure of Pain Carrie Haymore University of North Carolina at Charlotte
______________________________________________________________________________ Though long-standing stereotypes promote negative myths about sadomasochism, theorists and researchers agree that sadomasochistic desires and activities are normal, albeit not socially prominent, components of sexual functioning. Sadomasochism among consenting adults characterizes practices that include elements of implementing or receiving physical or psychological pain, dominance and submission, and bondage and discipline. Some activities, such as physical restriction, or bondage, are consistently much more commonly practiced than others, such as those involving acute pain, like genital piercing. Various researchers attribute the attraction of sadomasochism to individuals who are generally psychologically, socially, and sexually well adjusted. ______________________________________________________________________________
Sadomasochism: The Pleasure of Pain As a community that challenges traditional ideals of normal sexuality, the sadomasochistic subculture has long been misunderstood by mainstream society. Though sadomasochistic themes are beginning to be more prevalent in popular media, such as art, music, and fashion, individuals who choose to incorporate elements of sadomasochism into their sex lives are still often considered deviant. Sexual sadists are sometimes characterized as cruel, abusive, or violent, while sexual masochists may be denounced as victims who subject themselves to danger and oppression. In fact, these practices are even labeled as sexual disorders in the Diagnostic and Statistical Manual of Mental Disorders [DSM-IV] (American Psychiatric Association [APA], 1994). Research indicates, however, that these negative stereotypes are not typical of sadomasochistic behavior. Recent studies present self-identified sadomasochists as well-educated, well-adjusted, and sexually creative individuals who make safety and consensuality their main priorities. Defining Sadomasochism
Though sadomasochism is commonly referred to as SM, the acronym BDSM actually offers a broader description of three predominant themes in sadomasochistic behavior (Ernulf & Innala, 1995). These integral concepts are bondage and discipline (B & D), dominance and submission (D & S), and sadism and masochism (S & M). Though these themes are essentially interrelated, they are separate in denotation and do not necessarily overlap. Depending on individual preference, one may choose to integrate certain aspects of any combination of the three themes into his or her personal sexual repertoire. For clarification, the term “dominant” is used to represent the partner who implements various practices, while the term “submissive” refers to the partner who is the recipient of those practices.
In the practice of bondage and discipline, physical restriction and psychological restraint facilitate obedience, servitude, training, and punishment. Physical bondage may take a number of forms, such as binding one’s partner with intricate rope knots into a position that inhibits movement, or tightly corseting the submissive in order to promote posture and restrict movement. Psychological bondage also includes a myriad of practices: a collar worn by the
Undergraduate Journal of Psychology 2002 15 51
submissive, for instance, signifies obedience or ownership, and can be as strong a symbol of devotion as a wedding band (Wiseman, 1996). Dominance and submission are characterized by consensual power exchange that involves the execution of psychological or physical power upon the submissive partner, who in turn relinquishes his or her power to the dominant. Dominance and submission are often enacted within the script of fantasized roles, such as master or mistress and slave. An inequality of power characterizes this component of sadomasochism, and is demonstrated in activities such as the dominant commanding the submissive to kneel at his or her feet and perform oral sex. Krafft-Ebing (1965) described sadism as the desire to inflict pain, humiliation, or punishment for sexual pleasure. He described masochism as the desire to be subjugated to the will of another person through humiliation and physical or psychological pain. Though Krafft-Ebing viewed sadism and masochism as opposites, theorists such as Freud (1938) and Ellis (1926) described them as complimentary and intimately intertwined. This set of behaviors is most often portrayed by physical expressions like rhythmic flagellation (Ernulf & Innala, 1995). Alison, Santtila, Sandnabba, and Nordling (2001) proposed a slight variation of the three categories described by BDSM. In their description of sadomasochistic behavior, the three primary themes are still intact though with different titles, and a fourth category is introduced. In this model, physical restriction, humiliation, and administration of pain are the three complimentary categories. The fourth element included in this model is hypermasculinity, which encompasses practices most commonly present in the gay male scene, such as urolangia, which involves the use of urine in sexual activities, male genital torture, and fisting. Like Ernulf and Innala (1995), Alison et al. recognize that while overlap often exists, the different facets are distinct, and individuals may prefer only certain types of activities.
Scenes
Considering that sadomasochistic behavior often takes place within the context of temporarily adopted roles, the interaction is called a “scene.” In a study of male sadomasochistic behavior conducted by Sandnabba, Akademi, Santtila, and Nordling (1999), the researchers cited Townsend’s (1983) definition of the five primary elements usually included in a scene. These five elements are dominance and submission, pain experienced as pleasure, humiliation, fetishism, and ritualistic activities. Townsend’s list might not be the most appropriate description of a scene for two reasons. First, many researchers agree that humiliation is more clearly characterized as one type of dominance and submission rather than a separate element (Ernulf & Innala, 1995; Moser & Levitt 1987; Weinberg, Williams, & Moser, 1984). Second, the meaning of ritualistic activities is ambiguous. To his credit, however, Townsend included fetishism as a significant characteristic of sadomasochistic scenes. Fetishism is the sexual arousal to nonhuman objects, which are often articles of clothing (Allgeier & Allgeier, 2000). Leather, latex, corsets, and boots are fetish objects that are common in sadomasochistic scenes. Through observation and personal interviews with members of the sadomasochistic community, Weinberg, Williams, and Moser (1984) derived a slightly different set of criteria for a scene. The elements described by Weinberg et al. refer more to the social characteristics of scenes rather than the sexual elements listed by Townsend (1983). The interplay of dominance and submission is the only feature common to the two descriptions. Role-playing, consensuality, erotic connotation, and a mutually shared assumption of sadomasochism by the participants were the remaining four elements identified. The erotic meaning that is characteristic of scenes is
51
Undergraduate Journal of Psychology 2002 15 52
important to note; a person who considers him or herself a sadomasochist would not perceive accidental pain outside the context of the scene as pleasurable. Consensuality is of paramount importance in sadomasochistic scenes. Participation in a scene is voluntary. Limits and acceptable as well as unacceptable behaviors are agreed upon ahead of time. For example, prior to a scene, participants usually adapt a “safe word” or gesture. If one person feels his or her limits are being surpassed, or feels unsafe or uncomfortable with the scene, he or she will utter the safe word or make a mutually understood gesture that will either end the scene immediately or reduce the intensity of the scene (Wiseman, 1996). Some individuals argue, however, that observant, empathic dominants usually need no provocation to know if the submissive is uncomfortable with the course of a scene (Ernulf & Innala, 1995). Violation of established limits is condemned within the community, and beyond the scope of safe sadomasochism.
Practices
Prevalence of Activities
The specific behaviors performed are varied with regard to types of activities as well as their prevalence. Striking similarities can be examined in five relevant studies. Moser and Levitt (1987) conducted a study of 178 male and 47 female self-identified sadomasochists, gathered primarily through two nationally recognized sadomasochism-oriented groups and a genre-specific magazine. Participants were asked which of 37 sexual activities they had ever experienced, and which of those they enjoyed. With a response rate of 81.9% of participants having tried it, and 66.1% reporting having enjoyed it, the most common activity was spanking. The second most common behavior was bondage; 77.4% had experienced bondage, and 65.0% of those enjoyed it. Materials often used in bondage scenes, such as rope, chains, and gags, were also frequently reported. Approximately two-thirds of the participants had experienced humiliation, whipping, and fetishism. Acutely painful and semi-permanent or permanent forms of body modification such as tattoos (6.8%), branding (10.1%), and piercing (14.7%) were relatively rare. A comparable study by Breslow, Evans, and Langley (1985) produced similar results. Their sample was derived mostly from questionnaires included in three sadomasochistic-oriented magazines. A total of 182 individuals responded, including 130 males and 52 females. Ten males and 12 females admitted to being professional sex workers and were excluded from the sample. The most prevalent sexual interest reported by the participants was once again spanking, with 79% of males and 80% of females indicating that it was a preferred activity. Bondage and restraint, listed as separate categories, were reported as pleasurable by 60-67% of males and 83-87% of females. Stringent bondage was yet another category included in the questionnaire, though it was less common than bondage and restraint among the participants. Breslow et al.’s (1985) list of activities was less comprehensive than that of Moser and Levitt, and some behaviors listed such as “pain” and “torture” are ambiguous, as they do not specify the actual activities involved. Conducted as a comparison to Breslow et al.’s data, Levitt, Moser, and Jamison (1994) obtained their sample of 45 females from the same two well-known sadomasochism groups that supplied their 1987 study. Consistent with the comparison data, the activities that received the highest rates of enjoyment from participants were spanking, bondage, and oral sex, with response rates of 79%, 77%, and 74%, respectively.
Undergraduate Journal of Psychology 2002 15 53
Alison et al. (2001) found similar results among their sample of 162 males and 22 females recruited from two sadomasochistic-oriented organizations. Among the respondents to the questionnaire adapted from Sandnabba et al.’s (1999) survey, 88% had experienced bondage, 81.8% had tried flagellation, and 77.5% had participated in oral-anal stimulation, a category included in the list of only one of the previously discussed studies. Perhaps the unusually high rate of oral-anal stimulation could be attributed to the fact that approximately half of the participants were members of a gay male club.
The most comprehensive survey of 40 sadomasochistic practices, compiled by Sandnabba et al. (1999), was created to measure the prevalence of sexual interest in 164 heterosexual and homosexual males from 2 clubs that promote sadomasochism. This particular sample revealed higher rates of participation in most activities. Oral sex was the most common practice among 96.8 % of the heterosexual males and 98.9% of the gay males. With respect to comparison between the heterosexual and homosexual males, 92.1% and 87.6% had experienced bondage, 90.6% and 77.3% had engaged in flagellation, and 81.0% and 65.9% had incorporated humiliation into their scenes. The study also represented a greater rate of participants whose repertoires had involved leather outfits, reported by 79.7% of the heterosexuals and an astounding 96.6% of the homosexuals in the sample. Both heterosexual and homosexual males commonly reported handcuffs, chains, anal intercourse, spanking, and male genital torture. Though the more physically intense and potentially dangerous activities, including body modification, controlled breathing, and electric shocks remained consistently less prevalent, they were reported with greater frequency than in the other four studies.
When viewing the data as a whole, several patterns are readily apparent. The most common practices, oral sex, bondage, humiliation, and spanking, are activities associated with dominance and submission and bondage and discipline. Although flagellation was frequently reported, physically painful activities, related to the themes of sadism and masochism, were generally less common. In addition, four of the studies surveyed the types of scripts typically employed in sadomasochistic scenes. The most common role-playing script in each sample was that of master or mistress and slave. The highest rate of interest in this script was 83.9%, reported by the males in Sandnabba et al.’s (1999) sample. Other common role-playing scenarios include uniform scenes, reported by over half of the gay males in the study conducted by Sandnabba et al., and teacher and student scripts, experienced by nearly half of the heterosexual males in the same study. Roles
The research data are also fairly consistent regarding individuals’ preference for the dominant or submissive role. Males and females were both more likely to prefer the submissive role, though females more often cited versatility of roles. The most effective way to measure the range of role preferences seemed to be to on continuum. The levels of the continuum were exclusively submissive, predominantly submissive, enjoy both roles equally, predominantly dominant, and exclusively dominant. Breslow et al. (1985) found that 41% of the males and 40% of the females described themselves as predominantly or exclusively submissive, while only 33% of the males and 27.5% of the females preferred the dominant role. The remaining 26% of males and 32.5% of females stated that they enjoyed both roles equally. The data collected by Levitt et al.’s (1994) research on female sadomasochistic sexuality also indicates that females prefer the submissive role. Only 11.7% identified as dominant, while 47% preferred the submissive role, though 41.2% could be versatile. In Sandnabba et al.’s (1999) sample, 50.3% of the males favored the submissive role.
53
Undergraduate Journal of Psychology 2002 15 54
Sexual Bondage Since sexual bondage is such a common theme in sadomasochistic subculture, it certainly
merits further exploration. To examine the dynamics and provide some insight into individuals’ motives for engaging in bondage and discipline, Ernulf and Innala (1995) analyzed 514 messages pertaining to bondage that were posted to an Internet discussion group that caters to individuals who share that specific interest. The messages were sorted into 13 categories according to their descriptions of the bondage experience. The most frequent experience was play, described as sexually enhancing otherwise conventional sexual activities. The messages also described bondage as a power exchange between partners, an intensification of sexual pleasure due to the relinquishing of control and responsibility, tactile stimulation due to the physical pressure of the bonds, visual stimulation, and expression of trust. These specific motivations and experiences of individuals who enjoy sexual bondage add a more personal dimension to sadomasochistic activity.
Body Modification
Just as examining one of the most prevalent sadomasochistic activities, bondage, offers greater insight into the experience of participants, further investigation of one of the less common activities, body modification, is also relevant to explain more precisely the motivations of individuals involved. Various workshops and demonstrations on genital piercing, branding, burning, and cutting, sponsored by sadomasochistic organizations, provided Myers (1992) with valuable observations on this specialized interest. Myers noted that individuals often described a mental or physical high during the procedure, relating the modern ritual of such procedures to their ancient precursors, rituals performed as a means of transcendence. Motives cited for different types of body modification by those involved included sexual enhancement, pain, aesthetic value, and trust or loyalty. Myers asserted that sexual enhancement actually seemed to be the underlying motive of each of the other reasons stated. The specific pain involved in the activity was an essential component for many of the individuals. While mainstream culture may denounce extreme forms of body modification as mutilation, enthusiasts appreciate piercings, cuttings, brandings, and burnings for their unusual beauty. Finally, the permanence of these procedures can serve as a symbol of loyalty to one’s partner.
Demographics of Participants
Since the findings of the recent studies on sadomasochistic activities are so concordant, it is not surprising that they report similar demographics of their participants as well. According to the research, gender, age, education level, income, and personal satisfaction with their sexuality are all invariable characteristics among participants in the studies. In the sadomasochistic subculture, males outnumber females by as much as nearly 10 to 1 (Alison et al., 2001) to 4 to 1 (Breslow et al., 1985). Accurate representation of a stable proportion of different sexual orientations is virtually impossible to conclude from the available research, due to the inclusion of specifically gay clubs in some studies (Alison et al., 2001; Sandnabba et al., 1999). However, because of the open and experimental nature of the subculture, as well as the thriving gay male genre of sadomasochism, one could reasonably predict that the percentage of bisexuals and homosexuals involved in sadomasochism is higher than that of the general population. The predominant age of sadomasochistic individuals is remains stable between samples. The most common age of participants in the studies is between 30 and 40 for both males and females. While Moser and Levitt’s (1987) sample consisted of individuals with a mean age of 38.2 years,
Undergraduate Journal of Psychology 2002 15 55
Levitt et al. (1994) found the mean age of their sample to be 30.7 for females and 33.4 for males, indicating a possible trend of individuals becoming involved in sadomasochism at a younger age. Additionally, Breslow et al. (1985) reported that 42.7 % of their male participants and 39% of their female participants were between the ages of 31 to 40.
Compared to the general population, individuals in the samples were highly educated. The lowest estimate of individuals who had attended college was 21.3 %, provided by Sandnabba et al. (1999), which is significantly higher than 3.7% of general Finnish population, where the study was conducted. Moser and Levitt (1987) reported the highest proportion of college-educated individuals: 70.2% of their sample held a college degree, and another 24.7% had attended college. Approximately one-third of Breslow et al.’s (1985) sample had attended college, while nearly half of the individuals in Levitt et al.’s (1994) study had attended college, with another 41.1 % having attained a college degree or post-graduate education. Possibly correlated with the high level of education of many practitioners of sadomasochism, the research indicates those individuals also earn a greater monthly income than the general population. According to Breslow et al. (1985) and Sandnabba et al. (1999) nearly 25% earned $2000-3000 per month. Furthermore, Sandnabba’s 24% of sample reported a monthly of over $3000. This research indicates that individuals involved in sadomasochism are indeed socially adjusted and in fact function quite successfully in their environments.
Though in the DSM-IV the APA (1994) concludes that sexual sadism and masochism are characterized by marked distress or impairment in one’s life, the majority of sadomasochistic individuals are satisfied with incorporating those elements into their sexual lives. Only 5.8% report wishing they were not interested in sadomasochism (Moser & Levitt, 1987). In the same study, only 5.6% had been a patient in a psychiatric hospital. Sandnabba et al. (1999) found that from 79% to 86% of the individuals in their sample felt emotions of happiness, gladness, and safety following their first experience, which had most often occurred between the ages of 21 and 25. Breslow et al. (1985) also reported that the majority of participants in their study were comfortable with their sexual interests. These finding lend further support in favor of the well-adjusted, healthy mental, emotional, and sexual state of individuals who enjoy sadomasochism. Just as homosexuality has been excluded from its former status as a mental disorder of sexual deviance in the DSM, sexual sadism and masochism will likely be expelled as well, as more research is offers insight into sadomasochism as an acceptable sexual preference. Though individuals are compelled to engage in sadomasochism for different reasons, and therefore experience it differently, three themes are central to describing various practices: bondage and discipline, dominance and submission, and sadism and masochism. The interplay of these themes is essential to understanding the dynamics of sadomasochism. Individuals who participate in these practices describe their activities as an intense, explicitly focused yet transcendent physical, psychological, and emotional expression of their sexuality. Just as certain symbols, such as particular body types and clothing styles are eroticized by popular culture, symbols such as submission as an expression of devotion, or the aesthetics of a certain fetish object, are quintessential to sadomasochistic sexuality. The research demonstrates that sadomasochistic individuals are well-adjusted persons who simply experience sex and eroticism differently than the norm.
55
Undergraduate Journal of Psychology 2002 15 56
References Alison, L., P. Santtilla, N. K. Sandnabba, & N. Nordling. (2001). Sadomasochistically-oriented behavior: diversity in practice and meaning. Archives of Sexual Behavior, 24, 631-654. Allgeier, E. R., & A. R. Allgeier. (2000). Sexual interactions. Boston: Houghton Mifflin
Company American Psychiatric Association. (1994). Diagnostic and Statistical Manual of Mental
Disorders (4th ed.). Washington, D. C.: American Psychiatric Association. Breslow, N., L. Evans, & J. Langley. (1985). On the prevalence and roles of females in the sadomasochistic subculture: report of an empirical study. Archives of Sexual Behavior,
14, 303-317. Ellis, H. (1936). Studies in the psychology of sex. New York: Random House. Ernulf, K. E., and
Innala, S. M. (1995). Sexual bondage: a review and unobtrusive investigation. Archives of Sexual Behavior, 23, 631-654. Freud, S. (1938). The basic writings of Sigmund Freud. A. A. Brill (Ed & Trans.). New York: The Modern Library. Krafft-Ebing, R. V. (1965). Psychopathia sexualis. H. E. Wedeck (Trans.). New York: Random House. Levitt, E. E., Moser, C., & Jamison, K. V. (1994). The prevalence and some attributes of females in the sadomasochistic subculture: a second report. Archives of Sexual Behavior, 23, 465-473. Moser, C., & Levitt, E. E. (1997). An exploratory-descriptive study of a sadomasochistically oriented study. Journal of Sex Research, 23, 322-337. Myers, J. (1992). Nonmainstream body modification: genital piercing, branding, burning, and cutting. Journal of Contemporary Ethnography, 21, 267-306. Sandnabba, N. K., Adademi, A., Santilla, P., & Nordling, N. (1999). Sexual behavior and social adaptation among sadomasochistically-oriented males. Journal of Sex Research, 30, 1-13. Weinberg, M. S., Williams, C. J., & Moser, C. (1984). The social constituents of
sadomasochism. Social Problems, 31, 379-389. Wiseman, J. (1996). SM 101. San Francisco: Greenery Press.