Embed Size (px)
Citation preview
Exploring computer supported collaborative coordination throughsocial networks
Szabolcs Feczak, Liaquat Hossain⁎Project Management Graduate Programme, The University of Sydney, NSW 2006, Australia
a r t i c l e i n f o a b s t r a c t
The performance of work groups and in particular geographically distributed ones is negativelyaffected by communication issues and task dependencies.Contemporary science suggests social link optimization apart from improving the technicalaspects to address these issues. In our study, we focus on distributed coordination and projectperformance. Social network structure and coordination performance variables are describedby our framework with regards to distributed coordination during bug fixing process. Basedon the model and the literature reviewed, we propose two propositions—(i) the level of inter-connectedness has a negative relation with coordination performance; and (ii) centralitysocial network measures have positive relation with coordination performance variables. Weuse a sample of 415 Open Source Projects hosted on SourceForge.net. The results suggestthat both propositions are correct. Furthermore, in the methods section implementation ofan automated process is introduced to build graph definitions in adjacency matrix or NCOLformat from thousands of forum threads. We describe the implementation of a novel methodto plot sociograms in batch from hundreds of graph definitions automatically and calculatenetwork centrality and density measures for all of them at the same time. Finally, we suggestthe implications of this study to software development project management research.
© 2011 Published by Elsevier Inc.
Keywords:Social network analysisCentralityDistributed coordination
1. Introduction
Team work can reduce to total time required to solve a problem or complete a job, it can also improve the quality of the out-come. In case of more than one participant, however, the work has to be organized, the final goal has to be broken down intosmaller tasks so it can be allocated to specific members or smaller groups of the team. In order to work together, the membersare required to have knowledge about tasks, schedules, each other, goals and strategies. To acquire this knowledge, referred asgroup awareness the actors have to spend extra time to communicate (Gutwin et al., 2004). Coordination theory provides aframework to examine these dependencies in case of multiple actors pursuing goals together. The theory further suggests thatimplementing dependency management strategies and improving the efficiency of the communication between the actors canreduce the work distribution overhead (Malone, 1988). Due to an increase in the complexity of problems people encounter,over time work distribution becomes more and more extensive breaking through organizational and geographic boundaries.Therefore, distributed nature of the work groups becomes common. This feature of a team however changes the scenario of co-ordination because team members may experience longer geographical, temporal and socio-cultural distances compared tomembers of single site groups. This distance can cause longer delays, more frequent misunderstandings and without face toface communication trust issues may arise leading to further coordination problems. Overall distributed teams face more chal-lenges to achieve high performance. In this paper, we suggest that analysis of social features and mapping social networks can
Journal of High Technology Management Research 22 (2011) 121–140
⁎ Corresponding author. Tel.: +61 2 90369110; fax: +61 2 9351 8642.E-mail address: [email protected] (L. Hossain).
1047-8310/$ – see front matter © 2011 Published by Elsevier Inc.doi:10.1016/j.hitech.2011.09.005
Contents lists available at SciVerse ScienceDirect
Journal of High Technology Management Research
lead us to draw conclusions on the way distributed work groups coordinate. Social networks reflect on the communication struc-ture of a team therefore, analysis of these networks can help us to understand team dynamics and roles of different actors.
Socio-technical systems theory suggests that optimizing links between social aspects of society and technical aspects of ma-chines improve productivity and well being. As social network structure is one half of these systems, therefore the study of socialstructures has prominent significance to investigate issues of coordination processes in organizations. The quality of coordinationis positively correlated to team performance. Casting light on coordination gaps can lead to develop management processes toclose or minimize them, and as a result efficiency and effectiveness can be improved (Ahuja, Carley, & Galletta, 1997; Emery &Trist, 1960). Analyzing coordination problems in dynamic and dispersed collaboration groups through their social structure isan upcoming area of research (Madey, Freeh, & Tynan, 2002). The aim is to advise a social network structure which promotes bet-ter project outcomes than others or same outcomesmore efficiently with much less communication and dependency overhead. Inorder to achieve this, our objectives are:
i. identify the indirect measures for coordination performance;ii. draw relation between structural variables and coordination performance measures;iii. identify if the relation is positive or negative;iv. build a model for testing; andv. validate the theory with empirical findings.
2. Characteristics of Open Source projects
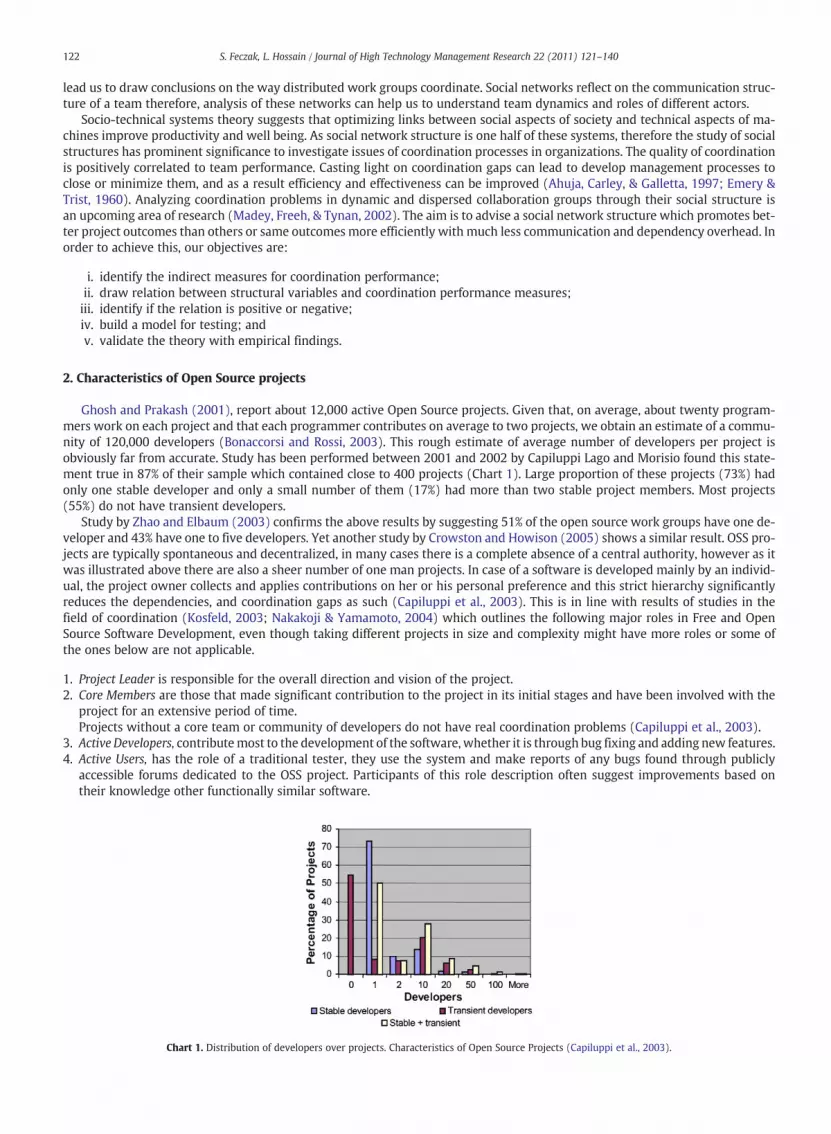
Ghosh and Prakash (2001), report about 12,000 active Open Source projects. Given that, on average, about twenty program-mers work on each project and that each programmer contributes on average to two projects, we obtain an estimate of a commu-nity of 120,000 developers (Bonaccorsi and Rossi, 2003). This rough estimate of average number of developers per project isobviously far from accurate. Study has been performed between 2001 and 2002 by Capiluppi Lago and Morisio found this state-ment true in 87% of their sample which contained close to 400 projects (Chart 1). Large proportion of these projects (73%) hadonly one stable developer and only a small number of them (17%) had more than two stable project members. Most projects(55%) do not have transient developers.
Study by Zhao and Elbaum (2003) confirms the above results by suggesting 51% of the open source work groups have one de-veloper and 43% have one to five developers. Yet another study by Crowston and Howison (2005) shows a similar result. OSS pro-jects are typically spontaneous and decentralized, in many cases there is a complete absence of a central authority, however as itwas illustrated above there are also a sheer number of one man projects. In case of a software is developed mainly by an individ-ual, the project owner collects and applies contributions on her or his personal preference and this strict hierarchy significantlyreduces the dependencies, and coordination gaps as such (Capiluppi et al., 2003). This is in line with results of studies in thefield of coordination (Kosfeld, 2003; Nakakoji & Yamamoto, 2004) which outlines the following major roles in Free and OpenSource Software Development, even though taking different projects in size and complexity might have more roles or some ofthe ones below are not applicable.
1. Project Leader is responsible for the overall direction and vision of the project.2. Core Members are those that made significant contribution to the project in its initial stages and have been involved with the
project for an extensive period of time.Projects without a core team or community of developers do not have real coordination problems (Capiluppi et al., 2003).
3. Active Developers, contributemost to the development of the software, whether it is through bug fixing and adding new features.4. Active Users, has the role of a traditional tester, they use the system and make reports of any bugs found through publicly
accessible forums dedicated to the OSS project. Participants of this role description often suggest improvements based ontheir knowledge other functionally similar software.
Chart 1. Distribution of developers over projects. Characteristics of Open Source Projects (Capiluppi et al., 2003).
122 S. Feczak, L. Hossain / Journal of High Technology Management Research 22 (2011) 121–140
5. Passive Users, these participants often only make minimal contribution to bug reporting or forum responses because theirmostly concerned with their personal use of the software.
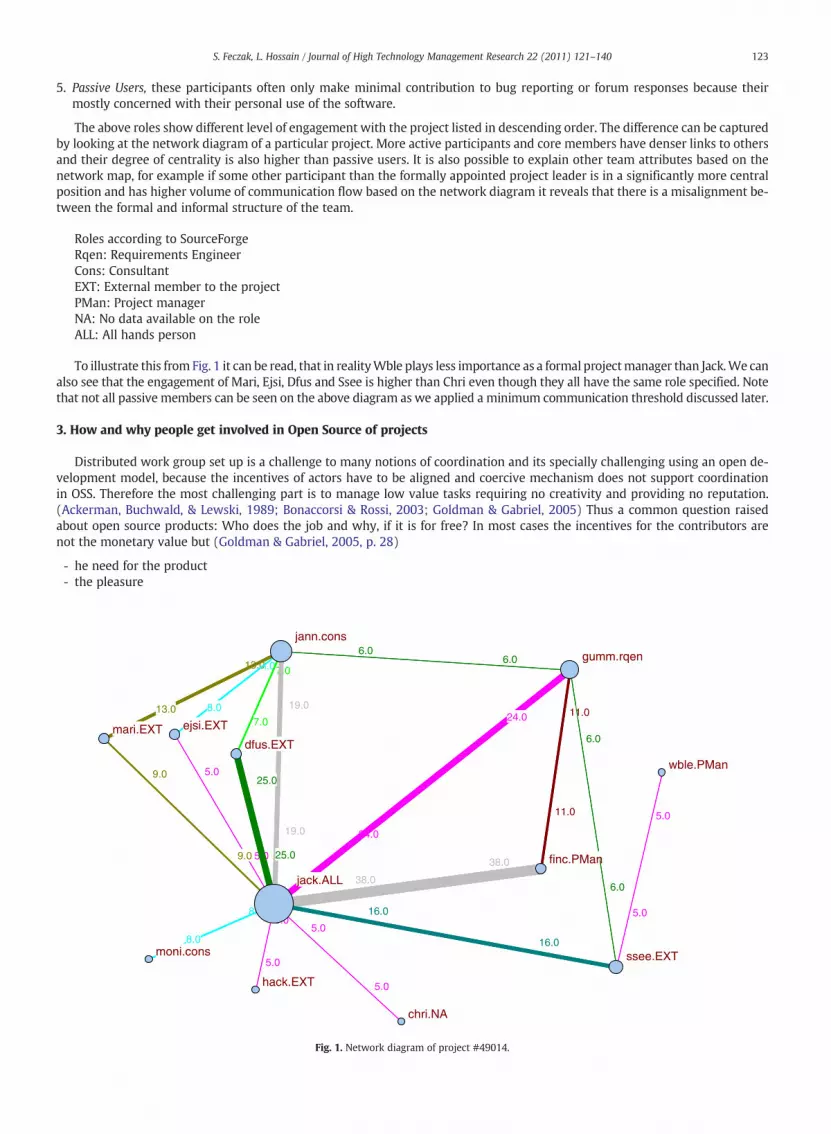
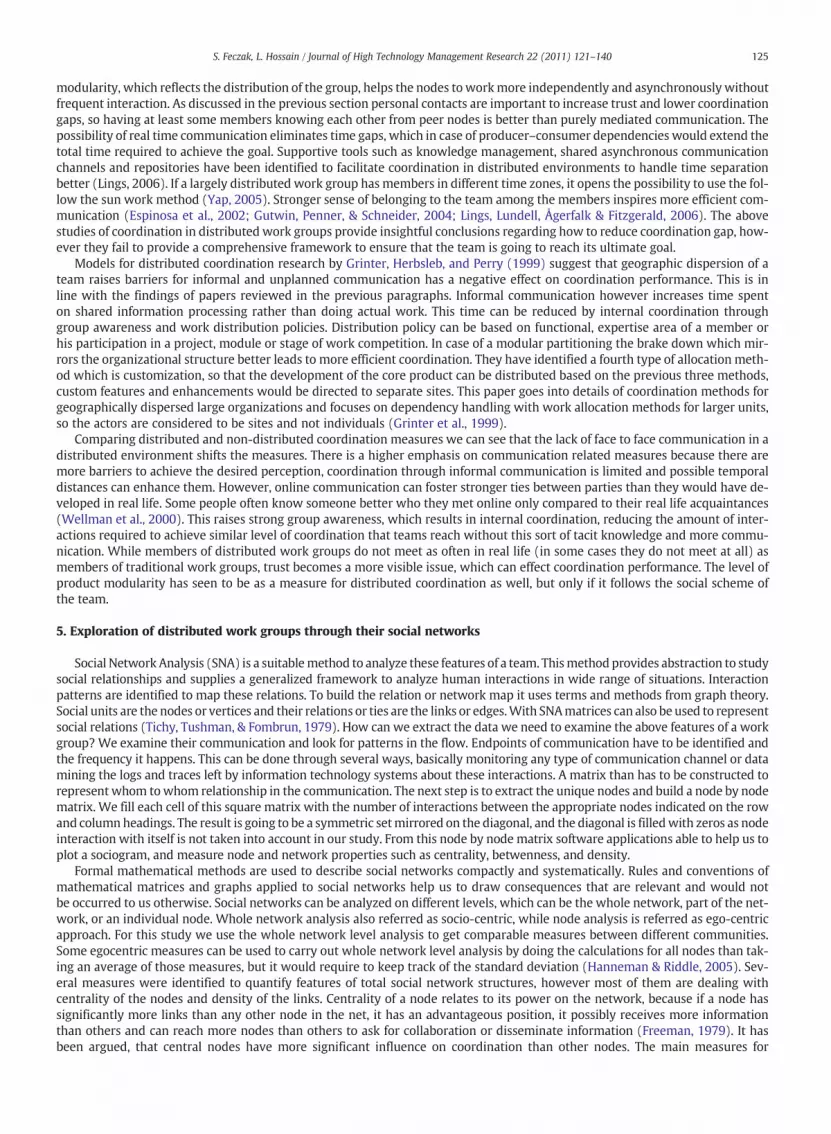
The above roles show different level of engagement with the project listed in descending order. The difference can be capturedby looking at the network diagram of a particular project. More active participants and core members have denser links to othersand their degree of centrality is also higher than passive users. It is also possible to explain other team attributes based on thenetwork map, for example if some other participant than the formally appointed project leader is in a significantly more centralposition and has higher volume of communication flow based on the network diagram it reveals that there is a misalignment be-tween the formal and informal structure of the team.
Roles according to SourceForgeRqen: Requirements EngineerCons: ConsultantEXT: External member to the projectPMan: Project managerNA: No data available on the roleALL: All hands person
To illustrate this from Fig. 1 it can be read, that in realityWble plays less importance as a formal projectmanager than Jack.We canalso see that the engagement of Mari, Ejsi, Dfus and Ssee is higher than Chri even though they all have the same role specified. Notethat not all passive members can be seen on the above diagram as we applied a minimum communication threshold discussed later.
3. How and why people get involved in Open Source of projects
Distributed work group set up is a challenge to many notions of coordination and its specially challenging using an open de-velopment model, because the incentives of actors have to be aligned and coercive mechanism does not support coordinationin OSS. Therefore the most challenging part is to manage low value tasks requiring no creativity and providing no reputation.(Ackerman, Buchwald, & Lewski, 1989; Bonaccorsi & Rossi, 2003; Goldman & Gabriel, 2005) Thus a common question raisedabout open source products: Who does the job and why, if it is for free? In most cases the incentives for the contributors arenot the monetary value but (Goldman & Gabriel, 2005, p. 28)
- he need for the product- the pleasure
8.0
19.0
13.0 7.0
6.0
8.0
5.0
19.0
5.0
8.0
9.0 25.0
38.0
16.0
24.0
5.05.0
8.0
13.0
9.0
7.0
25.0
38.0
11.0 5.0
16.0
5.0
6.0
6.0
24.0 11.0
6.0
5.0
5.0
jann.cons
ejsi.EXT
jack.ALL
moni.cons
mari.EXTdfus.EXT
finc.PMan
wble.PMan
ssee.EXT
gumm.rqen
chri.NA
hack.EXT
Fig. 1. Network diagram of project #49014.
123S. Feczak, L. Hossain / Journal of High Technology Management Research 22 (2011) 121–140
The enjoyment of learning, having fun during the making of the software.Some also consider the reputation and status gained by the achievement.
- socialization
Affiliation with mind brothers, feedback from the community.
- desire to give
Advocacy for fairness, based on the ideology of seeking the common good, hoping to make things better and wanting to givesomething back to the community.
4. Measuring coordination of distributed work groups
Coordination is present if multiple actors are connected to pursue a goal or several goals together. These actors need to be or-ganized in contrast with an individual effort where there is no such requirement. Furthermore extra amount of information pro-cessing is required which is not related with solving the original problem or achieving the goals set, but to handle the work(Malone, 1988). Basic components of coordination are:
1. a set of actors2. who perform tasks3. in order to achieve goals4. and encounter inter dependencies
It is important to note that it is possible to analyze the same activities in different ways depending on the purpose, becausecoordination elements are analytic concepts imposed by the observer. Therefore, we can easily adjust the application of themodel for example in the case of open source software development, we could consider a developer, a role, or the whole projectcommunity as an actor based on the scale of our analysis (Malone, 1988). Defining the set of goals is also arbitrarily decided by theresearcher. However some actors might have different or no goals compared with others in a certain scenario. It is possible thatnone of the actors alone has the goal which has been set by the observer, but the observed group as a whole (Malone, 1988). Hav-ing actors, tasks and goals does not necessarily mean coordination, it can be simply production. Goal relevant tasks can begrouped into two sets: production and coordination tasks. Those tasks which are related to achieve a goal and not to the addition-al information processing are the production tasks (Malone, 1988). In some cases coordination is almost a synonym of manage-ment. However it is more advantageous to use the coordination abstraction instead of the analytics of project managementbecause the brake down is defined by general terms, so it can be used transparently in different domains (Malone, 1988).
Based on the literature the following work group characteristics advise good coordination in a distributed environment. It isseen in existing studies of virtual groups that the presence of work distribution policy has impact on reducing the need for com-munication. Appropriate documentation results in less misunderstanding and eliminates interaction overheads. High level of
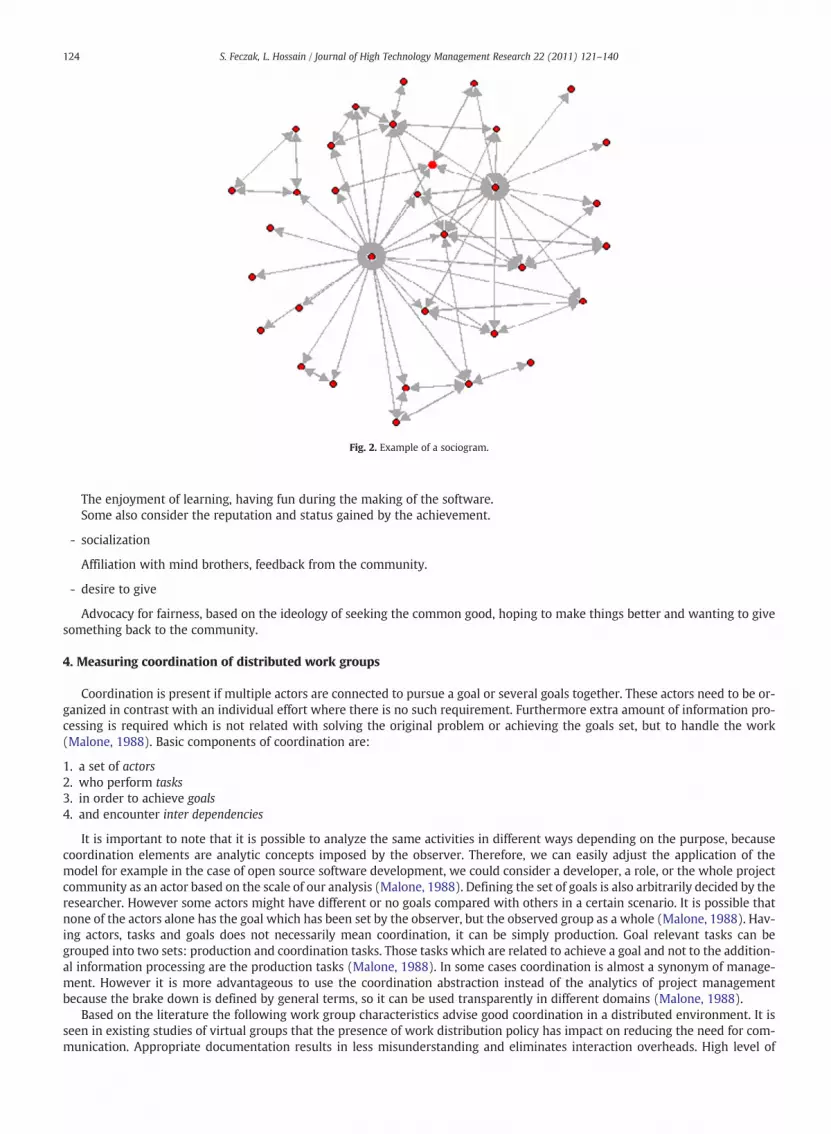
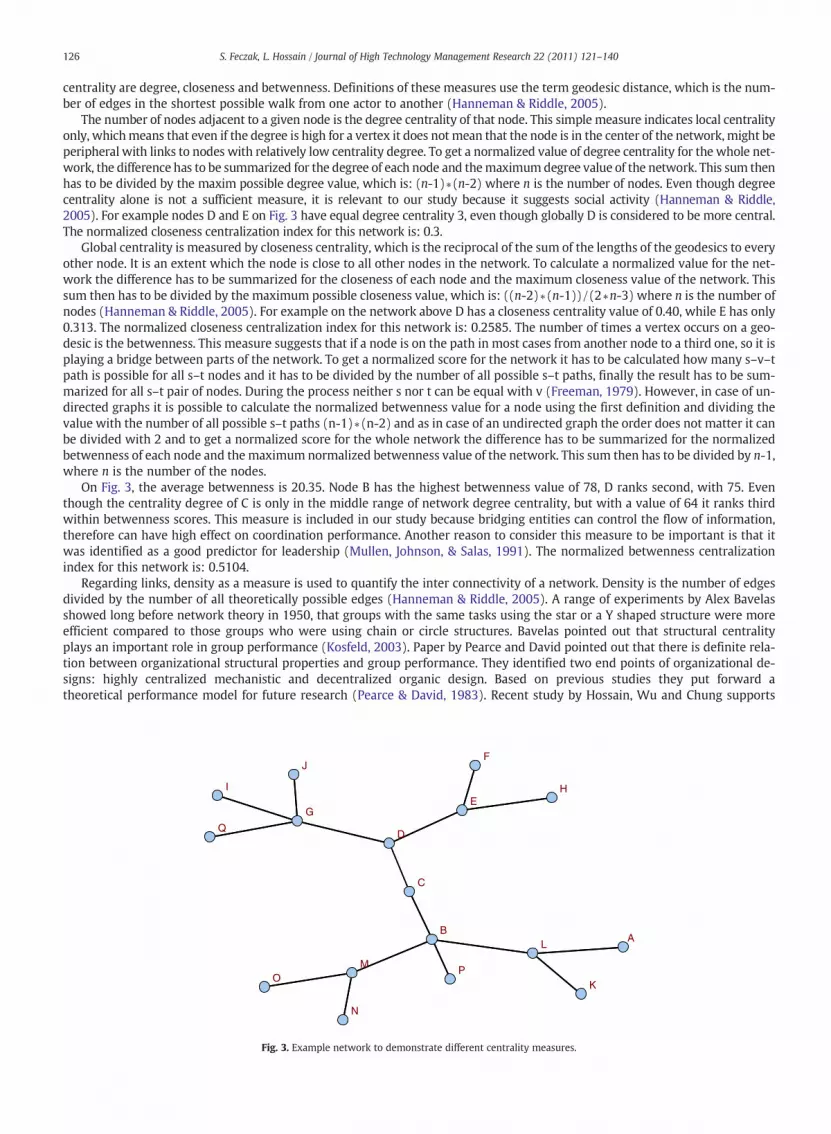
Fig. 2. Example of a sociogram.
124 S. Feczak, L. Hossain / Journal of High Technology Management Research 22 (2011) 121–140
modularity, which reflects the distribution of the group, helps the nodes to workmore independently and asynchronously withoutfrequent interaction. As discussed in the previous section personal contacts are important to increase trust and lower coordinationgaps, so having at least some members knowing each other from peer nodes is better than purely mediated communication. Thepossibility of real time communication eliminates time gaps, which in case of producer–consumer dependencies would extend thetotal time required to achieve the goal. Supportive tools such as knowledge management, shared asynchronous communicationchannels and repositories have been identified to facilitate coordination in distributed environments to handle time separationbetter (Lings, 2006). If a largely distributed work group has members in different time zones, it opens the possibility to use the fol-low the sun work method (Yap, 2005). Stronger sense of belonging to the team among the members inspires more efficient com-munication (Espinosa et al., 2002; Gutwin, Penner, & Schneider, 2004; Lings, Lundell, Ågerfalk & Fitzgerald, 2006). The abovestudies of coordination in distributed work groups provide insightful conclusions regarding how to reduce coordination gap, how-ever they fail to provide a comprehensive framework to ensure that the team is going to reach its ultimate goal.
Models for distributed coordination research by Grinter, Herbsleb, and Perry (1999) suggest that geographic dispersion of ateam raises barriers for informal and unplanned communication has a negative effect on coordination performance. This is inline with the findings of papers reviewed in the previous paragraphs. Informal communication however increases time spenton shared information processing rather than doing actual work. This time can be reduced by internal coordination throughgroup awareness and work distribution policies. Distribution policy can be based on functional, expertise area of a member orhis participation in a project, module or stage of work competition. In case of a modular partitioning the brake down which mir-rors the organizational structure better leads to more efficient coordination. They have identified a fourth type of allocation meth-od which is customization, so that the development of the core product can be distributed based on the previous three methods,custom features and enhancements would be directed to separate sites. This paper goes into details of coordination methods forgeographically dispersed large organizations and focuses on dependency handling with work allocation methods for larger units,so the actors are considered to be sites and not individuals (Grinter et al., 1999).
Comparing distributed and non-distributed coordination measures we can see that the lack of face to face communication in adistributed environment shifts the measures. There is a higher emphasis on communication related measures because there aremore barriers to achieve the desired perception, coordination through informal communication is limited and possible temporaldistances can enhance them. However, online communication can foster stronger ties between parties than they would have de-veloped in real life. Some people often know someone better who they met online only compared to their real life acquaintances(Wellman et al., 2000). This raises strong group awareness, which results in internal coordination, reducing the amount of inter-actions required to achieve similar level of coordination that teams reach without this sort of tacit knowledge and more commu-nication. While members of distributed work groups do not meet as often in real life (in some cases they do not meet at all) asmembers of traditional work groups, trust becomes a more visible issue, which can effect coordination performance. The level ofproduct modularity has seen to be as a measure for distributed coordination as well, but only if it follows the social scheme ofthe team.
5. Exploration of distributed work groups through their social networks
Social Network Analysis (SNA) is a suitablemethod to analyze these features of a team. Thismethod provides abstraction to studysocial relationships and supplies a generalized framework to analyze human interactions in wide range of situations. Interactionpatterns are identified to map these relations. To build the relation or network map it uses terms and methods from graph theory.Social units are the nodes or vertices and their relations or ties are the links or edges.With SNAmatrices can also be used to representsocial relations (Tichy, Tushman, & Fombrun, 1979). How can we extract the data we need to examine the above features of a workgroup? We examine their communication and look for patterns in the flow. Endpoints of communication have to be identified andthe frequency it happens. This can be done through several ways, basically monitoring any type of communication channel or datamining the logs and traces left by information technology systems about these interactions. A matrix than has to be constructed torepresent whom towhom relationship in the communication. The next step is to extract the unique nodes and build a node by nodematrix. We fill each cell of this square matrix with the number of interactions between the appropriate nodes indicated on the rowand columnheadings. The result is going to be a symmetric setmirrored on the diagonal, and the diagonal is filledwith zeros as nodeinteraction with itself is not taken into account in our study. From this node by node matrix software applications able to help us toplot a sociogram, and measure node and network properties such as centrality, betwenness, and density.
Formal mathematical methods are used to describe social networks compactly and systematically. Rules and conventions ofmathematical matrices and graphs applied to social networks help us to draw consequences that are relevant and would notbe occurred to us otherwise. Social networks can be analyzed on different levels, which can be the whole network, part of the net-work, or an individual node. Whole network analysis also referred as socio-centric, while node analysis is referred as ego-centricapproach. For this study we use the whole network level analysis to get comparable measures between different communities.Some egocentric measures can be used to carry out whole network level analysis by doing the calculations for all nodes than tak-ing an average of those measures, but it would require to keep track of the standard deviation (Hanneman & Riddle, 2005). Sev-eral measures were identified to quantify features of total social network structures, however most of them are dealing withcentrality of the nodes and density of the links. Centrality of a node relates to its power on the network, because if a node hassignificantly more links than any other node in the net, it has an advantageous position, it possibly receives more informationthan others and can reach more nodes than others to ask for collaboration or disseminate information (Freeman, 1979). It hasbeen argued, that central nodes have more significant influence on coordination than other nodes. The main measures for
125S. Feczak, L. Hossain / Journal of High Technology Management Research 22 (2011) 121–140
centrality are degree, closeness and betwenness. Definitions of these measures use the term geodesic distance, which is the num-ber of edges in the shortest possible walk from one actor to another (Hanneman & Riddle, 2005).
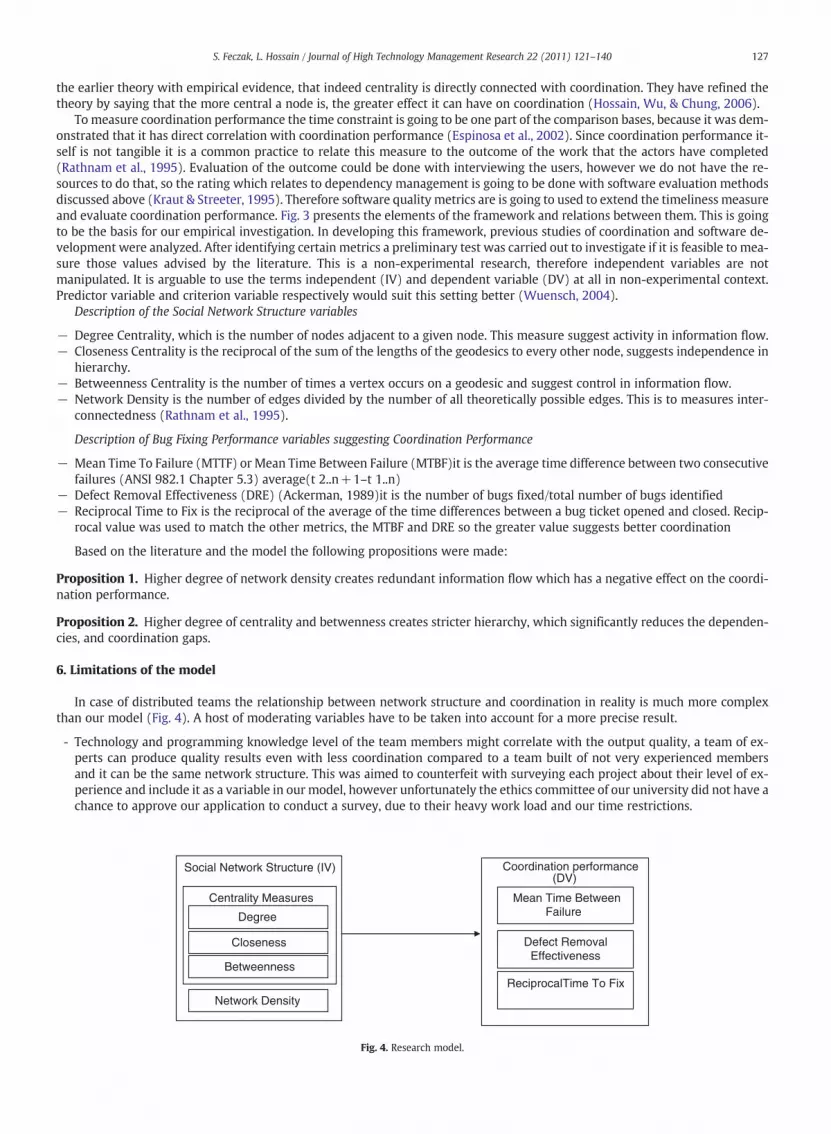
The number of nodes adjacent to a given node is the degree centrality of that node. This simple measure indicates local centralityonly, whichmeans that even if the degree is high for a vertex it does not mean that the node is in the center of the network, might beperipheral with links to nodes with relatively low centrality degree. To get a normalized value of degree centrality for the whole net-work, the difference has to be summarized for the degree of each node and themaximumdegree value of the network. This sum thenhas to be divided by the maxim possible degree value, which is: (n-1)∗(n-2) where n is the number of nodes. Even though degreecentrality alone is not a sufficient measure, it is relevant to our study because it suggests social activity (Hanneman & Riddle,2005). For example nodes D and E on Fig. 3 have equal degree centrality 3, even though globally D is considered to be more central.The normalized closeness centralization index for this network is: 0.3.
Global centrality is measured by closeness centrality, which is the reciprocal of the sum of the lengths of the geodesics to everyother node. It is an extent which the node is close to all other nodes in the network. To calculate a normalized value for the net-work the difference has to be summarized for the closeness of each node and the maximum closeness value of the network. Thissum then has to be divided by the maximum possible closeness value, which is: ((n-2)∗(n-1))/(2∗n-3) where n is the number ofnodes (Hanneman & Riddle, 2005). For example on the network above D has a closeness centrality value of 0.40, while E has only0.313. The normalized closeness centralization index for this network is: 0.2585. The number of times a vertex occurs on a geo-desic is the betwenness. This measure suggests that if a node is on the path in most cases from another node to a third one, so it isplaying a bridge between parts of the network. To get a normalized score for the network it has to be calculated how many s–v–tpath is possible for all s–t nodes and it has to be divided by the number of all possible s–t paths, finally the result has to be sum-marized for all s–t pair of nodes. During the process neither s nor t can be equal with v (Freeman, 1979). However, in case of un-directed graphs it is possible to calculate the normalized betwenness value for a node using the first definition and dividing thevalue with the number of all possible s–t paths (n-1)∗(n-2) and as in case of an undirected graph the order does not matter it canbe divided with 2 and to get a normalized score for the whole network the difference has to be summarized for the normalizedbetwenness of each node and the maximum normalized betwenness value of the network. This sum then has to be divided by n-1,where n is the number of the nodes.
On Fig. 3, the average betwenness is 20.35. Node B has the highest betwenness value of 78, D ranks second, with 75. Eventhough the centrality degree of C is only in the middle range of network degree centrality, but with a value of 64 it ranks thirdwithin betwenness scores. This measure is included in our study because bridging entities can control the flow of information,therefore can have high effect on coordination performance. Another reason to consider this measure to be important is that itwas identified as a good predictor for leadership (Mullen, Johnson, & Salas, 1991). The normalized betwenness centralizationindex for this network is: 0.5104.
Regarding links, density as a measure is used to quantify the inter connectivity of a network. Density is the number of edgesdivided by the number of all theoretically possible edges (Hanneman & Riddle, 2005). A range of experiments by Alex Bavelasshowed long before network theory in 1950, that groups with the same tasks using the star or a Y shaped structure were moreefficient compared to those groups who were using chain or circle structures. Bavelas pointed out that structural centralityplays an important role in group performance (Kosfeld, 2003). Paper by Pearce and David pointed out that there is definite rela-tion between organizational structural properties and group performance. They identified two end points of organizational de-signs: highly centralized mechanistic and decentralized organic design. Based on previous studies they put forward atheoretical performance model for future research (Pearce & David, 1983). Recent study by Hossain, Wu and Chung supports
AB
C
D
E
F
G
HI
J
K
L
M
N
OP
Q
Fig. 3. Example network to demonstrate different centrality measures.
126 S. Feczak, L. Hossain / Journal of High Technology Management Research 22 (2011) 121–140
the earlier theory with empirical evidence, that indeed centrality is directly connected with coordination. They have refined thetheory by saying that the more central a node is, the greater effect it can have on coordination (Hossain, Wu, & Chung, 2006).
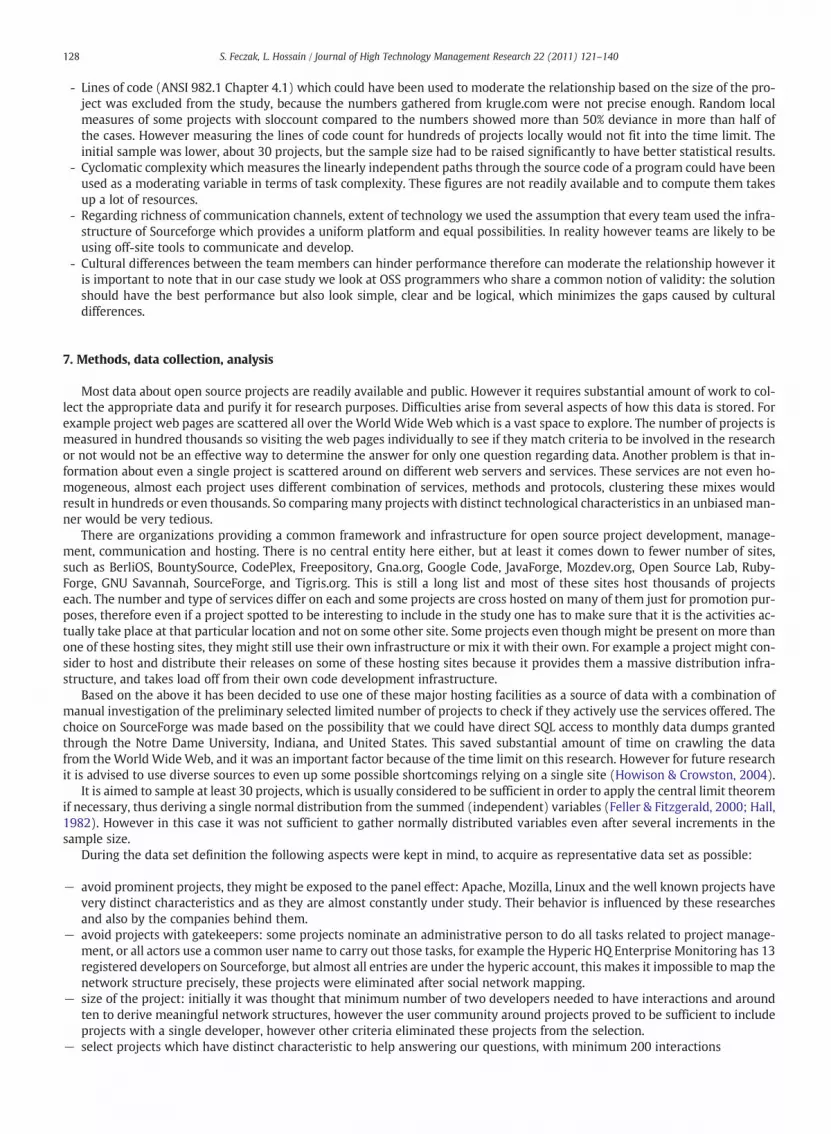
To measure coordination performance the time constraint is going to be one part of the comparison bases, because it was dem-onstrated that it has direct correlation with coordination performance (Espinosa et al., 2002). Since coordination performance it-self is not tangible it is a common practice to relate this measure to the outcome of the work that the actors have completed(Rathnam et al., 1995). Evaluation of the outcome could be done with interviewing the users, however we do not have the re-sources to do that, so the rating which relates to dependency management is going to be done with software evaluation methodsdiscussed above (Kraut & Streeter, 1995). Therefore software quality metrics are is going to used to extend the timeliness measureand evaluate coordination performance. Fig. 3 presents the elements of the framework and relations between them. This is goingto be the basis for our empirical investigation. In developing this framework, previous studies of coordination and software de-velopment were analyzed. After identifying certain metrics a preliminary test was carried out to investigate if it is feasible to mea-sure those values advised by the literature. This is a non-experimental research, therefore independent variables are notmanipulated. It is arguable to use the terms independent (IV) and dependent variable (DV) at all in non-experimental context.Predictor variable and criterion variable respectively would suit this setting better (Wuensch, 2004).
Description of the Social Network Structure variables
− Degree Centrality, which is the number of nodes adjacent to a given node. This measure suggest activity in information flow.− Closeness Centrality is the reciprocal of the sum of the lengths of the geodesics to every other node, suggests independence in
hierarchy.− Betweenness Centrality is the number of times a vertex occurs on a geodesic and suggest control in information flow.− Network Density is the number of edges divided by the number of all theoretically possible edges. This is to measures inter-
connectedness (Rathnam et al., 1995).
Description of Bug Fixing Performance variables suggesting Coordination Performance
− Mean Time To Failure (MTTF) or Mean Time Between Failure (MTBF)it is the average time difference between two consecutivefailures (ANSI 982.1 Chapter 5.3) average(t 2..n+1–t 1..n)
− Defect Removal Effectiveness (DRE) (Ackerman, 1989)it is the number of bugs fixed/total number of bugs identified− Reciprocal Time to Fix is the reciprocal of the average of the time differences between a bug ticket opened and closed. Recip-
rocal value was used to match the other metrics, the MTBF and DRE so the greater value suggests better coordination
Based on the literature and the model the following propositions were made:
Proposition 1. Higher degree of network density creates redundant information flow which has a negative effect on the coordi-nation performance.
Proposition 2. Higher degree of centrality and betwenness creates stricter hierarchy, which significantly reduces the dependen-cies, and coordination gaps.
6. Limitations of the model
In case of distributed teams the relationship between network structure and coordination in reality is much more complexthan our model (Fig. 4). A host of moderating variables have to be taken into account for a more precise result.
- Technology and programming knowledge level of the team members might correlate with the output quality, a team of ex-perts can produce quality results even with less coordination compared to a team built of not very experienced membersand it can be the same network structure. This was aimed to counterfeit with surveying each project about their level of ex-perience and include it as a variable in our model, however unfortunately the ethics committee of our university did not have achance to approve our application to conduct a survey, due to their heavy work load and our time restrictions.
Coordination performance (DV)
Social Network Structure (IV)
Degree
Network Density
Betweenness
Mean Time Between Failure
Defect Removal Effectiveness
ReciprocalTime To Fix
Closeness
Centrality Measures
Fig. 4. Research model.
127S. Feczak, L. Hossain / Journal of High Technology Management Research 22 (2011) 121–140
- Lines of code (ANSI 982.1 Chapter 4.1) which could have been used to moderate the relationship based on the size of the pro-ject was excluded from the study, because the numbers gathered from krugle.com were not precise enough. Random localmeasures of some projects with sloccount compared to the numbers showed more than 50% deviance in more than half ofthe cases. However measuring the lines of code count for hundreds of projects locally would not fit into the time limit. Theinitial sample was lower, about 30 projects, but the sample size had to be raised significantly to have better statistical results.
- Cyclomatic complexity which measures the linearly independent paths through the source code of a program could have beenused as a moderating variable in terms of task complexity. These figures are not readily available and to compute them takesup a lot of resources.
- Regarding richness of communication channels, extent of technology we used the assumption that every team used the infra-structure of Sourceforge which provides a uniform platform and equal possibilities. In reality however teams are likely to beusing off-site tools to communicate and develop.
- Cultural differences between the team members can hinder performance therefore can moderate the relationship however itis important to note that in our case study we look at OSS programmers who share a common notion of validity: the solutionshould have the best performance but also look simple, clear and be logical, which minimizes the gaps caused by culturaldifferences.
7. Methods, data collection, analysis
Most data about open source projects are readily available and public. However it requires substantial amount of work to col-lect the appropriate data and purify it for research purposes. Difficulties arise from several aspects of how this data is stored. Forexample project web pages are scattered all over the World Wide Web which is a vast space to explore. The number of projects ismeasured in hundred thousands so visiting the web pages individually to see if they match criteria to be involved in the researchor not would not be an effective way to determine the answer for only one question regarding data. Another problem is that in-formation about even a single project is scattered around on different web servers and services. These services are not even ho-mogeneous, almost each project uses different combination of services, methods and protocols, clustering these mixes wouldresult in hundreds or even thousands. So comparing many projects with distinct technological characteristics in an unbiased man-ner would be very tedious.
There are organizations providing a common framework and infrastructure for open source project development, manage-ment, communication and hosting. There is no central entity here either, but at least it comes down to fewer number of sites,such as BerliOS, BountySource, CodePlex, Freepository, Gna.org, Google Code, JavaForge, Mozdev.org, Open Source Lab, Ruby-Forge, GNU Savannah, SourceForge, and Tigris.org. This is still a long list and most of these sites host thousands of projectseach. The number and type of services differ on each and some projects are cross hosted on many of them just for promotion pur-poses, therefore even if a project spotted to be interesting to include in the study one has to make sure that it is the activities ac-tually take place at that particular location and not on some other site. Some projects even though might be present on more thanone of these hosting sites, they might still use their own infrastructure or mix it with their own. For example a project might con-sider to host and distribute their releases on some of these hosting sites because it provides them a massive distribution infra-structure, and takes load off from their own code development infrastructure.
Based on the above it has been decided to use one of these major hosting facilities as a source of data with a combination ofmanual investigation of the preliminary selected limited number of projects to check if they actively use the services offered. Thechoice on SourceForge was made based on the possibility that we could have direct SQL access to monthly data dumps grantedthrough the Notre Dame University, Indiana, and United States. This saved substantial amount of time on crawling the datafrom the World WideWeb, and it was an important factor because of the time limit on this research. However for future researchit is advised to use diverse sources to even up some possible shortcomings relying on a single site (Howison & Crowston, 2004).
It is aimed to sample at least 30 projects, which is usually considered to be sufficient in order to apply the central limit theoremif necessary, thus deriving a single normal distribution from the summed (independent) variables (Feller & Fitzgerald, 2000; Hall,1982). However in this case it was not sufficient to gather normally distributed variables even after several increments in thesample size.
During the data set definition the following aspects were kept in mind, to acquire as representative data set as possible:
− avoid prominent projects, they might be exposed to the panel effect: Apache, Mozilla, Linux and the well known projects havevery distinct characteristics and as they are almost constantly under study. Their behavior is influenced by these researchesand also by the companies behind them.
− avoid projects with gatekeepers: some projects nominate an administrative person to do all tasks related to project manage-ment, or all actors use a common user name to carry out those tasks, for example the Hyperic HQ Enterprise Monitoring has 13registered developers on Sourceforge, but almost all entries are under the hyperic account, this makes it impossible to map thenetwork structure precisely, these projects were eliminated after social network mapping.
− size of the project: initially it was thought that minimum number of two developers needed to have interactions and aroundten to derive meaningful network structures, however the user community around projects proved to be sufficient to includeprojects with a single developer, however other criteria eliminated these projects from the selection.
− select projects which have distinct characteristic to help answering our questions, with minimum 200 interactions
128 S. Feczak, L. Hossain / Journal of High Technology Management Research 22 (2011) 121–140
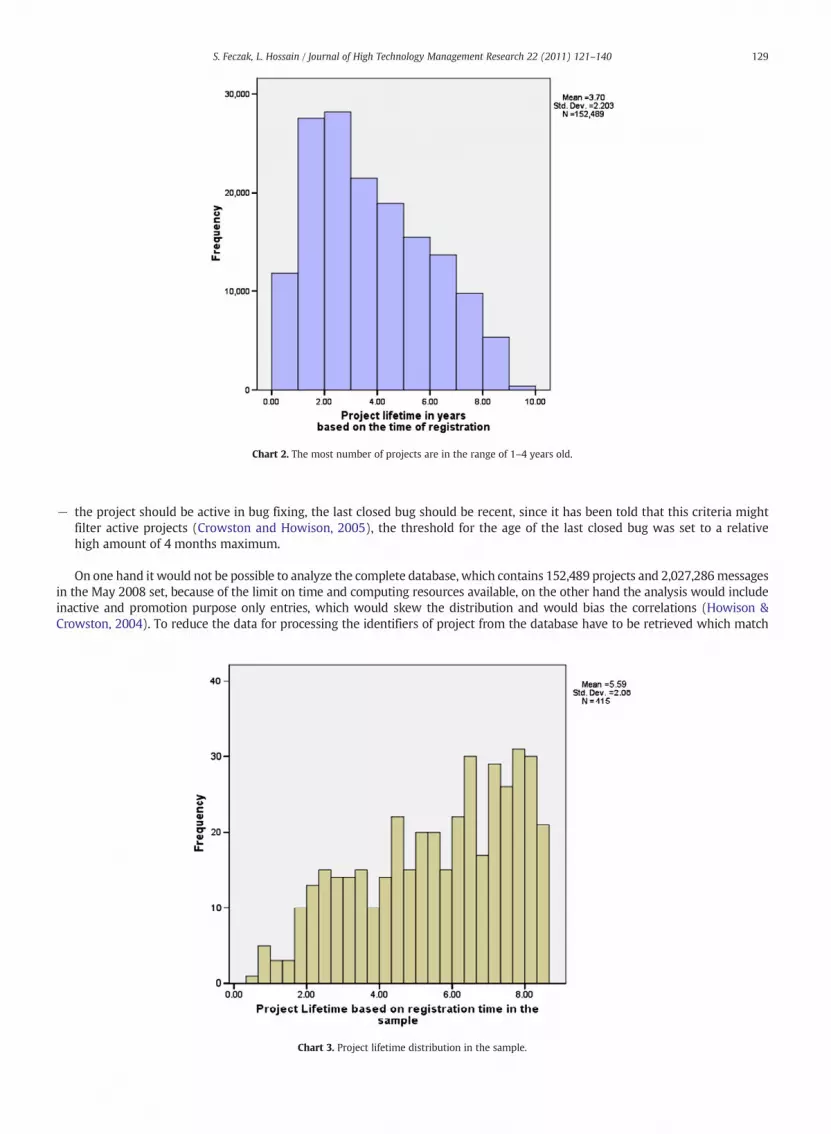
− the project should be active in bug fixing, the last closed bug should be recent, since it has been told that this criteria mightfilter active projects (Crowston and Howison, 2005), the threshold for the age of the last closed bug was set to a relativehigh amount of 4 months maximum.
On one hand it would not be possible to analyze the complete database, which contains 152,489 projects and 2,027,286messagesin the May 2008 set, because of the limit on time and computing resources available, on the other hand the analysis would includeinactive and promotion purpose only entries, which would skew the distribution and would bias the correlations (Howison &Crowston, 2004). To reduce the data for processing the identifiers of project from the database have to be retrieved which match
Chart 3. Project lifetime distribution in the sample.
Chart 2. The most number of projects are in the range of 1–4 years old.
129S. Feczak, L. Hossain / Journal of High Technology Management Research 22 (2011) 121–140
our criteria. Unfortunately the stored statistical values in the stats_project_all table were not reliable enough to use them. For the fol-lowing query returned 136 records with higher values than 1 for bugs_closed/bugs_opened ratio which are not realistic.
SELECT count(g.group_id) FROM sf0508.groups g, sf0508.stats_project_all spa WHERE spa.group_id = g.group_id ANDbugs_closed/bugs_opened N1.
On Chart 2 and Chart 3 project lifetime in the sample and population can be compared.The following query was used to select projects active in bug fixing during the last four months and having minimum 200
interactions:
SELECT agl.group_id,count(am.submitted_by),max(close_date) FROM sf0508.artifact a, sf0508.artifact_group_list agl, sf0508.arti-fact_message am WHERE a.artifact_id = am.artifact_id AND a.group_artifact_id = agl.group_artifact_id AND agl.name = ‘Bugs’group by agl.group_id having max(close_date)N1201867806 and count(am.submitted_by)N200 (Table 1)
At this stage the information is sufficient to determinate group identifiers (based on the above example: gid1=98294,gid2=98243, gid3=65346, …), which will be included in all further queries as an additional clause in the form of
WHERE [clause1..n] AND group_id in (gid1, gid2, gid3, …)
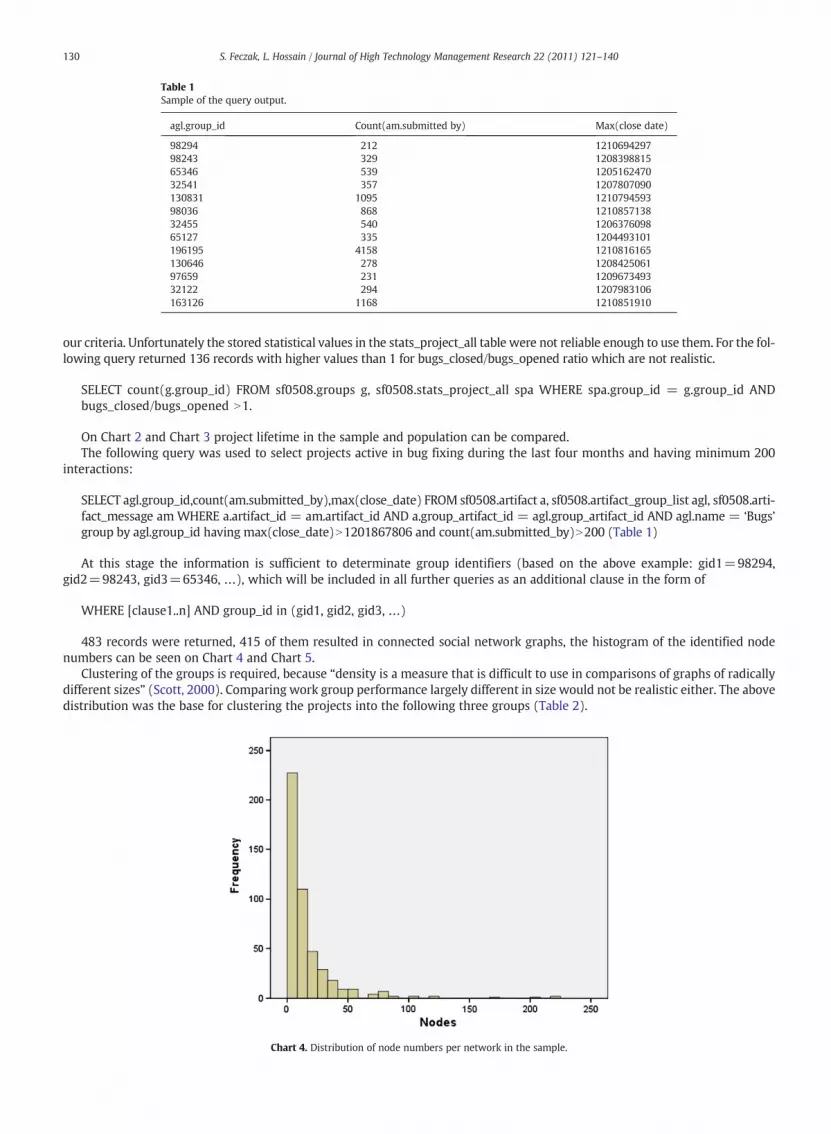
483 records were returned, 415 of them resulted in connected social network graphs, the histogram of the identified nodenumbers can be seen on Chart 4 and Chart 5.
Clustering of the groups is required, because “density is a measure that is difficult to use in comparisons of graphs of radicallydifferent sizes” (Scott, 2000). Comparing work group performance largely different in size would not be realistic either. The abovedistribution was the base for clustering the projects into the following three groups (Table 2).
Chart 4. Distribution of node numbers per network in the sample.
Table 1Sample of the query output.
agl.group_id Count(am.submitted by) Max(close date)
98294 212 121069429798243 329 120839881565346 539 120516247032541 357 1207807090130831 1095 121079459398036 868 121085713832455 540 120637609865127 335 1204493101196195 4158 1210816165130646 278 120842506197659 231 120967349332122 294 1207983106163126 1168 1210851910
130 S. Feczak, L. Hossain / Journal of High Technology Management Research 22 (2011) 121–140
8. Social network metrics
The following query returns the thread identifiers and the user identifier who participated in the thread with the time stampof the post, the records also include the user id of the thread initiator.
SELECTagl.group_id, a.artifact_id as thread, a.submitted_by as submitted, a.assigned_to as assigned, am.adddate as time, am.submitted_by as commentedFROMsf0508.artifact a, sf0508.artifact_group_list agl, sf0508.artifact_message amWHEREa.group_artifact_id = agl.group_artifact_id AND a.artifact_id = am.artifact_id AND agl.group_idin (gid1, gid2, gid3 …)order by agl.group_id,a.artifact_id,am.adddate
It is very important to sort the result by the time field, because it is assumed that actors who submitted a post earlier thansomeone else do not read the ones followed by them unless they post again in the thread. Each unique participant is identifiedby going through all lines and adding the identifier to a vector if it does not contain it yet. Based on that an empty adjacency ma-trix can be formed. Going through the lines again we count the number of times an actor could see a post from another actor inthe thread before him/her, this count becomes the weight of the link. We also consider the submitter and the assignee to be firstin the thread. Interactions within each thread counted separately, so even if two actors follow each other in the time line it doesnot count if it was on a different thread. That is why the primary sort key is the thread id and the secondary key is the time. At theend of this process the matrix is made symmetric based on the smaller number of interactions.
In the above example 169722 submitted fivemessages, which has been read by 1486, but 169722 only read 2messages from 1486so the normalized weight is 2 in both directions. In case between 171769 and 1486 the communication is one way, so it is not con-sidered to be a social link therefore we put down zero in both cells regarding these actors in the second version of the matrix.
During the measurement the threshold was set to minimum five interactions to consider a link significant (Adamic & Adar,2005). So the final step is to eliminate all elements of the matrix which has a weight less than five. In the above example only180520 and 169722 match these criteria. Therefore the final social network graph in case of the above example would consistof 2 nodes with two directed edges each of them having a weight five, or to simplify it one undirected edge with a weight of
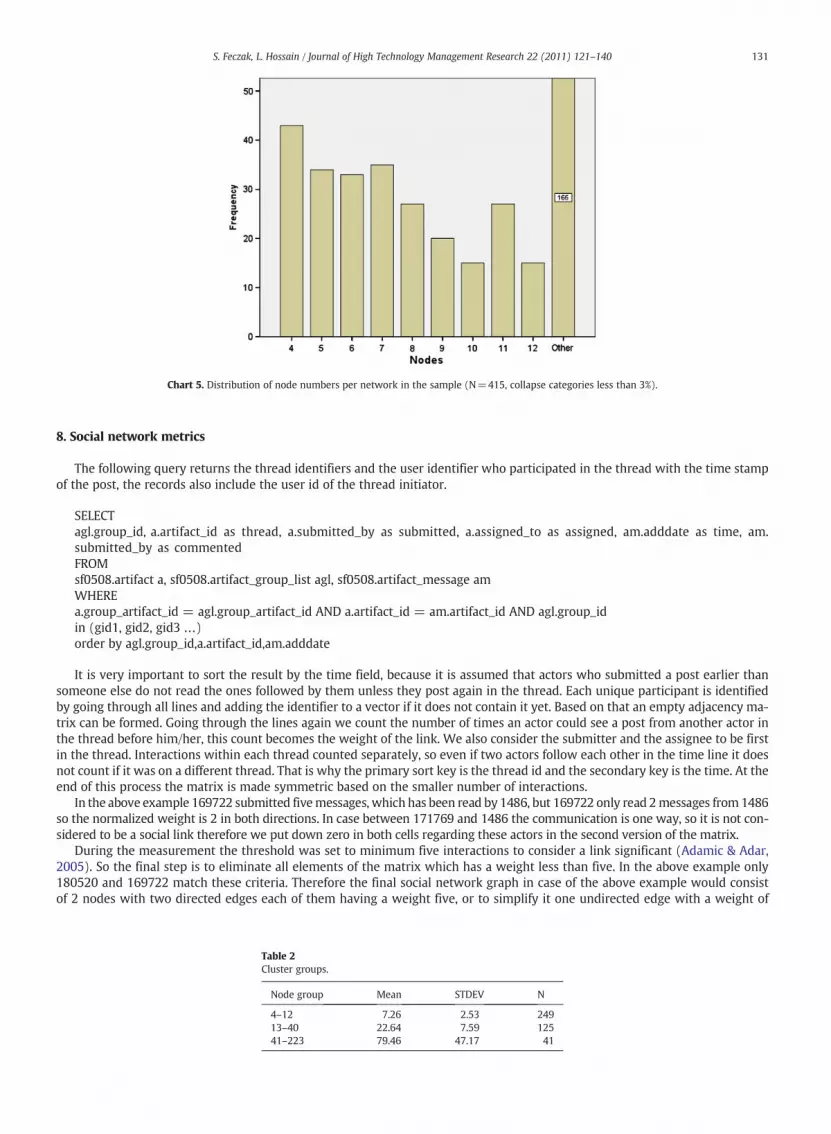
Chart 5. Distribution of node numbers per network in the sample (N=415, collapse categories less than 3%).
Table 2Cluster groups.
Node group Mean STDEV N
4–12 7.26 2.53 24913–40 22.64 7.59 12541–223 79.46 47.17 41
131S. Feczak, L. Hossain / Journal of High Technology Management Research 22 (2011) 121–140
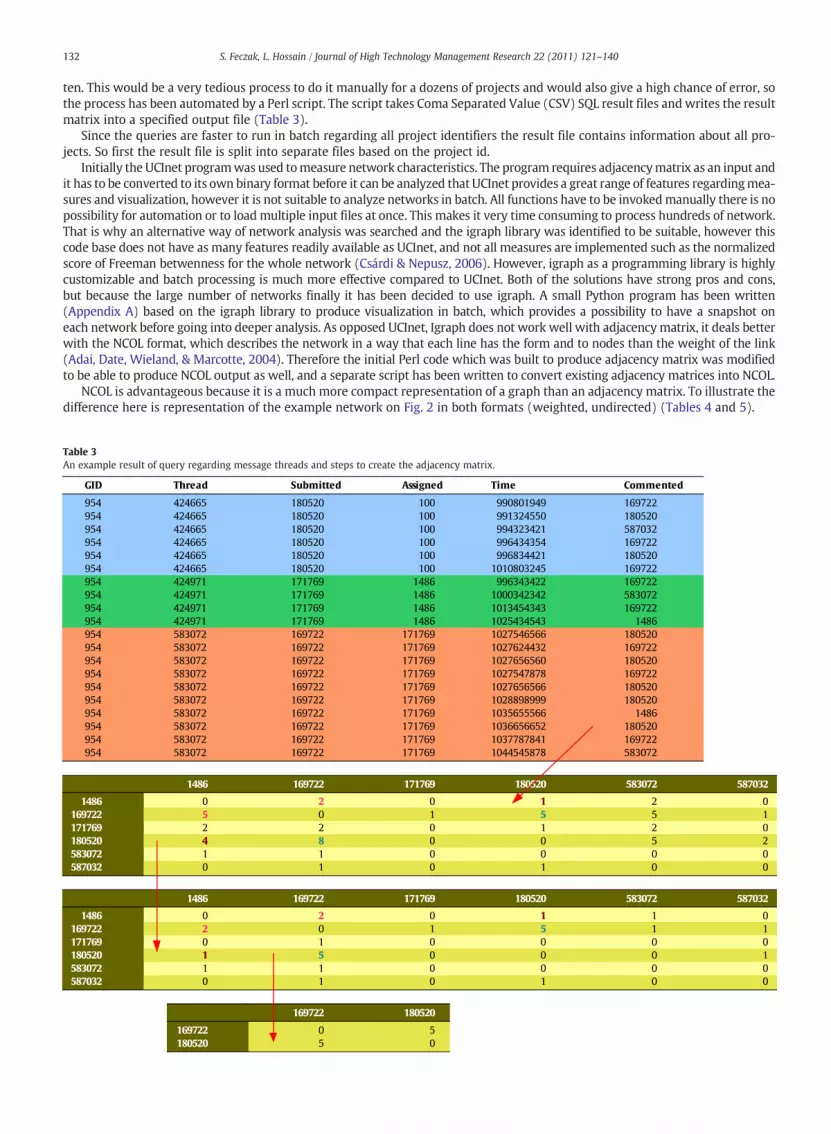
ten. This would be a very tedious process to do it manually for a dozens of projects and would also give a high chance of error, sothe process has been automated by a Perl script. The script takes Coma Separated Value (CSV) SQL result files and writes the resultmatrix into a specified output file (Table 3).
Since the queries are faster to run in batch regarding all project identifiers the result file contains information about all pro-jects. So first the result file is split into separate files based on the project id.
Initially the UCInet programwas used tomeasure network characteristics. The program requires adjacencymatrix as an input andit has to be converted to its own binary format before it can be analyzed that UCInet provides a great range of features regardingmea-sures and visualization, however it is not suitable to analyze networks in batch. All functions have to be invokedmanually there is nopossibility for automation or to load multiple input files at once. This makes it very time consuming to process hundreds of network.That is why an alternative way of network analysis was searched and the igraph library was identified to be suitable, however thiscode base does not have as many features readily available as UCInet, and not all measures are implemented such as the normalizedscore of Freeman betwenness for the whole network (Csárdi & Nepusz, 2006). However, igraph as a programming library is highlycustomizable and batch processing is much more effective compared to UCInet. Both of the solutions have strong pros and cons,but because the large number of networks finally it has been decided to use igraph. A small Python program has been written(Appendix A) based on the igraph library to produce visualization in batch, which provides a possibility to have a snapshot oneach network before going into deeper analysis. As opposed UCInet, Igraph does not work well with adjacencymatrix, it deals betterwith the NCOL format, which describes the network in a way that each line has the form and to nodes than the weight of the link(Adai, Date, Wieland, & Marcotte, 2004). Therefore the initial Perl code which was built to produce adjacency matrix was modifiedto be able to produce NCOL output as well, and a separate script has been written to convert existing adjacency matrices into NCOL.
NCOL is advantageous because it is a much more compact representation of a graph than an adjacency matrix. To illustrate thedifference here is representation of the example network on Fig. 2 in both formats (weighted, undirected) (Tables 4 and 5).
Table 3An example result of query regarding message threads and steps to create the adjacency matrix.
GID
954
954
954
954
954
954
954
954
954
954
954
954
954
954
954
954
954
954
954
954
Thread
424665
424665
424665
424665
424665
424665
424971
424971
424971
424971
583072
583072
583072
583072
583072
583072
583072
583072
583072
583072
Submitted
180520
180520
180520
180520
180520
180520
171769
171769
171769
171769
169722
169722
169722
169722
169722
169722
169722
169722
169722
169722
Assigned
100
100
100
100
100
100
1486
1486
1486
1486
171769
171769
171769
171769
171769
171769
171769
171769
171769
171769
Time
990801949
991324550
994323421
996434354
996834421
1010803245
996343422
1000342342
1013454343
1025434543
1027546566
1027624432
1027656560
1027547878
1027656566
1028898999
1035655566
1036656652
1037787841
1044545878
Commented
169722
180520
587032
169722
180520
169722
169722
583072
169722
1486
180520
169722
180520
169722
180520
180520
1486
180520
169722
583072
1486
169722
171769
180520
583072
587032
1486
0
5
2
4
1
0
169722
2
0
2
8
1
1
171769
0
1
0
0
0
0
180520
1
5
1
0
0
1
583072
2
5
2
5
0
0
587032
0
1
0
2
0
0
1486
169722
171769
180520
583072
587032
1486
0
2
0
1
1
0
169722
2
0
1
5
1
1
171769
0
1
0
0
0
0
180520
1
5
0
0
0
1
583072
1
1
0
0
0
0
587032
0
1
0
1
0
0
169722
180520
169722
0
5
180520
5
0
132 S. Feczak, L. Hossain / Journal of High Technology Management Research 22 (2011) 121–140
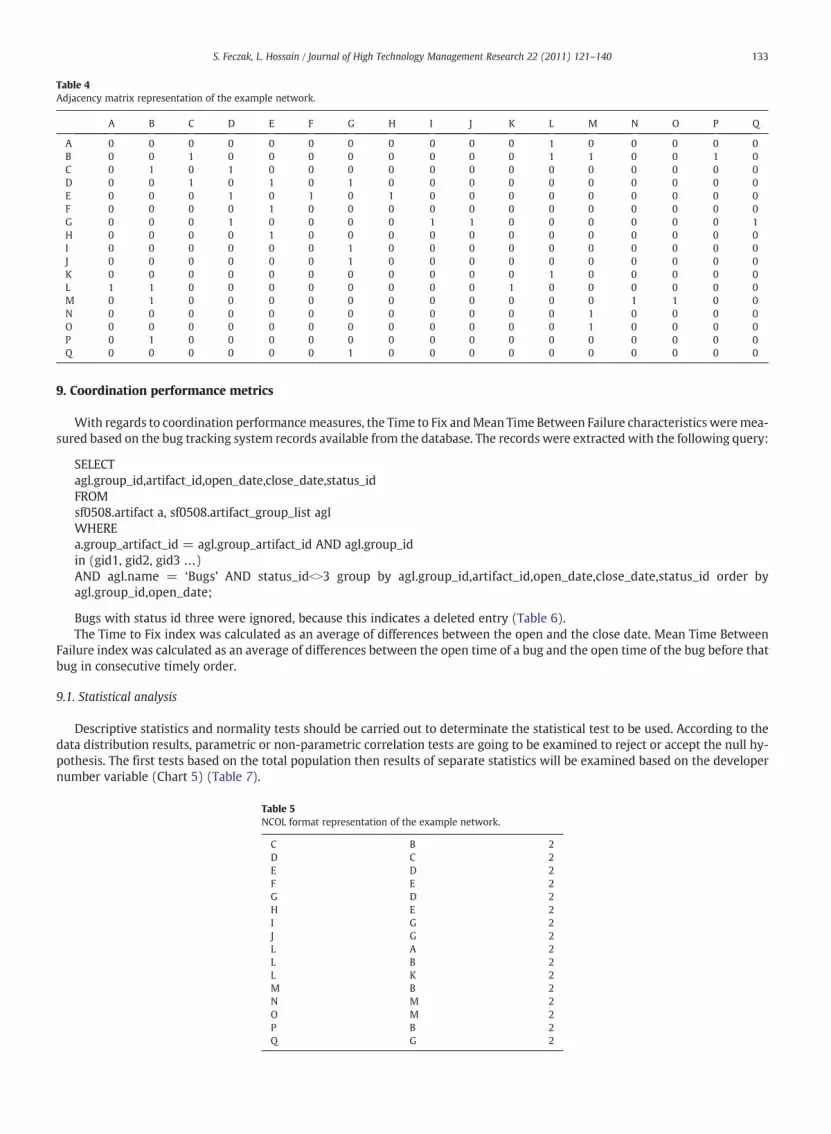
9. Coordination performance metrics
With regards to coordination performancemeasures, the Time to Fix andMean Time Between Failure characteristics weremea-sured based on the bug tracking system records available from the database. The records were extracted with the following query:
SELECTagl.group_id,artifact_id,open_date,close_date,status_idFROMsf0508.artifact a, sf0508.artifact_group_list aglWHEREa.group_artifact_id = agl.group_artifact_id AND agl.group_idin (gid1, gid2, gid3 …)AND agl.name = ‘Bugs’ AND status_idbN3 group by agl.group_id,artifact_id,open_date,close_date,status_id order byagl.group_id,open_date;
Bugs with status id three were ignored, because this indicates a deleted entry (Table 6).The Time to Fix index was calculated as an average of differences between the open and the close date. Mean Time Between
Failure index was calculated as an average of differences between the open time of a bug and the open time of the bug before thatbug in consecutive timely order.
9.1. Statistical analysis
Descriptive statistics and normality tests should be carried out to determinate the statistical test to be used. According to thedata distribution results, parametric or non-parametric correlation tests are going to be examined to reject or accept the null hy-pothesis. The first tests based on the total population then results of separate statistics will be examined based on the developernumber variable (Chart 5) (Table 7).
Table 5NCOL format representation of the example network.
C B 2D C 2E D 2F E 2G D 2H E 2I G 2J G 2L A 2L B 2L K 2M B 2N M 2O M 2P B 2Q G 2
Table 4Adjacency matrix representation of the example network.
A B C D E F G H I J K L M N O P Q
A 0 0 0 0 0 0 0 0 0 0 0 1 0 0 0 0 0B 0 0 1 0 0 0 0 0 0 0 0 1 1 0 0 1 0C 0 1 0 1 0 0 0 0 0 0 0 0 0 0 0 0 0D 0 0 1 0 1 0 1 0 0 0 0 0 0 0 0 0 0E 0 0 0 1 0 1 0 1 0 0 0 0 0 0 0 0 0F 0 0 0 0 1 0 0 0 0 0 0 0 0 0 0 0 0G 0 0 0 1 0 0 0 0 1 1 0 0 0 0 0 0 1H 0 0 0 0 1 0 0 0 0 0 0 0 0 0 0 0 0I 0 0 0 0 0 0 1 0 0 0 0 0 0 0 0 0 0J 0 0 0 0 0 0 1 0 0 0 0 0 0 0 0 0 0K 0 0 0 0 0 0 0 0 0 0 0 1 0 0 0 0 0L 1 1 0 0 0 0 0 0 0 0 1 0 0 0 0 0 0M 0 1 0 0 0 0 0 0 0 0 0 0 0 1 1 0 0N 0 0 0 0 0 0 0 0 0 0 0 0 1 0 0 0 0O 0 0 0 0 0 0 0 0 0 0 0 0 1 0 0 0 0P 0 1 0 0 0 0 0 0 0 0 0 0 0 0 0 0 0Q 0 0 0 0 0 0 1 0 0 0 0 0 0 0 0 0 0
133S. Feczak, L. Hossain / Journal of High Technology Management Research 22 (2011) 121–140
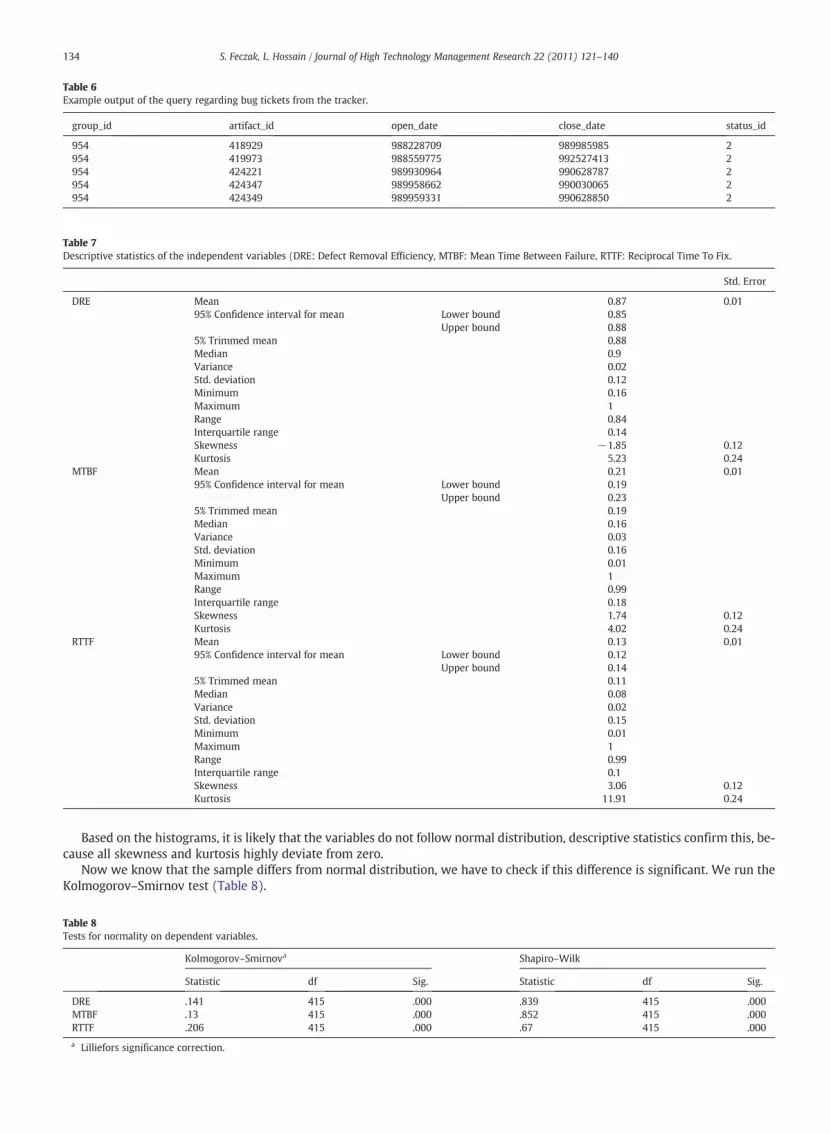
Based on the histograms, it is likely that the variables do not follow normal distribution, descriptive statistics confirm this, be-cause all skewness and kurtosis highly deviate from zero.
Now we know that the sample differs from normal distribution, we have to check if this difference is significant. We run theKolmogorov–Smirnov test (Table 8).
Table 6Example output of the query regarding bug tickets from the tracker.
group_id artifact_id open_date close_date status_id
954 418929 988228709 989985985 2954 419973 988559775 992527413 2954 424221 989930964 990628787 2954 424347 989958662 990030065 2954 424349 989959331 990628850 2
Table 7Descriptive statistics of the independent variables (DRE: Defect Removal Efficiency, MTBF: Mean Time Between Failure, RTTF: Reciprocal Time To Fix.
Std. Error
DRE Mean 0.87 0.0195% Confidence interval for mean Lower bound 0.85
Upper bound 0.885% Trimmed mean 0.88Median 0.9Variance 0.02Std. deviation 0.12Minimum 0.16Maximum 1Range 0.84Interquartile range 0.14Skewness −1.85 0.12Kurtosis 5.23 0.24
MTBF Mean 0.21 0.0195% Confidence interval for mean Lower bound 0.19
Upper bound 0.235% Trimmed mean 0.19Median 0.16Variance 0.03Std. deviation 0.16Minimum 0.01Maximum 1Range 0.99Interquartile range 0.18Skewness 1.74 0.12Kurtosis 4.02 0.24
RTTF Mean 0.13 0.0195% Confidence interval for mean Lower bound 0.12
Upper bound 0.145% Trimmed mean 0.11Median 0.08Variance 0.02Std. deviation 0.15Minimum 0.01Maximum 1Range 0.99Interquartile range 0.1Skewness 3.06 0.12Kurtosis 11.91 0.24
Table 8Tests for normality on dependent variables.
Kolmogorov–Smirnova Shapiro–Wilk
Statistic df Sig. Statistic df Sig.
DRE .141 415 .000 .839 415 .000MTBF .13 415 .000 .852 415 .000RTTF .206 415 .000 .67 415 .000
a Lilliefors significance correction.
134 S. Feczak, L. Hossain / Journal of High Technology Management Research 22 (2011) 121–140
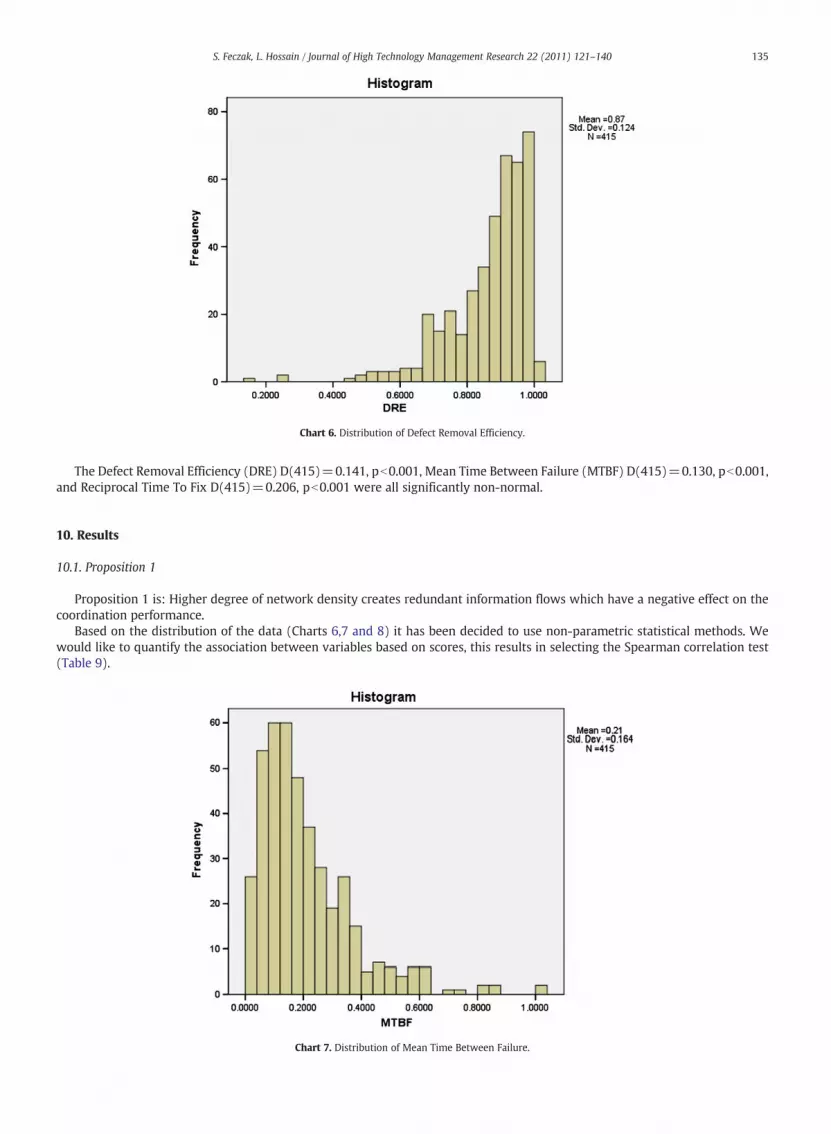
The Defect Removal Efficiency (DRE) D(415)=0.141, pb0.001, Mean Time Between Failure (MTBF) D(415)=0.130, pb0.001,and Reciprocal Time To Fix D(415)=0.206, pb0.001 were all significantly non-normal.
10. Results
10.1. Proposition 1
Proposition 1 is: Higher degree of network density creates redundant information flows which have a negative effect on thecoordination performance.
Based on the distribution of the data (Charts 6,7 and 8) it has been decided to use non-parametric statistical methods. Wewould like to quantify the association between variables based on scores, this results in selecting the Spearman correlation test(Table 9).
Chart 7. Distribution of Mean Time Between Failure.
Chart 6. Distribution of Defect Removal Efficiency.
135S. Feczak, L. Hossain / Journal of High Technology Management Research 22 (2011) 121–140
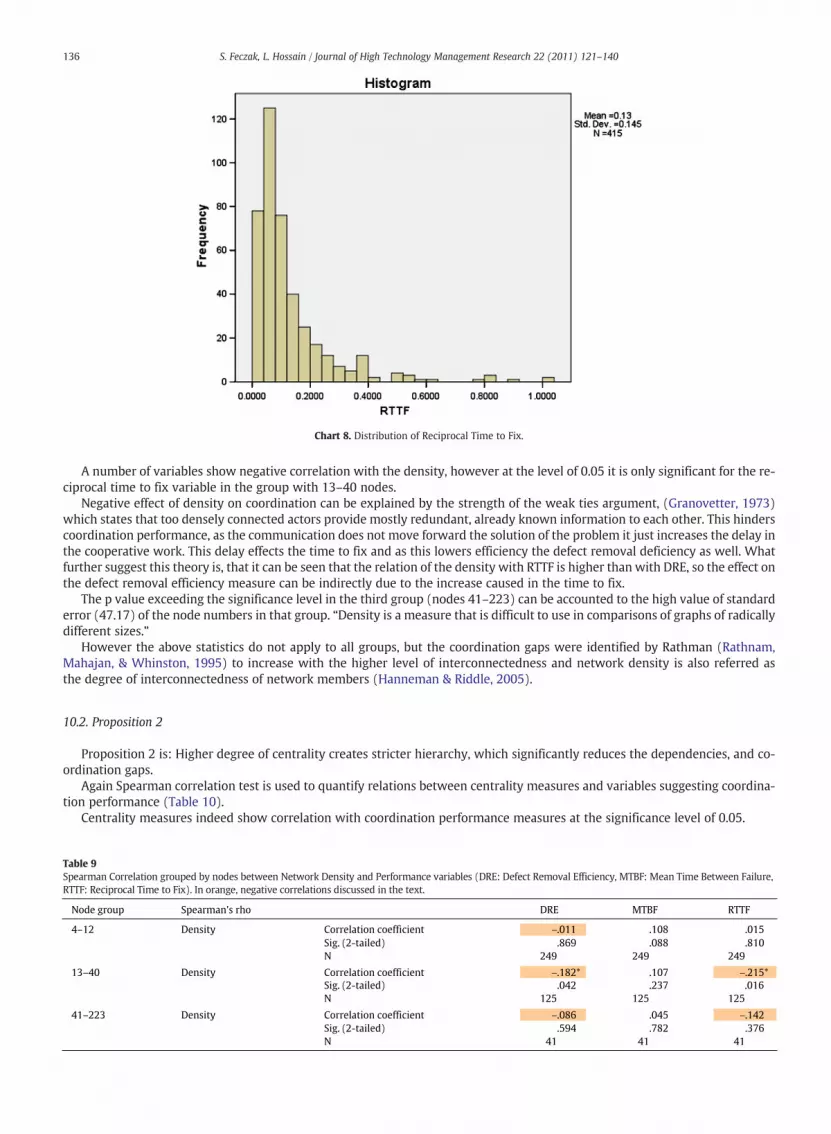
A number of variables show negative correlation with the density, however at the level of 0.05 it is only significant for the re-ciprocal time to fix variable in the group with 13–40 nodes.
Negative effect of density on coordination can be explained by the strength of the weak ties argument, (Granovetter, 1973)which states that too densely connected actors provide mostly redundant, already known information to each other. This hinderscoordination performance, as the communication does not move forward the solution of the problem it just increases the delay inthe cooperative work. This delay effects the time to fix and as this lowers efficiency the defect removal deficiency as well. Whatfurther suggest this theory is, that it can be seen that the relation of the density with RTTF is higher than with DRE, so the effect onthe defect removal efficiency measure can be indirectly due to the increase caused in the time to fix.
The p value exceeding the significance level in the third group (nodes 41–223) can be accounted to the high value of standarderror (47.17) of the node numbers in that group. “Density is a measure that is difficult to use in comparisons of graphs of radicallydifferent sizes.”
However the above statistics do not apply to all groups, but the coordination gaps were identified by Rathman (Rathnam,Mahajan, & Whinston, 1995) to increase with the higher level of interconnectedness and network density is also referred asthe degree of interconnectedness of network members (Hanneman & Riddle, 2005).
10.2. Proposition 2
Proposition 2 is: Higher degree of centrality creates stricter hierarchy, which significantly reduces the dependencies, and co-ordination gaps.
Again Spearman correlation test is used to quantify relations between centrality measures and variables suggesting coordina-tion performance (Table 10).
Centrality measures indeed show correlation with coordination performance measures at the significance level of 0.05.
Chart 8. Distribution of Reciprocal Time to Fix.
Table 9Spearman Correlation grouped by nodes between Network Density and Performance variables (DRE: Defect Removal Efficiency, MTBF: Mean Time Between Failure,RTTF: Reciprocal Time to Fix). In orange, negative correlations discussed in the text.
Node group Spearman's rho DRE MTBF RTTF
4–12 Density Correlation coefficient −.011 .108 .015
Sig. (2-tailed) .869 .088 .810
N 249 249 249
13–40 Density Correlation coefficient .107
Sig. (2-tailed) .042 .237 .016
N 125 125 125
41–223 Density Correlation coefficient −.086 .045 −.142
Sig. (2-tailed) .594 .782 .376
N 41 41 41
−.182* −.215*
136 S. Feczak, L. Hossain / Journal of High Technology Management Research 22 (2011) 121–140
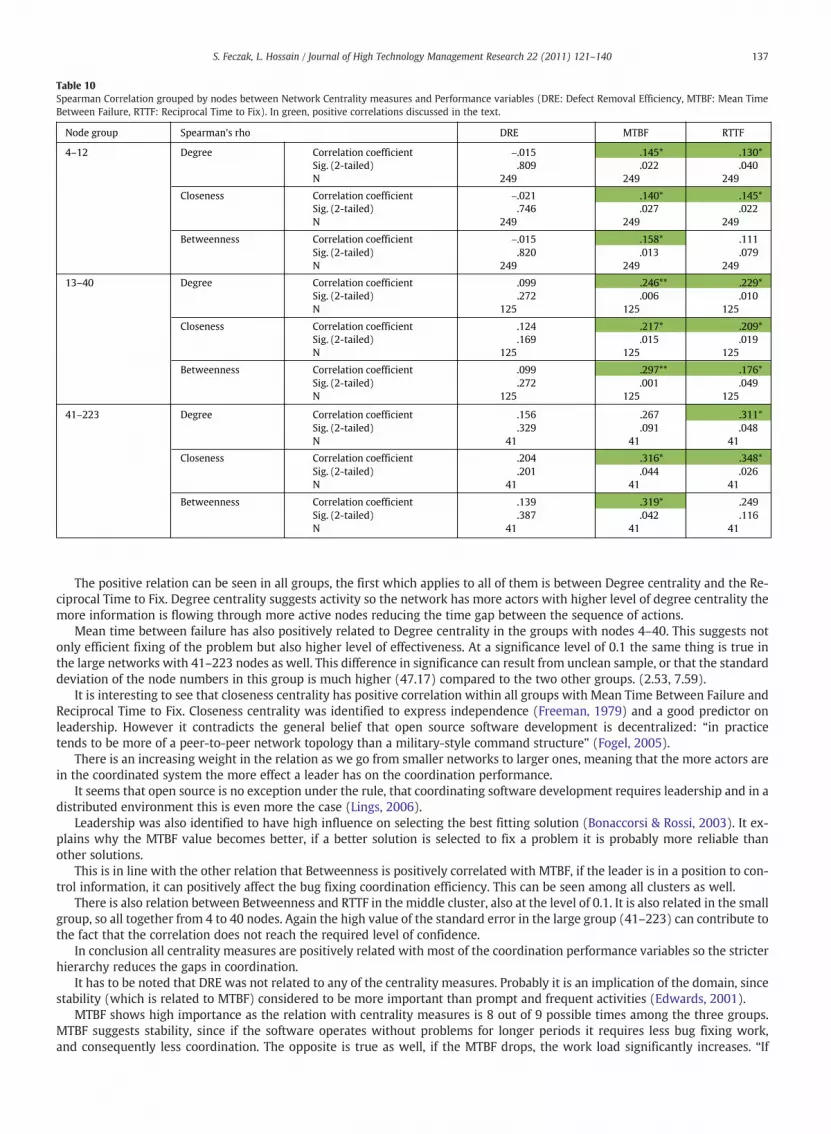
The positive relation can be seen in all groups, the first which applies to all of them is between Degree centrality and the Re-ciprocal Time to Fix. Degree centrality suggests activity so the network has more actors with higher level of degree centrality themore information is flowing through more active nodes reducing the time gap between the sequence of actions.
Mean time between failure has also positively related to Degree centrality in the groups with nodes 4–40. This suggests notonly efficient fixing of the problem but also higher level of effectiveness. At a significance level of 0.1 the same thing is true inthe large networks with 41–223 nodes as well. This difference in significance can result from unclean sample, or that the standarddeviation of the node numbers in this group is much higher (47.17) compared to the two other groups. (2.53, 7.59).
It is interesting to see that closeness centrality has positive correlation within all groups with Mean Time Between Failure andReciprocal Time to Fix. Closeness centrality was identified to express independence (Freeman, 1979) and a good predictor onleadership. However it contradicts the general belief that open source software development is decentralized: “in practicetends to be more of a peer-to-peer network topology than a military-style command structure” (Fogel, 2005).
There is an increasing weight in the relation as we go from smaller networks to larger ones, meaning that the more actors arein the coordinated system the more effect a leader has on the coordination performance.
It seems that open source is no exception under the rule, that coordinating software development requires leadership and in adistributed environment this is even more the case (Lings, 2006).
Leadership was also identified to have high influence on selecting the best fitting solution (Bonaccorsi & Rossi, 2003). It ex-plains why the MTBF value becomes better, if a better solution is selected to fix a problem it is probably more reliable thanother solutions.
This is in line with the other relation that Betweenness is positively correlated with MTBF, if the leader is in a position to con-trol information, it can positively affect the bug fixing coordination efficiency. This can be seen among all clusters as well.
There is also relation between Betweenness and RTTF in the middle cluster, also at the level of 0.1. It is also related in the smallgroup, so all together from 4 to 40 nodes. Again the high value of the standard error in the large group (41–223) can contribute tothe fact that the correlation does not reach the required level of confidence.
In conclusion all centrality measures are positively related with most of the coordination performance variables so the stricterhierarchy reduces the gaps in coordination.
It has to be noted that DRE was not related to any of the centrality measures. Probably it is an implication of the domain, sincestability (which is related to MTBF) considered to be more important than prompt and frequent activities (Edwards, 2001).
MTBF shows high importance as the relation with centrality measures is 8 out of 9 possible times among the three groups.MTBF suggests stability, since if the software operates without problems for longer periods it requires less bug fixing work,and consequently less coordination. The opposite is true as well, if the MTBF drops, the work load significantly increases. “If
Table 10Spearman Correlation grouped by nodes between Network Centrality measures and Performance variables (DRE: Defect Removal Efficiency, MTBF: Mean TimeBetween Failure, RTTF: Reciprocal Time to Fix). In green, positive correlations discussed in the text.
Node group Spearman's rho DRE MTBF RTTF
4–12 Degree Correlation coefficient −.015
Sig. (2-tailed) .809 .022 .040
N 249 249 249
Closeness Correlation coefficient −.021
Sig. (2-tailed) .746 .027 .022
N 249 249 249
Betweenness Correlation coefficient −.015 .111
Sig. (2-tailed) .820 .013 .079
N 249 249 249
13–40 Degree Correlation coefficient .099
Sig. (2-tailed) .272 .006 .010
N 125 125 125
Closeness Correlation coefficient .124
Sig. (2-tailed) .169 .015 .019
N 125 125 125
Betweenness Correlation coefficient .099
Sig. (2-tailed) .272 .001 .049
N 125 125 125
41–223 Degree Correlation coefficient .156 .267
Sig. (2-tailed) .329 .091 .048
N 41 41 41
Closeness Correlation coefficient .204
Sig. (2-tailed) .201 .044 .026
N 41 41 41
Betweenness Correlation coefficient .139 .249
Sig. (2-tailed) .387 .042 .116
N 41 41 41
.145* .130*
.140* .145*
.158*
.246** .229*
.217* .209*
.297** .176*
.311*
.316* .348*
.319*
137S. Feczak, L. Hossain / Journal of High Technology Management Research 22 (2011) 121–140
stability is not achieved, the need for communication within the project will significantly increase” (Fenton & Neil, 1999). Thiscommunication overhead than results in larger coordination gap.
11. Implications
The literature suggests many aspects of technology and social features of the teams to contribute to coordination problems.However these are difficult to capture, only a fraction of them are possible to be measured which limits the application of quan-titative methods without surveys. Therefore for future results it is highly advised to involve surveys directed to quantify directlynot measurable aspects of teams, such as identified by previous research (Rathnam et al., 1995):
− input uncertainty− interaction distances− role conflicts
Another important characteristic to calculate with would be team awareness (Carroll, Rosson, Convertino, & Ganoe, 2006;Cataldo, Wagstrom, Herbsleb, & Carley, 2006; Gutwin, Penner, & Schneider, 2004). Therefore collecting information about theexperience level of team members and their level of knowledge about each other, the tasks they have to complete, routine pro-cesses, schedules and strategies could be related to the level of implicit coordination without communication.
Measuring the software metrics advised by the literature is a highly resource intensive process, complexity index in particularrequires the most time to perform. Therefore these metrics have to be tested on a smaller pre-sample to see if there is any relationto the variables, if it worth doing the analysis on a large sample.
Using Sourceforge bug tracking tickets as a basis of mapping social structures is limited source, a great deal of the communi-cation is going through the E-mailing lists, however this is not straightforward to map to bug fixing processes. The other problemis that numeric user ids are not associated with email messages, the identifier is the email address of the sender or due to spamprotection some part or mingled version of it. There is no way introduced yet to reliably match these two identifiers. Thereforeone should decide on either of the sources to use as a basis of social network mapping. Another research could map the networkbased on both sources individually and compare them.
Using Sourceforge only itself limits the set of projects. FLOSSmole (Howison, Conklin, & Crowston, 2006) is a combined sourceof project information of several open source project development infrastructures. Even though the same method might not bepossible to use because the information stored in those data files does not go into the extent of messages and bug tracking tickets,however it is a good starting point to identify projects and trace them back to the original hosing environment like Freshmeat.Rubyforge, Objectweb, FSF and SourceKibitzer.
The measurement process involved merging results of many queries and outputs of several programs, even though the groupid was always used to match the results with the appropriate line of the master data sheet, the process is highly error prone, itwould have been advantageous to the measurement time and the probably for the precision as well to develop a master scriptto run all required steps systematically on the same groups and merging the results internally. Notre Dame web interface directlyand fetching the results automatically then running all measurements automatically producing a consistent output, it would notjust save time but it would also lower the margin of error when copy pasting results from outputs into the master files.
Calculating lines of code using sloccount (Wheeler, 2009) is a resource and time intensive process to fetch large amount ofdata over the network and run the analysis. Krugle.com. or koders.com maintains statistical data about lines of code in opensource projects, however they might not be up to date the reliability is questionable.
12. Conclusion
Motivated by the lack of research in the field of distributed coordination, building on existing theories, a model was designedand tested to measure coordination in the Open Source Software domain through the scenario of bug fixing. Empirical evidencewith an argument was provided to show that centrality has importance in performance of distributed coordination. Network cen-trality properties shown positive relationship with Mean Time Between Failure and Reciprocal Time To Fix. We can conclude thatcentrally has a bearing on coordination in distributed environments.
The implication of this, that modularity might be important for large projects (Hinds & Kiesler, 2002), but even in the opensource domain at least an informal centrally positioned leader is required to enhance the efficiency of a distributed work group.
Although the significance exceeded the confidence level in two out of three clusters regarding the negative relation betweendensity and coordination performance, but based on the results at least it is arguable that density has positive effect on coordina-tion. The results show similarities with the results of Rathman (Rathnam et al., 1995). This finding is interesting because theirstudy was not in distributed environment, however the results indicating that similar relation exists in distributed environments.The relation might not as strong as other theories suggest that distributed work groups need interconnections due to the tempo-ral and geographical distances they have to communicate asynchronously (Crowston & Howison, 2006).
The shortcomings of the UCInet social network software with respect to batch analysis of network graphs motivated the de-velopment of new tools based on the igraph library (Csárdi & Nepusz, 2006). The original purpose of igraph is to analyze extreme-ly large networks with ten thousands nodes individually. The software created uses igraph differently, making it possible to batchprocess hundreds of files describing social networks in NCOL format. The program generates the sociograms in PNG image formatwith colored lines based on the weights of the links, diameters of the nodes are set automatically scaling up to their centrality
138 S. Feczak, L. Hossain / Journal of High Technology Management Research 22 (2011) 121–140
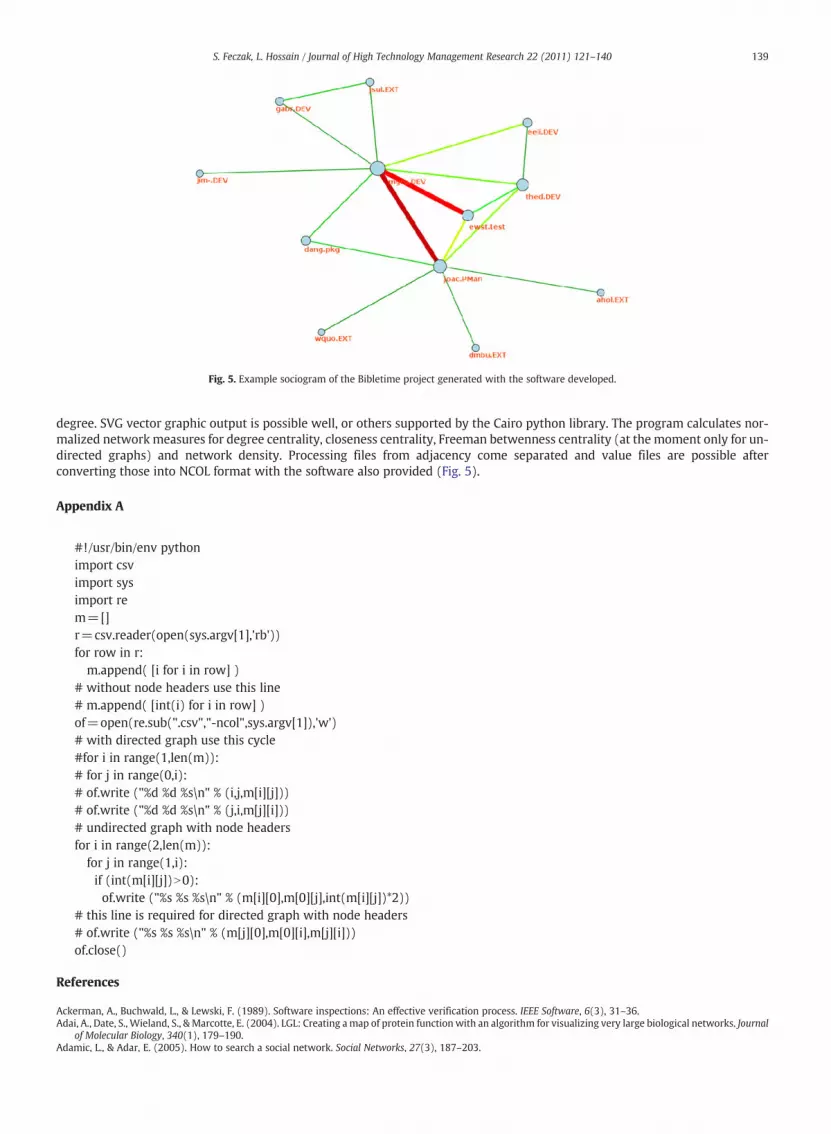
degree. SVG vector graphic output is possible well, or others supported by the Cairo python library. The program calculates nor-malized network measures for degree centrality, closeness centrality, Freeman betwenness centrality (at the moment only for un-directed graphs) and network density. Processing files from adjacency come separated and value files are possible afterconverting those into NCOL format with the software also provided (Fig. 5).
Appendix A
#!/usr/bin/env pythonimport csvimport sysimport rem=[]r=csv.reader(open(sys.argv[1],'rb'))for row in r:m.append( [i for i in row] )
# without node headers use this line# m.append( [int(i) for i in row] )of=open(re.sub(".csv","-ncol",sys.argv[1]),'w')# with directed graph use this cycle#for i in range(1,len(m)):# for j in range(0,i):# of.write ("%d %d %s\n" % (i,j,m[i][j]))# of.write ("%d %d %s\n" % (j,i,m[j][i]))# undirected graph with node headersfor i in range(2,len(m)):for j in range(1,i):if (int(m[i][j])N0):of.write ("%s %s %s\n" % (m[i][0],m[0][j],int(m[i][j])*2))
# this line is required for directed graph with node headers# of.write ("%s %s %s\n" % (m[j][0],m[0][i],m[j][i]))of.close()
References
Ackerman, A., Buchwald, L., & Lewski, F. (1989). Software inspections: An effective verification process. IEEE Software, 6(3), 31–36.Adai, A., Date, S., Wieland, S., &Marcotte, E. (2004). LGL: Creating amap of protein function with an algorithm for visualizing very large biological networks. Journal
of Molecular Biology, 340(1), 179–190.Adamic, L., & Adar, E. (2005). How to search a social network. Social Networks, 27(3), 187–203.
Fig. 5. Example sociogram of the Bibletime project generated with the software developed.
139S. Feczak, L. Hossain / Journal of High Technology Management Research 22 (2011) 121–140
Ahuja, M., Carley, K., & Galletta, D. (1997). Individual performance in distributed design groups: An empirical study.Bonaccorsi, A., & Rossi, C. (2003). Why open source software can succeed. Research Policy, 32(7), 1243–1258.Capiluppi, A., Lago, P., & Morisio, M. (2003). Characteristics of open source projects.Carroll, J., Rosson, M., Convertino, G., & Ganoe, C. (2006). Awareness and teamwork in computer-supported collaborations. Interacting with Computers, 18(1),
21–46.Cataldo, M., Wagstrom, P., Herbsleb, J., & Carley, K. (2006). Identification of coordination requirements: Implications for the design of collaboration and awareness
tools.Crowston, K., & Howison, J. (2005). The social structure of free and open source software development. First Monday, 10(2), 1–100.Crowston, K., & Howison, J. (2006). Hierarchy and centralization in free and open source software team communications. Knowledge, Technology & Policy, 18(4),
65–85.Csárdi, G., & Nepusz, T. (2006). The igraph software package for complex network research. InterJournal Complex Systems, 1695.Edwards, K. (2001). Towards a theory for understanding the open source software phenomenon. New definitions: Value, community, space.Emery, F., & Trist, E. (1960). Socio-technical systems. Management Science, Models and Techniques, 2, 83–97.Espinosa, J., Kraut, R., Slaughter, S., Lerch, J., Herbsleb, J., & Mockus, A. (2002). Shared mental models, familiarity, and coordination: A multi-method study of distributed
software teams.Feller, J., & Fitzgerald, B. (2000). A framework analysis of the open source software development paradigm.Fenton, N., & Neil, M. (1999). Software metrics: Successes, failures and new directions. Journal of Systems and Software, 47(2–3), 149–157.Fogel, K. (2005). Producing open source software: How to run a successful free software project. O'Reilly Media, Inc.Freeman, L. (1979). Centrality in social networks conceptual clarification. Social Networks, 1(3), 215–239.Ghosh, R., & Prakash, V. V. (2001). The Orbiten Free Software Survey. First Monday.Goldman, R., & Gabriel, R. (2005). Innovation happens elsewhere: Open source as business strategy. Morgan Kaufmann Pub.Granovetter, M. (1973). The strength of weak ties. The American Journal of Sociology, 78(6), 1360.Grinter, R., Herbsleb, J., & Perry, D. (1999). The geography of coordination: Dealing with distance in R&D work.Gutwin, C., Penner, R., & Schneider, K. (2004). Group awareness in distributed software development. In, 2004. ACM, 72–81.HALL, P. (1982). Rates of convergence in the central limit theorem. Pitman (Boston).Hanneman, R., & Riddle, M. (2005). Introduction to social network methods. Riverside, CA: University of California, Riverside.Hinds, P., & Kiesler, S. (2002). Distributed work. : The MIT Press.Hossain, L., Wu, A., & Chung, K. (2006). Actor centrality correlates to project based coordination.Howison, J., Conklin, M., & Crowston, K. (2006). FLOSSmole: A collaborative repository for FLOSS research data and analyses. International Journal of Information
Technology and Web Engineering, 1(3), 17–26.Howison, J., & Crowston, K. (2004). The perils and pitfalls of mining SourceForge.Kosfeld, M. (2003). Network experiments.Kraut, R., & Streeter, L. (1995). Coordination in software development.Lings, B., Lundell, B., Ågerfalk, P., & Fitzgerald, B. (2006). Ten strategies for successful distributed development. The Transfer and Diffusion of Information Technology for
Organizational Resilience, 119–137.Madey, G., Freeh, V., & Tynan, R. (2002). The open source software development phenomenon: An analysis based on social network theory.Malone, T. (1988). What is coordination theory.Mullen, B., Johnson, C., & Salas, E. (1991). Effects of communication network structure: Components of positional centrality. Social Networks, 13(2), 169–185.Nakakoji, K., & Yamamoto, Y. (2004). The co-evolution of systems and communities in free and open source software development. Free/Open Source Software
Development, 59.Pearce, J., & David, F. (1983). A social network approach to organizational design-performance. The Academy of Management Review, 8(3), 436–444.Rathnam, S., Mahajan, V., & Whinston, A. (1995). Facilitating coordination in customer support teams: A framework and its implications for the design of infor-
mation technology. Management Science, 1900–1921.Scott, J. (2000). Social network analysis: A handbook. Thousands Oaks Cal.: SAGE Publications.Tichy, N., Tushman, M., & Fombrun, C. (1979). Social network analysis for organizations. The Academy of Management Review, 4(4), 507–519.Wellman, B., Salaff, J., Dimitrova, D., Garton, L., Gulia, M., & Haythornthwaite, C. (2000). Computer Networks as Social Networks: Collaborative Work, Telework, and
Virtual Community, Knowledge and Communities.Wheeler, D. (2009). SLOCCount. Available from http://www.dwheeler.com/sloccountWuensch, K. L. (2004). Independent Variables and Dependent Variables. vol. 2008 Greenville.Yap, M. (2005). Follow the sun: Distributed extreme programming development.Zhao, L., & Elbaum, S. (2003). Quality assurance under the open source development model. Journal of Systems and Software, 66(1), 65–75.
140 S. Feczak, L. Hossain / Journal of High Technology Management Research 22 (2011) 121–140


