Embed Size (px)
Citation preview

ORIGINAL PAPER
Experimental partitioning of halogens and other trace elementsbetween olivine, pyroxenes, amphibole and aqueous fluid at 2 GPaand 900–1,300 �C
Alessandro Fabbrizio • Roland Stalder •
Kathrin Hametner • Detlef Gunther •
Katharina Marquardt
Received: 11 March 2013 / Accepted: 31 May 2013 / Published online: 19 June 2013
� The Author(s) 2013. This article is published with open access at Springerlink.com
Abstract We present new partition coefficients for vari-
ous trace elements including Cl between olivine, pyrox-
enes, amphibole and coexisting chlorine-bearing aqueous
fluid in a series of high-pressure experiments at 2 GPa
between 900 and 1,300 �C in natural and synthetic sys-
tems. Diamond aggregates were added to the experimental
capsule set-up in order to separate the fluid from the solid
residue and enable in situ analysis of the quenched solute
by LA–ICP–MS. The chlorine and fluorine contents in
mantle minerals were measured by electron microprobe,
and the nature of OH defects was investigated by infrared
spectroscopy. Furthermore, a fluorine-rich olivine from one
selected sample was investigated by TEM. Results reveal
average Cl concentrations in olivine and pyroxenes around
20 ppm and up to 900 ppm F in olivine, making olivine an
important repository of halogens in the mantle. Chlorine is
always incompatible with Cl partition coefficients DClolivine/fluid
varying between 10-5 and 10-3, whereas DClorthopyroxene/fluid
and DClclinopyroxene/fluid are *10-4 and DCl
amphibole/fluid is
*5 9 10-3. Furthermore, partitioning results for incom-
patible trace element show that compatibilities of
trace elements are generally ordered as Damph/fluid &Dcpx/fluid [ Dopx/fluid [ Dol/fluid but that Dmineral/fluid for Li
and P is very similar for all observed silicate phases.
Infrared spectra of olivine synthesized in a F-free Ti-
bearing system show absorption bands at 3,525 and
*3,570 cm-1. In F ± TiO2-bearing systems, additional
absorption bands appear at *3,535, *3,595, 3,640 and
3,670 cm-1. Absorption bands at *3,530 and *3,570
cm-1, previously assigned to humite-like point defects,
profit from low synthesis temperatures and the presence of
F. The presence of planar defects could not be proved by
TEM investigations, but dislocations in the olivine lattice
were observed and are suggested to be an important site for
halogen incorporation in olivine.
Keywords Halogens � Trace element partitioning �Mantle � Defects � TEM
Introduction
Mantle minerals such as olivine, ortho- and clinopyroxene
can host up to several hundreds ppm water (Rauch and
Keppler 2002; Hirschmann et al. 2005; Stalder et al. 2005,
2008; Grant et al. 2007a; Tenner et al. 2009). The incor-
poration mechanism of OH in mantle minerals is important
for understanding the rheology, partial melting, diffusion,
electrical conductivity, seismic wave speeds and attenua-
tion of the mantle and has been studied intensely in the
previous decades (e.g., Bell and Rossman 1992; Hirth and
Kohlstedt 1996; Karato and Jung 1998). In contrast, the
role of the halogens F and Cl in the mantle is not well
investigated. From geochemical considerations (Cl/K and
Communicated by J. Hoefs.
Electronic supplementary material The online version of thisarticle (doi:10.1007/s00410-013-0902-5) contains supplementarymaterial, which is available to authorized users.
A. Fabbrizio (&) � R. Stalder
Institute of Mineralogy and Petrography, University
of Innsbruck, Innrain 52f, 6020 Innsbruck, Austria
e-mail: [email protected]
K. Hametner � D. Gunther
Lab of Inorganic Chemistry, ETH Zurich, Wolfgang-Pauli-Str.
10, 8093 Zurich, Switzerland
K. Marquardt
Deutsches GeoForschungsZentrum, Section 3.3, Telegrafenberg,
14473 Potsdam, Germany
123
Contrib Mineral Petrol (2013) 166:639–653
DOI 10.1007/s00410-013-0902-5

F/P ratios of melt inclusions from mid-ocean ridge basalts
and the estimated K and P contents of the upper mantle),
the abundance of chlorine in the mantle is estimated to
approximately 1 ppm and that of fluorine to 16 ppm (Saal
et al. 2002). Despite their low abundances in the mantle,
halogens exert a significant role on the genesis and evo-
lution of magmas. Halogens play an important role in
volcanic and related magmatic systems (Aiuppa et al.
2009; Baker and Balcone-Boissard 2009; Webster et al.
2009). Halogens are separated from magma in the Earth’s
crust during cooling and crystallization (Carroll and
Webster 1994) and exert significant impact on the genesis
of hydrothermal systems (e.g., Reed 1997) and on the
transport of ore-forming metals (Yardley 2005; Vigneresse
2009).
Halogen solubilities in nominally anhydrous mantle
minerals at mantle conditions are scarcely documented, but
seem to be much higher than observed in natural samples
(Beyer et al. 2012). Experimental results in the system
Mg2SiO4–MgF2 (Bromiley and Kohn 2007) reveal up to
0.45 wt% F in forsterite, but no apparent correlation
between F and Mg concentrations in the olivine could be
established, and the incorporation mechanisms could not be
solved. In contrast, Cl solubilities are much lower. Chlorine
concentrations for forsterite and enstatite in fluid-bearing
systems cluster around 3 ppm in the system forsterite–
enstatite–pyrope–H2O–MgCl2 (Bernini et al. 2013). In
contrast, Cl concentrations around 20 ppm were observed
in the system MgO–SiO2–H2O ± TiO2 ± Al2O3 under
similar P–T conditions (Fabbrizio et al. 2013), where the
enhanced Cl solubilities in forsterite in the presence of
TiO2 suggest a Cl incorporation in forsterite via the sta-
bilization of defects that are stabilized by Ti, e.g., humite-
type defects. Ti plays an important role in the formation of
hydroxyl point defects in olivine associated with trace Ti
substitutions (Berry et al. 2005), and planar humite type
associated with Ti has been detected in olivine from dif-
ferent localities (Kitamura et al. 1987; Drury 1991; Risold
et al. 2001; Hermann et al. 2007) by transmission electron
microscopy (TEM). Both kinds of defects are able to host
halogens that substitute some of the OH. In addition to
planar and point defects, the growth of nanometer-sized
Ti-clinohumite nuclei during hydrous alteration in olivine
at 8 GPa and 1,300 K has been described (Wirth et al.
2001), otherwise no detailed TEM studies have been car-
ried out to confirm the presence of humite-type defects in
synthetic olivine. Olivine crystals that have been investi-
gated by TEM and revealed humite-type planar defects
exhibit IR absorption bands at 3,564 and 3,394 cm-1,
identical in energy to absorption bands in Ti-clinohumite
(Hermann et al. 2007). In contrast, Ti-related OH point
defects in olivine cause IR absorption bands at 3,525 and
3,572 cm-1 (Berry et al. 2005). Partitioning experiments at
upper mantle conditions between nominally halogen-free
minerals and coexisting basaltic melts both in natural and
in synthetic systems show that (1) F and Cl are always
incompatible in mantle minerals, (2) the compatibilities are
generally ordered as DCpx/melt [ DOpx/melt [ DGrt/melt [DOl/melt [ DPlag/melt and (3) F is less incompatible than Cl
(Beyer et al. 2012; Dalou et al. 2012).
In this study, we present new experimental results
derived from synthesis experiments at 2 GPa and
900–1,300 �C for F and Cl incorporation in olivine, ortho- ,
clinopyroxene, and amphibole and mineral/fluid partition
coefficient for Cl in the system MgO–SiO2–H2O ±
TiO2 ± NaCl ± MgF2 ± CaF2 and in natural composition
doped with TiO2, NaCl or CaF2. A combination of electron
microprobe and LA–ICP–MS was used to analyze Cl in the
resulting phases. The quality and quantity of OH defects in
olivine were characterized by IR spectroscopy, and trans-
mission electron microscopy (TEM) was used to investi-
gate the relations between the OH-related IR absorption
bands and humite-type defects.
Experimental and analytical methods
Starting materials and sample preparation
The starting materials for the experimental runs consisted of
a natural peridotite from Stoppling/Germany (details con-
cerning petrography see Oehm et al. 1983; composition was
determined by XRF: SiO2 = 44.2 wt%; Al2O3 = 1.3 wt%;
Fe2O3 = 9.4 wt%; MnO = 0.1 wt%; MgO = 43.6 wt%;
CaO = 1.3 wt%) and of a synthetic MSH (MgO =
40.3 wt%; SiO2 = 41.7 wt%; H2O = 18 wt%) powder
both doped with TiO2, NaCl, CaF2 or MgF2 (Table 1).
Starting mixtures were prepared by grounding the peri-
dotite and the synthetic Mg(OH)2–SiO2 mixture in an agate
mortar under ethanol for 1 h and subsequently in an
automatic milling machine for 1 h. The doping agents were
then added to the starting mixtures in the desired amount.
In addition, barium was added as BaTiO3 to the peridotite
mixture. Barium is highly incompatible in mantle minerals.
Therefore, it resides preferably in the fluid or melt phase
and can be used as internal standard for quantification of
LA–ICP–MS analyses. The doped starting mixtures were
ground again in the agate mortar under ethanol for 1 h to
achieve chemical homogeneity.
As sample containers, we used Pt capsules with an outer
(inner) diameter of 3.0 (2.6) mm. For experiments with the
diamond trap, a Pt ring with an inner diameter of 2.1 mm
and a height of 1 mm was inserted into the Pt capsule.
Then, *6 ll H2O was added to the capsule, corresponding
to 15 wt% of the starting powder ? water mixture. The
capsule was then filled with 6–7 mg of synthetic diamond
640 Contrib Mineral Petrol (2013) 166:639–653
123

crystals (grain size 20 lm) kindly provided by Servsix
GmbH (Karlstein, Germany) and with 35–55 mg of the
starting material powder. For experiments without the
diamond trap, the set-up of the capsule was the same
except for the Pt ring and for the diamond crystals that
were not used. For experiments with the MSH mixtures,
2 ll H2O was added to the capsule. The capsule was
welded while cooled in water, and the weight of the cap-
sule was compared before and after welding to ensure that
no water was lost during welding. The sealed capsule was
squeezed to a final cylindrical shape with a length of
5.5–6.5 mm and then held at 120 �C for 24 h, in order to
check whether the capsule was sealed properly.
Experiments
Experiments were carried out in an end-loaded piston-
cylinder apparatus at 2 GPa and temperatures in the range
of 900–1,300 �C for durations between 1 and 6 days at
Innsbruck University (Table 1). The concentric cylindrical
high-pressure assemblies consist (from outside to inside) of
a lead foil wrapped around a talc cell, a Pyrex cylinder, a
graphite furnace and inner pieces of crushable alumina
sleeves. In two experiments, the interior walls of the cap-
sules were lined with Ni (run F-4) and Fe foil (run F-5) to
control the fO2 (Table 1). At pressure and temperature of
interest (2.0 GPa and 1,300 �C), the calculated logfO2 for
the controlling reaction Fe–FeO is *3 log units below the
QFM buffer (QFM-3) and for the reaction Ni–NiO is *1.5
log units above the QFM buffer (QFM ? 1.5) (O’Neill
1988; O’Neill and Pownceby 1993). Run temperatures
were controlled within *1 �C of the set point using
Pt/Pt90Rh10 thermocouples accurate to within ±3 �C. The
range in temperature across the length of the capsules
during the experiments is estimated to be less than 20 �C.
The experimental charge is placed in the hotspot of the
experimental assembly to prevent unwanted crystal growth
within the diamond trap (Aerts et al. 2010). No pressure
correction was applied to the EMF. The power output was
monitored during the entire duration of all runs in order to
ensure that no temperature drift occurred. Each experiment
was initiated by gently increasing the sample pressure to
approximately 0.25 GPa followed by a heating to 1,400 �C
at a rate of 15 �C/min and a simultaneous pressure increase
until the final pressure was reached. To grow relatively
large, high-quality crystals necessary for IR spectroscopy,
Table 1 Starting mixtures, experimental conditionsa and phase relations of the run products
Run Starting material T (�C) Time (h) Run products identified
Cl-22 Peridotite ? 0.3 % TiO2 ? 22 % NaCl 1,300 24 ol, salt, fluid
Cl-23 Peridotite ? 0.3 % TiO2 ? 22 % NaCl 1,200 48 ol, salt, fluid
Cl-24 Peridotite ? 0.3 % TiO2 ? 22 % NaCl 1,100 72 ol, opx, salt, fluid
Cl-25 Peridotite ? 0.3 % TiO2 ? 22 % NaCl 1,000 96 ol, opx, cpx, salt, fluid
Cl-26 Peridotite ? 0.3 % TiO2 ? 22 % NaCl 900 144 ol, opx, cpx, amph, salt, fluid
Cl-22b Peridotite ? 0.3 % TiO2 ? 22 % NaCl 1,300 24 ol, salt, fluid
Cl-23b Peridotite ? 0.3 % TiO2 ? 22 % NaCl 1,200 48 ol, salt, fluid
Cl-24b Peridotite ? 0.3 % TiO2 ? 22 % NaCl 1,100 72 ol, opx, salt, fluid
Cl-25b Peridotite ? 0.3 % TiO2 ? 22 % NaCl 1,000 96 ol, opx, cpx, salt, fluid
Cl-26b Peridotite ? 0.3 % TiO2 ? 22 % NaCl 900 144 ol, opx, cpx, amph, salt, fluid
F-2 MSH ? 0.3 % TiO2 ? 1 % CaF2 1,300 24 fo, en, salt, fluid
F-3 MSH ? 0.3 % TiO2 ? 1 % CaF2 1,200 48 fo, chu, en, salt, fluid
Cl–F-1 MSH ? 22 % NaCl ? 2 % MgF2 1,200 48 fo, en, salt, fluid
F-1 MSH ? 0.3 % TiO2 ? 1 % CaF2 1,000 96 fo, en, di, tr, tlcd, salt, fluid
F-5c Peridotite ? 0.3 % TiO2 ? 22 % NaCl ? 2 % CaF2 1,300 24 ol, sp, salt, fluid
F-4c Peridotite ? 0.3 % TiO2 ? 22 % NaCl ? 2 % CaF2 1,300 24 ol, salt, fluid
F-6 Peridotite ? 0.3 % TiO2 ? 22 % NaCl ? 2 % CaF2 1,300 24 ol, opx, salt, fluid
F-7 Peridotite ? 0.3 % TiO2 ? 22 % NaCl ? 2 % CaF2 1,100 72 ol, opx, salt, fluid
Ol olivine, opx orthopyroxene, cpx clinopyroxene, amph amphibole, fo forsterite, en enstatite, chu clinohumite, di diopside, tlc talc, tr tremolite,
sp spinela All runs were performed at a pressure of 2 GPab Experiment performed with diamond trapc Capsule lined with Ni (F-4) and Fe (F-5) foild Supposed by mixed analysis fo ? tlc (Table 3)
Contrib Mineral Petrol (2013) 166:639–653 641
123

synthesis experiments were heated to 1,400 �C and then
slowly cooled to final temperature at a rate of 6 �C/h.
Depending on the temperature, the experimental run time
was in the range 24–144 h (Table 1), corresponding to the
time needed to achieve equilibrium in similar systems
under similar conditions (Stalder et al. 2001; Stalder and
Ulmer 2001; Fabbrizio et al. 2013). All runs were termi-
nated by switching off the power. After decompression, the
charge was removed from the assembly, and the recovered
capsule was weighed and pierced to check for potential
leakage. When pierced, the pH of the extruding fluid was
checked with indicator paper; the checked fluid was in all
cases neutral (pH = 7), indicating that the possibly dis-
solved alkalis are balanced by chlorine, that Al acidic and
basic species are negligible and that neutral complex such
as NaAl(OH)4 may form. Subsequently, the pierced cap-
sule was dried in an oven at 120 �C (upon drying, salt
crystals formed at the opening of the capsule) and weighed
again. Usually, the weight loss upon drying corresponds to
90–100 % of the initial water content. In the two samples
buffered by the reactions Fe–FeO and Ni–NiO, remnant
metal foil from the oxygen buffer material and brightly
colored crystalline material was recovered from the cap-
sule. The metal foil was analyzed by EDS during the
EMPA session. All recovered capsules were embedded in
epoxy and ground by hand. As soon as the trap became
visible, the sample was impregnated with epoxy to prevent
destruction during preparation. Later, the capsule was
ground until its maximum cross section was exposed.
Electron microprobe
Electron microprobe measurements were taken using a Jeol
Superprobe 8100 at Innsbruck University. The crystals were
analyzed with an electron beam energy of 15 keV, a beam
current of 10 nA, a focused beam and counting times of 20 s.
Subsequently, Ti, Na, Cl and F were measured with a beam
current of 400 nA and 240-s counting time on peak and 120 s
on the background. A detailed explanation of the analytical
protocol to measure chlorine concentrations, including a
comparison with samples for which the Cl contents were
independently determined, is reported in Fabbrizio et al.
(2013). Quartz (Si), diopside (Ca), olivine (Mg), rutile (Ti),
aegirine (Na), atacamite (Cl), corundum (Al), chromite (Cr),
almandine (Fe), rhodonite (Mn), Ni-olivine (Ni) and F-topaz
(F) were used as standards. Replicate analyses were carried
out on the same sample (30–40 points in each sample) to
check for compositional homogeneity. Limits of detection
were 2 ppm for Cl, 6 ppm for Na, 9 ppm for Ti and 15 ppm
for F. Associated relative errors (based on counting statistics)
were less than 10 % for Cl, less than 5 % for Na, *20 % for
Ti and less than 1 % for F. Due to the overlap of the FeLaover the FKa, fluorine was analyzed only in the Fe-free
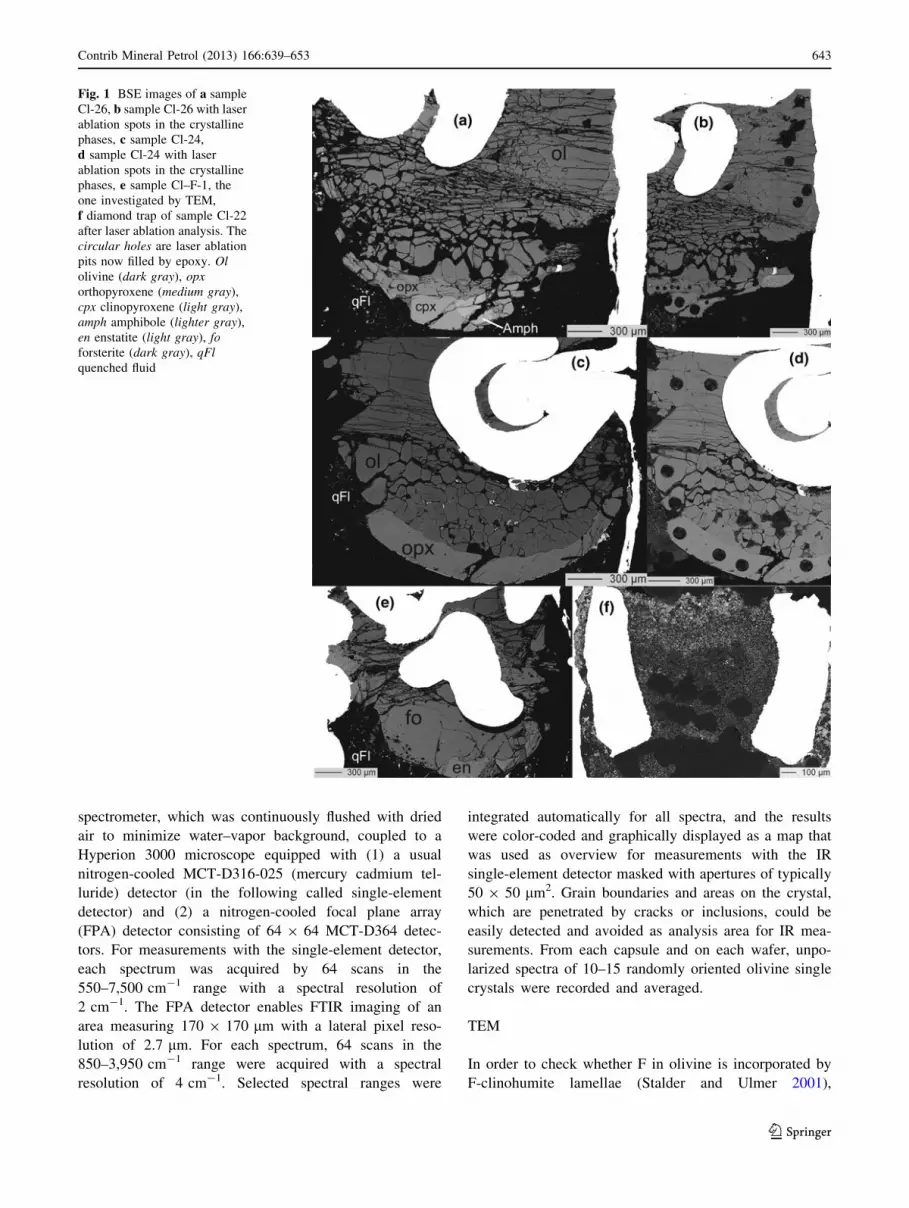
experiments. The BSE images show the absence of fluid
inclusions inside the crystals and the absence of beam
damage on the surface of the crystals after the electron
microprobe analysis for Cl (Fig. 1).
LA–ICP–MS
Element concentrations of the crystalline phases and of the
fluid solute trapped between the diamonds were analyzed by
LA–ICP–MS at the Laboratory for Inorganic Chemistry,
ETH Zurich, using a 193-nm ArF excimer laser system
(Gunther et al. 1997) coupled to an ELAN 6100 quadrupole
ICP–MS. All elements except Cl were standardized against a
NIST SRM610 glass, and a synthetic Cl-bearing basaltic
glass (Fabbrizio et al. 2013) was used as standard for Cl. The
glass was analyzed two times before and two times after
performing analyses of the samples of interest and served as
external standard. Na was used as internal standard for the
synthetic glass. Ba was used for internal standardization to
calculate element concentration in the quenched fluid, by
assuming that Ba (the most incompatible element in this
study) partitions totally into the fluid phase.
Diamond traps (Fig. 1f) were measured with the laser
imaged to 120 lm diameter at repetition rates of 5 Hz. Eight
analyses were carried out on the diamond trap for each
sample. In order to check the potential influence of mass
interferences of 23Na12C and 35Cl, both chlorine isotopes
(35Cl and 37Cl) were measured. Since the differences in the
isotope ratio were always below 3 %, the influence of this
interference was considered negligible. The detection limit
for chlorine was below 100 ppm. For minerals analysis, the
NIST SRM610 glass was used to calibrate elements. Element
concentration calculations were based on the Si concentra-
tion as determined by electron microprobe analysis. For the
analysis of the crystalline phases, the diameter of the laser
was adjusted as function of the crystal size (Fig. 1b, d); in
general, beam diameters of 50–120 lm were used at repe-
tition rates of 5 Hz.
IR spectroscopy
All experimental charges were cut as whole capsule by a
diamond wire saw to preserve the texture, and then, dou-
ble-sided polished wafers of 150 lm thickness were pre-
pared. Sample thicknesses were measured using a Mitutoyo
micrometer and are accurate to ±2 lm. In order to evaluate
the orientation of the measured olivine crystals, reference
spectra on oriented olivine crystals from Stoppling/Ger-
many (Oehm et al. 1983) were recorded that were later
compared with the olivine spectra of the experimental
charges (Fig. 2).
IR spectra were recorded at room temperature in
transmission mode using a Bruker Vertex 70 FTIR
642 Contrib Mineral Petrol (2013) 166:639–653
123
spectrometer, which was continuously flushed with dried
air to minimize water–vapor background, coupled to a
Hyperion 3000 microscope equipped with (1) a usual
nitrogen-cooled MCT-D316-025 (mercury cadmium tel-
luride) detector (in the following called single-element
detector) and (2) a nitrogen-cooled focal plane array
(FPA) detector consisting of 64 9 64 MCT-D364 detec-
tors. For measurements with the single-element detector,
each spectrum was acquired by 64 scans in the
550–7,500 cm-1 range with a spectral resolution of
2 cm-1. The FPA detector enables FTIR imaging of an
area measuring 170 9 170 lm with a lateral pixel reso-
lution of 2.7 lm. For each spectrum, 64 scans in the
850–3,950 cm-1 range were acquired with a spectral
resolution of 4 cm-1. Selected spectral ranges were
integrated automatically for all spectra, and the results
were color-coded and graphically displayed as a map that
was used as overview for measurements with the IR
single-element detector masked with apertures of typically
50 9 50 lm2. Grain boundaries and areas on the crystal,
which are penetrated by cracks or inclusions, could be
easily detected and avoided as analysis area for IR mea-
surements. From each capsule and on each wafer, unpo-
larized spectra of 10–15 randomly oriented olivine single
crystals were recorded and averaged.
TEM
In order to check whether F in olivine is incorporated by
F-clinohumite lamellae (Stalder and Ulmer 2001),
Fig. 1 BSE images of a sample
Cl-26, b sample Cl-26 with laser
ablation spots in the crystalline
phases, c sample Cl-24,
d sample Cl-24 with laser
ablation spots in the crystalline
phases, e sample Cl–F-1, the
one investigated by TEM,
f diamond trap of sample Cl-22
after laser ablation analysis. The
circular holes are laser ablation
pits now filled by epoxy. Ol
olivine (dark gray), opx
orthopyroxene (medium gray),
cpx clinopyroxene (light gray),
amph amphibole (lighter gray),
en enstatite (light gray), fo
forsterite (dark gray), qFl
quenched fluid
Contrib Mineral Petrol (2013) 166:639–653 643
123

transmission electron microscopy (TEM) was carried out
on a forsterite of run Cl–F-1 using a FEI Tecnai G2 F20
X-Twin transmission electron microscope at GeoFors-
chungsZentrum Potsdam, Germany, operated at 200 kV.
Selected area electron diffraction (SAED), combined with
bright field (BF), high-resolution (HR-TEM) and scanning
transmission electron microscopy using a high-angle
annular dark field detector in scanning transmission mode
(STEM-HAADF), was performed to investigate the local
defect structure of forsterite. The sample for TEM was
prepared by first determining the orientation of the olivine
using electron-backscattered diffraction (EBSD) with an
Ultra 55 Plus (Carl Zeiss SMT) field emission scanning
electron microscope. The foil for TEM was prepared by the
focused ion beam technique (FIB) (Wirth 2004; Lee et al.
2003; Phaneuf 1999) using a FEI FIB200TEM focused ion
beam device. After cutting the foil to the dimensions of
12 9 8 lm2 and a thickness of about 100 nm, the foil was
extracted from the excavation site using the lift-out tech-
nique (Giannuzzi et al. 1997). It was transferred to a copper
TEM grid with a holey carbon foil to sustain the TEM foil
using a manipulator.
Results
Textures of minerals and diamond traps
Experimental conditions and results are summarized in
Tables 1, 2 and 3 and in the Online Resource 1. Since one
of the aims of this study was the determination of mineral/
fluid partition coefficients, it is important to judge whether
crystals grew subsolidus (and consequently the term ‘fluid’
can be used) or supersolidus, i.e., in the presence of a
hydrous melt. The simple system forsterite–enstatite–water
approaches melting at 1,400 �C and 2 GPa (Kushiro and
Yoder 1969); however, the presence of NaCl suppresses
melting because it lowers the water activity (Aranovich and
Newton 1996, 1997; Shmulovich and Graham 1996). A Cl/
(Cl ? H2O) molar ratio of 0.2 and 0.4 increases the tem-
perature of the solidus in the system Mg2SiO4 ? Mg-
SiO3 ? H2O ? KCl at 5 GPa, respectively, of *200 and
*350 �C (Chu et al. 2011). Consequently, since the
experiments reported here have a Cl/(Cl ? H2O) molar
ratio of 0.3, they can be considered being subsolidus. The
textures of the experimental charges can serve as additional
constraint of the absence of a melt during the runs. Tex-
tures of representative run products are shown in Fig. 1. No
particular textural differences are noted between experi-
ments performed at different temperatures (Fig. 1a–e).
Phases interpreted to have crystallized in equilibrium with
each other in the absence of a melt are euhedral to sub-
hedral and typically have the same grain size. The quen-
ched phase is subhedral and typically displays acicular
habit. The small amount of quench phase (Fig. 1a–e) is
interpreted to represent the solute quenched from the sub-
solidus fluid phase. No abrupt increase in the amount of
quenched phase with temperature was observed, which is
interpreted to indicate the absence of a melt in all per-
formed experiments.
120014001600180020002200
50
100
150
200
300
35013481678176318512040
wavenumber cm1
mc/ecnabrosbA
T = 1300 °C
T = 1200 °C
T = 1200 °C
T = 1000 °C
nat. olivine
nat. olivine
nat. olivine
nat. olivine
MSH+TiO2+F
MSH+TiO2+F
MSH+FMSH+TiO2+F
Fig. 2 Polarized IR spectra of
olivine sections parallel to a, b,
c and average spectrum
(a ? b?c)/3. Unpolarized IR
spectra of olivine averaged over
10–15 randomly oriented
crystals from the
MSH ? F ± TiO2 system
644 Contrib Mineral Petrol (2013) 166:639–653
123

Phase assemblages
Run products were mainly composed of olivine, pyroxenes,
salt and aqueous fluid. In single cases, additional phases
such as clinohumite, amphibole or spinel were observed.
Individual phase assemblages are listed in Table 1. The
size of the crystals varied between 80 and 300 lm in the
natural system and was over 300 lm in the MSH system
(Fig. 1). Electron microprobe analyses are listed in the
Online Resource 1 and in Table 2. No chemical zoning
patterns were observed. In the experiments with the natural
composition, only olivine (Fo97) is present at temperature
above 1,100 �C, at 1,100 �C orthopyroxene appears, at
1,000 �C olivine coexists with ortho- and clinopyroxene
and at 900 �C amphibole occurred in addition. Spinel
coexists with olivine in the run buffered by the reaction
Fe–FeO. The Cl concentrations in olivine are 20 ± 14 ppm,
in opx 26 ± 10 ppm and in cpx 20 ± 4 ppm, whereas the Cl
contents of amphibole is 585 ± 36 ppm.
In the synthetic system, forsterite (Fo100) coexists with
enstatite in all runs. At 1,200 �C, clinohumite coexists with
forsterite and enstatite and at 1,000 �C F-tremolite
(4.2 wt% F), diopside (Di85En15 containing 690 ppm F)
and an unidentified F-bearing phase—supposedly talc—
Table 2 Analyses of the run products (model system and natural peridotite) by EMPA
Experiment
(P, GPa/T, �C)
F-2 F-3 Cl-F-1 F-1
(2/1300) (2/1200) (2/1200) (2/1000)
fo en fo en chu fo en fo en fo?tlc tr
SiO2 (wt%) 43.20 (18) 60.58 (33) 40.75 (58) 58.99 (86) 36.66 (40) 42.95 (51) 58.72 (51) 42.44 (22) 59.84 (30) 49.63 59.10 (48)
TiO2 0.0015 (5) 0.03 (0) 0.03 (0.01) 0.01 (1) 0.97 (10) – – – 0.06 (2) 0.40 0.24 (5)
Al2O3 – – – – – – – – – – –
Cr2O3 – – – – – – – – – – –
FeO – – – – – – – – – – –
MnO – – – – – – – – – – –
MgO 55.34 (21) 38.47 (25) 59.20 (38) 41.31 (19) 57.27 (40) 55.71 (23) 38.56 (30) 57.96 (31) 40.47 (14) 47.52 27.36 (95)
NiO – – – – – – – – – – –
CaO 0.03 (0) 0.18 (2) 0.02 (1) 0.29 (13) 0.00 – – 0.02 (1) 0.23 (10) 0.26 10.79 (7)
Na2O – – – – – 0.03 (4) 0.06 (7) – – – –
Cl – – – – – 0.017 (7) 0.003 (2) – – – –
F 0.00 0.00 0.077 (30) 0.00 3.06 (0.1) 0.090 (4) 0.00 0.00 0.00 3.14 2.04 (10)
Total 98.6 (3) 99.3 (4) 100.0 (9) 100.6 (9) 98.0 (5) 98.8 (5) 97.3 (5) 100.4 (3) 100.6 (4) 100.9 99.5 (5)
DClmineral/startmix 0.0016 0.00029
DFmineral/startmix 0.16 6.25 0.096 6.41 4.16
Experiment (P, GPa/T, �C) F-1 aF-5 bF-4 F-6 F-7
(2/1000) (2/1300) (2/1300) (2/1300) (2/1100)
di ol ox ol ol opx ol opx
SiO2 (wt%) 55.31 (14) 38.26 (44) 0.38 (3) 39.98 (23) 42.03 (13) 58.94 (31) 41.90 (13) 57.90 (24)
TiO2 0.21 (4) 0.023 (3) 0.99 (9) 0.0033 (11) 0.0037 (9) 0.07 (2) 0.0053 (15) 0.10 (1)
Al2O3 – 0.09 (2) 1.24 (3) 0.01 (1) 0.00 0.38 (14) 0.00 0.52 (7)
Cr2O3 – 0.07 (4) 1.99 (34) 0.13 (7) 0.09 (4) 0.34 (7) 0.04 (3) 0.46 (23)
FeO – 22.64 (93) 80.82 (57) 1.76 (38) 0.29 (5) 0.16 (6) 3.63 (24) 4.31 (7)
MnO – 0.07 (2) 0.06 (3) 0.11 (2) 0.07 (2) 0.06 (2) 0.07 (2) 0.11 (2)
MgO 21.73 (37) 39.22 (79) 14.71 (16) 46.21 (22) 55.90 (32 38.23 (5) 53.31 (19) 34.32 (25)
NiO – 0.02 (2) 0.12 (6) 12.07 (75) 0.06 (5) 0.03 (2) 0.32 (1) 0.13 (2)
CaO 22.66 (48) 0.34 (3) 0.02 (1) 0.09 (1) 0.05 (2) 0.44 (2) 0.06 (2) 1.27 (12)
Na2O – 0.02 (2) 0.10 (6) 0.04 (2) 0.05 (3) 0.13 (1) 0.04 (2) 0.20 (3)
Cl – 0.0014 (5) na 0.0015 (5) 0.0015 (5) 0.0019 (7) 0.0056 (20) 0.0034 (7)
F 0.069 (16) na na na na na na na
Total 100.0 100.7 (5) 100.4 (1) 100.4 (4) 98.6 (3) 98.8 (4) 99.39 (26) 99.33 (28)
DClmineral/startmix 0.00013 0.00014 0.00018 0.00053 0.00032
DFmineral/startmix 0.14
a Capsule lined with Fe foilb Capsule lined with Ni foil
Contrib Mineral Petrol (2013) 166:639–653 645
123

Ta
ble
3M
iner
al/fl
uid
par
titi
on
coef
fici
ents
Sam
ple
(P,
GP
a/T
,
�C)
2/1
3,0
02
/1,2
00
2/1
,10
02
/1,0
00
2/9
00
Min
eral
ol
ol
ol
op
xo
lo
px
cpx
ol
op
xcp
xam
ph
Cl
99
10
-5
(2)
1.8
91
0-
5(1
6)
29
10
-4
(0)
1.7
91
0-
4(8
)1
.89
10
-4
(8)
3.7
91
0-
4(3
)2
91
0-
4(1
)1
.59
10
-4
(3)
1.5
91
0-
4(4
)1
.49
10
-4
(2)
0.0
04
9(3
)
Li
0.1
3(4
)0
.07
(3)
0.3
3(1
3)
0.3
1(9
)0
.27
(10
)0
.18
(6)
0.2
5(1
1)
0.3
5(7
)0
.48
(7)
0.7
2(1
9)
0.8
2(3
0)
Na
0.0
04
8(2
)0
.00
18
(2)
0.0
02
0(1
)0
.01
8(2
)0
.00
37
(24
)0
.00
20
(0)
0.2
7(2
)0
.00
28
(4)
0.0
18
(3)
0.2
8(1
)0
.63
(0)
Rb
0.0
12
(11
)–
–0
.00
8(5
)0
.00
18
(8)
––
––
––
Sr
0.0
07
(4)
0.0
00
11
(8)
–0
.00
18
(9)
0.0
06
(4)
0.0
02
1(1
4)
0.2
3(1
2)
0.0
02
8(1
9)
0.0
03
4(2
3)
0.2
1(3
)0
.26
(7)
Ca
0.0
12
(3)
0.0
05
(2)
0.0
16
(8)
0.5
8(2
4)
0.0
49
(39
)0
.96
(73
)1
9(1
3)
0.0
25
(11
)0
.78
(34
)2
0(8
)7
(3)
Mg
3.3
0(3
8)
9(3
)3
8(9
)2
4(6
)8
1(3
7)
51
(23
)2
4(1
1)
12
2(9
3)
77
(59
)3
4(2
6)
39
(30
)
Mn
0.4
6(8
)0
.78
(28
)1
.17
(57
)4
(2)
2(1
)4
(2)
4(2
)1
.4(1
)4
.1(1
)5
.2(5
)3
.82
(22
)
Fe
13
(4)
7(4
)1
5(7
)3
2(1
4)
6(1
)1
0(2
)1
3(2
)3
2(9
)6
0(1
5)
92
(23
)1
09
(26
)
Ni
11
3(3
2)
45
(27
)1
13
(71
)5
0(3
2)
24
3(1
13
)9
4(4
4)
52
(24
)1
75
(15
)8
0(7
)5
8(5
)1
20
(23
)
B0
.02
2(6
)0
.08
5(5
9)
0.8
3(4
6)
0.8
(4)
0.0
73
(16
)–
–0
.50
(10
)–
–0
.58
(10
)
Al
0.0
04
5(2
4)
0.0
04
(1)
0.0
15
(7)
0.8
6(2
5)
0.1
0(6
)4
(2)
14
(8)
0.0
53
(26
)3
(2)
10
(5)
35
(17
)
Cr
0.7
5(8
)1
.75
(81
)1
2(4
)4
(1)
5(4
)2
4(1
5)
6.5
(5)
21
(6)
15
(5)
2.7
1(8
0)
2(1
)
Sc
0.1
3(2
)0
.28
(11
)1
.38
(54
)2
3(6
)9
(5)
76
(38
)4
27
(28
3)
––
––
La
––
––
––
0.7
7(3
4)
––
0.5
6(3
5)
0.9
3(6
6)
Ce
0.0
07
8(4
0)
–0
.02
2(1
5)
0.0
15
(9)
0.0
12
(9)
–0
.96
(62
)0
.01
6(1
1)
–1
.06
(38
)1
.76
(77
)
Pr
––
––
––
2(1
)–
–1
.82
(84
)2
.11
(93
)
Nd
––
––
––
3(2
)–
–4
(2)
4(2
)
Lu
0.0
17
(4)
0.0
17
(6)
0.0
43
(23
)1
.3(6
)0
.25
(17
)4
(3)
41
(29
)0
.20
(8)
8(3
)8
0(3
0)
37
(14
)
Y–
––
0.4
1(1
9)
–0
.27
(22
)6
(3)
–0
.54
(26
)1
6(5
)6
(2)
Ti
0.0
09
(3)
0.0
09
(3)
0.0
22
(6)
0.5
1(1
2)
0.1
7(8
)4
(2)
14
(6)
0.1
4(5
)4
(1)
4(1
)1
2(4
)
Zr
––
–0
.04
2(2
6)
––
––
–1
5(1
0)
36
(19
)
V0
.00
19
(4)
0.0
01
8(7
)0
.00
83
(36
)0
.03
9(1
7)
0.0
14
(14
)0
.07
3(6
5)
–0
.04
6(2
7)
0.2
2(1
2)
0.8
6(1
4)
7(1
)
P0
.12
(2)
0.0
9(3
)0
.23
(10
)0
.22
(10
)0
.23
(5)
0.2
8(7
)0
.27
(7)
0.2
1(9
)0
.35
(17
)0
.33
(14
)0
.29
(12
)
Nb
0.0
09
(3)
––
––
––
––
–9
(4)
Ta
0.0
08
6(2
3)
–0
.08
(4)
––
––
––
––
646 Contrib Mineral Petrol (2013) 166:639–653
123

occurred. At 1,200 �C, forsterite has a F content of
900 ± 40 ppm and a Cl content of 170 ± 70 ppm.
Enstatite shows a Cl content of 30 ± 20 ppm, similar to
the opx in the run with natural starting composition. The
aqueous fluids are homogeneous with respect to their major
element composition. Most trace elements were below
detection limit both in minerals and in the quenched solute.
Concentrations measured with LA–ICP–MS and calculated
partition coefficients (mineral/fluid) are illustrated in Fig. 3
and listed in the Online Resource 1 and in Table 3.
Fluid compositions
The compositions of the aqueous fluids were determined
with LA–ICP–MS (Online Resource 1). The aqueous fluids
of each run are homogenous with respect to their major
element composition and contain large amount of silicate
components (mainly Si, Mg, Al, Ca, Na and Cl). Measured
fluid compositions are generally consistent from run to run
with the temperature of the run.
The plot of the MgO/SiO2 molar ratios of the fluids
versus the temperature of the runs (Fig. 4) shows a positive
correlation, probably reflecting a decreased solubility of
silica with temperature.
Mineral/fluid partition coefficients
Mineral/fluid partition coefficients (Fig. 3) show that Cl
and the large ionic lithophile elements (LILE) always
partition into the fluid phase, whereas most other trace
elements behave compatible in clinopyroxene and amphi-
bole, moderately incompatible to compatible in orthopy-
roxene and incompatible in olivine (Fig. 3). These findings,
specifically the order Damph/fluid & Dcpx/fluid [ Dopx/fluid
[ Dol/fluid, is in general agreement with previous studies
(Mysen 1979; Brenan et al. 1995; Ayers et al. 1997; Stalder
et al. 1998; Caciagli et al. 2011; Fabbrizio et al. 2013). In
contrast, Dmineral/fluid is very similar for Li and P for all
observed silicate phases.
Measured olivine/fluid partition coefficients show that
olivine strongly depletes Cl, Na, Ce and Sr relative to the
fluid (Fig. 3), with low values for Cl *10-4, intermediate
values for Na and Sr (*10-3) and higher values for Ce
(*10-2). Olivine/fluid values for Li, B, Ti, Lu, V and P are
*10-1.
Orthopyroxene/fluid values (Fig. 3) are given as fol-
lows: Cl *10-4, Sr *10-3, Na and Ce *10-2, Li, Y, V
and P *10-1, Ti and Lu *5.
Clinopyroxene/fluid partition coefficients show a strong
enrichment of Pr, Nd, Zr, Ti, Y and Lu in clinopyroxene
relative to the fluid (Fig. 3), with values for Lu *102, for
Ti, Y, Nd, Pr and Zr in the range 1–10. Clinopyroxene/fluid
values for Na, Li, La, Sr, V and P are in the range 10-1–1
and for Cl are *10-4.
Amphibole is enriched in Nb, Ce, Pr, Nd, Zr, Ti, Y,
Lu and V with respect to the fluid with amphibole/fluid
values larger than 1 (Fig. 3). Amphibole/fluid values are
in the range *10-1–1 for Li, B, La, Sr, P and *5 9
10-3 for Cl.
Fig. 3 Representative mineral/fluid partition coefficients for coexis-
ting minerals from experiments Cl-26. The horizontal dashed line
represent the limit between compatibility (Dmineral/fluid [ 1) and
incompatibility (Dmineral/fluid \ 1)
Fig. 4 MgO/SiO2 molar ratio of the fluids calculated from the LA–
ICP–MS analyses (Online Resource 1) versus the temperature (�C) of
the runs
Contrib Mineral Petrol (2013) 166:639–653 647
123

One important factor controlling olivine-fluid trace
element partitioning is the solute content of the fluid phase
(Fig. 5). As observed in previous studies (Stalder et al.
2001; Kessel et al. 2004), the total solute content is posi-
tively correlated with temperature (Online Resource 1)
concomitant with a decrease in Dol/fluid. This trend is
extremely pronounced for some cations (e.g., Ti), with
Dol/fluid dropping by 1–2 log units as the solute content
increases to a similar extent. Similar effects on Dmineral/fluid
were reported by Brenan and Watson (1991) and Brenan
et al. (1995).
Cl and F partition coefficients
Cl mineral/fluid partition coefficients (DCl) were calculated
from the Cl concentration in the mineral measured by
EMPA and the Cl concentration of the coexisting fluid
measured by LA–ICP–MS. The DClol/fl is between 9 9 10-5
and 2 9 10-4. Chlorine in orthopyroxene is more com-
patible than in olivine with DClopx/fl values between
1.5 9 10-4 and 3.7 9 10-4. Clinopyroxene has DClcpx/fl
values of 1.4 9 10-4 and 2 9 10-4 similar to orthopy-
roxene, and amphibole shows the highest DClamph/fl value of
4.9 9 10-3. For fluorine and for runs performed without
diamond trap, the partition coefficients can be estimated as
the ratio between the concentration in mineral versus the
concentration in the starting mixture. We obtain DFfo/startmix
*0.1 for forsterite characterized by the presence of
humite-type point defects, DFchu/startmix = 6.25 and
DFDi/startmix = 0.14 for diopsidic pyroxene (Table 2). The
values for DClol/startmix are between 1.6 9 10-3 and
5.3 9 10-4 and that for DClopx/startmix vary between
1.8 9 10-4 and 3.2 9 10-4 in close agreement with the
calculated partition coefficients.
IR spectra and IR images
Unpolarized IR spectra collected on olivine are shown in
Fig. 6, and IR images that were recorded for visualization
of the OH defects on the entire experimental charge are
shown in Fig. 7.
Ti-bearing olivine crystals (Online Resource 1, Fig. 6),
synthesized using the natural peridotite as starting material,
exhibit absorption bands at 3,326, 3,354, 3,525, 3,571 and
3,612 cm-1. Olivine from the natural F-doped peridotite
(Table 2; Fig. 6) displays also the absorption band at
3,535, 3,595, 3,640 and 3,670 cm-1, and the band at
3,570 cm-1 tends to become stronger (i.e., higher inten-
sity). Olivine crystallized under relatively oxidizing con-
ditions (fO2 = QFM ? 1.5) shows an IR spectrum similar
to that of olivine crystallized with no constrain on fO2,
whereas the IR spectra of olivine crystallized under
reducing conditions (fO2 = QFM - 3) do not have bands
at 3,326 and 3,354 cm-1 and those over 3,500 cm-1 tend
to be less intense. This observation supports the idea that
the bands around 3,350 cm-1 can be assigned to Fe3?-
related OH defects (Berry et al. 2007) and that olivine
grown at low fO2 (below the Fe–FeO) contains much less
water with respect to crystals from relatively more oxidized
experiments (Grant et al. 2007b). Forsterite from the
F-bearing model system (Table 2; Fig. 6) displays the
strongest absorption bands at wavenumber similar to those
for olivine from the natural peridotite plus F system. The
main absorption bands are located at 3,569 and
3,536 cm-1, and the bands above 3,590 cm-1 are more
intense with respect to the bands for olivine from the
F-doped natural peridotite system. In addition, the bands at
3,326 and 3,354 cm-1 are absent. The thickness of the
samples is comparable, and hence, the intensity of
absorption is related to the amount of OH. The observed
spectra indicate that the presence of F in the system permits
to incorporate much more OH in olivine compared with
olivine from the Ti-bearing and F-free system.
IR images (Fig. 7) were recorded on the whole sample
Cl–F-1 containing the fluorine-rich forsterite crystals
(Table 2; Fig. 6). No absorption bands close to 3,400 cm-1
were detected, suggesting the absence or a very low
abundance of humite-type planar defects (Hermann et al.
2007).
Additional data on the amounts of water dissolved in
olivine are reported in the Online Resource 2.
Fig. 5 Partition coefficients logDol/fluid for some trace elements as
function of the inverse temperature (K)
648 Contrib Mineral Petrol (2013) 166:639–653
123

TEM
The analyzed TEM foils were cut from a forsterite crystal
from sample Cl–F-1 with orientation *[714] as deter-
mined by EBSD. This sample was chosen due to the high
fluorine content of its forsterite (Table 2). The foils were
cut after chemical polishing of the sample. Chemical
polishing results in preferential material removal in
regions with defects. Lamellar features that are approxi-
mately oriented in the direction expected for humite-type
defects (parallel (001)Ol) are observed in the BSE image
(Fig. 8a). Three TEM foils were cut, two across these
features and one parallel, in order to determine its origin.
Neither bright field TEM, nor HRTEM or STEM did
show any chemical or structural variations in the inves-
tigated foils. As far as planar defects such as humite-
lamellae are concerned, selected area diffraction in [100],
[110] or [010] should depict evidence in the form of
streaks, as humite has significantly different lattice
parameters to olivine, always assuming the presence of
enough such lamellae. The streaks in the diffraction
pattern would be perpendicular to the plane of their ori-
entation. Thus, the effect should best be visible on (001)
diffraction spots, examples are given in Hermann et al.
(2007), Kitamura et al. (1987), Risold et al. (2001), and
Wirth et al. (2001). No such streaks were observed.
Instead of lamellae, dislocations were observed in the
bright field image (Fig. 8b), indicating another type of
defect hitherto not considered as potential repository for
halogens and hydrogen. However, the absence of planar
defects cannot be proved, but the concentration is cer-
tainly rather low in this sample. Considering the fluorine
content of the analyzed forsterite (0.09 wt% F) and the
ideal fluorine content in stoichiometric F-clinohumite
(6.1 wt% F), the hypothetical fraction of F-clinohumite
hosted in the forsterite lattice is approximately 1.5%,
corresponding to 0.34 mol% clinohumite in forsterite. For
TEM observations, this would mean that only 1 out of
300 d-spacing perpendicular to the lamellae would appear
broader.
Discussion
Halogen partitioning and major hosts for halogens
in the mantle
Our single data point from experiment crystallizing for-
sterite with clinohumite defects gives DolF/Cl = 5.3, in
agreement with the general observation that F is less
incompatible than Cl in olivine (e.g., DolF/Cl values between
0.9 and 13 Hauri et al. 2006; Beyer et al. 2012; Dalou et al.
2012). Our results for chlorine partitioning between mantle
minerals and coexisting aqueous fluid (Table 3) are in good
agreement with results from the system forsterite–ensta-
tite–pyrope–H2O–MgCl2 at 1,100 �C and 2.6 GPa (Bernini
0
40
10
20
30
nat. syst. + TiO2
nat. syst. + TiO2
nat. syst. + TiO2
nat. syst. + TiO2
nat. syst. + TiO2
natural system + F + TiO2
natural system + F + TiO2
natural system + F + TiO2
natural system + F + TiO2
model system + F + TiO2
wavenumber cm-1
mc/ecnabrosbA
3700 3600 3500 3400 3300 3200
model system + F + TiO2
model system + F
model system + F +TiO2
f O2 = QFM-3
f O2 = QFM+1.5
T = 1300 °C
T = 1200 °C
T = 1200 °C
T = 1000 °C
T = 1300 °C
T = 1300 °C
T = 1300 °C
T = 1100 °C
T = 1300 °C
T = 1200 °CT = 1100 °CT = 1000 °CT = 900 °C
33263354353535703670 3640 3590 Fig. 6 Unpolarized IR spectra
of olivine averaged over 10–15
randomly oriented crystals for
each run. Spectra are
normalized to 1 cm thickness.
Vertical dashed lines indicate
the positions of OH bands.
Experimental run details are
labeled above each spectrum
Contrib Mineral Petrol (2013) 166:639–653 649
123

et al. 2013) and with those from the system MgO–SiO2–
H2O–NaCl ± TiO2 ± Al2O3 at 900–1,300 �C and 2 GPa
(Fabbrizio et al. 2013) having partition coefficients for DClfo/fl
and for DClen/fl between 10-5 and 10-3.
The observed Cl concentrations in olivine crystals from
this study are similar to the Cl content of olivine from high-
pressure serpentinite and from metamorphic harzburgite,
where Cl concentrations of 24–120 and 7–18 ppm,
respectively, were detected (Scambelluri et al. 2004).
Chlorine concentrations in natural olivine from spinel
peridotites and oceanic basalts are lower and fairly
homogeneous at 5.7 ± 0.5 ppm (Beyer et al. 2012). An
implication of the present work is that halogens in the
mantle may be incorporated in olivine as well as in other
nominally anhydrous minerals (for example, pyroxenes) in
addition to hydrous minerals such as amphibole, serpentine
or chlorite. Taking into account the modal proportions in
the mantle and estimations for the total halogen content
(Saal et al. 2002), olivine may be regarded as an important
host for halogens in the Earth’s mantle.
Incorporation mechanism of halogens into nominally
halogen-free minerals
In analogy to OH incorporation in olivine, two different
groups of defects can be encountered for halogen incorpo-
ration in olivine: point defects (Berry et al. 2005, 2007) and
planar defects (Kitamura et al. 1987; Hermann et al. 2007).
Both groups of defects permit to incorporate OH in the for-
sterite structure and thus can serve as host for halogens by
permitting a direct exchange between halogens and OH.
Planar defects are more likely close to the clinohumite
(a)
(c)(c)(b)(b)
(d)(d) (e)(e)
fo
en
0
2
4
6
8
500 µm
200 µm 200 µm
200 µm200 µm
b,c
d,e
A(3500-3680)A(3300-3450)
Visual image
Fig. 7 Visual image a of sample Cl–F-1, b–e IR images displaying
total absorbances in the wavenumber range (see color code right) b,
d 3,300–3,450 cm-1 and c, e 3,500–3,680 cm-1 color-coded accord-
ing to the scale bar to the right (not normalized to thickness). Each
pixel (2.7 9 2.7 lm2) contains the full information of an IR spectrum
and can be extracted separately. Note the absence of any band close to
3,400 cm-1 indicating the absence of humite-type planar defects
(Hermann et al. 2007). The rectangular feature left to the center in
(e) represents one 170 9 170 lm2 frame. Compared to the surround-
ing frames, it exhibits enhanced absorbance interpreted as analytical
artifact probably caused by an electric spike during data acquisition
650 Contrib Mineral Petrol (2013) 166:639–653
123
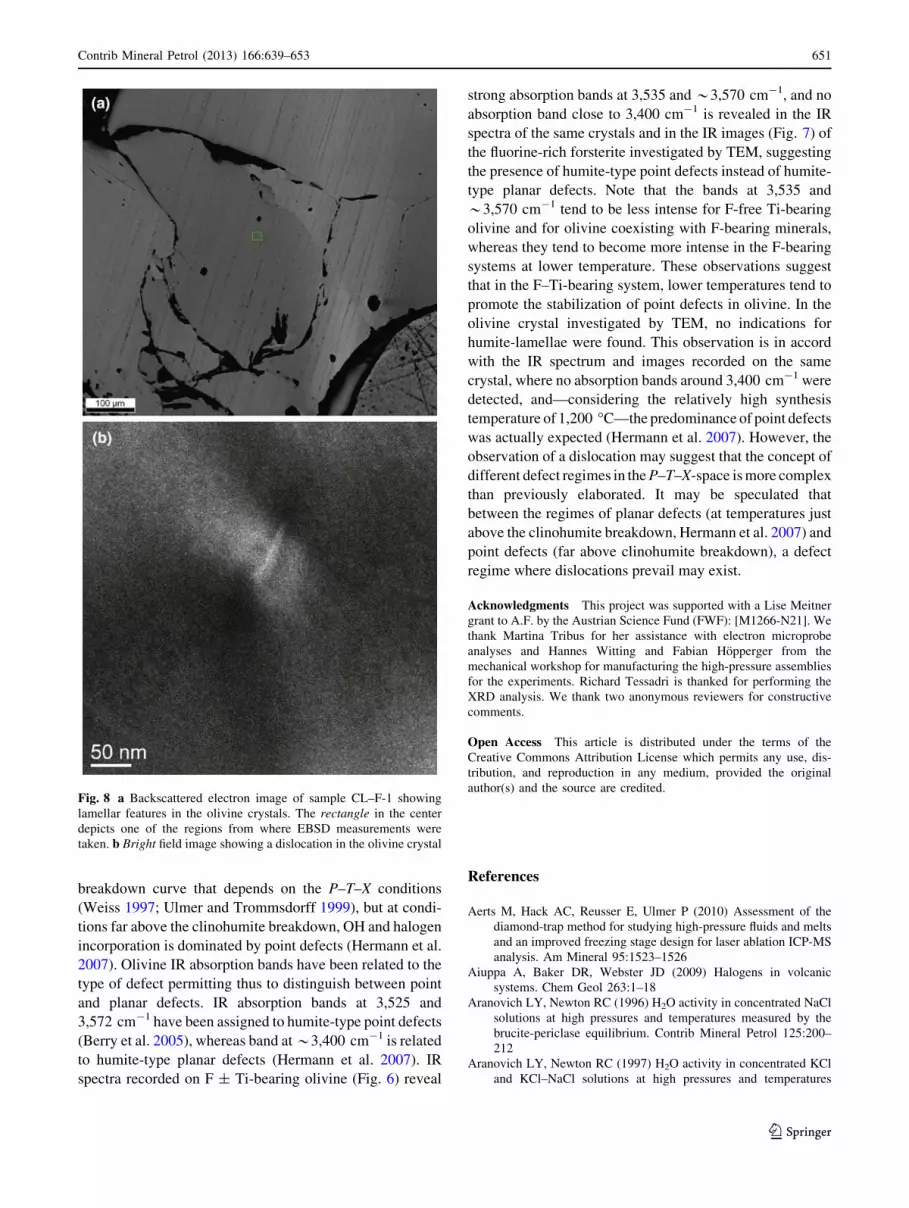
breakdown curve that depends on the P–T–X conditions
(Weiss 1997; Ulmer and Trommsdorff 1999), but at condi-
tions far above the clinohumite breakdown, OH and halogen
incorporation is dominated by point defects (Hermann et al.
2007). Olivine IR absorption bands have been related to the
type of defect permitting thus to distinguish between point
and planar defects. IR absorption bands at 3,525 and
3,572 cm-1 have been assigned to humite-type point defects
(Berry et al. 2005), whereas band at *3,400 cm-1 is related
to humite-type planar defects (Hermann et al. 2007). IR
spectra recorded on F ± Ti-bearing olivine (Fig. 6) reveal
strong absorption bands at 3,535 and *3,570 cm-1, and no
absorption band close to 3,400 cm-1 is revealed in the IR
spectra of the same crystals and in the IR images (Fig. 7) of
the fluorine-rich forsterite investigated by TEM, suggesting
the presence of humite-type point defects instead of humite-
type planar defects. Note that the bands at 3,535 and
*3,570 cm-1 tend to be less intense for F-free Ti-bearing
olivine and for olivine coexisting with F-bearing minerals,
whereas they tend to become more intense in the F-bearing
systems at lower temperature. These observations suggest
that in the F–Ti-bearing system, lower temperatures tend to
promote the stabilization of point defects in olivine. In the
olivine crystal investigated by TEM, no indications for
humite-lamellae were found. This observation is in accord
with the IR spectrum and images recorded on the same
crystal, where no absorption bands around 3,400 cm-1 were
detected, and—considering the relatively high synthesis
temperature of 1,200 �C—the predominance of point defects
was actually expected (Hermann et al. 2007). However, the
observation of a dislocation may suggest that the concept of
different defect regimes in the P–T–X-space is more complex
than previously elaborated. It may be speculated that
between the regimes of planar defects (at temperatures just
above the clinohumite breakdown, Hermann et al. 2007) and
point defects (far above clinohumite breakdown), a defect
regime where dislocations prevail may exist.
Acknowledgments This project was supported with a Lise Meitner
grant to A.F. by the Austrian Science Fund (FWF): [M1266-N21]. We
thank Martina Tribus for her assistance with electron microprobe
analyses and Hannes Witting and Fabian Hopperger from the
mechanical workshop for manufacturing the high-pressure assemblies
for the experiments. Richard Tessadri is thanked for performing the
XRD analysis. We thank two anonymous reviewers for constructive
comments.
Open Access This article is distributed under the terms of the
Creative Commons Attribution License which permits any use, dis-
tribution, and reproduction in any medium, provided the original
author(s) and the source are credited.
References
Aerts M, Hack AC, Reusser E, Ulmer P (2010) Assessment of the
diamond-trap method for studying high-pressure fluids and melts
and an improved freezing stage design for laser ablation ICP-MS
analysis. Am Mineral 95:1523–1526
Aiuppa A, Baker DR, Webster JD (2009) Halogens in volcanic
systems. Chem Geol 263:1–18
Aranovich LY, Newton RC (1996) H2O activity in concentrated NaCl
solutions at high pressures and temperatures measured by the
brucite-periclase equilibrium. Contrib Mineral Petrol 125:200–
212
Aranovich LY, Newton RC (1997) H2O activity in concentrated KCl
and KCl–NaCl solutions at high pressures and temperatures
Fig. 8 a Backscattered electron image of sample CL–F-1 showing
lamellar features in the olivine crystals. The rectangle in the center
depicts one of the regions from where EBSD measurements were
taken. b Bright field image showing a dislocation in the olivine crystal
Contrib Mineral Petrol (2013) 166:639–653 651
123

measured by the brucite-periclase equilibrium. Contrib Mineral
Petrol 127:261–271
Ayers JC, Dittmer SK, Layne GD (1997) Partitioning of elements
between peridotite and H2O at 2.0–3.0 GPa and 900–1100 �C,
and application to models of subduction zone processes. Earth
Planet Sci Lett 150:381–398
Baker DR, Balcone-Boissard E (2009) Halogen diffusion in magmatic
systems: our current state of knowledge. Chem Geol 263:82–88
Bell DR, Rossman GR (1992) Water in Earth’s mantle the role of
nominally anhydrous minerals. Science 255:1391–1397
Bernini D, Wiedenbeck M, Dolejs D, Keppler H (2013) Partitioning
of halogens between mantle minerals and aqueous fluids:
implications for the fluid flow regime in subduction zones.
Contrib Mineral Petrol 165:117–128
Berry AJ, Hermann J, O’Neill HSC, Foran GJ (2005) Fingerprinting
the water site in mantle olivine. Geology 33:869–872
Berry AJ, O’Neill HSC, Hermann J, Scott DR (2007) The infrared
signature of water associated with trivalent cations in olivine.
Earth Planet Sci Lett 261:134–142
Beyer C, Klemme S, Wiedenbeck M, Stracke A, Vollmer C (2012)
Fluorine in nominally fluorine-free mantle minerals: experimen-
tal partitioning of F between olivine, orthopyroxene and silicate
melts with implications for magmatic processes. Earth Planet Sci
Lett 337–338:1–9
Brenan JM, Watson EB (1991) Partitioning of trace elements between
olivine and aqueous fluids at high P-T conditions: implications
for the effect of fluid composition on trace elements transport.
Earth Planet Sci Lett 107:672–688
Brenan JM, Shaw HF, Ryerson FJ, Phinney DL (1995) Mineral-
aqueous fluid partitioning of trace elements at 900 �C and 2.0
GPa: constraints on the trace element chemistry of mantle and
deep crustal fluids. Geochim Cosmochim Acta 59:3331–3350
Bromiley DW, Kohn SC (2007) Comparisons between fluoride and
hydroxide incorporation in nominally anhydrous and fluorine-
free mantle minerals. Geochim Cosmochim Acta 71:A124
Caciagli N, Brenan JM, McDonough WF, Phinney D (2011) Mineral-
fluid partitioning of lithium and implications for slab-mantle
interaction. Chem Geol 280:384–398
Carroll MR, Webster JD (1994) Solubilities of sulfur, noble gases,
nitrogen, chlorine, and fluorine in magmas. Rev Mineral
Geochem 30:231–279
Chu L, Enggist A, Luth RW (2011) Effect of KCl on melting in the
Mg2SiO4–MgSiO3–H2O system at 5 GPa. Contrib Mineral Petrol
162:565–571
Dalou C, Koga KT, Shimizu N, Boulon J, Devidal J (2012)
Experimental determination of F and Cl partitioning between
lherzolite and basaltic melt. Contrib Mineral Petrol
163:591–609
Drury MR (1991) Hydration-induced climb dissociation of disloca-
tions in naturally deformed mantle olivine. Phys Chem Miner 18:
106–116
Fabbrizio A, Stalder R, Hametner K, Gunther D (2013) Experimental
chlorine partitioning between forsterite, enstatite and aqueous
fluid at upper mantle conditions. Geochim Cosmochim Acta.
doi:10.1016/j.gca.2013.05.026
Giannuzzi LA, Drown JL, Brown SR, Irwin RB, Stevie FA (1997)
Focused ion beam milling and micromanipulation lift-out for
site-specific cross-section TEM specimen preparation. In:
Anderson R, Walck S (eds) Proceedings of the Materials
Research Society: workshop on specimen preparation for TEM
of materials IV, vol 480. Materials Research Society, Pittsburgh,
pp 19–27
Grant K, Brooker RA, Kohn SC, Wood BJ (2007a) The effect of
oxygen fugacity on hydroxyl concentrations and speciation in
olivine: implications for water solubility in the upper mantle.
Earth Planet Sci Lett 261:217–229
Grant K, Ingrin J, Lorand JP, Dumas P (2007b) Water partitioning
between mantle minerals from peridotite xenoliths. Contrib
Mineral Petrol 154:15–34
Gunther D, Frischknecht R, Heinrich C, Kahlert H (1997) Capabilities
of an argon fluoride 193 nm excimer laser for laser ablation
inductively coupled plasma mass spectrometry microanalysis of
geological materials. J Anal Atom Spectrom 12:939–944
Hauri EH, Gaetani GA, Green TH (2006) Partitioning of water during
melting of the Earth’s upper mantle at H2O-undersaturated
conditions. Earth Planet Sci Lett 248:715–734
Hermann J, Fitz Gerald JD, Malaspina N, Berry AJ, Scambelluri M
(2007) OH-bearing planar defects in olivine produced by the
breakdown of ti-rich humite minerals from Dabie Shan (China).
Contrib Mineral Petrol 153:417–428
Hirschmann MM, Aubaud C, Withers AC (2005) Storage capacity of
H2O in nominally anhydrous minerals in the upper mantle. Earth
Planet Sci Lett 236:167–181
Hirth G, Kohlstedt DL (1996) Water in the oceanic upper mantle:
implications for rheology, melt extraction and the evolution of
the lithosphere. Earth Planet Sci Lett 144:93–108
Karato S, Jung H (1998) Water, partial melting and the origin of the
seismic low velocity zone in the upper mantle. Earth Planet Sci
Lett 157:193–207
Kessel R, Ulmer P, Pettke T, Schmidt MW, Thompson AB (2004) A
novel approach to determine high-pressure high-temperature
fluid and melt compositions using diamond-trap experiments.
Am Mineral 89:1078–1086
Kitamura M, Kondoh S, Morimoto N, Miller GH, Rossman GR,
Putnis A (1987) Planar OH-bearing defects in mantle olivine.
Nature 328:143–145
Kushiro I, Yoder HS (1969) Melting of forsterite and enstatite at high
pressures under hydrous conditions. Carnegie Inst Wash Year B
67:153–158
Lee MR, Bland PA, Graham G (2003) Preparation of TEM samples
by focused ion beam (FIB) techniques; applications to the study
of clays and phyllosilicates in meteorites. Mineral Mag
67:581–592
Mysen BO (1979) Trace element partitioning between garnet
peridotite minerals and water-rich vapor: experimental data
from 5 to 30 kbar. Am Mineral 64:274–287
O’Neill HSC (1988) Systems Fe–O and Cu–O: thermodynamic data
for the equilibria of Fe–‘‘FeO’’, Fe–Fe3O4, ‘‘FeO’’–Fe3O4,
Fe3O4–Fe2O3, Cu–Cu2O and Cu2O–CuO from emf measure-
ments. Am Mineral 73:470–487
O’Neill HSC, Pownceby MI (1993) Thermodynamic data from redox
reactions at high temperatures. 1. An experimental and theoret-
ical assessment of the electrochemical method using stabilized
zirconia electrolytes, with revised values for the Fe–FeO, Co–
CoO, Ni–NiO and Cu–Cu2O oxygen buffers, and new data from
the W–WO2 buffer. Contrib Mineral Petrol 114:296–314
Oehm J, Schneider A, Wedepohl KH (1983) Upper mantle rocks from
basalts of the northern Hessian depression (NW Germany).
Tschermaks Min Petr Mitt 32:25–48
Phaneuf MW (1999) Applications of focused ion beam microscopy to
materials science specimens. Micron 30:277–288
Rauch M, Keppler H (2002) Water solubility in orthopyroxene.
Contrib Mineral Petrol 143:525–536
Reed MH (1997) Hydrothermal alteration and its relationship to ore
fluid composition. In: Barnes HL (ed) Geochemistry of hydro-
thermal ore deposits, 3rd edn. Wiley, New York, pp 303–366
Risold AC, Trommsdorff V, Grobety B (2001) Genesis of ilmenite
rods and palisades along humite-type defects in olivine from
Alpe Arami. Contrib Mineral Petrol 140:619–628
Saal AE, Hauri EH, Langmuir CH, Perfit MR (2002) Vapour under
saturation in primitive mid-ocean-ridge basalt and the volatile
content of Earth’s upper mantle. Nature 419:451–455
652 Contrib Mineral Petrol (2013) 166:639–653
123
Scambelluri M, Munthener O, Ottolini L, Pettke T, Vannucci R
(2004) The fate of B, Cl and Li in the subducted oceanic mantle
and in the antigorite breakdown fluids. Earth Planet Sci Lett
222:217–234
Shmulovich KI, Graham CM (1996) Melting of albite and dehydra-
tion of brucite in H2O–NaCl fluids to 9 kbars and 700–900 �C:
implications for partial melting and water activities during high
pressure metamorphism. Contrib Mineral Petrol 124:370–382
Stalder R, Ulmer P (2001) Phase relations of a serpentine composition
between 5 and 14 GPa: significance of clinohumite and phase E
as water carriers into the transition zone. Contrib Mineral Petrol
140:670–679
Stalder R, Foley SF, Brey GP, Horn I (1998) Mineral-aqueous fluid
partitioning of trace elements at 900–1,200 �C and 3.0–5.7 GPa:
new experimental data for garnet, clinopyroxene and rutile, and
implications for mantle metasomatism. Geochim Cosmochim
Acta 62:1781–1801
Stalder R, Ulmer P, Thompson AB, Gunther D (2001) High pressure
fluids in the system MgO–SiO2–H2O under upper mantle
conditions. Contrib Mineral Petrol 140:607–618
Stalder R, Klemme S, Ludwig T, Skogby H (2005) Hydrogen
incorporation in orthopyroxene: interaction of different trivalent
cations. Contrib Mineral Petrol 150:473–485
Stalder R, Kronz A, Simon K (2008) Hydrogen incorporation in
enstatite in the system MgO–SiO2–H2O–NaCl. Contrib Mineral
Petrol 156:653–659
Tenner TJ, Hirschmann MM, Withers AC, Hervig RL (2009)
Hydrogen partitioning between nominally anhydrous upper
mantle minerals and melt between 3 and 5 GPa and applications
to hydrous peridotite partial melting. Chem Geol 262:42–56
Ulmer P, Trommsdorff V (1999) Phase relations of hydrous mantle
subducting to 300 km. In: Fei Y, Berthka CM, Mysen B (eds)
Mantle petrology: field observations and high pressure experi-
mentation: a tribute to Francis R. (Joe) Boyd. The Geochemical
Society, Special publication No. 6, pp 259–281
Vigneresse JL (2009) Evaluation of the chemical reactivity of the
fluid phase through hard–soft acid–base concepts in magmatic
intrusions with applications to ore generation. Chem Geol
263:69–81
Webster JD, Sintoni MF, De Vivo B (2009) The partitioning behavior
of Cl, S and H2O in aqueous vapor- ± saline liquid saturated
phonolitic and trachytic melts at 200 MPa. Chem Geol 263:
19–63
Weiss M (1997) Clinohumites: a field and experimental study.
Dissertation, ETH-Zurich
Wirth R (2004) Focused ion beam (FIB): a novel technology for
advanced application of micro- and nanoanalysis in geosciences
and applied mineralogy. Eur J Mineral 16:863–876
Wirth R, Dobrzhinetskaya L, Green HW II (2001) Electron micro-
scope study of the reaction olivine ? H2O ? TiO2 = titanian
clinohumite ? titanian chondrodite synthesized at 8 GPa,
1,300 K. Am Mineral 86:601–610
Yardley BWD (2005) Metal concentrations in crustal fluids and their
relationship to ore formation. Econ Geol 100:613–632
Contrib Mineral Petrol (2013) 166:639–653 653
123


