Embed Size (px)
Citation preview
River, Coastal and Estuarine Morphodynamics: RCEM2011 © 2011 Tsinghua University Press, Beijing
Experimental observation on bank retreat of salt marshes
Simona FRANCALANCI CERAFRI – Center of Research and Advanced Education for Hydrogeological Risk Prevention
Via XI Febbraio 2, 55040 Retignano di Stazzema (LU), Italy
Luca SOLARI, Lorenzo CAPPIETTI, Massimo RINALDI, Giorgio Valentino FEDERICI Department of Civil and Environmental Engineering, University of Florence
Via S.Marta 3, 50139 Florence, Italy
ABSTRACT: Salt marshes are among the richest ecosystems in terms of productivity and species
diversity, providing habitat to a diverse fauna population, important resources for fishing and recreation,
and a nutrient buffer at the land-sea interface. For these reasons salt marsh erosion represents a heavy loss
of soil and this complex phenomenon has enhanced more and more interest, among the scientific
community, to understand and quantify physical and biological processes and the related feedbacks to the
planimetric evolution of the tidal channels forming the drainage network inside the salt marshes.
The present work focuses on the retreat processes of the scarps delimiting the salt marshes due to the
impact of wind and tidal waves. To this aim, a physical model reproducing a salt marsh bank was build in
a laboratory inside a long wave current flume. The laboratory model (geometry, dimensions, material),
the tidal excursion and the wind wave climate were reproduced according the field observations collected
in the Venice lagoon. Experimental observations and laboratory measurements allowed revealing the key
mechanisms responsible for the bank retreat.
1 INTRODUCTION
Salt marshes are among the richest ecosystems in terms of productivity and species diversity, providing
habitat to a diverse fauna population, important resources for fishing and recreation, and a nutrient buffer
at the land-sea interface. Marsh vegetation also plays an important role in the dissipation of wave energy.
As a result, salt marshes provide a form of sea defence, reducing the need of sea walls or dikes to protect
the hinterland (Allen, 2000; Townend et al., 2010).
This notwithstanding, the eustatic rise of sea level, natural and/or man induced regional subsidence, and
the increasing anthropic pressure have caused considerable environmental damage to lagoon ecosystems,
including relevant changes to the sediment balance of the basin and vanishing of large marsh areas in
many part of the word (van der Wal & Pye, 2004; Marani et al., 2006). For instance, in the case of the
Venice lagoon, from the beginning of the last century, the whole salt marsh surface has halved and trends
would indicate that the marshes should completely disappear over the next 50 years. Therefore, instability
of scarps and surface sediment erosion play key roles in the equilibrium of such delicate environmental
system and often require engineered interventions to preserve the existing morphology (Cola et al., 2008)
The banks in the salt marshes are typically cohesive and vegetated, characterized at the edge by
relatively sub-vertical high cliffs. Erosion of the marsh cliffs is mainly caused by hydrodynamic forces of
waves (either due to wind or passing ships) and currents (van der Wal & Pye, 2004). The stability of the
cliffs depends mostly on cliff stratigraphy and height (van Eerdt, 1985), and, in the case of
grass-dominated marshes, on the thickness of the root mat (Allen, 1998). Field evidences suggest the
erosion process takes place in the form of a variety of concurring processes such as mass instability,
undercutting due to flow and wave erosion, seepage erosion commenced in a higher conductive layer,
vegetation and plant roots improving the strength of upper layers of the bank.
544
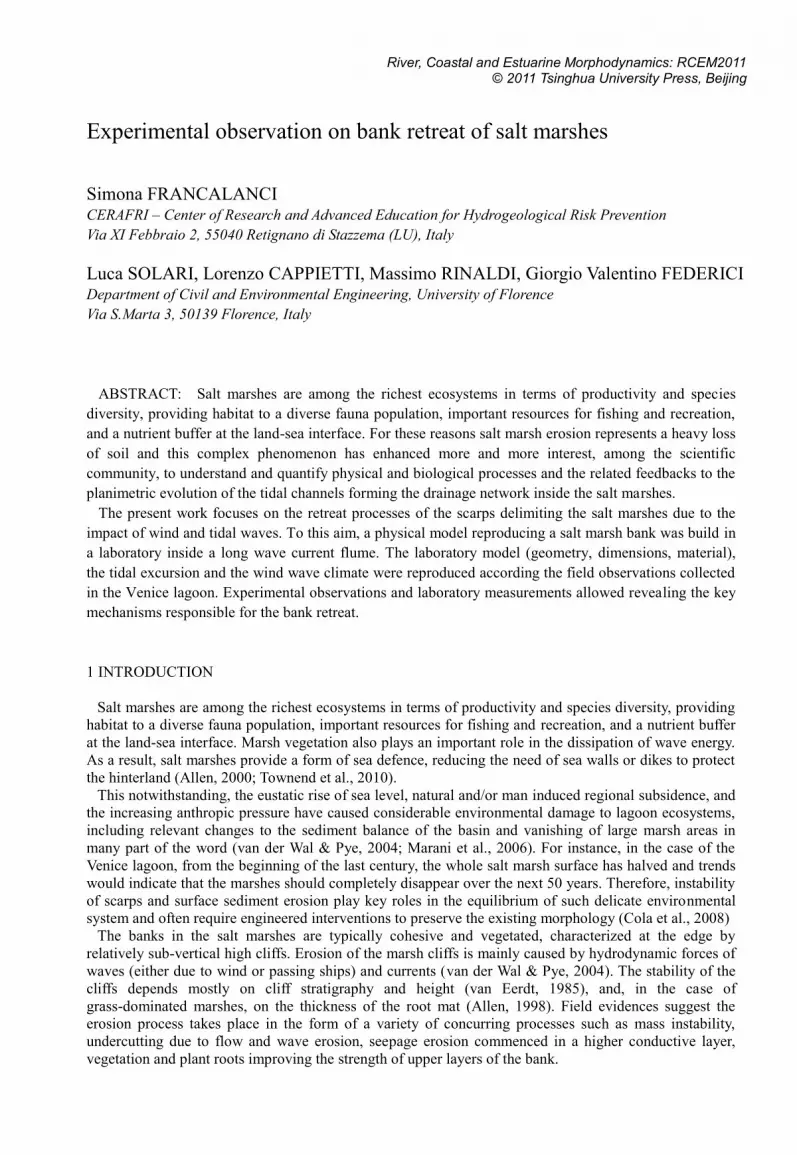
In the present work, we investigate the erosion processes of the banks delimiting the salt marshes under
the effects of tidal and wind waves. To this aim, we reproduced a bank in a laboratory flume. The
laboratory model (geometry and dimensions, material), the tidal excursion and the wind wave climate
were reproduced according the field observations collected in the Venice lagoon (Figure 1).
The same experiments were conducted in the case of both non-vegetated and vegetated bank.
This paper provides a first set of experimental results with an emphasis on the observed mechanisms
responsible for the bank retreat.
Figure 1 View of the scarp delimiting the salt marshes in the Venice Lagoon
2 EXPERIMENTAL SET-UP
2.1 Description of the experimental apparatus
The experiments were conducted in a glass-wall wave current flume which was about 50 m long, 0.75 m
wide and 0.8 m deep. The physical model of the salt marsh was build on one end of the flume, while at
the opposite side irregular waves were generated by an hydraulic piston type wave maker driven by a
Deterministic Spectral Amplitude method, according to Hughes (1995). The reproduced salt marsh bank
was 0.5 m wide, 0.6 m height, and about 1 m long. Note that this height appears to be very similar to
those typically found in the Venice lagoon. The bank was built using the same material (mainly fine
sediment in the range of mud and clay with the addition of some organic fractions) found in a salt marsh
in the Venice lagoon.
An identical, but vegetated, marsh bank was build in the channel, adjoining to the back of the non
vegetated bank; on the top of this bank, halophytic plants were grown. In this way, the additional effect of
the vegetation on the retreat processes could be investigated.
In the present work, only the experiments with the non vegetated bank are presented and discussed.
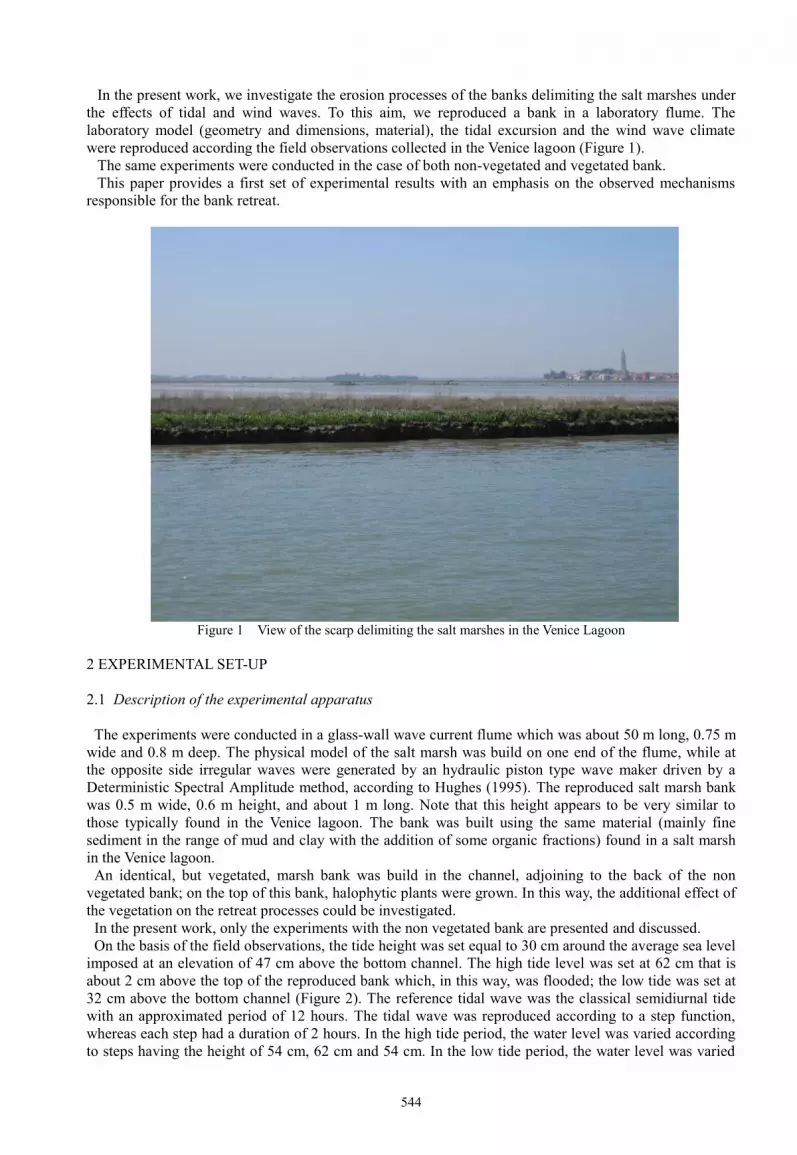
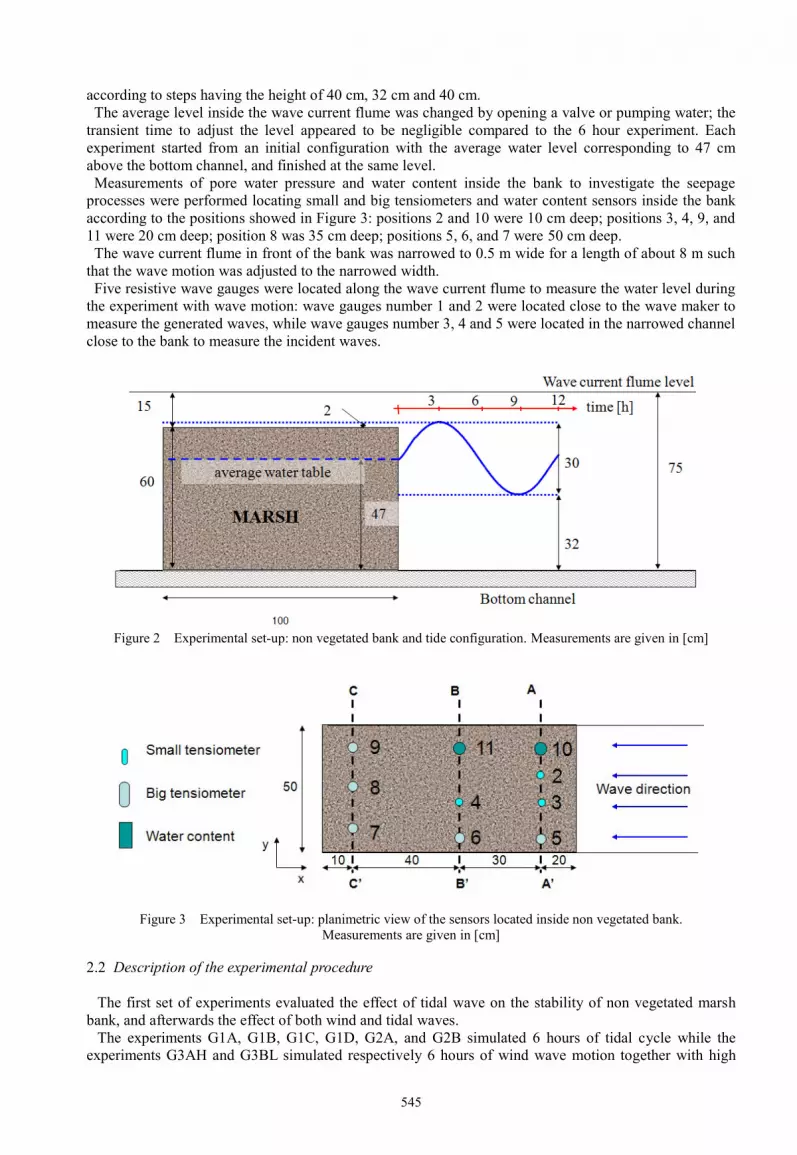
On the basis of the field observations, the tide height was set equal to 30 cm around the average sea level
imposed at an elevation of 47 cm above the bottom channel. The high tide level was set at 62 cm that is
about 2 cm above the top of the reproduced bank which, in this way, was flooded; the low tide was set at
32 cm above the bottom channel (Figure 2). The reference tidal wave was the classical semidiurnal tide
with an approximated period of 12 hours. The tidal wave was reproduced according to a step function,
whereas each step had a duration of 2 hours. In the high tide period, the water level was varied according
to steps having the height of 54 cm, 62 cm and 54 cm. In the low tide period, the water level was varied
545
according to steps having the height of 40 cm, 32 cm and 40 cm.
The average level inside the wave current flume was changed by opening a valve or pumping water; the
transient time to adjust the level appeared to be negligible compared to the 6 hour experiment. Each
experiment started from an initial configuration with the average water level corresponding to 47 cm
above the bottom channel, and finished at the same level.
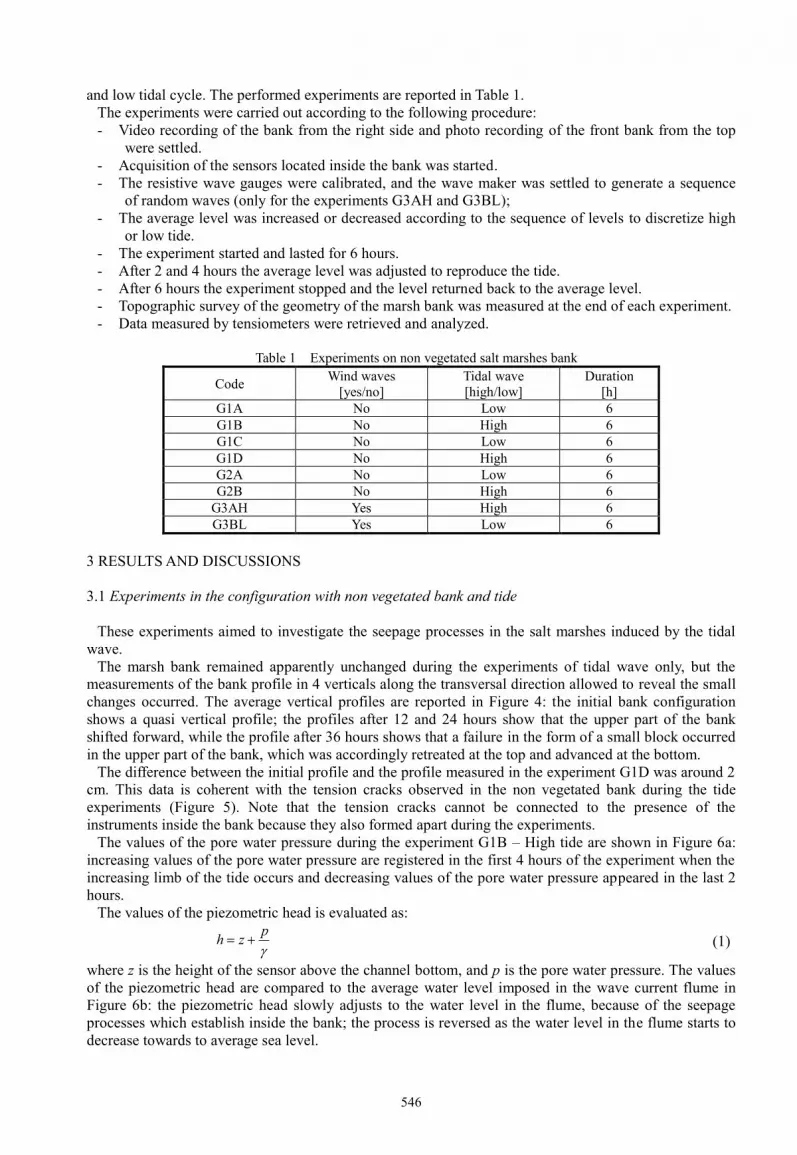
Measurements of pore water pressure and water content inside the bank to investigate the seepage
processes were performed locating small and big tensiometers and water content sensors inside the bank
according to the positions showed in Figure 3: positions 2 and 10 were 10 cm deep; positions 3, 4, 9, and
11 were 20 cm deep; position 8 was 35 cm deep; positions 5, 6, and 7 were 50 cm deep.
The wave current flume in front of the bank was narrowed to 0.5 m wide for a length of about 8 m such
that the wave motion was adjusted to the narrowed width.
Five resistive wave gauges were located along the wave current flume to measure the water level during
the experiment with wave motion: wave gauges number 1 and 2 were located close to the wave maker to
measure the generated waves, while wave gauges number 3, 4 and 5 were located in the narrowed channel
close to the bank to measure the incident waves.
Figure 2 Experimental set-up: non vegetated bank and tide configuration. Measurements are given in [cm]
Figure 3 Experimental set-up: planimetric view of the sensors located inside non vegetated bank.
Measurements are given in [cm]
2.2 Description of the experimental procedure
The first set of experiments evaluated the effect of tidal wave on the stability of non vegetated marsh
bank, and afterwards the effect of both wind and tidal waves.
The experiments G1A, G1B, G1C, G1D, G2A, and G2B simulated 6 hours of tidal cycle while the
experiments G3AH and G3BL simulated respectively 6 hours of wind wave motion together with high
546
and low tidal cycle. The performed experiments are reported in Table 1.
The experiments were carried out according to the following procedure:
- Video recording of the bank from the right side and photo recording of the front bank from the top
were settled.
- Acquisition of the sensors located inside the bank was started.
- The resistive wave gauges were calibrated, and the wave maker was settled to generate a sequence
of random waves (only for the experiments G3AH and G3BL);
- The average level was increased or decreased according to the sequence of levels to discretize high
or low tide.
- The experiment started and lasted for 6 hours.
- After 2 and 4 hours the average level was adjusted to reproduce the tide.
- After 6 hours the experiment stopped and the level returned back to the average level.
- Topographic survey of the geometry of the marsh bank was measured at the end of each experiment.
- Data measured by tensiometers were retrieved and analyzed.
Table 1 Experiments on non vegetated salt marshes bank
Code Wind waves
[yes/no]
Tidal wave
[high/low]
Duration
[h]
G1A No Low 6
G1B No High 6
G1C No Low 6
G1D No High 6
G2A No Low 6
G2B No High 6
G3AH Yes High 6
G3BL Yes Low 6
3 RESULTS AND DISCUSSIONS
3.1 Experiments in the configuration with non vegetated bank and tide
These experiments aimed to investigate the seepage processes in the salt marshes induced by the tidal
wave.
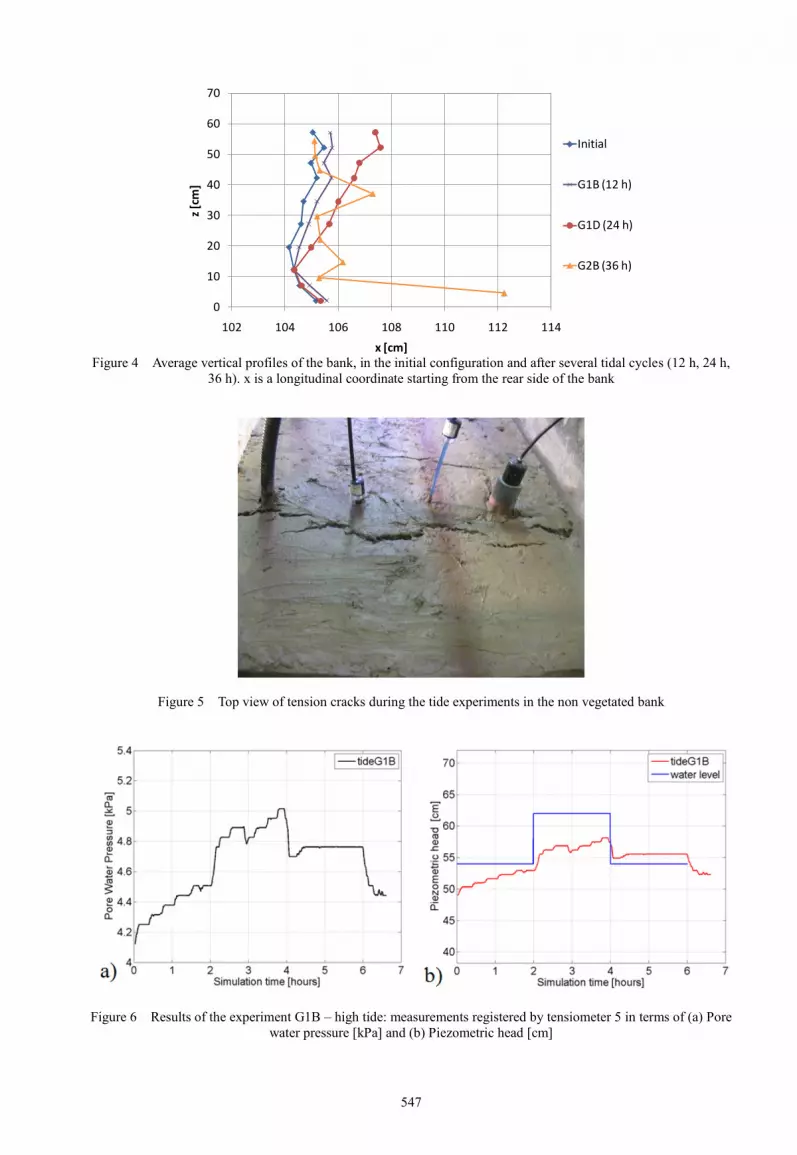
The marsh bank remained apparently unchanged during the experiments of tidal wave only, but the
measurements of the bank profile in 4 verticals along the transversal direction allowed to reveal the small
changes occurred. The average vertical profiles are reported in Figure 4: the initial bank configuration
shows a quasi vertical profile; the profiles after 12 and 24 hours show that the upper part of the bank
shifted forward, while the profile after 36 hours shows that a failure in the form of a small block occurred
in the upper part of the bank, which was accordingly retreated at the top and advanced at the bottom.
The difference between the initial profile and the profile measured in the experiment G1D was around 2
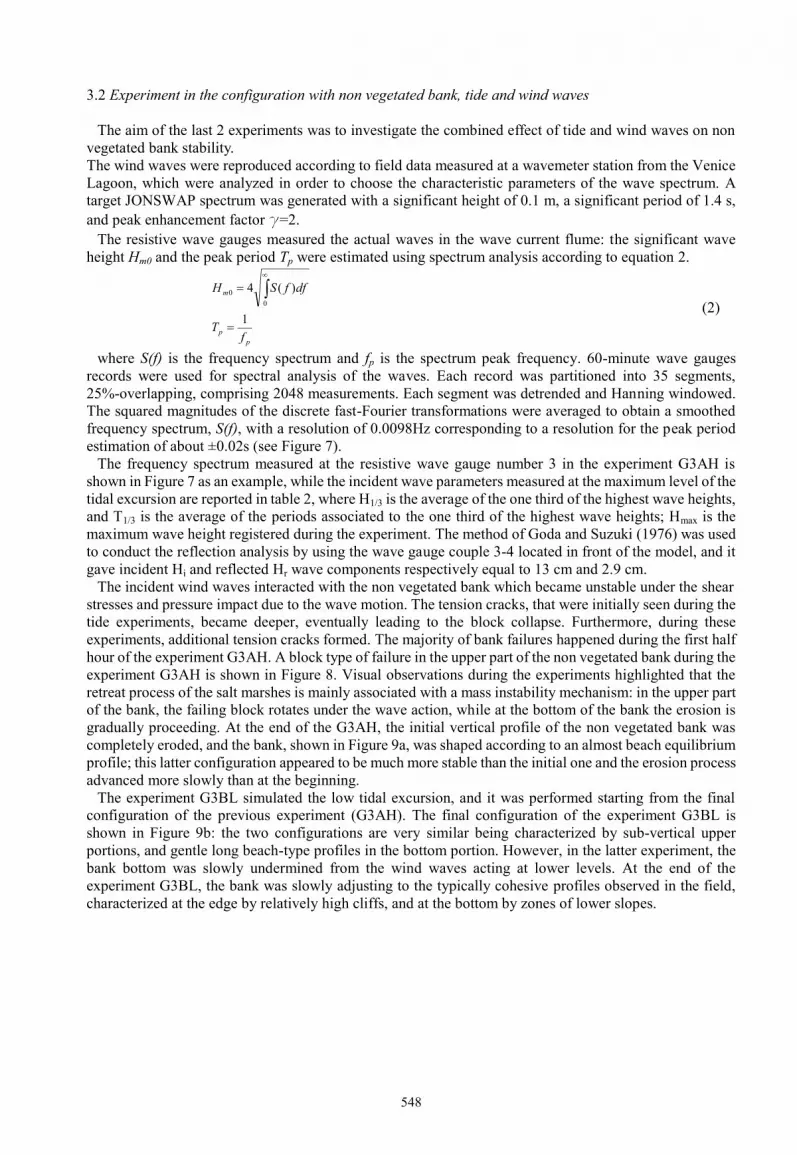
cm. This data is coherent with the tension cracks observed in the non vegetated bank during the tide
experiments (Figure 5). Note that the tension cracks cannot be connected to the presence of the
instruments inside the bank because they also formed apart during the experiments.
The values of the pore water pressure during the experiment G1B – High tide are shown in Figure 6a:
increasing values of the pore water pressure are registered in the first 4 hours of the experiment when the
increasing limb of the tide occurs and decreasing values of the pore water pressure appeared in the last 2
hours.
The values of the piezometric head is evaluated as:
pzh
(1)
where z is the height of the sensor above the channel bottom, and p is the pore water pressure. The values
of the piezometric head are compared to the average water level imposed in the wave current flume in
Figure 6b: the piezometric head slowly adjusts to the water level in the flume, because of the seepage
processes which establish inside the bank; the process is reversed as the water level in the flume starts to
decrease towards to average sea level.
547
0
10
20
30
40
50
60
70
102 104 106 108 110 112 114
z [c
m]
x [cm]
Average Vertical Profiles
Initial
G1B (12 h)
G1D (24 h)
G2B (36 h)
Figure 4 Average vertical profiles of the bank, in the initial configuration and after several tidal cycles (12 h, 24 h,
36 h). x is a longitudinal coordinate starting from the rear side of the bank
Figure 5 Top view of tension cracks during the tide experiments in the non vegetated bank
Figure 6 Results of the experiment G1B – high tide: measurements registered by tensiometer 5 in terms of (a) Pore
water pressure [kPa] and (b) Piezometric head [cm]
548
3.2 Experiment in the configuration with non vegetated bank, tide and wind waves
The aim of the last 2 experiments was to investigate the combined effect of tide and wind waves on non
vegetated bank stability.
The wind waves were reproduced according to field data measured at a wavemeter station from the Venice
Lagoon, which were analyzed in order to choose the characteristic parameters of the wave spectrum. A
target JONSWAP spectrum was generated with a significant height of 0.1 m, a significant period of 1.4 s,
and peak enhancement factor γ=2.
The resistive wave gauges measured the actual waves in the wave current flume: the significant wave
height Hm0 and the peak period Tp were estimated using spectrum analysis according to equation 2.
p
p
m
fT
dffSH
1
)(40
0
(2)
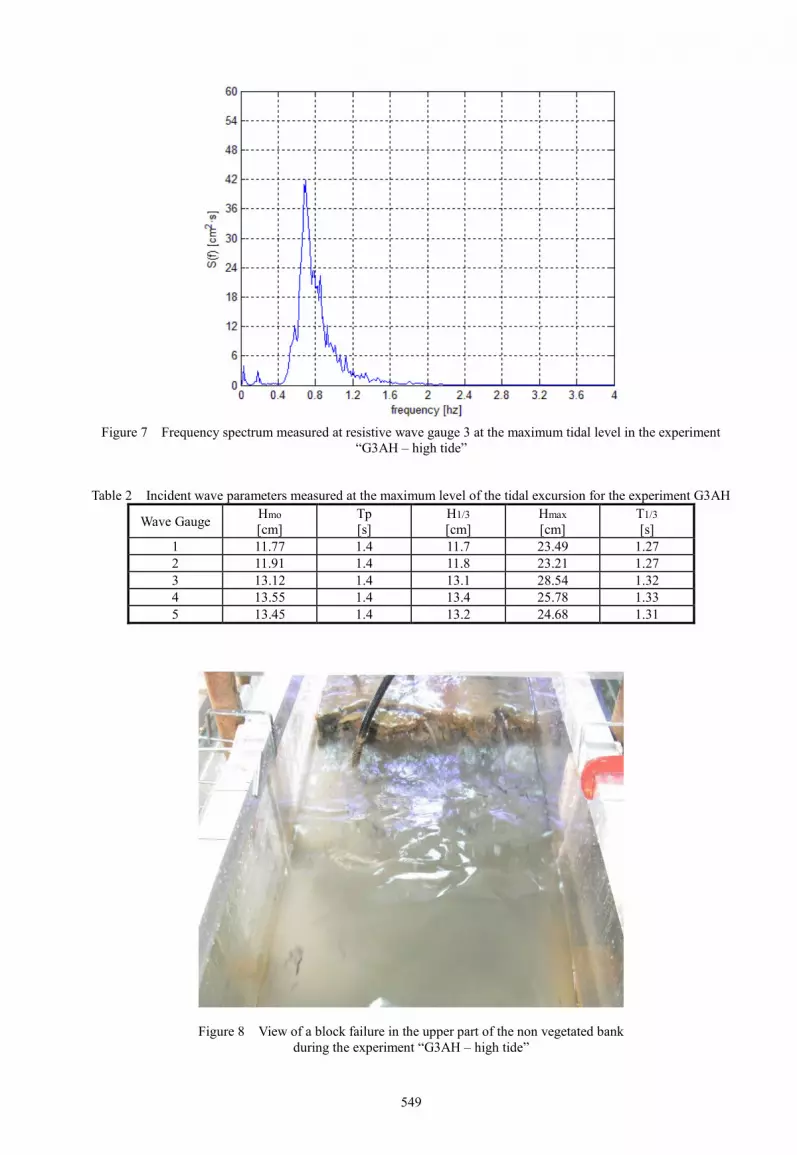
where S(f) is the frequency spectrum and fp is the spectrum peak frequency. 60-minute wave gauges
records were used for spectral analysis of the waves. Each record was partitioned into 35 segments,
25%-overlapping, comprising 2048 measurements. Each segment was detrended and Hanning windowed.
The squared magnitudes of the discrete fast-Fourier transformations were averaged to obtain a smoothed
frequency spectrum, S(f), with a resolution of 0.0098Hz corresponding to a resolution for the peak period
estimation of about ±0.02s (see Figure 7).
The frequency spectrum measured at the resistive wave gauge number 3 in the experiment G3AH is
shown in Figure 7 as an example, while the incident wave parameters measured at the maximum level of the
tidal excursion are reported in table 2, where H1/3 is the average of the one third of the highest wave heights,
and T1/3 is the average of the periods associated to the one third of the highest wave heights; Hmax is the
maximum wave height registered during the experiment. The method of Goda and Suzuki (1976) was used
to conduct the reflection analysis by using the wave gauge couple 3-4 located in front of the model, and it
gave incident Hi and reflected Hr wave components respectively equal to 13 cm and 2.9 cm.
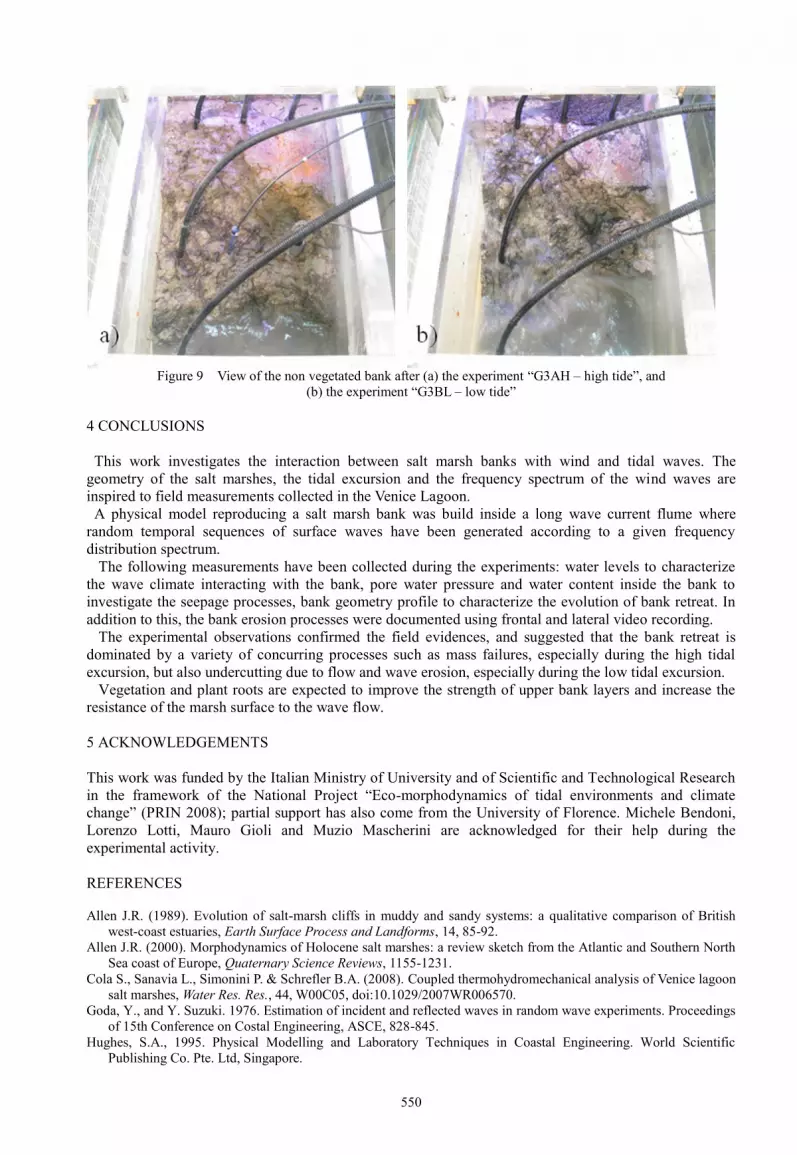
The incident wind waves interacted with the non vegetated bank which became unstable under the shear
stresses and pressure impact due to the wave motion. The tension cracks, that were initially seen during the
tide experiments, became deeper, eventually leading to the block collapse. Furthermore, during these
experiments, additional tension cracks formed. The majority of bank failures happened during the first half
hour of the experiment G3AH. A block type of failure in the upper part of the non vegetated bank during the
experiment G3AH is shown in Figure 8. Visual observations during the experiments highlighted that the
retreat process of the salt marshes is mainly associated with a mass instability mechanism: in the upper part
of the bank, the failing block rotates under the wave action, while at the bottom of the bank the erosion is
gradually proceeding. At the end of the G3AH, the initial vertical profile of the non vegetated bank was
completely eroded, and the bank, shown in Figure 9a, was shaped according to an almost beach equilibrium
profile; this latter configuration appeared to be much more stable than the initial one and the erosion process
advanced more slowly than at the beginning.
The experiment G3BL simulated the low tidal excursion, and it was performed starting from the final
configuration of the previous experiment (G3AH). The final configuration of the experiment G3BL is
shown in Figure 9b: the two configurations are very similar being characterized by sub-vertical upper
portions, and gentle long beach-type profiles in the bottom portion. However, in the latter experiment, the
bank bottom was slowly undermined from the wind waves acting at lower levels. At the end of the
experiment G3BL, the bank was slowly adjusting to the typically cohesive profiles observed in the field,
characterized at the edge by relatively high cliffs, and at the bottom by zones of lower slopes.
549
Figure 7 Frequency spectrum measured at resistive wave gauge 3 at the maximum tidal level in the experiment
“G3AH – high tide”
Table 2 Incident wave parameters measured at the maximum level of the tidal excursion for the experiment G3AH
Wave Gauge Hmo
[cm]
Tp
[s]
H1/3
[cm]
Hmax
[cm]
T1/3
[s]
1 11.77 1.4 11.7 23.49 1.27
2 11.91 1.4 11.8 23.21 1.27
3 13.12 1.4 13.1 28.54 1.32
4 13.55 1.4 13.4 25.78 1.33
5 13.45 1.4 13.2 24.68 1.31
Figure 8 View of a block failure in the upper part of the non vegetated bank
during the experiment “G3AH – high tide”
550
Figure 9 View of the non vegetated bank after (a) the experiment “G3AH – high tide”, and
(b) the experiment “G3BL – low tide”
4 CONCLUSIONS
This work investigates the interaction between salt marsh banks with wind and tidal waves. The
geometry of the salt marshes, the tidal excursion and the frequency spectrum of the wind waves are
inspired to field measurements collected in the Venice Lagoon.
A physical model reproducing a salt marsh bank was build inside a long wave current flume where
random temporal sequences of surface waves have been generated according to a given frequency
distribution spectrum.
The following measurements have been collected during the experiments: water levels to characterize
the wave climate interacting with the bank, pore water pressure and water content inside the bank to
investigate the seepage processes, bank geometry profile to characterize the evolution of bank retreat. In
addition to this, the bank erosion processes were documented using frontal and lateral video recording.
The experimental observations confirmed the field evidences, and suggested that the bank retreat is
dominated by a variety of concurring processes such as mass failures, especially during the high tidal
excursion, but also undercutting due to flow and wave erosion, especially during the low tidal excursion.
Vegetation and plant roots are expected to improve the strength of upper bank layers and increase the
resistance of the marsh surface to the wave flow.
5 ACKNOWLEDGEMENTS
This work was funded by the Italian Ministry of University and of Scientific and Technological Research
in the framework of the National Project “Eco-morphodynamics of tidal environments and climate
change” (PRIN 2008); partial support has also come from the University of Florence. Michele Bendoni,
Lorenzo Lotti, Mauro Gioli and Muzio Mascherini are acknowledged for their help during the
experimental activity.
REFERENCES
Allen J.R. (1989). Evolution of salt-marsh cliffs in muddy and sandy systems: a qualitative comparison of British
west-coast estuaries, Earth Surface Process and Landforms, 14, 85-92.
Allen J.R. (2000). Morphodynamics of Holocene salt marshes: a review sketch from the Atlantic and Southern North
Sea coast of Europe, Quaternary Science Reviews, 1155-1231.
Cola S., Sanavia L., Simonini P. & Schrefler B.A. (2008). Coupled thermohydromechanical analysis of Venice lagoon
salt marshes, Water Res. Res., 44, W00C05, doi:10.1029/2007WR006570.
Goda, Y., and Y. Suzuki. 1976. Estimation of incident and reflected waves in random wave experiments. Proceedings
of 15th Conference on Costal Engineering, ASCE, 828-845.
Hughes, S.A., 1995. Physical Modelling and Laboratory Techniques in Coastal Engineering. World Scientific
Publishing Co. Pte. Ltd, Singapore.
551
Marani, M., Silvestri S., Belluco E., Ursino N., Comerlati A., Tosatto O. & Putti M. (2006), Spatial organization
and ecohydrological interactions in oxygen-limited vegetation ecosystems, Water Resour. Res., 42, W06D06,
doi:10.1029/2005WR004582.
Townend I., Fletcher C., Knappen M. & Rossington K. (2010). A review of salt marsh dynamics, Water and
Environment Journal, doi: 10.1111/j.1747-6593.2010.00243.x
van der Wal D. & Pyea K. (2004). Patterns, rates and possible causes of saltmarsh erosion in the Greater Thames area
(UK), Geomorphology, 61, 373–391 doi:10.1016/j.geomorph.2004.02.005
van Eerdt M. (1985). Salt marsh cliff stability in the Oosterschelde, Earth Surface Process and Landforms, 10,
95-106.


