Embed Size (px)
Citation preview
Experimental evolution of plasmid genomes
Dissertation
zur Erlangung des Doktorgrades
der Mathematisch-Naturwissenschaftlichen Fakultät
der Christian-Albrechts-Universität zu Kiel
vorgelegt von
Judith Ilhan
Kiel, 2019

I
Erste Gutachterin: Prof. Dr. Tal Dagan
Zweiter Gutachter: PD Dr. Charles M.A.P. Franz
Tag der mündlichen Prüfung: 01.02.2019
Zum Druck genehmigt: 01.02.2019
II
Declaration I hereby declare that the thesis entitled “Experimental evolution of plasmid genomes“ has
been carried out in the Institute of General Microbiology at the Christian-Albrechts
University of Kiel, Kiel, Germany, under the guidance of Prof. Dr. Tal Dagan and Prof. Dr.
Itzhak Mizrahi. The work is original and has not been submitted in part or full by me for
any degree at any other University. I further declare that the material obtained from other
sources has been duly acknowledged in the thesis. My work has been produced in
compliance to the principles of good scientific practice in accordance with the guidelines
of the German science foundation. I hereby assure that I have not been revoked any of
my academic degrees.
___________________________ Judith Ilhan
III
Table of contents
1 Abstract 1
2 Introduction 3
2.1 Plasmid invasion and persistence 3
2.2 Plasmid genome evolution 5
2.3 Plasmid copy number and segregational drift 7
2.4 Objectives 9
3 Material and Methods 10
3.1 Bacterial strains and growth conditions 10
3.2 General DNA techniques 10
3.3 Construction of the host strains (wild-type and ∆mutS) 10
3.4 Construction of plasmids pLC and pHC 11
3.5 Quantitative Real-Time PCR 12
3.6 Chemostat characteristics 14
3.7 Experimental evolution 15
3.8 Proportion of plasmid-hosts and plasmid loss frequency 17
3.9 Whole genome sequencing 17
3.10 Variant detection 19 3.11 Statistical methods 21
4 Results 22
4.1 Optimization of chemostat culturing system 22 4.2 Experimental evolution of low- and high-copy plasmids 27
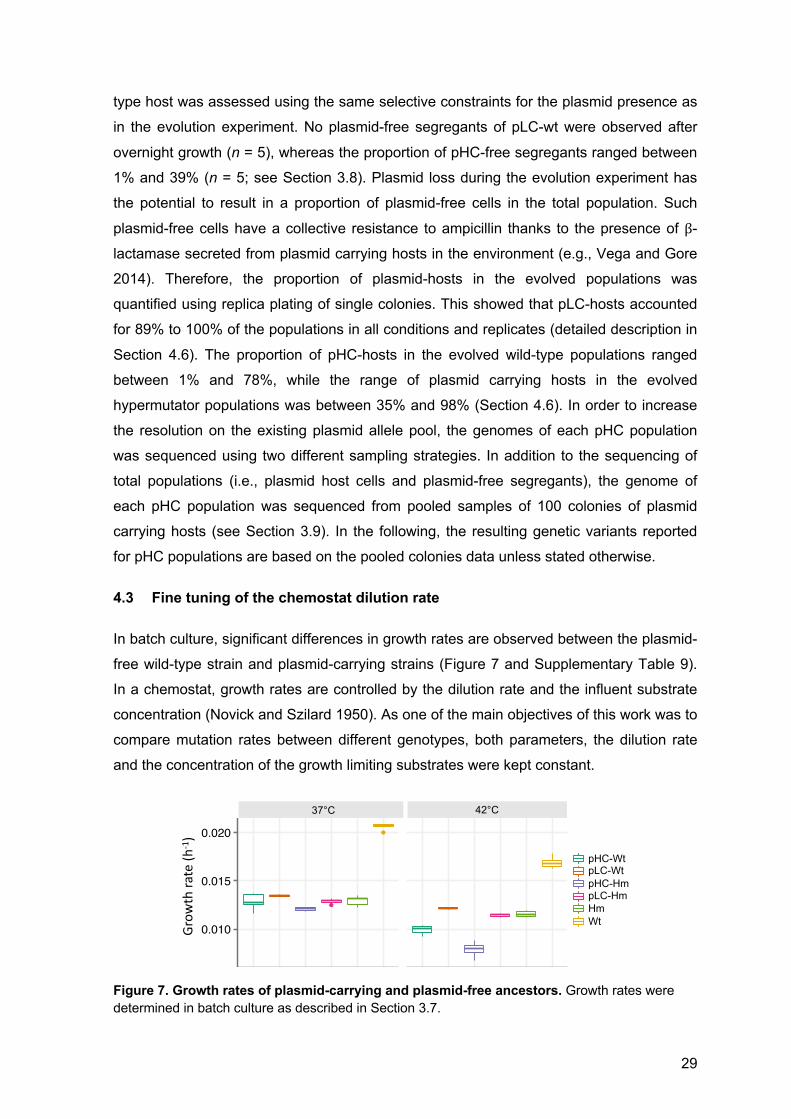
4.3 Fine tuning of the chemostat dilution rate 29
4.4 Population dynamics during experimental evolution 30
4.5 Plasmid copy number dynamics 32
4.6 Proportion of hosts 37
4.7 Plasmid genome evolution 41
4.8 Host chromosome evolution 51
5 Discussion 58
5.1 Evolution of the host chromosome vs. evolution of the plasmid 58
IV
5.2 Impact of population size and consideration of the experimental system 59
5.3 Segregational drift 61
6 Appendices 64
6.1 Simulations 64
6.1.1 Plasmid population dynamics. 64 6.1.2 Methodology 70
6.2 Supplementary Figures 72
6.3 Supplementary Tables 77
6.4 CD 97
7 References 98
8 Acknowledgements 107
1
1 Abstract The ubiquity of plasmids in all prokaryotic phyla and habitats and their ability to transfer
between cells marks them as prominent constituents of prokaryotic genomes. Many
plasmids are found in their host cell in multiple copies. The multi-copy state of plasmids
leads to an increased mutational supply of plasmid-encoded genes and genetically
heterogeneous plasmid genomes. Nonetheless, the segregation of plasmid copies into
daughter cells during cell division is considered to occur in the absence of selection on the
plasmid alleles. Consequently, I hypothesize that genetic drift of plasmid alleles during cell
division has implication for the evolutionary rates of plasmids by lowering the number of
accumulating mutations that are expected from the mutational supply. To test this
hypothesis, I performed an experimental evolution experiment of low- and high-copy non-
mobile plasmids in an Escherichia coli host. The results of the experiment revealed that
the evolutionary rate of multicopy plasmids does not reflect the increased mutational
supply expected according to their copy number. The results further suggest that many
plasmid mutations are quickly lost due to genetic drift during cell division. Here I term this
special type of allele dynamics in the population as ‘segregational drift’. Thus,
segregational drift of multicopy plasmids interferes with the retention and fixation of novel
plasmid variants. Furthermore, an examination of the experimentally evolved hosts
reveals a significant impact of the plasmid type on the host chromosome evolution. In
conclusion, depending on the selection pressure on newly emerging variants, plasmid
genomes may evolve slower than haploid chromosomes, regardless of their higher
mutational supply. Plasmid copy number is thus an important determinant of plasmid
evolvability due to the manifestation of segregational drift.
2
Zusammenfassung
Das ubiquitäre Vorkommen von Plasmiden in allen prokaryotischen Phyla und
Lebensräumen sowie ihre Fähigkeit, zwischen Zellen transferiert zu werden,
kennzeichnen sie als bedeutende Bestandteile prokaryotischer Genome. Viele Plasmide
liegen in ihrer Wirtszelle in mehreren Kopien vor. Der multiple Kopien-Zustand von
Plasmiden führt zu einem erhöhten Mutationsangebot von Plasmid-kodierten Genen und
zu genetisch heterogenen Plasmidgenomen. Es wird jedoch angenommen, dass die
Segregation von Plasmidkopien in Tochterzellen während der Zellteilung in Abwesenheit
von Selektion auf Plasmid-Allele verläuft. Daher stelle ich die Hypothese auf, dass der
genetische Drift von Plasmid-Allelen während der Zellteilung Auswirkungen auf die
Evolutionsraten von Plasmiden hat, indem die Anzahl der kumulierenden Mutationen, die
aufgrund des Mutationsangebots zu erwarten wären, verringert wird. Um diese Hypothese
zu testen, führte ich ein Evolutionsexperiment mit nicht-mobilen Plasmiden mit niedriger
und hoher Kopienzahl in Escherichia coli durch. Die Ergebnisse des Experiments zeigen,
dass die Evolutionsrate von Plasmiden mit multiplen Kopien nicht das erhöhte
Mutationsangebot widerspiegelt, das gemäß ihrer Kopienzahl zu erwarten wäre. Die
Ergebnisse legen ferner nahe, dass viele Plasmidmutationen aufgrund des genetischen
Drifts während der Zellteilung schnell verloren gehen. Hier bezeichne ich diese besondere
Allel-Dynamik in der Population als "Segregationsdrift". Dementsprechend beeinträchtigt
der Segregationsdrift die Retention und Fixierung neuer Plasmidvarianten von
Mehrfachkopien-Plasmiden. Darüber hinaus zeigt eine Untersuchung der experimentell
entwickelten Wirte einen signifikanten Einfluss des Plasmid-Typs auf die Entwicklung des
Wirts-Chromosoms. Zusammenfassend kann gesagt werden, dass, je nach
Selektionsdruck auf neu aufkommende Varianten, Plasmidgenome ungeachtet ihrer
höheren Mutationszufuhr langsamer als haploide Chromosomen evolvieren können. Die
Plasmid-Kopienzahl ist aufgrund der Manifestation des Segregationsdrifts eine wichtige
Determinante der Evolvierbarkeit von Plasmiden.
3
2 Introduction
Plasmids are genetic elements that colonize prokaryotic cells where they replicate
independently of the chromosome. Plasmids are considered as a major driving force in
prokaryotic ecology and evolution as they can be transferred between cells, making them
potent agents of lateral gene transfer (Lederberg 1946, Thomas and Nielsen 2005) and
microbial warfare (Czárán et al. 2002, Majeed et al. 2010). Plasmids may contribute to the
evolution of their host via the acquisition of genes encoding for new functions that are
beneficial under specific growth limiting conditions (e.g., antibiotics resistance (Porse et al.
2016) or resistance to heavy metals (Gullberg et al. 2014, Dziewit et al. 2015)), or during
adaptation to new habitats (e.g., catabolic functions (Schmidt et al. 2011)). Nonetheless,
the importance of plasmids goes beyond microbial evolution as they are widely used as
vectors for genetic engineering (Simon et al. 1983, Bevan 1984) as well as for
applications in biotechnology (Ullrich et al. 1977) and synthetic biology (Shetty et al.
2008). Therefore, understanding plasmid biology and evolution is of major interest for
basic microbiology research and biological applications.
2.1 Plasmid invasion and persistence
Mechanisms of plasmid invasion into a host cell are either active or passive. Conjugation,
for example, is an active invasion mechanism since conjugative plasmids encode the
proteins involved in the plasmid transfer. Plasmids that just encode the transfer core
components, require for their conjugal transfer the presence of a co-residing plasmid
encoding the conjugation machinery in the same host cell (reviewed in Shintani et al.
2015). In contrast, self-transmissible plasmids encode both the transfer and conjugative
machinery components and can therefore invade a broad range of hosts (e.g., Klümper et
al. 2015, Hall et al. 2016).
Non-mobile plasmids can invade hosts via natural transformation and thus, such
plasmids can invade niches that are rich in exogenous plasmid-DNA, such as aquatic
environments (Xue et al. 2015), biofilms (Williams et al. 1996) and soil microcosms
(Lorenz et al. 1991). Plasmid invasion via transformation has been considered to be a rare
event. However, recent studies revealed the presence of competence in Acinetobacter
baumannii (Ramirez et al. 2010, Wilharm et al. 2013) and in addition an uncommon
4
regulation of competence in Staphylococcus aureus (Morikawa et al. 2012, Fagerlund et
al. 2014). Such hitherto unknown mechanisms that are characteristic of natural
competence, offer an explanation for the presence and variety of non-self conjugative
plasmids in these organisms.
Phage-mediated plasmid invasion can occur via generalized transduction (e.g.,
Hertwig et al. 1999). Similarly, experimental evidence suggests that gene transfer agents
(GTAs) can potentially mediate plasmid invasion (Scolnik and Haselkorn 1984). In
addition, outer membrane vesicles (OMVs) can also serve as conductors of plasmids
entry into a new host as has been shown for both Gram-negative and Gram-positive
bacteria (Klieve et al. 2005, Fulsundar et al. 2014). Notably, OMVs have been shown to
mediate inter-specific plasmid transfer, e.g., between A. baylyi and Escherichia coli
(Fulsundar et al. 2014). Non-conjugal plasmids can be transferred via nanotubes, e.g.,
between Bacillus subtilis strains, yet the frequency of transfer is about 3 orders of
magnitude lower in comparison to plasmid transfer via conjugation (Dubey and Ben-
Yehuda 2011).
The entry of plasmids into a naïve host cell may be hindered at different levels. For
example, the conjugative transfer of plasmids can be blocked by exclusion systems that
maintain plasmid exclusivity within the host (e.g., Sakuma et al. 2013). In addition,
defense mechanisms against foreign DNA such as restriction modification systems (Roer
et al. 2014), CRISPR-Cas (Marraffini and Sontheimer 2008), or the recently described
Wadjet system (Doron et al. 2018) can act on the plasmid upon entry. Another important
factor restricting plasmid establishment is plasmid incompatibility. The presence of
plasmids that encode related partitioning systems in the same host cell can lead to
interference during plasmid partition and the consequent loss of one (or both) of the
plasmids (Hyland et al. 2014).
Plasmid long-term persistence is determined by a combination of several factors,
including plasmid mobility dynamics, the presence of host-beneficial genes, plasmid
stability mechanisms, and the level of co-adaptation between the plasmid and the host.
The persistence of plasmids carrying selective traits (i.e., beneficial) strongly depends on
the environmental conditions and might thus be transient. Examples are plasmids that
carry resistance genes that enable bacteria to grow under selective conditions of
antibiotics or heavy metals (e.g., Harrison et al. 2015). In contrast, plasmids that are
beneficial for the maintenance of the host lifestyle are expected to be highly persistent
over longer time-scales. An example for such a ‘lifestyle plasmid’ is observed the
Burkholderia cepacia complex whose members depend on plasmid-encoded virulence
factors for their pathogenic interaction with the host (Agnoli et al. 2011). Another example
for a ‘lifestyle plasmid’ is the plasmid-encoded rhamnose operon in Roseobacter that has
5
been shown to be essential for the host life cycle and its ecological success. The
rhamnose operon is essential for biofilm formation and the absence of the plasmid entails
a loss of the ability to switch between motile and sessile forms (Michael et al. 2016).
Notably, plasmid persistence can also occur independently of a plasmid-encoded
beneficial function. Plasmids that persist in the absence of a beneficial function typically
encode a “survival kit” that includes, in addition to mechanisms for stable replication, an
active partitioning mechanism, and a multimer resolution system that ensures reliable
inheritance of plasmids to daughter cells over generations (reviewed in Baxter and Funnell
2014). Persistent plasmids may also encode specific survival mechanisms, for example
addiction systems, that function in post-segregational killing of plasmid-free cells, thus
leading to an only-hosts population. Examples are restriction modification or toxin-
antitoxin (TA) systems that are often observed in plasmid genomes. For example, all four
plasmids in Synechocystis sp. PCC 6803 harbor at least three putative TA systems and
one plasmid encodes even ten different TA cassettes (Kopfmann et al. 2016).
An important aspect of plasmid persistence is the effect of plasmid maintenance
on the host fitness. When an invading plasmid imposes a metabolic burden on the host
(i.e., it has a negative effect on the host fitness), non-hosts are expected to take over the
population and the plasmid will go extinct. Accordingly, increasing evidence implies that a
mechanism for long-term plasmid persistence in naïve bacterial hosts is the reduction of
plasmid-associated fitness costs through coevolution (Loftie-Eaton et al. 2016, Porse et al.
2016, Harrison et al. 2015, Yano et al. 2016, San Millan et al. 2014). Plasmid-host
coevolution is most likely to occur under positive selection for the plasmid maintenance
and it may occur via adaptation of the plasmid backbone to the host replication machinery
(Yano et al. 2016, Sota et al. 2010). Additionally, adaptive mutations to the plasmid
maintenance may occur in the host chromosome, as was shown in an experimental
evolution study of a mercury-resistance megaplasmid in Pseudomonas fluorescens. In
that experiment, after 450 generations under selective conditions, a mutation at the
chromosome-encoded GacS/GacA two-component regulatory system led to an overall
down-regulation of translation, which improved host fitness and prevented the plasmid
from going extinct (Harrison et al. 2015).
2.2 Plasmid genome evolution
Experimental evolution studies of plasmid-host coevolution opened up opportunities to
follow plasmid adaptation and genome evolution in real time. Evolution of the plasmid
genome can occur at two levels of magnitude: single-nucleotide mutations or large-scale
structural changes (e.g., insertions, deletions, inversions and translocations). On a global

6
scale, single nucleotide substitutions drive the sequence amelioration of plasmids found in
long-term associations with defined host ranges towards the genomic signatures of their
hosts (Suzuki et al. 2010). Nucleotide substitutions in the plasmid backbone genes can
potentially affect the plasmid replication dynamics and adaptation to the host. Studies of
plasmid evolution within naïve hosts under strong selective conditions (e.g., for antibiotics
resistance) showed that SNPs in the plasmid backbone can arise rapidly and may lead to
the adaptation of a new host range (Fernández-Tresguerres et al. 1995, Maestro et al.
2003, Sota et al. 2010). In addition, the evolution of accessory genes that are encoded on
multicopy plasmids (i.e. copy number larger than one) may correspond to gene
amplification in prokaryotes (i.e., the presence of multiple paralogs on the chromosome).
In other words, the multiple copies of the plasmid-encoded gene are expected to increase
the mutation supply rate and enable rapid evolution of the gene. Indeed, a recent
experimental evolution study selecting for increased resistance to Ceftazidime
demonstrated that adaptive SNPs in blaTEM1 encoded on a plasmid with up to 19 copies
per cell could emerge within a very short time – only 42 generations of serial transfer (San
Millan et al. 2016).
Evolution of large-scale structural variants in plasmids is often observed in the
neighborhood of transposons and IS-elements. This suggests that such elements play a
prominent role in plasmid genome evolution. Transposition-mediated acquisition of new
genes (i.e., insertion) has the potential to have a significant impact on the plasmid fate, for
example, via the acquisition of a plasmid addiction system (Loftie-Eaton et al 2016).
Additionally, the presence of IS-elements can lead to large-scale deletions via
homologous recombination. An example is a large-scale deletion observed in an
experimental evolution study of plasmid adaptation in E. coli where an IS-element
mediated a large-scale deletion that led to a loss of the Type IV secretion system (T4SS)
comprising the conjugation machinery (Porse et al. 2016). This deletion rendered the
plasmid non-conjugative and consequently it had implications for the maintenance costs
of the plasmid and the plasmid host range. The transposition of IS elements between
plasmids can furthermore lead to the evolution of plasmid fusions (He et al. 2015).
Gene translocation from the plasmid to the chromosome constitutes an instance of
lateral gene transfer and may have implications for the plasmid fate. Thus, the
translocation of a beneficial gene from the plasmid to the chromosome may lead to
plasmid loss (Stoesser et al. 2016, Harrison et al. 2015). For example, a Tn5042
transposase-mediated translocation of a 10-genes mercury resistance operon (mer) has
been observed in P. fluorescence. The mer translocation led to subsequent loss of the
plasmid, yet, most of the population retained the plasmid and the chromosomal mer
variant rarely reached a high frequency in the population (Harrison et al. 2015). The
7
results of this experiment suggest that the mer translocation was not necessarily
beneficial for the host.
Recombination, including homologous recombination (Norberg et al. 2011), among
plasmids and other mobile elements appears to be frequent during plasmid evolution,
especially between IS-elements and transposons (He et al. 2015, Szabó et al. 2016). The
observation of prophages included in plasmid genomes indicates that lysogenic phages
can mediate large insertions into plasmids. Thus, transduction constitutes another
mechanism for the gain of accessory genes in plasmids. For example, a comparative
genomics study of megaplasmids in the Bacillus cereus group observed that these
plasmids must have resulted from multiple fusion events of smaller plasmids (Zheng et al.
2013), with 29 of 31 megaplasmids containing two or more conserved replicon regions.
Thus, plasmid fusions appear to be a frequent phenomenon and may underlie the
evolution of plasmids that display modular characteristics through reshuffling of structural
modules in the plasmid genome (Zaleski et al. 2015). Notably, the presence of multiple
replicons in a plasmid may prevent plasmid incompatibility (Chen et al. 2014) and facilitate
interaction with a broad range of hosts (Villa et al. 2010).
2.3 Plasmid copy number and segregational drift
Plasmids differ from the chromosomal genetic component in several key aspects,
including a relatively small genome size and a variable ploidy level. Plasmids are often
found in multiple copies in the cell where the plasmid copy number (PCN) depends on the
replicon type, the host genetics, and the environmental conditions (Nordström 2006,
Santos-Lopez et al. 2016). The copy number of natural plasmids ranges between 1-15 for
low-copy plasmids (Bazaral and Helinski 1968) and can reach 200 copies for high-copy
plasmids (Projan et al. 1987). Plasmids used for biotechnological applications are often
modified to have a higher copy number, e.g., 500-700 (Vieira and Messing 1982, Rosano
and Ceccarelli 2014), in order to maximize the protein expression level of focal genes.
Notably, genes encoded on multicopy plasmids residing within a single host cell may
comprise multiple alleles due to independent emergence of mutations in the plasmid
copies (Bedhomme et al. 2017, Rodriguez-Beltran et al. 2018). An increased plasmid
copy number has the potential to elevate the probability for the emergence of novel
mutations in the gene open reading frame. Consequently, the mutational supply of
plasmid-encoded genes is increased for multicopy plasmids. Indeed, it has been
previously shown that multicopy plasmids have the potential to enable rapid evolution of
plasmid-encoded antibiotic resistance genes under strong selective conditions for the
antibiotic resistance (San Millan et al. 2016).
8
The inheritance of multicopy plasmids to daughter cells depends on their
segregation mechanism. Some plasmids are equipped with an active partition system.
Such systems comprise plasmid-encoded proteins that function in the translocation of
plasmid copies toward the cell poles prior to cell division, thereby ensuring stable
inheritance (e.g., parABS system (Abeles et al. 1985, Baxter and Funnell 2014)). In the
absence of a partition system, plasmid segregation into daughter cells depends on the
physical distribution of plasmid copies in the cell during cell division (Wang 2017).
Notably, plasmid segregation into daughter cells in both routes is considered to occur in
the absence of selection on the plasmid allele pool. Consequently, the dynamics of
multicopy plasmid alleles in the population has a constant component of random genetic
drift. In other words, the distribution of plasmid alleles into daughter cells is independent of
the allele impact on the host fitness, also under selective conditions for a plasmid-
encoded trait. Here, this phenomenon is termed segregational drift. Previous studies
suggested that segregational drift plays a role in the evolution of eukaryotic organelles –
mitochondria and plastids (Birky 2001). Similar to multicopy plasmids, the mitochondrion
organelle is found in multiple copies in the cell (e.g., ~1,700 in mammalian cells (Robin
and Wong 1988)), and in addition, each mitochondrion organelle may harbor multiple
copies of the mitochondrial genome (e.g., up to 10 copies (Satoh and Kuroiwa 1991)).
Thus, the mutational supply on the mitochondrial genome is larger than the mitochondrial
genome size by several orders of magnitude. The combination of high mutational supply
on the mitochondrion genome and random segregation of the mitochondria during cell
division lead to genetic heterogeneity of the mitochondrial genomes within a single cell
(termed ‘mitochondrion heteroplasmy’ (Birky 2001)). Notably, many of the mitochondrial
alleles are found in very low frequency, thus the mitochondrial genetic heterogeneity is
observed only with the application of deep-sequencing approaches (e.g., He et al. 2010).
The consequences of segregational drift to the evolution of multicopy plasmids have been
so far overlooked.

9
2.4 Objectives
Here we hypothesize that segregational drift has implication for the evolutionary rates of
plasmids by lowering the number of accumulating mutations that are expected from the
mutational supply. Population genetics theory postulates that the effect of random genetic
drift on allele dynamics is inversely correlated with the effective population size. In a larger
population, the impact of genetic drift on the dynamics of allele frequency is reduced (see
Lanfear et al. 2013 for review). Thus, the implications of segregational drift to plasmid
genome evolution are expected to be dependent on the plasmid population size within the
cell, i.e., the plasmid copy number. To test this hypothesis we compare the evolutionary
rates of two model plasmids: a low-copy plasmid having ca. 10 copies per cell and a high-
copy plasmid having ca. 100 copies per cell. The mutational supply of the high-copy
plasmid is thus considered to be ca. 10-fold in comparison to the low-copy plasmid. In the
absence of segregational drift, the high copy plasmid is expected to accumulate much
more mutations in comparison to the low-copy plasmids. In contrast, if segregational drift
has an impact on plasmid genome evolution we would expect that the number of
accumulating mutations on the high-copy plasmid would be equal, or smaller, in
comparison to the low-copy plasmid.

10
3 Material and Methods 3.1 Bacterial strains and growth conditions
Escherichia coli K-12 substr. MG1655 (DSM no. 18039, DSMZ) and a mismatch-repair
deficient E. coli MG1655 derivative strain (∆mutS) were used in the evolution experiment.
Escherichia coli DH5α (Hanahan 1983) was used during construction of plasmids. All
strains were routinely grown at 37°C in LB medium with aeration. When required, growth
medium was supplemented with 100 µg ml-1 ampicillin, 15 µg ml-1 kanamycin or 3 µg ml-1
tetracycline. The evolution experiment was performed in M9 medium (M9/amp100)
prepared as described (Sambrook and Russell 2012), supplemented with 0.4% (w/v)
glucose, 0.1% (w/v) casamino acids, 20 mg L-1 uracil, 0.5 mg L-1 thiamine, 0.005% (v/v)
Antifoam 204 (Sigma-Aldrich), and 100 mg L-1 ampicillin.
3.2 General DNA techniques
Phusion polymerase (Thermo Fisher Scientific) was used for amplification of DNA-
fragments for cloning. DNA fragments obtained from restriction analysis were purified
using the Wizard SV Gel and PCR Clean-Up System (Promega). PCR products that were
judged as specific by gel-analysis, were used for ligations directly from PCR reaction
mixtures. Plasmids were isolated using the GeneJET Plasmid Miniprep Kit (Thermo Fisher
Scientific). Plasmid constructs were verified by restriction analysis and confirmed by
sequencing. To this end, DNA fragments obtained from restriction analysis or PCR were
ligated with pJET1.2/blunt cloning vector using CloneJET PCR Cloning Kit (Thermo Fisher
Scientific) and delivered into chemo-competent E. coli DH5α cells. Inserts were
sequenced using the pJET1.2 sequencing primer pair (CloneJET PCR Cloning Kit;
Thermo Fisher Scientific). Linear DNA fragments and plasmids were introduced into E.
coli MG1655 by electroporation using a Bio-Rad Gene Pulser device and parameters
reported previously (Dower et al. 1988). PCR-primers are listed in Supplementary Table 2.
3.3 Construction of the host strains (wild-type and ∆mutS)
A marker-free E. coli MG1655 ∆mutS deletion strain was constructed using the l Red/ET
Quick & Easy E. coli Gene Deletion Kit (GeneBridges). Briefly, the mutS gene was
replaced with a PCR generated DNA fragment (primer pair mutS_KO_F/R) containing a
11
kanamycin resistance marker gene flanked by FRT sites. The replacement of mutS with
the marker-containing cassette was verified by PCR (primer pair PGK_F/mutS_test_R).
One kanamycin resistant clone was chosen for the removal of the kanamycin resistance
marker through expression of the site specific FLP recombinase carried on plasmid 707-
FLPe (GeneBridges). One resulting kanamycin-sensitive clone that had lost 707-FLPe
was chosen and the deletion of the marker-containing cassette was verified by PCR using
primer pair mutS_test_F/R.
In order to potentially compare mutations occurring within non-coding segments of
DNA, both plasmids and host strains were equipped with segments of randomly
composed, non-coding DNA. A 600 bp-stretch of non-coding DNA (art3) was
commercially synthesized (GeneArt Strings Service, Thermo Fisher Scientific) and
inserted into the Tn7-specific attTn7 site of the wild-type and ∆mutS strain following the
method described previously (McKenzie and Craig 2006). Briefly, the art3 DNA-fragment
was amplified by using primers art3_F and art3_R and cloned into the NotI restriction site
present in the mini-Tn7-transposon carried on the transposition vector pGRG25 (GenBank
acc. no. DQ460223). The resulting plasmid was delivered into E. coli wild-type and the
∆mutS strain and a clone carrying the chromosomal attTn7::miniTn7(art3) insertion was
verified by PCR targeting the Tn7-insertion site using the primer pair attTn7_F/R.
3.4 Construction of plasmids pLC and pHC
Plasmid pBBR1MCS-5 (GenBank acc. no. U25061) was used to construct plasmid pLC.
The gentamicin resistance cassette was replaced by an ampicillin resistance marker (bla).
Therefore, a 1,944-bp fragment of plasmid pBBR1MCS-5 comprising the gentamicin
resistance gene and the lacZa gene fragment was excised with BstBI and BsaI. The
resulting plasmid backbone fragment (2,824 bp) comprised the origin of replication, the
rep gene and a fragment of the mob gene. This backbone fragment was blunted and
ligated to a blunted KpnI-SacI fragment containing bla with its promoter, giving plasmid
pBBR1-bla. The bla resistance cassette was obtained from pBluescript SK(+) into which
the bla fragment had been inserted into the EcoRV site as a blunted ClaI-NotI fragment
from plasmid pKD4 (GenBank acc. no. AY048743). Next, 600 bp long stretches of random
DNA (designated as art1 and art2) were inserted into the EcoRI site (art1) and into the
XhoI site (art2) of pBBR1-bla, giving plasmid pLC (GenBank acc. no. MH238456).
The high copy plasmid pHC (GenBank acc. no. MH238457) was constructed as
plasmid pLC, but the oriV and the repA gene were then replaced by a pUC origin of
replication. This was achieved by amplifying the plasmid except for the region comprising
the oriV and the repA gene (using primer pair inv_pLC_F/R). The resulting fragment
12
(2,735 bp) was treated with T4-Polynucleotide Kinase (New England Biolabs) and ligated
to a PCR fragment (916 bp) comprising the pUC-origin of replication amplified from
plasmid pCR4-TOPO (Thermo Fisher Scientific) with primer pair pUC-ori_F/R.
3.5 Quantitative Real-Time PCR
Quantitative Real-Time PCR (qPCR) was used to determine plasmid copy numbers
(PCN), to test for cross-contamination between culturing vessels in the evolution
experiment and to determine transcript levels. Reactions were carried out in a total
volume of 10 µl containing 1x iTaq Universal SYBR Green Supermix (Bio-Rad
Laboratories), 100 nM of each primer (final concentration) and 1 µl sample. All qPCR
reactions including positive and non-template controls were performed in technical
replicates on a CFX Connect Real-Time PCR Detection System (Bio-Rad Laboratories)
using the following cycling conditions for all reactions: 95°C for 3 min, 40 cycles of 10 s at
95°C and 1 min at 59°C. For melt curve analysis, a dissociation step was added at the
end by stepwise increase of temperature ranging from 55°C to 95°C and monitoring
changes in fluorescent signal every 0.5°C. Primers for qPCR were designed using
SnapGene software v.2.4 (GLS Biotech) and specificity and efficiency were tested using
qPCR-generated standard curves and melt-curve analysis of qPCR products. Primer
efficiency was calculated using the slope of a standard curve (R2 > 0.99) generated from a
10-fold series dilution of purified DNA (i.e., plasmid or chromosomal DNA) or using DNA
from whole cell extracts (see description below). Amplification efficiencies were greater
than 1.93 for each primer pair used in this study. Melt curve analysis of each reaction
indicated that the primer pairs were specific. In addition, qPCR amplicons were Sanger
sequenced. The amplicons shared a 100% nucleotide sequence identity with the
corresponding plasmid or chromosomal sequences. Cycle threshold (Ct) values were
determined after adjusting the fluorescence signal threshold using CFX Maestro software
(Bio-Rad Laboratories). Ct values varied ≤ 2% between technical replicates. All
quantifications were made using mean Ct values of technical replicates and considering
different amplification efficiencies of primer pairs. As control DNA, chromosomal DNA
extracted from E. coli MG1655 and plasmid DNA (i.e., pLC and pHC) were used.
Plasmid copy numbers were determined as described by (Skulj et al. 2008), but
with primers complementary to the idnT gene in the E. coli MG1655 background
(q_idnT_F/R) and complementary to the bla gene (q_bla_F/R) on plasmid pLC and pHC.
PCN is defined as the number of plasmids per chromosome. Thus, PCN is calculated as
the ratio of the number of plasmid specific amplicons and the number of chromosome
specific amplicons. To keep the quantity and quality of nucleic acids unchanged until

13
qPCR, PCN was determined from whole cell lysates without DNA purification (Skulj et al.
2008). Therefore, aliquots of overnight cultures or chemostat cultures were collected,
heated at 98°C for 10 min to disrupt cells, followed by immediate freezing at -20°C for at
least 20 min. After thawing, the samples were serially diluted 10-fold and qPCR reactions
were carried out using at least two different dilutions of a sample. Samples were always
kept on ice while processing. For the determination of single colony PCNs, colonies were
picked, streaked on M9 and M9/amp100 backup plates and diluted in 20 µl ddH20 and cells
were processed as described above. Unless otherwise stated, PCNs were determined as
the mean PCN of two sample dilutions and considering primer efficiencies.
Transcript levels of the chromosomal stress-response gene groEL and the
chromosomal reference gene idnT (Zhou et al. 2011) were assessed from chemostat
cultures using qPCR. The consistency of transcript levels between replicative cultures was
used in addition to optical density measurements at 600nm (OD600) and cell counts as an
indicator for the reproducibility of steady state growth. Total RNA was isolated from
chemostat cell cultures using a hot SDS/hot phenol method. To this end, cells of 500 µl
steady-state chemostat cultures were instantly lysed by adding 250 µl of SDS solution
(2% SDS, 16 mM EDTA) preheated to 100°C. After 5 min incubation at 100°C RNA was
isolated by two extractions with one volume acid phenol/chloroform solution (Thermo
Fisher Scientific) preheated to 65°C and one extraction with one volume of
chlorophorm:isoamyl alcohol (24:1). The RNA was isopropanol-precipitated, washed with
ice-cold 70% ethanol, dried and dissolved in Diethyl pyrocarbonate-treated water. Quality
and quantity of RNA was assessed using gel electrophoresis and and micro-
spectrophotometry (Nano Drop Technologies). To remove any genomic DNA
contamination, RNA was treated with RNase-free Ambion DNase I (Thermo Fisher
Scientific). Removal of DNA was confirmed by performing qPCR on 50 ng of RNA using
the idnT primer set. RNA samples found to yield Ct-values larger than 32 were judged to
be sufficiently free of DNA. First-strand cDNA synthesis of 500 ng total RNA was
performed using iScript cDNA synthesis kit (Bio-Rad Laboratories).
In addition to PCR, qPCR was used to test for cross-contamination between
chemostat cultures of different genotypes. Therefore, combinations of plasmid specific
primers and host genotype specific primers were used. Each sample was tested for the
presence of the mutS gene and for the presence of both plasmids using the following
primer pairs: q_pBB_rep_F/R complementary to the rep gene of plasmid pLC,
q_pUC_ori_F/R complementary to the ori of plasmid pHC, and primer pair q_mutS_F/R
complementary to the mutS gene in the E. coli MG1655 background.
14
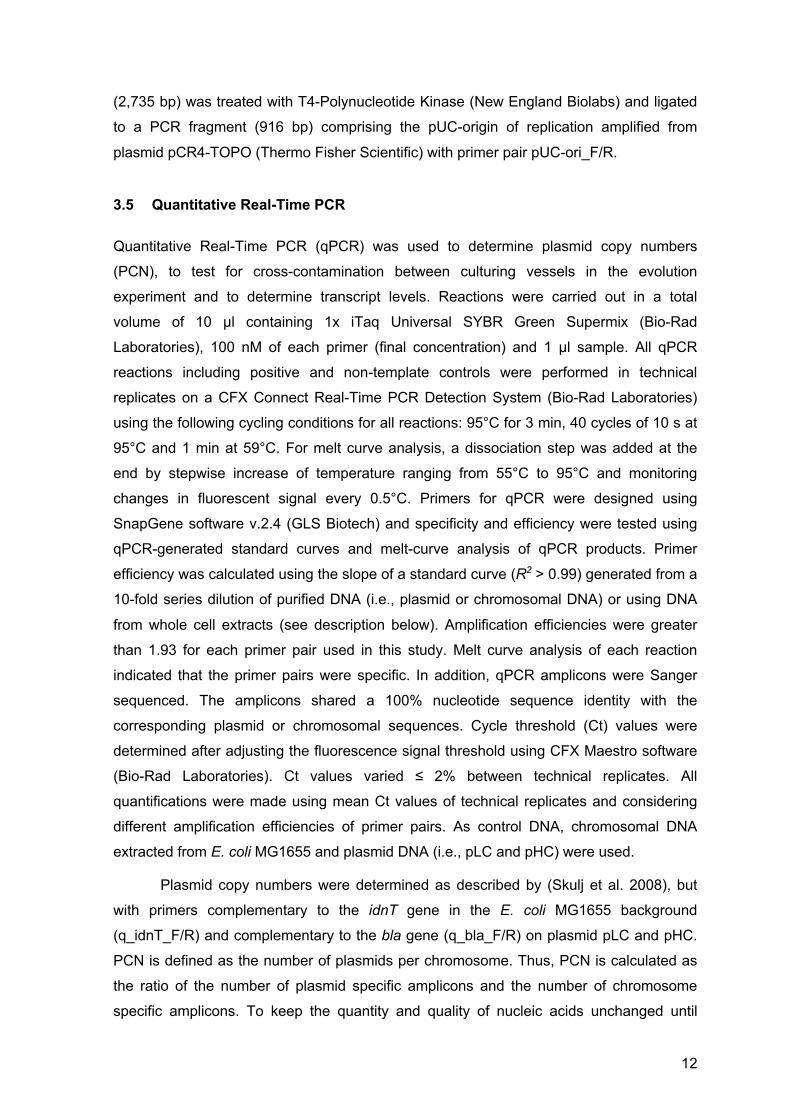
3.6 Chemostat characteristics
Chemostats were assembled from off-the-shelf materials similar in design previously
suggested for the cultivation of yeast (Miller et al. 2013). The entire chemostat culturing
system consists of four different modules; the culture vessels, the media supply, the air
supply and the efflux part. Modifications to the suggested chemostat design were
introduced to enable long-term cultivation of bacteria. An air break was placed between
the culture vessels and the medium supply tubing to prevent bacterial growth into the
medium supply module (Figure 1). An air break is composed of an autoclavable syringe
(20 ml), a plug with a needle for the tubing and a syringe filter (PES, 0.2 µm) as an
additional barrier.
Figure 1. A side view of the chemostat system as it was used in the evolution experiment. Additional details on the establishment are shown in Figure 3. Briefly, the system is composed of 1) Media carboy, 2) Peristaltic pump, 3) Air supply, 4) Culturing units and 5) Water bath. A culturing unit includes 6) Media inflow channel, 7) Air break, 8) Culturing vessel including an air supply channel (blue) and two culture effluent channels (red). Effluent reservoirs are shown in Supplementary Figure 4.
The culture vessels were equipped with a second effluent needle to ensure constant
efflux in case of clogging due to biofilm-formation. Furthermore, a gas washing bottle
(ddH20 supplemented with a biocide agent) was used instead of gas filters at the outlet of
the effluent reservoirs, because of frequent clogging of the filters (i.e., wetting). Similarly, a
gas washing bottle meant for air hydration within the air supply module was not included,
because of frequent malfunction of downstream gas filters (i.e. wetting of filters).
Additionally, no impact of evaporation on the culture was was observed at the dilution rate
used in this study. Effluent tubings were kept as short as possible to reduce flow
1
2
3
5
4
6
8
7

15
resistance and thus ensure stable efflux flow. Ultra-smooth Tygon tubing that reduces the
risk of particle entrapment was used to prevent biofilm formation at the inner surface of
the hoses. A complete list of all material is given in Supplementary Table 3. Samples for
measurement of OD, PCN and cell counts were collected from the effluent of the
chemostat populations. These samples were equivalent to samples taken directly from the
culture vessels (see Section 4.1). Each chemostat was operated at a dilution rate D of
0.27 h-1 corresponding to a flow rate of 90 µl min-1 and a turnover time of 3.7 h. The
uniformity of flow rates provided by the two multiplexed peristaltic tubing pumps was
assessed by measuring the volume of M9 medium pumped through all 24 channels of
each pump. This test was conducted after calibration of the pumps according to
manufacturer instructions. In addition, the uniformity of flow rates was tested each time
the tubing was replaced (every 2-3 weeks). There were no significant differences in the
media pumped through between the 24 channels of pump 1 and between the 24 channels
of pump 2 in any of the tests conducted throughout the course of the experiment.
Furthermore, there were no significant differences in volume pumped through between the
two peristaltic pumps.
3.7 Experimental evolution
To study the combined effects of mutation supply (i.e., mutation rate of the host), plasmid
copy number and growth condition (i.e., temperature), the evolution experiment was
conducted using a full factorial 2×2×2 design (Table 1). Therefore, plasmid pLC and pHC,
respectively, were transferred into the wild-type and the ∆mutS strain, giving for each host
genotype two plasmid-carrying subtypes (i.e., wt-pLC, wt-pHC, ∆mutS-pLC, and ∆mutS-
pHC). Six biological replicates of each of these subtypes were then evolved at 37°C and
42°C (Table 1).
Table 1. Experimental design. Factors, levels and number of biological replicates used in the evolution experiment.
Factor Levels Host genotype Wild-type Hypermutator
Plasmid type pLC pHC pLC pHC
Temperature 37°C 6 6 6 6 42°C 6 6 6 6
16
Prior to the experiment, a single colony of each subtype was used to found a
population that was serially passaged (1:1000) daily for about 100 generations in 5 ml
M9/amp100 media at 37°C to acclimate the populations to the media conditions. At the
onset of the evolution experiment, 50 µl overnight culture of each population was used to
inoculate six replicate chemostat cultures with a working volume of 20 ml. The 48
chemostat cultures were grown to stationary densities overnight (i.e., without addition of
media) at 37°C or 42°C and then continuously incubated at a dilution rate of 0.27 h-1.
Samples were collected as described in Section 4.1 at the time that steady-state growth
was achieved (generation 1). Steady state growth was routinely achieved after 26 h (see
Section 4.1). Every three weeks (approximately 200 generations), the chemostat cultures
were frozen and stored at -80°C in 25% (v/v) glycerol. From these frozen stocks, the
chemostat cultures were restarted as follows: 10 ml of the frozen stock culture were
pelleted by low-speed centrifugation (5,000 x g) for removal of glycerol and the cells were
harvested in the final culturing volume of 20 ml and transferred into chemostat vessels.
The remaining frozen cultures served as backups for the re-establishment of experimental
cultures in case of contamination or loss of culture due to malfunction of the chemostat
system. Prior to cryo-preservation of the chemostat cultures, all cultures were reciprocally
tested for cross-contamination using qPCR. Additional contamination control was done on
a regular basis by plating dilutions of the chemostat cultures on M9 and LB agar plates.
Each population was evolved for 90 days at steady-state resulting in approximately 800
generations.
Prior to the evolution experiment, the critical dilution rate was determined for each
strain (i.e., pLC-wt, pLC-hypermutator, pHC-wt, pHC-hypermutator) using the method of
washout (e.g., Pirt and Callow 1960)). To this end, for each strain three culturing vessels
were inoculated and grown to steady-state at 37°C and 42°C as described above. Culture
densities were then estimated by colony count after plating a sample on M9 agar. Next,
the dilution rate was increased and after reaching stead-state, culture densities were
estimated. This procedure was followed for each of the following dilution rates: 0.09 h-1,
0.18 h-1, 0.24 h-1, 0.38 h-1, 0.5 h-1. Because mutations affecting growth parameters of the
E. coli strains may occur during culturing, the replicates were re-established from the
same ancestor after two changes in dilution rate.
Growth rates of the ancestral plasmid carrying strains and the plasmid-free
hypermutator and wild-type E. coli strains were determined as follows. Cultures were
grown overnight in M9 medium to stationary phase, were diluted 100-fold in 10 ml fresh
M9 medium and 300 µl were then used to measure the optical density at 600nm in a 96-
well microtiter plate, which was incubated at 37°C or 42°C with agitation for at least 14
hours (6 replicates per culture) in a Multiskan GO Microplate Spectrophotometer (Thermo
17
Fisher Scientific). The OD600 was recorded every 10 min and the growth rate was
determined by nonlinear fitting of a logistic growth model using R package Growthcurver
(Sprouffske 2016).
3.8 Proportion of plasmid-hosts and plasmid loss frequency
The fractions of plasmid-bearing cells in ancestral and evolved populations were
determined by plating appropriate dilutions of archived cultures on M9 agar with and
without ampicillin (termed here differential plating). Colony forming units (CFU) were
counted after overnight incubation and the proportion of hosts was estimated as the ratio
of mean CFU/ml on selective and mean CFU/ml on non-selective medium. An additional
method (streak method) was used to determine the proportion of hosts by streaking single
colonies (grown on M9 medium) on M9/amp100 and M9 agar to obtain single colonies.
After overnight growth at 37°C or 42°C, the proportion of hosts was calculated as the ratio
of the number of test colonies grown selective medium and non-selective medium.
Cell population densities were estimated from the chemostat cultures approximately
every 100 generations by colony counting to determine the number of viable cells
(CFU/ml) or by measurement of optical density (OD600). Cell densities were determined
from biomass concentration (OD600) using a fitted standard curve (R2 = 0.9968) with the
linear relationship CFU/ml= 8.23 108 × OD - 1.58 × 10⁷.
To determine the segregational loss of plasmid pLC and pHC, five single colonies of
each strain (i.e., wt-pLC, wt-pHC) were picked from M9/amp100 agar plates and grown
overnight in 2 ml M9/amp100 with constant shaking at 37°C for approximately 4.4 ± 0.42
(SD) generations. Appropriate dilutions of stationary cell cultures were plated on M9 agar,
incubated overnight at 37°C, and 100 colonies per replicate were streaked onto
M9/amp200, M9/amp100, and M9 plates. The number of plasmid-free segregants was
determined from the comparison of colonies grown on selective and non-selective plates.
3.9 Whole genome sequencing
The ancestral populations of the wild-type and the ΔmutS strain carrying the designated
plasmids (wt-pHC, wt-pLC, ΔmutS-pHC, and ΔmutS-pLC) and the 48 populations evolved
for 800 generations were sequenced using Illumina sequencing technology. Population
sequencing was used to enable the detection of rare variants and to asses the frequency
of alleles within and across populations. Total DNA (genomic DNA plus plasmid DNA) was
isolated from archived samples stored at -80°C using the Wizard Genomic DNA
Purification kit (Promega). The preparation of DNA for sequencing of the evolved

18
populations differed between the two plasmids due to the difference in their stability within
the host. For pLC-populations, 1 ml of cell suspension from thawed samples was used for
DNA extraction. The frequent loss of pHC led to the presence of plasmid-free segregants
in the evolved populations. Therefore, in addition to the sequencing of DNA extracted from
total pHC-populations, DNA was sequenced from pooled colonies of plasmid-carrying
cells. The deep sequencing of plasmid-carrying hosts allows the detection of rare variants
from a population of cells with a potentially heterogeneous plasmid allele pool. DNA from
total pHC populations was isolated from archived samples as described for pLC-
populations. The preparation of DNA from plasmid-carrying cells included a preliminary
stage of selection for plasmid-hosts. Thus, frozen chemostat culture samples were first
plated on LB plates supplemented with ampicillin (100 µg ml-1) and grown overnight at
37°C or 42°C, to select plasmid-carrying cells. Then, 100 colonies per pHC-population
were pooled for extraction of total DNA (i.e., 4x600 colonies in total). Sample libraries for
Illumina sequencing were prepared using either the Nextera or Nextera XT library
preparation kit. All samples were quantified on a Qubit fluorometer (Invitrogen by Life
Technologies) and DNA fragment length distribution was assessed on a TapeStation
(Agilent Technologies). Libraries were sequenced on either a HiSeq 2500 platform with
2x125 bp reads or a NextSeq 500 platform with 2x150 bp reads (see Supplementary
Table 4 for details). Due to low initial coverage, some libraries of the wt-pLC and wt-pHC
populations were re-sequenced on a HiSeq 2500 platform. Sequence reads of evolved
and ancestral populations are found in SRA (SRA acc. SRP141152). Plasmid sequences
are found in GenBank (pLC: MH238456, pHC: MH238457).
19
3.10 Variant detection
Sequencing reads were trimmed to remove both Illumina specific adaptors and low quality
bases using the program Trimmomatic v.0.35 (Bolger et al. 2014) with these parameters
ILLUMINACLIP:NexteraPE-PE.fa:2:30:10 CROP:150/125 (NextSeq/HiSeq)
HEADCROP:5 LEADING:20 TRAILING:20 SLIDINGWINDOW:4:20 MINLEN:36. Quality of
sequencing reads was inspected before and after trimming using FastQC v.0.11.5
(Andrews 2016). Plasmid genomes of all ancestor samples were assembled by
plasmidSPAdes (SPAdes v.3.9.0; Bankevich et al. 2012, Nurk et al. 2013) using trimmed
paired end sequencing reads. To improve assembly speed and accuracy of the high copy
plasmid pHC of ancestor samples BBNorm (BBMap tool suite v.35.82;
https://sourceforge.net/projects/bbmap/) was used to normalize paired end read data to an
average coverage of 200x. This resulted in contigs with overhangs at each end which
enabled the mapping of otherwise non-alignable reads. There was no variation between
plasmid assemblies of the same type. Therefore, only one assembly of plasmids pLC and
pHC was used as a reference for variant detection. Plasmid genome assemblies were
verified and annotated using SnapGene software v.2.4 (GLS Biotech). Host chromosomes
were assembled by SPAdes (SPAdes v.3.9.0; Bankevich et al. 2012). The contig
containing the artificial sequence was extracted using BLAST (Altschul et al. 1990) and it
was used to replace the corresponding sequence in the E. coli K-12 MG1655 reference
genome file (NCBI accession no. NC_000913.3) using SnapGene software.
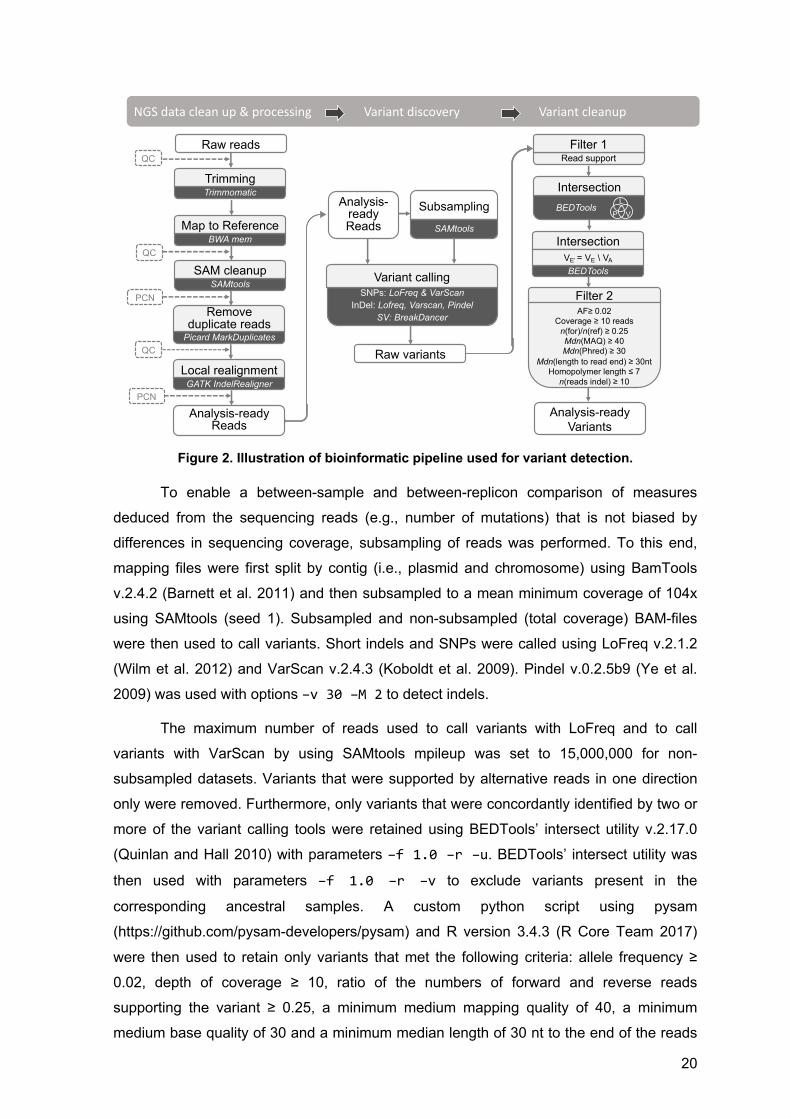
As illustrated in Figure 2, reads were then mapped to this reference genome and
to the assembled plasmid genomes using BWA-MEM v.0.7.5a-r405 (Li and Durbin 2009).
Corresponding mapping files of libraries that were sequenced twice were merged using
PICARD tools v.2.7.1 (http://broadinstitute.github.io/picard/). Mapping statistics were
retrieved using BAMStats v.1.25 (https://sourceforge.net/projects/bamstats/files/). Then,
indexing, local realignment of sequencing reads, removal of ambiguous aligned reads and
read duplicates were performed using PICARD tools, SAMtools v.0.1.19 (Li et al. 2009)
and GATK v.3.6 (McKenna et al. 2010) retaining only paired mapped reads with a
minimum mapping quality of 20.
20
Figure 2. Illustration of bioinformatic pipeline used for variant detection.
To enable a between-sample and between-replicon comparison of measures
deduced from the sequencing reads (e.g., number of mutations) that is not biased by
differences in sequencing coverage, subsampling of reads was performed. To this end,
mapping files were first split by contig (i.e., plasmid and chromosome) using BamTools
v.2.4.2 (Barnett et al. 2011) and then subsampled to a mean minimum coverage of 104x
using SAMtools (seed 1). Subsampled and non-subsampled (total coverage) BAM-files
were then used to call variants. Short indels and SNPs were called using LoFreq v.2.1.2
(Wilm et al. 2012) and VarScan v.2.4.3 (Koboldt et al. 2009). Pindel v.0.2.5b9 (Ye et al.
2009) was used with options –v 30 –M 2 to detect indels.
The maximum number of reads used to call variants with LoFreq and to call
variants with VarScan by using SAMtools mpileup was set to 15,000,000 for non-
subsampled datasets. Variants that were supported by alternative reads in one direction
only were removed. Furthermore, only variants that were concordantly identified by two or
more of the variant calling tools were retained using BEDTools’ intersect utility v.2.17.0
(Quinlan and Hall 2010) with parameters –f 1.0 –r –u. BEDTools’ intersect utility was
then used with parameters –f 1.0 –r –v to exclude variants present in the
corresponding ancestral samples. A custom python script using pysam
(https://github.com/pysam-developers/pysam) and R version 3.4.3 (R Core Team 2017)
were then used to retain only variants that met the following criteria: allele frequency ≥
0.02, depth of coverage ≥ 10, ratio of the numbers of forward and reverse reads
supporting the variant ≥ 0.25, a minimum medium mapping quality of 40, a minimum
medium base quality of 30 and a minimum median length of 30 nt to the end of the reads
Overview on the sequencing and data analysis
Raw reads
TrimmomaticTrimming
SAMtoolsSAM cleanup
GATK IndelRealignerLocal realignment
Picard MarkDuplicates
Remove duplicate reads
BWA memMap to Reference
Analysis-ready Reads
BEDTools
IntersectionL
VP
Read support Filter 1
BEDTools
IntersectionVE’ = VE \ VA
SNPs: LoFreq & VarScanInDel: Lofreq, Varscan, Pindel
SV: BreakDancer
Variant calling
SAMtools
SubsamplingAnalysis-ready Reads
Raw variants
Analysis-ready Variants
QC
QC
QC
NGS data clean up & processing Variant discovery Variant cleanup
PCN
PCN
Filter 2 AF≥ 0.02
Coverage ≥ 10 readsn(for)/n(ref) ≥ 0.25Mdn(MAQ) ≥ 40Mdn(Phred) ≥ 30
Mdn(length to read end) ≥ 30ntHomopolymer length ≤ 7
n(reads indel) ≥ 10

21
supporting the variant, a homopolymer length ≤ 7 and at least 10 reads supporting an
indel. Variants that were found in proximity of 20 nt to each other within the same sample
were excluded. Variants whose read support at the corresponding position in ancestor
samples was not sufficient to detect a variant (<10x) were excluded (an overview on filter
steps is shown in Figure 2).
Variant genomic location and the type of mutation, i.e., intergenic, synonymous,
non-synonymous, or nonsense, were annotated using an in-house Perl script. Plasmid
copy numbers were inferred from the de-duplicated (and non-de-duplicated), non-
subsampled BAM files as the ratio of plasmid to chromosomal mean coverage.
3.11 Statistical methods
Statistical data analysis and visualization were carried out in the R environment (R Core
Team 2017) using version 3.4.3 and packages reported in Supplementary Table 5.
22
4 Results
4.1 Optimization of chemostat culturing system
The chemostat system used in this study is based on a modular system suggested by
(Miller et al. 2013) for the cultivation of yeast. This culturing system is composed of a
media supply module, an air supply that also serves for the stirring of the culture, culturing
units, and an effluent module (see Methods for a detailed description). Because the
growth of bacteria differs in several components from that of yeast, various culturing tests
were conducted to evaluate the growth conditions for bacteria in that chemostat system.
In each test, four to six independent chemostat cultures of E. coli MG1655 harboring
plasmid pLC were grown at steady state for 7-21 days and 37°C. Unless otherwise stated,
a dilution rate of 0.18 h-1 and a working volume of 20 mL were used. In addition, to test for
contamination from external sources and to test for cross-contamination, three chemostat
vessels were not inoculated with bacteria. During each test, continuity of stirring and
media supply, culture volume, culture density or turbidity, and technical malfunctions were
monitored at least two times per day. Based on these tests, several modifications were
introduced to enable stable and continuous steady-state growth of bacteria for at least 21
days. During the first culturing test, bacterial biofilm formation within the media supply
hoses was observed after approximately five days of steady-state culturing. This was
most likely caused by aerosolized bacteria droplets, because the cultures were not in
direct contact with the media inlet needle (see Figure 3B) and no shaking was applied
during cultivation. The growth of bacteria into the media supply ports had the potential to
result in cross-contamination between culturing units as 24 units are connected through
one main media supply port (see Supplementary Figure 4A). Therefore, an air break
made from off-the-shelf materials was placed between a culturing unit and the media port
(see Figure 3B). Further test cultivation including the air break revealed sporadic biofilm
formation inside the media supply tubing after seven days of steady state growth.
Therefore, to prevent bacterial growth into the media supply hoses, syringe filters were
placed between the media supply hoses and the air breaks (Figure 3B) and the filters
were exchanged every third day. In addition, the air break units were exchanged at least
every six days, because growth of bacteria inside two out of six air break units was
observed after twelve days of culturing.
23
Furthermore, although special care was taken in the choice of hoses, biofilm
formation was observed within the effluent tubing leading to blockage of effluent ports.
Because the chemostat system was under constant positive pressure built up by tubing
pumps, the blockage resulted in the movement of bacterial culture into the air supply. The
hydrophobic gas filters downstream the manifold prevented the liquid to further move into
the manifold, which could have caused cross-contamination between culture vessels
connected through it (details shown in Supplementary Figure 4A). Therefore, to ensure
the continuity of the steady-state, a second effluent needle was placed into the culture
vessels. Although the second effluent port ensured steady-state culturing for at least ten
days, extensive biofilm formation especially in re-used hoses required the exchange of
effluent ports every eight to twelve days. Furthermore, owing to the small diameter of the
effluent hoses (2 mm), the risk of fast blockage of hoses due to biofilm-formation was
higher in comparison to hoses with larger diameters. Moreover, the small inner tube
diameter frequently caused disturbance of the steady state as the positive pressure
exerted by the pumps was not high enough to push the effluent through the tubing (40 cm
length). According to the Hagen-Poiseuille law, the flow resistance within a tube is
inversely proportional to the fourth power of the tube radius. Therefore, shortly after the
effluent needle port (approximately 15 cm), the hoses were transferred into a tubing with a
five-fold larger diameter. As a result, the flow resistance decreased and an improved
continuity of the outflow was observed. In this setup, the overflow of six cultures was
collected in a communal waste container that was emptied every third day (Figure 3A).
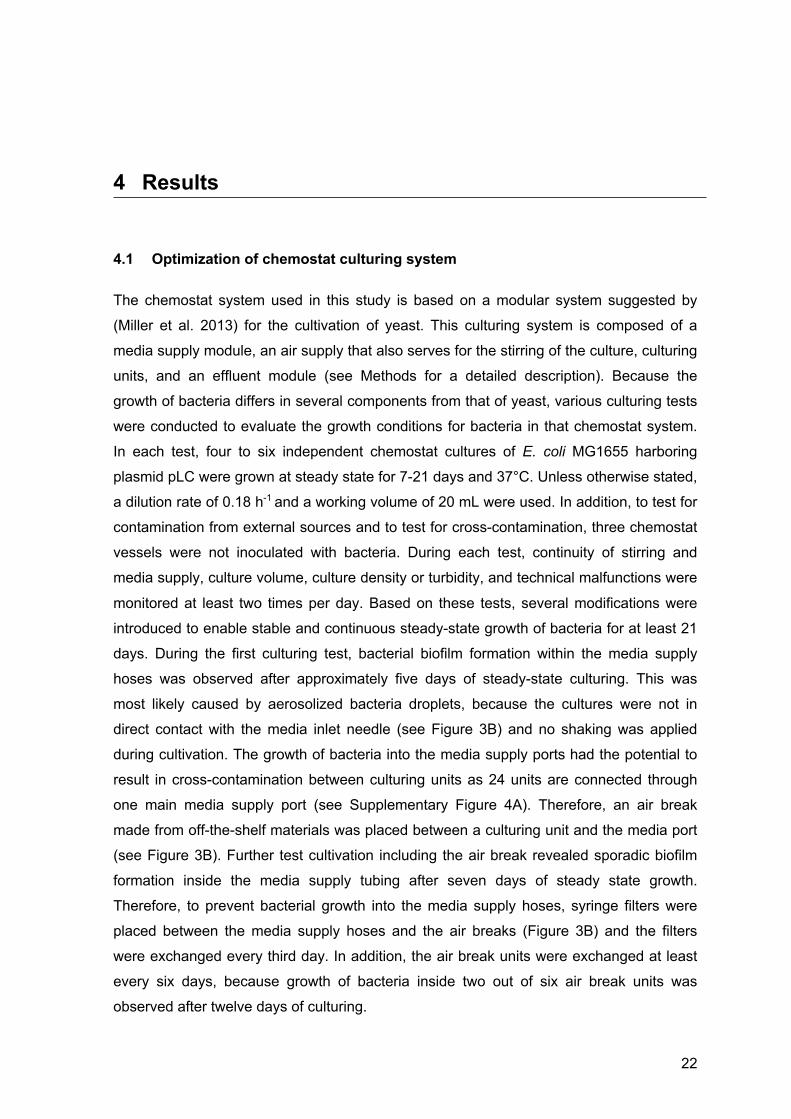
Figure 3. Establishment of a multiplexed miniature chemostat system for culturing of bacteria. (A) Chemostat system as it was used during establishment of the chemostat system: 1) media carboy, 2) peristaltic pump, 3) air supply, 4) water bath, 5) culturing units, 6) effluent reservoir, 7) air hydration bottle. (B) A culturing unit includes 8) a media inflow channel, 9) an air break and 10) a culturing vessel that includes an air supply channel (blue), two culture effluent channels (red), a media inlet needle (orange) and a sampling port (green). Note, that the distance from the tip of the media inlet needle to the surface of the liquid culture was approximately 6 cm.
1
2
4
3
5
6
A B
6 cm
5.5 cm
12 cm
7 8
9
10
24
To test for the possibility of contamination and cross-contamination between
culturing units by way of the effluent module, six chemostat units that were not inoculated
with bacteria were alternately arranged with six inoculated culturing vessels (example
shown in Supplementary Figure 4F). For the non-inoculated cultures, effluent lines and
culture vessels were monitored for bacterial growth by visual control and by plating
appropriate dilutions from the effluent every day for 10 days of steady-state growth. After
two days, bacterial contamination was found in two samples taken from the effluent of
non-inoculated culturing units (M = 37.5 CFU ml-1, SD = 17.08 CFU ml-1, n = 4). Using
PCR and genotype specific primers, it was verified that these were cross-contaminants.
To test whether the contaminants grew into the culture vessels or contamination was local
at the tips of the effluent tubings, a third sterile effluent needle along with a sterile effluent
hose was introduced into the concerned culturing vessels. Samples were then taken from
this port after pulling up the other two effluent needles (approximately 0.5 cm) such that
the overflow was released through this sampling port. No bacterial contamination was
found in any of the samples collected hourly from the two non-inoculated culture vessels
within a six hour time frame. This indicated that the bacterial contamination was locally at
the tip of the effluent tubing. Furthermore, following this sampling procedure, no
contamination was found in any of the non-inoculated culturing vessels at any other
sampling time point. This, and the visual inspection of the effluent tubing, further revealed
that contamination at the outlet of the effluent tubing did not grow into the culture vessels.
Therefore, to prevent cross-contamination during sampling, samples were thereafter
collected using the sampling port.
Furthermore, to prevent loss of culture volume due to evaporation and to prevent
the cultures from being contaminated with airborne bacteria, Miller et al. (2013) suggested
to aerate the cultures with hydrated air and to use gas filters (PTFE membrane filters)
downstream the hydration flask. During the culturing tests, frequent clogging of the air
filters as a consequence of wetting (condensation) was observed. This resulted in a lack
of positive pressure otherwise created by the air supply. As a consequence, liquid culture
moved into the air supply hose and steady-state growth ultimately collapsed. However,
the hydrophobic gas filters served as a barrier for bacterial culture to be pushed further
into the air supply. Hence, in order to keep this barrier, it was not an option to place the
gas filter upstream of the air hydration module (e.g., at the outlet of the air pumps). Thus,
a culturing test without the hydration module was conducted for seven days of steady
state growth. This trial experiment was carried out at 42°C, because evaporation of liquid
media is expected to increase with temperature and the evolution experiment was
planned to be conducted at 37°C and 42°C temperatures. As an indicator for the amount
of evaporated media, the culture volume was monitored and effluent was collected two
25
times a day. The effluent volume per unit time served as an indirect indicator for loss of
culture volume as the insertion depth of the effluent needles within the culture vessels was
fixed (shown in Figure 3B) and thus, in case of extensive culture volume loss due to
evaporation, the amount of effluent was expected to decrease over time. The culturing
test revealed no significant differences between the effluent volumes collected from the
chemostats operated with the air-hydration module and without the air-hydration module
(P = 0.933, using t-test; details in Supplementary Table 6). Therefore, the air hydration
module was excluded from the final chemostat setup, but gas filters were used
downstream the manifolds (as shown in Supplementary Figure 4). Similarly, gas filters at
the outlet of the collection vessels, meant to prevent the environment from being
contaminated with aerosolized bacteria droplets, were not used because of frequent
clogging of filters. Instead, a gas washing bottle was used (see Supplementary Figure
4A).
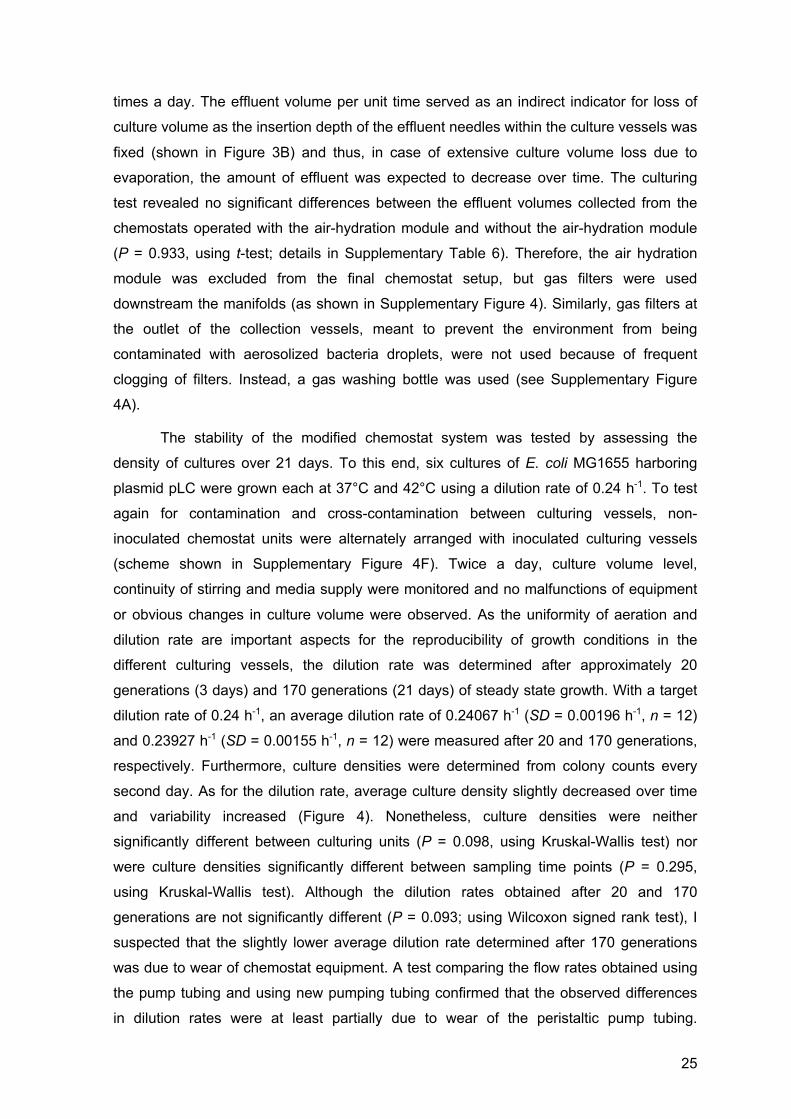
The stability of the modified chemostat system was tested by assessing the
density of cultures over 21 days. To this end, six cultures of E. coli MG1655 harboring
plasmid pLC were grown each at 37°C and 42°C using a dilution rate of 0.24 h-1. To test
again for contamination and cross-contamination between culturing vessels, non-
inoculated chemostat units were alternately arranged with inoculated culturing vessels
(scheme shown in Supplementary Figure 4F). Twice a day, culture volume level,
continuity of stirring and media supply were monitored and no malfunctions of equipment
or obvious changes in culture volume were observed. As the uniformity of aeration and
dilution rate are important aspects for the reproducibility of growth conditions in the
different culturing vessels, the dilution rate was determined after approximately 20
generations (3 days) and 170 generations (21 days) of steady state growth. With a target
dilution rate of 0.24 h-1, an average dilution rate of 0.24067 h-1 (SD = 0.00196 h-1, n = 12)
and 0.23927 h-1 (SD = 0.00155 h-1, n = 12) were measured after 20 and 170 generations,
respectively. Furthermore, culture densities were determined from colony counts every
second day. As for the dilution rate, average culture density slightly decreased over time
and variability increased (Figure 4). Nonetheless, culture densities were neither
significantly different between culturing units (P = 0.098, using Kruskal-Wallis test) nor
were culture densities significantly different between sampling time points (P = 0.295,
using Kruskal-Wallis test). Although the dilution rates obtained after 20 and 170
generations are not significantly different (P = 0.093; using Wilcoxon signed rank test), I
suspected that the slightly lower average dilution rate determined after 170 generations
was due to wear of chemostat equipment. A test comparing the flow rates obtained using
the pump tubing and using new pumping tubing confirmed that the observed differences
in dilution rates were at least partially due to wear of the peristaltic pump tubing.
26
Therefore, in the evolution experiment, the pump tubing was replaced at least every three
weeks.
Figure 4. Cell densities obtained during test cultivation using the chemostat system established in this study. Over a culturing period of 21 days (approx. 170 generations), cell densities were assessed from twelve chemostat cultures by colony-count method. Empty circles show the mean CFUs, which are connected by a solid line to show the trend. Raw data is reported in Supplementary Table 7.
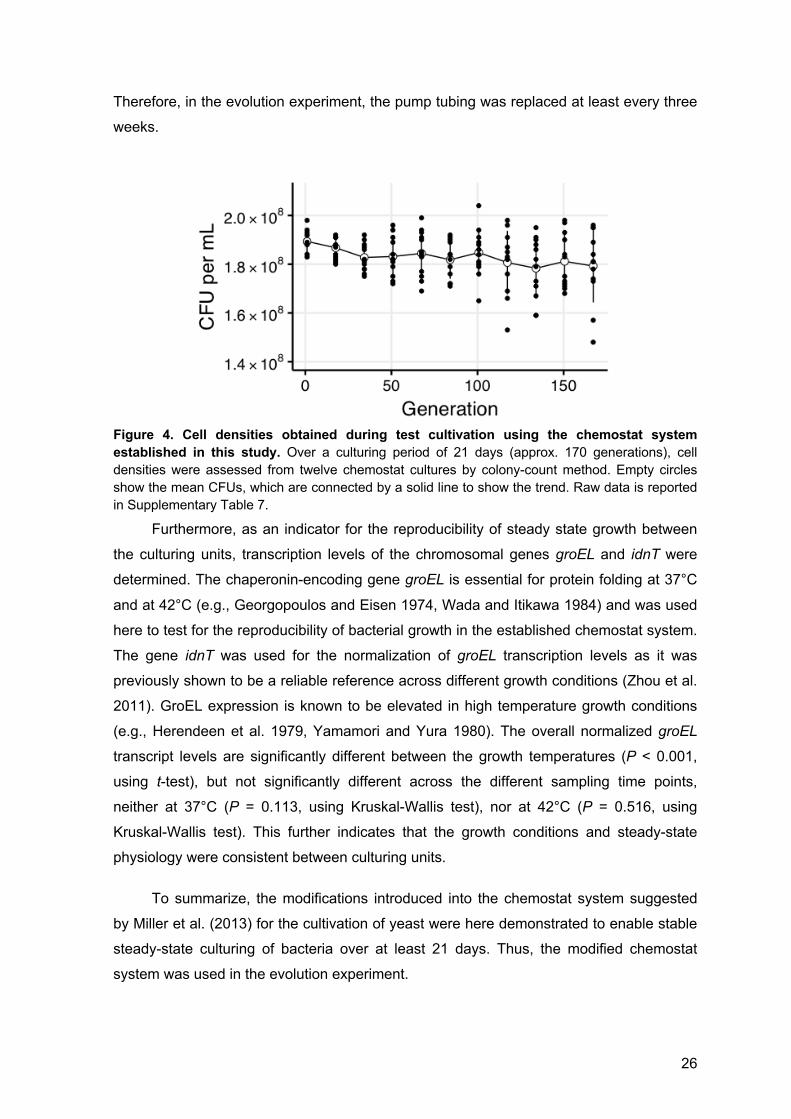
Furthermore, as an indicator for the reproducibility of steady state growth between
the culturing units, transcription levels of the chromosomal genes groEL and idnT were
determined. The chaperonin-encoding gene groEL is essential for protein folding at 37°C
and at 42°C (e.g., Georgopoulos and Eisen 1974, Wada and Itikawa 1984) and was used
here to test for the reproducibility of bacterial growth in the established chemostat system.
The gene idnT was used for the normalization of groEL transcription levels as it was
previously shown to be a reliable reference across different growth conditions (Zhou et al.
2011). GroEL expression is known to be elevated in high temperature growth conditions
(e.g., Herendeen et al. 1979, Yamamori and Yura 1980). The overall normalized groEL
transcript levels are significantly different between the growth temperatures (P < 0.001,
using t-test), but not significantly different across the different sampling time points,
neither at 37°C (P = 0.113, using Kruskal-Wallis test), nor at 42°C (P = 0.516, using
Kruskal-Wallis test). This further indicates that the growth conditions and steady-state
physiology were consistent between culturing units.
To summarize, the modifications introduced into the chemostat system suggested
by Miller et al. (2013) for the cultivation of yeast were here demonstrated to enable stable
steady-state culturing of bacteria over at least 21 days. Thus, the modified chemostat
system was used in the evolution experiment.
27
Figure 5. Transcription levels of the chaperonin gene groEL in E. coli MG1655, pLC. Transcription level of groEL gene were determined for a total of six independent chemostat cultures (indicated by different colors) grown at 37°C or 42°C. Samples were collected at four consecutive days after 144 hours of steady-state growth in the established chemostat system. Transcription levels are normalized to that of the reference gene idnT. Individual Ct-values are listed in Supplementary Table 8.
4.2 Experimental evolution of low- and high-copy plasmids
To compare the rate of evolution between low-copy and high-copy plasmid replicons an
experimental evolution approach was used. In the experiment, two model plasmids having
low- or high-copy number were evolved in an E. coli host under conditions selecting for
the plasmid presence. The low-copy model plasmid (pLC, 5.2 kb; Figure 6) is derived from
plasmid pBBR1 (Antoine and Locht 1992) that is known to stably replicate in a broad host
range despite lacking an active partitioning mechanism. The plasmid encodes an
ampicillin-resistance gene (bla; b-lactamase) and is non-mobile (i.e., it is not transmissible
via conjugation). The average pLC copy number in the wild-type E. coli host was 8.5 ±
0.56 (SD, n = 6; Figure 6), which is within the range calculated previously for pBBR1
(Jahn et al. 2016). The accessory part of the high copy number model plasmid (pHC, 4.8
kb; Figure 6) is identical to that of plasmid pLC, but the backbone comprises a pUC origin
of replication (Vieira and Messing 1982), that is a derivative of the ori of plasmid ColE1
(Hershfield et al. 1974). The copy number of plasmid pHC in the wild-type E. coli host was
approximately 80-fold higher than that of plasmid pLC (705.51 ± 17.78 SD, n = 6; using
qPCR; Figure 6). This is within the typical copy number range of the pUC plasmid
backbone (Rosano and Ceccarelli 2014). Notably, in the hypermutator E. coli MG1655
●
●●
●
●●
●
●
●
●●●
●
●
●
●●●
●
●
●
●
●
●
200
300
400
500
600
1 2 3 4day
level
Day
Rel
ativ
e tra
nscr
ipt l
evel
42°C37°C
●
●●
●
●●
●
●
●
●
●●
●
●
●
●●
●
●
●
●
●
●
●
200
300
400
500
600
1 2 3 4day
level
as.factor(temp)●
●
●
●
●
●
●
●
●
●
●
●
●
●
●
●
●
●
●
●
●
●
●
●
●
●
110111213141516171819220
2122232433744256789
●
●●
●
●●
●
●
●
●
●●
●
●
●
●●
●
●
●
●
●
●
●
200
300
400
500
600
1 2 3 4day
level
as.factor(temp)●
●
●
●
●
●
●
●
●
●
●
●
●
●
●
●
●
●
●
●
●
●
●
●
●
●
110111213141516171819220
2122232433744256789
28
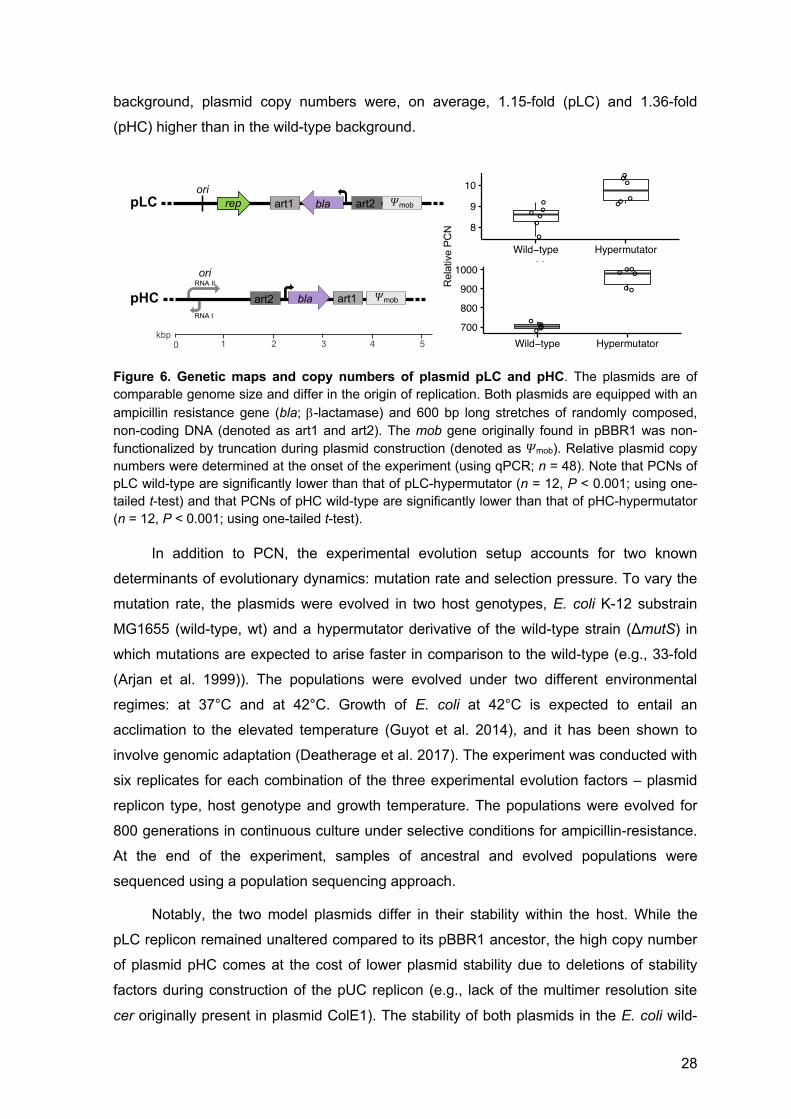
background, plasmid copy numbers were, on average, 1.15-fold (pLC) and 1.36-fold
(pHC) higher than in the wild-type background.
Figure 6. Genetic maps and copy numbers of plasmid pLC and pHC. The plasmids are of comparable genome size and differ in the origin of replication. Both plasmids are equipped with an ampicillin resistance gene (bla; b-lactamase) and 600 bp long stretches of randomly composed, non-coding DNA (denoted as art1 and art2). The mob gene originally found in pBBR1 was non-functionalized by truncation during plasmid construction (denoted as "mob). Relative plasmid copy numbers were determined at the onset of the experiment (using qPCR; n = 48). Note that PCNs of pLC wild-type are significantly lower than that of pLC-hypermutator (n = 12, P < 0.001; using one-tailed t-test) and that PCNs of pHC wild-type are significantly lower than that of pHC-hypermutator (n = 12, P < 0.001; using one-tailed t-test).
In addition to PCN, the experimental evolution setup accounts for two known
determinants of evolutionary dynamics: mutation rate and selection pressure. To vary the
mutation rate, the plasmids were evolved in two host genotypes, E. coli K-12 substrain
MG1655 (wild-type, wt) and a hypermutator derivative of the wild-type strain (ΔmutS) in
which mutations are expected to arise faster in comparison to the wild-type (e.g., 33-fold
(Arjan et al. 1999)). The populations were evolved under two different environmental
regimes: at 37°C and at 42°C. Growth of E. coli at 42°C is expected to entail an
acclimation to the elevated temperature (Guyot et al. 2014), and it has been shown to
involve genomic adaptation (Deatherage et al. 2017). The experiment was conducted with
six replicates for each combination of the three experimental evolution factors – plasmid
replicon type, host genotype and growth temperature. The populations were evolved for
800 generations in continuous culture under selective conditions for ampicillin-resistance.
At the end of the experiment, samples of ancestral and evolved populations were
sequenced using a population sequencing approach.
Notably, the two model plasmids differ in their stability within the host. While the
pLC replicon remained unaltered compared to its pBBR1 ancestor, the high copy number
of plasmid pHC comes at the cost of lower plasmid stability due to deletions of stability
factors during construction of the pUC replicon (e.g., lack of the multimer resolution site
cer originally present in plasmid ColE1). The stability of both plasmids in the E. coli wild-
oriRNA II
RNA I
art2 bla art1 !mob
repori
bla !mobart2art1
0 1 2 3 4 5kbp
pLC
pHC●●
●●●
●
●
●
●●
●
●
●
●
●
●
●
●
●
●
●
●●
●
pLC
pHC
Wild−type Hypermutator
Wild−type Hypermutator700
800
900
1000
8
9
10
Host genotype
PCN
●●
●●●
●
●
●
●●
●
●
●
●
●
●
●
●
●
●
●
●●
●
pLC
pHC
Wild−type Hypermutator
Wild−type Hypermutator700
800
900
1000
8
9
10
Host genotype
PCN
Rel
ativ
e PC
N
29
type host was assessed using the same selective constraints for the plasmid presence as
in the evolution experiment. No plasmid-free segregants of pLC-wt were observed after
overnight growth (n = 5), whereas the proportion of pHC-free segregants ranged between
1% and 39% (n = 5; see Section 3.8). Plasmid loss during the evolution experiment has
the potential to result in a proportion of plasmid-free cells in the total population. Such
plasmid-free cells have a collective resistance to ampicillin thanks to the presence of β-
lactamase secreted from plasmid carrying hosts in the environment (e.g., Vega and Gore
2014). Therefore, the proportion of plasmid-hosts in the evolved populations was
quantified using replica plating of single colonies. This showed that pLC-hosts accounted
for 89% to 100% of the populations in all conditions and replicates (detailed description in
Section 4.6). The proportion of pHC-hosts in the evolved wild-type populations ranged
between 1% and 78%, while the range of plasmid carrying hosts in the evolved
hypermutator populations was between 35% and 98% (Section 4.6). In order to increase
the resolution on the existing plasmid allele pool, the genomes of each pHC population
was sequenced using two different sampling strategies. In addition to the sequencing of
total populations (i.e., plasmid host cells and plasmid-free segregants), the genome of
each pHC population was sequenced from pooled samples of 100 colonies of plasmid
carrying hosts (see Section 3.9). In the following, the resulting genetic variants reported
for pHC populations are based on the pooled colonies data unless stated otherwise.
4.3 Fine tuning of the chemostat dilution rate
In batch culture, significant differences in growth rates are observed between the plasmid-
free wild-type strain and plasmid-carrying strains (Figure 7 and Supplementary Table 9).
In a chemostat, growth rates are controlled by the dilution rate and the influent substrate
concentration (Novick and Szilard 1950). As one of the main objectives of this work was to
compare mutation rates between different genotypes, both parameters, the dilution rate
and the concentration of the growth limiting substrates were kept constant.
Figure 7. Growth rates of plasmid-carrying and plasmid-free ancestors. Growth rates were determined in batch culture as described in Section 3.7.
●
●
37 42
A B C D hyper wt A B C D hyper wt
0.010
0.015
0.020
genotype
max_growth genotype
ABCDhyperwt
37°C 42°C
Grow
th ra
te (h
-1)
●
●
37 42
A B C D hyper wt A B C D hyper wt
0.010
0.015
0.020
genotype
max_growth genotype
ABCDhyperwt
pHC-WtpLC-WtpHC-HmpLC-HmHmWt
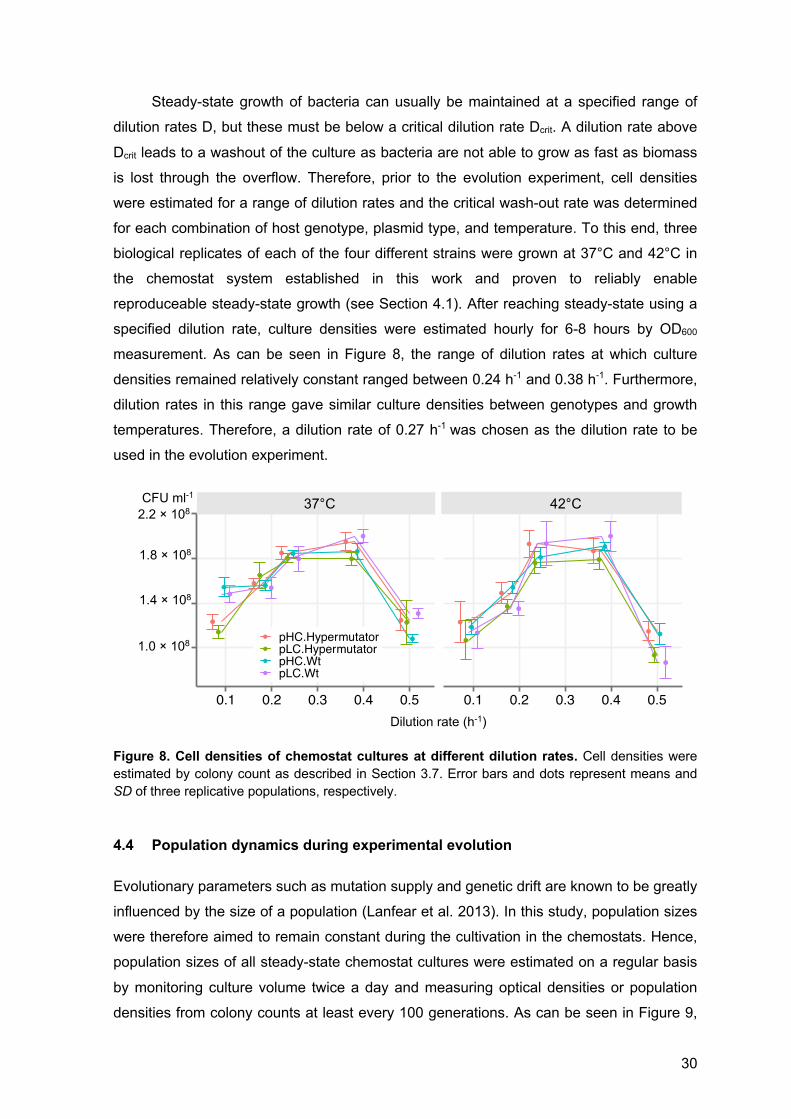
30
Steady-state growth of bacteria can usually be maintained at a specified range of
dilution rates D, but these must be below a critical dilution rate Dcrit. A dilution rate above
Dcrit leads to a washout of the culture as bacteria are not able to grow as fast as biomass
is lost through the overflow. Therefore, prior to the evolution experiment, cell densities
were estimated for a range of dilution rates and the critical wash-out rate was determined
for each combination of host genotype, plasmid type, and temperature. To this end, three
biological replicates of each of the four different strains were grown at 37°C and 42°C in
the chemostat system established in this work and proven to reliably enable
reproduceable steady-state growth (see Section 4.1). After reaching steady-state using a
specified dilution rate, culture densities were estimated hourly for 6-8 hours by OD600
measurement. As can be seen in Figure 8, the range of dilution rates at which culture
densities remained relatively constant ranged between 0.24 h-1 and 0.38 h-1. Furthermore,
dilution rates in this range gave similar culture densities between genotypes and growth
temperatures. Therefore, a dilution rate of 0.27 h-1 was chosen as the dilution rate to be
used in the evolution experiment.
Figure 8. Cell densities of chemostat cultures at different dilution rates. Cell densities were estimated by colony count as described in Section 3.7. Error bars and dots represent means and SD of three replicative populations, respectively.
4.4 Population dynamics during experimental evolution
Evolutionary parameters such as mutation supply and genetic drift are known to be greatly
influenced by the size of a population (Lanfear et al. 2013). In this study, population sizes
were therefore aimed to remain constant during the cultivation in the chemostats. Hence,
population sizes of all steady-state chemostat cultures were estimated on a regular basis
by monitoring culture volume twice a day and measuring optical densities or population
densities from colony counts at least every 100 generations. As can be seen in Figure 9,
●
●
●
●
●●
●
●
●●
●●
●
●
●
●
●
●
●●
●●
●
●
●
●
●
●
●
●●
●
●
●
●
●
●
●
●
●
37 42
0.1 0.2 0.3 0.4 0.5 0.1 0.2 0.3 0.4 0.5
1.0e+08
1.4e+08
1.8e+08
2.2e+08
dil_rate
mean_CFU interaction(plasmid, genotype)
●
●
●
●
pHC.HypermutatorpLC.HypermutatorpHC.WtpLC.Wt
37°C 42°C
1.8 × 10⁸
1.4 × 10⁸
1.0 × 10⁸
Dilution rate (h-1)
CFU ml-1
●
●
●
●
●●
●
● ●
●
●
●
● ●
●●
●
●
●
●
●
●
●
●
●
●
●
●
●
●
●
●
●●
●
●
●
●
●
●
37 42
0.1 0.2 0.3 0.4 0.5 0.1 0.2 0.3 0.4 0.5
1.0e+08
1.5e+08
2.0e+08
dil_rate
mean_CFU interaction(plasmid, genotype)
●
●
●
●
pHC.HypermutatorpLC.HypermutatorpHC.WtpLC.Wt
2.2 × 10⁸
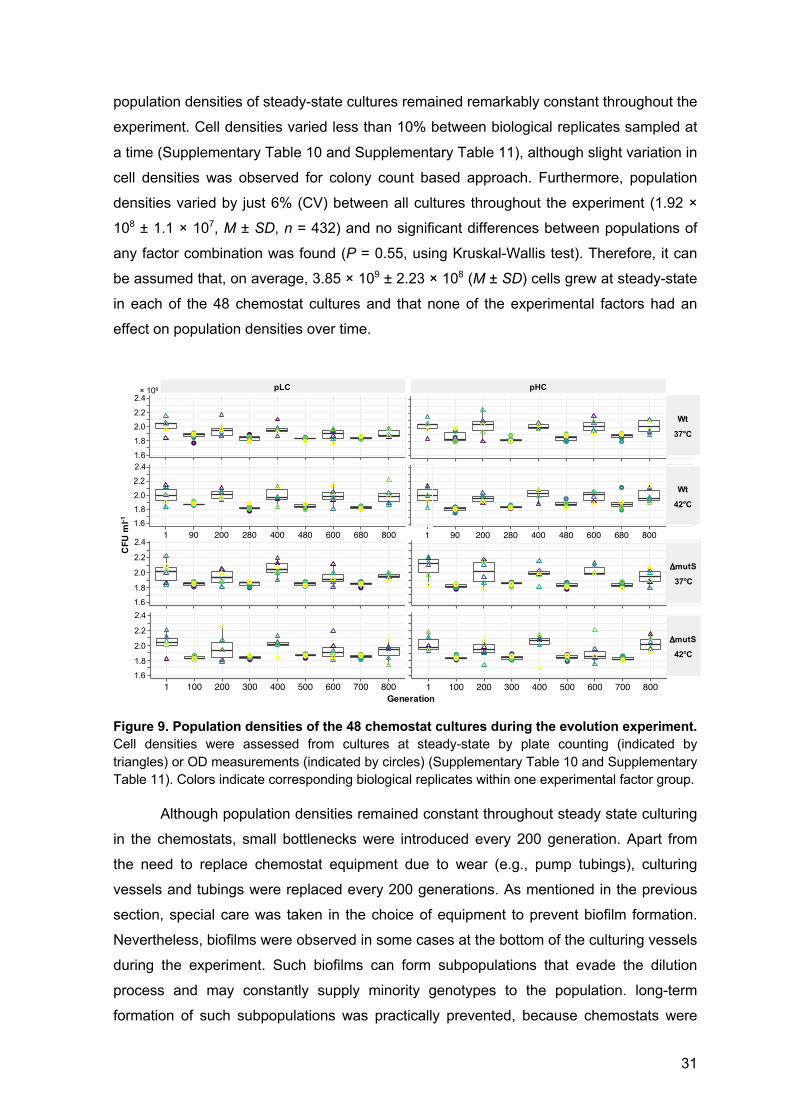
31
population densities of steady-state cultures remained remarkably constant throughout the
experiment. Cell densities varied less than 10% between biological replicates sampled at
a time (Supplementary Table 10 and Supplementary Table 11), although slight variation in
cell densities was observed for colony count based approach. Furthermore, population
densities varied by just 6% (CV) between all cultures throughout the experiment (1.92 ×
108 ± 1.1 × 10⁷, M ± SD, n = 432) and no significant differences between populations of
any factor combination was found (P = 0.55, using Kruskal-Wallis test). Therefore, it can
be assumed that, on average, 3.85 × 10⁹ ± 2.23 × 10⁸ (M ± SD) cells grew at steady-state
in each of the 48 chemostat cultures and that none of the experimental factors had an
effect on population densities over time.
Figure 9. Population densities of the 48 chemostat cultures during the evolution experiment. Cell densities were assessed from cultures at steady-state by plate counting (indicated by triangles) or OD measurements (indicated by circles) (Supplementary Table 10 and Supplementary Table 11). Colors indicate corresponding biological replicates within one experimental factor group.
Although population densities remained constant throughout steady state culturing
in the chemostats, small bottlenecks were introduced every 200 generation. Apart from
the need to replace chemostat equipment due to wear (e.g., pump tubings), culturing
vessels and tubings were replaced every 200 generations. As mentioned in the previous
section, special care was taken in the choice of equipment to prevent biofilm formation.
Nevertheless, biofilms were observed in some cases at the bottom of the culturing vessels
during the experiment. Such biofilms can form subpopulations that evade the dilution
process and may constantly supply minority genotypes to the population. long-term
formation of such subpopulations was practically prevented, because chemostats were
● ●●
●●● ● ●● ●
●●●
●●
●● ● ● ●● ●
● ●
●
●
●●
●● ● ●● ●
● ●●● ●
●●● ●
●● ●
● ●
●● ● ●● ●
● ●● ● ●●● ● ●●
● ●● ●
●● ● ●
● ●●
●●●
●●● ● ● ●
●● ● ●● ● ● ●● ● ●
●
mutSpLC
37°C
mutSpHC
37°C
mutSpLC
42°C
mutSpHC
42°C
1 100 200 300 400 500 600 700 800
1.6e+081.8e+082.0e+082.2e+082.4e+08
1.6e+081.8e+082.0e+082.2e+082.4e+08
1.6e+081.8e+082.0e+082.2e+082.4e+08
1.6e+081.8e+082.0e+082.2e+082.4e+08
1 100 200 300 400 500 600 700 800
1 100 200 300 400 500 600 700 800
1 100 200 300 400 500 600 700 800
Generation
CFU
ml−1
method● OD
plate countas.factor(replicate)●
●
●
●
●
●
123456
● ●●
●●● ● ●● ●
●●●
●●
●● ● ● ●● ●
● ●
●
●
●●
●● ● ●● ●
● ●●● ●
●●● ●
●● ●
● ●
●● ● ●● ●
● ●● ● ●●● ● ●●
● ●● ●
●● ● ●
● ●●
●●●
●●● ● ● ●
●● ● ●● ● ● ●● ● ●
●
mutSpLC
37°C
mutSpHC
37°C
mutSpLC
42°C
mutSpHC
42°C
1 100 200 300 400 500 600 700 800
1.6e+081.8e+082.0e+082.2e+082.4e+08
1.6e+081.8e+082.0e+082.2e+082.4e+08
1.6e+081.8e+082.0e+082.2e+082.4e+08
1.6e+081.8e+082.0e+082.2e+082.4e+08
1 100 200 300 400 500 600 700 800
1 100 200 300 400 500 600 700 800
1 100 200 300 400 500 600 700 800
Generation
CFU
ml−1
method● OD
plate countas.factor(replicate)●
●
●
●
●
●
123456
●
●● ●
●● ● ●● ● ● ●
●
●● ●● ● ● ●
●
● ●
●
● ● ●
●●
●● ●
●
● ● ●● ● ● ●●
● ● ●
●
●● ●
●
●● ●
●● ● ●
●●
● ●● ● ●●
●
● ●●
● ● ●●
● ●● ●
●●
● ●● ●
●
●
●
● ●●● ●
●●● ● ●
●
WtpLC
37°C
WtpHC
37°C
WtpLC
42°C
WtpHC
42°C
1 90 200 280 400 480 600 680 800
1.6e+081.8e+082.0e+082.2e+082.4e+08
1.6e+081.8e+082.0e+082.2e+082.4e+08
1.6e+081.8e+082.0e+082.2e+082.4e+08
1.6e+081.8e+082.0e+082.2e+082.4e+08
1 90 200 280 400 480 600 680 800
1 90 200 280 400 480 600 680 800
1 90 200 280 400 480 600 680 800
Generation
CFU
ml−1
method● OD
plate countas.factor(replicate)●
●
●
●
●
●
123456● ●
●●●
● ● ●● ●●
●●●
●●
● ● ● ●● ●● ●
●
●
●●
●● ● ●● ●
● ●●● ●
●●● ●
●● ●
● ●
●● ● ●● ●
● ●● ● ●●● ● ●●
● ●● ●
●● ● ●
● ●●
●●●
●●● ● ● ●
●● ● ●● ● ● ●● ● ●
●
mutSpLC
37°C
mutSpHC
37°C
mutSpLC
42°C
mutSpHC
42°C
1 100 200 300 400 500 600 700 800
1.6e+081.8e+082.0e+082.2e+082.4e+08
1.6e+081.8e+082.0e+082.2e+082.4e+08
1.6e+081.8e+082.0e+082.2e+082.4e+08
1.6e+081.8e+082.0e+082.2e+082.4e+08
1 100 200 300 400 500 600 700 800
1 100 200 300 400 500 600 700 800
1 100 200 300 400 500 600 700 800
Generation
CFU
ml−1
method● OD
plate countas.factor(replicate)●
●
●
●
●
●
123456
● ●●
●●● ● ●● ●
●●●
●●
●● ● ● ●● ●
● ●
●
●
●●
●● ● ●● ●
● ●●● ●
●●● ●
●● ●
● ●
●● ● ●● ●
● ●● ● ●●● ● ●●
● ●● ●
●● ● ●
● ●●
●●●
●●● ● ● ●
●● ● ●● ● ● ●● ● ●
●
mutSpLC
37°C
mutSpHC
37°C
mutSpLC
42°C
mutSpHC
42°C
1 100 200 300 400 500 600 700 800
1.6e+081.8e+082.0e+082.2e+082.4e+08
1.6e+081.8e+082.0e+082.2e+082.4e+08
1.6e+081.8e+082.0e+082.2e+082.4e+08
1.6e+081.8e+082.0e+082.2e+082.4e+08
1 100 200 300 400 500 600 700 800
1 100 200 300 400 500 600 700 800
1 100 200 300 400 500 600 700 800
Generation
CFU
ml−1
method● OD
plate countas.factor(replicate)●
●
●
●
●
●
123456
●
●● ●
●● ● ●● ● ● ●
●
●● ●● ● ● ●
●
● ●
●
● ● ●
●●
●● ●
●
● ● ●● ● ● ●●
● ● ●
●
●● ●
●
●● ●
●● ● ●
●●
● ●● ● ●●
●
● ●●
● ● ●●
● ●● ●
●●
● ●● ●
●
●
●
● ●●● ●
●●● ● ●
●
WtpLC
37°C
WtpHC
37°C
WtpLC
42°C
WtpHC
42°C
1 90 200 280 400 480 600 680 800
1.6e+081.8e+082.0e+082.2e+082.4e+08
1.6e+081.8e+082.0e+082.2e+082.4e+08
1.6e+081.8e+082.0e+082.2e+082.4e+08
1.6e+081.8e+082.0e+082.2e+082.4e+08
1 90 200 280 400 480 600 680 800
1 90 200 280 400 480 600 680 800
1 90 200 280 400 480 600 680 800
Generation
CFU
ml−1
method● OD
plate countas.factor(replicate)●
●
●
●
●
●
123456
pLC× 1082.4
2.22.0
1.8
1.62.4
2.2
2.01.81.6
2.4
2.2
2.0
1.8
1.62.4
2.2
2.0
1.8
1.6
●
●● ●
●● ● ●● ● ● ●
●
●● ●● ● ● ●
●
● ●
●
● ● ●
●●
●● ●
●
● ● ●● ● ● ●●
● ● ●
●
●● ●
●
●● ●
●● ● ●
●●
● ●● ● ●●
●
● ●●
● ● ●●
● ●● ●
●●
● ●● ●
●
●
●
● ●●● ●
●●● ● ●
●
WtpLC
37°C
WtpHC
37°C
WtpLC
42°C
WtpHC
42°C
1 90 200 280 400 480 600 680 800
1.6e+081.8e+082.0e+082.2e+082.4e+08
1.6e+081.8e+082.0e+082.2e+082.4e+08
1.6e+081.8e+082.0e+082.2e+082.4e+08
1.6e+081.8e+082.0e+082.2e+082.4e+08
1 90 200 280 400 480 600 680 800
1 90 200 280 400 480 600 680 800
1 90 200 280 400 480 600 680 800
Generation
CFU
ml−1
method● OD
plate countas.factor(replicate)●
●
●
●
●
●
123456
pHC
Wt
37°C
Wt
42°C
42°C
ΔmutS
37°C
ΔmutS
CFU
ml-1
Generation

32
monitored at least two times a day and possible biofilms were dissolved manually by
slewing the air inlet needle.
Furthermore, bacterial droplets can be aerosolized within the culturing vessel and
consequently bacteria can grow at parts that are not in direct contact with the liquid
culture. The formation of biofilms on the cork of the culturing vessel was the consequence.
This caused in some cases the growth of bacteria into the airbreak. Therefore, the whole
airbreak-assembly was exchanged every second day to prevent possible growth into the
upstream media supply and to prevent the risk of cross-contamination. Nevertheless, the
cork itself could not be exchanged that easily because it required the opening of the
system and thus contamination of the bacterial culture. Therefore, for maintenance and
cleaning purposes, chemostats were disassembled every 200 generations (i.e., every
three weeks) and total populations were stored at -80°C (see Section 3.7). Half of each
archived population was then used to re-establish the 48 chemostat cultures. This
reduction in cell population size corresponds to a minor bottleneck in comparison to
typical serial transfer experiments (e.g., Lenski et al. 1991, Vogwill et al. 2016). Although
the impact of this bottleneck size was not tested experimentally, it can be assumed that
the reduction of roughly 200 million cells to 100 million cells had only a minor impact on
the total diversity maintained in the populations.
4.5 Plasmid copy number dynamics
A factor that might affect the mutation supply rate of a plasmid is it’s copy number within a
population of cells. As outlined in Section 4.2, pLC and pHC plasmid copy numbers were
significantly higher in the hypermutator strain in comparison to the wild-type genetic
background. After acclimatization of the four genotypes to the media conditions used in
the evolution experiment (Section 3.7), plasmid copy numbers remained significantly
different between both host genotypes (Figure 10). This indicates, that the host genotype
has an impact on plasmid copy number that is independent of media conditions and that
these PCN differences were not transient. Furthermore, although each of the pLC
populations had undergone just one separated overnight cultivation after they were split
from the same ancestral population, pLC plasmid copy numbers varied among the twelve
populations used to found the chemostat (CV listed in Figure 10). Nevertheless, the
coefficient of variation was less than 10% and the copy number was within the range of
plasmid copy numbers reported previously for pBBR1-based plasmids (e.g., Troeschel et
al. 2012, Jahn et al. 2016).
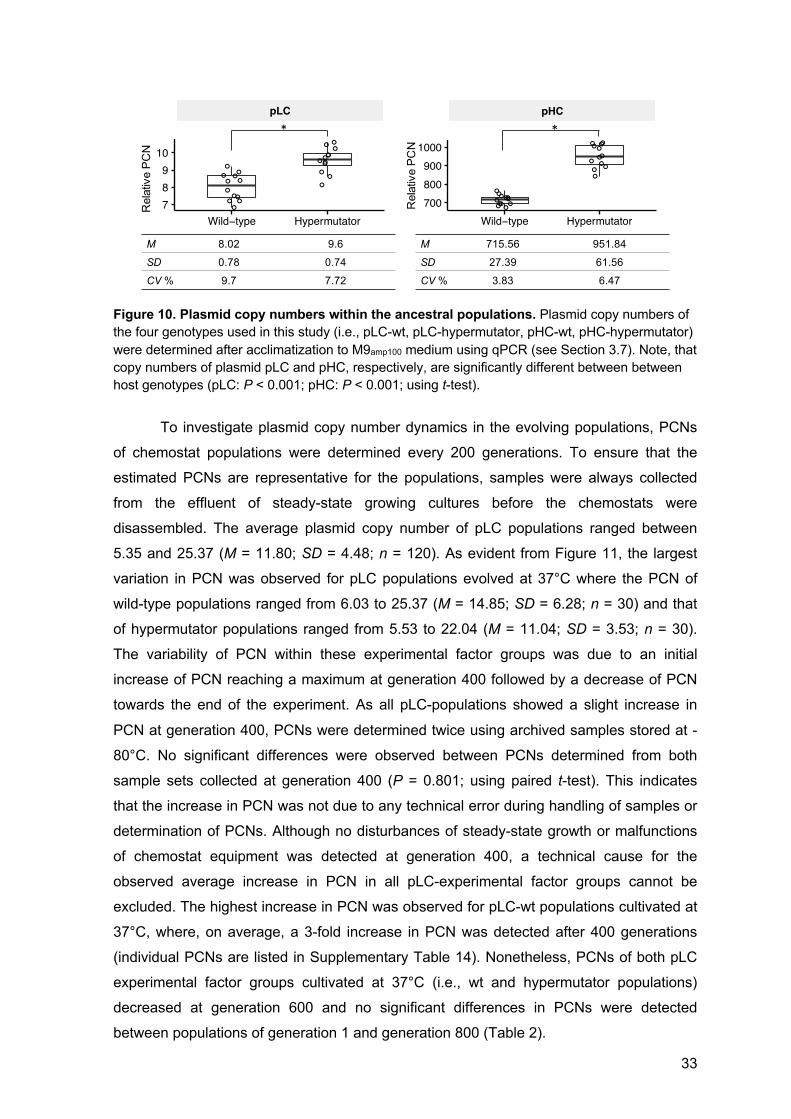
33
Figure 10. Plasmid copy numbers within the ancestral populations. Plasmid copy numbers of the four genotypes used in this study (i.e., pLC-wt, pLC-hypermutator, pHC-wt, pHC-hypermutator) were determined after acclimatization to M9amp100 medium using qPCR (see Section 3.7). Note, that copy numbers of plasmid pLC and pHC, respectively, are significantly different between between host genotypes (pLC: P < 0.001; pHC: P < 0.001; using t-test).
To investigate plasmid copy number dynamics in the evolving populations, PCNs
of chemostat populations were determined every 200 generations. To ensure that the
estimated PCNs are representative for the populations, samples were always collected
from the effluent of steady-state growing cultures before the chemostats were
disassembled. The average plasmid copy number of pLC populations ranged between
5.35 and 25.37 (M = 11.80; SD = 4.48; n = 120). As evident from Figure 11, the largest
variation in PCN was observed for pLC populations evolved at 37°C where the PCN of
wild-type populations ranged from 6.03 to 25.37 (M = 14.85; SD = 6.28; n = 30) and that
of hypermutator populations ranged from 5.53 to 22.04 (M = 11.04; SD = 3.53; n = 30).
The variability of PCN within these experimental factor groups was due to an initial
increase of PCN reaching a maximum at generation 400 followed by a decrease of PCN
towards the end of the experiment. As all pLC-populations showed a slight increase in
PCN at generation 400, PCNs were determined twice using archived samples stored at -
80°C. No significant differences were observed between PCNs determined from both
sample sets collected at generation 400 (P = 0.801; using paired t-test). This indicates
that the increase in PCN was not due to any technical error during handling of samples or
determination of PCNs. Although no disturbances of steady-state growth or malfunctions
of chemostat equipment was detected at generation 400, a technical cause for the
observed average increase in PCN in all pLC-experimental factor groups cannot be
excluded. The highest increase in PCN was observed for pLC-wt populations cultivated at
37°C, where, on average, a 3-fold increase in PCN was detected after 400 generations
(individual PCNs are listed in Supplementary Table 14). Nonetheless, PCNs of both pLC
experimental factor groups cultivated at 37°C (i.e., wt and hypermutator populations)
decreased at generation 600 and no significant differences in PCNs were detected
between populations of generation 1 and generation 800 (Table 2).
●
●●
● ●
●
●●
●●
●
●
●
●
●
●
●
●
●●
●
●
●
●
●●
●
●
●●
●
●●
●
●
●
●
●
●●
●
●
●
●
●
●
●
●
pLC
pHC
Wild−type Hypermutator
Wild−type Hypermutator7008009001000
78910
Host genotype
PCN
●
●●
● ●
●
●●
●●
●
●
●
●
●
●
●
●
●●
●
●
●
●
●●
●
●
●●
●
●●
●
●
●
●
●
●●
●
●
●
●
●
●
●
●
pLC
pHC
Wild−type Hypermutator
Wild−type Hypermutator7008009001000
78910
Host genotype
PCN
Rel
ativ
e PC
N
●
●●
● ●
●
●●
●●
●
●
●
●
●
●
●
●
●●
●
●
●
●
●●
●
●
●●
●
●●
●
●
●
●
●
●●
●
●
●
●
●
●
●
●
pLC
pHC
Wild−type Hypermutator
Wild−type Hypermutator7008009001000
78910
Host genotype
PCN
●
●●
● ●
●
●●
●●
●
●
●
●
●
●
●
●
●●
●
●
●
●
●●
●
●
●●
●
●●
●
●
●
●
●
●●
●
●
●
●
●
●
●
●
pLC
pHC
Wild−type Hypermutator
Wild−type Hypermutator7008009001000
78910
Host genotype
PCN
* *
Rel
ativ
e PC
N
M 8.02 9.6
SD 0.78 0.74
CV % 9.7 7.72
M 715.56 951.84
SD 27.39 61.56
CV % 3.83 6.47
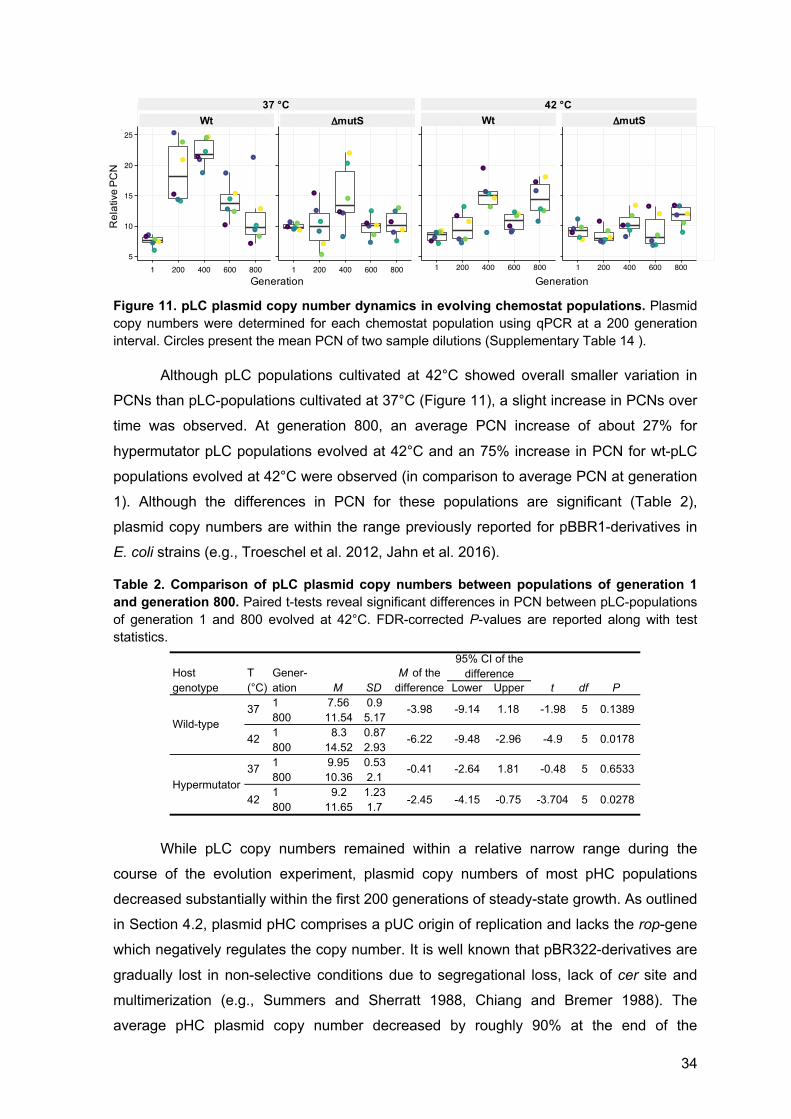
34
Figure 11. pLC plasmid copy number dynamics in evolving chemostat populations. Plasmid copy numbers were determined for each chemostat population using qPCR at a 200 generation interval. Circles present the mean PCN of two sample dilutions (Supplementary Table 14 ).
Although pLC populations cultivated at 42°C showed overall smaller variation in
PCNs than pLC-populations cultivated at 37°C (Figure 11), a slight increase in PCNs over
time was observed. At generation 800, an average PCN increase of about 27% for
hypermutator pLC populations evolved at 42°C and an 75% increase in PCN for wt-pLC
populations evolved at 42°C were observed (in comparison to average PCN at generation
1). Although the differences in PCN for these populations are significant (Table 2),
plasmid copy numbers are within the range previously reported for pBBR1-derivatives in
E. coli strains (e.g., Troeschel et al. 2012, Jahn et al. 2016).
Table 2. Comparison of pLC plasmid copy numbers between populations of generation 1 and generation 800. Paired t-tests reveal significant differences in PCN between pLC-populations of generation 1 and 800 evolved at 42°C. FDR-corrected P-values are reported along with test statistics.
While pLC copy numbers remained within a relative narrow range during the
course of the evolution experiment, plasmid copy numbers of most pHC populations
decreased substantially within the first 200 generations of steady-state growth. As outlined
in Section 4.2, plasmid pHC comprises a pUC origin of replication and lacks the rop-gene
which negatively regulates the copy number. It is well known that pBR322-derivatives are
gradually lost in non-selective conditions due to segregational loss, lack of cer site and
multimerization (e.g., Summers and Sherratt 1988, Chiang and Bremer 1988). The
average pHC plasmid copy number decreased by roughly 90% at the end of the
●●
●
●
●●
●
●
●●
●
●
●●
●
●
●●
●
●
●
●
●
●
●
●
●●
●
●
●●
●
●
●●
●
●
●
●●
●
●
●
●
●
●
●
●●●
●●
●
●
●●
●
●
●
●
●●●
●●
●
●
●
●
●
●
●
●
●
●
●●
●
●
●
●
●●
●
●
●
●
●
●
●
●
●
●
●●
●
●
●●●
●
●
●
●
●
●
●
●
●
●●●
●
●
●
●
●
●
●
WtpLC
mutSpLC
37°C
42°C
1 200 400 600 800 1 200 400 600 800
5
10
15
20
25
5
10
15
20
25
Generation
PCN
37 °C●
●
●
●
●●
●
●
●●
●
●
●●
●
●
●●
●
●
●
●
●
●
●
●
●●
●
●
●●
●
●
●●
●
●
●
●●
●
●
●
●
●
●
●
●●●
●●
●
●
●●
●
●
●
●
●●●
●●
●
●
●
●
●
●
●
●
●
●
●●
●
●
●
●
●●
●
●
●
●
●
●
●
●
●
●
●●
●
●
●●●
●
●
●
●
●
●
●
●
●
●●●
●
●
●
●
●
●
●
WtpLC
mutSpLC
37°C
42°C
1 200 400 600 800 1 200 400 600 800
5
10
15
20
25
5
10
15
20
25
Generation
PCN
●●
●
●
●●
●
●
●●
●
●
●●
●
●
●●
●
●
●
●
●
●
●
●
●●
●
●
●●
●
●
●●
●
●
●
●●
●
●
●
●
●
●
●
●●●
●●
●
●
●●
●
●
●
●
●●●
●●
●
●
●
●
●
●
●
●
●
●
●●
●
●
●
●
●●
●
●
●
●
●
●
●
●
●
●
●●
●
●
●●●
●
●
●
●
●
●
●
●
●
●●●
●
●
●
●
●
●
●
WtpLC
mutSpLC
37°C
42°C
1 200 400 600 800 1 200 400 600 800
5
10
15
20
25
5
10
15
20
25
Generation
PCN
42 °C
Generation Generation
Rel
ativ
e PC
NWt ΔmutS Wt ΔmutS
M SD Lower Upper t df P1 7.56 0.9800 11.54 5.171 8.3 0.87800 14.52 2.931 9.95 0.53800 10.36 2.11 9.2 1.23800 11.65 1.7
Host genotype
0.0278
0.6533
M of the difference
Gener-ation
T (°C)
5-2.45
-0.41
-4.15
-2.64
-0.75
1.81
-3.704
-0.48
95% CI of the difference
-9.14 1.18
5
0.13895-1.98Wild-type
42
-3.98
0.01785-4.9
37
-2.96-9.48-6.22
Hypermutator37
42
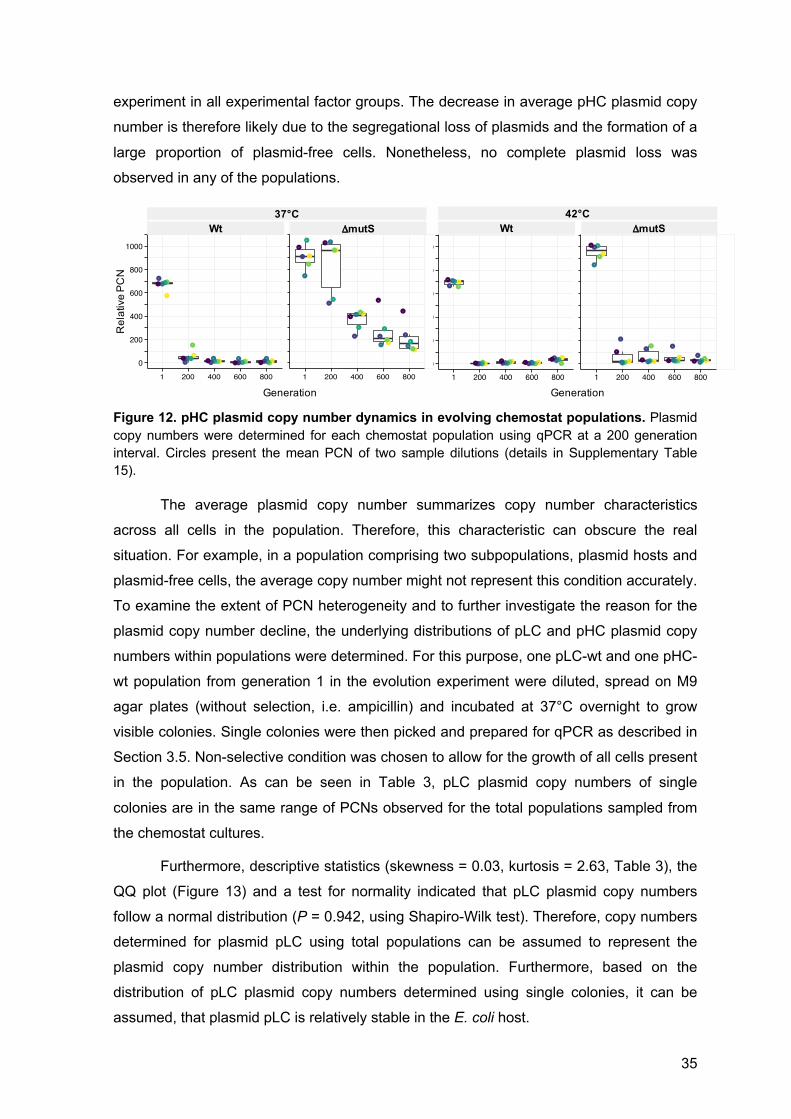
35
experiment in all experimental factor groups. The decrease in average pHC plasmid copy
number is therefore likely due to the segregational loss of plasmids and the formation of a
large proportion of plasmid-free cells. Nonetheless, no complete plasmid loss was
observed in any of the populations.
Figure 12. pHC plasmid copy number dynamics in evolving chemostat populations. Plasmid copy numbers were determined for each chemostat population using qPCR at a 200 generation interval. Circles present the mean PCN of two sample dilutions (details in Supplementary Table 15).
The average plasmid copy number summarizes copy number characteristics
across all cells in the population. Therefore, this characteristic can obscure the real
situation. For example, in a population comprising two subpopulations, plasmid hosts and
plasmid-free cells, the average copy number might not represent this condition accurately.
To examine the extent of PCN heterogeneity and to further investigate the reason for the
plasmid copy number decline, the underlying distributions of pLC and pHC plasmid copy
numbers within populations were determined. For this purpose, one pLC-wt and one pHC-
wt population from generation 1 in the evolution experiment were diluted, spread on M9
agar plates (without selection, i.e. ampicillin) and incubated at 37°C overnight to grow
visible colonies. Single colonies were then picked and prepared for qPCR as described in
Section 3.5. Non-selective condition was chosen to allow for the growth of all cells present
in the population. As can be seen in Table 3, pLC plasmid copy numbers of single
colonies are in the same range of PCNs observed for the total populations sampled from
the chemostat cultures.
Furthermore, descriptive statistics (skewness = 0.03, kurtosis = 2.63, Table 3), the
QQ plot (Figure 13) and a test for normality indicated that pLC plasmid copy numbers
follow a normal distribution (P = 0.942, using Shapiro-Wilk test). Therefore, copy numbers
determined for plasmid pLC using total populations can be assumed to represent the
plasmid copy number distribution within the population. Furthermore, based on the
distribution of pLC plasmid copy numbers determined using single colonies, it can be
assumed, that plasmid pLC is relatively stable in the E. coli host.
●
●●●
●
●
●
●
●●●●
●●●●
●● ●●●●●●
●●●
●●●
●●
●●
●
●
●●●●●●●●●●●
● ●●●●●●●
●●●
●●
●
●
●
●
●
●●●
●
●
●
●
●●
●
●
●
●
●●
●
●
●
●
●●
●●
●
●
●●
●
●
●●
●●●●
●
●
●
●
●●
●
●●●●●
●
● ●●●●
●
●
WtpHC
mutSpHC
37°C
42°C
1 200 400 600 800 1 200 400 600 800
0
200
400
600
800
1000
0
200
400
600
800
1000
Generation
PCN
37°CWt ΔmutS
●
●●●
●
●
●
●
●●●●
●●●●
●● ●●●●●●
●●●
●●●
●●
●●
●
●
●●●●●●●●●●●
● ●●●●●●●
●●●
●●
●
●
●
●
●
●●●
●
●
●
●
●●
●
●
●
●
●●
●
●
●
●
●●
●●
●
●
●●
●
●
●●
●●●●
●
●
●
●
●●
●
●●●●●
●
● ●●●●
●
●
WtpHC
mutSpHC
37°C
42°C
1 200 400 600 800 1 200 400 600 800
0
200
400
600
800
1000
0
200
400
600
800
1000
GenerationPC
N
●
●●●
●
●
●
●
●●●●
●●●●
●● ●●●●●●
●●●
●●●
●●
●●
●
●
●●●●●●●●●●●
● ●●●●●●●
●●●
●●
●
●
●
●
●
●●●
●
●
●
●
●●
●
●
●
●
●●
●
●
●
●
●●
●●
●
●
●●
●
●
●●
●●●●
●
●
●
●
●●
●
●●●●●
●
● ●●●●
●
●
WtpHC
mutSpHC
37°C
42°C
1 200 400 600 800 1 200 400 600 800
0
200
400
600
800
1000
0
200
400
600
800
1000
Generation
PCN
42°CWt ΔmutS
Rel
ativ
e PC
N
Generation Generation

36
Table 3. Descriptive statistics for pLC-wt and pHC-wt plasmid copy numbers determined from single colonies and total populations. Plasmid copy numbers were determined using single colonies or total populations (i.e., chemostat populations).
Plasmid copy numbers of the pHC-wt single colonies ranged from 0 to 7600
plasmids per chromosome. As shown in Figure 13, the majority of colonies showed a
relative PCN below 500 copies per chromosome (n = 52, Mdn = 399.8) and the underlying
distribution cannot by approximated by a normal distribution (kurtosis = 5.41; P < 0.001,
using Shapiro-Wilk test) and is skewed right (skewness = 1.51). This indicates that pHC
plasmids are partitioned unequally between daughter cells. Moreover, six colonies had a
relative plasmid copy number lower than 1. Differential re-streaking of these colonies on
selective and non-selective media as well as colony PCR confirmed that the plasmid was
present in five of the six colonies. Nevertheless, copy numbers below 1 suggested that
cells within these colonies were heterogenous with respect to plasmid copy number.
Figure 13. Distribution of plasmid copy numbers of single colonies. PCNs were determined from single colonies by plating appropriate dilutions of one Wt-pLC and one Wt-pHC population on M9 agar each. After ON growth at 37°C, PCNs were determined as described in the methods section. pLC: n=35; pHC: n=91. Note, that quantile plots are shown on the right.
Therefore, to investigate the copy number heterogeneity within single colonies,
three pHC-wt colonies were randomly chosen, streaked on non-selective media and
grown overnight to obtain single colonies. Then, twelve single colonies of each of the
three test colonies were randomly chosen for the determination of PCNs. The variability
(CV) in PCNs of single colonies ranged from 42% to 46% (see Supplementary Figure 5A).
Although this analysis is not a direct verification of PCN heterogeneity within single
colonies, it indicates the extent of PCN variability of plasmid pHC. In contrast, single
n Min. Q1 Mdn M Q3 Max.
single colonies 35 6.52 11.26 14.41 14.10 16.36 23.16
total population* 30 6.03 8.77 14.26 14.85 20.95 25.37
single colonies 91 0.00 104.70 399.80 1214.60 2209.20 7609.80
total population* 30 0.70 10.21 18.57 154.65 57.99 725.68*statistics derived from all populations cultivated at 37°C
pLC-wt
pHC-wt
●
●●●
●
●●
● ●
●
●
●●
●●●
●●
●
●
●●
●
●
●
●
●●
●
●
●
●
●●
●
●
●● ● ●
●
●●●
●
●
●●
●●
●
● ●●
●
●●●● ●
●●●
●
●●
●
●
●●
● ●●
●
●●
● ●●
●●
●
●●
●
●●
●
●
●
●A
0 1000 2000 3000 4000 5000 6000 7000PCN
genotype
●
● ●
●
●●
● ●●
●
●
●
●●
●
●
● ●●●
●●
●
●●
●
●
●
●●
●
●
●●
●
B
0 5 10 15 20 25PCN
genotype
pLC
pHC
● ● ● ●●●●●●●
●●●●●●●●●
●●●●●●●●●
●●●● ● ●
●
10
20
−2 −1 0 1 2Theoretical
Sample
● ● ●●●●●●●●●●●●●●●●●●●●●●●●●●●●●●●●●●●●●●●●●●●●●●●●●●●●●●●●●●●●●●
●●●●●●●●●●
●●●●●●●●●●●●●●
●●
●
−25000
250050007500
−2 −1 0 1 2Theoretical
Sample
37
colonies of pLC-wt revealed a maximum variability of 15% (Supplementary Figure 5B).
After regrowth on selective medium, PCNs of pHC-wt colonies were significantly higher
(0.49-fold to 1.18-fold, on average) in comparison to colonies grown on non-selective
media (P < 0.001, n = 36; using one-tailed t-test). In contrast, the comparison of PCNs of
pLC-wt colonies revealed that PCNs of colonies grown on selective medium are, on
average, 0.04-fold to 0.08-fold higher in comparison to PCNs of colonies grown on non-
selective medium (P = 0.166, n = 36; using one-tailed t-test). This demonstrates that the
copy number property of plasmid pHC is variable and depends on the selective regime.
To summarize, the copy number of plasmid pLC ranged between 6 to 25 copies per
chromosome. As indicated by the PCN distribution of single colonies, pLC copy numbers
are distributed normally within a population, which indicates that plasmid pLC is stable
under the tested conditions. Plasmid pHC, a derivative of plasmid pBR322 that lacks the
multimer resolution site, has a rather heterogenous distribution within the population and
is most likely gradually lost from a populations of cells (as indicated distribution of single
colony PCNs). Therefore, the decrease in population-wide average plasmid copy number
observed during the evolution experiment can be explained by pHC plasmid loss from the
population. To further investigate the cause for the pHC plasmid copy number decline, the
proportion of plasmid carrying cells was estimated.
4.6 Proportion of hosts
Segregation of plasmids leads to loss of plasmid DNA due to the unequal distribution of
plasmid copies between daughter cells during cell division. This phenomenon is well
known for high copy number plasmids like pHC that lack an active portioning mechanism
and a multimer resolution site. In a population of cells cultivated in a bioreactor, the
formation of plasmid-free segregants can overgrow plasmid-carrying cells, which results in
a heterogenous population of cells. To investigate the amount of plasmid free cells under
the conditions in the evolution experiment the proportion of hosts (i.e., plasmid carrying
cells) was estimated from populations sampled at generation 1 and generation 800.
The proportion of hosts was determined using the ampicillin resistance gene
encoded on both plasmids as a marker to distinguish plasmid carrying cells from plasmid-
free segregants. To this end, two methods, termed here differential plating and streak test,
were evaluated with respect to precision, accuracy and limitations. The differential plating
method is based on a sample of a population of cells that is spread on selective and non-
selective media. The proportion of hosts is then calculated as the ratio of colonies grown
on selective media and the number of colonies grown on non-selective media (e.g., Yano
et al. 2013). The streak method is based on single colonies that are streaked on selective
and non-selective media. The proportion of hosts is calculated as the ratio of colonies
38
grown on selective media to the total number of tested colonies. The main difference
between both methods is the number of random errors (e.g., dilution or counting error)
and the sampling units on which all statistical measures are based on. The sample unit of
the differential plating method is the total number of colonies counted on a plate, and that
of the streak method is a single colony. Both methods were evaluated using six test
samples containing pLC-wt cells mixed with plasmid-free wild-type cells to achieve
proportions of hosts ranging from 5% to 100%.
Both methods revealed similar estimated proportions and confidence intervals that
overlap for proportions larger than 0.05 (see Table 4 and Supplementary Figure 6).
Nevertheless, although, the precision reached with the differential plating method was
slightly higher for the differential plating method, a higher accuracy (relative error) for the
estimated proportion of host can be achieved using the streak method. Therefore, a
combination of both methods was used for the determination of the proportion of hosts.
Furthermore, to assess the sensitivity (true positive rate) and specificity of the streak
method, 100 colonies were randomly selected and were tested for the presence of the
plasmid using PCR. This test was done for both plasmids. While the specificity was 100%
for both plasmids, the sensitivity of the test method was estimated to be 93% for plasmid
pHC and 100% for plasmid pLC. Although the identification of true positive colonies
required to test some of the colonies twice, the false identification of true negatives was
presumably due to low cell fitness of the tested colonies such that they did not grow as
fast as other colonies. Nevertheless, since the streak method is a direct test method and
single colonies could be tested for the presence of the plasmid using PCR, the streak
method was mainly used to estimate the proportion of hosts.
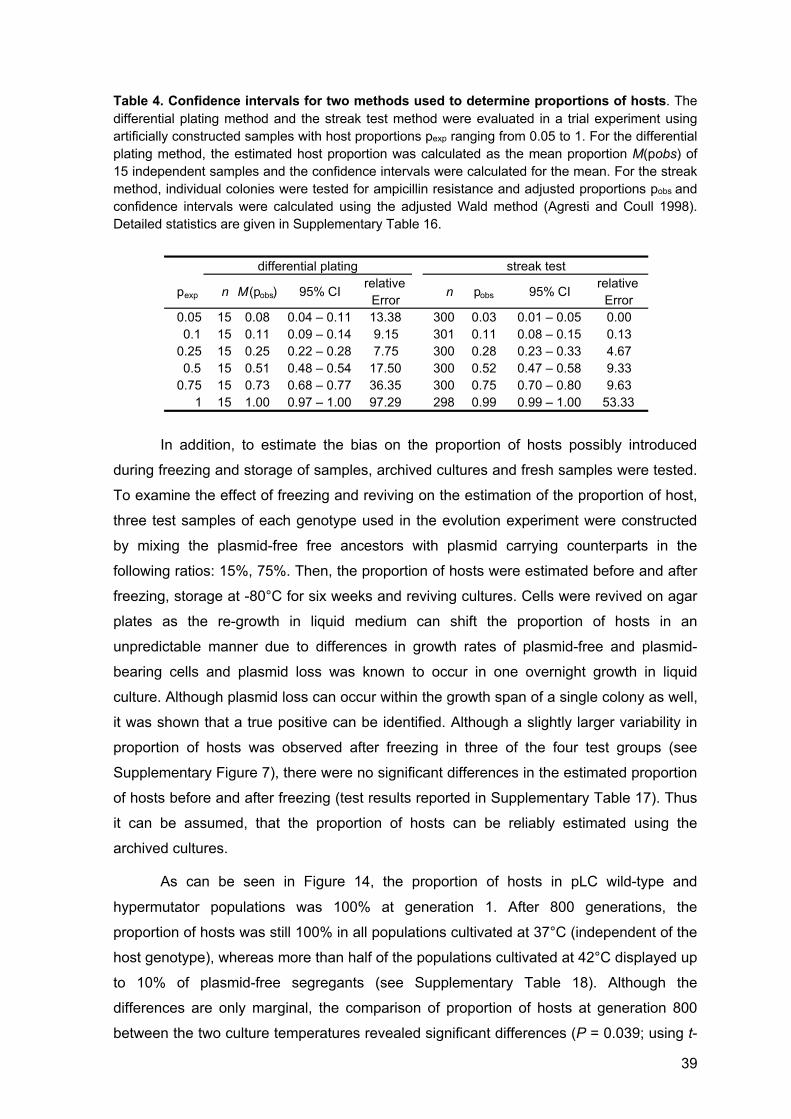
39
Table 4. Confidence intervals for two methods used to determine proportions of hosts. The differential plating method and the streak test method were evaluated in a trial experiment using artificially constructed samples with host proportions pexp ranging from 0.05 to 1. For the differential plating method, the estimated host proportion was calculated as the mean proportion M(pobs) of 15 independent samples and the confidence intervals were calculated for the mean. For the streak method, individual colonies were tested for ampicillin resistance and adjusted proportions pobs and confidence intervals were calculated using the adjusted Wald method (Agresti and Coull 1998). Detailed statistics are given in Supplementary Table 16.
In addition, to estimate the bias on the proportion of hosts possibly introduced
during freezing and storage of samples, archived cultures and fresh samples were tested.
To examine the effect of freezing and reviving on the estimation of the proportion of host,
three test samples of each genotype used in the evolution experiment were constructed
by mixing the plasmid-free free ancestors with plasmid carrying counterparts in the
following ratios: 15%, 75%. Then, the proportion of hosts were estimated before and after
freezing, storage at -80°C for six weeks and reviving cultures. Cells were revived on agar
plates as the re-growth in liquid medium can shift the proportion of hosts in an
unpredictable manner due to differences in growth rates of plasmid-free and plasmid-
bearing cells and plasmid loss was known to occur in one overnight growth in liquid
culture. Although plasmid loss can occur within the growth span of a single colony as well,
it was shown that a true positive can be identified. Although a slightly larger variability in
proportion of hosts was observed after freezing in three of the four test groups (see
Supplementary Figure 7), there were no significant differences in the estimated proportion
of hosts before and after freezing (test results reported in Supplementary Table 17). Thus
it can be assumed, that the proportion of hosts can be reliably estimated using the
archived cultures.
As can be seen in Figure 14, the proportion of hosts in pLC wild-type and
hypermutator populations was 100% at generation 1. After 800 generations, the
proportion of hosts was still 100% in all populations cultivated at 37°C (independent of the
host genotype), whereas more than half of the populations cultivated at 42°C displayed up
to 10% of plasmid-free segregants (see Supplementary Table 18). Although the
differences are only marginal, the comparison of proportion of hosts at generation 800
between the two culture temperatures revealed significant differences (P = 0.039; using t-
pexp n M(pobs) 95% CI relative Error n pobs 95% CI relative
Error0.05 15 0.08 0.04 – 0.11 13.38 300 0.03 0.01 – 0.05 0.000.1 15 0.11 0.09 – 0.14 9.15 301 0.11 0.08 – 0.15 0.13
0.25 15 0.25 0.22 – 0.28 7.75 300 0.28 0.23 – 0.33 4.670.5 15 0.51 0.48 – 0.54 17.50 300 0.52 0.47 – 0.58 9.33
0.75 15 0.73 0.68 – 0.77 36.35 300 0.75 0.70 – 0.80 9.631 15 1.00 0.97 – 1.00 97.29 298 0.99 0.99 – 1.00 53.33
streak testdifferential plating

40
test). This may suggest that the formation of pLC plasmid-free segregants at 42°C
occurred at a higher rate in comparison to populations cultivated at 37°C. Assuming that
plasmid-free segregants are constantly (even at a low rate) generated in a population, the
result indicates that plasmid-free segregants had at least a comparable or higher fitness in
comparison to plasmid-carrying cells in populations cultivated at 42°C.
Figure 14. Proportion of hosts at generation 1 and 800 in the evolution experiment. Proportion of hosts were estimated for each of the 48 chemostat populations using the streak method (Section 3.8). Confidence intervals are reported in Supplementary Table 18. Note that the minimum detection limit was 1%.
As described in Section 4.2, a decline in the number of plasmid-carrying cells was
observed for pHC-populations at the end of the experiment. Nonetheless, the magnitude
of decline differed between genotypes and culture temperatures (Figure 14). While the
average proportion of hosts was 0.07 ± 0.07 (SD; Mdn = 0.05) for wild-type populations
cultivated at 37°C, a higher average proportion of hosts was observed for wild-type
populations cultivated at 42°C (0.28 ± 0.25; Mdn = 0.2). In contrast to pHC-wt populations
cultivated at 37°C, the proportion of hosts in pHC-hypermutator populations cultivated at
37°C was remarkebly high (0.87 ± 0.23, M ± SD; Mdn = 0.97). Similarly, the average host
proportion of pHC-hypermutator populations cultivated at 42°C was higher (0.69 ± 0.19, M
± SD; Mdn = 0.78) in comparison to pHC-wt populations cultivated at 42°C.
As it is indicated by the growth rate differences between the ancestral plasmid-
carrying and plasmid-free strains (Section 4.3), both plasmid types imposed a fitness
burden on their hosts. Therefore, it can be suggested that competitive fitness differences
between plasmid carrying cells and plasmid-free segregants had an impact on the
establishment and propagation of plasmid-free cells in the chemostat populations.
Nevertheless, such fitness differences can decrease due to the emergence of
●● ●● ●●● ●●●●●
●●●●● ●●●●● ●●
●● ●●●●●● ●● ●●
●●
●
●● ●●●● ●●●
●●
●
●●●
● ●● ●●
●
●
●
●
●
●
●
●● ● ●● ●
● ●●
●
●
●● ●●● ●
●
●
●
●
●●
●
●●●
●●●
pLC − Wt pLC − Hypermutator pHC − Wt pHC − Hypermutator
37°C
42°C
1 800 1 800 1 800 1 800
0.00
0.25
0.50
0.75
1.00
0.00
0.25
0.50
0.75
1.00
Generation
Prop
ortio
n of
hos
ts

41
compensatory mutations (e.g., Harrison et al. 2015; Loftie-Eaton et al. 2017). Thus, in
comparison to the fitness differences of the ancestral strains, it might be the case for pHC-
wild-type populations cultivated at 42°C that these differences decreased in comparison to
populations cultivated at 37°C. On the other hand, for pHC-hypermutator populations, only
marginal growth rate differences between the plasmid-free and the ancestral plasmid-
carrying strains cultivated at 37°C were observed. Furthermore, there were no significant
differences in proportion of hosts between generation 1 and 800 for these populations (P
= 0.312, using Wilcoxon signed rank test; Supplementary Table 18). Thus it can be
assumed that plasmid carriage had no strong impact for the competitive fitness of
plasmid-free and plasmid-cyarrying strains in these populations.
Nonetheless, it needs to be kept in mind that periodic selection occurs in
chemostats cultures and this can have profound effect on the frequency of mutants during
cultivation (e.g., Dykhuizen and Hartl 1983). Therefore, a mutation that gives a fitness
advantage to a plasmid-free cell can lead to an increase in frequency of plasmid-free
cells, but a selectively favored mutation arising at a later time will rise in frequency again.
Hence, it has to be noted that the frequency of plasmid-carrying cells in the population
might have varied in all populations during the course of the experiment.
4.7 Plasmid genome evolution
For the identification of emerging mutations, sequencing reads of the ancestral and
evolved populations were trimmed and mapped to the reference E. coli MG1655 genome
and to the two assembled plasmid sequences. Sequencing coverage varied among the
populations and the replicons: the chromosomal coverage ranged between 109x and
327x, while the average coverage on the two plasmids was between 442x and 272,010x
(Supplementary Table 19). The ratio of the average coverage on the plasmids to that of
the chromosomes reflects the relative copy number of the plasmids within the sequenced
samples as the number of fragments in a sequencing library increases with the number of
a genetic elements present in a sample (e.g., Becker et al. 2016). As can be seen in
Figure 15A, the ratio of mean plasmid to chromosome coverage is within the range of
plasmid copy numbers determined for the ancestral populations and for single colonies
using qPCR (see Figure 10 and Figure 13). Nevertheless, the library preparation method
included PCR amplification of DNA fragments. Thus, beside optical duplicates produced
during the sequencing, sequencing reads contained PCR duplicates. The amount of PCR
and optical duplicates can be estimated using PICARD tools, but it is technically not
possible to distinguish PCR-generated duplicates from natural occurring duplicates as it
would be the case for multicopy-plasmids. Read duplicates have the potential to lead to
42
false representation of allele frequencies by increasing the proportion of an allele present
in the duplicates compared to an alternative allele. Additionally, population sequencing
(pool-seq) was used to enable the identification of rare, low frequency variants, but the
pooled cells or colonies were not individually barcoded such that a distinction of reads
belonging to a specific genotype was not possible. Therefore, a de-duplication step was
included prior to variant detection.
The deduplication of reads reduced the average coverage on the chromosome by
6.3% ± 1.0%, whereas the average coverage on the plasmids was reduced by 25% ± 11%
for plasmid pLC and by 63% ± 13% for plasmid pHC. Similar to the percentage change in
number of plasmid reads, relative PCNs were, on average, reduced by 61% ± 14% for
plasmid pHC and by 18% ± 11% for plasmid pLC (details shown in Figure 15A). As
evident from Figure 15B, there was a strong correlation between the initial number of
plasmid reads and the amount of plasmid reads removed during the deduplication
procedure (see also Supplementary Table 19 for details). Nonetheless, no such
correlation was found for chromosomal reads (Figure 15B) suggesting that the amount of
plasmid reads identified as optical and PCR duplicates is related to the number of
naturally occurring duplicates. Although such duplicates cannot be distinguished from
optical and PCR duplicates using the library preparation method used in this study (e.g.,
Mansukhani et al. 2018), it can be assumed that the amount of PCR-duplicates coincides
with the number of natural duplicates (i.e., plasmid copy number). Indeed, for RNA-seq
data, which normally comprises high rates of read duplicates, it has been shown, that read
duplication rates due to sampling strongly correlate with the total number of reads, but not
with that of PCR duplicates. Therefore, read duplicates were removed to identify variants
on chromosomes and plasmids, but were kept for the calculation of relative plasmid copy
numbers (similar to quantitative RNA-seq methods; e.g., Parekh et al. 2016, Bansal
2017).
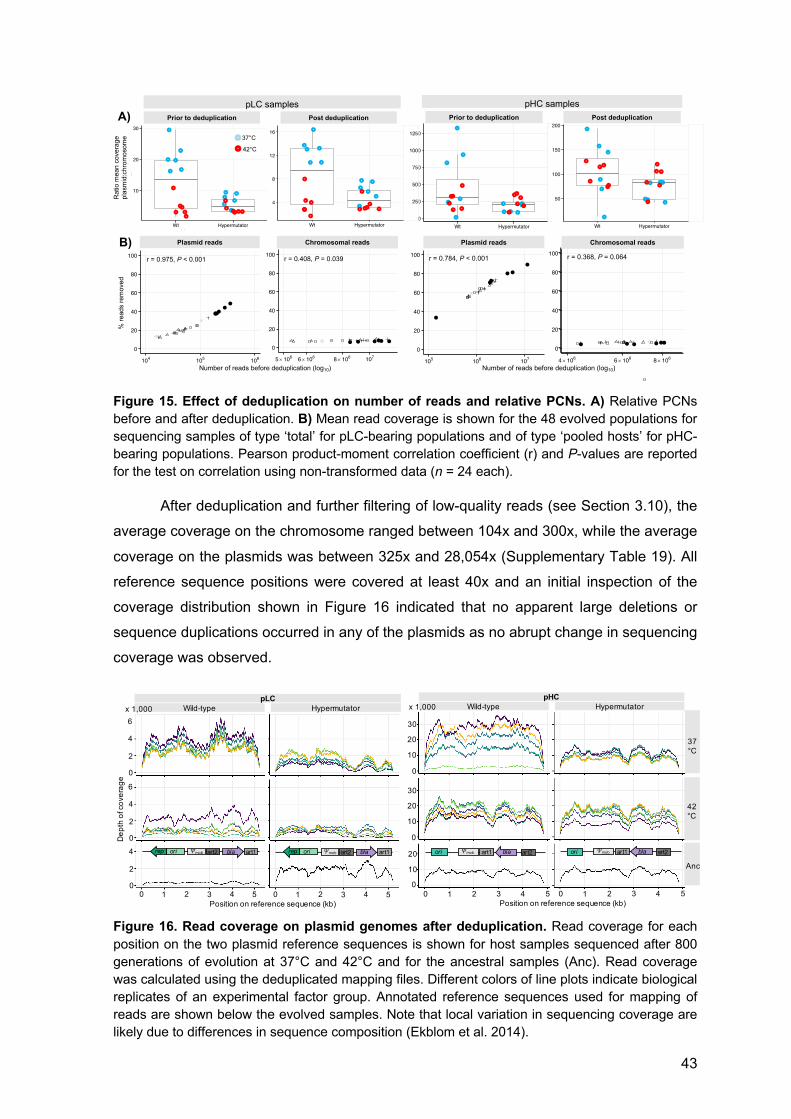
43
Figure 15. Effect of deduplication on number of reads and relative PCNs. A) Relative PCNs before and after deduplication. B) Mean read coverage is shown for the 48 evolved populations for sequencing samples of type ‘total’ for pLC-bearing populations and of type ‘pooled hosts’ for pHC-bearing populations. Pearson product-moment correlation coefficient (r) and P-values are reported for the test on correlation using non-transformed data (n = 24 each).
After deduplication and further filtering of low-quality reads (see Section 3.10), the
average coverage on the chromosome ranged between 104x and 300x, while the average
coverage on the plasmids was between 325x and 28,054x (Supplementary Table 19). All
reference sequence positions were covered at least 40x and an initial inspection of the
coverage distribution shown in Figure 16 indicated that no apparent large deletions or
sequence duplications occurred in any of the plasmids as no abrupt change in sequencing
coverage was observed.
Figure 16. Read coverage on plasmid genomes after deduplication. Read coverage for each position on the two plasmid reference sequences is shown for host samples sequenced after 800 generations of evolution at 37°C and 42°C and for the ancestral samples (Anc). Read coverage was calculated using the deduplicated mapping files. Different colors of line plots indicate biological replicates of an experimental factor group. Annotated reference sequences used for mapping of reads are shown below the evolved samples. Note that local variation in sequencing coverage are likely due to differences in sequence composition (Ekblom et al. 2014).
●●●●●
●
0
20
40
60
80
100
4 ´ 106 6 ´ 106 8 ´ 106
n_reads_before
perc_reduc
800interaction(genotype_2, temp) ●
Hypermutator.37Wt.37
●
●
●
●
●
●
0
20
40
60
80
100
105 106 107
n_reads_before
perc_reduc
800interaction(genotype_2, temp) ●
Hypermutator.37Wt.37
% r
eads r
em
oved
Hypermutator – 37°CWild-type – 37°C Hypermutator – 42°CWild-type – 42°C
Plasmid reads
Number of reads before deduplication (log10)
Chromosomal reads
r = 0.784, P < 0.001 r = 0.368, P = 0.064
●
●
●
●
●
●
●
●●
●
●
●●
●●
●●
●●
●
●
●
●
●
pHC
Wt Hypermutator0
250
500
750
1000
1250
Host.genotype2
PCN_befor
as.factor(T..C) ● ●37 42
Ratio m
ean c
overa
ge
pla
sm
id:c
hro
mosom
e
Prior to deduplication
●
●
●
●
●
●
●
●
●
●●
●
●
●●
●●
●●
●
●
●
●
●
pHC
Wt Hypermutator
50
100
150
200
Host.genotype2
PCN_after
as.factor(T..C) ● ●37 42
Post deduplication
pHC samples
●●●●●
●
0
20
40
60
80
100
4 ´ 106 6 ´ 106 8 ´ 106
n_reads_before
perc_reduc
800interaction(genotype_2, temp) ●
Hypermutator.37Wt.37
●
●
●
●
●
●
0
20
40
60
80
100
105 106 107
n_reads_before
perc_reduc
800interaction(genotype_2, temp) ●
Hypermutator.37Wt.37
% r
eads r
em
oved
Hypermutator – 37°CWild-type – 37°C Hypermutator – 42°CWild-type – 42°C
Plasmid reads
Number of reads before deduplication (log10)
Chromosomal reads
r = 0.784, P < 0.001 r = 0.368, P = 0.064
●
●
●
●
●
●
●
●●
●
●
●●
●●
●●
●●
●
●
●
●
●
pHC
Wt Hypermutator0
250
500
750
1000
1250
Host.genotype2
PCN_befor
as.factor(T..C) ● ●37 42
Ratio m
ean c
overa
ge
pla
sm
id:c
hro
mosom
e
Prior to deduplication
●
●
●
●
●
●
●
●
●
●●
●
●
●●
●●
●●
●
●
●
●
●
pHC
Wt Hypermutator
50
100
150
200
Host.genotype2
PCN_after
as.factor(T..C) ● ●37 42
Post deduplication
●
●●
● ●
●
●
●
●
●
●
●
●
●
●
●
●
●●
●
●●
●
●
pLC
Wt Hypermutator
4
8
12
16
Host.genotype2
PCN_after
as.factor(T..C) ● ●37 42
●
●
●
●●
●
●
●
●
●
●
●
●
●
●
●
●
● ●
●
●●
●
●
pLC
Wt Hypermutator
10
20
30
Host.genotype2
PCN_befor
as.factor(T..C) ● ●37 42
● ●● ●● ●
0
20
40
60
80
100
5 ´ 106 6 ´ 106 8 ´ 106 107
n_reads_before
perc_reduc
800interaction(genotype_2, temp) ●
Hypermutator.37Wt.37
r = 0.408, P = 0.039
●
●
●●
●
●
0
20
40
60
80
100
104 105 106
n_reads_before
perc_reduc
800interaction(genotype_2, temp) ●
Hypermutator.37Wt.37
r = 0.975, P < 0.001
% r
eads
rem
oved
Hypermutator – 37°CWild-type – 37°C Hypermutator – 42°CWild-type – 42°C
Plasmid reads
Number of reads before deduplication (log10)
Chromosomal reads
Rat
io m
ean
cove
rage
pl
asm
id:c
hrom
osom
ePrior to deduplication
●
●
●
●●
●
●
●
●
●
●
●
●
●
●
●
●
● ●
●
● ●
●
●
pLC
Wt Hypermutator
10
20
30
Host.genotype2
PCN_befor
as.factor(T..C) ● ●37 42
●
●
●
●●
●
●
●
●
●
●
●
●
●
●
●
●
● ●
●
● ●
●
●
pLC
Wt Hypermutator
10
20
30
Host.genotype2
PCN_befor
as.factor(T..C) ● ●37 4242°C
37°C
Post deduplication
pLC samplesA)
●
●●
● ●
●
●
●
●
●
●
●
●
●
●
●
●
●●
●
●●
●
●
pLC
Wt Hypermutator
4
8
12
16
Host.genotype2
PCN_after
as.factor(T..C) ● ●37 42
●
●
●
●●
●
●
●
●
●
●
●
●
●
●
●
●
● ●
●
●●
●
●
pLC
Wt Hypermutator
10
20
30
Host.genotype2
PCN_befor
as.factor(T..C) ● ●37 42
● ●● ●● ●
0
20
40
60
80
100
5 ´ 106 6 ´ 106 8 ´ 106 107
n_reads_before
perc_reduc
800interaction(genotype_2, temp) ●
Hypermutator.37Wt.37
r = 0.408, P = 0.039
●
●
●●
●
●
0
20
40
60
80
100
104 105 106
n_reads_before
perc_reduc
800interaction(genotype_2, temp) ●
Hypermutator.37Wt.37
r = 0.975, P < 0.001
% r
eads
rem
oved
Hypermutator – 37°CWild-type – 37°C Hypermutator – 42°CWild-type – 42°C
Plasmid reads
Number of reads before deduplication (log10)
Chromosomal reads
Rat
io m
ean
cove
rage
pl
asm
id:c
hrom
osom
e
Prior to deduplication
●
●
●
●●
●
●
●
●
●
●
●
●
●
●
●
●
● ●
●
● ●
●
●
pLC
Wt Hypermutator
10
20
30
Host.genotype2
PCN_befor
as.factor(T..C) ● ●37 42
●
●
●
●●
●
●
●
●
●
●
●
●
●
●
●
●
● ●
●
● ●
●
●
pLC
Wt Hypermutator
10
20
30
Host.genotype2
PCN_befor
as.factor(T..C) ● ●37 4242°C
37°C
Post deduplication
B)
6
4
2
0
Wild-type HypermutatorpLC
0 1 2 3 4 5 0 1 2 3 4 5
rep ori !mob art1art2 bla rep ori !mob art1art2 bla
Position on reference sequence (kb)
6
4
2
0
4
2
0
x 1,000
Dep
th o
f cov
erag
e
Wild-type Hypermutator
30
20
10
0
0
0
pHC
ori !mob art2art1 bla
0 1 2 3 4 5Position on reference sequence (kb)
ori !mob art2art1 bla
0 1 2 3 4 5
30
20
10
20
10
x 1,000
37°C
42°C
Anc
44
One aim of this study was to determine the frequency of plasmid mutations in
bacterial populations and to compare these frequencies to that of chromosomes. The
aforementioned theoretical prediction for mutations on plasmids showed, that those might
be of low allele frequency. The high coverage on the plasmid genomes increases the
detection sensitivity for rare and low-frequency variants. Nonetheless, in order to compare
the number of mutations across replicons and populations, the sequencing reads of each
replicon (i.e., chromosome and plasmids) were subsampled to match the lowest-coverage
dataset (104x) unless stated otherwise. Furthermore, variants occurring in both ancestral
and evolved populations were excluded as well as variants supported by reads in one
direction only. A major challenge in detecting rare variants in pooled samples is to
distinguish experimental noise such as alignment artefacts or sequencing errors from true
polymorphisms with low frequencies. Therefore, to eliminate possible false positive calls,
several variant filtering steps were implemented in the analysis pipeline (illustrated in ).
For example, owing to the previously reported low concordance between different variant
calling algorithms (e.g., Li 2014, O'Rawe et al. 2013), three variant callers were used in
this study. Furthermore, only variants detected concordantly by at least two of the variant
callers were retained. This resulted in a set of 50 plasmid variants identified in the 48
samples. In the following, 23 variants were removed as their allele frequency was below
the threshold of 2% and additional five variants were removed because of low alternative
base quality. This resulted in 22 variants of which two were single nucleotide substitutions
(hereafter termed point mutations) and the remaining 20 were insertion and deletions.
Owing to the known difficulties to reliably identify indels (e.g., Spencer et al. 2014), a
minimum threshold of 10 alternative reads was required to retain an indel variant resulting
in the elimination of 18 indels that did not pass this criteria.
The two point mutations identified using the conservative comparative genomic
analysis pipeline are located on plasmid pLC and were observed in two independent
populations (Table 5). Both mutations are located in an intergenic region and their allele
frequency is lower than 0.10 (see Figure 17). Two single nucleotide insertion mutations
observed on plasmid pHC were identified in two independent hypermutator populations
cultivated at 37°C. One insertion is located in an intergenic region and one is located
within the origin of replication (Figure 17). The insertion mutation located in the pUC-origin
of replication on plasmid pHC has the potential to change the secondary structure of
RNAI, the antisense repressor of the replication of pBR322-type plasmids (Tomizawa and
Itoh 1981). The insertion is located within a bubble of the RNAI secondary structure which
serves as a cleavage site of RNase E. DNA replication of ColE1-type plasmids has been
shown to be dependent on the rate of endonucleolytic cleavage of RNAI mediated by
RNase E (Lin-Chao and Cohen 1991). A comparison of the positional entropy (Huynen et

45
al. 1997) at this site reveals that the insertion mutation increases the positional entropy in
comparison to the reference like RNAI secondary structure (see Supplementary Figure 8).
Low values of positional entropy, which is related to positional base pairing probability,
indicate a strong agreement among low energy structures in a Boltzmann ensemble
(Garcia-Martin and Clote 2015). Therefore, there is the possibility that the formation of the
RNA secondary structure is altered at this specific position of the RNA and that the
change in the primary structure impacts the site for RNase E cleavage. Furthermore, this
mutation also changes the primary structure of RNAII which functions as the preprimer for
the DNA polymerase I to start initiation of plasmid replication. The insertion mutation is
located at the 5’-end of RNAII, but not within any of the known functional secondary
structures (e.g., the three stem loop structures known to interact with RNAI (Tomizawa
and Itoh 1981)). Nonetheless, it has to be noted that the plasmids evolved here are in
multicopy state where the RNA elements of the plasmid replication initiation are also
functional in trans (for example ColE1 plasmid (Muesing et al. 1981)).
Although allele frequencies of both insertion mutations are above 0.3, both
insertions are located in homopolymer stretches of seven identical nucleotides.
Homopolymer stretches have previously been shown to be one major source for false
indel calls (Fang et al. 2014). Furthermore, indel mutations differ from point mutations
(i.e., base substitutions) in the way they originate and the way they are repaired (e.g., Lee
et al. 2012, Kunkel 2010). Therefore, for the comparison of mutation frequencies only
point mutations were considered. Furthermore, only mutations occurring in intergenic
regions and non-RNA coding regions were considered for the comparison.
Figure 17. Genomic location of variants identified on plasmid pLC and pHC. Location of point mutations (red) and insertions (blue) are shown along with the change in nucleotide sequence (5’à3’) and the respective allele frequency below. Annotated reference sequences used for mapping of reads are shown at the bottom. Two point mutations were identified in pLC-hypermutator populations cultivated at 37°C (S32) and 42°C (S21). Single nucleotide insertions were identified in pHC-hypermutator populations cultivated at 37°C (S72, S68).
rep ori !mob art1art2 bla
0 1 2 3 4 5
CGGGCCCCGGCCCC
...
.........
CACGGGC......
......CACCGGC
ori !mob art2art1 bla
0 1 2 3 4 5
GTGGTTT......
......
TCGAGGG......
......TCGAGGGG
GTGGTTTT
kb kb
pLC pHC
S21
S32
S72
S68
0.08
0.08 0.3
0.35
46
Assuming an equal mutation rate between chromosome and plasmid, the paucity
of plasmid variants should be evaluated against the background of variants on the host
chromosome, where a total of 1,394 point mutations was observed. The expected
frequency of point mutations on the two plasmids was therefore calculated using the
chromosomal substitution frequency, the plasmid genome size and the plasmid copy
number. This shows that mutations are unlikely to occur on either of the plasmid types
evolved in the wild-type host due to the combination of low substitution rate and the
plasmid small genome size (Table 5). In contrast, the combination of high genetic
polymorphism in the hypermutator host with the high copy number of plasmid pHC are
likely to result in observable genetic variants on the pHC plasmid within the time span of
the experiment (Table 5 and Supplementary Table 21). Nonetheless, the subsampled
sequencing data for pHC did not reveal any point mutations occurring on that plasmid.
In order to increase the resolution for the detection of low-frequency point
mutations, the same variant calling pipeline was applied to the sequencing read datasets
without subsampling (i.e., full sequencing coverage). This analysis revealed one point
mutation on plasmid pHC at an intergenic position with a sequencing depth of ~9,600 and
a low allele frequency of AF = 0.03 (Table 6). In contrast, considering the full sequencing
depth for plasmid pLC, which is on average ~10x lower than that of plasmid pHC, two
additional intergenic point mutations were observed (Table 6). Thus, despite the high
sequencing depth, the observed number of point mutations on plasmid pHC does not
reach the expected frequency of point mutations (Table 5), even when the full sequence
coverage is included in the analysis.
The number of point mutations on the pHC plasmid was further validated by the
analysis of the total pHC population sequencing data (i.e., samples were prepared without
selection for plasmid hosts). Considering the full sequencing coverage, one additional
point mutation on the plasmid was detected. The intergenic point mutation was observed
with a low allele frequency of AF = 0.04 (Table 6) in one of the pHC populations having
the hypermutator host genotype. In addition, the number of point mutations observed on
the chromosome in the pooled pHC host populations was compared to that of the total
population sequencing data (Supplementary Table 21). The comparison shows that the
wild-type populations include, on average, two additional point mutations per population in
comparison to the corresponding data of pooled plasmid host colonies. The comparison of
hypermutator populations shows that the total population sequencing data includes, on
average, 14 point mutations per population less than the pooled colonies sequencing
data.
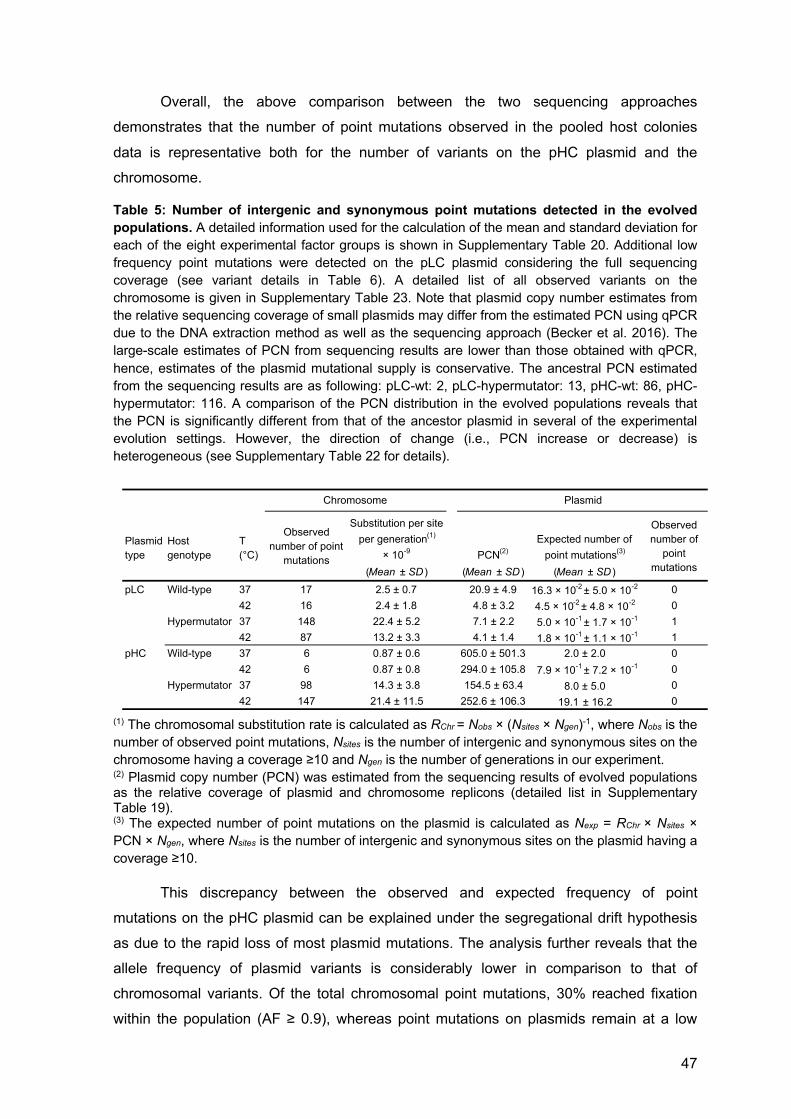
47
Overall, the above comparison between the two sequencing approaches
demonstrates that the number of point mutations observed in the pooled host colonies
data is representative both for the number of variants on the pHC plasmid and the
chromosome.
Table 5: Number of intergenic and synonymous point mutations detected in the evolved populations. A detailed information used for the calculation of the mean and standard deviation for each of the eight experimental factor groups is shown in Supplementary Table 20. Additional low frequency point mutations were detected on the pLC plasmid considering the full sequencing coverage (see variant details in Table 6). A detailed list of all observed variants on the chromosome is given in Supplementary Table 23. Note that plasmid copy number estimates from the relative sequencing coverage of small plasmids may differ from the estimated PCN using qPCR due to the DNA extraction method as well as the sequencing approach (Becker et al. 2016). The large-scale estimates of PCN from sequencing results are lower than those obtained with qPCR, hence, estimates of the plasmid mutational supply is conservative. The ancestral PCN estimated from the sequencing results are as following: pLC-wt: 2, pLC-hypermutator: 13, pHC-wt: 86, pHC-hypermutator: 116. A comparison of the PCN distribution in the evolved populations reveals that the PCN is significantly different from that of the ancestor plasmid in several of the experimental evolution settings. However, the direction of change (i.e., PCN increase or decrease) is heterogeneous (see Supplementary Table 22 for details).
(1) The chromosomal substitution rate is calculated as RChr = Nobs × (Nsites × Ngen)-1, where Nobs is the number of observed point mutations, Nsites is the number of intergenic and synonymous sites on the chromosome having a coverage ≥10 and Ngen is the number of generations in our experiment. (2) Plasmid copy number (PCN) was estimated from the sequencing results of evolved populations as the relative coverage of plasmid and chromosome replicons (detailed list in Supplementary Table 19). (3) The expected number of point mutations on the plasmid is calculated as Nexp = RChr × Nsites × PCN × Ngen, where Nsites is the number of intergenic and synonymous sites on the plasmid having a coverage ≥10.
This discrepancy between the observed and expected frequency of point
mutations on the pHC plasmid can be explained under the segregational drift hypothesis
as due to the rapid loss of most plasmid mutations. The analysis further reveals that the
allele frequency of plasmid variants is considerably lower in comparison to that of
chromosomal variants. Of the total chromosomal point mutations, 30% reached fixation
within the population (AF ≥ 0.9), whereas point mutations on plasmids remain at a low
Plasmid type
Host genotype
T (°C)
Substitution per site per generation(1)
× 10-9 PCN(2)Expected number of
point mutations(3)
(Mean ± SD ) (Mean ± SD ) (Mean ± SD ) pLC Wild-type 37 17 2.5 ± 0.7 20.9 ± 4.9 16.3 × 10⁻² ± 5.0 × 10⁻² 0
42 16 2.4 ± 1.8 4.8 ± 3.2 4.5 × 10⁻² ± 4.8 × 10⁻² 0Hypermutator 37 148 22.4 ± 5.2 7.1 ± 2.2 5.0 × 10⁻¹ ± 1.7 × 10⁻¹ 1
42 87 13.2 ± 3.3 4.1 ± 1.4 1.8 × 10⁻¹ ± 1.1 × 10⁻¹ 1pHC Wild-type 37 6 0.87 ± 0.6 605.0 ± 501.3 2.0 ± 2.0 0
42 6 0.87 ± 0.8 294.0 ± 105.8 7.9 × 10⁻¹ ± 7.2 × 10⁻¹ 0Hypermutator 37 98 14.3 ± 3.8 154.5 ± 63.4 8.0 ± 5.0 0
42 147 21.4 ± 11.5 252.6 ± 106.3 19.1 ± 16.2 0
Chromosome Plasmid
Observed number of point
mutations
Observed number of
point mutations
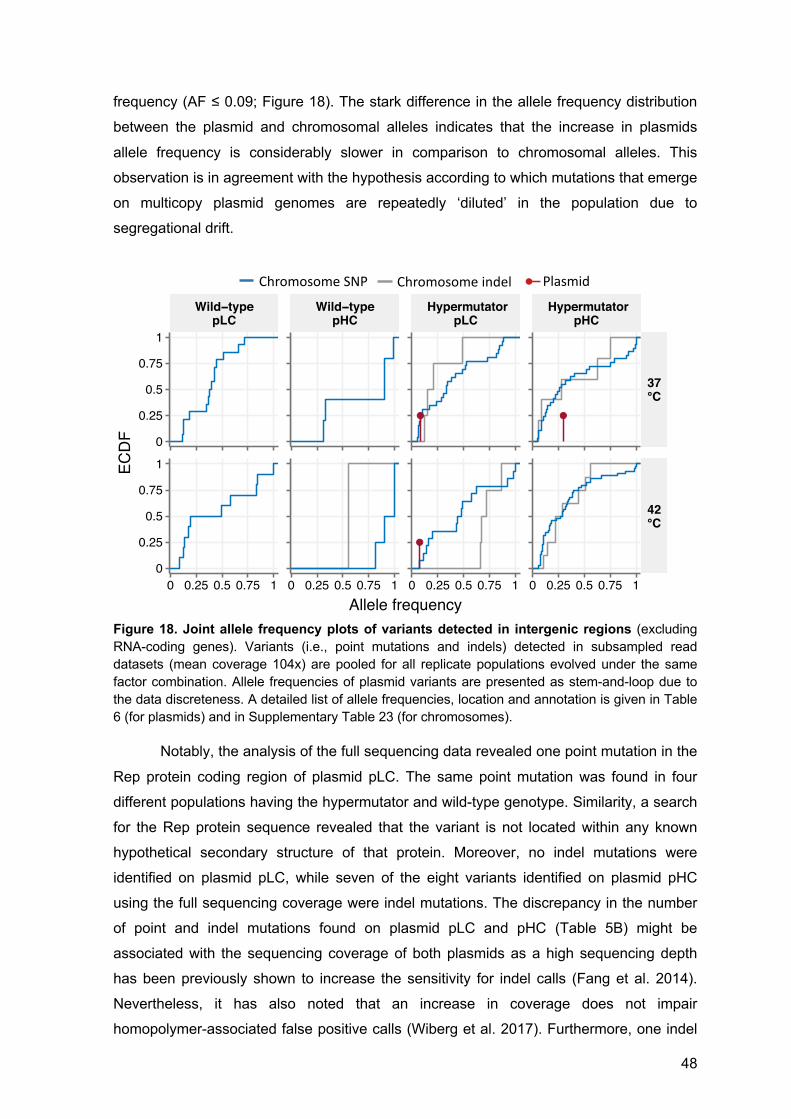
48
frequency (AF ≤ 0.09; Figure 18). The stark difference in the allele frequency distribution
between the plasmid and chromosomal alleles indicates that the increase in plasmids
allele frequency is considerably slower in comparison to chromosomal alleles. This
observation is in agreement with the hypothesis according to which mutations that emerge
on multicopy plasmid genomes are repeatedly ‘diluted’ in the population due to
segregational drift.
Figure 18. Joint allele frequency plots of variants detected in intergenic regions (excluding RNA-coding genes). Variants (i.e., point mutations and indels) detected in subsampled read datasets (mean coverage 104x) are pooled for all replicate populations evolved under the same factor combination. Allele frequencies of plasmid variants are presented as stem-and-loop due to the data discreteness. A detailed list of allele frequencies, location and annotation is given in Table 6 (for plasmids) and in Supplementary Table 23 (for chromosomes).
Notably, the analysis of the full sequencing data revealed one point mutation in the
Rep protein coding region of plasmid pLC. The same point mutation was found in four
different populations having the hypermutator and wild-type genotype. Similarity, a search
for the Rep protein sequence revealed that the variant is not located within any known
hypothetical secondary structure of that protein. Moreover, no indel mutations were
identified on plasmid pLC, while seven of the eight variants identified on plasmid pHC
using the full sequencing coverage were indel mutations. The discrepancy in the number
of point and indel mutations found on plasmid pLC and pHC (Table 5B) might be
associated with the sequencing coverage of both plasmids as a high sequencing depth
has been previously shown to increase the sensitivity for indel calls (Fang et al. 2014).
Nevertheless, it has also noted that an increase in coverage does not impair
homopolymer-associated false positive calls (Wiberg et al. 2017). Furthermore, one indel
●
●
●
Wild−typepLC
Wild−typepHC
HypermutatorpLC
HypermutatorpHC
37°C
42°C
0 0.25 0.5 0.75 1 0 0.25 0.5 0.75 1 0 0.25 0.5 0.75 1 0 0.25 0.5 0.75 1
0
0.25
0.5
0.75
1
0
0.25
0.5
0.75
1
Allele frequency
ECD
F
● ● ●Chromosome Plasmid NA PlasmidChromosome indelChromosome SNP

49
mutation located in intergenic regions was observed in four different populations (Table
6B). The identification of the same intergenic indel variant in independent samples is likely
an indicator for false positives arising from alignment artefacts or indicate a mutational
hotspot.
Table 6. Variants detected on plasmids in different samples sequenced after 800 generations of evolution in the chemostats. (A) Variants detected in plasmid host samples (i.e., total populations for pLC and pooled hosts for pHC) using subsampled read datasets (sub). (B) Variants detected in plasmid host samples using all sequencing reads (full). (C) Variants detected in evolved pHC-populations of sample type 'total population' (TP) using all sequencing reads. Note that variants detected in corresponding samples of 'pooled hosts' are reported in (B). Corresponding pHC-populations are indicated by the combination of plasmid type, host genotype, temperature, and replicate number. Note that also variants with an allele frequency <0.02 are reported. These were included to demonstrate that the sequencing of 'pooled host' samples can increase the resolution for variant detection. Notably, the two variants listed at the end of the table were also found in the corresponding samples of 'pooled hosts', but with an AF < 0.02 (using full coverage dataset). Wt: wild-type; Hm: Hypermutator; TP: total population; PH: pooled hosts. A description of all table fields is given in Supplementary Table 23. Note that the variant position refers to plasmid genome sequences published in GenBank database.
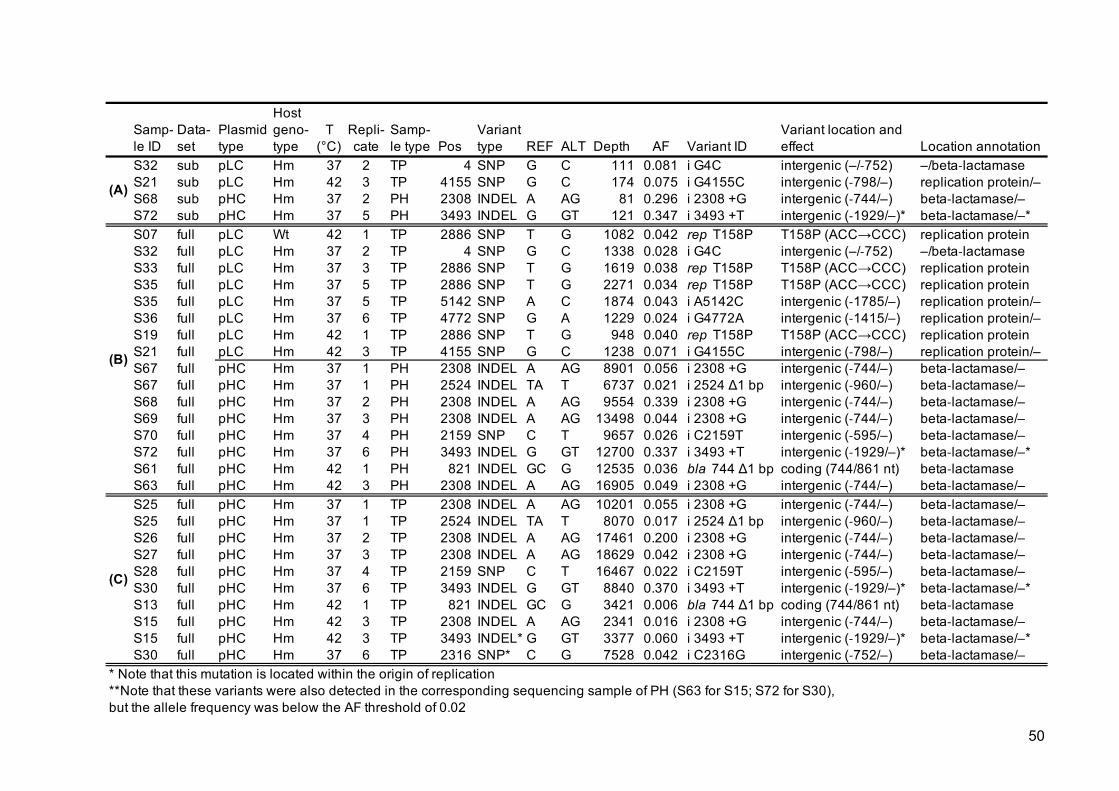
50
Samp-le ID
Data-set
Plasmid type
Host geno-type
T (°C)
Repli-cate
Samp-le type Pos
Variant type REF ALT Depth AF Variant ID
Variant location and effect Location annotation
S32 sub pLC Hm 37 2 TP 4 SNP G C 111 0.081 i G4C intergenic (–/-752) –/beta-lactamaseS21 sub pLC Hm 42 3 TP 4155 SNP G C 174 0.075 i G4155C intergenic (-798/–) replication protein/–S68 sub pHC Hm 37 2 PH 2308 INDEL A AG 81 0.296 i 2308 +G intergenic (-744/–) beta-lactamase/–S72 sub pHC Hm 37 5 PH 3493 INDEL G GT 121 0.347 i 3493 +T intergenic (-1929/–)* beta-lactamase/–*S07 full pLC Wt 42 1 TP 2886 SNP T G 1082 0.042 rep T158P T158P (ACC→CCC) replication protein S32 full pLC Hm 37 2 TP 4 SNP G C 1338 0.028 i G4C intergenic (–/-752) –/beta-lactamaseS33 full pLC Hm 37 3 TP 2886 SNP T G 1619 0.038 rep T158P T158P (ACC→CCC) replication protein S35 full pLC Hm 37 5 TP 2886 SNP T G 2271 0.034 rep T158P T158P (ACC→CCC) replication protein S35 full pLC Hm 37 5 TP 5142 SNP A C 1874 0.043 i A5142C intergenic (-1785/–) replication protein/–S36 full pLC Hm 37 6 TP 4772 SNP G A 1229 0.024 i G4772A intergenic (-1415/–) replication protein/–S19 full pLC Hm 42 1 TP 2886 SNP T G 948 0.040 rep T158P T158P (ACC→CCC) replication protein S21 full pLC Hm 42 3 TP 4155 SNP G C 1238 0.071 i G4155C intergenic (-798/–) replication protein/–S67 full pHC Hm 37 1 PH 2308 INDEL A AG 8901 0.056 i 2308 +G intergenic (-744/–) beta-lactamase/–S67 full pHC Hm 37 1 PH 2524 INDEL TA T 6737 0.021 i 2524 Δ1 bp intergenic (-960/–) beta-lactamase/–S68 full pHC Hm 37 2 PH 2308 INDEL A AG 9554 0.339 i 2308 +G intergenic (-744/–) beta-lactamase/–S69 full pHC Hm 37 3 PH 2308 INDEL A AG 13498 0.044 i 2308 +G intergenic (-744/–) beta-lactamase/–S70 full pHC Hm 37 4 PH 2159 SNP C T 9657 0.026 i C2159T intergenic (-595/–) beta-lactamase/–S72 full pHC Hm 37 6 PH 3493 INDEL G GT 12700 0.337 i 3493 +T intergenic (-1929/–)* beta-lactamase/–*S61 full pHC Hm 42 1 PH 821 INDEL GC G 12535 0.036 bla 744 Δ1 bp coding (744/861 nt) beta-lactamaseS63 full pHC Hm 42 3 PH 2308 INDEL A AG 16905 0.049 i 2308 +G intergenic (-744/–) beta-lactamase/–S25 full pHC Hm 37 1 TP 2308 INDEL A AG 10201 0.055 i 2308 +G intergenic (-744/–) beta-lactamase/–S25 full pHC Hm 37 1 TP 2524 INDEL TA T 8070 0.017 i 2524 Δ1 bp intergenic (-960/–) beta-lactamase/–S26 full pHC Hm 37 2 TP 2308 INDEL A AG 17461 0.200 i 2308 +G intergenic (-744/–) beta-lactamase/–S27 full pHC Hm 37 3 TP 2308 INDEL A AG 18629 0.042 i 2308 +G intergenic (-744/–) beta-lactamase/–S28 full pHC Hm 37 4 TP 2159 SNP C T 16467 0.022 i C2159T intergenic (-595/–) beta-lactamase/–S30 full pHC Hm 37 6 TP 3493 INDEL G GT 8840 0.370 i 3493 +T intergenic (-1929/–)* beta-lactamase/–*S13 full pHC Hm 42 1 TP 821 INDEL GC G 3421 0.006 bla 744 Δ1 bp coding (744/861 nt) beta-lactamaseS15 full pHC Hm 42 3 TP 2308 INDEL A AG 2341 0.016 i 2308 +G intergenic (-744/–) beta-lactamase/–S15 full pHC Hm 42 3 TP 3493 INDEL* G GT 3377 0.060 i 3493 +T intergenic (-1929/–)* beta-lactamase/–*S30 full pHC Hm 37 6 TP 2316 SNP* C G 7528 0.042 i C2316G intergenic (-752/–) beta-lactamase/–
* Note that this mutation is located within the origin of replication**Note that these variants were also detected in the corresponding sequencing sample of PH (S63 for S15; S72 for S30), but the allele frequency was below the AF threshold of 0.02
(A)
(B)
(C)

51
4.8 Host chromosome evolution
The comparison between the evolved and ancestral populations revealed that most of the
evolved genetic variants are found on the chromosome (n = 1,394; see Supplementary
Table 23). The majority of the chromosomal variants (90%) are observed in the
hypermutator populations where the substitution rate is, on average, 10-fold higher in
comparison to the wild-type populations (Table 5). Genetic variants are observed in 638
protein coding genes and ncRNA genes, of which 173 (27%) genes accumulated genetic
variants in more than one population. The distribution of common mutated genes reveals
a strong signal of parallel evolution among populations evolved under similar settings
(Figure 19).
Figure 19. Parallel evolution of the chromosome. A heatmap representing the number of shared
mutated genes among the 48 evolved populations. The number of genes mutated in population
pair x, y is calculated as the number of genes in which genetic variants (single base substitutions
or indels) are observed in both populations. Cells along the diagonal present the number of genes
where a mutation was detected in the corresponding population and at least one additional
population. Annotation bars at the top and left represent the experimental factors.
484746454443424140393837363534333231302928272625242322212019181716151413121110987654321 Plasmid type
pLCpHC
Culturing temperature37°C42°C
Host genotypeWildtypeHypermutator
0
10
20
30
40
50
Plasmid Temperature Host
484746454443424140393837363534333231302928272625242322212019181716151413121110987654321 Plasmid type
pLCpHC
Culturing temperature37°C42°C
Host genotypewild typehypermutator
051015202530
484746454443424140393837363534333231302928272625242322212019181716151413121110987654321 Plasmid type
pLCpHC
Culturing temperature37°C42°C
Host genotypewild typehypermutator
051015202530
484746454443424140393837363534333231302928272625242322212019181716151413121110987654321 Plasmid type
pLCpHC
Culturing temperature37°C42°C
Host genotypeWild−typeHypermutator
0
10
20
30
40
48 47 46 45 44 43 42 41 40 39 38 37 36 35 34 33 32 31 30 29 28 27 26 25 24 23 22 21 20 19 18 17 16 15 14 13 12 11 10 9 8 7 6 5 4 3 2 1Plasm
id typepLCpH
C
Culturing tem
perature37°C42°C
Host genotypeWildtype
Hyperm
utator0 10 20 30 40 501 10 20 30 40 50
No. genes
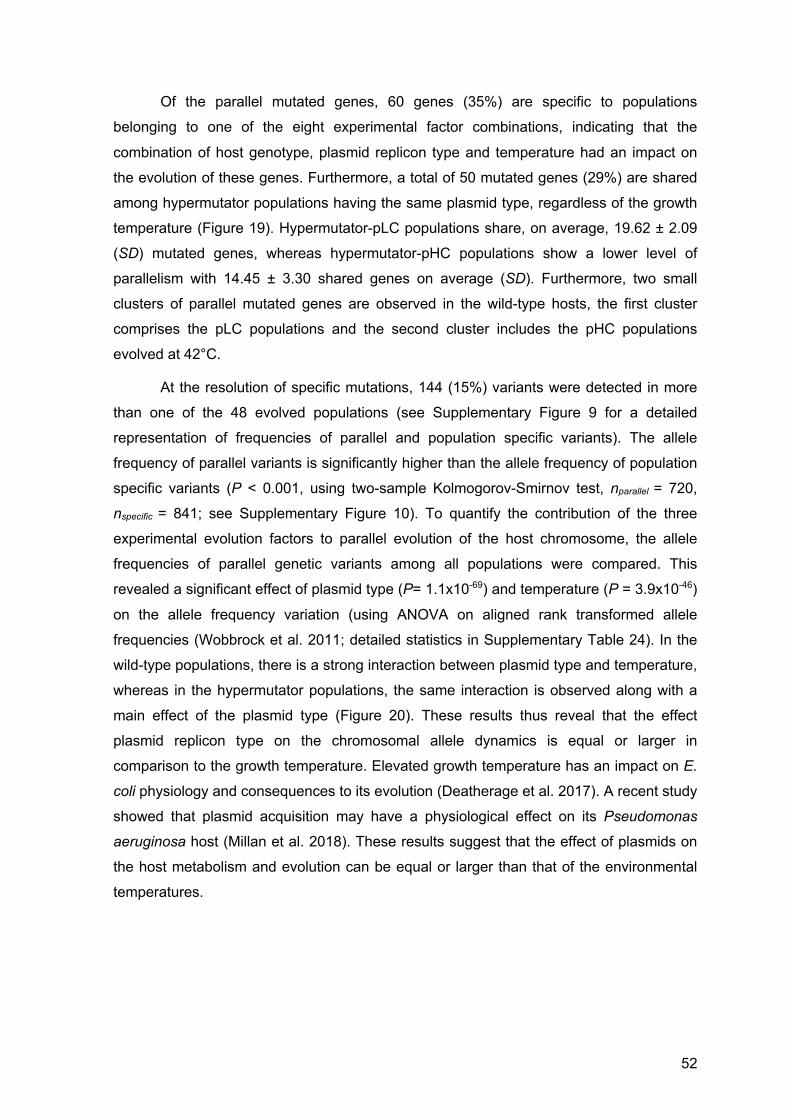
52
Of the parallel mutated genes, 60 genes (35%) are specific to populations
belonging to one of the eight experimental factor combinations, indicating that the
combination of host genotype, plasmid replicon type and temperature had an impact on
the evolution of these genes. Furthermore, a total of 50 mutated genes (29%) are shared
among hypermutator populations having the same plasmid type, regardless of the growth
temperature (Figure 19). Hypermutator-pLC populations share, on average, 19.62 ± 2.09
(SD) mutated genes, whereas hypermutator-pHC populations show a lower level of
parallelism with 14.45 ± 3.30 shared genes on average (SD). Furthermore, two small
clusters of parallel mutated genes are observed in the wild-type hosts, the first cluster
comprises the pLC populations and the second cluster includes the pHC populations
evolved at 42°C.
At the resolution of specific mutations, 144 (15%) variants were detected in more
than one of the 48 evolved populations (see Supplementary Figure 9 for a detailed
representation of frequencies of parallel and population specific variants). The allele
frequency of parallel variants is significantly higher than the allele frequency of population
specific variants (P < 0.001, using two-sample Kolmogorov-Smirnov test, nparallel = 720,
nspecific = 841; see Supplementary Figure 10). To quantify the contribution of the three
experimental evolution factors to parallel evolution of the host chromosome, the allele
frequencies of parallel genetic variants among all populations were compared. This
revealed a significant effect of plasmid type (P= 1.1x10-69) and temperature (P = 3.9x10-46)
on the allele frequency variation (using ANOVA on aligned rank transformed allele
frequencies (Wobbrock et al. 2011; detailed statistics in Supplementary Table 24). In the
wild-type populations, there is a strong interaction between plasmid type and temperature,
whereas in the hypermutator populations, the same interaction is observed along with a
main effect of the plasmid type (Figure 20). These results thus reveal that the effect
plasmid replicon type on the chromosomal allele dynamics is equal or larger in
comparison to the growth temperature. Elevated growth temperature has an impact on E.
coli physiology and consequences to its evolution (Deatherage et al. 2017). A recent study
showed that plasmid acquisition may have a physiological effect on its Pseudomonas
aeruginosa host (Millan et al. 2018). These results suggest that the effect of plasmids on
the host metabolism and evolution can be equal or larger than that of the environmental
temperatures.
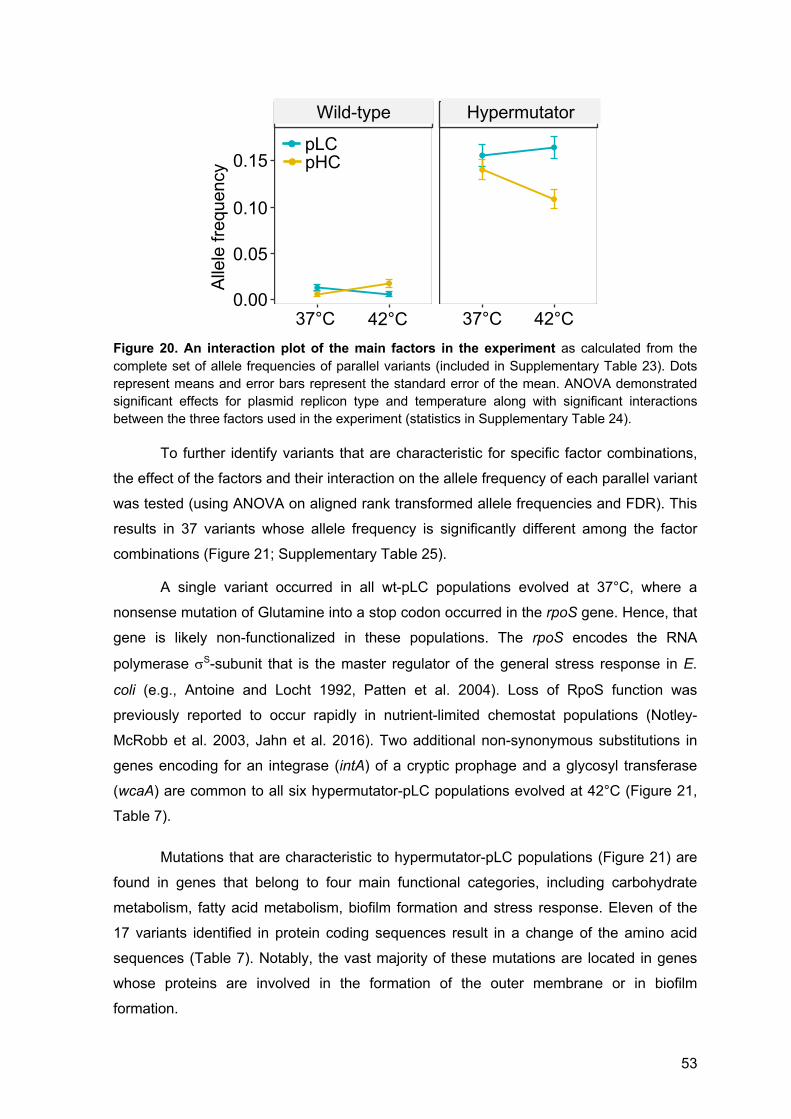
53
Figure 20. An interaction plot of the main factors in the experiment as calculated from the
complete set of allele frequencies of parallel variants (included in Supplementary Table 23). Dots
represent means and error bars represent the standard error of the mean. ANOVA demonstrated
significant effects for plasmid replicon type and temperature along with significant interactions
between the three factors used in the experiment (statistics in Supplementary Table 24).
To further identify variants that are characteristic for specific factor combinations,
the effect of the factors and their interaction on the allele frequency of each parallel variant
was tested (using ANOVA on aligned rank transformed allele frequencies and FDR). This
results in 37 variants whose allele frequency is significantly different among the factor
combinations (Figure 21; Supplementary Table 25).
A single variant occurred in all wt-pLC populations evolved at 37°C, where a
nonsense mutation of Glutamine into a stop codon occurred in the rpoS gene. Hence, that
gene is likely non-functionalized in these populations. The rpoS encodes the RNA
polymerase sS-subunit that is the master regulator of the general stress response in E.
coli (e.g., Antoine and Locht 1992, Patten et al. 2004). Loss of RpoS function was
previously reported to occur rapidly in nutrient-limited chemostat populations (Notley-
McRobb et al. 2003, Jahn et al. 2016). Two additional non-synonymous substitutions in
genes encoding for an integrase (intA) of a cryptic prophage and a glycosyl transferase
(wcaA) are common to all six hypermutator-pLC populations evolved at 42°C (Figure 21,
Table 7).
Mutations that are characteristic to hypermutator-pLC populations (Figure 21) are
found in genes that belong to four main functional categories, including carbohydrate
metabolism, fatty acid metabolism, biofilm formation and stress response. Eleven of the
17 variants identified in protein coding sequences result in a change of the amino acid
sequences (Table 7). Notably, the vast majority of these mutations are located in genes
whose proteins are involved in the formation of the outer membrane or in biofilm
formation.
●● ●
●
●
●
●
●
Wild−type Hypermutator
as.factor(temp)
mean_AF
● ●pLC pHC
0.15
0.10
0.05
0.0037°C 37°C42°C 42°C
Wild-type Hypermutator
Alle
le fr
eque
ncy
●● ●
●
●
●
●
●
Wild−type Hypermutator
as.factor(temp)
mean_AF
● ●pLC pHC
●● ●
●
●
●
●
●
Wild−type Hypermutator
as.factor(temp)
mean_AF
● ●pLC pHCpLCpHC
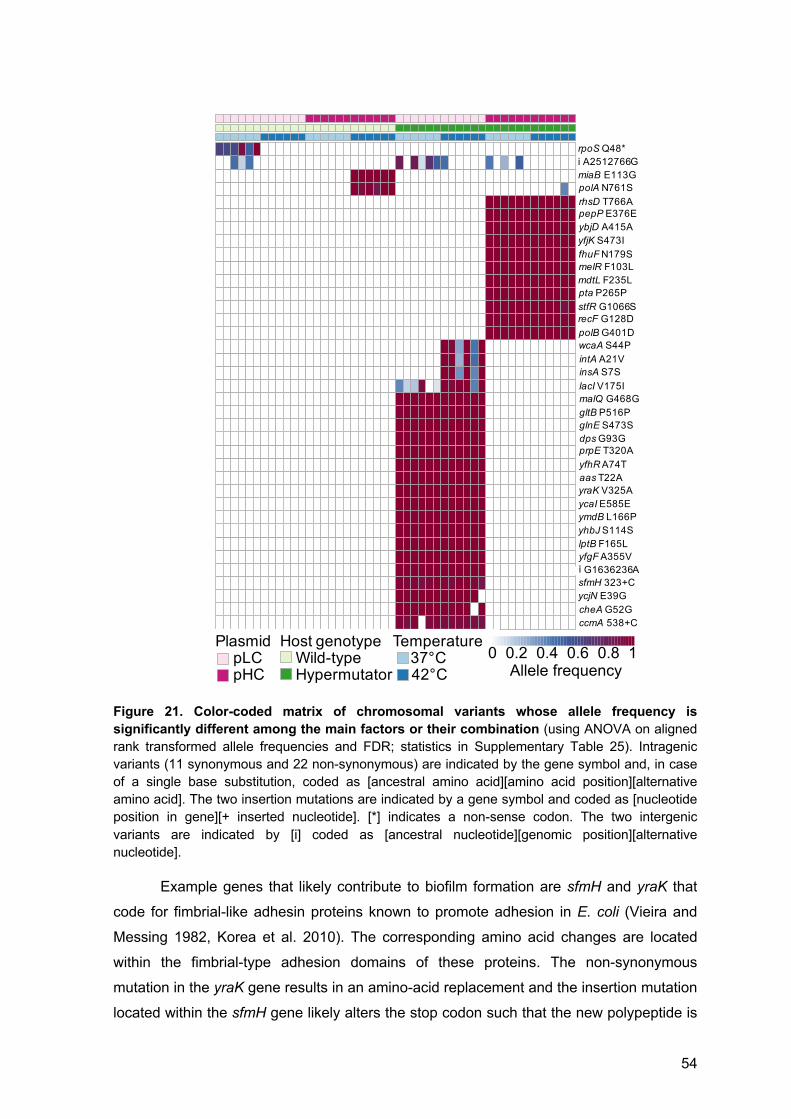
54
Figure 21. Color-coded matrix of chromosomal variants whose allele frequency is significantly different among the main factors or their combination (using ANOVA on aligned
rank transformed allele frequencies and FDR; statistics in Supplementary Table 25). Intragenic
variants (11 synonymous and 22 non-synonymous) are indicated by the gene symbol and, in case
of a single base substitution, coded as [ancestral amino acid][amino acid position][alternative
amino acid]. The two insertion mutations are indicated by a gene symbol and coded as [nucleotide
position in gene][+ inserted nucleotide]. [*] indicates a non-sense codon. The two intergenic
variants are indicated by [i] coded as [ancestral nucleotide][genomic position][alternative
nucleotide].
Example genes that likely contribute to biofilm formation are sfmH and yraK that
code for fimbrial-like adhesin proteins known to promote adhesion in E. coli (Vieira and
Messing 1982, Korea et al. 2010). The corresponding amino acid changes are located
within the fimbrial-type adhesion domains of these proteins. The non-synonymous
mutation in the yraK gene results in an amino-acid replacement and the insertion mutation
located within the sfmH gene likely alters the stop codon such that the new polypeptide is
i A2512766G miaB E113GpolA N761SrhsD T766ApepP E376EybjD A415AyfjK S473IfhuFN179SmelR F103LmdtL F235Lpta P265PstfR G1066SrecF G128DpolBG401DwcaA S44PintA A21VinsA S7SlacI V175ImalQ G468GgltB P516PglnE S473SdpsG93GprpE T320AyfhRA74Taas T22AyraK V325AycaI E585EymdB L166PyhbJS114SlptB F165LyfgFA355Vi G1636236AsfmH 323+CycjN E39GcheAG52GccmA 538+C
rpoSQ48*
Plasmid Temperature Host
484746454443424140393837363534333231302928272625242322212019181716151413121110987654321 Plasmid type
pLCpHC
Culturing temperature37°C42°C
Host genotypewild typehypermutator
051015202530
484746454443424140393837363534333231302928272625242322212019181716151413121110987654321 Plasmid type
pLCpHC
Culturing temperature37°C42°C
Host genotypewild typehypermutator
051015202530
484746454443424140393837363534333231302928272625242322212019181716151413121110987654321 Plasmid type
pLCpHC
Culturing temperature37°C42°C
Host genotypeWild−typeHypermutator
0
10
20
30
40
0 0.2 0.4 0.6 0.8 1Allele frequency
S74S75S76S77S78S79S07S08S09S10S11S12S81S86S90S95S98S102S55S56S57S58S59S60S31S32S33S34S35S36S19S20S21S22S23S24S67S68S69S70S71S72S61S62S63S64S65S66
ccmA 538 +C
cheA G52G
ycjN E39Gsfm
H 332 +Cp G
1636236AyfgF A355VlptB F165LyhbJ S114Sym
dB L166PycaI E585EyraK V325Aaas T22AyfhR A74TprpE T320Adps G
93GglnE S473SgltB P516Pm
alQ G
468GlacI V175IinsA S7SintA A21VwcaA S44PpolB G
401DrecF G
128DstfR G
1066Spta P265Pm
dtL F235Lm
elR F103LfhuF N179SyfjK S473IybjD A415ApepP E376ErhsD T766ApolA N761Sm
iaB E113Gi A2512766GrpoS Q
48*plasm
id_typepLCpHC
genotype_2W
tHyperm
utator
temp
3742
0 0.20.40.60.81
rows: manhattan / com
plete
S74S75S76S77S78S79S07S08S09S10S11S12S81S86S90S95S98S102S55S56S57S58S59S60S31S32S33S34S35S36S19S20S21S22S23S24S67S68S69S70S71S72S61S62S63S64S65S66
ccmA 538 +CcheA G52GycjN E39GsfmH 332 +Cp G1636236AyfgF A355VlptB F165LyhbJ S114SymdB L166PycaI E585EyraK V325Aaas T22AyfhR A74TprpE T320Adps G93GglnE S473SgltB P516PmalQ G468GlacI V175IinsA S7SintA A21VwcaA S44PpolB G401DrecF G128DstfR G1066Spta P265PmdtL F235LmelR F103LfhuF N179SyfjK S473IybjD A415ApepP E376ErhsD T766ApolA N761SmiaB E113Gi A2512766GrpoS Q48* plasmid_type
pLCpHC
genotype_2WtHypermutator
temp3742
00.20.40.60.81
rows: manhattan / complete
Plasmid Host genotype TemperaturepLC Wild-type 37°CpHC Hypermutator 42°C
i A2512766G miaB E113G polA N761S rhsD T766A pepP E376E ybjD A415A yfjK S473I fhuF N179S melR F103L mdtL F235L pta P265P stfR G1066S recF G128D polB G401D wcaA S44P intA A21V insA S7S lacI V175I malQ G468G gltB P516P glnE S473S dps G93G prpE T320A yfhR A74T aas T22A yraK V325A ycaI E585E ymdB L166P yhbJ S114S lptB F165L yfgF A355V p G1636236A sfmH 323 +C ycjN E39G cheA G52G ccmA 538 +C
rpoS Q48*
Plasmid Temperature Host
484746454443424140393837363534333231302928272625242322212019181716151413121110987654321 Plasmid type
pLCpHC
Culturing temperature37°C42°C
Host genotypewild typehypermutator
051015202530
484746454443424140393837363534333231302928272625242322212019181716151413121110987654321 Plasmid type
pLCpHC
Culturing temperature37°C42°C
Host genotypewild typehypermutator
051015202530
484746454443424140393837363534333231302928272625242322212019181716151413121110987654321 Plasmid type
pLCpHC
Culturing temperature37°C42°C
Host genotypeWild−typeHypermutator
0
10
20
30
40
0 0.2 0.4 0.6 0.8 1 Allele frequency
S74S75S76S77S78S79S07S08S09S10S11S12S81S86S90S95S98S102S55S56S57S58S59S60S31S32S33S34S35S36S19S20S21S22S23S24S67S68S69S70S71S72S61S62S63S64S65S66
ccmA 538 +C
cheA G52G
ycjN E39Gsfm
H 332 +Cp G
1636236AyfgF A355VlptB F165LyhbJ S114Sym
dB L166PycaI E585EyraK V325Aaas T22AyfhR A74TprpE T320Adps G
93GglnE S473SgltB P516Pm
alQ G
468GlacI V175IinsA S7SintA A21VwcaA S44PpolB G
401DrecF G
128DstfR G
1066Spta P265Pm
dtL F235Lm
elR F103LfhuF N179SyfjK S473IybjD A415ApepP E376ErhsD T766ApolA N761Sm
iaB E113Gi A2512766GrpoS Q
48*plasm
id_typepLCpHC
genotype_2W
tHyperm
utator
temp
3742
0 0.20.40.60.81
rows: manhattan / com
plete
S74S75S76S77S78S79S07S08S09S10S11S12S81S86S90S95S98S102S55S56S57S58S59S60S31S32S33S34S35S36S19S20S21S22S23S24S67S68S69S70S71S72S61S62S63S64S65S66
ccmA 538 +CcheA G52GycjN E39GsfmH 332 +Cp G1636236AyfgF A355VlptB F165LyhbJ S114SymdB L166PycaI E585EyraK V325Aaas T22AyfhR A74TprpE T320Adps G93GglnE S473SgltB P516PmalQ G468GlacI V175IinsA S7SintA A21VwcaA S44PpolB G401DrecF G128DstfR G1066Spta P265PmdtL F235LmelR F103LfhuF N179SyfjK S473IybjD A415ApepP E376ErhsD T766ApolA N761SmiaB E113Gi A2512766GrpoS Q48* plasmid_type
pLCpHC
genotype_2WtHypermutator
temp3742
00.20.40.60.81
rows: manhattan / complete
i A2512766G miaB E113G polA N761S rhsD T766A pepP E376E ybjD A415A yfjK S473I fhuF N179S melR F103L mdtL F235L pta P265P stfR G1066S recF G128D polB G401D wcaA S44P intA A21V insA S7S lacI V175I malQ G468G gltB P516P glnE S473S dps G93G prpE T320A yfhR A74T aas T22A yraK V325A ycaI E585E ymdB L166P yhbJ S114S lptB F165L yfgF A355V p G1636236A sfmH 323 +C ycjN E39G cheA G52G ccmA 538 +C
rpoS Q48*
Plasmid Temperature Host
484746454443424140393837363534333231302928272625242322212019181716151413121110987654321 Plasmid type
pLCpHC
Culturing temperature37°C42°C
Host genotypewild typehypermutator
051015202530
484746454443424140393837363534333231302928272625242322212019181716151413121110987654321 Plasmid type
pLCpHC
Culturing temperature37°C42°C
Host genotypewild typehypermutator
051015202530
484746454443424140393837363534333231302928272625242322212019181716151413121110987654321 Plasmid type
pLCpHC
Culturing temperature37°C42°C
Host genotypeWild−typeHypermutator
0
10
20
30
40
0 0.2 0.4 0.6 0.8 1 Allele frequency
S74S75S76S77S78S79S07S08S09S10S11S12S81S86S90S95S98S102S55S56S57S58S59S60S31S32S33S34S35S36S19S20S21S22S23S24S67S68S69S70S71S72S61S62S63S64S65S66
ccmA 538 +C
cheA G52G
ycjN E39G
sfmH
332 +Cp G
1636236AyfgF A355VlptB F165LyhbJ S114Sym
dB L166PycaI E585EyraK V325Aaas T22AyfhR
A74TprpE T320Adps G
93GglnE S473SgltB P516Pm
alQ G
468GlacI V175IinsA S7SintA A21Vw
caA S44PpolB G
401DrecF G
128DstfR
G1066S
pta P265Pm
dtL F235Lm
elR F103L
fhuF N179S
yfjK S473IybjD
A415ApepP E376ErhsD
T766ApolA N
761Sm
iaB E113Gi A2512766GrpoS Q
48*plasm
id_typepLCpH
C
genotype_2W
tH
ypermutator
temp
3742
0 0.20.40.60.81
rows: m
anhattan / complete
S74S75S76S77S78S79S07S08S09S10S11S12S81S86S90S95S98S102S55S56S57S58S59S60S31S32S33S34S35S36S19S20S21S22S23S24S67S68S69S70S71S72S61S62S63S64S65S66
ccmA 538 +CcheA G52GycjN E39GsfmH 332 +Cp G1636236AyfgF A355VlptB F165LyhbJ S114SymdB L166PycaI E585EyraK V325Aaas T22AyfhR A74TprpE T320Adps G93GglnE S473SgltB P516PmalQ G468GlacI V175IinsA S7SintA A21VwcaA S44PpolB G401DrecF G128DstfR G1066Spta P265PmdtL F235LmelR F103LfhuF N179SyfjK S473IybjD A415ApepP E376ErhsD T766ApolA N761SmiaB E113Gi A2512766GrpoS Q48* plasmid_type
pLCpHC
genotype_2WtHypermutator
temp3742
00.20.40.60.81
rows: manhattan / complete
i

55
only 123 amino acids long instead of 327 amino acid length. Example genes involved in
the formation of the outer membrane are the essential gene lptB and an acetyltransferase
encoding gene (aas) that participates in membrane phospholipid turnover (Hsu et al.
1991). LptB is part of a transporter complex involved in the translocation of
lipopolysaccharides from the inner to the outer membrane in E. coli (Sperandeo et al.
2006, Rosano and Ceccarelli 2014). The non-synonymous lptB mutation observed in all
hypermutator-pHC populations results in an amino-acid replacement located within the
ABC-transporter like domain of that protein (Table 7). Additional amino acid replacements
occurred in a propionyl-CoA synthetase (prpE) and the repressor of the lactose operon
(lacI) where the amino acid replacement is observed in the ligand binding domain (Pfam
annotation: periplasmic binding protein-like domain; Table 7). The propionyl-CoA
synthetase PrpE catalyzes the first step of propionate catabolism in E. coli (Textor et al.
1997, Arjan et al. 1999) and the amino acid replacement is located within a putative AMP
binding domain (Table 7).
Table 7. Functional categories of parallel chromosomal mutations observed in pLC-populations. Functions are reported for non-synonymous and frame-shift mutations whose allele
frequency is significantly different among the main factors or their combination. Functional
categories are assigned according to GO terminology. Putative functional domains are reported for
variants located in known functional domains as found in the Pfam database.
Variant Functional category Reference Pfam domains
rpoS Q48*regulation of transcription; stress response
Nguyen et al. 1993; Maciag et al. 2011
wcaA S44Plipopolysaccharide biosynthetic process
Stevenson et al. 1996 glycosyl transferase family 2
intA A21V provirus excision Kirby et al. 1994 DNA-binding domain
lacI V175I negative regulation of transcription Hudson and Fried 1990periplasmic binding protein-like domain
prpE T320A propionate catabolic process Guo and Oliver 2012 AMP binding domainyfhR A74T uncharacterized proteinaas T22A phospholipid biosynthetic process Hsu et al. 1991 acyltransferase domainyraK V325A cell adhesion Korea et al. 2010 fimbrial domain
ymdB L166Pnegative regulation of endoribonuclease activity; regulation of biofilm formation
Kim et al. 2008; Kim et al. 2013
lptB F165L lipopolysaccharide transport Sperandeo et al. 2006 ABC transporter-like domain
yfgF A355Vcellular response to anoxia; regulation of biofilm formation
Lacey et al. 2010
sfmH 332 +C cell adhesion; mannose binding Korea et al. 2010 fimbrial domain
ycjN E39Glipoprotein; predicted periplasmic binding protein
Moussatova et al. 2008extracellular solute-binding protein family
ccmA 538 +C heme transport Feissner et al. 2006
pLC hypermutator 37°C and 42°C
pLC hypermutator 42°C
pLC wild-type 37°C

56
The evolution of hypermutator-pHC populations is characterized by a majority of
non-synonymous point mutations (Table 8). These variants are fixed (i.e., AF > 0.9) in all
hypermutator-pHC populations. The mutated genes are classified into three main
categories including carbohydrate metabolism, stress response and DNA replication.
Example mutated genes are DNA polymerase II (polB) and DNA gap repair protein (recF).
The amino acid replacement observed in Pol II is located within the putative DNA
polymerase domain and according to UniProt database the polB G401D variant is a
frequently observed a natural variant. RecF is a component of the RecFOR complex that
functions in RecA-mediated recombinational DNA-repair (mainly ssDNA gaps; e.g., Handa
et al. 2009). The amino acid replacement observed in the RecF protein is not located
within any specific functional region.
A single variant located upstream of the mntH gene (i A2512766G; Figure 21) a
permease that is involved in the uptake of manganese (Haemig and Brooker 2004), was
identified in eleven populations evolved at 37°C and one population evolved at 42°C. It
was previously suggested that manganese supports the growth of iron-deficient E. coli
cells and it was shown that mntH expression is strongly induced in peroxide-stressed cells
(Anjem et al. 2009, Vega and Gore 2014). A promotor prediction revealed that this
mutation might results in altered sites involved in the transcriptional regulation of this gene
(Supplementary Figure 11).
Table 8. Functional categories of parallel chromosomal mutations observed in pHC-populations. Functions are reported for non-synonymous and frame-shift mutations whose allele
frequency is significantly different among the main factors or their combination. Functional
categories are assigned according to GO terminology. Pfam domains are reported for variants
located in known functional domains as found in the Pfam database.
Variant Functional category Reference Pfam domains
miaB E113G tRNA methylation Esberg et al. 1999
polA N761S e.g., DNA replication and repairSetlow and Kornberg 1972; Sharon et al. 1975 DNA polymerase family A
rhsD T766A cellular response to sulfur starvation van der Ploeg et al. 1996
yfjK S473Iresponse to ionizing radiation; defense response to virus
Yasui et al. 2014; Byrne et al. 2014
fhuF N179Ssiderophore-dependent iron import into cell; reductive iron assimilation
Matzanke et al. 2004
melR F103L regulation of transcription Webster et al. 1989mdtL F235L drug transmembrane transport Nishino and Yamaguchi 2001stfR G1066S structural protein of cryptic prophage Riley et al. 2006 Phage tail fibre repeat
recF G128De.g., DNA repair, double-strand break repair and SOS response
Villarroya et al. 1998
polB G401D e.g., DNA replication and repair Kornberg and Gefter 1971 DNA polymerase family B
pHC wild-type 42°C
pHC hypermutator 37°C and 42°C

57
A cluster including two non-synonymous substitutions is observed for wt-pHC
populations evolved at 42°C. The substitutions occurred in a gene encoding for a tRNA
modification enzyme (miaB) and the DNA polymerase I encoding gene (polA). Overall, 11
different polA mutations were identified in 16 pHC-populations and none in pLC-
populations (Supplementary Table 23). Mutations in polA have been previous reported to
decrease the copy number of high copy number ColE1 plasmid mutants in E. coli (Yang
and Polisky 1993). Most of the polA mutations identified here are located in the same
region (Klenow fragment), similarly to the previously reported mutants. This suggests that
the polA mutations observed in the wt-pHC populations evolved as a response to the pHC
high copy number. Nonetheless, notably no decrease in pHC copy number in the pHC
populations having the polA mutation was observed (Supplementary Tables 19 and 22).
Taken together, the differential acquisition of mutations in hypermutator populations
carrying plasmid pLC or pHC suggests that the plasmid replicon type had a significant
impact on the host chromosome evolution.
58
5 Discussion
5.1 Evolution of the host chromosome vs. evolution of the plasmid
Previous experimental evolution studies of plasmid-host adaptation noted that evolved
variants are mostly observed in the host chromosome rather than the plasmid genome
(e.g., Bouma and Lenski 1988, San Millan et al. 2014, San Millan et al. 2016, Santos-
Lopez et al. 2016, Loftie-Eaton et al. 2017), and this is indeed the case also for our study.
Naturally, the mutational supply of a chromosome of the size of E. coli (4.6 Mb) is higher
than the mutational supply of our model plasmid genomes. Consequently, more mutations
are likely to arise on the chromosome than on the plasmid. Notably, in most studies of
plasmid-host coevolution (including ours), the selection pressure is imposed on the
maintenance of the plasmid in the host population rather than a specific plasmid allele
(e.g., as in San Millan et al. 2016). Because plasmids depend on the host machinery for
their replication and persistence, the selection for plasmid maintenance is, in practice,
imposed on the host machinery rather than on the plasmid itself. Moreover, the potential
adaptive responses to the selective pressure for the plasmid maintenance are numerous
in the complex host chromosomes (e.g., San Millan et al. 2014, Harrison et al. 2015), but
are very limited in the genetically compact plasmid genome. This, in combination with the
higher mutational supply of the chromosome, implies that most adaptive variants are
expected to occur on the chromosome. This can explain the high frequency of genetic
variants observed on the chromosome in our experiment, as well as others (e.g., San
Millan et al. 2014, Harrison et al. 2015, Loftie-Eaton et al. 2017).
The significant effect of plasmid type on the chromosomal allele frequency
observed in the experiment (Figure 21) suggests that evolution of the host chromosome
depends on the replicon type of the model plasmids, with the origin of replication being a
prominent characteristic thereof. The evolutionary scenario portrayed here is highly
relevant for plasmid-mediated evolution of antibiotics resistant strains (e.g., Stoesser et al.
2016, Jechalke et al. 2014, Sandegren et al. 2011) as in such incidents, the antibiotics
impose a selection pressure for the plasmid maintenance in the population. These
findings suggest that the evolution of plasmid-mediated antibiotics resistance is expected
mostly to involve the host adaptation to the plasmid replicon type rather than evolution of
the plasmid encoded trait.
The results from the experimental evolution of model plasmids demonstrate that
the low-copy replicon has accumulated more point mutations in comparison to the high-
copy replicon (Table 5). This observation is in contrary to the expectation according to the
59
mutational supply on the plasmid genome. This deviation from the expectation can be
explained by the inverse correlation between population size and the impact of genetic
drift on allele dynamics in the population. The low-copy plasmid constitutes a small
replicon population within the cell. The dynamics of allele frequency due to drift in small
populations are expected to have large fluctuations such that novel alleles are quickly lost
or fixed (Bodmer and Cavalli-Sforza 1976). In contrast, the high copy plasmid constitutes
a large replicon population within the cell where fluctuations in allele frequency over time
are expected to be small (Bodmer and Cavalli-Sforza 1976).
Notably, plasmids are physically linked to their host and therefore, the fate of
plasmid genotypes strictly depend on their host fitness. In other words, the plasmid
genotypes observed at the end of the evolution experiment are likely linked with
evolutionary successful host genotype. Previous experimental evolution studies using a
chemostat system showed that the largest fitness improvement (i.e., adaptation to the
chemostat conditions) was reached after 150 to 200 generations (e.g., Wick et al. 2002,
Dykhuizen and Hartl 1981). Thus we speculate that evolutionary successful genotypes
have swiped through the population early on in the experiment. Considering that our
experiment was conducted with 800 generations, we hypothesize that most of the genetic
variation we observe has emerged later on during the experiment. This would explain the
fixation of chromosomal mutations that seem to be related to adaptation to chemostat
conditions. Accordingly, we suggest that the plasmid diversification occurred later on
within these co-existing chromosomal genotypes. Further time series analysis of the
evolved populations will elucidate the rise of plasmid mutations over time.
5.2 Impact of population size and consideration of the experimental system
In addition to differences in plasmid copy number, the accumulation of mutations on the
plasmid is affected also by the size of the (cell) population. In the hypermutator pHC
populations, where an observable number of plasmid mutations was expected to be
observed, the frequency of plasmid carrying cells was between 35% and 98% at the end
of the evolution experiment. For neutral mutations residing on a chromosome or plasmid
of copy number of one per cell, theory predicts that the rate of substitution is equal to the
rate of mutation and is independent of the population size. On the other hand, for
advantageous mutations, theory predicts that the mean number of mutant cells is a
product of the population size, the mutation rate and the selection coefficient (Graur
2015). The average estimated substitution rates for pLC and pHC are almost identical
(Table 5). Furthermore, assuming the selection regime was similar in all evolve
populations, leaves the population size as the main difference between the pLC and pHC
60
populations. Hence, one could hypothesize that the observed differences in the number of
mutations are the result of difference in the population size. Nonetheless, while the total
population size was not different among populations in the chemostat system, the
proportion of plasmid hosts – i.e., the host population size – was different between the
pLC and pHC populations. While pLC-Hypermutator populations comprised ca. 100%
hosts, the lowest fraction of hosts in pHC-Hypermutator populations was only 35%.
Therefore, without the impact of segregational drift, the number of adaptive point
mutations K on the pHC plasmid, is expected to be roughly three times larger than for
plasmid pLC. Given an average PCN of 10 for plasmid pLC and an average PCN of 100
for plasmid pHC, the ratio of the expected number of point mutations is calculated as:
where N is the population size, s is the selection coefficient and u is the mutation rate.
Consequently, even considering the differences in the number of plasmid carrying cells,
an increased number of mutations is expected for plasmid pHC. Note, that this is a
simplistic estimation that does not take into account the structured plasmid population
(see Appendix Section 6.1 and discussion below).
The choice of the experimental evolution system in this study deserved a special
consideration. Most of the experimental evolution studies published in the literature in the
last decade used the method of serial transfer experiments (see review in Barrick and
Lenski 2013). In comparison to serial batch experiments, where the evolved populations
experience serial bottlenecks, the population size in a chemostat system is kept constant
over time. This difference constitutes a significant advantage when studying population
genetics since most theoretical models of allele dynamics assume a constant population
size. In addition, the fluctuating population size in serial batch experiments is expected to
reduce the rate of molecular and phenotypic adaptation by reducing genetic diversity due
to a stochastic elimination of rare alleles (de Visser und Rozen 2005, Colegrave 2002).
Furthermore, in comparison to serial transfer experiments, the bacterial population size is
kept at a much larger size in chemostats (usually 108-1011 cells). Population genetic theory
predicts that genetic diversity increases with the population size and the mutation rate.
Therefore, the larger population size that can be achieved in a chemostat system allows
K = 2NsuKpLC
KpHC
=2NpLCsu×PCNpLC
2NpHCsu×PCNpHC
=NpLC ×PCNpLC
NpHC ×PCNpHC
=31×10100
=310
61
for the emergence of a higher genetic diversity in comparison to population sizes usually
used in serial batch experiments. Since our hypothesis predicted a paucity of observable
plasmid alleles (due to segregational drift) the latter property of the chemostat system
added an important component to our decision to establish and use a chemostat system
in this study.
5.3 Segregational drift
The impact of segregational drift on plasmid alleles is best understood in comparison to
the chromosomal alleles. While novel chromosomal alleles emerging on a haploid
chromosome are inherited to all daughter cells in the population, the inheritance of
plasmid alleles depends on the segregation pattern of plasmid copies. Indeed, simulated
evolution (Section 6.1) demonstrated that the frequency of neutral mutations emerging on
a multicopy plasmid is higher in comparison to a haploid chromosome, which is in
agreement with the higher mutational supply of multicopy plasmids (San Millan et al.
2016). Nevertheless, the simulation also showed that median allele frequency of
mutations arising on multicopy plasmids is lower than that of chromosomal mutations in a
comparable population size (i.e., number of replicons). Hence, the allele frequency of
mutations residing on multicopy plasmids is increasing slower in comparison to
chromosomal alleles. Following the emergence of a novel plasmid allele, plasmid
segregation during cell division has three potential outcomes for the plasmid genotype of
the daughter cells: 1) loss of the novel plasmid allele, 2) the presence of polymorphic
plasmid alleles in the cell, or 3) fixation of the novel plasmid allele in the cell (see
illustration in Figure 22).
The expected effect of plasmid copy number on the allele dynamics was observed
in the simulated evolution of beneficial alleles (i.e., s > 0; Section 6.1): on the low-copy
plasmid (p10), the loss of plasmid alleles occurs more frequently in comparison to the
chromosome, but the median fixation time is nearly the same as that of the chromosome.
Indeed, previous studies showed that under strong selective conditions, beneficial
mutations on multicopy plasmids can rise quickly to fixation (San Millan et al. 2016).
Notably, the simulation of beneficial alleles (Section 6.1) revealed that alleles on the high
copy plasmid (p100) remain polymorphic over a longer time scale and have a higher
median fixation time. For neutral alleles, segregational drift of multicopy plasmids hinders
the increase of plasmid allele frequency; it leads to frequent and rapid mutant allele loss
on the one hand, and to longer fixation time on the other hand. Altogether, these
simulations demonstrated that the effect of segregational drift on plasmid allele dynamics
counteracts the effect of higher mutational supply accompanying increased copy number.
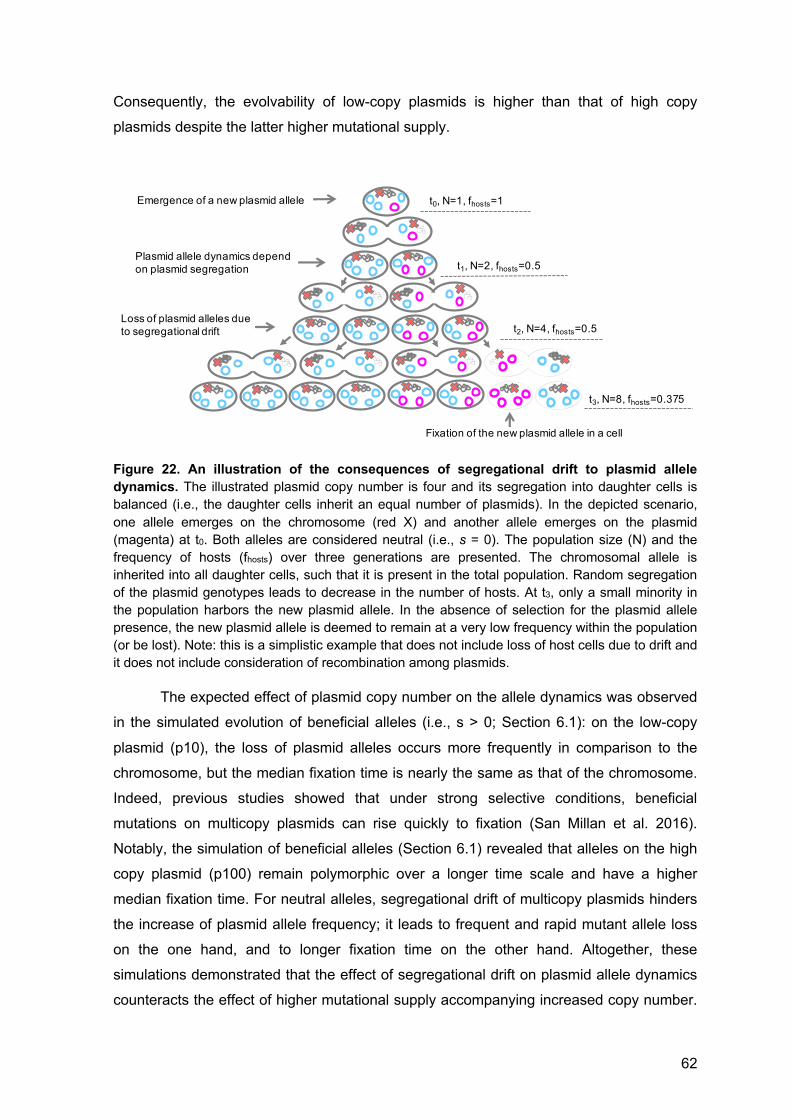
62
Consequently, the evolvability of low-copy plasmids is higher than that of high copy
plasmids despite the latter higher mutational supply.
Figure 22. An illustration of the consequences of segregational drift to plasmid allele dynamics. The illustrated plasmid copy number is four and its segregation into daughter cells is
balanced (i.e., the daughter cells inherit an equal number of plasmids). In the depicted scenario,
one allele emerges on the chromosome (red X) and another allele emerges on the plasmid
(magenta) at t0. Both alleles are considered neutral (i.e., s = 0). The population size (N) and the
frequency of hosts (fhosts) over three generations are presented. The chromosomal allele is
inherited into all daughter cells, such that it is present in the total population. Random segregation
of the plasmid genotypes leads to decrease in the number of hosts. At t3, only a small minority in
the population harbors the new plasmid allele. In the absence of selection for the plasmid allele
presence, the new plasmid allele is deemed to remain at a very low frequency within the population
(or be lost). Note: this is a simplistic example that does not include loss of host cells due to drift and
it does not include consideration of recombination among plasmids.
The expected effect of plasmid copy number on the allele dynamics was observed
in the simulated evolution of beneficial alleles (i.e., s > 0; Section 6.1): on the low-copy
plasmid (p10), the loss of plasmid alleles occurs more frequently in comparison to the
chromosome, but the median fixation time is nearly the same as that of the chromosome.
Indeed, previous studies showed that under strong selective conditions, beneficial
mutations on multicopy plasmids can rise quickly to fixation (San Millan et al. 2016).
Notably, the simulation of beneficial alleles (Section 6.1) revealed that alleles on the high
copy plasmid (p100) remain polymorphic over a longer time scale and have a higher
median fixation time. For neutral alleles, segregational drift of multicopy plasmids hinders
the increase of plasmid allele frequency; it leads to frequent and rapid mutant allele loss
on the one hand, and to longer fixation time on the other hand. Altogether, these
simulations demonstrated that the effect of segregational drift on plasmid allele dynamics
counteracts the effect of higher mutational supply accompanying increased copy number.
t0, N=1, fhosts=1
t1, N=2, fhosts=0.5
t2, N=4, fhosts=0.5
t3, N=8, fhosts=0.375
Emergence of a new plasmid allele
Loss of plasmid alleles due to segregational drift
Plasmid allele dynamics depend on plasmid segregation
Fixation of the new plasmid allele in a cell
63
Consequently, the evolvability of low-copy plasmids is higher than that of high copy
plasmids despite the latter higher mutational supply.
The impact of segregational drift is not expected to be limited to non-mobile plasmids
as mobile (or conjugative) plasmids are also found in multicopy state (e.g., Figurski and
Helinski 1979). Moreover, plasmid copy number may be heterogeneous within the
population, especially for plasmids that were modified towards a high copy number such
as the pUC origin (e.g., Münch et al. 2015). Furthermore, plasmid copy number can be
variable during evolution (e.g., San Millan et al. 2016, Santos-Lopez et al. 2016). Using
simulations (Section 6.1) it was demonstrated that segregational drift during the evolution
of plasmids having a constant copy number has an effect on their evolutionary rate. This
scenario is relevant for naturally occurring plasmids having a tightly controlled copy
number and segregation mechanisms. Variable plasmid copy number within the
population, and over time, is expected to have implications for the effect of segregational
drift on plasmid evolution and may thus lead to evolutionary rate heterogeneity in plasmid
genomes. The evolution of multicopy plasmids entails time spans of intra-cellular
heterogeneity, which is a situation also encountered by mitochondrial genomes within
single cells. Thus, within this study, the operation of analogous evolutionary processes in
bacterial plasmids and eukaryotic organelles was highlighted. In summary, a realistic
portrayal and modelling of plasmid genome evolution requires deeper understanding of
segregational drift.
64
6 Appendices 6.1 Simulations
To further test the segregational hypothesis I designed a simulation study in collaboration
with Dr. Anne Kupczok and Tal Dagan. This chapter of my thesis presents the results of
the simulations. The scripts were programmed by Anne Kupczok and analyzed by the
three of us.
6.1.1 Plasmid population dynamics.
What are the theoretical expectations for the impact of segregational drift on the dynamics
of plasmid alleles in comparison to chromosomal alleles? To address this question we
simulated plasmid and chromosome allele dynamics. For this purpose, we applied the
standard haploid Wright-Fisher model to simulate forward-time evolution of a population of
cells that is subject to random genetic drift (Gillespie 2010). In the simulation, the cell
population size remains constant throughout evolution. To simulate plasmid evolution, we
added an additional layer of random genetic drift by applying a Wright-Fisher model to the
plasmid inheritance (similarly to mitochondria simulated evolution (Peng and Kimmel
2005). Thus, during cell division, plasmid alleles are selected randomly into the daughter
cells of the next generation. In terms of population genetics, the plasmid population in the
simulated evolution has a substructure within the population. This implies that plasmid
allele dynamics have two hierarchical levels: within the cell and within the total population.
We compared the allele frequency dynamics of neutral variants emerging in a
population of N = 105 cells on a haploid chromosome (termed Cx105) and two multicopy
plasmids: one plasmid has a copy number of 10 plasmids per cell (termed p10x105), while
the second plasmid has 100 copies per cell (termed p100x105). The plasmid copy number
remains constant throughout the simulation, hence, a population of 105 cells harbors a
total of 106 p10 replicons. The total number of p100 replicon in such a population is 107. In
order to examine the effect of the increased total number of plasmid replicons, we
simulated in addition the allele dynamics of a haploid chromosome with two additional
population sizes. In the first population, the number of cells equals the total p10 replicons,
i.e., N = 106 (termed Cx106). In the second population the number of cells matches the
total p100x105 replicons, i.e., N = 107 (termed Cx107). In addition, we eliminate the effect
of replicon size on the probability of mutation by defining the plasmids and chromosomes
to have an equal size of 500 loci. The evolution of all replicons was simulated over 1,000
generations in 100 replicate populations. The simulation results reveal that the number of
accumulated mutations on the plasmids is higher in comparison to Cx105 and lower in
comparison to chromosomes with the respective population size (i.e., p10x105 vs. Cx106
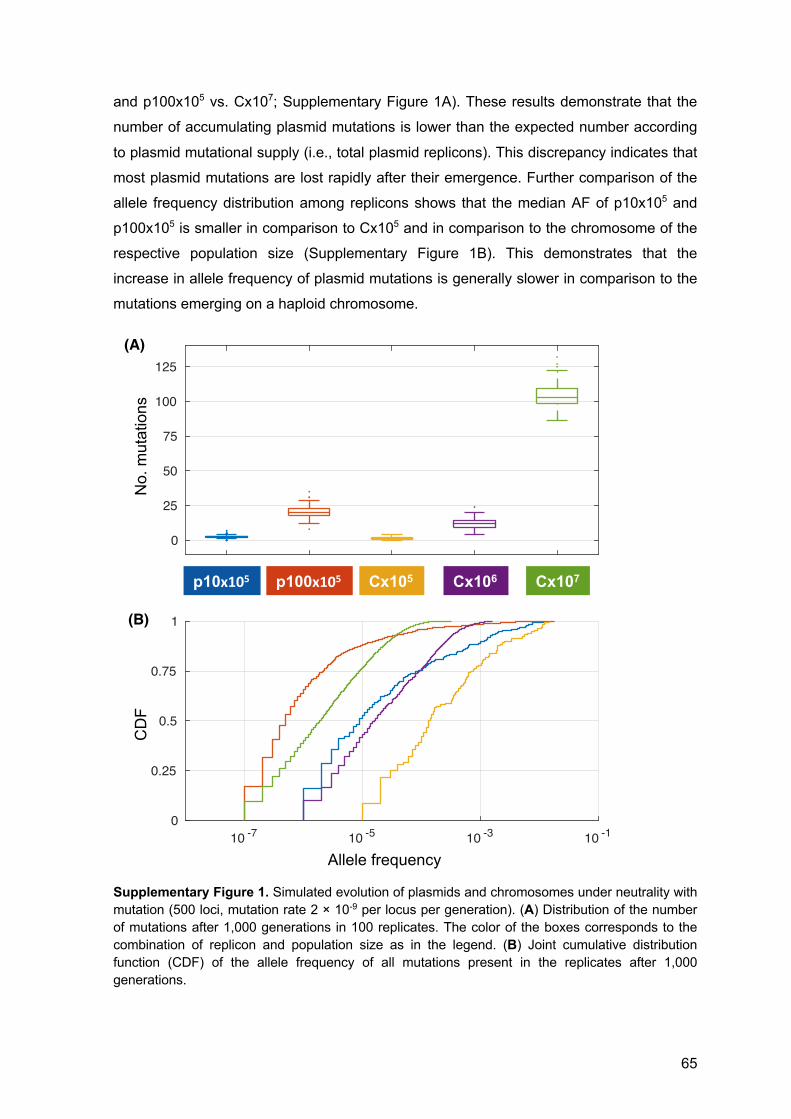
65
and p100x105 vs. Cx107; Supplementary Figure 1A). These results demonstrate that the
number of accumulating plasmid mutations is lower than the expected number according
to plasmid mutational supply (i.e., total plasmid replicons). This discrepancy indicates that
most plasmid mutations are lost rapidly after their emergence. Further comparison of the
allele frequency distribution among replicons shows that the median AF of p10x105 and
p100x105 is smaller in comparison to Cx105 and in comparison to the chromosome of the
respective population size (Supplementary Figure 1B). This demonstrates that the
increase in allele frequency of plasmid mutations is generally slower in comparison to the
mutations emerging on a haploid chromosome.
Supplementary Figure 1. Simulated evolution of plasmids and chromosomes under neutrality with
mutation (500 loci, mutation rate 2 × 10⁻⁹ per locus per generation). (A) Distribution of the number
of mutations after 1,000 generations in 100 replicates. The color of the boxes corresponds to the
combination of replicon and population size as in the legend. (B) Joint cumulative distribution
function (CDF) of the allele frequency of all mutations present in the replicates after 1,000
generations.
0
25
50
75
100
125
No.
Mut
atio
ns
(A)
10 -7 10 -5 10 -3 10 -1
Alelle frequency
0
0.25
0.5
0.75
1
CD
F
(B)
p10 p100 Chr10 5 Chr10 6 Chr10 7p10x105% p100x105% Cx105 Cx106 Cx107
Allele frequency
CD
F N
o. m
utat
ions
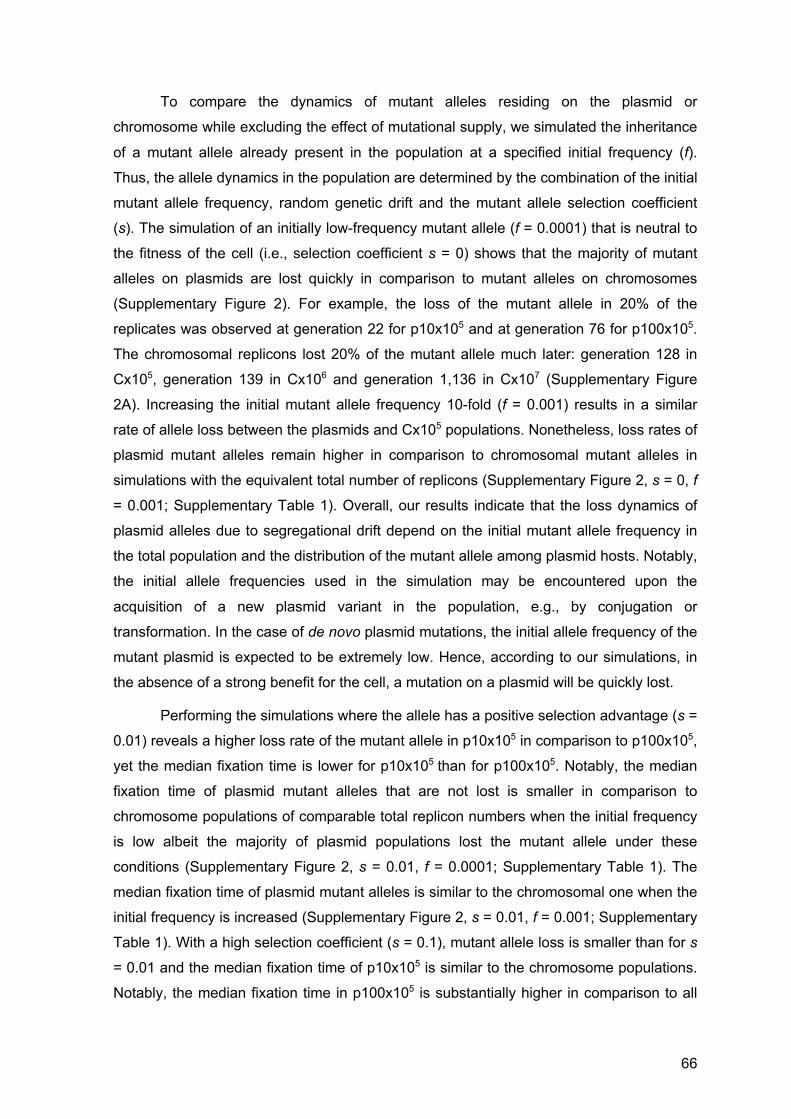
66
To compare the dynamics of mutant alleles residing on the plasmid or
chromosome while excluding the effect of mutational supply, we simulated the inheritance
of a mutant allele already present in the population at a specified initial frequency (f).
Thus, the allele dynamics in the population are determined by the combination of the initial
mutant allele frequency, random genetic drift and the mutant allele selection coefficient
(s). The simulation of an initially low-frequency mutant allele (f = 0.0001) that is neutral to
the fitness of the cell (i.e., selection coefficient s = 0) shows that the majority of mutant
alleles on plasmids are lost quickly in comparison to mutant alleles on chromosomes
(Supplementary Figure 2). For example, the loss of the mutant allele in 20% of the
replicates was observed at generation 22 for p10x105 and at generation 76 for p100x105.
The chromosomal replicons lost 20% of the mutant allele much later: generation 128 in
Cx105, generation 139 in Cx106 and generation 1,136 in Cx107 (Supplementary Figure
2A). Increasing the initial mutant allele frequency 10-fold (f = 0.001) results in a similar
rate of allele loss between the plasmids and Cx105 populations. Nonetheless, loss rates of
plasmid mutant alleles remain higher in comparison to chromosomal mutant alleles in
simulations with the equivalent total number of replicons (Supplementary Figure 2, s = 0, f
= 0.001; Supplementary Table 1). Overall, our results indicate that the loss dynamics of
plasmid alleles due to segregational drift depend on the initial mutant allele frequency in
the total population and the distribution of the mutant allele among plasmid hosts. Notably,
the initial allele frequencies used in the simulation may be encountered upon the
acquisition of a new plasmid variant in the population, e.g., by conjugation or
transformation. In the case of de novo plasmid mutations, the initial allele frequency of the
mutant plasmid is expected to be extremely low. Hence, according to our simulations, in
the absence of a strong benefit for the cell, a mutation on a plasmid will be quickly lost.
Performing the simulations where the allele has a positive selection advantage (s =
0.01) reveals a higher loss rate of the mutant allele in p10x105 in comparison to p100x105,
yet the median fixation time is lower for p10x105 than for p100x105. Notably, the median
fixation time of plasmid mutant alleles that are not lost is smaller in comparison to
chromosome populations of comparable total replicon numbers when the initial frequency
is low albeit the majority of plasmid populations lost the mutant allele under these
conditions (Supplementary Figure 2, s = 0.01, f = 0.0001; Supplementary Table 1). The
median fixation time of plasmid mutant alleles is similar to the chromosomal one when the
initial frequency is increased (Supplementary Figure 2, s = 0.01, f = 0.001; Supplementary
Table 1). With a high selection coefficient (s = 0.1), mutant allele loss is smaller than for s
= 0.01 and the median fixation time of p10x105 is similar to the chromosome populations.
Notably, the median fixation time in p100x105 is substantially higher in comparison to all
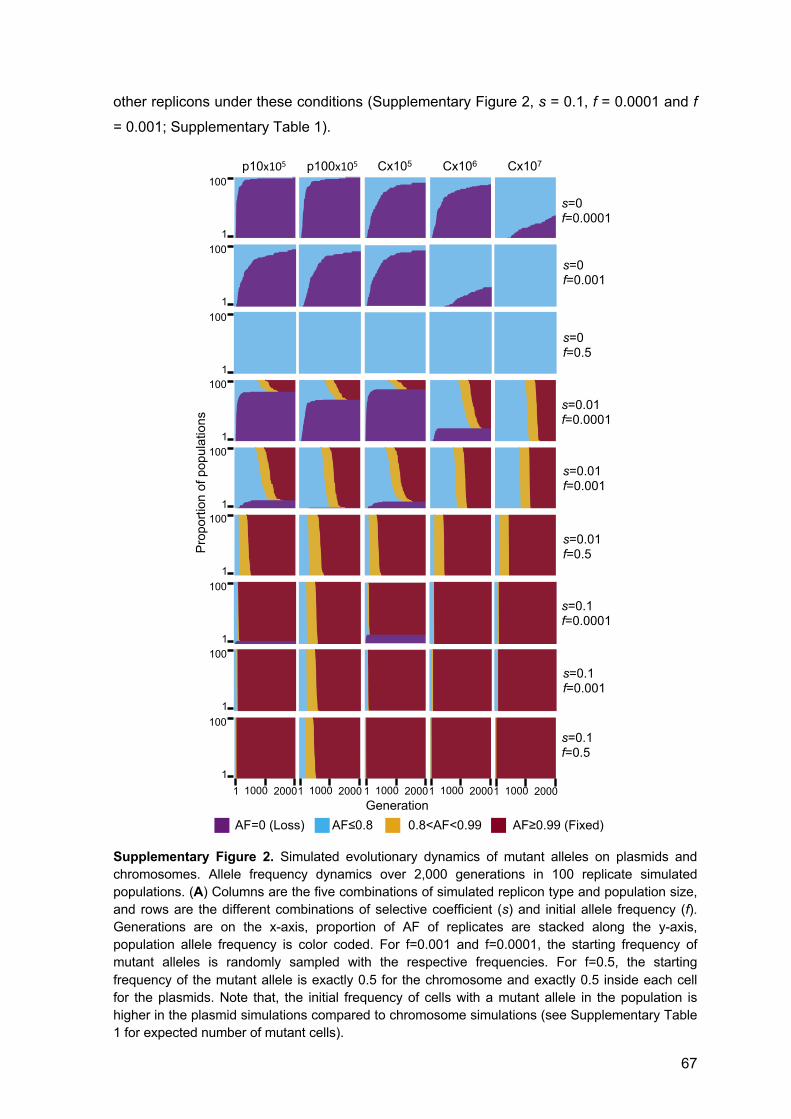
67
other replicons under these conditions (Supplementary Figure 2, s = 0.1, f = 0.0001 and f
= 0.001; Supplementary Table 1).
Supplementary Figure 2. Simulated evolutionary dynamics of mutant alleles on plasmids and
chromosomes. Allele frequency dynamics over 2,000 generations in 100 replicate simulated
populations. (A) Columns are the five combinations of simulated replicon type and population size,
and rows are the different combinations of selective coefficient (s) and initial allele frequency (f). Generations are on the x-axis, proportion of AF of replicates are stacked along the y-axis,
population allele frequency is color coded. For f=0.001 and f=0.0001, the starting frequency of
mutant alleles is randomly sampled with the respective frequencies. For f=0.5, the starting
frequency of the mutant allele is exactly 0.5 for the chromosome and exactly 0.5 inside each cell
for the plasmids. Note that, the initial frequency of cells with a mutant allele in the population is
higher in the plasmid simulations compared to chromosome simulations (see Supplementary Table
1 for expected number of mutant cells).
s=0 f=0.0001
s=0 f=0.001
s=0.01 f=0.0001
s=0.01 f=0.001
Pro
porti
on o
f pop
ulat
ions
p10x105% p100x105% Cx105 Cx106 Cx107
AF=0 (Loss) AF≤0.8 0.8<AF<0.99 AF≥0.99 (Fixed)
100
1
s=0.1 f=0.0001
s=0.1 f=0.001
1 2000 1000 Generation
100
1 100
1 100
1 100
1 100
1 100
1 100
1 100
1
1 2000 1000 1 2000 1000 1 2000 1000 1 2000 1000
s=0 f=0.5
s=0.1 f=0.5
s=0.01 f=0.5

68
Supplementary Table 1. Loss frequency and median fixation time during simulated evolution of
mutant alleles on plasmids and chromosomes. (A) The number of populations where the mutant
allele went extinct during the simulation is presented for each combination of simulated replicon
type and populations size, initial allele frequency (f) and selection coefficient (s) with 100 replicate
populations for each combination. The median fixation time across the 100 simulated replicate
populations is calculated as the medium number of generations where a) at least 1 plasmid per cell
is present in 80% of the cells, or where b) 80% of the cells harbor plasmid mutants only, or where
c) 80% of all replicons is of mutant type (i.e., mutant alleles in the population). (B) Expected
number of cells having a mutant allele in the initial population. The expected number of cells is
calculated by (1-(1-f)cp)×c with initial mutant allele frequency f, plasmid copy number cp and
number of cells c.
In the presence of balancing selection for multiple plasmid alleles (e.g., alleles
supplying resistance for different antibiotics), plasmid loci may remain polymorphic over a
long time-scale. Previous studies showed that when the balancing selection is replaced by
selection for only one of the plasmid alleles, alternative plasmid alleles may remain
polymorphic in the population for a certain time (Bedhomme et al. 2017, Rodriguez-
Beltran et al. 2018). We hypothesize that the persistence of alternative plasmid alleles in
the population in the absence of selection for the allele, is affected by segregational drift.
To test our hypothesis, we performed simulations of plasmid allele dynamics post
balancing selection. Thus, the initial mutant allele frequency is set to exactly f = 0.5 (i.e.,
each cell has equal proportions of the ancestral and mutant allele). Here we compare the
dynamics of plasmid alleles to chromosomal alleles with the same total replicons as in the
above simulations. Our results show that in the absence of selection for the mutant allele,
both the ancestral and the mutant allele remain in the population in equilibrium as
expected (Supplementary Figure 2, s = 0, f = 0.5; Supplementary Figure 3A, s = 0, f =
0.5). When the mutant allele is beneficial (s = 0.01 or s = 0.1), the ancestral allele persists
in the population when it is on the plasmid for a longer time scale in comparison to a
chromosomal allele of the same total replicon population (Supplementary Figure 2, s =
0.01 and s = 0.1, f = 0.5). Nonetheless, the proportion of mutant cells in the population
(A)
s f p10 p100 Chr105 Chr106 Chr107 p10 p100 p10 p100 p10 p100 Chr105 Chr106 Chr107
0 0.0001 99 99 91 89 37 – – – – – – – – –0 0.001 92 89 91 32 0 – – – – – – – – –0 0.01 34 39 40 0 0 – – – – – – – – –
0.01 0.0001 81 68 85 21 0 862 969 862 971 862 969 932 1089 10710.01 0.001 13 1 11 0 0 853 836 853 836 853 836 852 842 8330.01 0.01 0 0 0 0 0 600 620 600 627 600 622 604 602 6020.1 0.0001 5 0 14 0 0 114 110 114 330 114 258 111 113 1120.1 0.001 0 0 0 0 0 88 87 88 332 88 259 88 88 880.1 0.01 0 0 0 0 0 64 70 65 328 65 256 63 63 63
Loss (no. of populations out of 100)
a) At least 1 plasmid in cell
b) Cells with mutant plasmids only
Median fixation time (excluding loss)
c) Mutatant alleles in the population
(B) Average initial frequency in number of cells
f p10 p100 Chr105 Chr106 Chr107
0.0001 100 995 10 100 10000.001 996 9521 100 1000 100000.01 9562 63397 1000 10000 100000
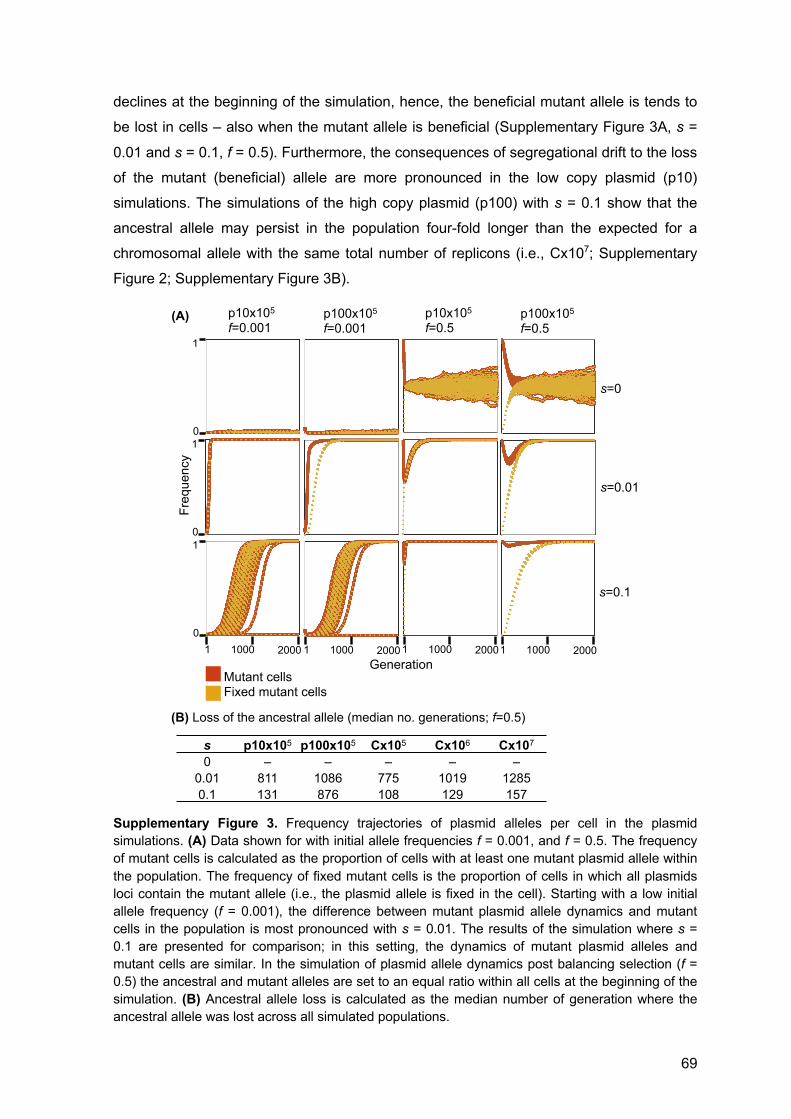
69
declines at the beginning of the simulation, hence, the beneficial mutant allele is tends to
be lost in cells – also when the mutant allele is beneficial (Supplementary Figure 3A, s =
0.01 and s = 0.1, f = 0.5). Furthermore, the consequences of segregational drift to the loss
of the mutant (beneficial) allele are more pronounced in the low copy plasmid (p10)
simulations. The simulations of the high copy plasmid (p100) with s = 0.1 show that the
ancestral allele may persist in the population four-fold longer than the expected for a
chromosomal allele with the same total number of replicons (i.e., Cx107; Supplementary
Figure 2; Supplementary Figure 3B).
Supplementary Figure 3. Frequency trajectories of plasmid alleles per cell in the plasmid
simulations. (A) Data shown for with initial allele frequencies f = 0.001, and f = 0.5. The frequency
of mutant cells is calculated as the proportion of cells with at least one mutant plasmid allele within
the population. The frequency of fixed mutant cells is the proportion of cells in which all plasmids
loci contain the mutant allele (i.e., the plasmid allele is fixed in the cell). Starting with a low initial
allele frequency (f = 0.001), the difference between mutant plasmid allele dynamics and mutant
cells in the population is most pronounced with s = 0.01. The results of the simulation where s =
0.1 are presented for comparison; in this setting, the dynamics of mutant plasmid alleles and
mutant cells are similar. In the simulation of plasmid allele dynamics post balancing selection (f =
0.5) the ancestral and mutant alleles are set to an equal ratio within all cells at the beginning of the
simulation. (B) Ancestral allele loss is calculated as the median number of generation where the
ancestral allele was lost across all simulated populations.
p10x105
f=0.001
Fre
quen
cy
Generation
1
0 1
0 1
0
s=0
s=0.01
s=0.1
Mutant cells Fixed mutant cells
s p10x105 p100x105 Cx105 Cx106 Cx107 0 – – – – –
0.01 811 1086 775 1019 1285 0.1 131 876 108 129 157
(A)
(B) Loss of the ancestral allele (median no. generations; f=0.5)
1 2000 1000 1 2000 1000 1 2000 1000 1 2000 1000
p100x105
f=0.001 p10x105
f=0.5 p100x105
f=0.5
70
The longer fixation time of p100x105 alleles under the simulated conditions of
strong selection (s = 0.1) are well explained by the effect of segregational drift on the rate
of plasmid allele fixation within the host cell. The high selection coefficient acts in favor of
cells harboring at least one plasmid mutant, such that those cells rise quickly to fixation
within the population. In comparison, the increase of the plasmid allele in the total
population is slower due to the effect of random genetic drift of plasmid alleles during cell
division, which hinders the increase of plasmid allele frequency in daughter cells. In other
words, when the plasmid copy number is high, plasmid alleles within the cell remain
polymorphic (i.e., heterogeneous) over a longer time scale, also when the mutant allele is
beneficial. This is also observed for the post balancing selection simulation where the loss
of the non-mutant (less beneficial) alleles is prolonged for higher copy numbers.
Notably, a plasmid copy number of 100 is within the range of PCNs observed in
natural isolates (Projan et al. 1987, Zhong et al. 2011), hence, the extended fixation (and
loss) time observed for p100x105 is likely to occur also under natural conditions. Since our
simulations do not include intra-host plasmid recombination, the observed differences in
allele dynamics between plasmids and chromosomes are solely due to inheritance and
segregational drift. Overall, the results of the simulation demonstrate that segregational
drift of multicopy plasmids has a considerable impact on plasmid allele dynamics in the
population by increasing the loss rate and fixation time of plasmid alleles.
6.1.2 Methodology
Forward-time simulations based non non-overlapping generations with a constant cell
population size were performed with python3.4 and the module simuPOP v1.1.8.3
(Chiang and Bremer 1988, Peng and Kimmel 2005). Two types of cells were simulated
independently. Cells with chromosomes have L haploid loci (ploidy=1). Cells with
plasmids have a predefined plasmid copy number cp that stays constant throughout the
simulation. Each plasmid has L loci, resulting in a total number of L´cp loci in each cell.
This was implemented based on cp customized chromosomes
(chromTypes=[sim.CUSTOMIZED]*cp), each with L haploid loci. Alleles were simulated as
binary (alleleType='binary'). Inheritance mode for the chromosome corresponds to a
Wright-Fisher model (operator RandomSelection()). Inheritance mode for the plasmid
corresponds to a Wright Fisher model with mitochondrial inheritance of organelles
(operator RandomSelection(ops=[sim.MitochondrialGenoTransmitter()])).
For the simulations with mutation, initial populations (t=0) were homogenous, i.e., all
loci had state 0. The mutation rate in the simulation was constant with 2 × 10⁻⁹ per locus
per generation (operator SNPmutator(u=2e-9)). For the simulated evolutionary dynamics
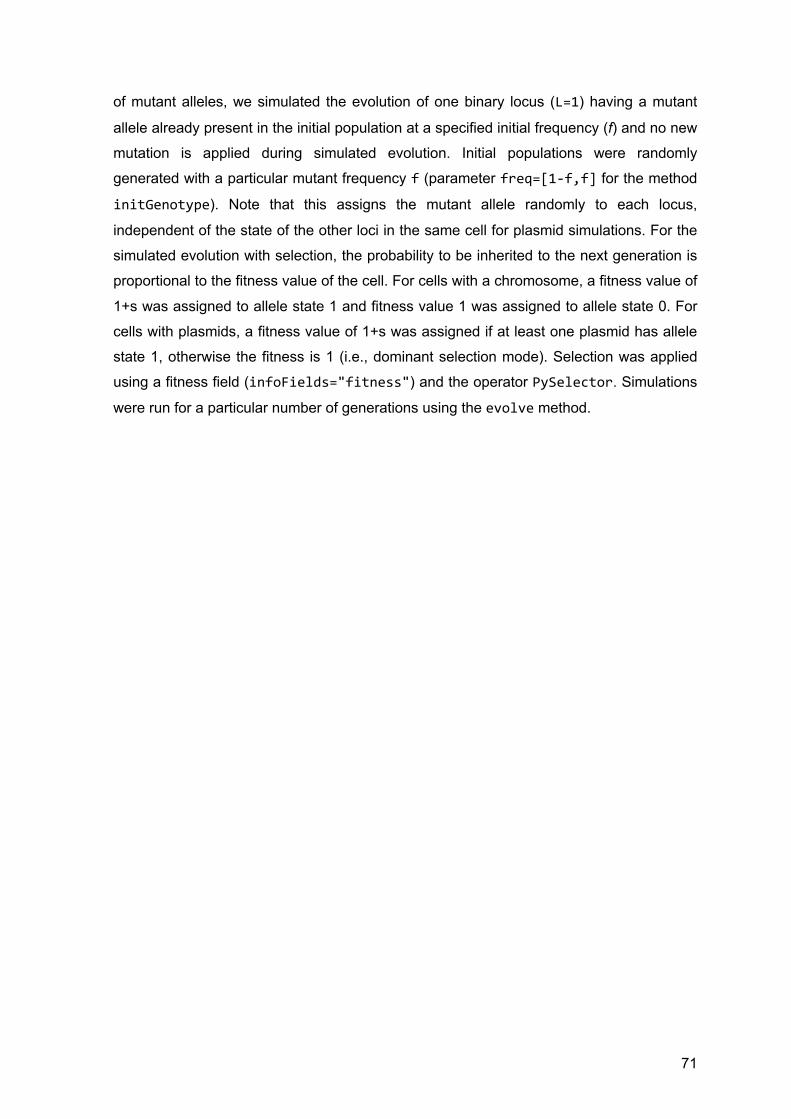
71
of mutant alleles, we simulated the evolution of one binary locus (L=1) having a mutant
allele already present in the initial population at a specified initial frequency (f) and no new
mutation is applied during simulated evolution. Initial populations were randomly
generated with a particular mutant frequency f (parameter freq=[1-f,f] for the method
initGenotype). Note that this assigns the mutant allele randomly to each locus,
independent of the state of the other loci in the same cell for plasmid simulations. For the
simulated evolution with selection, the probability to be inherited to the next generation is
proportional to the fitness value of the cell. For cells with a chromosome, a fitness value of
1+s was assigned to allele state 1 and fitness value 1 was assigned to allele state 0. For
cells with plasmids, a fitness value of 1+s was assigned if at least one plasmid has allele
state 1, otherwise the fitness is 1 (i.e., dominant selection mode). Selection was applied
using a fitness field (infoFields="fitness") and the operator PySelector. Simulations
were run for a particular number of generations using the evolve method.
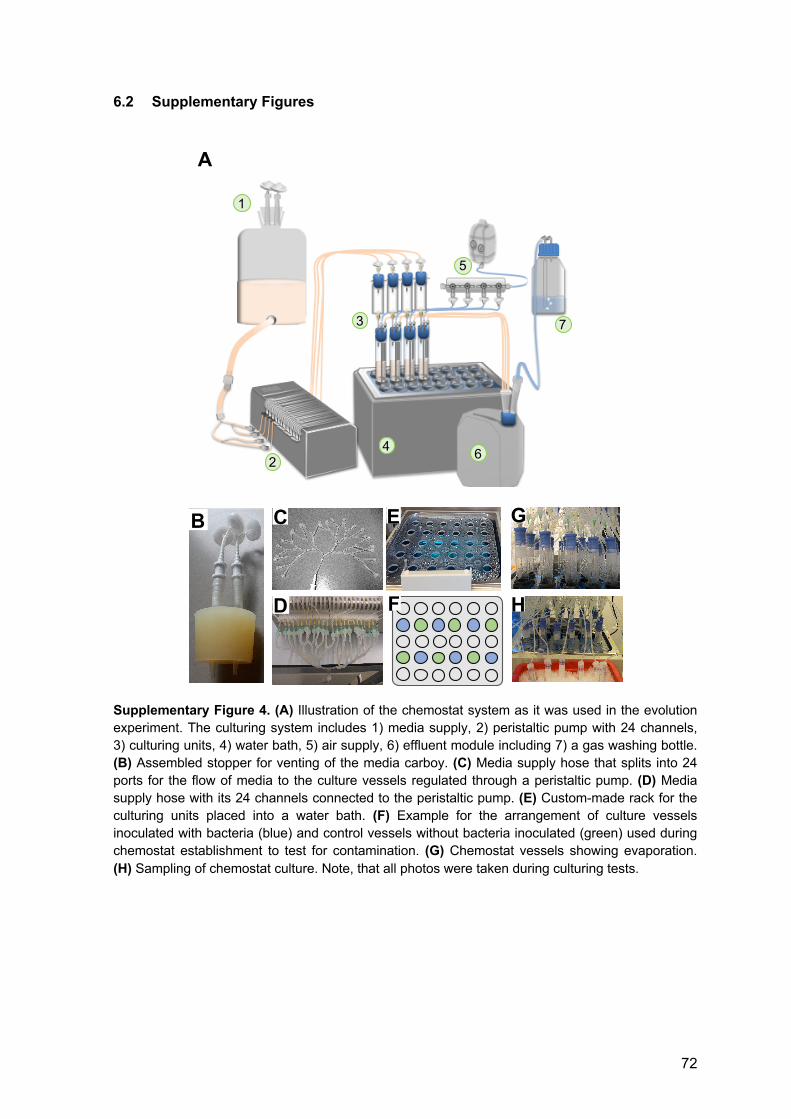
72
6.2 Supplementary Figures
Supplementary Figure 4. (A) Illustration of the chemostat system as it was used in the evolution
experiment. The culturing system includes 1) media supply, 2) peristaltic pump with 24 channels,
3) culturing units, 4) water bath, 5) air supply, 6) effluent module including 7) a gas washing bottle.
(B) Assembled stopper for venting of the media carboy. (C) Media supply hose that splits into 24
ports for the flow of media to the culture vessels regulated through a peristaltic pump. (D) Media
supply hose with its 24 channels connected to the peristaltic pump. (E) Custom-made rack for the
culturing units placed into a water bath. (F) Example for the arrangement of culture vessels
inoculated with bacteria (blue) and control vessels without bacteria inoculated (green) used during
chemostat establishment to test for contamination. (G) Chemostat vessels showing evaporation.
(H) Sampling of chemostat culture. Note, that all photos were taken during culturing tests.
C
D
B E
F H
G
A
1
2
3
4
5
6
7
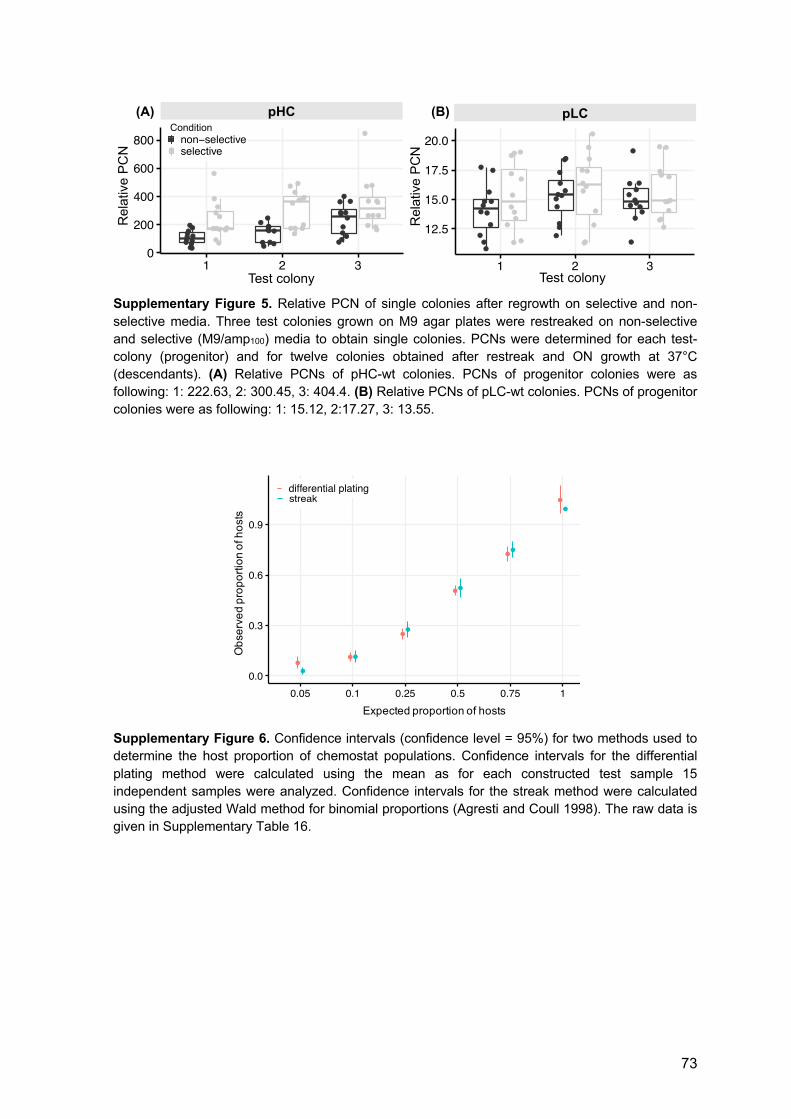
73
Supplementary Figure 5. Relative PCN of single colonies after regrowth on selective and non-
selective media. Three test colonies grown on M9 agar plates were restreaked on non-selective
and selective (M9/amp100) media to obtain single colonies. PCNs were determined for each test-
colony (progenitor) and for twelve colonies obtained after restreak and ON growth at 37°C
(descendants). (A) Relative PCNs of pHC-wt colonies. PCNs of progenitor colonies were as
following: 1: 222.63, 2: 300.45, 3: 404.4. (B) Relative PCNs of pLC-wt colonies. PCNs of progenitor
colonies were as following: 1: 15.12, 2:17.27, 3: 13.55.
Supplementary Figure 6. Confidence intervals (confidence level = 95%) for two methods used to
determine the host proportion of chemostat populations. Confidence intervals for the differential
plating method were calculated using the mean as for each constructed test sample 15
independent samples were analyzed. Confidence intervals for the streak method were calculated
using the adjusted Wald method for binomial proportions (Agresti and Coull 1998). The raw data is
given in Supplementary Table 16.
●
●
●
●
●●
●
●
●●
●
●
●
●
●
●
●
●●
●
●
●
●
●
●
●
●●
●
●
●
●
●
●
●
●
●
●
●
●
●
●
●
●
●
●
●
●●
●
● ●
●
●●
●
●
●
●
●●
●
●
●●
●
●
●
●
●
●
●
12.5
15.0
17.5
20.0
1 2 3as.factor(sample)
PCN
condition ● ●non−selective selective
●
●
●●
●
●
●
●
●
●
●
●●●●
●●
●●
●●
●
●●
●
●
●●
●●
●
●●
●
●
●
●
●●
●
●
●●
●●●
●
●●
●
●
●
●
●
●
●
●
●
●
●
●
●●
●
●●
●
●
●
●
●●
0
200
400
600
800
1 2 3as.factor(sample)
PCN
condition ● ●non−selective selective
Rel
ativ
ePC
N
Test colony Test colony
pLC
●
●
●●
●
●
●
●
●
●
●
●●●●
●●
●●
●●
●
●●
●
●
●●
●●
●
●●
●
●
●
●
●●
●
●
●●
●●●
●
●●
●
●
●
●
●
●
●
●
●
●
●
●
●●
●
●●
●
●
●
●
●●
0
200
400
600
800
1 2 3as.factor(sample)
PCN
condition ● ●non−selective selective
●
●
●●
●
●
●
●
●
●
●
●●●●
●●
●●
●●
●
●●
●
●
●●
●●
●
●●
●
●
●
●
●●
●
●
●●
●●●
●
●●
●
●
●
●
●
●
●
●
●
●
●
●
●●
●
●●
●
●
●
●
●●
0
200
400
600
800
1 2 3as.factor(sample)
PCN
condition ● ●non−selective selective
ConditionpHC(A) (B)
Rel
ativ
ePC
N
●
●
●●
●●
●●
●●
●
●
0.0
0.3
0.6
0.9
0.05 0.1 0.25 0.5 0.75 1
as.factor(expected_prop2)
CI_low
method ● ●differential plating streak
Expected proportion of hosts
Obs
erve
d pr
opor
tion
of h
osts
0.00
0.25
0.50
0.75
1.00
0.05 0.1 0.25 0.5 0.75 1
as.factor(expected_prop2)
CI_low
method differential plating streak
0.00
0.25
0.50
0.75
1.00
0.05 0.1 0.25 0.5 0.75 1
as.factor(expected_prop2)
CI_low
method differential plating streak

74
Supplementary Figure 7. Effect of freezing and reviving on proportion of hosts. The effect of
freezing and reving on the proportion of hosts in pLC-wt and pHC-wt populations with an expected
proportion of hosts of 0.15 and 0.75 was examined by estimating the proportions before and after
freezing at -80°C for six weeks. Five technical replicates were used per test group. Raw data is
reported in Supplementary Table 17.
Supplementary Figure 8. Ancestral and evolved predicted secondary structures of RNAI encoded
on plasmid pHC. Secondary structures were predicted using RNAfold (Lorenz et al. 2011, Gruber
et al. 2008). The evolved structures include a single nucleotide insertion mutation. Black arrows
indicate the ancestral state, red arrows indicate the evolved state. (A) The structures are colored
by base-pairing probabilities. For unpaired regions the color denotes the probability of being
unpaired. (B) The structures are colored by positional entropy.
●
pHC pLC
0.150.75
before after before after
0.125
0.150
0.175
0.69
0.72
0.75
0.78
freezing
obse
rved
pro
porti
on o
f hos
ts
Positional entropy
Base-pair probability
A
B
Ancestral RNAI Evolved RNAI
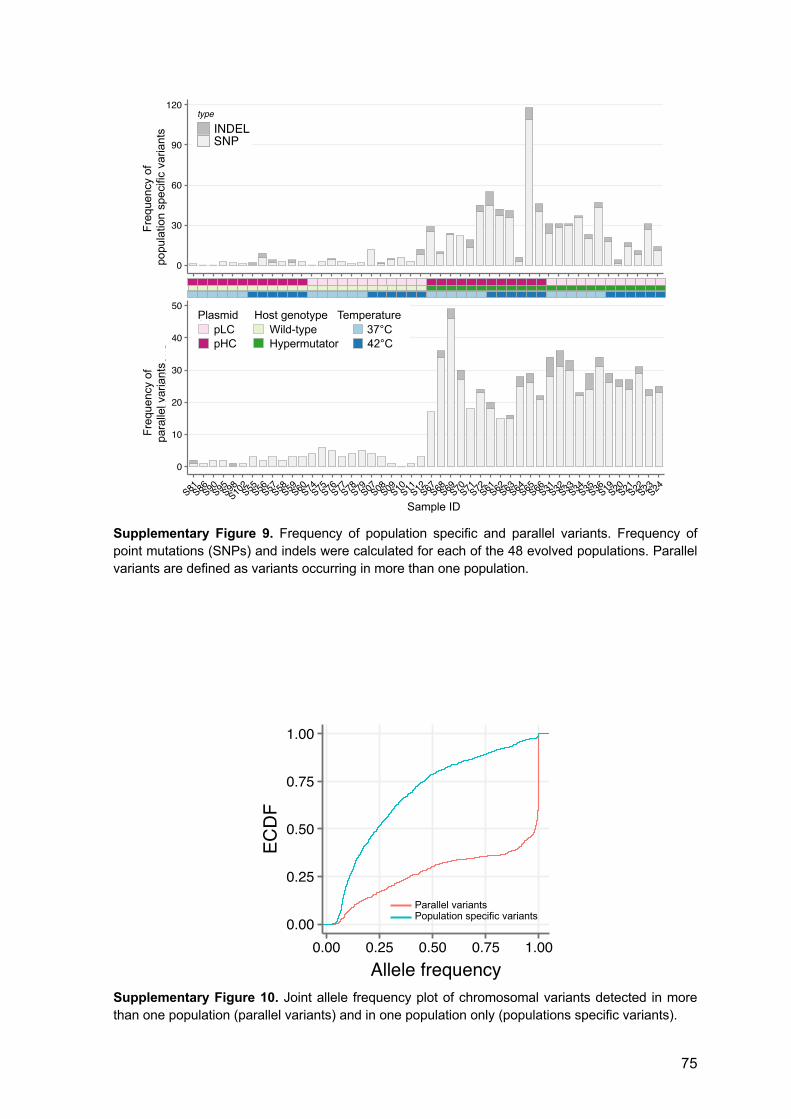
75
Supplementary Figure 9. Frequency of population specific and parallel variants. Frequency of
point mutations (SNPs) and indels were calculated for each of the 48 evolved populations. Parallel
variants are defined as variants occurring in more than one population.
Supplementary Figure 10. Joint allele frequency plot of chromosomal variants detected in more
than one population (parallel variants) and in one population only (populations specific variants).
0
10
20
30
40
50
S81S86S90S95S98S10
2S55S56S57S58S59S60S74S75S76S77S78S79S07S08S09S10S11S12S67S68S69S70S71S72S61S62S63S64S65S66S31S32S33S34S35S36S19S20S21S22S23S24
ID
No.
of m
utat
ions
type
INDELSNP
0
30
60
90
120
S81S86S90S95S98S10
2S55S56S57S58S59S60S74S75S76S77S78S79S07S08S09S10S11S12S67S68S69S70S71S72S61S62S63S64S65S66S31S32S33S34S35S36S19S20S21S22S23S24
ID
No.
of m
utat
ions
type
INDELSNP
Sample ID
0
30
60
90
120
S81S86S90S95S98S10
2S55S56S57S58S59S60S74S75S76S77S78S79S07S08S09S10S11S12S67S68S69S70S71S72S61S62S63S64S65S66S31S32S33S34S35S36S19S20S21S22S23S24
ID
No.
of m
utat
ions
type
INDELSNP
Freq
uenc
yof
para
llel v
aria
nts
Freq
uenc
yof
popu
latio
nsp
ecifi
cva
riant
s
484746454443424140393837363534333231302928272625242322212019181716151413121110987654321Plasmid type
pLCpHC
Culturing temperature37°C42°C
Host genotypeWildtypeHypermutator
0
10
20
30
40
50
484746454443424140393837363534333231302928272625242322212019181716151413121110987654321
Plasmid typepLCpHC
Culturing temperature37°C42°C
Host genotypeWildtypeHypermutator
0
10
20
30
40
50
484746454443424140393837363534333231302928272625242322212019181716151413121110987654321
Plasmid typepLCpHC
Culturing temperature37°C42°C
Host genotypeWildtypeHypermutator
0
10
20
30
40
50
Plasmid Host genotype TemperaturepLC Wild-type 37°CpHC Hypermutator 42°C
i A2512766G miaB E113G polA N761S rhsD T766A pepP E376E ybjD A415A yfjK S473I fhuF N179S melR F103L mdtL F235L pta P265P stfR G1066S recF G128D polB G401D wcaA S44P intA A21V insA S7S lacI V175I malQ G468G gltB P516P glnE S473S dps G93G prpE T320A yfhR A74T aas T22A yraK V325A ycaI E585E ymdB L166P yhbJ S114S lptB F165L yfgF A355V p G1636236A sfmH 323 +C ycjN E39G cheA G52G ccmA 538 +C
rpoS Q48*
Plasmid Temperature Host
484746454443424140393837363534333231302928272625242322212019181716151413121110987654321 Plasmid type
pLCpHC
Culturing temperature37°C42°C
Host genotypewild typehypermutator
051015202530
484746454443424140393837363534333231302928272625242322212019181716151413121110987654321 Plasmid type
pLCpHC
Culturing temperature37°C42°C
Host genotypewild typehypermutator
051015202530
484746454443424140393837363534333231302928272625242322212019181716151413121110987654321 Plasmid type
pLCpHC
Culturing temperature37°C42°C
Host genotypeWild−typeHypermutator
0
10
20
30
40
0 0.2 0.4 0.6 0.8 1 Allele frequency
S74S75S76S77S78S79S07S08S09S10S11S12S81S86S90S95S98S102S55S56S57S58S59S60S31S32S33S34S35S36S19S20S21S22S23S24S67S68S69S70S71S72S61S62S63S64S65S66
ccmA 538 +C
cheA G52G
ycjN E39G
sfmH
332 +Cp G
1636236AyfgF A355VlptB F165LyhbJ S114Sym
dB L166PycaI E585EyraK V325Aaas T22AyfhR
A74TprpE T320Adps G
93GglnE S473SgltB P516Pm
alQ G
468GlacI V175IinsA S7SintA A21Vw
caA S44PpolB G
401DrecF G
128DstfR
G1066S
pta P265Pm
dtL F235Lm
elR F103L
fhuF N179S
yfjK S473IybjD
A415ApepP E376ErhsD
T766ApolA N
761Sm
iaB E113Gi A2512766GrpoS Q
48*plasm
id_typepLCpH
C
genotype_2W
tH
ypermutator
temp
3742
0 0.20.40.60.81
rows: m
anhattan / complete
S74S75S76S77S78S79S07S08S09S10S11S12S81S86S90S95S98S102S55S56S57S58S59S60S31S32S33S34S35S36S19S20S21S22S23S24S67S68S69S70S71S72S61S62S63S64S65S66
ccmA 538 +CcheA G52GycjN E39GsfmH 332 +Cp G1636236AyfgF A355VlptB F165LyhbJ S114SymdB L166PycaI E585EyraK V325Aaas T22AyfhR A74TprpE T320Adps G93GglnE S473SgltB P516PmalQ G468GlacI V175IinsA S7SintA A21VwcaA S44PpolB G401DrecF G128DstfR G1066Spta P265PmdtL F235LmelR F103LfhuF N179SyfjK S473IybjD A415ApepP E376ErhsD T766ApolA N761SmiaB E113Gi A2512766GrpoS Q48* plasmid_type
pLCpHC
genotype_2WtHypermutator
temp3742
00.20.40.60.81
rows: manhattan / complete
0.00
0.25
0.50
0.75
1.00
0.00 0.25 0.50 0.75 1.00Allele frequency
ECD
F Mutation typeparallelunique
All mutations includedAllele Frequencies − parallel vs. unique mutations
Joint allele−frequency distribution of unique mutations is significantly smaller than that of parallel mutations (KS−test, p< 2.2e−32)
Parallel variantsPopulation specific variants
0.00
0.25
0.50
0.75
1.00
0.00 0.25 0.50 0.75 1.00Allele frequency
ECD
F Mutation typeparallelunique
All mutations includedAllele Frequencies − parallel vs. unique mutations
Joint allele−frequency distribution of unique mutations is significantly smaller than that of parallel mutations (KS−test, p< 2.2e−32)
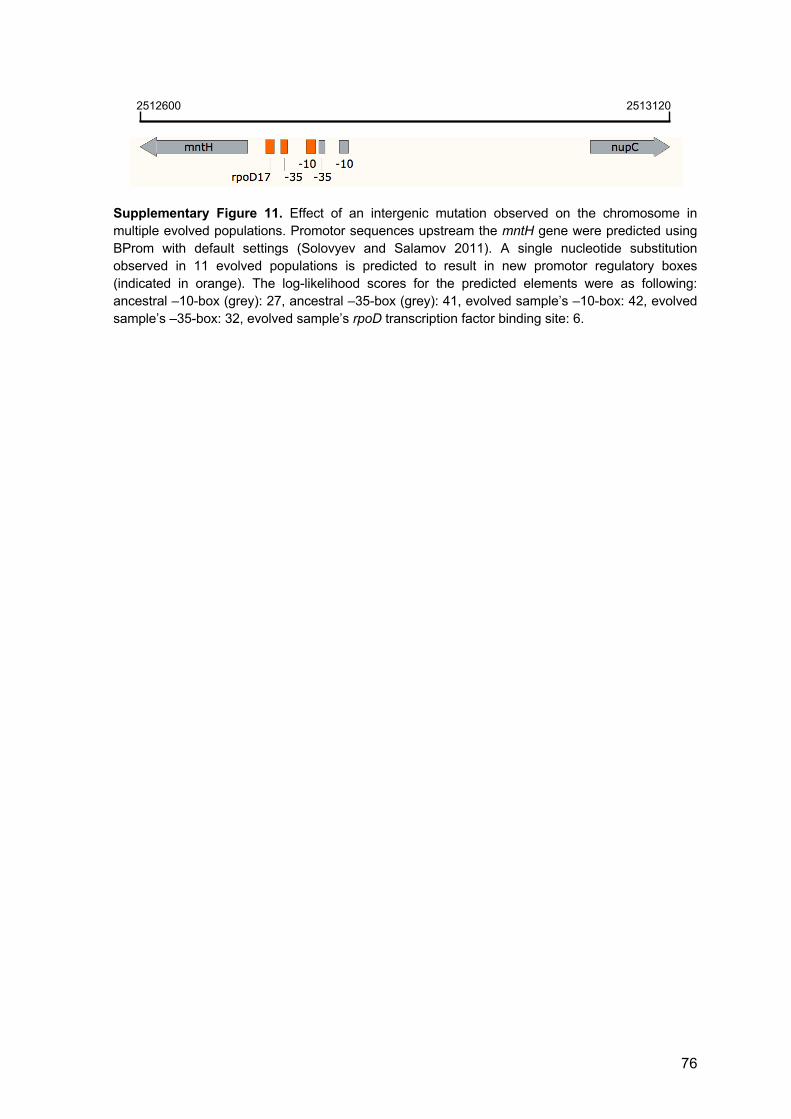
76
Supplementary Figure 11. Effect of an intergenic mutation observed on the chromosome in
multiple evolved populations. Promotor sequences upstream the mntH gene were predicted using
BProm with default settings (Solovyev and Salamov 2011). A single nucleotide substitution
observed in 11 evolved populations is predicted to result in new promotor regulatory boxes
(indicated in orange). The log-likelihood scores for the predicted elements were as following:
ancestral –10-box (grey): 27, ancestral –35-box (grey): 41, evolved sample’s –10-box: 42, evolved
sample’s –35-box: 32, evolved sample’s rpoD transcription factor binding site: 6.
2512600 2513120
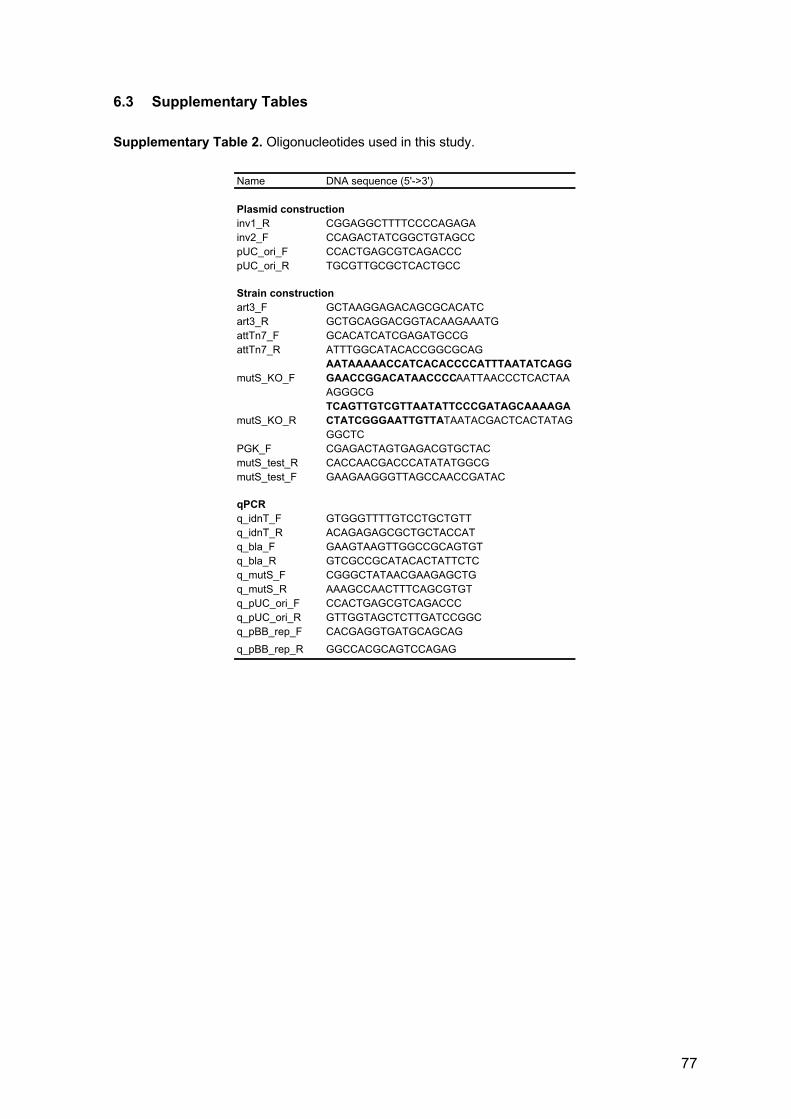
77
6.3 Supplementary Tables
Supplementary Table 2. Oligonucleotides used in this study.
Name DNA sequence (5'->3')
inv1_R CGGAGGCTTTTCCCCAGAGAinv2_F CCAGACTATCGGCTGTAGCCpUC_ori_F CCACTGAGCGTCAGACCCpUC_ori_R TGCGTTGCGCTCACTGCC
art3_F GCTAAGGAGACAGCGCACATCart3_R GCTGCAGGACGGTACAAGAAATGattTn7_F GCACATCATCGAGATGCCGattTn7_R ATTTGGCATACACCGGCGCAG
mutS_KO_FAATAAAAACCATCACACCCCATTTAATATCAGGGAACCGGACATAACCCCAATTAACCCTCACTAAAGGGCG
mutS_KO_RTCAGTTGTCGTTAATATTCCCGATAGCAAAAGACTATCGGGAATTGTTATAATACGACTCACTATAGGGCTC
PGK_F CGAGACTAGTGAGACGTGCTACmutS_test_R CACCAACGACCCATATATGGCGmutS_test_F GAAGAAGGGTTAGCCAACCGATAC
qPCRq_idnT_F GTGGGTTTTGTCCTGCTGTTq_idnT_R ACAGAGAGCGCTGCTACCATq_bla_F GAAGTAAGTTGGCCGCAGTGTq_bla_R GTCGCCGCATACACTATTCTCq_mutS_F CGGGCTATAACGAAGAGCTGq_mutS_R AAAGCCAACTTTCAGCGTGTq_pUC_ori_F CCACTGAGCGTCAGACCCq_pUC_ori_R GTTGGTAGCTCTTGATCCGGCq_pBB_rep_F CACGAGGTGATGCAGCAGq_pBB_rep_R GGCCACGCAGTCCAGAG
Plasmid construction
Strain construction

78
Supplementary Table 3 (part 1). Materials and equipment used to build the chemostat system for
the evolution experiment.
Media supplyNo.Item Specification Article no. Quantity Vendor Note1 Media carboys Carboy Nalgene PP 10 L, with PP
screw and tube connector (ID 13 mm)215-0118 2 VWR Filled with medium under sterile conditions
2 Stopper for carboy (and venting)
Rotilabo stoppers made of silicone rubber, bottom D 60 mm, top D 70 mm
TL37.1 2 ROTH 70 mm stoppers with holes commercially not available. Therefore, 2 holes were drilled into each stopper, 5 ml pipet tips and universal tubing connectors inserted and connected to gas filters; see Supplementary Figure 1.
3 Medium carboy outlet tubing
Biocompatible silicone tubing, platinum cured, Versilic, ID 10 mm
HC72.2 10 m ROTH
4 Hose clamp For tubes with OD up to 19 mm, acetal 229-0321 1 pack of 6 VWR5 Hose clamp For tubes with OD 3.2 mm - 11 mm,
acetal229-0320 1 pack of 12 VWR
6 Universal tubing connectors
For tubes with ID from 4/8 mm - 17 mm, PP
Y523.1 1 pack of 10 ROTH
7 Tubing that connects carboy outlet with quick connect
Biocompatible silicone tubing, platinum cured, Versilic, ID 6 mm
HC67.2 10 m ROTH Also used in other parts of the chemostat
8 Quick connect coupling female
PP with barrier, tubing ID 6.4 mm 2-1863 2 neoLab
9 Quick connect coupling male
PP with barrier, tubing ID 6.4 mm 2-1865 2 neoLab
10 Tube reducing connectors
PP, Rotilabo, connector I OD 8-12 mm, connector II OD 4-8 mm
E801.1 2 ROTH
11 Hose that connects carboy outlet tubing with pump tubing
Biocompatible silicone tubing, platinum cured, Versilic, ID 2 mm
HC62.1 50 m ROTH Also used in other parts of the chemostat
12 Y-shape tubing connector
Rotilabo Y-pieces, for hoses with ID 3 mm
E770.1 5 packs of 10 ROTH Used to split main media carboy outlet hose into 24 channels; see Supplementary Figure 1.
13 Tubing connector with Luer Lock male
Rotilabo Luer-tubing connectors, male, for hoses with ID 3.2 mm
CT60.1 10 packs of 10
ROTH
14 Needle to connect pump tubing with adjacent hoses
Disposable needles Sterican, blunt edge, 21G, length 22 mm
X134.1 2 packs of 100
ROTH
15 Peristaltic pump 24-channel tubing pump ISMATEC IPC-N ISM939D
224-1031 2 VWR
16 Pump tubing 2-stop tubing ISMATEC PharMed Ismaprene, ID 0.38 mm
ISMCSC0321
8 packs of 6 VWR New or autoclaved tubing requires running-in time (at least 1 hour)
17 Hose connecting pump tubing with air break
Biocompatible silicone tubing, platinum cured, Versilic, ID 2 mm
HC62.1 included in no. 11
ROTH
Air supplyNo.Item Specification Article no. Quantity Vendor Note18 Air pump Eheim air pump 400, pump capacity
400 L h-13704010 4 REBIE
Online shop19 Hose connecting air
pump with manifold Biocompatible silicone tubing, platinum cured, Versilic, ID 2 mm
HC62.1 included in no. 11
ROTH
20 Manifold 5-port manifold, 7x Luer Lock female 2-6357 8 neoLab21 Tubing connector
with Luer Lock male Rotilabo Luer-tubing connectors, male, for hoses with ID 3.2 mm
CT60.1 5 packs of 10 ROTH Used to connect manifold and hose (ID 2 mm)
22 Gas filter Syringe filter, PTFE membrane, 0.2 µm, D 25 mm
514-0070 1 pack of 100 VWR
23 Hose connecting gas filter and canula in culturing unit
Biocompatible silicone tubing, platinum cured, Versilic, ID 2 mm
HC62.1 included in no. 11
ROTH
24 Culture vessel inlet needle
Cannulas Luer-Lock connection, 1.2 × 150 mm
2-3118 16 packs of 3 NeoLab
Air breakNo.Item Specification Article no. Quantity Vendor Note25 Tubing connector
with Luer Lock male Rotilabo Luer-tubing connectors, male, for hoses with ID 3.2 mm
CT60.1 5 packs of 10 ROTH Used to connect hose (ID 2 mm) and syringe filter
26 Syringe filter Filtropur L 0.2 µm, AC membrane 83.1827.001 1 pack of 50 SARSTEDT
27 Syringe filter Filtropur S 0.2 µm, PES membrane 83.1826.001 1 pack of 50 SARSTEDT Used in case no. 25 not available, exchanged every day
28 Stopper Silicone sponge stopper, 30 × 19 × 25 mm
2-4254 5 packs of 10 NeoLab Used to plug syringe (air break)
29 Stopper Rotilabo stoppers made of natural rubber, bottom D 21 mm, top D 27 mm
C381.2 2 packs of 25 ROTH Used to plug syringe (air break)
30 Syringe Disposable syringe Omnifix, Luer-Lock-fitting, PP
T550.1 1 pack of 100 ROTH Autoclavable cylinder part used as air break
31 Culture vessel inlet needle
Disposable needles Sterican, long edge, 20 G, length 70 mm
C722.1 1 pack of 100 ROTH Used as inlet to culture vessel, connected to syringe
Connects pump tubing with adjacent hoses via Luer Lock male connector; see Supplementary Figure 1.
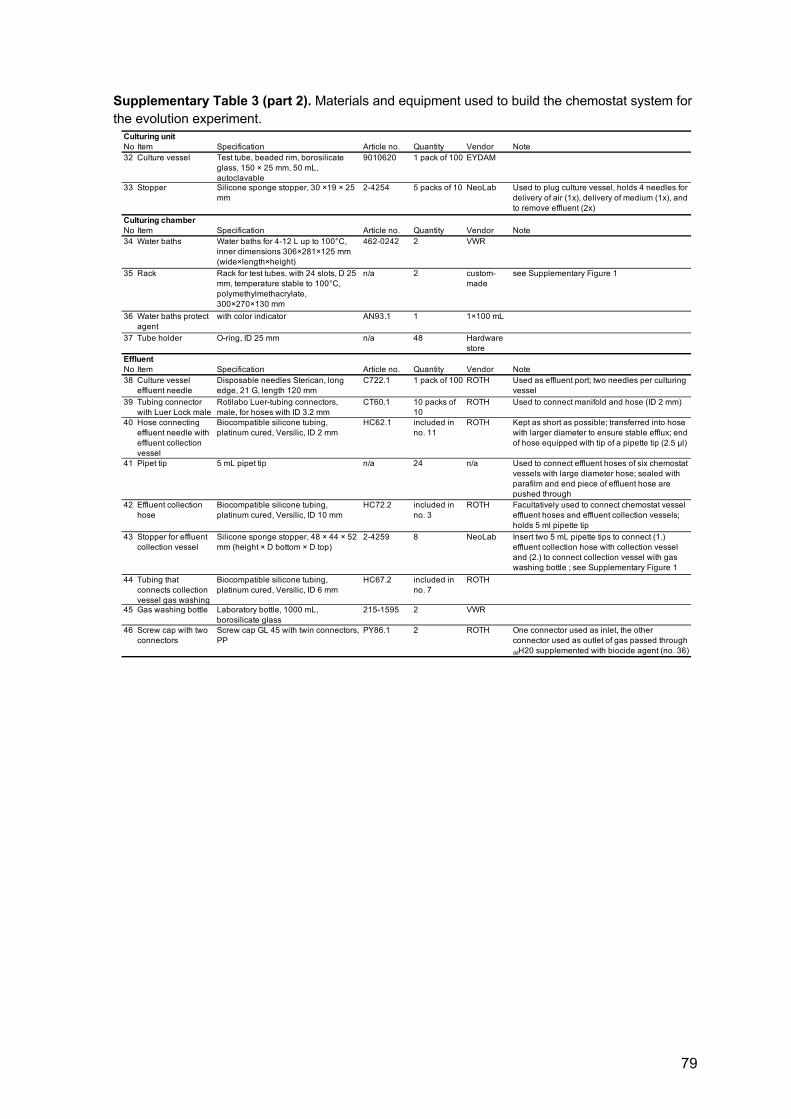
79
Supplementary Table 3 (part 2). Materials and equipment used to build the chemostat system for
the evolution experiment.
Culturing unitNo.Item Specification Article no. Quantity Vendor Note32 Culture vessel Test tube, beaded rim, borosilicate
glass, 150 × 25 mm, 50 mL, autoclavable
9010620 1 pack of 100 EYDAM
33 Stopper Silicone sponge stopper, 30 ×19 × 25 mm
2-4254 5 packs of 10 NeoLab Used to plug culture vessel, holds 4 needles for delivery of air (1x), delivery of medium (1x), and to remove effluent (2x)
Culturing chamberNo.Item Specification Article no. Quantity Vendor Note34 Water baths Water baths for 4-12 L up to 100°C,
inner dimensions 306×281×125 mm (wide×length×height)
462-0242 2 VWR
35 Rack Rack for test tubes, with 24 slots, D 25 mm, temperature stable to 100°C, polymethylmethacrylate, 300×270×130 mm
n/a 2 custom-made
see Supplementary Figure 1
36 Water baths protect agent
with color indicator AN93.1 1 1×100 mL
37 Tube holder O-ring, ID 25 mm n/a 48 Hardware store
EffluentNo.Item Specification Article no. Quantity Vendor Note38 Culture vessel
effluent needleDisposable needles Sterican, long edge, 21 G, length 120 mm
C722.1 1 pack of 100 ROTH Used as effluent port; two needles per culturing vessel
39 Tubing connector with Luer Lock male
Rotilabo Luer-tubing connectors, male, for hoses with ID 3.2 mm
CT60.1 10 packs of 10
ROTH Used to connect manifold and hose (ID 2 mm)
40 Hose connecting effluent needle with effluent collection vessel
Biocompatible silicone tubing, platinum cured, Versilic, ID 2 mm
HC62.1 included in no. 11
ROTH Kept as short as possible; transferred into hose with larger diameter to ensure stable efflux; end of hose equipped with tip of a pipette tip (2.5 µl)
41 Pipet tip 5 mL pipet tip n/a 24 n/a Used to connect effluent hoses of six chemostat vessels with large diameter hose; sealed with parafilm and end piece of effluent hose are pushed through
42 Effluent collection hose
Biocompatible silicone tubing, platinum cured, Versilic, ID 10 mm
HC72.2 included in no. 3
ROTH Facultatively used to connect chemostat vessel effluent hoses and effluent collection vessels; holds 5 ml pipette tip
43 Stopper for effluent collection vessel
Silicone sponge stopper, 48 × 44 × 52 mm (height × D bottom × D top)
2-4259 8 NeoLab Insert two 5 mL pipette tips to connect (1.) effluent collection hose with collection vessel and (2.) to connect collection vessel with gas washing bottle ; see Supplementary Figure 1
44 Tubing that connects collection vessel gas washing
Biocompatible silicone tubing, platinum cured, Versilic, ID 6 mm
HC67.2 included in no. 7
ROTH
45 Gas washing bottle Laboratory bottle, 1000 mL, borosilicate glass
215-1595 2 VWR
46 Screw cap with two connectors
Screw cap GL 45 with twin connectors, PP
PY86.1 2 ROTH One connector used as inlet, the other connector used as outlet of gas passed through ddH20 supplemented with biocide agent (no. 36)
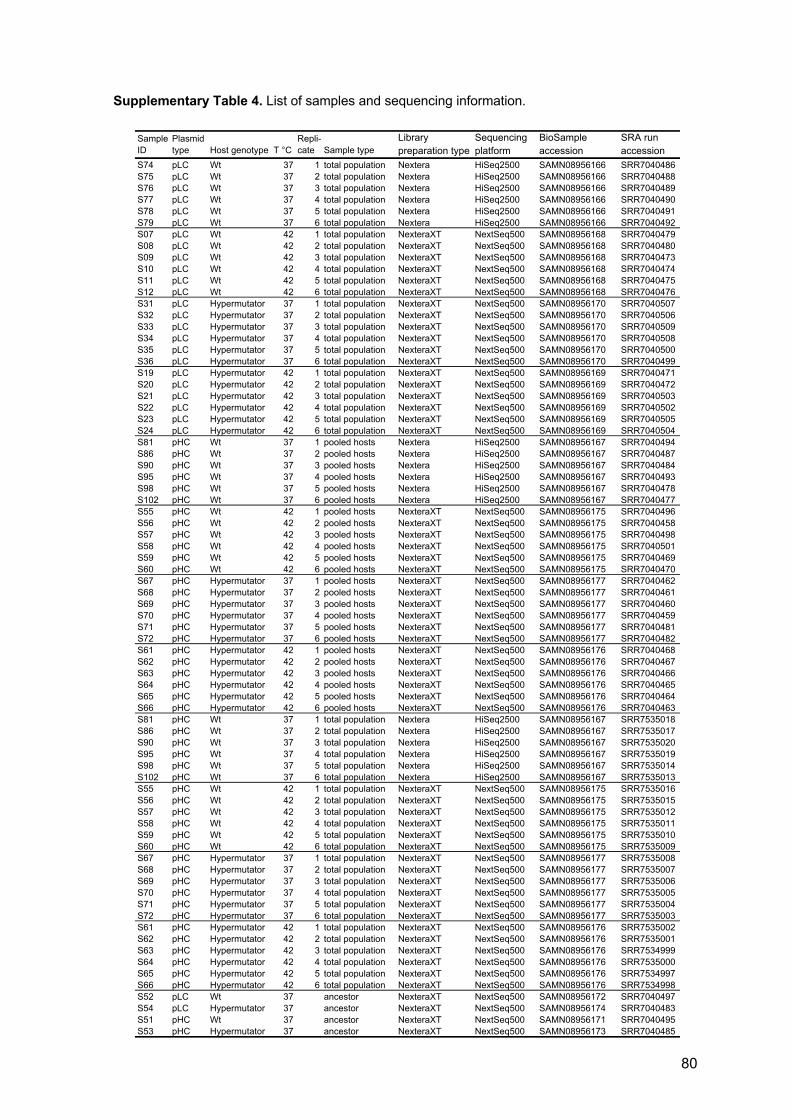
80
Supplementary Table 4. List of samples and sequencing information.
Sample ID
Plasmid type Host genotype T °C
Repli-cate Sample type
Library preparation type
Sequencing platform
BioSample accession
SRA run accession
S74 pLC Wt 37 1 total population Nextera HiSeq2500 SAMN08956166 SRR7040486S75 pLC Wt 37 2 total population Nextera HiSeq2500 SAMN08956166 SRR7040488S76 pLC Wt 37 3 total population Nextera HiSeq2500 SAMN08956166 SRR7040489S77 pLC Wt 37 4 total population Nextera HiSeq2500 SAMN08956166 SRR7040490S78 pLC Wt 37 5 total population Nextera HiSeq2500 SAMN08956166 SRR7040491S79 pLC Wt 37 6 total population Nextera HiSeq2500 SAMN08956166 SRR7040492S07 pLC Wt 42 1 total population NexteraXT NextSeq500 SAMN08956168 SRR7040479S08 pLC Wt 42 2 total population NexteraXT NextSeq500 SAMN08956168 SRR7040480S09 pLC Wt 42 3 total population NexteraXT NextSeq500 SAMN08956168 SRR7040473S10 pLC Wt 42 4 total population NexteraXT NextSeq500 SAMN08956168 SRR7040474S11 pLC Wt 42 5 total population NexteraXT NextSeq500 SAMN08956168 SRR7040475S12 pLC Wt 42 6 total population NexteraXT NextSeq500 SAMN08956168 SRR7040476S31 pLC Hypermutator 37 1 total population NexteraXT NextSeq500 SAMN08956170 SRR7040507S32 pLC Hypermutator 37 2 total population NexteraXT NextSeq500 SAMN08956170 SRR7040506S33 pLC Hypermutator 37 3 total population NexteraXT NextSeq500 SAMN08956170 SRR7040509S34 pLC Hypermutator 37 4 total population NexteraXT NextSeq500 SAMN08956170 SRR7040508S35 pLC Hypermutator 37 5 total population NexteraXT NextSeq500 SAMN08956170 SRR7040500S36 pLC Hypermutator 37 6 total population NexteraXT NextSeq500 SAMN08956170 SRR7040499S19 pLC Hypermutator 42 1 total population NexteraXT NextSeq500 SAMN08956169 SRR7040471S20 pLC Hypermutator 42 2 total population NexteraXT NextSeq500 SAMN08956169 SRR7040472S21 pLC Hypermutator 42 3 total population NexteraXT NextSeq500 SAMN08956169 SRR7040503S22 pLC Hypermutator 42 4 total population NexteraXT NextSeq500 SAMN08956169 SRR7040502S23 pLC Hypermutator 42 5 total population NexteraXT NextSeq500 SAMN08956169 SRR7040505S24 pLC Hypermutator 42 6 total population NexteraXT NextSeq500 SAMN08956169 SRR7040504S81 pHC Wt 37 1 pooled hosts Nextera HiSeq2500 SAMN08956167 SRR7040494S86 pHC Wt 37 2 pooled hosts Nextera HiSeq2500 SAMN08956167 SRR7040487S90 pHC Wt 37 3 pooled hosts Nextera HiSeq2500 SAMN08956167 SRR7040484S95 pHC Wt 37 4 pooled hosts Nextera HiSeq2500 SAMN08956167 SRR7040493S98 pHC Wt 37 5 pooled hosts Nextera HiSeq2500 SAMN08956167 SRR7040478S102 pHC Wt 37 6 pooled hosts Nextera HiSeq2500 SAMN08956167 SRR7040477S55 pHC Wt 42 1 pooled hosts NexteraXT NextSeq500 SAMN08956175 SRR7040496S56 pHC Wt 42 2 pooled hosts NexteraXT NextSeq500 SAMN08956175 SRR7040458S57 pHC Wt 42 3 pooled hosts NexteraXT NextSeq500 SAMN08956175 SRR7040498S58 pHC Wt 42 4 pooled hosts NexteraXT NextSeq500 SAMN08956175 SRR7040501S59 pHC Wt 42 5 pooled hosts NexteraXT NextSeq500 SAMN08956175 SRR7040469S60 pHC Wt 42 6 pooled hosts NexteraXT NextSeq500 SAMN08956175 SRR7040470S67 pHC Hypermutator 37 1 pooled hosts NexteraXT NextSeq500 SAMN08956177 SRR7040462S68 pHC Hypermutator 37 2 pooled hosts NexteraXT NextSeq500 SAMN08956177 SRR7040461S69 pHC Hypermutator 37 3 pooled hosts NexteraXT NextSeq500 SAMN08956177 SRR7040460S70 pHC Hypermutator 37 4 pooled hosts NexteraXT NextSeq500 SAMN08956177 SRR7040459S71 pHC Hypermutator 37 5 pooled hosts NexteraXT NextSeq500 SAMN08956177 SRR7040481S72 pHC Hypermutator 37 6 pooled hosts NexteraXT NextSeq500 SAMN08956177 SRR7040482S61 pHC Hypermutator 42 1 pooled hosts NexteraXT NextSeq500 SAMN08956176 SRR7040468S62 pHC Hypermutator 42 2 pooled hosts NexteraXT NextSeq500 SAMN08956176 SRR7040467S63 pHC Hypermutator 42 3 pooled hosts NexteraXT NextSeq500 SAMN08956176 SRR7040466S64 pHC Hypermutator 42 4 pooled hosts NexteraXT NextSeq500 SAMN08956176 SRR7040465S65 pHC Hypermutator 42 5 pooled hosts NexteraXT NextSeq500 SAMN08956176 SRR7040464S66 pHC Hypermutator 42 6 pooled hosts NexteraXT NextSeq500 SAMN08956176 SRR7040463S81 pHC Wt 37 1 total population Nextera HiSeq2500 SAMN08956167 SRR7535018S86 pHC Wt 37 2 total population Nextera HiSeq2500 SAMN08956167 SRR7535017S90 pHC Wt 37 3 total population Nextera HiSeq2500 SAMN08956167 SRR7535020S95 pHC Wt 37 4 total population Nextera HiSeq2500 SAMN08956167 SRR7535019S98 pHC Wt 37 5 total population Nextera HiSeq2500 SAMN08956167 SRR7535014S102 pHC Wt 37 6 total population Nextera HiSeq2500 SAMN08956167 SRR7535013S55 pHC Wt 42 1 total population NexteraXT NextSeq500 SAMN08956175 SRR7535016S56 pHC Wt 42 2 total population NexteraXT NextSeq500 SAMN08956175 SRR7535015S57 pHC Wt 42 3 total population NexteraXT NextSeq500 SAMN08956175 SRR7535012S58 pHC Wt 42 4 total population NexteraXT NextSeq500 SAMN08956175 SRR7535011S59 pHC Wt 42 5 total population NexteraXT NextSeq500 SAMN08956175 SRR7535010S60 pHC Wt 42 6 total population NexteraXT NextSeq500 SAMN08956175 SRR7535009S67 pHC Hypermutator 37 1 total population NexteraXT NextSeq500 SAMN08956177 SRR7535008S68 pHC Hypermutator 37 2 total population NexteraXT NextSeq500 SAMN08956177 SRR7535007S69 pHC Hypermutator 37 3 total population NexteraXT NextSeq500 SAMN08956177 SRR7535006S70 pHC Hypermutator 37 4 total population NexteraXT NextSeq500 SAMN08956177 SRR7535005S71 pHC Hypermutator 37 5 total population NexteraXT NextSeq500 SAMN08956177 SRR7535004S72 pHC Hypermutator 37 6 total population NexteraXT NextSeq500 SAMN08956177 SRR7535003S61 pHC Hypermutator 42 1 total population NexteraXT NextSeq500 SAMN08956176 SRR7535002S62 pHC Hypermutator 42 2 total population NexteraXT NextSeq500 SAMN08956176 SRR7535001S63 pHC Hypermutator 42 3 total population NexteraXT NextSeq500 SAMN08956176 SRR7534999S64 pHC Hypermutator 42 4 total population NexteraXT NextSeq500 SAMN08956176 SRR7535000S65 pHC Hypermutator 42 5 total population NexteraXT NextSeq500 SAMN08956176 SRR7534997S66 pHC Hypermutator 42 6 total population NexteraXT NextSeq500 SAMN08956176 SRR7534998S52 pLC Wt 37 ancestor NexteraXT NextSeq500 SAMN08956172 SRR7040497S54 pLC Hypermutator 37 ancestor NexteraXT NextSeq500 SAMN08956174 SRR7040483S51 pHC Wt 37 ancestor NexteraXT NextSeq500 SAMN08956171 SRR7040495S53 pHC Hypermutator 37 ancestor NexteraXT NextSeq500 SAMN08956173 SRR7040485
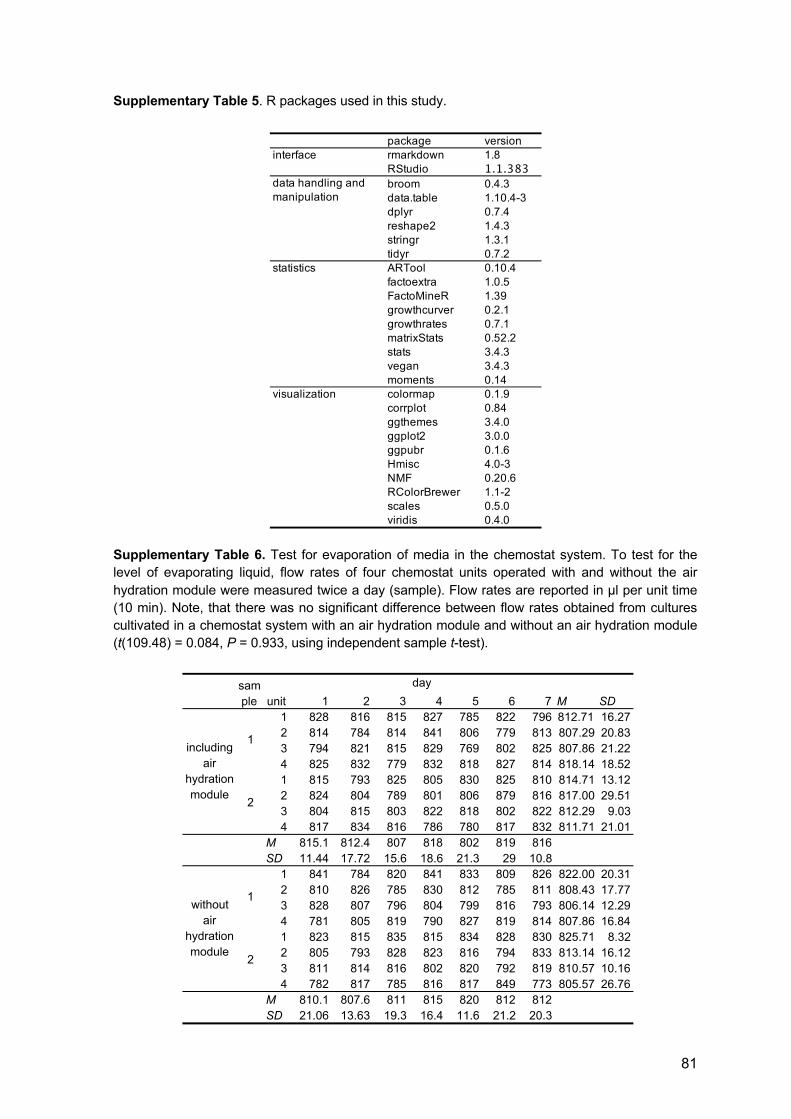
81
Supplementary Table 5. R packages used in this study.
Supplementary Table 6. Test for evaporation of media in the chemostat system. To test for the
level of evaporating liquid, flow rates of four chemostat units operated with and without the air
hydration module were measured twice a day (sample). Flow rates are reported in µl per unit time
(10 min). Note, that there was no significant difference between flow rates obtained from cultures
cultivated in a chemostat system with an air hydration module and without an air hydration module
(t(109.48) = 0.084, P = 0.933, using independent sample t-test).
package version
interface rmarkdown 1.8
RStudio 1.1.383broom 0.4.3
data.table 1.10.4-3
dplyr 0.7.4
reshape2 1.4.3
stringr 1.3.1
tidyr 0.7.2
statistics ARTool 0.10.4
factoextra 1.0.5
FactoMineR 1.39
growthcurver 0.2.1
growthrates 0.7.1
matrixStats 0.52.2
stats 3.4.3
vegan 3.4.3
moments 0.14
visualization colormap 0.1.9
corrplot 0.84
ggthemes 3.4.0
ggplot2 3.0.0
ggpubr 0.1.6
Hmisc 4.0-3
NMF 0.20.6
RColorBrewer 1.1-2
scales 0.5.0
viridis 0.4.0
data handling and
manipulation
1 2 3 4 5 6 7 M SD1 828 816 815 827 785 822 796 812.71 16.272 814 784 814 841 806 779 813 807.29 20.833 794 821 815 829 769 802 825 807.86 21.224 825 832 779 832 818 827 814 818.14 18.521 815 793 825 805 830 825 810 814.71 13.122 824 804 789 801 806 879 816 817.00 29.513 804 815 803 822 818 802 822 812.29 9.034 817 834 816 786 780 817 832 811.71 21.01
M 815.1 812.4 807 818 802 819 816SD 11.44 17.72 15.6 18.6 21.3 29 10.8
1 841 784 820 841 833 809 826 822.00 20.312 810 826 785 830 812 785 811 808.43 17.773 828 807 796 804 799 816 793 806.14 12.294 781 805 819 790 827 819 814 807.86 16.841 823 815 835 815 834 828 830 825.71 8.322 805 793 828 823 816 794 833 813.14 16.123 811 814 816 802 820 792 819 810.57 10.164 782 817 785 816 817 849 773 805.57 26.76
M 810.1 807.6 811 815 820 812 812SD 21.06 13.63 19.3 16.4 11.6 21.2 20.3
without air
hydration module
2
1
2
sample unit
day
1including air
hydration module

82
Supplementary Table 7. Cell densities obtained during test cultivation using the chemostat
system established in this study. Over a culturing period of 21 days, cell densities were assesed
from twelve chemostat cultures by colony-count method (presented as CFU mL-1 × 10⁻⁸).
Supplementary Table 8. Transcription levels of the chaperonin groEL and reference gene idnT in
E. coli MG1655, pLC. Transcript levels of groEL gene were determined for a total of six
independent chemostat cultures (1-6) grown at 37°C or 42°C. Samples were collected at four
consecutive days after 144 hours of steady-state growth in the chemostat system established here.
Normalized groEL transcript levels are calculated using DCt-method.
1 18 34 51 67 84 101 117 134 151 167 M SD37 1 1.84 1.83 1.78 1.82 1.69 1.76 1.80 1.87 1.59 1.68 1.81 1.77 0.0837 2 1.88 1.81 1.80 1.81 1.84 1.92 1.81 1.96 1.86 1.75 1.74 1.83 0.0737 3 1.93 1.92 1.92 1.72 1.83 1.91 2.04 1.83 1.82 1.97 1.84 1.88 0.0937 4 1.92 1.91 1.86 1.73 1.75 1.82 1.76 1.82 1.88 1.70 1.57 1.79 0.1037 5 1.98 1.87 1.75 1.84 1.94 1.72 1.89 1.69 1.79 1.71 1.95 1.83 0.1037 6 1.89 1.88 1.82 1.91 1.90 1.84 1.84 1.85 1.67 1.93 1.48 1.82 0.1342 7 1.83 1.82 1.81 1.89 1.77 1.79 1.88 1.98 1.91 1.90 1.78 1.85 0.0742 8 1.83 1.84 1.87 1.82 1.93 1.72 1.91 1.66 1.71 1.72 1.89 1.81 0.0942 9 1.84 1.80 1.76 1.96 1.91 1.90 1.94 1.82 1.59 1.83 1.81 1.83 0.1042 10 1.94 1.91 1.90 1.94 1.99 1.84 1.65 1.76 1.95 1.98 1.96 1.89 0.1042 11 1.92 1.91 1.88 1.75 1.73 1.89 1.79 1.53 1.73 1.73 1.95 1.80 0.1242 12 1.92 1.91 1.78 1.79 1.85 1.71 1.86 1.91 1.90 1.84 1.73 1.84 0.07M 1.89 1.87 1.83 1.83 1.84 1.82 1.85 1.81 1.78 1.81 1.79SD 0.05 0.04 0.06 0.08 0.09 0.08 0.10 0.13 0.12 0.11 0.15
UnitGenerationT
°C
dayculturing
unit T (°C) groEL idnT1 1 37 19.87 27.54 203.351 2 37 20.04 28.09 264.841 3 37 19.51 27.54 262.672 1 37 19.74 27.81 268.772 2 37 20.00 28.16 285.842 3 37 19.48 27.68 294.993 1 37 20.17 28.20 260.883 2 37 22.00 30.00 257.463 3 37 20.26 28.36 275.514 1 37 20.08 28.08 255.804 2 37 20.11 27.96 231.634 3 37 20.10 28.14 263.961 4 42 18.68 27.56 471.391 5 42 18.18 27.17 508.101 6 42 19.01 27.98 503.942 4 42 18.31 27.10 442.712 5 42 18.10 27.35 608.492 6 42 19.13 28.19 535.433 4 42 18.19 27.15 497.063 5 42 18.13 27.45 642.793 6 42 18.49 27.87 669.054 4 42 19.18 28.22 525.984 5 42 18.22 27.12 479.604 6 42 18.26 27.64 668.22
Mean(Ct) normalized transcript
level
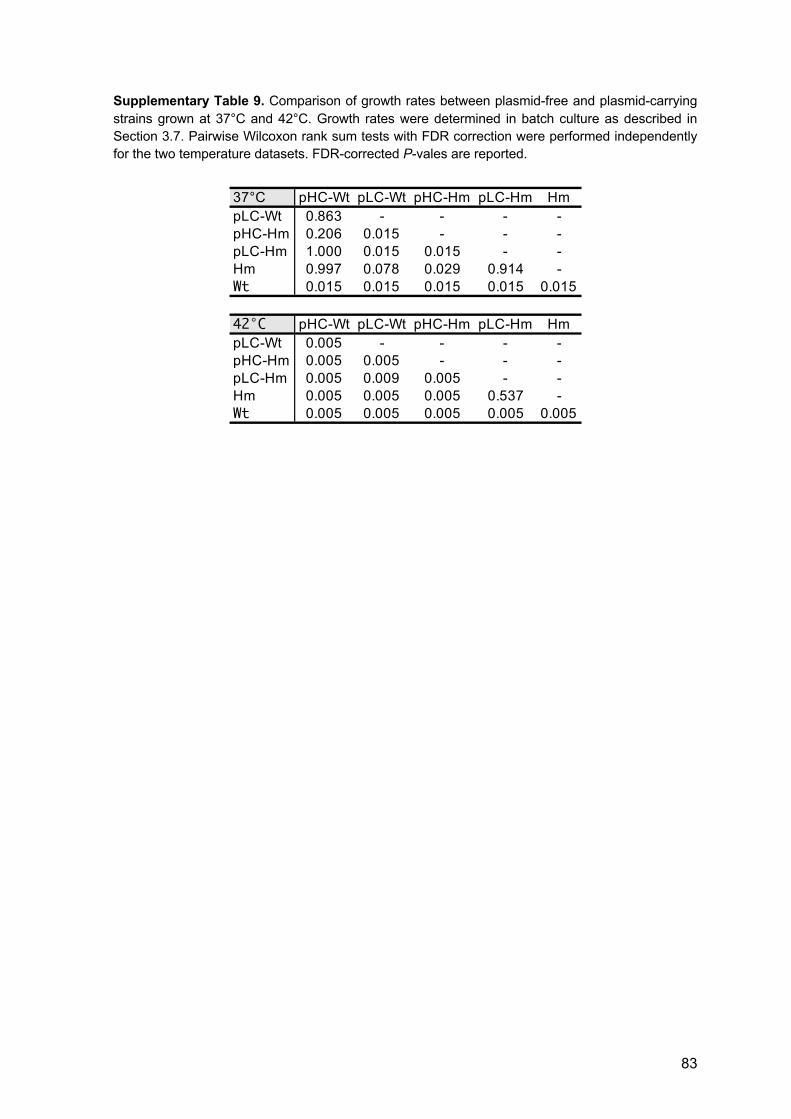
83
Supplementary Table 9. Comparison of growth rates between plasmid-free and plasmid-carrying
strains grown at 37°C and 42°C. Growth rates were determined in batch culture as described in
Section 3.7. Pairwise Wilcoxon rank sum tests with FDR correction were performed independently
for the two temperature datasets. FDR-corrected P-vales are reported.
37°C pHC-Wt pLC-Wt pHC-Hm pLC-Hm HmpLC-Wt 0.863 - - - -pHC-Hm 0.206 0.015 - - -pLC-Hm 1.000 0.015 0.015 - -Hm 0.997 0.078 0.029 0.914 -Wt 0.015 0.015 0.015 0.015 0.015
42°C pHC-Wt pLC-Wt pHC-Hm pLC-Hm HmpLC-Wt 0.005 - - - -pHC-Hm 0.005 0.005 - - -pLC-Hm 0.005 0.009 0.005 - -Hm 0.005 0.005 0.005 0.537 -Wt 0.005 0.005 0.005 0.005 0.005
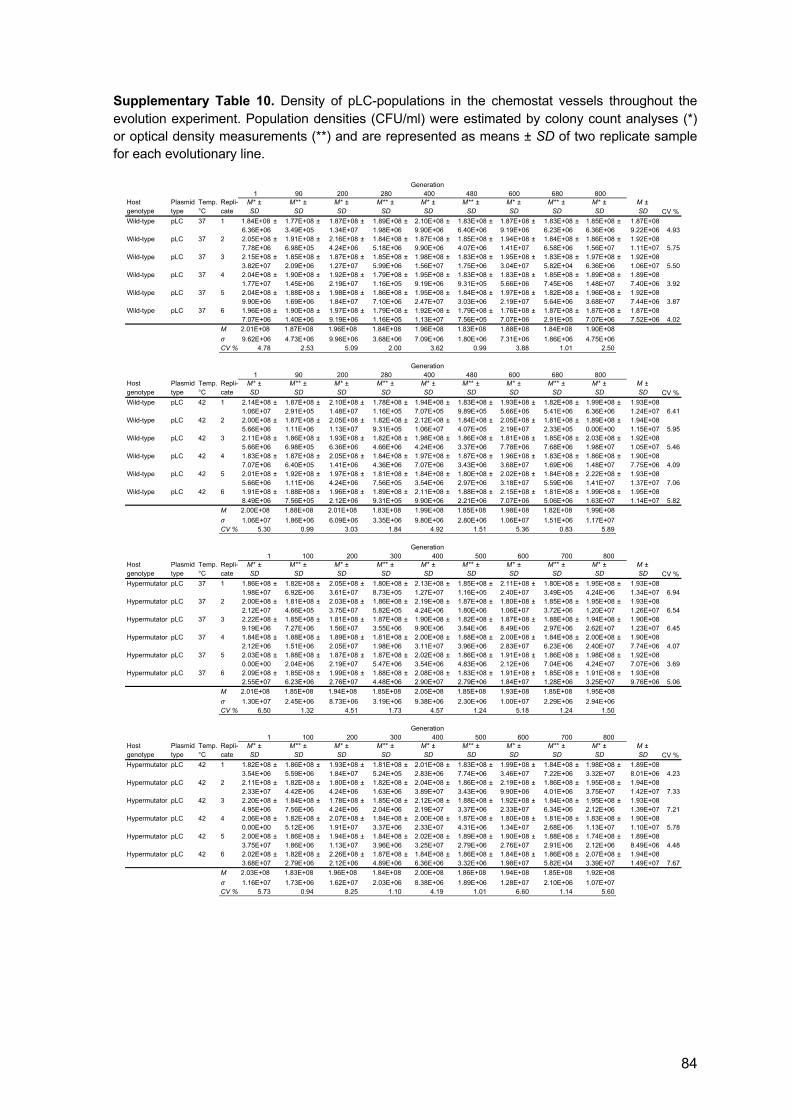
84
Supplementary Table 10. Density of pLC-populations in the chemostat vessels throughout the
evolution experiment. Population densities (CFU/ml) were estimated by colony count analyses (*)
or optical density measurements (**) and are represented as means ± SD of two replicate sample
for each evolutionary line.
1 90 200 280 400 480 600 680 800Host genotype
Plasmid type
Temp. °C
Repli-cate
M* ± SD
M** ± SD
M* ± SD
M** ± SD
M* ± SD
M** ± SD
M* ± SD
M** ± SD
M* ± SD
M ± SD CV %
Wild-type pLC 37 1 1.84E+08 ± 1.77E+08 ± 1.87E+08 ± 1.89E+08 ± 2.10E+08 ± 1.83E+08 ± 1.87E+08 ± 1.83E+08 ± 1.85E+08 ± 1.87E+086.36E+06 3.49E+05 1.34E+07 1.98E+06 9.90E+06 6.40E+06 9.19E+06 6.23E+06 6.36E+06 9.22E+06 4.93
Wild-type pLC 37 2 2.05E+08 ± 1.91E+08 ± 2.16E+08 ± 1.84E+08 ± 1.87E+08 ± 1.85E+08 ± 1.94E+08 ± 1.84E+08 ± 1.86E+08 ± 1.92E+087.78E+06 6.98E+05 4.24E+06 5.18E+06 9.90E+06 4.07E+06 1.41E+07 6.58E+06 1.56E+07 1.11E+07 5.75
Wild-type pLC 37 3 2.15E+08 ± 1.85E+08 ± 1.87E+08 ± 1.85E+08 ± 1.98E+08 ± 1.83E+08 ± 1.95E+08 ± 1.83E+08 ± 1.97E+08 ± 1.92E+083.82E+07 2.09E+06 1.27E+07 5.99E+06 1.56E+07 1.75E+06 3.04E+07 5.82E+04 6.36E+06 1.06E+07 5.50
Wild-type pLC 37 4 2.04E+08 ± 1.90E+08 ± 1.92E+08 ± 1.79E+08 ± 1.95E+08 ± 1.83E+08 ± 1.83E+08 ± 1.85E+08 ± 1.89E+08 ± 1.89E+081.77E+07 1.45E+06 2.19E+07 1.16E+05 9.19E+06 9.31E+05 5.66E+06 7.45E+06 1.48E+07 7.40E+06 3.92
Wild-type pLC 37 5 2.04E+08 ± 1.88E+08 ± 1.98E+08 ± 1.86E+08 ± 1.95E+08 ± 1.84E+08 ± 1.97E+08 ± 1.82E+08 ± 1.96E+08 ± 1.92E+089.90E+06 1.69E+06 1.84E+07 7.10E+06 2.47E+07 3.03E+06 2.19E+07 5.64E+06 3.68E+07 7.44E+06 3.87
Wild-type pLC 37 6 1.96E+08 ± 1.90E+08 ± 1.97E+08 ± 1.79E+08 ± 1.92E+08 ± 1.79E+08 ± 1.76E+08 ± 1.87E+08 ± 1.87E+08 ± 1.87E+087.07E+06 1.40E+06 9.19E+06 1.16E+05 1.13E+07 7.56E+05 7.07E+06 2.91E+05 7.07E+06 7.52E+06 4.02
M 2.01E+08 1.87E+08 1.96E+08 1.84E+08 1.96E+08 1.83E+08 1.88E+08 1.84E+08 1.90E+08! 9.62E+06 4.73E+06 9.96E+06 3.68E+06 7.09E+06 1.80E+06 7.31E+06 1.86E+06 4.75E+06CV % 4.78 2.53 5.09 2.00 3.62 0.99 3.88 1.01 2.50
1 90 200 280 400 480 600 680 800Host genotype
Plasmid type
Temp. °C
Repli-cate
M* ± SD
M** ± SD
M* ± SD
M** ± SD
M* ± SD
M** ± SD
M* ± SD
M** ± SD
M* ± SD
M ± SD CV %
Wild-type pLC 42 1 2.14E+08 ± 1.87E+08 ± 2.10E+08 ± 1.78E+08 ± 1.94E+08 ± 1.83E+08 ± 1.93E+08 ± 1.82E+08 ± 1.99E+08 ± 1.93E+081.06E+07 2.91E+05 1.48E+07 1.16E+05 7.07E+05 9.89E+05 5.66E+06 5.41E+06 6.36E+06 1.24E+07 6.41
Wild-type pLC 42 2 2.00E+08 ± 1.87E+08 ± 2.05E+08 ± 1.82E+08 ± 2.12E+08 ± 1.84E+08 ± 2.05E+08 ± 1.81E+08 ± 1.89E+08 ± 1.94E+085.66E+06 1.11E+06 1.13E+07 9.31E+05 1.06E+07 4.07E+05 2.19E+07 2.33E+05 0.00E+00 1.15E+07 5.95
Wild-type pLC 42 3 2.11E+08 ± 1.86E+08 ± 1.93E+08 ± 1.82E+08 ± 1.98E+08 ± 1.86E+08 ± 1.81E+08 ± 1.85E+08 ± 2.03E+08 ± 1.92E+085.66E+06 6.98E+05 6.36E+06 4.66E+06 4.24E+06 3.37E+06 7.78E+06 7.68E+06 1.98E+07 1.05E+07 5.46
Wild-type pLC 42 4 1.83E+08 ± 1.87E+08 ± 2.05E+08 ± 1.84E+08 ± 1.97E+08 ± 1.87E+08 ± 1.96E+08 ± 1.83E+08 ± 1.86E+08 ± 1.90E+087.07E+06 6.40E+05 1.41E+06 4.36E+06 7.07E+06 3.43E+06 3.68E+07 1.69E+06 1.48E+07 7.75E+06 4.09
Wild-type pLC 42 5 2.01E+08 ± 1.92E+08 ± 1.97E+08 ± 1.81E+08 ± 1.84E+08 ± 1.80E+08 ± 2.02E+08 ± 1.84E+08 ± 2.22E+08 ± 1.93E+085.66E+06 1.11E+06 4.24E+06 7.56E+05 3.54E+06 2.97E+06 3.18E+07 5.59E+06 1.41E+07 1.37E+07 7.06
Wild-type pLC 42 6 1.91E+08 ± 1.88E+08 ± 1.96E+08 ± 1.89E+08 ± 2.11E+08 ± 1.88E+08 ± 2.15E+08 ± 1.81E+08 ± 1.99E+08 ± 1.95E+088.49E+06 7.56E+05 2.12E+06 9.31E+05 9.90E+06 2.21E+06 7.07E+06 5.06E+06 1.63E+07 1.14E+07 5.82
M 2.00E+08 1.88E+08 2.01E+08 1.83E+08 1.99E+08 1.85E+08 1.98E+08 1.82E+08 1.99E+08! 1.06E+07 1.86E+06 6.09E+06 3.35E+06 9.80E+06 2.80E+06 1.06E+07 1.51E+06 1.17E+07CV % 5.30 0.99 3.03 1.84 4.92 1.51 5.36 0.83 5.89
1 100 200 300 400 500 600 700 800Host genotype
Plasmid type
Temp. °C
Repli-cate
M* ± SD
M** ± SD
M* ± SD
M** ± SD
M* ± SD
M** ± SD
M* ± SD
M** ± SD
M* ± SD
M ± SD CV %
Hypermutator pLC 37 1 1.86E+08 ± 1.82E+08 ± 2.05E+08 ± 1.80E+08 ± 2.13E+08 ± 1.85E+08 ± 2.11E+08 ± 1.80E+08 ± 1.95E+08 ± 1.93E+081.98E+07 6.92E+06 3.61E+07 8.73E+05 1.27E+07 1.16E+05 2.40E+07 3.49E+05 4.24E+06 1.34E+07 6.94
Hypermutator pLC 37 2 2.00E+08 ± 1.81E+08 ± 2.03E+08 ± 1.86E+08 ± 2.19E+08 ± 1.87E+08 ± 1.80E+08 ± 1.85E+08 ± 1.95E+08 ± 1.93E+082.12E+07 4.66E+05 3.75E+07 5.82E+05 4.24E+06 1.80E+06 1.06E+07 3.72E+06 1.20E+07 1.26E+07 6.54
Hypermutator pLC 37 3 2.22E+08 ± 1.85E+08 ± 1.81E+08 ± 1.87E+08 ± 1.90E+08 ± 1.82E+08 ± 1.87E+08 ± 1.88E+08 ± 1.94E+08 ± 1.90E+089.19E+06 7.27E+06 1.56E+07 3.55E+06 9.90E+06 3.84E+06 8.49E+06 2.97E+06 2.62E+07 1.23E+07 6.45
Hypermutator pLC 37 4 1.84E+08 ± 1.88E+08 ± 1.89E+08 ± 1.81E+08 ± 2.00E+08 ± 1.88E+08 ± 2.00E+08 ± 1.84E+08 ± 2.00E+08 ± 1.90E+082.12E+06 1.51E+06 2.05E+07 1.98E+06 3.11E+07 3.96E+06 2.83E+07 6.23E+06 2.40E+07 7.74E+06 4.07
Hypermutator pLC 37 5 2.03E+08 ± 1.88E+08 ± 1.87E+08 ± 1.87E+08 ± 2.02E+08 ± 1.86E+08 ± 1.91E+08 ± 1.86E+08 ± 1.98E+08 ± 1.92E+080.00E+00 2.04E+06 2.19E+07 5.47E+06 3.54E+06 4.83E+06 2.12E+06 7.04E+06 4.24E+07 7.07E+06 3.69
Hypermutator pLC 37 6 2.09E+08 ± 1.85E+08 ± 1.99E+08 ± 1.88E+08 ± 2.08E+08 ± 1.83E+08 ± 1.91E+08 ± 1.85E+08 ± 1.91E+08 ± 1.93E+082.55E+07 6.23E+06 2.76E+07 4.48E+06 2.90E+07 2.79E+06 1.84E+07 1.28E+06 3.25E+07 9.76E+06 5.06
M 2.01E+08 1.85E+08 1.94E+08 1.85E+08 2.05E+08 1.85E+08 1.93E+08 1.85E+08 1.95E+08! 1.30E+07 2.45E+06 8.73E+06 3.19E+06 9.38E+06 2.30E+06 1.00E+07 2.29E+06 2.94E+06CV % 6.50 1.32 4.51 1.73 4.57 1.24 5.18 1.24 1.50
1 100 200 300 400 500 600 700 800Host genotype
Plasmid type
Temp. °C
Repli-cate
M* ± SD
M** ± SD
M* ± SD
M** ± SD
M* ± SD
M** ± SD
M* ± SD
M** ± SD
M* ± SD
M ± SD CV %
Hypermutator pLC 42 1 1.82E+08 ± 1.86E+08 ± 1.93E+08 ± 1.81E+08 ± 2.01E+08 ± 1.83E+08 ± 1.99E+08 ± 1.84E+08 ± 1.98E+08 ± 1.89E+083.54E+06 5.59E+06 1.84E+07 5.24E+05 2.83E+06 7.74E+06 3.46E+07 7.22E+06 3.32E+07 8.01E+06 4.23
Hypermutator pLC 42 2 2.11E+08 ± 1.82E+08 ± 1.80E+08 ± 1.82E+08 ± 2.04E+08 ± 1.86E+08 ± 2.19E+08 ± 1.86E+08 ± 1.95E+08 ± 1.94E+082.33E+07 4.42E+06 4.24E+06 1.63E+06 3.89E+07 3.43E+06 9.90E+06 4.01E+06 3.75E+07 1.42E+07 7.33
Hypermutator pLC 42 3 2.20E+08 ± 1.84E+08 ± 1.78E+08 ± 1.85E+08 ± 2.12E+08 ± 1.88E+08 ± 1.92E+08 ± 1.84E+08 ± 1.95E+08 ± 1.93E+084.95E+06 7.56E+06 4.24E+06 2.04E+06 2.19E+07 3.37E+06 2.33E+07 6.34E+06 2.12E+06 1.39E+07 7.21
Hypermutator pLC 42 4 2.06E+08 ± 1.82E+08 ± 2.07E+08 ± 1.84E+08 ± 2.00E+08 ± 1.87E+08 ± 1.80E+08 ± 1.81E+08 ± 1.83E+08 ± 1.90E+080.00E+00 5.12E+06 1.91E+07 3.37E+06 2.33E+07 4.31E+06 1.34E+07 2.68E+06 1.13E+07 1.10E+07 5.78
Hypermutator pLC 42 5 2.00E+08 ± 1.86E+08 ± 1.94E+08 ± 1.84E+08 ± 2.02E+08 ± 1.89E+08 ± 1.90E+08 ± 1.88E+08 ± 1.74E+08 ± 1.89E+083.75E+07 1.86E+06 1.13E+07 3.96E+06 3.25E+07 2.79E+06 2.76E+07 2.91E+06 2.12E+06 8.49E+06 4.48
Hypermutator pLC 42 6 2.02E+08 ± 1.82E+08 ± 2.26E+08 ± 1.87E+08 ± 1.84E+08 ± 1.86E+08 ± 1.84E+08 ± 1.86E+08 ± 2.07E+08 ± 1.94E+083.68E+07 2.79E+06 2.12E+06 4.89E+06 6.36E+06 3.32E+06 1.98E+07 5.82E+04 3.39E+07 1.49E+07 7.67
M 2.03E+08 1.83E+08 1.96E+08 1.84E+08 2.00E+08 1.86E+08 1.94E+08 1.85E+08 1.92E+08! 1.16E+07 1.73E+06 1.62E+07 2.03E+06 8.38E+06 1.89E+06 1.28E+07 2.10E+06 1.07E+07CV % 5.73 0.94 8.25 1.10 4.19 1.01 6.60 1.14 5.60
Generation
Generation
Generation
Generation
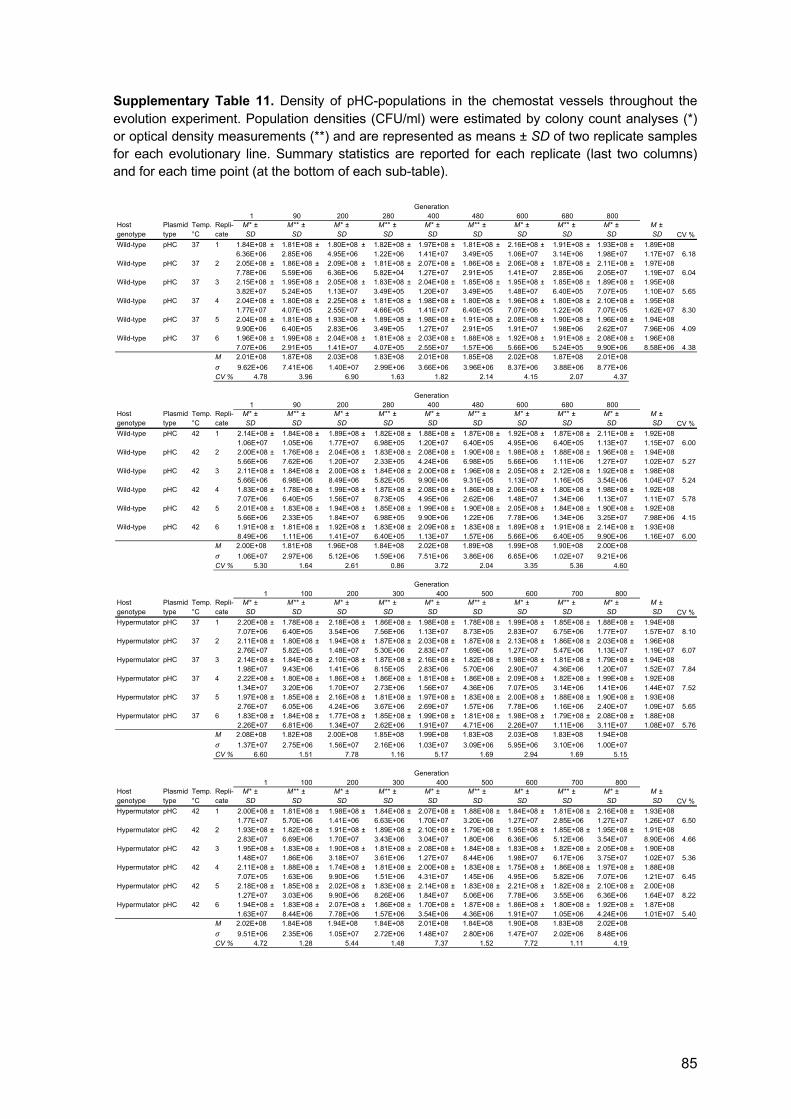
85
Supplementary Table 11. Density of pHC-populations in the chemostat vessels throughout the
evolution experiment. Population densities (CFU/ml) were estimated by colony count analyses (*)
or optical density measurements (**) and are represented as means ± SD of two replicate samples
for each evolutionary line. Summary statistics are reported for each replicate (last two columns)
and for each time point (at the bottom of each sub-table).
1 90 200 280 400 480 600 680 800Host genotype
Plasmid type
Temp. °C
Repli-cate
M* ± SD
M** ± SD
M* ± SD
M** ± SD
M* ± SD
M** ± SD
M* ± SD
M** ± SD
M* ± SD
M ± SD CV %
Wild-type pHC 37 1 1.84E+08 ± 1.81E+08 ± 1.80E+08 ± 1.82E+08 ± 1.97E+08 ± 1.81E+08 ± 2.16E+08 ± 1.91E+08 ± 1.93E+08 ± 1.89E+086.36E+06 2.85E+06 4.95E+06 1.22E+06 1.41E+07 3.49E+05 1.06E+07 3.14E+06 1.98E+07 1.17E+07 6.18
Wild-type pHC 37 2 2.05E+08 ± 1.86E+08 ± 2.09E+08 ± 1.81E+08 ± 2.07E+08 ± 1.86E+08 ± 2.06E+08 ± 1.87E+08 ± 2.11E+08 ± 1.97E+087.78E+06 5.59E+06 6.36E+06 5.82E+04 1.27E+07 2.91E+05 1.41E+07 2.85E+06 2.05E+07 1.19E+07 6.04
Wild-type pHC 37 3 2.15E+08 ± 1.95E+08 ± 2.05E+08 ± 1.83E+08 ± 2.04E+08 ± 1.85E+08 ± 1.95E+08 ± 1.85E+08 ± 1.89E+08 ± 1.95E+083.82E+07 5.24E+05 1.13E+07 3.49E+05 1.20E+07 3.49E+05 1.48E+07 6.40E+05 7.07E+05 1.10E+07 5.65
Wild-type pHC 37 4 2.04E+08 ± 1.80E+08 ± 2.25E+08 ± 1.81E+08 ± 1.98E+08 ± 1.80E+08 ± 1.96E+08 ± 1.80E+08 ± 2.10E+08 ± 1.95E+081.77E+07 4.07E+05 2.55E+07 4.66E+05 1.41E+07 6.40E+05 7.07E+06 1.22E+06 7.07E+05 1.62E+07 8.30
Wild-type pHC 37 5 2.04E+08 ± 1.81E+08 ± 1.93E+08 ± 1.89E+08 ± 1.98E+08 ± 1.91E+08 ± 2.08E+08 ± 1.90E+08 ± 1.96E+08 ± 1.94E+089.90E+06 6.40E+05 2.83E+06 3.49E+05 1.27E+07 2.91E+05 1.91E+07 1.98E+06 2.62E+07 7.96E+06 4.09
Wild-type pHC 37 6 1.96E+08 ± 1.99E+08 ± 2.04E+08 ± 1.81E+08 ± 2.03E+08 ± 1.88E+08 ± 1.92E+08 ± 1.91E+08 ± 2.08E+08 ± 1.96E+087.07E+06 2.91E+05 1.41E+07 4.07E+05 2.55E+07 1.57E+06 5.66E+06 5.24E+05 9.90E+06 8.58E+06 4.38
M 2.01E+08 1.87E+08 2.03E+08 1.83E+08 2.01E+08 1.85E+08 2.02E+08 1.87E+08 2.01E+08
! 9.62E+06 7.41E+06 1.40E+07 2.99E+06 3.66E+06 3.96E+06 8.37E+06 3.88E+06 8.77E+06CV % 4.78 3.96 6.90 1.63 1.82 2.14 4.15 2.07 4.37
1 90 200 280 400 480 600 680 800Host genotype
Plasmid type
Temp. °C
Repli-cate
M* ± SD
M** ± SD
M* ± SD
M** ± SD
M* ± SD
M** ± SD
M* ± SD
M** ± SD
M* ± SD
M ± SD CV %
Wild-type pHC 42 1 2.14E+08 ± 1.84E+08 ± 1.89E+08 ± 1.82E+08 ± 1.88E+08 ± 1.87E+08 ± 1.92E+08 ± 1.87E+08 ± 2.11E+08 ± 1.92E+081.06E+07 1.05E+06 1.77E+07 6.98E+05 1.20E+07 6.40E+05 4.95E+06 6.40E+05 1.13E+07 1.15E+07 6.00
Wild-type pHC 42 2 2.00E+08 ± 1.76E+08 ± 2.04E+08 ± 1.83E+08 ± 2.08E+08 ± 1.90E+08 ± 1.98E+08 ± 1.88E+08 ± 1.96E+08 ± 1.94E+085.66E+06 7.62E+06 1.20E+07 2.33E+05 4.24E+06 6.98E+05 5.66E+06 1.11E+06 1.27E+07 1.02E+07 5.27
Wild-type pHC 42 3 2.11E+08 ± 1.84E+08 ± 2.00E+08 ± 1.84E+08 ± 2.00E+08 ± 1.96E+08 ± 2.05E+08 ± 2.12E+08 ± 1.92E+08 ± 1.98E+085.66E+06 6.98E+06 8.49E+06 5.82E+05 9.90E+06 9.31E+05 1.13E+07 1.16E+05 3.54E+06 1.04E+07 5.24
Wild-type pHC 42 4 1.83E+08 ± 1.78E+08 ± 1.99E+08 ± 1.87E+08 ± 2.08E+08 ± 1.86E+08 ± 2.06E+08 ± 1.80E+08 ± 1.98E+08 ± 1.92E+087.07E+06 6.40E+05 1.56E+07 8.73E+05 4.95E+06 2.62E+06 1.48E+07 1.34E+06 1.13E+07 1.11E+07 5.78
Wild-type pHC 42 5 2.01E+08 ± 1.83E+08 ± 1.94E+08 ± 1.85E+08 ± 1.99E+08 ± 1.90E+08 ± 2.05E+08 ± 1.84E+08 ± 1.90E+08 ± 1.92E+085.66E+06 2.33E+05 1.84E+07 6.98E+05 9.90E+06 1.22E+06 7.78E+06 1.34E+06 3.25E+07 7.98E+06 4.15
Wild-type pHC 42 6 1.91E+08 ± 1.81E+08 ± 1.92E+08 ± 1.83E+08 ± 2.09E+08 ± 1.83E+08 ± 1.89E+08 ± 1.91E+08 ± 2.14E+08 ± 1.93E+088.49E+06 1.11E+06 1.41E+07 6.40E+05 1.13E+07 1.57E+06 5.66E+06 6.40E+05 9.90E+06 1.16E+07 6.00
M 2.00E+08 1.81E+08 1.96E+08 1.84E+08 2.02E+08 1.89E+08 1.99E+08 1.90E+08 2.00E+08
! 1.06E+07 2.97E+06 5.12E+06 1.59E+06 7.51E+06 3.86E+06 6.65E+06 1.02E+07 9.21E+06CV % 5.30 1.64 2.61 0.86 3.72 2.04 3.35 5.36 4.60
1 100 200 300 400 500 600 700 800Host genotype
Plasmid type
Temp. °C
Repli-cate
M* ± SD
M** ± SD
M* ± SD
M** ± SD
M* ± SD
M** ± SD
M* ± SD
M** ± SD
M* ± SD
M ± SD CV %
Hypermutator pHC 37 1 2.20E+08 ± 1.78E+08 ± 2.18E+08 ± 1.86E+08 ± 1.98E+08 ± 1.78E+08 ± 1.99E+08 ± 1.85E+08 ± 1.88E+08 ± 1.94E+087.07E+06 6.40E+05 3.54E+06 7.56E+06 1.13E+07 8.73E+05 2.83E+07 6.75E+06 1.77E+07 1.57E+07 8.10
Hypermutator pHC 37 2 2.11E+08 ± 1.80E+08 ± 1.94E+08 ± 1.87E+08 ± 2.03E+08 ± 1.87E+08 ± 2.13E+08 ± 1.86E+08 ± 2.03E+08 ± 1.96E+082.76E+07 5.82E+05 1.48E+07 5.30E+06 2.83E+07 1.69E+06 1.27E+07 5.47E+06 1.13E+07 1.19E+07 6.07
Hypermutator pHC 37 3 2.14E+08 ± 1.84E+08 ± 2.10E+08 ± 1.87E+08 ± 2.16E+08 ± 1.82E+08 ± 1.98E+08 ± 1.81E+08 ± 1.79E+08 ± 1.94E+081.98E+07 9.43E+06 1.41E+06 8.15E+05 2.83E+06 5.70E+06 2.90E+07 4.36E+06 1.20E+07 1.52E+07 7.84
Hypermutator pHC 37 4 2.22E+08 ± 1.80E+08 ± 1.86E+08 ± 1.86E+08 ± 1.81E+08 ± 1.86E+08 ± 2.09E+08 ± 1.82E+08 ± 1.99E+08 ± 1.92E+081.34E+07 3.20E+06 1.70E+07 2.73E+06 1.56E+07 4.36E+06 7.07E+05 3.14E+06 1.41E+06 1.44E+07 7.52
Hypermutator pHC 37 5 1.97E+08 ± 1.85E+08 ± 2.16E+08 ± 1.81E+08 ± 1.97E+08 ± 1.83E+08 ± 2.00E+08 ± 1.88E+08 ± 1.90E+08 ± 1.93E+082.76E+07 6.05E+06 4.24E+06 3.67E+06 2.69E+07 1.57E+06 7.78E+06 1.16E+06 2.40E+07 1.09E+07 5.65
Hypermutator pHC 37 6 1.83E+08 ± 1.84E+08 ± 1.77E+08 ± 1.85E+08 ± 1.99E+08 ± 1.81E+08 ± 1.98E+08 ± 1.79E+08 ± 2.08E+08 ± 1.88E+082.26E+07 6.81E+06 1.34E+07 2.62E+06 1.91E+07 4.71E+06 2.26E+07 1.11E+06 3.11E+07 1.08E+07 5.76
M 2.08E+08 1.82E+08 2.00E+08 1.85E+08 1.99E+08 1.83E+08 2.03E+08 1.83E+08 1.94E+08
! 1.37E+07 2.75E+06 1.56E+07 2.16E+06 1.03E+07 3.09E+06 5.95E+06 3.10E+06 1.00E+07CV % 6.60 1.51 7.78 1.16 5.17 1.69 2.94 1.69 5.15
1 100 200 300 400 500 600 700 800Host genotype
Plasmid type
Temp. °C
Repli-cate
M* ± SD
M** ± SD
M* ± SD
M** ± SD
M* ± SD
M** ± SD
M* ± SD
M** ± SD
M* ± SD
M ± SD CV %
Hypermutator pHC 42 1 2.00E+08 ± 1.81E+08 ± 1.98E+08 ± 1.84E+08 ± 2.07E+08 ± 1.88E+08 ± 1.84E+08 ± 1.81E+08 ± 2.16E+08 ± 1.93E+081.77E+07 5.70E+06 1.41E+06 6.63E+06 1.70E+07 3.20E+06 1.27E+07 2.85E+06 1.27E+07 1.26E+07 6.50
Hypermutator pHC 42 2 1.93E+08 ± 1.82E+08 ± 1.91E+08 ± 1.89E+08 ± 2.10E+08 ± 1.79E+08 ± 1.95E+08 ± 1.85E+08 ± 1.95E+08 ± 1.91E+082.83E+07 6.69E+06 1.70E+07 3.43E+06 3.04E+07 1.80E+06 6.36E+06 5.12E+06 3.54E+07 8.90E+06 4.66
Hypermutator pHC 42 3 1.95E+08 ± 1.83E+08 ± 1.90E+08 ± 1.81E+08 ± 2.08E+08 ± 1.84E+08 ± 1.83E+08 ± 1.82E+08 ± 2.05E+08 ± 1.90E+081.48E+07 1.86E+06 3.18E+07 3.61E+06 1.27E+07 8.44E+06 1.98E+07 6.17E+06 3.75E+07 1.02E+07 5.36
Hypermutator pHC 42 4 2.11E+08 ± 1.88E+08 ± 1.74E+08 ± 1.81E+08 ± 2.00E+08 ± 1.83E+08 ± 1.75E+08 ± 1.86E+08 ± 1.97E+08 ± 1.88E+087.07E+05 1.63E+06 9.90E+06 1.51E+06 4.31E+07 1.45E+06 4.95E+06 5.82E+06 7.07E+06 1.21E+07 6.45
Hypermutator pHC 42 5 2.18E+08 ± 1.85E+08 ± 2.02E+08 ± 1.83E+08 ± 2.14E+08 ± 1.83E+08 ± 2.21E+08 ± 1.82E+08 ± 2.10E+08 ± 2.00E+081.27E+07 3.03E+06 9.90E+06 8.26E+06 1.84E+07 5.06E+06 7.78E+06 3.55E+06 6.36E+06 1.64E+07 8.22
Hypermutator pHC 42 6 1.94E+08 ± 1.83E+08 ± 2.07E+08 ± 1.86E+08 ± 1.70E+08 ± 1.87E+08 ± 1.86E+08 ± 1.80E+08 ± 1.92E+08 ± 1.87E+081.63E+07 8.44E+06 7.78E+06 1.57E+06 3.54E+06 4.36E+06 1.91E+07 1.05E+06 4.24E+06 1.01E+07 5.40
M 2.02E+08 1.84E+08 1.94E+08 1.84E+08 2.01E+08 1.84E+08 1.90E+08 1.83E+08 2.02E+08
! 9.51E+06 2.35E+06 1.05E+07 2.72E+06 1.48E+07 2.80E+06 1.47E+07 2.02E+06 8.48E+06CV % 4.72 1.28 5.44 1.48 7.37 1.52 7.72 1.11 4.19
Generation
Generation
Generation
Generation

86
Supplementary Table 12. Independent-samples t-test for the comparison of population densities
between chemostat cultures belonging to different groups of experimenal factors. Individual
population densities are reported in Supplementary Table 10 and Supplementary Table 11.
Supplementary Table 13. Descriptive statistics for PCNs of single colonies.
N M SD t df p lower upper37°C 216 1.92E+08 1.10E+0742°C 216 1.92E+08 1.13E+07pLC 216 1.92E+08 1.05E+07pHC 216 1.93E+08 1.17E+07Wild-type 216 1.93E+08 1.05E+07Hypermutator 216 1.92E+08 1.18E+07
429.80
425.06
0.976 2.08E+06 2.14E+06
3.64E+06 5.71E+050.153
95% Confidence Interval of the Difference
-0.03
Experimental Factor Group
-0.59 424.27 0.554 2.74E+06 1.47E+06
-1.43
n Min. 1st Qu. Med M 3rd Qu. Max.pLC 35 6.52 11.26 14.41 14.10 16.36 23.16pHC 91 0.00 104.70 399.80 1214.60 2209.20 7609.80
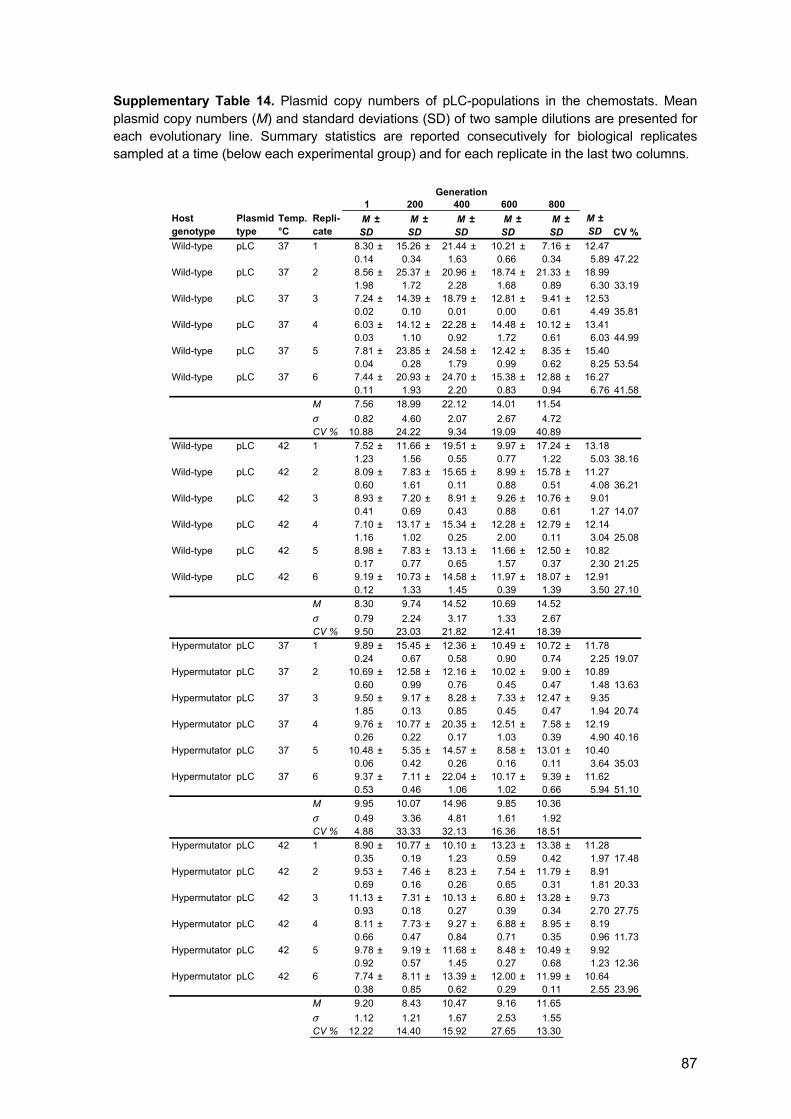
87
Supplementary Table 14. Plasmid copy numbers of pLC-populations in the chemostats. Mean
plasmid copy numbers (M) and standard deviations (SD) of two sample dilutions are presented for
each evolutionary line. Summary statistics are reported consecutively for biological replicates
sampled at a time (below each experimental group) and for each replicate in the last two columns.
Host genotype
Plasmid type
Temp. °C
Repli-cate
M ± SD CV %
Wild-type pLC 37 1 8.30 ± 15.26 ± 21.44 ± 10.21 ± 7.16 ± 12.470.14 0.34 1.63 0.66 0.34 5.89 47.22
Wild-type pLC 37 2 8.56 ± 25.37 ± 20.96 ± 18.74 ± 21.33 ± 18.991.98 1.72 2.28 1.68 0.89 6.30 33.19
Wild-type pLC 37 3 7.24 ± 14.39 ± 18.79 ± 12.81 ± 9.41 ± 12.530.02 0.10 0.01 0.00 0.61 4.49 35.81
Wild-type pLC 37 4 6.03 ± 14.12 ± 22.28 ± 14.48 ± 10.12 ± 13.410.03 1.10 0.92 1.72 0.61 6.03 44.99
Wild-type pLC 37 5 7.81 ± 23.85 ± 24.58 ± 12.42 ± 8.35 ± 15.400.04 0.28 1.79 0.99 0.62 8.25 53.54
Wild-type pLC 37 6 7.44 ± 20.93 ± 24.70 ± 15.38 ± 12.88 ± 16.270.11 1.93 2.20 0.83 0.94 6.76 41.58
M 7.56 18.99 22.12 14.01 11.54! 0.82 4.60 2.07 2.67 4.72CV % 10.88 24.22 9.34 19.09 40.89
Wild-type pLC 42 1 7.52 ± 11.66 ± 19.51 ± 9.97 ± 17.24 ± 13.181.23 1.56 0.55 0.77 1.22 5.03 38.16
Wild-type pLC 42 2 8.09 ± 7.83 ± 15.65 ± 8.99 ± 15.78 ± 11.270.60 1.61 0.11 0.88 0.51 4.08 36.21
Wild-type pLC 42 3 8.93 ± 7.20 ± 8.91 ± 9.26 ± 10.76 ± 9.010.41 0.69 0.43 0.88 0.61 1.27 14.07
Wild-type pLC 42 4 7.10 ± 13.17 ± 15.34 ± 12.28 ± 12.79 ± 12.141.16 1.02 0.25 2.00 0.11 3.04 25.08
Wild-type pLC 42 5 8.98 ± 7.83 ± 13.13 ± 11.66 ± 12.50 ± 10.820.17 0.77 0.65 1.57 0.37 2.30 21.25
Wild-type pLC 42 6 9.19 ± 10.73 ± 14.58 ± 11.97 ± 18.07 ± 12.910.12 1.33 1.45 0.39 1.39 3.50 27.10
M 8.30 9.74 14.52 10.69 14.52! 0.79 2.24 3.17 1.33 2.67CV % 9.50 23.03 21.82 12.41 18.39
Hypermutator pLC 37 1 9.89 ± 15.45 ± 12.36 ± 10.49 ± 10.72 ± 11.780.24 0.67 0.58 0.90 0.74 2.25 19.07
Hypermutator pLC 37 2 10.69 ± 12.58 ± 12.16 ± 10.02 ± 9.00 ± 10.890.60 0.99 0.76 0.45 0.47 1.48 13.63
Hypermutator pLC 37 3 9.50 ± 9.17 ± 8.28 ± 7.33 ± 12.47 ± 9.351.85 0.13 0.85 0.45 0.47 1.94 20.74
Hypermutator pLC 37 4 9.76 ± 10.77 ± 20.35 ± 12.51 ± 7.58 ± 12.190.26 0.22 0.17 1.03 0.39 4.90 40.16
Hypermutator pLC 37 5 10.48 ± 5.35 ± 14.57 ± 8.58 ± 13.01 ± 10.400.06 0.42 0.26 0.16 0.11 3.64 35.03
Hypermutator pLC 37 6 9.37 ± 7.11 ± 22.04 ± 10.17 ± 9.39 ± 11.620.53 0.46 1.06 1.02 0.66 5.94 51.10
M 9.95 10.07 14.96 9.85 10.36! 0.49 3.36 4.81 1.61 1.92CV % 4.88 33.33 32.13 16.36 18.51
Hypermutator pLC 42 1 8.90 ± 10.77 ± 10.10 ± 13.23 ± 13.38 ± 11.280.35 0.19 1.23 0.59 0.42 1.97 17.48
Hypermutator pLC 42 2 9.53 ± 7.46 ± 8.23 ± 7.54 ± 11.79 ± 8.910.69 0.16 0.26 0.65 0.31 1.81 20.33
Hypermutator pLC 42 3 11.13 ± 7.31 ± 10.13 ± 6.80 ± 13.28 ± 9.730.93 0.18 0.27 0.39 0.34 2.70 27.75
Hypermutator pLC 42 4 8.11 ± 7.73 ± 9.27 ± 6.88 ± 8.95 ± 8.190.66 0.47 0.84 0.71 0.35 0.96 11.73
Hypermutator pLC 42 5 9.78 ± 9.19 ± 11.68 ± 8.48 ± 10.49 ± 9.920.92 0.57 1.45 0.27 0.68 1.23 12.36
Hypermutator pLC 42 6 7.74 ± 8.11 ± 13.39 ± 12.00 ± 11.99 ± 10.640.38 0.85 0.62 0.29 0.11 2.55 23.96
M 9.20 8.43 10.47 9.16 11.65! 1.12 1.21 1.67 2.53 1.55CV % 12.22 14.40 15.92 27.65 13.30
M ± SD
M ± SD
M ± SD
M ± SD
M ± SD
Generation1 200 400 600 800
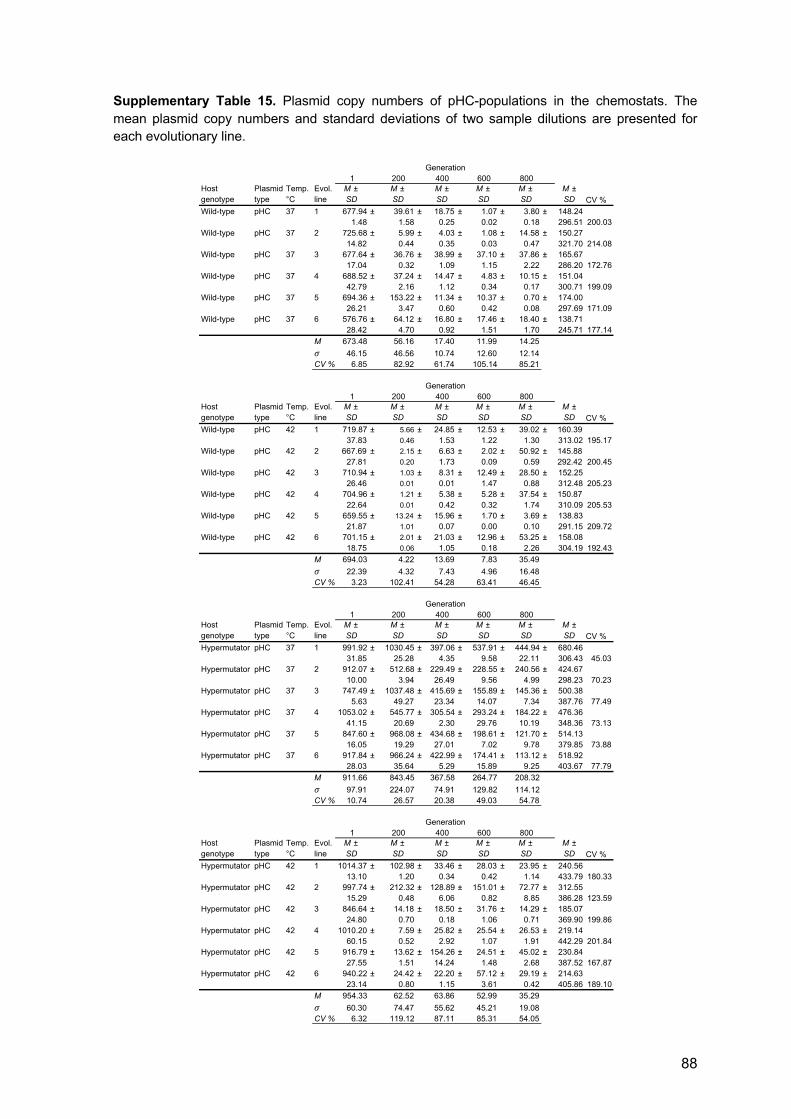
88
Supplementary Table 15. Plasmid copy numbers of pHC-populations in the chemostats. The
mean plasmid copy numbers and standard deviations of two sample dilutions are presented for
each evolutionary line.
1 200 400 600 800Host genotype
Plasmid type
Temp. °C
Evol. line
M ± SD
M ± SD
M ± SD
M ± SD
M ± SD
M ± SD CV %
Wild-type pHC 37 1 677.94 ± 39.61 ± 18.75 ± 1.07 ± 3.80 ± 148.241.48 1.58 0.25 0.02 0.18 296.51 200.03
Wild-type pHC 37 2 725.68 ± 5.99 ± 4.03 ± 1.08 ± 14.58 ± 150.2714.82 0.44 0.35 0.03 0.47 321.70 214.08
Wild-type pHC 37 3 677.64 ± 36.76 ± 38.99 ± 37.10 ± 37.86 ± 165.6717.04 0.32 1.09 1.15 2.22 286.20 172.76
Wild-type pHC 37 4 688.52 ± 37.24 ± 14.47 ± 4.83 ± 10.15 ± 151.0442.79 2.16 1.12 0.34 0.17 300.71 199.09
Wild-type pHC 37 5 694.36 ± 153.22 ± 11.34 ± 10.37 ± 0.70 ± 174.0026.21 3.47 0.60 0.42 0.08 297.69 171.09
Wild-type pHC 37 6 576.76 ± 64.12 ± 16.80 ± 17.46 ± 18.40 ± 138.7128.42 4.70 0.92 1.51 1.70 245.71 177.14
M 673.48 56.16 17.40 11.99 14.25! 46.15 46.56 10.74 12.60 12.14CV % 6.85 82.92 61.74 105.14 85.21
1 200 400 600 800Host genotype
Plasmid type
Temp. °C
Evol. line
M ± SD
M ± SD
M ± SD
M ± SD
M ± SD
M ± SD CV %
Wild-type pHC 42 1 719.87 ± 5.66 ± 24.85 ± 12.53 ± 39.02 ± 160.3937.83 0.46 1.53 1.22 1.30 313.02 195.17
Wild-type pHC 42 2 667.69 ± 2.15 ± 6.63 ± 2.02 ± 50.92 ± 145.8827.81 0.20 1.73 0.09 0.59 292.42 200.45
Wild-type pHC 42 3 710.94 ± 1.03 ± 8.31 ± 12.49 ± 28.50 ± 152.2526.46 0.01 0.01 1.47 0.88 312.48 205.23
Wild-type pHC 42 4 704.96 ± 1.21 ± 5.38 ± 5.28 ± 37.54 ± 150.8722.64 0.01 0.42 0.32 1.74 310.09 205.53
Wild-type pHC 42 5 659.55 ± 13.24 ± 15.96 ± 1.70 ± 3.69 ± 138.8321.87 1.01 0.07 0.00 0.10 291.15 209.72
Wild-type pHC 42 6 701.15 ± 2.01 ± 21.03 ± 12.96 ± 53.25 ± 158.0818.75 0.06 1.05 0.18 2.26 304.19 192.43
M 694.03 4.22 13.69 7.83 35.49! 22.39 4.32 7.43 4.96 16.48CV % 3.23 102.41 54.28 63.41 46.45
1 200 400 600 800Host genotype
Plasmid type
Temp. °C
Evol. line
M ± SD
M ± SD
M ± SD
M ± SD
M ± SD
M ± SD CV %
Hypermutator pHC 37 1 991.92 ± 1030.45 ± 397.06 ± 537.91 ± 444.94 ± 680.4631.85 25.28 4.35 9.58 22.11 306.43 45.03
Hypermutator pHC 37 2 912.07 ± 512.68 ± 229.49 ± 228.55 ± 240.56 ± 424.6710.00 3.94 26.49 9.56 4.99 298.23 70.23
Hypermutator pHC 37 3 747.49 ± 1037.48 ± 415.69 ± 155.89 ± 145.36 ± 500.385.63 49.27 23.34 14.07 7.34 387.76 77.49
Hypermutator pHC 37 4 1053.02 ± 545.77 ± 305.54 ± 293.24 ± 184.22 ± 476.3641.15 20.69 2.30 29.76 10.19 348.36 73.13
Hypermutator pHC 37 5 847.60 ± 968.08 ± 434.68 ± 198.61 ± 121.70 ± 514.1316.05 19.29 27.01 7.02 9.78 379.85 73.88
Hypermutator pHC 37 6 917.84 ± 966.24 ± 422.99 ± 174.41 ± 113.12 ± 518.9228.03 35.64 5.29 15.89 9.25 403.67 77.79
M 911.66 843.45 367.58 264.77 208.32! 97.91 224.07 74.91 129.82 114.12CV % 10.74 26.57 20.38 49.03 54.78
1 200 400 600 800Host genotype
Plasmid type
Temp. °C
Evol. line
M ± SD
M ± SD
M ± SD
M ± SD
M ± SD
M ± SD CV %
Hypermutator pHC 42 1 1014.37 ± 102.98 ± 33.46 ± 28.03 ± 23.95 ± 240.5613.10 1.20 0.34 0.42 1.14 433.79 180.33
Hypermutator pHC 42 2 997.74 ± 212.32 ± 128.89 ± 151.01 ± 72.77 ± 312.5515.29 0.48 6.06 0.82 8.85 386.28 123.59
Hypermutator pHC 42 3 846.64 ± 14.18 ± 18.50 ± 31.76 ± 14.29 ± 185.0724.80 0.70 0.18 1.06 0.71 369.90 199.86
Hypermutator pHC 42 4 1010.20 ± 7.59 ± 25.82 ± 25.54 ± 26.53 ± 219.1460.15 0.52 2.92 1.07 1.91 442.29 201.84
Hypermutator pHC 42 5 916.79 ± 13.62 ± 154.26 ± 24.51 ± 45.02 ± 230.8427.55 1.51 14.24 1.48 2.68 387.52 167.87
Hypermutator pHC 42 6 940.22 ± 24.42 ± 22.20 ± 57.12 ± 29.19 ± 214.6323.14 0.80 1.15 3.61 0.42 405.86 189.10
M 954.33 62.52 63.86 52.99 35.29! 60.30 74.47 55.62 45.21 19.08CV % 6.32 119.12 87.11 85.31 54.05
Generation
Generation
Generation
Generation
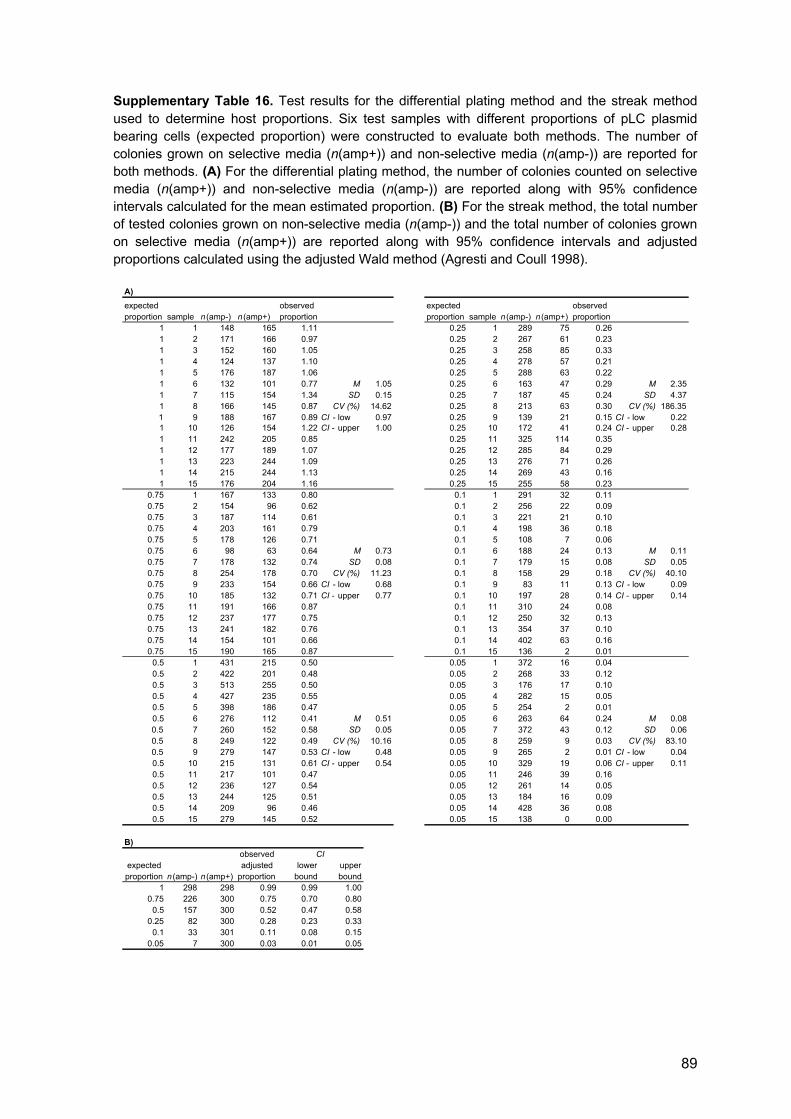
89
Supplementary Table 16. Test results for the differential plating method and the streak method
used to determine host proportions. Six test samples with different proportions of pLC plasmid
bearing cells (expected proportion) were constructed to evaluate both methods. The number of
colonies grown on selective media (n(amp+)) and non-selective media (n(amp-)) are reported for
both methods. (A) For the differential plating method, the number of colonies counted on selective
media (n(amp+)) and non-selective media (n(amp-)) are reported along with 95% confidence
intervals calculated for the mean estimated proportion. (B) For the streak method, the total number
of tested colonies grown on non-selective media (n(amp-)) and the total number of colonies grown
on selective media (n(amp+)) are reported along with 95% confidence intervals and adjusted
proportions calculated using the adjusted Wald method (Agresti and Coull 1998).
A)expected proportion sample n (amp-) n (amp+)
observed proportion
expected proportion sample n (amp-) n (amp+)
observed proportion
1 1 148 165 1.11 0.25 1 289 75 0.261 2 171 166 0.97 0.25 2 267 61 0.231 3 152 160 1.05 0.25 3 258 85 0.331 4 124 137 1.10 0.25 4 278 57 0.211 5 176 187 1.06 0.25 5 288 63 0.221 6 132 101 0.77 M 1.05 0.25 6 163 47 0.29 M 2.351 7 115 154 1.34 SD 0.15 0.25 7 187 45 0.24 SD 4.371 8 166 145 0.87 CV (%) 14.62 0.25 8 213 63 0.30 CV (%) 186.351 9 188 167 0.89 CI - low 0.97 0.25 9 139 21 0.15 CI - low 0.221 10 126 154 1.22 CI - upper 1.00 0.25 10 172 41 0.24 CI - upper 0.281 11 242 205 0.85 0.25 11 325 114 0.351 12 177 189 1.07 0.25 12 285 84 0.291 13 223 244 1.09 0.25 13 276 71 0.261 14 215 244 1.13 0.25 14 269 43 0.161 15 176 204 1.16 0.25 15 255 58 0.23
0.75 1 167 133 0.80 0.1 1 291 32 0.110.75 2 154 96 0.62 0.1 2 256 22 0.090.75 3 187 114 0.61 0.1 3 221 21 0.100.75 4 203 161 0.79 0.1 4 198 36 0.180.75 5 178 126 0.71 0.1 5 108 7 0.060.75 6 98 63 0.64 M 0.73 0.1 6 188 24 0.13 M 0.110.75 7 178 132 0.74 SD 0.08 0.1 7 179 15 0.08 SD 0.050.75 8 254 178 0.70 CV (%) 11.23 0.1 8 158 29 0.18 CV (%) 40.100.75 9 233 154 0.66 CI - low 0.68 0.1 9 83 11 0.13 CI - low 0.090.75 10 185 132 0.71 CI - upper 0.77 0.1 10 197 28 0.14 CI - upper 0.140.75 11 191 166 0.87 0.1 11 310 24 0.080.75 12 237 177 0.75 0.1 12 250 32 0.130.75 13 241 182 0.76 0.1 13 354 37 0.100.75 14 154 101 0.66 0.1 14 402 63 0.160.75 15 190 165 0.87 0.1 15 136 2 0.01
0.5 1 431 215 0.50 0.05 1 372 16 0.040.5 2 422 201 0.48 0.05 2 268 33 0.120.5 3 513 255 0.50 0.05 3 176 17 0.100.5 4 427 235 0.55 0.05 4 282 15 0.050.5 5 398 186 0.47 0.05 5 254 2 0.010.5 6 276 112 0.41 M 0.51 0.05 6 263 64 0.24 M 0.080.5 7 260 152 0.58 SD 0.05 0.05 7 372 43 0.12 SD 0.060.5 8 249 122 0.49 CV (%) 10.16 0.05 8 259 9 0.03 CV (%) 83.100.5 9 279 147 0.53 CI - low 0.48 0.05 9 265 2 0.01 CI - low 0.040.5 10 215 131 0.61 CI - upper 0.54 0.05 10 329 19 0.06 CI - upper 0.110.5 11 217 101 0.47 0.05 11 246 39 0.160.5 12 236 127 0.54 0.05 12 261 14 0.050.5 13 244 125 0.51 0.05 13 184 16 0.090.5 14 209 96 0.46 0.05 14 428 36 0.080.5 15 279 145 0.52 0.05 15 138 0 0.00
B)
n (amp-) n (amp+)lower
boundupper bound
1 298 298 0.99 0.99 1.000.75 226 300 0.75 0.70 0.80
0.5 157 300 0.52 0.47 0.580.25 82 300 0.28 0.23 0.33
0.1 33 301 0.11 0.08 0.150.05 7 300 0.03 0.01 0.05
CIobserved adjusted
proportionexpected proportion

90
Supplementary Table 17. Effect of freezing and reviving on proportion of hosts. The effect of
freezing and reving on the proportion of hosts in pLC-wt and pHC-wt populations with an expected
proportion of hosts of 0.15 and 0.75 was examined by estimating the proportions before and after
freezing at -80°C for six weeks using the streak method. A) Five technical replicates were used per
test group and the number of colonies grown selective media (n(amp+)) and non-selective media
are reported. B) Paired t-tests revealed no significant differences in observed proportions of hosts
before and after freezing and reviving.
A)
sample before after before after before after before after1 n(amp-) 167 129 253 206 241 237 213 149
n(amp+) 32 20 184 157 43 36 159 103pobs 0.19 0.16 0.73 0.76 0.18 0.15 0.75 0.69
2 n(amp-) 214 177 248 185 264 289 194 557n(amp+) 35 31 196 136 48 52 143 432pobs 0.16 0.18 0.79 0.74 0.18 0.18 0.74 0.78
3 n(amp-) 430 265 219 253 489 167 109 194n(amp+) 67 49 169 184 84 21 84 153pobs 0.16 0.18 0.77 0.73 0.17 0.13 0.77 0.79
4 n(amp-) 242 158 153 168 386 294 389 174n(amp+) 37 25 121 132 59 32 304 130pobs 0.15 0.16 0.79 0.79 0.15 0.11 0.78 0.75
5 n(amp-) 337 271 175 150 184 138 194 361n(amp+) 52 37 129 114 24 24 154 288pobs 0.15 0.14 0.74 0.76 0.13 0.17 0.79 0.80
pexp = 0.15 pexp = 0.75pLC-wt pHC-wt
pexp = 0.15 pexp = 0.75
B)genotype M SD Lower Upper t df
before 0.16 1.62E-02after 0.16 1.88E-02before 0.76 2.97E-02after 0.75 2.33E-02before 0.16 2.14E-02after 0.15 3.06E-02before 0.77 2.37E-02after 0.76 4.30E-02
40.3385.34E-025.80E-03 -4.18E-02
40.9026.12E-02-3.12E-021.50E-02
40.5285.88E-02-4.00E-029.40E-03pLC-wt
pHC-wt
expected p
40.1483.37E-02-3.03E-021.70E-03
95% CI of the differenceM of the difference
0.15
0.75
0.15
0.75

91
Supplementary Table 18. Host proportions in chemostat cultures at generation 1 and generation
800. Proportion of hosts were estimated using the streak method (Section 3.8) and the tested
number of colonies (n(amp-)) and resistant colonies (n(amp+)) is reported. Confidence intervals
were calculated using the adjusted Wald method (Agresti and Coull 1998).
Lower Upper Lower UpperpLC Wt 37 1 102 102 1.00 0.95 1.00 224 224 1.00 0.98 1.00pLC Wt 37 2 101 101 1.00 0.95 1.00 218 218 1.00 0.98 1.00pLC Wt 37 3 105 105 1.00 0.96 1.00 216 216 1.00 0.98 1.00pLC Wt 37 4 105 105 1.00 0.96 1.00 226 226 1.00 0.98 1.00pLC Wt 37 5 102 102 1.00 0.95 1.00 220 220 1.00 0.98 1.00pLC Wt 37 6 106 106 1.00 0.96 1.00 212 212 1.00 0.98 1.00pLC Wt 42 1 100 100 1.00 0.95 1.00 139 139 1.00 0.97 1.00pLC Wt 42 2 104 104 1.00 0.96 1.00 108 108 1.00 0.96 1.00pLC Wt 42 3 102 102 1.00 0.95 1.00 139 136 0.98 0.93 1.00pLC Wt 42 4 101 101 1.00 0.95 1.00 141 140 0.99 0.96 1.00pLC Wt 42 5 101 101 1.00 0.95 1.00 141 140 0.99 0.96 1.00pLC Wt 42 6 110 110 1.00 0.96 1.00 141 138 0.98 0.94 1.00pLC Hypermutator 37 1 112 112 1.00 0.96 1.00 147 147 1.00 0.97 1.00pLC Hypermutator 37 2 110 110 1.00 0.96 1.00 146 146 1.00 0.97 1.00pLC Hypermutator 37 3 101 101 1.00 0.95 1.00 141 141 1.00 0.97 1.00pLC Hypermutator 37 4 106 106 1.00 0.96 1.00 142 142 1.00 0.97 1.00pLC Hypermutator 37 5 124 124 1.00 0.96 1.00 147 147 1.00 0.97 1.00pLC Hypermutator 37 6 113 113 1.00 0.96 1.00 148 148 1.00 0.97 1.00pLC Hypermutator 42 1 109 109 1.00 0.96 1.00 128 126 0.98 0.94 1.00pLC Hypermutator 42 2 104 104 1.00 0.96 1.00 118 115 0.97 0.92 0.99pLC Hypermutator 42 3 105 105 1.00 0.96 1.00 126 112 0.89 0.82 0.93pLC Hypermutator 42 4 111 111 1.00 0.96 1.00 120 120 1.00 0.96 1.00pLC Hypermutator 42 5 107 107 1.00 0.96 1.00 123 123 1.00 0.96 1.00pLC Hypermutator 42 6 105 105 1.00 0.96 1.00 133 133 1.00 0.96 1.00pHC Wt 37 1 127 120 0.94 0.89 0.98 481 31 0.06 0.05 0.09pHC Wt 37 2 123 116 0.94 0.88 0.97 460 35 0.08 0.05 0.10pHC Wt 37 3 117 114 0.97 0.92 0.99 723 173 0.24 0.21 0.27pHC Wt 37 4 105 101 0.96 0.90 0.99 436 11 0.03 0.01 0.05pHC Wt 37 5 102 99 0.97 0.91 0.99 457 4 0.01 0.00 0.02pHC Wt 37 6 220 163 0.74 0.68 0.80 550 19 0.03 0.02 0.05pHC Wt 42 1 128 125 0.98 0.93 1.00 188 146 0.78 0.71 0.83pHC Wt 42 2 154 145 0.94 0.89 0.97 147 28 0.19 0.13 0.26pHC Wt 42 3 134 128 0.96 0.90 0.98 153 9 0.06 0.03 0.11pHC Wt 42 4 176 167 0.95 0.90 0.97 165 61 0.37 0.30 0.45pHC Wt 42 5 157 151 0.96 0.92 0.98 157 32 0.20 0.15 0.28pHC Wt 42 6 139 131 0.94 0.89 0.97 172 9 0.05 0.03 0.10pHC Hypermutator 37 1 158 146 0.92 0.87 0.96 180 176 0.98 0.94 0.99pHC Hypermutator 37 2 163 154 0.94 0.90 0.97 172 168 0.98 0.94 0.99pHC Hypermutator 37 3 157 146 0.93 0.88 0.96 179 170 0.95 0.90 0.98pHC Hypermutator 37 4 149 139 0.93 0.88 0.97 175 171 0.98 0.94 0.99pHC Hypermutator 37 5 142 135 0.95 0.90 0.98 232 81 0.35 0.29 0.41pHC Hypermutator 37 6 143 131 0.92 0.86 0.95 183 177 0.97 0.93 0.99pHC Hypermutator 42 1 144 131 0.91 0.85 0.95 157 118 0.75 0.68 0.81pHC Hypermutator 42 2 127 116 0.91 0.85 0.95 172 153 0.89 0.83 0.93pHC Hypermutator 42 3 165 156 0.95 0.90 0.97 157 126 0.80 0.73 0.86pHC Hypermutator 42 4 143 128 0.90 0.83 0.94 176 80 0.45 0.38 0.53pHC Hypermutator 42 5 155 142 0.92 0.86 0.95 165 67 0.41 0.33 0.48pHC Hypermutator 42 6 136 128 0.94 0.89 0.97 170 139 0.82 0.75 0.87
Repli-cate
Plasmid type
Proportion of hosts
Generation 1CI 95%
n (amp-) n (amp+)Proportion
of hostsT °C
Host genotype
CI 95%Generation 800
n (amp+)n (amp-)
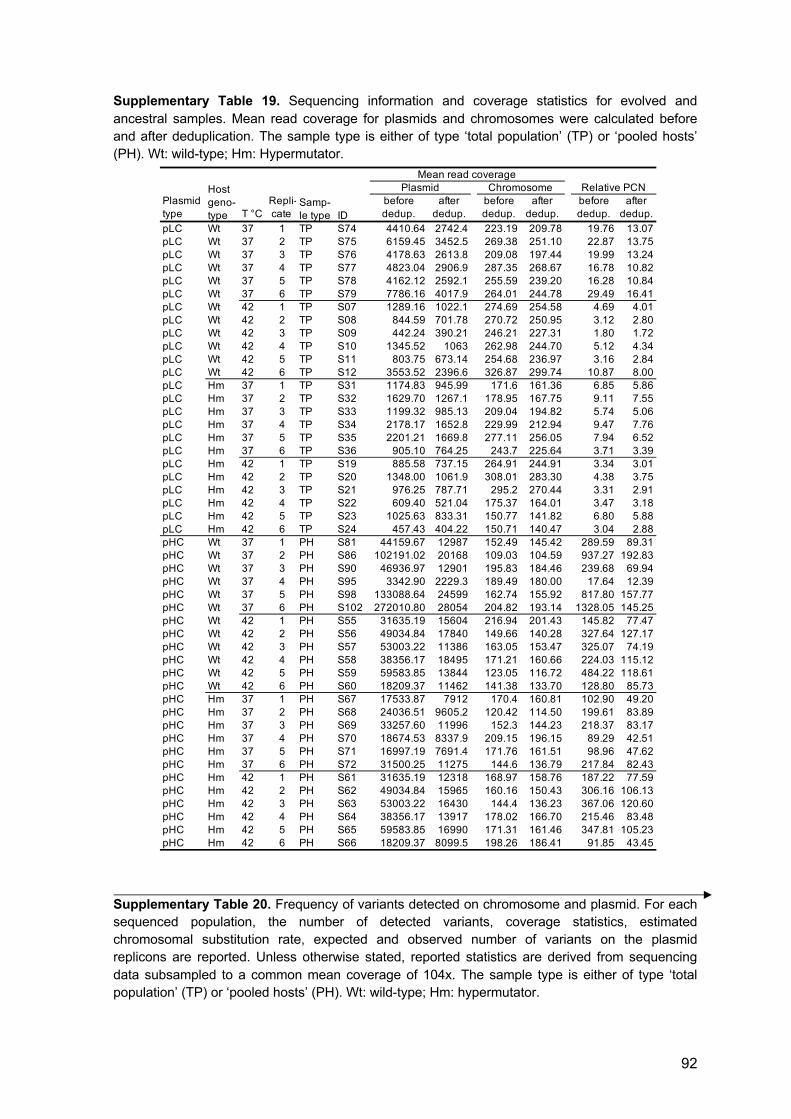
92
Supplementary Table 19. Sequencing information and coverage statistics for evolved and
ancestral samples. Mean read coverage for plasmids and chromosomes were calculated before
and after deduplication. The sample type is either of type ‘total population’ (TP) or ‘pooled hosts’
(PH). Wt: wild-type; Hm: Hypermutator.
Supplementary Table 20. Frequency of variants detected on chromosome and plasmid. For each
sequenced population, the number of detected variants, coverage statistics, estimated
chromosomal substitution rate, expected and observed number of variants on the plasmid
replicons are reported. Unless otherwise stated, reported statistics are derived from sequencing
data subsampled to a common mean coverage of 104x. The sample type is either of type ‘total
population’ (TP) or ‘pooled hosts’ (PH). Wt: wild-type; Hm: hypermutator.
Plasmid type T °C
Repli-cate
before dedup.
after dedup.
before dedup.
after dedup.
before dedup.
after dedup.
pLC Wt 37 1 TP S74 4410.64 2742.4 223.19 209.78 19.76 13.07pLC Wt 37 2 TP S75 6159.45 3452.5 269.38 251.10 22.87 13.75pLC Wt 37 3 TP S76 4178.63 2613.8 209.08 197.44 19.99 13.24pLC Wt 37 4 TP S77 4823.04 2906.9 287.35 268.67 16.78 10.82pLC Wt 37 5 TP S78 4162.12 2592.1 255.59 239.20 16.28 10.84pLC Wt 37 6 TP S79 7786.16 4017.9 264.01 244.78 29.49 16.41pLC Wt 42 1 TP S07 1289.16 1022.1 274.69 254.58 4.69 4.01pLC Wt 42 2 TP S08 844.59 701.78 270.72 250.95 3.12 2.80pLC Wt 42 3 TP S09 442.24 390.21 246.21 227.31 1.80 1.72pLC Wt 42 4 TP S10 1345.52 1063 262.98 244.70 5.12 4.34pLC Wt 42 5 TP S11 803.75 673.14 254.68 236.97 3.16 2.84pLC Wt 42 6 TP S12 3553.52 2396.6 326.87 299.74 10.87 8.00pLC Hm 37 1 TP S31 1174.83 945.99 171.6 161.36 6.85 5.86pLC Hm 37 2 TP S32 1629.70 1267.1 178.95 167.75 9.11 7.55pLC Hm 37 3 TP S33 1199.32 985.13 209.04 194.82 5.74 5.06pLC Hm 37 4 TP S34 2178.17 1652.8 229.99 212.94 9.47 7.76pLC Hm 37 5 TP S35 2201.21 1669.8 277.11 256.05 7.94 6.52pLC Hm 37 6 TP S36 905.10 764.25 243.7 225.64 3.71 3.39pLC Hm 42 1 TP S19 885.58 737.15 264.91 244.91 3.34 3.01pLC Hm 42 2 TP S20 1348.00 1061.9 308.01 283.30 4.38 3.75pLC Hm 42 3 TP S21 976.25 787.71 295.2 270.44 3.31 2.91pLC Hm 42 4 TP S22 609.40 521.04 175.37 164.01 3.47 3.18pLC Hm 42 5 TP S23 1025.63 833.31 150.77 141.82 6.80 5.88pLC Hm 42 6 TP S24 457.43 404.22 150.71 140.47 3.04 2.88pHC Wt 37 1 PH S81 44159.67 12987 152.49 145.42 289.59 89.31pHC Wt 37 2 PH S86 102191.02 20168 109.03 104.59 937.27 192.83pHC Wt 37 3 PH S90 46936.97 12901 195.83 184.46 239.68 69.94pHC Wt 37 4 PH S95 3342.90 2229.3 189.49 180.00 17.64 12.39pHC Wt 37 5 PH S98 133088.64 24599 162.74 155.92 817.80 157.77pHC Wt 37 6 PH S102 272010.80 28054 204.82 193.14 1328.05 145.25pHC Wt 42 1 PH S55 31635.19 15604 216.94 201.43 145.82 77.47pHC Wt 42 2 PH S56 49034.84 17840 149.66 140.28 327.64 127.17pHC Wt 42 3 PH S57 53003.22 11386 163.05 153.47 325.07 74.19pHC Wt 42 4 PH S58 38356.17 18495 171.21 160.66 224.03 115.12pHC Wt 42 5 PH S59 59583.85 13844 123.05 116.72 484.22 118.61pHC Wt 42 6 PH S60 18209.37 11462 141.38 133.70 128.80 85.73pHC Hm 37 1 PH S67 17533.87 7912 170.4 160.81 102.90 49.20pHC Hm 37 2 PH S68 24036.51 9605.2 120.42 114.50 199.61 83.89pHC Hm 37 3 PH S69 33257.60 11996 152.3 144.23 218.37 83.17pHC Hm 37 4 PH S70 18674.53 8337.9 209.15 196.15 89.29 42.51pHC Hm 37 5 PH S71 16997.19 7691.4 171.76 161.51 98.96 47.62pHC Hm 37 6 PH S72 31500.25 11275 144.6 136.79 217.84 82.43pHC Hm 42 1 PH S61 31635.19 12318 168.97 158.76 187.22 77.59pHC Hm 42 2 PH S62 49034.84 15965 160.16 150.43 306.16 106.13pHC Hm 42 3 PH S63 53003.22 16430 144.4 136.23 367.06 120.60pHC Hm 42 4 PH S64 38356.17 13917 178.02 166.70 215.46 83.48pHC Hm 42 5 PH S65 59583.85 16990 171.31 161.46 347.81 105.23pHC Hm 42 6 PH S66 18209.37 8099.5 198.26 186.41 91.85 43.45
Relative PCNHost geno-type
Samp-le type ID
Mean read coveragePlasmid Chromosome
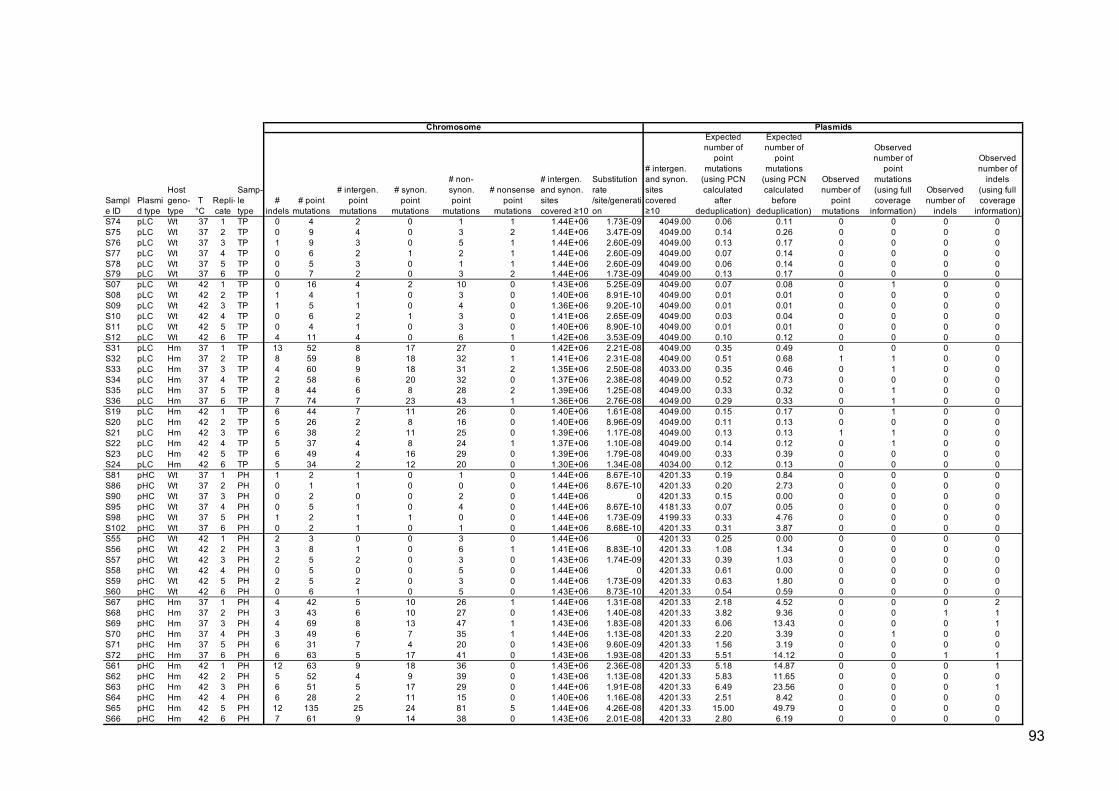
93
Sample ID
Plasmid type
Host geno-type
T °C
Repli-cate
Samp-le type
# indels
# point mutations
# intergen. point
mutations
# synon. point
mutations
# non-synon. point
mutations
# nonsense point
mutations
# intergen. and synon. sites covered ≥10
Substitution rate /site/generation
# intergen. and synon. sites covered ≥10
Expected number of
point mutations
(using PCN calculated
after deduplication)
Expected number of
point mutations
(using PCN calculated
before deduplication)
Observed number of
point mutations
Observed number of
point mutations (using full coverage
information)
Observed number of
indels
Observed number of
indels (using full coverage
information)S74 pLC Wt 37 1 TP 0 4 2 0 1 1 1.44E+06 1.73E-09 4049.00 0.06 0.11 0 0 0 0S75 pLC Wt 37 2 TP 0 9 4 0 3 2 1.44E+06 3.47E-09 4049.00 0.14 0.26 0 0 0 0S76 pLC Wt 37 3 TP 1 9 3 0 5 1 1.44E+06 2.60E-09 4049.00 0.13 0.17 0 0 0 0S77 pLC Wt 37 4 TP 0 6 2 1 2 1 1.44E+06 2.60E-09 4049.00 0.07 0.14 0 0 0 0S78 pLC Wt 37 5 TP 0 5 3 0 1 1 1.44E+06 2.60E-09 4049.00 0.06 0.14 0 0 0 0S79 pLC Wt 37 6 TP 0 7 2 0 3 2 1.44E+06 1.73E-09 4049.00 0.13 0.17 0 0 0 0S07 pLC Wt 42 1 TP 0 16 4 2 10 0 1.43E+06 5.25E-09 4049.00 0.07 0.08 0 1 0 0S08 pLC Wt 42 2 TP 1 4 1 0 3 0 1.40E+06 8.91E-10 4049.00 0.01 0.01 0 0 0 0S09 pLC Wt 42 3 TP 1 5 1 0 4 0 1.36E+06 9.20E-10 4049.00 0.01 0.01 0 0 0 0S10 pLC Wt 42 4 TP 0 6 2 1 3 0 1.41E+06 2.65E-09 4049.00 0.03 0.04 0 0 0 0S11 pLC Wt 42 5 TP 0 4 1 0 3 0 1.40E+06 8.90E-10 4049.00 0.01 0.01 0 0 0 0S12 pLC Wt 42 6 TP 4 11 4 0 6 1 1.42E+06 3.53E-09 4049.00 0.10 0.12 0 0 0 0S31 pLC Hm 37 1 TP 13 52 8 17 27 0 1.42E+06 2.21E-08 4049.00 0.35 0.49 0 0 0 0S32 pLC Hm 37 2 TP 8 59 8 18 32 1 1.41E+06 2.31E-08 4049.00 0.51 0.68 1 1 0 0S33 pLC Hm 37 3 TP 4 60 9 18 31 2 1.35E+06 2.50E-08 4033.00 0.35 0.46 0 1 0 0S34 pLC Hm 37 4 TP 2 58 6 20 32 0 1.37E+06 2.38E-08 4049.00 0.52 0.73 0 0 0 0S35 pLC Hm 37 5 TP 8 44 6 8 28 2 1.39E+06 1.25E-08 4049.00 0.33 0.32 0 1 0 0S36 pLC Hm 37 6 TP 7 74 7 23 43 1 1.36E+06 2.76E-08 4049.00 0.29 0.33 0 1 0 0S19 pLC Hm 42 1 TP 6 44 7 11 26 0 1.40E+06 1.61E-08 4049.00 0.15 0.17 0 1 0 0S20 pLC Hm 42 2 TP 5 26 2 8 16 0 1.40E+06 8.96E-09 4049.00 0.11 0.13 0 0 0 0S21 pLC Hm 42 3 TP 6 38 2 11 25 0 1.39E+06 1.17E-08 4049.00 0.13 0.13 1 1 0 0S22 pLC Hm 42 4 TP 5 37 4 8 24 1 1.37E+06 1.10E-08 4049.00 0.14 0.12 0 1 0 0S23 pLC Hm 42 5 TP 6 49 4 16 29 0 1.39E+06 1.79E-08 4049.00 0.33 0.39 0 0 0 0S24 pLC Hm 42 6 TP 5 34 2 12 20 0 1.30E+06 1.34E-08 4034.00 0.12 0.13 0 0 0 0S81 pHC Wt 37 1 PH 1 2 1 0 1 0 1.44E+06 8.67E-10 4201.33 0.19 0.84 0 0 0 0S86 pHC Wt 37 2 PH 0 1 1 0 0 0 1.44E+06 8.67E-10 4201.33 0.20 2.73 0 0 0 0S90 pHC Wt 37 3 PH 0 2 0 0 2 0 1.44E+06 0 4201.33 0.15 0.00 0 0 0 0S95 pHC Wt 37 4 PH 0 5 1 0 4 0 1.44E+06 8.67E-10 4181.33 0.07 0.05 0 0 0 0S98 pHC Wt 37 5 PH 1 2 1 1 0 0 1.44E+06 1.73E-09 4199.33 0.33 4.76 0 0 0 0S102 pHC Wt 37 6 PH 0 2 1 0 1 0 1.44E+06 8.68E-10 4201.33 0.31 3.87 0 0 0 0S55 pHC Wt 42 1 PH 2 3 0 0 3 0 1.44E+06 0 4201.33 0.25 0.00 0 0 0 0S56 pHC Wt 42 2 PH 3 8 1 0 6 1 1.41E+06 8.83E-10 4201.33 1.08 1.34 0 0 0 0S57 pHC Wt 42 3 PH 2 5 2 0 3 0 1.43E+06 1.74E-09 4201.33 0.39 1.03 0 0 0 0S58 pHC Wt 42 4 PH 0 5 0 0 5 0 1.44E+06 0 4201.33 0.61 0.00 0 0 0 0S59 pHC Wt 42 5 PH 2 5 2 0 3 0 1.44E+06 1.73E-09 4201.33 0.63 1.80 0 0 0 0S60 pHC Wt 42 6 PH 0 6 1 0 5 0 1.43E+06 8.73E-10 4201.33 0.54 0.59 0 0 0 0S67 pHC Hm 37 1 PH 4 42 5 10 26 1 1.44E+06 1.31E-08 4201.33 2.18 4.52 0 0 0 2S68 pHC Hm 37 2 PH 3 43 6 10 27 0 1.43E+06 1.40E-08 4201.33 3.82 9.36 0 0 1 1S69 pHC Hm 37 3 PH 4 69 8 13 47 1 1.43E+06 1.83E-08 4201.33 6.06 13.43 0 0 0 1S70 pHC Hm 37 4 PH 3 49 6 7 35 1 1.44E+06 1.13E-08 4201.33 2.20 3.39 0 1 0 0S71 pHC Hm 37 5 PH 6 31 7 4 20 0 1.43E+06 9.60E-09 4201.33 1.56 3.19 0 0 0 0S72 pHC Hm 37 6 PH 6 63 5 17 41 0 1.43E+06 1.93E-08 4201.33 5.51 14.12 0 0 1 1S61 pHC Hm 42 1 PH 12 63 9 18 36 0 1.43E+06 2.36E-08 4201.33 5.18 14.87 0 0 0 1S62 pHC Hm 42 2 PH 5 52 4 9 39 0 1.43E+06 1.13E-08 4201.33 5.83 11.65 0 0 0 0S63 pHC Hm 42 3 PH 6 51 5 17 29 0 1.44E+06 1.91E-08 4201.33 6.49 23.56 0 0 0 1S64 pHC Hm 42 4 PH 6 28 2 11 15 0 1.40E+06 1.16E-08 4201.33 2.51 8.42 0 0 0 0S65 pHC Hm 42 5 PH 12 135 25 24 81 5 1.44E+06 4.26E-08 4201.33 15.00 49.79 0 0 0 0S66 pHC Hm 42 6 PH 7 61 9 14 38 0 1.43E+06 2.01E-08 4201.33 2.80 6.19 0 0 0 0
Chromosome Plasmids

94
Supplementary Table 21. Comparison of the number of variants detected in pooled hosts and total population pHC sequencing samples. For each sequenced population, the number of detected variants, coverage statistics, estimated chromosomal substitution rate, expected and observed number of variants on the plasmid replicons are reported. Unless otherwise stated, reported statistics are derived from sequencing data subsampled to a common mean coverage of 104x. The sample type is either of type ‘total population’ (TP) or ‘pooled hosts’ (PH). Wt: wild-type; Hm: hypermutator.
Plasmid type
Host geno-type
T °C
Repli-cate
Sample ID – PH
Sample ID – TP PH TP
detected in both
samples PH TP
detected in both
samples
Library preparation type
Sequencing platform
BioSample accession
SRA run accession
Number of colonies tested
Proportion of hosts
Lower limit at a 95% confidence interval
Upper limit at a 95%
confidence interval
pHC Wt 37 1 S81 S84 1 2 0 1 0 0 Nextera HiSeq2500 SAMN08956167 SRR7535018 481 0.06 0.05 0.09pHC Wt 37 2 S86 S89 1 1 0 0 0 0 Nextera HiSeq2500 SAMN08956167 SRR7535017 460 0.08 0.05 0.10pHC Wt 37 3 S90 S93 2 3 1 0 0 0 Nextera HiSeq2500 SAMN08956167 SRR7535020 723 0.24 0.21 0.27pHC Wt 37 4 S95 S97 4 5 4 0 0 0 Nextera HiSeq2500 SAMN08956167 SRR7535019 436 0.03 0.01 0.05pHC Wt 37 5 S98 S101 2 8 0 1 1 0 Nextera HiSeq2500 SAMN08956167 SRR7535014 457 0.01 0.00 0.02pHC Wt 37 6 S102 S105 2 11 1 0 1 0 Nextera HiSeq2500 SAMN08956167 SRR7535013 550 0.03 0.02 0.05pHC Wt 42 1 S55 S01 4 5 4 2 2 2 NexteraXT NextSeq500 SAMN08956175 SRR7535016 188 0.78 0.71 0.83pHC Wt 42 2 S56 S02 7 6 3 2 1 0 NexteraXT NextSeq500 SAMN08956175 SRR7535015 147 0.19 0.13 0.26pHC Wt 42 3 S57 S03 4 5 3 1 1 1 NexteraXT NextSeq500 SAMN08956175 SRR7535012 153 0.06 0.03 0.11pHC Wt 42 4 S58 S04 5 6 2 0 0 0 NexteraXT NextSeq500 SAMN08956175 SRR7535011 165 0.37 0.30 0.45pHC Wt 42 5 S59 S05 4 6 2 2 1 0 NexteraXT NextSeq500 SAMN08956175 SRR7535010 157 0.20 0.15 0.27pHC Wt 42 6 S60 S06 7 9 3 0 1 0 NexteraXT NextSeq500 SAMN08956175 SRR7535009 172 0.05 0.03 0.10pHC Hm 37 1 S67 S25 42 39 36 4 4 4 NexteraXT NextSeq500 SAMN08956177 SRR7535008 180 0.98 0.94 0.99pHC Hm 37 2 S68 S26 40 29 14 2 6 2 NexteraXT NextSeq500 SAMN08956177 SRR7535007 172 0.98 0.94 0.99pHC Hm 37 3 S69 S27 66 29 23 4 3 2 NexteraXT NextSeq500 SAMN08956177 SRR7535006 179 0.95 0.91 0.97pHC Hm 37 4 S70 S28 44 44 36 3 3 3 NexteraXT NextSeq500 SAMN08956177 SRR7535005 175 0.98 0.94 0.99pHC Hm 37 5 S71 S29 32 8 7 5 5 5 NexteraXT NextSeq500 SAMN08956177 SRR7535004 232 0.35 0.29 0.41pHC Hm 37 6 S72 S30 61 60 52 2 5 2 NexteraXT NextSeq500 SAMN08956177 SRR7535003 183 0.97 0.93 0.99pHC Hm 42 1 S61 S13 60 47 29 9 14 1 NexteraXT NextSeq500 SAMN08956176 SRR7535002 157 0.75 0.68 0.81pHC Hm 42 2 S62 S14 49 40 22 5 6 0 NexteraXT NextSeq500 SAMN08956176 SRR7535001 172 0.89 0.83 0.93pHC Hm 42 3 S63 S15 49 57 38 6 9 4 NexteraXT NextSeq500 SAMN08956176 SRR7534999 157 0.80 0.73 0.86pHC Hm 42 4 S64 S16 27 33 26 7 6 5 NexteraXT NextSeq500 SAMN08956176 SRR7535000 176 0.45 0.38 0.53pHC Hm 42 5 S65 S17 106 48 26 5 7 1 NexteraXT NextSeq500 SAMN08956176 SRR7534997 165 0.41 0.33 0.48pHC Hm 42 6 S66 S18 53 29 24 8 8 3 NexteraXT NextSeq500 SAMN08956176 SRR7534998 170 0.82 0.75 0.87
# point mutations # indels Sequencing information on total population Proportion of hosts at generation 800
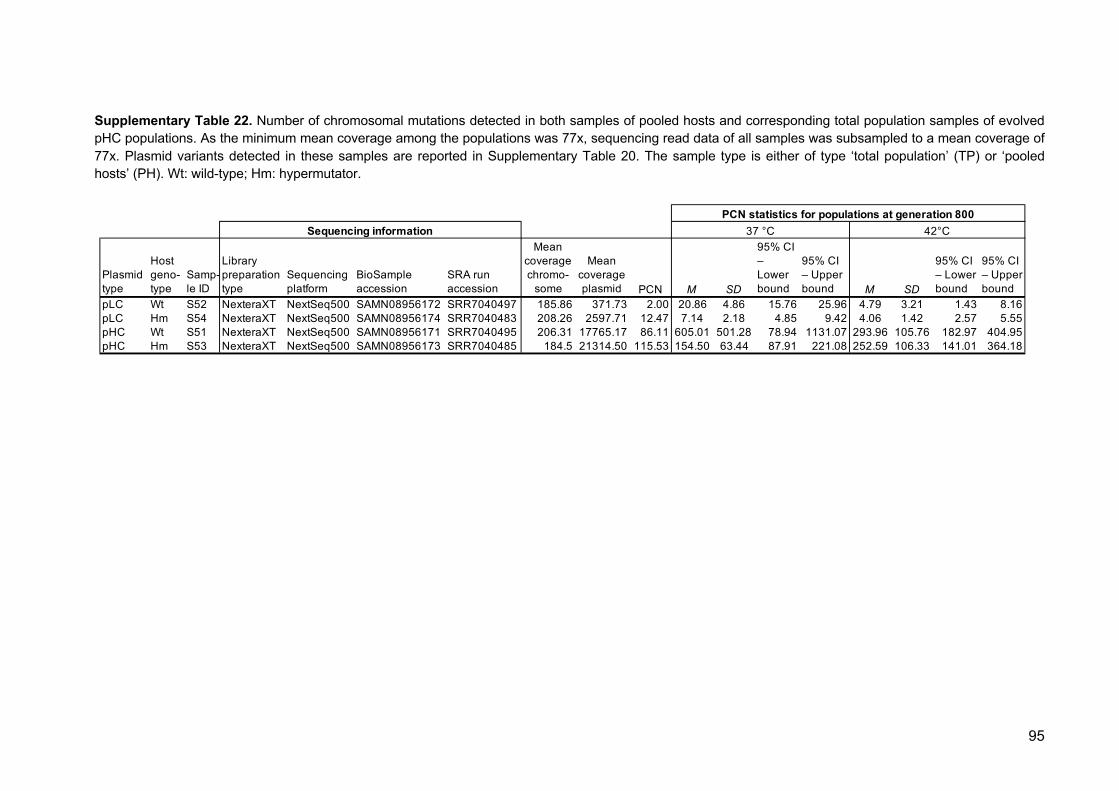
95
Supplementary Table 22. Number of chromosomal mutations detected in both samples of pooled hosts and corresponding total population samples of evolved pHC populations. As the minimum mean coverage among the populations was 77x, sequencing read data of all samples was subsampled to a mean coverage of 77x. Plasmid variants detected in these samples are reported in Supplementary Table 20. The sample type is either of type ‘total population’ (TP) or ‘pooled hosts’ (PH). Wt: wild-type; Hm: hypermutator.
Plasmid type
Host geno-type
Samp-le ID
Library preparation type
Sequencing platform
BioSample accession
SRA run accession
Mean coverage chromo-
some
Mean coverage plasmid PCN M SD
95% CI – Lower bound
95% CI – Upper bound M SD
95% CI – Lower bound
95% CI – Upper bound
pLC Wt S52 NexteraXT NextSeq500 SAMN08956172 SRR7040497 185.86 371.73 2.00 20.86 4.86 15.76 25.96 4.79 3.21 1.43 8.16pLC Hm S54 NexteraXT NextSeq500 SAMN08956174 SRR7040483 208.26 2597.71 12.47 7.14 2.18 4.85 9.42 4.06 1.42 2.57 5.55pHC Wt S51 NexteraXT NextSeq500 SAMN08956171 SRR7040495 206.31 17765.17 86.11 605.01 501.28 78.94 1131.07 293.96 105.76 182.97 404.95pHC Hm S53 NexteraXT NextSeq500 SAMN08956173 SRR7040485 184.5 21314.50 115.53 154.50 63.44 87.91 221.08 252.59 106.33 141.01 364.18
PCN statistics for populations at generation 800Sequencing information 37 °C 42°C
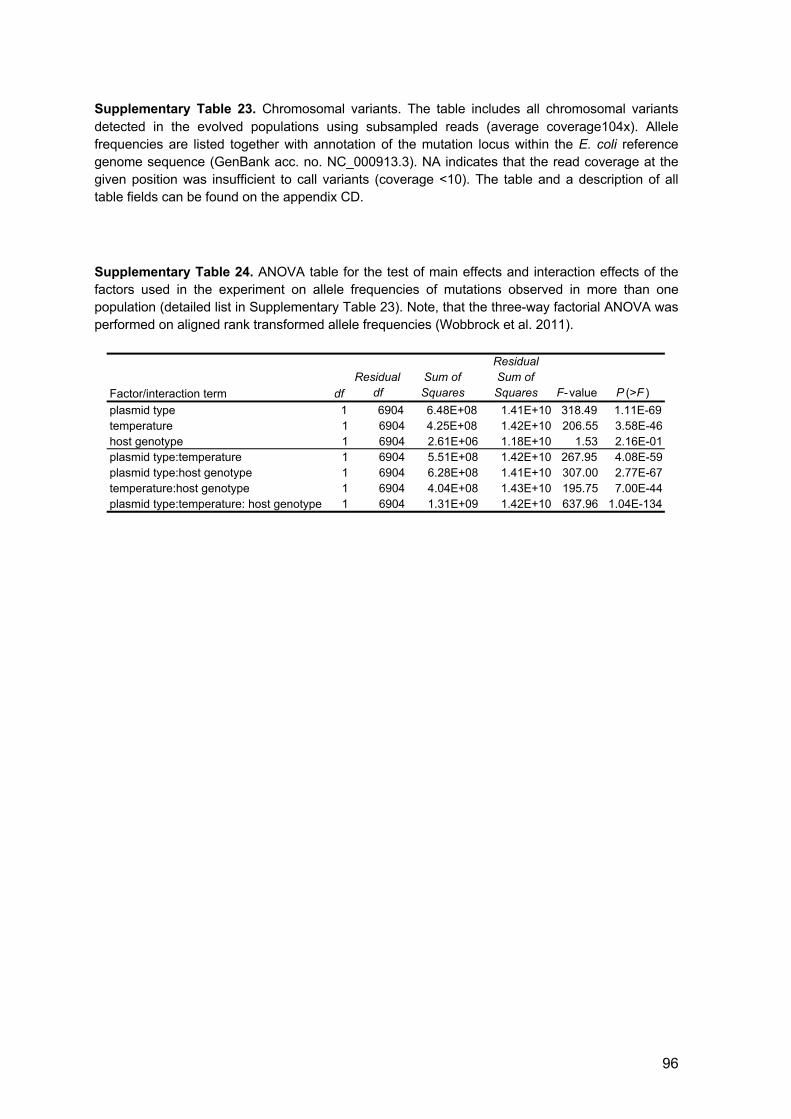
96
Supplementary Table 23. Chromosomal variants. The table includes all chromosomal variants detected in the evolved populations using subsampled reads (average coverage104x). Allele frequencies are listed together with annotation of the mutation locus within the E. coli reference genome sequence (GenBank acc. no. NC_000913.3). NA indicates that the read coverage at the given position was insufficient to call variants (coverage <10). The table and a description of all table fields can be found on the appendix CD.
Supplementary Table 24. ANOVA table for the test of main effects and interaction effects of the factors used in the experiment on allele frequencies of mutations observed in more than one population (detailed list in Supplementary Table 23). Note, that the three-way factorial ANOVA was performed on aligned rank transformed allele frequencies (Wobbrock et al. 2011).
Factor/interaction term dfResidual
dfSum of Squares
Residual Sum of Squares F- value P (>F )
plasmid type 1 6904 6.48E+08 1.41E+10 318.49 1.11E-69temperature 1 6904 4.25E+08 1.42E+10 206.55 3.58E-46host genotype 1 6904 2.61E+06 1.18E+10 1.53 2.16E-01plasmid type:temperature 1 6904 5.51E+08 1.42E+10 267.95 4.08E-59plasmid type:host genotype 1 6904 6.28E+08 1.41E+10 307.00 2.77E-67temperature:host genotype 1 6904 4.04E+08 1.43E+10 195.75 7.00E-44plasmid type:temperature: host genotype 1 6904 1.31E+09 1.42E+10 637.96 1.04E-134
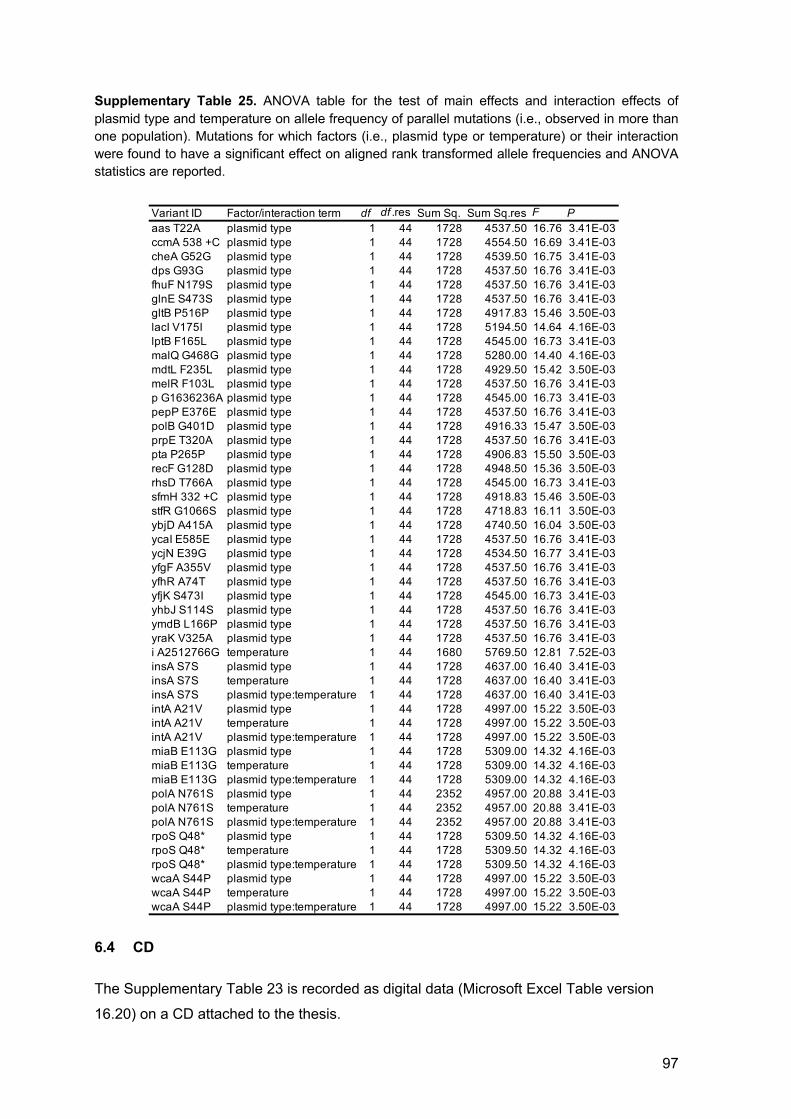
97
Supplementary Table 25. ANOVA table for the test of main effects and interaction effects of plasmid type and temperature on allele frequency of parallel mutations (i.e., observed in more than one population). Mutations for which factors (i.e., plasmid type or temperature) or their interaction were found to have a significant effect on aligned rank transformed allele frequencies and ANOVA statistics are reported.
6.4 CD
The Supplementary Table 23 is recorded as digital data (Microsoft Excel Table version
16.20) on a CD attached to the thesis.
Variant ID Factor/interaction term df df .res Sum Sq. Sum Sq.res F Paas T22A plasmid type 1 44 1728 4537.50 16.76 3.41E-03ccmA 538 +C plasmid type 1 44 1728 4554.50 16.69 3.41E-03cheA G52G plasmid type 1 44 1728 4539.50 16.75 3.41E-03dps G93G plasmid type 1 44 1728 4537.50 16.76 3.41E-03fhuF N179S plasmid type 1 44 1728 4537.50 16.76 3.41E-03glnE S473S plasmid type 1 44 1728 4537.50 16.76 3.41E-03gltB P516P plasmid type 1 44 1728 4917.83 15.46 3.50E-03lacI V175I plasmid type 1 44 1728 5194.50 14.64 4.16E-03lptB F165L plasmid type 1 44 1728 4545.00 16.73 3.41E-03malQ G468G plasmid type 1 44 1728 5280.00 14.40 4.16E-03mdtL F235L plasmid type 1 44 1728 4929.50 15.42 3.50E-03melR F103L plasmid type 1 44 1728 4537.50 16.76 3.41E-03p G1636236A plasmid type 1 44 1728 4545.00 16.73 3.41E-03pepP E376E plasmid type 1 44 1728 4537.50 16.76 3.41E-03polB G401D plasmid type 1 44 1728 4916.33 15.47 3.50E-03prpE T320A plasmid type 1 44 1728 4537.50 16.76 3.41E-03pta P265P plasmid type 1 44 1728 4906.83 15.50 3.50E-03recF G128D plasmid type 1 44 1728 4948.50 15.36 3.50E-03rhsD T766A plasmid type 1 44 1728 4545.00 16.73 3.41E-03sfmH 332 +C plasmid type 1 44 1728 4918.83 15.46 3.50E-03stfR G1066S plasmid type 1 44 1728 4718.83 16.11 3.50E-03ybjD A415A plasmid type 1 44 1728 4740.50 16.04 3.50E-03ycaI E585E plasmid type 1 44 1728 4537.50 16.76 3.41E-03ycjN E39G plasmid type 1 44 1728 4534.50 16.77 3.41E-03yfgF A355V plasmid type 1 44 1728 4537.50 16.76 3.41E-03yfhR A74T plasmid type 1 44 1728 4537.50 16.76 3.41E-03yfjK S473I plasmid type 1 44 1728 4545.00 16.73 3.41E-03yhbJ S114S plasmid type 1 44 1728 4537.50 16.76 3.41E-03ymdB L166P plasmid type 1 44 1728 4537.50 16.76 3.41E-03yraK V325A plasmid type 1 44 1728 4537.50 16.76 3.41E-03i A2512766G temperature 1 44 1680 5769.50 12.81 7.52E-03insA S7S plasmid type 1 44 1728 4637.00 16.40 3.41E-03insA S7S temperature 1 44 1728 4637.00 16.40 3.41E-03insA S7S plasmid type:temperature 1 44 1728 4637.00 16.40 3.41E-03intA A21V plasmid type 1 44 1728 4997.00 15.22 3.50E-03intA A21V temperature 1 44 1728 4997.00 15.22 3.50E-03intA A21V plasmid type:temperature 1 44 1728 4997.00 15.22 3.50E-03miaB E113G plasmid type 1 44 1728 5309.00 14.32 4.16E-03miaB E113G temperature 1 44 1728 5309.00 14.32 4.16E-03miaB E113G plasmid type:temperature 1 44 1728 5309.00 14.32 4.16E-03polA N761S plasmid type 1 44 2352 4957.00 20.88 3.41E-03polA N761S temperature 1 44 2352 4957.00 20.88 3.41E-03polA N761S plasmid type:temperature 1 44 2352 4957.00 20.88 3.41E-03rpoS Q48* plasmid type 1 44 1728 5309.50 14.32 4.16E-03rpoS Q48* temperature 1 44 1728 5309.50 14.32 4.16E-03rpoS Q48* plasmid type:temperature 1 44 1728 5309.50 14.32 4.16E-03wcaA S44P plasmid type 1 44 1728 4997.00 15.22 3.50E-03wcaA S44P temperature 1 44 1728 4997.00 15.22 3.50E-03wcaA S44P plasmid type:temperature 1 44 1728 4997.00 15.22 3.50E-03
98
7 References Abeles AL, Friedman SA, Austin SJ. 1985. Partition of unit-copy miniplasmids to daughter cells. III.
The DNA sequence and functional organization of the P1 partition region. J. Mol. Biol. 185:261–272.
Agnoli K, Schwager S, Uehlinger S, Vergunst A, Viteri DF, Nguyen DT, Sokol PA, Carlier A, Eberl L. 2011. Exposing the third chromosome of Burkholderia cepacia complex strains as a virulence plasmid. Mol. Microbiol. 83:362–378.
Agresti A, Coull BA. 1998. Approximate is better than “exact” for interval estimation of binomial proportions. Am. Stat. 52:119.
Altschul SF, Gish W, Miller W, Myers EW, Lipman DJ. 1990. Basic local alignment search tool. J. Mol. Biol. 215:403–410.
Andrews S. 2016. FASTQC. Available from: http://www.bioinformatics.babraham.ac.uk/projects/fastqc/
Anjem A, Varghese S, Imlay JA. 2009. Manganese import is a key element of the OxyR response to hydrogen peroxide in Escherichia coli. Mol. Microbiol. 72:844–858.
Antoine R, Locht C. 1992. Isolation and molecular characterization of a novel broad-host-range plasmid from Bordetella bronchiseptica with sequence similarities to plasmids from Gram-positive organisms. Mol. Microbiol. 6:1785–1799.
Arjan JA, Visser M, Zeyl CW, Gerrish PJ, Blanchard JL, Lenski RE. 1999. Diminishing returns from mutation supply rate in asexual populations. Science 283:404–406.
Bankevich A, Nurk S, Antipov D, Gurevich AA, Dvorkin M, Kulikov AS, Lesin VM, Nikolenko SI, Pham S, Prjibelski AD, et al. 2012. SPAdes: a new genome assembly algorithm and its applications to single-cell sequencing. J. Comput. Biol. 19:455–477.
Bansal V. 2017. A computational method for estimating the PCR duplication rate in DNA and RNA-seq experiments. BMC Bioinform. 18:43.
Barnett DW, Garrison EK, Quinlan AR, Stromberg MP, Marth GT. 2011. BamTools: a C++ API and toolkit for analyzing and managing BAM files. Bioinformatics 27:1691–1692.
Barrick JE, Lenski RE. 2013. Genome dynamics during experimental evolution. Nature 14:827–839.
Baxter JC, Funnell BE. 2014. Plasmid partition mechanisms. Microbiol. Spectr. 2(6).
Bazaral M, Helinski DR. 1968. Circular DNA forms of colicinogenic factors E1, E2 and E3 from Escherichia coli. J. Mol. Biol. 36:185–194.
Becker L, Steglich M, Fuchs S, Werner G, Nübel U. 2016. Comparison of six commercial kits to extract bacterial chromosome and plasmid DNA for MiSeq sequencing. Sci. Rep. 6:28063.
Bedhomme S, Perez Pantoja D, Bravo IG. 2017. Plasmid and clonal interference during post horizontal gene transfer evolution. Mol. Ecol. 26:1832–1847.
Bevan M. 1984. Binary Agrobacterium vectors for plant transformation. Nucleic Acids Res. 12:8711–8721.

99
Birky CW. 2001. The inheritance of genes in mitochondria and chloroplasts: laws, mechanisms, and models. Annu. Rev. Genet. 35:125–48.
Bodmer WF, Cavalli-Sforza LL. 1976. Genetics, evolution, and man. W H Freeman & Company.
Bolger AM, Lohse M, Usadel B. 2014. Trimmomatic: a flexible trimmer for Illumina sequence data. Bioinformatics 30:2114–2120.
Bouma JE, Lenski RE. 1988. Evolution of a bacteria/plasmid association. Nature 335:351–352.
Chen Z, Lin J, Ma C, Zhao S, She Q, Liang Y. 2014. Characterization of pMC11, a plasmid with dual origins of replication isolated from Lactobacillus casei MCJ and construction of shuttle vectors with each replicon. Appl. Microbiol. Biotechnol. 98:5977–5989.
Chiang CS, Bremer H. 1988. Stability of pBR322-derived plasmids. Plasmid 20:207–220.
Colegrave N. 2002. Sex releases the speed limit on evolution. Nature 420:664–666.
Czárán TL, Hoekstra RF, Pagie L. 2002. Chemical warfare between microbes promotes biodiversity. Proc. Natl. Acad. Sci. U.S.A. 99:786–90.
de Visser JAGM, Rozen DE. 2005. Limits to adaptation in asexual populations. J. Evol. Biol. 18:779–788.
Deatherage DE, Kepner JL, Bennett AF, Lenski RE, Barrick JE. 2017. Specificity of genome evolution in experimental populations of Escherichia coli evolved at different temperatures. Proc. Natl. Acad. Sci. U.S.A. 114:E1904–E1912.
Doron S, Melamed S, Ofir G, Leavitt A, Lopatina A, Keren M, Amitai G, Sorek R. 2018. Systematic discovery of antiphage defense systems in the microbial pangenome. Science 359:eaar4120.
Dower WJ, Miller JF, Ragsdale CW. 1988. High efficiency transformation of E. coli by high voltage electroporation. Nucleic Acids Res.16:6127–6145.
Dubey GP, Ben-Yehuda S. 2011. Intercellular nanotubes mediate bacterial communication. Cell 144:590–600.
Dykhuizen D, Hartl D. 1981. Evolution of competitive ability in Escherichia coli. Evolution 35:581–594.
Dykhuizen DE, Hartl DL. 1983. Selection in chemostats. Microbiol. Rev. 46:150–168.
Dziewit L, Pyzik A, Szuplewska M, Matlakowska R, Mielnicki S, Wibberg D, Schlüter A, Pühler A, Bartosik D. 2015. Diversity and role of plasmids in adaptation of bacteria inhabiting the Lubin copper mine in Poland, an environment rich in heavy metals. Front. Microbiol. 6:152.
Ekblom R, Smeds L, Ellegren H. 2014. Patterns of sequencing coverage bias revealed by ultra-deep sequencing of vertebrate mitochondria. BMC Genom. 15:467.
Fagerlund A, Granum PE, Håvarstein LS. 2014. Staphylococcus aureus competence genes: mapping of the SigH, ComK1 and ComK2 regulons by transcriptome sequencing. Mol. Microbiol. 94:557–579.
Fang H, Wu Y, Narzisi G, ORawe JA, Barrón LTJ, Rosenbaum J, Ronemus M, Iossifov I, Schatz MC, Lyon GJ. 2014. Reducing INDEL calling errors in whole genome and exome sequencing data. Genome Med. 6:1326.
Fernández-Tresguerres ME, Martín M, García de Viedma D, Giraldo R, Díaz-Orejas R. 1995. Host growth temperature and a conservative amino acid substitution in the replication protein of pPS10 influence plasmid host range. J. Bacteriol. 177:4377–4384.
100
Figurski DH, Helinski DR. 1979. Replication of an origin-containing derivative of plasmid RK2 dependent on a plasmid function provided in trans. Proc. Natl. Acad. Sci. U.S.A. 76:1648–1652.
Fulsundar S, Harms K, Flaten GE, Johnsen PJ, Chopade BA, Nielsen KM. 2014. Gene transfer potential of outer membrane vesicles of Acinetobacter baylyi and effects of stress on vesiculation. Appl. Environ. Microbiol. 80:3469–3483.
Garcia-Martin JA, Clote P. 2015. RNA thermodynamic structural entropy. PLoS ONE. 10:e0137859.
Georgopoulos CP, Eisen H. 1974. Bacterial mutants which block phage assembly. J. Supramol. Struct. 2:349–359.
Gillespie JH. 2010. Population genetics. Baltimore (MD). JHU Press.
Graur D. 2015. Molecular and genome evolution. Sunderland (MA). Sinauer Associates.
Gruber AR, Lorenz R, Bernhart SH, Neubock R, Hofacker IL. 2008. The Vienna RNA websuite. Nucleic Acids Res. 36:W70–W74.
Gullberg E, Albrecht LM, Karlsson C, Sandegren L, Andersson DI. 2014. Selection of a multidrug resistance plasmid by sublethal levels of antibiotics and heavy metals. mBio 5:e01918–14.
Guyot S, Pottier L, Hartmann A, Ragon M, Hauck Tiburski J, Molin P, Ferret E, Gervais P. 2014. Extremely rapid acclimation of Escherichia coli to high temperature over a few generations of a fed-batch culture during slow warming. Microbiologyopen 3:52–63.
Haemig HAH, Brooker RJ. 2004. Importance of conserved acidic residues in mntH, the Nramp homolog of Escherichia coli. J. Membr. Biol. 201:97–107.
Hall JPJ, Wood AJ, Harrison E, Brockhurst MA. 2016. Source-sink plasmid transfer dynamics maintain gene mobility in soil bacterial communities. Proc. Natl. Acad. Sci. U.S.A. 113:8260–8265.
Hanahan D. 1983. Studies on transformation of Escherichia coli with plasmids. J. Mol. Biol. 166:557–580.
Handa N, Morimatsu K, Lovett ST, Kowalczykowski SC. 2009. Reconstitution of initial steps of dsDNA break repair by the RecF pathway of E. coli. Genes Dev. 23:1234–1245.
Harrison E, Guymer D, Spiers AJ, Paterson S, Brockhurst MA. 2015. Parallel compensatory evolution stabilizes plasmids across the parasitism-mutualism continuum. Curr. Biol. 25:2034–2039.
He S, Hickman AB, Varani AM, Siguier P, Chandler M, Dekker JP, Dyda F. 2015. Insertion sequence IS 26 reorganizes plasmids in clinically isolated multidrug-resistant bacteria by replicative transposition. mBio 6:e00762–15.
He Y, Wu J, Dressman DC, Iacobuzio-Donahue C, Markowitz SD, Velculescu VE, Diaz LA Jr, Kinzler KW, Vogelstein B, Papadopoulos N. 2010. Heteroplasmic mitochondrial DNA mutations in normal and tumour cells. Nature 464:610–614.
Herendeen SL, VanBogelen RA, Neidhardt FC. 1979. Levels of major proteins of Escherichia coli during growth at different temperatures. J. Bacteriol. 139:185–194.
Hershfield V, Boyer HW, Yanofsky C, Lovett MA, Helinski DR. 1974. Plasmid ColE1 as a molecular vehicle for cloning and amplification of DNA. Proc. Natl. Acad. Sci. U.S.A. 71:3455–3459.
Hertwig S, Popp A, Freytag B, Lurz R, Appel B. 1999. Generalized transduction of small Yersinia enterocolitica plasmids. Appl. Environ. Microbiol. 65:3862–3866.
101
Hsu L, Jackowski S, Rock CO. 1991. Isolation and characterization of Escherichia coli K-12 mutants lacking both 2-acyl-glycerophosphoethanolamine acyltransferase and acyl-acyl carrier protein synthetase activity. J. Biol. Chem. 266:13783–13788.
Huynen M, Gutell R, Konings D. 1997. Assessing the reliability of RNA folding using statistical mechanics. J. Mol. Biol. 267:1104–1112.
Hyland EM, Wallace EWJ, Murray AW. 2014. A model for the evolution of biological specificity: a cross-reacting DNA-binding protein causes plasmid incompatibility. J. Bacteriol. 196:3002–3011.
Jahn M, Vorpahl C, Hübschmann T, Harms H, Müller S. 2016. Copy number variability of expression plasmids determined by cell sorting and Droplet Digital PCR. Microb. Cell Fact.15:211.
Jechalke S, Heuer H, Siemens J, Amelung W, Smalla K. 2014. Fate and effects of veterinary antibiotics in soil. Trends Microbiol. 22:536–545.
Klieve AV, Yokoyama MT, Forster RJ, Ouwerkerk D, Bain PA, Mawhinney EL. 2005. Naturally occurring DNA transfer system associated with membrane vesicles in cellulolytic Ruminococcus spp. of ruminal origin. Appl. Environ. Microbiol. 71:4248–4253.
Klümper U, Riber L, Dechesne A, Sannazzarro A, Hansen LH, Sørensen SJ, Smets BF. 2015. Broad host range plasmids can invade an unexpectedly diverse fraction of a soil bacterial community. ISME J. 9:934–945.
Koboldt DC, Chen K, Wylie T, Larson DE, McLellan MD, Mardis ER, Weinstock GM, Wilson RK, Ding L. 2009. VarScan: variant detection in massively parallel sequencing of individual and pooled samples. Bioinformatics 25:2283–2285.
Kopfmann S, Roesch SK, Hess WR. 2016. Type II toxin-antitoxin systems in the unicellular cyanobacterium Synechocystis sp. PCC 6803. Toxins (Basel) 8:E228.
Korea C-G, Badouraly R, Prevost M-C, Ghigo JM, Beloin C. 2010. Escherichia coli K-12 possesses multiple cryptic but functional chaperone-usher fimbriae with distinct surface specificities. Environ. Microbiol. 12:1957–1977.
Kunkel TA. 2010. Evolving views of DNA replication (in)fidelity. Cold Spring Harb. Symp. Quant. Biol. 74:91–101.
Lanfear R, Kokko H, Eyre-Walker A. 2013. Population size and the rate of evolution. Trends Ecol. Evol. 1:33-41.
Lederberg J, Tatum EL. 1946. Gene recombination in Escherichia coli. Nature 158(4016):558.
Lee HH, Popodi EE, Tang HH, Foster PLP. 2012. Rate and molecular spectrum of spontaneous mutations in the bacterium Escherichia coli as determined by whole-genome sequencing. Proc. Natl. Acad. Sci. U.S.A. 109:E2774–E2783.
Lenski RE, Rose MR, Simpson SC, Tadler SC. 1991. Long-term experimental evolution in Escherichia coli. I. Adaptation and divergence during 2,000 generations. Am. Nat. 138:1315–1341.
Li H, Durbin R. 2009. Fast and accurate short read alignment with Burrows-Wheeler transform. Bioinformatics 25:1754–1760.
Li H, Handsaker B, Wysoker A, Fennell T, Ruan J, Homer N, Marth G, Abecasis G, Durbin R. 2009. The Sequence Alignment/Map format and SAMtools. Bioinformatics 25:2078–2079.
Li H. 2014. Towards a better understanding of artefacts in variant calling from high-coverage samples. Bioinformatics 15:2843–51.
102
Lin-Chao S, Cohen SN. 1991. The rate of processing and degradation of antisense RNAI regulates the replication of ColE1-type plasmids in vivo. Cell 65:1233–1242.
Loftie-Eaton W, Bashford K, Quinn H, Dong K, Millstein J, Hunter S, Thomason MK, Merrikh H, Ponciano JM, Top EM. 2017. Compensatory mutations improve general permissiveness to antibiotic resistance plasmids. Nat. Ecol. Evol. 1:1354–1363.
Loftie-Eaton W, Yano H, Burleigh S, Simmons RS, Hughes JM, Rogers LM, Hunter SS, Settles ML, Forney LJ, Ponciano JM, Top EM. 2016. Evolutionary paths that expand plasmid host-range: implications for spread of antibiotic resistance. Mol. Biol. Evol. 33:885–897.
Lorenz MG, Gerjets D, Wackernagel W. 1991. Release of transforming plasmid and chromosomal DNA from two cultured soil bacteria. Arch. Microbiol. 156:319–326.
Lorenz R, Bernhart SH, Höner zu Siederdissen C, Tafer H, Flamm C, Stadler PF, Hofacker IL. 2011. ViennaRNA Package 2.0. Algorithms Mol. Biol. 6:26.
Maestro B, Sanz JM, Díaz-Orejas R, Fernandez-Tresguerres E. 2003. Modulation of pPS10 host range by plasmid-encoded RepA initiator protein. J. Bacteriol.185:1367–1375.
Majeed H, Gillor O, Kerr B, Riley MA. 2010. Competitive interactions in Escherichia coli populations: the role of bacteriocins. ISME J. 5:71–81.
Mansukhani S, Barber LJ, Kleftogiannis D, Moorcraft SY, Davidson M, Woolston A, Proszek PZ, Griffiths B, Fenwick K, Herman B, et al. 2018. Ultra-sensitive mutation detection and genome-wide DNA copy number reconstruction by error-corrected circulating tumor DNA sequencing. Clin. Chem. 64:1626–1635.
Marraffini LA, Sontheimer EJ. 2008. CRISPR interference limits horizontal gene transfer in staphylococci by targeting DNA. Science 322:1843–1845.
McKenna A, Hanna M, Banks E, Sivachenko A, Cibulskis K, Kernytsky A, Garimella K, Altshuler D, Gabriel S, Daly M, et al. 2010. The genome analysis toolkit: a MapReduce framework for analyzing next-generation DNA sequencing data. Genome Res. 20:1297–1303.
McKenzie GJ, Craig NL. 2006. Fast, easy and efficient: site-specific insertion of transgenes into enterobacterial chromosomes using Tn7 without need for selection of the insertion event. BMC Microbiol. 6:39.
Michael V, Frank O, Bartling P, Scheuner C, ker MGO, Brinkmann H, Petersen JOR. 2016. Biofilm plasmids with a rhamnose operon are widely distributed determinants of the “swim-or-stick” lifestyle in Roseobacters. ISME J. 10:2498–2513.
Millan AS, Toll-Riera M, Qi Q, Betts A, Hopkinson RJ, McCullagh J, MacLean RC. 2018. Integrative analysis of fitness and metabolic effects of plasmids in Pseudomonas aeruginosa PAO1. ISME J. 12:3014–3024.
Millan AS, Pena-Miller R, Toll-Riera M, Halbert ZV, McLean AR, Cooper BS, MacLean RC. 2014. Positive selection and compensatory adaptation interact to stabilize non-transmissible plasmids. Nat. Commun. 5:1–11.
Miller AW, Befort C, Kerr EO, Dunham MJ. 2013. Design and use of multiplexed chemostat arrays. JoVE:e50262.
Morikawa K, Takemura AJ, Inose Y, Tsai M, Nguyen Thi LT, Ohta T, Msadek T. 2012. Expression of a cryptic secondary sigma factor gene unveils natural competence for DNA transformation in Staphylococcus aureus. PLoS Pathog. 8:e1003003.
Muesing M, Tamm J, Shepard HM, Polisky B. 1981. A single base-pair alteration is responsible for the DNA overproduction phenotype of a plasmid copy-number mutant. Cell 24:235–242.
103
Münch KM, Müller J, Wienecke S, Bergmann S, Heyber S, Biedendieck R, Münch R, Jahn D. 2015. Polar fixation of plasmids during recombinant protein production in Bacillus megaterium results in population heterogeneity. Appl. Environ. Microbiol. 81:5976–5986.
Norberg P, m MBO, Jethava V, Dubhashi D, Hermansson M. 2011. The IncP-1 plasmid backbone adapts to different host bacterial species and evolves through homologous recombination. Nat. Commun. 2:272–11.
Nordström K. 2006. Plasmid R1--replication and its control. Plasmid 55:1–26.
Notley-McRobb L, Seeto S, Ferenci T. 2003. The influence of cellular physiology on the initiation of mutational pathways in Escherichia coli populations. Proc. Biol. Sci. 270:843–848.
Novick A, Szilard L. 1950. Description of the chemostat. Science 112:715–716.
Nurk S, Bankevich A, Antipov D, Gurevich AA, Korobeynikov A, Lapidus A, Prjibelski AD, Pyshkin A, Sirotkin A, Sirotkin Y, et al. 2013. Assembling single-cell genomes and mini-metagenomes from chimeric MDA products. J. Comput. Biol. 20:714–737.
O'Rawe J, Jiang T, Sun G, Wu Y, Wang W, Hu J, Bodily P, Tian L, Hakonarson H, Johnson WE, et al. 2013. Low concordance of multiple variant-calling pipelines: practical implications for exome and genome sequencing. Genome Med. 5:28.
Parekh S, Ziegenhain C, Vieth B, Enard W, Hellmann I. 2016. The impact of amplification on differential expression analyses by RNA-seq. Sci. Rep. 6:25533.
Patten CL, Kirchhof MG, Schertzberg MR, Morton RA, Schellhorn HE. 2004. Microarray analysis of RpoS-mediated gene expression in Escherichia coli K-12. Mol. Genet. Genomics 272:580–591.
Peng B, Kimmel M. 2005. simuPOP: a forward-time population genetics simulation environment. Bioinformatics 21:3686–3687.
PIRT SJ, CALLOW DS. 1960. Studies of the growth of Penicillium Chrysogenumin continuous flow culture with reference to penicillin production. J. Appl. Bacteriol. 23:87–98.
Porse A, Schønning K, Munck C, Sommer MOA. 2016. Survival and evolution of a large multidrug resistance plasmid in new clinical bacterial hosts. Mol. Biol. Evol. 33:2860–2873.
Projan SJ, Monod M, Narayanan CS, Dubnau D. 1987. Replication properties of pIM13, a naturally occurring plasmid found in Bacillus subtilis, and of its close relative pE5, a plasmid native to Staphylococcus aureus. J. Bacteriol. 169:5131–5139.
Quinlan AR, Hall IM. 2010. BEDTools: a flexible suite of utilities for comparing genomic features. Bioinformatics 26:841–842.
Ramirez MS, Don M, Merkier AK, Bistue AJS, Zorreguieta A, Centron D, Tolmasky ME. 2010. Naturally competent Acinetobacter baumannii clinical isolate as a convenient model for genetic studies. J. Clin. Microbiol. 48:1488–1490.
Robin ED, Wong R. 1988. Mitochondrial DNA molecules and virtual number of mitochondria per cell in mammalian cells. J. Cell. Physiol. 136:507–513.
Rodriguez-Beltran J, Hernandez-Beltran JCR, DelaFuente J, Escudero JA, Fuentes-Hernandez A, MacLean RC, a-Miller RPX, Millan AS. 2018. Multicopy plasmids allow bacteria to escape from fitness trade-offs during evolutionary innovation. Nat. Ecol. Evol. 2:873–881.
Roer L, Aarestrup FM, Hasman H. 2014. The EcoKI type I restriction-modification system in Escherichia coli affects but is not an absolute barrier for conjugation. J. Bacteriol. 197:337–342.
104
Rosano GL, Ceccarelli EA. 2014. Recombinant protein expression in Escherichia coli: advances and challenges. Front. Microbiol. 5:172.
Sakuma T, Tazumi S, Furuya N, Komano T. 2013. ExcA proteins of IncI1 plasmid R64 and IncIγ plasmid R621a recognize different segments of their cognate TraY proteins in entry exclusion. Plasmid 69:138–145.
Sambrook J, Russell DW. 2012. Molecular Cloning. CSHL Press.
Sandegren L, Linkevicius M, Lytsy B, Melhus Å, Andersson DI. 2011. Transfer of an Escherichia coli ST131 multiresistance cassette has created a Klebsiella pneumoniae-specific plasmid associated with a major nosocomial outbreak. J. Antimicrob. Chemother. 67:74–83.
San Millan A, Escudero JA, Gifford DR, Mazel D, MacLean RC. 2016. Multicopy plasmids potentiate the evolution of antibiotic resistance in bacteria. Nat. Ecol. Evol. 1:0010.
San Millan A, Heilbron K, MacLean RC. 2014. Positive epistasis between co-infecting plasmids promotes plasmid survival in bacterial populations. ISME J. 8:601–612.
Santos-Lopez A, Bernabe-Balas C, Ares-Arroyo M, Ortega-Huedo R, Hoefer A, San Millan A, Gonzalez-Zorn B. 2016. A naturally occurring SNP in plasmid pB1000 produces a reversible increase in antibiotic resistance. Antimicrob. Agents and Chemother. 61:e01735–16.
Satoh M, Kuroiwa T. 1991. Organization of multiple nucleoids and DNA molecules in mitochondria of a human cell. Exp. Cell Res. 196:137–140.
Schmidt R, Ahmetagic A, Philip DS, Pemberton JM. 2011. Catabolic Plasmids. In: eLS.
Scolnik PA, Haselkorn R. 1984. Activation of extra copies of genes coding for nitrogenase in Rhodopseudomonas capsulata. Nature 307:289–292.
Shetty RP, Endy D, Knight TF. 2008. Engineering BioBrick vectors from BioBrick parts. J. Biol. Eng. 2:5.
Shintani M, Sanchez ZK, Kimbara K. 2015. Genomics of microbial plasmids: classification and identification based on replication and transfer systems and host taxonomy. Front. Microbiol. 6:242.
Simon R, Priefer U, Pühler A. 1983. A broad host range mobilization system for in vivo genetic engineering: transposon mutagenesis in gram negative bacteria. 1:784–791.
Skulj M, Okrslar V, Jalen S, Jevsevar S, Slanc P, Strukelj B, Menart V. 2008. Improved determination of plasmid copy number using quantitative real-time PCR for monitoring fermentation processes. Microb. Cell Fact. 7:6.
Solovyev V, Salamov A. 2011. Automatic annotation of microbial genomes and metagenomic sequences. In: Metagenomics and its applications in agriculture, biomedicine and environmental studies (Ed. Li RW). Nova Science Publishers. p.61-78.
Sota M, Yano H, Hughes JM, Daughdrill GW, Abdo Z, Forney LJ, Top EM. 2010. Shifts in the host range of a promiscuous plasmid through parallel evolution of its replication initiation protein. ISME J. 4:1568–1580.
Spencer DH, Tyagi M, Vallania F, Bredemeyer AJ, Pfeifer JD, Mitra RD, Duncavage EJ. 2014. Performance of common analysis methods for detecting low-frequency single nucleotide variants in targeted next-generation sequence data. J. Mol. Diagn. 16:75–88.
Sperandeo P, Cescutti R, Villa R, Di Benedetto C, Candia D, Deho G, Polissi A. 2006. Characterization of lptA and lptB, two essential genes implicated in lipopolysaccharide transport to the outer membrane of Escherichia coli. J. Bacteriol. 189:244–253.
105
Sprouffske K, Wagner A. 2016. Growthcurver: an R package for obtaining interpretable metrics from microbial growthcurves. BMC Bioinformatics. 17:172
Stoesser N, Sheppard AE, Pankhurst L, De Maio N, Moore CE, Sebra R, Turner P, Anson LW, Kasarskis A, Batty EM, et al. 2016. Evolutionary history of the global emergence of the Escherichia coli epidemic clone ST131. mBio 7:e02162.
Summers DK, Sherratt DJ. 1988. Resolution of ColE1 dimers requires a DNA sequence implicated in the three-dimensional organization of the cer site. EMBO J. 7:851–858.
Suzuki H, Yano H, Brown CJ, Top EM. 2010. Predicting plasmid promiscuity based on genomic signature. J. Bacteriol. 192:6045–6055.
Szabó M, Nagy T, Wilk T, Farkas T, Hegyi A, Olasz F, Kiss J. 2016. Characterization of two multidrug-resistant IncA/C plasmids from the 1960s by using the MinION sequencer device. Antimicrob. Agents Chemother. 60:6780–6786.
Team RDC. R: A language and environment for statistical computing.
Textor S, Wendisch VF, De Graaf AA, Müller U, Linder MI, Linder D, Buckel W. 1997. Propionate oxidation in Escherichia coli: evidence for operation of a methylcitrate cycle in bacteria. Arch. Microbiol. 168:428–436.
Thomas CM, Nielsen KM. 2005. Mechanisms of, and barriers to, horizontal gene transfer between bacteria. Nat. Rev. Microbiol. 3:711–721.
Tomizawa J, Itoh T. 1981. Plasmid ColE1 incompatibility determined by interaction of RNA I with primer transcript. Proc. Natl. Acad. Sci. U.S.A. 78:6096–6100.
Troeschel SC, Thies S, Link O, Real CI, Knops K, Wilhelm S, Rosenau F, Jaeger K-E. 2012. Novel broad host range shuttle vectors for expression in Escherichia coli, Bacillus subtilis and Pseudomonas putida. J. Biotechnol. 161:71–79.
Ullrich A, Shine J, Chirgwin J, Pictet R, Tischer E, Rutter WJ, Goodman HM. 1977. Rat insulin genes: construction of plasmids containing the coding sequences. Science 196:1313–1319.
Vega NM, Gore J. 2014. Collective antibiotic resistance: mechanisms and implications. Curr. Opin. Microbiol. 21:28–34.
Vieira J, Messing J. 1982. The pUC plasmids, an M13mp7-derived system for insertion mutagenesis and sequencing with synthetic universal primers. Gene 19:259–268.
Villa L, García-Fernández A, Fortini D, Carattoli A. 2010. Replicon sequence typing of IncF plasmids carrying virulence and resistance determinants. J. Antimicrob. Chemother. 65:2518–2529.
Vogwill T, Phillips RL, Gifford DR, MacLean RC. 2016. Divergent evolution peaks under intermediate population bottlenecks during bacterial experimental evolution. Proc. Biol. Sci. 283:20160749.
Wada M, Itikawa H. 1984. Participation of Escherichia coli K-12 groE gene products in the synthesis of cellular DNA and RNA. J. Bacteriol. 157:694–696.
Wang Y. 2017. Spatial distribution of high copy number plasmids in bacteria. Plasmid 91:2–8.
Wiberg RAW, Gaggiotti OE, Morrissey MB, Ritchie MG. 2017. Identifying consistent allele frequency differences in studies of stratified populations. Methods Ecol. Evol. 8:1899–1909.
Wick LM, Weilenmann H, Egli T. 2002. The apparent clock-like evolution of Escherichia coli in glucose-limited chemostats is reproducible at large but not at small population sizes and can be explained with Monod kinetics. Microbiol. 148:2889–2902.
106
Wilharm G, Piesker J, Laue M, Skiebe E. 2013. DNA uptake by the nosocomial pathogen Acinetobacter baumannii occurs during movement along wet surfaces. J. Bacteriol. 195:4146–4153.
Williams HG, Day MJ, Fry JC, Stewart GJ. 1996. Natural transformation in river epilithon. Appl. Environ. Microbiol. 62:2994–2998.
Wilm A, Aw PPK, Bertrand D, Yeo GHT, Ong SH, Wong CH, Khor CC, Petric R, Hibberd ML, Nagarajan N. 2012. LoFreq: a sequence-quality aware, ultra-sensitive variant caller for uncovering cell-population heterogeneity from high-throughput sequencing datasets. Nucl. Acids Res. 40:11189–11201.
Wobbrock JO, Findlater L, Gergle D, Higgins JJ. 2011. The aligned rank transform for nonparametric factorial analyses using only ANOVA procedures. Proc. CHI'11. New York: ACM Press 143-146.
Xue H, Cordero OX, Camas FM, Trimble W, Meyer F, Guglielmini J, Rocha EPC, Polz MF. 2015.
Eco-evolutionary dynamics of episomes among ecologically cohesive bacterial populations. mBio 6:e00552–15.
Yamamori T, Yura T. 1980. Temperature-induced synthesis of specific proteins in Escherichia coli: evidence for transcriptional control. J. Bacteriol. 142:843–851.
Yang YL, Polisky B. 1993. Suppression of ColE1 high-copy-number mutants by mutations in the polA gene of Escherichia coli. J. Bacteriol. 175:428–437.
Yano H, Rogers LM, Knox MG, Heuer H, Smalla K, Brown CJ, Top EM. 2013. Host range diversification within the IncP-1 plasmid group. Microbiol. 159:2303–2315.
Yano H, Wegrzyn K, Loftie-Eaton W, Johnson J, Deckert GE, Rogers LM, Konieczny I, Top EM. 2016. Evolved plasmid-host interactions reduce plasmid interference cost. Mol. Microbiol.101:743–756.
Ye K, Schulz MH, Long Q, Apweiler R, Ning Z. 2009. Pindel: a pattern growth approach to detect break points of large deletions and medium sized insertions from paired-end short reads. Bioinformatics 25:2865–2871.
Zaleski P, Wawrzyniak P, Sobolewska A, Łukasiewicz N, Baran P et al. 2015. pIGWZ12 – A cryptic plasmid with a modular structure. Plasmid 79:37–47.
Zheng J, Peng D, Ruan L, Sun M. 2013. Evolution and dynamics of megaplasmids with genome sizes larger than 100 kb in the Bacillus cereus group. BMC Evol. Biol. 13:1–11.
Zhong C, Peng D, Ye W, Chai L, Qi J, Yu Z, Ruan L, Sun M. 2011. Determination of plasmid copy number reveals the total plasmid DNA amount is greater than the chromosomal DNA amount in Bacillus thuringiensis YBT-1520. PLoS ONE. 6:e16025.
Zhou K, Zhou L, Lim Q', Zou R, Stephanopoulos G, Too H-P. 2011. Novel reference genes for quantifying transcriptional responses of Escherichia coli to protein overexpression by quantitative PCR. BMC Mol. Biol. 12:18.

107
8 Acknowledgements Firstly, I would like to express my sincere gratitude to my advisor and mentor Tal for the
continuous support of my Ph.D. study and related research, for her motivation, fruitful
discussions, and for keeping her door always open. I could not have imagined having a
better advisor and mentor for my Ph.D.
I would also like to acknowledge PD Charles Franz as the second reader of this thesis,
and Prof. Ruth Schmitz-Streit and Prof. Stanislav Gorb for their interest in my work. I am
gratefully indebted to them for their very valuable comments on this thesis. I greatly appreciate the support received through the great collaborative work undertaken
with Dr. Anne Kupczok, Dr. Nils Hülter, Tanita Wein, Dr. Christian Wöhle, Samer Kadib
Alban and Dr. Giddy Landan and Prof. Itzhak Mizrahi – these outstanding collaborations
resulted in our publications entitled ‘Segregational drift and the interplay between plasmid
copy number and evolvability’ and ‘An evolutionary perspective on plasmid lifestyle
modes.’ With a special thank I would also like to mention Anne for her interest in this work and the
fast implementation of the simulations, Christian for your fantastic support during the initial
phase of data analysis and to Tana who greatly supported me in and outside the lab!
With a special mention to all my collogues and Nils, Devani, Katrin, Samer, Fernando,
Maxime and Sophie. It was fantastic to have the opportunity to work the majority of my
research with you.
I am grateful to my daughter and my husband for their never ending patience and my
siblings, who have provided me through moral and emotional support in my life.


