Embed Size (px)
Citation preview

Computer Coupling of Phase Diagrams and Thermochemistry 31 (2007) 351–360www.elsevier.com/locate/calphad
Experimental and thermodynamic study of tantalum-containing iron-basedalloys reinforced by carbides: Part I — Case of (Fe, Cr)-based ferritic steels
P. Berthod∗, Y. Hamini, L. Aranda, L. Hericher
Laboratoire de Chimie du Solide Mineral (UMR 7555), Universite Henri Poincare BP 239, 54506 Vandoeuvre-les-Nancy, France
Received 21 July 2006; received in revised form 15 December 2006; accepted 23 January 2007Available online 6 March 2007
Abstract
Experiments and thermodynamic calculations were performed on three iron-based alloys containing 30 wt% of chromium and 3 to 6 wt% oftantalum. Solidus temperatures, natures, and surface fractions of all phases present after an exposure for 50 h at 1000, 1100, and 1200 ◦C, weredetermined for each alloy. These results were compared to values calculated using Thermo-Calc. Two alloys display solidus temperatures above1400 ◦C, while all the liquidus temperatures are higher than 1500 ◦C. Tantalum carbides are present with high fractions, compared to similarCo-based and Ni-based alloys. Their observation and quantification using electron microscopy micrographs and image analysis may lead one tooverestimate the surface fractions of TaC. Calculations of carbide fractions from the chemical composition of the matrix is to be preferred. Aprecipitation of coarse chromium carbides may occur for 1100 and 1200 ◦C.c© 2007 Elsevier Ltd. All rights reserved.
Keywords: Iron-based alloys; Tantalum carbides; Chromium carbides; Experimental characterization; Thermodynamic modeling
1. Introduction
At high temperatures, the carbide phases are of a greatimportance for some superalloys since they allow them to reacha sufficient mechanical strength to resist creep flow or staticstresses to which these alloys can be exposed in service [1,2]. When a good resistance against high temperature corrosionis also required, superalloys must contain a high amountof chromium, which can lead to the existence of chromiumcarbides. Other carbides may exist when other carbide-formingelements are also present in the composition, like tantalum,which can induce the apparition of TaC carbides.
The mechanical behavior of such alloys at high temperaturesdepends on the initial carbide fractions as well as on the fractionof carbides after a long exposure at high temperatures. In somecases, a piece working at high temperatures is exposed to aunique temperature. But more generally the temperature is nothomogeneous in the whole piece. Therefore it could not onlybe useful to have a good knowledge of the microstructureat different temperatures, but also to own a tool allowing a
∗ Corresponding author. Tel.: +33 3 83 68 46 66; fax: +33 3 83 68 46 11.E-mail address: [email protected] (P. Berthod).
0364-5916/$ - see front matter c© 2007 Elsevier Ltd. All rights reserved.doi:10.1016/j.calphad.2007.01.007
quantitative prediction of microstructures at all the intermediatetemperatures. In addition, their elaboration by the casting ofthe alloys is more or less difficult depending on the meltingtemperature range, and both liquidus and solidus temperaturesare very useful indications to succeed in the melting of thealloys and in the filling of the mold before solidification.
The topic of this work is first to provide, for threetemperatures above 1000 ◦C, microstructure results for threeiron-based superalloys containing tantalum and strengthenedby chromium carbides and/or tantalum carbides. Second,the refractoriness and melting ranges are determined by themeasurements of both solidus and liquidus temperatures. Allthese data can be helpful to evaluate databases that arecandidates for thermodynamic calculations on such alloysand to improve them when mismatches are observed. A firstevaluation was performed on a database which does not containall the descriptions of the sub-systems of the quaternaryFe–Cr–C–Ta.
2. Experimental method
2.1. Elaboration of the alloys
All the studied alloys contain about 30 wt% of chromium,
352 P. Berthod et al. / Computer Coupling of Phase Diagrams and Thermochemistry 31 (2007) 351–360
which allows them to display a chromia-forming behavior fora good resistance at high temperature against both oxidationby air and corrosion by molten substances. Tantalum is alsopresent in all alloys, with two targeted contents: 3 wt% for theFETA1 and FETA2 alloys, and 6 wt% for the FETA3 alloy.Tantalum may form carbides with carbon, which is present inall the three alloys: 0.2 wt% for FETA1 and 0.4 wt% for thetwo other alloys. All three alloys were elaborated from pureelements (>99%, Alfa Aesar), by casting in a high frequencyinduction furnace (CELES), under an atmosphere of 300 mbarof argon gas. Solidification was achieved in the water-cooledcopper crucible of the furnace, and led to compact ingots ofnearly 100 g. Thereafter, the stresses that may have appearedduring solidification or during the cooling down to roomtemperature, were released with a short heat treatment. Thelatter was achieved in a tubular resistive furnace, with a heatingrate of 20 ◦C/min, an isothermal stage at 1000 ◦C for about 2 h,and a slow cooling at less than 5 ◦C/min. Cutting the ingotsallowed us to obtain samples for the tests. The dimensions ofthe two types of samples were approximately 2×2×8 mm3 forthermal analysis tests and 10×10×3 mm3 for high temperatureexposures.
2.2. Metallographic preparation, microstructure observations,and global chemical composition determination
The microstructures of the alloys were observed, on onehand after the casting and stress-releasing treatment, and on theother hand after each high temperature exposure. A cold resin(Araldite CY230 + Strengthener Escil HY956) was pouredaround the cut samples. They were then polished, firstly withSiC paper from 120 to 1200 grid under water, and secondly with1 µm diamond pastes. Metallographic observations were doneusing an XL30 Philips Scanning Electron Microscope (SEM),mainly in the Back Scattered Electrons mode (BSE) and withan acceleration voltage of 20 kV. The chemical compositionof each alloy was determined using the Energy DispersionSpectrometry (EDS) device of the SEM, to determine theobtained Fe, Cr, and Ta contents (carbon cannot be analyzedby EDS). This was done on five randomly selected areas, eachof about 0.17 mm2, and the average value was calculated.
2.3. Thermal analysis measurements
Differential Thermal Analysis (DTA) was performed on thealloys to determine both solidus and liquidus temperatures(when possible). The heating rate was 20 ◦C/min up to1200 ◦C, then 5 ◦C/min up to 1500 ◦C which is the maximumtemperature allowed by the apparatus. This was followed by acooling at 5 ◦C/min down to 1200 ◦C, then 20 ◦C/min down toroom temperature. The beginnings and ends of the fusion andthe solidification were measured on the heating part and on thecooling part. They were considered to be the temperatures atwhich the temperature evolution becomes not linear with time(beginnings of fusion and of solidification), or on the contrarybecomes linear again (ends of fusion and of solidification). Thesolidus and liquidus temperatures were determined as being the
values obtained on the heating curve. But the average value ofthe temperatures of the beginning (resp. end) of fusion and ofthe end (resp. beginning) of solidification were also considered.
2.4. High temperature treatments, carbides identification,matrix compositions, and phase surface fractions
Three samples of each alloy were exposed for 50 h to threedifferent temperatures (1000, 1100, and 1200 ◦C). Exposureswere performed in a high temperature furnace with a heatingrate of 20 ◦C/min and a cooling rate of 10 ◦C/min.
Thereafter, the samples were cut in two parts formicrostructure observations, using an Isomet 5000 saw, forthe preparation of samples for metallographic observations.The natures of the carbides that appeared in the alloys wereidentified using Wavelength Dispersion Spectrometry (WDS)with a CAMECA SX100 microprobe. The matrix compositionswere also determined using the same WDS apparatus, on fivedifferent locations, with the calculation of the average values ofall contents.
The volume fractions of carbides were determined in thefollowing two ways. The first way consisted in taking picturesof each alloy exposed to high temperatures, using the SEMin the BSE mode with a magnification of x500. This wasperformed on five different locations randomly selected (areasof 0.04 mm2). The BSE mode, for which the average atomicnumber induces different levels of gray, allowed the separationof the matrix (gray), chromium carbides (dark), and tantalumcarbides (white). Thereafter the surface fractions of all thephases were measured using the Photoshop CS software ofAdobe. Each surface fraction is thus the average of fivemeasures, and were assumed to be close to the volumefractions.
The second way consisted in calculating the mass fractionsof Cr23C6 and TaC (noted fw [Cr23C6] and fw [TaC]) from themass fraction of the matrix ( fw [mat]), respectively from:
– the analyzed Cr weight contents of the matrix (WCr[mat])and of the whole alloy (WCr[all]), and the theoretical Crweight content of the Cr23C6-carbides (WCr[Cr23C6] =
0.943), according to Eq. (1),– the analyzed Ta weight contents of the matrix (WTa[mat])
and of the whole alloy (WTa[all]), and the theoretical Taweight content of the TaC-carbides (WTa[TaC] = 0.938),according to Eq. (2),
fw[Cr23C6] =WCr[all] − fw[mat] × WCr[mat]
WCr[Cr23C6](1)
fw[TaC] =WTa[all] − fw[mat] × WTa[mat]
WTa[TaC](2)
in which fw [mat] is calculated according to Eq. (3):
fw[mat] =
1 −
(WCr[all]
WCr[Cr23C6]+
WTa[all]WTa[TaC]
)1 −
(WCr[mat]
WCr[Cr23C6]+
WTa[mat]WTa[TaC]
) . (3)
Thereafter, the corresponding volume fractions werecalculated according to Eq. (4):

P. Berthod et al. / Computer Coupling of Phase Diagrams and Thermochemistry 31 (2007) 351–360 353
Fig. 1. Initial microstructures of the three alloys (after solidification and stress-releasing heat treatment) (all pictures taken with MEB in BSE mode).
fv[φ j
]=
(fw [φ j]ρφ j
) /∑i
(fw [φi]ρφi
)(4)
in which fv[ϕ j], fw[ϕ j] and ρϕ j are the volume fraction, theweight fraction, and the density of the phase ϕ j respectively.The values used for the densities (expressed in g cm−3) are 7.6for the matrix (as given in [3] for ferritic steels and verifiedby direct measurement on samples), 6.941 for Cr7C3, 6.953 forCr23C6 and, 14.5 for TaC [4].
2.5. Thermodynamic calculations
Calculations were performed for the three alloys withthe Thermo-Calc software [5] and the database SSOL(SGTE) [6]. This database already contained the descriptionsof the following binary and ternary systems: Fe–C [7],Fe–Cr [8], C–Cr [9] and Fe–C–Cr [10]. It was supplementedwith the descriptions of two other systems: Ta–C [11] andTa–Cr [12]. Thermo-Calc calculations were performed for eachalloy using the chemical compositions determined by EDSmeasurements on the obtained alloys. The following quantitieswere calculated:– the solidus temperature and the liquidus temperature,– the natures of the phases present at 1000, 1100, and 1200 ◦C,
and their mass fractions, which were converted into volumefractions according to Eq. (4),
– the chemical composition of the matrix.
3. Results
3.1. Initial microstructures and chemical compositions
Fig. 1 shows the initial microstructures of the three alloys.Primary carbides, which appeared during solidification, can
be seen in the grain boundaries for all the alloys. They areexclusively tantalum carbides (white in BSE mode), with theTaC stoichiometry as shown by the WDS microprobe spotmeasures. Even for a low carbon content (FETA1), thesetantalum carbides are present and they form an interdendriticnetwork which is almost continuous. Some secondary TaCcarbides can also be observed, and they probably began toappear during the stress-releasing treatment. The TaC densityof the FETA2 alloy is similar to the previous alloy, even ifits carbon content is double. However, more carbon led to theappearance of another type of carbide, darker than the matrix.The FETA3 alloy is very different from the two previous alloys:tantalum carbides are present in significantly higher amounts,and they seem to form a continuous eutectic with the matrixalong the interdendritic areas.
The chemical compositions obtained for the three alloysby EDS measurements are given in Table 1 (in boldcharacters), where the targeted compositions are rememberedfor comparison. The chromium contents were always wellrespected while the tantalum contents are lower than thetargeted values for the FETA1 and FETA2 alloys, but a littlehigher than 6% for the FETA3 alloy. It was not possible toobtain a sufficiently accurate value of the carbon content forthe alloys, even by using the microprobe. But the targeted valuecan be considered well respected here, since the elaborationmode is the same as for the previous similar alloys for whichthe obtained carbon content was exactly the targeted one.
3.2. Solidus and liquidus temperatures
DTA experiments were carried out on the three alloys. Forthe assessment of the solidus temperature, the beginning of the
354 P. Berthod et al. / Computer Coupling of Phase Diagrams and Thermochemistry 31 (2007) 351–360
Table 1Chemical compositions of the studied alloys, targeted and obtained (in bold characters) (average values of EDS measurements performed on three ×250 areas)
Alloy Chemical composition Fe Cr Ta C
FETA1 Targeted Bal. 30 3 0.2Obtained Bal. 29.8 ± 0.7 2.1 ± 0.5 Supposed to be 0.2
FETA2 Targeted Bal. 30 3 0.4Obtained Bal. 29.5 ± 2.7 2.4 ± 0.4 Supposed to be 0.4
FETA3 Targeted Bal. 30 6 0.4Obtained Bal. 29.2 ± 1.6 6.2 ± 1.1 Supposed to be 0.4
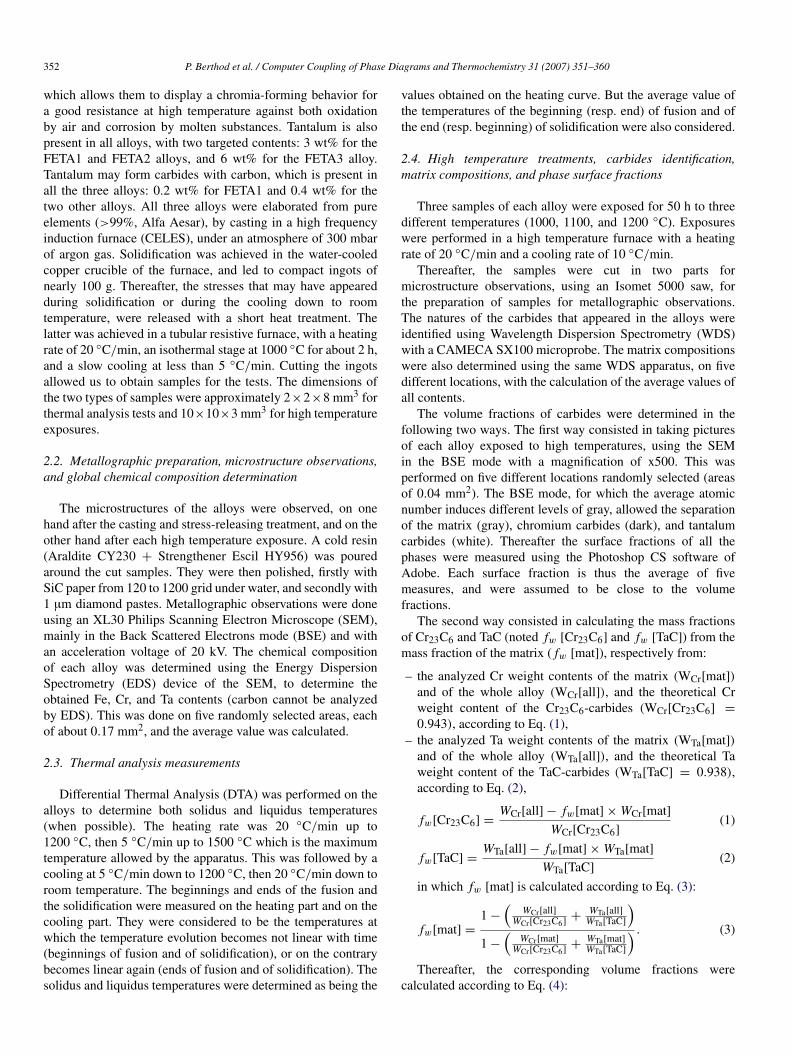
Fig. 2. An example of a DTA curve with the determination of the temperaturesof the beginnings and ends of fusion and solidification respectively (hereFETA2 alloy).
fusion (heating part of the curve) was first considered. Theaverage temperature of the beginning of fusion and the endof solidification, for heating and cooling respectively, was alsodetermined. Unfortunately it was never possible to obtain theliquidus temperature, since fusion was never finished whenthe temperature reached the maximum value allowed by theapparatus (about 1500 ◦C). As an example Fig. 2 displaysthe DTA curve obtained on the FETA2 alloy, while Table 2shows the values of solidus temperatures determined for thethree alloys, according to the two methods: during heating (inbold characters), and the average value between heating andcooling (in bold and italic characters).
The solidus temperatures are all very high (more than1300 ◦C), notably for the FETA1 and FETA3 alloys for whichthey are nearly 1400 ◦C. The liquidus temperatures were nevermeasured, but there are all higher than 1500 ◦C since totalfusion was never experimentally achieved.
3.3. Microstructure after exposures to high temperatures
Figs. 3–5 respectively display some selected BSE images ofthe FETA1, FETA2, and FETA3 alloys after exposure for 50 h at1000, 1100, and 1200 ◦C. In most cases, new microstructureshave evolved in order to correspond more to the equilibriumstate at the applied temperature.
For the alloy FETA1, there is no real difference betweenthe microstructure after stress-releasing heat treatment (doneat 1000 ◦C too) and the microstructure after exposure for50 h at 1000 ◦C. However, one can note that the secondary
Table 2Solidus and liquidus temperatures of the three alloys measured by DifferentialThermal Analysis (in bold characters) and computed by ThermoCalc
Alloy Solidus Temp. (◦C) Liquidus Temp. (◦C)DTA: heating only (average heating/cooling)Thermo-Calc
FETA1 1419 (1408) >1500 (>1500)1436 1525
FETA2 1320 (1302) >1500 (>1500)1298 1563
FETA3 1405 (1390) >1500 (>1500)1471 1713
TaC carbides became more compact and rounder during thisexposure in order to reduce the interfacial energy. For the heattreatment at 1100 ◦C, primary carbides are less present in thestructure, while some secondary carbides have disappeared.After 50 h at 1200 ◦C, the microstructure has evolvedsignificantly: the morphology of the TaC carbides is totallydifferent (some of them are more elongated), since aciculardark chromium carbides have appeared. WDS spot analysis wasoften difficult because of the small size of carbides. However,it showed that there are probably Cr23C6 carbides since theiratomic ratio M at.%/ C at.% is close to 4 or higher.
Like the previous alloy, the microstructure of FETA2 after50 h at 1000 ◦C remains quite similar to the initial one. For1100 ◦C, the tantalum carbides seem to be broken and moredispersed. After 50 h at 1200 ◦C, they are rounder and moredispersed while their surface fraction seems to have drasticallydecreased. New chromium carbides, darker than the previousones and with an acicular morphology, have appeared. One canthink that they are perhaps Cr7C3 carbides, since they are darkerthan the Cr23C6 that existed at 1000 and 1100 ◦C in the alloy,and their atomic ratio M at.%/ C at.% is lower than for Cr23C6.Here too, they were too small to allow a good stoichiometricdetermination with the microprobe.
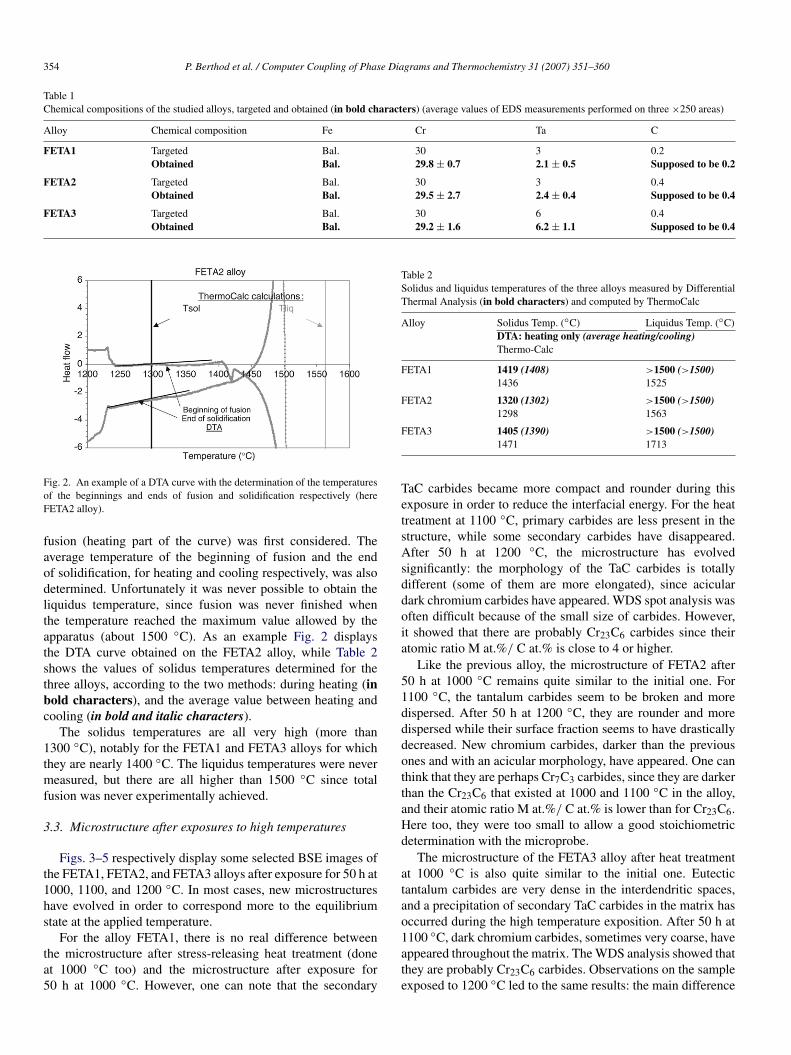
The microstructure of the FETA3 alloy after heat treatmentat 1000 ◦C is also quite similar to the initial one. Eutectictantalum carbides are very dense in the interdendritic spaces,and a precipitation of secondary TaC carbides in the matrix hasoccurred during the high temperature exposition. After 50 h at1100 ◦C, dark chromium carbides, sometimes very coarse, haveappeared throughout the matrix. The WDS analysis showed thatthey are probably Cr23C6 carbides. Observations on the sampleexposed to 1200 ◦C led to the same results: the main difference

P. Berthod et al. / Computer Coupling of Phase Diagrams and Thermochemistry 31 (2007) 351–360 355
Fig. 3. Stable microstructures of the FETA1 alloy after 50 h-exposure at 1000, 1100, and 1200 ◦C (all pictures taken with MEB in BSE mode at ×500).
Fig. 4. Stable microstructures of the FETA2 alloy after 50 h-exposure at 1000, 1100, and 1200 ◦C (all pictures taken with MEB in BSE mode at ×500).
was in the reduction of the apparent fraction of the TaC phase,by comparison to 1100 ◦C.
Five pictures were randomly taken on each alloy for eachtemperature with the MEB in BSE mode. Table 3 presents theresults of the image analysis performed on these pictures, i.e.the average value ± standard deviation (in bold characters).At 1000 ◦C, FETA1 and FETA3 only contain tantalum carbides,while FETA2 also contains chromium carbides (since its carbon
content is higher than for FETA1 for the same Ta content).Surprisingly, the image analysis led to higher values of the TaCsurface fractions in the FETA1 alloy than in the FETA2 alloyat 1000 ◦C, and to a similar surface fraction as in the FETA3alloy for 1000 ◦C. However, it can be seen on micrographs thatthe surface fraction of the TaC phase in the FETA1 alloy is, onthe contrary, quite similar to the one of the FETA2 alloy andnot so high as for the FETA3 alloy. The latter alloy contains
356 P. Berthod et al. / Computer Coupling of Phase Diagrams and Thermochemistry 31 (2007) 351–360
Fig. 5. Stable microstructures of the FETA3 alloy after 50 h-exposure at 1000, 1100, and 1200 ◦C (all pictures taken with MEB in BSE mode at ×500).
more TaC carbides than the two other alloys (except for FETA1at 1000 ◦C), because of its high tantalum content. The TaCsurface fractions of all alloys decrease when the temperatureincreases, while it is the contrary for the chromium carbides, asqualitatively shown before.
3.4. Chemical compositions of the alloys matrix
Table 4 displays the chemical compositions of the matrixof the alloys for the three temperatures (average values of 5WDS spot analyses performed with the microprobe, in boldcharacters). The matrix seems to never contain carbon, sincethe content is often zero or the standard deviation is of the sameorder of magnitude as the average value. An exception is theFETA2 alloy, which contains a significant (but low) quantity ofcarbon at 1000 ◦C. Tantalum is never significantly present in theFETA1 and FETA2 alloys. A very small quantity of tantalumseems to exist in the solid solution in the FETA3 matrix at 1100and 1200 ◦C, since the average value is reasonably higher thanthe standard deviation. On the contrary, chromium contents ofaround 30 wt% are present in all three alloys.
Thus, generally tantalum and carbon seem to haveexclusively formed carbides, either interdendritic or secondary,precipitated in the matrix, and are not present in the matrix.
4. Comparisons with thermodynamic calculations
4.1. Computed solidus and liquidus temperatures
Thermodynamic calculations were all performed from theobtained chemical compositions given in Table 1. The obtainedsolidus and liquidus temperatures are added in Table 2 forcomparison with the experimental DTA measures. There is a
significant mismatch between the experimental values and thecalculated ones, especially for the FETA3 alloy, for which thetantalum content is particularly high. Liquidus temperaturescalculated using Thermo-Calc are all higher than 1500 ◦C,i.e. the maximal temperature reached for the DTA experimentsthat was never high enough to obtain the totally liquid alloys.This is qualitatively good agreement between calculations andexperiment. In addition, calculations also show that the liquidustemperatures should increase with both the carbon content andthe tantalum content.
4.2. Computed matrix chemical compositions
Table 4 displays the chemical compositions obtained fromThermo-Calc calculations for the matrix of each alloy forall exposure temperatures, as well as the measured contents.Calculations show that the chromium content is always around30 wt%, whatever the alloy and the considered temperature.The calculated tantalum contents are very low for all alloys(compared to the alloy contents of 3 and 6 wt%Ta). Thematrix of the Ta-richest alloy, FETA3, logically contains moretantalum than the two others. The carbon contents are very low(but they can reach a quarter of the total content of the alloy) andincrease with temperature. For a given temperature, the FETA2matrix contains more carbon than the two other matrices.
The calculated Cr contents are generally in good agreementwith values obtained by the WDS analysis. The calculatedTa contents are generally higher than the WDS results, evenif the calculated values sometimes remain in the relativelylarge intervals of uncertainty of the WDS results. Moreover,calculated Ta contents are significantly higher than the WDSmeasures for FETA3 at all temperatures. For carbon, calculated

P. Berthod et al. / Computer Coupling of Phase Diagrams and Thermochemistry 31 (2007) 351–360 357
Table 3Surface fractions of carbides measured using image analysis performed on SEM-BSE pictures for each alloy and each temperature (in bold characters); comparisonwith volume fractions deduced from the Cr and Ta contents of the matrix (normal characters) and with volume fractions calculated using Thermo-Calc (italiccharacters)
Alloy Calculated volume fractions (%),vol. fract. from %Cr and %Ta in matrix (%)and surface fractions (%)
M23C6 TaC
FETA1 (Calculated mass fractions) 0 2.171200 ◦C Calculated volume fractions 0 1.15
Vol. frac. deduced from matrix %Cr and %Ta 0 1.12Measured by image analysis 1.98 ± 0.36 3.41 ± 0.24
FETA1 (Calculated mass fractions) 0 2.241100 ◦C Calculated volume fractions 0 1.19
Deduced from matrix %Cr and %Ta 0 1.16Measured by image analysis 0.13 ± 0.02 4.11 ± 0.29
FETA1 (Calculated mass fractions) 0.44 2.261000 ◦C Calculated volume fractions 0.48 1.20
Deduced from matrix %Cr and %Ta 0.30 1.17Measured by image analysis 0.06 ± 0.04 10.71 ± 0.59
FETA2 (Calculated mass fractions) 2.23 2.541200 ◦C Calculated volume fractions 2.47 1.35
Deduced from matrix %Cr and %Ta 1.26 1.32Measured by image analysis 2.46 ± 0.54 2.70 ± 0.61
FETA2 (Calculated mass fractions) 3.11 2.571100 ◦C Calculated volume fractions 3.44 1.36
Deduced from matrix %Cr and %Ta 2.08 1.33Measured by image analysis 1.19 ± 0.51 5.17 ± 0.91
FETA2 (Calculated mass fractions) 3.68 2.581000 ◦C Calculated volume fractions 4.06 1.36
Deduced from matrix %Cr and %Ta 2.57 1.34Measured by image analysis 1.44 ± 0.71 4.57 ± 1.32
FETA3 (Calculated mass fractions) 0 6.291200 ◦C Calculated volume fractions 0 3.40
Deduced from matrix %Cr and %Ta 0 3.32Measured by image analysis 3.45 ± 0.71 6.36 ± 1.35
FETA3 (Calculated mass fractions) 0 6.421100 ◦C Calculated volume fractions 0 3.47
Deduced from matrix %Cr and %Ta 0 3.39Measured by image analysis 3.86 ± 2.51 6.93 ± 0.31
FETA3 (Calculated mass fractions) 0 6.501000 ◦C Calculated volume fractions 0 3.52
Deduced from matrix %Cr and %Ta 0.04 3.44Measured by image analysis 0.07 ± 0.15 9.50 ± 0.96
and measured values are close to one another for the FETA1and FETA3 alloys, and the main mismatches exist for FETA2,with an inversion of order between 1000 and 1200 ◦C.
4.3. Computed mass fractions of carbides
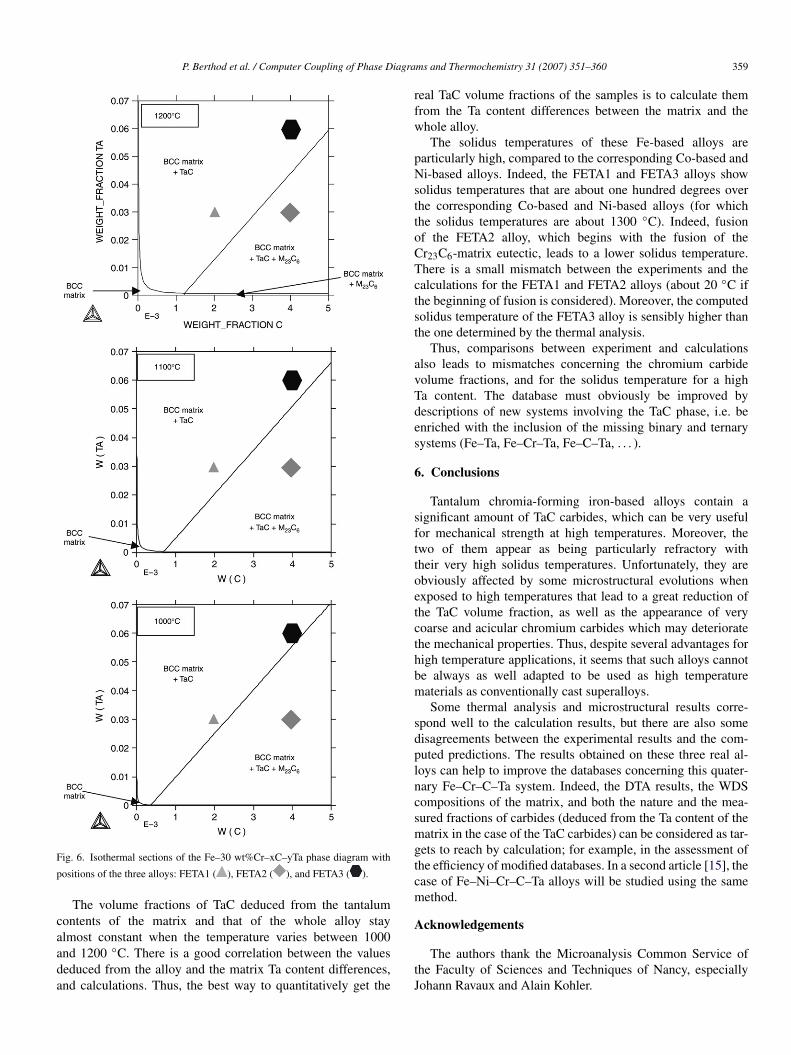
Fig. 6 shows the positions of the three alloys in isothermalsections of the Fe–30 wt%Cr–xC–yTa phase diagram at T =
1200, 1100, and 1000 ◦C, while Table 3 displays the calculatedmass fractions of the existing carbides computed by Thermo-Calc and their corresponding volume fractions. There are twotypes of experimental values of the carbide volume fractions:the first one is the volume fraction of TaC deduced from thetantalum content of the matrix according to (1) and (2), while
the second one (in bold characters) is the surface fractionmeasured by the image analysis on the samples after exposureto the considered temperature.
It appears that some disagreement exists about the existenceof chromium carbides in FETA1. Indeed, calculations showthat no chromium carbides exist at 1200 or 1100 ◦C, whileCr23C6 carbides appear at 1000 ◦C, with a low fraction.The experiments show chromium carbides at 1200 ◦C. Atthis temperature, Cr23C6 carbides become clearly visible. Themismatch is more serious for the TaC carbides: they alwaysexist according to both calculations and observations, but thesurface fractions measured on samples by the image analysis islargely greater than what is calculated by Thermo-Calc. Thedifference between the two decreases when the temperature
358 P. Berthod et al. / Computer Coupling of Phase Diagrams and Thermochemistry 31 (2007) 351–360
Table 4Matrix chemical compositions at 1000, 1100, and 1200 ◦C, analyzed with theWDS microprobe (in bold characters) and computed with Thermo-Calc
Alloy Fe Cr Ta CWeight contents analysed by microprobe (%)Calculated weight contents (%)
FETA1
1200 ◦C Bal. 29.9 ± 0.2 0.05 ± 0.04 030.5 0.11 0.07
1100 ◦C Bal. 30.7 ± 0.1 0.06 ± 0.05 0.08 ± 0.0830.5 0.04 0.06
1000 ◦C Bal. 29.9 ± 1.6 0.04 ± 0.05 0.11 ± 0.1030.3 0.02 0.04
FETA2
1200 ◦C Bal. 30.6 ± 0.2 0.02 ± 0.03 0.02 ± 0.0229.5 0.06 0.12
1100 ◦C Bal. 29.7 ± 0.2 0.05 ± 0.04 0.01 ± 0.0229.0 0.04 0.07
1000 ◦C Bal. 30.7 ± 0.1 0.05 ± 0.05 0.17 ± 0.0328.7 0.02 0.04
FETA3
1200 ◦C Bal. 30.9 ± 0.6 0.07 ± 0.03 031.2 0.34 0.02
1100 ◦C Bal. 31.9 ± 0.15 0.07 ± 0.02 0.01 ± 0.0131.2 0.21 0.01
1000 ◦C Bal. 33.1 ± 0.2 0.06 ± 0.04 031.2 0.12 0.01
exposure increases from 1000 (ratio of 10) to 1200 ◦C (ratioof 3).
According to calculations performed for the FETA2 alloy,chromium carbides would exist for the three temperatures, andthey are all of the Cr23C6 type. Excellent agreement exists for1200 ◦C between the calculation and the image analysis for thisalloy, while the calculated volume fractions are significantlygreater than the measured surface fractions (by a ratio of about3) for 1100 and 1000 ◦C. This order is inverted for TaCcarbides, which are present in samples with a greater surfacefraction than the calculated volume fractions, with a ratio of 2at 1200 ◦C up to a ratio of more than 3 for 1000 ◦C.
Calculations show that no chromium carbides would appearin the FETA3 alloy whatever the exposure temperature, whileTaC surface fractions in real samples are significantly greaterthan those predicted by Thermo-Calc (by a ratio of 2 or 3) at alltemperatures.
Thus, the image analysis leads to carbide volume fractions(supposedly equal to surface fractions) that often have the greatmismatches with calculations. TaC volume fractions obtainedby the image analysis are systematically higher than thoseobtained from calculations, but the calculation/experimentcorrespondence is obviously better when the volume fractionsdeduced from the tantalum contents of both each alloy andits matrix are considered: for all alloys and all temperatures,they are very close to one another. About the chromiumcarbides, the same stoichiometry is obtained from calculations
and from microanalysis, but there are also mismatchesbetween the calculated volume fractions and the experimentalones. Similarly, as with TaC carbides, the correspondence isalso improved when the chromium carbide volume fractionsdeduced from the matrix composition are considered. Theagreement is not so good as for TaC carbides, which is probablydue to a too light decrease of the matrix Cr content compared tothe Cr content in the whole alloy when chromium carbides arepresent.
5. Discussion
Tantalum, which is present in the studied alloys with aboutthe same atomic content as carbon (FETA1 and FETA3)and half this content (FETA2), leads to a high density oftantalum carbides, than in Co-based alloys [13] or Ni-basedalloys [14], and is clearly observed when the microstructuresare examined using the SEM in BSE mode. However, imageanalysis performed on the BSE pictures sometimes gives valuesof TaC surface fractions that are obviously overestimated. Agood example is the case of the FETA1 alloy which, accordingto surface fraction measurements, seems to contain more TaCcarbides after exposure at 1000 ◦C than the FETA2 alloy, whilethe comparison between the two sets of pictures shows that thedensity of the TaC phase is similar in the two alloys. This canbe explained by the high average atomic number of these TaCcarbides, which induces a white color that comes from the partof the TaC carbides that is just under the observed surface, aswell as from the TaC part that really emerges on surface. Thenthe image analysis, from which it is difficult to separate the twoparts of the TaC carbides, leads to higher results than thosereally observed. Another explanation for these differences isthat it cannot be always assumed that the surface fractions andvolume fractions are almost equal: this can depend on the shapeand the repartition of the considered particles. The assessmentof carbide mass fractions and volume fractions can be madewith a higher accuracy by the determination from the chemicalcomposition of the matrix that can be measured with a highprecision using a WDS microprobe. This is the reason whyonly the results obtained for the TaC carbides by this secondmethod are thereafter considered and compared to Thermo-Calc calculations.
During an exposure to 1000 ◦C for 50 h, no realmicrostructural changes occur in the alloys as compared tothe initial microstructures. This is not the case for 1100 and1200 ◦C, for which TaC tends to partially disappear whilenew acicular (and more or less coarse) chromium carbidesdevelop through the microstructure. These microstructuralevolutions with respect to temperature were not predicted by thethermodynamic calculations, for which no chromium carbideswill appear in FETA1 and FETA3. For FETA2, calculationslogically showed that such chromium carbides must exist,which is a logical consequence of an increased carbon contentfor a fixed tantalum content compared to FETA1. But thecorrespondence is never good for this FETA2 alloy, since thecalculated values are significantly higher than the measuredones.
P. Berthod et al. / Computer Coupling of Phase Diagrams and Thermochemistry 31 (2007) 351–360 359
Fig. 6. Isothermal sections of the Fe–30 wt%Cr–xC–yTa phase diagram with
positions of the three alloys: FETA1 ( ), FETA2 ( ), and FETA3 ( ).
The volume fractions of TaC deduced from the tantalumcontents of the matrix and that of the whole alloy stayalmost constant when the temperature varies between 1000and 1200 ◦C. There is a good correlation between the valuesdeduced from the alloy and the matrix Ta content differences,and calculations. Thus, the best way to quantitatively get the
real TaC volume fractions of the samples is to calculate themfrom the Ta content differences between the matrix and thewhole alloy.
The solidus temperatures of these Fe-based alloys areparticularly high, compared to the corresponding Co-based andNi-based alloys. Indeed, the FETA1 and FETA3 alloys showsolidus temperatures that are about one hundred degrees overthe corresponding Co-based and Ni-based alloys (for whichthe solidus temperatures are about 1300 ◦C). Indeed, fusionof the FETA2 alloy, which begins with the fusion of theCr23C6-matrix eutectic, leads to a lower solidus temperature.There is a small mismatch between the experiments and thecalculations for the FETA1 and FETA2 alloys (about 20 ◦C ifthe beginning of fusion is considered). Moreover, the computedsolidus temperature of the FETA3 alloy is sensibly higher thanthe one determined by the thermal analysis.
Thus, comparisons between experiment and calculationsalso leads to mismatches concerning the chromium carbidevolume fractions, and for the solidus temperature for a highTa content. The database must obviously be improved bydescriptions of new systems involving the TaC phase, i.e. beenriched with the inclusion of the missing binary and ternarysystems (Fe–Ta, Fe–Cr–Ta, Fe–C–Ta, . . . ).
6. Conclusions
Tantalum chromia-forming iron-based alloys contain asignificant amount of TaC carbides, which can be very usefulfor mechanical strength at high temperatures. Moreover, thetwo of them appear as being particularly refractory withtheir very high solidus temperatures. Unfortunately, they areobviously affected by some microstructural evolutions whenexposed to high temperatures that lead to a great reduction ofthe TaC volume fraction, as well as the appearance of verycoarse and acicular chromium carbides which may deterioratethe mechanical properties. Thus, despite several advantages forhigh temperature applications, it seems that such alloys cannotbe always as well adapted to be used as high temperaturematerials as conventionally cast superalloys.
Some thermal analysis and microstructural results corre-spond well to the calculation results, but there are also somedisagreements between the experimental results and the com-puted predictions. The results obtained on these three real al-loys can help to improve the databases concerning this quater-nary Fe–Cr–C–Ta system. Indeed, the DTA results, the WDScompositions of the matrix, and both the nature and the mea-sured fractions of carbides (deduced from the Ta content of thematrix in the case of the TaC carbides) can be considered as tar-gets to reach by calculation; for example, in the assessment ofthe efficiency of modified databases. In a second article [15], thecase of Fe–Ni–Cr–C–Ta alloys will be studied using the samemethod.
Acknowledgements
The authors thank the Microanalysis Common Service ofthe Faculty of Sciences and Techniques of Nancy, especiallyJohann Ravaux and Alain Kohler.
360 P. Berthod et al. / Computer Coupling of Phase Diagrams and Thermochemistry 31 (2007) 351–360
References
[1] E.F. Bradley, Superalloys: A Technical Guide, ASM International, 1988.[2] C.T. Sims, W.C. Hagel, The Superalloys, John Wiley & Sons, 1972.[3] J.P. Mercier, G. Zambelli, W. Kurz, Introduction a la science des
materiaux, Presses Polytechniques et Universitaires Romandes, 2002.[4] Handbook of Chemistry and Physics, 57th edition, 1976–1977.[5] Thermo-Calc version N: Foundation for Computational Thermodynamics,
Stockholm, Sweden, Copyright (1993, 2000). http://www.thermocalc.com.
[6] SGTE: Scientific Group Thermodata Europe database, update 1992.http://www.SGTE.org.
[7] P. Gustafson, Scan. J. Metall. 14 (1985) 259–264.[8] J.O. Anderson, B. Sundman, CALPHAD 11 (1987) 83–92.[9] J.O. Anderson, CALPHAD 11 (1987) 271–276.
[10] J.O. Anderson, Met. Trans. A 19A (1988) 627–636.[11] K. Frisk, A. Fernandez Guillermet, J. Alloys Compounds 238 (1996)
167–179.[12] N. Dupin, I. Ansara, J. Phase Equilibria 14 (1993) 451–456.[13] P. Berthod, S. Michon, L. Aranda, S. Mathieu, J.C. Gachon, CALPHAD
27 (2003) 353–359.[14] P. Berthod, L. Aranda, C. Vebert, S. Michon, CALPHAD 28 (2004)
159–166.[15] P. Berthod, Y. Hamini, L. Hericher, L. Aranda, CALPHAD 31 (3) (2007)
361–369.


