Embed Size (px)
Citation preview
82 International Journal of Research in Computer Applications And Robotics, x(x): xx-xx
INTERNATIONAL JOURNAL OF RESEARCH IN COMPUTER APPLICATIONS AND ROBOTICS www.ijrcar.in
Vol.2 Issue.2, Pg.: 82-92
February 2014
Lieutenant.J.Ganesan e t a l
Page 82
INTERNATIONAL JOURNAL OF
RESEARCH IN COMPUTER
APPLICATIONS AND ROBOTICS
ISSN 2320-7345
EXPERIMENTAL ANALYSIS OF TOTAL HARMONIC
DISTORTION BY APPLYING VARIOUS PWM
TECHNIQUES ON THREE PHASE SQUIRREL CAGE
MOTOR
P.Manikandan1, V.Neviya
2, Lieutenant.J.Ganesan
3, Dr.D.Prince Winston
4, D.Edison
Selvaraj5, K.Madhumidha
6, D.Aarthi Pradeepa
7, S.Eswari
8 and S.Mathumitha
9
1Head of the Department, Dept. of EEE, Sree Sowdambika College of Engineering, Aruppukottai, India
2,3Assistant Professor, Dept. of EEE, Sree Sowdambika College of Engineering, Aruppukottai, India 4Assistant Professor, Dept. of EEE, Kamaraj College of Engineering and Technology, Virudhunagar, India
5Assistant Professor (Guest Faculty), Dept. of EEE, Guindy, Anna University Chennai, India 6,7,8,9B.E-IV Year, Dept. of EEE, Sree Sowdambika College of Engineering, Aruppukottai, India
Abstract
It has been found that by using Pulse with modulation technique can greatly reduce the harmonics distortions generated
by the PV inverter. Harmonics reduction is the main consideration in three phase squirrel cage induction motor. We can
improve the performance of the three phase squirrel cage Induction motor by the reduction of THD. In this research work,
the harmonic distortion of the three phase induction motor was measured in terms of THD by Simulation model and the
results of the Multiple Pulse With Modulation and Sinusoidal Pulse With Modulation inputs were compared to discover
the lowest THD value. By using the PWM technique on the Three Phase Induction motor there was reduction in the
VTHD by 6.98% and CTHD by 3.12% which in turn reduces the iron, winding and stray losses occurred in three phase
squirrel cage induction motor.
Keywords: SPWM, MPWM, Simulink, Harmonics, Induction Motor
1. Introduction
In many Industrial applications, it is often required to control the output voltage of converters. The most
efficient method of controlling the output voltage is to incorporate Pulse width Modulation (PWM) control
within the inverters [1-3]. The commonly used techniques are Sinusoidal Pulse Width Modulation (SPWM)
and Multi Pulse Width Modulation (MPWM). SPWM is commonly used in industrial application. In this
scheme the width of each pulse is varied in proportion to the amplitude of a sine wave evaluated at the centre
of same pulse [9-11]. The gating signals are generated by comparing a sinusoidal reference signal with a
triangular carrier wave of frequency. The frequency of reference signal determines the inverter output
frequency and its peak amplitude controls the modulation index, and then in turn the RMS output voltage [5-6].
The number of pulses per half-cycle depends on the carrier frequency [7-10]. In MPWM, The harmonic
content can be reduced by using several pulses in each half cycle of output voltage. The gating signals are
produced by comparing reference signal with triangular carrier wave [2-4]. The intersections between the

83 International Journal of Research in Computer Applications And Robotics, x(x): xx-xx
INTERNATIONAL JOURNAL OF RESEARCH IN COMPUTER APPLICATIONS AND ROBOTICS www.ijrcar.in
Vol.2 Issue.2, Pg.: 82-92
February 2014
Lieutenant.J.Ganesan e t a l
Page 83
reference voltage waveform and the carrier waveform give the opening and closing times of the switches.PWM
is commonly used in applications like motor speed control, converters, audio amplifiers, etc. For example, it is
used to reduce the total power delivered to a load without losses, which normally occurs when a power source
is limited by a resistive element. PWM is used to adjust the voltage applied to the motor. Changing the duty
ratio of the switches changes the speed of the motor. The longer the pulse is closed compared to the opened
periods, the higher the power supplied to the load. The change of state between closing (ON) and opening
(OFF) is rapid, so that the average power dissipation is very low compared to the power being delivered.
Inverters are widely used in drives, UPS. This project presents a comparative study of performance between
Sinusoidal Pulse Width Modulation (SPWM) and Multiple Pulse Width Modulation (MPWM) inputs. This
technique has been designed and analysed using Mat lab Simulink model. The performance comparison are
analysed in terms of THD and Fast Fourier Transformation (FFT).
2. Harmonic analysis
Harmonics are integral multiples of some fundamental frequency that, when added together, result in a
distorted waveforms.
2.1 Sources of Harmonics The following sources create the harmonics in electrical circuits.
a. Adjustable speed drives
b. Power supplies
c. Electrical ballets
d. Uninterrupted power supplies
e. Arc Furnaces
f. Welding units and computers
2.2 Common Symptoms of Harmonics
Due to harmonics the following symptoms are observed in electrical equipments.
a. Transformer heating
b. Motor and generator heating and vibrations
c. Neutral heating
d. Nuisance fuse operations
e. Insulation deterioration
f. Electronic control malfunctioning
g. Inconsistent meter reading
h. Voltage regulator mal operations
2.3 Total Harmonics Distortion
The total harmonic distortion was a measurement of the harmonic distortion present and was defined
as the ratio of the sum of the powers of all harmonic components to the power of the fundamental frequency.
THD was used to characterize the linearity of audio systems and the power quality of electric power systems.
In power systems, lower THD means reduction in peak currents, heating, emissions, and core loss in motors.
Total harmonic distortion was measured as the percentage. Lower percentages were better. In reality, total
harmonic distortion was hardly perceptible to the human ear.
2.4 Voltage THD
Voltage distortion consists of very sharp notches and spikes in voltage. When applied to the
equivalent circuit, that high frequency voltage does not cause much change in the inductive magnetizing
current, but causes a change in the load current [8].
2.5 Current THD
Current THD was caused by the motor itself due to non-linearity of the magnetizing current. The
current THD will be higher when the motor was unloaded.
84 International Journal of Research in Computer Applications And Robotics, x(x): xx-xx
INTERNATIONAL JOURNAL OF RESEARCH IN COMPUTER APPLICATIONS AND ROBOTICS www.ijrcar.in
Vol.2 Issue.2, Pg.: 82-92
February 2014
Lieutenant.J.Ganesan e t a l
Page 84
2.6 THD Analysis The THD was the means to express the distortion affecting a current or voltage flowing at a given
point as a single number. THD analysis was done according to the standard IEC 61000-2-2.
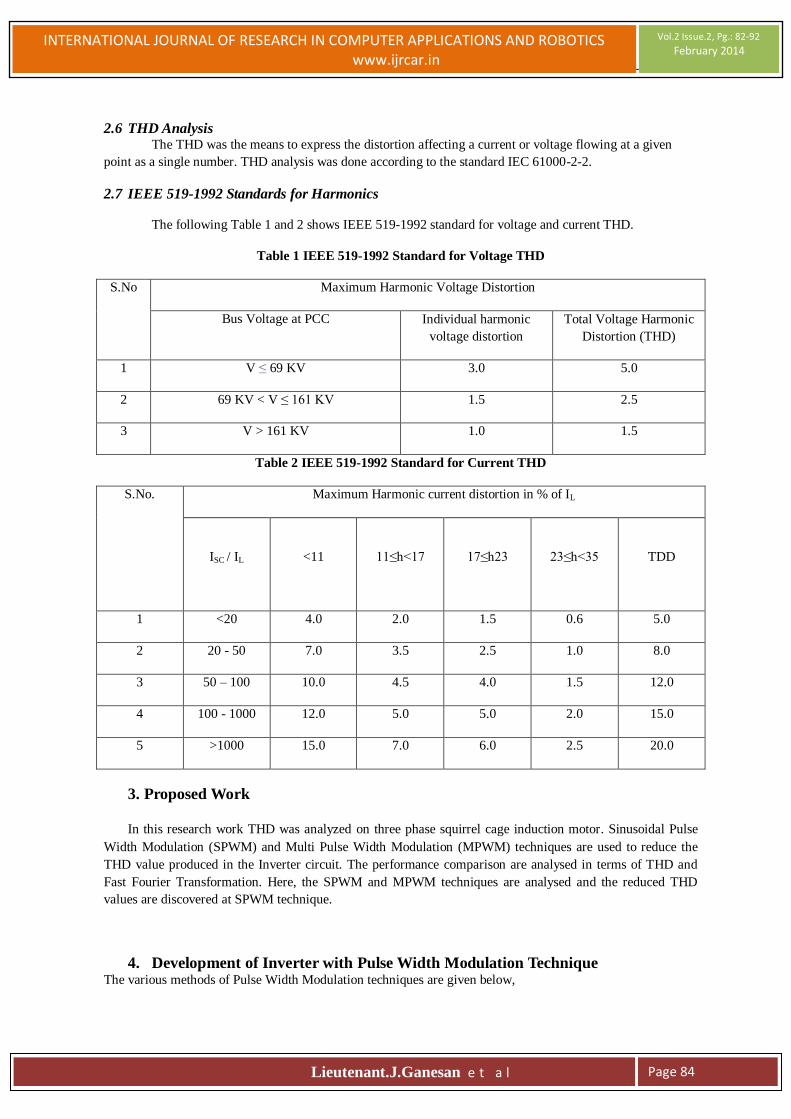
2.7 IEEE 519-1992 Standards for Harmonics
The following Table 1 and 2 shows IEEE 519-1992 standard for voltage and current THD.
Table 1 IEEE 519-1992 Standard for Voltage THD
S.No
Maximum Harmonic Voltage Distortion
Bus Voltage at PCC Individual harmonic
voltage distortion
Total Voltage Harmonic
Distortion (THD)
1 V ≤ 69 KV 3.0 5.0
2 69 KV < V ≤ 161 KV 1.5 2.5
3 V > 161 KV 1.0 1.5
Table 2 IEEE 519-1992 Standard for Current THD
S.No. Maximum Harmonic current distortion in % of IL
ISC / IL
<11
11≤h<17
17≤h23
23≤h<35
TDD
1 <20 4.0 2.0 1.5 0.6 5.0
2 20 - 50 7.0 3.5 2.5 1.0 8.0
3 50 – 100 10.0 4.5 4.0 1.5 12.0
4 100 - 1000 12.0 5.0 5.0 2.0 15.0
5 >1000 15.0 7.0 6.0 2.5 20.0
3. Proposed Work
In this research work THD was analyzed on three phase squirrel cage induction motor. Sinusoidal Pulse
Width Modulation (SPWM) and Multi Pulse Width Modulation (MPWM) techniques are used to reduce the
THD value produced in the Inverter circuit. The performance comparison are analysed in terms of THD and
Fast Fourier Transformation. Here, the SPWM and MPWM techniques are analysed and the reduced THD
values are discovered at SPWM technique.
4. Development of Inverter with Pulse Width Modulation Technique The various methods of Pulse Width Modulation techniques are given below,
85 International Journal of Research in Computer Applications And Robotics, x(x): xx-xx
INTERNATIONAL JOURNAL OF RESEARCH IN COMPUTER APPLICATIONS AND ROBOTICS www.ijrcar.in
Vol.2 Issue.2, Pg.: 82-92
February 2014
Lieutenant.J.Ganesan e t a l
Page 85
a. Delta Modulation PWM control
b. Delta-Sigma Modulation PWM control
c. Multiple Pulse Width Modulation (MPWM)
d. Sinusoidal Pulse Width Modulation (SPWM)
e. Third Harmonic Injection Pulse Width Modulation (THIPWM)
f. Space Vector Pulse Width Modulation (SVPWM)
The sinusoidal pulse-width modulation (SPWM) technique produces a sinusoidal waveform by
filtering an output pulse waveform with varying width. A high switching frequency leads to a better filtered
sinusoidal output waveform. The desired output voltage is achieved by varying the frequency and amplitude of
a reference or modulating voltage. The variations in the amplitude and frequency of the reference voltage
change the pulse-width patterns of the output voltage but keep the sinusoidal modulation.
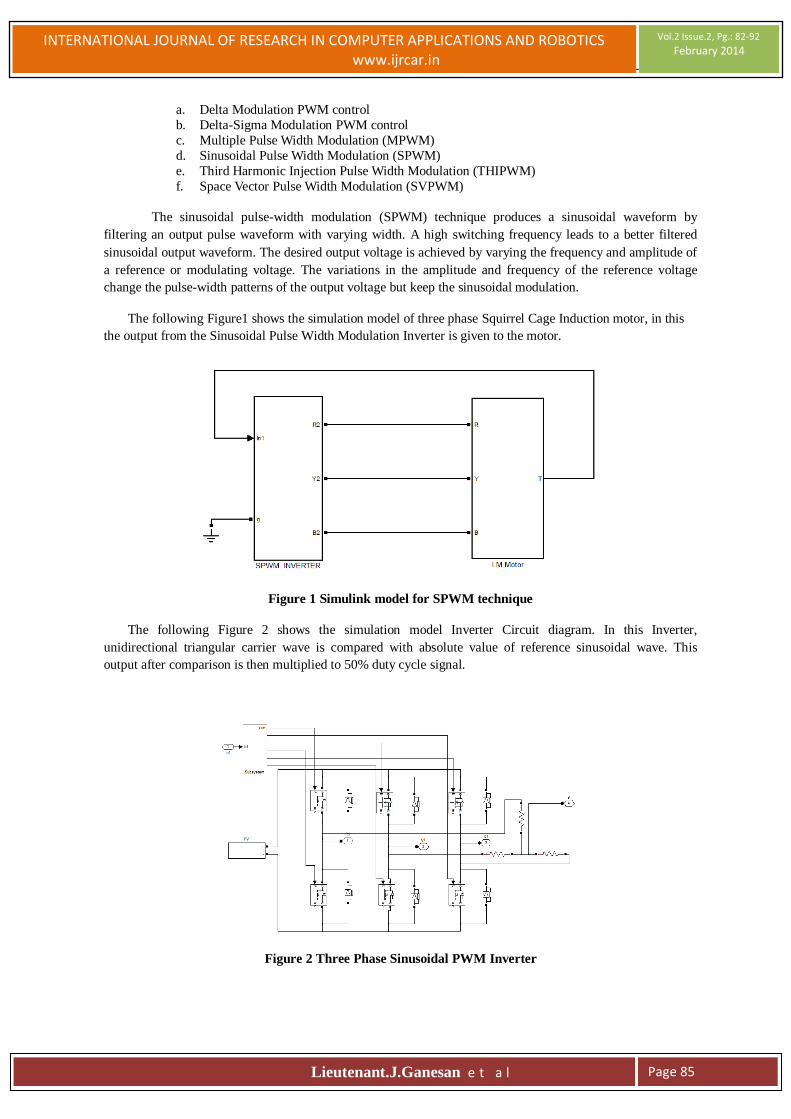
The following Figure1 shows the simulation model of three phase Squirrel Cage Induction motor, in this
the output from the Sinusoidal Pulse Width Modulation Inverter is given to the motor.
Figure 1 Simulink model for SPWM technique
The following Figure 2 shows the simulation model Inverter Circuit diagram. In this Inverter,
unidirectional triangular carrier wave is compared with absolute value of reference sinusoidal wave. This
output after comparison is then multiplied to 50% duty cycle signal.
Figure 2 Three Phase Sinusoidal PWM Inverter
86 International Journal of Research in Computer Applications And Robotics, x(x): xx-xx
INTERNATIONAL JOURNAL OF RESEARCH IN COMPUTER APPLICATIONS AND ROBOTICS www.ijrcar.in
Vol.2 Issue.2, Pg.: 82-92
February 2014
Lieutenant.J.Ganesan e t a l
Page 86
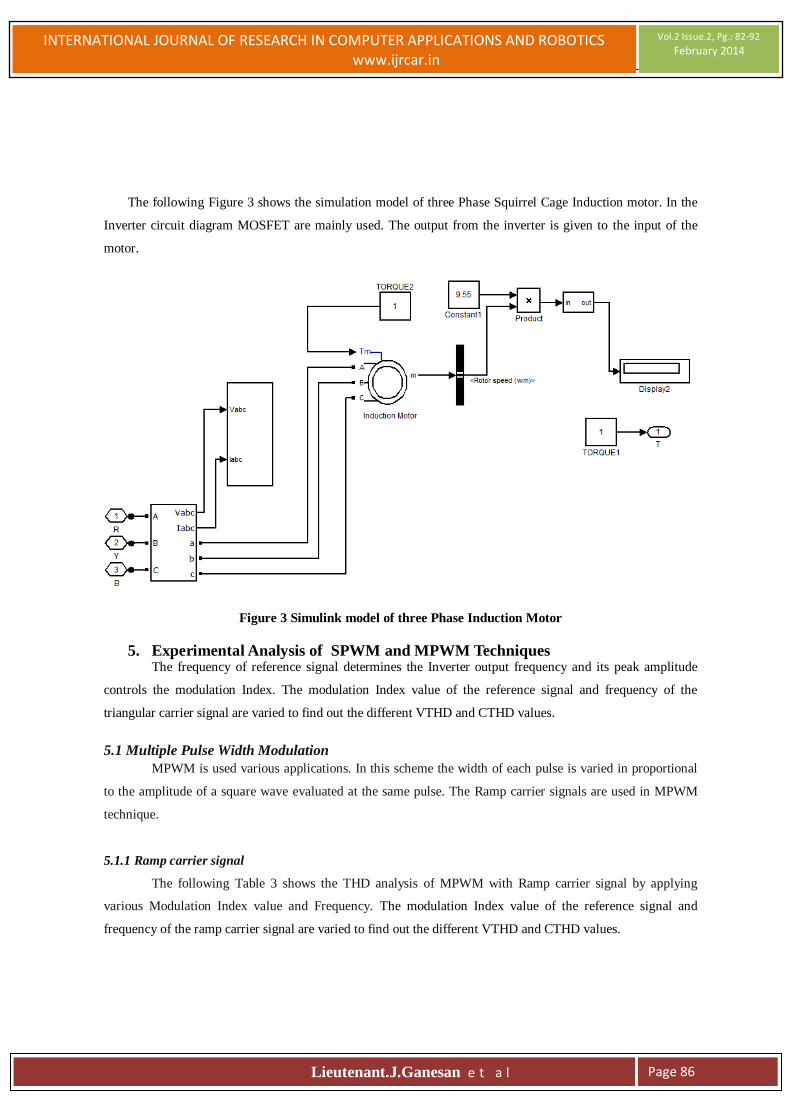
The following Figure 3 shows the simulation model of three Phase Squirrel Cage Induction motor. In the
Inverter circuit diagram MOSFET are mainly used. The output from the inverter is given to the input of the
motor.
Figure 3 Simulink model of three Phase Induction Motor
5. Experimental Analysis of SPWM and MPWM Techniques The frequency of reference signal determines the Inverter output frequency and its peak amplitude
controls the modulation Index. The modulation Index value of the reference signal and frequency of the
triangular carrier signal are varied to find out the different VTHD and CTHD values.
5.1 Multiple Pulse Width Modulation
MPWM is used various applications. In this scheme the width of each pulse is varied in proportional
to the amplitude of a square wave evaluated at the same pulse. The Ramp carrier signals are used in MPWM
technique.
5.1.1 Ramp carrier signal
The following Table 3 shows the THD analysis of MPWM with Ramp carrier signal by applying
various Modulation Index value and Frequency. The modulation Index value of the reference signal and
frequency of the ramp carrier signal are varied to find out the different VTHD and CTHD values.
87 International Journal of Research in Computer Applications And Robotics, x(x): xx-xx
INTERNATIONAL JOURNAL OF RESEARCH IN COMPUTER APPLICATIONS AND ROBOTICS www.ijrcar.in
Vol.2 Issue.2, Pg.: 82-92
February 2014
Lieutenant.J.Ganesan e t a l
Page 87
Table 3 THD analysis of MPWM with Ramp carrier signal
Frequency
Modulation
Index=0.9
Modulation
Index=0.8
Modulation
Index=0.7 Modulation Index=0.6
Modulation Index=0.5
VTHD
(%)
CTHD
(%)
VTHD
(%)
VTHD
(%)
CTHD
(%)
CTHD
(%)
VTHD
(%)
CTHD
(%) VTHD (%) CTHD (%)
500 40.33 80.23 48.54 95.08 55.44 86.65 68.02 112.41 84.78 132.05
1000 43.39 71.09 54.31 83.86 64.95 89.7 77.9 96.74 92.27 96.75
3000 31.2 74.51 31.38 72.27 31.59 69.51 31.24 73.19 32.04 68.38
5000 41.64 71.05 51.43 70.16 62.26 66.73 74.35 73.66 89.69 71.66
7000 31.50 74.03 31.69 71.11 31.50 66.78 32.71 67.95 33.46 70.46
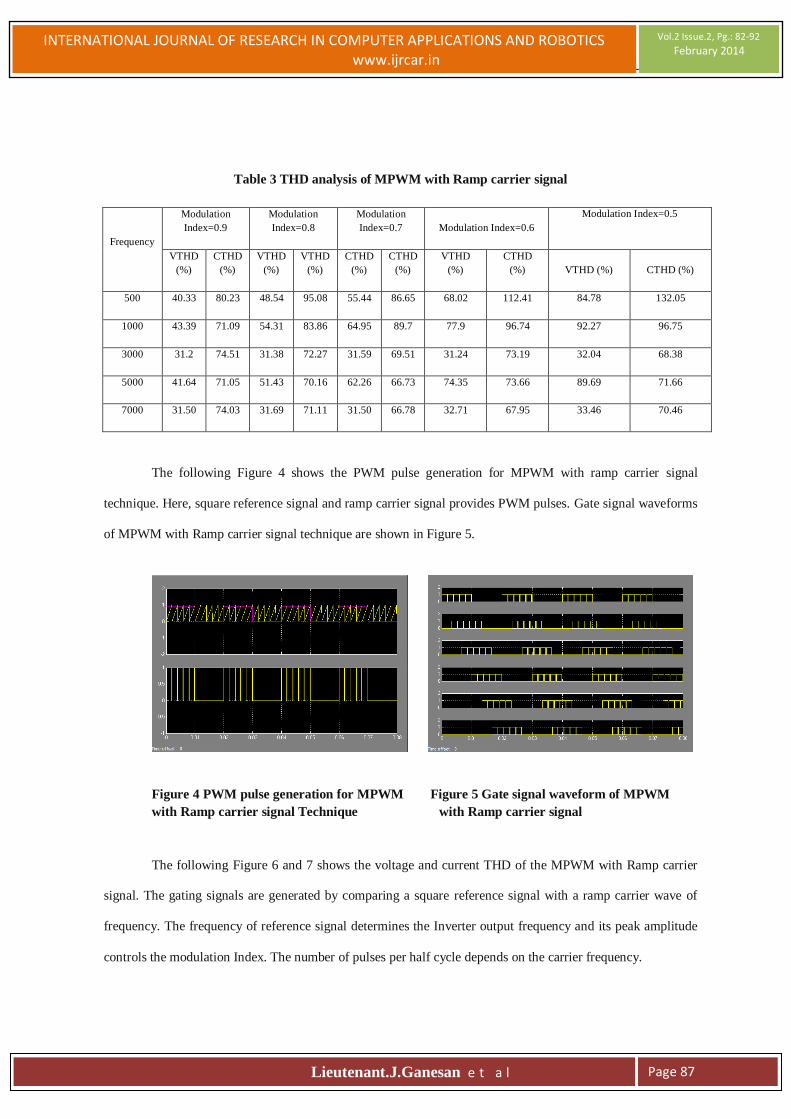
The following Figure 4 shows the PWM pulse generation for MPWM with ramp carrier signal
technique. Here, square reference signal and ramp carrier signal provides PWM pulses. Gate signal waveforms
of MPWM with Ramp carrier signal technique are shown in Figure 5.
Figure 4 PWM pulse generation for MPWM Figure 5 Gate signal waveform of MPWM
with Ramp carrier signal Technique with Ramp carrier signal
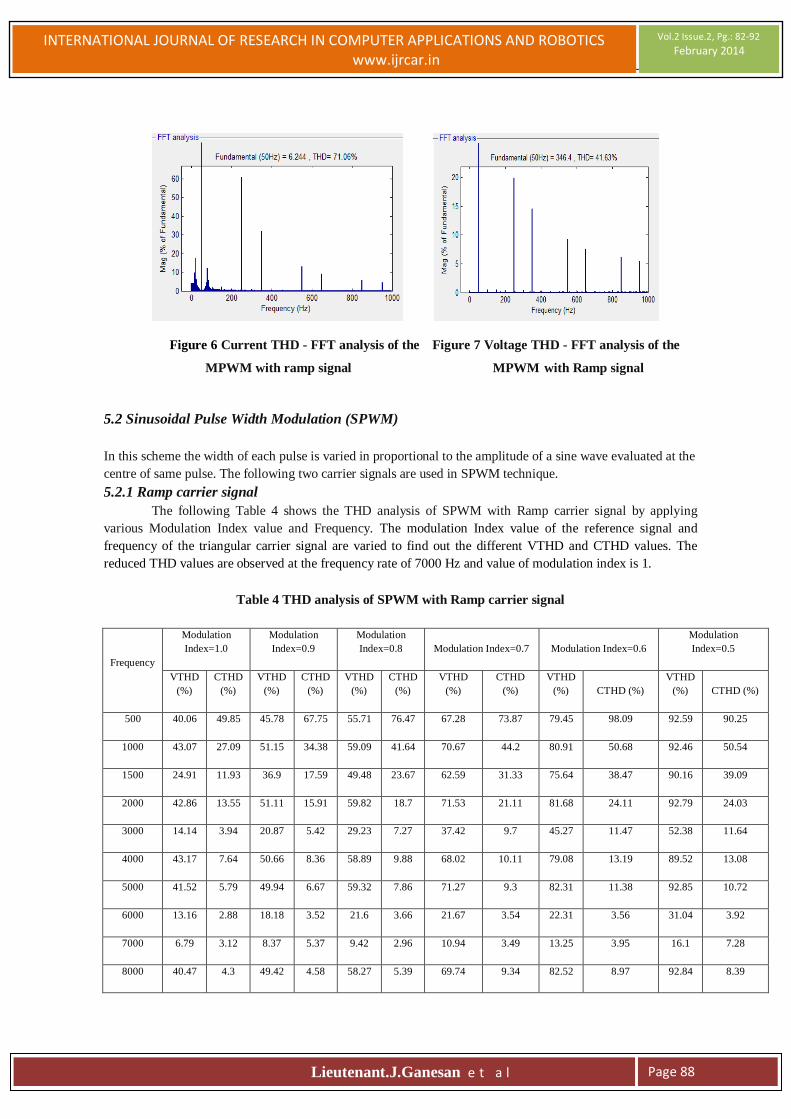
The following Figure 6 and 7 shows the voltage and current THD of the MPWM with Ramp carrier
signal. The gating signals are generated by comparing a square reference signal with a ramp carrier wave of
frequency. The frequency of reference signal determines the Inverter output frequency and its peak amplitude
controls the modulation Index. The number of pulses per half cycle depends on the carrier frequency.
88 International Journal of Research in Computer Applications And Robotics, x(x): xx-xx
INTERNATIONAL JOURNAL OF RESEARCH IN COMPUTER APPLICATIONS AND ROBOTICS www.ijrcar.in
Vol.2 Issue.2, Pg.: 82-92
February 2014
Lieutenant.J.Ganesan e t a l
Page 88
Figure 6 Current THD - FFT analysis of the Figure 7 Voltage THD - FFT analysis of the
MPWM with ramp signal MPWM with Ramp signal
5.2 Sinusoidal Pulse Width Modulation (SPWM)
In this scheme the width of each pulse is varied in proportional to the amplitude of a sine wave evaluated at the
centre of same pulse. The following two carrier signals are used in SPWM technique.
5.2.1 Ramp carrier signal
The following Table 4 shows the THD analysis of SPWM with Ramp carrier signal by applying
various Modulation Index value and Frequency. The modulation Index value of the reference signal and
frequency of the triangular carrier signal are varied to find out the different VTHD and CTHD values. The
reduced THD values are observed at the frequency rate of 7000 Hz and value of modulation index is 1.
Table 4 THD analysis of SPWM with Ramp carrier signal
Frequency
Modulation
Index=1.0
Modulation
Index=0.9
Modulation
Index=0.8 Modulation Index=0.7 Modulation Index=0.6
Modulation
Index=0.5
VTHD
(%)
CTHD
(%)
VTHD
(%)
CTHD
(%)
VTHD
(%)
CTHD
(%)
VTHD
(%)
CTHD
(%)
VTHD
(%) CTHD (%)
VTHD
(%) CTHD (%)
500 40.06 49.85 45.78 67.75 55.71 76.47 67.28 73.87 79.45 98.09 92.59 90.25
1000 43.07 27.09 51.15 34.38 59.09 41.64 70.67 44.2 80.91 50.68 92.46 50.54
1500 24.91 11.93 36.9 17.59 49.48 23.67 62.59 31.33 75.64 38.47 90.16 39.09
2000 42.86 13.55 51.11 15.91 59.82 18.7 71.53 21.11 81.68 24.11 92.79 24.03
3000 14.14 3.94 20.87 5.42 29.23 7.27 37.42 9.7 45.27 11.47 52.38 11.64
4000 43.17 7.64 50.66 8.36 58.89 9.88 68.02 10.11 79.08 13.19 89.52 13.08
5000 41.52 5.79 49.94 6.67 59.32 7.86 71.27 9.3 82.31 11.38 92.85 10.72
6000 13.16 2.88 18.18 3.52 21.6 3.66 21.67 3.54 22.31 3.56 31.04 3.92
7000 6.79 3.12 8.37 5.37 9.42 2.96 10.94 3.49 13.25 3.95 16.1 7.28
8000 40.47 4.3 49.42 4.58 58.27 5.39 69.74 9.34 82.52 8.97 92.84 8.39
89 International Journal of Research in Computer Applications And Robotics, x(x): xx-xx
INTERNATIONAL JOURNAL OF RESEARCH IN COMPUTER APPLICATIONS AND ROBOTICS www.ijrcar.in
Vol.2 Issue.2, Pg.: 82-92
February 2014
Lieutenant.J.Ganesan e t a l
Page 89
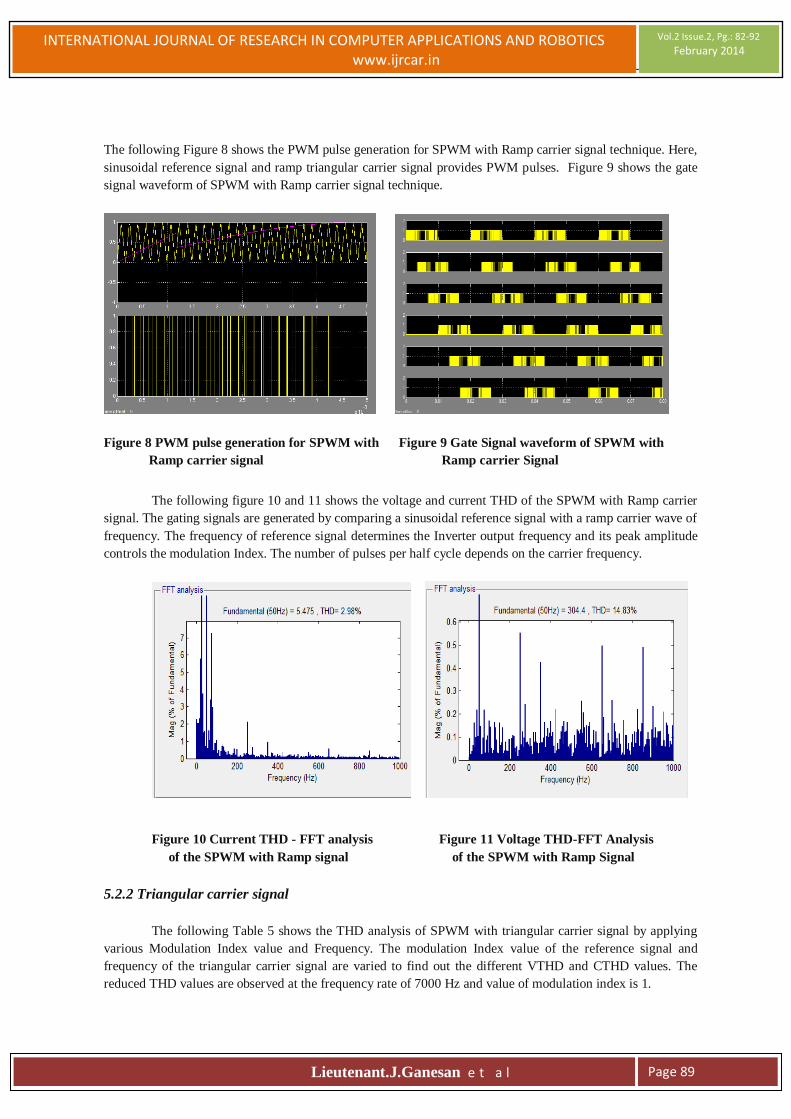
The following Figure 8 shows the PWM pulse generation for SPWM with Ramp carrier signal technique. Here,
sinusoidal reference signal and ramp triangular carrier signal provides PWM pulses. Figure 9 shows the gate
signal waveform of SPWM with Ramp carrier signal technique.
Figure 8 PWM pulse generation for SPWM with Figure 9 Gate Signal waveform of SPWM with
Ramp carrier signal Ramp carrier Signal
The following figure 10 and 11 shows the voltage and current THD of the SPWM with Ramp carrier
signal. The gating signals are generated by comparing a sinusoidal reference signal with a ramp carrier wave of
frequency. The frequency of reference signal determines the Inverter output frequency and its peak amplitude
controls the modulation Index. The number of pulses per half cycle depends on the carrier frequency.
Figure 10 Current THD - FFT analysis Figure 11 Voltage THD-FFT Analysis
of the SPWM with Ramp signal of the SPWM with Ramp Signal
5.2.2 Triangular carrier signal
The following Table 5 shows the THD analysis of SPWM with triangular carrier signal by applying
various Modulation Index value and Frequency. The modulation Index value of the reference signal and
frequency of the triangular carrier signal are varied to find out the different VTHD and CTHD values. The
reduced THD values are observed at the frequency rate of 7000 Hz and value of modulation index is 1.
90 International Journal of Research in Computer Applications And Robotics, x(x): xx-xx
INTERNATIONAL JOURNAL OF RESEARCH IN COMPUTER APPLICATIONS AND ROBOTICS www.ijrcar.in
Vol.2 Issue.2, Pg.: 82-92
February 2014
Lieutenant.J.Ganesan e t a l
Page 90
Table 5 THD analysis of SPWM with Triangular carrier signal
Frequency
Modulation
Index=1.0
Modulation
Index=0.9
Modulation
Index=0.8
Modulation
Index=0.7
Modulation
Index=0.6
Modulation
Index=0.5
VTHD
(%)
CTHD
(%)
VTHD
(%)
CTHD
(%)
VTHD
(%)
CTHD
(%)
VTHD
(%)
CTHD
(%)
VTHD
(%)
CTHD
(%)
VTHD
(%)
CTHD
(%)
500 39.41 49.85 45.78 67.75 55.71 76.47 67.28 73.87 79.45 98.09 92.59 90.25
1000 43.07 27.09 51.15 34.38 59.09 41.64 70.67 44.2 80.91 50.68 92.46 50.54
1500 24.91 11.93 36.9 17.59 49.48 23.67 62.59 31.33 75.64 38.47 90.16 39.09
2000 42.86 13.55 51.11 15.91 59.82 18.7 71.53 21.11 81.68 24.11 92.79 24.03
3000 14.14 3.94 20.87 5.42 29.23 7.27 37.42 9.7 45.27 11.47 52.38 11.64
4000 43.17 7.64 50.66 8.36 58.89 9.88 68.02 10.11 79.08 13.19 89.52 13.08
5000 41.52 5.79 49.94 6.67 59.32 7.86 71.27 9.3 82.31 11.38 92.85 10.72
6000 13.16 2.88 18.18 3.52 21.6 3.66 21.67 3.54 22.31 3.56 31.04 3.92
7000 6.79 3.12 8.37 5.37 9.42 2.96 10.94 3.49 13.25 3.95 16.1 7.28
8000 40.47 4.3 49.42 4.58 58.27 5.39 69.74 9.34 82.52 8.97 92.84 8.39
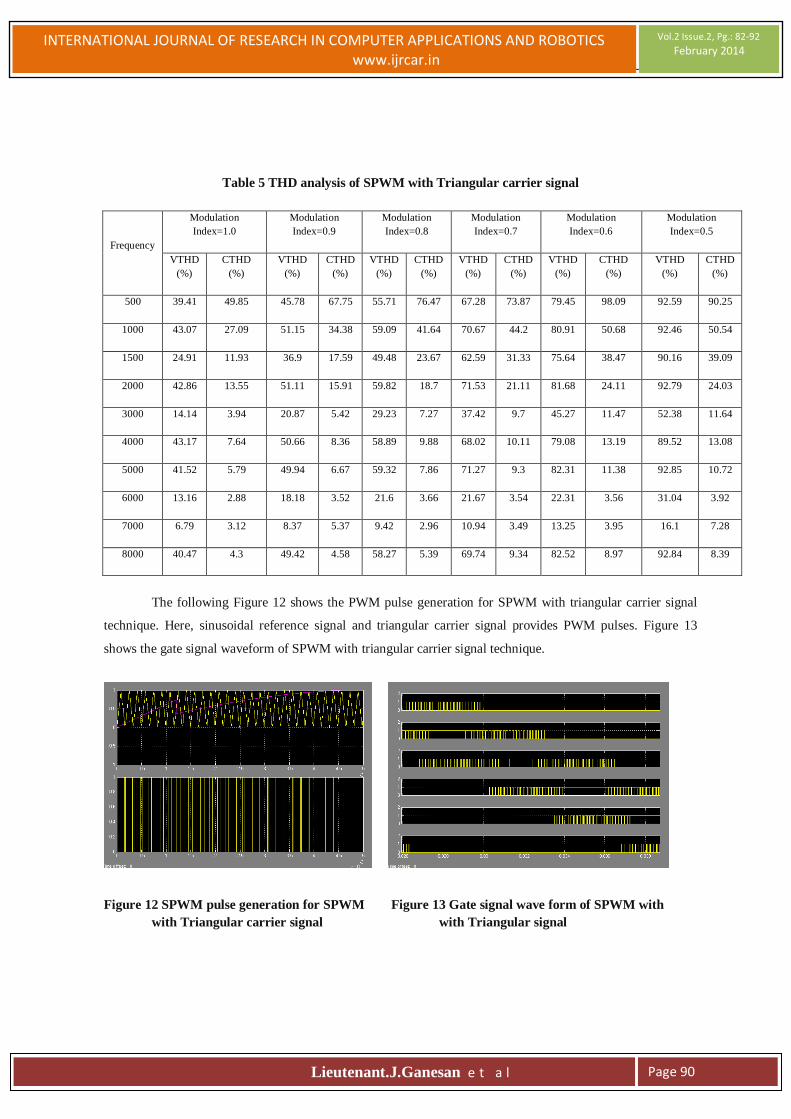
The following Figure 12 shows the PWM pulse generation for SPWM with triangular carrier signal
technique. Here, sinusoidal reference signal and triangular carrier signal provides PWM pulses. Figure 13
shows the gate signal waveform of SPWM with triangular carrier signal technique.
Figure 12 SPWM pulse generation for SPWM Figure 13 Gate signal wave form of SPWM with
with Triangular carrier signal with Triangular signal
91 International Journal of Research in Computer Applications And Robotics, x(x): xx-xx
INTERNATIONAL JOURNAL OF RESEARCH IN COMPUTER APPLICATIONS AND ROBOTICS www.ijrcar.in
Vol.2 Issue.2, Pg.: 82-92
February 2014
Lieutenant.J.Ganesan e t a l
Page 91
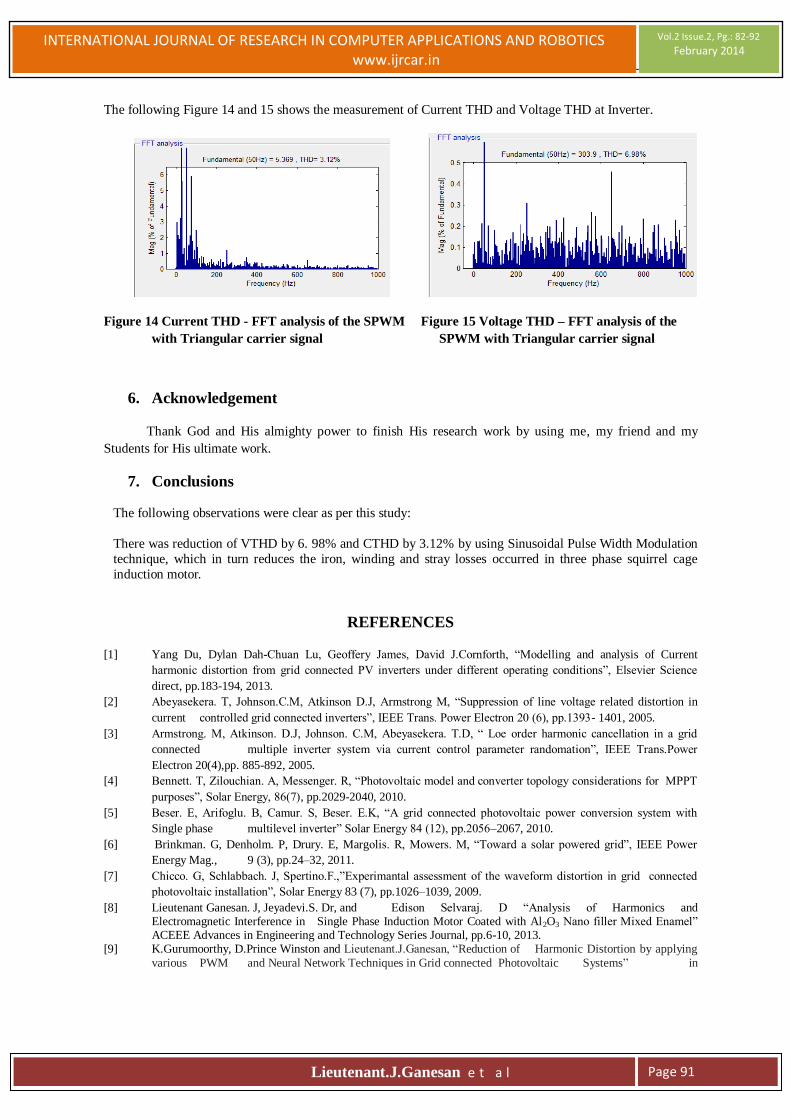
The following Figure 14 and 15 shows the measurement of Current THD and Voltage THD at Inverter.
Figure 14 Current THD - FFT analysis of the SPWM Figure 15 Voltage THD – FFT analysis of the
with Triangular carrier signal SPWM with Triangular carrier signal
6. Acknowledgement
Thank God and His almighty power to finish His research work by using me, my friend and my
Students for His ultimate work.
7. Conclusions
The following observations were clear as per this study:
There was reduction of VTHD by 6. 98% and CTHD by 3.12% by using Sinusoidal Pulse Width Modulation
technique, which in turn reduces the iron, winding and stray losses occurred in three phase squirrel cage
induction motor.
REFERENCES
[1] Yang Du, Dylan Dah-Chuan Lu, Geoffery James, David J.Cornforth, “Modelling and analysis of Current
harmonic distortion from grid connected PV inverters under different operating conditions”, Elsevier Science
direct, pp.183-194, 2013.
[2] Abeyasekera. T, Johnson.C.M, Atkinson D.J, Armstrong M, “Suppression of line voltage related distortion in
current controlled grid connected inverters”, IEEE Trans. Power Electron 20 (6), pp.1393- 1401, 2005.
[3] Armstrong. M, Atkinson. D.J, Johnson. C.M, Abeyasekera. T.D, “ Loe order harmonic cancellation in a grid
connected multiple inverter system via current control parameter randomation”, IEEE Trans.Power
Electron 20(4),pp. 885-892, 2005.
[4] Bennett. T, Zilouchian. A, Messenger. R, “Photovoltaic model and converter topology considerations for MPPT
purposes”, Solar Energy, 86(7), pp.2029-2040, 2010.
[5] Beser. E, Arifoglu. B, Camur. S, Beser. E.K, “A grid connected photovoltaic power conversion system with
Single phase multilevel inverter” Solar Energy 84 (12), pp.2056–2067, 2010.
[6] Brinkman. G, Denholm. P, Drury. E, Margolis. R, Mowers. M, “Toward a solar powered grid”, IEEE Power
Energy Mag., 9 (3), pp.24–32, 2011.
[7] Chicco. G, Schlabbach. J, Spertino.F.,”Experimantal assessment of the waveform distortion in grid connected
photovoltaic installation”, Solar Energy 83 (7), pp.1026–1039, 2009.
[8] Lieutenant Ganesan. J, Jeyadevi.S. Dr, and Edison Selvaraj. D “Analysis of Harmonics and Electromagnetic Interference in Single Phase Induction Motor Coated with Al2O3 Nano filler Mixed Enamel” ACEEE Advances in Engineering and Technology Series Journal, pp.6-10, 2013.
[9] K.Gurumoorthy, D.Prince Winston and Lieutenant.J.Ganesan, “Reduction of Harmonic Distortion by applying
various PWM and Neural Network Techniques in Grid connected Photovoltaic Systems” in

92 International Journal of Research in Computer Applications And Robotics, x(x): xx-xx
INTERNATIONAL JOURNAL OF RESEARCH IN COMPUTER APPLICATIONS AND ROBOTICS www.ijrcar.in
Vol.2 Issue.2, Pg.: 82-92
February 2014
Lieutenant.J.Ganesan e t a l
Page 92
International Journal of Research in Computer Applications and Robotics, Vol.1,Issue 8, pp.25- 29, 2013. [10] A.Mahendran, K.Muthulakshmi, D.Edison Selvaraj and Lieutenant.J.Ganesan, “Design and Implementation of a Fuzzy Logic Controller for Multilevel Inverter Topology” in International Journal of Research in Computer Applications and Robotics, Vol.1,Issue 9, pp.109-116, 2013.
[11] K.Gurumoorthy, D.Prince Winston, D.Edison Selvaraj and Lieutenant.J.Ganesan, “Reduction of Harmonic
Distortion by applying various PWM and Neural Network Techniques in Grid connected Photovoltaic Systems ”
in International Journal Advanced Research in Electrical, Electronics and Instrumentation
Engineering,Vol.2,Issue 12,pp.5892-5899, 2013.