Embed Size (px)
Citation preview

Corporate Overview Financial StatementsManagement Reports
1
Annual Report 2021 - 22
EXPANDINGHORIZONSExploring, Engaging & Empowering

2
Corporate Overview Financial StatementsManagement Reports
Forward-looking statement
In this Annual Report we may have disclosed forward-looking information to enable investors to comprehend our prospects and take
informed investment decisions. This report and other statements - written and oral - that we periodically make, may contain
forward-looking statements that set out anticipated results based on the management’s plans and assumptions. We have tried
wherever possible to identify such statements by using words such as ‘anticipates’, ‘estimates’, ‘expects’, ‘projects’, ‘intends’, ‘plans’,
‘believes’ and words of similar substance in connection with any discussion of future performance.
We cannot guarantee that these forward-looking statements will be realised, although we believe we have been prudent in our
assumptions. The achievement of results is subject to risks, uncertainties and inaccurate assumptions. Should known or unknown risks
or uncertainties materialise or should underlying assumptions prove inaccurate, our actual results could vary materially from those
anticipated, estimated or projected. Readers should bear this in mind.
We undertake no obligation to publicly update any forward-looking statements, whether as a result of new information, future events
or otherwise.
Note: Across this report, the word ‘Chola’ refers to ‘Cholamandalam Investment and Finance Company Limited.’

Corporate Overview Financial StatementsManagement Reports
3
Forward-looking statement
In this Annual Report we may have disclosed forward-looking information to enable investors to comprehend our prospects and take
informed investment decisions. This report and other statements - written and oral - that we periodically make, may contain
forward-looking statements that set out anticipated results based on the management’s plans and assumptions. We have tried
wherever possible to identify such statements by using words such as ‘anticipates’, ‘estimates’, ‘expects’, ‘projects’, ‘intends’, ‘plans’,
‘believes’ and words of similar substance in connection with any discussion of future performance.
We cannot guarantee that these forward-looking statements will be realised, although we believe we have been prudent in our
assumptions. The achievement of results is subject to risks, uncertainties and inaccurate assumptions. Should known or unknown risks
or uncertainties materialise or should underlying assumptions prove inaccurate, our actual results could vary materially from those
anticipated, estimated or projected. Readers should bear this in mind.
We undertake no obligation to publicly update any forward-looking statements, whether as a result of new information, future events
or otherwise.
Note: Across this report, the word ‘Chola’ refers to ‘Cholamandalam Investment and Finance Company Limited.’
03
Cholamandalam Investment and Finance Company Limited Annual Report 2021 - 22
Chola has a growing presence in the financial market despite the pandemic. Chola extended beyond and explored new horizons to cater to the changing needs of millions of customers. Chola launched two new businesses, Consumer & Small Enterprise Loan and Secured Business & Personal Loan. Chola acquired Payswiff Technologies Private Limited and also invested in Paytail Commerce Private Limited to participate in the fintech space. With a focus on end-to-end digitization, Chola continues to push digital transformation at the forefront. FY 22 has been a year of Expanding Horizons for Chola.
EXPANDINGHORIZONSExploring, Engaging & Empowering

4
Corporate Overview Financial StatementsManagement ReportsCholamandalam Investment and Finance Company Limited Annual Report 2021 - 22
CONTENTS
Ms. P. Sujatha
Phone: 044 40907172 (B) 40907055 (D)
Fax: 044 25346464
E-mail: [email protected]
SECRETARY
Board’s Report32
Management Discussion and Analysis52
Report on Corporate Governance60
General Shareholders Information72
Business Responsibility Report78
MANAGEMENT REPORTS
Dare House, No. 2, N.S.C. Bose Road, Parrys,
Chennai - 600 001
REGISTERED OFFICE
L65993TN1978PLC007576
CORPORATE IDENTITY NUMBER
AUDITORS
M/s. Price Waterhouse LLP252, Veer Savarkar Marg, Shivaji Park, Dadar (West), Mumbai 400028
M/s. Sundaram & Srinivasan,Chartered Accountants,23,CP Ramaswamy Road, Alwarpet,Chennai 600018
REGISTRAR & SHARE TRANSFER AGENT
KFin Technologies Limited(Formely KFin Technologies Private Limited)
Selenium Tower B, Plot 31-32, Gachibowli, Financial District, Nanakramguda, Hyderabad - 500 032Phone: 040 67162222 | Toll-free No.: 1800-309-4001Fax: 040 23420814
Standalone Financial Statements85
Consolidated Financial Statements183
FINANCIAL STATEMENTS
270 GLOSSARY
CORPORATE OVERVIEW
Corporate Information04
Message From The Chairman10
Board of Directors12
Pan India Presence15
Business Highlights16
Business Review18
CSR Initiatives29
Financial Highlights30
CORPORATE INFORMATION
BOARD OF DIRECTORS
Mr. Vellayan Subbiah
Mr. N. Ramesh Rajan
Mr. Ashok Kumar Barat
Mr. Anand Kumar
Ms. Bhama Krishnamurthy
Mr. Bharath Vasudevan
Mr. M.A.M. Arunachalam
Mr. Rohan Verma
Mr. Ravindra Kumar Kundu
04

Corporate Overview Financial StatementsManagement Reports
5
Cholamandalam Investment and Finance Company Limited Annual Report 2021 - 22
CONTENTS
Ms. P. Sujatha
Phone: 044 40907172 (B) 40907055 (D)
Fax: 044 25346464
E-mail: [email protected]
SECRETARY
Board’s Report32
Management Discussion and Analysis52
Report on Corporate Governance60
General Shareholders Information72
Business Responsibility Report78
MANAGEMENT REPORTS
Dare House, No. 2, N.S.C. Bose Road, Parrys,
Chennai - 600 001
REGISTERED OFFICE
L65993TN1978PLC007576
CORPORATE IDENTITY NUMBER
AUDITORS
M/s. Price Waterhouse LLP252, Veer Savarkar Marg, Shivaji Park, Dadar (West), Mumbai 400028
M/s. Sundaram & Srinivasan,Chartered Accountants,23,CP Ramaswamy Road, Alwarpet,Chennai 600018
REGISTRAR & SHARE TRANSFER AGENT
KFin Technologies Limited(Formely KFin Technologies Private Limited)
Selenium Tower B, Plot 31-32, Gachibowli, Financial District, Nanakramguda, Hyderabad - 500 032Phone: 040 67162222 | Toll-free No.: 1800-309-4001Fax: 040 23420814
Standalone Financial Statements85
Consolidated Financial Statements183
FINANCIAL STATEMENTS
270 GLOSSARY
CORPORATE OVERVIEW
Corporate Information04
Message From The Chairman10
Board of Directors12
Pan India Presence15
Business Highlights16
Business Review18
CSR Initiatives29
Financial Highlights30
CORPORATE INFORMATION
BOARD OF DIRECTORS
Mr. Vellayan Subbiah
Mr. N. Ramesh Rajan
Mr. Ashok Kumar Barat
Mr. Anand Kumar
Ms. Bhama Krishnamurthy
Mr. Bharath Vasudevan
Mr. M.A.M. Arunachalam
Mr. Rohan Verma
Mr. Ravindra Kumar Kundu
04
Cholamandalam Investment and Finance Company Limited Annual Report 2021 - 22
CHOLA’S STATEMENT OF PURPOSE
05
BELIEVE IN INDIAOur beliefs are the heart of our passion, the genes of our genius. We believe India is rising and it will con�nue to
rise. Because, the wisdom of our ancient civiliza�on is now being powered by the aspira�ons of one of the world's youngest popula�ons.
BELIEVE IN CHOLAWe believe that Chola is uniquely placed to fulfil these aspira�ons. Armed with a workforce, charged by the
fearless spirit of youth, each of our businesses gives wings to the dreams of millions of young Indians. Dreams that will power and propel Chola to the pinnacle of progress. We believe we will achieve this fully, by championing
our values. Values that allow us to be transparent and grow, so that young India with dreamscan come to us in faith and leave fulfilled.
This is our purpose.
And every great cause calls for great leadership. Marching under a banner of meritocracy, we believe in growing great leaders from within. Leaders who are young. Leaders who will make today be�er than yesterday.
Through transparency, through teamwork, we believe that each one of us is this leader. That each one of us can make a difference. Not just for our customers, but also for our country.
BELIEVE IN YOURSELFOnly one person controls your des�ny. That person is you! Chola trusts you and believes in you, so believe in
yourself. Believe that you will create Chola of the future.

6
Corporate Overview Financial StatementsManagement ReportsCholamandalam Investment and Finance Company Limited Annual Report 2021 - 22
OUR VISIONEnable Customers to Enter a Be�er Life.
Cholamandalam Investment and Finance Company Limited (Chola) was incorporated in 1978 as the financial services arm of the Murugappa Group. Chola commenced business as an equipment financing company and has today emerged as a comprehensive financial services provider offering vehicle finance, home loans, loan against property, SME loans, consumer & small enterprise loan, secured business & personal loan, insurance agency, mutual fund distribu�on and a variety of other financial services to customers.
Chola operates from 1,145 branches across India with Assets Under Management above `82,000 Crores.The subsidiaries of Chola are Cholamandalam Securi�es Limited, Cholamandalam Home Finance Limited and Payswiff Technologies Private Limited.
OUR MISSION
Key Facts
1,145 BranchesNa�onwide
AUM- INR
82,000+ Crores18.7+ lakh customers
ABOUT CHOLA
Switch from product focused to customer focused
Customer FirstLong term Customer focus requires
profitability and sustainability
Improving Efficiencies
People are our Primary Asset. Happier people = Happier Customers
People Power
06

Corporate Overview Financial StatementsManagement Reports
7
Cholamandalam Investment and Finance Company Limited Annual Report 2021 - 22
OUR VISIONEnable Customers to Enter a Be�er Life.
Cholamandalam Investment and Finance Company Limited (Chola) was incorporated in 1978 as the financial services arm of the Murugappa Group. Chola commenced business as an equipment financing company and has today emerged as a comprehensive financial services provider offering vehicle finance, home loans, loan against property, SME loans, consumer & small enterprise loan, secured business & personal loan, insurance agency, mutual fund distribu�on and a variety of other financial services to customers.
Chola operates from 1,145 branches across India with Assets Under Management above `82,000 Crores.The subsidiaries of Chola are Cholamandalam Securi�es Limited, Cholamandalam Home Finance Limited and Payswiff Technologies Private Limited.
OUR MISSION
Key Facts
1,145 BranchesNa�onwide
AUM- INR
82,000+ Crores18.7+ lakh customers
ABOUT CHOLA
Switch from product focused to customer focused
Customer FirstLong term Customer focus requires
profitability and sustainability
Improving Efficiencies
People are our Primary Asset. Happier people = Happier Customers
People Power
06
Cholamandalam Investment and Finance Company Limited Annual Report 2021 - 22
07
PRODUCTS WE OFFER
ONLINE PAYMENTGATEWAY SERVICES

8
Corporate Overview Financial StatementsManagement ReportsCholamandalam Investment and Finance Company Limited Annual Report 2021 - 22
ABOUT MURUGAPPA GROUP
08
Founded in 1900, the INR 417 Billion Murugappa Group is one of India's leading business conglomerates. The Group has 29 businesses including ten listed Companies traded in NSE & BSE. Headquartered in Chennai, the major companies of the Group include Carborundum Universal Ltd., CG Power and Industrial Solu�ons Ltd., Cholamandalam Financial Holdings Ltd., Cholamandalam Investment and Finance Company Ltd., Cholamandalam MS General Insurance Company Ltd., Coromandel Interna�onal Ltd., Coromandel Engineering Company Ltd., E.I.D. Parry (India) Ltd., Parry Agro Industries Ltd., Shanthi Gears Ltd., Tube Investments of India Ltd. and Wendt (India) Ltd.
Market leaders in served segments including Abrasives, Auto Components, Transmission systems, Cycles, Sugar, Farm Inputs, Fer�lisers, Planta�ons, Bio-products and Nutraceu�cals, the Group has forged strong alliances with leading interna�onal companies such as Groupe Chimique Tunisien, Foskor, Mitsui Sumitomo, Morgan Advanced Materials, Sociedad Química y Minera de Chile (SQM), Yanmar & Co. and Compagnie Des Phosphat De Gafsa (CPG). The Group has a wide geographical presence all over India and spanning 6 con�nents.
Renowned brands like BSA, Hercules, Montra, Mach City, Ballmaster, Ajax, Parry’s, Chola, Gromor, Shanthi Gears and Paramfos are from the Murugappa stable. The Group fosters an environment of professionalism and has a workforce of over 51,000 employees.
For more details, visit www.murugappa.com

Corporate Overview Financial StatementsManagement Reports
9
Cholamandalam Investment and Finance Company Limited Annual Report 2021 - 22
ABOUT MURUGAPPA GROUP
08
Founded in 1900, the INR 417 Billion Murugappa Group is one of India's leading business conglomerates. The Group has 29 businesses including ten listed Companies traded in NSE & BSE. Headquartered in Chennai, the major companies of the Group include Carborundum Universal Ltd., CG Power and Industrial Solu�ons Ltd., Cholamandalam Financial Holdings Ltd., Cholamandalam Investment and Finance Company Ltd., Cholamandalam MS General Insurance Company Ltd., Coromandel Interna�onal Ltd., Coromandel Engineering Company Ltd., E.I.D. Parry (India) Ltd., Parry Agro Industries Ltd., Shanthi Gears Ltd., Tube Investments of India Ltd. and Wendt (India) Ltd.
Market leaders in served segments including Abrasives, Auto Components, Transmission systems, Cycles, Sugar, Farm Inputs, Fer�lisers, Planta�ons, Bio-products and Nutraceu�cals, the Group has forged strong alliances with leading interna�onal companies such as Groupe Chimique Tunisien, Foskor, Mitsui Sumitomo, Morgan Advanced Materials, Sociedad Química y Minera de Chile (SQM), Yanmar & Co. and Compagnie Des Phosphat De Gafsa (CPG). The Group has a wide geographical presence all over India and spanning 6 con�nents.
Renowned brands like BSA, Hercules, Montra, Mach City, Ballmaster, Ajax, Parry’s, Chola, Gromor, Shanthi Gears and Paramfos are from the Murugappa stable. The Group fosters an environment of professionalism and has a workforce of over 51,000 employees.
For more details, visit www.murugappa.com
Cholamandalam Investment and Finance Company Limited Annual Report 2021 - 22
09
OUR JOURNEY
2022
FY 1979Commenced equipment financing
FY 2006-102010
Sold AMC Business | Focus on Secured Lending Lines(Vehicle Finance, Home Equity)
2009Exited Consumer Finance Business
2008Rights issue of ` 200 Cr
2007Commenced Home Equity Business
2006JV with DBS Bank, Singapore |
Commenced Consumer Finance
FY 2016-202020
AUM crossed ₹ 66k Cr | Increased branch network to 1091 |Maiden issue of Masala Bonds with CDC and ECB with IFC |
Equity infusion of ₹ 1200 Cr (QIP & Pref issue)2019
AUM crossed ₹ 54k Cr | PAT crossed ₹ 1000 Cr |Increased branch network to 900
2018 AUM crossed ₹ 43k Cr |
Increased branch network to 873 2017
AUM crossed ₹ 35k Cr |Adopted GNPA recogni�on at 90 days |
Increased branch network to 703 |Setup of GaadiBazaar Dealer Pla�orm
2016Adopted GNPA recogni�on at 120 days |
Total AUM crossed ₹ 30k Cr
Acquired Payswiff Technologies Pvt. Ltd |
Highest disbursement in the history of Chola |
AUM crossed ₹82k Cr |
Launched Consumer & Small Enterprise Loan (CSEL),
Secured Business & Personal Loan (SBPL)
FY 2011-15
2015 Adopted GNPA recogni�on at 150 Days |
Increased branch network to 534
2014AUM crossed ₹ 24k Cr | Commenced CE Business
2013AUM crossed ₹ 19k Cr | Commenced HL Business |
Increased VF branch network to 473
2012AUM crossed ₹ 13k Cr | Commenced tractor business
2011Obtained AFC status | Terminated JV with DBS |
Launch of Mobile App
FY 1990-2005Commenced vehicle finance business
Started Chola Securi�es | Started Chola Distribu�on
FY 20212021
AUM crossed ₹ 76k Cr |Increased branch network to 1137
- - - - - - - - - - - - - - - - - - - -
- - - - - - - - - - - - - - - - - - -
- - - - - - - - - - - - - - - - - - - - - -
- - - - - - - - - - - - - - - - - - - - - -
- - - - - - - - - - - - - - - - - - - - - -
- - - - - - - - - - - - - - - - - - - FY 2022
- - - - - - - - - - - - - - - - - - - - - -

10
Corporate Overview Financial StatementsManagement ReportsCholamandalam Investment and Finance Company Limited Annual Report 2021 - 22
10
MESSAGE FROM THE CHAIRMAN
Dear Shareholders,
FY 21 ended with hope that the COVID-19 pandemic was finally behind us. However, the second wave of the pandemic affected the lives and jobs of millions of Indians in the 1st quarter of FY 22. Through this phase, team Chola worked �relessly to ensure the health and safety of our people and their families. Our learnings from the first wave enabled us to be nimble and alter ‘ways of working’ to ensure business con�nuity and rapid return to normalcy. Despite the changing world order, driven primarily by the pandemic and unstable geo-poli�cal situa�on, I am very pleased to inform that your company con�nues to grow from strength to strength - closing the year with the best-ever disbursals, collec�ons, and profitability in Q4 of FY 22.
Last year, we embarked on a journey to chalk-out Chola’s strategy for the next decade. We have successfully put in place the building blocks for the next wave of profitable growth, thereby making FY 22 the year of ‘Expanding Horizons’.
I would like to highlight a few of the key ini�a�ves that we launched:
1. Ecosystem focus - Planned and well deliberated expansion across SME and consumer ecosystems through three new business lines:
a. Consumer and Small Enterprise Loans - focused on business loans, professional loans, and personal loans.
b. Secured Business and Personal Loans - focused on secured business loan against self-occupied residen�al property or commercial cum-residen�al property as collateral.
c. SME Loans - a wide suite of products including supply chain financing, term loans for capex, loan against shares, funding on hypotheca�on of machinery for specific industries, etc. to India’s SMEs.
2. Strategic acquisi�on of stake in Payswiff technologies Private Limited, a payments solu�on provider in India and Paytail Commerce Private Limited, a Fintech focused on offline Buy-now-pay-later through brand partnerships.
3. Strengthened the tech infrastructure to enhance flexibility, modularity, security, and scalability of our systems.
4. Adop�on of ‘Lean’ and ‘Kaizen’ at an organiza�on level to drive process efficiencies and reduce risk across all businesses and func�ons.
5. Development of Environmental, Social, and Governance (ESG) framework, thereby enhancing our posi�on as a responsible lender.
Industry Review
Despite the impact of the pandemic on the first quarter, most segments have shown posi�ve recovery trends. The Government has taken mul�ple steps to help overall business sen�ment.

Corporate Overview Financial StatementsManagement Reports
11
Cholamandalam Investment and Finance Company Limited Annual Report 2021 - 22
10
MESSAGE FROM THE CHAIRMAN
Dear Shareholders,
FY 21 ended with hope that the COVID-19 pandemic was finally behind us. However, the second wave of the pandemic affected the lives and jobs of millions of Indians in the 1st quarter of FY 22. Through this phase, team Chola worked �relessly to ensure the health and safety of our people and their families. Our learnings from the first wave enabled us to be nimble and alter ‘ways of working’ to ensure business con�nuity and rapid return to normalcy. Despite the changing world order, driven primarily by the pandemic and unstable geo-poli�cal situa�on, I am very pleased to inform that your company con�nues to grow from strength to strength - closing the year with the best-ever disbursals, collec�ons, and profitability in Q4 of FY 22.
Last year, we embarked on a journey to chalk-out Chola’s strategy for the next decade. We have successfully put in place the building blocks for the next wave of profitable growth, thereby making FY 22 the year of ‘Expanding Horizons’.
I would like to highlight a few of the key ini�a�ves that we launched:
1. Ecosystem focus - Planned and well deliberated expansion across SME and consumer ecosystems through three new business lines:
a. Consumer and Small Enterprise Loans - focused on business loans, professional loans, and personal loans.
b. Secured Business and Personal Loans - focused on secured business loan against self-occupied residen�al property or commercial cum-residen�al property as collateral.
c. SME Loans - a wide suite of products including supply chain financing, term loans for capex, loan against shares, funding on hypotheca�on of machinery for specific industries, etc. to India’s SMEs.
2. Strategic acquisi�on of stake in Payswiff technologies Private Limited, a payments solu�on provider in India and Paytail Commerce Private Limited, a Fintech focused on offline Buy-now-pay-later through brand partnerships.
3. Strengthened the tech infrastructure to enhance flexibility, modularity, security, and scalability of our systems.
4. Adop�on of ‘Lean’ and ‘Kaizen’ at an organiza�on level to drive process efficiencies and reduce risk across all businesses and func�ons.
5. Development of Environmental, Social, and Governance (ESG) framework, thereby enhancing our posi�on as a responsible lender.
Industry Review
Despite the impact of the pandemic on the first quarter, most segments have shown posi�ve recovery trends. The Government has taken mul�ple steps to help overall business sen�ment.
Cholamandalam Investment and Finance Company Limited Annual Report 2021 - 22
11
Vehicle Finance
• The Commercial Vehicle industry grew by 26% in FY 22 due to factors such as pent-up demand for light commercial vehicles, last mile connec�vity of small commercial vehicles and low base effect of previous year for heavy commercial vehicles.
• The Passenger Vehicle (Car & MUV) segment had a growth of 14% in FY 22 supported by improved semiconductor supplies towards the end of the year and increased demand for u�lity vehicles due to a shi� in customer preferences.
• The Two-wheeler industry grew by 11% in FY 22, this segment rebounded from the impact of the pandemic on rural demand.
• Used vehicle business contributed to 33% of disbursement volumes and was the least impacted segment in FY 22 indica�ng a cau�ous approach by customers towards buying new vehicles due to the macro-economic environment.
• The Construc�on Equipment segment had a marginal growth of 8% in FY 22 due to increasing cost of equipment prices, muted rentals and monsoon related impediments which impacted the road and construc�on sector.
• The Tractor industry had a minimal growth of 6% in FY 22 a�ributed by the huge base in FY 21, which was the ever all-�me high for tractor sales in India.
Loan Against Property
Loan Against Property (LAP) por�olio across NBFCs is es�mated to have grown 3% in FY 22, with many players shi�ing their focus to non-LAP por�olio in second half of FY 22 driven primarily by normalizing of business ac�vity.
Home Loans
Affordable housing por�olio across NBFCs and HFCs is es�mated to have grown at 13-14% in FY 22. The second wave hampered loan o�ake in the first quarter of FY 22. However, the second half of FY 22 witnessed recovery, driven by pent-up demand in housing, assistance from state and central Government schemes, increase in penetra�on by affordable HFCs in �er II and III ci�es, and a milder impact of the 3rd wave.
Company Review
Your company has achieved record disbursement in Q4 FY 22 of ̀12,718 Cr. and overall ̀35,490 Cr. in FY 22 (58% and 36%
growth respec�vely). We achieved a business AUM growth of
10% YoY reaching ̀76,907 Cr. PBT stood at ̀929 Cr. for Q4 FY 22 (187% Growth) and ̀ 2,891 Cr. for FY 22 (42% Growth).
With the changing market condi�ons, the regulators con�nued to be pro-ac�vely issuing new controls to steer the economy towards growth. The RBI, in par�cular, has made significant changes to regulatory requirements in the NBFC sector. I am happy to inform you that we have been very agile and responsive to these requirements, across all areas including NPA recogni�on and provisioning methodologies.
Chola’s well-structured ALM and market risk management enabled us to get the best out of the so� interest regime supported by the RBI, with our cost of funds among the best in our peer group.
Your company’s focus on CSR ac�vi�es con�nued during the year. As in other years we ensured that the budget was fully u�lised, and all the approved programs were implemented effec�vely. We also par�cipated in the efforts of the Government in providing support to the community during the pandemic.
Our long-term outlook for the Indian economy con�nues to remain bullish, driven by the changing geo-poli�cal scenario and the proac�ve steps taken by the Government to drive manufacturing in India. Chola’s legacy and strong pla�orm coupled with the new ini�a�ves gives us confidence to scale new heights and remain a relevant player in the country.
Our employees con�nue to be the greatest strength of Chola. As always, they have worked with extraordinary commitment during the last year. I express my gra�tude to all our employees and their families for their sustained support during these tough �mes. I would like to thank the Board for their guidance and support. I would also like to thank our customers, bankers, ra�ng agencies and business partners for their con�nued trust and patronage.
On behalf of the Board of Directors of Chola I wish to thank you all for your con�nued trust, confidence, and support.
Best wishes,
Vellayan Subbiah Chairman

12
Corporate Overview Financial StatementsManagement ReportsCholamandalam Investment and Finance Company Limited Annual Report 2021 - 22
12
BOARD OF DIRECTORS
Mr. Vellayan Subbiah (52 years) DIN: 01138759
Chairman & Non-Execu�ve Director
Holds a Bachelor of Technology in Civil Engineering from IIT Madras and an MBA from the University of Michigan.
Has over 25 years of experience in the varied fields of consul�ng, technology, projects, financial services and engineering in different posi�ons across different industries.
Has worked with Mckinsey and Company, 24/7 Customer Inc. etc.
Was a recipient of the Extraordinary Entrepreneur of the Year - TiECON 2014 Award.
Was the Managing Director of Tube Investments of India Limited (TII) from August, 2017 to March, 2022. Is the Execu�ve Vice Chairman of TII effec�ve 1 April, 2022.
Is the Chairman of CG Power and Industrial Solu�ons Limited and a director on the Boards of various other companies including SRF Limited and Cholamandalam Financial Holdings Limited.
Was the Managing Director of Chola from August, 2010 to August, 2017. Has been the Chairman of Chola effec�ve 12 November, 2020.
Mr. N. Ramesh Rajan(65 years) DIN: 01628318
Independent Director
Graduate in Commerce, a fellow member of the Ins�tute of Chartered Accountants of India.
Has 40 years of experience in the fields of finance, strategy and opera�ons.
Was the Chairman and Senior Partner, PwC India responsible for overall strategy and opera�ons of all PwC en��es in India.
As Chairman & Senior Partner had represented India on the Global Strategy Council of PwC Interna�onal and served as a member on PwC’s Central Cluster led by PwC, UK.
Is the founder and senior partner of LeapRidge Advisors LLP.
Is the Chairman of Indo Na�onal Limited and is also on the Boards of TTK Healthcare Limited, Kineco Limited and Rane (Madras) Limited.
Joined the Board of Chola on 30 October, 2018.
Graduate in Commerce, a Fellow member of the Ins�tute of Chartered Accountants of India, Ins�tute of Company Secretaries of India, Associate of the Ins�tute of Chartered Accountants of England & Wales and CPA (Australia). Is a cer�fied Mediator empanelled with the Ministry of Corporate Affairs, Government of India.
Re�red in 2016 as the Managing Director and Chief Execu�ve Officer of Forbes & Company Limited. Has held leadership posi�ons in various Indian and mul�na�onal organiza�ons, both in India and overseas - Hindustan Lever Limited, RPG Group, Pepsi, Electrolux, Telstra, and Heinz.
Is a director on the Boards of DCB Bank, Mahindra Intertrade, Bata, Huhtamaki, Alembic Pharmaceu�cals and Birlaso�. Is a Member of Managing Commi�ee of ASSOCHAM.
Is the past President of the Bombay Chamber of Commerce and Industry and The Council of EU Chambers of Commerce in India.
Joined the Board of Chola on 31 October, 2017.
Mr. Ashok Kumar Barat(65 years) DIN: 00492930
Independent Director

Corporate Overview Financial StatementsManagement Reports
13
Cholamandalam Investment and Finance Company Limited Annual Report 2021 - 22
12
BOARD OF DIRECTORS
Mr. Vellayan Subbiah (52 years) DIN: 01138759
Chairman & Non-Execu�ve Director
Holds a Bachelor of Technology in Civil Engineering from IIT Madras and an MBA from the University of Michigan.
Has over 25 years of experience in the varied fields of consul�ng, technology, projects, financial services and engineering in different posi�ons across different industries.
Has worked with Mckinsey and Company, 24/7 Customer Inc. etc.
Was a recipient of the Extraordinary Entrepreneur of the Year - TiECON 2014 Award.
Was the Managing Director of Tube Investments of India Limited (TII) from August, 2017 to March, 2022. Is the Execu�ve Vice Chairman of TII effec�ve 1 April, 2022.
Is the Chairman of CG Power and Industrial Solu�ons Limited and a director on the Boards of various other companies including SRF Limited and Cholamandalam Financial Holdings Limited.
Was the Managing Director of Chola from August, 2010 to August, 2017. Has been the Chairman of Chola effec�ve 12 November, 2020.
Mr. N. Ramesh Rajan(65 years) DIN: 01628318
Independent Director
Graduate in Commerce, a fellow member of the Ins�tute of Chartered Accountants of India.
Has 40 years of experience in the fields of finance, strategy and opera�ons.
Was the Chairman and Senior Partner, PwC India responsible for overall strategy and opera�ons of all PwC en��es in India.
As Chairman & Senior Partner had represented India on the Global Strategy Council of PwC Interna�onal and served as a member on PwC’s Central Cluster led by PwC, UK.
Is the founder and senior partner of LeapRidge Advisors LLP.
Is the Chairman of Indo Na�onal Limited and is also on the Boards of TTK Healthcare Limited, Kineco Limited and Rane (Madras) Limited.
Joined the Board of Chola on 30 October, 2018.
Graduate in Commerce, a Fellow member of the Ins�tute of Chartered Accountants of India, Ins�tute of Company Secretaries of India, Associate of the Ins�tute of Chartered Accountants of England & Wales and CPA (Australia). Is a cer�fied Mediator empanelled with the Ministry of Corporate Affairs, Government of India.
Re�red in 2016 as the Managing Director and Chief Execu�ve Officer of Forbes & Company Limited. Has held leadership posi�ons in various Indian and mul�na�onal organiza�ons, both in India and overseas - Hindustan Lever Limited, RPG Group, Pepsi, Electrolux, Telstra, and Heinz.
Is a director on the Boards of DCB Bank, Mahindra Intertrade, Bata, Huhtamaki, Alembic Pharmaceu�cals and Birlaso�. Is a Member of Managing Commi�ee of ASSOCHAM.
Is the past President of the Bombay Chamber of Commerce and Industry and The Council of EU Chambers of Commerce in India.
Joined the Board of Chola on 31 October, 2017.
Mr. Ashok Kumar Barat(65 years) DIN: 00492930
Independent Director
Cholamandalam Investment and Finance Company Limited Annual Report 2021 - 22
13
Mr. Anand Kumar (54 years) DIN: 00818724
Independent Director
Holds an MBA from Vanderbilt University, United States of America.
Is a co-founder and Partner of Gateway Partners, an investment firm focused on growth capital and strategic opportuni�es across markets in Southeast Asia, South Asia, the Middle East and Africa.
Has over 29 years of experience in investments, mergers & acquisi�ons, equity capital markets and leveraged finance in South and Southeast Asia with a strong network of rela�onships in the region.
Prior to co-founding Gateway Partners in 2014, has held leadership posi�ons in several leading investment banks including Standard Chartered Bank and Morgan Stanley.
Is a non-execu�ve director of TVS Supply Chain Solu�ons Limited and independent director of Tube Investments of India Limited and a few other companies in India and abroad.
Joined the Board of Chola on 16 March, 2021.
Holds a masters degree in science from Mumbai University.
Has a career spanning over 37 years in IDBI (now IDBI Bank) and SIDBI, an Apex Development Bank for MSMEs in India covering almost all areas of development banking opera�ons.
Has varied management and leadership experience in resource raising, forex, treasury opera�ons, credit dispensa�on and management, risk management, credit func�on, head of branch opera�ons and human resources division.
Was on the Boards of various venture capital companies, CIBIL, SBI Global Factors as a nominee director of SIDBI.
Is on the boards of various companies including Reliance Industrial Infrastructure Limited, Network18 Media and Investments Limited, Five Star Business Finance Limited, Muthoot Microfin Limited, CSB Bank Limited, Thirumalai Chemicals Limited, Poonawalla Housing Finance Limited and e-Eighteen.com Limited.
Joined the Board of Chola on 31 July, 2019.
Ms. Bhama Krishnamurthy(67 years) DIN: 02196839
Independent Director
Holds a B.Tech in Mechanical Engineering from IIT Madras and MBA from Indian Ins�tute of Management - Bangalore.
Has over 25 years of experience in the fields of financial services, risk management, product management, treasury, digital marke�ng, data science and technology.
Is the Chief Revenue Officer of Trust IQ Pvt. Ltd., an advanced data science and technology company and one of the largest providers of credit risk profile in Asia.
Was the Enterprise Risk Officer and Head of Risk, Analy�cs and Underwri�ng func�ons of Bajaj Finance Limited between 2014 and 2018.
Was the Regional Head of Risk Analy�cs, Head of Por�olio Management Division in Standard Chartered Bank.
Spent 9 years at Capital One, USA, driving numerous advanced analy�c led strategies in the Risk and Product domains.
Joined the Board of Chola on 16 March, 2021.
Mr. Bharath Vasudevan (47 years) DIN: 09104808
Independent Director
BOARD OF DIRECTORS

14
Corporate Overview Financial StatementsManagement ReportsCholamandalam Investment and Finance Company Limited Annual Report 2021 - 22
14
Mr. Rohan Verma(36 years) DIN: 01797489
Independent Director
Holds a Bachelor degree in Electrical Engineering from Stanford University and an MBA from London Business School.
Is a recipient of the President’s Award for Academic excellence in Stanford University and Dean’s List and Dis�nc�on Award from London Business School.
Is an Entrepreneur and a technology thought leader who created India’s very first interac�ve mapping portal mapmyindia.com at the age of 19 and has since built many technology innova�ons in the maps and loca�on space.
Is the chief execu�ve officer and execu�ve director of C.E. Info Systems Limited (MapmyIndia), India’s leading maps, naviga�on, loca�on technologies and GPS IoT company incorporated in 1992.
Is the Founder and Chairman of Infidreams Industries Private Limited, focused on crea�ng social good through technology.
Is a member of the FICCI Young Leaders Forum.
Joined the Board of Chola on 25 March, 2019.
Mr. M.A.M. Arunachalam(55 years) DIN: 00202958Non-Execu�ve Director
Mr. M.A.M. Arunachalam (also referred as Mr. Arun Murugappan) studied at the Doon School, Dehradun, holds a Bachelor degree in Commerce from Loyola College, Chennai and an MBA from the University of Chicago, USA.
Is the Execu�ve Chairman of Tube Investments of India Limited (TII) effec�ve 1 April, 2022 and was the non-execu�ve Chairman of TII from 11 November, 2020 to 31 March, 2022.
Is the Chairman of Shanthi Gears Limited, Parry Enterprises India Limited, Cholamandalam Home Finance Limited and TI Clean Mobility Private Limited.
Is also on the Boards of CG Power and Industrial Solu�ons Limited, Great Cycles and Crea�ve Cycles.
Joined the Board of Chola on 29 January, 2021.
Mr. Ravindra Kumar Kundu(54 years) DIN: 07337155
Execu�ve Director
Graduate in Commerce and has completed Post Graduate Programme in Management for Senior Execu�ves from the Kellogg School of Management, Indian School of Business and an Execu�ve Programme in Global Business Management from the Indian Ins�tute of Management Calcu�a.
Over 34 years of professional experience in automobile and financial services industry including 22 years in Chola.
Joined Chola as Senior Execu�ve - Marke�ng in the year 2000 and handled various func�ons including credit, collec�ons before taking up the role of Business Head of Vehicle Finance division of Chola.
Instrumental in growth of the Vehicle Finance business AUM from `20,000 crores to `52,000 crores.
Is the Chairman of Payswiff Technologies Private Limited.
Is also on the Boards of Cholamandalam Securi�es Limited, White Data Systems India Private Limited and Cholamandalam Home Finance Limited.
Has been the Execu�ve Director of Chola since 23 January, 2020.
BOARD OF DIRECTORS

Corporate Overview Financial StatementsManagement Reports
15
Cholamandalam Investment and Finance Company Limited Annual Report 2021 - 22
14
Mr. Rohan Verma(36 years) DIN: 01797489
Independent Director
Holds a Bachelor degree in Electrical Engineering from Stanford University and an MBA from London Business School.
Is a recipient of the President’s Award for Academic excellence in Stanford University and Dean’s List and Dis�nc�on Award from London Business School.
Is an Entrepreneur and a technology thought leader who created India’s very first interac�ve mapping portal mapmyindia.com at the age of 19 and has since built many technology innova�ons in the maps and loca�on space.
Is the chief execu�ve officer and execu�ve director of C.E. Info Systems Limited (MapmyIndia), India’s leading maps, naviga�on, loca�on technologies and GPS IoT company incorporated in 1992.
Is the Founder and Chairman of Infidreams Industries Private Limited, focused on crea�ng social good through technology.
Is a member of the FICCI Young Leaders Forum.
Joined the Board of Chola on 25 March, 2019.
Mr. M.A.M. Arunachalam(55 years) DIN: 00202958Non-Execu�ve Director
Mr. M.A.M. Arunachalam (also referred as Mr. Arun Murugappan) studied at the Doon School, Dehradun, holds a Bachelor degree in Commerce from Loyola College, Chennai and an MBA from the University of Chicago, USA.
Is the Execu�ve Chairman of Tube Investments of India Limited (TII) effec�ve 1 April, 2022 and was the non-execu�ve Chairman of TII from 11 November, 2020 to 31 March, 2022.
Is the Chairman of Shanthi Gears Limited, Parry Enterprises India Limited, Cholamandalam Home Finance Limited and TI Clean Mobility Private Limited.
Is also on the Boards of CG Power and Industrial Solu�ons Limited, Great Cycles and Crea�ve Cycles.
Joined the Board of Chola on 29 January, 2021.
Mr. Ravindra Kumar Kundu(54 years) DIN: 07337155
Execu�ve Director
Graduate in Commerce and has completed Post Graduate Programme in Management for Senior Execu�ves from the Kellogg School of Management, Indian School of Business and an Execu�ve Programme in Global Business Management from the Indian Ins�tute of Management Calcu�a.
Over 34 years of professional experience in automobile and financial services industry including 22 years in Chola.
Joined Chola as Senior Execu�ve - Marke�ng in the year 2000 and handled various func�ons including credit, collec�ons before taking up the role of Business Head of Vehicle Finance division of Chola.
Instrumental in growth of the Vehicle Finance business AUM from `20,000 crores to `52,000 crores.
Is the Chairman of Payswiff Technologies Private Limited.
Is also on the Boards of Cholamandalam Securi�es Limited, White Data Systems India Private Limited and Cholamandalam Home Finance Limited.
Has been the Execu�ve Director of Chola since 23 January, 2020.
BOARD OF DIRECTORS
Cholamandalam Investment and Finance Company Limited Annual Report 2021 - 22
15
• 1,145 branches across 27 states and 5 Union territories as on 31 March, 2022
• 79% locations are in Tier-III, Tier-IV, Tier V and Tier-VI towns
Note: Figures in brackets represents total no. of branches as on 31 March, 2022
OUR PRESENCE
Bihar (43)
Cha�sgarh (67)
Jharkand (29)
Odisha (59)
West Bengal (62)
Delhi (5)
Punjab (23)
Rajasthan (83) UP (73)
U�arakhand (16)
Karnataka (64)
Kerala (49)Tamil Nadu (117)
Maharashtra (119)
Puducherry (2)
Gujarat (65)
Goa (2)
Dadra and Nagar Haveli& Daman and Diu (1)
Madhya Pradesh(80)
Andhra Pradesh (53)
Assam (25)
Haryana (34)Chandigarh (2)
Himachal Pradesh (16)
Telangana (41)
Jammu & Kashmir (5)
Tripura (4)
Meghalaya (3)
Mizoram (1)
Sikkim (1)
Arunachal Pradesh (1)

16
Corporate Overview Financial StatementsManagement ReportsCholamandalam Investment and Finance Company Limited Annual Report 2021 - 22
PARTICULARS
Branch Network (in nos.)
Disbursement
Assets Under Management (AUM)
Net Income Margin (NIM)
Pro�t Before Tax (PBT)
Pro�t After Tax (PAT)
Return on Total Assets - PBT
Key Ratios (in %)
NIM
Expense Ratio
Gross NPA /Gross Stage 3 Assets
Net NPA / Stage 3 (Net o� ECL) Assets
Tier I Capital
Tier II Capital
Capital Adequacy Ratio
Return on Equity
Growth Ratios (in %)
AUM Growth
Disbursement Growth
Book Value per Share Growth
Disbursements per Branch
NIM per Branch
PAT per Branch
(` in crores)
FY22
1,145
7.9
2.8
6.8/4.4
4.8/2.6
16.5
3.1
19.6
8.3
36.3
22.3
31.0
5.1
1.9
3.9
20.4
35,490
82,904
5,840
3,771
2,891
2,147
KEY FIGURES (STANDALONE) IND_AS
Note: a. Refer glossary section for terms and ratios
FY21
1,137
7.3
2.3
4.0
2.2
15.1
3.9
19.1
14.3
-10.5
16.9
22.9
4.4
1.3
3.0
16.9
26,043
76,518
5,000
3,416
1,515
2,038
FY20
1,091
6.9
2.6
3.8
2.2
15.3
5.4
20.7
16.3
-4.5
26.2
26.7
3.8
1.0
2.7
15.2
29,091
66,943
4,123
2,545
1,052
1,586
FY19
911
7.0
2.6
2.7
1.7
12.4
4.9
17.4
31.9
21.3
21.1
33.4
3.8
1.3
3.7
20.9
30,451
57,560
3,460
2,190
1,186
1,823
FY18
870
7.7
3.0
3.4
2.2
13.2
5.1
18.4
24.3
35.1
18.9
28.9
3.3
1.1
3.7
19.6
25,114
43,629
2,870
1,754
918
1,401
BUSINESS HIGHLIGHTS
16

Corporate Overview Financial StatementsManagement Reports
17
Cholamandalam Investment and Finance Company Limited Annual Report 2021 - 22
PARTICULARS
Branch Network (in nos.)
Disbursement
Assets Under Management (AUM)
Net Income Margin (NIM)
Pro�t Before Tax (PBT)
Pro�t After Tax (PAT)
Return on Total Assets - PBT
Key Ratios (in %)
NIM
Expense Ratio
Gross NPA /Gross Stage 3 Assets
Net NPA / Stage 3 (Net o� ECL) Assets
Tier I Capital
Tier II Capital
Capital Adequacy Ratio
Return on Equity
Growth Ratios (in %)
AUM Growth
Disbursement Growth
Book Value per Share Growth
Disbursements per Branch
NIM per Branch
PAT per Branch
(` in crores)
FY22
1,145
7.9
2.8
6.8/4.4
4.8/2.6
16.5
3.1
19.6
8.3
36.3
22.3
31.0
5.1
1.9
3.9
20.4
35,490
82,904
5,840
3,771
2,891
2,147
KEY FIGURES (STANDALONE) IND_AS
Note: a. Refer glossary section for terms and ratios
FY21
1,137
7.3
2.3
4.0
2.2
15.1
3.9
19.1
14.3
-10.5
16.9
22.9
4.4
1.3
3.0
16.9
26,043
76,518
5,000
3,416
1,515
2,038
FY20
1,091
6.9
2.6
3.8
2.2
15.3
5.4
20.7
16.3
-4.5
26.2
26.7
3.8
1.0
2.7
15.2
29,091
66,943
4,123
2,545
1,052
1,586
FY19
911
7.0
2.6
2.7
1.7
12.4
4.9
17.4
31.9
21.3
21.1
33.4
3.8
1.3
3.7
20.9
30,451
57,560
3,460
2,190
1,186
1,823
FY18
870
7.7
3.0
3.4
2.2
13.2
5.1
18.4
24.3
35.1
18.9
28.9
3.3
1.1
3.7
19.6
25,114
43,629
2,870
1,754
918
1,401
BUSINESS HIGHLIGHTS
16
Cholamandalam Investment and Finance Company Limited Annual Report 2021 - 22
(� in crores)
CAGR: 9% YOY: 36%Disbursements
25,114
30,451
29,091 26,043
35,490
FY 18 FY 19 FY 20 FY 21 FY 22
(� in crores)
CAGR: 16% YOY: 10%Business AUM (Net)
42,924
54,279
60,549
69,996
76,907
FY 18 FY 19 FY 20 FY 21 FY 22
(� in crores)
CAGR: 24% YOY: 42%Pro�t After Tax
918
1,186
1,052
1,515
2,147
FY 18 FY 19 FY 20 FY 21 FY 22
(� in crores)
CAGR: 23% YOY: 22%Networth
6,176
8,172
9,560
FY 18 FY 19 FY 20 FY 21 FY 22
5,098
11,708
Note: a. Refer glossary section for terms and ratios
(in %)
PBT - ROTA %
3.7%
FY 19
3.7%
FY 18
FY 22
3.9%
FY 21
3.0%
FY 20
2.7%
(in %)
Loan Losses & Provisions
0.9%
0.7%
1.6%
2.0%
FY 18 FY 19 FY 20 FY 21 FY 22
1.2%
17
CHOLA - FINANCIAL SUMMARY

18
Corporate Overview Financial StatementsManagement ReportsCholamandalam Investment and Finance Company Limited Annual Report 2021 - 22
Key Differentiators
Three-decade exper�se in vehicle finance industry
Strong footprint in semi-urban and rural markets in addi�on to urban markets
Extremely diversified in terms of product, geography, & customer segments
Excellent rela�onships with dealers & manufacturers
Trusted & well-experienced in-house Sales, Credit Ops, Collec�on, and Legal teams
Digi�zed business opera�ons catering to the changing needs of the customers
Product customiza�on and personaliza�on to facilitate customers
Analy�cs driven underwri�ng and collec�ons
Simplified loan process enabling quick turnaround �me for customers
Buying and selling new & used vehicles through Gaadi Bazaar, a digital pla�orm powered by Chola
BUSINESS REVIEW - VEHICLE FINANCE
5%
3 Wheeler1%
2 Wheeler
Tractor10%
MINILCV4%
MUV 7%
HCV
8%
Used Vehicles
28%
LCV 20%
CE 6%
CAR 11%
18
DIVERSIFIED ASSET PORTFOLIO

Corporate Overview Financial StatementsManagement Reports
19
Cholamandalam Investment and Finance Company Limited Annual Report 2021 - 22
Key Differentiators
Three-decade exper�se in vehicle finance industry
Strong footprint in semi-urban and rural markets in addi�on to urban markets
Extremely diversified in terms of product, geography, & customer segments
Excellent rela�onships with dealers & manufacturers
Trusted & well-experienced in-house Sales, Credit Ops, Collec�on, and Legal teams
Digi�zed business opera�ons catering to the changing needs of the customers
Product customiza�on and personaliza�on to facilitate customers
Analy�cs driven underwri�ng and collec�ons
Simplified loan process enabling quick turnaround �me for customers
Buying and selling new & used vehicles through Gaadi Bazaar, a digital pla�orm powered by Chola
BUSINESS REVIEW - VEHICLE FINANCE
5%
3 Wheeler1%
2 Wheeler
Tractor10%
MINILCV4%
MUV 7%
HCV
8%
Used Vehicles
28%
LCV 20%
CE 6%
CAR 11%
18
DIVERSIFIED ASSET PORTFOLIO
Cholamandalam Investment and Finance Company Limited Annual Report 2021 - 22
(� in crores)
CAGR: 5% YOY: 26%Disbursements
(� in crores)
CAGR: 14% YOY: 5%Business AUM (Net)
52,881
FY 22
31,473
40,606
44,206
50,415
FY 18 FY 19 FY 20 FY 21
25,439
FY 22
20,607
24,983
23,387
20,249
FY 18 FY 19 FY 20 FY 21
(� in crores)
CAGR: 16% YOY: 4%
(� in crores)
CAGR: 20% YOY: 60%PBTIncome
4,241
5,485
6,624
7,440
7,721
FY 18 FY 19 FY 20 FY 21 FY 22
988
1,269
945
1,287
FY 18 FY 19 FY 20 FY 21 FY 22
2,054
a. Refer glossary section for terms and ratios
b. Income and PBT are reported at Business AUM level
Note:
19
VEHICLE FINANCE - FINANCIAL SUMMARY
PBT - ROTA %Loan Losses & Provisions
0.9%
0.9%
1.9%
2.5%
1.4%
FY 18 FY 19 FY 20 FY 21 FY 22
3.7%
3.6%
2.2%
4.1%
FY 18 FY 19 FY 20 FY 21 YF 22
2.7%
(in %)(in %)

20
Corporate Overview Financial StatementsManagement ReportsCholamandalam Investment and Finance Company Limited Annual Report 2021 - 22
BUSINESS REVIEW - LOAN AGAINST PROPERTY�
Cholamandalam Loan Against Property (LAP) business is one of the leading players in Indian NFBC LAP market. For over 15 years, LAP business is helping customers in realising their business dreams. Every customer rela�onship is being treated as an ongoing partnership and Chola takes pride in making their growth journey successful. Over the past few years, the business has undergone transforma�on in making the loan journey digital oriented and seamless for the customers. By embracing digital tools for on-boarding, verifica�on and collec�ons, Chola LAP commits to provide hassle free experience to both customers and channel partners.
PRODUCTS Business loans against property (Prime LAP)
Micro loans against property (Micro LAP)
Balance transfer of exis�ng property loans
CUSTOMER SEGMENTOur focus is on the middle socio-economic class and self-employed non-professionals
ASSET CLASS Residen�al & commercial proper�es
• Pan-India presence (388 branches and growing)
• Quick Turn Around Time
• Mul�ple product schemes to match funding requirements
• Personalized door-step service to customers
Key Differentiators
Cholamandalam Investment and Finance Company Limited Annual Report 2021 - 22
BUSINESS REVIEW - LOAN AGAINST PROPERTY�
Chola’s Loan Against Property (LAP) business is one of the leading players in Indian NFBC LAP market. For over 15 years, LAP business is helping customers in realising their business dreams. Every customer rela�onship is being treated as an ongoing partnership and Chola takes pride in making their growth journey successful. Over the past few years, the business has undergone transforma�on in making the loan journey digital oriented and seamless for the customers. By embracing digital tools for on-boarding, verifica�on and collec�ons, LAP business commits to provide hassle free experience to both customers and channel partners.
PRODUCTS Business loans against property (Prime LAP)
Micro loans against property (Micro LAP)
Balance transfer of exis�ng property loans
CUSTOMER SEGMENTOur focus is on the middle socio-economic class and self-employed non-professionals
ASSET CLASS Residen�al & commercial proper�es
• Pan-India presence (388 branches and growing)
• Quick Turn Around Time
• Mul�ple product schemes to match funding requirements
• Personalized door-step service to customers
Key Differentiators
20

Corporate Overview Financial StatementsManagement Reports
21
Cholamandalam Investment and Finance Company Limited Annual Report 2021 - 22
BUSINESS REVIEW - LOAN AGAINST PROPERTY�
Cholamandalam Loan Against Property (LAP) business is one of the leading players in Indian NFBC LAP market. For over 15 years, LAP business is helping customers in realising their business dreams. Every customer rela�onship is being treated as an ongoing partnership and Chola takes pride in making their growth journey successful. Over the past few years, the business has undergone transforma�on in making the loan journey digital oriented and seamless for the customers. By embracing digital tools for on-boarding, verifica�on and collec�ons, Chola LAP commits to provide hassle free experience to both customers and channel partners.
PRODUCTS Business loans against property (Prime LAP)
Micro loans against property (Micro LAP)
Balance transfer of exis�ng property loans
CUSTOMER SEGMENTOur focus is on the middle socio-economic class and self-employed non-professionals
ASSET CLASS Residen�al & commercial proper�es
• Pan-India presence (388 branches and growing)
• Quick Turn Around Time
• Mul�ple product schemes to match funding requirements
• Personalized door-step service to customers
Key Differentiators
Cholamandalam Investment and Finance Company Limited Annual Report 2021 - 22
BUSINESS REVIEW - LOAN AGAINST PROPERTY�
Chola’s Loan Against Property (LAP) business is one of the leading players in Indian NFBC LAP market. For over 15 years, LAP business is helping customers in realising their business dreams. Every customer rela�onship is being treated as an ongoing partnership and Chola takes pride in making their growth journey successful. Over the past few years, the business has undergone transforma�on in making the loan journey digital oriented and seamless for the customers. By embracing digital tools for on-boarding, verifica�on and collec�ons, LAP business commits to provide hassle free experience to both customers and channel partners.
PRODUCTS Business loans against property (Prime LAP)
Micro loans against property (Micro LAP)
Balance transfer of exis�ng property loans
CUSTOMER SEGMENTOur focus is on the middle socio-economic class and self-employed non-professionals
ASSET CLASS Residen�al & commercial proper�es
• Pan-India presence (388 branches and growing)
• Quick Turn Around Time
• Mul�ple product schemes to match funding requirements
• Personalized door-step service to customers
Key Differentiators
20 21
Cholamandalam Investment and Finance Company Limited Annual Report 2021 - 22
(� in crores)
CAGR: 17% YOY: 62%Disbursements
(� in crores)
CAGR: 14% YOY: 16%Business AUM (Net)
3,174
3,837
3,662
3,627
5,862
FY 18 FY 19 FY 20 FY 21 FY 22
10,095
11,626
12,960
14,777
17,115
FY 18 FY 19 FY 20 FY 21 FY 22
(� in crores)
CAGR: 11% YOY: 11%
(� in crores)
CAGR: 21% YOY: 55%PBTIncome
1,184
1,248
1,479
1,642
1,827
FY 18 FY 19 FY 20 FY 21 FY 22
221
305
244
475
306
FY 18 FY 19 FY 20 FY 21 FY 22
a. Refer glossary section for terms and ratios
b. Income and PBT are reported at Business AUM level
Note:
LOAN AGAINST PROPERTY - FINANCIAL SUMMARY
PBT - ROTA %Loan Losses & Provisions
2.3%
2.8%
2.0%
2.2%
3.0%
FY 18 FY 19 FY 20 FY 21 FY 22
0.8%
0.8%
1.1%
0.0%
0.7%
FY 21 FY 20 FY 19 FY 18 FY 22
(in %)(in %)

22
Corporate Overview Financial StatementsManagement ReportsCholamandalam Investment and Finance Company Limited Annual Report 2021 - 22
BUSINESS REVIEW - HOME LOAN
PRODUCTS Home Loans for Self construc�on
Loans for purchase of ready to occupy homes
Balance transfer of exis�ng home loans
Mixed use for residen�al and commercial
Shop Loans
The mission of Chola Home Loan is to enable lower and middle income families achieve their dream of owning a home. Over the past few years, Chola has been actively reaching out predominantly to lower middle income families in urban and semi-urban markets and is now a leading Home Loans provider with over 5000 Cr AUM. Chola’s e�orts was recognized by HUDCO (Housing and Urban Development Corporation Limited) as the “Best Performing Primary Lending Institution (PLIs) under PMAY (U) – CLSS” for the year 2021-2022 for its e�orts towards facilitating a home for customers through the Pradhan Mantri Awas Yojana.
99% of the portfolio comprises of Home Loans and is focused to be end-use driven. Our target group remains the Lower Middle Income Group (MIG) customer. Our average ticket size is `14 Lakhs with an average LTV of ~56% which re�ects the quality of houses and marketability. 95% of the portfolio comprises business owners with semi-formal income and signi�cant business vintage buying their �rst home. 26% of our customers are �rst time borrowers.
Chola enjoys a signi�cant presence in the Tier II, III, IV towns and cities. In FY 22, Home Loans were o�ered across 11 states (Tamil Nadu, Andhra Pradesh, Telangana, Karnataka, Kerala, Gujarat, Maharashtra, Madhya Pradesh, Haryana, Rajasthan and Chhattisgarh). Chola has set up multiple channels to reach out to prospective customers. These include referral agents, Direct Sales Agents (DSAs), Online platforms as well as a feet-on-street sales team.
Exper�se in Self-Construc�on with a unique product offering
Minimal documenta�on
Loan eligibility based on in-person income assessment for small and micro business owners
Customized eligibility for salaried customers
Transparent end-to-end digital onboarding
Comprehensive Self-Service App for Customers on Android, iOS, and Web
Key Differentiators
22

Corporate Overview Financial StatementsManagement Reports
23
Cholamandalam Investment and Finance Company Limited Annual Report 2021 - 22
BUSINESS REVIEW - HOME LOAN
PRODUCTS Home Loans for Self construc�on
Loans for purchase of ready to occupy homes
Balance transfer of exis�ng home loans
Mixed use for residen�al and commercial
Shop Loans
The mission of Chola Home Loan is to enable lower and middle income families achieve their dream of owning a home. Over the past few years, Chola has been actively reaching out predominantly to lower middle income families in urban and semi-urban markets and is now a leading Home Loans provider with over 5000 Cr AUM. Chola’s e�orts was recognized by HUDCO (Housing and Urban Development Corporation Limited) as the “Best Performing Primary Lending Institution (PLIs) under PMAY (U) – CLSS” for the year 2021-2022 for its e�orts towards facilitating a home for customers through the Pradhan Mantri Awas Yojana.
99% of the portfolio comprises of Home Loans and is focused to be end-use driven. Our target group remains the Lower Middle Income Group (MIG) customer. Our average ticket size is `14 Lakhs with an average LTV of ~56% which re�ects the quality of houses and marketability. 95% of the portfolio comprises business owners with semi-formal income and signi�cant business vintage buying their �rst home. 26% of our customers are �rst time borrowers.
Chola enjoys a signi�cant presence in the Tier II, III, IV towns and cities. In FY 22, Home Loans were o�ered across 11 states (Tamil Nadu, Andhra Pradesh, Telangana, Karnataka, Kerala, Gujarat, Maharashtra, Madhya Pradesh, Haryana, Rajasthan and Chhattisgarh). Chola has set up multiple channels to reach out to prospective customers. These include referral agents, Direct Sales Agents (DSAs), Online platforms as well as a feet-on-street sales team.
Exper�se in Self-Construc�on with a unique product offering
Minimal documenta�on
Loan eligibility based on in-person income assessment for small and micro business owners
Customized eligibility for salaried customers
Transparent end-to-end digital onboarding
Comprehensive Self-Service App for Customers on Android, iOS, and Web
Key Differentiators
22 23
Cholamandalam Investment and Finance Company Limited Annual Report 2021 - 22
(� in crores)
CAGR: 27% YOY: 2%Disbursements
(� in crores)
CAGR: 52% YOY: 21%Business AUM (Net)
606
1,157
1,505
1,542
1,571
FY 18 FY 19 FY 20 FY 21 FY 22
978
1,912
3,125
4,345
5,269
FY 18 FY 19 FY 20 FY 21 FY 22
(� in crores)
CAGR: 61% YOY: 29%
(� in crores)
CAGR: 136% YOY: 91%PBTIncome
101
189
357
519
671
FY 18 FY 19 FY 20 FY 21 FY 22
7
38
64
215
112
FY 18 FY 19 FY 20 FY 21 FY 22
a. Refer glossary section for terms and ratios
b. Income and PBT are reported at Business AUM level
Note:
PBT - ROTA %Loan Losses & Provisions
0.9%
2.8%
2.5%
3.1%
4.5%
FY 18 FY 19 FY 20 FY 21 FY 22
1.8%
0.8%
1.5%
0.3%
0.9%
FY 21 FY 20 FY 19 FY 18 FY 22
(in %)(in %)
HOME LOAN - FINANCIAL SUMMARY

24
Corporate Overview Financial StatementsManagement ReportsCholamandalam Investment and Finance Company Limited Annual Report 2021 - 22
24
Chola has launched the Consumer and Small Enterprise Loans (CSEL) business division to fuel its next phase of growth in the consumer and SME ecosystem. The CSEL division o�ers collateral-free loans to consumers and micro & small enterprises.
Product & Customer Segment
The CSEL division will focus on the following new product segments through traditional, direct to customer, and digital partnership channels:
Personal & Professional Loans: CSEL o�ers personal loans to salaried and self-employed professionals. The product range would include Term Loans & Flexi-loans.
Micro & Small Enterprise Loans: The MSME segment is signi�cantly under-penetrated in India with more than 60 percent of MSMEs not having access to formalized credit. Considering the importance and contribution of MSMEs to India’s economy, the CSEL division has introduced Small Enterprise Loans which is o�ered to small businesses in the manufacturing, trading, and services segments. The product range would include Term Loans, Flexi-loans etc.
Through the CSEL division, Chola has entered in strategic partnership with 3 leading Fintech companies – BankBazaar, Kreditbee and Paytail. With these alliances, the company intends to drive greater �nancial inclusion especially among those customers who are economically active but not having adequate access to formal credit.
Transparent end to end digital process powered by the trust of Chola brandSuperla�ve paperless customer experience journey with quick turnaround �meFlexible repayment op�on enabled through flexi loansStrong data driven underwri�ng and risk management capabili�esRobust collec�ons infrastructure with tele-calling and field teams
Key Differentiators
Personalized doorstep service to customers Unique Assessed Income Programme for business owners Transparent end-to-end digital processCustomized product focusing on new to credit customers
Key Differentiators
India has a sizeable segment of micro-enterprises that lack access to formal sources of credit and are funded majorly by unorganized sources such as chit funds, local money lenders and family and friends. Considering this opportunity, Chola has launched the Secured Business & Personal Loan (SBPL) vertical to better enable this segment of customers.
SBPL o�ers collateral backed business and personal loans on the basis of the credit assessment and cash�ow projections of these businesses.
Customer Segment
The products o�ered by SBPL are best suited for self-employed, non-professionals in the businesses of trading and services, with primary focus on tier II and III cities, as well as interior rural areas. While many of these customers are new to credit, there are businesses with regular cash �ows that need funds for day-to-day operations and business improvements. These loans will create positive impact in the lives of millions of informal micro enterprise customers in India.
BUSINESS REVIEW – CONSUMER & SMALL ENTERPRISES LOANS
BUSINESS REVIEW - SECURED BUSINESS & PERSONAL LOAN

Corporate Overview Financial StatementsManagement Reports
25
Cholamandalam Investment and Finance Company Limited Annual Report 2021 - 22
24
Chola has launched the Consumer and Small Enterprise Loans (CSEL) business division to fuel its next phase of growth in the consumer and SME ecosystem. The CSEL division o�ers collateral-free loans to consumers and micro & small enterprises.
Product & Customer Segment
The CSEL division will focus on the following new product segments through traditional, direct to customer, and digital partnership channels:
Personal & Professional Loans: CSEL o�ers personal loans to salaried and self-employed professionals. The product range would include Term Loans & Flexi-loans.
Micro & Small Enterprise Loans: The MSME segment is signi�cantly under-penetrated in India with more than 60 percent of MSMEs not having access to formalized credit. Considering the importance and contribution of MSMEs to India’s economy, the CSEL division has introduced Small Enterprise Loans which is o�ered to small businesses in the manufacturing, trading, and services segments. The product range would include Term Loans, Flexi-loans etc.
Through the CSEL division, Chola has entered in strategic partnership with 3 leading Fintech companies – BankBazaar, Kreditbee and Paytail. With these alliances, the company intends to drive greater �nancial inclusion especially among those customers who are economically active but not having adequate access to formal credit.
Transparent end to end digital process powered by the trust of Chola brandSuperla�ve paperless customer experience journey with quick turnaround �meFlexible repayment op�on enabled through flexi loansStrong data driven underwri�ng and risk management capabili�esRobust collec�ons infrastructure with tele-calling and field teams
Key Differentiators
Personalized doorstep service to customers Unique Assessed Income Programme for business owners Transparent end-to-end digital processCustomized product focusing on new to credit customers
Key Differentiators
India has a sizeable segment of micro-enterprises that lack access to formal sources of credit and are funded majorly by unorganized sources such as chit funds, local money lenders and family and friends. Considering this opportunity, Chola has launched the Secured Business & Personal Loan (SBPL) vertical to better enable this segment of customers.
SBPL o�ers collateral backed business and personal loans on the basis of the credit assessment and cash�ow projections of these businesses.
Customer Segment
The products o�ered by SBPL are best suited for self-employed, non-professionals in the businesses of trading and services, with primary focus on tier II and III cities, as well as interior rural areas. While many of these customers are new to credit, there are businesses with regular cash �ows that need funds for day-to-day operations and business improvements. These loans will create positive impact in the lives of millions of informal micro enterprise customers in India.
BUSINESS REVIEW – CONSUMER & SMALL ENTERPRISES LOANS
BUSINESS REVIEW - SECURED BUSINESS & PERSONAL LOAN
Cholamandalam Investment and Finance Company Limited Annual Report 2021 - 22
25
Chola has launched the Small and Medium Enterprise loans (SME) business division to fuel its next phase of growth in the SME Ecosystem. This division will o�er bouquet of products to meet the requirements for working capital and Capex of SMEs.
Product & Customer Segment
The SME division will focus on the following new product segments:
Supply Chain �nance: Supply chain �nance includes Vendor and Dealer �nance. This product is focused on reducing the working capital gap for the MSMEs. This is a short-term facility o�ered to SMEs supplying goods to large corporates or procuring the goods from large corporate to supply to the retailers.
Chola has entered into partnerships with leading Fintech companies for sourcing of supply chain �nance loans. With these
OUR SUBSIDIARIES
CHOLAMANDALAM SECURITIES LIMITED
Cholamandalam Securities Limited (CSEC) is a comprehensive investment solutions provider with over 20 years of experience in the �nancial market. CSEC o�ers and distributes a wide range of �nancial products. CSEC is a member of National Stock Exchange of India Limited & BSE Limited, a depository participant registered with National Securities Depository Limited (NSDL) & Central Depository Services (India) Limited (CDSL), a corporate agent with composite licence from Insurance Regulatory and Development Authority of India and an AMFI registered Mutual Fund Distributor.
alliances and through direct channels, the company intends to improve the access to working capital fund for MSMEs.
Term loan: Term loans o�ered for the MSME customers against industrial, commercial or residential property to meet the capex and long-term working capital requirement
Equipment Finance: These are short-term loans o�ered to MSME customers against the hypothecation of machines for machine tools, plastic & packaging, textile, healthcare and printing industry. Chola works with identi�ed industry leading OEMs to provide the facility in these targeted industry segments.
Loan against Securities: This division also o�ers loans to promoters and HNIs against the pledge of Securities and Mutual funds.
BUSINESS REVIEW – SMALL AND MEDIUM ENTERPRISES LOANS
PRODUCTS OFFERED
Stock Broking & Depository Participant Services
PRODUCTS DISTRIBUTED
Mutual Funds | Bonds & Debentures | Fixed Deposits | Insurance | PMS | Sovereign Gold Bonds | Initial Public O�er (IPO)
Bouquet of products to meet the various needs of an SME
Strong experience in underwriting of Self-employed non-professional segments
Focus only on standard machines with good resale value
Industry best turnaround time in providing facility to SMEs.
Key Differentiators
Trust of Chola brand
Flexible repayment
Strong data driven underwritingand risk management capabilities
Collections driven through multiple channels
CHOLAMANDALAM HOME FINANCE LIMITED
Cholamandalam Home Finance Limited is a corporate agent with composite licence from Insurance Regulatory and Development Authority of India for distributing insurance products.

26
Corporate Overview Financial StatementsManagement ReportsCholamandalam Investment and Finance Company Limited Annual Report 2021 - 22
OUR SUBSIDIARIES
PAYSWIFF TECHNOLOGIES PRIVATE LIMITED
Payswi� Technologies Private Limited (PAYSWIFF) is engaged in the business of enabling online payment gateway services for e-commerce businesses and provides e-commerce solutions. Payswi� is an omni channel payment transaction solution that lets business owners accept payments from their customers in-store, at home deliveries, online and on-the-go using mPOS and POS solutions.
26
FINANCE AND TREASURY
Finance and MIS function continued their unstinted support to the business teams during FY 22 and enabled the businesses to take informed decisions on business proposals and investments. During FY 22, there was a host of regulatory requirements on disclosures, and changes to delinquency tracking which were addressed e�ectively. Following are some of the key contributions during the year.
New business launches (CSEL, SME and SBPL)
New �ntech investments (Payswi� and Paytail)
Scenario Modelling for Expected Credit Losses
Agreement level Pro�tability and
Payment Module revamp
Key Contributions
FINANCE
TREASURY
FY 22 witnessed high liquidity on account of RBI’s stance to maintain an accommodative stance throughout the year. The interest rate was soft for the most part of the year on account of the second and third waves of COVID. In this environment, the Treasury function was highly responsive to the market dynamics and drove down the cost of funds, negotiated attractive rates upon interest rate resets. Priority Sector on lending and Securitisation of assets were done whenever market opportunities at �ne rates opened up. All regulatory compliance was in order, with asset liability mismatch well within the limit. The Liquidity Coverage Ratio (LCR) was maintained within the thresholds through prudent management of out�ows and timely borrowings.
The Enterprise Risk Management (ERM) functions include supporting business in evaluation of risk-return trade o�, identifying risk areas for mitigation, suggestion of measures to implement the same and involvement in risk mitigation during new product design. ERM also works closely with business to improve operational e�ciencies. All these are done in coordination with respective cross functional project teams.
In FY 22, ERM extended its scope to engage in a number of additional initiatives. A Risk Control Self-Assessment tool (RCSA) was introduced to test the e�ectiveness of control of key risks. ERM facilitated implementation of Risk Based Internal Audit with internal audit team to develop a risk based framework aligned to the ERM and audit objectives. ERM augmented the cyber security risk management by supporting the IT team in policy areas covering areas such as privilege access, IT Infrastructure, user end point controls, malware deterrence and other policies/procedures. ERM also monitors the liquidity risk of the company by participating in the ALM process – weekly ALM Support Group meetings and monthly ALCO reviews with the senior management. Additionally the ERM team rigorously monitors continuity of business in critical areas including testing readiness for emergencies.
ENTERPRISE RISK MANAGEMENT

Corporate Overview Financial StatementsManagement Reports
27
Cholamandalam Investment and Finance Company Limited Annual Report 2021 - 22
OUR SUBSIDIARIES
PAYSWIFF TECHNOLOGIES PRIVATE LIMITED
Payswi� Technologies Private Limited (PAYSWIFF) is engaged in the business of enabling online payment gateway services for e-commerce businesses and provides e-commerce solutions. Payswi� is an omni channel payment transaction solution that lets business owners accept payments from their customers in-store, at home deliveries, online and on-the-go using mPOS and POS solutions.
26
FINANCE AND TREASURY
Finance and MIS function continued their unstinted support to the business teams during FY 22 and enabled the businesses to take informed decisions on business proposals and investments. During FY 22, there was a host of regulatory requirements on disclosures, and changes to delinquency tracking which were addressed e�ectively. Following are some of the key contributions during the year.
New business launches (CSEL, SME and SBPL)
New �ntech investments (Payswi� and Paytail)
Scenario Modelling for Expected Credit Losses
Agreement level Pro�tability and
Payment Module revamp
Key Contributions
FINANCE
TREASURY
FY 22 witnessed high liquidity on account of RBI’s stance to maintain an accommodative stance throughout the year. The interest rate was soft for the most part of the year on account of the second and third waves of COVID. In this environment, the Treasury function was highly responsive to the market dynamics and drove down the cost of funds, negotiated attractive rates upon interest rate resets. Priority Sector on lending and Securitisation of assets were done whenever market opportunities at �ne rates opened up. All regulatory compliance was in order, with asset liability mismatch well within the limit. The Liquidity Coverage Ratio (LCR) was maintained within the thresholds through prudent management of out�ows and timely borrowings.
The Enterprise Risk Management (ERM) functions include supporting business in evaluation of risk-return trade o�, identifying risk areas for mitigation, suggestion of measures to implement the same and involvement in risk mitigation during new product design. ERM also works closely with business to improve operational e�ciencies. All these are done in coordination with respective cross functional project teams.
In FY 22, ERM extended its scope to engage in a number of additional initiatives. A Risk Control Self-Assessment tool (RCSA) was introduced to test the e�ectiveness of control of key risks. ERM facilitated implementation of Risk Based Internal Audit with internal audit team to develop a risk based framework aligned to the ERM and audit objectives. ERM augmented the cyber security risk management by supporting the IT team in policy areas covering areas such as privilege access, IT Infrastructure, user end point controls, malware deterrence and other policies/procedures. ERM also monitors the liquidity risk of the company by participating in the ALM process – weekly ALM Support Group meetings and monthly ALCO reviews with the senior management. Additionally the ERM team rigorously monitors continuity of business in critical areas including testing readiness for emergencies.
ENTERPRISE RISK MANAGEMENT
Cholamandalam Investment and Finance Company Limited Annual Report 2021 - 22
Analytics function helps the company to understand their customer at a deeper level, which allows the company to make informed decisions that promote better business outcomes. Deploying strong analytics and data driven capabilities are key to augment exponential growth and pro�tability, to improve e�ciency and to drive innovation and digital transformation. At Chola, we believe that seamless access to valuable data can provide insights to make our customers to enter a better life. Analytics function is engaged in driving a higher level of e�ciency across the key lifecycle stages of the customer, viz., onboarding and acquisition, repayment performance, customer retention and cross-sell.
During FY 22, Analytics function collaborated with stakeholders across various business verticals and other business enablers of the company and delivered these solutions, which inter alia enabled the following outcomes:
Acquisition scorecard models were built and implemented across business verticals to automate the decisioning mechanism with consistent and improved customer selection. This helps the company to segment applicants based on risk and to a�ord a faster onboarding journey for the low-risk segments.
Early warning models were designed and developed as part of enhanced collection strategy, thereby enabling a segmented treatment that helps to map the right collection e�ort with a given customer group.
Chola has shown resilient performance in FY 22 and has drafted ambitious growth plans for FY 23. Analytics will play the role of a growth enabler by developing pre-approved and pre-quali�ed o�er pools, thereby enabling direct acquisition on customer base. This will add value towards leveraging in-built analytics, machine learning and arti�cial intelligence capabilities of the company.
27
ANALYTICS
Enable better e�ciencies across key phases of Customer Lifecycle
ONBOARDING & ACQUISITION
Be�er customer selec�on through Underwri�ng models
Pricing based on risk-based pricing models
Improved delinquency management through Early warning systems and Risk of Flow models
Segmented approach to loss provisioning based on ECL models
REPAYMENT PERFORMANCE MANAGEMENT
CUSTOMER RETENTION & CROSS-SELL
Enable be�er customer reten�on through profiling ac�ve customers based on On-Us and Off-us repayment
Drive cross-sell using pre-approved and pre-qualified offers

28
Corporate Overview Financial StatementsManagement ReportsCholamandalam Investment and Finance Company Limited Annual Report 2021 - 22
Driving a digitally-ready, automation-�rst and data-led organization
The acceleration in adoption of digital solutions during the di�erent waves of the pandemic has established a new status-quo in the usage of digital technology across the business landscape. While supporting large scale transformation programs in the existing lines of business, the technology team has also been helped in the launch of new lines of business, both secured and unsecured, in a completely digital manner – spanning loan originations, management and loan collections.
The digital technology function is progressing forward in its vision of establishing a digitally-ready, automation-�rst, and data-led technology capability on top of a strong cyber-security foundation.
As part of expanding our horizons of digital service delivery across products, we continue to provide an enhanced set of functions and digital experience for our ecosystem partners – ranging from manufacturers and dealers in our Vehicle Finance business to FinTech partners in our Consumer and Small Enterprises Loan business. By making our applications and solutions integration ready, we aim to provide a wide array set of services for our customers, dealers, manufacturers, co-lending institutions, and other ecosystem partners that meet all their needs from a partner like us. This objective is to be in a state of digital readiness to work with any new ecosystem partner within a short period in a scalable and secure fashion, thus demonstrating our agility.
Besides providing a vast set of external digital interfaces, the company is also diligently reviewing and optimizing its internal operations and processes through an automation lens. Application of LEAN practices help ensure that processes are e�cient and optimal for digitization. This coupled with adoption and integration of new set of digital APIs / services related to data validation, data quality, and elimination of paper (wherever possible) help achieve optimization objectives.
INFORMATION TECHNOLOGYFurthermore, the company is also steadily increasing the usage of process automation tools and scripts.
This will target not only the mundane and repetitive activities but also scenarios where cognitive automation can assist in a large way and reduce human intervention only to exceptional cases. The aim is to address turnaround time for execution of such activities while driving up operational accuracy.
As we expand the business horizons to new product lines, an integrated and consistent view of customer and business data is critical to operate and grow at scale. Be it in usage of decisioning logic to drive top line disbursements for our products or collections optimization model to improve bottom line growth or proposing the right product or o�er to customer at appropriate time, quality data plays an important role.
A scalable big-data repository is being established to serve the data management, data access, and analytics needs of the enterprise. With right levels of security and data access controls, the data repository will not only serve the reporting, dashboard, and analytical needs of the organization but also provide a frictionless way of serving holistic data services to our customers in an integrated fashion, irrespective of the nature and number of relationships of the customer with the company.
The anywhere, anytime, and any device nature of delivery of digital services to our customers and employees’ mandates that focus on cyber security be paramount to support the technology-led operations of the business. The company’s focus on cyber security spans the process, people, and tools aspect of its digital technology setup.
With the rapidly changing technology landscape, people play the most critical role in ensuring success in delivery of the initiatives and the outcomes associated with the strategy. For the key identi�ed areas, the company will build in-house skills in key digital technology areas along with an innovation mindset to deliver di�erential impact for the business, given the rapid nature of changes in technology as well as the business domain.
28

Corporate Overview Financial StatementsManagement Reports
29
Cholamandalam Investment and Finance Company Limited Annual Report 2021 - 22
Driving a digitally-ready, automation-�rst and data-led organization
The acceleration in adoption of digital solutions during the di�erent waves of the pandemic has established a new status-quo in the usage of digital technology across the business landscape. While supporting large scale transformation programs in the existing lines of business, the technology team has also been helped in the launch of new lines of business, both secured and unsecured, in a completely digital manner – spanning loan originations, management and loan collections.
The digital technology function is progressing forward in its vision of establishing a digitally-ready, automation-�rst, and data-led technology capability on top of a strong cyber-security foundation.
As part of expanding our horizons of digital service delivery across products, we continue to provide an enhanced set of functions and digital experience for our ecosystem partners – ranging from manufacturers and dealers in our Vehicle Finance business to FinTech partners in our Consumer and Small Enterprises Loan business. By making our applications and solutions integration ready, we aim to provide a wide array set of services for our customers, dealers, manufacturers, co-lending institutions, and other ecosystem partners that meet all their needs from a partner like us. This objective is to be in a state of digital readiness to work with any new ecosystem partner within a short period in a scalable and secure fashion, thus demonstrating our agility.
Besides providing a vast set of external digital interfaces, the company is also diligently reviewing and optimizing its internal operations and processes through an automation lens. Application of LEAN practices help ensure that processes are e�cient and optimal for digitization. This coupled with adoption and integration of new set of digital APIs / services related to data validation, data quality, and elimination of paper (wherever possible) help achieve optimization objectives.
INFORMATION TECHNOLOGYFurthermore, the company is also steadily increasing the usage of process automation tools and scripts.
This will target not only the mundane and repetitive activities but also scenarios where cognitive automation can assist in a large way and reduce human intervention only to exceptional cases. The aim is to address turnaround time for execution of such activities while driving up operational accuracy.
As we expand the business horizons to new product lines, an integrated and consistent view of customer and business data is critical to operate and grow at scale. Be it in usage of decisioning logic to drive top line disbursements for our products or collections optimization model to improve bottom line growth or proposing the right product or o�er to customer at appropriate time, quality data plays an important role.
A scalable big-data repository is being established to serve the data management, data access, and analytics needs of the enterprise. With right levels of security and data access controls, the data repository will not only serve the reporting, dashboard, and analytical needs of the organization but also provide a frictionless way of serving holistic data services to our customers in an integrated fashion, irrespective of the nature and number of relationships of the customer with the company.
The anywhere, anytime, and any device nature of delivery of digital services to our customers and employees’ mandates that focus on cyber security be paramount to support the technology-led operations of the business. The company’s focus on cyber security spans the process, people, and tools aspect of its digital technology setup.
With the rapidly changing technology landscape, people play the most critical role in ensuring success in delivery of the initiatives and the outcomes associated with the strategy. For the key identi�ed areas, the company will build in-house skills in key digital technology areas along with an innovation mindset to deliver di�erential impact for the business, given the rapid nature of changes in technology as well as the business domain.
28
Cholamandalam Investment and Finance Company Limited Annual Report 2021 - 22
29
Chola’s CSR e�orts are towards creating awareness on health issues, making medical facilities available in highways, transport nagars and rural areas. Chola conduct regular health camps and eye camps, sponsor free heart surgeries for children of Commercial Vehicle Crew Members (CVCMs). Chola has aided schools in helping them provide quality education. Chola has facilitated the installation of bore wells, overhead tanks and Reverse Osmosis (RO) water plants. This has resulted in an assured water supply to communities and awareness about sustainable measures to save water. We ensure all our projects have the conditions for sustainability resulting in economic growth, greater social well-being, and protection of the environment. Our nationwide presence has made it easier to undertake activities across the country.
CORPORATE SOCIAL RESPONSIBILITY (CSR)
RAAHI - Eye Health Programme for CVCMs Healing Little Hearts – Free Heart Surgeries for children su�ering from Congenital Heart Disease (CHD) Promotion of overall mental well-being through yoga in partnership with Isha Yoga Foundation.
Healthcare
Puri�ed drinking water plants at Odisha Puri�ed drinking water plants & toilet facilities in Telangana
WASH (Water & Sanitation)
Vaccination drives PPE kits to healthcare workers Treatment of patients a�ected with COVID-19 Awareness campaign on hand hygiene and social distancing
Disaster Management
Chola participated virtually in the 2nd United Nations Global Sustainable Transport Conference heldin October 2021 at Beijing, China. Chola CSR focused on the importance of opportunities, challenges, and solutions towards achieving sustainable transport worldwide. In the conference Chola made recommendations on Sustainable Development Goals alignment with CVCMs and transport sector in India. Chola stressed on the need of clear visibility while driving.
Chola participates in 2nd United Nations Global Sustainable Transport Conference
Financial Literacy program at Kutch District, Gujarat Murugappa Polytechnic College My Dream Scholarship Program in Namakkal AID India foundation Nalandaway
Education

30
Corporate Overview Financial StatementsManagement ReportsCholamandalam Investment and Finance Company Limited Annual Report 2021 - 22
30
FINANCIAL HIGHLIGHTS
5,52,906
1,40,137
91,830
42,25,323
88,795
94,855
44,08,973
38,33,033
66,126
5,09,814
44,08,973
11.8
11.7
65%
65.22
2018FINANCIAL YEAR ENDED
OPERATING RESULTS
(� in Lakhs)
Total Income
Pro�t Before Tax (PBT)
Pro�t After Tax (PAT)
Assets
Loans(net) - Ind AS / Receivables under
�nancing activity - IGAAP
Cash, Bank and Cash Equivalents
Others
Total Assets
Liabilities and Equity
Borrowings
Others
Equity
Total Liabilities
Key Indicators*
Earnings per Equity Share - Basic (�)
Earnings per Equity Share - Diluted (�)
Dividend per Equity Share (%)
Book Value per Equity Share (�)
10,13,876
2,89,094
2,14,671
74,14,921
4,22,008
3,99,406
82,36,335
69,17,350
1,48,218
11,70,767
82,36,335
26.16
26.11
100%
142.59
2022
9,57,556
2,03,844
1,51,491
65,83,934
5,23,188
3,47,720
74,54,842
63,72,999
1,25,812
9,56,031
74,54,842
18.48
18.45
100%
116.58
2021
8,71,480
1,58,572
1,05,236
55,40,273
6,95,910
1,64,056
64,00,239
55,00,543
82,512
8,17,184
64,00,239
13.37
13.35
85%
99.71
2020
7,04,862
1,82,315
1,18,615
52,62,227
3,67,485
1,12,918
57,42,630
50,56,674
68,382
6,17,574
57,42,630
15.2
15.2
65%
78.99
2019

Corporate Overview Financial StatementsManagement Reports
31
Cholamandalam Investment and Finance Company Limited Annual Report 2021 - 22
30
FINANCIAL HIGHLIGHTS
5,52,906
1,40,137
91,830
42,25,323
88,795
94,855
44,08,973
38,33,033
66,126
5,09,814
44,08,973
11.8
11.7
65%
65.22
2018FINANCIAL YEAR ENDED
OPERATING RESULTS
(� in Lakhs)
Total Income
Pro�t Before Tax (PBT)
Pro�t After Tax (PAT)
Assets
Loans(net) - Ind AS / Receivables under
�nancing activity - IGAAP
Cash, Bank and Cash Equivalents
Others
Total Assets
Liabilities and Equity
Borrowings
Others
Equity
Total Liabilities
Key Indicators*
Earnings per Equity Share - Basic (�)
Earnings per Equity Share - Diluted (�)
Dividend per Equity Share (%)
Book Value per Equity Share (�)
10,13,876
2,89,094
2,14,671
74,14,921
4,22,008
3,99,406
82,36,335
69,17,350
1,48,218
11,70,767
82,36,335
26.16
26.11
100%
142.59
2022
9,57,556
2,03,844
1,51,491
65,83,934
5,23,188
3,47,720
74,54,842
63,72,999
1,25,812
9,56,031
74,54,842
18.48
18.45
100%
116.58
2021
8,71,480
1,58,572
1,05,236
55,40,273
6,95,910
1,64,056
64,00,239
55,00,543
82,512
8,17,184
64,00,239
13.37
13.35
85%
99.71
2020
7,04,862
1,82,315
1,18,615
52,62,227
3,67,485
1,12,918
57,42,630
50,56,674
68,382
6,17,574
57,42,630
15.2
15.2
65%
78.99
2019
Cholamandalam Investment and Finance Company Limited Annual Report 2021 - 22
*Equity shares have been divided into face value of � 2 per share, consequently previous year �gures have been adjusted.
Note: Numbers are as per IND AS from FY 18 onwards and rest of the years are as per IGAAP.
FINANCIAL HIGHLIGHTS
2,55,568
45,080
30,655
16,62,594
38,897
1,16,989
18,18,480
15,28,901
93,102
1,96,477
18,18,480
4.6
4.6
35%
27.46
2013FINANCIAL YEAR ENDED
OPERATING RESULTS
(� in Lakhs)
Total Income
Pro�t Before Tax (PBT)
Pro�t After Tax (PAT)
Assets
Loans(net) - Ind AS / Receivables under
�nancing activity - IGAAP
Cash, Bank and Cash Equivalents
Others
Total Assets
Liabilities and Equity
Borrowings
Others
Equity
Total Liabilities
Key Indicators*
Earnings per Equity Share - Basic (�)
Earnings per Equity Share - Diluted (�)
Dividend per Equity Share (%)
Book Value per Equity Share (�)
4,66,035
1,10,558
71,874
28,41,448
47,064
1,70,969
30,59,480
24,10,910
2,20,078
4,28,492
30,59,480
9.2
9.2
55%
54.84
2017
4,19,371
87,077
56,845
25,91,013
49,047
1,48,771
27,88,831
22,57,622
1,65,468
3,65,741
27,88,831
7.5
7.5
45%
47.32
2016
3,69,119
65,722
43,516
22,18,354
34,066
1,34,903
23,87,323
19,47,524
1,22,466
3,17,333
23,87,323
6.0
6.0
35%
40.70
2015
3,26,284
55,021
36,401
19,42,813
80,084
1,31,783
21,54,680
18,09,319
1,15,890
2,29,471
21,54,680
5.1
5.1
35%
32.05
2014
31

32
Corporate Overview Financial StatementsManagement Reports
Board’s Report
Your directors have pleasure in presenting the forty fourth annual report together with the audited accounts of the company for the year ended 31 March, 2022.
FINANCIAL RESULTS
Particulars 2021-22 2020-21
Gross Income 10,138.76 9,575.56
Profit Before Tax (PBT) 2,890.94 2,038.44
Profit After Tax (PAT) 2,146.71 1,514.91
Total Comprehensive income 2,267.95 1,480.13
Appropriation:Transfer to statutory and other reserves 1,430.00 1,060.00
Dividend – Equity (including Taxes) 164.14 106.56
` in crores
SHARE CAPITAL
During the year, there was an increase in paid up capital by ` 0.20 crores, consequent to allotment of shares upon exercise of stock options by employees under the company’s employee stock option schemes.
OPERATIONS
The FY 22 began with the second wave of COVID pandemic impacting the lives and livelihood of people across the country. Second wave was more impactful with more loss of lives than the first wave. Localized lockdowns were imposed by many states starting mid-April 2021 which extended in most states till June-2021. Many of our borrowers and employees were impacted due to the second wave, whereby the priority shifted from business to protecting the wellbeing of the affected stakeholders. This resulted in a setback in performance in Q1 on the disbursements and collections front. In view of the uncertainties created by the resurgence of COVID-19 pandemic in India, RBI extended the resolution framework 2.0 for restructuring of existing loans without a downgrade and your company had offered resolution plans under this framework to the eligible customers. Post July 2021 onwards, with the waning of second wave and the rise in vaccination coverage led to sharp and sustained reduction in COVID-19 infections which contributed to the return of customer confidence and business optimism. Pent-up demand, good monsoon led to economic revival in second half of FY 22 leading to a sharp recovery in disbursements and collections.
Despite slowdown due to 2nd wave in the first quarter of the year, your company ended the FY 22 with an all-time high disbursement of ` 35,490 crores which is a growth of 36% YoY. Vehicle Finance grew disbursements by 26% YoY to ` 25,439 crores with growth coming from both new and used segments across commercial and passenger vehicles. Loan against property business grew disbursements by 62% YoY to ` 5,862 crores and home loans business grew disbursements marginally by 2% YoY to ` 1,571 crores. New businesses consumer and small enterprise loans, secured business and personal loans launched in FY 22 along with small and medium enterprises loans business made aggregate disbursements of ` 2,618 crores which is a growth of 319% YoY.
The business AUM of the company as of 31 March, 2022 grew to ` 76,907 crores from ` 69,996 crores in previous year, which is a growth of 10% YoY.
The profit before tax of the company for the year FY 22 is ` 2,891 crores as against ` 2,038 crores, which is a growth of 42% YoY.
Your company continued to hold a strong liquidity position with ` 5,341 crores as cash balance as at end of 31 March, 2022 (including ` 1500 crores invested in Gsec shown under investments), with
a total liquidity position of ` 13,246 crores (including undrawn
sanctioned lines). The Asset Liability Management (ALM) is

Corporate Overview Financial StatementsManagement Reports
33
comfortable with no negative cumulative mismatches across all
time buckets.
OUTLOOK
The outlook for FY 23 looks positive with GDP of the country
projected to grow over 8% in FY 23. Industry outlook across all
our business segments is positive, and your company will look
to scale disbursements by expanding into new geography/
customer segments, driving market share growth through original
equipment manufacturer / dealer tie-ups, co-lending partnerships,
improving internal efficiencies through lean and digital initiatives.
Our strong collection infrastructure is driven by experienced field
teams with product level focus from early buckets. Your company is
running host of initiatives to digitize the collection processes which
will be analytics enabled and will help strengthen the asset quality
position back to pre-COVID levels.
DIVIDEND
Dividend distribution policy
The company has formulated a dividend distribution policy in
compliance with regulation 43A of SEBI (Listing Obligation and
Disclosure Requirement) Regulations, 2015 (Listing Regulations), a
copy of which is available on the website of the company. (weblink:
https://www.cholamandalam.com/company-policies.aspx)
Payment of dividend
Your company paid an interim dividend on the equity shares at the
rate of 65% (` 1.30 per equity share) as approved by the Board on
01 February 2022 for the year ended 31 March, 2022.
Your directors are pleased to recommend a final dividend of 35%
(` 0.70 per equity share) on the equity shares of the company. With
this, the total dividend will be 100% (` 2.00 per equity share) for the
year ended 31 March, 2022.
TRANSFER TO RESERVES
Your company transferred a sum of ` 430 crores to statutory
reserve as required under the Reserve Bank of India Act, 1934 and
` 1000 crores to general reserves.
FIXED DEPOSITS
The company is an NBFC - Investment and Credit Company (NBFC-
ICC). The company does not hold or accept deposits as of the date
of balance sheet.
CAPITAL ADEQUACY
The company’s capital adequacy ratio was at 19.6% as on
31 March, 2022 as against the statutory minimum capital adequacy
of 15% prescribed by RBI.
EMPLOYEE STOCK OPTION (ESOP) SCHEMES
ESOP 2016
Pursuant to the approval accorded by the shareholders on 3 January, 2017 the nomination and remuneration committee had formulated an employee stock option scheme 2016 (ESOP 2016).
During the year, the company made grants aggregating to 20,25,520 options to 56 employees. The total number of options issued as on 31 March, 2022 under ESOP 2016 is 45,22,020.
ESOP 2007
Pursuant to the approval accorded by the shareholders at the twenty ninth annual general meeting (AGM) of the company held on 30 July, 2007 the nomination and remuneration committee had formulated an employee stock option scheme 2007 (ESOP 2007). During the year, there have been no fresh grants under the scheme and no options are outstanding as on 31 March, 2022.
The schemes are in compliance with Securities and Exchange Board of India (Share Based Employee Benefits) Regulations, 2014 (SEBI (SBEB) Regulations) and the Companies Act, 2013 (the Act).
The certificate from M/s. Sridharan & Associates, company secretaries confirming that ESOP 2007 and ESOP 2016 have been implemented in accordance with the SEBI (SBEB) Regulations and shareholders resolutions has been obtained and will be available for the shareholders at the ensuing AGM.
The details of the schemes as on 31 March, 2022 are provided and disclosed on the website of the company (weblink: https://www.cholamandalam.com/esop.aspx)
DIRECTORS
Re-appointment
Mr. Vellayan Subbiah, director who retires by rotation at the ensuing AGM and being eligible, has offered himself for re-appointment and is recommended to the shareholders for approval.
During the year, there were no appointment / resignation of directors of the company.
DECLARATION FROM INDEPENDENT DIRECTORS
All the independent directors (IDs) have submitted their declaration of independence, as required pursuant to section 149(7) of the Act, confirming that they meet the criteria of independence as provided in section 149(6) of the Act. In the opinion of the board, the IDs fulfil the conditions specified in the Act and the rules made there under for appointment as IDs including the integrity, expertise and experience and confirm that they are independent of the management. All the IDs of the company have registered their names with the data bank of IDs and are in the process of completion of online proficiency self-assessment test as per the timeline notified by the Ministry of Corporate Affairs (MCA).

34
Corporate Overview Financial StatementsManagement Reports
KEY MANAGERIAL PERSONNEL
Pursuant to the provisions of section 203 of the Act read with the rules made there under, the following employees are the whole time key managerial personnel of the company during FY 22:
1. Mr. Ravindra Kumar Kundu, Executive Director
2. Mr. D. Arul Selvan, Chief Financial Officer and
3. Ms. P. Sujatha, Company Secretary
DIRECTORS’ RESPONSIBILITY STATEMENT
The directors’ responsibility statement as required under section 134(5) of the Act, reporting the compliance with accounting standards, is attached and forms part of the board’s report.
SIGNIFICANT AND MATERIAL ORDERS PASSED BY THE REGULATORS
There are no significant and material orders passed by the regulators or courts or tribunals which would impact the going concern status of the company and its future operations.
MATERIAL CHANGES AND COMMITMENTS AFFECTING THE FINANCIAL POSITION OF THE COMPANY
There are no significant material changes and commitments affecting the financial position of the company that occurred between the end of financial year and the date of this report.
MANAGEMENT DISCUSSION AND ANALYSIS
The management discussion and analysis report (MDA), highlighting the business-wise details is attached and forms part of this report. MDA also contains the details of the risk management framework of the company including the development and implementation of risk management policy and the key risks faced by the company.
CORPORATE GOVERNANCE REPORT
A report on corporate governance as per the Listing Regulations is attached and forms part of this report. The report also contains the details as required to be provided on the composition and category of directors, number of meetings of the board, composition of the various committees, annual board evaluation, remuneration policy, criteria for board nomination and senior management appointment, whistle blower policy/vigil mechanism, disclosure of relationships between directors inter-se, state of company’s affairs, etc.
The executive director and the chief financial officer have submitted a compliance certificate to the board regarding the financial statements and other matters as required under regulation 17(8) of the Listing Regulations.
BUSINESS RESPONSIBILITY REPORT
A business responsibility report is attached and forms part of this report.
CONSOLIDATED FINANCIAL STATEMENTS
The consolidated financial statement is prepared in accordance with the Act and the relevant accounting standards and forms part of this annual report.
AUDITORS
The company has implemented the guidelines for appointment of statutory auditors for Banks and NBFCs issued by RBI on 27 April, 2021. M/s. Price Waterhouse LLP, and M/s. Sundaram & Srinivasan, chartered accountants are the joint statutory auditors of the company. They were appointed as joint statutory auditors of the company at the 43rd AGM held on 30 July, 2021 for a period of three years commencing from the conclusion of 43rd AGM till the conclusion of 46th AGM. The statutory audit report is attached with financial statement and forms part of this report and does not contain any qualification, reservation or adverse remarks.
SECRETARIAL AUDIT
Pursuant to the provisions of the Act and the rules framed there under, M/s. R. Sridharan & Associates, company secretaries had undertaken a secretarial audit of the company for FY 22. The secretarial audit report is attached and forms part of this report and does not contain any qualification, reservation, or adverse remarks.
COST RECORD AND COST AUDIT
Maintenance of cost records and requirements of cost audit as prescribed under the provisions of section 148(1) of the Act is not applicable for the business activities carried out by the company.
ANNUAL RETURN
In accordance with sections 134(3)(a) and 92(3) of the Act, the annual return in form MGT-7 is placed on the website of the company and is available on the weblink: https://cholamandalam.com/files/MEDIA/ Annual-Return-2021-2022.pdf.
CORPORATE SOCIAL RESPONSIBILITY
The Murugappa group is known for its tradition of philanthropy and community service. The group’s philosophy is to reach out to the community by establishing service-oriented philanthropic institutions in the field of education and healthcare as the core focus areas. The company upholds the group’s tradition by earmarking a part of its income for carrying out its social responsibilities.
The company has been carrying out corporate social responsibility (CSR) activities for many years now even before it was mandated under the Act. The company has put in place a CSR policy. The policy along with composition of CSR committee and projects approved by the board are available on the website of the company (weblink: https://www.cholamandalam.com/community-relations.aspx).
As per the provisions of the Act, the company is required to spend at least 2% of the average net profits of the company made during the three immediately preceding financial years.
Corporate Overview Financial StatementsManagement Reports
35
This amount aggregated to ` 36.32 crores and the company spent ` 36.44 crores towards CSR activities during FY 22, the details of which are annexed to and forms part of this report.
INTERNAL FINANCIAL CONTROLS
Internal control framework including clear delegation of authority and standard operating procedures are established and laid out across all businesses and functions. These are reviewed periodically at all levels. The risk and control matrices are reviewed on a quarterly basis and control measures are tested and documented. These measures have helped in ensuring the adequacy of internal financial controls commensurate with the scale of operations of the company.
The internal financial controls with reference to the financial statements were tested and reported adequate.
RELATED PARTY TRANSACTIONS
The company has in place a policy on related party transactions as approved by the board and the same is available on the website of the company (weblink: https://www.cholamandalam.com/company- policies.aspx).
All transactions with related parties that were entered into during the financial year were in the ordinary course of business and were on an arm’s length basis. There were no materially significant transactions made by the company with promoters, directors, key managerial personnel or other designated persons which may have a potential conflict with the interest of the company at large. There were no contracts or arrangements entered into with related parties during the year to be disclosed under sections 188(1) and 134(h) of the Act in form AOC-2. All transactions with related parties were placed before the audit committee for prior approval at the beginning of the financial year. The transactions entered into pursuant to the approval so granted were placed before the audit committee for its review on a quarterly basis. None of the directors has any pecuniary relationship or transaction vis-à-vis the company.
INFORMATION AS PER SECTION 134(3)(m) OF THE ACT
During the year under review, the company has no major impact on account of conservation of energy or technology absorption. Foreign currency expenditure / remittances amounting to ` 639.30 crores towards repayment of overseas borrowing and interest, purchase of computer equipment, license fees and other professional charges were incurred during the year under review. The company does not have any foreign exchange earnings.
PARTICULARS OF LOANS, GUARANTEES OR INVESTMENTS
Being an NBFC, the disclosures regarding particulars of loans given, guarantees given and security provided is exempted under the provisions of section 186(11) of the Act.
As regards investments made by the company, the details of the same are provided under Note 10 in standalone financial statements
and Note 12 and Note 46 in consolidated financial statements of
the company for the year ended 31 March, 2022.
DISCLOSURE OF REMUNERATION
The disclosure with respect to remuneration as required under
section 197 of the Act read with rule 5 of the Companies
(Appointment and Remuneration of Managerial Personnel) Rules,
2014 is attached and forms part of this report.
PARTICULARS OF EMPLOYEES
In accordance with section 136 of the Act, the report and accounts
are being sent to the members and others entitled thereto. The
statement prescribed under rule 5(2) and 5(3) of the Companies
(Appointment and Remuneration of Managerial Personnel) Rules,
2014 is available for inspection. If any member is interested in
obtaining a copy, such member may send an e-mail to the company
secretary in this regard.
COMPLIANCE WITH SECRETARIAL STANDARDS ON BOARD AND GENERAL MEETINGS
The company has complied with all the provisions of secretarial
standards issued by the Institute of Company Secretaries of India in
respect of meetings of the board of directors and general meetings
held during the year.
INTERNAL COMPLAINTS COMMITTEE
The company has in place a policy for prevention of sexual
harassment in line with the requirements of the Sexual Harassment
of Women at the Workplace (Prevention, Prohibition and Redressal)
Act, 2013 (POSH Act). The company has complied with the
provisions relating to constitution of internal complaints committee
(ICC) under the POSH Act. ICC has been set up to redress complaints
received regarding sexual harassment. All employees are covered
under this policy. During the year, the company conducted
workshops for employees creating awareness about POSH Act.
During the calendar year ended 31 December, 2021, there were no
referrals received by ICC.
OTHER DISCLOSURES
There was no fraud reported by auditors of the company as given
under Section 143(12) of the Companies Act, 2013 (Read with
Companies (Audit and Auditors) Rules, 2014.
During the year ended 31 March, 2022, the company had made an
application amounting to ` 1.83 crores under the Insolvency and
Bankruptcy Code, 2016 (“the Code”). As at 31 March, 2022, total
number of applications filed and pending under the Code are
10 cases amounting to ` 27.63 crores. No proceeding is pending
against the company under the Code.
During the year, the company had not made any one-time
settlement with banks or financial institutions.

36
Corporate Overview Financial StatementsManagement Reports
HIGHLIGHTS OF PERFORMANCE OF SUBSIDIARIES / ASSOCIATES AND JOINT VENTURES
CHOLAMANDALAM SECURITIES LIMITED (CSEC)
In FY 22, CSEC had commenced the implementation of its Reimagination strategy and transformation to evolve as a (i) Digitally integrated financial services player (ii) Best-in-class company for customer journey and Tech enablement and (iii) High performance Feet-on-street and franchise enablement through digital journeys. During the year, CSEC increased its footprint from 22 branches to 34 branches. CSEC achieved a gross income of ` 40.01 crores for the year ended 31 March, 2022 and made a PBT of ` 7.48 crores as against a PBT of ` 6.84 crores in the previous year. The mutual fund AUM was at ` 839 crores. CSEC did not declare any dividend during the year. The PBT contribution of CSEC to the overall performance of the company was ` 7.48 crores during the year.
CHOLAMANDALAM HOME FINANCE LIMITED (CHFL)
CHFL recorded a gross income of ` 56.37 crores for the year ended 31 March, 2022 and made a profit before tax of ` 9.19 crores as against profit of ` 2.62 crores in the previous year. CHFL did not declare any dividend during the year. Currently, the company continues its focus on growing insurance corporate agency business.
The PBT contribution of CHFL to the overall performance of the company was ` 9.19 crores during the year.
WHITE DATA SYSTEMS INDIA PRIVATE LIMITED (WDSI)
WDSI recorded a gross income of ` 6.62 crores for the year ended 31 March, 2022 and made a loss of ` 0.36 crores as against a loss of ` 2.30 crores in the previous year. WDSI did not declare any dividend during the year.
VISHVAKARMA PAYMENTS PRIVATE LIMITED (VPPL)
The company forms part of the consortium for retail payments – Vishvakarma Payments Private Limited (VPPL) that has applied for a
New Umbrella Entity (NUE) License for retail payments with Reserve
Bank of India. The company holds 21% of equity share capital of
VPPL.
PAYSWIFF TECHNOLOGIES PRIVATE LIMITED (PTPL)
During the year, the company acquired 73.8% stake in equity
share capital of Payswiff Tehcnologies Private Limited (PTPL).
Consequently, the PTPL has become a subsidiary of the company.
PTPL is engaged in the business of enabling online payment gateway
services for e-commerce businesses and provides e-commerce
solutions. PTPL is an omni channel payment transaction
solution that lets business owners accept payments from their
customers in-store, at home deliveries, online, and on-the-go
using mPOS and POS solutions. PTPL recorded a gross income of
` 284.60 crores and made a loss of ` 33.78 crores for the year ended
31 March, 2022.
Payswiff Solutions Private Limited and Payswiff Services
Private Limited, subsidiaries of PTPL, recorded gross income of
` 284.90 crores and ` 0.66 crores respectively for the year ended
31 March, 2022.
ACKNOWLEDGEMENT
The directors wish to thank the company’s customers, vehicle
manufacturers, vehicle dealers, channel partners, banks, mutual
funds, rating agencies and shareholders for their continued
support. The directors also thank the employees of the company
for their contribution to the company’s operations during the year
under review.
On behalf of the board
Place : Chennai Vellayan Subbiah
Date : 5 May, 2022 Chairman

Corporate Overview Financial StatementsManagement Reports
37
Directors’ Responsibility Statement
The board of directors have instituted / put in place a framework of internal financial controls and compliance systems, which is reviewed by the management and the relevant board committees, including the audit committee and independently reviewed by the internal, joint statutory and secretarial auditors.
Pursuant to section 134(5) of the Companies Act, 2013, the board of directors, confirm that:
(i) in the preparation of the annual accounts, the applicable accounting standards have been followed and that there were no material departures therefrom;
(ii) they have, in the selection of the accounting policies, consulted the joint statutory auditors and have applied their recommendations consistently and made judgments and estimates that are reasonable and prudent so as to give a true and fair view of the state of affairs of the company as at 31 March, 2022 and of the profit of the company for the year ended on that date;
(iii) they have taken proper and sufficient care for the maintenance of adequate accounting records in accordance with the provisions of the Companies Act, 2013, for safeguarding the assets of the company and for preventing and detecting fraud and other irregularities;
(iv) they have prepared the annual accounts on a going concern basis;
(v) they have laid down internal financial controls to be followed by the company and that such internal financial controls are adequate and were operating effectively during the year ended 31 March, 2022; and
(vi) proper system has been devised to ensure compliance with the provisions of all applicable laws and that such systems were adequate and operating effectively during the year ended 31 March, 2022.
On behalf of the board
Place : Chennai Vellayan SubbiahDate : 5 May, 2022 Chairman

38
Corporate Overview Financial StatementsManagement Reports
Annexure-ISecretarial Audit Reportfor the financial year ended 31st March, 2022[Pursuant to Section 204(1) of the Companies Act, 2013 and Rule No.9 of the Companies (Appointment and Remuneration of Managerial Personnel) Rules, 2014 and Regulation 24 A of the SEBI (Listing Obligations and Disclosure Requirements), Regulations, 2015 as amended]
ToThe Members,CHOLAMANDALAM INVESTMENT AND FINANCE COMPANY LIMITEDCIN: L65993TN1978PLC007576, Dare House, No. 2 N.S.C Bose Road, Parrys, Chennai – 600001
We have conducted the Secretarial Audit of the compliance of applicable statutory provisions and the adherence to good corporate practices by CHOLAMANDALAM INVESTMENT AND FINANCE COMPANY LIMITED [Corporate Identification Number: L65993TN1978PLC007576] (hereinafter referred as “the Company”) for the financial year ended 31st March, 2022. Secretarial Audit was conducted in a manner that provided us a reasonable basis for evaluating the corporate conducts/statutory compliances and expressing our opinion thereon.
Based on our verification of the Company’s books, papers, minute books, forms and returns filed and other records maintained and also the information provided by the Company, its officers, agents and authorized representatives during the conduct of secretarial audit, we hereby report that in our opinion, the Company has, during the audit period covering the financial year ended on 31st March, 2022 complied with the statutory provisions listed hereunder and also that the Company has proper Board-processes and compliance mechanism in place to the extent, in the manner and subject to the reporting made hereinafter:
We have examined the books, papers, minute books, forms and returns filed and other records maintained by the Company for the financial year ended on 31st March, 2022 according to the provisions of:
(i) The Companies Act, 2013 (the Act) and the rules made there under;
(ii) The Securities Contracts (Regulation) Act, 1956 (‘SCRA’) and the rules made there under;
(iii) The Depositories Act, 1996 and the Regulations and Bye-laws framed there under;
(iv) The Company has complied with the applicable provisions of Foreign Exchange Management Act, 1999 and the rules and regulations made there under to the extent of External Commercial Borrowings. There was no Foreign Direct Investment and Overseas Direct Investment during the year under review;
(v) The following Regulations and Guidelines prescribed under the Securities and Exchange Board of India Act, 1992 (‘SEBI Act’):-
a) The Securities and Exchange Board of India (Substantial Acquisition of Shares and Takeovers) Regulations, 2011;
b) The Securities and Exchange Board of India (Prohibition of Insider Trading) Regulations, 2015;
c) The Securities and Exchange Board of India (Issue of Capital and Disclosure Requirements) Regulations, 2018 (not applicable during the period under review);
d) The Employee Stock Option Plan, 2016 approved under the Securities and Exchange Board of India (Share Based Employee Benefits) Regulations, 2014 & the Securities and Exchange Board of India (Share Based Employee Benefits and Sweat Equity) Regulations, 2021and the Employee Stock Option Scheme, 2007 approved under the Securities and Exchange Board of India (Employee Stock Option Scheme and Employee Stock Purchase Scheme) Guidelines, 1999;
e) The Securities and Exchange Board of India (Issue and Listing of Debt Securities) Regulations, 2008 & the Securities and Exchange Board of India (Issue and Listing of Non-Convertible Securities) Regulations, 2021;
f ) The Securities and Exchange Board of India (Registrars to an Issue and Share Transfer Agents) Regulations, 1993 regarding the Companies Act and dealing with client; (Not applicable as the company is not registered as Registrar to an Issue and Share transfer Agent during the year under review).
g) The Securities and Exchange Board of India (Delisting of Equity Shares) Regulations, 2009; (not applicable during the year under review); and
h) The Securities and Exchange Board of India (Buyback of Securities) Regulations, 2018; (not applicable during the year under review);
(vi) Other laws specifically applicable to the Company are -
a) Reserve Bank of India Act, 1934, Rules, Regulations, guidelines, circulars, directions, notifications made thereunder.
b) Non-Banking Financial Company – Systemically Important Non-Deposit taking Company (Reserve Bank) Directions, 2016.
c) Non-Banking Financial Companies Acceptance of Public Deposits (Reserve Bank) Directions, 2016.
d) NBFC Auditors Report Reserve Bank Directions, 2016.
We believe that the audit evidence which we have obtained is sufficient and appropriate to provide a basis for our audit opinion.

Corporate Overview Financial StatementsManagement Reports
39
In our opinion and to the best of our information and according to explanations given to us, we believe that the systems and mechanisms established by the Company are adequate to ensure compliance of laws as mentioned above.
We have also examined compliance with the applicable clauses / regulations of the following:
(i) Secretarial Standards with respect to Meetings of Board of Directors (SS-1) and General Meetings (SS-2) issued by the Institute of Company Secretaries of India.
(ii) The Uniform Listing Agreement entered into with BSE Limited and National Stock Exchange of India Limited pursuant to the provisions of the SEBI (Listing Obligations and Disclosure Requirements) Regulations, 2015.
During the period under review, the Company has complied with the provisions of the Act, Rules, Regulations, Guidelines, Standards, etc. issued by the Ministry of Corporate Affairs, Securities and Exchange Board of India and such other regulatory authorities for such acts, rules, regulations, standards etc. as mentioned above.
We further report that
The Board of Directors of the company is duly constituted with proper balance of Executive Director, Non-Executive Directors, Woman Independent Director and Independent Directors. There were no changes in the composition of the Board of Directors during the financial year under review.
Adequate notice is given to all directors before schedule of the Board/Committee Meetings, agenda and detailed notes on agenda were sent at least seven days in advance and a system exists for seeking and obtaining further information and clarifications on the agenda items before the meeting and for meaningful participation at the meeting. Notes on agenda which are circulated less than the specified period, the necessary compliances under the Act and Secretarial Standards on Board Meeting are complied with.
During the year under review, directors have participated in the board / committees meetings through video conferencing, such meetings were properly convened and recorded in compliance with the provisions of Section 173 (2) of the Act read with Rule 3 & 4 of Companies (Meetings of Board and its Powers) Rules, 2014. Further, the Circulars, Regulations and Guidelines issued by the Ministry of Corporate Affairs, Securities and Exchange Board of India and other relevant regulatory authorities in view of the pandemic pertaining to Board/ Committee meetings, General Meetings and other provisions of the Act, Rules and Regulations have been complied with by the Company.
Based on the verification of the records and minutes, the decisions were carried out with the consent of the Board of Directors / Committee Members and no Director / Members of the Committee dissented on the decisions taken at such Board / Committee Meetings. Further, in the minutes of the General Meeting, the number of votes cast against the resolution(s) have been recorded.
We further report that based on the review of compliance mechanism established by the Company and on the basis of our review and audit of the records and books, we are of the opinion that the management has adequate systems and processes commensurate with its size and operations, to monitor and
ensure compliance with all applicable laws, rules, regulations and
guidelines.
We further report that the above mentioned Company being a
listed entity this report is also issued pursuant to Regulation 24A of
SEBI (Listing Obligations and Disclosure Requirements) Regulations,
2015 as amended and circular No. CIR/CFD/CMD1/27/2019 dated
8th February, 2019 issued by Securities and Exchange Board of India.
We further report that as per the information and explanations
provided by the Management, the Company does not have any
Material Unlisted Subsidiary (ies) Incorporated in India as defined in
Regulation 16(1)(c) and Regulation 24A of SEBI (Listing Obligations
and Disclosure Requirements) Regulations, 2015 during the period
under review.
We further report that during the audit period, the Company has
1. Invested in equity shares of Payswiff Technologies Private
Limited aggregating to 73.82% of the paid-up equity capital
and effective 8th February, 2022, Payswiff Technologies Private
Limited has become a subsidiary of the Company;
2. Issued secured redeemable non-convertible debentures for
` 3,926.40 Crores and unsecured redeemable non-convertible
debentures for ` 570 Crores.
3. Redeemed secured redeemable non-convertible debentures for
` 2,635.30 Crores and unsecured redeemable non-convertible
debentures for ` 872.70 Crores.
4. Pursuant to RBI guidelines on appointment of statutory auditors
of Banks and NBFCs, the statutory audit of the company should
be conducted under joint audit of a minimum of two audit firms
and consequently, M/s. S.R. Batliboi and Associates appointed
as the statutory auditors of the company at the 39th AGM of
the company held on 27th July, 2017, communicated their
intention to resign as statutory auditors of the company and
the resignation was effective upon signing the limited review
reports for the quarter ended 30 June, 2021. Subsequently,
M/s. Price Waterhouse LLP and M/s. Sundaram & Srinivasan,
Chartered Accountants were appointed as the joint statutory
auditors of the Company at the 43rd AGM held on 30 July, 2021
for a period of three years commencing from the conclusion of
43rd AGM till the conclusion of 46th AGM.
For R. Sridharan & Associates
Company Secretaries CS R.SRIDHARAN
CP No. 3239FCS No. 4775
PR NO.657/2020UIN: S2003TN063400
UDIN: F004775D000264155
Place : ChennaiDate : 5 May, 2022
This report is to be read with our letter of even date which is annexed as ANNEXURE -A and forms an integral part of this report.

40
Corporate Overview Financial StatementsManagement Reports
Annexure-AToThe Members,CHOLAMANDALAM INVESTMENT AND FINANCE COMPANY LIMITEDCIN: L65993TN1978PLC007576,Dare House, No. 2 N.S.C Bose Road, Parrys, Chennai – 600001
Our report of even date is to be read along with this letter.
1. Maintenance of secretarial records is the responsibility of the management of the company. Our responsibility is to express an opinion on these secretarial records based on our audit.
2. We have followed the audit practices and processes as were appropriate to obtain reasonable assurance about the correctness of the contents of the Secretarial records as per the Auditing Standards (CSAS-1 to CSAS-4) and Guidance Notes on ICSI Auditing Standards and Guidance Note on Secretarial Audit issued by The Institute of Company Secretaries of India. The verification was done to ensure that correct facts are reflected in secretarial records. We believe that the processes and practices, we followed provide a reasonable basis for our opinion.
3. We have not verified the correctness and appropriateness of financial records and Books of Accounts of the company as well as correctness of the values and figures reported in various disclosures and returns as required to be filed by the company under the specified laws.
4. Whereever required, we have obtained the Management representation about the compliance of laws, rules and regulations and happening of events etc.
5. It is the responsibility of the management of the company to devise proper systems to ensure compliance with the provisions of Corporate and other applicable laws, rules, regulations, standards and to ensure that the systems are adequate and operate effectively. Our examination was limited to the verification of procedures on test basis.
6. The Secretarial Audit report is neither an assurance as to the future viability of the company nor of the efficacy or effectiveness with which the management has conducted the affairs of the company.
For R. Sridharan & Associates
Company Secretaries
CS R.SRIDHARANCP No. 3239
FCS No. 4775PR NO.657/2020
UIN: S2003TN063400UDIN: F004775D000264155
Place : ChennaiDate : 5 May , 2022

Corporate Overview Financial StatementsManagement Reports
41
Annexure-IICSR ReportAnnual Report on Corporate Social Responsibility (CSR) Activities:
1. Brief outline on CSR Policy of the Company.
Traditionally, Cholamandalam Investment and Finance Company Limited, financial services arm of the Murugappa Group endeavoured to strengthen the social infrastructure and nurture communities in India. Chola’s multi-stakeholder engagement programmes/projects and initiatives focus towards achieving an all-inclusive development and growth in various geographies, across the country. Corporate Social Responsibility (CSR) has been an ideal and structured vehicle for this journey of development that helps the underprivileged and the marginalised to ‘Enter a Better Life’.
Giving back to the society has been an integral part of the Murugappa Group and we take pride in working and contributing towards the nation building and helping the communities to enter a better life. As always, during this year too, inclusion became the central theme of our CSR programmes and initiatives, as COVID-19 pandemic heightened the vulnerability of the marginalised segments such as children, women, the elderly and specially abled.
While Chola intervenes in all the themes of development, it focuses more on community development through healthcare, education including research & development.
With the continuation of COVID-19 pandemic during most part of the year, mobility suffered a setback and projects had to be supported and executed from respective locations. Further, the amendments to the CSR rules called for the increased monitoring of the projects. Despite the above challenges, the company with its strong and reputed partner network, engaged with around 3,50,000 beneficiaries.
Over the past 6 years the programme, the flagship project, aimed at the commercial vehicle crew members (CVCMs) comprehensive welfare (CVCMs include drivers, helpers/cleaners, single truck owners, mechanics and their family members), has been developed and nurtured in a steady and phased manner. The programme had eye check-ups at various places, frequented by the CVCMs, across the country. Comprehensive data has been collected to ascertain gaps and needs. Over the years, steadily the programme included, eye check-ups (over 25,000 persons have been checked for and 11,600 spectacles have been provided free of cost), health check-ups, literacy programmes that included financial literacy to CVCMs as well as their family members (about 25,000 members),
scholarship support to continue and pursue higher education of the children of the CVCMs, mother and child health care, free heart surgeries for the children of CVCMs.
Glimpses of Work with CVCMs
• Project programmes in 15 states of India
• Covered more than 195,000 CVCMs and their family members
• Free treatment and surgeries for Congenital Heart Defects (CHDs) for 190 children of CVCMs
• 193 Scholarships for the children of CVCMs
• Financial Literacy of about 25,000 CVCMs and their families
Health Care
Chola is putting its efforts in India’s goal of achieving sustainable development goals (SDGs) by working with India’s large commercial vehicle population which is estimated at 5-6 million drivers and helpers, out of whom, about 2-2.5 million are classified as long-distance drivers.
Truck drivers in India, in their lifetime, have to travel long distances, on an extensive spread of national and state highways that range from well-engineered roads to a complete absence of roads sometimes. Their occupation predisposes them to a multitude of risk factors such as prolonged sitting and motor vehicle driving, tight running schedules, reduced rest breaks, traffic congestion, the sedentary nature of job, and resultant physical, psychological and behavioural problems. It affects the health status of the driver and may result in road accidents on the highways.
Chola launched RAAHI in October 2017, one of the Country’s biggest Eye Health programme for the CVCM community for reaching out to CVCMs with the prime focus on improving their overall well being, especially eye health, and in the process to minimise road accidents. The programme includes not only mobile health camps but also static facilities at 30 locations, mostly on or around the Golden Quadrilateral network in the country. The key strength of the programme is real time based data management which allows the CVCMs to receive eye screening services at one location and spectacle pick-up at their preferred location. Company’s approach to the eye health of the CVCMs is pertinent – exploring what interventions work better, in providing eye health services, for this most vulnerable and mobile group of community.

42
Corporate Overview Financial StatementsManagement Reports
In India, it is estimated that over 240,000 children are born with Congenital Heart Defects (CHDs). The current available care for them is grossly inadequate and in many cases beyond the means of an ordinary and economically poor family. This poses a tremendous challenge for the families, society and health care system. In India there are just about 60 centers that cater to children with CHDs.
Causes of CHD are multi-factored, both genetic and environmental. Primarily among the affecting factors are malnutrition in mothers, consanguineous marriage, lack of awareness of family planning, viral infections, alcohol consumption, and smoking during pregnancy. Various studies highlight that the incidence of CHD is higher among lower income families and children in these families do not get diagnosed on time, leading to higher morbidity and mortality.
Healing Little Hearts is an initiative by Chola which so far supported surgeries of 190 children suffering from CHDs and belonging to CMCV families across India. The complete treatment for treating the respective CHD has been provided to the affected, totally free of cost.
Divine Mother and Child Health Programme, a programme for strengthening maternal health has been initiated for improving accessibility and building capacities for quality maternal health care. The programme envisages and endeavours to provide consultation, comprehensive screening, detection and intervention for pregnant women and their children. This programme is not only done at the premises of partner’s selected hospital facility but also as a mobile service provider by visiting the places of the patients/beneficiaries which are predominantly located on peri-urban areas and economically poorer localities.
A major implication of the Sustainable Development Goals (SDGs) and target 3.4 for mental health policy and practice is the renewed emphasis on implementing a strong public health approach that addresses the needs of individuals and families affected by mental disorders and psychosocial disabilities but also protects or acts against known determinants of mental health that typically have their origin outside the health sector, including socioeconomic status, educational attainment and (in)equality.
Cancer Treatment for children (27 children) from across the country has been supported by our interventions.
With good mental health, people feel more confident to carry out activities of daily living, including self-care, education, employment and participation in social life. Therefore, investment in mental health is essential for the sustainability of health and socio-economic policies. Chola is investing in promotion of overall well being through Yoga (about 150,000 beneficiaries participated).
Water, Sanitation and Hygiene (WASH) Access to clean and safe drinking water still remains a major problem for most of the rural communities. While some communities lack access to water
facilities some face contamination problem. Excess fluoride in the water content in rural areas is leading to dental, joint issues and skeletal fluorosis. Water contamination is a problem in slum areas due to old pipe lines, mix of water with sewer drains etc., leading to multiple health issues such as diarrhea, typhoid, skin diseases, etc. This situation results in dire consequences to the rural poor as their family medical expenses increase and the productivity decreases.
Under this initiative, Chola worked with villages in Odisha and Telangana and extended interventions such as building toilets, providing purified drinking water facilities for villages and schools. Chola installed Ultra filtration water plants in 22 villages of Telangana. While doing so Chola has not forgotten the environment issues and encourages partners to provide solar power wherever possible for the purposes.
Chola supports people through its Mobile Health Clinics (125 patients minimum per week of operation).
Under the COVID-19 Health Disaster Management, Chola supported welfare activities for the CVCM community and supported partners during COVID-19 pandemic. Among various welfare activities undertaken, Chola supported with masks, face shields, vaccination and PPE kits for health workers.
Chola supported the treatment of patients infected with COVID-19, especially children belonging to poor socio-economic section of society. Chola ran awareness campaigns on hand hygiene and social distancing across 12 locations in the country.
In addition, Chola contributed an aggregate sum of `2.50 crore to Tamil Nadu State Disaster Relief Fund during the year to aid the fight against COVID.
For its good work in the field of Health for the CVCMS, Chola has been invited to participate in the United Nations Global Sustainable Transport Conference, an honour and recognition for Chola’s work in the sector. This provided an opportunity for the company to focus attention on the opportunities, challenges, and solutions towards achieving sustainable transport worldwide.
Education
Education initiatives of Chola are aligned with the national goals and complement the goal of the Country in ensuring ‘basic education for all’. Chola has been undertaking multi-dimensional initiatives to reduce dropouts, provide better educational infrastructure, supplying appropriate equipment, books, financial assistance, scholarships to promote meritorious girl students to continue education. The educational programmes and initiatives are developed keeping in mind the specific requirements of an area or the community.
As part of the Financial Literacy program, Chola reached out to the CVCMs and their families, especially women to make them aware of income and expenditure, banking systems, saving practices, digital transactions, financial planning and money safety in a series of

Corporate Overview Financial StatementsManagement Reports
43
sessions at 2 blocks of Kutch District, Gujarat (Anjar / Gandhidham and Bhuj).
Chola supports the Murugappa Polytechnic College that imparts quality education and training of international standards in engineering and technology through continuous improvement, teamwork, growth and innovation. It offers courses in Civil Engineering, Computer Engineering, Electrical Engineering, Electronics and Communication Engineering, Mechanical Engineering and Electronics.
Chola has been running Scholarship Programmes for children from the trucker’s community (193 beneficiaries) during the past two years in Rajasthan and in Tamilnadu. These are regions where the truck drivers go away from home for months, on long distance driving of the trucks to the extreme parts of India. They belong to low income group and their children are first generation learners in school. The resurgence of COVID situation and the subsequent lockdown and travel restrictions have resulted in loss of jobs for many resulting in a crippling cash crunch for these CVCMs. It has, indeed, been a very challenging period for them. Many students discontinued their studies after class 10 and 12 due to lack of funds. This scholarship enables such children to continue their higher education in higher secondary classes or colleges with the help of the scholarship. Chola believes that in supporting such children from the community enables them to dream bigger and helps them find a footing in the world. Chola has provided scholarships to 193 students in courses of IT, nursing, ITI etc.
Chola has been supporting other educational needs such as classroom infrastructure (two schools), edu-aids and equipment (58 beneficiaries), education through art programmes (1,700 students), providing mini libraries (2,500 students) towards better and quality education and access to children of special abilities (at least 132 students).
Other Interventions
Chola has invested about 9-10% in other areas of interventions
such as Arts and Heritage conservation/preservation, Environment
and Sports activities across the country. These activities include
preserving antique, historical and rare books, helping setting up
infrastructure for a small arts museum, protecting flora, fauna
and fisheries, and encouraging sports of national and Olympian
importance.
Looking into the future
Road transportation will continue to flourish and will have
the lion's share of freight in the country. This is because of the
last-mile connectivity and can be achieved only through the road
network. Despite the demand for truck drivers in the country being
on the rise, much pay disparity exists and the trucking community
finds it continuously difficult to make both ends meet, thus forcing
them to live in poverty.
Stressful conditions, lack of infrastructural facilities for clean toilets,
non-existent career prospects within the driver community, lack of
sufficient and timely income results in a crisis and absence of job
satisfaction. As the present community sees hardly any prospects
for their children in this profession the new generation is being
discouraged to take up the driving and allied profession. This
situation will have severe consequences on the supply and demand
scenario in the country for drivers, which in turn would have great
ramifications on the country’s logistics map.
Chola will continue to monitor the situation and contribute in
bringing better support to the CVCMs and other underprivileged
and marginalised communities. Chola will also intervene in
Environment issues in most of its programmes/projects, towards a
better Environment, Social and Governance foot print.
2. Composition of CSR Committee (as on March 31, 2022):
Sl. Designation /
Number of meetings of Number of meetings of No. Name of the Director
Nature of Directorship CSR Committee held CSR Committee attended
during the year during the year
1 Mr. Vellayan Subbiah Non-executive / Promoter 2 2 Director / Chairman
2 Ms. Bhama Krishnamurthy Non-executive / Independent 2 2 Director
3 Mr. M.A.M. Arunachalam Non-executive / Promoter 2 2 Director
3. Provide the web-link where Composition of CSR committee, CSR Policy and CSR projects approved by the board are disclosed on the website of the company.
- https://www.cholamandalam.com/community-relations.aspx
4. Provide the details of Impact assessment of CSR projects carried out in pursuance of sub-rule (3) of rule 8 of the Companies (Corporate Social responsibility Policy) Rules, 2014, if applicable (attach the report).

44
Corporate Overview Financial StatementsManagement Reports
1 Support Education in Murugappa Polytechnic College
3 Sustainable farming project with Murugappa Chettiar research Center
5 The Gift of life Sai Sanjeevani Hospital
7 Support medical facilities for underprivileged at Valliammai Aachi Hospital
2 Support Expansion of Sir Ivan Stedford Hospital
4 Project Raahi
6 Covid -19 Containment Project with The Childs Trust
Suitable courses being provided
Crop Production - Development of bio inputs like bio-fertilizers, growth promoters
Providing Paediatric care
1.Care Provided 2.Serving the needy 3.Conduciveness 4.Availability of similar service in that area
1. Proper care 2. Project site conduciveness 3. Availability of similar services in the area
1. Addressing the challenges of non-availability and non- affordability of quality eye care. 2. Improved the availability, accessibility and quality of eye care provided to them
The molecular laboratory at CTMRF has led to early diagnosis of the virus, effective treatment and recovery.
Access to upgraded online learning labs
Soil health and Management
Quality health care Reduced cases of death
1. Well-equipped IP block 2. OPD Services 3. Lab and Scan Facilities 4. Pharmacy
1. Space availability 2. Ward and bed availability
1. Standard operating protocol 2. Involvement of state government
Clinical laboratory plays a vital role
Affordability
The Crop production project was useful in reaching out to over 400 farmers in the year 2021. Overall 1200 farmers were reached.
Zero Cost treatment
1. Affordable Cost 2.Utilization Rate 3.Quality Care Services 4.Improved Staff Performance
Affordability
1. Project locations across states 2. Project implementation strategy includes local eye care 3. Using technology for every purpose is a step up in the entire ecosystem
1. Project locations across states 2. Project implementation strategy includes local eye care 3. Using technology for every purpose is a step up in the entire ecosystem
Solar plants inside campus
Direct increase in the commercial benefits for the farmers as a result of the improved yields.
Continuity of services
1. Continuity of services by the partner 2.Building team capacity and motivation 3.Addressing patient needs
Solar plants inside campus
1. Hub and spoke model of the project. 2. Advocacy efforts
Early treatment
Access to Education for First-Generation Learners
Knowledge transfer and skill development of farmers.
Alignment with UN SDG 3
1.Improved Access to Health care 2.Income Generation Opportunities 3.Overriding Stigma and Barriers in Healthcare
Access to Education for First-Generation Learners
1. Improving the lives of the truck drivers 2. Increasing earning power 3. Occupational and public safety 4.Fostering the ability to perform everyday tasks.
Prompt treatment and support was provided
Name of the project
The programme objectives were evaluated using the REES framework. REES framework measures the performance of the projects on five parameters – Relevance, Effectiveness, Efficiency, Sustainability and Social Impact. Key findings of the impact assessment are given below. Detailed report can be accessed at https://www.cholamandalam.com/community-relations.aspx.
Social ImpactSustainabilityEfficiencyEffectivenessRelevance
5. Details of the amount available for set off in pursuance of sub-rule (3) of rule 7 of the Companies (Corporate Social responsibility Policy) Rules, 2014 and amount required for set off for the financial year, if any - Nil
6. Average net profit of the company as per section 135(5). - `1,85,177.33 lakhs
7. (a) Two percent of average net profit of the company as per section 135(5) - `3,631.55 lakhs
(b) Surplus arising out of the CSR projects or programmes or activities of the previous financial years - Nil
(c) Amount required to be set off for the financial year, if any - Nil
(d) Total CSR obligation for the financial year (7a+7b-7c) - `3,631.55 lakhs

Corporate Overview Financial StatementsManagement Reports
45
8. (a) CSR amount spent or unspent for the financial year:
(b) Details of CSR amount spent against ongoing projects for the financial year: Not applicable
(c) Details of CSR amount spent against other than ongoing projects for the financial year:
Total Amount Spent for the Financial Year
(in ` lakhs)
Amount Unspent (in ` lakhs)
Total Amount transferred to Unspent CSR Account as per section 135(6)
Amount transferred to any fund specified under Schedule VII as per second proviso to section 135(5)
Nil3,643.87 lakhs
Amount Date of transfer
Nil
Amount
NANA
Name of the Fund
NA
Date of transfer
SN. Name of the Item Local Project Amount Amount Amount Mode Project from the area duration allocated spent in trans- of list of for the the -ferred Imple- activities project current to -mentation in (` in financial Unspent - Direct Schedule lakhs) Year CSR (Yes/No) VII to (` in Account
the Act State District lakhs) for the Name CSR project Regis- as per -tration section number 135(6) (` in lakhs)
1 SAKSHAM – Health Yes Rajas- Jaipur 12 33.01 33.01 No No Aravali CSR Truckers’ Eye -than months 00000735 Health Programme
2 SWACCHA Wash Yes Telen- Osma- 12 49.00 49.00 No No Bala Vikasa CSR Telangana -gana nabad months Social Service Society 00000313
Project-Phase IV
3 Containment Disaster Yes Tamil Chennai 12 50.00 50.00 No No Child Trust CSR of COVID-19’ Manage- Nadu months 00002494
Project -ment
4 Arts in Education Education Yes Tamil Chennai 12 16.22 16.22 No No Nalandaway CSR Project Nadu months 00001780
5 Environment Environ- Yes Spiti Laksha- 12 52.43 52.43 No No Nature CSR sustainability -ment Laksha- dweep months Conservation 00001665 project -dweep Foundation
6 Financial inclusion Education Yes Gujarat Kutch 12 61.59 61.59 No No PRAYAS CSR of commercial months 00000542 vehicle members & crew
7 Truckers Eye Health Yes PAN PAN 12 234.46 234.46 No No Royal CSR Health Project India India months Commonwealth 00001381 Phase - V Society for the blind
8 The gift of life- Health Yes PAN PAN 12 120.00 120.00 No No Sri Sathya Sai Health CSR Phase III India India months & Education Trust 00001048
9 Cancer treatment Health Yes Tamil PAN India 12 15.00 15.00 No No Tiara Haemophilia CSR for Children Nadu months and Cancer 00000448 Project Foundation
10 Swaccha Odisha WASH Yes Odisha Cuttack 12 56.48 56.48 No No Women CSR Grama Vikas months Education and 00000911 Project Phase V Environment
11 Eureka School Education Yes Tamil Chennai 12 21.00 21.00 No No AID India CSR Infrastructural Nadu months 00000027 Development Project
Location of the project
Mode of Implementation -
Through Implementing Agency

46
Corporate Overview Financial StatementsManagement Reports
12 Swachh Poondi WASH Yes Tamil Chennai 12 55.00 55.00 No No Voice CSR
Lake Project Nadu months Foundation 00000951
13 WORTH Education Education Yes Tamil Chennai 12 11.89 11.89 No No Worth Trust CSR
for Visually Nadu months 00005475
Impaired
persons - Project
14 Chola –Enrico Sports Yes West Kolkata 12 5.00 5.00 No No Enrico Piperno CSR
Piperno Tennis Bengal Month Table Tennis 00003565
Training project Trust
15 Chola-SOS Children Rural Yes Pudu- Pudu- 12 2.52 2.52 No No SOS CSR
empowerment Develop- -cherry cherry months 00000692
program -ment
16 Towards Arts and Art Yes Tamil Chennai 12 15.00 15.00 No No Madras Crafts CSR
Museum project Nadu months Foundation 00012633
17 My dream Education Yes Tamil Namakkal 12 75.50 75.50 No No Women Organization CSR
scholarship Nadu months For Rural 00002346
Project development
18 Chola Sports Sports Yes Tamil Chennai 12 5.00 5.00 No No Tamil Nadu CSR training project in Nadu months Tennis Association 00012872
Partnership
with TNTA
19 The gift of life Health Yes PAN PAN 12 120.00 120.00 No No Sri Sathya Sai CSR India India months Health & Education 00001048 Trust
20 Maternal and child Health Yes Chhatt- Raipur 12 50.00 50.00 No No Sri Sathya Sai CSR health initiative -isgarh months Health & Education 00001048 benefitting CVCMs Trust (Commercial vehicle crew members).
21 Chola Isha Rural Yes Tamil Coimba- 12 44.00 44.00 No No Isha CSR Action for Develop- Nadu -tore months Outreach 00009670 Rural -ment Rejuvenation
22 Chola-Isha Yes Tamil Coimba- 12 360.00 360.00 No No Isha CSR Sadhanapada Nadu -tore months Foundation 00001845
23 Yoga for all Health Yes Tamil Coimba- 12 96.00 96.00 No No Isha Institute of CSR Nadu -tore months Inner Sciences 00012815
24 Chola -Golf Sports Yes Delhi New Delhi 12 15.00 15.00 No No Golf Foundation CSR sports training months 00000885
25 Holistic school Education Yes Tamil Chennai 12 19.99 19.99 No No United way Chennai CSR development Nadu months 00000572
SN. Name of the Item Local Project Amount Amount Amount Mode Project from the area duration allocated spent in trans- of list of for the the -ferred Imple- activities project current to -mentation in (` in financial Unspent - Direct Schedule lakhs) Year CSR (Yes/No) VII to (` in Account
the Act State District lakhs) for the Name CSR project Regis- as per -tration section number 135(6) (` in lakhs)
Location of the project
Mode of Implementation -
Through Implementing Agency

Corporate Overview Financial StatementsManagement Reports
47
26 Restoration of Environ Yes Tamil Kanya- 12 9.45 9.45 No No Bombay Natural CSR Saltpans for the ment Nadu -kumari months History society 00005463 Conservation of migratory Waterbirds
27 New classroom Education Yes Tamil Chennai 12 14.00 14.00 No No Rotary Midcity CSR construction in Nadu months 00005813 Govt. high school
28 Pragati - Integrated Health Yes Maha- Thane 12 9.24 9.24 No No Tata Institute of CSR Rural Health and -rashtra months Social Sciences 00003475 Development Project
29 50 Mini library in Education Yes Maha- Thane 12 5.00 5.00 No No Samaveshi CSR anganwadis -rashtra months Pathashala foundation 00014540
30 Mobile van Health Yes Tamil Chennai 12 32.78 32.78 No No Sewabharthy CSR for CVCM Nadu months 00004180
31 Inclusive School Education Yes Tamil Pudu- 12 9.45 9.45 No No Sathya Special School CSR Equipment project Nadu -cherry months 00003953
32 Preservation of Art Yes Tamil Chennai 12 10.00 10.00 No No Roja Muthiah Research CSR early books Nadu months Library Trust 000019626
33 Construction of Health Yes Tamil Conoor 12 5.00 5.00 No No Rotary club of Nilgiri CSR hospital in Conoor Nadu months 00003496
34 Energy Treatment Health Yes Tamil Katpadi 12 25.40 25.40 No No Worth Trust CSR plant from Food Nadu months 00005475 waste and School bus for Intellectually Challenged persons
35 Tamilnadu Disaster Disaster Yes Tamil Tamil 12 200.00 200.00 No No Tamil Nadu Disaster - Relief Fund - COVID Manage- Nadu Nadu Month Relief Fund -ment
36 Conservation work Environ- Yes Spiti and Spiti and 12 90.19 90.19 No No Nature Conservation CSR in Spiti and -ment Laksh- Laksh- months Foundation 00001665 Lakshadweep -dweep -dweep
37 15 Ultra Filtration WASH Yes Telen- Osma- 12 49.20 49.20 No No Bala Vikasa Social CSR Plants in Telangana -gana -nabad months Service Society 00000313
38 Using renewable Rural Yes Tamil Chennai 12 44.04 44.04 No No Voice CSR Solar energy to Develop- Nadu months foundation 00005475 power project of -ment Swachh Poondi Phase -1,2 and 3
39 ENT device in ICH Health Yes Tamil Chennai 12 25.00 25.00 No No United way Chennai CSR Nadu months 00000572
40 Congenital Heart Health Yes PAN PAN 12 73.00 73.00 No No Sri Sathya Disease Sai CSR Disease surgeries India India months Health & Education 00001048 for children of Trust CVCM
SN. Name of the Item Local Project Amount Amount Amount Mode Project from the area duration allocated spent in trans- of list of for the the -ferred Imple- activities project current to -mentation in (` in financial Unspent - Direct Schedule lakhs) Year CSR (Yes/No) VII to (` in Account
the Act State District lakhs) for the Name CSR project Regis- as per -tration section number 135(6) (` in lakhs)
Location of the project
Mode of Implementation -
Through Implementing Agency

48
Corporate Overview Financial StatementsManagement Reports
41 Studies on Education Yes Tamil Chennai 12 24.00 24.00 No No Shri AMM Murugappa CSR Biodiversity and Nadu months Chettiar Research 00000057 Climate - Wildlife Center, Chennai Biology (MCRC)
42 Studies on Education Yes Tamil Chennai 12 58.00 58.00 No No MCRC CSR Biodiversity and Nadu months 00000057 Climate - Agroforestry
43 Studies on Education Yes Tamil Chennai 12 65.00 65.00 No No MCRC CSR Bioenergy from agro Nadu months 00000057 and other wastes
44 Research & Develop Education Yes Tamil Chennai 12 55.00 55.00 No No MCRC CSR ment on use of Nadu months 00000057 Enzymes & novel applications of natural products for rural India
45 Research & Education Yes Tamil Chennai 12 61.00 61.00 No No MCRC CSR Development on Nadu months 00000057 natural products of natural dyes and pigments for rural India
46 Research and Education Yes Tamil Chennai 12 65.00 65.00 No No MCRC CSR Development on Nadu months 00000057 nutritional foods / supplements for rural communities
47 Research and Education Yes Tamil Chennai 12 66.00 66.00 No No MCRC CSR development of Soil Nadu months 00000057 Health Management in rural areas
48 Research & Education Yes Tamil Chennai 12 61.00 61.00 No No MCRC CSR Development on Nadu months 00000057 Solar based devices used in daily life in rural areas
49 Research and Education Yes Tamil Chennai 12 64.00 64.00 No No MCRC CSR
development of Nadu months 00000057 Sustainable agricultural practices - Crop protection for small land holding farmers
50 Research and Education Yes Tamil Chennai 12 67.00 67.00 No No MCRC CSR
Development of Nadu months 00000057 Sustainable Agricultural Practices for Small Land Holding Farmers
51 Testing and Rural Yes Tamil Chennai 12 50.00 40.00 No No MCRC CSR development of TATA develop- Nadu months 00000057 Swach Jal Tech water -ment purifier
SN. Name of the Item Local Project Amount Amount Amount Mode Project from the area duration allocated spent in trans- of list of for the the -ferred Imple- activities project current to -mentation in (` in financial Unspent - Direct Schedule lakhs) Year CSR (Yes/No) VII to (` in Account
the Act State District lakhs) for the Name CSR project Regis- as per -tration section number 135(6) (` in lakhs)
Location of the project
Mode of Implementation -
Through Implementing Agency

Corporate Overview Financial StatementsManagement Reports
49
52 Sir Ivan Stedeford Health Yes Tamil Chennai 12 509.50 509.50 No No AMM Foundation CSR Hospital-Expansion Nadu months 00000050 & Renovation
53 Murugappa Youth Sports Yes Tamil Chennai 12 17.69 17.69 No No AMM Foundation CSR Football Academy Nadu months 00000050
54 Mobile Health Health Yes Tamil Kanya- 12 13.45 13.45 No No AMM Foundation CSR Van-Assam Nadu -kumari months 00000050
55 Renovation of Health Yes Kanya- Chennai 12 49.78 49.78 No No AMM Foundation CSR Vallammai Achi -kumari months 00000050 Hospital
56 Dialysis centre- Health Yes Tamil Chennai 12 110.29 110.29 No No AMM Foundation CSR AMM Foundation- Nadu months 00000050 Valliammai Achi Hospital
57 Murugappa Science Education Yes Tamil Chennai 12 10.00 10.00 No No AMM Foundation CSR Centre Nadu months 00000050
58 Impact assessment 46.94 46.94
59 Admin 64.39 64.39
Total 3,643.87 3,643.87
(d) Amount spent in Administrative Overheads - ` 64.39 lakhs (e) Amount spent on Impact Assessment, if applicable - ` 46.94 lakhs (f) Total amount spent for the Financial Year (8b+8c+8d+8e) - ` 3,643.87 lakhs (g) Excess amount for set off, if any-
SN. Name of the Item Local Project Amount Amount Amount Mode Project from the area duration allocated spent in trans- of list of for the the -ferred Imple- activities project current to -mentation in (` in financial Unspent - Direct Schedule lakhs) Year CSR (Yes/No) VII to (` in Account
the Act State District lakhs) for the Name CSR project Regis- as per -tration section number 135(6) (` in lakhs)
Location of the project
Mode of Implementation -
Through Implementing Agency
Sl. No. Particulars Amount (in `)
(i) Two percent of average net profit of the company as per section 135(5) ` 3,631.55 lakhs
(ii) Total amount spent for the Financial Year ` 3,643.87 lakhs
(iii) Excess amount spent for the financial year [(ii)-(i)] ` 12.32 lakhs
(iv) Surplus arising out of the CSR projects or programmes or activities of the previous financial years, if any -
(v) Amount available for set off in succeeding financial years [(iii)-(iv)] -
9. (a) Details of Unspent CSR amount for the preceding three financial years: - Nil
(b) Details of CSR amount spent in the financial year for ongoing projects of the preceding financial year(s): - Nil
10. In case of creation or acquisition of capital asset, furnish the details relating to the asset so created or acquired through CSR spent in the financial year (asset-wise details). - Nil
(a) Date of creation or acquisition of the capital asset(s).
(b) Amount of CSR spent for creation or acquisition of capital asset.
(c) Details of the entity or public authority or beneficiary under whose name such capital asset is registered, their address etc.
(d) Provide details of the capital asset(s) created or acquired (including complete address and location of the capital asset).
11. Specify the reason(s), if the company has failed to spend two per cent of the average net profit as per section 135(5). – Not applicable
On behalf of the Board
Place : Chennai Ravindra Kumar Kundu Vellayan SubbiahDate : 5 May, 2022 Executive Director Chairman - CSR Committee

50
Corporate Overview Financial StatementsManagement Reports
Annexure-IIIInformation under section 197(12) of the Companies Act, 2013 read with Rule 5 of the Companies (Appointment and Remuneration of Managerial Personnel) Rules, 2014 and forming part of the board’s report for the year ended 31 March, 2022
Nature of Disclosure Particulars
Name of the Director / Designation % increase of Ratio of Remuneration in Remuneration to 2022 as compared Median to 2021 Remuneration of employees
Non-Executive Directors
Mr. Vellayan Subbiah, Non-executive Director / Chairman 900%* 13.49:1
Mr. Ashok Kumar Barat, Non-executive / Nil 1.35:1
Independent Director
Mr. N. Ramesh Rajan, Non-executive / Nil 1.35:1
Independent Director
Mr. Rohan Verma, Non-executive / Nil 1.35:1
Independent Director
Ms. Bhama Krishnamurthy, Non-executive / Nil 1.35:1
Independent Director
Mr. M.A.M. Arunachalam, Non-executive Director Nil 1.35:1
Mr. Anand Kumar, Non-executive / Nil 1.35:1
Independent Director
Mr. Bharath Vasudevan, Non-executive / Nil 1.35:1
Independent Director
Executive Director
Mr. Ravindra Kumar Kundu, Executive Director 21.40% 35.75:1
a) Ratio of the remuneration of each director to the median remuneration of the employees of the company for the financial year
c) Percentage increase in median remuneration of employees in the financial year
35% increase in median remuneration (The increase in median remuneration as compared with FY 21 is on account of annual increment for FY 21 was effective from January, 2021 and the revised remuneration for the previous year was only for 3 months. Whereas the FY 22 median remuneration has impact of two increments to employees in July, 2021 and January, 2022)
Mr. D. Arul Selvan, Chief Financial Officer 26.51%
Ms. P. Sujatha, Company Secretary 12.08%
b) Percentage increase in remuneration of Chief Financial Officer and Company Secretary in the financial year
Name of the KMP / Designation % increasein remuneration
in 2022 ascompared to 2021

Corporate Overview Financial StatementsManagement Reports
51
Nature of Disclosure Particulars
On behalf of the board
Place : Chennai Vellayan SubbiahDate : 5 May, 2022 Chairman
Note:* Increase in remuneration to non-executive chairman is on account of considerable amount of time spent by him towards the affairs of the company viz, reviewing the performance of various businesses of the company and its subsidiaries along with senior management team on a periodical basis, devising the long term strategy, giving strategic directions and advising the company in exploring new opportunities.
e) Average percentile increase already made in the salaries of employees other than the managerial personnel in the last financial year and its comparison with the percentile increase in the managerial remuneration and justification thereof and point out if there are any exceptional circumstances for increase in the managerial remuneration
f ) Affirmation that the remuneration is as per the remuneration policy of the company
For employees other than managerial personnel who were in employment for the whole of FY 21 and FY 22, the average increase is 10.08%. The average increase for managerial personnel is 20%.
The remuneration is in line with the remuneration policy of the company.
d) Number of permanent employees on the rolls of company (as of 31 March, 2022)
9,125

52
Corporate Overview Financial StatementsManagement Reports
Management Discussion and AnalysisMACROECONOMIC OVERVIEWThe financial year 2022 was quite eventful when the Indian economy started witnessing green shoots of recovery post the first wave of Covid19 pandemic, the second wave of Covid struck hard right from the beginning of FY 22. Unlike the nationwide lockdown during the first wave in FY 21, state level localised lockdowns and targeted containment strategy had a less pronounced impact on the economy. Rapid vaccination programme roll-out and Governmental support, led to upticks across a range of indicators, including the mobility index, direct tax collections, and electricity demand, reflect positive levels of economic growth.
While demand is yet to fully recover to pre-covid levels, consumer prices continue to increase steeply registering a CPI inflation and WPI inflation at 6.95% and 14.55% respectively in March 2022. The pressure on consumer prices is expected to continue in FY 23, with surging commodity prices, disruptions in global supply chains and rising freight costs. RBI has revised its inflation forecast upwards for FY 23 to 6.7% from earlier estimate of 4.5%. RBI announced a cumulative hike in repo rate by 90 basis points in this fiscal the first-rate hike since August 2018, which signalled the reversal of the reduction cycle. RBI used its policy levers to preserve macroeconomic and financial stability while enhancing the economy’s resilience. RBI has been progressively absorbing excess liquidity in the system through variable rate reverse repo operations. This has been in conjunction with the selling of Govt Securities (G-Sec) through open market operations. RBI is expected to withdraw the liquidity overhang in a gradual and calibrated manner over a multi-year time frame in a non-disruptive manner.
The Government of India’s renewed commitment with its continued investment in strengthening the country's infrastructure with proposal to fund infrastructure through PM Gati Shakti, Public Private Partnerships, is expected to boost the economic growth. RBI forecast for GDP growth for FY 23 is at 7.2% as against provisional estimate of GDP growth for FY 22 at 8.7%. India is likely to maintain its position as the fastest growing major economy. World Bank has also forecasted India’s GDP growth for fiscal year 2022-23 above 7.0%. Continuous uptick in High Frequency Indicators (HFIs) point towards economic recovery in India. Also, the Government's impetus on infrastructure development and domestic manufacturing is anticipated to further this growth, create more jobs and help build supply chain resilience.
INDUSTRY GROWTH PROSPECTS
Automobile IndustryCommercial vehicles and passenger vehicles registered double digit growth in FY 22 after two years of continuous de-growth backed by improvement in economic activity, revival of construction / mining activities and improvement in semiconductor supplies towards the end of the year.
The domestic commercial vehicle industry grew by 26% in FY 22, supported by a low base and improvement in economic activity. Medium and heavy commercial vehicles (MHCV’s) recorded a 54% growth, light commercial vehicles (LCV’s) with 15% growth and small commercial vehicles (SCV’s) with 23% growth.
The commercial vehicle industry is expected to deliver double digit growth in FY 23 driven by freight demand, replacement demand which had been postponed over the last two years, structural economic recovery and higher infra spends by the Government. However, inflation in fuel prices and its impact on viability of fleet operators will remain a key challenge in FY 23.
The domestic car and utility vehicle industry had witnessed a 14% growth in FY 22 after consecutive years of negative growth aided by improvement in semiconductor supplies towards the end of the year and improvement in sale of utility vehicles due to shift in customer preferences. It is expected to post healthy growth aided by improvement in semiconductor supplies and materialisation of pent-up demand.
A gradual recovery in two-wheeler demand is expected in FY 23 with a decent growth year on year considering a low base.
Tractor Industry:The domestic tractor sales remained healthy in the first half of FY 22 even after the second wave but witnessed some moderation due to uneven rainfalls during the second half of the year. Tractor industry had witnessed a de-growth of 6% in FY 22 attributable to the huge volumes in FY 21 which was the ever all-time high for tractor sales in India, Tractor volumes might show minimal growth in FY 23 given the high base and moderation in demand.
Construction Equipment Industry: After strong volume surge in H1 of FY 22, the volumes in construction equipment moderated significantly during the second half and had a de-growth of around 8%. Major factors that contributed to the de-growth were increasing cost of equipment prices, muted rentals and monsoon related impediments which impacted the road and construction sector. With an expectation of higher allocation to infra sector by the Government and restoration of normalcy in mining and construction activity it is expected that this industry will grow in FY 23.
LOAN AGAINST PROPERTYWith improvement in economy and lenders being positive towards mortgage-based lending, LAP segment is expected to perform better in FY 23. During the year, growth rate in LAP segment was higher than non-LAP segment (secured non-LAP and unsecured) as non-banks preferred mortgage-based lending over cash-flow-based lending in the short-run given the potential risks in other segments.

Corporate Overview Financial StatementsManagement Reports
53
As per CRISIL NBFC Report Oct 2021 (MSME LAP), LAP portfolio of NBFCs is estimated at ` 2.5 Lakhs crores as of FY21. Non-banks are unlikely to be as aggressive as they were in the past, where the segment witnessed a double digit CAGR of 12% between FY 17 and FY 20. Higher growth in the past was due to lower interest rates and increased penetration.Source: CRISIL NBFC Report
HOME LOANSIndustry Growth Prospects
The Indian Housing Finance market is estimated to be about ` 24 lakh crore and grew at around 9-11% in FY 22. The growth rate of affordable housing market was lower at around 6 - 8%, given that the impact of Covid on this segment (EWS, LIG, MIG customers), was more severe vis-a-vis the overall segment, which includes salaried individuals also, whose incomes have been relatively stable. Q1 of FY 22 was significantly impacted by the second wave of Covid-19 and its impact was felt through subsequent quarters. In terms of ticket size the sub ` 25 lakh segment contributes more than 43% of the mortgage outstanding. Analysts expect the housing sector to grow 10 - 12% in FY23 and affordable housing to grow at 7-9% in the same period.
With collections improving across most segments by Q4 FY 22, analysts expect GNPAs to stabilize in FY 23 and improve by 10 bps. Regulatory and fiscal environment remains conducive for the demand in affordable housing segment.
BUSINESS ANALYSIS
VEHICLE FINANCEThe vehicle finance (VF) disbursements during the year were at an all-time high of ` 25,439 crores against ` 20,249 crores in the previous year with a growth of 26%. The VF division was able to grow significantly in the new commercial vehicle and new passenger vehicle segment over last year by 46% and 44% respectively. The used vehicle disbursements also contributed 30% growth over the previous year. The PBT during the year was ` 2,054 crores as against ` 1,287 crores in the previous year with a growth of 60%. The VF division continued its razor-sharp focus on asset quality through a coordinated collection strategy, which helped in restricting gross stage 3 assets to 3.90% inspite of the second COVID wave in Q1 which had a severe impact on customer cash flows.
The company’s vast branch network helps in acquiring new customers and creates proximity with customers helping in better collection efficiency and higher repeat business. The VF division has more than 80% of branches in the rural areas, towns and semi urban areas, a key strength which will enable your company to capitalise the rebound in rural demand for tractors, two-wheelers and passenger cars. Uptick in the demand for small commercial vehicle and light commercial vehicle will help the division to garner greater market share with its presence in rural areas along with a balanced collection approach. Chola is one of the key players in the used vehicle financing business and will continue to maintain a vigilant approach in this segment which had contributed to 33% of disbursement volume in FY 22.
It has been proven that digital transformation can be a competitive advantage in gaining market share by attracting digitally savvy customers who expect convenient, paper-less processes and channel partners who expect quick response and better transparency. Several benefits are expected to accrue to the organization which are:
a) enhanced and differentiated experience for all stakeholders who are primarily customers, dealers and employees
b) Optimized credit cost through revamped underwriting engine,
c) contained operating risk through multiple digital interventions, and
d) Reduced processing cost resulting from enhanced employee productivity.
Chola has been strong in the lower and lower middle segments of the customer pyramid. It had not forayed in the upper middle and upper segment of the customer pyramid due to challenges related to pricing. Through co-lending opportunities Chola would be foraying into this un-tapped customer segment by providing competitive pricing which in turn will help Chola to increase customer base and the market share.
The company has designed a multi-pronged long-term strategy to minimize the cost of operations and credit losses to maximize ROA and customer experience. Operating model enhancements have been prioritized and implemented at product level. The business will continue to endeavour in expanding and strengthening its existing relationships with customers, manufacturers, brokers and dealers, utilizing new tools and platforms such as Gaadi Bazaar. Gaadi Bazaar platform has currently enabled best price discovery for used vehicles through a seamless and transparent sale-purchase process, and creation of a customer, dealer/broker base which ensures higher stickiness.
The business has a robust collection mechanism in place aided with a strong credit risk assessment framework which will help in steering through any strong under currents in the market.
LOAN AGAINST PROPERTY (LAP)With rebound in economy during FY 22, the focus of business was to stabilize collections, scale up disbursements, get systems and processes equipped to handle COVID induced challenges. The business continues to focus on a systematic approach to build a healthy portfolio mix, with more than 80% of our portfolio as Self-Occupied Residential Properties (SORP) and an average loan ticket size of less than ` 45 Lakhs. Portfolio Loan-to-Value (LTV) ratio at origination is consciously maintained at 52% levels which provides adequate security cover to the business.
Inspite of localised lockdowns in Q1 FY 22, the business clocked ` 5,862 crores of disbursements in FY 22, which is 62% higher than FY 21 disbursements. The business had started exceeding pre-COVID level of monthly disbursements with adequate branch expansion while strengthening credit policy in tune with market developments. Assets Under Management (AUM) for the business grew by 16% to ̀ 17,115 crores in FY 22 compared to ̀ 14,777 crores in FY 21 inspite of the challenging macro-economic situation.
To build a resilient and scalable business platform, the business has performed geographical restructuring activity across zones. The business, with its presence in 388 branches (as of March 2022) pan India, has primary focus on Tier 2, Tier 3 and Tier 4 cities. Out of these 388 branches, 380 branches are co-located/ shared with other business verticals which will help in optimizing branch operating costs.
HOME LOANS (HL)As of March 31, 2022, the HL business had 43,056 live accounts (25% growth Y-o-Y) with an AUM of ` 5,269 crores (21% growth Y-o-Y). 89% of the portfolio is from Tier II, III, IV cities and towns.

54
Corporate Overview Financial StatementsManagement Reports
The disbursements grew 2% Y-o-Y from ` 1,542 crores in FY 21 to ` 1,571 crores in FY 22. 98% of the portfolio is end-use driven. The target group remains the lower middle income group customer. The average ticket size is ` 14 lakhs with an average LTV of 56% which reflects adequacy of headroom in case of marketability of the underlying assets. 95% of the portfolio comprises business owners with semi-formal income and significant business vintage buying their first home and 26% of customers are first time borrowers. The HL business is built on Chola’s inherent strength in lending to the lower middle income (LMI) segment with a customized eligibility program for business owners and salaried customers. Chola offers loans for self-construction, purchase of resale flats/ independent houses, purchase of new flats/independent houses, balance transfer from other financiers, additional loans for existing customers and Shop Loans. Self-construction remains a strong focus of the company with significant proportion of the portfolio and fresh disbursements sourced from this segment.
Chola enjoys a significant presence in Tier II, III, IV towns and cities. The business has been strengthening the channel partner network in order to reach out to more customers. This year the business expanded its footprint in Madhya Pradesh and Haryana. HL are serviced through 217 branches across 11 states. Given that these customers are mostly first-time buyers the sales officers guides and facilitates the customer through the entire borrowing process. The business has also adopted technology to offer contact-less service delivery to its customers round the clock with a comprehensive customer service mobile application and web portal in vernacular language to ensure greater accessibility for customers.
DIGITAL JOURNEY
With an aim to reduce physical touchpoint with stakeholders, the business has upgraded its system with a host of integrations covering entire stakeholder ecosystem. VideoPD, eNACH, KYC verification and validation. GST and Bank statement analysis were introduced by keeping customer priorities in mind, apart from introducing a dedicated customer facing application. Also, online payment modes for collections have been introduced to provide customers with multiple payment options. For vendors, online portals have been introduced to liaise and share documents with the business. Employees have been provided with mobile tab devices, and digital collaboration tools/applications have been introduced to minimize physical presence at branch offices.
ASSET LIABILITY MANAGEMENT (ALM)
The green shoots of economic revival which was seen in Q4 of FY 21, succumbed to the onslaught of covid second wave in Q1 FY 22. The second wave had a heavy impact on the economy, in response to which the RBI maintained an accommodative stance in its monetary policy for most of the year. Just when business confidence was looking up in the economy in Q3, the third wave hit the country, albeit with a milder impact than the earlier waves.
The company kept ALM in focus, watching RBI’s commentaries, observing the market dynamics and engaging in continuous dialogue with lenders to ensure a healthy ALM even when the economy was impacted during the second and third covid waves.
The company monitored liquidity closely and ensured availability of funds at the best rates throughout the year. The company took a conservative stance and maintained an optimum level of liquid
assets to ensure a comfortable ALM position. This conservative policy of the company helped in ensuring that company met all maturities and obligations comfortably.
The company continued to avail long term bank borrowings at competitive rates. Market borrowings were attractive on account of benign interest rate outlook in FY22, and company raised market borrowings to take advantage of the downward trend in interest rate.
Long-term borrowings - in the form of medium-term bank loans (Rupee / FCNR), medium/long-term NCDs, and Tier II - contributed 91% of the gross incremental borrowings. Sale of receivables by way of securitisation amounting to ` 1600 crores helped in the matching of inflows and outflow, over the tenure of the loan book as well as in reducing the borrowing costs.
RESOURCES & TREASURYDuring the year, the company raised funds from banks/ Financial Institutions and from money markets to support the growth of its businesses at competitive interest rates without compromising the right mix of long and short-term borrowings, thereby maintaining a healthy asset liability position. The borrowing profile as on March 31, 2022, is given below:
BANK BORROWING

Corporate Overview Financial StatementsManagement Reports
55
In FY 22, the company mobilised ` 22,719 crores (net) of medium- term loans and ` 150 crores (net) as working capital / cash credit / short term loan facilities from banks. The company continued getting support for its money market issuances from banks through subscription of Commercial Papers (CPs) and Non-convertible Debentures (NCDs). The company continued to enjoy the steadfast support of the lending banks and the strong relationship helped manage the borrowing plan for FY 22.
MARKET BORROWINGDuring FY 22, the company raised CP of ` 5,550 crores of which ` 2,750 crores were repaid in FY22. CP outstanding as at the end of the year was ` 2,766 crores. Medium and long-term secured NCDs to the tune of ` 3,951 crores were mobilised at competitive rates. At the end of FY 22, outstanding NCD stood at `10,252 crores.
The Tier II borrowings raised during the year was ` 195 crores of Perpetual debt and ` 350 crores of Sub Debt. As at the end of FY 22, Tier II borrowings stood at ` 3,734 crores.
MOVEMENT IN INTEREST COSTThe company maintained its strategy of reducing interest cost without compromising ALM requirements. This was achieved by selecting an appropriate sourcing strategy, in response to the uncertain market conditions. The mix of borrowings was increased in favour of bank borrowings, in view of the opportunities presented by the shifting of benchmark from MCLR to market -linked benchmarks. Additionally, borrowings against Priority Sector Assets continued in 21-22, at competitive rates. As a percentage of average borrowings, interest cost stood at 6.6% in FY 22 as compared to 7.6% in FY 21. This significant cost reduction was the result of successful negotiation of interest rates at the time of reset of interest rates on banks loans and by moving from MCLR to market linked benchmarks. Raising market borrowings at times when the interest rates were soft, also contributed to the reduction in interest cost.
During FY 22, securitisation of ` 1,600 crores was done at competitive rates resulting in significant savings of interest costs. The benefits of the low interest cost on these deals will continue to accrue to the company in subsequent financial years.
CAPITAL ADEQUACY RATIO (CAR)
As at the end of FY 22, the capital adequacy ratio stood at 19.62% (Tier I: 16.49% and Tier II: 3.13%).
INVESTMENTS
The company’s investments of ` 2,076 crores include investments in G-sec of ` 1543.48 crores, investments in subsidiaries, joint ventures, and associates of ` 532.66 crores.
During the year, the company invested `450 crores and acquired 73.8% stake in equity share capital of Payswiff Technologies Private Limited and invested ` 9.75 crores and acquired 16.29% stake in equity share capital of Paytail Commerce Private Limited.
FINANCIAL REVIEW
The company’s aggregate disbursements grew by 36% from ` 26,043 crores in FY 21 to ` 35,490 crores in FY 22. The AUM for the company grew by 8% (YoY) and the growth of on-balance sheet assets was 11%. The business AUM (including on book and assigned net of provisions) in FY 22 grew by 10% and stood at ̀ 76,907 crores as against ` 69,996 crores recorded in FY 21. The lower growth of
AUM as compared to disbursement is due to the run-down impact of the assets capitalised on account of moratorium in FY 21.
Asset quality as on March 2022 represented by stage 3 assets stood at 4.37% with adequate provision coverage of 39.7% of ECL provision, as against 3.96% last FY with provision coverage of 44.3%. Stage 3 provisions for March 2022 included additional provisions towards future contingencies and macro factors for ` 500 crores. The increase in stage 3 assets is due to the impact of COVID in Q1 of FY22, when stage 3 assets moved up to 6.7%, which was progressively reduced to 4.37%.
Profit after tax (PAT) for the year ended FY 22 were at ` 2,147 crores as against `1,515 crores in FY 21, which is a growth of 42%. PBT-ROTA stood at 3.9% in FY 22 as against 3% in FY 21.
HUMAN RESOURCES (HR)
Collaborative approach focusing on business goals
As the unpredictability presented by the pandemic situation began to show signs of fading, the HR team worked in realigning process, rolling out interventions to facilitate employees’ physical, mental and financial well-being.
Key Highlights of FY21-22:
• Reimagining the recruitment process
• Business partnering to enhance productivity - People Strategy Project
• Continue to focus on employee wellness
• Building capabilities & enhancements in technological front
Reimagining the recruitment process:
With remote working & hybrid working model, the competition for top talent increased multifold. The human resource teams put together strategies to support meeting the staffing needs of the organization.
As at 31st March 2022, the company headcount was at 8,920, which is a 17% growth in comparison to last financial year. During the year 2,455 employees were hired. Two new businesses (CSEL, SBPL) were launched during the financial year. Hiring strategy was planned and executed in collaboration with these business. Home grown leaders from other business verticals were identified for leaderships roles in both the new businesses.
People Strategy Project: Business partnering to facilitate productivity enhancement –
The emergence of the “People Strategy Project” was one of the major highlights of FY22. The project objective was on facilitating the productivity enhancement through different HR interventions focusing on standardization and alignment of HR process with business outcome.
Interventions rolled out:
Success profiling of Feet On Street (FOS) – This intervention focused on understanding the personality traits and demographic background of productive employees.
Demographic Profiling: Demographic data was analyzed to understand significant factors which are common in productive

56
Corporate Overview Financial StatementsManagement Reports
FOS. The framework for the profiling was built on employees who have spent more than one year in Chola, their performance and incentive earned. 47 profiling sheets were developed based on the geography and products.
Behavioural Assessment – Based on the role study and focused group interview, competency dictionary framework was validated. Based on the validation psychometric assessment was developed both in English and vernacular languages.
Structured Interview - Role and experience wise standard Interview assessment sheet was developed for bringing in uniformity in selection of FOS.
Deployment and alignments: The objective of the intervention is to check the current deployment of SFEs and align them as per market demand. Employees were short-listed based on vintage, the trend of productivity, and salary level. The challenges faced by the employees were also recorded.
Employee Wellness:
Chola continues to place safety and well-being of the employees as high priority. Campaigns for safety and employee support programs for pandemic situation were on top of the list.
Stay Safe Campaign: Extensive tracking with the employee hospitalization trends captured from 1st Wave by regional HR team. Employees presenting symptoms were meticulously followed for doctor reviews and progress in health. Webinars were conducted on guided meditation. On call Doctors were available 24/7.
Safe Drive Initiative: Our business requires strong ties with customers and regular field visits; therefore “Employee Road Safety Training” is given to all employees. 5700 employees are also proactively trained on Behavior-Based Road Safety Techniques, Monsoon Road Safety, and Winter Road Safety measures to ensure their personal safety.
Health and Fitness campaign: The importance of physical health and mental health are increasingly focussed upon. Younger generation is also prone to life threatening diseases nowadays. Thus, the CHOLA EHS team launched Health and Fitness Campaign called “30+”, which aims to create awareness about health issues and to facilitate employees adapt a healthy lifestyle.
Employee Support programs - COVID Initiatives:
• Cash benefit for immediate relief of COVID affected employees and additional death cover on account of the pandemic.
• Interest free loans for COVID affected employees and family on easy repayment terms
• Additional Death Cover on account of the pandemic was provided. Insurance coverage for the family members for a
period of 12 months
• Vaccination Support program conducted.
• Support for education of deceased frontline field
employees’ children up to graduation
• Employment opportunity on merit for the eligible
dependents of the deceased employee.
Learning and Development:
Learning at Chola has always been closely aligned to ensure that
employee productivity and readiness for the job roles are manifested
in the desired manner. The primary focus has always been on
gauging and building the functional competence of employees
and supplementing critical roles with required behavioral inputs as
the role demands.
Efforts this year were towards building the following learning
ecosystems at Chola –
• Structured Induction Program for all employees
• Trained over 2300+ employees on functional and
behavioral competencies
• Hyper-drive linked learning events to enhance operational
process efficiency at VF Branches.
• Lean Management efforts towards enhancing the
productivity of frontline sales teams.
Employee Engagement - Digital – Phygital to Physical
Engagement:
FY 22 was a year of transitions in the employee’s work style. The year
started with the employees working from the home and ended with
employees working from the office. Our employee engagement
initiatives like virtual programs for kids, yoga, marathon and
celebrations were tailored to employee’s work style.
TECHNOLOGY INITIATIVES
The bounce back experience since the pandemic has further
reinforced the need to provide an uninterrupted, anywhere, any
channel experience for our business stakeholders – employees,
customers, and ecosystem partners. Our quest for seamless digital
experience financial services space is now expanding in horizon
and getting embedded into daily life.
We are creating and enhancing the experience of internal as well
as external stakeholders on a regular basis. In addition to having
a seamless, secure data framework across our systems, we are also
creating APIs and digital frameworks that can be accessed from
our upstream market players. Our systems are ready to digitally
integrate and talk to our customers, dealers, manufacturers,
valuators, co-lending institutions, and many other partners. We
already have active integration with multiple entities, and we are

Corporate Overview Financial StatementsManagement Reports
57
committed towards increasing and improvising these layers to
be the financial services partner of choice based on our digital
strengths.
Our Phygital ideology has got deep-rooted in us to a phase where
system solutions today work in tandem with employees to enhance
their digital experience. This includes extensive use of design
thinking and user journeys to simplify data capture as well as the
quality of data being captured. While LEAN helps ensure an efficient
and effective digitization process, the focus on user experience in
our systems further ensures that our systems are intuitive enough
for users to adopt and work on the solutions from muscle memory.
Besides designing & developing solutions with process efficiency
on one side, the company is also assiduously driving automation
in the regular business activities carried out by teams across
functions & businesses. This ranges from combination of home-
grown automation scripts and robotic-process automation tools to
cognitive automation solutions. The objective is to drive a higher
index of automation while increasing the efficiency of operations
and eliminating potential aspects of human error / output variance
in these activities.
Data driven decisioning has been integral to our way of working,
and we are progressively deploying frameworks and tools by
which the data can be accessible to the right person to take the
right decision. An integrated view of data helps across the entire
cycle of business operations spanning planning, budgeting, credit
decisioning, and analytical aspects of sales, collections, portfolio,
and fraud among others. The end goal is towards easy access to
data that helps decision makers take pro-active actions while
having appropriate data access controls and ability to enforce
needs-driven access to data.
With the 24 x 7 nature of digital interactions, relentless focus on
cyber security is paramount. Our target has always been to be a
resilient and transparent digital technology operation where
systems operate seamlessly without business getting affected
by system non-performance. Besides following secure solution
development practices, the company continues to strengthen and
optimally upgrade key digital assets such as compute, storage,
software, and networks along with requisite access controls,
data integrity, and conformance to regulatory guidelines – with
objective of ensuring confidentiality, integrity, and availability
of the systems and underlying data. Besides tools and processes,
there is continued emphasis on driving awareness amongst staff
on appropriate handling of data and do’s / don’t’s of cyber related
activities.
With a platform approach and focus areas of experience, data, and
cyber security, the technology backbone for the company is ready
to act as catalyst for the next phase of growth.
RISK MANAGEMENT
The company’s DNA has risk management baked into its approach
to market. Given the nature of the business this has become
an imperative measure of its performance by the eco system –
investors, shareholders and regulators. Hence it has become an
integral part of the company’s operations.
Risk Management Framework: This is built on the following pillars
a. Identification of various risks in all lines of business and
functions including processes and policies
b. Assessment of these risks - assigning probability and
impact of each risk the importance to mitigation and
controls is weighted
c. Mitigation of risks – reviewing the adequacy of the controls
and checks to ensure the best outcomes
d. Measurement and monitoring of risks by establishing key
risk indicators with thresholds for all critical risks and
e. Adequate review mechanism to monitor and control risks.
Company’s risk management division works as a value centre
by constantly engaging with the business and providing key
insights into the portfolio based on data driven analysis. The key
risks faced by the company are credit risk, liquidity risk, interest
rate risk, operational risk, reputational and regulatory risk, which
are broadly classified as credit risk, market risk and operational
risk. The company has a well-established risk reporting and
monitoring framework. The in-house developed risk monitoring
tool, Chola composite risk index, measures the movement of top
critical risks. This provides the level and direction of risks, which are
arrived at based on the two-level risk thresholds for the identified
key risk indicators and are aligned to the overall company’s risk
appetite framework approved by the Board. The company’s risk
management initiatives and risk MIS are reviewed monthly by the
top management. This process enables the company to reassess
the top critical risks in a changing environment that need focus.
Risk Governance structure:
The company’s overall risk governance is handled by three lines
of defence to ensure the effectiveness of an organization’s risk
management framework including monitoring and assurance
functions within the organization.
a. Under the first line of defence, risk champions are identified
in each functional and business unit to take ownership,
responsibility and accountability for directly assessing,
controlling and mitigating risks.
b. The risk management team under the guidance of the
risk management committee acts as the second line of

58
Corporate Overview Financial StatementsManagement Reports
defence. The risk management division has established a
comprehensive risk management framework across the
business and provides appropriate analysis and reports on
risk exposures in its pursuit of creating awareness across
the company about risk management. The RMC of the
board meets minimum of four times a year and reviews
the risk management policy, implementation of risk
management framework, monitoring of critical risks, and
review of various other initiatives with a structured annual
plan.
c. Third line of defence constitutes internal auditors,
consultants and statutory auditors, who provide assurance
to the Audit Committee and senior management on the
effectiveness of internal governance and risk processes.
CREDIT RISK
Credit risk arises when a borrower is unable to meet his financial
obligations to the lender. This arises on account of inadequate
assessment of the borrower’s payment capabilities or on account
of uncertainties in his earning potential. The effective management
of credit risk requires the establishment of appropriate credit risk
policies and processes. The company has comprehensive and
well-defined credit policies across various businesses, products,
and segments, which encompass credit approval process for
all businesses along with guidelines for mitigating the risks
associated with them. The appraisal process includes detailed risk
assessment of the borrowers, physical verification and field visits.
The company has a robust post sanction monitoring process to
identify credit portfolio trends and early warning signals. This
enables it to implement necessary changes to the credit policy,
whenever the need arises. Also, being in asset financing business,
most of the company’s lending is covered by adequate collaterals
from the borrowers. The company has a robust online application
underwriting model to assess the credit worthiness of the borrower
for underwriting decisions for its vehicle finance, loan against
property and home loan business. The company also has a well-
developed model for the vehicle finance portfolio, to help business
teams plan volume with adequate pricing of risk for different
segments of the portfolio.
MARKET RISK
Market risk is the possibility of loss arising from changes in the
value of a financial instrument due to changes in market variables
such as interest rates, exchange rates and other asset prices. The
company’s exposure to market risk is a function of asset liability
management and interest rate sensitivity assessment. The
company can be exposed to interest rate risk and liquidity risk, if
the same are not managed properly. The company continuously
monitors these risks and manages them through appropriate risk
limits. The Asset Liability Management Committee (ALCO) reviews
monthly the market-related trends and risks and adopts various
strategies related to assets and liabilities, in line with the company’s
risk management framework. ALCO activities are in turn monitored
and reviewed by a board sub-committee. In addition, the company
has put in an ALM support group which meets weekly to review the
liquidity position of the company.
OPERATIONAL RISK
Operational risk is the risk of loss resulting from inadequate or
failed internal processes, people, or systems, or from external
events. The operational risks of the company are managed through
comprehensive internal control systems and procedures and key
back up processes. To further strengthen the control framework
and effectiveness, the company has established risk control self-
assessment at branches to identify process lapses by way of
exception reporting. This enables the management to evaluate key
areas of operational risks and the process to adequately mitigate
them on an ongoing basis. The company also undertakes risk-
based audits on a regular basis across all business units / functions.
While examining the effectiveness of control framework through
self-assessment, the risk-based audit would assure effective
implementation of self-certification and internal financial controls
adherence, thereby, reducing enterprise exposure. The company
has put in place a robust Disaster Recovery (DR) plan, which is
periodically tested. Business Continuity Plan (BCP) is also in place
to ensure seamless continuity of operations including services
to customers and periodic testing is carried out to address gaps
in the framework, if any. DR and BCP audits are conducted on a
periodical basis to provide assurance regarding the effectiveness
of the company’s readiness. The company is continuously engaged
in creating risk awareness and culture across the organisation
through training on risk management tools and communication
through risk e-newsletters.
ESG INITIATIVES
Chola has espoused ESG for several years and continues to
embed dimensions of sustainable governance and growth in all
aspects of our business. Chola emphasizes the financial inclusion
of marginalized groups of people through financial products and
services that address their socio – economic realities. Social impact
is integral to Chola’s business and our customer centric approach
enables us to reach millions of Indians seeking financial support
to improve their lives, whether through entrepreneurship, and
employment or home ownership. Our intent to create positive social
impact is further demonstrated through initiatives for employee
wellbeing and corporate social responsibility (CSR) programs for
the betterment of marginalized communities. Acknowledging
that sustainability planning is key to long term operations and

Corporate Overview Financial StatementsManagement Reports
59
CONSOLIDATED RESULTS
The consolidated profit after tax for the year under review was ` 2,153.51 crores in FY 22, as against ` 1,520.86 crores in FY 21.
On behalf of the board
Place : Chennai Vellayan SubbiahDate : May 5, 2022 Chairman
BALANCE SHEETParticulars Mar-21 Mar-22 Growth %AssetsBusiness Assets 65,839 74,149 13%Cash & Bank Balances 5,232 4,220 -19%Other Assets 3,477 3,994 15%Total 74,548 82,363 10%Networth 9,560 11,708 22%Borrowings 59,383 65,737 11%Securitisation 4,347 3,437 -21%Other Liabilities 1,258 1,482 18%Total 74,548 82,363 10%
` in Crores
STATEMENT OF PROFIT & LOSSParticulars Mar-21 Mar-22 Growth %Disbursements 26,043 35,490 36%Income 9,576 10,139 6%Cost of Funds -4,576 -4,299 -6%Net Margin 5,000 5,840 17%Operating Expenses -1,583 -2,069 31%Provisions and Losses -1,378 -880 -36%Profit Before Tax (PBT) 2,038 2,891 42%Current and Deferred Tax -524 -744 42%Profit After Tax (PAT) 1,515 2,147 42%
` in Crores
KEY RATIOSParticulars Mar-21 Mar-22 Growth %Return on Equity - PAT 16.9% 20.4% 20%Return on Total Assets - PAT 2.2% 2.9% 31%Total Assets under 76,518 82,904 8% management- ` In croresEarnings per share - Basic in ` 18.48 26.16 42%Market Price-Closing in ` 559 718 29%Market Capitalisation 45,824 58,915 29% - ` In croresCAR 19.1% 19.6% 3%Operating Expenses to Assets -2.3% -2.8% 20%Profit Before Tax to Income 21.3% 28.5% 34%
profitable growth, we have initiated several measures to reduce our environmental footprint and have formulated plans to decarbonize in the years to come.
The Company is committed to enhancing our ESG performance and consciousness of sustainability within the organization. We have articulated our sustainability agenda with an ESG framework along with well defined focus areas and road map to fulfil our priorities. This framework will guide us to reinforce principles of ESG in all aspects of our business, and focus our efforts on responsible products, improving efficiency, people power and environmental consciousness. For more details on ESG, please visit the company website https://cholamandalam.com/esg.aspx
INTERNAL CONTROL SYSTEMS
Risk Based Internal Audit (RBIA) has been implemented from March 2022 as per RBI circular dated 3 February, 2021. The Internal Audit function has been playing an integral role in helping the Company to strengthen and maintain solid cultures of compliance. To effectively manage risks across various products and processes, Chola has adopted “Three Lines of Defence” model where business and support units act as the first line of defence in identifying risks, risk management and compliance oversight functions established by management act as second line of defence, Internal Audit acts as the third lines of defence. Each of these three “lines” plays a distinct role within the organization’s wider governance framework.
An internal control framework, including internal financial controls, encompassing clear delegation of authority and standard operating procedures, are available across all business and functions. The Audit Committee regularly reviews the internal audit reports and the adequacy and effectiveness of internal controls. Internal Audit Team continuously evaluates the internal controls operating in various business operations of the organization based on proper risk analysis and also review the effectiveness of the governing processes. Internal audit team has a rigorous audit calendar spanning across multiple business processes and they independently review the design and operating effectiveness of internal financial controls. Internal audit managers are placed across the country to review the effectiveness of the internal controls across branches.
RESULT OF OPERATIONS
The company’s balance sheet size has steadily grown, compared to the previous year. A summarised version of the same is given below:

60
Corporate Overview Financial StatementsManagement Reports
Report on Corporate Governance
Corporate governance is about commitment to values and ethical business conduct. It is also about how an organization is managed viz., its corporate and business structure, its culture, policies, and the manner in which it deals with various stakeholders. Timely and accurate disclosure of information regarding the financial position of the company, its performance and ownership forms part of the corporate governance.
CORPORATE GOVERNANCE PHILOSOPHY
The company is committed to the highest standards of corporate governance in all its activities and processes.
The company has always believed in and practices the highest standards of corporate governance. The board recognizes that governance expectations are constantly evolving such as fast changing regulations, ESG, digital interruptions etc., and is committed to keep standards of transparency and dissemination of information under continuous review to meet both letter and spirit of the law and its own demanding levels of business ethics.
The company believes that sound corporate governance practices are crucial to the smooth and efficient operation of a company and its ability to attract investment, protect the rights of its stakeholders and provide shareholder value. Everything the company does is defined and conditioned by the high standards of governance, which serve its values. The company firmly believes in and follows the below principle:
“The fundamental principle of economic activity is that no man you transact with will lose; then you shall not.”
The corporate governance philosophy of the company is driven by the following fundamental principles:
n Adhere to corporate governance standards beyond the letter of law;
n Maintain transparency and high degree of disclosure levels;
n Maintain a clear distinction between the personal interest and the corporate interest;
n Have a transparent corporate structure driven by business needs; and
n Ensure compliance with applicable laws.
BOARD OF DIRECTORS
The corporate governance practices of the company ensure that the board of directors (the board) remains informed, independent, and involved in the company and that there are ongoing efforts towards better governance to mitigate “non-business” risks.
The board is fully aware of its fiduciary responsibilities and recognizes its responsibilities to shareholders and other stakeholders to uphold the highest standards in all matters concerning the company and has empowered responsible persons to implement its broad policies and guidelines and has set up adequate review processes.
The board is committed to representing the long-term interests of the stakeholders and in providing effective governance over the company’s affairs and exercise reasonable business judgment on the affairs of the company.
The company’s day to day affairs is managed by the executive director (ED) and a competent management team, under the overall supervision of the chairman and the board. The company has in place an appropriate risk management system covering various risks that the company is exposed to, including fraud risks, which are discussed and reviewed by the audit committee and the board every quarter. The company’s commitment to ethical and lawful business conduct is a fundamental shared value of the board, the senior management, and all employees of the company. Consistent with its values and beliefs, the company has formulated a Code of Conduct applicable to the board and senior management. Further, the company has also adopted a Code of Conduct to regulate, monitor and report trading by insiders in the securities of the company and a whistle blower policy for reporting any concerns or grievances by directors, employees / customers, and vendors in their dealings with the company. In order to ensure that the whistle blower mechanism is effective and as prescribed, direct access to the chairman of the audit committee is provided to the complainant.
Composition
The board has been constituted in a manner as per regulation
17 of the SEBI (Listing Obligations and Disclosure Requirements)
Regulations, 2015 (Listing Regulations) and the Companies Act,
2013 (the Act). The board has a mix of executive / non-executive

Corporate Overview Financial StatementsManagement Reports
61
and independent directors, including a woman independent
director to ensure proper governance and management. The
board members have collective experience in diverse fields like
banking and financial services, audit, finance, risk, compliance, data
science and technology. The directors are appointed based on their
qualification and experience in varied fields. None of the directors
are inter-se related.
Core Skills / expertise / competencies
In terms of Listing Regulations, the following are the list of core skills/
expertise / competencies identified by the board in the context of
the company’s business and sector for effective functioning:
The names of directors who have the above skills / expertise /
competencies are as follows:
Formal induction and familiarisation programme for directors
The company’s independent directors are eminent professionals
with several decades of experience in banking and financial
services industry, technology, finance, governance, risk
management, analytics, data science and management areas
and are fully conversant and familiar with the business of
the company. The company has an ongoing familiarisation
programme for all directors with regard to their roles, duties, rights,
responsibilities in the company, nature of the industry in which the
company operates, the business model of the company, etc. The
programme is embedded in the regular meeting agenda where
alongside the review of operations, information on the industry,
competition and company strategy are presented on a quarterly
basis. The details of the familiarisation programme attended by
directors are available on the website of the company (weblink:
https://www.cholamandalam.com/files/media/Familiarisation-
programme-imparted-to-Independent-Directors.pdf).
At the time of induction of a director on the board of the company,
a formal invitation to join the board of the company is sent out
along with a brief introduction about the company. A copy of the
company’s latest annual report and the schedule of the upcoming
board / committee meetings for the calendar year are forwarded
to the director. The director is explained in detail the compliances
required of him / her under the Act, the Listing Regulations and
other relevant regulations and his / her affirmation is taken with
respect to the same. By way of an introduction the company
conducts a familiarisation program covering all the businesses,
functions and regulations impacting the company to new directors.
Additionally, the company’s code of conduct which interalia
explains the values and beliefs of the company, functions, duties,
and responsibilities as a director of the company, including the
duties of independent directors in terms of the Act is given to the
director at the time of joining and on an annual basis. Further, there
is a detailed quarterly discussion and presentation on review of
operations of the company and the regulatory updates impacting
the business which helps the director familiarise himself / herself
with the company, its business, and the regulatory framework in
which the company operates.
The details of directors as of 31 March, 2022, including the details
of their other board directorship and committee membership
reckoned in line with regulation 26 of the Listing Regulations and
the Act as well as their shareholdings, are given below:
Core Skills / expertise / competencies Status
Finance Competency Strategy, planning and marketing availableTechnology Governance & RiskManagement and leadership
Name of the director Skills/expertise/competencies
Mr. Vellayan Subbiah Finance, strategy, planning, governance
& risk, technology, management and
leadership
Mr. N. Ramesh Rajan Finance, governance & risk,
management and leadership
Mr. Ashok Kumar Barat Finance, strategy, planning and
marketing, governance & risk,
management, and leadership
Ms. Bhama Krishnamurthy Finance, governance & risk,
management and leadership
Mr. Rohan Verma Technology, strategy, planning and
marketing, management, and leadership
Mr. M.A.M. Arunachalam Finance, Management and leadership,
governance & risk, strategy, planning
and marketing
Mr. Anand Kumar Finance, strategy, planning and
marketing, governance & risk, technology
management, and leadership
Mr. Bharath Vasudevan Finance, technology, strategy, planning
and marketing, governance & risk,
management and leadership
Mr. Ravindra Kumar Kundu Finance, Management and leadership,
strategy, planning and
marketing

62
Corporate Overview Financial StatementsManagement Reports
In the opinion of the board, the independent directors of the company fulfill the conditions specified in Listing Regulations /Companies Act, 2013 and are independent of the management of the company.
All the board members, including independent directors, have opportunity and access to interact with the management.
Separate meeting of independent directors
During the year under review, in line with the requirement under section 149(8) and schedule IV of the Act, the independent directors
had a separate meeting on 15 March, 2022 without the presence of the non-independent directors and management team.
Board Meetings
The board meets at regular intervals with an annual calendar and a formal schedule of matters specifically reserved for its attention to ensure that it exercises full control over significant strategic, financial, operational and compliance matters. The board is regularly briefed and updated on the key activities of the business and is provided with comprehensive briefings and presentations on operations,
The names of the other listed entities where the directors are holding directorship as at 31 March, 2022 are given below:
Name of the director Name of the listed entity Category of directorship
Mr. Vellayan Subbiah SRF Limited Non-executive / Independent Director Tube Investments of India Limited Vice Chairman / Promoter Cholamandalam Financial Holdings Limited Non-executive Director / Promoter CG Power and Industrial Solutions Limited Non-executive Director / Chairman / PromoterMr. N. Ramesh Rajan Indo - National Limited Non-executive / Independent Director / Chairman TTK Healthcare Limited Non-executive / Independent Director Rane (Madras) LimitedMr. Ashok Kumar Barat Bata India Limited Non-executive / Independent Director Birlasoft Limited DCB Bank Limited Huhtamaki India Limited Alembic Pharmaceuticals LimitedMs. Bhama Krishnamurthy Reliance Industrial Infrastructure Limited Non-executive / Independent Director CSB Bank Ltd. Network 18 Media & Investments Limited Thirumalai Chemicals LimitedMr. Rohan Verma C.E. Info Systems Limited Chief Executive Officer and Executive Director / PromoterMr. M.A.M. Arunachalam Tube Investment of India Limited Non-executive Chairman / Promoter CG Power and Industrial Solutions Limited Non-executive Director / Promoter Shanthi Gears Limited Mr. Anand Kumar Tube Investments of India Limited Non-executive / Independent DirectorMr. Bharath Vasudevan - -Mr. Ravindra Kumar Kundu - -
* For the purpose of directorship / committee membership, all public / private companies and section 8 companies have been considered.** only chairmanship / membership of audit committee and stakeholders’ relationship committee have been considered.
Name of the director Executive / Non-executive / No. of directorship No. of shares No. of board Independent / Promoter including CIFCL* held in the committee membership (Out of which as company including CIFCL** chairman) (Out of which as chairman)
Mr. Vellayan Subbiah Non-executive / Promoter director / 9(2) Nil 4(1) ChairmanMr. N. Ramesh Rajan Non-executive / Independent director 5(1) Nil 5 (3)Mr. Ashok Kumar Barat Non-executive / Independent director 7 Nil 7(5)Ms. Bhama Krishnamurthy Non-executive / Independent director 9 Nil 8(1)Mr. Rohan Verma Non-executive / Independent director 3 Nil 1Mr. M.A.M. Arunachalam Non-executive / Promoter director 9(4) 65,000 6(2)Mr. Anand Kumar Non-executive / Independent director 5 Nil 2Mr. Bharath Vasudevan Non-executive / Independent director 1 Nil NilMr. Ravindra Kumar Kundu Executive Director 6 1,66,685 1

Corporate Overview Financial StatementsManagement Reports
63
quarterly financial statements and other matters concerning the company. Besides, information about statutory compliance, minutes of all the subsidiary companies and committees of the board and information as required under the Listing Regulations are also provided to the directors on a quarterly basis. The board at every meeting also reviews the important regulatory changes and correspondence between two meetings.
The Board and the committee have a system of communication and follow up on actions taken by the management as suggested by the board / Committees and the same is updated to them board at the subsequent meetings.
The dates of the board meetings are fixed in advance for the calendar year to enable maximum attendance from directors. During the year, the board met 6 times on 07 May, 2021, 30 July, 2021, 29 October, 2021, 13 December, 2021, 01 February, 2022 and 15 March, 2022. The Act, read with the relevant rules made there under and the listing Regulations, facilitates the participation of a director in board / committee meetings through video conferencing or other audio visual means. There were specific circulars enabling directors to attend all the meetings on Audio visual means in view of the continuing pandemic situation. Accordingly, the company also provided the option to participate through video conferencing to enable the directors’ participation at the meetings.
The board periodically reviews the matters required to be placed before it and interalia reviews and approves the quarterly financial statements, corporate strategies, business plan, annual budgets, and capital expenditures. It monitors the overall performance and reviews other matters which require the board’s attention.
The board also takes on record the declarations and confirmations made by the executive director, chief financial officer, and company secretary, regarding compliances of all laws on a quarterly basis.
Certificate from Company Secretary in Practice
Mr. R. Sridharan of M/s. R. Sridharan & Associates has issued a certificate as required under the Listing Regulations, confirming that none of the directors on the board of the company has been debarred or disqualified from being appointed or continuing as director of companies by SEBI / Ministry of Corporate Affairs or any such statutory authority. A certificate to this effect has been enclosed with this report.
COMMITTEES OF THE BOARD
The board has constituted various committees to support the board in discharging its responsibilities.
There are seven committees constituted by the board - audit committee, stakeholders’ relationship committee, corporate social responsibility committee, nomination and remuneration committee, risk management committee, IT strategy committee and business committee.
The board at the time of constitution of each committee fixes the terms of reference, reviews it and delegates powers from time to
time. Various recommendations of the committees are submitted to the board for approval. During the year, the board had accepted all recommendations of the committees. The minutes of the meetings of all the committees are circulated to the board for its information.
AUDIT COMMITTEE
Terms of Reference
The committee acts as a link between the board, the statutory auditors, and the internal auditors. The role of the audit committee includes overseeing the financial reporting process and disclosure of financial information, review of financial statements, adequacy of internal financial controls and risk management systems, review and approval of transactions with related parties, findings of internal audits / investigations, whistle blower policy, monitoring the usage of funds from issue proceeds, review the financial statements, in particular, the investments made by the unlisted subsidiary companies, review of usage of loans, advances received, investment in the subsidiaries exceeding ` 100 crore or 10% of the asset size of the subsidiary, review of compliance with the provisions of SEBI Prohibition of Insider Trading Regulations at least once a financial year. The committee also verifies the adequacy in the systems for internal controls, to grant approvals for transactions with related parties which are in the ordinary course of business and on an arm’s length basis, scrutiny of inter-corporate loans and investments, besides recommending the appointment / removal of the joint statutory auditors, the internal auditors and fixing their remuneration and review of the effectiveness of audit process, consider and comment on cost benefits/impact of schemes involving merger and demerger, approval of risk based internal audit plan, review of performance of internal auditor, formulation of quality assurance and improvement program of the internal audit function, review of consolidated position of major risks faced by the organization, review of pending high and medium risk observations.
Composition & Meetings
As at 31 March, 2022 the committee comprised of five non- executive directors - four independent directors and one promoter director. The committee comprised of Mr. N. Ramesh Rajan, independent director as the chairman, Mr. Ashok Kumar Barat, Ms. Bhama Krishnamurthy, Mr. Anand Kumar, and Mr. M.A.M. Arunachalam, as its members and Mr. Vellayan Subbiah, chairman of the board, Mr. Rohan Verma, Mr. Bharath Vasudevan, directors and Mr. Ravindra Kumar Kundu, executive director as permanent invitees. The company secretary acts as the secretary to the committee. During the year, the committee met seven times. All members of audit committee have knowledge of financial management, audit, and accounts. The joint statutory auditors, the internal auditors and senior management are invited to attend the meetings of the committee. The company has in place a system for an independent meeting of the committee with the joint statutory and internal auditors without the presence of the non-independent directors and management team. The committee met the joint statutory auditors as well as internal auditors during the year.

64
Corporate Overview Financial StatementsManagement Reports
NOMINATION AND REMUNERATION COMMITTEE
Terms of Reference
The role of the committee is to determine the company’s policy on remuneration to executive directors and senior management, including periodic increments in salary. The committee is also empowered to determine the annual commission / incentives of the executive directors and the minimum remuneration of the executive directors in the event of inadequacy of profits besides implementing, remuneration including commission payable to non-executive directors, administering, and monitoring the employee stock option plan / schemes of the company. The terms of reference interalia includes the role of the committee to further consider and recommend persons who are qualified for board positions, evaluate directors performance prior to recommendation for re-appointments, identify persons who are qualified to be in senior management and recommend their appointments, remuneration payable and removal, formulate the criteria for determining qualifications, positive attributes and independence of a director and devising a policy on board diversity, determine whether to extend or continue the terms of appointment of independent director on the basis of the report of performance evaluation. Decisions for selecting a director is based on the merit, qualification, competency, and the company’s business needs. Such candidates shall be free of conflict of interest that would interfere with their ability to discharge their duties. The recommendations of the committee are placed before the board for its approval.
Composition & Meetings
As at 31 March, 2022, the committee comprised of Mr. Anand Kumar, independent director as the chairman, Mr. Vellayan Subbiah and Mr. N Ramesh Rajan as its members. The majority of the members of this committee are independent directors. The committee had three meetings during the year ended 31 March, 2022.
REMUNERATION OF DIRECTORS
Remuneration Policy
The success of any organisation in achieving good performance and governance depends on its ability to attract quality individuals on the board.
The company has in place a remuneration policy which is guided by the principles and objectives as enumerated in section 178 of the Act.
Currently, Mr. Ravindra Kumar Kundu is the executive director (ED) on the board. The compensation to Mr. Ravindra Kumar Kundu is within the scale approved by the board and shareholders. The elements of compensation comprise a fixed component, performance incentive and employee stock options. The compensation is determined based on the level of responsibility and scales prevailing in the industry. ED is not paid sitting fees for any board / committee meetings attended by him.
The compensation to the non-executive directors takes the form of commission on profits. Though the shareholders have approved payment of commission up to one per cent of the net profits of the company for each year calculated as per the provisions of section 198 of the Act, the actual commission paid to the directors
is restricted to a fixed sum within the above limit annually on the basis of their tenure in office during the financial year. The sum is reviewed periodically taking into consideration various factors such as performance of the company, time devoted by each of the directors in attending to the affairs and business of the company and the extent of responsibilities cast on the directors under various laws and other relevant factors. The Chairman of the Board and Audit Committee are paid differential commission in view of their enhanced role on the Board/Committees.
The non-executive directors are also paid sitting fees subject to the statutory ceiling for all board and committee meetings attended by them.
Criteria for Board Nomination
The nomination and remuneration committee is responsible for identifying persons for initial nomination as directors and evaluating incumbent directors for their continued service. The committee has formulated a charter in terms of the provisions of the Act, regulation 19(4) of the Listing Regulations and RBI Regulations applicable for non-banking finance companies, which interalia, deals with the personal traits, competencies, experience, background, and other fit and proper criteria. These attributes shall be considered for nominating candidates for board positions/ re-appointment of directors.
Criteria for appointment in senior management
The nomination and remuneration committee is responsible for identifying and recommending persons who are qualified to be appointed in senior management including recommending their remuneration. The committee has formulated the charter in terms of the provisions of the Act and the Listing Regulations, which interalia, deals with the criteria for identifying persons who are qualified to be appointed in senior management and periodical review of succession planning for board and senior management. These attributes shall be considered for nominating candidates for senior management position.
Performance Evaluation
In terms of the provisions of the Act and the Listing Regulations, the board carries out an annual performance evaluation of its own performance. The directors individually including the ED carry out a self as well as a peer evaluation. Individual committees carry out an evaluation of the working of the committees. The performance evaluation of the independent directors is carried out by the entire board. The performance of the chairman and the non-independent directors are carried out by the independent directors. Chairman anchors the sessions on self, peer, committee, and board effectiveness evaluations. Chairman of the nomination and remuneration committee anchors the session on chairman evaluation.
Policy on Board diversity
The nomination and remuneration committee has devised a policy on board diversity which sets out the approach to diversity on the board of the company. The policy provides for having a truly diverse board, comprising of appropriately qualified people with a broad range of experience relevant to the business of the company.

Corporate Overview Financial StatementsManagement Reports
65
STAKEHOLDERS RELATIONSHIP COMMITTEE
Terms of Reference
The role of the committee includes formulation of shareholders’ servicing plans and policies, share transmissions, issue of duplicate share certificates, issue of share certificates for split, rematerialisation, consolidation of shares, etc. The committee also monitors and reviews the mechanism of dematerialisation of shares and payment of dividends, adherence to the service standards in respect of various services being rendered by the Registrar & Share Transfer Agent, measures taken for effective exercise of voting rights by shareholders, approve transfer of shares to the Investors Education and Protection Fund. It further looks into the redressing of shareholders’ grievances like non-receipt of balance sheet, non- receipt of declared dividends and determining, monitoring, and reviewing the standards for resolution of shareholders’ grievances.
During the year, the company had received one complaint from the shareholder which has been resolved. There were no investor complaints pending as at 31 March, 2022 and no complaints that were not solved to the satisfaction of shareholders.
Composition & Meetings
As at 31 March, 2022, the committee comprised of Mr. M.A.M. Arunachalam as the chairman, Mr. Rohan Verma and
Mr. Ravindra Kumar Kundu as its members. Ms. P. Sujatha, company secretary is the compliance officer. During the year, the committee held two meetings.
RISK MANAGEMENT COMMITTEE
Terms of Reference
The role of the committee includes formulation and review of the risk management policy, ensures appropriate methodology, processes and systems are in place to monitor and evaluate risks associated with the business. The committee also monitors and oversees implementation of the risk management policy, including evaluating the adequacy of risk management systems and review the risk management policy, review the appointment, removal, and terms of remuneration of the chief risk officer, review the annual risk management framework document including action plan and its progress. Besides, the committee periodically monitors the critical risk exposures by specialised analysis and quality reviews and reports to the board the details of any significant developments, identify and make recommendations to the board, to the extent necessary on resources and staffing required for effective risk management and the action taken to manage the exposures, seek information from employee, obtain outside legal advice, secure attendance of outsiders with relevant expertise and carry out any
Directors of the company were paid sitting fees of ` 50,000/- for every meeting of board and audit committee and ` 30,000/- for every meeting of stakeholders’ relationship committee, nomination and remuneration committee, risk management committee, corporate social responsibility committee, IT strategy committee and business committee during the FY 22.
In view of the considerable amount of time spent on reviewing the performance of various businesses, devising the long-term strategy, giving strategic directions to the management and advising the company in exploring new opportunities, a differential commission of `100 lakhs will be paid to Mr. Vellayan Subbiah for the financial year ended 31 March, 2022 subject to the approval of the shareholders. The commission provided below will be paid subject to approval of the shareholders for the audited accounts for FY 22.
The details of commission provided / sitting fees paid to non-executive directors for the year ended 31 March, 2022 are as follows:
Remuneration of non-executive directors
` in lakhs Name of the director Commission Sitting Fees paid Total
Mr. Vellayan Subbiah 100.00 6.00 106.00Mr. N. Ramesh Rajan 12.00 8.60 20.60Mr. Ashok Kumar Barat 10.00 8.60 18.60Ms. Bhama Krishnamurthy 10.00 8.30 18.30 Mr. Rohan Verma 10.00 2.90 12.90Mr. M.A.M. Arunachalam 10.00 9.20 19.20Mr. Anand Kumar 10.00 6.60 16.60Mr. Bharath Vasudevan 10.00 4.50 14.50TOTAL 172.00 54.70 226.70
Note:Commission will be paid subject to deduction of tax as applicable.
` in lakhs
Note:Mr. Ravindra Kumar Kundu is not eligible for any severance fee. Service contract and the notice period are as per the terms of agreement entered into by them with the company.
Remuneration of executive director/sDetails of the remuneration of the executive director for the year ended 31 March, 2022 are as follows:
Name of the Director Salary Allowance Incentive (provisional) Perquisites & Contributions TotalMr. Ravindra Kumar Kundu 106.56 50.77 72.07 43.95 273.36

66
Corporate Overview Financial StatementsManagement Reports
other function as may be necessary to ensure that an effective risk management system is in place.
Composition & Meetings
As at 31 March, 2022 the committee comprised of Mr. Ashok Kumar Barat as the chairman, Mr. N. Ramesh Rajan, Ms. Bhama Krishnamurthy, Mr. M.A.M. Arunachalam, Mr. Bharath Vasudevan and Mr. Ravindra Kumar Kundu as its members and business and functional heads of the company as permanent invitees. The committee held four meetings during the year ended 31 March, 2022.
Meetings with chief risk officer
During the year under review, in line with the requirement under RBI regulations, the committee had separate meetings with Mr. Shankar Subramanian, chief risk officer of the company without the presence of the executive director and the management team.
IT STRATEGY COMMITTEE
Terms of Reference
The role of committee includes approving Information Technology (IT) strategy and policy documents and ensuring that the management has put an effective strategic planning process in place and ascertaining implementation processes and practices that ensure that IT delivers value to the business; Ensuring IT investments represent a balance of risks and benefits, the budgets are acceptable and monitoring the method that management uses to determine the IT resources needed to achieve strategic goals and provide high-level direction for sourcing and use of IT resources and Ensuring proper balance of IT investments for sustaining company’s growth and becoming aware about exposure towards IT risks and controls. The committee also reviews the information security and cyber security framework and IT disaster recovery process of the company.
Composition & Meetings
As at 31 March, 2022, the committee comprised of Mr. Ashok Kumar Barat as the chairman, Mr. Rohan Verma, Mr. Bharath Vasudevan
and Mr. Vellayan Subbiah as its members. The committee held two meetings during the year ended 31 March, 2022.
BUSINESS COMMITTEE
Terms of Reference
The role of the committee includes review of the business of the company, including approval and review of business proposals beyond certain financial limits, review and recommend new product notes to the board for approval, approve borrowings within the limits prescribed by the board, approve assignment of receivables and oversee the asset liability management system of the company.
Composition & Meetings
As at 31 March, 2022, the business committee comprised of Mr. Vellayan Subbiah as the chairman, Mr. M.A.M. Arunachalam and Mr. Ravindra Kumar Kundu as its members. The senior management is invited to attend the meetings of the committee. The committee held two meetings during the year.
CORPORATE SOCIAL RESPONSIBILITY COMMITTEE
Terms of Reference
The role of the committee includes formulation and recommendation of a corporate social responsibility (CSR) policy for the company, recommend the amount of expenditure to be incurred on the CSR activities, monitor the CSR policy of the company from time to time and institute a transparent monitoring mechanism for implementing the CSR activities and carry out any other function or activity as may be required to ensure that the CSR objectives are met.
Composition & Meetings
As at 31 March, 2022, the committee comprised of Mr. Vellayan
Subbiah as the chairman, Ms. Bhama Krishnamurthy and
Mr. M.A.M. Arunachalam as its members. The committee held two
meetings during the year ended 31 March, 2022.
Name of the directors Board Audit Stakeholders Nomination & Business Risk Corporate IT strategy Attendance(Attendance committee relationship remuneration committee management social committee at last AGM
%) committee committee committee responsibilitycommittee
ATTENDANCE AT BOARD, COMMITTEE AND GENERAL MEETINGS
Mr. Vellayan Subbiah 6 (100%) NA 1 3 2 NA 2 2 Yes
Mr. N. Ramesh Rajan 6 (100%) 7 NA 3 NA 4 NA NA Yes
Mr. Ashok Kumar Barat 6(100%) 7 NA 1 NA 4 NA 2 Yes
Ms. Bhama Krishnamurthy 6 (100%) 7 NA NA NA 4 2 NA Yes
Mr. Rohan Verma 4 (67%) NA 1 NA NA NA NA 2 Yes
Mr. M.A.M. Arunachalam 6(100%) 7 1 NA 2 4 2 NA Yes
Mr. Anand Kumar 6 (100%) 7 NA 2 NA NA NA NA Yes
Mr. Bharath Vasudevan 6 (100%) NA NA NA NA 3 NA 2 Yes
Mr. Ravindra Kumar Kundu 6 (100%) NA 2 NA 2 3 NA NA Yes

Corporate Overview Financial StatementsManagement Reports
67
POSTAL BALLOT
No postal ballot was conducted during FY 22.
Proposed resolutions through postal ballot
No special resolution is proposed to be conducted through postal
ballot.
COMPLIANCE REPORT
A detailed compliance report is placed before the board every
quarter and highlights of the report is circulated to the board along
with the agenda every quarter. The company secretary submits a
compliance certificate to the board on a quarterly basis. The board
reviews the compliance of all applicable laws every quarter and
gives appropriate directions, wherever necessary.
SECRETARIAL AUDIT
The company annually conducts a secretarial audit by an
independent practicing company secretary. For the year ended
31 March, 2022 M/s. R. Sridharan & Associates, company secretaries,
had conducted the secretarial audit and the certificate was placed
before the board and attached to this report.
RECONCILIATION OF SHARE CAPITAL AUDIT
As required by the Securities and Exchange Board of India (SEBI),
quarterly audit of the company’s share capital is being carried
out by an independent auditor with a view to reconcile the total
share capital admitted with National Securities Depository Limited
(NSDL) and Central Depository Services (India) Limited (CDSL)
and held in physical form, with the issued and listed capital. The
certificate issued by an independent practicing company secretary
is submitted to the stock exchanges and is also placed before the
board of directors.
CODE OF CONDUCT
The board has adopted a code to regulate, monitor and report
trading by insiders in securities of the company. The code interalia
requires pre-clearance for dealing in the securities of the company
and prohibits the purchase or sale of securities of the company while
in possession of unpublished price sensitive information in relation
to the company and during the period when the trading window
is closed. The board has further approved the code for practices
and procedures for fair disclosure of unpublished price sensitive
information and policy governing the procedure of inquiry in case of
actual or suspected leak of unpublished price sensitive information.
The code has also been hosted on the website of the company.
CODE FOR PREVENTION OF INSIDER TRADING
The board has adopted a code to regulate, monitor and report
trading by insiders in securities of the company. The code interalia
requires pre-clearance for dealing in the securities of the company
and prohibits the purchase or sale of securities of the company
while in possession of unpublished price sensitive information in
relation to the company and during the period when the trading
window is closed. The board has further approved the code for
practices and procedures for fair disclosure of unpublished price
sensitive information and policy governing the procedure of inquiry
in case of actual or suspected leak of unpublished price sensitive
information. The code has also been hosted on the website of the
company.
COMPLIANCE CERTIFICATE ON CORPORATE GOVERNANCE
The certificate on compliance of corporate governance norms from
a practicing company secretary is annexed to the report.
DETAILS OF SPECIAL RESOLUTIONS PASSED
Particulars of special resolutions passed in the previous three annual general meetings are given below:
Date of AGM Details
30 July, 2019 - Approval for borrowing powers of the Company - Issue of securities on private placement basis under section 42 of the Act - Approval for payment of commission to non-executive directors30 July, 2020 - Issue of securities on private placement basis under section 42 of the Act30 July, 2021 - Issue of securities on private placement basis under section 42 of the Act
GENERAL BODY MEETINGSParticulars of venue, date, and time of the previous three annual general meetings are given below:
Year Date and Time Venue
2019 30 July, 2019 at 3.30 p.m. The Music Academy, New No.168 (Old No.306), T.T.K Road, Royapettah, Chennai - 600 0142020 30 July, 2020 at 3.30 p.m. Video Conferencing2021 30 July, 2021 at 3.30 p.m. Video Conferencing

68
Corporate Overview Financial StatementsManagement Reports
CEO/CFO CERTIFICATION
Executive director and chief financial officer have given a compliance
certificate to the board with regard to financial statements and
internal control systems as contemplated under regulation 17(8) of
the Listing Regulations.
SUBSIDIARY COMPANIES
A policy on material subsidiaries has been formulated and
the same is posted on the company’s website (weblink:
https://www.cholamandalam.com/company-policies.aspx).
The financial statements of subsidiary companies are tabled at the
audit committee and board meetings every quarter. The company
does not have any material subsidiary whose net worth exceeds
10% of the consolidated income or net worth of the company
during the immediately preceding financial year.
DISCLOSURES
Related party transactions
All transactions with related parties that were entered into during
the financial year were in the ordinary course of business and
were on an arm’s length basis. There were no material transactions
with related parties i.e., transactions of the company of material
nature, with its promoters, the directors or the management, their
subsidiaries, or relatives, etc., that may have potential conflict with
the interest of company at large.
Suitable disclosures as required in compliance with accounting
standards with related parties are disclosed in note 37 of the
financial statements in the annual report.
The board has put in place a policy on related party transactions and
the same has been uploaded on the company’s website (weblink:
https:// www.cholamandalam.com/company-policies.aspx).
Disclosure by listed entity and its subsidiaries of ‘Loans and
advances’ in the nature of loans to firms/companies in which
directors are interested by name and amount.
Suitable disclosures as required in compliance with accounting
standards in which directors are interested are disclosed in note 37
of the financial statements in the annual report.
Fee disclosures as required by clause 10(k), Part C, Schedule V
of the Listing Regulations:
Total fees for all services paid by the company and its subsidiaries,
on a consolidated basis, to M/s. Price Waterhouse LLP, and
M/s. Sundaram & Srinivasan, Chartered Accountants, joint statutory
auditors of the company and other firms in the network entity of
which the statutory auditor is a part, as included in the consolidated
financial statements of the company for the year ended
31 March, 2022, is as follows:
Disclosure under Sexual Harassment of Women at Workplace
(Prevention, Prohibition and Redressal) Act, 2013:
During the year, the company had not received any complaint
under the Sexual Harassment of Women at Workplace (Prevention,
Prohibition and Redressal) Act, 2013.
Whistle blower policy / vigil mechanism
The company has established a whistle blower mechanism to
provide an avenue to raise concerns. The mechanism provides
for adequate safeguards against victimization of directors /
employees/ customers who avail of the mechanism and also
for appointment of an ombudsperson who will deal with the
complaints received. The policy also lays down the process to be
followed for dealing with complaints and in exceptional cases, also
provides for direct access to the chairperson of the audit committee.
During the year, no personnel have been denied access to the
audit committee. The policy is available on the website (weblink:
https://www.cholamandalam.com/company-policies.aspx).
Penalties
There were no penalties, strictures imposed on the company by
stock exchange(s) or SEBI or any statutory authority, on any matter
related to capital markets, during the last three years.
COMPLIANCE WITH CORPORATE GOVERNANCE NORMS
The company has complied with all mandatory requirements
of corporate governance norms as enumerated in chapter IV of
the Listing Regulations. The requirements of regulation 17 to
regulation 27 of the Listing Regulations and clauses (b) to (i) of
the sub-regulation (2) of regulation 46 to the extent applicable
to the company have been complied with as disclosed in this
report. The company has also adopted the following discretionary
requirements specified in Part E of Schedule II in terms of regulation
27(1) of the Listing Regulations:
i. Modified opinion(s) in audit report: Company’s financial
statements have unmodified audit opinions.
ii. Reporting of internal auditor: The internal auditors of the
company directly report to the audit committee.
Particulars Amount` in lakhs
Fees for audit and related services paid to joint statutory auditors and affiliates firms and to entities of the network of which the statutory auditor is a part
Other fees paid to joint statutory auditors & affiliates firms and to entities of the network of which the statutory auditor is a part
Total fees* 72.15
-
72.15
*Includes input tax credit expensed wherever applicable

Corporate Overview Financial StatementsManagement Reports
69
Declaration on Code of ConductThis is to confirm that the board has laid down a Code of Conduct for all board members and senior management of the company. The
Code of Conduct has also been posted on the website of the company. It is further confirmed that all directors and senior management
personnel of the company have affirmed compliance with the Code of Conduct of the company for the year ended March 31, 2022, as
envisaged in Schedule V under regulation 34 (3) of the Listing Regulations.
Place: Chennai Ravindra Kumar KunduDate: 5 May, 2022 Executive Director
MEANS OF COMMUNICATION
The audited financial results, quarterly results, and other major announcements like notices of annual general meeting and book closures were published in Business Line and Dinamani and are also available on the company’s website www.cholamandalam.com. Press releases are given in the leading newspapers and also posted on the company’s website. The investors’ presentations and call transcripts are also posted on the company’s website. The company has posted a shareholder’s satisfaction survey on its website to ascertain the level of the shareholders satisfaction. Further, the shareholding pattern and presentations made to analysts and investors from time to time are also displayed on the website of the company.
MANAGEMENT DISCUSSION & ANALYSIS
A management discussion & analysis forms part of the annual
report.
GENERAL SHAREHOLDER INFORMATION
A separate section on the above has been included in the annual
report.
On behalf of the board
Place : Chennai Vellayan SubbiahDate : 5 May, 2022 Chairman

70
Corporate Overview Financial StatementsManagement Reports
Certificate from Company Secretary in PracticePursuant to Regulation 34 (3) read with Schedule V Para-C Sub clause (10) (i) of SEBI (Listing Obligations and Disclosure Requirements) Regulations, 2015 as amended
The Members,CHOLAMANDALAM INVESTMENT AND FINANCE COMPANY LIMITEDDare House, No. 2, N.S.C Bose Road, Parrys, Chennai - 600001
We have examined the relevant registers, records, forms, returns and disclosures received from the Directors of CHOLAMANDALAM INVESTMENT AND FINANCE COMPANY LIMITED (CIN: L65993TN1978PLC007576) having its Registered Office at Dare House No. 2, N.S.C Bose Road, Parrys, Chennai – 600001 (hereinafter referred to as “The Company”) as produced before us by the Company for the purpose of issuing this certificate, in accordance with Regulation 34 (3) read with Schedule V Part-C Sub clause 10 (i) of the Securities and Exchange Board of India (Listing Obligations and Disclosure Requirements) Regulations 2015.
In our opinion and according to the verifications (including Director Identification Number (DIN) Status at the portal www.mca.gov.in) and based on such examination as well as information and explanations furnished to us, which to the best of our knowledge and belief were necessary for the purpose of issue of this certificate and based on such verification as considered necessary, we hereby certify that none of the Directors as stated below on the Board of the Company as on 31st March 2022 have been debarred or disqualified from being appointed or continuing as Directors of Companies by the Securities and Exchange Board India / Ministry of Corporate Affairs or any such other statutory authority.
S.NO DIN NAME OF THE DIRECTOR DESIGNATION DATE OF APPOINTMENT
1. 01138759 Vellayan Subbiah Non-Executive - Non Independent / 11/11/2020 Promoter Director / Chairman 2. 00492930 Ashok Kumar Barat Non-Executive - Independent Director 31/10/2017 3. 01628318 N Ramesh Rajan Non-Executive - Independent Director 30/10/2018 4. 02196839 Bhama Krishnamurthy Non-Executive - Independent Director 31/07/2019 5. 01797489 Rohan Verma Non-Executive - Independent Director 25/03/2019 6. 00202958 M A M Arunachalam Non-Executive - Non Independent / 29/01/2021 Promoter Director 7. 00818724 Anand Kumar Non-Executive - Independent Director 16/03/2021 8. 09104808 Bharath Vasudevan Non-Executive - Independent Director 16/03/2021 9. 07337155 Ravindra Kumar Kundu Executive Director 23/01/2020
Ensuring the eligibility for the appointment/ continuity of every Director on the Board is the responsibility of the management of the Company. Our responsibility is to express an opinion on these based on our verification. This certificate is neither an assurance as to the future viability of the Company nor of the efficiency or effectiveness with which the management has conducted the affairs of the Company.
For R. Sridharan & Associates Company Secretaries
CS. R. Sridharan CP No. 3239 FCS No. 4775 PR.NO.675/2020
UIN: S2003TN063400UDIN: F004775D000264177
Place : ChennaiDate : 5 May, 2022

Corporate Overview Financial StatementsManagement Reports
71
The Members,CHOLAMANDALAM INVESTMENT AND FINANCE COMPANY LIMITEDDare House, No. 2, N.S.C Bose Road,Parrys, Chennai - 600001
We have examined documents, books, papers, minutes, forms and returns filed and other relevant records maintained by CHOLAMANDALAM INVESTMENT AND FINANCE COMPANY LIMITED, (CIN: L65993TN1978PLC007576) [hereinafter referred as “the Company”] having its Registered Office at Dare House, No.2, N.S.C Bose Road, Parrys, Chennai- 600001, for the purpose of certifying compliance of the conditions of Corporate Governance under Regulations 17 to 27 and clauses (b) to (i) of Regulation 46(2) and para C, D and E of Schedule V and Regulation 34 (3) to the SEBI (Listing Obligations and Disclosure Requirements) Regulations, 2015 as amended (hereinafter called “SEBI (LODR) Regulations 2015”) for the financial year ended 31st March, 2022. We have obtained all the information and explanations, which to the best of our knowledge and belief were necessary for the purpose of certification.
The compliance of the conditions of Corporate Governance is the responsibility of the management. Our examination was limited to the procedures and implementation thereof, adopted by the Company for ensuring the compliance of the conditions of Corporate Governance. It is neither an audit nor an expression of opinion on the financial statements of the Company.
In our opinion and on the basis of our examination of the records produced, explanations and information furnished, we certify that the Company has complied regarding the conditions of Corporate Governance as stipulated under the SEBI (LODR) Regulations 2015 for the financial year ended 31st March, 2022.
This Certificate is neither an assurance as to the future viability of the Company nor of the efficacy or effectiveness with which the management has conducted the affairs of the Company.
For R. Sridharan & Associates Company Secretaries CS. R. Sridharan FCS No. 4775
CP No. 3239PR NO.657/2020
UIN: S2003TN063400UDIN: F004775D000264166
Place : ChennaiDate : 5 May, 2022
Independent certificate on compliance with the conditions of Corporate Governance as per provisions of Chapter IV of Securities and Exchange Board of India (Listing Obligations and Disclosure Requirements) Regulations, 2015, as amended

72
Corporate Overview Financial StatementsManagement Reports
General Shareholders InformationREGISTERED OFFICE“Dare House”, No.2, N.S.C. Bose Road, Parrys, Chennai - 600 001.
CORPORATE IDENTITY NUMBER (CIN)L65993TN1978PLC007576
ANNUAL GENERAL MEETINGDate Time Mode
29 July, 2022 4.00 p.m. The annual general meeting (AGM) will be held through video conference in compliance with applicable guidelines and circulars issued by the Ministry of Corporate Affairs (MCA) and Securities and Exchange Board of India (SEBI).
FINANCIAL YEAR
1 April to 31 March.
LISTING ON STOCK EXCHANGES
Equity Shares:
BSE Limited National Stock Exchange of India LimitedFloor 25, Phiroze Jeejeebhoy Towers Exchange Plaza, Plot No.C-1, G Block, Bandra Kurla Complex,Dalal Street, Fort, Mumbai - 400 001. Bandra (E), Mumbai - 400 051Stock Code: 511243 Stock Code: CHOLAFIN EQ
DATES OF BOOK CLOSURE
Monday, 26 July, 2022 to Friday, 29 July, 2022 (both days inclusive).
DIVIDEND PAYMENT DATE
The board at its meeting held on 1 February, 2022 had approved payment of interim dividend on the equity shares for the year ended 31 March, 2022 at the rate of 65% (` 1.30 per equity share of ` 2 each) and fixed the record date as 11 February, 2022. The dividend was paid to all the shareholders by 25 February, 2022.
The board at its meeting held on 5 May, 2022 has further recommended payment of final dividend of 35% (` 0.70 per equity share of `2 each), for the year ended 31 March, 2022. The same will be paid within 30 days upon declaration by the shareholders at the ensuing annual general meeting.
Debt Securities:
Debt securities are listed in the Wholesale Debt Market (WDM) Segment of NSE and F - Class Segment of BSE Limited.
Payment of Listing fees
The listing fees for equity shares for FY 22 were paid to the above stock exchanges.

Corporate Overview Financial StatementsManagement Reports
73
REGISTRAR AND SHARE TRANSFER AGENT
KFin Technologies Limited (KFin) is the Registrar and Share Transfer Agent (RTA) for handling the physical and electronic registry work. The shareholders are requested to send their share related requests / queries to the RTA.
SHARE PRICE DATA
April, 2021 592.50 511.10 31,61,780 592.50 510.85 8,98,63,000
May, 2021 582.55 524.00 38,56,734 572.05 524.00 13,86,68,975
June, 2021 580.60 513.05 35,23,680 566.00 513.25 6,82,93,491
July, 2021 521.55 476.00 53,33,483 519.25 475.75 5,88,76,629
August, 2021 553.50 483.25 46,07,038 538.00 484.20 7,46,79,688
September, 2021 609.60 555.70 26,22,130 591.70 554.75 5,19,13,118
October, 2021 623.50 558.50 42,21,778 603.50 558.65 5,17,03,450
November, 2021 662.40 542.65 19,93,579 640.00 542.20 5,90,85,299
December, 2021 579.30 492.95 13,68,578 576.80 492.80 4,61,37,392
January, 2022 654.00 537.00 21,68,592 638.00 537.25 7,46,67,879
February, 2022 691.75 637.85 20,36,342 689.00 639.20 6,14,05,325
March, 2022 733.70 606.55 13,85,273 725.30 607.30 4,74,61,979
Month High Low Vol. High Low Vol. (in `) (in `) (in `) (in `)
The contact details of the RTA are as follows:KFIN Technologies Limited(Unit: Cholamandalam Investment and Finance Company Limited) Tower B, Plot 31-32, Gachibowli, Financial District, Nanakramguda,Hyderabad - 500 032, Telengana | Phone No.: 040-67162222 | Toll Free No.: 18003094001| Fax No: 040-2342 0814Email: [email protected] | Website: www.kfintech.com or https://ris.kfintech.com/Contact person: Mr. Rajkumar Kale - Assistant Vice President - Corporate Registry
National Stock Exchange of India LimitedBSE Limited
300
400
500
600
700
800
13000
14000
15000
16000
17000
18000
19000
Apr/
21
May
/21
Jun/
21
Jul/2
1
Aug/
21
Sep/
21
Oct
/21
Nov
/21
Dec/
21
Jan/
22
Feb/
22
Mar
/22
Chol
a (in
Rs)
NSE
NIF
TY
NIFTY Cholamandalam Share Price
Cholamandalam share price performance in comparison with NSE NIFTY
Cholamandalam share price performance in comparison with NSE NIFTY

74
Corporate Overview Financial StatementsManagement Reports
TRUSTEES FOR THE DEBENTURE HOLDERS
The company has appointed IDBI Trusteeship Services Limited and Catalyst Trusteeship Limited debenture trustees registered with SEBI, as the trustees on behalf of the debenture holders.
The contact details of the Trustees are as follows:
1. IDBI Trusteeship Services Limited Asian Building, Ground Floor,
17, R. Kamani Marg, Ballard Estate, Mumbai - 400 001 Phone : 022-40807035 Website : www.idbitrustee.co.in E-mail : [email protected] Contact person : Ms. Anjalee Athalye, Asst. VP (Operations)
Dematerialisation of shares and liquidity
The company’s shares are tradable in the electronic form only. The company has established connectivity with National Securities Depository Limited and Central Depository Services (India) Limited. As of 31 March, 2022, 99.88% of the company’s shares were held in dematerialised form. The company’s shares are regularly traded on National Stock Exchange of India Limited and BSE Limited under the ISIN: INE121A01024.
Share Transfer System
Effective 1 April, 2019, SEBI has disallowed listed companies from accepting request for transfer of securities which are held in physical form. The shareholders who continue to hold shares in physical form after this date, will not be able to lodge the shares with company / its RTA for further transfer. Shareholders shall mandatorily convert them to demat form if they wish to effect any transfer. Only the requests for transmission and transposition of securities in physical form will be accepted by the company / RTA. There are 2,296 shareholders holding 0.12% of the company’s shares in physical form. Those shareholders whose shares are held in physical mode may consider moving to dematerialised mode as they will not be able to transfer them in physical mode and also it is a safer and easier way to hold.
Updation of KYC details
SEBI vide circular dated 3 November, 2021, has mandated furnishing of details like PAN, nomination, mobile number, email address, specimen signature, bank details by the respective shareholders. Effective from 1 January, 2022, any service requests or complaints received from the shareholder, will not be processed by RTA till the aforesaid details / documents are provided to RTA. On or after 1 April, 2023, in case any of the above cited documents / details are not available in the Folio(s), RTA shall be constrained to freeze such Folio(s). Relevant details and forms prescribed by SEBI in this regard are available on the website of the company at https://www.cholamandalam.com/sebi-norms.aspx.
Nomination facility
As per the SEBI circular dated 3 November, 2021, facility for registering nomination is available for members in respect of the shares held by them. Shareholders who have not yet registered their nomination are requested to register the same by submitting Form No. SH-13. If a shareholder desires to opt out or cancel the earlier nomination and record a fresh nomination, he / she may submit the same in Form ISR-3 or SH-14 as the case may be. The said forms can be downloaded from the Company’s website https://www.cholamandalam.com/sebi-norms.aspx. The shareholders holding shares in dematerialised form are requested to submit their nomination form to the concerned depository participants and to RTA in case the shares are held in physical form.
Transmission of shares/issue of duplicate share certificates in demat mode only
As per SEBI norms, with effect from 25 January, 2022, all transmission requests including issuance of duplicate share certificates are mandatorily to be processed in dematerialised form only.
Payment of dividend through NACH
The company uses National Automated Clearing House (NACH) facility for payment of dividends directly to the bank accounts of shareholders. The shareholders may use the facility by providing their bank account number to the depository participant / RTA, as may be relevant, to enable the company to effect the dividend payment through the NACH mode.
Green initiative in corporate governance
The Companies Act, 2013 and the underlying rules permit companies to send various documents including the financial statements through electronic mode to the shareholders. In compliance with the circulars issued by MCA and SEBI, electronic copies of the notice of the AGM and annual report for FY 22 will be sent to all the shareholders whose email addresses are registered with the company / depository participants. Shareholders are requested to register their e-mail ID with the depository participant, if the holding is in electronic mode. If shares are held in physical mode, the shareholders are requested to furnish their email addresses to RTA for receiving the above documents by electronic mode.
2. Catalyst Trusteeship Limited GDA House, Plot No. 85, Bhusari Colony (Right),
Paud Road, Pune - 411 038 Phone : 020-6680 7200/7223/7224-209 Website : www.catalysttrustee.com E-mail : [email protected] Contact person : Ms. Shamal Nalawade- Asst. VP

Corporate Overview Financial StatementsManagement Reports
75
Details of complaints received and redressed
During the year, one investor service complaint relating to non-receipt of split share certificate was received. No investor service complaint was pending as at 31 March, 2022.
Contact details of the designated official for assisting and handling investor grievances
In terms of regulation 46(2)(k) of the Listing Regulations, the contact details of the designated official for assisting and handling investor grievances are as below:
Ms. P. Sujatha, Company Secretary“Dare House”, No.2, N.S.C. Bose Road, Parrys, Chennai‐600 001Phone: 044-40907172 (bd.) 40907055 (d) | Fax: 044-25346464E‐mail: [email protected] | [email protected] | [email protected]
CREDIT RATING The credit rating details of the company as at 31 March, 2022 are as follows:
ICRA LT NCD / SD [ICRA]AA+ with Stable Outlook NA NCD MLD - February 25, 2022 / CC / TL NCD - March 22, 2022 LTL/CC - February 24, 2022
LT PD [ICRA]AA with Stable Outlook NA PDI - March 22, 2022
ST CP / [ICRA]A1+ NA CP - March 22, 2022 WCDL
CRISIL ST CP [CRISIL]A1+ NA CP - March 14, 2022
LT SD [CRISIL]AA+ / Stable NA
CARE LT SD CARE AA+ NA
LT PD CARE AA NA
INDIA Ratings LT NCD / SD IND AA+ with Stable Outlook NA NCD / SD - March 23, 2022 and Research Private Ltd LT PD IND AA with Stable Outlook NA PD - March 23, 2022
Rating Agency Term Type Rating as on 31 March, 2022 Revisions during the year Obtained during the year
Note: Note: LT – Long term loan, ST – Short term loan, NCD – Non-convertible debenture, SD – Subordinated debt instrument, CC – Cash credit, TL – Term loan, CP – Commercial paper, WCDL – Working capital demand loans, PD – Perpetual debt instrument
FY to which the dividend relates Date of declaration Due date for transfer to IEPF
2015 - Final 31 July, 2015 04 September, 20222016 - Interim 29 January, 2016 05 March, 2023 - Final 29 July, 2016 03 September, 20232017 - Interim 25 January, 2017 01 March, 2024 - Final 27 July, 2017 31 August, 20242018 - Interim 30 January, 2018 06 March, 2025 - Final 26 July, 2018 30 August, 20252019 - Interim 30 January, 2019 06 March, 2026 - Final 30 July, 2019 03 September, 20262020 - Interim I 12 December, 2019 16 January, 2027 - Interim – II 26 February, 2020 02 April, 20272021 - Interim 29 January, 2021 05 March, 2028 - Final 30 July, 2021 03 September, 20282022 - Interim 01 February, 2022 08 March, 2029
Payment of unclaimed / unpaid dividend
In respect of unclaimed dividends, the company sends periodical reminders to the shareholders before transferring the unclaimed dividends to the investor education and protection fund (IEPF) established by the central government. The dividends that are lying unclaimed / unpaid with the company for a period of seven consecutive years are transferred from time to time to IEPF. The company has remitted ` 5.70 lakhs to IEPF during the year.
Year wise details of the dividends to be transferred to IEPF are given below:

76
Corporate Overview Financial StatementsManagement Reports
Transfer of Equity Shares to IEPF
In accordance with the provisions of section 124 and 125 of the Act, read with Investor Education and Protection Fund Authority (Accounting, Audit, Transfer and Refund) Rules, 2016 (IEPF), the underlying shares of all dividends which remain unpaid/unclaimed for a period of seven consecutive years be transferred to Investor Education and Protection Fund (IEPF). As required under the said rules, the company had published a notice in the newspapers inviting the shareholders attention to the aforesaid rules. The company had also sent out individual communication to the concerned shareholders whose shares are liable to be transferred to IEPF Account, pursuant to the said rules and also displayed the details of such shareholders and shares due for transfer on the website of the company at www.cholamandalam.com in line with the requirements. During the year, the company had transferred 26,426 shares pertaining to 86 shareholders to the demat account maintained by IEPF authority. Shareholders may note that both the unclaimed dividend and corresponding shares transferred to IEPF including all benefits accruing on such shares, if any, can be claimed from IEPF authority, as per the procedure prescribed in the rules. No claim shall lie in respect thereof with the company.
Unclaimed Suspense Account
In terms of regulation 34(3) of the Listing Regulations, all the shares issued in physical form pursuant to a public issue or any other issue, which remain unclaimed had been dematerialised and transferred to a folio in the name of unclaimed suspense account. The voting rights of these shares shall remain frozen till the rightful owner of such shares claims the shares.
The details regarding the shares which are in the unclaimed suspense account are given below:
S. No. Description Total No. of cases Total Shares
1 No. of shareholders and outstanding shares lying in the unclaimed suspense account 2 950 at the beginning of the year 2 No. of shareholders who approached for transfer of shares from unclaimed suspense - - account during the year 3 No. of shareholders to whom shares were transferred from the unclaimed suspense - - account during the year 4 No. of shares transferred to IEPF authority 2 950 5 No. of shareholders and outstanding shares lying in the unclaimed suspense Nil Nil account at the end of the year
Distribution of Shareholding as on 31 March, 2022
Sl. No. Category (Shares) No. of Holders % to Holders No. of Shares % to Equity
1 1 – 500 1,06,463 84.42 1,06,69,945 1.30 2 501 – 1000 10,475 8.31 74,28,570 0.90 3 1001 – 3000 5,800 4.60 97,55,563 1.19 4 3001 – 10000 1,986 1.57 1,06,44,028 1.30 5 10001 – 20000 487 0.39 69,39,946 0.85 6 20001 – 100000 530 0.42 2,36,69,399 2.88 7 100001 and above 375 0.30 75,19,64,370 91.58 TOTAL 1,26,116 100.00 82,10,71,821 100.00
SHAREHOLDING PATTERN
Category (Shares) As at 31 March, 2022 No. of % of Shares shareholding
Promoter and promoter group 42,32,37,948 51.55Foreign Portfolio Investors / Foreign Institutional Investors 14,45,59,510 17.60Mutual Funds / Trust / Banks / Financial Institutions / AIFs / QIBs 19,71,28,659 24.01Private Corporate Bodies / NBFCs Resident Individuals and others 5,61,45,704 6.84TOTAL 82,10,71,821 100.00

Corporate Overview Financial StatementsManagement Reports
77
OUTSTANDING GDRs/ADRs ETC.
The company has not issued any GDR / ADR or any convertible instruments that is likely to impact the equity share capital of the company.
COMMODITY PRICE RISK / FOREIGN EXCHANGE RISK AND COMMODITY HEDGING ACTIVITIES
The company is in financial services business and has no exposure to commodity price risk and commodity hedging activities and hence the disclosure pertaining to SEBI circular dated 15 November, 2018 is not applicable. In respect of certain computer related purchases involving payment in foreign currency the payment is made basis the rate prevailing on the date of payment and as per the terms mentioned in contract. To this extent, if the currency movement is adverse, the payment would be impacted by such currency exposure.
LOCATION
The company's registered office is in Chennai and it operates out of 1,145 branches across the country.
On behalf of the board
Place : Chennai Vellayan SubbiahDate : 5 May, 2022 Chairman

78
Corporate Overview Financial StatementsManagement Reports
Business Responsibility ReportSECTION A: GENERAL INFORMATION ABOUT THE COMPANY
1. Corporate Identity Number (CIN) of the company: L65993TN1978PLC0075762. Name of the company: Cholamandalam Investment and Finance Company Limited3. Registered office address: “Dare House”, No.2, N.S.C. Bose Road, Parrys, Chennai - 6000014. Website: www.cholamandalam.com5. E-mail id: [email protected]. Financial Year reported: 01.04.2021 - 31.03.20227. Sector(s) that the company is engaged in (industrial activity code-wise):
NIC Code Group Description
K 649 Financial Services - Lending
8. List three key services that the company provides (as in balance sheet): Key services rendered by the company are 1. Vehicle Finance 2. Loan against Property, Home Loans 3. SME Loans
9. Total number of locations where business activity is undertaken by the company: (a) Number of international locations (Provide details of major 5): Nil (b) Number of national locations: 1,145 branches
10. Markets served by the company - local / state / national / international: National
SECTION B: FINANCIAL DETAILS OF THE COMPANY1. Paid Up capital: ` 164.21 crores2. Total turnover: ` 10,048.29 crores3. Total profit after taxes: ` 2,146.71 crores4. Total Spending on Corporate Social Responsibility (CSR) as percentage of profit after tax (%): Refer CSR report5. List of activities in which expenditure in 4 above has been incurred: Refer CSR report
SECTION C: OTHER DETAILS
1. Does the company have any subsidiary company/companies? Yes, the company has three subsidiaries as on 31.03.2022 namely: 1. Cholamandalam Securities Limited 2. Cholamandalam Home Finance Limited and 3. Payswiff Technologies Private Limited
2. Do the subsidiary company/companies participate in the Business Responsibility (BR) initiatives of the parent company? If yes, then indicate the number of such subsidiary company(s):
BR initiatives of the parent company are generally followed by the subsidiary companies to the extent possible.
3. Do any other entity/entities (e.g. suppliers, distributors etc.) that the company does business with, participate in the BR initiatives of the company? If yes, then indicate the percentage of such entity/entities? [Less than 30%, 30-60%, More than 60%]:
Not applicable.
SECTION D: BR INFORMATION
1. Details of director/directors responsible for BR: (a) Details of the director/director responsible for implementation of the BR policy/policies: 1. Director Identification Number (DIN): 07337155 2. Name: Mr. Ravindra Kumar Kundu 3. Designation: Executive Director

Corporate Overview Financial StatementsManagement Reports
79
(b) Details of the BR head:
1 DIN (if applicable) 073371552 Name Mr. Ravindra Kumar Kundu3 Designation Executive Director4 Telephone number 044 - 4090 71725 E-mail id [email protected]
SN. Particulars Details
* National standards # The Company has in place an internal task force which evaluates the working of this policy.
(b) If answer to the question at serial number 1 against any principle, is ‘No’, please explain why: Not applicable.
2. Principle-wise (as per NVGs) BR Policy/policies
(a) Details of compliance (Reply in Y/N)
SN. Questions P 1 P 2 P 3 P 4 P 5 P 6 P 7 P 8 P 9
1 Do you have a policy/policies for all the principles? Y Y Y Y Y Y Y Y Y
2 Has the policy being formulated in consultation Y Y Y Y Y Y Y Y Y with the relevant stakeholders?
3 Does the policy conform to any national/international Y* Y* Y* Y* Y* Y* Y* Y* Y* standards?
4 Has the policy being approved by the board? If yes, Y Y Y Y Y Y Y Y Y has it been signed by MD/owner/CEO/ appropriate board director?
5 Does the company have a specified committee of the Y Y Y Y Y Y Y Y Y board /director /official to oversee the implementation of the policy?
6 Indicate the link for the policy to be viewed online? https://www.cholamandalam.com/company-policies.aspx
7 Has the policy been formally communicated to all Y Y Y Y Y Y Y Y Y relevant internal and external stakeholders?
8 Does the company have in-house structure Y Y Y Y Y Y Y Y Y to implement the policy /policies?
9 Does the company have a grievance redressal Y Y Y Y Y Y Y Y Y mechanism related to the policy/policies to address stakeholders’ grievances related to the policy/policies?
10 Has the company carried out independent audit/ Y Y Y Y Y Y Y Y Y evaluation of the working of this policy by an internal or external agency?#
3. Governance related to BR
(a) Indicate the frequency with which the board of directors, committee of the board or CEO to assess the BR performance of the company. Within 3 months, 3-6 months, Annually, More than 1 year.
The BR performance is assessed annually. In addition to this, the ESG performance and implementation plans are discussed during Board meetings. The Company understands the need to formalize accountability for ESG related aspects and has set up an internal steering committee who will be primarily responsible for implementation of the ESG policy across the company.
(b) Does the company publish a BR or a Sustainability Report? What is the hyperlink for viewing this report? How frequently it is published?
Yes, the company publishes a BR annually (https://www.cholamandalam.com/annual-reports.aspx.) and published a sustainability report (https://www.cholamandalam.com/esg.aspx) for the financial year 2020-2021.

80
Corporate Overview Financial StatementsManagement Reports
Particulars Received Resolved Pending
Customer complaints 812 812 0Shareholder / Debenture holder 1 1 0
Principle 2 - To provide services that are safe and contribute to sustainability throughout their life cycle
1. List up to 3 of your products or services whose design has incorporated social or environmental concerns, risks and/or opportunities.
The company being an Non-Banking Finance Company though not engaged in a business concerning design of products that could raise social concerns, economic risks and/or hazardous opportunities has designed its financial lending activities to ensure financial inclusion of various marginalized sections of the society, predominantly in geographies with limited presence of organized financiers.
Vehicle Finance business provides loans that contribute to the economic development and social well-being of the borrowers and at the same time support the cause of a greener environment. The lending policies of the company are carefully designed to avoid exposure to areas & segments having social concerns, economic risks and/or hazardous opportunities.
The company emphasises on lending for the purchase of commercial vehicles, tractors, construction equipment, Multi Utility Vehicles, etc, that add value to the economy and other products like cars, two wheelers which enhance the quality of life and augment the social status of the borrower.
Further, to ensure that the company contributes to provide sustainability of benefits to the borrowers throughout the life cycle of the loan and the product, the company is providing loans for vehicle acquisition, vehicle maintenance, protection of asset and life by financing insurance and proving loans for working capital management, refinance on assets for meeting exigencies, household expenses, festival, education, family needs etc.
Chola’s SME (SME – Small and Medium Enterprises) business provide loans to micro business owners who may not have banking access to grow their business and thereby enhance their standard of living.
Chola’s Loan Against Property business provides loans that contributes to Economic development and social wellbeing of the borrowers and supports green revolution by going digital. Onboarding process is simplified to ensure maximum information is collected and verified digitally. Chola’s LAP division offers secured long-term loans to borrowers also within Micro Small and Medium Enterprise (MSME) community, against their residential or commercial properties. Primary focus of this division is on self-employed non-professionals (kirana stores, small scale manufacturing units, Retail shops, etc.) who need financial support to either start new business or expand existing businesses. Chola is one of the key players in loan against property business in NBFC space and plays an important role in development of MSME community, thereby contributing positively to the growing Indian economy. Most of the MSME customers are organized and have not been catered by formal banking system, thus bridging the credit gap faced by them.
The new product lines in Chola - Consumer and Small Enterprise Loan (CSEL) and Secured Business and Personal Loans (SBPL) support borrowers from a social concerns’ perspective. CSEL provides personal loans to individuals and underserved MSMEs, who do not have access to organised credit, based on bureau data and alternate data sets. SBPL focusses on lending to smaller ticket size MSMEs with offerings of term loans, equipment finance, working capital finance and supply chain finance. Both product lines operate on PAN India basis.
The company does not extend loans to entities and activities that do not meet certain strict ESG criteria such as child labor, borrowers lacking in appropriate governance or ethical practices amongst others. Credit policies of the company is designed to avoid exposure to areas & segments having ESG concerns, economical risk and/or hazardous opportunities.
Hence, Chola is enabling people to enter a better life through economic upliftment and social growth.
SECTION E: PRINCIPLE-WISE PERFORMANCE
Principle 1 - To conduct and govern themselves with ethics, transparency and accountability
1. Does the policy relating to ethics, bribery and corruption cover only the company? Yes/No. Does it extend to the group/joint ventures/ suppliers/contractors/NGOs/others?
The policy extends to the company, its subsidiaries and its business associates. The company’s commitment to ethical and lawful business conduct is a fundamental shared value of the board of directors, the senior management and all employees of the company. The company adopts highest governance standards and its employees adhere to the robust “Code of Conduct and Ethics Policy”. The employees are also required to comply with relevant legal, regulatory and internal compliance requirements in letter and spirit.
2. How many stakeholder complaints have been received in the past financial year and what percentage was satisfactorily resolved by the management? If so, provide details thereof, in about 50 words or so.

Corporate Overview Financial StatementsManagement Reports
81
8. What percentage of your under mentioned employees were given safety & skill up-gradation training in the last year?
The organization continuously strives towards establishing a safe working culture by imparting various programs. Chola has a dedicated Environment Health and Safety team which is committed to maintaining highest standards of health, safety and wellbeing of employees. The company has also designed processes and practices during the year to ensure interaction with the employees on a periodic basis to check on their safety and also to educate on precautions to be taken. Webinars were conducted on guided meditation practices. On call Doctors are also available 24/7 for support.
Chola as a company requires strong connect with customers and involves regular field visits by employees; therefore “Employee Road Safety Training” is given to all employees. Additionally, around 5700 employees are also trained on Behavior-Based Road Safety Techniques, Monsoon Road Safety, and Winter Road Safety measures to ensure their personal safety. During the year, the company has launched Health and Fitness Campaign to create awareness about health issues and to facilitate employees adapt a healthy lifestyle.
To reach greater heights, improving the productivity and behavioural & process related training were organized during the year covering over 6,100 employees. These covered 266 area offices and 3457 Sales Field Executives (SFE) and Credit Operations Executives (COE). Capability-building efforts towards learning dissemination to last-mile employees were anchored through structured Train The Trainer (TTT), along with Products Teams and functional stakeholders. 400 employees at Branch, Area,
2. For each such product, provide the following details in respect of resource use (energy, water, raw material etc.) per unit of product (optional):
Not applicable. The company’s products are structured to focus on social aspects also.
3. Does the company have procedures in place for sustainable sourcing (including transportation)? If yes, what percentage of your inputs was sourced sustainably? Also, provide details thereof, in about 50 words or so.
The company is in the process of putting in place procedures for sustainable sourcing.
4. Has the company taken any steps to procure goods and services from local & small producers, including communities surrounding their place of work? If yes, what steps have been taken to improve their capacity and capability of local and small vendors?
Yes, the company procures goods and services from local and small producers, including communities surrounding their place of work wherever possible. The organization lays emphasis on local hiring, especially since it operates largely in Tier III, IV, V and VI cities it helps to connect with customers better and also contribute to the employability in the local area.
5. Does the company have a mechanism to recycle products and waste? If yes what is the percentage of recycling of products and waste (separately as 10%). Also, provide details thereof, in about 50 words or so.
E-Waste: Chola strives to make sure that e-waste is recycled through an organization having a valid permit and follows the required protocols laid down by regulatory bodies.
Environmental Conservation: The company has adopted several measures sensitising the employees on environmental conservation including the usage of paper and water. The company is also promoting consciousness amongst employees on adopting environmentally friendlier options at the workplace.
Principle 3 - To promote the well-being of all employees
1. Please indicate the total number of employees - 9,125
2. Please indicate the total number of employees hired on temporary/contractual/casual basis - 2,803
3. Please indicate the number of permanent women employees - 269
4. Please indicate the number of permanent employees with disabilities - 23
5. Do you have an employee association that is recognized by management - No
6. What percentage of your permanent employees is members of this recognized employee association? - Not applicable.
7. Please indicate the number of complaints relating to child labour, forced labour, involuntary labour, sexual harassment in the last financial year and pending, as on the end of the financial year.
SN. Category No. of complaints filed No. of complaints pending as during the financial year on end of the financial year
1 Child labour/forced labour/involuntary labour - -2 Sexual harassment - -3 Discriminatory employment - -

82
Corporate Overview Financial StatementsManagement Reports
Region, and zonal levels were covered in this initiative. Behavioural and process related training were attended by around 2,300 employees.
Principle 4 - Businesses should respect the interests of, and be responsive towards all stakeholders, especially those who are disadvantaged, vulnerable and marginalized.
1. Has the company mapped its internal and external stakeholders? Yes/No.
Yes.
2. Out of the above, has the company identified the disadvantaged, vulnerable & marginalized stakeholders.
Chola’s vehicle finance and home loan business offers a highly diversified range of products in diverse rural, semi – urban and urban geographies ensuring financial inclusion of especially those who are disadvantaged, vulnerable and marginalized. Chola believes that affordable and appropriate access to financial services is a key driver of economic growth, poverty alleviation and prosperity. Hence, Chola provides finance for home loans, acquisition of new assets for economic upliftment as well as for working capital/ vehicle maintenance, and financing insurance to protect their assets and life.
The Company has set up 80% of its branches in Tier-III, Tier-IV, Tier V and Tier-VI towns ensuring financial inclusion of vulnerable sections of the society who are also first time buyers and first time users.
3. Are there any special initiatives taken by the company to engage with the disadvantaged, vulnerable and marginalized stakeholders. If so, provide details thereof, in about 50 words or so.
The company initiatives on improving accessibility to finance are covered in point 2 above. Further to this, Chola also has a Corporate Social Responsibility Committee in place which works on strategies to include expectations of different stakeholders including customers & communities who are at the bottom of the social pyramid. The company initiates various projects through their CSR initiatives for the upliftment of the stakeholders. The major focus areas of CSR at Chola include:
• Healthcare
• Holistic development of commercial vehicle crew members
• Access to education & rural sports.
• WASH (Water, Sanitation and Hygiene)
• Environmental sustainability
• Rural development
• Promoting arts, culture and heritage
Principle 5 - Businesses should respect and promote human rights
1. Does the policy of the company on human rights cover only the company or extend to the group/joint ventures/suppliers/ contractors/NGOs/others?
The policy on human rights covers the company, customers and its associates. Human rights are a matter of great importance at Chola. The Company appreciates that human rights are inherent, universal, indivisible and interdependent in nature. Care is taken to integrate respect for human rights in the management systems, wherever applicable, in particular through assessing and managing human rights impacts of operations. Access to grievance redressal mechanisms set up for all individuals impacted by the business is provided. The company recognizes and respects the human rights of all relevant stakeholders and groups within and beyond the workplace, including that of communities, consumers and vulnerable and marginalized groups and the business units within their sphere of influence, endeavour to promote the awareness and realization of human rights across their value chain and will not complicit with human rights abuses by a third party.
2. How many stakeholder complaints have been received in the past financial year and what percent was satisfactorily resolved by the management?
The company received 812 customer complaints during the financial year. 100% customer complaints were resolved by the management as on 31 March, 2022. An MIS on customer complaints is circulated to the customer grievance redressal committee ("the committee").
The committee under the chairmanship of Executive Director reviews the customer complaints on a quarterly basis.

Corporate Overview Financial StatementsManagement Reports
83
Principle 6 - Business should respect, protect, and make efforts to restore the environment
1. Does the policy related to Principle 6 cover only the company or extends to the Group/Joint Ventures/Suppliers/Contractors/ NGOs/ others.
The ESG policy is applicable to the company. The company has taken steps in identifying material partners for Chola in its ESG journey. Details can be accessed from the Sustainability report published by the company on its website. ( https://www.cholamandalam.com/esg.aspx )
2. Does the company have strategies/ initiatives to address global environmental issues such as climate change, global warming, etc? Y/N. If yes, please give hyperlink for web page etc.
Yes. Chola’s efforts are on sustainable financing with a target to support the cause of a greener environment through initiating electric vehicle financing and attempting to increase loan disbursements to electrical vehicles. (https://www.cholamandalam.com/esg.aspx)
3. Does the company identify and assess potential environmental risks? Y/N.
Not applicable.
4. Does the company have any project related to Clean Development Mechanism? If so, provide details thereof, in about 50 words or so. Also, if Yes, whether any environmental compliance report is filed?
No.
5. Has the company undertaken any other initiatives on - clean technology, energy efficiency, renewable energy, etc. Y/N. If yes, please give hyperlink for web page etc.:
Yes, in considering long-run planning, reduction of risk, and conservation of resources in administrative planning, sustainability has a significant contributory role. The company is progressing towards:
• Achieving green building status for its own premises under construction
• Adopting energy efficient solutions for office lighting across all locations
• Reduced water consumption across all locations through efficient water solutions
6. Are the Emissions/Waste generated by the company within the permissible limits given by CPCB/SPCB for the financial year being reported?
Not applicable.
7. Number of show cause/ legal notices received from CPCB/SPCB which are pending (i.e. not resolved to satisfaction) as on end of FY.
Nil.
Principle 7 - Businesses, when engaged in influencing public and regulatory policy, should do so in a responsible manner
1. Is your company a member of any trade and chamber or association? If Yes, Name only those major ones that your business deals with:
• Confederation of Indian Industry • Finance Industry Development Council • Finance Companies’ Association (India) • South India Hire Purchase Association
2. Have you advocated/lobbied through above associations for the advancement or improvement of public good? Yes/No; if yes specify the broad areas (drop box: Governance and Administration, Economic Reforms, Inclusive Development Policies, Energy security, Water, Food Security, Sustainable Business Principles, Others
Yes. Representations had been submitted to the Government and regulatory authorities on various matters for the improvement of public good on areas relating to governance and administration, economic reforms, inclusive development policies and sustainable business principles.
Principle 8 - Businesses should support inclusive growth and equitable development
1. Does the company have specified programmes/initiatives/projects in pursuit of the policy related to Principle 8? If yes details thereof.
Yes, please refer CSR Report.
2. Are the programmes/projects undertaken through in-house team/own foundation/external NGO/government structures/any other organization?
Please refer CSR Report.
3. Have you done any impact assessment of your initiative?
We have done impact assessment study for the Health, Environment, Rural Development, Arts & Culture and WASH projects.

84
Corporate Overview Financial StatementsManagement Reports
4. What is your company’s direct contribution to community development projects - Amount in INR and the details of the projects undertaken?
Please refer CSR Report.
5. Have you taken steps to ensure that this community development initiative is successfully adopted by the community? Please explain in 50 words, or so.
Yes, the company works with villages in Odisha and Telangana and has extended community interventions such as building toilets, providing purified drinking water facilities for villages and schools. Chola installed Ultra filtration water plants in 22 villages of Telangana. While doing so, Chola has a process in place to follow up these initiatives to retain its focus on environmental issues and has strongly encourages communities to participate wherever possible to keep it self-sustainable.
Principle 9 - Businesses should engage with and provide value to their customers and consumers in a responsible manner
1. What percentage of customer complaints/consumer cases are pending as on the end of the financial year.
There were no customer complaints pending at the end of the financial year.
2. Does the company display product information on the product label, over and above what is mandated as per local laws? Yes/No/ N.A./Remarks (additional information)
Not Applicable.
3. Is there any case filed by any stakeholder against the company regarding unfair trade practices, irresponsible advertising and/ or anti- competitive behaviour during the last five years and pending as at the end of the financial year. If so, provide details thereof, in about 50 words or so.
No.
4. Did your company carry out any consumer survey/consumer satisfaction trends?
Customer satisfaction trend (CSAT) is monitored basis inflow and query to complaint percentages. Further, we also monitor the transactional CSAT for customer calls that land on the inbound toll free number basis a SMS that goes out at the conclusion of the call asking for satisfaction levels. At present, our transactional CSAT stands at 94%.

Corporate Overview Financial StatementsManagement Reports
85
Independent Auditor’s ReportTo the Members of Cholamandalam Investment and Finance Company Limited
Report on the Audit of the Standalone financial statements
Opinion
1 We have audited the accompanying standalone financial statements of Cholamandalam Investment and Finance Company Limited (“the Company”), which comprise the Standalone Balance Sheet as at March 31, 2022, and the Standalone Statement of Profit and Loss (including Other Comprehensive Income), the Statement of Changes in Equity and the Standalone Cash Flow Statement for the year then ended, and notes to the standalone financial statements, including a summary of significant accounting policies and other explanatory information.
2. In our opinion and to the best of our information and according to the explanations given to us, the aforesaid standalone financial statements give the information required by the Companies Act, 2013 (“the Act") in the manner so required and give a true and fair view in conformity with the accounting principles generally accepted in India, of the state of affairs of the Company as at March 31, 2022, and total comprehensive income (comprising of profit and other comprehensive income), changes in equity and its cash flows for the year then ended.
Basis for Opinion
3. We conducted our audit in accordance with the Standards on Auditing (SAs) specified under Section 143(10) of the Act. Our responsibilities under those Standards are further described in the “Auditor’s Responsibilities for the Audit of the Standalone financial statements” section of our report. We are independent of the Company in accordance with the Code of Ethics issued by the Institute of Chartered Accountants of India together with the ethical requirements that are relevant to our audit of the standalone financial statements under the provisions of the Act and the Rules thereunder, and we have fulfilled our other ethical responsibilities in accordance with these requirements and the Code of Ethics. We believe that the audit evidence we have obtained is sufficient and appropriate to provide a basis for our opinion.
Key Audit Matters
4. Key audit matters are those matters that, in our professional judgment, were of most significance in our audit of the standalone financial statements of the current period. These matters were addressed in the context of our audit of the standalone financial statements as a whole and in forming our opinion thereon, and we do not provide a separate opinion on these matters.
Assessment of impairment loss allowance based on expected credit loss (ECL) on Loans (Refer Note 9 of the standalone financial statements)
The loan balances towards vehicle finance, home loans, loans against property, and other loans aggregating to INR 76,47,789 lakhs and the associated impairment allowances aggregating to INR 2,32,868 lakhs are significant to the standalone financial statements and involves judgement around the determination of the impairment allowance in line with the requirements of the Ind AS 109 “Financial Instruments”.
Impairment allowances represent management’s estimate of the losses incurred within the loan portfolios at the balance sheet date and are inherently judgmental. Impairment, based on ECL model, is calculated using main variables, viz. ‘Staging’, ‘Exposure At Default’, ‘Probability of Default’ and ‘Loss Given Default’ as specified under Ind AS 109.
The audit procedures performed by us to assess appropriateness of the impairment allowance based on ECL on loans included the following:
• We understood and evaluated the design and tested the operating effectiveness of the key controls put in place by the management over:
i. the assumptions used in the calculation of ECL and its various aspects such as determination of Probability of Default, Loss Given Default, Exposure At Default, Staging of Loans, etc.;
ii. the completeness and accuracy of source data used by the Management in the ECL computation; and
iii. ECL computations for their reasonableness.
• We, along with the assistance of the auditor’s our expert, verified the appropriateness of methodology and models used by the Company and reasonableness of the assumptions used within the computation process to estimate the impairment provision.
Key audit matters How our audit addressed the key audit matter

86
Corporate Overview Financial StatementsManagement Reports
Quantitative factors like days past due, behaviour of the portfolio, historical losses incurred on defaults and macro-economic data points identified by the Management’s expert and qualitative factors like nature of the underlying loan, deterioration in credit quality, correlation of macro- economic variables to determine expected losses, uncertainty over realisability of security, judgement in relation to management overlays and related Reserve Bank of India (RBI) guidelines, to the extent applicable, etc. have been taken into account in the ECL computation.
Given the inherent judgmental nature and the complexity of model involved, we determined this to be a Key Audit Matter.
Assessment of Direct tax and Indirect tax litigations and related disclosure of contingent liabilities (Refer to Note 38 (a) of the Standalone Financial Statements)
As at March 31, 2022, the Company has exposure towards litigations relating to various tax matters as set out in the aforesaid Notes.
Significant management judgement is required to assess matters relating to direct tax and indirect tax litigations, to determine the probability of occurrence of material outflow of economic resources and whether a provision should be recognised or a disclosure should be made. The management judgement is also supported with legal advice in certain cases as considered appropriate.
As the ultimate outcome of the matters are uncertain and the positions taken by the management are based on the application of their best judgement, related legal advice including those relating to interpretation of laws/regulations, it is considered to be a Key Audit Matter.
Audit in an Information Technology (IT) enabled environment – including considerations on exceptions identified in IT Environment
The IT environment of the entity involves a few independent and inter- dependent IT systems used in the operations of the entity for processing and recording of the business transactions. As a result, there is a high degree of reliance and dependency on such IT systems for the financial reporting process of the entity.
Appropriate IT general controls and IT application controls are required to ensure that such IT systems can process the data as required, completely, accurately, and consistently for reliable financial reporting.
We have identified certain key IT applications and the related IT infrastructure (herein after referred to as “In-scope IT systems”), which have an impact on the financial reporting process and the
• We test-checked the completeness and accuracy of source data used.
• We recomputed the impairment provision for a sample of loans across the loan portfolio to verify the arithmetical accuracy and compliance with the requirements of Ind AS 109.
• We evaluated the reasonableness of the judgement involved in management overlays that form part of the impairment provision, and the related approvals.
We evaluated the adequacy of presentation and disclosures in relation to impairment loss allowance in the Standalone Financial Statements.
Our audit procedures included the following:
• We understood, assessed and tested the design and operating effectiveness of key controls surrounding assessment of litigations relating to direct and indirect tax laws and regulations ;
• We inquired with management the recent developments and the status of the material litigations which were reviewed and noted by the Audit Committee;
• We performed our assessment on a test check basis on the underlying calculations supporting the contingent liabilities related to litigations disclosed in the Standalone Financial Statements;
• We used auditor’s expert to gain an understanding and to evaluate the disputed tax matters;
• We considered external legal opinions, where relevant, obtained by management and examined by the auditor’s expert;
• We obtained the listings from the management and got it reconfirmed from management’s consultants;
• We evaluated the adequacy of presentation and disclosures in relation to litigations in the Standalone Financial Statements.
Our audit procedures with respect to this matter included the following:
In assessing the controls over the IT systems, we have involved our Technology Assurance specialists to obtain an understanding of the IT environment, IT infrastructure and IT systems.
With respect to the “In-scope IT systems” identified as relevant to the audit of the financial statements and financial reporting process of the entity, we have evaluated and tested relevant IT general controls or relied upon service auditor’s report, where applicable.
On such “In-scope IT systems”, we have covered the key IT general controls with respect to the following domains:
• Program change management, which includes that program changes are moved to the production environment as per defined procedures and relevant segregation of environment is ensured.
Key audit matters How our audit addressed the key audit matter
Independent Auditor’s Report (Contd.)

Corporate Overview Financial StatementsManagement Reports
87
related controls as a key audit matter because of the increased level of automation; a few systems being used by the entity for processing financial transactions; and the complexity of the IT architecture; and its impact on the financial records and financial reporting process of the entity.
• User access management, which includes user access provisioning, de- provisioning, access review, password management, sensitive access rights and segregation of duties to ensure that privileged access to applications, operating system and databases in the production environment were granted only to authorized personnel.
• Other areas that were assessed under the IT control environment included backup management, business continuity and disaster recovery, incident management, batch processing and monitoring.
We have also evaluated the design and tested the operating effectiveness of key IT application controls within key business processes, which included testing automated calculations, automated accounting procedures, system interfaces, system reconciliation controls and key system generated reports, as applicable.
Where control deficiencies have been identified, we have tested compensating controls or performed alternative audit procedures, where necessary.
Key audit matters How our audit addressed the key audit matter
Independent Auditor’s Report (Contd.)
Other Information
5. The Company’s Board of Directors is responsible for the other information. The other information comprises the information included in the Annual Report (Financial Highlights, Board’s report, Management Discussion and Analysis and Report on Corporate Governance), but does not include the standalone financial statements and our auditor’s report thereon.
Our opinion on the standalone financial statements does not cover the other information and we do not express any form of assurance conclusion thereon.
In connection with our audit of the standalone financial statements, our responsibility is to read the other information and, in doing so, consider whether the other information is materially inconsistent with the standalone financial statements or our knowledge obtained in the audit or otherwise appears to be materially misstated. If, based on the work we have performed, we conclude that there is a material misstatement of this other information, we are required to report that fact.
We have nothing to report in this regard.
Responsibilities of management and those charged with governance for the standalone financial statements
6. The Company’s Board of Directors is responsible for the matters stated in Section 134(5) of the Act with respect to the preparation of these standalone financial statements that give a true and fair view of the financial position, financial performance, changes in equity and cash flows of the Company in accordance with the accounting principles generally accepted in India, including the Accounting Standards specified under Section 133 of the Act. This responsibility also includes maintenance of adequate accounting records in accordance with the provisions of the Act for safeguarding of the assets of the Company and for preventing and detecting frauds and other irregularities; selection and application of appropriate accounting policies; making judgments and estimates that are reasonable and prudent; and design, implementation and maintenance of adequate internal financial controls, that were operating effectively for ensuring the accuracy and completeness of the accounting records, relevant to the preparation and presentation of the standalone financial statements that give a true and fair view and are free from material misstatement, whether due to fraud or error.
7. In preparing the standalone financial statements, management is responsible for assessing the Company’s ability to continue as a going concern, disclosing, as applicable, matters related to going concern and using the going concern basis of accounting unless management either intends to liquidate the Company or to cease operations, or has no realistic alternative but to do so. Those Board of Directors are also responsible for overseeing the Company’s financial reporting process.

88
Corporate Overview Financial StatementsManagement Reports
Auditor’s responsibilities for the audit of the standalone financial statements
8. Our objectives are to obtain reasonable assurance about whether the standalone financial statements as a whole are free from material misstatement, whether due to fraud or error, and to issue an auditor’s report that includes our opinion. Reasonable assurance is a high level of assurance but is not a guarantee that an audit conducted in accordance with SAs will always detect a material misstatement when it exists. Misstatements can arise from fraud or error and are considered material if, individually or in the aggregate, they could reasonably be expected to influence the economic decisions of users taken on the basis of these standalone financial statements.
9. As part of an audit in accordance with SAs, we exercise professional judgment and maintain professional scepticism throughout the audit. We also:
l Identify and assess the risks of material misstatement of the standalone financial statements, whether due to fraud or error, design and perform audit procedures responsive to those risks, and obtain audit evidence that is sufficient and appropriate to provide a basis for our opinion. The risk of not detecting a material misstatement resulting from fraud is higher than for one resulting from error, as fraud may involve collusion, forgery, intentional omissions, misrepresentations, or the override of internal control.
l Obtain an understanding of internal control relevant to the audit in order to design audit procedures that are appropriate in the circumstances. Under Section 143(3)(i) of the Act, we are also responsible for expressing our opinion on whether the company has adequate internal financial controls with reference to standalone financial statements in place and the operating effectiveness of such controls.
l Evaluate the appropriateness of accounting policies used and the reasonableness of accounting estimates and related disclosures made by management.
l Conclude on the appropriateness of management’s use of the going concern basis of accounting and, based on the audit evidence obtained, whether a material uncertainty exists related to events or conditions that may cast significant doubt on the Company’s ability to continue as a going concern. If we conclude that a material uncertainty exists, we are required to draw attention in our auditor’s report to the related disclosures in the standalone financial statements or, if such disclosures are inadequate, to modify our opinion. Our conclusions are based on the audit evidence obtained up to the date of our auditor’s report. However, future events or conditions may cause the Company to cease to continue as a going concern.
l Evaluate the overall presentation, structure and content of the standalone financial statements, including the disclosures, and whether the financial statements represent the underlying transactions and events in a manner that achieves fair presentation.
10. We communicate with those charged with governance regarding, among other matters, the planned scope and timing of the audit and significant audit findings, including any significant deficiencies in internal control that we identify during our audit.
11. We also provide those charged with governance with a statement that we have complied with relevant ethical requirements regarding independence, and to communicate with them all relationships and other matters that may reasonably be thought to bear on our independence, and where applicable, related safeguards.
12. From the matters communicated with those charged with governance, we determine those matters that were of most significance in the audit of the standalone financial statements of the current period and are therefore the key audit matters. We describe these matters in our auditor’s report unless law or regulation precludes public disclosure about the matter or when, in extremely rare circumstances, we determine that a matter should not be communicated in our report because the adverse consequences of doing so would reasonably be expected to outweigh the public interest benefits of such communication.
Other Matter
13. The standalone financial statements of the Company for the year ended March 31, 2021, were audited by another firm of chartered accountants under the Companies Act, 1956/ Act who, vide their report dated May 07, 2021, expressed an unmodified opinion on those standalone financial statements.
Our opinion is not modified in respect of above matter.
Report on other legal and regulatory requirements
14. As required by the Companies (Auditor’s Report) Order, 2020 (“the Order”), issued by the Central Government of India in terms of sub-section (11) of Section 143 of the Act, we give in the Annexure B a statement on the matters specified in paragraphs 3 and 4 of the Order, to the extent applicable.
15. As required by Section 143(3) of the Act, we report that:
(a) We have sought and obtained all the information and explanations which to the best of our knowledge and belief were necessary for the purposes of our audit.
Independent Auditor’s Report (Contd.)

Corporate Overview Financial StatementsManagement Reports
89
(b) In our opinion, proper books of account as required by law have been kept by the Company so far as it appears from our examination of those books
(c) The Balance Sheet, the Statement of Profit and Loss (including other comprehensive income), the Statement of Changes in Equity and the Statement of Cash Flows dealt with by this Report are in agreement with the books of account.
(d) In our opinion, the aforesaid standalone financial statements comply with the Accounting Standards specified under Section 133 of the Act.
(e) On the basis of the written representations received from the directors as on March 31, 2022 taken on record by the Board of Directors, none of the directors is disqualified as on March 31, 2022 from being appointed as a director in terms of Section 164(2) of the Act.
(f ) With respect to the adequacy of the internal financial controls with reference to standalone financial statements of the Company and the operating effectiveness of such controls, refer to our separate Report in “Annexure A”.
(g) With respect to the other matters to be included in the Auditor’s Report in accordance with Rule 11 of the Companies (Audit and Auditors) Rules, 2014 (as amended), in our opinion and to the best of our information and according to the explanations given to us:
i. The Company has disclosed the impact of pending litigations on its financial position in its standalone financial statements – Refer Note 38(a) to the standalone financial statements;
ii. The Company has made provision, as required under the applicable law or accounting standards, for material foreseeable losses, if any, on long-term contracts including derivative contracts – Refer Note 7 and Note 9 to the standalone financial statements;
iii. There has been no delay in transferring amounts, required to be transferred, to the Investor Education and Protection Fund by the Company during the year.
iv. (a) The management has represented that, to the best of its knowledge and belief, no funds have been advanced or loaned or invested (either from borrowed funds or share premium or any other sources or kind of funds) by the Company to or in any other person(s) or entity(ies), including foreign entities (“Intermediaries”), with the understanding, whether recorded in writing or otherwise, that the Intermediary shall, whether, directly or indirectly, lend or invest in other persons or entities identified in any manner whatsoever by or on behalf of the Company (“Ultimate Beneficiaries”) or provide any guarantee, security or the like on behalf of the Ultimate Beneficiaries (Refer Note 50A Part II - Other Disclosures to the standalone financial statements);
(b) The management has represented that, to the best of its knowledge and belief, no funds have been received by the Company from any person(s) or entity(ies), including foreign entities (“Funding Parties”), with the understanding, whether recorded in writing or otherwise, that the Company shall, whether, directly or indirectly, lend or invest in other persons or entities identified in any manner whatsoever by or on behalf of the Funding Party (“Ultimate Beneficiaries”) or provide any guarantee, security or the like on behalf of the Ultimate Beneficiaries (Refer Note 50A Part II - Other Disclosures to the standalone financial statements); and
(c) Based on such audit procedures that we considered reasonable and appropriate in the circumstances, nothing has come to our notice that has caused us to believe that the representations under sub-clause (a) and (b) contain any material misstatement.
v. The dividend declared and paid during the year by the Company is in compliance with Section 123 of the Act.
16. The Company has paid/ provided for managerial remuneration in accordance with the requisite approvals mandated by the provisions of Section 197 read with Schedule V to the Act.
Independent Auditor’s Report (Contd.)
For Sundaram and Srinivasan For Price Waterhouse LLPChartered Accountants Chartered AccountantsFirm Registration No. : 004207S Firm Registration No. : 301112E /E300264
S. Usha A. J. ShaikhPartner PartnerMembership No. : 211785 Membership No. : 203637UDIN : 22211785AIKTFO9980 UDIN : 22203637AIKXQO1770
Place : Chennai Place : ChennaiDate : May 5, 2022 Date : May 5, 2022

90
Corporate Overview Financial StatementsManagement Reports
Annexure A to Independent Auditor’s ReportReferred to in paragraph 15(f) of the Independent Auditor’s Report of even date to the members of Cholamandalam Investment and Finance Company Limited on the standalone financial statements as at the year ended March 31, 2022
Report on the Internal Financial Controls with reference to Financial Statements under clause (i) of sub-section 3 of Section 143 of the Act1. We have audited the internal financial controls with reference to financial statements of Cholamandalam Investment and Finance
Company Limited (“the Company”) as of March 31, 2022 in conjunction with our audit of the standalone financial statements of the Company for the year ended on that date.
Management’s Responsibility for Internal Financial Controls
2. The Company’s management is responsible for establishing and maintaining internal financial controls based on the internal control over financial reporting criteria established by the Company considering the essential components of internal control stated in the Guidance Note on Audit of Internal Financial Controls Over Financial Reporting (“the Guidance Note”) issued by the Institute of Chartered Accountants of India (“ICAI”). These responsibilities include the design, implementation and maintenance of adequate internal financial controls that were operating effectively for ensuring the orderly and efficient conduct of its business, including adherence to company’s policies, the safeguarding of its assets, the prevention and detection of frauds and errors, the accuracy and completeness of the accounting records, and the timely preparation of reliable financial information, as required under the Act.
Auditor’s Responsibility
3. Our responsibility is to express an opinion on the Company's internal financial controls with reference to standalone financial statements based on our audit. We conducted our audit in accordance with the Guidance Note and the Standards on Auditing deemed to be prescribed under Section 143(10) of the Act to the extent applicable to an audit of internal financial controls, both applicable to an audit of internal financial controls and both issued by the ICAI. Those Standards and the Guidance Note require that we comply with ethical requirements and plan and perform the audit to obtain reasonable assurance about whether adequate internal financial controls with reference to standalone financial statements was established and maintained and if such controls operated effectively in all material respects.
4. Our audit involves performing procedures to obtain audit evidence about the adequacy of the internal financial controls system with reference to financial statements and their operating effectiveness. Our audit of internal financial controls with reference to standalone financial statements included obtaining an understanding of internal financial controls with reference to standalone financial statements, assessing the risk that a material weakness exists, and testing and evaluating the design and operating effectiveness of internal control based on the assessed risk. The procedures selected depend on the auditor’s judgement, including the assessment of the risks of material misstatement of the standalone financial statements, whether due to fraud or error.
5. We believe that the audit evidence we have obtained is sufficient and appropriate to provide a basis for our audit opinion on the Company’s internal financial controls system with reference to standalone financial statements.
Meaning of Internal Financial Controls with reference to financial statements
6. A company's internal financial controls with reference to standalone financial statements is a process designed to provide reasonable assurance regarding the reliability of financial reporting and the preparation of standalone financial statements for external purposes in accordance with generally accepted accounting principles. A company's internal financial controls with reference to standalone financial statements includes those policies and procedures that (1) pertain to the maintenance of records that, in reasonable detail, accurately and fairly reflect the transactions and dispositions of the assets of the company; (2) provide reasonable assurance that transactions are recorded as necessary to permit preparation of standalone financial statements in accordance with generally accepted accounting principles, and that receipts and expenditures of the company are being made only in accordance with authorisations of management and directors of the company; and (3) provide reasonable assurance regarding prevention or timely detection of unauthorised acquisition, use, or disposition of the company's assets that could have a material effect on the standalone financial statements.

Corporate Overview Financial StatementsManagement Reports
91
Inherent Limitations of Internal Financial Controls with reference to financial statements
7. Because of the inherent limitations of internal financial controls with reference to standalone financial statements, including the possibility of collusion or improper management override of controls, material misstatements due to error or fraud may occur and not be detected. Also, projections of any evaluation of the internal financial controls with reference to standalone financial statements to future periods are subject to the risk that the internal financial control controls with reference to standalone financial statements may become inadequate because of changes in conditions, or that the degree of compliance with the policies or procedures may deteriorate.
Opinion
8. In our opinion, the Company has, in all material respects, an adequate internal financial controls system with reference to standalone financial statements and such internal financial controls with reference to standalone financial statements were operating effectively as at March 31, 2022, based on the internal control over financial reporting criteria established by the Company considering the essential components of internal control stated in the Guidance Note issued by ICAI.
For Sundaram and Srinivasan For Price Waterhouse LLPChartered Accountants Chartered AccountantsFirm Registration No. : 004207S Firm Registration No. : 301112E /E300264
S. Usha A. J. ShaikhPartner PartnerMembership No. : 211785 Membership No. : 203637UDIN : 22211785AIKTFO9980 UDIN : 22203637AIKXQO1770
Place : Chennai Place : ChennaiDate : May 5, 2022 Date : May 5, 2022
Annexure A to Independent Auditor’s Report (Contd.)Referred to in paragraph 15(f) of the Independent Auditor’s Report of even date to the members of Cholamandalam Investment and Finance Company Limited on the standalone financial statements as at the year ended March 31, 2022

92
Corporate Overview Financial StatementsManagement Reports
i. (a) (A) The Company is maintaining proper records showing full particulars, including quantitative details and situation, of Property, Plant and Equipment.
(B) The Company is maintaining proper records showing full particulars of Intangible Assets.
(b) The Property, Plant and Equipment of the Company have been physically verified by the Management during the year and no material discrepancies have been noticed on such verification. In our opinion, the frequency of verification is reasonable.
(c) The title deeds of all the immovable properties (other than properties where the Company is the lessee and the lease agreements are duly executed in favour of the lessee), as disclosed in Notes 13 and 14 to the standalone financial statements, are held in the name of the Company.
(d) The Company has chosen cost model for its Property, Plant and Equipment (including Right of Use assets) and intangible assets. Consequently, the question of our commenting on whether the revaluation is based on the valuation by a Registered Valuer, or specifying the amount of change, if the change is 10% or more in the aggregate of the net carrying value of each class of Property, Plant and Equipment (including Right of Use assets) or intangible assets does not arise.
(e) Based on the information and explanations furnished to us, no proceedings have been initiated on or are pending against the Company for holding benami property under the Prohibition of Benami Property Transactions Act, 1988 (as amended in 2016) (formerly the Benami Transactions (Prohibition) Act, 1988 (45 of 1988)) and Rules made thereunder, and therefore the question of our commenting on whether the Company has appropriately disclosed the details in its financial statements does not arise (Refer Note 50A to the standalone financial statements).
ii. (a) The Company is in the business of rendering services and, consequently, does not hold any inventory. Therefore, the provisions of clause 3(ii)(a) of the Order are not applicable to the Company.
(b) During the year, the Company has been sanctioned working capital limits in excess of ` 5 crores, in aggregate, from banks on the basis of security of current assets. The Company has filed quarterly returns or statements with such banks, which are in agreement with the unaudited books of account. (Also refer Note 18.1 (vi) to the financial statements)
iii. (a) The Company is registered with Reserve Bank of India (RBI) under section 45-IA as a non- banking financial company, and its principal business is to give loans. Accordingly, the provisions of clause 3(iii)(a) of the Order are not applicable to the Company
(b) Based on our examination and the information and explanations given to us, in respect of investments/ guarantees/ securities/ loans/ advances in nature of loan, in our opinion, the terms and conditions under which such loans were granted/ investments were made/ guarantees provided/ security provided are not prejudicial to the Company’s interest.
(c) In respect of the loans/ advances in nature of loan, the schedule of repayment of principal and payment of interest has been stipulated by the Company. Considering that the Company is a non-banking financial company engaged in the business of granting loans majorly to retail customers for vehicle finance, affordable housing etc., the entity-wise details of the amount, due date for payment and extent of delay (that has been suggested in the Guidance Note on CARO 2020 issued by the Institute of Chartered Accountants of India for reporting under this clause) have not been reported because it is not practicable to furnish such details owing to the voluminous nature of data generated in the normal course of the Company’s business. Further, except for the instances where there are delays or defaults in repayment of principal and/ or interest, the parties are repaying the principal amounts, as stipulated, and are also regular in payment of interest, as applicable. The Company has recognised provisions against the above loans, in accordance with the principles of Indian Accounting Standards (Ind AS) and the guidelines issued by the Reserve Bank of India (“RBI”) for Income Recognition and Asset Classification (refere Note 9 and 53 to the financial statements).
(d) In respect of the loans/ advances in nature of loans, the total amount overdue for more than ninety days as at March 31, 2022 is ` 3,48,118 lakhs. In such instances, in our opinion, based on information and explanations provided to us, reasonable steps have been taken by the Company for the recovery of the principal amounts and the interest thereon. Refer Note 9.2 in the standalone financial statements for details of number of cases and the amount of principal and interest overdue as at March 31, 2022.
(e) This Company is registered with the Reserve Bank of India (RBI) under section 45-IA as a non- banking financial company, and its principal business is to give loans. Accordingly, the provisions of clause 3(iii)(e) of the Order are not applicable to the Company.
(f ) The loans/advances in nature of loans granted during the year, including to promoters/related parties had stipulated the scheduled repayment of principal and payment of interest and the same were not repayable on demand.
Annexure B to Independent Auditor’s ReportReferred to in paragraph 14 of the Independent Auditor’s Report of even date to the members of Cholamandalam Investment and Finance Company Limited on the standalone financial statements as of and for the year ended March 31, 2022

Corporate Overview Financial StatementsManagement Reports
93
Annexure B to Independent Auditor’s Report (Contd.)Referred to in paragraph 14 of the Independent Auditor’s Report of even date to the members of Cholamandalam Investment and Finance Company Limited on the standalone financial statements as of and for the year ended March 31, 2022
iv. In our opinion and according to the information and explanations given to us, the Company has complied with the provisions of Section 185 and sub-section (1) of Section 186 of the Act in respect of the loans and investments made and guarantees and security provided by it. The provisions of sub-sections (2) to (11) of Section 186 are not applicable to the Company as it is a non-banking financial company registered with the RBI engaged in the business of giving loans.
v. The Company has not accepted any deposits or amounts which are deemed to be deposits within the meaning of Sections 73, 74, 75 and 76 of the Act and the Rules framed there under to the extent notified. Further, the provisions of sub-sections (1) of Section 73 are not applicable to the company as it is a non-banking financial company registered with the RBI engaged in the business of giving loans.
vi. The Central Government of India has not specified the maintenance of cost records under sub- section (1) of Section 148 of the Act for any of the products of the Company.
vii. (a) According to the information and explanations given to us and the records of the Company examined by us, in our opinion, the Company is regular in depositing the undisputed statutory dues, including goods and services tax, provident fund, employees’ state insurance, income tax, sales tax, service tax, value added tax, cess, and other material statutory dues, as applicable, with the appropriate authorities.
(b) According to the information and explanations given to us and the records of the Company examined by us, the particulars of statutory dues referred to in sub-clause (a) as at March 31, 2022 which have not been deposited on account of a dispute, are as follows:
viii. According to the information and explanations given to us and the records of the Company examined by us, there are no transactions in the books of account that has been surrendered or disclosed as income during the year in the tax assessments under the Income Tax Act, 1961, that has not been recorded in the books of account.
ix. (a) According to the records of the Company examined by us and the information and explanation given to us, the Company has not defaulted in repayment of loans or other borrowings or in the payment of interest to any lender during the year.
(b) According to the information and explanations given to us and on the basis of our audit procedures, we report that the Company has not been declared Wilful Defaulter by any bank or financial institution or government or any government authority.
Name of the statute Nature of dues Amount Period to which Forum where the Remarks, (in ` lakhs) the amounts relates dispute is pending if anyIncome Tax Act, 1961 Tax and interest 20.52 2005-06 Assessing Officer
Income Tax Act, 1961 Tax and interest 0.11 2008-09 High Court
Income Tax Act, 1961 Tax and interest 641.49 1990-91, 1991-92, Income Tax Appellate Tribunal 2009-10
Income Tax Act, 1961 Tax and interest 58.32 2015-16 Assessing Officer (International Taxation
Income Tax Act, 1961 Tax and interest 9,951.31 2013-14, 2015-16, CIT (Appeals) 2016-17, 2017-18
Bihar Finance Act, 1981 Sales tax 2.19 1992-93, 1993-94 Sales Tax Appellate Tribunal, Jamshedpur
Delhi Sales Tax Act, 1975 Sales tax 7.58 1991-92 Deputy Commissioner of Sales Tax, Appeals
Gujarat Sales Tax Act, 1969 Sales tax 2.03 1997-98 Sales Tax Appellate Tribunal, Baroda
Odisha Value Added Tax Act, 2004 Sales tax 302.56 2007-08 to 2013-14 Odisha Sales Tax Appellate Tribunal
Rajasthan Sales Tax Act Sales tax 101.63 2006-07 to 2014-15 Supreme Court
Rajasthan Sales Tax Act Sales tax 14.73 2012-13, 2016-17, Assessing Officer 2017-18
Tamilnadu General Sales Tax Act, 1959 TNGST and CST 998.80 1995-96 High Court
Tamilnadu Value Added Tax Act, 2006 Sales tax 392.58 2006-07 to 2013-14 High Court
Finance Act, 1994 Service tax 19,689.95 2005-06 to 2017-18 CESTAT
Goods and Services Tax Act, 2018 Goods and 10.96 2017-18 Commissioner of GST (Appeals) Services Tax

94
Corporate Overview Financial StatementsManagement Reports
Annexure B to Independent Auditor’s Report (Contd.)Referred to in paragraph 14 of the Independent Auditor’s Report of even date to the members of Cholamandalam Investment and Finance Company Limited on the standalone financial statements as of and for the year ended March 31, 2022 (c) In our opinion, and according to the information and explanations given to us, the term loans have been applied for the purposes
for which they were obtained. (Also refer Note 18.1 (v) to the financial statements)
(d) According to the information and explanations given to us, and the procedures performed by us, and on an overall examination of the financial statements of the Company, we report that no funds raised on short-term basis have been used for long-term purposes by the Company.
(e) According to the information and explanations given to us and on an overall examination of the financial statements of the Company, we report that the Company has not taken any funds from any entity or person on account of or to meet the obligations of its subsidiaries, associates or joint ventures.
(f ) According to the information and explanations given to us and procedures performed by us, we report that the Company has not raised loans during the year on the pledge of securities held in its subsidiaries, joint ventures or associate companies
x. (a) The Company has not raised any money by way of initial public offer or further public offer (including debt instruments) during the year. Accordingly, the reporting under clause 3(x)(a) of the Order is not applicable to the Company.
(b) The Company has not made any preferential allotment or private placement of shares or fully or partially or optionally convertible debentures during the year. Accordingly, the reporting under clause 3(x)(b) of the Order is not applicable to the Company.
xi. (a) During the course of our examination of the books and records of the Company, carried out in accordance with the generally accepted auditing practices in India, and according to the information and explanations given to us, we have neither come across any instance of material fraud by the Company or on the Company, noticed or reported during the year, nor have we been informed of any such case by the Management.
(b) During the course of our examination of the books and records of the Company, carried out in accordance with the generally accepted auditing practices in India, and according to the information and explanations given to us, a report under Section 143(12) of the Act, in Form ADT-4, as prescribed under rule 13 of Companies (Audit and Auditors) Rules, 2014 was not required to be filed with the Central Government. Accordingly, the reporting under clause 3(xi)(b) of the Order is not applicable to the Company.
(c) During the course of our examination of the books and records of the Company carried out in accordance with the generally accepted auditing practices in India, and according to the information and explanations given to us, the Company has received whistle-blower complaints during the year, which have been considered by us for any bearing on our audit and reporting.
xii. As the Company is not a Nidhi Company and the Nidhi Rules, 2014 are not applicable to it, the reporting under clause 3(xii) of the Order is not applicable to the Company.
xiii. The Company has entered into transactions with related parties in compliance with the provisions of Sections 177 and 188 of the Act. The details of such related party transactions have been disclosed in the financial statements as required under Indian Accounting Standard 24 “Related Party Disclosures specified under Section 133 of the Act.
xiv. (a) In our opinion and according to the information and explanation given to us, the Company has an internal audit system commensurate with the size and nature of its business.
xiv. (b) The reports of the Internal Auditor for the period under audit have been considered by us.
xv. The Company has not entered into any non-cash transactions with its directors or persons connected with him. Accordingly, the reporting on compliance with the provisions of Section 192 of the Act under clause 3(xv) of the Order is not applicable to the Company.
xvi. (a) The Company is required to and has been registered under Section 45-IA of the Reserve Bank of India Act, 1934 as an Non Deposit Taking Systemically Important Investment and Credit Company.
(b) The Company has conducted non-banking financial activities during the year and the Company holds a valid Certificate of Registration from the Reserve Bank of India as per the Reserve Bank of India Act, 1934.
(c) The Company is not a Core Investment Company (CIC) as defined in the regulations made by the Reserve Bank of India. Accordingly, the reporting under clause 3(xvi)(c) of the Order is not applicable to the Company.
(d) Based on the information and explanations provided by the management of the Company, the Group has two CICs as part of the Group has to CICs as part of the Group. We have not, however, separately evaluated whether the information provided by the management is accurate and complete.
xvii. The Company has not incurred any cash losses in the financial year or in the immediately preceding financial year.

Corporate Overview Financial StatementsManagement Reports
95
Annexure B to Independent Auditor’s Report (Contd.)Referred to in paragraph 14 of the Independent Auditor’s Report of even date to the members of Cholamandalam Investment and Finance Company Limited on the standalone financial statements as of and for the year ended March 31, 2022xviii. There has been resignation of the statutory auditors of the Company during the year. As stated in the resignation letter dated July 30,
2021 of the outgoing statutory auditors, the resignation was pursuant to the "Guidelines for Appointment of Statutory Central Auditors (SCAs)/ Statutory Auditors (SAs) of Commercial Banks (excluding RRBs), UCBs and NBFCs (including HFCs)" issued by RBI on April 27, 2021. We noted no issues, objections or concerns raised by the outgoing statutory auditors in their aforesaid letter.
xix. According to the information and explanations given to us and on the basis of the financial ratios (Also refer Note X to the financial statements), ageing and expected dates of realisation of financial assets and payment of financial liabilities, other information accompanying the financial statements, our knowledge of the Board of Directors and management plans and based on our examination of the evidence supporting the assumptions, nothing has come to our attention, which causes us to believe that any material uncertainty exists as on the date of the audit report that Company is not capable of meeting its liabilities existing at the date of balance sheet as and when they fall due within a period of one year from the balance sheet date. We, however, state that this is not an assurance as to the future viability of the Company. We further state that our reporting is based on the facts up to the date of the audit report and we neither give any guarantee nor any assurance that all liabilities falling due within a period of one year from the balance sheet date will get discharged by the Company as and when they fall due.
xx. (a) In respect of other than ongoing projects, as at balance sheet date, the Company does not have any amount remaining unspent under Section 135(5) of the Act.
(b) In respect of ongoing projects, as at balance sheet date, the Company does not have any amount remaining unspent under Section 135(5) of the Act. Accordingly, reporting under this clause is not applicable.
xxi. The reporting under clause 3(xxi) of the Order is not applicable in respect of audit of Standalone Financial Statements. Accordingly, no comment in respect of the said clause has been included in this report.
For Sundaram and Srinivasan For Price Waterhouse LLPChartered Accountants Chartered AccountantsFirm Registration No. : 004207S Firm Registration No. : 301112E /E300264
S. Usha A. J. ShaikhPartner PartnerMembership No. : 211785 Membership No. : 203637UDIN : 22211785AIKTFO9980 UDIN : 22203637AIKXQO1770
Place : Chennai Place : ChennaiDate : May 5, 2022 Date : May 5, 2022

96
Corporate Overview Financial StatementsManagement Reports
Standalone Balance Sheet As at March 31, 2022
This is the Standalone Statement of Balance Sheet referred to in our report of even date
The accompanying notes are integral part of the Standalone financial statements
For Price Waterhouse LLP For Sundaram and Srinivasan For and on behalf of the Board of DirectorsChartered Accountants Chartered Accountants ICAI Firm Regn No. : 301112E/ E300264 ICAI Firm Regn No. : 004207S A.J. Shaikh S. Usha Ravindra Kumar Kundu Vellayan SubbiahPartner Partner Executive Director ChairmanMembership No. : 203637 Membership No. : 211785
Date : May 5, 2022 P. Sujatha D. Arul SelvanPlace : Chennai Company Secretary Chief Financial Officer
` in lakhs
ASSETSFinancial Assets Cash and Cash Equivalents 5 2,65,788 1,44,785 Bank Balances other than Cash and Cash Equivalents 6 1,56,220 3,78,403 Derivative financial instruments 7 18,653 4,587 Receivables 8 i) Trade Receivables 3,247 2,031 ii) Other Receivables 9,554 4,612 Loans 9 74,14,921 65,83,934 Investments 10 2,07,616 1,61,882 Other Financial Assets 11 32,088 53,637 81,08,087 73,33,871 Non- Financial Assets Current tax assets(Net) 25,071 14,615 Deferred tax assets (Net) 12 67,143 76,380 Investment Property 13 13 13 Property, Plant and Equipment 14 23,989 20,302 Capital Work in Progress 2,303 - Intangible assets under development 1,395 982 Intangible assets 15 1,455 1,645 Other Non-Financial Assets 16 6,879 7,034 1,28,248 1,20,971 TOTAL ASSETS 82,36,335 74,54,842
LIABILITIES AND EQUITYFinancial Liabilities Derivative financial instruments 7 16,956 12,742 Payables (I) Trade Payables i) Total outstanding dues of micro and small enterprises 33 & 50A 306 - ii) Total outstanding dues of creditors other than micro and small enterprises 7,984 5,267 (II) Other Payables i) Total outstanding dues of micro and small enterprises - - ii) Total ou tstanding dues of creditors other than micro and small enterprises 71,990 54,239 Debt Securities 17 13,32,110 12,35,767 Borrowings(Other than Debt Securities) 18 52,00,452 47,18,226 Subordinated Liabilities 19 3,84,788 4,19,006 Other Financial Liabilities 20 33,343 33,804 70,47,929 64,79,051 Non-Financial Liabilities Current Tax Liabilities(Net) - 4,225 Provisions 21 11,827 10,958 Other Non-Financial Liabilities 22 5,811 4,577 17,638 19,760Equity Equity Share Capital 23A 16,428 16,407 Other Equity 23B 11,54,340 9,39,624 11,70,768 9,56,031TOTAL LIABILITIES AND EQUITY 82,36,335 74,54,842
Note No. As at As at March 31, 2022 March 31, 2021

Corporate Overview Financial StatementsManagement Reports
97
The accompanying notes are integral part of the Standalone financial statements
This is the Standalone Statement of Profit and Loss referred to in our report of even date
Standalone Statement of Profit and Loss for the year ended March 31, 2022
` in lakhs
Revenue from Operations Interest Income 24A 9,56,681 9,22,416
Fee Income 24B 38,374 20,685
Net gain on fair value change on financial instruments 24C 1,299 463
Sale of Services 24D 8,475 8,037
Total Revenue from operations (I) 10,04,829 9,51,601Other Income (II) 25 9,048 5,955
Total Income (III) = (I) + (II) 10,13,877 9,57,556 Expenses Finance costs 26 4,29,882 4,57,591
Impairment of financial Instruments (Net) 27 88,030 1,37,777
Employee benefits expense 28 89,453 74,853
Depreciation and amortisation expense 13, 14 & 15 9,735 9,830
Other expenses 29 1,07,683 73,661
Total Expenses (IV) 7,24,783 7,53,712 Profit before tax (V) = (III) - (IV) 2,89,094 2,03,844 Tax expense/(benefit)
- Current tax 69,196 75,086
- Adjustment of tax relating to earlier periods 68 394
- Deferred tax 5,159 (23,127)
Net tax expense (VI) 74,423 52,353
Profit for the year - A = (V) - (VI) 2,14,671 1,51,491 Other Comprehensive income: i) Items that will not be reclassified to profit or loss: Re-measurement gains / (losses) of Post employment benefit Obligations (net) 5 (127)
Income tax impact (1) 32
ii) Items that will be reclassified to profit or loss: Net Gain On Cashflow Hedge Reserve 42.8 16,197 (4,521)
Income tax impact (4,077) 1,138
Other comprehensive income/(loss) net of tax for the year (B) 12,124 (3,478)Total comprehensive income net of tax for the year (A + B) 2,26,795 1,48,013 Earnings per equity share of ` 2 each 30
Basic (`) 26.16 18.48
Diluted (`) 26.11 18.45
Note No. Year ended Year ended March 31, 2022 March 31, 2021
For Price Waterhouse LLP For Sundaram and Srinivasan For and on behalf of the Board of DirectorsChartered Accountants Chartered Accountants ICAI Firm Regn No. : 301112E/ E300264 ICAI Firm Regn No. : 004207S A.J. Shaikh S. Usha Ravindra Kumar Kundu Vellayan SubbiahPartner Partner Executive Director ChairmanMembership No. : 203637 Membership No. : 211785
Date : May 5, 2022 P. Sujatha D. Arul SelvanPlace : Chennai Company Secretary Chief Financial Officer

98
Corporate Overview Financial StatementsManagement Reports
Stan
dalo
ne S
tate
men
t of C
hang
es in
Equ
ity fo
r th
e ye
ar e
nd
ed M
arch
31
, 20
22
` in
lak
hs
B) O
ther
Eq
uit
y (R
efer
No
te 2
3B)
Par
ticu
lars
Sh
are
Cap
ital
Se
curi
ties
C
apit
al
Gen
eral
R
etai
ned
St
atu
tory
Sh
are
bas
ed
Deb
t Eq
uit
y Eff
ecti
ve
Tota
l
app
licat
ion
Res
erve
P
rem
ium
R
edem
pti
on
R
eser
ve
earn
ing
s R
eser
ve
Pay
men
ts
inst
rum
ents
in
stru
men
ts p
ort
ion
of
M
on
ey
Res
erve
Res
erve
th
rou
gh
Oth
er
thro
ug
h O
ther
ca
shfl
ow
Pe
nd
ing
C
om
pre
hen
sive
Co
mp
reh
ensi
ve
hed
ge
fo
r
Inco
me
inco
me
al
lotm
ent
Res
erve
an
d S
urp
lus
` in
lak
hs
A) E
qu
ity
Shar
e C
apit
alB
alan
ce a
s at
M
arch
31,
202
1
16,4
07
Ch
ang
es in
Eq
uit
y Sh
are
cap
ital
d
ue
to p
rio
r ye
ar e
rro
rs
-
Res
tate
d B
alan
ce a
t th
e b
egin
nin
g o
f th
e cu
rren
t re
po
rtin
g y
ear
16,4
07
Ch
ang
es in
Eq
uit
y sh
are
cap
ital
d
uri
ng
th
e cu
rren
t ye
ar
21
Bal
ance
as
at
Mar
ch 3
1, 2
022
16,4
28
Bala
nce
as a
t Mar
ch 3
1, 2
021
-
4
2
,86,
605
3
,300
3
,73,
913
1
,24,
021
1
,59,
046
3
,445
-
(1
29)
(10,
581)
9
,39,
624
Chan
ges
in a
ccou
ntin
g po
licy/
-
-
-
-
-
-
-
-
-
-
-
-
pr
ior p
erio
d er
rors
Rest
ated
Bal
ance
at t
he b
egin
ning
-
4
2
,86,
605
3
,300
3
,73,
913
1
,24,
021
1
,59,
046
3
,445
(129
) (1
0,58
1)
9,3
9,62
4
of th
e cu
rren
t rep
orti
ng p
erio
dRe
mea
sure
men
t of d
efine
d
-
-
-
-
-
4
-
-
-
4
bene
fit p
lans
Tota
l com
preh
ensi
ve in
com
e
-
-
-
-
-
-
-
-
12,
120
1
2,12
0
for t
he p
erio
d, n
et o
f inc
ome
tax
Div
iden
d in
clud
ing
tax
-
-
-
-
-
(1
6,41
4)
-
-
-
(16,
414)
Tran
sfer
to re
tain
ed e
arni
ngs
2,1
4,67
1
2
,14,
671
Chan
ges
durin
g th
e pe
riod
-
-
2
,287
-
-
-
2,0
48
-
-
4
,335
Tra
nsfe
r to
rese
rves
from
Ret
aine
d
-
-
-
1
,00,
000
(1
,43,
000)
4
3,00
0
-
-
-
-
ea
rnin
gs d
urin
g th
e ye
arBa
lanc
e as
at M
arch
31,
202
2
-
4
2,8
8,89
2
3,3
00
4,7
3,91
3
1,7
9,28
2
2,0
2,04
6
5,4
93
-
(129
) 1
,539
1
1,54
,340

Corporate Overview Financial StatementsManagement Reports
99
` in
lak
hs
` in
lak
hs
Stan
dalo
ne S
tate
men
t of C
hang
es in
Equ
ity fo
r th
e ye
ar e
nd
ed M
arch
31
, 20
22
(Con
td.)
For P
rice
Wat
erho
use
LLP
For S
unda
ram
and
Sri
niva
san
Fo
r and
on
beha
lf of
the
Boar
d of
Dir
ecto
rsCh
arte
red
Acco
unta
nts
Char
tere
d Ac
coun
tant
s
ICA
I Firm
Reg
n N
o. :
3011
12E/
E30
0264
IC
AI F
irm R
egn
No.
: 00
4207
S
A.J
. Sha
ikh
S. U
sha
Ravi
ndra
Kum
ar K
undu
Ve
llaya
n Su
bbia
hPa
rtne
r Pa
rtne
r Ex
ecut
ive
Dire
ctor
Ch
airm
anM
embe
rshi
p N
o. :
2036
37
Mem
bers
hip
No.
: 21
1785
Dat
e :
May
5, 2
022
P.
Suj
atha
D
. Aru
l Sel
van
Plac
e : C
henn
ai
Co
mpa
ny S
ecre
tary
Ch
ief F
inan
cial
Offi
cer
Thi
s is
the
Stan
dalo
ne S
tate
men
t of C
hang
es in
Equ
ity re
ferr
ed to
in o
ur re
port
of e
ven
date
.
Bala
nce
as a
t Mar
ch 3
1, 2
020
1
0
4
2,8
5,67
8
3,3
00
2,9
8,77
7
89,
281
1
,28,
046
3
,017
-
(1
29)
(7,1
98)
8,0
0,78
6 Ch
ange
s in
acc
ount
ing
polic
y -
-
-
-
-
-
-
-
-
-
-
-
/p
rior p
erio
d er
rors
Rest
ated
Bal
ance
at t
he b
egin
ning
1
0
4
2,8
5,67
8
3,3
00
2,9
8,77
7
89,
281
1
,28,
046
3
,017
-
(1
29)
(7,1
98)
8,0
0,78
6
of th
e cu
rren
t rep
orti
ng p
erio
dRe
mea
sure
men
t of d
efine
d
-
-
-
-
-
(95)
-
-
-
-
-
(9
5)
bene
fit p
lans
Tota
l com
preh
ensi
ve in
com
e
-
-
-
-
-
-
-
-
-
(3
,383
) (3
,383
)fo
r the
per
iod,
net
of i
ncom
e ta
xD
ivid
end
incl
udin
g ta
x
-
-
-
-
-
(10,
656)
-
-
-
-
-
(1
0,65
6)Tr
ansf
er to
reta
ined
ear
ning
s
-
-
-
-
-
1,5
1,49
1
-
-
-
-
-
1,5
1,49
1 Ch
ange
s du
ring
the
perio
d
(10)
927
-
1
36
-
-
428
-
-
-
1
,481
Tr
ansf
er to
rese
rves
from
Ret
aine
d
-
-
-
-
75,
000
(1
,06,
000)
3
1,00
0
-
-
-
-
-
earn
ings
dur
ing
the
year
Bala
nce
as a
t Mar
ch 3
1, 2
021
-
4
2
,86,
605
3
,300
3
,73,
913
1
,24,
021
1
,59,
046
3
,445
-
(1
29)
(10,
581)
9
,39,
624
B) O
ther
Eq
uit
y (R
efer
No
te 2
3B)
The
acc
ompa
nyin
g no
tes
are
inte
gral
par
t of t
he S
tand
alon
e fin
anci
al s
tate
men
ts
Par
ticu
lars
Sh
are
Cap
ital
Se
curi
ties
C
apit
al
Gen
eral
R
etai
ned
St
atu
tory
Sh
are
bas
ed
Deb
t Eq
uit
y Eff
ecti
ve
Tota
l
app
licat
ion
Res
erve
P
rem
ium
R
edem
pti
on
R
eser
ve
earn
ing
s R
eser
ve
Pay
men
ts
inst
rum
ents
in
stru
men
ts p
ort
ion
of
M
on
ey
Res
erve
Res
erve
th
rou
gh
Oth
er
thro
ug
h O
ther
ca
shfl
ow
Pe
nd
ing
C
om
pre
hen
sive
Co
mp
reh
ensi
ve
hed
ge
fo
r
Inco
me
inco
me
al
lotm
ent
Res
erve
an
d S
urp
lus
Sta
ndal
one
Stat
emen
t of C
hang
es in
Equ
ity
for t
he y
ear e
nded
Mar
ch 3
1, 2
021
A) E
qu
ity
Shar
e C
apit
al
Pre
vio
us
rep
ort
ing
per
iod
Bal
ance
as
on
M
arch
31,
202
0
16,3
98
Ch
ang
es in
Eq
uit
y Sh
are
cap
ital
d
ue
to p
rio
r ye
ar e
rro
rs
-
Res
tate
d B
alan
ce a
t th
e b
egin
nin
g o
f th
e cu
rren
t re
po
rtin
g y
ear
16,3
98
Ch
ang
es in
Eq
uit
y sh
are
cap
ital
d
uri
ng
th
e cu
rren
t ye
ar
9
Bal
ance
as
on
M
arch
31,
202
1
16,4
07

100
Corporate Overview Financial StatementsManagement Reports
Standalone Cash Flow Statement for the year ended March 31, 2022
` in lakhs Particulars Year ended Year ended March 31, 2022 March 31, 2021
Cash Flow from Operating Activities
Profit Before Tax 2,89,094 2,03,844
Adjustments to reconcile profit before tax to net cash flows:
Depreciation and amortisation expense 9,735 9,830
Impairment of financial instruments 88,030 1,37,777
Finance Costs 4,29,882 4,57,591
Loss on Sale of Property, plant and equipment (Net) 7 54
Net gain on fair value change in financial instrument (1,299) (463)
Interest Income on bank deposits and other investments (24,168) (34,694)
Interest on Income Tax Refund (662) (336)
Short Term Rent Concessions (112) (630)
Share based payment expense 2,020 561
5,03,433 5,69,690
Operating Profit Before Working Capital Changes 7,92,527 7,73,534
Adjustments for :-
(Increase)/Decrease in operating Assets
Loans (9,19,017) (11,81,438)
Trade receivables (6,158) (769)
Other Financial Assets 21,549 (14,961)
Other Non Financial Assets 155 (9,03,471) (1,917) (11,99,085)
Increase/(Decrease) in operating liabilities and provisions
Payables 20,807 20,699
Other Financial liabilities (2,551) 6,756
Provisions 869 1,882
Other Non Financial liabilities 1,234 20,359 1 29,338
Cash Flow used in Operations (90,585) (3,96,213)
Finance Costs paid (4,11,731) (4,54,564)
Interest Received on Bank Deposits and other investments 26,042 35,399
(3,85,689) (4,19,165)
(4,76,274) (8,15,378)
Income tax paid (Net of refunds) (84,478) (70,326)
Net Cash Used in Operating Activities (A) (5,60,752) (8,85,704)
Cash Flow from Investing Activities
Purchase of Property, plant and Equipment and Intangible Assets (7,092) (3,111)
Capital Work in Progress (2,303) -
Proceeds from Sale of Property, plant and equipment 192 150
Investment in Subsidiaries/Associates (45,976) -
Purchase of Mutual Funds Units (42,11,289) (17,68,421)
Redemption of Mutual Funds Units 42,12,589 17,68,884
Movement of Investment (net) 242 (1,54,590)
Investment in Bank Fixed Deposits (net of withdrawals) 2,20,305 (18,800)
Net Cash Used in Investing Activities (B) 1,66,668 (1,75,888)

Corporate Overview Financial StatementsManagement Reports
101
Standalone Cash Flow Statement for the year ended March 31, 2022
` in lakhs
Cash Flow from Financing Activities
Proceeds from issue of Share Capital (Including Securities Premium) 2,308 936
Payment of Lease liabilities (5,411) (4,914)
Proceeds from issue of Debt securities 9,50,140 18,76,079
Redemption of Debt securities (8,43,426) (13,75,181)
Proceeds from Borrowing other than debt securities 25,27,481 48,56,670
Repayment of Borrowings other than debt securities (20,66,818) (44,52,011)
Proceeds from issue of subordinated liabilities 54,500 14,500
Repayment of subordinated liabilities (87,270) (34,650)
5,34,607 8,85,407
Dividends Paid (16,417) (10,655)
Net Cash From Financing Activities (C) 5,15,087 8,70,774
Net Increase/(Decrease) in Cash and Cash Equivalents (A+B+C) 1,21,003 (1,90,818)
Cash and Cash Equivalents at the Beginning of the Year 1,44,785 3,35,603
Cash and Cash Equivalents at the End of the Year 2,65,788 1,44,785
Components of Cash and Cash Equivalents:
Cash on hand 1,603 3,179
Balances with banks
- In Current Accounts 11,506 1,38,636
- In Deposit Accounts - Original maturity of 3 months or less 2,50,034 -
Cheques, drafts on hand 2,645 2,970
Total 2,65,788 1,44,785
The accompanying notes are integral part of the Standalone financial statements
This is the Standalone Cash Flow Statement referred to in our report of even date.
Particulars Year ended Year ended March 31, 2022 March 31, 2021
For Price Waterhouse LLP For Sundaram and Srinivasan For and on behalf of the Board of DirectorsChartered Accountants Chartered Accountants ICAI Firm Regn No. : 301112E/ E300264 ICAI Firm Regn No. : 004207S A.J. Shaikh S. Usha Ravindra Kumar Kundu Vellayan SubbiahPartner Partner Executive Director ChairmanMembership No. : 203637 Membership No. : 211785
Date : May 5, 2022 P. Sujatha D. Arul SelvanPlace : Chennai Company Secretary Chief Financial Officer

102
Corporate Overview Financial StatementsManagement Reports
1. Corporate information
Cholamandalam Investment and Finance Company Limited (“the Company”) (CIN L65993TN1978PLC007576) is a public limited Company domiciled in India. The Company is listed on Bombay Stock Exchange and National Stock Exchange. The Company is one of the premier diversified non-banking finance companies in India, engaged in providing vehicle finance, home loans and Loan against property.
The standalone financial statements are presented in INR which is also functional currency of the Company.
2.1 Basis of preparation
The standalone financial statements of the Company have been prepared in accordance with Indian Accounting Standards (Ind AS) notified under the Companies (Indian Accounting Standards) Rules, 2015 (as amended from time to time).
The standalone financial statements have been prepared on a historical cost basis, except for fair value through other comprehensive income (FVOCI) instruments, fair value through Profit and Loss (FVTPL) instruments, derivative financial instruments and certain other financial assets and financial liabilities measured at fair value (refer accounting policy regarding financial instruments)
In the preparation of the financial statements, Management makes estimates and assumptions considered in that affect reported amounts of assets and liabilities (including contingent liabilities) as of the date of the financial statements and the reported income and expenses during the year. Although these estimates are based on the management’s best knowledge of current events and actions, uncertainty about these assumptions and estimates could result in the outcomes requiring a material adjustment to the carrying amounts of assets or liabilities in future periods
The standalone financial statements are presented in Indian Rupees (INR) and all values are rounded to the nearest lakhs, except when otherwise indicated.
The regulatory disclosures as required by Master Directions for Non-Banking Financial Company - Systemically Important Non-Deposit taking Company Directions, 2016 issued by the RBI (‘RBI Master Directions’) to be included as a part of the Notes to Accounts are prepared as per the Ind AS financial statements, pursuant to the RBI notification on Implementation of Indian Accounting Standards, dated March 13, 2020.
2.2 Presentation of financial statements
Financial assets and financial liabilities are generally reported gross in the balance sheet. They are only offset and reported net when, in addition to having an unconditional legally enforceable right to offset the recognised amounts without being contingent on a future event, the parties also intend to settle on a net basis in all the following circumstances:
• The normal course of business
• The event of default
• The event of insolvency or bankruptcy of the Company and/or its counterparties
3. Significant accounting policies
3.1 Financial instruments – initial recognition
3.1.1 Date of recognition
Financial assets and liabilities, with the exception of loans, debt securities, and borrowings are initially recognised on the trade date, i.e., the date that the Company becomes a party to the contractual provisions of the instrument. Loans are recognised when fund transfers are initiated to the customers’ account or cheques for disbursement have been prepared by the Company (as per the terms of the agreement with the borrowers) or when the Company assumes unconditional obligations to release the disbursement amount to third party on the direction of the borrower, whichever is earlier. The Company recognises debt securities and borrowings when funds reach the Company.
3.1.2 Initial measurement of financial instruments
The classification of financial instruments at initial recognition depends on their contractual terms and the business model for managing the instruments. Financial instruments are initially measured at their fair value, except in the case of financial assets and financial liabilities recorded at FVTPL (Fair value through profit and loss). Transaction costs/fees which are directly attributable to acquisition of financial assets or financial liabilities are recognised immediately in statement of profit and loss in case of instruments measured at FVTPL and or , are added to, or subtracted from, this amount for other categories.
3.1.3 Measurement categories of financial assets and liabilities
The Company classifies all of its financial assets and financial liabilities based on the business model for
Notes forming part of the Standalone Financial Statements (Contd.) For the year ended March 31, 2022

Corporate Overview Financial StatementsManagement Reports
103
Notes forming part of the Standalone Financial Statements (Contd.) For the year ended March 31, 2022
managing the assets and the asset’s contractual terms, measured at either:
• Amortised cost • FVTPL • FVOCI3.2 Financial assets and liabilities3.2.1 Bank balances, Loans, Trade receivables and financial
investments at amortised cost The Company measures financial assets at amortised cost
if both of the following conditions are met: • The financial asset is held within a business model with
the objective to hold financial assets in order to collect contractual cash flows and
• The contractual terms of the financial asset give rise on specified dates to cash flows that are solely payments of principal and interest (SPPI) on the principal amount outstanding.
The details of these conditions are outlined below.
3.2.1.1 Business model assessment
The Company determines its business model at the level that best reflects how it manages Company’s of financial assets to achieve its business objective.
The Company's business model is not assessed on an instrument-by-instrument basis, but at a higher level of aggregated portfolios and is based on observable factors such as:
• How the performance of the business model and the financial assets held within that business model are evaluated and reported to the entity's key management personnel
• The risks that affect the performance of the business model (and the financial assets held within that business model) and, in particular, the way those risks are managed
• How managers of the business are compensated (for example, whether the compensation is based on the fair value of the assets managed or on the contractual cash flows collected)
• The expected frequency, value and timing of sales are also important aspects of the Company’s assessment
The business model assessment is based on reasonably expected scenarios without taking 'worst case' or 'stress case’ scenarios into account. If cash flows after initial recognition are realised in a way that is different from the Company's original expectations, the Company does not change the classification of the remaining financial assets held in that business model, but incorporates such
information when assessing newly originated or newly purchased financial assets going forward.
3.2.1.2 The SPPI test
As a second step of its classification process the Company assesses the contractual terms of financial to identify whether they meet the SPPI test.
‘Principal’ for the purpose of this test is defined as the fair value of the financial asset at initial recognition and may change over the life of the financial asset (for example, if there are repayments of principal or amortisation of the premium/discount).
The most significant elements of interest within a lending arrangement are typically the consideration for the time value of money and credit risk. To make the SPPI assessment, the Company applies judgement and considers relevant factors such as the currency in which the financial asset is denominated, and the period for which the interest rate is set.
Contractual terms that introduce exposure to risk or volatility in contractual cashflow that are unrelated to a basic lending arrangement do not give to contractual cashflows that are SPPI, such financial assets are either classified as FVTPL /FVOCI
3.2.2 Investment in Mutual funds
The Company recognises the investment on trade date and is classified and measured, at fair value through profit or loss. Any gain/losses on disposal or subsequent re-measurement is recognised in the statement of Profit and Loss.
3.2.3 Equity instruments
Investment in Subsidiaries and Joint Ventures are carried at Cost in the Separate Financial Statements as permitted under Ind AS 27.
The Company subsequently measures all equity investments other than investment in subsidiaries and associates, at fair value through profit or loss, unless the Company’s management has elected to classify irrevocably some of its equity investments as equity instruments at FVOCI, when such instruments meet the definition of Equity under Ind AS 32 Financial Instruments: Presentation and are not held for trading. Such classification is determined on an instrument-by-instrument basis.
Gains and losses on these equity instruments are never recycled to profit or loss. Dividends are recognised in profit or loss as dividend income when the right of the payment has been established, except when the Company benefits

104
Corporate Overview Financial StatementsManagement Reports
from such proceeds as a recovery of part of the cost of the instrument, in which case, such gains are recorded in OCI (Other Comprehensive Income).Equity instruments at FVOCI are not subject to an impairment assessment.
3.2.4 Debt securities and other borrowed funds
After initial measurement, debt issued and other borrowed funds are subsequently measured at amortised cost. Amortised cost is calculated by taking into account any discount or premium on issue funds, and costs that are an integral part of the EIR.
3.2.5 Undrawn loan commitments
Undrawn loan commitments are commitments under which, over the duration of the commitment, the Company is required to provide a loan with pre-specified terms to the customer. Undrawn loan commitments are in the scope of the ECL requirements.
The nominal contractual value of undrawn loan commitments, where the loan agreed to be provided is on market terms, are not recorded in the balance sheet. The nominal values of these commitments together with the corresponding ECLs are disclosed in notes.
3.3 Reclassification of financial assets and liabilities
The Company does not reclassify its financial assets subsequent to their initial recognition, apart from the exceptional circumstances in which the Company acquires, disposes of, or terminates a business line. Financial liabilities are never reclassified.
3.4 Derecognition of financial assets and liabilities
3.4.1 Derecognition of financial assets
A modification of a financial asset occurs when the contractual terms governing the cash flows of a financial asset are renegotiated or otherwise modified between the initial recognition and maturity of the financial asset. A modification affects the amount and/or timing of the contractual cash flows either immediately or at a future date. The company renegotiates loans to customers in financial difficulty to maximise collection and minimise the risk of default. Modification of loan terms is granted in cases where although the borrower made all reasonable efforts to pay under the original contractual terms, there is a risk of default or default has already happened and the borrower is expected to be able to meet the revised terms. The revised terms in most of the cases include an extension of the maturity of the loan, changes to the timing of the cash flows of the loan (principal and interest repayment). When a financial asset is modified the company assesses whether this modification results in derecognition. In accordance with the company’s policy, a modification
results in derecognition when it gives rise to substantially different terms. When the contractual terms of a financial asset are modified and the modification does not result in derecognition, the financial asset is considered as impaired, which is reviewed after a period of 12 months from the date of modification. In case of modifications done in compliance with regulatory guidelines/ directives, the financial asset’s risk is considered to have increased significantly since initial recognition. Where a modification does not lead to derecognition, the company calculates the modification gain/loss comparing the gross carrying amount before and after the modification (excluding the ECL allowance).
A financial asset (or, where applicable, a part of a financial asset or part of a group of similar financial assets) is derecognised when the rights to receive cash flows from the financial asset have expired. The Company also derecognises the financial asset if it has both transferred the financial asset and the transfer qualifies for derecognition.
The Company has transferred the financial asset if, and only if, either:
• The Company has transferred its contractual rights to receive cash flows from the financial asset
Or
• It retains the rights to the cash flows, but has assumed an obligation to pay the received cash flows in full without material delay to a third party under a ‘pass–through’ arrangement.
Pass-through arrangements are transactions whereby the Company retains the contractual rights to receive the cash flows of a financial asset (the 'original asset'), but assumes a contractual obligation to pay those cash flows to one or more entities, when all of the following three conditions are met:
• The Company has no obligation to pay amounts to the eventual recipients unless it has collected equivalent amounts from the original asset, excluding short-term advances with the right to full recovery of the amount lent plus accrued interest at market rates
• The Company cannot sell or pledge the original asset other than as security to the eventual recipients
• The Company has to remit any cash flows it collects on behalf of the eventual recipients without material delay. In addition, the Company is not entitled to reinvest such cash flows, except for investments in cash or cash equivalents including interest earned, during the period between the collection date and the date of required remittance to the eventual recipients.
Notes forming part of the Standalone Financial Statements (Contd.) For the year ended March 31, 2022

Corporate Overview Financial StatementsManagement Reports
105
A transfer only qualifies for derecognition if either:
• The Company has transferred substantially all the risks and rewards of the asset
Or
• The Company has neither transferred nor retained substantially all the risks and rewards of the asset, but has transferred control of the asset
The Company considers control to be transferred if and only if, the transferee has the practical ability to sell the asset in its entirety to an unrelated third party and is able to exercise that ability unilaterally and without imposing additional restrictions on the transfer.
When the Company has neither transferred nor retained substantially all the risks and rewards and has retained control of the asset, the asset continues to be recognised only to the extent of the Company’s continuing involvement, in which case, the Company also recognises an associated liability. The transferred asset and the associated liability are measured on a basis that reflects the rights and obligations that the Company has retained.
Continuing involvement that takes the form of a guarantee over the transferred asset is measured at the lower of the original carrying amount of the asset and the maximum amount of consideration the Company could be required to pay.
In case where transfer of a part of financial assets qualifies for de-recognition, any difference between the proceeds received on such sale and the carrying value of the transferred asset is recognised as gain or loss on de-recognition of such financial asset previously carried under amortisation cost category. The resulting interest only strip initially is recognised at FVTPL and re-assessed at the end of every reporting period.
3.4.2 Financial liabilities
A financial liability is derecognised when the obligation under the liability is discharged, cancelled or expires. Where an existing financial liability is replaced by another from the same lender on substantially different terms, or the terms of an existing liability are substantially modified, such an exchange or modification is treated as a derecognition of the original liability and the recognition of a new liability. The difference between the carrying value of the original financial liability and the consideration paid is recognised in profit or loss.
3.5 Impairment of financial assets
3.5.1 Overview of the ECL principles
The Company records allowance for expected credit losses for all financial assets other than FVTPL, together with loan commitments. Equity instruments are not subject to impairment.
Loans
The ECL allowance is based on the credit losses expected to arise over the life of the asset (the lifetime expected credit loss or LTECL), unless there has been no significant increase in credit risk since origination, in which case, the allowance is based on the 12 months’ expected credit loss (12mECL) as outlined in Notes.
The 12mECL is the portion of LTECLs that represent the ECLs that result from default events on a financial instrument that are possible within the 12 months after the reporting date.
Both LTECLs and 12mECLs are calculated on either an individual basis or a collective basis, depending on the nature of the underlying portfolio of financial instruments.
The Company has established a policy to perform an assessment, at the end of each reporting period, of whether a financial instrument’s credit risk has increased significantly since initial recognition, by considering the change in the risk of default occurring over the remaining life of the financial instrument.
Based on the above process, the Company categorises its loans into Stage 1, Stage 2 and Stage 3, as described below:
Stage 1: When loans are first recognised, the Company recognises an allowance based on 12mECLs. Stage 1 loans also include facilities where the credit risk has improved and the loan has been reclassified from Stage 2 or Stage 3. Stage 2: When a loan has shown a significant increase in credit risk since origination, the Company records an allowance for the LTECLs. Stage 2 loans also include facilities, where the credit risk has improved and the loan has been reclassified from Stage 3.
Stage 3: Loans considered credit-impaired. The Company records an allowance for the LTECLs.
3.5.2 The calculation of ECLs
The Company calculates ECLs to measure the expected cash shortfalls, discounted at an approximation to the EIR. A cash shortfall is the difference between the cash flows that are due to an entity in accordance with the contract and the cash flows that the entity expects to receive.
Notes forming part of the Standalone Financial Statements (Contd.) For the year ended March 31, 2022

106
Corporate Overview Financial StatementsManagement Reports
The key elements of the ECL are summarised below:
PD: The Probability of Default is an estimate of the likelihood of default over a given time horizon. A default may only happen at a certain time over the assessed period, if the facility has not been previously derecognised and is still in the portfolio.
EAD: The Exposure at Default is an estimate of the exposure at a future default date (in case of Stage 1 and Stage 2), taking into account expected changes in the exposure after the reporting date, including repayments of principal and interest, whether scheduled by contract or otherwise, expected drawdowns on committed facilities, and accrued interest from missed payments. In case of Stage 3 loans EAD represents exposure when the default occurred.
LGD: The Loss Given Default is an estimate of the loss arising in the case where a default occurs at a given time. It is based on the difference between the contractual cash flows due and those that the lender would expect to receive, including from the realisation of any collateral. It is usually expressed as a percentage of the EAD.
Impairment losses and releases are accounted for and disclosed separately from modification losses or gains that are accounted for as an adjustment of the financial asset’s gross carrying value
The mechanics of the ECL method are summarised below:
Stage 1: The 12mECL is calculated as the portion of LTECLs that represent the ECLs that result from default events on a financial instrument that are possible within the 12 months after the reporting date. The Company calculates the 12mECL allowance based on the expectation of a default occurring in the 12 months following the reporting date. These expected 12-month default probabilities are applied to a forecast EAD and multiplied by the expected LGD and discounted by an approximation to the original EIR.
Stage 2: When a loan has shown a significant increase in credit risk since origination, the Company records an allowance for the LTECLs PDs and LGDs are estimated over the lifetime of the instrument. The expected cash shortfalls are discounted by an approximation to the original EIR.
Stage 3: For loans considered credit-impaired, the Company recognises the lifetime expected credit losses for these loans. The method is similar to that for Stage 2 assets, with the PD set at 100%.
Loan commitment: When estimating LTECLs for undrawn loan commitments, the Company estimates the expected
portion of the loan commitment that will be drawn down over its expected life. The ECL is then based on the present value of the expected shortfalls in cash flows if the loan is drawn down. The expected cash shortfalls are discounted at an approximation to the expected EIR on the loan. For an undrawn loan commitment, ECLs are calculated and presented under provisions.
Other Financial assets: The Company follows 'simplified approach' for recognition of impairment loss allowance on other financial assets. The application of simplified approach does not require the Company to track changes in credit risk and calculated on case by case approach, taking into consideration different recovery scenarios.
3.5.3 Forward looking information
The Company considers a broad range of forward looking information with reference to external forecasts of economic parameters such as GDP growth, Inflation etc., as considered relevant so as to determine the impact of macro-economic factors on the Company’s ECL estimates.
The inputs and models used for calculating ECLs are recalibrated periodically through the use of available incremental and recent information. Further, internal estimates of PD, LGD rates used in the ECL model may not always capture all the characteristics of the market / external environment as at the date of the financial statements. To reflect this, qualitative adjustments or overlays are made as temporary adjustments to reflect the emerging risks reasonably.
3.6 Collateral repossessed
The Company generally does not use the assets repossessed for the internal operations. The underlying loans in respect of which collaterals have been repossessed with an intention to realize by way of sale are considered as Stage 3 assets and the ECL allowance is determined based on the estimated net realisable value of the repossessed asset. Any surplus funds are returned to the borrower and accordingly collateral repossessed are not recorded on the balance sheet and not treated as non-current assets held for sale.
3.7 Write-offs
Financial assets are written off either partially or in their entirety only when the Company has no reasonable expectation of recovery. If the amount to be written off is greater than the accumulated loss allowance, the difference recorded as an expense in the period of write off. Any subsequent recoveries are credited to impairment on financial instrument on statement of profit and loss.
Notes forming part of the Standalone Financial Statements (Contd.) For the year ended March 31, 2022

Corporate Overview Financial StatementsManagement Reports
107
3.8 Restructured, rescheduled and modified loans
The Company sometimes makes concessions or
modifications to the original terms of loans such as
changing the instalment value or changing the tenor
of the loan, as a response to the borrower’s request. The
Company considers the modification of the loan only
before the loans gets credit impaired.
When the loan has been renegotiated or modified but not
derecognised, the Company also reassesses whether there
has been a significant increase in credit risk. The Company
also considers whether the assets should be classified as
Stage 3. Once an asset has been classified as restructured,
it will remain restructured for a period of year from the
date on which it has been restructured.
Loans which have been renegotiated or modified
in accordance with RBI Notifications (including
extensions granted) - RBI/2020-21/16 DOR.No.BP.
BC/3/21.04.048/2020-21- Resolution Framework for
COVID-19 related Stress and RBI/2020-21/17 DOR.No.BP.
BC/4/21.04.048/2020-21- Micro, Small and Medium
Enterprises (MSME) sector – Restructuring of Advances,
have been classified as Stage 2 due to significant increase
in credit risk.
3.9 Derivative and Hedge accounting
Derivatives are only used for economic hedging purposes
and not as speculative investments. However, where
derivatives do not meet the hedge accounting criteria, they
are classified as ‘held for trading’ for accounting purposes
and are accounted for at FVPL.
Derivatives are initially recognised at fair value at the date
a derivative contract is entered into and are subsequently
remeasured to their fair value at each balance sheet date.
The resulting gain/loss is recognised in profit or loss
immediately unless the derivative is designated and is
effective as a hedging instrument , in which event the timing
of the recognition in profit or loss depends on the nature of
the hedge relationship.
The Company makes use of derivative instruments to
manage exposures to interest rate and foreign currency. In
order to manage particular risks, the Company applies hedge
accounting for transactions that meet specified criteria.
At the inception of a hedge relationship, the Company formally designates and documents the hedge relationship to which the Company wishes to apply hedge accounting and the risk management objective and strategy for undertaking the hedge. The documentation includes the Company’s risk management objective and strategy for undertaking hedge, the hedging/ economic relationship, the hedged item or transaction, the nature of the risk being hedged, hedge ratio and how the entity will assess the effectiveness of changes in the hedging instrument’s fair value in offsetting the exposure to changes in the hedged item’s fair value or cash flows attributable to the hedged risk. Such hedges are expected to be highly effective in achieving offsetting changes in fair value or cash flows and are assessed on an ongoing basis to determine that they actually have been highly effective throughout the financial reporting periods for which they were designated.
Hedges that meet the strict criteria for hedge accounting are accounted for as cash flow hedge
A cash flow hedge is a hedge of the exposure to variability in cash flows that is attributable to a particular risk associated with a recognised asset or liability (such as all or some future interest payments on variable rate debt) or a highly probable forecast transaction and could affect profit or loss.
For designated and qualifying cash flow hedges, the effective portion of the cumulative gain or loss on the hedging instrument is initially recognised directly in OCI within equity (cash flow hedge reserve).
The ineffective portion of the gain or loss on the hedging instrument is recognised immediately in net gain/loss on fair value changes in the profit and loss statement.
When the hedged cash flow affects the statement of profit and loss, the effective portion of the gain or loss on the hedging instrument is recorded in the corresponding income or expense line of the statement of profit and loss. When the forecast transaction subsequently results in the recognition of a non-financial asset or a non-financial liability, the gains and losses previously recognised in OCI are reversed and included in the initial cost of the asset or liability.
When a hedging instrument expires, is sold, terminated, exercised, or when a hedge no longer meets the criteria for hedge accounting, any cumulative gain or loss that has been recognised in OCI at that time remains in OCI and is recognised when the hedged forecast transaction is ultimately recognised in the statement of profit and loss. When a forecast transaction is no longer expected to occur, the cumulative gain or loss that was reported in OCI is immediately transferred to the statement of profit and loss.
Notes forming part of the Standalone Financial Statements (Contd.) For the year ended March 31, 2022

108
Corporate Overview Financial StatementsManagement Reports
3.10 Recognition of interest income
3.10.1 The effective interest rate method
Under Ind AS 109 interest income is recorded using the effective interest rate (‘EIR’) method for all financial instruments measured at amortised cost. The EIR is the rate that discounts estimated future cash receipts through the expected life of the financial instrument to the net carrying amount of the financial asset.
3.10.2 Interest Income
The EIR (and therefore, the amortised cost of the asset) is calculated by taking into account the fees and costs that are an integral part of the EIR. For credit-impaired financial assets interest income is calculated by applying the EIR to the amortised cost of the credit-impaired financial assets (i.e. the gross carrying amount less the allowance for expected credit losses).
3.11 Taxes
3.11.1 Current tax
Current tax comprises amount of tax payable in respect to the taxable income or loss for the year determined in accordance with Income Tax Act,1961 and any adjustment to tax payable or receivable in respect of prior years.
Current tax assets and liabilities for the current and prior years are measured at the amount expected to be recovered from, or paid to, the taxation authorities. The tax rates and tax laws used to compute the amount are those that are enacted, or substantively enacted, by the reporting date in the countries where the Company operates and generates taxable income.
Current tax assets and liabilities are offset only if there is a legally enforceable right to set off the recognised amounts and is intended to realise the asset and settle the liability on a net basis or simultaneously.
Current income tax relating to items recognised outside profit or loss is recognised outside profit or loss (either in other comprehensive income or in equity). Current tax items are recognised in correlation to the underlying transaction either in OCI or directly in equity. Management periodically evaluates positions taken in the tax returns with respect to situations in which applicable tax regulations are subject to interpretation and establishes provisions where appropriate.
3.11.2 Deferred Tax
Deferred tax is provided on temporary differences at the reporting date between the tax bases of assets and
liabilities and their carrying amounts for financial reporting purposes.
Deferred tax liabilities are recognised for all taxable temporary differences. Deferred tax assets are recognised to the extent that it is probable that taxable profit will be available against which the deductible temporary differences, and the carry forward of unused tax credits and unused tax losses can be utilised.
The carrying amount of deferred tax assets is reviewed at each reporting date and reduced to the extent that it is no longer probable that sufficient taxable profit will be available to allow all or part of the deferred tax asset to be utilised. Unrecognised deferred tax assets are re-assessed at each reporting date and are recognised to the extent that it has become probable that future taxable profits will allow the deferred tax asset to be recovered.
Deferred tax assets and liabilities are measured at the tax rates that are expected to apply in the year when the asset is realised or the liability is settled, based on tax rates (and tax laws) that have been enacted or substantively enacted at the reporting date. Deferred tax relating to items recognised outside profit or loss is recognised outside profit or loss (either in other comprehensive income or in equity). Deferred tax items are recognised in correlation to the underlying transaction either in OCI or directly in equity.
Deferred tax assets and deferred tax liabilities are offset if a legally enforceable right exists to set off current tax assets against current tax liabilities and the deferred taxes relate to the same taxable entity and the same taxation authority and intends to settle on net basis.
3.12 Investment Property
Investment property represents property held to earn rentals or for capital appreciation or both.
Investment properties are measured initially at cost, including transaction costs. Subsequent to initial recognition, investment properties are stated at cost less accumulated depreciation and accumulated impairment loss, if any.
Depreciation on building classified as investment property has been provided on the straight-line method over a period of 60 years based on the Company’s estimate of their useful lives taking into consideration technical factors, which is the same as the period prescribed in Sch II to the Companies Act 2013.
Though the Company measures investment property using cost based measurement, the fair value of
Notes forming part of the Standalone Financial Statements (Contd.) For the year ended March 31, 2022

Corporate Overview Financial StatementsManagement Reports
109
investment property is disclosed in the notes. Fair values are determined based on an annual evaluation performed by an external independent valuer applying valuation models.
Investment properties are derecognised either when they have been disposed of or when they are permanently withdrawn from use and no future economic benefit is expected from their disposal. The difference between the net disposal proceeds and the carrying amount of the asset is recognised in the statement of profit and loss in the period of derecognition.
3.13 Property, plant and equipment
Property plant and equipment is stated at cost (net of tax/duty credits availed) excluding the costs of day–to–day servicing, less accumulated depreciation and accumulated impairment in value. Cost includes professional fees/charges related to acquisition of property plant and equipment. Changes in the expected useful life are accounted for by changing the amortisation period or methodology, as appropriate, and treated as changes in accounting estimates.
Subsequent expenditure incurred, is capitalised only if it results in economic useful life beyond the original estimate.
Depreciation is calculated using the straight–line method to write down the cost of property and equipment to their residual values over their estimated useful lives. Land is not depreciated.
Useful life of assets as per Schedule II:
Useful life of assets based on Management’s estimation and which are different from those specified in schedule II:
*The Company, based on technical assessment made by technical expert and management estimate, depreciates Furniture & Fixtures and vehicles over estimated useful lives which are different from the useful life prescribed in Schedule II to the Companies Act, 2013
The residual values, useful lives and methods of depreciation of property, plant and equipment are
reviewed at each financial year end and adjusted prospectively, if appropriate.
Assets individually costing less than or equal to ` 5,000 are fully depreciated in the year of acquisition
Property plant and equipment is derecognised on disposal or when no future economic benefits are expected from its use. Any gain or loss arising on derecognition of the asset (calculated as the difference between the net disposal proceeds and the carrying amount of the asset) is recognised in other income / expense in the statement of profit and loss in the year the asset is derecognised. The date of disposal of an item of property, plant and equipment is the date the recipient obtains control of that item in accordance with the requirements for determining when a performance obligation is satisfied in Ind AS 115.
3.14 Intangible assets
The Company’s intangible assets mainly include the value of computer software.
An intangible asset is recognised only when its cost can be measured reliably and it is probable that the expected future economic benefits that are attributable to it will flow to the Company.
Intangible assets acquired separately are measured on initial recognition at cost. Subsequently, they are carried at cost less accumulated amortisation and impairment losses if any, and are amortised over their estimated useful life on the straight-line basis over a 3-year period or the license period whichever is lower.
The carrying amount of the assets is reviewed at each Balance sheet date to ascertain impairment based on internal or external factors. Impairment is recognised, if the carrying value exceeds the higher of the net selling price of the assets and its value in use.
3.15 Impairment of non–financial assets
The Company assesses, at each reporting date, whether there is an indication that an asset may be impaired. If any indication exists, or when annual impairment testing for an asset is required, the Company estimates the asset’s recoverable amount. An asset’s recoverable amount is the higher of an asset’s or cash-generating unit’s (CGU) fair value less costs of disposal and its value in use. Recoverable amount is determined for an individual asset, unless the asset does not generate cash inflows that are largely independent of those from other assets or Group of assets. When the carrying amount of an asset or CGU exceeds its recoverable amount, the asset is considered impaired and is written down to its recoverable amount.
Asset Description Estimated Useful Life Furniture and Fixtures* 5 years Vehicles* 5 years
Asset Description Estimated Useful Life Buildings 60 years Computer Equipment 3 years Other Equipment 5 years Leasehold improvements Lease period or 5 years whichever is lower
Notes forming part of the Standalone Financial Statements (Contd.) For the year ended March 31, 2022

110
Corporate Overview Financial StatementsManagement Reports
In assessing value in use, the estimated future cash flows are discounted to their present value using a pre-tax discount rate that reflects current market assessments of the time value of money and the risks specific to the asset. In determining fair value less costs of disposal, recent market transactions are taken into account. If no such transactions can be identified, an appropriate valuation model is used. These calculations are corroborated by valuation multiples, quoted share prices for publicly traded companies or other available fair value indicators.
The Company bases its impairment calculation on detailed budgets and forecast calculations, which are prepared separately for each of the Company’s CGUs to which the individual assets are allocated. These budgets and forecast calculations generally cover a period of five years. For longer periods, a long-term growth rate is calculated and applied to project future cash flows after the fifth year. To estimate cash flow projections beyond periods covered by the most recent budgets/forecasts, the Company extrapolates cash flow projections in the budget using a steady or declining growth rate for subsequent years, unless an increasing rate can be justified. In any case, this growth rate does not exceed the long-term average growth rate for the products, industries, or country or countries in which the entity operates, or for the market in which the asset is used.
Impairment losses of continuing operations, are recognised in the statement of profit and loss.
For assets excluding goodwill, an assessment is made at each reporting date to determine whether there is an indication that previously recognised impairment losses no longer exist or have decreased. If such indication exists, the Company estimates the asset’s or CGU’s recoverable amount. A previously recognised impairment loss is reversed only if there has been a change in the assumptions used to determine the asset’s recoverable amount since the last impairment loss was recognised. The reversal is limited so that the carrying amount of the asset does not exceed its recoverable amount, nor exceed the carrying amount that would have been determined, net of depreciation, had no impairment loss been recognised for the asset in prior years. Such reversal is recognised in the statement of profit or loss unless the asset is carried at a revalued amount, in which case, the reversal is treated as a revaluation increase.
3.16 Employee benefits
(i) Short-term obligations
Liabilities for wages and salaries, including non-monetary benefits that are expected to be settled wholly within 12
months after the end of the period in which the employees render the related service are recognised in respect of employees’ services up to the end of the reporting period and are measured at the amounts expected to be paid when the liabilities are settled. The liabilities are presented as employee benefit obligations in the balance sheet.
(ii) Post-employment obligations
The company operates the following post-employment schemes:
(a) defined contribution plans such as provident fund
(b) defined benefit plans such as gratuity, pension, post-employment medical plans
a) Defined Contribution Scheme
Retirement benefit in the form of provident fund is a defined contribution scheme. The Company has no obligation, other than the contribution payable to the provident fund. The Company recognises contribution payable to the provident fund scheme as an expense, when an employee renders the related service. If the contribution payable to the scheme for service received before the balance sheet date exceeds the contribution already paid, the deficit payable to the scheme is recognised as a liability after deducting the contribution already paid. If the contribution already paid exceeds the contribution due for services received before the balance sheet date, then excess is recognised as an asset to the extent that the pre-payment will lead to, for example, a reduction in future payment or a cash refund.
Employees’ State Insurance: The Company contributes to Employees State Insurance Scheme and recognizes such contribution as an expense in the Statement of Profit and Loss in the period when services are rendered by the employees.
Superannuation: The Company contributes a sum equivalent to 15% of eligible employees’ salary to a Superannuation Fund administered by trustees and managed by Life Insurance Corporation of India (“LIC”). The Company has no liability for future Superannuation Fund benefits other than its contribution and recognizes such contributions as an expense in the Statement of Profit and Loss in the period when services are rendered by the employees.
b) Defined Benefit Scheme
Gratuity: The Company makes contribution to a Gratuity Fund administered by trustees and managed by LIC. The Company accounts its liability for future gratuity benefits based on actuarial valuation, as at the Balance Sheet date, determined every year by an independent actuary using the Projected Unit Credit method.
Notes forming part of the Standalone Financial Statements (Contd.) For the year ended March 31, 2022

Corporate Overview Financial StatementsManagement Reports
111
Re-measurements, comprising of actuarial gains and losses, the effect of the asset ceiling, excluding amounts included in net interest on the net defined benefit liability and the return on plan assets (excluding amounts included in net interest on the net defined benefit liability), are recognised immediately in the balance sheet with a corresponding debit or credit to retained earnings through OCI in the period in which they occur. Remeasurements are not reclassified to profit or loss in subsequent periods.
Past service costs are recognised in profit or loss on the earlier of:
• The date of the plan amendment or curtailment, and
• The date that the Company recognises related restructuring costs
Net interest is calculated by applying the discount rate to the net defined benefit liability or asset. The Company recognises the following changes in the net defined benefit obligation as an expense in the statement of profit and loss:
• Service costs comprising current service costs, past-service costs, gains and losses on curtailments and non-routine settlements; and
• Net interest expense or income
c)Compensated Absences : The Company treats its liability for compensated absences based on actuarial valuation as at the Balance Sheet date, determined by an independent actuary using the Projected Unit Credit method.
Actuarial gains and losses are recognised in the Statement of Profit and Loss in the year in which they occur and not deferred.
3.17 Share Based Payments
Stock options are granted to the employees under the stock option scheme. The costs of stock options granted to the employees (equity-settled awards) of the Company are measured at the fair value of the equity instruments granted. For each stock option, the measurement of fair value is performed on the grant date. The grant date is the date on which the Company and the employees agree to the stock option scheme. The fair value so determined is revised only if the stock option scheme is modified in a manner that is beneficial to the employees.
This cost is recognised, together with a corresponding increase in share-based payment (SBP) reserves in equity, over the period in which the performance and/or service conditions are fulfilled in employee benefits expense. The cumulative expense recognised for equity-settled transactions at each reporting date until the vesting date reflects the extent to which the vesting period has expired and the Company’s best estimate of the number of equity instruments that will ultimately vest. The statement of
profit and loss expense or Credit for a period represents the movement in cumulative expense recognised as at the beginning and end of that period and is recognised in employee benefits expense. On cancellation or lapse of options granted to employees, the compensation charged to statement of profit and loss is credited with corresponding decrease in equity.
The dilutive effect of outstanding options is reflected as additional share dilution in the computation of diluted earnings per share.
If the options vests in instalments (i.e. the options vest pro rata over the service period), then each instalment is treated as a separate share option grant because each instalment has a different vesting period.
3.18 Provisions and Contingent liabilities
Provisions are recognised only when the Company has a present obligation (legal or constructive) as a result of past events, and it is probable that an outflow of resources embodying economic benefits will be required to settle the obligation, and a reliable estimate can be made of the amount of the obligation. When the effect of the time value of money is material, the Company determines the level of provision by discounting the expected cash flows at a pre-tax rate reflecting the current rates specific to the liability. The expense relating to any provision is presented in the statement of profit and loss net of any reimbursement.
Provision are reviewed at each balance sheet date and adjusted to reflect the current best estimate. If it is no longer probable that an outflow of resources would be required to settle the obligation, the provision is reversed
Contingent liability is disclosed in case of present obligation arising from past events, when it is not probable that an outflow of resources will be required to settle the obligations and the present obligation arising from past events, when no reliable estimate is possible.
3.19 Dividends on ordinary shares
The Company recognises a liability to make cash distributions to equity holders when the distribution is authorised and the distribution is no longer at the discretion of the Company. As per the Companies Act, 2013 in India, a distribution is authorised when it is approved by the shareholders. A corresponding amount is recognised directly in equity.
3.20 Determination of Fair value
The Company measures financial instruments, such as, derivatives at fair value at each balance sheet date.
Fair value is the price that would be received to sell an asset or paid to transfer a liability in an orderly transaction between market participants at the measurement date.
Notes forming part of the Standalone Financial Statements (Contd.) For the year ended March 31, 2022

112
Corporate Overview Financial StatementsManagement Reports
The fair value measurement is based on the presumption that the transaction to sell the asset or transfer the liability takes place either:
• In the principal market for the asset or liability, or • In the absence of a principal market, in the most advantageous market for the asset or liability The principal or the most advantageous market must be
accessible by the Company. The fair value of an asset or a liability is measured using
the assumptions that market participants would use when pricing the asset or liability, assuming that market participants act in their economic best interest.
A fair value measurement of a non-financial asset takes into account a market participant’s ability to generate economic benefits by using the asset in its highest and best use or by selling it to another market participant that would use the asset in its highest and best use.
The Company uses valuation techniques that are appropriate in the circumstances and for which sufficient data are available to measure fair value, maximising the use of relevant observable inputs and minimising the use of unobservable inputs.
In order to show how fair values have been derived, financial instruments are classified based on a hierarchy of valuation techniques, as summarised below:
• Level 1 financial instruments - Those where the inputs used in the valuation are unadjusted quoted prices from active markets for identical assets or liabilities that the Company has access to at the measurement date. The Company considers markets as active only if there are sufficient trading activities with regards to the volume and liquidity of the identical assets or liabilities and when there are binding and exercisable price quotes available on the balance sheet date.
• Level 2 financial instruments - Those where the inputs that are used for valuation and are significant, are derived from directly or indirectly observable market data available over the entire period of the instrument’s life. Such inputs include quoted prices for similar assets or liabilities in active markets, quoted prices for identical instruments in inactive markets and observable inputs other than quoted prices such as interest rates and yield curves, implied volatilities, and credit spreads. In addition, adjustments may be required for the condition or location of the asset or the extent to which it relates to items that are comparable to the valued instrument. However, if such adjustments are based on unobservable inputs which are significant to the entire measurement, the Company will classify the instruments as Level 3.
• Level 3 financial instruments - Those that include one or more unobservable input that is significant to the measurement as whole.
For assets and liabilities that are recognised in the financial statements on a recurring basis, the Company determines whether transfers have occurred between levels in the hierarchy by re-assessing categorisation (based on the lowest level input that is significant to the fair value measurement as a whole) at the end of each reporting period.
The Company evaluates the levelling at each reporting period on an instrument-by-instrument basis and reclassifies instruments when necessary based on the facts at the end of the reporting period.
3.21 Recognition of Income
Revenue (other than for those items to which Ind AS 109 Financial Instruments are applicable) is measured at fair value of the consideration received or receivable.
The Company recognises revenue from contracts with customers based on a five-step model as set out in Ind 115:
Step 1: Identify contract(s) with a customer: A contract is defined as an agreement between two or more parties that creates enforceable rights and obligations and sets out the criteria for every contract that must be met.
Step 2: Identify performance obligations in the contract: A performance obligation is a promise in a contract with a customer to transfer a good or service to the customer.
Step 3: Determine the transaction price: The transaction price is the amount of consideration to which the Company expects to be entitled in exchange for transferring promised goods or services to a customer, excluding amounts collected on behalf of third parties.
Step 4: Allocate the transaction price to the performance obligations in the contract: For a contract that has more than one performance obligation, the Company allocates the transaction price to each performance obligation in an amount that depicts the amount of consideration to which the Company expects to be entitled in exchange for satisfying each performance obligation.
Step 5: Recognise revenue when (or as) the Company satisfies a performance obligation.
3.21.1 Interest on overdue balances and Other Charges
Overdue interest in respect of loans is recognised upon realisation.
Notes forming part of the Standalone Financial Statements (Contd.) For the year ended March 31, 2022

Corporate Overview Financial StatementsManagement Reports
113
3.21.2 Fee Income & Sale of Service
a) Fee income from loans are recognised upon satisfaction of following:
i) Completion of service
ii) and realisation of the fee income.
b) Servicing and collections fees on assignment are recognised upon completion of service.
c) Advertising income is recognised over the contract period as and when related services are rendered.
3.22 Dividend Income
Dividend income (including from FVOCI investments) is recognised when the Company’s right to receive the payment is established and it is probable that the economic benefits associated with the dividend will flow to the entity and the amount of the dividend can be measured reliably. This is generally when the shareholders of the investee company approve the dividend.
3.23 Input Tax credit (Goods and Service Tax)
Input Tax Credit is accounted for in the books in the period when the underlying service / supply received is accounted to the extent permitted as per the applicable regulatory laws and when there is no uncertainty in availing / utilising the same. The ineligible input credit is charged off to the respective expense or capitalised as part of asset cost as applicable.
3.24 Foreign Currency transactions
The Company’s financial statements are presented in Indian Rupees (INR) which is also the Company’s functional currency.
Transactions in foreign currencies are initially recorded by the Company at their respective functional currency spot rates at the date the transaction first qualifies for recognition.
Foreign currency denominated monetary assets and liabilities are translated at the functional currency spot rates of exchange at the reporting date and exchange gains and losses arising on settlement and restatement are recognized in the statement of profit and loss.
Foreign exchange differences are regarded as an adjustment to borrowing cost are presented in the statement of profit and loss within finance cost.
Non-monetary items that are measured in terms of historical cost in a foreign currency are translated using the exchange rates at the dates of the initial transactions. Non-monetary items measured at fair value in a foreign currency are translated using the exchange rates at the date when the fair value is determined. The gain or loss arising on translation of non-monetary items measured at fair value is treated in line with the recognition of the gain or loss on the change in fair value of the item (i.e., translation differences on items whose
fair value gain or loss is recognized in OCI or profit or loss are also recognized in OCI or profit or loss, respectively).
3.25 Earnings Per Share
Basic Earnings Per Share is calculated by dividing the net profit or loss for the period attributable to equity shareholders by the weighted average number of equity shares outstanding during the period.
Earnings considered for Earnings per share is the net profit for the period after deducting preference dividend, if any, and attributable tax thereto for the period.
The weighted average number of equity shares outstanding during the period and for all periods presented is adjusted for events, such as bonus shares, other than the conversion of potential equity shares, that have changed the number of equity shares outstanding, without a corresponding change in resources. For the purpose of calculating diluted earnings per share, the net profit or loss for the period attributable to equity shareholders and the weighted average number of shares outstanding during the period is adjusted for the effects of all dilutive potential equity shares.
3.26 Segment Information
An operating segment is a component of the Company that engages in the business activities from which it may earn revenues and incur expenses , whose operating results are regularly reviewed by Company’s executive vice president and Chief Financial officer(“Chief operating decision maker”)
Revenue and expenses have been identified to segments on the basis of their relationship to the operating activities of the Segment. Revenue and expenses, which relate to the enterprise as a whole and are not allocable to Segments on a reasonable basis have been included under “Un-allocable”.
Assets and liabilities have been identified to segments on the basis of their relationship to the operating activities of the Segment. Assets and liabilities, which relate to the enterprise as a whole and are not allocable to Segments on a reasonable basis have been included under “Un-allocable”.
3.27 Cash Flow Statement
Cash flows are reported using the indirect method, where by profit / (loss) before tax is adjusted for the effects of transactions of non-cash nature and any deferrals or accruals of past or future cash receipts or payments
For the purpose of the Statement of Cash Flows, cash and cash equivalents as defined above, net of outstanding
Notes forming part of the Standalone Financial Statements (Contd.) For the year ended March 31, 2022

114
Corporate Overview Financial StatementsManagement Reports
bank overdrafts as they are considered an integral part of cash management of the Company.
3.28 Cash and Cash equivalents
Cash and cash equivalent in the balance sheet comprise cash at banks and on hand and short-term deposits with an original maturity of three months or less, which are subject to an insignificant risk of changes in value.
3.29 Leases
The Company’s lease asset consists of leases for buildings. The Company assesses whether a contract contains a lease, at inception of a contract. A contract is, or contains, a lease if the contract conveys the right to control the use of an identified asset for a period of time in exchange for consideration. To assess whether a contract conveys the right to control the use of an identified asset, the Company assesses whether: (i) the contract involves the use of an identified asset (ii) the Company has substantially all of the economic benefits from the use of the asset through the period of the lease and (iii) the Company has the right to direct the use of the asset.
At the date of commencement of the lease, the Company recognises a right-to-use asset and a corresponding lease liability for all lease arrangements in which it is a lessee, except for leases with a term of twelve months or less (short-term leases) and low value leases. For these short-term and low value leases, the Company recognises the lease payments as an operating expense on a straight-line basis over the term of the lease.
The right-to-use asset is initially recognised at cost which comprises of the initial amount of lease liability adjusted for lease payments made or prior to commencement date plus any direct cost i.e. lease incentives. They are subsequently measured at cost less accumulated depreciation and impairment loss if any.
Certain lease arrangements include the options to extend or terminate the lease before the end of the lease term. ROU assets and lease liabilities includes these options when it is reasonably certain that they will be exercised.
Right-to-Use assets are depreciated from the commencement date on a straight-line basis over the shorter of the lease term. Right to use assets are evaluated for recoverability whenever events or changes in the circumstances indicate that their carrying amounts may not be recoverable.
The lease liability is initially measured at amortised cost at the present value of the future lease payments. The lease payments are discounted using the incremental borrowing rates in the country of domicile of the leases. The Company
has used single discount rate to a portfolio of leases with similar characteristics. Lease liabilities are remeasured with a corresponding adjustment to the related right to use asset if the Company changes its assessment if the whether it will exercise an extension or a termination option.
The Company has opted to presented the Right to use as a part of the block of asset to which the lease pertains to and consequently, the Right to use asset has been presented as a part of Property, plant and equipment under the Buildings block, whereas the lease liability is presented under Other Financial Liabilities in the Balance Sheet. Lease payments made by the Company are classified as financing cash flows.
The Company applies the short-term lease recognition exemption to its short-term leases of Buildings (i.e., those leases that have a lease term of 12 months or less from the commencement date and do not contain a purchase option). Lease payments on short-term leases are recognised as expense on a straight-line basis over the lease term.
4A. Significant accounting judgements, estimates and assumptions
The preparation of the Company’s financial statements requires management to make judgements, estimates and assumptions that affect the reported amount of revenues, expenses, assets and liabilities, and the accompanying disclosures, as well as the disclosure of contingent liabilities. Uncertainty about these assumptions and estimates could result in outcomes that require a material adjustment to the carrying amount of assets or liabilities affected in future period
In the process of applying the Company’s accounting policies, management has made the following judgements/estimates, which have a significant risk of causing a material adjustment to the carrying amounts of assets and liabilities within the next financial year.
i Business Model Assessment
The Company from time to time enters into direct bilateral assignment deals, which qualify for de-recognition under Ind AS 109. Accordingly, the assessment of the Company’s business model for managing its financial assets becomes a critical judgment.
Further, the Company also made an investment in the Government securities in order to comply the liquidity ratio compliance as required by RBI pursuant to its master directions. The Company intends to hold these assets till maturity expects that any sale if any necessitated by requirements are likely to be infrequent and immaterial.
Notes forming part of the Standalone Financial Statements (Contd.) For the year ended March 31, 2022

Corporate Overview Financial StatementsManagement Reports
115
Accordingly the related assessment becomes a critical judgement to determine the business model for such financial assets under Ind AS.
Refer Note 3.2.1.1 for related details.
ii Fair value of financial instruments
The fair value of financial instruments is the price that would be received to sell an asset or paid to transfer a liability in an orderly transaction in the principal (or most advantageous) market at the measurement date under current market conditions (i.e., an exit price) regardless of whether that price is directly observable or estimated using another valuation technique. When the fair values of financial assets and financial liabilities recorded in the balance sheet cannot be derived from active markets, they are determined using a variety of valuation techniques that include the use of valuation models. The inputs to these models are taken from observable markets where possible, but where this is not feasible, estimation is required in establishing fair values. Judgements and estimates include considerations of liquidity and model inputs related to items such as credit risk (both own and counterparty), funding value adjustments, correlation and volatility. For further details about determination of fair value please see Fair value note in Accounting policy
iii Impairment of financial asset
The measurement of impairment losses across all categories of financial assets requires judgement, in particular, the estimation of the amount and timing of future cash flows and collateral values when determining impairment losses and the assessment of a significant increase in credit risk. These estimates are driven by a number of factors, changes in which can result in different levels of allowances.
The Company’s ECL calculations are outputs of complex models with a number of underlying assumptions regarding the choice of variable inputs and their interdependencies. Elements of the ECL models that are considered accounting estimates include:
• The Company’s criteria for assessing if there has been a significant increase in credit risk and so allowances for financial assets should be measured on a LTECL basis and the qualitative assessment
• The segmentation of financial assets when their ECL is assessed on a collective basis
• Development of ECL models, including the various formulas and the choice of inputs
• Determination of temporary adjustments as qualitative adjustment or overlays based on broad range of forward looking information as economic inputs.
The Company has considered the impact of COVID-19 pandemic and the moratorium given to borrowers pursuant to the COVID-19 regulatory package announced by Reserve Bank of India, in determination of impairment allowance for the year. Also refer note 2.3.It has been the Company’s policy to regularly review its models in the context of actual loss experience and adjust when necessary.
iv. Leases
a. Determining the lease term of contracts with renewal and termination options – Company as lessee
The Company determines the lease term as the non-cancellable term of the lease, together with any periods covered by an option to extend the lease if it is reasonably certain to be exercised, or any periods covered by an option to terminate the lease, if it is reasonably certain not to be exercised. The Company applies judgement in evaluating whether it is reasonably certain whether or not to exercise the option to renew or terminate the lease. That is, it considers all relevant factors that create an economic incentive for it to exercise either the renewal or termination.
b. Estimating the incremental borrowing rate
The Company cannot readily determine the interest rate implicit in the lease, therefore, it uses its incremental borrowing rate (IBR) to measure lease liabilities. The IBR is the rate of interest that the Company would have to pay to for its borrowings.
v Provisions and other contingent liabilities
When the Company can reliably measure the outflow of economic benefits in relation to a specific case and considers such outflows to be probable, the Company records a provision against the case. Where the probability of outflow is considered to be remote, or probable, but a reliable estimate cannot be made, a contingent liability is disclosed.
Given the subjectivity and uncertainty of determining the probability and amount of losses, the Company takes into account a number of factors including legal advice, the stage of the matter and historical evidence from similar incidents. Significant judgement is required to conclude on these estimates.
Notes forming part of the Standalone Financial Statements (Contd.) For the year ended March 31, 2022

116
Corporate Overview Financial StatementsManagement Reports
Notes forming part of the Standalone Financial Statements (Contd.) For the year ended March 31, 2022
4B. New Standards and amendments
(i) Interest Rate Benchmark Reform – Amendments to Ind AS 107 and Ind AS 109:
The Ministry of Corporate Affairs had earlier notified amendments to Ind AS 109, Financial Instruments and Ind AS 107, Financial Instruments: Disclosures which were effective from April 1, 2020 (the Phase 1 amendments). Those amendments provided temporary reliefs from applying specific hedge accounting requirements to relationships affected by IBOR reform.
The amendments to Ind AS 109, Financial Instruments and Ind AS 107, Financial Instruments: Disclosures which are effective from April 1, 2021 (the Phase 2 amendments) address the issues that arise during the reform of an interest rate benchmark rate, including the replacement of one benchmark rate with an alternative one.
The key reliefs provided by the Phase 2 amendments are as follows:
• Changes to contractual cash flows
When changing the basis for determining contractual cash flows for financial assets and liabilities (including lease liabilities), the reliefs have the effect that the changes, that are necessary as a direct consequence of IBOR reform and which are considered economically equivalent, will not result in an immediate gain or loss in profit and loss.
• Hedge accounting
The hedge accounting reliefs will allow most Ind AS 109 hedge relationships that are directly affected by IBOR reform to continue. However, additional ineffectiveness might need to be recorded.
This amendment had no significant impact on the financial statements of the Company
The amendments provide relief to lessees from applying Ind AS 116 guidance on lease modification accounting for rent concessions arising as a direct consequence of the COVID-19 pandemic. As a practical expedient, a lessee may elect not to assess whether a COVID-19 related
rent concession from a lessor is a lease modification. A
lessee that makes this election accounts for any change
in lease payments resulting from the COVID-19 related
rent concession the same way it would account for the
change under Ind AS 116, if the change were not a lease
modification.
The amendments are applicable for annual reporting
periods beginning on or after the 1 April 2020. In case,
a lessee has not yet approved the financial statements
for issue before the issuance of this amendment, then
the same may be applied for annual reporting periods
beginning on or after the 1 April 2019.
This amendment had no significant impact on the
consolidated financial statements of the Company
(ii) COVID-19-related Rent Concessions – Amendments to Ind AS 116
As a result of the COVID-19 pandemic, rent concessions
have been granted to lessees. Such concessions might
take a variety of forms, including payment holidays and
deferral of lease payments. Previously, an amendment to
Ind AS 116, Leases provided lessees with an option to treat
qualifying rent concessions in the same way as they would
if they were not lease modifications. In many cases, this
will result in accounting for the concessions as variable
lease payments in the period in which they are granted.
Entities applying the practical expedients must disclose
this fact, whether the expedient has been applied to all
qualifying rent concessions or, if not, information about
the nature of the contracts to which it has been applied,
as well as the amount recognised in profit or loss arising
from the rent concessions. The relief was originally limited
to reduction in lease payments that were due on or before
30 June 2021. However, it was subsequently extended to
30 June 2022

Corporate Overview Financial StatementsManagement Reports
117
` in lakhs
` in lakhs
` in lakhs
Note : 5 CASH AND CASH EQUIVALENTS Cash on hand 1,603 3,179 Balances with banks - In Current Accounts 11,506 1,38,636 - In Deposit Accounts - Original maturity of 3 months or less 2,50,034 - Cheques, drafts on hand 2,645 2,970Total 2,65,788 1,44,785
Note : 6 BANK BALANCES OTHER THAN CASH AND CASH EQUIVALENTS - In Deposit Accounts - Original maturity more than 3 months 1,08,302 2,78,758 - In earmarked accounts - Margin account for derivatives 13,913 10,585 - In Unpaid Dividend Accounts 71 74 - Deposits with Banks as collateral towards securitisation loan 33,907 31,978 - Deposits with Banks as collateral towards Overdraft facility (Refer note18) - 57,000 - Escrow account on unclaimed debentures 19 - - Other deposit Account on amalgamation of Cholamandalam Factoring Limited 8 8Total 1,56,220 3,78,403
Part I
(i) Other derivatives - Cross Currency Interest Rate Swap 1,89,723 10,809 - 2,34,373 2,634 914
(ii) Overnight Index Swaps - - 282 - - -
(iii) Forward Contracts 1,94,890 7,844 16,674 1,40,286 1,953 11,828
Total Derivative financial Instruments 3,84,613 18,653 16,956 3,74,659 4,587 12,742
Part II
Included in above (Part I) are derivatives held for
hedging and risk management purposes as follows:
(i) Cash flow hedging:
Others - Cross currency interest rate swap 1,89,723 10,809 - 2,34,373 2,634 914
(ii) Interest rate Swaps - - 282 - - -
(iii) Forward Contracts 1,94,890 7,844 16,674 1,40,286 1,953 11,828
Total Derivative financial Instruments 3,84,613 18,653 16,956 3,74,659 4,587 12,742
Particulars As at As at March 31, 2022 March 31, 2021
Particulars As at As at March 31, 2022 March 31, 2021
Particulars Notional Fair Fair Notional Fair Fair amounts Value Value amounts Value Value -Assets -Liabilites -Assets -Liabilites
As at March 31, 2022 As at March 31, 2021
Note : 7 DERIVATIVE FINANCIAL INSTRUMENTS
The Company has a Board approved policy for entering into derivative transactions. Derivative transaction comprises of Currency, Interest Rate Swaps and forward contracts. The Company undertakes such transactions for hedging interest / foreign exchange risk on borrowing. The Asset Liability Management Committee and Business Committee periodically monitors and reviews the risks involved.The notional amount for interest rate swap represents the foreign currency borrowing on which Company has entered to hedge the variable interest rate.
Notes forming part of the Standalone Financial Statements (Contd.) For the year ended March 31, 2022

118
Corporate Overview Financial StatementsManagement Reports
` in lakhs
` in lakhs
Note : 8 RECEIVABLES (Unsecured)(i) Trade Receivables Considered Good* 3,247 2,031Subtotal (i) 3,247 2,031(ii) Other Receivables Considered Good* 9,554 4,612 Subtotal (ii) 9,554 4,612 Total (i)+(ii) 12,801 6,643
Note : 9 LOANS (At amortised cost)(A)(i) Bills Discounted 37,099 13,417(ii) Term loans 76,10,690 68,14,958 Total (A) - Gross 76,47,789 68,28,375Less: Impairment Allowance for (i) & (ii) (2,32,868) (2,44,441) Total (A) - Net 74,14,921 65,83,934 (B)(i) Secured by tangible assets 75,08,560 67,85,357(ii) Unsecured 1,39,229 43,018 Total (B) - Gross 76,47,789 68,28,375Less: Impairment Allowance for (i) & (ii) (2,32,868) (2,44,441) Total (B) - Net 74,14,921 65,83,934(C)(I) Loans In India(i) Public Sector - -(ii) Others 76,47,789 68,28,375Less: Impairment Allowance (2,32,868) (2,44,441) Total ( C)(I) - Net 74,14,921 65,83,934
Particulars As at As at March 31, 2022 March 31, 2021
Particulars As at As at March 31, 2022 March 31, 2021
*Includes dues from related parties (Refer Note 37)No trade or other receivable are due from directors or other officers of the company either severally or jointly with any other person.*Respective ageing was given in note 50A
All loans are in India and have been granted to individuals or entities other than public sectorThe Company has not granted loans and advances in the nature of loans to Promoters, Directors , Key Managerial Personnel or related parties u/s2(76) either repayable on demand or without specifying terms/period. Refer related party disclosure(Note 37)Secured indicates loans secured, wholly or partly, by way of hypothecation of automobile assets and / or pledge of securities and / or equitable mortgage of property and / or equipment and including undertaking to create a security.Term loans includes unsecured short term loans to a subsidiary and associate. These loans have been classified under Stage 1 Category at the various reporting periods and related impairment provision as per the Company's accounting policy has been created. The details of the same are disclosed below:
Notes forming part of the Standalone Financial Statements (Contd.) For the year ended March 31, 2022
` in lakhs Particulars As at As at March 31, 2022 March 31, 2021Loan - Outstanding Value Cholamandalam Securities Limited 450 - White Data System India Private Limited 300 340Impairment AllowanceCholamandalam Securities Limited - -White Data System India Private Limited* * ** Represents amount less than ` 1,00,000

Corporate Overview Financial StatementsManagement Reports
119
` in lakhs
Stage 1 Stage 2 Stage 3 Total Stage 1 Stage 2 Stage 3 Total
Gross Carrying amount Impairment allowance
Bills discountedOpening as on April 1, 2021 9,678 - 3,739 13,417 57 - 3,434 3,491 New assets originated 33,290 39 - 33,329 270 4 - 274 Exposure de-recognised /matured/repaid (9,332) - (315) (9,647) (75) - (221) (296)Transfer to Stage 1 71 - (71) - 21 - (21) - Transfer to Stage 2 - - - - - - - - Transfer to Stage 3 (416) - 416 - (2) - 2 - Impact on account of exposures transferred - - - - - - 118 118 during the period between stagesImpact of changes on items within the - - - - - - 166 166 same stageClosing as on March 31, 2022 33,291 39 3,769 37,099 271 4 3,478 3,753Term loansOpening as on April 1, 2021 61,25,086 4,23,110 2,66,762 68,14,958 53,673 70,963 1,16,315 2,40,951 New assets originated 32,21,557 13,708 8,464 32,43,729 16,917 1,359 1,182 19,458 Exposure de-recognised /matured/repaid (20,99,167) (2,16,387) (78,580) (23,94,134) (36,643) (26,255) (15,211) (78,109)Transfer to Stage 1 50,781 (39,278) (11,503) - 10,106 (6,801) (3,305) - Transfer to Stage 2 (4,77,609) 4,83,290 (5,681) - (7,437) 9,024 (1,587) - Transfer to Stage 3 (1,11,057) (70,302) 1,81,359 - (2,181) (12,310) 14,491 - Impact on account of exposures transferred 117 4,888 7,706 12,711 - 38,427 44,058 82,485 during the period between stagesImpact of changes on items within 19,839 3,205 9,930 32,974 1,311 218 11,617 13,146 the same stageWrite off* (31,077) (20,526) (47,945) (99,548) (1,726) (8,667) (38,423) (48,816)Closing as on March 31, 2022 66,98,470 5,81,708 3,30,512 76,10,690 34,020 65,958 1,29,137 2,29,115Bills DiscountedOpening as on April 1, 2020 5,142 42 3,414 8,598 31 4 3,173 3,208 New assets originated 9,678 - 430 10,108 57 - 125 182 Exposure de-recognised /matured/repaid (5,142) - (147) (5,289) (31) (103) (134)Transfer to Stage 3 - (42) 42 - - (4) 4 - Impact on account of exposures transferred - - - - - - 38 38 during the year between stages (net)Impact of changes on items within the - - - - - - 197 197 same stage (net)Closing as on March 31, 2021 9,678 - 3,739 13,417 57 - 3,434 3,491Term loansOpening as on April 1, 2020 52,69,032 2,02,024 2,12,916 56,83,972 39,091 23,342 86,656 1,49,089 New assets originated 24,24,901 15,298 7,604 24,47,803 37,558 6,175 2,704 46,437 Exposure de-recognised /matured/repaid (11,85,960) (58,822) (47,464) (12,92,246) (20,161) (4,487) (8,028) (32,676)Transfer to Stage 1 65,509 (56,814) (8,695) - 8,889 (6,055) (2,834) - Transfer to Stage 2 (3,52,885) 3,59,980 (7,095) - (8,308) 10,745 (2,437) - Transfer to Stage 3 (81,332) (43,717) 1,25,049 - (2,120) (5,357) 7,477 - Impact on account of exposures transferred 139 10,451 7,862 18,452 112 48,112 34,511 82,735 during the year between stagesImpact of changes on items within the same stage - - 8,382 8,382 - - 19,077 19,077 Write off* (14,318) (5,290) (31,797) (51,405) (1,388) (1,512) (20,811) (23,711)Closing as on March 31, 2021 61,25,086 4,23,110 2,66,762 68,14,958 53,673 70,963 1,16,315 2,40,951
Note : 9.1 LOANSAn analysis of changes in the gross carrying amount and corresponding ECL allowances in relations to loans
Notes forming part of the Standalone Financial Statements (Contd.) For the year ended March 31, 2022

120
Corporate Overview Financial StatementsManagement Reports
Note : 9.1 LOANS (Contd.)
Note : 9.2 OVERDUE GREATER THAN 90 DAYS AS ON MARCH 31, 2022
ECL across stages have been computed on collective basis.The Company uses Days past due of the customer to determine the credit quality of loans*Total write off includes Loss on disposal of repossessed vehicles - ` 60,124 Lakhs for the year ended March 31, 2022 (` 27,211 lakhs -March 31, 2021)
` in lakhs Particulars As at As at March 31, 2022 March 31, 2021Note : 10 INVESTMENTS Investment in Equity Instruments* Unquoted - a) Subsidiaries at cost Cholamandalam Home Finance Limited 4,240 4,240 4,24,00,000 Equity shares of `10 each fully paid up Cholamandalam Securities Limited 2,250 2,250 2,25,00,014 Equity shares of ` 10 each fully paid up b) Joint Venture Payswiff Technologies Private Limited 27,73,227 45,001 - Equity shares of ` 10 each fully paid up c) Associate at cost White Data System India Private Limited 800 800 12,75,917 Equity shares of ` 10 each fully paid up Vishvakarma Payments Private Limited - - 2,100 Equity shares of ` 10 each fully paid up Paytail commerce Private limited 975 - 27,482 Equity shares of ` 10 each fully paid up d) Others - Unquoted - FVOCI ** Amaravathi Sri Venkatesa Paper Mills Limited - - 2,93,272 Equity shares of ` 10 each fully paid up# Saraswat Co-operative Bank Limited - - 1,000 Equity shares of ` 10 each fully paid up# The Shamrao Vithal Co-operative Bank Limited - - 1,000 Equity shares of ` 25 each fully paid up# Chola Insurance Distribution Services Private Limited 2 2 19,133 Equity shares of ` 10 each fully paid up Chennai Willingdon Corporate Foundation 5 shares of ` 10 each fully paid up e) Investment in Indian Government Securities - amortised cost 1,54,348 1,54,590 (Issued by Government of India)
Total 2,07,616 1,61,882 *Investments are made in India**The Company has designated certain unquoted equity instruments as FVOCI on the basis that these are not held for trading.# represents amount less than ` 1 lakh.
Notes forming part of the Standalone Financial Statements (Contd.) For the year ended March 31, 2022
` in lakhs No. of cases Principal Overdue outstanding Instalments* 87,914 2,03,229 1,44,889*Overdue instalments includes principal amount overdue and interest overdue
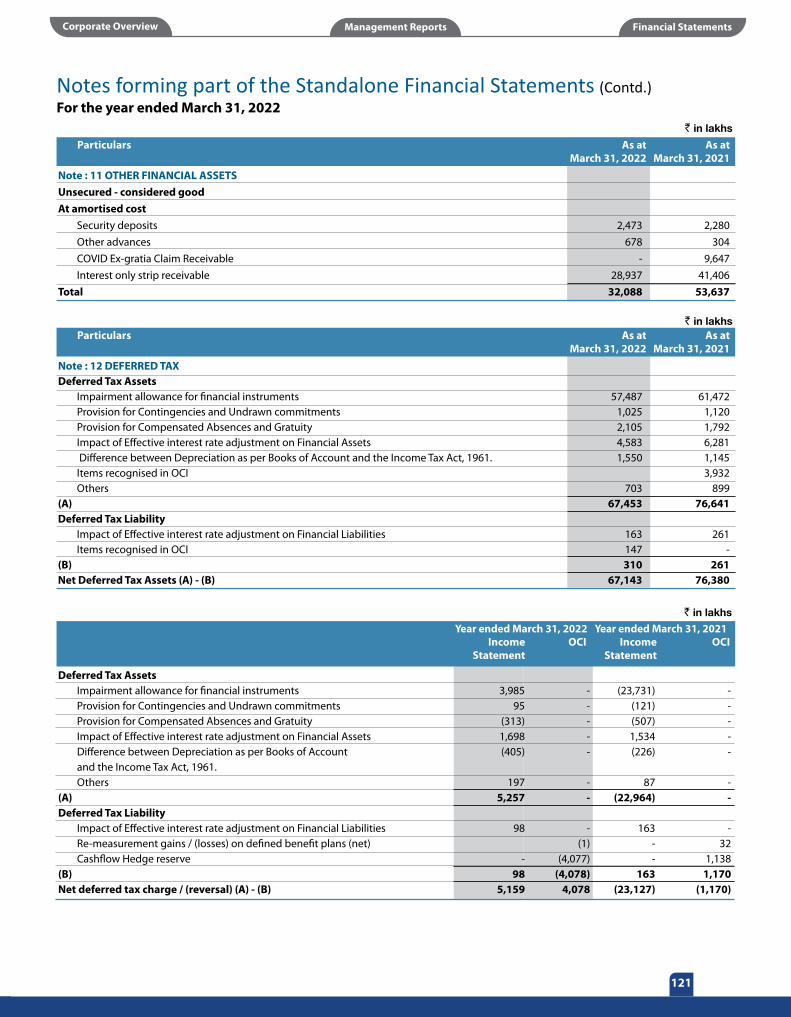
Corporate Overview Financial StatementsManagement Reports
121
Particulars
` in lakhs
Note : 12 DEFERRED TAXDeferred Tax Assets Impairment allowance for financial instruments 57,487 61,472 Provision for Contingencies and Undrawn commitments 1,025 1,120 Provision for Compensated Absences and Gratuity 2,105 1,792 Impact of Effective interest rate adjustment on Financial Assets 4,583 6,281 Difference between Depreciation as per Books of Account and the Income Tax Act, 1961. 1,550 1,145 Items recognised in OCI 3,932 Others 703 899 (A) 67,453 76,641 Deferred Tax Liability Impact of Effective interest rate adjustment on Financial Liabilities 163 261 Items recognised in OCI 147 -(B) 310 261 Net Deferred Tax Assets (A) - (B) 67,143 76,380
Particulars As at As at March 31, 2022 March 31, 2021
` in lakhs
Note : 11 OTHER FINANCIAL ASSETSUnsecured - considered goodAt amortised cost Security deposits 2,473 2,280 Other advances 678 304 COVID Ex-gratia Claim Receivable - 9,647 Interest only strip receivable 28,937 41,406Total 32,088 53,637
Particulars As at As at March 31, 2022 March 31, 2021
Notes forming part of the Standalone Financial Statements (Contd.) For the year ended March 31, 2022
` in lakhs
Deferred Tax Assets Impairment allowance for financial instruments 3,985 - (23,731) - Provision for Contingencies and Undrawn commitments 95 - (121) - Provision for Compensated Absences and Gratuity (313) - (507) - Impact of Effective interest rate adjustment on Financial Assets 1,698 - 1,534 - Difference between Depreciation as per Books of Account (405) - (226) - and the Income Tax Act, 1961. Others 197 - 87 -(A) 5,257 - (22,964) -Deferred Tax Liability Impact of Effective interest rate adjustment on Financial Liabilities 98 - 163 - Re-measurement gains / (losses) on defined benefit plans (net) (1) - 32 Cashflow Hedge reserve - (4,077) - 1,138 (B) 98 (4,078) 163 1,170 Net deferred tax charge / (reversal) (A) - (B) 5,159 4,078 (23,127) (1,170)
Year ended March 31, 2022 Year ended March 31, 2021 Income OCI Income OCI Statement Statement

122
Corporate Overview Financial StatementsManagement Reports
Notes forming part of the Standalone Financial Statements (Contd.) For the year ended March 31, 2022
` in lakhs
Note : 13 INVESTMENT PROPERTYGross carrying amount as at April 1, 2020 14 Additions -Disposals - Gross carrying amount as at March 31, 2021 14Additions - Disposals -Gross carrying amount as at March 31, 2022 14 Accumulated depreciation and impairmentBalance as at April 1, 2020 -Depreciation for the year 1Depreciation on disposals - Balance as at March 31, 2021** 1Depreciation for the year -Depreciation on disposals -Balance as at March 31, 2022** 1Net Carrying amountAs at March 31, 2021 13 As at March 31, 2022 13 Useful Life of the asset (In Years) 60 Method of depreciation Straight line method
Particular
The Company's investment property consists of 4 properties and has let out one property as at March 31, 2022.** represents amount less than ` 1,00,000
` in lakhsIncome earned and expense incurred in connection with investment property
Rental Income 5 4Direct Operating expense from property that generated rental income 1 1Direct Operating expense from property that did not generate the rental income - -
Particulars Year ended Year ended March 31, 2022 March 31, 2021
` in lakhs
iv) Fair ValueInvestment Property (` in Lakhs) 309 304
As at As at March 31, 2022 March 31, 2021
ii) Contractual obligationsThere are no contractual obligations to purchase, construct or develop investment property.
iii) Leasing ArrangementsCertain investment properties are leased out to tenants under cancellable operating lease.
Particulars Valuation Significant Range Sensitivity of Fair value Sensitivity technique unobservable (Weighted avg) the input to (` in lakhs) (` in lakhs) inputs fair value
v) Sensitivity analysisInvestment Property Professional Price per ` 7,000 - 13,000 5% 309 15 As at March 31, 2022 valuer Sq. feet per Sq. feetInvestment Property Professional Price per ` 7,000 - 13,000 5% 304 15 As at March 31, 2021 valuer Sq. feet per Sq. feet
vi) The Title Deeds of the Immovable Properties mentioned above are in the name of the company

Corporate Overview Financial StatementsManagement Reports
123
Notes forming part of the Standalone Financial Statements (Contd.) For the year ended March 31, 2022
Note1. Details of Immovable properties of land and buildings (Owned Assets), whose title deeds have been pledged in favour of Trustees for the benefit
of debenture holders as security, has been explained in Note 17.12. The Company has elected to include ROU assets pertaining to lease of buildings as part of the Property, plant and equipment as permitted under
paragraph 47 of Ind AS 116.3. The Title Deeds of the Immovable Properties mentioned above are in the name of the company.4. Company has not carried out any revaluation of property, plant and equipment during the year ended March 31, 2022
` in lakhs
Note : 14 PROPERTY, PLANT AND EQUIPMENT
Gross carrying amount 3,956 8,174 2,784 2,393 4,895 1,973 2,305 14,860 41,340 as at April 1, 2020 Additions - 1,444 164 77 132 205 - 1,504 3,526 Disposals - 25 24 6 14 398 - 22 489 Gross carrying amount 3,956 9,593 2,924 2,464 5,013 1,780 2,305 16,342 44,377 as at March 31, 2021Additions - 3,774 263 208 348 1,005 - 7,041 12,639 Disposals - 552 39 10 16 560 - 291 1,468 Gross carrying amount 3,956 12,815 3,148 2,662 5,345 2,225 2,305 23,092 55,548 as at March 31, 2022Accumulated depreciation / amortisation and impairment Balance as at April 1, 2020 - 5,211 1,431 1,683 2,435 668 123 4,190 15,741 Depreciation for the year - 1,923 527 288 885 387 43 4,553 8,606 Depreciation on disposals - 18 13 5 11 214 - 11 272 Balance as at March 31, 2021 - 7,116 1,945 1,966 3,309 841 166 8,732 24,075 Depreciation for the year - 1,976 475 330 824 390 41 4,426 8,462 Depreciation on disposals - 535 25 10 14 394 - 978 Balance as at March 31, 2022 - 8,557 2,395 2,286 4,119 837 207 13,158 31,559 Net Carrying amount As at March 31, 2021 3,956 2,477 979 498 1,704 939 2,139 7,610 20,302 As at March 31, 2022 3,956 4,258 753 376 1,226 1,388 2,098 9,934 23,989 Useful Life of the asset (In Years) 3 5 5 5 5 60 upto 5Method of depreciation Straight-line method
Particulars Freehold Computer Office Furniture Leasehold Vehicles Buildings Total Land Equipment Equipment and Fixtures Improvements (Refer Note below)
Owned Assets
Right of Use Assets
` in lakhs Particulars Computer Software
Note : 15 INTANGIBLE ASSETSGross carrying amount as at April 1, 2020 6,220 Additions 1,133 Disposals -Gross carrying amount as at March 31, 2021 7,353 Additions 1,081 Disposals - Gross carrying amount as at March 31, 2022 8,434 Accumulated Amortization and impairment Balance as at April 1, 2020 4,473 Amortization for the year 1,235 Amortization on disposals -Balance as at March 31, 2021 5,708

124
Corporate Overview Financial StatementsManagement Reports
Notes forming part of the Standalone Financial Statements (Contd.) For the year ended March 31, 2022
` in lakhs Particulars Computer Software
Amortization for the year 1,271 Amortization on disposals -Balance as at March 31, 2022 6,979 Net Carrying amount As at March 31, 2021 1,645 As at March 31, 2022 1,455 Useful Life of the asset (In Years) 3 Method of depreciation Straight line method
1. Company has not carried out any revaluation of intangible assets during the year ended March 31, 2022.
Note : 15 INTANGIBLE ASSETS (Contd.)
` in lakhs
Note : 16 OTHER NON FINANCIAL ASSETSPrepaid expenses 2,431 1,495 Capital advances 143 1,006 GST Input Credit 993 1,816 Others 3,312 2,717 Total 6,879 7,034
Particulars As at As at March 31, 2022 March 31, 2021
Note : 17 DEBT SECURITIES (at amortised cost) Redeemable Non-Convertible Debentures Medium-Term - Secured 10,52,995 9,34,263 Medium-Term - Unsecured 2,500 - Commercial Papers - Unsecured 2,76,615 3,01,504 Total 13,32,110 12,35,767
` in lakhs Particulars As at As at March 31, 2022 March 31, 2021
All debt securities have been contracted in India17.1 Security
(i) Redeemable Non-Convertible Debentures - Medium-term is secured by way of specific charge on assets under hypothecation relating to Vehicle Finance, Loan against property, Bills discounted and other loans and pari passu charge on immovable property which are owned assets of the Company situated at Chennai.
(ii) The Company has not defaulted in the repayment of dues to its lenders.

Corporate Overview Financial StatementsManagement Reports
125
17.2 Details of Debentures - Contractual principal repayment value
(i) Secured Redeemable Non-Convertible Debentures - Redeemable at par - No put call option No. of Debentures Face Value ` Balance as at Due date of Rate of interest % redemption March 31, 2022 March 31, 2021 ` in lakhs
2,700 10,00,000 27,000 Mar-27 7.30
250 10,00,000 2,500 2,500 Nov-26 8.55
5,000 10,00,000 50,000 50,000 Jul-25 7.92
4,974 10,00,000 49,740 Mar-25 7.08
2,000 10,00,000 20,000 Feb-25 5.85
8,600 10,00,000 86,000 Dec-24 5.57 to 6.30
1,500 10,00,000 15,000 15,000 Oct-24 6.80
4,000 10,00,000 40,000 Aug-24 5.53 to 5.58
6,000 10,00,000 60,000 30,000 Jul-24 5.46 to 7.38
1,500 10,00,000 15,000 15,000 Apr-24 8.6179
6,850 10,00,000 68,500 58,500 Feb-24 6.25 to 6.45
5,500 10,00,000 55,000 55,000 Dec-23 6.10
6,023 10,00,000 60,230 35,230 Sep-23 5.58 to 8.80
1,990 10,00,000 19,900 Aug-23 9.06
9,000 10,00,000 90,000 15,000 May-23 5.70 to 7.50
3,250 10,00,000 32,500 32,500 Apr-23 6.26
8,000 10,00,000 80,000 80,000 Mar-23 5.85 to 5.68
3,350 10,00,000 33,500 33,500 Feb-23 5.70 to 7.41
5,900 10,00,000 59,000 59,000 Dec-22 5.48 to 7.98
6,150 10,00,000 61,500 61,500 Nov-22 5.45 to 8.00
3,523 10,00,000 35,230 35,230 Sep-22 8.70
2,000 10,00,000 20,000 20,000 Jun-22 7.20
1,050 10,00,000 10,500 Mar-22 8.35 to 9.06
2,000 10,00,000 20,000 Dec-21 6.93
3,523 10,00,000 35,230 Sep-21 8.45
3,250 10,00,000 32,500 Aug-21 6.74 to 8
2,550 10,00,000 25,500 Jul-21 8.9765
4,010 10,00,000 40,100 Jun-21 8.49 to 8.52
4,100 10,00,000 41,000 May-21 6.90
4,770 10,00,000 47,700 Apr-21 8.0874
9,80,600 8,50,490
Note : 17 DEBT SECURITIES (at amortised cost) (Contd.)
Notes forming part of the Standalone Financial Statements (Contd.) For the year ended March 31, 2022

126
Corporate Overview Financial StatementsManagement Reports
(ii) Secured Redeemable Non-Convertible Debentures - Redeemable at premium - No put call option
1000 10,00,000 10,000 - Mar-27 14,22,599 4,22,599 1250 10,00,000 12,500 12,500 Jul-25 14,61,481 4,61,481 850 10,00,000 8,500 8,500 Jul-25 13,53,045 3,53,045 500 10,00,000 5,000 5,000 Jan-23 12,54,470 2,54,470 250 10,00,000 2,500 2,500 Dec-24 12,93,960 2,93,960 350 10,00,000 3,500 3,500 Oct-24 13,01,025 3,01,025 1100 10,00,000 11,000 May-21 12,94,211 2,94,211 42,000 43,000
No. of Debentures Face Value ` Balance as at Due date of Redemption Premium ` redemption price ` March 31, 2022 March 31, 2021 ` in lakhs ` in lakhs
(iii) Secured Redeemable Non-Convertible Debentures - Redeemable at par - with Put option
(iv) UnSecured Redeemable Non-Convertible Debentures - Redeemable at par - No put call option
No. of Debentures Face Value ` Balance as at Due date of Put option Rate of redemption date interest % March 31, 2022 March 31, 2021 ` in lakhs ` in lakhs
No. of Debentures Face Value ` Balance as at Due date of Put option Rate of redemption date interest % March 31, 2022 March 31, 2021 ` in lakhs ` in lakhs
10 10,00,000 100 100 Aug-23 Jul-21 9.06 100 100
250 10,00,000 2,500 - Jul-23 - 5.12 2,500 - -
17.2 Details of Debentures - Contractual principal repayment value (Contd.)
` in lakhs
Note : 18 BORROWINGS (Other than Debt Securities) at amortised costA) Term Loans i) a) From Banks - Secured - Rupee Loans 41,87,373 35,68,218 - Foreign currency Loans 61,577 - - External Commercial Borrowings 1,94,543 2,39,869 b) From Banks - Unsecured Short term loans - 20,000 ii) From Other Parties - Secured Financial Institutions - Rupee Loans 1,53,894 1,72,786 - External Commercial Borrowings 1,44,285 1,37,230 Securitisation - Rupee Loans 3,43,306 4,34,452 B) Loan repayable on demand - Secured 1,15,474 1,45,671 from Banks - Rupee Loans (Refer Note 6 and 18.1.(vi)) Total 52,00,452 47,18,226 Borrowings within India 48,61,624 43,41,127 Borrowings Outside India 3,38,828 3,77,099
Particulars As at As at March 31, 2022 March 31, 2021
Notes forming part of the Standalone Financial Statements (Contd.) For the year ended March 31, 2022

Corporate Overview Financial StatementsManagement Reports
127
18.1 Security(i) Secured term loans from banks and financial institution are secured by way of specific / pari passu charge on assets under hypothecation
relating to automobile financing and loans against immovable property.(ii) Loan repayable on demand is in the nature of Cash Credit from banks and is secured by way of floating charge on assets under
hypothecation and other assets.(iii) The Company has not defaulted in the repayment of dues to its lenders.(iv) Securitisation rupee loan represents the net outstanding value (Net of Investment in Pass- through Certificates) of the proceeds
received by the Company from securitisation trust in respect of loan assets transferred by the Company pursuant to Deed of Assignment. The Company has provided Credit enhancement to the trust by way of cash collateral and Bank guarantee.
(v) The Company has utilised the borrowings for the purpose for which it was obtained(vi) The quarterly statements or returns of current assets filed by the company with banks are in agreement with books of accounts
18.2 Details of term loans - Contractual principal repayment value` in lakhs
Base Rate / MCLR < 1year 1 1,40,000 86,250 2 1,98,750 1,25,016 3 - 30,000 4 87,756 1,78,750 8 50,000 60,395 12 - 20,000 1 - 2 years 1 60,000 1,40,000 2 1,10,000 1,92,917 4 81,506 1,92,949 8 50,000 60,395 12 - 20,000 2 - 3 years 1 5,000 33,333 2 80,000 1,22,500 3 7,796 - 4 51,111 1,61,699 8 - 60,395 12 - 20,000 3 - 4 years 1 5,000 10,000 2 - 80,000 3 4,500 - 4 25,111 1,41,699 6 - 7,796 12 - 20,000 4 - 5 years 1 - 5,000 3 - 57,441 4 - 25,111 9 - 15,000 Base Rate/ MCLR + spread (0.10%) < 1year 1 60,000 3,85,000 2 25,000 - 3 - 50,000 1 - 2 years 1 60,000 35,000 2 25,000 30,000 3 - 50,000 2 - 3 years 1 - 70,000 2 - 30,000 3 - 50,000 Rate based on T Bill + Spread < 1 year 1 1,71,550 48,200 2 22,500 15,000
Rate of Interest Maturity Instalments Amount outstanding March 31, 2022 March 31, 2021
Note : 18 BORROWINGS (Contd.)
Notes forming part of the Standalone Financial Statements (Contd.) For the year ended March 31, 2022

128
Corporate Overview Financial StatementsManagement Reports
18.2 Details of term loans - Contractual principal repayment value (Contd.)` in lakhs
3 6,000 - 4 1,41,352 41,667 12 20,000 - 1 - 2 years 1 1,46,000 41,050 2 - 12,500 3 12,500 - 4 2,13,726 66,667 12 20,000 - 2 - 3 years 1 1,08,000 25,000 3 43,500 12,500 4 1,05,726 50,000 12 20,000 - 3 - 4 years 1 88,000 - 2 28,571 - 4 28,583 - 9 15,000 - 4 - 5 years 1 92,375 - 4 11,083 - Fixed Rate < 1year 1 20,000 51,000 2 10,000 16,000 4 53,040 40,400 1 - 2 years 1 33,300 20,000 2 10,000 10,000 4 38,040 39,400 2 - 3 years 1 1,51,633 - 2 22,100 43,300 3 10,220 - 4 - 24,400 3 - 4 years 1 1,51,733 - 2 10,000 55,400 4 - 5 years 1 1,18,333 - 2 - 43,400 Repo < 1year 1 23,333 42,500 2 82,940 15,000 3 24,333 3,333 4 1,13,286 82,976 8 36,000 36,000 12 83,333 83,333 1 - 2 years 1 23,333 8,333 2 30,000 15,000 3 3,333 3,333 4 2,51,666 49,643 6 41,667 - 8 - 36,000 12 - 83,333 2 - 3 years 1 60,119 8,333 2 15,000 15,000 3 25,179 3,334 4 2,12,451 49,643
Rate of Interest Maturity Instalments Amount outstanding March 31, 2022 March 31, 2021
Notes forming part of the Standalone Financial Statements (Contd.) For the year ended March 31, 2022

Corporate Overview Financial StatementsManagement Reports
129
Details of Securitised loan
` in lakhs
` in lakhs
6 - 41,667 3 - 4 years 1 - 10,119 2 15,000 - 3 1,875 3,750 4 1,43,880 37,500 4 - 5 years 1 3,500 - 2 1,000 - 3 79,420 - 4 22,000 - > 5 Years 1 5,000 - Total 43,47,043 38,50,660 3M MIBOR + Spread < 1year 1 7,500 - 1-2 years 1 - 7,500 USD 3M LIBOR + Spread < 1year 4 21,570 5,202 1-2 years 4 21,570 20,807 2-3 years 4 21,570 20,807 3 - 4 years 4 21,570 20,807 4 - 5 years 4 21,570 20,807 >5 Years 5 26,963 46,815 USD 6M LIBOR + Spread < 1year 1 1,36,418 36,553 1-2 years 1 - 1,31,589 2-3 years 1 69,725 - 3 - 4 years 1 - 67,257 USD 12M LIBOR + Spread < 1year 1 61,528 - Total 4,09,984 3,78,144 The Company has raised funds in the form of Foreign Currency Loans/ External Commercial Borrowings whose interest payments
are benchmarked to LIBOR rates. The maturity of some of those contracts are beyond June 2023 (IBOR Transition date). Based on the assessment performed by the
Company, no significant impact is assessed on those contracts upon this transition.
Less than 1 year 1,42,619 1,75,343
Fixed 1-2 year 83,830 1,09,355
(4.9% to 8%) 2-3 year 38,337 45,570
3-4 year 13,014 12,428
4-5 year 3,094 4,451
more than 5 years 8,055 12,990
Total 2,88,949 3,60,137 Less than 1 year 6,779 6,501
Floating 1-2 year 5,804 6,925
Base Rate/ MCLR - spread 2-3 year 6,095 7,459
(0.75% to 2.65%) 3-4 year 6,088 7,866
4-5 year 5,630 7,832
more than 5 years 23,734 37,198
Total 54,130 73,781
* Represents amounts to be paid to the securitisation trust as per the securitisation cash flows net of amounts to be received against Investment in PTC.
Rate of Interest Maturity Instalments Amount outstanding March 31, 2022 March 31, 2021
Rate of Interest Maturity Amount outstanding* March 31, 2022 March 31, 2021
18.2 Details of term loans - Contractual principal repayment value (Contd.)
Notes forming part of the Standalone Financial Statements (Contd.) For the year ended March 31, 2022

130
Corporate Overview Financial StatementsManagement Reports
` in lakhs
Note : 19 SUBORDINATED LIABILITIES (at amortised cost)
Perpetual Debt - Unsecured 1,32,899 1,48,920
Subordinated Debt - Unsecured
a) Rupee Denominated Bonds 40,736 40,684
b) Other Subordinated Debts 2,11,153 2,29,402
Total 3,84,788 4,19,006
As at As at March 31, 2022 March 31, 2021
i) All Subordinated liabilities have been contracted in India except for Rupee denominated bonds.ii) The Company has not defaulted in the repayment of dues to its lenders.
Particulars
19.1 Details of Subordinated Liabilities - Contractual principal repayment value
(i) Unsecured Redeemable Non-Convertible Debentures - Subordinated debt - Redeemable at par - No put call option
No. of Debentures Face Value ` Balance as at Due date of Rate of interest % redemption March 31, 2022 March 31, 2021 ` in lakhs ` in lakhs
150 1,00,00,000 15,000 Feb-32 8.10
200 1,00,00,000 20,000 Oct-31 7.90
400 1,00,00,000 40,000 40,000 Jan-30 9.25
3000 10,00,000 30,000 30,000 Aug-28 9.75
5300 10,00,000 53,000 53,000 Mar-28 9.05
1500 10,00,000 15,000 15,000 Aug-27 8.53
2500 10,00,000 25,000 25,000 Jun-27 8.78 to 8.80
100 10,00,000 1,000 1,000 Nov-26 9.20
150 10,00,000 1,500 1,500 Jun-24 11.00
50 10,00,000 500 500 May-24 11.00
250 10,00,000 2,500 2,500 Apr-24 11.00
250 10,00,000 2,500 2,500 Mar-24 11.00
200 10,00,000 2,000 2,000 Feb-24 11.00
250 10,00,000 2,500 2,500 Jan-24 11.00
2000 10,00,000 20,000 20,000 Nov-23 9.08 to 9.20
500 10,00,000 5,000 5,000 Oct-23 9.08
150 10,00,000 1,500 1,500 Sep-23 11.00
600 10,00,000 6,000 6,000 Dec-22 11.05 to 11.25
3,150 10,00,000 31,500 Nov-21 10.02
1000 10,00,000 10000 Jun-21 11.30
1000 10,00,000 10000 May-21 11.30
2,43,000 2,59,500
Notes forming part of the Standalone Financial Statements (Contd.) For the year ended March 31, 2022
(ii) Unsecured Redeemable Non-Convertible Debentures - Subordinated debt -Redeemable at premium - No put call option
150 10,00,000 1,500 1,500 Nov-23 17,57,947 7,57,947 1,500 1,500
No. of Debentures Face Value ` Balance as at Due date of Redemption Premium ` redemption price ` March 31, 2022 March 31, 2021 ` in lakhs ` in lakhs

Corporate Overview Financial StatementsManagement Reports
131
` in lakhs
Note : 20 OTHER FINANCIAL LIABILITIESUnpaid dividend 71 74 Advance from customers 2,963 5,239 Security deposits received 343 80 Collections towards derecognised assets pending remittance 17,837 18,928 Lease liability (Refer note 48) 10,998 8,905 Other liabilities 1,131 578 Total 33,343 33,804
Particulars As at As at March 31, 2022 March 31, 2021
(iii) Unsecured Redeemable Non-Convertible Debentures - Perpetual debt
No. of Debentures Face Value ` Balance as at Maturity Date Rate of interest % - Perpetual# (increase by 100 bps March 31, 2022 March 31, 2021 if call option is not ` in lakhs ` in lakhs exercised on the due date)
19.1 Details of Subordinated Liabilities - Contractual principal repayment value (Contd.)
25 1,00,00,000 2,500 Mar-32 9.10 30 1,00,00,000 3,000 Sep-31 8.98 40 1,00,00,000 4,000 Jul-31 9.05 100 1,00,00,000 10,000 May-31 9.2 2000 5,00,000 10,000 10,000 Mar-31 9.25 900 5,00,000 4,500 4,500 Nov-30 9.30 1000 5,00,000 5,000 5,000 Dec-29 10.75 1120 5,00,000 5,600 5,600 Mar-29 10.83 5000 5,00,000 25,000 25,000 Feb-29 10.88 500 5,00,000 2,500 2,500 Aug-24 12.80 174 10,00,000 1,740 1,740 Jul-24 12.90 500 5,00,000 2,500 2,500 Jun-24 12.90 500 5,00,000 2,500 2,500 Feb-24 12.90 50 10,00,000 500 500 Jan-24 12.60 1,031 10,00,000 10,310 10,310 Dec-23 12.50 to 12.60 245 10,00,000 2,450 2,450 Oct-23 12.60 1,000 5,00,000 5,000 5,000 Oct-23 12.90 300 10,00,000 3,000 3,000 Feb-23 12.80 1450 10,00,000 14,500 14,500 Dec-22 12.70 to 12.80 860 5,00,000 4,300 4,300 Sep-22 12.75 2000 5,00,000 10,000 10,000 Aug-22 12.90 200 5,00,000 1,000 Mar-22 12.50 700 5,00,000 3,500 Jan-22 12.50 3,500 5,00,000 17,500 Dec-21 12.50 to 12.95 320 5,00,000 1,600 Aug-21 12.50 413 5,00,000 2,065 Jul-21 12.50 2,021 5,00,000 10,105 Jun-21 12.50 1,28,900 1,45,170
# Company can redeem using Call option on the maturity date with prior approval of RBI.
Notes forming part of the Standalone Financial Statements (Contd.) For the year ended March 31, 2022

132
Corporate Overview Financial StatementsManagement Reports
` in lakhs
` in lakhs
` in lakhs
` in lakhs
Note : 21 PROVISIONSProvision for Employee Benefits - Compensated absences (Refer Note 35) 7,754 6,508 7,754 6,508Other ProvisionsProvision for contingencies and service tax claims (Refer note 39) 3,953 4,346 Provision for expected credit loss towards undrawn commitments (Refer Note 39) 120 104 4,073 4,450 Total 11,827 10,958
Note : 22 OTHER NON FINANCIAL LIABILITIESIncome received in advance 607 1,150 Statutory liabilities 4,563 2,568 Others 641 859Total 5,811 4,577
Note : 23 A) EQUITY SHARE CAPITALAUTHORISED Equity Shares of ` 2 each with voting rights 1,20,00,00,000 24,000 1,20,00,00,000 24,000 Preference Shares of ` 100 each 5,00,00,000 50,000 5,00,00,000 50,000 74,000 74,000 ISSUED Equity Shares of ` 2 each with voting rights 82,17,55,591 16,435 82,02,61,529 16,405 16,435 16,405 SUBSCRIBED AND FULLY PAID UP Equity Shares of ` 2 each with voting rights 82,10,71,821 16,421 81,95,77,759 16,400 Add : Forfeited Shares 6,54,500 7 6,54,500 7 16,428 16,407
Equity SharesAt the beginning of the year (` 2/- each) 82,00,35,129 16,400 81,95,77,759 16,391Issued during the year Employees Stock Option (ESOP) Scheme 10,36,692 21 4,57,370 9Outstanding at the end of the year - `2/- each 82,10,71,821 16,421 82,00,35,129 16,400Forfeited shares Equity Shares - Amount originally paid up 6,54,500 7 6,54,500 7
Particulars As at As at March 31, 2022 March 31, 2021
Particulars As at As at March 31, 2022 March 31, 2021
As at March 31, 2022 As at March 31, 2021 Nos. Amount Nos. Amount
As at March 31, 2022 As at March 31, 2021 Nos. Amount Nos. Amount
a) Reconciliation of number of shares and amount outstanding at the beginning and at the end of the year:
Particulars
Notes forming part of the Standalone Financial Statements (Contd.) For the year ended March 31, 2022

Corporate Overview Financial StatementsManagement Reports
133
` in lakhs
Cholamandalam Financial Holdings Limited 37,28,85,889 45.41 37,28,85,889 45.50- Holding Company
Cholamandalam Financial Holdings Limited 37,28,85,889 37,28,85,889
As at March 31, 2022 As at March 31, 2021 Nos. % holding Nos. % holding in the class in the class
As at As at March 31, 2022 March 31, 2021
c) Details of shareholding more than 5% shares in the Company
i) Terms/rights attached to Equity shares
The Company has only one class of equity shares having a par value of ` 2 (March 2019 - ` 10) per share. All these shares have the same rights and preferences with respect to payment of dividend, repayment of capital and voting. The dividend proposed by the Board of Directors is subject to the approval of the shareholders in the ensuing Annual General Meeting except for interim dividend.
Repayment of capital will be in proportion to the number of equity shares held.
b) Equity Shares held by Holding Company
d) Shares held by Promoters as on March 31,2022 - Please refer Annexure A As per records of the Company, including its register of shareholders/members and other declarations received from shareholders
regarding beneficial interest, the above shareholding represents both legal and beneficial ownership of shares.
Equity Shares
Note : 23 A) EQUITY SHARE CAPITAL (Contd.)
Notes forming part of the Standalone Financial Statements (Contd.) For the year ended March 31, 2022
Valli Annamalai 12,500 - 12,500 - - M Vellachi 1,94,660 0.02 11,60,427 0.14 0.12M A M Arunachalam 65,000 0.01 65,000 0.01 - Arun Alagappan 9,50,000 0.12 9,50,000 0.12 - M.A.Alagappan 24,88,760 0.30 24,88,760 0.30 - Lakshmi Chockalingam 6,685 - 6,685 - - A Vellayan 1,35,785 0.02 1,35,785 0.02 - Lalitha Vellayan 1,39,630 0.02 1,39,630 0.02 - Meyyammai Venkatachalam 50,255 0.01 50,255 0.01 - M V Valli Murugappan 21,56,350 0.26 - - (0.26) M M Murugappan 21,035 - 21,035 - - A M Meyyammai 2,51,880 0.03 2,51,880 0.03 - M V Subbiah HUF (M V Subbiah holds 10,000 - 10,000 - - shares in the capacity of Karta) Meenakshi Murugappan 245 - 245 - - Valli Alagappan 5,000 - 5,000 - - A Venkatachalam 2,09,605 0.03 2,09,605 0.03 - V Narayanan 2,54,000 0.03 2,54,000 0.03 - V Arunachalam 2,42,515 0.03 2,42,515 0.03 - Arun Venkatachalam 4,03,750 0.05 4,03,750 0.05 - Solachi Ramanathan 20,000 - 20,000 - - Vedika Meyyammai Arunachalam 1,08,280 0.01 1,08,280 0.01 - A V Nagalakshmi 15,960 - 15,960 - - M V AR Meenakshi 8,53,155 0.10 8,53,155 0.10 - A. Keertika Unnamalai 2,47,440 0.03 2,27,440 0.03 -
Annexure ADetails of Shareholding of promoters and promoter Group as on March 31,2022Promoters Name No. of shares as on
March 31, 2021 No. of shares as on
March 31, 2022 % to
shares % to
shares % Change
during the year

134
Corporate Overview Financial StatementsManagement Reports
Note : 23 A) EQUITY SHARE CAPITAL (Contd.)
Notes forming part of the Standalone Financial Statements (Contd.) For the year ended March 31, 2022
Sigapi Arunachalam 74,255 0.01 74,255 0.01 - Uma Ramanathan 23,500 - 23,500 - - V Vasantha 1,250 - 1,250 - - Dhruv M Arunachalam 50,000 0.01 50,000 0.01 - Kanika Subbiah 67,000 0.01 67,000 0.01 - Pranav Alagappan 3,11,440 0.04 3,11,440 0.04 - Valli Arunachalam - - 11,90,583 0.15 0.15A Venkatachalam HUF (A Venkatachalam 7,000 - 7,000 - - holds shares in the capacity of Karta) A A Alagammai 2,894 - 2,894 - - Umayal R 49,455 0.01 49,455 0.01 - Valliammai Murugappan 12,890 - 12,890 - - Ambadi Enterprises Ltd 2,91,380 0.04 2,91,380 0.04 - A M M Vellayan Sons P Ltd 26,575 - 26,575 - - Carborundum Universal Limited 500 - 500 - - E.I.D. Parry (India) Ltd. 1,965 - 1,965 - - M.M.Muthiah Research Foundation 1,41,750 0.02 1,41,750 0.02 - Ambadi Investments Limited (formerly Ambadi 3,37,21,870 4.11 3,37,21,870 4.11 - Investments Private Limited) Parry Enterprises India Ltd 1,965 - 1,965 - - Cholamandalam Financial Holdings Limited 37,28,85,889 45.47 37,28,85,889 45.41 (0.06) (Formerly TI Financial Holdings Ltd)AR Lakshmi Achi Trust 4,77,145 0.06 4,77,145 0.06 - M A Alagappan Holdings Private Limited 1,70,700 0.02 1,70,700 0.02 - Murugappa Educational and Medical Foundation 1,965 - 1,965 - - MA Murugappan Holdings LLP (M A Murugappan 75,000 0.01 75,000 0.01 - Holdings Private Ltd was converted its status to LLP)Lakshmi Ramaswamy Family Trust(A A Alagammai & 5,85,630 0.07 5,85,630 0.07 - Lakshmi Ramaswamy Trustees holds shares for Trust) Murugappan Arunachalam Children Trust 74,405 0.01 74,405 0.01 - (Sigappi Arunachalam, MAM Arunachalam, AM Meyammai are Trustees) Valli Subbiah Benefit Trust (S Vellayan & A Vellayan, 2,33,375 0.03 1,93,375 0.02 (0.01) Trustees holds shares for Trust)V S Bhairavi Trust (M V Subbiah & 1,88,875 0.02 1,88,875 0.02 - Kanika Subbiah, Trustees holds shares for Trust)Arun Murugappan Children Trust (MAM Arunachalam 1,41,160 0.02 1,41,160 0.02 - & Sigappi Arunachalam Trustees holds shares for Trust)MA.Alagappan Grand Children Trust (Arun Alagappan 1,57,250 0.02 1,57,250 0.02 - and AA Alagammai, Trustees holds shares for Trust)K S Shambhavi Trust (M V Subbiah & S Vellayan, 1,55,955 0.02 1,55,955 0.02 - Trustees holds shares for Trust)M V Seetha Subbiah Benefit Trust 2,64,000 0.03 2,64,000 0.03 - (S Vellayan & A Vellayan, Trustees holds shares for Trust)Kadamane Estates - Firm- M.A.Alagappan holds 3,55,850 0.04 3,55,850 0.04 - shares in the capacity of Partner
Annexure ADetails of Shareholding of promoters and promoter Group as on March 31,2022Promoters Name No. of shares as on
March 31, 2021 No. of shares as on
March 31, 2022 % to
shares % to
shares % Change
during the year

Corporate Overview Financial StatementsManagement Reports
135
` in lakhs
Note : 23 B) OTHER EQUITYStatutory Reserve (Refer Note a) Balance at the beginning of the year 1,59,046 1,28,046 Add: Amount transferred from retained earnings 43,000 31,000 Closing balance at the end of the year 2,02,046 1,59,046 Capital Reserve (Refer Note b) Balance at the beginning of the year 4 4Add: Changes during the year - - Closing balance at the end of the year 4 4 Capital Redemption Reserve (Refer Note c) Balance at the beginning of the year 3,300 3,300 Add: Changes during the year - - Closing balance at the end of the year 3,300 3,300 Securities Premium Account (Refer Note d) Balance at the beginning of the year 2,86,605 2,85,678 Add: Premium on ESOPs exercised 2,287 927Closing balance at the end of the year 2,88,892 2,86,605General Reserve (Refer Note e)Balance at the beginning of the year 3,73,913 2,98,777Add: Amount transferred from Share Based Payment Reserve - 136Add: Amount transferred from retained earnings 1,00,000 75,000Closing balance at the end of the year 4,73,913 3,73,913Share Based Payments Reserve (Refer Note f) Balance at the beginning of the year 3,445 3,017Addition during the period 2,048 564Transfer to General reserve - (136)Closing balance at the end of the year 5,493 3,445
Particulars As at As at March 31, 2022 March 31, 2021
Notes forming part of the Standalone Financial Statements (Contd.) For the year ended March 31, 2022
M M Muthiah Family Trust (M M Murugappan, 46,620 0.01 46,620 0.01 - M M Muthiah, Trustees holds shares for Trust)M M Veerappan Family Trust (M M Murugappan & 46,055 0.01 46,055 0.01 - Meenakshi Murugappan, Trustees holds shares for Trust)M V Muthiah Family Trust (M M Venkatachalam & 4,74,130 0.06 4,74,130 0.06 - M V Muthiah, Trustees holds shares for Trust)M V Subramanian Family Trust (M M Venkatachalam & 4,74,130 0.06 4,74,130 0.06 - M V Subramanian, Trustees holds shares for Trust)M M Murugappan Family Trust (M M Murugappan & 3,33,000 0.04 3,33,000 0.04 - Meenakshi Murugappan Trustees holds shares forTrust)Meenakshi Murugappan Family Trust (M M Murugappan & 25,000 - 25,000 - - Meenakshi Murugappan, Trustees for Trust) M M Venkatachalam Family Trust(M M Venkatachalam 1,22,550 0.01 1,22,550 0.01 - Lakshmi Venkatachalam, Trustees for Trust) Saraswathi Trust (M V Subbiah, S Vellayan & M V Seetha Subbiah, 7,79,785 0.10 7,79,785 0.09 - Trustees holds shares for Trust)Shambho Trust (M V Subbiah,S Vellayan, 16,01,300 0.20 16,01,300 0.20 - Trustees holds shares for Trust) 42,32,97,948 51.62 42,32,37,948 51.55
Annexure ADetails of Shareholding of promoters and promoter Group as on March 31,2022
Note : 23 A) EQUITY SHARE CAPITAL (Contd.)
Promoters Name No. of shares as on March 31, 2021
No. of shares as on March 31, 2022
% to shares
% to shares
% Change during
the year

136
Corporate Overview Financial StatementsManagement Reports
Note : 23 B) OTHER EQUITY (Contd.) ` in lakhs
Retained Earnings (Refer Note g)Balance at the beginning of the year 1,24,021 89,281Profit for the year 2,14,671 1,51,491Less: Dividend Equity (16,414) (10,656) Transfer to Statutory Reserve (43,000) (31,000) Transfer to General Reserve (1,00,000) (75,000)Re-measurement Gain / (Loss) on Defined Benefit Obligations (Net) transferred to 4 (95) Retained EarningsClosing balance at the end of the year 1,79,282 1,24,021Cash flow hedge reserve (Refer Note h)Balance at the beginning of the year (10,581) (7,198)Addition 12,120 (3,383)Closing balance at the end of the year 1,539 (10,581)FVOCI Reserve (Refer Note i)Balance at the beginning of the year (129) (129)Closing balance at the end of the year (129) (129)Total Other Equity 11,54,340 9,39,624
Particulars As at As at March 31, 2022 March 31, 2021
a) Statutory reserve represents the reserve created as per Section 45IC of the RBI Act, 1934, pursuant to which a Non-Banking Financial Company shall create a reserve fund and transfer therein a sum not less than twenty per cent of its net profit annually as disclosed in the Statement of Profit and Loss account, before any dividend is declared.
b) Capital reserve represents the reserve created on account of amalgamation of Chola Factoring Limited in the year 2013-14.c) Capital redemption reserve represents the amount equal to the nominal value of shares that were redeemed during the prior years.
The reserve can be utilized only for limited purposes such as issuance of bonus shares in accordance with the provisions of the Companies Act, 2013
d) Securities premium reserve is used to record the premium on issue of shares. The premium received during the year represents the premium received towards allotment of shares. The reserve can be utilized only for limited purposes such as issuance of bonus shares, buy back of its own shares and securities in accordance with the provisions of the Companies Act, 2013.
e) The general reserve is a free reserve, retained from Company’s profits and can be utilized upon fulfilling certain conditions in accordance with specific requirement of Companies Act, 2013.
f ) Under IND AS 102, fair value of the options granted is required to be accounted as expense over the life of the vesting period as employee compensation costs, reflecting the period of receipt of service. Share based payment reserve represents the among of reserve created for recognition of employee compensation cost at grant date and fair value of options vested and but not execersied by the employess and unvested options are recoginised in statement of profit and loss account
g) The amount that can be distributed by the Company as dividends to its equity shareholders is determined based on the financial position of the Company and also considering the requirements of the Companies Act, 2013. Thus, the amounts reported in retained earnings are not distributable in entirety.
h) Cash flow hedge reserve represents the cumulative effective portion of gains or losses arising on changes in fair value of hedging instruments entered into for cash flow hedges, which shall be reclassified to profit or loss only when the hedged transaction affects the profit or loss, or included as a basis adjustment to the non-financial hedged item, consistent with the Company accounting policies.
i) FVOCI Reserve represents the cumulative gains and losses arising on the revaluation of equity instruments measured at fair value through Other Comprehensive Income.
Proposed dividendThe Board of Directors of the Company have recommended a final dividend of 35% being ` 0.70 per share on the equity shares of the Company, for the year ended March 31, 2022 (` 0.70 per share - March 31, 2021) which is subject to approval of shareholders. Consequently the proposed dividend has not been recognised in the books in accordance with IND AS 10.
Notes forming part of the Standalone Financial Statements (Contd.) For the year ended March 31, 2022

Corporate Overview Financial StatementsManagement Reports
137
` in lakhs
REVENUE FROM OPERATIONSNote : 24A - Interest Income(i) Interest - on financial assets measured at amortised cost (a) Loans - Bills Discounting 1,751 766 - Term loans 9,30,762 8,86,956 (b) Term Deposits With Banks - under lien 1,544 2,147 - free of lien 11,753 26,947 (C) Others - Deposits with Financial Institutions 1,359 2,299 - Investment in Government Securities 9,512 3,301 Total (A) 9,56,681 9,22,416 Note : 24B - Fee Income(i) Fee Income* -Term loans 38,374 20,685 Total (B) 38,374 20,685 *Services are rendered at a point in timeNote : 24C - Net gain on fair value change on financial instruments Net gain on fair value changes on assets measured at FVTPL Investment in mutual funds 1,299 463 Total (C) 1,299 463 Note : 24D - Sale of Services(i )Sale of Services (a) Servicing and Collection fee on Assignment 504 691 (b) Other Service Income 7,971 7,346 Total (D) 8,475 8,037 Note: Timing of revenue recognition Services rendered at a point in time 7,875 7,437 Services rendered over a time 600 600 Total 8,475 8,037
Particulars Year ended Year ended March 31, 2022 March 31, 2021
Notes forming part of the Standalone Financial Statements (Contd.) For the year ended March 31, 2022
` in lakhs
Note : 25 OTHER INCOMERecovery of Bad debts 8,335 5,594 Interest on Income tax refund 662 336 Rent 51 25Total 9,048 5,955
Particulars Year ended Year ended March 31, 2022 March 31, 2021
` in lakhs
Note : 26 FINANCE COSTInterest on financial liabilities measured at amortised cost - Debt securities 78,886 74,325 - Borrowings other than debt securities 3,07,383 3,37,970 - Subordinated liabilities 39,662 42,835Others - Bank charges 1,891 1,537 - Interest on lease liability 870 924 - Interest on income tax 1,190 -Total 4,29,882 4,57,591
Particulars Year ended Year ended March 31, 2022 March 31, 2021

138
Corporate Overview Financial StatementsManagement Reports
` in lakhs
Note : 27 IMPAIRMENT OF FINANCIAL INSTRUMENTSImpairment provision - Loans - measured at amortised cost 87,990 1,37,777Loss on sale of Investments 40 - Total 88,030 1,37,777
Particulars Year ended Year ended March 31, 2022 March 31, 2021
Notes forming part of the Standalone Financial Statements (Contd.) For the year ended March 31, 2022
` in lakhs
Note : 28 EMPLOYEE BENEFITS EXPENSESalaries, bonus and commission 81,095 69,258 Contribution to provident and other funds - Employees' provident fund 3,473 2,953 - Superannuation fund 403 337 Share based payment Expense 2,020 561 Gratuity expense (Refer note 35) 1,274 1,117 Staff welfare expenses 1,188 627 Total 89,453 74,853
Particulars Year ended Year ended March 31, 2022 March 31, 2021
` in lakhs
Note : 29 OTHER EXPENSESRent and facility charges 1,198 734 Rates and taxes 5,173 2,047 Energy cost 1,107 1,011 Repairs and maintenance 585 400 Communication costs 3,125 2,772 Printing and stationery 1,817 1,233 Advertisement and publicity expenses 1,298 1,267 Directors fees, allowances and expenses 147 109 Auditors' remuneration (Refer note 32) 94 80 Legal and professional charges 11,928 4,083 Insurance 2,791 1,591 Travelling and conveyance 4,795 2,641 Information technology expenses 4,775 3,243 Loss on sale of property, plant and equipment(Net) 7 54 Recovery charges 42,425 26,657 Corporate social responsibility expenditure (Refer note 29.1) 3,644 3,207 Outsource cost 22,591 22,417 Miscellaneous expenses 340 289 1,07,840 73,835 Less : Expenses recovered (157) (174)Total 1,07,683 73,661
Particulars Year ended Year ended March 31, 2022 March 31, 2021

Corporate Overview Financial StatementsManagement Reports
139
` in lakhs
29.1 Details of CSR expenditureGross Amount required to be spent towards CSR u/s 135 (5) of Companies Act , 2013 (A) 3,632 3,207Amount approved by the Board to be spent during the year 3,644 3,207Amount spent during the year (B) (a) Construction/ acquisition of asset - -(b) Others 3,644 3,207Excess/(shortfall) (A-B) 12 -None of the CSR projects undertaken by the Company has been fall under definition of "On-going Projects"There is no amount required to be contributed to specified fund u/s 135(6)
Particulars Year ended Year ended March 31, 2022 March 31, 2021
Notes forming part of the Standalone Financial Statements (Contd.) For the year ended March 31, 2022
Note : 29 OTHER EXPENSES (Contd.)
Profit After Tax Attributable to Equity Shareholders (` in lakhs) 2,14,671 1,51,491Weighted Average Number of Equity Shares (Basic) 82,05,81,106 81,96,69,366Add: Dilutive effect relating to ESOP 15,91,805 14,30,020Weighted Average Number of Equity Shares (Diluted) 82,21,72,911 82,10,99,386Earnings per Share - Basic (`) 26.16 18.48Earnings per Share - Diluted (`) 26.11 18.45Face Value Per Share (`) 2 2
Note : 30a) Earnings per share
Note: Earnings per Share calculations are done in accordance with Ind AS 33 "Earnings per Share".b) Income tax reconciliationThe tax charge shown in the statement of profit and loss differs from the tax charge that would apply if all profits had been charged at India corporate tax rate. Reconciliation between the tax expense and the accounting profit multiplied by India's domestic tax rate for the years ended 31 March, 2022 and 2021 is, as follows:
Particulars Year ended Year ended March 31, 2022 March 31, 2021
Accounting profit before tax from continuing operations 2,89,094 2,03,844Income tax rate of 25.17% (31 March 2021: 25.17%) 72,759 51,308Effects of:Impact of difference in tax base for Donations and CSR Expense 918 813Share based payment expense – No deduction claimed under tax 508 141Impact Deduction u/s 80JJA (28) (28)Other Adjustments 266 119Income tax expense reported in statement of profit and loss 74,423 52,353
Particulars Year ended Year ended March 31, 2022 March 31, 2021
` in lakhs
Note : 31 TRANSFER OF FINANCIAL ASSETS
31.1 Transferred financial assets that are not derecognised in their entirety
The following tables provide a summary of financial assets that have been transferred in such a way that part or all of the transferred financial assets do not qualify for derecognition, together with the associated liabilities:
A) SecuritisationThe Company has Securitised certain loans, however the Company has not transferred substantially all risks and rewards, hence these assets have not been de-recognised in its entirety.

140
Corporate Overview Financial StatementsManagement Reports
Note : 31 TRANSFER OF FINANCIAL ASSETS (Contd.)
Notes forming part of the Standalone Financial Statements (Contd.) For the year ended March 31, 2022
B) Direct bilateral assignmentThe Company has transferred certain loans (measured at amortised cost) by way of direct bilateral assignment, as a source of finance.As per the terms of these deals, since substantial risk and rewards related to these assets were transferred to the buyer, the assets have been de-recognised from the Company’s balance sheet.The table below summarises the carrying amount of the derecognised financial assets measured at amortised cost and the gain/(loss) on derecognition, per type of asset.
AssignmentCarrying amount of de-recognised financial asset 2,76,499 4,16,042Carrying amount of Retained Assets at amortised cost 31,734 47,502
AssignmentGain on sale of the de-recognised financial asset - -
Particulars As at As at March 31, 2022 March 31, 2021
Particulars Year ended Year ended March 31, 2022 March 31, 2021
` in lakhs
` in lakhs
31.2 The Company has not transferred any assets that are derecognised in their entirety where the Company continues to have continuing involvement.
Note : 32 AUDITORS’ REMUNERATIONStatutory Audit 52 4 47Limited Review 16 5 16Tax Audit - - 5Other Services 1 11 5Reimbursement of Expenses(incl. input tax credit expensed) 3 2 7Total 72 22* 80* Represents the amount paid to the previous auditor during the year ended 31st March 2022
Particulars Year ended Year ended March 31, 2022 March 31, 2021
` in lakhs
` in lakhs
SecuritisationsCarrying amount of transferred assets measured at amortised cost 3,75,013 4,75,242Carrying amount of associated liabilities (Debt securities - measured at amortised cost) 3,67,247 4,63,916Fair value of assets 3,80,513 4,76,131Fair value of associated liabilities 3,66,882 4,37,374Net position at Fair Value 13,631 38,757
Particulars As at As at March 31, 2022 March 31, 2021
` in lakhs
Principal amount due to suppliers under MSMED Act, as at the year end 306 -Interest accrued and due to suppliers under MSMED Act, on the above amount as at the year end - -Payment made to suppliers (other than interest) beyond the appointed day, during the year - -Interest paid to suppliers under MSMED Act (other than Section 16) - -Interest paid to suppliers under MSMED Act (Section 16) - -Interest due and payable to suppliers under MSMED Act, for payments already made - -Interest accrued and remaining unpaid at the year end to suppliers under MSMED Act - -
Particulars As at As at March 31, 2022 March 31, 2021
Note : 33 MICRO, SMALL & MEDIUM ENTERPRISES
Based on and to the extent of the information received by the Company from the suppliers during the year regarding their status under the Micro, Small and Medium Enterprises Development Act, 2006 (MSMED Act), the relevant particulars are furnished below:

Corporate Overview Financial StatementsManagement Reports
141
Notes forming part of the Standalone Financial Statements (Contd.) For the year ended March 31, 2022
Note : 35 RETIREMENT BENEFIT
A) Defined contribution plan
A defined contribution plan is a post-employment benefit plan under which the Company pays fixed contributions and where there is no legal or constructive obligation to pay further contributions. During the year, the Company recognised ` 3,473 lakhs (Previous Year - ` 2,953 lakhs) to Provident Fund under Defined Contribution Plan, ` 403 lakhs (Previous Year - ` 337 lakhs) for Contributions to Superannuation Fund and ` 32 lakhs (Previous Year - ` 49 lakhs) for Contributions to Employee State Insurance Scheme in the Statement of Profit and Loss.
B) Defined Benefit Plan
1) Gratuity
The Company’s defined benefit gratuity plan requires contributions to be made to a separately administered fund. The gratuity plan is funded with Life Insurance Corporation of India (LIC). The gratuity plan is governed by the Payment of Gratuity Act, 1972. Under the Act, employee who has completed five years of service is entitled to specific benefit. The level of benefits provided depends on the member’s length of service and salary at retirement age. The following tables summarise the components of net benefit expense recognised in the statement of profit or loss and the funded status and amounts recognised in the balance sheet for the respective plans :
c) There is no dividend paid in foreign currency.
` in lakhs
Defined Benefit Obligation at the beginning of the year 7,303 5,989Current Service Cost 1,150 1,026Interest Cost 456 386Remeasurement Losses/(Gains) a. Effect of changes in financial assumptions (234) 90 b. Effect of experience adjustments 222 36Benefits Paid (434) (224)Defined Benefit Obligation at the end of the year 8,463 7,303Change in Fair value of Plan AssetsFair Value of Plan Assets at the Beginning of the Year 5,311 4,575Expected Returns on Plan Assets 332 295Employer’s Contribution 2052 664Benefits Paid (434) (224)Return on plan assets (excluding interest income) (7) -Transfer in/out (9) -Fair Value of Plan Assets at the end of the year 7,245 5,310
Particulars Year ended Year ended March 31, 2022 March 31, 2021
Change in Defined Benefit Obligation and Fair value of Plan assets:
` in lakhs
` in lakhs
Membership fees - 3Interest on borrowings 21,549 12,166License fees 472 173Professional charges 30 547
Purchase of Computer Equipment 1,346 265Borrowing origination costs 32 1,468Repayment of Borrowing 40,492 -
Particulars Year ended Year ended March 31, 2022 March 31, 2021
Particulars Year ended Year ended March 31, 2022 March 31, 2021
Note: 34 a) EXPENDITURE IN FOREIGN CURRENCIES
Note: b) REMITTANCES IN FOREIGN CURRENCIES

142
Corporate Overview Financial StatementsManagement Reports
` in lakhs
Amount Recognised in the Balance SheetFair Value of Plan Assets as at the End of the Year 7,245 5,310Defined benefit obligation at the End of the Year (8,463) (7,303)Amount Recognised in the Balance Sheet under Other Payables (1,218) (1,993)Cost of the Defined Benefit Plan for the YearCurrent Service Cost 1,150 1,026Net interest Expense 456 386Expected Return on Plan Assets (332) (295)Net Cost recognized in the statement of Profit and Loss* 1,274 1,117Remeasurement Losses/(Gains) a) Effect of changes in financial assumptions (234) 90 b) Effect of experience adjustments 222 36 c) Return on plan assets (excluding interest income) 7 -Net cost recognized in Other Comprehensive Income (5) 126AssumptionsDiscount Rate 6.70% p.a. 6.25% p.a.Future salary increase 7.50% p.a. 7.50% p.a.Attrition Rate - Senior management 13% p.a. 13% p.a. - Middle management 13% p.a. 13% p.a. - Others 13% p.a. 13% p.a.Expected rate of return on Plan Assets 7.50% p.a. 7.50% p.a.Mortality Indian Assured Indian Assured Lives (2012-14) Lives (2012-14) Ultimate UltimateMaturity profile of Defined Benefit ObligationsWeighted average duration (Based on discounted cash flows) 6 years 6 yearsExpected Cash flows over the next (valued on undiscounted basis)Within the next 12 months (next annual reporting period) 1,210 964Between 2 and 5 years 4,173 3,478Between 5 and 10 years 3,868 3,277Beyond 10 Years 4,314 3,805 Total Expected Cash flows 13,565 11,524
Particulars Year ended Year ended March 31, 2022 March 31, 2021
Note : 35 RETIREMENT BENEFIT (Contd.)
Notes forming part of the Standalone Financial Statements (Contd.) For the year ended March 31, 2022
Sensitivity Analysis:
Notes:1. The estimate of future salary increase takes into account inflation, seniority, promotion and other relevant factors.2. The Company’s best estimate of contribution during the next year is ` 2,432 lakhs.3. Discount rate is based on the prevailing market yields of Indian Government Bonds as at the Balance Sheet date for the estimated term
of the obligation.4. The entire Plan Assets are invested in insurer managed funds with Life Insurance Corporation of India (LIC).5. The above sensitivity analysis are based on change in an assumption which is holding all the other assumptions constant. In practice,
this is unlikely to occur, and changes in some assumptions may be correlated. When calculating the sensitivity of defined benefit obligation to significant actuarial assumptions the same method of present value of defined benefit obligations calculated with Projected unit cost method at the end of the reporting period has been applied while calculating defined benefit liability recognised in the balance sheet.
6. The method and type of assumptions used in preparing the sensitivity analysis does not change as compared to the prior period
` in lakhs
Discount Rate (+/- 1%) 7,980 8,999 6,869 7,787Salary Growth Rate (+/- 1%) 8,925 8,028 7,728 6,906 Attrition Rate (+/- 50% of attrition rates) 8,341 8,621 7,117 7,576 Mortality Rate (+/- 10% of mortality rates) 8,463 8,463 7,303 7,303
Particulars March 31, 2022 March 31, 2021 Increase Decrease Increase Decrease
* Recognized under Employee Benefit Expenses

Corporate Overview Financial StatementsManagement Reports
143
Note : 35 RETIREMENT BENEFIT (Contd.)
Note : 36 SEGMENT INFORMATION
DESCRIPTION OF RISK EXPOSURES
Valuations are performed on certain basic set of pre-determined assumptions and other regulatory framework which may vary over time. Thus, the Company is exposed to various risks in providing the above gratuity benefit which are as follows:
(a) Interest Rate risk:The plan exposes the company to the risk of fall in interest rates . A fall in interest rates will result in an increase in the ultimate cost of providing the above benefit and will thus result in an increase in the value of the liability(as shown in financial statements).
(b) Liquidity Risk: This is the risk that the company is not able to meet the short-term gratuity payouts .This may arise due to non-availability of enough cash/cash equivalent to meet the liabilities or holding of illiquid assets not being sold in time.
(c) Salary Escalation Risk: The present value of the defined benefit plan is calculated with the assumption of salary increase rate of plan participants in future .Deviation in the rate of increase of salary in future for plan participants from the rate of increase in salary used to determine the present value of obligation will have a bearing on the plan's liability.
(d) Demographic Risk: The Company has used certain mortality and attrition assumptions in valuation of the liability. The Company is exposed to the risk of actual experience turning out to be worse compared to the assumption.
(e) Regulatory Risk: Gratuity benefit is paid in accordance with the requirements of the Payment of Gratuity Act,1972 (as amended from time to time). There is a risk of change in regulations requiring higher gratuity payouts (e.g.Increase in the maximum limit on gratuity of ` 20,00,000)
(f) Asset Liability Mismatching or Market Risk: The duration of the liability is longer compared to duration of assets, exposing the Company to market risk for volatilities/fall in interest rate.
(g) Investment Risk:The probability or likelihood of occurrence of losses relative to the expected return on an particular investment.
The Company is primarily engaged in the business of financing. All the activities of the Company revolve around the main business. Further, the Company does not have any separate geographic segments other than India
During year ending 31 March 2022, For management purposes, the Company has been organised into the following operating segments based on products and services, as follows
Vehicle Finance - Loans to customers against purchase of new/used vehicles, tractors, construction equipment and loan to automobile dealers.
Loan against property - Loans to customer against immovable property
Home Loans - loans given for acquisition of residential property
Other loans - This includes, loan against shares and other unsecured loans
The Chief Operating Decision Maker (CODM) monitors the operating results of its business units separately for making decisions about resource allocation and performance assessment. Segment performance is evaluated based on operating profits or losses and is measured consistently with operating profits or losses in the financial statements. However, income taxes are managed on a entity as whole basis and are not allocated to operating segments.
Notes:
1. The Company has not funded its Compensated Absences liability and the same continues to remain as unfunded as at March 31, 2022.
2. The estimate of future salary increase takes into account inflation, seniority, promotion and other relevant factors.
3. Discount rate is based on the prevailing market yields of Indian Government Bonds as at the Balance Sheet date for the estimated term of the obligation.
Notes forming part of the Standalone Financial Statements (Contd.) For the year ended March 31, 2022
Discount Rate 6.70% p.a. 6.25% p.a.Future salary increase 7.50% p.a. 7.50% p.a.Attrition Rate - Senior management 13% p.a. 13% p.a. - Middle management 13% p.a. 13% p.a. - Others 13% p.a. 13% p.a.Mortality Indian Assured Indian Assured Lives (2012-14) Lives (2012-14) Ultimate Ultimate
Assumptions March 31, 2022 March 31, 2021
2. Compensated Absences

144
Corporate Overview Financial StatementsManagement Reports
Note : 36 SEGMENT INFORMATION (Contd.)` in lakhs
Revenue from Operations - Interest Income 7,08,861 1,55,970 59,453 8,196 24,201 9,56,681 - Net gain on derecognition of financial -
instruments under amortised cost category
- Fee Income 32,994 4,706 464 190 20 38,374 - Net gain on Fair value change on financial instrument 1,299 1,299 - Sale of Services 7,961 389 125 - - 8,475 - Others
Segment revenue from Operations (I) 7,49,816 1,61,065 60,042 8,386 25,520 10,04,829Other Income (II) 8,021 284 1 28 714 9,048Total Segment Income - (I) + (II) 7,57,837 1,61,349 60,043 8,414 26,234 10,13,877Expenses
- Finance costs 3,20,214 90,709 26,237 3,936 (11,214) 4,29,882 - Impairment of Financial Instruments 72,262 10,625 4,381 720 42 88,030 - Employee benefits expense 68,601 11,180 5,899 3,492 281 89,453 - Depreciation and amortisation expense 8,097 982 536 120 - 9,735 - Other expenses 88,735 6,988 4,045 4,227 3,688 1,07,683Segment Expenses 5,57,909 1,20,484 41,098 12,495 (7,203) 7,24,783Segment Profit / (loss) before taxation 1,99,928 40,865 18,945 -4,081 33,437 2,89,094Tax expense 74,423Profit for the year 2,14,671
Year ended March 31, 2022 Particulars Vehicle Loan against Home Loans Others Unallocable Total finance property
Notes forming part of the Standalone Financial Statements (Contd.) For the year ended March 31, 2022
` in lakhs
Revenue from Operations - Interest Income 6,93,467 1,44,319 46,679 3,229 34,722 9,22,416 - Net gain on derecognition of financial instruments - - - - - under amortised cost category - Fee Income 18,224 2,180 181 89 12 20,685 - Net gain on Fair value change on financial instrument - - - - 463 463 - Sale of Services 7,096 540 400 - - 8,037Segment revenue from Operations (I) 7,18,787 1,47,039 47,260 3,318 35,197 9,51,601 - Other income (II) 5,244 287 - 63 361 5,955Total Segment Income - (I) + (II) 7,24,031 1,47,326 47,260 3,381 35,558 9,57,556Expenses - Finance costs 3,50,978 84,871 20,670 2,493 (1,421) 4,57,591 - Impairment of Financial Instruments 1,18,036 14,847 5,479 -582 (3) 1,37,777 - Employee benefits expense 61,327 7,692 4,971 695 168 74,853 - Depreciation and amortisation expense 8,388 1,039 371 32 - 9,830 - Other expenses 61,102 4,939 3,591 164 3,865 73,661Segment Expenses 5,99,831 1,13,388 35,082 2,802 2,609 7,53,712Segment Profit / (loss) before taxation 1,24,200 33,938 12,178 579 32,949 2,03,844Tax expense 52,353Profit for the year 1,51,491
Year ended March 31, 2021 Particulars Vehicle Loan against Home Loans Others Unallocable Total finance property

Corporate Overview Financial StatementsManagement Reports
145
Note : 36 SEGMENT INFORMATION (Contd.)
` in lakhs
As on March 31, 2022
Segment Assets 52,18,720 15,57,057 4,74,236 1,64,160 74,14,173Unallocable Assets 8,22,162 8,22,162Total Assets 82,36,335Segment Liabilities 44,76,896 13,35,726 4,06,825 1,40,825 63,60,272Unallocable Liabilities 7,05,295 7,05,295Total Liabilities 70,65,567As on March 31, 2021 Segment Assets 48,93,657 12,71,552 3,72,558 45,828 65,83,595Unallocable Assets 8,71,247 8,71,247Total Assets 74,54,842Segment Liabilities 42,66,080 11,08,484 3,24,780 39,951 57,39,295Unallocable Liabilities 7,59,516 7,59,516Total Liabilities 64,98,811
Note : 37 RELATED PARTY DISCLOSURES
List of Related Parties:
l Holding Company: Cholamandalam Financial Holdings Limited (formerly known as TI Financial Holdings Limited) l Entity having significant influence over holding Company: Ambadi Investments Limitedl Subsidiaries of the entity which has significant influence over holding Company: Parry Enterprises Limited and Parry Agro Limitedl Fellow Subsidiaries: Cholamandalam MS General Insurance Company Limited, Cholamandalam Health Insurance Limitedl Joint Venture of Holding Company: Cholamandalam MS Risk Services Limitedl Subsidiaries: Cholamandalam Securities Limited, Cholamandalam Home Finance Limitedl Joint Venture: Payswiff Technologies Private Limited and its subsidiaries (from 8th February 2022)l Associate : White Data Systems India Private Limited, Vishvakarma Payments Private Limited (from 30th March 2021), Paytail Commerce Private
Limited (from 15th September 2021)l Key Managerial Personnel: a. Mr. Arun Alagappan, Managing Director (upto February 14, 2021) b. Mr. D. Arulselvan, Chief Financial Officer c. Ms. P.Sujatha, Company Secretary d. Mr. Ravindra Kumar Kundu, Executive Director l Non-Executive Directors a) Mr. Ashok Kumar Barat b) Mr. M.M. Murugappan (upto November 11, 2020) c) Mr. N. Ramesh Rajan d) Mr. Rohan Verma e) Ms. Bhama Krishnamurthy f ) Mr. Vellayan Subbiah (From November 11, 2020) g) Mr. M.A.M. Arunachalam (From January 29, 2021) h) Mr. Anand Kumar (From March 16, 2021) i) Mr. Bharath Vasudevan (From March 16, 2021)
In computing the segment information, certain estimates and assumptions have been made by the management.As the assets are allocated to segment based on certain assumptions, hence additions to the Property, plant and equipment have not been disclosed separately for each specific segment.There are no revenue from transactions with a single external customer or counter party which amounted to 10% or more of the Company's total revenue in the Current year and Previous year.
Notes forming part of the Standalone Financial Statements (Contd.) For the year ended March 31, 2022
Particulars Vehicle Loan against Home Loans Others Unallocable Total finance property

146
Corporate Overview Financial StatementsManagement Reports
` in lakhs
Dividend Payments (Equity Shares) a) Cholamandalam Financial Holdings Limited 7,458 4,848 b) Ambadi Investments Limited 674 438 c) Parry Enterprises India Limited * * d) AR Lakshmi Archi Trust # 10 - e) M A Murugappan Holdings LLP# 2 1 f ) Kadamane Estates Co# 7 5Amount received towards Reimbursement of expenses a) Cholamandalam Financial Holdings Limited 118 104 b) Cholamandalam Securities Limited 404 213 c) Cholamandalam Home Finance Limited 5,209 3,544 d) Cholamandalam MS General Insurance Company Limited 6 5 e) Parry Enterprises India Limited 1 1 f ) Cholamandalam MS Risk Services Limited - *Expenses – Reimbursed a) Cholamandalam Home Finance Limited 145 157 b) White Data Systems India Private Limited 3 - c) Cherry Tin Online Private Limited# 8 - d) Cholamandalam Securities Limited 8 -Services Received a) Cholamandalam Securities Limited 23 15 b) White Data Systems India Private Limited 24 29 c) Parry Enterprises India Limited 194 72 d) Cholamandalam MS General Insurance Company Limited 217 196 e) Cholamandalam MS Risk Services Limited 1 -Amount received towards other Reimbursements a) Cholamandalam Securities Limited 33 1Rental Income a) Cholamandalam Securities Limited 5 8Rental Expense a) Cholamandalam Home Finance Limited 63 126Loans given a) Cholamandalam Securities Limited 6,550 1,600 b) White Data Systems India Private Limited 300 340 c) Payswiff Solutions Private Limited 300 -Loans recovered a) Cholamandalam Securities Limited 6,100 2,300 b) White Data Systems India Private Limited 340 340 c) ) Payswiff Solutions Private Limited 300 -Interest Income Received a) Cholamandalam Securities Limited 9 1 b) White Data Systems India Private Limited 21 26 c) Payswiff Solutions Private Limited 1 -Loans availed a) Cholamandalam Home Finance Limited 6,850 22,820
Particulars Year ended Year ended March 31, 2022 March 31, 2021
a) Transactions during the yearNote : 37 RELATED PARTY DISCLOSURES (Contd.)
Notes forming part of the Standalone Financial Statements (Contd.) For the year ended March 31, 2022

Corporate Overview Financial StatementsManagement Reports
147
Loans repaid a) Cholamandalam Home Finance Limited 6,850 22,820Interest Expense a) Cholamandalam Home Finance Limited 140 80 b) Cholamandalam MS General Insurance Company Limited 1,313 1,603Subscriptions/Advertisement Expenses a) Finance Industry Development Council# 1 - Commission and Sitting fees to non-executive Directors 137 100
` in lakhs Particulars As at As at March 31, 2022 March 31, 2021
b) Balances Outstanding at the year end.
c) Remuneration to Key Managerial Personnel
` in lakhs
Loans - Receivable a) Cholamandalam Securities Limited 450 - b) White Data Systems India Private Limited 300 340 c) Medall Healthcare Private Limited# 1,732 -Debt Securities – Payable a) Cholamandalam MS General Insurance Company Limited (14,793) (18,527)Other Receivable / (Payable) a) Cholamandalam Financial Holdings Limited - 2 b) Paytail Commerce Private Limited 437 - c) Cholamandalam Securities Limited 14 (5) d) Cholamandalam Home Finance Limited 599 272 e) Cholamandalam MS General Insurance Company Limited - 1 f ) White Data Systems India Private Limited (10) (6) g) Parry Enterprises India Limited (44) * h) Cholamandalam MS Risk Services Limited (1) -
Short- term employee benefits 557 794Post–employment pension (defined Contribution) 84 92Dividend Payments 8 17Share based payments 271 27Sale of Vehicle(s) 4 21Sale of Asset * -Relatives of KMP and Directors 11 7* Represents amounts less than ` 1 lakh# Represents entities included as per Companies Act , 2013
Particulars As at As at March 31, 2022 March 31, 2021
Particulars Year ended Year ended March 31, 2022 March 31, 2021
Note : 37 RELATED PARTY DISCLOSURES (Contd.)
Notes forming part of the Standalone Financial Statements (Contd.) For the year ended March 31, 2022

148
Corporate Overview Financial StatementsManagement Reports
Disclosure pursuant to Schedule V of Clause A.2 and 2A of Regulation 34 (3) and Regulation 53(f) of the SEBI (Listing Obligations and Disclosure Requirements) Regulations, 2015.
i) Disclosures relating Loans and Advances /Investments
ii) Cholamandalam Financial Holdings Limited (CFHL), promoter-group company holds 45.41% of equity shares of the company. Disclosure relating to transactions with CFHL is given above.
` in lakhs
(A) To Subsidiaries - Cholamandalam Securities Limited 450 2,600 - 700(B) To Associates - White Data Systems India Private Limited 300 340 340 340(C) To Joint Venture - Payswiff Technologies Private Limited and its subsidiaries - 3,230 - - To Firms/Companies in which Directors are Interested - - - - (other than (A) and (B) above)(D) Investments by the loanee in the shares of parent company - - - - and subsidiary company
2021-2022 2020-2021Sl Loans and Advances in the nature of Loans Outstanding Maximum Outstanding Maximum at the Amount at the Amount year end Outstanding year end Outstanding during year March 2021
Note : 37 RELATED PARTY DISCLOSURES (Contd.)
Notes forming part of the Standalone Financial Statements (Contd.) For the year ended March 31, 2022
Note : 38 CONTINGENT LIABILITIES AND COMMITMENTS (a) Contested Claims not provided for: ` in lakhs
` in lakhs
Income tax and Interest on Tax issues where the Company has gone on appeal 29,977 22,465
Decided in the Company’s favour by Appellate Authorities and for which the Department is on further 634 21,898 appeal with respect to Income Tax
Sales Tax issues pending before Appellate Authorities in respect of which the Company is on appeal. 1952 2,573
Decided in the Company’s favour by Appellate Authorities and for which the Department is on 102 - further appeal with respect to Sales Tax
Service Tax & GST issues pending before Appellate Authorities in respect of which the Company 19,992 19,992 is on appeal.
Disputed claims against the Company lodged by various parties under litigation 14,458 10,801 (to the extent quantifiable)
Capital commitments 3,992 3,650
Disbursements – Undrawn lines 1,48,588 1,24,190
i) The Company is of the opinion that for the above demands, based on the management estimate no significant liabilities are expected to arise.
ii) It is not practicable for the Company to estimate the timings of the cashflows, if any, in respect of the above pending resolution of the respective proceedings.
iii) The Company does not expect any reimbursement in respect of the above contingent liabilities.iv) Future Cash outflows in respect of the above are determinable only on receipt of judgements/decisions pending with various forums/
authorities.
(b) Commitments
c) The Code on Social Security, 2020 (‘The Code’) relating to employee benefits during employment and post-employment benefits, received Presidential assent in September 2020. The Code has been published in the Gazette of India. However, the date on which the Code will come into effect has not been notified. The Ministry of Labour and Employment has also released draft rules thereunder on 13 November 2020 and has invited suggestions from stakeholders, which are under consideration by the Ministry. The Company will evaluate the rules, assess the impact, if any, and account for the same once the rules are notified and become effective.
Particulars As at As at March 31, 2022 March 31, 2021
Particulars As at As at March 31, 2022 March 31, 2021

Corporate Overview Financial StatementsManagement Reports
149
Notes forming part of the Standalone Financial Statements (Contd.) For the year ended March 31, 2022
` in lakhs
Provision for Contingencies and Service Tax claims 4,346 108 501 3,953Provision for Undrawn commitments 104 16 - 120
Particulars As at Additional Utilisation/ As at March 31, 2021 Provision Reversal March 31, 2022
Note : 39 CHANGES IN PROVISIONS
Note : 40 ESOP DISCLOSURE
Undrawn loan commitments are commitments under which the Company is required to provide a loan under pre-sanctioned terms to the customer.
The undrawn commitments provided by the Company are predominantly in the nature of limits provided for Automobile dealers based on the monthly loan conversions and partly disbursed loans for immovable properties. These undrawn limits are converted within a short period of time and do not generally remain undisbursed / undrawn beyond one year from the reporting date. The undrawn loan commitments amount outstanding as at March 31, 2022 is ` 1,48,588 lakhs (` 1,24,190 lakhs as at March 31, 2021).
The Company creates expected credit loss provision on the undrawn commitments outstanding as at the end of the reporting period and the related expected credit loss on these commitments as at March 31, 2022 is ` 120 lakhs (` 104 lakhs as at March 31, 2021)
ESOP 2007The Board at its meeting held on June 22, 2007, approved an issue of Stock Options up to a maximum of 5% of the issued Equity Capital of the Company (before Rights Issue) aggregating to 1,904,162 Equity Shares (prior to share split) in a manner provided in the SEBI (Employee Stock Option Scheme and Employee Stock Purchase Scheme) Guidelines.ESOP 2016The Board at its meeting held on October 7, 2016, approved to create, and grant from time to time, in one or more tranches, not exceeding 1,56,25,510 Employee Stock Options to or for the benefit of such person(s) who are in permanent employment of the company including some of subsidiaries, managing director and whole time director, (other than promoter/promoter group of the company, independent directors and directors holding directly or indirectly more than 10% of the outstanding equity shares of the company), as may be decided by the board, exercisable into not more than 1,56,25,510 equity shares of face value of `2/- each fully paid-up, on such terms and in such manner as the board may decide in accordance with the provisions of the applicable laws and the provisions of ESOP 2016.In this regard, the Company has recognised expense amounting to ` 2020 lakhs for employees services received during the year, shown under Employee Benefit Expenses (Refer Note 28).The movement in Stock Options during the current period are given below:
` in lakhs
Provision for Contingencies and Service Tax claims 3,838 508 - 4,346Provision for Undrawn commitments 131 89 116 104
Particulars As at Additional Utilisation/ As at March 31, 2020 Provision Reversal March 31, 2021
Employee Stock Option Plan 2007
GT25 25 Apr 08 - - - - - - - - - - Apr 2008GT27 27 Jan 11 - - - - - - - - - - JAN 2011AGT27 27 Jan 11 - - - - - - - - - - JAN 2011BGT30 30 Apr 11 10,240 - - - 10,240 - - - 33 - APR 2011GT27 27 Oct 11 8,580 - - - 8,580 - - - 31 - OCT 2011Total 18,820 - - - 18,820 - - - - -
Particulars Date of As at Addition Options Options Options As at As at As at Exercise Weighted Grant 31.03.2021 in number Granted Forfeited Exercised 31.03.2022 31.03.2022 31.03.2022 Price Average of options on / Expired and ` Remaining account of allotted Contractual share split* Life
Options outstanding
Options outstanding
Options vested but not
exercised
Options unvestedDuring the Year

150
Corporate Overview Financial StatementsManagement Reports
Employee Stock Option Plan 2016
GT25 25 Jan 17 16,64,690 - - - 6,01,040 10,63,650 10,63,650 - 202 - JAN2017 GT30 30 Jan 18 2,04,085 - - - 84,675 1,19,410 1,89,240 - 262 - JAN2018GT30 30 Jan 18 87,300 - - - - 87,300 17,470 - 262 - JAN2018AGT23 23 Apr 18 26,940 - - - - 26,940 13,470 13,470 312 0.06 years APR2018GT26 26 Jul 18 1,40,360 - - - 3,000 1,37,360 1,08,560 28,800 299 - JUL2018GT30 30 Oct 18 2,97,400 - - - 70,100 2,27,300 1,30,580 96,720 254 0.58 years OCT2018GT19 19 Mar 19 5,71,180 - - - 1,36,260 4,34,920 2,86,750 1,48,170 278 0.97 years MAR2019GT30 30 Jul 19 26,772 - - - 26,772 - - - 248 - JUL2019GT05 5 Nov 19 2,50,040 - - - 51,740 1,98,300 32,940 1,65,360 316 1.10 years NOV2019GT23 23 Jan 20 42,400 - - 10,600 - 31,800 - 31,800 318 1.32 years JAN2020GT03 3 Jun 20 2,11,900 - - - 44,285 1,67,615 - 1,69,520 158 1.30 years JUNE2020GT03 3 Jun 20 1,905 - - - - 1,905 - - 158 1.30 years JUNE2020AGT07 7 May 21 - - 10,66,600 - - 10,66,600 - 10,66,600 580 1.80 years MAY2021GT30 30 Jul 21 - - 24,700 - - 24,700 - 24,700 487 2.03 years JULY2021GT29 29 Oct 21 - - 8,08,120 - - 8,08,120 - 8,08,120 609 2.28 years OCT2021GT01 1 Feb 22 - - 1,26,100 - - 1,26,100 - 1,26,100 630 2.54 years FEB2022Total 35,24,972 - 20,25,520 10,600 10,17,872 45,22,020 18,42,660 26,79,360
Note: Includes options (vested and unvested) issued employees of subsidiary as at March 31, 2022 - 11,276 options prior to share split (March 31, 2021 - 11,276 options)
*Equity shares of face value of ` 10/- have been split into face value of ` 2 per share on June 18, 2019, pursuant to resolution passed through postal ballot on June 3, 2019
Note : 40 ESOP DISCLOSURE (Contd.)
Notes forming part of the Standalone Financial Statements (Contd.) For the year ended March 31, 2022
Particulars Date of As at Addition Options Options Options As at As at As at Exercise Weighted Grant 31.03.2021 in number Granted Forfeited Exercised 31.03.2022 31.03.2022 31.03.2022 Price Average of options on / Expired and ` Remaining account of allotted Contractual share split* Life
Options outstanding
Options outstanding
Options vested but not
exercised
Options unvestedDuring the Year

Corporate Overview Financial StatementsManagement Reports
151
Employee Stock Option Plan 2016
Note : 40 ESOP DISCLOSURE (Contd.)
GT25 25 Jan 17 21,18,600 - - 1,92,140 2,61,770 16,64,690 16,64,690 - 202 - JAN2017GT30 30 Jan 18 2,38,485 - - - 34,400 2,04,085 2,04,085 - 262 - JAN2018GT30 30 Jan 18 89,800 - - - 2,500 87,300 60,360 26,940 262 0.84 years JAN2018AGT23 23 Apr 18 44,900 - - - 17,960 26,940 - 26,940 312 0.56 years APR2018GT26 26 Jul 18 2,74,860 - - 1,31,500 3,000 1,40,360 86,600 53,760 299 0.32 years JUL2018GT30 30 Oct 18 3,67,300 - - 44,900 25,000 2,97,400 1,03,960 1,93,440 254 1.08 years OCT2018GT19 19 Mar 19 5,88,460 - - - 17,280 5,71,180 2,75,740 2,95,440 278 1.47 years MAR2019GT30 30 Jul 19 31,632 - 4,860 - 26,772 13,386 13,386 248 0.33 years JUL2019GT05 5 Nov 19 2,75,600 - - 25,560 2,50,040 29,560 2,20,480 316 1.73 years NOV2019GT23 23 Jan 20 53,000 - - 10,600 42,400 - 42,400 318 1.94 years JAN2020GT03 3 Jun 20 - - 2,11,900 - - 2,11,900 - 2,11,900 158 1.88 years JUNE2020GT03 3 Jun 20 - - 1,905 - - 1,905 - 1,905 158 0.18 years JUNE2020ATotal 40,82,637 - 2,13,805 3,73,400 3,98,070 35,24,972 24,38,381 10,86,591
Particulars Date of As at Addition Options Options Options As at As at As at Exercise Weighted Grant 31.03.2020 in number Granted Forfeited Exercised 31.03.2021 31.03.2021 31.03.2021 Price ` Average of options / Expired and Remaining on account allotted Contractual of share split* Life
Options outstanding During the Year
Notes forming part of the Standalone Financial Statements (Contd.) For the year ended March 31, 2022
Employee Stock Option Plan 2007
Gt 25 25 Apr 08 - - - - - - - - - - Apr 2008GT 27 27 Jan 11 23,120 - - - 23,120 - - - 38 - JAN 2011AGT 27 27 Jan 11 - - - - - - - - - JAN 2011BGT 30 30 Apr 11 25,240 - - - 15,000 10,240 10,240 - 33 - APR 2011GT 27 27 Oct 11 29,760 - - - 21,180 8,580 8,580 - 31 - OCT 2011Total 78,120 - - - 59,300 18,820 18,820 -
Particulars Date of As at Addition Options Options Options As at As at As at Exercise Weighted Grant 31.03.2020 in number Granted Forfeited Exercised 31.03.2021 31.03.2021 31.03.2021 Price ` Average of options / Expired and Remaining on account allotted Contractual of share split* Life
Options outstanding
Options outstanding
Options outstanding
Options vested but not
exercised
Options vested but not
exercised
Options unvested
Options unvested
During the Year

152
Corporate Overview Financial StatementsManagement Reports
Note: Includes options (vested and unvested) issued employees of subsidiary as at March 31, 2021 - 11,276 options prior to share split (March 31, 2020 - 11,276 options)
*Equity shares of face value of ` 10/- have been split into face value of ` 2 per share on June 18, 2019, pursuant to resolution passed through postal ballot on June 3, 2019
The following tables list the inputs to the Black Scholes model used for the plans for the year ended March 31, 2022:
The shareholders of the Company, at the 34th Annual General Meeting held on July 30, 2012, authorised extension of exercise period from 3 years from the date of vesting to 6 years from the date of vesting. Accordingly, the Company has measured the fair value of the options using the Black Scholes model immediately before and after the date of modification to arrive at the incremental fair value arising due to the extension of the exercise period. The incremental fair value so calculated is recognised from the modification date over the vesting period in addition to the amount based on the grant date fair value of the stock options.
The incremental (benefit)/cost due to modification of the exercise period from 3 years to 6 years from the date of vesting for the year ended March 31, 2022 is ` Nil (March 31, 2021- ` Nil)
The fair value of the options has been calculated using the Black Scholes model on the date of modification.
The assumptions considered for the calculation of the fair value (on the date of modification) are as follows:
Note : 40 ESOP DISCLOSURE (Contd.)
ESOP 2007
30 Jul 07 7.10% - 7.56% 3-6 years 40.64% -43.16% 5.65% 193.40 61.42
24 Oct 07 7.87% -7.98% 3-6 years 41.24% -43.84% 5.65% 149.90 44.25
25 Jan 08 6.14% -7.10% 3-6 years 44.58% -47.63% 5.65% 262.20 78.15
25 Apr 08 7.79% - 8.00% 2.5-5.5 years 45.78% - 53.39% 3.97% 191.80 76.74
30 Jul 08 9.14% - 9.27% 2.5-5.5 years 46.52% - 53.14% 3.97% 105.00 39.22
24 Oct 08 7.54% - 7.68% 2.5-5.5 years 48.2% - 55.48% 3.97% 37.70 14.01
27 Jan 11
- Tranche I 8% 4 years 59.50% 10% 187.60 94.82
- Tranche II 8% 3.4 years 61.63% 10% 187.60 90.62
30 Apr 11 8% 4 years 59.40% 25% 162.55 73.07
28 Jul 11 8% 4 years 58.64% 25% 175.35 79.17
27 Oct 11 8% 4 years 57.52% 25% 154.55 67.26
Date of Grant Risk Free Expected Life Expected Dividend Yield Price of the Fair Value Interest Rate Volatility underlying of the Option Share in the (`) Market at the time of the Option Grant (`)
Variables
Variables Post Modification
Risk Free Interest Rate 7.92%-8.12%
Expected Life 0.12 years- 6.25 years
Expected Volatility 28.28%-63.00%
Dividend Yield 1.18%
Price of the underlying share in market at the time of the option grant.(`) 212.05
Notes forming part of the Standalone Financial Statements (Contd.) For the year ended March 31, 2022

Corporate Overview Financial StatementsManagement Reports
153
Notes forming part of the Standalone Financial Statements (Contd.) For the year ended March 31, 2022
ESOP 2016
25 Jan 17 6.36% - 6.67% 3.5 - 6.51 years 33.39% - 34.47% 0.54% 1,010.00 401.2930 Jan 18 7.11% - 7.45% 3.5 - 5.50 years 30.16% - 31.46% 0.42% 1,309.70 496.82 30 Jan 18 7.11% - 7.45% 3.5 - 5.50 years 30.16% - 31.46% 0.42% 1,309.70 531.8423 Apr 18 7.45% - 7.81% 3.51 - 6.51 years 30.33% - 32.38% 0.42% 1,562.35 646.08 26 Jul 18 7.71% - 7.92% 3.51 - 5.51 years 30.56% - 31.83% 0.43% 1,497.30 586.32 30 Oct 18 7.61% - 7.85% 3.51 - 6.51 years 32.34% - 32.70% 0.51% 1,268.50 531.36 19 Mar 19 6.91% - 7.25% 3.51 - 6.51 years 32.19% - 32.59% 0.47% 1,390.05 564.13 30 Jul 19 6.15% - 6.27% 3.51 - 4.51 years 32.21% - 32.93% 0.52% 248.20 83.66* 5 Nov 19 6.15% - 6.27% 3.51 - 4.51 years 32.21% - 32.93% 0.52% 316.00 112.09* 23 Jan 20 6.15% - 6.27% 3.51 - 4.51 years 32.21% - 32.93% 0.52% 317.00 109.51* 3 Jun 20 5% 3.50 years 47.50% 1.33% 157.90 58.27*7 May 21 5.12% - 6.02% 3.5 - 6.51 years 52.06% - 43.62% 0.34% 580.30 276.8430 Jul 21 5.25% - 6.20% 3.50 - 6.51 years 52.06% - 43.65% 0.41% 487.15 232.48 29 Oct 21 5.22% - 6.17% 3.50 - 6.51 years 53.2% - 43.93% 0.33% 609.00 293.95 1 Feb 22 5.49% - 6.50% 3.50 - 6.51 years 53.81% - 44.42% 0.32% 629.50 309.23 * Fair value option of equity shares issued under this grant is post share split with a face value of ` 2/- each
Date of Grant Risk Free Expected Life Expected Dividend Yield Price of the Fair Value Interest Rate Volatility underlying of the Option Share in the (`) Market at the time of the Option Grant (`)
Variables
Note : 40 ESOP DISCLOSURE (Contd.)
Note : 41 SHARING OF COSTS
The Company shares certain costs / service charges with other companies. These costs have been allocated between the Companies on a basis mutually agreed between them, which has been relied upon by the Auditors.
Note : 42.1 CAPITAL MANAGEMENT
The Company maintains an actively managed capital base to cover risks inherent in the business, meeting the capital adequacy requirements of Reserve Bank of India (RBI), maintain strong credit rating and healthy capital ratios in order to support business and maximise shareholder value. The adequacy of the Company’s capital is monitored by the Board using, among other measures, the regulations issued by RBI.
The Company manages its capital structure and makes adjustments to it according to changes in economic conditions and the risk characteristics of its activities. In order to maintain or adjust the capital structure, the Company may adjust the amount of dividend payment to shareholders, return capital to shareholders or issue capital securities.
The Company has complied in full with the capital requirements prescribed by RBI over the reported period. The Capital adequacy ratio as of March 31, 2022 is 19.62% (March 31, 2021- 19.10%) as against the regulatory requirement of 15%.
Note : 42.2 FINANCIAL RISK MANAGEMENT
The key financial risks faced by the company are credit and market risks comprising liquidity risk, interest rate risk and foreign currency risks.
Note : 42.2.1 CREDIT RISK
Credit risk arises when a borrower is unable to meet his financial obligations to the lender. This could be either because of wrong assessment of the borrower’s payment capabilities or due to uncertainties in his future earning potential. The effective management of credit risk requires the establishment of appropriate credit risk policies and processes.

154
Corporate Overview Financial StatementsManagement Reports
42.2.1.1 ASSESSMENT METHODOLOGY
The company has comprehensive and well-defined credit policies across various businesses, products and segments, which encompass credit approval process for all businesses along with guidelines for mitigating the risks associated with them. The appraisal process includes detailed risk assessment of the borrowers, physical verifications and field visits. The company has a robust post sanction monitoring process to identify credit portfolio trends and early warning signals. This enables it to implement necessary changes to the credit policy, whenever the need arises. Also, being in asset financing business, most of the company’s lending is covered by adequate collaterals from the borrowers. The company has a robust online application underwriting model to assess the credit worthiness of the borrower for underwriting decisions for its vehicle finance, Loan Against Property and home loan business. The company also has a well- developed model for the vehicle finance portfolio, to help business teams plan volume with adequate pricing of risk for different segments of the portfolio.
42.2.1.2 RISK MANAGEMENT AND PORTFOLIO REVIEW
The company has a robust portfolio review mechanism. Key metrics like early delinquency, default rates are tracked, monitored and reviewed daily. Business teams review key trends in these Key Risk Indicators and location level strategies are adopted.
42.2.1.3 ECL METHODOLOGY
The Company records allowance for expected credit losses for all financial assets including loan commitments, other than those measured at FVTPL. Equity instruments carried at cost are not subject to impairment under the ECL methodology.
42.2.1.4 ASSUMPTIONS AND ESTIMATION TECHNIQUES
The Company calculates ECLs to measure the expected cash shortfalls, discounted at an approximation to the EIR. A cash shortfall is the difference between the cash flows that are due to an entity in accordance with the contract and the cash flows that the entity expects to receive. ECL is computed on collective basis. The portfolio is segmented based on shared risk characteristics for the computation of ECL.
The key elements of the ECL are summarised below:
42.2.1.4(a) PD
The Probability of Default is an estimate of the likelihood of default over a given time horizon. A default may only happen at a certain time over the assessed period, if the facility has not been previously derecognised and is still in the portfolio. While computing probability of default, significant outlier events are suitably handled to ensure it does not skew the outcomes.
A 12M marginal PD is computed by creating cohorts of accounts starting in Stage 1 at the beginning of the year and subsequently moving to Stage 3 at any point in time during the year.
A conditional average probability of default is computed by taking cohort of which were in Stage 2 at the beginning the year and subsequently moved to Stage 3 anytime in each subsequent year.
42.2.1.4(b) EAD
The Exposure at Default is an estimate of the exposure at a future default date (in case of Stage 1 and Stage 2), taking into account expected changes in the exposure after the reporting date, including repayments of principal and interest, whether scheduled by contract or otherwise, expected drawdowns on committed facilities, and accrued interest from missed payments. In case of Stage 3 loans EAD represents exposure when the default occurred.
42.2.1.4(c) LGD
The Loss Given Default is an estimate of the loss arising in the case where a default occurs at a given time. It is based on the difference between the contractual cash flows due and those that the lender would expect to receive, including from the realisation of any collateral. It is usually expressed as a percentage of the EAD.The recoveries are discounted back to the default date using customer IRR. This present value of recovery is used for LGD computation. A recovery rate (RR) computed as the ratio of present value of recovery to the EAD (1 – RR), gives the LGD.
42.2.1.5 MECHANICS OF THE ECL METHOD
Stage 1:
All loans (other than purchased credit impaired asset) are categorised as Stage 1 on initial recognition.The 12 months ECL is calculated as the portion of LTECLs that represent the ECLs that result from default events on a financial instrument that are possible within the 12 months after the reporting date. The Company calculates the 12 months ECL allowance based on the expectation of a default occurring in the 12 months following the reporting date. These expected 12-month default probabilities are applied to EAD and multiplied by the expected LGD and discounted by an approximation to the original EIR.
Stage 2:
Loans which are past due for more than 30 days are categorised as Stage 2. When a loan has shown a significant increase in credit risk since origination, the Company records an allowance for the LTECLs PDs and LGDs are estimated over the lifetime of the instrument. The expected cash shortfalls are discounted by an approximation to the original EIR.
Stage 3:
Loans which are past due for more than 90 days are categorised as Stage 3. For loans considered credit-impaired, the Company recognises the lifetime expected credit losses for these loans. The method is similar to that for Stage 2 assets, with the PD set at 100%
Note : 42 CAPITAL MANAGEMENT (Contd.)
Notes forming part of the Standalone Financial Statements (Contd.) For the year ended March 31, 2022

Corporate Overview Financial StatementsManagement Reports
155
Note : 42 CAPITAL MANAGEMENT (Contd.)Restructured loans are categorised as Stage 3 on the date of restructuring and remain so for a period of one year. Post this, regular staging criteria applies.
Loans which have been renegotiated or modified in accordance with RBI Notifications for COVID-19 related stress, has been classified as Stage 2 due to significant increase in credit risk.
The Post Implementation Staging of Loans restructured under Covid Resolution framework shall follow the Days Past Due of respective loan agreements.
In respect of new lending products introduced during the year, the company follows simplified matrix approach for determining impairment allowance based on industry practise in the absence of historical information. These loans constitutes less than 1% of the total loan book.
Loan Movement across stages during the year is given in a note 9.1
Loan commitment:When estimating LTECLs for undrawn loan commitments, the Company estimates the expected portion of the loan commitment that will be drawn down over its expected life. The ECL is then based on the present value of the expected shortfalls in cash flows if the loan is drawn down. The expected cash shortfalls are discounted at an approximation to the expected EIR on the loan. For an undrawn loan commitment, ECLs are calculated and presented under provisions.
Other Financial assets:The Company follows 'simplified approach' for recognition of impairment loss allowance on other financial assets. The application of simplified approach does not require the Company to track changes in credit risk and calculated on case by case approach, taking into consideration different recovery scenarios.
Based on Management's assessment of ECL on trade receivables/ other financial assets, the provisions are not material to financial statements (Nil as at March 31, 2021).
42.2.1.6 Incorporation of forward looking statements in ECL modelThe Company considers a broad range of forward looking information with reference to external forecasts of economic parameters such as GDP growth,Inflation, Government Expenditure etc., as considered relevant so as to determine the impact of macro-economic factors on the Company’s ECL estimates.
The inputs and models used for calculating ECLs are recalibrated periodically through the use of available incremental and recent information. Further, internal estimates of PD, LGD rates used in the ECL model may not always capture all the characteristics of the market / external environment as at the date of the financial statements. To reflect this, qualitative adjustments or overlays are made as temporary adjustments to reflect the emerging risks reasonably.
Annual data from 2010 to 2026 (including forecasts for 5 years) were obtained from World Economic Outlook, October 2021 published by International Monetary Fund (IMF). IMF provides historical and forecasted data for important economic indicators country-wise. The data provided for India is used for the analysis. Macro variables that were compared against default rates at segment level to determine the key variables having correlation with the default rates using appropriate statistical techniques. Vasicek model has been incorporated to find the Point in Time (PIT) PD. The company has formulated the methodology for creation of macro-economic scenarios under the premise of economic baseline, upside and downside condition. A final PIT PD is arrived as the scenario weighted PIT PD under different macroeconomic scenarios.
Notes forming part of the Standalone Financial Statements (Contd.) For the year ended March 31, 2022
42.2.1.7 Macro economic variables
Heavy Commercial Gross domestic product, current prices USD Inflation, end of period consumer prices Vehicle
Light Commercial Gross domestic product, current prices USD Inflation, end of period consumer prices Vehicle
Car & MUV Gross domestic product, current prices USD Inflation, end of period consumer prices
Mini Light Gross domestic product per capita, Inflation, end of period consumer prices Commercial Vehicle constant prices USD
Used Vehicles General government total expenditure Gross domestic product per capita, constant prices USD
Shubh General government total expenditure Gross domestic product per capita, constant prices USD
Tractor Inflation, average consumer prices General government total expenditure
Construction Gross domestic product per capita, Gross domestic product, current prices USD Equipment constant prices USD
Loan Against Property Gross domestic product, current prices USD Inflation, end of period consumer prices
Home Loan Inflation, average consumer prices General government total expenditure
Segment Macro-Economic Variables correlated for each segment

156
Corporate Overview Financial StatementsManagement Reports
Note : 42 CAPITAL MANAGEMENT (Contd.)
Notes forming part of the Standalone Financial Statements (Contd.) For the year ended March 31, 2022
` in lakhs
Concentration of credit risk arise when a number of counterparties or exposures have comparable economic characteristics, or such counterparties are engaged in similar activities or operate in same geographical area or industry sector so that collective ability to meet contractual obligations is uniformly affected by changes in economic, political or other conditions. The Company is in retail lending business on pan India basis targeting primarily customers who either do not get credit or sufficient credit from the traditional banking sector. Vehicle Finance (consisting of new and used Commercial Vehicles, Passenger Vehicles, Tractors, Construction Equipment and Trade advance to Automobile dealers) is lending against security (other than for trade advance) of Vehicle/ Tractor / Equipment and contributes to 69% of the loan book of the Company as of March 31, 2022 (72% as of March 31, 2021). Hypothecation endorsement is made in favour of the Company in the Registration Certificate in respect of all registerable collateral. Portfolio is reasonably well diversified across South, North, East and Western parts of the country. Similarly, sub segments within Vehicle Finance like Heavy Commercial Vehicles, Light Commercial Vehicles, Car and Multi Utility Vehicles, three wheeler and Small Commercial Vehicles, Refinance against existing vehicles, older vehicles (first time buyers), Tractors and Construction Equipment have portfolio share between 10% and 6% leading to well diversified sub product mix.Loan Against Property is mortgage loan against security of existing immovable property (primarily self-occupied residential property) to self- employed non-professional category of borrowers and contributes to 22 % of the lending book of the Company as of March 31, 2022 (22% as of March 31, 2021). Portfolio is concentrated in North 35% with small presence in East 5%. South has 35% and West contributes 25% of the overall exposure of the company.The Concentration of risk is managed by Company for each product by its region and its sub-segments. Company did not overly depend on few regions or sub-segments as of March 31, 2022.
42.2.1.8 Concentration of credit risk and Collateral and Credit Enhancements
42.2.1.8(a) Concentration of credit risk
Year ended Increase/ (Decrease) Impact on Expected Credit Losses of GDP (ECL)-Increase/(Decrease)March 31, 2022 Decrease by 5% 518
March 31, 2022 Increase by 5% (535)
Since the company has used Gross Domestic Product (GDP) as a predominant macro economic variable the sensitivity around the same is given below:
Although collateral can be an important mitigation of credit risk, it is the Company’s practice to lend on the basis of the customer’s ability to meet the obligations out of cash flow resources other than placing primary reliance on collateral and other credit risk enhancements.The Company obtains first and exclusive charge on all collateral that it obtains for the loans given. Vehicle Finance and Loan Against Property loans are secured by collateral at the time of origination. In case of Vehicle loans, Company values the vehicle either through proforma invoice (for new vehicles) or using registered valuer for used vehicles. In case of Loan against Property, the value of the property at the time of origination will be arrived by obtaining two valuation reports from Company’s empanelled valuers.Hypothecation endorsement is obtained in favour of the Company in the Registration Certificate of the Vehicle/ Tractor / Equipment funded under the vehicle finance category.Immovable Property is the collateral for Loan Against Property. Security Interest in favour of the Company is created by Mortgage through deposit of title deed which is registered wherever required by law.In respect of Other loans, Home loans follow the same process as Loan Against Property and pledge is created in favour for the Company for loan against securities. 99% of the Company’s term loan are secured by way of tangible Collateral.In respect of some unsecured lending, the company obtains First Loss Default Guarantee or similar arrangement from external service providers as partial cover against potential credit default.
42.2.1.8(b) Collateral and Credit enhancements
` in lakhsMaximum Loan Other Net exposure Associatedexposure to Vehicles (b) against loans (d) (e)=(a-b-c-d) ECL credit risk (a) property (c)
3,30,532 2,33,024 2,40,987 23,823 (1,67,302) 1,26,650
Maximum Loan Other Net exposure Associatedexposure to Vehicles (b) against loans (d) (e)=(a-b-c-d) ECLcredit risk (a) property (c)
2,64,053 1,90,025 2,15,929 20,285 (1,62,186) 1,14,030
Note: Column (b), (c), (d) of the above table, represents fair value of collateral
Fair value of collateral held against credit impaired assets - March 31, 2022
Fair value of collateral held against credit impaired assets - March 31,2021

Corporate Overview Financial StatementsManagement Reports
157
Notes forming part of the Standalone Financial Statements (Contd.) For the year ended March 31, 2022
Valuation of Collateral:
a) Vehicles including construction equipment and tractors are valued at original cost less 20% depreciation per year on WDV
b) Immovable property is valued based on the amount as per the valuation report at the time of sanctioning of loan
c) Other loans are valued based on book debts at cost or securities at market value
42.2.2 Market Risk
Market Risk is the possibility of loss arising from changes in the value of a financial instrument as a result of changes in market variables such as interest rates, exchange rates. The company’s exposure to market risk is a function of asset liability management and interest rate sensitivity assessment. The company is exposed to interest rate risk and liquidity risk, if the same is not managed properly. The company continuously monitors these risks and manages them through appropriate risk limits. The Asset Liability Management Committee (ALCO) reviews market-related trends and risks and adopts various strategies related to assets and liabilities, in line with the company’s risk management framework. ALCO activities are in turn monitored and reviewed by a board sub-committee. In addition, the company has put in an Asset Liability Management (ALM) support group which meets frequently to review the liquidity position of the company.
42.2.2.1 Liquidity Risk
Liquidity risk is defined as the risk that the Company will encounter difficulty in meeting obligations associated with financial liabilities that are settled by delivering cash or another financial asset. Liquidity risk arises because of the possibility that the Company might be unable to meet its payment obligations when they fall due as a result of mismatches in the timing of the cash flows under both normal and stress circumstances. Such scenarios could occur when funding needed for illiquid asset positions is not available to the Company on acceptable terms. To limit this risk, management has arranged for diversified funding sources and adopted a policy of availing funding in line with the tenor and repayment pattern of its receivables and monitors future cash flows and liquidity on a daily basis. The Company has developed internal control processes and contingency plans for managing liquidity risk. This incorporates an assessment of expected cash flows and the availability of unencumbered receivables which could be used to secure funding by way of assignment if required. The Company also has lines of credit that it can access to meet liquidity needs. These are reviewed by the Asset Liability Committee (ALCO) on a monthly basis. The ALCO provides strategic direction and guidance on liquidity risk management. A sub-committee of the ALCO, comprising members from the Treasury and Risk functions, monitor liquidity risks on a weekly basis and decisions are taken on the funding plan and levels of investible surplus, from the ALM perspective. This sets the boundaries for daily cash flow management.
Analysis of Financial assets and Financial liabilities by remaining contractual maturities given in note -47.42.2.2.2 Interest Rate RiskThe Company being in the business of lending raises money from diversified sources like market borrowings, term Loan from banks and financial institutions, foreign currency borrowings etc. Financial assets and liabilities constitute significant portion, changes in market interest rates can adversely affect the financial condition. The fluctuations in interest rates can be due to internal and external factors. Internal factors include the composition of assets and liabilities across maturities, existing rates and re-pricing of various sources of borrowings. External factors include macro-economic developments, competitive pressures, regulatory developments and global factors. The movement in interest rates (upward / downward) will impact the Net Interest Income depending upon rate sensitivity of the asset or liability. The company uses traditional gap analysis report to determine the vulnerability to movements in interest rates. The Gap is the difference between Rate Sensitive Assets (RSA) and Rate Sensitive Liabilities (RSL) for each time bucket. A positive gap indicates that the company can benefit from rising interest rates while a negative gap indicates that the company can benefit from declining interest rates. Based on market conditions, the company enters into interest rate swap to mitigate interest rate risk.
Note : 42 CAPITAL MANAGEMENT (Contd.)
` in lakhs
` in lakhs
Year ended Increase/(Decrease) Impact on Profit before TaxMarch 31, 2022 Increase by 100 bps (14,340)
March 31, 2022 Decrease by 100 bps 14,340
Year ended Increase/(Decrease) Impact on Profit before TaxMarch 31, 2021 Increase by 100 bps (10,360)
March 31, 2021 Decrease by 100 bps 10,360
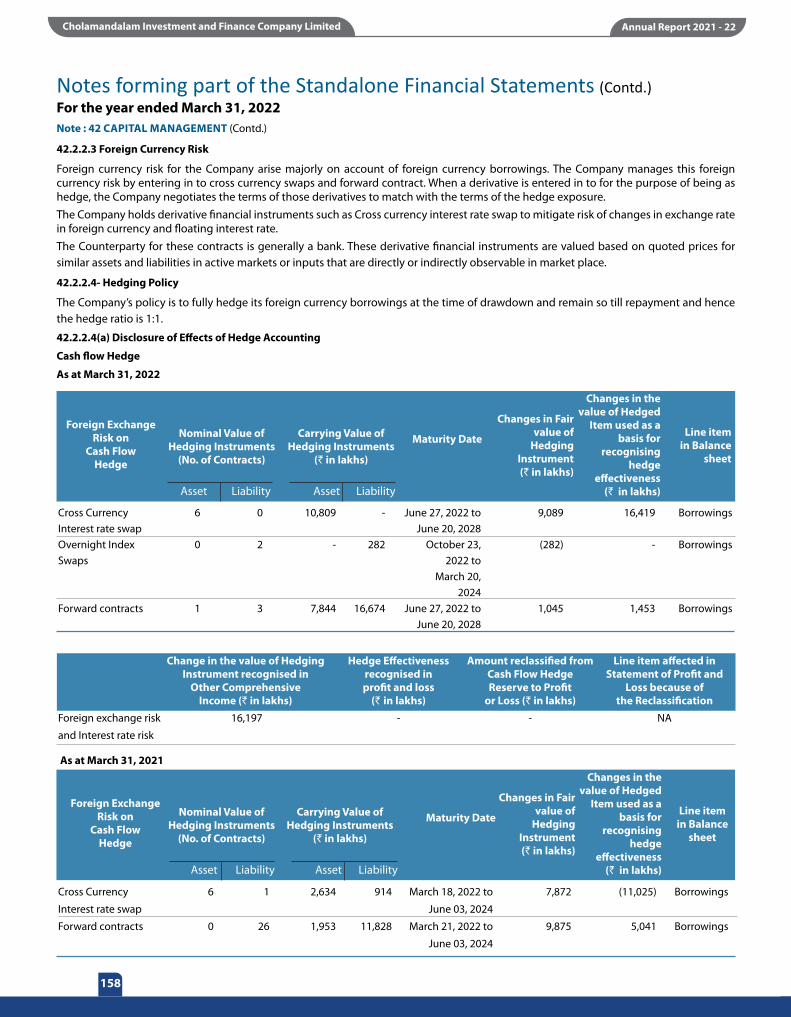
158
Corporate Overview Financial StatementsManagement Reports
Note : 42 CAPITAL MANAGEMENT (Contd.)
Notes forming part of the Standalone Financial Statements (Contd.) For the year ended March 31, 2022
42.2.2.3 Foreign Currency Risk
Foreign currency risk for the Company arise majorly on account of foreign currency borrowings. The Company manages this foreign currency risk by entering in to cross currency swaps and forward contract. When a derivative is entered in to for the purpose of being as hedge, the Company negotiates the terms of those derivatives to match with the terms of the hedge exposure. The Company holds derivative financial instruments such as Cross currency interest rate swap to mitigate risk of changes in exchange rate in foreign currency and floating interest rate.The Counterparty for these contracts is generally a bank. These derivative financial instruments are valued based on quoted prices for similar assets and liabilities in active markets or inputs that are directly or indirectly observable in market place.
42.2.2.4- Hedging Policy
The Company’s policy is to fully hedge its foreign currency borrowings at the time of drawdown and remain so till repayment and hence the hedge ratio is 1:1.
42.2.2.4(a) Disclosure of Effects of Hedge Accounting
Cash flow Hedge
As at March 31, 2022
Cross Currency 6 0 10,809 - June 27, 2022 to 9,089 16,419 BorrowingsInterest rate swap June 20, 2028Overnight Index 0 2 - 282 October 23, (282) - BorrowingsSwaps 2022 to March 20, 2024Forward contracts 1 3 7,844 16,674 June 27, 2022 to 1,045 1,453 Borrowings June 20, 2028
Foreign Exchange Risk on
Cash Flow Hedge
Nominal Value of Hedging Instruments
(No. of Contracts)
Carrying Value of Hedging Instruments
(` in lakhs)
Maturity Date Line item in Balance
sheet
Changes in Fair value of
Hedging Instrument (` in lakhs)
Changes in the value of Hedged
Item used as a basis for
recognising hedge
effectiveness (` in lakhs)Asset AssetLiability Liability
Change in the value of Hedging Hedge Effectiveness Amount reclassified from Line item affected in Instrument recognised in recognised in Cash Flow Hedge Statement of Profit and Other Comprehensive profit and loss Reserve to Profit Loss because of Income (` in lakhs) (` in lakhs) or Loss (` in lakhs) the ReclassificationForeign exchange risk 16,197 - - NA
and Interest rate risk
Cross Currency 6 1 2,634 914 March 18, 2022 to 7,872 (11,025) Borrowings
Interest rate swap June 03, 2024
Forward contracts 0 26 1,953 11,828 March 21, 2022 to 9,875 5,041 Borrowings
June 03, 2024
Foreign Exchange Risk on
Cash Flow Hedge
Nominal Value of Hedging Instruments
(No. of Contracts)
Carrying Value of Hedging Instruments
(` in lakhs)
Maturity Date Line item in Balance
sheet
Changes in Fair value of
Hedging Instrument (` in lakhs)
Changes in the value of Hedged
Item used as a basis for
recognising hedge
effectiveness (` in lakhs)Asset AssetLiability Liability
As at March 31, 2021

Corporate Overview Financial StatementsManagement Reports
159
Notes forming part of the Standalone Financial Statements (Contd.) For the year ended March 31, 2022
Change in the value of Hedging Hedge Effectiveness Amount reclassified from Line item affected in Instrument recognised in recognised in Cash Flow Hedge Statement of Profit and Other Comprehensive profit and loss Reserve to Profit Loss because of Income (` in lakhs) (` in lakhs) or Loss (` in lakhs) the Reclassification
Foreign exchange risk (4,521) - - NA and Interest rate risk
As at March 31, 2021
Note : 43 EVENTS AFTER REPORTING DATE
There have been no events after the reporting date that require disclosure in the financial statements.
Note : 44
44.1 - Fair value of financial instruments not measured at fair value
Set out below is a comparison, by class, of the carrying amounts and fair values of the Company ’s financial instruments that are not carried at fair value in the balance sheet. This table does not include the fair values of non–financial assets and non–financial liabilities.
` in lakhs
Financial Assets Cash and Cash Equivalents 2,65,788 2,65,788 1,44,785 1,44,785 Bank balances Other than Cash and Cash Equivalents 1,56,220 1,56,220 3,78,403 3,78,403 Receivables i) Trade Receivables 3,247 3,247 2,031 2,031 ii) Other Receivables 9,554 9,554 4,612 4,612 Loans 74,14,921 75,16,903 65,83,934 68,38,189 Investments in Government Securities 1,54,348 1,42,665 1,54,590 1,46,905 Other Financial Assets 32,088 32,088 53,637 53,637 Total Financial Assets 80,36,166 81,26,465 73,21,992 75,68,562 Financial Liabilities Payables i) Trade Payables - Due to MSME 306 306 - - ii) Trade Payables - Other than MSME 7,984 7,984 5,267 5,267 iii) Other Payables 71,990 71,990 54,239 54,239 Debt Securities 13,32,110 13,32,560 12,35,767 12,36,407 Borrowings(Other than Debt Securities) 52,00,452 52,48,454 47,18,226 47,15,550 Subordinated Liabilities 3,84,788 3,86,858 4,19,006 4,20,811 Other Financial Liabilities 33,343 33,343 33,804 33,804 Total Financial Liabilities 70,30,973 70,81,495 64,66,309 64,66,078
March 31, 2022 March 31, 2021 Carrying Fair Carrying Fair Value Value Value Value
Note : 42 CAPITAL MANAGEMENT (Contd.)
The Management assessed that cash and cash equivalents, bank balance other than Cash and cash equivalents, receivable, other financial assets,
payables and other financial liabilities approximates their carrying amount largely due to short term maturities of these instruments.
Note 44.2 - Fair value hierarchy
The fair value of the financial assets and liabilities is included at the amount at which the instrument could be exchanged in a current transaction
between willing parties, other than in a forced or liquidation sale. The following methods and assumptions were used to estimate the fair values
of financial assets or liabilities disclosed under level 2 category.
i) The fair value of loans have estimated by discounting expected future cash flows using discount rate equal to the rate near to the
reporting date of the comparable product.

160
Corporate Overview Financial StatementsManagement Reports
Notes forming part of the Standalone Financial Statements (Contd.) For the year ended March 31, 2022
ii) The fair value of debt securities, borrowings other than debt securities and subordinated liabilities have estimated by discounting expected future cash flows discounting rate
iii) Derivatives are fair valued using observable inputs / rates iv) The fair value of investment in Government securities are derived from rate equal to the rate near to the reporting date of the
comparable product.
The following table provides the fair value measurement hierarchy of the Company's financial assets and financial liabilities
` in lakhs Fair value measurement using Carrying Quoted price in Significant observable Significant unobservable Value active markets (Level 1) inputs (Level 2) inputs (Level 3)
Assets measured at Fair value FVOCI Equity Instruments - - - -
Derivative financial instruments 18,653 - 18,653 -
Assets for which fair values are disclosedLoans 74,14,921 - 75,16,903
Investments in Government securities 1,54,348 - 1,42,665 -
Investment Properties * 13 - - 309
There have been no transfers between different levels during the period.
* Fair value of investment property is calculated based on valuation given by external independent valuer.
Quantitative disclosure fair value measurement hierarchy of assets as at March 31, 2022
Note : 44 Fair value hierarchy (Contd.)
` in lakhs
` in lakhs
Fair value measurement using Carrying Quoted price in Significant observable Significant unobservable Value active markets (Level 1) inputs (Level 2) inputs (Level 3)
Liabilities measured at Fair value Derivative financial instruments 16,956 - 16,956 -
Liabilities for which fair values are disclosed Debt Securities 13,32,110 - 13,32,560 -
Borrowings(Other than Debt Securities) 52,00,452 - 52,48,454 -
Subordinated Liabilities 3,84,788 - 3,86,858 -
There have been no transfers between the level 1 and level 2 during the period.
Fair value measurement using Carrying Quoted price in Significant observable Significant unobservable Value active markets (Level 1) inputs (Level 2) inputs (Level 3)
Assets measured at Fair value FVOCI Equity Instruments - - - -
Derivative financial instruments 4,587 - 4,587 -
Assets for which fair values are disclosed Loans 65,83,934 - 68,38,189
Investment in Government securities 1,54,590 - 1,46,905 -
Investment Properties * 14 - - 304
There have been no transfers between different levels during the period.* Fair value of investment property is calculated based on valuation given by external independent valuer.
Quantitative disclosure fair value measurement hierarchy of liabilities as at March 31, 2022
Quantitative disclosure fair value measurement hierarchy of assets as at March 31, 2021

Corporate Overview Financial StatementsManagement Reports
161
Notes forming part of the Standalone Financial Statements (Contd.) For the year ended March 31, 2022Note : 44.2 - Fair value hierarchy (Contd.)
Fair value measurement using Carrying Quoted price in Significant observable Significant unobservable Value active markets (Level 1) inputs (Level 2) inputs (Level 3)
Liabilities measured at Fair value
Derivative financial instruments 12,742 - 12,742 -
Liabilities for which fair values are disclosed
Debt Securities 12,35,767 - 12,36,407 -
Borrowings (Other than Debt Securities) 47,18,226 - 47,15,550 -
Subordinated Liabilities 4,19,006 - 4,20,811 -
There have been no transfers between different levels during the period.
Quantitative disclosure fair value measurement hierarchy of liabilities as at March 31, 2021
44.3 Summary of Financial assets and liabilities which are recognised at amortised cost` in lakhs
Financial Assets
Cash and Cash Equivalents 2,65,788 1,44,785
Bank balances other than Cash and Cash Equivalents 1,56,220 3,78,403
Loans 74,14,921 65,83,934
Other Financial Assets 32,088 53,637
Investments in Government Securities 1,54,348 1,54,590
Financial Liabilities
Debt Securities 13,32,110 12,35,767
Borrowings(Other than Debt Securities) 52,00,452 47,18,226
Subordinated Liabilities 3,84,788 4,19,006
Other Financial liabilities 33,343 33,804
44.4 Refer Note 13 for sensitivity analysis for investment property, whose fair value is disclosed under the level 3 category.
Particulars March 31, 2022 March 31, 2021
Note : 45 MATURITY ANALYSIS
The table below shows an analysis of assets and liabilities analysed according to when they are expected to be recovered or settled. ` in lakhs
As on March 31, 2022
Financial Assets
Cash and Cash Equivalents 2,65,788 2,65,788 -
Bank balances Other than Cash and Cash Equivalents 1,56,220 1,40,478 15,742
Derivative financial instruments 18,653 7,554 11,099
Receivables -
i) Trade Receivables 3,247 3,247 -
ii) Other Receivables 9,554 9,554 -
Loans 74,14,921 21,12,758 53,02,163
Investments 2,07,616 909 2,06,707
Other Financial Assets 32,088 7,557 24,531
Total Financial Assets 81,08,087 25,47,845 55,60,242
Maturity Amount Within 12 After 12 months months

162
Corporate Overview Financial StatementsManagement Reports
Notes forming part of the Standalone Financial Statements (Contd.) For the year ended March 31, 2022Note : 45 MATURITY ANALYSIS (Contd.) ` in lakhs
Non- Financial Assets
Current tax assets (Net) 25,071 - 25,071
Deferred tax assets (Net) 67,143 - 67,143
Investment Property 13 - 13
Property, Plant and Equipment 23,989 - 23,989
Capital Work in Progress 2,303 - 2,303
Intangible assets under development 1,395 - 1,395
Other Intangible assets 1,455 - 1,455
Other Non-Financial Assets 6,879 993 5,886
Total Non- Financial Assets 1,28,248 993 1,27,255
Financial Liabilities
Derivative financial instruments 16,956 2,165 14,791
Payables
i) Trade Payables - Due to MSME 306 306 -
ii) Trade Payables - Other than MSME 7,984 7,984 -
iii) Other Payables 71,990 71,990 -
Debt Securities 13,32,110 5,98,192 7,33,918
Borrowings (Other than Debt Securities) 52,00,452 18,51,620 33,48,832
Subordinated Liabilities 3,84,788 50,604 3,34,184
Other Financial Liabilities 33,343 20,774 12,569
Total Financial Liabilities 70,47,929 26,03,635 44,44,294
Non-Financial Liabilities
Current tax liabilities - - -
Provisions 11,827 - 11,827
Other Non-Financial Liabilities 5,811 4,563 1,248
Total Non-Financial Liabilities 17,638 4,563 13,075
Maturity Amount Within 12 After 12 months months
` in lakhs
As on March 31, 2021
Financial Assets
Cash and Cash Equivalents 1,44,785 1,44,785 -
Bank balances Other than Cash and Cash Equivalents 3,78,403 3,78,403 -
Derivative financial instruments 4,587 - 4,587
Receivables -
i) Trade Receivables 2,031 2,031 -
ii) Other Receivables 4,612 4,612 -
Loans 65,83,934 19,71,863 46,12,071
Investments 1,61,882 9,714 1,52,168
Other Financial Assets 53,637 26,982 26,655
Total Financial Assets 73,33,871 25,38,390 47,95,481
Maturity Amount Within 12 After 12 months months

Corporate Overview Financial StatementsManagement Reports
163
Notes forming part of the Standalone Financial Statements (Contd.) For the year ended March 31, 2022Note : 45 MATURITY ANALYSIS (Contd.) ` in lakhs
Non- Financial Assets
Current tax assets (Net) 14,615 - 14,615
Deferred tax assets (Net) 76,380 - 76,380
Investment Property 13 - 13
Property, Plant and Equipment 20,302 - 20,302
Capital Work in Progress - - -
Intangible assets under development 982 - 982
Intangible assets 1,645 - 1,645
Other Non-Financial Assets 7,034 1,816 5,218
Total Non- Financial Assets 1,20,971 1,816 1,19,155
Financial Liabilities
Derivative financial instruments 12,742 - 12,742
Payables
i) Trade Payables - Due to MSME - - -
ii) Trade Payables - Other than MSME 5,267 5,267 -
ii) Other Payables 54,239 54,239 -
Debt Securities 12,35,767 6,04,785 6,30,982
Borrowings(Other than Debt Securities) 47,18,226 16,91,807 30,26,419
Subordinated Liabilities 4,19,006 1,01,959 3,17,047
Other Financial Liabilities 33,804 29,229 4,575
Total Financial Liabilities 64,79,051 24,87,286 39,91,765
Non-Financial Liabilities
Current tax liabilities 4,225 4,225 -
Provisions 10,958 10,958 -
Other Non-Financial Liabilities 4,577 3,303 1,274
Total Non-Financial Liabilities 19,760 18,486 1,274
Maturity Amount Within 12 After 12 months months
` in lakhs
Debt Securities 12,35,767 1,06,714 - (10,371) 13,32,110
Borrowings other than debt securities 47,18,226 4,60,663 11,888 9,675 52,00,452
Subordinated liabilities 4,19,006 (32,770) - (1,448) 3,84,788
Total 63,72,999 5,34,607 11,888 (2,144) 69,17,350
Particulars April 01, 2021 Cash flows Exchange Others March 31, 2022 Difference
Note : 46 CHANGE IN LIABILITIES ARISING FROM FINANCING ACTIVITIES
` in lakhs
Debt Securities 7,32,683 5,00,898 - 2,186 12,35,767
Borrowings other than debt securities 43,27,308 4,04,659 (13,268) (473) 47,18,226
Subordinated liabilities 4,40,552 (20,150) - (1,396) 4,19,006
Total 55,00,543 8,85,407 (13,268) 317 63,72,999
(i) Others column represents the effect of interest accrued but not paid on borrowing, amortisation of processing fees etc
(ii) Liabilities represents of Debt securities, Borrowings (other than debt securities) and Subordinated Liabilities
Particulars April 01, 2020 Cash flows Exchange Others March 31, 2021 Difference
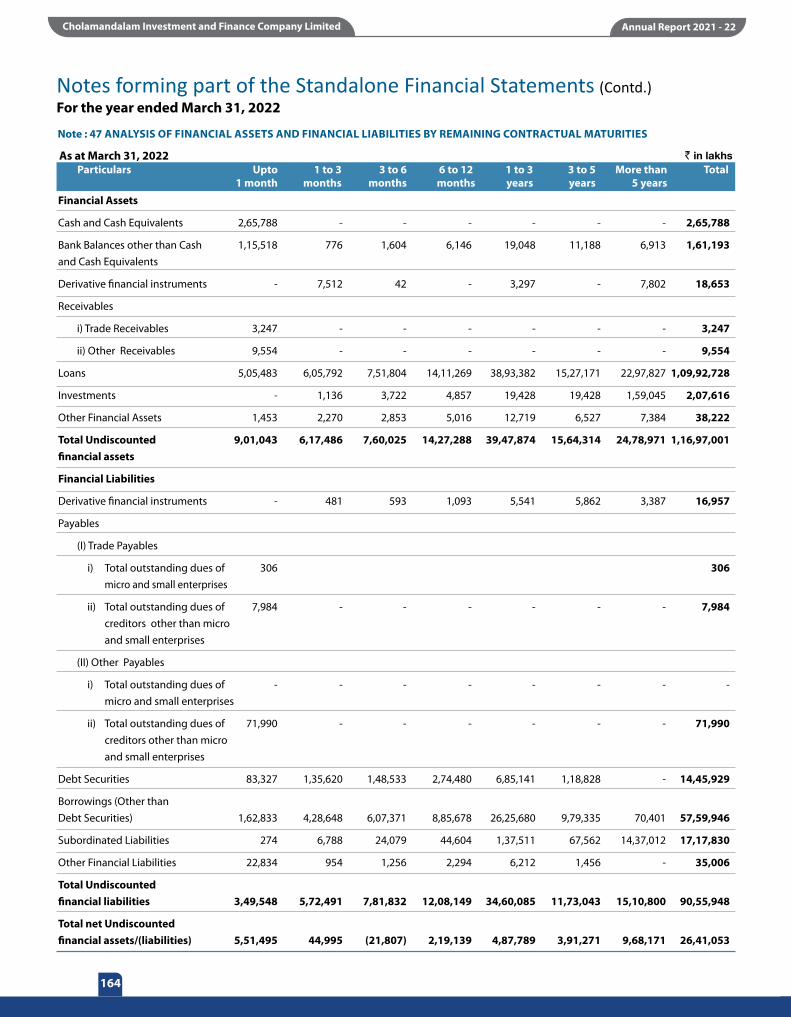
164
Corporate Overview Financial StatementsManagement Reports
Notes forming part of the Standalone Financial Statements (Contd.) For the year ended March 31, 2022
Financial Assets
Cash and Cash Equivalents 2,65,788 - - - - - - 2,65,788
Bank Balances other than Cash 1,15,518 776 1,604 6,146 19,048 11,188 6,913 1,61,193 and Cash Equivalents
Derivative financial instruments - 7,512 42 - 3,297 - 7,802 18,653
Receivables
i) Trade Receivables 3,247 - - - - - - 3,247
ii) Other Receivables 9,554 - - - - - - 9,554
Loans 5,05,483 6,05,792 7,51,804 14,11,269 38,93,382 15,27,171 22,97,827 1,09,92,728
Investments - 1,136 3,722 4,857 19,428 19,428 1,59,045 2,07,616
Other Financial Assets 1,453 2,270 2,853 5,016 12,719 6,527 7,384 38,222
Total Undiscounted 9,01,043 6,17,486 7,60,025 14,27,288 39,47,874 15,64,314 24,78,971 1,16,97,001 financial assets
Financial Liabilities
Derivative financial instruments - 481 593 1,093 5,541 5,862 3,387 16,957
Payables
(I) Trade Payables
i) Total outstanding dues of 306 306 micro and small enterprises
ii) Total outstanding dues of 7,984 - - - - - - 7,984 creditors other than micro and small enterprises
(II) Other Payables
i) Total outstanding dues of - - - - - - - - micro and small enterprises
ii) Total outstanding dues of 71,990 - - - - - - 71,990 creditors other than micro and small enterprises
Debt Securities 83,327 1,35,620 1,48,533 2,74,480 6,85,141 1,18,828 - 14,45,929
Borrowings (Other than Debt Securities) 1,62,833 4,28,648 6,07,371 8,85,678 26,25,680 9,79,335 70,401 57,59,946
Subordinated Liabilities 274 6,788 24,079 44,604 1,37,511 67,562 14,37,012 17,17,830
Other Financial Liabilities 22,834 954 1,256 2,294 6,212 1,456 - 35,006
Total Undiscounted financial liabilities 3,49,548 5,72,491 7,81,832 12,08,149 34,60,085 11,73,043 15,10,800 90,55,948
Total net Undiscounted financial assets/(liabilities) 5,51,495 44,995 (21,807) 2,19,139 4,87,789 3,91,271 9,68,171 26,41,053
` in lakhs Particulars Upto 1 to 3 3 to 6 6 to 12 1 to 3 3 to 5 More than Total 1 month months months months years years 5 years
As at March 31, 2022
Note : 47 ANALYSIS OF FINANCIAL ASSETS AND FINANCIAL LIABILITIES BY REMAINING CONTRACTUAL MATURITIES

Corporate Overview Financial StatementsManagement Reports
165
Notes forming part of the Standalone Financial Statements (Contd.) For the year ended March 31, 2022
Financial Assets Cash and Cash Equivalents 1,55,370 - - - - - - 1,55,370 Bank Balances other than 96,303 1,02,196 1,36,657 3,577 13,043 10,571 11,444 3,73,791 Cash and Cash Equivalents
Derivative financial instruments - - - - - - 4,587 4,587
Receivables
ii) Other Receivables 4,612 - - - - - - 4,612 Loans 5,02,874 5,38,796 7,04,685 13,47,385 37,59,707 13,26,678 19,71,659 1,01,51,784 Investments - 1,135 3,722 4,857 19,428 19,428 1,13,312 1,61,882 Other Financial Assets 1,641 12,851 4,368 7,475 18,298 10,630 10,672 65,935 Total Undiscounted financial assets 7,60,800 6,54,978 8,49,432 13,63,294 38,10,476 13,67,307 21,11,674 1,09,17,961Financial Liabilities Derivative financial instruments - - - - - - 12,742 12,742 Payables
(I) Trade Payables
i) Total outstanding dues of - -
micro and small enterprises
ii) Total outstanding dues of 5,267 - - - - - - 5,267 creditors other than micro
and small enterprises
(II) Other Payables
i) Total outstanding dues of
micro and small enterprises - - - - - - - -
ii) Total outstanding dues of 54,239 - - - - - - 54,239 creditors other than micro
and small enterprises
Debt Securities 1,13,137 2,70,683 1,08,618 1,48,066 5,52,907 1,60,428 2,712 13,56,551 Borrowings (Other than Debt Securities) 1,59,219 3,08,806 7,48,826 7,09,140 25,22,320 6,94,544 1,10,157 52,53,012 Subordinated Liabilities 273 37,967 12,769 78,271 1,66,250 76,319 15,33,381 19,05,230 Other Financial Liabilities 40,771 884 1,159 1,994 9,838 583 - 55,229 Total Undiscounted financial liabilities 3,72,906 6,18,340 8,71,372 9,37,471 32,51,315 9,31,874 16,58,992 86,42,270Total net Undiscounted financial assets/(liabilities) 3,87,894 36,638 (21,940) 4,25,823 5,59,161 4,35,433 4,52,682 22,75,691
` in lakhs Particulars Upto 1 to 3 3 to 6 6 to 12 1 to 3 3 to 5 More than Total 1 month months months months years years 5 years
As at March 31, 2021
Note : 47 ANALYSIS OF FINANCIAL ASSETS AND FINANCIAL LIABILITIES BY REMAINING CONTRACTUAL MATURITIES (Contd.)
Note : 48 DISCLOSURES IN CONNECTION WITH IND AS 116 - LEASES
The Company has taken office premises on lease for its operations.
The Company’s obligations under its leases are secured by the lessor’s title to the leased assets. Generally, the Company is restricted from assigning and subleasing the leased assets and some contracts require the Company to maintain certain financial ratios. There are several lease contracts that include extension and termination options and variable lease payments, which are further discussed below.
The Company also has certain leases of machinery with lease terms of 12 months or less. The Company applies the ‘short-term lease’ recognition exemptions for these leases.
Set out below are the carrying amounts of lease liabilities included under financial liabilities and right to use asset included in Property, Plant and Equipment and the movements during the period:

166
Corporate Overview Financial StatementsManagement Reports
OTHER DISCLOSURES(i) Movement in the carrying value of the Right to Use Asset
(ii) Classification of current and non current liabilities of the lease liabilities
(iii) Movement in the carrying value of the Lease Liability
(iv) Contractual Maturities of Lease liability outstanding
(v) The following are the amount recognised in the Profit or Loss statement
Lease expenses relating to short term leases aggregated to ` 112 lakhs (` 109 lakhs - March 31, 2021) during the year ended March 31, 2022.
Lease liabilities are recognised at weighted average incremental borrowing rate ranging from 8% to 12%.
The Company does not face a significant liquidity risk with regard to its lease liabilities as the current assets are sufficient to meet the obligations related to the lease liabilities as and when they fall due.
The Company has several lease contracts that includes extension and termination contracts. These options are negotiated by the Management to provide flexibility in managing the leased-asset portfolio and align with Company's business needs. Management exercises significant judgement in determining whether these extension and termination are reasonably certain to be exercised.
The company has not defaulted in its lease obligations
Opening Balance 7,610 10,670 Depreciation charge for the Period (4,426) (4,542)Additions during the Period 7,041 1,504 Adjustment/Deletion (291) (22)Closing Balance 9,934 7,610
Current liabilities 4,690 4,330Non Current Liabilities 6,308 4,575Total Lease liabilities 10,998 8,905
Opening Balance 8,905 12,042 Interest Expense 870 924 Lease Payments [Total Cash Outflow] (5,411) (4,914)Short term rent concession (112) (630)Additions during the year 7,041 1,504 Adjustment/Deletion (295) (21)Closing Balance 10,998 8,905
Less than one year 4,993 4,497 One to five Years 7,668 5,497 More than Five years - - Total 12,661 9,994
Depreciation expense of right-of-use assets 4,426 4,542 Interest expense on lease liabilities 870 924 Expense relating to short-term leases (included in other expenses) 112 109 Expense relating to leases of low-value assets (included in other expenses) - - Variable lease payments (included in other expenses) - - Total amount recognised in profit or loss 5,408 5,575
Particulars - Buildings As on March 31, 2022 As on March 31, 2021
Particulars As on March 31, 2022 As on March 31, 2021
Particulars As on March 31, 2022 As on March 31, 2021
Particulars As on March 31, 2022 As on March 31, 2021
For the year endedParticulars As on March 31, 2022 As on March 31, 2021
Note : 48 DISCLOSURES IN CONNECTION WITH IND AS 116 - LEASES (Contd.)
Notes forming part of the Standalone Financial Statements (Contd.) For the year ended March 31, 2022
` in lakhs
` in lakhs
` in lakhs
` in lakhs
` in lakhs

Corporate Overview Financial StatementsManagement Reports
167
Notes forming part of the Standalone Financial Statements (Contd.) For the year ended March 31, 2022
` in lakhs
1. No of SPEs holding assets for securitisation transactions originated by the originator (only the SPVs 27 30 relating to outstanding securitization exposures to be reported here)2. Total amount of securitised assets as per books of the SPEs 3,67,247 4,63,9163. Total amount of exposures retained by the originator to comply with MRR as on the date of balance sheet a) Off-balance sheet exposures • First loss - - • Others - - b) On-balance sheet exposures • First loss 32,096 31,857 • Others (Second loss) 1,711 - • Others (PTC Investment) 24,169 29,9964. Amount of exposures to securitisation transactions other than MRR a) Off-balance sheet exposures i) Exposure to own securitisations • First loss - - • Others - - ii) Exposure to third party securitisations - - • First loss - - • Others - - b) On-balance sheet exposures i) Exposure to own securitisations • First loss - - • Others - - ii) Exposure to third party securitisations • First loss - - • Others - -5. Sale consideration received for the securitised assets 8,66,123 9,64,026 Gain/loss on sale on account of securitisation Nil Nil6. Form and quantum (outstanding value) of services provided by way of, liquidity support, Nil Nil post-securitisation asset servicing, etc. First Loss Credit Facility – Bank Fixed Deposit 32,096 31,857 Second Loss Credit Facility – Bank Fixed Deposit 1,711 -7. Performance of facility provided. Please provide separately for each facility viz. Credit enhancement, liquidity support, servicing agent etc. Mention percent in bracket as of total value of facility provided. First Loss Credit Facility – Bank Fixed Deposit (a) Amount paid (utilised) 6,523 (20.3%) 8,443 (23.9%) (b) Repayment received (replenishment) 6,506 (20.3%) 5,019 (14.2%) (c) Outstanding amount 17 (0.05%) 3,424 (9.7%)8. Average default rate of portfolios observed in the past. Please provide breakup separately Vehicle loans - Vehicle loans - for each asset class i.e. RMBS, Vehicle Loans etc 1.4% 1.4% Loan against Loan against Property - 0.6% Property - 0.7%9. Amount and number of additional/top up loan given on same underlying asset. Please provide breakup separately for each asset class i.e. RMBS, Vehicle Loans etc Vehicle Loans No. of Additional / Top up loan 4,468 7,351 Amount of Loan 8,824 12,146 Loan Against Property No. of Additional / Top up loan 1,054 1,313 Amount of Loan 27,518 37,77710. Investor complaints (a) Directly/Indirectly received and; Nil Nil (b) Complaints outstanding Nil Nil
Sl. Particulars As at As atNo. March 31, 2022 March 31, 2021
Note : 49 DISCLOSURES TO BE MADE IN NOTES TO ACCOUNTS BY ORIGINATORS PURSUANT TO RBI DIRECTIONS,2021 DATED SEPTEMBER 24, 2021

168
Corporate Overview Financial StatementsManagement Reports
Note : 50 A - ADDITIONAL DISCLOSURES UNDER SCHEDULE III DIVISION III
Notes forming part of the Standalone Financial Statements (Contd.) For the year ended March 31, 2022
` in lakhs
` in lakhs
` in lakhs
` in lakhs
Outstanding for following periods from due date of transaction Particulars Less than 6 Months 1-2 2-3 More than Total 6 Months to 1 Year Years years 3 years (i) Undisputed Trade receivables -considered good 3,193 53 - - - 3,246
(ii) Undisputed Trade Receivables - - - - - -
- which have significant increase in credit risk
(iii) Undisputed Trade Receivables –credit impaired - - - - - -
(iv) Disputed Trade Receivables–considered good - - - - - -
(v) Disputed Trade Receivables - - - - - -
– which have significant increase in credit risk
(vi) Disputed Trade Receivables – credit impaired - - - - - -
Total 3,193 53 - - - 3,246
Outstanding for following periods from due date of transaction Particulars Less than 6 Months 1-2 2-3 More than Total 6 Months to 1 Year Years years 3 years (i) Undisputed Trade receivables -considered good 1,762 248 21 - - 2,031
(ii) Undisputed Trade Receivables - - - - - -
–which have significant increase in credit risk
(iii) Undisputed Trade Receivables –credit impaired - - - - - -
(iv) Disputed Trade Receivables– considered good - - - - - -
(v) Disputed Trade Receivables - - - - - -
– which have significant increase in credit risk
(vi) Disputed Trade Receivables – credit impaired - - - - - -
Total 1,762 248 21 - - 2,031
Amount in CWIP for a period of Capital -work -in progress Less than 1-2 2-3 More than Total 1 Year Years years 3 yearsProjects in Progress 2,303 - - - 2,303
Projects Temporarily Suspended - - - - -
Note:
The above amount pertains to one project which is expected to be completed by December 2022
Amount in Intangible assets under development for a period of Intangible assets under development Less than 1-2 2-3 More than Total 1 Year Years years 3 yearsProjects in Progress 979 284 85 46 1,394
Projects Temporarily Suspended - - - - -
Part 1 - Ageing AnalysisA. Trade Receivables ageing schedule as on March 31, 2022
B. Trade Receivables ageing schedule as on March 31, 2021
C. Capital work in progress aging schedule for the year ended March 31, 2022
D. Intangible assets under development aging schedule as on March 31, 2022

Corporate Overview Financial StatementsManagement Reports
169
Note : 50 A - ADDITIONAL DISCLOSURES UNDER SCHEDULE III DIVISION III (Contd.)
Notes forming part of the Standalone Financial Statements (Contd.) For the year ended March 31, 2022
` in lakhs
` in lakhs
To be completed in Name of the Project Less than 1-2 2-3 More than 1 Year Years years 3 yearsNew Loan Origination system -VF -Gallop 926 - - -
Loan Origination system -Enhancements -Leap 73 - - -
Dealer Portal -Dealer plus 57 - - -
Dedupe system upgrade -Prime360 52 - - -
Procure to Pay System- BAZ 38 - - -
Analytical Tool for Business Decision Making -Analytics BDM 34 - - -
Other Projects 214 - - -
Total 1,394 - - -
To be completed in Name of the Project Less than 1-2 2-3 More than 1 Year Years years 3 yearsNew Loan Origination system -VF -Gallop - 193 - -
Loan Origination system -Enhancements -Leap 469 - - -
Dealer Portal -Dealer plus - 57 - -
Loan Management System - Finnone - 159 - -
Analytical Tool for Business Decision Making -Analytics BDM - 30 - -
Other Projects 73 - - -
Total 542 439 - -
` in lakhs
` in lakhs
` in lakhs
Amount in Intangible assets under development for a period of Intangible assets Less than 1-2 2-3 More than Total under development 1 Year Years years 3 yearsProjects in Progress 474 335 138 34 981
Projects Temporarily Suspended - - - - -
Outstanding for following periods from due date of Transaction Particulars Less than 1-2 2-3 More than Total 1 Year Years years 3 years(i) MSME 306 - - - 306
(ii) Others 7,964 20 - - 7,984
(iii) Disputed dues – MSME - - - - -
(iv) Disputed dues - Others - - - - -
Total 8,270 20 - - 8,290
Outstanding for following periods from due date of Transaction Particulars Less than 1-2 2-3 More than Total 1 Year Years years 3 years(i) MSME - - - - -
(ii) Others 5,127 5 18 - 5,150
(iii) Disputed dues – MSME - - - - -
(iv) Disputed dues - Others - 117 - - 117
Total 5,127 122 18 - 5,267
E. Intangible assets under development aging schedule as on March 31, 2021
F. Trade Payables ageing schedule as on March 31, 2022
G. Trade Payables ageing schedule as on March 31, 2021

170
Corporate Overview Financial StatementsManagement Reports
Note : 50 A - ADDITIONAL DISCLOSURES UNDER SCHEDULE III DIVISION III (Contd.)
Notes forming part of the Standalone Financial Statements (Contd.) For the year ended March 31, 2022
Sl. Particulars Amount AmountNo. Outstanding Overdue As at March 31, 2021
` in lakhs
Note : 50 - B DISCLOSURE PURSUANT TO RESERVE BANK OF INDIA NOTIFICATION DNBS.193DG (VL) - 2007 DATED FEBRUARY 22, 2007:
Sl. Particulars Amount AmountNo. Outstanding Overdue As at March 31, 2022
` in lakhs
Liabilities: (1) Loans and Advances availed by the NBFC inclusive of interest accrued thereon but not paid:(a) Debentures - Secured 10,52,995 - - Unsecured 2,54,389 - (other than falling within the meaning of public deposits) - Perpetual Debt Instrument 1,32,899 -(b) Deferred Credits -(c) Term Loans 50,84,977 -(d) Inter-Corporate Loans and Borrowings - -(e) Commercial Paper 2,76,615 - Other Loans 1,15,475 - (Represents Working Capital Demand Loans and Cash Credit from Banks along with Interest Accrued but Not Due on above)
Liabilities: (1) Loans and Advances availed by the NBFC inclusive of interest accrued thereon but not paid:(a) Debentures - Secured 9,34,263 - - Unsecured 2,70,086 - (other than falling within the meaning of public deposits) - Perpetual Debt Instrument 1,48,920 -(b) Deferred Credits -(c) Term Loans 45,52,555 -(d) Inter-Corporate Loans and Borrowings - -(e) Commercial Paper 3,01,504 - Other Loans 1,65,671 - (Represents Working Capital Demand Loans & Cash Credit from Banks along with Interest Accrued but Not Due on above)
Part - II - Other DisclosuresNo proceedings have been initiated on or are pending against the group for holding benami property under the Benami Transactions (Prohibition) Act, 1988 (45 of 1988) and Rules made thereunder.The Company has not been declared wilful defaulter by any bank or financial institution or Government or any Government authority.As per the inforamation available with the company, Company has no transactions with the companies struck off under section 248 of the Companies Act, 2013 or section 560 of Companies Act, 1956.There has been no charges or satisfaction yet to be registered with ROC beyond the statutory period.The Company being an non-banking finance company, as part of its normal business, grants loans and advances to its customers, other entities and persons ensuring adherence to all regulatory requirements. Further, the company has also borrowed funds from banks, financial institutions in compliance with regulatory requirements in the ordinary course of businessOther than the transactions described above, no funds have been advanced or loaned or invested (either from borrowed funds or share premium or any other sources or kind of funds) by the Company to or in any other persons or entities, including foreign entities (“Intermediaries”) with the understanding, whether recorded in writing or otherwise, that the Intermediary shall lend or invest in party identified by or on behalf of the Company (Ultimate Beneficiaries). The Company has also not received any fund from any parties (Funding Party) with the understanding that the Company shall whether, directly or indirectly lend or invest in other persons or entities identified by or on behalf of the Funding Party (“Ultimate Beneficiaries”) or provide any guarantee, security or the like on behalf of the Ultimate Beneficiaries Company has not traded or invested in Crypto currency or Virtual Currency during the financial year ended March 31, 2022

Corporate Overview Financial StatementsManagement Reports
171
Note : 50 - B DISCLOSURE PURSUANT TO RESERVE BANK OF INDIA NOTIFICATION DNBS.193DG (VL) - 2007 DATED FEBRUARY 22, 2007: (Contd.)
Notes forming part of the Standalone Financial Statements (Contd.) For the year ended March 31, 2022
(4) Break-up of Investments (net of provision for diminution in value): Current Investments: I Quoted:(i) Shares: (a) Equity - - (b) Preference - -(ii) Debentures and Bonds - -(iii) Units of Mutual Funds - -(iv) Government Securities (Net of amortisation) - -(v) Others - -II Unquoted:(i) Shares: (a) Equity - - (b) Preference - -(ii) Debentures and Bonds - -(iii) Units of Mutual Funds - -(iv) Government Securities - - Long-term Investments:I Quoted:(i) Shares: (a) Equity - - (b) Preference - -(ii) Debentures and Bonds - -(iii) Units of Mutual Funds - -(iv) Government Securities (Net of amortisation) - -(v) Others - -II Unquoted:(i) Shares: (a) Equity (Net of Provision for Diminution in Value of Investment) 53,268 7,292 (b) Preference -(ii) Debentures and Bonds -(iii) Units of Mutual Funds -(iv) Government Securities 1,54,348 1,54,590(v) Others - Investment in Pass Through Certificates - - Investment property 13 13
Sl. Particulars Amount AmountNo. Outstanding Outstanding As at March As at March 31, 2022 31, 2021
` in lakhs
(2) Break-up of Loans and Advances including Bills Receivables [other than those included in (3) below]: (including interest accrued)(a) Secured 21,04,825 16,80,011(b) Unsecured 1,32,005 37,084(3) Break up of Leased Assets and Stock on Hire and Other Assets counting towards AFC activities(i) Lease Assets including Lease Rentals Accrued and Due: - -(ii) Stock on Hire including Hire Charges under Sundry Debtors: (a) Assets on hire - - (b) Repossessed assets - -(iii) Other Loans counting towards AFC Activities (a) Loans where assets have been repossessed(Net) - - (b) Loans other than (a) above 51,78,092 48,66,838

172
Corporate Overview Financial StatementsManagement Reports
Category Amount (Net of provision for Non-performing assets) Secured Unsecured Total
` in lakhs
As at March 31, 20221. Related Parties * (a) Subsidiaries - 450 450 (b) Companies in the same Group - 300 300 (c) Other Related Parties - - -2. Other than Related Parties 72,82,917 1,31,255 74,14,172 Total 72,82,917 1,32,005 74,14,922 As at March 31, 20211. Related Parties * (a) Subsidiaries - 340 340 (b) Companies in the same Group - - - (c) Other Related Parties - - -2. Other than Related Parties 65,46,850 36,744 65,83,594 Total 65,46,850 37,084 65,83,934
* Related Parties are as identified in Note 37 above.
(5) Borrower Group-wise Classification of Assets Financed as in (2) and (3) above
Notes forming part of the Standalone Financial Statements (Contd.) For the year ended March 31, 2022Note : 50 - B DISCLOSURE PURSUANT TO RESERVE BANK OF INDIA NOTIFICATION DNBS.193DG (VL) - 2007 DATED FEBRUARY 22, 2007: (Contd.)
Category Market value / Break - up Book Value Value or Fair Value or (Net of Net Asset Value Provisioning)
` in lakhs
As at March 31, 20221. Related Parties *(a) Subsidiaries 6,490 6,490(b) Joint Ventures 45,001 45,001(c) Companies in the Same Group(d) Other Related Parties 1,775 1,7752. Other than Related Parties 1,42,667 1,54,350 Total 1,95,933 2,07,616 As at March 31, 20211. Related Parties *(a) Subsidiaries 6,490 6,490(b) Companies in the Same Group - -(c) Other Related Parties 800 8002. Other than Related Parties 1,54,592 1,54,592 Total 1,61,882 1,61,882
(6) Investor Group-wise Classification of all Investments (Current and Long Term) in Shares and Securities (both Quoted and Unquoted) :

Corporate Overview Financial StatementsManagement Reports
173
Note : 50 - B DISCLOSURE PURSUANT TO RESERVE BANK OF INDIA NOTIFICATION DNBS.193DG (VL) - 2007 DATED FEBRUARY 22, 2007: (Contd.)
Note : 51. A. Disclosure Pursuant to Reserve Bank of India Notification RBI/2014-15/299 DNBR (PD) CC.No.002/03.10.001/2014-15 dated November 10, 2014:
Notes forming part of the Standalone Financial Statements (Contd.) For the year ended March 31, 2022
` in lakhsii. Investments Particulars As at As at March 31, 2022 March 31, 2021
(1) Value of Investments (i) Gross Value of Investments (a) In India 2,07,744 1,62,024 (b) Outside India - - (ii) Provisions for Depreciation (a) In India (129) (129) (b) Outside India, - - (iii) Net Value of Investments (a) In India 2,07,615 1,61,895 (b) Outside India. - -(2) Movement of provisions held towards depreciation on investments. (i) Opening balance 129 129 (ii) Add: Provisions made during the year - - (iii) Less: Reversal of provision during the year - - (iv) Closing balance 129 129
Particulars As at As at March 31, 2022 March 31, 2021
` in lakhs
Tier I Capital 11,79,865 9,39,023Tier II Capital 2,23,680 2,44,044Total Capital 14,03,545 11,83,067Total Risk Weighted Assets 71,53,663 61,93,249Capital RatiosTier I Capital as a Percentage of Total Risk Weighted Assets (%) 16.49% 15.16%Tier II Capital as a Percentage of Total Risk Weighted Assets (%) 3.13% 3.94%Total (%) 19.62% 19.10%Amount of Subordinated Debt raised as Tier – II capital during the year 35,000 -Amount raised by issue of Perpetual Debt instruments during the year 19,500 14,500
i. Capital Adequacy Ratio
(7) Other Information Amount Outstanding as at March 31, 2022 March 31, 2021
` in lakhs
(i) Gross Non-Performing Assets a) With Related Parties * - - b) With Others 5,21,203 2,70,501(ii) Net Non-Performing Assets a) With Related Parties * - - b) With Others 3,62,979 1,50,752(iii) Assets Acquired in Satisfaction of Debt a) With Related Parties * - - b) With Others - -
* Related Parties are as identified in Note 37 above.

174
Corporate Overview Financial StatementsManagement Reports
Not
es fo
rmin
g pa
rt o
f the
Sta
ndal
one
Fina
ncia
l Sta
tem
ents
(Con
td.)
For t
he y
ear e
nded
Mar
ch 3
1, 2
022
Not
e : 5
1. A
. DIS
CLO
SURE
PU
RSU
AN
T TO
RES
ERV
E BA
NK
OF
IND
IA N
OTI
FICA
TIO
N R
BI/2
014-
15/2
99 D
NBR
(PD
) CC.
NO
.002
/03.
10.0
01/2
014-
15 D
ATED
NO
VEM
BER
10, 2
014:
iii
. Ass
et L
iabi
lity
Man
agem
ent
Mat
urit
y pa
tter
n of
cer
tain
item
s of
ass
ets
and
liabi
litie
sA
s at
Mar
ch 3
1, 2
022
As
at M
arch
31,
202
1
15-3
0 da
ys1
to 2
m
onth
s2
to 3
m
onth
s3
to 6
m
onth
s6
to 1
2 m
onth
s1
to 3
yea
rs3
to 5
yea
rsM
ore
than
5
Year
s
Part
icul
ars
1-7
days
8-14
day
s15
-30
days
1 to
2
mon
ths
2 to
3
mon
ths
3 to
6
mon
ths
6 to
12
mon
ths
1 to
3 y
ears
3 to
5 y
ears
Mor
e th
an 5
Ye
ars
Tota
l
Part
icul
ars
1-7
days
8-14
day
s15
-30
days
1 to
2
mon
ths
2 to
3
mon
ths
3 to
6
mon
ths
6 to
12
mon
ths
1 to
3 y
ears
3 to
5 y
ears
Mor
e th
an 5
Ye
ars
Tota
l
Tota
l
` in
lakh
s
` in
lakh
s
Liab
iliti
es
Borr
owin
g fr
om B
anks
(1
,03,
189)
(6
,299
) (3
4,50
0)
(87,
586)
(2
,91,
893)
(5
,40,
555)
(7
,75,
246)
(2
3,69
,375
) (9
,15,
937)
(5
8,00
1)
(51,
82,5
81)
Mar
ket B
orro
win
gs
(19)
(1
,254
) (8
1,96
1)
(5,9
67)
(1,2
2,68
4)
(1,6
1,53
9)
(2,7
5,37
4)
(6,8
8,74
4)
(1,1
3,82
7)
(2,6
5,53
0)
(17,
16,8
99)
Tota
l
(1
,03,
208)
(7
,553
) (1
,16,
461)
(9
3,55
3)
(4,1
4,57
7)
(7,0
2,09
4) (
10,5
0,62
0) (
30,5
8,11
9) (
10,2
9,76
4)
(3,2
3,53
1)
(68,
99,4
80)
Ass
ets
Adva
nces
(Net
of P
rovi
sion
4
7,84
1
22,
399
1
,06,
922
1
,74,
498
1
,59,
201
6
,27,
624
9
,74,
274
2
6,98
,005
1
2,21
,309
1
3,82
,848
7
4,14
,921
for N
on P
erfo
rmin
g A
sset
s)
Inve
stm
ent (
Net
of P
rovi
sion
-
600
3
10
2
,06,
706
2
,07,
616
for D
imin
utio
n in
Val
ue o
f Inv
estm
ents
)
Tota
l
4
7,84
1
22,
399
1
,06,
922
1
,74,
498
1
,59,
801
6
,27,
934
9
,74,
274
2
6,98
,005
1
2,21
,309
1
5,89
,554
7
6,22
,537
Liab
iliti
es
Borr
owin
g fr
om B
anks
4
9,04
1
6,2
95
81,
993
9
0,97
5
1,8
3,82
0
6,7
8,69
0
5,9
8,95
2
22,
75,3
40
6,5
2,34
0
94,
795
4
7,12
,241
Mar
ket B
orro
win
gs
-
62,
676
5
0,36
3
1,3
7,02
9
1,6
5,47
7
1,0
9,06
3
1,8
2,13
6
5,8
5,06
7
1,4
9,38
8
2,1
3,57
5
16,
54,7
74
Tota
l
49
,041
6
8,97
1
1,3
2,35
6
2,2
8,00
4
3,4
9,29
7
7,8
7,75
3
7,8
1,08
8
28,
60,4
07
8,0
1,72
8
3,0
8,37
0
63,
67,0
15
Ass
ets
Adva
nces
(Net
of P
rovi
sion
3
7,94
7
36,
598
8
9,99
8
1,1
0,95
0
1,2
1,85
4
6,0
9,04
1
9,6
5,47
5
26,
34,3
76
9,1
8,45
8
10,
59,2
37
65,
83,9
34
for N
on P
erfo
rmin
g A
sset
s)
Inve
stm
ent (
Net
of P
rovi
sion
-
-
-
-
1
,135
3
,722
4
,857
1
9,42
8
19,
428
1
,13,
312
1
,61,
882
for D
imin
utio
n in
Val
ue o
f Inv
estm
ents
)
Tota
l
3
7,94
7
36,
598
8
9,99
8
1,1
0,95
0
1,2
2,98
9
6,1
2,76
3
9,7
0,33
2
26,
53,8
04
9,3
7,88
6
11,
72,5
49
67,
45,8
16

Corporate Overview Financial StatementsManagement Reports
175
Notes forming part of the Standalone Financial Statements (Contd.) For the year ended March 31, 2022
` in lakhsv. Exposure to the Capital Market
Particulars As at As at March 31, 2022 March 31, 2021
(i) direct investment in equity shares, convertible bonds, convertible debentures and units of - - equity-oriented mutual funds the corpus of which is not exclusively invested in corporate debt;(ii) Advances against shares/bonds/debentures or other securities or on clean basis to individuals - - for investment in shares (including IPOs/ ESOPs), convertible bonds, convertible debentures, and units of equity-oriented mutual funds;(iii) advances for any other purposes where shares or convertible bonds or convertible debentures or 7,098 3,052 units of equity oriented mutual funds are taken as primary security;(iv) Advances for any other purposes to the extent secured by the collateral security of shares or - - convertible bonds or convertible debentures or units of equity oriented mutual funds i.e. where the primary security other than shares/convertible bonds /convertible debentures / units of equity oriented mutual funds' does not fully cover the advances;(v) secured and unsecured advances to stockbrokers and guarantees issued on behalf of stock brokers - - and market makers;(vi) Loans sanctioned to corporates against the security of shares/bonds/ debentures or other securities - - or on clean basis for meeting promoter's contribution to the equity of new companies in anticipation of raising resources;(vii) bridge loans to companies against expected equity flows/issues; - -(viii) all exposures to Venture Capital Funds (both registered and unregistered) - - Pending Disbursements 1,151 4,802 Total Exposure 8,249 7,854
vi. Other Regulator Registration
vii. Penalties levied by the above Regulators - Nil
S. No. Regulator Registration no.
1 Ministry of Corporate Affairs CIN: L65993TN1978PLC007576 2 Reserve Bank of India Certificate of Registration dt. 09/06/2011 No. 07-00306
` in lakhsiv. Exposure to the Real Estate Sector, both Direct and Indirect Particulars As at As at March 31, 2022 March 31, 2021(a) Direct Exposure (Net of Advances from Customers) (i) Residential Mortgages - Lending fully secured by mortgages on residential property that is or will be occupied by the borrower or that is rented: - individual housing loans upto ` 15 lakhs 5,06,860 3,11,572 - individual housing loans more than ` 15 lakhs 13,74,527 12,96,770 (ii) Commercial Real Estate - Lending secured by mortgages on commercial real estates (office buildings, retails space, multipurpose commercial premises, multi-family residential buildings, multi-tenanted commercial premises, industrial or warehouse space, hotels, land acquisition, development and construction etc.). - Fund Based 2,70,788 1,57,662 - Non Fund based (iii) Investments in Mortgage Backed Securities (MBS) and other securitized exposures - a. Residential - - b. Commercial Real Estate - -(b) Indirect Exposure Fund based and non-fund based exposures on National Housing Bank (NHB) and Housing Finance Companies (HFCs). Total Exposure 21,52,175 17,66,004Note: The above summary is prepared based on the information available with the Company.
Note : 51. A. DISCLOSURE PURSUANT TO RESERVE BANK OF INDIA NOTIFICATION RBI/2014-15/299 DNBR (PD) CC.NO.002/ 03.10.001/2014-15 DATED NOVEMBER 10, 2014: (Contd.)

176
Corporate Overview Financial StatementsManagement Reports
` in lakhs
Note : 51. A. DISCLOSURE PURSUANT TO RESERVE BANK OF INDIA NOTIFICATION RBI/2014-15/299 DNBR (PD) CC.NO.002/03.10.001 /2014-15 DATED NOVEMBER 10, 2014: (Contd.)
Notes forming part of the Standalone Financial Statements (Contd.) For the year ended March 31, 2022
Particulars As at As at March 31, 2022 March 31, 2021
Particulars As at As at March 31, 2022 March 31, 2021
Commercial paper & Non- convertible Debentures – Short Term ICRA A1+,CRISIL A1+ ICRA A1+,CRISIL A1+Working Capital Demand Loans ICRA A1+ ICRA A1+Cash Credit ICRA AA+ ICRA AA+Bank Term Loans ICRA AA+ ICRA AA+Non-Convertible Debentures – Long term ICRA AA+, IND AA+ ICRA AA+, IND AA+Subordinated Debt ICRA AA+, CARE AA+, ICRA AA+, CARE AA+, CRISIL AA+, IND AA+ CRISIL AA+, IND AA+Perpetual Debt ICRA AA, CARE AA, ICRA AA, IND AA CARE AA, IND AA
Total Advances to twenty largest borrowers 35,883 37,166Percentage of Advances to twenty largest borrowers to Total Advances of the NBFC 0.47% 0.54%
ix. Concentration of Advances
viii. Ratings assigned by Credit Rating Agencies
` in lakhs
` in lakhs
Particulars As at As at March 31, 2022 March 31, 2021
Particulars As at As at March 31, 2022 March 31, 2021
Sl. Sector Percentage of NPAs Percentage of NPAsNo. to Total Advances in to Total Advances in that sector as on that sector as on March 31, 2022 March 31, 20211. Agriculture & allied activities - -2. MSME - -3. Corporate borrowers - -4. Services - -5. Unsecured personal loans 0.12% -6. Auto loans 6.65% 3.08%7. Other loans 7.39% 6.51%
Total Exposure to twenty largest borrowers/customers 35,906 37,802Percentage of Exposures to twenty largest borrowers /Customers to Total Exposure of the 0.47% 0.54% NBFC on borrowers/customers.
Total Exposure to top four NPA accounts 3,351 3,625
x. Concentration of Exposures
xi. Concentration of NPAs
xii. Sector-wise NPAs

Corporate Overview Financial StatementsManagement Reports
177
Note : 51. A. DISCLOSURE PURSUANT TO RESERVE BANK OF INDIA NOTIFICATION RBI/2014-15/299 DNBR (PD) CC.NO.002/03.10.001/ 2014-15 DATED NOVEMBER 10, 2014: (Contd.)
Notes forming part of the Standalone Financial Statements (Contd.) For the year ended March 31, 2022
` in lakhs Particulars As at As at March 31, 2022 March 31, 2021(i) Net NPAs to Net Advances(%) 4.85% 2.25%(ii) Movement of Gross NPA (a) Opening balance 2,70,501 2,16,331 (b) Additions during the year 4,33,575 1,49,369 (c) Reductions during the year 1,82,873 95,199 (d) Closing balance 5,21,203 2,70,501(iii) Movement of Net NPA (a) Opening balance 1,50,752 1,26,501 (b) Additions during the year 3,33,582 85,237 (c) Reductions during the year 1,21,355 60,986 (d) Closing balance 3,62,979 1,50,752(iv) Movement of provisions for NPAs (excluding provisions on standard assets) (a) Opening balance 1,19,749 89,829 (b) Provisions made during the year 99,993 64,133 (c) Write-off / write-back of excess provisions 61,519 34,213 (d) Closing balance 1,58,224 1,19,749
xiii. Movement of NPAs
` in lakhsxiv. Disclosure on Restructured Accounts
Type of Restructuring Asset classification Standard Sub-standard Doubtful Loss details Advances Advances Advances Advances Number of borrowers 13,702 641 - -Restructured loans as on Amount Outstanding 1,32,153 7,052 - -April 1, 2021 Provision thereon 18,700 1,999 - -Fresh Restructured during Number of borrowers 37,135 16,297 - -the year Amount Outstanding 2,94,029 1,04,776 - - Provision thereon 31,459 12,794 - -Upgradations to restructured Number of borrowers 10,477 - - -category Amount Outstanding 55,363 - - - Provision thereon 5,534 - - -Restructured loans ceases Number of borrowers - - - - to attract higher provision Amount Outstanding - - - - or additional risk weight at Provision thereon - - - -the end of yearDowngrade of restructured Number of borrowers - 8,500 47 - accounts during the year Amount Outstanding - 68,522 916 - Provision thereon - 16,306 319 -Write-off of restructured Number of borrowers 3,647 1,442 - - accounts during the year Amount Outstanding 29,568 9,455 - - Provision thereon 3,866 1,360 - -Restructured loans as on Number of borrowers 38,912 13,388 19 -March 31, 2022 Amount Outstanding 2,84,343 98,224 240 - Provision thereon 29,230 23,727 114 -Note: Includes accounts restructured under Covid resolution framework 1.0 and 2.0
xv. Customer Complaints No. of Complaints
Particulars March 31, 2022 March 31, 2021
(a) Pending as at beginning of the year 0 8(b) Received during the year 812 1,169(c) Redressed during the year 812 1,177(d) Pending as at end of the year 0 0
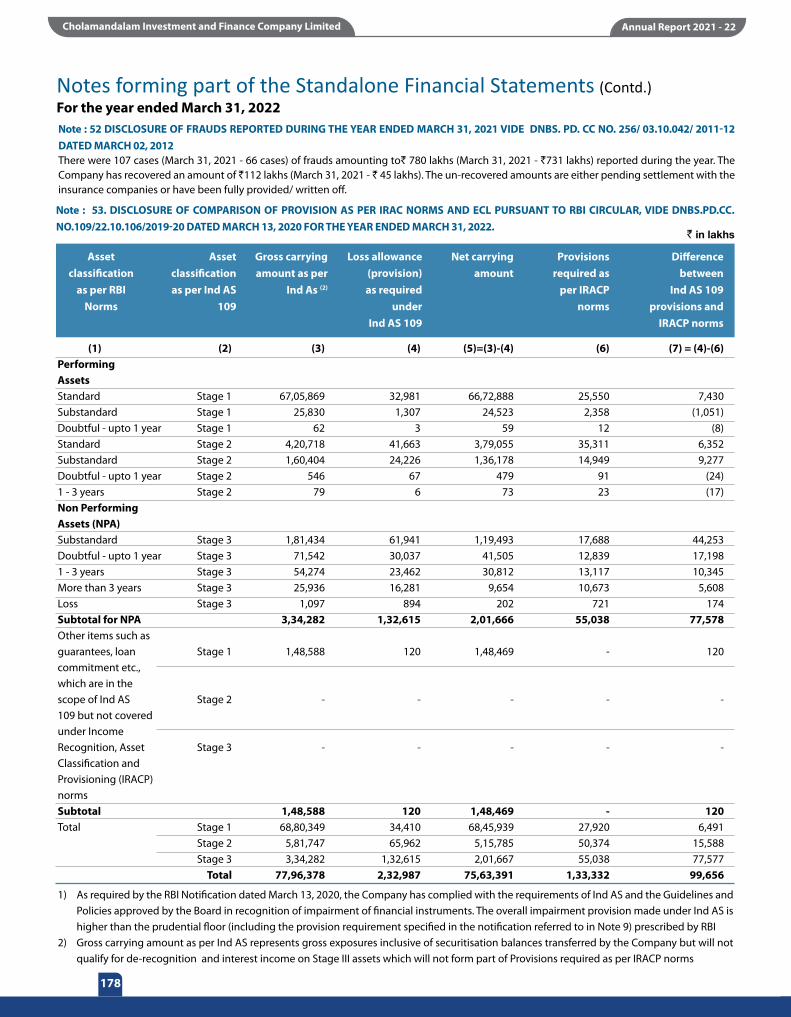
178
Corporate Overview Financial StatementsManagement Reports
Notes forming part of the Standalone Financial Statements (Contd.) For the year ended March 31, 2022Note : 52 DISCLOSURE OF FRAUDS REPORTED DURING THE YEAR ENDED MARCH 31, 2021 VIDE DNBS. PD. CC NO. 256/ 03.10.042/ 2011-12 DATED MARCH 02, 2012There were 107 cases (March 31, 2021 - 66 cases) of frauds amounting to` 780 lakhs (March 31, 2021 - `731 lakhs) reported during the year. The Company has recovered an amount of `112 lakhs (March 31, 2021 - ` 45 lakhs). The un-recovered amounts are either pending settlement with the insurance companies or have been fully provided/ written off.
(1) (2) (3) (4) (5)=(3)-(4) (6) (7) = (4)-(6) Performing AssetsStandard Stage 1 67,05,869 32,981 66,72,888 25,550 7,430Substandard Stage 1 25,830 1,307 24,523 2,358 (1,051)Doubtful - upto 1 year Stage 1 62 3 59 12 (8)Standard Stage 2 4,20,718 41,663 3,79,055 35,311 6,352Substandard Stage 2 1,60,404 24,226 1,36,178 14,949 9,277Doubtful - upto 1 year Stage 2 546 67 479 91 (24)1 - 3 years Stage 2 79 6 73 23 (17)Non Performing Assets (NPA)Substandard Stage 3 1,81,434 61,941 1,19,493 17,688 44,253Doubtful - upto 1 year Stage 3 71,542 30,037 41,505 12,839 17,1981 - 3 years Stage 3 54,274 23,462 30,812 13,117 10,345More than 3 years Stage 3 25,936 16,281 9,654 10,673 5,608Loss Stage 3 1,097 894 202 721 174Subtotal for NPA 3,34,282 1,32,615 2,01,666 55,038 77,578Other items such as guarantees, loan Stage 1 1,48,588 120 1,48,469 - 120 commitment etc., which are in the scope of Ind AS Stage 2 - - - - - 109 but not covered under Income Recognition, Asset Stage 3 - - - - - Classification and Provisioning (IRACP) norms Subtotal 1,48,588 120 1,48,469 - 120Total Stage 1 68,80,349 34,410 68,45,939 27,920 6,491 Stage 2 5,81,747 65,962 5,15,785 50,374 15,588 Stage 3 3,34,282 1,32,615 2,01,667 55,038 77,577 Total 77,96,378 2,32,987 75,63,391 1,33,332 99,656
1) As required by the RBI Notification dated March 13, 2020, the Company has complied with the requirements of Ind AS and the Guidelines and Policies approved by the Board in recognition of impairment of financial instruments. The overall impairment provision made under Ind AS is higher than the prudential floor (including the provision requirement specified in the notification referred to in Note 9) prescribed by RBI
2) Gross carrying amount as per Ind AS represents gross exposures inclusive of securitisation balances transferred by the Company but will not qualify for de-recognition and interest income on Stage III assets which will not form part of Provisions required as per IRACP norms
` in lakhs
Asset classification
as per RBI Norms
Asset classification as per Ind AS
109
Gross carrying amount as per
Ind As (2)
Loss allowance (provision) as required
under Ind AS 109
Net carrying amount
Provisions required as
per IRACP norms
Difference between
Ind AS 109 provisions and
IRACP norms
Note : 53. DISCLOSURE OF COMPARISON OF PROVISION AS PER IRAC NORMS AND ECL PURSUANT TO RBI CIRCULAR, VIDE DNBS.PD.CC.NO.109/22.10.106/2019-20 DATED MARCH 13, 2020 FOR THE YEAR ENDED MARCH 31, 2022.

Corporate Overview Financial StatementsManagement Reports
179
Notes forming part of the Standalone Financial Statements (Contd.) For the year ended March 31, 2022
Amount in SMA/overdue categories as of February 29, 2020 Nil 13,20,164 Respective amounts in SMA/overdue categories, where the moratorium/deferment was extended, Nil 11,67,712 in terms of paragraph 2 and 3 (as of February 29, 2020) Respective amount where asset classification benefits is extended (net of accounts which have moved Nil Nil out of SMA/overdue category during the moratorium period)* Provisions made during the period (As per para 4, Applicable to NBFC’s covered under Ind AS)** Nil Nil Provisions adjusted against slippages in terms of paragraph 6 of the circular Nil Nil Residual provision Nil Nil
*there are nil accounts where asset classification benefit has been extended as on March 31, 2021. Post the moratorium period, the movement of aging has been at actuals.** The above provision does not include management overlay provision of Rs 1,967 lakhs as of March 31, 2020.
` in lakhs Particulars March 31, 2022 March 31, 2021
Note : 54. DISCLOSURE ON MORATORIUM – COVID 19 REGULATORY PACKAGE – ASSET CLASSIFICATION AND PROVISIONING FOR THE YEAR ENDED MARCH 31, 2022 IN PURSUANT TO THE NOTIFICATION VIDE: DOR.NO.BP.BC.63/21.04.048/2019-20 DATED APRIL 17, 2020.
Note : 55. DISCLOSURES PURSUANT TO RBI NOTIFICATION - RBL/2020-21116 DOR NO.BP.13C/3121 .C4,048/2020-21 DATED 6 AUGUST 2020 AND NOTIFICATION RBI/2021-2022/31 DATED MAY 5, 2021
Type of borrower Exposure to accounts classified as standard
consequent to implementation of
resolution plan- Position as at March 31,2021 (A)
Of (A) aggregate debt that
slipped during the year
Of (A) amount written off during the
year
Of (A) amount paid by the borrowers
during the year
Exposure to accounts classified as standard
consequent to implementation of
resolution plan- Position as at March 31,2022
Personal Loans 33,962 3,381 63 668 29,850Corporate persons # - - - - -Of which MSME - - - - -Others* 4,43,096 71,664 10,449 1,10,439 2,50,544Total 4,77,058 75,045 10,512 1,11,107 2,80,394
# As defined in Section 3(7) of the Insolvency and Bankruptcy Code. 2016
* Others consists of Vehicle finance and loan against property
56.1 Liquidity Risk
Public disclosure on liquidity risk -March 31, 2022
(i) Funding concentration based on significant counterparty (both deposits and borrowings)
Sr. No. No. of Significant Counterparties Amount (` In Lakhs) % of Total Deposits % of Total Liabilities1 15 47,94,629 NA 67.9%
(ii) Top 20 large deposits (% of total deposits)
Not Applicable
(iii) Top 10 borrowings (% of total borrowings)
Amount (` In Lakhs) % of Total Borrowings19,14,814 27.8%

180
Corporate Overview Financial StatementsManagement Reports
Note : 56.1 LIQUIDITY RISK (Contd.)
Notes forming part of the Standalone Financial Statements (Contd.) For the year ended March 31, 2022
(iv) Funding concentration based on significant instrument / product
(v) Stock Ratios:(a) Commercial papers as a % of total public funds, total liabilities and total assets :
(b) Non-convertible debentures (original maturity of less than one year) as a % of total public funds, total liabilities and total assets – Not Applicable. Non-convertible debentures of original maturity of less than one year have not been issued
(c) Other short-term liabilities, if any as a % of total public funds, total liabilities and total assets :
(vi) Institutional set-up for liquidity risk management:Liquidity risk is defined as the risk that the Company will encounter difficulty in meeting obligations associated with financial liabilities that are settled by delivering cash or another financial asset. Liquidity risk arises because of the possibility that the Company might be unable to meet its payment obligations when they fall due as a result of mismatches in the timing of the cash flows under both normal and stress circumstances. Such scenarios could occur when funding needed for illiquid asset positions is not available to the Company on acceptable terms. To limit this risk, management has arranged for diversified funding sources and adopted a policy of availing funding in line with the tenor and repayment pattern of its receivables and monitors future cash flows and liquidity on a daily basis. The Company has developed internal control processes and contingency plans for managing liquidity risk. This incorporates an assessment of expected cash flows and the availability of unencumbered receivables which could be used to secure funding by way of assignment if required. The Company also has lines of credit that it can access to meet liquidity needs. These are reviewed by the Asset Liability Committee (ALCO) on a monthly basis. The ALCO provides strategic direction and guidance on liquidity risk management. A sub-committee of the ALCO, comprising members from the Treasury and Risk functions, monitor liquidity risks on a weekly basis and decisions are taken on the funding plan and levels of investible surplus, from the ALM perspective. This sets the boundaries for daily cash flow management.Notes:1) A "Significant Counterparty" is defined as a single counterparty or group of connected or affiliated counterparties accounting in aggregate
for more than 1% of total liabilities.2) A "significant instrument/product" is defined as a single instrument/product of group of similar instruments/products which in aggregate
amount to more than 1% of the total liabilities.3) Total Borrowing has been computed as Gross Total Debt basis extant regulatory ALM guidelines.4) Total Liabilities has been computed as Total Assets less Equity share capital less Reserve & Surplus and computed basis extant regulatory ALM
guidelines.5) Commercial Paper for stock ratio is the Gross outstanding (i.e. Maturity amount).6) Other Short-term Liabilities represents liabilities other than borrowings which are payable within one year ,basis extant regulatory ALM
guidelines.7) Public Funds = Total Borrowings as computed above.
Refer Note No 47 for the summary of maturity profile of undiscounted cash flows of the Company’s financial assets and financial liabilities as at reporting period.
Sr. No. Name of the instrument / product Amount (` In Lakhs) %of Total Liabilities 1 Rupee Term Loans 44,55,020 63.0% 2 NCDs (including PDI & Sub Debt) 13,58,600 19.2% 3 CPs 2,80,000 4.0% 4 ECB Loans 3,40,956 4.8% 5 Securitisation 3,43,078 4.9% 6 FCNR (B) Loans 61,528 0.9% 7 Rupee Denominated Bonds 40,000 0.6% TOTAL 68,79,182 97.4%
Commercial Papers as a % of total public funds 4.1%Commercial Papers as a % of total liabilities 4.0%Commercial Papers as a % of total assets 3.4%
Other Short-term liabilities as a % of total public funds 1.6%Other Short-term liabilities as a % of total liabilities 1.5%Other Short-term liabilities as a % of total assets 1.3%

Corporate Overview Financial StatementsManagement Reports
181
Note : 56.2 LIQUIDITY COVERAGE RATIO
Notes forming part of the Standalone Financial Statements (Contd.) For the year ended March 31, 2022
The Liquidity Coverage Ratio (LCR) is a key compliance requirement for a resilient and stable financial sector. Its objective is the promotion of short-term resilience of the liquidity risk profile of financial institutions by ensuring that it has sufficient High Quality Liquid Assets (HQLA) to survive a significant stress scenario lasting for one month. The Liquidity Coverage Ratio is expected to improve the financial sector’s ability to absorb shocks arising from financial and economic stress, whatever the source, thus reducing the risk of spill over from the financial sector to the real economy.
Liquidity Management of the company is supervised by the Asset Liability Committee. The management is of the view that the company has in place robust processes to monitor and manage liquidity risks and sufficient liquidity cover to meet its likely future short-term requirements.
The company has a diversified mix of borrowings with respect to the source, type of instrument, tenor and nature of security. The Asset Liability Committee constantly reviews and monitors the funding mix and ensures the optimum mix of funds based on the cash flow requirements, market conditions and keeping the interest rate view in consideration. Additionally, the Company has lines of credit that it can access to meet liquidity needs.
These are reviewed by the Asset Liability Committee (ALCO) on a monthly basis. The Asset Liability Committee provides strategic direction and guidance on liquidity risk management. A sub-committee of the Asset Liability Committee, comprising members from the Treasury and Risk functions, monitor liquidity risks on a weekly basis and decisions are taken on the funding plan and levels of investible surplus, from the Asset Liability Management perspective. This sets the boundaries for daily cash flow management.
In line with RBI regulations, the cash outflows and inflows have been stressed by 115% and 75% of their respective original values for computing LCR. The key drivers on the inflow side are the expected collections from the performing assets of the company and on the outflow side the scheduled maturities. The High Quality Liquid Assets are entirely held in Government Securities which are classified as Level 1 assets with no haircut.
The LCR has been consistently maintained above 100% through the year which is well over the regulatory threshold of 60%. The company has internal risk thresholds for LCR approved by the Risk Managing Committee which is higher than the regulatory requirement. The High Quality Liquid Assets (HQLA) as on March 31,2022 is held in the form of Government Securities to meet the LCR requirements
Particulars Q1 FY22-Avg Q2 FY22-Avg Q3 FY22-Avg Q4 FY22-Avg
High Quality Liquid Assets 1,46,465 1,47,406 1,45,562 1,42,665Cash Outflows: Deposits - -Un-Secured wholesale funding 93,790 1,221 53,438 1,08,735Secured wholesale funding 1,81,549 3,06,198 1,33,495 1,22,450Additional Requirements, of which - -(i) Outflows related to derivatives exposures - - - - and other collateral requirements.(ii) Outflows related to loss of funding on debt products - - - -(iii) Credit and Liquidity facilities - - - -Other Contractual funding obligations 1,95,986 1,79,867 2,19,233 2,46,561Other Contingent funding obligations 12,731 13,231 13,773 14,685Total Cash Outflows 4,84,056 5,00,517 4,19,938 4,92,431Cash InflowsSecured Lending - - - -Inflows from fully performing exposures 1,82,800 2,13,400 2,38,416 2,60,459Other cash inflows 3,80,183 3,66,954 1,94,297 2,48,912Total Cash Inflows 5,62,983 5,80,354 4,32,713 5,09,371TOTAL HIGH QUALITY LIQUID ASSETS 1,46,465 1,47,406 1,45,562 1,42,665TOTAL NET CASH FLOWS 1,21,014 1,25,129 1,04,985 1,23,108LIQUIDITY COVERAGE RATIO (%) 121% 118% 139% 116%
` in lakhs

182
Corporate Overview Financial StatementsManagement Reports
For Price Waterhouse LLP For and on behalf of the Board of directorsChartered Accountants ICAI Firm Regn No.301112E/ E300264
A.J. Shaikh Ravindra Kumar Kundu Vellayan SubbiahPartner Executive Director ChairmanMembership No. : 203637
For Sundaram and SrinivasanChartered AccountantsICAI Firm Regn No. : 004207S
S. Usha P. Sujatha D. Arul SelvanPartner Company Secretary Chief Financial OfficerMembership No. : 211785
Date : May 5, 2022Place : Chennai
Notes forming part of the Standalone Financial Statements (Contd.) For the year ended March 31, 2022The company has maintained LCR well above the regulatory threshold of 60% throughout the financial year. All foreign currency borrowings are fully hedged at the time of drawn of each loan. Hence there is no risk to the company on account of derivatives or collateral calls thereof or mismatch in currency.

Corporate Overview Financial StatementsManagement Reports
183
Independent Auditor’s ReportTo the Members of Cholamandalam Investment and Finance Company Limited
Report on the Audit of the Consolidated Financial Statements
Opinion1. We have audited the accompanying consolidated financial statements of Cholamandalam Investment and Finance Company Limited
(hereinafter referred to as the “Holding Company”) and its subsidiaries (Holding Company and its subsidiaries together referred to as “the Group”), its associates and joint venture (refer Note 3A to the attached consolidated financial statements), which comprise the Consolidated Balance Sheet as at March 31 2022, and the Consolidated Statement of Profit and Loss (including Other Comprehensive Income) , the Consolidated Statement of Changes in Equity and the Consolidated Statement of Cash Flows for the year then ended, and notes to the consolidated financial statements, including a summary of significant accounting policies and other explanatory information (hereinafter referred to as “the consolidated financial statements”).
2. In our opinion and to the best of our information and according to the explanations given to us, the aforesaid consolidated financial statements give the information required by the Companies Act, 2013 (“the Act”) in the manner so required and give a true and fair view in conformity with the accounting principles generally accepted in India, of the consolidated state of affairs of the Group, its associates and joint venture as at March 31, 2022, of consolidated total comprehensive income (comprising of profit and other comprehensive income), consolidated changes in equity and its consolidated cash flows for the year then ended.
Basis for Opinion3. We conducted our audit in accordance with the Standards on Auditing (SAs) specified under Section 143(10) of the Act. Our
responsibilities under those Standards are further described in the “Auditor’s Responsibilities for the Audit of the Consolidated Financial Statements” section of our report. We are independent of the Group, its associates and jointly controlled entities in accordance with the ethical requirements that are relevant to our audit of the consolidated financial statements in India in terms of the Code of Ethics issued by the Institute of Chartered Accountants of India and the relevant provisions of the Act, and we have fulfilled our other ethical responsibilities in accordance with these requirements. We believe that the audit evidence we have obtained is sufficient and appropriate to provide a basis for our opinion.
Key audit matters
4. Key Audit are those matters that, in our professional judgment, were of most significance in our audit of the Consolidated financial statements of the current period. These matters were addressed in the context of our audit of the Consolidated financial statements as a whole and in forming our opinion thereon, and we do not provide a separate opinion on these matters.
Assessment of impairment loss allowance based on expected credit loss (ECL) on Loans (Refer Note 11 of the consolidated financial statements)The loan balances towards vehicle finance, home loans, loans against property, and other loans aggregating to INR 76,47,339 lakhs and the associated impairment allowances aggregating to INR 2,32,868 lakhs are significant to the consolidated financial statements and involves judgement around the determination of the impairment allowance in line with the requirements of the Ind AS 109 “Financial Instruments”.Impairment allowances represent management’s estimate of the losses incurred within the loan portfolios at the balance sheet date and are inherently judgmental. Impairment, based on ECL model, is calculated using main variables, viz. ‘Staging’, ‘Exposure At Default’, ‘Probability of Default’ and ‘Loss Given Default’ as specified under Ind AS 109.Quantitative factors like days past due, behaviour of the portfolio, historical losses incurred on defaults and macro-economic data points identified by the Management’s expert and qualitative factors like nature of the underlying loan, deterioration in credit quality, correlation of macro-economic variables to determine expected losses, uncertainty over realisability of security, judgement in relation to management overlays and related Reserve Bank of India (RBI) guidelines, to the extent applicable, etc. have been taken into account in the ECL computation.
The audit procedures performed by us to assess appropriateness of the impairment allowance based on ECL on loans included the following:
• We understood and evaluated the design and tested the operating effectiveness of the key controls put in place by the management over:
i. the assumptions used in the calculation of ECL and its various aspects such as determination of Probability of Default, Loss Given Default, Exposure At Default, Staging of Loans, etc.;
ii. the completeness and accuracy of source data used by the Management in the ECL computation; and
iii. ECL computations for their reasonableness.
• We, along with the assistance of the auditor’s our expert, verified the appropriateness of methodology and models used by the Company and reasonableness of the assumptions used within the computation process to estimate the impairment provision.
• We test-checked the completeness and accuracy of source data used.
• We recomputed the impairment provision for a sample of loans across the loan portfolio to verify the arithmetical accuracy and compliance with the requirements of Ind AS 109.
Key audit matters How our audit addressed the key audit matter

184
Corporate Overview Financial StatementsManagement Reports
Given the inherent judgmental nature and the complexity of model involved, we determined this to be a key audit matter.
Assessment of Direct tax and Indirect tax litigations and related disclosure of contingent liabilities (Refer to Note 40 of the consolidated Financial statements)As at March 31, 2022, the Company has exposure towards litigations relating to various tax matters as set out in the aforesaid Notes.
Significant management judgement is required to assess matters relating to direct tax and indirect tax litigations, to determine the probability of occurrence of material outflow of economic resources and whether a provision should be recognised or a disclosure should be made. The management judgement is also supported with legal advice in certain cases as considered appropriate.
As the ultimate outcome of the matters are uncertain and the positions taken by the management are based on the application of their best judgement, related legal advice including those relating to interpretation of laws/regulations, it is considered to be a Key Audit Matter.
Audit in an Information Technology (IT) enabled environment - including considerations on exceptions identified in IT Environment
The IT environment of the entity involves a few independent and inter-dependent IT systems used in the operations of the entity for processing and recording of the business transactions. As a result, there is a high degree of reliance and dependency on such IT systems for the financial reporting process of the entity. Appropriate IT general controls and IT application controls are required to ensure that such IT systems can process the data as required, completely, accurately, and consistently for reliable financial reporting.We have identified certain key IT applications and the related IT infrastructure (herein after referred to as “In-scope IT systems”), which have an impact on the financial reporting process and the related controls as a key audit matter because of the increased level of automation; a few systems being used by the entity for processing financial transactions; and the complexity of the IT architecture; and its impact on the financial records and financial reporting process of the entity.
• We evaluated the reasonableness of the judgement involved in management overlays that form part of the impairment provision, and the related approvals.
We evaluated the adequacy of Presentation and disclosure in relation to impairment loss allowance in the consolidated financial statements.
Our audit procedures included the following:• We understood, assessed and tested the design and operating
effectiveness of key controls surrounding assessment of litigations relating to direct and indirect tax laws and regulations ;
• We inquired with management the recent developments and the status of the material litigations which were reviewed and noted by the Audit Committee;
• We performed our assessment on a test check basis on the underlying calculations supporting the contingent liabilities related to litigations disclosed in the Consolidated Financial Statements;
• We used auditor’s expert to gain an understanding and to evaluate the disputed tax matters;
• We considered external legal opinions, where relevant, obtained by management and examined by the auditor’s expert;
• We obtained the listings from the management and got it reconfirmed from management’s consultants;
• We evaluated the adequacy of presentation and disclosures in relation to litigations in the Consolidated Financial Statements.
Our audit procedures with respect to this matter included the following:
In assessing the controls over the IT systems, we have involved our Technology Assurance specialists to obtain an understanding of the IT environment, IT infrastructure and IT systems.
With respect to the “In-scope IT systems” identified as relevant to the audit of the financial statements and financial reporting process of the entity, we have evaluated and tested relevant IT general controls or relied upon service auditor’s report, where applicable.
On such “In-scope IT systems”, we have covered the key IT general controls with respect to the following domains:• Program change management, which includes that program
changes are moved to the production environment as per defined procedures and relevant segregation of environment is ensured.
• User access management, which includes user access provisioning, de-provisioning, access review, password management, sensitive access rights and segregation of duties to ensure that privileged access to applications, operating system and databases in the production environment were granted only to authorized personnel.
• Other areas that were assessed under IT control environment included backup management, business continuity and disaster recovery, incident management, batch processing and monitoring.
Independent Auditor’s Report (Contd.)
Key audit matters How our audit addressed the key audit matter

Corporate Overview Financial StatementsManagement Reports
185
Independent Auditor’s Report (Contd.)
Other Information
5. The Holding Company’s Board of Directors is responsible for the other information. The other information comprises the information included in the Annual Report (Financial Highlights, Board’s report, Management Discussion and Analysis and Report on Corporate Governance), but does not include the Consolidated financial statements and our auditor’s report thereon.
Our opinion on the Consolidated financial statements does not cover the other information and we do not express any form of assurance conclusion thereon.
In connection with our audit of the Consolidated financial statements, our responsibility is to read the other information and, in doing so, consider whether the other information is materially inconsistent with the Consolidated financial statements or our knowledge obtained in the audit or otherwise appears to be materially misstated. If, based on the work we have performed, we conclude that there is a material misstatement of this other information, we are required to report that fact.
We have nothing to report in this regard.
Responsibilities of Management and Those Charged with Governance for the Consolidated Financial Statements
6. The Holding Company’s Board of Directors is responsible for the preparation and presentation of these consolidated financial statements in term of the requirements of the Act that give a true and fair view of the consolidated financial position, consolidated financial performance and consolidated cash flows, and changes in equity of the Group including its associates and joint venture in accordance with the accounting principles generally accepted in India, including the Accounting Standards specified under Section 133 of the Act. The respective Board of Directors of the companies included in the Group and of its associates and joint venture are responsible for maintenance of adequate accounting records in accordance with the provisions of the Act for safeguarding the assets of the Group and for preventing and detecting frauds and other irregularities; selection and application of appropriate accounting policies; making judgments and estimates that are reasonable and prudent; and the design, implementation and maintenance of adequate internal financial controls, that were operating effectively for ensuring accuracy and completeness of the accounting records, relevant to the preparation and presentation of the consolidated financial statements that give a true and fair view and are free from material misstatement, whether due to fraud or error, which have been used for the purpose of preparation of the consolidated financial statements by the Directors of the Holding Company, as aforesaid.
7. In preparing the consolidated financial statements, the respective Board of Directors of the companies included in the Group and of its associates and joint venture are responsible for assessing the ability of the Group and of its associates and jointly controlled entities/ joint ventures to continue as a going concern, disclosing, as applicable, matters related to going concern and using the going concern basis of accounting unless management either intends to liquidate the Group or to cease operations, or has no realistic alternative but to do so.
8. The respective Board of Directors of the companies included in the Group and of its associates and joint venture are responsible for overseeing the financial reporting process of the Group and of its associates and joint venture.
We have also evaluated the design and tested the operating effectiveness of key IT application controls within key business process, which included testing automated calculations, automated accounting procedures, system interfaces, system reconciliation controls and key system generated reports, as applicable.
Where control deficiencies have been identified, we have tested compensating controls or performed alternative audit procedures, where necessary.
Key audit matters How our audit addressed the key audit matter

186
Corporate Overview Financial StatementsManagement Reports
Independent Auditor’s Report (Contd.)
Auditor’s Responsibilities for the Audit of the Consolidated Financial Statements
9. Our objectives are to obtain reasonable assurance about whether the consolidated financial statements as a whole are free from material misstatement, whether due to fraud or error, and to issue an auditor’s report that includes our opinion. Reasonable assurance is a high level of assurance but is not a guarantee that an audit conducted in accordance with SAs will always detect a material misstatement when it exists. Misstatements can arise from fraud or error and are considered material if, individually or in the aggregate, they could reasonably be expected to influence the economic decisions of users taken on the basis of these consolidated financial statements.
10. As part of an audit in accordance with SAs, we exercise professional judgment and maintain professional scepticism throughout the audit. We also:
• Identify and assess the risks of material misstatement of the consolidated financial statements, whether due to fraud or error, design and perform audit procedures responsive to those risks, and obtain audit evidence that is sufficient and appropriate to provide a basis for our opinion. The risk of not detecting a material misstatement resulting from fraud is higher than for one resulting from error, as fraud may involve collusion, forgery, intentional omissions, misrepresentations, or the override of internal control.
• Obtain an understanding of internal control relevant to the audit in order to design audit procedures that are appropriate in the circumstances. Under Section 143(3)(i) of the Act, we are also responsible for expressing our opinion on whether the Holding company has adequate internal financial controls with reference to consolidated financial statements in place and the operating effectiveness of such controls.
• Evaluate the appropriateness of accounting policies used and the reasonableness of accounting estimates and related disclosures made by management.
• Conclude on the appropriateness of management’s use of the going concern basis of accounting and, based on the audit evidence obtained, whether a material uncertainty exists related to events or conditions that may cast significant doubt on the ability of the Group and its associates and jointly controlled entities/ joint ventures to continue as a going concern. If we conclude that a material uncertainty exists, we are required to draw attention in our auditor’s report to the related disclosures in the consolidated financial statements or, if such disclosures are inadequate, to modify our opinion. Our conclusions are based on the audit evidence obtained up to the date of our auditor’s report. However, future events or conditions may cause the Group and its associates and jointly controlled entities/ joint ventures to cease to continue as a going concern.
• Evaluate the overall presentation, structure and content of the consolidated financial statements, including the disclosures, and whether the consolidated financial statements represent the underlying transactions and events in a manner that achieves fair presentation.
• Obtain sufficient appropriate audit evidence regarding the financial information of the entities or business activities within the Group and its associates and jointly controlled entities/ joint ventures to express an opinion on the consolidated financial statements. We are responsible for the direction, supervision and performance of the audit of the financial statements of such entities included in the consolidated financial statements of which we are the independent auditors. For the other entities included in the consolidated financial statements, which have been audited by other auditors, such other auditors remain responsible for the direction, supervision and performance of the audits carried out by them. We remain solely responsible for our audit opinion.
11. We communicate with those charged with governance of the Holding Company and such other entities included in the consolidated financial statements of which we are the independent auditors regarding, among other matters, the planned scope and timing of the audit and significant audit findings, including any significant deficiencies in internal control that we identify during our audit.
Corporate Overview Financial StatementsManagement Reports
187
Independent Auditor’s Report (Contd.)
12. We also provide those charged with governance with a statement that we have complied with relevant ethical requirements regarding independence, and to communicate with them all relationships and other matters that may reasonably be thought to bear on our independence, and where applicable, related safeguards.
13. From the matters communicated with those charged with governance, we determine those matters that were of most significance in the audit of the consolidated financial statements of the current period and are therefore the key audit matters. We describe these matters in our auditor’s report unless law or regulation precludes public disclosure about the matter or when, in extremely rare circumstances, we determine that a matter should not be communicated in our report because the adverse consequences of doing so would reasonably be expected to outweigh the public interest benefits of such communication.
Other Matters
14. The consolidated financial statements of the Company for the year ended March 31, 2021, were audited by another firm of chartered accountants under the Act who, vide their report dated May 7 2021, expressed an unmodified opinion on those consolidated financial statements.
15. We did not audit the financial statements of 2 subsidiaries, whose financial statements reflect total assets of Rs 18,074.01 Lakhs as at March 31 2022, total revenue of ` 9,638.53 lakhs, profit after tax of ` 1,228.05 lakhs total comprehensive income (comprising of profit and other comprehensive income) of Rs 2,732 lakhs and net cash inflows amounting to Rs 838.54 lakhs for the year ended on that date, as considered in the consolidated financial statements. These financial statements have been audited by other auditors whose reports have been furnished to us by the Management, and our opinion on the consolidated financial statements insofar as it relates to the amounts and disclosures included in respect of these subsidiaries, and our report in terms of sub- section (3) of Section 143 of the Act including report on Other Information insofar as it relates to these subsidiaries, is based solely on the reports of the other auditors.
16. The consolidated financial statements also include the Group’s share of loss of ` 538 lakhs and total comprehensive income of ` (538) lakhs for the year ended March 31 2022 as considered in the consolidated financial statements, in respect of 3 associates and 1 joint venture respectively, whose financial statements have not been audited by us. These financial statements are unaudited and have been furnished to us by the Management, and our opinion on the consolidated financial statements insofar as it relates to the amounts and disclosures included in respect of these joint venture and associates and our report in terms of sub-section (3) of Section 143 of the Act including report on Other Information insofar as it relates to the aforesaid associates and joint venture, is based solely on such unaudited financial statements. In our opinion and according to the information and explanations given to us by the Management, these financial statements are not material to the Group.
Our opinion on the consolidated financial statements, and our report on Other Legal and Regulatory Requirements below, is not modified in respect of the above matters with respect to our reliance on the work done and the reports of the other auditors and the financial statements certified by the Management.
Report on Other Legal and Regulatory Requirements
17. As required by paragraph 3(xxi) of the Companies (Auditor’s Report) Order, 2020 (“CARO 2020”), issued by the Central Government of India in terms of sub-section (11) of Section 143 of the Act, we report that there are no qualifications or adverse remarks included by the respective auditors in their CARO 2020 reports issued in respect of the standalone financial statements of the companies which are included in these Consolidated Financial Statements.
18. As required by Section 143(3) of the Act, we report, to the extent applicable, that:
a) We have sought and obtained all the information and explanations which to the best of our knowledge and belief were necessary for the purposes of our audit of the aforesaid consolidated financial statements.
b) In our opinion, proper books of account as required by law relating to preparation of the aforesaid consolidated financial statements have been kept so far as it appears from our examination of those books and the reports of the other auditors.

188
Corporate Overview Financial StatementsManagement Reports
Independent Auditor’s Report (Contd.)
c) The Consolidated Balance Sheet, the Consolidated Statement of Profit and Loss (including other comprehensive income), the Consolidated Statement of Changes in Equity and the Consolidated Statement of Cash Flows dealt with by this Report are in agreement with the relevant books of account and records maintained for the purpose of preparation of the consolidated financial statements.
d) In our opinion, the aforesaid consolidated financial statements comply with the Accounting Standards specified under Section 133 of the Act.
e) On the basis of the written representations received from the directors of the Holding Company as on March 31 2022 taken on record by the Board of Directors of the Holding Company and the reports of the statutory auditors of its subsidiary companies, incorporated in India, none of the directors of the Group companies, incorporated in India is disqualified as on March 31 2022 from being appointed as a director in terms of Section 164(2) of the Act.
f ) With respect to the adequacy of internal financial controls with reference to consolidated financial statements of the Group and the operating effectiveness of such controls, refer to our separate report in Annexure A.
g) The managerial remuneration has been paid and provided in accordance with the requisite approvals mandated by the provisions of Section 197 of the Act read with Schedule V to the Act. (Section 197(16) is only with respect to remuneration paid to directors to its directors, not for the group as a whole)
h) With respect to the other matters to be included in the Auditor’s Report in accordance with Rule 11 of the Companies (Audit and Auditor’s) Rules, 2014, in our opinion and to the best of our information and according to the explanations given to us:
i. The consolidated financial statements disclose the impact, if any, of pending litigations on the consolidated financial position of the Group, its associates and joint venture– Refer Note 40 to the consolidated financial statements.
ii. Provision has been made in the consolidated financial statements, as required under the applicable law or accounting standards, for material foreseeable losses, if any, on long-term contracts including derivative contracts as at March 31 2022– Refer Note 9 and 11 to the consolidated financial statements in respect of such items as it relates to the Group, its associates and joint venture
iii. There has been no delay in transferring amounts required to be transferred to the Investor Education and Protection Fund by the Group, associates and joint venture incorporated in India during the year.
iv. (a) The respective Managements of the Company and its subsidiaries which are companies incorporated in India whose financial statements have been audited under the Act have represented to us and to the other auditors of such subsidiaries respectively that, to the best of their knowledge and belief, no funds which are material either individually or in the aggregate have been advanced or loaned or invested either from borrowed funds or share premium or any other sources or kind of funds by the Company or any of such subsidiaries to or in any other person(s) or entity(ies), including foreign entities (“Intermediaries”), with the understanding, whether recorded in writing or otherwise, that the Intermediary shall, directly or indirectly, lend or invest in other persons or entities identified in any manner whatsoever by or on behalf of the Company or any of such subsidiaries (“Ultimate Beneficiaries”) or provide any guarantee, security or the like on behalf of the Ultimate Beneficiaries. (Refer Note 51 (Part II) to consolidated Financial statements)
(b) The respective Managements of the Company and its subsidiaries which are companies incorporated in India whose financial statements have been audited under the Act have represented to us and to the other auditors of such subsidiaries respectively that, to the best of their knowledge and belief, no funds which are material either individually or in the aggregate have been received by the Company or any of such subsidiaries from any person(s) or entity(ies), including foreign entities (“Funding Parties”), with the understanding, whether recorded in writing or otherwise, that the Company or any of such subsidiaries shall, directly or indirectly, lend

Corporate Overview Financial StatementsManagement Reports
189
Independent Auditor’s Report (Contd.)
or invest in other persons or entities identified in any manner whatsoever by or on behalf of the Funding Party (“Ultimate Beneficiaries”) or provide any guarantee, security or the like on behalf of the Ultimate Beneficiaries. (Refer Note 51 (Part II) to consolidated Financial statements)
(c) Based on the audit procedures, that has been considered reasonable and appropriate in the circumstances, performed by us and those performed by the auditors of the subsidiaries which are companies incorporated in India whose financial statements have been audited under the Act, nothing has come to our or other auditor’s notice that has caused us or the other auditor to believe that the representations under sub-clause (i) and (ii) of Rule 11(e) contain any material misstatement.
v. The dividend declared and paid during the year by the Holding Company, is in compliance with Section 123 of the Act.
19. The Group have paid/ provided for managerial remuneration in accordance with the requisite approvals mandated by the provisions of Section 197 read with Schedule V to the Act.
For Sundaram and Srinivasan For Price Waterhouse LLPChartered Accountants Chartered AccountantsFirm Registration No. : 004207S Firm Registration No. : 301112E /E300264
S. Usha A. J. ShaikhPartner PartnerMembership No. : 211785 Membership No. : 203637UDIN : 22211785AILFWS3979 UDIN : 22203637AIKXXN7433
Place : Chennai Place : ChennaiDate : May 5, 2022 Date : May 5, 2022

190
Corporate Overview Financial StatementsManagement Reports
1. In conjunction with our audit of the consolidated financial statements of the Company as of and for the year ended March 31, 2022, we have audited the internal financial controls with reference to financial statements of Cholamandalam Investment and Finance Company Limited (hereinafter referred to as “the Holding Company”) and its subsidiary companies, its associate companies and joint venture, which are companies incorporated in India, as of that date. Reporting under clause (i) of sub section 3 of Section 143 of the Act in respect of the adequacy of the internal financial controls with reference to financial statements is not applicable to 3 associates and joint venture incorporated in India namely Paytail commerce Private limited,Vishvakarma Payments Private Limited and White Data System India Private Limited (Associates) and Payswiff Technologies Private Limited (Joint venture) pursuant to MCA notification GSR 583(E) dated 13 June 2017
Management’s Responsibility for Internal Financial Controls2. The respective Board of Directors of the Holding Company, its subsidiary companies, to whom reporting under clause (i) of sub
section 3 of Section 143 of the Act in respect of the adequacy of the internal financial controls with reference to financial statements is applicable, which are companies incorporated in India, are responsible for establishing and maintaining internal financial controls based on internal control over financial reporting criteria established by the Company considering the essential components of internal control stated in the Guidance Note on Audit of Internal Financial Controls Over Financial Reporting (“the Guidance Note”) issued by the Institute of Chartered Accountants of India (“ICAI”). These responsibilities include the design, implementation and maintenance of adequate internal financial controls that were operating effectively for ensuring the orderly and efficient conduct of its business, including adherence to the respective company’s policies, the safeguarding of its assets, the prevention and detection of frauds and errors, the accuracy and completeness of the accounting records, and the timely preparation of reliable financial information, as required under the Act.
Auditor’s Responsibility3. Our responsibility is to express an opinion on the Company's internal financial controls with reference to financial statements based
on our audit. We conducted our audit in accordance with the Guidance Note issued by the ICAI and the Standards on Auditing deemed to be prescribed under Section 143(10) of the Companies Act, 2013, to the extent applicable to an audit of internal financial controls, both applicable to an audit of internal financial controls and both issued by the ICAI. Those Standards and the Guidance Note require that we comply with ethical requirements and plan and perform the audit to obtain reasonable assurance about whether adequate internal financial controls with reference to financial statements was established and maintained and if such controls operated effectively in all material respects.
4. Our audit involves performing procedures to obtain audit evidence about the adequacy of the internal financial controls system with reference to financial statements and their operating effectiveness. Our audit of internal financial controls with reference to financial statements included obtaining an understanding of internal financial controls with reference to financial statements, assessing the risk that a material weakness exists, and testing and evaluating the design and operating effectiveness of internal control based on the assessed risk. The procedures selected depend on the auditor’s judgement, including the assessment of the risks of material misstatement of the consolidated financial statements, whether due to fraud or error.
5. We believe that the audit evidence we have obtained and the audit evidence obtained by the other auditors in terms of their reports referred to in the Other Matters paragraph below is sufficient and appropriate to provide a basis for our audit opinion on the Holding Company’s internal financial controls system with reference to consolidated financial statements.
Meaning of Internal Financial Controls with reference to Consolidated financial statements6. A company's internal financial control with reference to financial statements is a process designed to provide reasonable assurance
regarding the reliability of financial reporting and the preparation of financial statements for external purposes in accordance with generally accepted accounting principles. A company's internal financial control with reference to financial statements includes those policies and procedures that (1) pertain to the maintenance of records that, in reasonable detail, accurately and fairly reflect the transactions and dispositions of the assets of the company; (2) provide reasonable assurance that transactions are recorded as necessary to permit preparation of Consolidated financial statements in accordance with generally accepted accounting principles, and that receipts and expenditures of the company are being made only in accordance with authorisations of management and directors of the company; and (3) provide reasonable assurance regarding prevention or timely detection of unauthorised acquisition, use, or disposition of the company's assets that could have a material effect on the financial statements.
Inherent Limitations of Internal Financial Controls with reference to financial statements
7. Because of the inherent limitations of internal financial controls with reference to financial statements, including the possibility of collusion or improper management override of controls, material misstatements due to error or fraud may occur and not be detected. Also, projections of any evaluation of the internal financial controls with reference to financial statements to future periods are subject
Annexure A to Independent Auditor’s ReportReferred to in paragraph 18f of the Independent Auditor’s Report of even date to the members of Cholamandalam Investment and Finance Company Limited on the consolidated financial statements as at year ended March 31, 2022Report on the Internal Financial Controls with reference to Consolidated Financial Statements under clause (i) of sub-section 3 of Section 143 of the Act

Corporate Overview Financial StatementsManagement Reports
191
to the risk that the internal financial control with reference to financial statements may become inadequate because of changes in conditions, or that the degree of compliance with the policies or procedures may deteriorate.
Opinion
8. In our opinion, the Holding Company, its subsidiary companies, its associate companies and jointly controlled companies, which are companies incorporated in India, have, in all material respects, an adequate internal financial controls system with reference to financial statements and such internal financial controls with reference to Consolidated financial statements were operating effectively as at March 31, 2022, based on the internal control over financial reporting criteria established by the Company considering the essential components of internal control stated in the Guidance Note issued by the ICAI.
Other Matters
9. Our aforesaid reports under Section 143(3)(i) of the Act on the adequacy and operating effectiveness of the internal financial controls with reference to financial statements insofar as it relates to two subsidiary companies, which are companies incorporated in India, is based on the corresponding reports of the auditors of such companies incorporated in India. Our opinion is not modified in respect of this matter.
For Sundaram and Srinivasan For Price Waterhouse LLPChartered Accountants Chartered AccountantsFirm Registration No. : 004207S Firm Registration No. : 301112E /E300264
S. Usha A. J. ShaikhPartner PartnerMembership No. : 211785 Membership No. : 203637UDIN : 22211785AILFWS3979 UDIN : 22203637AIKXXN7433
Place : Chennai Place : ChennaiDate : May 5, 2022 Date : May 5, 2022
Annexure A to Independent Auditor’s Report (Contd.)Referred to in paragraph 18f of the Independent Auditor’s Report of even date to the members of Cholamandalam Investment and Finance Company Limited on the consolidated financial statements as at year ended March 31, 2022Report on the Internal Financial Controls with reference to Consolidated Financial Statements under clause (i) of sub-section 3 of Section 143 of the Act

192
Corporate Overview Financial StatementsManagement Reports
The accompanying notes are integral part of the Consolidated financial statements
This is the Consolidated Balance Sheet referred to in our report of even date
Consolidated Balance Sheet As at March 31, 2022
` in lakhs
ASSETSFinancial Assets Cash and cash equivalents 7 2,69,884 1,48,036 Bank balances other than cash and cash equivalents 8 1,60,300 3,79,941 Derivative financial instruments 9 18,653 4,587 Receivables 10 i) Trade receivables 7,131 5,660 ii) Other receivables 8,964 4,211 Loans 11 74,14,471 65,83,934 Investments 12 i) Associate 3,303 2,424 ii) Others 1,57,643 1,55,925 iii) Joint Venture 46 44,559 - Other financial assets 13 33,522 56,804 81,18,430 73,41,522 Non- Financial Assets Current tax assets 25,200 14,767 Deferred tax assets (Net) 14 67,491 76,897 Investment property 15 13 13 Property, plant and equipment 16 24,215 20,826 Capital Work in Progress 2,303 - Intangible assets under development 1,432 991 Other intangible assets 17 1,632 1,920 Other non-financial assets 18 7,152 7,480 1,29,438 1,22,894 TOTAL ASSETS 82,47,868 74,64,416
LIABILITIES AND EQUITYFinancial Liabilities Derivative financial instruments 9 16,956 12,742 Payables (I) Trade payables i) Total outstanding dues of micro and small enterprises 36 & 51 306 - ii) Total outstanding dues of creditors other than micro and small enterprises 12,453 9,859 (II) Other payables i) Total outstanding dues of micro and small enterprises - - ii) Total outstanding dues of creditors other than micro and small enterprises 72,000 54,278 Debt securities 19 13,32,110 12,35,767 Borrowings(Other than Debt securities) 20 52,00,452 47,18,226 Subordinated liabilities 21 3,84,788 4,19,006 Other financial liabilities 22 33,952 34,592 70,53,017 64,84,470 Non-Financial Liabilities Current tax Liabilities - 4,225 Deferred tax Liabilities (Net) 65 - Provisions 23 11,968 11,045 Other non-financial liabilities 24 5,918 4,696 17,951 19,966Equity Equity share capital 25 16,428 16,407 Other equity 26 11,60,472 9,43,573 Total Equity 11,76,900 9,59,980 TOTAL LIABILITIES AND EQUITY 82,47,868 74,64,416
Note No. As at As at March 31, 2022 March 31, 2021
For Price Waterhouse LLP For Sundaram and Srinivasan For and on behalf of the Board of DirectorsChartered Accountants Chartered Accountants ICAI Firm Regn No. : 301112E/ E300264 ICAI Firm Regn No. : 004207S A.J. Shaikh S. Usha Ravindra Kumar Kundu Vellayan SubbiahPartner Partner Executive Director ChairmanMembership No. : 203637 Membership No. : 211785
Date : May 5, 2022 P. Sujatha D. Arul SelvanPlace : Chennai Company Secretary Chief Financial Officer

Corporate Overview Financial StatementsManagement Reports
193
For Price Waterhouse LLP For Sundaram and Srinivasan For and on behalf of the Board of DirectorsChartered Accountants Chartered Accountants ICAI Firm Regn No. : 301112E/ E300264 ICAI Firm Regn No. : 004207S A.J. Shaikh S. Usha Ravindra Kumar Kundu Vellayan SubbiahPartner Partner Executive Director ChairmanMembership No. : 203637 Membership No. : 211785
Date : May 5, 2022 P. Sujatha D. Arul SelvanPlace : Chennai Company Secretary Chief Financial Officer
Consolidated Statement of Profit and Loss for the year ended March 31, 2022
The accompanying notes are integral part of the Consolidated financial statements
This is the Consolidated Statement of Profit and Loss referred to in our report of even date
` in lakhs
Revenue from Operations - Interest income 27A 9,56,735 9,22,477 - Fee & commission income 27B 47,254 26,939 - Net gain on fair value change on financial Instrument 27C 1,611 487 - Sale of services 27D 8,475 8,037 Total Revenue from operations (I) 10,14,075 9,57,940 Other income (II) 28 9,106 6,032 Total Income (III) = (I) + (II) 10,23,181 9,63,972Expenses - Finance costs 29 4,29,766 4,57,554 - Impairment of financial instruments 30 88,034 1,37,805 - Employee benefits expense 31 95,720 79,101 - Depreciation and amortisation expense 15, 16 & 17 10,063 10,230 - Other expenses 32 1,08,838 74,492 Total Expenses (IV) 7,32,421 7,59,182 Profit before tax (V) = (III) - (IV) 2,90,760 2,04,790 Tax expense/(benefit) - Current tax - Pertaining to profit for the current period 69,452 75,320 - Adjustment of tax relating to earlier periods 68 392 - Deferred tax 14 5,351 (23,061)Net tax expense (VI) 74,871 52,651 Profit for the period - A = (V) - (VI) 2,15,889 1,52,139 Share of loss from Associates (net of tax) (96) (53)Share of loss from Joint Venture (net of tax) (442) - Profit for the period 2,15,351 1,52,086 Other Comprehensive income: i) Other comprehensive income not to be reclassified to profit or loss in subsequent periods: Re-measurement gains / (losses) on defined benefit obligations (net) 3 (133) Income tax impact (1) 33 Net (Loss) / gain on equity instruments designated at FVOCI for the year 1,647 558 Income tax impact (141) - ii) Other comprehensive income to be reclassified to profit or loss in subsequent periods: Cashflow Hedge Reserve 16,196 (4,521) Income tax impact (4,077) 1,138 Other comprehensive income/(loss) net of tax for the period (B) 13,627 (2,925) Total Comprehensive Income net of tax (A) + (B) 2,28,978 1,49,161 Profit for the period attributable to : Equity holders of the Parent Company 2,15,351 1,52,086 Non-Controlling Interest - -Other Comprehensive Income (net of tax) for the period attributable to : Equity holders of the Parent Company 13,627 (2,925) Non-Controlling Interest - Total Comprehensive Income for the period attributable to : Equity holders of the Parent Company 2,28,978 1,49,161 Non-Controlling Interest - Earnings per equity share of ` 2 each 33 Basic (`) 26.24 18.55 Diluted (`) 26.19 18.52
Note No. Year ended Year ended March 31, 2022 March 31, 2021
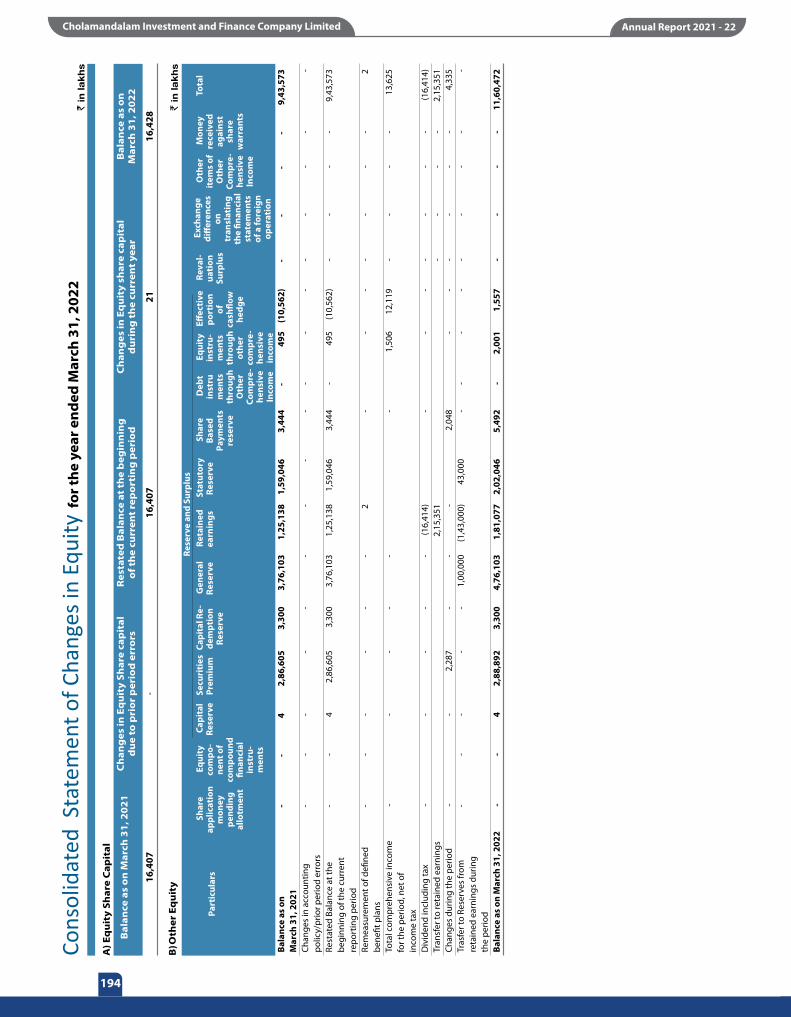
194
Corporate Overview Financial StatementsManagement Reports
Cons
olid
ated
Sta
tem
ent o
f Cha
nges
in E
quity
for
the
year
en
ded
Mar
ch 3
1, 2
02
2`
in la
kh
s
Bala
nce
as o
n
- -
4 2,
86,6
05
3,30
0
3,7
6,10
3
1,2
5,13
8 1,
59,0
46
3,4
44
- 49
5 (1
0,56
2)
- -
- -
9,43
,573
M
arch
31,
202
1Ch
ange
s in
acc
ount
ing
-
-
-
-
-
-
-
-
-
-
-
-
-
-
-
-
-
polic
y/pr
ior p
erio
d er
rors
Rest
ated
Bal
ance
at t
he
-
-
4
2,8
6,60
5
3,3
00
3,7
6,10
3
1,2
5,13
8
1,5
9,04
6
3,4
44
-
495
(1
0,56
2)
-
-
-
-
9,4
3,57
3 be
ginn
ing
of th
e cu
rren
t re
port
ing
perio
d Re
mea
sure
men
t of d
efine
d -
-
-
-
-
-
2
-
-
-
-
-
-
-
2
be
nefit
pla
nsTo
tal c
ompr
ehen
sive
inco
me
-
-
-
-
-
-
1
,506
1
2,11
9
-
-
-
-
13,
625
for t
he p
erio
d, n
et o
f in
com
e ta
xD
ivid
end
incl
udin
g ta
x
-
-
-
-
-
(1
6,41
4)
-
-
-
-
-
-
-
(16,
414)
Tran
sfer
to re
tain
ed e
arni
ngs
2
,15,
351
-
-
-
-
2,1
5,35
1Ch
ange
s du
ring
the
perio
d
-
-
2
,287
-
-
-
2,0
48
-
-
-
-
-
-
4
,335
Tras
fer t
o Re
serv
es fr
om
-
-
-
-
-
1,0
0,00
0
(1,4
3,00
0)
43,
000
-
-
-
-
-
-
-
-
-
reta
ined
ear
ning
s du
ring
th
e pe
riod
Bala
nce
as o
n M
arch
31,
202
2 -
-
4
2
,88,
892
3
,300
4
,76,
103
1
,81,
077
2,
02,0
46
5,4
92
-
2,0
01
1,5
57
-
-
-
-
11,
60,4
72
B) O
ther
Eq
uit
y
A) E
qu
ity
Shar
e C
apit
al
Bal
ance
as
on
Mar
ch 3
1, 2
021
16,4
07
Ch
ang
es in
Eq
uit
y Sh
are
cap
ital
d
ue
to p
rio
r p
erio
d e
rro
rs
-
Res
tate
d B
alan
ce a
t th
e b
egin
nin
g
of t
he
curr
ent
rep
ort
ing
per
iod
16,4
07
Ch
ang
es in
Eq
uit
y sh
are
cap
ital
d
uri
ng
th
e cu
rren
t ye
ar
21
Bal
ance
as
on
M
arch
31,
202
2
16,4
28
` in
lak
hs
Par
ticu
lars
S
hare
ap
plic
atio
n m
oney
pe
ndin
g al
lotm
ent
Equ
ity
com
po-
nent
of
com
poun
d fin
anci
al
inst
ru-
men
ts
Sec
urit
ies
Prem
ium
Cap
ital
Re-
dem
ptio
n Re
serv
e
Gen
eral
Re
serv
e R
etai
ned
ea
rnin
gs S
tatu
tory
Re
serv
e
Res
erve
and
Sur
plus
S
hare
Ba
sed
Paym
ents
re
serv
e
Deb
t in
stru
m
ents
th
roug
h O
ther
Co
mpr
e-he
nsiv
e In
com
e
Equ
ity
inst
ru-
men
ts
thro
ugh
othe
r co
mpr
e-he
nsiv
e in
com
e
Eff
ecti
ve
port
ion
of
cash
flow
he
dge
Rev
al-
uati
on
Surp
lus
Oth
er
item
s of
O
ther
Co
mpr
e-he
nsiv
e In
com
e
Mon
ey
rece
ived
ag
ains
t sh
are
war
rant
s
Tot
al E
xcha
nge
diff
eren
ces
on
tran
slat
ing
the
finan
cial
st
atem
ents
of
a fo
reig
n op
erat
ion
Cap
ital
Re
serv
e

Corporate Overview Financial StatementsManagement Reports
195
For P
rice
Wat
erho
use
LLP
For S
unda
ram
and
Sri
niva
san
Fo
r and
on
beha
lf of
the
Boar
d of
Dir
ecto
rsCh
arte
red
Acco
unta
nts
Char
tere
d Ac
coun
tant
s
ICA
I Firm
Reg
n N
o. :
3011
12E/
E30
0264
IC
AI F
irm R
egn
No.
: 00
4207
S
A.J
. Sha
ikh
S. U
sha
Ravi
ndra
Kum
ar K
undu
Ve
llaya
n Su
bbia
hPa
rtne
r Pa
rtne
r Ex
ecut
ive
Dire
ctor
Ch
airm
anM
embe
rshi
p N
o. :
2036
37
Mem
bers
hip
No.
: 21
1785
Dat
e :
May
5, 2
022
P.
Suj
atha
D
. Aru
l Sel
van
Plac
e : C
henn
ai
Co
mpa
ny S
ecre
tary
Ch
ief F
inan
cial
Offi
cer
This
is th
e Co
nsol
idat
ed S
tate
men
t of C
hang
es in
Equ
ity
refe
rred
to in
our
repo
rt o
f eve
n da
te
Bala
nce
as o
n M
arch
31,
202
0 1
0
-
4
2,8
5,67
8
3,3
00
3,0
0,96
7
89,
808
1,
28,0
46
3,0
17
-
(63)
(7
,179
) -
-
-
-
8
,03,
588
Chan
ges
in a
ccou
ntin
g
-
-
-
-
-
-
-
-
-
-
-
-
-
-
-
-
-
polic
y/pr
ior p
erio
d er
rors
Rest
ated
Bal
ance
at t
he
10
-
4
2
,85,
678
3
,300
3
,00,
967
8
9,80
8
1,2
8,04
6
3,0
17
-
(63)
(7
,179
) -
-
-
-
8
,03,
588
be
ginn
ing
of th
e cu
rren
t re
port
ing
perio
dRe
mea
sure
men
t of d
efine
d -
-
-
-
-
-
(1
00)
-
-
-
-
-
-
-
(100
) be
nefit
pla
nsTo
tal c
ompr
ehen
sive
inco
me
-
-
-
-
-
-
-
558
(3
,383
) -
-
-
-
(2
,825
) fo
r the
per
iod,
net
of
inco
me
tax
Div
iden
d in
clud
ing
tax
-
-
-
-
-
(10,
656)
-
-
-
-
-
-
-
(1
0,65
6)Tr
ansf
er to
reta
ined
ear
ning
s
1,5
2,08
6
- -
- -
1,52
,086
Chan
ges
durin
g th
e pe
riod
(
10)
-
9
27
-
136
-
427
-
-
-
-
-
-
1,4
80
Tran
sfer
to R
eser
ves
from
75,0
00
(1,0
6,00
0)
31,
000
re
tain
ed e
arni
ngs
durin
g
the
perio
dBa
lanc
e as
on
Mar
ch 3
1, 2
021
-
-
4
2,8
6,60
5
3,3
00
3,7
6,10
3
1,2
5,13
8
1,59
,046
3
,444
-
4
95
(10,
562)
-
-
-
-
9
,43,
573
B) O
ther
Eq
uit
y`
in la
kh
s
` in
lak
hs
Par
ticu
lars
S
hare
ap
plic
atio
n m
oney
pe
ndin
g al
lotm
ent
Equ
ity
com
po-
nent
of
com
poun
d fin
anci
al
inst
ru-
men
ts
Sec
urit
ies
Prem
ium
Cap
ital
Re-
dem
ptio
n Re
serv
e
Gen
eral
Re
serv
e R
etai
ned
ea
rnin
gs S
tatu
tory
Re
serv
e
Res
erve
and
Sur
plus
S
hare
Ba
sed
Paym
ents
re
serv
e
Deb
t in
stru
m
ents
th
roug
h O
ther
Co
mpr
e-he
nsiv
e In
com
e
Equ
ity
inst
ru-
men
ts
thro
ugh
othe
r co
mpr
e-he
nsiv
e in
com
e
Eff
ecti
ve
port
ion
of
cash
flow
he
dge
Rev
al-
uati
on
Surp
lus
Oth
er
item
s of
O
ther
Co
mpr
e-he
nsiv
e In
com
e
Mon
ey
rece
ived
ag
ains
t sh
are
war
rant
s
Tot
al E
xcha
nge
diff
eren
ces
on
tran
slat
ing
the
finan
cial
st
atem
ents
of
a fo
reig
n op
erat
ion
Cap
ital
Re
serv
e
Cons
olid
ated
Sta
tem
ent o
f Cha
nges
in E
quity
for
the
year
en
ded
Mar
ch 3
1, 2
02
2 (C
ontd
.)
Pre
vio
us
rep
ort
ing
per
iod
A) E
qu
ity
Shar
e C
apit
al
Bal
ance
as
on
Mar
ch 3
1, 2
020
16,3
98
Ch
ang
es in
Eq
uit
y Sh
are
cap
ital
d
ue
to p
rio
r p
erio
d e
rro
rs
0
Res
tate
d B
alan
ce a
t th
e b
egin
nin
g
of t
he
curr
ent
rep
ort
ing
per
iod
16,3
98
Ch
ang
es in
Eq
uit
y sh
are
cap
ital
d
uri
ng
th
e cu
rren
t ye
ar
9
Bal
ance
as
on
M
arch
31,
202
1
16,
407

196
Corporate Overview Financial StatementsManagement Reports
Consolidated Cash Flow Statement for the year ended March 31, 2022
` in lakhs Particulars Year ended Year ended March 31, 2022 March 31, 2021
Cash Flow from Operating Activities
Profit Before Tax 2,90,760 2,04,790
Adjustments to reconcile profit before tax to net cash flows:
Depreciation and amortisation expense 10,063 10,230
Impairment of financial instruments 87,994 1,32,211
Finance Costs 4,29,766 4,57,554
Loss on Sale of Property plant and equipment ( Net ) 7 54
Net gain on fair value change in financial instruments (1,611) (487)
Interest Income on bank deposits and other investments (24,232) (34,756)
Dividend on Investments (17) (13)
Income tax refund (663) (378)
Short Term Rent Concessions (112) (630)
Share based payment expense 2,048 564
5,03,243 5,64,349
Operating Profit Before Working Capital Changes 7,94,003 7,69,139
Adjustments for :-
(Increase)/Decrease in operating Assets
Loans (9,18,531) (11,76,572)
Trade Receivables (6,224) (3,316)
Other Financial Assets 23,282 (15,532)
Other Non Financial Assets 328 (9,01,145) (1,877) (11,97,297)
Increase/(Decrease) in operating liabilities & Provisions
Payables 20,625 16,332
Other Financial liabilities (2,424) 13,954
Provisions 923 1,894
Other NonFinancial liabilities 1,242 20,366 19 32,199
Cash Flow used in Operations (86,776) (3,95,959)
Finance Costs paid (4,11,750) (4,54,493)
Dividend received 17 13
Interest Received on Bank Deposits and Other Investments 26,085 35,543
(3,85,648) (4,18,937)
(4,72,424) (8,14,896)
Income tax paid (Net of refunds) (84,709) (69,929)
Net Cash Used in Operating Activities (A) (5,57,133) (8,84,825)

Corporate Overview Financial StatementsManagement Reports
197
Consolidated Cash Flow Statement (Contd.) for the year ended March 31, 2022
` in lakhs Particulars Year ended Year ended March 31, 2022 March 31, 2021
Cash Flow from Investing Activities
Purchase of Property, Plant and Equipment and Intangible Assets (7,288) (3,289)
Capital Work in Progress (2,303) -
Proceeds from Sale of Property, Plant and Equipment 192 150
Investment in Bank Fixed Deposits (Net of withdrawals) 2,17,788 (17,388)
Purchase of Mutual Funds Units (42,11,289) (17,68,421)
Redemption of Mutual Funds Units 42,12,589 17,68,884
Investment in Joint Venture and Associate (45,976) -
Increase in investments (net) 241 (1,54,552)
Net Cash Used in Investing Activities (B) 1,63,954 (1,74,616)
Cash Flow from Financing Activities
Proceeds from issue of Share Capital (Including Securities Premium) 2,308 936
Payment of Lease liabilities (5,470) (5,026)
Proceeds from issue of debt securities 9,50,140 18,76,079
Redemption of Debt securities (8,43,426) (13,75,181)
Borrowing - Other than debt securities 25,20,631 48,33,850
Repayment of borrowing - Other than debt securities (20,59,969) (44,29,191)
Proceeds from issue of subordinated liabilities 54,500 14,500
Repayment of subordinated liabilities (87,270) (34,650)
5,34,606 8,85,407
Dividends Paid (16,417) (10,655)
Net Cash Flow From Financing Activities (C) 5,15,027 8,70,662
Net Increase / (Decrease) in Cash and Cash Equivalents (A+B+C) 1,21,848 (1,88,779)
Cash and Cash Equivalents at the Beginning of the Year (Refer Note below) 1,48,036 3,36,815
Cash and Cash Equivalents at the End of the period (Refer Note Below) 2,69,884 1,48,036
Components of Cash and Cash Equivalents:
Cash on hand 1,603 3,180
Balances with banks
- In Current Accounts 11,700 1,38,985
- In Deposit Accounts - Original maturity 3 months or less 2,53,936 2,901
Cheques, drafts on hand 2,645 2,970
Total 2,69,884 1,48,036
This is the consolidated cash flow statement referred to in our report of even date
For Price Waterhouse LLP For Sundaram and Srinivasan For and on behalf of the Board of DirectorsChartered Accountants Chartered Accountants ICAI Firm Regn No. : 301112E/ E300264 ICAI Firm Regn No. : 004207S A.J. Shaikh S. Usha Ravindra Kumar Kundu Vellayan SubbiahPartner Partner Executive Director ChairmanMembership No. : 203637 Membership No. : 211785
Date : May 5, 2022 P. Sujatha D. Arul SelvanPlace : Chennai Company Secretary Chief Financial Officer

198
Corporate Overview Financial StatementsManagement Reports
1. Corporate Information Cholamandalam Investment and Finance Company
Limited (“the Company”) (CIN L65993TN1978PLC007576) is a public limited Company domiciled in India and the equity shares of the Company is listed on Bombay Stock Exchange and National Stock Exchange. The Company and its subsidiaries viz. Cholamandalam Securities Limited and Cholamandalam Home Finance Limited (together hereinafter referred to as “Group”). The Group is one of the premier diversified financial services companies in India, engaged in providing vehicle finance, home loans and Loan against property, business of broking and distribution of financial products.
The Consolidated financial statements are presented in INR which is also functional currency of the Group.
2.1 Basis of Consolidation The Consolidated financial statements of the Group have
been prepared in accordance with Indian Accounting Standards (Ind AS) notified under the Companies (Indian Accounting Standards) Rules, 2015 (as amended from time to time).
The Consolidated financial statements have been prepared in accordance with Ind AS. The Consolidated financial statements have been prepared on a historical cost basis, except for fair value through other comprehensive income (FVOCI) instruments, fair value through profit and loss (FVTPL) instruments, derivative financial instruments and certain financial assets and financial liabilities measured at fair value (refer accounting policy regarding financial instruments).
The Consolidated financial statements are presented in Indian Rupees (INR) and all values are rounded to the nearest lakhs, except when otherwise indicated.
The Consolidated financial statements comprise the financial statements of the Company, its subsidiaries (being the entity that it controls) and its Associates and Joint Venture as at March 31, 2022. Control is evidenced when the Group is exposed, or has rights, to variable returns from its involvement with the investee and has the ability to affect those returns through its power over the investee.
Generally, there is a presumption that a majority of voting rights result in control. To support this presumption and when the Group has less than a majority of the voting or similar rights of an investee, the Group considers all relevant facts and circumstances in assessing whether it has power over an investee, including:
• The contractual arrangement with the other vote holders of the investee
• Rights arising from other contractual arrangements
• The Group’s voting rights and potential voting rights
• The size of the Group’s holding of voting rights relative to the size and dispersion of the holdings of the other voting rights holders
The Group re-assesses whether or not it controls an investee if facts and circumstances indicate that there are changes to one or more of the three elements of control. Consolidation of a subsidiary begins when the Group obtains control over the subsidiary and ceases when the Group loses control of the subsidiary. Assets, liabilities, income and expenses of a subsidiary acquired or disposed of during the period are included in the Consolidated financial statements from the date the Group gains control until the date the Group ceases to control the subsidiary.
Consolidated financial statements are prepared using uniform accounting policies for like transactions and other events in similar circumstances. If a member of the Group uses accounting policies other than those adopted in the Consolidated financial statements for like transactions and events in similar circumstances, appropriate adjustments are made to that Group member’s financial statements in preparing the Consolidated financial statements to ensure conformity with the Group’s accounting policies.
The financial statements of all entities used for the purpose of consolidation are drawn up to same reporting date as that of the parent company, i.e., year ended on March 31.
Consolidation procedure:
(a) Combine like items of assets, liabilities, equity, income, expenses and cash flows of the parent with those of its subsidiaries. For this purpose, income and expenses of the subsidiary are based on the amounts of the assets and liabilities recognised in the Consolidated financial statements at the acquisition date.
(b) Offset (eliminate) the carrying amount of the parent’s investment in each subsidiary and the parent’s portion of equity of each subsidiary. Business combinations policy explains how to account for any related goodwill.
(c) Eliminate in full intra-group assets and liabilities, equity, income, expenses and cash flows relating to transactions between entities of the Group (profits or losses resulting from intra-group transactions that are recognised in assets, such as inventory and fixed assets, are eliminated in full). Intra-group losses may indicate an impairment that requires recognition in the Consolidated financial statements. Ind AS 12 Income Taxes applies to temporary differences that arise from the elimination of profits and losses resulting from intragroup transactions.
Notes forming part of the Consolidated Financial Statements For the year ended March 31, 2022

Corporate Overview Financial StatementsManagement Reports
199
Notes forming part of the Consolidated Financial Statements (Contd.) For the year ended March 31, 2022 Profit or loss and each component of OCI are attributed to
the equity holders of the parent of the Group and to the
non-controlling interests, even if this results in the non-
controlling interests having a deficit balance.
When necessary, adjustments are made to the financial
statements of subsidiaries to bring their accounting
policies in line with the Group’s accounting policies. All
intra-group assets, liabilities, equity, income, expenses
and cash flows relating to transactions between members
of the Group are eliminated in full on consolidation.
If the Group loses control over a subsidiary, it:
• Derecognises the assets (including goodwill) and
liabilities of the subsidiary
• Derecognises the carrying amount of any non-
controlling interests
• Derecognises the cumulative translation differences
recorded in equity
• Recognises the fair value of the consideration received
• Recognises the fair value of any investment retained
• Recognises any surplus or deficit in profit or loss
Reclassifies the parent’s share of components previously
recognised in OCI to profit or loss or retained earnings, as
appropriate, as would be required if the Group had directly
disposed of the related assets or liabilities
A change in the ownership interest of a subsidiary, without
loss of control, is accounted for as an equity transaction.
3A Particulars of consolidation
The financial statements of the following subsidiaries/
associates/joint venture (all incorporated in India) have
been considered for consolidation:
* Even though, the Group holds 73.82% of the paid up equity capital of Payswiff Technologies Private Limited(Payswiff), however, in view of founder reserved matters and dispute resolution mechanism envisaged in the shareholder agreement executed between the group and founders of Payswiff, the group is considered to have joint control over the entity as per Ind AS 28 read with IND AS 110. Hence it is classified as investment in Joint venture
3B Investment in Associates/Joint Venture
An associate is an entity over which the Group has significant influence. Significant influence is the power to participate in the financial and operating policy decisions of the investee.
A Joint venture is a joint arrangement whereby parties that have joint control of the arrangement have rights to the net assets of the arrangement.
The Group’s investments in its associates & joint ventures are accounted for using the equity method. Under the equity method, the investment in associates & joint ventures is initially recognised at cost. The carrying amount of the investment is adjusted to recognise changes in the Group’s share of net assets of the associates & joint ventures since the acquisition date. Goodwill relating to the associates & joint ventures is included in the carrying amount of the investment and is not tested for impairment individually.
The statement of profit and loss reflects the Group’s share of the results of operations of the associates & joint ventures. Any change in OCI of those investees is presented as part of the Group’s OCI. In addition, when there has been a change recognised directly in the equity of the associates & joint ventures, the Group recognises its share of any changes, when applicable, in the statement of changes in equity. Unrealised gains and losses resulting from transactions between the Group and the associates are eliminated to the extent of the interest in the associates & joint ventures.
If an entity’s share of losses of an associates & joint ventures equal or exceeds its interest in the associates & joint ventures (which includes any long-term interest that, in substance, form part of the Group’s net investment in the associates), the entity discontinues recognising its share of further losses. Additional losses are recognised only to the extent that the Group has incurred legal or constructive obligations or made payments on behalf of the associates. If the associates & joint ventures subsequently reports profits, the entity resumes recognising its share of those
Name of the Company Percentage of Voting Power as on March 31, March 31, 2022 2021Cholamandalam Securities 100.00% 100.00% Limited (CSEC)Cholamandalam Home 100.00% 100.00% Finance Limited (CHFL) White Data Systems 30.87% 30.87% India Private Limited Vishvakarma Payments 21.00% 21.00% Private LimitedPaytail Commerce 16.29% - Private LimitedPayswiff Technologies 73.82% - Private Limited*

200
Corporate Overview Financial StatementsManagement Reports
Notes forming part of the Consolidated Financial Statements (Contd.) For the year ended March 31, 2022
profits only after its share of the profits equals the share of
losses not recognised.
The aggregate of the Group’s share of profit or loss of
associates & joint ventures is shown on the face of the
statement of profit and loss.
The financial statements of the associates & joint ventures
are prepared for the same reporting period as the Group.
When necessary, adjustments are made to bring the
accounting policies in line with those of the Group.
After application of the equity method, the Group
determines whether it is necessary to recognise an
impairment loss on its investment in its associates & joint
ventures. At each reporting date, the Group determines
whether there is objective evidence that the investment
in the associates is impaired. If there is such evidence,
the Group calculates the amount of impairment as the
difference between the recoverable amount of the
associates & joint ventures and its carrying value, and then
recognises the impairment loss with respect to the Group’s
investment in associates & joint ventures.
Upon loss of significant influence over the associates, the
Group measures and recognises any retained investment
at its fair value. Any difference between the carrying
amount of the associates upon loss of significant influence
and the fair value of the retained investment and proceeds
from disposal is recognised in profit or loss.
4. Presentation of financial statements
The Group presents its balance sheet in order of liquidity.
An analysis regarding recovery or settlement within
12 months after the reporting date (current) and more
than 12 months after the reporting date (non–current) is
presented in notes to the financial statements.
Financial assets and financial liabilities are generally
reported gross in the balance sheet. They are only offset and
reported net when, in addition to having an unconditional
legally enforceable right to offset the recognised amounts
without being contingent on a future event, the parties
also intend to settle on a net basis in all of the following
circumstances:
• The normal course of business
• The event of default
• The event of insolvency or bankruptcy of the Group
and/or its counterparties
5. Significant accounting policies5.1 Financial instruments – initial recognition
5.1.1 Date of recognition
Financial assets and liabilities, with the exception of loans, debt securities, and borrowings are initially recognised on the trade date, i.e., the date that the Group becomes a party to the contractual provisions of the instrument. Loans are recognised when fund transfers are initiated to the customers’ account or cheques for disbursement have been prepared by the Group (as per the terms of the agreement with the borrowers). The Group recognises debt securities and borrowings when funds reach the Group.
5.1.2 Initial measurement of financial instruments
All financial instruments are recognised initially at fair value, including transaction costs that are attributable to the acquisition of financial instrument, except in the case of financial instruments which are FVTPL (Fair value through profit and loss), where the transaction costs are charged to the statement of profit and loss.
5.1.3 Measurement categories of financial assets and liabilities
The Group classifies all of its financial assets based on the business model for managing the assets and the asset’s contractual terms, measured at either:
• Amortised cost
• FVTPL
• FVOCI
5.1.4 Financial assets and liabilities
5.1.4.1 Bank balances, Loans, Trade receivables and financial investments at amortised cost
The Group measures financial assets at amortised cost if both of the following conditions are met:
• The financial asset is held within a business model with the objective to hold financial assets in order to collect contractual cash flows and
• The contractual terms of the financial asset give rise on specified dates to cash flows that are solely payments of principal and interest (SPPI) on the principal amount outstanding.
The details of these conditions are outlined below.
5.1.4.1.1 Business model assessment
The Group determines its business model at the level that best reflects how it manages Group’s of financial assets to achieve its business objective.

Corporate Overview Financial StatementsManagement Reports
201
The Group's business model is not assessed on an instrument-by-instrument basis, but at a higher level of aggregated portfolios and is based on observable factors such as:
• How the performance of the business model and the financial assets held within that business model are evaluated and reported to the entity's key management personnel
• The risks that affect the performance of the business model (and the financial assets held within that business model) and, in particular, the way those risks are managed
• How managers of the business are compensated (for example, whether the compensation is based on the fair value of the assets managed or on the contractual cash flows collected)
• The expected frequency, value and timing of sales are also important aspects of the Group’s assessment
The business model assessment is based on reasonably expected scenarios without taking 'worst case' or 'stress case’ scenarios into account. If cash flows after initial recognition are realised in a way that is different from the Group's original expectations, the Group does not change the classification of the remaining financial assets held in that business model, but incorporates such information when assessing newly originated or newly purchased financial assets going forward.
5.1.4.1.2 The SPPI test
As a second step of its classification process the Group assesses the contractual terms of financial instruments to identify whether they meet the SPPI test.
‘Principal’ for the purpose of this test is defined as the fair value of the financial asset at initial recognition and may change over the life of the financial asset (for example, if there are repayments of principal or amortisation of the premium/discount).
The most significant elements of interest within a lending arrangement are typically the consideration for the time value of money and credit risk. To make the SPPI assessment, the Group applies judgement and considers relevant factors such as the currency in which the financial asset is denominated, and the period for which the interest rate is set.
5.1.5 Investment in Mutual funds
The Company recognises the investment on trade date and is classified and measured, at fair value through profit or loss. Any gain/losses on disposal or subsequent re-measurement is recognised in the statement of Profit and Loss.
5.1.6 Equity instruments
The Group subsequently measures all equity investments at fair value through profit or loss, unless the Group’s management has elected to classify irrevocably some of its equity investments as equity instruments at FVOCI, when such instruments meet the definition of Equity under Ind AS 32 Financial Instruments: Presentation and are not held for trading. Such classification is determined on an instrument-by-instrument basis.
Gains and losses on these equity instruments are never recycled to profit or loss. Dividends are recognised in profit or loss as dividend income when the right of the payment has been established, except when the Group benefits from such proceeds as a recovery of part of the cost of the instrument, in which case, such gains are recorded in OCI (Other Comprehensive Income). Equity instruments at FVOCI are not subject to an impairment assessment.
5.1.7 Debt securities and other borrowed funds
After initial measurement, debt issued and other borrowed funds are subsequently measured at amortised cost. Amortised cost is calculated by taking into account any discount or premium on issue funds, and costs that are an integral part of the Effective Interest rate (EIR).
5.1.8 Undrawn loan commitments
Undrawn loan commitments are commitments under which, over the duration of the commitment, the Group is required to provide a loan with pre-specified terms to the customer. Undrawn loan commitments are in the scope of the ECL requirements.
The nominal contractual value of undrawn loan commitments, where the loan agreed to be provided is on market terms, are not recorded in the balance sheet. The nominal values of these commitments together with the corresponding ECLs are disclosed in notes.
5.1.9 Reclassification of financial assets and liabilities
The Group does not reclassify its financial assets subsequent to their initial recognition, apart from the exceptional circumstances in which the Group acquires, disposes of, or terminates a business line. Financial liabilities are never
Notes forming part of the Consolidated Financial Statements (Contd.) For the year ended March 31, 2022

202
Corporate Overview Financial StatementsManagement Reports
reclassified. The Group did not reclassify any of its financial assets or liabilities during the reporting period.
5.2 Derecognition of financial assets and liabilities
5.2.1 Derecognition of financial asset
The Group derecognises a financial asset, such as a loan to a customer, when the terms and conditions have been renegotiated to the extent that, substantially, it becomes a new loan, with the difference recognised as a derecognition gain or loss, to the extent that an impairment loss has not already been recorded. The newly recognised loans are classified as Stage 1 for ECL measurement purposes, unless the new loan is deemed to be POCI.
When assessing whether or not to derecognise a loan to a customer, amongst others, the Group considers the following factors:
• Change in currency of the loan
• Introduction of an equity feature
• Change in counterparty
If the modification is such that the instrument would no longer meet the SPPI criterion.
If the modification does not result in cash flows that are substantially different, the modification does not result in derecognition. Based on the change in cash flows discounted at the original EIR, the Group records a modification gain or loss, to the extent that an impairment loss has not already been recorded.
A financial asset (or, where applicable, a part of a financial asset or part of a group of similar financial assets) is derecognised when the rights to receive cash flows from the financial asset have expired. The Group also derecognises the financial asset if it has both transferred the financial asset and the transfer qualifies for derecognition.
The Group has transferred the financial asset if, and only if, either:
• The Group has transferred its contractual rights to receive cash flows from the financial asset
Or
• It retains the rights to the cash flows but has assumed an obligation to pay the received cash flows in full without material delay to a third party under a ‘pass–through’ arrangement.
Pass-through arrangements are transactions whereby the Group retains the contractual rights to receive the cash flows of a financial asset (the 'original asset'), but assumes a contractual obligation to pay those cash flows to one or more entities when all of the following three conditions are met:
• The Group has no obligation to pay amounts to the eventual recipients unless it has collected equivalent amounts from the original asset, excluding short-term advances with the right to full recovery of the amount lent plus accrued interest at market rates
• The Group cannot sell or pledge the original asset other than as security to the eventual recipients
• The Group has to remit any cash flows it collects on behalf of the eventual recipients without material delay. In addition, the Group is not entitled to reinvest such cash flows, except for investments in cash or cash equivalents including interest earned, during the period between the collection date and the date of required remittance to the eventual recipients.
A transfer only qualifies for derecognition if either:
• The Group has transferred substantially all the risks and rewards of the asset
Or
• The Group has neither transferred nor retained substantially all the risks and rewards of the asset, but has transferred control of the asset
The Group considers control to be transferred if and only if, the transferee has the practical ability to sell the asset in its entirety to an unrelated third party and is able to exercise that ability unilaterally and without imposing additional restrictions on the transfer.
When the Group has neither transferred nor retained substantially all the risks and rewards and has retained control of the asset, the asset continues to be recognised only to the extent of the Group’s continuing involvement, in which case, the Group also recognises an associated liability. The transferred asset and the associated liability are measured on a basis that reflects the rights and obligations that the Group has retained.
Continuing involvement that takes the form of a guarantee over the transferred asset is measured at the lower of the original carrying amount of the asset and the maximum amount of consideration the Group could be required to pay.
In case where transfer of a part of financial assets qualifies for de-recognition, any difference between the proceeds received on such sale and the carrying value of the transferred asset is recognised as gain or loss on de-recognition of such financial asset previously carried under amortisation cost category. The resulting interest only strip initially is recognised at FVTPL.
Notes forming part of the Consolidated Financial Statements (Contd.) For the year ended March 31, 2022

Corporate Overview Financial StatementsManagement Reports
203
5.2.2 Financial liabilities
A financial liability is derecognised when the obligation under the liability is discharged, cancelled or expires. Where an existing financial liability is replaced by another from the same lender on substantially different terms, or the terms of an existing liability are substantially modified, such an exchange or modification is treated as a derecognition of the original liability and the recognition of a new liability. The difference between the carrying value of the original financial liability and the consideration paid is recognised in profit or loss.
5.3 Impairment of financial assets
5.3.1 Overview of the ECL principles
The Group records allowance for expected credit losses for all loans, other debt financial assets not held at FVTPL, together with loan commitments, in this section all referred to as ‘financial instruments’. Equity instruments are not subject to impairment under Ind AS 109.
The ECL allowance is based on the credit losses expected to arise over the life of the asset (the lifetime expected credit loss or LTECL), unless there has been no significant increase in credit risk since origination, in which case, the allowance is based on the 12 months’ expected credit loss (12mECL) as outlined in these notes.
The 12mECL is the portion of LTECLs that represent the ECLs that result from default events on a financial instrument that are possible within the 12 months after the reporting date.
Both LTECLs and 12mECLs are calculated on either an individual basis or a collective basis, depending on the nature of the underlying portfolio of financial instrument.
The Group has established a policy to perform an assessment, at the end of each reporting period, of whether a financial instrument’s credit risk has increased significantly since initial recognition, by considering the change in the risk of default occurring over the remaining life of the financial instrument.
Based on the above process, the Group categorises its loans into Stage 1, Stage 2 and Stage 3, as described below:
Stage 1: When loans are first recognised, the Group recognises an allowance based on 12mECLs. Stage 1 loans also include facilities where the credit risk has improved and the loan has been reclassified from Stage 2.
Stage 2: When a loan has shown a significant increase in credit risk since origination, the Group records an allowance for the LTECLs. Stage 2 loans also include facilities, where the credit risk has improved and the loan has been reclassified from Stage 3.
Stage 3: Loans that has been credit-impaired are based on the following, for which it records an allowance for the LTECLs.
a) Contractual payments of either principal or interest are past due for more than 90 days;
b) The loan is considered to be in default by the management.
The calculation of ECLs
The Group calculates ECLs to measure the expected cash shortfalls, discounted at an approximation to the EIR. A cash shortfall is the difference between the cash flows that are due to an entity in accordance with the contract and the cash flows that the entity expects to receive.
The key elements of the ECL are summarised below:
PD:
The Probability of Default is an estimate of the likelihood of default over a given time horizon. A default may only happen at a certain time over the assessed period, if the facility has not been previously derecognised and is still in the portfolio.
EAD:
The Exposure at Default is an estimate of the exposure at a future default date (in case of Stage 1 and Stage 2), taking into account expected changes in the exposure after the reporting date, including repayments of principal and interest, whether scheduled by contract or otherwise, expected drawdowns on committed facilities, and accrued interest from missed payments. In case of Stage 3 loans EAD represents exposure when the default occurred.
LGD:
The Loss Given Default is an estimate of the loss arising in the case where a default occurs at a given time. It is based on the difference between the contractual cash flows due and those that the lender would expect to receive, including from the realisation of any collateral. It is usually expressed as a percentage of the EAD.
Impairment losses and releases are accounted for and disclosed separately from modification losses or gains that are accounted for as an adjustment of the financial asset’s gross carrying value
The mechanics of the ECL method are summarised below:
Stage 1: The 12mECL is calculated as the portion of LTECLs that represent the ECLs that result from default events on a financial instrument that are possible within the 12 months after the reporting date. The Group calculates the 12mECL allowance based on the expectation of a default occurring in the 12 months following the reporting date.
Notes forming part of the Consolidated Financial Statements (Contd.) For the year ended March 31, 2022

204
Corporate Overview Financial StatementsManagement Reports
These expected 12-month default probabilities are applied to a forecast EAD and multiplied by the expected LGD and discounted by an approximation to the original EIR.
Stage 2: When a loan has shown a significant increase in credit risk since origination, the Group records an allowance for the LTECLs PDs and LGDs are estimated over the lifetime of the instrument. The expected cash shortfalls are discounted by an approximation to the original EIR.
Stage 3: For loans considered credit-impaired, the Group recognises the lifetime expected credit losses for these loans. The method is similar to that for Stage 2 assets, with the PD set at 100%.
Loan commitment:
When estimating LTECLs for undrawn loan commitments, the Group estimates the expected portion of the loan commitment that will be drawn down over its expected life. The ECL is then based on the present value of the expected shortfalls in cash flows if the loan is drawn down. The expected cash shortfalls are discounted at an approximation to the expected EIR on the loan. For an undrawn loan commitment, ECLs are calculated and presented under provision.
5.3.2 Forward looking information
The Group considers a broad range of forward looking information with reference to external forecasts of economic parameters such as GDP growth, unemployment rates etc., as considered relevant so as to determine the impact of macro-economic factors on the Group’s ECL estimates.
The inputs and models used for calculating ECLs are recalibrated periodically through the use of available incremental and recent information. Further, internal estimates of PD, LGD rates used in the ECL model may not always capture all the characteristics of the market / external environment as at the date of the financial statements. To reflect this, qualitative adjustments or overlays are made as temporary adjustments to reflect the emerging risks reasonably.
5.4 Collateral repossessed
In connection with recovery of outstanding dues from borrowers, the Group from time to time and in the normal course of business, resorts to regular repossession of collateral provided against vehicle loans and in certain cases, also exercises its right over property through legal procedures which include seizure of property (wherever applicable). Such assets repossessed are not used for the internal operations. As per the Group’s accounting policy,
repossessed assets are not recorded in the balance sheet, and instead their estimated realisable value is considered in determining the ECL allowance for the related Stage 3 financial assets.
5.5 Write-offs
Financial assets are written off either partially or in their entirety only when the Group has no reasonable expectation of recovery. If the amount to be written off is greater than the accumulated loss allowance, the difference recorded as an expense in the period of write off. Any subsequent recoveries are credited to impairment on financial instrument in the Consolidated statement of profit and loss.
5.6 Restructured, rescheduled and modified loans
The Group sometimes makes concessions or modifications to the original terms of loans such as changing the instalment value or changing the tenor of the loan, as a response to the borrower’s request. The Group considers the modification of the loan only before the loans gets credit impaired.
When the loan has been renegotiated or modified but not derecognised, the Group also reassesses whether there has been a significant increase in credit risk. The Group also considers whether the assets should be classified as Stage 3. Once an asset has been classified as restructured, it will remain restructured for a period of year from the date on which it has been restructured.
Loans which have been renegotiated or modified in accordance with RBI Notifications - RBI/2020-21/16 DOR.No.BP.BC/3/21.04.048/2020-21- Resolution Framework for COVID-19 related Stress and RBI/2020-21/17 DOR.No.BP.BC/4/21.04.048/2020-21- Micro, Small and Medium Enterprises (MSME) sector – Restructuring of Advances have been classified as Stage 2 due to significant increase in credit risk.
5.7 Derivative and Hedge accounting
Derivatives are only used for economic hedging purposes and not as speculative investments. However, where derivatives do not meet the hedge accounting criteria, they are classified as ‘held for trading’ for accounting purposes and are accounted for at FVPL.
Derivatives are initially recognised at fair value at the date a derivative contract is entered into and are subsequently remeasured to their fair value at each balance sheet date. The resulting gain/loss is recognised in profit or loss immediately unless the derivative is designated and is effective as a hedging instrument, in which event the timing of the recognition in profit or loss depends on the nature of the hedge relationship.
Notes forming part of the Consolidated Financial Statements (Contd.) For the year ended March 31, 2022

Corporate Overview Financial StatementsManagement Reports
205
The Group makes use of derivative instruments to manage exposures to interest rate and foreign currency. In order to manage particular risks, the Group applies hedge accounting for transactions that meet specified criteria.
At the inception of a hedge relationship, the Group formally designates and documents the hedge relationship to which the Group wishes to apply hedge accounting and the risk management objective and strategy for undertaking the hedge. The documentation includes the Group’s risk management objective and strategy for undertaking hedge, the hedging/ economic relationship, the hedged item or transaction, the nature of the risk being hedged, hedge ratio and how the entity will assess the effectiveness of changes in the hedging instrument’s fair value in offsetting the exposure to changes in the hedged item’s fair value or cash flows attributable to the hedged risk. Such hedges are expected to be highly effective in achieving offsetting changes in fair value or cash flows and are assessed on an ongoing basis to determine that they actually have been highly effective throughout the financial reporting periods for which they were designated.
Hedges that meet the strict criteria for hedge accounting are accounted for as cash flow hedge
A cash flow hedge is a hedge of the exposure to variability in cash flows that is attributable to a particular risk associated with a recognised asset or liability (such as all or some future interest payments on variable rate debt) or a highly probable forecast transaction and could affect profit or loss.
For designated and qualifying cash flow hedges, the effective portion of the cumulative gain or loss on the hedging instrument is initially recognised directly in OCI within equity (cash flow hedge reserve).
The ineffective portion of the gain or loss on the hedging instrument is recognised immediately in net gain/loss on fair value changes in the profit and loss statement.
When the hedged cash flow affects the statement of profit and loss, the effective portion of the gain or loss on the hedging instrument is recorded in the corresponding income or expense line of the statement of profit and loss. When the forecast transaction subsequently results in the recognition of a non-financial asset or a non-financial liability, the gains and losses previously recognised in OCI are reversed and included in the initial cost of the asset or liability.
When a hedging instrument expires, is sold, terminated, exercised, or when a hedge no longer meets the criteria for hedge accounting, any cumulative gain or loss that
has been recognised in OCI at that time re-mains in OCI and is recognised when the hedged forecast transaction is ultimately recognised in the statement of profit and loss. When a forecast transaction is no longer expected to occur, the cumulative gain or loss that was reported in OCI is immediately transferred to the statement of profit and loss.
5.8 Recognition of interest income
5.8.1 The effective interest rate method
Under Ind AS 109 interest income is recorded using the effective interest rate (‘EIR’) method for all financial instruments measured at amortised cost. The EIR is the rate that discounts estimated future cash receipts through the expected life of the financial instrument to the net carrying amount of the financial asset.
Interest Income
The EIR (and therefore, the amortised cost of the asset) is calculated by taking into account the fees and costs that are an integral part of the EIR. The Group recognises interest income using a rate of return that represents the best estimate of a constant rate of return over the life of the loan. For credit-impaired financial assets interest income is calculated by applying the EIR to the amortised cost of the credit-impaired financial assets (i.e. the gross carrying amount less the allowance for expected credit losses).
5.9 Taxes
5.9.1 Current Tax
Current tax assets and liabilities for the current and prior years are measured at the amount expected to be recovered from, or paid to, the taxation authorities. The tax rates and tax laws used to compute the amount are those that are enacted, or substantively enacted, by the reporting date in the countries where the Group operates and generates taxable income.
Current income tax relating to items recognised outside profit or loss is recognised outside profit or loss (either in other comprehensive income or in equity). Current tax items are recognised in correlation to the underlying transaction either in OCI or directly in equity. Management periodically evaluates positions taken in the tax returns with respect to situations in which applicable tax regulations are subject to interpretation and establishes provisions where appropriate.
5.9.2 Deferred Tax
Deferred tax is provided on temporary differences at the reporting date between the tax bases of assets and liabilities and their carrying amounts for financial reporting purposes.
Notes forming part of the Consolidated Financial Statements (Contd.) For the year ended March 31, 2022

206
Corporate Overview Financial StatementsManagement Reports
Deferred tax liabilities are recognised for all taxable temporary differences, except:
• In respect of taxable temporary differences associated with investments in subsidiaries, where the timing of the reversal of the temporary differences can be controlled and it is probable that the temporary differences will not reverse in the foreseeable future
Deferred tax assets are recognised for all deductible temporary differences, the carry forward of unused tax credits and any unused tax losses. Deferred tax assets are recognised to the extent that it is probable that taxable profit will be available against which the deductible temporary differences, and the carry forward of unused tax credits and unused tax losses can be utilised, except:
• When the deferred tax asset relating to the deductible temporary difference arises from the initial recognition of an asset or liability in a transaction that is not a business combination and, at the time of the transaction, affects neither the accounting profit nor taxable profit or loss
• In respect of deductible temporary differences associated with investments in subsidiaries, associates and interests in joint ventures, deferred tax assets are recognised only to the extent that it is probable that the temporary differences will reverse in the foreseeable future and taxable profit will be available against which the temporary differences can be utilised
The carrying amount of deferred tax assets is reviewed at each reporting date and reduced to the extent that it is no longer probable that sufficient taxable profit will be available to allow all or part of the deferred tax asset to be utilised. Unrecognised deferred tax assets are re-assessed at each reporting date and are recognised to the extent that it has become probable that future taxable profits will allow the deferred tax asset to be recovered.
Deferred tax assets and liabilities are measured at the tax rates that are expected to apply in the year when the asset is realised or the liability is settled, based on tax rates (and tax laws) that have been enacted or substantively enacted at the reporting date. Deferred tax relating to items recognised outside profit or loss is recognised outside profit or loss (either in other comprehensive income or in equity). Deferred tax items are recognised in correlation
to the underlying transaction either in OCI or directly in equity.
Deferred tax assets and deferred tax liabilities are offset if a legally enforceable right exists to set off current tax assets against current tax liabilities and the deferred taxes relate to the same taxable entity and the same taxation authority.
5.9.3 Minimum Alternative Tax (MAT)
Minimum alternate tax (MAT) paid in a year is charged to the statement of profit and loss as current tax for the year. The deferred tax asset is recognised for MAT credit available only to the extent that it is probable that the concerned Group will pay normal income tax during the specified period, i.e., the period for which MAT credit is allowed to be carried forward. In the year in which the Group recognizes MAT credit as an asset, it is created by way of credit to the statement of profit and loss and shown as part of deferred tax asset. The Group reviews the “MAT credit entitlement” asset at each reporting date and writes down the asset to the extent that it is no longer probable that it will pay normal tax during the specified period.
5.10 Investment Property
Investment property represents property held to earn rentals or for capital appreciation or both.
Investment properties are measured initially at cost, including transaction costs. Subsequent to initial recognition, investment properties are stated at cost less accumulated depreciation and accumulated impairment loss, if any.
Depreciation on building classified as investment property has been provided on the straight-line method over a period of 60 years based on the Group’s estimate of their useful lives taking into consideration technical factors, which is the same as the period prescribed in Sch II to the Companies Act 2013.
Though the Group measures investment property using cost based measurement, the fair value of investment property is disclosed in the notes. Fair values are determined based on an annual evaluation performed by an external independent valuer applying valuation models.
Investment properties are derecognised either when they have been disposed of or when they are permanently withdrawn from use and no future economic benefit is expected from their disposal. The difference between the net disposal proceeds and the carrying amount of the asset is recognised in the statement of profit and loss in the period of derecognition.
Notes forming part of the Consolidated Financial Statements (Contd.) For the year ended March 31, 2022
Corporate Overview Financial StatementsManagement Reports
207
5.11 Property, plant and equipment
Property plant and equipment is stated at cost excluding the costs of day–to–day servicing, less accumulated depreciation and accumulated impairment in value. Changes in the expected useful life are accounted for by changing the amortisation period or methodology, as appropriate, and treated as changes in accounting estimates.
Depreciation is calculated using the straight–line method to write down the cost of property and equipment to their residual values over their estimated useful lives which is similar to those provided under Schedule II. Land is not depreciated.
Useful life of assets which is same as those prescribed as per Schedule II of the Companies Act, 2013:
Useful life of assets based on Management’s estimation and which are different from those specified in schedule II:
*The Group, based on technical assessment made by technical expert and management estimate, depreciates Furniture & Fixtures and vehicles over estimated useful lives which are different from the useful life prescribed in Schedule II to the Companies Act, 2013.
The residual values, useful lives and methods of depreciation of property, plant and equipment are reviewed at each financial year end and adjusted prospectively, if appropriate.
Assets individually costing less than or equal to ` 5,000 are fully depreciated in the year of acquisition.
Property plant and equipment is derecognised on disposal or when no future economic benefits are expected from its use. Any gain or loss arising on derecognition of the asset (calculated as the difference between the net disposal proceeds and the carrying amount of the asset) is recognised in other income / expense in the statement of profit and loss in the year the asset is derecognised. The date of disposal of an item of property, plant and
equipment is the date the recipient obtains control of that item in accordance with the requirements for determining when a performance obligation is satisfied in Ind AS 115.
Right-of-use assets are depreciated from the commencement date on a straight-line basis over the shorter of the lease term and useful life of the underlying asset.
5.12 Intangible assets
The Group’s other intangible assets mainly include the value of computer software. An intangible asset is recognised only when its cost can be measured reliably and it is probable that the expected future economic benefits that are attributable to it will flow to the Group. Intangible assets acquired separately are measured on initial recognition at cost. Subsequently, they are carried at cost less accumulated amortisation and impairment losses if any, and are amortised over their estimated useful life on the straight line basis over a 3 year period or the license period whichever is lower. The carrying amount of the assets is reviewed at each Balance sheet date to ascertain impairment based on internal or external factors. Impairment is recognised, if the carrying value exceeds the higher of the net selling price of the assets and its value in use.
5.13 Impairment of non–financial assets
The Group assesses, at each reporting date, whether there is an indication that an asset may be impaired. If any indication exists, or when annual impairment testing for an asset is required, the Group estimates the asset’s recoverable amount. An asset’s recoverable amount is the higher of an asset’s or cash-generating unit’s (CGU) fair value less costs of disposal and its value in use. Recoverable amount is determined for an individual asset, unless the asset does not generate cash inflows that are largely independent of those from other assets or Group of assets. When the carrying amount of an asset or CGU exceeds its recoverable amount, the asset is considered impaired and is written down to its recoverable amount.
In assessing value in use, the estimated future cash flows are discounted to their present value using a pre-tax discount rate that reflects current market assessments of the time value of money and the risks specific to the asset. In determining fair value less costs of disposal, recent market transactions are taken into account. If no such transactions can be identified, an appropriate valuation model is used. These calculations are corroborated by valuation multiples, quoted share prices for publicly traded companies or other available fair value indicators.
The Group bases its impairment calculation on detailed budgets and forecast calculations, which are prepared
Asset Description Estimated Useful Life Buildings 60 years Computer Equipment 3 years Other Equipment 5 years Leasehold improvements Lease Period or 5 years, whichever is lower
Asset Description Estimated Useful LifeFurniture and Fixtures* 5 yearsVehicles* 5 yearsMembership card of stock 10 years exchanges
Notes forming part of the Consolidated Financial Statements (Contd.) For the year ended March 31, 2022

208
Corporate Overview Financial StatementsManagement Reports
separately for each of the Group’s CGUs to which the individual assets are allocated. These budgets and forecast calculations generally cover a period of five years. For longer periods, a long-term growth rate is calculated and applied to project future cash flows after the fifth year. To estimate cash flow projections beyond periods covered by the most recent budgets/forecasts, the Group extrapolates cash flow projections in the budget using a steady or declining growth rate for subsequent years, unless an increasing rate can be justified. In any case, this growth rate does not exceed the long-term average growth rate for the products, industries, or country or countries in which the entity operates, or for the market in which the asset is used.
Impairment losses of continuing operations, are recognised in the statement of profit and loss.
For assets excluding goodwill, an assessment is made at each reporting date to determine whether there is an indication that previously recognised impairment losses no longer exist or have decreased. If such indication exists, the Group estimates the asset’s or CGU’s recoverable amount. A previously recognised impairment loss is reversed only if there has been a change in the assumptions used to determine the asset’s recoverable amount since the last impairment loss was recognised. The reversal is limited so that the carrying amount of the asset does not exceed its recoverable amount, nor exceed the carrying amount that would have been determined, net of depreciation, had no impairment loss been recognised for the asset in prior years. Such reversal is recognised in the statement of profit or loss unless the asset is carried at a revalued amount, in which case, the reversal is treated as a revaluation increase.
Goodwill is tested for impairment annually and when circumstances indicate that the carrying value may be impaired. Impairment is determined for goodwill by assessing the recoverable amount of each CGU (or group of CGUs) to which the goodwill relates. When the recoverable amount of the CGU is less than its carrying amount, an impairment loss is recognised. Impairment losses relating to goodwill cannot be reversed in future periods.
Intangible assets with indefinite useful lives are tested for impairment annually at the CGU level, as appropriate, and when circumstances indicate that the carrying value may be impaired.
5.14 Employee benefits
i) Short-term obligations
Liabilities for wages and salaries, including non-monetary benefits that are expected to be settled wholly within 12 months after the end of the period
in which the employees render the related service are recognised in respect of employees’ services up to the end of the reporting period and are measured at the amounts expected to be paid when the liabilities are settled. The liabilities are presented as employee benefit obligations in the balance sheet.
ii) Post-employment obligation.
The company operates the following post-employment schemes:
(a) defined contribution plans such as provident fund
(b) defined benefit plans such as gratuity, pension, post-employment medical plans
Retirement benefit in the form of provident fund is a defined contribution scheme. The Group has no obligation, other than the contribution payable to the provident fund. The Group recognises contribution payable to the provident fund scheme as an expense, when an employee renders the related service. If the contribution payable to the scheme for service received before the balance sheet date exceeds the contribution already paid, the deficit payable to the scheme is recognised as a liability after deducting the contribution already paid. If the contribution already paid exceeds the contribution due for services received before the balance sheet date, then excess is recognised as an asset to the extent that the pre-payment will lead to, for example, a reduction in future payment or a cash refund.
Employees’ State Insurance: The Group contributes to Employees State Insurance Scheme and recognizes such contribution as an expense in the Statement of Profit and Loss in the period when services are rendered by the employees.
Superannuation: The Group contributes a sum equivalent to 15% of eligible employees’ salary to a Superannuation Fund administered by trustees and managed by Life Insurance Corporation of India (“LIC”). The Group has no liability for future Superannuation Fund benefits other than its contribution and recognizes such contributions as an expense in the Statement of Profit and Loss in the period when services are rendered by the employees.
The Group makes contribution to a Gratuity Fund administered by trustees and managed by LIC. The Group accounts its liability for future gratuity benefits based on actuarial valuation, as at the Balance Sheet date, determined every year by an independent actuary using the Projected Unit Credit method.
Re-measurements, comprising of actuarial gains and losses, the effect of the asset ceiling, excluding amounts included in net interest on the net defined benefit liability
Notes forming part of the Consolidated Financial Statements (Contd.) For the year ended March 31, 2022

Corporate Overview Financial StatementsManagement Reports
209
and the return on plan assets (excluding amounts included in net interest on the net defined benefit liability), are recognised immediately in the balance sheet with a corresponding debit or credit to retained earnings through OCI in the period in which they occur. Remeasurements are not reclassified to profit or loss in subsequent periods.
Past service costs are recognised in profit or loss on the earlier of:
• The date of the plan amendment or curtailment, and
• The date that the Group recognises related restructuring cost
Net interest is calculated by applying the discount rate to the net defined benefit liability or asset. The Group recognises the following changes in the net defined benefit obligation as an expense in the Consolidated statement of profit and loss:
• Service costs comprising current service costs, past-service costs, gains and losses on curtailments and non-routine settlements; and
• Net interest expense or income.
5.15 Share Based Payments
Stock options are granted to the employees under the stock option scheme. The costs of stock options granted to the employees (equity-settled awards) of the Group are measured at the fair value of the equity instruments granted. For each stock option, the measurement of fair value is performed on the grant date. The grant date is the date on which the Group and the employees agree to the stock option scheme. The fair value so determined is revised only if the stock option scheme is modified in a manner that is beneficial to the employees.
This cost is recognised, together with a corresponding increase in share-based payment (SBP) reserves in equity, over the period in which the performance and/or service conditions are fulfilled in employee benefits expense. The cumulative expense recognised for equity-settled transactions at each reporting date until the vesting date reflects the extent to which the vesting period has expired and the Group’s best estimate of the number of equity instruments that will ultimately vest. The statement of profit and loss expense or Credit for a period represents the movement in cumulative expense recognised as at the beginning and end of that period and is recognised in employee benefits expense.
The dilutive effect of outstanding options is reflected as additional share dilution in the computation of diluted earnings per share.
If the options vests in instalments (i.e. the options vest pro rata over the service period), then each instalment is treated as a separate share option grant because each instalment has a different vesting period.
5.16 Provisions
Provisions are recognised when the Group has a present obligation (legal or constructive) as a result of past events, and it is probable that an outflow of resources embodying economic benefits will be required to settle the obligation, and a reliable estimate can be made of the amount of the obligation. When the effect of the time value of money is material, the Group determines the level of provision by discounting the expected cash flows at a pre-tax rate reflecting the current rates specific to the liability. The expense relating to any provision is presented in the statement of profit and loss net of any reimbursement.
5.16.1 Provision for Claw Back of Commission Income
The estimated liability for claw back of commission income is recorded in the period in which the underlying revenue is recognised. These estimates are established using historical information on the nature, frequency and expected average cost of claw back and management estimates regarding possible future incidence. The estimates used for accounting of claw back claims are reviewed periodically and revisions are made as required.
5.17 Dividends on ordinary shares
The Group recognises a liability to make cash distributions to equity holders of the parent when the distribution is authorised and the distribution is no longer at the discretion of the Group. As per the Companies Act, 2013 in India, a distribution is authorised when it is approved by the shareholders. A corresponding amount is recognised directly in equity.
5.18 Determination of Fair value
The Group measures financial instruments, such as, derivatives at fair value at each balance sheet date.
Fair value is the price that would be received to sell an asset or paid to transfer a liability in an orderly transaction between market participants at the measurement date. The fair value measurement is based on the presumption that the transaction to sell the asset or transfer the liability takes place either:
• In the principal market for the asset or liability, or • In the absence of a principal market, in the most advantageous market for the asset or liability
The principal or the most advantageous market must be accessible by the Group.
Notes forming part of the Consolidated Financial Statements (Contd.) For the year ended March 31, 2022

210
Corporate Overview Financial StatementsManagement Reports
The fair value of an asset or a liability is measured using the assumptions that market participants would use when pricing the asset or liability, assuming that market participants act in their economic best interest.
A fair value measurement of a non-financial asset takes into account a market participant’s ability to generate economic benefits by using the asset in its highest and best use or by selling it to another market participant that would use the asset in its highest and best use.
The Group uses valuation techniques that are appropriate in the circumstances and for which sufficient data are available to measure fair value, maximising the use of relevant observable inputs and minimising the use of unobservable inputs.
In order to show how fair values have been derived, financial instruments are classified based on a hierarchy of valuation techniques, as summarised below:
• Level 1 financial instruments − Those where the inputs used in the valuation are unadjusted quoted prices from active markets for identical assets or liabilities that the Group has access to at the measurement date. The Group considers markets as active only if there are sufficient trading activities with regards to the volume and liquidity of the identical assets or liabilities and when there are binding and exercisable price quotes available on the balance sheet date.
• Level 2 financial instruments − Those where the inputs that are used for valuation and are significant, are derived from directly or indirectly observable market data available over the entire period of the instrument’s life. Such inputs include quoted prices for similar assets or liabilities in active markets, quoted prices for identical instruments in inactive markets and observable inputs other than quoted prices such as interest rates and yield curves, implied volatilities, and credit spreads. In addition, adjustments may be required for the condition or location of the asset or the extent to which it relates to items that are comparable to the valued instrument. However, if such adjustments are based on unobservable inputs which are significant to the entire measurement, the Group will classify the instruments as Level 3.
• Level 3 financial instruments − Those that include one or more unobservable input that is significant to the measurement as whole.
For assets and liabilities that are recognised in the financial statements on a recurring basis, the Group determines whether transfers have occurred between levels in the hierarchy by re-assessing categorisation (based on the lowest level input that is significant to the fair value measurement as a whole) at the end of each reporting period.
The Group evaluates the levelling at each reporting period on an instrument-by-instrument basis and reclassifies instruments when necessary based on the facts at the end of the reporting period.
5.19 Recognition of Income
Revenue (other than for those items to which Ind AS 109 Financial Instruments are applicable) is measured at fair value of the consideration received or receivable.
The Group recognises revenue from contracts with customers based on a five step model as set out in Ind 115:
Step 1: Identify contract(s) with a customer: A contract is defined as an agreement between two or more parties that creates enforceable rights and obligations and sets out the criteria for every contract that must be met.
Step 2: Identify performance obligations in the contract: A performance obligation is a promise in a contract with a customer to transfer a good or service to the customer.
Step 3: Determine the transaction price: The transaction price is the amount of consideration to which the Group expects to be entitled in exchange for transferring promised goods or services to a customer, excluding amounts collected on behalf of third parties.
Step 4: Allocate the transaction price to the performance obligations in the contract: For a contract that has more than one performance obligation, the Group allocates the transaction price to each performance obligation in an amount that depicts the amount of consideration to which the Group expects to be entitled in exchange for satisfying each performance obligation.
Step 5: Recognise revenue when (or as) the Group satisfies a performance obligation.
5.19.1 Interest on overdue balances and Other Charges
Overdue interest in respect of loans is recognised upon realisation.
5.19.2 Fee Income & Sale of Services
a) Fee income from loans are recognised upon satisfaction of following:
i) Completion of service
ii) and realisation of the fee income.
Notes forming part of the Consolidated Financial Statements (Contd.) For the year ended March 31, 2022

Corporate Overview Financial StatementsManagement Reports
211
b) Servicing and collections fees on assignment are recognised upon completion of service.
c) Advertising income is recognised over the contract period as and when related services are rendered.
d) Revenue from contract with customer is recognised point in time when performance obligation is satisfied (when the trade is executed). These include brokerage fees which is charged per transaction executed.
5.19.3 Contract Balances
Contract assets
A contract asset is the right to consideration in exchange for services transferred to the customer. If the Group performs by transferring services to a customer before the customer pays consideration or before payment is due, a contract asset is recognised for the earned consideration that is conditional.
Contract liabilities
A contract liability is the obligation to transfer services to a customer for which the Group has received consideration (or an amount of consideration is due) from the customer. If a customer pays consideration before the Group transfers services to the customer, a contract liability is recognised when the payment is made or the payment is due (whichever is earlier). Contract liabilities are recognised as revenue when the Group performs under the contract.
5.20 Dividend Income
Dividend income (including from FVOCI investments) is recognised when the Group’s right to receive the payment is established and it is probable that the economic benefits associated with the dividend will flow to the entity and the amount of the dividend can be measured reliably. This is generally when the shareholders approve the dividend.
5.21 Input Tax credit (Goods and Service Tax)
Input Tax Credit is accounted for in the books in the period when the underlying service / supply received is accounted to the extent permitted as per the applicable regulatory laws and when there is no uncertainty in availing / utilising the same. The ineligible input credit is charged off to the respective expense or capitalised as part of asset cost as applicable.
5.22 Foreign Currency transaction
The Group’s financial statements are presented in Indian Rupees (INR) which is also the Group’s functional currency.
Transactions in foreign currencies are initially recorded by the Group at their respective functional currency spot rates at the date the transaction first qualifies for recognition.
Foreign currency denominated monetary assets and liabilities are translated at the functional currency spot rates of exchange at the reporting date and exchange gains and losses arising on settlement and restatement are recognized in the statement of profit and loss.
Non-monetary items that are measured in terms of historical cost in a foreign currency are translated using the exchange rates at the dates of the initial transactions. Non-monetary items measured at fair value in a foreign currency are translated using the exchange rates at the date when the fair value is determined. The gain or loss arising on translation of non-monetary items measured at fair value is treated in line with the recognition of the gain or loss on the change in fair value of the item (i.e., translation differences on items whose fair value gain or loss is recognized in OCI or profit or loss are also recognized in OCI or profit or loss, respectively).
5.23 Earnings Per Share
Basic Earnings Per Share is calculated by dividing the net profit or loss for the period attributable to equity shareholders by the weighted average number of equity shares outstanding during the period.
The weighted average number of equity shares outstanding during the period and for all periods presented is adjusted for events, such as bonus shares, other than the conversion of potential equity shares, that have changed the number of equity shares outstanding, without a corresponding change in resources. For the purpose of calculating diluted earnings per share, the net profit or loss for the period attributable to equity shareholders and the weighted average number of shares outstanding during the period is adjusted for the effects of all dilutive potential equity shares.
5.24 Segment Information
The accounting policies adopted for Segment reporting are in line with the accounting policies of the Group with the following additional policies:
Revenue and expenses have been identified to segments on the basis of their relationship to the operating activities of the Segment. Revenue and expenses, which relate to the enterprise as a whole and are not allocable to Segments on a reasonable basis have been included under “Un-allocable”.
Assets and liabilities have been identified to segments on the basis of their relationship to the operating activities of the segment. Assets and liabilities, which relate to the
Notes forming part of the Consolidated Financial Statements (Contd.) For the year ended March 31, 2022

212
Corporate Overview Financial StatementsManagement Reports
enterprise as a whole and are not allocable to segments on a reasonable basis have been included under “Un-allocable”.
5.25 Cash and Cash equivalents
Cash and cash equivalent in the balance sheet comprise cash at banks and on hand and short-term deposits with an original maturity of three months or less, which are
subject to an insignificant risk of changes in value.
5.26 Cash Flow Statement
Cash flows are reported using the indirect method, where by profit / (loss) before tax is adjusted for the effects of transactions of non-cash nature and any deferrals or accruals of past or future cash receipts or payments.
For the purpose of the Statement of Cash Flows, cash and cash equivalents as defined above, net of outstanding bank overdrafts as they are considered an integral part of cash management of the Group.
5.27 Leases
The Group’s lease asset consists of leases for buildings. The Group assesses whether a contract contains a lease, at inception of a contract. A contract is, or contains, a lease if the contract conveys the right to control the use of an identified asset for a period of time in exchange for consideration. To assess whether a contract conveys the right to control the use of an identified asset, the Group assesses whether: (i) the contract involves the use of an identified asset (ii) the Group has substantially all of the economic benefits from the use of the asset through the period of the lease and (iii) the Group has the right to direct the use of the asset.
At the date of commencement of the lease, the Group recognises a right-of-use asset (“ROU”) and a corresponding lease liability for all lease arrangements in which it is a lessee, except for leases with a term of twelve months or less (short-term leases) and low value leases. For these short-term and low value leases, the Group recognises the lease payments as an operating expense on a straight-line basis over the term of the lease.
Certain lease arrangements include the options to extend or terminate the lease before the end of the lease term. ROU assets and lease liabilities includes these options when it is reasonably certain that they will be exercised.
Right-of-Use assets are depreciated from the commencement date on a straight-line basis over the
shorter of the lease term. Right to use assets are evaluated for recoverability whenever events or changes in the circumstances indicate that their carrying amounts may not be recoverable.
The lease liability is initially measured at amortised cost at the present value of the future lease payments. The lease payments are discounted using the incremental borrowing rates in the country of domicile of the leases. Lease liabilities are remeasured with a corresponding adjustment to the related right to use asset if the Group changes its assessment if the whether it will exercise an extension or a termination option.
ROU asset has been presented under Property, plant and equipment while lease liability is presented under Other Financial Liabilities in the Balance Sheet. Lease payments made by the Group are classified as financing cash flows.
The Group applies the short-term lease recognition exemption to its short-term leases of Buildings (i.e., those leases that have a lease term of 12 months or less from the commencement date and do not contain a purchase option). Lease payments on short-term leases are recognised as expense on a straight-line basis over the lease term.
5.28 Trade receivable
The Group follows ‘simplified approach’ for recognition of impairment loss allowance on trade receivables. The application of simplified approach does not require the Group to track changes in credit risk. Rather, it recognises impairment loss allowance based on lifetime ECLs at each reporting date, right from its initial recognition. The Group uses a provision matrix to determine impairment loss allowance on portfolio of its trade receivables. The provision matrix is based on its historically observed default rates over the expected life of the trade receivables and is adjusted for forward-looking estimates. At every reporting date, the historical observed default rates are updated for changes in the forward-looking estimates.
6A. Significant accounting judgements, estimates and assumptions
The preparation of the Group’s financial statements requires management to make judgements, estimates and assumptions that affect the reported amount of revenues, expenses, assets and liabilities, and the accompanying disclosures, as well as the disclosure of contingent liabilities. Uncertainty about these assumptions and
Notes forming part of the Consolidated Financial Statements (Contd.) For the year ended March 31, 2022

Corporate Overview Financial StatementsManagement Reports
213
estimates could result in outcomes that require a material adjustment to the carrying amount of assets or liabilities affected in future period.
In the process of applying the Group’s accounting policies, management has made the following judgements/estimates, which have a significant risk of causing a material adjustment to the carrying amounts of assets and liabilities.
i) De-recognition of Financial instruments
The Group enters into securitisation transactions where financial assets are transferred to a structured entity for a consideration. The financial assets transferred qualify for derecognition only when substantial risk and rewards are transferred.
This assessment includes judgements reflecting all relevant evidence including the past performance of the assets transferred and credit risk that the Group has been exposed to. Based on this assessment, the Group believes that the credit enhancement provided pursuant to the transfer of financial assets under securitisation are higher than the loss incurred on the similar portfolios of the Group hence it has been concluded that securitisation transactions entered by the Group does not qualify de-recognition since substantial risk and rewards of the ownership has not been transferred. The transactions are treated as financing arrangements and the sale consideration received is treated as borrowings.
ii) Fair value of financial instruments
The fair value of financial instruments is the price that would be received to sell an asset or paid to transfer a liability in an orderly transaction in the principal (or most advantageous) market at the measurement date under current market conditions (i.e., an exit price) regardless of whether that price is directly observable or estimated using another valuation technique. When the fair values of financial assets and financial liabilities recorded in the balance sheet cannot be derived from active markets, they are determined using a variety of valuation techniques that include the use of valuation models. The inputs to these models are taken from observable markets where possible, but where this is not feasible, estimation is required in establishing fair values. Judgements and estimates include considerations of liquidity and model inputs related to items such as credit risk (both own and counterparty), funding value adjustments, correlation and volatility. For further details about determination of fair value please see Fair value note in Accounting policy.
iii) Impairment of financial asset
The measurement of impairment losses across all categories of financial assets requires judgement, in particular, the estimation of the amount and timing of future cash flows and collateral values when determining impairment losses and the assessment of a significant increase in credit risk. These estimates are driven by a number of factors, changes in which can result in different levels of allowances.
The Group’s ECL calculations are outputs of complex models with a number of underlying assumptions regarding the choice of variable inputs and their interdependencies. Elements of the ECL models that are considered accounting estimates include:
• The Group’s criteria for assessing if there has been a significant increase in credit risk and so allowances for financial assets should be measured on a LTECL basis and the qualitative assessment
• The segmentation of financial assets when their ECL is assessed on a collective basis
• Development of ECL models, including the various formulas and the choice of inputs
• Determination of temporary adjustments as qualitative adjustment or overlays based on broad range of forward looking information as economic inputs
The Group has considered the impact of COVID-19 pandemic and the moratorium given to borrowers pursuant to the COVID-19 regulatory package announced by Reserve Bank of India, in determination of impairment allowance for the year. Also refer note 2.3.
It has been the Group’s policy to regularly review its models in the context of actual loss experience and adjust when necessary.
iv) Leases
a. Determining the lease term of contracts with renewal and termination options – Group as lessee
The Group determines the lease term as the non-cancellable term of the lease, together with any periods covered by an option to extend the lease if it is reasonably certain to be exercised, or any periods covered by an option to terminate the lease, if it is reasonably certain not to be exercised. The Group applies judgement in evaluating whether it is reasonably certain whether or not to exercise the option to renew or terminate the lease. That is, it considers all relevant factors that create an economic incentive for it to exercise either the renewal or termination.
Notes forming part of the Consolidated Financial Statements (Contd.) For the year ended March 31, 2022

214
Corporate Overview Financial StatementsManagement Reports
b. Estimating the incremental borrowing rate
The Group cannot readily determine the interest rate implicit in the lease, therefore, it uses its incremental borrowing rate (IBR) to measure lease liabilities. The IBR is the rate of interest that the Group would have to pay to for its borrowings.
v) Provisions and other contingent liabilities
When the Group can reliably measure the outflow of economic benefits in relation to a specific case and considers such outflows to be probable, the Group records a provision against the case. Where the probability of outflow is considered to be remote, or probable, but a reliable estimate cannot be made, a contingent liability is disclosed.
Given the subjectivity and uncertainty of determining the probability and amount of losses, the Group takes into account a number of factors including legal advice, the stage of the matter and historical evidence from similar incidents. Significant judgement is required to conclude on these estimates.
vi) Business Model Assessment
The Group from time to time enters into direct bilateral assignment deals, which qualify for de-recognition under Ind AS 109. Accordingly, the assessment of the business model for managing its financial assets its financial assets becomes a critical judgement.
Further, the Group also made an investment in the Government securities in order to comply the liquidity
ratio compliance as required by RBI pursuant to its master directions. The Group intends to hold these assets till maturity expects that any sale if any necessitated by requirements are likely to be infrequent and immaterial. Accordingly the related assessment becomes a critical judgement to determine the business model for such financial assets under Ind AS.
Refer Note 5.1.4.1.1 for related details.
6B. Amendments to Ind AS 116: COVID-19-Related Rent Concessions
The amendments provide relief to lessees from applying Ind AS 116 guidance on lease modification accounting for rent concessions arising as a direct consequence of the COVID-19 pandemic. As a practical expedient, a lessee may elect not to assess whether a COVID-19 related rent concession from a lessor is a lease modification. A lessee that makes this election accounts for any change in lease payments resulting from the COVID-19 related rent concession the same way it would account for the change under Ind AS 116, if the change were not a lease modification.
The amendments are applicable for annual reporting periods beginning on or after the 1 April 2020. In case, a lessee has not yet approved the financial statements for issue before the issuance of this amendment, then the same may be applied for annual reporting periods beginning on or after the 1 April 2019. This amendment had no significant impact on the Consolidated financial statements of the Group.
Notes forming part of the Consolidated Financial Statements (Contd.) For the year ended March 31, 2022

Corporate Overview Financial StatementsManagement Reports
215
` in lakhs
` in lakhs
Note : 7 CASH AND CASH EQUIVALENTSCash on hand 1,603 3,180 Balances with banks - In Current Accounts 11,700 1,38,985 - In Deposit Accounts - Original maturity 3 months or less 2,53,936 2,901 Cheques, drafts on hand 2,645 2,970 Total 2,69,884 1,48,036
Note : 8 BANK BALANCES OTHER THAN CASH AND CASH EQUIVALENTS
- In Deposit Accounts - Original maturity more than 3 months 1,08,302 2,78,758
- Non current bank balances 4,080 1,538
- In earmarked accounts
- Margin account for borrowings 13,913 10,585
- In Unpaid Dividend Accounts 71 74
- Deposits with Banks as collateral towards securitisation loan 33,907 31,978
- Deposits with Banks as collateral towards Overdraft facility (Refer Note 20) - 57,000
- Escrow account on unclaimed debentures 19 -
- Other deposit Account on amalgamation of Cholamandalam Factoring Limited 8 8
Total 1,60,300 3,79,941
Particulars As at As at March 31, 2022 March 31, 2021
Particulars As at As at March 31, 2022 March 31, 2021
` in lakhs
Part I(i) Other derivatives - Cross Currency Interest Rate Swap 1,89,723 10,809 - 2,34,373 2,634 914 (ii) Overnight Index Swaps - - 282 - - -(iii) Forward Contracts 1,94,890 7,844 16,674 1,40,286 1,953 11,828Total Derivative financial Instruments 3,84,613 18,653 16,956 3,74,659 4,587 12,742 Part II Included in above (Part I) are derivatives held for hedging and risk management purposes as follows:(i) Cash flow hedging: Others - Cross currency interest rate swap 1,89,723 10,809 - 2,34,373 2,634 914 (ii) Overnight Index Swaps - - 282 - - -(iii) Forward Contracts 1,94,890 7,844 16,674 1,40,286 1,953 11,828Total Derivative financial Instruments 3,84,613 18,653 16,956 3,74,659 4,587 12,742
Particulars Notional Fair Fair Notional Fair Fair amounts Value Value amounts Value Value -Assets -Liabilites -Assets -Liabilites
As at 31st March 2022 As at 31st March 2021
Note : 9 DERIVATIVE FINANCIAL INSTRUMENTS
Notes forming part of the Consolidated Financial Statements (Contd.) For the year ended March 31, 2022

216
Corporate Overview Financial StatementsManagement Reports
` in lakhs
Note : 10 RECEIVABLES(i) Trade Receivables Secured - Considered good* 3,189 3,033 Unsecured - Considered good 3,944 2,628 7,133 5,661Provision for Impairment on receivables (2) (1) 7,131 5,660Trade Receivables credit impaired 48 44 Provision for Impairment on receivables (48) (44)Total Trade receivablesConsidered good 7,133 5,661Trade Receivables credit impaired 48 44 Total 7,181 5,705Provision for Impairment on receivables (50) (45)Subtotal (i) 7,131 5,660 (ii) Other Receivables Considered Good* 8,964 4,211Subtotal (ii) 8,964 4,211Total (i)+(ii) 16,095 9,871
Particulars As at As at March 31, 2022 March 31, 2021
Particulars As at As at March 31, 2022 March 31, 2021
` in lakhs
Note : 11 LOANS (At amortised cost)(A) (i) Bills Discounted 37,099 13,417 (ii) Term loans 76,10,240 68,14,958 Total (A) - Gross 76,47,339 68,28,375 Less: Impairment Allowance for (i) & (ii) (2,32,868) (2,44,441) Total (A) - Net 74,14,471 65,83,934 (B) (i) Secured 75,08,101 67,85,357 (ii) Unsecured 1,39,238 43,018 Total (B) - Gross 76,47,339 68,28,375 Less: Impairment Allowance (2,32,868) (2,44,441) Total (B) - Net 74,14,471 65,83,934
*Includes dues from related parties (Refer Note 39) and Refer Note 51 – Part 1 for ageingNo trade or other receivable are due from directors or other officers of the company either severally or jointly with any other person.
All loans are in India and have been granted to individuals or entities other than public sector.The Company has not granted loans and advances in the nature of loans to Promoters, Directors , Key Managerial Personnel or related parties u/s2 (76) either repayable on demand or without specifying terms/period. Refer related party disclosure (Note 39)Secured indicates loans secured, wholly or partly, by way of hypothecation of automobile assets and / or pledge of securities and / or equitable mortgage of property and / or advances generated out of loans and / or equipments and including undertaking to create a security.Term loans includes unsecured short term loan to an associate. The loans have been classified under Stage 1 Category at the various reporting periods and related impairment provision as per the Group's accounting policy has been created. The details of the same aredisclosed below:
The Group has a Board approved policy for entering into derivative transactions. Derivative transaction represents Currency, Interest Rate Swaps and forward contracts . The Group undertakes such transactions for hedging interest/foreign exchange risk on borrowings. The Asset Liability Management Committee and Business Committee periodically monitors and reviews the risks involved.The notional amount for interest rate swap represents the foreign currency borrowing on which Company has entered to hedge the variable interest rate.
Note : 9 DERIVATIVE FINANCIAL INSTRUMENTS (Contd.)
Notes forming part of the Consolidated Financial Statements (Contd.) For the year ended March 31, 2022

Corporate Overview Financial StatementsManagement Reports
217
` in lakhs
` in lakhs
Stage 1 Stage 2 Stage 3 Total Stage 1 Stage 2 Stage 3 Total
Gross Carrying amount Impairment allowance
Bills discountedOpening as on April 1, 2021 9,678 - 3,739 13,417 57 - 3,434 3,491 New assets originated 33,290 39 - 33,329 270 4 - 274 Exposure de-recognised /Matured/Repaid (9,332) - (315) (9,647) (75) - (221) (296)Transfer to Stage 1 71 - (71) - 21 - (21) - Transfer to Stage 2 - - - - - - - - Transfer to Stage 3 (416) - 416 - (2) - 2 - Impact on account of exposures - - - - - - 118 118 transferred during the period between stagesImpact of changes on items within the - - - - - - 166 166 same stageClosing as on March 31, 2022 33,291 39 3,769 37,099 271 4 3,478 3,753 Term loansOpening as on April 1, 2021 61,25,086 4,23,110 2,66,762 68,14,958 53,673 70,963 1,16,315 2,40,951 New assets originated 32,21,107 13,708 8,464 32,43,729 16,917 1,359 1,182 19,458 Exposure de-recognised / matured / repaid (20,99,167) (2,16,387) (78,580) (23,94,134) (36,643) (26,255) (15,211) (78,109)Transfer to Stage 1 50,781 (39,278) (11,503) - 10,106 (6,801) (3,305) - Transfer to Stage 2 (4,77,609) 4,83,290 (5,681) - (7,437) 9,024 (1,587) - Transfer to Stage 3 (1,11,057) (70,302) 1,81,359 - (2,181) (12,310) 14,491 - Impact on account of exposures transferred 117 4,888 7,706 12,711 - 38,427 44,058 82,485 during the period between stagesImpact of changes on items 19,839 3,205 9,930 32,974 1,311 218 11,617 13,146 within the same stageWrite off* (31,077) (20,526) (47,945) (99,548) (1,726) (8,667) (38,423) (48,816)Closing as on March 31, 2022 66,98,020 5,81,708 3,30,512 76,10,240 34,020 65,958 1,29,137 2,29,115Bills DiscountedOpening as on April 1, 2020 5,142 42 3,414 8,598 31 4 3,173 3,208 New assets originated 9,678 - 430 10,108 57 - 125 182 Exposure de-recongnised / (5,142) - (147) (5,289) (31) - (103) (134) Recovery from Active LoansRecovery from Matured Loans - - - - Transfer to Stage 3 - (42) 42 - - (4) 4 - Impact on account of exposures transferred - - - - - - 38 38 during the year between stages (net)Impact of changes on items within - - - - - - 197 197 the same stage (net)Closing as on March 31, 2021 9,678 - 3,739 13,417 57 - 3,434 3,491
Note : 11.1 LOANS
An analysis of changes in the gross carrying amount and corresponding ECL allowances in relations to loans
Loan - Oustanding Value White Data System India Private Limited - Associate 300 340 Impairment Provision White Data System India Private Limited - Associate* 0 0
* Represents amount less than ` 50,000
Particulars As at As at March 31, 2022 March 31, 2021
Note : 11 LOANS (At amortised cost) (Contd.)
Notes forming part of the Consolidated Financial Statements (Contd.) For the year ended March 31, 2022

218
Corporate Overview Financial StatementsManagement Reports
` in lakhs
Stage 1 Stage 2 Stage 3 Total Stage 1 Stage 2 Stage 3 Total
Gross Carrying amount Impairment allowance
Term loansOpening as on April 1, 2020 52,69,032 2,02,024 2,12,916 56,83,972 39,091 23,342 86,656 1,49,089
New assets originated 24,24,901 15,298 7,604 24,47,803 37,558 6,175 2,704 46,437
Exposure de-recongnised / Recovery (11,85,960) (58,822) (47,464) (12,92,246) (20,161) (4,487) (8,028) (32,676)
from Active Loans
Recovery from Matured Loans - -
Transfer to Stage 1 65,509 (56,814) (8,695) - 8,889 (6,055) (2,834) -
Transfer to Stage 2 (3,52,885) 3,59,980 (7,095) - (8,308) 10,745 (2,437) -
Transfer to Stage 3 (81,332) (43,717) 1,25,049 - (2,120) (5,357) 7,477 -
Impact on account of exposures transferred 139 10,451 7,862 18,452 112 48,112 34,511 82,735
during the year between stages
Impact of changes on items - - 8,382 8,382 - - 19,077 19,077
within the same stage
Write off (14,318) (5,290) (31,797) (51,405) (1,388) (1,512) (20,811) (23,711)
Closing as on March 31, 2021 61,25,086 4,23,110 2,66,762 68,14,958 53,673 70,963 1,16,315 2,40,951
Note : 11.1 LOANS (Contd.)
Notes forming part of the Consolidated Financial Statements (Contd.) For the year ended March 31, 2022
` in lakhs
Note : 12 INVESTMENTS Investment in Equity Instruments* a) Unquoted - FVOCI ** Amaravathi Sri Venkatesa Paper Mills Limited
2,93,272 Equity shares of ` 10 each fully paid up# - -
Saraswat Co-operative Bank Limited
1,000 Equity shares of ` 10 each fully paid up# - -
The Shamrao Vithal Co-operative Bank Limited
1,000 Equity shares of ` 25 each fully paid up# - -
Chennai Willingdon Corporate Foundation
5 shares of ` 10 each: cost ` 50 only# - -
Chola Insurance Services Private Ltd.
19,133 Equity shares of `10 each fully paid up 2 2
Madras Enterprises Private Limited
30,286 equity shares of `10 each fully paid up March 31, 2021 - Nil Shares 5 -
MSE Financial Ltd
4,10,400 Equity shares of ` 1 each fully paid up March 31, 2021 - 2,85,000 Equity Shares# 4 -
Particulars As at As at March 31, 2022 March 31, 2021
No. of cases Principal outstanding Overdue as at March 31, 2022 Instalments* 87,914 2,03,229 1,44,889
*Overdue instalments includes principal amount overdue and interest overdue
ECL across stages have been computed on collective basis.The Group uses Days past due of the customer to determine the credit quality of loans*Total write off includes Loss on disposal of repossessed vehicles - ` 60,124 Lakhs for the year ended March 31, 2022 (` 27,211 lakhs - March 31, 2021)
Note : 11.2 Overdue greater than 90 days as on March 31, 2022

Corporate Overview Financial StatementsManagement Reports
219
Note : 12 INVESTMENTS (Contd.)
` in lakhs
Note : 13 OTHER FINANCIAL ASSETAt amortised cost Unsecured - considered good (unless otherwise stated)Security deposits 3,864 5,397 Interest only strip receivable 28,937 41,406 COVID Ex-gratia Claim Receivable - 9,647 Other advances 721 354 Total 33,522 56,804
Particulars As at As at March 31, 2022 March 31, 2021
` in lakhs
Note : 14 DEFERRED TAXDeferred Tax AssetsImpairment allowance for financial instruments 57,501 61,471 Provision for Contingencies and undrawn commitments 1,025 1,132 Provision for Compensated Absences and Gratuity 2,144 1,812 Impact of Effective interest rate adjustment on Financial Assets 4,583 6,281 Difference in depreciation as per Books of Accounts and Income Tax Act, 1961 1,626 1,604 Carry forward of tax losses 65 - MAT credit entitlement 310 26 Items recognised in OCI 3,933 Others 706 899 (A) 67,960 77,158 Deferred Tax Liability Impact of Effective interest rate adjustment on Financial Liabilities 163 261 Fair Valuation of Investment 224 - Items recognised in OCI 147 - (B) 534 261 Net Deferred Tax Assets (A) - (B) 67,426 76,897
Particulars As at As at March 31, 2022 March 31, 2021
Notes forming part of the Consolidated Financial Statements (Contd.) For the year ended March 31, 2022
*Investments are made in India** The Group has designated certain unquoted investments as FVOCI on the basis that these are not held for trading.# represents amount less than ` 1 lakh.
b) Quoted - FVOCI Bombay Stock Exchange Limited 1,95,000 Equity shares of ` 2 each fully paid up March31, 2021- 65000 Equity Shares 1,841 371 Coromandel Engineering Co. Ltd 25,00,100 Equity shares of ` 10 each fully paid up 843 675 c) Unquoted - FVTPL Faering Capital India Evolving Fund 21,662 units of `10 each fully paid up 600 288 d) Investment in Government Securities - amortised cost 1,54,348 1,54,589 (Issued by Government of India) Total 1,57,643 1,55,925
Particulars As at As at March 31, 2022 March 31, 2021

220
Corporate Overview Financial StatementsManagement Reports
` in lakhs
Deferred Tax Assets Impairment allowance for financial instruments 3,970 - (23,730) - Provision for Contingencies and undrawn commitments 107 - (128) - Provision for Claw back - - 1 - Provision for Compensated Absences and Gratuity (332) - (499) - Impact of Effective interest rate adjustment on Financial Assets 1,698 - 1,534 - Contract liability as per IND AS 115 - - - - Difference in depreciation as per Books of Accounts and Income Tax Act, 1961 (22) - (636) - Carry forward of tax losses and MAT entitlement credit (389) - 439 - Others 193 - 121 -(A) 5,225 - (22,898) - Deferred Tax Liability Impact of Effective interest rate adjustment on Financial Liabilities 98 - 163 - Fair Valuation of Investment (224) - - - Re-measurement gains / (losses) on defined benefit plans (Net) - (1) - 33 Cashflow Hedge Reserve - (4,077) - 1,138 (B) (126) (4,219) 163 1,171 Net deferred tax charge / (reversal) (A) - (B) 5,351 4,219 (23,061) (1,171)
Year ended March 31, 2022 Year ended March 31, 2021 Income OCI Income OCI Statement Statement
Particulars
` in lakhs
Note : 15 INVESTMENT PROPERTIESGross carrying amount as at April 1, 2020 14 Additions - Disposals - Gross carrying amount as at March 31, 2021 14 Additions - Disposals - Gross carrying amount as at March 31, 2022 14 Accumulated depreciation and impairmentBalance as at April 1, 2021 -Depreciation for the year 1Depreciation on disposals Balance as at March 31, 2021** 1Depreciation for the period -Depreciation on disposals -Balance as at March 31, 2022** 1Net Carrying amount As at March 31, 2021 13 As at March 31, 2022 13 Useful Life of the asset (In Years) 60 Method of depreciation Straight line method
Particulars Total
The Group's investment property consists of 4 properties and has let out one property as at March 31, 2022** represents amount less than ` 1,00,000
Note : 14 DEFERRED TAX (Contd.)
Notes forming part of the Consolidated Financial Statements (Contd.) For the year ended March 31, 2022

Corporate Overview Financial StatementsManagement Reports
221
` in lakhs
` in lakhs
Rental Income 5 4 Direct Operating expense from property that generated rental income 1 1 Direct Operating expense from property that did not generated rental income - -
Investment Property 309 304
Particulars Year ended Year ended 31.03.2022 31.03.2021
Particulars As at As at March 31, 2022 March 31, 2021
i) Income earned and expense incurred in connection with Investment Property
ii) Contractual obligationsThere are no contractual obligations to purchase, construct or develop investment property.iii) Leasing ArrangementsCertain investment properties are leased out to tenants under cancellable operating lease.iv) Fair Value
Note : 15 INVESTMENT PROPERTIES (Contd.)
Investment property Professional Price per `7,000 - `13,000 5% 309 15 As at March 31 2022 valuer Sq. feet per Sq. feetInvestment property Professional Price per `7,000 - `13,000 5% 304 15 As at March 31 2021 valuer Sq. feet per Sq. feet
Particulars Valuation Significant Range Sensitivity of Fair value Sensitivity technique unobservable (Weighted avg) the input to (` in lakhs) (` in lakhs) inputs fair value
` in lakhs
Note : 16 PROPERTY, PLANT AND EQUIPMENTGross carrying amount as at 3,956 8,391 2,848 2,463 5,041 1,986 2,305 15,289 42,279 April 1, 2020Additions - 1,447 169 81 142 218 - 1,563 3,620 Disposals - 25 24 6 14 408 - 37 514 Gross carrying amount as at 3,956 9,813 2,993 2,538 5,169 1,796 2,305 16,815 45,385 March 31, 2021Additions - 3,846 264 208 348 1,017 - 7,041 12,724 Disposals - 552 39 10 16 560 - 693 1,870 Gross carrying amount as at 3,956 13,107 3,218 2,736 5,501 2,253 2,305 23,163 56,239 March 31, 2022Accumulated depreciation / amortisation and impairment Balance as at April 1, 2020 - 5,330 1,456 1,724 2,479 672 123 4,259 16,043 Depreciation for the year - 1,975 539 296 911 390 43 4,645 8,799 Depreciation on disposals - 17 13 6 12 224 - 11 283 Balance as at March 31, 2021 - 7,288 1,982 2,014 3,378 838 166 8,893 24,559 Depreciation for the year - 2,027 487 338 851 395 41 4,470 8,609 Depreciation on disposals - 535 25 10 14 394 - 166 1,144 Balance as at March 31, 2022 - 8,780 2,444 2,342 4,215 839 207 13,197 32,024 Net Carrying amount As at March 31, 2021 3,956 2,525 1,011 524 1,791 958 2,139 7,922 20,826 As at March 31, 2022 3,956 4,327 774 394 1,286 1,414 2,098 9,966 24,215 Useful Life of the asset (In Years) 3 5 5 5 5 60 upto 5 Method of depreciation Straight-line method
Particulars Freehold Computer Office Furniture Leasehold Vehicles Buildings Total Land Equipment Equipment and Fixtures Improvements (Refer Note below)
Own Assets
Right of Use Asset
v) Sensitivity analysis
Notes forming part of the Consolidated Financial Statements (Contd.) For the year ended March 31, 2022
vi) The Title Deeds of the Immovable Properties mentioned above are in the name of the company

222
Corporate Overview Financial StatementsManagement Reports
Note
1. Details of Immovable properties of land and buildings, whose title deeds have been pledged in favour of Trustees for the benefit of debenture holders as security, has been explained in Note 19.1
2. The Group has elected to include ROU assets pertaining to lease of buildings as part of the Property, plant and equipment as permitted under paragraph 47 of Ind AS 116.
3. The Title Deeds of the Immovable Properties mentioned above are in the name of the Group
4. Company has not carried out any revaluation of property, plant and equipment during the year ended March 31, 2022
Note : 16 PROPERTY, PLANT AND EQUIPMEN (Contd.)
` in lakhs
Note : 17 INTANGIBLE ASSETSGross carrying amount as at March 31, 2020 6,760 Additions 1,284 Disposals - Gross carrying amount as at March 31, 2021 8,044 Additions 1,164 Disposals - Gross carrying amount as at March 31, 2022 9,208 Accumulated Amortization and impairment Balance as at April 1, 2020 4,693 Amortization for the year 1,431 Amortization on disposals - Balance as at March 31, 2021 6,124 Amortization for the period 1,452 Amortization on disposals - Balance as at March 31, 2022 7,576 Net Carrying amount As at March 31, 2021 1,920 As at March 31, 2022 1,632 Useful Life of the asset (In Years) 3 Method of depreciation Straight line method
Particulars
` in lakhs
Note : 18 OTHER NON FINANCIAL ASSETSUnsecured - considered goodPrepaid expenses 2,495 1,563 Capital advances 144 1,012 Other assets 3,327 2,722 GST Input Credit 1,186 2,183 Total 7,152 7,480
Particulars As at As at March 31, 2022 March 31, 2021
` in lakhs
Note : 19 DEBT SECURITIES (at amortised cost)Redeemable Non-Convertible Debentures Medium - Term - Secured 10,52,995 9,34,263 Medium - Term - Unsecured 2,500 - Commercial Papers - Unsecured 2,76,615 3,01,504 Total 13,32,110 12,35,767
Particulars As at As at March 31, 2022 March 31, 2021
Notes forming part of the Consolidated Financial Statements (Contd.) For the year ended March 31, 2022

Corporate Overview Financial StatementsManagement Reports
223
Note : 19 DEBT SECURITIES (at amortised cost) (Contd.)All debt securities have been contracted in India 19.1 Security(i) Redeemable Non-Convertible Debentures - Medium-term is secured by way of specific charge on assets under hypothecation
relating to Vehicle Finance, Loan against property, Bills discounted and other loans and pari passu charge on immovable property situated at Chennai.
(ii) The Group has not defaulted in the repayment of dues to its lenders.
19.2 Details of Debentures - Contractual principal repayment value (i) Secured Redeemable Non-Convertible Debentures - Redeemable at par - No put call option
No. of Debentures Face Value ` Balance as at Due date of Rate of interest % redemption March 31, 2022 March 31, 2021 ` in lakhs ` in lakhs
2,700 10,00,000 27,000 Mar-27 7.30
250 10,00,000 2,500 2,500 Nov-26 8.55
5,000 10,00,000 50,000 50,000 Jul-25 7.92
4,974 10,00,000 49,740 Mar-25 7.08
2,000 10,00,000 20,000 Feb-25 5.85
8,600 10,00,000 86,000 Dec-24 5.57 to 6.30
1,500 10,00,000 15,000 15,000 Oct-24 6.80
4,000 10,00,000 40,000 Aug-24 5.53 to 5.58
6,000 10,00,000 60,000 30,000 Jul-24 5.46 to 7.38
1,500 10,00,000 15,000 15,000 Apr-24 8.6179
6,850 10,00,000 68,500 58,500 Feb-24 6.25 to 6.45
5,500 10,00,000 55,000 55,000 Dec-23 6.10
6,023 10,00,000 60,230 35,230 Sep-23 5.58 to 8.80
1,990 10,00,000 19,900 Aug-23 9.06
9,000 10,00,000 90,000 15,000 May-23 5.70 to 7.50
3,250 10,00,000 32,500 32,500 Apr-23 6.26
8,000 10,00,000 80,000 80,000 Mar-23 5.85 to 5.68
3,350 10,00,000 33,500 33,500 Feb-23 5.70 to 7.41
5,900 10,00,000 59,000 59,000 Dec-22 5.48 to 7.98
6,150 10,00,000 61,500 61,500 Nov-22 5.45 to 8.00
3,523 10,00,000 35,230 35,230 Sep-22 8.70
2,000 10,00,000 20,000 20,000 Jun-22 7.20
1,050 10,00,000 10,500 Mar-22 8.35 to 9.06
2,000 10,00,000 20,000 Dec-21 6.93
3,523 10,00,000 35,230 Sep-21 8.45
3,250 10,00,000 32,500 Aug-21 6.74 to 8
2,550 10,00,000 25,500 Jul-21 8.9765
4,010 10,00,000 40,100 Jun-21 8.49 to 8.52
4,100 10,00,000 41,000 May-21 6.90
4,770 1,000,000 47,700 Apr-21 8.0874
9,80,600 8,50,490
Notes forming part of the Consolidated Financial Statements (Contd.) For the year ended March 31, 2022

224
Corporate Overview Financial StatementsManagement Reports
` in lakhs
Note : 20 BORROWINGS (Other than Debt Securities) at amortised costA) Term Loans (i) (a) From Banks - Secured - Rupee Loans 41,87,373 35,68,218 - Foreign currency Loans 61,577 - - External Commercial Borrowings 1,94,543 2,39,869 (b) From Banks - Unsecured - Short term loans - 20,000 ii) From Other Parties - Secured (a) Financial Institutions - Rupee Loans 1,53,894 1,72,786 (b) External Commercial Borrowings 1,44,285 1,37,230 (c) Securitisation - Rupee Loans 3,43,306 4,34,452 B) Loan repayable on demand - Secured from Banks - Rupee Loans (Refer Note 8 and 20.1(vi)) 1,15,474 1,45,671 Total 52,00,452 47,18,226
Particulars As at As at March 31, 2022 March 31, 2021
Borrowings within India 48,61,624 43,41,127 Borrowings Outside India 3,38,828 3,77,099
(ii) Secured Redeemable Non-Convertible Debentures - Redeemable at premium - No put call option
No. of Debentures Face Value ` Balance as at Due date of Redemption Premium ` redemption price ` March 31, 2022 March 31, 2021 ` in lakhs ` in lakhs
(iii) Secured Redeemable Non-Convertible Debentures - Redeemable at par - with Put option
No. of Debentures Face Value ` Balance as at Due date of Put option Rate of redemption date interest % March 31, 2022 March 31, 2021 ` in lakhs ` in lakhs
10 10,00,000 100 100 Aug-23 Jul-21 9.06 100 100
1000 10,00,000 10,000 - Mar-27 14,22,599 4,22,599 1250 10,00,000 12,500 12,500 Jul-25 14,61,481 4,61,481 850 10,00,000 8,500 8,500 Jul-25 13,53,045 3,53,045 500 10,00,000 5,000 5,000 Jan-23 12,54,470 2,54,470 250 10,00,000 2,500 2,500 Dec-24 12,93,960 2,93,960 350 10,00,000 3,500 3,500 Oct-24 13,01,025 3,01,025 1100 10,00,000 - 11,000 May-21 12,94,211 2,94,211 42,000 43,000
Note : 19 DEBT SECURITIES (at amortised cost) (Contd.)
` in lakhs
Notes forming part of the Consolidated Financial Statements (Contd.) For the year ended March 31, 2022
No. of Debentures Face Value ` Balance as at Due date of Put option Rate of redemption date interest % March 31, 2022 March 31, 2021 ` in lakhs ` in lakhs
10 10,00,000 2500 - Jul-23 9.06 2500 -
(iv) UnSecured Redeemable Non-Convertible Debentures - Redeemable at par - No Put Call option

Corporate Overview Financial StatementsManagement Reports
225
20.1 Security (i) Secured term loans from banks and financial institution are secured by way of specific /pari passu charge on assets under hypothecation relating to automobile financing and loans against immovable property. (ii) Loan repayable on demand is in the nature of Cash Credit from banks and is secured by way of floating charge on assets under hypothecation and other assets. (iii) The Group has not defaulted in the repayment of dues to its lenders. (iv) Securitisation borrowing represents the net outstanding value (Net of Investment in Pass-through Certificates) of the proceeds
received by the Group from securitisation trust in respect of loan assets transferred by the Group pursuant to Deed of Assignment. The Group has provided Credit enhancement to the trust by way of cash collateral and Bank guarantee and also refer note 8
(v) The Group has utilised the borrowings for the purpose for which it was obtained (vi) The quarterly statements or returns of current assets filed by the company with banks are in agreement with books of accounts 20.2 Details of term loans - Contractual principal repayment value
` in lakhs
Base Rate / MCLR < 1year 1 1,40,000 86,250 2 1,98,750 1,25,016 3 - 30,000 4 87,756 1,78,750 8 50,000 60,395 12 - 20,000 1 - 2 years 1 60,000 1,40,000 2 1,10,000 1,92,917 3 - - 4 81,506 1,92,949 8 50,000 60,395 12 - 20,000 2 - 3 years 1 5,000 33,333 2 80,000 1,22,500 3 7,796 - 4 51,111 1,61,699 8 - 60,395 12 - 20,000 3 - 4 years 1 5,000 10,000 2 - 80,000 3 4,500 - 4 25,111 1,41,699 6 - 7,796 12 - 20,000 4 - 5 years 1 - 5,000 2 - - 3 - 57,441 4 - 25,111 7 - - 9 - 15,000 Base Rate/ MCLR + spread (0.10) < 1year 1 60,000 3,85,000 2 25,000 - 3 - 50,000 4 - - 1 - 2 years 1 60,000 35,000 2 25,000 30,000
Rate of Interest Maturity Instalments Amount outstanding March 31, 2022 March 31, 2021
Note : 20 BORROWINGS (Contd.)
Notes forming part of the Consolidated Financial Statements (Contd.) For the year ended March 31, 2022

226
Corporate Overview Financial StatementsManagement Reports
20.2 Details of term loans - Contractual principal repayment value (Contd.)` in lakhs
3 - 50,000 4 - - 5 - - 6 - - 2 - 3 years 1 - 70,000 2 - 30,000 3 - 50,000 Rate based on T Bill + Spread < 1 year 1 1,71,550 48,200 2 22,500 15,000 3 6,000 - 4 1,41,352 41,667 12 20,000 - 1 - 2 years 1 1,46,000 41,050 2 - 12,500 3 12,500 - 4 2,13,726 66,667 12 20,000 - 2 - 3 years 1 1,08,000 25,000 3 43,500 12,500 4 1,05,726 50,000 12 20,000 - 3 - 4 years 1 88,000 - 2 28,571 - 4 28,583 - 9 15,000 - 4 - 5 years 1 92,375 - 4 11,083 - Fixed Rate < 1year 1 20,000 51,000 2 10,000 16,000 4 53,040 40,400 1 - 2 years 1 33,300 20,000 2 10,000 10,000 4 38,040 39,400 2 - 3 years 1 1,51,633 - 2 22,100 43,300 3 10,220 - 4 - 24,400 3 - 4 years 1 1,51,733 - 2 10,000 55,400 4 - 5 years 1 1,18,333 - 2 - 43,400 Repo < 1year 1 23,333 42,500 2 82,940 15,000 3 24,333 3,333 4 1,13,286 82,976 8 36,000 36,000 12 83,333 83,333
Rate of Interest Maturity Instalments Amount outstanding March 31, 2022 March 31, 2021
Notes forming part of the Consolidated Financial Statements (Contd.) For the year ended March 31, 2022

Corporate Overview Financial StatementsManagement Reports
227
20.2 Details of term loans - Contractual principal repayment value (Contd.)` in lakhs
1 - 2 years 1 23,333 8,333
2 30,000 15,000
3 3,333 3,333
4 2,51,666 49,643
6 41,667 -
8 - 36,000
12 - 83,333
2 - 3 years 1 60,119 8,333
2 15,000 15,000
3 25,179 3,334
4 2,12,451 49,643
6 - 41,667
3 - 4 years 1 - 10,119
2 15,000 -
3 1,875 3,750
4 1,43,880 37,500
4 - 5 years 1 3,500 -
2 1,000 -
3 79,420 -
4 22,000 -
> 5 Years 1 5,000
Total 43,47,043 38,50,660
3M MIBOR + Spread < 1year 1 7,500 -
1-2 years 1 - 7,500
USD 3M LIBOR + Spread < 1year 4 21,570 5,202
1-2 years 4 21,570 20,807
2-3 years 4 21,570 20,807
3-4 years 4 21,570 20,807
4 - 5 years 4 21,570 20,807
>5 Years 5 26,963 46,815
USD 6M LIBOR + Spread < 1year 1 1,36,418 36,553
1-2 years 1 - 1,31,589
2-3 years 1 69,725 -
3-4 years 1 - 67,257
USD 12M LIBOR + Spread < 1year 1 61,528 -
Total 4,09,984 3,78,144
Rate of Interest Maturity Instalments Amount outstanding*
March 31, 2022 March 31, 2021
Notes forming part of the Consolidated Financial Statements (Contd.) For the year ended March 31, 2022
The Group has raised funds in the form of Foreign Currency Loans/ External Commercial Borrowings whose interest payments are benchmarked to LIBOR rates.The maturity of some of those contracts are beyond June 2023 (IBOR Transition date). Based on the assessment performed by the Group, no significant impact is assessed on those contracts upon this transition

228
Corporate Overview Financial StatementsManagement Reports
21.1 Details of Subordinated Liabilities - Contractual principal repayment value (i) Unsecured Redeemable Non-Convertible Debentures - Subordinated debt - Redeemable at par - No put call option
No. of Debentures Face Value ` Balance as at Due date of Rate of interest % redemption March 31, 2022 March 31, 2021 ` in lakhs ` in lakhs
150 1,00,00,000 15,000 Feb-32 8.10 200 1,00,00,000 20,000 Oct-31 7.90 400 1,00,00,000 40,000 40,000 Jan-30 9.25 3000 10,00,000 30,000 30,000 Aug-28 9.75 5300 10,00,000 53,000 53,000 Mar-28 9.05 1500 10,00,000 15,000 15,000 Aug-27 8.53 2500 10,00,000 25,000 25,000 Jun-27 8.78 to 8.80 100 10,00,000 1,000 1,000 Nov-26 9.20 150 10,00,000 1,500 1,500 Jun-24 11.00 50 10,00,000 500 500 May-24 11.00 250 10,00,000 2,500 2,500 Apr-24 11.00 250 10,00,000 2,500 2,500 Mar-24 11.00 200 10,00,000 2,000 2,000 Feb-24 11.00 250 10,00,000 2,500 2,500 Jan-24 11.00 2000 10,00,000 20,000 20,000 Nov-23 9.08 to 9.20 500 10,00,000 5,000 5,000 Oct-23 9.08 150 10,00,000 1,500 1,500 Sep-23 11.00 600 10,00,000 6,000 6,000 Dec-22 11.05 to 11.25 3,150 10,00,000 - 31,500 Nov-21 10.02 1000 10,00,000 - 10,000 Jun-21 11.30 1000 10,00,000 - 10,000 May-21 11.30 2,43,000 2,59,500
Notes forming part of the Consolidated Financial Statements (Contd.) For the year ended March 31, 2022
* Represents amounts to be paid to the securitisation trust as per the securitisation cash flows net of amounts to be received against Investment in PTC.
Details of Securitised loan
Less than 1 year 1,42,619 1,75,343 Fixed 1-2 year 83,830 1,09,355 (4.9% to 8%) 2-3 year 38,337 45,570 3-4 year 13,014 12,428 4-5 year 3,094 4,451 more than 5 years 8,055 12,990 Total 2,88,949 3,60,137 Less than 1 year 6,779 6,501 Floating 1-2 year 5,804 6,925 Base Rate/ MCLR - spread 2-3 year 6,095 7,459 (0.75% to 2.65%) 3-4 year 6,088 7,866 4-5 year 5,630 7,832 more than 5 years 23,734 37,198 Total 54,130 73,781
Rate of Interest Maturity Amount outstanding*
March 31, 2022 March 31, 2021
20.2 Details of term loans - Contractual principal repayment value (Contd.)
(i) All Subordinated liabilities have been contracted in India except for Rupee denominated bonds.(ii) The Group has not defaulted in the repayment of dues to its lenders.
` in lakhs
` in lakhs
Note : 21 SUBORDINATED LIABILITIES (at amortised cost)Perpetual Debt - Unsecured 1,32,899 1,48,920 Subordinated Debt - Unsecured a) Rupee Denominated Bonds 40,736 40,684 b) Other Subordinated Debts 2,11,153 2,29,402 Total 3,84,788 4,19,006
Particulars As at As at March 31, 2022 March 31, 2021

Corporate Overview Financial StatementsManagement Reports
229
21.1 Details of Subordinated Liabilities - Contractual principal repayment value (Contd.)
1,000 5,00,000 5,000 5,000 Oct-23 12.90 300 10,00,000 3,000 3,000 Feb-23 12.80 1450 10,00,000 14,500 14,500 Dec-22 12.70 to 12.80 860 5,00,000 4,300 4,300 Sep-22 12.75 2000 5,00,000 10,000 10,000 Aug-22 12.90 200 5,00,000 1,000 Mar-22 12.50 700 5,00,000 3,500 Jan-22 12.50 3,500 5,00,000 17,500 Dec-21 12.50 to 12.95 320 5,00,000 1,600 Aug-21 12.50 413 5,00,000 2,065 Jul-21 12.50 2,021 5,00,000 10,105 Jun-21 12.50 1,28,900 1,45,170
# Group can redeem using Call option on the maturity date with prior approval of RBI.
Notes forming part of the Consolidated Financial Statements (Contd.) For the year ended March 31, 2022
(ii) Unsecured Redeemable Non-Convertible Debentures - Subordinated debt -Redeemable at premium - No put call option
150 10,00,000 1,500 1,500 Nov-23 17,57,947 7,57,947 1,500 1,500
No. of Debentures Face Value ` Balance as at Due date of Redemption Premium ` redemption price ` March 31, 2022 March 31, 2021 ` in lakhs ` in lakhs
(iii) Unsecured Redeemable Non-Convertible Debentures - Perpetual debt
25 1,00,00,000 2,500 Mar-32 9.10 30 1,00,00,000 3,000 Sep-31 8.98 40 1,00,00,000 4,000 Jul-31 9.05 100 1,00,00,000 10,000 May-31 9.2 2000 5,00,000 10,000 10,000 Mar-31 9.25 900 5,00,000 4,500 4,500 Nov-30 9.30 1000 5,00,000 5,000 5,000 Dec-29 10.75 1120 5,00,000 5,600 5,600 Mar-29 10.83 5000 5,00,000 25,000 25,000 Feb-29 10.88 500 5,00,000 2,500 2,500 Aug-24 12.80 174 10,00,000 1,740 1,740 Jul-24 12.90 500 5,00,000 2,500 2,500 Jun-24 12.90 500 5,00,000 2,500 2,500 Feb-24 12.90 50 10,00,000 500 500 Jan-24 12.60 1,031 10,00,000 10,310 10,310 Dec-23 12.50 to 12.60 245 10,00,000 2,450 2,450 Oct-23 12.60
No. of Debentures Face Value ` Balance as at Maturity Date Rate of interest % - Perpetual (increase by 100 bps March 31, 2022 March 31, 2021 # if call option is not ` in lakhs ` in lakhs exercised on the due date)
` in lakhs
Note : 22 OTHER FINANCIAL LIABILITIESUnpaid dividend 71 74 Advance from customers 3,323 5,529 Security deposits received 343 80 Collections towards derecognised assets pending remittance 17,837 18,928 Lease liability (Refer Note 49) 11,036 9,253 Other liabilities 1,342 728 Total 33,952 34,592
Particulars As at As at March 31, 2022 March 31, 2021

230
Corporate Overview Financial StatementsManagement Reports
` in lakhs As at March 31, 2022 As at March 31, 2021 Nos. Amount Nos. Amount
a) Reconciliation of number of shares and amount outstanding at the beginning and at the end of the year/period:Particulars
` in lakhs
Note : 25 EQUITY SHARE CAPITALAUTHORISED Equity Shares of ` 2 each with voting rights 1,20,00,00,000 24,000 1,20,00,00,000 24,000 Preference Shares of ` 100 each 5,00,00,000 50,000 5,00,00,000 50,000 74,000 74,000 ISSUED Equity Shares of ` 2 each with voting rights 82,17,55,591 16,435 82,02,61,529 16,405 16,435 16,405SUBSCRIBED AND FULLY PAID UP Equity Shares of ` 2 each with voting rights 82,10,71,821 16,421 82,00,35,129 16,400 Add : Forfeited Shares 6,54,500 7 6,54,500 7 16,428 16,407
As at March 31, 2022 As at March 31, 2021 Nos. Amount Nos. Amount
Particulars
Notes forming part of the Consolidated Financial Statements (Contd.) For the year ended March 31, 2022
Equity SharesAt the beginning of the year 82,00,35,129 16,400 81,95,77,759 16,391 Additional shares pursuant to share split during the period - Issued during the yeara) Employees Stock Option (ESOP) Scheme 10,36,692 21 4,57,370 9 Outstanding at the end of the period/ year 82,10,71,821 16,421 82,00,35,129 16,400 Forfeited sharesEquity Shares - Amount originally paid up 6,54,500 7 6,54,500 7
` in lakhs
Note : 23 PROVISIONSProvision for Employee BenefitsCompensated absences (Refer Note 37) 7,895 6,594 7,895 6,594 Other ProvisionsProvision for contingencies and service tax claims (Refer Note 41) 3,953 4,347 Provision for expected credit loss towards undrawn commitments (Refer note 41) 120 104 4,073 4,451 Total 11,968 11,045
Particulars As at As at March 31, 2022 March 31, 2021
` in lakhs
Note : 24 OTHER NON FINANCIAL LIABILITIESIncome received in advance 607 1,150 Statutory liabilities 4,670 2,687 Others 641 859 Total 5,918 4,696
Particulars As at As at March 31, 2022 March 31, 2021
Terms/rights attached to Equity shares The Company has only one class of equity shares having a par value of `2 per share. All these shares have the same rights and
preferences with respect to payment of dividend, repayment of capital and voting. The dividend proposed by the Board of Directors is subject to the approval of the shareholders in the ensuing Annual General Meeting except for interim dividend.
Repayment of capital will be in proportion to the number of equity shares held.

Corporate Overview Financial StatementsManagement Reports
231
As per records of the Company, including its register of shareholders/members and other declarations received from shareholders regarding beneficial interest, the above shareholding represents both legal and beneficial ownership of shares.
d) Shares held by Promoters as on March 31,2022 - Please refer Annexure A As per records of the Company, including its register of shareholders/members and other declarations received from shareholders regarding beneficial interest, the above shareholding represents both legal and beneficial ownership of shares.
` in lakhs
Note : 26 OTHER EQUITYStatutory Reserve (Refer Note a) Balance at the beginning of the year 1,59,046 1,28,046
Add: Amount transferred from retained earnings 43,000 31,000
Closing balance at the end of the year 2,02,046 1,59,046 Capital Reserve (Refer Note b) Balance at the beginning of the year 4 4
Add: Changes during the year - -
Closing balance at the end of the year 4 4 Capital Redemption Reserve (Refer Note c) Balance at the beginning of the year 3,300 3,300
Add: Changes during the year - -
Closing balance at the end of the year 3,300 3,300 Securities Premium Account (Refer Note d) Balance at the beginning of the year 2,86,605 2,85,678
Add: Premium on ESOPs exercised 2,287 927
Closing balance at the end of the year 2,88,892 2,86,605 General Reserve (Refer Note e) Balance at the beginning of the year 3,76,103 3,00,967
Add: Amount transferred from retained earnings 1,00,000 75,000
Add: Amount transferred from Share Based Payment Reserve - 136
Closing balance at the end of the year 4,76,103 3,76,103 Share Based Payments Reserve (Refer Note f) Balance at the beginning of the year 3,444 3,017
Addition during the year 2,048 563
Transfer to General reserve - (136) Closing balance at the end of the year 5,492 3,444
Particulars As at As at March 31, 2022 March 31, 2021
Note : 25 EQUITY SHARE CAPITAL (Contd.)
Notes forming part of the Consolidated Financial Statements (Contd.) For the year ended March 31, 2022
Cholamandalam Financial Holdings Limited 37,28,85,889 37,28,85,889
Particulars As at As at March 31, 2022 March 31, 2021
b) Equity Shares held by Holding Company
` in lakhs
As at March 31, 2022 As at March 31, 2021 Nos. % holding Nos. % holding in the class in the class
c) Details of shareholding more than 5% shares in the Company
Equity SharesCholamandalam Financial Holdings Limited - Holding Company 37,28,85,889 45.41 37,28,85,889 45.47
Particulars
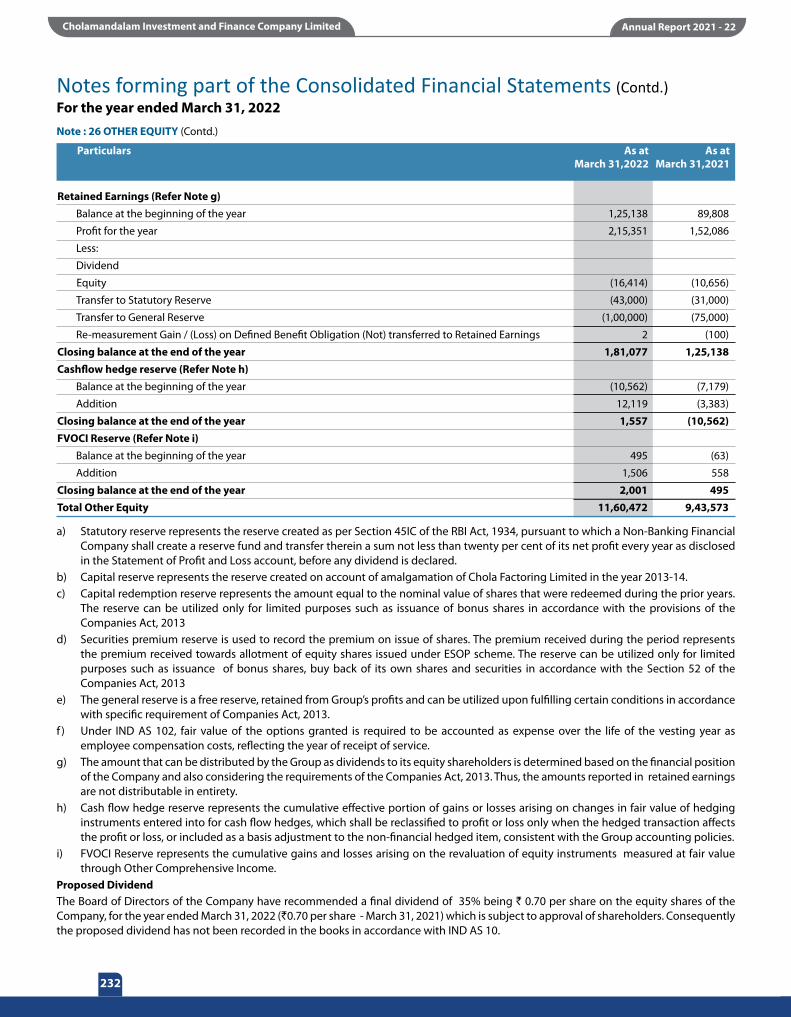
232
Corporate Overview Financial StatementsManagement Reports
a) Statutory reserve represents the reserve created as per Section 45IC of the RBI Act, 1934, pursuant to which a Non-Banking Financial Company shall create a reserve fund and transfer therein a sum not less than twenty per cent of its net profit every year as disclosed in the Statement of Profit and Loss account, before any dividend is declared.
b) Capital reserve represents the reserve created on account of amalgamation of Chola Factoring Limited in the year 2013-14.c) Capital redemption reserve represents the amount equal to the nominal value of shares that were redeemed during the prior years.
The reserve can be utilized only for limited purposes such as issuance of bonus shares in accordance with the provisions of the Companies Act, 2013
d) Securities premium reserve is used to record the premium on issue of shares. The premium received during the period represents the premium received towards allotment of equity shares issued under ESOP scheme. The reserve can be utilized only for limited purposes such as issuance of bonus shares, buy back of its own shares and securities in accordance with the Section 52 of the Companies Act, 2013
e) The general reserve is a free reserve, retained from Group’s profits and can be utilized upon fulfilling certain conditions in accordance with specific requirement of Companies Act, 2013.
f ) Under IND AS 102, fair value of the options granted is required to be accounted as expense over the life of the vesting year as employee compensation costs, reflecting the year of receipt of service.
g) The amount that can be distributed by the Group as dividends to its equity shareholders is determined based on the financial position of the Company and also considering the requirements of the Companies Act, 2013. Thus, the amounts reported in retained earnings are not distributable in entirety.
h) Cash flow hedge reserve represents the cumulative effective portion of gains or losses arising on changes in fair value of hedging instruments entered into for cash flow hedges, which shall be reclassified to profit or loss only when the hedged transaction affects the profit or loss, or included as a basis adjustment to the non-financial hedged item, consistent with the Group accounting policies.
i) FVOCI Reserve represents the cumulative gains and losses arising on the revaluation of equity instruments measured at fair value through Other Comprehensive Income.
Proposed DividendThe Board of Directors of the Company have recommended a final dividend of 35% being ` 0.70 per share on the equity shares of the Company, for the year ended March 31, 2022 (`0.70 per share - March 31, 2021) which is subject to approval of shareholders. Consequently the proposed dividend has not been recorded in the books in accordance with IND AS 10.
Retained Earnings (Refer Note g) Balance at the beginning of the year 1,25,138 89,808
Profit for the year 2,15,351 1,52,086
Less:
Dividend
Equity (16,414) (10,656)
Transfer to Statutory Reserve (43,000) (31,000)
Transfer to General Reserve (1,00,000) (75,000)
Re-measurement Gain / (Loss) on Defined Benefit Obligation (Not) transferred to Retained Earnings 2 (100)
Closing balance at the end of the year 1,81,077 1,25,138 Cashflow hedge reserve (Refer Note h) Balance at the beginning of the year (10,562) (7,179)
Addition 12,119 (3,383)
Closing balance at the end of the year 1,557 (10,562) FVOCI Reserve (Refer Note i) Balance at the beginning of the year 495 (63)
Addition 1,506 558
Closing balance at the end of the year 2,001 495 Total Other Equity 11,60,472 9,43,573
Particulars As at As at March 31,2022 March 31,2021
Notes forming part of the Consolidated Financial Statements (Contd.) For the year ended March 31, 2022Note : 26 OTHER EQUITY (Contd.)

Corporate Overview Financial StatementsManagement Reports
233
Notes forming part of the Consolidated Financial Statements (Contd.) For the year ended March 31, 2022
Valli Annamalai 12,500 - 12,500 - - M Vellachi 1,94,660 0.02 11,60,427 0.14 0.12 M A M Arunachalam 65,000 0.01 65,000 0.01 - Arun Alagappan 9,50,000 0.12 9,50,000 0.12 - M.A.Alagappan 24,88,760 0.30 24,88,760 0.30 - Lakshmi Chockalingam 6,685 - 6,685 - - A Vellayan 1,35,785 0.02 1,35,785 0.02 - Lalitha Vellayan 1,39,630 0.02 1,39,630 0.02 - Meyyammai Venkatachalam 50,255 0.01 50,255 0.01 - M V Valli Murugappan 21,56,350 0.26 - - (0.26) M M Murugappan 21,035 - 21,035 - - A M Meyyammai 2,51,880 0.03 2,51,880 0.03 - M V Subbiah HUF (M V Subbiah holds 10,000 - 10,000 - - shares in the capacity of Karta)Meenakshi Murugappan 245 - 245 - - Valli Alagappan 5,000 - 5,000 - - A Venkatachalam 2,09,605 0.03 2,09,605 0.03 - V Narayanan 2,54,000 0.03 2,54,000 0.03 - V Arunachalam 2,42,515 0.03 2,42,515 0.03 - Arun Venkatachalam 4,03,750 0.05 4,03,750 0.05 - Solachi Ramanathan 20,000 - 20,000 - - Vedika Meyyammai Arunachalam 1,08,280 0.01 1,08,280 0.01 - A V Nagalakshmi 15,960 - 15,960 - - M V AR Meenakshi 8,53,155 0.10 8,53,155 0.10 - A. Keertika Unnamalai 2,47,440 0.03 2,27,440 0.03 - Sigapi Arunachalam 74,255 0.01 74,255 0.01 - Uma Ramanathan 23,500 - 23,500 - - V Vasantha 1,250 - 1,250 - - Dhruv M Arunachalam 50,000 0.01 50,000 0.01 - Kanika Subbiah 67,000 0.01 67,000 0.01 - Pranav Alagappan 3,11,440 0.04 3,11,440 0.04 - Valli Arunachalam - - 11,90,583 0.15 0.15A Venkatachalam HUF 7,000 - 7,000 - - (A Venkatachalam hols shares in the capacity of Karta)A A Alagammai 2,894 - 2,894 - - Umayal R 49,455 0.01 49,455 0.01 - Valliammai Murugappan 12,890 - 12,890 - - Ambadi Enterprises Ltd 2,91,380 0.04 2,91,380 0.04 - A M M Vellayan Sons P Ltd 26,575 - 26,575 - - Carborundum Universal Limited 500 - 500 - - E.I.D. Parry (India) Ltd. 1,965 - 1,965 - - M.M.Muthiah Research Foundation 1,41,750 0.02 1,41,750 0.02 - Ambadi Investments Limited 3,37,21,870 4.11 3,37,21,870 4.11 - (formerly Ambadi Investments Private Limited)Parry Enterprises India Ltd 1,965 - 1,965 - - Cholamandalam Financial Holdings Limited 37,28,85,889 45.47 37,28,85,889 45.41 (0.06) (Formerly TI Financial Holdings Ltd)
Annexure ADetails of Shareholding of promoters and promoter Group as on March 31,2022Promoters Name No. of shares as on
March 31, 2021 No. of shares as on
March 31, 2022 % to
shares % to
shares % Change
during the year

234
Corporate Overview Financial StatementsManagement Reports
Notes forming part of the Consolidated Financial Statements (Contd.) For the year ended March 31, 2022
Annexure ADetails of Shareholding of promoters and promoter Group as on March 31,2022
AR Lakshmi Achi Trust 4,77,145 0.06 4,77,145 0.06 - M A Alagappan Holdings Private Limited 1,70,700 0.02 1,70,700 0.02 - Murugappa Educational and Medical Foundation 1,965 - 1,965 - - MA Murugappan Holdings LLP 75,000 0.01 75,000 0.01 - (M A Murugappan Holdings Private Ltd was converted its status to LLP)Lakshmi Ramaswamy Family Trust 5,85,630 0.07 5,85,630 0.07 - (A A Alagammai & Lakshmi Ramaswamy Trustees holds shares for Trust)Murugappan Arunachalam Children Trust 74,405 0.01 74,405 0.01 - (Sigappi Arunachalam, MAM Arunachalam, AM Meyammai are Trustees) Valli Subbiah Benefit Trust 2,33,375 0.03 1,93,375 0.02 (0.01) (S Vellayan & A Vellayan, Trustees holds shares for Trust) V S Bhairavi Trust 1,88,875 0.02 1,88,875 0.02 - (M V Subbiah & Kanika Subbiah, Trustees holds shares for Trust) Arun Murugappan Children Trust (MAM Arunachalam 1,41,160 0.02 1,41,160 0.02 - & Sigappi Arunachalam Trustees holds shares for Trust) MA.Alagappan Grand Children Trust (Arun Alagappan and 1,57,250 0.02 1,57,250 0.02 - AA Alagammai, Trustees holds shares for Trust) K S Shambhavi Trust (M V Subbiah & S Vellayan, 1,55,955 0.02 1,55,955 0.02 - Trustees holds shares for Trust) M V Seetha Subbiah Benefit Trust (S Vellayan & A Vellayan, 2,64,000 0.03 2,64,000 0.03 - Trustees holds shares for Trust) Kadamane Estates - Firm- M.A.Alagappan holds shares 3,55,850 0.04 3,55,850 0.04 - in the capacity of Partner M M Muthiah Family Trust (M M Murugappan, 46,620 0.01 46,620 0.01 - M M Muthiah, Trustees holds shares for Trust) M M Veerappan Family Trust (M M Murugappan & 46,055 0.01 46,055 0.01 - Meenakshi Murugappan, Trustees holds shares for Trust) M V Muthiah Family Trust (M M Venkatachalam & 4,74,130 0.06 4,74,130 0.06 - M V Muthiah, Trustees holds shares for Trust) M V Subramanian Family Trust (M M Venkatachalam & 4,74,130 0.06 4,74,130 0.06 - M V Subramanian, Trustees holds shares for Trust) M M Murugappan Family Trust (M M Murugappan & 3,33,000 0.04 3,33,000 0.04 - Meenakshi Murugappan Trustees holds shares forTrust) Meenakshi Murugappan Family Trust (M M Murugappan & 25,000 - 25,000 - - Meenakshi Murugappan, Trustees for Trust) M M Venkatachalam Family Trust (M M Venkatachalam 1,22,550 0.01 1,22,550 0.01 - Lakshmi Venkatachalam, Trustees for Trust) Saraswathi Trust (M V Subbiah, S Vellayan & 7,79,785 0.10 7,79,785 0.09 - M V Seetha Subbiah, Trustees holds shares for Trust) Shambho Trust (M V Subbiah,S Vellayan, 16,01,300 0.20 16,01,300 0.20 - Trustees holds shares for Trust) 42,32,97,948 51.62 42,32,37,948 51.55
Promoters Name No. of shares as on March 31, 2021
No. of shares as on March 31, 2022
% to shares
% to shares
% Change during
the year

Corporate Overview Financial StatementsManagement Reports
235
` in lakhs
REVENUE FROM OPERATIONSNote : 27A - Interest income(i) Interest - on financial assets measured at amortised cost (a) Loans - Bills Discounting 1,751 766 - Term Loans 9,30,752 8,86,955 (b) Bank Deposits - under lien 1,544 2,147 - free of lien 11,817 27,009 (c) Other Deposits - Deposits with Financial Institutions 1,359 2,299 - Investment in Government Securities 9,512 3,301 Total (A) 9,56,735 9,22,477 Note: 27B-Fee & Commission income(i) Fee & Commission income * - Term loans 38,374 20,685 - Others 8,880 6,254 Total (B) 47,254 26,939 *Services are transferred at a point in timeNote: 27C-Net gain on fair value change on financial instrument Net gain on fair value changes on assets measured at FVTPL - Income from mutual funds 1,611 487 Total (C) 1,611 487 Note: 27D-Sale of Services(i) Sale of Services (Refer note below) (a) Servicing and Collection fee on Assignment 504 691 (b) Other Service Income 7,971 7,346 Total (D) 8,475 8,037 Note: Timing of revenue recognitionServices transferred at a point in time 7,875 7,437 Services transferred over a time 600 600 Total 8,475 8,037
Particulars Period ended Period ended March 31, 2022 March 31, 2021
Notes forming part of the Consolidated Financial Statements (Contd.) For the year ended March 31, 2022
` in lakhs
Note : 28 OTHER INCOME Recovery of Bad debts 8,335 5,594 Interest income on Income tax refund 663 378 Dividend Income 17 13 Rent 51 25 Profit on sale of Property, Plant & Equipment (Net) - 2 Miscellaneous Income 40 20 Total 9,106 6,032
Particulars Period ended Period ended March 31, 2022 March 31, 2021

236
Corporate Overview Financial StatementsManagement Reports
Note : 30 IMPAIRMENT ON FINANCIAL INSTRUMENTSImpairment provision - Loans - measured at amortised cost 87,994 1,37,805 Loss on sale of Investment 40 - Total 88,034 1,37,805
Particulars Period ended Period ended March 31, 2022 March 31, 2021
` in lakhs
Note : 31 EMPLOYEE BENEFITS EXPENSESalaries, Bonus and Commission 87,184 73,399 Contribution to Provident and Other Funds -Employees' Provident Fund 3,546 3,006 -Superannuation Fund 412 344 Share based employee payments 2,048 564 Gratuity Expense (Refer note 37) 1,297 1,136 Staff Welfare Expenses 1,233 652 Total 95,720 79,101
Particulars Period ended Period ended March 31, 2022 March 31, 2021
Notes forming part of the Consolidated Financial Statements (Contd.) For the year ended March 31, 2022
` in lakhs
` in lakhs
Note : 29 FINANCE COSTSInterest on financial liabilities measured at amortised cost - Debt Securities 78,886 74,325 - Borrowings Other than Debt securities 3,07,243 3,37,890 - Subordinated Liabilities 39,662 42,835 Others - Bank charges 1,902 1,546 - Interest on lease liability 883 958 - Interest on income tax 1,190 - Total 4,29,766 4,57,554
Particulars Period ended Period ended March 31, 2022 March 31, 2021
` in lakhs
Note : 32 OTHER EXPENSESRent and facility charges 1,142 625 Rates and Taxes 5,229 2,098 Energy cost 1,107 1,011 Repairs and Maintenance 553 360 Communication Costs 3,172 2,814 Business development expense 4 34 Brokerage 524 290 Printing and Stationery 1,817 1,233 Advertisement and publicity Expenses 1,298 1,267 Directors Fees, allowances and expenses 149 110 Auditors' Remuneration 114 99 Legal and Professional Charges 12,024 4,277 Insurance 2,854 1,647 Travelling and Conveyance 4,858 2,677
Particulars Period ended Period ended March 31, 2022 March 31, 2021

Corporate Overview Financial StatementsManagement Reports
237
` in lakhs
Information Technology Expenses 4,993 3,309 Loss on Sale of Property, Plant and Equipment (Net) 7 54 Recovery Charges 42,425 26,657 Corporate Social Responsibility Expenditure 3,654 3,207 Outsource cost 22,651 22,469 Miscellaneous Expenses 343 293 1,08,918 74,531 Less : Expenses Recovered (80) (39)Total 1,08,838 74,492
Particulars Period ended Period ended March 31, 2022 March 31, 2021
Note: Earnings per Share calculations are done in accordance with Ind AS 33 "Earnings per Share".
Profit After Tax Attributable to Equity Shareholders (` in lakhs) 2,15,351 1,52,086Weighted Average Number of Equity Shares (Basic) 82,05,81,106 81,96,69,366Add: Dilutive effect relating to ESOP/CCPS 15,91,805 14,30,020Weighted Average Number of Equity Shares (Diluted) 82,21,72,911 82,10,99,386Earnings per Share - Basic (`) 26.24 18.55Earnings per Share - Diluted (`) 26.19 18.52Face Value Per Share (`) 2.00 2.00
Note : 33 EARNINGS PER SHARE Particulars Year ended Year ended March 31, 2022 March 31, 2021
Notes forming part of the Consolidated Financial Statements (Contd.) For the year ended March 31, 2022
Note : 32 OTHER EXPENSES (Contd.)
The tax charge shown in the statement of profit and loss differs from the tax charge that would apply if all profits had been charged at Indian corporate tax rate. A reconciliation between the tax expense and the accounting profit multiplied by India’s domestic tax rate for the year ended March 31, 2022 and March 31, 2021, is as follows:
` in lakhs
Accounting profit before tax from continuing operations 2,90,760 2,04,790Income tax rate of 25.17% (March 31, 2021: 25.17%) 73,178 51,546Effects of: Impact of difference in tax base for Donations & CSR expense 918 813Share based payment expense – No deduction claimed under tax 508 141Impact of Deduction u/s 80JJA (28) (28)Other adjustments 295 179 Income tax expense reported in Consolidated statement of Profit and Loss 74,871 52,651
Note : 34 INCOME TAX RECONCILIATION
Particulars Year ended Year ended March 31, 2022 March 31, 2021

238
Corporate Overview Financial StatementsManagement Reports
Note : 35 TRANSFER OF FINANCIAL ASSETS
35.1 Transferred financial assets that are not derecognised in their entirety
The following tables provide a summary of financial assets that have been transferred in such a way that part or all of the transferred financial assets do not qualify for derecognition, together with the associated liabilities:
` in lakhs
SecuritisationsCarrying amount of transferred assets measured at amortised cost 3,75,013 4,75,242Carrying amount of associated liabilities (Borrowings other than Debt securities - measured at amortised cost) 3,67,247 4,63,916Fair value of assets 3,80,513 4,76,131Fair value of associated liabilities 3,42,767 4,37,374Net position at Fair Value 37,746 38,757
Particulars As at As at March 31, 2022 March 31, 2021
A) Securitisation
The Group has Securitised certain loans, however the Group has not transferred substantially all risks and rewards, hence these assets have not been de-recognised.
B) Direct bilateral assignment
The Group has transferred certain loans (measured at amortised cost) by way of direct bilateral assignment, as a source of finance.
As per the terms of these deals, since substantial risk and rewards related to these assets were transferred to the buyer, the assets have been de-recognised from the Group’s balance sheet.
The table below summarises the carrying amount of the derecognised financial assets measured at amortised cost and the gain/(loss) on derecognition, per type of asset.
` in lakhs
AssignmentCarrying amount of de-recognised financial asset 2,76,499 4,16,042Carrying amount of Retained Assets at amortised cost 31,734 47,502
Particulars As at As at March 31, 2022 March 31, 2021
AssignmentGain on sale of the de-recognised financial asset - -
Particulars For the Year Ended For the Year Ended March 31, 2022 March 31, 2021
` in lakhs
Notes forming part of the Consolidated Financial Statements (Contd.) For the year ended March 31, 2022
35.2 The Group has not transferred any assets that are derecognised in their entirety where the Group continues to have continuing involvement.Note : 36 MICRO, SMALL & MEDIUM ENTERPRISES
Based on and to the extent of the information received by the Group from the suppliers during the year regarding their status under the Micro, Small and Medium Enterprises Development Act, 2006 (MSMED Act) are furnished below:
` in lakhs
Principal amount due to suppliers under MSMED Act, as at the year end 306 -Interest accrued and due to suppliers under MSMED Act, on the above amount as at the year end - -Payment made to suppliers (other than interest) beyond the appointed day, during the year - -Interest paid to suppliers under MSMED Act (other than Section 16) - -Interest paid to suppliers under MSMED Act (Section 16) - -Interest due and payable to suppliers under MSMED Act, for payments already made - -Interest accrued and remaining unpaid at the year end to suppliers under MSMED Act - -
Particulars As at As at March 31, 2022 March 31, 2021

Corporate Overview Financial StatementsManagement Reports
239
Note : 37 RETIREMENT BENEFIT
A) Defined contribution plan
A defined contribution plan is a post-employment benefit plan under which the Group pays fixed contributions and where there is no legal or constructive obligation to pay further contributions. During the period, the Group recognised ` 3,546 lakhs (Previous year - ` 3,006 lakhs) to Provident Fund under Defined Contribution Plan, ` 412 lakhs (Previous year - ` 344 lakhs) for Contributions to Superannuation Fund and ` 33 lakhs (Previous year - ` 50 lakhs) for Contributions to Employee State Insurance Scheme in the Statement of Profit and Loss.
B) Gratuity
The Group’s defined benefit gratuity plan requires contributions to be made to a separately administered fund. The gratuity plan is funded with Life Insurance Corporation of India (LIC). The gratuity plan is governed by the Payment of Gratuity Act, 1972. Under the Act, employee who has completed five years of service is entitled to specific benefit. The level of benefits provided depends on the member’s length of service and salary at retirement age. The following tables summarise the components of net benefit expense recognised in the statement of profit or loss and the funded status and amounts recognised in the balance sheet for the respective plans:
Change in Defined Benefit Obligation and Fair Value of Plan assets:
` in lakhs
Defined Benefit Obligation at the beginning of the year 7,451 6,118Current Service Cost 1,169 1,042Interest Cost 465 395Remeasurement Losses/(Gains) a. Effect of changes in financial assumptions (238) 89 b. Effect of experience adjustments 230 37Benefits Paid (444) (230)Defined Benefit Obligation at the end of the year 8,633 7,451Change in Fair value of Plan AssetsFair Value of Plan Assets at the Beginning of the Year 5,422 4,679Expected Returns on Plan Assets 338 301Employer’s Contribution 2,098 677Benefits Paid (444) (230)Return on plan assets (excluding interest income) (5) (5)Fair Value of Plan Assets at the end of the year 7,409 5,422Amount Recognised in the Balance Sheet Fair Value of Plan Assets as at the End of the Year 7,409 5,422Defined benefit obligation at the End of the Year (8,633) (7,451)Amount Recognised in the Balance Sheet under Other Payables (1,224) (2,029)Cost of the Defined Benefit Plan for the YearCurrent Service Cost 1,169 1,042Net interest Expense 465 395Expected Return on Plan Assets (338) (301)Net Cost recognized in the statement of Profit and Loss* 1,296 1,136Remeasurement Losses/(Gains) a) Effect of changes in financial assumptions (237) 89 b) Effect of experience adjustments 229 37 c) Changes in demographic assumptions - d) Return on plan assets (excluding interest income) 5 7Net cost recognized in Other Comprehensive Income (3) 133AssumptionsDiscount Rate 6.70% p.a 6.25% p.a.Future salary increase 7.50% p.a 7.50% p.a.
Particulars Year ended Year ended March 31, 2022 March 31, 2021
Notes forming part of the Consolidated Financial Statements (Contd.) For the year ended March 31, 2022

240
Corporate Overview Financial StatementsManagement Reports
` in lakhs
Attrition Rate - Senior management 13% p.a. 13% p.a. - Middle management 13% p.a. 13% p.a. - Others 13% p.a. 13% p.a.Expected rate of return on Plan Assets 6.70% -7.50%p.a 6.25% -7.10%p.aMortality Indian Assured Indian Assured Lives (2012-14) Lives (2012-14) Ultimate UltimateMaturity profile of Defined Benefit ObligationsWeighted average duration (Based on discounted cash flows) 6 Years 6 YearsExpected Cash flows over the next (valued on undiscounted basis)Within the next 12 months (next annual reporting period) 1,239 664Between 2 and 5 years 4,274 3,008Between 5 and 10 years 3,939 2,874Beyond 10 Years 4,351 3,363 Total Expected Cash flows 13,803 9,909
*Recognised under Employee Benefit Expenses
Particulars Year ended Year ended March 31, 2022 March 31, 2021
Note : 37 RETIREMENT BENEFIT (Contd.)
Notes forming part of the Consolidated Financial Statements (Contd.) For the year ended March 31, 2022
Sensitivity Analysis:Discount Rate (+/- 1%) 8,143 9,178 6,831 7,946Salary Growth Rate (+/- 1%) 9,103 8,192 7,884 7,049Attrition Rate (+/- 50% of attrition rates) 8,508 8,797 7,262 7,731Mortality Rate (+/- 10% of mortality rates) 8,634 8,634 7,303 7,303
Particulars March 31, 2022 March 31, 2021 Increase Decrease Increase Decrease
Notes:1. The estimate of future salary increase takes into account inflation, seniority, promotion and other relevant factors.
2. The Group’s best estimate of contribution during the next year is ` 2,460 lakhs
3. Discount rate is based on the prevailing market yields of Indian Government Bonds as at the Balance Sheet date for the estimated term of the obligation.
4. The entire Plan Assets are invested in insurer managed funds with Life Insurance Corporation of India (LIC).
5. The above sensitivity analysis are based on change in an assumption which is holding all the other assumptions constant. In practice, this is unlikely to occur, and changes in some assumptions may be correlated. When calculating the sensitivity of defined benefit obligation to significant actuarial assumptions the same method of present value of defined benefit obligations calculated with Projected unit cost method at the end of the reporting period has been applied while calculating defined benefit liability recognised in the balance sheet.
6. The method and type of assumptions used in preparing the sensitivity analysis does not change compared to the prior period

Corporate Overview Financial StatementsManagement Reports
241
Description of Risk exposuresValuations are performed on certain basic set of pre-determined assumptions and other regulatory framework which may vary over time. Thus, the Company is exposed to various risks in providing the above gratuity benefit which are as follows:
(a) Interest Rate risk:The plan exposes the Group to the risk of fall in interest rates . A fall in interest rates will result in an increase in the ultimate cost of providing the above benefit and will thus result in an increase in the value of the liability (as shown in financial statements).
(b Liquidity Risk: This is the risk that the Group is not able to meet the short-term gratuity payouts .This may arise due to non-availability of enough cash/cash equivalent to meet the liabilities or holding of illiquid assets not being sold in time.
(c) Salary Escalation Risk: The present value of the defined benefit plan is calculated with the assumption of salary increase rate of plan participants in future. Deviation in the rate of increase of salary in future for plan participants from the rate of increase in salary used to determine the present value of obligation will have a bearing on the plan's liability.
(d) Demographic Risk: The Group has used certain mortality and attrition assumptions in valuation of the liability. The Group is exposed to the risk of actual experience turning out to be worse compared to the assumption.
(e) Regulatory Risk: Gratuity benefit is paid in accordance with the requirements of the Payment of Gratuity Act,1972 (as amended from time to time).There is a risk of change in regulations requiring higher gratuity payouts (e.g.Increase in the maximum limit on gratuity of ` 20,00,000)
(f) Asset Liability Mismatching or Market Risk: The duration of the liability is longer compared to duration of assets, exposing the Group to market risk for volatilities/fall in interest rate.
(g) Investment Risk:The probability or likelihood of occurrence of losses relative to the expected return on an particular investment.
Notes:1. The Group has not funded its Compensated Absences liability and the same continues to remain as unfunded as at March 31, 2022.
2. The estimate of future salary increase takes into account inflation, seniority, promotion and other relevant factors.
3. Discount rate is based on the prevailing market yields of Indian Government Bonds as at the Balance Sheet date for the estimated term of the obligation.
C) Compensated Absences
Discount Rate 6.70% p.a. 6.25% p.a.Future salary increase 7.50% p.a. 7.50% p.a.Attrition Rate - Senior management 13% p.a. 13% p.a.- Middle management 13% p.a. 13% p.a.- Others 13% p.a. 13% p.a.Mortality Indian Assured Indian Assured Lives (2012-14) Lives (2012-14) Ultimate Ultimate
Assumptions March 31, 2022 March 31, 2021
Note : 38 SEGMENT INFORMATIONThe Group is primarily engaged in the business of financing. All the activities of the Group revolve around the main business. Further, the Group does not have any separate geographic segments other than IndiaDuring year ended March 31, 2022, for management purposes, the Group has been organised into the following operating segments based on products and services, as follows- Vehicle Finance Loans - Loans to customers against purchase of new/used vehicles, tractors, construction equipments and loan to
automobile dealers.- Loan against property - Loans to customer against immovable property- Home Loans - loans given for acquisition of residential property- Others -Loan against shares, and other unsecured loans & security broking and insurance agency business.The Chief Operating Decision Maker (CODM) monitors the operating results of its business units separately for making decisions about resource allocation and performance assessment. Segment performance is evaluated based on operating profits or losses and is measured consistently with operating profits or losses in the financial statements. However, income taxes are managed on an entity as whole basis and are not allocated to operating segments.
Notes forming part of the Consolidated Financial Statements (Contd.) For the year ended March 31, 2022Note : 37 RETIREMENT BENEFIT (Contd.)

242
Corporate Overview Financial StatementsManagement Reports
Note : 38 SEGMENT REPORTING (Contd.) ` in lakhs
` in lakhs
Revenue from Operations Interest Income 7,08,861 1,55,970 59,453 8,250 24,201 9,56,735 Net gain on derecognition of financial instruments
under amortised cost category
Fee Income 32,994 4,706 464 9,070 20 47,254 Net gain on Fair value change on 312 1,299 1,611 financial instrument
Sale of Services 7,961 389 125 - - 8,475 Segment revenue from Operations (I) Other income (II) 8,021 284 1 86 714 9,106
Total Segment Income - (I) + (II) 7,57,837 1,61,349 60,043 17,718 26,234 10,23,181Expenses Finance costs 3,20,214 90,709 26,237 3,820 (11,214) 4,29,766
Impairment of Financial Instruments 72,262 10,625 4,381 724 42 88,034
Employee benefits expense 68,601 11,180 5,899 9,759 281 95,720
Depreciation and amortisation expense 8,097 982 536 448 - 10,063
Other expenses 88,735 6,988 4,045 5,382 3,688 1,08,838
Segment Expenses 5,57,909 1,20,484 41,098 20,133 (7,203) 7,32,421 Segment Profit before taxation 1,99,928 40,865 18,945 (2,415) 33,437 2,90,760 Tax expense 74,871 Share of loss from associate and Joint Venture (538) (538) Profit for the year 2,15,351
Revenue from Operations Interest Income 6,93,467 1,44,319 46,679 3,290 34,722 9,22,477 Net gain on derecognition of financial - - - - - - instruments under amortised cost categoryFee Income 18,224 2,180 181 6,342 12 26,939 Net gain on Fair value change on financial - - - 487 487 instrument Sale of Services 7,096 540 401 - - 8,037 Segment revenue from Operations (I) - Other income (II) 5,244 287 - 140 361 6,032 Total Segment Income (I) + (II) 7,24,031 1,47,326 47,261 9,772 35,582 9,63,972 Expenses Finance costs 3,50,978 84,871 20,670 2,456 (1,421) 4,57,554 Impairment of Financial Instruments 1,18,036 14,847 5,479 (554) (3) 1,37,805 Employee benefits expense 61,327 7,692 4,971 4,943 168 79,101 Depreciation and amortisation expense 8,388 1,039 371 432 - 10,230 Other expenses 61,102 4,939 3,591 995 3,865 74,492 Segment Expenses 5,99,831 1,13,388 35,082 8,272 2,609 7,59,182 Segment Profit before taxation 1,24,200 33,938 12,179 1,500 32,973 2,04,790 Tax expense 52,651 Share of loss from associate (53) (53) Profit for the year 1,52,086
Year ended March 31, 2022
Year ended March 31, 2021
Particulars Vehicle Loan against Home Loans Others Unallocable Total finance property
Particulars Vehicle Loan against Home Loans Others Unallocable Total finance property
Notes forming part of the Consolidated Financial Statements (Contd.) For the year ended March 31, 2022

Corporate Overview Financial StatementsManagement Reports
243
Note : 38 SEGMENT REPORTING (Contd.) ` in lakhs
As on March 31, 2022
Segment Assets 52,18,720 15,57,057 4,74,236 1,75,693 74,25,706
Unallocable Assets 8,22,162 8,22,162
Total Assets 82,47,868 Segment Liabilities 44,76,896 13,35,726 4,06,825 1,46,226 63,65,673
Unallocable Liabilities 7,05,295 7,05,295
Total Liabilities 70,70,968 As on March 31, 2021
Segment Assets 48,93,657 12,71,552 3,72,558 55,402 65,93,169
Unallocable Assets 8,71,247 8,71,247
Total Assets 74,64,416 Segment Liabilities 42,66,080 11,08,484 3,24,780 45,576 57,44,920
Unallocable Liabilities 7,59,516 7,59,516
Total Liabilities 65,04,436
In computing the segment information, certain estimates and assumptions have been made by the management, which have not been relied upon.As the asset are allocated to segment based on certain assumptions, hence additions to the Property, plant and equipment have not disclosed separately for each specific segment.There are no revenue from transactions with a single external customer or counter party which amounted to 10% or more of the Group's total revenue in the Current year and Previous year.
Particulars Vehicle Loan against Home Loans Others Unallocable Total finance property
Note : 39 RELATED PARTY DISCLOSURESList of Related Parties• Holding Company: Cholamandalam Financial holdings limited (formerly known as TI Financial Holdings Limited)
• Entity having significant influence over holding Company: Ambadi Investments Limited
• Subsidiaries of the entity which has significant influence over holding Company: Parry Enterprises India Limited and Parry Agro Limited.
• Fellow Subsidiaries: Cholamandalam MS General Insurance Company Limited
• Joint Venture of Holding Company: Cholamandalam MS Risk services Limited
• Associates : White Data Systems India Private Limited, Vishvakarma Payments Private Limited (from 30 March, 2021), Paytail Commerce Private Limited (from 15 September, 2021)
• Joint Venture: Payswiff Technologies Private Limited and its subsidiaries (from 8 February, 2022)
• Key Managerial Personnel: c. Mr. Arun Alagappan, Managing Director (upto February 14, 2021)
d. Mr. D. Arulselvan, Chief Financial Officer
e. Ms. P.Sujatha, Company Secretary
f. Mr. Ravindra Kumar Kundu, Executive Director
• Non-Executive Directors a) Mr. Ashok Kumar Barat
b) Mr. M M Murugappan (upto November 11, 2020)
c) Mr. N Ramesh Rajan
d) Mr. Rohan Verma
e) Ms. Bhama Krishnamurthy
f ) Mr. Vellayan Subbiah (From November 11, 2020)
g) Mr. M A M Arunachalam (From January 29, 2021)
h) Mr. Anand Kumar (From March16, 2021)
i) Mr. Bharath Vasudevan (From March16, 2021)
Notes forming part of the Consolidated Financial Statements (Contd.) For the year ended March 31, 2022

244
Corporate Overview Financial StatementsManagement Reports
` in lakhs
Note : 39 a) TRANSACTIONS DURING THE YEAR Dividend Payments (Equity Shares) a) Cholamandalam Financial Holdings Limited 7,458 4,848 b) Ambadi Investments Limited 674 438 c) Parry Enterprises India Limited * * d) AR Lakshmi Archi Trust # 10 - e) M A Murugappan Holdings LLP# 2 1 f ) Kadamane Estates Co # 7 5Amount received towards reimbursement of expenses a) Cholamandalam Financial Holdings Limited 118 104 b) Cholamandalam MS General Insurance Company Limited 6 5 c) Parry Enterprises India Limited 1 1 d) Cholamandalam MS Risk Services Limited - *Services Received a) Cholamandalam MS General Insurance Company Limited 217 201 b) Parry Enterprises India Limited 194 74 c) White Data Systems India Private Limited 24 29 d) Cholamandalam MS Risk Services Limited 1 -Expenses – Reimburse a) White Data Systems India Private Limited 3 - b) Cherry Tin Online Private Limited# 8 - c) Parry Enterprises India Limited 7 -Services rendered a) Cholamandalam MS General Insurance Company Limited 5,891 4,008 b) Cholamandalam Financial Holdings Limited * * c) Ambadi Investments Limited - * d) Key Managerial Personnel * * e) Parry Enterprises India Limited * -Loans given a) White Data Systems India Private Limited 300 340 b) Payswiff Solutions Private Limited 300 -Loans recovered a) White Data Systems India Private Limited 340 340 b) Payswiff Solutions Private Limited 300 -Interest Expense a) Cholamandalam MS General Insurance Company Limited 1,313 1,603Interest Income a) White Data Systems India Private Limited 21 26 b) Payswiff Solutions Private Limited 1 -Subscriptions/Advertisement Expenses a) Finance Industry Development Council# 1 -Commission and Sitting fees to non-executive Directors 137 102
Particulars Year ended Year ended March 31, 2022 March 31, 2021
` in lakhs
Note : 39 b) BALANCES OUTSTANDING AT THE YEAR ENDLoans - Receivable a) White Data Systems India Private Limited 300 340 b) Medall Healthcare Private Limited# 1,732 -Debt Securities - Payable a) Cholamandalam MS General Insurance Company Limited (14,793) (18,527)
Particulars As at As at March 31, 2022 March 31, 2021
Note : 39 RELATED PARTY DISCLOSURES (Contd.)
Notes forming part of the Consolidated Financial Statements (Contd.) For the year ended March 31, 2022

Corporate Overview Financial StatementsManagement Reports
245
` in lakhs
Note : 39 c) REMUNERATION TO KEY MANAGERIAL PERSONNELShort- term employee benefits 557 794Post- employment pension (defined Contribution) 84 92Dividend Payments 8 17Share based payments 271 27Sale of Vehicle(s) 4 21Sale of Asset * -Relatives of KMP and Directors 11 7
Particulars Year ended Year ended March 31, 2022 March 31, 2021
* Represents amounts less than ` 1 lakh
Note : 40 CONTINGENT LIABILITIES AND COMMITMENTS(a) Contested Claims not provided for: ` in lakhs
Income tax and Interest on Tax issues where the Group has gone on appeal 29,977 22,465Decided in the Group’s favour by Appellate Authorities and for which the Department is onfurther appeal with respect to Income Tax 634 21,898Sales Tax issues pending before Appellate Authorities in respect of which the Group is on appeal. 1,952 2,573Decided in the Company’s favour by Appellate Authorities and for which the Department is onfurther appeal with respect to Sales Tax 102 -Service Tax & GST issues pending before Appellate Authorities in respect of which the Group is on appeal. 19,992 19,992Disputed claims against the Group lodged by various parties under litigation (to the extent quantifiable) 14,458 10,801
Particulars As at As at March 31, 2022 March 31, 2021
i) The Group is of the opinion that the above demands based on management estimate no significant liabilities are expected to arise.ii) It is not practicable for the Group to estimate the timings of the cashflows, if any, in respect of the above pending resolution of the respective
proceedings.iii) The Group does not expect any reimbursement in respect of the above contingent liabilities.iv) Future Cash outflows in respect of the above are determinable only on receipt of judgements/decisions pending with various forums/authorities.
(c) The Code on Social Security, 2020 (‘ The Code’) relating to employee benefits during employment and post-employment benefits, received Presidential assent in September 2020. The Code has been published in the Gazette of India. However, the date on which the Code will come into effect has not been notified. The Ministry of Labour and Employment has also released draft rules thereunder on 13 November 2020 and has invited suggestions from stakeholders, which are under consideration by the Ministry. The Group will evaluate the rules, assess the impact, if any, and account for the same once the rules are notified and become effective.
(b) Commitments ` in lakhs
Capital commitments 4,021 3,678Disbursements - Undrawn lines 1,48,588 1,24,190
Particulars As at As at March 31, 2022 March 31, 2021
Notes forming part of the Consolidated Financial Statements (Contd.) For the year ended March 31, 2022
Other Receivable / (Payable) a) Cholamandalam Financial Holdings Limited * 2 b) Paytail Commerce Private Limited 437 - c) Cholamandalam MS General Insurance Company Limited 661 340 d) White Data Systems India Private Limited (10) (6) e) Parry Enterprises India Limited (45) 1 f ) Cholamandalam MS Risk Services Limited (1) - g) Ambadi Investments Limited * -
# Represents entities included as per Companies Act
Note : 39 b) BALANCES OUTSTANDING AT THE YEAR END (Contd.) ` in lakhs Particulars As at As at March 31, 2022 March 31, 2021

246
Corporate Overview Financial StatementsManagement Reports
` in lakhs
Provision for Contingencies and Service Tax claims 3,838 508 - 4,346Provision for Expected credit loss allowance towards Undrawn commitments 131 89 116 104
Particulars As at Additional Utilisation/ As at March 31, 2020 Provision Reversal March 31, 2021
Undrawn loan commitments are commitments under which the Group is required to provide a loan under pre-sanctioned terms to the customer.
The undrawn commitments provided by the Group are predominantly in the nature of limits provided for Automobile dealers based on the monthly loan conversions and partly disbursed loans for immovable properties. These undrawn limits are converted within a short period of time and do not generally remain undisbursed / undrawn beyond one year from the reporting date. The undrawn loan commitments amount outstanding as at March 31, 2022 is ` 1,48,588 lakhs (`1,24,190 lakhs as at March 31, 2021).
The Group creates expected credit loss provision on the undrawn commitments outstanding as at the end of the reporting period and the related expected credit loss on these commitments as at March 31, 2022 is `120 lakhs (` 104 lakhs as at March 31, 2021).
ESOP 2007The Board at its meeting held on June 22, 2007, approved an issue of Stock Options up to a maximum of 5% of the issued Equity Capital of the Company (before Rights Issue) aggregating to 1,904,162 Equity Shares (prior to share split) in a manner provided in the SEBI (Employee Stock Option Scheme and Employee Stock Purchase Scheme) Guidelines.ESOP 2016The Board at its meeting held on October 7, 2016, approved to create, and grant from time to time, in one or more tranches, not exceeding 1,56,25,510 Employee Stock Options to or for the benefit of such person(s) who are in permanent employment of the company including some of subsidiaries, managing director and whole time director, (other than promoter/promoter group of the company, independent directors and directors holding directly or indirectly more than 10% of the outstanding equity shares of the company), as may be decided by the board, exercisable into not more than 1,56,25,510 equity shares of face value of ` 2/- each fully paid-up, on such terms and in such manner as the board may decide in accordance with the provisions of the applicable laws and the provisions of ESOP 2016.In this regard, the Group has recognised expense amounting to ̀ 2,048 lakhs for employees services received during the year, shown under Employee Benefit Expenses (Refer Note 31).The movement in Stock Options during the current period are given below:
Note : 42 ESOP DISCLOSURE
Employee Stock Option Plan 2007
GT25 25-Apr-08 - - - - - - - - - - Apr 2008GT27 27-Jan-11 - - - - - - - - - - JAN 2011AGT27 27 Jan 11 - - - - - - - - - JAN 2011BGT30 30-Apr-11 10,240 - - - 10,240 - - - 33 - APR 2011GT27 27-Oct-11 8,580 - - - 8,580 - - - 31 - OCT 2011Total 18,820 - - - 18,820 - - -
Particulars Date of As at Addition Options Options Options As at As at As at Exercise Weighted Grant 31.03.2021 in number Granted Forfeited Exercised 31.03.2022 31.03.2022 31.03.2022 Price Average of options / Expired and Remaining on account allotted Contractual of share split* Life
Options outstanding
Options outstanding
Options vested but not
exercised
Options unvestedDuring the Year
Notes forming part of the Consolidated Financial Statements (Contd.) For the year ended March 31, 2022
` in lakhs
Provision for Contingencies and Service Tax claims 4,346 108 501 3,953Provision for Expected credit loss allowance towards Undrawn commitments 104 16 - 120
Particulars As at Additional Utilisation/ As at March 31, 2021 Provision Reversal March 31, 2022
Note : 41 CHANGES IN PROVISIONS
(d) Bank Guarantee: ` in lakhs Particulars As at As at March 31,2022 March 31,2021Outstanding bank guarantees given to stock exchanges/stock holding corporation of India limited tomeet margin requirements 3,050 1,485
Note : 40 CONTINGENT LIABILITIES AND COMMITMENTS (Contd.)

Corporate Overview Financial StatementsManagement Reports
247
GT25 25-Jan-17 16,64,690 - - - 6,01,040 10,63,650 10,63,650 - 202 - JAN 2017GT30 30-Jan-18 2,04,085 - - - 84,675 1,19,410 1,89,240 - 262 - JAN 2018GT30 30-Jan-18 87,300 - - - - 87,300 17,470 - 262 - JAN2018AGT23 23-Apr-18 26,940 - - - - 26,940 13,470 13,470 312 0.06 years APR 2018GT26 26-Jul-18 1,40,360 - - - 3,000 1,37,360 1,08,560 28,800 299 - JUL 2018GT30 30-Oct-18 2,97,400 - - - 70,100 2,27,300 1,30,580 96,720 254 0.58 years OCT 2018GT19 19-Mar-19 5,71,180 - - - 1,36,260 4,34,920 2,86,750 1,48,170 278 0.97 years MAR 2019GT30 30-Jul-19 26,772 - - - 26,772 - - - 248 - JUL 2019GT05 5-Nov-19 2,50,040 - - - 51,740 1,98,300 32,940 1,65,360 316 1.10 years NOV2019GT23 23-Jan-20 42,400 - - 10,600 - 31,800 - 31,800 318 1.32 years JAN2020GT03 3-Jun-20 2,11,900 - - - 44,285 1,67,615 - 1,69,520 158 1.30 years JUNE2020GT03 3-Jun-20 1,905 - - - - 1,905 - - 158 1.30 years JUNE2020AGT07 7-May-21 - - 10,66,600 - - 10,66,600 - 10,66,600 580 1.80 yearsMAY2021GT30 30-Jul-21 - - 24,700 - - 24,700 - 24,700 487 2.03 yearsJULY2021GT29 29-Oct-21 - - 8,08,120 - - 8,08,120 - 8,08,120 609 2.28 yearsOCt2021GT01 1-Feb-22 - - 1,26,100 - - 1,26,100 - 1,26,100 630 2.54 yearsFEB2022Total 35,24,972 - 20,25,520 10,600 10,17,872 45,22,020 18,42,660 26,79,360
Note : 42 ESOP DISCLOSURE (Contd.)
*Equity shares of face value of ` 10/- have been split into face value of ` 2 per share on June 18, 2019, pursuant to resolution passed through postal ballot on June 3, 2019
Employee Stock Option Plan 2016
GT25 25-Apr-08 - - - - - - - - - - Apr 2008GT27 27-Jan-11 23,120 - - - 23,120 - - - 38 - JAN 2011A GT27 27-Jan-11 - - - - - - - - - JAN 2011BGT30 30-Apr-11 25,240 - - - 15,000 10,240 10,240 - 33 - APR 2011GT27 27-Oct-11 29,760 - - - 21,180 8,580 8,580 - 31 - OCT 2011Total 78,120 - - - 59,300 18,820 18,820 -
Particulars Date of As at Addition Options Options Options As at As at As at Exercise Weighted Grant 31.03.2021 in number Granted Forfeited Exercised 31.03.2022 31.03.2022 31.03.2022 Price Average of options / Expired and Remaining on account allotted Contractual of share split* Life
Particulars Date of As at Addition Options Options Options As at As at As at Exercise Weighted Grant 31.03.2020 in number Granted Forfeited Exercised 31.03.2021 31.03.2021 31.03.2021 Price Average of options / Expired and Remaining on account allotted Contractual of share split* Life
Options outstanding
Options outstanding
Options outstanding
Options outstanding
Options vested but not
exercised
Options vested but not
exercised
Options unvested
Options unvested
During the Year
During the Year 2020-21
Employee Stock Option Plan 2007The movement in Stock Options during the previous year are given below:
Notes forming part of the Consolidated Financial Statements (Contd.) For the year ended March 31, 2022

248
Corporate Overview Financial StatementsManagement Reports
30-Jul-07 7.10% - 7.56% 3-6 years 40.64% -43.16% 5.65% 193.40 61.42 24-Oct-07 7.87% -7.98% 3-6 years 41.24% -43.84% 5.65% 149.90 44.25 25-Jan-08 6.14% -7.10% 3-6 years 44.58% -47.63% 5.65% 262.20 78.15 25-Apr-08 7.79% - 8.00% 2.5-5.5 years 45.78% - 53.39% 3.97% 191.80 76.74 30-Jul-08 9.14% - 9.27% 2.5-5.5 years 46.52% - 53.14% 3.97% 105.00 39.22 24-Oct-08 7.54% - 7.68% 2.5-5.5 years 48.2% - 55.48% 3.97% 37.70 14.01 27-Jan-11 - Tranche I 8% 4 years 59.50% 10% 187.60 94.82 - Tranche II 8% 3.4 years 61.63% 10% 187.60 90.62 30-Apr-11 8% 4 years 59.40% 25% 162.55 73.07 28-Jul-11 8% 4 years 58.64% 25% 175.35 79.17 27-Oct-11 8% 4 years 57.52% 25% 154.55 67.26
Employee Stock Option Plan 2016
GT25 25 Jan 17 21,18,600 - - 1,92,140 2,61,770 16,64,690 16,64,690 - 202 - JAN2017GT30 30 Jan 18 2,38,485 - - - 34,400 2,04,085 2,04,085 - 262 - JAN2018 GT30 30 Jan 18 89,800 - - - 2,500 87,300 60,360 26,940 262 0.84 years JAN2018A GT23 23 Apr 18 44,900 - - - 17,960 26,940 - 26,940 312 0.56 years APR2018 GT26 26 Jul 18 2,74,860 - - 1,31,500 3,000 1,40,360 86,600 53,760 299 0.32 years JUL2018 GT30 30 Oct 18 3,67,300 - - 44,900 25,000 2,97,400 1,03,960 1,93,440 254 1.08 years OCT2018 GT19 19 Mar 19 5,88,460 - - - 17,280 5,71,180 2,75,740 2,95,440 278 1.47 years MAR2019 GT30 30 Jul 19 31,632 - 4,860 - 26,772 13,386 13,386 248 0.33 years JUL2019 GT05 5 Nov 19 2,75,600 - - 25,560 2,50,040 29,560 2,20,480 316 1.73 years NOV2019 GT23 23 Jan 20 53,000 - - 10,600 42,400 - 42,400 318 1.94 years JAN2020 GT03 3 Jun 20 - - 2,11,900 - - 2,11,900 - 2,11,900 158 1.88 years JUNE2020 GT03 3 Jun 20 - - 1,905 - - 1,905 - 1,905 158 0.18 years JUNE2020A Total 40,82,637 - 2,13,805 3,73,400 3,98,070 35,24,972 24,38,381 10,86,591
Particulars Date of As at Addition Options Options Options As at As at As at Exercise Weighted Grant 31.03.2020 in number Granted Forfeited Exercised 31.03.2021 31.03.2021 31.03.2021 Price Average of options / Expired and Remaining on account allotted Contractual of share split* Life
Options outstanding
Options outstanding
Options vested but not
exercised
Options unvestedDuring the Year
2020-21
Note : 42 ESOP DISCLOSURE (Contd.)
ESOP 2007
*Equity shares of face value of ` 10/- have been split into face value of ` 2 per share on June 18, 2019, pursuant to resolution passed through postal ballot on June 3, 2019
The following tables list the inputs to the Black Scholes model used for the plans for the year ended March 31, 2021
Notes forming part of the Consolidated Financial Statements (Contd.) For the year ended March 31, 2022
Date of Grant Risk Free Expected Life Expected Dividend Yield Price of the Fair Value Interest Rate Volatility underlying of the Option Share in the (`) Market at the time of the Option Grant (`)
Variables

Corporate Overview Financial StatementsManagement Reports
249
The shareholders of the Company, at the 34th Annual General Meeting held on July 30, 2012, authorised extension of exercise period from 3 years from the date of vesting to 6 years from the date of vesting. Accordingly, the Company has measured the fair value of the options using the Black Scholes model immediately before and after the date of modification to arrive at the incremental fair value arising due to the extension of the exercise period. The incremental fair value so calculated is recognised from the modification date over the vesting period in addition to the amount based on the grant date fair value of the stock options.
The incremental (benefit)/cost due to modification of the exercise period from 3 years to 6 years from the date of vesting for the year ended March 31, 2022 is ` Nil (March 31, 2021- ` Nil)
The fair value of the options has been calculated using the Black Scholes model on the date of modification.
The assumptions considered for the calculation of the fair value (on the date of modification) are as follows:
Variables Post Modification
Risk Free Interest Rate 7.92%-8.12%
Expected Life 0.12 years- 6.25 years
Expected Volatility 28.28%-63.00%
Dividend Yield 1.18%
Price of the underlying share in market at the time of the option grant.(`) 212.05
Note : 42 ESOP DISCLOSURE (Contd.)
ESOP 2016
25-Jan-17 6.36% - 6.67% 3.5 - 6.51 years 33.39% - 34.47% 0.54% 1,010.00 401.29 30-Jan-18 7.11% - 7.45% 3.5 - 5.50 years 30.16% - 31.46% 0.42% 1,309.70 496.82 30-Jan-18 7.11% - 7.45% 3.5 - 5.50 years 30.16% - 31.46% 0.42% 1,309.70 531.84 23-Apr-18 7.45% - 7.81% 3.51 - 6.51 years 30.33% - 32.38% 0.42% 1,562.35 646.08 26-Jul-18 7.71% - 7.92% 3.51 - 5.51 years 30.56% - 31.83% 0.43% 1,497.30 586.32 30-Oct-18 7.61% - 7.85% 3.51 - 6.51 years 32.34% - 32.70% 0.51% 1,268.50 531.36 19-Mar-19 6.91% - 7.25% 3.51 - 6.51 years 32.19% - 32.59% 0.47% 1,390.05 564.13 30-Jul-19 6.15% - 6.27% 3.51 - 4.51 years 32.21% - 32.93% 0.52% 248.20 83.66* 5-Nov-19 6.15% - 6.27% 3.51 - 4.51 years 32.21% - 32.93% 0.52% 316.00 112.09* 23-Jan-20 6.15% - 6.27% 3.51 - 4.51 years 32.21% - 32.93% 0.52% 317.00 109.51* 3-Jun-20 5% 3.50 years 47.50% 1.33% 157.90 58.27* 7-May-21 5.12% - 6.02% 3.5 - 6.5 years 52.06% - 43.62% 0.34% 580.30 276.84 30-Jul-21 5.25% - 6.20% 3.50 - 6.51 years 52.06% - 43.65% 0.41% 487.15 232.48 29-Oct-21 5.22% - 6.17% 3.50 - 6.51 years 53.2% - 43.93% 0.33% 609.00 293.95 1-Feb-22 5.49% - 6.50% 3.50 - 6.51 years 53.81% - 44.42% 0.32% 629.50 309.23
* Fair value option of equity shares issued under this grant is post share split with a face value of ` 2/- each
Date of Grant Risk Free Expected Life Expected Dividend Yield Price of the Fair Value Interest Rate Volatility underlying of the Option Share in the (`) Market at the time of the Option Grant (`)
Variables
` in lakhs
Debt Securities 12,35,767 1,06,714 - (10,371) 13,32,110
Borrowings other than debt securities 47,18,226 4,60,663 11,888 9,675 52,00,452
Subordinated liabilities 4,19,006 (32,770) - (1,448) 3,84,788
Total 63,72,999 5,34,607 11,888 (2,144) 69,17,350
Particulars April 01, 2021 Cash flows Exchange Other March 31, 2022 Difference
Note : 43 CHANGE IN LIABILITIES ARISING FROM FINANCING ACTIVITIES
Notes forming part of the Consolidated Financial Statements (Contd.) For the year ended March 31, 2022

250
Corporate Overview Financial StatementsManagement Reports
` in lakhsNote : 43 CHANGE IN LIABILITIES ARISING FROM FINANCING ACTIVITIES (Contd.)
Debt Securities 7,32,683 5,00,898 - 2,186 12,35,767
Borrowings other than debt securities 43,27,308 4,04,659 (13,268) (473) 47,18,226
Subordinated liabilities 4,40,552 (20,150) - (1,396) 4,19,006
Total 55,00,543 8,85,407 (13,268) 317 63,72,999
Particulars April 1, 2020 Cash flows Exchange Other March 31, 2021 Difference
(i) Others column represents the effect of interest accrued but not paid on borrowing, amortisation of processing fees etc
(ii) Liabilities represents of Debt securities, Borrowings (other than debt securities) and Subordinated Liabilities
Note : 44 MATURITY ANALYSIS
The table below shows an analysis of assets and liabilities analysed according to when they are expected to be recovered or settled. ` in lakhs
As on March 31, 2022Financial Assets Cash and Cash Equivalents 2,69,884 2,69,884 - Bank balances Other than Cash and Cash Equivalents 1,60,300 1,43,154 17,146 Derivative financial instruments 18,653 7,554 11,099 Receivables i) Trade Receivables 7,131 7,131 - ii) Other Receivables 8,964 8,964 - Loans 74,14,471 21,12,308 53,02,163 Investments i) Associate 3,303 - 3,303 ii) Others 1,57,643 909 1,56,734 iii) Joint Venture 44,559 - 44,559 Other Financial Assets 33,522 8,848 24,674 Total Financial Assets 81,18,430 25,58,752 55,59,678 Non- Financial Assets Current tax assets (Net) 25,200 - 25,200 Deferred tax assets (Net) 67,491 - 67,491 Investment Property 13 - 13 Property, Plant and Equipment 24,215 - 24,215 Capital Work in Progress 2,303 - 2,303 Intangible assets under development 1,432 37 1,395 Other Intangible assets 1,632 - 1,632 Other Non-Financial Assets 7,152 1,266 5,886 Total Non- Financial Assets 1,29,438 1,303 1,28,135 Financial Liabilities Derivative financial instruments 16,956 2,165 14,791 Payables i) Trade Payables-Due to MSME 306 306 - ii) Trade Payables-Other than MSME 12,453 12,453 iii) Other Payables 72,000 72,000 - Debt Securities 13,32,110 5,98,192 7,33,918 Borrowings (Other than Debt Securities) 52,00,452 18,51,620 33,48,832 Subordinated Liabilities 3,84,788 50,604 3,34,184 Other Financial Liabilities 33,952 20,992 12,960 Total Financial Liabilities 70,53,017 26,08,332 44,44,685 Non-Financial Liabilities Current tax liabilities - - - Deferred tax Liabilities 65 - 65 Provisions 11,968 2 11,966 Other Non-Financial Liabilities 5,918 4,591 1,327 Total Non-Financial Liabilities 17,951 4,593 13,358
Particulars Amount Within After 12 months 12 months
Maturity
Notes forming part of the Consolidated Financial Statements (Contd.) For the year ended March 31, 2022

Corporate Overview Financial StatementsManagement Reports
251
As on March 31, 2021
Financial Assets
Cash and Cash Equivalents 1,48,036 1,48,036 -
Bank balances Other than Cash and
Cash Equivalents 3,79,941 3,44,269 35,672
Derivative financial instruments 4,587 4,587
Receivables
i) Trade Receivables 5,660 5,660 -
ii) Other Receivables 4,211 4,211 -
Loans 65,83,934 19,71,863 46,12,071
Investments
i) Associate 2,424 - 2,424
ii) Others 1,55,925 - 1,55,925
iii) Joint Venture - - -
Other Financial Assets 59,445 15,470 43,975
Total Financial Assets 73,44,163 24,89,509 48,54,654
Non- Financial Assets
Current tax assets (Net) 14,767 - 14,767
Deferred tax assets (Net) 76,897 - 76,897
Investment Property 13 - 13
Property, Plant and Equipment 20,826 - 20,826
Intangible assets under development 991 - 991
Other Intangible assets 1,920 - 1,920
Other Non-Financial Assets 4,839 1,894 2,945
Total Non- Financial Assets 1,20,253 1,894 1,18,359
Financial Liabilities
Derivative financial instruments 12,742 - 12,742
Payables -
i) Trade Payables-Due to MSME 9,859 9,859 -
ii) Trade Payables-Other than MSME - - -
iii) Other Payables 54,278 54,278 -
Debt Securities 12,35,767 6,04,785 6,30,982
Borrowings (Other than Debt Securities) 47,18,226 16,91,807 30,26,419
Subordinated Liabilities 4,19,006 1,01,959 3,17,047
Other Financial Liabilities 34,592 30,047 4,545
Total Financial Liabilities 64,84,470 24,92,735 39,91,735
Non-Financial Liabilities
Current tax liabilities 4,225 4,225 -
Provisions 11,045 11,044 1
Other Non-Financial Liabilities 4,696 3,422 1,274
Total Non-Financial Liabilities 19,966 18,691 1,275
Note : 44 MATURITY ANALYSIS (Contd.)
The table below shows an analysis of assets and liabilities analysed according to when they are expected to be recovered or settled. ` in lakhs
Particulars Amount Within After 12 months 12 months
Maturity
Notes forming part of the Consolidated Financial Statements (Contd.) For the year ended March 31, 2022

252
Corporate Overview Financial StatementsManagement Reports
Note : 45.1 CAPITAL MANAGEMENT
The Group maintains an actively managed capital base to cover risks inherent in the business, meeting the capital adequacy requirements of Reserve Bank of India (RBI), maintain strong credit rating and healthy capital ratios in order to support business and maximise shareholder value. The adequacy of the Group’s capital is monitored by the Board using, among other measures, the regulations issued by RBI.
The Group manages its capital structure and makes adjustments to it according to changes in economic conditions and the risk characteristics of its activities. In order to maintain or adjust the capital structure, the Group may adjust the amount of dividend payment to shareholders, return capital to shareholders or issue capital securities.
The Group has complied in full with the capital requirements prescribed by RBI over the reported period. The Capital adequacy ratio as of March 31, 2022 is 19.62% (March 31, 2021- 19.10%) as against the regulatory requirement of 15%.
45.2 FINANCIAL RISK MANAGEMENT
The key financial risks faced by the Group are credit and market risks comprising liquidity risk, interest rate risk and foreign currency risks.
45.2.1 Credit Risk
Credit risk arises when a borrower is unable to meet his financial obligations to the lender. This could be either because of wrong assessment of the borrower’s payment capabilities or due to uncertainties in his future earning potential. The effective management of credit risk requires the establishment of appropriate credit risk policies and processes.
45.2.1.1 Assessment Methodology
The Group has comprehensive and well-defined credit policies across various businesses, products and segments, which encompass credit approval process for all businesses along with guidelines for mitigating the risks associated with them. The appraisal process includes detailed risk assessment of the borrowers, physical verifications and field visits. The Group has a robust post sanction monitoring process to identify credit portfolio trends and early warning signals. This enables it to implement necessary changes to the credit policy, whenever the need arises. Also, being in asset financing business, most of the Group’s lending is covered by adequate collaterals from the borrowers. The Group has a robust online application underwriting model to assess the credit worthiness of the borrower for underwriting decisions for its vehicle finance, Loan Against Property and home loan business. The Group also has a well-developed model for the vehicle finance portfolio, to help business teams plan volume with adequate pricing of risk for different segments of the portfolio.
45.2.1.2 Risk Management and Portfolio Review
The Group has a robust portfolio review mechanism. Key metrics like early delinquency, default rates are tracked, monitored and reviewed daily. Business teams review key trends in these Key Risk Indicators and location level strategies are adopted.
45.2.1.3 ECL Methodology
The Group records allowance for expected credit losses for all financial assets including loan commitments, other than those measured at FVTPL. Equity instruments carried at cost are not subject to impairment under the ECL methodology.
45.2.1.4 Assumptions and Estimation techniques
The Group calculates ECLs to measure the expected cash shortfalls, discounted at an approximation to the EIR. A cash shortfall is the difference between the cash flows that are due to an entity in accordance with the contract and the cash flows that the entity expects to receive. ECL is computed on collective basis. The portfolio is segmented based on shared risk characteristics for the computation of ECL.
The key elements of the ECL are summarised below:
45.2.1.4(a) PD
The Probability of Default is an estimate of the likelihood of default over a given time horizon. A default may only happen at a certain time over the assessed period, if the facility has not been previously derecognised and is still in the portfolio. While computing probability of default, significant outlier events are suitably handled to ensure it does not skew the outcomes.
A 12M marginal PD is computed by creating cohorts of accounts starting in Stage 1 at the beginning of the year and subsequently moving to Stage 3 at any point in time during the year.
A conditional average probability of default is computed by taking cohort of which were in Stage 2 at the beginning the year and subsequently moved to Stage 3 anytime in each subsequent year
45.2.1.4(b) EAD
The Exposure at Default is an estimate of the exposure at a future default date (in case of Stage 1 and Stage 2), taking into account expected changes in the exposure after the reporting date, including repayments of principal and interest, whether scheduled by contract or otherwise, expected drawdowns on committed facilities, and accrued interest from missed payments. In case of Stage 3 loans EAD represents exposure when the default occurred.
Notes forming part of the Consolidated Financial Statements (Contd.) For the year ended March 31, 2022

Corporate Overview Financial StatementsManagement Reports
253
45.2.1.4(c) LGD The Loss Given Default is an estimate of the loss arising in the case where a default occurs at a given time. It is based on the difference between the contractual cash flows due and those that the lender would expect to receive, including from the realisation of any collateral. It is usually expressed as a percentage of the EAD. The recoveries are discounted back to the default date using customer IRR. This present value of recovery is used for LGD computation. A recovery rate (RR) computed as the ratio of present value of recovery to the EAD (1 – RR), gives the LGD.45.2.1.5 Mechanics of the ECL methodStage 1:All loans (other than purchased credit impaired asset) are categorised as Stage 1 on initial recognition.The 12months ECL is calculated as the portion of LTECLs that represent the ECLs that result from default events on a financial instrument that are possible within the 12 months after the reporting date. The Group calculates the 12monthsECL allowance based on the expectation of a default occurring in the 12 months following the reporting date. These expected 12-month default probabilities are applied to EAD and multiplied by the expected LGD and discounted by an approximation to the original EIR.Stage 2:Loans which are past due for more than 30 days are categorised as Stage 2. When a loan has shown a significant increase in credit risk since origination, the Group records an allowance for the LTECLs PDs and LGDs are estimated over the lifetime of the instrument. The expected cash shortfalls are discounted by an approximation to the original EIR.Stage 3:Loans which are past due for more than 90 days are categorised as Stage 3. For loans considered credit-impaired, the Group recognises the lifetime expected credit losses for these loans. The method is similar to that for Stage 2 assets, with the PD set at 100%Restructured loans are categorised as Stage 3 on the date of restructuring and remain so for a period of one year. Post this, regular staging criteria applies.Loans which have been renegotiated or modified in accordance with RBI Notifications for COVID-19 related stress has been classified as Stage 2 due to significant increase in credit risk.The Post Implementation Staging of Loans restructured under Covid Resolution framework shall follow the Days Past Due of respective loan agreements.In respect of new lending products introduced during the year, the Group follows simplified matrix approach for determining impairment allowance based on industry practise in the absence of historical information. These loans constitutes less than 1% of the total loan book.Loan Movement across stages during the year is given in a note 9.1Loan commitment:When estimating LTECLs for undrawn loan commitments, the Group estimates the expected portion of the loan commitment that will be drawn down over its expected life. The ECL is then based on the present value of the expected shortfalls in cash flows if the loan is drawn down. The expected cash shortfalls are discounted at an approximation to the expected EIR on the loan. For an undrawn loan commitment, ECLs are calculated and presented under provisions.Other Financial assets:The Group follows 'simplified approach' for recognition of impairment loss allowance on other financial assets. The application of simplified approach does not require the Group to track changes in credit risk and calculated on case by case approach, taking into consideration different recovery scenarios.Based on Management's assessment of ECL on trade receivables/ other financial assets, the provisions are not material to financial statements (Nil as at March 31, 2021).45.2.1.6 Incorporation of forward looking statements in ECL modelThe Group considers a broad range of forward looking information with reference to external forecasts of economic parameters such as GDP growth, Inflation, Government Expenditure etc., as considered relevant so as to determine the impact of macro-economic factors on the Group’s ECL estimates. The inputs and models used for calculating ECLs are recalibrated periodically through the use of available incremental and recent information. Further, internal estimates of PD, LGD rates used in the ECL model may not always capture all the characteristics of the market / external environment as at the date of the financial statements. To reflect this, qualitative adjustments or overlays are made as temporary adjustments to reflect the emerging risks reasonably.Annual data from 2010 to 2026 (including forecasts for 5 years) were obtained from World Economic Outlook, October 2021 published by International Monetary Fund (IMF). IMF provides historical and forecasted data for important economic indicators country-wise. The data provided for India is used for the analysis. Macro variables that were compared against default rates at segment level to determine the key variables having correlation with the default rates using appropriate statistical techniques. Vasicek model has been incorporated to find the Point in Time (PIT) PD. The Group has formulated the methodology for creation of macro-economic scenarios under the premise of economic baseline, upside and downside condition. A final PIT PD is arrived as the scenario weighted PIT PD under different macroeconomic scenarios.
Note : 45 CAPITAL MANAGEMENT (Contd.)
Notes forming part of the Consolidated Financial Statements (Contd.) For the year ended March 31, 2022

254
Corporate Overview Financial StatementsManagement Reports
Note : 45 CAPITAL MANAGEMENT (Contd.)
Notes forming part of the Consolidated Financial Statements (Contd.) For the year ended March 31, 2022
Segment Macro-Economic Variables correlated for each segment
Heavy Commercial Vehicle Gross domestic product, current prices USD Inflation, end of period consumer prices
Light Commercial Vehicle Gross domestic product, current prices USD Inflation, end of period consumer prices
Car & MUV Gross domestic product, current prices USD Inflation, end of period consumer prices
Mini Light Commercial Vehicle Gross domestic product per capita, constant Inflation, end of period consumer prices prices USDUsed Vehicles General government total expenditure Gross domestic product per capita, constant prices USD
Shubh General government total expenditure Gross domestic product per capita, constant prices USD
Tractor Inflation, average consumer prices General government total expenditure
Construction Equipment Gross domestic product per capita, constant Gross domestic product, current prices USD prices USD
Loan Against Property Gross domestic product, current prices USD Inflation, end of period consumer prices
Home Loan Inflation, average consumer prices General government total expenditure
Since the company has used Gross Domestic Product (GDP) as a predominant macro economic variable the sensitivity around the same is given below
Year ended Increase/(Decrease) of GDP Impact on Expected Credit Losses (ECL)-Increase/(Decrease)
March 31,2022 Decrease by 5% 518
March 31,2022 Increase by 5% (535)
45.2.1.8 Concentration of credit risk and Collateral and Credit Enhancements
45.2.1.8(a) Concentration of credit risk
Concentration of credit risk arise when a number of counterparties or exposures have comparable economic characteristics, or such counterparties are engaged in similar activities or operate in same geographical area or industry sector so that collective ability to meet contractual obligations is uniformly affected by changes in economic, political or other conditions. The Group is in retail lending business on pan India basis targeting primarily customers who either do not get credit or sufficient credit from the traditional banking sector. Vehicle Finance (consisting of new and used Commercial Vehicles, Passenger Vehicles, Tractors, Construction Equipment and Trade advance to Automobile dealers) is lending against security (other than for trade advance) of Vehicle/ Tractor / Equipment and contributes to 69% of the loan book of the Group as of March 31, 2022 (72% as of March 31, 2021). Hypothecation endorsement is made in favour of the Group in the Registration Certificate in respect of all registerable collateral. Portfolio is reasonably well diversified across South, North, East and Western parts of the country. Similarly, sub segments within Vehicle Finance like Heavy Commercial Vehicles, Light Commercial Vehicles, Car and Multi Utility Vehicles, three wheeler and Small Commercial Vehicles, Refinance against existing vehicles, older vehicles (first time buyers), Tractors and Construction Equipment have portfolio share between 10% and 6% leading to well diversified sub product mix.
Loan Against Property is mortgage loan against security of existing immovable property (primarily self-occupied residential property) to self- employed non-professional category of borrowers and contributes to 22% of the lending book of the Group as of March 31, 2022 (22% as of March 31, 2021). Portfolio is concentrated in North 35% with small presence in East 5%. South has 35% and West contributes 25% of the overall exposure of the Group.
The Concentration of risk is managed by Group for each product by its region and its sub-segments. Group did not overly depend on few regions or sub-segments as of March 31, 2022.
45.2.1.8(b) Collateral and Credit enhancements
Although collateral can be an important mitigation of credit risk, it is the Group’s practice to lend on the basis of the customer’s ability to meet the obligations out of cash flow resources other than placing primary reliance on collateral and other credit risk enhancements.
The Group obtains first and exclusive charge on all collateral that it obtains for the loans given. Vehicle Finance and Loan Against Property are secured by collateral at the time of origination. In case of Vehicle loans, Group values the vehicle either through proforma invoice (for
45.2.1.7 Macro economic variables
` in lakhs

Corporate Overview Financial StatementsManagement Reports
255
Notes forming part of the Consolidated Financial Statements (Contd.) For the year ended March 31, 2022
new vehicles) or using registered valuer for used vehicles. In case of Loan Against Property loans, the value of the property at the time of origination will be arrived by obtaining two valuation reports from Group’s empanelled valuers.
Hypothecation endorsement is obtained in favour of the Group in the Registration Certificate of the Vehicle/ Tractor / Equipment funded under the vehicle finance category.
Immovable Property is the collateral for Loan Against Property. Security Interest in favour of the Group is created by Mortgage through deposit of title deed which is registered wherever required by law.
In respect of Other loans, Home loans follow the same process as Loan Against Property and pledge is created in favour for the Group for loan against securities.
99% of the Group’s term loan are secured by way of tangible Collateral.
In respect of some unsecured lending, the Group obtains First Loss Default Guarantee or similar arrangement from external service providers as partial cover against potential credit default.
Note : 45 CAPITAL MANAGEMENT (Contd.)
2,64,053 1,90,025 2,15,929 20,285 (1,62,186) 1,14,030
Maximum exposure to credit risk (a)
Fair value of collateral held against credit impaired assets - March 31,2022
Vehicles (b) Loan against property (c)
Other loans (d) Net exposure (e)=(a-b-c-d)
Associated ECL
Maximum exposure to credit risk (a)
Fair value of collateral held against credit impaired assets - March 31,2021
Vehicles (b) Loan against property (c)
Other loans (d) Net exposure (e)=(a-b-c-d)
Associated ECL
Note: Column (b), (c), (d) of the above table, represents fair value of collateral
Valuation of Collateral:a) Vehicles including construction equipment and tractors are valued at original cost less 20% depreciation per year on WDV b) Immovable property is valued based on the amount as per the valuation report at the time of sanctioning of loanc) Other loans – Book debts at Cost or Securities at market value
45.2.2 Market Risk
Market Risk is the possibility of loss arising from changes in the value of a financial instrument as a result of changes in market variables such as interest rates, exchange rates. The Group’s exposure to market risk is a function of asset liability management and interest rate sensitivity assessment. The Group is exposed to interest rate risk and liquidity risk, if the same is not managed properly. The Group continuously monitors these risks and manages them through appropriate risk limits. The Asset Liability Management Committee (ALCO) reviews market-related trends and risks and adopts various strategies related to assets and liabilities, in line with the Group’s risk management framework. ALCO activities are in turn monitored and reviewed by a board sub-committee. In addition, the Group has put in an Asset Liability Management (ALM) support group which meets frequently to review the liquidity position of the Group.
45.2.2.1 Liquidity Risk
Liquidity risk is defined as the risk that the Group will encounter difficulty in meeting obligations associated with financial liabilities that are settled by delivering cash or another financial asset. Liquidity risk arises because of the possibility that the Group might be unable to meet its payment obligations when they fall due as a result of mismatches in the timing of the cash flows under both normal and stress circumstances. Such scenarios could occur when funding needed for illiquid asset positions is not available to the Group on acceptable terms. To limit this risk, management has arranged for diversified funding sources and adopted a policy of availing funding in line with the tenor and repayment pattern of its receivables and monitors future cash flows and liquidity on a daily basis. The Group has developed internal control processes and contingency plans for managing liquidity risk. This incorporates an assessment of expected cash flows and the availability of unencumbered receivables which could be used to secure funding by way of assignment if required. The Group also has lines of credit that it can access to meet liquidity needs. These are reviewed by the Asset Liability Committee (ALCO) on a monthly basis. The ALCO provides strategic direction and guidance on liquidity risk management. A sub-committee of the ALCO, comprising members
` in lakhs
` in lakhs
3,30,532 2,33,024 2,40,987 23,823 (1,67,302) 1,26,650

256
Corporate Overview Financial StatementsManagement Reports
Foreign Nominal Carrying Maturity Date Changes in Changes in the value Line item Exchange Value of Hedging Value of Hedging Fair value of of Hedged Item in Balance Risk on Cash Instruments Instruments Hedging used as a basis for sheet Flow Hedge (No. of Contracts) (` in Lakhs) Instrument recognising hedge (` in lakhs) effectiveness (` in lakhs)
As at March 31, 2022
Asset Liability Asset Liability Cross Currency 6 0 10,809 - June 27, 2022 9,089 16,419 Borrowings Interest rate swap to June 20, 2028Overnight Index 0 2 - 282 October 23, 2022 (282) - Borrowings Swaps to March 20,2024Forward contracts 0 3 7,844 16,674 June 27, 2022 to 1,045 1,453 Borrowings June 20, 2028
45.3 Disclosure of Effects of Hedge Accounting Cash flow Hedge
from the Treasury and Risk functions, monitor liquidity risks on a weekly basis and decisions are taken on the funding plan and levels of investible surplus, from the ALM perspective. This sets the boundaries for daily cash flow management.
Analysis of Financial assets and Financial liabilities by remaining contractual maturities given in note 47.
45.2.2.2 Interest Rate Risk
The Group being in the business of lending raises money from diversified sources like market borrowings, term Loan from banks and financial institutions, foreign currency borrowings etc. Financial assets and liabilities constitute significant portion, changes in market interest rates can adversely affect the financial condition. The fluctuations in interest rates can be due to internal and external factors. Internal factors include the composition of assets and liabilities across maturities, existing rates and re-pricing of various sources of borrowings. External factors include macro-economic developments, competitive pressures, regulatory developments and global factors. The movement in interest rates (upward / downward) will impact the Net Interest Income depending upon rate sensitivity of the asset or liability. The Group uses traditional gap analysis report to determine the vulnerability to movements in interest rates. The Gap is the difference between Rate Sensitive Assets (RSA) and Rate Sensitive Liabilities (RSL) for each time bucket. A positive gap indicates that the Group can benefit from rising interest rates while a negative gap indicates that the Group can benefit from declining interest rates. Based on market conditions, the Group enters into interest rate swap to mitigate interest rate risk.
Notes forming part of the Consolidated Financial Statements (Contd.) For the year ended March 31, 2022Note : 45 CAPITAL MANAGEMENT (Contd.)
Year ended Increase/(Decrease) Impact on Profit beforex Tax
March 31, 2022 Increase by 100 bps (14,340)
March 31, 2022 Decrease by 100 bps 14,340
` in lakhs
45.2.2.3 Foreign Currency RiskForeign currency risk for the Group arise majorly on account of foreign currency borrowings. The Group manages this foreign currency risk by entering in to cross currency swaps and forward contract. When a derivative is entered in to for the purpose of being as hedge, the Group negotiates the terms of those derivatives to match with the terms of the hedge exposure. The Group holds derivative financial instruments such as Cross currency interest rate swap to mitigate risk of changes in exchange rate in foreign currency and floating interest rate.The Counterparty for these contracts is generally a bank. These derivative financial instruments are valued based on quoted prices for similar assets and liabilities in active markets or inputs that are directly or indirectly observable in market place.45.2.2.4 Hedging PolicyThe Group’s policy is to fully hedge its foreign currency borrowings at the time of drawdown and remain so till repayment and hence the hedge ratio is 1:1.
Year ended Increase/(Decrease) Impact on Profit before Tax
March 31, 2021 Increase by 100 bps (10,360)
March 31, 2021 Decrease by 100 bps 10,360

Corporate Overview Financial StatementsManagement Reports
257
Notes forming part of the Consolidated Financial Statements (Contd.) For the year ended March 31, 2022Note : 45 CAPITAL MANAGEMENT (Contd.)
Foreign Nominal Carrying Maturity Date Changes in Changes in the value Line item Exchange Value of Hedging Value of Hedging Fair value of of Hedged Item in Balance Risk on Cash Instruments Instruments Hedging used as a basis for sheet Flow Hedge (No. of Contracts) (` in Lakhs) Instrument recognising hedge (` in lakhs) effectiveness (` in lakhs)
As at March 31, 2021
Asset Liability Asset Liability Cross Currency 6 1 2,634 914 March 18, 2022 7,872 (11,025) Borrowings Interest rate swap to June 03, 2024 Forward contracts 0 26 1,953 11,828 March 21, 2022 9,875 5,041 Borrowings to June 03, 2024
Foreign exchange (4,521) - - NA risk and Interest rate risk
Cash flow Hedge Change in the value of Hedge Effectiveness Amount reclassified Line item affected in Hedging Instrument recognised in profit from Cash Flow Hedge Statement of Profit recognised in Other and loss Reserve to Profit or Loss and Loss because of Comprehensive Income the Reclassification (` in Lakhs)
Foreign exchange 16,197 - - NA risk and Interest rate risk
Cash flow Hedge Change in the value of Hedge Effectiveness Amount reclassified Line item affected in Hedging Instrument recognised in profit from Cash Flow Hedge Statement of Profit recognised in Other and loss Reserve to Profit or Loss and Loss because of Comprehensive Income (` in Lakhs) (` in Lakhs) the Reclassification (` in Lakhs)
Year ended March 31, 2022
` in lakhs
` in lakhs
Value of Investment in Joint Venture 45,001 Less: Cumulative Share of Loss of from Joint venture (442)Closing value of Investment 44,559
Current assets 4,025 Non-current assets 5,033 Current liabilities (5,239)Non-current liabilities (152)Equity 3,667 Proportion of the Group’s ownership 74%Group's share in the Equity of the Joint venture 2,714
Particulars As at March 31, 2022
Particulars March 31, 2022
Note 46 : (i) INVESTMENT IN JOINT VENTUREThe Group has acquired equity shares of Payswiff Technologies Private Limited (Payswiff), from its founders and other existing shareholders towards strategic investment in the equity shares of Payswiff up to a sum not exceeding ̀ 450 Crores in one or more tranches. This will result in the Group holding up to 73.84% of the equity capital of Payswiff. Payswiff is engaged in the business of enabling online payment gateway services for e-commerce businesses and provides e-commerce solutions. Payswiff is an omni channel payment transaction solution that lets business owners accept payments from their customers in-store, at home deliveries, online, and on-the-go using mPOS and POS solution
Even though, the Group holds 73.82% of the paid up equity capital of payswiff, however, in view of founder reserved matters and dispute resolution mechanism envisaged in the shareholder agreement executed between the Group and founders of payswiff, the Group is considered to have joint control over the entity as per Ind AS 28 read with IND AS 110. Hence it is classified as investment in Joint venture
As at March 31, 2021

258
Corporate Overview Financial StatementsManagement Reports
Notes forming part of the Consolidated Financial Statements (Contd.) For the year ended March 31, 2022Note : 46 (ii) INVESTMENT IN AN ASSOCIATESa) The Group had recognised the value of investment in associate - White Data Systems India Private Limited (WDSI) at fair value on the date of loss of control and the same is carried at cost as at reporting date.
The Group has a 30.87% interest in White Data Systems India Private Limited, which is in the business of providing freight data solutions encompassing technology, certification and finance offering in India. The WDSI has dedicated logistics platform “i-loads”, seamlessly connects load providers, logistics agents, brokers and transporters through its disruptive technology. It is accounted for using the equity method in the consolidated financial statements. The following table illustrates the summarised financial information of the Group’s investment in White Data Systems India Private Limited:
` in lakhs
` in lakhs
Value of Investment in Subsidiary on the date of loss of control 2,554 2,554 Less: Cumulative Share of Loss of from Associate (152) (130)Closing value of Investment 2,402 2,424
Current assets 1,954 2,483Non-current assets 2,422 1,713Current liabilities (921) (700)Non-current liabilities (60) (47)Equity 3,395 3,449 Proportion of the Group’s ownership 30.87% 30.87%Group's share in the Equity of the associate 1,048 1,065
Particulars As at As at March 31, 2022 March 31, 2021
Particulars March 31, 2022 March 31, 2021
Revenue from contracts with customers 461 Other Income 200 Depreciation & amortization 190 Finance cost 23 Employee benefit 142 Other expense 278 Profit before tax 28Deferred tax reversal 8 Profit for the year (continuing operations) 36Other comprehensive loss that may be reclassified to profit or loss in subsequent periods, net of tax Other comprehensive income that will not be reclassified to profit or loss in the subsequent periods, net of tax (5) Total comprehensive income for the year (continuing operations) 31Group’s share of profit for the year 11Adjustment relating to prior periods (33)Group’s share of loss considered in the consolidated statement of Profit and loss for the year ended March 31, 2022 (22)
Particulars Year ended March 31, 2022
` in lakhs
The associate has no contingent liabilities or capital commitments as at March 31, 2022 and March 31, 2021.
b) Vishwakarma Payments Private Limited (VPPL) is a consortium of 7 entities formed for the purpose of applying to the Reserve Bank of India (RBI) for an NUE (New Umbrella Entity) license within the framework of RBI circular. The licensed NUE is to focus on retail payment systems by developing interoperable infrastructure which will cater to banks and non-banks and enable innovative use-cases to solve the diversity, depth and width of consumers and small businesses in India. VPPL is incorporated with an equity capital of ` 1 lakh and its networth as March 31, 2022 is ` 1 lakh. It can commence operations only on receipt of license from RBI. The Group holds 21% stake in VPPL.
c) The Group had recognised the value of investment in associate - Paytail Commerce Private Limited (Paytail) at amortised Cost. The Group has acquired 16.29% of the Equity Share Capital of Paytail Commerce Private Limited in September 2021. By virtue of the voting and other rights as per the share purchase agreement, Paytail Commerce Private Limited has been assessed as an associate of the Group.

Corporate Overview Financial StatementsManagement Reports
259
Notes forming part of the Consolidated Financial Statements (Contd.) For the year ended March 31, 2022
Operating Income 256Expenses 767Profit before tax (511)Income tax expense -Profit for the year (continuing operations) (511)Other comprehensive loss that may be reclassified to profit or loss in subsequent periods, net of taxOther comprehensive income that will not be reclassified to profit or loss in the subsequent periods, net of tax -Total comprehensive income for the year (continuing operations) (511)Group’s share of loss for the year (74)Adjustment relating to prior periods - Group’s share of loss considered in the consolidated statement of Profit and loss for the year ended March 31, 2022 (74)
Particulars Year ended March 31, 2022
Note : 47
Note : 47.1 FAIR VALUE OF FINANCIAL INSTRUMENTS
Set out below is a comparison, by class, of the carrying amounts and fair values of the Group’s financial instruments that are not carried at fair value in the financial statements. This table does not include the fair values of non–financial assets and non–financial liabilities.
Note : 46 INVESTMENT IN AN ASSOCIATE (Contd.) ` in lakhs
Value of investment in Associate 975Less: Cumulative Share of Loss of from Associate (74)Closing value of Investment 901
Current assets 330Non-current assets 470Current liabilities -Non-current liabilities (7)Equity 793 Proportion of the Group’s ownership 16.29%Group's share in the Equity of the associate 129
Particulars As at March 31, 2022
Particulars March 31, 2022
` in lakhs
Financial Assets
Cash and Cash Equivalents 2,69,884 2,69,884 1,48,036 1,48,738
Bank balances Other than Cash and Cash Equivalents 1,60,300 1,60,300 3,79,941 3,79,239
Receivables
i) Trade Receivables 7,131 7,131 5,660 5,660
ii) Other Receivables 8,964 8,963 4,211 4,211
Loans 74,14,471 75,16,453 65,83,934 68,38,189
Investments other than associates 1,57,643 1,38,665 1,55,925 1,48,239
Other Financial Assets 33,522 36,748 56,804 59,445
Total Financial Assets 80,51,915 81,38,144 73,34,511 75,83,721
Particulars March 31, 2022 March 31, 2021 Carrying Fair Carrying Fair Value Value Value Value

260
Corporate Overview Financial StatementsManagement Reports
The Management assessed that cash and cash equivalents, bank balance other than Cash and cash equivalents, receivable, other financial assets, payables and other financial liabilities approximates their carrying amount largely due to short term maturities of these instruments.
Note 47.2 Fair value hierarchy
The fair value of the financial assets and liabilities is included at the amount at which the instrument could be exchanged in a current transaction between willing parties, other than in a forced or liquidation sale. The following methods and assumptions were used to estimate the fair values of financial assets or liabilities.i) Derivatives are fair valued using market observable rates and publishing pricesii) The fair value of loans have estimated by discounting expected future cash flows using discount rate equal to the rate near to the
reporting date of the comparable product.iii) The fair value of debt securities, borrowings other than debt securities and subordinated liabilities have estimated by discounting
expected future cash flows discounting rate near to report date based on comparable rate / market observable data.iv) The fair values of quoted equity investments are derived from quoted market prices in active markets.v) The fair value of investment in Government securities are derived from rate near to the reporting date of the comparable product.
Notes forming part of the Consolidated Financial Statements (Contd.) For the year ended March 31, 2022
` in lakhs
Financial Liabilities
Payables
i) Trade Payables - Due to MSME 306 306 - -
ii) Trade Payables - Other than MSME 12,453 12,453 9,859 9,859
iii) Other Payables 72,000 72,212 54,278 54,278
Debt Securities 13,32,110 13,32,560 12,35,767 12,36,047
Borrowings (Other than Debt Securities) 52,00,452 52,48,454 47,18,226 47,15,550
Subordinated Liabilities 3,84,788 3,86,858 4,19,006 4,20,811
Other Financial Liabilities 33,952 33,951 34,592 34,592
Total Financial Liabilities 70,36,061 70,86,794 64,71,728 64,71,137
Particulars March 31, 2022 March 31, 2021 Carrying Fair Carrying Fair Value Value Value Value
Note : 47.1 FAIR VALUE OF FINANCIAL INSTRUMENTS (Contd.)
` in lakhs
Assets measured at Fair valueFVTOCI Equity Instruments 2,688 2,688 - - FVTPL Equity Instruments 600 - - 600 Derivative financial instruments 18,653 - 18,653 - Assets for which fair values are disclosed Loans 74,14,471 - 75,16,453 Investments in Government Securities 1,57,643 - 1,46,905 - Investment Properties * 13 - - 304
Carrying Quoted price in Significant Significant Value active markets observable unobservable (Level 1) inputs inputs (Level 2) (Level 3)
Fair value measurement usingParticulars
The following table provides the fair value measurement hierarchy of the Group's financial assets and financial liabilities
Quantitative disclosure fair value measurement hierarchy of assets as at March 31, 2022
There have been no transfers between different levels during the period.* Fair value of investment property is calculated based on valuation given by external independent valuer.

Corporate Overview Financial StatementsManagement Reports
261
` in lakhsQuantitative disclosure fair value measurement hierarchy of liabilities as at March 31, 2022
There have been no transfers between different levels during the period.
Quantitative disclosure fair value measurement hierarchy of assets as at March 31, 2021
Liabilities measured at Fair valueDerivative financial instruments 16,956 - 16,956 - Liabilities for which fair values are disclosedDebt Securities 13,32,110 - 13,32,560 - Borrowings (Other than Debt Securities) 52,00,452 - 52,48,454 - Subordinated Liabilities 3,84,788 - 3,86,858 -
Assets measured at Fair valueFVTOCI Equity Instruments 1,046 1,046 - Derivative financial instruments 288 - 288 Derivative financial instruments 4,587 - 4,587 - Assets for which fair values are disclosedLoans 65,83,934 - 68,38,189 Investment in Government Securities 1,55,925 1,46,905 Investment Properties * 14 - - 304
Carrying Quoted price in Significant Significant Value active markets observable unobservable (Level 1) inputs inputs (Level 2) (Level 3)
Fair value measurement usingParticulars
` in lakhs
There have been no transfers between different levels during the period.* Fair value of investment property is calculated based on valuation given by external independent valuer.
Carrying Quoted price in Significant Significant Value active markets observable unobservable (Level 1) inputs inputs (Level 2) (Level 3)
Fair value measurement usingParticulars
Note : 47.2 FAIR VALUE HIERARCHY (Contd.)
Notes forming part of the Consolidated Financial Statements (Contd.) For the year ended March 31, 2022
Quantitative disclosure fair value measurement hierarchy of liabilities as at March 31, 2021 ` in lakhs
There have been no transfers between different levels during the period.
Liabilities measured at Fair valueDerivative financial instruments 12,742 - 12,742 - Liabilities for which fair values are disclosed Debt Securities 12,35,767 - 12,36,407 - Borrowings (Other than Debt Securities) 47,18,226 - 47,15,550 - Subordinated Liabilities 4,19,006 - 4,20,811 -
Carrying Quoted price in Significant Significant Value active markets observable unobservable (Level 1) inputs inputs (Level 2) (Level 3)
Fair value measurement usingParticulars
Note 47.3 Summary of Financial assets and liabilities which are recognised at amortised cost
47.4 Refer Note 15 for sensitivity analysis for investment property, whose fair value is disclosed under the level 3 category.
` in lakhs
Financial AssetsCash and Cash Equivalents 2,69,884 1,48,036 Bank balances other than Cash and Cash Equivalents 1,60,300 3,79,941 Loans 74,13,721 65,83,934 Investments other than associates 1,57,643 1,55,925 Other Financial Assets 33,522 56,804 Financial Liabilities Debt Securities 13,32,110 12,35,767 Borrowings (Other than Debt Securities) 52,00,452 47,18,226 Subordinated Liabilities 3,84,788 4,19,006 Other Financial liabilities 33,952 34,592
Particulars March 31, 2022 March 31, 2021

262
Corporate Overview Financial StatementsManagement Reports
Note : 48 ANALYSIS OF FINANCIAL ASSETS AND FINANCIAL LIABILITIES BY REMAINING CONTRACTUAL MATURITIES
` in lakhs
Financial AssetsCash and Cash Equivalents 2,67,881 - - - - - - 2,67,881 Bank balances other than Cash 1,19,461 877 1,807 6,576 20,453 11,188 6,913 1,67,275 and Cash EquivalentsDerivative financial instruments - 7,512 42 - 3,297 - 7,802 18,653 Receivables i) Trade Receivables 7,131 - - - - - - 7,131 ii) Other Receivables 9,554 - - - - - - 9,554 Loans 5,05,483 6,05,792 7,51,804 14,11,269 38,93,382 15,27,171 22,97,827 1,09,92,728 Investments i) Associate and Joint Venture - - - - - - 47,862 47,862 ii) Others - 1,136 3,722 4,857 20,028 19,428 1,13,876 1,63,047 Other Financial Assets 2,741 2,270 2,853 5,018 12,724 6,527 7,522 39,655 Total Undiscounted financial assets 9,12,251 6,17,587 7,60,228 14,27,720 39,49,884 15,64,314 24,81,802 1,17,13,786 financial assetsFinancial LiabilitiesDerivative financial instruments - 481 593 1,093 5,541 5,862 3,387 16,957 Payables
Particulars Upto 1 to 3 3 to 6 6 to 12 1 to 3 3 to 5 More than Total 1 month months months months years years 5 years
As at March 31, 2022
Notes forming part of the Consolidated Financial Statements (Contd.) For the year ended March 31, 2022
(I) Trade Payables - - - - - - - i) Total outstanding dues of 306 - - - - - - 306 micro and small enterprises ii) Total outstanding dues of 13,043 - - - - - - 13,043 creditors other than micro and small enterprises (II) Other Payables i) Total outstanding dues of - - - - - - - - micro and small enterprises ii) Total outstanding dues of 71,997 - - - 3 - - 72,000 creditors other than micro and small enterprises Debt Securities 83,327 1,35,620 1,48,533 2,74,480 6,85,141 1,18,828 - 14,45,929 Borrowings (Other than Debt 1,62,933 4,28,998 6,07,371 8,85,678 26,25,680 9,79,335 70,401 57,60,396 Securities) Subordinated Liabilities 274 6,788 24,079 44,604 1,37,511 67,562 14,37,012 17,17,830 Other Financial Liabilities 22,901 969 1,381 2,304 6,603 1,456 - 35,614 Total Undiscounted financial liabilities 3,54,781 5,72,856 7,81,957 12,08,159 34,60,479 11,73,043 15,10,800 90,62,075 Total net Undiscounted financial assets/(liabilities) 5,57,470 44,731 (21,729) 2,19,561 4,89,405 3,91,271 9,71,002 26,51,711

Corporate Overview Financial StatementsManagement Reports
263
` in lakhs
Financial Assets Cash and Cash Equivalents 1,59,322 - - - - - 1,59,322 Bank balances other than 96,373 1,02,355 1,36,807 4,033 13,043 10,571 11,444 3,74,626 Cash and Cash EquivalentsDerivative financial instruments - - - - - - 4,587 4,587 Receivables i) Trade Receivables 5,660 - - - - - - 5,660 ii) Other Receivables 4,211 - - - - - - 4,211 Loans 5,02,874 5,38,796 7,04,685 13,47,385 37,59,707 13,26,678 19,71,659 1,01,51,784 Investments i) Associate - - - - - - 2,424 2,424 ii) Others - 1,135 3,722 4,857 19,716 19,428 1,07,068 1,55,926 Other Financial Assets 4,605 12,851 4,368 7,535 18,303 10,630 10,810 69,102 Total Undiscounted financial 7,73,045 6,55,137 8,49,582 13,63,810 38,10,769 13,67,307 21,07,992 1,09,27,642 assetsFinancial Liabilities Derivative financial instruments - - - - - - 12,742 12,742 Payables - - - - - - - (I) Trade Payables - - - - - - - i) Total outstanding dues of - - - - - - - micro and small enterprises ii) Total outstanding dues of 9,859 - - - - - - 9,859 creditors other than micro and small enterprises(II) Other Payables - - - - - - - i) Total outstanding dues of - - - - - - - - micro and small enterprises ii) Total outstanding dues of 54,278 - - - - - - 54,278 creditors other than micro and small enterprisesDebt Securities 1,13,137 2,70,683 1,08,618 1,48,066 5,52,907 1,60,428 2,712 13,56,551 Borrowings (Other than Debt Securities) 1,59,219 3,08,806 7,48,826 7,09,140 25,22,320 6,94,544 1,10,157 52,53,012 Subordinated Liabilities 273 37,967 12,769 78,271 1,66,250 76,319 15,33,381 19,05,230 Other Financial Liabilities 41,066 913 1,302 2,069 10,402 583 - 56,335 Total Undiscounted 3,77,832 6,18,369 8,71,515 9,37,546 32,51,879 9,31,874 16,58,992 86,48,007 financial liabilitiesTotal net Undiscounted) 3,95,213 36,768 (21,933) 4,26,264 5,58,890 4,35,433 4,49,000 22,79,635 financial assets/(liabilities)
Particulars Upto 1 to 3 3 to 6 6 to 12 1 to 3 3 to 5 More than Total 1 month months months months years years 5 years
As at March 31, 2021
Notes forming part of the Consolidated Financial Statements (Contd.) For the year ended March 31, 2022Note : 48 ANALYSIS OF FINANCIAL ASSETS AND FINANCIAL LIABILITIES BY REMAINING CONTRACTUAL MATURITIES (Contd.)
Note : 49 DISCLOSURES IN CONNECTION WITH IND AS 116 - LEASES
The Group has taken office premises on lease for its operations.
The Group’s obligations under its leases are secured by the lessor’s title to the leased assets. Generally, the Group is restricted from assigning and subleasing the leased assets and some contracts require the Group to maintain certain financial ratios. There are several lease contracts that include extension and termination options and variable lease payments, which are further discussed below.
The Group also has certain leases of machinery with lease terms of 12 months or less. The Group applies the ‘short-term lease’ recognition exemptions for these leases.
Set out below are the carrying amounts of lease liabilities included under financial liabilities and right to use asset included in Property, Plant and Equipment and the movements during the period:

264
Corporate Overview Financial StatementsManagement Reports
Other Disclosures(i) Movement in the carrying value of the Right to Use Asset
(ii) Classification of current and non current liabilities of the lease liabilities
` in lakhs
Opening Balance 7,922 11,030 Depreciation charge for the Period (4,470) (4,634) Additions during the Period 7,041 1,563 Adjustment/Deletion (527) (37) Closing Balance 9,966 7,922
Current liablities 4,709 4,450 Non Current Liabilities 6,327 4,803 Total Lease liabilities 11,036 9,253
Particulars - Buildings As on As on March 31, 2022 March 31, 2021
Particulars As on As on March 31, 2022 March 31, 2021
Notes forming part of the Consolidated Financial Statements (Contd.) For the year ended March 31, 2022Note : 49 DISCLOSURES IN CONNECTION WITH IND AS 116 - LEASES (Contd.)
(iii) Movement in the carrying value of the Lease Liability
(iv) Contractual Maturities of Lease liability outstanding
(v) The following are the amount recognised in the Profit or Loss statement
Opening Balance 9,253 12,425 Interest Expense 884 958 Lease Payments [Total Cash Outflow] (5,470) (5,026) Short term rent concession (112) (630) Additions during the year 7,041 1,563 Adjustment/Deletion (560) (37) Closing Balance 11,036 9,253
Less than one year 5,013 4,618 One to five Years 7,691 5,780 Total 12,704 10,398
Depreciation expense of right-of-use assets 4,470 4,634 Interest expense on lease liabilities 884 958 Expense relating to short-term leases (included in other expenses) -112 3 Expense relating to leases of low-value assets (included in other expenses) - Variable lease payments (included in other expenses) - Total amount recognised in profit or loss 5,242 5,595
Lease expenses relating to short term leases aggregated to ` 119 Lakhs during the year ended March 31, 2022
Lease liabilities are recognised at weighted average incremental borrowing rate ranging from 8% to 12%.
The Group does not face a significant liquidity risk with regard to its lease liabilities as the current assets are sufficient to meet the obligations related to the lease liabilities as and when they fall due.
The Group has several lease contracts that includes extension and termination contracts. These options are negotiated by the Management to provide flexibility in managing the leased-asset portfolio and align with Group's business needs. Management exercises significant judgement in determining whether these extension and termination are reasonably certain to be exercised.
The Group has not defaulted in its lease obligations
Particulars As on As on March 31, 2022 March 31, 2021
Particulars As on As on March 31, 2022 March 31, 2021
Particulars For the Year ended For the Year ended March 31, 2022 March 31, 2021

Corporate Overview Financial StatementsManagement Reports
265
` in lakhs
I. ParentCholamandalam Investment and Finance Company Limited 95% 11,16,752 100% 2,14,522 89% 12,123 99% 2,26,645 II. Subsidiaries Cholamandalam Securities Limited 0% 5,762 0% 548 10% 1,336 1% 1,884 Cholamandalam Home Finance Limited 1% 6,223 0% 819 1% 168 0% 987 Minority Interests in all subsidiaries 0% 0 0% 0 0% 0 0% - III. Joint Venture (Investment as per equity method) Payswiff Technologies Private Limited 4% 44,560 0% (441) 0% 0 0% (441)IV. Associates (Investment as per equity method) White Data Systems India Private Limited 0% 2,702 0% (22) 0% 0 0% (22)Vishvakarma Payments Private Limited 0% 0 0% 0 0% 0 0% 0Paytail Commerce Private Limited 0% 901 0% (75) 0% 0 0% (75) 100% 11,76,900 100% 2,15,351 100% 13,627 100% 2,28,978
I. ParentCholamandalam Investment 99% 9,48,743 100% 1,51,410 119% (3,478) 99% 1,47,932 and Finance Company LimitedII. SubsidiariesCholamandalam Securities Limited 0% 3,437 0% 492 -6% 175 0% 667 Cholamandalam Home 1% 5,376 0% 236 -13% 379 0% 615 Finance LimitedMinority Interests in all 0% 0 0% 0 0% 0 0% - subsidiariesIII. Associates (Investment as per equity method) White Data Systems 0% 2,424 0% (53) 0% 0 0% (53)India Private LimitedVishvakarma Payments 0% 0 0% 0 0% 0 0% 0Private Limited 100% 9,59,980 100% 1,52,085 100% (2,924) 100% 1,49,161
Name of the As % of As % of As % of As % of entities Consolidated Consolidated Consolidated Consolidated Net Assets Profit and Loss Other Total Comprehensive Comprehensive Amount Amount Income Amount Income Amount
Name of the As % of As % of As % of As % of entities Consolidated Consolidated Consolidated Consolidated Net Assets Profit and Loss Other Total Comprehensive Comprehensive Amount Amount Income Amount Income Amount
Net Assets (i.e total assets less total liabilities)
Net Assets (i.e total assets less total liabilities)
Share in Profit and Loss
Share in Profit and Loss
Other Comprehensive Income
Other Comprehensive Income
Total Comprehensive Income
Total Comprehensive Income
As at March 31, 2022
As at March 31, 2021
Note : 50 ADDITIONAL INFORMATION AS REQUIRED BY PARAGRAPH 2 OF THE GENERAL INSTRUCTIONS FOR PREPARATION OF CONSOLIDATED FINANCIAL STATEMENTS TO SCHEDULE III TO THE COMPANIES ACT, 2013 AS AT AND FOR THE YEAR ENDED MARCH 31, 2022 AND MARCH 31, 2021
Notes forming part of the Consolidated Financial Statements (Contd.) For the year ended March 31, 2022

266
Corporate Overview Financial StatementsManagement Reports
Notes forming part of the Consolidated Financial Statements (Contd.) For the year ended March 31, 2022Note : 51ADDITIONAL DISCLOSURES UNDER SCHEDULE III DIVISION III Part 1 -Ageing AnalysisA. Trade Receivables ageing schedule as on March 31,2022 ` in lakhs
(i)Undisputed Trade receivables -considered good 7,005 54 1 23 - 7,083 (ii) UndisputedTrade Receivables - which have - - - - - -significant increase in credit risk (iii) Undisputed 2 5 4 5 32 48Trade Receivables - credit impaired (iv) Disputed TradeReceivables - considered good - - - - - -(v) Disputed Trade Receivables – - - - - - -which have significant increase in credit risk (vi) Disputed Trade Receivables – - - - - - -credit impaired Total 7,007 59 5 28 32 7,131
(i)Undisputed Trade receivables -considered good 5,363 253 - - 5,616 (ii) Undisputed - - - - - -Trade Receivables - which have significant increasein credit risk (iii) Undisputed 1 4 5 9 25 44Trade Receivables - credit impaired (iv) Disputed Trade - - - - - -Receivables - considered good (v) Disputed Trade Receivables – - - - - - -which have significant increase in credit risk (vi) Disputed Trade Receivables – - - - - - -credit impaired
Total 5,364 257 5 9 25 5,660
Particulars Less than 6 6 Months 1-2 years 2-3 years More than Total Months to 1 Year 3 years
Outstanding for following periods from due date of transaction
B. Trade Receivables ageing schedule as on March 31, 2021
Particulars Less than 6 6 Months 1-2 years 2-3 years More than Total Months to 1 Year 3 years
Outstanding for following periods from due date of transcation

Corporate Overview Financial StatementsManagement Reports
267
Notes forming part of the Consolidated Financial Statements (Contd.) For the year ended March 31, 2022Note : 51 ADDITIONAL DISCLOSURES UNDER SCHEDULE III DIVISION III (Contd.)C. CWIP ageing schedule as on March 31,2022
` in lakhs
Projects in Progress 2,303 2,303
Projects Temporarily Suspended - - - - -
Capital-work-in-progress Less than 1 year 1-2 years 2-3 years More than Total 3 years
Amount in CWIP for a period of
D. Intangible assets under development ageing schedule as on March 31, 2022
Projects in Progress 1,017 284 85 46 1,432
Projects Temporarily Suspended -
Less than 1 year 1-2 years 2-3 years More than Total 3 years
Amount in Intangible assets under development for a period ofIntangible assets under development
Note: The amount pertains to one project which is expected to be completed by Dec 2022
E. Intangible assets under development ageing schedule as on March 31, 2021
Projects in Progress 478 338 141 34 991
Projects Temporarily Suspended -
Less than 1 year 1-2 years 2-3 years More than Total 3 years
Amount in Intangible assets under development for a period of
F. Trade Payables ageing schedule as on March 31, 2022
(i) MSME 306 306
(ii) Others 12,402 5 7 39 12,453
(iii) Disputed dues - MSME -
(iv) Disputed dues - Others -
Total 12,708 5 7 39 12,759
Particulars Less than 1 year 1-2 years 2-3 years More than Total 3 years
Outstanding for following periods from due date of Transaction
G. Trade Payables ageing schedule as on March 31, 2021
(i) MSME -
(ii) Others 9,671 12 22 37 9,742
(iii) Disputed dues - MSME -
(iv) Disputed dues - Others 117 117
Total 9,671 129 22 37 9,859
Particulars Less than 1 year 1-2 years 2-3 years More than Total 3 years
Outstanding for following periods from due date of Transaction
Intangible assets under development

268
Corporate Overview Financial StatementsManagement Reports
There have been no events after the reporting date that require disclosure in the financial statements.
Note : 51 ADDITIONAL DISCLOSURES UNDER SCHEDULE III DIVISION III
Note : 52 EVENTS AFTER REPORTING DATE
For Price Waterhouse LLP For and on behalf of the Board of DirectorsChartered AccountantsICAI Firm Regn No. : 301112E/ E30026 A.J. Shaikh Ravindra Kumar Kundu Vellayan SubbiahPartner Executive Director ChairmanMembership No. : 221268
For Sundaram and Srinivasan Chartered AccountantsICAI Firm Regn No. : 004207S
S. Usha P. Sujatha D. Arul SelvanPartner Company Secretary Chief Financial OfficerMembership No. : 211785
Date : May 5, 2022Place : Chennai
Part - II - Other DisclosuresNo proceedings have been initiated on or are pending against the group for holding benami property under the Benami Transactions (Prohibition) Act, 1988 (45 of 1988) and Rules made thereunder.
Group has not been declared wilful defaulter by any bank or financial institution or government or any government authority.
As per the information available, the Group has no transactions with the companies struck off under section 248 of the Companies Act, 2013 or section 560 of Companies Act, 1956.
There has been no charges or satisfaction yet to be registered with ROC beyond the statutory period.
The Group being an non-banking finance company, as part of its normal business, grants loans and advances to its customers, other entities and persons ensuring adherence to all regulatory requirements. Further, the company has also borrowed funds from banks, financial institutions in compliance with regulatory requirements in the ordinary course of business
Other than the transactions described above, no funds have been advanced or loaned or invested (either from borrowed funds or share premium or any other sources or kind of funds) by the Group to or in any other persons or entities, including foreign entities (“Intermediaries”) with the understanding, whether recorded in writing or otherwise, that the Intermediary shall lend or invest in party identified by or on behalf of the Group (Ultimate Beneficiaries). The Group has also not received any fund from any parties (Funding Party) with the understanding that the Group shall whether, directly or indirectly lend or invest in other persons or entities identified by or on behalf of the Funding Party (“Ultimate Beneficiaries”) or provide any guarantee, security or the like on behalf of the Ultimate Beneficiaries.
Group has not traded or invested in Crypto currency or Virtual Currency during the financial year ended March 31, 2022
Notes forming part of the Consolidated Financial Statements (Contd.) For the year ended March 31, 2022

Corporate Overview Financial StatementsManagement Reports
269
Form AOC-1(Pursuant to first proviso to sub-section (3) of section 129 read with rule 5 of Companies (Accounts) Rules, 2014)
Statement containing salient features of the financial statement of subsidiaries/ associate companies/ joint venturesPart “A”: Subsidiaries
Part “B”: Associates and Joint VenturesStatement pursuant to Section 129 (3) of the Companies Act, 2013 related to Associate Companies and Joint Ventures
Name of the subsidiary Cholamandalam Home Finance Limited Cholamandalam Securities Limited
Reporting period for the subsidiary concerned, if different from the holding company’s reporting period
March 31, 2022 March 31, 2022
Reporting currency and Exchange rate as on the last date of the relevant Financial year in the case of foreign subsidiaries.
Not applicable Not applicable
Share capital 4,240 2,250
Reserves & surplus 1,983 3,062
Total assets 6,879 11,096
Total Liabilities 656 5,784
Investments 1,442 1,850
Turnover 5,637 4,001
Profit/(Loss) before taxation 919 748
Provision for taxation 240 209
Profit/(Loss) after taxation 679 539
Proposed Dividend - -
% of shareholding 100.00% 100.00%
Names of subsidiaries which are yet to commence operations
Not applicable Not applicable
Names of subsidiaries which have been liquidated or sold during the year.
Not applicable Not applicable
` in lakhs
Name of Associates
White Data Systems India Private
Limited
Vishvakarma Payments
Private Limited
Paytail Commerce Private Limited
Payswiff Technologies Private Limited
Latest Balance Sheet Date March 31, 2022 March 31, 2022 March 31, 2022 March 31, 2022
Shares of Associate/Joint Ventures held by the company on the year end
No. 12,75,917 2,100 27,482 27,73,227
Amount of Investment in Associates/Joint Venture (` in lakhs)
800 0.21 975 45,001
Extend of Holding % 30.87% 21.00% 16.25% 73.84%
Description of how there is significant influence By way of shareholding
By way of shareholding
By way of shareholding and rights in share holding agreement
By way of shareholding and rights in share
holding agreement
Reason why the associate/joint venture is not consolidated
Not applicable Not applicable Not applicable Not applicable
Networth attributable to Shareholding as per latest Balance Sheet
1,048 1.00 129 2,714
Profit / (Loss) for the year - ` in lakhs 36 0* (511) (3,378)
Considered in Consolidation - ` in Lakhs 11 0* (74) (442)
Not Considered in Consolidation – ` in Lakhs 25 0* (437) (2,936)
Names of associates or joint ventures which are yet to commence operations
Not applicable Not applicable Not applicable Not applicable
Names of associates or joint ventures which have been liquidated or sold during the year.
Not applicable Not applicable Not applicable Not applicable
*represents amount less than ` 50,000
For and on behalf of the Board of Directors
Date : May 5, 2022 Vellayan Subbiah Ravindra Kumar Kundu D. Arul Selvan P. SujathaPlace : Chennai Chairman Executive Director Chief Financial Officer Company Secretary

270
Corporate Overview Financial StatementsManagement Reports
A. TERMSAssets Under Management (AUM) Business AUM and InvestmentsBusiness AUM On - Balance sheet Business assets and Off - Balance sheet Business assetsBusiness AUM(Net) Business AUM less Expected Credit Losses(ECL) provisionsNet credit Losses (NCL) Loan losses and ECL provision
C. INVESTOR RATIOSEarnings per Equity share Profit After Tax/Weighted Average number of sharesBook value per Equity share Networth/Total Number of SharesDividend per Equity share Interim Dividend paid & Final Dividend proposed per Equity shareCAR (Capital Adequacy Ratio) Tier I & Tier II Capital/Risk Weighted Assets
B. PERFORMANCE RATIOSOperating Expenses to Assets Total Expenses (Less: Finance Costs & Impairment of Financial Instruments)/Average
of Closing AssetsLoan Losses % Impairment of Financial instruments/Average of Closing AssetsPBT-ROTA Profit Before Tax/Average of Closing AssetsProt Before Tax to Income Profit Before Tax/Total IncomeReturn on Total Assets - PAT Profit After Tax/Average of Closing AssetsReturn on Equity - PAT Profit After Tax/Average of Shareholder's funds
Closing assets Represents Business AUM for Respective Business and represents on-balance sheet business assets and Investment at Company’s level for computing ratios

Corporate Overview Financial StatementsManagement Reports
271
Notes:

272
Corporate Overview Financial StatementsManagement Reports
E - mail : [email protected] | Website : www.cholamandalam.com


![nameless horizons [second edition]](https://img.dokumen.tips/doc/110x75/635753af3cd558f04e04c6ad/nameless-horizons-second-edition.jpg)