Embed Size (px)
Citation preview
EXECUTIVE SUMMARY
EXPANSION OF SUGARCANE CRUSHING CAPACITY FROM 4500 TCD
TO 7500 TCD, COGENERATION POWER PLANT CAPACITY FROM
14.75 MW TO 29.5 MW, AND ESTABLISHMENT OF 150 KLPD
DISTILLERY TO PRODUCE RECTIFIED SPIRIT/EXTRA NEUTRAL
ALCOHOL/ETHANOL BASED ON B”/C” HEAVY MOLASSES/
SUGARCANE JUICE/SYRUP/GRAINS
AT
MAHATMA PHULE NAGAR, TALUKA KANNAD, DISTRICT
AURAGNABAD, MAHARASHTRA -
BY
BARAMATI AGRO LIMITED (UNIT 2)
AREA:63.17 HECTARES
COST OF THE EXPANSION: Rs. 150 CR.
STANDARD TORS GRANTED: NO.IA-J-11011/81/2021-IA-II(I) DATED
17.04.2021
EXECUTIVE SUMMARY
1. 0 INTRODUCTION
Baramati Agro Limited (Unit 2) is a private limited company and is located at post Mahatma Phule
Nagar, Taluka Kannad, District Aurangabad. The industry is registered under the in the state of
Maharashtra under the Companies Act, 1956 Vide Registration Number 11-045873 dated 2nd
March 2006.
The industry started its first crushing operation in the year 2013 with the installed capacity of 2500 TCD.
The industry expanded its sugarcane crushing capacity from 2500 TCD to 4500 TCD and established
14.75 MW Cogeneration power plant to fulfill he power requirement of the sugar unit.
The command area is rich in sugarcane cultivation and has excellent irrigation facilities. Considering the
Sugarcane cultivation potential and the availability of sugarcane in the command area the industry
proposes to expand its sugarcane crushing capacity from 4500 TCD to 7500 TCD and Co-generation
power plant capacity from 14.75 MW to 29.5 MW in order to utilized additional bagasse generated after
the proposed expansion of sugar unit. The industry also proposes to establish 150 KLPD distillery to
consume the available molasses from its own sugar unit and utilize sugarcane juice/syrup/grains for the
production of RS/ENA/Ethanol. In the command area, the availability of Grains is also abundant and as
such Grains based distillery unit is also proposed of the same capacity of 150 KLPD for production of
RS/ENA/Ethanol as per demand.
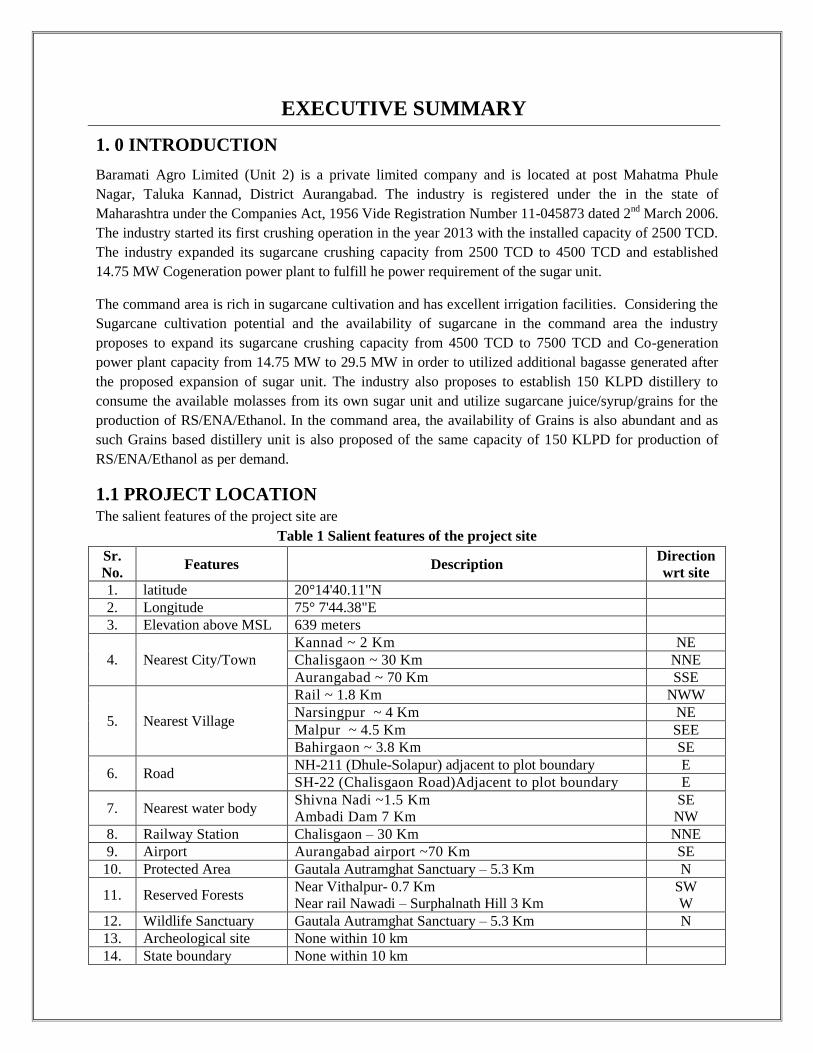
1.1 PROJECT LOCATION The salient features of the project site are
Table 1 Salient features of the project site
Sr.
No. Features Description
Direction
wrt site
1. latitude 20°14'40.11"N
2. Longitude 75° 7'44.38"E
3. Elevation above MSL 639 meters
4. Nearest City/Town
Kannad ~ 2 Km NE
Chalisgaon ~ 30 Km NNE
Aurangabad ~ 70 Km SSE
5. Nearest Village
Rail ~ 1.8 Km NWW
Narsingpur ~ 4 Km NE
Malpur ~ 4.5 Km SEE
Bahirgaon ~ 3.8 Km SE
6. Road NH-211 (Dhule-Solapur) adjacent to plot boundary E
SH-22 (Chalisgaon Road)Adjacent to plot boundary E
7. Nearest water body Shivna Nadi ~1.5 Km
Ambadi Dam 7 Km
SE
NW
8. Railway Station Chalisgaon – 30 Km NNE
9. Airport Aurangabad airport ~70 Km SE
10. Protected Area Gautala Autramghat Sanctuary – 5.3 Km N
11. Reserved Forests Near Vithalpur- 0.7 Km
Near rail Nawadi – Surphalnath Hill 3 Km
SW
W
12. Wildlife Sanctuary Gautala Autramghat Sanctuary – 5.3 Km N
13. Archeological site None within 10 km
14. State boundary None within 10 km

Sr.
No. Features Description
Direction
wrt site
15. Defense installations None within 10 km
16. Average Rainfall 502 mm
17. Seismicity II
2.0 PROJECT DESCRIPTION The details about the maufacturing capacity of existing unit as well as after the proposed expansion are
given in table below
Table 2 Existing and Proposed Products manufacturing quantities
Sr.
no. Description Unit
Existing
Capacity
Proposed
Capacity Total Remark
1. Sugar Unit TCD 4500 3000 7500
2 Co-generation Power MW 14.75 14.75 29.5
3. Distillery Unit KLPD 0 150 150
Rectified Spirit or
KLPD
150 150 Only one
product at
a time
Extra Neutral Alcohol or 150 150
Ethanol 150 150
2.1 RESOURCE REQUIREMENT AND INFRASTRUCTURE FACILITIES
A) Raw material requirement
The details of the raw material requirement for sugar and distillery unit and its source are given in table
below. The sugarcane is transported in bullock cart, Tractors etc and other chemicals are transported to
the site through designated vehicles by Pakka Roads. The other raw materials like bagasse and Molasses
are produced from its own sugar unit. Incase shortage of molasses, if any shall be purchased from nearby
sugar industries. Grains shall be purchased from farmers and transported to the site in designated vehicles
Sugar and Cogeneration power plant division
Table 3 Raw material requirement and its source for sugar unit
Sr.
No. Item
Quantity
Unit Source Existing as
per CTO Proposed Total
1 Sugar Cane 4500 3000 7500 MT/day Farmers
Consumable Chemicals
1 Sulfur 2500 1666.7 4116.7 Kg/Day
Open Market 2 Lime 6750 4500 11250 Kg/Day
3 Ortho phosphoric
Acid 315 210 525 Kg/Day
Utilities
1 Total Steam
Requirement 110 60 170 TPH
Own 110 TPH
existing Boiler =
Additional 60 TPH
Boiler
Sr.
No. Item
Quantity
Unit Source Existing as
per CTO Proposed Total
2 Fuel Bagasse 1175 640 1815 MT/Day Sugar unit
3 Water 0 0 0 CMD
4 Power 7 3 10 MW Own Co-generation
power plant
5 Manpower 480 440 920 Nos Local
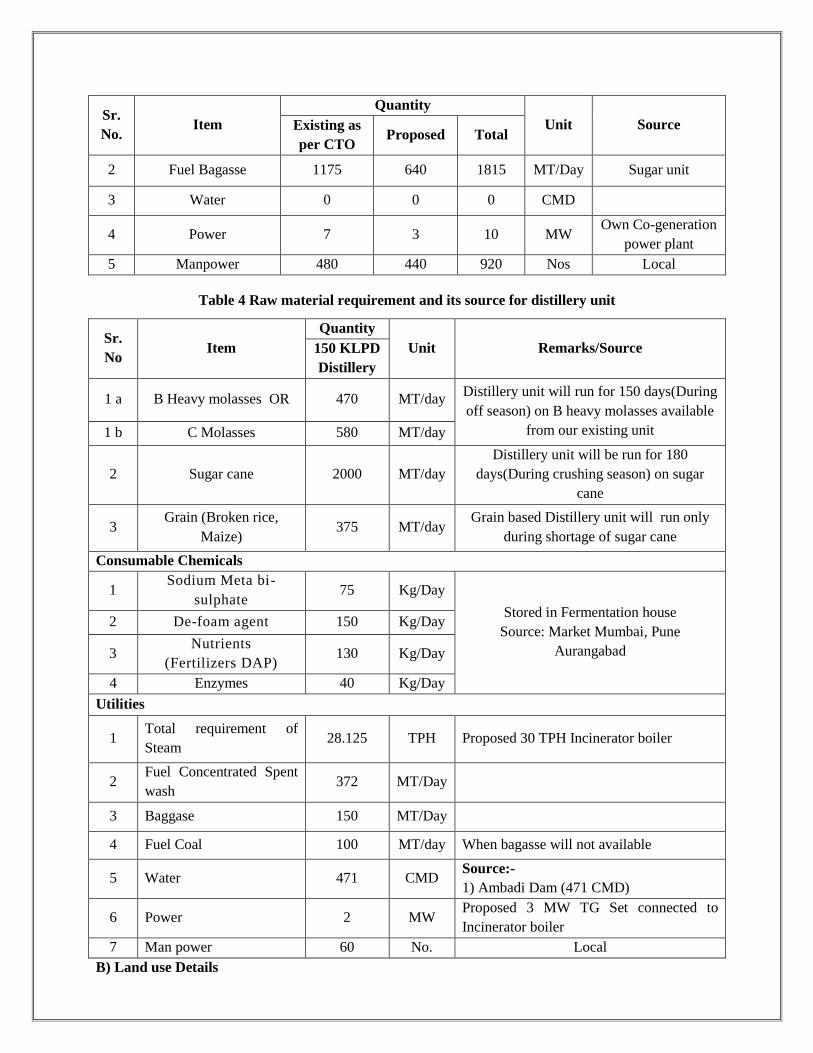
Table 4 Raw material requirement and its source for distillery unit
Sr.
No Item
Quantity
Unit Remarks/Source 150 KLPD
Distillery
1 a B Heavy molasses OR 470 MT/day Distillery unit will run for 150 days(During
off season) on B heavy molasses available
from our existing unit 1 b C Molasses 580 MT/day
2 Sugar cane 2000 MT/day
Distillery unit will be run for 180
days(During crushing season) on sugar
cane
3 Grain (Broken rice,
Maize) 375 MT/day
Grain based Distillery unit will run only
during shortage of sugar cane
Consumable Chemicals
1 Sodium Meta bi-
sulphate 75 Kg/Day
Stored in Fermentation house
Source: Market Mumbai, Pune
Aurangabad
2 De-foam agent 150 Kg/Day
3 Nutrients
(Fertilizers DAP) 130 Kg/Day
4 Enzymes 40 Kg/Day
Utilities
1 Total requirement of
Steam 28.125 TPH Proposed 30 TPH Incinerator boiler
2 Fuel Concentrated Spent
wash 372 MT/Day
3 Baggase 150 MT/Day
4 Fuel Coal 100 MT/day When bagasse will not available
5 Water 471 CMD Source:-
1) Ambadi Dam (471 CMD)
6 Power 2 MW Proposed 3 MW TG Set connected to
Incinerator boiler
7 Man power 60 No. Local
B) Land use Details
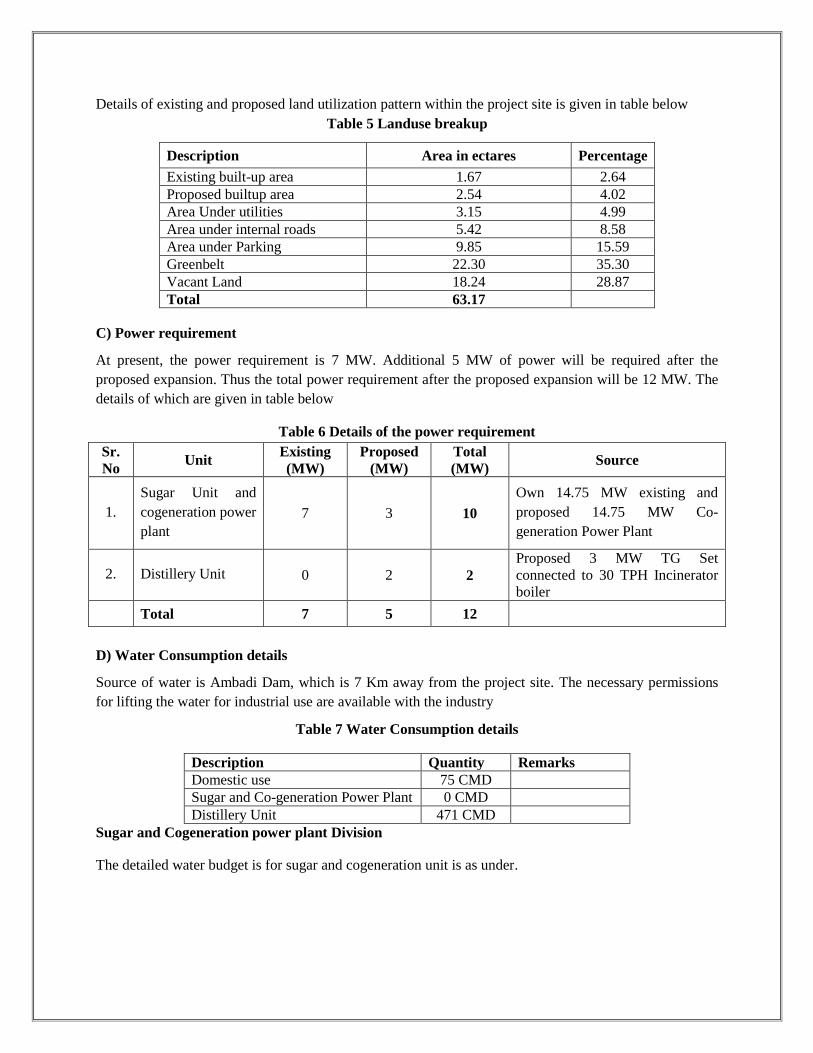
Details of existing and proposed land utilization pattern within the project site is given in table below
Table 5 Landuse breakup
Description Area in ectares Percentage
Existing built-up area 1.67 2.64
Proposed builtup area 2.54 4.02
Area Under utilities 3.15 4.99
Area under internal roads 5.42 8.58
Area under Parking 9.85 15.59
Greenbelt 22.30 35.30
Vacant Land 18.24 28.87
Total 63.17
C) Power requirement
At present, the power requirement is 7 MW. Additional 5 MW of power will be required after the
proposed expansion. Thus the total power requirement after the proposed expansion will be 12 MW. The
details of which are given in table below
Table 6 Details of the power requirement
Sr.
No Unit
Existing
(MW)
Proposed
(MW)
Total
(MW) Source
1.
Sugar Unit and
cogeneration power
plant
7 3 10
Own 14.75 MW existing and
proposed 14.75 MW Co-
generation Power Plant
2. Distillery Unit 0 2 2
Proposed 3 MW TG Set
connected to 30 TPH Incinerator
boiler
Total 7 5 12
D) Water Consumption details
Source of water is Ambadi Dam, which is 7 Km away from the project site. The necessary permissions
for lifting the water for industrial use are available with the industry
Table 7 Water Consumption details
Description Quantity Remarks
Domestic use 75 CMD
Sugar and Co-generation Power Plant 0 CMD
Distillery Unit 471 CMD
Sugar and Cogeneration power plant Division
The detailed water budget is for sugar and cogeneration unit is as under.

Figure-1 Water balance flow diagram for 7500 TCD Sugar unit
Excess Condensate to CPU
1575 MT
To Distillery Unit
265 MT
To reservoir
843 MT
Water from cane
5250 MT
Raw water intake
0.00 MT
Boiler Make-up
467 MT
Evaporation Loss
75 MT
Overflow
1000 MT
Spray Pond
1500- 1000 = 500 MT
Water Loss in Product/By-product
1297.5 MT
Waste Water
577.5 MT
SUGAR
MILL
Vent Loss
225 MT
Boiler Blow down
59 MT
ETP
1136.5 MT
Used as raw water
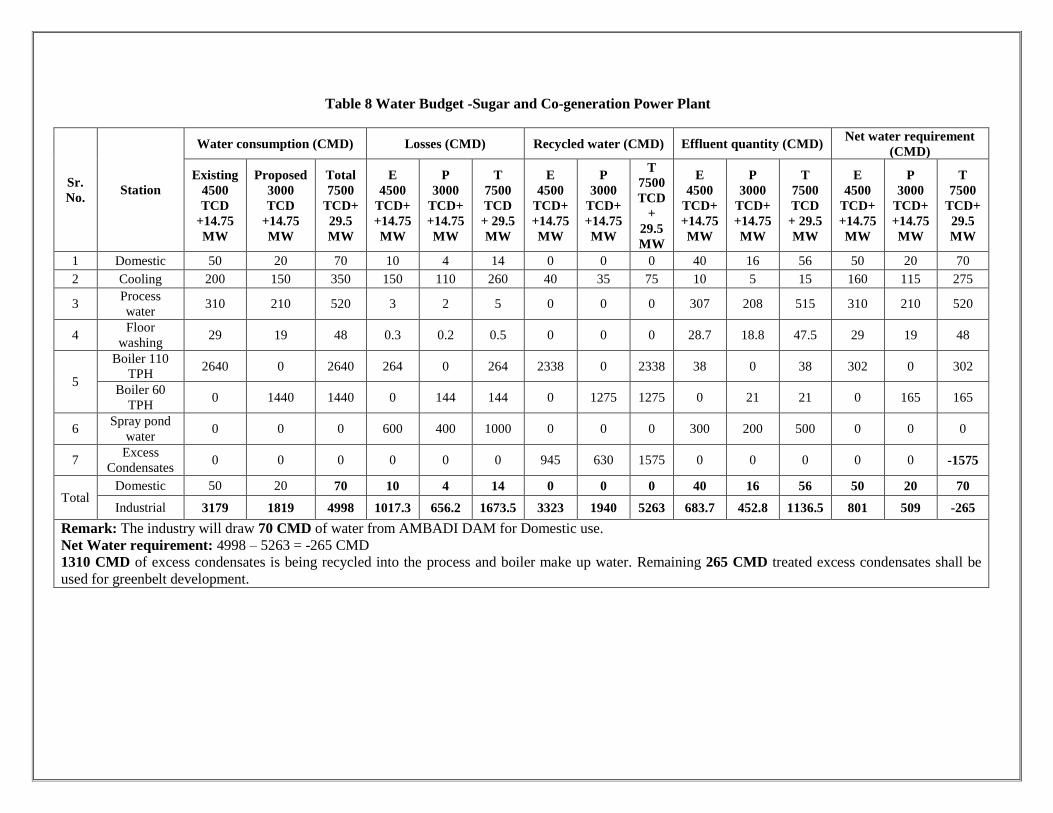
Table 8 Water Budget -Sugar and Co-generation Power Plant
Sr.
No. Station
Water consumption (CMD) Losses (CMD) Recycled water (CMD) Effluent quantity (CMD) Net water requirement
(CMD)
Existing
4500
TCD
+14.75
MW
Proposed
3000
TCD
+14.75
MW
Total
7500
TCD+
29.5
MW
E
4500
TCD+
+14.75
MW
P
3000
TCD+
+14.75
MW
T
7500
TCD
+ 29.5
MW
E
4500
TCD+
+14.75
MW
P
3000
TCD+
+14.75
MW
T
7500
TCD
+
29.5
MW
E
4500
TCD+
+14.75
MW
P
3000
TCD+
+14.75
MW
T
7500
TCD
+ 29.5
MW
E
4500
TCD+
+14.75
MW
P
3000
TCD+
+14.75
MW
T
7500
TCD+
29.5
MW
1 Domestic 50 20 70 10 4 14 0 0 0 40 16 56 50 20 70
2 Cooling 200 150 350 150 110 260 40 35 75 10 5 15 160 115 275
3 Process
water 310 210 520 3 2 5 0 0 0 307 208 515 310 210 520
4 Floor
washing 29 19 48 0.3 0.2 0.5 0 0 0 28.7 18.8 47.5 29 19 48
5
Boiler 110
TPH 2640 0 2640 264 0 264 2338 0 2338 38 0 38 302 0 302
Boiler 60
TPH 0 1440 1440 0 144 144 0 1275 1275 0 21 21 0 165 165
6 Spray pond
water 0 0 0 600 400 1000 0 0 0 300 200 500 0 0 0
7 Excess
Condensates 0 0 0 0 0 0 945 630 1575 0 0 0 0 0 -1575
Total Domestic 50 20 70 10 4 14 0 0 0 40 16 56 50 20 70
Industrial 3179 1819 4998 1017.3 656.2 1673.5 3323 1940 5263 683.7 452.8 1136.5 801 509 -265
Remark: The industry will draw 70 CMD of water from AMBADI DAM for Domestic use.
Net Water requirement: 4998 – 5263 = -265 CMD
1310 CMD of excess condensates is being recycled into the process and boiler make up water. Remaining 265 CMD treated excess condensates shall be
used for greenbelt development.

Distillery division
Table 9 Water consumption details for various raw materials
Sr.
No. Propose
Water consumption (CMD)
C Molasses B heavy
molasses Sugarcane juice/ syrup Grains
Domestic
1 Domestic 5 5 5 5
Industrial
1 Process 1350 1050 576 783
2 Boiler make up 87 87 87 87
3 Cooling tower makeup 200 200 200 200
4 Washings 35 35 35 35
Total 1672 1372 898 1105
Table 10 Wastewater generation details for various raw materials
Sr.
No. Propose
Wastewater Generation (CMD)
Remarks C
Molasses
B heavy
molasses
Sugarcane
juice/ syrup Grains
Domestic
1
Domestic 4 4 4 4
To Septic tank
followed by
soak pit
Industrial
1 Process
a Concentrated
Spentwash 280 204 65
84- DDGS
for Cattle
feed
To 30 TPH
Incinerator
boiler
b Spentlees 225 225 225 0 To CPU
c MEE Condensates 975 670 587 694 To CPU
2 Boiler blow down 15 15 15 15 To CPU
3 Cooling tower blow
down 15 15 15 15
To CPU
4 Washings 35 35 35 35 To CPU
Total 1545 1164 942 843
Table 11Treated effluent recycled from ZLD System for various raw materials
Sr.
No. Propose
Wastewater Generation (CMD)
Remarks C
Molasses
B heavy
molasses
Sugarcane
juice/ syrup Grains
1 Treated effluent
recycled from CPU 1265 960 877 759 None
Table 12 Net freshwater requirement for various raw materials
Sr.
No. Propose
Wastewater Generation (CMD)
C
Molasses
B heavy
molasses
Sugarcane
juice/ syrup Grains
Industrial
1 Total water consumption including
domestic 1677 1377 903 1110
2 Treated effluent recycled from CPU 1265 960 877 759
Net fresh water requirement 412 471 26 351

E) Wastewater generation and its treatment technology
Sugar and Co-generation power plant
Table 13 Details of effluent generation, treatment scheme and disposal arrangement for sugar unit
and co-generation power plant
Sr.
No. Description
Quantity
CMD Treatment technology and disposal
1 Sugar factory trade
effluent 562.5
Treated in Sugar ETP based on primary and secondary
treatment and disposed on land for irrigation
2 Co-generation Power
plant effluent 74
Treated along with sugar factory effluent based on primary
and secondary treatment and disposed on land for
irrigation
3 Excess Condensates 1575
Treated in condensate polishing unit based on primary,
secondary and tertiary treatment and reused as process
water or utilities
4 Spray pond overflow 500 Treated in ETP after primary treatment as sedimentation
5 Domestic effluent 56 Septic tank followed by soak pit and disposed on land for
gardening
Distillery unit
The industry shall adopt Zero Liquid Discharge System for the treatment of wastewater generated from
the proposed distillery unit. The effluent streams are separated into strong stream (Spent wash) and weak
stream (Spent lees, Utilities process condensates etc). The raw spent wash is treated based on
Concentration and Incineration principles.
a) C Molasses as raw material:
The raw spent wash (1255 CMD) shall be concentrated in MEE (280 CMD (372 MT)). The evaporator
condensates (975 CMD) shall be treated in proposed condensate polishing unit based on primary,
secondary and tertiary treatment along with other dilute effluent streams (Spentlees-225 CMD, Boiler
blow down of 15 CMD, Cooling tower blow down of 15 CMD, and Fermenter washings of 35 CMD
totaling to 290 CMD) and recycled back as process water.
b) B’ Heavy Molasses as raw material:
The raw spent wash (874 CMD) shall be concentrated in MEE (204 CMD (271 MT)). The evaporator
condensates (670 CMD) shall be treated in proposed condensate polishing unit based on primary,
secondary and tertiary treatment along with other dilute effluent streams and recycled back as process
water.
c) Sugarcane Juice/ Syrup as raw material:
The raw spent wash (652 CMD) shall be concentrated in MEE (65 CMD (86 MT)). The evaporator
condensates (587 CMD) shall be treated in proposed condensate polishing unit based on primary,
secondary and tertiary treatment along with other dilute effluent streams and recycled back as process
water.
d) Grain as raw material:
Spent wash which comes out from Analyser column contains 6 – 7 % solids (978 CMD). It is passed
through Decanter centrifuge to separate the suspended solids present in spent wash. The part of suspended
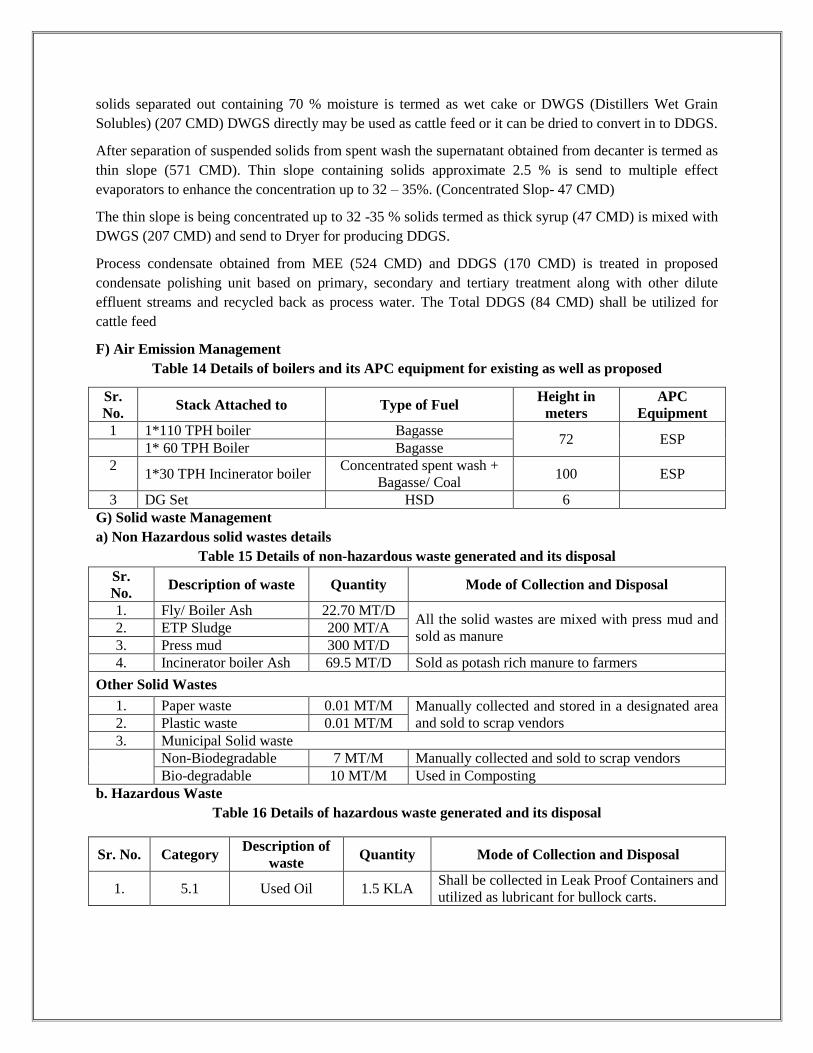
solids separated out containing 70 % moisture is termed as wet cake or DWGS (Distillers Wet Grain
Solubles) (207 CMD) DWGS directly may be used as cattle feed or it can be dried to convert in to DDGS.
After separation of suspended solids from spent wash the supernatant obtained from decanter is termed as
thin slope (571 CMD). Thin slope containing solids approximate 2.5 % is send to multiple effect
evaporators to enhance the concentration up to 32 – 35%. (Concentrated Slop- 47 CMD)
The thin slope is being concentrated up to 32 -35 % solids termed as thick syrup (47 CMD) is mixed with
DWGS (207 CMD) and send to Dryer for producing DDGS.
Process condensate obtained from MEE (524 CMD) and DDGS (170 CMD) is treated in proposed
condensate polishing unit based on primary, secondary and tertiary treatment along with other dilute
effluent streams and recycled back as process water. The Total DDGS (84 CMD) shall be utilized for
cattle feed
F) Air Emission Management
Table 14 Details of boilers and its APC equipment for existing as well as proposed
Sr.
No. Stack Attached to Type of Fuel
Height in
meters
APC
Equipment
1 1*110 TPH boiler Bagasse 72 ESP
1* 60 TPH Boiler Bagasse
2 1*30 TPH Incinerator boiler
Concentrated spent wash +
Bagasse/ Coal 100 ESP
3 DG Set HSD 6
G) Solid waste Management
a) Non Hazardous solid wastes details
Table 15 Details of non-hazardous waste generated and its disposal
Sr.
No. Description of waste Quantity Mode of Collection and Disposal
1. Fly/ Boiler Ash 22.70 MT/D All the solid wastes are mixed with press mud and
sold as manure 2. ETP Sludge 200 MT/A
3. Press mud 300 MT/D
4. Incinerator boiler Ash 69.5 MT/D Sold as potash rich manure to farmers
Other Solid Wastes
1. Paper waste 0.01 MT/M Manually collected and stored in a designated area
and sold to scrap vendors 2. Plastic waste 0.01 MT/M
3. Municipal Solid waste
Non-Biodegradable 7 MT/M Manually collected and sold to scrap vendors
Bio-degradable 10 MT/M Used in Composting
b. Hazardous Waste
Table 16 Details of hazardous waste generated and its disposal
Sr. No. Category Description of
waste Quantity Mode of Collection and Disposal
1. 5.1 Used Oil 1.5 KLA Shall be collected in Leak Proof Containers and
utilized as lubricant for bullock carts.

3. 0 BASELINE ENVIRONMENTAL STATUS
3.1 AIR ENVIRONMENT
3.1.1 Meteorological characteristics of the study area
Figure-2 Windrose diagram for the study area (blowing from)
From Figure 3.11 it can be seen that the Average wind speed of the study period is 1.9 m/s. and the
predominant wind direction is from Northwest to Southeast direction. This has been used in selecting the
receptors. A maximum number of receptors are in Southeast direction, which is opposite to predominant
wind direction.

Table 17 Receptor summary
Sr.
No. Symbol Description Latitude Longitude
1 AAQ-1 Near main gate 20°14'46.44"N 75° 7'52.73"E
2 AAQ-2 Near ETP 20°14'34.44"N 75° 7'44.03"E
3 AAQ-3 Near Balaji nagar, Kannad 20°15'42.30"N 75° 8'7.37"E
4 AAQ-4 Near Kunjkheda 20°14'37.19"N 75°11'18.67"E
5 AAQ-5 Near bahirgaon 20°13'52.66"N 75° 9'34.29"E
6 AAQ-6 Near Bhakangaon 20°12'11.60"N 75°10'34.51"E
7 AAQ-7 Near Rail Nawadi 20°14'23.51"N 75° 5'56.09"E
8 AAQ-8 Near Rail 20°15'1.36"N 75° 6'47.37"E
9 AAQ-9 Near Andhaner 20°16'26.04"N 75° 6'4.28"E
Figure-3 10 km. radius study area map indicating Ambient air quality monitoring locations
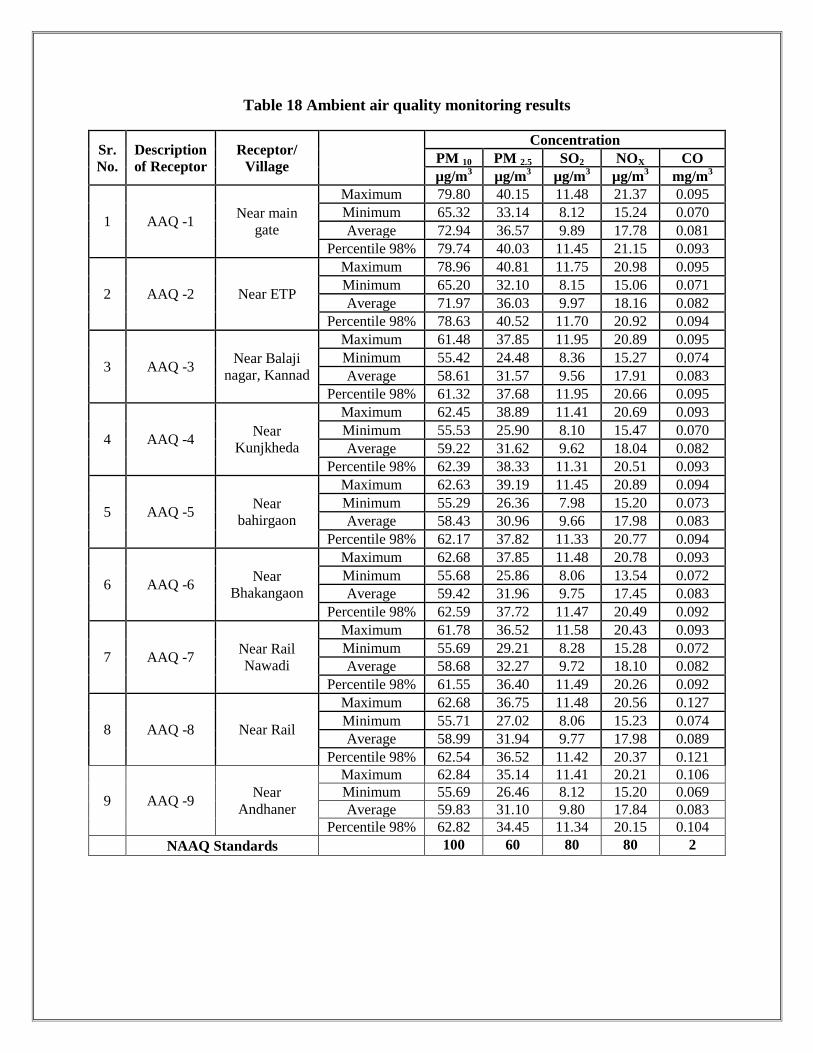
Table 18 Ambient air quality monitoring results
Sr.
No.
Description
of Receptor
Receptor/
Village
Concentration
PM 10 PM 2.5 SO2 NOX CO
µg/m3 µg/m
3 µg/m
3 µg/m
3 mg/m
3
1 AAQ -1 Near main
gate
Maximum 79.80 40.15 11.48 21.37 0.095
Minimum 65.32 33.14 8.12 15.24 0.070
Average 72.94 36.57 9.89 17.78 0.081
Percentile 98% 79.74 40.03 11.45 21.15 0.093
2 AAQ -2 Near ETP
Maximum 78.96 40.81 11.75 20.98 0.095
Minimum 65.20 32.10 8.15 15.06 0.071
Average 71.97 36.03 9.97 18.16 0.082
Percentile 98% 78.63 40.52 11.70 20.92 0.094
3 AAQ -3 Near Balaji
nagar, Kannad
Maximum 61.48 37.85 11.95 20.89 0.095
Minimum 55.42 24.48 8.36 15.27 0.074
Average 58.61 31.57 9.56 17.91 0.083
Percentile 98% 61.32 37.68 11.95 20.66 0.095
4 AAQ -4 Near
Kunjkheda
Maximum 62.45 38.89 11.41 20.69 0.093
Minimum 55.53 25.90 8.10 15.47 0.070
Average 59.22 31.62 9.62 18.04 0.082
Percentile 98% 62.39 38.33 11.31 20.51 0.093
5 AAQ -5 Near
bahirgaon
Maximum 62.63 39.19 11.45 20.89 0.094
Minimum 55.29 26.36 7.98 15.20 0.073
Average 58.43 30.96 9.66 17.98 0.083
Percentile 98% 62.17 37.82 11.33 20.77 0.094
6 AAQ -6 Near
Bhakangaon
Maximum 62.68 37.85 11.48 20.78 0.093
Minimum 55.68 25.86 8.06 13.54 0.072
Average 59.42 31.96 9.75 17.45 0.083
Percentile 98% 62.59 37.72 11.47 20.49 0.092
7 AAQ -7 Near Rail
Nawadi
Maximum 61.78 36.52 11.58 20.43 0.093
Minimum 55.69 29.21 8.28 15.28 0.072
Average 58.68 32.27 9.72 18.10 0.082
Percentile 98% 61.55 36.40 11.49 20.26 0.092
8 AAQ -8 Near Rail
Maximum 62.68 36.75 11.48 20.56 0.127
Minimum 55.71 27.02 8.06 15.23 0.074
Average 58.99 31.94 9.77 17.98 0.089
Percentile 98% 62.54 36.52 11.42 20.37 0.121
9 AAQ -9 Near
Andhaner
Maximum 62.84 35.14 11.41 20.21 0.106
Minimum 55.69 26.46 8.12 15.20 0.069
Average 59.83 31.10 9.80 17.84 0.083
Percentile 98% 62.82 34.45 11.34 20.15 0.104
NAAQ Standards 100 60 80 80 2
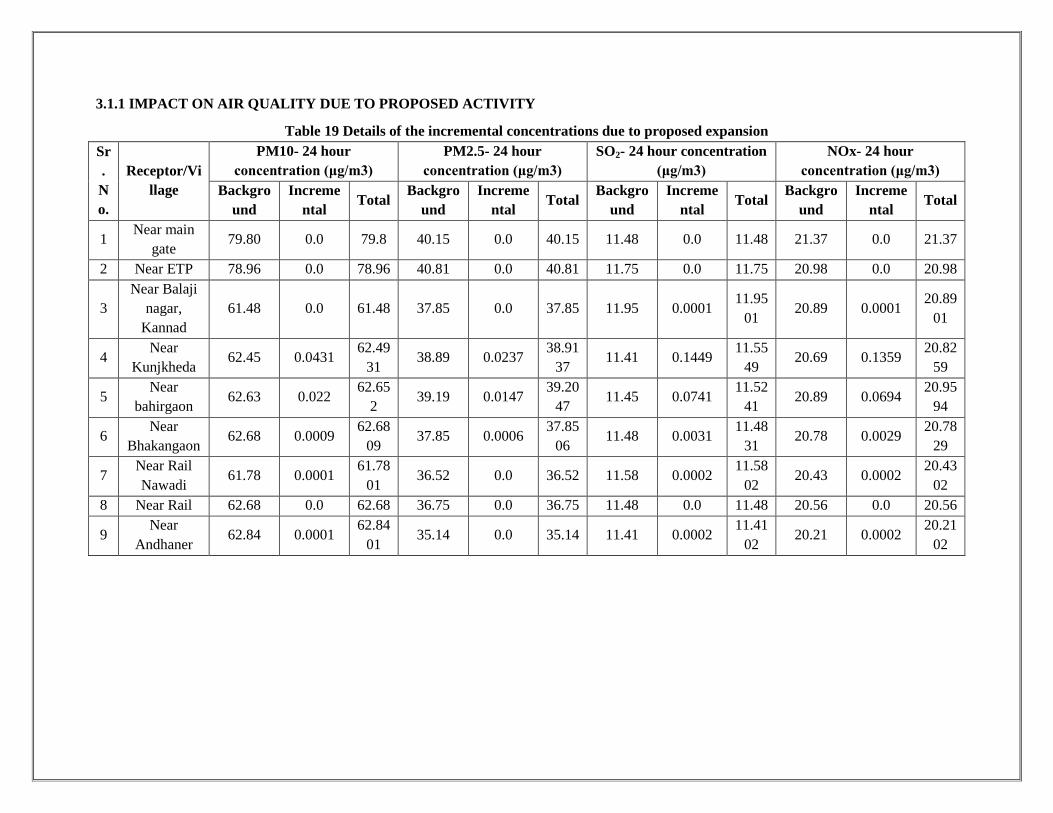
3.1.1 IMPACT ON AIR QUALITY DUE TO PROPOSED ACTIVITY
Table 19 Details of the incremental concentrations due to proposed expansion
Sr
.
N
o.
Receptor/Vi
llage
PM10- 24 hour
concentration (μg/m3)
PM2.5- 24 hour
concentration (μg/m3)
SO2- 24 hour concentration
(μg/m3)
NOx- 24 hour
concentration (μg/m3)
Backgro
und
Increme
ntal Total
Backgro
und
Increme
ntal Total
Backgro
und
Increme
ntal Total
Backgro
und
Increme
ntal Total
1 Near main
gate 79.80 0.0 79.8 40.15 0.0 40.15 11.48 0.0 11.48 21.37 0.0 21.37
2 Near ETP 78.96 0.0 78.96 40.81 0.0 40.81 11.75 0.0 11.75 20.98 0.0 20.98
3
Near Balaji
nagar,
Kannad
61.48 0.0 61.48 37.85 0.0 37.85 11.95 0.0001 11.95
01 20.89 0.0001
20.89
01
4 Near
Kunjkheda 62.45 0.0431
62.49
31 38.89 0.0237
38.91
37 11.41 0.1449
11.55
49 20.69 0.1359
20.82
59
5 Near
bahirgaon 62.63 0.022
62.65
2 39.19 0.0147
39.20
47 11.45 0.0741
11.52
41 20.89 0.0694
20.95
94
6 Near
Bhakangaon 62.68 0.0009
62.68
09 37.85 0.0006
37.85
06 11.48 0.0031
11.48
31 20.78 0.0029
20.78
29
7 Near Rail
Nawadi 61.78 0.0001
61.78
01 36.52 0.0 36.52 11.58 0.0002
11.58
02 20.43 0.0002
20.43
02
8 Near Rail 62.68 0.0 62.68 36.75 0.0 36.75 11.48 0.0 11.48 20.56 0.0 20.56
9 Near
Andhaner 62.84 0.0001
62.84
01 35.14 0.0 35.14 11.41 0.0002
11.41
02 20.21 0.0002
20.21
02
3.2 WATER ENVIRONMENT
The unit is located at Mahatma Phule Nagar, Taluka Kannad, District Aurangabad, Maharashtra. Majority
of the study area (10 km around site) is under agriculture land use. The industry is lifting fresh water from
Ambadi Dam which is 7 km away from the industry. The permission is already available with the
industry from respective authorities.
Ambadi Dam and Shivana River are main source of water for agriculture use. Shivana River is flowing at
1.5 km towards east from the project site .Groundwater is used as an alternate source in surrounding
villages for domestic and drinking purposes. Therefore it is important to assess the existing baseline status
of both ground water quality and surface water quality within the study area.
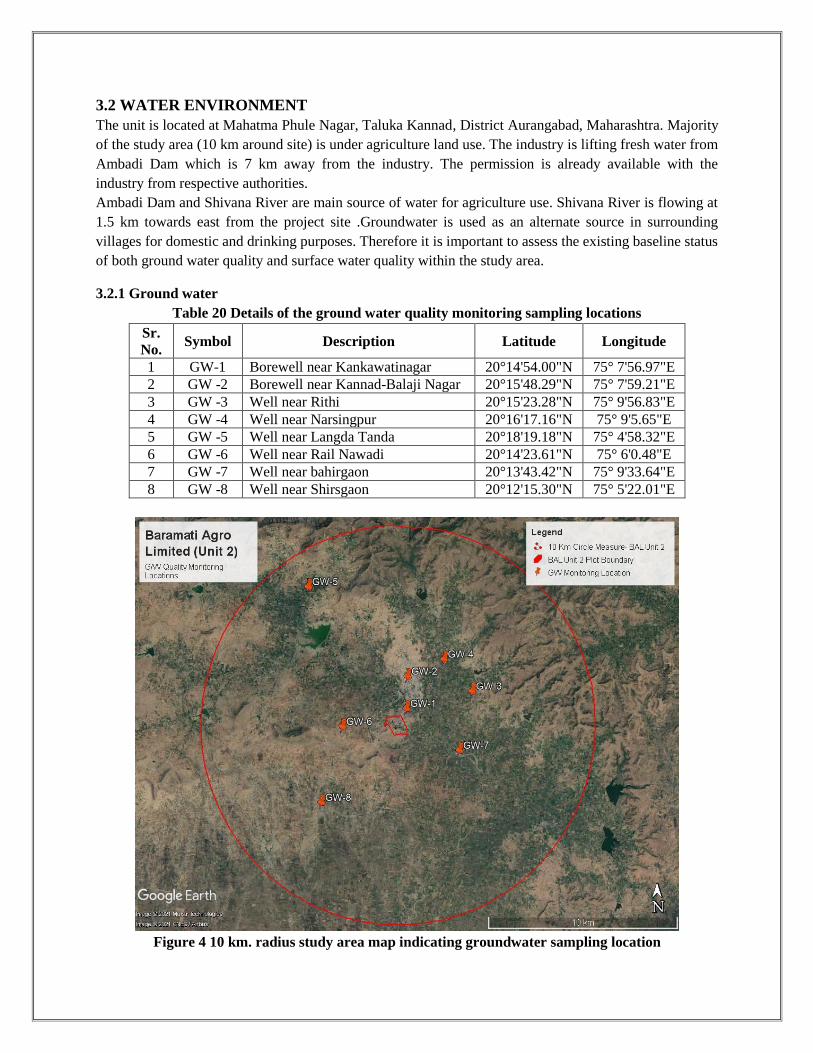
3.2.1 Ground water
Table 20 Details of the ground water quality monitoring sampling locations
Sr.
No. Symbol Description Latitude Longitude
1 GW-1 Borewell near Kankawatinagar 20°14'54.00"N 75° 7'56.97"E
2 GW -2 Borewell near Kannad-Balaji Nagar 20°15'48.29"N 75° 7'59.21"E
3 GW -3 Well near Rithi 20°15'23.28"N 75° 9'56.83"E
4 GW -4 Well near Narsingpur 20°16'17.16"N 75° 9'5.65"E
5 GW -5 Well near Langda Tanda 20°18'19.18"N 75° 4'58.32"E
6 GW -6 Well near Rail Nawadi 20°14'23.61"N 75° 6'0.48"E
7 GW -7 Well near bahirgaon 20°13'43.42"N 75° 9'33.64"E
8 GW -8 Well near Shirsgaon 20°12'15.30"N 75° 5'22.01"E
Figure 4 10 km. radius study area map indicating groundwater sampling location

Table 21 Groundwater analysis report within 10 km radius of the study area
Sr.
No Description Unit
Results Desirable Permissible
GW-1 GW-2 GW-3 GW-4 GW-5 GW-6 GW-7 GW-8 IS 10500:2012
Standards
1 pH --- 6.94 6.92 6.96 6.8 6.58 6.75 6.26 6.14 6.5-8.5 No
relaxation
2 Temperature oC 26 26.4 26 26 26 26 26 26 Not Specified
3 Turbidity NTU 1.3 1.26 1.6 1.5 1.47 1.5 1.5 1.3 1 5
4 Electrical
Conductivity
mS/c
m 0.580 0.619 0.599 0.636 0.542 0.568 0.583 0.606 Not Specified
5 Total Dissolved
Solids mg/lit 362 387 374 398 339 355 364 379 500 2000
6 Total Suspended
Solids mg/lit 3 5 5 4 3 5 3 4 Not Specified
7 Salinity ppt 1.6 1.5 2 1.8 1.3 1.5 1.2 1.6 Not Specified
8 Chemical Oxygen
Demand mg/lit 9 12 8 7 8 8 8 9 Not Specified
9
Biochemical
Oxygen Demand @
27oC for 3 days
mg/lit 3 5 4 3 4 3 3 3 Not Specified
10 Chlorides as Cl- mg/lit 112 118 125 100 88 123 114 131 250 1000
11 Sulphates as SO4-- mg/lit 39 37 48 50 45 41 43 42 200 400
12 Fluoride as Fˉ mg/lit 0.55 0.4 0.65 0.5 0.62 0.6 0.54 0.58 1 1.5
13 Total Alkalinity as
CaCO3 mg/lit 152 158 160 168 153 120 147 155 200 600
14 Nitrate as NO3 mg/lit 1.7 1.2 1.8 1.6 1.6 1.6 1.6 1.5 45 No
relaxation
15 Nitrite as NO2 mg/lit 0.04 0.05 0.09 0.12 0.1 0.14 0.1 0.12 Not Specified
16 Ammonia as N mg/lit 0.35 0.16 0.25 0.22 0.23 0.25 0.22 0.28 0.5 No
Relaxation
17 Total Phosphate as
PO4 mg/lit 0.19 0.18 0.12 0.18 0.15 0.16 0.18 0.15 Not Specified
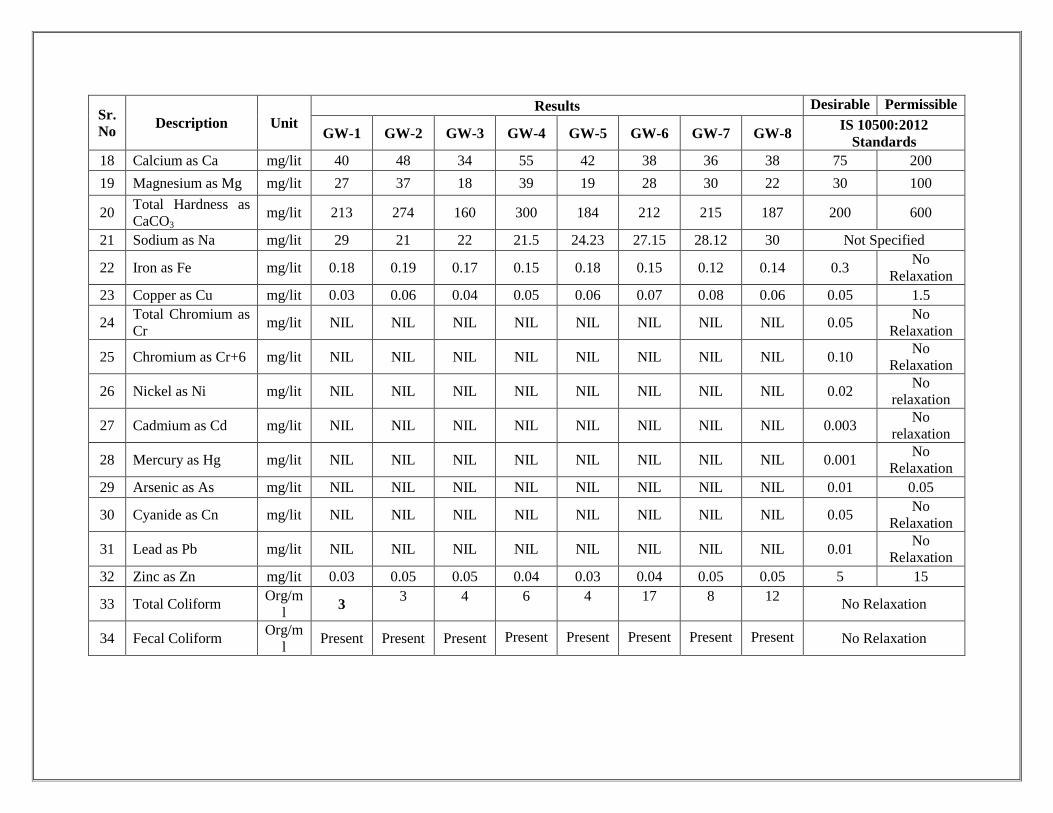
Sr.
No Description Unit
Results Desirable Permissible
GW-1 GW-2 GW-3 GW-4 GW-5 GW-6 GW-7 GW-8 IS 10500:2012
Standards
18 Calcium as Ca mg/lit 40 48 34 55 42 38 36 38 75 200
19 Magnesium as Mg mg/lit 27 37 18 39 19 28 30 22 30 100
20 Total Hardness as
CaCO3 mg/lit 213 274 160 300 184 212 215 187 200 600
21 Sodium as Na mg/lit 29 21 22 21.5 24.23 27.15 28.12 30 Not Specified
22 Iron as Fe mg/lit 0.18 0.19 0.17 0.15 0.18 0.15 0.12 0.14 0.3 No
Relaxation
23 Copper as Cu mg/lit 0.03 0.06 0.04 0.05 0.06 0.07 0.08 0.06 0.05 1.5
24 Total Chromium as
Cr mg/lit NIL NIL NIL NIL NIL NIL NIL NIL 0.05
No
Relaxation
25 Chromium as Cr+6 mg/lit NIL NIL NIL NIL NIL NIL NIL NIL 0.10 No
Relaxation
26 Nickel as Ni mg/lit NIL NIL NIL NIL NIL NIL NIL NIL 0.02 No
relaxation
27 Cadmium as Cd mg/lit NIL NIL NIL NIL NIL NIL NIL NIL 0.003 No
relaxation
28 Mercury as Hg mg/lit NIL NIL NIL NIL NIL NIL NIL NIL 0.001 No
Relaxation
29 Arsenic as As mg/lit NIL NIL NIL NIL NIL NIL NIL NIL 0.01 0.05
30 Cyanide as Cn mg/lit NIL NIL NIL NIL NIL NIL NIL NIL 0.05 No
Relaxation
31 Lead as Pb mg/lit NIL NIL NIL NIL NIL NIL NIL NIL 0.01 No
Relaxation
32 Zinc as Zn mg/lit 0.03 0.05 0.05 0.04 0.03 0.04 0.05 0.05 5 15
33 Total Coliform Org/m
l 3
3 4 6 4 17 8 12 No Relaxation
34 Fecal Coliform Org/m
l Present Present Present Present Present Present Present Present No Relaxation
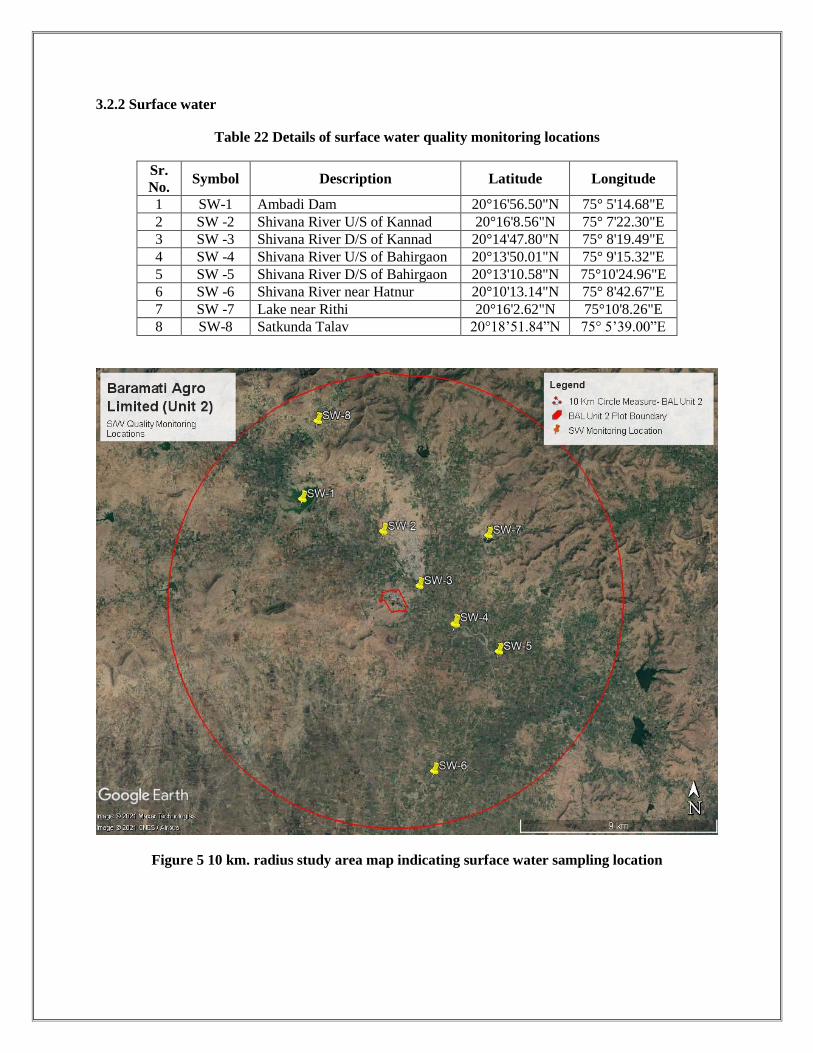
3.2.2 Surface water
Table 22 Details of surface water quality monitoring locations
Sr.
No. Symbol Description Latitude Longitude
1 SW-1 Ambadi Dam 20°16'56.50"N 75° 5'14.68"E
2 SW -2 Shivana River U/S of Kannad 20°16'8.56"N 75° 7'22.30"E
3 SW -3 Shivana River D/S of Kannad 20°14'47.80"N 75° 8'19.49"E
4 SW -4 Shivana River U/S of Bahirgaon 20°13'50.01"N 75° 9'15.32"E
5 SW -5 Shivana River D/S of Bahirgaon 20°13'10.58"N 75°10'24.96"E
6 SW -6 Shivana River near Hatnur 20°10'13.14"N 75° 8'42.67"E
7 SW -7 Lake near Rithi 20°16'2.62"N 75°10'8.26"E
8 SW-8 Satkunda Talav 20°18’51.84”N 75° 5’39.00”E
Figure 5 10 km. radius study area map indicating surface water sampling location

Table 23 Surface water analysis report within 10 km radius of the study area
Sr No Description Unit
Results Desirable Permissible
SW-1 SW-2 SW-3 SW-4 SW-5 SW-6 SW-7 SW-8 IS 10500:2012
Standards
1 pH --- 7.24 7.18 7.63 7.35 7.63 7.14 7.1 7.1 6.5-8.5 No
relaxation
2 Temperature oC 28 27 27 27 27.4 27 27 27 Not Specified
3 Turbidity NTU 0.6 1.2 1.4 1.3 1.6 1.35 1.4 1.4 1 5
4 Electrical
Conductivity mS/cm 0.451 0.476 0.516 0.544 0.586 0.608 0.454 0.426 Not Specified
5 Total Dissolved
Solids mg/lit 282 297 322 340 366 380 284 266 500 2000
6 Total Suspended
Solids mg/lit 8 6 18 6 6 8 10 10 Not Specified
7 Salinity ppt 30 4.5 5.1 4.3 4.4 4.5 4.4 4.4 Not Specified
8 Dissolved Oxygen mg/lit 4.8 5.5 5.4 5.3 5.2 5.4 4.7 4.6
9 Chemical Oxygen
Demand mg/lit 26 32 40 38 42 48 28 25 Not Specified
10
Biochemical Oxygen
Demand @ 27oC for 3
days
mg/lit 10 14 18 19 20 21 12 15 Not Specified
11 Chlorides as Cl- mg/lit 68 72 82 94 96 104 80 78 250 1000
12 Sulphates as SO4-- mg/lit 28 34 40 42 55 60 38 35 200 400
13 Fluoride as Fˉ mg/lit 0 0.56 0.57 0.4 0.5 0.4 0 0 1 1.5
14 Total Alkalinity as
CaCO3 mg/lit 120 132 134 145 151 154 112 95 200 600
15 Nitrate as NO3 mg/lit 3.2 3.4 5.2 4.2 6.2 6.8 3.1 1.9 45 No
relaxation
16 Nitrite mg/lit 1.33 0.02 0.18 0.03 0.65 0.02 0.02 0.02 Not Specified
17 Ammonia as N mg/lit 0.1 0.22 0.6 0.21 0.19 0.24 0.2 0.2 0.5 No
Relaxation
18 Total Phosphate as
PO4 mg/lit 0.21 0.05 0.18 0.03 0.09 0.05 0.06 0.06 Not Specified
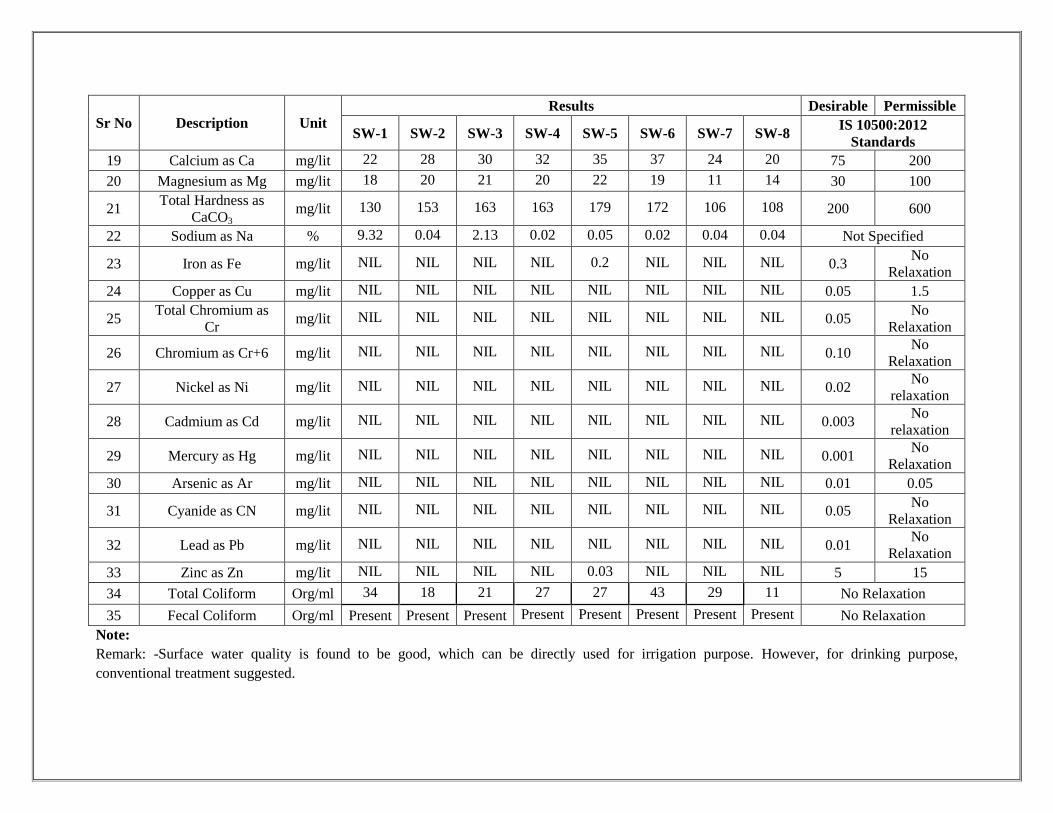
Sr No Description Unit
Results Desirable Permissible
SW-1 SW-2 SW-3 SW-4 SW-5 SW-6 SW-7 SW-8 IS 10500:2012
Standards
19 Calcium as Ca mg/lit 22 28 30 32 35 37 24 20 75 200
20 Magnesium as Mg mg/lit 18 20 21 20 22 19 11 14 30 100
21 Total Hardness as
CaCO3 mg/lit 130 153 163 163 179 172 106 108 200 600
22 Sodium as Na % 9.32 0.04 2.13 0.02 0.05 0.02 0.04 0.04 Not Specified
23 Iron as Fe mg/lit NIL NIL NIL NIL 0.2 NIL NIL NIL 0.3 No
Relaxation
24 Copper as Cu mg/lit NIL NIL NIL NIL NIL NIL NIL NIL 0.05 1.5
25 Total Chromium as
Cr mg/lit NIL NIL NIL NIL NIL NIL NIL NIL 0.05
No
Relaxation
26 Chromium as Cr+6 mg/lit NIL NIL NIL NIL NIL NIL NIL NIL 0.10 No
Relaxation
27 Nickel as Ni mg/lit NIL NIL NIL NIL NIL NIL NIL NIL 0.02 No
relaxation
28 Cadmium as Cd mg/lit NIL NIL NIL NIL NIL NIL NIL NIL 0.003 No
relaxation
29 Mercury as Hg mg/lit NIL NIL NIL NIL NIL NIL NIL NIL 0.001 No
Relaxation
30 Arsenic as Ar mg/lit NIL NIL NIL NIL NIL NIL NIL NIL 0.01 0.05
31 Cyanide as CN mg/lit NIL NIL NIL NIL NIL NIL NIL NIL 0.05 No
Relaxation
32 Lead as Pb mg/lit NIL NIL NIL NIL NIL NIL NIL NIL 0.01 No
Relaxation
33 Zinc as Zn mg/lit NIL NIL NIL NIL 0.03 NIL NIL NIL 5 15
34 Total Coliform Org/ml 34 18 21 27 27 43 29 11 No Relaxation
35 Fecal Coliform Org/ml Present Present Present Present Present Present Present Present No Relaxation
Note:
Remark: -Surface water quality is found to be good, which can be directly used for irrigation purpose. However, for drinking purpose,
conventional treatment suggested.

Summary of the groundwater and surface water quality monitoring results
Table 24 Water Analysis Results
Sr. No Parameters Ground water Surface water
Min Max Min Max
1. pH 6.14 6.96 7.10 7.63
2. Total Dissolved Solids (mg/l) 39 398 266 380
3. Total Hardness (mg/l) 160 300 106 179
4. Chlorides (mg/l) 88 131 68 104
5. Fluoride (mg/l) 0.4 0.65 0 0.57
6. Sulphates (mg/l) 37 50 28 60
3.3 SOIL ENVIRONMENT
Table 25 Details of the soil sampling locations
Sr.
No. Symbol Description Latitude Longitude
1 S-1 Near Water storage reservior 20°14'28.72"N 75° 7'42.99"E
2 S-2 Near Kankawatinagar 20°14'53.82"N 75° 7'55.89"E
3 S-3 Near Kannad 20°15'56.71"N 75° 7'39.17"E
4 S-4 Near Rithi 20°15'48.79"N 75°10'15.85"E
5 S-5 Near Rail Nawadi 20°14'29.01"N 75° 6'3.06"E
6 S-6 Near Palasgaon 20°12'36.35"N 75° 5'57.13"E
7 S-7 Near Bhokangaon 20°12'12.81"N 75°10'28.61"E
8 S-8 Near hatnur 20° 9'56.90"N 75° 8'0.73"E
Figure 6 10 km. radius study area map indicating soil sampling location

Table 26 Soil Analysis report within 10 km radius of the study area
Sr.
No. Description Unit
RESULT Standard as per
Ministry of
Agriculture 2011 S-1 S-2 S-3 S-4 S-5 S-6 S-7 S-8
01 pH @ 25 oC --- 7.81 7.14 7.44 7.44 7.14 7.30 7.59 7.42 < 8.5
02 Electric Conductance mS/cm 0.546 0.574 0.560 0.62 0.65 0.42 0.514 0.580 0.15 – 0.65
03 Colour Black Black Black Black Black Black Black Black Ministry of
Agriculture 2011
04 Texture --- Not Specified
04A Clay % 53.00 57.00 48.00 33.00 35.00 37.00 48.00 42.00 Not Specified
04B Sand % 30.00 38.00 26.00 45.00 40.00 46.00 32.00 33.00 Not Specified
04C Silt % 17.00 5.00 26.00 22.00 25.00 17.00 20.00 21.00 Not Specified
05 Organic Matter % 0.50 0.48 0.52 0.45 0.51 0.60 0.58 0.57 0.5 – 0.75
06 Bulk Density g/cm3 1.22 1.55 1.45 1.35 1.20 1.20 1.15 1.10 Not Specified
07 Porosity % 50.00 48.00 54.00 46.00 42.00 52.00 46.00 40.00 Not Specified
08 Permeability % 32.00 33.00 34.00 32.00 38.00 40.00 38.00 34.00 Not Specified
09 Water Holding Capacity % 42.00 40.00 42.00 54.00 53.00 58.00 49.00 46.00 Not Specified
10 Sodium Adsorption Ratio
(SAR) --- 11.45 10.77 11.54 11.00 12.00 12.00 13.10 12.75 10-18
11 Total Nitrogen Content kg/ha 312.00 320.00 328.00 275.00 271.00 293.00 302.00 312.00 280 - 560
12 Available Potassium kg/ha 158.12 142.23 140.10 163.00 161.00 174.00 156.00 153.14 108-280
13 Available Sodium mg/kg 92.10 88.12 81.53 124.78 124.26 110.80 98.75 92.55 Not Specified
14 Available Phosphorus as P kg/ha 14.70 10.30 14.20 18.60 15.74 17.46 13.45 11.24 10- 24.60
15 Cation Exchange Capacity meq/100gm 0.52 0.58 0.52 0.75 0.75 0.60 0.54 0.51 Not Specified
16 Iron as Fe mg/kg 5.12 5.44 5.12 4.22 4.10 4.12 3.85 3.40 Not Specified
17 Nickel as Ni mg/kg 2.30 2.65 2.47 3.35 3.15 3.40 2.65 2.82 Not Specified
18 Zinc as Zn mg/kg 3.44 3.12 3.55 4.12 4.66 4.50 3.90 3.34 Not Specified
19 Copper as Cu mg/kg 4.42 4.74 4.32 2.00 1.80 3.00 4.12 4.11 Not Specified
Summary of the results
The soil samples were collected at total eight locations within the study area.
The finding of the study reveals that pH of soil in the area ranged between 7.14 to 7.81 which is an
indicative of the neutral to slightly alkaline soil.
The values for Nitrogen was found to be better to more than sufficient at all location ranging between
271 to 328 kg/ha.
The concentration of Phosphorous was found to be less at all the locations ranging between 11.24 to
18.60 kg/ha.
The concentration of organic carbon was found to be medium to on an average sufficient at all the
locations ranging between 0.45 to 0.60%.
It is important to note that the concentration of potassium was found to be less at all locations ranging
between 140.10 to 174 kg/ha. This indicates it is required to use potash rich fertilizers for agriculture
purposes
Based on the above findings it can be concluded that the soil samples can be classified as per soil
classification given by Tondon H.L.S. (2005). The samples fall under low to medium low fertile
soils.
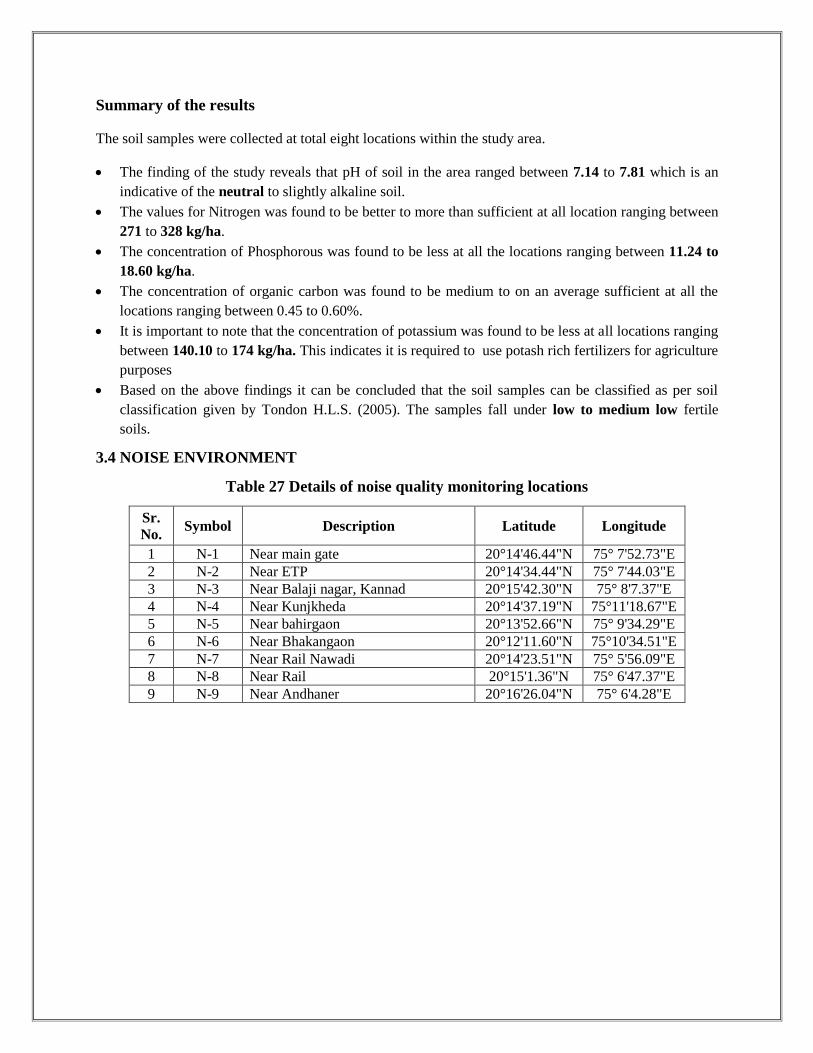
3.4 NOISE ENVIRONMENT
Table 27 Details of noise quality monitoring locations
Sr.
No. Symbol Description Latitude Longitude
1 N-1 Near main gate 20°14'46.44"N 75° 7'52.73"E
2 N-2 Near ETP 20°14'34.44"N 75° 7'44.03"E
3 N-3 Near Balaji nagar, Kannad 20°15'42.30"N 75° 8'7.37"E
4 N-4 Near Kunjkheda 20°14'37.19"N 75°11'18.67"E
5 N-5 Near bahirgaon 20°13'52.66"N 75° 9'34.29"E
6 N-6 Near Bhakangaon 20°12'11.60"N 75°10'34.51"E
7 N-7 Near Rail Nawadi 20°14'23.51"N 75° 5'56.09"E
8 N-8 Near Rail 20°15'1.36"N 75° 6'47.37"E
9 N-9 Near Andhaner 20°16'26.04"N 75° 6'4.28"E

Figure 7 10 km. radius study area map indicating noise quality sampling location
Table 28 Noise levels of the study area
Sr
No Location Category Of Area
(Leq dB(A)) Average CPCB limit (Leq dB(A))
Day time Night time Day time Night time
1 Near main gate Industrial Area 69.6 66.96 75 70
2 Near ETP Industrial Area 70.61 67.39 75 70
3 Near Balaji nagar, Kannad Residential Area 52.54 40.50 55 45
4 Near Kunjkheda Residential Area 53.29 41.13 55 45
5 Near bahirgaon Residential Area 53.96 40.18 55 45
6 Near Bhakangaon Residential Area 52.98 40.79 55 45
7 Near Rail Nawadi Residential Area 53.71 41.38 55 45
8 Near Rail Residential Area 52.41 40.24 55 45
9 Near Andhaner Residential Area 53.72 40.65 55 45
Summary of the results
Daytime Noise Levels (Leq)day
Industrial Zone: The day time noise level at the Project site was found in the range of 69.60 – 70.61 dB
(A), which is well below the permissible limit of 75 dB (A).
Residential Zone: The daytime noise levels in all the residential locations were observed to be in the
range of 52.41dB (A) to 53.96 dB (A).
Night time Noise Levels (Leq)night
Industrial Zone: The night time noise level in the Project site was observed in the range of 66.96 – 67.39
dB (A), which is well below the permissible limit of 70 dB (A).
Residential Zone: The night time noise levels in all the residential locations were observed to be in the
range of 40.18 dB (A) 41.38 dB (A)
The industry is making all efforts to control the noise levels within the limits by providing acoustic
measures and silencer pads etc. all the employees in these work places shall be provided with ear plugs /
muffs.
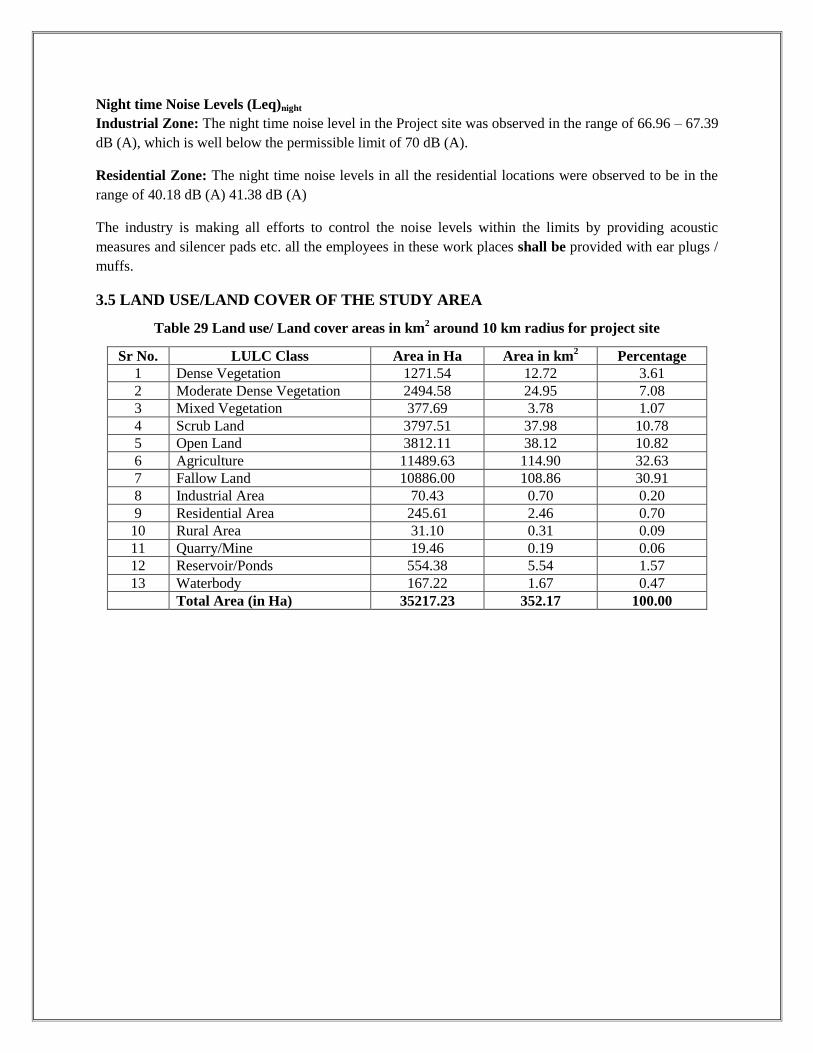
3.5 LAND USE/LAND COVER OF THE STUDY AREA
Table 29 Land use/ Land cover areas in km2 around 10 km radius for project site
Sr No. LULC Class Area in Ha Area in km2 Percentage
1 Dense Vegetation 1271.54 12.72 3.61
2 Moderate Dense Vegetation 2494.58 24.95 7.08
3 Mixed Vegetation 377.69 3.78 1.07
4 Scrub Land 3797.51 37.98 10.78
5 Open Land 3812.11 38.12 10.82
6 Agriculture 11489.63 114.90 32.63
7 Fallow Land 10886.00 108.86 30.91
8 Industrial Area 70.43 0.70 0.20
9 Residential Area 245.61 2.46 0.70
10 Rural Area 31.10 0.31 0.09
11 Quarry/Mine 19.46 0.19 0.06
12 Reservoir/Ponds 554.38 5.54 1.57
13 Waterbody 167.22 1.67 0.47
Total Area (in Ha) 35217.23 352.17 100.00
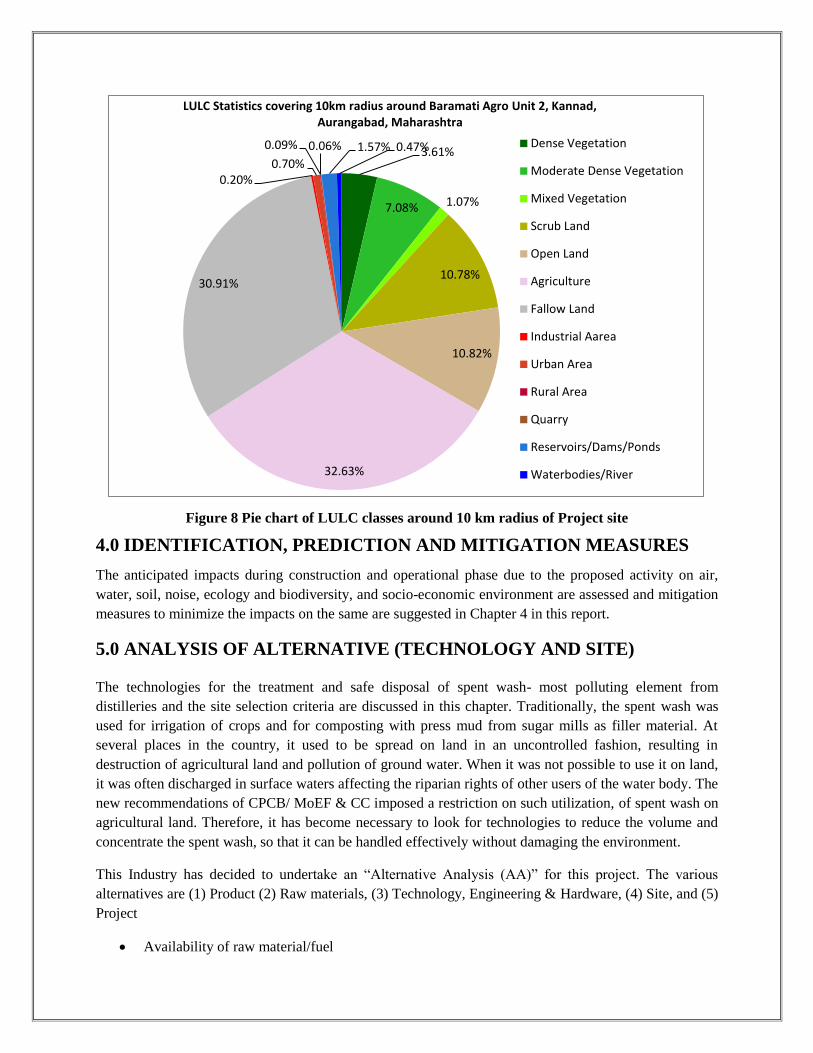
Figure 8 Pie chart of LULC classes around 10 km radius of Project site
4.0 IDENTIFICATION, PREDICTION AND MITIGATION MEASURES
The anticipated impacts during construction and operational phase due to the proposed activity on air,
water, soil, noise, ecology and biodiversity, and socio-economic environment are assessed and mitigation
measures to minimize the impacts on the same are suggested in Chapter 4 in this report.
5.0 ANALYSIS OF ALTERNATIVE (TECHNOLOGY AND SITE)
The technologies for the treatment and safe disposal of spent wash- most polluting element from
distilleries and the site selection criteria are discussed in this chapter. Traditionally, the spent wash was
used for irrigation of crops and for composting with press mud from sugar mills as filler material. At
several places in the country, it used to be spread on land in an uncontrolled fashion, resulting in
destruction of agricultural land and pollution of ground water. When it was not possible to use it on land,
it was often discharged in surface waters affecting the riparian rights of other users of the water body. The
new recommendations of CPCB/ MoEF & CC imposed a restriction on such utilization, of spent wash on
agricultural land. Therefore, it has become necessary to look for technologies to reduce the volume and
concentrate the spent wash, so that it can be handled effectively without damaging the environment.
This Industry has decided to undertake an “Alternative Analysis (AA)” for this project. The various
alternatives are (1) Product (2) Raw materials, (3) Technology, Engineering & Hardware, (4) Site, and (5)
Project
Availability of raw material/fuel
3.61%
7.08% 1.07%
10.78%
10.82%
32.63%
30.91%
0.20% 0.70%
0.09% 0.06% 1.57% 0.47%
LULC Statistics covering 10km radius around Baramati Agro Unit 2, Kannad, Aurangabad, Maharashtra
Dense Vegetation
Moderate Dense Vegetation
Mixed Vegetation
Scrub Land
Open Land
Agriculture
Fallow Land
Industrial Aarea
Urban Area
Rural Area
Quarry
Reservoirs/Dams/Ponds
Waterbodies/River

Proximity of molasses as a raw material and cost-effective transportation logistics
Availability of water supply
The availability of water from the source is adequate to meet the requirement of the proposed
sugar & distillery expansion. For proposed project water will be sourced from Ujani dam
Availability of infrastructural facility
Industrial infrastructural facilities such as roads, transport, security, water, power, administration etc. are
available with existing factory. Community facilities such as quarters, medical services, education and
training facility etc. are also available at site.
6.0 ENVIRONMENT MONITORING PROGRAMME
Table 30 Environment management programme
SR.
NO ITEM PARAMETERS
FREQUENCY OF
MONITORING LOCATION
1.
Ambient Air
quality at
appropriate location
for PM10, PM2.5,
SO2,and NOx,
PM10, PM2.5, SO2,and NOx 24 hourly,
Quarterly
5 Locations
1 @ Upwind and 2@
downwind directions
from stack @ 1200 to
each other
Near entry and exit
gates
2.
Stationary
Emission from
Stack
PM, SO2, NOx
PM, SO2, NOx Monthly 1 DG set Stack,
2 Boiler Stack
3.
Water Water quality parameters as
per 10500:2012 Monthly
Drinking water
locations
Waste water quality
(treated and
Untreated)
pH, BOD, COD, TSS, Flow,
TDS etc. Monthly
ETP inlet and Outlet
CPU Inlet and outlet
Spentwash
4. Noise Day and Night levels
Equivalent noise level- dB (A)
Quarterly or as
often as required
6 Locations
Upwind and
downwind directions
Near boilers and near
main gate and ETP.
5.
Soil (Qualitative
and quantitative
testing/analysis to
check the soil
fertility,)
pH, Cation Exchange
Capacity, Total Nitrogen,
Phosphorous, Potassium,
moisture, Permeability,
Conductivity, Texture &
structure, Organic carbon
Quarterly or as
often as required
1 near Greenbelt
1 near ETP
Composite sample
shall be taken at each
location
6. Solid waste
generation Manual record keeping To be updated daily

SR.
NO ITEM PARAMETERS
FREQUENCY OF
MONITORING LOCATION
monitoring /
Record Keeping
7
Greenbelt and
plantation
monitoring
Type of species shall be
decided based on soil &
climatic conditions. The
number of trees would be 1500
per hectare, however; the
number of trees would vary
depending on the type of soil
Six Monthly
8
Carbon and Water
foot Print
Monitoring
Maintain the data of raw
materials consumption, steam
consumption, vehicle
frequency for transport of raw
materials, effluent generation,
air emissions, hazardous waste
generation, and raw material
recovery
Daily and Monthly
7.0 ADDITIONAL STUDIES
7.1: RISK ASSESSMENT
Hazard analysis involves the identification and quantification of the various hazards (unsafe condition)
that exist in the plant during both construction and operation phases. On the other hand, risk analysis
deals with the identification and quantification of the risk, the plant equipment and Personnel exposed to
accidents resulting from the hazards present in the plant. Risk analysis involves the identification and
assessment of risks to the population, which is likely to be exposed to as a result of hazards incidence.
This requires an assessment of failure probability, credible accident scenario, vulnerability of population,
etc. Much of this information is difficult to get or generate consequently, the risk analysis in present case
is confined to worst case and maximum credible accident studies and safety and risk aspect related to
sulphitation process, alcohol storage and plant operations. Detailed Quantitative Risk Assessment (QRA)
on potentially more hazardous and risky situations have been carried out in details and presented in the
report in the later part.
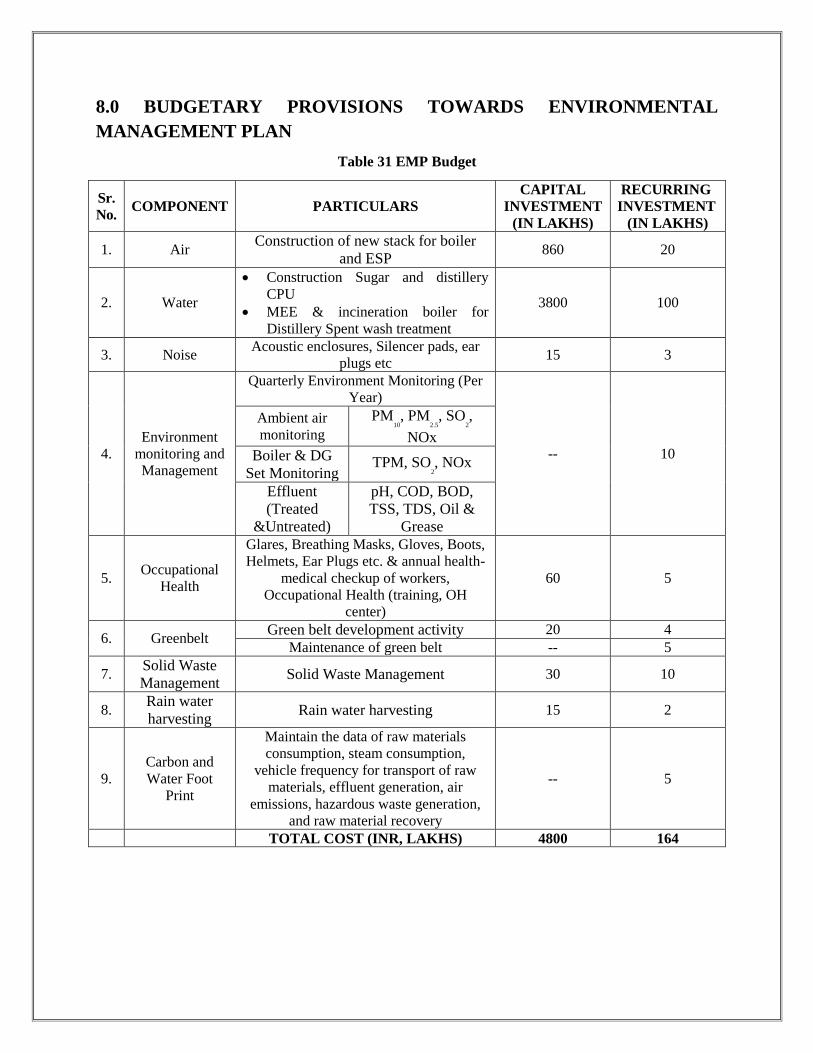
8.0 BUDGETARY PROVISIONS TOWARDS ENVIRONMENTAL
MANAGEMENT PLAN
Table 31 EMP Budget
Sr.
No. COMPONENT PARTICULARS
CAPITAL
INVESTMENT
(IN LAKHS)
RECURRING
INVESTMENT
(IN LAKHS)
1. Air Construction of new stack for boiler
and ESP 860 20
2. Water
Construction Sugar and distillery
CPU
MEE & incineration boiler for
Distillery Spent wash treatment
3800 100
3. Noise Acoustic enclosures, Silencer pads, ear
plugs etc 15 3
4.
Environment
monitoring and
Management
Quarterly Environment Monitoring (Per
Year)
-- 10
Ambient air
monitoring
PM10, PM
2.5, SO
2,
NOx
Boiler & DG
Set Monitoring TPM, SO
2, NOx
Effluent
(Treated
&Untreated)
pH, COD, BOD,
TSS, TDS, Oil &
Grease
5. Occupational
Health
Glares, Breathing Masks, Gloves, Boots,
Helmets, Ear Plugs etc. & annual health-
medical checkup of workers,
Occupational Health (training, OH
center)
60 5
6. Greenbelt Green belt development activity 20 4
Maintenance of green belt -- 5
7. Solid Waste
Management Solid Waste Management 30 10
8. Rain water
harvesting Rain water harvesting 15 2
9.
Carbon and
Water Foot
Maintain the data of raw materials
consumption, steam consumption,
vehicle frequency for transport of raw
materials, effluent generation, air
emissions, hazardous waste generation,
and raw material recovery
-- 5
TOTAL COST (INR, LAKHS) 4800 164
9.0 GREENBELT DEVELOPMENT PLAN
According to CPCB guidelines, 1500 trees should be available per hectare of land for Greenbelt
development. Total plot area of the industry is 63.17 Hectares, out of which 22.30 Hectares of land is
reserved for greenbelt development; hence there should be minimum 33450 no. of trees. At present there
are 21728 trees, the remaining 11722 trees will be planted within 3 years. The industry proposes to plant
1000 to 1500 trees per year in order to increase the greenbelt over and above 33% of the total factory area
10.0 CORPORATE ENVIRONMENT RESPONSIBILITY PLAN
The capital cost of the proposed expansion project is Rs. 150 Crores. The industry has reserved Rs. 1.125
Crores (0.75 % of the cost of the project as per Office Memorandum Vide F. No. 22-65/2017-IA.III
Dated 01.05.2018) which will be spent on the activities like sanitation and health, education, and
educational facilities as a cost towards corporate environment responsibility (CER).
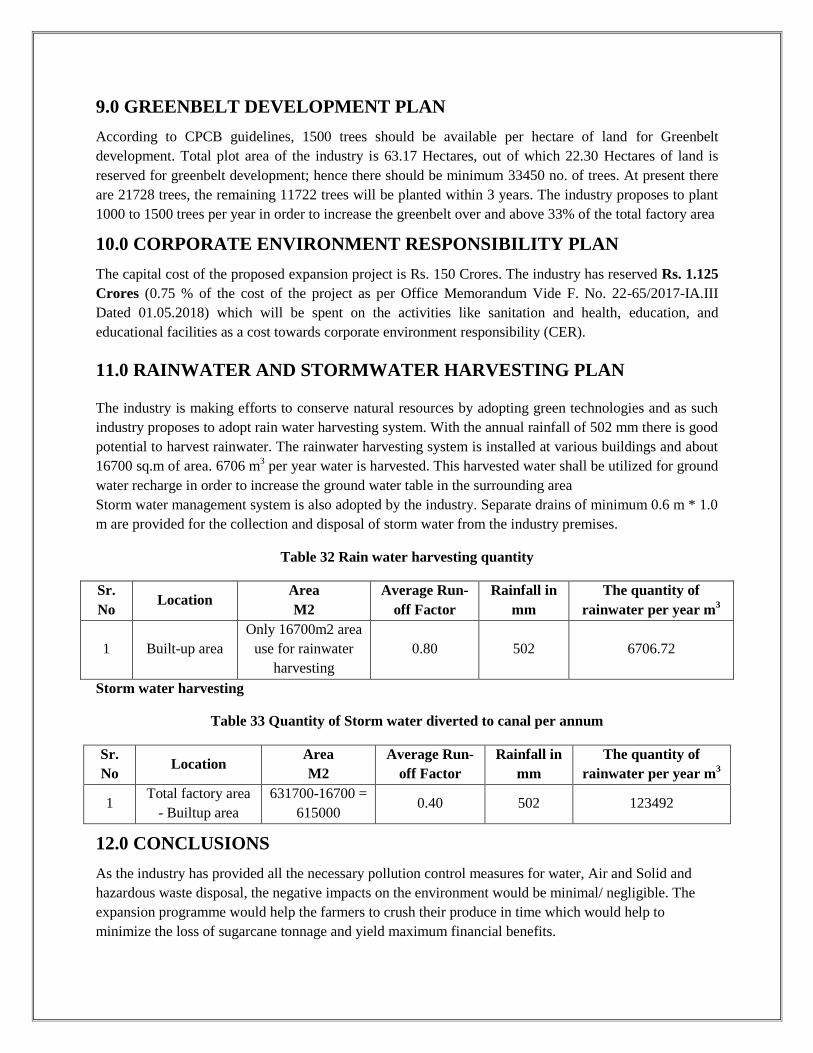
11.0 RAINWATER AND STORMWATER HARVESTING PLAN
The industry is making efforts to conserve natural resources by adopting green technologies and as such
industry proposes to adopt rain water harvesting system. With the annual rainfall of 502 mm there is good
potential to harvest rainwater. The rainwater harvesting system is installed at various buildings and about
16700 sq.m of area. 6706 m3 per year water is harvested. This harvested water shall be utilized for ground
water recharge in order to increase the ground water table in the surrounding area
Storm water management system is also adopted by the industry. Separate drains of minimum 0.6 m * 1.0
m are provided for the collection and disposal of storm water from the industry premises.
Table 32 Rain water harvesting quantity
Sr.
No Location
Area
M2
Average Run-
off Factor
Rainfall in
mm
The quantity of
rainwater per year m3
1 Built-up area
Only 16700m2 area
use for rainwater
harvesting
0.80 502 6706.72
Storm water harvesting
Table 33 Quantity of Storm water diverted to canal per annum
Sr.
No Location
Area
M2
Average Run-
off Factor
Rainfall in
mm
The quantity of
rainwater per year m3
1 Total factory area
- Builtup area
631700-16700 =
615000 0.40 502 123492
12.0 CONCLUSIONS
As the industry has provided all the necessary pollution control measures for water, Air and Solid and
hazardous waste disposal, the negative impacts on the environment would be minimal/ negligible. The
expansion programme would help the farmers to crush their produce in time which would help to
minimize the loss of sugarcane tonnage and yield maximum financial benefits.


