Embed Size (px)
Citation preview
Healthy Iowans: Iowa’s Health Improvement Plan 2017-2021
Is Iowa’s Health Improving?
Executive Summary
Bureau of Public Health Performance July 2021
Protecting and Improving the Health of Iowans
Acknowledgements
Suggested Citation: Iowa Department of Public Health. Healthy Iowans: Is Iowa’s Health Improving? Des Moines: Iowa Dept. of Public Health, July 2021. Healthy Iowans Website: https://idph.iowa.gov/healthy-iowans/plan#progress.
Governor: Kim Reynolds Lieutenant Governor: Adam Gregg IDPH Interim Director: Kelly Garcia
Report Contact Information: Jonn Durbin, MA, CPM [email protected] 515-452-5766
<<Rest of Page Intentionally Left Blank>>
Is Iowa's Health Improving? Executive Summary July 2021 Page 2 of 20
Table of Contents Executive Summary ................................................................................................................................................... 4
Summary of Progress on Measures of Health Improvement ................................................................................ 4
Progress in Health Equity and the Social Determinants of Health ........................................................................ 6
Progress in Addressing the Life Course ................................................................................................................. 8
Progress in Health System Improvement ...............................................................................................................9
Progress in Acute Disease: Vaccinations ............................................................................................................. 10
Progress in Addictive Behaviors .......................................................................................................................... 10
Progress in Chronic Disease ................................................................................................................................. 11
Progress in Disaster Preparedness ...................................................................................................................... 13
Progress in Environmental Health: Water Quality .............................................................................................. 13
Progress in Healthy Living .................................................................................................................................... 14
Progress in Injury & Violence .............................................................................................................................. 18
Progress in Mental Health, Illness, & Suicide ...................................................................................................... 20
Is Iowa's Health Improving? Executive Summary July 2021 Page 3 of 20
Executive Summary
This report documents progress on measures of Iowa’s health status and shows areas where there is a need for continued concern. A companion report, Taking Action to Improve Health in Iowa, details the work of more than 90 partners that have taken on responsibility for objectives and strategies in the plan.
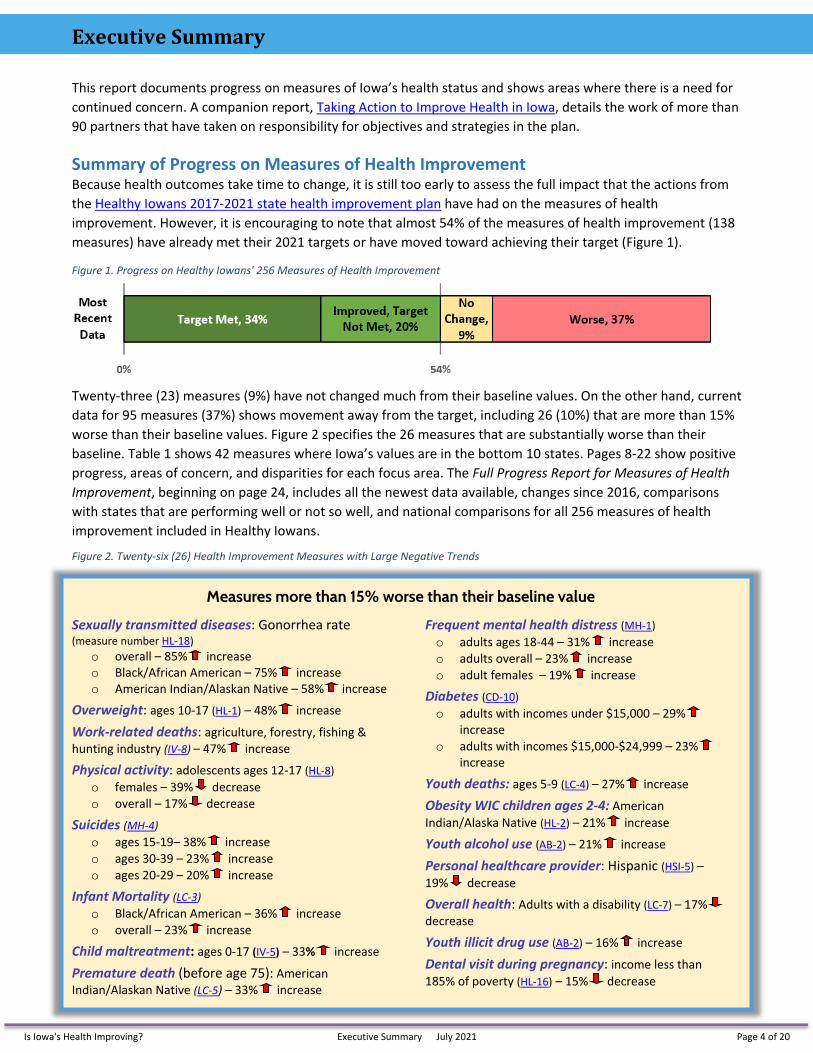
Summary of Progress on Measures of Health Improvement Because health outcomes take time to change, it is still too early to assess the full impact that the actions from the Healthy Iowans 2017-2021 state health improvement plan have had on the measures of health improvement. However, it is encouraging to note that almost 54% of the measures of health improvement (138 measures) have already met their 2021 targets or have moved toward achieving their target (Figure 1).
Figure 1. Progress on Healthy Iowans' 256 Measures of Health Improvement
Twenty-three (23) measures (9%) have not changed much from their baseline values. On the other hand, current data for 95 measures (37%) shows movement away from the target, including 26 (10%) that are more than 15% worse than their baseline values. Figure 2 specifies the 26 measures that are substantially worse than their baseline. Table 1 shows 42 measures where Iowa’s values are in the bottom 10 states. Pages 8-22 show positive progress, areas of concern, and disparities for each focus area. The Full Progress Report for Measures of Health Improvement, beginning on page 24, includes all the newest data available, changes since 2016, comparisons with states that are performing well or not so well, and national comparisons for all 256 measures of health improvement included in Healthy Iowans.
Figure 2. Twenty-six (26) Health Improvement Measures with Large Negative Trends
Measures more than 15% worse than their baseline value Sexually transmitted diseases: Gonorrhea rate (measure number HL-18)
o overall – 85% increaseo Black/African American – 75% increaseo American Indian/Alaskan Native – 58% increase
Overweight: ages 10-17 (HL-1) – 48% increase Work-related deaths: agriculture, forestry, fishing & hunting industry (IV-8) – 47% increase Physical activity: adolescents ages 12-17 (HL-8)
o females – 39% decreaseo overall – 17% decrease
Suicides (MH-4) o ages 15-19– 38% increaseo ages 30-39 – 23% increaseo ages 20-29 – 20% increase
Infant Mortality (LC-3)o Black/African American – 36% increaseo overall – 23% increase
Child maltreatment: ages 0-17 (IV-5) – 33% increase Premature death (before age 75): American Indian/Alaskan Native (LC-5) – 33% increase
Frequent mental health distress (MH-1) o adults ages 18-44 – 31% increaseo adults overall – 23% increaseo adult females – 19% increase
Diabetes (CD-10) o adults with incomes under $15,000 – 29%
increaseo adults with incomes $15,000-$24,999 – 23%
increase
Youth deaths: ages 5-9 (LC-4) – 27% increase
Obesity WIC children ages 2-4: American Indian/Alaska Native (HL-2) – 21% increase Youth alcohol use (AB-2) – 21% increase Personal healthcare provider: Hispanic (HSI-5) – 19% decrease Overall health: Adults with a disability (LC-7) – 17%decrease Youth illicit drug use (AB-2) – 16% increase Dental visit during pregnancy: income less than 185% of poverty (HL-16) – 15% decrease
Is Iowa's Health Improving? Executive Summary July 2021 Page 4 of 20
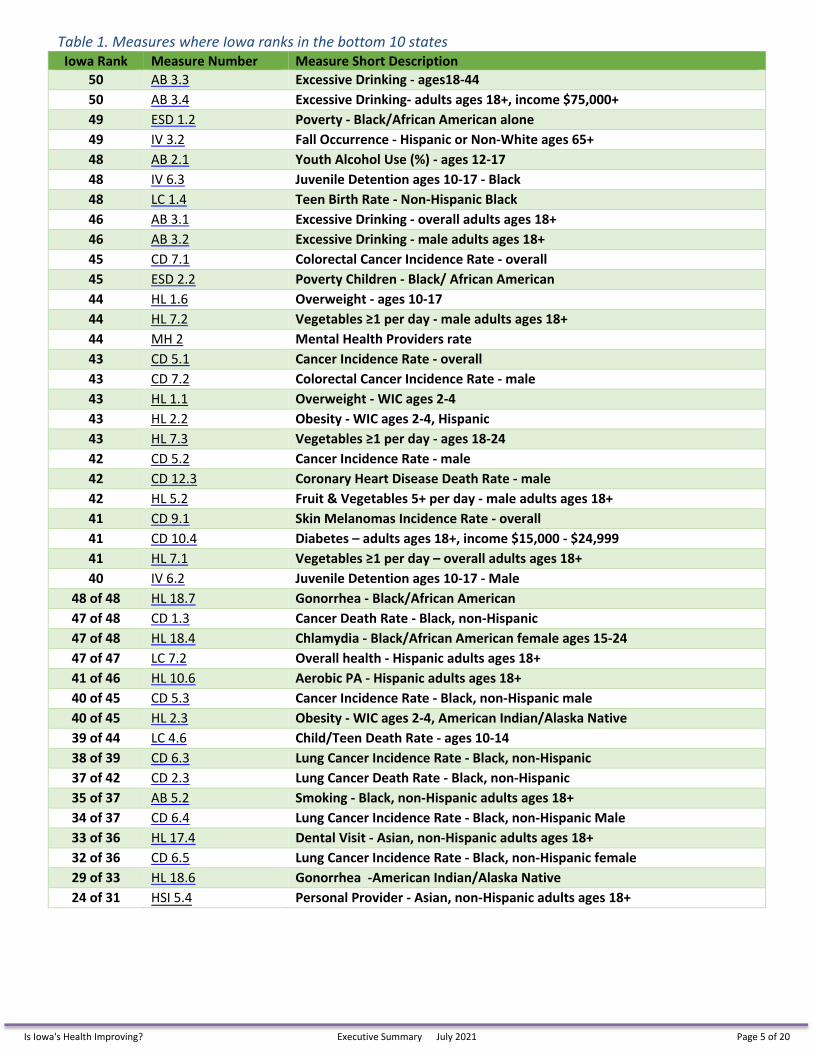
Table 1. Measures where Iowa ranks in the bottom 10 states Iowa Rank Measure Number Measure Short Description
50 AB 3.3 Excessive Drinking - ages18-44 50 AB 3.4 Excessive Drinking- adults ages 18+, income $75,000+ 49 ESD 1.2 Poverty - Black/African American alone 49 IV 3.2 Fall Occurrence - Hispanic or Non-White ages 65+ 48 AB 2.1 Youth Alcohol Use (%) - ages 12-17 48 IV 6.3 Juvenile Detention ages 10-17 - Black 48 LC 1.4 Teen Birth Rate - Non-Hispanic Black 46 AB 3.1 Excessive Drinking - overall adults ages 18+ 46 AB 3.2 Excessive Drinking - male adults ages 18+ 45 CD 7.1 Colorectal Cancer Incidence Rate - overall 45 ESD 2.2 Poverty Children - Black/ African American 44 HL 1.6 Overweight - ages 10-17 44 HL 7.2 Vegetables ≥1 per day - male adults ages 18+ 44 MH 2 Mental Health Providers rate 43 CD 5.1 Cancer Incidence Rate - overall 43 CD 7.2 Colorectal Cancer Incidence Rate - male 43 HL 1.1 Overweight - WIC ages 2-4 43 HL 2.2 Obesity - WIC ages 2-4, Hispanic 43 HL 7.3 Vegetables ≥1 per day - ages 18-24 42 CD 5.2 Cancer Incidence Rate - male 42 CD 12.3 Coronary Heart Disease Death Rate - male 42 HL 5.2 Fruit & Vegetables 5+ per day - male adults ages 18+ 41 CD 9.1 Skin Melanomas Incidence Rate - overall 41 CD 10.4 Diabetes – adults ages 18+, income $15,000 - $24,999 41 HL 7.1 Vegetables ≥1 per day – overall adults ages 18+ 40 IV 6.2 Juvenile Detention ages 10-17 - Male
48 of 48 HL 18.7 Gonorrhea - Black/African American 47 of 48 CD 1.3 Cancer Death Rate - Black, non-Hispanic 47 of 48 HL 18.4 Chlamydia - Black/African American female ages 15-24 47 of 47 LC 7.2 Overall health - Hispanic adults ages 18+ 41 of 46 HL 10.6 Aerobic PA - Hispanic adults ages 18+ 40 of 45 CD 5.3 Cancer Incidence Rate - Black, non-Hispanic male 40 of 45 HL 2.3 Obesity - WIC ages 2-4, American Indian/Alaska Native 39 of 44 LC 4.6 Child/Teen Death Rate - ages 10-14 38 of 39 CD 6.3 Lung Cancer Incidence Rate - Black, non-Hispanic 37 of 42 CD 2.3 Lung Cancer Death Rate - Black, non-Hispanic 35 of 37 AB 5.2 Smoking - Black, non-Hispanic adults ages 18+ 34 of 37 CD 6.4 Lung Cancer Incidence Rate - Black, non-Hispanic Male 33 of 36 HL 17.4 Dental Visit - Asian, non-Hispanic adults ages 18+ 32 of 36 CD 6.5 Lung Cancer Incidence Rate - Black, non-Hispanic female 29 of 33 HL 18.6 Gonorrhea -American Indian/Alaska Native 24 of 31 HSI 5.4 Personal Provider - Asian, non-Hispanic adults ages 18+
Is Iowa's Health Improving? Executive Summary July 2021 Page 5 of 20
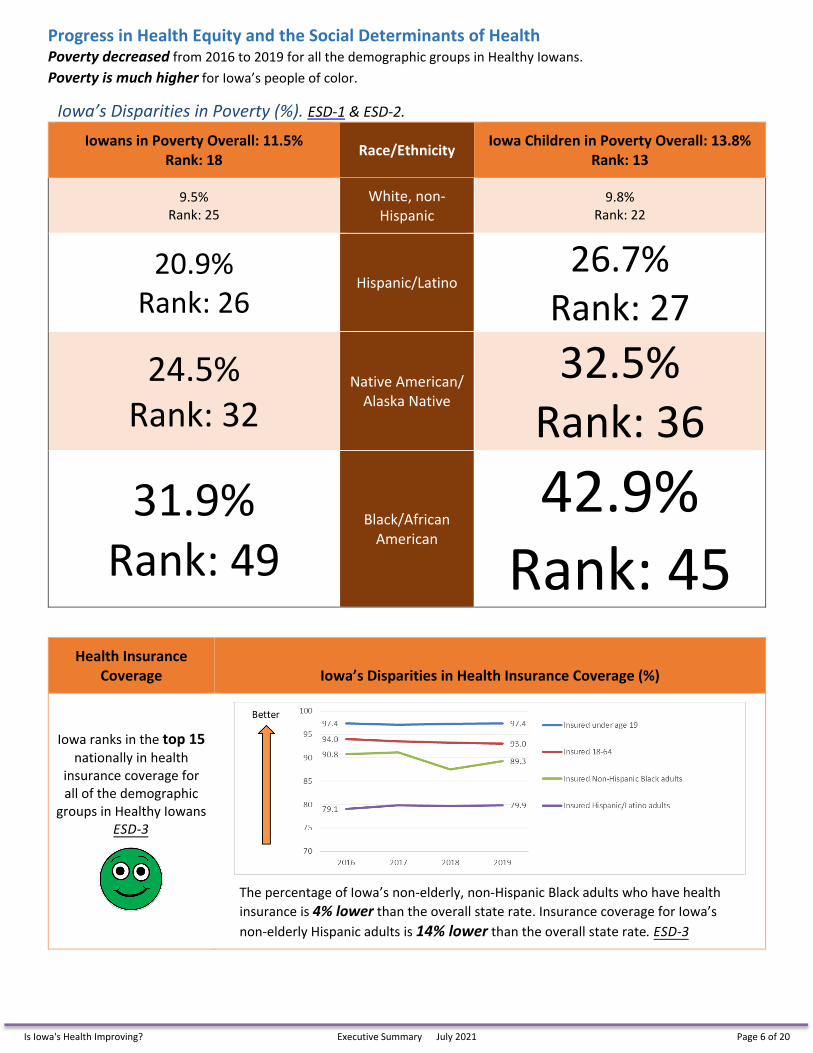
Progress in Health Equity and the Social Determinants of Health Poverty decreased from 2016 to 2019 for all the demographic groups in Healthy Iowans. Poverty is much higher for Iowa’s people of color.
Iowa’s Disparities in Poverty (%). ESD-1 & ESD-2. Iowans in Poverty Overall: 11.5%
Rank: 18 Race/Ethnicity Iowa Children in Poverty Overall: 13.8% Rank: 13
9.5% Rank: 25
White, non-Hispanic
9.8% Rank: 22
20.9% Rank: 26
Hispanic/Latino 26.7%
Rank: 27 24.5%
Rank: 32 Native American/
Alaska Native
32.5% Rank: 36
31.9% Rank: 49
Black/African American
42.9% Rank: 45
Health Insurance Coverage Iowa’s Disparities in Health Insurance Coverage (%)
Iowa ranks in the top 15 nationally in health
insurance coverage for all of the demographic
groups in Healthy Iowans ESD-3
The percentage of Iowa’s non-elderly, non-Hispanic Black adults who have health insurance is 4% lower than the overall state rate. Insurance coverage for Iowa’s non-elderly Hispanic adults is 14% lower than the overall state rate. ESD-3
Is Iowa's Health Improving? Executive Summary July 2021 Page 6 of 20
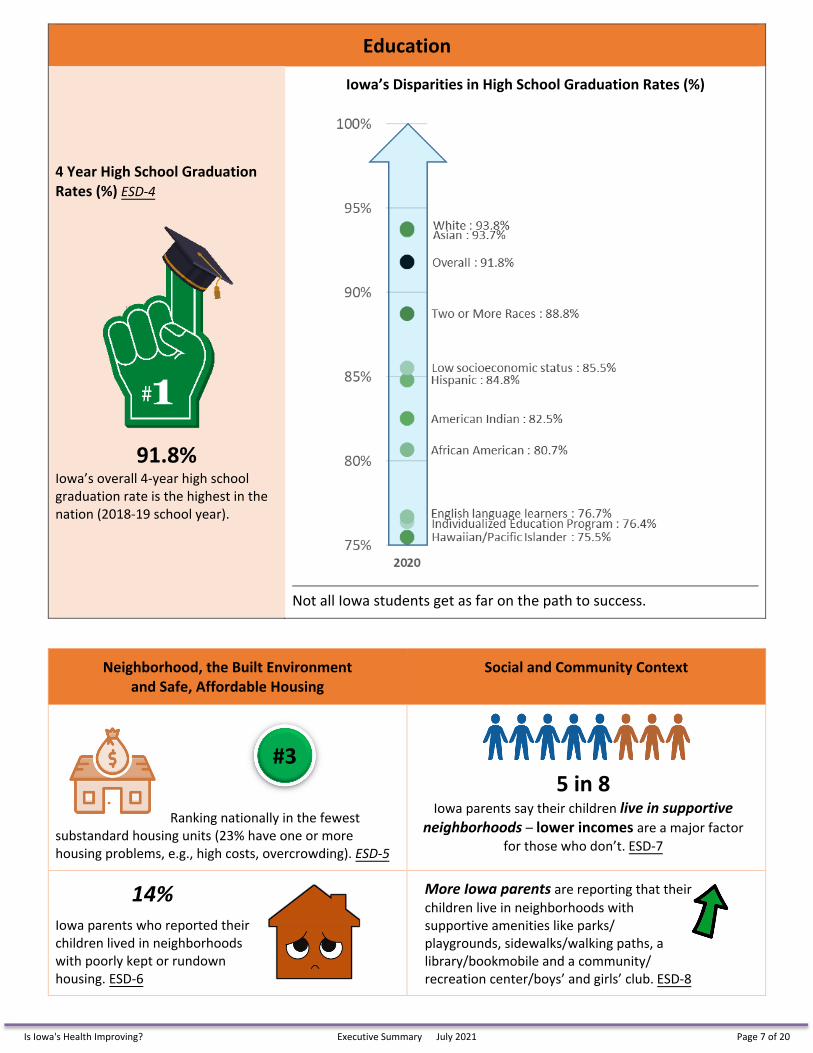
Education
4 Year High School Graduation Rates (%) ESD-4
91.8% Iowa’s overall 4-year high school graduation rate is the highest in the nation (2018-19 school year).
Iowa’s Disparities in High School Graduation Rates (%)
Not all Iowa students get as far on the path to success.
Neighborhood, the Built Environment and Safe, Affordable Housing
Social and Community Context
Ranking nationally in the fewest substandard housing units (23% have one or more housing problems, e.g., high costs, overcrowding). ESD-5
5 in 8 Iowa parents say their children live in supportive
neighborhoods – lower incomes are a major factor for those who don’t. ESD-7
14% Iowa parents who reported their children lived in neighborhoods with poorly kept or rundown housing. ESD-6
More Iowa parents are reporting that their children live in neighborhoods with supportive amenities like parks/ playgrounds, sidewalks/walking paths, a library/bookmobile and a community/ recreation center/boys’ and girls’ club. ESD-8
#3
Is Iowa's Health Improving? Executive Summary July 2021 Page 7 of 20
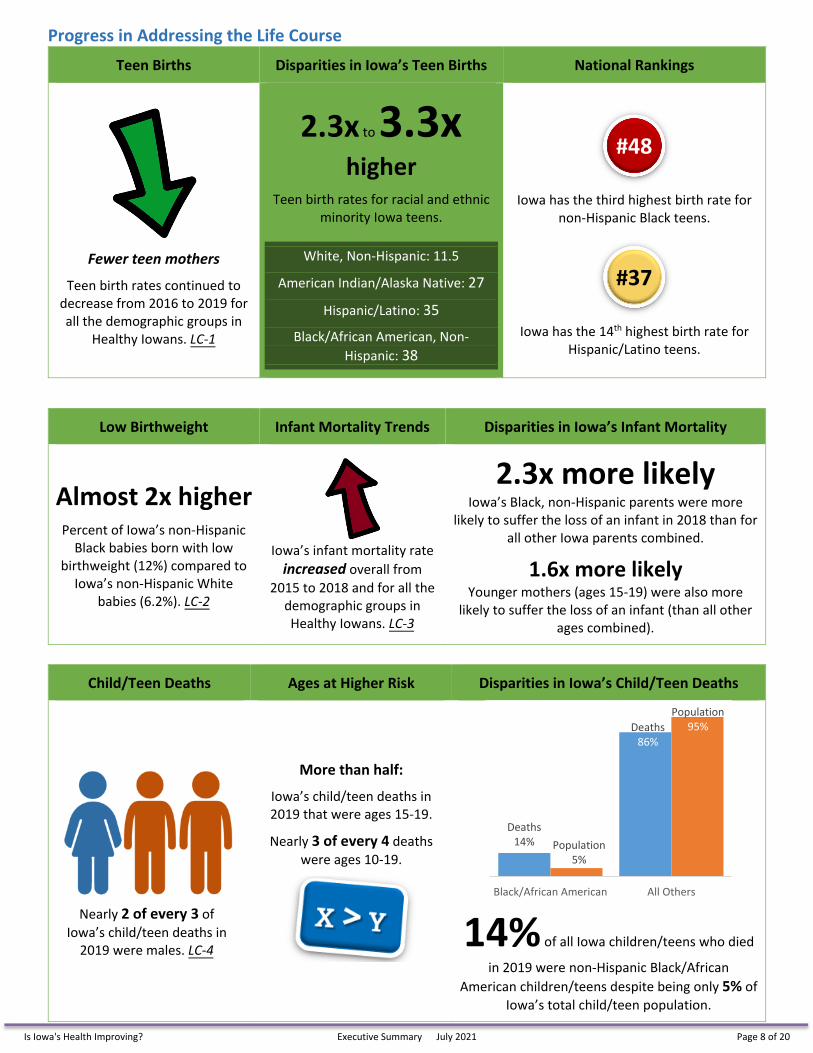
Progress in Addressing the Life Course Teen Births Disparities in Iowa’s Teen Births National Rankings
Fewer teen mothers
Teen birth rates continued to decrease from 2016 to 2019 for all the demographic groups in
Healthy Iowans. LC-1
2.3x to 3.3xhigher
Teen birth rates for racial and ethnic minority Iowa teens.
White, Non-Hispanic: 11.5
American Indian/Alaska Native: 27
Hispanic/Latino: 35
Black/African American, Non-Hispanic: 38
Iowa has the third highest birth rate for non-Hispanic Black teens.
Iowa has the 14th highest birth rate for Hispanic/Latino teens.
#48
#37
Low Birthweight Infant Mortality Trends Disparities in Iowa’s Infant Mortality
Almost 2x higherPercent of Iowa’s non-Hispanic
Black babies born with low birthweight (12%) compared to
Iowa’s non-Hispanic White babies (6.2%). LC-2
Iowa’s infant mortality rate increased overall from
2015 to 2018 and for all the demographic groups in Healthy Iowans. LC-3
2.3x more likely Iowa’s Black, non-Hispanic parents were more
likely to suffer the loss of an infant in 2018 than for all other Iowa parents combined.
1.6x more likelyYounger mothers (ages 15-19) were also more
likely to suffer the loss of an infant (than all other ages combined).
Child/Teen Deaths Ages at Higher Risk Disparities in Iowa’s Child/Teen Deaths
Nearly 2 of every 3 of Iowa’s child/teen deaths in
2019 were males. LC-4
More than half:
Iowa’s child/teen deaths in 2019 that were ages 15-19.
Nearly 3 of every 4 deaths were ages 10-19.
14% of all Iowa children/teens who died
in 2019 were non-Hispanic Black/African American children/teens despite being only 5% of
Iowa’s total child/teen population.
Deaths14%
Deaths86%
Population5%
Population95%
Black/African American All Others
Is Iowa's Health Improving? Executive Summary July 2021 Page 8 of 20
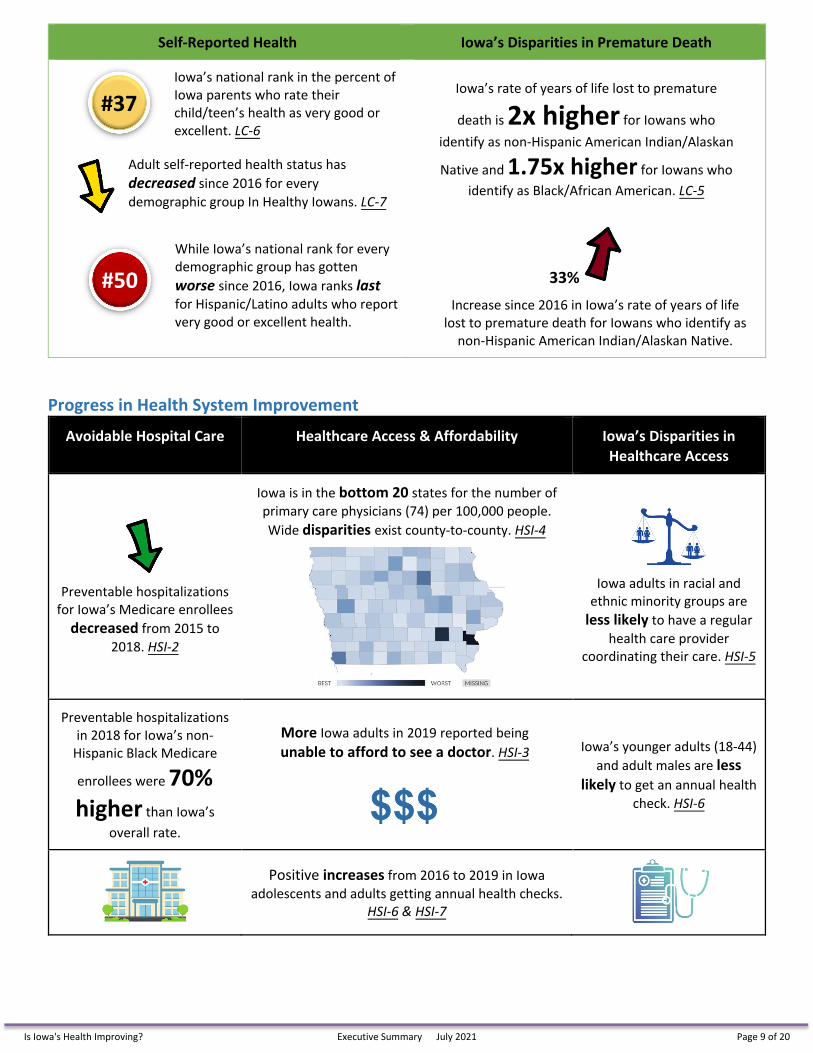
Self-Reported Health Iowa’s Disparities in Premature Death
Iowa’s national rank in the percent of Iowa parents who rate their child/teen’s health as very good or excellent. LC-6
Adult self-reported health status has decreased since 2016 for every demographic group In Healthy Iowans. LC-7
Iowa’s rate of years of life lost to premature
death is 2x higher for Iowans whoidentify as non-Hispanic American Indian/Alaskan
Native and 1.75x higher for Iowans whoidentify as Black/African American. LC-5
While Iowa’s national rank for every demographic group has gotten worse since 2016, Iowa ranks last for Hispanic/Latino adults who report very good or excellent health.
33% Increase since 2016 in Iowa’s rate of years of life
lost to premature death for Iowans who identify as non-Hispanic American Indian/Alaskan Native.
#37
#50
Progress in Health System Improvement
Avoidable Hospital Care Healthcare Access & Affordability Iowa’s Disparities in Healthcare Access
Preventable hospitalizations for Iowa’s Medicare enrollees
decreased from 2015 to 2018. HSI-2
Iowa is in the bottom 20 states for the number of primary care physicians (74) per 100,000 people. Wide disparities exist county-to-county. HSI-4
Iowa adults in racial and ethnic minority groups are
less likely to have a regular health care provider
coordinating their care. HSI-5
Preventable hospitalizations in 2018 for Iowa’s non-
Hispanic Black Medicare
enrollees were 70% higher than Iowa’s
overall rate.
More Iowa adults in 2019 reported being unable to afford to see a doctor. HSI-3 Iowa’s younger adults (18-44)
and adult males are less likely to get an annual health
check. HSI-6
Positive increases from 2016 to 2019 in Iowa adolescents and adults getting annual health checks.
HSI-6 & HSI-7
Is Iowa's Health Improving? Executive Summary July 2021 Page 9 of 20
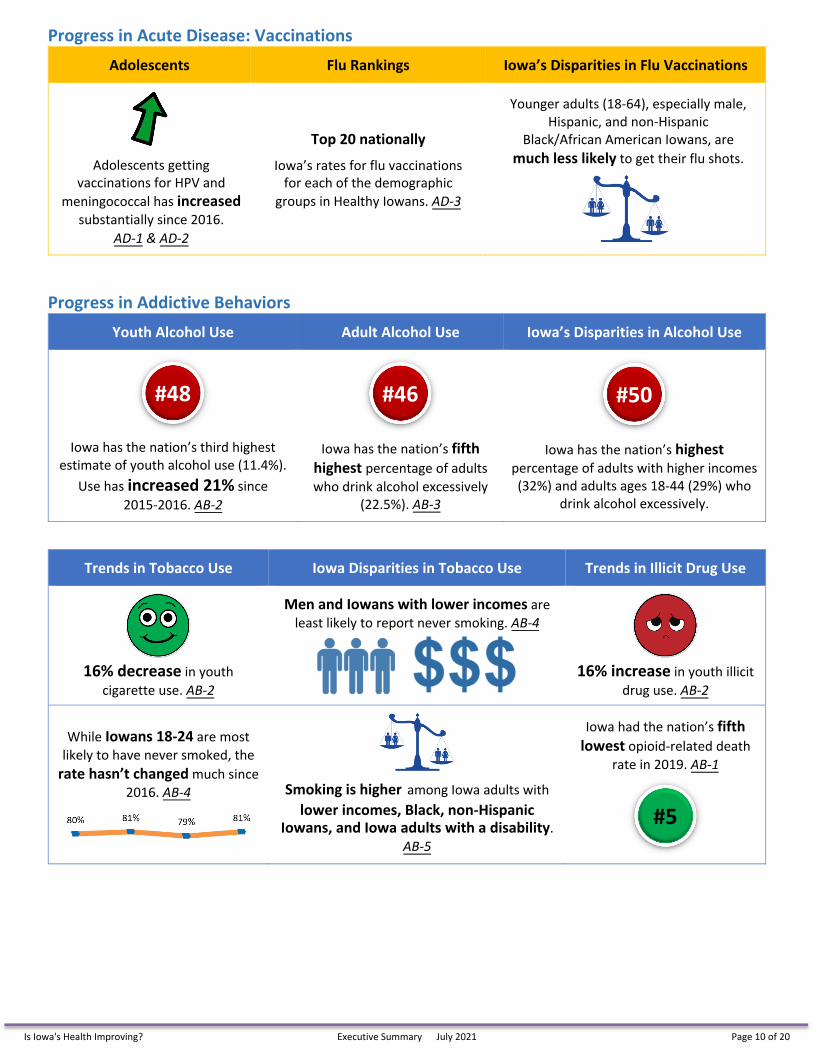
Progress in Acute Disease: Vaccinations Adolescents Flu Rankings Iowa’s Disparities in Flu Vaccinations
Adolescents getting vaccinations for HPV and
meningococcal has increased substantially since 2016.
AD-1 & AD-2
Top 20 nationally
Iowa’s rates for flu vaccinations for each of the demographic
groups in Healthy Iowans. AD-3
Younger adults (18-64), especially male, Hispanic, and non-Hispanic
Black/African American Iowans, are much less likely to get their flu shots.
#48 #46 #50
Progress in Addictive Behaviors Youth Alcohol Use Adult Alcohol Use Iowa’s Disparities in Alcohol Use
Iowa has the nation’s third highest estimate of youth alcohol use (11.4%).
Use has increased 21% since 2015-2016. AB-2
Iowa has the nation’s fifth highest percentage of adults who drink alcohol excessively
(22.5%). AB-3
Iowa has the nation’s highest percentage of adults with higher incomes (32%) and adults ages 18-44 (29%) who
drink alcohol excessively.
Trends in Tobacco Use Iowa Disparities in Tobacco Use Trends in Illicit Drug Use
16% decrease in youth cigarette use. AB-2
Men and Iowans with lower incomes are least likely to report never smoking. AB-4
16% increase in youth illicit drug use. AB-2
While Iowans 18-24 are most likely to have never smoked, the
rate hasn’t changed much since 2016. AB-4 Smoking is higher among Iowa adults with
lower incomes, Black, non-Hispanic Iowans, and Iowa adults with a disability.
AB-5
Iowa had the nation’s fifth lowest opioid-related death
rate in 2019. AB-1
#5
Is Iowa's Health Improving? Executive Summary July 2021 Page 10 of 20
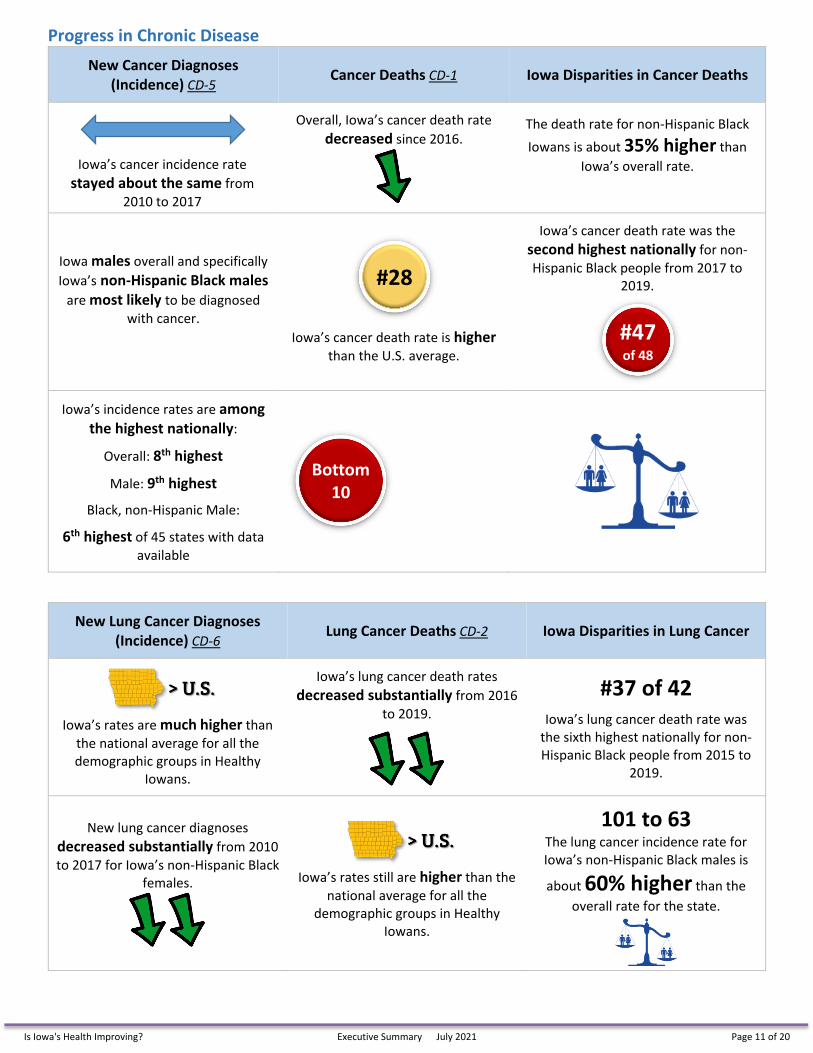
Progress in Chronic Disease New Cancer Diagnoses
(Incidence) CD-5 Cancer Deaths CD-1 Iowa Disparities in Cancer Deaths
Iowa’s cancer incidence rate stayed about the same from
2010 to 2017
Overall, Iowa’s cancer death rate decreased since 2016.
The death rate for non-Hispanic Black Iowans is about 35% higher than
Iowa’s overall rate.
Iowa males overall and specifically Iowa’s non-Hispanic Black males
are most likely to be diagnosed with cancer.
Iowa’s cancer death rate is higher than the U.S. average.
Iowa’s cancer death rate was the second highest nationally for non-Hispanic Black people from 2017 to
2019.
Iowa’s incidence rates are among the highest nationally:
Overall: 8th highest
Male: 9th highest
Black, non-Hispanic Male:
6th highest of 45 states with data available
#28
#47of 48
Bottom 10
New Lung Cancer Diagnoses (Incidence) CD-6 Lung Cancer Deaths CD-2 Iowa Disparities in Lung Cancer
Iowa’s rates are much higher than the national average for all the demographic groups in Healthy
Iowans.
Iowa’s lung cancer death rates decreased substantially from 2016
to 2019. #37 of 42
Iowa’s lung cancer death rate was the sixth highest nationally for non-Hispanic Black people from 2015 to
2019.
New lung cancer diagnoses decreased substantially from 2010 to 2017 for Iowa’s non-Hispanic Black
females. Iowa’s rates still are higher than the national average for all the
demographic groups in Healthy Iowans.
101 to 63 The lung cancer incidence rate for Iowa’s non-Hispanic Black males is
about 60% higher than theoverall rate for the state.
Is Iowa's Health Improving? Executive Summary July 2021 Page 11 of 20
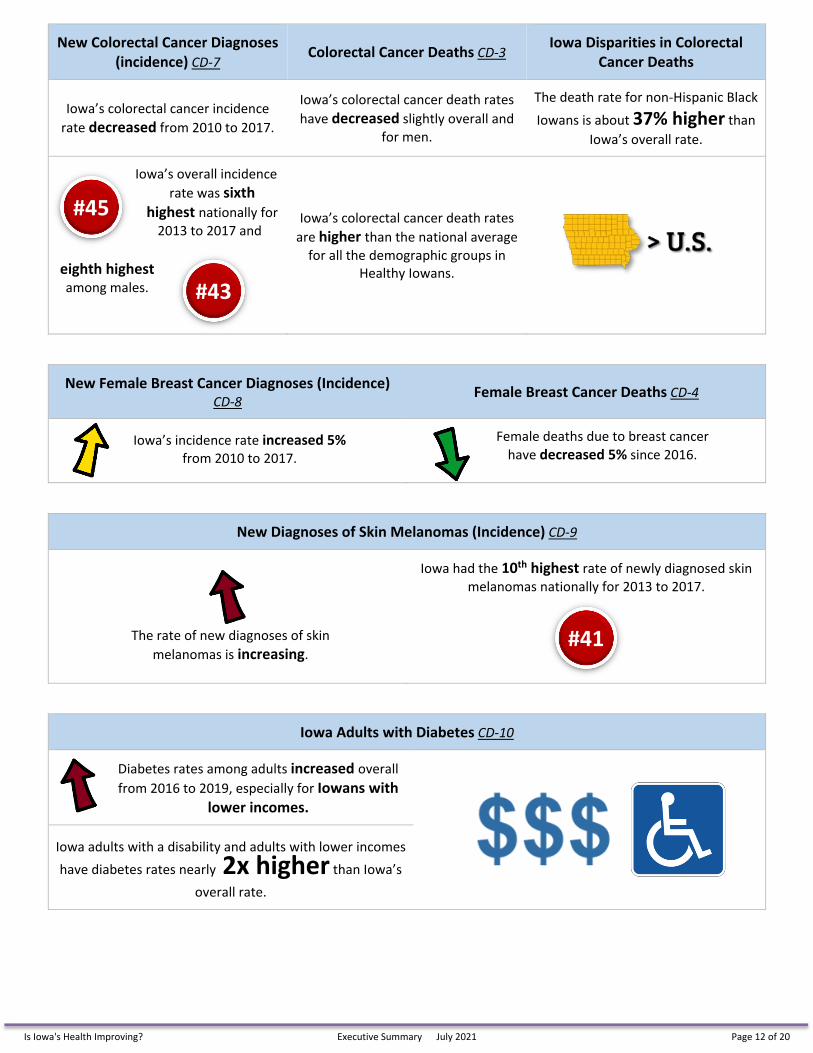
New Colorectal Cancer Diagnoses (incidence) CD-7 Colorectal Cancer Deaths CD-3 Iowa Disparities in Colorectal
Cancer Deaths
Iowa’s colorectal cancer incidence rate decreased from 2010 to 2017.
Iowa’s colorectal cancer death rates have decreased slightly overall and
for men.
The death rate for non-Hispanic Black Iowans is about 37% higher than
Iowa’s overall rate.
Iowa’s overall incidence rate was sixth
highest nationally for 2013 to 2017 and
eighth highest among males.
Iowa’s colorectal cancer death rates are higher than the national average
for all the demographic groups in Healthy Iowans.
New Female Breast Cancer Diagnoses (Incidence) CD-8
Female Breast Cancer Deaths CD-4
Iowa’s incidence rate increased 5% from 2010 to 2017.
Female deaths due to breast cancer have decreased 5% since 2016.
New Diagnoses of Skin Melanomas (Incidence) CD-9
The rate of new diagnoses of skin melanomas is increasing.
Iowa had the 10th highest rate of newly diagnosed skin melanomas nationally for 2013 to 2017.
Iowa Adults with Diabetes CD-10
Diabetes rates among adults increased overall from 2016 to 2019, especially for Iowans with
lower incomes.
Iowa adults with a disability and adults with lower incomes have diabetes rates nearly 2x higher than Iowa’s
overall rate.
#41
#45
#43
Is Iowa's Health Improving? Executive Summary July 2021 Page 12 of 20
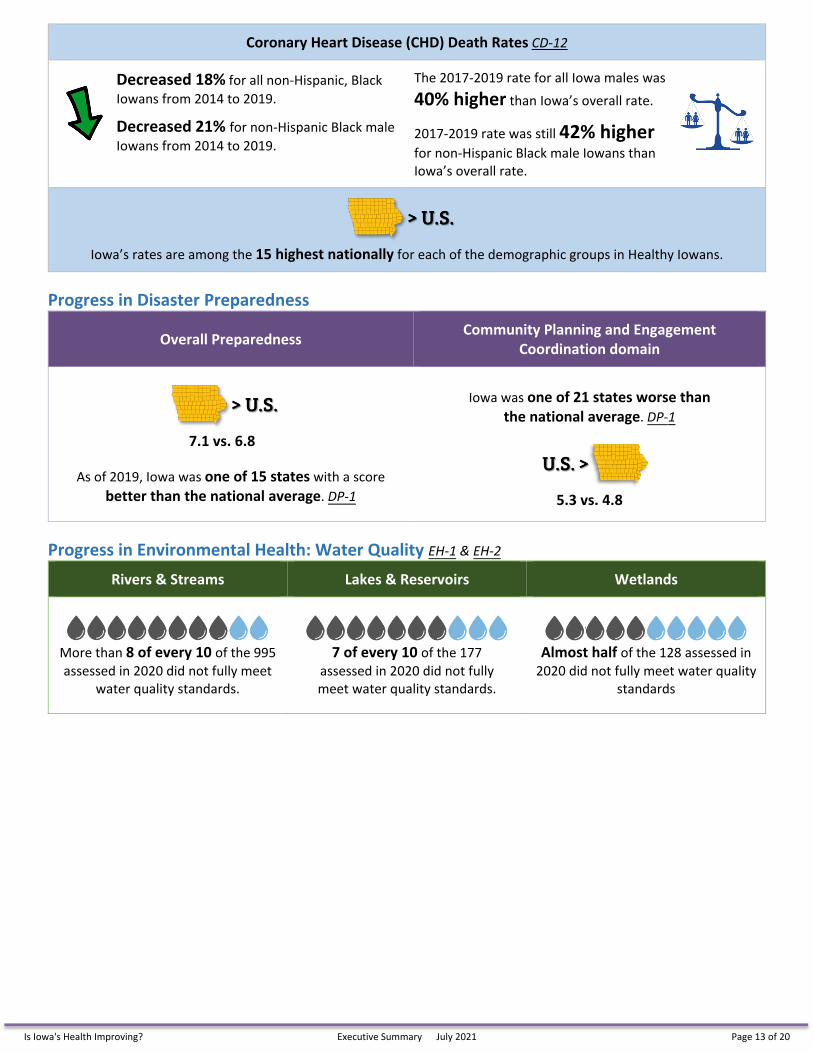
Coronary Heart Disease (CHD) Death Rates CD-12
Decreased 18% for all non-Hispanic, Black Iowans from 2014 to 2019.
Decreased 21% for non-Hispanic Black male Iowans from 2014 to 2019.
The 2017-2019 rate for all Iowa males was 40% higher than Iowa’s overall rate.
2017-2019 rate was still 42% higherfor non-Hispanic Black male Iowans than Iowa’s overall rate.
Iowa’s rates are among the 15 highest nationally for each of the demographic groups in Healthy Iowans.
Progress in Disaster Preparedness
Overall Preparedness Community Planning and Engagement Coordination domain
7.1 vs. 6.8
As of 2019, Iowa was one of 15 states with a score better than the national average. DP-1
Iowa was one of 21 states worse than the national average. DP-1
5.3 vs. 4.8
Progress in Environmental Health: Water Quality EH-1 & EH-2 Rivers & Streams Lakes & Reservoirs Wetlands
More than 8 of every 10 of the 995 assessed in 2020 did not fully meet
water quality standards.
7 of every 10 of the 177 assessed in 2020 did not fully meet water quality standards.
Almost half of the 128 assessed in 2020 did not fully meet water quality
standards
Is Iowa's Health Improving? Executive Summary July 2021 Page 13 of 20
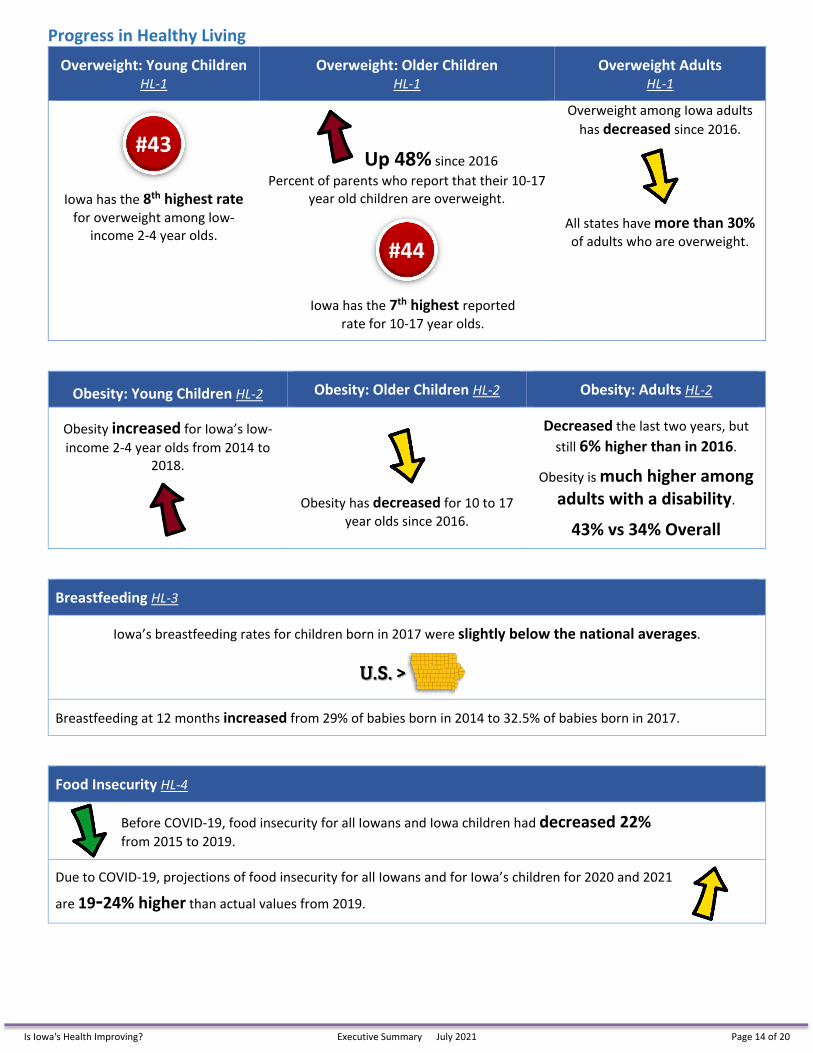
Progress in Healthy Living Overweight: Young Children
HL-1 Overweight: Older Children
HL-1 Overweight Adults
HL-1
Iowa has the 8th highest rate for overweight among low-
income 2-4 year olds.
Up 48% since 2016 Percent of parents who report that their 10-17
year old children are overweight.
Iowa has the 7th highest reported rate for 10-17 year olds.
Overweight among Iowa adults has decreased since 2016.
All states have more than 30% of adults who are overweight.
Obesity: Young Children HL-2 Obesity: Older Children HL-2 Obesity: Adults HL-2
Obesity increased for Iowa’s low-income 2-4 year olds from 2014 to
2018.
Obesity has decreased for 10 to 17 year olds since 2016.
Decreased the last two years, but still 6% higher than in 2016.
Obesity is much higher among adults with a disability.
43% vs 34% Overall
Breastfeeding HL-3
Iowa’s breastfeeding rates for children born in 2017 were slightly below the national averages.
Breastfeeding at 12 months increased from 29% of babies born in 2014 to 32.5% of babies born in 2017.
Food Insecurity HL-4
Before COVID-19, food insecurity for all Iowans and Iowa children had decreased 22%from 2015 to 2019.
Due to COVID-19, projections of food insecurity for all Iowans and for Iowa’s children for 2020 and 2021
are 19-24% higher than actual values from 2019.
#43
#44
Is Iowa's Health Improving? Executive Summary July 2021 Page 14 of 20
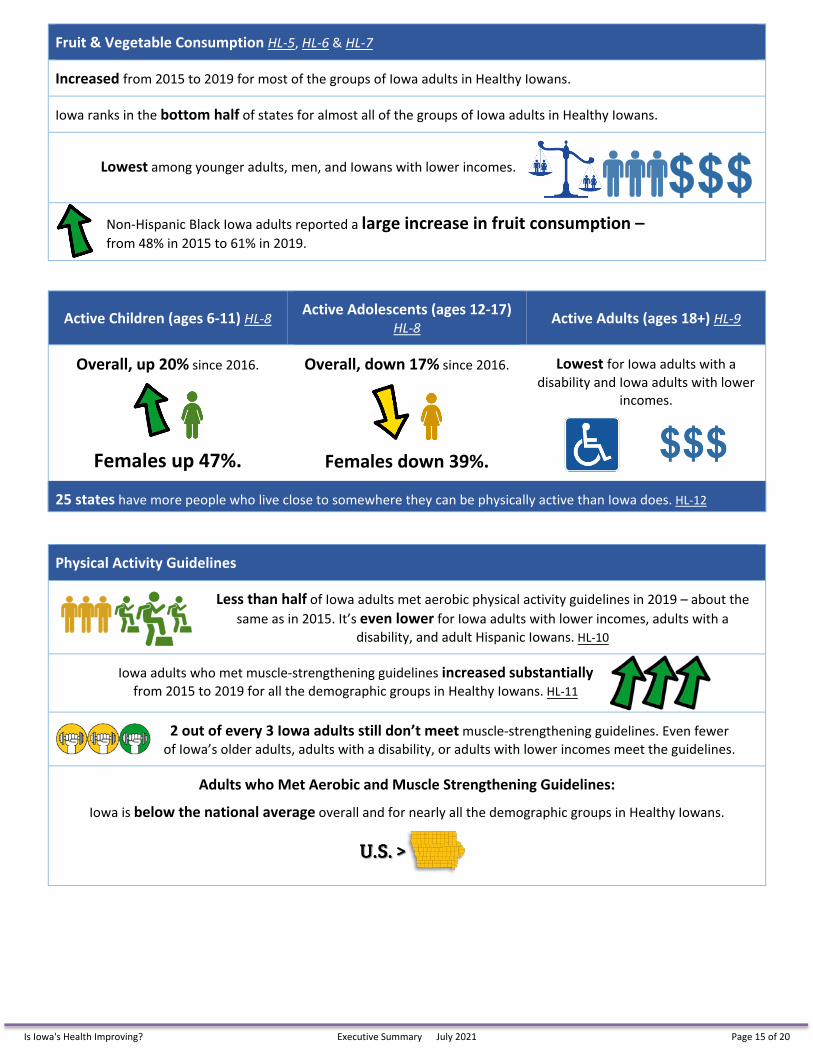
Fruit & Vegetable Consumption HL-5, HL-6 & HL-7
Increased from 2015 to 2019 for most of the groups of Iowa adults in Healthy Iowans.
Iowa ranks in the bottom half of states for almost all of the groups of Iowa adults in Healthy Iowans.
Lowest among younger adults, men, and Iowans with lower incomes.
Non-Hispanic Black Iowa adults reported a large increase in fruit consumption – from 48% in 2015 to 61% in 2019.
Active Children (ages 6-11) HL-8 Active Adolescents (ages 12-17)HL-8 Active Adults (ages 18+) HL-9
Overall, up 20% since 2016.
Females up 47%.
Overall, down 17% since 2016.
Females down 39%.
Lowest for Iowa adults with a disability and Iowa adults with lower
incomes.
25 states have more people who live close to somewhere they can be physically active than Iowa does. HL-12
Physical Activity Guidelines
Less than half of Iowa adults met aerobic physical activity guidelines in 2019 – about the same as in 2015. It’s even lower for Iowa adults with lower incomes, adults with a
disability, and adult Hispanic Iowans. HL-10
Iowa adults who met muscle-strengthening guidelines increased substantially from 2015 to 2019 for all the demographic groups in Healthy Iowans. HL-11
2 out of every 3 Iowa adults still don’t meet muscle-strengthening guidelines. Even fewer of Iowa’s older adults, adults with a disability, or adults with lower incomes meet the guidelines.
Adults who Met Aerobic and Muscle Strengthening Guidelines:
Iowa is below the national average overall and for nearly all the demographic groups in Healthy Iowans.
Is Iowa's Health Improving? Executive Summary July 2021 Page 15 of 20
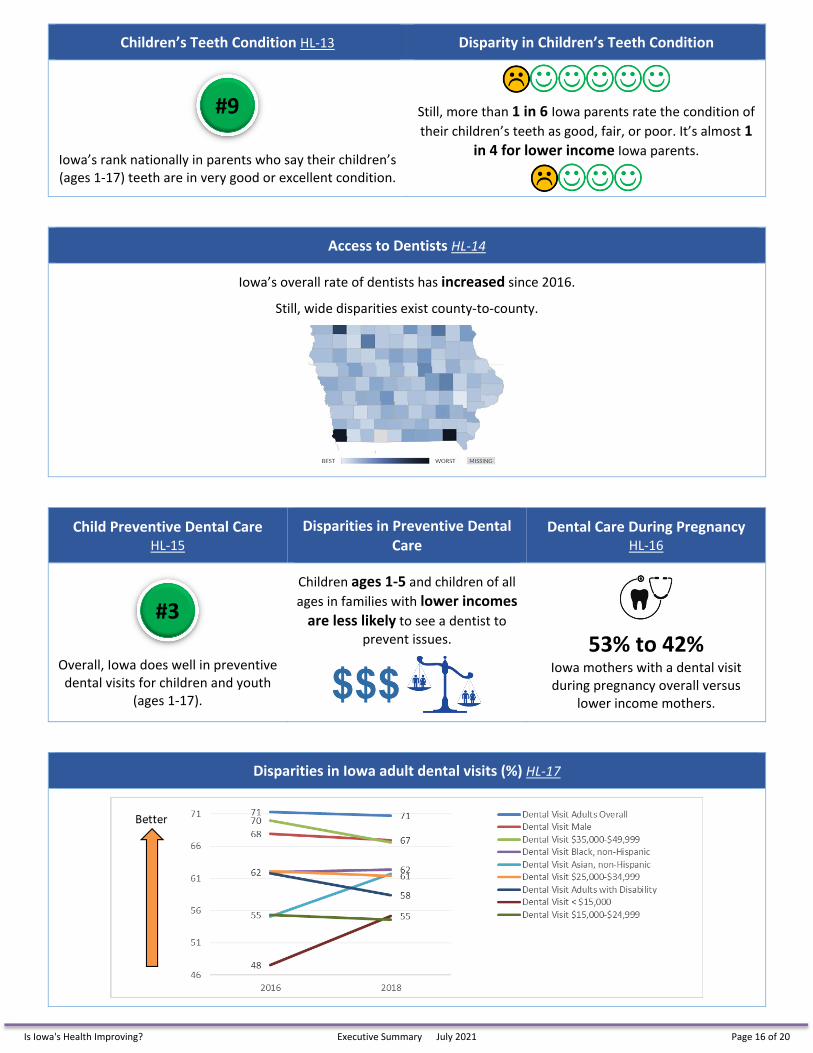
Children’s Teeth Condition HL-13 Disparity in Children’s Teeth Condition
Iowa’s rank nationally in parents who say their children’s (ages 1-17) teeth are in very good or excellent condition.
Still, more than 1 in 6 Iowa parents rate the condition of their children’s teeth as good, fair, or poor. It’s almost 1
in 4 for lower income Iowa parents.
Access to Dentists HL-14
Iowa’s overall rate of dentists has increased since 2016.
Still, wide disparities exist county-to-county.
Child Preventive Dental Care HL-15
Disparities in Preventive Dental Care
Dental Care During Pregnancy HL-16
Overall, Iowa does well in preventive dental visits for children and youth
(ages 1-17).
Children ages 1-5 and children of all ages in families with lower incomes
are less likely to see a dentist to prevent issues. 53% to 42%
Iowa mothers with a dental visit during pregnancy overall versus
lower income mothers.
Disparities in Iowa adult dental visits (%) HL-17
#9
#3
Is Iowa's Health Improving? Executive Summary July 2021 Page 16 of 20
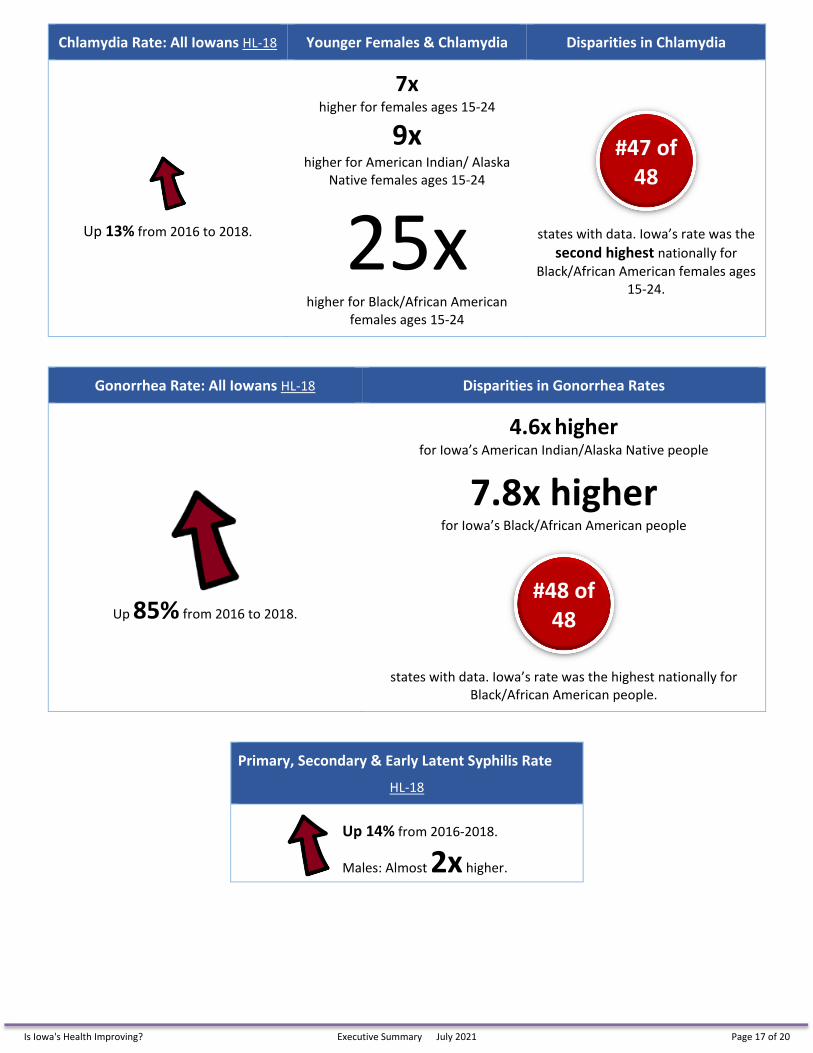
Chlamydia Rate: All Iowans HL-18 Younger Females & Chlamydia Disparities in Chlamydia
Up 13% from 2016 to 2018.
7xhigher for females ages 15-24
9xhigher for American Indian/ Alaska
Native females ages 15-24
25xhigher for Black/African American
females ages 15-24
states with data. Iowa’s rate was the second highest nationally for
Black/African American females ages 15-24.
Gonorrhea Rate: All Iowans HL-18 Disparities in Gonorrhea Rates
Up 85% from 2016 to 2018.
4.6x higherfor Iowa’s American Indian/Alaska Native people
7.8x higherfor Iowa’s Black/African American people
states with data. Iowa’s rate was the highest nationally for Black/African American people.
Primary, Secondary & Early Latent Syphilis Rate
HL-18
Up 14% from 2016-2018.
Males: Almost 2x higher.
#47 of 48
#48 of 48
Is Iowa's Health Improving? Executive Summary July 2021 Page 17 of 20
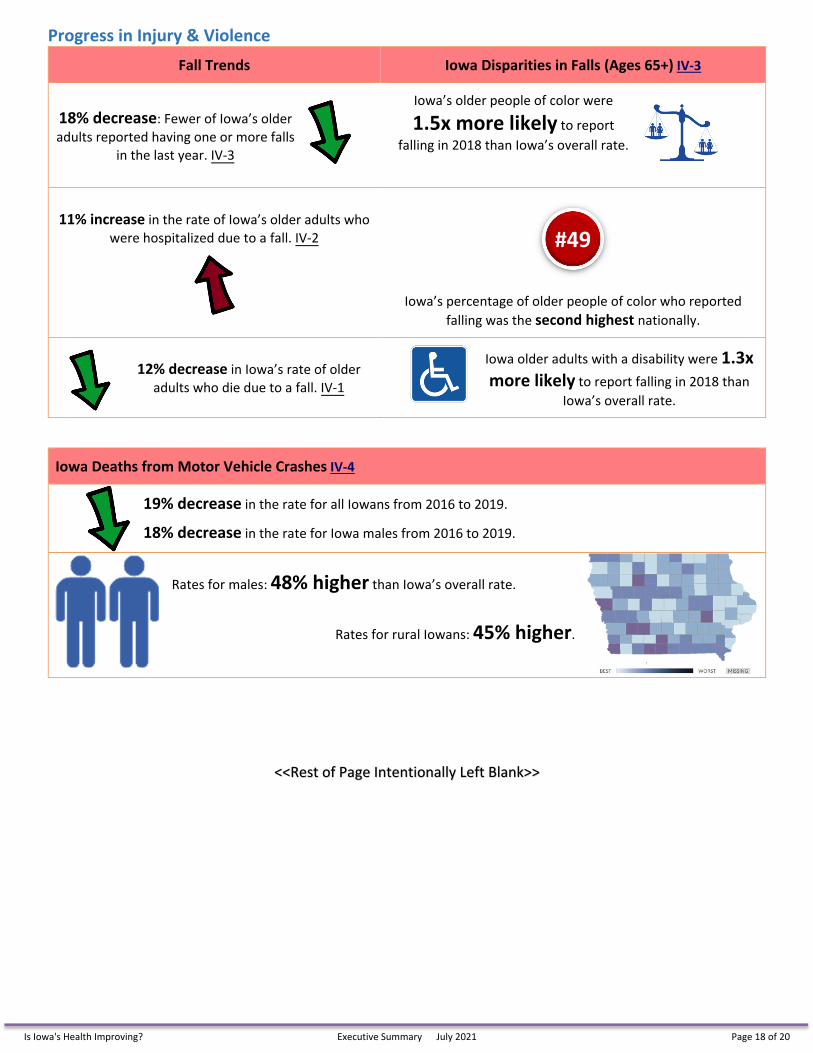
Progress in Injury & Violence Fall Trends Iowa Disparities in Falls (Ages 65+) IV-3
18% decrease: Fewer of Iowa’s older adults reported having one or more falls
in the last year. IV-3
Iowa’s older people of color were
1.5x more likely to reportfalling in 2018 than Iowa’s overall rate.
11% increase in the rate of Iowa’s older adults who were hospitalized due to a fall. IV-2
Iowa’s percentage of older people of color who reported falling was the second highest nationally.
12% decrease in Iowa’s rate of older adults who die due to a fall. IV-1
Iowa older adults with a disability were 1.3x more likely to report falling in 2018 than
Iowa’s overall rate.
Iowa Deaths from Motor Vehicle Crashes IV-4
19% decrease in the rate for all Iowans from 2016 to 2019.
18% decrease in the rate for Iowa males from 2016 to 2019.
Rates for males: 48% higher than Iowa’s overall rate.
Rates for rural Iowans: 45% higher.
<<Rest of Page Intentionally Left Blank>>
#49
Is Iowa's Health Improving? Executive Summary July 2021 Page 18 of 20
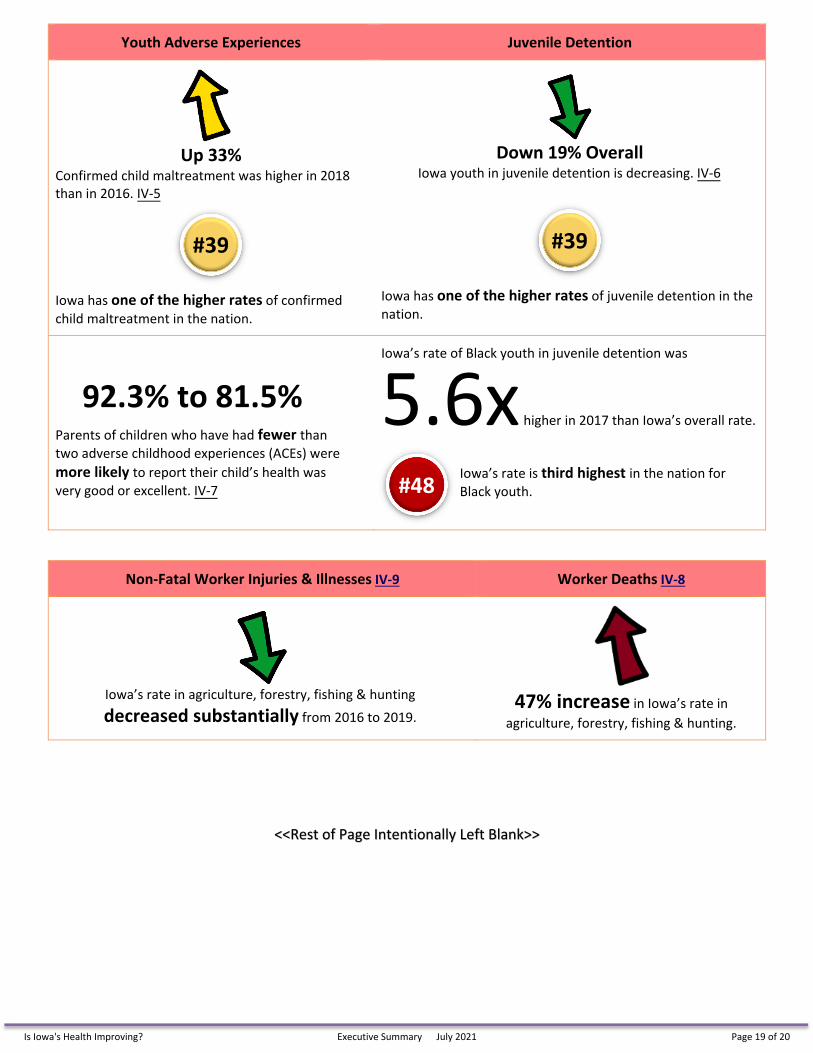
Youth Adverse Experiences Juvenile Detention
Up 33% Confirmed child maltreatment was higher in 2018 than in 2016. IV-5
Iowa has one of the higher rates of confirmed child maltreatment in the nation.
Down 19% Overall Iowa youth in juvenile detention is decreasing. IV-6
Iowa has one of the higher rates of juvenile detention in the nation.
92.3% to 81.5% Parents of children who have had fewer than two adverse childhood experiences (ACEs) were more likely to report their child’s health was very good or excellent. IV-7
Iowa’s rate of Black youth in juvenile detention was
5.6x higher in 2017 than Iowa’s overall rate.
Iowa’s rate is third highest in the nation for Black youth.
Non-Fatal Worker Injuries & Illnesses IV-9 Worker Deaths IV-8
Iowa’s rate in agriculture, forestry, fishing & hunting decreased substantially from 2016 to 2019.
47% increase in Iowa’s rate inagriculture, forestry, fishing & hunting.
<<Rest of Page Intentionally Left Blank>>
#39 #39
#48
Is Iowa's Health Improving? Executive Summary July 2021 Page 19 of 20
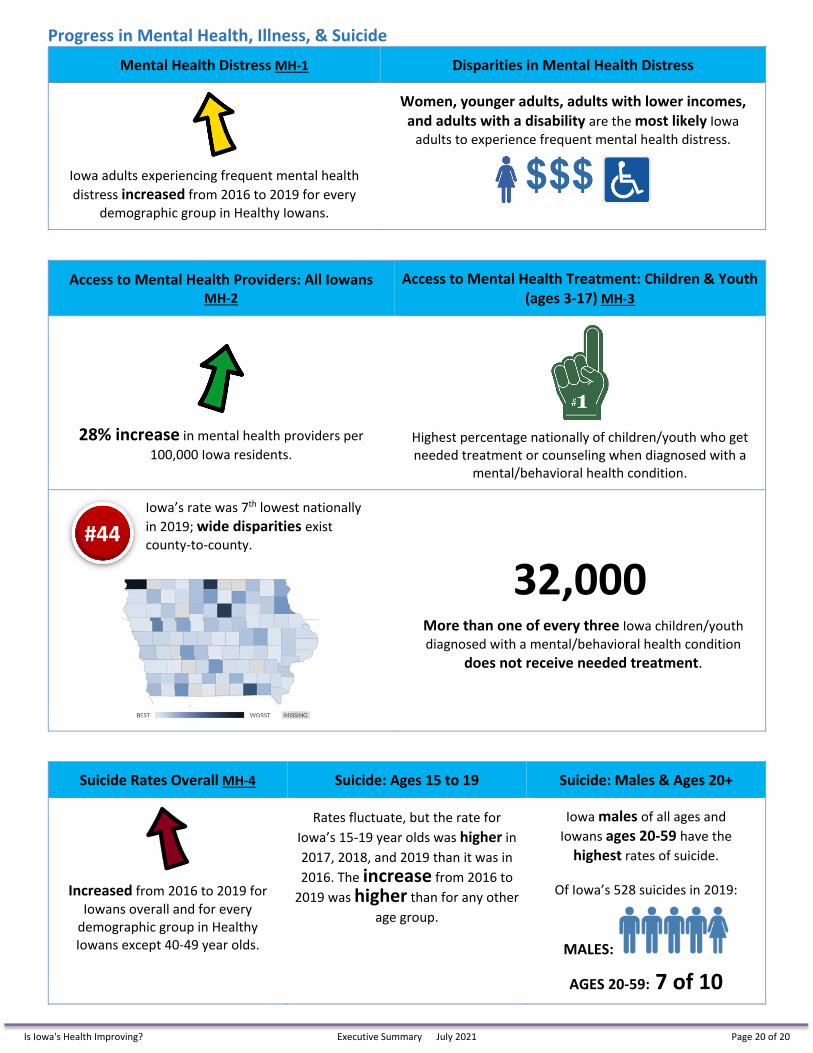
Progress in Mental Health, Illness, & Suicide Mental Health Distress MH-1 Disparities in Mental Health Distress
Iowa adults experiencing frequent mental health distress increased from 2016 to 2019 for every
demographic group in Healthy Iowans.
Women, younger adults, adults with lower incomes, and adults with a disability are the most likely Iowa
adults to experience frequent mental health distress.
Access to Mental Health Providers: All Iowans MH-2
Access to Mental Health Treatment: Children & Youth (ages 3-17) MH-3
28% increase in mental health providers per100,000 Iowa residents.
Highest percentage nationally of children/youth who get needed treatment or counseling when diagnosed with a
mental/behavioral health condition.
Iowa’s rate was 7th lowest nationally in 2019; wide disparities exist county-to-county.
32,000 More than one of every three Iowa children/youth diagnosed with a mental/behavioral health condition
does not receive needed treatment.
Suicide Rates Overall MH-4 Suicide: Ages 15 to 19 Suicide: Males & Ages 20+
Increased from 2016 to 2019 for Iowans overall and for every
demographic group in Healthy Iowans except 40-49 year olds.
Rates fluctuate, but the rate for Iowa’s 15-19 year olds was higher in 2017, 2018, and 2019 than it was in 2016. The increase from 2016 to
2019 was higher than for any otherage group.
Iowa males of all ages and Iowans ages 20-59 have the
highest rates of suicide.
Of Iowa’s 528 suicides in 2019:
MALES:
AGES 20-59: 7 of 10
#44
Is Iowa's Health Improving? Executive Summary July 2021 Page 20 of 20


