Embed Size (px)
Citation preview
Proceedings of the NARST 2009 Annuat Meeting
EXAMINATION OF A NEW MODEL OF SCIENCE TEACHER IDENTITY (STI)AMONG PRESERVICE SCIENCE TEACHERS
In this shrdy, a new concep$ral model ofscience Teacher Identity (STI) was prcposedand examined. We explored how the conshuct dimensions of science teacher identity can
be conceptualized; whether the level of sci€nce teacher identity can be va.lidly and.rcliably rr€!flred; add whether preliminary evidenc€ in su?port ofthe model can begathered. For this study, a 48{uestiofiEire was developed wing items in Likert formatto m€asure the nine postulated dimensions ofthe proposed STI model: science teachers'personal leaming experietrce, having l owledge and skills, community practice, science
teaching pra4tice, degree of success, locial respect, beli€f ard value in science teaching,intrinsic satisfaction, and reFeseatation. To validate the construct validty ofninedimensions, the model of sTI was quantitatively add qu4litatively examiDed usbg a
sample of l7 Feservice scietrce t€ache$ who were completing a graduate level science
teacher prepantion programs. Tecbniques used included administration ofa surveyilstnfnen! interviewg ard docusellt aaa]]sis, To exarnjqe fle uld€rlyisg structu'alformation of the STI model, subscale score reliabilities and corelations of each
dimension of the STI model to a vadety ofvaxiables were analyzed using srrvey dataftom an instrument administered to 414 experienced scionce teachers. Results Fovidedernpirical evidence that the construct of science teacher ide ity catr be explicitly modeledand reliabty rneas*ed. Also, pretirninary findingE suppolt Jhe colstruct €lidity of dleSTI model, with several hypothesized correlations implied by the model beingdocumented, and the change in level ofSTl expected to be associated with professionaldevelopment experiences being observed.
{}arn }uEg Chi, The Ohi'o State Unir'€rsityDavid L. Haury, The Ohio State Universib
lntroduction
Efforts to improve student perf.omance in science aae hampered by shortages ofqualifie.dteachers, and teacher shortages rcsult ftom the combined effects of a'l iDsulficient supplyofnew, well-qualified scienc€ teachers, and a high tumover ofscietrce teachers duringthe early yea$ of tbeir-Fofesioqal experierce. .Many begDEing science teached leavethe classroom within the first few yeals of teachitg (CSMTP & NRC, 2001; Ingersoll,2001)- The prima.ry reason they leave teaching is "dissatisfaction" related to professionaliszues: lack of leadership, lack ofrcspect ftom students, parents, and priocipals, poorsuppod ftom administmtor:s, overly large classes, insufficient equipped classrooms {md
laboratories, and ao inadequate incedi\4 aod wage (Colrz'alez aad Bto$.A 200qInge$oll, 2001 ; Liu and Ramsey, 2008; NCMST, 2000). This dissatisfactiotr with theteachidg profession might drive begiming science teache$ to have low levels of self-confidence, self-rcspect, and self-esteem as scietrc€ teachers, possibly weakening their
Fofessional identity as science teachen. Beginning science teachers having weak science
t€.'eheridenrties ar€ tikeb to qoickb become disilhrsioned wi$ thei chosen prqftssion.Consequently, begirming science teacheN may be leaving the profession before they have
had an opporhmity to d€velop a sound, stable science teacher idenlity.

Proceedinos of ihe NARST 2009 Annla1 Meelino
Given the possible relationships among professional identity, teachei reteation, and self-perceptions, teacher identify is receiving ilqeased attention as an important consfiuct inscience teacher education. Research has shown teacher identity to be strongly associatedwith adaptatiorL motivation, confidence, satisfaction, cornmitment arld ellicacy int €colning a te3ch€I (Beijaard, Vedoop, & Verrnunt, 2000; Beijesrd, Meijer, & Verloop2004; Jakubowski & Dembo, 2004; Stan, et a1.2o03; stan, et a1.,2006). Teacheridentity has also Foved to be a key Fedictor ofteachers' peformance, retedion, bumout,and tutrover (Brown, 2006; Da, Elliot, & Kington, 2005; Snyder & SFertzer,1984).Therefore, greater undeistanding of teacher identity would be useftl for teacher educators
who seek to faoilitste tear{er preparation atrd devetopmefit. As the importanoe of tgae,her
identity has become morc appaxent in teacher educatiot, research focusitrg on teacheridentity has begun to emerge during the past decade. The tbree main areas of research ontea.her identity to d4te can be categorized as follows: the fomation teacher identity,charactedstics of teachs identity, and representation ofteacher identity (Beijazr{ et al.,2004). Though rcsearch interest in the construct ofteacher identity has rccently itrcreased(Beijaard, et a/., 2000; Beljaard" et a1.,2o04), science teacher identity is not explicitlydefined; there is rlo model to reprcsed the construction ofscience teacher ide ity; andnoknown, comprehensive inshument, scale, or measue ofscience &acher ide ity that hadyet been developed pdor to this study-
Thus, this sfudy involved the construction ofa cooceptual model ofscience teacheridentity and development ofa new instrument to measue the level of science teacher
ide ify, Furlher, this study examined quantitatively and qualitatively the efficacy ofthemodel ofscielceleacher ideqtity iD explicatiry th€ self-consftrctio! of science teach€ridentity among Feservice science teaahqs wi0tin the context ofa gaduate level scienceteacher preparation prcgram. In short, the purpose ofthis study was to gain empiricalevidence that a conceptual model of scietrce teachq identity can be developed, that thelevel of science teacher identity can be validly and reliably measured, and that changes ofSTI dimeffiioos cer be prdicted in rchion to professional developmert prograrns andprofessional experiences.
Conceptual Framework
The concephral ftamework Foviding the structure for this shrdy is gounded in thercsearch ofprcfessional identity in fields within and outside of education, aod in previousqualitative studies focusing on science teachers. Initial formulation ofthe conceptualftamework was based on tetr principles ofteacher identity proposed by Danielwicz(2001), with m€difi€otiors hfluenced by the four dimensiens of identiq in a oodelsuggested by Helm(1998) ard the seven elements ofphlsician teacher identity identifiedby Stan et al.(2006).
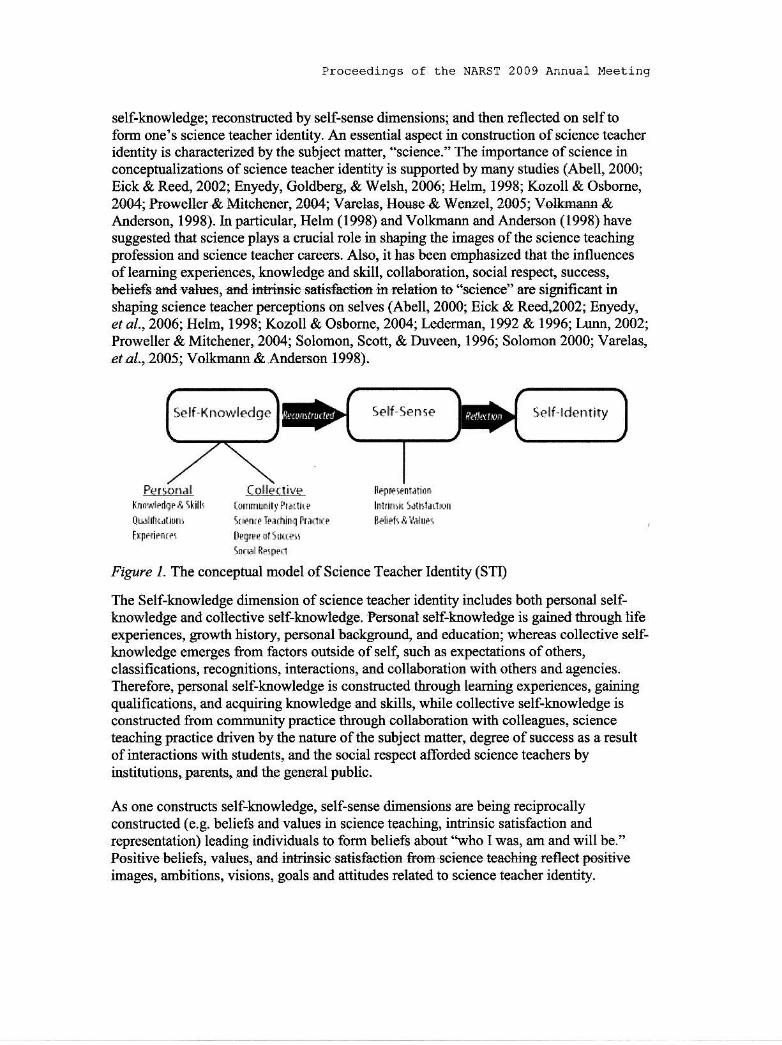
Science teacher identity, the!, is codceptualized in a new model consisting of twocompotrents: a structural compone that inclutles self-loowledge and self-sensedimensions, and a procedural component (Figure l ). In this new model, science teacheridentity is rooted in a consfiuction of self-kno$ledge, including personal and collective
Proceedinqs of the NARST 2009 Annual Meeting
self-knowledgei rcconsfiucted by self-sense dimensions; and then reflected on selftofolm one's science tea4her identity. Ar essential aspect in conshuction of science teacheridentity is chancterized by the subject matte!, "science." The impoiance of science inconceptualizations of scierce teacher identity is suppoled by many studies (Abell, 2000;Eick & Reed, 2002; Enyedy, Goldberg, & welsh, 2006; Heln, 1998; Kozoll & osbome,2004; Prweller & Mitohener, 2004; varelas, !trou!€ & Weuel, 2005; Vsllqas &Anderson, 1998). In particutar, Helm (1998) ad volkmann ard Anderson (1998) havesuggested that science plays a crucial role in shaping the imaggs ofthe science teachingprofession and science teacher caresls. Also, it has been ernphasized that the influercesof leaming experiences, howl€dge add skill, collaboration, social respect, success,betiefs and l'alues, aad intrinsi'c satisfactiot in relation to "seienc€" are significart inshaping science teacher perceptions on selves (Abell, 2000; Eick & Reed ,2002; Enyedy,et a1,2006i Helj'!.,1998; Kozoll & Osbome, 2004; l,ederman, 1992 & 1996]' l,trfJn,2$02;Proweller & Mitchener, 2004; Solomoq Scott, & Duveen, 1996; Solomon 2000; Varelas,et a1.,2005; Vollmann & tudenon 1998).
Perlondl folle(live nrrFfii inlimrrcd,rr,lllilh (otrmlltttPrrltns hnnltn(ldtlhd4ll]l]llh(rtluhi ! ffir.'|ilt)in{ lradre 8rdrfi,q l,tuAk|lai.nd Dsqruollftd!
!trelRpjred
Figure I . The concepfial model of Science Teacher Idettity (STl)
The Self-knowledge dimension of science teacher identity includes both personal selfknowledge and collective self-knovr'tedge. Fersonel s€tf-knowledge is gained tbrcugh lifeexperiences, grc$'th history, personal backgoun4 and education; whereas collective self-knowledge emerges Aom facto$ outside of self, such as expectations ofothers,classifications, recogrritiors, interactions, and collaboration with others and agencies.Thereforc, p€$otral self-krowledge is constructed tbrough leaming experiences, gainingqualificatiods, and acquidog knowledge and skills, wbile colleotive self-knowledge isconstructed ftom community practice tbrcugh collaboralion with colleagues, scienceteaching pmctice ddven by the nature ofthe subject matter, degree ofsuccess as a rcsultof intemctions with students, and the social respect afforded science teache$ byitrstiturioN. pareDts, and rhe getreral pubtic.
As one consructs self-loowledge, self-sense dimensions are being rcciprocallycoNtructed (e.g. beliefs and values ra scieoce teachin& int nsic satisfactioD andrepresentation) leading individuals to form beliefs about '1 ho I was, am and will be."Positive beliefs, values, and intrinsic setisfection florn sci'ence teoc,+riBg rellect positiveimages, ambitiols, visions, goals and attitudes related to science teacher identity.
Self-Knowledqe
Proceedings of the NARST 2009 Annual Meetlng
Through the process ofreflection on selves based on self-knowledge and self-seme,science teacheis construct a science teacher identity.
Fleld-Testing of the STI Mod€l
Both quantitative ard qualitative research methods were employed to begin the corNtructv'alidation process for the dimensions of STI md the shuchrral formation of the STImodel. The construct validation process for the STI dimensions combine a quartitativehethod--one-goup prctest-posftest design using atr STI questionnaire-with qualitativemethods: document analysis and petsonal ilterviews ofprese ice science teachers
enrolled in a graduate level science teacher preparation progarn. In atl aftempt to furtherexamine construct validity and explicate the structural formalion of science teacher
identity, the STI model wai quantitatively exploaed using a cross-sectional sampling ofscience teache$ from a brcad range of grade levels by conducting direct and indirectadministrations of a survey instrument.
Construd VafidationThough many studies have included consideration ofan assu$ed attibute ofteachersreferred to as teacher identity, there is no dircct way to measwe this supposed attribute,and there has been tro prior attempt that w€ are aware ofto itrditectly estimate the level ofscience teacher identity specifically. The STI model is intended as a way ofrepresentingthe teacher identity athibute in the specifrc context of science teaching, and establishingthe construct validity ofthis representation will necessarily involve a lengthy process ofseeking evidence for the theoretical pattem ofrclationships (nomological network) that ,
one should find associated with STL we begin the process in this study using thefollowing strategie,s:
. Operationalizing the postulated oine dimensions of the STI model by coDstructing anSTI hstrument with nine subscales ooresponding to the nine dimensions of the STImodel. The subscale items ale checked for content validity, and the reliabilides ofthesubscales aDd total instiument are calculated.
. Exanriningthe frrnctional sbuchrrc ofthe instrumentusing factor anallsis andexamining the pattem of corelahons among subscales for evidence ofposfulatedinterrelationships.
. Exarnining the pattem ofrelationships between instrunent scorcs and subscale scores
and extemal vadables that are Fedicted to be positively or legatively corelated.. lnvestigating the degee of change in level ofSTl associated with panicipation in a
science teaEher prepamtion program that is assumed to increase the level of STL Aone-group pretest-posttest design was used to investigate the chatrge in the level ofscieoc€ teacher identity anong presewice science teachers before add after student
teaching during a sciedce teacher preparation Fogram. The STI instrument was
embedded withir a questionnaire that was administered at th€ begitning of Winter
Quarter 2008 and about 20 u/eeks later at the end ofspring Quater 2008. Personal
interviews and document analyses were conducted by Summer Quarter 2008. Thequestions included in the penonal inGrviews were designed in both open-ended andstructured fo{rnats. Tlree-tlrDe inter1'iews wele conducted with six padicipaltsselected by purposive sampling in order to gath€r presewice science teachers' beliefs
Proceedinqs of the NARST 2009 Annual Meeting
and opidons about the process of development ofthei o\1'rl science teacher identity-Interylew responses were iecorded by taking notes alld with audio-tapes that werelater tra.nscdbed. Document analysis was used to identiry relevant participantinformation for data triangulation. The docurnents were collected through electronicmeans using course m:rnagement software. Collected documents included portfolios,r€fl€ctims on field placem€nt experi€nc€s, jownel enfies, evaluations of classes,academic rccords including biography and course grades, and mentors' orsupervisors' evaluations.
The STI model predicts a pattem ofrclationships, both intemal to the instmmert itself,and among a varie8 of external variables and srlres on ths STI inshument and subseales.The extent to which this predicted pattem ofrclationships is observed will be taketr asevidence that the STI model and its associated instunient exhibit a degee ofconstructvalidity.
PatticipantsThe participants in this study werc rcpresentative ofthe targot population: preservice andpracticing science teachers. They were t pical ofpreservice teacbers intending to becomelicensed science teachers and practicing teachers with licensure as life science,/biolos/teachers, chemistry teachers, physics teachers, earth science teache$, e{vhonmentalscience teache$, physical science teache6, or geneal scietrce teacheN. The contenttvalidation prccess for the STI dimensions i[cluded 17 padiciparts who were graduatestudents enrolled in a science teacher prcpamtion pmgram (e.g. M. Ed. program) at amajor Midwestem rcsearch university. All participants were survej'ed using the newlydeveloped STI instumsnt. For interyiews, six respotrdents were selected by purposive ,
sampling. According to scores ftom the fust administation ofthe questiotuaire, allparticipants werc grcuped into one ofthree lwels: wealq modemte and sfrong levels ofscience teacher idetrtity. Then, lists of subgrcup members wele oeated for a fiutherselectior. From each subgoup. two respoodeDts wera selected as interviewees.
RecruitmentParticipants weie recruited tbrough verbal requests and electronic mail r€quests. For theconstnrct validation process, all members ofa preservice science teacher cohort r ereinvited to paxticipate, and a total of20 graduate students were rccruited through verbalrequests. For dtect admidstmtioq ofthe survey instlumetrt, 65 participatrts who atteaded acoEferences held by prcfessional associations of science teachers werc rccruited throughverbal request. For an indirect administmtion oflhe survey irstrument, over 300participants participated in an online survey through the electronic mailing list servers ofprofessional associations of science teachen.
lnstrumentsFor this study, an instrument measudng STI was developed for use with trneservice andpracticing science teachers. The 48-items of the STI instrument were generated from thenine dimensions of the model's sructulal components, iDcluding self-knowledge andself-sense dimensiors of science teacher idertity. Each itern of the iostrument is scoredon a s-point Likert scale, ftom "stfongly disagee" to "stroogly agrce." The contentvalidity of items was verified in a previous pilot study. I$tnrctioDs are included in the
Proceedinqs of the NARST 2009 Annual Meetinq
questionnairq and participants were advised that there are no correct or incorectanswerq fi.ank opinions are desired.
Data CollectionThe data have been collected tbrough various means: pe$onal inteNiews, documentanalysis, and administration ofa questionnaiE. Personal interviews were conducted with6 pa icipants at the beginning, middle, and end ofstudent teaching. A structuredinteffiew format was followe4 wifl all rcspondents being asked $e safte sedes of open-ended questions. For Document analysis, documents were collected thrcugh electonicmeans using a course lvuxrgemeDt program that enables instructors and sfudents toarchive online-notes, discussions, and assignments.). Collected document data includedprimary and secondary sources. Primary sources that participants created diectly wereportfolios, reflections, arld evaluations ofcourses; secondaq/ sources that others createdabout participants itrcluded mentors' and zupervisoA' evaluations of student teaching andacademic records including biographies and course grades. Participants who aftendedconferences held by professional assooiations ofscience teachet were suveyedimmediately following recruitlnent. For an indircct administration, participants who maybe members ofprofessiodal associations of science teachen were invited to participate inan onJine survey by providing the Internet address through the elecffonic mailing listserye$ ofprcfessional associations of science teache$ ftom the end ofJuly through etrdofAugust 2008.
Data AnalysisThe collected data were analyzed quantitatively and qualitatively. Scores on theinstnrment were oharacterized using descriptive statistics, including means, modes,standard deviations and variances. The reliability ofthe instrurnent wa$ established usingCronbach's alphas for the questionnaire as a whole, and for each subscale oftheitrstlument. Factor aralysis was used to detemine the correlation of factors associatedwith the conc€ptual dimensions of STI science teachers' pe$onal leamiag experience,having knowledge aad skills, commulrity practice, science teaching practicg degree ofsuccess, social iespect, b€lief ard value i! science teaching, intrinsic satisfaction, andrcpresentation. Whole scale and subscale scores ofparticipants were alalyzed by multiplestatistic anal'6is to undeNtand group differences based on biogr4phic profiles, e.g.,degee, years ofteaching and subject areas, In order to hvestigate the level ofchanges inSTI associated with engagement in a science teacher prepa@hor prognm, particuladystudent teaching, statistical techniques iocluditrg descdptive slatistics, t-test and ANOVAanalysis were used to analyze both pretest and posttest scores ofthe instument. Personalinterview data and document analysis were anallzed by ftee-flowing text analysis.Througi tbis Focess, both inclusive and exclusive elements in rclation to the conceptualftarnework were considered potentially impofiant elements itr constructing a model thatrepresents the rclationships among them. For ensuring the trust',rorthiness ofqualitativedata (e.g., interview atrd docurnent analysis), member checking ftom participants andpeer debriefing ftom expert parcl members (e.g. faculty membe$) werc conducted-
Results
Proceedinqs of the NARST 2009 Annual Meeting
Canslruct ValidatianThe model of science teacher identity was conshucted by two components, a stnrchrralcomponent and prooedural component. The constnrct ofa sfiuctural component includmgself-knowledge and self-sense dimensions werc included as nine dimensions in theinstrument ofSTI. The construct ofnine dimensions were quantitatively and
$ditatively validated using survey data througb ad.ainistration ofth€ iast useat of STIand intewiew and document data.
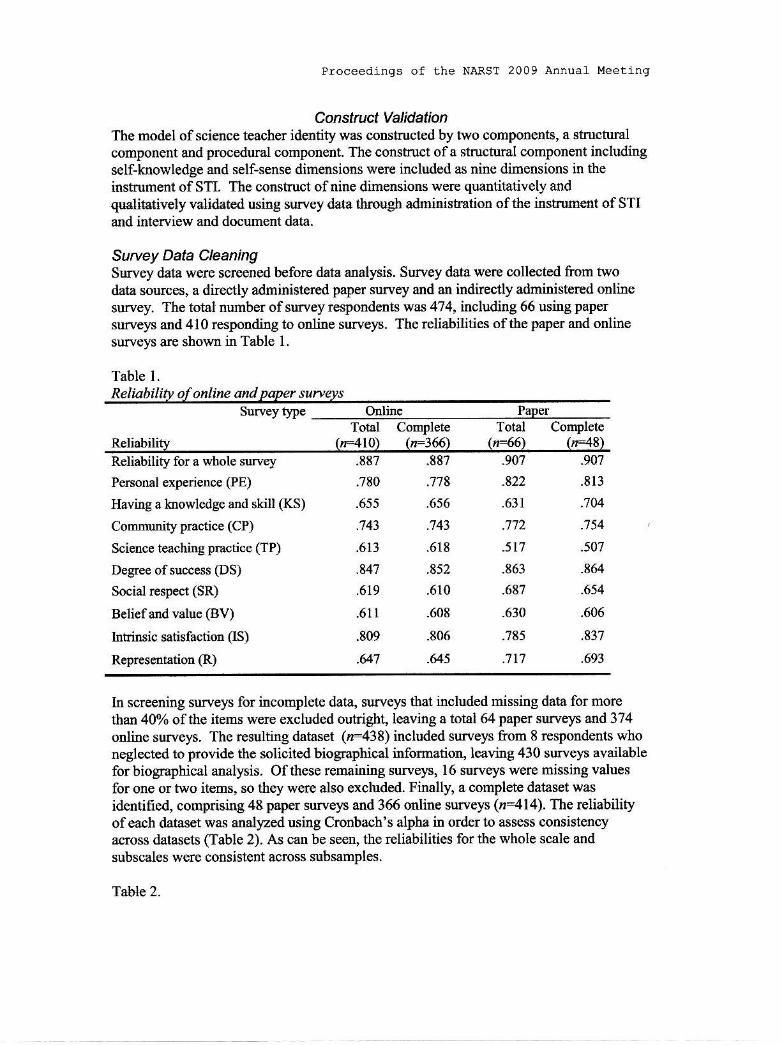
Suruey Data CleaningSurvey data werc screened before data adalysis. S!rvey data werc collected fiom twodata souces, a directly administered paper survey and an indirectly admiqistered onlinesuvey, The total number ofsuwey respondents was 474, including 66 using papersulve's and 410 responding to online surve's. Th€ reliabilities ofthe paper and onlinesurveys are shown in Table 1.
Table lReliability of ohli e and paper suweys
Survey type Paper
Total Conpiete Total Cornpl€teReliability ("=4r0) (n-166) Ora6\ (,48)Reliability for a whole survey
Personal experienc€ (PE)
Having a knowledge and skill (Ks)
Community practice (CP)
science teaching practice (TP)
Degree ofsuccess (DS)
Social rcspect (SR)
Beliefand valu€ (Bv)
lntdnsic satisfaction (lS)
ReFessntation (R)
.887
.780
.655
.743
.6r3
.u1
.619
.6tt
.809
.647
.887
.778
.656
.743
.618
.852
.610
.608
.806
645
.907
.822
.63t
.772
.517
.863
.687
.630
.785
.7l',7
.90'1
.813
.704
.154
.507
.864
.654
.606
.837
.693
In scleenirg suweys fol incotuplete data, surveys that included missing data for morethan 40olo of the items were excluded outrighl leaviag a total 64 paper surve)s and 374online slrrvels. The resulting dataset (r:438) included survet6 fiom 8 rcspondents whoDeglected to provide the solicited biographical inforrnation, leaying 430 survqs availablefor biographical analysis. Ofthese remaining surve)s, 16 sur:ve)s were misslng values
for one or two items, so they were also excluded. Finall, a complete datart was
identified, comprisiqg 48 paper surveys and 366 oalhe surveys (a:414). The reliabilityofeach dataset was atrallzed using Croobach's alpha in ordel to assess consistelcyacross datasets (Table 2). As can be seen, the reliabilities for the whole scale and
subscales were consistent across subsamples.
Teble 2.

Proceedings of the NARST 2009 Annual Meeting
Re I iab i lily of Survev Datasets
ReliabilityTotal lncompl€ie I
(n476\ (r+38)lncomplete II Complete
fr=430) (n414\A whole survey
P€lsonal €xp€.i€ac€ (PE)
Ituviry a knowledge and skill (KS)
CorDmunity practice (CP)
Science teaching practice (T?)
D€gee ofsuccess (DS)
Social respect (SR)
Beliefand valrc (B\)
Inhinsic satisfaction (IS)
Representation (R)
.889
.787
.652
.743
.593
.849
.630
.613
.806
.657
.889
.783
.651
.741
.597
.851
.633
.613
.806
.657
.889
.786
.654
.743
.59'1
.855
.625
.610
.803
.656
.889
.783
.663
.'739
.600
.853
.6t?
.609
.810
.651
SuNey PafticipantsThe total number ofparticipaats contributing to the final dataset, then, r as 4?6preservice and Facticing scieoce teachers, includirlg 410 who particlpated in the onlinesurvey and 66 who paxticipated iD tbe paper survey. Ofthese, 87 % (414) ofparticipartscompleted the survey in its entirety, includirg 114 males and 300 females. Ofparticipantsprovidiog conplete biographical ilformatio!, 28 id@tified thes$elves as preserviceteachers, rvhile 402 identified themselves as practicing teachers: 93 certified aselementary school science teache$, 313 cefiified as secondary school teachers, and 23cqtified as both elementary and secoDdary school science teache$. One practicingteacher was not yet cefiified. The number ofyears of teaching for practicmg teachers
ianged from 0 to 43, with the average number ofyears being 244 I 0.55.
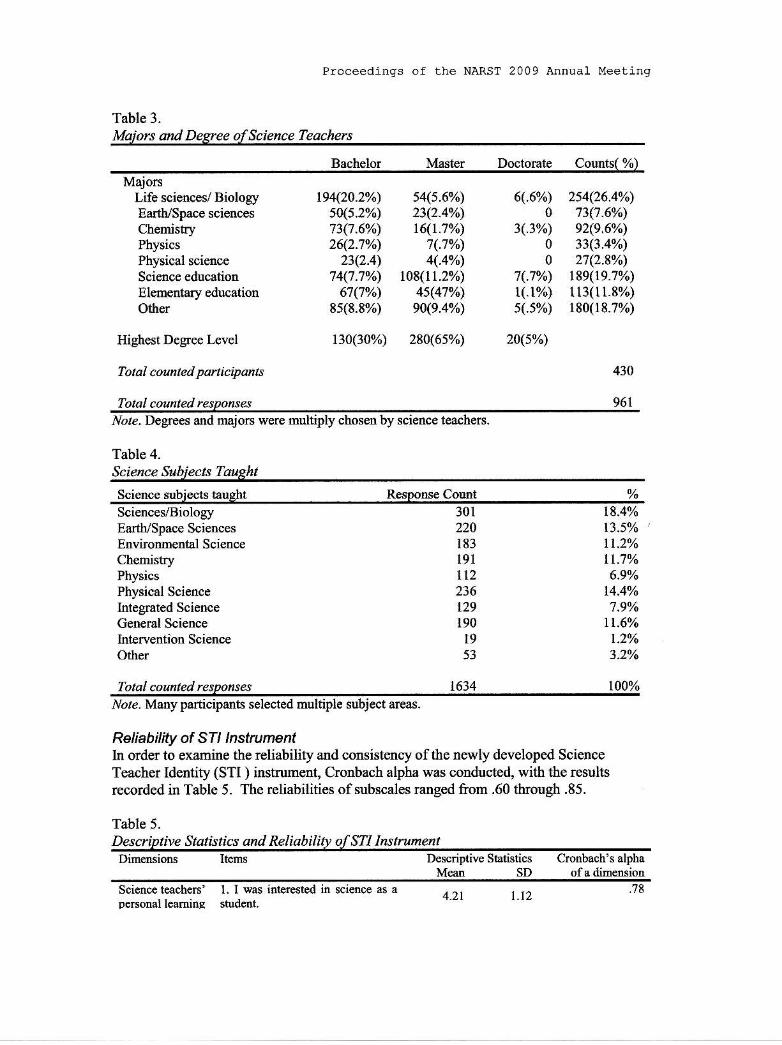
As show[ in Table 3, 130 pafiicipants repoited having a bachelor's degee as the highestdegree, 280 had a master's degee, aad 20 reported baving a doctoml degee. In terms ofacademic majo$, 26.4 o% ofparticipants reponed majoring in life sciences and biology;7,6% maF.ed in earth sci€aces; 9.6% majnred h chenistry; 3.4 % majored in ph,sics ;2.8% majorcd in pb€ical scie'l,cei 19 ,1yo
''Jajorcd in science educatiotu I L8% majorcd
in elementary education; and 18.?% majored in other subjects (e.g. music, vocationeducation, teohnolory, and oathematics). The science subjects taught included lifescience and biologr, ph1'sical science, earth scierce, chemisty, geneml science,envbomental scieDce, and physics (See Table 4.).
Proceedings of the NARST 2009 Annua] Meeting
Table 3.Maiors and Degree of Science Teachers
Bachelor Doctorate Counts( o/o)
MajolsLife sciences/ Biolos/Esnh/Space sciencesChemistryPhysicsPhysical scierceScience educationEleo€ntary educationOlh€r
Highest D€gre€ l,€vel
To t al c ounted part i cipan t s
Toktl cofited responses
r94Q02%)50(s.2w73(7.60/.,26Q.7V0
23(2.4)74(7.7o1q)
67(7%)85(8.8%)
t30(30o/r')
54(s.6o/.')23(2.4%\t6(t.7%)
1(.7o/.\4(.4o/"\
108(11.2%)45(47W
9o(9.4o/,)
280(65o/0)
6(.6o/;)0
3(.3%)00
7(.7%)1(.1ol")s(.5o/")
2o(s%\
2s4(26.4o/.)73(1.6%\92(9.60/0)33(3.4%)27(23y0
t89(19.7%)113(11.87.)180(18.7%)
430
961
l{ot€. Degre€s and majo$ were multiply chosen by science leachers.
Table 4.Science Sabieels Taught
Science subiects taueht R€spons€ Count
ScienceYBiologyEarth./Space SciencesEnvironmental Sci€nc€ChemistryPhysicsPhysical Sci€nceIniegaied ScienceGeneml ScienceIntgrventioa ScienceOther
Tobl coun@d responses
301220183191
t12236r29190t953
18.4%t3.syoLt.2yo
6.90/.14.40/"
7.90/.lr.6yo
r.2yo3.2yo
r00%r634tole. Many participa s selecxed multiple subject areas.
Reliability of STI lnstrumenlln order to examine the reliability and consistency ofthe newly developed ScienceTeacher Identity (STI ) instnrme4t, CroDbach alpha was conducted, v.ith the resultsrecorded ir Table 5. The reliabilities of subscales ranged from .60 tbrougb .85.
Table 5.DescriDtive Statistics and Reliability ofSTI Instrume t
D€$riptivestatistics Cronbach'salphaMean SD ofa dimensiotr
Sci€nc€ t€achffs' l. I x?s i erested in sci€nce as apcsonalleaminq student.
4_2t 1.12.14

exp€li€trc€ 2.I enjoyed leaning scienc€in q.t+ .98schools.J I $€5 8dod.l doirg saience in 4.tt .95sohools.4. I gercally rec€ived lowe.gades in science than orher 4.2O .93
subjets-5. I had a sience teeher that I 3,42 t.26wad io be alike.
Kro$ledge b. I loow dd udeBta the @jor& sklls science concep$ and s.ience 4.61 .57
process€! that I plan to teach.7. Wh€n I t€ach, I am able io
rnregnoe my kno*ledge ofscience wirh howledge ofsrience teachine and lerming
8. I fe€l shlled as a sci(tdhn 4.35 .69
I. ll ls inponsnr bo rne to developmy knowledge and !€achiag skills10. I l13e the Intemet, joumak, andadiol€s to Sain hfomarion about 4-65 .60scienc€ teaching.
Communily I l. I feel part of a commonily of 3.93 .96praclice s.ienc€ l€achers.12. I belong to professio.alassociations or groups of $ience 4.54 .68
teachers.13. I ftequently talk to coll€agues 4.n _88about teaching eience.14. It is helpful to be abl€ todis€us the progress of shdents 4.42 .65with cofleagues.15. I enjoy sharbg ideas andresuces abod teaching science. 4 oJ ))
ftienceteaching lC I am nol sure haw sci€ncepractice ditr€rs ftorn other dtuciplines and 4.03 .86
subject areas.
17. My understanding of scienceshaps ny philosphy ard attitude 4-09 .8tabout t€aching.18. I plan m inquiry'based science 4.04 .85l€ssons.19. I uie an inquiry apgoach to 3.90 .g1t€achin8.20. t ue div€ne instructions strdaciiviiies to teach science.21. I find it dilficult to d€monsirare :11 !:my scrotific howledse sbleteachiry sci€nce.
Degree of 22. I intemst with students to findth€k n€€ds, int€resti, and 4.17 .67ab ities of l€amiDs sci€tr@
23. I help students become more 4.26 _66ensased in learnins sci€nc€.
Proceedinqs of the NARST 2009 Annual Meetinq
.74
.66
60
.85

Proceedinqs of lhe NARST 2009 Annual Meeting
24. t cl€lte a flenble atrd
supportive leaming envirorD€ 4.27 -64for shrdentl.25. I positively inpact student 4.20 .65
achi€vement ir scienc€.26. I help students to perc€iv€ the 4.10 .6,1
&ique n tut€ ofsoi€nc€.2l I ^6 ^ .ole model who 4.20 .69
generat€s int€r€sts in science.
Social rcspect 28. I eDjoy the social r€sp€ct I g€t 3.sg .95as a scienc€ ieach€r.
29. Students and leachets r€sardne as an effective $i€nce 4.2a .60tscher.
30. It is imponant that rny goodt€aching is recognized in son€ 4.28 .76trays.
31. I apprcoiate it {tlen nyins.itutions acknowledge ny 4.00 .88suc€€ss a! a sci€nc€ t€achef.
Beli€fand \alue 32. lt's importad to ne contributein science to improvernent of scienc€ 4.34 .'71
teaching teaohing prof€ssion.33. I fmd it satisfying to think that
I m conhibuting to lh€ 3.44 1.15profession by teachins.
34. I nake leaming sciencerrea ndnl and inter$ting to 4.26 .74students.
J5. The qudity of n) teachingcontdbutes to my career 4.34 -59advaDcorent.
lntrinsic 16. I tJdy eoJoy beirs a siencesalBlbcnon r€a.her.
37. Working wth sndents hm its 434 .69costs, but it's wonh it
18. I find srisfacrioo in wahhing 4.25 7Jmy students' pro8ress.
39. I find satisfaction in my ownd€velopnent as a science 4.80 .41
ieacher.40. Scienc€ teachitrs is very 436 .,t3
rewarding job.41.It is imponant io me to wo* in 4.,n .4,1
s{hools.42. Science is enjoyable to me. 4.50 .56
R€pr6entation 43. I see m)self as a scid@ 4.56 .62t€ache{.
**:"T.1,.':.'1*J# " -- 4s4 '63
45. I rould like to spend rnore 3.91 .94time t€aching snrdenis.
46 r *oukt li&e k' b€ a b€trer 45t .59scienc€ t€acher for Bv studeDts.
.62
.61
.81
.65

Proceecrinqs of the NARST 2009 Annual Meerinq
47 I wonld like to h€ noftinvoived in a commudty of
48. I would like being rewarded for
4.O2
4.t2
4.26
a2
.90
'14 .89
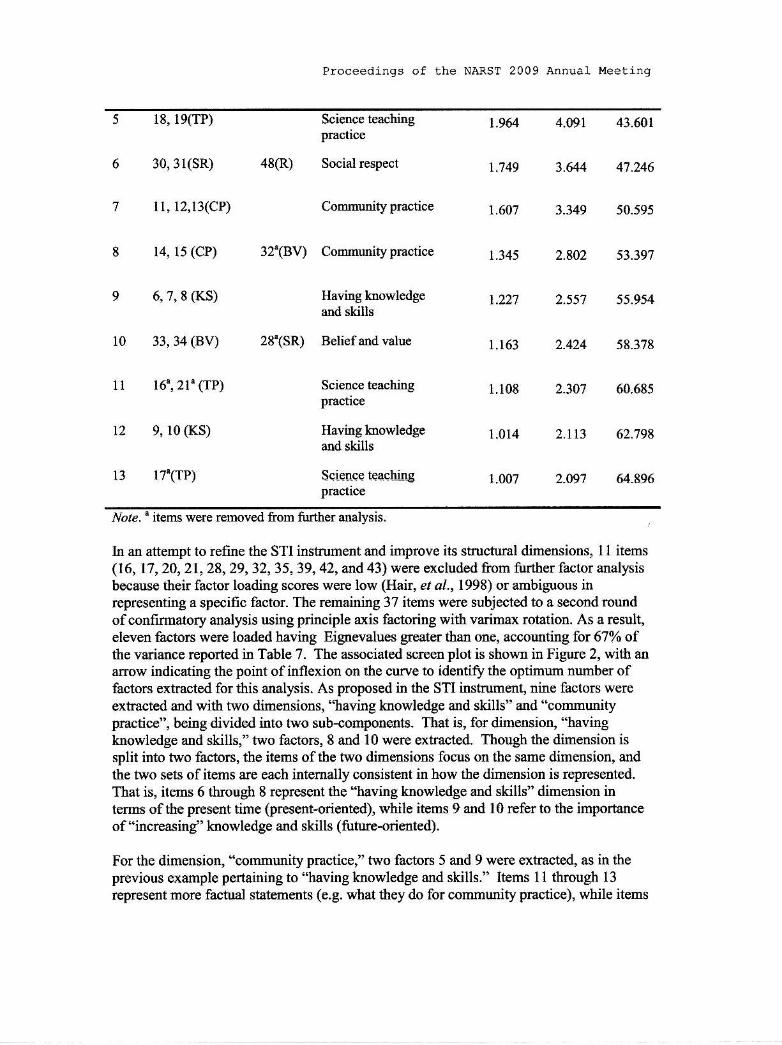
Factor Analysis of STI lnstruni€nlTo validate the factors postulated in the underlying structue of the ST! a confirmatoryfactor atralysis was cooducted, The initial48 items ofthe STI illstument were subjectedto principal-axis factoring with varimax rctation. Tbirteen factors emerged havingEignevalues greater than one, accormting for 64 0/o ofthe variance in the Gsults (Table 6.).In addition to the nine Foposed dimensions the STI inshumsnt, some item clusters weresplit into two components. For example, the dimension labeled as "science teachingpractices" was divided into three factors, "community practice" was divided into twofactors, and'lhaving loowledge and skills" was divided hto two factors. Consequeitlt atotal ofthirt€en factors, including nine postulated factors, were extmcted. As shown inTable 6, factors 3, 4, 5, 7, 9, I l, 12, and 13 werc purely extracted as Foposed for the STIinstrument. Facto$ l,2,6, 8, and l0 were mixed with items associated with otherdimensions of STl. For example, for factor l, the items intended to rEresent "degree ofsuccess", items 22-27, load€d o{ this farlor, alotrg witb item 35{BV}, 29{SR), ad 20(TPithat were intended to measrue othgr dlmensions. These mixed items were removed for afurther factor analysis as shown in Tables 6 and 7. In addition, items 16 and 21 wereextracted togethet but sepantely from the itehs of Faator 5 with which they werepresumed to be associated. Item 17 was also removed because it loaded separately with a,
Io lo'ading value (.393). Although item 48 was proposed for the 'leprcsentatior"dimension, this item loaded on factor 6, along with items, 30 and 3 I representing "socialrespect." Because the content of item 48 is similar in meaning as iterns 30 and 31, thisitem was recoded and retained for a fiEther factor anal)sis.
Table 6.Initial Factor Analysis Resalt for 48 llems ofs
Extracted itemsFact
MixedIteeis
RepresentativeIt€ms
Representativedimensior$
Cum.
%Eigenl.alue
22,23, 24,25,26,21 (DS)
36, 37 , 38,39,40,41,42 (rS)
r,2,3,4,5 (PE)
44,45,46,41a)
3s'(BV) Dege€ of succrss2y(sR)201rP)43'(R ) Idrinsic satisfactiod
20.753 20.753
1.301 28.060
6.47s 34.53s
4.976 39.510
Pelsonal experience
Regese*xioa
9.962
3.507
3.r08
2.388
Proceedlngs of the NARST 2009 Atnual r4eeting
l0
18,19(TP)
30,31(SR)
11,12,r3(CP)
14, 15 (CP)
6,7, 8 (KS)
33,34 (BV)
Science teachingpmctice
Social respect
Coomunity practice
4.091 43.601
3.644 41.246
3.349 50.595
2.802 53.397
2.5s7 55.954
2424 58 378
48(R)
1. 4
t.749
L601
1.345
1.163
1l 16",21'(TP)
12 9, 10 (KS)
t3 l7'(TP)
1.108 2.W 60.685
1.014 2.113 62.798
1.007 2.091 64,896
32'(BV) Cotrmunitypraciice
Having loowledgeand skils
28'(SR) Beliefandvalue
Scienc€ t€achingpnlctice
Having knowledgeand skills
Saieqa€ teacbirypractice
ly'ote. ' items were remov€d fiom fu(her analysis.
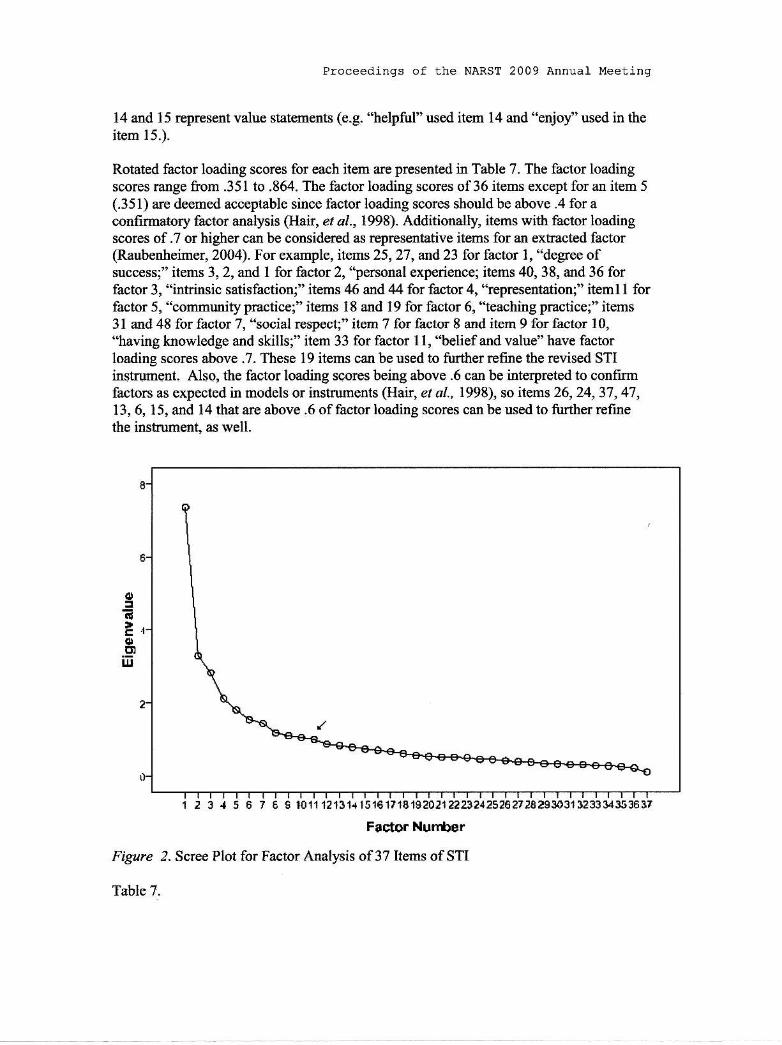
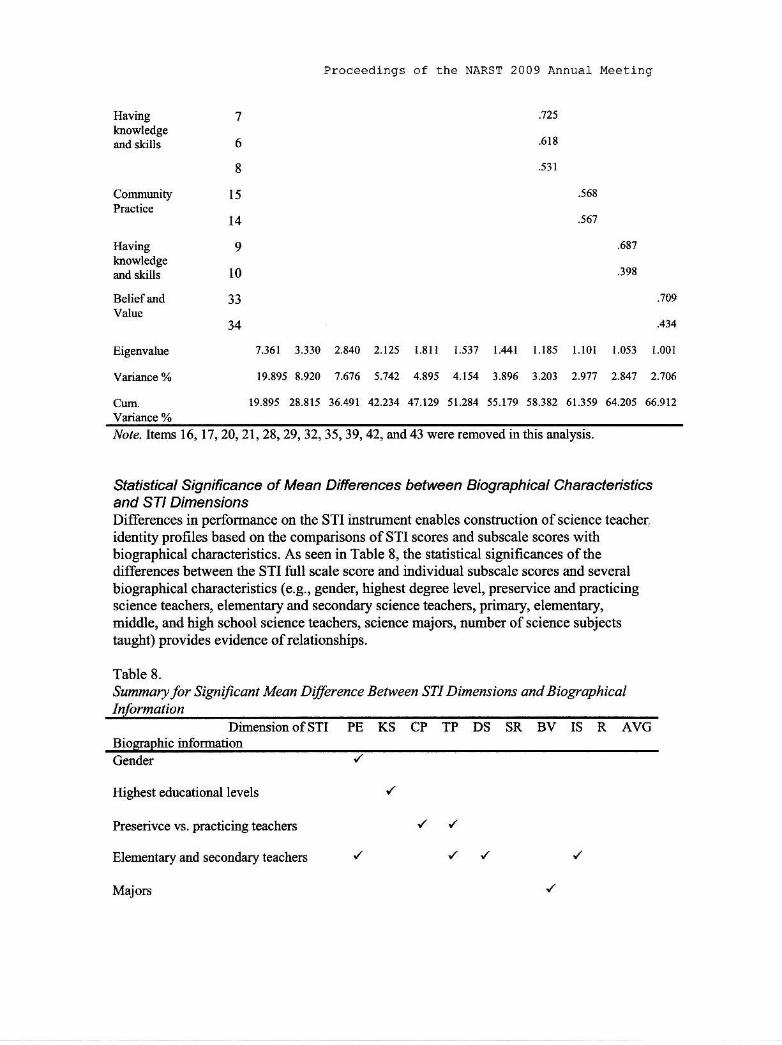
Io an attempt to refine the STI instrument and i&prove its shuctual drmensions, I I items(16, 17,20, 21,28,29, 32, 35,39, 42, and 43) were excluded from turther frrtor analysisbecause their factoi loadrng scores were low (Hair, e, a/., 1998) or ambiguous illrepresenting a specifrc factor. The remainirg 37 items lvere subjected to a secoDd roundofcotrfirmatory analysis using principle axis factoring with varimaa rotation. As a result,eleveo factoN were loaded having Eignevalues greater thatr ode, accoutrtitrg for 67010 ofthe variance reported in Table 7. The associated sffeen plot is showtr in Figure 2, with anarrow indicating the point of inflexion on the curve to identiry the optimum number offactoG exhacted for this anallsis. As poposed in the STI hstrument, nine factors weteextracted aDd with two dimensions, "having l owledge and skills" and 'toomunitypmctice", being divided into two sub-cooponents- That is, for dirier$ior! '.llavingknowledge and skills," two factors, 8 and 10 were extracted. Though the dimension issplit into two factors, the items ofthe two dimensions focus on the same dimensio4 andthe two sets of itens ale each intemally consistert in how the dimension is represetrted.That is, items 6 through 8 represent the "having knowledge and skills" dimension inten6 of the present time (pr€sed-orientcd), vr'hile iterns q and l0 refer to the importanceof"idcreasing" l owledge and skills (fuhre-oriented).
For the dimension, "community practice," two facton 5 and 9 vere extracte4 as in theprevious example pedaining to "having knowledge aod skills." Items 1 I through I 3
reprcsent more fachral statements (e.9. what they do for cornmunity practice), while items
Proceedlngs of the NARST 2009 Annual Meeting
14 and 15 represent value statemena (e.g. "h6lpful" used itern 14 and "enjoy'used in theitem 15.).
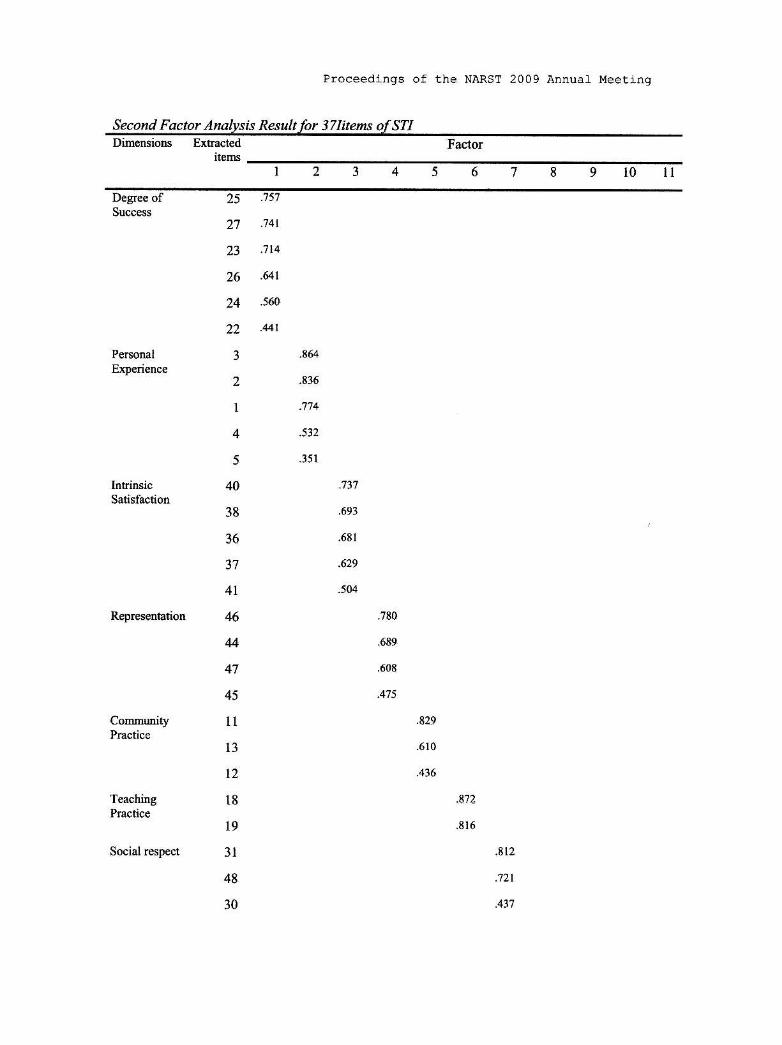
Rotated factor loading scores for each item are plesented in Table 7. The factor loadingscores range ftom .351 to ,864. The factor loading scores of36 items except for an item 5
(.351) are deemed acceptable since factor loading scores should be above .4 for acodfrrfilalory factor enalysis (Heir, et al., 1998]. Additioially, items with fa.tor loadhgscores of .7 or higher catr be considered as representative items for an extmcted factor(Raubenheimer, 2004). For example, iterns 25, 27, and 23 for factor l, "degree ofsuccessf items 3,2, and I for fa.tor 2, "personal experience; items 40, 38, and 36 forfactor 3, "htrinsic satisfaction;" items 46 ard 44 for factor 4, 'lepresentation;" iteml I forfactor 5, "community practice;" items 18 and 19 for factor 6, "teaching praatice;" items3l a'd,d 48 for factot 7, "social rcspecc" item 7 for factor I and item 9 for factor I0,"having knowledge and skills;" item 33 for factor 11, "beliefand value" have factorloading scores above .7. These I 9 items can be used to fifther refine the revised STIinstrument. Also, the factor loading scores being above .6 can be interprcted to qonfirmfactors as expected in models or instrulBents (Ilair, e, al, 1998), so items 26,24,3'7,47,13, 6, 15, and 14 that arc above ,6 of factor loading scores can be used to fi[ther refmethe insbument, as well.
Facto. Nunter
Fi8?/e ?. Sftee Plot for Factor Analysis of3T Items ofSTI
o
g-
iii
123r56?€3101112'13'1.151€1t14152O2122292125262724293O3'1323334353637
Proceedinqs of the NARST 2009 Allual l4eetinq
Seca44lqctor Analysis Result far 3Tlitens of STIDim€nsions ExFdcled
it€msI 2 3 4 5 6 7 8 9 l0 ll
Degr€c of 25 .151
27 .14t
23 .7t4
26 .641
24 .5@
22 .441
Penonel 3 .864
2 .E36
| 774
4 .532
5 .351
Int insic 40 .737
Satisfaclion38 .693
36 .68r
37 .629
41 .504
ReprEs€ntation 46 .780
44 .6&9
47 .608
45 .47s
Co@ity 11
13
t2
Teachitrs 18
19
Social respect 3l
48
30
.829
.6r0
.436
.E12
.El6
.812
.721
.417
Proceedings of the NARST 2009 ADnual Meeting
dd skills 6
8
community 15
l4
Having
Havins
.'t25
.618
.531
.568
.56?
knowledg€and skifls l0
Beliefand 33
34
Eigenvalu€
.68?
.39E
.709
.434
7.361 3.330 2.E4O 2.125 1.a11 1.531 1.,141 1.185 l lol 1.053 1.001
19.895 8.920 ?.6?6 5.742 4.895 4.154 3.896 3.203 2.917 2_W7 2.7M
19.895 28.815 36.491 42.234 47.129 5t,244 55_l?9 58_382 61.359 64.205 66.912
Note. llelns 16, 17 ,20, 2l, 28,29, 32,35, 39, 42, a'!d 43 w€r€ r€moved in this amlysis.
gatistical Significance of Mean Differences between Biognphical Charadertsticsand STI DimensionsDifferences in perfonnance on the STI instrument enables consfuction ofscience teacher,identity profiles based on the comparisons ofsTl scores and subscale scores withbiographical characteristics. As seen in Table 8, the statistical significances of thedifferences between the STI firll soale score and individual subscale scores and seveftrlbiographical chaBcteristics (e.9., gender, highest degree level, preselvice and Facticingscience teache$, elementaxy and secondary scietrce tBachers, pdmary, elementary,middle, aad high sohootr s€ience tea.h€rs, sei€noe majors, ftutrber of scierce subjectstaught) provides evidence of rclatiodships.
Table 8.Summary for Signifcant Mearl Dfurence Bea,ree STI Dimensions akd BiogaphicalInformation
Dirnension ofSTI PE KS eF TP DS SR BV IS R AVGBioqraDhic inforDationGender
Highest oducational l€vels '/Preserivce vs, practicing teachers / /
Elementary atrd secondary teachers ,/ / ,/
Majols
Proceedings of the NARST 2009 Annua] Meeting
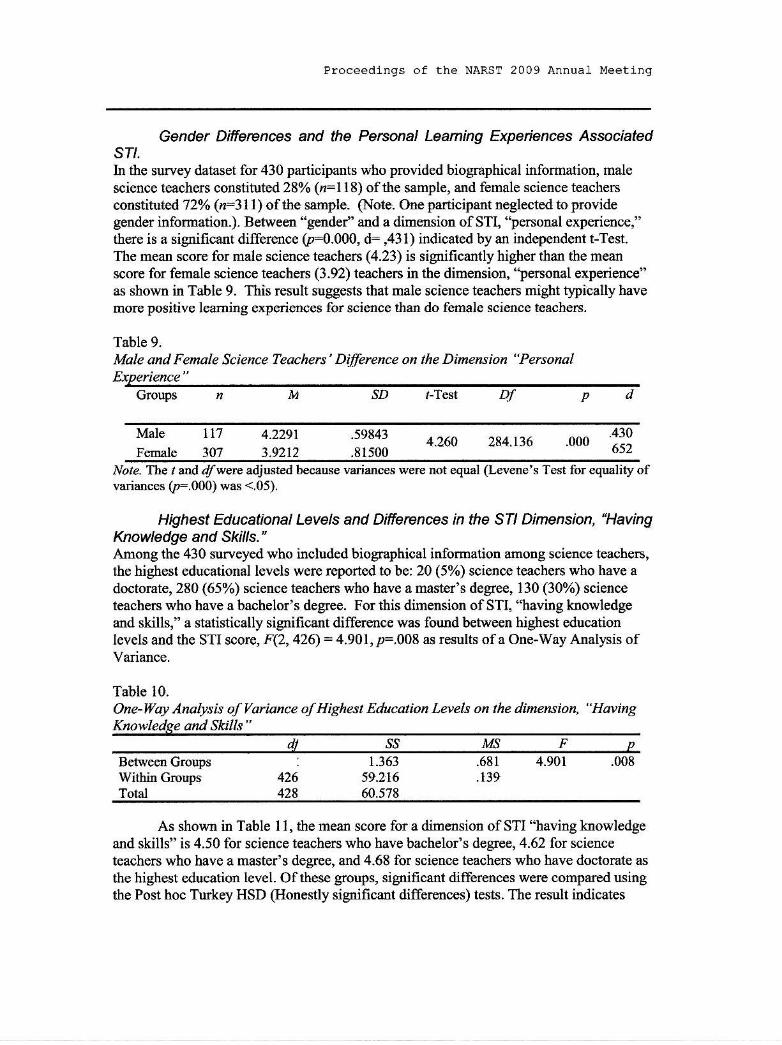
Gender Differences and the Personal Leaming Expeiences Associaledsr/.I! the survey dataset for 430 participants who Fovided biographical infonnation, malescience teachers constituted 28% (r=l l8) ofthe sample, and female science teachersconsiitufed 72% (ri=311) ofthe sampli"'. (Note. One participent aeglected to providegender informatiotr.). Between "gendel' and a dimension of STI, "pedonal experience,"there is a sigdificant difference (p:0.000, d: ,431) irdicated by atr jldependent t-Test.The mean score for male science teachers (4.23) is significantly higher than tbe meanscore for female science teachers (3.92) teachers in the dimension, 'be$onal expenence"as shown in Table 9. This resllt suggests that male science teachers might tpically havemor€ positive l€aruing experiences for science ihan do female science teachels.
Table 9.Male and Female Science
Groups tt Df
Teache$' Diference on the Dinehsion
Male ll7Female 30J
4.260 284.t36 .'. ::!4.22913.E212
.59843
.8 t500Note. T'r.e t and dfwete adjwted b€caus€ variances were not equal (L€vere's Test fo. equality ofvariances (p=.000) was <.05).
Highe€t Educational Levels and Differences in the STI Dimension, "HavingKnowledge and Sklls."Amotrg the 430 surveyed who bcluded biographical information arnong scietrc€ teache6,the highest educational levels were reported to be: 20 (5%) science teachen who have a
doctorate, 280 (65%) science teachers who have a master's degree, 130 (30%) scienceteachem who have a bachelor's degree. For this dimension ofSTI, "having knowledgeand skills," a statistically significant difference was found between highest educationlevels and the STI score, F(2,426) = 4,901, p=.008 as results ofa one-way Analysis ofVa ance,
Tabl€ 10.One-llay Analyis of Yariance ofHighest Education Letels on the dimension, "HavingIinowledge and Skills"
dtBetween GroupsWithin GmupsTotal
42i428
1.363s9.21660.578
.681
.1394.901
As shown in Table I I , the mea! score for a dimension of STI 'lhaving knowledgeand skills" is 4.50 for science leachers who have bachelor's degee, 4.62 for sciencet€a4hers who have a master's degee, and 4.68 for science teache$ who have doctomte as
the highest educatioa level. Of these groups, significant differences were comparcd usingthe Post hoc Tukey HSD (Honestly significant diffeFtrces) tests. fhe rcsult indicates
Proceedinqs of the NARST 2009 Annual Meeting
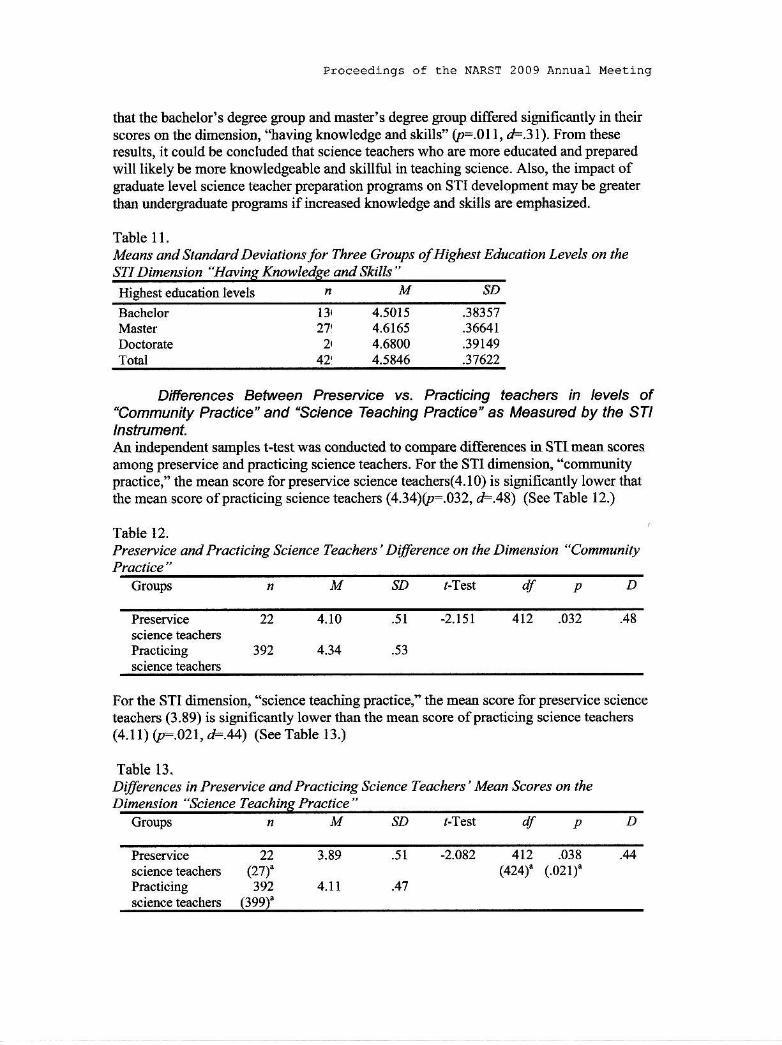
that the bachelor's degree group and maste/s degree group differed signiflcantly in theirscores oD the dimeDsion, "having knowledge and skills" (p=.01l, dL.3l). From theseresults, it could be concluded that science teachen who are more educated and prepared
will likely be more knowledgeable and skillful in teaching science- Also, the impact ofgmduate level scienc€ teacher preparation programs oD STI developnent may be geaterthan wdergraduate programs ifincreased krrowledge end skills a{e emphesized.
Table 11.Means and Slandard Deviatiohs fot Three Groups ofHighest Education Levels on theSTI Dimension "HavinE Ktowledge and Shlls"
SDHighest education levek
BachelorMasterDoctorateTotal
4.50154.61654.68004.s446
.38357
.3664r
.39t49
.37622
13,
27'2l
42'
Differences Between Presevice vs. Pnc,licing teachers in levels of"Community Pnctice" and "Science Teaching Practice' as Measured by the STIlnstrument.An independent samples t-test was conducted io aoopare diEe&nces in STI m€an saorcs
among preservice and practicing scietrc€ teacheN. For the STI dimensio!, 'tornmrmitypftctice," the mean score for preservice science teachers(4.10) is significantly lower thatthe mean score ofpmcticing science teachers (4.34)(p-.032, d=.48) (See Table 12.)
Table 12.
Preservice and Practicikg Science Teachers' Dfference on the Dimension "Community
Croups r-Test df
Prscticing
.51
.53
22
392
4.10
4.34
:2.151 412 .032 .48
For the STI dimeNioD, "science teachiqg praclrire," the mean score for prcsewice scienceteachen (3.89) is signifrcaltly lower than the mean score ofpmcticing science teachers(4.11\ (p=.021, d=.qq (See Table 13.)
Tablo 13.Differences in Preservice a d Practicing Science Teachers' Mean Scores on theDt^e^ion "S"i"*" f.*hi
Croups t-Test df
science teachersPracticing
22(21)'392
(399f
3.89
4.11
.51 LO82
.47
4r2 .038(424)' (.021)'
.44
Proceedings of the NARST 2009 Annual Meelrng
( )" $haws statistics ftom atr haampl€tQ dala se(!-430).
These results predict that preservice science teachers might have a lack ofmernbership orparticipation as a science teacher and experience to teach science tha[ practicing scienceteache$.
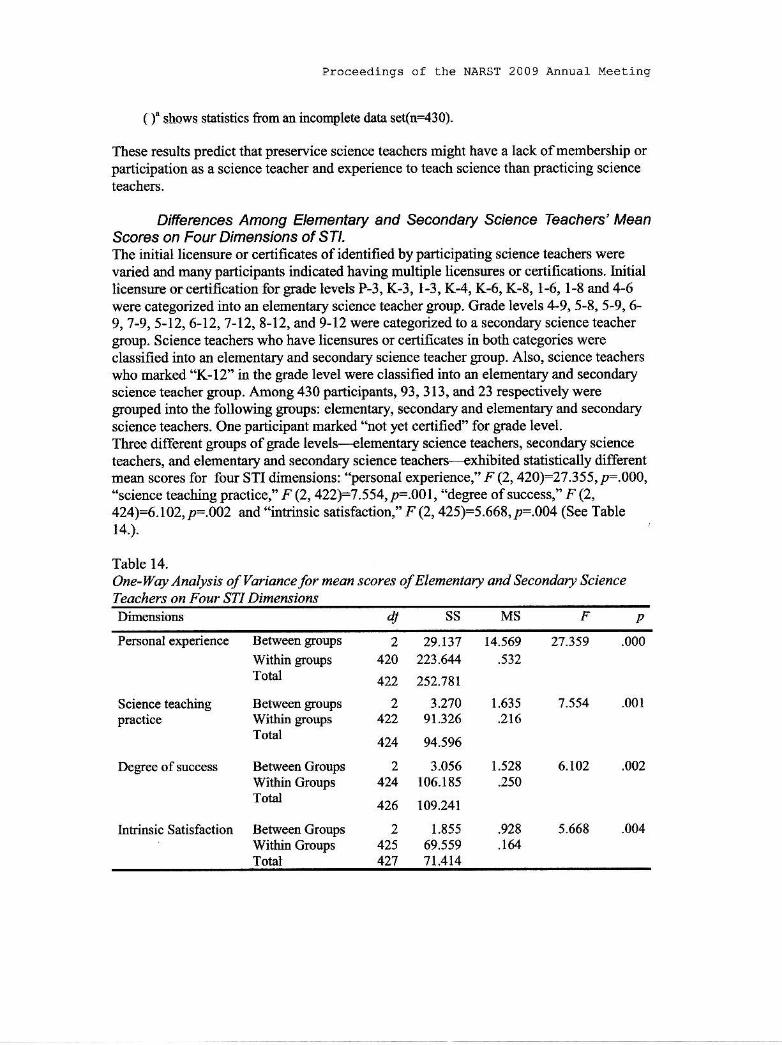
Differences Among Elementary and Secondary Science leachers' MeanScores on Four Dimensions of STl.The initial licensure or ceftificates of identified by participating science teacheN werevaried and many participants indicated having multiple lic€nsues or certifrcations. Initialliceffure or cediffcatiotr for grade lel€ls P-3, K-3, l-3, K-4, K-6, K-8, l-6, l-8 atrd 4-6\rere categodzed into an elementary scietce teacher goup. Gmde levels 4-9,5-a,5-9,6-9,7-9,5-12,6-12,7-12, 8-12, and 9-12 were categorized to a secondaly science teache!group. Science teacheB who have licensures oI cefiificates in both categories wereclassifred into an elementary aad secondary scielce teacher grcup. Also, science teachelswho marked "K-12" il the gtade level were classified into an elementary and secondaryscience teacher gloup. Amotrg 430 participants, 93, 313, and 23 rcspectively weregrouped into the following groups: €lernentaly, secondary a[d elementary and secondary
science teachers. One participant marked'1ot yet certified" for grade level.Three differed groups of gade levels----elementary science teache$, secondaxy science
teachers, and elementary and secondary science teachert--exhibited statistically differentmean soores for four STI dimensiots: 'lersoral expedence," F Q,420):27.355, p-.00O,"science teaching practlce," F (2,422)=7.554,p=.001, "degree of success," F (2,424)=6.102, p=-OO2 and "intrinsic satisfaction," F (2,425)=5.668, p=.004 (See Tablet4.).
Table 14.One-Way Analysis of Yariance for mean scores ofElementory ond Secohdary ScienceTeachers on Four STI DimensionsDimsnsioDs dl
Science teachingpractice
Degrce of success
Personal experienc€ Between groups
Within groupsTotal
Betwe gmupsWithi! groupsTotal
Between CroupsW_ithiD GroupsTota.l
Betweetr GrowsWithin GmupsTota}
27.359 .000
1.554 .001
6.102 .OO2
5.668 .004
2420
422
14.569
.532
1.635.2t6
t.528.250
.928
.164
24.22
424
2424
426
2425427
29.t37223.U4
252.781
3.2',709r.326
94.596
3.056106.185
to9.ut1.855
69.5597t.4t4
Iftrinsic Satisfaction

Proceedings of rhe NARST 2009 Annual Meelinq
Meaos and standaid deviatiorN for eacb group's scores on foul STI dimensioff aftpresented in Table 15. The mean scores were anal)zed by po6t hoc tests using turkeyHSD and Games-Howell because the rcsults for two dimensiotrs, "science teachingpractice" and "degee of success" can be assumed to exhibit about equal vaxiancesbetween groups, but the equal variances camot be assumed for the mean soorcs in theoth€r two dirB€*sio*ls, '!,ersooal experiences" and "iatrinsic satisfactiot." By post hocturkey HSD (Honestly significant differences) tests, significant mean differences betweenelementary science teachers and secondary science teache$ grcups in dimensions"science teaching practice" and "degree of success" werc .19509 (p=.000, F.40 )at\d .17127(p=4.011, d= .34) respectively. As shown in Table 15, elemertary scienceteachers' mean scores in two dimensiofls, "science teaching praaiice" and *d%ree ofsuccess" (TP 4.23, DS= 4.31) arc significantly higher thaa those of secondary soienceteache6(TP= 4.04, DS:4.15). From these findings, it can be suggested that elementaryscience teachers might believe that they are more successful in teaching science than dosecondary science teachers.Accoding to the Games-Ilowell post hoc test, the mean scorc ofsecondary scietrceteachers (4.17) is significantly different folm the mean scorc of elementaq/ scienceteachers (3.53) in the dimension "personal leaming experience" (D:.000, F.81). Thisresult suggests that secondary scietrce teachers have morc positive experiences inleaming scieirce therr do elalrrrdary sciellaa taaalr9rs. Ia th]€ dimaNion, "i!tsinsiasatisfaction," therc were signiflcant mean differences between elementary scienceteachers and elementary a.[d secondary science teacheis (p=.005, aF.69) alld betweensecondary science teachers and elementary and secondary science teacheN (p:.000,,F.76). The mean score ofelementary ard secondaxy science teachers (4.77) issignificantly higher tban both elementary science teachers (4.56) aad secordaqr scienceteachers (4.49). Science teache$ lice4sed or certified for both elementary and seconda4/science tearhers may experience more idtrinsic satisfaction as scietrce teacheN thanscience teacheE licensed or certified for either elementary or secoddary science teachers.
Table I5.Means and Standard Deviatiow for Elementary and Secondary Science Teachets onFour STI Dimensionc
$s, SD
ElementaryscienceTeacherssecondaryScienceTeachersElemeDtary andSecondarySci€Dc€TeachersTolal
3.5165 .90238 4.2326 .46604 4.3208 .4532',t 4.ss1 .34?6R
313 4.1579 .67529 4.0375 A6241 4.1495 .5t333 4.4A92 .42803
3.9130 .61103 4.U64 .4997 439A6 .50437 4.',1702 .25750
429 4.M6 .7'73 4,M6 .4'7234 4.mt2.5tt639 4.5189 4.08
Proceedings of the NARST 2009 Annua] Meeting
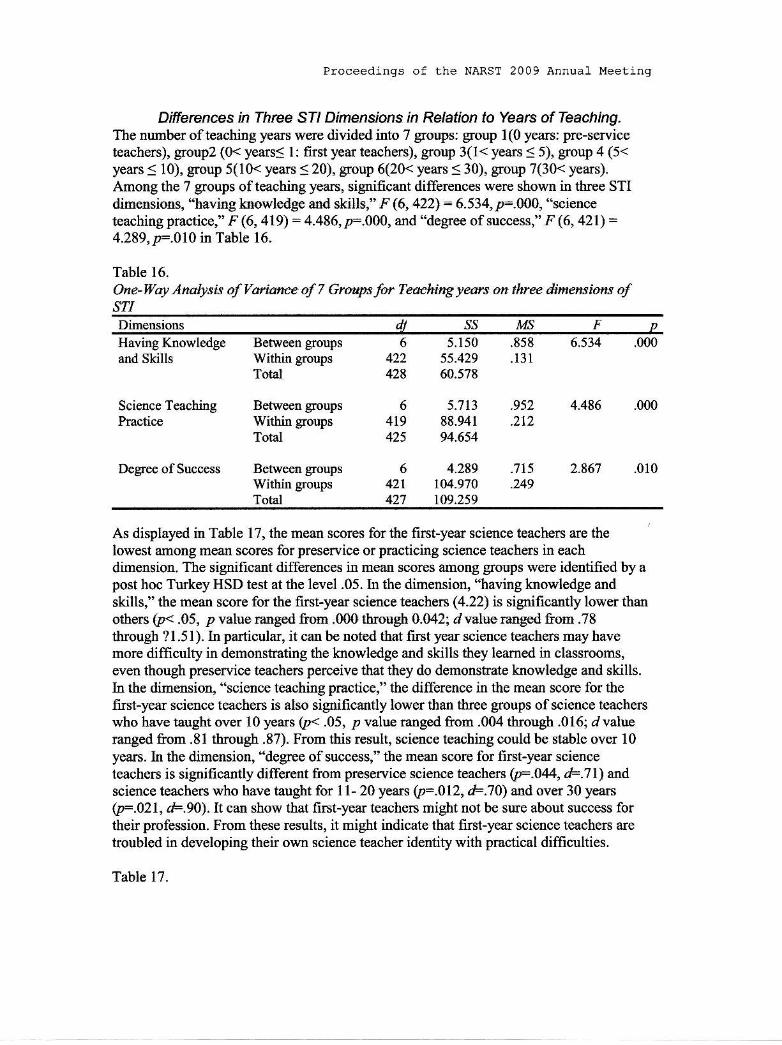
Ditrerences in Three STI Dimensians in Relation to Years of Teaching.The number ofteaching years were divided into 7 groups: group l(0 years: prc-serviceteachers), group2 (O< yea$S l: fust year teache6), goup 3(1< years I 5), group 4 (5<years S 10), goup 5(10< years S 20), goup 6(20< yea$ < 30), group 7(30< years).
Among the 7 groups of teaching years, significant differences were shos'n in thee sTIdih€trsio{s, "heviEg knowledg€ ard skills," "F (6, 422} - 6.53o O.OOO, "." "*"teaching practice," F (6 , 419) = 4.486, p=.000, and "degree of success ," F (6, 421) =4.289,p=.010 in Table 16.
Table 16.
Obe-V6y Anttlysis of ltariarce of V Groups for Teaehing years ot three dimeBiot8 ofST]Dimensions dlltuving Krowledgeand skills
Sci€nce T€achingPractic€
Degrc€ of Success
Between groupsWithin groupsTotai
Betweetr goupsWithin groupsTotaI
Between goupsWithin groupsTotal
6.s34 .000
.952
.'715
.249
6422428
6419425
6421421
5.1s055.42960.578
5.7t388.94194.654
4.249l0{'.970to9.259
.858
.131
4.486 .000
2467 010
As displayed in Table 1?, the mean scores for the first-year science teacheN are thelowest among mean scores for presewice or pmcticing science teachers in eachdimension. The significant differences in mean scorcs arnong groups were identified by apost hoc Tuftey HSD test at the level .05. In the dimension, ':having knowledge andskills," the mean score for the fi$t-year science teachen (4.22) is signifrcantly lower thanothers (p< .05, p value ranged from .000 tbrongh 0.042; r/value ranged fiom .78through ?l.51). In pafioular, it oan be noted that fiIst year science teachers may havemorc dilnculty in demoastrating the knowledge and skills they leamed in clas$ooms,even though preseffice teachers perceive that they do demonstrate knowledge and skills.In the dimension, "science teaching practice," the difference in the mean score for thefirst-year science teachers is atso sigiificantly tower than three groups of science teacherswho have taught over 10 years (p< .05, p value ranged from .004 through .016; / valuerarged from .81 though .87). Frcm this result, science teaching could be stable over l0years. ln the dimension, "degree of success," the mean score for fi$t-year sciencefeachers is significantly dillereat from preseryice science teachers (p=.044, F.7l) a
science teachers who have taught for 1l- 20 years (p=-012, F.70) and over 30 years
QF.021, d=.90).Il cur show that fiIst-year teachers might not be sure about success fortheir profession. From these results, it might indicate that fi$t-year science teachers aretroubled in developing their own science teacher identity with pEctical difiiculties.
Table l?.

Proceedings of lhe NARST 2009 Annual Meeting
Means and Slandard Deviatiarrs far 7 Grcaps ofTeaching years an Three STI
Teaching YearsSD s, SD
Gl: Years=0
G2: 0< y€{:s:: IG3: 1< years < 5G4:5< y€an < 10
G5: 10< years : 20G6: 20< years S 30C7: 30< yean
Tot l
28
2t104
85
105
5l35
429
4.5351
4.219n4.5096
4.58124.65524.6745
4.73t44.5846
.36531
.36826
.35018
.37113
.39467
.33211
.30657
3.8889
3.78574.03534.05624.197t4.196t4.20834.W2
.5063?
.52478
.418r'.1
.49542
.48979
.38831
.42608
.47193
4.3141 .481503.8730 .630054.1378 .480164.1706 .47414.2825 .544064.2026 .4834r
4.3194 .4t2844.200s .50584
Differences in Mean Score for The Dinension, Belief and Value"According to Science Major.From the dataset for secondary science teacheF (r-336), the number of science teacherswho majored in a single fie1d of sciences was 159. Ofthese, 89 majored in lifescience/biology, 17 majored in eartVspaoe science, 14 majored in chemistry, 4 majoredin ph)sics, I majored in phlsical science, and 33 majored in science education. Tocompensate for the disparity ia nunbers ofpaficipaDts across groupg four groupsclassified as chemistry, pblsics, and phlsical science were combhed into a single group.There was a significant mean difference ofbetween major grcups and the STI dimension,"belief and value," -F (3,155Y3.6'77 p=.014. T'be post-hoc test using Tu*ey (HSD) testrevealed that the mean soore for the combined goup ofchemishy, ph)sics and ph)sical ,
scieNe is lowEr thatr mean scores ofall other groups, in psticular, statistically lowerthan the mean score of science education groups (p: .009, F 1.0.).
Table 18.One-Ilay Analysis of l/ariance among Science Major Groups on the Dimension, "Beliefand Value"
s3dJ
B€tween GroupsWithin GroupsTotal
155158
3.49649.11852.614
1.165.3r7
3.677 .014
Table 19.Means and Standard Deviatio sfot Four Gloups ofSciebce Majors on the Dime sion,"Rplipfnhll Vnl p'
Science MajonLifelBiologyEath/Space ScienceChemisfy, Physics & Physical scienceScience EducationTotal
89l8l933
159
4.05064.01393.78954.31064.0692
.57798
.59700
.487'79
.54138
.5Tt06
Proceedinqs of lhe NARST 2009 Annual Meetinq
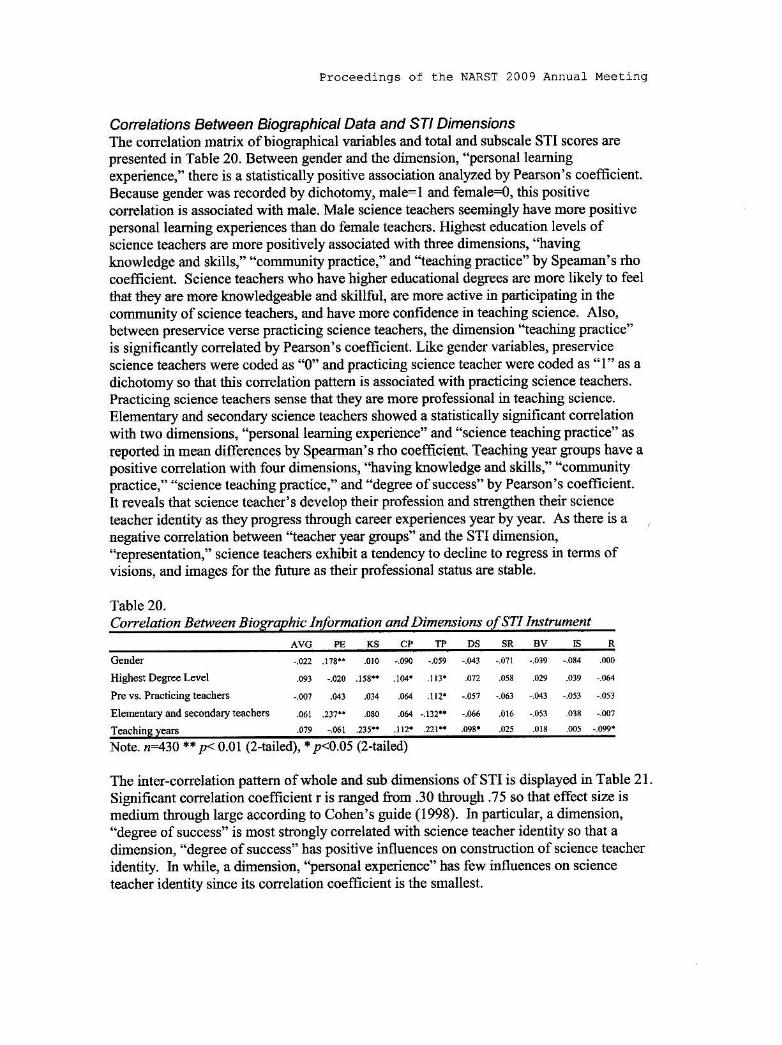
Carelations Between Biowphical Data and SI/ DimeosiorsThe cor€latior matix ofbiographical variables and total and subscale STI scorcs atepresented in Table 20. Between gender and the dimension, 'Dersonal leamingexperience," there is a statisticalty positive association analyzed by Pea$on's coefficient.Because gender was recorded by dichotomy, male:l and female=0, this positiveco{relatio* is associated witb mgl€. Male science teathers seerEingly have morc positivepelsotral leaming experiences than do female teachers. Highest education levels ofscience teachers are morc positively associated with three dimensions, "havingknowledge and skills," "community practice," and "teaching practice" by Speaman's rhocoefficiert. Science teachers wbo have higho educaiional degtees are more likely to feelthat they are more knowledgeable and skillfrrl, are mofe active ia paxticipatifig in thecommunity ofscience teachers, and have more confidence in teaching science. Also,between preservice velse practicing science teacheff, the dimension "teaching pmctice"is signi{icantly co(elated by Pea$on's coe{ficient. Like gender variables, preservice
science teachers were coded as "0" and practicitg science teachel were coded as "1" as adichotomy so that this cotelahbn pattem is associated wr'th practicing science teache$.Prscticing science teachers sense that they arc more professional in teaching science.
Elementary and secondary science teaphers showed a statistically significant correlationwith two dimensions, 'lersonal leaming experielce" atrd "science teachhg practice" as
lepartad i4 Eean ditrererres by SpaarEa,q's rho aoQfflaie[t. Taaahilg y9ar goups have apositive corelation vith four dimensions, "having knowledge and skills," "communitypmctice," "science teaching practice," and "degree of success" by PeaNon's coelficient.It rcveals that sci€nce teacher's develop their Fofession and strengthen theil science
teacher identity as they progress through career experiences year by year. As therc is a ,
negative correlation between "teacher year $oup!'' atrd the STI dime4sio4"iepresentation," science teachers exhibit a tendency to decline to regrcss ltr terms ofvisiorN, and images for the futule as their professional status are stable-
Table 20.Cunelahon Eetween Biogaphic Information and Dimensions ufSn hsmtmeit
AV{; PE KS CP T? DS SRBVISR
Prc w. Preticins tehe6
.022 .r73.. .0r0 -.071 .,0r9 -.034 .000
-.007 .04r .034 .064 lr2r -0t7
Ele@tlry and *condary l@h
Not€. r=430 'i Z< 0.01 (2-tail€d), 'p<0.05 (2-tailed)
The inter-correlation pattem ofwhole and srb dimensions of STI is displayed in Table 21.Significant corelatiotr coelficient r is raoged ftom .30 thrcugh .75 so that effect size ismedium tbrough large according to Cohen's guide (1998). In particular, a dimension,"degree of success" is most strongly corelated with science teacher identity so that adimension, "degree of success" has positive influences on constructtotr of science teachelidentity. In $.hile, a dimension, 'lersonal experience" has ftw influences on scisnce
teacher idetrtity since its corelation coefficient is the smallest.

Ploceedinqs of the NARST 2009 Annua] Meetinq
Table 21.Inter conelation of STI
PE
asCP
DS
SR
Is
,523t'
.16?.1 .t29rr .011
.413.. .479...395'.
,068 .002
Note. r:430 'r''p< 0.01 (2-tailed), *p<0.05 (2-tailed)
Development of Science Teacher ldentv among Preservice Science TeachersThe new STI insfument can be used to examine the effects ofprofessional developmentexpedenc€s on scierce teacher identify. I 7 preservice science teachers in a context ofgraduate levels ofscience teacher prepaiation progams showed significant charge ofscience teacher ider ity using the STI instument before and after student leaching aodifierview and docurnent anallsis.
Qu antitative Data Anal ysi sAs results ofone-group pretest-posttest among prcsewice science tearhers, ihe level ofscience teacher identity beforc and affer student teaching was signiflcalrtly increased.Padicularty, scores offive dimensions of Sfi, Aaving knowledge and skitts" (16F -2.416, p=.02a, E.5a;"science teaching practice," 416ts -3.257, p=.005, F.79; "degeeof success," (16): -3.574, p:.003, d=.84; "btinsic satisfaction," (16F -2.506, p=.023,F.64 and'?epresentation" {16)- -2.308, /-.035, F.50 are increased as well, in Table22. Tbree levels of science teacher identity, weak, modeete, and strong groups dividedafter the first adrnidistratioo ofthe questiontraire showed the change ofthe level ofscienc€ teachcr identity before ard after student teaching in Table 23. The STI score ofaweak science teacher was significantly increased before (,1F3.48 SF.l6) and afterstudent teaching (,1F3.80, SF.35), (5)= -3.2'19, F.022, d=l .15.
Table 22.Ihe Level ofchange among Preservice Science Teachers for 9 Dimensions and Score ofScience Teacher ldenlity
STI FTesr PMranB€fore
Personal
Experience4.31
(.s7)
4.24106
I 040 .1144.39
(.42)
4.0r

Proceedings of the NARST 2009 Annua] Meeting
knowled€€ and ( 43) G1\skillscolnmuniry 3.91765 4.o4 -.979 342practice (.52) (.52)
Science teaching 3.72 4 10 '3 25'7 .005
practice (.4:'\ (.49)
Degrc€ ofsuccess 3.65 4.0'l '3.574 003
(.44) (.55)
3.43 3.5E -.840 .413
(.41) (.74)SocialRespect
Beliefand value 3.96 4.01 -.416 .683
IntrinsicSatisfaction
Representation 3.86 4.16 -2 308 .035
(.52) (.68)
4.03 4,43 -2.506 .023
(.70) (.52\
AVG
(.62) (.56)
3.92 4.13 -2.308 .035
(.43) (.43')
ly'ote. ( ) preseDts standard deviatiorl
Table 23.The Chonge of Three Levels of Science Teachet ldentity Gro ps amohg Presewice
Science Teachers
GroupsBeforc Aftei
3.48 3.80 -3.2',t9 .022
(.16) (.35)3.87 4.15 -1.200 .296
(.oe) (.48)4.40 4-M -5',19 342
(.082) (.0?5) -.781 .470
Mr"ft" ""-t* "f pffi"tp-t- b.fore shrded teaching was 21 but 3 participants miss€d a post-
test and I participant left a school for private reason 6fter shd€nt teaching.
t-T€st P
(n=6)
Modemte(tFs)
SkoDg(na)
These rcsults can claim that prcseFice science teache$ have exp€rienced for professional
development itr improvitrg in having knowledge and skills to teach science: being more
comfofable and co;fident in teachitrg scietrce and classtoom malagpment; satisrying
intrinsically for their profession; and representing positively th€mselves as a science
teacher- These chaEg€s ofprofessional d€v€l,opm€4t can be pr€di€ted by STI instn'6ent'

Proc€edinqs of the NARST 2009 Annual lleeting
Qualitative Data AnalysisTo fifther examine the construct validify of tle science teacber idetrtity model,qualitative data were collected tbrough interviews and document analysis. Pe$onalintefliews were conducted with six participants who were grouped into three levels ofscience teacher identitl weak, moderate, and shong STI. Although two participants wereassigned to each group, one participsnt assigned to the weak group, ard ote padicipentassigned to the strong goup declined to participate in the fmal interview for personalrcasons. Tlrough these interviews, four themes were explored: the decision to become ascience teaoher, strdent teachirg expedelc€s and scierce teacher preparation programs,development iD tbe teacbing Fofession, and the scienc€ teacher and science teaching.
Decision to Become a Science TeacherSeveral reasons for becoming a science teacher werc identifled (e.g., personalbackgroun4 prefercnce for a subject, "science," academic success in science, scienceteachers, and family support). The most i]nportallt aspect in the decision to become ascierce teacher was "science" as a $*iect arca. Panicipants had positive experiencesrelated to science. For example, almost all interiewees me ioned tbat science was morcintelesting tlan other subjects, regardless oftheir grades in science. Participants alsomentioned wanting to be like their past scietrce tEachers, because their teachers were rolemodels for them. All irterviewees showed a stong enthusiasm in scierce. Also, duringthe first interview, they had strong canfidence in their ability to teach in the subjtct area.As secoDdary science tescherr have more positive learniag experiences, theseinterviewees who me preparing to be secondary science teachers also show positiveaft itudes toward science.
Student Teaching Experience and the Science Teacher PreparationPrognm.All interyiewees agreed that the science teacher Feparation prograE helped them tobecome a science teacher. They said that they were not science teacheN before theyenrolled in science tcacher cducatid programs, brt by the eld ofthe program, tbreeinterviewees believed that they became science teacheG even lhough they would not geta positio! as a science teacher. For example, one of irterviewee said, "Now, I am ascience teacher and I feel that I'm a science teacher. I argue and talk that. I Foved that. Igive atr example. It's me!" They appreciated that they leamed morc about how to teachsciencc atrd what to teach than what they had expected through the scienc! tcacherprepa.ation progmms. One of interviewees enjoyed exploring and plaming how to teachwhat he newly leamed in the teacher education Fogram. He felt he could develop hisown action research project during student teachiry. Among the vadous aspects ofthescience teacher preparation program (e.g., courseworlq student teaching, portfolio,rcflection seminax, action research and mock interview), student teaching expedenceswerc considered the most influential in Fomoting their Fofessional gm\''th and helpingthem preparc as a science teacher. Some participants emphasized that student teachingwas so important that it made theltr be a real teacher. Whetr they fiIst felt themselves tobe a science teacher was when they taught science in classrooms during sfudett teaching.Through the interviews, dree crucial aspects of student teaching on development ofscience teacher identity were identifed. First, student teachirg provid€s ar opportunity

Proceedinqs of the NARST 2009 Annual Meeting
for teacher irtems to experience the practical aspects ofteaching science. Theinteryiewees suggested that they could apply the knowledge and skills that they hadleamed and been leaming throughout the teachd education ptog&m. Second, it involvesthem as a science teacher ill the school cofimunity and in the science teacher professional
commmity. Through student teachirg, teacher interns develop a variety ofrelationshipswith diverse memb€$ ofthe educational community: faculty, rB€lltors, supervisors,
students, and other science teachers. Interviewees found the basis for their satisfactionand commifnent in teaching science through developing a rapport v.ith students. Third,student teaching promotes increased confideDce in teaching science thtough experiencinga degrce ofsuccess. Either failue or success in implementing lesson plans or activities inclassrooms werc valDable in helping them to come to leam about their weakness andstengths in teaching science and managing clas$ooms. overall, student teachingexperiences was felt to have a more valuable impact on the development of science
teacher identity than other aspect of the program.
Development of leaching Prcfession.Progress in professional preparation was reported as being in varyi4 stages ofdevelopmgnt during the middle of the program, but almost at the same level of 90-100%complete for all irterviewees by the end ofthe progtam. Teacher intems felt that tleywarc alrcady saierrpe teaahc$ or leady to be scieDle teaahqs by tl]p cni ofthe Fogram.Some intervie{ees did express concenls regarding thei! fi$t year ofteachin& but theybelieved that they would be perfeptly fine science teachets aiiet fi$t,€ar ofteaching.These conoems were represented as a critical crisis of fust-yeat teacheN for developmentin the science teaching profession as presented in comparison of mean differences withteaching years groupr. Inteniewees identified themselves as being more professional as
science teachers than they were at the beginning ofthe plogram. They mentioned theirlesson plaas as a good example to show their professional development atrd growthbecause it has been changed and improved in comparison with their besinning and
eDding of student t€acbing.
Science Teacher and Science Teaching.Before entedng the science teacher prepamtion program, initial perceptions and images
of science teachers held by prcservice science teachers were vaded. Therc were positiveor tregative perception and images. They indicated that social respect influenced slightlyon the carcer decisions. For example, "science teacheN are alwa)s smart than otherteachers." "Being a sci€nce teachers were so boringjob." They pointed out several
characteristics of good science teache6: being knowledgeable, preparing and planninglessons, having a passion, est4blishing good rclationship with students, and managing and
organizing clas$ooms. About scieoce teaching, they had an etrthusiasm and passion.
They had challenges or difficulties ofteaching science, which are mostly rclated tocontent knowledge and pedagogical ldowledge. Although they had a bachelor's degree inscience majon, they felt a lack of pedagogical content knowledge to teach science tostude s. These interpretations might suggest the same co4clusion that secondary science
teache$ have lower in confidence ilr s€ieace tescbitrg p*actice and degree of s*ccess thando elementary science teachem.
Proceedings of the NARST 2009 Annual Meeli.g
Discussion
Results ofthis study include descriptive statistics, estimates ofreliability ofan instrumentused to measure the level of science teacher identity and its postulated dimensions,correlation pattems among several variables purportedly related to the conceptual modelon which the hstnun€at is hs€d, co$parisorls of STI scores atnong va.ious groups ofscience teachers, and the outcome ofa factor analysis used to examine the Fedicteddimensions of science teacher identity. Therefore, we provide empirical evidencesupporting a new conceptual model of science teacher identity as follows;
. Tbe underling structt]re ofthe STI model is identifie4 and ar array ofpredictedcorrelations are presented. Factor anallsis provides evidenc€ thtt the scaledeveloped to measue science teacher identity does compdse nine subscalesrcpresenting nine dimensions of the STI model. Though a total of I I facto$ wereextracted tkough con{irmatory factor alalysis, forrl factors axe interpreted as
representing two complementary aspects oftwo factors. All factor loading scoresarc interyrcted as sigtrificanl and tbere are no mixed facto$. Fufiher, the ninefactors accourf for 640/o ofthe vsriance in scale scores, and all subscales are
significantly corelated as predicted, with the excsptiotr of some corelation on onesvbscale (Persona| E perience)
. It is demonstrated that tlrc proposad drfnltlsiolls af $cielca teacher identity aan bereliably and validly measured with a newly constucted instrument. Total ST1 scoreexhibited a reliability co€Ificient of.E9 when used with the paricipants ofthisstudy, and subscale reliabilities ranged ftom .60 to .85. To check for sampling biasthat could result ftom excluding data fiom participants who did not respond to allitems ofthe survey, reliability coeffrcients were calculated for all participadgroupings, and the results were consistent across grcups. Evidence of contentvalidity was provided in a pilot study, ard evidence of construct validity wasinitiated with this study. Preliminary evidence is provided by confirmation ofmodel shucture through factor anal)sis; robustness ofrcliability coefricients aqossgonps studie4 tfte pattem ofpositive correlations among STI instnnent subscales,the pattem ofrelationships noted between STI scores and a vaxiety ofextemalbiogaphical variables, and confimation of a.n itrcrease in STI levels as teacherintems progess thiough a teacher prepamtion progmm.
. The new STI ilstnrment can be used to examine the effects ofprofessionaldevelopment expedences on science teacher identiry. In this study, STI scale scoreswere found to increase as teacher intems progFssed tbrough the field component oftheir teacher prepalation proglam.
. The STI instument can provide science teacher identify profiles ofwhole or sub-dimensions ofgroups based on biographical information. As one would predict ifthe STI model is valid, STI scale score was found to be positively associated withincreased teaching experience, knowledge and skills, level ofeducatio4 and othervariables associated with pe$onal and professional gro*th.
Our interpretation ofthe results presented herc is that Science Teacher Identity is arlattdbute that can be indirectly measued usiEg the STI instIus€nt des$ibed here. Th€instrument strucrule rcflects a conceptual model ofscience teacher identity that has been
constructed on the basis of the avarlable reseaxch. both within education and in related

Proceedings of the NARST 2009 Annuat Meeting
professional areas. The pattem ofcotrelations and compadsons presented here also
provide initial evidence of construct validity, but there is clearly much work to be done totest the tunctional utility ofboth the STI model and the associated STI instrument.
Contribution to the Teaching and Learning of Science
Beyond inqeasing awal€ness ofthe psychologlcal construct of science teacher identity as
atr emerying vaxiable of interest io the science education discourse commtmity, theavailability ofan instrument to measure science teachor idedity provides a powerfirl newtool for examining longstaDding issues and concems in the field. ln particular, this newinstrEnent can be used to broaden rcsearch on: a) the effects of science teacherprepamtion programs and professional developmed experiences; b) facton related torequitment, retention, and tumover amorg scielce teachers; and c) the influence ofpmfessional pmctices and expectations on plofessional identity- Among science teacher
educators, the outcones ofthis study identifu scie[ce teacher identity as alr importantvariable to consider when gauging the impact ofteacher preparation prog€ms. On a moreindividual level, for science teachers, finditgs from use of this new model and irstnrmentmay provide guidelines for career decisioN and pmfessional development pathwa)s.
ReferencesAbell, S. K. (2000). From professor to colleague: Creating a professional identity as
collabomtor in elementary scier.ce. Journal ofResearch in Science TeachinS,
37(6),548-562.Beijaar4 D., Verloop, N., and vemun! l. D. (2000). Teachers' perceptions ofprofessional
identity: an exploratory shrdy ftom a personal knowledgepe$pective. Teachw andTeacher ed cation, I6,'149-764.
Beijaard, D., Meter, P. C., and Verloop, N. (2004). Reconsidering research on teache$'professional identity. Teac hing and Teacher education, 20,101-128.
B:own, T. (2006). Negotiathg psychological distu$an€€ in pr€-s€rvice teacher educatios.Teaching and Teacher education, 2 2, 67 5-689 .
Committee on science and mathematics teacher prcparation & National research coutrcil.(2001). Educating teochers of science, mathemotics, and technologl: Newprcclice for the new millenrrium. Washtttgtofi, DC: National Academy Press.
Cohen, J. (1988). Srottstieal power atd analy*is for the behavioral scietcer {2nd cd.).Hillsdale, NJ: Lawrence Eilbaum Associates.
Day, C., Elliot, 8., and Kington, A. (2005). Reform, standards and teacher identity:Challenges of sustainiq cofirnitlne'l,t. Teaching and teacher edueation, 2 I , 563'577.
Danelwicz, I. (2001). Teachihg selves: Identity, pedagogt, and teacher education(Ch4pters 5 & 6, pp. l l l-179). Albant NY: state University ofNew York Press
Eick, C. J. and Reed, C. (2002). What makes an inquiy-orietrted science teacher? Theinfluence of leaming histories on student teachd role identity and Factice.Science tulucation, 86, 4Q1 -416.
Enyedy, N. Goldberg, J., and wels\ K. M. (2006). Complex dilemmas of identity andpmctice. Science Education, 90, 68-93 .

Proceedings of the NARS1 2009 Annual Meeting
GorEalez, L. E., Brown, M., & Slate,l. (2008). Teachers who left the teachingprofession: A qualitativ. '.Jfndercta'J.ding. The Qualitative Report, I3(l),l-ll.
Hair, J.F., JI. I Anderson, R. E., Tatham, R.L. and Black, W.C. (1998). Multivariate dataanalysis with readings. 56 ed.. Englewood Cliffs. NJ: Prentice-Haly
Helms, J. V. (1998). Science-and me: Subject mafter and identity in secondary school6ci€nc€ t€erhers. "Ior.md! ef Resesxh ir. Scie4ce Teaching, 35(7'1,811l3y'.
Ingersoll, R.M. (2001) Teacher Tumover ard Teacher Shortages: An OrganizalionalAnal1sis. Ameictm Educational Research Joumal, 38 (3): 499-534.
Jakubowski, T. G. aDd Dembo, M. (2004). The telationship ofself-efficacy, identity style,and stage of change with academic self-regulatioi. Jounal ofcollege Readingand Leominq, 3 X\), 7 -24,
Kozoll, R. and Osbome, M. D. (20M). Firding meaning in science: Lifeworl4 identity,utd self. Science Education, 88, 151 -l8l .
taderman, N. G.. (1992) Shrdents' and teache6' conceptions ofthe natue ofscience: a
aevielv of the research, Joumal of Research in Scie ce Teachitlg, 29,331-359.LederarDn, N. G. (1996). Teachen' understanding ofthe natwe ofscience ard classroom
practice: factors that facililste or impede the relalionship, Joumal ofResearch inScience Teachike, 3 6\8'), 91 6-929.
Liu, x. S. and Ramsey, J. (2008). Teachen'jos satisfactioD: Anallsis ofthe teacher
follow-up survey iD thr Uldtad Stalas far 2000-2001. Teoching and TeacherEducation, 24, I 173 -l 184.
Lwm, S. (2002). 'What we think we can safely say...': Primary teache$' vi€ws ofthenatue of science. -Britir h Educational Research Joumal, 28(5),649-672.
Proweller, A. and Mitchener, C. P. (2004). Building teacher identity with urban youth:Voices ofb€gindng middle school science teachets i! an alternative certificatio$prcgram. Joumal oJ Research in Science Teaching, 41(10), 1044-1062.
Raubenheim, J. E. (2004). An item selection prccedure to maximize scale reliability andvalidity. South African Joumal of Industrial Psycholog), 30(4),59-64.
Snyder, E. and SFeitzer, E. (1984). ldentity and commitm€trt to the teacher role.Teaching sociologt, 1I (2), l5l-166.
Solomon, J-, Scott, L., & Duveen, J. (1996). I-arge-scale exploration ofpupils'understanding of the nature of scietfie, Sciehce Educatiott,80,493-508.
Solo on, J. (2000). Pinal word. Interchange, 31(4) 361-368.Starr, S., e/ a/. (2003) Commrmity FeceptoB' yiews ofthei identities as teachers.
Acadetuic Medici e, Z8(8), 820-825.Stan, S., et af. (2006). Initial testing of an instrument to measure teacher id€ntity ir
physicians. Teaching and Leaming Medicine, 1 8(2), 1 17 -125.The Natioral Commission on Mathematics aod Science Teaching for the 2l"t century
[NCMST]. (2000).Berre it's tao late: A rcpott to lhe nalion fram the natianalcommission on mathematics and scknce kachingfor he 2f' cennry.Washington, DC: U.S. Depafiment ofEducation.
Vaxeals, M., House, R., and Wenzel, S. (2005). Beginning teachers immersed intoscience: Scientist and science teacher idsntities. Science Education, 89,402-516.
Volkmann, M- J. and And€rso*, M. A- {1998)- Cr€atfug prof€ssional idertity: Diledmasand rn€taphols of a first-year chemistry teacher. Scierce Mucation, 82(3),293-310.


